REVIEW PAPER Strategies for reducing the carbon footprint of field crops for semiarid areas. A review Yantai Gan & Chang Liang & Chantal Hamel & Herb Cutforth & Hong Wang Accepted: 23 November 2010 / Published online: 8 March 2011 # INRA and Springer Science+Business Media B.V. 2011 Abstract The Earth’s climate is rapidly changing largely due to increasing anthropogenic greenhouse gas (GHG) emissions. Agricultural practices during crop production, food processing, and product marketing all generate GHG, contributing to the global climate change. The general public and farmers are urging the development and adoption of effective measures to reduce GHG emissions from all agricultural activities and sectors. However, quantitative information is not available in regard to what strategies and practices should be adopted to reduce emission from agriculture and how crop productivity would affect the intensity of GHG emission. To provide the potential solution, we estimated the carbon footprint [i.e., the total amount of GHG associated with the production and distribution of a given food product expressed in carbon dioxide equivalence (CO 2 e)] for some of the major field crops grown on the Canadian prairie and assessed the effect of crop sequences on the carbon footprint of durum wheat. Key strategies for reducing the carbon footprint of various field crops grown in semiarid areas were identified. Carbon footprints were estimated using emissions from (1) the decomposition of crop straw and roots; (2) the manufacture of N and P fertilizers and their rates of application; (3) the production of herbicides and fungicides; and (4) miscellaneous farm field operations. Production and application of N fertilizers accounted for 57% to 65% of the total footprint, those from crop residue decomposition 16% to 30%, and the remaining portion of the footprint included CO 2 e from the production of P fertilizer and pesticides, and from miscellaneous field operations. Crops grown in the Brown soil zone had the lowest carbon footprint, averaging 0.46 kg CO 2 e kg -1 of grain, whereas crops grown in the Black soil zone had a larger average carbon footprint of 0.83 kg CO 2 e kg −1 of grain. The average carbon footprint for crops grown in the Dark Brown soil zone was intermediate to the other two at 0.61 kg CO 2 e kg −1 of grain. One kilogram of grain product emitted 0.80 kg CO 2 e for canola (Brassica napus L.), 0.59 for mustard (Brassica juncea L.) and flaxseed (Linum usitatissimum L.), 0.46 for spring wheat (Triticum aestivum L.), and 0.20 to 0.33 kg CO 2 e for chickpea (Cicer arietinum L.), dry pea (Pisum sativum L.), and lentil (Lens culinaris Medik.). Durum wheat (T . aestivum L.) preceded by an N-fixing crop (i.e., pulses) emitted total greenhouse gases of 673 kg CO 2 e, 20% lower than when the crop was preceded by a cereal crop. Similarly, durum wheat preceded by an oilseed emitted 744 kg CO 2 e, 11% lower than when preceded by a cereal. The carbon footprint for durum grown after a pulse was 0.25 kg CO 2 e per kg of the grain and 0.28 kg CO 2 e per kg of the grain when grown after an oilseed: a reduction in the carbon footprint of 24% to 32% than when grown after a cereal. The average carbon footprint can be lowered by as much as 24% for crops grown in the Black, 28% in the Dark Brown, and 37% in the Brown soil zones, through improved agronomic practices, increased N use efficiency, use of diversified cropping systems, adoption of crop cultivars with high harvest index, and the use of soil bioresources such as P-solublizers and arbuscular mycor- rhizal fungi in crop production. Y. Gan (*) : C. Hamel : H. Cutforth : H. Wang Semiarid Prairie Agricultural Research Centre, Agriculture and Agri-Food Canada, Swift Current, SK S9H 3X2, Canada e-mail: [email protected] C. Liang Greenhouse Gas Emission Division, Environment Canada, 9th Floor, Fontain Building, 200 Sacré-Coeur, Gatineau, QC K1A 0H3, Canada Agronomy Sust. Developm. (2011) 31:643–656 DOI 10.1007/s13593-011-0011-7

Welcome message from author
This document is posted to help you gain knowledge. Please leave a comment to let me know what you think about it! Share it to your friends and learn new things together.
Transcript

REVIEW PAPER
Strategies for reducing the carbon footprint of field cropsfor semiarid areas. A review
Yantai Gan & Chang Liang & Chantal Hamel &Herb Cutforth & Hong Wang
Accepted: 23 November 2010 /Published online: 8 March 2011# INRA and Springer Science+Business Media B.V. 2011
Abstract The Earth’s climate is rapidly changing largelydue to increasing anthropogenic greenhouse gas (GHG)emissions. Agricultural practices during crop production,food processing, and product marketing all generate GHG,contributing to the global climate change. The generalpublic and farmers are urging the development andadoption of effective measures to reduce GHG emissionsfrom all agricultural activities and sectors. However,quantitative information is not available in regard to whatstrategies and practices should be adopted to reduceemission from agriculture and how crop productivity wouldaffect the intensity of GHG emission. To provide thepotential solution, we estimated the carbon footprint [i.e.,the total amount of GHG associated with the productionand distribution of a given food product expressed incarbon dioxide equivalence (CO2e)] for some of the majorfield crops grown on the Canadian prairie and assessed theeffect of crop sequences on the carbon footprint of durumwheat. Key strategies for reducing the carbon footprint ofvarious field crops grown in semiarid areas were identified.Carbon footprints were estimated using emissions from (1)the decomposition of crop straw and roots; (2) themanufacture of N and P fertilizers and their rates ofapplication; (3) the production of herbicides and fungicides;
and (4) miscellaneous farm field operations. Production andapplication of N fertilizers accounted for 57% to 65% of thetotal footprint, those from crop residue decomposition 16%to 30%, and the remaining portion of the footprint includedCO2e from the production of P fertilizer and pesticides, andfrom miscellaneous field operations. Crops grown in theBrown soil zone had the lowest carbon footprint, averaging0.46 kg CO2e kg−1 of grain, whereas crops grown in theBlack soil zone had a larger average carbon footprint of0.83 kg CO2e kg−1 of grain. The average carbon footprintfor crops grown in the Dark Brown soil zone wasintermediate to the other two at 0.61 kg CO2e kg−1 ofgrain. One kilogram of grain product emitted 0.80 kg CO2efor canola (Brassica napus L.), 0.59 for mustard (Brassicajuncea L.) and flaxseed (Linum usitatissimum L.), 0.46 forspring wheat (Triticum aestivum L.), and 0.20 to 0.33 kgCO2e for chickpea (Cicer arietinum L.), dry pea (Pisumsativum L.), and lentil (Lens culinaris Medik.). Durumwheat (T. aestivum L.) preceded by an N-fixing crop (i.e.,pulses) emitted total greenhouse gases of 673 kg CO2e,20% lower than when the crop was preceded by a cerealcrop. Similarly, durum wheat preceded by an oilseedemitted 744 kg CO2e, 11% lower than when preceded bya cereal. The carbon footprint for durum grown after a pulsewas 0.25 kg CO2e per kg of the grain and 0.28 kg CO2e perkg of the grain when grown after an oilseed: a reduction inthe carbon footprint of 24% to 32% than when grown aftera cereal. The average carbon footprint can be lowered by asmuch as 24% for crops grown in the Black, 28% in theDark Brown, and 37% in the Brown soil zones, throughimproved agronomic practices, increased N use efficiency,use of diversified cropping systems, adoption of cropcultivars with high harvest index, and the use of soilbioresources such as P-solublizers and arbuscular mycor-rhizal fungi in crop production.
Y. Gan (*) : C. Hamel :H. Cutforth :H. WangSemiarid Prairie Agricultural Research Centre,Agriculture and Agri-Food Canada,Swift Current, SK S9H 3X2, Canadae-mail: [email protected]
C. LiangGreenhouse Gas Emission Division, Environment Canada,9th Floor, Fontain Building, 200 Sacré-Coeur,Gatineau, QC K1A 0H3, Canada
Agronomy Sust. Developm. (2011) 31:643–656DOI 10.1007/s13593-011-0011-7

Keywords Carbon footprint . Legumes . Oilseeds .
Broadleaf crops . Biochar . Crop diversification . Carbonsequestration . Straw management . Input . N-fixation
Contents
1. Introduction . . . . . . . . . . . . . . . . . . . . . . . . . . . . . 22. Calculation of carbon footprints . . . . . . . . . . . . . . . 33. Strategies and practices for lowering carbon footprints . 33.1. Choosing crop species with a low carbon footprint . . 33.2. Diversifying cropping systems to reduce carbon
footprints . . . . . . . . . . . . . . . . . . . . . . . . . . . . . . 53.3. Including biological N-fixation to reduce the input of
synthetic N fertilizer . . . . . . . . . . . . . . . . . . . . . . . 73.4. Improving nutrient use efficiency using biotechnologies
valorizing soil microbial resources . . . . . . . . . . . . . 83.5. Cropping systems and energy use efficiency in the
semiarid Canadian prairie . . . . . . . . . . . . . . . . . . . 103.6. Improving crop residue management in farming
systems . . . . . . . . . . . . . . . . . . . . . . . . . . . . . . . 114. Conclusions . . . . . . . . . . . . . . . . . . . . . . . . . . . . 125. References . . . . . . . . . . . . . . . . . . . . . . . . . . . . . 12
1 Introduction
Scientific evidence suggests the Earth’s climate has recentlybeen rapidly changing, largely due to increasing anthropo-genic greenhouse gas (GHG) emissions (Ruddiman 2003;IPCC 2006). Policy-makers, the general public, and farmersare concerned about climate change and are urging thedevelopment and adoption of effective measures to reduceGHG emissions from all sectors. Ambitious actions leadingto drastic reduction of GHG emissions may initially bedetrimental to the growth of the economy (Wiedmann et al.2006), but this initial cost will likely be small comparedwith the damage caused by climate change several decadeshence (Viscusi and Zeckhauser 2006).
Agriculture includes the production of various grains,fibers, feedstocks, and fresh produce such as vegetables andfruits, as well as marketing these products along foodchains. Crop production, food processing, and productmarketing all generate GHG, contributing to global climatechange (Dyer et al. 2010). In 2008, agriculture in Canadaproduced approximately 62 million tonnes of CO2 equiv-alent emissions, about 8% of Canada’s total emissions(Environment Canada 2010). Nearly two thirds of agricul-tural emissions occur as N2O, which has 300 times theglobal warming potential of CO2 (Forster et al. 2007).Emissions in agriculture also include those from the inputsof fertilizers, manures, plant litter, and those from theinterwoven flows of N among several pools. Farming alsoremoves CH4 from the ecosystem by the oxidative activity
of soil microbes, but such removals are small comparedwith emissions (Janzen et al. 2006).
“Carbon footprint” has become a widely used term in thepublic debate on the abatement action required to diminishthe threat of global climate change (Wiedmann and Minx2008). The term originally stemmed from the first academicpublication discussing “ecological footprinting” by Rees(1992) and was further defined by Wackernagel (1994) whoprovided a more detailed method of calculating footprints.In general, carbon footprint stands for a certain amount ofgaseous emissions that are relevant to climate change andassociated with human production or consumption activi-ties. Wiedmann and Minx (2008) discussed in detail thedefinition of carbon footprint and defined carbon footprintas “a measure of the exclusive total amount of carbondioxide emissions that is directly and indirectly caused byan activity or is accumulated over the life stages of aproduct”. However, this definition does not emphasizeemissions of greenhouse gases other than CO2. Withregards to crop production and other agricultural services,a larger portion of the total GHG emission occurs as N2O,rather than CO2 (Janzen et al. 2006). Therefore, in ourdiscussion, the carbon footprint relevant to agriculturalproducts and processes is defined as the total amount ofgreenhouse gas emission associated with a food product ora service, expressed in carbon dioxide equivalence (CO2e).The focus is on two components: (1) the total emission perunit area per year expressed as kilograms CO2e per hectareper year, and (2) the emission per unit (kilograms) ofproduct produced expressed as kilograms CO2e perkilogram of product. These two components parallel theapproaches with which the efficiency of agriculturalproductivity is evaluated, i.e., (1) the net production perunit area such as grain yield per hectare per year and (2) thecosts associated with the production of a unit of productsuch as input costs per kilograms of grain produced.
Most consumers and citizens are willing to pay formeasures leading to drastic reductions in GHG emis-sions. A growing number of consumers want to know thecarbon footprint of the food products they buy in grocerystores. In response, some multinational food companieshave proposed that suppliers identify on product labelsthe CO2e emissions released in the production of thatparticular food item. Farmers are eager to adopt improvedmitigation practices on their farms. Therefore, it is criticalthat integrated strategies and practices are developed forfarming systems so as to maximize agriculture’s produc-tivity while minimizing the greenhouse gas emissions inthe production of grains, fibers, feedstocks, and otheragricultural products. In this paper, we determined thecarbon footprint of seven major field crops grown on theCanadian prairie and assessed the effect of croppingsystems on the carbon footprint of a major grain crop—
644 Yantai Gan et al

durum wheat. We also used some examples from theCanadian prairies and summarized key agronomic strate-gies for reducing the carbon footprint of field crops grownin semiarid environments.
2 Calculation of carbon footprints
We estimated the carbon footprint of various products usingthe sum of the greenhouse gas emissions from (a) thedecomposition of straw and roots, (b) the application ofsynthetic N fertilizers, (c) the manufacture of N and Pfertilizers, (d) the production of herbicides and fungicides, and(e) various farm field operations including pre-seeding tillage,sowing, spraying pesticides, harvesting grain products, andstorage of grains on-farm when needed. Other emissions suchas those associated with labor and machinery depreciationwere assumed to be similar between crop species or croppingsystems and thus, unless stated otherwise, omitted in thecomparisons of various cropping systems.
When a field crop is harvested, a portion of the crop isleft on the soil surface to decompose. The remaining plantmatter such as straw and roots is a nitrogen (N) source fornitrification and denitrification, contributing directly andindirectly to N2O production (Forster et al. 2007). Similar-ly, the application of synthetic N fertilizers for cropproduction generates N2O. The amount of N contained inthe straw and roots from various crops were estimated usingspecific crop N concentrations (Janzen et al. 2003), alongwith crop yields (Gan et al. 2009). The total emissions fromcrop components were estimated using the Intergovern-mental Panel on Climate Change (IPCC) methodology(IPCC 2006) adapted for Canadian conditions (Rochette etal. 2008). Emissions from crop residue decompositionincluded direct and leaching emissions. Emissions fromsynthetic N application included direct, volatilization, andleaching emissions. Direct emission factors for crop residuedecomposition and synthetic N application were determinedusing the approach of Rochette et al. (2008) as follows:
EF ¼ 0:022 P=PE� 0:0048 ð1Þwhere EF is the emission factor with a unit of kilogramsN2O-N per kilogram N; P/PE is the ratio of precipitation topotential evapotranspiration during the growing season(May 1–October 31) based on long-term (1950–2008) data.Similarly, the fraction of N subject to leaching (FRACleach)is estimated to be proportional to P/PE (Rochette et al.2008) as follows:
FRACLeach ¼ 0:3247 P=PE� 0:0247 ð2ÞFor synthetic N fertilizer applied in crop production, a
portion of N is volatilized and emitted to the atmosphere.
The IPCC default volatilization factor of NH3 and NOx
(FRACGASM=0.1) was used, and the emission factorsassociated with leaching and volatilization of N were takenfrom the 2006 IPCC guidelines (IPCC 2006). The climaticconditions and emission factors for different soil-climaticzones of western Canada are listed in Table 1. Emissionsfrom the production, transportation, storage, and transfer ofN and P fertilizers to farm fields were estimated using themethod of Lal (2004); the average emission factor was4.8 kg CO2e kg−1 N and 0.73 kg CO2e kg−1 P2O5.
Herbicides and fungicides such as boscalid, bromoxynil,glyphosate, imazamox, imazethapyr, pyraclostrobin, andsethoxydim, are routinely used in the production of fieldcrops on the Canadian prairies. Emission factors for each ofthese individual pesticides are not available, but we assumethat the emission during the processes of production,transportation, storage, and field application are similarbetween products. Thus, an average emission factor of23.1 kg CO2e ha−1 was used for herbicides and 14.3 kgCO2e ha−1 for fungicides; the estimates were based on theactive ingredient of the product (Lal 2004). The absolutevalue of the carbon footprint for individual productscalculated using these factors may vary since the produc-tion of each product may differ widely. However, therelative values of the carbon footprint estimated for variouscrop species (Table 2), and the general trends amongcropping systems (Table 3) will be reasonable given that theportion of the footprint from pesticides used in agricultureis generally small (Lal 2004).
The emissions associated with miscellaneous farmoperations such as no-till planting, pesticide spraying,windrowing (in case of canola), and combine harvestingwere estimated using a factor of 14 kg CO2e ha
−1 for no-tillplanting, 5 kg CO2e ha−1 for herbicide and fungicideapplication, 18 kg CO2e ha−1 for windrowing, and 37 kgCO2e ha−1 for harvesting (adapted from Lal 2004).
3 Strategies and practices for lowering carbonfootprints
3.1 Choosing crop species with a low carbon footprint
The carbon footprint of a grain product varies with cropspecies, agronomic practices, and climatic conditions underwhich the crop is grown. About 32 million ha of farmlandare under annual crop production on the Canadian prairies(Campbell et al. 2002), accounting for >80% of the annualcrop land in Canada. There are three major soil zones onthe prairies: the Brown (Aridic Haploboroll), Dark Brown(Typic Boroll), and Black (Typic Haplustoll) Chernozems.Climatic conditions, and thus crops grown, fertilizer andchemical inputs, and field operations vary substantially
Strategies for reducing the carbon footprint of field crops 645

among the soil zones. The estimates of the carbon footprintfor various crops are dependent upon the prevailing climate,and therefore, soil zone.
Calculated using the models described above, theaverage emissions were 484, 717, and 1,024 kg CO2eha−1 for field crops grown in the Brown, Dark Brown, andBlack soil zones, respectively (Table 2). Major contributorsto the emissions are production, transportation, storage andtransfer, application of synthetic N fertilizers, and cropresidue decomposition (data not shown). Production andapplication of N fertilizers account for about 57% to 65%of the total emissions, and crop residue decompositionaccounts for a further 16 to 30%, with the percentagesincreasing with soil zone: Brown<Dark Brown<Black soilzone. The higher emissions associated with crop residuedecomposition for the Black soil zone are mainly due togreater crop yield and to a higher emission factor because
of more favorable climatic conditions during the growingseason (Table 1). The remaining 13% to 18% of the emissiontotal are associated with the production of phosphorusfertilizers, herbicides, fungicides, and inoculants (for pulsecrops), as well as miscellaneous field operations.
Nitrous oxide is mostly produced during denitrification,which is greatly influenced by soil moisture (Flynn et al.2005). In moisture-limited conditions, N2O emissions in-crease with increased rainfall (Dobbie et al. 1999; Flynn et al.2005). The soil N2O emissions due to crop residuedecomposition and application of synthetic N fertilizers areestimated as 0.004, 0.008, and 0.0125 kg N2O-N kg−1 N forthe Brown, Dark Brown, and Black soil zones, respectively—largely because of differences in precipitation and potentialevapotranspiration (Table 1).
Among the various crop species evaluated, canola hadthe largest emission, averaging 1105 kg CO2e ha−1 across
Table 2 Average annual total emissions and estimated carbon footprints of various field crops grown in the Brown, Dark Brown, and Black soilzones of the Canadian prairie
Crop Total emission, kg CO2e ha−1 Carbon footprint, kg CO2e kg−1 of product
Brown Dark Brown Black Brown Dark Brown Black
Canola 884a 1,326 1,606 0.691 0.913 0.979
Mustard 496 515 480 0.601 0.652 1.56
Flaxseed 446 826 829 0.456 0.658 0.727
Chickpea 283 362 NAb 0.254 0.406 N/A
Dry pea 352 602 711 0.189 0.287 0.335
Lentil 189 245 NAb 0.164 0.237 N/A
Spr. wheat 741 1,145 1,493 0.383 0.533 0.56
Means 484 717 1,024 0.391 0.526 0.832
a Total emissions for a given crop were calculated to include greenhouse gas emissions from (1) the decomposition of straw and roots, (2) the application ofsynthetic N fertilizers, (3) the manufacture of N and P fertilizers, (4) the production of herbicides and fungicides, and (5) miscellaneous farm fieldoperations such as tillage, planting of the crops, spraying of pesticides, and harvesting of the grain products, and crop productivity (the dry weight of grain,straw, and roots) were obtained from Gan et al. (2009)b This crop is not produced in this soil zone
Table 1 Climatic conditions and emission factors for the Brown, Dark Brown, and Black soil zones of the Canadian prairies
Climatic conditions and emission factors Soil zones
Brown Dark Brown Black
Long-term growing seasona precipitation (P), mm 203 288 309
Long-term growing season potential evapotranspiration (PE), mm 503 495 394
P/PE 0.40 0.58 0.78
Emission factor (EF), kg N2O-N kg−1 N 0.004 0.008 0.0125
Leaching factor of N (FRACLEACH),% 10.6 16.4 0.23
Volatilization of NH3 and NOx (FRACGASM),% 0.1 0.1 0.1
Leaching emission factor (EFLEACH), kg N2O-N kg−1 0.0075 0.0075 0.0075
Volatilization emission factor (EFVOLAT), kg N2O-N kg−1 N 0.01 0.01 0.01
aMay 1–August 31, 1940–2004
PE is potential evapotranspiration
646 Yantai Gan et al

the Canadian semiarid prairie represented by the Brown andDark Brown soil zones, followed by spring wheat at 943 kgCO2e ha−1 and then by flaxseed at 636 kg CO2e ha−1
(Table 2). The three N-fixing crops (i.e., pulse crops:chickpea, lentil, and dry pea) had an average emission of339 kg CO2e ha
−1, 65% lower than the emissions of canolaand spring wheat. Overall, the total emission by a crop ishighly associated with the quantity of N fertilizer applied,modified by the crop yield and the N concentrations in thevarious crop components such as straw and roots.
The estimate of carbon footprint is based on the emissionsreleased in the production of 1 kg of crop product (Table 2).In our results, the carbon footprints were, in decreasing order,0.80 kg CO2e for canola, 0.59 kg CO2e for mustard andflaxseed, 0.46 kg CO2e for spring wheat, and 0.20∼0.33 kgCO2e kg
−1 of product for pulses grown in the Brown and theDark Brown soil zones. The carbon footprint for cropsproduced in the Black soil zone were ranked similarly buthad greater magnitude (Table 2). Comparing among soilzones, crops in the Brown soil zone had the lowest yields butthe greatest efficiency in terms of lowering carbon footprintper kilogram of crop product (averaging 0.46 kg CO2e kg
−1 ofgrain), whereas the opposite occurred for the Black soil zonewhere crop yields are general greater but the efficiency islower and carbon footprints are greater (averaging 0.83 kgCO2e kg
−1 of grain). Products from the Dark Brown soil zoneare intermediate to the other two (averaging 0.61 kg CO2ekg−1 of grain).
Drinkwater et al. (1998) observed that legume-basedcropping systems reduced soil organic carbon and nitrogen
losses compared with cereal-based cropping systems.However, numerous studies from the Canadian prairieshave shown that the effect of crop species on soil organiccarbon was minimal (Liang et al. 2002; Liang et al. 2005;McConkey et al. 2003). Therefore, in our estimation ofcarbon footprint, the influence of crop species on soilorganic carbon is assumed to be quite small compared withthe influence of soil N and other factors.
3.2 Diversifying cropping systems to reduce carbonfootprints
The adoption of diversified cropping systems can reducethe carbon footprint of crop products. In a field studyconducted in southern Saskatchewan, Gan et al. (2003)found that diversified cropping systems compared withmonoculture systems significantly reduced the productioninputs and increased the grain and straw yields of durumwheat. Thus, compared with monoculture systems, durumwheat grown in diversified cropping systems had a lowercarbon footprint (Table 3). Durum wheat preceded by apulse crop (chickpea, dry pea, or lentil) produced grain witha carbon footprint of 0.200 kg CO2e kg−1 of product, 46%lower than when preceded by a cereal crop. Furthermore,durum wheat had a carbon footprint of 0.301 kg CO2e kg
−1
of grain when grown after an oilseed crop (canola ormustard), 19% lower than when grown after a cereal.Numerous studies have shown that using improved agro-nomic practices such as early seeding, optimum plantpopulation density, and proper crop rotation sequences
Table 3 Crop yield, total emission, and estimated carbon footprints of durum wheat grown in diverse cropping systems where durum wheat waspreceded by various oilseeds and pulse crops in the previous 2 years
Crops in previous2 years beforedurum wheat
Durum grain yield,kg ha−1
Sources of emission, kg CO2e ha−1 Totalemission
Carbon footprint,kg CO2e kg−1 product
Cropproductivity
Input
Straw Roots Nutrient/pesti.b Farm operat.c
Cereal–cereala 2,240 122 50 404 257 833 0.372
Cereal–oilseed 2,510 136 59 392 251 838 0.334
Cereal–pulse 2,500 100 46 361 232 739 0.296
Oilseed–cereal 2,560 94 41 398 255 788 0.308
Oilseed–oilseed 2,540 94 41 355 229 719 0.283
Oilseed-pulse 2,620 97 47 332 215 691 0.264
Pulse–cereal 2,560 116 51 355 228 750 0.293
Pulse–oilseed 2,630 117 54 356 229 756 0.287
Pulse–pulse 2,660 126 59 276 181 642 0.241
a Cereal–spring wheat; oilseed–canola or mustard; pulses–chickpea, lentil, or dry peab Includes N, P, seed, herbicides, and fungicidesc Includes no-till planting, herbicide and fungicide spraying, windrowing, and combine harvesting
Strategies for reducing the carbon footprint of field crops 647
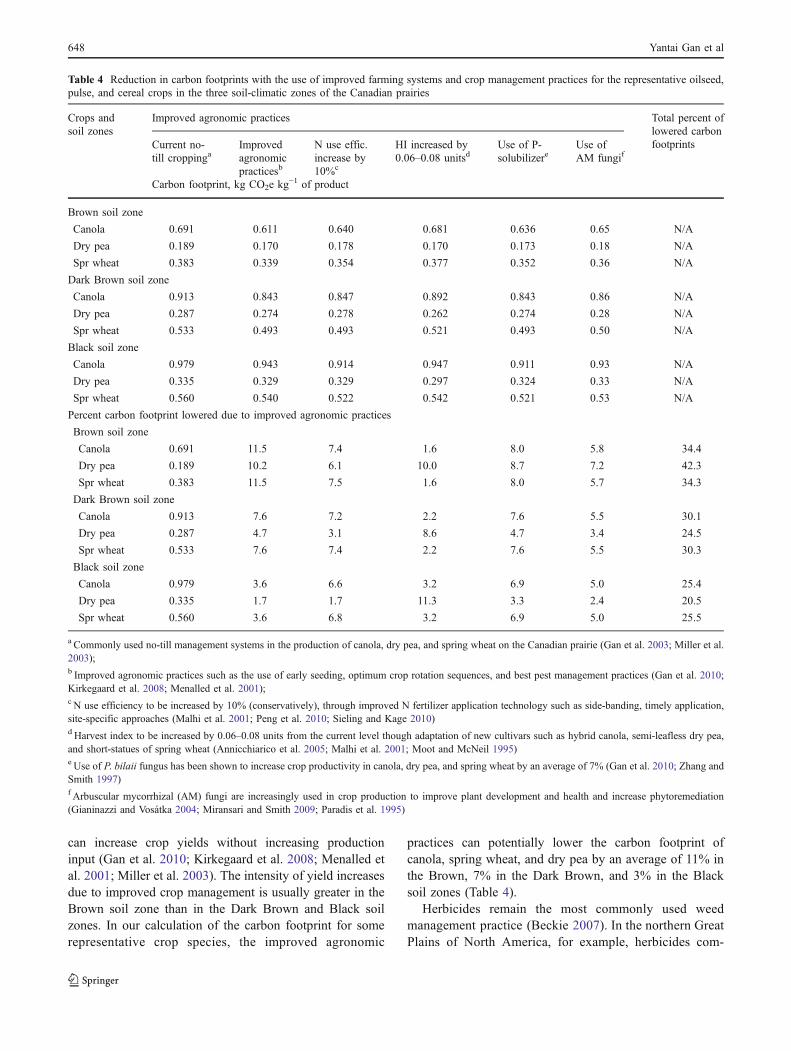
can increase crop yields without increasing productioninput (Gan et al. 2010; Kirkegaard et al. 2008; Menalled etal. 2001; Miller et al. 2003). The intensity of yield increasesdue to improved crop management is usually greater in theBrown soil zone than in the Dark Brown and Black soilzones. In our calculation of the carbon footprint for somerepresentative crop species, the improved agronomic
practices can potentially lower the carbon footprint ofcanola, spring wheat, and dry pea by an average of 11% inthe Brown, 7% in the Dark Brown, and 3% in the Blacksoil zones (Table 4).
Herbicides remain the most commonly used weedmanagement practice (Beckie 2007). In the northern GreatPlains of North America, for example, herbicides com-
Table 4 Reduction in carbon footprints with the use of improved farming systems and crop management practices for the representative oilseed,pulse, and cereal crops in the three soil-climatic zones of the Canadian prairies
Crops andsoil zones
Improved agronomic practices Total percent oflowered carbonfootprintsCurrent no-
till croppingaImprovedagronomicpracticesb
N use effic.increase by10%c
HI increased by0.06–0.08 unitsd
Use of P-solubilizere
Use ofAM fungif
Carbon footprint, kg CO2e kg−1 of product
Brown soil zone
Canola 0.691 0.611 0.640 0.681 0.636 0.65 N/A
Dry pea 0.189 0.170 0.178 0.170 0.173 0.18 N/A
Spr wheat 0.383 0.339 0.354 0.377 0.352 0.36 N/A
Dark Brown soil zone
Canola 0.913 0.843 0.847 0.892 0.843 0.86 N/A
Dry pea 0.287 0.274 0.278 0.262 0.274 0.28 N/A
Spr wheat 0.533 0.493 0.493 0.521 0.493 0.50 N/A
Black soil zone
Canola 0.979 0.943 0.914 0.947 0.911 0.93 N/A
Dry pea 0.335 0.329 0.329 0.297 0.324 0.33 N/A
Spr wheat 0.560 0.540 0.522 0.542 0.521 0.53 N/A
Percent carbon footprint lowered due to improved agronomic practices
Brown soil zone
Canola 0.691 11.5 7.4 1.6 8.0 5.8 34.4
Dry pea 0.189 10.2 6.1 10.0 8.7 7.2 42.3
Spr wheat 0.383 11.5 7.5 1.6 8.0 5.7 34.3
Dark Brown soil zone
Canola 0.913 7.6 7.2 2.2 7.6 5.5 30.1
Dry pea 0.287 4.7 3.1 8.6 4.7 3.4 24.5
Spr wheat 0.533 7.6 7.4 2.2 7.6 5.5 30.3
Black soil zone
Canola 0.979 3.6 6.6 3.2 6.9 5.0 25.4
Dry pea 0.335 1.7 1.7 11.3 3.3 2.4 20.5
Spr wheat 0.560 3.6 6.8 3.2 6.9 5.0 25.5
a Commonly used no-till management systems in the production of canola, dry pea, and spring wheat on the Canadian prairie (Gan et al. 2003; Miller et al.2003);b Improved agronomic practices such as the use of early seeding, optimum crop rotation sequences, and best pest management practices (Gan et al. 2010;Kirkegaard et al. 2008; Menalled et al. 2001);c N use efficiency to be increased by 10% (conservatively), through improved N fertilizer application technology such as side-banding, timely application,site-specific approaches (Malhi et al. 2001; Peng et al. 2010; Sieling and Kage 2010)d Harvest index to be increased by 0.06–0.08 units from the current level though adaptation of new cultivars such as hybrid canola, semi-leafless dry pea,and short-statues of spring wheat (Annicchiarico et al. 2005; Malhi et al. 2001; Moot and McNeil 1995)e Use of P. bilaii fungus has been shown to increase crop productivity in canola, dry pea, and spring wheat by an average of 7% (Gan et al. 2010; Zhang andSmith 1997)f Arbuscular mycorrhizal (AM) fungi are increasingly used in crop production to improve plant development and health and increase phytoremediation(Gianinazzi and Vosátka 2004; Miransari and Smith 2009; Paradis et al. 1995)
648 Yantai Gan et al

prise approximately 85% of the pesticide input in cerealcrop production (Derksen et al. 2002). Weed managementthrough the adoption of diverse cropping systems has beenrecognized as a key component in the development ofsustainable agricultural systems (Menalled et al. 2001). Indiversified crop sequences, weeds are exposed to a widerange of causes of mortality. A myriad of stresses areimposed on the weeds by growing crops with differentplanting and harvesting dates, different morphology andphenology, competitive characteristics, and crop residues(Fig. 1). With increased crop diversification in a rotation,weeds are subjected to an increased diversity of controlmethods, including timing and intensity of tillage and/orherbicide application, wider spectrum of herbicides, andvarying degrees of crop competitiveness. These changesfrom one crop species to another generate microenviron-ments that do not favor the establishment and proliferationof any one particular weed species. As a consequence,crop diversification reduces weed abundance (Westermanet al. 2005) and herbicide input (Harker et al. 2009), andincreases crop productivity (Menalled et al. 2001).
Integrating various cultural practices will significantlyreduce herbicide input in crop production (Harker et al.2009). For example, a high-management package (i.e.,greater competitive cultivars, higher-than-normal seedingrates, and rotating cereal with oilseed crops) coupled witha half rate (1/2×) of herbicides achieved a level of wild oatcontrol similar to a low-management package (i.e., lowercompetitive cultivars, normal to lower seeding rates, andcereal monoculture) coupled with a full rate (1×) ofherbicide (Harker et al. 2009). Furthermore, wild oat seedproduction at ¼× rate was reduced by 94% when
competitive (tall) barley cultivars were seeded at doublethe seeding rate and rotated with canola and field pea,compared with continuously planting short barley culti-vars at normal rates. At the quarter herbicide rate, wild oatbiomass was reduced two-, six-, or 19-fold, respectively,when the accompanying crop was grown using one, two,and three components of the management package. Theseresults indicate that using diversified cropping systemscan substantially reduce pesticide input in crop productionand thus reduce the carbon footprint of the crop products.Even though pesticides are a small contributor to theestimate of a carbon footprint (data not shown), optimiz-ing crop health with improved agronomic managementcreates opportunities for improving crop productivitywhile further reducing carbon footprints in the productionof field crops (Table 4).
3.3 Including biological N-fixation to reduce the inputof synthetic N fertilizer
The Haber-Bosch process of industrial N2-fixation isenergy intensive. In Canada, for example, natural gas usedin industrial N2-fixation accounts for about 70% of the costof N fertilizer (Agriculture and Agri-Food Canada AAFC2009). Manufacturing the 620,285 t of N fertilizer appliedin the Canadian Prairie Provinces in a single growingseason releases about 15.7 million tonnes CO2e, andtransporting the N fertilizer further increases CO2 emis-sions. Using biological N-fixation through the inclusion ofpulse crops in crop rotations can reduce the dependence ofagriculture on synthetic N fertilizers (Crews and Peoples2004) and thus reduce agricultures carbon footprint. Studies
Year 2 – Chem. Fallow -
J F M A M J J A S O N D
Year 3 – W. Wheat -
J F M A M J J A S O N D
Year 1 – W. Wheat -
J F M A M J J A S O N D
herbicide canopy
J F M A M J J A S O N D
Year 1 - W. Wheat -
J F M A M J J A S O N D
Year 3 – Hay Barley -
Year 2 – Ch. Pea-
J F M A M J J A S O N D
Overall Impact
J F M A M J J A S O N D
Overall Impact
J F M A M J J A S O N D
Year 4 – Chem. Fallow-
J F M A M J J A S O N D
Year 4 – Chem. Fallow -
J F M A M J J A S O N D
Conventional Wheat-Fallow Diversified Rotation
Fig. 1 Conventional and diver-sified rotations differ in the typeand timing of weed managementpractices (symbols), seedingdates, and canopy characteristicsand closure times (lines). In thediversified rotations, the contin-uous variations in herbicides,canopies, and seeding datesmakes it very difficult for aspecific weed to adapt to thechanging environmental condi-tions (adopted from Gan et al.2010)
Strategies for reducing the carbon footprint of field crops 649

have shown that N use efficiency can be increasedsubstantially simply through improved N fertilizer applica-tion technology such as side-banding, timely application,site-specific approaches (Malhi et al. 2001; Peng et al.2010; Sieling and Kage 2010). In our estimate, if N useefficiency can be increased by 10%, which is highlypossible using improved N management practices, thecarbon footprint of canola and wheat, two N-loving crops,can be decreased by 7% (Table 4). Also, legume–rhizobialassociations are effective solar-driven N2-fixing systems inwhich atmospheric N2 is transformed into ammonia,without net CO2 emissions.
In addition to fixing their N requirements, pulse cropsleave a portion of their biologically fixed-N in the soil(Table 5). The contribution of rhizodeposition, roots, andnodules that remained in the soil after harvest was oftenignored leading to underestimation of the real contributionof biologically fixed-N by pulses. For example, chickpea,once considered a poor contributor to soil N with an N-balance close to zero, enriches the soil N pool with annualcontributions at 58 kg ha−1 (Table 5), and this number canbe even greater when the release of mineralized-N fromroots and nodules is accounted for (Khan et al. 2003;Herridge et al. 2008).
Large amounts of N are exported from farm fields inlegume grain. To meet the demand for N by the plants fortheir growth and development, as well as making positivecontributions to soil N, pulse plants need to fix a substantialamount of N from the atmosphere (Ndfa) via N-fixation.Often, growing conditions such as drought and elevated soilnitrate levels negatively impact nitrogenase activity in pulsenodules (Marino et al. 2009) and therefore, reduce N-fixation (Walley et al. 2007). The effect, however, varieswith crop species; lentil and dry pea tend to fix more N thus
contributing greater amounts of N to the soil than commonbean and chickpea (Table 5).
Not only do pulses fulfill their N requirementthrough biological N2-fixation and thus reduce N fertil-izer use in agricultural systems, but also pulses enhancethe productivity of subsequent crops through otherundetermined means (Gan et al. 2003; Kirkegaard et al.2008). Globally, pulses contribute about 21 million tonnesof fixed-N per year, accounting for one third of the totalbiological N2 fixation in agroecosystems (Herridge et al.2008). This contribution can be further improved byincreasing the frequency of pulses in cropping rotations,reducing the negative impact of high residual soil N onN2-fixation and improving the synchrony between N-mineralization from pulse residue and the peak N demandof the following crop (Marino et al. 2009; Sieling andKage 2010).
3.4 Improving nutrient use efficiency using biotechnologiesvalorizing soil microbial resources
Abundant use of fertilizer in agriculture often causesenvironmental problems including N2O emissions (VanNoordwijk and Cadisch 2002), largely because the recoveryrates of fertilizer N, P, and K by crops are as low as 50%,25%, and 40%, respectively (Prasad 2009). Soil microbialresources can be used to improve the use efficiency of thesenutrients as several fungi and bacteria interact with thegrowth of plant roots (Fig. 2), and function as biofertilizersand biopesticides (Hynes et al. 2008).
Soil microorganisms, such as arbuscular mycorrhizalfungi (AM fungi), P solubilizing fungi and bacteria, andN2-fixers, can enhance plant nutrition and improve plantgrowth through the induction of changes in plant metabo-
Table 5 Estimates of the contribution of various pulses to the globalinput of biological N2-fixation to soil (adopted from Herridge et al.2008), minimum level of N derived from N fixation (Ndfa) necessaryfor a positive contribution to soil N from pulse crops expressed as
kilograms of fixed-N per hectare and as percent of fixed-N in the pulsecrop, as compared with mean Ndfa observed in the Northern GreatPlains (adopted from Walley et al. 2007)
Pulse species Global N contribution (kg N ha–1 year–1) Minimum Ndfa required for a positivecontribution to soil N
Mean Ndfa (% of total N uptake)
(kg N ha–1) (% of total N uptake)
Common bean 23 49.5 52.1 40.7
Chickpea 58 37.4 56.1 50.0
Dry pea 86 68.4 46.7 52.4
Lentil 51 47.3 47.8 57.9
Faba bean 107 85.7 65.3 84.1
Groundnut 88 N/A N/A N/A
Soybean 176 N/A N/A N/A
Other pulses 41 N/A N/A N/A
NA not available
650 Yantai Gan et al

lism. Many bacteria can produce auxins, gibberellins,cytokinins, and ethylene in amounts stimulating plantgrowth, increasing root branching or shoot development(Van Loon 2007). A long list of plant-growth-promotingrhizobacteria can be isolated from field crops in the prairieecozone (Hynes et al. 2008). Several bacteria possess theenzyme 1-aminocyclopropane-1-carboxilic acid (ACC) de-aminase and use ACC, the precursor of ethylene, as asource of food. They remove ACC from the rhizosphere,stimulating root elongation and plant growth in the process.The AM fungi are also known to reduce the impact ofenvironmental stresses caused by toxic metals (Audet andCharest 2008), high temperature (Paradis et al. 1995), andsevere drought (Augé 2001) in their host plants byimproving hormone production, binding metals, modifyingelectrolyte concentration in plant cytoplasm, and extractingwater from the soil (Hynes et al. 2008). Other endophyticfungi (i.e., dark septate endophytes) are emerging asimportant plant associates. The abundance of these endo-phytes can improve drought tolerance of their host plants instressful environments (Yuan et al. 2010).
Biopesticides involve bacteria as well as fungi. WhereasAM fungi can “sanitize” the rooting soil through baitingand nutritional interactions (St-Arnaud et al. 1996), otherorganisms such as Trichoderma are toxin-producing antag-onists (Reino et al. 2008). Pseudomonas fluorescens alsoinhibit soil-borne pathogens through siderophore-relatedsequestration of Fe and starvation (Choudhary et al. 2009).Microorganisms can also influence gene expression andactivate or “prime” plant defense mechanisms through
systemic acquired resistance (SAR) and systemicallyinduced resistance (SIR) to pathogens (Van Loon 2007).SAR and SIR operate through production of signalingcompounds by plant-growth-promoting rhizobacteria, andplants may produce bioactive molecules, in a two-wayprocess paralleling legume–rhizobia cross-talk (Van Loon2007), opening the possibility of manipulating plant diseaseresistance with manufactured signal molecules. Compoundsacting on microbial associates of plants could be used tomanage crop rhizosphere and reduce the amount ofagrochemical used on-farm, as minute amounts of thesesignal molecules are required for bioactivity, thus reducingthe carbon footprint of crops.
Opportunities for rhizosphere management are offeredby the discovery of bioactive molecules. Research hasshown that flavonoids produced in minute amounts bylegume plants were involved in the induction of nodulation(Rolfe 1988). Genistein, a flavonoid produced by soybean,turns on nod genes in Bradyrhizobium japonicum, initiatingthe process of nodulation in the plant (Zhang and Smith1997). This discovery led to the formulation of genistein-amended soybean inoculants for early nodulation in coolsoils (Leibovitch et al. 2001). Lipochito-oligosaccharides(LCO) produced by B. japonicum is responsive to hostplant signal and acts as a plant-growth promoter (Miransariand Smith 2009). LCOs have been commercialized as LCOPromoter Technology TM for use in corn and soybeanproduction.
The AM fungi symbiosis in plants is also stimulated byflavonoids such as formononetin, biochanin-A (Fries et al.
Glomus spp. (Biofertilizer)
Rhizobium spp. (Biofertilizer)
N2-fixation Plant growth regulation
P-solubilization
Beneficial effect on the plant
Plant mineral nutrition Plant growth regulation Increased water uptake
Improved growth
Improved growth
Improved plant nutrition Production/degradation of plant
growth factors
Trichoderma spp. (Biocontrol)
Pseudomonas spp. (Biocontrol)
Dis
ease
sup
pres
son
Dis
ease
sup
pres
sonSiderophore production
Induced plant resistance Antimicrobial compounds
Parasitism Competition
Production of exudates Stimulation of antagonistic
microorganisms
Improved plant nutrition Competition
Induced plant resistance
Antimicrobial compounds
Fig. 2 Interactions amongplant-growth-promoting-micro-organisms and the growth anddevelopment of field crops(modified from Avis et al. 2008)
Strategies for reducing the carbon footprint of field crops 651

1998), and eupalitin (Cruz et al. 2004). Formononetin-based technology is commercialized as Myconate®, indifferent formulations, as a stimulant for mycorrhizaldevelopment. Several compounds are involved in theregulation of the AM symbiosis. Arbuscular mycorrhizalfungi were shown to be influenced by the polyaminesputrescine and spermidine (El et al. 1996), the nucleosidederivative 5′-deoxy-5′-methylamino-adenosine (Kuwada etal. 2006), and by tryptophan dimer, a peptide (Horii et al.2009).
Whereas signal molecules can be manufactured andapplied in inoculants or directly on plants, a moreinteresting approach for farmers would be the selection ofcrop genotypes with better host quality to valorize existingsoil bioresources. The genetic variability necessary for theselection of plant genotypes forming effective symbioseswith AM fungi exists (Sawers et al. 2010) and breedingprograms targeting better symbiosis in wheat have beenundertaken at least in Canada and Europe. Efficiency ofnutrient acquisition has rarely been considered. In fact,breeding under conditions of nutrient abundance may haveselected against efficient nutrient acquisition and nutrientproviding plant symbioses (Lynch 2007). Little effort hasbeen made in the selection of plants for superior symbioticperformance in crops other than legumes. Yet, plantsymbioses have the potential to improve crop performancethrough better tolerance to drought stress and protectionagainst disease organisms, in addition to promotingefficient nutrient acquisition (Afza et al. 2010). Thesestrategies and practices of utilizing plant symbioses toimprove nutrient use efficiency will be critically importantin reducing carbon footprints in agriculture. For example,the use of Penicillium bilaii, a P-solublizing fungus, alongwith AM fungi, has been shown to improve plant health,enhance plant phytoremediation, and increase crop yield incanola and wheat by 7% to 30% (Gianinazzi and Vosátka2004; Miransari and Smith 2009; Paradis et al. 1995; Zhangand Smith 1997). Based on the low end of the increasedcrop productivity (conservatively), we estimate that thecarbon footprint of canola and wheat can be lowered by13% with the application of P-solublizing fungi and AMfungi (Table 5).
3.5 Cropping systems and energy use efficiencyin the semiarid Canadian prairie
The burning of fossil fuels is an obvious and major form ofenergy input into agriculture (Zentner et al. 2009). Fossilfuels are used to power farm machinery used in variousfarming operations such as seeding, cultivating, spraying,harvesting, haying, crop drying, transporting products tomarkets, etc. Fossil fuels are also used in the manufactureand repair of farm machinery and the manufacture and
transport of fertilizers, pesticides and other crop inputs(Janzen et al. 1998). Energy input to agricultural systemsdepends upon numerous factors, two of which are tillagemanagement and crop rotation including cropping intensityand crop diversity (Zentner et al. 2009). Managementpractices include intensity of tillage—conventional (such assummerfallowing or several tillage operations for weedcontrol, seedbed preparation, seeding), conservational (re-duced, minimum, and no-till systems), organic (intensivetillage for seeding, weed control, trash management).Conventional and conservational management systems usefertilizers for nutrient replenishment and pesticides forweed, insect and disease control, whereas organic manage-ment includes non-chemical pest control and legumes aswell as manures for nutrient replenishment. Crop diversityranges from low intensity diversification (such as mono-culture cereal-based cropping systems often includingsummerfallow) to higher intensity diversification such asrotations using annual cereal, oilseed, and pulse crops, orrotations including annual crops and perennial forages.
Generally, there is little difference in total energy use byconventional compared with conservational cropping sys-tems (Table 6; Zentner et al. 1989, 2009). Energy use in theform of fuel and machinery is lower for no-till direct-seeding compared with conventional tillage practices.However, in order to respond to the increased soil waterreserves often associated with reduced tillage systems,fertilizer and pesticide application rates are often increased.Thus, energy use in the production and distribution ofpesticides and fertilizers, especially N, is higher for direct-seeding compared with conventional production systems. Incontrast, savings in energy input are significantly higherwith organic systems because of the non-use of pesticidesor inorganic fertilizers (Table 6; Hoeppner et al. 2006;Zentner et al. 2009).
In annual crops, production practices that reduce theapplication rate of fertilizer N decrease the energy input tothe system (Zentner et al. 1989) and thus will reduce thecarbon footprint of crop products significantly (Table 4).More diversified rotations that include pulse crops alongwith cereals reduce energy requirements because thenitrogen-fixation capabilities of the pulses reduce theoverall fertilizer N requirements for the rotation. Cereal–oilseed rotations usually have higher energy requirementsthan cereal–pulse rotations mainly because oilseeds requirefertilizer N while pulses supply N by symbiosis (Table 5).
On the Canadian prairie, energy use efficiency (EUE),yield per unit energy input or the ratio of energy output(yield of grain and forage) to energy input, is highest fororganic systems and lower but similar for conventionaland conservational systems (Table 6; Hoeppner et al.2006; Zentner et al. 2009). For example, average yields ofannual crops on organic farms in the eastern and central
652 Yantai Gan et al

prairies are typically lower than on conventional farms(Entz et al. 2000; Zentner et al. 2009). However, energyinputs are much lower on organic farms contributing to thehigher EUE. Organically, managed crop rotations thatinclude annual and perennial forage crops have the highestenergy use efficiencies. This practice is especially advan-tageous in semiarid areas where yield reduction from pestinfestations is usually less severe compared with morehumid and subhumid regions. Using our model, weestimated that the carbon footprint of canola producedunder organic systems in the semiarid Brown soil zonewas 0.18 kg CO2e kg−1 of product, about one third of thecarbon print of canola produced under conservationsystems (0.69 kg CO2e kg−1). Similarly, spring wheatproduced under the organic systems in the semiarid Brownsoil zone had a carbon footprint of 0.11 kg CO2e kg−1,significantly lower than 0.38 kg CO2e kg−1 whenproduced under conservation systems.
Overall, fossil fuel use in agriculture is a relatively smallpart of the emissions from Canadian farms compared withon-farm sources of methane and nitrous oxide (Janzen et al.2006). About 2.8% of the national energy consumptionfrom 1997 to 2003 was used in agricultural production(Dyer and Desjardins 2006). Because of the low profile offarm energy use on the scale of climate change issues,policy-makers, and researchers are often linking farm fueluse with other relevant sectors such as transportation offarm fertilizers and machinery (Dyer and Desjardins 2007).
3.6 Improving crop residue management in farmingsystems
Crop residues produced worldwide are estimated at 2,962million tonnes, equivalent to 1,333 million tonnes of carbon,per year (Lal 1995). Proper management of crop residue will
improve agricultural productivity and reduce the carbonfootprint of crop products. Crop residues retained on the soilsurface, through the use of conservation tillage, can providethe following benefits: increase carbon sequestration ofatmospheric CO2 into soils (VandenBygaart et al. 2003);reduce fuel use and greenhouse gas emissions (West andMarland 2002); protect the soil surface from water and winderosion and thus reduce fertilizer input (Unger 1978; Malhiet al. 2001); improve soil aggregate stability, rainfall captureefficiency, and water holding capacity (Campbell et al. 1995,1989); improve biodiversity both above and below ground(Swift et al. 1996); improve plant-mycorrhizae associations(McGonigle and Miller 1993); and lower nitrous oxideemissions (Ussiri et al. 2009). Also, crop residue can beincorporated into the near-surface soil using conventional orstrip tillage practices (Al-Kaisi and Licht 2004). When cropresidues are incorporated deeper into the sub-soil horizons,carbon placed beneath the plow layer will decompose veryslowly because of reduced exposure to climatic elements.Also, growing deep-rooted plants has been shown toimprove soil structure and increase soil carbon in the sub-soil horizons.
Biochar is a charcoal made by heating biomass underoxygen-limited conditions (e.g., slow pyrolysis). Charcoalis a stable solid rich in carbon and can be used to lockcarbon in the soil. Since biochar can sequester carbon in thesoil for hundreds to thousands of years, it has receivedconsiderable interest as a potential tool to sequesteratmospheric carbon. As well, recent research has shownthat the use of biochar can reduce leaching, increase theavailability of nutrients for plant growth, reduce the amountof fertilizer required in crop production, and decreasenitrous oxide and methane emissions (Laird et al. 2009).
With regards to crop residue management, numerousstudies from the Canadian prairies have shown that soil
Table 6 Average annual production, total energy input, energyoutput, net energy production, and energy use efficiency measuredas grain yield per unit energy input and as the ratio energy output/
energy input for conventional, conservational, and organic croppingsystems in the Canadian Prairies
Croppingsystem
Yield, kgha−1 year−1
Energy input,MJ ha−1 year−1
Energy output,MJ ha−1 year−1
Net energy, MJha−1 year−1
Yield/energy, kgha−1 GJ−1 year−1
Energy out/energy in
Source
Conventional 1,472 3,856 26,541 22,687 391 6.88 Zentner et al. 2009
Conservational 1,419 3,854 25,592 21,737 375 6.64 (1996–2007)
Organic 940 1,889 16,600 14,711 497 8.79
Conventional 4,906 58,466 11.9 Hoeppner et al. 2006
Organic 1,934 41,428 21.4 (1992–2003)
Conventional 7,157 37,989 30,832 321 5.31 Zentner et al. 2004
Conservational 7,171 39,287 32,111 324 5.48 (1987–1998)
Conventional 4,038 21,073 17,035 406 5.22 Zentner et al. 1998
Conservational 4,374 20,606 16,232 364 4.71 (1982–1993)
Also identified are the duration of the study and the publication from which the data was obtained
Strategies for reducing the carbon footprint of field crops 653

organic matter is largely influenced by tillage and croprotations (summerfallow versus no-till cropping) and lessinfluenced by crop species (Liang et al. 2002; Liang et al.2005; McConkey et al. 2003).
4 Conclusions
In this paper, we estimated the relative intensities ofgreenhouse gas emission from the production of variousfield crops grown on the Canadian prairie and determinedthe effect of soil-climatic conditions, crop species, anddifferent cropping systems on the carbon footprint of a cropproduct. Based on the model we developed, field cropsgrown in the more humid Black soil zone had substantiallygreater carbon footprint than the crops grown in the drierBrown and Dark Brown soil zones. Under the samegrowing conditions, canola and wheat had significantlygreater carbon footprint than pulse crops (chickpea, drypea, lentil). Durum wheat grown in diversified croppingsystems had a lower carbon footprint than when grown incereal monoculture systems. This information is critical forestablishing inventories of greenhouse gas emissions fromcropping systems involving cereals, oilseeds, and pulsecrops. We identified major strategies and practices forpotentially lowering the carbon footprint of field cropsgrown in semiarid regions. With the model we developed,the carbon footprint of major field crops grown on theCanadian prairie can be collectively lowered as much as24% in the Black, 28% in the Dark Brown, and 37% in theBrown soil zones. These percentage decreases are veryconservative and can be achieved during crop productionthrough adoption of agronomic practices that, for example,increase N use efficiency, grow crop cultivars with highharvest index, and use soil bioresources such as P-solublizers and arbuscular mycorrhizal fungi. To ourknowledge, this information is unique and potentiallyuseful as a reference source for policy-makers and cropmodelers who are interested in estimating the carbonfootprint of various cropping systems or estimating sector-wide commodity-specific emissions. The absolute value ofthe estimated carbon footprint will change depending oncrop productivity, cropping system, and associated pro-duction inputs, especially the rate of nitrogen fertilizer,and farm operations such as tillage and crop residuemanagement.
We must realize that the concept of carbon footprint isstill relatively new. There is a lack of knowledge aboutemissions from the various activities in the value chain forfood production, processing, and marketing. More detailedstudies on life cycle assessment would help evaluate howdifferent cropping options and varying agricultural ecosys-tems would affect the carbon footprint of a crop product
and of the emissions along the value chain of foodprocessing and marketing. Some quantitative estimates ofthe impacts of agricultural ecosystems on environmentalvariables in the upstream and downstream processes needto be considered when estimating the carbon footprint of acrop product. Furthermore, the methodology for calculationof carbon footprints varies between sectors or betweendifferent ecosystems. The carbon footprint estimated for afood product can be affected by the process of production,climatic conditions under which the product is grown, andthe process for delivery of the product to market afterleaving the farm gate. These and other challenges make itdifficult to adequately calculate carbon footprint in somecases. Also, there is a need to develop a commonmethodology to document detailed emissions at each levelin the production cycle, so that all emissions along with theentire food chain can be synthesized into the calculation ofthe carbon footprint.
References
Afza A, Bano A, Fatima M (2010) Higher soybean yield byinoculation with N-fixing and P-solubilizing bacteria. AgronSustain Dev 30:487–495. doi:10.1051/agro/2009041
Agriculture and Agri-Food Canada (AAFC) (2009) North AmericanFertilizer Prices, Production and Consumption, in: Korol M.,Larivière É. (Eds.), Fertilizer Pricing in Canada, http://www4.agr.gc.ca/AAFC-AAC/display-afficher.do?id=1179252532274&lang=eng#table3.9
Al-Kaisi M, Licht MA (2004) Effect of strip tillage on corn nitrogenuptake and residual soil nitrate accumulation compared with no-tillage and chisel plow, Agron J 96:1164–1171
Annicchiarico P, Abdellaoui Z, Kelkouli M, Zerargui H (2005) Grainyield, straw yield and economic value of tall and semi-dwarfdurum wheat cultivars in Algeria. J Agric Sci 143:57–64
Audet P, Charest C (2008) Allocation plasticity and plant-metalpartitioning: Meta-analytical perspectives in phytoremediation.Environ Pollut 156:290–296
Augé RM (2001) Water relations, drought and vesicular-arbuscularmycorrhizal symbiosis. Mycorrhiza 11:3–42
Avis TJ, Gravel V, Antoun H, Tweddell RJ (2008) Multifacetedbeneficial effects of rhizosphere microorganisms on plant healthand productivity. Soil Biol Biochem 40:1733–1740
Beckie HJ (2007) Beneficial management practices to combatherbicide-resistant grass weeds in the northern Great Plains.Weed Technol 21:290–299
Campbell CA, Biederbeck VO, Schnitzer M, Selles F, Zentner RP (1989)Effect of 6 years of zero tillage and N fertilizer management onchanges in soil quality of an Orthic Brown Chernozem insouthwestern Saskatchewan. Soil Tillage Res 14:39–52
Campbell CA, McConkey BG, Zentner RP, Dyck FB, Selles F, CurtinD (1995) Carbon sequestration in a Brown Chernozem asaffected by tillage and rotation. Can J Soil Sci 75:449–458
Campbell CA, Zentner RP, Gameda S, Blomert B, Wall DD (2002)Production of annual crops on the Canadian prairies: Trendsduring 1976-1998. Can J Soil Sci 82:45–57
Choudhary DK, Prakash A, Wray V, Johri BN (2009) Insights of thefluorescent pseudomonads in plant growth regulation. Curr SciIndia 97:170–179
654 Yantai Gan et al

Crews TE, Peoples MB (2004) Legume versus fertilizer sources ofnitrogen: ecological tradeoffs and human needs. Agric EcosysEnviron 102:279–297
Cruz AF, Ishii T, Matsumoto I, Kadoya K (2004) Relationshipbetween arbuscular mycorrhizal fungal development and eupali-tin content in bahiagrass roots grown in a satsuma mandarinorchard. J Japan Soc Hortic Sci 73:529–533
Derksen DA, Anderson RL, Blackshaw RE, Maxwell B (2002) Weeddynamics and management strategies for cropping systems in thenorthern Great Plains. Agron J 94:174–185
Dobbie KE, McTaggart IP, Smith KA (1999) Nitrous oxide emissionsfrom intensive agricultural systems: Variations between crops andseasons, key driving variables, and mean emission factors. JGeophys Res Atmos 104:26891–26899
Drinkwater LE, Wagoner P, Sarrantonio M (1998) Legume-basedcropping systems have reduced carbon and nitrogen losses.Nature 396:262–265
Dyer JA, Desjardins RL (2006) Carbon dioxide emissions associatedwith the manufacturing of tractors and farm machinery inCanada. Biosyst Eng 93:107–118
Dyer JA, Desjardins RL (2007) Energy-based GHG emissions fromCanadian agriculture. J Energy Inst 80:93–95
Dyer J.A., Vergé X.P.C., Desjardins R.L., Worth E.D., McConkey B.G. (2010) The impact of increased biodiesel production on thegreenhouse gas emissions from field crops in Canada, EnergySust. Devel. (in press).
El GN, Paynot M, Martin-Tanguy J, Morandi D, Gianinazzi S (1996)Effect of polyamines and polyamine biosynthesis inhibitors onspore germination and hyphal growth of Glomus mosseae. MycolRes 100:597–600
Entz MH, Guilford R, Gulden R (2000) Crop yield and soil nutrientstatus on 14 organic farms in the eastern portion of the northernGreat Plains. Can J Plant Sci 81:351–354
Environment Canada. (2010) National Inventory submission: Green-house Gas Sources and Sinks in Canada, Greenhouse GasDivision, Environment Canada, Ottawa, ON. http://unfccc.int/national_reports/annex_i_ghg_inventories/national_inventories_submissions/items/5270.php
Flynn HC, Smith J, Smith KA, Wright J, Smith P, Massheder J (2005)Climate- and crop-responsive emission factors significantly alterestimates of current and future nitrous oxide emissions fromfertilizer use, Glob. Change Bio 11:1522–1536
Forster P, Ramaswamy V, Artaxo P, Berntsen T, Betts R, Fahey DW,Haywood J, Lean J, Lowe DC, Myhre G (2007) Changes inAtmospheric Constituents and in Radiative Forcing. In: SolomonS, Qin D, Manning M, Chen Z, Marquis M, Averyt KB, TignorM, Miller HL (eds) Climate Change 2007: The Physical ScienceBasis. Contribution of Working Group I to the Fourth Assess-ment Report of the Intergovernmental Panel on Climate Change.Cambridge University Press, New York, pp 129–234
Fries LLM, Pacovsky RS, Safir GR (1998) Influence of phosphorusand formononetin on isozyme expression in the Zea mays-Glomus intraradices symbiosis. Physiol Plantarum 103:172–180
Gan YT, Miller PR, McConkey BG, Zentner RP, Stevenson FC,McDonald CL (2003) Influence of diverse cropping sequenceson durum wheat yield and protein in the semiarid northern GreatPlains. Agron J 95:245–252
Gan YT, Campbell CA, Jansen HH, Lemke R, Liu LP, Basnyat P,McDonald CL (2009) Carbon input to soil by oilseed and pulsecrops in semiarid environment. Agric Ecosys Environ 132:290–297
Gan YT, Kutcher R, Menalled F, Lafond L, Brandt S (2010) Cropdiversification and intensification with broadleaf crops in cereal-based cropping systems in the Northern Great Plains of NorthAmerica. In: Malhi SS, Gan YT, Schoenau JJ, Lemke RL, LiebigMA (eds) Recent Trends in Soil Science and Agronomy Research
in the Northern Great Plains of North America. ResearchSignpost, Trivandrum, Kerala, India, p 427
Gianinazzi S, Vosátka M (2004) Inoculum of arbuscular mycorrhizalfungi for production systems: science meets business. Can J Bot82:1264–1271
Harker KN, O’Donovan JT, Irvine RB, Turkington TK, Clayton GW(2009) Integrating cropping systems with cultural techniquesaugments wild oat (Avena fatua) management in barley. WeedSci 57:326–337
Herridge DF, Peoples MB, Boddey RM (2008) Global inputs ofbiological nitrogen fixation in agricultural systems. Plant Soil311:1–18
Hoeppner JW, Entz MH, McConkey BG, Zentner RP, Nagy CN(2006) Energy use and efficiency in two Canadian organic andconventional crop production systems. Renew Agric Food Syst21:60–67
Horii S, Matsumura A, Kuramoto M, Ishii T (2009) Tryptophan dimerproduced by water-stressed bahia grass is an attractant forGigaspora margarita and Glomus caledonium. World J Micro-biol Biotechol 25:1207–1215
Hynes RK, Leung GCY, Hirkala DLM, Nelson LM (2008) Isolation,selection, and characterization of beneficial rhizobacteria frompea, lentil, and chickpea grown in western Canada. Can JMicrobiol 54:248–258
IPCC. (2006) 2006 IPCC Guidelines for National Greenhouse GasInventories: Volume 4: Agriculture, Forestry and other Land Use.Intergovernmental Panel on Climate Change. Paris, France.http://www.ipcc-nggip.iges.or.jp/public/2006gl/vol4.htm.
Janzen HH, Desjardins RL, Asselin JMR, Grace B (1998) The healthof our air: Toward sustainable agriculture in Canada. Agricultureand Agri-Food Canada, Ottawa, Ontario, p 98
Janzen HH, Beauchemin KA, Bruinsma Y, Campbell CA, DesjardinsRL, Ellert BH, Smith EG (2003) The fate of nitrogen inagroecosystems: An illustration using Canadian estimates. NutrCycl Agroecosyst 67:85–102
Janzen HH, Angers DA, Boehm M (2006) A proposed approach toestimate and reduce net greenhouse gas emissions from wholefarms. Can J Soil Sci 86:401–418
Khan DF, Peoples MB, Schwenke GD, Felton WL, Chen D, HerridgeDF (2003) Effects of below-ground nitrogen on N balances offield-grown fababean, chickpea, and barley. Aust J Agric Res54:333–340
Kirkegaard J, Christen O, Krupinsky J, Layzell D (2008) Break cropbenefits in temperate wheat production. Field Crops Res107:185–195
Kuwada K, Kuramoto M, Utamura M, Matsushita I, Ishii T (2006)Isolation and structural elucidation of a growth stimulant forarbuscular mycorrhizal fungus from Laminaria japonica Are-schoug. J Appl Phycol 18:795–800
Laird D, Fleming P, Wang B, Karlen D (2009) Impact of biocharamendments on soil quality for a typical midwestern agriculturalsoil, Poster presentation. North American Biochar Conference,Boulder, Colorado, USA
Lal R (1995) The role of residues management in sustainableagricultural systems. J Sustain Agric 5:51–78
Lal R (2004) Carbon emission from farm operations. Environ Int30:981–990
Leibovitch S, Migner P, Zhang F, Smith DL (2001) Evaluation ofthe effect of SoyaSignal technology on soybean yield [Glycinemax (L.) Merr.] under field conditions over 6 years in easternCanada and the northern United States, J. Agron. Crop Sci187:281–292
Liang B.C., McConkey B.G., Campbell C.A., Johnston A.M., MoulinA.P. (2002) Short-term crop rotation and tillage effects on soilorganic carbon on the Canadian prairies. An internationalsymposium on agricultural practices and policies for carbon
Strategies for reducing the carbon footprint of field crops 655

sequestration, Soil. Sci. Soc. Am. J., Special Publication, 287–293.
Liang BC, Campbell CA, McConkey BG, Padbury G, Collas P (2005)An empirical model for estimating carbon sequestration on theCanadian prairies. Can J Soil Sci 85:549–556
Lynch JP (2007) Turner review no. 14. Roots of the second greenrevolution. Aust J Bot 55:493–512
Malhi SS, Grant CA, Johnston AM, Gill KS (2001) Nitrogenfertilization management for no-till cereal production in theCanadian Great Plains: A review. Soil Tillage Res 60:101–122
Marino D, Pucciariello C, Puppo A, Frendo P (2009) Chapter 5 TheRedox State, a referee of the legume-rhizobia symbiotic game.Adv Bot Res 10:115–151
McConkey BG, Liang BC, Campbell CA, Curtin D, Moulin A, BrandtSA, Lafond GP (2003) Crop rotation and tillage impact oncarbon sequestration in Canadian prairie soils. Soil Tillage Res74:81–90
McGonigle TP, Miller MH (1993) Mycorrhizal development andphosphorus absorption in maize under conventional and reducedtillage. Soil Sci Soc Am J 57:1002–1006
Menalled FD, Gross KL, Hammond M (2001) Weed aboveground andseedbank community responses to agricultural managementsystems. Ecol Appl 11:1586–1601
Miller PR, Gan Y, McConkey BG, McDonald CL (2003) Pulse cropsfor the northern Great Plains: I. Grain productivity and residualeffects on soil water and nitrogen. Agron J 95:972–979
Miransari M, Smith D (2009) Rhizobial lipo-chitooligosaccharidesand Gibberellins enhance barley (Hordeum vulgare L.) seedgermination. Biotechnol 8:270–275
Moot DJ, McNeil DL (1995) Yield components, harvest index andplant type in relation to yield differences in field pea genotypes.Euphytica 86:31–40
Paradis R, Dalpe Y, Charest C (1995) The combined effect ofarbuscular mycorrhizas and short-term cold exposure on wheat.New Phytol 129:637–642
Peng S, Buresh RJ, Huang J, Zhong X, Zou Y, Yang J, Wang G, LiuY, Hu R, Tang Q, Cui K, Zhang F, Dobermann A (2010)Improving nitrogen fertilization in rice by site-specific Nmanagement-A review, Agron Sustain Dev 30, 649–656. doi:10.1051/agro/2010002.
Prasad R (2009) Efficient fertilizer use: The key to food security andbetter environment. J Trop Agric Food Sci 47:1–17
Rees WE (1992) Ecological footprints and appropriated carryingcapacity: what urban economics leaves out, Environ. Urbanisa-tion 4, 121–130, doi:10.1177/095624789200400212.
Reino JL, Guerrero RF, Hernández-Galán R, Collado IG (2008)Secondary metabolites from species of the biocontrol agentTrichoderma. Physiol Rev 7:89–123
Rochette P, Worth DE, Lemke RL, McConkey BG, Pennock DJ,Wagner-Riddle C, Desjardins RL (2008) Estimation of N2Oemissions from agricultural soils in Canada. I. Development of acountry-specific methodology. Can J Soil Sci 88:641–654
Rolfe BG (1988) Flavones and isoflavones as inducing substances oflegume nodulation. Biofactors 1:3–10
Ruddiman WF (2003) The anthropogenic greenhouse era beganthousands of years ago. Clim Change 61:261–293
Sawers RJH, Gebreselassie MN, Janos DP, Paszkowski U (2010)Characterizing variation in mycorrhiza effect among diverse plantvarieties. Theor Appl Genet 120:1029–1039
Sieling K, Kage H (2010) Efficient N management using winteroilseed rape - A review, Agron. Sustain. Dev. 30, 271–279. doi:10.1051/agro/2009036.
St-Arnaud M, Hamel C, Vimard B, Caron M, Fortin JA (1996)Enhanced hyphal growth and spore production of the arbuscularmycorrhizal fungus Glomus intraradices in an in vitro system inthe absence of host roots. Mycol Res 100:328–332
Swift MJ, Vandermeer J, Ramakrishnan PS, Anderson JM, Ong CK,Hawkins BA (1996) Biodiversity and agroecosystem function.In: Mooney HA, Cushman JH, Medina E, Sala OE, Schulze ED(eds) Functional Roles in Biodiversity: A Global Perspective.John Wiley & Sons, New York, pp 261–290
Unger PW (1978) Straw-mulch rate effect on soil water storage andsorghum yield. Soil Sci Soc Am J 42:486–491
Ussiri DAN, Lal R, Jarecki MK (2009) Nitrous oxide and methaneemissions from long-term tillage under a continuous corncropping system in Ohio. Soil Tillage Res 104:247–255
Van Loon LC (2007) Plant responses to plant growth-promotingrhizobacteria. Eur J Plant Pathol 119:243–254
Van Noordwijk M, Cadisch G (2002) Access and excess problems inplant nutrition. Plant Soil 247:25–40
VandenBygaart AJ, Gregorich EG, Angers DA (2003) Influence ofagricultural management on soil organic carbon: A compen-dium and assessment of Canadian studies. Can J Soil Sci83:363–380
Viscusi WK, Zeckhauser RJ (2006) The perception and valuation ofrisks of climate change: a rational and behavioral blend. ClimChange 77:151–177
Wackernagel M. (1994) Ecological footprint and appropriatedcarrying capacity: A tool for planning toward sustainability.(PhD thesis), Vancouver, Canada: School of Community andRegional Planning, The University of British Columbia.OCLC 41839429.
Walley FL, Clayton GW, Miller PR, Carr PM, Lafond GP (2007)Nitrogen economy of pulse crop production in the NorthernGreat Plains. Agron J 99:1710–1718
West TO, Marland G (2002) A synthesis of carbon sequestration,carbon emissions, and net carbon flux in agriculture: comparingtillage practices in the United States. Agric Ecosyst Environ9:217–232
Westerman PR, Liebman M, Menalled FD, Heggenstaller AH, HartzlerRG, Dixon PM (2005) Are many little hammers effective?Velvetleaf (Abutilon theophrasti) population dynamics in two-and four-year crop rotation systems. Weed Sci 53:382–392
Wiedmann T, Minx J (2008) A definition of ‘carbon footprint’. In:Pertsova CC (ed) Ecological Economics Research Trends:Chapter 1. Nova, Hauppauge NY, USA, pp 1–11
Wiedmann T, Minx J, Barrett J, Wackernagel M (2006) Allocatingecological footprints to final consumption categories with input-output analysis. Ecol Econ 56:28–48
Yuan ZL, Zhang CL, Lin FC (2010) Role of diverse non-systemicfungal endophytes in plant performance and response to stress:progress and approaches, J. Plant Growth Regul 29:116–126
Zentner RP, Stumborg MA, Campbell CA (1989) Effect of croprotations and fertilization on energy balance in typical productionsystems on the Canadian Prairies. Agric Ecosyst Environ25:217–232
Zentner RP, McConkey BG, Stumborg MA, Campbell CA, Selles F(1998) Energy performance of conservation tillage managementfor spring wheat production in the Brown soil zone. Can J PlantSci 78:553–563
Zentner RP, Lafond GP, Derksen DA, Nagy CN, Wall DD, May WE(2004) Effects of tillage method and crop rotation on non-renewable energy use efficiency for a thin Black Chernozem inthe Canadian Prairies. Soil Tillage Res 77:125–136
Zentner R.P., Brandt S.A., Nagy C.N., Frick B. (2009) Economics andenergy use efficiency of alternative cropping strategies for theDark Brown soil zone of Saskatchewan, Saskatchewan Agricul-ture Development Fund Final Report: Project 20070029. http://www.agr.gov.sk.ca/apps/adf/adf_admin/reports/20070029.pdf
Zhang F, Smith DL (1997) Application of genistein to inoculate soil toovercome low spring soil temperature inhibition of soybeannodulation and nitrogen fixation. Plant Soil 192:141–151
656 Yantai Gan et al
Related Documents


![Evaluation ofhydrologic parameters in a semiarid rangeland ... · Evaluation ofhydrologic parameters in a semiarid rangeland using remotely sensed spectral data ... [Rosema, 1990],](https://static.cupdf.com/doc/110x72/5b365c827f8b9a6b548e6079/evaluation-ofhydrologic-parameters-in-a-semiarid-rangeland-evaluation-ofhydrologic.jpg)


