1

Welcome message from author
This document is posted to help you gain knowledge. Please leave a comment to let me know what you think about it! Share it to your friends and learn new things together.
Transcript
1
2
CGIAR Challenge Program on Water and Food
2nd International Forum on Water and Food
Fighting Poverty Through Sustainable Water Use: Volumes I, II, III and IV. Proceedings of the CGIAR Challenge Program on Water and Food 2nd International Forum on Water and Food, Addis Ababa, Ethiopia, November 10—14, 2008. Proceedings Volume I ISBN 978-92-990053-0-9 Volume II ISBN 978-92-990053-1-6 Volume III ISBN 978-92-990053-2-3 Volume IV ISBN 978-92-990053-3-0
I
Acknowledgements
The CGIAR Challenge Program on Water and Food would like to thank all those in its community-of-practice who contributed to the production of these four volumes of papers and posters. Humphreys, E., Bayot, R.S., van Brakel, M., Gichuki, F., Svendsen, M., White, D., Wester, P., Huber-Lee, A., Cook, S., Douthwaite, B., Hoanh, C.T., Johnson, N., Nguyen-Khoa, S., Vidal, A., MacIntyre, I., and MacIntyre, R.
(Editors) 2008. Fighting Poverty Through Sustainable Water Use: Volumes I, II, III and IV. Proceedings of the CGIAR Challenge Program on Water and Food 2nd International Forum on Water and Food, Addis Ababa, Ethiopia, November 10—14, 2008. The CGIAR Challenge Program on Water and Food, Colombo. 183pp. ISBN 978-92-990053-0-9 Front cover design: Meskerm Gosaya, Emmer Advertising, Addis Ababa, Ethiopia Pre-press assembly: Yoseph Ali, MDSC, Addis Ababa, Ethiopia Note on cover design: The Amharic lettering in the lower right hand corner translates as “International
Program and Water and Food”. The colours in the keyline at the bottom of the page are those of the Ethiopian Flag, and the obelisk is a famous landmark of Axum – a historic city of Ethiopia and a world treasure. Their inclusion on the cover and use in other Forum print materials is recognition of the wonderful hospitality of the Ethiopian people and a thank you for being such a generous host country for the 2nd International Forum on Water and Food.
II
Foreword Every two years the CGIAR Challenge Program on Water and Food holds an International Forum on Water and Food, during which we present our research results, debate these, and consider ways in which we can better deliver these into impact. Another important function of this second Forum is to consolidate CPWF research priorities for our second 5-year phase starting in 2009. We are particularly glad to introduce these three volumes of papers originating from CPWF phase one projects. All papers were peer-reviewed, and a total of 154 papers were selected for publication in these proceedings. They include papers from all 9 Basin Focal Projects, 30 of the 1st competitive call projects, 3 of the Small Grants projects for innovation, and 2 Themes. We wish to congratulate all of you who contributed papers to these proceedings, and thank you for tremendous enthusiasm and cooperation enabling us to meet very tight publication deadlines so that all papers could be available, in hard copy, at the Forum. All this was achieved in less than 9 months, from the time of the call for Abstracts to release at the Forum. We are also proud of the excellent teamwork of the CPWF Theme Leaders and Basin Focal Project Leadership team, who worked very hard reviewing abstracts, reviewing and editing papers, and checking revised papers, and who designed and selected the papers for the sessions, based on your submissions. The publication of these proceedings is the result of a truly CPWF global community effort. We also thank Reg and Ida MacIntyre for their painstaking editing to tight deadlines. The papers are provided in 3 volumes as follows: Volume 1 - 4 invited Key Concept Papers from the Phase 1 projects, one invited Keynote paper from Dr Carlos Sere, DG of ILRI entitled ‘Swimming upstream’ – the water and livestock nexus, and 36 papers on Cross-cutting topics : Governance ; Innovative modelling tools ; Agriculture, water and health; Resilience to climate change ; and Participatory modelling and knowledge integration Volume 2 – 44 papers from Phase 1 projects directly relevant to the CPWF Phase 2 Topic 1 Increasing rainwater productivity. Major sub-themes include increasing water productivity of rainfed cropping systems, optimising the use of scarce irrigation water, and livestock water productivity Volume 3 – 69 papers from Phase 1 projects directly relevant to CPWF Phase 2 Topics 2, 3 and 4 – (2) Multi-purpose water systems, (3) Water benefits sharing for poverty alleviation and conflict resolution, and (4) Drivers and processes of change Five years is at the same time long from an outside perspective, but short for multi-disciplinary projects including partners from different horizons, backgrounds, and often river basins. These Proceedings present many, but not all, of the fine achievements and outcomes of theCPWF Phase 1 projects. Dr. Jonathan Woolley Dr. Alain Vidal, Cemagref Program Coordinator Forum Convener, Chair Organising Committee
CGIAR Challenge Program on Water and Food
www.waterandfood.org
III
Table of Contents
ACKNOWLEDGEMENTS ................................................................................................................................................. I FOREWORD ............................................................................................................................................................... II TABLE OF CONTENTS .................................................................................................................................................. III KEY NOTES ................................................................................................................................................................ 1 ‘SWIMMING UPSTREAM’ – THE WATER AND LIVESTOCK NEXUS ............................................................................................ 1 USING THE SEEMINGLY UNINTERESTING AFRICAN TRANSBOUNDARY WATER LAW DATABASE TO DERIVE SURPRISINGLY INTERESTING
WATER POLICY LESSONS .................................................................................................................................. 11 ADAPTING TO CHANGE–HOW TO ACCELERATE IMPACT ..................................................................................................... 16 IS WATER PRODUCTIVITY RELEVANT IN FISHERIES AND AQUACULTURE? ................................................................................ 22 STRATEGIES FOR IMPROVING LIVESTOCK WATER PRODUCTIVITY ........................................................................................ 28 AGRICULTURE, WATER AND HEALTH ............................................................................................................................ 34 PA173 MOSQUITOES AND MALARIA IN THE VICINITY OF THE KOKA RESERVOIR, ETHIOPIA. ...................................................... 34 PA 176 WASTEWATER IRRIGATION AND PERCEPTIONS IN URBAN AND PERIURBAN KUMASI, GHANA .......................................... 38 PA 178 PREVALENCE OF SNAIL‐BORNE DISEASES IN IRRIGATED AREAS OF THE SUDAN .............................................................. 42 PO017 WATER PRODUCTION SYSTEMS AND METHODS FOR THEIR IMPROVEMENT IN AL GADARIF STATE, EASTERN SUDAN ............ 45 PA181 SPATIAL‐TEMPORAL VARIABILITY OF GROUNDWATER QUALITY IN ZHENGZHOU AREA, CHINA .......................................... 49 GOVERNANCE: LINKING COMMUNITIES ACROSS BOUNDARIES .......................................................................................... 53 PA085 FROM LOCAL TO TRANSBOUNDARY: STRENGTHENING WATER INSTITUTIONS IN THE VOLTA AND LIMPOPO BASINS .............. 53 PA040 GOING AGAINST THE FLOW: A CRITICAL ANALYSIS OF VIRTUAL WATER TRADE IN THE CONTEXT OF INDIA’S NATIONAL RIVER
LINKING PROGRAM ......................................................................................................................................... 58 PA079 BEYOND ‘BASIN’: THE POLITICS OF SCALE IN MEKONG WATER GOVERNANCE............................................................... 65 PA086 WATER RIGHTS IN INFORMAL ECONOMIES IN THE LIMPOPO AND VOLTA BASINS .......................................................... 69 PA080 GROUNDWATER GOVERNANCE IN THE INDO‐GANGETIC BASIN: AN INTERPLAY OF HYDROLOGY AND SOCIO‐ECOLOGY ........ 73 PA084 TRANSBOUNDARY WATER GOVERNANCE INSTITUTIONAL ARCHITECTURE: REFLECTIONS FROM ETHIOPIA AND SUDAN ........... 77 PA083 IMPROVING MEKONG WATER INVESTMENT AND ALLOCATION CHOICES ...................................................................... 81 PA065 PROCESS‐ORIENTED INTEGRATED NATURAL RESOURCE MANAGEMENT (INRM) IMPLEMENTATION AT THE BASIN LEVEL: CAN IT
GIVE NEW INSIGHTS TO STATE RESTRUCTURING IN NEPAL? ..................................................................................... 85 PA050 EQUITY IN TWO IRRIGATION SYSTEMS, BEGNAS WATERSHED, NEPAL ........................................................................ 89 PA106 HETEROGENEITY OF GROUNDWATER MARKET DEVELOPMENT AND OPERATION IN RURAL NORTHERN CHINA ..................... 93
INNOVATIVE MODELING TOOLS ................................................................................................................................... 97 PA130 USING DAILY RAINFALL DATA AND IDF CURVES TO ESTIMATE THE IMPACT OF LAND COVER CHANGE ON RAINFALL RUNOFF.... 97 PA 142 SURFACE ENERGY BALANCE MODELING TO TRACK WATER CONSUMPTION BY HETEROGENEOUS LAND USES IN THE KARKHEH
RIVER BASIN, IRAN....................................................................................................................................... 101 PA 138 REMOTE SENSING‐BASED ACTUAL EVAPOTRANSPIRATION DETERMINATION IN THE NOTWANE SUBCATCHMENT OF THE
LIMPOPO BASIN OF BOTSWANA ..................................................................................................................... 105 PA126 IMPACT OF WATERSHED INTERVENTIONS ON RUNOFF AND SEDIMENTATION IN GUMERA WATERSHED ........................... 109 PA200 SCALING‐UP IN WATERSHED MANAGEMENT RESEARCH PROJECTS ............................................................................ 114 PA134 WATER PRODUCTIVITY MAPPING TO IDENTIFY OPPORTUNITIES TO IMPROVE AGRICULTURAL WATER MANAGEMENT IN THE
KARKHEH RIVER BASIN, IRAN ......................................................................................................................... 119 PA136 MONITORING AGRICULTURAL WATER CONSUMPTION AND IRRIGATION PERFORMANCE USING FREE MODIS IMAGES FOR A
LARGE IRRIGATION SYSTEM IN PAKISTAN ........................................................................................................... 123 PA139 SIMULATION OF SMALLHOLDER FARMING SYSTEMS IN THE OLIFANTS RIVER BASIN, SOUTH AFRICA ............................... 127 PA032 A METHODOLOGY FOR THE ASSESSMENT OF AGRICULTURAL WATER PRODUCTIVITY AT THE RIVER BASIN LEVEL ................. 131 PO018 CALIBRATING RUNOFF MODELS IN UNGAUGED BASINS USING SMALL RESERVOIRS AS SATELLITE OBSERVED RUNOFF GAUGES 135 PARTICIPATORY MODELING AND KNOWLEDGE INTEGRATION .......................................................................................... 143 PA126 BASIN FOCAL PROJECT (BFP ANDES): CONCEPTS AND ADVANCES ........................................................................... 143 PA141 SPATIAL VARIATION AND MANAGEMENT OF LIVESTOCK WATER PRODUCTIVITY IN THE NILE BASIN ................................. 146 PA145 WATER MANAGEMENT ACROSS SCALES IN THE SÃO FRANCISCO RIVER BASIN, BRAZIL:POLICY OPTIONS AND POVERTY
CONSEQUENCES ........................................................................................................................................... 150

IV
PA133 SYSTEM CHARACTERIZATION FOR INTEGRATED RESOURCE ANALYSIS OF RICE‐BASED LIVELIHOOD SYSTEMS IN UPLAND LAO PDR ................................................................................................................................................................ 155
PA127 ROLE‐PLAYING GAMES AND INSTITUTIONAL ENGAGEMENT FOR MODELING LAND AND WATER MANAGEMENT IN A NORTHERN
THAILAND WATERSHED ................................................................................................................................. 160 RESILIENCE TO CLIMATE CHANGE ............................................................................................................................... 164 PA184 DETERMINANTS OF FARMERS’ CHOICE OF ADAPTATION METHODS TO CLIMATE CHANGE IN THE NILE BASIN OF ETHIOPIA ... 164 PA187 IMPACT OF CLIMATE CHANGE ON STREAMFLOW IN THE YELLOW RIVER BASIN ........................................................... 167 PA190 IMPACT OF EXTREME CLIMATE VARIABILITY ON WATER RESOURCE DEVELOPMENT PLANNING ........................................ 170 PA201 GLOBAL PROCESSES AND DRIVERS OF CHANGE: IMPACTS ON RIVER BASINS IN ASIA, AFRICA AND LATIN AMERICA ............. 176 PA183 ASSESSING LAND SUITABILITY FOR CROP PRODUCTION IN THE KARKHEH RIVER BASIN, IRAN ......................................... 177 PA188 CLIMATE CHANGE MITIGATION STRATEGIES FOR AGRICULTURE WATER DEMANDS IN THE KARKHEH RIVER BASIN, IRAN ...... 181
1
Key notes
‘Swimming upstream’ – the water and livestock nexus
Carlos Sere, Don Peden, Gabrielle Persley and Nancy Johnson1
International Livestock Research Institute
Abstract The purpose of this paper is to discuss the importance of livestock in relation to improving agricultural water management. This issue is addressed across the spectrum of global, regional (basin-watershed), farming system, animal and household levels of water management. The paper also discusses future research priorities, for the two fold purpose of ensuring that: (1) livestock keeping contributes to more productive and sustainable use of agricultural water in the future; and (2) livestock play an effective role as a pathway out of poverty for the 600 million people world wide who depend on livestock for their livelihoods. The paper concludes that the Water and Food Challenge Program has in its short life succeeded in drawing researchers’ and policymakers’ attention to a range of livestock related issues influencing water productivity. Having successfully raised awareness, efforts now need to concentrate on: (1) understanding the main drivers shaping the nature of the trade-offs amongst water and livestock; (2) quantifying the relative importance of feasible technology, policy and institutional interventions at various levels to improve system performance, and (3) engaging social change processes that will turn the knowledge developed into action on the ground. Given the overarching scenario of rapidly increasing water scarcity globally and rapidly growing demand for animal products in the developing world, research and development investments at the water, food and livestock intersection should have significant payoff in terms of overall benefits - for people, livestock and the environment. Media grab The importance of livestock as a key component in improving agricultural water management is increasingly being recognized, as livestock play both positive and negative roles at global, river basin, farming system, animal and household levels of water management. The purpose of understanding livestock water productivity is to identify options by which co-management of water and livestock resources can help address pressing development problems such as achieving food security, reducing global poverty, mitigating and adapting to climate change, restoring biodiversity, and conserving and enhancing soil fertility, water quality and the quantity of water resources. 1. Introduction Purpose The purpose of this paper is to discuss the importance of livestock in relation to improving agricultural water management, at global, regional (basin-watershed), farming system, animal and household levels of water management. The paper also discusses future research priorities, for the two fold purpose of ensuring that: (1) livestock keeping contributes to more productive and sustainable use of agricultural water; and (2) livestock play an effective role as a pathway out of poverty for the 600 million people world wide who depend on livestock for their livelihoods. Context In the evolution of the livestock–water agenda, there has been a progressive inclusion of livestock in the agenda of the Challenge Program on Water and Food (CPWF), over the course of the first phase of CPWF, as the importance of livestock in relation to water was increasingly recognized. Livestock is now recognized as a mainstream agenda in the CPWF second phase, as evidenced by the fact that ILRI is co hosting the Second International Forum on Water and Food. The incremental inclusion of livestock in the CPWF agenda is also demonstrated by the trends of priorities and projects during the first phase of the program. These demonstrated that livestock became increasingly important in the CPWF research priorities and to the resulting CPWF projects. For example, the original five CPWF Thematic areas were: Crop water productivity; people and watersheds; aquatic ecosystems and fisheries; integrated basin management; and global and national food and water system. In the first call for
1 Other contributing authors were: Ana Maria Caliz, Salah Darghouth, Mohammed Rachid Doukkali, Mona El-Kady, Thierry Facon, M. Gopalakrishnan, David Groenfeldt, Chu Thai Hoanh, Intizar Hussain, Jean-Yves Jamin, Flemming Konradsen, Alejandro León, Ruth Meinzen-Dick, Kathleen Miller, Monirul Mirza, Claudia Ringler, Lisa Schipper, Aidan Senzanje, Girma Tadesse, Rebecca Tharme, Paul van Hofwegen, Robina Wahaj, Consuelo Varela-Ortega, Robert Yoder, and Gao Zhanyi
2
proposals in 2004, 33 projects were funded and one dealt explicitly with livestock (PN37-Nile basin livestock water productivity). By the time of the CPWF second call in 2006, the CPWF agenda focused on 6 priority areas and one was specific to livestock. The new priorities were: • Research on groundwater and poverty reduction • Political drivers of success in water rights and allocations among users and uses • Research to quantify livestock use of, and impact on, water resources in diverse production systems • Valuation of aquatic ecosystem goods and services • Approaches that prevent or mitigate land and water degradation under high population density and improve small-scale agricultural livelihoods • Alternative policies and methodologies for enhancing fisheries management In Phase 2 the research will be organized around 4 topics: • Rainwater management in rain fed agricultural systems • Multi-purpose water systems • Benefit sharing • Global drivers Livestock are integrated within each of these four topics in Phase 2. How and why did this integration happen? A number of factors contributed to the recognition of the importance of livestock in relation to water and food: Firstly was the work of Don Peden and his colleagues through their research project and their contribution of a chapter of the CGIAR Comprehensive assessment (‘Water for food, water for life’), that highlighted the important role of livestock (Peden et al. 2007). This work clarified water use and impact issues in livestock and livestock-based systems. Secondly, the Basin focus of the CPWF, especially in the basin focal projects (BFPs), highlighted the importance of rangelands, where livestock are the critically important component. Thirdly, was the CPWF emphasis on systems thinking – a water focus requires looking at how different components of a system fit together, rather than looking at individual components in isolation. This made people realize that livestock are an important component in most agricultural systems, not just the extensive pastoral systems that dominate in land use. Fish also benefit from this integrated perspective. Thus livestock are increasingly being integrated across the agricultural water management agenda through the Challenge program Similarly, ILRI is integrating water into its livestock and poverty agenda, since water is one of the factors that affect the ability of livestock to provide pathways out of poverty for the 600 million people who depend on livestock for their livelihoods (see ILRI’s Strategy Livestock a pathway out of poverty at www.ilri.org). ILRI has identified seven global issues where livestock play a major role, and these issues drive ILRI’s research agenda. They are: 1. Intensification 2. Vulnerability and sustainability 3. Markets and sanitary/phyto-sanitary standards 4. Emerging diseases 5. Climate change 6. Vaccine development 7. Animal genetic resources Livestock-water issues feature to some extent in all these issues, but more so in Issues 1 Intensification; 2 Vulnerability and sustainability; and 5, Climate change. Thus, there are synergies between the CPWF’s new research priorities and ILRI’s livestock related research agenda. For example, in the management of rain water in rain fed agricultural systems, there is a link with ILRI’s work on the intensification of crop/livestock systems where water availability is a limiting factor. In dealing with the global drivers of changes, such as climate change, trade and market access and global efforts to reduce poverty, the livestock-water nexus is a critical link. The opportunities to promote these synergies between the agricultural water and livestock agendas is one of our desired outcomes of this conference. 2. The new paradigm of agricultural water productivity From 1950 onwards, large public and private investments in agricultural water for irrigation helped fuel the Green Revolution that led to huge increases in food production, especially in increasing rice and wheat production Asia (Faures et al. 2007). Much research during these years focused on increasing various aspects of water use efficiency for irrigated crop production. Many significant gains in food security and reduced poverty resulted, albeit with increasing environmental degradation in irrigated areas and human health risks (such as increasing incidence of malaria). The CGIAR’s Comprehensive Assessment of Water Management in Agriculture (Molden 2007) highlights emerging trends toward a new paradigm of investment, development, and use of agricultural water especially in developing countries. For irrigation, future trends will likely focus on improving the profitability of existing irrigation systems rather than expanding areas devoted to irrigation, although some regional variation will arise.
3
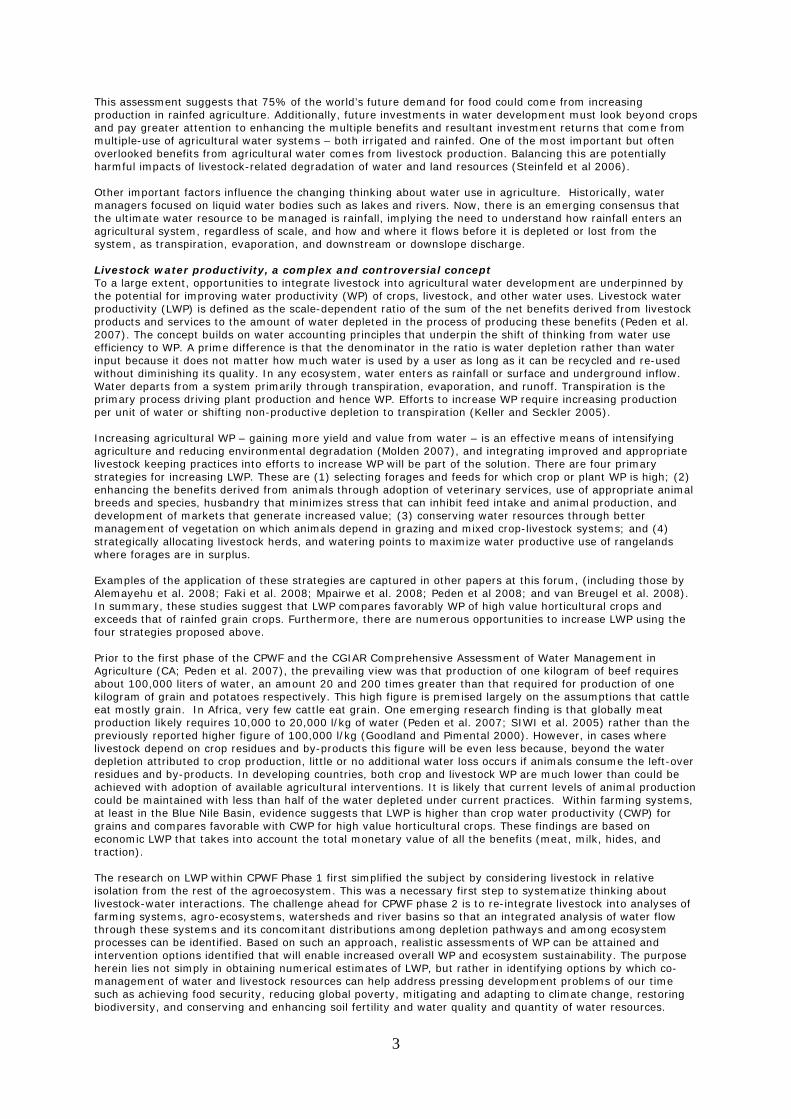
This assessment suggests that 75% of the world’s future demand for food could come from increasing production in rainfed agriculture. Additionally, future investments in water development must look beyond crops and pay greater attention to enhancing the multiple benefits and resultant investment returns that come from multiple-use of agricultural water systems – both irrigated and rainfed. One of the most important but often overlooked benefits from agricultural water comes from livestock production. Balancing this are potentially harmful impacts of livestock-related degradation of water and land resources (Steinfeld et al 2006). Other important factors influence the changing thinking about water use in agriculture. Historically, water managers focused on liquid water bodies such as lakes and rivers. Now, there is an emerging consensus that the ultimate water resource to be managed is rainfall, implying the need to understand how rainfall enters an agricultural system, regardless of scale, and how and where it flows before it is depleted or lost from the system, as transpiration, evaporation, and downstream or downslope discharge. Livestock water productivity, a complex and controversial concept To a large extent, opportunities to integrate livestock into agricultural water development are underpinned by the potential for improving water productivity (WP) of crops, livestock, and other water uses. Livestock water productivity (LWP) is defined as the scale-dependent ratio of the sum of the net benefits derived from livestock products and services to the amount of water depleted in the process of producing these benefits (Peden et al. 2007). The concept builds on water accounting principles that underpin the shift of thinking from water use efficiency to WP. A prime difference is that the denominator in the ratio is water depletion rather than water input because it does not matter how much water is used by a user as long as it can be recycled and re-used without diminishing its quality. In any ecosystem, water enters as rainfall or surface and underground inflow. Water departs from a system primarily through transpiration, evaporation, and runoff. Transpiration is the primary process driving plant production and hence WP. Efforts to increase WP require increasing production per unit of water or shifting non-productive depletion to transpiration (Keller and Seckler 2005). Increasing agricultural WP – gaining more yield and value from water – is an effective means of intensifying agriculture and reducing environmental degradation (Molden 2007), and integrating improved and appropriate livestock keeping practices into efforts to increase WP will be part of the solution. There are four primary strategies for increasing LWP. These are (1) selecting forages and feeds for which crop or plant WP is high; (2) enhancing the benefits derived from animals through adoption of veterinary services, use of appropriate animal breeds and species, husbandry that minimizes stress that can inhibit feed intake and animal production, and development of markets that generate increased value; (3) conserving water resources through better management of vegetation on which animals depend in grazing and mixed crop-livestock systems; and (4) strategically allocating livestock herds, and watering points to maximize water productive use of rangelands where forages are in surplus. Examples of the application of these strategies are captured in other papers at this forum, (including those by Alemayehu et al. 2008; Faki et al. 2008; Mpairwe et al. 2008; Peden et al 2008; and van Breugel et al. 2008). In summary, these studies suggest that LWP compares favorably WP of high value horticultural crops and exceeds that of rainfed grain crops. Furthermore, there are numerous opportunities to increase LWP using the four strategies proposed above. Prior to the first phase of the CPWF and the CGIAR Comprehensive Assessment of Water Management in Agriculture (CA; Peden et al. 2007), the prevailing view was that production of one kilogram of beef requires about 100,000 liters of water, an amount 20 and 200 times greater than that required for production of one kilogram of grain and potatoes respectively. This high figure is premised largely on the assumptions that cattle eat mostly grain. In Africa, very few cattle eat grain. One emerging research finding is that globally meat production likely requires 10,000 to 20,000 l/kg of water (Peden et al. 2007; SIWI et al. 2005) rather than the previously reported higher figure of 100,000 l/kg (Goodland and Pimental 2000). However, in cases where livestock depend on crop residues and by-products this figure will be even less because, beyond the water depletion attributed to crop production, little or no additional water loss occurs if animals consume the left-over residues and by-products. In developing countries, both crop and livestock WP are much lower than could be achieved with adoption of available agricultural interventions. It is likely that current levels of animal production could be maintained with less than half of the water depleted under current practices. Within farming systems, at least in the Blue Nile Basin, evidence suggests that LWP is higher than crop water productivity (CWP) for grains and compares favorable with CWP for high value horticultural crops. These findings are based on economic LWP that takes into account the total monetary value of all the benefits (meat, milk, hides, and traction). The research on LWP within CPWF Phase 1 first simplified the subject by considering livestock in relative isolation from the rest of the agroecosystem. This was a necessary first step to systematize thinking about livestock-water interactions. The challenge ahead for CPWF phase 2 is to re-integrate livestock into analyses of farming systems, agro-ecosystems, watersheds and river basins so that an integrated analysis of water flow through these systems and its concomitant distributions among depletion pathways and among ecosystem processes can be identified. Based on such an approach, realistic assessments of WP can be attained and intervention options identified that will enable increased overall WP and ecosystem sustainability. The purpose herein lies not simply in obtaining numerical estimates of LWP, but rather in identifying options by which co-management of water and livestock resources can help address pressing development problems of our time such as achieving food security, reducing global poverty, mitigating and adapting to climate change, restoring biodiversity, and conserving and enhancing soil fertility and water quality and quantity of water resources.
4
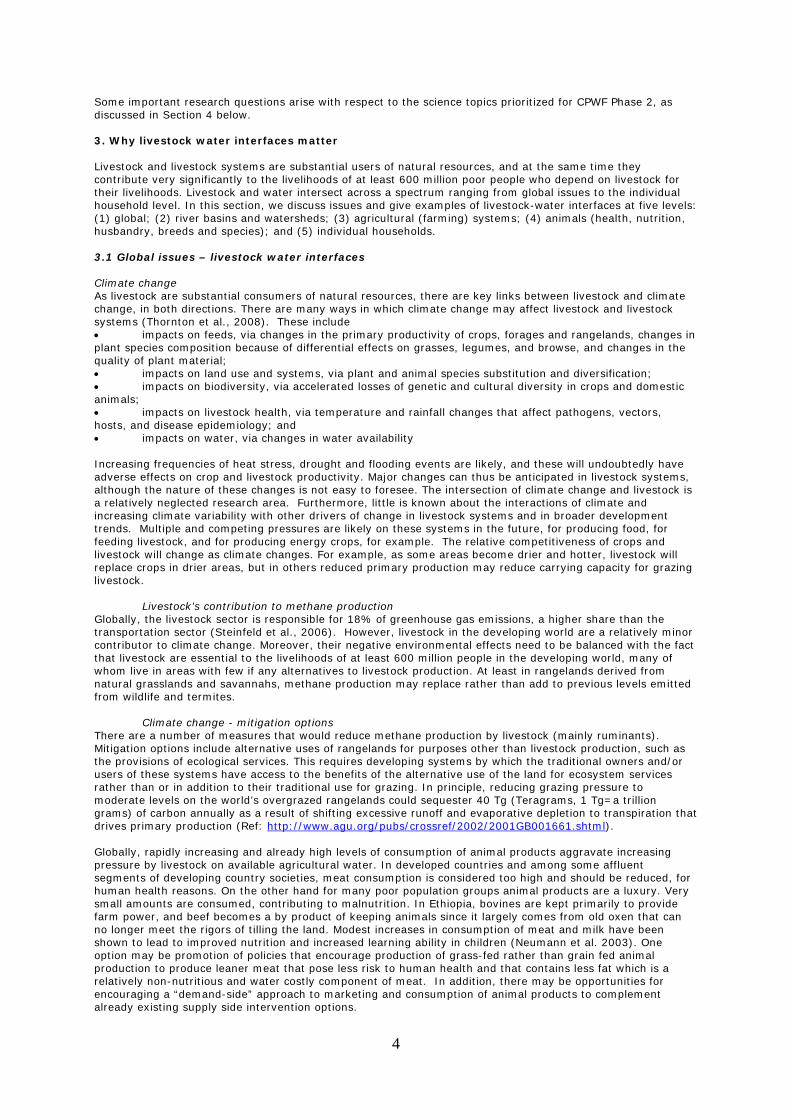
Some important research questions arise with respect to the science topics prioritized for CPWF Phase 2, as discussed in Section 4 below. 3. Why livestock water interfaces matter Livestock and livestock systems are substantial users of natural resources, and at the same time they contribute very significantly to the livelihoods of at least 600 million poor people who depend on livestock for their livelihoods. Livestock and water intersect across a spectrum ranging from global issues to the individual household level. In this section, we discuss issues and give examples of livestock-water interfaces at five levels: (1) global; (2) river basins and watersheds; (3) agricultural (farming) systems; (4) animals (health, nutrition, husbandry, breeds and species); and (5) individual households. 3.1 Global issues – livestock water interfaces Climate change As livestock are substantial consumers of natural resources, there are key links between livestock and climate change, in both directions. There are many ways in which climate change may affect livestock and livestock systems (Thornton et al., 2008). These include • impacts on feeds, via changes in the primary productivity of crops, forages and rangelands, changes in plant species composition because of differential effects on grasses, legumes, and browse, and changes in the quality of plant material; • impacts on land use and systems, via plant and animal species substitution and diversification; • impacts on biodiversity, via accelerated losses of genetic and cultural diversity in crops and domestic animals; • impacts on livestock health, via temperature and rainfall changes that affect pathogens, vectors, hosts, and disease epidemiology; and • impacts on water, via changes in water availability Increasing frequencies of heat stress, drought and flooding events are likely, and these will undoubtedly have adverse effects on crop and livestock productivity. Major changes can thus be anticipated in livestock systems, although the nature of these changes is not easy to foresee. The intersection of climate change and livestock is a relatively neglected research area. Furthermore, little is known about the interactions of climate and increasing climate variability with other drivers of change in livestock systems and in broader development trends. Multiple and competing pressures are likely on these systems in the future, for producing food, for feeding livestock, and for producing energy crops, for example. The relative competitiveness of crops and livestock will change as climate changes. For example, as some areas become drier and hotter, livestock will replace crops in drier areas, but in others reduced primary production may reduce carrying capacity for grazing livestock.
Livestock’s contribution to methane production Globally, the livestock sector is responsible for 18% of greenhouse gas emissions, a higher share than the transportation sector (Steinfeld et al., 2006). However, livestock in the developing world are a relatively minor contributor to climate change. Moreover, their negative environmental effects need to be balanced with the fact that livestock are essential to the livelihoods of at least 600 million people in the developing world, many of whom live in areas with few if any alternatives to livestock production. At least in rangelands derived from natural grasslands and savannahs, methane production may replace rather than add to previous levels emitted from wildlife and termites.
Climate change - mitigation options There are a number of measures that would reduce methane production by livestock (mainly ruminants). Mitigation options include alternative uses of rangelands for purposes other than livestock production, such as the provisions of ecological services. This requires developing systems by which the traditional owners and/or users of these systems have access to the benefits of the alternative use of the land for ecosystem services rather than or in addition to their traditional use for grazing. In principle, reducing grazing pressure to moderate levels on the world’s overgrazed rangelands could sequester 40 Tg (Teragrams, 1 Tg=a trillion grams) of carbon annually as a result of shifting excessive runoff and evaporative depletion to transpiration that drives primary production (Ref: http://www.agu.org/pubs/crossref/2002/2001GB001661.shtml). Globally, rapidly increasing and already high levels of consumption of animal products aggravate increasing pressure by livestock on available agricultural water. In developed countries and among some affluent segments of developing country societies, meat consumption is considered too high and should be reduced, for human health reasons. On the other hand for many poor population groups animal products are a luxury. Very small amounts are consumed, contributing to malnutrition. In Ethiopia, bovines are kept primarily to provide farm power, and beef becomes a by product of keeping animals since it largely comes from old oxen that can no longer meet the rigors of tilling the land. Modest increases in consumption of meat and milk have been shown to lead to improved nutrition and increased learning ability in children (Neumann et al. 2003). One option may be promotion of policies that encourage production of grass-fed rather than grain fed animal production to produce leaner meat that pose less risk to human health and that contains less fat which is a relatively non-nutritious and water costly component of meat. In addition, there may be opportunities for encouraging a “demand-side” approach to marketing and consumption of animal products to complement already existing supply side intervention options.
5
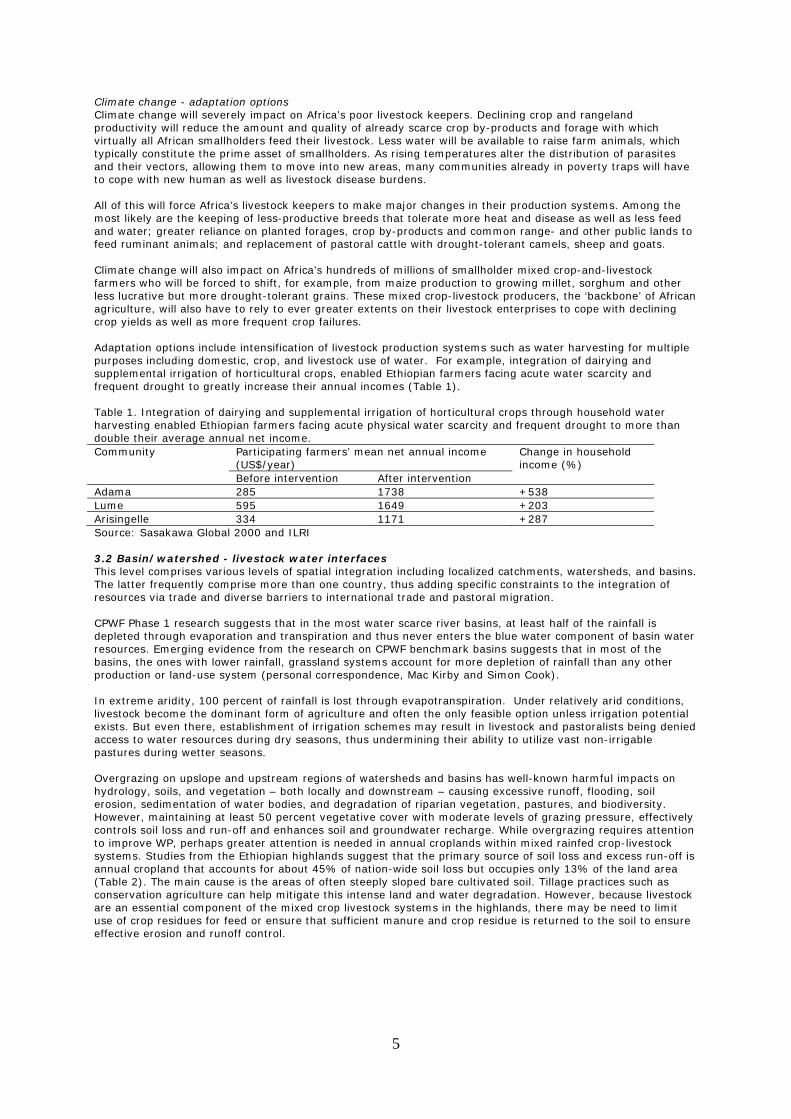
Climate change - adaptation options Climate change will severely impact on Africa’s poor livestock keepers. Declining crop and rangeland productivity will reduce the amount and quality of already scarce crop by-products and forage with which virtually all African smallholders feed their livestock. Less water will be available to raise farm animals, which typically constitute the prime asset of smallholders. As rising temperatures alter the distribution of parasites and their vectors, allowing them to move into new areas, many communities already in poverty traps will have to cope with new human as well as livestock disease burdens. All of this will force Africa’s livestock keepers to make major changes in their production systems. Among the most likely are the keeping of less-productive breeds that tolerate more heat and disease as well as less feed and water; greater reliance on planted forages, crop by-products and common range- and other public lands to feed ruminant animals; and replacement of pastoral cattle with drought-tolerant camels, sheep and goats. Climate change will also impact on Africa’s hundreds of millions of smallholder mixed crop-and-livestock farmers who will be forced to shift, for example, from maize production to growing millet, sorghum and other less lucrative but more drought-tolerant grains. These mixed crop-livestock producers, the ‘backbone’ of African agriculture, will also have to rely to ever greater extents on their livestock enterprises to cope with declining crop yields as well as more frequent crop failures. Adaptation options include intensification of livestock production systems such as water harvesting for multiple purposes including domestic, crop, and livestock use of water. For example, integration of dairying and supplemental irrigation of horticultural crops, enabled Ethiopian farmers facing acute water scarcity and frequent drought to greatly increase their annual incomes (Table 1). Table 1. Integration of dairying and supplemental irrigation of horticultural crops through household water harvesting enabled Ethiopian farmers facing acute physical water scarcity and frequent drought to more than double their average annual net income. Community Participating farmers’ mean net annual income
(US$/year) Change in household income (%)
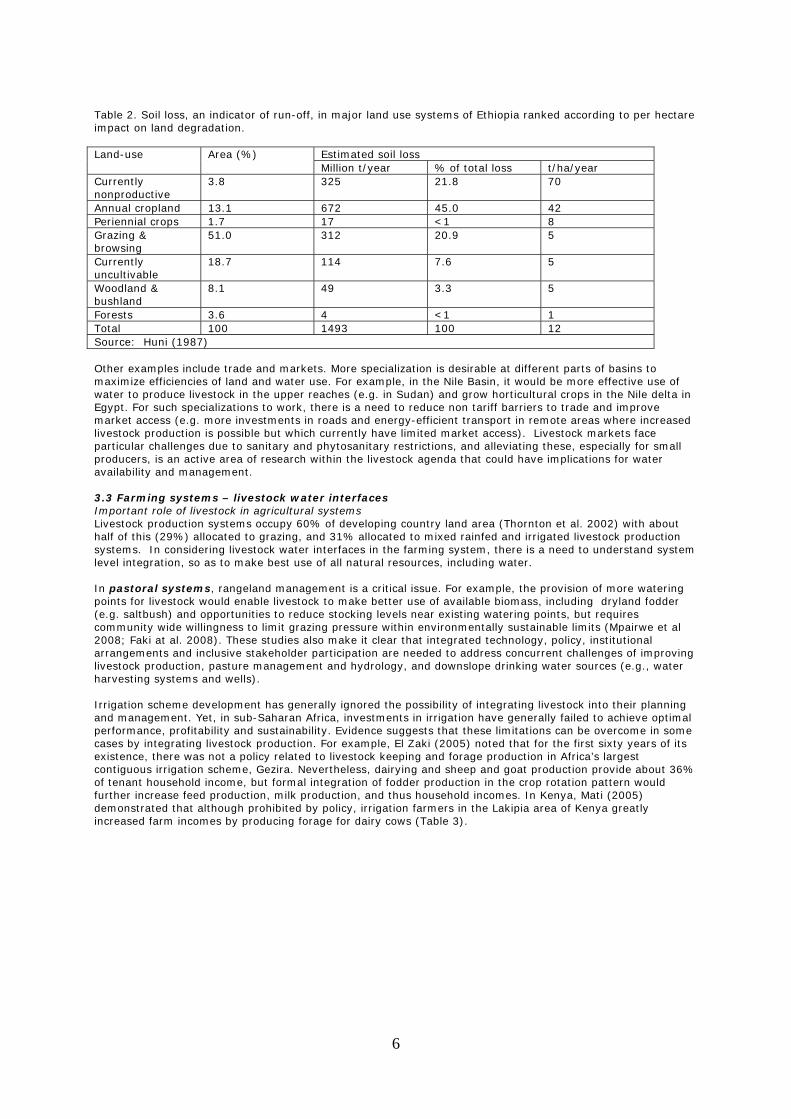
Before intervention After intervention Adama 285 1738 +538 Lume 595 1649 +203 Arisingelle 334 1171 +287 Source: Sasakawa Global 2000 and ILRI 3.2 Basin/watershed - livestock water interfaces This level comprises various levels of spatial integration including localized catchments, watersheds, and basins. The latter frequently comprise more than one country, thus adding specific constraints to the integration of resources via trade and diverse barriers to international trade and pastoral migration. CPWF Phase 1 research suggests that in the most water scarce river basins, at least half of the rainfall is depleted through evaporation and transpiration and thus never enters the blue water component of basin water resources. Emerging evidence from the research on CPWF benchmark basins suggests that in most of the basins, the ones with lower rainfall, grassland systems account for more depletion of rainfall than any other production or land-use system (personal correspondence, Mac Kirby and Simon Cook). In extreme aridity, 100 percent of rainfall is lost through evapotranspiration. Under relatively arid conditions, livestock become the dominant form of agriculture and often the only feasible option unless irrigation potential exists. But even there, establishment of irrigation schemes may result in livestock and pastoralists being denied access to water resources during dry seasons, thus undermining their ability to utilize vast non-irrigable pastures during wetter seasons. Overgrazing on upslope and upstream regions of watersheds and basins has well-known harmful impacts on hydrology, soils, and vegetation – both locally and downstream – causing excessive runoff, flooding, soil erosion, sedimentation of water bodies, and degradation of riparian vegetation, pastures, and biodiversity. However, maintaining at least 50 percent vegetative cover with moderate levels of grazing pressure, effectively controls soil loss and run-off and enhances soil and groundwater recharge. While overgrazing requires attention to improve WP, perhaps greater attention is needed in annual croplands within mixed rainfed crop-livestock systems. Studies from the Ethiopian highlands suggest that the primary source of soil loss and excess run-off is annual cropland that accounts for about 45% of nation-wide soil loss but occupies only 13% of the land area (Table 2). The main cause is the areas of often steeply sloped bare cultivated soil. Tillage practices such as conservation agriculture can help mitigate this intense land and water degradation. However, because livestock are an essential component of the mixed crop livestock systems in the highlands, there may be need to limit use of crop residues for feed or ensure that sufficient manure and crop residue is returned to the soil to ensure effective erosion and runoff control.
6
Table 2. Soil loss, an indicator of run-off, in major land use systems of Ethiopia ranked according to per hectare impact on land degradation. Land-use Area (%) Estimated soil loss
Million t/year % of total loss t/ha/year Currently nonproductive
3.8 325 21.8 70
Annual cropland 13.1 672 45.0 42 Periennial crops 1.7 17 <1 8 Grazing & browsing
51.0 312 20.9 5
Currently uncultivable
18.7 114 7.6 5
Woodland & bushland
8.1 49 3.3 5
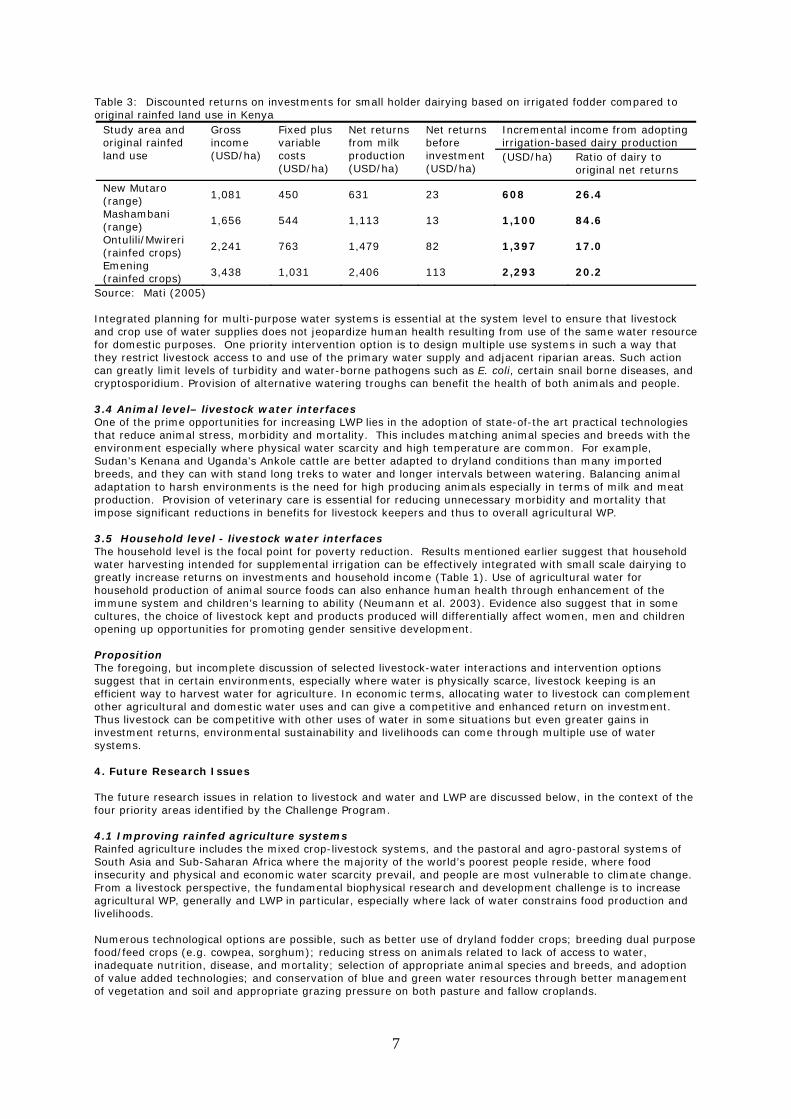
Forests 3.6 4 <1 1 Total 100 1493 100 12 Source: Huni (1987) Other examples include trade and markets. More specialization is desirable at different parts of basins to maximize efficiencies of land and water use. For example, in the Nile Basin, it would be more effective use of water to produce livestock in the upper reaches (e.g. in Sudan) and grow horticultural crops in the Nile delta in Egypt. For such specializations to work, there is a need to reduce non tariff barriers to trade and improve market access (e.g. more investments in roads and energy-efficient transport in remote areas where increased livestock production is possible but which currently have limited market access). Livestock markets face particular challenges due to sanitary and phytosanitary restrictions, and alleviating these, especially for small producers, is an active area of research within the livestock agenda that could have implications for water availability and management. 3.3 Farming systems – livestock water interfaces Important role of livestock in agricultural systems Livestock production systems occupy 60% of developing country land area (Thornton et al. 2002) with about half of this (29%) allocated to grazing, and 31% allocated to mixed rainfed and irrigated livestock production systems. In considering livestock water interfaces in the farming system, there is a need to understand system level integration, so as to make best use of all natural resources, including water. In pastoral systems, rangeland management is a critical issue. For example, the provision of more watering points for livestock would enable livestock to make better use of available biomass, including dryland fodder (e.g. saltbush) and opportunities to reduce stocking levels near existing watering points, but requires community wide willingness to limit grazing pressure within environmentally sustainable limits (Mpairwe et al 2008; Faki at al. 2008). These studies also make it clear that integrated technology, policy, institutional arrangements and inclusive stakeholder participation are needed to address concurrent challenges of improving livestock production, pasture management and hydrology, and downslope drinking water sources (e.g., water harvesting systems and wells). Irrigation scheme development has generally ignored the possibility of integrating livestock into their planning and management. Yet, in sub-Saharan Africa, investments in irrigation have generally failed to achieve optimal performance, profitability and sustainability. Evidence suggests that these limitations can be overcome in some cases by integrating livestock production. For example, El Zaki (2005) noted that for the first sixty years of its existence, there was not a policy related to livestock keeping and forage production in Africa’s largest contiguous irrigation scheme, Gezira. Nevertheless, dairying and sheep and goat production provide about 36% of tenant household income, but formal integration of fodder production in the crop rotation pattern would further increase feed production, milk production, and thus household incomes. In Kenya, Mati (2005) demonstrated that although prohibited by policy, irrigation farmers in the Lakipia area of Kenya greatly increased farm incomes by producing forage for dairy cows (Table 3).
7
Table 3: Discounted returns on investments for small holder dairying based on irrigated fodder compared to original rainfed land use in Kenya
Study area and original rainfed land use
Gross income (USD/ha)
Fixed plus variable costs (USD/ha)
Net returns from milk production (USD/ha)
Net returns before investment (USD/ha)
Incremental income from adopting irrigation-based dairy production (USD/ha) Ratio of dairy to
original net returns
New Mutaro (range)
1,081 450 631 23 608 26.4
Mashambani (range)
1,656 544 1,113 13 1,100 84.6
Ontulili/Mwireri (rainfed crops)
2,241 763 1,479 82 1,397 17.0
Emening (rainfed crops)
3,438 1,031 2,406 113 2,293 20.2
Source: Mati (2005) Integrated planning for multi-purpose water systems is essential at the system level to ensure that livestock and crop use of water supplies does not jeopardize human health resulting from use of the same water resource for domestic purposes. One priority intervention option is to design multiple use systems in such a way that they restrict livestock access to and use of the primary water supply and adjacent riparian areas. Such action can greatly limit levels of turbidity and water-borne pathogens such as E. coli, certain snail borne diseases, and cryptosporidium. Provision of alternative watering troughs can benefit the health of both animals and people. 3.4 Animal level– livestock water interfaces One of the prime opportunities for increasing LWP lies in the adoption of state-of-the art practical technologies that reduce animal stress, morbidity and mortality. This includes matching animal species and breeds with the environment especially where physical water scarcity and high temperature are common. For example, Sudan’s Kenana and Uganda’s Ankole cattle are better adapted to dryland conditions than many imported breeds, and they can with stand long treks to water and longer intervals between watering. Balancing animal adaptation to harsh environments is the need for high producing animals especially in terms of milk and meat production. Provision of veterinary care is essential for reducing unnecessary morbidity and mortality that impose significant reductions in benefits for livestock keepers and thus to overall agricultural WP. 3.5 Household level - livestock water interfaces The household level is the focal point for poverty reduction. Results mentioned earlier suggest that household water harvesting intended for supplemental irrigation can be effectively integrated with small scale dairying to greatly increase returns on investments and household income (Table 1). Use of agricultural water for household production of animal source foods can also enhance human health through enhancement of the immune system and children’s learning to ability (Neumann et al. 2003). Evidence also suggest that in some cultures, the choice of livestock kept and products produced will differentially affect women, men and children opening up opportunities for promoting gender sensitive development. Proposition The foregoing, but incomplete discussion of selected livestock-water interactions and intervention options suggest that in certain environments, especially where water is physically scarce, livestock keeping is an efficient way to harvest water for agriculture. In economic terms, allocating water to livestock can complement other agricultural and domestic water uses and can give a competitive and enhanced return on investment. Thus livestock can be competitive with other uses of water in some situations but even greater gains in investment returns, environmental sustainability and livelihoods can come through multiple use of water systems. 4. Future Research Issues The future research issues in relation to livestock and water and LWP are discussed below, in the context of the four priority areas identified by the Challenge Program. 4.1 Improving rainfed agriculture systems Rainfed agriculture includes the mixed crop-livestock systems, and the pastoral and agro-pastoral systems of South Asia and Sub-Saharan Africa where the majority of the world’s poorest people reside, where food insecurity and physical and economic water scarcity prevail, and people are most vulnerable to climate change. From a livestock perspective, the fundamental biophysical research and development challenge is to increase agricultural WP, generally and LWP in particular, especially where lack of water constrains food production and livelihoods. Numerous technological options are possible, such as better use of dryland fodder crops; breeding dual purpose food/feed crops (e.g. cowpea, sorghum); reducing stress on animals related to lack of access to water, inadequate nutrition, disease, and mortality; selection of appropriate animal species and breeds, and adoption of value added technologies; and conservation of blue and green water resources through better management of vegetation and soil and appropriate grazing pressure on both pasture and fallow croplands.
8
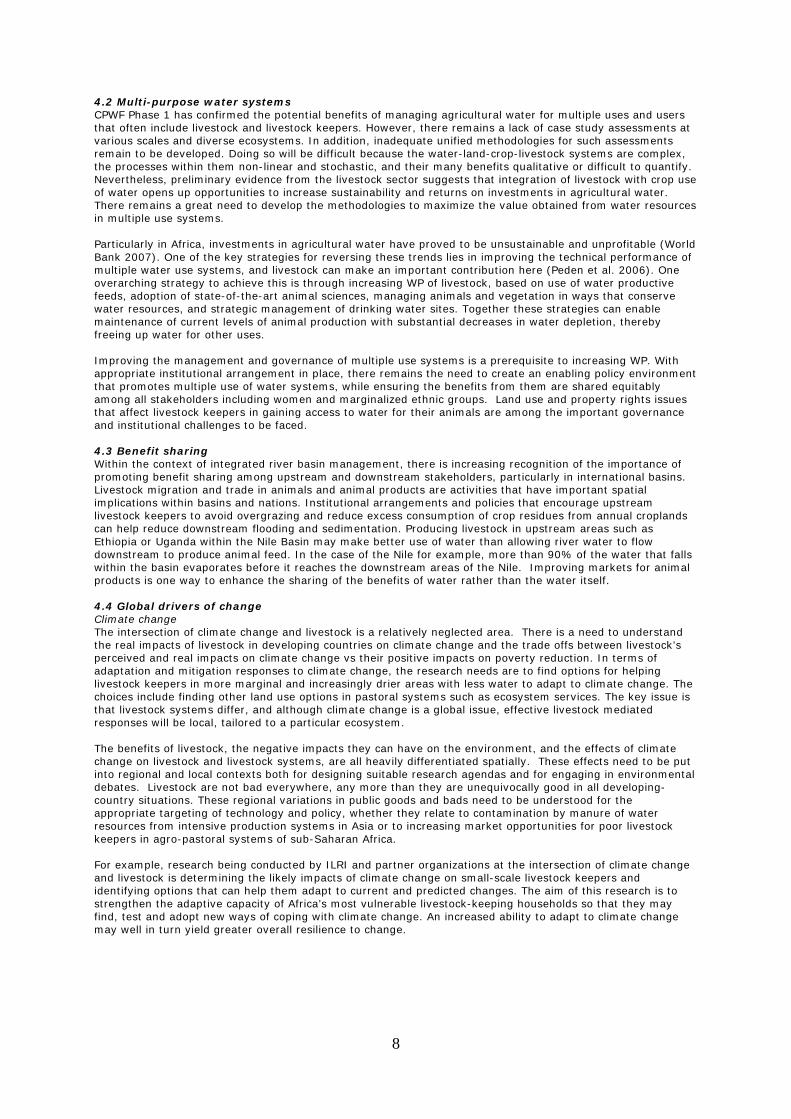
4.2 Multi-purpose water systems CPWF Phase 1 has confirmed the potential benefits of managing agricultural water for multiple uses and users that often include livestock and livestock keepers. However, there remains a lack of case study assessments at various scales and diverse ecosystems. In addition, inadequate unified methodologies for such assessments remain to be developed. Doing so will be difficult because the water-land-crop-livestock systems are complex, the processes within them non-linear and stochastic, and their many benefits qualitative or difficult to quantify. Nevertheless, preliminary evidence from the livestock sector suggests that integration of livestock with crop use of water opens up opportunities to increase sustainability and returns on investments in agricultural water. There remains a great need to develop the methodologies to maximize the value obtained from water resources in multiple use systems. Particularly in Africa, investments in agricultural water have proved to be unsustainable and unprofitable (World Bank 2007). One of the key strategies for reversing these trends lies in improving the technical performance of multiple water use systems, and livestock can make an important contribution here (Peden et al. 2006). One overarching strategy to achieve this is through increasing WP of livestock, based on use of water productive feeds, adoption of state-of-the-art animal sciences, managing animals and vegetation in ways that conserve water resources, and strategic management of drinking water sites. Together these strategies can enable maintenance of current levels of animal production with substantial decreases in water depletion, thereby freeing up water for other uses. Improving the management and governance of multiple use systems is a prerequisite to increasing WP. With appropriate institutional arrangement in place, there remains the need to create an enabling policy environment that promotes multiple use of water systems, while ensuring the benefits from them are shared equitably among all stakeholders including women and marginalized ethnic groups. Land use and property rights issues that affect livestock keepers in gaining access to water for their animals are among the important governance and institutional challenges to be faced. 4.3 Benefit sharing Within the context of integrated river basin management, there is increasing recognition of the importance of promoting benefit sharing among upstream and downstream stakeholders, particularly in international basins. Livestock migration and trade in animals and animal products are activities that have important spatial implications within basins and nations. Institutional arrangements and policies that encourage upstream livestock keepers to avoid overgrazing and reduce excess consumption of crop residues from annual croplands can help reduce downstream flooding and sedimentation. Producing livestock in upstream areas such as Ethiopia or Uganda within the Nile Basin may make better use of water than allowing river water to flow downstream to produce animal feed. In the case of the Nile for example, more than 90% of the water that falls within the basin evaporates before it reaches the downstream areas of the Nile. Improving markets for animal products is one way to enhance the sharing of the benefits of water rather than the water itself. 4.4 Global drivers of change Climate change The intersection of climate change and livestock is a relatively neglected area. There is a need to understand the real impacts of livestock in developing countries on climate change and the trade offs between livestock’s perceived and real impacts on climate change vs their positive impacts on poverty reduction. In terms of adaptation and mitigation responses to climate change, the research needs are to find options for helping livestock keepers in more marginal and increasingly drier areas with less water to adapt to climate change. The choices include finding other land use options in pastoral systems such as ecosystem services. The key issue is that livestock systems differ, and although climate change is a global issue, effective livestock mediated responses will be local, tailored to a particular ecosystem. The benefits of livestock, the negative impacts they can have on the environment, and the effects of climate change on livestock and livestock systems, are all heavily differentiated spatially. These effects need to be put into regional and local contexts both for designing suitable research agendas and for engaging in environmental debates. Livestock are not bad everywhere, any more than they are unequivocally good in all developing-country situations. These regional variations in public goods and bads need to be understood for the appropriate targeting of technology and policy, whether they relate to contamination by manure of water resources from intensive production systems in Asia or to increasing market opportunities for poor livestock keepers in agro-pastoral systems of sub-Saharan Africa. For example, research being conducted by ILRI and partner organizations at the intersection of climate change and livestock is determining the likely impacts of climate change on small-scale livestock keepers and identifying options that can help them adapt to current and predicted changes. The aim of this research is to strengthen the adaptive capacity of Africa’s most vulnerable livestock-keeping households so that they may find, test and adopt new ways of coping with climate change. An increased ability to adapt to climate change may well in turn yield greater overall resilience to change.
9
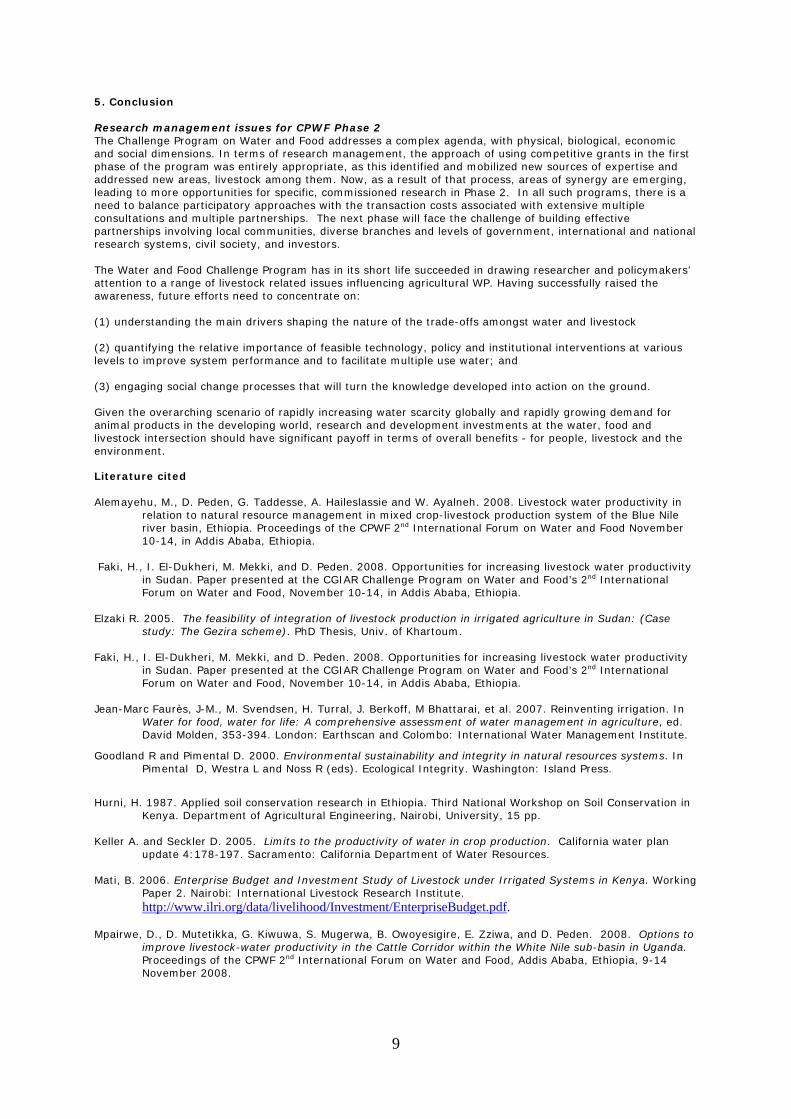
5. Conclusion Research management issues for CPWF Phase 2 The Challenge Program on Water and Food addresses a complex agenda, with physical, biological, economic and social dimensions. In terms of research management, the approach of using competitive grants in the first phase of the program was entirely appropriate, as this identified and mobilized new sources of expertise and addressed new areas, livestock among them. Now, as a result of that process, areas of synergy are emerging, leading to more opportunities for specific, commissioned research in Phase 2. In all such programs, there is a need to balance participatory approaches with the transaction costs associated with extensive multiple consultations and multiple partnerships. The next phase will face the challenge of building effective partnerships involving local communities, diverse branches and levels of government, international and national research systems, civil society, and investors. The Water and Food Challenge Program has in its short life succeeded in drawing researcher and policymakers’ attention to a range of livestock related issues influencing agricultural WP. Having successfully raised the awareness, future efforts need to concentrate on: (1) understanding the main drivers shaping the nature of the trade-offs amongst water and livestock (2) quantifying the relative importance of feasible technology, policy and institutional interventions at various levels to improve system performance and to facilitate multiple use water; and (3) engaging social change processes that will turn the knowledge developed into action on the ground. Given the overarching scenario of rapidly increasing water scarcity globally and rapidly growing demand for animal products in the developing world, research and development investments at the water, food and livestock intersection should have significant payoff in terms of overall benefits - for people, livestock and the environment. Literature cited Alemayehu, M., D. Peden, G. Taddesse, A. Haileslassie and W. Ayalneh. 2008. Livestock water productivity in
relation to natural resource management in mixed crop-livestock production system of the Blue Nile river basin, Ethiopia. Proceedings of the CPWF 2nd International Forum on Water and Food November 10-14, in Addis Ababa, Ethiopia.
Faki, H., I. El-Dukheri, M. Mekki, and D. Peden. 2008. Opportunities for increasing livestock water productivity
in Sudan. Paper presented at the CGIAR Challenge Program on Water and Food’s 2nd International Forum on Water and Food, November 10-14, in Addis Ababa, Ethiopia.
Elzaki R. 2005. The feasibility of integration of livestock production in irrigated agriculture in Sudan: (Case
study: The Gezira scheme). PhD Thesis, Univ. of Khartoum. Faki, H., I. El-Dukheri, M. Mekki, and D. Peden. 2008. Opportunities for increasing livestock water productivity
in Sudan. Paper presented at the CGIAR Challenge Program on Water and Food’s 2nd International Forum on Water and Food, November 10-14, in Addis Ababa, Ethiopia.
Jean-Marc Faurès, J-M., M. Svendsen, H. Turral, J. Berkoff, M Bhattarai, et al. 2007. Reinventing irrigation. In
Water for food, water for life: A comprehensive assessment of water management in agriculture, ed. David Molden, 353-394. London: Earthscan and Colombo: International Water Management Institute.
Goodland R and Pimental D. 2000. Environmental sustainability and integrity in natural resources systems. In Pimental D, Westra L and Noss R (eds). Ecological Integrity. Washington: Island Press.
Hurni, H. 1987. Applied soil conservation research in Ethiopia. Third National Workshop on Soil Conservation in
Kenya. Department of Agricultural Engineering, Nairobi, University, 15 pp. Keller A. and Seckler D. 2005. Limits to the productivity of water in crop production. California water plan
update 4:178-197. Sacramento: California Department of Water Resources. Mati, B. 2006. Enterprise Budget and Investment Study of Livestock under Irrigated Systems in Kenya. Working
Paper 2. Nairobi: International Livestock Research Institute. http://www.ilri.org/data/livelihood/Investment/EnterpriseBudget.pdf.
Mpairwe, D., D. Mutetikka, G. Kiwuwa, S. Mugerwa, B. Owoyesigire, E. Zziwa, and D. Peden. 2008. Options to
improve livestock-water productivity in the Cattle Corridor within the White Nile sub-basin in Uganda. Proceedings of the CPWF 2nd International Forum on Water and Food, Addis Ababa, Ethiopia, 9-14 November 2008.
10
Neumann, C, Bwibo N, Murphy S, Sigman M, Whaley S, Allen L, Guthrie D, Weiss R and Demment M. 2003. Animal source foods improve dietary quality, micronutrient status, growth and cognitive function in Kenyan school children: Background, Study Design and findings. J. Nutrition, 133:3941S-3949S.
Molden, D. 2007. Summary for decision makers. In Water for food, water for life: A comprehensive assessment
of water management in agriculture, ed. David Molden, 1-34. London: Earthscan and Colombo: International Water Management Institute.
Peden D, Freeman A, Astatke A and Notenbaert A. 2006. Investment options for integrated water-livestock-
crop production in sub-Saharan Africa. ILRI Research Paper #1. Nairobi: International Livestock Research Institute.
Peden, D., G. Tadesse, and A.K. Misra. 2007. Water and livestock for human development. In Water for food,
water for life: A comprehensive assessment of water management in agriculture, ed. David Molden, 485-514. London: Earthscan and Colombo: International Water Management Institute.
SIWI, IFPRI, IUCN, IWMI. 2005. Let it reign: The new water paradigm for global food security. Final report to
CSD-13. Stockholm: Stockholm International Water Institute. Steinfeld, H., P. Gerber, T. Wassenaar, V. Castel, M. Rosales, and C. de Haan. 2006. Livestock’s long shadow:
Environmental issues and options. Rome: FAO. Thornton P, Kruska R, Henninger N, Kristjanson P, Reid R, Atieno F, Odero A and Ndegwa T. 2002. Mapping
poverty and livestock in the developing world. Nairobi: ILRI. Thornton P K, Notenbaert A, van de Steeg J, Herrero M, 2008. The livestock-climate-poverty nexus: A
discussion paper on ILRI research in relation to climate change. ILRI, Nairobi, Kenya, 80 pp. Online at http://www.ilri.org/Infoserv/webpub/fulldocs/ DiscuPaper11_ Climate/Livesto_Climat_Pover_Nexus_DP11.pdf
World Bank Group. 1998. Meat Processing and Rendering. Pollution Prevention and Abatement Handbook.
Washington: World Bank. Van Breugel, P., M. Herrero, J.A. van de Steeg and D. Peden. 2008. Recommendation domains and key aspects
of livestock-water productivity in the Nile basin. Proceedings of the CPWF 2nd International Forum on Water and Food, Addis Ababa, Ethiopia, 9-14 November 2008.
11
Using the seemingly uninteresting African transboundary water law database to derive surprisingly interesting water policy lessons
M. F. Giordano and J. Lautze
International Water Management Institute,
PO Box 2075, Colombo, Sri Lanka [email protected] Abstract With the exception of island states, every African country has territory in at least one transboundary river basin, and virtually every African basin greater than 50,000 km2 crosses at least one national boundary. As a result, most African water management is also, by definition, transboundary water management. Despite this, evaluation of the state of transboundary water institutions as well as policy and research needs for the peaceful and productive use of Africa’s rivers has been hampered by the simple lack of a complete or near complete collection of African transboundary water law. This gap was partially filled through a collection assembled under the auspices of a CPWF project. This paper describes the treaty collection, freely available at www.africanwaterlaw.org and provides some examples of how it has been used to derive policy and research insights. Media grab World’s largest collection of African transboundary water law provides new tool for improving water policy and the policymaking process. Introduction Africa is a land of transboundary waters. With the exception of island states, every African country has territory in at least one transboundary river basin, transboundary basins cover 62% of Africa’s total land area, and virtually every basin greater than 50,000 km2 crosses at least one national boundary. Because of the transboundary nature of most of the continent’s waters, most African water management is also, by definition, transboundary water management. The importance of transboundary waters and transboundary water management institutions to Africa has not gone unnoticed. A number of studies have analyzed general issues in African transboundary water management, while others have examined transboundary institutions in particular basins, most prominently the Nile, or geographic regions. Noticeable for its absence in past research, however, has been a comprehensive and systematic analysis of the development, nature, and extent of transboundary water law in Africa. This knowledge gap severely limits the ability of current and future decision-makers to employ a vital tool for developing and improving African transboundary water law in the future–an understanding of its past. One major obstacle to developing such an understanding has been the lack of a complete or near complete collection of African transboundary water law. This paper describes work, initially conducted under the auspices of the CPWF, to help remedy that knowledge gap through the documentation of a new collection of African transboundary water agreements, and highlights some of the policy-relevant outcomes and their use that have followed. Methods The fundamental problem in analyzing transboundary water law in Africa (and elsewhere) is the lack of a comprehensive compilation of relevant agreements, treaties, protocols, and amendments. Until the late 1990s, the largest published collection (FAO 1997) relating to African waters included just 40 documents. An expanded on-line collection of agreements was later made available through the Transboundary Freshwater Dispute Database (TFDD) project. The TFDD contains most of the treaties in the FAO collection and more than 30 other agreements. Despite this expansion, research into African agreements as part of CPWF 47 'African Models of Transboundary Governance' revealed a number of gaps. To fill the gaps, a systematic search of available literature, published treaty collections, and of on-line collections of international environmental law was undertaken along with interviews with key individuals. Criteria developed by Wolf (1999, p. 160) were applied in the search so that only agreements concerning 'water as a scarce or consumable resource, a quantity to be managed, or an ecosystem to be improved or maintained...' were included while those dealing 'only with boundaries, navigation or fishing rights' were excluded. Results This process resulted in the 'discovery' of more than 80 additional agreements relating to transboundary waters in Africa bringing the total to more than 150, almost doubling the known total. Application of Wolf’s criteria to the FAO and TFDD collections, however, resulted in the exclusion of five of their agreements. Four of these agreements were signed during Africa’s colonial period and discuss water, not as a resource to be regulated or shared, but rather as a means to enabling transportation or fishing. One agreement was signed between South Africa and an 'independent' homeland not recognized as sovereign by the UN. With the reduction in the initial number of treaties, the body of African transboundary water law is nevertheless now known to include some
12
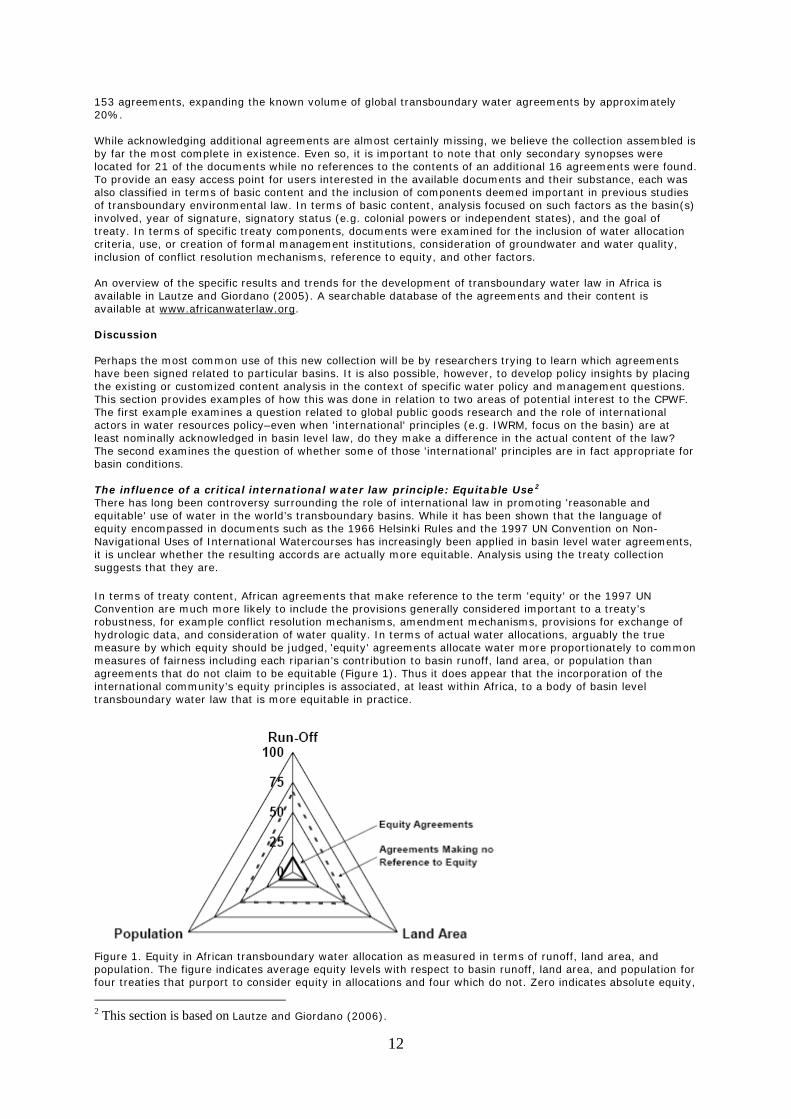
153 agreements, expanding the known volume of global transboundary water agreements by approximately 20%. While acknowledging additional agreements are almost certainly missing, we believe the collection assembled is by far the most complete in existence. Even so, it is important to note that only secondary synopses were located for 21 of the documents while no references to the contents of an additional 16 agreements were found. To provide an easy access point for users interested in the available documents and their substance, each was also classified in terms of basic content and the inclusion of components deemed important in previous studies of transboundary environmental law. In terms of basic content, analysis focused on such factors as the basin(s) involved, year of signature, signatory status (e.g. colonial powers or independent states), and the goal of treaty. In terms of specific treaty components, documents were examined for the inclusion of water allocation criteria, use, or creation of formal management institutions, consideration of groundwater and water quality, inclusion of conflict resolution mechanisms, reference to equity, and other factors. An overview of the specific results and trends for the development of transboundary water law in Africa is available in Lautze and Giordano (2005). A searchable database of the agreements and their content is available at www.africanwaterlaw.org. Discussion Perhaps the most common use of this new collection will be by researchers trying to learn which agreements have been signed related to particular basins. It is also possible, however, to develop policy insights by placing the existing or customized content analysis in the context of specific water policy and management questions. This section provides examples of how this was done in relation to two areas of potential interest to the CPWF. The first example examines a question related to global public goods research and the role of international actors in water resources policy–even when 'international' principles (e.g. IWRM, focus on the basin) are at least nominally acknowledged in basin level law, do they make a difference in the actual content of the law? The second examines the question of whether some of those 'international' principles are in fact appropriate for basin conditions. The influence of a critical international water law principle: Equitable Use2 There has long been controversy surrounding the role of international law in promoting 'reasonable and equitable' use of water in the world’s transboundary basins. While it has been shown that the language of equity encompassed in documents such as the 1966 Helsinki Rules and the 1997 UN Convention on Non-Navigational Uses of International Watercourses has increasingly been applied in basin level water agreements, it is unclear whether the resulting accords are actually more equitable. Analysis using the treaty collection suggests that they are. In terms of treaty content, African agreements that make reference to the term 'equity' or the 1997 UN Convention are much more likely to include the provisions generally considered important to a treaty’s robustness, for example conflict resolution mechanisms, amendment mechanisms, provisions for exchange of hydrologic data, and consideration of water quality. In terms of actual water allocations, arguably the true measure by which equity should be judged,
'equity' agreements allocate water more proportionately to common
measures of fairness including each riparian’s contribution to basin runoff, land area, or population than agreements that do not claim to be equitable (Figure 1). Thus it does appear that the incorporation of the international community’s equity principles is associated, at least within Africa, to a body of basin level transboundary water law that is more equitable in practice.
Figure 1. Equity in African transboundary water allocation as measured in terms of runoff, land area, and population. The figure indicates average equity levels with respect to basin runoff, land area, and population for four treaties that purport to consider equity in allocations and four which do not. Zero indicates absolute equity,
2 This section is based on Lautze and Giordano (2006).
13
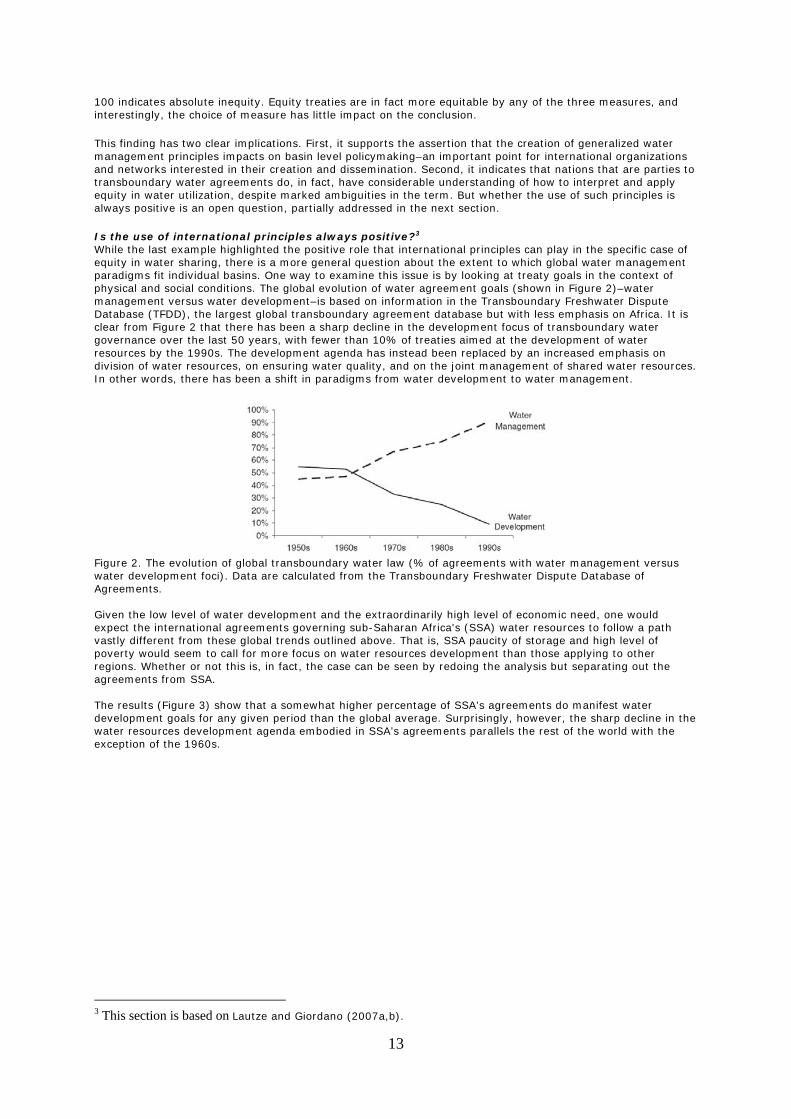
100 indicates absolute inequity. Equity treaties are in fact more equitable by any of the three measures, and interestingly, the choice of measure has little impact on the conclusion. This finding has two clear implications. First, it supports the assertion that the creation of generalized water management principles impacts on basin level policymaking–an important point for international organizations and networks interested in their creation and dissemination. Second, it indicates that nations that are parties to transboundary water agreements do, in fact, have considerable understanding of how to interpret and apply equity in water utilization, despite marked ambiguities in the term. But whether the use of such principles is always positive is an open question, partially addressed in the next section. Is the use of international principles always positive?3 While the last example highlighted the positive role that international principles can play in the specific case of equity in water sharing, there is a more general question about the extent to which global water management paradigms fit individual basins. One way to examine this issue is by looking at treaty goals in the context of physical and social conditions. The global evolution of water agreement goals (shown in Figure 2)–water management versus water development–is based on information in the Transboundary Freshwater Dispute Database (TFDD), the largest global transboundary agreement database but with less emphasis on Africa. It is clear from Figure 2 that there has been a sharp decline in the development focus of transboundary water governance over the last 50 years, with fewer than 10% of treaties aimed at the development of water resources by the 1990s. The development agenda has instead been replaced by an increased emphasis on division of water resources, on ensuring water quality, and on the joint management of shared water resources. In other words, there has been a shift in paradigms from water development to water management.
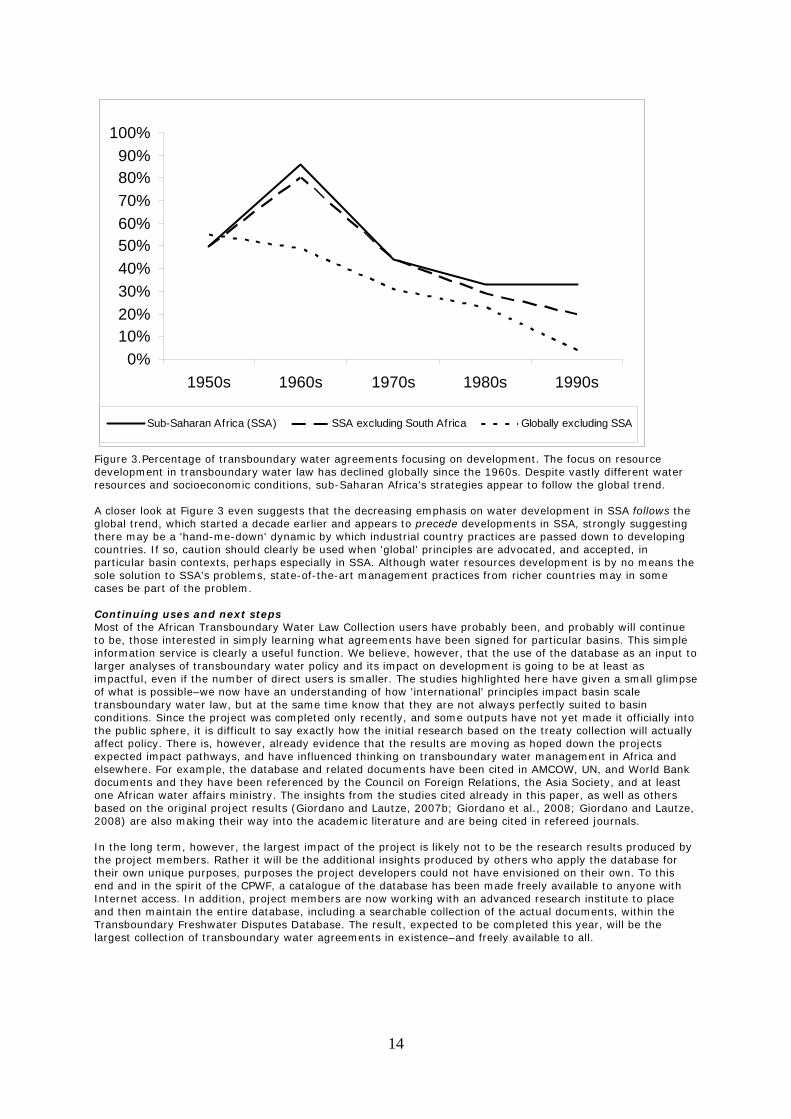
Figure 2. The evolution of global transboundary water law (% of agreements with water management versus water development foci). Data are calculated from the Transboundary Freshwater Dispute Database of Agreements. Given the low level of water development and the extraordinarily high level of economic need, one would expect the international agreements governing sub-Saharan Africa's (SSA) water resources to follow a path vastly different from these global trends outlined above. That is, SSA paucity of storage and high level of poverty would seem to call for more focus on water resources development than those applying to other regions. Whether or not this is, in fact, the case can be seen by redoing the analysis but separating out the agreements from SSA. The results (Figure 3) show that a somewhat higher percentage of SSA’s agreements do manifest water development goals for any given period than the global average. Surprisingly, however, the sharp decline in the water resources development agenda embodied in SSA’s agreements parallels the rest of the world with the exception of the 1960s.
3 This section is based on Lautze and Giordano (2007a,b).
14
Figure 3.Percentage of transboundary water agreements focusing on development. The focus on resource development in transboundary water law has declined globally since the 1960s. Despite vastly different water resources and socioeconomic conditions, sub-Saharan Africa’s strategies appear to follow the global trend. A closer look at Figure 3 even suggests that the decreasing emphasis on water development in SSA follows the global trend, which started a decade earlier and appears to precede developments in SSA, strongly suggesting there may be a 'hand-me-down' dynamic by which industrial country practices are passed down to developing countries. If so, caution should clearly be used when 'global' principles are advocated, and accepted, in particular basin contexts, perhaps especially in SSA. Although water resources development is by no means the sole solution to SSA’s problems, state-of-the-art management practices from richer countries may in some cases be part of the problem. Continuing uses and next steps Most of the African Transboundary Water Law Collection users have probably been, and probably will continue to be, those interested in simply learning what agreements have been signed for particular basins. This simple information service is clearly a useful function. We believe, however, that the use of the database as an input to larger analyses of transboundary water policy and its impact on development is going to be at least as impactful, even if the number of direct users is smaller. The studies highlighted here have given a small glimpse of what is possible–we now have an understanding of how 'international' principles impact basin scale transboundary water law, but at the same time know that they are not always perfectly suited to basin conditions. Since the project was completed only recently, and some outputs have not yet made it officially into the public sphere, it is difficult to say exactly how the initial research based on the treaty collection will actually affect policy. There is, however, already evidence that the results are moving as hoped down the projects expected impact pathways, and have influenced thinking on transboundary water management in Africa and elsewhere. For example, the database and related documents have been cited in AMCOW, UN, and World Bank documents and they have been referenced by the Council on Foreign Relations, the Asia Society, and at least one African water affairs ministry. The insights from the studies cited already in this paper, as well as others based on the original project results (Giordano and Lautze, 2007b; Giordano et al., 2008; Giordano and Lautze, 2008) are also making their way into the academic literature and are being cited in refereed journals. In the long term, however, the largest impact of the project is likely not to be the research results produced by the project members. Rather it will be the additional insights produced by others who apply the database for their own unique purposes, purposes the project developers could not have envisioned on their own. To this end and in the spirit of the CPWF, a catalogue of the database has been made freely available to anyone with Internet access. In addition, project members are now working with an advanced research institute to place and then maintain the entire database, including a searchable collection of the actual documents, within the Transboundary Freshwater Disputes Database. The result, expected to be completed this year, will be the largest collection of transboundary water agreements in existence–and freely available to all.
0%10%20%30%40%50%60%70%80%90%
100%
1950s 1960s 1970s 1980s 1990s
Sub-Saharan Africa (SSA) SSA excluding South Africa Globally excluding SSA
15
Acknowledgments The African Water Law Database was produced in part from funding of PN 47 ‘African Models of Transboundary Governance,’ a project of the CGIAR Challenge Program on Water and Food. Additional funding and resources for the database and its analysis was provided by the International Water Management Institute, Oregon State University, and the U.S. Agency for International Development. References FAO. 1997. Treaties Concerning the Non-Navigational Uses of International Watercourses–Africa, FAO
Legislative Study No. 61. Giordano, M., and J. Lautze. 2008. Transboundary Waters in Extreme Environments: The role of international
actors in Africa. In Clive Lipchin (ed.) Transboundary Natural Resources Governance in Regions of Extreme Conditions. Springer.
Giordano, M., A. Wolf, and M. Giordano. 2008. Institutions for International Basins. In SHARE: Lessons in the
management of trans-boundary water resources. Claudia Saddoff, Kelly Thomas/Alejandro (eds.). IUCN, Geneva.
Lautze, J., and M. Giordano. 2005. Transboundary Water Law in Africa: Development, Nature, and Geography.
Natural Resources Journal, 45(4): 1053-87. Lautze, J., and M. Giordano. 2006. Does ‘equity’ really matter in international water law? Evidence from Africa.
Colorado Journal of International Environmental Law and Policy.17(1): 89-122. Lautze, J., and M. Giordano. 2007a. Demanding Supply Management and Supplying Demand Management:
Transboundary Waters in Sub-Saharan Africa. Journal of Environment and Development, 16: 290-306. Lautze, J., and M. Giordano. 2007b. A History of Transboundary Law in Africa. Chapter 5 in M. Grieco, M.
Kitoussou, and M. Ndulo, (eds.) The Hydropolitics of Africa: A Contemporary Challenge. Cambridge Scholars Press.
Wolf, A. 1999. The Transboundary Freshwater Dispute Database Project, Water International, 24, 160-3. The African Transboundary Water Law Page is available on-line at www.africanwaterlaw.org Transboundary Freshwater Disputes Database. Available on-line at http://www.transboundarywaters.orst.edu/
16
Adapting to change–how to accelerate impact
J. Rubiano1, S. Cook2, and B. Douthwaite3
1King’s College, University of London, [email protected]
2Basin Focal Project, CPWF 3International Center for Tropical Agriculture CIAT, Cali, Colombia
Abstract
CPWF (Challenge Program on Water and Food) is supporting water research projects throughout the world. The activities and actions at these localities are expected to have a significant influence on the way water resources are managed. But what about the areas where CPWF has not yet reached? Should it not be expected that successful research outputs from these projects are adopted elsewhere and become normal practice? How can we be sure that this transfer of knowledge from one area can equally succeed in another? If we want to adapt to changes fast, we need to use information in an intelligent way, spreading success-stories in appropriate places, through methods that can help to strategically anticipate where resource investments are going to make their highest revenues. Using illustrated examples from several CPWF case studies, the Extrapolation Domain Analysis (EDA) method is presented here. EDA is becoming a successful method to support decision-makers targeting investments to accelerate impact.
Media grab
This analysis shows where local projects have regional or global potential to change the lives of millions. Introduction
In 2002, CPWF was initiated in response to a perceived global food and water crisis, in which agricultural water consumers were heading for increasing conflicts with other water users. It was argued that because agriculture uses over 70% of the world’s fresh water and further, since food demand was increasing, the world needed more ‘crop per drop’ to head off the impending crisis. We now realize that the problem is broader than simply a matter of crop per drop, and that, as a result of the recent food crisis, there is a need to react more quickly than we previously thought. CPWF needs global impact to help address this global problem. Yet, like all research-for-development programs, it must start small, with projects on the ground. Projects try new ideas and learn how people adapt to them, and how local or national institutions support or hinder change arising from projects. Individually, projects have local impact, but the expectation is that change that originates from them will spread to other areas, ultimately improving life for millions of people across entire regions. A body of research has developed to study and promote these processes. This aims to accelerate change through processes termed up- or out-scaling. By and large, out-scaling is presumed to operate over a homogeneous surface, in which change is considered to be equally likely in any direction. While this assumption is obviously incorrect, few methods exist to assist the out-scaling process. These contrast with the overly deterministic methods of land evaluation used to guide development in the 1970s and 1980s, in which geographic variations in land quality were considered to dominate the change process (Beek et al., 1987; Dent and Young, 1981). Our goal was to apply geographic knowledge to an out-scaling process by identifying ‘project domain areas.’ These are essentially benchmarks, which identify where areas that appear promising for out-scaling from projects. We refer to the areas as ‘geographic extrapolation domains.’ The results are intended to guide projects toward other areas that appear promising and avoid those that offer little scope for out-scaling. The principles we adopted are as follows:
• We consider that change starts in projects and spreads from them according to a limited set of factors
determined from pilot study sites. • Project participants decide which factors determine the extrapolation domain. • Searches for extrapolation domains should cover the entire pan-tropical region to include new areas
that may be unfamiliar to project originators. • Extrapolation domains should guide, not proscribe. They should avoid representing certainties in ‘black
and white’ that do not exist, but show shades of gray that can represent the true state of project participants knowledge.
• The process should be transparent and the domains should be easily updateable, to accommodate new knowledge as it becomes available.
We applied the method to eleven projects selected from the complete list of projects supported by CPWF (Table 1). Results of extrapolation domains were combined to provide insights as to where in the world CPWF seems to promise highest potential for research impacts.
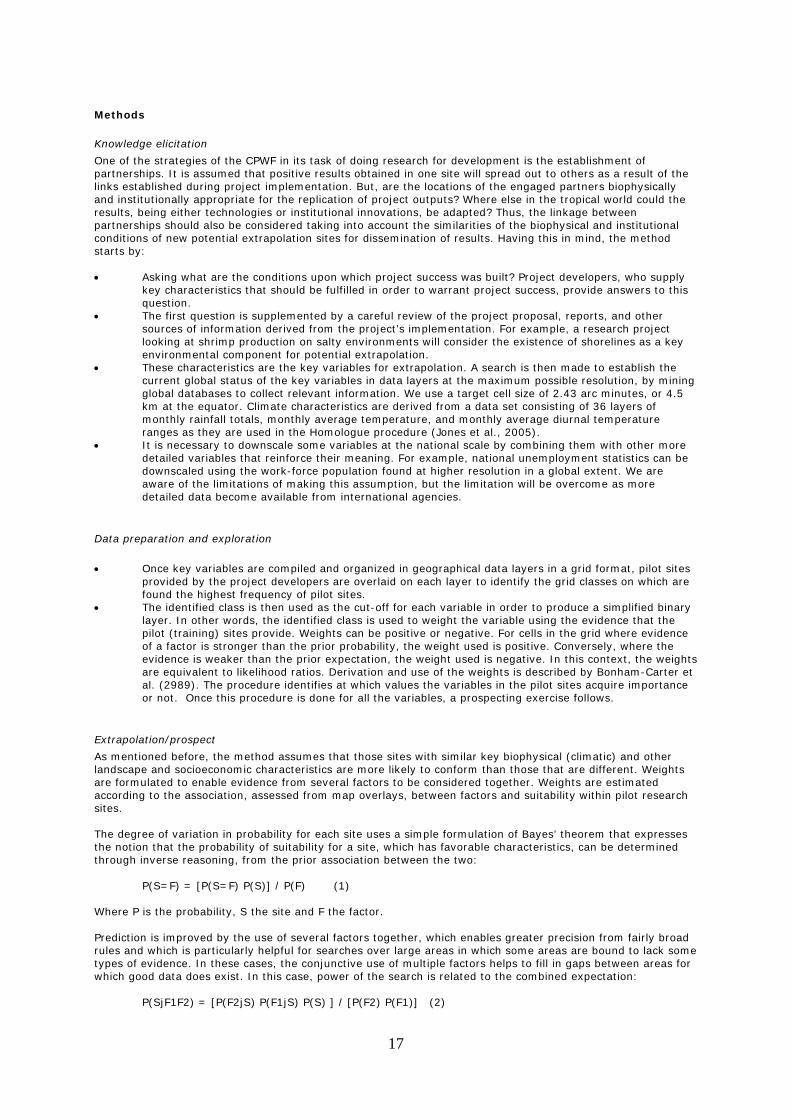
17
Methods
Knowledge elicitation
One of the strategies of the CPWF in its task of doing research for development is the establishment of partnerships. It is assumed that positive results obtained in one site will spread out to others as a result of the links established during project implementation. But, are the locations of the engaged partners biophysically and institutionally appropriate for the replication of project outputs? Where else in the tropical world could the results, being either technologies or institutional innovations, be adapted? Thus, the linkage between partnerships should also be considered taking into account the similarities of the biophysical and institutional conditions of new potential extrapolation sites for dissemination of results. Having this in mind, the method starts by: • Asking what are the conditions upon which project success was built? Project developers, who supply
key characteristics that should be fulfilled in order to warrant project success, provide answers to this question.
• The first question is supplemented by a careful review of the project proposal, reports, and other sources of information derived from the project’s implementation. For example, a research project looking at shrimp production on salty environments will consider the existence of shorelines as a key environmental component for potential extrapolation.
• These characteristics are the key variables for extrapolation. A search is then made to establish the current global status of the key variables in data layers at the maximum possible resolution, by mining global databases to collect relevant information. We use a target cell size of 2.43 arc minutes, or 4.5 km at the equator. Climate characteristics are derived from a data set consisting of 36 layers of monthly rainfall totals, monthly average temperature, and monthly average diurnal temperature ranges as they are used in the Homologue procedure (Jones et al., 2005).
• It is necessary to downscale some variables at the national scale by combining them with other more detailed variables that reinforce their meaning. For example, national unemployment statistics can be downscaled using the work-force population found at higher resolution in a global extent. We are aware of the limitations of making this assumption, but the limitation will be overcome as more detailed data become available from international agencies.
Data preparation and exploration
• Once key variables are compiled and organized in geographical data layers in a grid format, pilot sites
provided by the project developers are overlaid on each layer to identify the grid classes on which are found the highest frequency of pilot sites.
• The identified class is then used as the cut-off for each variable in order to produce a simplified binary layer. In other words, the identified class is used to weight the variable using the evidence that the pilot (training) sites provide. Weights can be positive or negative. For cells in the grid where evidence of a factor is stronger than the prior probability, the weight used is positive. Conversely, where the evidence is weaker than the prior expectation, the weight used is negative. In this context, the weights are equivalent to likelihood ratios. Derivation and use of the weights is described by Bonham-Carter et al. (2989). The procedure identifies at which values the variables in the pilot sites acquire importance or not. Once this procedure is done for all the variables, a prospecting exercise follows.
Extrapolation/prospect
As mentioned before, the method assumes that those sites with similar key biophysical (climatic) and other landscape and socioeconomic characteristics are more likely to conform than those that are different. Weights are formulated to enable evidence from several factors to be considered together. Weights are estimated according to the association, assessed from map overlays, between factors and suitability within pilot research sites. The degree of variation in probability for each site uses a simple formulation of Bayes’ theorem that expresses the notion that the probability of suitability for a site, which has favorable characteristics, can be determined through inverse reasoning, from the prior association between the two: P(S=F) = [P(S=F) P(S)] / P(F) (1) Where P is the probability, S the site and F the factor. Prediction is improved by the use of several factors together, which enables greater precision from fairly broad rules and which is particularly helpful for searches over large areas in which some areas are bound to lack some types of evidence. In these cases, the conjunctive use of multiple factors helps to fill in gaps between areas for which good data does exist. In this case, power of the search is related to the combined expectation: P(SjF1F2) = [P(F2jS) P(F1jS) P(S) ] / [P(F2) P(F1)] (2)
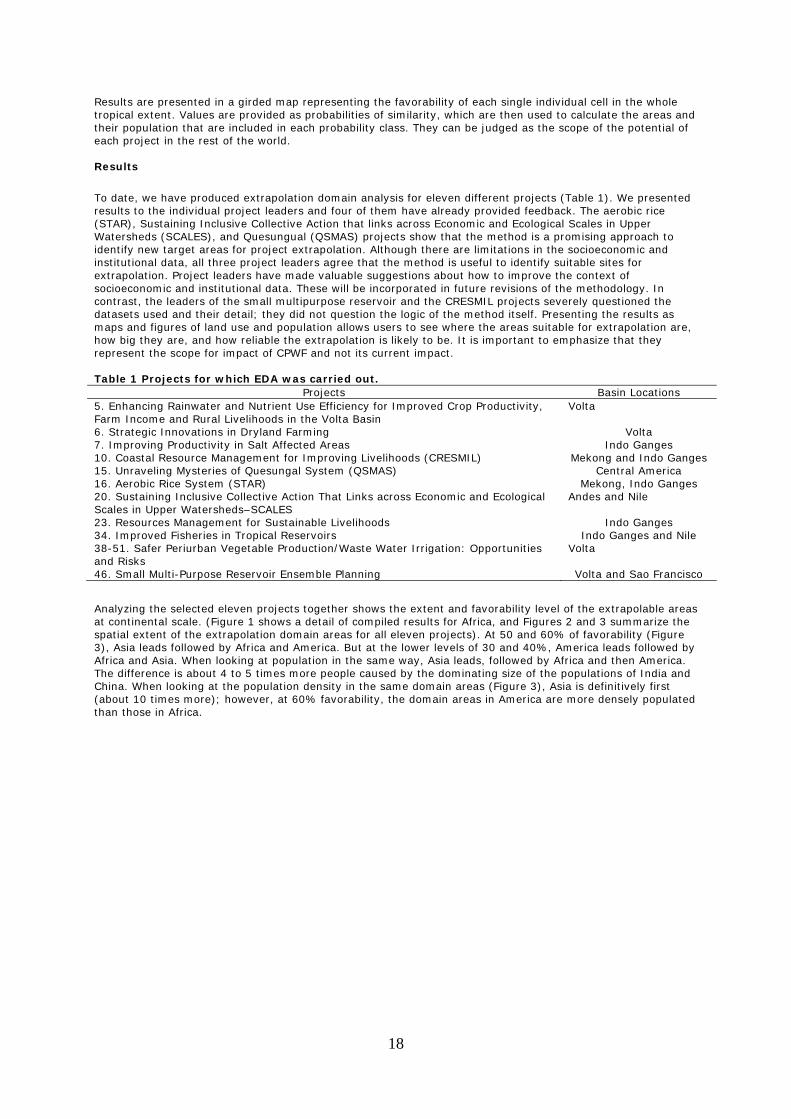
18
Results are presented in a girded map representing the favorability of each single individual cell in the whole tropical extent. Values are provided as probabilities of similarity, which are then used to calculate the areas and their population that are included in each probability class. They can be judged as the scope of the potential of each project in the rest of the world. Results
To date, we have produced extrapolation domain analysis for eleven different projects (Table 1). We presented results to the individual project leaders and four of them have already provided feedback. The aerobic rice (STAR), Sustaining Inclusive Collective Action that links across Economic and Ecological Scales in Upper Watersheds (SCALES), and Quesungual (QSMAS) projects show that the method is a promising approach to identify new target areas for project extrapolation. Although there are limitations in the socioeconomic and institutional data, all three project leaders agree that the method is useful to identify suitable sites for extrapolation. Project leaders have made valuable suggestions about how to improve the context of socioeconomic and institutional data. These will be incorporated in future revisions of the methodology. In contrast, the leaders of the small multipurpose reservoir and the CRESMIL projects severely questioned the datasets used and their detail; they did not question the logic of the method itself. Presenting the results as maps and figures of land use and population allows users to see where the areas suitable for extrapolation are, how big they are, and how reliable the extrapolation is likely to be. It is important to emphasize that they represent the scope for impact of CPWF and not its current impact. Table 1 Projects for which EDA was carried out.
Projects Basin Locations 5. Enhancing Rainwater and Nutrient Use Efficiency for Improved Crop Productivity, Farm Income and Rural Livelihoods in the Volta Basin
Volta
6. Strategic Innovations in Dryland Farming Volta 7. Improving Productivity in Salt Affected Areas Indo Ganges 10. Coastal Resource Management for Improving Livelihoods (CRESMIL) Mekong and Indo Ganges 15. Unraveling Mysteries of Quesungal System (QSMAS) Central America 16. Aerobic Rice System (STAR) Mekong, Indo Ganges 20. Sustaining Inclusive Collective Action That Links across Economic and Ecological Scales in Upper Watersheds–SCALES
Andes and Nile
23. Resources Management for Sustainable Livelihoods Indo Ganges 34. Improved Fisheries in Tropical Reservoirs Indo Ganges and Nile 38-51. Safer Periurban Vegetable Production/Waste Water Irrigation: Opportunities and Risks
Volta
46. Small Multi-Purpose Reservoir Ensemble Planning Volta and Sao Francisco
Analyzing the selected eleven projects together shows the extent and favorability level of the extrapolable areas at continental scale. (Figure 1 shows a detail of compiled results for Africa, and Figures 2 and 3 summarize the spatial extent of the extrapolation domain areas for all eleven projects). At 50 and 60% of favorability (Figure 3), Asia leads followed by Africa and America. But at the lower levels of 30 and 40%, America leads followed by Africa and Asia. When looking at population in the same way, Asia leads, followed by Africa and then America. The difference is about 4 to 5 times more people caused by the dominating size of the populations of India and China. When looking at the population density in the same domain areas (Figure 3), Asia is definitively first (about 10 times more); however, at 60% favorability, the domain areas in America are more densely populated than those in Africa.
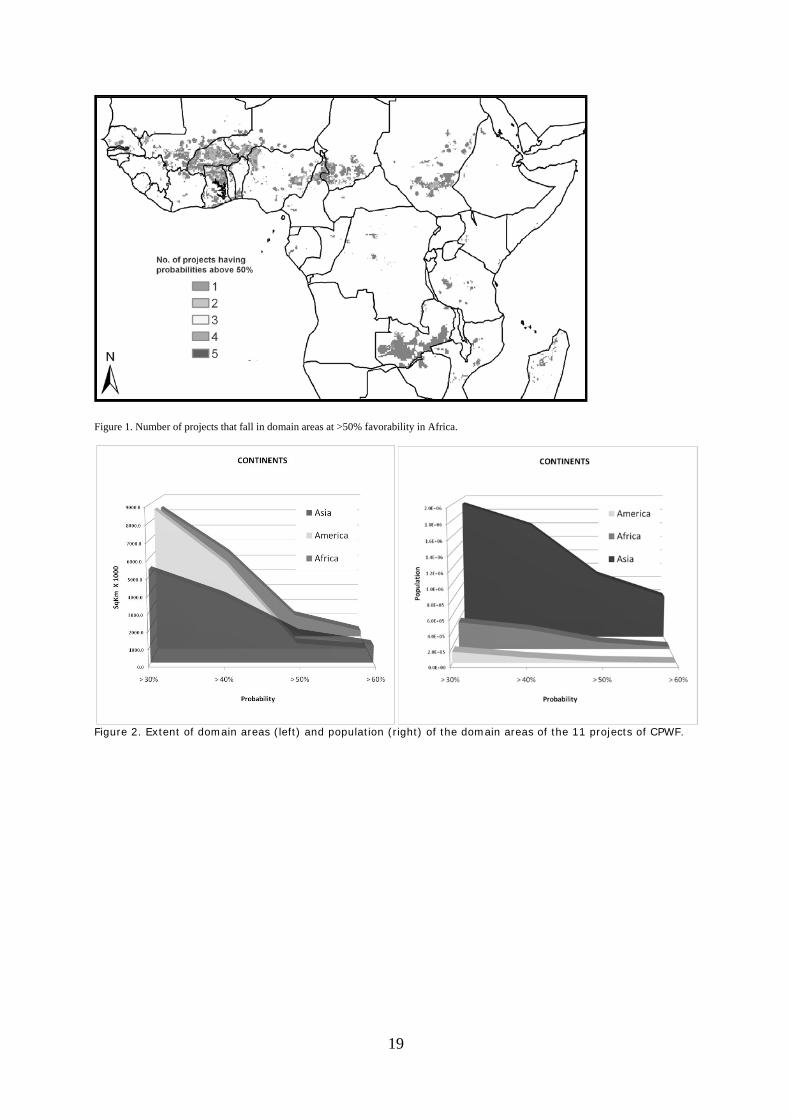
19
Figure 1. Number of projects that fall in domain areas at >50% favorability in Africa.
Figure 2. Extent of domain areas (left) and population (right) of the domain areas of the 11 projects of CPWF.
Figure 3.
Discussi
Although socioeconproject ouresearch-beyond thallows proscientists The combhow the eindicate. project exare unsui In a few cthis occurextrapolacan leadsmethod rthrough. The methpopulatioresearch.America, definitionsuch as t It is impoexpert tooverlookescientist. at a pilot As with m‘potentialquantitat
Population de
on and conc
the methodonomic data anutcomes from-for-developmhe original proogram manag
s to identify w
bination of diaextrapolation Normally, thisxperts focus oitable.
cases, the resrs either becaation dependes to a refinemerequires contin
hod of EDA proon. This can be For example which could h of sites for rehe institutiona
ossible for this be importanted for the pur It is impossib site and thos
many other exl impact’ and aive methods,
ensity by cont
clusions
logy presentend institutionam localized arement programsoject domain, gers to supporhere to initiat
alogue and traoccurs. This is seems to beon areas worth
sults seriouslyuse the extrad were unavaent of input dnued dialogue
ovides spatiale used by pro, the populatiohelp prioritize esearch, not tal environmen
s or any othert. The processposes of a globle to satisfy ce that can rea
xploratory metalso limitation however, the
tinent and pro
ed here requirel information,as to regionals to see where and normallyrt projects conte dialogue wit
ansparent coms essential for
e consistent why of further e
y overestimatepolation modeilable or unreata or better
e. This takes t
estimates thagram manageon densities in efforts. Theretaken into accnt and level of
r method of sps of discussingobal scan, reqconflicting reqasonably be p
thods carried ns when lookin method prov
20
obability value
es more deve it is far in adl and even gloe projects willy beyond the gnsistent with tth new partne
mputation of ur project scienith the beliefsexamination,
e or underestiel omitted an liable. This radefinition of cime and requi
at can be crosers to gauge tn Asia indicatee are, howevecount here, thf local particip
patial evaluatig what is esseuires dialogue
quirements of ortrayed at a
out at global ng at the detavides a transpa
e in the combi
lopment, partvance of anyt
obal settings. have (or whegeographic exthe interests oers in areas be
uncertainty enntists to get a s and knowledand avoid wa
mate potentia influential facises useful qu
critical factorsires commitm
ss-referenced he numbers oe greater poteer, many otheat would even
pation.
on to portray ntial to show,e between the representing global scale,
scale, there aail of the resularent deductiv
ned domain a
ticularly in thething else avaThis is a key
ere they will laxperience of pof their prograeyond their or
ables project feeling for wh
dge of project sting time and
al areas for ouctor, or becauuestions from . The downsident from proj
against otherof people poteential in that cr strategic issntually influen
all factors be, and what cane spatial analyall factors congiven availab
are big assumplts. In the absve method to
areas.
e handling of ailable in extraissue for manack) impact, froject expertsam, and allowriginal pilot sit
experts to unhat the extrap experts. It cad money on a
ut-scaling. Nose the data on project scientde of this is thect scientists
r data such asentially affectecontinent thansues involved nce final invest
elieved by the n be reasonabysts and projensidered of imle data.
ptions when dsence of altern assess areas
apolating nagers of far s. This
ws project tes.
nderstand polations an help reas that
rmally, n which tists that hat the to follow
s ed by n Africa or in the tments,
project bly ct
mportance
defining native suitable
21
for further effort, while explicitly stating the uncertainty of this prediction. Results are intended to guide decision-makers toward geographic gaps, new challenges, and overall indicate where there exist opportunities for impact. The method should therefore be considered as a first major step of out-scaling, that can help define promising new areas. Acknowledgments This paper presents findings of the Impact Module of the Basin Focal Projects, a CGIAR Challenge Program on Water and Food project. We thank the ongoing collaboration of project implementers and the BFP team for their positive feedback. References
Bonham-Carter, G.F., F.P. Agterberg, and D.F. Wright. 1989. Weights of evidence modeling: A new approach to
mapping mineral potential. In: F.P.Agterberg, G.F. Bonham-Carter, (eds) Statistical Applications in the Earth Sciences. Canada: Geological Survey of Canada. Pp. 171-83.
Beek, K. J., P.A. Burrough, and D.E. McCormack. 1987. Land evaluation: status and perspectives. In:
Proceedings of the International Workshop on Quantified Land Evaluation Procedures. Enschede: International Institute for Aerospace and Earth Sciences (ITC). Pp. 2.
Dent, D., and Young, A. (1981). Soil survey and land evaluation. London: George Allen and Unwin. Jones, P.G., W. Diaz, and J.H. Cock. 2005. Homologue: A Computer Systems for Identifying Similar
Environments throughout the Tropical World. Cali, Colombia: Centro Internacional de Agricultura Tropical.
22
Is water productivity relevant in fisheries and aquaculture?
Sophie Nguyen-Khoa1, Martin van Brakel2, and Malcolm Beveridge3
1International Water Management Institute and WorldFish Center, Colombo, Sri Lanka 2WorldFish Center, Penang, Malaysia
3WorldFish Center, Cairo, Egypt Abstract We present a critical analysis of the application of the water productivity concept in fisheries and aquaculture, defining the scope of application of the concept and limitations. A revised framework is presented and potential issues raised, highlighting areas for further research. A pluralistic approach including socialecological assessments and the explicit consideration of trade-offs between the objectives of increased food production, ecosystem conservation and poverty alleviation is proposed. This may set the scene for further developments of the water productivity concept beyond fisheries and aquaculture. Media grab Water productivity can essentially be applied when water is a limiting factor to aquatic resource production and in confined water bodies. Beyond these conditions, the concept must be further developed to fully reflect the social and ecological dimensions of fisheries and aquaculture. Introduction The identification of issues raised by the concept of water productivity in fisheries and aquaculture will help define the scope and limitations of its application. Issues range from the assessment of both fisheries output (or value) and quantities of water used, analysis across spatial and temporal scales, and the multiple objectives assigned to increased water productivity. The multiple benefits of fisheries and aquaculture and the multiple functions of water Water productivity is defined by the Comprehensive Assessment of Water Management in Agriculture as 'the ratio of the net benefits from crop, forestry, fishery, livestock, and mixed agricultural systems to the amount of water required to produce those benefits' (CAWMA, 2007; Molden et al., 2007). Benefits from fisheries and aquaculture include the production of food, livelihood improvement, nutrition and health (http://www.fao.org/focus/e/fisheries/nutr.htm, Dugan et al., 2007), and the contribution of fisheries to ecosystem resilience. A wide range of fish and crustaceans of very different nutritional value and with different ecosystem requirements is thus included. Assessment of fisheries value has proved difficult because the valuation of ecosystem nonprovisioning services (e.g. MEA, 2005) and sociocultural benefits of fisheries have received insufficient attention. Fisheries plays a variety of roles in rural livelihoods, ranging from a specialist occupation for wealth accumulation to a safety net for the poor (Smith et al., 2005). Access, property rights, and control over common aquatic resources are of fundamental importance especially to the landless poor and to women. Thus in some situations (e.g. crop production failure) modest production of aquatic resources by vulnerable communities may have disproportionate social benefits to livelihoods. The definition of the water unit also presents difficulties. In fisheries and aquaculture, water plays roles as a supportive medium, as a habitat providing food, and shelter and as a medium to facilitate migration with many species needing to move between spawning, nursery, and feeding areas within a river basin (Lorenzen et al., 2007). Aquatic habitats and the ecological services they provide result from specific geomorphological and hydrological conditions. Water requirements for fisheries and aquaculture are both qualitative and quantitative in nature. Direct consumption for the accumulation of aquatic resources biomass is negligible and water requirements are therefore essentially nonconsumptive. Water may, however, be consumed indirectly in the production of aquaculture seed or via percolation, seepage, and evaporation from ponds or reservoirs. Water requirements are characteristically highly dynamic (e.g. seasonality and timing of river flow), especially in tropical floodplains. Issue of scale: from local to river basin, from rapid change to long-term trend The benefits (output, value) delivered by fisheries and aquaculture depend on social and ecological factors that occur at different spatial (local-regional) and temporal (short-term―long-term) scales. The challenge is to derive measurable and verifiable indicators of the social-ecological processes underlying the delivery of benefits, and to identify where and when water becomes a critical determinant of these processes. The following indicates important water-related issues at different spatial and temporal scales. Important issues related to spatial scales are as follows: • Local aquatic resource biodiversity and ecological integrity are strongly influenced by ecoregional
factors occurring at the scale of one or several river basins.
23
• While individual species may be sensitive to subtle changes in water resource availability and quality, communities may be highly resilient thanks to compensatory mechanisms (e.g. change in species composition to compensate for the reduction of one species).
• To complete their life cycle, migratory species require connectivity between aquatic habitats within watersheds.
• The socioeconomic benefits of fisheries and aquaculture may be distributed across the ecosystem, for example the ‘winners’ benefiting from increased production in an irrigation reservoir vs. the ‘losers’ in the impacted delta downstream of the dam.
• National policies that encourage increased water productivity may conflict with existing local governance (e.g. customary rights).
Important issues related to temporal scales are as follows: • Different species or life-stages have different water resource requirements, for example migrant vs.
resident species, daily feeding vs. seasonal spawning. • Annual and inter-annual variations of water availability are crucial in the assessment of water
productivity. When water becomes scarce, temporarily or long-term, its value often changes dramatically, and fisheries and aquaculture water requirements may conflict with other users (agriculture, livestock, domestic use).
• Fisheries production can vary greatly with water fluctuations. For example, excessive drawdown of reservoir water levels may deplete fish stocks, taking years to rebuild.
• Long-term changes in ecosystems value need to be accounted for (e.g. through discounting factors of economic assessments) because degraded ecosystems are likely to have less capacity to produce and sustain aquatic resource production.
• Livelihoods change at different rates. For example irrigation development may decrease the importance of fishing in livelihood strategies, whilst the cultural importance of fishing may persist despite developmental change.
Therefore rather than a diagnostic assessment, a dynamic analysis of fisheries and aquaculture at different spatial scales is required. The multiple objectives of increased water productivity The objectives of increased water productivity are increased food production, poverty alleviation, and ecosystem conservation (CAWMA, 2007). Although linked, the objectives are not always congruent. The concept of water productivity reflects the objective of food production, but is poorer at capturing the water-related issues of ecosystem conservation and poverty alleviation. The concept also does not sufficiently capture inherent trade-offs between different uses of water. Increased food production may be at the expense of other ecosystem services, e.g. water for aquaculture versus water used to sustain capture fisheries; environmental flows versus reservoir fisheries. In turn, losses to a crop may be a gain for ecosystems, e.g. seepage from irrigation canals feeds groundwater. Where access or property rights are not considered, increased water productivity may adversely affect the poor. For example, auctioned village ponds in India have generally increased the water productivity through aquaculture while limiting access of poor villagers through the introduction of barriers to entry or the creation of incentives for wealthier people to compete for water and fish resources. Last, who determines the objectives? Increasing water productivity worldwide needs the contribution of local stakeholders. The objectives promoted at international levels primarily by policymakers and scientists do not necessarily translate well at the local level and stakeholders have little incentive to contribute to the objective (see CAWMA, 2007). Scope for application Our recommendation is to limit applications of water productivity in fisheries and aquaculture, as currently defined, to the following conditions: • Diagnostic assessment. • At the use level essentially. • For managed and controlled production systems in confined water bodies. • Where water is a limiting factor to aquatic resources production, such as seasonal or durable water
scarcity. Care must also be taken in applying the concept. Because ecosystem services and sociocultural values are not adequately represented implications must be carefully considered. Revising the water productivity framework Given the limitations of the current concept, we propose revising the water productivity framework proposed by Molden (1997) and adapted by Peden et al. (2007) for application to livestock. We first elaborate the concept at the use level; at the service and river basin levels, we incorporate these uses into a multiple use and user framework (Figure 1).
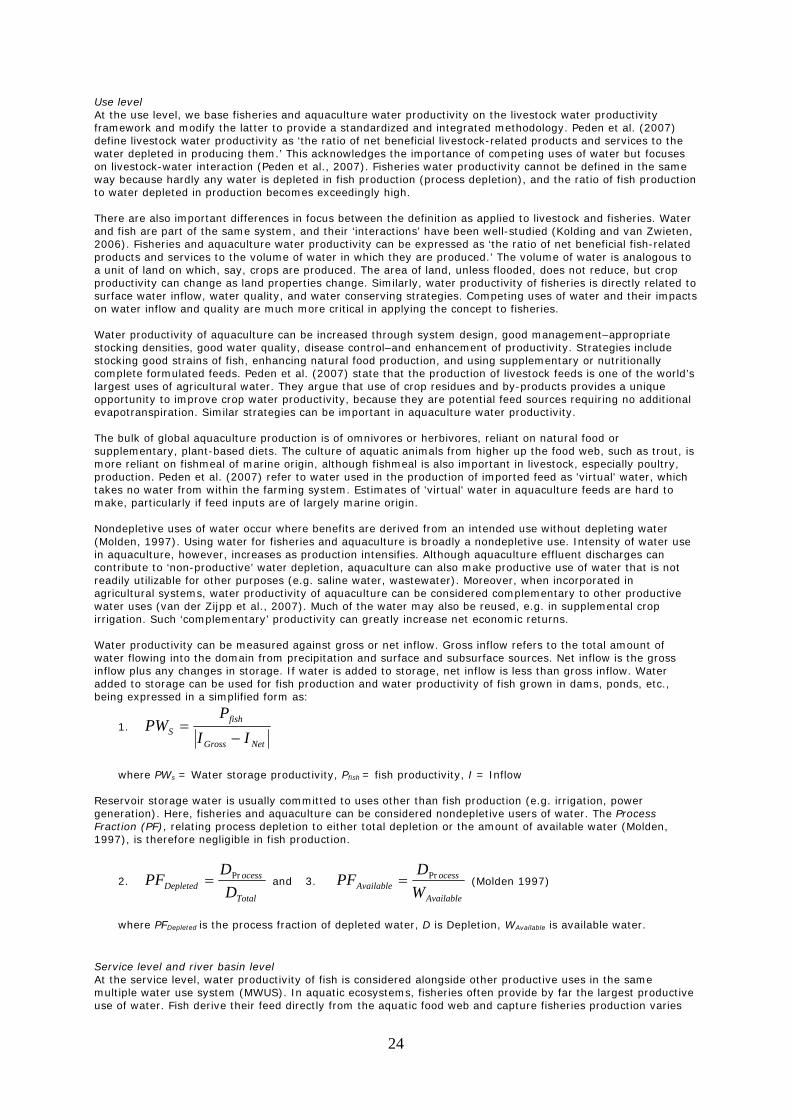
24
Use level At the use level, we base fisheries and aquaculture water productivity on the livestock water productivity framework and modify the latter to provide a standardized and integrated methodology. Peden et al. (2007) define livestock water productivity as ‘the ratio of net beneficial livestock-related products and services to the water depleted in producing them.’ This acknowledges the importance of competing uses of water but focuses on livestock-water interaction (Peden et al., 2007). Fisheries water productivity cannot be defined in the same way because hardly any water is depleted in fish production (process depletion), and the ratio of fish production to water depleted in production becomes exceedingly high. There are also important differences in focus between the definition as applied to livestock and fisheries. Water and fish are part of the same system, and their ‘interactions’ have been well-studied (Kolding and van Zwieten, 2006). Fisheries and aquaculture water productivity can be expressed as ‘the ratio of net beneficial fish-related products and services to the volume of water in which they are produced.’ The volume of water is analogous to a unit of land on which, say, crops are produced. The area of land, unless flooded, does not reduce, but crop productivity can change as land properties change. Similarly, water productivity of fisheries is directly related to surface water inflow, water quality, and water conserving strategies. Competing uses of water and their impacts on water inflow and quality are much more critical in applying the concept to fisheries. Water productivity of aquaculture can be increased through system design, good management–appropriate stocking densities, good water quality, disease control–and enhancement of productivity. Strategies include stocking good strains of fish, enhancing natural food production, and using supplementary or nutritionally complete formulated feeds. Peden et al. (2007) state that the production of livestock feeds is one of the world’s largest uses of agricultural water. They argue that use of crop residues and by-products provides a unique opportunity to improve crop water productivity, because they are potential feed sources requiring no additional evapotranspiration. Similar strategies can be important in aquaculture water productivity. The bulk of global aquaculture production is of omnivores or herbivores, reliant on natural food or supplementary, plant-based diets. The culture of aquatic animals from higher up the food web, such as trout, is more reliant on fishmeal of marine origin, although fishmeal is also important in livestock, especially poultry, production. Peden et al. (2007) refer to water used in the production of imported feed as 'virtual' water, which takes no water from within the farming system. Estimates of 'virtual' water in aquaculture feeds are hard to make, particularly if feed inputs are of largely marine origin. Nondepletive uses of water occur where benefits are derived from an intended use without depleting water (Molden, 1997). Using water for fisheries and aquaculture is broadly a nondepletive use. Intensity of water use in aquaculture, however, increases as production intensifies. Although aquaculture effluent discharges can contribute to ‘non-productive’ water depletion, aquaculture can also make productive use of water that is not readily utilizable for other purposes (e.g. saline water, wastewater). Moreover, when incorporated in agricultural systems, water productivity of aquaculture can be considered complementary to other productive water uses (van der Zijpp et al., 2007). Much of the water may also be reused, e.g. in supplemental crop irrigation. Such ‘complementary’ productivity can greatly increase net economic returns. Water productivity can be measured against gross or net inflow. Gross inflow refers to the total amount of water flowing into the domain from precipitation and surface and subsurface sources. Net inflow is the gross inflow plus any changes in storage. If water is added to storage, net inflow is less than gross inflow. Water added to storage can be used for fish production and water productivity of fish grown in dams, ponds, etc., being expressed in a simplified form as:
1. NetGross
fishS II
PPW
−=
where PWs = Water storage productivity, Pfish = fish productivity, I = Inflow Reservoir storage water is usually committed to uses other than fish production (e.g. irrigation, power generation). Here, fisheries and aquaculture can be considered nondepletive users of water. The Process Fraction (PF), relating process depletion to either total depletion or the amount of available water (Molden, 1997), is therefore negligible in fish production.
2. Total
ocessDepleted D
DPF Pr= and 3.
Available
ocessAvailable W
DPF Pr= (Molden 1997)
where PFDepleted is the process fraction of depleted water, D is Depletion, WAvailable is available water.
Service level and river basin level At the service level, water productivity of fish is considered alongside other productive uses in the same multiple water use system (MWUS). In aquatic ecosystems, fisheries often provide by far the largest productive use of water. Fish derive their feed directly from the aquatic food web and capture fisheries production varies
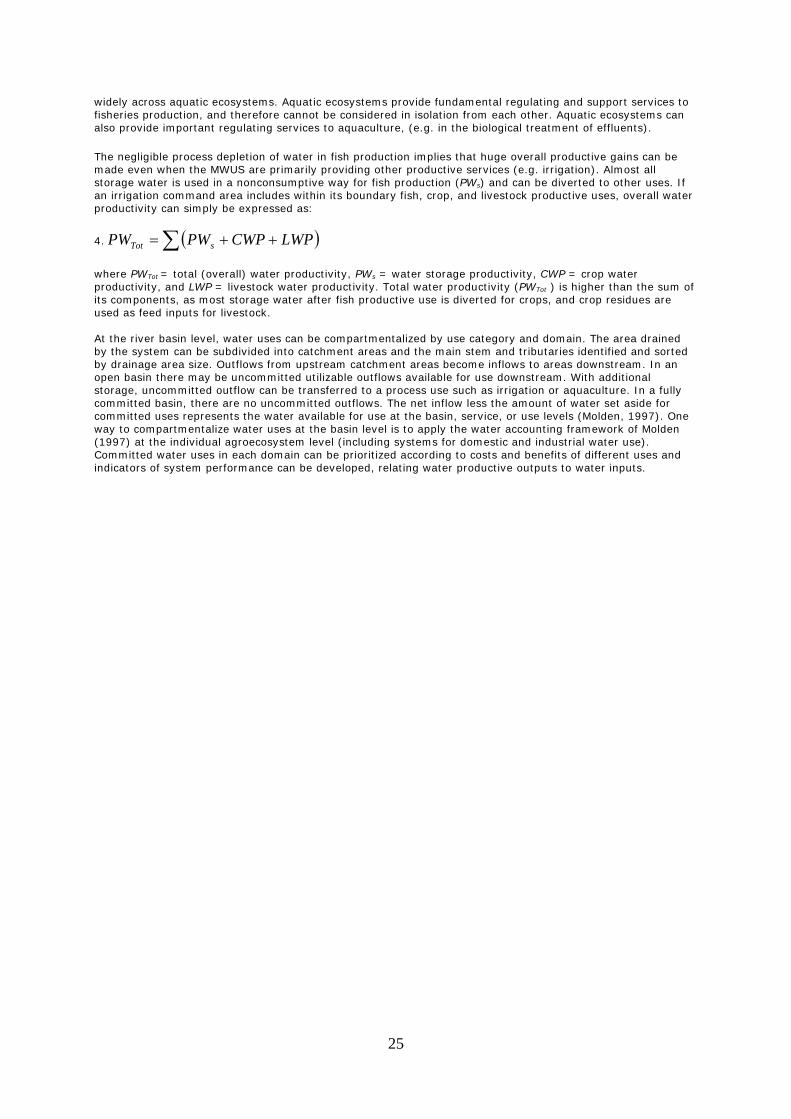
25
widely across aquatic ecosystems. Aquatic ecosystems provide fundamental regulating and support services to fisheries production, and therefore cannot be considered in isolation from each other. Aquatic ecosystems can also provide important regulating services to aquaculture, (e.g. in the biological treatment of effluents).
The negligible process depletion of water in fish production implies that huge overall productive gains can be made even when the MWUS are primarily providing other productive services (e.g. irrigation). Almost all storage water is used in a nonconsumptive way for fish production (PWs) and can be diverted to other uses. If an irrigation command area includes within its boundary fish, crop, and livestock productive uses, overall water productivity can simply be expressed as:
4. ( )∑ ++= LWPCWPPWPW sTot
where PWTot = total (overall) water productivity, PWs = water storage productivity, CWP = crop water productivity, and LWP = livestock water productivity. Total water productivity (PWTot ) is higher than the sum of its components, as most storage water after fish productive use is diverted for crops, and crop residues are used as feed inputs for livestock. At the river basin level, water uses can be compartmentalized by use category and domain. The area drained by the system can be subdivided into catchment areas and the main stem and tributaries identified and sorted by drainage area size. Outflows from upstream catchment areas become inflows to areas downstream. In an open basin there may be uncommitted utilizable outflows available for use downstream. With additional storage, uncommitted outflow can be transferred to a process use such as irrigation or aquaculture. In a fully committed basin, there are no uncommitted outflows. The net inflow less the amount of water set aside for committed uses represents the water available for use at the basin, service, or use levels (Molden, 1997). One way to compartmentalize water uses at the basin level is to apply the water accounting framework of Molden (1997) at the individual agroecosystem level (including systems for domestic and industrial water use). Committed water uses in each domain can be prioritized according to costs and benefits of different uses and indicators of system performance can be developed, relating water productive outputs to water inputs.
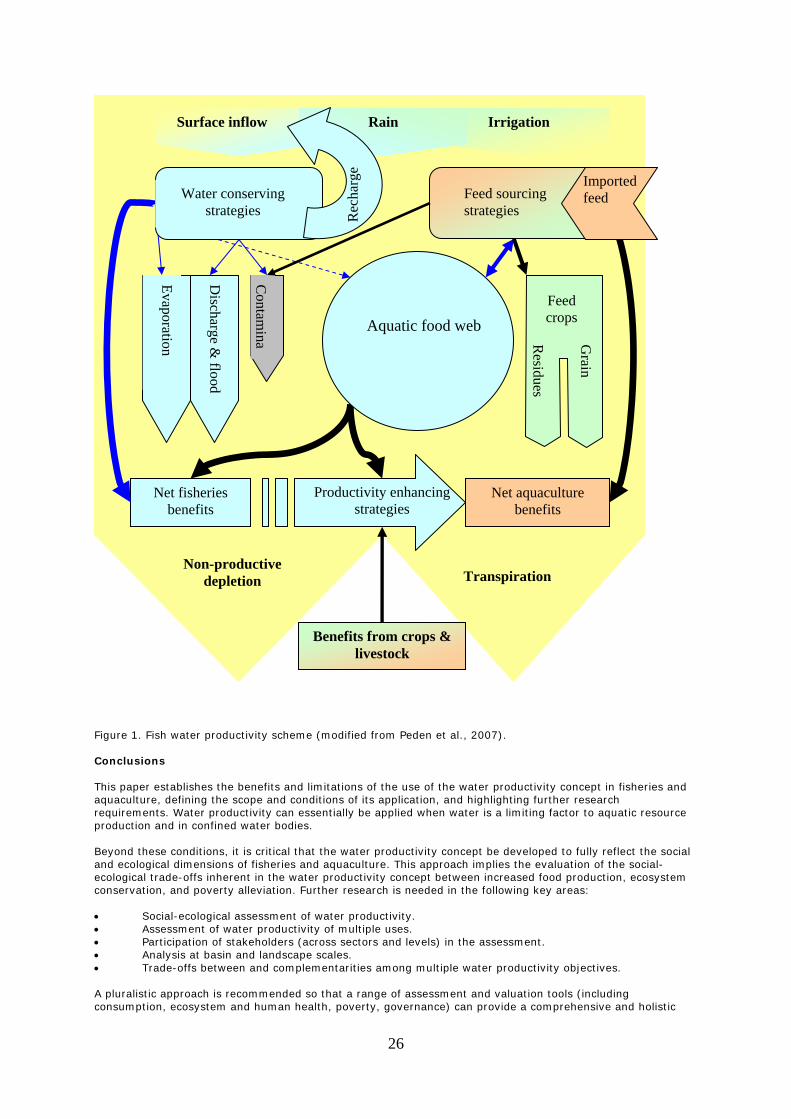
26
Figure 1. Fish water productivity scheme (modified from Peden et al., 2007). Conclusions This paper establishes the benefits and limitations of the use of the water productivity concept in fisheries and aquaculture, defining the scope and conditions of its application, and highlighting further research requirements. Water productivity can essentially be applied when water is a limiting factor to aquatic resource production and in confined water bodies. Beyond these conditions, it is critical that the water productivity concept be developed to fully reflect the social and ecological dimensions of fisheries and aquaculture. This approach implies the evaluation of the social-ecological trade-offs inherent in the water productivity concept between increased food production, ecosystem conservation, and poverty alleviation. Further research is needed in the following key areas: • Social-ecological assessment of water productivity. • Assessment of water productivity of multiple uses. • Participation of stakeholders (across sectors and levels) in the assessment. • Analysis at basin and landscape scales. • Trade-offs between and complementarities among multiple water productivity objectives. A pluralistic approach is recommended so that a range of assessment and valuation tools (including consumption, ecosystem and human health, poverty, governance) can provide a comprehensive and holistic
Net fisheries benefits
Net aquaculture benefits
Productivity enhancing strategies
Feed crops
Grain
Residues
Evaporation
Discharge &
flood
Contam
ina
Feed sourcing strategies
Water conserving strategies
Surface inflow Irrigation Rain
Rec
harg
e
Benefits from crops & livestock
Non-productive depletion Transpiration
Imported feed
Aquatic food web

27
assessment of fisheries costs and benefits in a context of multiple uses of water. This may set the scene for a broader revision of the concept beyond fisheries and aquaculture. Acknowledgments This paper has been produced by the leadership team of Theme 3, ‘Aquatic Ecosystems and Fisheries’ of the CGIAR Challenge Program on Water and Food (CPWF). The authors are grateful to Laurence Smith and Max Finlayson for their challenging and valuable comments on an earlier draft. References Comprehensive Assessment of Water Management in Agriculture (CAWMA). 2007. Water for Food, Water for
Life: A Comprehensive Assessment of Water Management in Agriculture. London: Earthscan, and Colombo: International Water Management Institute.
Dugan, P., V.V. Sugunan, R.L. Welcomme, C. Bene, R.E. Brummett, and M.C.M Beveridge. 2007. Inland
fisheries and aquaculture. In: Molden D. (Ed.) Water for Food, Water for Life: A Comprehensive Assessment of Water Management in Agriculture. Earthscan, London, and International Water Management Institute, Colombo. pp. 459-83.
Kolding, J., and P. van Zwieten. 2006. Improving productivity in tropical lakes and reservoirs. Challenge
Program on Water and Food–Aquatic Ecosystems and Fisheries Review Series 1. Theme 3 of CPWF. C/o WorldFish Center, Cairo, Egypt. pp. 139.
Lorenzen, K., L.E.D. Smith, S. Nguyen-Khoa, M. Burton, and C. Garaway. 2007. Guidance Manual: Management of
Impacts of Irrigation Development on Fisheries. The WorldFish Center & International Water Management Institute, Colombo, Sri Lanka.
Millennium Ecosystem Assessment (MEA). 2005. Ecosystems and Human Well-Being: Synthesis. Washington, D.C.:
Island Press. Molden, D. 1997. Accounting for Water Use and Productivity, SWIM Paper 1, International Water Management
Institute, Colombo, Sri Lanka. Molden, D., T.Y. Oweis, S. Pasquale, J.W. Kijne, Munir A. Hanjra, Prem S. Bindraban, B.A.M. Bouman, S.E.
Cook, O. Erenstein, H. Farahani, A. Hachum, J. Hoogeveen, H. Mahoo, V. Nangia, D. Peden, A. Sikka, P. Silva, H. Turral, A. Upadhyaya, and S. Zwart. 2007. Pathways for increasing agricultural water productivity. In Molden, D. (Ed.). Water for Food, Water for Life: A Comprehensive Assessment of Water Management in Agriculture. London, UK: Earthscan; Colombo, Sri Lanka: IWMI. pp. 279-310.
Peden, D., G. Tadesse, A.K. Misra, F.A. Ahmed, A. Astatke, W. Ayalneh, M. Herrero, G. Kiwuwa, T. Kumsa, B.
Mati, D. Mpairwe, T. Wassenaar, and A. Yimegnuhal. 2007. Water and livestock for human development. In Molden, D. (Ed.). Water for Food, Water for Life: A Comprehensive Assessment of Water Management in Agriculture. London, UK: Earthscan; Colombo, Sri Lanka: IWMI. pp. 485-514.
Smith, L.E.D.. S. Nguyen-Khoa, and K .Lorenzen. 2005. Livelihood functions in inland fisheries: policy implications
in developing countries. Water Policy, 7: 359-83. van der Zijpp, A.J., J.A.J. Verreth, Le Quang Tri, M.E.F. van Mensvoort, R.H. Bosma, and M.C.M. Beveridge (Eds.).
2007. Fishponds in Farming Systems. Wageningen Publishers, Netherlands. pp. 310.
28
Strategies for Improving Livestock Water Productivity
D. Peden1, T. Amede1,2, A. Haileslassie1, and G. Taddesse1
1International Livestock Research Institute, Addis Ababa, Ethiopia ([email protected]) 2International Water Management Institute (IWMI), Addis Ababa, Ethiopia
Abstract Increasing agricultural water productivity (WP) is a global priority for sustaining future food production and ecosystem services. Previous WP studies focused on crop production especially under irrigation. Livestock keeping, however, occupies more land area worldwide than crops. It is also a major component of agricultural GDP, providing meat, milk, income, farm power, manure (for fuel, soil fertility replenishment, and house construction), insurance, and wealth savings to hundreds of millions of people worldwide, but livestock keeping requires a lot of water. Unfortunately, inappropriate livestock keeping practices often cause needless water degradation and depletion. Within the CGIAR Challenge Program on Water and Food, this project employed a water accounting approach to develop a livestock water productivity (LWP) assessment framework that was used to identify strategies for increasing LWP, assess LWP in the Blue Nile Basin, and suggest opportunities to improve LWP more widely. Four major strategies for increasing LWP are: providing feeds composed of plants having high crop water productivities; using marketing and animal sciences such as genetics, veterinary health services, and nutrition to maximize potential benefits derived from animal products and services; adopting animal management practices that encourage increased transpiration and infiltration and reduced runoff, evaporation, and contamination; and spatially allocating watering sites to balance supply and demand for animal feed and dinking water. In the Nile region, LWP currently compares favorably with crop water productivity. There is still a great opportunity to further increase LWP by integrating investments, development, and management of agricultural water and livestock in the Nile and other developing regions of the world. Media grab Livestock can use scarce agricultural water more effectively, efficiently, sustainably, and profitably through better integration of livestock and water investment, development, and management. Introduction More than six billion people use about 7130 km3/year of agricultural water, or 70% of global water withdrawal to produce their food. Water use will increase by about 100-130 km3/year to 12,000-13,500 km3/year (Molden, 2007) excluding demand for possible production of biofuel and requirements for maintaining environmental health and ecosystems services. The world community must find ways to meet current and future food requirements without use of additional water resources. Providing water for all future food production will challenge humanity. In brief, agricultural WP must and can increase. Worldwide, livestock production takes place on more land area than crop production and makes a major contribution to agricultural GDP (Peden et al., 2007). Animal source foods help satisfy human nutritional needs for protein, micronutrients, and energy. Annually, global meat and milk consumption is growing at 2.1 and 1.7%, respectively, higher than rates of increasing production. In developing countries, livestock also generate income and provide manure, hides, insurance in times of drought, traction power, and cultural value. Notwithstanding the many benefits people derive from domestic animals, livestock also contribute to land and water degradation. As part of global efforts to increase agricultural water productivity, current levels of livestock production can be maintained while substantially decreasing water use and depletion (Steinfeld et al., 2006; Peden et al., 2007). This paper outlines an assessment framework that helps identify strategies to increase LWP, and briefly describes selected case studies from the Blue Nile River Basin. Livestock water productivity assessment framework We define LWP as the ratio of the total net beneficial livestock-related products and services to the water depleted in producing them. LWP is a systems concept based on water accounting principles that is applicable to diverse agricultural systems and to scales ranging from household to river basin levels (Figure 1). Livestock provide people, especially the poor in developing countries, with multiple benefits derived from diverse animal species and breeds. Estimating LWP requires estimates of the total value of these good and services. We normally use monetary units for benefits and express LWP in units such as US$/km3 of water. Water within agroecosystems occurs in lakes, rivers, ponds, reservoirs, and soil moisture, and in water locked up in the tissues of plants, animals, and microorganisms (Falkenmark et al., 1998). Water enters a system as rainfall and surface and subsurface inflow. Water depletion or loss from the system includes transpiration (T), evaporation (E), and downstream discharge. Sustainable water management requires long-term inflow and depletion to be in balance, preferably with sufficient storage to offset short-term scarcity due to droughts. Once depleted, water is no longer available and has no further value within the system. Water contamination is a depletion process that makes water less valuable to future users even though it may remain within the system. Estimating livestock-related water inflow, depletion, and storage is a primary requirement of assessing LWP.
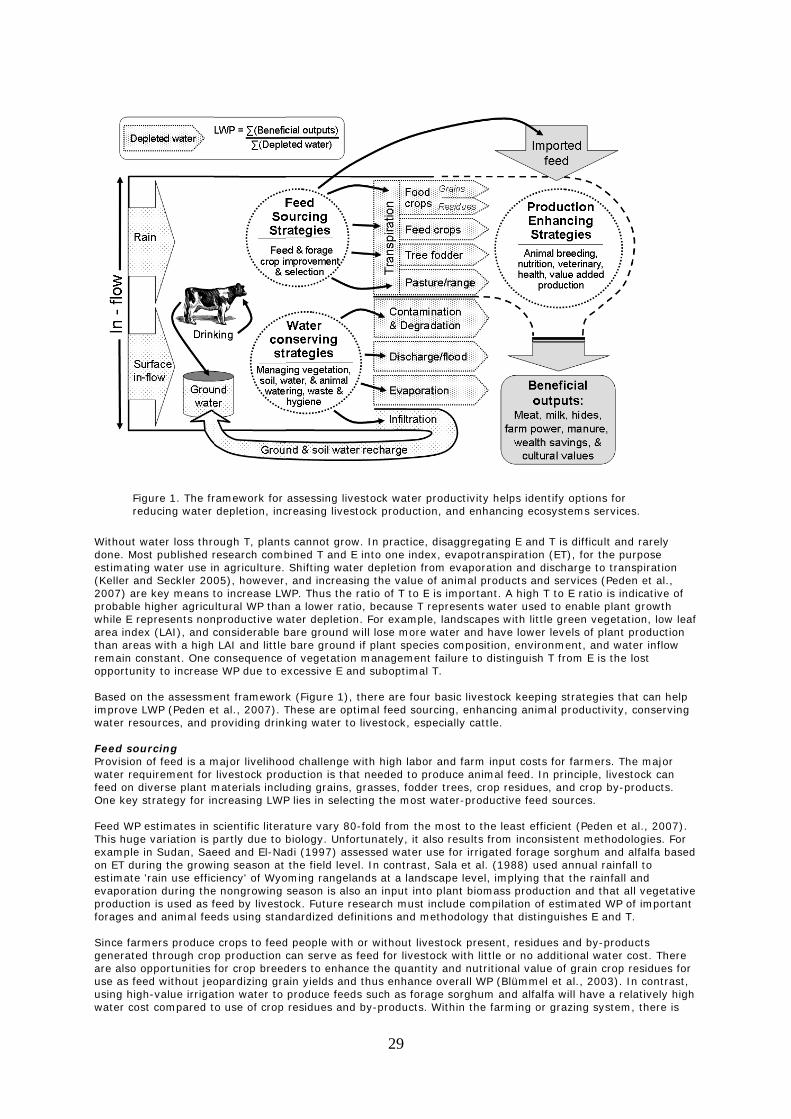
Without wdone. Moestimatin(Keller an2007) areprobable while E rearea indethan arearemain coopportun Based onimprove Lwater res Feed souProvision water reqfeed on dOne key s Feed WP This hugeexample on ET durestimate evaporatiproductioforages a Since farmgeneratedare also ouse as feeusing higwater cos
Figre
water loss throst published rg water use in
nd Seckler 200e key means t higher agricuepresents nonex (LAI), and cas with a high onstant. One city to increase
the assessmeLWP (Peden esources, and p
urcing of feed is a mquirement for diverse plant mstrategy for in
estimates in se variation is pin Sudan, Saering the growi 'rain use efficion during theon is used as fand animal fee
mers produced through croopportunities ed without jeoh-value irrigast compared t
gure 1. The freducing water
ough T, plantsresearch combn agriculture. 05), however,to increase LWltural WP than
nproductive waconsiderable b LAI and littleconsequence e WP due to e
ent frameworet al., 2007). Tproviding drin
major livelihoo livestock prodmaterials incluncreasing LWP
scientific literapartly due to eed and El-Naing season at ciency' of Wyoe nongrowing feed by livestoeds using stan
crops to feedp production for crop breedopardizing gration water to o use of crop
ramework for depletion, inc
s cannot growbined T and E Shifting wate, and increasiWP. Thus the rn a lower ratioater depletionbare ground we bare ground of vegetation
excessive E an
k (Figure 1), tThese are optking water to
od challenge wduction is thatuding grains, gP lies in select
ature vary 80biology. Unfor
adi (1997) ass the field leveoming rangelaseason is alsoock. Future rendardized defi
d people with can serve as fders to enhanain yields and produce feeds residues and
assessing livecreasing livest
29
w. In practice, into one inde
er depletion frng the value oratio of T to Eo, because T rn. For examplewill lose more if plant specie management
nd suboptimal
there are fourimal feed sou livestock, esp
with high labot needed to pgrasses, foddeting the most
-fold from thertunately, it asessed water ul. In contrast,nds at a lands
o an input intoesearch must initions and m
or without livefeed for livestce the quantit thus enhances such as fora by-products.
estock water ptock productio
disaggregatinex, evapotransom evaporatioof animal prod is important.represents wae, landscapes water and haes compositiot failure to dis T.
r basic livestorcing, enhancpecially cattle.
r and farm inproduce animaer trees, crop water-produc
e most to the lso results frouse for irrigate, Sala et al. (1scape level, imo plant biomasinclude compi
methodology th
estock presentock with littlety and nutritioe overall WP (age sorghum a Within the fa
productivity heon, and enhan
ng E and T is spiration (ET)on and dischaducts and serv A high T to E
ater used to e with little greve lower leven, environme
stinguish T fro
ck keeping stcing animal pr.
put costs for fl feed. In prin residues, and
ctive feed sour
least efficientom inconsistened forage sorg1988) used anmplying that tss production ilation of estimhat distinguish
nt, residues ane or no additioonal value of g(Blümmel et aand alfalfa wilrming or graz
elps identify oncing ecosyste
difficult and ra, for the purp
arge to transpvices (Peden eE ratio is indicnable plant green vegetationls of plant pront, and water
om E is the los
rategies that roductivity, co
farmers. The mnciple, livestocd crop by-prodrces.
(Peden et al.nt methodologghum and alfannual rainfall tthe rainfall an and that all v
mated WP of ihes E and T.
nd by-productonal water cosgrain crop resl., 2003). In cl have a relat
zing system, t
options for ems services.
arely ose iration et al., ative of rowth n, low leaf oduction r inflow st
can help nserving
major ck can ducts.
, 2007). gies. For alfa based to d vegetative mportant
ts st. There sidues for contrast, ively high here is
30
need to determine what feed sourcing options will give the highest LWP. Grazing on vegetation that has little value for other human needs or for maintenance of ecosystem health may confer a low water cost source for feed. In the extreme, importing feed enables animal production without incurring any water cost for feed from within the system. In essence, virtual water supports animal production especially in urban and periurban dairying and fattening. One implication is that future evolution of the LWP framework may benefit by considering the price of depleted water rather than its volume. Efforts to increase LWP through feed sourcing demands caution. First, the feeds selected must meet the nutritional requirements of the animal. One promising option under development is to estimate water productivity of feed using the ratio of metabolizable energy to water depleted. Second, high LWP does not necessarily mean high production, and livestock keepers need to maintain profitable enterprises. Water for feed is a concept that is closely linked to 'water for vegetation' where vegetation may or may not be consumed by animals as feed. The section below on conserving water resources describes the nonconsumptive influence of livestock on vegetation and water, but briefly, sustainable allocation of pasture, residues, and by-products for feed implies maintenance of essential ecosystem services. In extensive production systems, animal feeds are about 50% digestible with the other half emerging from the animal as manure. Only about half of the water depleted to produce feed actually supports animal maintenance and production. Often, manure is highly valued and widely used for replenishing soil fertility, domestic fuel, and construction of housing. However, manure may be a major cause of environmental degradation, especially water contamination. Thus, manure management can have a major influence on the net beneficial benefits derived from livestock and thus on LWP. Oxen, equines, and buffaloes provide farm power for crop production and marketing in many basins including the Blue Nile. Water used for feed to enable animal traction is an input into crop production. Where farm power is the primary use of an animal, beef may actually be a by-product of animal production and only be 'produced' when an animal is no longer capable of cultivating land. Enhancing animal productivity Historically, animal science research emphasized increasing livestock production often focusing on single outputs such as meat and milk. Most of this research took place in industrial countries, and gave little emphasis to developing country livestock production systems involving multiple animal sourced products and services. In all countries, the total water cost of animal production has been largely ignored. No matter how much or how little water plants transpire to produce animal feeds, LWP will be low if livestock do not use feed efficiently. High rates of mortality and morbidity lower LWP by reducing beneficial outputs. Just as it is important to ensure good crop health and soil fertility to achieve high levels of crop water productivity, one key to enhancing LWP requires good animal husbandry that maintains healthy animals with appropriate quantity and quality of feed intake in a stress-free environment. Numerous technologies and practices can help achieve this state (Ranjhan, 2001; Steinfeld et al., 2006; Peden et al., 2007). Animals use feed energy for maintenance and for productive growth, lactation, reproduction, and farm power. Energy not used for maintenance may become available for production. In much of Africa, feed scarcity limits intake, implying that most consumed feed supports maintenance leaving little for production. Increasing the ratio of feed energy for production to maintenance has high potential for increasing LWP. For example, providing on-site drinking water to dairy cows instead of having them trek daily for drinking water reduces stress and expenditure of energy enabling substantive increases in milk production (Muli, 2000). Constructing shelter against extreme temperature, providing veterinary services to reduce morbidity and mortality, and where practical, night grazing also reduce stress on animals enabling greater production and higher LWP. Traction power from oxen is a vital input for crop production in the Ethiopian Nile region. Farmers use oxen for only short periods each year, but must maintain them and breeding adults year-round, making maintenance costs relatively high. Technologies such as conservation agriculture could reduce the need for cultivation and oxen, leading to an overall increase in WP. Increasing the daily feed intake of domestic animals has been a primary goal of the animal sciences. Although this strategy may help increase energy flow for production, it may not increase feed conversion efficiency for that production and by implication for LWP. Opportunities exist to select and breed animals having higher feed conversion efficiency and not just higher rates of intake (Basareb, 2003). Formulating feeds and feed strategies with appropriate nutrients and forage composition can help increase feed conversion efficiency (Gebreselassie et al., 2008) and thereby reduce water requirements for feed production. Because the LWP concept measures benefits in monetary units, it follows that market conditions influence conversion of water to beneficial animal outputs. Thus, LWP may be higher when livestock keepers have good access to markets, have disease-free, high-quality, and high-value products, and can add value at the farm/gate such as converting liquid milk to butter or cheese. Caution is needed, however, when relying only on monetary valuation of LWP, because this does not allow disaggregation of animal products into diverse nutrients required for human nutrition. There remains a need to recognize that animal-source foods provide essential nutrients such as Vitamin B12 and micronutrients that are often not otherwise readily available to poor farmers producing crops on nutrient-depleted soils.Conserving water resources Conserving water is a key strategy for increasing LWP. The primary challenge to conserving agricultural water is maintaining high levels of vegetative ground cover that promote increased transpiration, infiltration, and soil
31
water-holding capacity and decreased evaporation and discharge. In grazing areas, herds may need to limit animal stocking rates to levels that allow moderate production and avoid overgrazing that removes excessive ground cover or shifts plant species composition from palatable to unpalatable types. Well-managed grassland is often the best land-use in terms of capturing rainfall, encouraging its storage in soil, and promoting transpiration and thus plant production. This is especially true in drylands and on steep slopes. Where livestock depend partly or entirely on crop residues and by-products, maintaining vegetative ground cover is also vital, but different management options exist. For much of the year traditionally cultivated land is devoid of vegetative cover, vulnerable to water loss through runoff and evaporation, and may suffer from declining soil organic matter and water-holding capacity. In Ethiopia, soil erosion and by implication runoff is eight times higher on annual croplands than on grazing lands (Hurni, 1990). As on grazing land, increasing WP requires concerted effort to maximize water depletion by transpiration and to reduce evaporation and runoff. Conservation agriculture and restricting cultivation from steep slopes and rainfed areas subject to high risk of drought can help increase WP. In some cases, water harvesting and groundwater recharge techniques can capture surplus water enabling storage for dry seasons and higher WP on a year-round basis. Because livestock keeping is highly integrated into rainfed agriculture in developing countries and feed scarcity is widespread, excessive use of crop residues for livestock and energy aggravates degradation of land and water resources associated with cultivation. Interventions, aimed at producing animal feeds utilizing crop residues and by-products, must accommodate the need to maintain vegetative cover and soil moisture. Providing drinking water Livestock, especially cattle, are highly dependent on water resources, particularly in arid and semiarid lands. Without drinking water, they die, and when drinking is restricted in amounts and frequency, stress reduces animal production. The agroecosystem process of animal drinking takes place within the system. Water drunk within it is not depleted because it remains within and supports ecosystem functioning. After animals consume water, it can be lost as fecal moisture or urine and deposited on the soil-vegetation complex from which it may infiltrate or evaporate. A very small amount may be lost as evaporation from the pulmonary tissues of the animal. Nevertheless, drinking water must be of high quality and available in small but adequate quantities. Although the cost of providing a unit of drinking water may also be high, the amount of water drunk is less than 2% of that needed to produce feed (Peden et al., 2007). Livestock drink about 30-50 l/TLU/day, with variation dependent on many factors such as species, breed, ambient temperature, water quality, feed intake, water content of feed, animal activity, pregnancy, and lactation (King, 1983). Water loss through urine and feces also must be replaced through drinking or with the water content of feed. Water consumed is correlated with feed intake and ranges from about 3.6 to 8.5 l/kg of feed at ambient temperature below about 150C to 270C, respectively. Lactating cows drink more, as much as 85 l/day for high producers. Water deprivation reduces feed intake and hence weight gains, milk production, and LWP. In mixed crop-livestock systems of sub-Saharan Africa, piped water, although expensive, delivered to the farm combined with zero grazing will increase production (Muli, 2000) and LWP. Poor management of livestock and water in pastoral areas means that watering sites are often contaminated or filled with sediments, adjacent pastures overgrazed, domestic use of the water jeopardized, and animal and human health put at risk. Yet, perhaps the most important contribution of providing drinking water in grazing lands is the opportunity to more optimally distribute livestock, especially cattle, over grazing land enabling them to make more effective use of forages without overgrazing them. For example, one case study in Wyoming demonstrated that 77% of grazing occurred within 366 m of water and 65% of available pasture was more than 730 m from water (Gerrish and Davis, 1999). In Africa, livestock watering points are often inadequate in number and suboptimally distributed and managed. In Sudan, Faki et al. (2008) indicate that achieving an optimal spatial distribution of livestock and drinking water sites can greatly increase LWP and reduce land and water degradation in large parts of the Nile Basin. Case studies Preliminary assessments in the Ethiopian highlands suggest that LWP is comparable to WP of high-value produce such as tomatoes and garlic and higher than grains (Table 1). Tulu (2007) also reported that WP of domestic water was higher than for crops and livestock. Curtis (2007), using a netback analysis as a proxy for LWP, demonstrated similar trends. Haileslassie et al. (2008) observed that increased wealth enables poor farmers to invest in agricultural inputs that are more water productive, whereas Molden (2007) suggested that higher LWP could contribute to reducing poverty. Complementary research from Gumera also suggests that LWP may be higher on privately tenured land compared to communal lands especially on steep slopes, but community enforced local bylaws can help increase LWP on the latter (Alemayehu et al., 2008). While there is need for more methodological development and assessments of LWP from other sites and production systems, the Ethiopian research and subjective observations from Sudan and Uganda suggest a few consistent patterns. First LWP compares favorably with crop WP. Second, there is much room for further increases in LWP. Third, LWP appears to be inversely correlated with poverty, but the causal linkages require further research. Emerging from these studies and from Peden et al., (2007), the most important intervention option required to increase LWP is enabling policy, appropriate institutional arrangements, and willingness of stakeholders to integrate investments, development, and management of livestock and water resources.
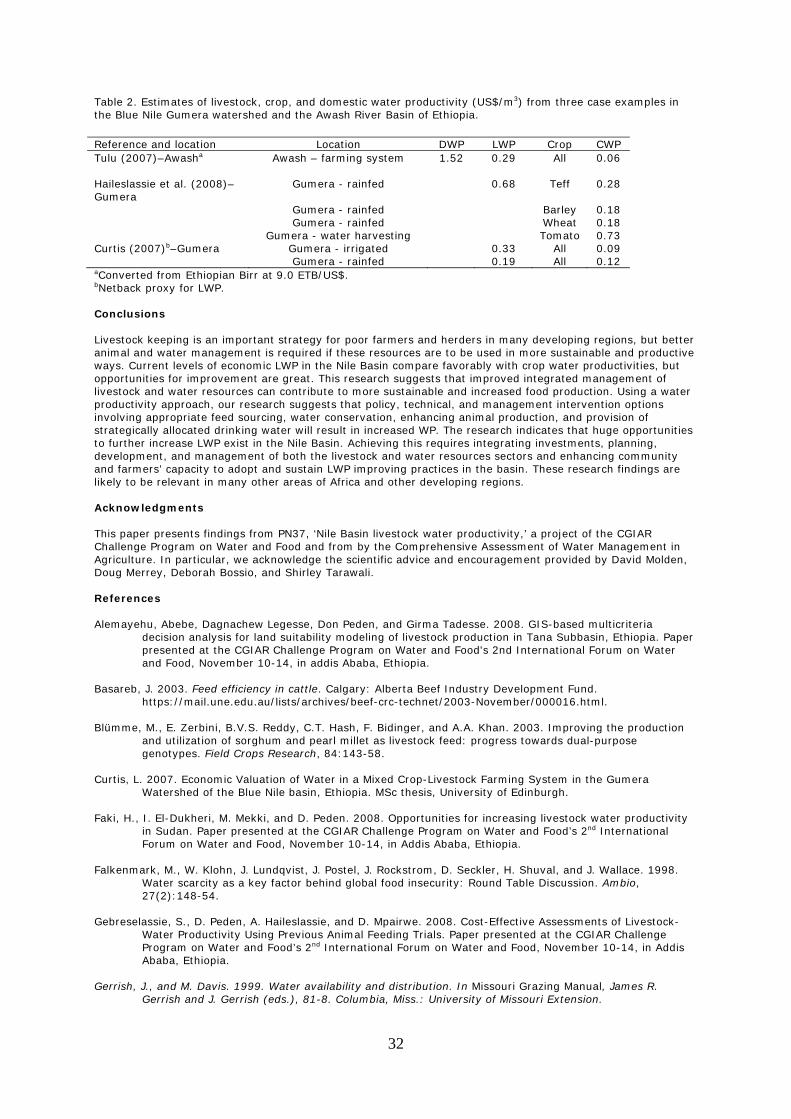
32
Table 2. Estimates of livestock, crop, and domestic water productivity (US$/m3) from three case examples in the Blue Nile Gumera watershed and the Awash River Basin of Ethiopia.
Reference and location Location DWP LWP Crop CWP Tulu (2007)–Awasha Awash – farming system 1.52 0.29 All 0.06 Haileslassie et al. (2008)–Gumera
Gumera - rainfed 0.68 Teff 0.28
Gumera - rainfed Barley 0.18 Gumera - rainfed Wheat 0.18 Gumera - water harvesting Tomato 0.73 Curtis (2007)b–Gumera Gumera - irrigated 0.33 All 0.09 Gumera - rainfed 0.19 All 0.12 aConverted from Ethiopian Birr at 9.0 ETB/US$. bNetback proxy for LWP. Conclusions Livestock keeping is an important strategy for poor farmers and herders in many developing regions, but better animal and water management is required if these resources are to be used in more sustainable and productive ways. Current levels of economic LWP in the Nile Basin compare favorably with crop water productivities, but opportunities for improvement are great. This research suggests that improved integrated management of livestock and water resources can contribute to more sustainable and increased food production. Using a water productivity approach, our research suggests that policy, technical, and management intervention options involving appropriate feed sourcing, water conservation, enhancing animal production, and provision of strategically allocated drinking water will result in increased WP. The research indicates that huge opportunities to further increase LWP exist in the Nile Basin. Achieving this requires integrating investments, planning, development, and management of both the livestock and water resources sectors and enhancing community and farmers’ capacity to adopt and sustain LWP improving practices in the basin. These research findings are likely to be relevant in many other areas of Africa and other developing regions. Acknowledgments This paper presents findings from PN37, ‘Nile Basin livestock water productivity,’ a project of the CGIAR Challenge Program on Water and Food and from by the Comprehensive Assessment of Water Management in Agriculture. In particular, we acknowledge the scientific advice and encouragement provided by David Molden, Doug Merrey, Deborah Bossio, and Shirley Tarawali. References Alemayehu, Abebe, Dagnachew Legesse, Don Peden, and Girma Tadesse. 2008. GIS-based multicriteria
decision analysis for land suitability modeling of livestock production in Tana Subbasin, Ethiopia. Paper presented at the CGIAR Challenge Program on Water and Food's 2nd International Forum on Water and Food, November 10-14, in addis Ababa, Ethiopia.
Basareb, J. 2003. Feed efficiency in cattle. Calgary: Alberta Beef Industry Development Fund.
https://mail.une.edu.au/lists/archives/beef-crc-technet/2003-November/000016.html. Blümme, M., E. Zerbini, B.V.S. Reddy, C.T. Hash, F. Bidinger, and A.A. Khan. 2003. Improving the production
and utilization of sorghum and pearl millet as livestock feed: progress towards dual-purpose genotypes. Field Crops Research, 84:143-58.
Curtis, L. 2007. Economic Valuation of Water in a Mixed Crop-Livestock Farming System in the Gumera
Watershed of the Blue Nile basin, Ethiopia. MSc thesis, University of Edinburgh. Faki, H., I. El-Dukheri, M. Mekki, and D. Peden. 2008. Opportunities for increasing livestock water productivity
in Sudan. Paper presented at the CGIAR Challenge Program on Water and Food’s 2nd International Forum on Water and Food, November 10-14, in Addis Ababa, Ethiopia.
Falkenmark, M., W. Klohn, J. Lundqvist, J. Postel, J. Rockstrom, D. Seckler, H. Shuval, and J. Wallace. 1998.
Water scarcity as a key factor behind global food insecurity: Round Table Discussion. Ambio, 27(2):148-54.
Gebreselassie, S., D. Peden, A. Haileslassie, and D. Mpairwe. 2008. Cost-Effective Assessments of Livestock-
Water Productivity Using Previous Animal Feeding Trials. Paper presented at the CGIAR Challenge Program on Water and Food’s 2nd International Forum on Water and Food, November 10-14, in Addis Ababa, Ethiopia.
Gerrish, J., and M. Davis. 1999. Water availability and distribution. In Missouri Grazing Manual, James R.
Gerrish and J. Gerrish (eds.), 81-8. Columbia, Miss.: University of Missouri Extension.
33
Haileslassie, A., S. Gebreselassie, D. Peden, T. Amede, and K. Descheemaeker. 2008. Poverty impact on water productivity: Fostering pro-poor water management technologies. Paper presented at the CGIAR Challenge Program on Water and Food’s 2nd International Forum on Water and Food, November 10-14, in Addis Ababa, Ethiopia.
Hurni, H. 1990. Degradation and conservation of soil resources in the Ethiopian Highlands. In African mountains
and highlands: Problems and perspectives, Hans Hurni and Bruno Messerli (eds.), 51-63, Marceline, Missouri: African Mountains Association.
Keller, A., and D. Seckler. 2005. Limits to the productivity of water in crop production. In California Water Plan
Update 2005, Vol. 4. Arnold Schwarzenegger, Mike Chrisman, and Lester A. Snow (eds.), 177-97. Sacramento, California: Department of Water Resources.
King, J. 1983. Livestock water needs in pastoral Africa in relation to climate and forage. Nairobi: International
Livestock Research Institute. Molden, D. 2007. Summary for decision makers. In Water for food, water for life: A comprehensive assessment
of water management in agriculture, David Molden (ed.), 1-34. London: Earthscan and Colombo: International Water Management Institute.
Muli, A. 2000. Factors affecting amount of water offered to dairy cattle in Kiambu District and their effects on
productivity. BSc. thesis, University of Nairobi. Peden, D., G. Tadesse, and A.K. Misra. 2007. Water and livestock for human development. In Water for food,
water for life: A comprehensive assessment of water management in agriculture, David Molden (ed.), 485-514. London: Earthscan and Colombo: International Water Management Institute.
Ranjhan, S.K. 2001. Animal nutrition in the tropics. London: Sangam Books Ltd. Saeed, I., and A. El-Nadi. 1997. Irrigation effects on the growth, yield and water use efficiency of alfalfa.
Irrigation Science, 17(2): 63-8. Sala, O., W. Parton, A. Joyce, and W. Lauenroth. 1988. Primary production of the central grasslands of the
United States. Ecology, 69(1): 40-5. Steinfeld, H., P. Gerber, T. Wassenaar, V. Castel, M. Rosales, and C. de Haan. 2006. Livestock’s long shadow:
Environmental issues and options. Rome: FAO. Tulu, M., 2007. Estimation of Livestock, Domestic Use and Crop Water Productivities of SG-2000 Water Harvesting Pilot Projects in
Ethiopia. Addis Ababa: International Livestock Research Institute.
34
Agriculture, water and health
Mosquitoes and malaria in the vicinity of the Koka Reservoir, Ethiopia.
Solomon Kibret1, Matthew McCartney1, and Jonathan Lautze2
1International Water Management Institute (IWMI), Addis Ababa, Ethiopia
2Tufts University, Boston, USA Corresponding author: [email protected]
Abstract To determine the impact of the Koka Reservoir, Ethiopia, on malaria transmission, larval and adult Anopheles mosquitoes were collected fortnightly between August 2006 and December 2007 in two villages close to the reservoir (< 0.8 km) and two control villages, situated farther away (>7 km). During the study, the mean number of positive larval sites was 6.5 times higher in the reservoir villages than in the control villages. Shoreline puddles were the major mosquito-breeding habitats in the reservoir villages, while temporary puddles, formed during the wet season, served as the major breeding sites in the control villages. Throughout the study, larval and adult mosquito densities were significantly higher in the reservoir villages than in the control villages. In the reservoir villages, vector abundance and malaria case rates were correlated with water level changes in the reservoir. When reservoir water levels were high, drawdown rates faster than 0.5 m/month correlated with lower vector abundance and reduced malaria transmission. These findings indicate the possibility of using dam operation as an additional tool for reducing malaria in communities close to the reservoir. Media grab Reservoir shorelines provide important breeding habitat for mosquitoes and may intensify malaria transmission. Modifying dam operation has the potential to reduce malaria in nearby communities. Introduction An increase in the number of large dams has been identified by governments and key international actors (e.g. the World Bank) as crucial for economic growth and poverty reduction in many parts of sub-Saharan Africa (World Bank, 2004). Experience shows, however, that inadequate consideration of both environmental and public health impacts can seriously undermine the envisioned benefits of investments (McCartney et al., 2007). Key among the potential negative effects of large dams is intensified malaria transmission, resulting from changes in environmental conditions that increase vector (i.e. Anopheles mosquito) abundance (Keiser et al., 2005). Studies demonstrating the efficacy of conventional malaria control strategies are abundant (Lengeler and Snow, 1996). There are, however, many examples highlighting their limitations (e.g. Guyatt et al., 2002). Lack of financial resources for medical and chemical control measures is a major constraint on broader use in sub-Saharan Africa. Their efficacy is further reduced as a consequence of resistance of mosquitoes to insecticides, and the malaria parasite to drugs. This calls for cost-effective and efficient malaria control measures such as environmental management through larval habitat modification. Recent research has devoted increasing attention to environmental management, particularly water management, to reduce malaria incidence (Utzinger et al., 2001; Yohannes et al., 2005). Appropriate management of mosquito larval habitats can help suppress malaria transmission (Tennessee Valley Authority, 1947). The main objectives of the present study were to investigate: 1) the impact of impounded water on mosquitoes and malaria in an area of seasonal transmission, and 2) the possibility of using dam operation as a tool for malaria reduction.
The study area In Ethiopia, malaria affects 4-5 million people annually, with morbidity and fatality rates of 13-35% and 15-17%, respectively (Ministry of Health, 2005). Anopheles arabiensis and An. pharoensis are the major malaria vectors in the country. This study comprised both epidemiological and entomological surveys conducted in the vicinity of the Koka reservoir (storage 1500 million m3) in Central Ethiopia, which is located in the Awash River Basin at 1590 m, approximately 100 km southeast of Addis Ababa (Figure 1). The dam, commissioned in 1960, was built primarily for hydropower generation. It is, however, now also used for downstream irrigation and flood control. Most households in the area primarily depend on subsistence rainfed agriculture and livestock-herding. Most people live in traditional mud huts, known as 'tukuls.' Malaria is seasonally demarcated, with peak transmission following the wet season, generally lasting from mid-September to mid-November. Malaria control authorities in the region seek to reduce malaria risk mainly by means of indoor residual spraying (IRS) with DDT or malathion in selected villages, and by treatment of diagnosed cases with anti-malarial drugs.
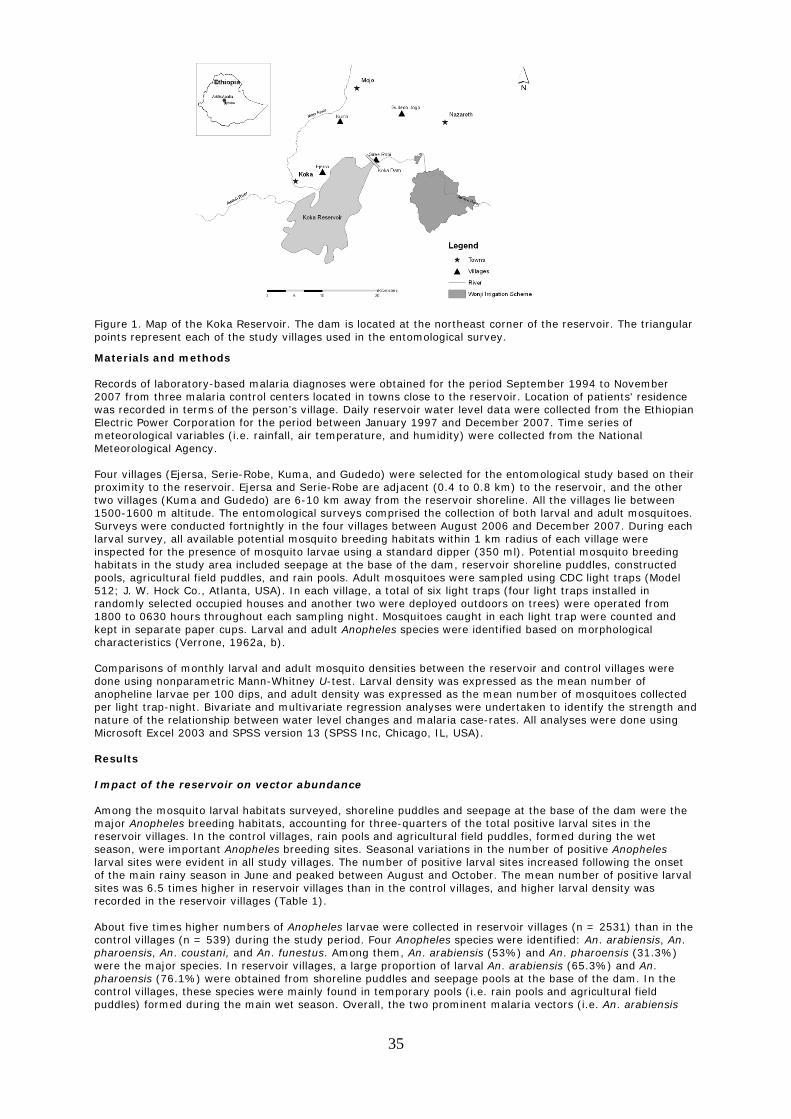
Figure 1. points rep
Material Records o2007 fromwas recorElectric PmeteoroloMeteorolo Four villaproximitytwo villag1500-160Surveys wlarval surinspectedhabitats ipools, ag512; J. Wrandomly1800 to 0kept in secharacter Comparisdone usinanophelinper light nature ofMicrosoft Results Impact o Among thmajor Anreservoir season, wlarval siteof the masites wasrecorded About fivecontrol vipharoenswere the pharoenscontrol vipuddles)
Map of the Kopresent each
s and metho
of laboratory-m three malarrded in terms ower Corporaogical variableogical Agency
ges (Ejersa, Sy to the reservges (Kuma and00 m altitude.were conductervey, all availad for the presein the study aricultural field
W. Hock Co., Ay selected occu0630 hours theparate paperristics (Verron
sons of monthng nonparamene larvae per trap-night. Bif the relations Excel 2003 a
of the reserv
he mosquito laopheles breed villages. In thwere importanes were evideain rainy seaso 6.5 times hig in the reservo
e times higheillages (n = 53sis, An. cousta major speciessis (76.1%) weillages, these formed during
oka Reservoirof the study v
ods
based malariaria control cen of the person
ation for the pes (i.e. rainfal.
Serie-Robe, Kvoir. Ejersa and Gudedo) are The entomoled fortnightly able potential ence of mosqurea included s
d puddles, andAtlanta, USA). upied houses roughout eac
r cups. Larval ne, 1962a, b).
hly larval and aetric Mann-Wh100 dips, andvariate and mhip between wnd SPSS vers
voir on vecto
arval habitats ding habitats, he control villant Anopheles bnt in all studyon in June angher in reservoir villages (T
r numbers of 39) during theani, and An. fus. In reservoirere obtained fspecies were g the main we
r. The dam is villages used i
a diagnoses wnters located in’s village. Daeriod betweenll, air tempera
uma, and Gudnd Serie-Robee 6-10 km awogical surveys in the four vi mosquito breuito larvae usiseepage at thd rain pools. A In each villag and another th sampling ni and adult Ano
adult mosquithitney U-test. d adult densitymultivariate rewater level chsion 13 (SPSS
or abundance
surveyed, sh accounting foages, rain poobreeding sitesy villages. Thed peaked betwoir villages thable 1).
Anopheles lare study periodunestus. Amonr villages, a lafrom shoreline mainly found et season. Ov
35
located at then the entomo
were obtained n towns closeily reservoir wn January 199ature, and hum
dedo) were see are adjacentway from the rs comprised tllages betwee
eeding habitating a standarde base of the
Adult mosquitoge, a total of stwo were depght. Mosquitoopheles specie
to densities be Larval densityy was expressgression analyanges and ma Inc, Chicago,
e
oreline puddleor three-quartols and agricus. Seasonal vae number of poween August aan in the cont
rvae were colld. Four Anophng them, An. arge proportioe puddles and in temporaryerall, the two
e northeast coological survey
for the periode to the reservwater level dat97 and Decemmidity) were c
elected for thet (0.4 to 0.8 kreservoir shorehe collection o
en August 200s within 1 kmd dipper (350 dam, reservooes were samsix light traps loyed outdoor
oes caught in ees were identi
etween the rey was express
sed as the meayses were undalaria case-rat, IL, USA).
es and seepagters of the totltural field pu
ariations in theositive larval sand October. trol villages, a
lected in reserheles species warabiensis (53
on of larval And seepage pooy pools (i.e. ra prominent m
orner of the rey.
d September 1voir. Location ta were collec
mber 2007. Timcollected from
e entomologicakm) to the reseline. All the vof both larval
06 and Decemm radius of eac
ml). Potentiaoir shoreline ppled using CD (four light trars on trees) weach light trapified based on
servoir and cosed as the mean number of dertaken to idtes. All analys
ge at the basetal positive larddles, formede number of psites increaseThe mean nu
and higher lar
rvoir villages were identified3%) and An. p
n. arabiensis (ols at the baseain pools and aalaria vectors
eservoir. The t
1994 to Novem of patients' rected from the me series of
m the National
al study basedervoir, and thvillages lie bet and adult mober 2007. Du
ch village werel mosquito bruddles, const
DC light traps aps installed i
were operated p were counten morphologic
ontrol villagesean number off mosquitoes cdentify the strses were done
e of the dam wrval sites in thd during the wpositive Anophd following thmber of posit
rval density wa
(n = 2531) thd: An. arabienpharoensis (365.3%) and A
e of the dam. agricultural fies (i.e. An. arab
triangular
mber esidence Ethiopian
d on their he other tween
osquitoes. ring each e eeding ructed (Model n from ed and al
s were f collected ength and e using
were the he wet heles he onset ive larval as
han in the nsis, An. 1.3%)
An. In the eld biensis
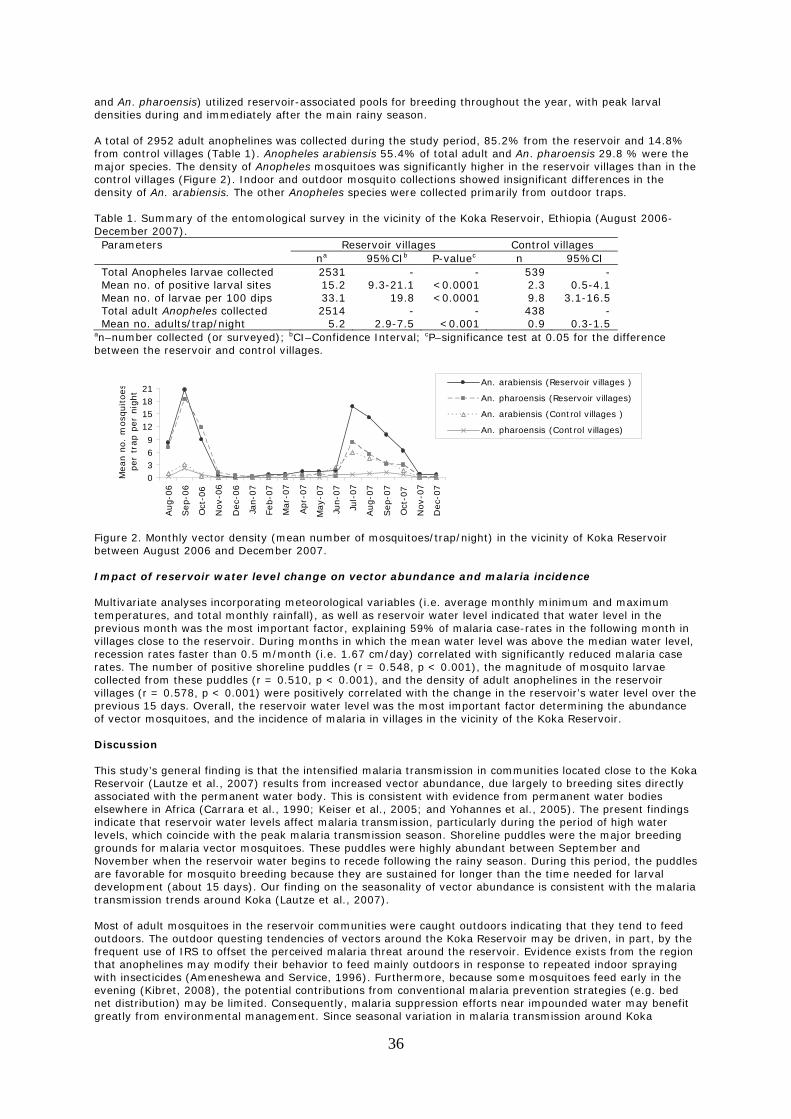
36
and An. pharoensis) utilized reservoir-associated pools for breeding throughout the year, with peak larval densities during and immediately after the main rainy season. A total of 2952 adult anophelines was collected during the study period, 85.2% from the reservoir and 14.8% from control villages (Table 1). Anopheles arabiensis 55.4% of total adult and An. pharoensis 29.8 % were the major species. The density of Anopheles mosquitoes was significantly higher in the reservoir villages than in the control villages (Figure 2). Indoor and outdoor mosquito collections showed insignificant differences in the density of An. arabiensis. The other Anopheles species were collected primarily from outdoor traps. Table 1. Summary of the entomological survey in the vicinity of the Koka Reservoir, Ethiopia (August 2006-December 2007). Parameters Reservoir villages Control villages
na 95%CIb P-valuec n 95%CI Total Anopheles larvae collected 2531 - - 539 - Mean no. of positive larval sites 15.2 9.3-21.1 <0.0001 2.3 0.5-4.1 Mean no. of larvae per 100 dips 33.1 19.8 <0.0001 9.8 3.1-16.5 Total adult Anopheles collected 2514 - - 438 - Mean no. adults/trap/night 5.2 2.9-7.5 <0.001 0.9 0.3-1.5
an–number collected (or surveyed); bCI–Confidence Interval; cP–significance test at 0.05 for the difference between the reservoir and control villages.
Figure 2. Monthly vector density (mean number of mosquitoes/trap/night) in the vicinity of Koka Reservoir between August 2006 and December 2007. Impact of reservoir water level change on vector abundance and malaria incidence Multivariate analyses incorporating meteorological variables (i.e. average monthly minimum and maximum temperatures, and total monthly rainfall), as well as reservoir water level indicated that water level in the previous month was the most important factor, explaining 59% of malaria case-rates in the following month in villages close to the reservoir. During months in which the mean water level was above the median water level, recession rates faster than 0.5 m/month (i.e. 1.67 cm/day) correlated with significantly reduced malaria case rates. The number of positive shoreline puddles (r = 0.548, p < 0.001), the magnitude of mosquito larvae collected from these puddles (r = 0.510, p < 0.001), and the density of adult anophelines in the reservoir villages (r = 0.578, p < 0.001) were positively correlated with the change in the reservoir’s water level over the previous 15 days. Overall, the reservoir water level was the most important factor determining the abundance of vector mosquitoes, and the incidence of malaria in villages in the vicinity of the Koka Reservoir. Discussion This study’s general finding is that the intensified malaria transmission in communities located close to the Koka Reservoir (Lautze et al., 2007) results from increased vector abundance, due largely to breeding sites directly associated with the permanent water body. This is consistent with evidence from permanent water bodies elsewhere in Africa (Carrara et al., 1990; Keiser et al., 2005; and Yohannes et al., 2005). The present findings indicate that reservoir water levels affect malaria transmission, particularly during the period of high water levels, which coincide with the peak malaria transmission season. Shoreline puddles were the major breeding grounds for malaria vector mosquitoes. These puddles were highly abundant between September and November when the reservoir water begins to recede following the rainy season. During this period, the puddles are favorable for mosquito breeding because they are sustained for longer than the time needed for larval development (about 15 days). Our finding on the seasonality of vector abundance is consistent with the malaria transmission trends around Koka (Lautze et al., 2007). Most of adult mosquitoes in the reservoir communities were caught outdoors indicating that they tend to feed outdoors. The outdoor questing tendencies of vectors around the Koka Reservoir may be driven, in part, by the frequent use of IRS to offset the perceived malaria threat around the reservoir. Evidence exists from the region that anophelines may modify their behavior to feed mainly outdoors in response to repeated indoor spraying with insecticides (Ameneshewa and Service, 1996). Furthermore, because some mosquitoes feed early in the evening (Kibret, 2008), the potential contributions from conventional malaria prevention strategies (e.g. bed net distribution) may be limited. Consequently, malaria suppression efforts near impounded water may benefit greatly from environmental management. Since seasonal variation in malaria transmission around Koka
0369
12151821
Aug-0
6
Sep-0
6
Oct
-06
Nov-0
6
Dec-
06
Jan-0
7
Feb-0
7
Mar-
07
Apr-
07
May-0
7
Jun-0
7
Jul-
07
Aug-0
7
Sep-0
7
Oct
-07
Nov-0
7
Dec-
07
Mean n
o.
mosq
uitoes
per
trap p
er
nig
ht
An. arabiensis (Reservoir villages )
An. pharoensis (Reservoir villages)
An. arabiensis (Control villages )
An. pharoensis (Control villages)
37
appears to be a function of the impounded water level, disrupting larval development in shoreline sites, when the reservoir is full, could comprise a valuable component of an integrated malaria control strategy. Conclusions and recommendations The Koka reservoir has substantially increased the abundance of malaria vectors in adjacent communities, due mainly to breeding in reservoir-associated sites. Consequently, communities close to the reservoir are at increased malaria risk. The outdoor-feeding tendencies evidenced among local malaria vectors indicate that conventional malaria control strategies, such as bed nets and use of IRS, may not markedly reduce malaria transmission around the reservoir. The results from this study suggest that manipulation of reservoir water levels, during periods of peak transmission, could play a key role in improving malaria interventions in the area. Given the large number of dams to be built in sub-Saharan Africa in the near future, further research is required to better predict the likely public health implications in different hydroecological settings, and to assess the general feasibility of using water level manipulation to reduce adverse health impacts. Acknowledgments This paper presents findings from PN 36: ‘Improved planning of large dam operation: using decision support systems to optimize livelihood benefits, safeguard health and protect the environment’ a project of the CGIAR Challenge Program on Water and Food. The authors thank Richard Pollack, Andrew Spielman, and Eline Boelee for assistance. They are grateful to the Oramia Health Bureau, the Ethiopian Electric Power Corporation, and the National Meteorological Agency for the provision of data. References Ameneshewa, B., and A. Service. 1996. Resting habits of Anopheles arabiensis in the Awash River Valley of
Ethiopia. Annals of Tropical Medicine and Parasitology, 90: 515-21. Carrara, G.C., V. Petrarca, M. Niang, and M. Coluzzi. 1990. Anopheles pharoensis and transmission of
Plasmodium falciparum in the Senegal River delta. Medical and Veterinarian Entomology 4: 421–24. Guyatt, H., S. Ochola, and R. Snow. 2002. Too Poor to pay: charging for insecticide treated bednets in highland
Kenya. Tropical Medicine and International Health 7: 846-50. Keiser, J., D.E. Castro, M.F. Maltese, R. Bos, M. Tanner, B.H. Singer, and J. Utzinger. 2005. Effect of irrigation
and large dams on the burden of malaria on a global and regional scale. American Journal of Tropical Medicine and Hygiene 72: 392-406.
Kibret, S. 2008. Entomological studies on the impact of a small-scale irrigation scheme on malaria transmission
around Zeway, Central Ethiopia. MSc Thesis, Addis Ababa University. Lautze, J., M. McCartney, P. Kirshen, D. Olana, G. Jayasinghe, and A. Spielman. 2007. Effect of a large dam on
malaria risk: the Koka Reservoir in Ethiopia. Tropical Medicine and International Health 12: 1-10. Lengeler, C., and R. Snow. 1996. From efficacy to effectiveness: insecticide-treated bed nets in Africa. Bulletin
of the World Health Organization 74: 325-32. McCartney, M.P., E. Boelee, O. Cofie, and C.M. Mutero. 2007. Minimizing the negative environmental and health
impacts of agriculture water resources development in sub-Saharan Africa. Colombo, Sri Lanka: International Water Management Institute. IWMI Working paper 117. 41 pp.
Ministry of Health. 2005. Malaria Profile. Addis Ababa: Commercial Printing Press. Tennessee Valley Authority. 1947. Malaria control on impounded water. Washington D.C.: U.S. Government
Printing Office. Utzinger, J., Y. Tozan, and B. Singer. 2001. Efficacy and cost effectiveness of environmental management for
malaria control. Tropical Medicine and International Health 6: 677-87. Verrone, G. 1962a. Outline for the determination of malarial mosquitoes in Ethiopia. Part I. Adult female
Anophelines. Mosquito News 22: 37-49. Verrone, G. 1962b. Outline for the determination of malarial mosquitoes in Ethiopia. Part II. Anopheline larvae.
Mosquito News 22: 394-401. World Bank. 2004. Water resources sector strategy: strategic directions for World Bank engagement.
Washington, D.C.: The World Bank Press. Yohannes, M., H. Mituku, T.A. Ghebreyesus, K. Witten, A. Getachew, P. Byass, and S. Lindsay. 2005. Can
source reduction of mosquito larval habitat reduce transmission of malaria in Tigray, Ethiopia? Tropical Medicine and International Health 10: 1274-85.
38
Wastewater irrigation and perceptions in urban and periurban Kumasi, Ghana
J. Gane, J.A. Bakang, H. Takyi, K. Obiri-Danso, and R.C. Abaidoo
Kwame Nkrumah University of Science and Technology (KNUST), Kumasi, Ghana [email protected] Abstract Most urban and periurban regions in developing sub-Saharan African countries use wastewater for irrigation that often contains domestic, hospital, and industrial waste, a practice that poses a severe threat to public health. Simply banning the practice may not be appropriate since there are no feasible and accessible alternatives to this mode of irrigation. The aim of this study was to explore local notions of contamination and environmental health risks among selected communities involved in the production, distribution and/or consumption of waste-water irrigated vegetables in urban and periurban Kumasi, and to assess local practices related to the handling of waste-water irrigated vegetables at selected points of the production, distribution, and consumption chain. Qualitative methods such as in-depth interviews, observations, photographs, focus group discussions, desk work and consultation with key informants were used. Results show that the use of wastewater for irrigation is a major source of livelihood for 78% of the urban-periurban communities in the vegetable production-distribution chain. Farming and handling practices were major sources of contamination of water for irrigation and of vegetables/food. Furthermore, 70.2% of the respondents believe that the use of inorganic chemicals is the main trigger for health risks associated with wastewater vegetable production. Urban farmers perceived their irrigation water sources to be suitable because they dig the wells themselves, use it for some domestic purposes, and have not had any health-related problems. Periurban farmers were aware that irrigation water derived from the river was polluted but perceived most of the vegetables grown by them to be safe because they were not eaten uncooked. Vegetable distributors (middle women, sedentary sellers, and hawkers) believed that washing the vegetables removes all the pathogenic organisms, while the user side (i.e. cook shop owners or fast-food sellers and housewives) considered various treatment methods as sufficient to get rid of any health risks that may be generated in the production-distribution level. No effective monitoring schemes by environmental health officers on the different safety practices were in place, however. Educational programs based on safety practices should be put in place for all stakeholders involved in the chain. Media grab Livelihood and health safety in wastewater vegetable production–promoting a balance. Introduction Most urban and periurban regions in developing sub-Saharan African countries use wastewater for irrigation purposes, which often contain domestic, hospital, and industrial waste. Whereas the common definition considers wastewater as spent or used water from private homes or the industry, containing dissolved and suspended matter (e.g. Herren and Donahne, 1991), Rashid-Sally et al. (2004) note that irrigation and drainage canals and other water bodies that receive untreated wastewater and are highly polluted may also be considered as wastewater. According to the International Water Management Institute (IWMI) (2002) the use of raw, diluted or partially treated wastewater in agriculture can be a threat to people’s health and the environment. Buechler et al. (2002) report that the main risk for the public arises when vegetables or salad grown with untreated wastewater are consumed raw. Thus, the aim of this study was to explore the socioeconomic background of local communities, local production, and distribution practices and notions on environmental health risks in relation to vegetable production, using wastewater at selected points of the production, distribution, and consumption in urban and periurban Kumasi. Methods Study area Kumasi (Figure 1c.) is the second largest city in Ghana and has a total land area of 225 km². It has an annual average rainfall of 1420 mm and about 120 days of rain. At least two of every three households in the city practice some kind of backyard farming. The periurban area of Kumasi has a radius of approximately 40 km from the city centre (Adam, 2001).
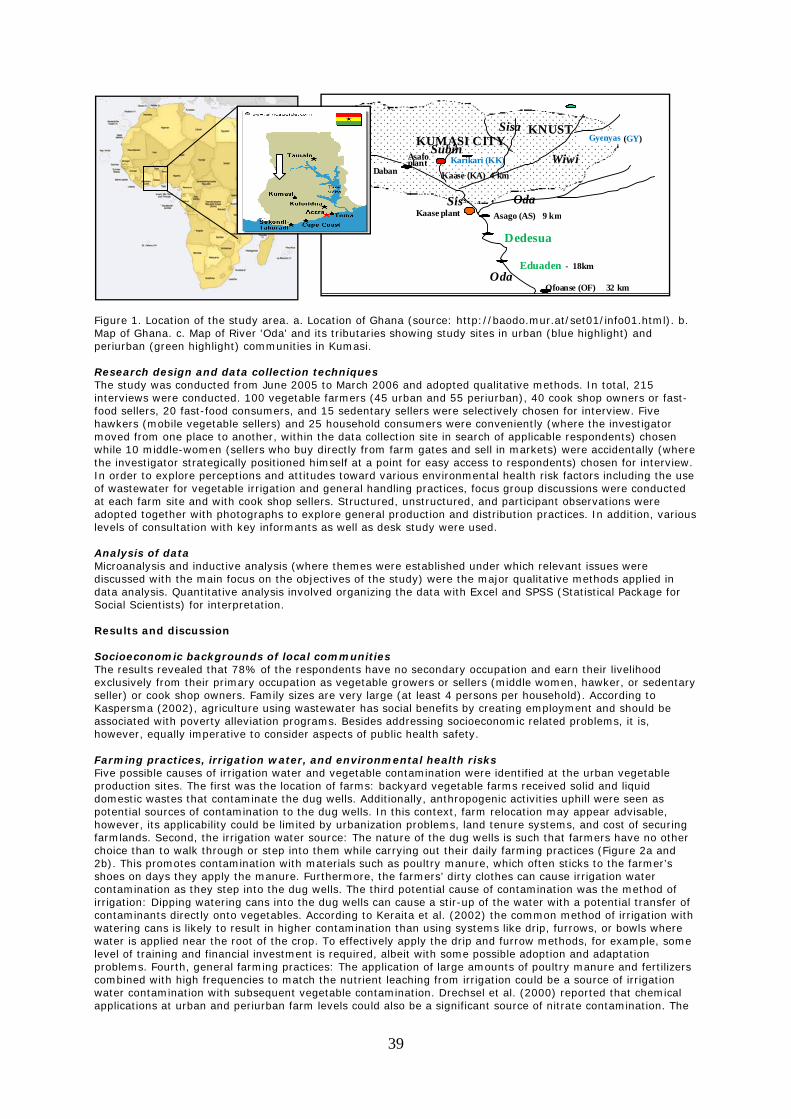
39
Figure 1. Location of the study area. a. Location of Ghana (source: http://baodo.mur.at/set01/info01.html). b. Map of Ghana. c. Map of River 'Oda' and its tributaries showing study sites in urban (blue highlight) and periurban (green highlight) communities in Kumasi. Research design and data collection techniques The study was conducted from June 2005 to March 2006 and adopted qualitative methods. In total, 215 interviews were conducted. 100 vegetable farmers (45 urban and 55 periurban), 40 cook shop owners or fast-food sellers, 20 fast-food consumers, and 15 sedentary sellers were selectively chosen for interview. Five hawkers (mobile vegetable sellers) and 25 household consumers were conveniently (where the investigator moved from one place to another, within the data collection site in search of applicable respondents) chosen while 10 middle-women (sellers who buy directly from farm gates and sell in markets) were accidentally (where the investigator strategically positioned himself at a point for easy access to respondents) chosen for interview. In order to explore perceptions and attitudes toward various environmental health risk factors including the use of wastewater for vegetable irrigation and general handling practices, focus group discussions were conducted at each farm site and with cook shop sellers. Structured, unstructured, and participant observations were adopted together with photographs to explore general production and distribution practices. In addition, various levels of consultation with key informants as well as desk study were used. Analysis of data Microanalysis and inductive analysis (where themes were established under which relevant issues were discussed with the main focus on the objectives of the study) were the major qualitative methods applied in data analysis. Quantitative analysis involved organizing the data with Excel and SPSS (Statistical Package for Social Scientists) for interpretation. Results and discussion Socioeconomic backgrounds of local communities The results revealed that 78% of the respondents have no secondary occupation and earn their livelihood exclusively from their primary occupation as vegetable growers or sellers (middle women, hawker, or sedentary seller) or cook shop owners. Family sizes are very large (at least 4 persons per household). According to Kaspersma (2002), agriculture using wastewater has social benefits by creating employment and should be associated with poverty alleviation programs. Besides addressing socioeconomic related problems, it is, however, equally imperative to consider aspects of public health safety. Farming practices, irrigation water, and environmental health risks Five possible causes of irrigation water and vegetable contamination were identified at the urban vegetable production sites. The first was the location of farms: backyard vegetable farms received solid and liquid domestic wastes that contaminate the dug wells. Additionally, anthropogenic activities uphill were seen as potential sources of contamination to the dug wells. In this context, farm relocation may appear advisable, however, its applicability could be limited by urbanization problems, land tenure systems, and cost of securing farmlands. Second, the irrigation water source: The nature of the dug wells is such that farmers have no other choice than to walk through or step into them while carrying out their daily farming practices (Figure 2a and 2b). This promotes contamination with materials such as poultry manure, which often sticks to the farmer’s shoes on days they apply the manure. Furthermore, the farmers’ dirty clothes can cause irrigation water contamination as they step into the dug wells. The third potential cause of contamination was the method of irrigation: Dipping watering cans into the dug wells can cause a stir-up of the water with a potential transfer of contaminants directly onto vegetables. According to Keraita et al. (2002) the common method of irrigation with watering cans is likely to result in higher contamination than using systems like drip, furrows, or bowls where water is applied near the root of the crop. To effectively apply the drip and furrow methods, for example, some level of training and financial investment is required, albeit with some possible adoption and adaptation problems. Fourth, general farming practices: The application of large amounts of poultry manure and fertilizers combined with high frequencies to match the nutrient leaching from irrigation could be a source of irrigation water contamination with subsequent vegetable contamination. Drechsel et al. (2000) reported that chemical applications at urban and periurban farm levels could also be a significant source of nitrate contamination. The
Kaase (KA) 4 km
Asago (AS) 9 km
KUMASI CITY
Kaase plant
Dedesua
Eduaden - 18km
Ofoanse (OF) 32 km
Asafo plant
KNUST Subin
Wiwi
Sisa
Sisa Oda
Oda
Daban Karikari (KK)
Gyenyas (GY)
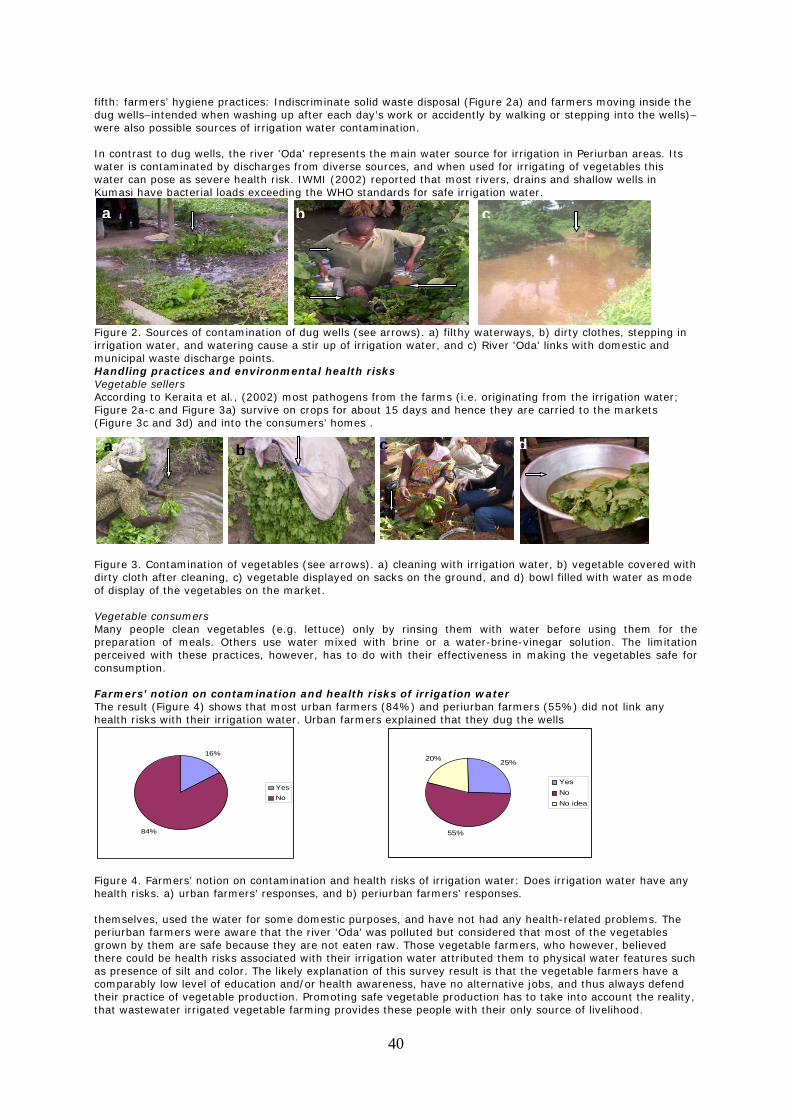
40
fifth: farmers’ hygiene practices: Indiscriminate solid waste disposal (Figure 2a) and farmers moving inside the dug wells–intended when washing up after each day’s work or accidently by walking or stepping into the wells)–were also possible sources of irrigation water contamination. In contrast to dug wells, the river 'Oda' represents the main water source for irrigation in Periurban areas. Its water is contaminated by discharges from diverse sources, and when used for irrigating of vegetables this water can pose as severe health risk. IWMI (2002) reported that most rivers, drains and shallow wells in Kumasi have bacterial loads exceeding the WHO standards for safe irrigation water.
Figure 2. Sources of contamination of dug wells (see arrows). a) filthy waterways, b) dirty clothes, stepping in irrigation water, and watering cause a stir up of irrigation water, and c) River 'Oda' links with domestic and municipal waste discharge points. Handling practices and environmental health risks Vegetable sellers According to Keraita et al., (2002) most pathogens from the farms (i.e. originating from the irrigation water; Figure 2a-c and Figure 3a) survive on crops for about 15 days and hence they are carried to the markets (Figure 3c and 3d) and into the consumers’ homes .
Figure 3. Contamination of vegetables (see arrows). a) cleaning with irrigation water, b) vegetable covered with dirty cloth after cleaning, c) vegetable displayed on sacks on the ground, and d) bowl filled with water as mode of display of the vegetables on the market. Vegetable consumers Many people clean vegetables (e.g. lettuce) only by rinsing them with water before using them for the preparation of meals. Others use water mixed with brine or a water-brine-vinegar solution. The limitation perceived with these practices, however, has to do with their effectiveness in making the vegetables safe for consumption. Farmers’ notion on contamination and health risks of irrigation water The result (Figure 4) shows that most urban farmers (84%) and periurban farmers (55%) did not link any health risks with their irrigation water. Urban farmers explained that they dug the wells
Figure 4. Farmers’ notion on contamination and health risks of irrigation water: Does irrigation water have any health risks. a) urban farmers’ responses, and b) periurban farmers’ responses. themselves, used the water for some domestic purposes, and have not had any health-related problems. The periurban farmers were aware that the river 'Oda' was polluted but considered that most of the vegetables grown by them are safe because they are not eaten raw. Those vegetable farmers, who however, believed there could be health risks associated with their irrigation water attributed them to physical water features such as presence of silt and color. The likely explanation of this survey result is that the vegetable farmers have a comparably low level of education and/or health awareness, have no alternative jobs, and thus always defend their practice of vegetable production. Promoting safe vegetable production has to take into account the reality, that wastewater irrigated vegetable farming provides these people with their only source of livelihood.
16%
84%
YesNo
25%
55%
20%
YesNoNo idea
ca b
a b c d
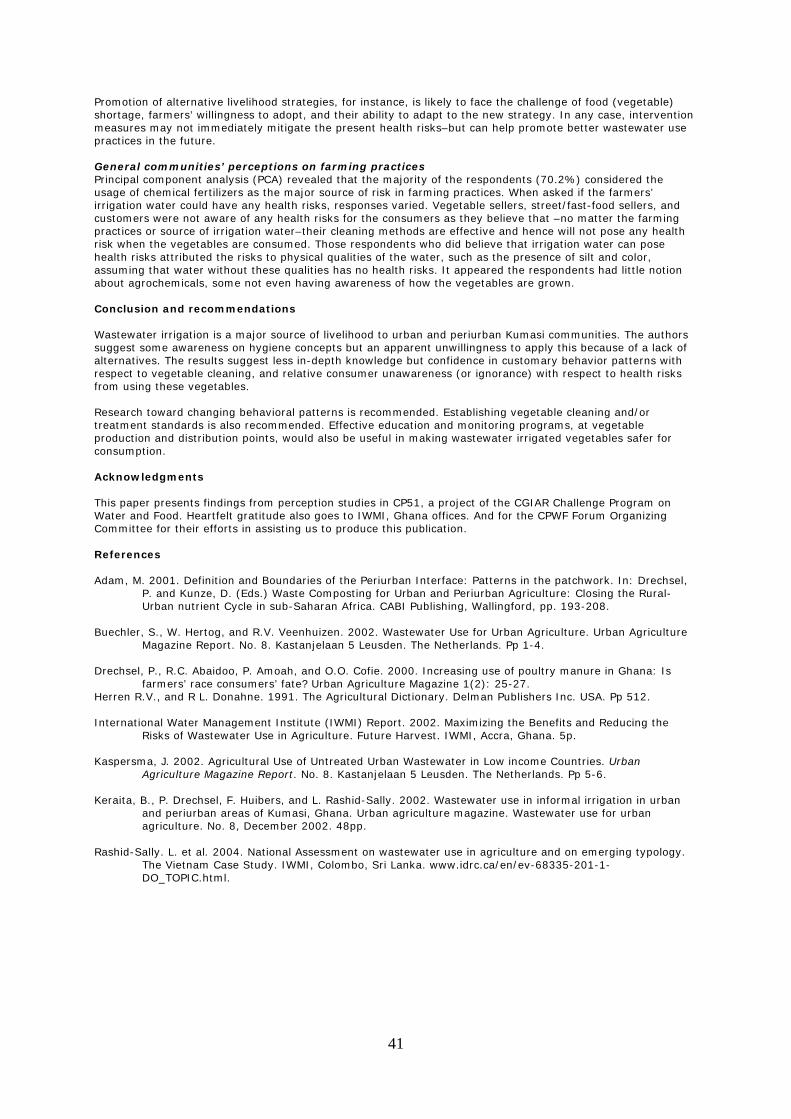
41
Promotion of alternative livelihood strategies, for instance, is likely to face the challenge of food (vegetable) shortage, farmers’ willingness to adopt, and their ability to adapt to the new strategy. In any case, intervention measures may not immediately mitigate the present health risks–but can help promote better wastewater use practices in the future. General communities’ perceptions on farming practices Principal component analysis (PCA) revealed that the majority of the respondents (70.2%) considered the usage of chemical fertilizers as the major source of risk in farming practices. When asked if the farmers’ irrigation water could have any health risks, responses varied. Vegetable sellers, street/fast-food sellers, and customers were not aware of any health risks for the consumers as they believe that –no matter the farming practices or source of irrigation water–their cleaning methods are effective and hence will not pose any health risk when the vegetables are consumed. Those respondents who did believe that irrigation water can pose health risks attributed the risks to physical qualities of the water, such as the presence of silt and color, assuming that water without these qualities has no health risks. It appeared the respondents had little notion about agrochemicals, some not even having awareness of how the vegetables are grown. Conclusion and recommendations Wastewater irrigation is a major source of livelihood to urban and periurban Kumasi communities. The authors suggest some awareness on hygiene concepts but an apparent unwillingness to apply this because of a lack of alternatives. The results suggest less in-depth knowledge but confidence in customary behavior patterns with respect to vegetable cleaning, and relative consumer unawareness (or ignorance) with respect to health risks from using these vegetables. Research toward changing behavioral patterns is recommended. Establishing vegetable cleaning and/or treatment standards is also recommended. Effective education and monitoring programs, at vegetable production and distribution points, would also be useful in making wastewater irrigated vegetables safer for consumption. Acknowledgments This paper presents findings from perception studies in CP51, a project of the CGIAR Challenge Program on Water and Food. Heartfelt gratitude also goes to IWMI, Ghana offices. And for the CPWF Forum Organizing Committee for their efforts in assisting us to produce this publication. References Adam, M. 2001. Definition and Boundaries of the Periurban Interface: Patterns in the patchwork. In: Drechsel,
P. and Kunze, D. (Eds.) Waste Composting for Urban and Periurban Agriculture: Closing the Rural-Urban nutrient Cycle in sub-Saharan Africa. CABI Publishing, Wallingford, pp. 193-208.
Buechler, S., W. Hertog, and R.V. Veenhuizen. 2002. Wastewater Use for Urban Agriculture. Urban Agriculture
Magazine Report. No. 8. Kastanjelaan 5 Leusden. The Netherlands. Pp 1-4. Drechsel, P., R.C. Abaidoo, P. Amoah, and O.O. Cofie. 2000. Increasing use of poultry manure in Ghana: Is
farmers’ race consumers’ fate? Urban Agriculture Magazine 1(2): 25-27. Herren R.V., and R L. Donahne. 1991. The Agricultural Dictionary. Delman Publishers Inc. USA. Pp 512. International Water Management Institute (IWMI) Report. 2002. Maximizing the Benefits and Reducing the
Risks of Wastewater Use in Agriculture. Future Harvest. IWMI, Accra, Ghana. 5p. Kaspersma, J. 2002. Agricultural Use of Untreated Urban Wastewater in Low income Countries. Urban
Agriculture Magazine Report. No. 8. Kastanjelaan 5 Leusden. The Netherlands. Pp 5-6. Keraita, B., P. Drechsel, F. Huibers, and L. Rashid-Sally. 2002. Wastewater use in informal irrigation in urban
and periurban areas of Kumasi, Ghana. Urban agriculture magazine. Wastewater use for urban agriculture. No. 8, December 2002. 48pp.
Rashid-Sally. L. et al. 2004. National Assessment on wastewater use in agriculture and on emerging typology.
The Vietnam Case Study. IWMI, Colombo, Sri Lanka. www.idrc.ca/en/ev-68335-201-1-DO_TOPIC.html.
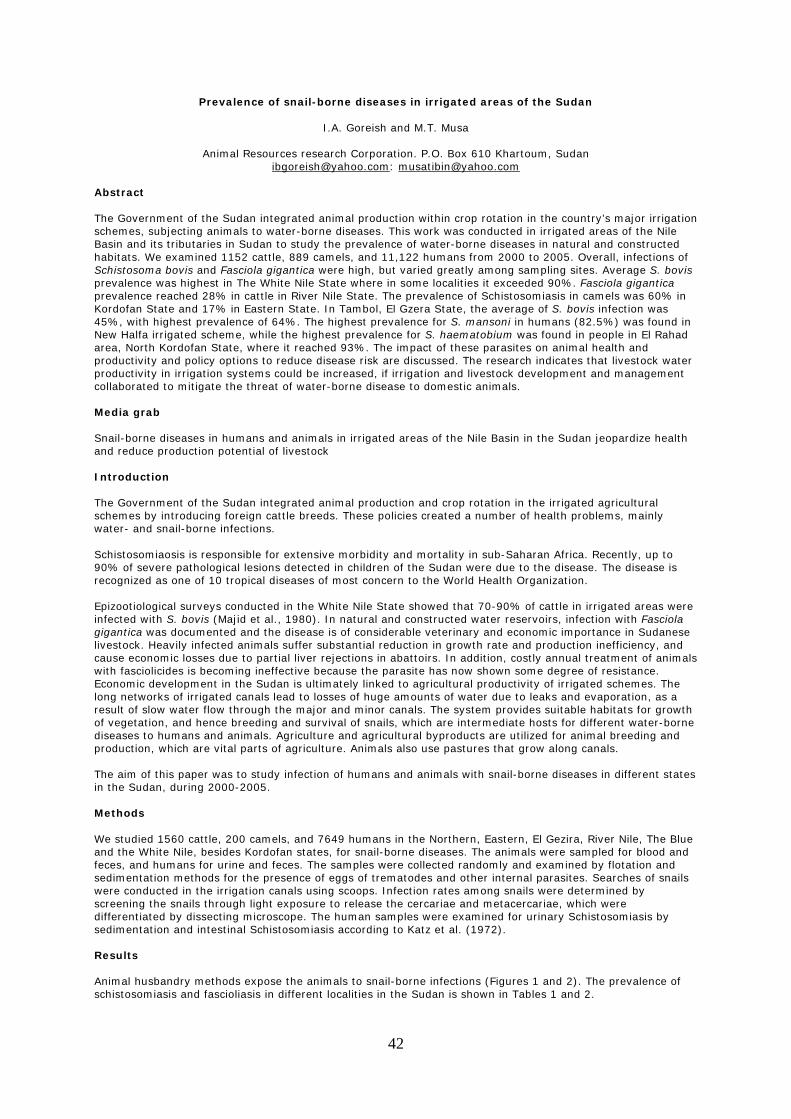
42
Prevalence of snail-borne diseases in irrigated areas of the Sudan
I.A. Goreish and M.T. Musa
Animal Resources research Corporation. P.O. Box 610 Khartoum, Sudan [email protected]: [email protected]
Abstract The Government of the Sudan integrated animal production within crop rotation in the country’s major irrigation schemes, subjecting animals to water-borne diseases. This work was conducted in irrigated areas of the Nile Basin and its tributaries in Sudan to study the prevalence of water-borne diseases in natural and constructed habitats. We examined 1152 cattle, 889 camels, and 11,122 humans from 2000 to 2005. Overall, infections of Schistosoma bovis and Fasciola gigantica were high, but varied greatly among sampling sites. Average S. bovis prevalence was highest in The White Nile State where in some localities it exceeded 90%. Fasciola gigantica prevalence reached 28% in cattle in River Nile State. The prevalence of Schistosomiasis in camels was 60% in Kordofan State and 17% in Eastern State. In Tambol, El Gzera State, the average of S. bovis infection was 45%, with highest prevalence of 64%. The highest prevalence for S. mansoni in humans (82.5%) was found in New Halfa irrigated scheme, while the highest prevalence for S. haematobium was found in people in El Rahad area, North Kordofan State, where it reached 93%. The impact of these parasites on animal health and productivity and policy options to reduce disease risk are discussed. The research indicates that livestock water productivity in irrigation systems could be increased, if irrigation and livestock development and management collaborated to mitigate the threat of water-borne disease to domestic animals. Media grab Snail-borne diseases in humans and animals in irrigated areas of the Nile Basin in the Sudan jeopardize health and reduce production potential of livestock Introduction The Government of the Sudan integrated animal production and crop rotation in the irrigated agricultural schemes by introducing foreign cattle breeds. These policies created a number of health problems, mainly water- and snail-borne infections. Schistosomiaosis is responsible for extensive morbidity and mortality in sub-Saharan Africa. Recently, up to 90% of severe pathological lesions detected in children of the Sudan were due to the disease. The disease is recognized as one of 10 tropical diseases of most concern to the World Health Organization. Epizootiological surveys conducted in the White Nile State showed that 70-90% of cattle in irrigated areas were infected with S. bovis (Majid et al., 1980). In natural and constructed water reservoirs, infection with Fasciola gigantica was documented and the disease is of considerable veterinary and economic importance in Sudanese livestock. Heavily infected animals suffer substantial reduction in growth rate and production inefficiency, and cause economic losses due to partial liver rejections in abattoirs. In addition, costly annual treatment of animals with fasciolicides is becoming ineffective because the parasite has now shown some degree of resistance. Economic development in the Sudan is ultimately linked to agricultural productivity of irrigated schemes. The long networks of irrigated canals lead to losses of huge amounts of water due to leaks and evaporation, as a result of slow water flow through the major and minor canals. The system provides suitable habitats for growth of vegetation, and hence breeding and survival of snails, which are intermediate hosts for different water-borne diseases to humans and animals. Agriculture and agricultural byproducts are utilized for animal breeding and production, which are vital parts of agriculture. Animals also use pastures that grow along canals. The aim of this paper was to study infection of humans and animals with snail-borne diseases in different states in the Sudan, during 2000-2005. Methods We studied 1560 cattle, 200 camels, and 7649 humans in the Northern, Eastern, El Gezira, River Nile, The Blue and the White Nile, besides Kordofan states, for snail-borne diseases. The animals were sampled for blood and feces, and humans for urine and feces. The samples were collected randomly and examined by flotation and sedimentation methods for the presence of eggs of trematodes and other internal parasites. Searches of snails were conducted in the irrigation canals using scoops. Infection rates among snails were determined by screening the snails through light exposure to release the cercariae and metacercariae, which were differentiated by dissecting microscope. The human samples were examined for urinary Schistosomiasis by sedimentation and intestinal Schistosomiasis according to Katz et al. (1972). Results Animal husbandry methods expose the animals to snail-borne infections (Figures 1 and 2). The prevalence of schistosomiasis and fascioliasis in different localities in the Sudan is shown in Tables 1 and 2.
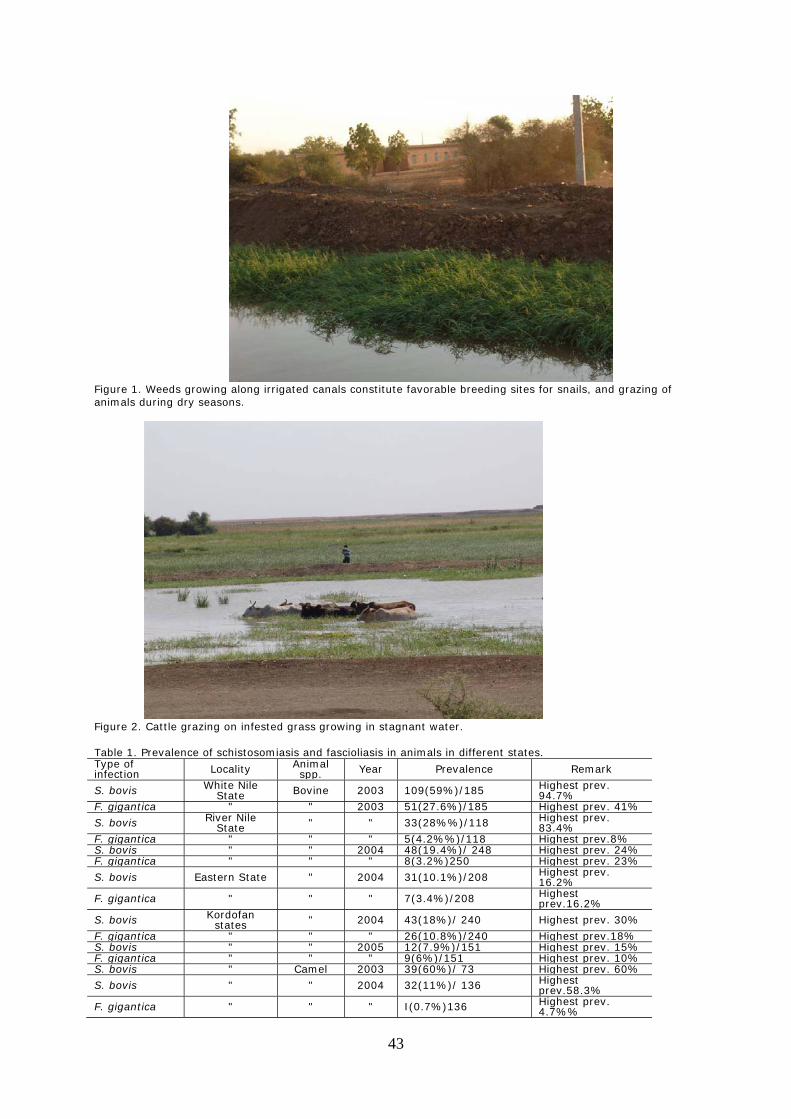
43
Figure 1. Weeds growing along irrigated canals constitute favorable breeding sites for snails, and grazing of animals during dry seasons.
Figure 2. Cattle grazing on infested grass growing in stagnant water. Table 1. Prevalence of schistosomiasis and fascioliasis in animals in different states. Type of infection Locality Animal
spp. Year Prevalence Remark
S. bovis White Nile State Bovine 2003 109(59%)/185 Highest prev.
94.7% F. gigantica " " 2003 51(27.6%)/185 Highest prev. 41%
S. bovis River Nile State " " 33(28%%)/118 Highest prev.
83.4% F. gigantica " " " 5(4.2%%)/118 Highest prev.8% S. bovis " " 2004 48(19.4%)/ 248 Highest prev. 24% F. gigantica " " " 8(3.2%)250 Highest prev. 23%
S. bovis Eastern State " 2004 31(10.1%)/208 Highest prev. 16.2%
F. gigantica " " " 7(3.4%)/208 Highest prev.16.2%
S. bovis Kordofan states " 2004 43(18%)/ 240 Highest prev. 30%
F. gigantica " " " 26(10.8%)/240 Highest prev.18% S. bovis " " 2005 12(7.9%)/151 Highest prev. 15% F. gigantica " " " 9(6%)/151 Highest prev. 10% S. bovis " Camel 2003 39(60%)/ 73 Highest prev. 60%
S. bovis " " 2004 32(11%)/ 136 Highest prev.58.3%
F. gigantica " " " I(0.7%)136 Highest prev. 4.7%%
44
S. bovis " " 2005 7(13%)/ 54 Highest prev. 11% S. bovis Eastern State " 2003 11(4%)/ 258 Highest prev.13% S. bovis " " 2004 14(17.2%)/171 Highest prev. 20%
S. bovis Tambol,EL Gezira State " 2003 7(6.3%)/111 Highest prev. 15%
S. bovis " " 2004 39(45%)/ 86 Highest prev. 64% Key: prev. = prevalence Table 2. Prevalence of schistosomiasis in human in different states. S. mansoni Gezira State human 2000 1415(56%)/2528 Highest prev. 98.%
" " " 2002 263(27.3%)/964 Highest prev. 44% " " " 2005 22(22.4%)/102 Highest prev. 22.4%%
S. haematobium White Nile State " 2002 628(50.4%)1256 Highest prev. 50.4% " Kordofan State " 2002 357(36.6%)976 Highest prev. 48% " " " 2005 667(53.4%)1249 Highest prev. 53.4%
S. mansoni Darfur " 2002 82(26.9%)/304 " Eastern State " 2004 1166(55%)/2120 " " " 2005 65(35.9%)/181
S. haematobium River Nile state " 2000 62(21.7%)/285 " " " 2005 76(22.6%)/336 " Khartoum " 2002 77(41.6%)/187 " " " 2004 219(27.3%)/ 527 " " " 2005 45(42.1%)107
Total 4477(40.3%)11122 Key: prev. = prevalence Discussion The present system of irrigation, which depends on passive gravity irrigation, leads to water depletion by evaporation and stagnation and results in growth of weeds along canals. The wet and humid environments provide suitable conditions for the development of nematodes and trematode eggs, which infect freshwater snails. Freshwater snails are the intermediate hosts of Schistosoma, Fasciola, and Paramphistoma species that infect humans and animals. These conditions also provide ideal breeding sites for some insects and nematode parasites such as Haemonchus spp. and hook worms. As a result the development of irrigation schemes without taking into consideration the negative side effects of water-borne parasites will result in undesirable consequences for human and livestock health. Water-associated diseases are debilitating and seriously reduce productivity of agricultural communities in the Sudan (El Tash, 2005). The results of this study revealed a high prevalence of Schistosomiasis and Fascioliasis in cattle, camels, and humans examined in most of the localities studied. Costs of diagnosis and treatment of humans and animals, loss of laborers, morbidity and morality, and reduced animal production due to the diseases caused by water-borne parasites are immense. Loss of water via the different processes stated is to be taken seriously. Water is a scarce resource and adequate water-saving strategies are indispensable. Several intervention methods are proposed: • The system of distribution of water should be better maintained in a way to minimize water losses
through evaporation, leaks, and cracks. • Minimize growth of vegetation along irrigated canals that creates a breeding site for the snails that are
the intermediate hosts of many parasitic diseases such as Schistosomiasis, Fascioliasis, and Paramphistomiasis. The grass could be processed by drying (i.e. silage as feedstuff for livestock).
• Snails' intermediate host must be controlled by use of muluscicides that are safe to people, animal, and environments. Biological control such as predators (grass carp, major carps, catfish, and Gambosia fish) may also be used.
• Avoidance of contamination of canalization system with animal and human feces. This could be achieved by provision of healthy water and sanitary facilities.
• Public awareness and community education about the problems of snail-borne diseases. • Effective treatments of humans and animals are imperative. • Vaccination of humans and animals through production of effective vaccine. Acknowledgments This work was done as part of CPWF PN 37, Nile Basin Livestock Water Productivity, a project of the CGIAR Challenge Program on Water and Food. Special thanks to Dr. Don Peden, livestock productivity coordinator, for his valuable input. References Ahmed, A.A., 2007. Schistosomiasis in Gunaid sugar cane Scheme, Sudan. Sudan Journal of Basic Science,
11(B), 139-47. El Tash, L.A. 2005. Socioeconomic analysis of malaria burden in Gazira and Khartoum States. PhD Thesis in
Economics, University of Khartoum, Sudan. Katz, N., A. Chven, and J. Pekegrino. 1972. A simple device for qualitative stool thick-smear technique in
Schistosoma mansoni. Revista de Institut Medicine Tropical de Sao Paulo, 14: 397-400. 'Majid, A.A., T.F. de C. Marchal, M.F. Hussein, H.O. Bushara, M.G. Talyor, G.S. Nelson, and J.D. Dargie. 1980.
Epizootiological observations on Schistosoma bovis in the White Nile province. Am. J. trop. Med. Hyg. 299(3): 435-41.
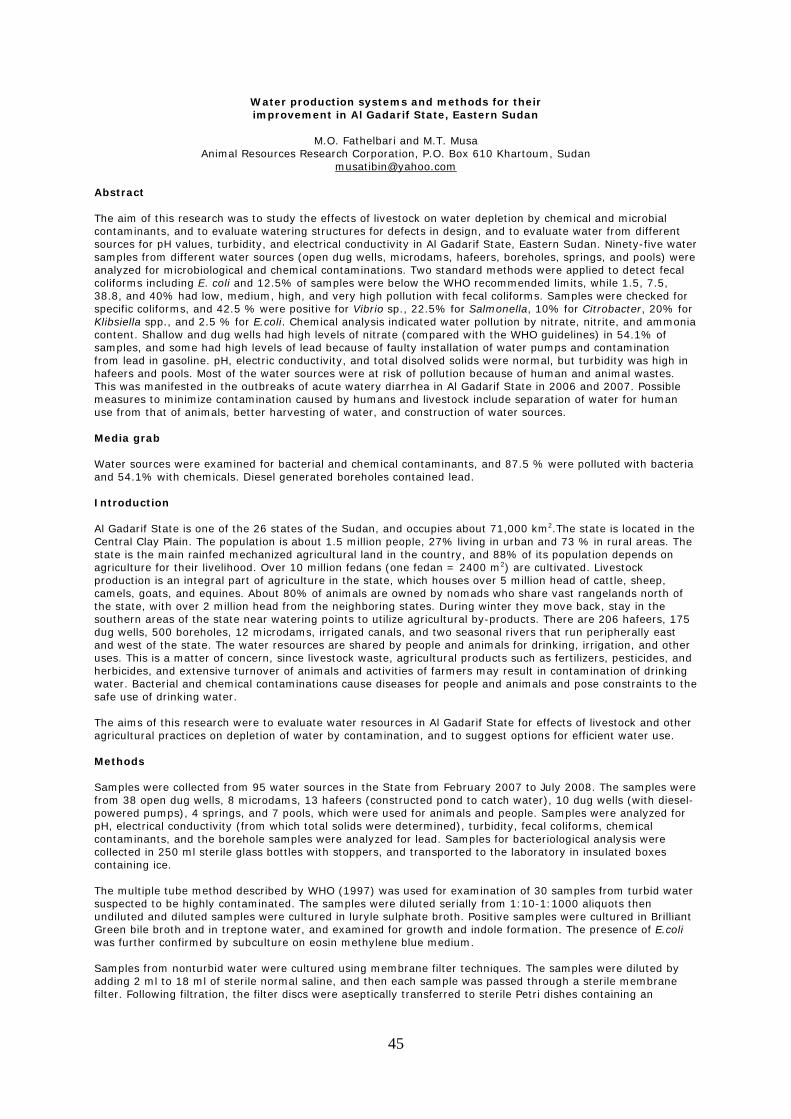
45
Water production systems and methods for their improvement in Al Gadarif State, Eastern Sudan
M.O. Fathelbari and M.T. Musa
Animal Resources Research Corporation, P.O. Box 610 Khartoum, Sudan [email protected]
Abstract The aim of this research was to study the effects of livestock on water depletion by chemical and microbial contaminants, and to evaluate watering structures for defects in design, and to evaluate water from different sources for pH values, turbidity, and electrical conductivity in Al Gadarif State, Eastern Sudan. Ninety-five water samples from different water sources (open dug wells, microdams, hafeers, boreholes, springs, and pools) were analyzed for microbiological and chemical contaminations. Two standard methods were applied to detect fecal coliforms including E. coli and 12.5% of samples were below the WHO recommended limits, while 1.5, 7.5, 38.8, and 40% had low, medium, high, and very high pollution with fecal coliforms. Samples were checked for specific coliforms, and 42.5 % were positive for Vibrio sp., 22.5% for Salmonella, 10% for Citrobacter, 20% for Klibsiella spp., and 2.5 % for E.coli. Chemical analysis indicated water pollution by nitrate, nitrite, and ammonia content. Shallow and dug wells had high levels of nitrate (compared with the WHO guidelines) in 54.1% of samples, and some had high levels of lead because of faulty installation of water pumps and contamination from lead in gasoline. pH, electric conductivity, and total disolved solids were normal, but turbidity was high in hafeers and pools. Most of the water sources were at risk of pollution because of human and animal wastes. This was manifested in the outbreaks of acute watery diarrhea in Al Gadarif State in 2006 and 2007. Possible measures to minimize contamination caused by humans and livestock include separation of water for human use from that of animals, better harvesting of water, and construction of water sources. Media grab Water sources were examined for bacterial and chemical contaminants, and 87.5 % were polluted with bacteria and 54.1% with chemicals. Diesel generated boreholes contained lead. Introduction Al Gadarif State is one of the 26 states of the Sudan, and occupies about 71,000 km2.The state is located in the Central Clay Plain. The population is about 1.5 million people, 27% living in urban and 73 % in rural areas. The state is the main rainfed mechanized agricultural land in the country, and 88% of its population depends on agriculture for their livelihood. Over 10 million fedans (one fedan = 2400 m2) are cultivated. Livestock production is an integral part of agriculture in the state, which houses over 5 million head of cattle, sheep, camels, goats, and equines. About 80% of animals are owned by nomads who share vast rangelands north of the state, with over 2 million head from the neighboring states. During winter they move back, stay in the southern areas of the state near watering points to utilize agricultural by-products. There are 206 hafeers, 175 dug wells, 500 boreholes, 12 microdams, irrigated canals, and two seasonal rivers that run peripherally east and west of the state. The water resources are shared by people and animals for drinking, irrigation, and other uses. This is a matter of concern, since livestock waste, agricultural products such as fertilizers, pesticides, and herbicides, and extensive turnover of animals and activities of farmers may result in contamination of drinking water. Bacterial and chemical contaminations cause diseases for people and animals and pose constraints to the safe use of drinking water. The aims of this research were to evaluate water resources in Al Gadarif State for effects of livestock and other agricultural practices on depletion of water by contamination, and to suggest options for efficient water use. Methods Samples were collected from 95 water sources in the State from February 2007 to July 2008. The samples were from 38 open dug wells, 8 microdams, 13 hafeers (constructed pond to catch water), 10 dug wells (with diesel-powered pumps), 4 springs, and 7 pools, which were used for animals and people. Samples were analyzed for pH, electrical conductivity (from which total solids were determined), turbidity, fecal coliforms, chemical contaminants, and the borehole samples were analyzed for lead. Samples for bacteriological analysis were collected in 250 ml sterile glass bottles with stoppers, and transported to the laboratory in insulated boxes containing ice. The multiple tube method described by WHO (1997) was used for examination of 30 samples from turbid water suspected to be highly contaminated. The samples were diluted serially from 1:10-1:1000 aliquots then undiluted and diluted samples were cultured in luryle sulphate broth. Positive samples were cultured in Brilliant Green bile broth and in treptone water, and examined for growth and indole formation. The presence of E.coli was further confirmed by subculture on eosin methylene blue medium. Samples from nonturbid water were cultured using membrane filter techniques. The samples were diluted by adding 2 ml to 18 ml of sterile normal saline, and then each sample was passed through a sterile membrane filter. Following filtration, the filter discs were aseptically transferred to sterile Petri dishes containing an
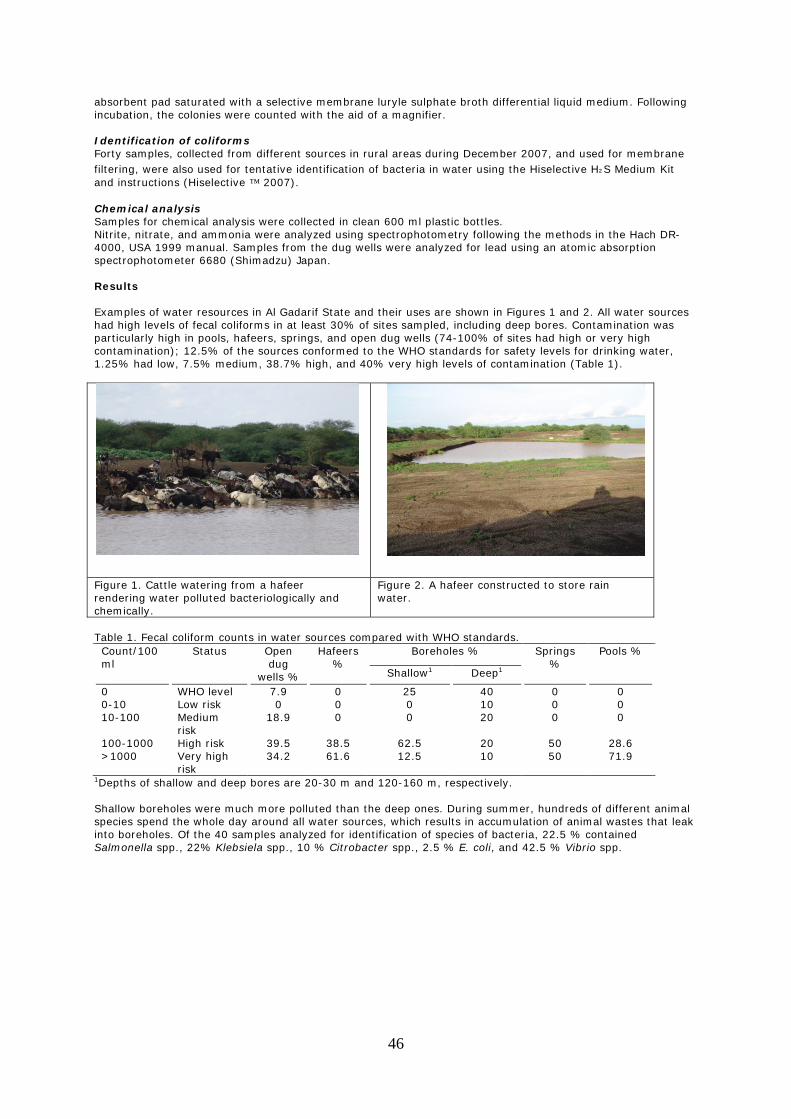
46
absorbent pad saturated with a selective membrane luryle sulphate broth differential liquid medium. Following incubation, the colonies were counted with the aid of a magnifier. Identification of coliforms Forty samples, collected from different sources in rural areas during December 2007, and used for membrane filtering, were also used for tentative identification of bacteria in water using the Hiselective H²S Medium Kit and instructions (Hiselective ™ 2007). Chemical analysis Samples for chemical analysis were collected in clean 600 ml plastic bottles. Nitrite, nitrate, and ammonia were analyzed using spectrophotometry following the methods in the Hach DR-4000, USA 1999 manual. Samples from the dug wells were analyzed for lead using an atomic absorption spectrophotometer 6680 (Shimadzu) Japan. Results Examples of water resources in Al Gadarif State and their uses are shown in Figures 1 and 2. All water sources had high levels of fecal coliforms in at least 30% of sites sampled, including deep bores. Contamination was particularly high in pools, hafeers, springs, and open dug wells (74-100% of sites had high or very high contamination); 12.5% of the sources conformed to the WHO standards for safety levels for drinking water, 1.25% had low, 7.5% medium, 38.7% high, and 40% very high levels of contamination (Table 1).
Figure 1. Cattle watering from a hafeer rendering water polluted bacteriologically and chemically.
Figure 2. A hafeer constructed to store rain water.
Table 1. Fecal coliform counts in water sources compared with WHO standards. Count/100 ml
Status Open dug
wells %
Hafeers %
Boreholes % Springs %
Pools %
Shallow1 Deep1
0 WHO level 7.9 0 25 40 0 0 0-10 Low risk 0 0 0 10 0 0 10-100 Medium
risk 18.9 0 0 20 0 0
100-1000 High risk 39.5 38.5 62.5 20 50 28.6 >1000 Very high
risk 34.2 61.6 12.5 10 50 71.9
1Depths of shallow and deep bores are 20-30 m and 120-160 m, respectively. Shallow boreholes were much more polluted than the deep ones. During summer, hundreds of different animal species spend the whole day around all water sources, which results in accumulation of animal wastes that leak into boreholes. Of the 40 samples analyzed for identification of species of bacteria, 22.5 % contained Salmonella spp., 22% Klebsiela spp., 10 % Citrobacter spp., 2.5 % E. coli, and 42.5 % Vibrio spp.
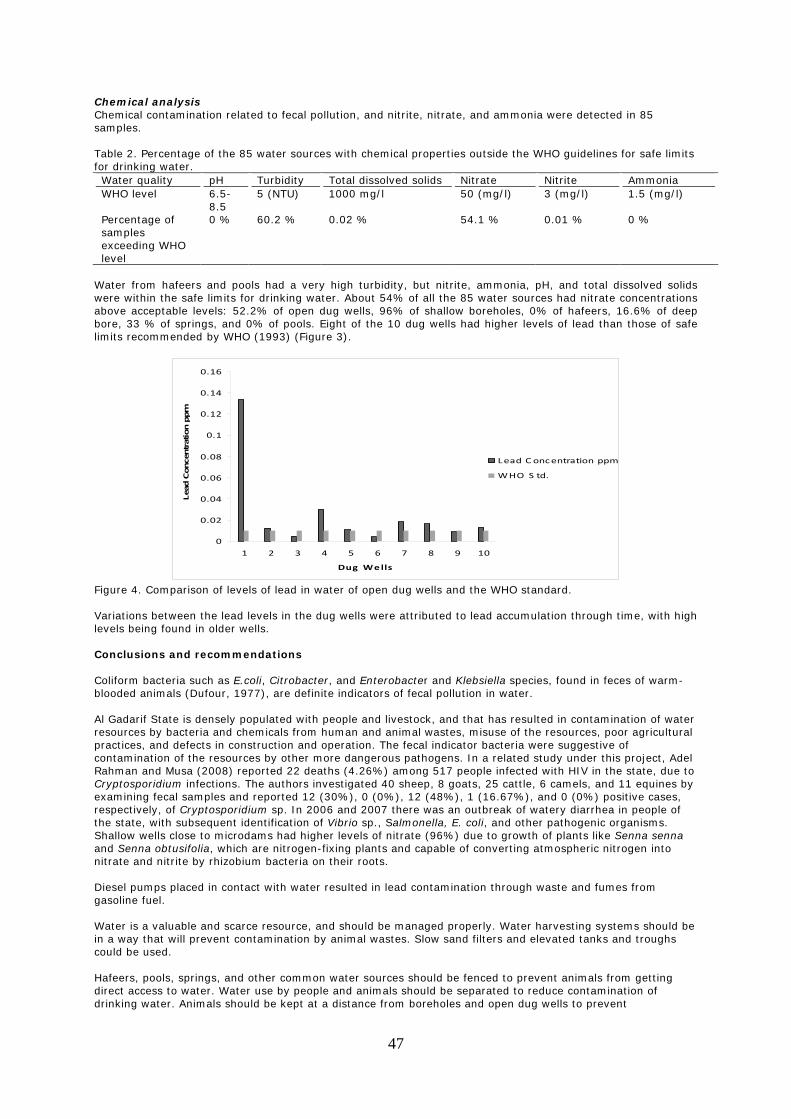
47
Chemical analysis Chemical contamination related to fecal pollution, and nitrite, nitrate, and ammonia were detected in 85 samples. Table 2. Percentage of the 85 water sources with chemical properties outside the WHO guidelines for safe limits for drinking water. Water quality pH Turbidity Total dissolved solids Nitrate Nitrite Ammonia WHO level 6.5-
8.5 5 (NTU) 1000 mg/l 50 (mg/l) 3 (mg/l) 1.5 (mg/l)
Percentage of samples exceeding WHO level
0 % 60.2 % 0.02 % 54.1 % 0.01 % 0 %
Water from hafeers and pools had a very high turbidity, but nitrite, ammonia, pH, and total dissolved solids were within the safe limits for drinking water. About 54% of all the 85 water sources had nitrate concentrations above acceptable levels: 52.2% of open dug wells, 96% of shallow boreholes, 0% of hafeers, 16.6% of deep bore, 33 % of springs, and 0% of pools. Eight of the 10 dug wells had higher levels of lead than those of safe limits recommended by WHO (1993) (Figure 3).
Figure 4. Comparison of levels of lead in water of open dug wells and the WHO standard. Variations between the lead levels in the dug wells were attributed to lead accumulation through time, with high levels being found in older wells. Conclusions and recommendations Coliform bacteria such as E.coli, Citrobacter, and Enterobacter and Klebsiella species, found in feces of warm-blooded animals (Dufour, 1977), are definite indicators of fecal pollution in water. Al Gadarif State is densely populated with people and livestock, and that has resulted in contamination of water resources by bacteria and chemicals from human and animal wastes, misuse of the resources, poor agricultural practices, and defects in construction and operation. The fecal indicator bacteria were suggestive of contamination of the resources by other more dangerous pathogens. In a related study under this project, Adel Rahman and Musa (2008) reported 22 deaths (4.26%) among 517 people infected with HIV in the state, due to Cryptosporidium infections. The authors investigated 40 sheep, 8 goats, 25 cattle, 6 camels, and 11 equines by examining fecal samples and reported 12 (30%), 0 (0%), 12 (48%), 1 (16.67%), and 0 (0%) positive cases, respectively, of Cryptosporidium sp. In 2006 and 2007 there was an outbreak of watery diarrhea in people of the state, with subsequent identification of Vibrio sp., Salmonella, E. coli, and other pathogenic organisms. Shallow wells close to microdams had higher levels of nitrate (96%) due to growth of plants like Senna senna and Senna obtusifolia, which are nitrogen-fixing plants and capable of converting atmospheric nitrogen into nitrate and nitrite by rhizobium bacteria on their roots. Diesel pumps placed in contact with water resulted in lead contamination through waste and fumes from gasoline fuel. Water is a valuable and scarce resource, and should be managed properly. Water harvesting systems should be in a way that will prevent contamination by animal wastes. Slow sand filters and elevated tanks and troughs could be used. Hafeers, pools, springs, and other common water sources should be fenced to prevent animals from getting direct access to water. Water use by people and animals should be separated to reduce contamination of drinking water. Animals should be kept at a distance from boreholes and open dug wells to prevent
0
0.02
0.04
0.06
0.08
0.1
0.12
0.14
0.16
1 2 3 4 5 6 7 8 9 10
Dug Wells
Lead Concentration ppm
Lead C oncentration ppm
WHO S td.
48
contamination of water by animal waste. Humans should also dispose their waste properly. Water from different sources should be examined periodically for pollution and be chlorinated for safe use. Open dug wells should be constructed properly to prevent inflow and overflow of water that causes contamination. Diesel water pumps should be replaced with electric motor pumps to prevent contamination. Acknowledgments This paper presents findings from CPWF PN 37, Nile Basin Livestock Water Productivity, a Project of the CGIAR Challenge Program on Water and Food. References Adel Rahman, S.M., and M.T. Musa. 2008. Cryptosporidial infections in animals and man in Al Gadarif State,
Sudan. Journal of Veterinary Research (in press). Dufour, A.P. 1977. Escherichia coli: The Fecal coliform. In A.W. Hoadley, and B.J. Dutka, (eds.). Bacterical
indicator/health hazards associated with water. West Conshohocken, Pennsylvania: ASTM International.
WHO. 1993. Guidelines for Drinking Water Quality, 2nd ed. Vol. 1 WHO, Geneva. WHO. 1997. Reference for MPN and MF methods: Guidelines for Drinking-Water Quality 2nd ed. Vol. 3
Surveillance and Control of Community Supplies, WHO, Geneva.
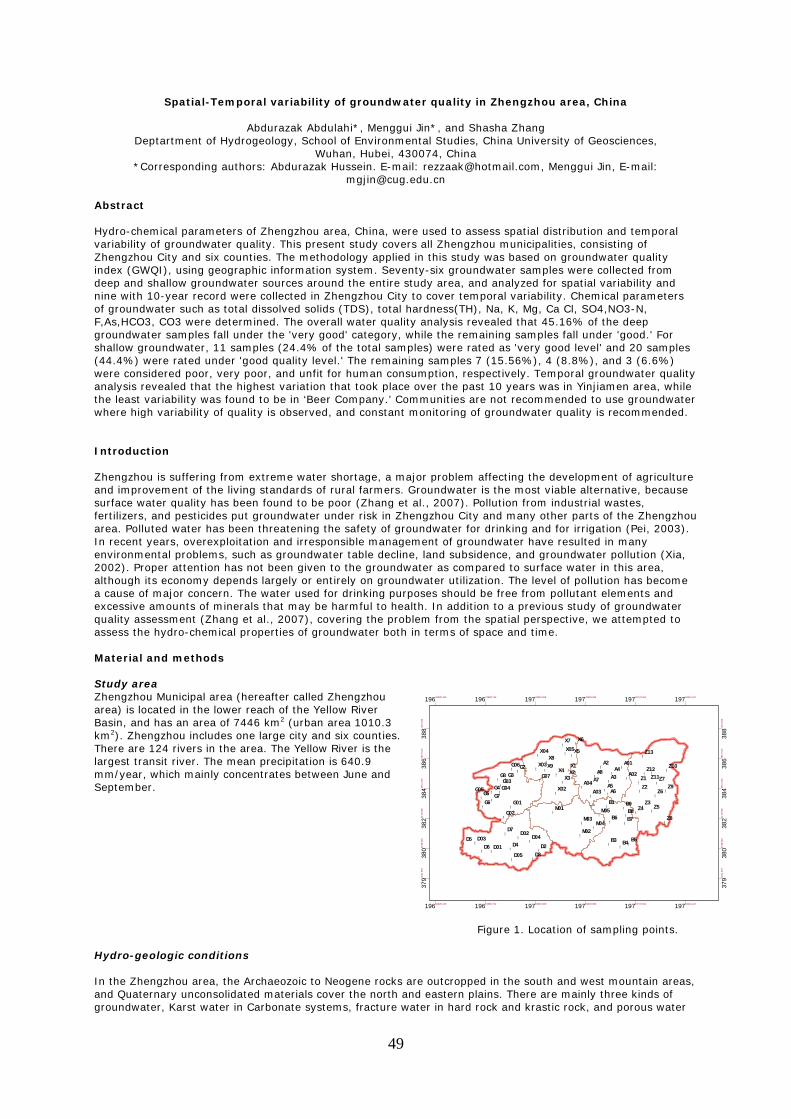
49
Spatial-Temporal variability of groundwater quality in Zhengzhou area, China
Abdurazak Abdulahi*, Menggui Jin*, and Shasha Zhang Deptartment of Hydrogeology, School of Environmental Studies, China University of Geosciences,
Wuhan, Hubei, 430074, China *Corresponding authors: Abdurazak Hussein. E-mail: [email protected], Menggui Jin, E-mail:
[email protected] Abstract Hydro-chemical parameters of Zhengzhou area, China, were used to assess spatial distribution and temporal variability of groundwater quality. This present study covers all Zhengzhou municipalities, consisting of Zhengzhou City and six counties. The methodology applied in this study was based on groundwater quality index (GWQI), using geographic information system. Seventy-six groundwater samples were collected from deep and shallow groundwater sources around the entire study area, and analyzed for spatial variability and nine with 10-year record were collected in Zhengzhou City to cover temporal variability. Chemical parameters of groundwater such as total dissolved solids (TDS), total hardness(TH), Na, K, Mg, Ca Cl, SO4,NO3-N, F,As,HCO3, CO3 were determined. The overall water quality analysis revealed that 45.16% of the deep groundwater samples fall under the 'very good' category, while the remaining samples fall under 'good.' For shallow groundwater, 11 samples (24.4% of the total samples) were rated as 'very good level' and 20 samples (44.4%) were rated under 'good quality level.' The remaining samples 7 (15.56%), 4 (8.8%), and 3 (6.6%) were considered poor, very poor, and unfit for human consumption, respectively. Temporal groundwater quality analysis revealed that the highest variation that took place over the past 10 years was in Yinjiamen area, while the least variability was found to be in ‘Beer Company.’ Communities are not recommended to use groundwater where high variability of quality is observed, and constant monitoring of groundwater quality is recommended. Introduction Zhengzhou is suffering from extreme water shortage, a major problem affecting the development of agriculture and improvement of the living standards of rural farmers. Groundwater is the most viable alternative, because surface water quality has been found to be poor (Zhang et al., 2007). Pollution from industrial wastes, fertilizers, and pesticides put groundwater under risk in Zhengzhou City and many other parts of the Zhengzhou area. Polluted water has been threatening the safety of groundwater for drinking and for irrigation (Pei, 2003). In recent years, overexploitation and irresponsible management of groundwater have resulted in many environmental problems, such as groundwater table decline, land subsidence, and groundwater pollution (Xia, 2002). Proper attention has not been given to the groundwater as compared to surface water in this area, although its economy depends largely or entirely on groundwater utilization. The level of pollution has become a cause of major concern. The water used for drinking purposes should be free from pollutant elements and excessive amounts of minerals that may be harmful to health. In addition to a previous study of groundwater quality assessment (Zhang et al., 2007), covering the problem from the spatial perspective, we attempted to assess the hydro-chemical properties of groundwater both in terms of space and time. Material and methods Study area Zhengzhou Municipal area (hereafter called Zhengzhou area) is located in the lower reach of the Yellow River Basin, and has an area of 7446 km2 (urban area 1010.3 km2). Zhengzhou includes one large city and six counties. There are 124 rivers in the area. The Yellow River is the largest transit river. The mean precipitation is 640.9 mm/year, which mainly concentrates between June and September.
Figure 1. Location of sampling points.
Hydro-geologic conditions In the Zhengzhou area, the Archaeozoic to Neogene rocks are outcropped in the south and west mountain areas, and Quaternary unconsolidated materials cover the north and eastern plains. There are mainly three kinds of groundwater, Karst water in Carbonate systems, fracture water in hard rock and krastic rock, and porous water
!
!!
!
! !
!
!
!! !
!
!
!
!
!
!!
!
!
!!
!
!
!
!
!
!!
!
!
!
!!!
!
!
!
!!
! ! !
!
!!
!
!
!
!!
!
!!
!!
!
!
!!
!!
!
!!
!
!
! !
!
!
!
!!
!
!
Z1
Z6
Z8
Z5Z3
Z4B8B9
B7
B5B4
B6
D3D2D4D6
D5
D7
B3
B1
Z2 Z9Z7
A4A3
A5A6
A2
A7A8
X6
X5
X7
X1
X3X2X4
X9X8
G2G3G8
G4G7
G6G5
Z10Z12A01
A02
A03A04
X05X04
X03
G07
X02
M05
M02M04
M03
M01
D04D02
D05D01
D03
G02
G01
G05 G04G03
G06
Z11
Z13
19642328.135
19642328.135
19672688.752
19672688.752
19703049.368
19703049.368
19733409.984
19733409.984
19763770.601
19763770.601
19794131.217
19794131.217
37900
31.5
92
37900
31.5
92
38082
38.0
80
38082
38.0
80
38264
44.5
68
38264
44.5
68
38446
51.0
56
38446
51.0
56
38628
57.5
45
38628
57.5
45
38810
64.0
33
38810
64.0
33
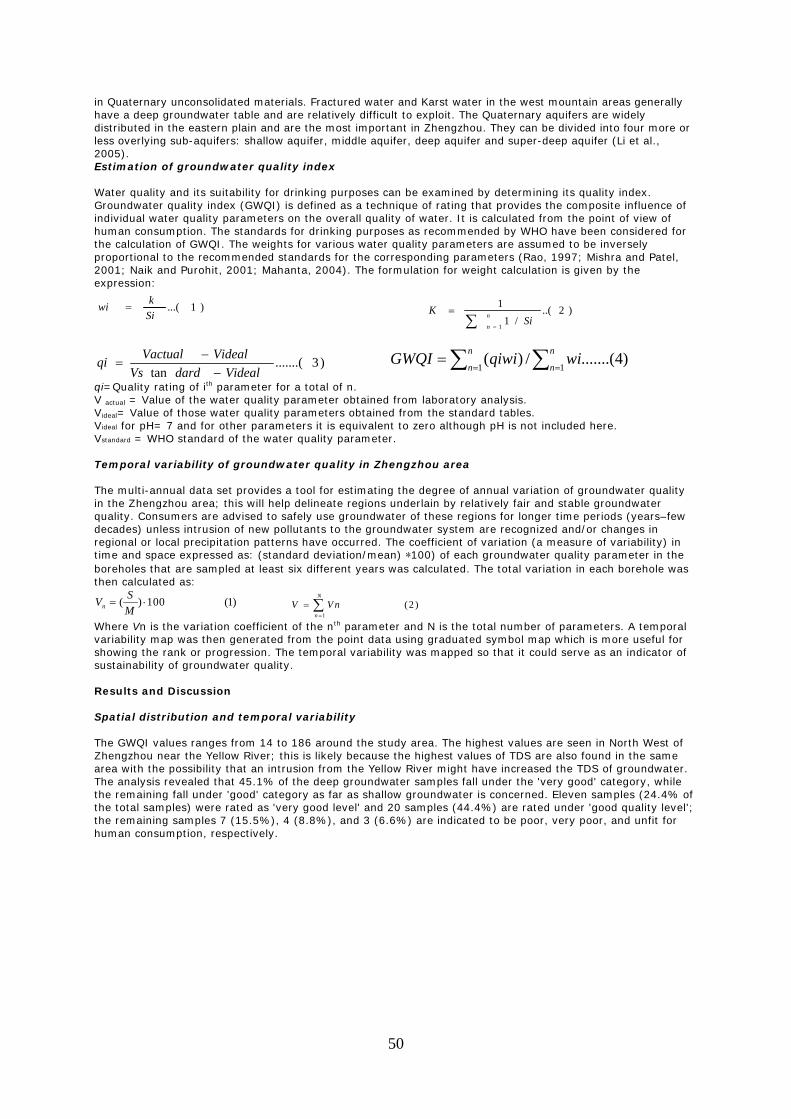
50
in Quaternary unconsolidated materials. Fractured water and Karst water in the west mountain areas generally have a deep groundwater table and are relatively difficult to exploit. The Quaternary aquifers are widely distributed in the eastern plain and are the most important in Zhengzhou. They can be divided into four more or less overlying sub-aquifers: shallow aquifer, middle aquifer, deep aquifer and super-deep aquifer (Li et al., 2005). Estimation of groundwater quality index Water quality and its suitability for drinking purposes can be examined by determining its quality index. Groundwater quality index (GWQI) is defined as a technique of rating that provides the composite influence of individual water quality parameters on the overall quality of water. It is calculated from the point of view of human consumption. The standards for drinking purposes as recommended by WHO have been considered for the calculation of GWQI. The weights for various water quality parameters are assumed to be inversely proportional to the recommended standards for the corresponding parameters (Rao, 1997; Mishra and Patel, 2001; Naik and Purohit, 2001; Mahanta, 2004). The formulation for weight calculation is given by the expression:
)1...(Sikwi =
)2..(/1
1
1∑ =
= n
nSi
K
)3.......(
tan VidealdardVsVidealVactualqi−
−= )4.......(/)(
11 ∑∑ ===
n
n
n
nwiqiwiGWQI
qi=Quality rating of ith parameter for a total of n. V actual = Value of the water quality parameter obtained from laboratory analysis. Videal= Value of those water quality parameters obtained from the standard tables. Videal for pH= 7 and for other parameters it is equivalent to zero although pH is not included here. Vstandard = WHO standard of the water quality parameter. Temporal variability of groundwater quality in Zhengzhou area The multi-annual data set provides a tool for estimating the degree of annual variation of groundwater quality in the Zhengzhou area; this will help delineate regions underlain by relatively fair and stable groundwater quality. Consumers are advised to safely use groundwater of these regions for longer time periods (years–few decades) unless intrusion of new pollutants to the groundwater system are recognized and/or changes in regional or local precipitation patterns have occurred. The coefficient of variation (a measure of variability) in time and space expressed as: (standard deviation/mean) ∗100) of each groundwater quality parameter in the boreholes that are sampled at least six different years was calculated. The total variation in each borehole was then calculated as:
( ) 100 (1)nSVM
= ⋅ 1
(2 )N
n
V V n=
= ∑
Where Vn is the variation coefficient of the nth parameter and N is the total number of parameters. A temporal variability map was then generated from the point data using graduated symbol map which is more useful for showing the rank or progression. The temporal variability was mapped so that it could serve as an indicator of sustainability of groundwater quality. Results and Discussion Spatial distribution and temporal variability The GWQI values ranges from 14 to 186 around the study area. The highest values are seen in North West of Zhengzhou near the Yellow River; this is likely because the highest values of TDS are also found in the same area with the possibility that an intrusion from the Yellow River might have increased the TDS of groundwater. The analysis revealed that 45.1% of the deep groundwater samples fall under the 'very good' category, while the remaining fall under 'good' category as far as shallow groundwater is concerned. Eleven samples (24.4% of the total samples) were rated as 'very good level' and 20 samples (44.4%) are rated under 'good quality level'; the remaining samples 7 (15.5%), 4 (8.8%), and 3 (6.6%) are indicated to be poor, very poor, and unfit for human consumption, respectively.
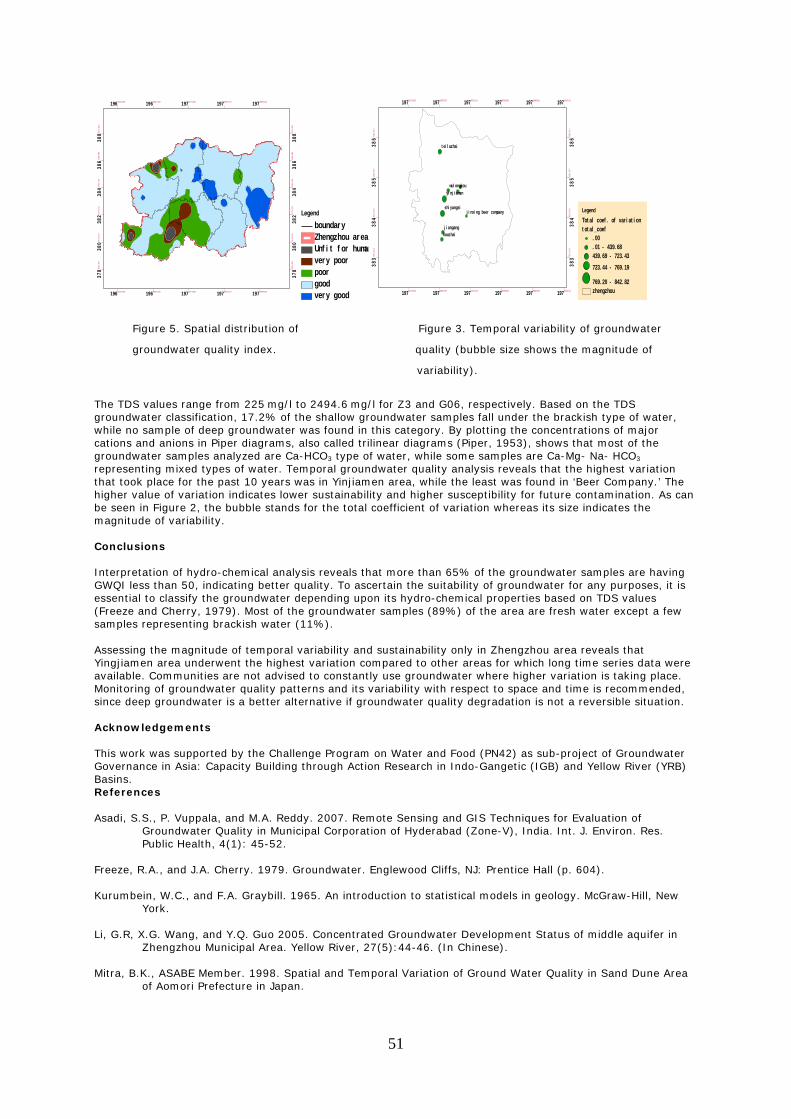
51
Figure 5. Spatial distribution of Figure 3. Temporal variability of groundwater
groundwater quality index. quality (bubble size shows the magnitude of
variability).
The TDS values range from 225 mg/l to 2494.6 mg/l for Z3 and G06, respectively. Based on the TDS groundwater classification, 17.2% of the shallow groundwater samples fall under the brackish type of water, while no sample of deep groundwater was found in this category. By plotting the concentrations of major cations and anions in Piper diagrams, also called trilinear diagrams (Piper, 1953), shows that most of the groundwater samples analyzed are Ca-HCO3 type of water, while some samples are Ca-Mg- Na- HCO3 representing mixed types of water. Temporal groundwater quality analysis reveals that the highest variation that took place for the past 10 years was in Yinjiamen area, while the least was found in ‘Beer Company.’ The higher value of variation indicates lower sustainability and higher susceptibility for future contamination. As can be seen in Figure 2, the bubble stands for the total coefficient of variation whereas its size indicates the magnitude of variability. Conclusions Interpretation of hydro-chemical analysis reveals that more than 65% of the groundwater samples are having GWQI less than 50, indicating better quality. To ascertain the suitability of groundwater for any purposes, it is essential to classify the groundwater depending upon its hydro-chemical properties based on TDS values (Freeze and Cherry, 1979). Most of the groundwater samples (89%) of the area are fresh water except a few samples representing brackish water (11%). Assessing the magnitude of temporal variability and sustainability only in Zhengzhou area reveals that Yingjiamen area underwent the highest variation compared to other areas for which long time series data were available. Communities are not advised to constantly use groundwater where higher variation is taking place. Monitoring of groundwater quality patterns and its variability with respect to space and time is recommended, since deep groundwater is a better alternative if groundwater quality degradation is not a reversible situation. Acknowledgements This work was supported by the Challenge Program on Water and Food (PN42) as sub-project of Groundwater Governance in Asia: Capacity Building through Action Research in Indo-Gangetic (IGB) and Yellow River (YRB) Basins. References Asadi, S.S., P. Vuppala, and M.A. Reddy. 2007. Remote Sensing and GIS Techniques for Evaluation of
Groundwater Quality in Municipal Corporation of Hyderabad (Zone-V), India. Int. J. Environ. Res. Public Health, 4(1): 45-52.
Freeze, R.A., and J.A. Cherry. 1979. Groundwater. Englewood Cliffs, NJ: Prentice Hall (p. 604). Kurumbein, W.C., and F.A. Graybill. 1965. An introduction to statistical models in geology. McGraw-Hill, New
York. Li, G.R, X.G. Wang, and Y.Q. Guo 2005. Concentrated Groundwater Development Status of middle aquifer in
Zhengzhou Municipal Area. Yellow River, 27(5):44-46. (In Chinese). Mitra, B.K., ASABE Member. 1998. Spatial and Temporal Variation of Ground Water Quality in Sand Dune Area
of Aomori Prefecture in Japan.
19655451.568
19655451.568
19685812.185
19685812.185
19716172.801
19716172.801
19746533.417
19746533.417
19776894.034
19776894.034
37893
42.9
41
37893
42.9
41
38075
49.4
30
38075
49.4
30
38257
55.9
18
38257
55.9
18
38439
62.4
06
38439
62.4
06
38621
68.8
95
38621
68.8
95
38803
75.3
83
38803
75.3
83
Legend
boundar yZhengzhou areaUnf i t f or humanvery poor poorgoodvery good
houzhaij i angang
yi nj i amenwul ongkou
t ei l uzhai
shi yangsij i nxi ng beer company
19725179.359
19725179.359
19736355.790
19736355.790
19747532.220
19747532.220
19758708.650
19758708.650
19769885.081
19769885.081
19781061.511
19781061.511
38379
94.2
68
38379
94.2
68
38480
18.4
82
38480
18.4
82
38580
42.6
97
38580
42.6
97
38680
66.9
12
38680
66.9
12
LegendTot al coef . of var i at i on t ot al _coef
. 00
. 01 - 439. 68439. 69 - 723. 43723. 44 - 769. 19
769. 20 - 842. 82zhengzhou
52
Naik, S., and K.M. Purohit. 2001. Studies on water quality of River Brahmani in Sundargarh district, Orissa. Indian J. Environ. Ecoplan. 5(2): 397–402.
Pei, Y.S.(2003. Irrigation Development Strategy of China for Early 21st Century. Technology of Water
Resources. 23(3): 1-5. (In Chinese). Piper, A.M. 1953. A graphical procedure in the geochemical interpretation of water analysis. USGS. Ground
Water Note 12. Rao, N.S. 1997. Studies on water quality index in hard rock terrain of Guntur district, Andhra Pradesh, India.
In: Proceedings of national seminar on hydrogeology. Simsek, C. and O. Gunduz. 2007. IWQ Index: A GIS-Integrated Technique to Assess Irrigation Water Quality. Xia, Jun. 2002. A Perspective on Hydrological Base of Water Security Problem and its Application in North
China. Progress in Geography. 21(6): 51-526. (In Chinese). Zhang�S.S., M.G. Jin, G. Chen, and B.F. Al Bassam. 2007. Assessment of Groundwater Quality in Zhengzhou,
China. Paper presented at the International Conference on Geological Engineering. October 2007: 91-96. Wuhan, China.
53
Governance: linking communities across boundaries
From local to transboundary: strengthening water institutions in the Volta and Limpopo Basins
A. Sullivan1, J. Goldin2, E. Manzungu3, B. Ampomah4, Y. Dembele5, Y. Opoku-Ankomah6,
G. Ricardo7, I. Pereira8, and R. Meinzen-Dick8
[email protected], IWMI 2African Water Issues Research Unit, University of Pretoria, South Africa
3Department of Soil Science and Engineering, University of Zimbabwe 4Water Resources Commission, Ghana
5National Institute for Agricultural Research, Burkina Faso 6Water Research Institute, Ghana
7Universidade Eduardo Mondlane, Mozambique 8International Food Policy Research Institute
Abstract This research was driven by the question: Which indigenous practices and institutions are most conducive to equitable or pro-poor investments within sub-Saharan African transboundary institutions? The major objectives, therefore, were to assess local level water governance structures and strategies, and distill out key principles that could be incorporated into transboundary institutions. The study employed a number of methods in nearly 20 sites in six countries across the Limpopo and Volta basins..Country level case studies were produced for Botswana, Mozambique, South Africa, Zimbabwe, Burkina Faso, and Ghana. Main sources of field data, collected by graduate students from each country, included local officials, community leaders, community members, and other water resources users. Findings suggest that local water institutions that included elements of traditional and modern institutions were more respected by community members and therefore considered stronger. A key local principle was ‘some for all,’ suggesting that water is consumed with some awareness of other (downstream) users. A local livelihoods perspective on water resources management, whereby basic human needs were met first, was commonly reflected by respondents. Other findings germane at the transnational level were: (1) parties endeavor to avoid conflict over water, which often results from the exclusion of parties from decision-making processes; (2) customary institutions take a holistic approach to water resources management and minimize risk by accessing multiple water sources for multiple purposes; and (3) water resources management continues to be highly gendered suggesting that the traditionally powerless remain so. Scarce communication across institutions often confines their influence to geographically specific areas, a strong argument for future transboundary-scale water resources governance and development efforts. Translating and incorporating local experiences to the national and transboundary levels remains a challenge due, in part, to varying interpretations of equitable and efficient water use and distribution based upon perspective and scale. Media grab While incorporating local water management experiences into transboundary institutions can strengthen them and increase the voice of the rural poor, serious challenges emerge from various interpretations of equitable and efficient water resources use. Introduction This project was designed to address the question: How can transboundary water management in Africa be strengthened? While appropriate strategies may be gleaned from examples around the world, it was hypothesized that distinctly African solutions might better address: (1) the nature of water scarcity in sub-Saharan Africa–largely economic rather than solely physical; and (2) underrepresented water users–overwhelmingly poor rural dwellers, given the persistence of indigenous arrangements for water resources management. The hypothesis of this research was that transboundary water governance institutions capable of responding to needs and conditions in sub-Saharan Africa must incorporate local traditions and social arrangements for water management. Such a ‘bottom-up’ approach would be expected to increase institutional resilience while acknowledging and addressing differential needs of poor people. This research proves timely as both study basins are in the process of establishing river basin organizations, the unit of management promoted in Integrated Water Resources Management (IWRM) reform. Background With over 60 international river basins on the continent, nearly every African country shares at least one. Therefore, most efforts at basin-level integrated water resources management in Africa require international cooperation among riparian countries. While a number of longstanding international agreements are in place, few offer examples of effective basin-scale organizations. As riparian countries develop their own institutional
54
frameworks for IWRM, basin-scale institutions are evolving as a necessary level of governance, cooperation, diplomacy, and management. Ongoing efforts at developing basin-scale water governance institutions are receiving widespread support and encouragement. However, linking and relating these to local water management practices has been little explored. Emerging basin institutions in Africa face their own particular challenges, highlighting the importance of not copying other transboundary experiences. In light of climate change and the current food crisis, sub-Saharan Africa’s overwhelmingly poor, rural-based population needs their voice heard in discussions over access to life and livelihood securing natural resources. Secondly, generally speaking, water scarcity in sub-Saharan Africa is primarily ‘economic’ resulting more from a lack of financial and human resources than an overall lack of water. Therefore capacity-building for new resource development may be even more pressing than negotiating over scarce resources among competing users. Finally, customary natural resource governance structures and strategies persist to varying degrees across Africa–a testimony to their durability, flexibility and acceptability. Without romanticizing their efficacy or pretences of equity, this suggests a certain willingness to follow the rules and trust in the system. This project sought, first and foremost, to design a methodology for linking appropriate customary water governance characteristics and strategies to emerging basin institutions in sub-Saharan Africa. Therefore it supported partners in developing a network of scientists to research, document, and disseminate examples of local and customary water-related institutions; created basin level profiles of historical water governance as well as country level case studies of local water governance arrangements; and synthesized findings into recommendations for incorporating customary principles into basin-level institutions. Methods The research is based on a mixed method study designed to collect and analyze data on selected themes deemed necessary for understanding the form, function and evolution of local level water governance institutions. The following main themes were explored: (1) major historical events with local impact; (2) physical/ecological and climatic aspects of the local water sources; (3) water uses/livelihoods by user groups; (4) cultural aspects around water users in the community; and (5) institutional mechanisms or meditating institutions affecting access to and control of water resources. Data were collected using secondary sources, surveys, informant interviews, focus group meetings, and direct observation. A summary of themes, methods, and expected findings is given in Table 1. Table 1. Summary of research themes, methods, and expected findings. Theme Data collection via Expected findings Major historical events and their impact at the local level
Secondary data sources Timelines, disaggregated focus groups Informant interviews
*Changes in the natural resource base, resource use, users and mediating institutions over time *Local strategies for coping with change
Physical/ecological and climatic aspects of local water sources
Direct observation Survey Informant interviews
*Characteristics of water sources including aspects of seasonality, quality, quantity, extraction *Local institutional reaction to changes in water resources
Water uses, livelihoods by user groups
Direct observation Survey Focus group meetings
*Which water users used water from which sources, for which activities and when *Range of rural livelihoods depending upon which water sources and when
Cultural aspects around water uses
Informant interviews Focus group meetings
*Perpetuation and enforcement of local rules via mythology, folklore *How customary institutions/rules are perpetuated, sanctions for breaking rules
Mediating institutions
Survey Informant interviews Focus group meetings
*Existence/persistence of customary or local water governance institutions *The nature of rules and regulations by which these institutions govern local water resources and users *Enforcement mechanisms
Although customary water governance arrangements were the focus of the field research, the overall goal was to ascertain which, if any, characteristics of customary arrangements would strengthen transboundary institutions. Research sites were therefore selected where multiple uses, users, and sources intersected, presenting boundaries between local institutions. While these boundaries were not a proxy for transnational boundaries, they did offer living examples of how different institutions governed various aspects of access to and control of water resources. Field research was organized under a country team leader and conducted by teams of university students from the study country. Following a project-specific, one-week social science research methods training course, country teams began planning where, when, and how to conduct field work. Initial steps included studying secondary data sources (including existing water legislation) and background information on customary water laws within the study area. Data collection instruments, except surveys, were customized by each country team to allow them to collect the necessary information in a culturally sensitive manner. Although translated into
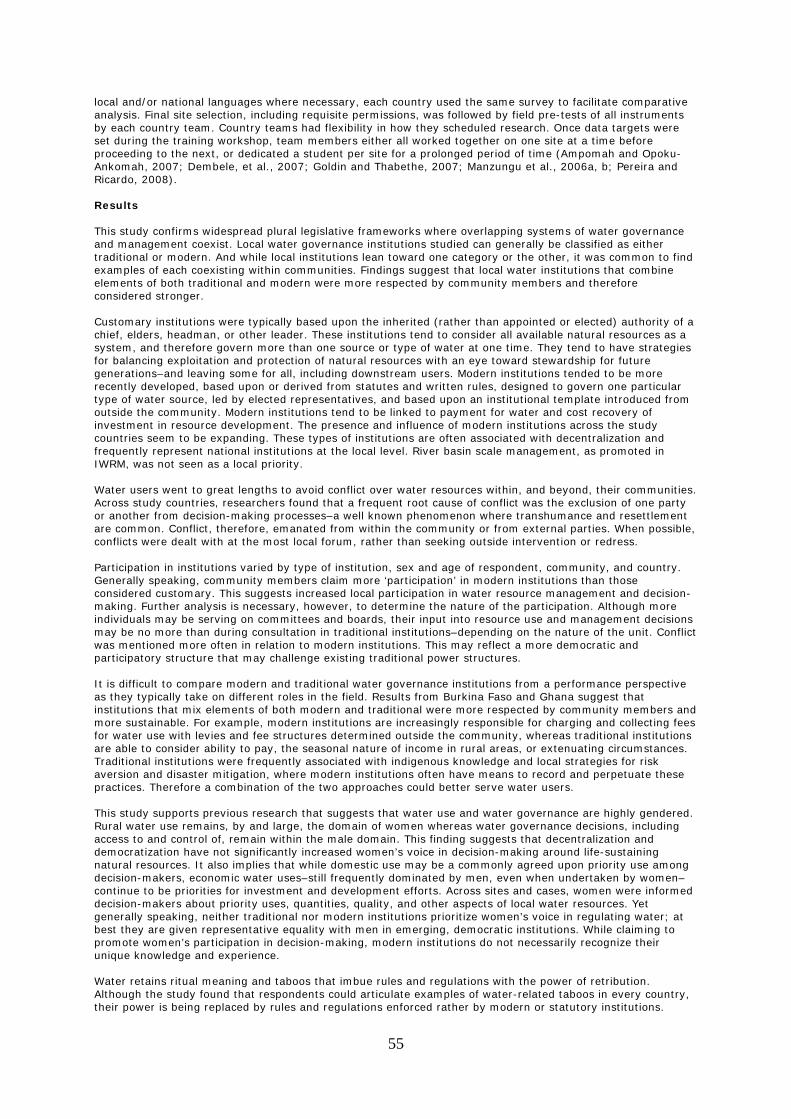
55
local and/or national languages where necessary, each country used the same survey to facilitate comparative analysis. Final site selection, including requisite permissions, was followed by field pre-tests of all instruments by each country team. Country teams had flexibility in how they scheduled research. Once data targets were set during the training workshop, team members either all worked together on one site at a time before proceeding to the next, or dedicated a student per site for a prolonged period of time (Ampomah and Opoku-Ankomah, 2007; Dembele, et al., 2007; Goldin and Thabethe, 2007; Manzungu et al., 2006a, b; Pereira and Ricardo, 2008). Results This study confirms widespread plural legislative frameworks where overlapping systems of water governance and management coexist. Local water governance institutions studied can generally be classified as either traditional or modern. And while local institutions lean toward one category or the other, it was common to find examples of each coexisting within communities. Findings suggest that local water institutions that combine elements of both traditional and modern were more respected by community members and therefore considered stronger. Customary institutions were typically based upon the inherited (rather than appointed or elected) authority of a chief, elders, headman, or other leader. These institutions tend to consider all available natural resources as a system, and therefore govern more than one source or type of water at one time. They tend to have strategies for balancing exploitation and protection of natural resources with an eye toward stewardship for future generations–and leaving some for all, including downstream users. Modern institutions tended to be more recently developed, based upon or derived from statutes and written rules, designed to govern one particular type of water source, led by elected representatives, and based upon an institutional template introduced from outside the community. Modern institutions tend to be linked to payment for water and cost recovery of investment in resource development. The presence and influence of modern institutions across the study countries seem to be expanding. These types of institutions are often associated with decentralization and frequently represent national institutions at the local level. River basin scale management, as promoted in IWRM, was not seen as a local priority. Water users went to great lengths to avoid conflict over water resources within, and beyond, their communities. Across study countries, researchers found that a frequent root cause of conflict was the exclusion of one party or another from decision-making processes–a well known phenomenon where transhumance and resettlement are common. Conflict, therefore, emanated from within the community or from external parties. When possible, conflicts were dealt with at the most local forum, rather than seeking outside intervention or redress. Participation in institutions varied by type of institution, sex and age of respondent, community, and country. Generally speaking, community members claim more ‘participation’ in modern institutions than those considered customary. This suggests increased local participation in water resource management and decision-making. Further analysis is necessary, however, to determine the nature of the participation. Although more individuals may be serving on committees and boards, their input into resource use and management decisions may be no more than during consultation in traditional institutions–depending on the nature of the unit. Conflict was mentioned more often in relation to modern institutions. This may reflect a more democratic and participatory structure that may challenge existing traditional power structures. It is difficult to compare modern and traditional water governance institutions from a performance perspective as they typically take on different roles in the field. Results from Burkina Faso and Ghana suggest that institutions that mix elements of both modern and traditional were more respected by community members and more sustainable. For example, modern institutions are increasingly responsible for charging and collecting fees for water use with levies and fee structures determined outside the community, whereas traditional institutions are able to consider ability to pay, the seasonal nature of income in rural areas, or extenuating circumstances. Traditional institutions were frequently associated with indigenous knowledge and local strategies for risk aversion and disaster mitigation, where modern institutions often have means to record and perpetuate these practices. Therefore a combination of the two approaches could better serve water users. This study supports previous research that suggests that water use and water governance are highly gendered. Rural water use remains, by and large, the domain of women whereas water governance decisions, including access to and control of, remain within the male domain. This finding suggests that decentralization and democratization have not significantly increased women’s voice in decision-making around life-sustaining natural resources. It also implies that while domestic use may be a commonly agreed upon priority use among decision-makers, economic water uses–still frequently dominated by men, even when undertaken by women–continue to be priorities for investment and development efforts. Across sites and cases, women were informed decision-makers about priority uses, quantities, quality, and other aspects of local water resources. Yet generally speaking, neither traditional nor modern institutions prioritize women’s voice in regulating water; at best they are given representative equality with men in emerging, democratic institutions. While claiming to promote women’s participation in decision-making, modern institutions do not necessarily recognize their unique knowledge and experience. Water retains ritual meaning and taboos that imbue rules and regulations with the power of retribution. Although the study found that respondents could articulate examples of water-related taboos in every country, their power is being replaced by rules and regulations enforced rather by modern or statutory institutions.
56
Taboos were offered that ranged from how and why local populations protect the watery habitat of their totem (crocodiles) in Ghana, to honoring the power of the Rain Queen in South Africa. While respondents frequently provided the ‘story line’ of local myths and taboos, there was little supporting evidence of actual punishment for noncompliance. Findings suggest younger generations are less inclined to respect local taboos and myths than their elders, a point frequently mentioned during interviews with older informants. Communities depend upon multiple water sources to meet their water needs for multiple uses throughout the year. This strategy gives communities a measure of insulation from risk and gives them options for dealing with changing ecological conditions. Few if any respondents relied on a sole source of water year-round for all their needs, and demonstrated rich indigenous knowledge on the behavior of water sources and ecologies. The majority of respondents in the study suggested that they used multiple sources of water throughout the year to meet their domestic and commercial needs. Accessing multiple water sources allows local users to spread and minimize their risk should any one source dry up, become contaminated, or be labeled off-limits. Discussion This study has generated a picture of local water governance institutions that allows resource users to support their own livelihoods while managing resources for downstream users and their own future use. The purpose was to derive customary strategies that could be synthesized for incorporation into transboundary river basin organizations in sub-Saharan Africa. Two points influence which strategies to incorporate and how: the nature of water scarcity, economic rather than physical; and the historically limited voice of the majority water users, that is the rural poor. The holistic nature of local level water governance—simultaneous attention to many sources—is a strategy worth emphasizing at the basin level where primacy is often given to economically lucrative sources, uses, and users. In a recent paper at the First African Water Week, Turton (2008) promotes a benefit sharing paradigm where the first element is a new perspective on water that replaces distributing a limited stock of water with water as a flux that is capable of being cascaded, numerous times, around a system. His claim that this perspective creates a much bigger pie and is reflected by local institutions that promote using available sources for various needs–often times cascading water through users and uses. This approach also highlights the need to invest in water resources development—addressing the economic scarcity—to facilitate potential cascades. The benefit-sharing paradigm also addresses issues around decision-making, and how best to position those in power. He recommends a strong platform of institutionalized decision-making where no one decision-maker has to assume the worst and make corresponding decisions. This option resonates with the need to amplify the voice of the rural poor and offers a place and process for their interests to be represented, at the same forum, as other basin stakeholders. Increasing modernization of local water governance institutions ideally increases community members’ participation in decisions about how available water is managed. Modernizing institutions, however, can also focus on making more water available to more people by engaging in dialogue about water rights, service delivery, and accountability. River basin organizations are a repository of technical knowledge on hydrology, ecology, and climate within their boundary. Such data sets may be a point of contention as each partner tends to believe in and trust their own information more than any others. While not scientifically tested, indigenous knowledge systems may have a role to play in informing basin organizations on matters relating to early drought and flood warning systems. Conclusions and recommendations Nascent transboundary water governance institutions in Africa have an opportunity to develop themselves into flexible assets-based systems of support for basin partners. They can do so by replacing elements of the traditional paradigm such as water as a limited stock, national sovereignty above all, and highly structured institutions, for an approach based upon benefit sharing–creating a bigger pie and managing it better. Identifying local level governance strategies that both serve communities of users and protect water resources is a precondition to scaling up, into emerging and evolving modern institutions. Exploring the DNA of customary water institutions is a necessary step, particularly in light of the pressure to transform them into more democratic and decentralized statutory bodies. Although inoculating emerging institutions with certain elements will be productive, it must be recognized that customary institutions are far from perfect and have, in the past, perpetuated rather than addressed longstanding inequalities. It is recommended that future research examine emerging frameworks and structures of transboundary river basin organizations to assess their willingness or ability to incorporate customary or indigenous strategies into their operations. Once willingness and ability has been confirmed, it will be necessary to find and replicate institutional structures and patterns that truly give voice to the traditionally powerless. Acknowledgments This paper presents findings from PN 47 ‘African Models of Transboundary Governance,’ a project of the CGIAR Challenge Program on Water and Food. The authors gratefully acknowledge contributions of all participating researchers without whom this work would not have been possible.
57
References Ampomah, B., and Y. Opoku-Ankomah. 2007. Case Study of customary and traditional water governance in
Ghana. CP 47, African Models of Transboundary Water Governance. Submitted to CPWF. 61 pages. Dembele, Y., L. Some, K. Some, L. Konate/Bambara, R. Konseiga, and A. Dissa. 2007. Case study of customary
and traditional water governance in Burkina Faso. CP 47, African Models of Transboundary Water Governance. Submitted to CPWF. 106 pages.
Goldin, J., and N. Thabethe. 2007. Case study of customary and traditional water governance in South Africa.
CP 47, African Models of Transboundary Water Governance. Submitted to CPWF. 75 pages. Manzungu, E., T. Mpho, A. Mudanga, and T. Lekoko. 2006. Case study of customary and traditional water
governance in Botswana. CP 47, African Models of Transboundary Water Governance. Submitted to CPWF.
Manzungu, E., T. Mukamba, and A. Nyamwanza. 2006. Case study of customary and traditional water
governance in Zimbabwe. CP 47, African Models of Transboundary Water Governance. Submitted to CPWF. 73 pages. 47 pages.
Pereira, I., and G. Ricardo. 2008. Case study of customary and traditional water governance in Mozambique. CP
47, African Models of Transboundary Water Governance. Submitted to CPWF. 66 pages. Turton, T. 2008. Reflections from South Africa on a Possible Benefit-Sharing Paradigm for Trans-boundary
Waters. Invited paper at the First African Water Week. 26-28,2008. Tunis, Tunisia. CSIR. Forthcoming in special issue of the International Journal of Water Resources Management as Reflections on Water in South Africa.
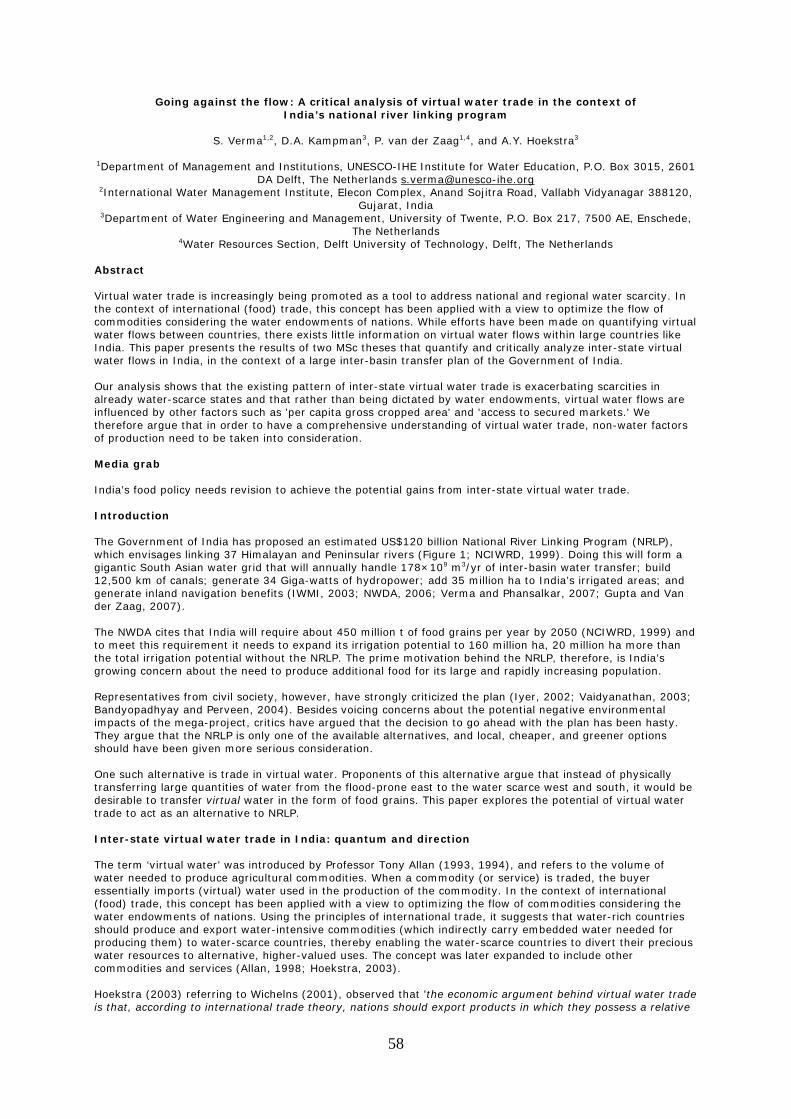
58
Going against the flow: A critical analysis of virtual water trade in the context of India’s national river linking program
S. Verma1,2, D.A. Kampman3, P. van der Zaag1,4, and A.Y. Hoekstra3
1Department of Management and Institutions, UNESCO-IHE Institute for Water Education, P.O. Box 3015, 2601
DA Delft, The Netherlands [email protected] 2International Water Management Institute, Elecon Complex, Anand Sojitra Road, Vallabh Vidyanagar 388120,
Gujarat, India 3Department of Water Engineering and Management, University of Twente, P.O. Box 217, 7500 AE, Enschede,
The Netherlands 4Water Resources Section, Delft University of Technology, Delft, The Netherlands
Abstract Virtual water trade is increasingly being promoted as a tool to address national and regional water scarcity. In the context of international (food) trade, this concept has been applied with a view to optimize the flow of commodities considering the water endowments of nations. While efforts have been made on quantifying virtual water flows between countries, there exists little information on virtual water flows within large countries like India. This paper presents the results of two MSc theses that quantify and critically analyze inter-state virtual water flows in India, in the context of a large inter-basin transfer plan of the Government of India. Our analysis shows that the existing pattern of inter-state virtual water trade is exacerbating scarcities in already water-scarce states and that rather than being dictated by water endowments, virtual water flows are influenced by other factors such as 'per capita gross cropped area' and 'access to secured markets.' We therefore argue that in order to have a comprehensive understanding of virtual water trade, non-water factors of production need to be taken into consideration. Media grab India’s food policy needs revision to achieve the potential gains from inter-state virtual water trade. Introduction The Government of India has proposed an estimated US$120 billion National River Linking Program (NRLP), which envisages linking 37 Himalayan and Peninsular rivers (Figure 1; NCIWRD, 1999). Doing this will form a gigantic South Asian water grid that will annually handle 178×109 m3/yr of inter-basin water transfer; build 12,500 km of canals; generate 34 Giga-watts of hydropower; add 35 million ha to India’s irrigated areas; and generate inland navigation benefits (IWMI, 2003; NWDA, 2006; Verma and Phansalkar, 2007; Gupta and Van der Zaag, 2007). The NWDA cites that India will require about 450 million t of food grains per year by 2050 (NCIWRD, 1999) and to meet this requirement it needs to expand its irrigation potential to 160 million ha, 20 million ha more than the total irrigation potential without the NRLP. The prime motivation behind the NRLP, therefore, is India’s growing concern about the need to produce additional food for its large and rapidly increasing population. Representatives from civil society, however, have strongly criticized the plan (Iyer, 2002; Vaidyanathan, 2003; Bandyopadhyay and Perveen, 2004). Besides voicing concerns about the potential negative environmental impacts of the mega-project, critics have argued that the decision to go ahead with the plan has been hasty. They argue that the NRLP is only one of the available alternatives, and local, cheaper, and greener options should have been given more serious consideration. One such alternative is trade in virtual water. Proponents of this alternative argue that instead of physically transferring large quantities of water from the flood-prone east to the water scarce west and south, it would be desirable to transfer virtual water in the form of food grains. This paper explores the potential of virtual water trade to act as an alternative to NRLP. Inter-state virtual water trade in India: quantum and direction The term ‘virtual water’ was introduced by Professor Tony Allan (1993, 1994), and refers to the volume of water needed to produce agricultural commodities. When a commodity (or service) is traded, the buyer essentially imports (virtual) water used in the production of the commodity. In the context of international (food) trade, this concept has been applied with a view to optimizing the flow of commodities considering the water endowments of nations. Using the principles of international trade, it suggests that water-rich countries should produce and export water-intensive commodities (which indirectly carry embedded water needed for producing them) to water-scarce countries, thereby enabling the water-scarce countries to divert their precious water resources to alternative, higher-valued uses. The concept was later expanded to include other commodities and services (Allan, 1998; Hoekstra, 2003). Hoekstra (2003) referring to Wichelns (2001), observed that 'the economic argument behind virtual water trade is that, according to international trade theory, nations should export products in which they possess a relative
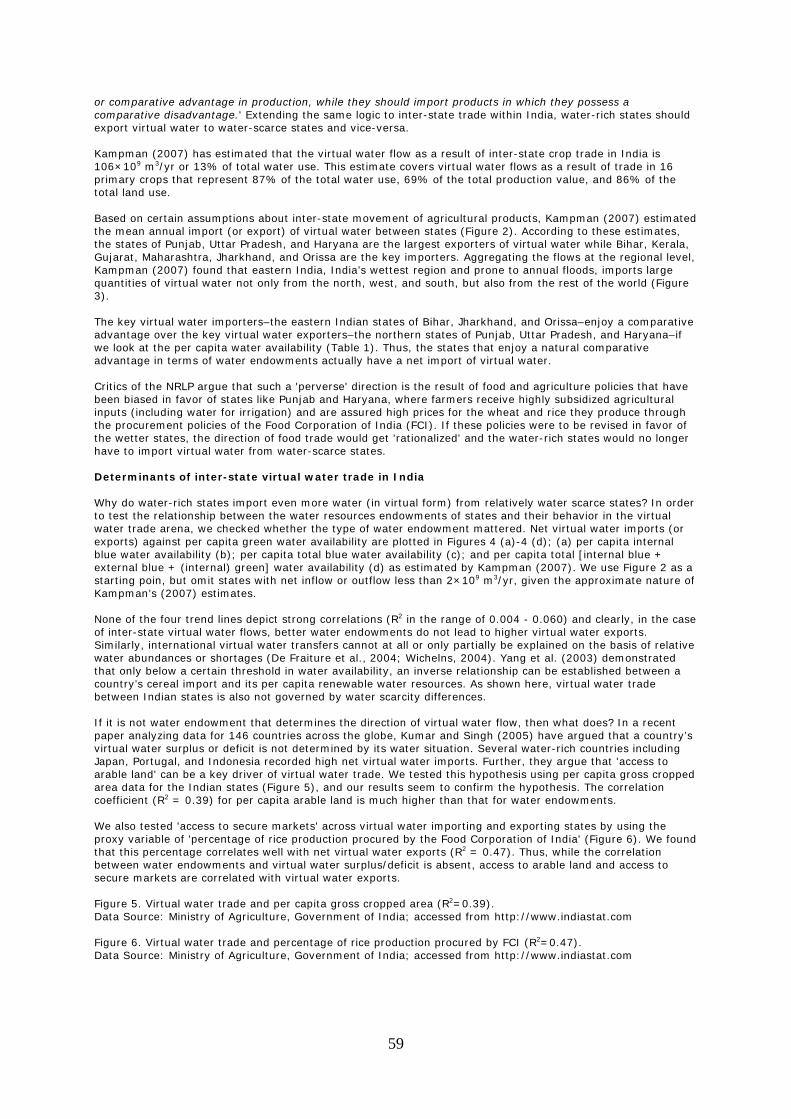
59
or comparative advantage in production, while they should import products in which they possess a comparative disadvantage.' Extending the same logic to inter-state trade within India, water-rich states should export virtual water to water-scarce states and vice-versa. Kampman (2007) has estimated that the virtual water flow as a result of inter-state crop trade in India is 106×109 m3/yr or 13% of total water use. This estimate covers virtual water flows as a result of trade in 16 primary crops that represent 87% of the total water use, 69% of the total production value, and 86% of the total land use. Based on certain assumptions about inter-state movement of agricultural products, Kampman (2007) estimated the mean annual import (or export) of virtual water between states (Figure 2). According to these estimates, the states of Punjab, Uttar Pradesh, and Haryana are the largest exporters of virtual water while Bihar, Kerala, Gujarat, Maharashtra, Jharkhand, and Orissa are the key importers. Aggregating the flows at the regional level, Kampman (2007) found that eastern India, India’s wettest region and prone to annual floods, imports large quantities of virtual water not only from the north, west, and south, but also from the rest of the world (Figure 3). The key virtual water importers–the eastern Indian states of Bihar, Jharkhand, and Orissa–enjoy a comparative advantage over the key virtual water exporters–the northern states of Punjab, Uttar Pradesh, and Haryana–if we look at the per capita water availability (Table 1). Thus, the states that enjoy a natural comparative advantage in terms of water endowments actually have a net import of virtual water. Critics of the NRLP argue that such a 'perverse' direction is the result of food and agriculture policies that have been biased in favor of states like Punjab and Haryana, where farmers receive highly subsidized agricultural inputs (including water for irrigation) and are assured high prices for the wheat and rice they produce through the procurement policies of the Food Corporation of India (FCI). If these policies were to be revised in favor of the wetter states, the direction of food trade would get 'rationalized' and the water-rich states would no longer have to import virtual water from water-scarce states. Determinants of inter-state virtual water trade in India Why do water-rich states import even more water (in virtual form) from relatively water scarce states? In order to test the relationship between the water resources endowments of states and their behavior in the virtual water trade arena, we checked whether the type of water endowment mattered. Net virtual water imports (or exports) against per capita green water availability are plotted in Figures 4 (a)-4 (d); (a) per capita internal blue water availability (b); per capita total blue water availability (c); and per capita total [internal blue + external blue + (internal) green] water availability (d) as estimated by Kampman (2007). We use Figure 2 as a starting poin, but omit states with net inflow or outflow less than 2×10⁹ m3/yr, given the approximate nature of Kampman’s (2007) estimates. None of the four trend lines depict strong correlations (R2 in the range of 0.004 - 0.060) and clearly, in the case of inter-state virtual water flows, better water endowments do not lead to higher virtual water exports. Similarly, international virtual water transfers cannot at all or only partially be explained on the basis of relative water abundances or shortages (De Fraiture et al., 2004; Wichelns, 2004). Yang et al. (2003) demonstrated that only below a certain threshold in water availability, an inverse relationship can be established between a country’s cereal import and its per capita renewable water resources. As shown here, virtual water trade between Indian states is also not governed by water scarcity differences. If it is not water endowment that determines the direction of virtual water flow, then what does? In a recent paper analyzing data for 146 countries across the globe, Kumar and Singh (2005) have argued that a country’s virtual water surplus or deficit is not determined by its water situation. Several water-rich countries including Japan, Portugal, and Indonesia recorded high net virtual water imports. Further, they argue that 'access to arable land' can be a key driver of virtual water trade. We tested this hypothesis using per capita gross cropped area data for the Indian states (Figure 5), and our results seem to confirm the hypothesis. The correlation coefficient (R2 = 0.39) for per capita arable land is much higher than that for water endowments. We also tested 'access to secure markets' across virtual water importing and exporting states by using the proxy variable of 'percentage of rice production procured by the Food Corporation of India' (Figure 6). We found that this percentage correlates well with net virtual water exports (R2 = 0.47). Thus, while the correlation between water endowments and virtual water surplus/deficit is absent, access to arable land and access to secure markets are correlated with virtual water exports. Figure 5. Virtual water trade and per capita gross cropped area (R2=0.39). Data Source: Ministry of Agriculture, Government of India; accessed from http://www.indiastat.com Figure 6. Virtual water trade and percentage of rice production procured by FCI (R2=0.47). Data Source: Ministry of Agriculture, Government of India; accessed from http://www.indiastat.com
60
Conclusions: Food policy for India, assuming water matters Mean annual inter-state virtual water trade as embodied in agricultural commodities in India has been estimated to be 106×109 m3/yr for the years 1997–2001 (Kampman, 2007). Although these estimates are neither precise nor comprehensive, they do illustrate that the quantum of inter-state virtual water trade is comparable to the proposed inter-basin water transfers proposed by the Government of India under the NRLP (178×109 m3/yr). Significantly, the estimates also show that the direction of virtual water trade runs opposite to the proposed physical transfers. While physical water transfers are proposed from ‘surplus’ to ‘deficit’ basins, inter-state virtual water flows move from water-scarce to water-rich regions. The existing pattern of virtual water trade is exacerbating scarcities in water-scarce regions and our analysis has shown that rather than being dictated by water endowments, trade patterns are influenced by factors such as per capita availability of arable land and more importantly by biases in food and agriculture policies of the Government of India, as indicated by the Food Corporation of India’s procurement patterns. Given that the desperation of the 1960s and 1970s with respect to national food security no longer exists, there is a strong case for reversing this trend through changes in food procurement and input subsidy policies. According to international trade theory, there are five basic reasons why trade takes place between two entities: (1) differences in technological abilities; (2) differences in resource endowments; (3) differences in demand; (4) existence of economies of scale; and (5) existence of government policies that might create new comparative advantages and disadvantages that are different from natural advantages and disadvantages (Suranovic, 2007). Much of the literature on virtual water trade so far has focused almost entirely on differences caused by water endowments. We argue, however, that in order to have a comprehensive understanding of the behavior of agents in trade, all other reasons including endowments of nonwater factors of production (such as land) and the impact of government policies need to be taken into consideration. The NRLP is often wrongly portrayed as a solution only to the problem of national food security, Its promises go much further however. For instance, if the promise of flood protection in the east is achieved through careful implementation, it might free up scarce land resources by preventing waterlogging. This will boost food production potential in the water-rich but food-deficit regions. Another significant potential benefit of the NRLP could be hydropower generation. The NRLP promises to add 34 Giga-watts of largely CO2-neutral hydropower capacity to a fast-growing, energy-hungry economy. On the other hand, on top of the implementation costs, additional costs of the NRLP will include potential adverse environmental and social consequences for affected ecosystems and communities. Finally, while our analysis based on estimates of trade balances at the state level provides a conceptual picture of the conflict between the two alternatives of virtual water trade and physical inter-basin water transfers, the same can more accurately be evaluated by carrying out an empirical study of the potential of virtual water trade in a particular proposed river link. Three of the 30 odd links proposed under the NRLP are independent links, and the first one most likely to be implemented is the Ken-Betwa link between two adjoining sub-basins in central India. Carrying out such an analysis at that scale with data on actual (as opposed to estimated) trade and better estimates of water resources in the donor and recipient basins will be a useful exercise to further our understanding of virtual and physical transfers across river basins, and their possible tradeoffs. Acknowledgments This paper presents findings from PN48 ‘Strategic analysis of river linking’, a project of the CGIAR Challenge Program on Water and Food. The paper stems from the Masters’ thesis of Shilp Verma at UNESCO-IHE under the supervision of Pieter van der Zaag and Frank Rijsberman (Verma, 2007), which was financially supported by PN48. The paper is further based on another Masters’ thesis undertaken at the University of Twente by Doeke Kampman and supervised by Arjen Hoekstra and Maarten Krol (Kampman, 2007). The paper has benefited from comments by Joyeeta Gupta (UNESCO-IHE, Delft and Vrije University, Amsterdam). An earlier version of the paper was presented (in oral and poster format) at the European Geosciences Union (EGU) conference in Vienna (April 2007) under the title 'Virtual Water and India’s Water Future 2050' (Verma and Van der Zaag, 2007). References Allan, J.A. 1993. Fortunately there are substitutes for water otherwise our hydro-political futures would be
impossible. In: ODA (Ed.) Priorities for water resources allocation and management, pp. 13-26, Overseas Development Administration (ODA), London.
Allan, J.A. 1994. Overall perspectives on countries and regions. In: P. Rogers, and P. Lydon. (Eds.) Water in the
Arab World: Perspectives and Prognoses, pp. 65-100, Harvard University Press, Cambridge, Massachusetts.
Allan, J.A. 1998. Virtual water: A strategic resource, global solutions to regional deficits. Groundwater, 36(4):
545-6.
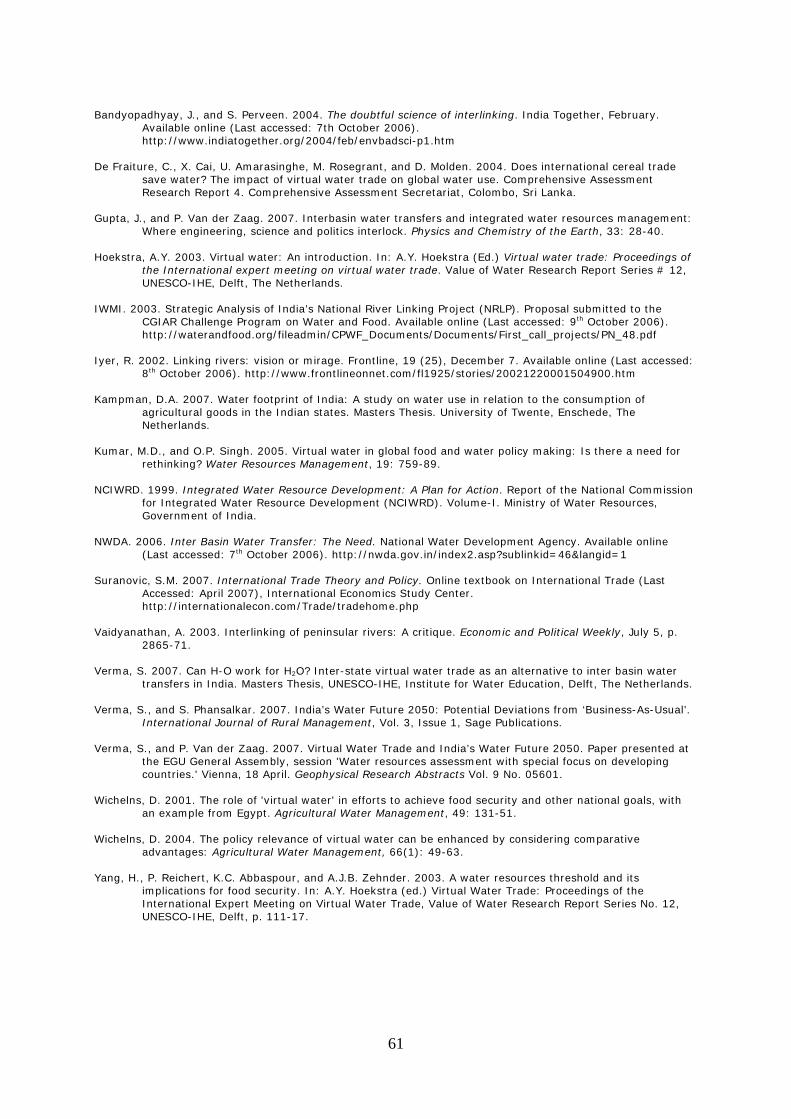
61
Bandyopadhyay, J., and S. Perveen. 2004. The doubtful science of interlinking. India Together, February.
Available online (Last accessed: 7th October 2006). http://www.indiatogether.org/2004/feb/envbadsci-p1.htm
De Fraiture, C., X. Cai, U. Amarasinghe, M. Rosegrant, and D. Molden. 2004. Does international cereal trade
save water? The impact of virtual water trade on global water use. Comprehensive Assessment Research Report 4. Comprehensive Assessment Secretariat, Colombo, Sri Lanka.
Gupta, J., and P. Van der Zaag. 2007. Interbasin water transfers and integrated water resources management:
Where engineering, science and politics interlock. Physics and Chemistry of the Earth, 33: 28-40. Hoekstra, A.Y. 2003. Virtual water: An introduction. In: A.Y. Hoekstra (Ed.) Virtual water trade: Proceedings of
the International expert meeting on virtual water trade. Value of Water Research Report Series # 12, UNESCO-IHE, Delft, The Netherlands.
IWMI. 2003. Strategic Analysis of India’s National River Linking Project (NRLP). Proposal submitted to the
CGIAR Challenge Program on Water and Food. Available online (Last accessed: 9th October 2006). http://waterandfood.org/fileadmin/CPWF_Documents/Documents/First_call_projects/PN_48.pdf
Iyer, R. 2002. Linking rivers: vision or mirage. Frontline, 19 (25), December 7. Available online (Last accessed:
8th October 2006). http://www.frontlineonnet.com/fl1925/stories/20021220001504900.htm Kampman, D.A. 2007. Water footprint of India: A study on water use in relation to the consumption of
agricultural goods in the Indian states. Masters Thesis. University of Twente, Enschede, The Netherlands.
Kumar, M.D., and O.P. Singh. 2005. Virtual water in global food and water policy making: Is there a need for
rethinking? Water Resources Management, 19: 759-89. NCIWRD. 1999. Integrated Water Resource Development: A Plan for Action. Report of the National Commission
for Integrated Water Resource Development (NCIWRD). Volume-I. Ministry of Water Resources, Government of India.
NWDA. 2006. Inter Basin Water Transfer: The Need. National Water Development Agency. Available online
(Last accessed: 7th October 2006). http://nwda.gov.in/index2.asp?sublinkid=46&langid=1 Suranovic, S.M. 2007. International Trade Theory and Policy. Online textbook on International Trade (Last
Accessed: April 2007), International Economics Study Center. http://internationalecon.com/Trade/tradehome.php
Vaidyanathan, A. 2003. Interlinking of peninsular rivers: A critique. Economic and Political Weekly, July 5, p.
2865-71. Verma, S. 2007. Can H-O work for H2O? Inter-state virtual water trade as an alternative to inter basin water
transfers in India. Masters Thesis, UNESCO-IHE, Institute for Water Education, Delft, The Netherlands. Verma, S., and S. Phansalkar. 2007. India’s Water Future 2050: Potential Deviations from ‘Business-As-Usual’.
International Journal of Rural Management, Vol. 3, Issue 1, Sage Publications. Verma, S., and P. Van der Zaag. 2007. Virtual Water Trade and India’s Water Future 2050. Paper presented at
the EGU General Assembly, session 'Water resources assessment with special focus on developing countries.' Vienna, 18 April. Geophysical Research Abstracts Vol. 9 No. 05601.
Wichelns, D. 2001. The role of 'virtual water' in efforts to achieve food security and other national goals, with
an example from Egypt. Agricultural Water Management, 49: 131-51. Wichelns, D. 2004. The policy relevance of virtual water can be enhanced by considering comparative
advantages: Agricultural Water Management, 66(1): 49-63. Yang, H., P. Reichert, K.C. Abbaspour, and A.J.B. Zehnder. 2003. A water resources threshold and its
implications for food security. In: A.Y. Hoekstra (ed.) Virtual Water Trade: Proceedings of the International Expert Meeting on Virtual Water Trade, Value of Water Research Report Series No. 12, UNESCO-IHE, Delft, p. 111-17.
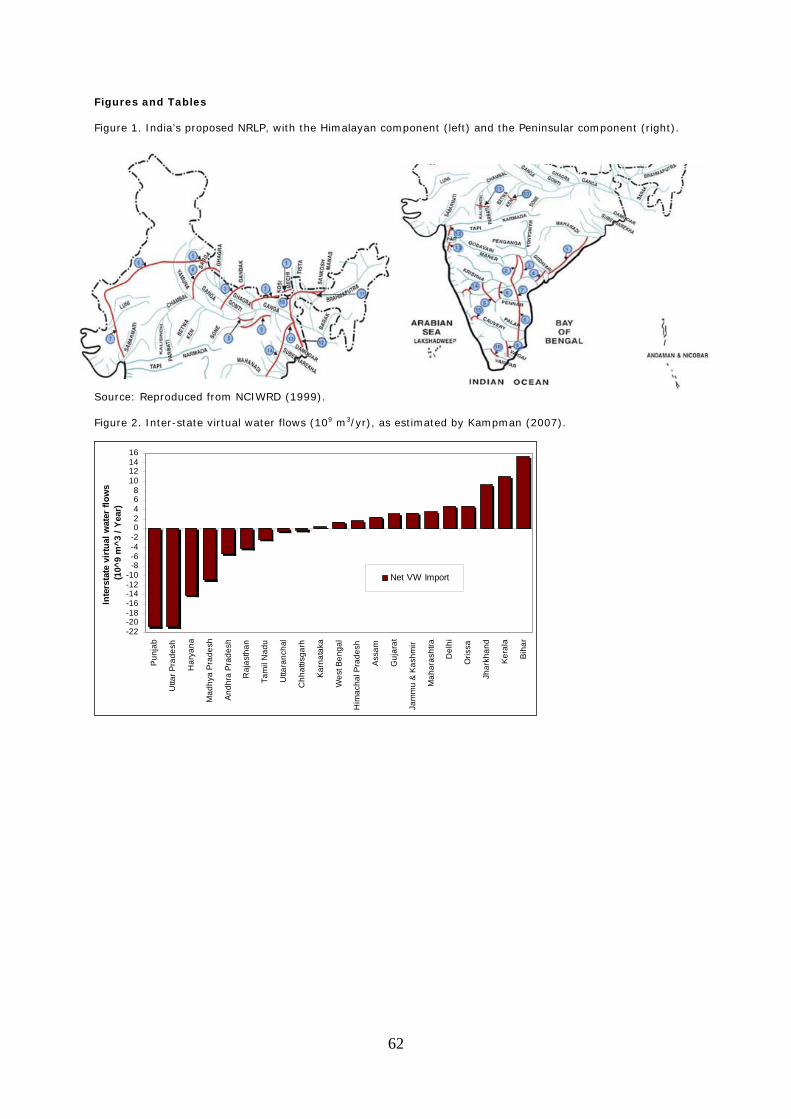
62
Figures and Tables Figure 1. India’s proposed NRLP, with the Himalayan component (left) and the Peninsular component (right).
Source: Reproduced from NCIWRD (1999). Figure 2. Inter-state virtual water flows (109 m3/yr), as estimated by Kampman (2007).
-22-20-18-16-14-12-10
-8-6-4-202468
10121416
Pun
jab
Utta
r Pra
desh
Har
yana
Mad
hya
Pra
desh
And
hra
Pra
desh
Raj
asth
an
Tam
il N
adu
Utta
ranc
hal
Chh
attis
garh
Karn
atak
a
Wes
t Ben
gal
Him
acha
l Pra
desh
Ass
am
Guj
arat
Jam
mu
& K
ashm
ir
Mah
aras
htra
Del
hi
Oris
sa
Jhar
khan
d
Ker
ala
Bih
ar
Inte
rsta
te v
irtu
al w
ater
flow
s (1
0^9
m^3
/ Ye
ar)
Net VW Import
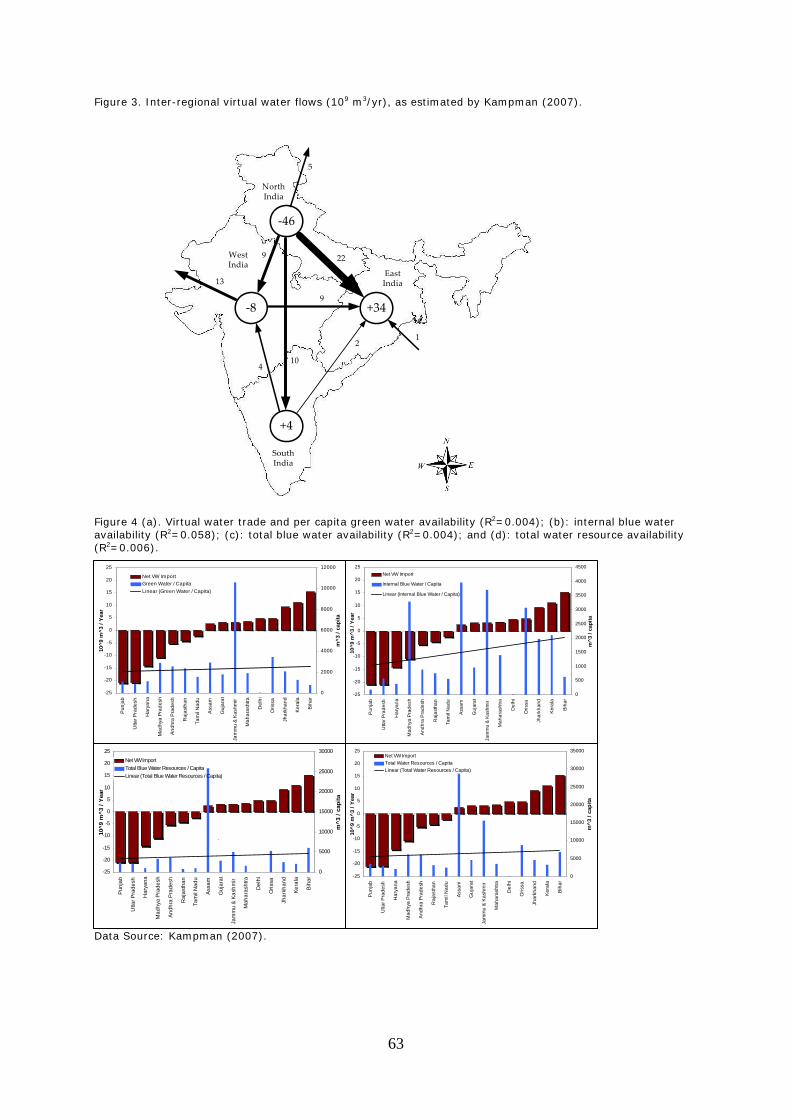
63
Figure 3. Inter-regional virtual water flows (109 m3/yr), as estimated by Kampman (2007).
Figure 4 (a). Virtual water trade and per capita green water availability (R2=0.004); (b): internal blue water availability (R2=0.058); (c): total blue water availability (R2=0.004); and (d): total water resource availability (R2=0.006).
Data Source: Kampman (2007).
9
4
2
9
22
10
+4
‐8 +34
‐46
1
13
5
North India
South India
East India
West India
-25
-20
-15
-10
-5
0
5
10
15
20
25
Pun
jab
Utta
r Pra
desh
Har
yana
Mad
hya
Prad
esh
Andh
ra P
rade
sh
Raj
asth
an
Tam
il N
adu
Ass
am
Guj
arat
Jam
mu
& K
ashm
ir
Mah
aras
htra
Del
hi
Oris
sa
Jhar
khan
d
Ker
ala
Biha
r
10^9
m^3
/ Y
ear
0
2000
4000
6000
8000
10000
12000
m^3
/ ca
pita
Net VW ImportGreen Water / CapitaLinear (Green Water / Capita)
-25
-20
-15
-10
-5
0
5
10
15
20
25
Pun
jab
Utta
r Pra
desh
Har
yana
Mad
hya
Pra
desh
And
hra
Pra
desh
Raj
asth
an
Tam
il N
adu
Ass
am
Guj
arat
Jam
mu
& Ka
shm
ir
Mah
aras
htra
Del
hi
Oris
sa
Jhar
khan
d
Ker
ala
Bih
ar
10^9
m^3
/ Ye
ar
0
500
1000
1500
2000
2500
3000
3500
4000
4500
m^3
/ ca
pita
Net VW Import
Internal Blue Water / Capita
Linear (Internal Blue Water / Capita)
-25
-20
-15
-10
-5
0
5
10
15
20
25
Punj
ab
Utta
r Pra
desh
Har
yana
Mad
hya
Pra
desh
And
hra
Pra
desh
Raj
asth
an
Tam
il N
adu
Assa
m
Guj
arat
Jam
mu
& Ka
shm
ir
Mah
aras
htra
Del
hi
Oris
sa
Jhar
khan
d
Ker
ala
Biha
r
10^9
m^3
/ Y
ear
0
5000
10000
15000
20000
25000
30000
m^3
/ ca
pita
Net VW ImportTotal Blue Water Resources / CapitaLinear (Total Blue Water Resources / Capita)
`
-25
-20
-15
-10
-5
0
5
10
15
20
25
Pun
jab
Utta
r Pra
desh
Har
yana
Mad
hya
Prad
esh
Andh
ra P
rade
sh
Raj
asth
an
Tam
il N
adu
Ass
am
Guj
arat
Jam
mu
& K
ashm
ir
Mah
aras
htra
Del
hi
Oris
sa
Jhar
khan
d
Ker
ala
Biha
r
10^9
m^3
/ Y
ear
0
5000
10000
15000
20000
25000
30000
35000
m^3
/ ca
pita
Net VW ImportTotal Water Resources / CapitaLinear (Total Water Resources / Capita)
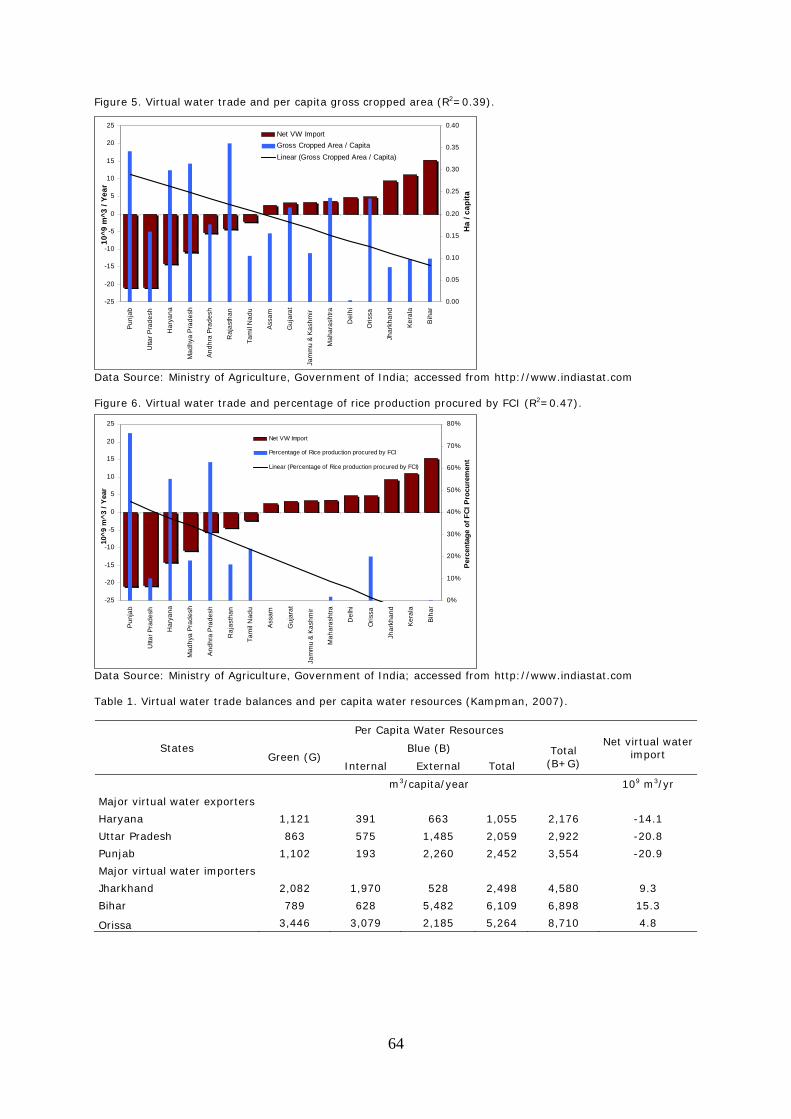
64
Figure 5. Virtual water trade and per capita gross cropped area (R2=0.39).
Data Source: Ministry of Agriculture, Government of India; accessed from http://www.indiastat.com Figure 6. Virtual water trade and percentage of rice production procured by FCI (R2=0.47).
Data Source: Ministry of Agriculture, Government of India; accessed from http://www.indiastat.com Table 1. Virtual water trade balances and per capita water resources (Kampman, 2007).
States
Per Capita Water Resources Net virtual water
import Green (G) Blue (B) Total
(B+G) Internal External Total
m3/capita/year 109 m3/yr
Major virtual water exporters
Haryana 1,121 391 663 1,055 2,176 -14.1
Uttar Pradesh 863 575 1,485 2,059 2,922 -20.8
Punjab 1,102 193 2,260 2,452 3,554 -20.9
Major virtual water importers
Jharkhand 2,082 1,970 528 2,498 4,580 9.3
Bihar 789 628 5,482 6,109 6,898 15.3
Orissa 3,446 3,079 2,185 5,264 8,710 4.8
-25
-20
-15
-10
-5
0
5
10
15
20
25Pu
njab
Utta
r Pra
desh
Har
yana
Mad
hya
Pra
desh
Andh
ra P
rade
sh
Raj
asth
an
Tam
il N
adu
Assa
m
Guj
arat
Jam
mu
& K
ashm
ir
Mah
aras
htra
Del
hi
Oris
sa
Jhar
khan
d
Kera
la
Bih
ar
10^9
m^3
/ Ye
ar
0.00
0.05
0.10
0.15
0.20
0.25
0.30
0.35
0.40
Ha
/ cap
ita
Net VW ImportGross Cropped Area / CapitaLinear (Gross Cropped Area / Capita)
-25
-20
-15
-10
-5
0
5
10
15
20
25
Pun
jab
Utta
r Pra
desh
Har
yana
Mad
hya
Pra
desh
And
hra
Pra
desh
Raj
asth
an
Tam
il N
adu
Ass
am
Guj
arat
Jam
mu
& K
ashm
ir
Mah
aras
htra
Del
hi
Oris
sa
Jhar
khan
d
Ker
ala
Bih
ar
10^9
m^3
/ Ye
ar
0%
10%
20%
30%
40%
50%
60%
70%
80%
Perc
enta
ge o
f FCI
Pro
cure
men
t
Net VW Import
Percentage of Rice production procured by FCI
Linear (Percentage of Rice production procured by FCI)
65
Beyond ‘Basin’: the politics of scale in Mekong water governance
L. Lebel1, R.C. Bastakoti1, R. Daniel1, and S. Ratanawilailak1
1Unit for Social and Environmental Research, Chiang Mai University, Thailand [email protected] Abstract The appropriate scales for science, management, and decision-making cannot be unambiguously derived from physical characteristics of water resources. Scales are a joint product of social and biophysical processes. Actors contest spatial, temporal, and jurisdictional boundaries and levels and try to shape agenda to fit the levels at which they have most influence. Despite the popularity of basin notions among water experts, basins are often not the sole, or even primary, unit of water management. Political and various administrative boundaries with consequences for water- and land-uses often have different edges and are nested in separate hierarchies. Moreover, the hydrological unity of basins defined at a particular spatial level, are increasingly undermined by interbasin transfers and use of groundwater. There is no single, correct, area for managing water. Water politics is multiscale and invariably cuts across 'basin' boundaries. Media grab There is no single, correct, area for managing water. Water politics is multiscale and cuts across ‘basin’ boundaries. Introduction The river basin is widely portrayed as the ‘natural’ and ‘ideal’ unit of management for water resources. There are some good reasons for this: the interconnections along waterways are important for fish and other aquatic organisms; many of the strong influences of land-use on river flows are within basin; storage, diversion and use of water upstream affects water available or flood risks downstream. But there are also important limitations: basins are increasingly linked by physical diversions and transfers; groundwater interactions may not fully reflect surface flows; administrative and other political boundaries often do not correspond to basins; at levels below that of the entire basin, subdivisions are usually highly arbitrary. In this paper we focus on how the politics of scale can undermine the ‘basin’ as the sole or primary unit of management. The politics of scale is a metaphor used mostly in political geography and related fields. It has been helpful in drawing attention to the ways in which scale choices are constrained overtly by politics and more subtly by choices of technologies, institutional designs and measurements (Lebel et al., 2005). In doing so, however, the scale metaphor has been stretched to cover a lot of different spatial relationships; there are benefits for understanding and action in the case of water, in particular, of distinguishing issues of scale from those of place and position (Lebel et al., 2005). The politics of scale consists of at least three distinct governance problems relevant to efforts to improve water governance. First is the problem of transferability: Can institutional designs that work well at one level be transferred to another level? There are successful examples of communities that manage small upper tributary watersheds and local irrigation systems. There are also modest successes with larger international basins. But are structures and rules interchangeable across levels or scales? Second is the problem of interplay: Can the interaction between institutions operating at different levels on the same scale be guided in such a way that improves performance? There are many instances where local level institutions respond to changes in national level ones, and sometimes where national responds to international ones. Governance is multilevel and a vertical interplay of institutions can be important. But are there ways to make those interactions mostly constructive? Third is the problem of scale choice: Can political contests over choices of scales and levels be made fair and accountable? Actors contest spatial, temporal, and jurisdictional boundaries and levels, and try to shape agenda to fit the levels at which they have most influence. Institutional and less structured forms of engagement need to ensure that actors with a range of different level-dependent interests are represented. But what if capacities to engage are largely concentrated at a single level? Methods The Mekong region is taken here to cover Burma/Myanmar, Thailand, Lao PDR, Vietnam, Cambodia, and Yunnan Province in China. It thus includes, but is not restricted to, the Mekong River. This paper draws on experiences in four case studies of water politics at very different spatial levels. These are: (1) Negotiation and cooperation in the Mekong River Basin following and under the 1995 Mekong Agreement; (2) Management of risks to the Tonle Sap flood pulse ecosystem from mainstream Mekong infrastructure; (3) Interaction between communal and state irrigation schemes in the main valley of the Upper Ping River Basin; and (4) Conflict resolution in a sprinkler irrigation scheme in Mae Hae, a small upper tributary watershed in northern Thailand. Case studies 1 and 2 draw largely on secondary sources, including government documents, previously published accounts, and newspaper articles. Case study 3 draws on both primary data collected by the authors through in-depth interviews and secondary data. Case study 4 draws entirely on primary interviews, direct observation in field, and in watershed network meetings.
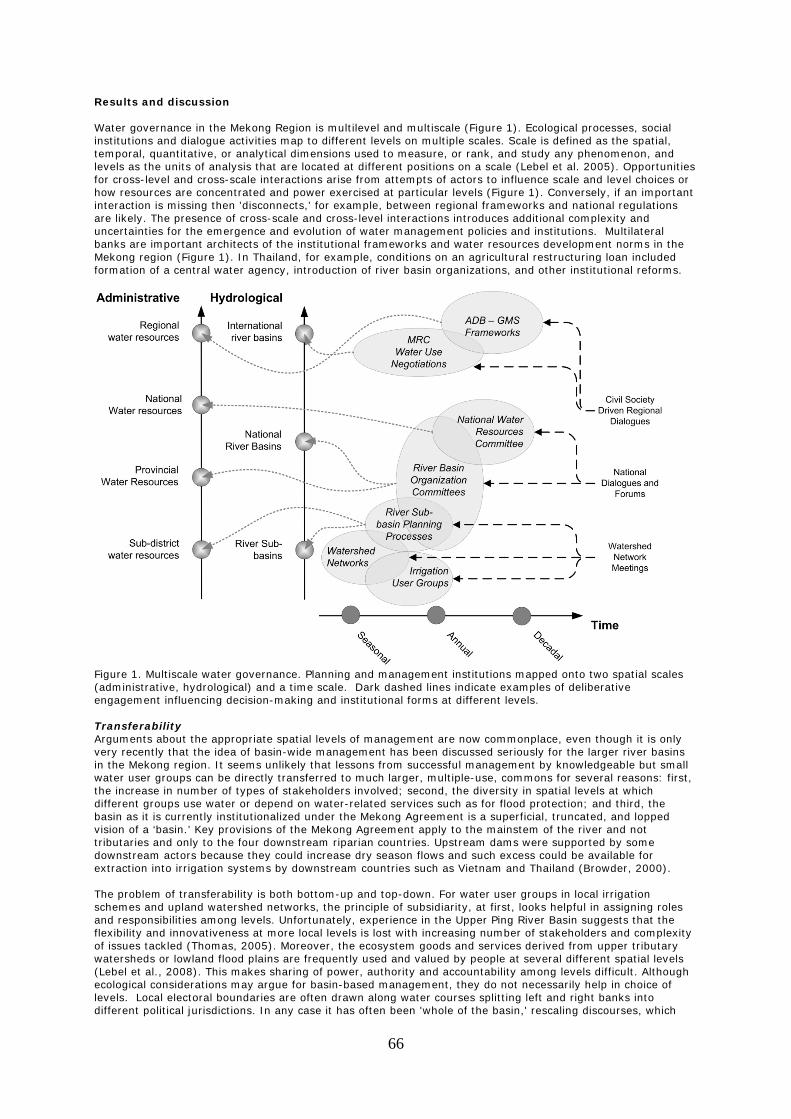
66
Results and discussion Water governance in the Mekong Region is multilevel and multiscale (Figure 1). Ecological processes, social institutions and dialogue activities map to different levels on multiple scales. Scale is defined as the spatial, temporal, quantitative, or analytical dimensions used to measure, or rank, and study any phenomenon, and levels as the units of analysis that are located at different positions on a scale (Lebel et al. 2005). Opportunities for cross-level and cross-scale interactions arise from attempts of actors to influence scale and level choices or how resources are concentrated and power exercised at particular levels (Figure 1). Conversely, if an important interaction is missing then 'disconnects,' for example, between regional frameworks and national regulations are likely. The presence of cross-scale and cross-level interactions introduces additional complexity and uncertainties for the emergence and evolution of water management policies and institutions. Multilateral banks are important architects of the institutional frameworks and water resources development norms in the Mekong region (Figure 1). In Thailand, for example, conditions on an agricultural restructuring loan included formation of a central water agency, introduction of river basin organizations, and other institutional reforms.
Figure 1. Multiscale water governance. Planning and management institutions mapped onto two spatial scales (administrative, hydrological) and a time scale. Dark dashed lines indicate examples of deliberative engagement influencing decision-making and institutional forms at different levels. Transferability Arguments about the appropriate spatial levels of management are now commonplace, even though it is only very recently that the idea of basin-wide management has been discussed seriously for the larger river basins in the Mekong region. It seems unlikely that lessons from successful management by knowledgeable but small water user groups can be directly transferred to much larger, multiple-use, commons for several reasons: first, the increase in number of types of stakeholders involved; second, the diversity in spatial levels at which different groups use water or depend on water-related services such as for flood protection; and third, the basin as it is currently institutionalized under the Mekong Agreement is a superficial, truncated, and lopped vision of a ‘basin.’ Key provisions of the Mekong Agreement apply to the mainstem of the river and not tributaries and only to the four downstream riparian countries. Upstream dams were supported by some downstream actors because they could increase dry season flows and such excess could be available for extraction into irrigation systems by downstream countries such as Vietnam and Thailand (Browder, 2000). The problem of transferability is both bottom-up and top-down. For water user groups in local irrigation schemes and upland watershed networks, the principle of subsidiarity, at first, looks helpful in assigning roles and responsibilities among levels. Unfortunately, experience in the Upper Ping River Basin suggests that the flexibility and innovativeness at more local levels is lost with increasing number of stakeholders and complexity of issues tackled (Thomas, 2005). Moreover, the ecosystem goods and services derived from upper tributary watersheds or lowland flood plains are frequently used and valued by people at several different spatial levels (Lebel et al., 2008). This makes sharing of power, authority and accountability among levels difficult. Although ecological considerations may argue for basin-based management, they do not necessarily help in choice of levels. Local electoral boundaries are often drawn along water courses splitting left and right banks into different political jurisdictions. In any case it has often been 'whole of the basin,' rescaling discourses, which
67
have been used to justify 'larger scale' views of development in which those key ecological processes important to livelihoods of fishers or farmers at smaller spatial and temporal levels are rendered invisible. Vertical interplay The Mekong River Agreement of 1995 is a relatively well studied component of the water regime in the Mekong region (Browder, 2000; Dore, 2003). It established the Mekong River Commission (MRC), a secretariat, and a set of National Mekong Committees (NMCs). Regime formation has been complicated by the presence of a very powerful nonmember upstream state, China, and a relatively more industrialized and wealthy midstream, member state, Thailand, both willing and able to develop water resources on their own territory and make bilateral deals to meet their own rapidly expanding water, energy, and transport demands. The relationship between the MRC and the member countries remains tenuous because the MRC has little influence beyond the NMCs. As a result states can make NMCs more or less powerful through the organizations they assign to positions and responsibilities. Each country has made strategic assignments about who is on committees and who they send to regional meetings. But within countries there are also important levels at which objectives can be set and which pit different interests against each other (Molle, 2007; Sneddon, 2002). Conflicts over water are often more nuanced than a contest between monolithic state and united community interests. Rather both state and local communities pursue diverse agenda. Even the bounding or defining of what a 'community' is, or where the community level is on the social scale, are contested and, consequently, shaped by various discourses, decisions, and practices (Lebel et al., 2008). Many actors in the region are concerned about the aggregate implications of mainstream and tributary dams in all of the countries on the natural flood regimes important to productivity and proper functioning of wetlands, especially Tonle Sap Lake (Sokhem and Sunada, 2006). Managing Tonle Sap Basin without consideration of the mainstream of the Mekong is always going to be difficult, given that it is the seasonal reversal in flows arising from peak flows in the mainstream of the Mekong that drive the flood pulse within the Lake and its flood pulse dynamics. At very small geographical areas, interplay among existing institutions can be crucial to water governance. Thus in the upper reaches of Mae Hae watershed, local institutions associated with elders in Hmong and Karen communities are important to conflict resolution over dry season water shortages. At the same time, conflicts among villages have co-opted a forest-protection oriented watershed network to help solve problems that cut across district administrative boundaries and basins as farmers pipe water across ridges in what are effectively micro interbasin transfers. Here cross-scale and cross-level interactions are important and the former is multibasin. Contesting scale Scale represents a class of key choices, commitments, and constraints that actors contest or are forced to accept. Actors contest scales and levels, overtly through debates, media releases, lobbying and protests, and more subtly, through use and control of technologies, indicators, measurements and controlling the channels of contestation (Lebel et al., 2005). Some actors push for hydrological scales with levels that correspond to manageable units in their models or infrastructure they operate. Others promote conventional, area-based administrative hierarchies, arguing that this is where capacity, accountability, and legitimacy already exist. Either way level-dependent interests matter. Thus, to protect Chiang Mai City from floodwaters of the Upper Ping River, and Bangkok from floodwaters of the Chao Phraya River, the preferred unit of management is rescaled to all the basin area upstream. But the Ping is one tributary of the Chao Phraya, and there are wetlands and rainfed and irrigated farming lands with distinct flood-related interests. The scales and levels in use are a joint product of social and biophysical processes; they are not unambiguously defined by the physics of flows, the dynamics of ecosystems, or the rules of water use (Lebel et al., 2005). One of the fundamental concerns about development in the Mekong region is how water resources are being governed has neither been fair or sustainable. While the interests and needs of minorities, women, migrants and diverse groups of the poor, are often claimed in the rhetoric of projects, organizations, and policies, meaningful representation in defining and choosing among development alternatives has been rare. International banks and firms have sometimes had better access to information from, and stronger accountability relationships with, national governments than a country’s own citizens. A key consequence is that completed water projects often have significant disconnects with local livelihoods. The rescaling of regions via large infrastructure projects is also from a livelihood perspective a change of resolution. Local uses of water resources for irrigation and fishing are simply made invisible by a high, regional, vantage point and the statistics or policies operating at the level. Energy, for example, is often framed in national-level benefits but individual project-level impacts, whereas fishery livelihood implications may be framed at the level of local jurisdictions or more broadly through aggregate and cumulative project impacts. Deliberation takes place at different levels and may involve debating choices about appropriate scales and levels for water management and consequently who should be involved in conversations. Many actors have strong preconceptions about the importance of their own or other levels. Some actors are free to select their vantage points, whereas others are restricted by mandates to viewing water resources and management from a particular level. Conclusions and recommendations Despite the popularity of basin notions among water experts, basins are often not the sole, or even primary, unit of water management. Political and various administrative boundaries with consequences for water–and land-uses often have different edges and are nested in separate hierarchies. Given the many different possible
68
ways of setting levels of management and choosing the specific spatial scale or area-based hierarchy for administration, it is not surprising to find both pluralism of scales and levels in practice, and also some rather poor fits between institutional designs and specific management objectives and needs. The contrast between administrative and basin-based hierarchies is a frequent reality for water resources management. There is no single, correct area, for managing water. The implication for water policy is that deliberation, negotiation, and decision-making institutions will usually need to be multilevel, multicenter, and flexible enough to adapt to changing resource conditions and uses. Acknowledgments This paper presents findings from PN50 ‘Enhancing multi-scale Mekong water governance,’ a project of the CGIAR Challenge Program on Water and Food. We thank our colleagues in M-POWER (www.mpowernet.org) for sharing findings with us over the years. References Browder, G. 2000. An analysis of the negotiations for the 1995 Mekong Agreement. International Negotiation,
5:237-61. Dore, J. 2003. The governance of increasing Mekong regionalism. Pages 405-440 in Mingsarn Kaosa-ard, and J.
Dore (ed.) Social Challenges for the Mekong Region. White Lotus, Bangkok. Lebel, L., R. Daniel, N. Badenoch, and P. Garden. 2008. A multi-level perspective on conserving with
communities: experiences from upper tributary watersheds in montane mainland southeast Asia. International Journal of the Commons, 1:127-54.
Lebel, L., P. Garden, and M. Imamura. 2005. Politics of scale, position and place in the governance of water
resources in the Mekong region. Ecology and Society, 10:18. [online] URL: http://www.ecologyandsociety.org/vol10/iss12/art18/.
Molle, F. 2007. Scales and power in river basin management: the Chao Phraya River in Thailand. The
Geographical Journal, 173:358-73. Sneddon, C. 2002. Water conflicts and river basins: the contradictions of co-management and scale in
northeast Thailand. Society and Natural Resources, 15:725-41. Sokhem, P., and K. Sunada. 2006. The governance of the Tonle Sap Lake, Cambodia: integration of local,
national and international levels. Water Resources Development, 22:399-416. Thomas, D.E. 2005. Developing Watershed Management Organizations in Pilot Sub-Basins of the Ping River
Basin. Office of Natural Resources and Environmental Policy and Planning, Ministry of Natural Resources and Environment.
69
Water rights in informal economies in the Limpopo and Volta basins
B. van Koppen1, T. Shah1, R. Namara1, B. Barry1, P. van der Zaag2, and E. Obeng Bekoe3
1IWMI [email protected] 2Unesco-IHE, Netherlands
3CSIR, Ghana
Abstract The CPWF project CP66 ‘Water rights in informal economies in the Limpopo and Volta basins’ evaluates the newly promulgated water laws in the riparian countries of the Limpopo and Volta basins from the perspective of the majority of water users: informal small-scale water users in rural areas whose use and management of water for a range of uses is governed by informal local arrangements. The project also assesses the alignment of the new laws with the dominant policy agenda of governments, agricultural and rural development and financing agencies for rural small-scale users, which is to invest in the development of usually abundant water resources. This paper presents the results of the inception phase, in particular the central concept of ‘hydraulic property rights creation’ and the hypotheses for the three components of the research in each of the participating countries: Burkina Faso, Ghana, Mozambique, South Africa, and Zimbabwe. The components are: an historical analysis of water legislation; the quantitative mapping of the informal water economies; and the qualitative mapping of informal water economies. Media grab There is a strong contradiction between the newly promulgated water laws and the policy agenda for and endeavors of the majority of informal rural small-scale water users, which focus on investments in water development. Introduction Since the 1990s, many African countries have promulgated new water legislation. In line with a global trend, all reforms promoted state property of water resources and permit systems as the supposed ‘more efficient and better allocation of water resources’ that would allow ‘for most beneficial use of available water resources, satisfying the public interest in the best way’ (GWP Toolbox 2007). Riparian countries in the Limpopo and Volta basins were among the frontrunners: Mozambique Water Law 16/91 in 1991, Ghana Water Resources Commission Act (Act 552) in 1996, Zimbabwe Water Act no 31/98 in 1998, South Africa National Water Act no.36 in 1998, and Burkina Faso Loi d’orientation relative à l’eau no 002-2001/AN in 2001. This research addresses the problem that emerges from early implementation experiences, which is that implementation of the new laws including revenue raising may be relatively straightforward among the handful of formal large-scale users, such as water supply providers, hydropower companies, industries, or large irrigation schemes. Implementation is considerably more problematic, however, in informal rural and periurban settings in low- and middle-income countries. These informal water economies encompass the country’s large majority of water users, whose agrarian livelihoods depend in many ways upon water for multiple domestic and productive uses. In large numbers, they directly access groundwater and surface water for self-supply, often without the state even being aware. Regulating all these informal users is not only logistically a daunting task, but may also negatively interfere in well-functioning existing informal or customary water arrangements. Moreover, enhanced regulation and upwards financing streams seem at odds with the priorities of the same governments and international water development and investment institutions. This is to encourage investments in water resources development for agricultural and rural growth for which considerable support, including downwards financing streams, is devoted. The latter addresses sub-Saharan Africa’s economic water scarcity in order to expand the paltry 3% of the region’s water resources that have been developed to the present. The issue is increasing the pie of available water resources for all, and not sharing a limited pie, which would justify the stronger focus on regulation. Accordingly, the key hypothesis of the Challenge Program on Water and Food CP66 project is that there is a strong contradiction between the new water laws on the one hand, and the rural realities of informal water users and the dominant policy agenda of the same institutions on the other hand. To test this hypothesis, the project will evaluate the early experiences of law implementation from the perspective of the water entitlements of the large majority of small-scale water users. This will allow deriving recommendations for both legislation (texts and implementation practices) and other public support that empowers small-scale water users and strengthens their claims to water. The project team is composed of (a) high-level policy-makers and lawyers responsible for implementation in four riparian countries of the Limpopo and Volta basins: Direction Générale des Ressources en Eau Burkina Faso, Water Resources Commission Ghana, ARA-Sul Mozambique, and Department of Water Affairs South Africa; (b) national academic institutions (Water Research Institute Ghana, Eduardo Mondlane University Mozambique, Water Research Commission South Africa, Program of Land and Agrarian Studies (PLAAS), University of Western Cape, South Africa); and (c) two global research institutes (Unesco-IHE, and IWMI as the lead organization). The links between land and water rights are studied in-depth. The project also draws on
70
insights in formal and informal water economies in South Asia through IWMI–TATA and Crossing Boundaries, and it compares with Latin America through links with the Water Law and Indigenous Rights Program (WALIR). This paper presents the results of the inception phase: the literature review, the inception workshop in February 2008, the conceptualization of water rights, and the hypotheses of the three components of the empirical research. Methods During the inception phase a common generic conceptual framework was elaborated. This included, first, a ‘Water Wheel’ which synthesized the conditions that need to be in place in order to ‘promote a system to support small-scale water users in realizing their water entitlements’. The eight conditions identified were based on the expert knowledge of project participants, as facilitated by Picoteam. Second, the concept of ‘water rights’ was further refined, focusing on the concept of ‘hydraulic property rights creation processes’. Third, a generic research design for all countries was elaborated and fine-tuned during field visits by entire country teams and the international institutions. The latter has three components: • Formal water law: its history and current texts and early implementation experiences. • Quantitative mapping of informal water economies by quantifying numbers and volumes of water used
by formal and informal water users according to the categories stipulated in the laws. • Qualitative mapping of informal water economies by analyzing and documenting case studies of
processes of ‘hydraulic property rights creation’ in endogenous (or local, customary; either individual or communal) and exogenous (publicly supported communal) cases of infrastructure development.
Results and discussion Hydraulic property rights creation The project team adopted the concept of ‘hydraulic property rights creation’ as the core of vesting claims to water. This concept not only allows analyzing empirical processes, including women’s exclusion from water entitlements, but is especially relevant for this project’s focus on the alignment between the legislation and the major policy agenda in sub-Saharan Africa of investing in rural water development. On the basis of earlier conceptualization and empirical evidence, the concept was operationalized as follows (Coward, 1986; Boelens and Dávila, 1998; Mohamed-Katere and van der Zaag, 2003). Hydraulic property rights creation is defined as the process of establishing recognized claims to water of certain quantity and quality on a particular site at certain timings. Making investments in the physical infrastructure to abstract, store, and/or convey water and, thus, create such use value of water in terms of quantity, quality, site and timing, is the single most important ground for vesting claims to water conveyed. Others who have not contributed to the investments can be excluded, although this is less the case for everybody needing drinking water and for household and community members. Investments may be individual (investments in small pumps or homestead wells), or communal (village reservoirs and irrigation furrows). Processes of hydraulic property rights creation may be entirely ‘endogenous’ (or ‘local’ or ‘informal’), with claims recognized at the local level by communities, or they may depend upon government, formal NGOs, or other outsiders (publicly supported or ‘exogenous’). In the case of public investments, governments that build the systems can exert claims, but the public constructors mostly expect users to take up at least part of the investments in operation and maintenance, as a condition for their formal entitlement to the water conveyed. Lack of clarity on such hand-over and lack of other needed support may lead to a process of ‘hydraulic property rights extinction’: water could physically be made available, but nobody exerts claims. Hydraulic property rights creation is related to land tenure. Access to land situated above groundwater or near surface water is an important practical and sometimes also legal condition for vesting water rights. Servitudes may be obligatory, though. The weaker land claims of tenants and most women affect their incentives to invest in land-bound infrastructure, unless arrangements with those holding the stronger land rights assure sufficient sharing of benefits. Water uses are typically for multiple purposes. In exogenous water infrastructure development, which typically follows the rigid fragmentation of the water sector bureaucracies according to single uses, either domestic or irrigation or livestock, or fisheries, the factual uses of these single-use designed schemes are, invariably, multiple as well. In each country, the project applies this concept of hydraulic property rights creation to analyze a set of frequently occurring endogenous and exogenous and individual and communal processes of water rights creation by small-scale rural users. They include groundwater development (manual and mechanized irrigation, domestic supplies, livestock, other enterprises) and surface water development (reservoirs of various sizes, recession agriculture, irrigation furrows, fisheries, other enterprises). Findings will enhance the understanding of the nature and the triggers of water rights creation and the respective roles of communities and public agencies. The factual role of the new water laws will be studied where possible, but such cases are very few, because the new laws have hardly been implemented as yet in informal settings (except in Zimbabwe). Findings from this component will be compared with two other components on the formal law: first, a historical analysis of the laws and early implementation of the recently promulgated law, and, second, a quantitative assessment of the numbers and volumes of informal water users according to the formal legal categories. Testing of the following generic hypotheses will allow deriving recommendations for water legislation along with other public support to boost wide-scale investments in hydraulic property rights creation.
71
Hypotheses formal water legislation: texts and implementation • Recent water law reforms were strongly influenced by European or Latin American countries and based
on fragmentary experiences from high- and middle-income countries with a tradition of permit systems. No new law has been piloted or tested beforehand.
• The laws were formulated and adopted without consulting small-scale water users; the extensive public consultations in South Africa were white-dominated.
• The water reforms deflected public resources away from the prevailing infrastructure development agendas in rural areas.
• In all countries, except in Sahel Burkina Faso and some parts of South Africa, significant quantities of water resources are still uncommitted so water scarcity is predominantly economic water scarcity.
• The new laws consolidate state ownership of water resources and (almost) all-encompassing requirements for registration (or declaration) or permits (or right, license, authorization, or concession–according to the country’s terminologies for this essentially similar legal tool). This implied a modification of existing permit systems in Zimbabwe. Although permit conditions slightly changed in Zimbabwe (by introducing, for example, time-limits and taxation), in Zimbabwe and Mozambique the major change was that the existing permit systems were now to be enforced among informal users in rural areas where those systems had largely been dormant. In francophone Burkina Faso and former British common law Ghana and South Africa, the reform entailed a new declaration of state ownership of water resources and the introduction of registration and permit systems nationwide. Although Burkina Faso and Ghana prescribe the immediate ‘regularization’ of existing water uses into permits, South Africa recognizes existing lawful uses and even discourages conversion of those existing uses into licenses, until an optional area-specific, state-led project of ‘compulsory licensing’ is implemented.
• Water managers and planners in governments adopted the new permit systems on the assumption that it would facilitate better implementation of the following functions:
• Permits are supposed to allow for better water allocation in cases of competition, although the precise mechanisms, other than through tradable permits or taxation, remain unclear. The laws also deal with allocation issues in other ways (e.g. prioritization, assurance of supply incorporated in the license).
• Obligatory registration and permit applications give information about the resource to be managed.
• Tying payment conditions to permits introduces ‘the user pays’ principle for water management tasks by government (or the catchment management agency); however, there is no comparison with alternative methods for taxation of new uses. In South Africa existing water users, whether lawful or not, are charged without conversion to licenses.
• Tying waste discharge charges to permits operationalizes the polluter pays principle, as is starting to be implemented in South Africa.
• All laws exempt micro water uses or ‘de minimis’ water uses (Hodgson, 2004) from registration or permit application obligations. Definitions vary and refer to farm size (e.g. below 3 ha of irrigable land as in Burkina; or below 1 ha in Ghana); to lifting method (e.g. manual lifting in Ghana); to purpose (with ‘subsistence’ production exempted from registration obligations in South Africa and Zimbabwe). Although this includes a large number of informal rural users, there is still a considerable grey area of large numbers of informal users that, according to the law, should register or obtain a permit. During the law formulation no quantitative assessments of these numbers were made.
• Traditional authorities are marginally and instrumentally included in the law as one of the many stakeholders for public participation, administrative data collection, and in some cases, for permit allocation.
• The implementation capacity of the water ministry and collaborating ministries is far below what is required for implementation and enforcement of the laws.
• Registration and permit requirements require disproportionate transaction and other costs by both the state and the users for smaller-scale users and represent a greater hurdle for investments for small-scale users than for large-scale users.
• Trying to replace a normative framework of claims to water that are anchored in informal community-based water arrangements (without the notion of exclusive rights) by a framework of claims based on permit systems (for individuals or even newly defined collectivities) negatively affects the essence of community-based water arrangements and well-working conflict resolution mechanisms.
• As administrative permit application procedures disproportionately disadvantage the smaller-scale users, forcing permit systems on informal rural settings is likely to exacerbate inequities in water entitlements. This is the case even in South Africa, where the goal of compulsory licensing is to redress such inequities.
• Increasing inequities among users and logistic burdens for the state can be avoided by disconnecting the obligations of permits from any entitlement, and by introducing procedures for water-sharing issues that build upon existing arrangements.
Hypotheses quantitative mapping of informal water economies • Less than 10% of the country’s total water users, who together use more than 80% of the nation’s
developed water resources, are formally (potentially) captured in government’s data bases. The remaining 90% of users is informal. Their largest portion falls under exempted uses, but a considerable number of water users would formally require to be registered and/or apply for a permit.
• Estimates of the numbers of informal users can be made on the basis of existing databases (census, surveys), which are considerably more cost-effective for government and users than requiring users to register/apply for a permit.
72
Hypotheses qualitative mapping of informal water economies • Water resources are locally perceived as an open access resource in areas with abundant water
resources. • Local authorities and community members have a favorable attitude toward other community
members’ investments in infrastructure and water use, but they enforce restrictions for ‘outsiders.’ • Directly accessing natural streams and water bodies (domestic, cattle, navigation, sand digging) is
subject to community regulations about the site of use and pollution prevention, but not the quantity. • There are spontaneous large-scale local arrangements with regard to fishing (Lake Volta). • Weak land tenure security (plots for groundwater, riparian lands along streams, homesteads, sites for
brick-making) hampers investments by women and leasers. Land tenure is no problem for those holding the primary land rights.
• Making private investments in infrastructure gives strongest rights to the water conveyed, including the right to exclude others from most uses, or to require compensation.
• In the case of growing dry-season competition for water, regulation is largely a matter of voluntary withdrawal by those for whom the enterprise becomes too unattractive. These are often the poor and women.
• Local hydraulic property creation has a higher benefit-cost ratio than public hydraulic property creation. The public sector can enhance its efficacy by better recognizing and building upon local investment strategies.
• Triggers to invest in water development include: knowledge about a technology, availability of appropriate technologies, access to capital or credits, good markets.
• Registration and permit application represent an administrative obstacle for investments by informal water users that outweighs any greater water security that permits are assumed to give.
• Public support that during the planning and construction phases fails to carefully craft users’ hydraulic property rights creation and the related obligations for operation and maintenance, contributes to lack of repairs and maintenance, siltation, and under-use if not abandonment of the infrastructure.
Conclusions and recommendations The research outlined above will generate recommendations for adaptations in the law and in other public support that build upon people’s ongoing spontaneous investments in water development. Acknowledgments This paper presents results from the inception phase of PN66 ‘Water rights in informal economies in the Limpopo and Volta basin,’ a project of the CGIAR Challenge Program on Water and Food. References Boelens, R., and G. Dávila (eds.) 1998. Searching for Equity, R. Assen, The Netherlands: Van Gorcum. Coward, Walter E. Jr. 1986. State and locality in Asian irrigation development: the property factor. In: K.C.
Nobe, and R.K. Shanpath (eds.) Irrigation management in developing countries: current issues and approaches. Proceedings of an Invited Seminar Series sponsored by the International School for Agricultural and Resource Development (ISARD). Studies in Water and Policy Management. No. 8. Boulder and London: Westview Press.
Hodgson, S. 2004. Land and water–the rights interface. FAO Legislative Study 84. Rome: Food and Agricultural
Organization of the United Nations. Mohamed-Katerere, J., and P. van der Zaag. 2003. Untying the /Knot of Silence'; making water policy and law
responsive to local normative systems. In: F.A. Hassan, M. Reuss, J. Trottier, C. Bernhardt, A.T. Wolf, J. Mohamed-Katerere, and P. van der Zaag (eds.), History and Future of Shared Water Resources. IHP Technical Documents in Hydrology–PCCP Series No. 6. UNESCO, Paris.
73
Groundwater Governance in the Indo-Gangetic Basin: an Interplay of Hydrology and Socio-Ecology
Bharat Sharma1*, Aditi Mukherjee2, Ravish Chandra3, Adlul Islam4, Bhaskar Dass5, Md. Razu Ahmed6
1International Water Management Institute, New Delhi Office, India
2International Water Management Institute, Colombo, Sri Lanka 3Rajendra Agricultural University, Pusa, India
4ICAR Research Complex for Eastern Region, Patna, India 5Jadavpur University, Kolkata, India
6Centre for Environment and Geographical Information System, Dhaka, Bangladesh *e-mail: [email protected]
Abstract Groundwater irrigation has emerged as a major socio-technical reality and has added substantive economic gains in the Indo-Gangetic Basin countries. In the Indo-Gangetic Basin the hydrology and socio-ecology and the associated agriculture and human livelihoods undergo significant shifts as one traverses from the semi-arid and water-scarce Indus Basin in the northwest to the sub-humid and water-sufficient eastern Gangetic Basin. However, basin-wide analysis shows that stage of development and utilization of the groundwater resource has limited relationship to the abundance of resource availability. Studies made at five sites in the basin under the CPWF Groundwater Governance in Asia (GGA) Project revealed that groundwater use produced higher benefits as compared to canal irrigation and conjunctive water use. Small and marginal farmers with scattered land holdings do not, however, have sufficient resources to install their own pump sets, and must depend upon their neighbors for purchase of groundwater. Furthermore, a mismatch between the basin hydrological conditions and the energy policies are leading to over-exploitation of the resource in the Indus Basin and constraining the optimal use of the resource in the eastern Gangetic Basin. We present policy options for improving the productivity, livelihoods, and resource sustainability for the small and marginal farmers of the basin. Media grab Construction of new tube wells in high-potential areas, increasing electrification in rural areas, and proper targeting of subsidies will lead to poverty alleviation for the poor and marginal farmers of the Indo-Gangetic Basin. Introduction The Indo-Gangetic Basin, though blessed with a vast network of dams, canals, and strong irrigation bureaucracy, has lost its historical supremacy of the surface irrigation systems to the more informal, demand-based and equitable groundwater irrigation. Most canal commands in the region are shrinking with groundwater taking over the critical role of irrigation provisioning. In large parts of the Indo-Gangetic Basin finding a farmer who either does not have his own pump or does not purchase water from his neighboring pump-owner may be a difficult task (Shah, 2006). The present size of the groundwater economy in the region is substantial, and it is groundwater irrigation that largely account for the variations in the value of agricultural output per hectare (Table 1; Deb Roy and Shah, 2002). Table 1. The size of groundwater economy in Indo-Gangetic basin countries*. India Pakistan Punjab Bangladesh Nepal terai Wells (million) 20 0.5 0.8 0.06 Avg. output/ well (m3/hr) 25 100 30 30 Avg. hours of operation/well/yr 330 1090 1300 205 Price of pump irrigation ($/hr) 1 2 1.5 1.5 Groundwater used (km3) 215 54.5 31.2 0.37 Value of groundwater used/ year US$ billion 8.6 1.1 1.6 0.02
(*Adapted from Deb Roy and Shah, 2002) The studies showed that with the prevailing energy and agriculture produce pricing policies (and subsidies) for cereals, groundwater use will continue to expand (Sinha et al., 2006). Groundwater irrigation is helping in catalyzing the spread of the green revolution into new areas that were not covered by surface irrigation in the 1970s. Despite this, the development, use, sharing and groundwater markets, and the agricultural production and large social benefits produced by the groundwater resource are not uniform and depend heavily upon the prevailing hydrology and socioecology of the given region/state in the vast basin, albeit with very interesting twists. Understanding sustainable groundwater management in the developing world requires blending of three distinct perspectives: (a) the resource, (b) the user, and (3) the institutional. CPWF Project on Groundwater Governance in Asia (GGA), through its cross-cutting research at five sites in four countries of the basin representing varying agro-ecologies, helped to better understand the groundwater resource and governance issues and their adaptations at the local level.
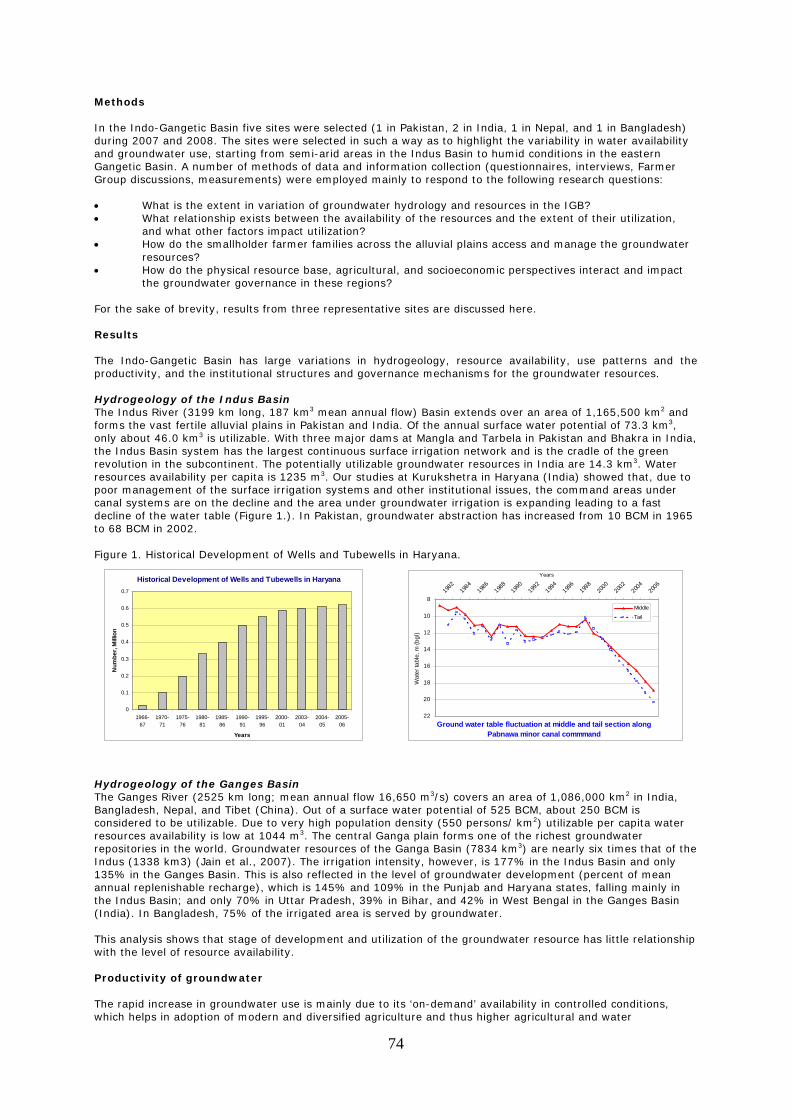
74
Methods In the Indo-Gangetic Basin five sites were selected (1 in Pakistan, 2 in India, 1 in Nepal, and 1 in Bangladesh) during 2007 and 2008. The sites were selected in such a way as to highlight the variability in water availability and groundwater use, starting from semi-arid areas in the Indus Basin to humid conditions in the eastern Gangetic Basin. A number of methods of data and information collection (questionnaires, interviews, Farmer Group discussions, measurements) were employed mainly to respond to the following research questions: • What is the extent in variation of groundwater hydrology and resources in the IGB? • What relationship exists between the availability of the resources and the extent of their utilization,
and what other factors impact utilization? • How do the smallholder farmer families across the alluvial plains access and manage the groundwater
resources? • How do the physical resource base, agricultural, and socioeconomic perspectives interact and impact
the groundwater governance in these regions? For the sake of brevity, results from three representative sites are discussed here. Results The Indo-Gangetic Basin has large variations in hydrogeology, resource availability, use patterns and the productivity, and the institutional structures and governance mechanisms for the groundwater resources. Hydrogeology of the Indus Basin The Indus River (3199 km long, 187 km3 mean annual flow) Basin extends over an area of 1,165,500 km2 and forms the vast fertile alluvial plains in Pakistan and India. Of the annual surface water potential of 73.3 km3, only about 46.0 km3 is utilizable. With three major dams at Mangla and Tarbela in Pakistan and Bhakra in India, the Indus Basin system has the largest continuous surface irrigation network and is the cradle of the green revolution in the subcontinent. The potentially utilizable groundwater resources in India are 14.3 km3. Water resources availability per capita is 1235 m3. Our studies at Kurukshetra in Haryana (India) showed that, due to poor management of the surface irrigation systems and other institutional issues, the command areas under canal systems are on the decline and the area under groundwater irrigation is expanding leading to a fast decline of the water table (Figure 1.). In Pakistan, groundwater abstraction has increased from 10 BCM in 1965 to 68 BCM in 2002. Figure 1. Historical Development of Wells and Tubewells in Haryana. Hydrogeology of the Ganges Basin The Ganges River (2525 km long; mean annual flow 16,650 m3/s) covers an area of 1,086,000 km2 in India, Bangladesh, Nepal, and Tibet (China). Out of a surface water potential of 525 BCM, about 250 BCM is considered to be utilizable. Due to very high population density (550 persons/ km2) utilizable per capita water resources availability is low at 1044 m3. The central Ganga plain forms one of the richest groundwater repositories in the world. Groundwater resources of the Ganga Basin (7834 km3) are nearly six times that of the Indus (1338 km3) (Jain et al., 2007). The irrigation intensity, however, is 177% in the Indus Basin and only 135% in the Ganges Basin. This is also reflected in the level of groundwater development (percent of mean annual replenishable recharge), which is 145% and 109% in the Punjab and Haryana states, falling mainly in the Indus Basin; and only 70% in Uttar Pradesh, 39% in Bihar, and 42% in West Bengal in the Ganges Basin (India). In Bangladesh, 75% of the irrigated area is served by groundwater. This analysis shows that stage of development and utilization of the groundwater resource has little relationship with the level of resource availability. Productivity of groundwater The rapid increase in groundwater use is mainly due to its ‘on-demand’ availability in controlled conditions, which helps in adoption of modern and diversified agriculture and thus higher agricultural and water
Historical Development of Wells and Tubewells in Haryana
0
0.1
0.2
0.3
0.4
0.5
0.6
0.7
1966-67
1970-71
1975-76
1980-81
1985-86
1990-91
1995-96
2000-01
2003-04
2004-05
2005-06
Years
Num
ber,
Mill
ion
Ground water table fluctuation at middle and tail section along Pabnawa minor canal commmand
8
10
12
14
16
18
20
22
1982
1984
1986
1988
1990
1992
1994
1996
1998
2000
2002
2004
2006
Years
Wat
er ta
ble,
m (b
gl)
Middle
Tail
75
productivity and improved livelihoods. Research studies at different sites in the basin showed that groundwater use produced higher irrigation and total water productivity as compared to canal irrigation and conjunctive water use (Table 2). Table 2. Water productivity of coarse paddy and basmati rice for different sources of irrigation (Kurukshetra site, India). Crop Sources of irrigation Irrigation water
productivity (Rs/m3) Total water
productivity(Rs/m3) Coarse paddy Canal irrigation 2.19 1.77
Conjunctive irrigation 3.07 2.43 Tubewell irrigation 4.21 3.06
Basmati Canal irrigation 4.13 3.39 Conjunctive irrigation 4.44 3.80 Tubewell irrigation 6.63 4.93
Benefits due to groundwater irrigation also depend upon the depth of groundwater and nature of the water extraction mechanisms. Studies on groundwater irrigation benefits in Bangladesh showed that irrigation by low lift pumps (LLP) and shallow tubewells (STW) was highly profitable. Benefit-cost ratio for these two modes were 4.5:1 and 2.0:1, respectively (Zahid and Ahmed, 2006). Profits to small and marginal farmers Unfortunately, the benefits due to groundwater irrigation are not uniform in the basin. Small and marginal farmers with scattered land holdings do not have sufficient resources and command areas to install their own pump sets, and depend upon their wealthy neighbors for purchase of the groundwater. As groundwater markets are not well developed in the rural landscape, the poor farmers are at the receiving end and these additional costs further erode their meager profits (Table 3). Similarly, the farmers purchasing groundwater for cultivating boro rice in Bangladesh incur higher costs of cultivation compared to the water sellers (Table 4). Table 3. Productivity of major crops (average for three villages in Vaishali district in Bihar, India). Particulars Paddy Wheat
Productivity (kg/ha)
Water productivity (kg/m3)
Productivity (kg/ha)
Water productivity (kg/m3)
Pump owner 2,373 3.21 2,679 2.20 Non pump owner 1,741 2.70 2,238 1.76 All 2,116 3.04 2,477 2.10
Source: Primary GGA survey, 2007. Table 4. Variations in cost of cultivation of boro paddy for the water buyers and sellers in Bangladesh.
Particulars Total cost (BD Taka/ha) Total cost for water buyer 35,407 Total cost for water seller with diesel motive power 34,271 Total cost for water seller with electric motive power 27,839
These farmers were more prudent in their water use, and by applying smaller water amounts at the appropriate time were able to achieve higher water productivities (Table 5). Table 5. Groundwater productivity and applied irrigation rate for boro rice in the study area in Bangladesh.
Village Water productivity (kg/m3) Applied irrigation rate (m3/ha)
Water seller Water buyer Water seller Water buyer Naktikandi 0.27 0.36 19,068 13,189 Kharakandi 0.57 0.58 8,998 8,291 Purankandi 0.31 0.35 16,462 13,718 Natunkandi 0.42 0.46 12,090 10,374 Sikdererkandi 0.35 0.41 19,890 6,765 Average 0.38 0.43 15,306 10,467
The income of the pump owners and water buyers and sellers also depends on their farm size. Though water buyers always have lower incomes than the pump owners and water sellers, contrary to the general belief the small landholders tend to be more laborious and generate higher incomes/acre as compared to the large farms (Table 6, GGA survey in Nepal terai-2008). In certain rural societies (Hoshiarpur district, Indian Punjab), where kinship bondages in the village were still strong, the pump owners supplied water to the non pump-owning neighbors without making any profit, and the cost and productivity of the two categories of farmers were quite similar. Impact of water and energy policies Groundwater can be accessed only by expending some form of energy: electricity in developed regions and diesel in remote and underdeveloped regions. As such, availability and pricing policies have great impact on the use of groundwater and are often termed as ‘water-energy nexus.’ By comparison, more developed parts (but water scarce) of the Indus Basin have more progressive or even populist energy policies (free energy supply to
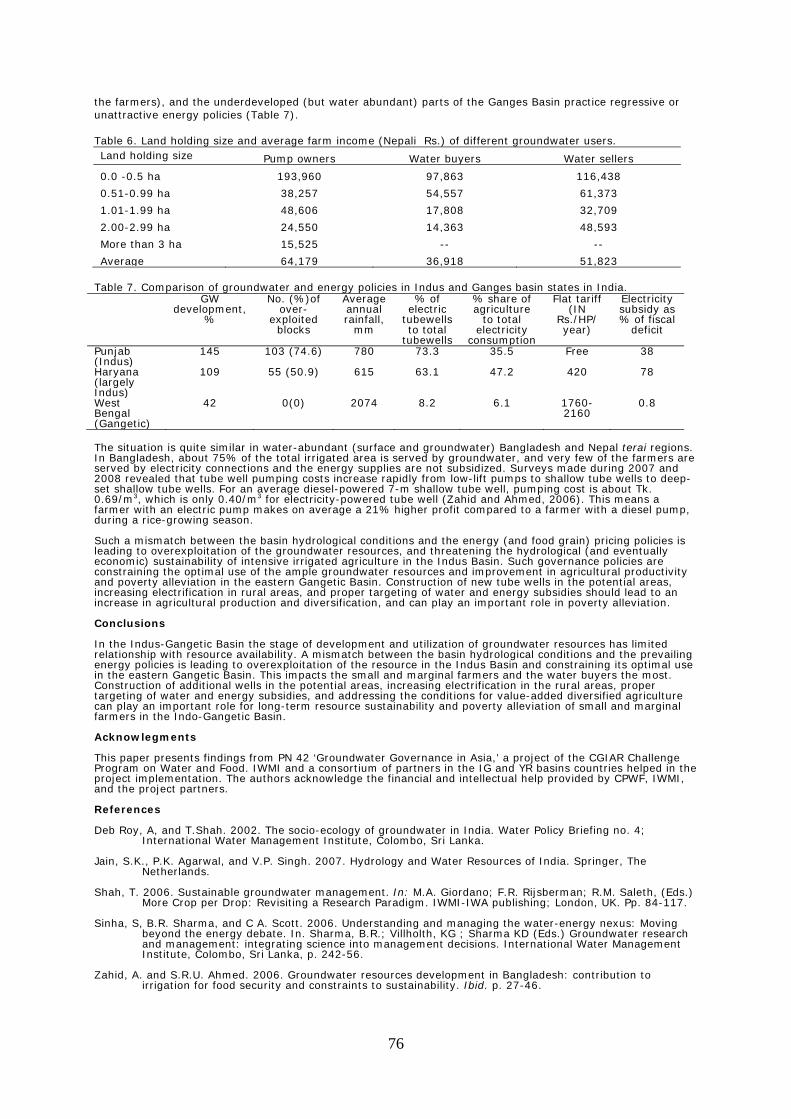
76
the farmers), and the underdeveloped (but water abundant) parts of the Ganges Basin practice regressive or unattractive energy policies (Table 7). Table 6. Land holding size and average farm income (Nepali Rs.) of different groundwater users. Land holding size Pump owners Water buyers Water sellers
0.0 -0.5 ha 193,960 97,863 116,438
0.51-0.99 ha 38,257 54,557 61,373
1.01-1.99 ha 48,606 17,808 32,709
2.00-2.99 ha 24,550 14,363 48,593
More than 3 ha 15,525 -- --
Average 64,179 36,918 51,823 Table 7. Comparison of groundwater and energy policies in Indus and Ganges basin states in India. GW
development,%
No. (%)of over-
exploited blocks
Average annual rainfall,
mm
% of electric
tubewells to total
tubewells
% share of agriculture
to total electricity
consumption
Flat tariff (IN
Rs./HP/ year)
Electricity subsidy as % of fiscal
deficit
Punjab (Indus)
145 103 (74.6) 780 73.3 35.5 Free 38
Haryana (largely Indus)
109 55 (50.9) 615 63.1 47.2 420 78
West Bengal (Gangetic)
42 0(0) 2074 8.2 6.1 1760-2160
0.8
The situation is quite similar in water-abundant (surface and groundwater) Bangladesh and Nepal terai regions. In Bangladesh, about 75% of the total irrigated area is served by groundwater, and very few of the farmers are served by electricity connections and the energy supplies are not subsidized. Surveys made during 2007 and 2008 revealed that tube well pumping costs increase rapidly from low-lift pumps to shallow tube wells to deep-set shallow tube wells. For an average diesel-powered 7-m shallow tube well, pumping cost is about Tk. 0.69/m3, which is only 0.40/m3 for electricity-powered tube well (Zahid and Ahmed, 2006). This means a farmer with an electric pump makes on average a 21% higher profit compared to a farmer with a diesel pump, during a rice-growing season. Such a mismatch between the basin hydrological conditions and the energy (and food grain) pricing policies is leading to overexploitation of the groundwater resources, and threatening the hydrological (and eventually economic) sustainability of intensive irrigated agriculture in the Indus Basin. Such governance policies are constraining the optimal use of the ample groundwater resources and improvement in agricultural productivity and poverty alleviation in the eastern Gangetic Basin. Construction of new tube wells in the potential areas, increasing electrification in rural areas, and proper targeting of water and energy subsidies should lead to an increase in agricultural production and diversification, and can play an important role in poverty alleviation. Conclusions In the Indus-Gangetic Basin the stage of development and utilization of groundwater resources has limited relationship with resource availability. A mismatch between the basin hydrological conditions and the prevailing energy policies is leading to overexploitation of the resource in the Indus Basin and constraining its optimal use in the eastern Gangetic Basin. This impacts the small and marginal farmers and the water buyers the most. Construction of additional wells in the potential areas, increasing electrification in the rural areas, proper targeting of water and energy subsidies, and addressing the conditions for value-added diversified agriculture can play an important role for long-term resource sustainability and poverty alleviation of small and marginal farmers in the Indo-Gangetic Basin. Acknowlegments This paper presents findings from PN 42 ‘Groundwater Governance in Asia,’ a project of the CGIAR Challenge Program on Water and Food. IWMI and a consortium of partners in the IG and YR basins countries helped in the project implementation. The authors acknowledge the financial and intellectual help provided by CPWF, IWMI, and the project partners. References Deb Roy, A, and T.Shah. 2002. The socio-ecology of groundwater in India. Water Policy Briefing no. 4;
International Water Management Institute, Colombo, Sri Lanka. Jain, S.K., P.K. Agarwal, and V.P. Singh. 2007. Hydrology and Water Resources of India. Springer, The
Netherlands. Shah, T. 2006. Sustainable groundwater management. In: M.A. Giordano; F.R. Rijsberman; R.M. Saleth, (Eds.)
More Crop per Drop: Revisiting a Research Paradigm. IWMI-IWA publishing; London, UK. Pp. 84-117. Sinha, S, B.R. Sharma, and C A. Scott. 2006. Understanding and managing the water-energy nexus: Moving
beyond the energy debate. In. Sharma, B.R.; Villholth, KG ; Sharma KD (Eds.) Groundwater research and management: integrating science into management decisions. International Water Management Institute, Colombo, Sri Lanka, p. 242-56.
Zahid, A. and S.R.U. Ahmed. 2006. Groundwater resources development in Bangladesh: contribution to
irrigation for food security and constraints to sustainability. Ibid. p. 27-46.
77
Transboundary water governance institutional architecture: reflections from Ethiopia and Sudan
Everisto Mapedza1, Amare Haileselassie2, Fitsum Hagos1, Matthew McCartney1,
Seleshi Bekele Awualchew1, and Tesfaye Tafesse3
1International Water Management Institute 2International Livestock Research Institute (ILRI)
3University of Addis Ababa Author for correspondence: [email protected] or [email protected]
Abstract Transboundary water resource governance is premised on equitable water-and water related benefit sharing. Using the case of the Blue Nile (Ethiopia and Sudan), we explore the conceptual issues that need consideration in the crafting of cross-border cooperation within the water sector. Drawing on global experiences with transboundary water management, we first evaluate how upstream and downstream concerns are addressed by transboundary water management institutions. Second, we explore the kinds of institutional design and the issues that need to be considered to result in win-win scenarios for upstream and downstream users, as well as the mechanisms of benefit sharing negotiated amongst different stakeholders. Third, we examine ways of addressing equity and livelihoods in transboundary institutional arrangements. Finally, we attempt to assess how transboundary institutions can address broader historical, political, and economic issues and their implications for sustainable transboundary water governance. This paper raise key issues that need to be addressed in establishing transboundary governance institutions. Media grab To succeed, transboundary water governance has to bring benefits to all stakeholders and has to engage with the specific historical legacy of water development. Introduction According to IWMI’s 2006 Comprehensive Assessment Report, water scarcity (both physical and economic) is a major concern for developing countries in their effort to move out of poverty and meet the Millennium Development Goals (Molden, 2007). The Comprehensive Assessment also argues that with the current global water demands and increasing population, the demand for water will outstrip the available and potential water resources if the current water development model is continued. Furthermore, water resources do not coincide with administrative or political boundaries. Consequently, there is a need to go beyond national interests and engage in transboundary water cooperation. This paper is based on the ongoing upstream-downstream project that is being carried out by IWMI and its partners in Ethiopia and Sudan. This project covers the transboundary Blue Nile River, which is known as the Abbay in Ethiopia. The concept of transboundary natural resources management is strongly related to ‘bioregionalism,’ which views the world as consisting of contiguous but discrete ‘bioregions’ with the boundaries of each bioregion defined by nature rather than legislation or political expedience (cf. Wolmer, 2003). According to Tessera (2006) 'The Nile River Basin in general hosts problems which call for regional or subregional cooperation.' The severe erosion in the upper catchments of the Abbay/Blue Nile River basins has impacts downstream within and across political borders. Since river basin problems cut across political borders, cooperation across the Nile River Basin is necessary. In river basin management, absolute sovereignty does not work since transboundary cooperation is needed. Sudan, for instance, views upstream reservoirs in Ethiopia as being an efficient way to control floods and an efficient way to store water, as it reduces loss of water through evaporation in either Sudan or Egypt, which have higher temperatures than Ethiopia. The Wall Street Journal adds that ‘Engineers from both countries agree that dams in the cool and moist Ethiopian highlands, storing water in deep natural gorges, would lose far less water to evaporation than the Aswan Dam in the hot, dry Egyptian desert. They calculate the savings on evaporation could compensate for the amount of water Ethiopia proposes to use for irrigation’ (The Wall Street Journal 23 November 2003). The Nile Basin Initiative is an attempt based on to promote an Integrated Water Resource Management approach within the Blue Nile River Basin. This is the realization that sedimentation and siltation of dams and reservoirs downstream is a result of upstream land uses. The increased frequency and magnitude of drought in the Ethiopian Highlands has also affected the quality and quantity of water downstream in Sudan and Egypt (Tessera, 2006). The impact of environmental degradation is forcing countries to cooperate in order to address ‘common dangers’ that cannot be effectively addressed without the cooperation of other countries. Tessera (2006) notes that the impact of land degradation in the subbasin can hardly be solved by any means other than cooperative watershed management. Silt accumulation in the Roseires Dam in Sudan is largely attributed to the upstream activities in the Ethiopian Highlands. The Atbara and Blue Nile are said to contribute 53% of seasonal waters but contribute 90% of the sediment in the Nile (Tessera, 2006). Sedimentation is also negatively affecting the Sennar and Aswan Dams and the related irrigation schemes. The Upstream-Downstream project has found that total storage loss in Sennar due to sedimentation is 660 Mm3 (i.e. 70% of its original capacity) since the dam was built in 1925 and for Roseires is 1,200 Mm3 (i.e. 40% of original capacity) since the dam was built in 1964 (field visit 22-27 February 2008). Despite sedimentation being bad for most dams and water
78
reservoirs, in Egypt the building of the Aswan High Dam has further denied downstream farmers the rich silt that made the Nile valley productive. This complicates assessment of costs and benefits of upstream-downstream water users within a river basin. Downstream impacts of sedimentation include reduced benefits from irrigation, hydropower, navigation, water quality, water quantity, flood control, fishing, and recreation. Poor water quality will result in more expensive water purification methods, such as the special filters for the Khartoum water supply (Shapland, 1997). Removal of sediment in Sudan’s reservoirs and related irrigation schemes accounts for half of the operation and maintenance budget (Ahmed, 2000; Conway, 2000). Sudan is spending US$800 million in flood mitigation measures. If mechanisms could be put in place upstream that would result in the reduction of, say, the flood mitigation budget, Sudan may be willing to contribute financially toward sustainable upstream watershed management costs. The Payment for Environmental Services (PES) component of this study has found out that farmers are largely willing to pay in kind–rather than in cash for improved upstream land and water management that benefits the downstream dwellers (Alemayehu et al., 2008). Steps toward transboundary cooperation Attempts at cooperation and benefit sharing within the Blue Nile Basin go back to the 1960s. The 1959 Water Sharing Agreement allocated the Nile waters as follows: Egypt 66%, Sudan 22%, and surface evaporation and surface seepage at High Aswan Dam at 12%. Ethiopia was not included in this water sharing agreement, nor were the other basin countries (FAO, 2007, p.8). In 1967 the Hydrometeorological Survey of the Equatorial Lakes (Hydromet) was launched with the support of the United Nations Development Fund (UNDP), with the primary objective of enhancing the collection of hydro meteorological data. Hydromet operated until 1992. In 1993 the Technical Cooperation Commission for the Promotion and Development of the Nile (TECCONILE) was formed to promote development (World Bank, 2005). In 1993, the Canadian International Development Agency (CIDA) funded 10 Nile 2002 Conferences that aimed at promoting dialogue and cooperation within the Nile Basin. In 1995 CIDA supported the development of a Nile Basin action plan under the auspices of TECCONILE. In 1997 the Nile Basin Council of Ministers requested the World Bank to lead and coordinate their donor activities (World Bank, 2005). In 1997, with UNDP support, the riparian countries also established a forum for dialogue on a ‘Cooperative Framework’ for the Nile Basin, with three representatives from each riparian country. In February 1999, the Nile Basin Initiative succeeded the TECCONILE. The NBI was spearheaded by the Council of Ministers of Water Affairs of the Nile Basin states (Nile Council of Ministers or Nile-COM). ‘The NBI seeks to develop the river in a cooperative manner, share substantial socioeconomic benefits, and promote regional peace and security. The NBI started with a participatory process of dialogue among the riparian countries that resulted in their agreeing on a shared vision: to achieve sustainable socioeconomic development through the equitable utilization of, and benefit from, the common Nile Basin water resources, and a Strategic Action Program to translate this vision into concrete activities and projects’ (World Bank, 2005). Institutional design issues Transboundary River Basin institutions must represent the interests of the member states without bias. This will result in the transboundary institutions acquiring legitimacy and the necessary support. Enabling policies and institutions should be in place to be able to monitor and enforce compliance. The institutions carrying out this exercise must have meaningful powers but they must also be accountable to the upstream and downstream water users, with higher level institutions having oversight powers only. It is important to recognize that the need to satisfy societal requirements has expanded beyond the objective of simply water supply. Increasingly a diversity of concerned parties and organizations seek input into water-related decision-making processes. The downstream and upstream water users need to participate actively, not only in the first negotiation process, but also in the fine-tuning of the transboundary water management arrangements over time. Transboundary water governance institutions must not be disconnected from local level institutions. This means that there must be nested institutional arrangements where small local institutions form the building blocks, which come together to create larger management institutions. Thus multiple layers of management that link small-scale interactions to larger, and ultimately basin-scale actions. Experiences elsewhere demonstrate that there tends to be a disconnection between the river basin management institutions and the water users who are supposed to be served by the transboundary water management institutions. For instance, at societal level, the Mekong River Commission remains far removed from the basin water users (Hirsch, 2006). Experiences from the southern Africa region through the Southern African Development Community (SADC) Protocol on Shared Watercourse Systems and its subsequent amendments has helped to desecuritize the issue of transboundary water management (Turton, 2008; Ramoeli, 2002) and enabled Transboundary water management institutions to be viewed as part of regional integration. An institutionalized transboundary knowledge database is an important component of sharing knowledge and resultant confidence in the data used by the transboundary institutions. The data are available to all stakeholders. In the Nile River Basin, the Nile Basin Initiative is attempting to do that. The southern African countries have similar initiatives for the Limpopo and Zambezi River basins (Turton, 2008; Ramoeli, 2002). The Volta Basin Technical committee also includes all the six riparian countries in data collection and validation (Lautze et al., 2008).
79
Benefit sharing in transboundary water governance Whilst benefit sharing seems to have made significant strides, there are still a number of operational issues that need to be resolved in the context of benefit sharing in transboundary water governance. In this paper, benefit sharing is viewed as offering flexibility to riparians to separate the physical distribution of river development (where activities are undertaken), from the economic distribution of benefits (who receives the benefits of those activities.) This allows riparians to focus firstly on generating basin-wide benefits (a positive-sum exercise), and secondly on sharing those benefits in a manner that is agreed as fair (see Sadoff and Grey, 2005; Turton, 2008). Research findings in the Upstream-Downstream study have to be juxtaposed to the wealth of global experience on benefit sharing (Sadoff and Grey, 2002, 2005; Yu, 2007). The Payment for Environmental Services (PES) results under the Upstream-Downstream project are an important move in that direction. Benefit sharing takes place at various scales and levels. In Ethiopia, for instance, it may vary from a small watershed project to regional government, which may or may not coincide with hydrological zones, going up to the transboundary level where international law and conventions begin to apply. Who benefits and who loses from benefit sharing? Some studies from Latin America are beginning to caution that benefits can potentially accrue to the most powerful whilst not addressing the needs of the poor and female-headed households. An understanding of the power relationships at different scales will help inform the structuring of benefit sharing. In the Senegal River Basin, for instance, an artificial river flood is provided each year in order to support local livelihoods (UNESCO, 2003). How do you develop a sustainable and targeted funding mechanism that will be used to ‘compensate’ those bearing the costs of watershed and transboundary river basin management? Selling electricity at a cheaper price to the upstream country might benefit the country as a whole, but not the specific watershed community. This might result in poorly targeted incentives that might not reward the poor upstream farmers who are bearing the cost of upstream river basin management. How are the payments going to be made? Should the reward be for only good management or also for actively improving the upstream areas within the river basin? Who pays and for what (Poras and Grieg-Gran, 2007)? Most current transboundary benefit-sharing initiatives are largely funded by donors and nongovernmental organizations. Upstream-downstream cooperation delves into broader international relations and political economy issues. What makes transboundary basin level management successful? What is the power balance amongst the states that are involved (hegemony, neohegemony, or realisms in international cooperation)? Transboundary Basin Management in the Blue Nile seems to indicate power asymmetry that might be reflected in who shapes what is considered ‘knowledge.’ Despite the establishment of ENTRO, ‘scientific’ data still seem to be contested and hardly shared (although this could be improving). (Scientific data especially concerning the Nile can easily be politically ‘tainted’ in order to reflect the various country positions.) Confidence building and establishing trust will need to take place first before detailed discussions on benefit sharing (Sadoff and Grey, 2005). Transboundary benefit sharing presents different benefit sharing matrices in which water allocation need not be the only potential benefit. It is possible to share benefits from water without sharing the actual water (Sadoff and Grey, 2005). Within the Blue Nile this is still a contested issue that needs to be resolved, especially in light of the 1959 Water Sharing Agreement between Egypt and Sudan. Any transboundary river basin management has to be grounded within the specific political and historical settings rather than being an imposition of blue print solutions (Merrey et al., 2007). Finally, transboundary benefit sharing is premised on the assumption that it is feasible to establish these costs and benefits. In most river basins good practices take a lot of time to produce results, and this is further complicated by natural phenomena such as climate change and changing rainfall patterns that also potentially contribute toward land degradation. Establishing causality in most river basins causes many difficulties. ‘Values’ are also normative, and largely depend on the specific contexts and communities and it is often difficult to have a common understanding across subnational levels let alone international boundaries. The physical size of the basin means that local-level institutions dealing with local issues often find it difficult to acknowledge issues facing others in the basin, who may be located many hundreds of kilometers away, and for whom the key issues may be very different. Conclusion Although transboundary water governance is the way forward for an integrated approach to water management, there are a number of issues that such an institutional architecture needs to address. For the fluid ‘benefits beyond boundaries’ to be meaningful to all the individual countries involved, the issue of benefit-sharing mechanisms needs to be critically reviewed in practice. Equity has also to be assessed at various levels from the transboundary to the local level. Will equity at the transboundary level necessarily imply equity at the local level? How can all the stakeholders’ maxmize the benefits whilst minimizing the costs. Finally, transboundary institutional architecture has to be grounded in the water historical trajectories. How do you deal with past agreements on water sharing while moving forward with one shared vision on transboundary water management? This is a further complex equity issue that addresses the weight that needs to be given to existing water use.
80
Acknowledgments This paper presents conceptual issues from the ongoing CP19 - Improved Water and Land Management in the Ethiopian Highlands and its Impact on Downstream Stakeholders Dependent on the Blue Nile research being carried out in Ethiopia and Sudan, a project of the CGIAR Challenge Program on Water and Food. This paper is a result of the ongoing research work being carried out by IWMI and its partners.. References Ahmed, S. E. 2000. Environmental Impact of the alluvial nature of the Nile on irrigated agriculture in Sudan. In
Comprehensive Water Resource Development of the Nile Basin: Priorities for the new century, 8th Nile2002 conference proceedings, Addis Ababa, Ethiopia, June 26-30, 2000: 390-402.
Alemayehu, B., F. Hagos, A. Haileslassie, E. Mapedza, S. Gebreselasse, S. B. Awulachew, and D. Peden. 2008.
Prospects for Payment for Environmental Services in the Blue Nile Basin. Paper prepared for the CPWF Conference.
Conway, D. 2000. The climate and hydrology of the Upper Blue Nile River. The Geographical Journal 166(1):
49-62. Food and Agriculture Organization (Content source); Jim Kundell (Topic Editor). 2007. Water profile of Sudan.
In: Encyclopedia of Earth. Eds. Cutler J. Cleveland (Washington, D.C.: Environmental Information Coalition, National Council for Science and the Environment). [First published in the Encyclopedia of Earth March 19, 2007; Last revised March 25, 2007; Retrieved January 28, 2008]. <http://www.eoearth.org/article/Water_profile_of_Sudan>
Hirsch, P. 2006. Water Governance Reform and Catchment Management in the Mekong Region. The Journal of
Environment and Development, 15(2), June 2006: 184-201. Lautze, Jonathan, Boubacar Barry, and Eva Youkhana. 2008. Changing paradigms in Volta Basin water
management: customary national and transboundary. Water Policy: 1-19. Merrey, D.J., R. Meinzen-Dick, P. Mollinga, and E. Karar. 2007. Policy and institutional reform: the art of the
possible. In Water for Food, Water for Life: A Comprehensive Assessment of Water Management in Agriculture. David Molden (ed.). UK: Earthscan and IWMI.
Molden, D. 2007. Water for Food, Water for Life: A Comprehensive Assessment of Water Management in
Agriculture. Earthscan and IWMI: UK and USA. Porras, I., and M. Grieg-Gran. 2007. All that Glitters: A Review of Payments for Watershed Services in
Developing Countries. London: IIED. Ramoeli, P. 2002. SADC Protocol on Shared Watercourses: Its History and Current Status. In Hydropolitics in
the Developing World: A Southern African Perspective, Antony Richard Turton and R. Henwood (ed.), Pretoria: African Water Issues Research Unit (AWIRU).
Sadoff, C., and D. Grey. 2005. Cooperation on International Rivers: A Continuum for Securing and Sharing
Benefits. Water International: 30(4): 420-27. December. Sadoff, Claudia W., and David Grey. 2000. Beyond the River: the Benefits of Cooperation on International
Rivers. Water Policy, 4(5): 389-403. Shapland, G. 1997. River of Discord: International water disputes in the Middle East. London: Hunt and
Company. Tessera, A. 2006. Watershed management approach in reversing soil degradation: Ethiopian experiences and
lesson learnt. In proceedings of Nile Basin development forum: the role of the River Nile in poverty reduction and economic development in the region. November 30-December 2, 2006. Addis Ababa, Ethiopia. 174-195.
Turton, A.R. 2008. Reflections from South Africa on a Possible Benefit-Sharing Paradigm for Trans-boundary
Waters. Paper Presented at the First African Water Week Hosted by AMCOW and the African Development Bank, Tunis, Tunisia, 26-28 March.
UNESCO. 2003. Water for People Water For Life. UNESCO: Paris. Wall Street Journal. 2007. Ravaged by Famine: Ethiopia finally gets help from the Nile. Rodger Thurow,
Electronic version on www.cindybeads.com/famine.htm accessed on 16 September 2007. Wolmer, W. 2003. Transboundary Conservation: The Politics of Ecological Integrity in the Great Limpopo Trans-
frontier Park. Journal of Southern Africa Studies, 29(1): 261-78. World Bank. 2005. Nile Basin Initiative, Efficient Water Use for Agricultural Production, a Project Appraisal
Document, AFRICA/MNA Region, AFTS2. Yu, Winston. 2007. 'Benefit-Sharing Case Study: The Development of the Senegal River Basin.' World Bank,
unpublished.
81
Improving Mekong water investment and allocation choices
J. Dore1, T. Foran2, E. Sajor3, and K. Lazarus4
1Australian National University, Griffin, ACT, [email protected]
2Chiang Mai University, Thailand, [email protected] 3Asian Institute of Technology, Thailand, [email protected]
3M-POWER Lao PDR, [email protected]
Abstract A better understanding of the links between political drivers and deliberative processes and tools (such as scenario building) is essential. A multidisciplinary, multicountry team is searching for ‘success’ – or at least lessons to inform future policy ‘experiments’–by reviewing some of the past and present experiences in Mekong Region water resources development decision-making. In the political arenas of various places we are exploring just how certain water allocation decisions have been made (seeking to learn from), or could be made (seeking to influence) in the future. Findings are confirming the view that whilst ‘progressive’ processes and tools exist, their use is often overwhelmed or ignored by decision-makers responding to other political drivers. The researchers are unpacking why this is the case, and what can be done to improve the way in which investment and allocation choices are being made. Media grab Scenarios are stories of possible, alternative futures. They can be used as a water allocation tool to open up discussions and inform decision-making. The illuminatory aspect of scenarios is often unappreciated, and the tool can be abused and avoided. Introduction This paper introduces research on the political drivers of water allocation choice-making among users and uses within [and between] countries. To us, “political drivers” is informal language for what social scientists refer to as causal mechanisms (for an example of drivers analysis, see Foran, 2006). When studying change, basic drivers include: competing interests (e.g. those of local people versus energy planners), competing discourses, and institutions. 'Allocation' we have defined as formal and informal decision processes (and non-decisions) that alter the physical distribution of water, and water-related rewards, risks, rights, and responsibilities (4Rs). We are interested whether use of particular processes and tools has led, or is leading toward, improved allocation. The research focuses on the Mekong River Basin, which is embedded within the larger frame of the Mekong Region’s institutional context and its associated water politics. When we say region we are referring to the “territory, ecosystems, people, economies and politics of Cambodia, Lao PDR, Myanmar, Thailand, Vietnam, and China’s Yunnan Province” (Mingsarn and Dore, 2003). Water politics in ‘the Mekong’ involves diplomacy, knowledge-based advocacy, rights-based advocacy, cooperative regionalisms, and also unilateral action by state and non-state actors. Overt and repressed disputes can be observed at many different levels. (For a recent overview of Mekong water governance issues, see Lebel et al., 2007). The existing governance context constrains enquiry and deliberation. Within and between the Mekong riparian countries, decision-making processes remain relatively closed. There are, however, many state and non-state actors committed to more transparent and holistic processes. Given this, under what conditions, and via what political drivers, do 'progressive' processes and tools–such as scenario building, environmental flows assessment, and deliberation–reduce the severity of disputes over, and improve the fairness of, water-related investment and allocation in the Mekong Region? Methods The research team–the authors are part of a larger group of M-POWER colleagues (see Acknowledgments)–are exploring how particular processes and tools have been used in different places and political arenas in the Mekong Region to negotiate or allocate water. The processes being examined are: multistakeholder platforms (MSPs) and consensus-building. The tools being examined are: scenarios and modeling, environmental flows, cumulative impact assessment (CIA), and strategic environmental assessment (SEA); and market-based instruments–including payments for ecosystem services (PES). These processes and tools have demonstrated promise, yet appear to have substantial unfulfilled potential to drive improved water-related investment and allocation by bringing in different perspectives and fostering deliberation to inform and shape negotiations and decisions. The team is undertaking reviews of ‘processes and tools’ and in-depth studies of ‘places and arenas.’ Evidence and findings of the process and tool reviews will be robust, but general. The individual place-based studies will provide in-depth and nuanced analysis that can illustrate our wider findings. The last phase of the project (due to finish by late 2009) will synthesize the findings.
82
Process and tool reviews Reviews being undertaken in this research are evaluating a particular process or tool in water allocation using a multiple-case, holistic study approach. This method employs a comparative assessment in two or more places with similar or contrasting contexts, pursuing answers to a detailed common research protocol. Extracts follow to provide the flavor of the enquiry. Multistakeholder platforms (MSPs) and consensus building How do different actors understand and use MSPs and consensus building? What is the current impact of MSPs and consensus building on water allocation? What is the potential impact of MSPs and consensus building?
Scenarios and modeling For us, scenarios are usefully constructed as plausible stories of the future. But, how do different actors understand and use scenario-building and modeling in water allocation governance? What is the current impact of scenarios and modeling? What is the potential impact of scenarios and modeling?
Environmental flows How do different actors understand and use environmental flows assessments in water allocation governance? What is the current impact of environmental flows assessments and its various discourses?
Cumulative impact assessment (CIA) and strategic environmental assessment (SEA) There is a developing body of experience in the Mekong Region with CIA (e.g. Nam Theun 2, Nam Ngum 3, soon available) will be efforts looking at the impact of Mekong mainstream dams and diversions. How have these CIAs informed or impacted the decisions being taken about the construction and operation of water-related infrastructure? There are also new experiences within the region with SEA. What are the differences between CIA and SEA? What can we learn from recent SEA work, such as analyzing the Vietnam Hydropower Plan? Market instruments–PES and pricing Of course, market instruments are favored by many as an aid to allocating water. Whether it be economics estimates of returns, pricing, or benefit sharing–experiments abound. This ongoing research is particularly interested in Payments for Ecosystem Services, and the way PES is being promoted in the Mekong Region. But, we want to frame the analysis within the larger field of market instruments to aid water allocation and associated investment. Place and arena studies In the political arenas of various places we are exploring just how certain water allocation decisions have been made (seeking to learn from), or could be made (seeking to influence) in the future. Place and arena studies are location-based, single-case research focused on water allocation initiatives and decisions in a particular context. There are often several relevant arenas to any place. Each study is significant in illuminating practice and issues, due to it being typical, critical, unique, or showing up something special.
Mekong River Basin Four studies are underway at the Mekong River Basin level:
Basin-wide scenarios and hydrological modeling Contrasting analysis of recent Mekong River Basin hydrological modeling efforts: e.g. the Mekong River Commission’s (MRC) decision support framework (DSF), water utilization program modeling by a Finnish consortium (WUP-FIN), water utilization program modeling by Japanese consultants (WUP-JICA), scenario flow regimes developed in the earlier phases of the MRC basin development planning program and integrated basin flow management (IBFM), Norconsult scenario flow regimes done as part of Nam Thuen 2 cumulative impact assessment, Mekong uses being made of the water evaluation and planning (WEAP) software, CSIRO’s water accounting spreadsheet used in the CPWF’s Mekong Basin Focal Project, and the University of Washington’s Variable Infiltration Capacity (VIC) model.
Integrated basin flow management (IBFM) Analysis of process and use of socioeconomic tools by the MRC IBFM environmental flows work, and the MRC BDP scenarios, within a wider analysis of the MRC water utilization program 'A' from 1998-2007.
Tonle Sap Tonle Sap receives a lot of attention, deservedly, due to its critical importance to Cambodia. In recent years, the surrounding Tonle Sap Basin has been changed by extensive building of dams and barriers to natural water flow. How are these infrastructure investment decisions being taken? How might this change with the advent of the Tonle Sap Basin Authority?
Qualitative rural development and change scenarios Scenarios are needed that are more adept at bringing in livelihoods and subsistence users. Team members are analyzing what has been done in the past, but then pointing to what could be done, to improve scenarios work in the future.
83
Other studies are focusing on other parts of the Mekong River Basin and region. Chi-Mun The Chi-Mun River Basin (and northeast Thailand) provides a real opportunity to learn from its rich history. There are three particular cases that appear favorable for analysis: impact assessments at Hua Na Dam, hydrodevelopment at Pak Mu; and planning water transfers. These significant cases include the two most influential state-actors in the case of water developments in Thailand: the Royal Irrigation Department (RID) and the Electricity Generating Authority of Thailand (EGAT). Each case offers good insights at different scales: from community (Hua Na, Pak Mun, Lam Dom Yai/Lam Se Bai) to regional/transboundary scale (Pak Mun, Hua Na/Khong-Chi-Mun Project, Lao-Thai Transfer), to highlight the differences in issues and political drivers of water allocation, and also to understand how local initiatives/processes can alter the overall trajectory of hydro decision-making. They are grounded in similar and interlinked political contexts and timeframes (albeit all with their particularities), and are all part of contemporary political discourses on water infrastructural development in the Chi-Mun Basin.
Nam Ngum Nam Ngum is perhaps the most important river basin in Laos. It is home to 10% of Lao people, >30% of dry-season rice production, and has the largest reservoir and oldest hydropower scheme Nam Ngum 1. A major CIA was completed in 2008 on a proposed hydropower expansion, with seven new projects being promoted, and a huge range of international actors involved from Thailand, Japan, China, and USA. How is this CIA influencing, or not, decision-making? At the same time, a River Basin Organisation (RBO) is being formed. There is extensive mining already and more proposed, requiring energy and water. Part of the basin also has significant unrest, with struggles for control over territory and resources between competing Lao actors. What will be the future of the water resources of this basin? How will it be decided? What is the current trajectory of development, and what is driving that? What are other scenarios? Who and what is driving the creation of the RBO? Songkhram Songkhram is a relatively small sub-basin of the Mekong in northeast Thailand. It is another pulsing system (as with Tonle Sap) in which Mekong mainstream flows have a significant impact on the size and duration of the Songkhram River flood. The dependency of local communities on fisheries has been well documented in recent years by both Thai Baan and MRC research. Major infrastructure has been installed in the basin. Other ideas have thus far been rejected. How were these decisions taken? What drove the decisions?
Periurban development As cities grow, household and industrial demands for finite water resources increase. How are municipalities making decisions about water allocation? What is driving these decisions? What processes and tools are being used in places such as Hanoi, Rachaburi, and on Thailand’s eastern seaboard? Our research is joining forces with an AIT environmental management project to examine our research question in several periurban contexts.
Irrigation expansion in Vietnam and Cambodia How did/does Vietnam use processes and tools to make decisions about their grand expansion of irrigation in the delta? How is Cambodia making decisions now about their extensive new irrigation development? How are decisions being taken in the Mekong Region about new schemes vis-a-vis modernization of existing infrastructure? Upper watersheds in Yunnan and Ping The common research protocol is also being used to look at aspects of two watersheds in China’s Yunnan province, and a northern Thailand watershed (Ping, a sub-basin of the Chao Phraya). Discussion
Actors differ in their behavior, due to differing discourses (ideas, narratives, knowledge), powers, accountabilities, and adaptiveness to new situations. This is part of what makes water allocation difficult. For example, there are contrasting views on the importance of sustaining rural livelihoods that are dependent on living aquatic resources, vis-a-vis, sacrificing those resources for the ‘greater good’ of the province, country, basin, or region. In the Lower Mekong River Basin there is a resurgence of interest by the governments of the region in Mekong River mainstream dams and diversions. It is critical that there is a public examination of the pros and cons of different basin development options and that the full range of knowledges and perspectives are brought into decision-making. We expect that all the processes and tools could yet play an important role.
For example, scenarios are stories that outline possible futures. They are a tool to open up discussions and inform decision-making. Scenarios have been recently used as part of several assessment processes, including some under the auspices of the Mekong River Commission (MRC). These were intended to inform discussions about the impact of proceeding and proposed water resources developments on the future of the basin. They have not yet played this informing, catalytic role because details of their products were kept out of the public
84
domain. That this has occurred highlights difficulties that can arise when formal, track 1, intergovernment organizations also act as knowledge brokers. A way beyond this impasse is being found in 2008. Lessons from these past experiences are being drawn. Water security, food security, and energy security are all high on the national and transboundary political agenda in the Mekong and important choices have to be made. We suspect the processes and tools, and use of the 4Rs framework, have substantial unfulfilled potential to drive improved water sharing and allocation in the Mekong and elsewhere, by focusing attention on options and impacts and fostering higher quality debate between stakeholders.
The task of PN67 is to describe and explain the interaction between political drivers (causal mechanisms) and decision-making practices (processes, tools) in particular cases (places, arenas) where society is negotiating or taking decisions about water resources development and allocation. Conclusions and recommendations
A better understanding of the links between political drivers and deliberative processes and tools is essential. An M-POWER research team is searching for success – or at least lessons to inform future policy ‘experiments’ – by reviewing some of the past and present experiences in Mekong Region water resources development decision-making. In the political arenas of various places we are exploring how certain water allocation decisions have been made (seeking to learn from), or could be made (seeking to influence) in the future. At the same time many of the research team are actively engaged in processes shaping the politics of the region and in this way seeking a closer connection between research and impact.
Acknowledgments
This paper overviews PN67 ‘Improving Mekong Water Allocation,’ a project of the CGIAR Challenge Program on Water and Food being undertaken by the M-POWER knowledge network. M-POWER is an acronym for a program of action research that aims to improve water governance in the Mekong Region. The acronym stands for Mekong Program on Water Environment and Resilience. We chose the acronym as a play on the verb 'empower' as this is an apt one-word description of motivation for engaging in research about governance in order to bring about progressive changes. Results are being elaborated in forthcoming publications by the research team in 2009.
References
Foran, T 2006. Rivers of Contention: Pak Mun Dam, Electricity Planning, and State–Society Relations in
Thailand, 1932–2004. PhD Thesis, Division of Geography, Department of Geosciences, University of Sydney. http://hdl.handle.net/2123/1984.
Lebel L, J. Dore. D. Rajesh, and Yang Saing Koma (eds.) 2007. Democratising Water Governance in the Mekong
Region. Silkworm and Mekong Press, Chiang Mai, 283. http://www.mekongpress.com/each_titles/DWG.htm.
Mingsarn, Kaosa-ard, and J. Dore (eds.) (2003) Social Challenges for the Mekong Region. White Lotus,
Bangkok, 448. http://www.rockmekong.org/pubs/publications_2003.htm.
85
Process-oriented integrated natural resource management (INRM) implementation at the basin level: can it give new insights to State restructuring in Nepal?
S. Thapa1, J. Soussan2, D. Pant3, J .Hill4, U. Parajuli5, K. Sharma6, and B. Bhatta7
1World Wildlife Fund Nepal, WWF Nepal [email protected]
2Stockholm Environment Institute, SEI-York 3International Water Management Institute Nepal, IWMI Nepal
4University of East Anglia, UK 5Nepal Engineering College
6Department of Irrigation, Nepal 7Institute of Water and Human Resources Development, Nepal
Abstract This paper is based on the results of the action research project on integrated management of water, forest and land resources in a small basin of Gandaki River System in Nepal. Nepal was declared a Democratic Republic on 28 May 2008–this being the most historical decision for the country that overthrew the country’s monarchy of over 200 years. The next 4-5 years, the transitional period of writing the country’s new Constitution, are expected to culminate in a durable structure of governance tailored to national culture and priorities. Ongoing discussion on the Federal System of governance is an indicator of likely governance changes that will emerge in Nepal. This paper suggests that the formation of a common platform for integrated natural resource management (INRM) can generate simple and practical ideas for the management of natural resources for the 'New Nepal.' By expediting the process and institutional coordination for INRM at local levels, it can contribute to the restructuring of the country. A process-oriented implementation of INRM may face minimal impact from the envisaged changes in governance structures. Media grab The process of formation of a common platform for management of land, forest, and water resources at basin level offers one reference Nepal’s federal restructuring can take. Introduction This paper is based on the analysis of results from the Challenge Program on Water and Food project (CP23): 'Integrated management of water, forest, and land resources in a micro-basin of Gandaki River System in Nepal.' The research constituted a series of steps for a common platform created for integrated management of natural resources by utilizing the INRM principles. The project defines common platform as 'an independently functioning organization' constituting representation of several basin-level natural resources organizations (for example, forest user group, water users association, boater’s association, mothers’ group). According to a definition of the INRM Task Force of the Consultative Group of International Agricultural Research (CGIAR) (Task Force on INRM, 2001), INRM is 'an approach that integrates research on different types of natural resources, into stakeholder-driven processes of adaptive management and innovation, to improve livelihoods, agro-ecosystem resilience, agricultural productivity and environmental services, at community, eco-regional and global scales of intervention and impact.' We suggest that the strongly and rapidly evolving community-based natural resource management organizations can contribute to positive policy reform, including governance restructuring of the country, build synergy, and enhance the capacities of local organizations. The institutional settings for natural resource management in Nepal can no longer be analyzed independently from the overall existing political situation and administrative organizational structure that is currently under discussion. The country was declared the 'Democratic Republic' on 28 May 2008 by overthrowing the monarchy system of the country that reigned for over 200 years. With the declaration, the hotcake of present day discussion and debate has been revolving around what is meant by the 'Federal' system for the country. Against the above background, this paper analyzes the results and experience of the 'process of the project,' which led to the evolutionary formation of a common platform for integrated natural resource management (INRM). The 'process of the project' gives simple and practical ideas for the management of natural resources for the future 'New Nepal.' Methods The project was implemented in Begnas Basin, which is located in one of Nepal’s major river systems–Gandaki River. The basin has an area of about 3406 ha, of which 1838.5 ha is mountainous upper watershed, and the remaining 1567.5 ha forms the downstream valley floor. The Begnas Basin is undergoing rapid land-use changes enforced by new market pressures in the region. The construction of irrigation systems, urbanization, and delineation of community forest area has also brought change in land-use patterns in the basin. The action research involved a series of steps for a common platform creation for integrated management of natural resources. The project process constituted four steps: Resource and livelihoods assessment The assessment of the resource and community organizational functionality was the inception phase activity of the project in Begnas Basin that exhibited diversity in its every aspect–including resources and the people. Begnas Basin is ethnically heterogeneous and there is differentiation in socioeconomic conditions within the
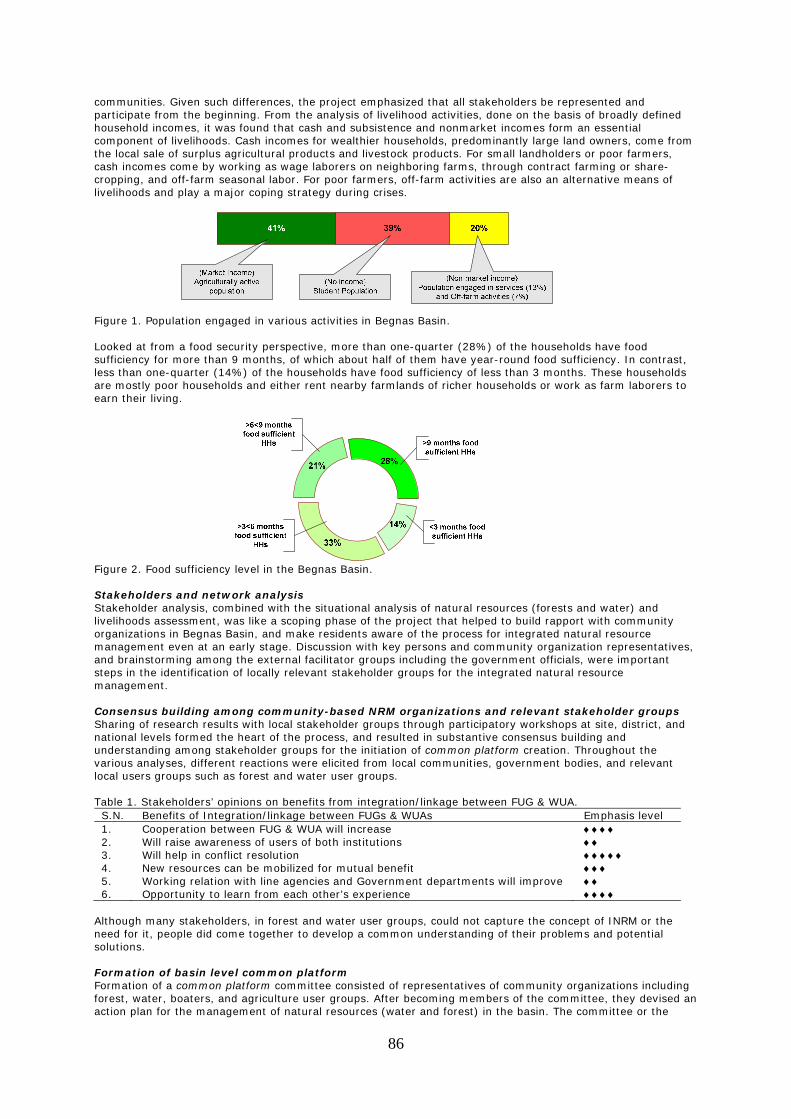
86
communities. Given such differences, the project emphasized that all stakeholders be represented and participate from the beginning. From the analysis of livelihood activities, done on the basis of broadly defined household incomes, it was found that cash and subsistence and nonmarket incomes form an essential component of livelihoods. Cash incomes for wealthier households, predominantly large land owners, come from the local sale of surplus agricultural products and livestock products. For small landholders or poor farmers, cash incomes come by working as wage laborers on neighboring farms, through contract farming or share-cropping, and off-farm seasonal labor. For poor farmers, off-farm activities are also an alternative means of livelihoods and play a major coping strategy during crises.
Figure 1. Population engaged in various activities in Begnas Basin. Looked at from a food security perspective, more than one-quarter (28%) of the households have food sufficiency for more than 9 months, of which about half of them have year-round food sufficiency. In contrast, less than one-quarter (14%) of the households have food sufficiency of less than 3 months. These households are mostly poor households and either rent nearby farmlands of richer households or work as farm laborers to earn their living.
Figure 2. Food sufficiency level in the Begnas Basin. Stakeholders and network analysis Stakeholder analysis, combined with the situational analysis of natural resources (forests and water) and livelihoods assessment, was like a scoping phase of the project that helped to build rapport with community organizations in Begnas Basin, and make residents aware of the process for integrated natural resource management even at an early stage. Discussion with key persons and community organization representatives, and brainstorming among the external facilitator groups including the government officials, were important steps in the identification of locally relevant stakeholder groups for the integrated natural resource management. Consensus building among community-based NRM organizations and relevant stakeholder groups Sharing of research results with local stakeholder groups through participatory workshops at site, district, and national levels formed the heart of the process, and resulted in substantive consensus building and understanding among stakeholder groups for the initiation of common platform creation. Throughout the various analyses, different reactions were elicited from local communities, government bodies, and relevant local users groups such as forest and water user groups. Table 1. Stakeholders’ opinions on benefits from integration/linkage between FUG & WUA. S.N. Benefits of Integration/linkage between FUGs & WUAs Emphasis level 1. Cooperation between FUG & WUA will increase ♦♦♦♦ 2. Will raise awareness of users of both institutions ♦♦ 3. Will help in conflict resolution ♦♦♦♦♦ 4. New resources can be mobilized for mutual benefit ♦♦♦ 5. Working relation with line agencies and Government departments will improve ♦♦ 6. Opportunity to learn from each other’s experience ♦♦♦♦
Although many stakeholders, in forest and water user groups, could not capture the concept of INRM or the need for it, people did come together to develop a common understanding of their problems and potential solutions. Formation of basin level common platform Formation of a common platform committee consisted of representatives of community organizations including forest, water, boaters, and agriculture user groups. After becoming members of the committee, they devised an action plan for the management of natural resources (water and forest) in the basin. The committee or the
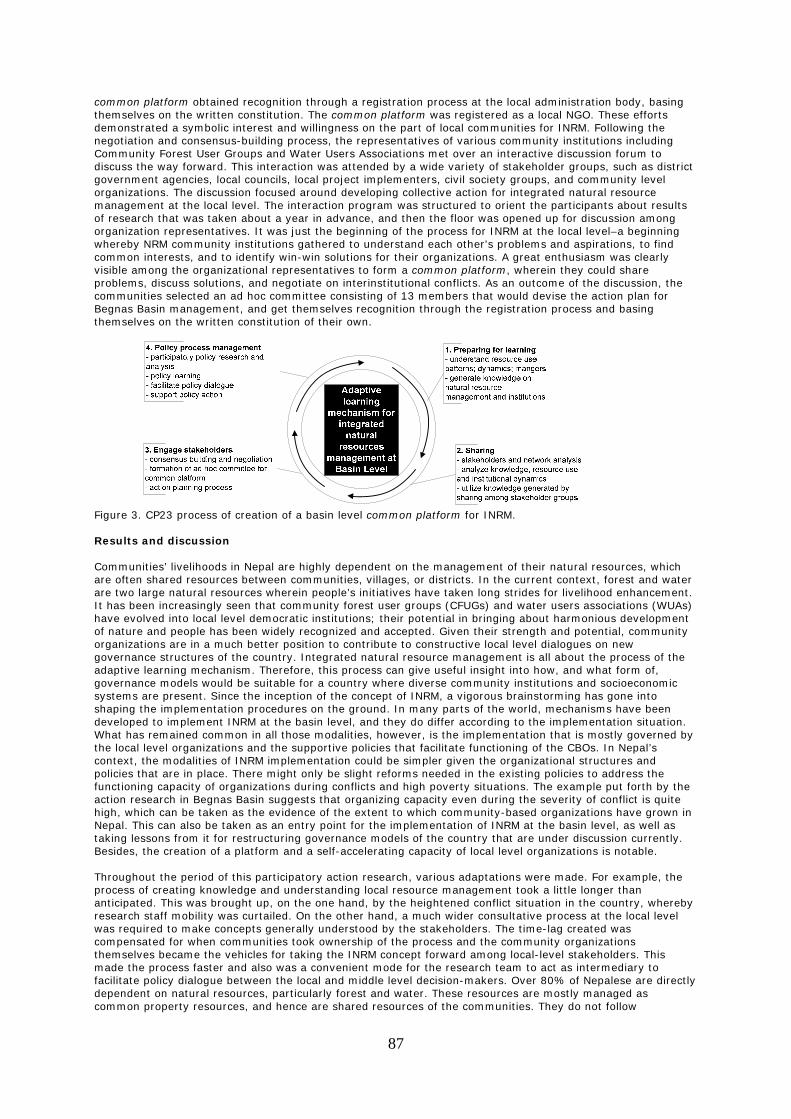
87
common platform obtained recognition through a registration process at the local administration body, basing themselves on the written constitution. The common platform was registered as a local NGO. These efforts demonstrated a symbolic interest and willingness on the part of local communities for INRM. Following the negotiation and consensus-building process, the representatives of various community institutions including Community Forest User Groups and Water Users Associations met over an interactive discussion forum to discuss the way forward. This interaction was attended by a wide variety of stakeholder groups, such as district government agencies, local councils, local project implementers, civil society groups, and community level organizations. The discussion focused around developing collective action for integrated natural resource management at the local level. The interaction program was structured to orient the participants about results of research that was taken about a year in advance, and then the floor was opened up for discussion among organization representatives. It was just the beginning of the process for INRM at the local level–a beginning whereby NRM community institutions gathered to understand each other's problems and aspirations, to find common interests, and to identify win-win solutions for their organizations. A great enthusiasm was clearly visible among the organizational representatives to form a common platform, wherein they could share problems, discuss solutions, and negotiate on interinstitutional conflicts. As an outcome of the discussion, the communities selected an ad hoc committee consisting of 13 members that would devise the action plan for Begnas Basin management, and get themselves recognition through the registration process and basing themselves on the written constitution of their own.
Figure 3. CP23 process of creation of a basin level common platform for INRM. Results and discussion Communities’ livelihoods in Nepal are highly dependent on the management of their natural resources, which are often shared resources between communities, villages, or districts. In the current context, forest and water are two large natural resources wherein people’s initiatives have taken long strides for livelihood enhancement. It has been increasingly seen that community forest user groups (CFUGs) and water users associations (WUAs) have evolved into local level democratic institutions; their potential in bringing about harmonious development of nature and people has been widely recognized and accepted. Given their strength and potential, community organizations are in a much better position to contribute to constructive local level dialogues on new governance structures of the country. Integrated natural resource management is all about the process of the adaptive learning mechanism. Therefore, this process can give useful insight into how, and what form of, governance models would be suitable for a country where diverse community institutions and socioeconomic systems are present. Since the inception of the concept of INRM, a vigorous brainstorming has gone into shaping the implementation procedures on the ground. In many parts of the world, mechanisms have been developed to implement INRM at the basin level, and they do differ according to the implementation situation. What has remained common in all those modalities, however, is the implementation that is mostly governed by the local level organizations and the supportive policies that facilitate functioning of the CBOs. In Nepal’s context, the modalities of INRM implementation could be simpler given the organizational structures and policies that are in place. There might only be slight reforms needed in the existing policies to address the functioning capacity of organizations during conflicts and high poverty situations. The example put forth by the action research in Begnas Basin suggests that organizing capacity even during the severity of conflict is quite high, which can be taken as the evidence of the extent to which community-based organizations have grown in Nepal. This can also be taken as an entry point for the implementation of INRM at the basin level, as well as taking lessons from it for restructuring governance models of the country that are under discussion currently. Besides, the creation of a platform and a self-accelerating capacity of local level organizations is notable. Throughout the period of this participatory action research, various adaptations were made. For example, the process of creating knowledge and understanding local resource management took a little longer than anticipated. This was brought up, on the one hand, by the heightened conflict situation in the country, whereby research staff mobility was curtailed. On the other hand, a much wider consultative process at the local level was required to make concepts generally understood by the stakeholders. The time-lag created was compensated for when communities took ownership of the process and the community organizations themselves became the vehicles for taking the INRM concept forward among local-level stakeholders. This made the process faster and also was a convenient mode for the research team to act as intermediary to facilitate policy dialogue between the local and middle level decision-makers. Over 80% of Nepalese are directly dependent on natural resources, particularly forest and water. These resources are mostly managed as common property resources, and hence are shared resources of the communities. They do not follow
88
administrative boundaries of the country, district, or village. Given this situation, awareness has significantly grown that new organizational arrangements and geographical boundaries are needed to respond to the theoretical and practical challenges that Nepal faces in governance restructuring. The contours of such awareness and discussion have been on the top of the agenda of common people and their elected representatives. The challenge revolves around cultural and ethnic criteria, natural resource (water and forests) boundaries, and more recently much attention has also been grabbed by the topographical boundaries based on ethnic prevalence. The multiplicity of scenarios, the presence of uncertainty, and the diversity of interests are all part and parcel of current discussions and debates of restructuring governance in Nepal. Therefore, accepting the complexity of restructuring would be the first step in choosing appropriate criteria, tools, and logistics. This paper suggests only one way, the INRM process, to contribute to the discussion. Conclusions and recommendations We contend that restructuring the country’s governance can be guided somewhat from the community-based organizations that have well-established processes and systems for major resources such as water and forest management at the local level. Community-based organizations such as forest user groups and water users associations have evolved through time, and tested approaches of dealing with diversity of situations, problems, ethnic groups, and benefits-sharing mechanisms. Building on such organizations, is the common platform for basin management, which democratizes and promotes integrated management of natural resources by giving voice to all stakeholders. Throughout the period of this participatory action research on INRM implementation in Begnas Basin, various adaptations were made. For example, the process of creating knowledge and understanding local resource management took a little longer than anticipated. This was influenced by the heightened conflict situation in the country, which curtailed the mobility of the research staff, and by the much wider consultative process at the local level to make the concept generally understood by the stakeholders. The time-lag created was compensated for when communities took ownership of the process, and community institutions themselves became the vehicles for taking the INRM concept forward to local level stakeholders. Such a process in involving the formation of basin level common platforms is likely to make them more stable as they constitute the characteristics of transformation and adaptation through time, and interactions between various community actors. From a social democratic perspective, including the poor, disadvantaged, and diverse stakeholders in a basin level common platform is premised on the redistribution and sharing of power and resources. This will enable stakeholders to participate in decisions that impact their natural resource base, and take action to resolve conflicts. This could inform the federal structuring process in the country that it needs to be an inclusive process wherein negotiations are based on redistribution of resources and power-sharing mechanisms. Acknowledgments This paper analyzes research results from PN23, 'Linking community-based water and forest management for sustainable livelihoods of the poor in fragile upper catchment of the Indus-Ganges Basin,' a project of the CGIAR Challenge Program on Water and Food. The writing of this paper has been supported by funds channeled through Stockholm Environment Institute, SEI-York. References Task Force on INRM. 2001. Integrated Management for Sustainable Agriculture, Forestry and Fisheries: A brief
report on the INRM workshop held at CIAT, Cali, Colombia, 28-31 August.
89
Equity in two irrigation systems, Begnas Watershed, Nepal
J.K.W.Hill1, D.R.Pant2, and S.Thapa3
1School of Development Studies, University of East Anglia, Norwich, UK [email protected] 2International Water Management Institute (IWMI), Kathmandu, Nepal
3Stockholm Environment Institute, York, UK Abstract This study investigates the status of equity amongst stakeholders in terms of the use and management of two irrigation systems; one an aged farmer managed irrigation system (FMIS) in the upper watershed, the other a section of a two-decades-old joint agency-farmer-managed irrigation system (A-FMIS) in the lower watershed. It is not intended to be a comparative study. The challenge in the upland irrigation system is the rising population, and the conversion of land previously under other uses to rice terraces. For these, irrigation is required, yet all water sources are claimed. Disputes between social groups are stalling the planning and execution of canal improvement works, which could potentially increase water flows and improve water access and equity for users. The lowland A-FMIS is currently in a period of transition; operation and maintenance (O&M) tasks are being turned over to farmers. At the farm level, use of distributive technologies and fewer CA farmers allows water distribution and system management to function well and equitably. At the system level, however, conflicts exist over water allocation, and maintenance is lacking. O&M is likely to improve with system turn-over, as main and branch canal committee members become accountable to users. Media grab A focus on equity within irrigation systems supports legitimate claims for access to water by farming households, thereby increasing food production. Introduction About 76% of Nepal’s population depends on agriculture for its livelihood. Approximately 38% of Nepal’s total GDP comes from agricultural activities (Sharma et al., 2004). To increase agricultural production, the role of irrigation is pivotal. A focus on increasing productivity, however, often leads to an inattention to equity concerns. Inequity in irrigation access and system management can affect system sustainability and hence food production. Hence, this study focuses on equity in irrigation. Begnas Watershed has several farmer-managed irrigation systems (FMIS) in the uplands, named kulos (simple run-of-the-river diversions). The Begnas Irrigation System (BIS), a joint agency-farmer-managed irrigation system (A-FMIS), operates in the plains. Initiated in 1984 and completed in 1988, the BIS has a 300 ha reservoir (Begnas Taal), a 19 km2 catchment area, and a command area (CA) greater than its official 540 ha (Parajuli, 2006). Conflicts are present in both system types. IWMI-Nepal and partner organizations conducted a research project in the watershed examining resource management and sustainable livelihoods. This study was undertaken by the lead author during a 3-month internship at IWMI-Nepal in 2006. It contributes to two of the research project’s objectives; first, to identify opportunities for strengthening livelihoods by assessing present use and analyzing constraining and facilitating factors for enhancing water productivity; second, to assess the status of equity amongst stakeholders in terms of resource use and management. Methods Our main purpose was to assess the status of equity amongst stakeholders of the two irrigation systems. Theoretically this study understands irrigation to be a sociotechnical phenomenon and water to be a politically contested resource (Mollinga, 2008). Water control and water rights are conceived to have sociolegal, socioeconomic, political, organizational, and technical dimensions (Boelens, 2008). The concept of equity is recognized to be heterogeneous, and a social construct: while official or legal justice is often expressed in general rules and concepts (equality and generality), equity involves local, particular conceptions of what is just or fair (diversity and locality). Self-determination, therefore, is considered to be a prerequisite for local equity (Boelens and Davila, 1998). We analyzed and tried to understand the diversity of equity conceptions in farmer organizational forms, the ways rules and rights are constructed and used in practice, and the power they represent. The principal methods utilized are ethnographic methods, including surveying the irrigation systems from source to farm plot; developing resource maps enabling an understanding of the irrigation systems’ physical elements, technologies employed, sources, CAs and boundaries, and stakeholders; social mapping and compilation of genealogies, for understanding systems’ normative and organizational elements, and for inclusion within the study’s remit of all community members; and focus group discussions and informal interviews with water-users and other key stakeholders. Irrigation system rather than social community is the unit of enquiry. Two irrigation systems were selected after preliminary investigative surveys of Dund Khola (river) in the hills, and the BIS. Chapatari ko Kulo was
90
selected both because it is the largest kulo originating from Dund Khola and because its stakeholders include farmers from the research project’s selected hamlets. Furthermore, it is an older kulo, has an informal unregistered committee, and in recent years has not received outside technical or financial assistance. Downstream Sat Muhane gaun (village) and BIS’ branch canal (BC4) were selected. Char Say Phant (CSP), a portion of land within subbranch (SB) 1 of BC4, and its management committee, was chosen partly because of its small and manageable size. Chapatari ko Kulo’s CA is 10 ha and CSP’s CA is 7 ha; there are 56-60 and 20 farmers, respectively, in each CA. Results Equity in an upstream FMIS: Chapatari ko Kulo Almost 70% of Nepal’s irrigated area is covered by FMIS, which produce 40% of the country’s food production (Pradhan, 2000). In Begnas Watershed, four FMIS sourced from the east bank of Dund Khola irrigate the khet (rice terraces) below Lamichhane gaun, population 198, and Thapa gaun, population 159. The upper two kulos are owned by Lamichhane farmers, and serve a CA known as Tallo Bari (2-2.5 ha), which previously was bari (homestead land), but in response to population growth was converted to khet thus requiring irrigation. The largest of the four kulos, named Chapatari ko Kulo, is also the oldest. Its headworks are located at the source of Dund Khola, from which it may divert the maximum flow it requires. The kulo serves a fixed CA (10 ha), known as Chapa Tari, which contains khet belonging to 41 of Lamichhane gaun’s 42 households, to some of Thapa gaun’s 31 households, as well as to several other villages’ households. East of its fixed CA, Chapatari ko Kulo provides water solely for paddy transplantation, to khet owned by Lamichhane farmers and to khet converted from bari owned by Thapa farmers. The fourth kulo is small-sized, serving a CA of <2 ha. Chapatari ko Kulo’s disputed origins fuel the tension between Lamichhane and Thapa farmers over the kulo’s CA boundary and water rights. Unlike Lamichhane’s farmers, the Thapa’s are geophysically unable to construct a kulo to irrigate their converted bari, and can only, potentially, irrigate their newly formed khet using Chapatari ko Kulo. The Brahmin Lamichhane’s, however, dominate the kulo’s informal management, and are unwilling to extend its CA. They claim prior appropriation rights to the kulo, maintaining that their forefathers, four brothers, constructed the kulo nine or ten generations ago. The Chetri Thapa’s disagree claiming the Lamichhane’s forefathers’ bought the land after travelling to Mizoram for work, thereafter assuming control of the kulo. Caste, however, does not appear to influence water control here. The issue is customary water rights; regardless of the kulo’s origins, the Lamichhane’s have for decades acted as the kulo’s irrigation management collective, defining and authorizing collective and individual water rights over the kulo’s control and uses. In the present-day, upgrading the conveyance efficiency of the kulo’s earthen canal–and improved management practices–would greatly improve Chapatari ko Kulo’s productivity (Parajuli, 2006). A UNDP project, the Participatory District Development Program (PDDP), several years ago offered NRs 60-70 thousand (US$1000) contribution toward the kulo’s physical upgrading, though Thapa and Lamichhane disagreement led the project to withdraw after three meetings: a Thapa had informed the PDDP that the kulo’s CA should be enlarged to benefit more of the political ward’s farmers, while the Lamichhane’s had disagreed, stating that the kulo’s water was already insufficient for its existing CA. Although no defined management practices exist for the allocation and distribution of the kulo’s water (Parajuli, 2006), rules do exist that highlight locally-defined notions of equity. Access rights are tied to the CA khet, and lower CA farmers must wait for those above them to fulfill their water needs. During paddy transplantation water is made available for farmers having land to the east of the fixed CA; and rotation is practiced. From around 1995-2000 up until 2006, the kulo’s CA was extended a little to the east, according to the Lamichhane’s, to include khet that was theirs from an earlier time. Seven Lamichhane households benefitted from this. At a meeting of about 15 Lamichhane farmers in 2006, however, it was pronounced that the previous historic CA would be adhered to, for two stated reasons: first, an ex-Indian army Lamichhane farmer overstepped the limit when he diverted water from CA farmers taking water for transplantation, to irrigate his khet outside of the CA; second, if a Lamichhane taking water outside of the CA was to sell their khet, the new landowner would claim and demand water. A further possible reason (researcher’s view) is that the Lamichhanes realized that the Thapa’s demand for irrigation access was strengthened by their allowing non-CA (Lamichhane) farmers to irrigate khet. Equity in a section of a joint A-FMIS: Char Say Phant, of Begnas Irrigation System About 25% of Nepal’s net irrigated area is under AMIS (DOI, 2004, in Sharma et al., 2004). Large- and medium-sized AMIS have been criticized for failing to achieve anticipated agricultural production, and to recover operation and maintenance (O&M) costs; only 2% of O&M costs are recovered annually. Solutions to these problems are being sought via AMIS turnover to farmers (Sharma, 2004), including the empowerment of Water Users Associations (WUAs), and the collection of irrigation service fees. This is the case in the BIS, where management organization is formal but unelected at higher levels, and informal and unregistered at lower levels. Under the BIS main committee (WUA) are four branch canal (BC) committees. BC4 irrigates over 500 ha, and was created by farmers after the BIS’ formal construction, for these farmers’ khet could not receive the required water through BC2 and BC3. A link was made from BC3 joining it to an old kulo, thereafter named BC4 (Parajuli, 2006). Under BC4 there are four recently-formed sub-branch (SB) committees. SB2 of BC4 has an estimated CA of 100 ha, SB3 and SB4 each of 200 ha, while the SB1 committee, formed by the farmers of Char Say Phant (CSP), represents just 7 ha of land. It does not represent all of SB1’s khet; for aside from the 7 ha CSP, a 6 ha section of khet known as Dundey Phant remains under the purview of BC4’s committee. Such complications relating to scale, and fit, possibly complicate management throughout the BIS.
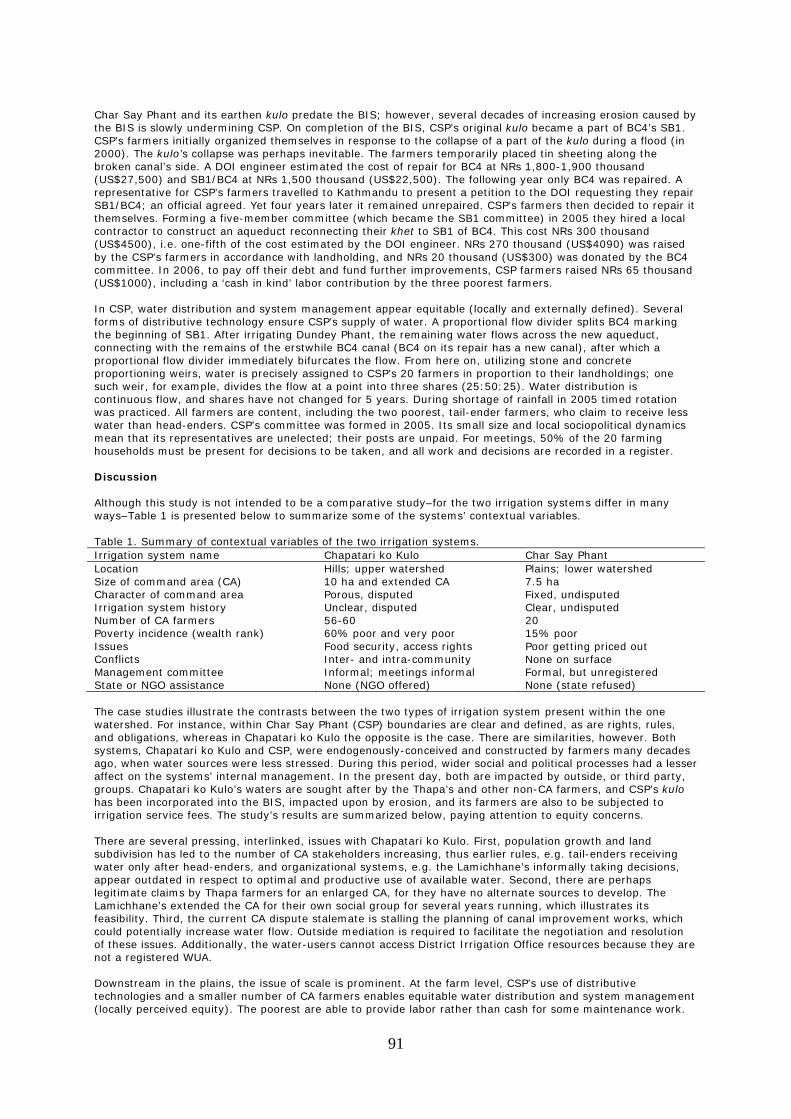
91
Char Say Phant and its earthen kulo predate the BIS; however, several decades of increasing erosion caused by the BIS is slowly undermining CSP. On completion of the BIS, CSP’s original kulo became a part of BC4’s SB1. CSP’s farmers initially organized themselves in response to the collapse of a part of the kulo during a flood (in 2000). The kulo’s collapse was perhaps inevitable. The farmers temporarily placed tin sheeting along the broken canal’s side. A DOI engineer estimated the cost of repair for BC4 at NRs 1,800-1,900 thousand (US$27,500) and SB1/BC4 at NRs 1,500 thousand (US$22,500). The following year only BC4 was repaired. A representative for CSP’s farmers travelled to Kathmandu to present a petition to the DOI requesting they repair SB1/BC4; an official agreed. Yet four years later it remained unrepaired. CSP’s farmers then decided to repair it themselves. Forming a five-member committee (which became the SB1 committee) in 2005 they hired a local contractor to construct an aqueduct reconnecting their khet to SB1 of BC4. This cost NRs 300 thousand (US$4500), i.e. one-fifth of the cost estimated by the DOI engineer. NRs 270 thousand (US$4090) was raised by the CSP’s farmers in accordance with landholding, and NRs 20 thousand (US$300) was donated by the BC4 committee. In 2006, to pay off their debt and fund further improvements, CSP farmers raised NRs 65 thousand (US$1000), including a ‘cash in kind’ labor contribution by the three poorest farmers. In CSP, water distribution and system management appear equitable (locally and externally defined). Several forms of distributive technology ensure CSP’s supply of water. A proportional flow divider splits BC4 marking the beginning of SB1. After irrigating Dundey Phant, the remaining water flows across the new aqueduct, connecting with the remains of the erstwhile BC4 canal (BC4 on its repair has a new canal), after which a proportional flow divider immediately bifurcates the flow. From here on, utilizing stone and concrete proportioning weirs, water is precisely assigned to CSP’s 20 farmers in proportion to their landholdings; one such weir, for example, divides the flow at a point into three shares (25:50:25). Water distribution is continuous flow, and shares have not changed for 5 years. During shortage of rainfall in 2005 timed rotation was practiced. All farmers are content, including the two poorest, tail-ender farmers, who claim to receive less water than head-enders. CSP’s committee was formed in 2005. Its small size and local sociopolitical dynamics mean that its representatives are unelected; their posts are unpaid. For meetings, 50% of the 20 farming households must be present for decisions to be taken, and all work and decisions are recorded in a register. Discussion Although this study is not intended to be a comparative study–for the two irrigation systems differ in many ways–Table 1 is presented below to summarize some of the systems’ contextual variables. Table 1. Summary of contextual variables of the two irrigation systems. Irrigation system name Chapatari ko Kulo Char Say Phant Location Hills; upper watershed Plains; lower watershed Size of command area (CA) 10 ha and extended CA 7.5 ha Character of command area Porous, disputed Fixed, undisputed Irrigation system history Unclear, disputed Clear, undisputed Number of CA farmers 56-60 20 Poverty incidence (wealth rank) 60% poor and very poor 15% poor Issues Food security, access rights Poor getting priced out Conflicts Inter- and intra-community None on surface Management committee Informal; meetings informal Formal, but unregistered State or NGO assistance None (NGO offered) None (state refused) The case studies illustrate the contrasts between the two types of irrigation system present within the one watershed. For instance, within Char Say Phant (CSP) boundaries are clear and defined, as are rights, rules, and obligations, whereas in Chapatari ko Kulo the opposite is the case. There are similarities, however. Both systems, Chapatari ko Kulo and CSP, were endogenously-conceived and constructed by farmers many decades ago, when water sources were less stressed. During this period, wider social and political processes had a lesser affect on the systems’ internal management. In the present day, both are impacted by outside, or third party, groups. Chapatari ko Kulo’s waters are sought after by the Thapa’s and other non-CA farmers, and CSP’s kulo has been incorporated into the BIS, impacted upon by erosion, and its farmers are also to be subjected to irrigation service fees. The study’s results are summarized below, paying attention to equity concerns. There are several pressing, interlinked, issues with Chapatari ko Kulo. First, population growth and land subdivision has led to the number of CA stakeholders increasing, thus earlier rules, e.g. tail-enders receiving water only after head-enders, and organizational systems, e.g. the Lamichhane’s informally taking decisions, appear outdated in respect to optimal and productive use of available water. Second, there are perhaps legitimate claims by Thapa farmers for an enlarged CA, for they have no alternate sources to develop. The Lamichhane’s extended the CA for their own social group for several years running, which illustrates its feasibility. Third, the current CA dispute stalemate is stalling the planning of canal improvement works, which could potentially increase water flow. Outside mediation is required to facilitate the negotiation and resolution of these issues. Additionally, the water-users cannot access District Irrigation Office resources because they are not a registered WUA. Downstream in the plains, the issue of scale is prominent. At the farm level, CSP’s use of distributive technologies and a smaller number of CA farmers enables equitable water distribution and system management (locally perceived equity). The poorest are able to provide labor rather than cash for some maintenance work.
92
The two poorest farmers, however, are getting priced out of CSP’s CA: one has sold his land to a family member currently in India; the other has mortgaged his land to another (externally defined inequity). Thus equity concerns in CSP’s CA relate to the rising cost of maintaining land, hence water rights (externally defined). At the BIS system level several concerns are identified; conflicts over water allocation between BC committees and their farmers, poor canal maintenance, and increasing erosion. As a group the farmers of CSP, therefore, are likely to feel excluded or overlooked by the DOI and the BIS’s higher management, for not only were they refused support to repair their kulo, but irrigation service fees are being introduced too. Conclusions and recommendations The farmers of informal FMIS such as Chapatari ko Kulo have themselves generated equitable rules for water access: for example, the provision of water for the transplantation of paddy in non-CA land. The dispute regarding the CA boundary, not unusual for a FMIS, is long unresolved because of a lack of dispute resolution mechanisms above the farmers, indicating the impact of wider social and political processes. External mediation–via the creation of platforms for farmer negotiation–is required to facilitate the farmers’ self-realization of equitable solutions to the problems they face. This study is, however, unable to comment on what the equity outcomes of Chapatari ko Kulo’s informal collective registering itself as a formal WUA would be: would this formalize the status quo, or facilitate change? The turnover to farmers of joint A-FMIS such as the BIS appears necessary, for in such systems farmers require incentives to organize to improve their water management. Furthermore, the processes of O&M are more accountable, cost effective, and equitable at smaller scales (locally defined). The presence of unelected higher level committee members, without even basic information such as CA sizes, raises doubts at the system level regarding how and for whom decisions are being taken and money spent (externally defined equity concern). The costs of maintaining land within the CA are increasing, with greater demands for contributions for maintenance, including the new O&M irrigation service fees. A further equity concern (externally defined), therefore, regarding the fate of poorer farmers: can they maintain landholdings in joint A-FMIS, and if not, what becomes of them? Acknowledgments This paper presents findings of a PhD field study conducted in PN23 ‘Resource Management for Sustainable Livelihoods,’ a project of the CGIAR Challenge Program on Water and Food. This research received inputs from the DOI, Nepal, the Institute of Water and Human Resource Development, Nepal, SORUP-Nepal, and Sunil Tiwari (research assistant). The PhD field study was jointly funded by the Economic and Social Research Council, and the Natural Environment Research Council, UK. References Boelens, R., and G. Davila (eds.) 1998 Searching for equity: Conceptions of justice and equity in peasant
irrigation. Assen, The Netherlands: Van Gorcum. Boelens, R. 2008. The rules of the game and the game of the rules: Normalization and resistance in Andean
water control. The Netherlands, Wageningen University. Mollinga, P.P. 2008 Water, politics and development: Framing a political sociology of water resources
management. Water Alternatives, 1: 7-23. Parajuli, U. 2006. Fieldwork report for CPWF No. 23, August, 2006, Kathmandu. Pradhan, P., F. Benda-Beckmann, and K. Benda-Beckmann (eds.) 2000. Water, land and law: Changing rights
to land and water in Nepal. Freedeal & Wageningen Agricultural University. Pradhan, P. 2000. Farmer managed irrigation systems in Nepal at the crossroad. Paper presented at the 8th
biennial conference of the International Association for the Study of Common Property, in Bloomington, Indiana, USA.
Sharma, K.R., D. Molden, H. Hemchuri, and S. Upadhyaya. 2004. A review of assistance to farmer managed
irrigation systems. In Irrigation conditions, visions and the concept of integrated water resources management. Lalitpur, Nepal: Department of Irrigation.
Sharma, K.R. (ed.) 2004. Irrigation conditions, visions and the concept of integrated water resources
management. Lalitpur, Nepal: Department of Irrigation.
93
Heterogeneity of groundwater market development and operation in Rural Northern China
Ruijian Chen
Jia 11th, Datun Road, Anwai, Beijing, China, Institute of Geographic Sciences and Natural Resources Research,
Center for Chinese Agricultural Policy, Chinese Academy of Sciences. Tel: 0086-10-64888982-100. Email: [email protected]
Abstract The positive impacts of groundwater markets in providing access to irrigation to small and marginal farmers are well addressed in the literature. Groundwater problems and their agricultural consequences in northern China are heterogeneous across space, and thus may cause differences in the market operation. This paper explores the real operation of the development of groundwater markets, with a comprehensive and descriptive analysis of how and, to a lesser extent, why the groundwater market is operating differently. Results show that the development level and operation style–sellers and buyers, service, tubewell characteristics, fees charging, and monopoly status–are really quite heterogeneous across regions. Water resource endowments and other factors covered by existing research are reviewed and confirm the contribution and diversity of the groundwater market in northern China. Media grab Groundwater markets in northern rural China: forgotten diversity. Introduction Since the end of the 1960s, groundwater has been the primary source of irrigation water in China, surpassing surface water use. With increasing dependence on groundwater for irrigation, China is now facing new problems in the groundwater economy. Water tables have declined sharply in the last decade, especially in northern China. With the privatization of tubewells, groundwater markets began to emerge. From the start, researchers, and especially agricultural economists, have shown great interest in such an institutional shift in China. Most of them agree with the positive impacts of groundwater markets in providing access to irrigation to small and marginal farmers. Less is known, however, about how the groundwater markets are really operating at present, particularly, how the different phases and different parts of the market are operating. Previous research found that groundwater problems and their agricultural consequences in northern China were heterogeneous across space. So when exploring the impacts of groundwater markets or making new related policy, it is necessary for researchers or policymakers to understand how each part of the market is operating, and how it varies across regions. This paper explores the real operation of the development of groundwater markets, providing a comprehensive and descriptive analysis of how and, to a lesser extent, why the groundwater market operates differently in different areas. We focus on a few factors that could cause the diversity of the market operation when understanding the multiple aspects of groundwater markets in northern China. In view of the complex nature of the topic, the focus will mostly be on factors identified in the literature, such as resource constraints and institutional factors. Methods To assess the nature of China’s groundwater markets, we base our analysis on survey data that trained enumerators (including the author) collected in China’s Heibei and Henan provinces from December 2007 to January 2008. In total, 200 households, 20 village leaders, and 58 tubewell owners were interviewed. The households and the leaders are evenly distributed in two provinces (Hebei and Henan), four counties (Xian, Ci, Yanjin, and Kaifeng) and 20 villages. To achieve a representative sample, according to the irrigation ratio of the farmland of each county, we made our sample cover the water-abundant areas, water scarce areas, and the normal area between abundant and scarce (mostly called 'normal area' in this paper). We also selected villages using each type of water source: groundwater, surface water, and both sources (conjunctive water use). The characteristics of groundwater markets are analyzed as follows: a) whether the markets are operating evenly across regions; and b) how those factors often mentioned in existing literature are contributing to the diversity of the market operation. Most of our analysis is based on statistical description. In the last section of this paper, multivariate analysis is introduced and an econometrical model is developed to understand the determinants of water price and monopoly issues because of more complex relationships among the variables. Results Obvious variation exists on the time for a market to emerge in the sample villages. Three villages already had a groundwater market in the early 1980s, and a groundwater market started in two villages in 1983. This means the market emerged just after China established the Family-Contract responsibility system. Although in some villages (like five sampled villages in Kaifeng county) groundwater markets do not exist even now, in 9 of the 20 villages, more than 75% of tubewells are selling water, while this share in other villages is much less. In 12 villages, sellers sell more than 75% of their pumped water to their neighbors, while there are still six villages within which sellers sell less than 25% of their pumped water. Statistical analysis suggests that groundwater markets in water-scarce areas tend to emerge earlier and be more developed in terms of depth and breadth (Zhang et al., 2008). Stability of land rights is another institutional factor that could encourage the emergence and development of water markets. The income level of farmers has little effect on market development.
94
Although farmers more dependent on farming are always poorer, they have, however, created more developed groundwater markets in northern China. Generally buyers and sellers are not very different by income and land endowment. When reexamining this in areas with different water scarcity levels (i.e. different depths to the water table), we found that in relatively scarce areas the difference remains obvious. This means that the greater the water scarcity, the more the market is relied on by resource-poor farmers, and then it is more equity enhancing. The characteristics of tubewells also show great diversity. The depth of wells ranges from 11 to 350 m, and the cheapest one is 2000 Yuan (the most expensive one is 60 times that amount). Great diversity also exists in ownership. Some tubewells are owned individually, and a well in Yaoshang in Xian County has 200 shareholders. Data suggest that the investments owners paid for their tubewells show a nearly pure linear correlation with water scarcity. The degree of water scarcity affects ownership in many ways. On the one hand, higher scarcity means higher cost to dig a well, and is beyond what individuals can afford. In relatively water-scarce areas, farmers need to organize themselves to share the total cost. On the other hand, higher scarcity can also bring more privatization (Wang et al., 2005). Great differences are also found in the level of service. Among our sample of farmers, some could access water quite conveniently. The sellers not only dig wells and pump water, but also convey water by underground pipe to farmers’ plots or to places near the plots. In most cases when sellers provide water with underground pipes, farmers only need several sections of plastic hose that every farmer can afford, connected to the nearest outlets to their plots. In other cases, sellers are only responsible for digging wells and pumping. Conveyance is totally done by the buyers, mostly with hoses or canals. This means the service remains completely self-help. Farmers drive their own tractors to the spot where the seller’s tubewell is located, sink their own pump, and then extend their own hoses to their plots. In this entire irrigating process, the sellers are absent. The only service they provide is digging the well. In order to understand how the different types of services are adopted across villages, we examined the impacts of the extent of water scarcity and market development level (breadth and depth). The level of service is associated with the water endowment, and better service always occurs in the more water-scarce areas. The farmers and sellers told us that in water-scarce areas the sellers depend on underground pipe to extend the command area to achieve a return on their investment earlier, or to earn higher profits. This is similar to findings in Gujarat, India, which is highly water-scarce. All tubewell owners have underground pipelines and supply water directly to the buyers’ field, whereas in water-abundant West Bengal, most water channels are unlined. The development of a market, which is measured by the share of water sold to buyers to the total pumped water, changes with quality of services. This means that if the pumping behavior is more market oriented, better services tend to be provided. Because most of China's efforts to encourage the use of sophisticated water-saving technologies, such as drip and sprinkler irrigation, have failed, more interest is being shown in increasing water prices to encourage water users to save water. Before assessing the effectiveness of price policy, it is important to understand the determinants of water price. Market prices of water can be highly uneven, with great variation across villages and within the same villages. Village average prices range from 0.16 to 0.60 Yuan/m3. Within the same village, the highest price can often be several times higher than the lowest price. Many researchers have observed the absence of competition in the groundwater market in developing countries. Shah (1993) characterized groundwater markets as monopolistic or oligopolistic given the high price-cost ratio. On the other hand, Fujita and Hossain (1995) consider the high ratio to be reasonable because the rate of return on capital investment is close to the interest rate in the informal financial market. In this paper, we pay considerable attention to those findings in South Asia, and examine related information when we try to understand the water pricing and monopoly issue in northern China. We similarly compare the informal financial market interest rate and the share of price-cost margin in our target 10 villages. The share of price-cost margin is very large in most villages, and the prices of water are higher than the interest rate in the informal financial market (it could be considered as the opportunity cost of the investment capital) and thus justify sellers’ sinking tubewells. In two villages, the margin share and the price are really close. In eight other villages, however, the difference between margin share and price is greater than 20%. In three villages, the differences are greater than 35%, which should not be defined as close. So the arguments of Fujita and Hossain (1995) in South Asia do not totally explain such diversity across villages. Although we have taken the opportunity cost of investment into account, at least in some villages there is still the possibility for the existence of market power. In order to understand water prices and monopoly issues, we set up a simple econometric model as follows:
vijhvvijhvvijvvvvijh ZVMQWOSP εληδθφγβα ++++++++=
In the function for water scarcity vS, we again use water table of a village for a proxy. And the price of
electricity for a village is introduced as the operation cost ( vO). vW
is a weather dummy and it equals to 1 if it’s a drought year for the village. This variable is to control the demand for irrigating water. Next, the status of
the substitute goods supply vijQ could affect the price. We use two variables to control the substitute goods
supply for a plot. If a plot has a canal available then the canal dummy equals to 1, and if a plot has a collective tubewell available then the collective well dummy equals to 1. The number of sellers in a village is used to
95
measure the monopoly status ( vM). A few interviewed sellers frankly told us that they even allied themselves
with other sellers in the same village to enhance the water price. This usually occurs in the villages with fewer
sellers. We include the pump characteristic vijhV which means the actual pumped water volume per hour in
village v household i plot j and round h of irrigation. And we also add in some controlled variables vZ, such as
total land area of a village to control village size and county dummy variables. We use ordinary least square (OLS) regression to estimate the effect of the different variables on water price and the econometric regression performs well (Table 1, column 1). The coefficients of all variables of interest have the expected signs and most of the coefficients are statistically significant. The depth to the water table used is positively and significantly correlated with water price. This is probably because deeper water tables always have higher sinking cost and lower tubewell intensity. Consistent with other reports in the literature, the operation cost measured by electricity tariff positively affects the water price and it is also quite significant at the 1% level. Furthermore, the degree of monopolization as measured by number of sellers in a village negatively affects the price, i.e. in those villages where fewer owners are selling water, prices are higher, and this is also significant at the 1% level. Table 1. Regression results of water price determinants. Dependent variable: log of price Standardized Coef. Fixed cost
Water table 0.001 0.119 (2.07)* Variable cost
Price of electricity 1.163 0.234 (2.72)** Weather condition (1 for a drought season; 0 for others) 0.231 0.098 (2.74)** Substitute goods
Canal dummy (1:A canal available for the plot ;0: others) -0.31 -0.209 (6.25)**
Collective tubewell dummy (1:A collective well available; 0 : others)
-0.281 -0.169
(6.13)** Monopoly
Number of selling water tubewells -0.015 -0.238 (4.76)**
We also include the standardized coefficients (it is so-called β coefficients) in the second column to compare the extent of effects of those variables. According to the figures in the last column, the fixed costs and operation costs have significant and large effects on water price. When two types of costs change by one time standard deviation, the price changes by 0.119 and 0.234 times standard deviation, respectively. As for monopoly variable, the value is 0.238. These facts argue that despite the large effects of water scarcity and operation cost, market power is also acting as a price promoter. Other controlled variables are less significant or less important for our analysis, and we do not discuss them here. Conclusions and recommendations This paper attempts to understand the actual operation status of groundwater markets in northern China. Using our three data sets, we found that although groundwater markets are developing fast in northern China, their development is not synchronous. Groundwater market development and operation show great diversity in northern China. Water resources constraints are always one of the major factors determining how the markets are conducted. As a result, there is both bad and good news for farmers in water-scarce areas. The bad news is they are facing higher water prices due to the higher costs to dig wells, there are few available tubewells, and they have higher operation costs and are monopolies. As for the good news, there are relatively developed groundwater markets in water-scarce areas, and markets are more equity-enhancing and provide better services. In short, farmers in water-scarce areas need more help to participate in a market, but markets are better utilized where there are more sellers to limit the monopoly power. Groundwater markets are playing an important role for farmers to access water. The role as well as the implementation, however; is played unevenly. Before policymakers work out any policy related to groundwater, the great diversity of the operation of groundwater markets should be taken into account. The implications of such diversity for regions with different resource endowments should be well understood.

96
Acknowledgments This paper presents findings from PN42 ‘Groundwater Governance in Asia,’ a project of the CGIAR Challenge Program on Water and Food. References Fujita, K., and F. Hossain. 1995. Role of the groundwater market in agricultural development and income
distribution: a case study in a northwest Bangladesh Village. The Developing Economies, 33(4): 442-63.
Shah, T. 1993. Groundwater Markets and Irrigation Development: Political Economy and Practical Policy. Oxford University Press, Bombay.
Wang, J., J. Huang, and S. Rozelle. 2005. Evolution of tubewell ownership and production in the North China Plain. Australian Journal of Agricultural and Resource Economics, 49(2): 177-96.
Zhang, L., J. Wang, J. Huang, and S. Rozelle. 2008. Development of groundwater markets in China: a glimpse into progress. World Development, 36(4): 706-26.
97
Innovative modeling tools
Using daily rainfall data and IDF curves to estimate the impact of land cover change on rainfall runoff
E. Kemp-Benedict1, A. Huber-Lee2, and Lineu N. Rodrigues
1Stockholm Environment Institute [email protected]
2CPWF, c/o International Water Management Institute 3EMBRAPA Cerrados
Abstract
When developing scenarios for small reservoir systems, a frequent input is a precipitation time-series at daily time step. Total rainfall, however, is not always sufficient for understanding catchment dynamics and reservoir filling and discharge. Instead, the rainfall pattern for an entire storm, or at least the peak intensity, is needed. While this information is not directly available, typical patterns are represented by intensity-duration-frequency (IDF) curves. We show how a standard parameterization of IDF curves can be used to obtain a probability density of peak intensity given the total rainfall from a storm. We use the results to estimate the amount of rain that exceeds the infiltration capacity of the soil under different land cover in the Buriti Vermelho catchment within the São Francisco River Basin. Media grab We show how to make effective use of daily rainfall and parameterized rainfall patterns to study the impact of land-use change on water resources. Introduction In many practical applications time series of total rainfall per day are available, but for some hydrological and soil erosion models, peak rainfall intensity is needed. For example, if the intensity of rainfall exceeds the infiltration capacity of the soil, it can lead either to depression storage or to Hortonian overland flow. Either of these outcomes could affect soil moisture and groundwater storage. There is a statistical relationship between rainfall and peak intensity. The goal for the calculations that follow is to take total rainfall from a storm event as an input and estimate a probability distribution of peak intensity. This approach can be contrasted to that of Wyseure et al. (2002), who identified an empirical relationship between 30-minute average intensity as a function of rainfall and used the relationship to model rainwater harvesting. The calculation presented below linking daily rainfall to peak intensity assumes one storm event per day. Combining this assumption with a parameterized form for an intensity-duration-frequency (IDF) curve, the conditional probability distribution for peak intensity given total rainfall is derived. It should be possible to collect the required information in many studies, even ones with limited data. This conditional probability is derived and then applied to the case of infiltration excess in the Buriti Vermilho catchment within the São Francisco River Basin. The results are preliminary, but agree qualitatively with observations of the cerrado. Methods The approach taken in this paper is to deduce, starting from a parameterized intensity-duration-frequency (IDF) curve, the statistical distribution of peak intensity as a function of total storm rainfall (although, as mentioned above, we assume one storm per day, and use daily rainfall). The statistical distribution is derived by using the standard statistical interpretation of the return period (or frequency) (Ward et al., 2004). Parameterization of IDF curves Intensity-duration-frequency (IDF) curves relate average intensity I to the return period T and duration D. The parameterization used for this paper is
, (1) In this parameterization, b has units of 1/time (e.g., 1/minute), while A has units of intensity (e.g., mm/hr). The storm return period T is defined in terms of the quantiles of a probability distribution, and so it is dimensionless. For a storm with a return period T, the probability that a storm of that type will be exceeded in a year (the exceedance probability) is 1/T. Specifically, the return period expresses the probability that the average intensity of a storm will exceed a threshold for a storm of a specified duration (Ward et al., 2004). This can be written the following way,
. (2)
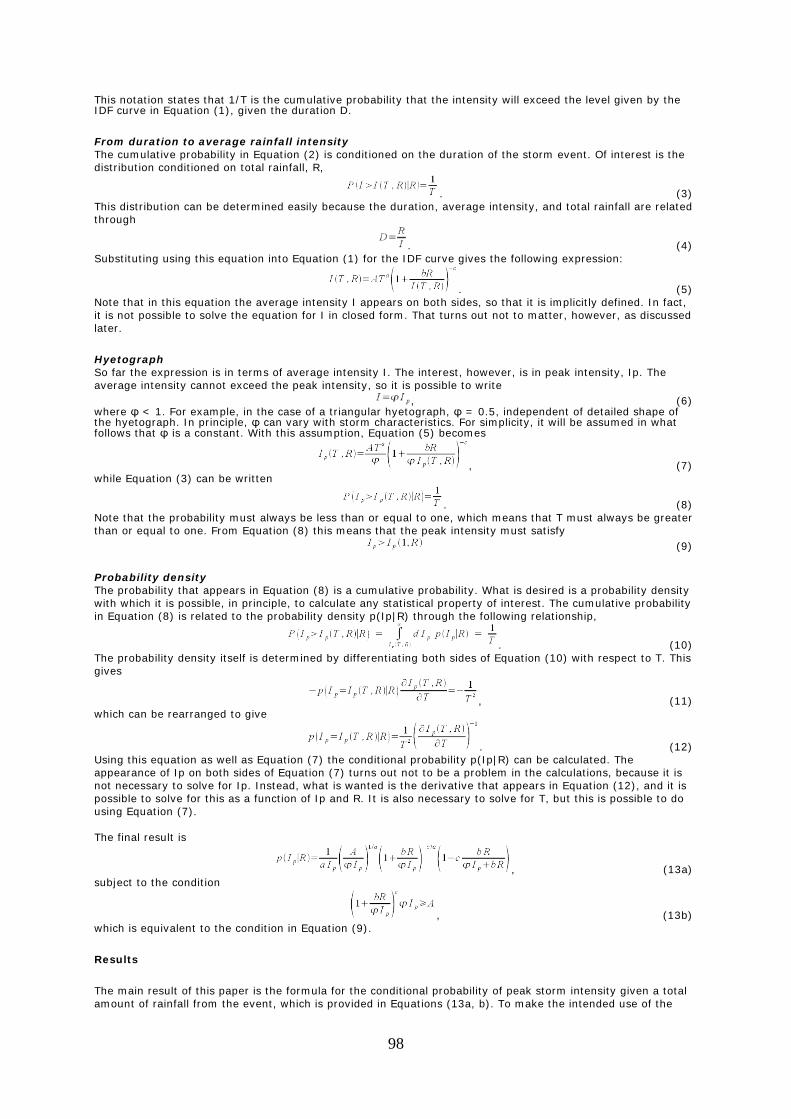
98
This notation states that 1/T is the cumulative probability that the intensity will exceed the level given by the IDF curve in Equation (1), given the duration D.
From duration to average rainfall intensity The cumulative probability in Equation (2) is conditioned on the duration of the storm event. Of interest is the distribution conditioned on total rainfall, R,
. (3) This distribution can be determined easily because the duration, average intensity, and total rainfall are related through
. (4) Substituting using this equation into Equation (1) for the IDF curve gives the following expression:
. (5) Note that in this equation the average intensity I appears on both sides, so that it is implicitly defined. In fact, it is not possible to solve the equation for I in closed form. That turns out not to matter, however, as discussed later.
Hyetograph So far the expression is in terms of average intensity I. The interest, however, is in peak intensity, Ip. The average intensity cannot exceed the peak intensity, so it is possible to write , (6) where φ < 1. For example, in the case of a triangular hyetograph, φ = 0.5, independent of detailed shape of the hyetograph. In principle, φ can vary with storm characteristics. For simplicity, it will be assumed in what follows that φ is a constant. With this assumption, Equation (5) becomes
, (7) while Equation (3) can be written
. (8) Note that the probability must always be less than or equal to one, which means that T must always be greater than or equal to one. From Equation (8) this means that the peak intensity must satisfy (9)
Probability density The probability that appears in Equation (8) is a cumulative probability. What is desired is a probability density with which it is possible, in principle, to calculate any statistical property of interest. The cumulative probability in Equation (8) is related to the probability density p(Ip|R) through the following relationship,
. (10) The probability density itself is determined by differentiating both sides of Equation (10) with respect to T. This gives
, (11) which can be rearranged to give
. (12) Using this equation as well as Equation (7) the conditional probability p(Ip|R) can be calculated. The appearance of Ip on both sides of Equation (7) turns out not to be a problem in the calculations, because it is not necessary to solve for Ip. Instead, what is wanted is the derivative that appears in Equation (12), and it is possible to solve for this as a function of Ip and R. It is also necessary to solve for T, but this is possible to do using Equation (7). The final result is
, (13a) subject to the condition
, (13b) which is equivalent to the condition in Equation (9).
Results
The main result of this paper is the formula for the conditional probability of peak storm intensity given a total amount of rainfall from the event, which is provided in Equations (13a, b). To make the intended use of the
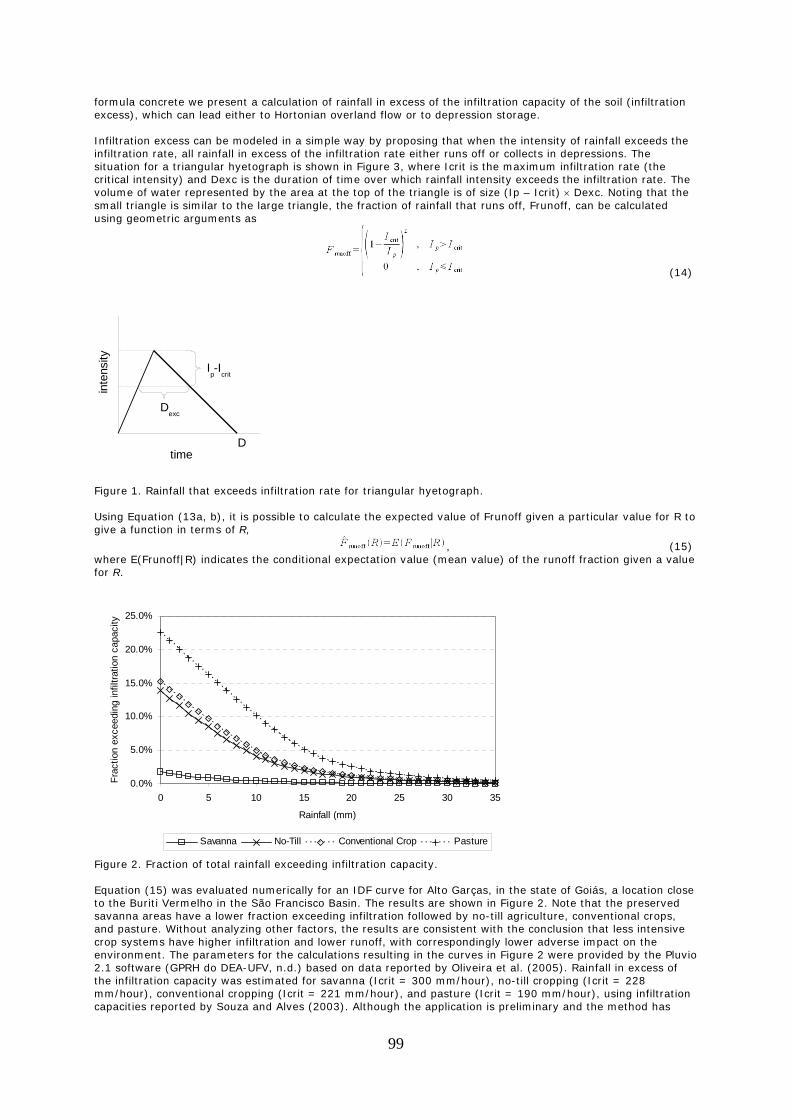
99
formula concrete we present a calculation of rainfall in excess of the infiltration capacity of the soil (infiltration excess), which can lead either to Hortonian overland flow or to depression storage. Infiltration excess can be modeled in a simple way by proposing that when the intensity of rainfall exceeds the infiltration rate, all rainfall in excess of the infiltration rate either runs off or collects in depressions. The situation for a triangular hyetograph is shown in Figure 3, where Icrit is the maximum infiltration rate (the critical intensity) and Dexc is the duration of time over which rainfall intensity exceeds the infiltration rate. The volume of water represented by the area at the top of the triangle is of size (Ip – Icrit) × Dexc. Noting that the small triangle is similar to the large triangle, the fraction of rainfall that runs off, Frunoff, can be calculated using geometric arguments as
(14)
Figure 1. Rainfall that exceeds infiltration rate for triangular hyetograph. Using Equation (13a, b), it is possible to calculate the expected value of Frunoff given a particular value for R to give a function in terms of R,
, (15) where E(Frunoff|R) indicates the conditional expectation value (mean value) of the runoff fraction given a value for R.
Figure 2. Fraction of total rainfall exceeding infiltration capacity. Equation (15) was evaluated numerically for an IDF curve for Alto Garças, in the state of Goiás, a location close to the Buriti Vermelho in the São Francisco Basin. The results are shown in Figure 2. Note that the preserved savanna areas have a lower fraction exceeding infiltration followed by no-till agriculture, conventional crops, and pasture. Without analyzing other factors, the results are consistent with the conclusion that less intensive crop systems have higher infiltration and lower runoff, with correspondingly lower adverse impact on the environment. The parameters for the calculations resulting in the curves in Figure 2 were provided by the Pluvio 2.1 software (GPRH do DEA-UFV, n.d.) based on data reported by Oliveira et al. (2005). Rainfall in excess of the infiltration capacity was estimated for savanna (Icrit = 300 mm/hour), no-till cropping (Icrit = 228 mm/hour), conventional cropping (Icrit = 221 mm/hour), and pasture (Icrit = 190 mm/hour), using infiltration capacities reported by Souza and Alves (2003). Although the application is preliminary and the method has
time
inte
nsity
D
Ip-I
crit
Dexc
0.0%
5.0%
10.0%
15.0%
20.0%
25.0%
0 5 10 15 20 25 30 35
Rainfall (mm)
Frac
tion
exce
edin
g in
filtra
tion
capa
city
Savanna No-Till Conventional Crop Pasture
100
neither been calibrated nor validated, the results are consistent with qualitative observations of the cerrado, that in the natural state infiltration rates are very high and runoff is unusual, while cultivation leads to high runoff and erosion (Landers, 2001). Discussion There are sharp differences between the degrees to which the intensity of rainfall exceeds the infiltration capacity for the different land covers shown in Figure 2. The soil of the Brazilian savanna (cerrado) is predominantly a quickly-draining oxisol (Buol, 2006). Different soil uses and managements can modify its structure, which affects water infiltration and runoff. Without suitable management (for example, rainwater harvesting) a substantially greater amount of runoff can be expected from Hortonian overland flow, especially for relatively brief but intense storm events, as can be seen from Figure 2.
Conclusions and recommendations
The methods presented in this paper appear promising for estimating intensity using readily available data encoded in intensity-duration-frequency (IDF) curves. Possible applications include modeling of water harvesting, the water resource implications of land use and land cover, and soil erosion. An application to the Brazilian savanna (cerrado) was presented. Aside from the IDF curve the necessary input was an estimate of infiltration capacity. The results suggest that under conversion of the cerrado to agricultural use, the intensity of rainfall could substantially exceed the infiltration capacity of the soil, especially for relatively brief and intense storms, with implications for soil and water resources.
While this method has only been tested in the Brazilian cerrados, the soil type and lack of data are a problem throughout the developing world, and the method has the potential for broad application.
Acknowledgments
This paper presents findings from PN46 Small Reservoirs Project, a project of the CGIAR Challenge Program on Water and Food. The authors would like to thank Vishal Mehta for his comments on the ideas presented in this paper.
References
Buol, S.W. 2006. Oxisols. In Lal. R. (ed.) Encyclopedia of Soil Science, 2nd Edition, Vol. 2. New York: Taylor
and Francis Group. Grupo de Pesquisa em Recursos Hídricos do Departamento de Engenharia Agrícola de Universidade Federal de
Viçosa (GPRH do DEA-UFV). n.d. Pluvio 2.1 Software. URL: http://www.ufv.br/dea/gprh/softwares.htm.
Landers, J.N. 2001. Zero Tillage Development in Tropical Brazil: The Story of a Successful NGO Activity. FAO
Agricultural Services Bulletin 147. URL: http://www.fao.org/docrep/004/y2638e/y2638e00.htm#toc. Oliveira, L F.C., F.C. Cortês, T.R. Wehr, L.B. Borges, P.H.L. Sarmento, and N.P. Grieblier. 2005. Intensidade-
duração-frequência de chuvas para localidades no Estado do Goiás e Distrito Federal. Pesquisa Agropecuária Tropical, 35: 13-8.
Souza, Z.M. de, and M.C. Alves. 2003. Movimento de água e resistência à penetração em um Latossolo
Vermelho distrófico de cerrado, sob diferentes usos e manejos. Revista Brasileira de Engenharia Agrícola e Ambiental, 7(1): 18-23.
Ward, A.D., S.W. Trimble, and M.G. Wolman. 2004. Environmental Hydrology, 2nd Edition. Boca Raton: Lewis
Publishers. Wyseure, G.C.L., J.W. Gowing, and M.D.B. Young. 2002. PARCHED-THIRST: An Agrohydrological Model for
Planning Rainwater Harvesting Systems in Semi-Arid Areas. Chapter 10 in V. P. Singh and D. K. Frevert, (eds.) Mathematical Models of Small Watershed Hydrology and Applications. Highlands Ranch, Colorado: Water Resources Publications, LLC.
101
Surface energy balance modeling to track water consumption by heterogeneous land uses in the Karkheh River Basin, Iran
L.P. Muthuwatta1,4, Mobin-ud-Din Ahmad2,3, M.G. Bos4, and T.H.M. Rientjes4
1International Water Management Institute (IWMI), Global Research Division, P.O. Box 2075, Colombo, Sri Lanka [email protected]
2formerly at International Water Management Institute (IWMI), Global Research Division, P. O. Box. 2075, Colombo, Sri Lanka
3CSIRO Land and Water, Locked Bag 588, Building 24, Charles Sturt University, Wagga Wagga Campus, NSW 2678, Australia
4International Institute for Geo-information Science and Earth Observation (ITC), PO Box 6, 7500AA, Enschede, The Netherlands
Abstract Spatially distributed actual evapotranspiration (ETa) values were estimated based on satellite data and the Surface Energy Balance System (SEBS) approach for the Karkheh River Basin in Iran. Nineteen cloud-free MODIS (Moderate Resolution Imaging Spectroradiometer) images were acquired and processed to represent a complete cropping year from November 2002 to October 2003. Precipitation data from 30 rain gauges were used to estimate spatial patterns of rainfall over the basin. Estimated ETa was verified using subcatchment scale water balance analysis. The water balance closure terms (Equation 2) at sub-basin scale ranged from 6.4 to 0.6% of the precipitation. ETa from rainfed wheat was 302 mm/season. Average ETa from the irrigated wheat areas in upper and lower Karkheh are 432 mm/season and 448 mm/season, respectively. The results are used for water balance analysis and reveal that during the study period, the Karkheh Basin received 18,507x106 m3 as precipitation while ETa was estimated at 16,680x106 m3. Estimated outflow from the basin is 7.8% of precipitation and indicates that water is a very scarce resource in the Karkheh. Therefore within the current context, the most viable option for the Karkheh Basin is to improve water productivity through water demand management rather than focusing on additional water resources development. Media grab Freely available satellite data is a cost-effective source to generate valuable water management information on large river basins. Introduction Limited water supply is a major constraint on development and agricultural activities in many parts of the world. In such situations, efficient management of water to fulfil the requirements of different uses is essential, and requires information on water availability and consumption in both spatial and temporal scales. There is often, however, a lack of field data on the actual consumption and availability of water. This hampers judicious management and planning of water resources. This is particularly relevant to the Karkheh River Basin (KRB), in which water resources are considered to be scarce. More importantly, the basin covers 10% of Iran’s irrigated area and produces more than 9% of all crops. Twenty percent of wheat production comes from the basin. Wheat, barley, maize, and chickpea are the main crops in the basin. In the upper basin, rainfed and irrigated agriculture are practiced. In the lower basin, irrigated agriculture is practiced with water from the Karkheh reservoir. In the upper areas of KRB the reported groundwater abstractions are in the order of 3500x106
m3/year to 4000x106 m3/year. Karkheh River finally drains into the Hoor-Al-Azim swamp which is a trans-boundary wetland located at the Iran-Iraq border, and more importantly is a Ramsar site. Therefore, considering prevalent water scarcity, it is important to have quantitative information about water resources in the basin. Through this information it is possible to determine options for future development by ensuring sufficient water allocation among different uses that includes the swamp. The objective of this study is to estimate the water availability in the basin while estimating water consumption by different land uses. ETa and precipitation data were estimated based on satellite remote sensing and geo-statistical techniques, along with the observed stream flow data to understand water availability. Methods To estimate the distribution of precipitation, the Sutcliffe and Carpenter (1968) method was adopted and modified. This method was originally developed for estimating precipitation in heterogeneous terrains of Western Iran, and it incorporates the influence of topography on annual precipitation. The influence of topography on annual precipitation is assessed by establishing a linear regression between precipitation and elevations recorded at gauging stations. Based on this regression, a precipitation gradient related to the elevation (precipitation lapse rate) is established. Then the topographic influence (trend component) is removed from the precipitation records. To do that the observed precipitation data at the stations were converted into the equitant values at the standard elevation using the lapse rate. The standard elevation is established by trial and error with the objective of finding an elevation for which precipitation does not show a specific trend. For this area standard elevation is found as 1200 m. To estimate the precipitation at un-sampled locations, these standardized point values are interpolated to a grid using simple Kriging. After the interpolation the trend component is added back to the precipitation grid. Precipitation data from 30 stations were used for the interpolation. This interpolated precipitation was validated through standard cross validation procedure (Daly et
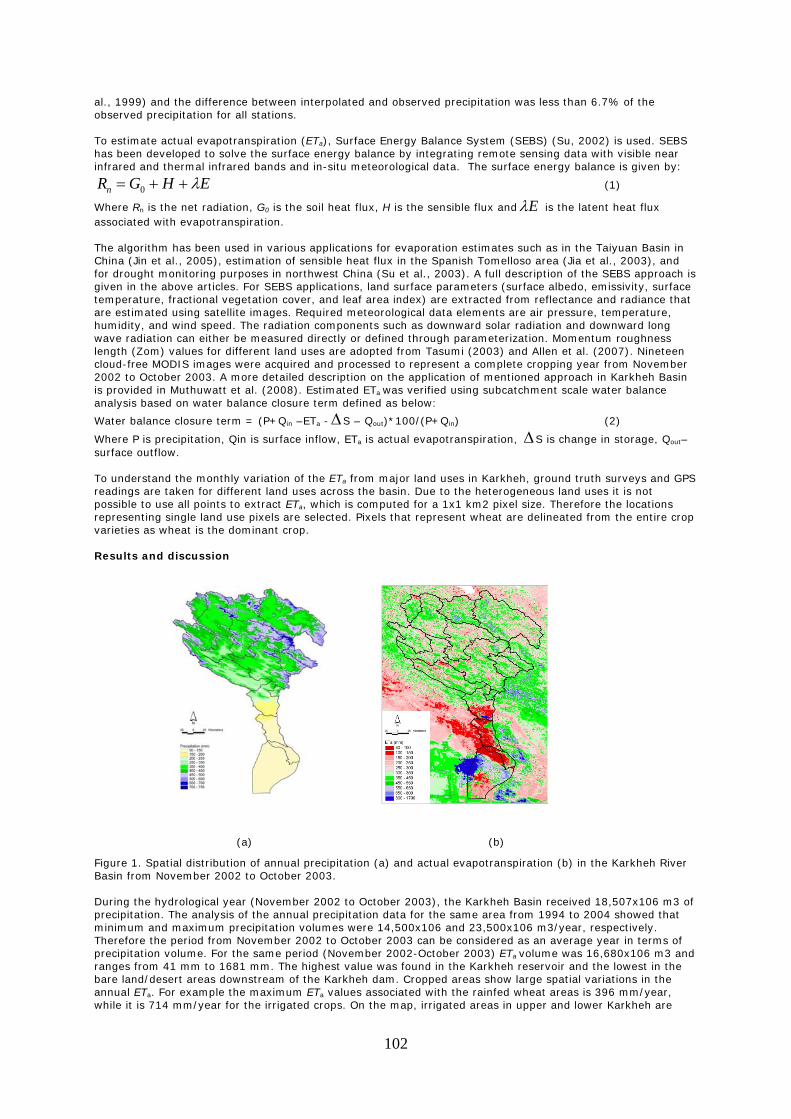
102
al., 1999) and the difference between interpolated and observed precipitation was less than 6.7% of the observed precipitation for all stations. To estimate actual evapotranspiration (ETa), Surface Energy Balance System (SEBS) (Su, 2002) is used. SEBS has been developed to solve the surface energy balance by integrating remote sensing data with visible near infrared and thermal infrared bands and in-situ meteorological data. The surface energy balance is given by:
EHGRn λ++= 0 (1)
Where Rn is the net radiation, G0 is the soil heat flux, H is the sensible flux and Eλ is the latent heat flux associated with evapotranspiration. The algorithm has been used in various applications for evaporation estimates such as in the Taiyuan Basin in China (Jin et al., 2005), estimation of sensible heat flux in the Spanish Tomelloso area (Jia et al., 2003), and for drought monitoring purposes in northwest China (Su et al., 2003). A full description of the SEBS approach is given in the above articles. For SEBS applications, land surface parameters (surface albedo, emissivity, surface temperature, fractional vegetation cover, and leaf area index) are extracted from reflectance and radiance that are estimated using satellite images. Required meteorological data elements are air pressure, temperature, humidity, and wind speed. The radiation components such as downward solar radiation and downward long wave radiation can either be measured directly or defined through parameterization. Momentum roughness length (Zom) values for different land uses are adopted from Tasumi (2003) and Allen et al. (2007). Nineteen cloud-free MODIS images were acquired and processed to represent a complete cropping year from November 2002 to October 2003. A more detailed description on the application of mentioned approach in Karkheh Basin is provided in Muthuwatt et al. (2008). Estimated ETa was verified using subcatchment scale water balance analysis based on water balance closure term defined as below:
Water balance closure term = (P+Qin –ETa -ΔS – Qout)*100/(P+Qin) (2)
Where P is precipitation, Qin is surface inflow, ETa is actual evapotranspiration, ΔS is change in storage, Qout–surface outflow. To understand the monthly variation of the ETa from major land uses in Karkheh, ground truth surveys and GPS readings are taken for different land uses across the basin. Due to the heterogeneous land uses it is not possible to use all points to extract ETa, which is computed for a 1x1 km2 pixel size. Therefore the locations representing single land use pixels are selected. Pixels that represent wheat are delineated from the entire crop varieties as wheat is the dominant crop. Results and discussion
(a) (b)
Figure 1. Spatial distribution of annual precipitation (a) and actual evapotranspiration (b) in the Karkheh River Basin from November 2002 to October 2003. During the hydrological year (November 2002 to October 2003), the Karkheh Basin received 18,507x106 m3 of precipitation. The analysis of the annual precipitation data for the same area from 1994 to 2004 showed that minimum and maximum precipitation volumes were 14,500x106 and 23,500x106 m3/year, respectively. Therefore the period from November 2002 to October 2003 can be considered as an average year in terms of precipitation volume. For the same period (November 2002-October 2003) ETa volume was 16,680x106 m3 and ranges from 41 mm to 1681 mm. The highest value was found in the Karkheh reservoir and the lowest in the bare land/desert areas downstream of the Karkheh dam. Cropped areas show large spatial variations in the annual ETa. For example the maximum ETa values associated with the rainfed wheat areas is 396 mm/year, while it is 714 mm/year for the irrigated crops. On the map, irrigated areas in upper and lower Karkheh are
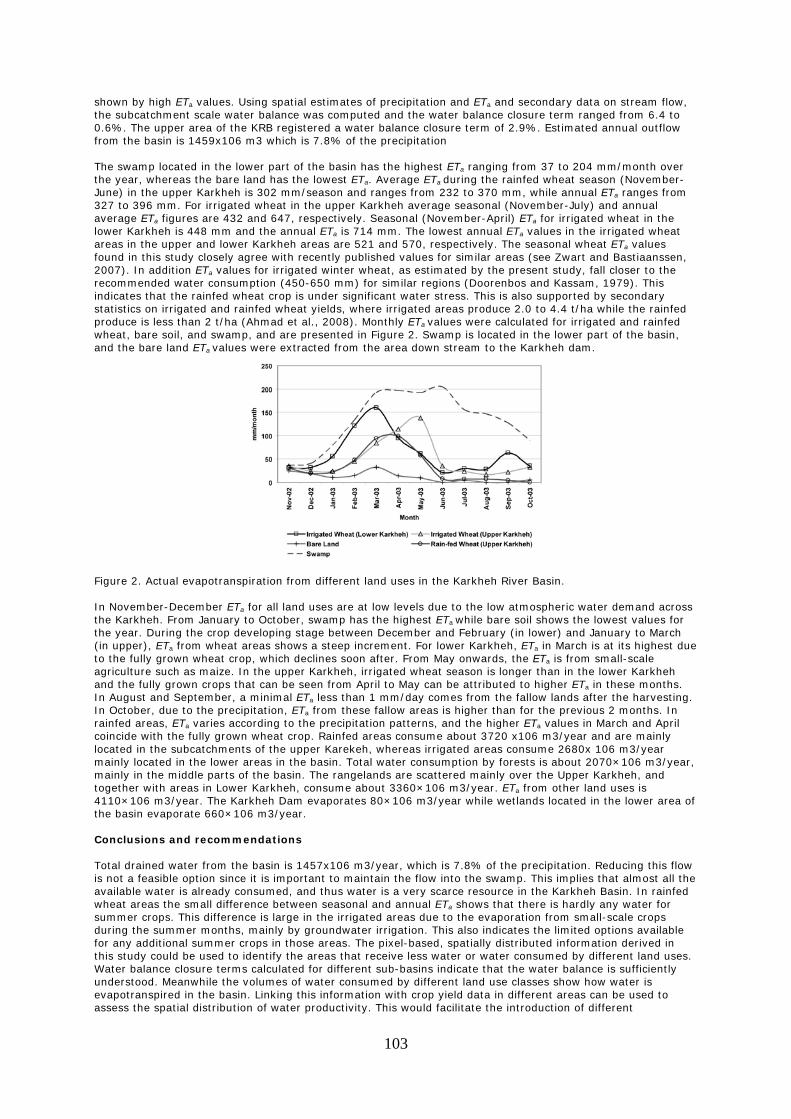
103
shown by high ETa values. Using spatial estimates of precipitation and ETa and secondary data on stream flow, the subcatchment scale water balance was computed and the water balance closure term ranged from 6.4 to 0.6%. The upper area of the KRB registered a water balance closure term of 2.9%. Estimated annual outflow from the basin is 1459x106 m3 which is 7.8% of the precipitation The swamp located in the lower part of the basin has the highest ETa ranging from 37 to 204 mm/month over the year, whereas the bare land has the lowest ETa. Average ETa during the rainfed wheat season (November-June) in the upper Karkheh is 302 mm/season and ranges from 232 to 370 mm, while annual ETa ranges from 327 to 396 mm. For irrigated wheat in the upper Karkheh average seasonal (November-July) and annual average ETa figures are 432 and 647, respectively. Seasonal (November-April) ETa for irrigated wheat in the lower Karkheh is 448 mm and the annual ETa is 714 mm. The lowest annual ETa values in the irrigated wheat areas in the upper and lower Karkheh areas are 521 and 570, respectively. The seasonal wheat ETa values found in this study closely agree with recently published values for similar areas (see Zwart and Bastiaanssen, 2007). In addition ETa values for irrigated winter wheat, as estimated by the present study, fall closer to the recommended water consumption (450-650 mm) for similar regions (Doorenbos and Kassam, 1979). This indicates that the rainfed wheat crop is under significant water stress. This is also supported by secondary statistics on irrigated and rainfed wheat yields, where irrigated areas produce 2.0 to 4.4 t/ha while the rainfed produce is less than 2 t/ha (Ahmad et al., 2008). Monthly ETa values were calculated for irrigated and rainfed wheat, bare soil, and swamp, and are presented in Figure 2. Swamp is located in the lower part of the basin, and the bare land ETa values were extracted from the area down stream to the Karkheh dam.
Figure 2. Actual evapotranspiration from different land uses in the Karkheh River Basin. In November-December ETa for all land uses are at low levels due to the low atmospheric water demand across the Karkheh. From January to October, swamp has the highest ETa while bare soil shows the lowest values for the year. During the crop developing stage between December and February (in lower) and January to March (in upper), ETa from wheat areas shows a steep increment. For lower Karkheh, ETa in March is at its highest due to the fully grown wheat crop, which declines soon after. From May onwards, the ETa is from small-scale agriculture such as maize. In the upper Karkheh, irrigated wheat season is longer than in the lower Karkheh and the fully grown crops that can be seen from April to May can be attributed to higher ETa in these months. In August and September, a minimal ETa less than 1 mm/day comes from the fallow lands after the harvesting. In October, due to the precipitation, ETa from these fallow areas is higher than for the previous 2 months. In rainfed areas, ETa varies according to the precipitation patterns, and the higher ETa values in March and April coincide with the fully grown wheat crop. Rainfed areas consume about 3720 x106 m3/year and are mainly located in the subcatchments of the upper Karekeh, whereas irrigated areas consume 2680x 106 m3/year mainly located in the lower areas in the basin. Total water consumption by forests is about 2070×106 m3/year, mainly in the middle parts of the basin. The rangelands are scattered mainly over the Upper Karkheh, and together with areas in Lower Karkheh, consume about 3360×106 m3/year. ETa from other land uses is 4110×106 m3/year. The Karkheh Dam evaporates 80×106 m3/year while wetlands located in the lower area of the basin evaporate 660×106 m3/year. Conclusions and recommendations Total drained water from the basin is 1457x106 m3/year, which is 7.8% of the precipitation. Reducing this flow is not a feasible option since it is important to maintain the flow into the swamp. This implies that almost all the available water is already consumed, and thus water is a very scarce resource in the Karkheh Basin. In rainfed wheat areas the small difference between seasonal and annual ETa shows that there is hardly any water for summer crops. This difference is large in the irrigated areas due to the evaporation from small-scale crops during the summer months, mainly by groundwater irrigation. This also indicates the limited options available for any additional summer crops in those areas. The pixel-based, spatially distributed information derived in this study could be used to identify the areas that receive less water or water consumed by different land uses. Water balance closure terms calculated for different sub-basins indicate that the water balance is sufficiently understood. Meanwhile the volumes of water consumed by different land use classes show how water is evapotranspired in the basin. Linking this information with crop yield data in different areas can be used to assess the spatial distribution of water productivity. This would facilitate the introduction of different
104
management interventions to different areas in the basin based on the real ground situation. Furthermore, the freely available satellite data along with the SEBS algorithm and geostatistical techniques are effective for estimating spatial patterns of water consumption and availability. Acknowledgments This paper presents the findings from PN 57, ‘Basin Focal Project for the Karkheh,’ a project of the CGIAR Challenge Program on Water and Food. The authors would like to acknowledge the valuable help from the Karkheh Basin Focal Project team members, especially Mr. Ilyas Masih, Dr. Hugh Turral, and Mr. Poolad Karimi. Special thanks to the Iranian Meteorological Organization and the Energy Ministry of Iran for providing data for the study. This study was jointly financed by the International Water Management Institute (IWMI), the International Institute for Geo-Information Science and Earth Observation (ITC), and the Challenge Program on Water and Food (CPWF) Karkheh Basin Focal Project. References Ahmad, M.D, M.A.Islam, I. Masih, L.P. Muthuwatta, P. Karimi, and H.Turral. 2008. Mapping basin level water
productivity using remote sensing and secondary data in Karkheh river basin Iran. IWRA XIIIth World Water Congress, Montpellier, France, from 1-4 September 2008.
Allen, R.G., M. Tasumi, and R. Trezza. 2007. Satellite based energy balance for mapping evapotranspiration
with internalized calibration (METRIC)–model. Journal of Irrigation and Drainage Engineering, 133:4. Daly, C., R.P. Neilson, and D.L. Phillips. 1999. A statistical–topographic model for mapping climatological
precipitation over mountainous terrain. Journal of Applied Meteorology, 33: 140-58. Doorenbos, J., and A.H. Kassam.1979. Yield response to water. Irrigation and Drainage Paper, 33, FAO Rome,
Italy. Jia, L., Z. Su, B. van den Hurk, M. Menenti, A. Moene, H.A.R. De Bruin, J.J.B. Yrisarry, M. Ibanez, and A.
Cuesta. 2003. Estimation of sensible heat flux using the Surface Energy Balance System (SEBS) and ATSR measurements. Physics and Chemistry of the Earth, Parts A/B/C, 28(1-3): 75-88.
Jin, X., L. Wan, and Z. Su. 2005. Research on evaporation of Taiyuan Basin area by using remote sensing.
Hydrology and Earth System Science Discussion. 2:209-27. Muthuwatt, L.P., M.D. Ahma, M.G. Bos, and T.H.M. Rientjes. 2008. Assessment of water availability and
consumption in the Karkheh River Basin–Iran–Using remote sensing and geo-statistics. Water Resources Management (Submitted).
Su, Z. 2002. The surface energy balance system (SEBS) for estimation of turbulent heat flux. Hydrology and
Earth System Sciences, 6(1): 85-9. Su, Z., A. Yacob, J. Wen, G. Roerink, Y. He, B. Gao, H. Boogaard, and C.V. Diepen. 2003. Assessing relative soil
moisture with remote sensing data: theory, experimental validation, and application to drought monitoring over the North China Plain. Physics and Chemistry of the Earth, 28:89-101.
Sutcliffe, J.V., and T.G. Carpenter. 1968. The assessment of runoff from the mountainous and semi –arid areas
in western Iran. Hydrological aspects of the utilization of water (IAHS General Assembly of Bern), 383-394. IAHS public.76,IAHS press, Wallingford, UK.
Tasumi, M. 2003. Progress in operational estimation of regional evapotranspiration using satellite imagery. PhD
diss. University of Idaho. Zwart, S.J., and W.G.M. Bastiaanssen.2007. SEBAL for detecting spatial variation of water productivity and scope for
improvement in eight irrigated wheat systems. Agriculture Water Management, 89: 287-96.
105
Remote sensing-based actual evapotranspiration determination in the Notwane subcatchment of the Limpopo Basin of Botswana
1B.F. Alemaw and B. Munyai2
1Department of Geology, University of Botswana, P.Bag 00704, Gaborone, Botswana [email protected]
2Graduate Student, Hydrogeology Programme, Department of Geology, University of Botswana. P.Bag 00704, Gaborone, Botswana
Abstract
Catchment water balances and crop water demands are important elements in agricultural water management in arid and semiarid basins such as the Limpopo Basin. Remote sensing (RS) was used to determine evapotranspiration (ET) over the Notwane subcatchment of the Limpopo Basin of Botswana, based on the Simplified-Surface Energy Balance Index (S-SEBI) using MODIS data obtained on 21 April 2007. The study was motivated by the need to determine the spatial variation of evapotranspiration, which can be used to determine the spatial variability of other water balance components. Remote sensing-based estimates were compared with those calculated from meteorological data using the Penman-Monteith equation or the FAO method (FAOET ref). RS-based estimates of ET (RSETref) were comparable to those derived from meteorological data using the FAO method with ratio RSETref/ FAOET ref of 0.98. The results also indicate that ET is highest on urban catchments (431 mm/day) and lowest in pasture or rangeland in poor condition. These preliminary results suggest that the RS-based S-SEBI model provides a method of determining spatial variation of ET in the subcatchment where data availability for other methods is limited. It is recommended that use of RS data in determining and modeling ET in the catchment be encouraged by acquisition of more RS data sets. This would improve the temporal resolution of the ET estimates in addition to determining local calibration parameters for input into the RS-based MODELS. The remote sensing-based estimates provide ample opportunity to improve assessments of water balance, water availability, and access for the Limpopo Basin Focal Project. Media grab
Remote sensing data can determine actual evapotranspiration in the Notwane Subcatchment of the Limpopo Basin. Iintroduction
Evapotranspiration (ET) is one of the most important components of the hydrological cycle, yet it is one of the most difficult and most expensive parameters to measure in hydrological studies (Allen et al., 1998). Methods for determining ET are summarized by Lee et al., (2004). Ayenew (2003), Wu et al. (2006), and Mo et al. (2004) argue that there is a need to move away from the classic hydrologic models, where ET is captured in an empirical or conceptual way resulting in the parameter being lumped over the model area, to an approach where ET is captured as a physical process that varies spatially. Remote sensing provides the data needed to solve the energy balance equation on a pixel by pixel basis, thereby providing acceptable estimates of the spatial variability of ET based on surface temperature, reflection, and net radiation (Wu et al., 2006). The objectives of our study (which is part of an ongoing study to determine the spatial variation of recharge in the Notwane Subcatchment) were to: • Determine the spatial variation of ET over the Notwane Catchment. • Determine the variation of ET with land-use land cover. • Verify the applicability of RS-based methods in determining ET in arid to semiarid climates with limited
ground-based measurements. Methods Actual ET from MODIS data (NASA, 2008) was determined using the Simplified-Surface Energy Balance Index (S-SEBI) (Roerink et al., 2000) by solving for elements of the surface energy balance on a pixel by pixel basis, as summarized below. The surface energy balance equation is given in equation 1:
λEHoGnR ++= (1)
Where
nR is net radiation [Wm-2]
oG is soil heat flux [Wm-2]
H is sensible heat flux [Wm-2] λE is latent heat flux [Wm-2]
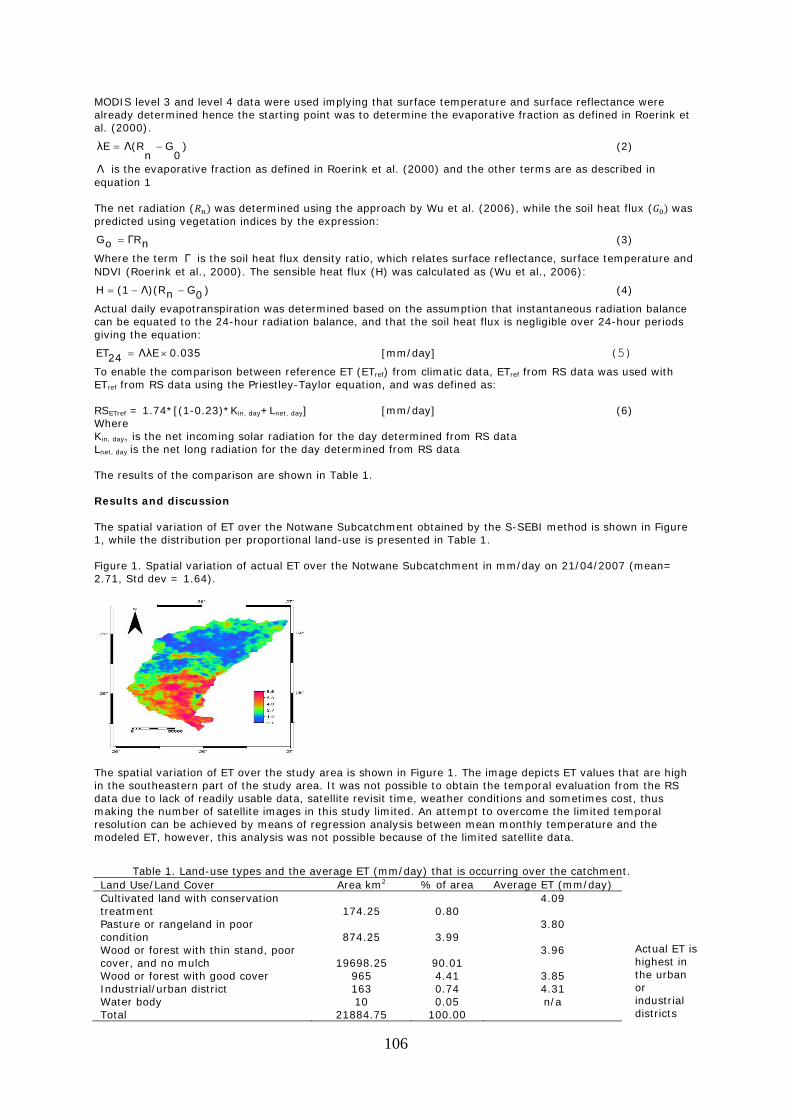
106
MODIS level 3 and level 4 data were used implying that surface temperature and surface reflectance were already determined hence the starting point was to determine the evaporative fraction as defined in Roerink et al. (2000).
)0
Gn
Λ(RλE −= (2)
Λ is the evaporative fraction as defined in Roerink et al. (2000) and the other terms are as described in equation 1 The net radiation ( was determined using the approach by Wu et al. (2006), while the soil heat flux ( was predicted using vegetation indices by the expression:
nΓRoG = (3)
Where the term Γ is the soil heat flux density ratio, which relates surface reflectance, surface temperature and NDVI (Roerink et al., 2000). The sensible heat flux (H) was calculated as (Wu et al., 2006):
)0GnΛ)(R(1H −−= (4)
Actual daily evapotranspiration was determined based on the assumption that instantaneous radiation balance can be equated to the 24-hour radiation balance, and that the soil heat flux is negligible over 24-hour periods giving the equation:
0.035ΛλE24ET ×= [mm/day] (5)
To enable the comparison between reference ET (ETref) from climatic data, ETref from RS data was used with ETref from RS data using the Priestley-Taylor equation, and was defined as: RSETref = 1.74*[(1-0.23)*Kin, day+Lnet, day] [mm/day] (6) Where Kin, day, is the net incoming solar radiation for the day determined from RS data Lnet, day is the net long radiation for the day determined from RS data The results of the comparison are shown in Table 1. Results and discussion The spatial variation of ET over the Notwane Subcatchment obtained by the S-SEBI method is shown in Figure 1, while the distribution per proportional land-use is presented in Table 1. Figure 1. Spatial variation of actual ET over the Notwane Subcatchment in mm/day on 21/04/2007 (mean= 2.71, Std dev = 1.64).
The spatial variation of ET over the study area is shown in Figure 1. The image depicts ET values that are high in the southeastern part of the study area. It was not possible to obtain the temporal evaluation from the RS data due to lack of readily usable data, satellite revisit time, weather conditions and sometimes cost, thus making the number of satellite images in this study limited. An attempt to overcome the limited temporal resolution can be achieved by means of regression analysis between mean monthly temperature and the modeled ET, however, this analysis was not possible because of the limited satellite data.
Table 1. Land-use types and the average ET (mm/day) that is occurring over the catchment. Actual ET is highest in the urban or industrial districts
Land Use/Land Cover Area km2 % of area Average ET (mm/day) Cultivated land with conservation treatment 174.25 0.80
4.09
Pasture or rangeland in poor condition 874.25 3.99
3.80
Wood or forest with thin stand, poor cover, and no mulch 19698.25 90.01
3.96
Wood or forest with good cover 965 4.41 3.85 Industrial/urban district 163 0.74 4.31 Water body 10 0.05 n/a Total 21884.75 100.00
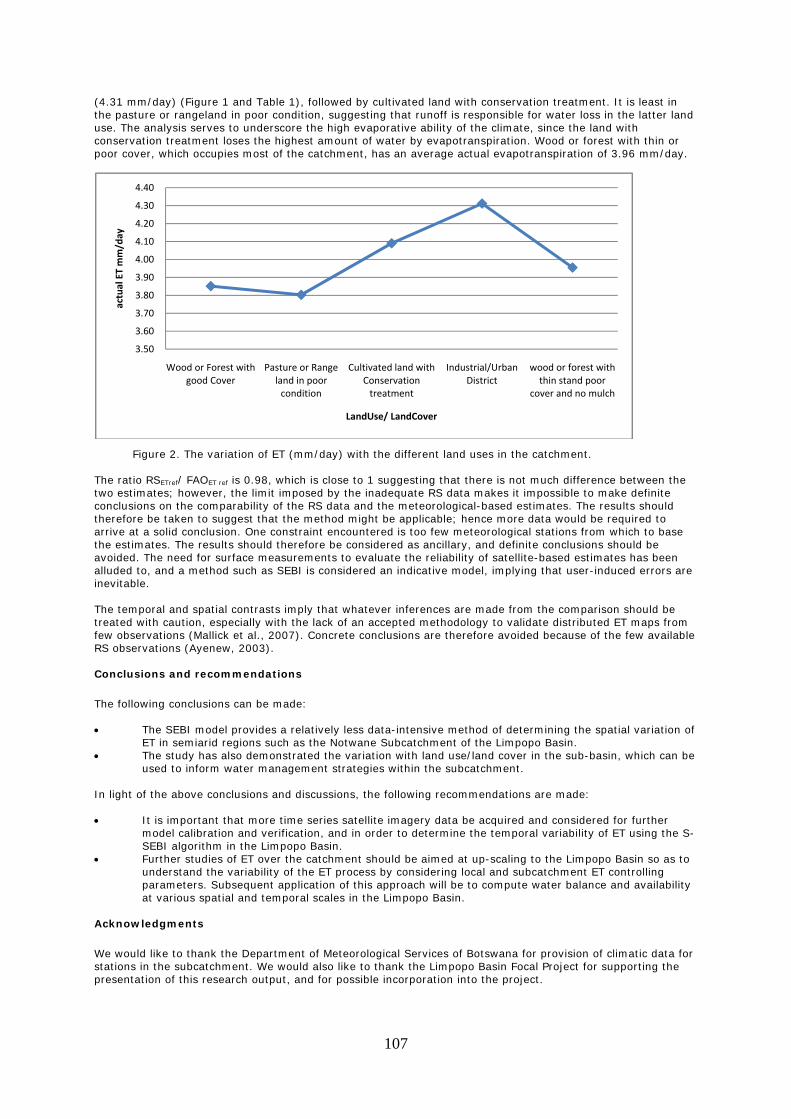
107
(4.31 mm/day) (Figure 1 and Table 1), followed by cultivated land with conservation treatment. It is least in the pasture or rangeland in poor condition, suggesting that runoff is responsible for water loss in the latter land use. The analysis serves to underscore the high evaporative ability of the climate, since the land with conservation treatment loses the highest amount of water by evapotranspiration. Wood or forest with thin or poor cover, which occupies most of the catchment, has an average actual evapotranspiration of 3.96 mm/day.
Figure 2. The variation of ET (mm/day) with the different land uses in the catchment.
The ratio RSETref/ FAOET ref is 0.98, which is close to 1 suggesting that there is not much difference between the two estimates; however, the limit imposed by the inadequate RS data makes it impossible to make definite conclusions on the comparability of the RS data and the meteorological-based estimates. The results should therefore be taken to suggest that the method might be applicable; hence more data would be required to arrive at a solid conclusion. One constraint encountered is too few meteorological stations from which to base the estimates. The results should therefore be considered as ancillary, and definite conclusions should be avoided. The need for surface measurements to evaluate the reliability of satellite-based estimates has been alluded to, and a method such as SEBI is considered an indicative model, implying that user-induced errors are inevitable. The temporal and spatial contrasts imply that whatever inferences are made from the comparison should be treated with caution, especially with the lack of an accepted methodology to validate distributed ET maps from few observations (Mallick et al., 2007). Concrete conclusions are therefore avoided because of the few available RS observations (Ayenew, 2003). Conclusions and recommendations
The following conclusions can be made: • The SEBI model provides a relatively less data-intensive method of determining the spatial variation of
ET in semiarid regions such as the Notwane Subcatchment of the Limpopo Basin. • The study has also demonstrated the variation with land use/land cover in the sub-basin, which can be
used to inform water management strategies within the subcatchment. In light of the above conclusions and discussions, the following recommendations are made: • It is important that more time series satellite imagery data be acquired and considered for further
model calibration and verification, and in order to determine the temporal variability of ET using the S-SEBI algorithm in the Limpopo Basin.
• Further studies of ET over the catchment should be aimed at up-scaling to the Limpopo Basin so as to understand the variability of the ET process by considering local and subcatchment ET controlling parameters. Subsequent application of this approach will be to compute water balance and availability at various spatial and temporal scales in the Limpopo Basin.
Acknowledgments
We would like to thank the Department of Meteorological Services of Botswana for provision of climatic data for stations in the subcatchment. We would also like to thank the Limpopo Basin Focal Project for supporting the presentation of this research output, and for possible incorporation into the project.
3.50
3.60
3.70
3.80
3.90
4.00
4.10
4.20
4.30
4.40
Wood or Forest with good Cover
Pasture or Range land in poor condition
Cultivated land with Conservation treatment
Industrial/Urban District
wood or forest with thin stand poor
cover and no mulch
actual ET mm/day
LandUse/ LandCover
108
References
Allen, R.G., L.S. Pereira, D. Raes, and M. Smith. 1998. Crop evapotranspiration -Guidelines for computing crop
water requirements–FAO Irrigation and Drainage Paper 56, Food and Agriculture Organization of the United Nations, Rome.
Ayenew, T. 2003. Evapotranspiration estimation using thematic mapper spectral satellite data in the Ethiopian
rift and adjacent highlands. Journal of Hydrology.279 (2003): 83-93. Lee, T.S., M.M.M. Najim, and H.M. Aminul. 2004. Estimating evapotranspiration of irrigated rice at the West
Coast of the Peninsular of Malaysia. Journal of Applied Irrigation Science, 39 (1/2004): 103-17. ISSN 0049-8602.
Mallick, K., B.K. Bhattacharya, S. Chaurasia, S. Dutta, R. Nigam, J. Mukherjee, S. Banerjee, G. Kar, V.U.M. Rao,
A.S. Gadgil, and J.S. Parihar. 2007 Evapotranspiration using MODIS data and limited ground observations over selected agroecosystems in India. International Journal of Remote Sensing, 28(10): 2091-2110.
Mo, X., S. Liu, Z. Lin, and W. Zhao. 2004. Simulating temporal and spatial variation of evapotranspiration over
the Lushi Basin. Journal of Hydrology, 285(2004): 125-42. NASA. 2008. MODIS/Terra Surface reflectance Daily L2G Global 500m SIN Grid and MODIS/Aqua Land Surface
Temperature/ Emissivity Daily L3 Global/ 1 km SIN Grid V005; Data set from internet site of http://edcdaac.usgs.gov/modis/mod09ghkv4.asp, accessed January.
Roerink, G.J., Z. Su, and M. Menenti. 2000. S-SEBI: A simple Remote Sensing algorithm to estimate the
surface energy balance. Physics and Chemistry of the Earth (B), 25 (2): 147-57. Elsevier Science Limited.
Wu, W., C.A.S. Hall, F.N. Scatena, and L.J. Quacjenbush. 2006. Spatial modeling of evapotranspiration in the
Luquillo experimental forest of Puerto Rico using remotely sensed data. Journal of Hydrology, 328: 733-52.
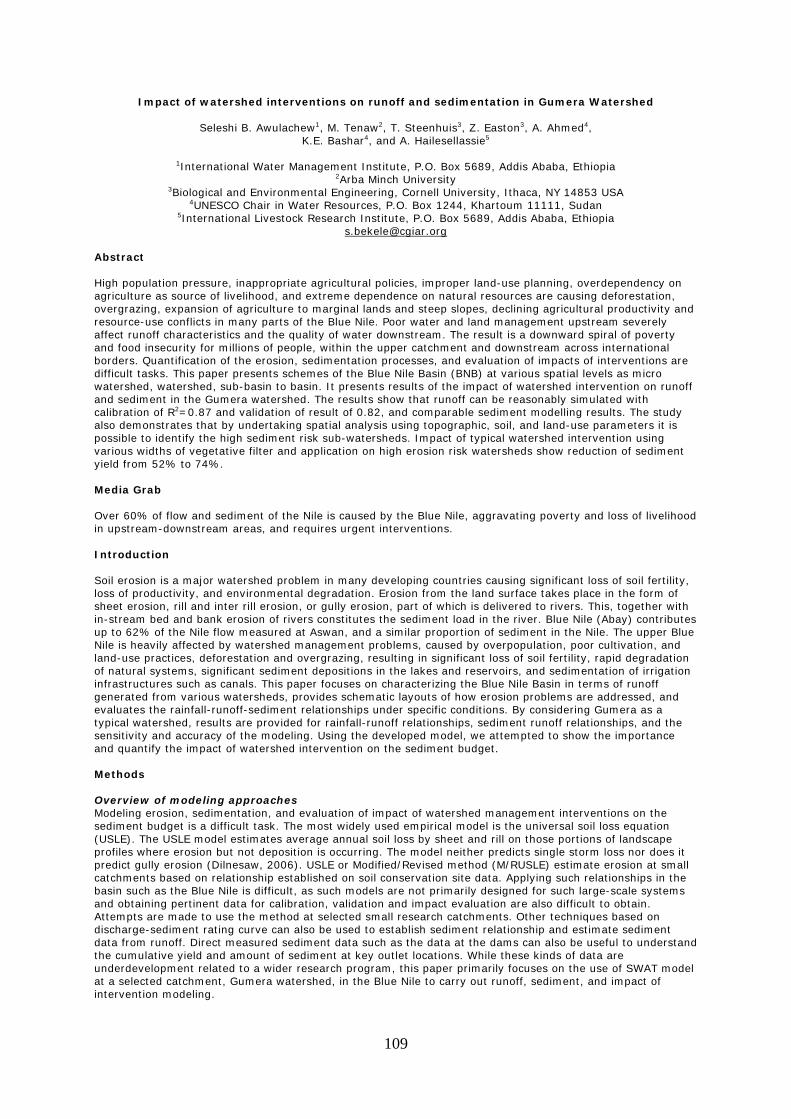
109
Impact of watershed interventions on runoff and sedimentation in Gumera Watershed
Seleshi B. Awulachew1, M. Tenaw2, T. Steenhuis3, Z. Easton3, A. Ahmed4, K.E. Bashar4, and A. Hailesellassie5
1International Water Management Institute, P.O. Box 5689, Addis Ababa, Ethiopia
2Arba Minch University 3Biological and Environmental Engineering, Cornell University, Ithaca, NY 14853 USA
4UNESCO Chair in Water Resources, P.O. Box 1244, Khartoum 11111, Sudan 5International Livestock Research Institute, P.O. Box 5689, Addis Ababa, Ethiopia
[email protected] Abstract High population pressure, inappropriate agricultural policies, improper land-use planning, overdependency on agriculture as source of livelihood, and extreme dependence on natural resources are causing deforestation, overgrazing, expansion of agriculture to marginal lands and steep slopes, declining agricultural productivity and resource-use conflicts in many parts of the Blue Nile. Poor water and land management upstream severely affect runoff characteristics and the quality of water downstream. The result is a downward spiral of poverty and food insecurity for millions of people, within the upper catchment and downstream across international borders. Quantification of the erosion, sedimentation processes, and evaluation of impacts of interventions are difficult tasks. This paper presents schemes of the Blue Nile Basin (BNB) at various spatial levels as micro watershed, watershed, sub-basin to basin. It presents results of the impact of watershed intervention on runoff and sediment in the Gumera watershed. The results show that runoff can be reasonably simulated with calibration of R2=0.87 and validation of result of 0.82, and comparable sediment modelling results. The study also demonstrates that by undertaking spatial analysis using topographic, soil, and land-use parameters it is possible to identify the high sediment risk sub-watersheds. Impact of typical watershed intervention using various widths of vegetative filter and application on high erosion risk watersheds show reduction of sediment yield from 52% to 74%. Media Grab Over 60% of flow and sediment of the Nile is caused by the Blue Nile, aggravating poverty and loss of livelihood in upstream-downstream areas, and requires urgent interventions. Introduction Soil erosion is a major watershed problem in many developing countries causing significant loss of soil fertility, loss of productivity, and environmental degradation. Erosion from the land surface takes place in the form of sheet erosion, rill and inter rill erosion, or gully erosion, part of which is delivered to rivers. This, together with in-stream bed and bank erosion of rivers constitutes the sediment load in the river. Blue Nile (Abay) contributes up to 62% of the Nile flow measured at Aswan, and a similar proportion of sediment in the Nile. The upper Blue Nile is heavily affected by watershed management problems, caused by overpopulation, poor cultivation, and land-use practices, deforestation and overgrazing, resulting in significant loss of soil fertility, rapid degradation of natural systems, significant sediment depositions in the lakes and reservoirs, and sedimentation of irrigation infrastructures such as canals. This paper focuses on characterizing the Blue Nile Basin in terms of runoff generated from various watersheds, provides schematic layouts of how erosion problems are addressed, and evaluates the rainfall-runoff-sediment relationships under specific conditions. By considering Gumera as a typical watershed, results are provided for rainfall-runoff relationships, sediment runoff relationships, and the sensitivity and accuracy of the modeling. Using the developed model, we attempted to show the importance and quantify the impact of watershed intervention on the sediment budget. Methods Overview of modeling approaches Modeling erosion, sedimentation, and evaluation of impact of watershed management interventions on the sediment budget is a difficult task. The most widely used empirical model is the universal soil loss equation (USLE). The USLE model estimates average annual soil loss by sheet and rill on those portions of landscape profiles where erosion but not deposition is occurring. The model neither predicts single storm loss nor does it predict gully erosion (Dilnesaw, 2006). USLE or Modified/Revised method (M/RUSLE) estimate erosion at small catchments based on relationship established on soil conservation site data. Applying such relationships in the basin such as the Blue Nile is difficult, as such models are not primarily designed for such large-scale systems and obtaining pertinent data for calibration, validation and impact evaluation are also difficult to obtain. Attempts are made to use the method at selected small research catchments. Other techniques based on discharge-sediment rating curve can also be used to establish sediment relationship and estimate sediment data from runoff. Direct measured sediment data such as the data at the dams can also be useful to understand the cumulative yield and amount of sediment at key outlet locations. While these kinds of data are underdevelopment related to a wider research program, this paper primarily focuses on the use of SWAT model at a selected catchment, Gumera watershed, in the Blue Nile to carry out runoff, sediment, and impact of intervention modeling.
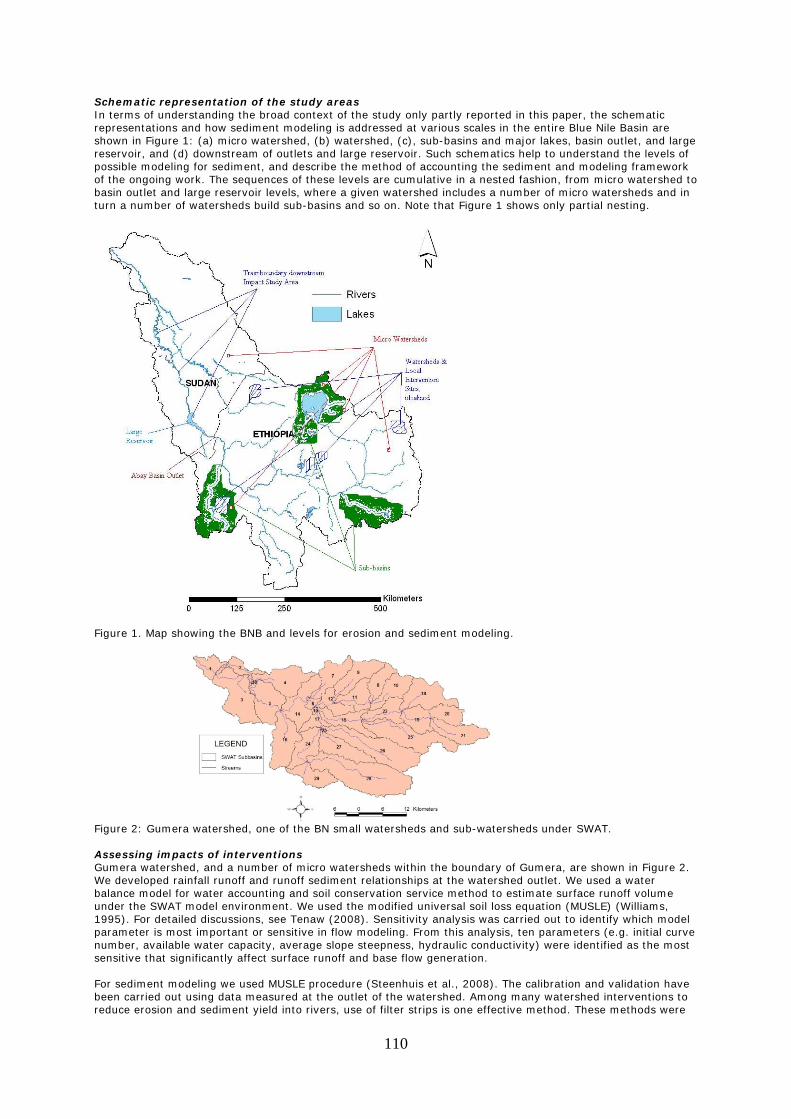
110
Schematic representation of the study areas In terms of understanding the broad context of the study only partly reported in this paper, the schematic representations and how sediment modeling is addressed at various scales in the entire Blue Nile Basin are shown in Figure 1: (a) micro watershed, (b) watershed, (c), sub-basins and major lakes, basin outlet, and large reservoir, and (d) downstream of outlets and large reservoir. Such schematics help to understand the levels of possible modeling for sediment, and describe the method of accounting the sediment and modeling framework of the ongoing work. The sequences of these levels are cumulative in a nested fashion, from micro watershed to basin outlet and large reservoir levels, where a given watershed includes a number of micro watersheds and in turn a number of watersheds build sub-basins and so on. Note that Figure 1 shows only partial nesting.
Figure 1. Map showing the BNB and levels for erosion and sediment modeling.
Figure 2: Gumera watershed, one of the BN small watersheds and sub-watersheds under SWAT. Assessing impacts of interventions Gumera watershed, and a number of micro watersheds within the boundary of Gumera, are shown in Figure 2. We developed rainfall runoff and runoff sediment relationships at the watershed outlet. We used a water balance model for water accounting and soil conservation service method to estimate surface runoff volume under the SWAT model environment. We used the modified universal soil loss equation (MUSLE) (Williams, 1995). For detailed discussions, see Tenaw (2008). Sensitivity analysis was carried out to identify which model parameter is most important or sensitive in flow modeling. From this analysis, ten parameters (e.g. initial curve number, available water capacity, average slope steepness, hydraulic conductivity) were identified as the most sensitive that significantly affect surface runoff and base flow generation. For sediment modeling we used MUSLE procedure (Steenhuis et al., 2008). The calibration and validation have been carried out using data measured at the outlet of the watershed. Among many watershed interventions to reduce erosion and sediment yield into rivers, use of filter strips is one effective method. These methods were
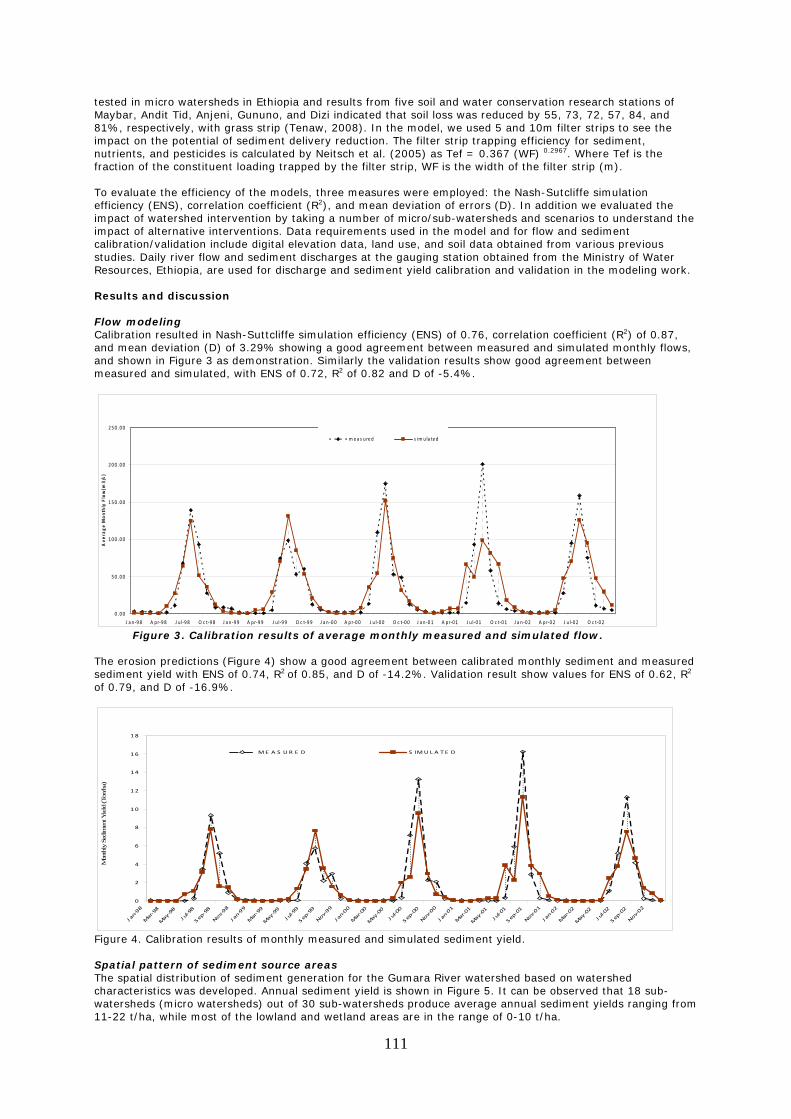
111
tested in micro watersheds in Ethiopia and results from five soil and water conservation research stations of Maybar, Andit Tid, Anjeni, Gununo, and Dizi indicated that soil loss was reduced by 55, 73, 72, 57, 84, and 81%, respectively, with grass strip (Tenaw, 2008). In the model, we used 5 and 10m filter strips to see the impact on the potential of sediment delivery reduction. The filter strip trapping efficiency for sediment, nutrients, and pesticides is calculated by Neitsch et al. (2005) as Tef = 0.367 (WF) 0.2967. Where Tef is the fraction of the constituent loading trapped by the filter strip, WF is the width of the filter strip (m). To evaluate the efficiency of the models, three measures were employed: the Nash-Sutcliffe simulation efficiency (ENS), correlation coefficient (R2), and mean deviation of errors (D). In addition we evaluated the impact of watershed intervention by taking a number of micro/sub-watersheds and scenarios to understand the impact of alternative interventions. Data requirements used in the model and for flow and sediment calibration/validation include digital elevation data, land use, and soil data obtained from various previous studies. Daily river flow and sediment discharges at the gauging station obtained from the Ministry of Water Resources, Ethiopia, are used for discharge and sediment yield calibration and validation in the modeling work. Results and discussion Flow modeling Calibration resulted in Nash-Suttcliffe simulation efficiency (ENS) of 0.76, correlation coefficient (R2) of 0.87, and mean deviation (D) of 3.29% showing a good agreement between measured and simulated monthly flows, and shown in Figure 3 as demonstration. Similarly the validation results show good agreement between measured and simulated, with ENS of 0.72, R2 of 0.82 and D of -5.4%.
Figure 3. Calibration results of average monthly measured and simulated flow.
The erosion predictions (Figure 4) show a good agreement between calibrated monthly sediment and measured sediment yield with ENS of 0.74, R2 of 0.85, and D of -14.2%. Validation result show values for ENS of 0.62, R2
of 0.79, and D of -16.9%.
Figure 4. Calibration results of monthly measured and simulated sediment yield. Spatial pattern of sediment source areas The spatial distribution of sediment generation for the Gumara River watershed based on watershed characteristics was developed. Annual sediment yield is shown in Figure 5. It can be observed that 18 sub-watersheds (micro watersheds) out of 30 sub-watersheds produce average annual sediment yields ranging from 11-22 t/ha, while most of the lowland and wetland areas are in the range of 0-10 t/ha.
0 .00
50 .00
100 .00
150 .00
200 .00
250 .00
J a n ‐98 A pr‐98 J u l‐98 O c t‐98 J a n ‐99 A pr‐99 J u l‐99 O c t‐99 J a n ‐00 A pr‐00 J u l‐00 O c t‐00 J a n ‐01 A pr‐01 J u l‐01 O c t‐01 J a n ‐02 A pr‐02 J u l‐02 O c t‐02
Avera
ge M
onth
ly Flow(m
3/s)
m ea s ured s im ula ted
0
2
4
6
8
10
12
14
16
18
J an‐98
Mar‐98
May‐98
Jul‐98
Sep‐98
Nov‐98
J an‐99
Mar‐99
May‐99
J ul‐99
Sep‐99
Nov‐99
J an‐00
Mar‐00
May‐00
J ul‐00
Sep‐00
Nov‐00
J an‐01
Mar‐01
May‐01
Jul‐01
Sep‐01
Nov‐01
J an‐02
Mar‐02
May‐02
J ul‐02
Sep‐02
Nov‐02
Mon
thly
Sed
imen
t Yie
ld (T
on/h
a)
ME A S U R E D S IMU L A T E D
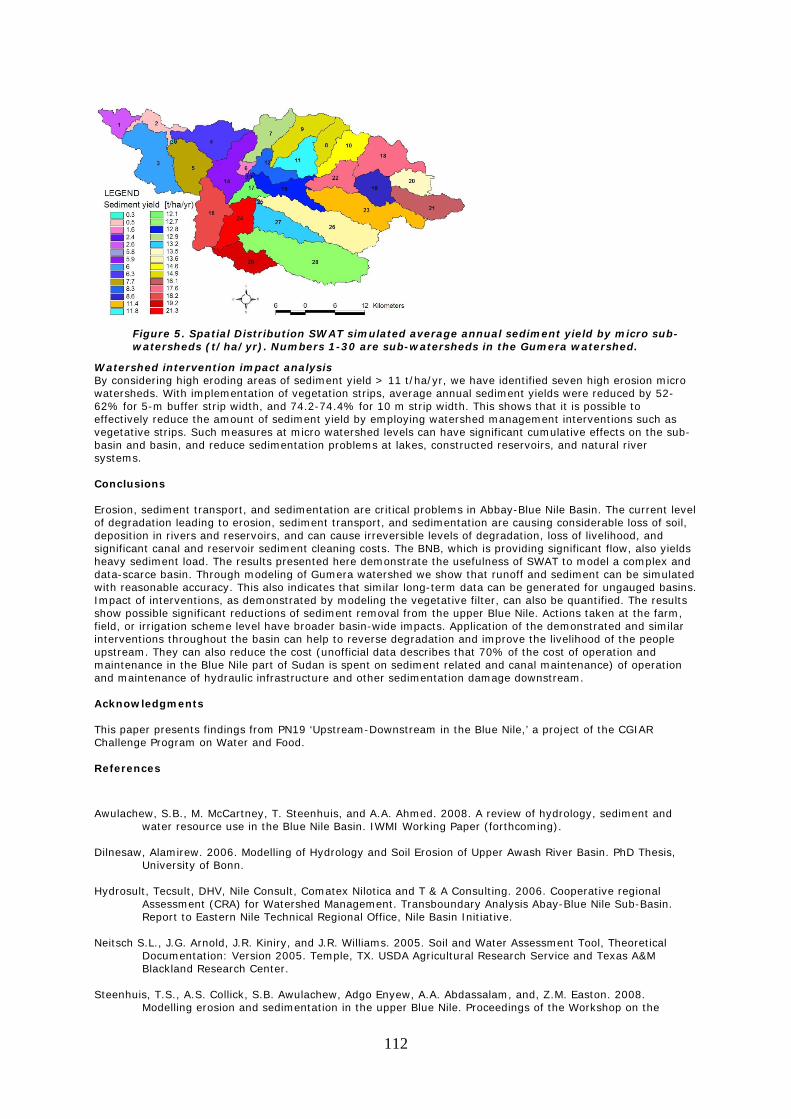
112
Figure 5. Spatial Distribution SWAT simulated average annual sediment yield by micro sub-watersheds (t/ha/yr). Numbers 1-30 are sub-watersheds in the Gumera watershed.
Watershed intervention impact analysis By considering high eroding areas of sediment yield > 11 t/ha/yr, we have identified seven high erosion micro watersheds. With implementation of vegetation strips, average annual sediment yields were reduced by 52-62% for 5-m buffer strip width, and 74.2-74.4% for 10 m strip width. This shows that it is possible to effectively reduce the amount of sediment yield by employing watershed management interventions such as vegetative strips. Such measures at micro watershed levels can have significant cumulative effects on the sub-basin and basin, and reduce sedimentation problems at lakes, constructed reservoirs, and natural river systems. Conclusions Erosion, sediment transport, and sedimentation are critical problems in Abbay-Blue Nile Basin. The current level of degradation leading to erosion, sediment transport, and sedimentation are causing considerable loss of soil, deposition in rivers and reservoirs, and can cause irreversible levels of degradation, loss of livelihood, and significant canal and reservoir sediment cleaning costs. The BNB, which is providing significant flow, also yields heavy sediment load. The results presented here demonstrate the usefulness of SWAT to model a complex and data-scarce basin. Through modeling of Gumera watershed we show that runoff and sediment can be simulated with reasonable accuracy. This also indicates that similar long-term data can be generated for ungauged basins. Impact of interventions, as demonstrated by modeling the vegetative filter, can also be quantified. The results show possible significant reductions of sediment removal from the upper Blue Nile. Actions taken at the farm, field, or irrigation scheme level have broader basin-wide impacts. Application of the demonstrated and similar interventions throughout the basin can help to reverse degradation and improve the livelihood of the people upstream. They can also reduce the cost (unofficial data describes that 70% of the cost of operation and maintenance in the Blue Nile part of Sudan is spent on sediment related and canal maintenance) of operation and maintenance of hydraulic infrastructure and other sedimentation damage downstream. Acknowledgments This paper presents findings from PN19 ‘Upstream-Downstream in the Blue Nile,’ a project of the CGIAR Challenge Program on Water and Food. References
Awulachew, S.B., M. McCartney, T. Steenhuis, and A.A. Ahmed. 2008. A review of hydrology, sediment and water resource use in the Blue Nile Basin. IWMI Working Paper (forthcoming).
Dilnesaw, Alamirew. 2006. Modelling of Hydrology and Soil Erosion of Upper Awash River Basin. PhD Thesis,
University of Bonn. Hydrosult, Tecsult, DHV, Nile Consult, Comatex Nilotica and T & A Consulting. 2006. Cooperative regional
Assessment (CRA) for Watershed Management. Transboundary Analysis Abay-Blue Nile Sub-Basin. Report to Eastern Nile Technical Regional Office, Nile Basin Initiative.
Neitsch S.L., J.G. Arnold, J.R. Kiniry, and J.R. Williams. 2005. Soil and Water Assessment Tool, Theoretical
Documentation: Version 2005. Temple, TX. USDA Agricultural Research Service and Texas A&M Blackland Research Center.
Steenhuis, T.S., A.S. Collick, S.B. Awulachew, Adgo Enyew, A.A. Abdassalam, and, Z.M. Easton. 2008.
Modelling erosion and sedimentation in the upper Blue Nile. Proceedings of the Workshop on the

113
Hydrology and Ecology of the Nile River Basin under Extreme Conditions, June 16-19, 2008, Addis Ababa.
Tenaw, A., 2008. SWAT based runoff and sediment yield modeling (a case study of Gumara watershed in Lake
Tana sub basin), Ethiopia. M.Sc. Thesis. Arba Minch University, Ethiopia. Williams, J.R. 1995. Chapter 25: The EPIC model. p. 909-1000. In: V.P. Singh (ed.) Computer Models of
Watershed Hydrology. Water Resources Publications, Highlands Ranch, CO. White E.D., Z.M. Easton, D.R. Fuka, E.S. Collick, E. Adgo, M. McCartney, S.B. Awulachew, Y.G. Selassie, and
T.S. Steenhuis. 2008. Adapting the soil and water assessment tool (SWAT) for the Nile Basin (unofficial data describes that 70% of the cost of operation and maintenance in the Blue Nile part of Sudan is spent on sediment related and canal maintenance).
114
Scaling-up in watershed management research projects
J.Rubiano1, A. Peralta2, and N. Johnson3
1King’s College University of London [email protected]
2Michigan State University, USA
3International Livestock Research Institute, Nairobi, Kenya
Abstract
A selection of CPWF Theme 2 water research projects was subjected to a detailed analysis about their scaling-up strategies. The analysis was based on the best practices for scaling-up research in natural resources, selected from the frameworks summarized by Gündel et al. (2001) and DFID-NRSP (2002). Representativity, key characteristics for replication, scale, project outputs, uncertainty, and budget were analyzed. Results show that a supportive environment for project development seems to be the most crucial factor that warrants scaling-up. More than biophysical, institutional scale dependency seems to be the most critical for the water projects in consideration, yet it is rarely one of the criteria used for site selection.
Media grab This study identifies the critical factor for scaling-up a selection of Challenge Program on Water and Food projects.
Introduction The overall goal of this research was to explore the scale-dependent nature of water research projects and characterize their strategies to scaling-up. Given the intrinsic complexity of a dynamic resource such as water and the multiple relationships that its natural flow entails, it is assumed that the exercise of dealing with water requires different levels and scales of biophysical and socioeconomic variables to be taken into account if inferences are to be applied elsewhere. The specific objectives were:
• Obtain a better understanding of how projects deal with scale and scale-related concepts, in general as related to scaling-up.
• Benchmark where projects are with respect to the 'state of the art' standards for scaling-up. • Identify implications of results for projects and donors.
Methods
Project leaders of the 16 projects under the coordination of Theme 2 of CPWF were invited to contribute in answering a questionnaire, designed to collect data to answer the first two objectives, based on the good practices for scaling-up research in natural resources selected from the frameworks summarized by Gündel et al. (2001) and the DFID-NRSP (2002) report. Gündel et al. (2001) identified prerequisites for successful scaling-up that need to be fully considered at the preproject and implementation phases of a piece of research. The DFID-NRSP guidelines focused on communications and emphasized that 'for scaling-up to be feasible, research teams must develop and implement sound communication strategies as an integral part of the research process. This supposes to ensure that new knowledge will be available for users (development practitioners, planners, farmers) in forms that they can utilize and adapt' (DFID-NRSP, 2002, p.1). Both sets of guidelines are complementary and at the time of this research were considered to be the state of the art. Eight of sixteen projects answered the questionnaire (Table 1). Five of the projects are mainly Theme 2, two are mainly Theme 1, and the other one is mainly Theme 4. There are projects in all the CPWF benchmark basins with the exception of the Yellow River, and three projects work in more than one basin. The objectives considered by these projects relate to action research to understand and support sustainable, pro-poor change processes at different scales. Four of the projects have objectives to strengthen local capacity for innovation around equitable and sustainable management, four to support local stakeholder forums, and five to implement scaling-up strategies. Only one of the projects doesn’t have objectives directly related to scaling-up. Half of the projects are addressing biophysical issues and the other half mainly institutional ones.
115
Results and discussion
Answers to the first section of the questionnaire are discussed in the following paragraphs. The ‘best practices’ according to the Gündel et al. (2001) guide that were or were not considered by the selected projects are shown in Table 2. Responses were taken together independently of the type of project. Given that all of these started as part of the CPWF, it was assumed that all belong to the category of water-related research projects, and it is in these terms that the discussion is presented.
Contextual issues of interviewed projects
Representativity
Representativity means, in this case, that the catchments where projects are working have biophysical, social, institutional, and/or economic characteristics that can be found in other catchments in the tropics, in the same basin or in other basins. In general, the main variable mentioned by six of the eight respondents that stated the similarity with other tropical catchments was the erratic rainfall pattern and dry environments. In consequence, the restriction to water access imposed by this climatic fact is a cause of existing conflicts between uses and users at different locations in the watersheds as reported by projects P20, P23, and P25. These characteristics, plus some socioeconomic ones like poverty and the high dependence on agriculture, were also mentioned by project P40. These characteristics are quite general so it would be expected that these projects could be easily applied in many different places, however, this is not the case since there are many other important characteristics that makes them projects site-specific, which are important to consider and anticipate for a successful scaling-up strategy.
Key characteristics for replication
According to the responses, a supportive institutional environment, defined as the context in which natural resource management strategies are designed and implemented, is the most important factor in project replication. There is disagreement, however, about what this means since some projects think that the presence of institutions is important so that they can take up findings, while others responded that lack of existing institutions was better for the project since it left space for the creation of new ones. Other key socioeconomic and political characteristics mentioned by respondents included: willingness of farmers to participate and incorporate innovations (P23 and P25); markets poorly developed (P23); and land smallholding with lack of clear property rights (P46). Other characteristics included socioeconomic (P20) and ethnic heterogeneity (P23) in the composition of the social groups, and the existence of complex relationships between water users, which seems to be a generality. The existence of water externalities was mentioned (P20 and P40), as well as poverty and dependence on income from agriculture (P24 and P8). In terms of biophysical factors a dry environment and water scarcity was considered important for most (P8, P24, P46), although some mentioned a lower limit (rather high) of annual rainfall (P23).
Scale
According to Hanckock et al. (2003) 'scaling-up' is: 'To efficiently increase the socioeconomic impact from a small to a large scale of coverage'. Menter et al. (2004, p 14) provided a compilation of terminology used in the context of scaling-up research that expands the previous definition. In this study, however, definition was not provided in the questionnaire in order to avoid bias in responses. In spite of this, all projects considered themselves as scale dependent, because of the kind of problems they are dealing with, not only in biophysical terms, but also in institutional terms. There is a different nature of solutions given the scale at which the work is being done (P23), and the fact that what happens to one scale has an influence on the other ones (P20, P23, P46, P17). There are social dependencies between scales because projects’ work with institutions such as households or catchments scale organizations (P25, P24, P20, P23, and P17), or because water productivity was considered by itself a scale-dependent issue (P8), or because the nature of the externality addressed determines the scale (P40). It means that taking their findings toward a wider context implies consideration of the type of institutions in charge of results use and/or dissemination on which the information was produced. Institutional scale was considered as the most important for projects, and if we take a look at the previous section, the replication of the projects is linked with an appropriate institutional environment and the willingness of households, farmers, and institutions to participate and to try innovations. The importance given to institutions and to the social-institutional scale contrasts with the relative lack of attention paid to it in the representativity. One reason for this may be that it is not so easy to characterize and assess representativity of an institutional environment as it is for relatively simple biophysical measures such as rainfall. Biophysical dependency of projects was mentioned referring the biophysical singularities in which projects were working on. Spatial, temporal, and hydrological scales were mentioned by projects. On the other hand for project P8 spatial scale is predominant, and for project P17 the biophysical scale is more important.
116
Project Outputs Rather than chemical, biological, or mechanical technologies, the main expected project outputs are institutional innovations such as methods, processes, and approaches for supporting decision-making by different stakeholder groups. Institutional innovations may be more flexible than other types of technologies in that they can be applied in a range of biophysical environments. Institutional innovations, however, still require rigorous validation, and should come with well defined recommendation domains that identify the conditions–social, institutional, and biophysical–under which they are, or are not, likely to work. The importance that projects place on institutional factors for replication implies that they recognize this, yet the relative lack of importance of institutional issues in terms of representativity of sites suggests that it will be difficult for projects to do systematic validation along nonbiophysical scales. How generic are each of these project outputs? It is a question that requires further investigation in each case. The predominance, however, of these types of outputs instead of concrete technological objects is a reflection of the complexity of the problems water research projects are dealing with. There are not simple straightforward solutions or at least we do not know them yet.
Uncertainty The sources of uncertainty that have to be faced in order to scale-up these research results, included, for most of respondents, institutional factors such as institutional instability (P24), lack of appropriate local capacities (P24, P40, 17, 46 and P25), which are mentioned for almost all the projects; openness to changes, when talking about replication of projects and its scale dependence (P24, P20, P23, P8), and the lack of appropriate information (P20, P40, P8). In addition to these factors, from the project’s developers it was recognized that a lack of knowledge about what is 'actionable' at institutional levels and a limited amount of resources to invest in capacity-building required for projects outputs implementation (P40), not implying that this is an expressed responsibility of a research project, perhaps more a commitment of partners from national organizations. External sources of uncertainty were also attributed to market fluctuations and climate variability (P8, P17). What is interesting about these sources of institutional uncertainty is that they can be seen not so much as sources of uncertainty in the sense of exogenous factors that affect success or failure, but rather as aspects of the institutional environment on which successful scaling-up will depend. For example, if the stability or capacity of certain types of institutions is critical for success, then the project needs to think about whether or not these criteria are likely to be met in the areas to which the project is targeting its outputs. Similarly, if farmers’ willingness and ability to participate are critical (P23, P8), then these factors can be assessed in advance, or at least noted in the documentation of the output. The same can be said of availability of secondary data (P20, P40, P8). These results further support the perception that projects see institutions and institutional environments as things that are very important, but that cannot be characterized and understood to the same extent that biophysical environments can. This suggests that projects would benefit from greater involvement from political or social scientists. It can also be seen as a challenge to social and political scientists to orient their work more toward addressing the kinds of questions faced by these projects.
Budget Those who answered with a figure of how much was spent on scaling-up were on average around 17% of total budget (10% minimum and 30% maximum). Some argued that this will depend on the type of project, and some others found this difficult to estimate. The average figure, however, obtained here is twice the recommended in Gündel’s framework. Allocation of resources to anticipate scaling-up process will have an effect while reducing resources allocated to core research.
Conclusions
Contextual issues • The location of projects seems not to obey a profound analysis of sites representativity, especially
social and institutional factors, which in the end are most critical to success and scaling-up. • A supportive environment for project development seems to be the most crucial factor that warrants
scaling-up. • Institutional scale dependency seems to be the most critical for the water projects in consideration. • Main outputs refer to methods and processes so adaptation to other context is potentially more
complex than physically based technologies, and involves scales other than biophysical. • The uncertainty to achieve outputs was attributed mainly to institutional factors and users
participation/commitment. In a secondary position climate and markets fluctuations were suggested. • Budget figures for scaling-up activities averaged 17% of total budgets, which is above the
recommended best practice. Good practices use, importance, complexity to implement and assess • The definition of funding mechanisms was considered of high importance for a successful
implementation of scaling-up activities. • Indicators, planning of monitoring, and evaluation methods seems to be the more objective way to
trace implementation and success of scaling-up activities. • The importance of partnerships as a strategy to scale-up research is contradictory. In some cases,
high priority is given to partnerships but in others, no. This may have to do with the type of partner they work with and what the partner is expected to do. It also suggests that researchers' lack of confidence in their participation, though it is not clear whether this is due to lack of capacity or lack of buy-in to project objectives.
• Several of the good practices recommended by Gündel et al (2001) fall into what local partners, e.g. NGOs and NARS, used to do, such as capacity-building, institutional reform, networking strengthening, multi-media dissemination among others, with a close participation of researchers. These activities are a serious matter and if considered crucial, adequate resources should be allocated to scale up research by these means.
117
• Clear rules to distribute responsibilities must be a consequence of adequate communication with local partners and where possible with final users. Donors also have a responsibility in providing the resources needed to facilitate this, otherwise, simple good practices would not even be considered by research projects at all.
• If it is true that complexity rather than importance determines which scaling activities get done, then donors and researchers need to think about how these can be simplified and/or how to ensure that sufficient capacity and funding are available to ensure that they get done.
Acknowledgments This paper presents findings from Theme 2 'Water and People in Catchments,' a project of the CGIAR Challenge Program on Water and Food. We are very thankful to the CPWF and the project leaders and implementers who contributed substantially to this study.
References Gündel, S., J. Hancock, and S. Anderson. 2001. Scaling-up Strategies for Research in Natural Resources
Management:A Comparative Review. Chatham, UK: Natural Resources Institute. DFID-Natural Resources Systems Progamme (DFID-NRSP). 2002. Scaling-up and communication: Guidelines
for enhancing the developmental impact of natural resources systems research, 8 pp. http://www.livelihoods.org/post/Docs/NRSP_scaling.pdf
Hancock, J., F. Procto,r and C. Csaki. 2003. Scaling-up the impact of good practices in rural development: a
working paper to support implementation of the World Bank's rural development strategy. Report Number 26031. The International Bank for Reconstruction and Development. Agriculture and Rural Development Department. Washington, DC 20433 http://www-wds.worldbank.org/servlet/WDSContentServer/WDSP/IB/2004/01/30/000160016_20040130163125/Rendered/PDF/260310White0co1e1up1final1formatted.pdf
Menter, H., S. Kaaria, N. Johnson, and J. Ashby. 2004. Scaling-up. In Scaling-up and out: Achieving widespread
impact through agricultural research, D Pachico (ed.) Cali, Colombia: Centro Internacional de Agricultura Tropical (CIAT).
Table 2. List of Challenge Program on Water and Food research projects participating in this study.
Title Basin
8-Improving Water Productivity in Karkheh Improving On-farm Agricultural Water Productivity in the Karkheh River Basin
Karkheh
17-IWRM for Improved Rural Livelihoods The Challenge of Integrated Water Resource Management for Improved Rural Livelihoods, Managing Risk, Mitigating Drought and Improving Water Productivity in the Water Scarce Limpopo Basin
Limpopo
20-SCALES Sustaining inclusive collective action that links across economic and ecological scales in upper watersheds
Andes Nile
23-Research Management for Sustainable livelihoods Linking Community-Based Water and Forest Management for Sustainable Livelihoods of the Poor in Fragile Upper Catchments of the Indus-Ganges Basin
Indo-Ganges
24-Livelihood resilience in dry areas Strengthening livelihood resilience in upper catchments of dry areas by integrated natural resource management
Karkheh
25-Companion modeling and water dynamics Companion Modeling for resilient water management: stakeholders perceptions of water dynamics, and collective learning at the catchment scale
Mekong
40-Integrating Governance and Modeling Integrating knowledge from computational modeling with multi-stakeholder governance: Towards more secure livelihoods through improved tools for integrated river basin management
Volta Nile
46-Small multipurpose reservoir ensemble planning Planning and evaluating ensembles of small, multi-purpose reservoirs for the improvement of smallholder livelihoods and food security: tools and procedures
Limpopo São Francisco
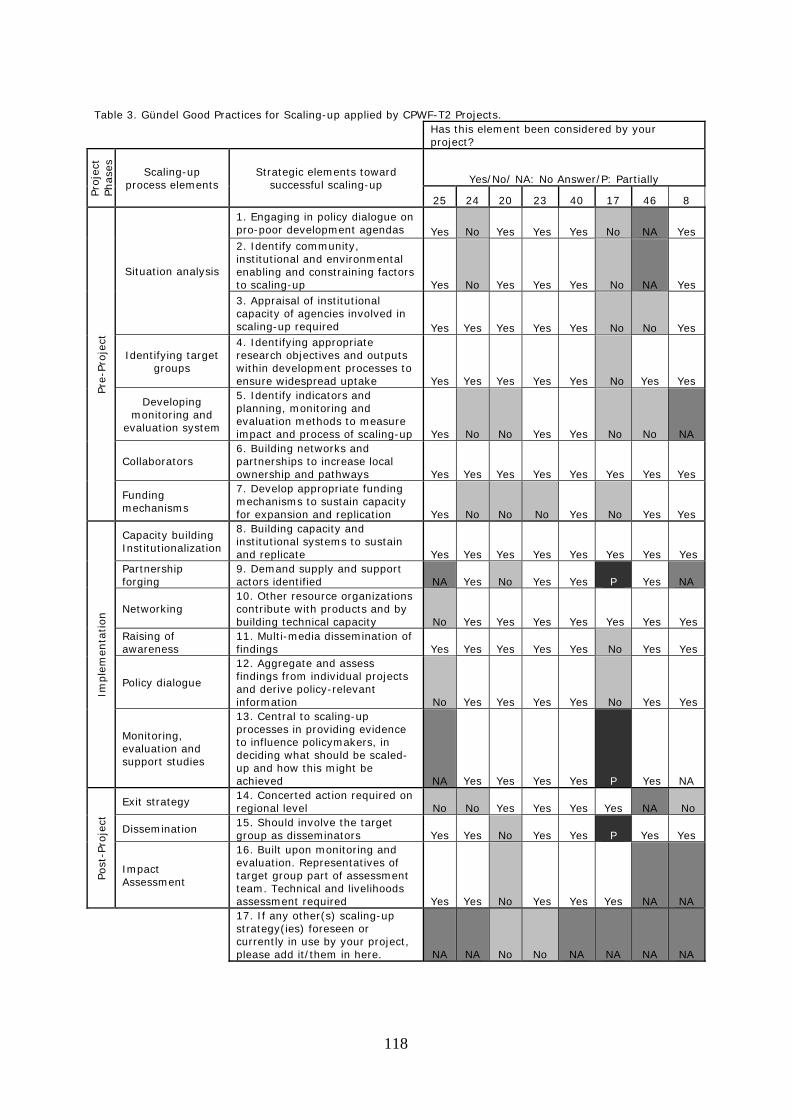
118
Table 3. Gündel Good Practices for Scaling-up applied by CPWF-T2 Projects.
Has this element been considered by your project?
Proje
ct
Phas
es
Scaling-up process elements
Strategic elements toward successful scaling-up Yes/No/ NA: No Answer/P: Partially
25 24 20 23 40 17 46 8
Pre-
Proje
ct
Situation analysis
1. Engaging in policy dialogue on pro-poor development agendas Yes No Yes Yes Yes No NA Yes 2. Identify community, institutional and environmental enabling and constraining factors to scaling-up Yes No Yes Yes Yes No NA Yes 3. Appraisal of institutional capacity of agencies involved in scaling-up required Yes Yes Yes Yes Yes No No Yes
Identifying target groups
4. Identifying appropriate research objectives and outputs within development processes to ensure widespread uptake Yes Yes Yes Yes Yes No Yes Yes
Developing monitoring and
evaluation system
5. Identify indicators and planning, monitoring and evaluation methods to measure impact and process of scaling-up Yes No No Yes Yes No No NA
Collaborators 6. Building networks and partnerships to increase local ownership and pathways Yes Yes Yes Yes Yes Yes Yes Yes
Funding mechanisms
7. Develop appropriate funding mechanisms to sustain capacity for expansion and replication Yes No No No Yes No Yes Yes
Imple
men
tation
Capacity building Institutionalization
8. Building capacity and institutional systems to sustain and replicate Yes Yes Yes Yes Yes Yes Yes Yes
Partnership forging
9. Demand supply and support actors identified NA Yes No Yes Yes P Yes NA
Networking 10. Other resource organizations contribute with products and by building technical capacity No Yes Yes Yes Yes Yes Yes Yes
Raising of awareness
11. Multi-media dissemination of findings Yes Yes Yes Yes Yes No Yes Yes
Policy dialogue
12. Aggregate and assess findings from individual projects and derive policy-relevant information No Yes Yes Yes Yes No Yes Yes
Monitoring, evaluation and support studies
13. Central to scaling-up processes in providing evidence to influence policymakers, in deciding what should be scaled-up and how this might be achieved NA Yes Yes Yes Yes P Yes NA
Post
-Pro
ject
Exit strategy 14. Concerted action required on regional level No No Yes Yes Yes Yes NA No
Dissemination 15. Should involve the target group as disseminators Yes Yes No Yes Yes P Yes Yes
Impact Assessment
16. Built upon monitoring and evaluation. Representatives of target group part of assessment team. Technical and livelihoods assessment required Yes Yes No Yes Yes Yes NA NA
17. If any other(s) scaling-up strategy(ies) foreseen or currently in use by your project, please add it/them in here. NA NA No No NA NA NA NA
119
Water productivity mapping to identify opportunities to improve agricultural water management in the Karkheh River Basin, Iran
Mobin-ud Din Ahmad1,2, Md. Aminul Islam3, Ilyas Masih3, Lal Muthuwatta3,
Poolad Karimi3, and Hugh Turral1
1Formerly at International Water Management Institute (IWMI), Global Research Division, P. O. Box. 2075, Colombo, Sri Lanka
2CSIRO Land and Water, Locked Bag 588, Building 24, Charles Sturt University, Wagga Wagga Campus, NSW 2678, Australia. [email protected]
3International Water Management Institute (IWMI), Global Research Division, P. O. Box. 2075, Colombo, Sri Lanka
Abstract Water productivity (WP) mapping is essential to evaluate the performance of current water use at the river basin scale. Generally, WP estimates beyond field scale are lacking due to unavailability of the required data at larger scales, i.e., water availability and consumption estimates are usually at hydrological scales of sub-catchment to river basin and physical or economic gains from the use of water are usually available at administrative scales such as district or province. This paper demonstrates an approach, applied to the Karkheh Basin, Iran, to estimate economic WP, gross value of production per unit of actual evapotranspiration, at sub-catchment to basin scales. The approach uses readily available satellite images and routine secondary agricultural and meteorological data. WP is estimated for all agricultural enterprises including rainfed and irrigated agriculture, overall vegetation production and livestock. WP mapping identified high and low performing areas to help policymakers and managers target better resource (re)allocation and measures to enhance productivity in the Karkheh Basin. The approach is applicable to other river basins.
Media grab The water productivity mapping approach presented in this paper provided necessary estimates of sub-catchment to basin level water productivity and its spatial variation, which are required for targeting improvement campaigns. Introduction Improving WP in agriculture is seen as a major contributor to address the current and future water challenges in Iran. Information on WP in Iran in general, and in the Karkheh Basin in particular, is limited, however, (CPWF, 2003; Ghafouri, 2007), which undermines the judicious planning and management of scarce water resources. At present, there are some estimates of WP for crops at the field scale (Moayeri et al., 2007), but no estimates of WP beyond the field scale. We do not have information to help understand how changes in water use in one location may have impact on productivity in other locations and across scales. This is the major bottleneck for water policymakers to identify the possibilities and viable options to enhance WP in a sustainable manner. The major goal of this paper is to fill these information gaps, by providing explicit estimates of water productivity using both physical and economic measures. The specific objective of this paper is to estimate the economic WP at sub-catchment to basin scales in terms of both vegetative areas (i.e., irrigated and rainfed crops, orchards, rangelands, and forests), and including livestock. Methods The Karkheh Basin covers an area of about 5.08 million ha. Administratively, the Karkheh Basin is distributed among seven provinces and 32 districts. Hydrologically, it is divided into five main catchments (sub-basins) (Figure 1). The climate of the basin is mainly semiarid, with large variations in the average annual precipitation between the southern and northern regions. Annual rainfall in the southern part of the basin (the Lower Karkheh) is about 150 mm and in the northern part (Upper Karkheh) it increases to 750 mm (1961-90 average). Farming activities are principally livestock rearing on rangelands and rainfed agriculture in the Upper Karkheh, complemented by irrigated cropping. Livestock is tightly integrated into all farming systems, with cattle predominating in the lowland, and sheep and goats in the uplands. The dominant crops in Upper Karkheh are wheat, maize, barley, and chickpea.
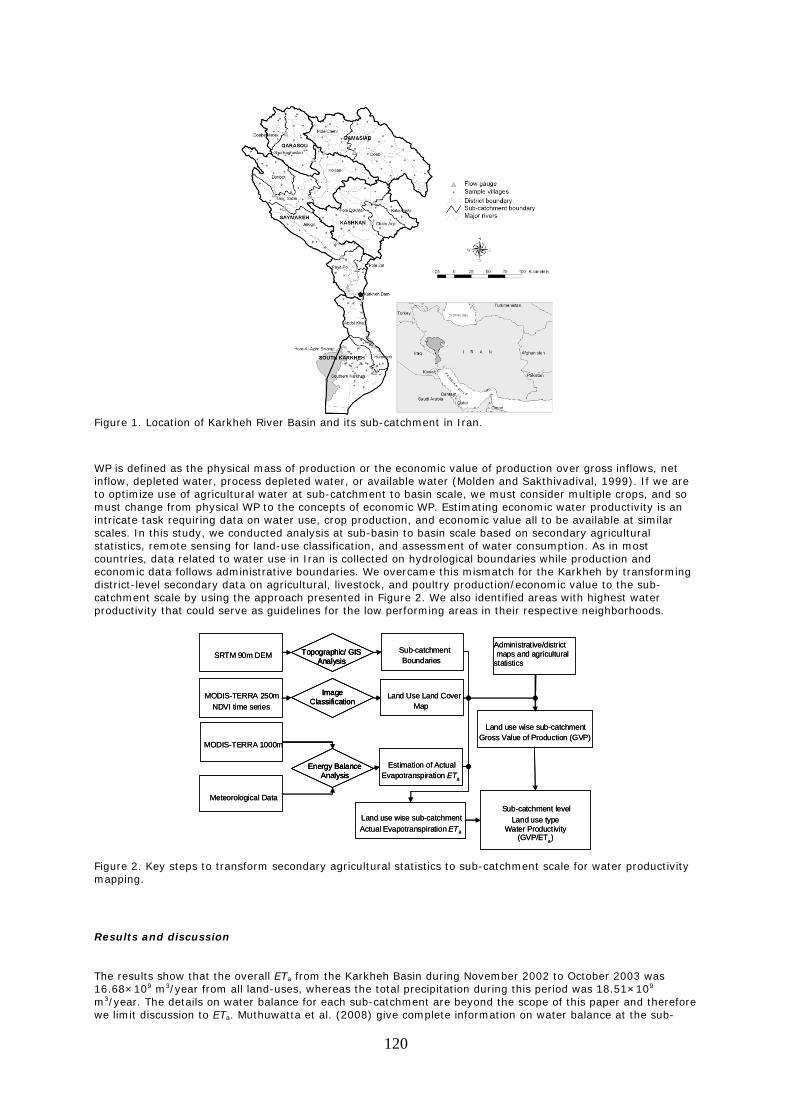
120
Figure 1. Location of Karkheh River Basin and its sub-catchment in Iran.
WP is defined as the physical mass of production or the economic value of production over gross inflows, net inflow, depleted water, process depleted water, or available water (Molden and Sakthivadival, 1999). If we are to optimize use of agricultural water at sub-catchment to basin scale, we must consider multiple crops, and so must change from physical WP to the concepts of economic WP. Estimating economic water productivity is an intricate task requiring data on water use, crop production, and economic value all to be available at similar scales. In this study, we conducted analysis at sub-basin to basin scale based on secondary agricultural statistics, remote sensing for land-use classification, and assessment of water consumption. As in most countries, data related to water use in Iran is collected on hydrological boundaries while production and economic data follows administrative boundaries. We overcame this mismatch for the Karkheh by transforming district-level secondary data on agricultural, livestock, and poultry production/economic value to the sub-catchment scale by using the approach presented in Figure 2. We also identified areas with highest water productivity that could serve as guidelines for the low performing areas in their respective neighborhoods.
Figure 2. Key steps to transform secondary agricultural statistics to sub-catchment scale for water productivity mapping.
Results and discussion
The results show that the overall ETa from the Karkheh Basin during November 2002 to October 2003 was 16.68×10⁹ m3/year from all land-uses, whereas the total precipitation during this period was 18.51×10⁹ m3/year. The details on water balance for each sub-catchment are beyond the scope of this paper and therefore we limit discussion to ETa. Muthuwatta et al. (2008) give complete information on water balance at the sub-
MODIS-TERRA 1000m
MODIS-TERRA 250m NDVI time series
SRTM 90m DEM Sub-catchmentBoundaries
Land Use Land CoverMap
Estimation of Actual Evapotranspiration ETa
Administrative/districtmaps and agricultural
statistics
Meteorological Data
Image Classification
Topographic/ GIS Analysis
Energy Balance Analysis
Land use wise sub-catchment Actual Evapotranspiration ETa
Land use wise sub-catchment Gross Value of Production (GVP)
Sub-catchment level Land use type
Water Productivity(GVP/ETa)
MODIS-TERRA 1000m
MODIS-TERRA 250m NDVI time series
SRTM 90m DEM Sub-catchmentBoundaries
Land Use Land CoverMap
Estimation of Actual Evapotranspiration ETa
Administrative/districtmaps and agricultural
statistics
Meteorological Data
Image Classification
Image Classification
Topographic/ GIS Analysis
Topographic/ GIS Analysis
Energy Balance Analysis
Energy Balance Analysis
Land use wise sub-catchment Actual Evapotranspiration ETa
Land use wise sub-catchment Gross Value of Production (GVP)
Sub-catchment level Land use type
Water Productivity(GVP/ETa)
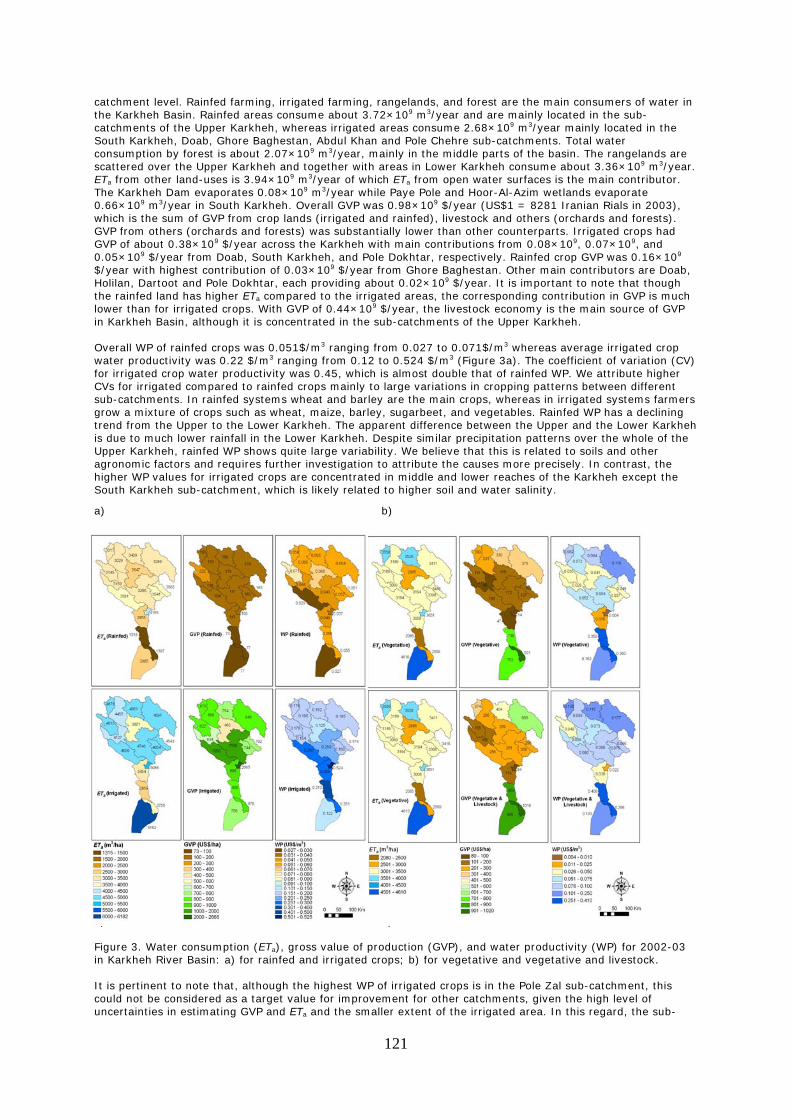
121
catchment level. Rainfed farming, irrigated farming, rangelands, and forest are the main consumers of water in the Karkheh Basin. Rainfed areas consume about 3.72×10⁹ m3/year and are mainly located in the sub-catchments of the Upper Karkheh, whereas irrigated areas consume 2.68×10⁹ m3/year mainly located in the South Karkheh, Doab, Ghore Baghestan, Abdul Khan and Pole Chehre sub-catchments. Total water consumption by forest is about 2.07×10⁹ m3/year, mainly in the middle parts of the basin. The rangelands are scattered over the Upper Karkheh and together with areas in Lower Karkheh consume about 3.36×10⁹ m3/year. ETa from other land-uses is 3.94×10⁹ m3/year of which ETa from open water surfaces is the main contributor. The Karkheh Dam evaporates 0.08×10⁹ m3/year while Paye Pole and Hoor-Al-Azim wetlands evaporate 0.66×10⁹ m3/year in South Karkheh. Overall GVP was 0.98×10⁹ $/year (US$1 = 8281 Iranian Rials in 2003), which is the sum of GVP from crop lands (irrigated and rainfed), livestock and others (orchards and forests). GVP from others (orchards and forests) was substantially lower than other counterparts. Irrigated crops had GVP of about 0.38×10⁹ $/year across the Karkheh with main contributions from 0.08×10⁹, 0.07×10⁹, and 0.05×10⁹ $/year from Doab, South Karkheh, and Pole Dokhtar, respectively. Rainfed crop GVP was 0.16×10⁹ $/year with highest contribution of 0.03×10⁹ $/year from Ghore Baghestan. Other main contributors are Doab, Holilan, Dartoot and Pole Dokhtar, each providing about 0.02×10⁹ $/year. It is important to note that though the rainfed land has higher ETa compared to the irrigated areas, the corresponding contribution in GVP is much lower than for irrigated crops. With GVP of 0.44×10⁹ $/year, the livestock economy is the main source of GVP in Karkheh Basin, although it is concentrated in the sub-catchments of the Upper Karkheh. Overall WP of rainfed crops was 0.051$/m3 ranging from 0.027 to 0.071$/m3 whereas average irrigated crop water productivity was 0.22 $/m3 ranging from 0.12 to 0.524 $/m3 (Figure 3a). The coefficient of variation (CV) for irrigated crop water productivity was 0.45, which is almost double that of rainfed WP. We attribute higher CVs for irrigated compared to rainfed crops mainly to large variations in cropping patterns between different sub-catchments. In rainfed systems wheat and barley are the main crops, whereas in irrigated systems farmers grow a mixture of crops such as wheat, maize, barley, sugarbeet, and vegetables. Rainfed WP has a declining trend from the Upper to the Lower Karkheh. The apparent difference between the Upper and the Lower Karkheh is due to much lower rainfall in the Lower Karkheh. Despite similar precipitation patterns over the whole of the Upper Karkheh, rainfed WP shows quite large variability. We believe that this is related to soils and other agronomic factors and requires further investigation to attribute the causes more precisely. In contrast, the higher WP values for irrigated crops are concentrated in middle and lower reaches of the Karkheh except the South Karkheh sub-catchment, which is likely related to higher soil and water salinity.
a) b)
a) b) Figure 3. Water consumption (ETa), gross value of production (GVP), and water productivity (WP) for 2002-03 in Karkheh River Basin: a) for rainfed and irrigated crops; b) for vegetative and vegetative and livestock. It is pertinent to note that, although the highest WP of irrigated crops is in the Pole Zal sub-catchment, this could not be considered as a target value for improvement for other catchments, given the high level of uncertainties in estimating GVP and ETa and the smaller extent of the irrigated area. In this regard, the sub-
122
catchments with highest water productivity, namely Jelogir, Pole Dokhtar, Ghore Baghestan and Doab in the Upper Karkheh and Abdul Khan and Hamedieh in the Lower Karkheh could serve as targets for medium-term interventions in neighboring low-performing sub-catchments. Vegetative water productivity (estimated by dividing the economic value of all vegetative areas, i.e. sum of irrigated and rainfed crops, orchards, rangelands and forests, by their total water consumption) was 0.097 $/m3. There was wide variation, however, across sub-catchments and values ranged from 0.004 to 0.36 $/m3 for the Pole Zal and Hamedieh sub-catchment, respectively (Figure 3b). The higher values are due to higher proportion of irrigated land in a particular sub-catchment, whereas lower values are due to dominance of other land uses (i.e. rangelands, forest, and rainfed crops). The magnitude and distribution of economic WP for agriculture changes substantially when livestock are included. The average value of overall vegetative and livestock WP becomes 0.129 $/m3, with a range of 0.022 to 0.408 $/m3 (Figure 3b). The impact of including livestock in WP calculation is more prominent in the Upper Karkheh. The reasons are a high proportion of grass and rangelands as well as rainfed vegetation, which is an important grazing resource in addition to residues from irrigated and rainfed crops. This highlights an important policy dimension whereby increased allocation to cropped land should not ignore the importance of livestock in overall economic gains from the use of water.
Summary and conclusions
This study shows that in the Karkheh Basin of Iran there has been little work on WP, particularly above the field and farm scales. To fill these gaps, this study quantifies WP at sub-catchment and basin scale using a range of datasets including secondary agricultural statistics and satellite images. Mapping WP of irrigated systems has identified high performing areas in both the Upper (Jelogir, Pole Dokhtar, Ghore Baghestan and Doab sub-catchments) and the Lower Karkheh (Abdul Khan and Hamedieh sub-catchments). Similarly for rainfed sub-catchments, we identify Dartoot, Holilan, and Ghore Baghestan as areas with high water productivity. Interventions focusing on the causes of high performance of these areas such as irrigation, good agronomy, and market chains could guide policy interventions to reduce the productivity gaps of their low-performing neighbors. Shifting to higher value crops could also contribute to increasing WP, but might contradict national targets of food sufficiency. Including livestock in estimates of economic WP substantially changes the map of basin WP and the magnitude of the results. This highlights the importance of accounting fully for all components in systems of agricultural production, especially if the estimates are to be used for the purpose of possible reallocation of water away from the rural sector. The approach presented here exemplifies how the combined use of freely-available remote-sensing data and routine secondary data/statistics, coupled with advanced GIS techniques, can be used to compute WP at different scales such as sub-catchment to river basin. This methodology provides essential information to water managers and policymakers on water-use performance/water productivity by helping them to identify high- and low-performing regions. They can then better target resources reallocation and campaigns to enhance productivity within a river basin.
Acknowledgments
This paper presents the findings from PN 57 ‘Basin Focal Project for the Karkheh,’ a project of the CGIAR Challenge Program on Water and Food. We thank the Agricultural Research and Extension Organization, Ministry of Jihad-e-Agriculture, the Iranian Meteorological Department, and Statistical Center of Iran for providing the relevant data. We also thank the IWMI-Iran office for providing local information.
References
CPWF. 2003. Karkheh River Basin: Protecting dry land under environmental siege. Karkheh basin brochure.
Challenge Program on Water and Food (CPWF). http://www.waterandfood.org/. Ghafouri, M. (ed.) 2007. International Workshop on Improving Water Productivity and Livelihood Resilience in
Karkheh River Basin: Extended abstracts. September 10-11, 2007. Soil Conservation and Watershed Management Research Institutes (SCWNRI): Tehran, Iran.
Moayeri, M., H. Dehghanisanij, H. Sedgi, H. Farahani, F. Abbasi, A.F. Nato, and E. Pazira. 2007. Assessment of
wheat water productivity and methods of improvement in south Karkheh River Basin. In Ghafouri, M. (ed.) International workshop on improving water productivity and livelihood resilience in Karkheh River Basin: Extended abstracts. September 10-11, 2007. Soil Conservation and Watershed Management Research Institutes (SCWNRI): Tehran, Iran.
Molden, D., and R. Sakthivadival. 1999. Water accounting to assess use and productivity of water. Water
Resources Development, 15, 55-71. Muthuwatta, L.P., M.D. Ahmad, M.G. Bos, and T.H.M. Rientjes. 2008. Assessment of water availability and
consumption in the Karkheh River Basin, Iran–using remote sensing and geo-statistical procedures. Water Resources Management (submitted).
123
Monitoring agricultural water consumption and irrigation performance using free MODIS images for a large irrigation system in Pakistan
Mobin-ud Din Ahmad1,2 and Nilantha Gamage3
1Formerly at International Water Management Institute (IWMI), Global Research Division, P. O. Box. 2075, Colombo, Sri Lanka
2CSIRO, Land and Water, Locked Bag 588, Building 24, Charles Sturt University, Wagga Wagga Campus, NSW 2678, Australia. Email: [email protected]
3International Water Management Institute (IWMI), Global Research Division, P. O. Box. 2075, Colombo, Sri Lanka
Abstract Irrigation policymakers and managers need information on the irrigation performance at various scales to devise appropriate water management strategies, in particular, considering declining water availability, further threats from climate change, and continually rising population and food demand. In practice it is often difficult to access sufficient water supply and use data to determine crop water consumption and irrigation performance. Energy balance techniques using remote sensing data have been developed by various researchers over the last 20 years, and can be used as a tool to directly estimate actual evapotranspiration, i.e. water consumption. This study demonstrates how remote sensing-based estimates of water consumption and water stress can be combined to provide better estimates of system and irrigation performance (adequacy and reliability) at a variety of scales than other options. A principal benefit of the approach is that it allows identification of areas where adequacy and reliability as a function of evaporative function is less than potential, thereby providing insights into where and how irrigation systems can be managed to improve overall performance and increase water productivity in a sustainable manner. To demonstrate the advantages, the approach was applied in the Indus Basin irrigation system of Pakistan’s Punjab Province. Remote sensing-based indicators reflecting adequacy and reliability of irrigation water availability were estimated. Media grab Public domain satellite data and sate-of-the-art remote sensing techniques can be used to monitor irrigation system performance across a range of spatial scales, from field to basin, especially in data-scarce regions of the world. Introduction The irrigation sector has played an important role in global food production, and in the 21st century it remains an important part of the strategy to feed the global population in the future, and may often be the only option in some arid and semiarid countries, such as Pakistan. With about 16 million ha of irrigated area, the Indus Basin irrigation system in Pakistan is one of the largest contiguous irrigation systems in the world, which plays an important role in the economy of the country. To evaluate the irrigation performance and manage scarce water resources in such a large irrigation system, water policymakers and managers are often confronted with the paucity of reliable information. This paper demonstrates how the remote sensing derived raster maps of actual evapotranspiration and evaporative fraction can be merged with vector maps of the irrigation water delivery systems to understand the real-time performance under actual field conditions. In this study, two indicators, as proposed by Ahmad et al. (2008), representing adequacy and reliability, were selected to evaluate the performance of the Indus irrigation system in Punjab, Pakistan. The study covers the entire canal irrigation system of the Indus Basin (approximately 8.5 million ha of cropped area, Figure 1a) of Punjab Province fed by the five rivers. Most areas in Punjab experience fairly cool winters with December and January being the coolest, with temperatures sometimes going below 0°C. By March, the temperature begins to rise reaching 46-50°C in June-July. The onset of the southwest monsoon is anticipated to reach Punjab by the end of May and continues until July-August. Almost 75% of the annual rainfall occurs during the monsoon season from mid-June to mid-September. Due to scanty and erratic rainfall, successful agriculture is only possible with irrigation from surface and groundwater. Rice, cotton, sugarcane, and forage crops dominate the summer season (Kharif–May to October), whereas wheat and forage are the major crops in winter (Rabi–November to April). In some parts, sugarcane is also cultivated, which is an annual crop. Methods Several models are available (Kustas et al., 2003) to compute actual evapotranspiration and the evaporative fraction using satellite images. In this study, the Surface Energy Balance Algorithm for Land (SEBAL) has been used for the calculation of actual evapotranspiration and the evaporative fraction. SEBAL is an image processing model that computes a complete radiation and energy balance along with resistances for momentum, heat, and water vapor transport for each pixel (Bastiaanssen et al., 1998, 2002). The key input data for SEBAL consists of spectral radiance in the visible, near-infrared, and thermal infrared part of the spectrum. In addition to satellite images, the SEBAL model requires the routine weather data parameters (wind speed, humidity, solar radiation, and air temperature). SEBAL is a well-tested and widely used method to compute ETa (Bastiaanssen et al., 1998; Tasumi et al., 2003; Ahmad et al., 2008) and validated in Pakistan (Bastiaanssen et al., 2002).
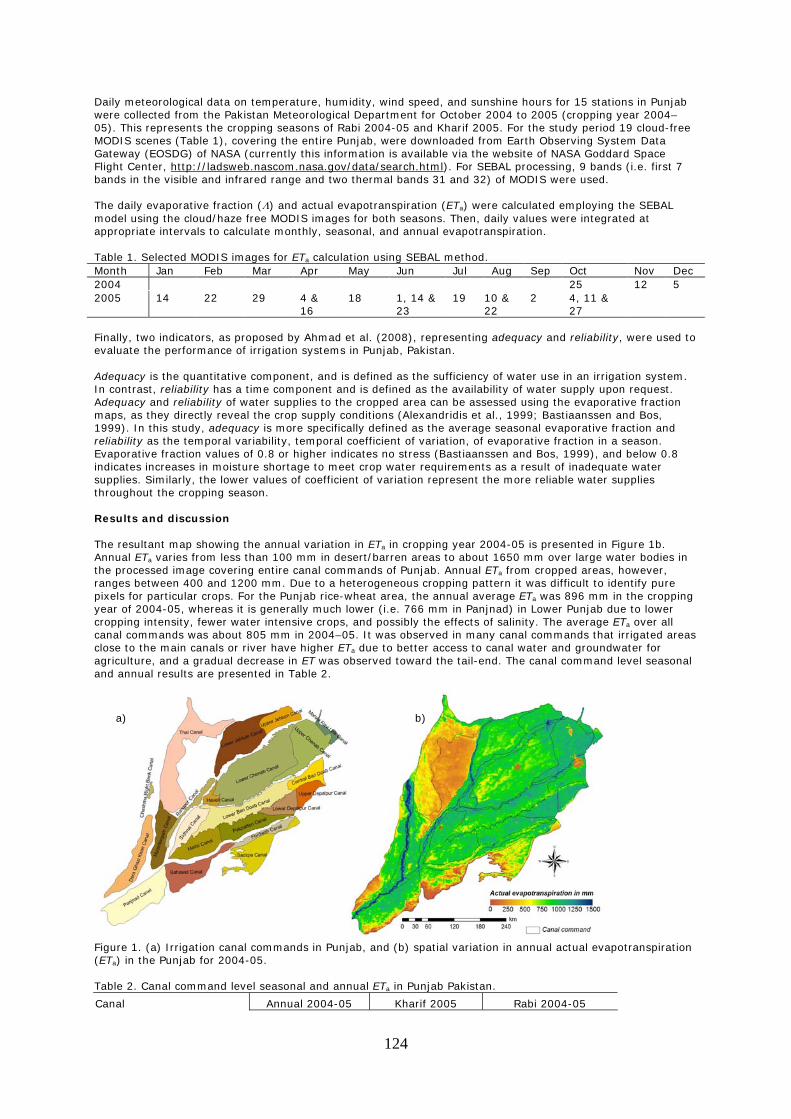
124
Daily meteorological data on temperature, humidity, wind speed, and sunshine hours for 15 stations in Punjab were collected from the Pakistan Meteorological Department for October 2004 to 2005 (cropping year 2004–05). This represents the cropping seasons of Rabi 2004-05 and Kharif 2005. For the study period 19 cloud-free MODIS scenes (Table 1), covering the entire Punjab, were downloaded from Earth Observing System Data Gateway (EOSDG) of NASA (currently this information is available via the website of NASA Goddard Space Flight Center, http://ladsweb.nascom.nasa.gov/data/search.html). For SEBAL processing, 9 bands (i.e. first 7 bands in the visible and infrared range and two thermal bands 31 and 32) of MODIS were used. The daily evaporative fraction (Λ) and actual evapotranspiration (ETa) were calculated employing the SEBAL model using the cloud/haze free MODIS images for both seasons. Then, daily values were integrated at appropriate intervals to calculate monthly, seasonal, and annual evapotranspiration. Table 1. Selected MODIS images for ETa calculation using SEBAL method. Month Jan Feb Mar Apr May Jun Jul Aug Sep Oct Nov Dec 2004 25 12 5 2005 14 22 29 4 &
16 18 1, 14 &
23 19 10 &
22 2 4, 11 &
27
Finally, two indicators, as proposed by Ahmad et al. (2008), representing adequacy and reliability, were used to evaluate the performance of irrigation systems in Punjab, Pakistan. Adequacy is the quantitative component, and is defined as the sufficiency of water use in an irrigation system. In contrast, reliability has a time component and is defined as the availability of water supply upon request. Adequacy and reliability of water supplies to the cropped area can be assessed using the evaporative fraction maps, as they directly reveal the crop supply conditions (Alexandridis et al., 1999; Bastiaanssen and Bos, 1999). In this study, adequacy is more specifically defined as the average seasonal evaporative fraction and reliability as the temporal variability, temporal coefficient of variation, of evaporative fraction in a season. Evaporative fraction values of 0.8 or higher indicates no stress (Bastiaanssen and Bos, 1999), and below 0.8 indicates increases in moisture shortage to meet crop water requirements as a result of inadequate water supplies. Similarly, the lower values of coefficient of variation represent the more reliable water supplies throughout the cropping season. Results and discussion The resultant map showing the annual variation in ETa in cropping year 2004-05 is presented in Figure 1b. Annual ETa varies from less than 100 mm in desert/barren areas to about 1650 mm over large water bodies in the processed image covering entire canal commands of Punjab. Annual ETa from cropped areas, however, ranges between 400 and 1200 mm. Due to a heterogeneous cropping pattern it was difficult to identify pure pixels for particular crops. For the Punjab rice-wheat area, the annual average ETa was 896 mm in the cropping year of 2004-05, whereas it is generally much lower (i.e. 766 mm in Panjnad) in Lower Punjab due to lower cropping intensity, fewer water intensive crops, and possibly the effects of salinity. The average ETa over all canal commands was about 805 mm in 2004–05. It was observed in many canal commands that irrigated areas close to the main canals or river have higher ETa due to better access to canal water and groundwater for agriculture, and a gradual decrease in ET was observed toward the tail-end. The canal command level seasonal and annual results are presented in Table 2.
Figure 1. (a) Irrigation canal commands in Punjab, and (b) spatial variation in annual actual evapotranspiration (ETa) in the Punjab for 2004-05. Table 2. Canal command level seasonal and annual ETa in Punjab Pakistan.
Canal Annual 2004-05 Kharif 2005 Rabi 2004-05
a) b)
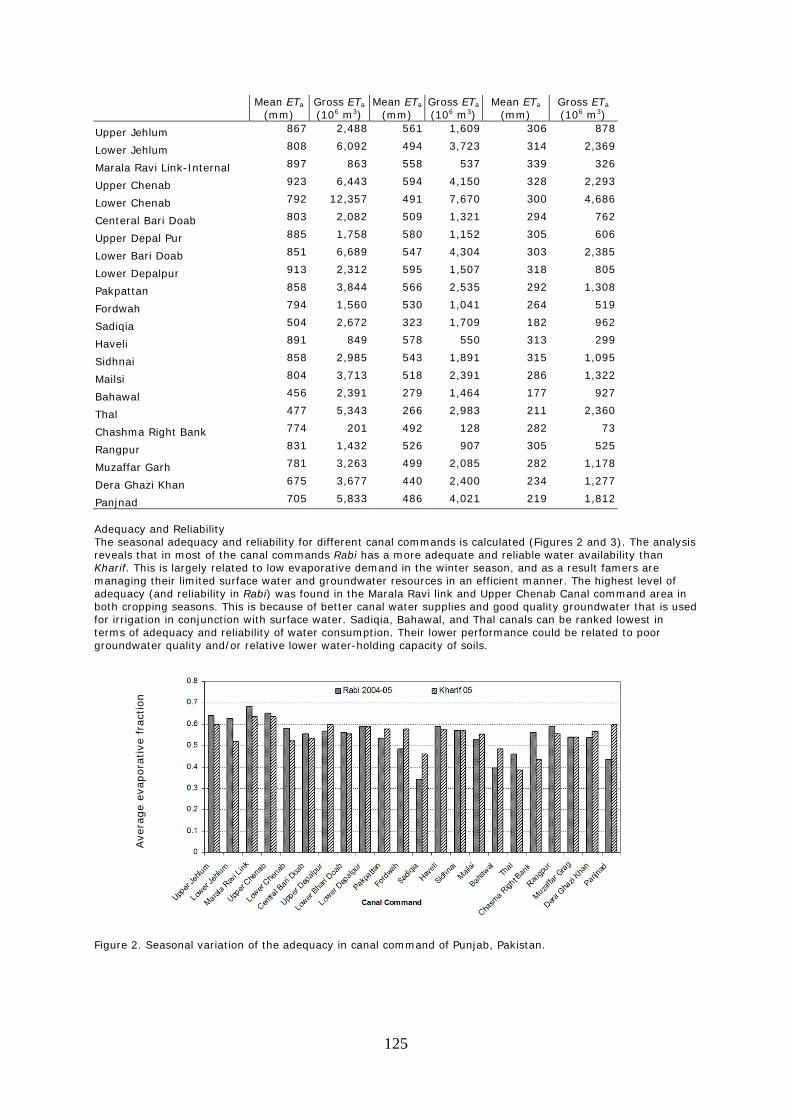
125
Mean ETa (mm)
Gross ETa (106 m3)
Mean ETa (mm)
Gross ETa (106 m3)
Mean ETa (mm)
Gross ETa (106 m3)
Upper Jehlum 867 2,488 561 1,609 306 878
Lower Jehlum 808 6,092 494 3,723 314 2,369
Marala Ravi Link-Internal 897 863 558 537 339 326
Upper Chenab 923 6,443 594 4,150 328 2,293
Lower Chenab 792 12,357 491 7,670 300 4,686
Centeral Bari Doab 803 2,082 509 1,321 294 762
Upper Depal Pur 885 1,758 580 1,152 305 606
Lower Bari Doab 851 6,689 547 4,304 303 2,385
Lower Depalpur 913 2,312 595 1,507 318 805
Pakpattan 858 3,844 566 2,535 292 1,308
Fordwah 794 1,560 530 1,041 264 519
Sadiqia 504 2,672 323 1,709 182 962
Haveli 891 849 578 550 313 299
Sidhnai 858 2,985 543 1,891 315 1,095
Mailsi 804 3,713 518 2,391 286 1,322
Bahawal 456 2,391 279 1,464 177 927
Thal 477 5,343 266 2,983 211 2,360
Chashma Right Bank 774 201 492 128 282 73
Rangpur 831 1,432 526 907 305 525
Muzaffar Garh 781 3,263 499 2,085 282 1,178
Dera Ghazi Khan 675 3,677 440 2,400 234 1,277
Panjnad 705 5,833 486 4,021 219 1,812
Adequacy and Reliability The seasonal adequacy and reliability for different canal commands is calculated (Figures 2 and 3). The analysis reveals that in most of the canal commands Rabi has a more adequate and reliable water availability than Kharif. This is largely related to low evaporative demand in the winter season, and as a result famers are managing their limited surface water and groundwater resources in an efficient manner. The highest level of adequacy (and reliability in Rabi) was found in the Marala Ravi link and Upper Chenab Canal command area in both cropping seasons. This is because of better canal water supplies and good quality groundwater that is used for irrigation in conjunction with surface water. Sadiqia, Bahawal, and Thal canals can be ranked lowest in terms of adequacy and reliability of water consumption. Their lower performance could be related to poor groundwater quality and/or relative lower water-holding capacity of soils.
Figure 2. Seasonal variation of the adequacy in canal command of Punjab, Pakistan.
Ave
rage
evap
ora
tive
fra
ctio
n
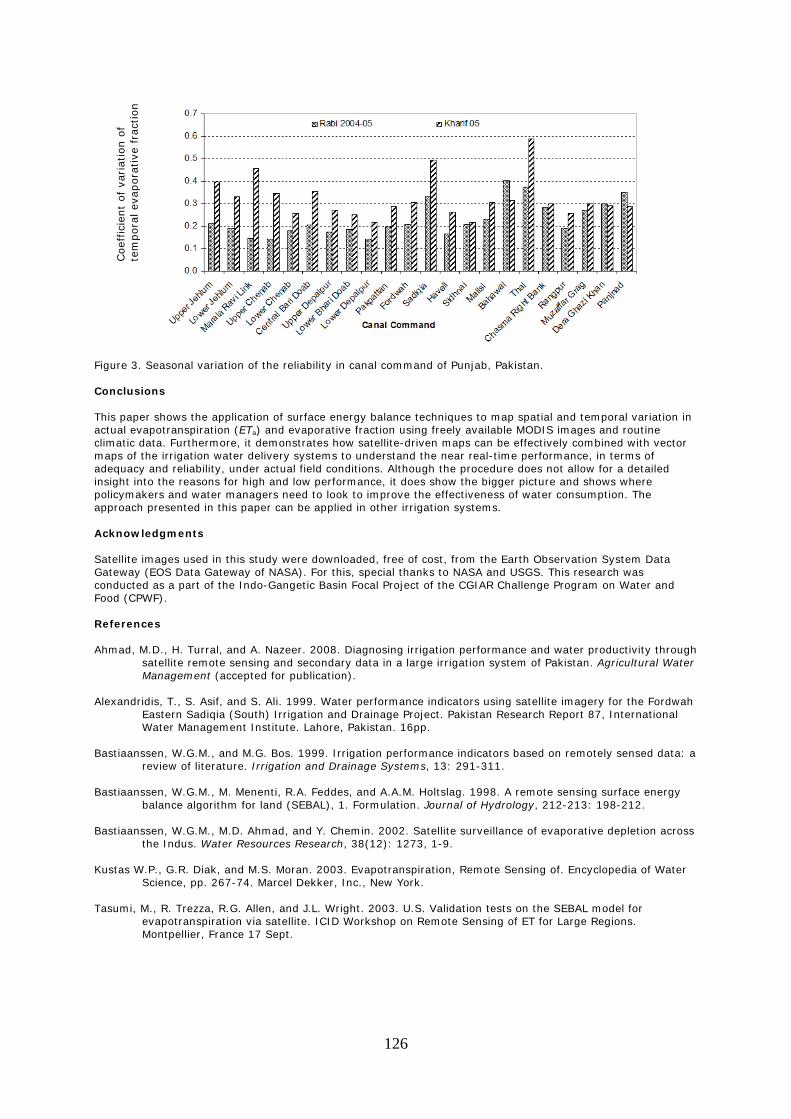
126
Figure 3. Seasonal variation of the reliability in canal command of Punjab, Pakistan. Conclusions This paper shows the application of surface energy balance techniques to map spatial and temporal variation in actual evapotranspiration (ETa) and evaporative fraction using freely available MODIS images and routine climatic data. Furthermore, it demonstrates how satellite-driven maps can be effectively combined with vector maps of the irrigation water delivery systems to understand the near real-time performance, in terms of adequacy and reliability, under actual field conditions. Although the procedure does not allow for a detailed insight into the reasons for high and low performance, it does show the bigger picture and shows where policymakers and water managers need to look to improve the effectiveness of water consumption. The approach presented in this paper can be applied in other irrigation systems. Acknowledgments Satellite images used in this study were downloaded, free of cost, from the Earth Observation System Data Gateway (EOS Data Gateway of NASA). For this, special thanks to NASA and USGS. This research was conducted as a part of the Indo-Gangetic Basin Focal Project of the CGIAR Challenge Program on Water and Food (CPWF). References Ahmad, M.D., H. Turral, and A. Nazeer. 2008. Diagnosing irrigation performance and water productivity through
satellite remote sensing and secondary data in a large irrigation system of Pakistan. Agricultural Water Management (accepted for publication).
Alexandridis, T., S. Asif, and S. Ali. 1999. Water performance indicators using satellite imagery for the Fordwah
Eastern Sadiqia (South) Irrigation and Drainage Project. Pakistan Research Report 87, International Water Management Institute. Lahore, Pakistan. 16pp.
Bastiaanssen, W.G.M., and M.G. Bos. 1999. Irrigation performance indicators based on remotely sensed data: a
review of literature. Irrigation and Drainage Systems, 13: 291-311. Bastiaanssen, W.G.M., M. Menenti, R.A. Feddes, and A.A.M. Holtslag. 1998. A remote sensing surface energy
balance algorithm for land (SEBAL), 1. Formulation. Journal of Hydrology, 212-213: 198-212. Bastiaanssen, W.G.M., M.D. Ahmad, and Y. Chemin. 2002. Satellite surveillance of evaporative depletion across
the Indus. Water Resources Research, 38(12): 1273, 1-9. Kustas W.P., G.R. Diak, and M.S. Moran. 2003. Evapotranspiration, Remote Sensing of. Encyclopedia of Water
Science, pp. 267-74. Marcel Dekker, Inc., New York. Tasumi, M., R. Trezza, R.G. Allen, and J.L. Wright. 2003. U.S. Validation tests on the SEBAL model for
evapotranspiration via satellite. ICID Workshop on Remote Sensing of ET for Large Regions. Montpellier, France 17 Sept.
Coef
fici
ent
of
variat
ion o
f te
mpora
l ev
apora
tive
fra
ctio
n
127
Simulation of smallholder farming systems in the Olifants River Basin, South Africa
Manuel S Magombeyi1 and Akpofure E Taigbenu1
1School of Civil and Environmental Engineering, Witwatersrand University, Private Bag X3 Wits, 2050. RSA.
[email protected] (M S Magombeyi) Abstract Smallholder farming systems are characterized by low yields and high risks of crop failure, thereby threatening family food security. A farming systems simulation model, OLYMPE, is used to improve understanding of the existing farming practices in semiarid Olifants River Basin, South Africa, and identify opportunities for improvements. The socioeconomic analysis component of OLYMPE is used to explore, over a 10-year period, farmer income subject to constraints of capital, land, water availability, labor, and market price dynamics. Five farming systems types were identified from surveys and these were refined and validated with farmers and extension officers. Farms with high livestock units were the most resilient to climatic variability and market shocks, followed by farms with crop diversification. Extreme events, however, such as cyclones affected all the farms to different degrees. Annual returns on labor ranged from 0 to ZAR 7646/person, with the highest under Type E followed by Type C, with ZAR 1822/person (US$1 = 8.28 ZAR–October 2008). OLYMPE model was able to simulate the farming systems productions in the catchment with good performance. The results indicate that livestock and crop diversification are most adept strategies to ensure stable income and food security for smallholder farmers. Hence, technology innovations and policies should articulate solutions to poor yields based on these two farm types in the Olifants Basin. Media grab Farming simulations and gross margin calculations are essential in planning the most attractive strategies for mitigation of crop yield risks and altering farm development. Introduction Population growth and the consequent increase in food demand have resulted in strong demands to increase resource use efficiency and innovative technology in the 21st century (Weibe, 2002; UNDP, 2006). Food security and sustainable land use have been the focus of a number of domestic (DWAF, 2004) and international policy initiatives. Challenges still remain, however, with more than 800 million people undernourished mostly from Africa and Asia (Weibe, 2002). To many of these smallholder resource-constrained farmers, food security depends on farm production and income from agriculture. Addressing these challenges in the Olifants River Basin of South Africa where agriculture contributes more than 40% of total family income requires an improved understanding of the nonlinear dynamic links among farming practices, in relation to land, economic environmental externalities, and food security. Furthermore, the farmers are at high risk of crop failure due to continued trends in erratic and uneven distribution patterns of precipitation during the growing season (Stern et al., 1982; Berry et al., 2006; Magombeyi and Taigbenu, 2008). Challenges of data availability limit analysis of the interactions between agriculture resources and food security, resulting in widely varying policy responses. With recent methodology developments in modeling, we are in a position to have an improved understanding of how agriculture production affects food security, through food supplies and family incomes, and how food security in turn influences farmers’ decisions. The knowledge of local farming systems performance under hazards and farmers’ strategies in different contexts can contribute to improved, timely, and better adapted technology innovations. This paper focuses on Olympe (Attonaty et al., 1999; Penot, 2003) model application to five smallholder farming systems to evaluate their performance under climatic risk and fluctuating commodity prices, and to demonstrate the best opportunities that characterize the farming systems. Modelling farming systems The early stages (1950s) of farming systems modeling emphasized linear programming based on profit maximization, during which economists analyzed farm growth, response to policies, and cost minimization (Matthews et al., 2000). Other models assessed various farm enterprise options in the face of price risks and land degradation (Hansen et al., 1997). In a more holistic approach, Edwards-Jones et al. (1998) linked CERES-Maize model, family decision-making, and demographic models to represent a subsistence farming system. This approach was further extended in OLYMPE model. Twinned to the exploration of constraints and opportunities, Olympe model as a dialogue tool among farmers, researchers, and planners makes it possible to evaluate technical decisions from a socioeconomic point of view (Penot et al., 2004). Study area The study area is located in the B72A quaternary (lowest water management area) catchment in the Olifants River Basin of South Africa (Figure 1). The main crops grown in the area are maize, green beans, sugar beans, groundnuts, spinach, cabbage, and tomato (Ntsheme, 2005). Major risks to agriculture in the area are related to fluctuation in weather conditions (mean annual rainfall of 630 mm), resulting in high variability of crop yields (Magombeyi and Taigbenu, 2008) and market prices (Ellis, 1988; Penot et al., 2004; Fabre, 2006).
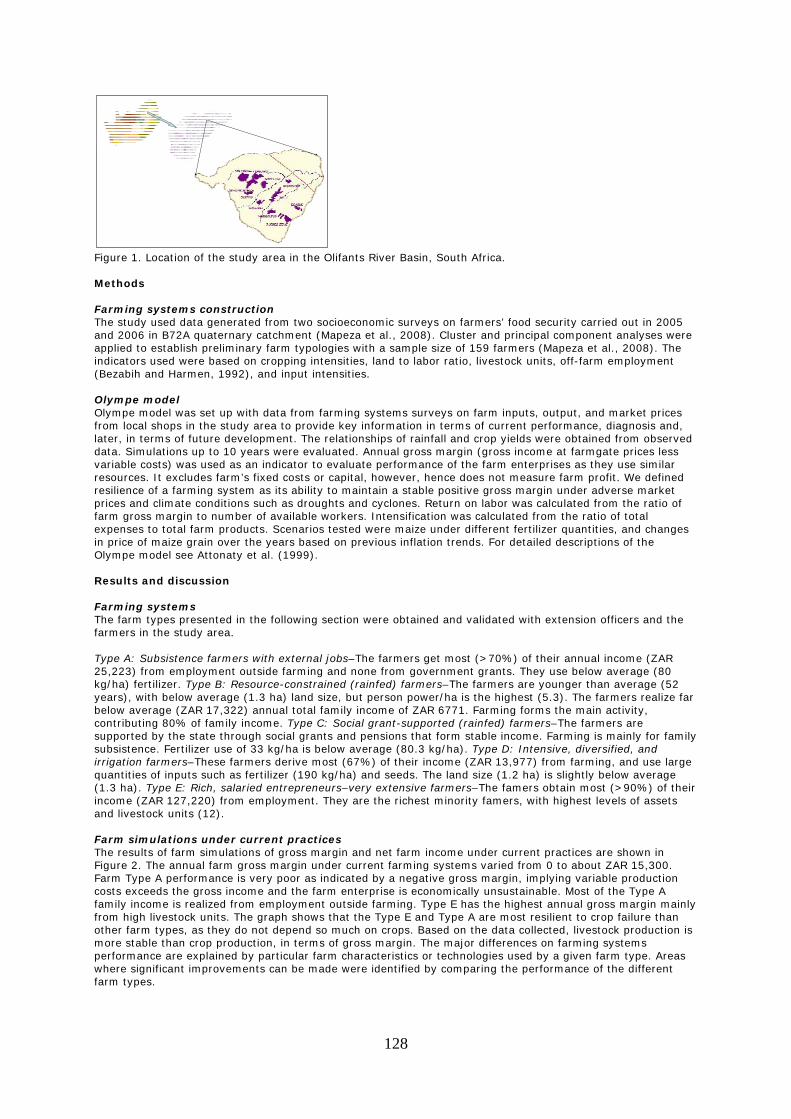
128
Figure 1. Location of the study area in the Olifants River Basin, South Africa. Methods Farming systems construction The study used data generated from two socioeconomic surveys on farmers’ food security carried out in 2005 and 2006 in B72A quaternary catchment (Mapeza et al., 2008). Cluster and principal component analyses were applied to establish preliminary farm typologies with a sample size of 159 farmers (Mapeza et al., 2008). The indicators used were based on cropping intensities, land to labor ratio, livestock units, off-farm employment (Bezabih and Harmen, 1992), and input intensities. Olympe model Olympe model was set up with data from farming systems surveys on farm inputs, output, and market prices from local shops in the study area to provide key information in terms of current performance, diagnosis and, later, in terms of future development. The relationships of rainfall and crop yields were obtained from observed data. Simulations up to 10 years were evaluated. Annual gross margin (gross income at farmgate prices less variable costs) was used as an indicator to evaluate performance of the farm enterprises as they use similar resources. It excludes farm’s fixed costs or capital, however, hence does not measure farm profit. We defined resilience of a farming system as its ability to maintain a stable positive gross margin under adverse market prices and climate conditions such as droughts and cyclones. Return on labor was calculated from the ratio of farm gross margin to number of available workers. Intensification was calculated from the ratio of total expenses to total farm products. Scenarios tested were maize under different fertilizer quantities, and changes in price of maize grain over the years based on previous inflation trends. For detailed descriptions of the Olympe model see Attonaty et al. (1999). Results and discussion Farming systems The farm types presented in the following section were obtained and validated with extension officers and the farmers in the study area. Type A: Subsistence farmers with external jobs–The farmers get most (>70%) of their annual income (ZAR 25,223) from employment outside farming and none from government grants. They use below average (80 kg/ha) fertilizer. Type B: Resource-constrained (rainfed) farmers–The farmers are younger than average (52 years), with below average (1.3 ha) land size, but person power/ha is the highest (5.3). The farmers realize far below average (ZAR 17,322) annual total family income of ZAR 6771. Farming forms the main activity, contributing 80% of family income. Type C: Social grant-supported (rainfed) farmers–The farmers are supported by the state through social grants and pensions that form stable income. Farming is mainly for family subsistence. Fertilizer use of 33 kg/ha is below average (80.3 kg/ha). Type D: Intensive, diversified, and irrigation farmers–These farmers derive most (67%) of their income (ZAR 13,977) from farming, and use large quantities of inputs such as fertilizer (190 kg/ha) and seeds. The land size (1.2 ha) is slightly below average (1.3 ha). Type E: Rich, salaried entrepreneurs–very extensive farmers–The famers obtain most (>90%) of their income (ZAR 127,220) from employment. They are the richest minority famers, with highest levels of assets and livestock units (12). Farm simulations under current practices The results of farm simulations of gross margin and net farm income under current practices are shown in Figure 2. The annual farm gross margin under current farming systems varied from 0 to about ZAR 15,300. Farm Type A performance is very poor as indicated by a negative gross margin, implying variable production costs exceeds the gross income and the farm enterprise is economically unsustainable. Most of the Type A family income is realized from employment outside farming. Type E has the highest annual gross margin mainly from high livestock units. The graph shows that the Type E and Type A are most resilient to crop failure than other farm types, as they do not depend so much on crops. Based on the data collected, livestock production is more stable than crop production, in terms of gross margin. The major differences on farming systems performance are explained by particular farm characteristics or technologies used by a given farm type. Areas where significant improvements can be made were identified by comparing the performance of the different farm types.
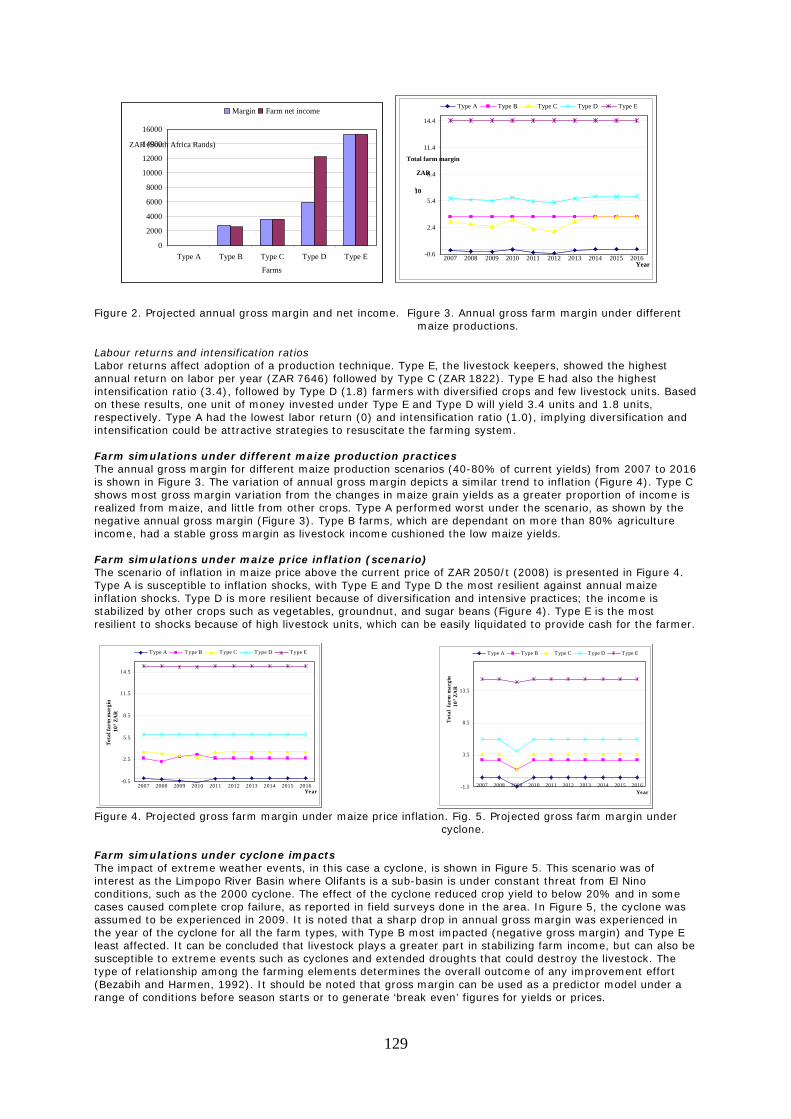
129
Figure 2. Projected annual gross margin and net income. Figure 3. Annual gross farm margin under different
maize productions. Labour returns and intensification ratios Labor returns affect adoption of a production technique. Type E, the livestock keepers, showed the highest annual return on labor per year (ZAR 7646) followed by Type C (ZAR 1822). Type E had also the highest intensification ratio (3.4), followed by Type D (1.8) farmers with diversified crops and few livestock units. Based on these results, one unit of money invested under Type E and Type D will yield 3.4 units and 1.8 units, respectively. Type A had the lowest labor return (0) and intensification ratio (1.0), implying diversification and intensification could be attractive strategies to resuscitate the farming system. Farm simulations under different maize production practices The annual gross margin for different maize production scenarios (40-80% of current yields) from 2007 to 2016 is shown in Figure 3. The variation of annual gross margin depicts a similar trend to inflation (Figure 4). Type C shows most gross margin variation from the changes in maize grain yields as a greater proportion of income is realized from maize, and little from other crops. Type A performed worst under the scenario, as shown by the negative annual gross margin (Figure 3). Type B farms, which are dependant on more than 80% agriculture income, had a stable gross margin as livestock income cushioned the low maize yields. Farm simulations under maize price inflation (scenario) The scenario of inflation in maize price above the current price of ZAR 2050/t (2008) is presented in Figure 4. Type A is susceptible to inflation shocks, with Type E and Type D the most resilient against annual maize inflation shocks. Type D is more resilient because of diversification and intensive practices; the income is stabilized by other crops such as vegetables, groundnut, and sugar beans (Figure 4). Type E is the most resilient to shocks because of high livestock units, which can be easily liquidated to provide cash for the farmer.
Figure 4. Projected gross farm margin under maize price inflation. Fig. 5. Projected gross farm margin under
cyclone. Farm simulations under cyclone impacts The impact of extreme weather events, in this case a cyclone, is shown in Figure 5. This scenario was of interest as the Limpopo River Basin where Olifants is a sub-basin is under constant threat from El Nino conditions, such as the 2000 cyclone. The effect of the cyclone reduced crop yield to below 20% and in some cases caused complete crop failure, as reported in field surveys done in the area. In Figure 5, the cyclone was assumed to be experienced in 2009. It is noted that a sharp drop in annual gross margin was experienced in the year of the cyclone for all the farm types, with Type B most impacted (negative gross margin) and Type E least affected. It can be concluded that livestock plays a greater part in stabilizing farm income, but can also be susceptible to extreme events such as cyclones and extended droughts that could destroy the livestock. The type of relationship among the farming elements determines the overall outcome of any improvement effort (Bezabih and Harmen, 1992). It should be noted that gross margin can be used as a predictor model under a range of conditions before season starts or to generate ‘break even’ figures for yields or prices.
-0.5
2.5
5.5
8.5
11.5
14.5
2007 2008 2009 2010 2011 2012 2013 2014 2015 2016Year
Tota
l far
m m
argi
n10
3 ZA
R
Type A Type B Type C Type D Type E
0
2000
4000
6000
8000
10000
12000
14000
16000
Type A Type B Type C Type D Type E
Farms
ZAR (South Africa Rands)
Margin Farm net income
-0.6
2.4
5.4
8.4
11.4
14.4
2007 2008 2009 2010 2011 2012 2013 2014 2015 2016Year
Total farm margin
103
ZAR
Type A Type B Type C Type D Type E
-1.5
3.5
8.5
13.5
2007 2008 2009 2010 2011 2012 2013 2014 2015 2016Year
Tota
l fa
rm m
argi
n--
103 Z
AR
Type A Type B Type C Type D Type E
130
Conclusions and recommendations A farming simulation model for smallholder farmers was presented. Different farming systems experience different constraints, and may not adopt the same technological innovations based on environment and socioeconomic conditions. The results demonstrate the great opportunities that exist for upgrading farming systems in the catchment. Livestock rearing and crop diversification are some of the opportunities to improve resilience of smallholder farming systems. For crop production, harvesting rainwater in storage facilities offers one way of realizing supplementary irrigation, and stabilizing yields in the face of intra-seasonal dry spells. Suitable marketing strategies are also important. In conclusion, the use of the Olympe model helps to define feasible strategies for farmer development, risks mitigation, and the impact of agricultural policies and markets for farmers, researchers, planners, and policymakers. Not all good solutions satisfy all the farm types, however. The next step is to discuss with the farmers the different management practices that enhance their crop yields, and assess their robustness using the Olympe model.
Acknowledgemnts This paper presents findings from PN 17, a project of the CGIAR Challenge Program on Water and Food. References Attonaty, J.M., C. Chatelin, and F. Garcia. 1999. Interactive simulation modeling in farm decision-making.
Computers and Electronics in Agriculture, 22: 157–70. Berry, P.M., M.D.A. Rounsevell, P.A. Harrison, and E. Audsley. 2006. Assessing the vulnerability of agricultural
land use and species to climate change and the role of policy facilitating adaptation. Environmental Science & Policy, 9: 189-204.
Bezabih, E., and S. Harmen. 1992. Impovement strategies for farming systems in the Eastern Highlands of
Ethopia. Agricultural Economics, 8: 57-77. Department of Water Affairs and Forestry (DWAF). 2004. National Water Resources Strategy (NWRS). Our blue
print for survival. First Edition, Government of South Africa. Edwards-Jones, G., J.B. Dent, O .Morgan, and M.J. McGregor. 1998. Incorporating farm household decision-
making within whole farm models. In: G.Y. Tsuji, G. Hoogenboom, and P.K. Thornton (eds.) Understanding Options for Agricultural Production. Kluwer Academic Publishers, Dordrecht, Netherlands, pp. 347-65.
Ellis, F. 1988. Peasant Economics: Farm Households and Agrarian Development. Cambridge University Press,
Cambridge, UK. Fabre, A. 2006. Market access for small scale farmers cultivating under rainfed conditions in the Limpopo
Province (South Africa): Functions, uses and outlets of maize and sorghum productions, ISARA. Hansen, J.W., E.B. Knapp, and J.W. Jones. 1997. Determinants of sustainability of a Columbian hillside farm.
Expl. Agric., 33(4): 425-48. Magombeyi, M.S., and A.E. Taigbenu. 2008. Crop yield risk analysis and mitigation of smallholder farmers at
quaternary catchment level: Case study of B72A in Olifants River Basin, South Africa. Physics and Chemistry of the Earth, 33: 744-56.
Mapeza, E., C. Cheron, S. Morardet, and M.S. Magombeyi. 2008. Socio-economic conditions and agricultural
water management practices of smallholders in quaternary catchment B72A, Olifants River Basin, South Africa. Report to Waternet.
Matthews, R., W. Stephens, T. Hess, T. Mason, and A. Graves. 2000. Applications of soil/crop simulation models
in developing countries. DFID NRSP Programme Development Report PD082. Silsoe, UK: Institute of Water and Environment, Cranfield University.
Ntsheme, O.P. 2005. A survey of the current on-farm agricultural land and water management practices in the
Olifants catchment: A case of the quaternary catchment B72A. Master of Science Thesis in Water Resources Engineering and Management, University of Zimbabwe.
Penot, E. 2003. Formation à l'utilisation du logiciel de modélisation des exploitations agricoles 'Olympe.'
Rapport de mission à Yaoundé (Cameroun) du 07 au 12 avril 2003. Montpellier, CIRAD TERA. Penot, E., M. Le Bars, O. Deheuvels, P. Le Grusse, and J.M. Attonaty. 2004. Farming systems modelling in
tropical agriculture using the software 'Olympe.' Montpellier, CIRAD TERA, France. Stern, R.D., M.D. Dennett, and I.C Dale. 1982. Analyzing daily rainfall measurements to give agronomically
useful results. II. A modeling approach. Expl. Agric., 18: 237-53. United Nations Development Programme (UNDP). 2006. Human Development Report 2006. Beyond Scarcity:
Power, poverty and the global water crisis, UNDP, New York, USA. Weibe, K. 2002. Linking land quality, agricultural productivity, and food security. Economic Research Service.
AER-823, USDA, USA.
131
A methodology for the assessment of agricultural water productivity at the river basin level
T. Oweis1, H. Farahani1, T. Hsiao2, N. Ben Mechlia3, E. De Pauw1, A. Bruggeman1, A. Hachum1, and B.Hessari4
1International Center for Agricultural Research in the Dry Areas (ICARDA), Aleppo, Syria. [email protected]
2The University of California-Davis, Davis, California, USA 3Institut National Agronomique de Tunisie (INAT), Tunisia
4Agricultural Research and Extension Organization, Tehran, Iran
Abstract A methodology was developed to assess, map, and conduct water productivity (WP) diagnostic analysis of major land uses across a river basin using systematic and logical order of: (1) down-scaling across the basin to delineate major land-use areas; (2) using the land-use coverage to delineate major agroecosystems as first level classification zoning of the basin; (3) selecting representative watersheds with each zone that encompasses the major land-uses; (4) estimating WP at the selected watershed(s) for all crops and land-uses; and, (5) out-scaling WP values from watershed(s) to zones and across the basin. Historic yield data of major crops are used together with rain and irrigation water and ET data to estimate WP of crops at each watershed. The methodology presented here leads to multiple outputs, but by far the most important outputs are the powerful maps of WP and other variables known to cause variations in WP across the basin, including: the spatial variability in precipitation, temperature, soils, topography, and livelihoods and management. Maps of WP (in kg/m3 and US$/m3) across the basin can help to identify the variability over the prevailing gradient of precipitation, temperature, soils, elevation, and slopes, in addition to the gradient of poverty and livelihoods. Comparison of these maps provides valuable, yet holistic, information as to the WP gaps, probable causes of the variation in WP, and areas of potential WP improvements. Media grab Spatial assessment of agricultural water productivity at the watershed and basin levels can be used to identify the gaps and areas of potential WP improvements. Introduction The world is currently facing the challenge of producing more food with less water. The understanding of how water is acquired, managed, and used is the key to the solution of this dilemma. Food production places a high demand on water. Increasingly, agriculture, especially in water-scarce areas, is giving up part of its water to other competing sectors. Thus, more food must be produced with less water. The most logical solution to this problem is to increase the return per unit of water used, usually termed WP. It is a solution that stretches across disciplines and levels and certainly requires the concerted action of all stakeholders: farmers, water managers, hydrologists, agronomists, water resources specialists, engineers, socioeconomists, and policymakers. Water productivity is defined as the return per unit of water consumed (Molden et al., 2007). At different scales, WP affects different stakeholders who have different sets of objectives. At the farm level, the farmer is interested in getting family food security and highest income; at the irrigation scheme, maximizing total production or economical return is the goal. At basin/regional level, national food security, health, and environmental protection are issues to stakeholders and policymakers. Focus has primarily been on plant and field scale, while recently WP at higher levels such as project, basin, and regional scales is prominently used. At basin scale, the interaction between the upstream and downstream uses and users of water becomes more evident, raising acute equity issues. Deterioration of water quality that reduces the value and utility of water to downstream users is another basin-wide water issue. The basin perspective allows us to look with greater clarity at the importance of the institutional interventions regarding how planning, policies, rights, regulations, monitoring, and water user organizations need to be designed and implemented, to enhance the effective functioning of organizations at basin and system levels as well as at the level of individual uses or users. To improve the livelihoods of the large agricultural population in the region, the development and adoption of technologies and strategies that facilitate the maximization of agricultural WP are becoming increasingly more important. Research findings have shown that substantial and sustainable improvements in WP are attainable, but can best be achieved through community-based integrated natural resource management (NRM) approaches at the basin level. The objective of this study is to set a generic methodology and framework for assessing current agricultural WP at basin/sub-basin levels. The Karkheh River Basin (KRB) in Iran is used here to illustrate the proposed methodology. Methods Assumptions Agricultural WP in this paper refers to the measured output per unit of water consumed in evapotranspiration or in quality deterioration. Value derived from unit of water use is extremely complex because: (1) basins include a host of activities that can modify water pathways of any subsystem; (2) land presents a system of activities that interact in ways other than water including food, energy, income, or other social exchange; and (3) the
132
valuation systems for different benefits and costs can be difficult to compare. Each of these factors requires simplification through assumptions. For agricultural water use, the primary focus is placed on food production, therefore WP is defined as food output per unit of water consumed. Output resulting from water use includes: (a) biomass in agriculture and natural vegetation; (b) nutritional content of various forms of food produced with water; and (c) economic and societal value created by water use in different sectors (agriculture, fisheries, livestock, and nonagricultural uses of water). In all cases water is quantified as the amount that crosses the boundary of the scale considered, or changes in the amount stored entirely within these boundaries, during the time period of analysis. Field water management is the lowest scale at which water management interventions may be used to increase productivity (Molden et al., 2007). Water management to improve productivity at multifield scale attempts to minimize irrigation and runoff and reuse where appropriate. At this scale, WP is also expressed as above for each field, or as the output and input parameters for the whole farm. The intention of estimating WP is to develop consistent indicators that represent the value unit of water use. In cropping systems, the interest lies with measuring WP with respect to the amount of water consumed by crop(s) as ET. As we scale up from field to farm and to basin, one needs to know the amounts depleted in agricultural production, ET losses from return or unused flows, and losses to sinks such as saline groundwater. Since there are feedback effects of changing water use in the hydrologic pathway (e.g., upstream-downstream interactions), it is also necessary to consider the impacts of different interventions and the scale of adoption in a way that internalizes hydrologic feedback as to quantity and quality. This is done by integration of the production system, the hydrology and the economics within one modeling framework. To compare WP across different enterprises, economic terms are needed. Although the full range of benefits from agricultural production extends far beyond the simple measure of market value of local production, economic production per unit water consumed is used here to assess WP. The methodology ignores trade-offs, since water consumed by one user is denied to downstream users. As water becomes scarcer, the marginal cost of such loss becomes significant. Analysis of trade-off between the competing uses requires comparative production functions, most of which are nonlinear and may have poorly defined interactions over and above those connected with water use. The basin is the highest order scale for hydrologic flows and physical water management. Value and biomass are the common measures of output for basin WP. Agricultural WP at the basin scale is not simply a linear extrapolation of the individual system-level agricultural WPs. A number of trade-offs exist with allocating water for agriculture versus ecosystems. As a result, the WP definition that allows comparison across contexts includes multiple uses of water. These are best captured in the term value, which reflects appreciation society holds for biodiversity, ecosystem integrity, habitat maintenance, aesthetics, cultural importance, and goods and services based on hydrologic flows. The water input denominator is not only the physical depletion of water but also the degradation in quality. Livestock WP is assessed on the basis of feed/fodder water consumption and of virtual water for the imported feed (water for drinking is negligible). It is important to note that WP is not only scale and user specific, but also site and management specific. Unit water is expected to produce more biomass in a cool than in a hot, dry environment. Soil type, water quality, crop variety, production input, and water and crop management are among the factors impacting WP. Policies, values, and market prices influence WP. For meaningful comparison of WP at different locations and/or environments, there is a need to normalize the values of WP (Oweis and Hachum, 2003). Zoning of river basin with GIS Zonation of a basin is concerned with the convenience of studying the WP within the different sectors in order to propose actions for its improvement. Water using (consuming) agricultural unit is defined as a set of: (1) practices (management, technologies, or cropping systems); (2) measurable production determinants (production factors including physical such as climatic, topography, soils; water quality such as fresh, saline, low quality; production inputs such as irrigation, seed, fertilizers, energy); and (3) measurable outputs such as yield, biomass, or value. As we are mostly concerned with water, delineation of workable areas within a basin should therefore reflect a change in water use (rainfed/irrigated), in management procedure (different counties, large districts), and in water quality (fresh/saline waters) (De Pauw et al., 2006). Analysis of WP is carried out for these major zones on the basis of variation in production factors and management procedures. In combination with watershed boundaries, the agroecological zoning (AEZ), or eventually a higher-level framework that includes socioeconomic information, is a suitable basis for the identification of representative locations in order to conduct detailed WP benchmark studies. The process can be summarized in three steps: First, the AEZ are regrouped into a smaller number that is commensurate with the number of benchmark sites that are planned for a particular project area; Second, selection criteria are defined and eventually ranked; Third, watersheds are selected that maximize scores on the major criteria. An important step in improving WP is mapping the bright and hot spots of current productivity. A spatially differentiated assessment is a difficult exercise in view of the lack of spatially disaggregated crop yield and water use data. Such information is usually available only in the form of averages or totals for statistical units, normally covering large administrative areas such as provinces, rarely districts, and is supplemented by scattered data from research stations, household surveys if available, generalizations for entire farming systems, or even educated guesses. The key challenge is to combine the coarse-resolution data from statistical surveys with the fine-resolution data from biophysical studies. Potential WP for different crops or land-use systems can be mapped if the potential yields to be achieved under the different WP-enhancing options can be
133
estimated, and if the water resources that are available for use under different allocation scenarios are known. The lack of soil data with appropriate resolutions, particularly with respect to water storage properties, remains a major bottleneck in the reliable extrapolation of yield potential calculations outside the research stations (Szõnyi et al., 2005; You and Wood, 2004). Determining WP in a representative sub-basin Water balances at the basin and sub-basin (watershed) is essential to provide estimates of average annual evapotranspiration of a (sub-) basin for comparison with the evapotranspiration estimates computed for different crops at the crop level. A sub-basin is defined here as a subset of the basin system encompassing all major outputs, practices, and determinants, i.e. an aggregation of water using units with contrasting determinants that is different from the hydrological definition. Ideally a sub-basin for pilot studies will coincide with a hydrological entity where water accounting is possible with a reasonable degree of accuracy. The use of water by crops is calculated using the transpiration efficiency procedure as follows: T = Y/m (1) Where T is transpiration and Y is yield. Yield (Y) is obtained from national statistics as they reflect the effect of various determinants, and crop coefficient (m) could be estimated by experts from research data and literature. Evaporative losses associated with transpiration represent a fraction of T and are specific to land producing units. Partitioning of ET between Evaporation and Transpiration depends on the crop cover development and the wetting frequency from rainfall and irrigation. Management determines to a large extent this partitioning. Some evaporative losses are unavoidable, but those related to management (varieties, cropping period, and irrigation practices) represent the domain of major improvements in WP. The ET is thus written as: ET = (1+ a) T = (1+a) Y/m (2) The parameter 'a' relates to evaporative losses associated with transpiration during the growing cycle (0.2-0.6), to be determined by expertise. The agriculture administrative areas or districts within watersheds offer an immediate source of yearly baseline data and long-term statistics for yield, prevailing systems, water resources, and livelihoods. For instance, in KRB national statistics are available every 5 years since 1950, with each census including nearly 600 attributes per village (e.g., climate, elevation, yield, water resources, population, livestock, horticulture, land-use, fishery, agroforestry, gender, etc.) that can be aggregated to other scales of district, township, and province for analysis. The goal is to utilize and capture any diverse racial, cultural, or policy issues, and management characteristics of the administrative districts, that may have a bearing on yield and the productivity of water. These are compared with (or overlaid on) WP maps to deduce constraints and limitations to WP and the causes of its spatial variability for a given land-use and across different land-uses. We recognize that the administrative areas or districts may not coincide with the boundaries of watershed and/or that of the sub-zone, but perfect matching can be forced in GIS. Any spatial correspondence or correlation between a WP map and any other climate, soil, topography (elevation and slope), yield, livelihood and poverty level, and cultural and management skills, can then be documented as possible constraints or sources of variability in WP. Any spatial correspondence between these maps will be valuable information in diagnostic analysis of WP variability. The usefulness of the WP mapping, in conjunction with developing coverage for other factors listed above, is that it identifies the communities or areas within the basin that are in need of a closer examination. That is called ‘direct sampling’ as opposed to the traditional ‘random’ or ‘grid’ sampling of the whole basin. Direct sampling of the communities where the above diagnostic procedure yields correlation between WP and other related factors is a more efficient sampling. Overlaying the WP map and the other climate, topography, soils, and livelihood (or poverty) maps may help tagging low WP areas with the prevailing climatic and biophysical and social conditions. It is generally observed that the poorer and less educated the community, the lower the productivity due to inadequate management, technical support, machinery, capital, and quality seeds and fertilizers, in addition to farmers’ lack of desire for improvement. The overlaying of WP and poverty maps may even prove to be an effective and simple methodology for socioeconomists to map poverty using a WP map as a surrogate or proxy. Because of the lack of accurate data at many watershed(s), and the fact that many data values are approximate, there must be a mass balance check performed for the watershed. A mass balance is simply a water balance check that calculates the total water used across the watershed using all calculated WP values, and compares the sum with the independent water balance (i.e. the watershed input and output of water) that was calculated previously using the water budget/accounting modeling of this methodology. Out-scaling WP to sub-basins and across the basin By far the most difficult aspect of the WP assessment at the basin level is the selection of the pilot watershed(s) and the subsequent calculation and mapping of WP. This is accomplished by assigning calculated WP value at the watershed level to the corresponding areas at the zone level. Following the out-scaling to the zone level, the same mass balance or water balance check should be performed for each zone, comparing the total water used from the WP calculations with the independent water balance. WP maps (in kg/m3 and US$/m3) for each zone are then produced identifying the spatial variability of WP for individual crops and systems across each zone. Such maps portray the variability in productivity of a given crop across the zone as affected by climate, topography, soils, and cultural and management practices. Additionally, maps of WP are compared with maps of production and livelihoods using the statistics for the administrative boundaries.
134
Statistical measures of WP values are also calculated for each zone to quantify the mean and the variability. A mean WP for the zone can be calculated as the area-weighted mean of all individual WP values across the zone. The mean zonal WP values are useful for holistic comparisons of zones across the basin and between basins. For instance, a quick comparison of WP from the rainfed zone in Karkheh River Basin in western Iran to that from Amu Darya or Euphrates River Basin should indicate the effectiveness of the dryland farming practices in these culturally diverse environments in capturing and using rainfall. This final step in the assessment procedure simply maps the zones or the spatial distribution of WP across the entire basin composed of two or more zones. The same mass balance analysis as explained previously is then conducted at the basin level to gauge water balance errors. Similar map comparisons between WP across the basin should also be done with overlaying on climate, soils, topography, administrative statistics, and poverty and livelihood maps to gauge possible sources and constraints to inefficiency as caused by these factors. Conclusions and recommendations The above newly proposed methodology to assess, map, and conduct diagnostic analysis of WP of major land-uses across a basin uses a systematic and logical order of: (1) down-scaling across the basin to delineate major land-use areas; (2) using the land-use coverage to delineate major agroecosystems as first-level classification zoning of the basin; (3) selecting representative watersheds with each zone that encompasses the major land-uses; (4) estimating WP across the selected watershed(s) for all land-uses; and (5) out-scaling WP values from watershed(s) to zones and to the basin. We identified rainfed, irrigated, and mixes of rainfed and irrigated agricultural systems as major agroecosystems. These agroecosystems are the natural outcome of the prevailing aridity of the climate and the state and availability of the surface and groundwater resources. The methodology presented herein leads to multiple outputs as listed above, but by far the most important outputs are the powerful maps of WP and maps of other variables known to cause variations in WP across the basin, i.e. the spatial variability in precipitation, temperature, soils, topography, and livelihoods and management. Maps of biophysical and economical WP (in kg/m3 and US$/m3) across the basin help identify the variability over the prevailing gradient of precipitation, temperature, soils, elevation, and slopes in addition to the gradient of poverty and livelihoods. Comparison of these maps provides valuable, yet holistic, information as to the probable causes of the variation in WP. One such example of the diagnostic ability of the maps is to understand, for instance, why WP of dryland wheat is lower in one area of a watershed or basin, and whether that has to do with rainfall, topography, upstream/downstream configurations, soil characteristics, and/or poverty. This methodology is in its infancy and should be further perfected and polished. Future work on this methodology needs to concentrate on practical applications of the methodology to a range of basins to gauge its usefulness and improve data gathering and computations. Further application should allow checking the robustness of the methodology and comparing WP for various crops, not only at sub-basin and basin levels, but also at the country and the regional levels, and to explore chances for improvements in selected sectors. Acknowledgments This paper presents findings from CPWF PN8 ‘Improving agricultural productivity in Karkheh River Basin,’ a project of the CGIAR Challenge Program on Water and Food. References De Pauw, E., A. Ghaffari, and S.A. Mirghasemi. 2006. Agroecological Zones of Karkheh River Basin. Potential
and challenges in the spatial synthesis of land resource information for planners and decision-makers. Paper presented at the Challenge Program on Water and Food Forum, Vientiane, Lao PDR, 5-11 November 2006.
Molden, D., T. Oweis, P. Steduto, J. Kijne, Jacob M. Hanjra, and P. Bindraban. 2007. Pathways for increasing
agricultural water productivity. Chapter 7. In David Molden (ed.) Water for Food, Water for Life. A Comprehensive Assessment of Water Management I. Agriculture. London: Earthscan.
Oweis, T., and A. Hachum. 2003. Improving water productivity in the dry areas of West Asia and North Africa.
In Water Productivity in Agriculture: Limits and Opportunities for Improvement. J. Kine, R. Barker, and D. Molden. (eds.) CABI Publishing, CAB International, Wallingford, Oxon OX10 8DE, UK.
Szõnyi, J.A., E. De Pauw, A. Aw-Hassan, R. La Rovere, and B. Nseir. 2005. Mapping agricultural income
distribution in rural Syria: a case study in linking poverty to resource endowment. International Center for Agricultural Research in the Dry Areas (ICARDA). Aleppo, Syria, viii + 48 p. 1 CD.
You, L., and S. Wood. 2004. Assessing the spatial distribution of crop production using a cross-entropy method.
IFPRI, EPTD Discussion Paper No. 126.
135
Calibrating runoff models in ungauged basins using small reservoirs as satellite observed runoff gauges
Jens Liebe1, Nick van de Giesen2, Winston Andah3, Marc Andreini4,
Todd Walter5, and Tammo Steenhuis6
1Center for Development Research (ZEF), Bonn University, Bonn, Germany, [email protected] 2Delft University of Technology, Stevinweg 1, 2628 CN Delft, Netherlands, [email protected]
3Water Research Institute and CPWF Volta Basin, Accra, Ghana, [email protected] 4International Water Management Institute, Colombo, Sri Lanka, [email protected]
5Cornell University, Ithaca, NY, USA, [email protected] 6Cornell University, Ithaca, NY, USA, [email protected]
Abstract Throughout the semiarid areas of the world, thousands of small reservoirs (< 100 ha) provide the rural population with water for irrigation, household use, cattle, and fishing. Despite their benefits to the local population, further development should take into account the hydrological impact on downstream water users. Such impact assessment, however, requires hydrological models, but models on runoff production from such headwatersheds are commonly not available. In the Upper East Region of Ghana, the Small Reservoirs Project has conducted a study on calibrating hydrological models for such headwatersheds, using small reservoirs as remotely sensed runoff gauges. Reservoir surface areas can be monitored with radar satellites (i.e. ENVISAT, Radarsat, etc.) or optical systems (i.e. Landsat, Spot, Aster, etc.). These surface areas can be translated into storage volumes, using a regional area-volume equation. Storage volume changes are then determined from the surface area changes observed during the filling of the reservoirs. These satellite-observed storage changes were used in combination with publicly available rainfall data to calibrate a simple hydrological model (Thornthwaite and Mather model) that explains the runoff generation from these headwatersheds. With such runoff models, and observed reservoir storage changes, the impact of small reservoirs on the generated runoff can be determined. Media grab Introduction In many semiarid regions of the world, small reservoirs serve the scattered rural population with water for multiple purposes, such as irrigation, fishing, livestock watering, household use, or building. In the Volta Basin, small reservoirs were constructed since the 1950s and now exist in large numbers. Between the mid 1980s and 1999 the number of reservoirs in the region increased by 41% (van de Giesen et al., 2000). Given the large population increase in the Basin (3% in Burkina Faso, 2% in Ghana), the demand for water is still increasing, especially in the drier northern parts upstream of Lake Volta. In the Volta Basin, upstream development of water resources may have a direct impact on hydropower generation at Akosombo dam, which is located at the outlet of the basin. To coordinate the development of water resources, and to prevent conflict between the upstream and downstream riparians, Burkina Faso and Ghana, knowledge of the impact of further development of small reservoirs is of great interest. To assess the impact of small reservoirs on downstream water availability, it is necessary to understand the runoff production in their watersheds. Runoff production from headwatersheds is often difficult to determine due to the lack of adequate models and data. This study investigated whether small reservoirs can be used as remotely sensed runoff gauges, and if they can be used to calibrate simple hydrological models. In the Upper East Region of Ghana, and northern Togo, the surface areas of eight reservoirs (Figure 1) were monitored during their filling period in 2005 and 2006, using ENVISAT ASAR radar images.
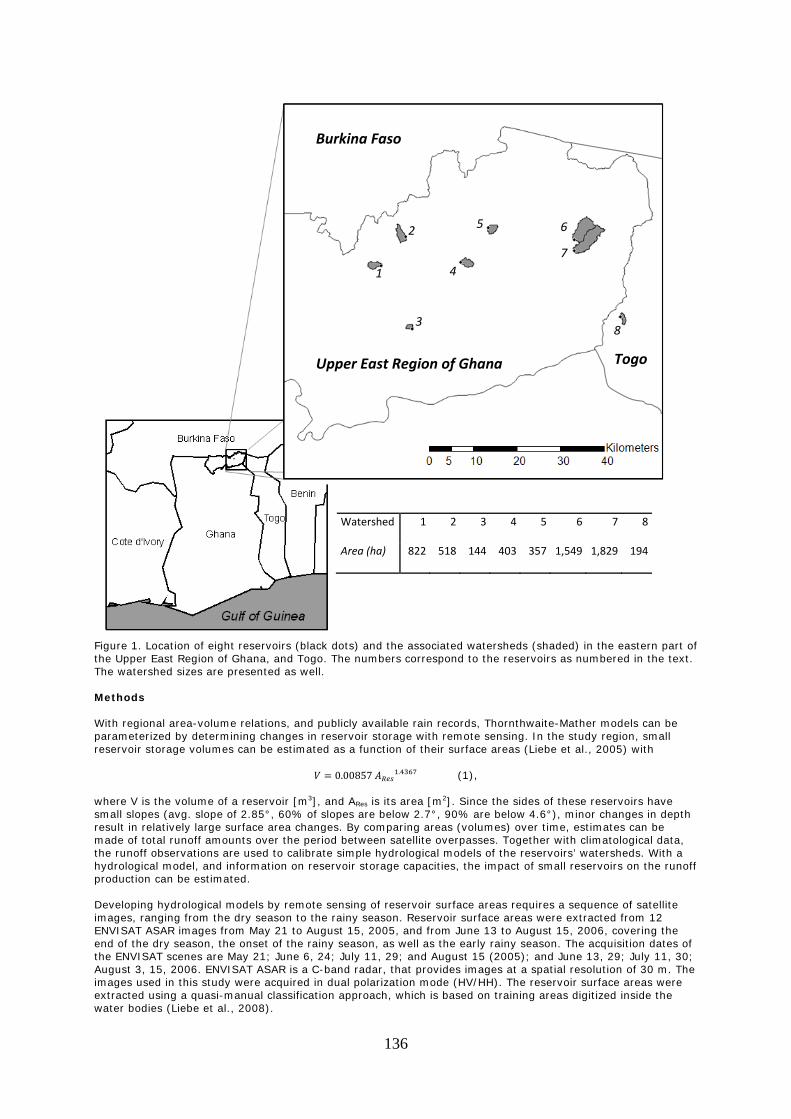
136
Figure 1. Location of eight reservoirs (black dots) and the associated watersheds (shaded) in the eastern part of the Upper East Region of Ghana, and Togo. The numbers correspond to the reservoirs as numbered in the text. The watershed sizes are presented as well. Methods With regional area-volume relations, and publicly available rain records, Thornthwaite-Mather models can be parameterized by determining changes in reservoir storage with remote sensing. In the study region, small reservoir storage volumes can be estimated as a function of their surface areas (Liebe et al., 2005) with
0.00857 . (1), where V is the volume of a reservoir [m3], and ARes is its area [m2]. Since the sides of these reservoirs have small slopes (avg. slope of 2.85°, 60% of slopes are below 2.7°, 90% are below 4.6°), minor changes in depth result in relatively large surface area changes. By comparing areas (volumes) over time, estimates can be made of total runoff amounts over the period between satellite overpasses. Together with climatological data, the runoff observations are used to calibrate simple hydrological models of the reservoirs’ watersheds. With a hydrological model, and information on reservoir storage capacities, the impact of small reservoirs on the runoff production can be estimated. Developing hydrological models by remote sensing of reservoir surface areas requires a sequence of satellite images, ranging from the dry season to the rainy season. Reservoir surface areas were extracted from 12 ENVISAT ASAR images from May 21 to August 15, 2005, and from June 13 to August 15, 2006, covering the end of the dry season, the onset of the rainy season, as well as the early rainy season. The acquisition dates of the ENVISAT scenes are May 21; June 6, 24; July 11, 29; and August 15 (2005); and June 13, 29; July 11, 30; August 3, 15, 2006. ENVISAT ASAR is a C-band radar, that provides images at a spatial resolution of 30 m. The images used in this study were acquired in dual polarization mode (HV/HH). The reservoir surface areas were extracted using a quasi-manual classification approach, which is based on training areas digitized inside the water bodies (Liebe et al., 2008).
1
2
3
4
5 6
7
8
Burkina Faso
Upper East Region of Ghana Togo
Watershed 1 2 3 4 5 6 7 8
Area (ha) 822 518 144 403 357 1,549 1,829 194
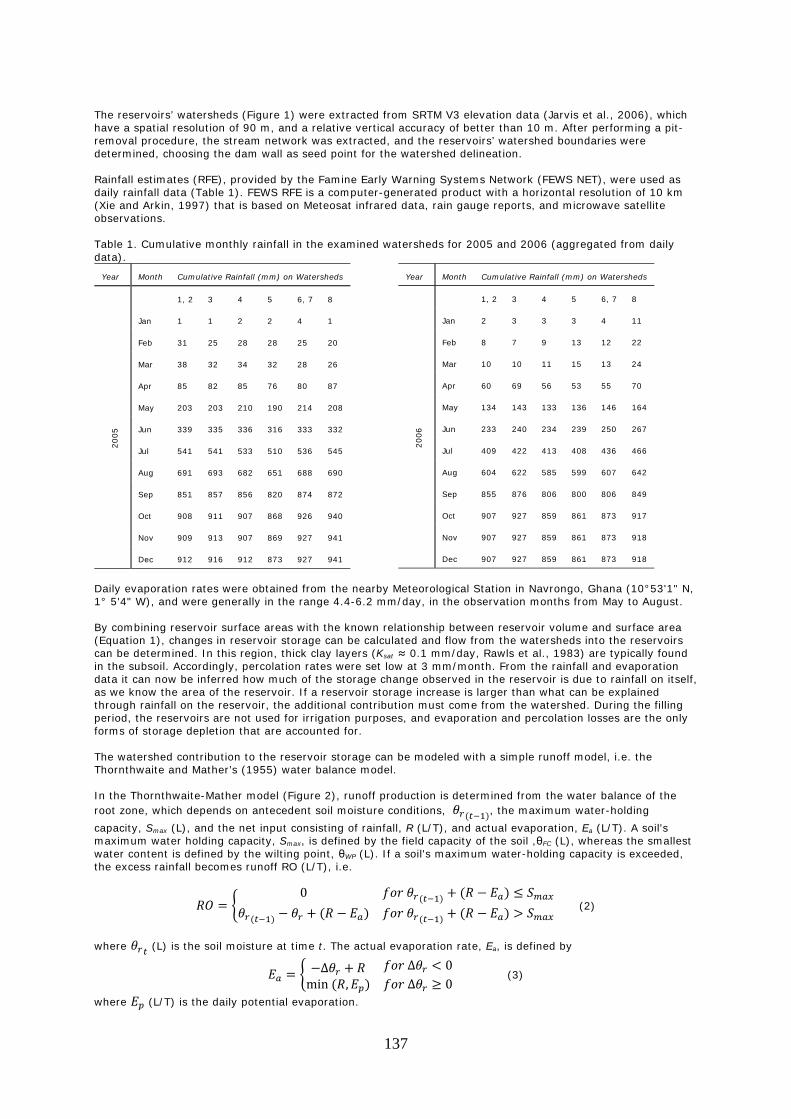
137
The reservoirs’ watersheds (Figure 1) were extracted from SRTM V3 elevation data (Jarvis et al., 2006), which have a spatial resolution of 90 m, and a relative vertical accuracy of better than 10 m. After performing a pit-removal procedure, the stream network was extracted, and the reservoirs’ watershed boundaries were determined, choosing the dam wall as seed point for the watershed delineation. Rainfall estimates (RFE), provided by the Famine Early Warning Systems Network (FEWS NET), were used as daily rainfall data (Table 1). FEWS RFE is a computer-generated product with a horizontal resolution of 10 km (Xie and Arkin, 1997) that is based on Meteosat infrared data, rain gauge reports, and microwave satellite observations. Table 1. Cumulative monthly rainfall in the examined watersheds for 2005 and 2006 (aggregated from daily data).
Year Month Cumulative Rainfall (mm) on Watersheds
1, 2 3 4 5 6, 7 8
2005
Jan 1 1 2 2 4 1
Feb 31 25 28 28 25 20
Mar 38 32 34 32 28 26
Apr 85 82 85 76 80 87
May 203 203 210 190 214 208
Jun 339 335 336 316 333 332
Jul 541 541 533 510 536 545
Aug 691 693 682 651 688 690
Sep 851 857 856 820 874 872
Oct 908 911 907 868 926 940
Nov 909 913 907 869 927 941
Dec 912 916 912 873 927 941
Year Month Cumulative Rainfall (mm) on Watersheds
1, 2 3 4 5 6, 7 8
2006
Jan 2 3 3 3 4 11
Feb 8 7 9 13 12 22
Mar 10 10 11 15 13 24
Apr 60 69 56 53 55 70
May 134 143 133 136 146 164
Jun 233 240 234 239 250 267
Jul 409 422 413 408 436 466
Aug 604 622 585 599 607 642
Sep 855 876 806 800 806 849
Oct 907 927 859 861 873 917
Nov 907 927 859 861 873 918
Dec 907 927 859 861 873 918
Daily evaporation rates were obtained from the nearby Meteorological Station in Navrongo, Ghana (10°53'1" N, 1° 5'4" W), and were generally in the range 4.4-6.2 mm/day, in the observation months from May to August. By combining reservoir surface areas with the known relationship between reservoir volume and surface area (Equation 1), changes in reservoir storage can be calculated and flow from the watersheds into the reservoirs can be determined. In this region, thick clay layers (Ksat ≈ 0.1 mm/day, Rawls et al., 1983) are typically found in the subsoil. Accordingly, percolation rates were set low at 3 mm/month. From the rainfall and evaporation data it can now be inferred how much of the storage change observed in the reservoir is due to rainfall on itself, as we know the area of the reservoir. If a reservoir storage increase is larger than what can be explained through rainfall on the reservoir, the additional contribution must come from the watershed. During the filling period, the reservoirs are not used for irrigation purposes, and evaporation and percolation losses are the only forms of storage depletion that are accounted for. The watershed contribution to the reservoir storage can be modeled with a simple runoff model, i.e. the Thornthwaite and Mather’s (1955) water balance model. In the Thornthwaite-Mather model (Figure 2), runoff production is determined from the water balance of the root zone, which depends on antecedent soil moisture conditions, , the maximum water-holding
capacity, Smax (L), and the net input consisting of rainfall, R (L/T), and actual evaporation, Ea (L/T). A soil's maximum water holding capacity, Smax, is defined by the field capacity of the soil ,θFC (L), whereas the smallest water content is defined by the wilting point, θWP (L). If a soil's maximum water-holding capacity is exceeded, the excess rainfall becomes runoff RO (L/T), i.e.
0 (2)
where (L) is the soil moisture at time t. The actual evaporation rate, Ea, is defined by
∆ ∆ 0min , ∆ 0
(3)
where (L/T) is the daily potential evaporation.
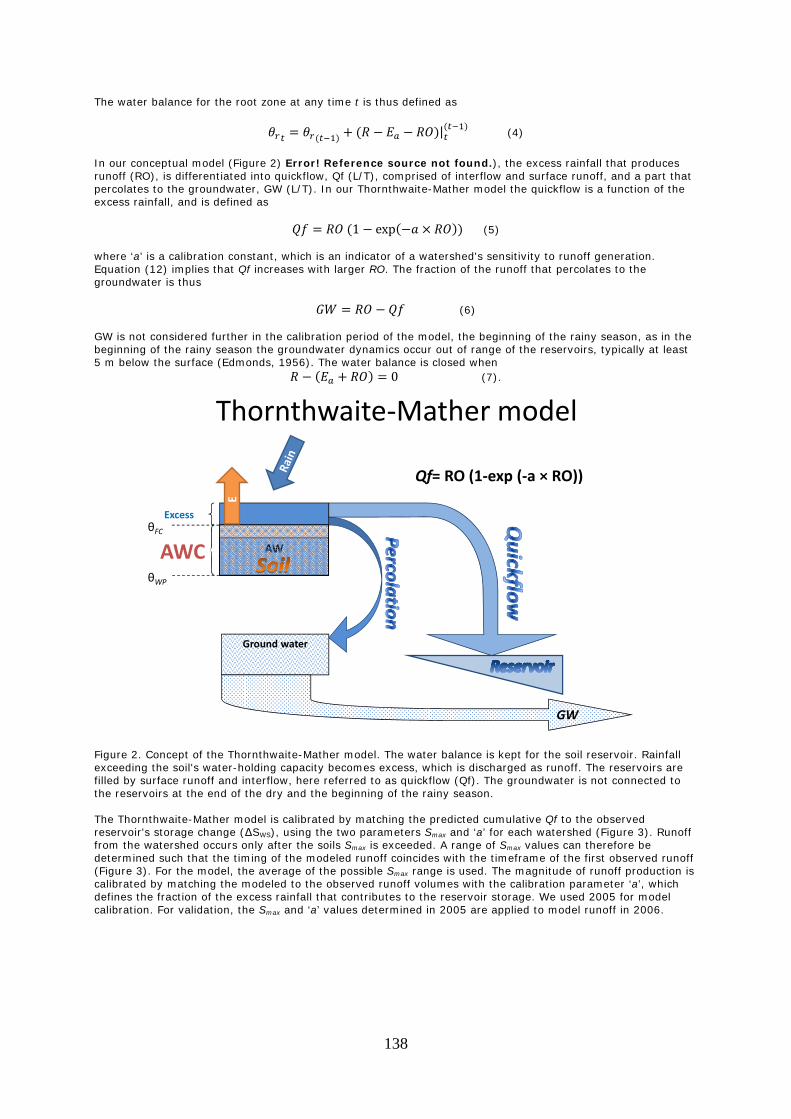
138
The water balance for the root zone at any time t is thus defined as
| (4)
In our conceptual model (Figure 2) Error! Reference source not found.), the excess rainfall that produces runoff (RO), is differentiated into quickflow, Qf (L/T), comprised of interflow and surface runoff, and a part that percolates to the groundwater, GW (L/T). In our Thornthwaite-Mather model the quickflow is a function of the excess rainfall, and is defined as
1 exp (5) where ‘a’ is a calibration constant, which is an indicator of a watershed's sensitivity to runoff generation. Equation (12) implies that Qf increases with larger RO. The fraction of the runoff that percolates to the groundwater is thus
(6) GW is not considered further in the calibration period of the model, the beginning of the rainy season, as in the beginning of the rainy season the groundwater dynamics occur out of range of the reservoirs, typically at least 5 m below the surface (Edmonds, 1956). The water balance is closed when
0 (7).
Figure 2. Concept of the Thornthwaite-Mather model. The water balance is kept for the soil reservoir. Rainfall exceeding the soil's water-holding capacity becomes excess, which is discharged as runoff. The reservoirs are filled by surface runoff and interflow, here referred to as quickflow (Qf). The groundwater is not connected to the reservoirs at the end of the dry and the beginning of the rainy season. The Thornthwaite-Mather model is calibrated by matching the predicted cumulative Qf to the observed reservoir's storage change (∆SWS), using the two parameters Smax and ‘a’ for each watershed (Figure 3). Runoff from the watershed occurs only after the soils Smax is exceeded. A range of Smax values can therefore be determined such that the timing of the modeled runoff coincides with the timeframe of the first observed runoff (Figure 3). For the model, the average of the possible Smax range is used. The magnitude of runoff production is calibrated by matching the modeled to the observed runoff volumes with the calibration parameter ‘a’, which defines the fraction of the excess rainfall that contributes to the reservoir storage. We used 2005 for model calibration. For validation, the Smax and ‘a’ values determined in 2005 are applied to model runoff in 2006.
Thornthwaite‐Mather model
AWAWC
θFC
θWP
Ground water
Excess
GW
E
Qf= RO (1‐exp (‐a × RO))
AWC
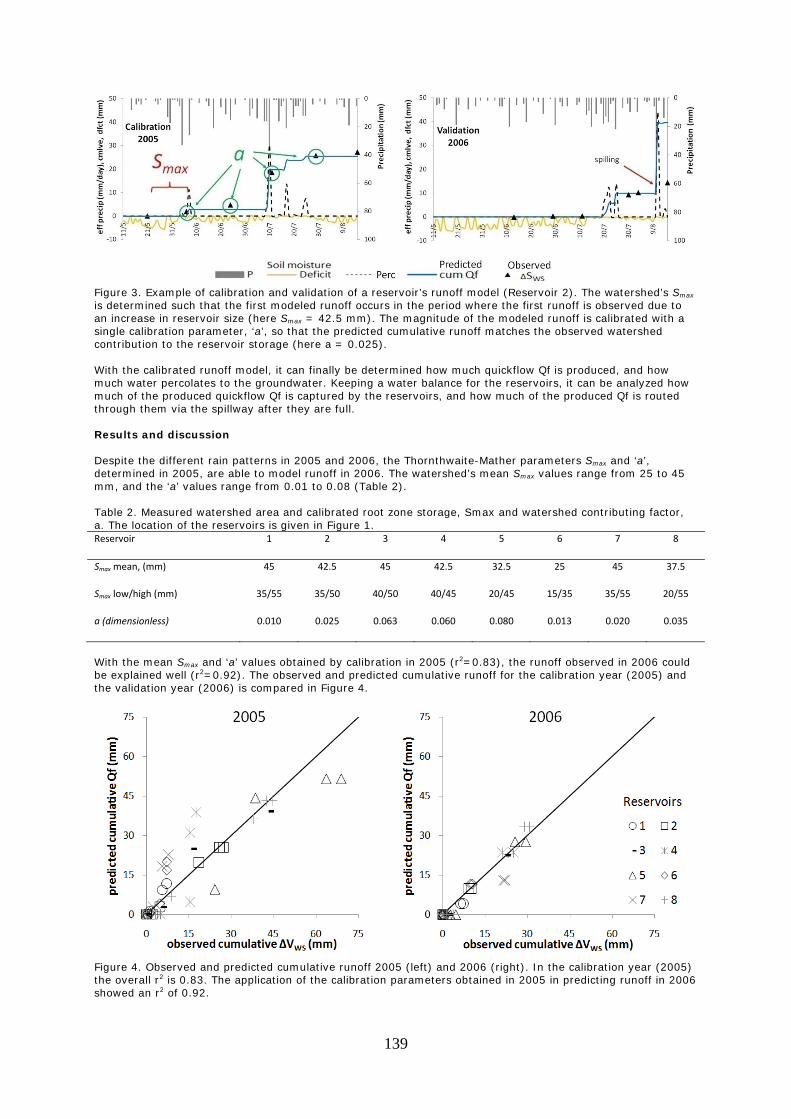
139
Figure 3. Example of calibration and validation of a reservoir’s runoff model (Reservoir 2). The watershed’s Smax is determined such that the first modeled runoff occurs in the period where the first runoff is observed due to an increase in reservoir size (here Smax = 42.5 mm). The magnitude of the modeled runoff is calibrated with a single calibration parameter, ‘a’, so that the predicted cumulative runoff matches the observed watershed contribution to the reservoir storage (here a = 0.025). With the calibrated runoff model, it can finally be determined how much quickflow Qf is produced, and how much water percolates to the groundwater. Keeping a water balance for the reservoirs, it can be analyzed how much of the produced quickflow Qf is captured by the reservoirs, and how much of the produced Qf is routed through them via the spillway after they are full. Results and discussion Despite the different rain patterns in 2005 and 2006, the Thornthwaite-Mather parameters Smax and ‘a’, determined in 2005, are able to model runoff in 2006. The watershed’s mean Smax values range from 25 to 45 mm, and the ‘a’ values range from 0.01 to 0.08 (Table 2). Table 2. Measured watershed area and calibrated root zone storage, Smax and watershed contributing factor, a. The location of the reservoirs is given in Figure 1. Reservoir 1 2 3 4 5 6 7 8
Smax mean, (mm) 45 42.5 45 42.5 32.5 25 45 37.5
Smax low/high (mm) 35/55 35/50 40/50 40/45 20/45 15/35 35/55 20/55
a (dimensionless) 0.010 0.025 0.063 0.060 0.080 0.013 0.020 0.035
With the mean Smax and ‘a’ values obtained by calibration in 2005 (r2=0.83), the runoff observed in 2006 could be explained well (r2=0.92). The observed and predicted cumulative runoff for the calibration year (2005) and the validation year (2006) is compared in Figure 4.
Figure 4. Observed and predicted cumulative runoff 2005 (left) and 2006 (right). In the calibration year (2005) the overall r2 is 0.83. The application of the calibration parameters obtained in 2005 in predicting runoff in 2006 showed an r2 of 0.92.
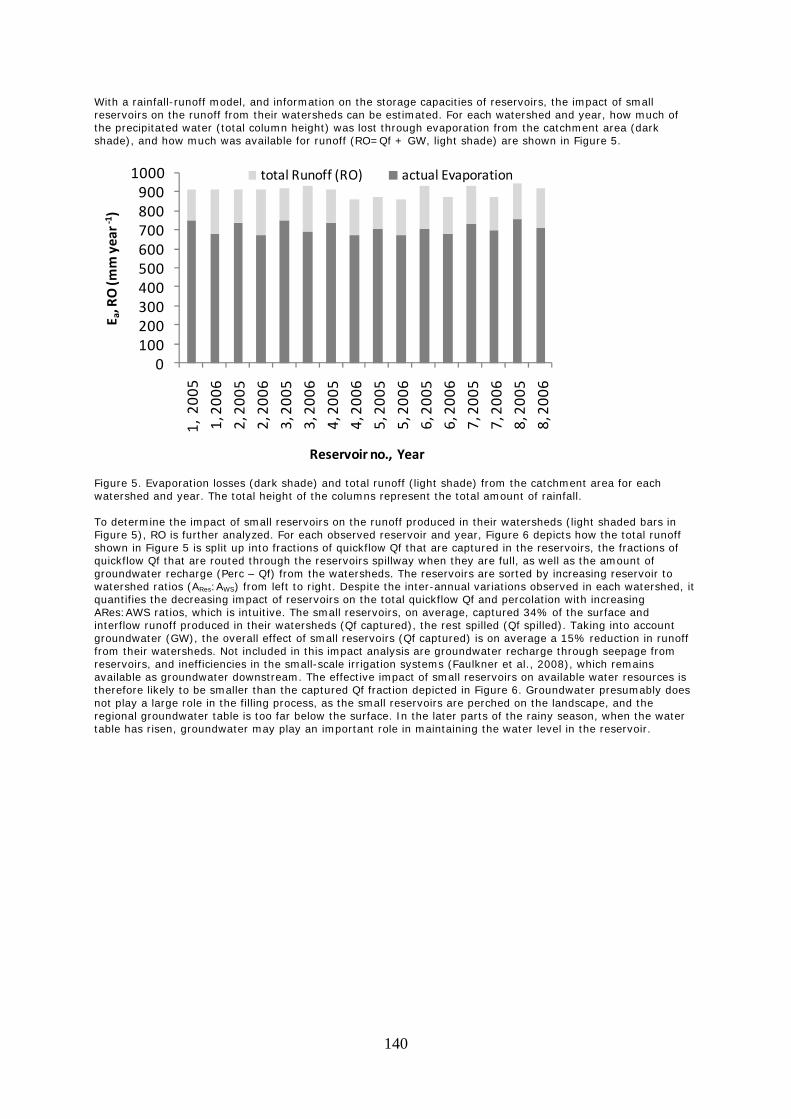
140
With a rainfall-runoff model, and information on the storage capacities of reservoirs, the impact of small reservoirs on the runoff from their watersheds can be estimated. For each watershed and year, how much of the precipitated water (total column height) was lost through evaporation from the catchment area (dark shade), and how much was available for runoff (RO=Qf + GW, light shade) are shown in Figure 5.
01002003004005006007008009001000
1, 200
5
1, 200
6
2, 200
5
2, 200
6
3, 200
5
3, 200
6
4, 200
5
4, 200
6
5, 200
5
5, 200
6
6, 200
5
6, 200
6
7, 200
5
7, 200
6
8, 200
5
8, 200
6
E a, RO (m
m year‐1 )
Reservoir no., Year
total Runoff (RO) actual Evaporation
Figure 5. Evaporation losses (dark shade) and total runoff (light shade) from the catchment area for each watershed and year. The total height of the columns represent the total amount of rainfall. To determine the impact of small reservoirs on the runoff produced in their watersheds (light shaded bars in Figure 5), RO is further analyzed. For each observed reservoir and year, Figure 6 depicts how the total runoff shown in Figure 5 is split up into fractions of quickflow Qf that are captured in the reservoirs, the fractions of quickflow Qf that are routed through the reservoirs spillway when they are full, as well as the amount of groundwater recharge (Perc – Qf) from the watersheds. The reservoirs are sorted by increasing reservoir to watershed ratios (ARes:AWS) from left to right. Despite the inter-annual variations observed in each watershed, it quantifies the decreasing impact of reservoirs on the total quickflow Qf and percolation with increasing ARes:AWS ratios, which is intuitive. The small reservoirs, on average, captured 34% of the surface and interflow runoff produced in their watersheds (Qf captured), the rest spilled (Qf spilled). Taking into account groundwater (GW), the overall effect of small reservoirs (Qf captured) is on average a 15% reduction in runoff from their watersheds. Not included in this impact analysis are groundwater recharge through seepage from reservoirs, and inefficiencies in the small-scale irrigation systems (Faulkner et al., 2008), which remains available as groundwater downstream. The effective impact of small reservoirs on available water resources is therefore likely to be smaller than the captured Qf fraction depicted in Figure 6. Groundwater presumably does not play a large role in the filling process, as the small reservoirs are perched on the landscape, and the regional groundwater table is too far below the surface. In the later parts of the rainy season, when the water table has risen, groundwater may play an important role in maintaining the water level in the reservoir.
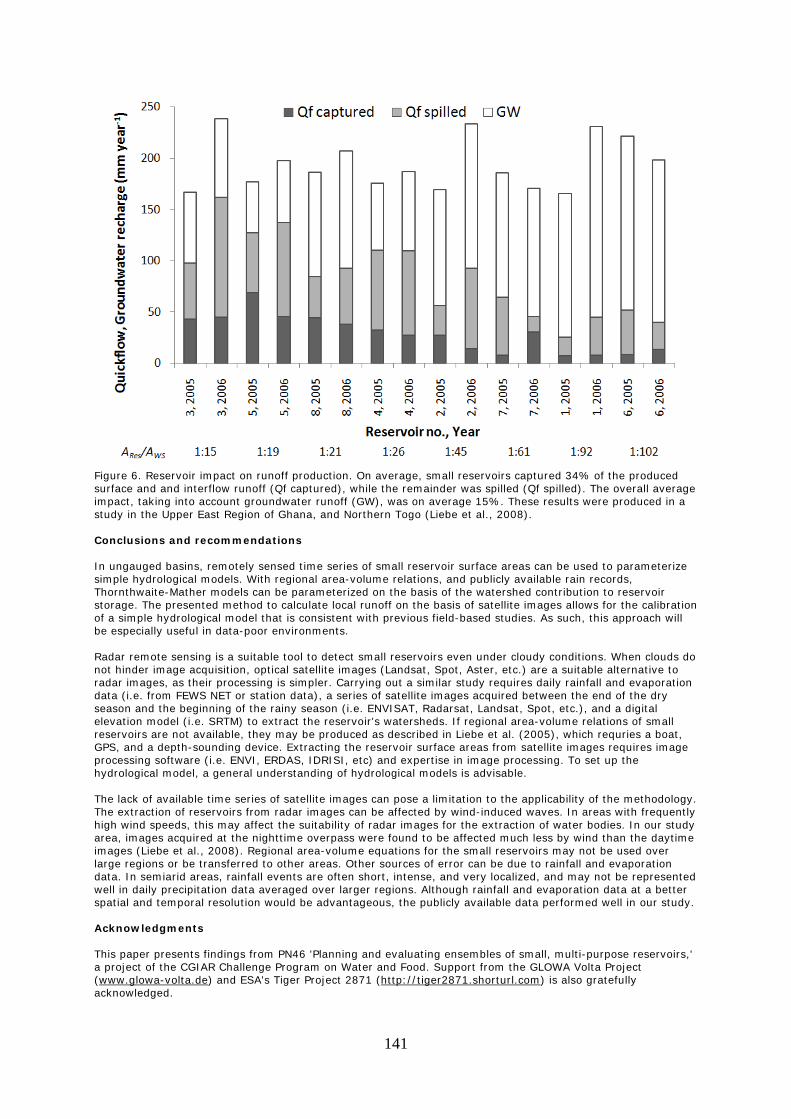
141
Figure 6. Reservoir impact on runoff production. On average, small reservoirs captured 34% of the produced surface and and interflow runoff (Qf captured), while the remainder was spilled (Qf spilled). The overall average impact, taking into account groundwater runoff (GW), was on average 15%. These results were produced in a study in the Upper East Region of Ghana, and Northern Togo (Liebe et al., 2008). Conclusions and recommendations In ungauged basins, remotely sensed time series of small reservoir surface areas can be used to parameterize simple hydrological models. With regional area-volume relations, and publicly available rain records, Thornthwaite-Mather models can be parameterized on the basis of the watershed contribution to reservoir storage. The presented method to calculate local runoff on the basis of satellite images allows for the calibration of a simple hydrological model that is consistent with previous field-based studies. As such, this approach will be especially useful in data-poor environments. Radar remote sensing is a suitable tool to detect small reservoirs even under cloudy conditions. When clouds do not hinder image acquisition, optical satellite images (Landsat, Spot, Aster, etc.) are a suitable alternative to radar images, as their processing is simpler. Carrying out a similar study requires daily rainfall and evaporation data (i.e. from FEWS NET or station data), a series of satellite images acquired between the end of the dry season and the beginning of the rainy season (i.e. ENVISAT, Radarsat, Landsat, Spot, etc.), and a digital elevation model (i.e. SRTM) to extract the reservoir's watersheds. If regional area-volume relations of small reservoirs are not available, they may be produced as described in Liebe et al. (2005), which requries a boat, GPS, and a depth-sounding device. Extracting the reservoir surface areas from satellite images requires image processing software (i.e. ENVI, ERDAS, IDRISI, etc) and expertise in image processing. To set up the hydrological model, a general understanding of hydrological models is advisable. The lack of available time series of satellite images can pose a limitation to the applicability of the methodology. The extraction of reservoirs from radar images can be affected by wind-induced waves. In areas with frequently high wind speeds, this may affect the suitability of radar images for the extraction of water bodies. In our study area, images acquired at the nighttime overpass were found to be affected much less by wind than the daytime images (Liebe et al., 2008). Regional area-volume equations for the small reservoirs may not be used over large regions or be transferred to other areas. Other sources of error can be due to rainfall and evaporation data. In semiarid areas, rainfall events are often short, intense, and very localized, and may not be represented well in daily precipitation data averaged over larger regions. Although rainfall and evaporation data at a better spatial and temporal resolution would be advantageous, the publicly available data performed well in our study. Acknowledgments This paper presents findings from PN46 'Planning and evaluating ensembles of small, multi-purpose reservoirs,' a project of the CGIAR Challenge Program on Water and Food. Support from the GLOWA Volta Project (www.glowa-volta.de) and ESA's Tiger Project 2871 (http://tiger2871.shorturl.com) is also gratefully acknowledged.
142
References Faulkner, J.W., T. Steenhuis, N. van de Giesen, M. Andreini, and J.R. Liebe. 2008. Water use, and economic
benefit of two small reservoir irrigation schemes in Ghana's Upper East Region. Irrigation and Drainage, 57: 151-3.
FEWS NET. Satellite/Image Data. http://earlywarning.cr.usgs.gov/adds/datatheme.php (accessed July 5,
2007). Jarvis, A., H.I. Reuter, A. Nelson, and E. Guevara. 2006. Hole-filled seamless SRTM data V3.
http://srtm.csi.cgiar.org (accessed 07 15, 2007). Liebe, J., N. van de Giesen, and M. Andreini. 2005. Estimation of small reservoir storage capacities in a
semiarid environment. A case study in the Upper East Region of Ghana. Physics and Chemistry of the Earth, 30: 448–54.
Liebe, J., N. van de Giesen, M. Andreini, and T.S. Steenhuis. 2008. Suitability and limitations of ENVISAT ASAR
for monitoring small reservoirs in a semiarid area. IEEE Transactions on Geoscience and Remote Sensing. Accepted for publication.
Rawls, W.J., D.L. Brakensiek, and N. Miller. 1983. Green-Ampt infiltration parameters from soils data. Journal
of Hydraulic Engineering, Proceedings of the American Society of Civil Engineers, 109: 62-70. Thornthwaite, C.W., and J.R. Mather. 1955. The water balance. Publ. Climatol., 8(1): 1–104. Xie, P., and P.A. Arkin. 1997. A 17-year monthly analysis based on gauge observations, satellite estimates, and
numerical model outputs. Bulletin of the American Meteorological Society, 78(11): 2539-58.
143
Participatory modeling and knowledge integration
Basin Focal Project (BFP Andes): concepts and advances
M. Mulligan1, J. Rubiano1, D. White2, G. Hyman2, and M. Saravia3
1King’s College, University of London, [email protected] 2International Center for Tropical Agriculture, CIAT
3Consorcio para el Desarrollo Sostenible de la Ecorregión Andina, CONDESAN
Abstract
Water resources are highly variable in the Andes. Catchments on slopes often have very different water balances as the region has some of the wettest and driest parts on Earth. Water poverty has little to do with water quantity, and is more associated with water quality, competing demands, inequitable access, and the ineffective management of water resources. BFP Andes is working with local stakeholders to develop a geo-browser-based policy support system (PSS) for the management of water by identifying upstream-downstream interactions, especially within the context of hydropower projects and payments for environmental services schemes. The tool is being designed to integrate three key activities: understanding context, analyzing investment/interventions, and examining likely consequences/impacts. The tool combines diverse biophysical, socioeconomic, and political-institutional data and knowledge in a framework enabling systematic analysis of specific water management interventions (conservation agriculture, dams) and examination of associated economic, social, and environmental impacts. The team is working at two different spatial levels of analysis: regional and sub-basin. This will allow us to test the tool on-site while developing applicable methods in other sub-basins. The tool is expected to be of wider use, including other CPWF basins in the world.
Media grab
We can foresee the likely impacts of water management investments in the Andes.
Introduction
The Andes Basin is not a single basin, but rather a system of basins located along the Andes range on the western side of South America. It comprises a broad range of environments, from the driest to the wettest on earth, and with altitudes that go up to more than 6000 m. Many different people from different cultural backgrounds use and manage the water resources. Although the research team selected a small number of sub-basins in which to focus research activities, these sub-basins are representative of others in the Andes. This presents big challenges, as the Andes region is not a unified basin but a series of independent sub-basins with different needs and potentials. Sub-basins in the region have from none to high but seasonally and inter-annually variable rainfall, steep slopes, and spatial heterogeneity responding differently to climate change. Poverty exists but is not generally related to lack of water. Instead it is a consequence of excess water. Unbalanced distribution of water and lack of capacity to capture water resources exacerbates poverty in the Andes, however. The region has several productivity hazards: landslides, soil erosion/degradation, nutrient losses that have downstream impacts such as sedimentation, water pollution, and flooding with impacts on health, poverty, and well-being. Given the rapid development and land-use changes in the Andes, there are increased and competing demands for water in the valleys and in the steep uplands. In response to all these forces, institutions are also changing; new and promising alternatives are emerging, such as schemes for the management of environmental services and other nonagricultural livelihood options. Current and future major users of water other than agriculture include proposed major dam projects, growing mega-cities due to rapid urbanization, inter-basin transfers, mining, and petroleum activities, all of which need to be considered if water resources are going to be managed effectively and equitably. THE BFP team is analyzing the issues in this context to identify the best alternatives to increase the productivity of water used for agriculture, in ways that effectively contribute to poverty alleviation, enhanced food security, and improved human health, while leaving more water for the environment and other users. The expected output at the end of the BFP is a comprehensive analysis of major changes in agricultural water use and the identification of significant intervention opportunities in selected Andean basins.
Methods
The project builds on a review of what the residents of the basins need to improve their livelihoods. To ensure feasibility, it is necessary to simplify the complexity of the problem, allow access to baseline data and information, and provide tools for testing effects of alternative policy options (interventions), including their intended and unintended consequences. The team is developing a Policy Support System (PSS), which is the tool that helps integrate and frame diverse biophysical, socioeconomic, and institutional data; conduct analysis
144
and test scenarios of strategic interventions in the region while keeping track of their effect on key indicators (Figure 1). The PSS will be accessible to the general public, but it is expected that key stakeholders, involved from the initial steps in its development will be the main users. The CPWF, international NGOs, and development agencies will be able to use the PSS and its modeling capabilities to answer questions about impact of climate change in a particular area, the impacts of land-use change on downstream water supply to cities/dams and agricultural systems, and the current institutional constraints for particular interventions in specific zones. A key premise in the development of the PSS is that policies are more effective and equitable when based on science (natural and social). Our team will provide prompt and evidence-based information to institutions for decision-making related to water resources. The PSS will have clearly defined outputs requiring specific inputs. Research activities are integrated within a knowledge base and organized into six modules, or work packages (WP). The PSS enables systematic analysis of policies and interventions in the face of scenarios for change. One objective is to generate simple yet informed messages without losing the important contributions of complex data and science. The PSS is also a flexible and dynamic decision support tool in contrast to static data and publications. In building the PSS we are combining the best available data and knowledge of process, to develop a visual and informative tool for a wide range of audiences and at a wide range of scales. The PSS will serve as a learning, discussion, and teaching tool.
Results
Our initial work has focused on identifying the fundamental processes related to poverty, institutions, and the status and trends of water availability and productivity. A method for institutional analysis at finer resolutions than currently available is being developed, to take into account the degree on which local institutional environments at different levels could trigger or block particular interventions on water resource management (Figure 2). To this end, the interventions team is also analyzing previous successes of sub-basin organizations. Where have they worked and why have they succeeded? Also considered are lessons from failed efforts. Contacts with key stakeholders have been established to help us develop the knowledge resources for an informed and participatory development of the tool. Expected results out of the PSS include: • Diagnosis of current status of water poverty, water productivity, environmental security and
institutional context. • Maps of long-term average water availability and trends. • Maps of resource sensitivity to land use and climate change. • Maps of the poverty outcomes of changing access to water. • Maps of the sensitivity of food production to climate (variability and change) and land-use change. • Database of organizations, institutions, and intervention projects and likely outcomes of a range of
these in the basin. • Summary of points of contact and types of data/information required by institutions. The PSS will bring additional benefits to users of the system and the water resources research and development community. First, basin leaders and users can update the system as new knowledge and information becomes available. Second, the methodological process of building the tool can lead to its further development and use within the Andes BFP and with other BFP groups.
Conclusions
One of the first benefits of developing a PSS is formulating an analytical framework to understand better the complexity behind water, agriculture, and poverty. Even for the hydrology of a basin there are many different ways to frame water availability and productivity processes. With the goal of making this a usable tool, current water uses, potential alternatives, and decision impacts are presented in an easy and understandable way.
Acknowledgments
This brief presents findings from the Andes BFP in its first six months of implementation; the team thanks the CGIAR Challenge Program on Water and Food and the basin stakeholders.
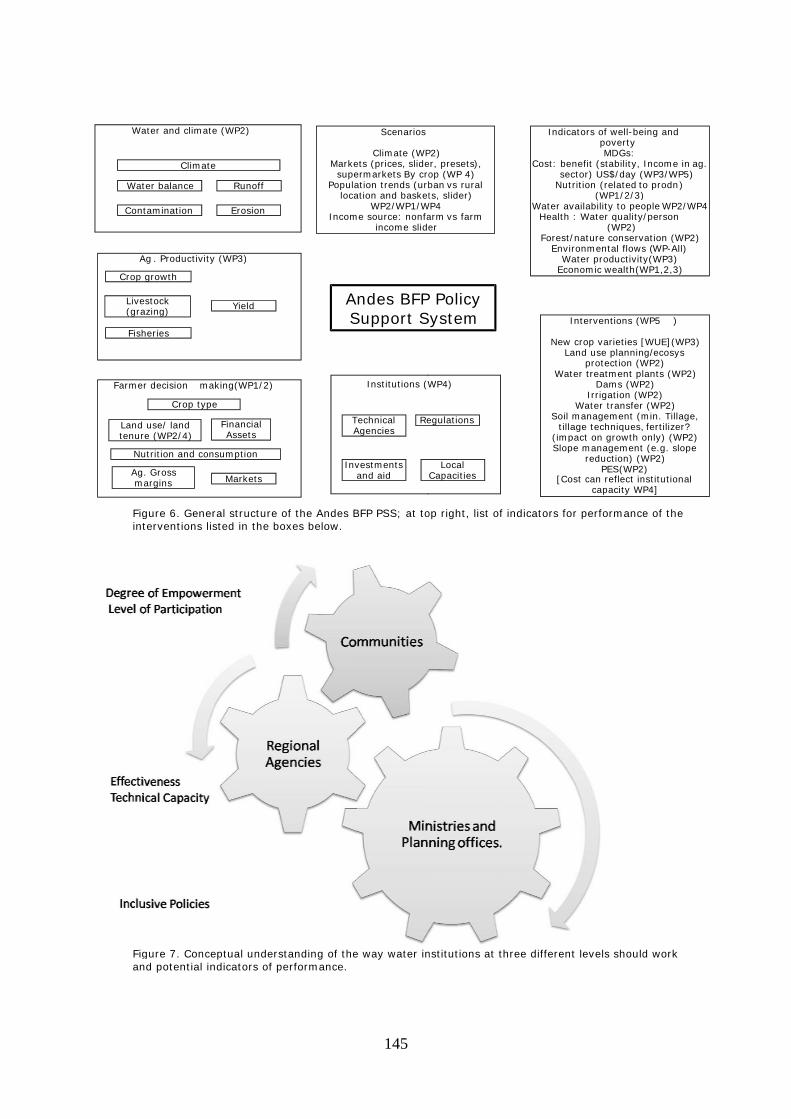
Figint
Figan
Wa
A
Farme
Wat
Con
Crop
Landtenur
Live(gra
Agm
Nu
Fish
gure 6. Generterventions lis
gure 7. Concend potential in
ater and climate
Ag . Productivity
r decision ma
Climate
ter balance
tamination
growth
use/ land re (WP2/4)
Crop type
estock azing)
. Gross argins
utrition and con
heries
ral structure osted in the bo
eptual understndicators of pe
e (WP2)
y (WP3)
king(WP1/2)
e
Erosion Runoff
Yield
e
sumption Markets
FinancialAssets
of the Andes Bxes below.
tanding of theerformance.
Markesupe
Populaloca
Incom
AS
TA
Inva
145
BFP PSS; at to
e way water in
Scenarios
Climate (WPets (prices, slideermarkets By croation trends (urbation and basket
WP2/WP1/Wme source: nonfa
income slide
ndes BFPSupport S
Institutions (W
Technical Agencies
Re
vestments and aid
op right, list of
nstitutions at t
P2) er, presets),op (WP 4)ban vs rural ts, slider)
WP4arm vs farm er
P Policy ystem
WP4)
egulations
Local Capacities
f indicators fo
three different
Indica
Cost: besec
Nut
Water avHealth
Forest/Envi
WaEco
I
New La
Wat
Soil tilla
(impSlop
[Co
or performance
t levels should
ators of well-bepovertyMDGs :
nefit (stability, ctor) US$/day (rition (related to
(WP1/2/3)vailability to peo : Water quality/
(WP2)/nature conservronmental flowsater productivityonomic wealth(W
Interventions (W
crop varieties [and use plannin
protection (Wter treatment pl
Dams (WPIrrigation (W
Water transfer management (mage techniques,pact on growth ope management
reduction) (WPES(WP2
ost can reflect incapacity W
e of the
d work
eing and
Income in ag. WP3/WP5)o prodn) ) ople WP2/WP4/person
vation (WP2)s ( WP-All)y(WP3)
WP1,2,3)
WP5 )
[WUE](WP3)g/ecosys
WP2)ants (WP2)
P2)WP2) (WP2)min. Tillage, fertilizer?only) (WP2) (e.g. slopeWP2))
nstitutionalP4]
146
Spatial variation and management of livestock water productivity in the Nile Basin
P. van Breugel1, M. Herrero1, J.A. van de Steeg1, and D. Peden1
1ILRI, International Livestock Research Institute, Nairobi, Kenya. [email protected]
Abstract
Livestock are major consumers of water but also sustain millions of pastoralist and farming families. In regions where water is a scarce commodity, such as the Nile Basin, there is a need for strategies to improve livestock water productivity (LWP). This study seeks to contribute to this need through a better understanding of the spatial distribution of livestock water and feed demand, and their linkage to water availability. An inventory of available data at regional and national levels needed to calculate feed demand and water for feed production was made. Next, a spatial framework was developed in which dynamic models of digestion in ruminants and crop water requirements, and estimates of animal drinking water requirements, were combined to estimate total livestock water requirements. The latter were subsequently compared to water availability within the basin. Hotspots and recommendation domains for strategies for increasing LWP were identified, including areas where livestock production might best be encouraged or discouraged within the context of increasing water productivity and reducing land degradation. Sharing such information between upstream and downstream stakeholders and among stakeholders across subbasins can contribute to strategies for increasing water productivity basin wide.
Media grab
Livestock water productivity differs widely across the Nile Basin; the development of strategies toward increased water productivity therefore needs to be regionally explicit. Introduction In the Nile Basin, agriculture is facing major challenges, such as limited water access in large parts of the basin, widespread poverty, and a rapidly growing population. It is a region where the agricultural landscape is dominated by livestock and crop-livestock production systems, making livestock not only an important source of income in rural areas but also a potential contributor to water scarcity problems. To reduce poverty and to meet future demand for food, an increase in food production will be essential. The limited water resources in large parts of the basin necessitate this increase to happen without a strong increase in water demand. To identify best options to increase agricultural water productivity and the role of livestock herein, a more spatially explicit understanding of livestock water demand versus water availability across the Nile Basin is imperative. The principal objective of this study was to estimate livestock water demand and productivity in the Nile Basin, and compare them to water availability and some key factors that are expected to determine or influence the LWP (e.g., market access, potential erosion, and variance in dry matter production (DMP), thus providing basic information for the identification of areas where interventions are most needed and likely to have a significant impact. Methods Based on the well-established notion that the main part of water use by livestock is through feed production (Peden et al., 2007), we developed an analytical framework linking models on ruminant digestion, crop water requirement, spatial data on dry matter production and evapotranspiration to estimate livestock water requirements across the Nile Basin. The framework was developed for cattle, goats, and sheep. A brief and simplified summary of the applied methodology is given. For spatial distribution of feed demand, we used a dynamic model of digestion in ruminants, following the approach elaborated by Herrero et al. (2008). This model allows the prediction of feed intake and how this varies with diet quality, milk production, and level of activities (walking, stall-fed), therefore making the estimates of feed intake more accurate. The model requires inputs on: (1) diet composition; (2) milk production and average bodyweight gain; (3) level of activity; and (4) terrain conditions. Data for these variables covering the whole basin are not available. Instead, most of the determinants of livestock feed and water demand have been studied at local scales, with results that are often difficult to compare or to upscale owing to the wide variety in methods, data, and assumptions used. We therefore opted to use generic estimates per livestock production system (LPS). The LPS classification adopted in this study was based on the Seré and Steinfeld (1996) classification, which was mapped using the methods described in Thornton et al. (2006). The diet of African domestic ruminants is varied and depends largely on agroecology and on the type and level of intensity of production system in which animals are kept. Moreover, it will differ between lactating and nonlactating animals and among seasons. These dietary differences are essential to identify the differences in feed between systems and regions. Based on work by Herrero et al. (2008), we defined different types of generic feeds as a function of the region (north, east, central Africa, and the Horn of Africa), LPS, season, and lactating versus nonlactating animals. Similarly, we used expert based estimations of the level of activity per LPS and season, which were expressed as a fraction of the maintenance energy of an animal.
147
Total daily water requirement per animal was calculated by summing the daily water required to produce the different feeds (grains, crop residues, natural vegetation, or a combination of these) in the livestock’s diet. Water for crop feed production (m3/kg) was estimated using the single-crop coefficient procedure described in Allen et al. (1998). In this procedure, the crop water requirement (CWR, m3/ha) is calculated from the reference evapotranspiration (ETo) using the crop coefficient (Kc) to adjust for crop characteristics, environmental conditions, and the growth stage of the crop. Default crop Kc values as well as some refinements of these values incorporating the effect of soil type (dominant soils only), leaf area index (LAI), estimated number of rainfall days in the month and length of growing period were based on guidelines by Allen et al. (1998). To obtain the crop water use per kilogram of dry matter, the CWR was divided by estimated crop yield (kg/ha) of the respective crops. Yield estimates were derived from You and Wood (2004), who used an entropy-based approach to spatially disaggregate subnational crop production statistics based on information on farming system characteristics, land cover data, biophysical crop suitability assessments, and population density. For the rangeland-based system we assumed that diet was solely based on free-range grazing. The ratio of the livestock dry mass consumption/km2 to the total plant DMP/km2 was used as a proxy for the fraction of the actual evapotranspiration (AET) used to produce the feed. As the last step, the water required to produce the daily livestock feed demand was multiplied by livestock density (derived from modeled livestock density data layers from the Gridded Livestock of the World database, (Wint and Robinson, 2007), to get total water requirement per hectare. LWP, defined as the scale dependent efficiency of direct and indirect use of water for provision of livestock products and services (Peden et al., 2007), can be calculated as the ratio of net beneficial livestock-related products and services to the water depleted in producing them. Unfortunately, consistent estimations of livestock products and other benefits are difficult to come by at the basin scale. We therefore did not attempt to come up with a comprehensive estimate of LWP, but instead opted to illustrate differences in LWP between systems using milk production as a proxy for overall production levels. Although there are many factors potentially influencing water productivity (Peden et al., 2007) we considered four main factors that may play a role at a regional scale. One was market access. The others were inter-annual variation in DMP, access to drinking water, using distance to the nearest perennial rivers in the dry season as a proxy, and potential erosion risk, which was calculated at a 1 km2 scale following the Universal Soil Loss Equation (USLE; Wischmeier and Smith, 1978). Results and discussion
Livestock water requirement varies widely across the Nile Basin, between LPS and between cattle and small ruminants (goat and sheep) (Table 1). An important factor influencing livestock water requirement is the large differences in feed requirement, which in our model ranged between 2.4 and 4.4 Mt dry matter per TLU/year for cattle. (TLU is tropical livestock unit, equivalent to 250 kg live body weight.) Table 1. (A) Annual water requirements (median and 0.1-0.9 percentile range) to produce the feed per animal for cattle (left) and goat and sheep (right), in m3/yr/TLU (x 1000). (B) The same but after discounting water use for crop residues in the mixed farming systems. Cattle Small ruminants A B A B LPSa median range median range median range median range LGA 2.0 1.4-8.0 3.3 2.3-13.0 LGH 1.5 1.4-1.7 2.5 2.3-2.9 LGHYP 7.9 7.1-8.0 13.5 13.5-13.6 LGT 1.5 1.4-2.0 2.3 2.3-3.1 MIA 3.9 3.3-7.1 1.8 1.3-2.8 6.6 4.9-10.0 2.8 2.1-6.0 MIHYP 1.0 1.0-6.9 0.9 0.9-2.5 14.3 4.9-14.3 1.6 1.6-2.2 MRA 2.5 1.4-3.8 1.5 1.3-2.1 3.8 2.3-5.9 2.1 1.6-3.6 MRH 1.9 1.4-8.8 1.6 1.3-6.4 2.5 2.3-8.7 1.6 1.6-2.0 MRT 2.3 1.6-8.6 1.9 1.4-7.0 3.5 2.3-8.9 1.9 1.6-2.9
aLGA, LGH, LGHYP, and LGT are the pastoral systems in arid, humid, hyperarid, and temperate zones. Likewise, MIA and MIHYP are the irrigated mixed farming systems in arid and hyperarid areas while MRA, MRH, and MRT are the mixed farming systems in arid, humid, and temperate zones.
At the animal level, milk production and level of activity are key factors that determine the livestock feed requirements over and above the feed needed for pure maintenance. Especially in systems with a relative high milk production, water requirements are high. Obviously the benefits from milk production are correspondingly high, thus making the ability to sell these milk-based products a key aspect of total livestock water productivity. Market access, expressed here as travel time to the nearest market, varies considerably across the basin (Figure 1d). For example, median travel times in the temperate pastoral areas are very long, which suggests that LWP when expressed in monetary values will be considerably lower in these areas. Sensitivity analyses showed that some modest gains in LWP can be obtained by a better targeted diet composition. More gains, however, are realized through the integration of food and feed production. Use of crop by-products means that the same unit of water used to produce food for human consumption also contributes to livestock production. Thus, this water is already accounted for and thus does not enter into the LWP equation
for livesto(compareare used,access anbut also wValues foof CWP, a
Figure 1. potential DMP is th Notwithstlivestock ratio of livproduce slow, but wminimal leven exce2B). Thesround) inshortagesLWP needonly. Impwater andin wet ye There areSudd in smentioneimprove pmight notare not p Conclusi
Using genpotentiallexample,reason foequally toto the samlivestock different productiv One of thlack detafor errorsfactors deinterpretihere is a regional orelativelyacross scregional pas validat
ock water. Tae A and B in T, as is the casnd processing within LPS (Tar CWP are lowand thus LWP
Median value influence on he coefficient o
tanding the la densities on tvestock watersufficient liveswhen accountevel of biomaeed 100% in sse results sug these areas, s, such as sead to consider tportant factorsd feed), as wears as a buffe
e also large arsouthern Sudaed is market apotential of art limit productroperly mana
ions and reco
neralized assuly wrong conc the growing
or critics to argo all livestock me problems water use anparts of the b
vity.
he key challenil and accuracs in LWP estimetermining LWng LWP, whic first step towoverview of liv
y easily adapteales easier. Tpatterns, thertions of used
king this factoTable 1). Differe for goats in capacities. Dable 1; Figure w to very low if they are in
es (symbols) alivestock wateof variance of
rge differencethe one hand r use vs. totalstock feed liesting for the poass needed to some areas (Fgest that repo thus pointingasonal livestocthe role of lives to take into ell as current er.
reas where facan where wateccess. Anothereas with currtion in the shoged, a serious
ommendatio
umptions on liclusions on theof grain for fegue for reduct production syor to the samd productivity
basin underline
ges in the devcy, while localmates and limiWP. A first stepch will at leastard such an avestock watered to use witho further adva
re is a need foassumptions.
or into accounrences are esp the Nile deltaifferences in l 1), which is lin large parts tegrated.
and 25-75% (er productivityf the annual D
es in livestockand water an water use giv
s between 5 aortion of the A maintain the Figure 2a). Inorted livestockg at the imporck migration oestock in the account includrought-copin
ctors other ther use is < 10er is access torently low liveort run, but ms risk in espec
ons
vestock watere role and impeed resources,tion of livestoystems ignore
me extent. Sucy as well as the the need for
velopment of information its our ability p is to come ut allow us to uapproach. Ther use and prodh higher resoluance toward aor an approach
148
nt results in copecially high ia. This methodivestock wateinked to large of the basin,
10-90% for dy. The arid an
DMP between 1
k water use and feed availabven in Figure nd 25% of the
AET that is act ecosystem an low rainfall yk densities catance of adap
or feed importresilience of tde livestock a
ng strategies t
an direct feed% of available
o drinking watstock densitie
may result in scially the temp
r use and prodportance of liv, which requirck products in
es the large dich is the case e differences r region- and
region-specifis often difficuto develop a bup with a morupscale and coe resulting spaductivity, whilution data at san understandh that better i
onsiderably lon areas whered will, howeve
er use and proe differences i suggesting co
d) percentiles d hyperarid a1999 and 200
nd LWP at the bility on the ot2. Overall, the annual actuually channelend competing years these arnnot always b
ptation strategt. It also undehe production
asset values, mthat often invo
d resource cone water (Figurer, which whe
es. On the othsevere limitatiperate mixed
ductivity carryvestock in rurares relatively ln human dietsversity in thes in the Nile Ba in challenges system-specif
ic strategies isult to up-scalebetter spatiallre unified apprompare resultsatially explicit e the underlysmaller scale,ding of local isntegrates loca
wer livestock e high-qualityer, require invoductivity are n crop water onsiderable sc
lines of varioureas are lump
03.
animal and sther hand thae amount of wal evapotransed into consu uses, percenteas will expan
be maintainedgies to cope werlines that strn system, rathmobility, and olve maintain
nstraints play re 1). One poten improved mer hand, factoons in the fut farming syste
y the danger oal societies (Plarge amountss. Yet, to extese systems, w
asin, where th faced by livesfic strategies
s that global a. This results y explicit undroach toward s across sitesdata layers ofing analytical making up-sc
ssues and howal and regiona
water use esty processed revestments in mnot only high productivity (cope for impro
us factors withped in these fi
system level, iat largely detewater requiredspiration. This mable biomastages may apnd considerab (at least not
with temporal rategies to imher than in prostorage capacing high stock
a role, e.g., etential factor may dramaticaors such as erure, when resems.
of oversimplifeden et al., 2s of water, hand this criticis
which do not ce wide range stock keepersfor increasing
and regional d in considerabderstanding ofmeasuring an. The work preffer a broad b framework cacaling and com
w these relate al level analys
timates esidues market between CWP). ovements
h a igures. CV
t is ermine the d to seems ss, proach or ly (Figure year-
prove oduction city (both king levels
east of the already ally rosion risk sources
fied and 007). For s been a sm contribute in s in g water
data often ble scope f the key nd esented
brush an be mparisons to ses as well
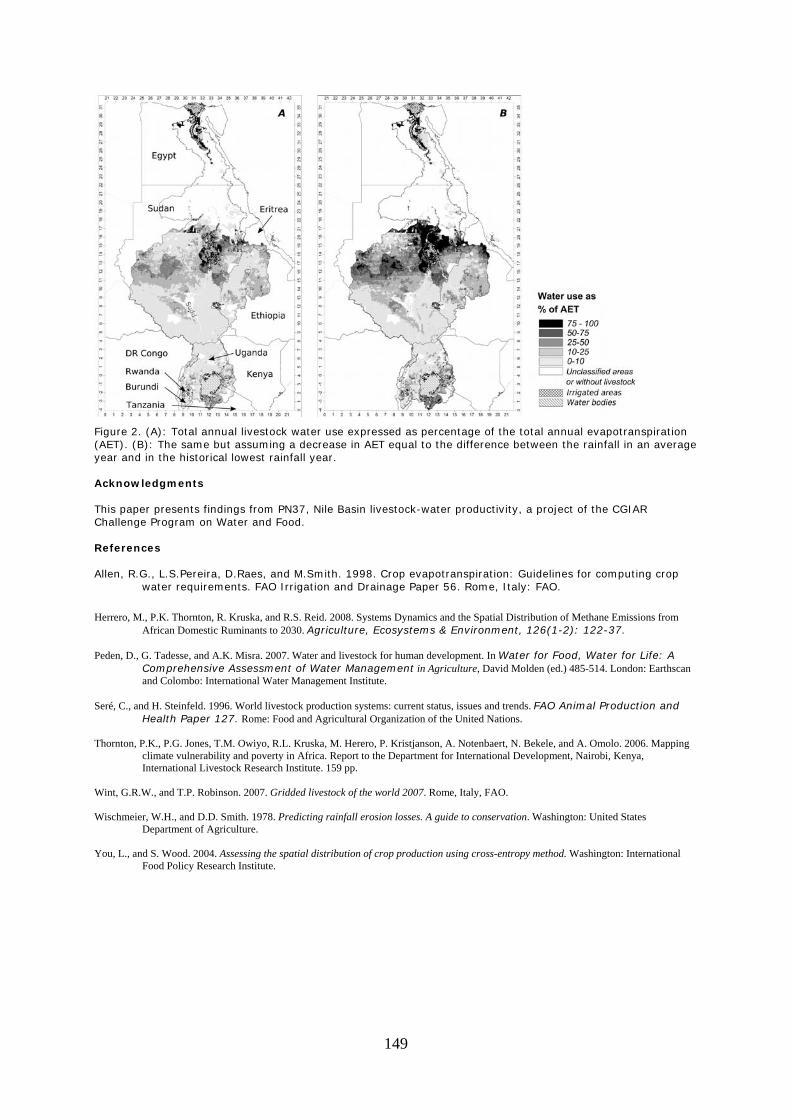
149
Figure 2. (A): Total annual livestock water use expressed as percentage of the total annual evapotranspiration (AET). (B): The same but assuming a decrease in AET equal to the difference between the rainfall in an average year and in the historical lowest rainfall year. Acknowledgments This paper presents findings from PN37, Nile Basin livestock-water productivity, a project of the CGIAR Challenge Program on Water and Food. References Allen, R.G., L.S.Pereira, D.Raes, and M.Smith. 1998. Crop evapotranspiration: Guidelines for computing crop
water requirements. FAO Irrigation and Drainage Paper 56. Rome, Italy: FAO.
Herrero, M., P.K. Thornton, R. Kruska, and R.S. Reid. 2008. Systems Dynamics and the Spatial Distribution of Methane Emissions from
African Domestic Ruminants to 2030. Agriculture, Ecosystems & Environment, 126(1-2): 122-37. Peden, D., G. Tadesse, and A.K. Misra. 2007. Water and livestock for human development. In Water for Food, Water for Life: A
Comprehensive Assessment of Water Management in Agriculture, David Molden (ed.) 485-514. London: Earthscan and Colombo: International Water Management Institute.
Seré, C., and H. Steinfeld. 1996. World livestock production systems: current status, issues and trends. FAO Animal Production and
Health Paper 127. Rome: Food and Agricultural Organization of the United Nations. Thornton, P.K., P.G. Jones, T.M. Owiyo, R.L. Kruska, M. Herero, P. Kristjanson, A. Notenbaert, N. Bekele, and A. Omolo. 2006. Mapping
climate vulnerability and poverty in Africa. Report to the Department for International Development, Nairobi, Kenya, International Livestock Research Institute. 159 pp.
Wint, G.R.W., and T.P. Robinson. 2007. Gridded livestock of the world 2007. Rome, Italy, FAO. Wischmeier, W.H., and D.D. Smith. 1978. Predicting rainfall erosion losses. A guide to conservation. Washington: United States
Department of Agriculture. You, L., and S. Wood. 2004. Assessing the spatial distribution of crop production using cross-entropy method. Washington: International
Food Policy Research Institute.
150
Water management across scales in the São Francisco River Basin, Brazil: policy options and poverty consequences
M. Maneta1, M. Torres1, W. Wallender1, R. Howitt1, S. Vosti1, L.N. Rodrigues2, L.H. Bassoi3,
S. Allen1, L. Bennett1, and J. Young1
1University of California, Davis; 2Embrapa Savannah Research Station, Brazil; 3Embrapa Tropical Semi-Arid, Brazil: Corresponding author–Stephen A. Vosti ([email protected])
Abstract Policymakers, managers of water use associations, and many others in the São Francisco River Basin (SFRB) in Brazil are considering policy actions that will directly or indirectly change the costs and availability of groundwater and surface water for agricultural users. While in many cases such actions may bring about increases in water use efficiency, little is known about the likely effects of proposed policy changes on farmer behavior, farmer incomes, agricultural employment, rural poverty, or water resources in the short or long term. This paper reports the results of interdisciplinary research aiming to fill these large scientific gaps, by developing and using three interrelated models of water-agriculture-poverty links at the plot, subcatchment, and basin-wide spatial levels. Basin-wide trends and characteristics related to access to water, agriculture, and rural poverty are briefly discussed, and the models developed in the context of this project are presented. Results suggest that under some agroecological and socioeconomic conditions water-poverty links do exist, and in these cases, policies that affect access to water can reduce poverty. Under most circumstances, however, water and poverty are not directly linked, so policies unrelated to water will also need to be relied upon to meet poverty alleviation objectives. Media grab In the context of the SFRB, persistent rural poverty cannot be addressed by increasing smallholder access to irrigation water alone. Escaping rural poverty requires changes in product mix and increases in agricultural productivity; irrigation is necessary but not sufficient to achieve these objectives. Introduction Much is known about the SFRB as a whole, and quite a lot of very detailed information exists for specific sub-regions of the approximately 640,000 km2 that comprise it. In addition, a series of recent priority-setting exercises for the SFRB have identified issues and knowledge gaps. Building on this knowledge base the following set of key policy issues was compiled, and served as our guideposts for research, outreach, and training activities. Regarding water for agriculture, many options exist throughout the SFRB for diverting more surface water and groundwater to agriculture, and in some subcatchment areas conflicts among competing water user groups are intensifying. Key remaining issues throughout the SFRB include: how much surface water should be diverted for agriculture? How much groundwater should be pumped? What investments to increase water use efficiency are needed? Since market forces are already exerting substantial pressures regarding the spatial location of agricultural activities, and the amounts and sources of surface and groundwater being used by agriculture, questions regarding the role of public policy in managing water resource use to achieve social objectives (including poverty reduction and ecosystem management) loom large. Regarding rural poverty, while significant progress has been made in reducing rural poverty over the past several decades, large and persistent pockets of rural poverty continue to exist in the SFRB (Torres et al., 2007), and questions remain regarding the role of access to irrigation water in determining rural poverty, and (related) the scope for policy action aimed at increasing access to water to cost-effectively reduce rural poverty. At the basin spatial extent, questions about the links between hydroelectric power generation, water for irrigation, and environmental flows are becoming increasing pressing; beyond the basin spatial extent, intra-basin transfers are being hotly contested. Methods Several, interrelated research tools were developed to address these policy questions (Vosti et al., 2007b). A basin-wide descriptive analysis of water availability and use, agriculture, and poverty sets the stage for predictive modeling at the basin, sub-basin, and plot levels (Vosti et al., 2007a, 2008). At basin level, an aggregate mass balance hydrologic model was developed and linked to a municípal-level economic model of agriculture to predict the effects of alternative water policies and public sector water management strategies on product mix, production technology, and area under plow, and the consequences of these agricultural choices for poverty, water productivity, and flows of water for environmental and other purposes (Maneta et al., 2008b; Torres et al., 2008). The models generate spatially explicit estimates of flows and storage on an annual basis, with the potential to predict agriculture and water use/availability into the future. For the 9 km2 subcatchment area of Buriti Vermelho located near Brasilia, an integrated model was constructed from the field to the watershed scale, consisting of a hydrologic model linked to an economic model of agriculture (Maneta et al.,
151
2006, 2007). The sub-basin hydrologic model is a spatially distributed, three-dimensional, variably-saturated flow and transport model, with full reactive salt chemistry capabilities. Given initial conditions of surface water allocation, and soil, surface water, and groundwater quality (provided by the hydrologic model), a farm-level economic model of agriculture predicts the types and spatial extents of agricultural activities on an annual basis, and (with the help of the hydrologic model) produce spatially distributed information on: cropping patterns, water applications, groundwater pumping, irrigation efficiencies, crop yields, and revenues from agricultural activities. The output from the economic model was subsequently used by the hydrologic model to simulate the impacts of these management decisions on the water system, including water available for environmental flows. The economic model of agriculture in turn is updated annually by the hydrologic model to account for changes in surface water and groundwater availability (and hence, irrigation water costs). At plot level, land use system (LUS) analysis was used to assess the impacts on smallholders and other agriculturalists of changes in, for example, water availability, water costs, input and product prices (Bennett et al., 2008). All models are used to assess the effects of public and private water management interventions, with special attention paid to effects on smallholder income and rural employment (and hence, poverty) and water productivity. Results and discussion Rural poverty There are essentially three snapshots of poverty available recently (since about 1990) for Brazil, but only one (2003) can be used to assess rural poverty; all data are available at the municipality level. We know where poverty is concentrated (in the total population since 1990, and for rural areas in 2003) and we know the depth of that poverty according to the Brazilian poverty measurement methods (based on minimum salaries per month) (Vosti et al., 2007a; Torres et al., 2007). We also know changes over time in the number, spatial location, and depth of poverty over time. The bottom line is that poverty has been reduced in most areas, and has become (by some measures of poverty) an increasingly urban issue. This general reduction in, but geographic concentration of, rural poverty has been accompanied (and perhaps promoted) by large rural-urban migration flows over the past 30 years. Water-poverty links Based on the results of models deployed at all three spatial levels, we have little evidence to support poverty/water access links among smallholders, but the evidence we do have suggests that the links may not be very strong; improving access to water may be a necessary condition for improving rural livelihoods in some areas and for some types of agriculturalists, but it is unlikely to be a sufficient condition for doing so. Having greater access to water (i.e., reducing the costs of establishing and managing irrigation systems) will surely allow farmers to alter product mixes and change the amount of irrigated area on their farms, and for subsistence farmers this can help meet food needs. There are, however, very few purely subsistence farmers in the SFRB, and moving from subsistence farming to more commercial farming is generally the pathway out of poverty for those who remain on their land. So, agriculturalists must increasingly wrestle with issues related to the marketing of their products, and the very rapid changes in the structure of food and fiber markets in Brazil is making this ever more challenging for smallholders and even for some medium-scale farmers. That said, an indirect link between poverty reduction and access to water has been quite strong in some areas of the SFRB, but in these cases irrigation has led to poverty reduction via increased rural employment (and increased wage rates) on medium- and large-scale commercial farms. Water availability One vexing issue for policymakers is measuring water availability at different spatial scales and under different weather scenarios. Our models were used to explore these issues. At the basin level, we have estimated water availability at the pixel and at the municipality level using rainfall/runoff relationships (Maneta et al., 2008a), and at the subcatchment spatial extent under unforced conditions we have estimated water availability ‘on average’ and under an array of weather conditions (Maneta et al., 2008b). At subcatchment spatial level, we have developed a hydrologic model for the Buriti Vermelho subcatchment area, and used this model to estimate water availability (including access to groundwater) to each farmer for an average year and under an array of weather conditions (Maneta et al., 2008c). At plot level, we have developed LUS models that measure access to water at farm level, the on-farm investments required to manage flows onto farms and on-farm storage, and the plot-level investments required to move and apply water to a given plot (e.g., Bennett et al., 2008). In summary, our results demonstrate that: 1) decision-makers have an array of options for measuring and monitoring water availability, 2) all options have the potential to capture annual, seasonal, and spatial patterns of water availability, 3) while correlated, specific estimates of water availability vary across options, even at specific points of time and space; 4) including groundwater in estimates of water availability is challenging but doing so offers a much more realistic estimate of water availability from the farmer perspective; and 5) economic factors determining water availability may be more important than hydrologic factors. Climate change The linked hydro-economic models (one at the basin spatial level and the other at the subcatchment spatial level) demonstrate the large effects of potential climate change (via changes in precipitation and changes in evapotranspiration) on water availability and the highly nonuniform spatial distribution of these effects (e.g., those close to major tributaries or with access to good-quality groundwater are less affected than others). These models, however, also clearly demonstrate that adjustments made by farmers in cropping area, product mix, and irrigation technology reduce the economic impacts of these climate shocks (Maneta et al., 2008b).
152
Water productivity Water productivity is an endogenous variable that is determined by the incentives/constraints to investments in cropping patterns, spatial extent of agriculture, and water use technologies. No farmers seek to maximize water use efficiency, instead, farmers maximize the profits from farming operations subject to an array of socioeconomic and agroecological constraints, and water use is a decision variable in that process (Torres et al 2008). That said, as is the case in human fertility, this clearly endogenous variable can have externality effects–e.g., increased water use efficiency of upstream users may increase water availability of downstream users, and in the absence of water markets, this externality will not be dealt with efficiently. So, the issue of water productivity can be of policy relevance, but primarily if spatial and temporal issues are included in discussions of it. Water productivity and agricultural modernization We are inclined to interpret water productivity in the same way we interpret labor productivity. Under normal development paths, labor moves from being an abundant input to one in short supply relative to other inputs, and hence its marginal and average values increase. In a well-functioning labor market, one does not expect to find large spatial variations in wages paid for a given task, and any differentials that do exist are explained by information and transportation (and transaction) costs. One also expects to find increasingly segmented labor markets, as human capital develops (unevenly across the population, usually) to meet the increasingly diverse needs of the market. Can we expect the same sorts of things to be true for water, another input into production processes? Probably so, but with some important caveats. As water becomes more scarce, we would expect its value to increase and to see it being used more efficiently and allocated to uses in which its marginal value is highest (e.g., Torres et al., 2007). We also would not expect to see large spatial differences in some measures of water productivity, in part because water (like labor) can be moved to erase these differences, but also because crops can ‘move’ to relatively cheap sources of water, sometimes seasonally (Torres et al., 2008). All this will likely happen with a lag (as is often the case with labor movements, too), since there are legal and other impediments to moving water and crops, and both will require public and private investments to realize. Lastly, water seems to be more homogeneous than labor, so water market segmentation (based on, say, water quality) in agriculture is not likely to occur. The exception may be poor-quality groundwater which can limit agricultural production options. Who manages water resources? We have found water management to be very, very site-specific in the SFRB. If one begins at the plot level and works ‘up’ to the basin spatial level, things can become a bit clearer. At plot level, farmers choose to manage rainfall and runoff, if it makes economic sense to do so (e.g., Bennett et al., 2008). The same thing essentially plays out at farm level as regards rainfall and runoff; some plots on the farm merit attention while others may not. The same is true for on-farm storage; economic factors determine the location and capacity of storage, which can be zero. As one moves to the subcatchment spatial level, one finds some subcatchments in which some farmers manage runoff while other farmers do not (e.g., Torres et al., 2008). In other subcatchments, some surface water is collectively managed, but not all agriculturalists have access to this water or influence over surface water management decisions. At the basin scale, there are a few very important decisionmakers, most notably those who chose to establish and manage hydroelectric dams; these users have altered the flow of the SFR very substantially and will continue to do so into the foreseeable future. The bottom line is that some parts of the water resource ‘pool’ in the SFRB are carefully managed (by individuals, collections of individuals, or by government officials, or combinations of these actors), while other parts of this ‘pool’ are not. Increasingly, the links between the managed and the unmanaged parts of the water resource ‘pool’ are coming into the policy arena. Policy instruments for managing water resources In some areas, especially in large-scale irrigation projects, farmers do pay for water, though generally the ‘price’ is established to recover investments in water conveyance infrastructure and to cover overhead costs rather than to ‘signal’ water scarcity to farmers. Indeed, the only limitations on water taken from the SFR are the technical limits given by the water conveyance investments that were made when irrigation projects were established, and the agreements regarding the amount (and timing) of electricity that can be used for pumping. That said, all of the models we have developed demonstrate that changes in water prices can affect water use via changes in cultivated area, product mix, and production technology (including irrigation technology), and that these adjustments by farmers will help buffer the effects of increases in water prices on agricultural incomes and hence poverty. Since water, however, is one of many inputs used in the production process, adjustments to agriculture in response to changes in water prices will not always be significant or immediate. Regional territorial development strategies New spatial units of observation (territories) and new forms of policy action are being contemplated to promote rural development and poverty reductions (e.g., Schejtman and Berdegué, 2005). The Petrolina-Juazeiro area in the SFRB is often cited as an example of irrigation-led agricultural intensification that has led to poverty reductions. Expansion of area dedicated to irrigated agriculture can contribute to growth and poverty reduction, as the Petrolina case has demonstrated, but not without hydrologic consequences. Our research (Manetta et al., 2008a) suggests that selective replications of the ‘Petrolina’ experience in the SFRB as regards water needs will lead to dramatic seasonal changes in water availability, in some cases leading to zero seasonal flows in important tributaries. Agronomic ‘fine-tuning’ of seasonal water needs can help address seasonal water shortages, but such actions could cause agriculturalists to ‘miss’ their seasonally profitable product niches. Increases in water use efficiency are possible, and increasing water charges will help promote this objective, but existing irrigation costs (water conveyance, on-farm water management, etc.) already provide incentives
153
for doing so, and it is not clear what the marginal economic or hydrologic impacts on water use of increased water charges would be. Expansion of rainfed agriculture Substantial scope exists in the SFRB for expanding rainfed agriculture (Vosti et al., 2008), and doing so could help put downward pressure on food prices (especially for basic grains) and would not likely have large effects on the hydrology of the SFRB (broad-based, intensive management of runoff could affect this outcome). This expansion, however, would likely be undertaken by medium- and large-scale commercial enterprises, so the production-related effects on rural poverty would be small; indeed, most smallholders already have options for expanding their rainfed agricultural activities and choose not to do so for an array of economic and other reasons. Conclusions and recommendations Reducing rural poverty in the SFRB Large, persistent pockets of rural poverty continue to exist in the SFRB, and while reallocating agricultural water to these areas may be necessary to reduce poverty, it will not be sufficient. Changes in product mix and production technologies are required to enhance agricultural productivity and profitability; such changes require increased access to credit and agricultural extension services, and especially enhanced access to markets. Promoting agricultural growth in the SFRB Great potential exists for expanding rainfed and irrigated agriculture in the SFRB, and doing so will promote basin-wide growth and poverty reductions (especially if agriculture generates employment). Careful thought, however, should be given to where irrigation-led expansions of agriculture are located, since downstream hydrological and economic effects can be large. Managing agricultural water resources in the SFRB Successful irrigation-led poverty reduction and broad-based agricultural growth in the SFRB will have hydrologic consequences for agriculture, ecosystem service flows, and hydroelectric power generation. Therefore, basin-wide planning and management are required. At the basin-wide spatial extent, governing bodies are in place to take up this challenge; at more local levels, management entities need to be strengthened (or created) and linked to effectively participate in water management dialog. Investing in predictive capacity While the institutional mechanisms for managing water resources in the SFRB are increasingly ‘in place,’ the same is not true for the scientific capacity to predict the hydrologic or economic consequences of alternative management options, at any spatial scale. The need for developing this scientific capacity and for collecting the needed data (especially hydrologic data) to use this new predictive capacity is quite urgent; failure to make these critical long-term investments will result in the undue influence of politics in setting water use policies in the SFRB. Acknowledgments This research was undertaken by the São Francisco Basin Focal Project, a project of the CGIAR Challenge Program on Water and Food. Additional support was provided by the Center for Natural Resources Policy Analysis (CNRPA) at the University of California, Davis, and the Brazilian Agricultural Research Corporation (Embrapa). We also very gratefully acknowledge the contributions made by the participants in two Land Use Systems training workshops convened in Brazil in 2006 and 2007. Very able research assistance in compiling and interpreting data was provided by Katherine Laumas, Erik Lue, and Pedro Gasparinetti. The opinions expressed in this paper are not necessarily those of the supporting agencies. References Bennett, Lisa, J.L. Pimenta de Aguiar, T. Sousa, S.A. Vosti, S. Allen, J. Young, L.H. Bassoi, R. Howitt, M.
Maneta, L. Rodrigues, M. Torres, and W.W. Wallender. 2008. Land Use System (LUS) Analysis of Rainfed and Irrigated Lime Production Systems in the Middle São Francisco River Basin, Brazil. UC Davis-Embrapa São Francisco River Basin Research Team Working Paper, June 3, 2008.
Maneta, Marco P., P.N. Singh, M. Torres, W.W. Wallender, S.A. Vosti, L. Rodrigues, L. Bassoi, and J. Young.
2008a. A Parsimonious Crop-Water Productivity Index: An Application to Brazil. Area (forthcoming). Maneta, Marco, M. Torres, S.A. Vosti, W.W. Wallender, S. Allen, L. Bassoi, L. Bennett, R. Howitt, L. Rodrigues,
and J. Young. 2008b. Assessing agriculture-water links at basin scale: A hydro-economic model of the São Francisco River Basin, Brazil. Paper Prepared for the IWRA World Water Congress, September 1-4, 2008, Montpellier, France.
Maneta, Marco, L. Rodrigues, W.W. Wallender, S. Allen, L.H. Bassoi, L. Bennett, R. Howitt, M. Torres, S.A.
Vosti, and J. Young. 2008c. Modeling the Hydrology of the Buriti Vermelho Subcatchment Area of the São Francisco River Basin. UC Davis-Embrapa São Francisco River Basin Research Team Working Paper, June 1, 2008.
154
Maneta, Marco, M. Torres, R. Howitt, S.A. Vosti, W.W. Wallender, L. Bassoi, L. Rodrigues, and J. Young. 2007. A Detailed Hydro-Economic Model for Assessing the Effects of Surface Water and Groundwater Policies: A Demonstration Model from Brazil. Selected Paper prepared for the American Agricultural Economics Association Annual Meeting, Portland, Oregon, July 29-August 1, 2007. Revised: May 31, 2007.
Maneta, Marco, M. Torres, S. Vosti, W. Wallender, R. Howitt, L. Rodrigues, L. Bassoi, and J. Young. 2006. A
linked hydro-economic model to examine the effects of water policy on rural poverty. Poster prepared for and presented at the Fall Meeting of the American Geophysical Union, San Francisco, USA. 11-15 December 2006.
Schejtman, Alexander, and Julio A. Berdegué. 2005. El Impacto Social de la Integración Regional en América
Latina Rural. Documento preparado para el Banco Interamericano de Desarrollo. Mimeo. Torres, Marcelo, M. Maneta, S.A. Vosti, S. Allen, L. H. Bassoi, L. Bennett, R. Howitt, L. Rodrigues, M. Torres, J.
Young, and W.W. Wallender. 2008. An Economic Model of Agriculture for the São Francisco River Basin: Specification, Calibration, Preliminary Simulations. UC Davis-Embrapa São Francisco River Basin Research Team Working Paper, June 2, 2008.
Torres, Marcelo, S.A. Vosti, L.H. Bassoi, R. Howitt, M. Maneta, L. Rodrigues, W.W. Wallender, and J. Young.
2007. Spatial Patterns of Rural Poverty in the São Francisco River Basin, Brazil. Selected Paper prepared for the American Agricultural Economics Association Annual Meeting, Portland, Oregon, July 29-August 1, 2007. Revised: May 29, 2007.
Vosti, Stephen A., S. Allen, J. Young, L.H. Bassoi, L. Bennett, R. Howitt, M. Maneta, L. Rodrigues, M. Torres,
and W.W. Wallender. 2008. Characterizing Agriculture and Agricultural Change in the São Francisco River Basin, Brazil. UC Davis-Embrapa São Francisco River Basin Research Team Working Paper, June 1, 2008.
Vosti, Stephen A., S. Allen, J. Young, L.H. Bassoi, L. Bennett, R. Howitt, M. Maneta, L. Rodrigues, M. Torres,
and W.W. Wallender. 2007a. Characterizing Population and Poverty Trends in the São Francisco River Basin, Brazil. UC Davis-Embrapa São Francisco River Basin Research Team Working Paper, December 1, 2007.
Vosti, Stephen A., and SFRB Team. 2007b. Understanding Poverty-Environment Synergies and Trade-Offs:
Measurement Tools and Policy Implications. Presentation to the Population, Poverty and Environments Workshop of the Beahrs Environmental Leadership Program, Summer 2007, University of California, Berkeley. June 16, 2007.
155
System characterization for integrated resource analysis of rice-based livelihood systems in upland Lao PDR
R. Ritzema1,2, R. Plant1, B. Samson2, B. Vongphuthone3, and S. Pandey2
1University of California at Davis, California, USA [email protected]
2International Rice Research Institute, Los Baños, Philippines 3Northern Agriculture and Forestry Research Centre of Lao PDR, Luang Prabang, Lao PDR
Abstract Poverty assessments for the uplands of Lao PDR identified strong correlations between rice sufficiency and food security, leading CPWF PN11 partners to examine the productivity of the region’s upland rice and wetland rice agroecosystems, as well as the productivity and availability of water on which these ecosystems depend. Significant spatiotemporal interactions between rice production, water, land-use, and other biophysical resources necessitate an approach that places agronomic alternatives in the context of the overall landscape, and which enables linkages to socioeconomic factors. This paper presents the methodology used for characterizing several target upland Lao biophysical systems in support of a scenario-analysis modeling framework. The latter is used to assess impacts of changes in land-use and water management technologies on water availability, rice production, and economic benefit. System characterization followed a dual-track approach that gave comparative understanding of biophysical resource linkages and endowments from two target villages, as well as detailed land-use and water flow data from one catchment. Media grab Land and water resource data, gathered from two villages in the Lao uplands, provided insight into rice-water-landscape interactions and informed poverty alleviation strategies. Introduction The upland communities of Lao PDR are typically comprised of marginalized peoples characterized by severe poverty and food insecurity (WB, 1995; ADB, 2001). They devote most of their economic and biophysical resources to producing rice, the staple crop (Pandey et al., 2002). Valley bottoms are often devoted to paddy rice production on bunded terraces, while upland rice and small amounts of other cash crops are grown in shifting cultivation systems on the steeper slopes. Rising population pressures are resulting in intensification and corresponding degradation of agricultural resources through soil erosion, loss of water supply, and reduction of primary forest cover, resulting in drastic reductions in fallow periods (Schoeneberger et al., 1998; Graeme and Lefroy, 1999). Poverty assessments in northern Lao PDR have correlated food security with rice sufficiency (ADB, 2001). Recognizing this linkage, PN11 partners have aimed to develop improved paddy rice technologies for the uplands, as well as innovative approaches for managing key resources, such as water, nutrients, labor, and capital, taking into account their interactions across the landscape. A platform of spatially-based modeling tools currently under development recognizes the need for a systems-level approach by linking spatial and watershed hydrology software into a coherent framework. This platform has the collective capability to simulate and analyze key upland biophysical processes on a sub-catchment scale, and enables analysis of impacts to water availability, rice production, and economic flows under various land-use scenarios, including upslope land-use mosaics and increased paddy area. A modeling endeavor presupposes the need for both system descriptions and input data. This paper presents the methodology used to characterize the biophysical resource systems of two target villages in upland Lao PDR in support of model development and deployment. Though both field data collection and model development are currently ongoing, an overview of the target systems and some results from preliminary analysis that influence model and scenario development are presented. Methods Initial research focused on characterization of the biophysical resource systems of these two target villages and purposed to: (1) gain understanding of spatiotemporal resource flows, processes, and linkages for model development and preliminary analysis; and (2) build an input data set for envisioned model application. Luang Prabang Province typifies the upland environments, agroecosystems, and socioeconomic characteristics found throughout northern Lao PDR. Project objectives that were focused on interactions between water availability, rice production, and poverty suggested that community-level analysis was most appropriate, resulting in the selection of two target villages within 60 km of the town of Luang Prabang. The villages of Ban Fay and Ban Silalek, though sharing many commonalities, represent differing population, ethnic composition, land area, demographics, resource endowments, and histories. Early assessments revealed that the quality of secondary biophysical and remotely sensed elevation and land-use data was inadequate for modeling and land-use analysis when truthed against topographic features and
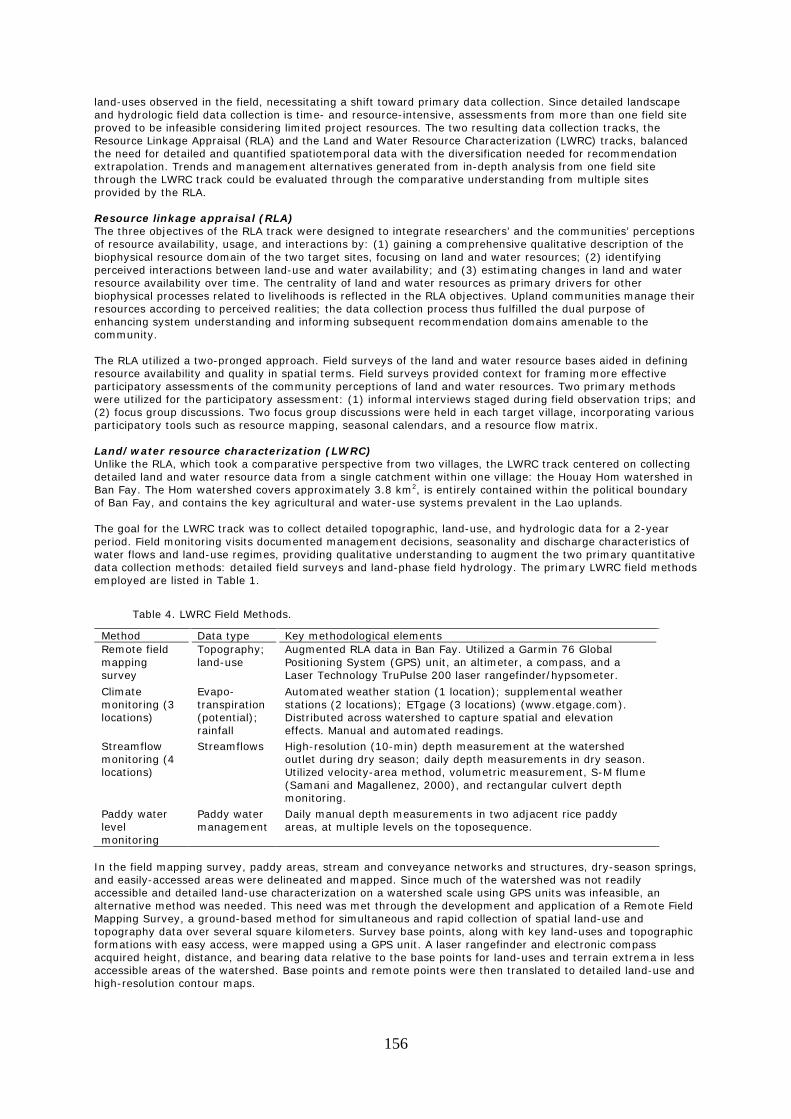
156
land-uses observed in the field, necessitating a shift toward primary data collection. Since detailed landscape and hydrologic field data collection is time- and resource-intensive, assessments from more than one field site proved to be infeasible considering limited project resources. The two resulting data collection tracks, the Resource Linkage Appraisal (RLA) and the Land and Water Resource Characterization (LWRC) tracks, balanced the need for detailed and quantified spatiotemporal data with the diversification needed for recommendation extrapolation. Trends and management alternatives generated from in-depth analysis from one field site through the LWRC track could be evaluated through the comparative understanding from multiple sites provided by the RLA. Resource linkage appraisal (RLA) The three objectives of the RLA track were designed to integrate researchers’ and the communities’ perceptions of resource availability, usage, and interactions by: (1) gaining a comprehensive qualitative description of the biophysical resource domain of the two target sites, focusing on land and water resources; (2) identifying perceived interactions between land-use and water availability; and (3) estimating changes in land and water resource availability over time. The centrality of land and water resources as primary drivers for other biophysical processes related to livelihoods is reflected in the RLA objectives. Upland communities manage their resources according to perceived realities; the data collection process thus fulfilled the dual purpose of enhancing system understanding and informing subsequent recommendation domains amenable to the community. The RLA utilized a two-pronged approach. Field surveys of the land and water resource bases aided in defining resource availability and quality in spatial terms. Field surveys provided context for framing more effective participatory assessments of the community perceptions of land and water resources. Two primary methods were utilized for the participatory assessment: (1) informal interviews staged during field observation trips; and (2) focus group discussions. Two focus group discussions were held in each target village, incorporating various participatory tools such as resource mapping, seasonal calendars, and a resource flow matrix. Land/water resource characterization (LWRC) Unlike the RLA, which took a comparative perspective from two villages, the LWRC track centered on collecting detailed land and water resource data from a single catchment within one village: the Houay Hom watershed in Ban Fay. The Hom watershed covers approximately 3.8 km2, is entirely contained within the political boundary of Ban Fay, and contains the key agricultural and water-use systems prevalent in the Lao uplands. The goal for the LWRC track was to collect detailed topographic, land-use, and hydrologic data for a 2-year period. Field monitoring visits documented management decisions, seasonality and discharge characteristics of water flows and land-use regimes, providing qualitative understanding to augment the two primary quantitative data collection methods: detailed field surveys and land-phase field hydrology. The primary LWRC field methods employed are listed in Table 1.
Table 4. LWRC Field Methods.
Method Data type Key methodological elements Remote field mapping survey
Topography; land-use
Augmented RLA data in Ban Fay. Utilized a Garmin 76 Global Positioning System (GPS) unit, an altimeter, a compass, and a Laser Technology TruPulse 200 laser rangefinder/hypsometer.
Climate monitoring (3 locations)
Evapo-transpiration (potential); rainfall
Automated weather station (1 location); supplemental weather stations (2 locations); ETgage (3 locations) (www.etgage.com). Distributed across watershed to capture spatial and elevation effects. Manual and automated readings.
Streamflow monitoring (4 locations)
Streamflows High-resolution (10-min) depth measurement at the watershed outlet during dry season; daily depth measurements in dry season. Utilized velocity-area method, volumetric measurement, S-M flume (Samani and Magallenez, 2000), and rectangular culvert depth monitoring.
Paddy water level monitoring
Paddy water management
Daily manual depth measurements in two adjacent rice paddy areas, at multiple levels on the toposequence.
In the field mapping survey, paddy areas, stream and conveyance networks and structures, dry-season springs, and easily-accessed areas were delineated and mapped. Since much of the watershed was not readily accessible and detailed land-use characterization on a watershed scale using GPS units was infeasible, an alternative method was needed. This need was met through the development and application of a Remote Field Mapping Survey, a ground-based method for simultaneous and rapid collection of spatial land-use and topography data over several square kilometers. Survey base points, along with key land-uses and topographic formations with easy access, were mapped using a GPS unit. A laser rangefinder and electronic compass acquired height, distance, and bearing data relative to the base points for land-uses and terrain extrema in less accessible areas of the watershed. Base points and remote points were then translated to detailed land-use and high-resolution contour maps.
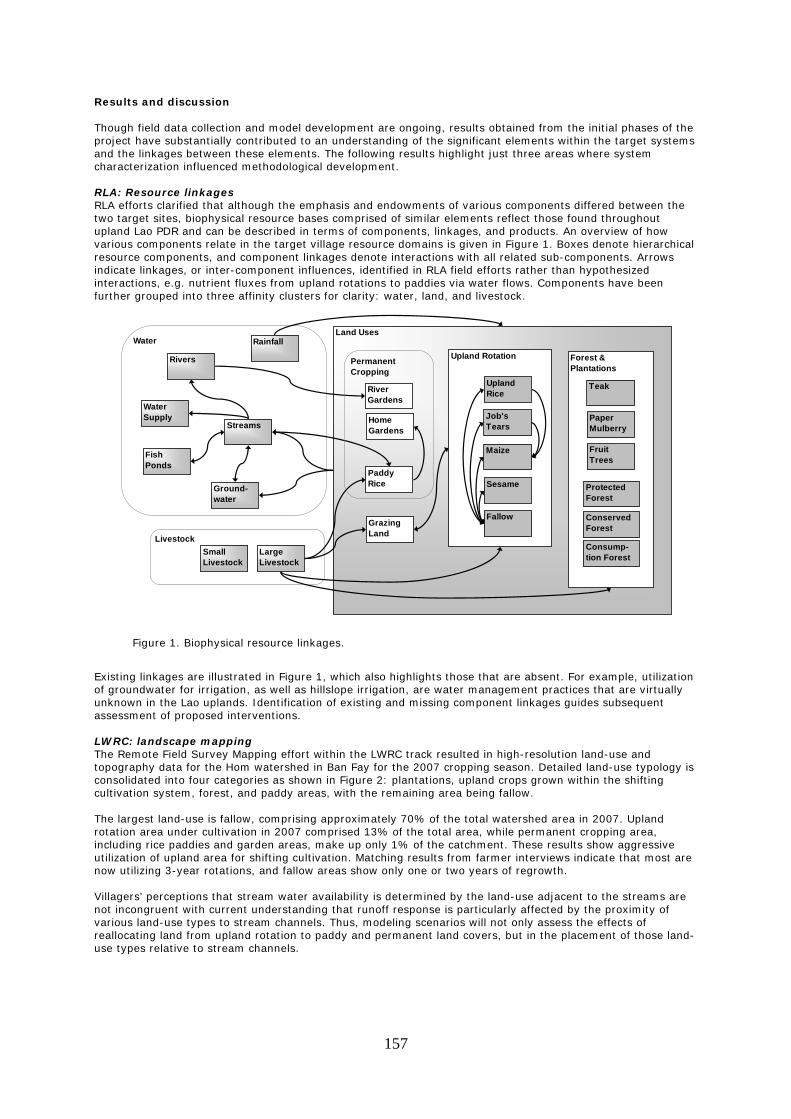
157
Results and discussion Though field data collection and model development are ongoing, results obtained from the initial phases of the project have substantially contributed to an understanding of the significant elements within the target systems and the linkages between these elements. The following results highlight just three areas where system characterization influenced methodological development. RLA: Resource linkages RLA efforts clarified that although the emphasis and endowments of various components differed between the two target sites, biophysical resource bases comprised of similar elements reflect those found throughout upland Lao PDR and can be described in terms of components, linkages, and products. An overview of how various components relate in the target village resource domains is given in Figure 1. Boxes denote hierarchical resource components, and component linkages denote interactions with all related sub-components. Arrows indicate linkages, or inter-component influences, identified in RLA field efforts rather than hypothesized interactions, e.g. nutrient fluxes from upland rotations to paddies via water flows. Components have been further grouped into three affinity clusters for clarity: water, land, and livestock.
Figure 1. Biophysical resource linkages.
Existing linkages are illustrated in Figure 1, which also highlights those that are absent. For example, utilization of groundwater for irrigation, as well as hillslope irrigation, are water management practices that are virtually unknown in the Lao uplands. Identification of existing and missing component linkages guides subsequent assessment of proposed interventions. LWRC: landscape mapping The Remote Field Survey Mapping effort within the LWRC track resulted in high-resolution land-use and topography data for the Hom watershed in Ban Fay for the 2007 cropping season. Detailed land-use typology is consolidated into four categories as shown in Figure 2: plantations, upland crops grown within the shifting cultivation system, forest, and paddy areas, with the remaining area being fallow. The largest land-use is fallow, comprising approximately 70% of the total watershed area in 2007. Upland rotation area under cultivation in 2007 comprised 13% of the total area, while permanent cropping area, including rice paddies and garden areas, make up only 1% of the catchment. These results show aggressive utilization of upland area for shifting cultivation. Matching results from farmer interviews indicate that most are now utilizing 3-year rotations, and fallow areas show only one or two years of regrowth. Villagers’ perceptions that stream water availability is determined by the land-use adjacent to the streams are not incongruent with current understanding that runoff response is particularly affected by the proximity of various land-use types to stream channels. Thus, modeling scenarios will not only assess the effects of reallocating land from upland rotation to paddy and permanent land covers, but in the placement of those land-use types relative to stream channels.
Water
Livestock
Land UsesRainfall
Upland Rotation
Upland Rice
Job's Tears
Maize
Sesame
Fallow
Large Livestock
Small Livestock
Paddy Rice
Forest & Plantations
Ground-water
Streams
Water Supply
Fish Ponds
Rivers
Grazing Land
ConservedForest
Consump-tion Forest
Teak
Paper Mulberry
Fruit Trees
ProtectedForest
RiverGardens
Home Gardens
Permanent Cropping
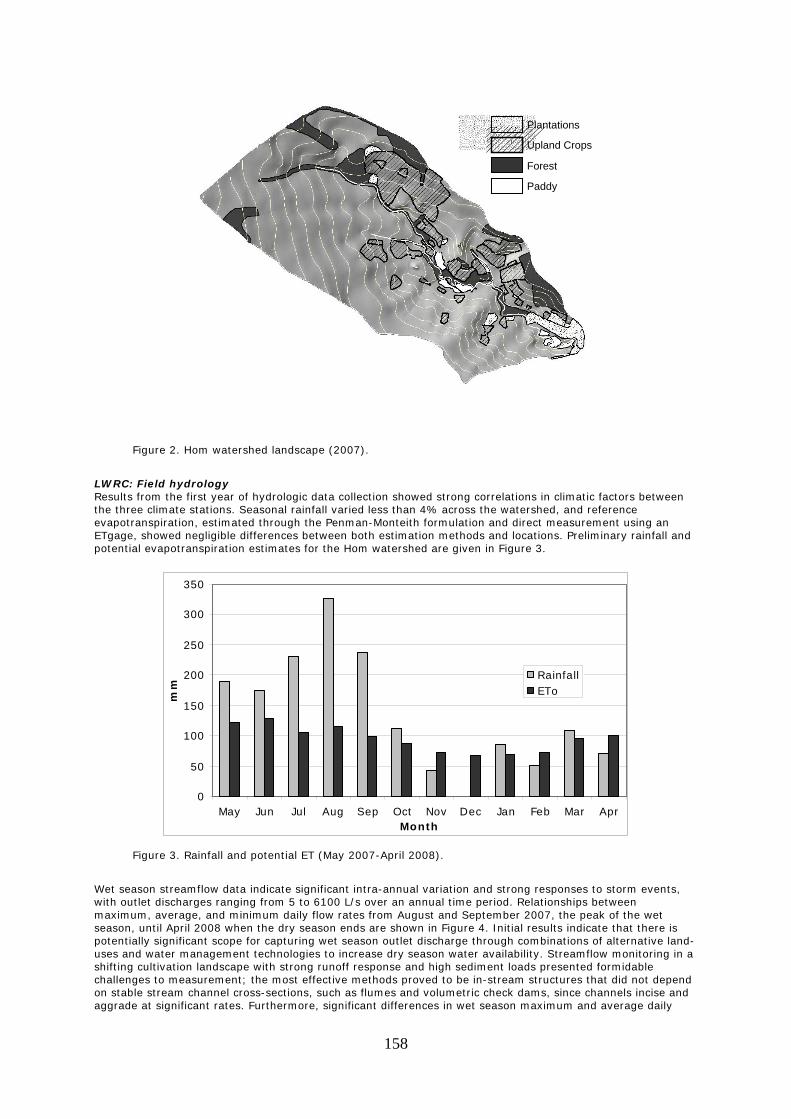
158
Figure 2. Hom watershed landscape (2007).
LWRC: Field hydrology Results from the first year of hydrologic data collection showed strong correlations in climatic factors between the three climate stations. Seasonal rainfall varied less than 4% across the watershed, and reference evapotranspiration, estimated through the Penman-Monteith formulation and direct measurement using an ETgage, showed negligible differences between both estimation methods and locations. Preliminary rainfall and potential evapotranspiration estimates for the Hom watershed are given in Figure 3.
Figure 3. Rainfall and potential ET (May 2007-April 2008).
Wet season streamflow data indicate significant intra-annual variation and strong responses to storm events, with outlet discharges ranging from 5 to 6100 L/s over an annual time period. Relationships between maximum, average, and minimum daily flow rates from August and September 2007, the peak of the wet season, until April 2008 when the dry season ends are shown in Figure 4. Initial results indicate that there is potentially significant scope for capturing wet season outlet discharge through combinations of alternative land-uses and water management technologies to increase dry season water availability. Streamflow monitoring in a shifting cultivation landscape with strong runoff response and high sediment loads presented formidable challenges to measurement; the most effective methods proved to be in-stream structures that did not depend on stable stream channel cross-sections, such as flumes and volumetric check dams, since channels incise and aggrade at significant rates. Furthermore, significant differences in wet season maximum and average daily
0
50
100
150
200
250
300
350
May Jun Jul Aug Sep Oct Nov Dec Jan Feb Mar AprMonth
mm
RainfallETo
Plantations
Upland Crops Forest
Paddy
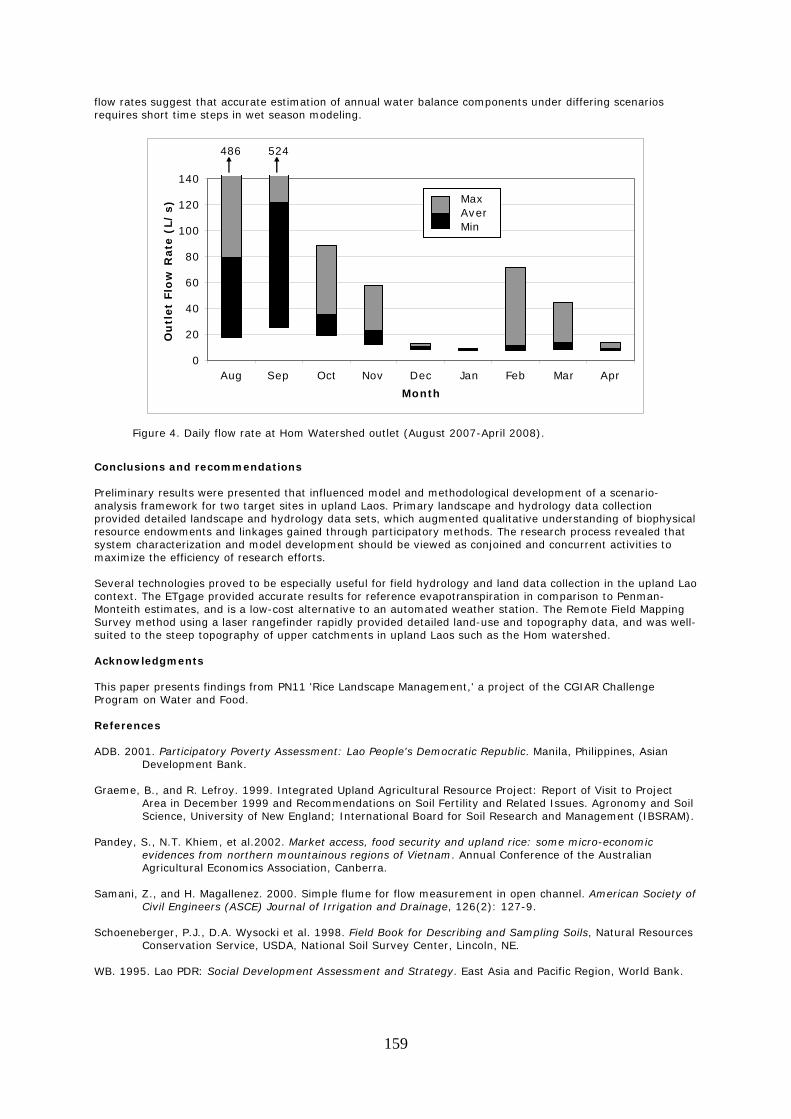
159
flow rates suggest that accurate estimation of annual water balance components under differing scenarios requires short time steps in wet season modeling.
Figure 4. Daily flow rate at Hom Watershed outlet (August 2007-April 2008).
Conclusions and recommendations Preliminary results were presented that influenced model and methodological development of a scenario-analysis framework for two target sites in upland Laos. Primary landscape and hydrology data collection provided detailed landscape and hydrology data sets, which augmented qualitative understanding of biophysical resource endowments and linkages gained through participatory methods. The research process revealed that system characterization and model development should be viewed as conjoined and concurrent activities to maximize the efficiency of research efforts. Several technologies proved to be especially useful for field hydrology and land data collection in the upland Lao context. The ETgage provided accurate results for reference evapotranspiration in comparison to Penman-Monteith estimates, and is a low-cost alternative to an automated weather station. The Remote Field Mapping Survey method using a laser rangefinder rapidly provided detailed land-use and topography data, and was well-suited to the steep topography of upper catchments in upland Laos such as the Hom watershed. Acknowledgments This paper presents findings from PN11 'Rice Landscape Management,' a project of the CGIAR Challenge Program on Water and Food. References ADB. 2001. Participatory Poverty Assessment: Lao People's Democratic Republic. Manila, Philippines, Asian
Development Bank. Graeme, B., and R. Lefroy. 1999. Integrated Upland Agricultural Resource Project: Report of Visit to Project
Area in December 1999 and Recommendations on Soil Fertility and Related Issues. Agronomy and Soil Science, University of New England; International Board for Soil Research and Management (IBSRAM).
Pandey, S., N.T. Khiem, et al.2002. Market access, food security and upland rice: some micro-economic
evidences from northern mountainous regions of Vietnam. Annual Conference of the Australian Agricultural Economics Association, Canberra.
Samani, Z., and H. Magallenez. 2000. Simple flume for flow measurement in open channel. American Society of
Civil Engineers (ASCE) Journal of Irrigation and Drainage, 126(2): 127-9. Schoeneberger, P.J., D.A. Wysocki et al. 1998. Field Book for Describing and Sampling Soils, Natural Resources
Conservation Service, USDA, National Soil Survey Center, Lincoln, NE. WB. 1995. Lao PDR: Social Development Assessment and Strategy. East Asia and Pacific Region, World Bank.
0
20
40
60
80
100
120
140
Aug Sep Oct Nov Dec Jan Feb Mar Apr
Month
Ou
tlet
Flo
w R
ate
(L/
s)
486 524
MaxAverMin
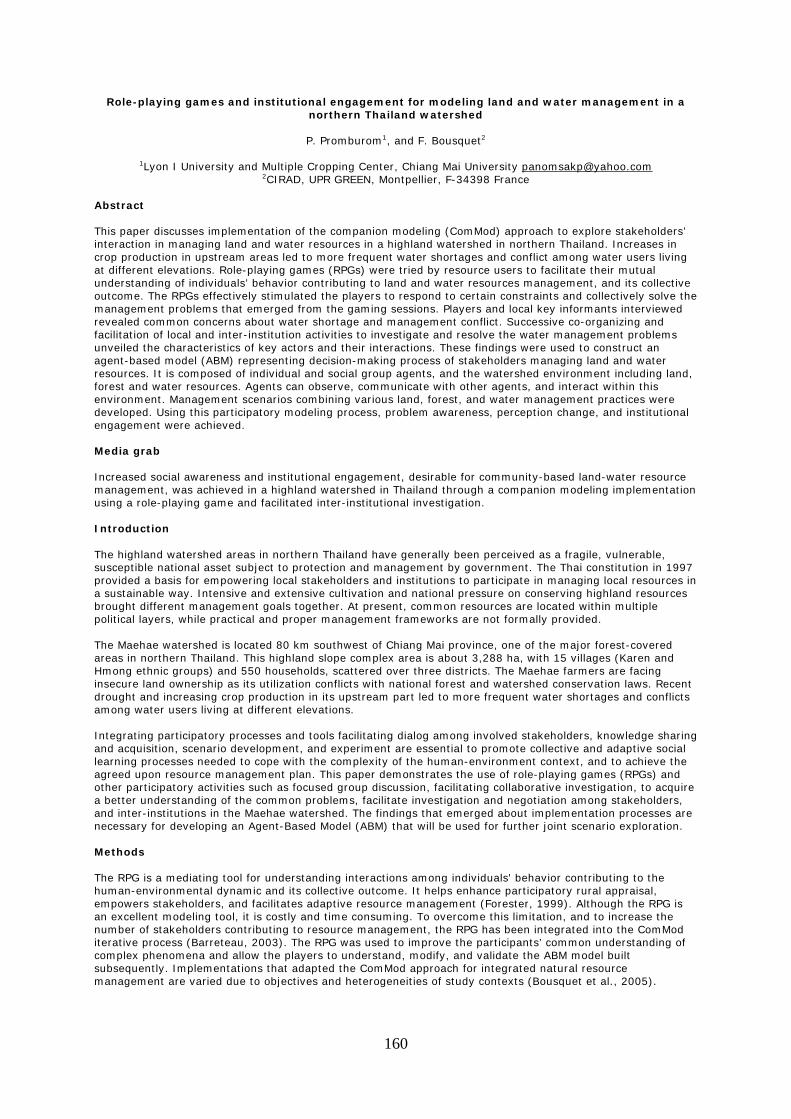
160
Role-playing games and institutional engagement for modeling land and water management in a northern Thailand watershed
P. Promburom1, and F. Bousquet2
1Lyon I University and Multiple Cropping Center, Chiang Mai University [email protected]
2CIRAD, UPR GREEN, Montpellier, F-34398 France Abstract This paper discusses implementation of the companion modeling (ComMod) approach to explore stakeholders’ interaction in managing land and water resources in a highland watershed in northern Thailand. Increases in crop production in upstream areas led to more frequent water shortages and conflict among water users living at different elevations. Role-playing games (RPGs) were tried by resource users to facilitate their mutual understanding of individuals’ behavior contributing to land and water resources management, and its collective outcome. The RPGs effectively stimulated the players to respond to certain constraints and collectively solve the management problems that emerged from the gaming sessions. Players and local key informants interviewed revealed common concerns about water shortage and management conflict. Successive co-organizing and facilitation of local and inter-institution activities to investigate and resolve the water management problems unveiled the characteristics of key actors and their interactions. These findings were used to construct an agent-based model (ABM) representing decision-making process of stakeholders managing land and water resources. It is composed of individual and social group agents, and the watershed environment including land, forest and water resources. Agents can observe, communicate with other agents, and interact within this environment. Management scenarios combining various land, forest, and water management practices were developed. Using this participatory modeling process, problem awareness, perception change, and institutional engagement were achieved. Media grab Increased social awareness and institutional engagement, desirable for community-based land-water resource management, was achieved in a highland watershed in Thailand through a companion modeling implementation using a role-playing game and facilitated inter-institutional investigation. Introduction The highland watershed areas in northern Thailand have generally been perceived as a fragile, vulnerable, susceptible national asset subject to protection and management by government. The Thai constitution in 1997 provided a basis for empowering local stakeholders and institutions to participate in managing local resources in a sustainable way. Intensive and extensive cultivation and national pressure on conserving highland resources brought different management goals together. At present, common resources are located within multiple political layers, while practical and proper management frameworks are not formally provided. The Maehae watershed is located 80 km southwest of Chiang Mai province, one of the major forest-covered areas in northern Thailand. This highland slope complex area is about 3,288 ha, with 15 villages (Karen and Hmong ethnic groups) and 550 households, scattered over three districts. The Maehae farmers are facing insecure land ownership as its utilization conflicts with national forest and watershed conservation laws. Recent drought and increasing crop production in its upstream part led to more frequent water shortages and conflicts among water users living at different elevations. Integrating participatory processes and tools facilitating dialog among involved stakeholders, knowledge sharing and acquisition, scenario development, and experiment are essential to promote collective and adaptive social learning processes needed to cope with the complexity of the human-environment context, and to achieve the agreed upon resource management plan. This paper demonstrates the use of role-playing games (RPGs) and other participatory activities such as focused group discussion, facilitating collaborative investigation, to acquire a better understanding of the common problems, facilitate investigation and negotiation among stakeholders, and inter-institutions in the Maehae watershed. The findings that emerged about implementation processes are necessary for developing an Agent-Based Model (ABM) that will be used for further joint scenario exploration. Methods The RPG is a mediating tool for understanding interactions among individuals' behavior contributing to the human-environmental dynamic and its collective outcome. It helps enhance participatory rural appraisal, empowers stakeholders, and facilitates adaptive resource management (Forester, 1999). Although the RPG is an excellent modeling tool, it is costly and time consuming. To overcome this limitation, and to increase the number of stakeholders contributing to resource management, the RPG has been integrated into the ComMod iterative process (Barreteau, 2003). The RPG was used to improve the participants’ common understanding of complex phenomena and allow the players to understand, modify, and validate the ABM model built subsequently. Implementations that adapted the ComMod approach for integrated natural resource management are varied due to objectives and heterogeneities of study contexts (Bousquet et al., 2005).
161
This paper illustrates the use of RPG to acquire knowledge on stakeholders’ behavior, and to enhance co-learning processes among them at the Maehae watershed regarding conflict in land and water resources use. Two RPG sessions were conducted to simulate and analyze resource management issues that evolved during the investigation, from land and forest issues to water-sharing problems among upstream and downstream water users. To solve this inter-community water-sharing problem, which could not be achieved by using the RPG only, a collective understanding and intervention at village and institution levels is required. Therefore, we co-organized and facilitated collective discussions and investigations, e.g. collective field survey, problem analysis workshop, negotiation and management scenarios development, with high levels of stakeholders’ participation and institutional engagement. The results and lessons learnt from the games and findings were analyzed and used in building an ABM. The successive steps of the evolving ComMod process implemented in Maehae are shown in Figure 1.
Figure 1. Successive steps and implementation level of the evolving ComMod processes used in Maehae, Chiang Mai Province, 2004-2007. Results The initial question of this research was: how are land and forest resources being accessed and managed under different interests of the Royal Forestry Department (RFD), which is responsible for watershed resource conservation, and the Maehae local people who are farming in the watershed? Compared to other watershed areas having similar socio-agricultural elements in Chiang Mai Province, the Maehae forest area was being well maintained (Ekasingh et al., 2001). Key informant interviews provided inconsistent information and unclear explanations on how this situation emerged. In early 2004, the two sessions of land and forest RPG were conducted to acquire a better understanding of the relationships and interactions between farmers and the local forester representing the RFD performing their respective roles of farming and protecting the forest area. The RPG and player interviews revealed a close relationship between Maehae people and the forester in trying to balance the needs of farmland and forest conservation. Maehae villages have been coordinating the local watershed resource conservation network ('village network') for more than 10 years. One of the main tasks is to manage and protect forest areas. Rules and regulations on access to forest resources were set up and agreed upon by all members. One objective was to lower the degree of forest law enforcement, since most of the local farmland falls into the reserved forest category. Villagers assume that the quality of their forest management performance would result in less strict law enforcement and more secure land-use rights for agriculture. Due to a severe drought in late 2004, the farm and forest land issue emerged because of increased water scarcity and conflicts between upstream and downstream farmers. Further investigations and field surveys were conducted to acquire knowledge on water uses and management practices. Different levels of water scarcity at various places in Maehae, and some conflicts, were found and reported. The water management problem has been discussed in the village network monthly meeting. The problem remained unresolved, however, either due to the severity of the problem or it was complicated and required a long process to reach a practical solution and agreement. In addition, social tensions tended to increase. An RPG session dealing with water management by farmers in upstream and downstream areas was conducted to clarify existing local water management rules, and to facilitate discussions toward managing certain water scarcity problems. The players found that the game based on the ‘first-come first served’ rule leading to unequal water distribution among users, represented the actual water management well. They wished that an agreement on water sharing could emerge as had happened during the game, but this was difficult to manage at the level of individual players, and collective action among communities was needed. Therefore co-organized collective activities facilitated by the research team were conducted to stimulate a collaborative investigation among villages. The Maehae villages’ leaders including committee members of sub-district (Tambon) Administration Organization (TAO, the official local organization established during Thai constitution period in 1990s) and a representative from Provincial Administration Organization (PAO) surveyed the upstream area where the conflicts occurred, and then discussed alternative management solutions. Four meetings and discussions were conducted at the village level to brainstorm and reformulate possible solutions. Information synthesized from these collective activities, overlaying of aerial photographs with other state-
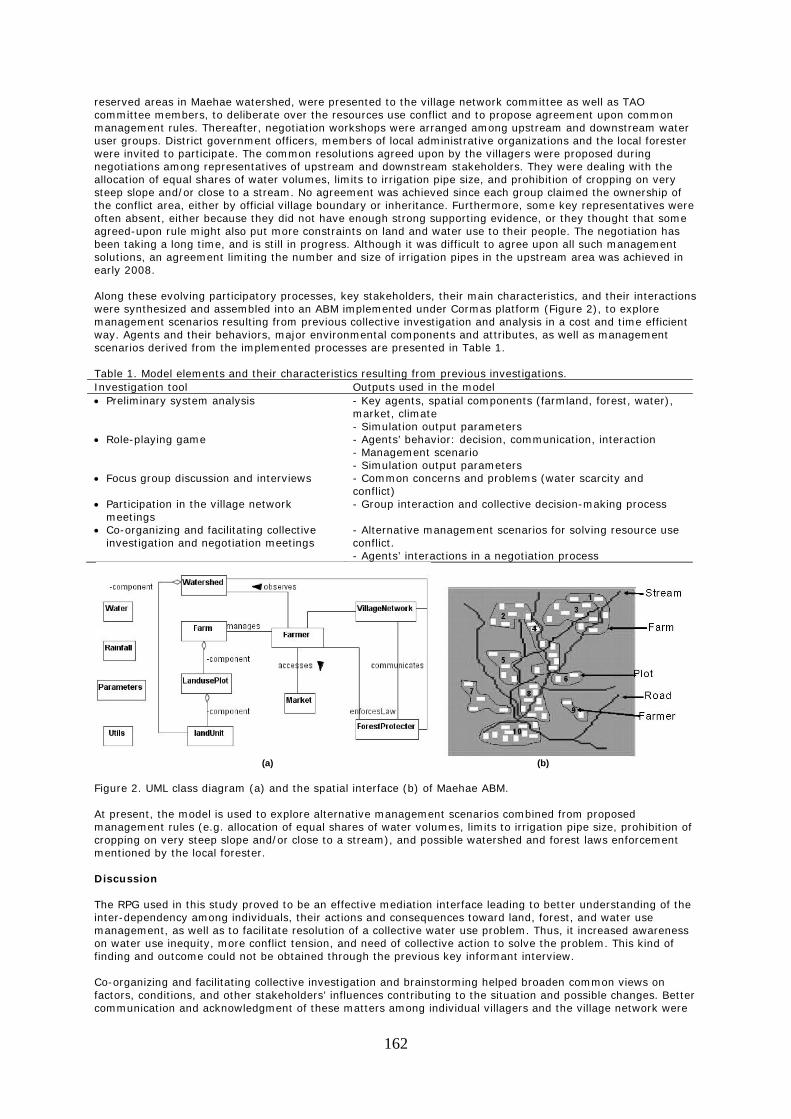
162
reserved areas in Maehae watershed, were presented to the village network committee as well as TAO committee members, to deliberate over the resources use conflict and to propose agreement upon common management rules. Thereafter, negotiation workshops were arranged among upstream and downstream water user groups. District government officers, members of local administrative organizations and the local forester were invited to participate. The common resolutions agreed upon by the villagers were proposed during negotiations among representatives of upstream and downstream stakeholders. They were dealing with the allocation of equal shares of water volumes, limits to irrigation pipe size, and prohibition of cropping on very steep slope and/or close to a stream. No agreement was achieved since each group claimed the ownership of the conflict area, either by official village boundary or inheritance. Furthermore, some key representatives were often absent, either because they did not have enough strong supporting evidence, or they thought that some agreed-upon rule might also put more constraints on land and water use to their people. The negotiation has been taking a long time, and is still in progress. Although it was difficult to agree upon all such management solutions, an agreement limiting the number and size of irrigation pipes in the upstream area was achieved in early 2008. Along these evolving participatory processes, key stakeholders, their main characteristics, and their interactions were synthesized and assembled into an ABM implemented under Cormas platform (Figure 2), to explore management scenarios resulting from previous collective investigation and analysis in a cost and time efficient way. Agents and their behaviors, major environmental components and attributes, as well as management scenarios derived from the implemented processes are presented in Table 1. Table 1. Model elements and their characteristics resulting from previous investigations. Investigation tool Outputs used in the model • Preliminary system analysis - Key agents, spatial components (farmland, forest, water),
market, climate - Simulation output parameters
• Role-playing game - Agents’ behavior: decision, communication, interaction - Management scenario - Simulation output parameters
• Focus group discussion and interviews - Common concerns and problems (water scarcity and conflict)
• Participation in the village network meetings
- Group interaction and collective decision-making process
• Co-organizing and facilitating collective investigation and negotiation meetings
- Alternative management scenarios for solving resource use conflict. - Agents’ interactions in a negotiation process
(a) (b) Figure 2. UML class diagram (a) and the spatial interface (b) of Maehae ABM. At present, the model is used to explore alternative management scenarios combined from proposed management rules (e.g. allocation of equal shares of water volumes, limits to irrigation pipe size, prohibition of cropping on very steep slope and/or close to a stream), and possible watershed and forest laws enforcement mentioned by the local forester. Discussion The RPG used in this study proved to be an effective mediation interface leading to better understanding of the inter-dependency among individuals, their actions and consequences toward land, forest, and water use management, as well as to facilitate resolution of a collective water use problem. Thus, it increased awareness on water use inequity, more conflict tension, and need of collective action to solve the problem. This kind of finding and outcome could not be obtained through the previous key informant interview. Co-organizing and facilitating collective investigation and brainstorming helped broaden common views on factors, conditions, and other stakeholders’ influences contributing to the situation and possible changes. Better communication and acknowledgment of these matters among individual villagers and the village network were
163
required to create awareness and better collaboration in seeking common resolutions. Because of their lack of legitimacy to implement such formulated resolutions, the village leaders managed to incorporate TAO, PAO, and district government officers into subsequent deliberative and negotiation processes. Increased numbers of stakeholders, however, required more time and effort in organizing such collaborative workshops. The resource use problem could be solved by applying simple management rules such as equal water sharing suggested in the water RPG. This kind of scenario does not require ABM simulation to quantify amounts of water for each user, but it raised the questions of how to formulate, agree upon, and implement such a rule. Therefore, a collective intervention at the community and institutional level is needed. During these collective processes, most of the activities and outcomes in this case study were determined by the stakeholders and some local circumstances (e.g. a severe drought), ensuring a high level of stakeholder participation, promoting social learning, awareness, and engagement. At present, the developed AMB can be used to explore other suggested management rules. Some of these, such as cropping on steep slopes and near a stream, require model simulation to provide the quantitative outputs for further negotiation and decision-making. Such collaborative simulations will be run when the proposed scenarios are agreed upon by all the concerned stakeholders. Conclusions and recommendations This paper presents an application of the ComMod approach to promote mutual understanding and support collective water management in a complex social-ecology system. The implementation incorporates individuals’ participation and linkages with institutions at a higher level of organization. The RPG was effective for knowledge acquisition and perception exchange among individuals, while at the inter-institutional level, awareness and change in perception and action evolved through institutional engagement mechanisms. The ownership of the process initiated by researchers was gradually shifted to local stakeholders. Although management rules were collectively proposed and one was agreed upon, and all can be further assessed by the ABM, however, supportive community-based resource management policy is crucially needed to legitimize this valuable outcome, and to enhance and ensure local participation for sustainable water resource management in the future. Acknowledgments This paper presents findings from PN25 'Companion modeling for resilient water management,' a project of the CGIAR Challenge Program on Water and Food. The authors would like to acknowledge the financial support received from the project, also the Ford Foundation who provided funding support at the beginning of this study. References Barreteau, O., 2003. Our Companion Modeling Approach. Journal of Artificial Societies and Social Simulation 6
(1). <http://jasss.soc.surrey.ac.uk/6/2/1.html> Bousquet, F., G. Trébuil, S. Boissau, C. Baron, P. d'Aquino, and J.C. Castella. 2005. Knowledge integration for
participatory land management: the use of multi-agent simulations and a companion modeling approach. In: A. Neef (ed.) Participatory Approaches for Sustainable Land Use in Southeast Asia. White Lotus, Bangkok, pp. 291-310.
Ekasingh, M,, C. Samranpong, and W. Weerajit. 2001. Land use and cover changes detection in Maehae and
Nong Hoi. Annual Academic Conference 2001, Chiang Mai, Thailand, Royal Project Foundation. p 286-307.
Forester, J. 1999. The Deliberative Practitioner: Encouraging Participatory Planning Processes. MIT Press,
Cambridge, MA.
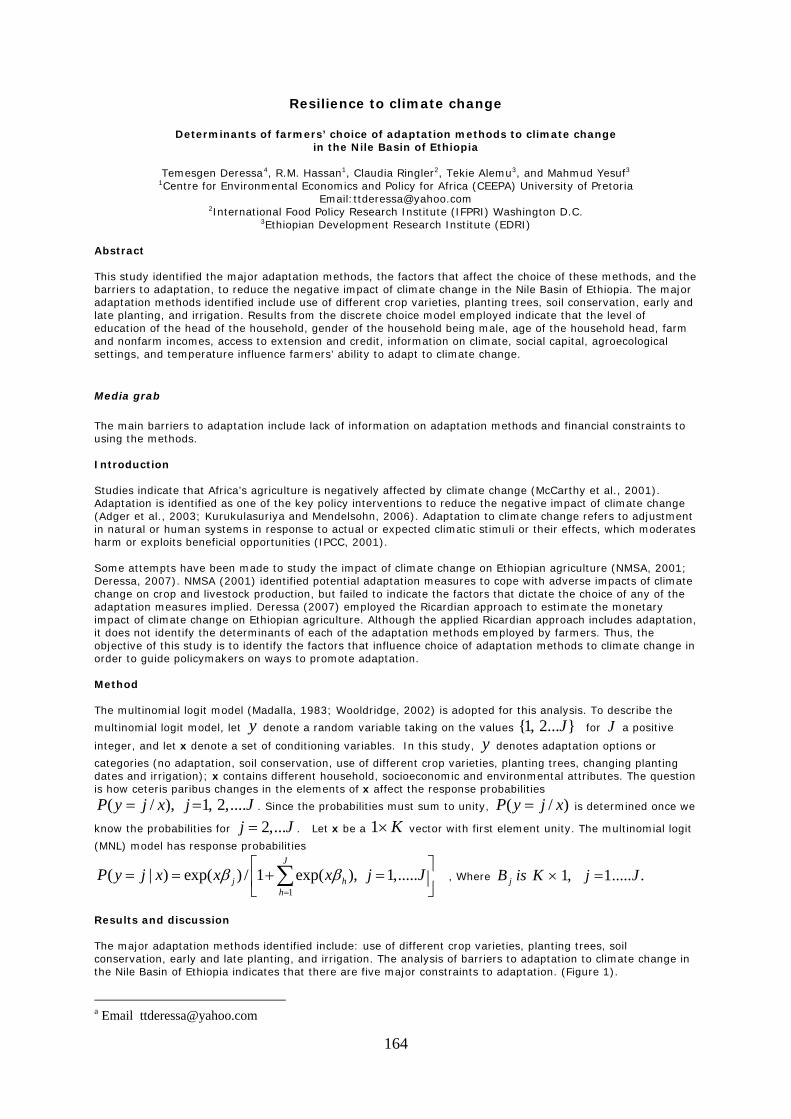
164
Resilience to climate change
Determinants of farmers’ choice of adaptation methods to climate change in the Nile Basin of Ethiopia
Temesgen Deressa4, R.M. Hassan1, Claudia Ringler2, Tekie Alemu3, and Mahmud Yesuf3
1Centre for Environmental Economics and Policy for Africa (CEEPA) University of Pretoria Email:[email protected]
2International Food Policy Research Institute (IFPRI) Washington D.C. 3Ethiopian Development Research Institute (EDRI)
Abstract This study identified the major adaptation methods, the factors that affect the choice of these methods, and the barriers to adaptation, to reduce the negative impact of climate change in the Nile Basin of Ethiopia. The major adaptation methods identified include use of different crop varieties, planting trees, soil conservation, early and late planting, and irrigation. Results from the discrete choice model employed indicate that the level of education of the head of the household, gender of the household being male, age of the household head, farm and nonfarm incomes, access to extension and credit, information on climate, social capital, agroecological settings, and temperature influence farmers’ ability to adapt to climate change.
Media grab
The main barriers to adaptation include lack of information on adaptation methods and financial constraints to using the methods. Introduction Studies indicate that Africa’s agriculture is negatively affected by climate change (McCarthy et al., 2001). Adaptation is identified as one of the key policy interventions to reduce the negative impact of climate change (Adger et al., 2003; Kurukulasuriya and Mendelsohn, 2006). Adaptation to climate change refers to adjustment in natural or human systems in response to actual or expected climatic stimuli or their effects, which moderates harm or exploits beneficial opportunities (IPCC, 2001). Some attempts have been made to study the impact of climate change on Ethiopian agriculture (NMSA, 2001; Deressa, 2007). NMSA (2001) identified potential adaptation measures to cope with adverse impacts of climate change on crop and livestock production, but failed to indicate the factors that dictate the choice of any of the adaptation measures implied. Deressa (2007) employed the Ricardian approach to estimate the monetary impact of climate change on Ethiopian agriculture. Although the applied Ricardian approach includes adaptation, it does not identify the determinants of each of the adaptation methods employed by farmers. Thus, the objective of this study is to identify the factors that influence choice of adaptation methods to climate change in order to guide policymakers on ways to promote adaptation. Method The multinomial logit model (Madalla, 1983; Wooldridge, 2002) is adopted for this analysis. To describe the
multinomial logit model, let y denote a random variable taking on the values }...2,1{ J for J a positive
integer, and let x denote a set of conditioning variables. In this study, y denotes adaptation options or
categories (no adaptation, soil conservation, use of different crop varieties, planting trees, changing planting dates and irrigation); x contains different household, socioeconomic and environmental attributes. The question is how ceteris paribus changes in the elements of x affect the response probabilities
JjxjyP ....,2,1),/( == . Since the probabilities must sum to unity, )/( xjyP = is determined once we
know the probabilities for Jj ...,2= . Let x be a K×1 vector with first element unity. The multinomial logit
(MNL) model has response probabilities
1( | ) exp( ) / 1 exp( ), 1,.....
J
j hh
P y j x x x j Jβ β=
⎡ ⎤= = + =⎢ ⎥
⎣ ⎦∑ , Where ......1,1 JjKisB j =×
Results and discussion The major adaptation methods identified include: use of different crop varieties, planting trees, soil conservation, early and late planting, and irrigation. The analysis of barriers to adaptation to climate change in the Nile Basin of Ethiopia indicates that there are five major constraints to adaptation. (Figure 1).
a Email [email protected]
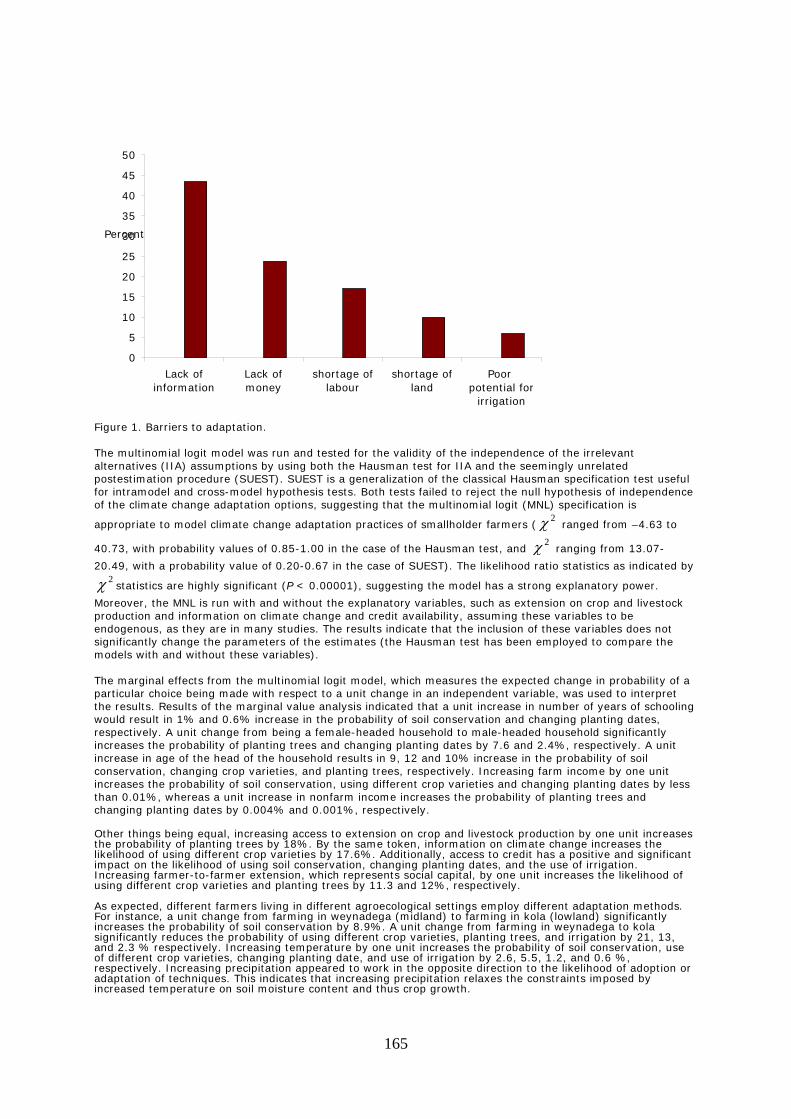
165
Figure 1. Barriers to adaptation. The multinomial logit model was run and tested for the validity of the independence of the irrelevant alternatives (IIA) assumptions by using both the Hausman test for IIA and the seemingly unrelated postestimation procedure (SUEST). SUEST is a generalization of the classical Hausman specification test useful for intramodel and cross-model hypothesis tests. Both tests failed to reject the null hypothesis of independence of the climate change adaptation options, suggesting that the multinomial logit (MNL) specification is
appropriate to model climate change adaptation practices of smallholder farmers (2χ ranged from –4.63 to
40.73, with probability values of 0.85-1.00 in the case of the Hausman test, and 2χ ranging from 13.07-
20.49, with a probability value of 0.20-0.67 in the case of SUEST). The likelihood ratio statistics as indicated by 2χ statistics are highly significant (P < 0.00001), suggesting the model has a strong explanatory power.
Moreover, the MNL is run with and without the explanatory variables, such as extension on crop and livestock production and information on climate change and credit availability, assuming these variables to be endogenous, as they are in many studies. The results indicate that the inclusion of these variables does not significantly change the parameters of the estimates (the Hausman test has been employed to compare the models with and without these variables). The marginal effects from the multinomial logit model, which measures the expected change in probability of a particular choice being made with respect to a unit change in an independent variable, was used to interpret the results. Results of the marginal value analysis indicated that a unit increase in number of years of schooling would result in 1% and 0.6% increase in the probability of soil conservation and changing planting dates, respectively. A unit change from being a female-headed household to male-headed household significantly increases the probability of planting trees and changing planting dates by 7.6 and 2.4%, respectively. A unit increase in age of the head of the household results in 9, 12 and 10% increase in the probability of soil conservation, changing crop varieties, and planting trees, respectively. Increasing farm income by one unit increases the probability of soil conservation, using different crop varieties and changing planting dates by less than 0.01%, whereas a unit increase in nonfarm income increases the probability of planting trees and changing planting dates by 0.004% and 0.001%, respectively. Other things being equal, increasing access to extension on crop and livestock production by one unit increases the probability of planting trees by 18%. By the same token, information on climate change increases the likelihood of using different crop varieties by 17.6%. Additionally, access to credit has a positive and significant impact on the likelihood of using soil conservation, changing planting dates, and the use of irrigation. Increasing farmer-to-farmer extension, which represents social capital, by one unit increases the likelihood of using different crop varieties and planting trees by 11.3 and 12%, respectively. As expected, different farmers living in different agroecological settings employ different adaptation methods. For instance, a unit change from farming in weynadega (midland) to farming in kola (lowland) significantly increases the probability of soil conservation by 8.9%. A unit change from farming in weynadega to kola significantly reduces the probability of using different crop varieties, planting trees, and irrigation by 21, 13, and 2.3 % respectively. Increasing temperature by one unit increases the probability of soil conservation, use of different crop varieties, changing planting date, and use of irrigation by 2.6, 5.5, 1.2, and 0.6 %, respectively. Increasing precipitation appeared to work in the opposite direction to the likelihood of adoption or adaptation of techniques. This indicates that increasing precipitation relaxes the constraints imposed by increased temperature on soil moisture content and thus crop growth.
0
5
10
15
20
25
30
35
40
45
50
Lack of information
Lack of money
shortage oflabour
shortage ofland
Poor potential for
irrigation
Percent
166
Conclusions and recommendations Farmers indicated that they adapted to climate change by using different methods, and the major ones were included in this study. Those who did not use any of the methods considered under this study described lack of information on adaptation methods and lack of money as the major constraints to adaptation. The results from the marginal analysis indicate that most of the household variables, institutional factors (availability of information), social capital, agroecological features, and temperature influence adaptation to climate change in the Nile Basin of Ethiopia. Based on the analysis of constraints to adaptation and factors that dictate adaptation to climate change, different policy options could be suggested. These policy options include: awareness creation on climate change and adaptation methods, facilitating the availability of credit, investment on yield-increasing technology packages to increase farm income, creating opportunities for off-farm employment, research on use of new crop varieties and livestock species that are more suited to drier conditions, encourage informal social networks, and investment in irrigation. Acknowledgments This paper presents findings from 'Analyzing the Determinants of Farmers’ Choice of Adaptation Methods and Perceptions of Climate Change in the Nile Basin of Ethiopia,' a project of the CGIAR Challenge Program on Water and Food, supported by the German Government. The authors would like to thank Wisdom Akpalu, Elizabeth Bryan, and Edward Kato for reviewing this report and giving constructive comments. Tim Sulser and Minale Kasie contributed to this research by participating in the pretesting stage and adjusting the questionnaire accordingly. References Adger, W.N., S. Huq, K. Brown, D. Conway, and M. Hulme. 2003. Adaptation to climate change in the
developing world. Progress in Development Studies, 3: 179-95. Deressa, T. 2007. Measuring the Economic Impact of Climate Change on Ethiopian Agriculture: Ricardian
Approach. World Bank Policy Research Paper No. 4342. World Bank, Washington, D.C. IPCC (Intergovernmental Panel on Climate Change). 2001. Climate Change: The Scientific Basis.
http://www.ipcc.ch/ Kurukulasuriya, P., and R. Mendelsohn. 2006. A Ricardian Analysis of the Impact of Climate Change on African
Crop Land. CEEPA Discussion Paper No. 8. Centre for Environmental Economics and Policy in Africa. Pretoria, South Africa: University of Pretoria.
Madalla, G. 1983. Limited Dependent and Qualitative Variables in Econometrics. Cambridge University Press,
New York. McCarthy J, O.F. Canziani, N.A. Leary, D.J. Dokken, and C. White (eds.) 2001. Climate Change 2001: Impacts,
Adaptation and Vulnerability. Contribution of Working Group II to the Third Assessment Report of the Intergovernmental Panel on Climate Change. Cambridge: Cambridge University Press.
National Meteorological Services Agency (NMSA). 2001. Initial National Communication of Ethiopia to the United
Nations Framework Convention on Climate Change (UNFCCC). Addis Ababa, Ethiopia. Wooldridge, J.M. 2002. Econometric Analysis of Cross Section and Panel Data. The MIT Press, Cambridge,
Massachusetts.
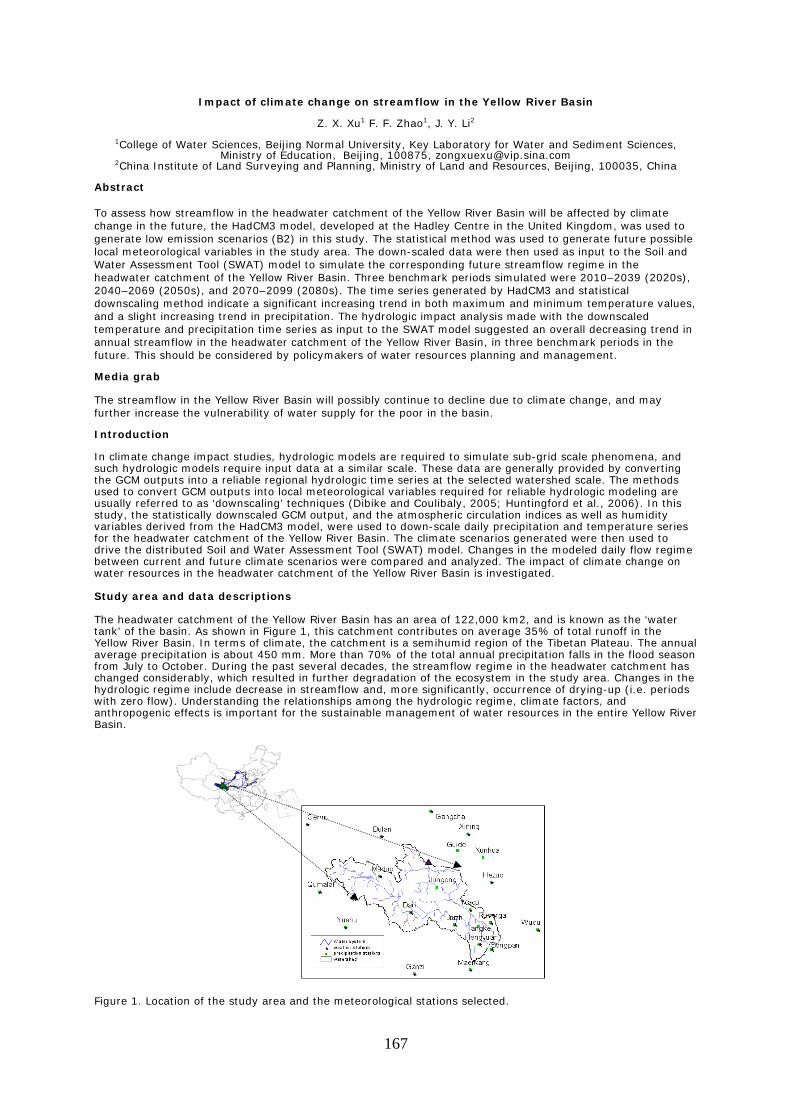
167
Impact of climate change on streamflow in the Yellow River Basin
Z. X. Xu1 F. F. Zhao1, J. Y. Li2
1College of Water Sciences, Beijing Normal University, Key Laboratory for Water and Sediment Sciences, Ministry of Education,Beijing, 100875, [email protected]
2China Institute of Land Surveying and Planning, Ministry of Land and Resources, Beijing, 100035, China Abstract To assess how streamflow in the headwater catchment of the Yellow River Basin will be affected by climate change in the future, the HadCM3 model, developed at the Hadley Centre in the United Kingdom, was used to generate low emission scenarios (B2) in this study. The statistical method was used to generate future possible local meteorological variables in the study area. The down-scaled data were then used as input to the Soil and Water Assessment Tool (SWAT) model to simulate the corresponding future streamflow regime in the headwater catchment of the Yellow River Basin. Three benchmark periods simulated were 2010–2039 (2020s), 2040–2069 (2050s), and 2070–2099 (2080s). The time series generated by HadCM3 and statistical downscaling method indicate a significant increasing trend in both maximum and minimum temperature values, and a slight increasing trend in precipitation. The hydrologic impact analysis made with the downscaled temperature and precipitation time series as input to the SWAT model suggested an overall decreasing trend in annual streamflow in the headwater catchment of the Yellow River Basin, in three benchmark periods in the future. This should be considered by policymakers of water resources planning and management. Media grab The streamflow in the Yellow River Basin will possibly continue to decline due to climate change, and may further increase the vulnerability of water supply for the poor in the basin. Introduction In climate change impact studies, hydrologic models are required to simulate sub-grid scale phenomena, and such hydrologic models require input data at a similar scale. These data are generally provided by converting the GCM outputs into a reliable regional hydrologic time series at the selected watershed scale. The methods used to convert GCM outputs into local meteorological variables required for reliable hydrologic modeling are usually referred to as ‘downscaling’ techniques (Dibike and Coulibaly, 2005; Huntingford et al., 2006). In this study, the statistically downscaled GCM output, and the atmospheric circulation indices as well as humidity variables derived from the HadCM3 model, were used to down-scale daily precipitation and temperature series for the headwater catchment of the Yellow River Basin. The climate scenarios generated were then used to drive the distributed Soil and Water Assessment Tool (SWAT) model. Changes in the modeled daily flow regime between current and future climate scenarios were compared and analyzed. The impact of climate change on water resources in the headwater catchment of the Yellow River Basin is investigated. Study area and data descriptions The headwater catchment of the Yellow River Basin has an area of 122,000 km2, and is known as the ‘water tank’ of the basin. As shown in Figure 1, this catchment contributes on average 35% of total runoff in the Yellow River Basin. In terms of climate, the catchment is a semihumid region of the Tibetan Plateau. The annual average precipitation is about 450 mm. More than 70% of the total annual precipitation falls in the flood season from July to October. During the past several decades, the streamflow regime in the headwater catchment has changed considerably, which resulted in further degradation of the ecosystem in the study area. Changes in the hydrologic regime include decrease in streamflow and, more significantly, occurrence of drying-up (i.e. periods with zero flow). Understanding the relationships among the hydrologic regime, climate factors, and anthropogenic effects is important for the sustainable management of water resources in the entire Yellow River Basin. Figure 1. Location of the study area and the meteorological stations selected.
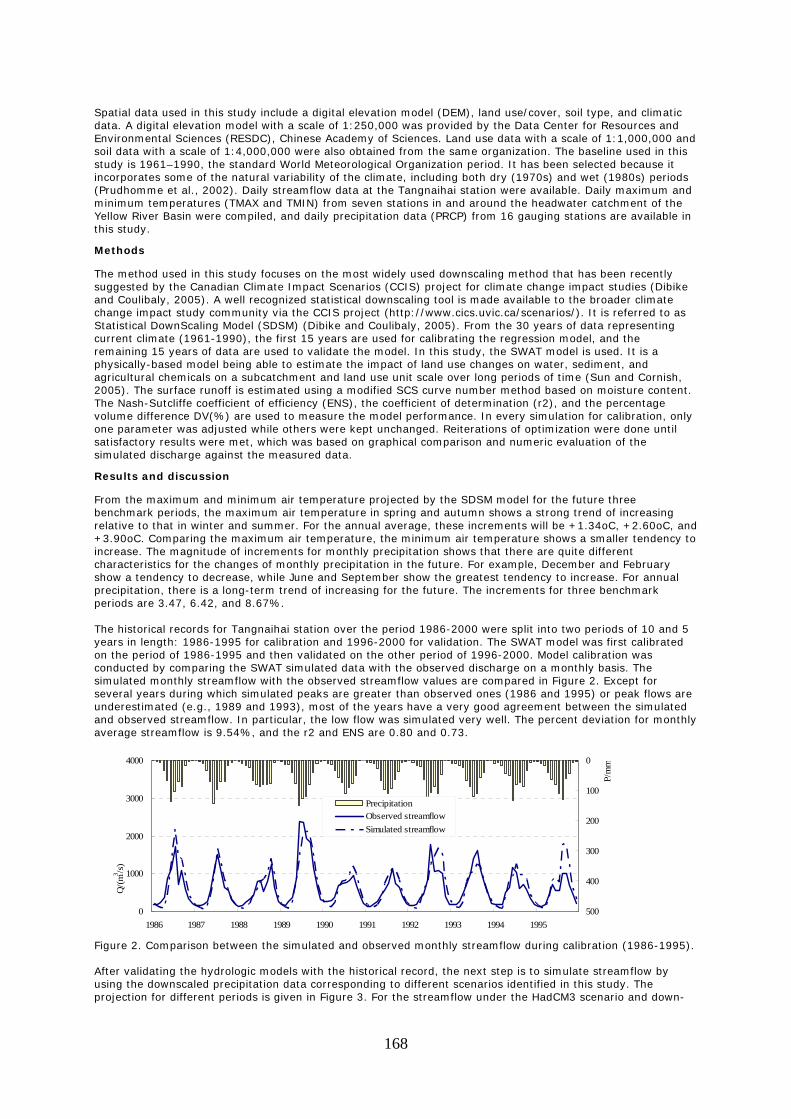
168
Spatial data used in this study include a digital elevation model (DEM), land use/cover, soil type, and climatic data. A digital elevation model with a scale of 1:250,000 was provided by the Data Center for Resources and Environmental Sciences (RESDC), Chinese Academy of Sciences. Land use data with a scale of 1:1,000,000 and soil data with a scale of 1:4,000,000 were also obtained from the same organization. The baseline used in this study is 1961–1990, the standard World Meteorological Organization period. It has been selected because it incorporates some of the natural variability of the climate, including both dry (1970s) and wet (1980s) periods (Prudhomme et al., 2002). Daily streamflow data at the Tangnaihai station were available. Daily maximum and minimum temperatures (TMAX and TMIN) from seven stations in and around the headwater catchment of the Yellow River Basin were compiled, and daily precipitation data (PRCP) from 16 gauging stations are available in this study. Methods The method used in this study focuses on the most widely used downscaling method that has been recently suggested by the Canadian Climate Impact Scenarios (CCIS) project for climate change impact studies (Dibike and Coulibaly, 2005). A well recognized statistical downscaling tool is made available to the broader climate change impact study community via the CCIS project (http://www.cics.uvic.ca/scenarios/). It is referred to as Statistical DownScaling Model (SDSM) (Dibike and Coulibaly, 2005). From the 30 years of data representing current climate (1961-1990), the first 15 years are used for calibrating the regression model, and the remaining 15 years of data are used to validate the model. In this study, the SWAT model is used. It is a physically-based model being able to estimate the impact of land use changes on water, sediment, and agricultural chemicals on a subcatchment and land use unit scale over long periods of time (Sun and Cornish, 2005). The surface runoff is estimated using a modified SCS curve number method based on moisture content. The Nash-Sutcliffe coefficient of efficiency (ENS), the coefficient of determination (r2), and the percentage volume difference DV(%) are used to measure the model performance. In every simulation for calibration, only one parameter was adjusted while others were kept unchanged. Reiterations of optimization were done until satisfactory results were met, which was based on graphical comparison and numeric evaluation of the simulated discharge against the measured data. Results and discussion From the maximum and minimum air temperature projected by the SDSM model for the future three benchmark periods, the maximum air temperature in spring and autumn shows a strong trend of increasing relative to that in winter and summer. For the annual average, these increments will be +1.34oC, +2.60oC, and +3.90oC. Comparing the maximum air temperature, the minimum air temperature shows a smaller tendency to increase. The magnitude of increments for monthly precipitation shows that there are quite different characteristics for the changes of monthly precipitation in the future. For example, December and February show a tendency to decrease, while June and September show the greatest tendency to increase. For annual precipitation, there is a long-term trend of increasing for the future. The increments for three benchmark periods are 3.47, 6.42, and 8.67%. The historical records for Tangnaihai station over the period 1986-2000 were split into two periods of 10 and 5 years in length: 1986-1995 for calibration and 1996-2000 for validation. The SWAT model was first calibrated on the period of 1986-1995 and then validated on the other period of 1996-2000. Model calibration was conducted by comparing the SWAT simulated data with the observed discharge on a monthly basis. The simulated monthly streamflow with the observed streamflow values are compared in Figure 2. Except for several years during which simulated peaks are greater than observed ones (1986 and 1995) or peak flows are underestimated (e.g., 1989 and 1993), most of the years have a very good agreement between the simulated and observed streamflow. In particular, the low flow was simulated very well. The percent deviation for monthly average streamflow is 9.54%, and the r2 and ENS are 0.80 and 0.73. Figure 2. Comparison between the simulated and observed monthly streamflow during calibration (1986-1995). After validating the hydrologic models with the historical record, the next step is to simulate streamflow by using the downscaled precipitation data corresponding to different scenarios identified in this study. The projection for different periods is given in Figure 3. For the streamflow under the HadCM3 scenario and down-
0
1000
2000
3000
4000
1986 1987 1988 1989 1990 1991 1992 1993 1994 1995
Q/(m
3 /s)
0
100
200
300
400
500
P/m
m
PrecipitationObserved streamflowSimulated streamflow
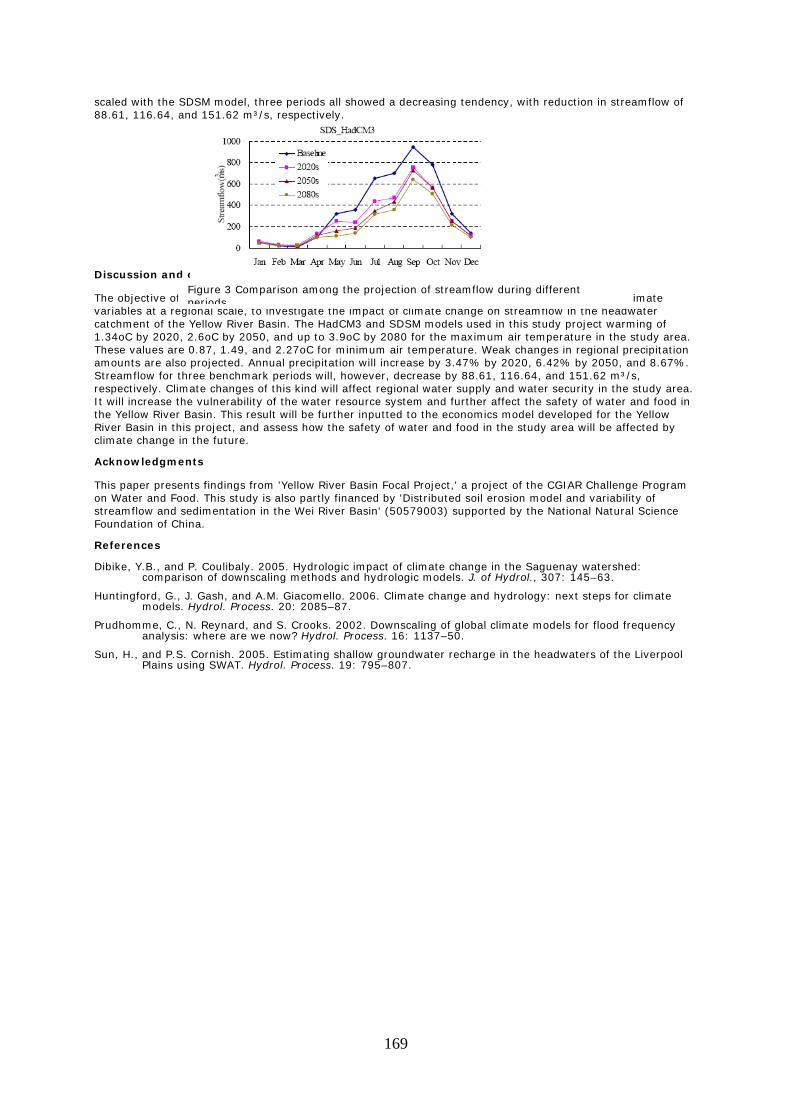
169
scaled with the SDSM model, three periods all showed a decreasing tendency, with reduction in streamflow of 88.61, 116.64, and 151.62 m³/s, respectively. Discussion and conclusions The objective of this study is to downscale large-scale atmospheric variables from GCM outputs to climate variables at a regional scale, to investigate the impact of climate change on streamflow in the headwater catchment of the Yellow River Basin. The HadCM3 and SDSM models used in this study project warming of 1.34oC by 2020, 2.6oC by 2050, and up to 3.9oC by 2080 for the maximum air temperature in the study area. These values are 0.87, 1.49, and 2.27oC for minimum air temperature. Weak changes in regional precipitation amounts are also projected. Annual precipitation will increase by 3.47% by 2020, 6.42% by 2050, and 8.67%. Streamflow for three benchmark periods will, however, decrease by 88.61, 116.64, and 151.62 m³/s, respectively. Climate changes of this kind will affect regional water supply and water security in the study area. It will increase the vulnerability of the water resource system and further affect the safety of water and food in the Yellow River Basin. This result will be further inputted to the economics model developed for the Yellow River Basin in this project, and assess how the safety of water and food in the study area will be affected by climate change in the future. Acknowledgments This paper presents findings from 'Yellow River Basin Focal Project,' a project of the CGIAR Challenge Program on Water and Food. This study is also partly financed by 'Distributed soil erosion model and variability of streamflow and sedimentation in the Wei River Basin' (50579003) supported by the National Natural Science Foundation of China. References Dibike, Y.B., and P. Coulibaly. 2005. Hydrologic impact of climate change in the Saguenay watershed:
comparison of downscaling methods and hydrologic models. J. of Hydrol., 307: 145–63.
Huntingford, G., J. Gash, and A.M. Giacomello. 2006. Climate change and hydrology: next steps for climate models. Hydrol. Process. 20: 2085–87.
Prudhomme, C., N. Reynard, and S. Crooks. 2002. Downscaling of global climate models for flood frequency analysis: where are we now? Hydrol. Process. 16: 1137–50.
Sun, H., and P.S. Cornish. 2005. Estimating shallow groundwater recharge in the headwaters of the Liverpool Plains using SWAT. Hydrol. Process. 19: 795–807.
Figure 3 Comparison among the projection of streamflow during different periods
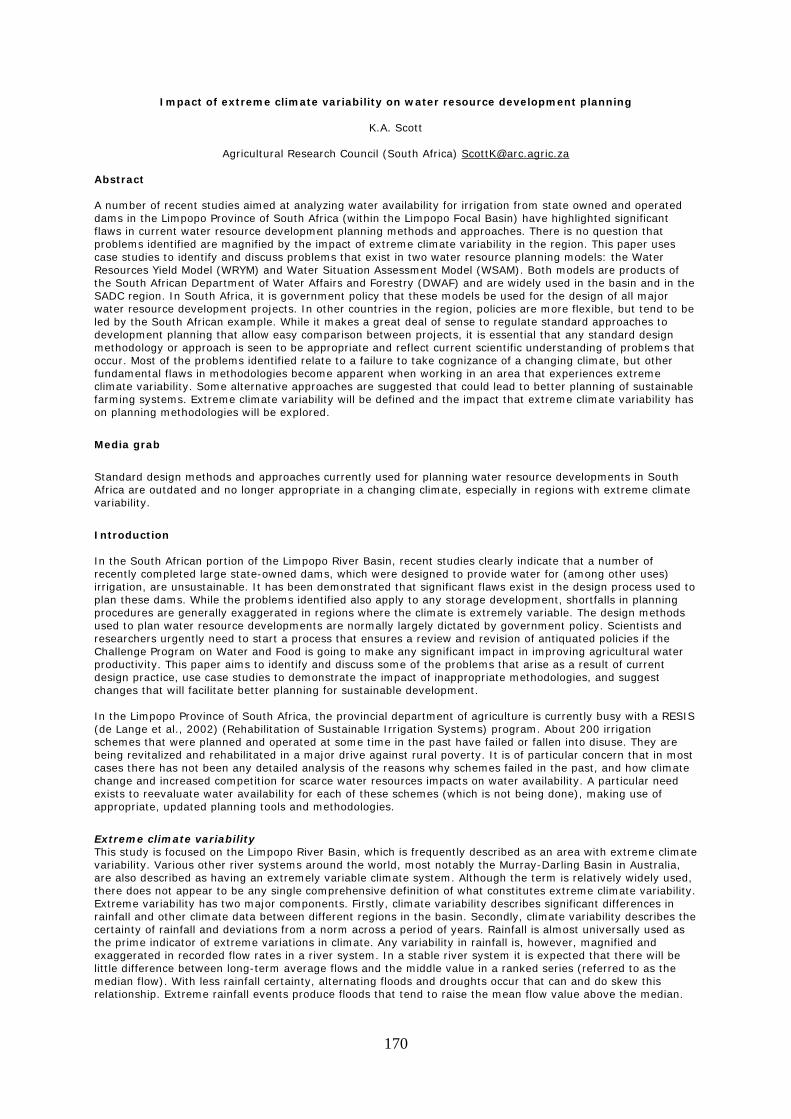
170
Impact of extreme climate variability on water resource development planning
K.A. Scott
Agricultural Research Council (South Africa) [email protected]
Abstract A number of recent studies aimed at analyzing water availability for irrigation from state owned and operated dams in the Limpopo Province of South Africa (within the Limpopo Focal Basin) have highlighted significant flaws in current water resource development planning methods and approaches. There is no question that problems identified are magnified by the impact of extreme climate variability in the region. This paper uses case studies to identify and discuss problems that exist in two water resource planning models: the Water Resources Yield Model (WRYM) and Water Situation Assessment Model (WSAM). Both models are products of the South African Department of Water Affairs and Forestry (DWAF) and are widely used in the basin and in the SADC region. In South Africa, it is government policy that these models be used for the design of all major water resource development projects. In other countries in the region, policies are more flexible, but tend to be led by the South African example. While it makes a great deal of sense to regulate standard approaches to development planning that allow easy comparison between projects, it is essential that any standard design methodology or approach is seen to be appropriate and reflect current scientific understanding of problems that occur. Most of the problems identified relate to a failure to take cognizance of a changing climate, but other fundamental flaws in methodologies become apparent when working in an area that experiences extreme climate variability. Some alternative approaches are suggested that could lead to better planning of sustainable farming systems. Extreme climate variability will be defined and the impact that extreme climate variability has on planning methodologies will be explored.
Media grab
Standard design methods and approaches currently used for planning water resource developments in South Africa are outdated and no longer appropriate in a changing climate, especially in regions with extreme climate variability.
Introduction In the South African portion of the Limpopo River Basin, recent studies clearly indicate that a number of recently completed large state-owned dams, which were designed to provide water for (among other uses) irrigation, are unsustainable. It has been demonstrated that significant flaws exist in the design process used to plan these dams. While the problems identified also apply to any storage development, shortfalls in planning procedures are generally exaggerated in regions where the climate is extremely variable. The design methods used to plan water resource developments are normally largely dictated by government policy. Scientists and researchers urgently need to start a process that ensures a review and revision of antiquated policies if the Challenge Program on Water and Food is going to make any significant impact in improving agricultural water productivity. This paper aims to identify and discuss some of the problems that arise as a result of current design practice, use case studies to demonstrate the impact of inappropriate methodologies, and suggest changes that will facilitate better planning for sustainable development. In the Limpopo Province of South Africa, the provincial department of agriculture is currently busy with a RESIS (de Lange et al., 2002) (Rehabilitation of Sustainable Irrigation Systems) program. About 200 irrigation schemes that were planned and operated at some time in the past have failed or fallen into disuse. They are being revitalized and rehabilitated in a major drive against rural poverty. It is of particular concern that in most cases there has not been any detailed analysis of the reasons why schemes failed in the past, and how climate change and increased competition for scarce water resources impacts on water availability. A particular need exists to reevaluate water availability for each of these schemes (which is not being done), making use of appropriate, updated planning tools and methodologies.
Extreme climate variability This study is focused on the Limpopo River Basin, which is frequently described as an area with extreme climate variability. Various other river systems around the world, most notably the Murray-Darling Basin in Australia, are also described as having an extremely variable climate system. Although the term is relatively widely used, there does not appear to be any single comprehensive definition of what constitutes extreme climate variability. Extreme variability has two major components. Firstly, climate variability describes significant differences in rainfall and other climate data between different regions in the basin. Secondly, climate variability describes the certainty of rainfall and deviations from a norm across a period of years. Rainfall is almost universally used as the prime indicator of extreme variations in climate. Any variability in rainfall is, however, magnified and exaggerated in recorded flow rates in a river system. In a stable river system it is expected that there will be little difference between long-term average flows and the middle value in a ranked series (referred to as the median flow). With less rainfall certainty, alternating floods and droughts occur that can and do skew this relationship. Extreme rainfall events produce floods that tend to raise the mean flow value above the median.
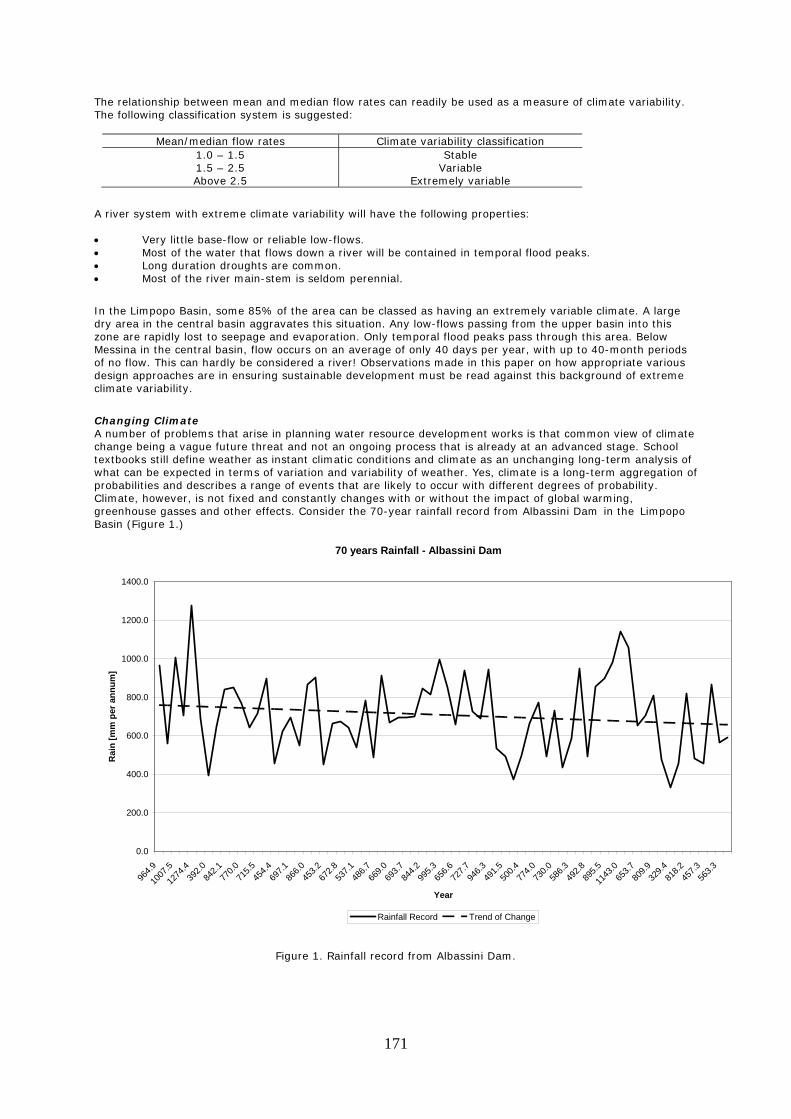
171
The relationship between mean and median flow rates can readily be used as a measure of climate variability. The following classification system is suggested:
Mean/median flow rates Climate variability classification 1.0 – 1.5 Stable 1.5 – 2.5 Variable Above 2.5 Extremely variable
A river system with extreme climate variability will have the following properties: • Very little base-flow or reliable low-flows. • Most of the water that flows down a river will be contained in temporal flood peaks. • Long duration droughts are common. • Most of the river main-stem is seldom perennial.
In the Limpopo Basin, some 85% of the area can be classed as having an extremely variable climate. A large dry area in the central basin aggravates this situation. Any low-flows passing from the upper basin into this zone are rapidly lost to seepage and evaporation. Only temporal flood peaks pass through this area. Below Messina in the central basin, flow occurs on an average of only 40 days per year, with up to 40-month periods of no flow. This can hardly be considered a river! Observations made in this paper on how appropriate various design approaches are in ensuring sustainable development must be read against this background of extreme climate variability.
Changing Climate A number of problems that arise in planning water resource development works is that common view of climate change being a vague future threat and not an ongoing process that is already at an advanced stage. School textbooks still define weather as instant climatic conditions and climate as an unchanging long-term analysis of what can be expected in terms of variation and variability of weather. Yes, climate is a long-term aggregation of probabilities and describes a range of events that are likely to occur with different degrees of probability. Climate, however, is not fixed and constantly changes with or without the impact of global warming, greenhouse gasses and other effects. Consider the 70-year rainfall record from Albassini Dam in the Limpopo Basin (Figure 1.)
Figure 1. Rainfall record from Albassini Dam.
70 years Rainfall - Albassini Dam
0.0
200.0
400.0
600.0
800.0
1000.0
1200.0
1400.0
964.9
1007
.5
1274
.439
2.084
2.177
0.071
5.545
4.469
7.186
6.045
3.267
2.853
7.148
6.766
9.069
3.784
4.299
5.365
6.672
7.794
6.349
1.550
0.477
4.073
0.058
6.349
2.889
5.5
1143
.065
3.780
9.932
9.481
8.245
7.356
3.3
Year
Rai
n [m
m p
er a
nnum
]
Rainfall Record Trend of Change
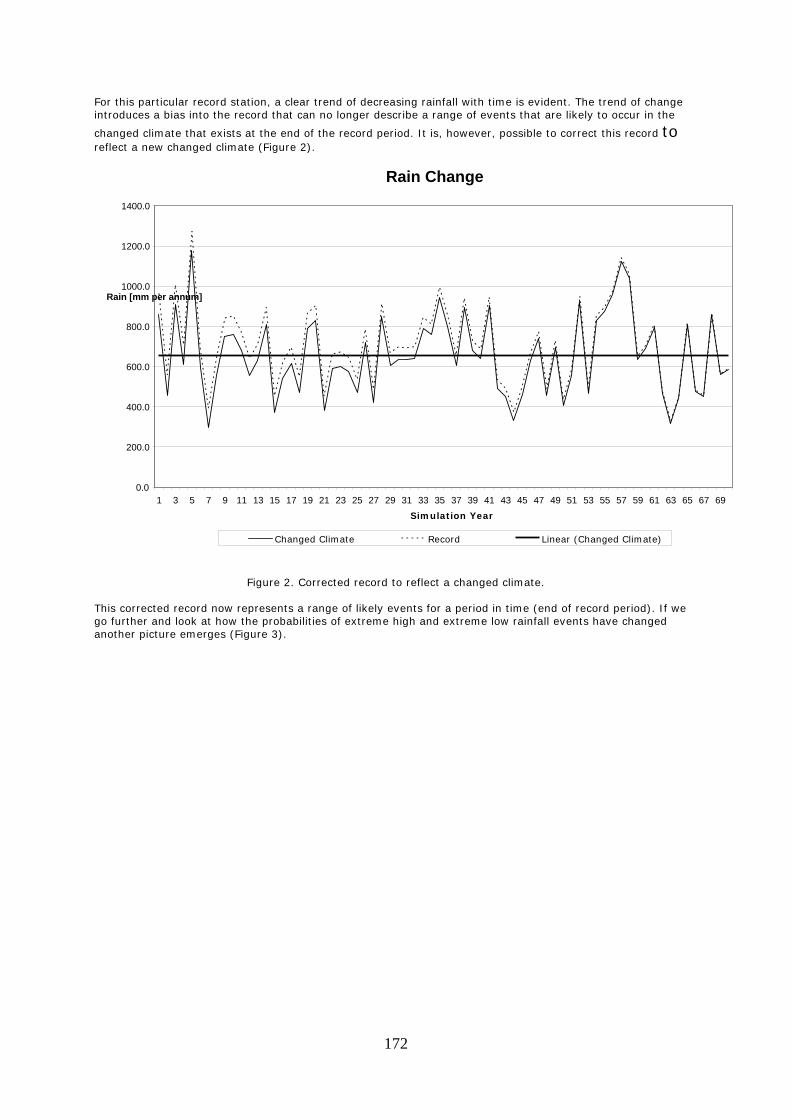
172
For this particular record station, a clear trend of decreasing rainfall with time is evident. The trend of change introduces a bias into the record that can no longer describe a range of events that are likely to occur in the
changed climate that exists at the end of the record period. It is, however, possible to correct this record to reflect a new changed climate (Figure 2).
Figure 2. Corrected record to reflect a changed climate. This corrected record now represents a range of likely events for a period in time (end of record period). If we go further and look at how the probabilities of extreme high and extreme low rainfall events have changed another picture emerges (Figure 3).
Rain Change
0.0
200.0
400.0
600.0
800.0
1000.0
1200.0
1400.0
1 3 5 7 9 11 13 15 17 19 21 23 25 27 29 31 33 35 37 39 41 43 45 47 49 51 53 55 57 59 61 63 65 67 69
Simulation Year
Rain [mm per annum]
Changed Climate Record Linear (Changed Climate)
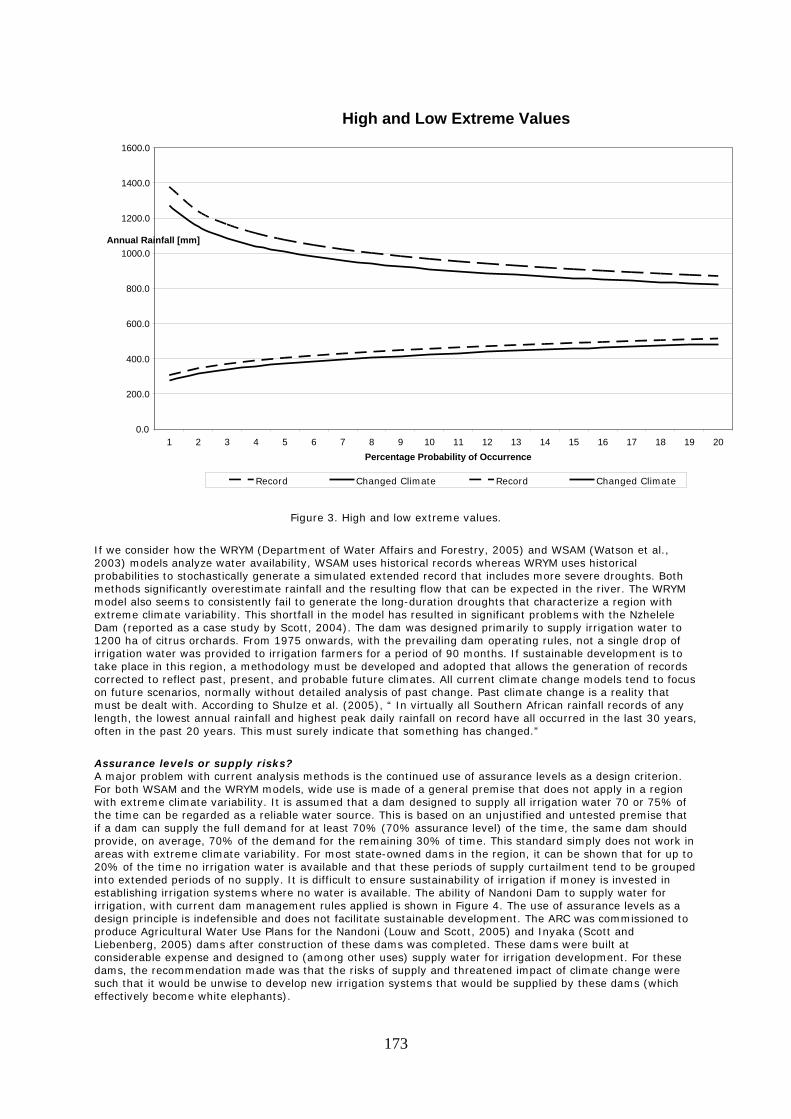
173
Figure 3. High and low extreme values.
If we consider how the WRYM (Department of Water Affairs and Forestry, 2005) and WSAM (Watson et al., 2003) models analyze water availability, WSAM uses historical records whereas WRYM uses historical probabilities to stochastically generate a simulated extended record that includes more severe droughts. Both methods significantly overestimate rainfall and the resulting flow that can be expected in the river. The WRYM model also seems to consistently fail to generate the long-duration droughts that characterize a region with extreme climate variability. This shortfall in the model has resulted in significant problems with the Nzhelele Dam (reported as a case study by Scott, 2004). The dam was designed primarily to supply irrigation water to 1200 ha of citrus orchards. From 1975 onwards, with the prevailing dam operating rules, not a single drop of irrigation water was provided to irrigation farmers for a period of 90 months. If sustainable development is to take place in this region, a methodology must be developed and adopted that allows the generation of records corrected to reflect past, present, and probable future climates. All current climate change models tend to focus on future scenarios, normally without detailed analysis of past change. Past climate change is a reality that must be dealt with. According to Shulze et al. (2005), “ In virtually all Southern African rainfall records of any length, the lowest annual rainfall and highest peak daily rainfall on record have all occurred in the last 30 years, often in the past 20 years. This must surely indicate that something has changed.” Assurance levels or supply risks? A major problem with current analysis methods is the continued use of assurance levels as a design criterion. For both WSAM and the WRYM models, wide use is made of a general premise that does not apply in a region with extreme climate variability. It is assumed that a dam designed to supply all irrigation water 70 or 75% of the time can be regarded as a reliable water source. This is based on an unjustified and untested premise that if a dam can supply the full demand for at least 70% (70% assurance level) of the time, the same dam should provide, on average, 70% of the demand for the remaining 30% of time. This standard simply does not work in areas with extreme climate variability. For most state-owned dams in the region, it can be shown that for up to 20% of the time no irrigation water is available and that these periods of supply curtailment tend to be grouped into extended periods of no supply. It is difficult to ensure sustainability of irrigation if money is invested in establishing irrigation systems where no water is available. The ability of Nandoni Dam to supply water for irrigation, with current dam management rules applied is shown in Figure 4. The use of assurance levels as a design principle is indefensible and does not facilitate sustainable development. The ARC was commissioned to produce Agricultural Water Use Plans for the Nandoni (Louw and Scott, 2005) and Inyaka (Scott and Liebenberg, 2005) dams after construction of these dams was completed. These dams were built at considerable expense and designed to (among other uses) supply water for irrigation development. For these dams, the recommendation made was that the risks of supply and threatened impact of climate change were such that it would be unwise to develop new irrigation systems that would be supplied by these dams (which effectively become white elephants).
High and Low Extreme Values
0.0
200.0
400.0
600.0
800.0
1000.0
1200.0
1400.0
1600.0
1 2 3 4 5 6 7 8 9 10 11 12 13 14 15 16 17 18 19 20Percentage Probability of Occurrence
Annual Rainfall [mm]
Record Changed Climate Record Changed Climate
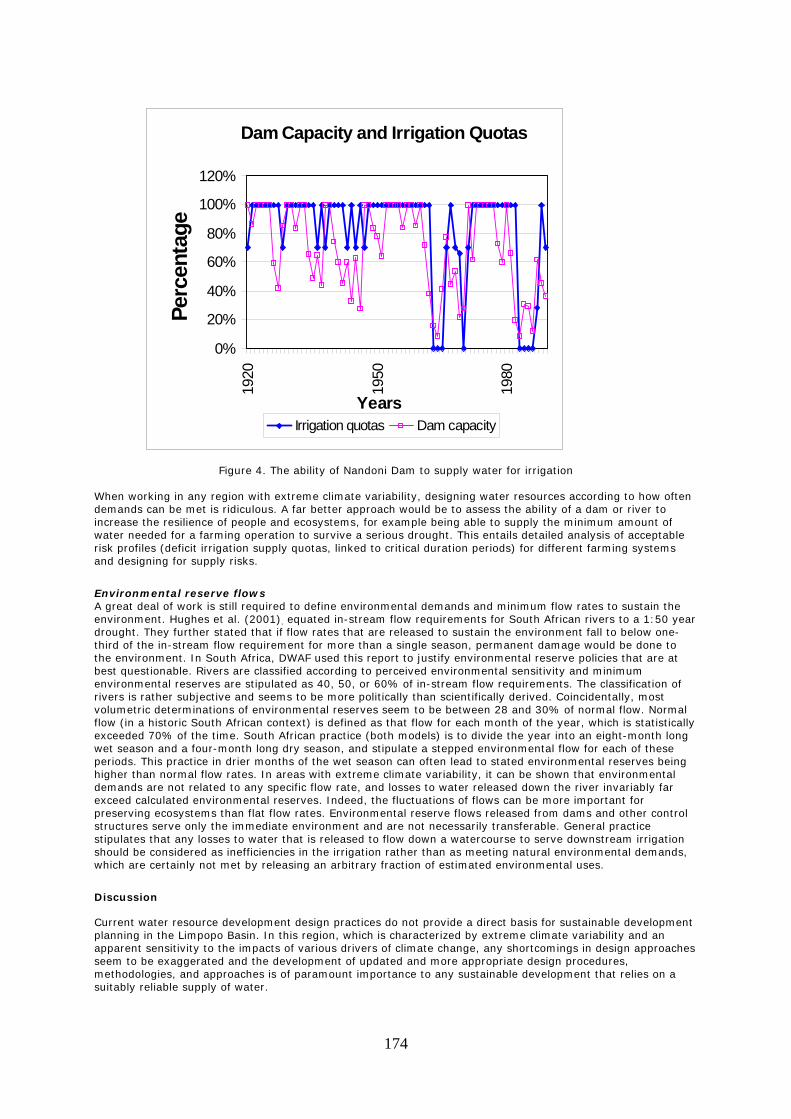
174
Dam Capacity and Irrigation Quotas
0%
20%
40%
60%
80%
100%
120%
1920
1950
1980
Years
Perc
enta
ge
Irrigation quotas Dam capacity
Figure 4. The ability of Nandoni Dam to supply water for irrigation When working in any region with extreme climate variability, designing water resources according to how often demands can be met is ridiculous. A far better approach would be to assess the ability of a dam or river to increase the resilience of people and ecosystems, for example being able to supply the minimum amount of water needed for a farming operation to survive a serious drought. This entails detailed analysis of acceptable risk profiles (deficit irrigation supply quotas, linked to critical duration periods) for different farming systems and designing for supply risks.
Environmental reserve flows A great deal of work is still required to define environmental demands and minimum flow rates to sustain the environment. Hughes et al. (2001), equated in-stream flow requirements for South African rivers to a 1:50 year drought. They further stated that if flow rates that are released to sustain the environment fall to below one-third of the in-stream flow requirement for more than a single season, permanent damage would be done to the environment. In South Africa, DWAF used this report to justify environmental reserve policies that are at best questionable. Rivers are classified according to perceived environmental sensitivity and minimum environmental reserves are stipulated as 40, 50, or 60% of in-stream flow requirements. The classification of rivers is rather subjective and seems to be more politically than scientifically derived. Coincidentally, most volumetric determinations of environmental reserves seem to be between 28 and 30% of normal flow. Normal flow (in a historic South African context) is defined as that flow for each month of the year, which is statistically exceeded 70% of the time. South African practice (both models) is to divide the year into an eight-month long wet season and a four-month long dry season, and stipulate a stepped environmental flow for each of these periods. This practice in drier months of the wet season can often lead to stated environmental reserves being higher than normal flow rates. In areas with extreme climate variability, it can be shown that environmental demands are not related to any specific flow rate, and losses to water released down the river invariably far exceed calculated environmental reserves. Indeed, the fluctuations of flows can be more important for preserving ecosystems than flat flow rates. Environmental reserve flows released from dams and other control structures serve only the immediate environment and are not necessarily transferable. General practice stipulates that any losses to water that is released to flow down a watercourse to serve downstream irrigation should be considered as inefficiencies in the irrigation rather than as meeting natural environmental demands, which are certainly not met by releasing an arbitrary fraction of estimated environmental uses. Discussion Current water resource development design practices do not provide a direct basis for sustainable development planning in the Limpopo Basin. In this region, which is characterized by extreme climate variability and an apparent sensitivity to the impacts of various drivers of climate change, any shortcomings in design approaches seem to be exaggerated and the development of updated and more appropriate design procedures, methodologies, and approaches is of paramount importance to any sustainable development that relies on a suitably reliable supply of water.
175
Conclusions and recommendations A great deal of work is required to address these issues, including: • Developing a simple climate adjustment model and distributing to all persons involved in agricultural
development planning in the Limpopo and similar regions. • A more appropriate methodology for assessing acceptable levels of water supply risk. • Clearer, simpler, more objective and defendable guidelines for assessing requirements for
environmental reserve flows. Acknowledgments This paper represents a collaboration between work done under Work Package 2 of the 'Limpopo Basin Focal Project,' a project of the CGIAR Challenge Program on Water and Food, and ongoing work funded by the South African National Department of Agriculture to 'Develop Guidelines for the Rapid Appraisal of Agricultural Water Availability in Rural Areas.' References de Lange, M. et al. 2002. Rehabilitation of Sustainable Irrigation Systems in the Limpopo Province of South
Africa, Limpopo Department of Agriculture. Department of Water Affairs and Forestry. 2005. Water Resources Yield Model, 2005. South Africa. Hughes, D. et al. 2001. Factors Influencing the Determination of Environmental Reserve Flows for South African
River Systems – Poorly referenced and partially copied in WSAM (see also Watson et al., 2003). Louw, A.A., and K.A. Scott. 2005. Agricultural Water Use Plan for the Inyaka Dam in the Limpopo Province;
Commissioned report by Limpopo Department of Agriculture. Schulze, R.E. et al. 2005. Climate Change and Water Resources in Southern Africa: Studies on Scenarios,
Impacts, Vulnerabilities and Adaptation. WRC (Water Research Commission of South Africa) Report No. 1430/1/05.
Scott, K.A. 2004. Development of an Irrigation Water Supply Risk Assessment Model; ARC (Agricultural
Research Council of South Africa) Institute for Agricultural Engineering; Interim report to Limpopo Province Department of Agriculture: Study of Irrigation Development Potential for the RESIS project.
Scott K.A., and F. Liebenberg. 2005. Agricultural Water Use Plan for the Nandoni Dam in the Limpopo Province;
Commissioned Report by the Limpopo Department of Agriculture. Watson, M., et al. 2003. Water Situation Assessment Model (WSAM), A Decision Support System for
Reconnaissance Level Planning; Volume 1 – Theoretical Guide; Department of Water Affairs and Forestry, Chief Directorate Strategic Planning, South Africa (2005 version).

176
Global processes and drivers of change: Impacts on river basins in Asia, Africa and Latin America
Mark Svendson, Annette Huber-Lee ([email protected]), Simon Cook and Claudia Ringler
CGIAR Challenge Program on Water and Food
Abstract The world water and food situation is under rapid change due to new driving forces, including globalization, energy and climate policy, and rapid income growth and urbanization in developing countries. The livelihoods of the poor who tend to be water- and food-insecure are particularly in jeopardy. Analyzing and interpreting how these driving forces might play out is essential for policy makers at all scales - from farmers to district leaders to national and international decision-makers. It is clear that water, food and agricultural policies in any basin or nation have to consider global drivers and processes of change. In this paper, we demonstrate the important implications of changing climate, trade policies, biofuels, urbanization and national policies on selected river basins in the developing world: the Ganges, Limpopo, Mekong, Nile and Volta. Results demonstrate the high level of global interdependence and the need for proactive policies to enhance the water and food situation for the poor and for protecting ecosystems.
177
Assessing land suitability for crop production in the Karkheh River Basin, Iran
A. Ghaffari1, E. De Pauw2, and S.A. Mirghasemi3
1Dryland Agricultural Research Institute (DARI), P.O. Box 119, Maragheh, Iran 2International Center for Agricultural Research in the Dry Areas (ICARDA), P.O. Box 5466, Aleppo, Syria
3Forest, Range and Watershed Management Organization (FRWMO), P.O. Box 113, Tehran, Iran Abstract Assessing the suitability of an area for crop production requires a considerable effort in terms of information collection that presents both opportunities and limitations to decision-makers. A GIS has been used to match the suitability for winter wheat based on the biological requirements of a crop and the quality and characteristics of land within the Karkheh River Basin (KRB), Iran. The methodology adopted combines land quality attributes that most influence crop suitability, including long-term average annual rainfall, accumulated temperature, soil, and topography data. Overall suitability is assessed by the Simple Limitation Approach (SLA) in preference to a GIS model, which provides weighted attribute scores. The results showed that under current climate conditions 8.7, 7.6, and 28% of the area is ‘highly’, ‘moderately,’ and ‘marginally’ suitable for winter wheat and the remainder (55.7%) is unsuitable. Under various climate change scenarios, the suitability of land for winter wheat showed considerable variation: assuming increased temperature and precipitation, ‘highly and moderately suitable’ areas increased but in the case of decreased precipitation, ‘highly suitable’ areas decreased as much as 91%. The methodology can readily be adapted and developed for other soil and climatic conditions. Media grab Increased temperature and less precipitation due to climate change will reduce the areas that are highly suitable for wheat from 13.3 to 0.8% in Karkheh River Basin. Introduction There is mounting evidence for real global climate change. Global mean temperatures are now about 0.6 °C higher than 130 years ago, and 1997 and 1998 were the warmest since 1860 (WMO, 2000). If present trends continue, the average temperature of the planet will increase by 2.36 °C by the end of the 21st Century (Mcginty et al., 1997). This paper describes a climate-soil-site model to assess climate change impacts on land suitability for rainfed winter wheat, focusing on the potential effects of temperature increase and rainfall variables on the land suitability in KRB, Iran. GIS-based assessments are made for the present-day climate (defined as 1973-1998), and for various scenarios of future climate by 2025, through a Simple Limitation Approach (SLA) (Ghaffari, 2000). Methods Study area The study area is the Karkheh River Basin, located in the west of Iran. The area is about 50,700 km2 and altitude varies between 3 m in Dasht Azadeghan and 3645 m in the Karin Mountains. Soil The original 1:1,000,000 digitized Soil Map of Iran (Banaei, 2000) was clipped to the KRB outline. The Soil Map of Iran is a soil association map, in which the soil components are classified according to Soil Taxonomy. Based on the dominant soil type, the soil classes were then regrouped in accordance with their major properties with respect to ‘usability’ into ‘soil management domains’(SMD). Topography Topographical maps were used to select site slopes and altitude information relevant to land suitability. This study used a landform panorama Digital Terrain Model (DTM) of raster format, 10 m resolution, supplied by the Forest, Range and Watershed Management Organization (FRWMO), Iran. Climate The most important climate characteristics are temperature and rainfall. A database of point climatic data covering monthly averages of precipitation, minimum and maximum temperature for the main stations in Iran, covering the period 1973-1998, was made available by the Organization of Meteorology. Climate change scenarios Several climate scenarios based on sensitivity tests were selected for use in the study area. Temperature increase agreed with the analysis of historical climatic data over the last 30 years in the study area. Analysis of rainfall trends did not show such increases, so three options are explored: one consistent with current average rainfall conditions, one 20% less, and one 20% more. The scenarios are summarized as follows:
178
Scenario 1 = +20% rainfall. Scenario 2 = -20% rainfall. Scenario 3 = +1.5°C. Scenario 4 = +1.5°C and +20% rainfall. Scenario 5 = +1.5°C and - 20% rainfall.
Land suitability The overall suitability is expressed in three classes: highly suitable (HS), moderately suitable (MS), and marginally suitable (MG). Moderately suitable and marginally suitable land was expected to have a crop yield of 60-80% and 40-60% of the yield under optimal conditions with practicable and economic inputs, respectively. Unsuitable (U) land was assumed to have severe limitations that could rarely or never be overcome by economic use of inputs or management practices. Geographical information systems (GIS) The GIS methodology used in this study identifies input data for the land suitability models and develops a modeling procedure for processing and output presentation. Digitized maps, the geographical distribution of soils, topography, and agroclimatic regions were captured together with attribute data (e.g. SMD). Overall suitability is recognized by the Simple Limitation Approach (SLA). This method utilizes the concept of 'most limiting factor,' which corresponds to Liebig’s 'Law of the Minimum.' Results Changes in mean annual precipitation and extreme temperatures were calculated. Temperature increase applied to the year 2050 is assumed to be 1.5 °C more than the current mean temperature. The distribution of mean annual temperatures was based on the 1973-98 record for the study area. Slope Suitability was assessed first in terms of topography. Elevation alone did not affect land suitability since the whole study area was highly or moderately suitable for this crop under consideration. On the other hand, slopes greatly affect land suitability. About 22% of the area was marginally suitable with slopes between 8 and 20%; 35% of the study area has very steep slopes (more than 20%), which were unsuitable for crop production in general. Accumulated temperature Approximately 66% of the study area was considered ‘highly suitable,’ with little land (7%) ‘unsuitable.’ Accumulated temperature does not affect land suitability for winter wheat, because the lowest accumulated temperature was 1000C ° above 0°C between January and June. Precipitation Highly suitable and moderately suitable areas were 50.4 and 31.7%, respectively. Only 13.7% of the study area is unsuitable, with 4.3% of the area in the marginal category.
Soil management domain Soil management domain is an important limiting factor for winter cereals within the study area. Only 28% of the study area is highly suitable and 1.7% moderately suitable; the remainder was marginally suitable (54.4%) or unsuitable (16.1%). Data for land suited to winter wheat growing under water-limited (rainfed) conditions is presented in Table 1. Nearly 8.7% and 7.6% of the study area was found to be highly and moderately suitable, respectively (Table 2). The remainder was marginally suitable (28%) or unsuitable (55.7%). This overall suitability map for winter wheat was produced by an overlay of maps of accumulated temperature, precipitation, slope, and soil management domain. With increasing temperature, there is a shift from marginally and moderately suitable areas to moderately and highly suitable areas. A comparison of climate change impacts shows that ‘highly and moderately suitable’ areas increased in all scenarios except those in which precipitation declines (Table 2). The effect of climate change scenarios on land suitability for winter wheat in the study area is shown in Figure 1. By increasing temperature alone, the highly and moderately suitable areas increased by 6% and 176% for Scenario 3 (T+1.5°C), respectively. Increasing temperature with accompanying increasing precipitation, increased highly and moderately suitable areas by 53% and 69% for Scenario 4 (T+1.5°C & P + 20%), respectively. If temperature increases are accompanied with rainfall decreases, highly suitable areas fall to -90% (Scenario 5). The main reason for this is water stress risk, not the direct effect of temperature. In Scenario 2, a 20% decrease in precipitation caused the highly suitable area to decrease by about 91%. In this case, we would expect that climate change has some advantage for this crop in this area.
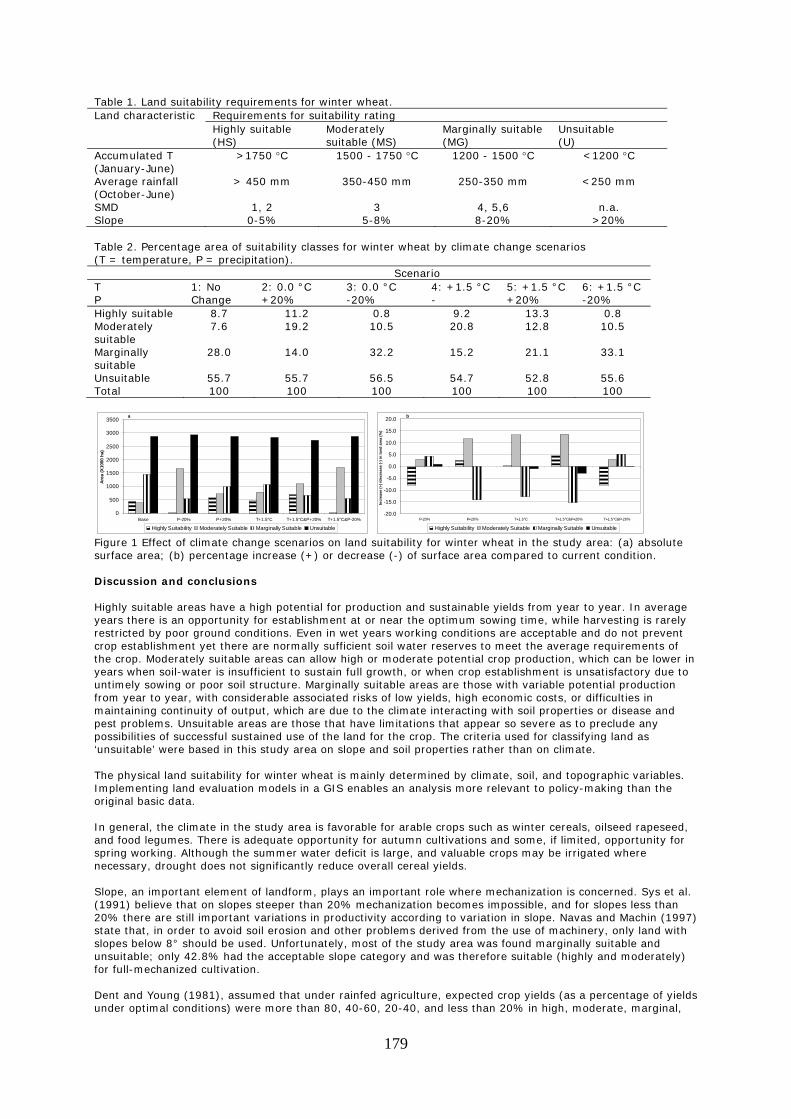
179
Table 1. Land suitability requirements for winter wheat. Land characteristic Requirements for suitability rating
Highly suitable (HS)
Moderately suitable (MS)
Marginally suitable (MG)
Unsuitable (U)
Accumulated T (January-June)
>1750 °C 1500 - 1750 °C 1200 - 1500 °C <1200 °C
Average rainfall (October-June)
> 450 mm 350-450 mm 250-350 mm <250 mm
SMD 1, 2 3 4, 5,6 n.a. Slope 0-5% 5-8% 8-20% >20% Table 2. Percentage area of suitability classes for winter wheat by climate change scenarios (T = temperature, P = precipitation). Scenario T P
1: No Change
2: 0.0 °C +20%
3: 0.0 °C -20%
4: +1.5 °C -
5: +1.5 °C +20%
6: +1.5 °C -20%
Highly suitable 8.7 11.2 0.8 9.2 13.3 0.8 Moderately suitable
7.6 19.2 10.5 20.8 12.8 10.5
Marginally suitable
28.0 14.0 32.2 15.2 21.1 33.1
Unsuitable 55.7 55.7 56.5 54.7 52.8 55.6 Total 100 100 100 100 100 100
Figure 1 Effect of climate change scenarios on land suitability for winter wheat in the study area: (a) absolute surface area; (b) percentage increase (+) or decrease (-) of surface area compared to current condition. Discussion and conclusions Highly suitable areas have a high potential for production and sustainable yields from year to year. In average years there is an opportunity for establishment at or near the optimum sowing time, while harvesting is rarely restricted by poor ground conditions. Even in wet years working conditions are acceptable and do not prevent crop establishment yet there are normally sufficient soil water reserves to meet the average requirements of the crop. Moderately suitable areas can allow high or moderate potential crop production, which can be lower in years when soil-water is insufficient to sustain full growth, or when crop establishment is unsatisfactory due to untimely sowing or poor soil structure. Marginally suitable areas are those with variable potential production from year to year, with considerable associated risks of low yields, high economic costs, or difficulties in maintaining continuity of output, which are due to the climate interacting with soil properties or disease and pest problems. Unsuitable areas are those that have limitations that appear so severe as to preclude any possibilities of successful sustained use of the land for the crop. The criteria used for classifying land as ‘unsuitable’ were based in this study area on slope and soil properties rather than on climate. The physical land suitability for winter wheat is mainly determined by climate, soil, and topographic variables. Implementing land evaluation models in a GIS enables an analysis more relevant to policy-making than the original basic data. In general, the climate in the study area is favorable for arable crops such as winter cereals, oilseed rapeseed, and food legumes. There is adequate opportunity for autumn cultivations and some, if limited, opportunity for spring working. Although the summer water deficit is large, and valuable crops may be irrigated where necessary, drought does not significantly reduce overall cereal yields. Slope, an important element of landform, plays an important role where mechanization is concerned. Sys et al. (1991) believe that on slopes steeper than 20% mechanization becomes impossible, and for slopes less than 20% there are still important variations in productivity according to variation in slope. Navas and Machin (1997) state that, in order to avoid soil erosion and other problems derived from the use of machinery, only land with slopes below 8° should be used. Unfortunately, most of the study area was found marginally suitable and unsuitable; only 42.8% had the acceptable slope category and was therefore suitable (highly and moderately) for full-mechanized cultivation. Dent and Young (1981), assumed that under rainfed agriculture, expected crop yields (as a percentage of yields under optimal conditions) were more than 80, 40-60, 20-40, and less than 20% in high, moderate, marginal,
a
0
500
1000
1500
2000
2500
3000
3500
Base P-20% P+20% T+1.5°C T+1.5°C&P+20% T+1.5°C&P-20%
Area
(X10
00 h
a)
Highly Suitability Moderately Suitable Marginally Suitable Unsuitable
b
-20.0
-15.0
-10.0
-5.0
0.0
5.0
10.0
15.0
20.0
P-20% P+20% T+1.5°C T+1.5°C&P+20% T+1.5°C&P-20%
Incr
ease
(+) /
decr
ease
(-) i
n la
nd a
rea
(%)
Highly Suitability Moderately Suitable Marginally Suitable Unsuitable
180
and unsuited areas, respectively. Because in the present study evaluation is based on an average of 25 years of climate data, we may also assume that expected crop yields are close to the potential production during more than 80, 40-60, 20-40, and less than 20% of years for high, moderate, marginal, and unsuited areas, respectively. All the climatic and environmental factors that affect land suitability for winter wheat in the study area are summarized in Table 1. Average accumulated temperature above 0°C (degree-days) between January and June (the first 6 months of the year) is applied as recommended by McRae (1988) to be a good measure of the heat energy available for plant growth. Also, these variables are used in management practices. It has been found, in Western Europe, that the best response to fertilizer application in the spring is when 200 degree-days have accumulated. Climate change scenarios have been used to estimate the distribution of suitability for rainfed winter wheat using as a comparator the baseline climate (means 1973-98). The general trends show that land classified currently as highly, moderately, or marginally suitable is likely to benefit from increased temperature or from increased temperature accompanied by increased precipitation, but is likely to suffer by decreased precipitation, as these areas decrease in response to changing the soil water balance so as to increase water stress. Acknowledgments This paper presents findings from Project 24 ‘Strengthening Livelihood Resilience in Karkheh River Basin,’ part of the CGIAR Challenge Program on Water and Food. References Banaei, M.H. 2000. Soil map of the I.R.Iran '(in Farsi).' Iran: Soil and Water Research Institute. Dent, D., and A. Young. 1981. Soil survey and land evaluation. London: Allen and Unwin. Ghaffari, A. 2000. Application of GIS and crop simulation modelling to assess crop suitability and production
potential under current and climate change scenarios in the Stour Catchment, Kent, UK. PhD thesis, Wye College, University of London.
Mcginty, K., D. Albritton, and J. Melillo. 1997. White House press briefing on climate change. The White House,
Office of the Press Secretary. McRae, S.G. 1988. Practical pedology studying soils in the field. Chichester, England: Ellis Horwood Limited. Navas, A., and J. Machin. 1997. Assessing erosion risks in the gypsiferous steppe of Litigio NE Spain. An
approach using GIS. Journal of Arid Environments, 37(3): 433-41. Sys, Ir. C., E. van Ranst, and J. Debaveye. 1991. Land evaluation. Part I. Principles in land evaluation and crop
production calculations. International training centre for post-graduate soil scientists, University Ghent. World Meteorological Organization (WMO). 2000. Statement on the status of the global climate in 1999. WMO,
No. 913, Geneva.
181
Climate change mitigation strategies for agriculture water demands in the Karkheh River Basin, Iran
M. Ghafouri1 and A. Sabziparvar1
1Soil Conservation and Watershed Management Research Institute, Tehran, Iran ([email protected])
Abstract Climate change is threatening the environment, water resources, agriculture, natural resources, and human welfare in the Middle East and Iran. Iran is situated in one of the most arid regions of the world. The average annual precipitation is 242 mm, which is less than one-third of the world average. Increasing trends have been found in annual average temperature for most parts of the country. It is predicted that by 2050, Iran will experience a 20-25% reduction in rainfall during the dry season extending from April to September, and 10-15% increase in reference crop evapotranspiration during the growing season. Besides, available water resources of the country are insufficient to support nationwide required agricultural production. In this paper, we present and discuss mitigation strategies and government policies on water resources development for future conditions, and mitigation strategies for agricultural water demand as the main user of water. Long-term development strategies for water resources include issues of demand management, equity in water distribution such as inter-basin transfer, public awareness, and recycling. A number of innovative approaches in water conservation have been developed that are suitable for arid and semiarid regions of the country, including flood utilization and aquifer recharge. Some innovative approaches have been proposed and tested with a significant success rate in the CPWF Livelihood Resilience Project 24, in the Karkheh River Basin. Most parts of the upland catchments of the KRB are under dryland farming practices over two seasons, autumn and spring. Climate change appears to be likely to affect the spring season, which represents a significant part of catchment resident income. Approaches such as supplementary irrigation, biological fertilizers, and changing planting seasons have been considered as part of this CPWF project in Iran. Media grab
Strategic solutions are presented to the public and policymakers in agriculture and water sectors to mitigate the impacts of future climate change in the Karkheh River Basin of Iran. Introduction There is little doubt that predicted climate change resulting from global warming presents potentially dramatic and far-reaching threats to the environment, human welfare, and socioeconomic systems on a global scale. Iran is located between 44° 02' and 63° 20' E longitude and 25° 03' to 39° 46' N latitude. Based on the Köppen climate classification, most parts of the country are categorized as generally having arid (BW) and semiarid (BS) climates (Sabziparvar, 2008). Iran is situated in one of the most arid regions of the world, with an average annual precipitation of 242 mm, less than one-third of the world average (Figure 1). This precipitation is under conditions in which 179 mm of rainfall is directly evaporated. In other words, 71% of the precipitation is lost due to evaporation, while annual potential evaporation of the country is between 1500 and 2000 mm. The Karkheh River Basin (KRB) receives between 100 and 400 mm of rainfall annually, where it supports considerable dryland farming of wheat and other legumes such as chickpea and lentil. The upper parts of KRB receive sufficient rainfall for dryland farming, however, with climate change the rainfall in the spring season will be reduced, which will affect the planting of wheat and legumes. In addition to the reduction in dryland farming products, the increase in temperature is likely to cause the shifting of some rangeland plant species to higher altitudes where it may effect the required feed for livestock, unless some resistant varieties are developed in time. Agriculture plays an important role in the economy of Iran. It accounts for 18% of GDP, 25% of employment, supplies more than 85% of food requirements, 25% of non-oil exports, and 90% of raw materials used in industry. On average the country receives 413.60 x 10⁶ Ml of precipitation out of which 125.27 x 10⁶ Ml runs off as surface water through ephemeral and permanent rivers. The uncontrolled surface water resources of the country reach 70 x 106 Ml–twice as much as the controlled volume. Out of 165 million hectares (Mha) of the country's areas, about 37 Mha are suitable for irrigated and dryland agriculture. Due to current water resource limitations, only 8.1 Mha of lands are under irrigated agriculture consuming more than 93% (84 billion cubic meter) of total supplied water resources (93 billion cubic meter) of the country (Shoaei and Heidari, 2006).
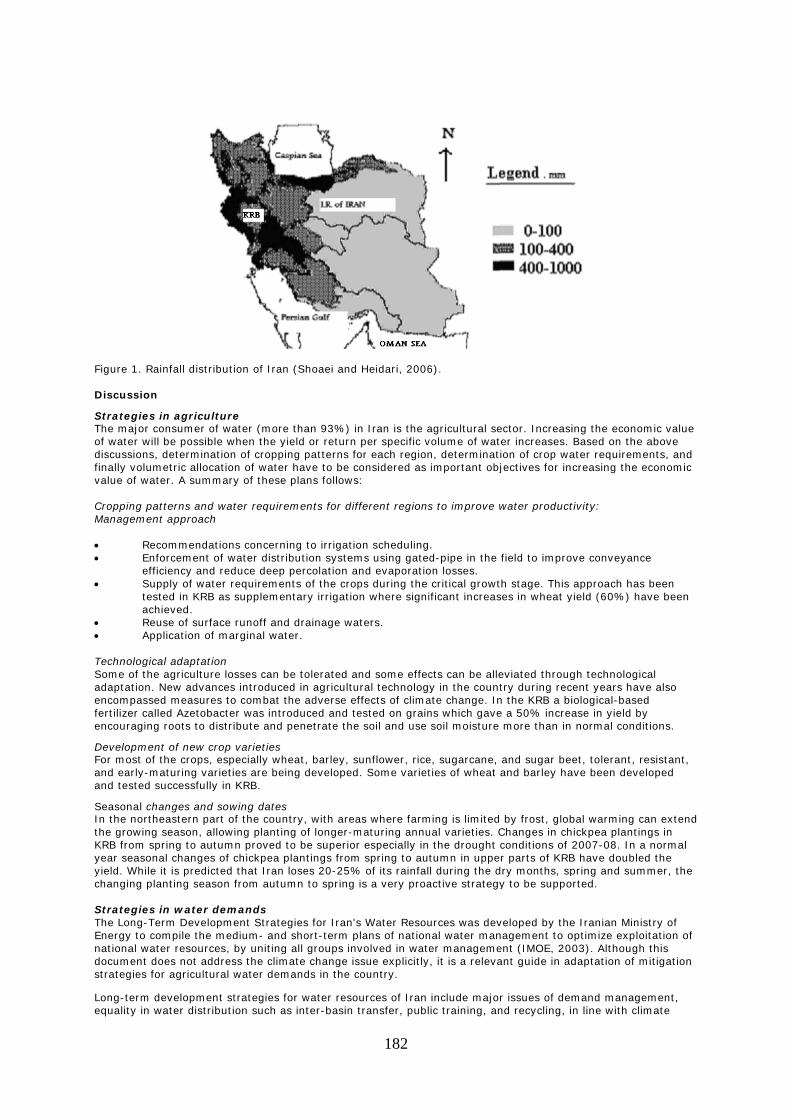
Figure 1. Discussi StrategieThe majoof water wdiscussiofinally vovalue of w Cropping Managem • •
e• S
ta
• • A TechnologSome of tadaptatioencompafertilizer cencourag DevelopmFor most and earlyand teste Seasonal In the nothe growiKRB fromyear seasyield. Whchanging StrategieThe LongEnergy tonational wdocumenstrategies Long-termequality i
Rainfall distri
on
es in agriculor consumer owill be possibns, determinalumetric allocwater. A summ
patterns and ment approach
RecommendaEnforcement oefficiency andSupply of wattested in KRBachieved. Reuse of surfaApplication of
gical adaptatiothe agricultur
on. New advanssed measurecalled Azetobaing roots to d
ment of new cr of the crops,
y-maturing vaed successfully
changes and rtheastern paing season, al
m spring to autsonal changeshile it is predic planting seas
es in water d-Term Develo
o compile the water resourct does not adds for agricultu
m developmenn water distri
ibution of Iran
lture of water (morele when the yation of croppiation of watermary of these
water requireh
tions concernof water distr
d reduce deep ter requireme as suppleme
ace runoff andf marginal wat
on re losses can bnces introducees to combat tacter was intr
distribute and
rop varieties especially whrieties are beiy in KRB.
sowing datesart of the counllowing plantintumn proved s of chickpea pcted that Iran son from autu
demands opment Strate medium- andes, by unitingdress the clim
ural water dem
nt strategies fbution such a
n (Shoaei and
e than 93%) iyield or return ing patterns for have to be c plans follows
ements for dif
ing to irrigatioibution system percolation ants of the crontary irrigatio
d drainage water.
be tolerated aed in agricultuthe adverse efroduced and tepenetrate the
heat, barley, sing developed
s ntry, with areang of longer-mto be superiorplantings from loses 20-25%mn to spring
egies for Iran'sd short-term pg all groups invmate change ismands in the c
for water resos inter-basin
182
Heidari, 2006
n Iran is the a per specific vor each regionconsidered as s:
fferent regions
on schedulingms using gatend evaporatiops during the
on where signi
aters.
nd some effecural technologffects of climaested on graine soil and use
sunflower, riced. Some variet
as where farmmaturing annur especially in
m spring to au% of its rainfal is a very proa
s Water Resouplans of nationvolved in watessue explicitlycountry.
ources of Iran transfer, publ
6).
agricultural sevolume of watn, determinat important obj
s to improve w
. d-pipe in the on losses. critical growtificant increas
cts can be alley in the count
ate change. Inns which gave soil moisture
e, sugarcane, ties of wheat
ming is limited ual varieties. C the drought ctumn in uppel during the dactive strategy
urces was devnal water maner manageme
y, it is a releva
include majoric training, an
ector. Increasier increases. ion of crop wajectives for in
water product
field to impro
th stage. This ses in wheat y
eviated througtry during recn the KRB a bie a 50% increa more than in
and sugar beand barley ha
by frost, globChanges in chconditions of r parts of KRB
dry months, spy to be suppo
veloped by thenagement to oent (IMOE, 20ant guide in ad
r issues of demnd recycling, i
ing the econoBased on the ater requiremecreasing the e
tivity:
ove conveyanc
approach hasyield (60%) ha
gh technologiccent years haviological-basease in yield by normal condi
et, tolerant, rave been deve
bal warming chickpea plantin2007-08. In aB have doublepring and sumrted.
e Iranian Minioptimize explo03). Althoughdaptation of m
mand managen line with cli
mic value above ents, and economic
ce
s been ave been
cal ve also d y itions.
resistant, eloped
can extend ngs in a normal ed the mmer, the
stry of oitation of h this mitigation
ement, mate
183
change consequences and control management. A number of innovative approaches in water conservation were developed suitable for the arid and semiarid regions of the country. These are flood utilization and aquifer recharge as applied to national research projects for the future, as climate change affects the country surface water resources (Sharifi and Ghafouri, 1997). A considerable number of research institutes in watershed management, agriculture, and natural resources have been established under the governmental research and development strategy support. United Nations affiliated organizations such as UNDP are assisting Iran in adapting some measures to minimize the effect of climate change on water resources and agriculture. Although there is no NGO directly active on the climate change issue, a few NGOs are working on human impacts on the environment, which indirectly help raise awareness about the negative impacts of climate change in Iran. The following measures are recommended to minimize the future impacts of climate change on Iran water resources (Shoaei and Heidari, 2006): • Integrated ground and surface water management; e.g the pilot project of flood utilization and aquifer
management on 60,000 ha of the alluvial fans of the country, and the extension of the practice on 1.5 million ha in the Fourth and Fifth Development Programs in the country.
• Construct low-cost miniature reservoirs for local irrigation. • Rehabilitate small tanks in dry and semi-dry zones. • Improve water use techniques. • Improve efficiency of water supply systems; e. g. gradual changing of traditional surface basin and
furrow irrigation systems to pressurized sprinkler irrigation is a major effort of the Ministry of Agriculture in Iran.
Conclusions and recommendations A strategy at the national level should be developed to prepare a comprehensive inventory, and a monitoring and evaluation program outlining the state of water resources. Agroecological zoning helps in assessing the land-use potential for resource allocation and preparation for possible future shifting, and prevention of undesirable land-use changes due to climate change. We should develop new crop varieties or species that will survive the effect of temperature increases due to climate change. New heat-resistant crops, low-water requirement crops, and diversified farming systems should be developed. Diversification can more easily minimize environmental and socioeconomic risks. Although in recent years preliminary investigations have been undertaken on the impact of climate change on water resources, there are still many uncertainties. Developing and applying response strategies, techniques, and methodologies for assessing the potential adverse effects of climate change, through changes in groundwater levels, temperature, precipitation, and sea level rises, on freshwater resources and flood risk are proposed (Kowsar, 1991). Also, it seems appropriate to conduct case studies and establish linkages between climate change and the current occurrences of droughts and floods in certain regions. Rivers, which are important sources of water supply for the metropolitan areas in the country, are directly or indirectly affected by the changes in precipitation and temperature (UNFCCC, 2003). In recent years, metropolitan regions in Iran are becoming more and more vulnerable to extreme climate conditions such as drought. Thus the operation of existing facilities for water resources and newly established plans for more facilities should be reviewed and redesigned. The planning method by itself should also be reviewed. Construction of water resource facilities such as dams, aqueducts, well fields, levees, banks, and drainage channels and non-construction measures including water conservation, integrated ground and surface water management, and improved water supply should be considered for adaptation to climate change. These should be developed by the Iranian Ministry of Energy as medium and short-term plans of national water management bringing together all groups involved in water management (IMOE, 2003). Although The Long-Term Development Strategies for Iran's Water Resources does not address the climate change issue explicitly, it is a relevant guide in adaptation of mitigation strategies for agricultural water demands in the country. Acknowledgments Parts of this paper are based on data from PN24, 'Livelihood Resilience in Upper Karkheh River Basin,' a project of the CGIAR Challenge Program on Water and Food. References IMOE (Iranian Ministry of Energy). 2003. Long-Term Development Strategies for Iran's Water Resources.
Publisher: Public Relations and International Affairs Bureau of Iran Water Resources Management Company.
Kowsar, A. 1991. Floodwater Spreading for Desertification Control: An Integrated Approach. Desertification
Bulletin, No. 19. Sharifi, F., and M. Ghafouri. 1997. Flood spreading in Iran–an integrated approach. IRCSA Newsletter, Rain
Drop. Shoaei, Z., and N. Heidari. 2006. Country Report, ECO-IDB-FAO. Workshop on Water Demand Management,
Islamabad, Pakistan, Agricultural Research and Education Organization, Ministry of Jihad-e-Agriculture. Sabziparvar, A.A. 2008. Weather and climate in agriculture. In Press, Bu-Ali Sina University, Hamedan, Iran (in
Persian). UNFCCC. 2003. Initial National Communication to UNFCCC. Department of Environment, National Climate
Change Office, Tehran, Iran.
Related Documents