STRATEGIES FOR EFFECTIVE PROJECT STAKEHOLDER ENGAGEMENT (ProStakE) DR. SAIPOL BARI ABD KARIM MIVMM, MACPM, MAPM(UK) [email protected] Faculty Of Built Environment University Of Malaya 50603 Kuala Lumpur ©Saipol Bari 1

Welcome message from author
This document is posted to help you gain knowledge. Please leave a comment to let me know what you think about it! Share it to your friends and learn new things together.
Transcript
STRATEGIES FOR EFFECTIVE PROJECT STAKEHOLDER ENGAGEMENT (ProStakE)
DR. SAIPOL BARI ABD KARIM MIVMM, MACPM, MAPM(UK) [email protected]
Faculty Of Built Environment University Of Malaya 50603 Kuala Lumpur
© Saipol Bari 1
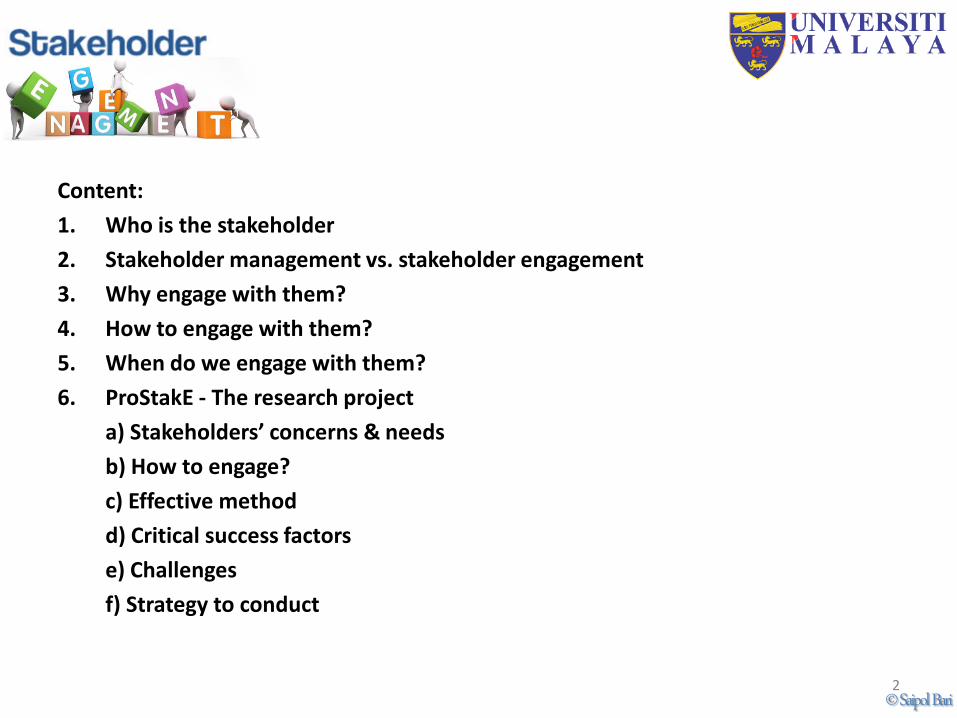
Content:
1. Who is the stakeholder
2. Stakeholder management vs. stakeholder engagement
3. Why engage with them?
4. How to engage with them?
5. When do we engage with them?
6. ProStakE - The research project
a) Stakeholders’ concerns & needs
b) How to engage?
c) Effective method
d) Critical success factors
e) Challenges
f) Strategy to conduct
© Saipol Bari 2

Considerable asset
Group / Individual
Can contribute knowledge
insights and support
Can affect or be affected
Have an expectation
Receive associated direct and
indirect benefits
and/or losses
© Saipol Bari 3

• Creating and destroying value What is a
stakeholder?
• Legal contract with the client Internal
stakeholders
• All others with a direct interest in the project
External stakeholders
• Influence the progress of the project.
Project stakeholders
© Saipol Bari 4
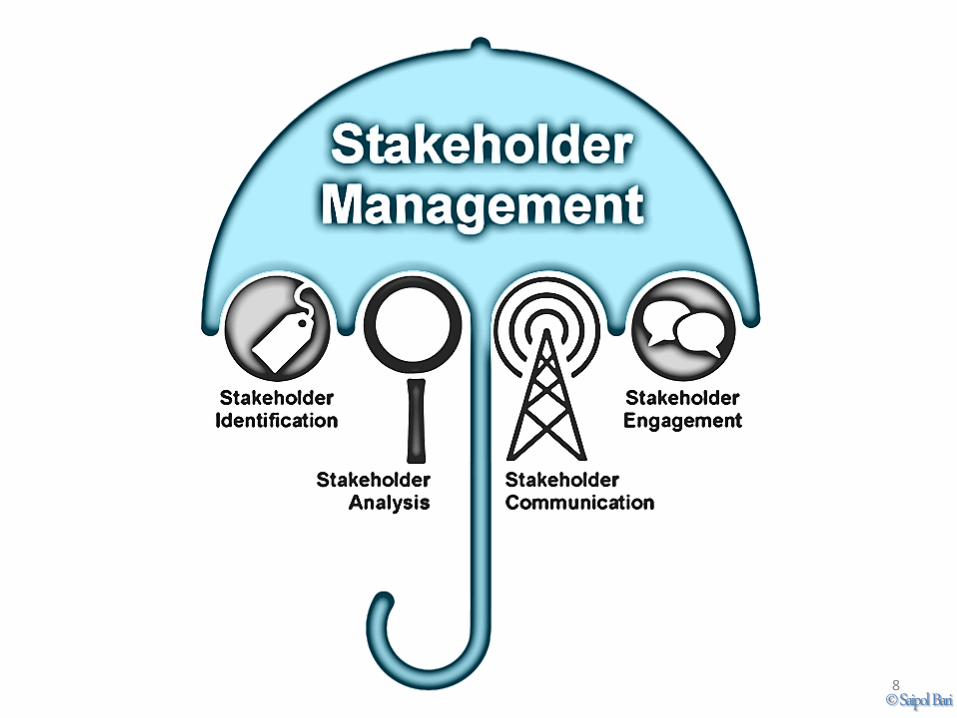
STAKEHOLDER MANAGEMENT VS.
STAKEHOLDER ENGAGEMENT
© Saipol Bari 5
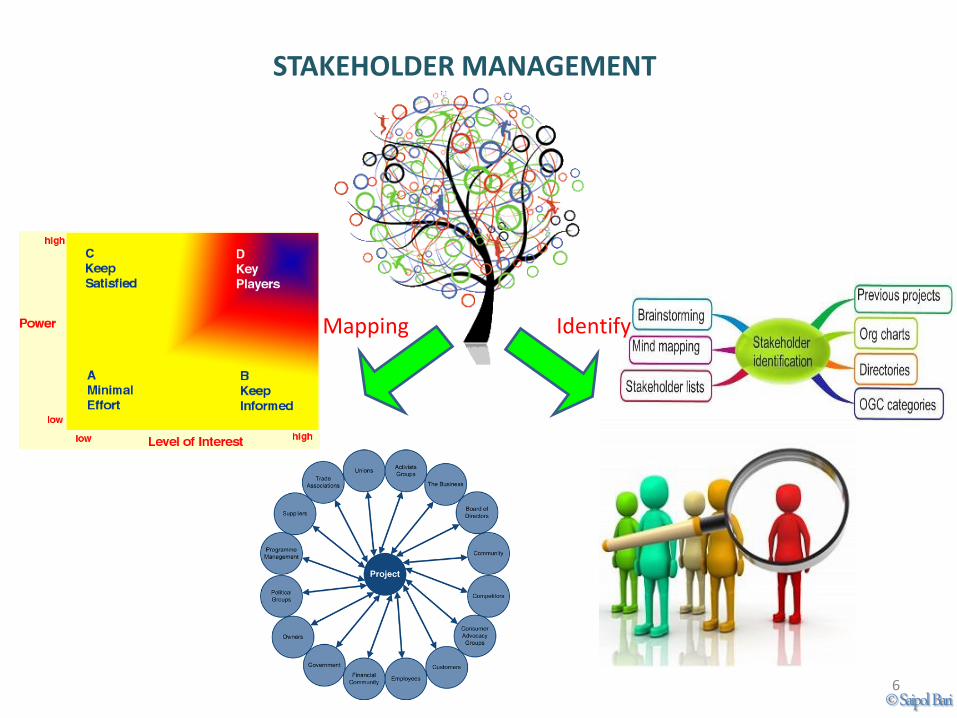
STAKEHOLDER MANAGEMENT
Mapping Identify
© Saipol Bari 6
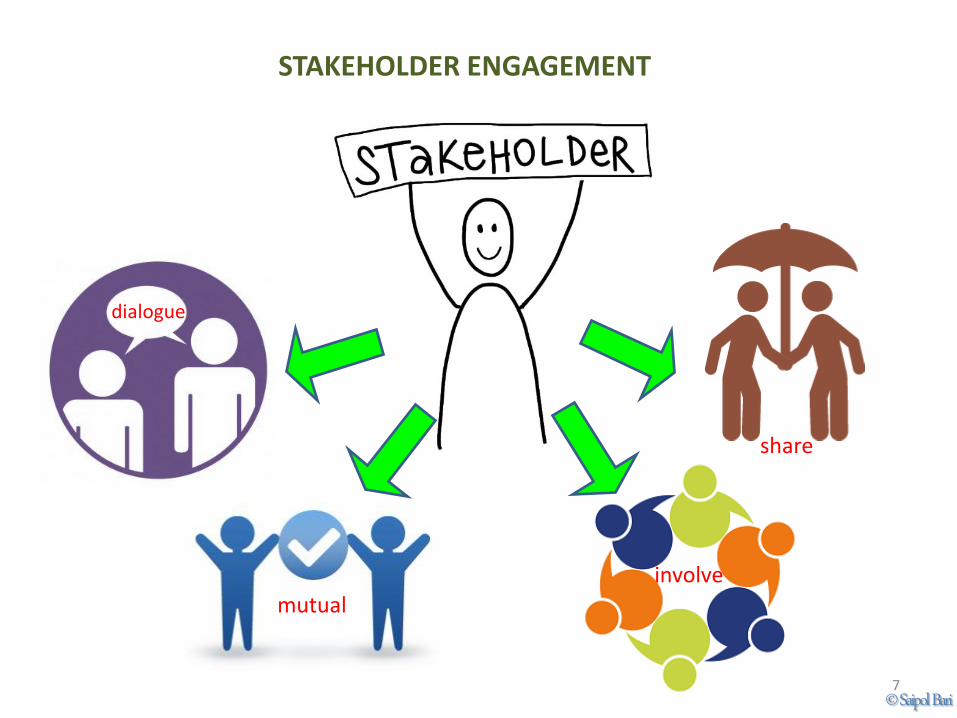
STAKEHOLDER ENGAGEMENT
dialogue
share
involve
mutual
© Saipol Bari 7
© Saipol Bari 8
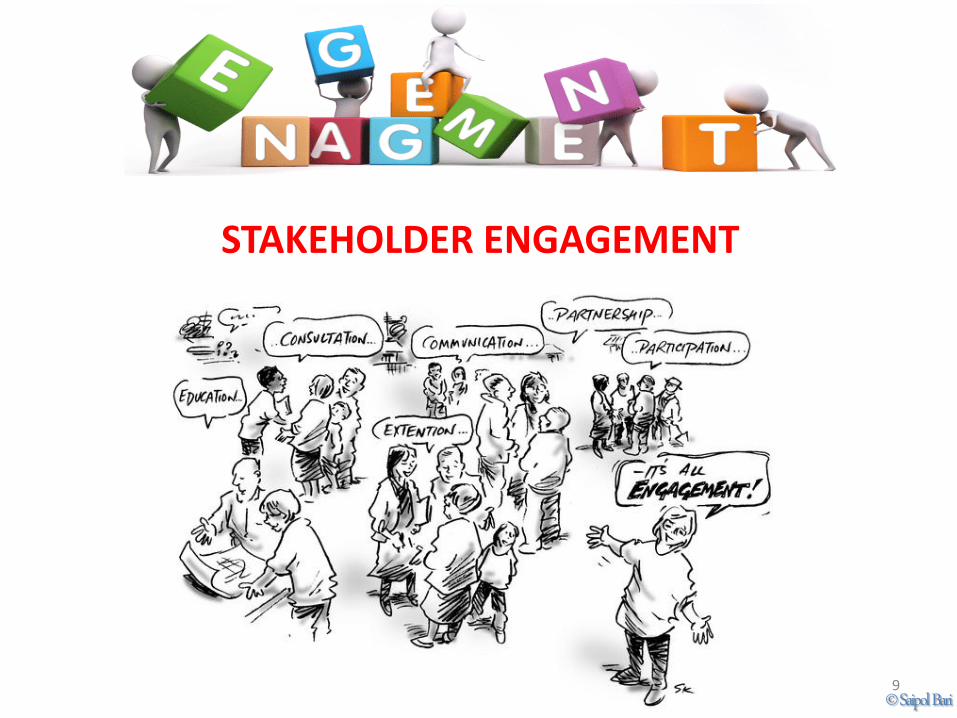
STAKEHOLDER ENGAGEMENT
© Saipol Bari 9
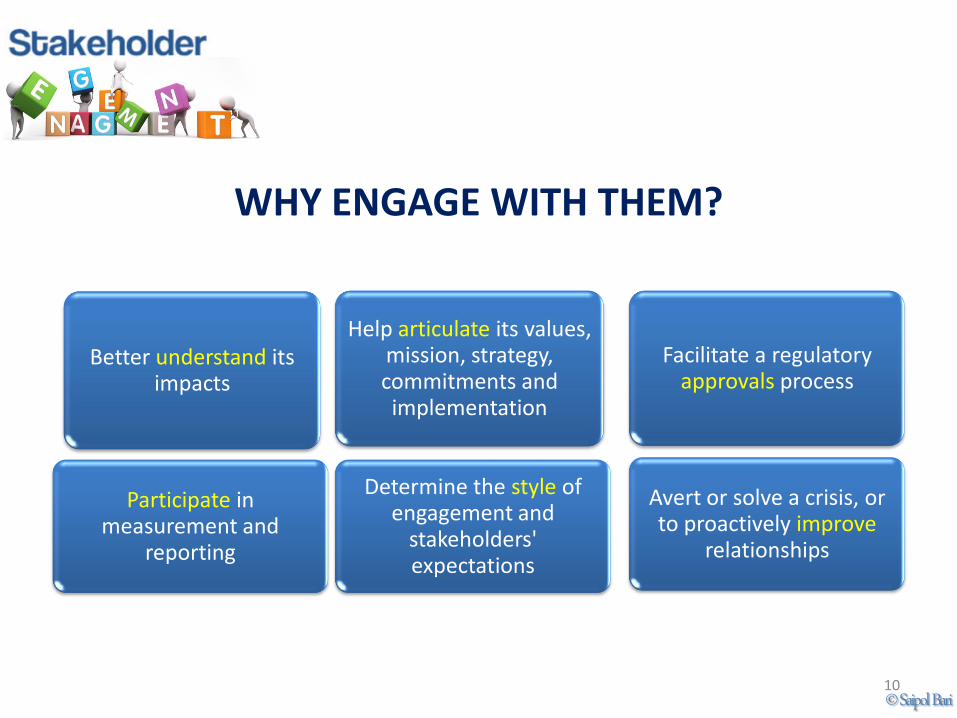
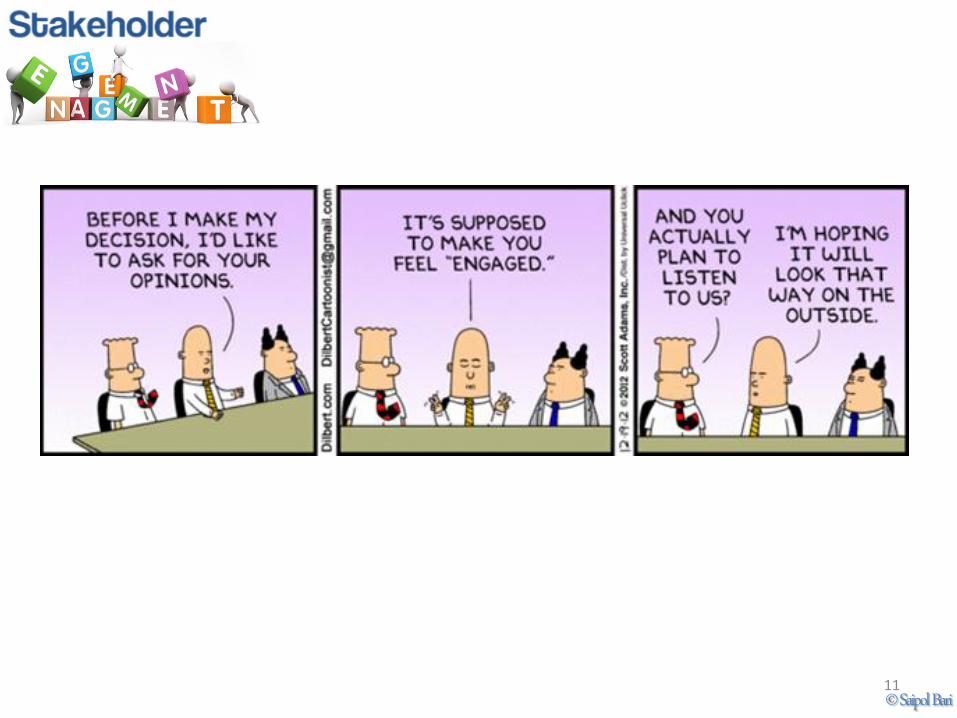
WHY ENGAGE WITH THEM?
Better understand its impacts
Help articulate its values, mission, strategy, commitments and implementation
Participate in measurement and
reporting
Determine the style of engagement and
stakeholders' expectations
Facilitate a regulatory approvals process
Avert or solve a crisis, or to proactively improve
relationships
© Saipol Bari 10
© Saipol Bari 11
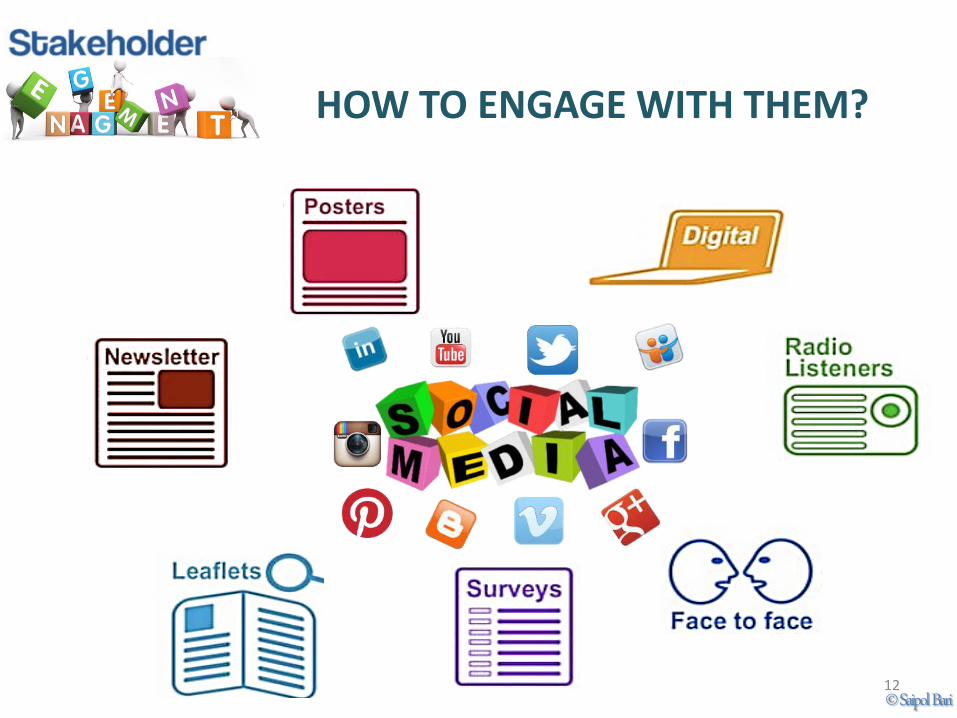
HOW TO ENGAGE WITH THEM?
© Saipol Bari 12
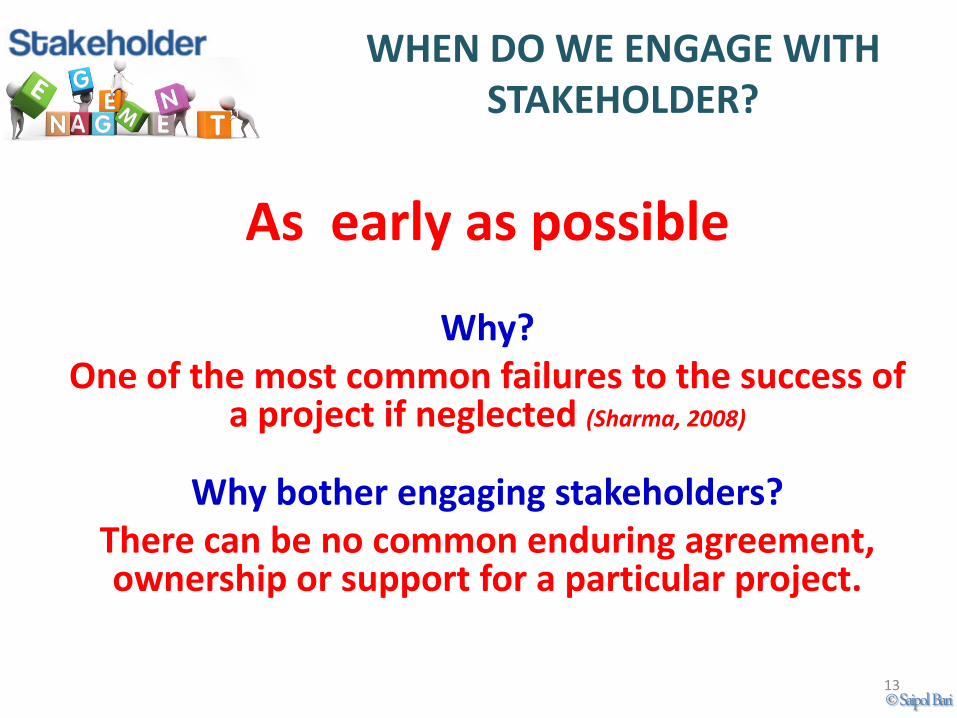
As early as possible
Why? One of the most common failures to the success of
a project if neglected (Sharma, 2008)
Why bother engaging stakeholders? There can be no common enduring agreement, ownership or support for a particular project.
WHEN DO WE ENGAGE WITH STAKEHOLDER?
© Saipol Bari 13

THE RESEARCH PROJECT:
© Saipol Bari 14
PROSTAKE
AIM To develop effective strategies for project
stakeholders engagement (ProStakE)
SCOPE Stakeholder engagement
Infrastructure projects
© Saipol Bari 15
OBJECTIVES To explore the needs of different groups of stakeholders
To investigate the critical success factor to stakeholder engagement
To investigate the challenges of stakeholder engagement practices.
To develop an effective process for stakeholder engagement.
© Saipol Bari 16
- Distributed to project managers, quantity surveyors, engineers, senior executives (public relations, corporate communication, etc.) in Greater KL/KV area
- Hand delivered and by email
- Questionnaire was designed based on literature review
- To identify and evaluate the current practices of stakeholder engagement in local infrastructure projects
Questionnaires
© Saipol Bari 17
© Saipol Bari 18
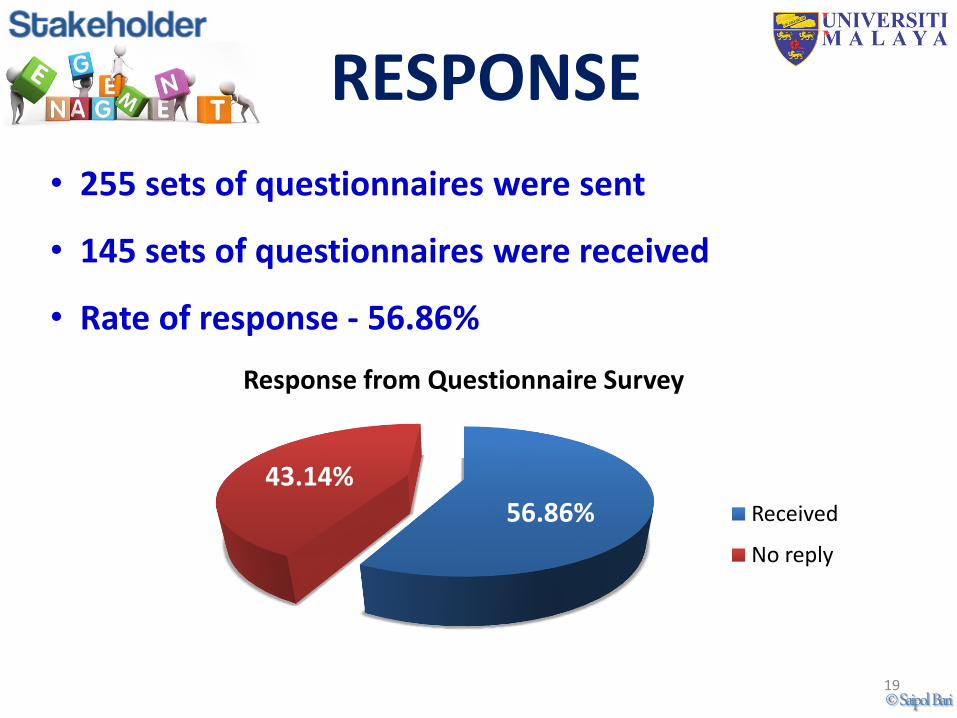
56.86% 43.14%
Response from Questionnaire Survey
Received
No reply
• 255 sets of questionnaires were sent
• 145 sets of questionnaires were received
• Rate of response - 56.86%
RESPONSE
© Saipol Bari 19
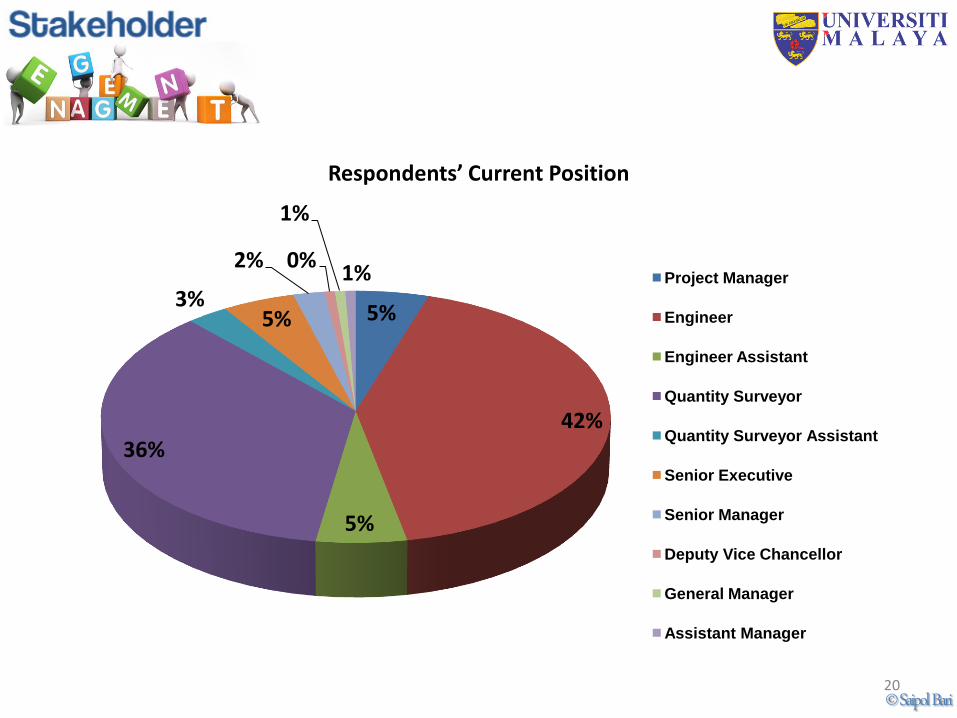
5%
42%
5%
36%
3% 5%
2% 0%
1%
1%
Respondents’ Current Position
Project Manager
Engineer
Engineer Assistant
Quantity Surveyor
Quantity Surveyor Assistant
Senior Executive
Senior Manager
Deputy Vice Chancellor
General Manager
Assistant Manager
© Saipol Bari 20
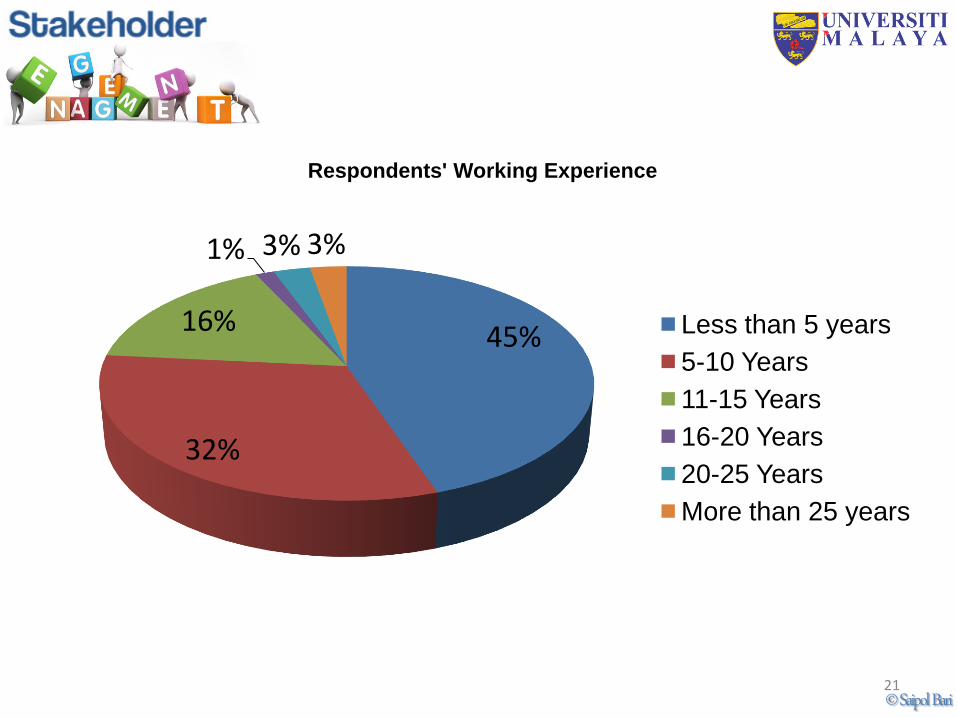
45%
32%
16%
1% 3% 3%
Respondents' Working Experience
Less than 5 years
5-10 Years
11-15 Years
16-20 Years
20-25 Years
More than 25 years
© Saipol Bari 21
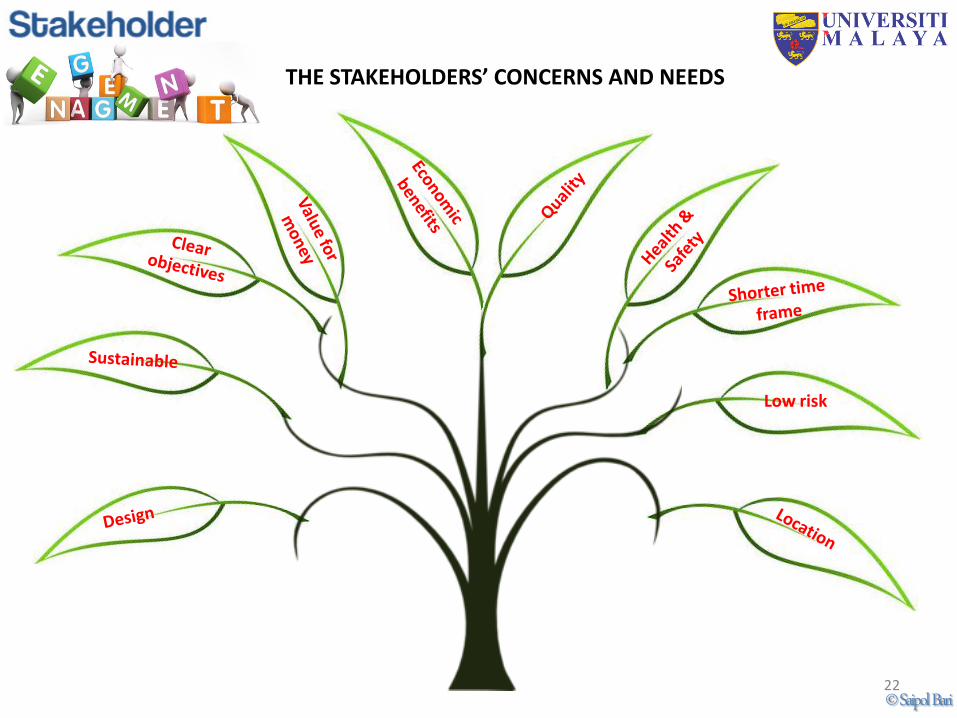
THE STAKEHOLDERS’ CONCERNS AND NEEDS
Low risk
© Saipol Bari 22
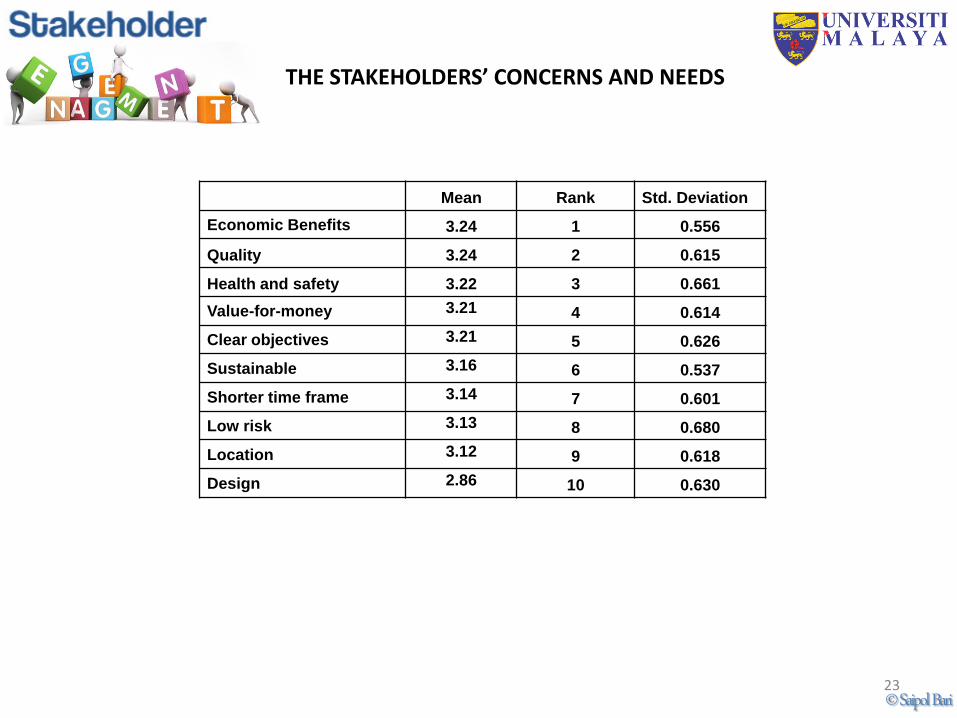
Mean Rank Std. Deviation
Economic Benefits 3.24 1 0.556
Quality 3.24 2 0.615
Health and safety 3.22 3 0.661
Value-for-money 3.21 4 0.614
Clear objectives 3.21 5 0.626
Sustainable 3.16 6 0.537
Shorter time frame 3.14 7 0.601
Low risk 3.13 8 0.680
Location 3.12 9 0.618
Design 2.86 10 0.630
THE STAKEHOLDERS’ CONCERNS AND NEEDS
© Saipol Bari 23
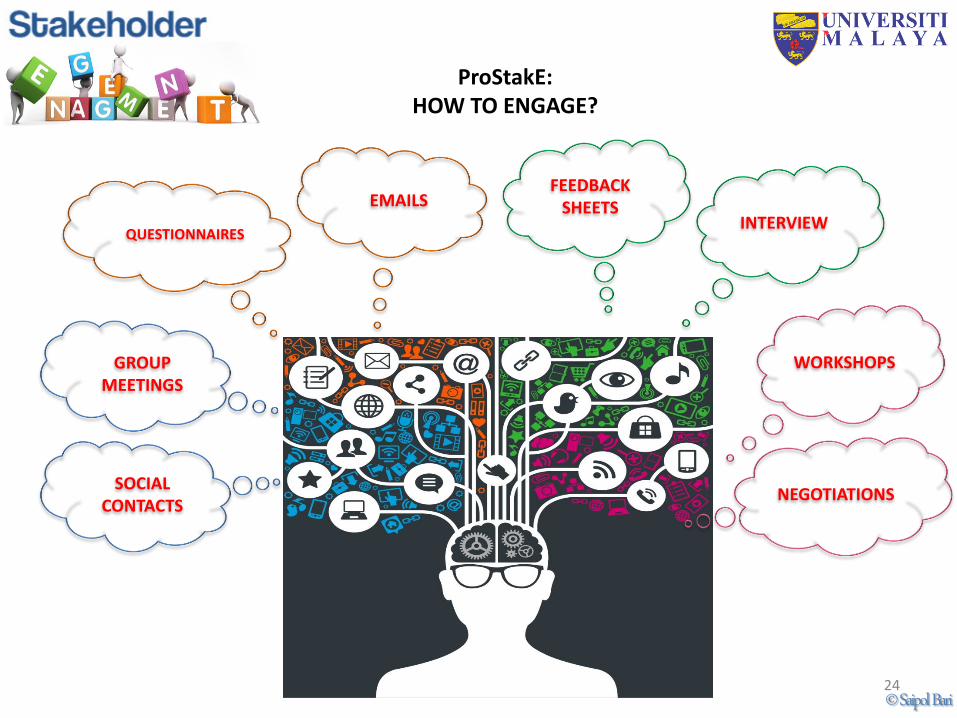
ProStakE: HOW TO ENGAGE?
WORKSHOPS
NEGOTIATIONS
INTERVIEW
FEEDBACK SHEETS EMAILS
QUESTIONNAIRES
GROUP MEETINGS
SOCIAL CONTACTS
© Saipol Bari 24
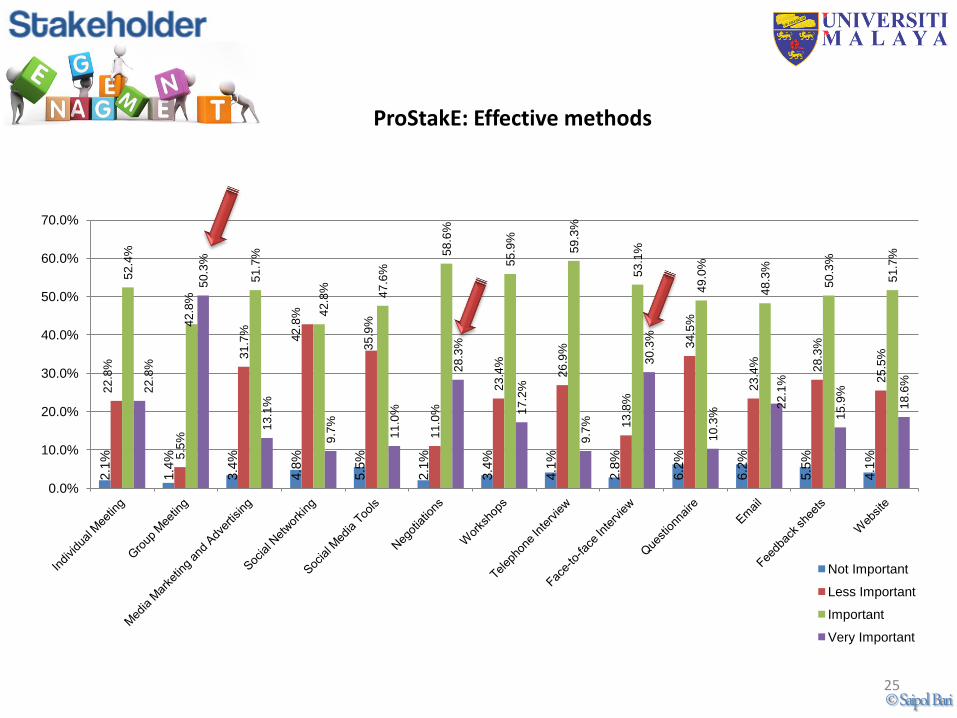
ProStakE: Effective methods 2.1
%
1.4
%
3.4
%
4.8
%
5.5
%
2.1
%
3.4
%
4.1
%
2.8
%
6.2
%
6.2
%
5.5
%
4.1
%
22
.8%
5.5
%
31
.7%
42
.8%
35
.9%
11
.0%
23
.4%
26
.9%
13
.8%
34
.5%
23
.4%
28
.3%
25
.5%
52
.4%
42
.8%
51
.7%
42
.8%
47
.6%
58
.6%
55
.9%
59
.3%
53
.1%
49
.0%
48
.3%
50
.3%
51
.7%
22
.8%
50
.3%
13
.1%
9.7
%
11
.0%
28
.3%
17
.2%
9.7
%
30
.3%
10
.3%
22
.1%
15
.9%
18
.6%
0.0%
10.0%
20.0%
30.0%
40.0%
50.0%
60.0%
70.0%
Not Important
Less Important
Important
Very Important
© Saipol Bari 25
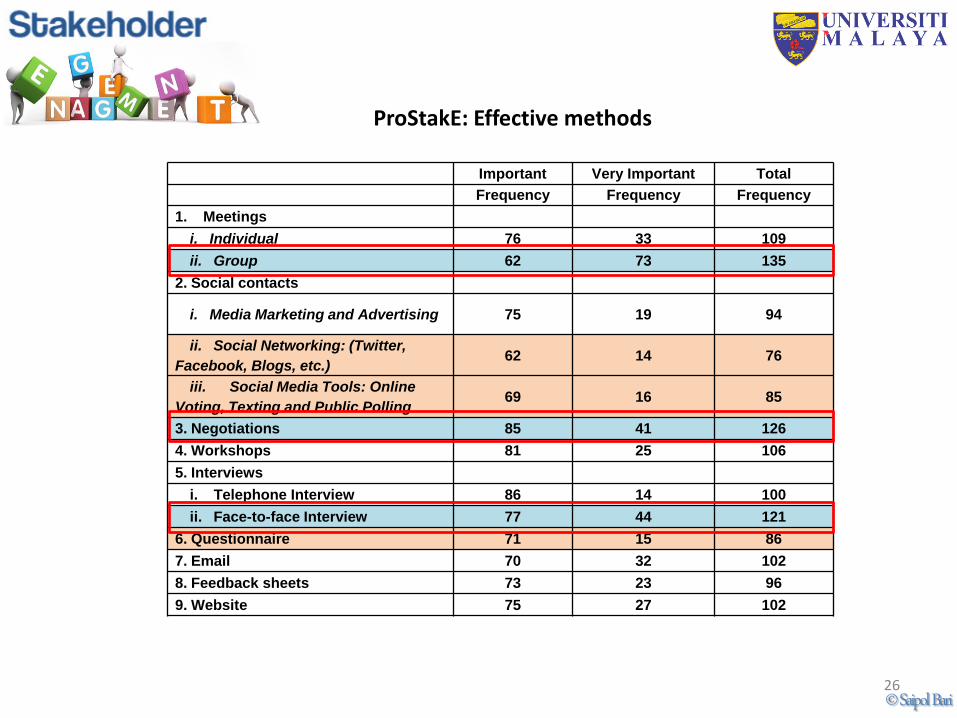
ProStakE: Effective methods
Important Very Important Total
Frequency Frequency Frequency
1. Meetings
i. Individual 76 33 109
ii. Group 62 73 135
2. Social contacts
i. Media Marketing and Advertising 75 19 94
ii. Social Networking: (Twitter,
Facebook, Blogs, etc.) 62 14 76
iii. Social Media Tools: Online
Voting, Texting and Public Polling 69 16 85
3. Negotiations 85 41 126
4. Workshops 81 25 106
5. Interviews
i. Telephone Interview 86 14 100
ii. Face-to-face Interview 77 44 121
6. Questionnaire 71 15 86
7. Email 70 32 102
8. Feedback sheets 73 23 96
9. Website 75 27 102
© Saipol Bari 26
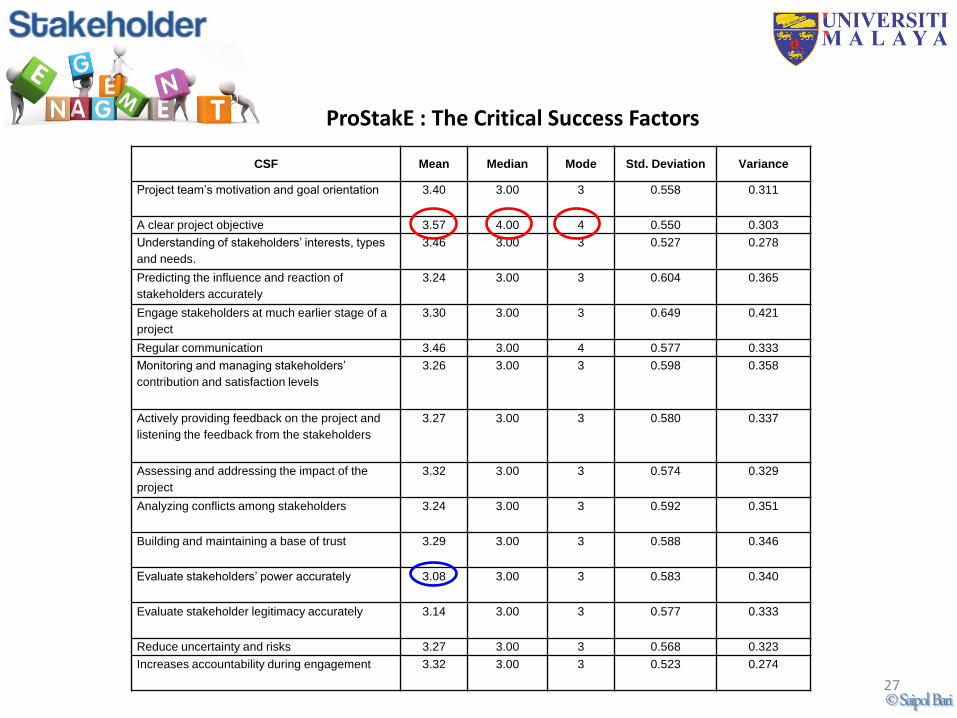
ProStakE : The Critical Success Factors
CSF Mean Median Mode Std. Deviation Variance
Project team’s motivation and goal orientation 3.40 3.00 3 0.558 0.311
A clear project objective 3.57 4.00 4 0.550 0.303
Understanding of stakeholders’ interests, types
and needs.
3.46 3.00 3 0.527 0.278
Predicting the influence and reaction of
stakeholders accurately
3.24 3.00 3 0.604 0.365
Engage stakeholders at much earlier stage of a
project
3.30 3.00 3 0.649 0.421
Regular communication 3.46 3.00 4 0.577 0.333
Monitoring and managing stakeholders’
contribution and satisfaction levels
3.26 3.00 3 0.598 0.358
Actively providing feedback on the project and
listening the feedback from the stakeholders
3.27 3.00 3 0.580 0.337
Assessing and addressing the impact of the
project
3.32 3.00 3 0.574 0.329
Analyzing conflicts among stakeholders 3.24 3.00 3 0.592 0.351
Building and maintaining a base of trust 3.29 3.00 3 0.588 0.346
Evaluate stakeholders’ power accurately 3.08 3.00 3 0.583 0.340
Evaluate stakeholder legitimacy accurately 3.14 3.00 3 0.577 0.333
Reduce uncertainty and risks 3.27 3.00 3 0.568 0.323
Increases accountability during engagement 3.32 3.00 3 0.523 0.274
© Saipol Bari 27
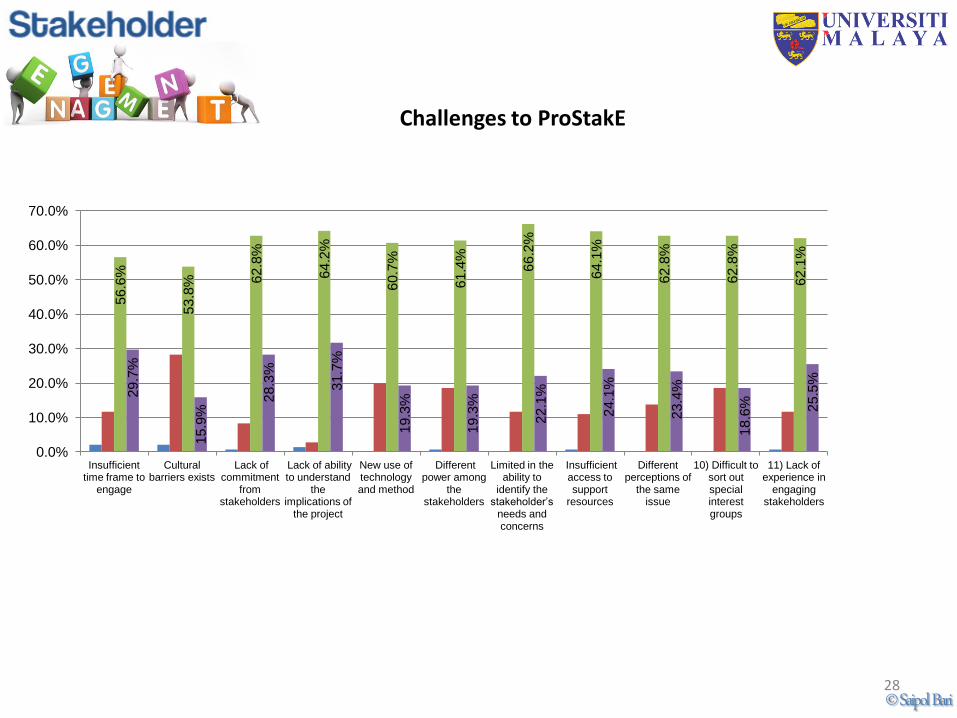
Challenges to ProStakE 5
6.6
%
53.8
%
62
.8%
64
.2%
60
.7%
61
.4%
66
.2%
64
.1%
62
.8%
62
.8%
62
.1%
29
.7%
15
.9%
28
.3%
31
.7%
19
.3%
19
.3%
22
.1%
24
.1%
23
.4%
18.6
%
25
.5%
0.0%
10.0%
20.0%
30.0%
40.0%
50.0%
60.0%
70.0%
Insufficient time frame to
engage
Cultural barriers exists
Lack of commitment
from stakeholders
Lack of ability to understand
the implications of
the project
New use of technology and method
Different power among
the stakeholders
Limited in the ability to
identify the stakeholder’s
needs and concerns
Insufficient access to support
resources
Different perceptions of
the same issue
10) Difficult to sort out special interest groups
11) Lack of experience in
engaging stakeholders
© Saipol Bari 28
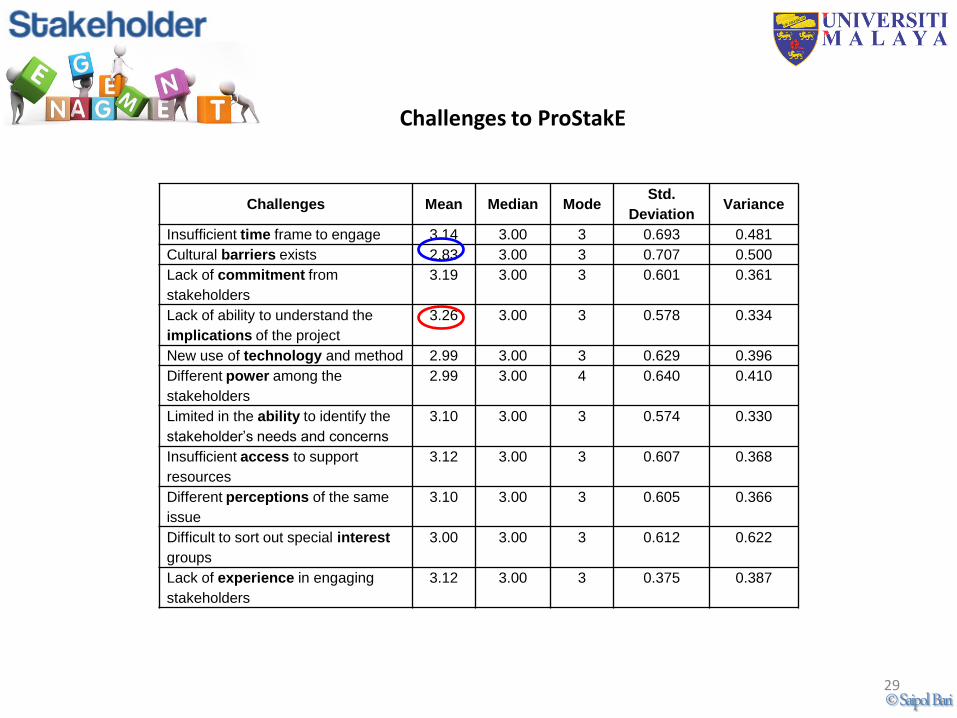
Challenges to ProStakE
Challenges Mean Median Mode Std.
Deviation Variance
Insufficient time frame to engage 3.14 3.00 3 0.693 0.481
Cultural barriers exists 2.83 3.00 3 0.707 0.500
Lack of commitment from
stakeholders
3.19 3.00 3 0.601 0.361
Lack of ability to understand the
implications of the project
3.26 3.00 3 0.578 0.334
New use of technology and method 2.99 3.00 3 0.629 0.396
Different power among the
stakeholders
2.99 3.00 4 0.640 0.410
Limited in the ability to identify the
stakeholder’s needs and concerns
3.10 3.00 3 0.574 0.330
Insufficient access to support
resources
3.12 3.00 3 0.607 0.368
Different perceptions of the same
issue
3.10 3.00 3 0.605 0.366
Difficult to sort out special interest
groups
3.00 3.00 3 0.612 0.622
Lack of experience in engaging
stakeholders
3.12 3.00 3 0.375 0.387
© Saipol Bari 29
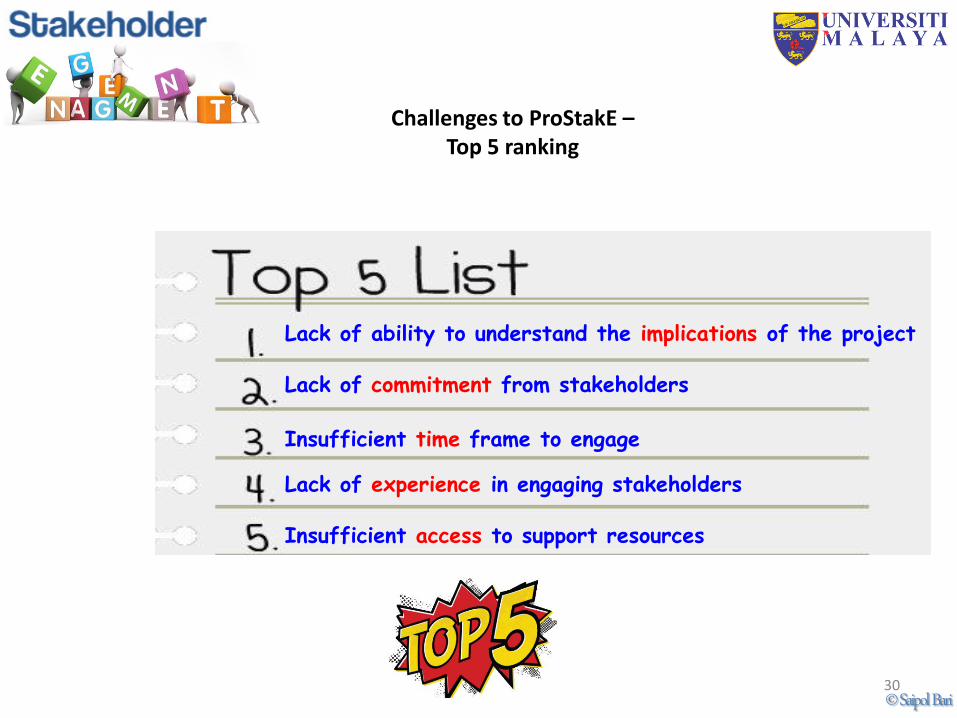
Challenges to ProStakE – Top 5 ranking
Lack of ability to understand the implications of the project
Lack of commitment from stakeholders
Insufficient time frame to engage
Lack of experience in engaging stakeholders
Insufficient access to support resources
© Saipol Bari 30
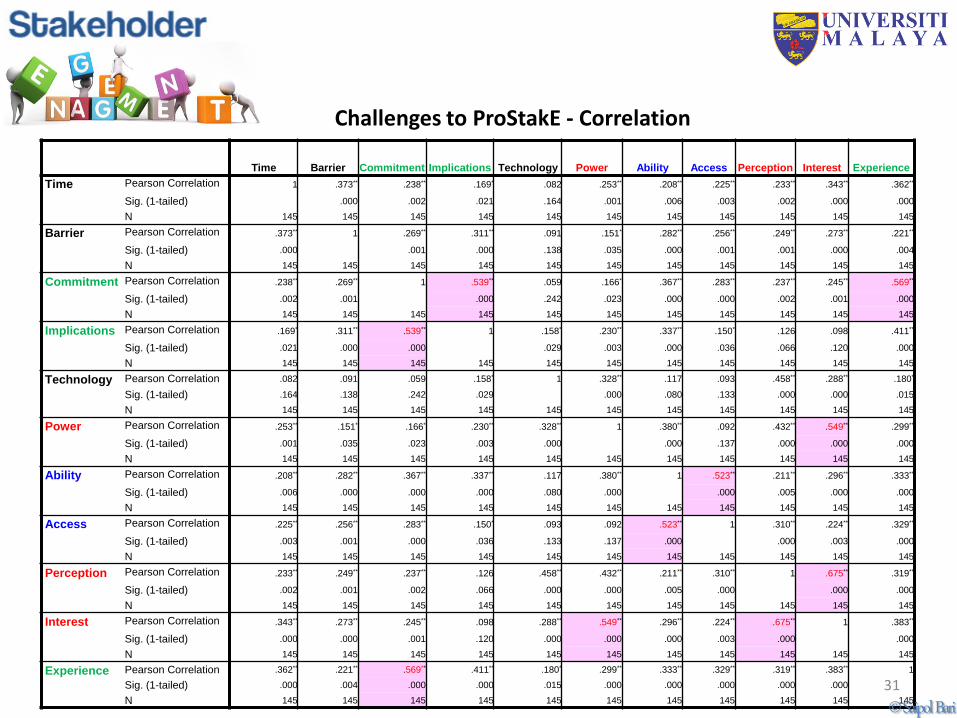
Challenges to ProStakE - Correlation
Time Barrier Commitment Implications Technology Power Ability Access Perception Interest Experience
Time Pearson Correlation 1 .373** .238** .169* .082 .253** .208** .225** .233** .343** .362**
Sig. (1-tailed) .000 .002 .021 .164 .001 .006 .003 .002 .000 .000
N 145 145 145 145 145 145 145 145 145 145 145
Barrier Pearson Correlation .373** 1 .269** .311** .091 .151* .282** .256** .249** .273** .221**
Sig. (1-tailed) .000 .001 .000 .138 .035 .000 .001 .001 .000 .004
N 145 145 145 145 145 145 145 145 145 145 145
Commitment Pearson Correlation .238** .269** 1 .539** .059 .166* .367** .283** .237** .245** .569**
Sig. (1-tailed) .002 .001 .000 .242 .023 .000 .000 .002 .001 .000
N 145 145 145 145 145 145 145 145 145 145 145
Implications Pearson Correlation .169* .311** .539** 1 .158* .230** .337** .150* .126 .098 .411**
Sig. (1-tailed) .021 .000 .000 .029 .003 .000 .036 .066 .120 .000
N 145 145 145 145 145 145 145 145 145 145 145
Technology Pearson Correlation .082 .091 .059 .158* 1 .328** .117 .093 .458** .288** .180*
Sig. (1-tailed) .164 .138 .242 .029 .000 .080 .133 .000 .000 .015
N 145 145 145 145 145 145 145 145 145 145 145
Power Pearson Correlation .253** .151* .166* .230** .328** 1 .380** .092 .432** .549** .299**
Sig. (1-tailed) .001 .035 .023 .003 .000 .000 .137 .000 .000 .000
N 145 145 145 145 145 145 145 145 145 145 145
Ability Pearson Correlation .208** .282** .367** .337** .117 .380** 1 .523** .211** .296** .333**
Sig. (1-tailed) .006 .000 .000 .000 .080 .000 .000 .005 .000 .000
N 145 145 145 145 145 145 145 145 145 145 145
Access Pearson Correlation .225** .256** .283** .150* .093 .092 .523** 1 .310** .224** .329**
Sig. (1-tailed) .003 .001 .000 .036 .133 .137 .000 .000 .003 .000
N 145 145 145 145 145 145 145 145 145 145 145
Perception Pearson Correlation .233** .249** .237** .126 .458** .432** .211** .310** 1 .675** .319**
Sig. (1-tailed) .002 .001 .002 .066 .000 .000 .005 .000 .000 .000
N 145 145 145 145 145 145 145 145 145 145 145
Interest Pearson Correlation .343** .273** .245** .098 .288** .549** .296** .224** .675** 1 .383**
Sig. (1-tailed) .000 .000 .001 .120 .000 .000 .000 .003 .000 .000
N 145 145 145 145 145 145 145 145 145 145 145
Experience Pearson Correlation .362** .221** .569** .411** .180* .299** .333** .329** .319** .383** 1
Sig. (1-tailed) .000 .004 .000 .000 .015 .000 .000 .000 .000 .000
N 145 145 145 145 145 145 145 145 145 145 145 © Saipol Bari 31
Challenges to ProStakE - Correlation
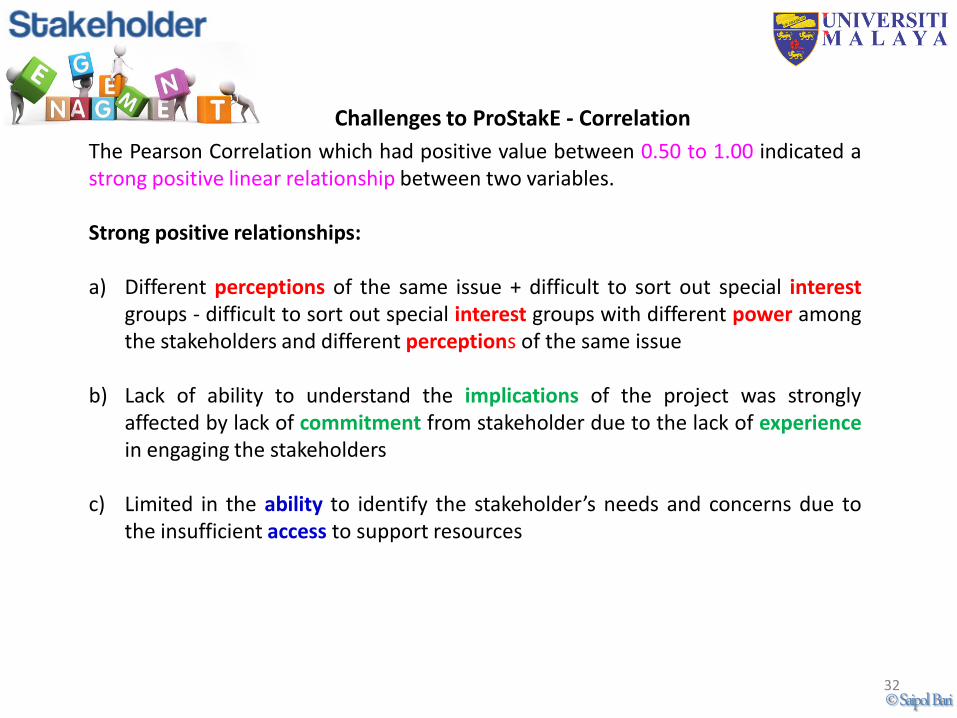
The Pearson Correlation which had positive value between 0.50 to 1.00 indicated a strong positive linear relationship between two variables. Strong positive relationships: a) Different perceptions of the same issue + difficult to sort out special interest
groups - difficult to sort out special interest groups with different power among the stakeholders and different perceptions of the same issue
b) Lack of ability to understand the implications of the project was strongly affected by lack of commitment from stakeholder due to the lack of experience in engaging the stakeholders
c) Limited in the ability to identify the stakeholder’s needs and concerns due to the insufficient access to support resources
© Saipol Bari 32
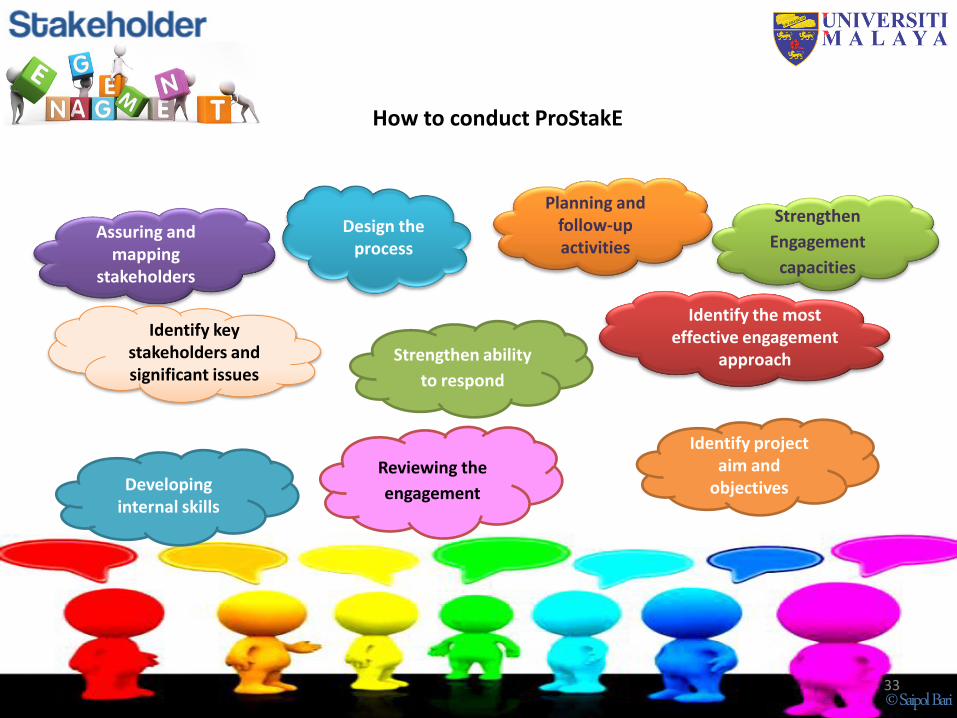
How to conduct ProStakE
Developing internal skills
Assuring and mapping
stakeholders
Planning and follow-up activities
Identify key stakeholders and significant issues
Design the process
Identify project aim and
objectives
Strengthen ability
to respond
Reviewing the
engagement
Identify the most effective engagement
approach
Strengthen
Engagement
capacities
© Saipol Bari 33
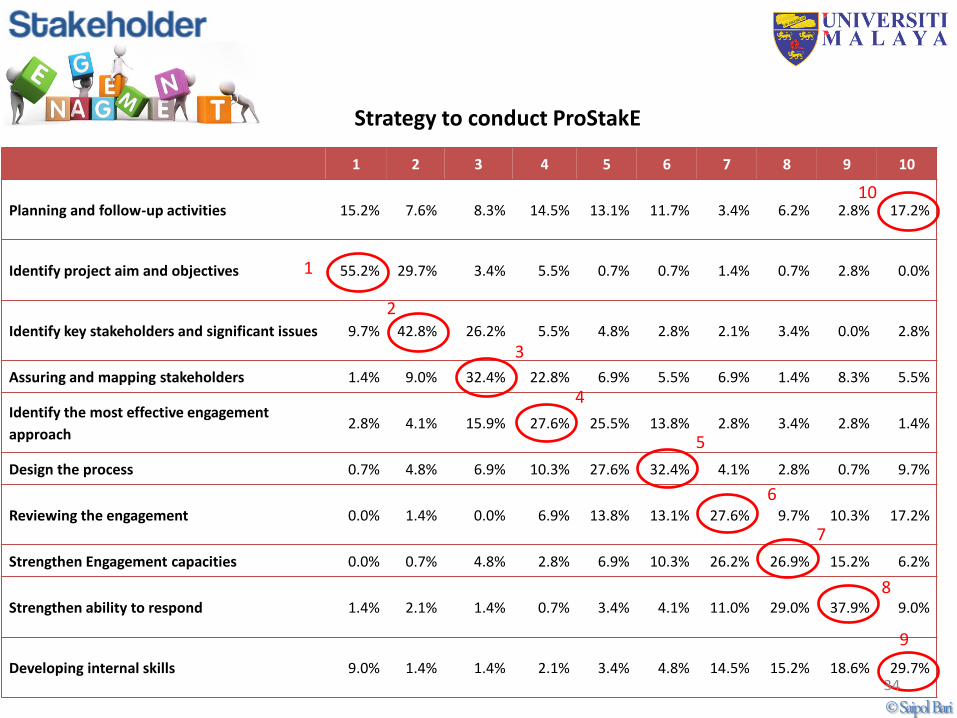
1 2 3 4 5 6 7 8 9 10
Planning and follow-up activities 15.2% 7.6% 8.3% 14.5% 13.1% 11.7% 3.4% 6.2% 2.8% 17.2%
Identify project aim and objectives 55.2% 29.7% 3.4% 5.5% 0.7% 0.7% 1.4% 0.7% 2.8% 0.0%
Identify key stakeholders and significant issues 9.7% 42.8% 26.2% 5.5% 4.8% 2.8% 2.1% 3.4% 0.0% 2.8%
Assuring and mapping stakeholders 1.4% 9.0% 32.4% 22.8% 6.9% 5.5% 6.9% 1.4% 8.3% 5.5%
Identify the most effective engagement
approach 2.8% 4.1% 15.9% 27.6% 25.5% 13.8% 2.8% 3.4% 2.8% 1.4%
Design the process 0.7% 4.8% 6.9% 10.3% 27.6% 32.4% 4.1% 2.8% 0.7% 9.7%
Reviewing the engagement 0.0% 1.4% 0.0% 6.9% 13.8% 13.1% 27.6% 9.7% 10.3% 17.2%
Strengthen Engagement capacities 0.0% 0.7% 4.8% 2.8% 6.9% 10.3% 26.2% 26.9% 15.2% 6.2%
Strengthen ability to respond 1.4% 2.1% 1.4% 0.7% 3.4% 4.1% 11.0% 29.0% 37.9% 9.0%
Developing internal skills 9.0% 1.4% 1.4% 2.1% 3.4% 4.8% 14.5% 15.2% 18.6% 29.7%
1
2
3
10
5
4
8
9
7
6
Strategy to conduct ProStakE
© Saipol Bari 34
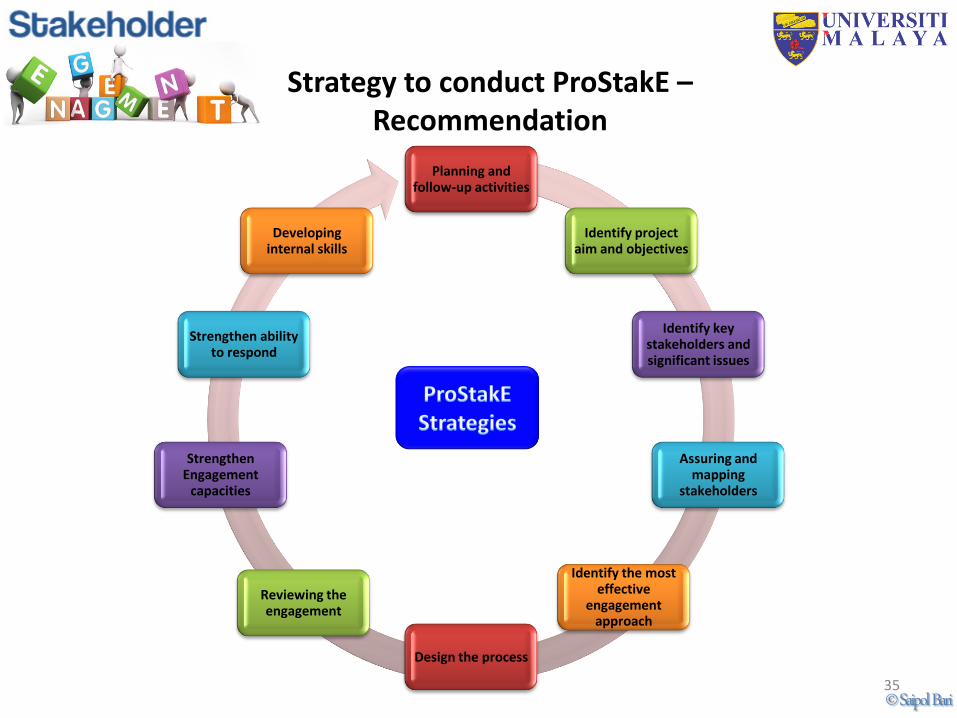
Planning and follow-up activities
Identify project aim and objectives
Identify key stakeholders and significant issues
Assuring and mapping
stakeholders
Identify the most effective
engagement approach
Design the process
Reviewing the engagement
Strengthen Engagement
capacities
Strengthen ability to respond
Developing internal skills
Strategy to conduct ProStakE – Recommendation
© Saipol Bari 35
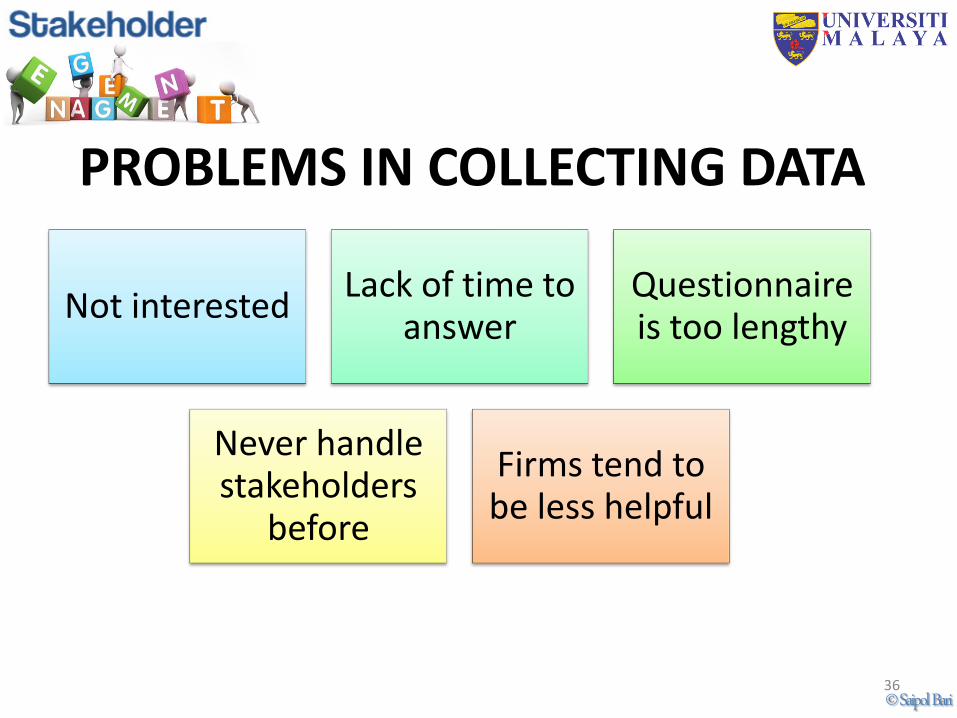
PROBLEMS IN COLLECTING DATA
Not interested Lack of time to
answer Questionnaire is too lengthy
Never handle stakeholders
before
Firms tend to be less helpful
© Saipol Bari 36
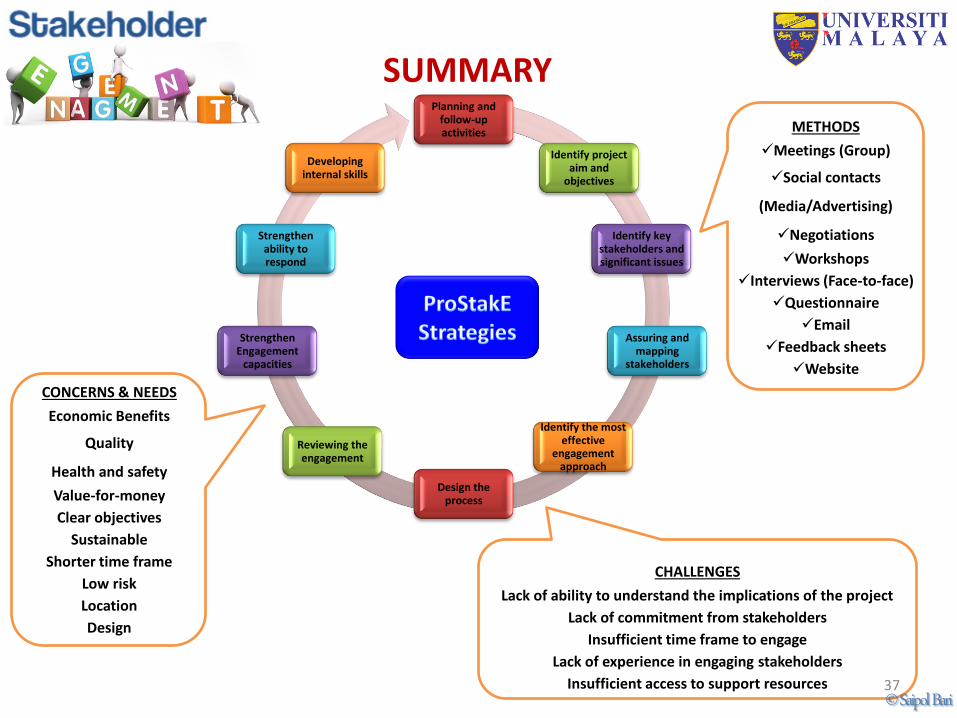
CONCERNS & NEEDS
Economic Benefits
Quality
Health and safety
Value-for-money
Clear objectives
Sustainable
Shorter time frame
Low risk
Location
Design
SUMMARY
METHODS
Meetings (Group)
Social contacts
(Media/Advertising)
Negotiations
Workshops
Interviews (Face-to-face)
Questionnaire
Feedback sheets
Website
CHALLENGES
Lack of ability to understand the implications of the project
Lack of commitment from stakeholders
Insufficient time frame to engage
Lack of experience in engaging stakeholders
Insufficient access to support resources
Planning and follow-up activities
Identify project aim and
objectives
Identify key stakeholders and significant issues
Assuring and mapping
stakeholders
Identify the most effective
engagement approach
Design the process
Reviewing the engagement
Strengthen Engagement
capacities
Strengthen ability to respond
Developing internal skills
© Saipol Bari 37

• Lack of the knowledge in stakeholder engagement
• Lack of practice of stakeholder engagement
• Regular communication among stakeholders is essential
© Saipol Bari 38
© Saipol Bari 39

© Saipol Bari 40
Related Documents