ANALYTICAL BIOCHEMISTRY Analytical Biochemistry 353 (2006) 43–56 www.elsevier.com/locate/yabio 0003-2697/$ - see front matter © 2006 Elsevier Inc. All rights reserved. doi:10.1016/j.ab.2006.03.023 Strategies for comparing gene expression proWles from diVerent microarray platforms: Application to a case–control experiment Marco Severgnini a,b , Silvio Bicciato c , Eleonora Mangano b,d , Francesca Scarlatti b,e , Alessandra Mezzelani b , Michela Mattioli f , Riccardo Ghidoni b,e , Clelia Peano a,b , Raoul Bonnal a,b , Federica Viti a , Luciano Milanesi a,b , Gianluca De Bellis a,b , Cristina Battaglia b,d,¤ a Institute of Biomedical Technologies, National Research Council, Milan, Italy b Interdisciplinary Center for Biomolecular Studies and Industrial Applications (CISI), University of Milan, Milan, Italy c Department of Chemical Process Engineering, University of Padua, Padua, Italy d Department of Sciences and Biomedical Technologies, University of Milan, Milan, Italy e Laboratory of Biochemistry and Molecular Biology, San Paolo University Hospital, University of Milan, Milan, Italy f Laboratory of Experimental Hematology and Molecular Genetics, Department of Hematology 2, Ospedale Maggiore, IRCCS, Milan, Italy Received 30 November 2005 Available online 3 April 2006 Abstract Meta-analysis of microarray data is increasingly important, considering both the availability of multiple platforms using disparate technologies and the accumulation in public repositories of data sets from diVerent laboratories. We addressed the issue of comparing gene expression proWles from two microarray platforms by devising a standardized investigative strategy. We tested this procedure by studying MDA-MB-231 cells, which undergo apoptosis on treatment with resveratrol. Gene expression proWles were obtained using high- density, short-oligonucleotide, single-color microarray platforms: GeneChip (AVymetrix) and CodeLink (Amersham). Interplatform analyses were carried out on 8414 common transcripts represented on both platforms, as identiWed by LocusLink ID, representing 70.8% and 88.6% of annotated GeneChip and CodeLink features, respectively. We identiWed 105 diVerentially expressed genes (DEGs) on Code- Link and 42 DEGs on GeneChip. Among them, only 9 DEGs were commonly identiWed by both platforms. Multiple analyses (BLAST alignment of probes with target sequences, gene ontology, literature mining, and quantitative real-time PCR) permitted us to investigate the factors contributing to the generation of platform-dependent results in single-color microarray experiments. An eVective approach to cross-platform comparison involves microarrays of similar technologies, samples prepared by identical methods, and a standardized bat- tery of bioinformatic and statistical analyses. © 2006 Elsevier Inc. All rights reserved. Keywords: Platform comparison; High-density microarray; Comparison strategy Platform comparison of microarray measurements is one of the most interesting development Welds of arraying technology, as evidenced by the exponential increase in the number of articles on the subject [1]. Meta-analysis of microarray data from diVerent sources and platforms is becoming increasingly important, especially considering the accumulation in public repositories of data sets from diVer- ent laboratories concerning the same biological questions. However, there is no consensus on the best methods for meta-analysis of microarray data. The agreement of data sets generated using diVerent types of microarray slides and platforms has been studied previ- ously, yet results are confounding and conXicting. Several studies reported poor superimposition of results obtained * Corresponding author. E-mail address: [email protected] (C. Battaglia).

Welcome message from author
This document is posted to help you gain knowledge. Please leave a comment to let me know what you think about it! Share it to your friends and learn new things together.
Transcript

ANALYTICALBIOCHEMISTRY
Analytical Biochemistry 353 (2006) 43–56
www.elsevier.com/locate/yabio
Strategies for comparing gene expression proWles from diVerent microarray platforms: Application to a case–control experiment
Marco Severgnini a,b, Silvio Bicciato c, Eleonora Mangano b,d, Francesca Scarlatti b,e, Alessandra Mezzelani b, Michela Mattioli f, Riccardo Ghidoni b,e, Clelia Peano a,b,
Raoul Bonnal a,b, Federica Viti a, Luciano Milanesi a,b, Gianluca De Bellis a,b, Cristina Battaglia b,d,¤
a Institute of Biomedical Technologies, National Research Council, Milan, Italyb Interdisciplinary Center for Biomolecular Studies and Industrial Applications (CISI), University of Milan, Milan, Italy
c Department of Chemical Process Engineering, University of Padua, Padua, Italyd Department of Sciences and Biomedical Technologies, University of Milan, Milan, Italy
e Laboratory of Biochemistry and Molecular Biology, San Paolo University Hospital, University of Milan, Milan, Italyf Laboratory of Experimental Hematology and Molecular Genetics, Department of Hematology 2, Ospedale Maggiore, IRCCS, Milan, Italy
Received 30 November 2005Available online 3 April 2006
Abstract
Meta-analysis of microarray data is increasingly important, considering both the availability of multiple platforms using disparatetechnologies and the accumulation in public repositories of data sets from diVerent laboratories. We addressed the issue of comparinggene expression proWles from two microarray platforms by devising a standardized investigative strategy. We tested this procedure bystudying MDA-MB-231 cells, which undergo apoptosis on treatment with resveratrol. Gene expression proWles were obtained using high-density, short-oligonucleotide, single-color microarray platforms: GeneChip (AVymetrix) and CodeLink (Amersham). Interplatformanalyses were carried out on 8414 common transcripts represented on both platforms, as identiWed by LocusLink ID, representing 70.8%and 88.6% of annotated GeneChip and CodeLink features, respectively. We identiWed 105 diVerentially expressed genes (DEGs) on Code-Link and 42 DEGs on GeneChip. Among them, only 9 DEGs were commonly identiWed by both platforms. Multiple analyses (BLASTalignment of probes with target sequences, gene ontology, literature mining, and quantitative real-time PCR) permitted us to investigatethe factors contributing to the generation of platform-dependent results in single-color microarray experiments. An eVective approach tocross-platform comparison involves microarrays of similar technologies, samples prepared by identical methods, and a standardized bat-tery of bioinformatic and statistical analyses.© 2006 Elsevier Inc. All rights reserved.
Keywords: Platform comparison; High-density microarray; Comparison strategy
Platform comparison of microarray measurements isone of the most interesting development Welds of arrayingtechnology, as evidenced by the exponential increase in thenumber of articles on the subject [1]. Meta-analysis ofmicroarray data from diVerent sources and platforms is
* Corresponding author.E-mail address: [email protected] (C. Battaglia).
0003-2697/$ - see front matter © 2006 Elsevier Inc. All rights reserved.doi:10.1016/j.ab.2006.03.023
becoming increasingly important, especially considering theaccumulation in public repositories of data sets from diVer-ent laboratories concerning the same biological questions.However, there is no consensus on the best methods formeta-analysis of microarray data.
The agreement of data sets generated using diVerent typesof microarray slides and platforms has been studied previ-ously, yet results are confounding and conXicting. Severalstudies reported poor superimposition of results obtained

44 Comparing gene expression profiles / M. Severgnini et al. / Anal. Biochem. 353 (2006) 43–56
from two or three commercial arraying platforms [2–5]. Oth-ers found a better superimposition of commercial microarrayplatforms, with elevated correlation coeYcients [6–9]. More-over, the protocols used to compare two or more microarraytechnologies often are case dependent. Variables that renderplatform comparisons diYcult include widely disparate tech-nologies and diVerences in both the preparation of samplesand the analysis of microarray raw data.
In the interest of addressing critical issues in microarraycross-comparison, we designed and tested a standardizedstrategy to compare transcriptional analyses from two com-mercial single-color microarray platforms. We selected plat-forms that used similar technologies. AVymetrix’s GeneChipExpression Analysis Arrays [10] and Amersham’s CodeLinkBioarrays [11] both employ short-oligonucleotide DNAmicroarrays and a one-color detection protocol, obtainedwith streptavidin conjugated with phycoerythrin (PE, Gene-Chip)1 or cyanine 5 (CodeLink). Moreover, to have compara-ble RNA samples for investigation on the two platforms, westudied changes in gene expression in a metastatic breast can-cer cell line (MDA-MB-231), that undergoes apoptosis whentreated with the antitumoral agent resveratrol [12]. Our inves-tigative strategy employed a battery of bioinformatic and sta-tistical analyses, permitting us to study the extent to whichgene expression proWles are platform dependent, howsequences of microarray probes inXuence outcomes, andwhether gene expression signatures from microarray technol-ogy are reliable and biologically relevant. In this article, weillustrate how this meta-analysis approach is eVective instudying the factors that lead to the generation of platform-speciWc results.
Materials and methods
The human breast cancer cell line MDA-MB-231 wasobtained from American Tissue Culture Collection (Rock-ville, MD, USA) and maintained in Dulbecco’s modiWedEagle’s medium (DMEM) supplemented with 5% fetalbovine serum, 100 mg/ml streptomycin, and penicillin at37 °C and 5% CO2. Resveratrol (Cayman Chemical, AnnArbor, MI, USA) was prepared in ethanol. To evaluate theeVects of resveratrol on gene expression, cells were seededin six-well tissue culture plates at 4£ 105 cells/well andallowed to adhere for 24 h prior to treatment. Then resvera-trol was added to a Wnal concentration of 32 �M, and thecells were cultured for 48 h prior to use (treated samples). Incontrol samples, vehicle was added.
1 Abbreviations used: PE, phycoerythrin; DMEM, Dulbecco’s modiWedEagle’s medium; cRNA, complementary RNA; cDNA, complementaryDNA; PMT, photomultiplier tube; dChip, DNA–Chip Analyzer; HG-UI33A, Human Genome U133A; EDTA, ethylenediaminetetraacetic acid;BSA, bovine serum albumin; MAS, Microarray Suite; P, present; FU,Xuorescence units; RMA, robust multiarray average; PM, perfect match;A, absent; MIAME, Minimum Information about Microarray Experi-ment database; SAM, signiWcance analysis for microarray; DEG, diVeren-tially expressed gene; qPCR, quantitative real-time PCR.
RNA and complementary RNA preparation
RNA and complementary RNA (cRNA) were preparedusing a single procedure to avoid diVerences introduced byspeciWc target preparation protocols. BrieXy, total RNAwas puriWed from a total of four independent wells ofMDA-MB-231 cultures, treated with resveratrol (nD2) orvehicle (nD2), using TRI Reagent (Sigma, St. Louis, MO,USA). An additional puriWcation step was carried out usingthe RNAeasy kit (Qiagen, Valencia, CA, USA). Total RNAsamples were quality-checked by microcapillary electro-phoresis using the 2100 BioAnalyzer (Agilent, Palo Alto,CA, USA).
Double-stranded complementary DNA (cDNA) wassynthesized from 5 �g total RNA using the SuperscriptChoice System (Invitrogen, Carlsbad, CA, USA). cDNAwas puriWed by phenol–chloroform extraction and ethanolprecipitation. In vitro transcription and biotin labeling ofcRNA were carried out using the Bioarray HighYield RNATranscript Labeling Kit (Enzo Life Sciences, Farmingdale,NY, USA). The reaction mix was incubated for 5 h at 37 °C,and cRNA was puriWed using the RNAeasy kit. cRNA wasquantiWed by absorption at 260 nm and checked for qualityby microcapillary electrophoresis. A typical cRNA samplehad a size range of 500–3000 bases.
The four samples of biotinylated cRNA (two treatedand two controls) were fragmented in 40 mM Tris–acetate(TrisOAc, pH 7.9), 100 mM KOAc, and 31.5 mM MgOAcat 94 °C for 35 min. The fragmented cRNA samples werechecked for quality on GeneChip Test3 array prior to thecomparative study of two microarray platforms.
Amersham CodeLink hybridization, processing, and analysis
CodeLink UniSet Human I Bioarrays were obtainedfrom GE Healthcare (formerly Amersham Bioscience, Pis-cataway, NJ, USA). These DNA microarray slides contain10,461 oligonucleotide probes (30 bases in length), of which513 are internal controls and 9948 are “discovery” probes.Probe sequences are designed on human transcripts depos-ited in the National Center for Biotechnology Informa-tion’s Reference Sequence (RefSeq) and dbEST databasesand on some sequences from LifeSeq Gold and Foundationdatabases (Incyte, Wilmington, DE, USA).
The four samples of fragmented biotinylated cRNA(10 �g cRNA each) were prepared for hybridization to thebioarrays using the Expression Assay Reagent Kit (Wnalvolume, 260 �l). The hybridization solution was heated at90 °C for 5 min to denature the cRNA, chilled on ice, andvortexed vigorously for 5 s, and 250 �l was injected into theinlet port of the hybridization chamber, previously placedin a 12-slide shaker tray. The hybridization chamber portswere sealed with 1-cm sealing strips, and the shaker trayswere loaded into a shaking incubator (Innova 4080, NewBrunswick ScientiWc, Edison, NJ, USA) with the hybridiza-tion chambers facing up. Slides were incubated for 18 h at37 °C while shaking at 300 rpm.
Comparing gene expression profiles / M. Severgnini et al. / Anal. Biochem. 353 (2006) 43–56 45
After hybridization, the 12-slide shaker tray wasremoved from the incubator and the hybridization cham-ber was removed from each slide. Each slide was brieXyrinsed in TNT buVer (0.1 M Tris–HCl [pH 7.6], 0.15 MNaCl, and 0.05% Tween 20) at room temperature and thenwashed in TNT buVer at 42 °C for 60 min. The signal wasdeveloped using a 1:500 dilution of streptavidin–Cy5 (GEHealthcare) in TNT buVer for 30 min at room temperature.Excess dye was removed by washing four times with TNTbuVer, for 5 min each, at room temperature. Slides wererinsed in deionized water and dried under nitrogen.
The processed slides were scanned on an Axon GenePixScanner (Axon, Molecular Devices, Union City, CA, USA)with the laser set at 635 nm, the photomultiplier tube(PMT) at 600 V, and the scan resolution at 10�m. Code-Link Expression Analysis Software (version 4.1, AmershamBioscience) was used to analyze images for each slide. Sig-nal intensities of spots were normalized using the DNA–Chip Analyzer (dChip) invariant set algorithm [13,14]. Spotquality was evaluated using data Xagging from CodeLinkExpression Analysis Software. The software allows investi-gators to overcome the problem of donut-shaped spots (thestandard shape of CodeLink Bioarray features) with diY-cult identiWcation of signiWcant pixels in each feature. Spotswith intensity below that of the negative control (absence ofan oligonucleotide probe) were excluded, as were those withirregular shapes or near-background intensities. In particu-lar, we required that each included spot had intensity abovethe negative control threshold for at least one control sam-ple and one treated sample and had a “good” Xag in at leasttwo of four arrays.
AVymetrix GeneChip hybridization, processing, and analysis
GeneChip Human Genome U133A Array (HG-U133A)from AVymetrix (Santa Clara, CA, USA) is a microarray of22,215 probe sets, each composed of 11 pairs of 25-baseprobes (11 “perfect match” and 11 “mismatch” probes).The probe sets represent 68 internal controls and 18,400human transcripts and variants deposited in GenBank,dbEST, and RefSeq databases. Prior to use, the micro-arrays were Wlled with 250 �l prewarmed (45 °C) 1£Meshybridization buVer (100 mM Mes, 1 M NaCl, 20 mM eth-ylenediaminetetraacetic acid [EDTA], and 0.01% Tween 20)and placed for 15 min at 45 °C in the Hybridization Oven640 (AVymetrix).
Following the manufacturer’s instructions, we prepareda hybridization solution containing 150 �l 2£hybridizationbuVer, 5 �l control oligonucleotide B2 (3 nM), 15�l20£ eukaryotic hybridization controls (BioB, BioC, BioD,and Cre), 3 �l herring sperm DNA (10 mg/ml, Promega,Madison, WI, USA), 3 �l acetylated bovine serum albumin(BSA, 50 mg/ml), 15 �g fragmented biotinylated cRNA, andH2O to a Wnal volume of 300 �l. The hybridization solutionwas denatured for 5 min at 99 °C, incubated at 45 °C for5 min, and then centrifuged at 14,000 rpm for 5 min. TheMes hybridization buVer was removed from the prewarmed
GeneChips and replaced with 200 �l hybridization solution.Hybridization took place in the Hybridization Oven 640with rotation at 60 rpm for 16 h at 45 °C.
Washing and Xuorescent labeling were performed on theFluidics Station FS400 (AVymetrix) according to protocolEukGE-WS2 for eukaryotic samples. Staining was Wrstachieved with streptavidin-conjugated PE and was thenampliWed immunochemically with biotinylated anti-strep-tavidin antibody followed by streptavidin-conjugated PEReadings were carried out on the G2500A GeneArrayscanner (Agilent). Data quality was controlled using Micro-array Suite (MAS, version 5.0), monitoring average featuresignal per chip, average background, percentage of present(P) features in the array, and 3�:5� probe ratios. The averagesignal was greater than 500 Xuorescence units (FU) for con-trol samples and greater than 700 FU for treated samples,with background intensity one order of magnitude less thanthe average signal. All four samples had a percentage of Pfeatures near 50% (commonly accepted threshold) and a3�:5� ratio for actin and GAPDH controls less than 2.8.
Probe-level data were converted to expression valuesusing the robust multiarray average (RMA) procedure [15].Intensities of perfect match (PM) probes were background-adjusted and normalized using the invariant set procedure.Probe sets having an absent (A) call on all four arrays wereused to estimate a threshold, Wxed at the 95th percentile oftheir signal distribution (190 FU), for including the remain-ing probe sets in the analysis. Probe sets with A calls in allfour arrays and a mean intensity in both control andtreated samples of less than 190 FU were Wltered out.
Microarray data analysis: intra- and interplatform comparisons
Data sets of unWltered signal intensities (four samples foreach platform) were formatted according to the MinimumInformation about Microarray Experiment (MIAME)database guidelines [16,17] and submitted to the ArrayEx-press database [18], where they are available with accessionnumber E-MEXP-232.
Microarray data were Wrst analyzed for each platformseparately. Normalized signal intensities were log-trans-formed for graphical analysis of distribution using Matlab(Mathworks, Natick, MA, USA). We determined intraplat-form reproducibility by calculating Pearson’s and Spear-man’s correlation coeYcients for treated and controlduplicate samples on data sets of Wltered features. ThendiVerentially expressed genes (treated vs. control samples)were identiWed using both the dChip Compare Samplesprocedure and signiWcance analysis for microarray (SAM).The dChip Compare Samples procedure compares meanintensities of two groups (e.g., treated vs. control) and iden-tiWes microarray features with a more than twofold changeas well as an absolute diVerence of more than 100 FU. The“use lower 90% conWdence bound” option was selected toconservatively estimate the real fold change. At SAM, user-tunable parameter delta was set to 1.8682 (CodeLink) or
46 Comparing gene expression profiles / M. Severgnini et al. / Anal. Biochem. 353 (2006) 43–56
2.2403 (GeneChip) and a minimum twofold change wasrequested between control and treated groups. The null sta-tistic for class comparison was obtained from all possiblerandom shuZings of treated and control samples.
To permit interplatform analysis, it was necessary to Wrstidentify the genes represented on both microarrays (“commongenes”) by comparing LocusLink IDs.2 LocusLink IDs wereobtained for 21,080 (95%) of 22,215 GeneChip probe setsusing the annotation Wle provided by AVymetrix’s NetAVxAnalysis Center [19,20]. LocusLink IDs for CodeLink probeswere obtained by searching with GenBank numbers in theSource database [21,22]. If more than one LocusLink ID wasassociated with a GenBank number, the correct match wasdetermined on the basis of the corresponding CodeLinkdescriptions. Genes not annotated in Source were evaluatedwith DAVID [23,24]. Overall, we annotated 9501 CodeLinkprobes (95% of all discovery probes). Annotated probes(CodeLink) and probe sets (GeneChip) were characterized interms of ontology using FatiGO [25,26] to access the Biologi-cal Process functional annotation.
Interplatform comparisons, including hierarchical clus-tering and analysis of frequency distributions [5], were per-formed after normalization of signal intensities forcommon genes. Normalization was accomplished by ztransformation; that is, the signal intensity of each micro-array feature was adjusted by subtracting the mean inten-sity for the entire microarray and dividing by thecorresponding standard deviation. To highlight similaritiesand diVerences in the gene expression proWles of the fourdata sets from each platform, z-transformed values (zscores) were analyzed with dChip’s Hierarchical Clusteringfunction using Pearson’s correlation coeYcient and averagelinkage as distance and linkage methods, respectively. The zscores were also compared between platforms for the fourindependent samples by the calculation of correlationcoeYcients. Because z transformation is expected to gener-ate a normal distribution of intensities with meanD0 andSDD 1, we analyzed the actual distribution of z scores foreach platform using Matlab.
Sequence correspondence between microarray probes andtarget transcripts was evaluated for diVerentially expressedgenes (DEGs) identiWed on each platform. Sequences of HG-U133A GeneChip probes were retrieved from the NetAVxAnalysis Center (sequences were last updated 28 March2003); sequences of CodeLink probes were not available.Using a Perl script running bl2seq of Standalone BLAST(version 2.2.9), we conducted pairwise alignments of each ofthe 11 probes constituting the GeneChip probe sets to therespective mRNA sequences retrieved from RefSeq [27]. Todetermine whether each probe was correctly aligned on its
2 EVective 1 March 2005, LocusLink has been incorporated into EntrezGene, as explained at www.ncbi.nlm.nih.gov/entrez/query/static/help/gene-faq.html#archives. Nonetheless, the ID numbers associated with the fea-tures of the two platforms studied here are the same, and the procedure forcomparing the genes remains valid.
target or not, we set a threshold of 24 of 25 bases (totallength of each probe) correctly matching the mRNAsequence. These probes were considered to be “exact”matches, whereas probes with less than 24 bases matchingwere considered to be nonspeciWc for their target.
When BLAST was unable to demonstrate alignment tothe target sequence, we used blastall of stand-alone BLASTto attempt alignments with sequences in the human mRNAdatabase [28]. BLAST results were ordered according to e-value scores from lowest to highest and then queried (usingRefSeq number) to Wnd a match between the AVymetrixU133A probe set annotation and the BLAST output Wle.When the query found no relevant match, the best hit washighlighted to understand whether the sequence reallyaligned to a diVerent gene.
The distribution of DEGs into biological functional cat-egories and the comparison between platform-speciWcresults were performed using FatiGO. Step-down minPadjusted P values were calculated as in Al-Shahrour andco-workers [25].
Literature mining
We used a literature mining procedure to determinewhether the DEGs identiWed in resveratrol-treated cells hadalready been implicated to play roles in relevant biologicalprocesses. We submitted six keywords and the platform-speciWc lists of DEGs to PubMatrix [29,30] to identifysimilar citations in the literature indexed in Medline. Thekeywords corresponded to general biological functionalcategories (cell growth, metabolism, and physiologicalprocess) and to speciWc aspects of the cell model system(apoptosis, resveratrol, and breast cancer).
Quantitative real-time PCR
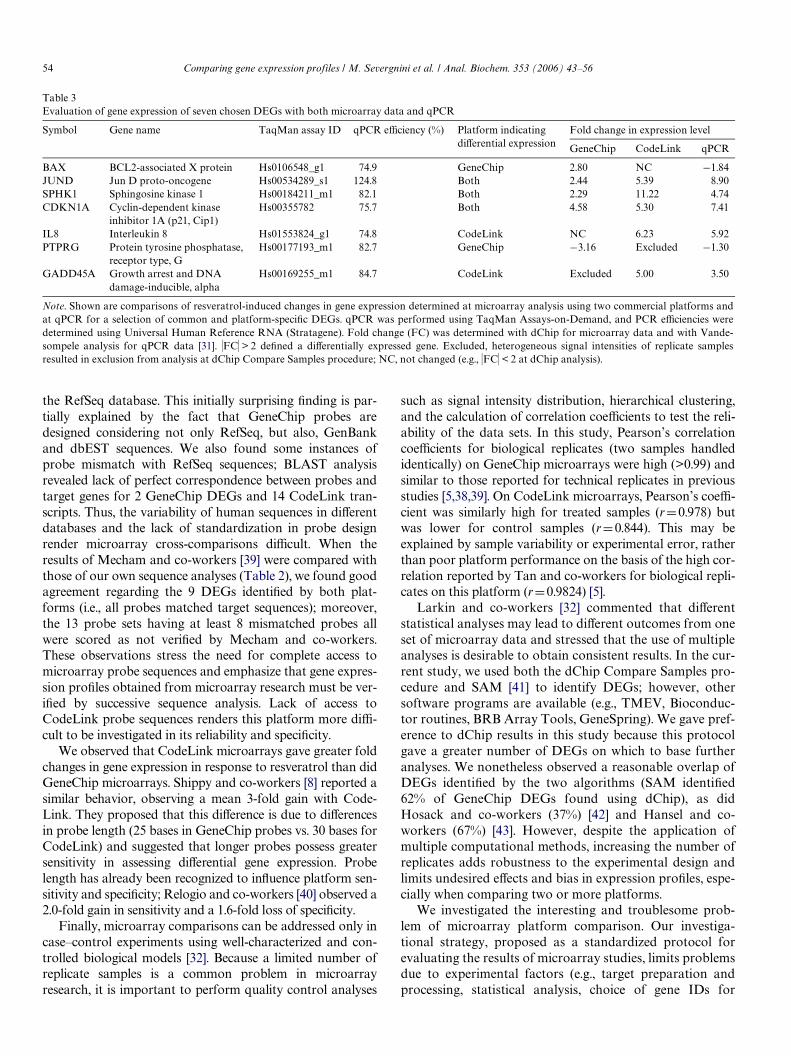
Quantitative real-time PCR (qPCR) evaluation ofexpression levels was performed on a selection of seven bio-logically relevant DEGs identiWed by microarray analysisand on three housekeeping genes (GAPDH, ACTB, andHPRT1). BrieXy, 1 �g total RNA from control and resvera-trol-treated samples and 1 �g Universal Human ReferenceRNA (Stratagene, La Jolla, CA, USA) were reverse-tran-scribed using the High-Capacity cDNA Archive Kit(Applied Biosystems, Foster City, CA, USA). To determinePCR eYciencies for the 10 genes, standard qPCR curveswere generated using 20, 2, 0.2, and 0.02 ng UniversalHuman Reference RNA. qPCR was performed in duplicatein an iCycler Thermal Cycler (Bio-Rad, Hercules, CA,USA) using TaqMan Assays-on-Demand (Applied Biosys-tems) in 20 �l containing 1£TaqMan Universal PCR Mas-ter Mix, No AmpErase UNG, 1£Target Assay Mix, andcDNA template. Samples were heated for 10 min at 95 °Cand then subjected to 40 cycles of denaturation at 95 °C for15 s and annealing extension at 60 °C for 1 min. To evaluateexpression levels in control and treated samples, qPCR wasperformed in duplicate using 20 ng cDNA.
Comparing gene expression profiles / M. Severgnini et al. / Anal. Biochem. 353 (2006) 43–56 47
Following the analysis of Vandesompele and co-workers[31], we veriWed the constitutive expression of the threehousekeeping genes, evaluating the single control normali-zation error (E) and internal control gene stability measure(M). Constitutively expressed genes have values of Et 1and Mt 0. qPCR eYciencies from standard curves and�Ct (threshold cycle) values for control and treated sam-ples were used to calculate relative expression levels accord-ing to the algorithm of Vandesompele and co-workers [31]using the Gene Expression Macro (Bio-Rad). Then foldchange was calculated as the ratio of the means of expres-sion values for two treated samples and two control sam-ples, with a gene with a fold change greater than 2 beingconsidered diVerentially expressed.
Results
We developed an investigative strategy to address criti-cal issues associated with microarray cross-comparison andto compare gene expression proWles obtained from diVerentsingle-color microarray platforms. SpeciWcally, we appliedthis strategy to compare properties and monitored tran-scriptional signals and performances of two commercialplatforms, using a simple case–control biological model ofresveratrol-induced apoptosis in the MDA-MB-231 breastcancer cell line. The study involved the duplicate analysis ofRNA from control and treated cells, evaluated on Code-Link and GeneChip microarrays in a four-sample experi-ment (Fig. 1).
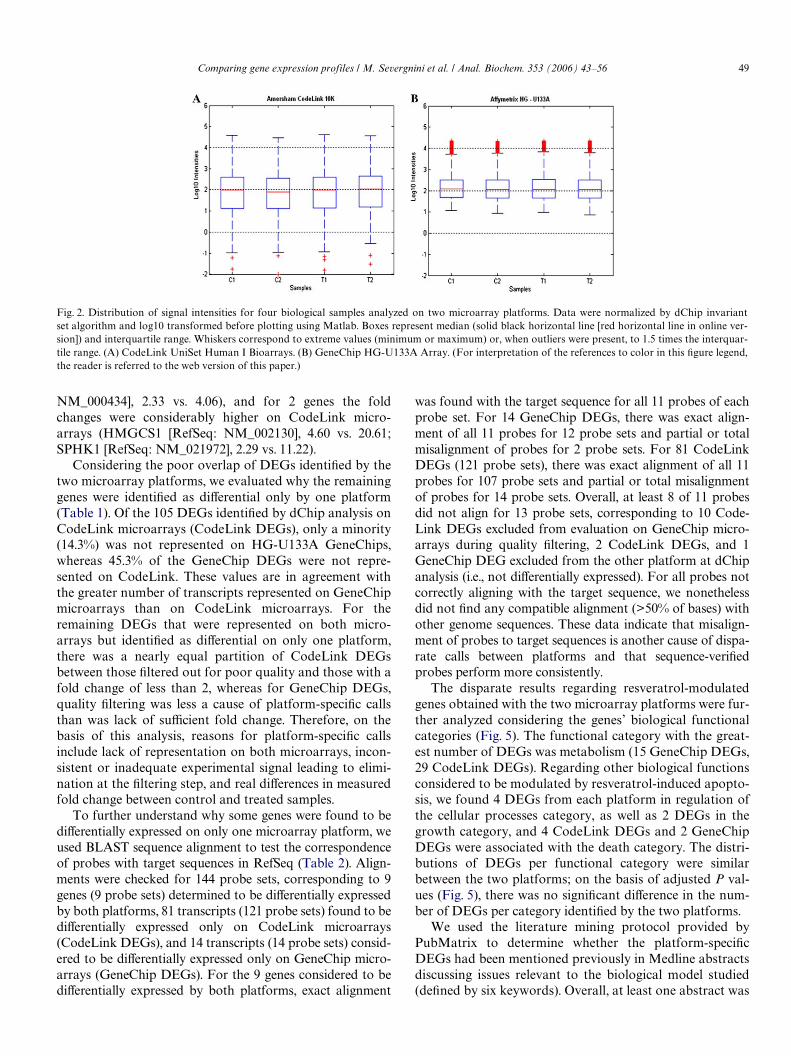
Following hybridization of biotinylated cRNA to micro-arrays, Xuorescent detection of signals, invariant set nor-malization, and Wltering, we generated a list of 7032 probeson CodeLink microarrays (71% of 9948 discovery probes)and 8081 probe sets on GeneChip microarrays (36% of22,215 probe sets). We Wrst evaluated the distribution ofsignal intensities of each array (Fig. 2). Median intensitywas similar between control and treated samples andbetween CodeLink and GeneChip microarrays. Variance insignal was similar among the four samples within each plat-form but was greater on CodeLink microarrays than onGeneChip microarrays. The lack of major variations inoverall signal distribution among the samples justiWed sub-sequent investigation for DEGs.
CodeLink microarrays showed good correlationbetween the two replicates of resveratrol-treated samples(Pearson’s rD 0.978, Spearman’s rD0.970), whereas corre-lation between duplicate control samples was somewhatless (Pearson’s rD0.844, Spearman’s rD0.807). The dChipCompare Sample procedure between control and treatedsamples identiWed 105 DEGs (107 probes); of these, 87transcripts (89 probes) were upregulated by approximately2- to 20-fold and 18 transcripts (18 probes) were downregu-lated by 2- to 110-fold (see list of CodeLink DEGs in sup-plementary material). Using SAM, 54 transcripts werefound to be modulated by resveratrol; of these, 45 wereupregulated and 9 were downregulated (data not shown). Atotal of 39 transcripts (37.1% of dChip DEGs)—32 upregu-
lated and 7 downregulated—were identiWed as diVerentiallyexpressed by both dChip and SAM.
GeneChip microarrays showed high correlation betweenthe two replicates of both control and resveratrol-treatedsamples (controls: Pearson’s rD0.994, Spearman’s rD0.975; treated: Pearson’s rD 0.993; Spearman’s rD 0.968).The dChip Compare Samples procedure between controland treated samples revealed 42 DEGs (47 probe sets); ofthese, 32 transcripts (36 probe sets) were upregulated byapproximately 2- to 5-fold and 10 transcripts (11 probesets) were downregulated by 2- to 5-fold (see list of Gene-Chip DEGs in supplementary material). SAM identiWed 47transcripts to be modulated by resveratrol; of these, 38 wereupregulated and 9 were downregulated. A total of 26 tran-scripts (61.9% of dChip DEGs)—21 upregulated and 5downregulated—were identiWed as diVerentially expressedby both dChip and SAM.
To have a perspective for comparing platform-speciWcgene expression proWles, we Wrst compared the identities andbiological functional categories of all genes represented onthe microarrays. Although the number of human transcriptsrepresented on GeneChip is greater than that represented onCodeLink microarrays (22,215 probe sets vs. 9948 probes),FatiGO analysis indicated that there were no signiWcantdiVerences between platforms (P > 0.05) regarding the num-ber of genes per functional category (data not shown). Fur-thermore, on the basis of LocusLink comparisons forannotated probes, we determined that 8414 human tran-scripts are represented on both CodeLink and GeneChipmicroarrays. On GeneChip microarrays, these 8414 “com-mon genes” are represented by 14,934 probe sets (70.8% ofannotated probe sets). On CodeLink microarrays, these tran-scripts correspond to 88.6% of annotated probes.
The z-transformed signal intensities of common geneswere used in hierarchical clustering analysis to assess the per-formances of the two platforms (Fig. 3). The analysis of the“heat maps” revealed similar color proWles for duplicatesamples on GeneChip microarrays but more variable pat-terns for CodeLink microarrays, especially for the two con-trol samples; these observations are consistent with thesomewhat lower correlation coeYcients for these samples.Hierarchical clustering clearly distinguished the two types ofmicroarrays and correctly associated resveratrol-treated sam-ples on both platforms, whereas control samples were cor-rectly associated only on GeneChip. The obvious diVerencesin color proWles between platforms for the four independentsamples were conWrmed by the low values of Pearson’s andSpearman’s correlation coeYcients: r< 0.5 and r <0.6, respec-tively, for all four determinations. The two microarray plat-forms were also distinguished on the shape of the z scoredistributions for all four samples (Fig. 4), where the Gene-Chip distributions were smoother than those of CodeLinkmicroarrays that showed numerous spikes.
When platform-speciWc lists of DEGs were compared,only 9 human transcripts (corresponding to 21.4% and8.5% of GeneChip and CodeLink DEGs, respectively) wereidentiWed on both platforms as being resveratrol sensitive.

48 Comparing gene expression profiles / M. Severgnini et al. / Anal. Biochem. 353 (2006) 43–56
These 9 transcripts were upregulated according to both [RefSeq: NM_005542], 3.89 vs. 3.29; IRF7 [RefSeq:
Fig. 1. Experimental strategy for microarray platform comparison. The study compared Amersham’s CodeLink Bioarrays (left side) and AVymetrix’sGeneChip Expression Analysis Arrays (right side); the center refers to common procedures and outcomes. The horizontal line divides analyses on all genesrepresented on the microarrays (top) from those represented on DEGs (bottom). The main steps of the experimental strategy are numbered as follows: (1)DEGs were determined on each microarray platform; (2) genes represented on both microarrays were identiWed by LocusLink ID comparison, permittingus to deWne a population of genes that can be studied on both platforms; (3) common and platform-speciWc DEGs underwent a battery of analyses toinvestigate factors contributing to the generation of platform-dependent results.
platforms; for 7 genes the fold changes in expression levelwere comparable for GeneChip and CodeLink microarrays(CDKN1A [RefSeq: NM_000389], 4.58 vs 5.30; INSIG1
NM_004031], 3.14 vs. 4.06; ECM1 [RefSeq: NM_022664],2.67 vs. 4.46; KAL1 [RefSeq: NM_000216], 2.52 vs. 4.83;JUND [RefSeq: NM_005354], 2.44 vs. 5.39; NEU1 [RefSeq:
Comparing gene expression profiles / M. Severgnini et al. / Anal. Biochem. 353 (2006) 43–56 49
NM_000434], 2.33 vs. 4.06), and for 2 genes the fold was found with the target sequence for all 11 probes of each
Fig. 2. Distribution of signal intensities for four biological samples analyzed on two microarray platforms. Data were normalized by dChip invariantset algorithm and log10 transformed before plotting using Matlab. Boxes represent median (solid black horizontal line [red horizontal line in online ver-sion]) and interquartile range. Whiskers correspond to extreme values (minimum or maximum) or, when outliers were present, to 1.5 times the interquar-tile range. (A) CodeLink UniSet Human I Bioarrays. (B) GeneChip HG-U133A Array. (For interpretation of the references to color in this Wgure legend,the reader is referred to the web version of this paper.)
changes were considerably higher on CodeLink micro-arrays (HMGCS1 [RefSeq: NM_002130], 4.60 vs. 20.61;SPHK1 [RefSeq: NM_021972], 2.29 vs. 11.22).
Considering the poor overlap of DEGs identiWed by thetwo microarray platforms, we evaluated why the remaininggenes were identiWed as diVerential only by one platform(Table 1). Of the 105 DEGs identiWed by dChip analysis onCodeLink microarrays (CodeLink DEGs), only a minority(14.3%) was not represented on HG-U133A GeneChips,whereas 45.3% of the GeneChip DEGs were not repre-sented on CodeLink. These values are in agreement withthe greater number of transcripts represented on GeneChipmicroarrays than on CodeLink microarrays. For theremaining DEGs that were represented on both micro-arrays but identiWed as diVerential on only one platform,there was a nearly equal partition of CodeLink DEGsbetween those Wltered out for poor quality and those with afold change of less than 2, whereas for GeneChip DEGs,quality Wltering was less a cause of platform-speciWc callsthan was lack of suYcient fold change. Therefore, on thebasis of this analysis, reasons for platform-speciWc callsinclude lack of representation on both microarrays, incon-sistent or inadequate experimental signal leading to elimi-nation at the Wltering step, and real diVerences in measuredfold change between control and treated samples.
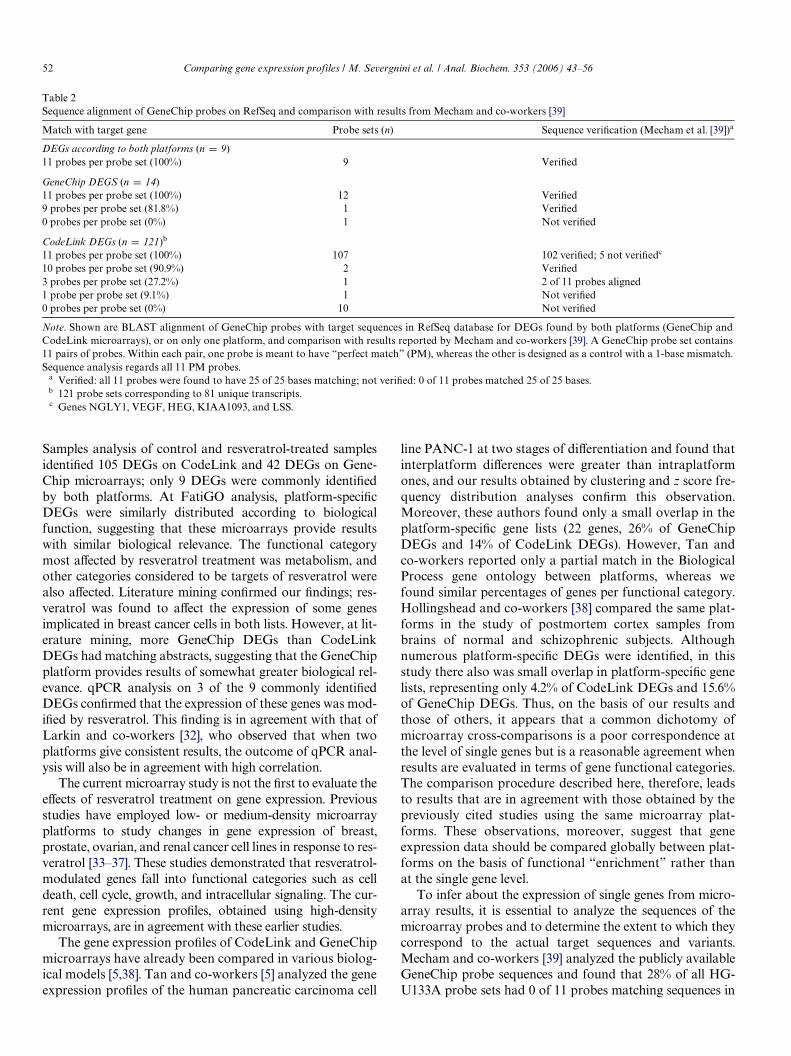
To further understand why some genes were found to bediVerentially expressed on only one microarray platform, weused BLAST sequence alignment to test the correspondenceof probes with target sequences in RefSeq (Table 2). Align-ments were checked for 144 probe sets, corresponding to 9genes (9 probe sets) determined to be diVerentially expressedby both platforms, 81 transcripts (121 probe sets) found to bediVerentially expressed only on CodeLink microarrays(CodeLink DEGs), and 14 transcripts (14 probe sets) consid-ered to be diVerentially expressed only on GeneChip micro-arrays (GeneChip DEGs). For the 9 genes considered to bediVerentially expressed by both platforms, exact alignment
probe set. For 14 GeneChip DEGs, there was exact align-ment of all 11 probes for 12 probe sets and partial or totalmisalignment of probes for 2 probe sets. For 81 CodeLinkDEGs (121 probe sets), there was exact alignment of all 11probes for 107 probe sets and partial or total misalignmentof probes for 14 probe sets. Overall, at least 8 of 11 probesdid not align for 13 probe sets, corresponding to 10 Code-Link DEGs excluded from evaluation on GeneChip micro-arrays during quality Wltering, 2 CodeLink DEGs, and 1GeneChip DEG excluded from the other platform at dChipanalysis (i.e., not diVerentially expressed). For all probes notcorrectly aligning with the target sequence, we nonethelessdid not Wnd any compatible alignment (>50% of bases) withother genome sequences. These data indicate that misalign-ment of probes to target sequences is another cause of dispa-rate calls between platforms and that sequence-veriWedprobes perform more consistently.
The disparate results regarding resveratrol-modulatedgenes obtained with the two microarray platforms were fur-ther analyzed considering the genes’ biological functionalcategories (Fig. 5). The functional category with the great-est number of DEGs was metabolism (15 GeneChip DEGs,29 CodeLink DEGs). Regarding other biological functionsconsidered to be modulated by resveratrol-induced apopto-sis, we found 4 DEGs from each platform in regulation ofthe cellular processes category, as well as 2 DEGs in thegrowth category, and 4 CodeLink DEGs and 2 GeneChipDEGs were associated with the death category. The distri-butions of DEGs per functional category were similarbetween the two platforms; on the basis of adjusted P val-ues (Fig. 5), there was no signiWcant diVerence in the num-ber of DEGs per category identiWed by the two platforms.
We used the literature mining protocol provided byPubMatrix to determine whether the platform-speciWcDEGs had been mentioned previously in Medline abstractsdiscussing issues relevant to the biological model studied(deWned by six keywords). Overall, at least one abstract was

50 Comparing gene expression profiles / M. Severgnini et al. / Anal. Biochem. 353 (2006) 43–56
found for 80 (76%) of 105 CodeLink DEGs and for 37(88%) of 42 GeneChip DEGs. Considering the three key-words for biological functional categories (metabolism, cellgrowth, and physiological process), at least one abstract wasfound for the same 80 CodeLink DEGs and 37 GeneChipDEGs, and there was good correlation (r > 0.90) betweenthe percentages of genes with abstracts matching a keywordand the percentages of genes associated with the same bio-logical functional category. Regarding the three speciWckeywords (apoptosis, resveratrol, and breast cancer), at leastone abstract was identiWed for 41 (39%) of 105 CodeLinkDEGs and for 26 (62%) of 42 GeneChip DEGs.
Fig. 3. Hierarchical clustering of transcripts common to both microarrayplatforms: dChip hierarchical clustering of signal intensities for 8414genes commonly represented on CodeLink and GeneChip platforms fortwo control and two resveratrol-treated samples. Data were z-trans-formed before clustering and representation. The z scores were colored foreach line according to their being below or above the mean for that line.Red means that the gene had a z score above the mean for that line (gene),and green means that the gene had a z score below the mean.
Gene expression proWles obtained at microarray analysiswere compared with those obtained from qPCR. Vande-sompele analysis determined error (E) to be 1.04§0.03(mean§SD) for the expression of three presumed house-keeping genes (GAPDH [AB: Hs99999905_m1], ACTB [AB:Hs99999903_m1], and HPRT1 [AB: Hs9999990 9_m1]) inthe four biological samples. Moreover, for these genes, valuesof the Vandesompele stability measure (M) were close to zero(0.133, 0.115, and 0.135, respectively). These values of E andM conWrm that the three genes are constitutively expressed inthe MDA-MB-231 cell line and thus could be used for nor-malization purposes in the following analysis. The relativeexpression levels and fold changes due to resveratrol treat-ment were then calculated for seven genes: three found to beupregulated on both platforms, two GeneChip DEGs, andtwo CodeLink DEGs (Table 3). qPCR eYciencies for theseven assays ranged from 74.8% to 124.8%; one of the assayshaving low qPCR eYciency was that for BCL2-associated Xprotein (BAX [AB: Hs0106548_g1]). Interestingly, standardqPCR curves for BAX had unusually long lag phases andreduced alpha angles (data not shown), suggesting a problemof assay design or the presence of splicing variants. qPCRconWrmed the upregulated expression of three commonDEGs and two CodeLink DEGs, whereas it did not conWrmresveratrol sensitivity for the two GeneChip DEGs (includ-ing BAX). Pearson’s correlation coeYcient for the agreementbetween qPCR and GeneChip microarray results was 0.732(0.84 excluding BAX); for the comparison with CodeLinkmicroarray results, Pearson’s rD0.681 (0.616 excludingBAX).
Discussion
A diYcult aspect of interpreting microarray cross-com-parison data involves the heterogeneous manner in whichsamples are processed and data are analyzed on diVerentplatforms. Many articles have already tried to point outsome of these critical aspects, with conclusions so disparatethat it is hard for researchers to reach a consensus onwhether microarray data are robust, reproducible, and plat-form independent [2–9]. To maximize the comparability ofgene expression proWles from two microarray platforms,experimental designs and data mining approaches shouldbe standardized so that all samples are handled identicallyand undergo parallel analyses. The approach for platformcomparison that we have proposed and applied to real sam-ples can be summarized as follows: (i) selection of plat-forms based on similar technologies (e.g., single color as inAVymetrix’s GeneChip Gene Expression Analysis Arraysand Amersham’s CodeLink Bioarrays); (ii) identiWcation ofa simple cellular model to eliminate variability due to RNApreparation (e.g., the well-known apoptotic behavior of acell line to the antitumor agent resveratrol [12]); (iii) elabo-ration of microarray data using the same statistical soft-ware to identify diVerentially expressed genes (step 1 ofFig. 1); (iv) comparison of the genes represented on eachmicroarray to identify a population that can be studied

Comparing gene expression profiles / M. Severgnini et al. / Anal. Biochem. 353 (2006) 43–56 51
with both platforms (step 2 of Fig. 1); and (v) application ofmultiple analyses, including sequence comparisons ofprobes with target genes, functional category annotation,literature mining, and qPCR validation (step 3 of Fig. 1), tothe platform-speciWc DEGs as well as to “common” DEGs.This battery of analyses, applied to both platforms, permit-ted us to investigate the factors contributing to the genera-tion of platform-dependent results.
Using FatiGO to analyze the genes represented on the twomicroarrays, we found no signiWcant diVerence in terms ofdistribution by biological functional category, despite thefact that GeneChip microarrays represent many more tran-scripts than do CodeLink microarrays. Overall, 8414 tran-scripts are represented on both platforms, corresponding to70.8% of GeneChip probe sets and 88.6% of CodeLinkprobes with LocusLink annotations. dChip Compare
Fig. 4. The z score frequency distribution for transcripts common to both microarray platforms. Distribution of z-transformed signal intensities from fourindependent samples (two control and two resveratrol treated) for 8414 genes commonly represented on both CodeLink (black traces [blue traces in onlineversion]) and GeneChip (gray traces [green traces in online version]) microarrays. (For interpretation of the references to color in this Wgure legend, thereader is referred to the web version of this paper.)
Table 1Correspondence between DEGs in MDA-MB-231 cells, treated with resveratrol or vehicle, according to two diVerent microarray platforms
Note. Percentages are in parentheses.a The 81 CodeLink transcripts are represented by 121 GeneChip probe sets.
GeneChip CodeLink
Total DEGs (n) 42 105
Common (n) 9 (21.4) 9 (8.5)
Representation of the platform-speciWc DEGs on the other platform (n)
Not represented 19 (45.3) 15 (14.3)Represented 14 (33.3) 81 (77.2)
DEGs represented on both platforms and Wltered out or not diVerentially expressed on the other platform (n)
Represented genesExcluded by quality Wltering
142
121a
65Not diVerentially expressed 12 56
52 Comparing gene expression profiles / M. Severgnini et al. / Anal. Biochem. 353 (2006) 43–56
Samples analysis of control and resveratrol-treated samplesidentiWed 105 DEGs on CodeLink and 42 DEGs on Gene-Chip microarrays; only 9 DEGs were commonly identiWedby both platforms. At FatiGO analysis, platform-speciWcDEGs were similarly distributed according to biologicalfunction, suggesting that these microarrays provide resultswith similar biological relevance. The functional categorymost aVected by resveratrol treatment was metabolism, andother categories considered to be targets of resveratrol werealso aVected. Literature mining conWrmed our Wndings; res-veratrol was found to aVect the expression of some genesimplicated in breast cancer cells in both lists. However, at lit-erature mining, more GeneChip DEGs than CodeLinkDEGs had matching abstracts, suggesting that the GeneChipplatform provides results of somewhat greater biological rel-evance. qPCR analysis on 3 of the 9 commonly identiWedDEGs conWrmed that the expression of these genes was mod-iWed by resveratrol. This Wnding is in agreement with that ofLarkin and co-workers [32], who observed that when twoplatforms give consistent results, the outcome of qPCR anal-ysis will also be in agreement with high correlation.
The current microarray study is not the Wrst to evaluate theeVects of resveratrol treatment on gene expression. Previousstudies have employed low- or medium-density microarrayplatforms to study changes in gene expression of breast,prostate, ovarian, and renal cancer cell lines in response to res-veratrol [33–37]. These studies demonstrated that resveratrol-modulated genes fall into functional categories such as celldeath, cell cycle, growth, and intracellular signaling. The cur-rent gene expression proWles, obtained using high-densitymicroarrays, are in agreement with these earlier studies.
The gene expression proWles of CodeLink and GeneChipmicroarrays have already been compared in various biolog-ical models [5,38]. Tan and co-workers [5] analyzed the geneexpression proWles of the human pancreatic carcinoma cell
line PANC-1 at two stages of diVerentiation and found thatinterplatform diVerences were greater than intraplatformones, and our results obtained by clustering and z score fre-quency distribution analyses conWrm this observation.Moreover, these authors found only a small overlap in theplatform-speciWc gene lists (22 genes, 26% of GeneChipDEGs and 14% of CodeLink DEGs). However, Tan andco-workers reported only a partial match in the BiologicalProcess gene ontology between platforms, whereas wefound similar percentages of genes per functional category.Hollingshead and co-workers [38] compared the same plat-forms in the study of postmortem cortex samples frombrains of normal and schizophrenic subjects. Althoughnumerous platform-speciWc DEGs were identiWed, in thisstudy there also was small overlap in platform-speciWc genelists, representing only 4.2% of CodeLink DEGs and 15.6%of GeneChip DEGs. Thus, on the basis of our results andthose of others, it appears that a common dichotomy ofmicroarray cross-comparisons is a poor correspondence atthe level of single genes but is a reasonable agreement whenresults are evaluated in terms of gene functional categories.The comparison procedure described here, therefore, leadsto results that are in agreement with those obtained by thepreviously cited studies using the same microarray plat-forms. These observations, moreover, suggest that geneexpression data should be compared globally between plat-forms on the basis of functional “enrichment” rather thanat the single gene level.
To infer about the expression of single genes from micro-array results, it is essential to analyze the sequences of themicroarray probes and to determine the extent to which theycorrespond to the actual target sequences and variants.Mecham and co-workers [39] analyzed the publicly availableGeneChip probe sequences and found that 28% of all HG-U133A probe sets had 0 of 11 probes matching sequences in
Table 2Sequence alignment of GeneChip probes on RefSeq and comparison with results from Mecham and co-workers [39]
Note. Shown are BLAST alignment of GeneChip probes with target sequences in RefSeq database for DEGs found by both platforms (GeneChip andCodeLink microarrays), or on only one platform, and comparison with results reported by Mecham and co-workers [39]. A GeneChip probe set contains11 pairs of probes. Within each pair, one probe is meant to have “perfect match” (PM), whereas the other is designed as a control with a 1-base mismatch.Sequence analysis regards all 11 PM probes.
a VeriWed: all 11 probes were found to have 25 of 25 bases matching; not veriWed: 0 of 11 probes matched 25 of 25 bases.b 121 probe sets corresponding to 81 unique transcripts.c Genes NGLY1, VEGF, HEG, KIAA1093, and LSS.
Match with target gene Probe sets (n) Sequence veriWcation (Mecham et al. [39])a
DEGs according to both platforms (n D 9)11 probes per probe set (100%) 9 VeriWed
GeneChip DEGS (n D 14)11 probes per probe set (100%) 12 VeriWed9 probes per probe set (81.8%) 1 VeriWed0 probes per probe set (0%) 1 Not veriWed
CodeLink DEGs (n D 121)b
11 probes per probe set (100%) 107 102 veriWed; 5 not veriWedc
10 probes per probe set (90.9%) 2 VeriWed3 probes per probe set (27.2%) 1 2 of 11 probes aligned1 probe per probe set (9.1%) 1 Not veriWed0 probes per probe set (0%) 10 Not veriWed

Comparing gene expression profiles / M. Severgnini et al. / Anal. Biochem. 353 (2006) 43–56 53
Fig. 5. Biological Process functional annotation for DEG lists: biological functional categories of DEGs identiWed on CodeLink (black bars [green bars inonline version]) and GeneChip (light gray bars [red bars in online version]) microarray platforms, analyzed using FatiGO. Percentages of genes in eachcategory were calculated with respect to the total number of DEGs identiWed with each microarray (105 and 42, respectively). DiVerences in numbers ofgenes per category were evaluated on the basis of step-down minP adjusted P values [25]; no signiWcant diVerences were found. (For interpretation of thereferences to color in this Wgure legend, the reader is referred to the web version of this paper.)
54 Comparing gene expression profiles / M. Severgnini et al. / Anal. Biochem. 353 (2006) 43–56
the RefSeq database. This initially surprising Wnding is par-tially explained by the fact that GeneChip probes aredesigned considering not only RefSeq, but also, GenBankand dbEST sequences. We also found some instances ofprobe mismatch with RefSeq sequences; BLAST analysisrevealed lack of perfect correspondence between probes andtarget genes for 2 GeneChip DEGs and 14 CodeLink tran-scripts. Thus, the variability of human sequences in diVerentdatabases and the lack of standardization in probe designrender microarray cross-comparisons diYcult. When theresults of Mecham and co-workers [39] were compared withthose of our own sequence analyses (Table 2), we found goodagreement regarding the 9 DEGs identiWed by both plat-forms (i.e., all probes matched target sequences); moreover,the 13 probe sets having at least 8 mismatched probes allwere scored as not veriWed by Mecham and co-workers.These observations stress the need for complete access tomicroarray probe sequences and emphasize that gene expres-sion proWles obtained from microarray research must be ver-iWed by successive sequence analysis. Lack of access toCodeLink probe sequences renders this platform more diY-
cult to be investigated in its reliability and speciWcity.We observed that CodeLink microarrays gave greater fold
changes in gene expression in response to resveratrol than didGeneChip microarrays. Shippy and co-workers [8] reported asimilar behavior, observing a mean 3-fold gain with Code-Link. They proposed that this diVerence is due to diVerencesin probe length (25 bases in GeneChip probes vs. 30 bases forCodeLink) and suggested that longer probes possess greatersensitivity in assessing diVerential gene expression. Probelength has already been recognized to inXuence platform sen-sitivity and speciWcity; Relogio and co-workers [40] observed a2.0-fold gain in sensitivity and a 1.6-fold loss of speciWcity.
Finally, microarray comparisons can be addressed only incase–control experiments using well-characterized and con-trolled biological models [32]. Because a limited number ofreplicate samples is a common problem in microarrayresearch, it is important to perform quality control analyses
such as signal intensity distribution, hierarchical clustering,and the calculation of correlation coeYcients to test the reli-ability of the data sets. In this study, Pearson’s correlationcoeYcients for biological replicates (two samples handledidentically) on GeneChip microarrays were high (>0.99) andsimilar to those reported for technical replicates in previousstudies [5,38,39]. On CodeLink microarrays, Pearson’s coeY-
cient was similarly high for treated samples (rD0.978) butwas lower for control samples (rD0.844). This may beexplained by sample variability or experimental error, ratherthan poor platform performance on the basis of the high cor-relation reported by Tan and co-workers for biological repli-cates on this platform (rD0.9824) [5].
Larkin and co-workers [32] commented that diVerentstatistical analyses may lead to diVerent outcomes from oneset of microarray data and stressed that the use of multipleanalyses is desirable to obtain consistent results. In the cur-rent study, we used both the dChip Compare Samples pro-cedure and SAM [41] to identify DEGs; however, othersoftware programs are available (e.g., TMEV, Bioconduc-tor routines, BRB Array Tools, GeneSpring). We gave pref-erence to dChip results in this study because this protocolgave a greater number of DEGs on which to base furtheranalyses. We nonetheless observed a reasonable overlap ofDEGs identiWed by the two algorithms (SAM identiWed62% of GeneChip DEGs found using dChip), as didHosack and co-workers (37%) [42] and Hansel and co-workers (67%) [43]. However, despite the application ofmultiple computational methods, increasing the number ofreplicates adds robustness to the experimental design andlimits undesired eVects and bias in expression proWles, espe-cially when comparing two or more platforms.
We investigated the interesting and troublesome prob-lem of microarray platform comparison. Our investiga-tional strategy, proposed as a standardized protocol forevaluating the results of microarray studies, limits problemsdue to experimental factors (e.g., target preparation andprocessing, statistical analysis, choice of gene IDs for
Table 3Evaluation of gene expression of seven chosen DEGs with both microarray data and qPCR
Note. Shown are comparisons of resveratrol-induced changes in gene expression determined at microarray analysis using two commercial platforms andat qPCR for a selection of common and platform-speciWc DEGs. qPCR was performed using TaqMan Assays-on-Demand, and PCR eYciencies weredetermined using Universal Human Reference RNA (Stratagene). Fold change (FC) was determined with dChip for microarray data and with Vande-sompele analysis for qPCR data [31]. �FC� > 2 deWned a diVerentially expressed gene. Excluded, heterogeneous signal intensities of replicate samplesresulted in exclusion from analysis at dChip Compare Samples procedure; NC, not changed (e.g., �FC� < 2 at dChip analysis).
Symbol Gene name TaqMan assay ID qPCR eYciency (%) Platform indicating diVerential expression
Fold change in expression level
GeneChip CodeLink qPCR
BAX BCL2-associated X protein Hs0106548_g1 74.9 GeneChip 2.80 NC ¡1.84JUND Jun D proto-oncogene Hs00534289_s1 124.8 Both 2.44 5.39 8.90SPHK1 Sphingosine kinase 1 Hs00184211_m1 82.1 Both 2.29 11.22 4.74CDKN1A Cyclin-dependent kinase
inhibitor 1A (p21, Cip1)Hs00355782 75.7 Both 4.58 5.30 7.41
IL8 Interleukin 8 Hs01553824_g1 74.8 CodeLink NC 6.23 5.92PTPRG Protein tyrosine phosphatase,
receptor type, GHs00177193_m1 82.7 GeneChip ¡3.16 Excluded ¡1.30
GADD45A Growth arrest and DNA damage-inducible, alpha
Hs00169255_m1 84.7 CodeLink Excluded 5.00 3.50
Comparing gene expression profiles / M. Severgnini et al. / Anal. Biochem. 353 (2006) 43–56 55
identifying common transcripts). However, technical vari-ables relating to the microarray platform (e.g., probedesign, hybridization protocols, signal generation) can pro-foundly aVect the comparability of gene expression pat-terns across studies. Comparability is highest when thesetechnical variables are standardized [44,45]. If microarrayproducers would standardize probe design to a commondatabase and publicly release probe sequences, researcherswould have greater possibilities of controlling variationsand comparing data. Using our standardized strategy forcomparing microarray data from multiple platforms, weobserved a poor correspondence at the level of single genesbut observed a reasonable agreement in terms of functionalcategories. These observations suggest that gene expressiondata should be compared globally between platforms onthe basis of functional annotations rather than at the singlegene level. Finally, gene expression proWles obtained frommicroarray research must be veriWed by successive sequenceanalysis.
Acknowledgments
We thank Gavin Hardy (GE Healthcare, UK) for hispatience and precious help in preparing CodeLink data forsubmission to ArrayExpress, and we thank Valerie Mata-rese for editing and critically reviewing the manuscript.This work was supported by grants from the Italian Minis-try of University and Research (MIUR-FIRBRBNE01TZZ8 and MIUR-FIRB RBNE01HCFK) and byfunds from the Center for Biomolecular Studies and Indus-trial Applications (CISI, Milan, Italy).
Appendix A. Supplementary data
Supplementary data associated with this article can befound, in the online version, at doi:10.1016/j.ab.2006.03.023.
References
[1] G. Hardiman, Microarray platforms: comparisons and contrasts,Pharmacogenomics 5 (2004) 487–502.
[2] R. Kothapalli, S.J. Yoder, S. Mane, T.P. Loughran Jr., Microarrayresults: how accurate are they? BMC Bioinform. 1 (2002) 22.
[3] W.P. Kuo, T.K. Jenssen, A.J. Butte, L. Ohno-Machado, I.S. Kohane,Analysis of matched mRNA measurements from two diVerent micro-array technologies, Bioinformatics 3 (2002) 405–412.
[4] J. Li, M. Pankratz, J.A. Johnson, DiVerential gene expression patternsrevealed by oligonucleotide versus long cDNA arrays, Toxicol. Sci. 2(2002) 383–390.
[5] P.K. Tan, T.J. Downey, E.L. Spitznagel Jr., P. Xu, D. Fu, D.S. Dimit-rov, R.A. Lempicki, B.M. Raaka, M.C. Cam, Evaluation of geneexpression measurements from commercial microarray platforms,Nucleic Acids Res. 19 (2003) 5676–5684.
[6] A. Barczak, M.W. Rodriguez, K. Hanspers, L.L. Koth, Y.C. Tai, B.M.Bolstad, T.P. Speed, D.J. Erle, Spotted long oligonucleotide arrays forhuman gene expression analysis, Genome Res. 7 (2003) 1775–1785.
[7] P.J. Park, Y.A. Cao, S.Y. Lee, J.W. Kim, M.S. Chang, R. Hart, S. Choi,Current issues for DNA microarrays: platform comparison, doublelinear ampliWcation, and universal RNA reference, J. Biotechnol. 3(2004) 225–245.
[8] R. Shippy, T.J. Sendera, R. Lockner, C. Palaniappan, T. Kaysser-Kra-nich, G. Watts, J. Alsobrook, Performance evaluation of commercialshort-oligonucleotide microarrays and the impact of noise in makingcross-platform correlations, BMC Genom. 1 (2004) 61.
[9] C.L. Yauk, M.L. Berndt, A. Williams, G.R. Douglas, Comprehensivecomparison of six microarray technologies, Nucleic Acids Res. 15(2004) e124.
[10] D.J. Lockhart, H. Dong, M.C. Byrne, M.T. Follettie, M.V. Gallo, M.S.Chee, M. Mittmann, C. Wang, M. Kobayashi, H. Horton, E.L. Brown,Expression monitoring by hybridization to high-density oligonucleo-tide arrays, Nat. Biotechnol. 13 (1996) 1675–1680.
[11] R. Ramakrishnan, D. Dorris, A. Lublinsky, A. Nguyen, M. Dom-anus, A. Prokhorova, L. Gieser, E. Touma, R. Lockner, M. Tata,X. Zhu, M. Patterson, R. Shippy, T.J. Sendera, A. Mazumder, Anassessment of Motorola CodeLink microarray performance forgene expression proWling applications, Nucleic Acids Res. 7 (2002)e30.
[12] F. Scarlatti, G. Sala, G. Somenzi, P. Signorelli, N. Sacchi, R. Ghidoni,Resveratrol induces growth inhibition and apoptosis in metastaticbreast cancer cells via de novo ceramide signaling, FASEB J. 15(2003) 2339–2341.
[13] C. Li, W.H. Wong, Model-based analysis of oligonucleotide arrays:model validation, design issues and standard error application,Genome Biol. 8 (2001).
[14] C. Li, W.H. Wong, Model-based analysis of oligonucleotide arrays:expression index computation and outlier detection, Proc. Natl. Acad.Sci. USA. 1 (2001) 31–36.
[15] R.A. Irizarry, B.M. Bolstad, F. Collin, L.M. Cope, B. Hobbs, T.P.Speed, Summaries of AVymetrix GeneChip probe level data, NucleicAcids Res. 4 (2003) e15.
[16] A. Brazma, P. Hingamp, J. Quackenbush, G. Sherlock, P. Spellman, C.Stoeckert, J. Aach, W. Ansorge, C.A. Ball, H.C. Causton, T. Gaaster-land, P. Glenisson, F.C. Holstege, I.F. Kim, V. Markowitz, J.C.Matese, H. Parkinson, A. Robinson, U. Sarkans, S. Schulze-Kremer, J.Stewart, R. Taylor, J. Vilo, M. Vingron, Minimum Information abouta Microarray Experiment (MIAME): toward standards for micro-array data, Nat. Genet. 4 (2001) 365–371.
[17] MIAME, Minimum Information about Microarray Experiment,<http://mged.org/Workgroups/MIAME/miame.html>.
[18] ArrayExpress, EBI’s ArrayExpress database for microarray experi-ments, <www.ebi.ac.uk/arrayexpress>.
[19] NetAVx, AVymetrix’s NetAVx Analysis Center, <www.aVyme-trix.com/analysis/index.aVx>.
[20] G. Liu, A.E. Loraine, R. Shigeta, M. Cline, J. Cheng, V. Valmeekam, S.Sun, D. Kulp, M.A. Siani-Rose, NetAVx: aVymetrix probesets andannotations, Nucleic Acids Res. 1 (2003) 82–86.
[21] Source, Stanford’s Source functional annotation web-based tool,<http://source.stanford.edu>.
[22] M. Diehn, G. Sherlock, G. Binkley, H. Jin, J.C. Matese, T. Hernandez-Boussard, C.A. Rees, J.M. Cherry, D. Botstein, P.O. Brown, A.A. Ali-zadeh, SOURCE: a uniWed genomic resource of functional annota-tions, ontologies, and gene expression data, Nucleic Acids Res. 1(2003) 219–223.
[23] DAVID, SAIC Frederick’s Database for Annotation, Visualization,and Integrated Discovery, <http://apps1.niaid.nih.gov/david>.
[24] G. Dennis Jr., B.T. Sherman, D.A. Hosack, J. Yang, W. Gao, H.C.Lane, R.A. Lempicki, DAVID: database for annotation, visualiza-tion, and integrated discovery, Genome Biol. 5 (2003) P3.
[25] F. Al-Shahrour, R. Diaz-Uriarte, J. Dopazo, FatiGO: a web tool forWnding signiWcant associations of gene ontology terms with groups ofgenes, Bioinformatics 4 (2004) 578–580.
[26] FatiGO, CIPF’s FatiGO annotation tool, <www.fatigo.org>.[27] K.D. Pruitt, T. Tatusova, D.R. Maglott, NCBI Reference Sequence
(RefSeq): a curated non-redundant sequence database of genomes,transcripts, and proteins, Nucleic Acids Res. (database issue) (2005)D501–D504.
[28] Refseq, NCBI RefSeq database, <ftp://ftp.ncbi.nih.gov/refseq/H_sapi-ens/mRNA_Prot/human.rna.fna.gz>.
56 Comparing gene expression profiles / M. Severgnini et al. / Anal. Biochem. 353 (2006) 43–56
[29] K.G. Becker, D.A. Hosack, G. Dennis Jr., R.A. Lempicki, T.J. Bright,C. Cheadle, J. Engel, PubMatrix: a tool for multiplex literature min-ing, BMC Bioinform. 1 (2003) 61.
[30] PubMatrix, Literature mining tool, <http://pubmatrix.grc.nia.nih.gov/>.
[31] J. Vandesompele, K. De Preter, F. Pattyn, B. Poppe, N. Van Roy, A.De Paepe, F. Speleman, Accurate normalization of real-time quanti-tative RT–PCR data by geometric averaging of multiple internal con-trol genes, Genome Biol. 7 (2002).
[32] J.E. Larkin, B.C. Frank, H. Gavras, R. Sultana, J. Quackenbush, Inde-pendence and reproducibility across microarray platforms, Nat.Methods 5 (2005) 337–344.
[33] A.S. Levenson, I.L. Kliakhandler, K.M. Svoboda, K.M. Pease, S.A.Kaiser, J.E. Ward III, V.C. Jordan, Molecular classiWcation of selec-tive oestrogen receptor modulators on the basis of gene expressionproWles of breast cancer cells expressing oestrogen receptor alpha, Br.J. Cancer 4 (2002) 449–456.
[34] B.A. Narayanan, N.K. Narayanan, G.G. Re, D.W. Nixon, DiVerentialexpression of genes induced by resveratrol in LNCaP cells: P53-medi-ated molecular targets, Intl. J. Cancer 2 (2003) 204–212.
[35] B.A. Narayanan, N.K. Narayanan, G.D. Stoner, B.P. Bullock, Interac-tive gene expression pattern in prostate cancer cells exposed to pheno-lic antioxidants, Life Sci. 15 (2002) 1821–1839.
[36] T. Shi, L.S. Liou, P. Sadhukhan, Z.H. Duan, A.C. Novick, J.G. Hissong,A. Almasan, J.A. DiDonato, EVects of resveratrol on gene expression inrenal cell carcinoma, Cancer Biol. Ther. 9 (2004) 882–888.
[37] S.H. Yang, J.S. Kim, T.J. Oh, M.S. Kim, S.W. Lee, S.K. Woo, H.S.Cho, Y.H. Choi, Y.H. Kim, S.Y. Rha, H.C. Chung, S.W. An, Genome-scale analysis of resveratrol-induced gene expression proWle in humanovarian cancer cells using a cDNA microarray, Intl. J. Oncol. 4 (2003)741–750.
[38] D. Hollingshead, D.A. Lewis, K. Mirnics, Platform inXuence on DNAmicroarray data in postmortem brain research, Neurobiol. Dis. 3(2005) 649–655.
[39] B.H. Mecham, D.Z. Wetmore, Z. Szallasi, Y. Sadovsky, I. Kohane,T.J. Mariani, Increased measurement accuracy for sequence-veriWedmicroarray probes, Physiol. Genom. 3 (2004) 308–315.
[40] A. Relogio, C. Schwager, A. Richter, W. Ansorge, J. Valcarcel, Opti-mization of oligonucleotide-based DNA microarrays, Nucleic AcidsRes. 11 (2002) e51.
[41] V.G. Tusher, R. Tibshirani, G. Chu, SigniWcance analysis of micro-arrays applied to the ionizing radiation response, Proc. Natl. Acad.Sci. USA. 9 (2001) 5116–5121.
[42] D.A. Hosack, G. Dennis Jr., B.T. Sherman, H.C. Lane, R.A. Lempicki,Identifying biological themes within lists of genes with EASE,Genome Biol. 10 (2003) R70.
[43] D.E. Hansel, A. Rahman, M. Hidalgo, P.J. Thuluvath, K.D. Lillemoe,R. Shulick, J.L. Ku, J.G. Park, K. Miyazaki, R. Ashfaq, I.I. Wistuba,R. Varma, L. Hawthorne, J. Geradts, P. Argani, A. Maitra, IdentiWca-tion of novel cellular targets in biliary tract cancers using global geneexpression technology, Am. J. Pathol. 1 (2003) 217–229.
[44] T. Bammler, R.P. Beyer, S. Bhattacharya, G.A. Boorman, A. Boyles,B.U. Bradford, R.E. Bumgarner, P.R. Bushel, K. Chaturvedi, D. Choi,M.L. Cunningham, S. Deng, H.K. Dressman, R.D. Fannin, F.M.Farin, J.H. Freedman, R.C. Fry, A. Harper, M.C. Humble, P. Hurban,T.J. Kavanagh, W.K. Kaufmann, K.F. Kerr, L. Jing, J.A. Lapidus,M.R. Lasarev, J. Li, Y.J. Li, E.K. Lobenhofer, X. Lu, R.L. Malek, S.Milton, S.R. Nagalla, P. O’Malley, V.S. Palmer, P. Pattee, R.S. Paules,C.M. Perou, K. Phillips, L.X. Qin, Y. Qiu, S.D. Quigley, M. Rodland,I. Rusyn, L.D. Samson, D.A. Schwartz, Y. Shi, J.L. Shin, S.O. Sieber, S.Slifer, M.C. Speer, P.S. Spencer, D.I. Sproles, J.A. Swenberg, W.A.Suk, R.C. Sullivan, R. Tian, R.W. Tennant, S.A. Todd, C.J. Tucker, B.Van Houten, B.K. Weis, S. Xuan, H. Zarbl, Standardizing global geneexpression analysis between laboratories and across platforms, Nat.Methods 5 (2005) 351–356.
[45] Y. Moreau, S. Aerts, B. De Moor, B. De Strooper, M. Dabrowski,Comparison and meta-analysis of microarray data: from the bench tothe computer desk, Trends Genet. 10 (2003) 570–577.
Related Documents


