Strategic Thinking Skills and Their Economic Importance * Syngjoo Choi † Seonghoon Kim ‡ Wooyoung Lim § September 11, 2021 Abstract We conduct a large-scale experiment to measure strategic thinking skills and ex- plore their linkage to labor market outcomes. Two incentivized measures of higher- order rationality and backward induction have strong, gender-dependent associations with labor market outcomes, even after controlling for education and cognitive and noncognitive skills. Male labor income and labor market participation are positively associated with strategic thinking skills, whereas these outcomes for females are nega- tively related. We propose a model of collective household labor supply in which strate- gic thinking skills facilitate task specialization between home production and labor market participation, offering a coherent account of the gender-dependent findings. Keywords: Strategic Thinking Skills, Higher-Order Rationality, Backward Induction, Labor Income, Online Experiments JEL classification numbers: C91, D91, J24 * We are grateful to Arun Advani, Adam Brandenburger, Vince Crawford, Miguel Costa-Gomes, Astrid Hopfensitz, Shih En Lu, Erik Lindqvist, Albert Park, Daniel Silverman, and Joel Sobel for valuable com- ments and helpful discussions. We also thank seminar participants at HKUST, the University of Cam- bridge, University College London, University of Vienna, the 2017 SURE Behavioral Economics Workshop, and the Korean Econometric Society study group meeting. We thank Eungik Lee and Junxing Chay for their excellent research assistance and Chris Wickens for technical advice on oTree. The IRB approvals are obtained from Singapore Management University and Seoul National University. This study is sup- ported by a Tier 1 research grant from the Singapore Ministry of Education (MOE) (16-C244-SMU-002) and Creative-Pioneering Researchers Program through Seoul National University. The Singapore Life Panel data collection was financially supported by the Singapore MOE Academic Research Fund Tier 3 grant (MOE2013-T3-1-009). † Department of Economics, Seoul National University. Email: [email protected] ‡ School of Economics, Singapore Management University and IZA. Email: [email protected] § Department of Economics, Hong Kong University of Science and Technology. Email: [email protected]

Welcome message from author
This document is posted to help you gain knowledge. Please leave a comment to let me know what you think about it! Share it to your friends and learn new things together.
Transcript
Strategic Thinking Skillsand Their Economic Importance∗
Syngjoo Choi† Seonghoon Kim‡ Wooyoung Lim§
September 11, 2021
Abstract
We conduct a large-scale experiment to measure strategic thinking skills and ex-plore their linkage to labor market outcomes. Two incentivized measures of higher-order rationality and backward induction have strong, gender-dependent associationswith labor market outcomes, even after controlling for education and cognitive andnoncognitive skills. Male labor income and labor market participation are positivelyassociated with strategic thinking skills, whereas these outcomes for females are nega-tively related. We propose a model of collective household labor supply in which strate-gic thinking skills facilitate task specialization between home production and labormarket participation, offering a coherent account of the gender-dependent findings.
Keywords: Strategic Thinking Skills, Higher-Order Rationality, Backward Induction,Labor Income, Online ExperimentsJEL classification numbers: C91, D91, J24
∗We are grateful to Arun Advani, Adam Brandenburger, Vince Crawford, Miguel Costa-Gomes, AstridHopfensitz, Shih En Lu, Erik Lindqvist, Albert Park, Daniel Silverman, and Joel Sobel for valuable com-ments and helpful discussions. We also thank seminar participants at HKUST, the University of Cam-bridge, University College London, University of Vienna, the 2017 SURE Behavioral Economics Workshop,and the Korean Econometric Society study group meeting. We thank Eungik Lee and Junxing Chay fortheir excellent research assistance and Chris Wickens for technical advice on oTree. The IRB approvalsare obtained from Singapore Management University and Seoul National University. This study is sup-ported by a Tier 1 research grant from the Singapore Ministry of Education (MOE) (16-C244-SMU-002) andCreative-Pioneering Researchers Program through Seoul National University. The Singapore Life Paneldata collection was financially supported by the Singapore MOE Academic Research Fund Tier 3 grant(MOE2013-T3-1-009).
†Department of Economics, Seoul National University. Email: [email protected]‡School of Economics, Singapore Management University and IZA. Email: [email protected]§Department of Economics, Hong Kong University of Science and Technology. Email: [email protected]

1 Introduction
Humans, as social creatures, engage in numerous interpersonal interactions throughout
their lives. The ability to understand motivations, anticipate the behavior of other people,
and respond to others is essential to social relationships and economic success. People with
higher strategic thinking skills may maintain better interpersonal relations and secure
higher economic returns.
In this paper, we argue that strategic thinking is a skill of significant economic im-
portance, distinct from the traditional collection of cognitive and noncognitive skills. To
measure skills of strategic thinking and support our claim, we resort to the experimen-
tal methods of detecting depth of strategic reasoning in situations of simultaneous and
sequential interaction. We conduct a large-scale experiment in two countries and investi-
gate whether these measures of strategic thinking skills are associated with individuals’
labor market outcomes.
The canonical approach to understanding interpersonal interaction in economics is
based on the concept of Nash equilibrium, which requires no limit in human abilities of
strategic reasoning (Aumann and Brandenburger, 1995; Polak, 1999).1 While the stan-
dard equilibrium approach offers a powerful tool for analyzing strategic interactions, it
overlooks the possibility that individuals differ in the capability of their strategic rea-
soning particularly when there is no opportunity to learn from repeated play. In contrast,
the experimental economics literature has documented that human reasoning in interper-
sonal interactions in laboratories and fields is far below the level of sophistication assumed
by the standard theory and exhibits a large degree of individual heterogeneity (e.g., Nagel,
1995; Camerer et al., 2004; Crawford et al., 2013).21Aumann and Brandenburger (1995) provide epidemic conditions for Nash equilibrium and show that
common knowledge of the players’ conjectures about one another’s strategies, in the presence of other con-ditions, yields Nash equilibrium. In the case of complete information games, Polak (1999) shows that theepidemic conditions proposed by Aumann and Brandenburger (1995) jointly imply the common knowledgeof rationality.
2One standard approach to identifying individual-level strategic thinking skills has been to associateplayers’ first-order beliefs with choice data (e.g., Costa-Gomes and Weizsacker, 2008; Healy, 2011) or toimpose structural assumptions on players’ beliefs (e.g., Nagel, 1995; Camerer et al., 2004; Crawford et al.,
2
We consider two elementary aspects of strategic reasoning in interpersonal interaction:
(i) engaging in introspective reasoning in situations of simultaneous interaction, and (ii)
exercising backward induction in situations of sequential interaction. These elements
are essential in the game-theoretic analysis of strategic interaction: the former relates
to higher-order rationality or rationalizability (Bernheim, 1984; Pearce, 1984), while the
latter is key to sequential rationality serving as a refinement of the Nash equilibrium
(Selten, 1965).3
To measure higher-order rationality (HOR), we develop a five-person line-network game,
motivated by Kneeland (2015). A series of two-person normal-form games are connected
by a network structure of opponents. Participants make a request for money (Arad and
Rubinstein, 2012) in each of the five different positions in random order without any feed-
back. The choice data from the line-network structure of the opponent enable us to mea-
sure different levels of HOR reasoning.
Our second measure is developed based on a series of two-player sequential-move games
that require different steps of backward-induction (BI) reasoning (Dufwenberg et al., 2010;
Gneezy et al., 2010). Each game has a first-mover advantage. To reduce confounding, hu-
man participants always move first and play against a computer player, programmed to
play an optimal strategy. This design allows us to measure BI reasoning at the individual
level.
To implement these measures, we recruited participants from the Singapore Life Panel
(SLP), a nationally representative sample of people 50–70 years old in Singapore. The2013; Burchardi and Penczynski, 2014) and examine choice data. Kneeland (2015) proposes a multipersonnormal-form network game that allows her to identify an individual’s strategic sophistication by looking atchoice data without imposing structural assumptions on beliefs or directly eliciting higher-order beliefs.
3The existing studies (e.g., Nagel, 1995; Crawford et al., 2013; Kneeland, 2015) have focused on identi-fying individuals’ strategic sophistication using a simultaneous-move game. Little attention has been paidto identifying individuals’ strategic thinking skill levels in an environment with sequential moves. Bin-more et al. (2002) and Dufwenberg and Van Essen (2018) report experimental evidence that individuals failto play according to the logic of backward induction. However, neither study is interested in identifyingindividual-level heterogeneity. In a centipede-game experiment, Palacios-Huerta and Volij (2009) find thatthe equilibrium play occurred significantly more often when subjects were expert chess players. Garcıa-Pola et al. (2020) also use a set of centipede games to identify the nonequilibrium model that explains theobserved behavior in the lab.
3
final sample consists of 2,146 Singaporeans whose ages range between 50 and 65. We
take advantage of detailed information on their socioeconomic characteristics as well as
a rich set of cognitive and noncognitive skill measures available in the large-scale panel
data. To demonstrate the robustness of the descriptive statistics of our strategic thinking
measures, we also recruited 786 participants from the Korean Labor and Income Panel
Study (KLIPS), a nationally representative sample of urban households and individuals
in South Korea.
We view our measures of strategic reasoning as capturing fundamental aspects that all
types of strategic interaction in real life commonly share. Those with higher capabilities
in exercising strategic reasoning are more likely to shape social and economic relations,
thereby serving their interests better over their life span. As a result, strategic thinking
skills can be an important factor explaining the social and economic welfare of individ-
uals. To examine the issue, we focus on the individual labor outcomes, considering both
labor supply and earnings, of the participants and their spouses. We examine the asso-
ciations separately by gender following the literature documenting gender differences in
labor supply decisions within the couple (e.g. Altonji and Blank, 1999; Kuziemko et al.,
2018).
First, we find significant positive associations between labor income (including zero
income) and male participants’ own measures of strategic thinking skills. These associa-
tions are robust to conditioning on a conventional set of cognitive and noncognitive skills
as well as sociodemographic characteristics: a one-level increase in the BI score and a
one standard deviation (SD) increase in the HOR score are significantly associated with
respective 37 percent and 58 percent increases in own labor income after controlling for
sociodemographic characteristics and cognitive and noncognitive skills.
Regarding female labor income, we find a different pattern; namely, female partici-
pants’ BI score is negatively associated with their labor income. The result is robust to
conditioning on cognitive and noncognitive skills as well as sociodemographic character-
istics: a one-level increase in female respondents’ BI score is significantly associated with
4
a 47 percent decrease in their labor income. We do not find any significant association
between female labor income and their own HOR score.
Second, regarding the extensive margin of labor supply (i.e., whether to earn a positive
labor income), we find strong gender-specific associations between labor supply and strate-
gic thinking skills. Male participants with higher HOR and BI scores are significantly
more likely to work and less likely to be retired or unemployed. In contrast, female partic-
ipants with higher BI scores are less likely to work and, in the composition of labor status,
more likely to be a homemaker and thus out of the labor force. The gender-dependent
patterns suggest that strategic thinking skills are associated not only with individual de-
cision making of labor supply but also with intrahousehold interactions. In fact, there is a
strong positive linkage between female participants’ skills of strategic thinking and their
spouses’ labor income, suggesting that a variety of intrahousehold interactions, including
partner matching, intrahousehold labor supply decision making, and spillover/crossover
between home and work, can play a role.
Third, given the nontrivial fraction of the sample reporting zero labor income, we es-
timate the gradient between strategic thinking skills and labor income at different parts
of the labor income distribution using the quantile regression method. The magnitude of
the gradient is larger on lower quantiles of the distribution, suggesting that the average
estimated coefficients are influenced by the extensive margin of labor supply at the low
end of the distribution. Nevertheless, strategic thinking skills remain to be significantly
associated with labor income at the high end of the distribution. For instance, a one-SD
increase in male participants’ HOR score is significantly associated with respective 15
percent and 12 percent increases in own labor income on the 80th and 90th percentiles of
the distribution. Similarly, a one-level increase in female participants’ BI score is signifi-
cantly associated with 11–12 percent decrease in their labor income on the 80th and 90th
percentiles of the distribution.
To account for these empirical findings, we develop a theoretical model built upon
the literature of collective labor supply with home production and workplace production
5
(e.g., Apps and Rees, 1997; Chiappori, 1997) by adding two features: (i) positive home-to-
workplace spillover (e.g., Barnett, 1994; Kirchmeyer, 1992) and strategic thinking skills
as the means of facilitating better coordination for home-to-workplace spillover, and (ii) in-
dividual heterogeneity in productivity over two tasks for the possibility of intrahousehold
task specialization according to comparative advantage. We characterize the condition
on the relationship between strategic thinking skills and the productivity parameters of
domestic and marketable goods production that determines the intrahousehold specializa-
tion between home production and workplace production. Strategic thinking skills play
a role in promoting task specialization within the couple between home production and
labor market participation for workplace production.4 This model provides a coherent ac-
count of the gender-dependent associations between the measures of strategic thinking
skills and labor market outcomes from our study.
The literature on strategic thinking skills has focused on identifying individuals’ strate-
gic thinking skills in a controlled laboratory environment with some exceptions, including
Bosch-Domenech et al. (2002). To our knowledge, we are the first paper that provides
empirical evidence that strategic thinking skills are important components shaping one’s
economic success, even after controlling for a variety of individual characteristics, includ-
ing education attainment, family background, cognitive skills, and noncognitive skills. In
addition, to account for the empirical findings of these associations, we provide a model of
collective household labor supply in which strategic thinking skills facilitate coordination
on task allocation in producing the domestic good and the marketable good.
Recently, researchers have explored the relationship between strategic thinking skills
and other cognitive and noncognitive skills. In repeated strategic interactions, Gill and
Prowse (2016) find that both cognitive ability and noncognitive skills are correlated with
level-k thinking.5 Using a sample of children aged 5–12 years old, Fe et al. (2020) conduct4Deming (2017) explores similarly the role of social skills in a task allocation problem across heteroge-
neous workers in the workplace.5Alaoui and Penta (2016) offer a theory to endogenize the depth of strategic thinking in response to the
individual’s own and opponent’s cognitive abilities and their incentives of exercising cognitive processes.They also provide experimental evidence suggesting a positive relationship between strategic thinking and
6

experiments to investigate how psychometric measures of theory-of-mind and cognitive
ability are related to level-k behavior of children in a variety of incentivized strategic in-
teractions. They find that higher theory-of-mind and cognitive abilities predict a higher
degree of strategic thinking skills in competitive games. Our paper also establishes a pos-
itive but weak correlation between measures of cognitive ability, including a measure of
theory-of-mind capabilities using the Reading the Mind in the Eyes test (Baron-Cohen
et al., 2001), and measures of strategic thinking skills. Furthermore, we document that
strategic thinking skills play a distinctive role in explaining labor market outcomes.
We also contribute to the literature on human capital and its importance in the labor
market. While human skills are multidimensional in nature (e.g., Heckman et al., 2006b;
Cunha and Heckman, 2007), the literature has traditionally focused on cognitive skills
(e.g., Herrnstein and Murray, 1994; Hanushek and Woessmann, 2008) and, more recently,
on a growing list of noncognitive skills, including personality, grit, and self-efficacy (Bowles
et al., 2001; Heckman and Rubinstein, 2001; Borghans et al., 2008; Almlund et al., 2011;
Lindqvist and Vestman, 2011; Heckman et al., 2019). A few studies document the impor-
tance of social skills in the labor market, related to the theme of this paper. Deming (2017)
reports that the U.S. labor market increasingly rewards social skills by providing higher
wages for jobs requiring high levels of social interaction. Borghans et al. (2008) document
that sociability in youth is a good predictor of later job assignment and that the returns to
interpersonal styles vary across jobs depending on the types of interpersonal tasks. Conti
et al. (2013) use friendship nomination in high school as a proxy of social skills and show
that it is a good predictor of future earnings. Our study uses game-theoretic measures of
individual’s strategic thinking skills, uncovers the gender-dependent associations between
these measures and individual labor incomes, and develops a model offering a coherent
account on the findings.
The remainder of the paper is structured as follows. Section 2 describes how we mea-
sure strategic thinking skills and presents empirical features of these measures. In Sec-cognitive abilities.
7
tion 3, we report the estimation results documenting the economic importance of strategic
thinking skills. Section 4 presents the model of collective household labor supply in which
strategic thinking skills facilitate intrahousehold task specialization. We check the ro-
bustness of our main findings in Section 5. Section 6 concludes.
2 Experimental Design and Measurements
2.1 Measuring Strategic Thinking Skills
2.1.1 Line(-Network) Game: Higher-Order Rationality Measure
The HOR measure is built on the Line-Network Game (hereafter, the Line Game), de-
veloped to identify individual heterogeneity in conducting introspective thinking during
the iterative elimination of strictly dominated strategies (i.e., rationalizability, Bernheim
(1984) and Pearce (1984)). It is a five-person simultaneous-move, dominance solvable, net-
work game, a la Kneeland (2015). It consists of a series of two-person games, each of which
is adapted from the 11-20 money request game of Arad and Rubinstein (2012), with the
opponent structure determined by the line network. Figure A1 in Appendix A presents a
sample decision screen for the Line Game.
In the game, there are five positions–A, B, C, D, and E. Each player is assigned to one
of the five positions and makes a decision simultaneously and independently; the position
A player makes a money request of either S$10 or S$50; players in any other position
make a money request from 5 options: S$10, S$20, S$30, S$40 or S$50.6 The payoff of
the position A player is the amount of money s/he requested. The payoffs of players in
any other position consist of two parts: each player receives 1) the amount of money s/he
requested and 2) an additional amount of S$100 if and only if the money s/he requested is
S$10 lower than the money requested by his/her opponent. The opponent of each player is6S$1 is equivalent to 0.72 US$ or 0.64 euro as of June 15, 2020.
8
defined as a player who occupies a position to the left of that player in the line network.7
Each individual plays the game five times, in a random order, in each of the five posi-
tions. The following set of choices is implied by the full rationality of players: First, the
player in position A chooses S$50. Correctly anticipating this choice, the player in position
B chooses S$40. This iterative process continues, resulting in the choices of S$30, S$20
and S$10 by the players in positions C, D, and E, respectively.
Our goal is to measure how well each individual in this simultaneous-move environ-
ment performs introspective thinking by forming a correct belief about the choices made
by others who are not necessarily fully rational.8 To obtain this measurement, we de-
fine “HOR score” as the average expected payoff of an individual, calculated based on
his/her choice in each position matched with the empirical distribution of his/her oppo-
nent’s choices. Specifically, we first obtain the empirical choice distribution for each posi-
tion from our choice data. We then match an individual’s choice in each position with the
empirical choice distribution for his/her opponent’s position to obtain the expected payoff
for each position. Finally, we take the average of the expected payoffs from all five posi-
tions to obtain the HOR score of the individual. A standardized version of this measure
(having a mean of 0 and a standard deviation of 1 by gender) will be used for our main
empirical analyses. In addition, two other variables—discretized HOR score and HOR or-
der measure—are constructed based on individuals’ performance in the Line Game and
used to demonstrate the robustness of our results. These two variables will be defined and
discussed in Section 5.1.
Table 1 below presents the empirical distributions of the HOR scores obtained from
the SLP and KLIPS data. The two distributions share the same qualitative features,
although the distribution from the SLP data first order stochastically dominates that from7The position A player is the opponent of the position B player. The position B player is the opponent of
the position C player. The position C player is the opponent of the position D player. The position D playeris the opponent of the position E player. However, the opponent relationship is asymmetric. For example,the position B player is not the opponent of the position A player.
8The full-rationality benchmark is also considered, and our results do not depend on which measure weadopt. For more details, see Section 5.
9
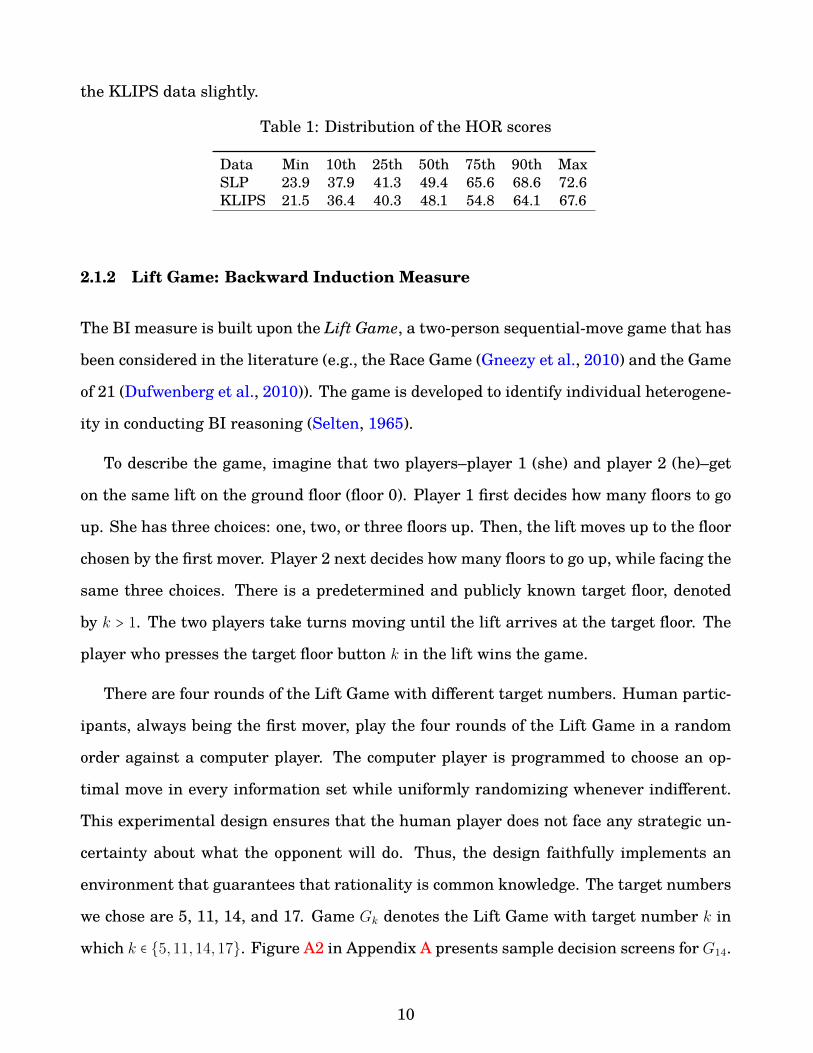
the KLIPS data slightly.
Table 1: Distribution of the HOR scores
Data Min 10th 25th 50th 75th 90th MaxSLP 23.9 37.9 41.3 49.4 65.6 68.6 72.6KLIPS 21.5 36.4 40.3 48.1 54.8 64.1 67.6
2.1.2 Lift Game: Backward Induction Measure
The BI measure is built upon the Lift Game, a two-person sequential-move game that has
been considered in the literature (e.g., the Race Game (Gneezy et al., 2010) and the Game
of 21 (Dufwenberg et al., 2010)). The game is developed to identify individual heterogene-
ity in conducting BI reasoning (Selten, 1965).
To describe the game, imagine that two players–player 1 (she) and player 2 (he)–get
on the same lift on the ground floor (floor 0). Player 1 first decides how many floors to go
up. She has three choices: one, two, or three floors up. Then, the lift moves up to the floor
chosen by the first mover. Player 2 next decides how many floors to go up, while facing the
same three choices. There is a predetermined and publicly known target floor, denoted
by k > 1. The two players take turns moving until the lift arrives at the target floor. The
player who presses the target floor button k in the lift wins the game.
There are four rounds of the Lift Game with different target numbers. Human partic-
ipants, always being the first mover, play the four rounds of the Lift Game in a random
order against a computer player. The computer player is programmed to choose an op-
timal move in every information set while uniformly randomizing whenever indifferent.
This experimental design ensures that the human player does not face any strategic un-
certainty about what the opponent will do. Thus, the design faithfully implements an
environment that guarantees that rationality is common knowledge. The target numbers
we chose are 5, 11, 14, and 17. Game Gk denotes the Lift Game with target number k in
which k ∈ {5,11,14,17}. Figure A2 in Appendix A presents sample decision screens for G14.
10
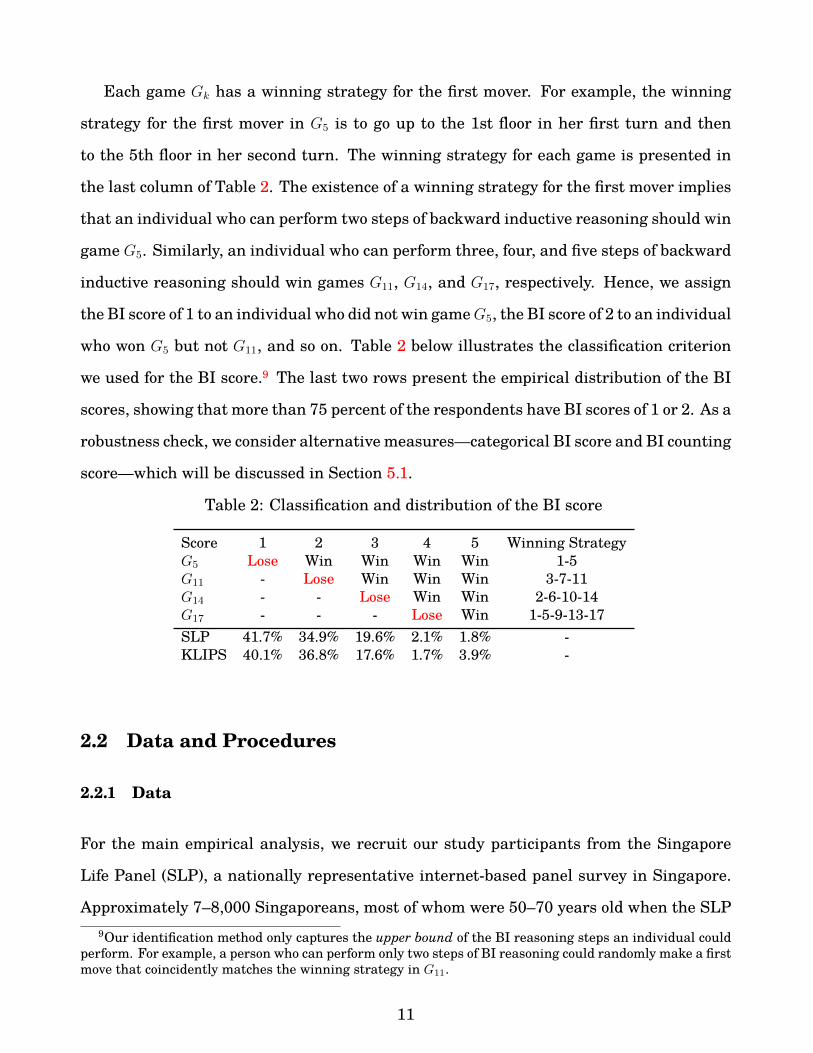
Each game Gk has a winning strategy for the first mover. For example, the winning
strategy for the first mover in G5 is to go up to the 1st floor in her first turn and then
to the 5th floor in her second turn. The winning strategy for each game is presented in
the last column of Table 2. The existence of a winning strategy for the first mover implies
that an individual who can perform two steps of backward inductive reasoning should win
game G5. Similarly, an individual who can perform three, four, and five steps of backward
inductive reasoning should win games G11, G14, and G17, respectively. Hence, we assign
the BI score of 1 to an individual who did not win gameG5, the BI score of 2 to an individual
who won G5 but not G11, and so on. Table 2 below illustrates the classification criterion
we used for the BI score.9 The last two rows present the empirical distribution of the BI
scores, showing that more than 75 percent of the respondents have BI scores of 1 or 2. As a
robustness check, we consider alternative measures—categorical BI score and BI counting
score—which will be discussed in Section 5.1.
Table 2: Classification and distribution of the BI score
Score 1 2 3 4 5 Winning StrategyG5 Lose Win Win Win Win 1-5G11 - Lose Win Win Win 3-7-11G14 - - Lose Win Win 2-6-10-14G17 - - - Lose Win 1-5-9-13-17SLP 41.7% 34.9% 19.6% 2.1% 1.8% -KLIPS 40.1% 36.8% 17.6% 1.7% 3.9% -
2.2 Data and Procedures
2.2.1 Data
For the main empirical analysis, we recruit our study participants from the Singapore
Life Panel (SLP), a nationally representative internet-based panel survey in Singapore.
Approximately 7–8,000 Singaporeans, most of whom were 50–70 years old when the SLP9Our identification method only captures the upper bound of the BI reasoning steps an individual could
perform. For example, a person who can perform only two steps of BI reasoning could randomly make a firstmove that coincidently matches the winning strategy in G11.
11
was launched in July 2015, participate in the survey every month. The SLP has been col-
lecting a rich array of individual and household characteristics, such as family structure,
labor market outcomes, and health. The online nature of the survey allows researchers to
flexibly ask various types of questions in an interactive manner.
In the 2017 August wave, we invited 3,595 respondents between 50 and 65 years old to
participate in our study. We deliberately decided to not invite those aged over 65 years to
focus on the working-age population. At the time of the survey, the Retirement and Re-
employment Act in Singapore mandated most employers offer continued employment until
65. In addition, the official pension claiming age in Singapore, called the Payout Eligibility
Age, is 65. Participants were informed that they would receive S$5 upon completing the
tasks in our study and up to S$150 based on their performance in each task. A total of
2,787 (78%) accepted our offer, and 2,146 completed all tasks in our study.
As measures of cognitive ability, we use education attainments and two internationally
popular and well-validated tests of fluid intelligence and social cognition. The Intelligence
Structure Test (IST) is our measure of fluid intelligence (Cattell, 1963). It is an interna-
tionally used and popular nonverbal cognitive ability test first developed in 1953 (Beaudu-
cel et al., 2010). The validity and reliability of the IST as a measure of cognitive ability
have been established over more than 1800 samples. The figural matrix part of the IST
consists of 20 questions and is very similar to the Raven’s Matrices test. Figure A3 shows
a sample question. The full-length test includes other dimensions of intelligence such as
verbal memory and numerical knowledge, but we could not implement those components
due to the survey time constraints.10
The Reading the Mind in the Eyes Test (hereafter, Eyes Test), developed by Baron-
Cohen et al. (2001), is our measure of an individual’s theory of mind or social cognition,
i.e., an individual’s ability to recognize another individual’s mental state (Astington et al.,
1988). It concerns reading cues in face-to-face human interaction, ignored in mathemati-
cal descriptions of strategic interaction but found to play an important role (e.g., Scharle-10According to the publisher, the time length of the full test components ranges from 77–130 minutes.
12
mann et al., 2001; Stirrat and Perrett, 2010). The Eyes test contains 28 questions, each
of which shows a photo of the human eye area, and asks the respondent to choose a word
that best describes the person’s mental state. The validity and reliability of the Eyes test
are also well established across many countries (Olderbak et al., 2015).
As measures of noncognitive traits and economic preferences, we use financial planning
horizon, risk tolerance, self-efficacy, and personal optimism. The detailed definitions of the
cognitive and noncognitive trait variables are included in Appendix D.
The correlation analysis reported in Appendix B suggests that our measures of strate-
gic thinking skills and convention measures of cognitive skills (IST score, Eyes Test score)
are weakly correlated. In addition, our strategic thinking measures are either uncorre-
lated or weakly correlated with postsecondary education and other noncognitive skills.
Column (1) of Table A3 reports sample characteristics of the study participants who
completed all tasks. Participants are, on average, 58.5 years old, and almost half of them
are male. 91 percent are ethnic Chinese, and 82 percent are married with almost 3 chil-
dren. 45 percent of participants received at least postsecondary education, and the av-
erage cognitive ability, in terms of the IST score, is 10.8 (out of 20), which is more than
1 point higher than 9.6, the score corresponding to an IQ score of 100 according to the
test’s manual (Beauducel et al., 2010). 70 percent of participants report positive annual
labor income, earning approximately S$50,283 on average. We do not have information
on hourly wages due to a lack of data on specific work hours.
Column (2) of Table A3 reports the sample characteristics of study dropouts, i.e., those
who accepted our invitation but did not complete the survey module. Column (3) of Ta-
ble A3 presents the sample characteristics of nonparticipants, i.e., those who did not ac-
cept our invitation. In general, participants, dropouts, and nonparticipants are similar
in terms of individual characteristics. However, participants are different from others
in some dimensions, such as ethnicity, cognitive ability, and financial planning horizon.
Hence, we acknowledge that the results should be interpreted with caution given that the
13
participant sample is different from the dropout and nonparticipant samples. Table A5
in Appendix E shows the descriptive statistics of the KLIPS sample. For the regression
analysis, we focus on the SLP sample and do not use the KLIPS sample due to the small
sample size.
2.2.2 Procedures
Our study comprised two tasks that correspond to the strategic thinking measures dis-
cussed in Section 2.1. In Task I, each participant played four rounds of the Lift Game. In
Task II, each participant was randomly matched with four other participants and played
five rounds of the Line Game.11
The cash payment consisted of three parts. First, upon completing the experiment,
every participant received the show-up fee of S$5. Second, for each participant, one game
(out of 4 games) in Task I was chosen randomly; the winning participant received S$5, and
the others received S$0. Third, the dollar amount each participant earned in one randomly
chosen round (out of 5 rounds) in Task II was paid to the participant depending on the
outcome of a lucky draw in which each participant had a 10 percent chance of winning.
Participants received a minimum amount of S$5 (US$3.7) and a maximum amount of
S$150 (US$110.5) by participating in the experiment, which lasted approximately twenty
minutes on average.12 The total amount paid to the subjects was S$27,000 (US$19,959);
67 percent of subjects received S$5. 23 percent received S$10. The remainder received
S$15 or more.11In Tasks I and II, after reading the instructions, participants were asked to answer a few comprehension
quiz questions and to play a practice round. The scripts for the experimental instructions are available inthe Appendix. The Eyes Test was conducted in Task III.
12Due to an administrative restriction, the payment was delivered in the following month in the form of acash voucher for the largest grocery store chain in Singapore.
14
3 Strategic Thinking and Labor Market Outcomes
To establish that strategic thinking skills are strong predictors of an individual’s economic
outcomes, we consider the labor incomes of participants as the real-world outcomes of in-
terest. Identifying the determinants of individuals’ labor income is a key area of research
in labor economics (e.g., Mincer, 1958; Pencavel, 1986; Blundell and Macurdy, 1999; Heck-
man et al., 2006a). The literature has shown that various skills contribute to inequality
in labor market outcomes (Heckman, 1995; Katz and Autor, 1999; Heckman and Kautz,
2012). Therefore, it is natural for us to investigate whether our measures of strategic
thinking skills can independently explain variations in labor income.
We use annual labor income data collected in January 2015 (i.e., annual labor income
earned during the calendar year 2014) for the main empirical analysis.13 The participants
in our study are aged 50–65 years; thus, 30% of participants report zero annual labor
income. Hence, it is also important to study the association between strategic thinking
skills and the extensive margin of labor supply. We define the extensive margin as a
binary indicator that takes the value of 1 if a participant has a positive labor income and
0 otherwise. The extensive margin analysis refers to the analysis of labor income using
this binary indicator as a dependent variable, while the intensive margin analysis refers
to the analysis omitting zero-income earners.14
We conduct the empirical analysis separately by gender. The gender gap in labor in-
come and labor market participation has historically been substantial and persistent, al-
though it has decreased to some extent over recent decades (Altonji and Blank, 1999;
Kuziemko et al., 2018). This gap depends on the degree of gender discrimination in hir-
ing and workplace relations as well as on differences in gender roles in intrahousehold
labor supply (Chiappori, 1992; Fernandez and Fogli, 2009; Bertrand et al., 2015; Charles
et al., 2018). Unless such gender differences in the labor market are orthogonal to strate-
gic thinking skills, establishing their association with labor outcomes would be biased if13We extend the analysis by pooling multiyear income data in Section 5.2. The results are robust.14Powell (2020) adopted the same interpretation when studying the impacts of tax rebates on earnings.
15
we pool the data over gender.
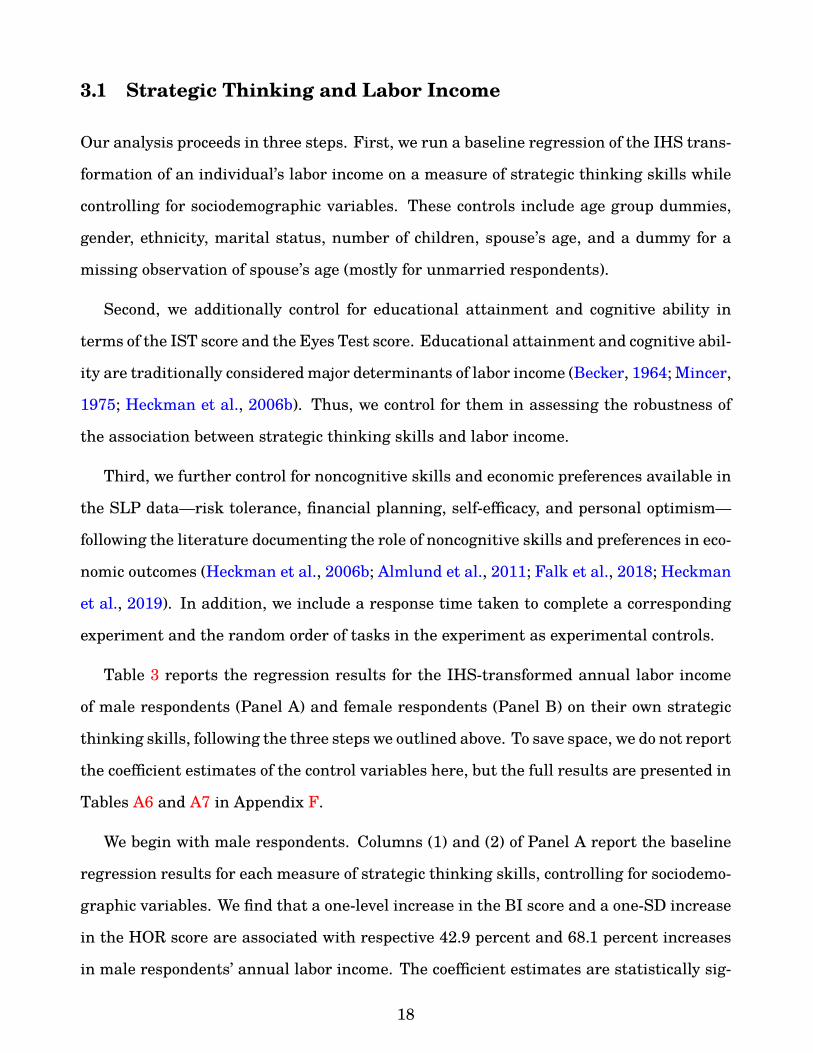
Before proceeding to the regression analysis, we present Figures 1 and 2 showing the
mean and 95 percent confidence intervals of annual labor income and the likelihood of
working (i.e., reporting a positive annual labor income). Each figure is drawn by partition-
ing the sample according to the ranking of each measure of strategic thinking skills and
cognitive ability.15 There are notable differences between male and female participants
in terms of the unconditional association between strategic thinking skills and labor out-
comes. On the one hand, male participants with higher scores for BI and HOR earn a
higher annual labor income and are more likely to participate in the labor market. On the
other hand, female participants with higher BI scores are less likely to supply their labor
in the market and consequently earn lower annual labor income. These patterns reveal
the gender-specific relationship between strategic thinking skills and labor outcomes. It is
also noteworthy that the IST score measuring cognitive ability is strongly correlated with
labor income for both male and female participants, while the Eyes Test score measuring
social cognition is not clearly correlated with labor income.
We transform the annual labor income variable with the inverse hyperbolic sine (IHS)
function (Burbidge et al., 1988) and use it as the primary dependent variable in the regres-
sion analysis. The IHS transformation has the same interpretation of the log transforma-
tion (i.e., percent change) but provides the advantage that it is defined at zero. Thus, we
do not need to drop zero-income earners from the sample. This transformation method has
been widely used in the literature analyzing medical spending, wealth and savings (Car-
roll et al., 2003; Pence, 2006; Gelber, 2011) as well as earnings (Powell, 2020), in which
the variable of interest frequently takes the value of zero.15Figure A5 in Appendix G presents the mean and the 95 percent confidence intervals of annual labor
income by gender conditional on positive labor income. The general patterns for this restricted sample arequalitatively similar to those shown in Figure 1.
16
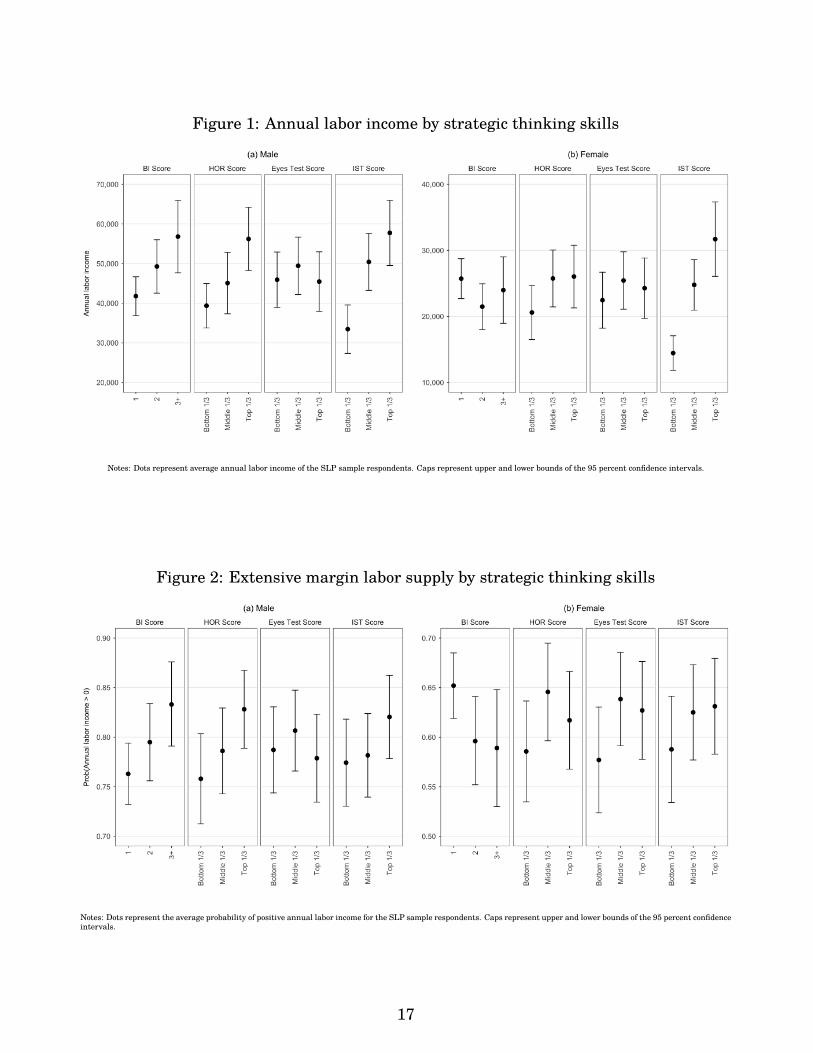
Figure 1: Annual labor income by strategic thinking skills
Notes: Dots represent average annual labor income of the SLP sample respondents. Caps represent upper and lower bounds of the 95 percent confidence intervals.
Figure 2: Extensive margin labor supply by strategic thinking skills
Notes: Dots represent the average probability of positive annual labor income for the SLP sample respondents. Caps represent upper and lower bounds of the 95 percent confidenceintervals.
17
3.1 Strategic Thinking and Labor Income
Our analysis proceeds in three steps. First, we run a baseline regression of the IHS trans-
formation of an individual’s labor income on a measure of strategic thinking skills while
controlling for sociodemographic variables. These controls include age group dummies,
gender, ethnicity, marital status, number of children, spouse’s age, and a dummy for a
missing observation of spouse’s age (mostly for unmarried respondents).
Second, we additionally control for educational attainment and cognitive ability in
terms of the IST score and the Eyes Test score. Educational attainment and cognitive abil-
ity are traditionally considered major determinants of labor income (Becker, 1964; Mincer,
1975; Heckman et al., 2006b). Thus, we control for them in assessing the robustness of
the association between strategic thinking skills and labor income.
Third, we further control for noncognitive skills and economic preferences available in
the SLP data—risk tolerance, financial planning, self-efficacy, and personal optimism—
following the literature documenting the role of noncognitive skills and preferences in eco-
nomic outcomes (Heckman et al., 2006b; Almlund et al., 2011; Falk et al., 2018; Heckman
et al., 2019). In addition, we include a response time taken to complete a corresponding
experiment and the random order of tasks in the experiment as experimental controls.
Table 3 reports the regression results for the IHS-transformed annual labor income
of male respondents (Panel A) and female respondents (Panel B) on their own strategic
thinking skills, following the three steps we outlined above. To save space, we do not report
the coefficient estimates of the control variables here, but the full results are presented in
Tables A6 and A7 in Appendix F.
We begin with male respondents. Columns (1) and (2) of Panel A report the baseline
regression results for each measure of strategic thinking skills, controlling for sociodemo-
graphic variables. We find that a one-level increase in the BI score and a one-SD increase
in the HOR score are associated with respective 42.9 percent and 68.1 percent increases
in male respondents’ annual labor income. The coefficient estimates are statistically sig-
18
nificant at the 1 percent level.
The findings from the baseline regression might be partially driven by educational at-
tainment, and cognitive ability, which can be correlated with both strategic thinking skills
and labor income. Hence, in columns (3) and (4), we additionally control for educational
attainment, IST score, and Eyes Test score. The coefficient estimates on the BI score and
the HOR score—0.375 and 0.612, respectively—remain significant at the 5 percent level,
although the magnitudes drop slightly by about 0.05 for the BI score and 0.07 for the HOR
score.
Columns (5) and (6) show the regression results, further controlling for noncognitive
traits and experimental variables. We find that a one-level increase in a male respondent’s
BI score is associated with a 37 percent increase in his annual income, and a one-SD
increase in his HOR score is associated with a 58 percent higher annual labor income. It
is noteworthy that the magnitudes for the BI score and the HOR score decrease by only
13–15 percent compared with those from the baseline specification reported in columns
(1) and (2).
We turn to female respondents. In the baseline specification, columns (1) and (2) of
Panel B, we find that a one-level increase in a female respondent’s BI score is associated
with a 36.7 percent lower annual labor income. The coefficient estimate is statistically
significant at the 5 percent level. The coefficient estimate of the HOR score is positive but
imprecisely estimated.
In columns (3) and (4), the negative association between the BI score and annual labor
income for female respondents becomes even greater in magnitude and in significance
after additionally controlling for educational attainment, the IST score, and the Eyes Test
score. The association with the HOR level is close to zero and statistically insignificant.
In columns (5) and (6), with further controls for noncognitive and preference traits and
experimental variables, the association of the BI score with female labor income remains
statistically significant at the 1 percent level: a one-level increase in a female respon-
19
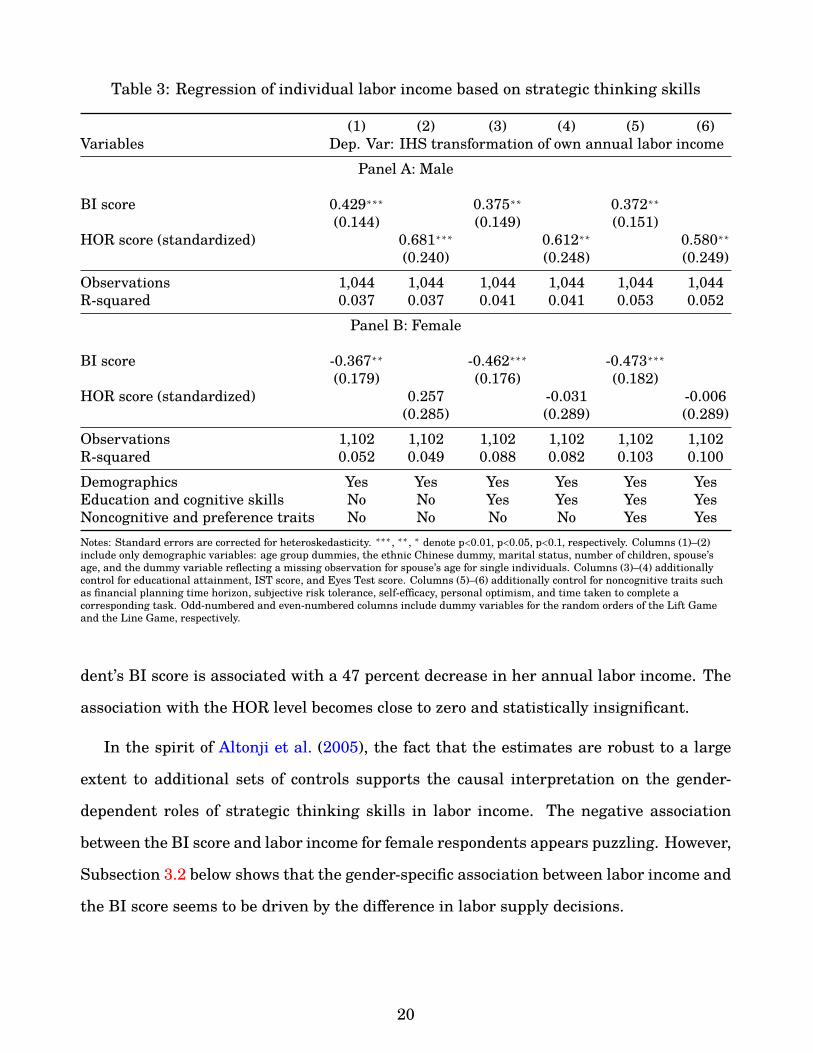
Table 3: Regression of individual labor income based on strategic thinking skills
(1) (2) (3) (4) (5) (6)Variables Dep. Var: IHS transformation of own annual labor income
Panel A: Male
BI score 0.429∗∗∗ 0.375∗∗ 0.372∗∗(0.144) (0.149) (0.151)
HOR score (standardized) 0.681∗∗∗ 0.612∗∗ 0.580∗∗(0.240) (0.248) (0.249)
Observations 1,044 1,044 1,044 1,044 1,044 1,044R-squared 0.037 0.037 0.041 0.041 0.053 0.052
Panel B: Female
BI score -0.367∗∗ -0.462∗∗∗ -0.473∗∗∗(0.179) (0.176) (0.182)
HOR score (standardized) 0.257 -0.031 -0.006(0.285) (0.289) (0.289)
Observations 1,102 1,102 1,102 1,102 1,102 1,102R-squared 0.052 0.049 0.088 0.082 0.103 0.100Demographics Yes Yes Yes Yes Yes YesEducation and cognitive skills No No Yes Yes Yes YesNoncognitive and preference traits No No No No Yes YesNotes: Standard errors are corrected for heteroskedasticity. ∗∗∗, ∗∗, ∗ denote p<0.01, p<0.05, p<0.1, respectively. Columns (1)–(2)include only demographic variables: age group dummies, the ethnic Chinese dummy, marital status, number of children, spouse’sage, and the dummy variable reflecting a missing observation for spouse’s age for single individuals. Columns (3)–(4) additionallycontrol for educational attainment, IST score, and Eyes Test score. Columns (5)–(6) additionally control for noncognitive traits suchas financial planning time horizon, subjective risk tolerance, self-efficacy, personal optimism, and time taken to complete acorresponding task. Odd-numbered and even-numbered columns include dummy variables for the random orders of the Lift Gameand the Line Game, respectively.
dent’s BI score is associated with a 47 percent decrease in her annual labor income. The
association with the HOR level becomes close to zero and statistically insignificant.
In the spirit of Altonji et al. (2005), the fact that the estimates are robust to a large
extent to additional sets of controls supports the causal interpretation on the gender-
dependent roles of strategic thinking skills in labor income. The negative association
between the BI score and labor income for female respondents appears puzzling. However,
Subsection 3.2 below shows that the gender-specific association between labor income and
the BI score seems to be driven by the difference in labor supply decisions.
20
3.2 Extensive Margin of Labor Supply
The preceding analysis of labor income does not distinguish the extensive and intensive
margins of labor supply because the IHS-transformed annual labor income contains ob-
servations with zero income. In this subsection, we examine the relationship between
strategic thinking skills and the extensive margin of labor supply by gender. 16
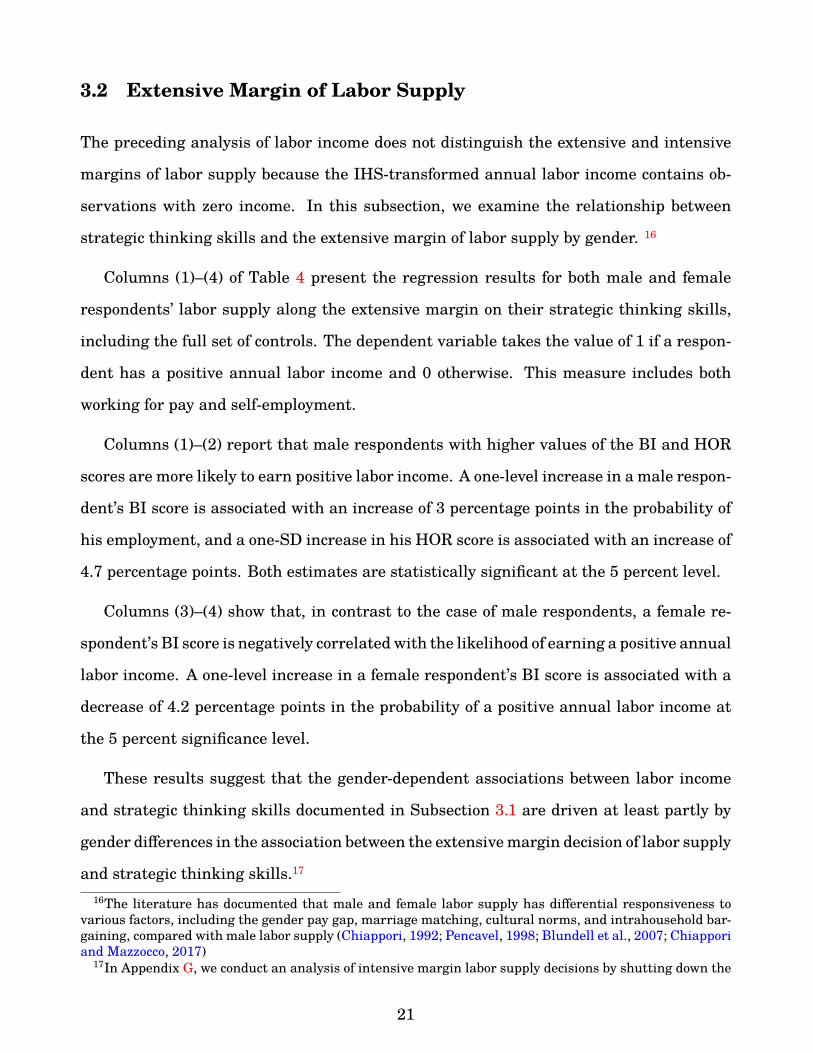
Columns (1)–(4) of Table 4 present the regression results for both male and female
respondents’ labor supply along the extensive margin on their strategic thinking skills,
including the full set of controls. The dependent variable takes the value of 1 if a respon-
dent has a positive annual labor income and 0 otherwise. This measure includes both
working for pay and self-employment.
Columns (1)–(2) report that male respondents with higher values of the BI and HOR
scores are more likely to earn positive labor income. A one-level increase in a male respon-
dent’s BI score is associated with an increase of 3 percentage points in the probability of
his employment, and a one-SD increase in his HOR score is associated with an increase of
4.7 percentage points. Both estimates are statistically significant at the 5 percent level.
Columns (3)–(4) show that, in contrast to the case of male respondents, a female re-
spondent’s BI score is negatively correlated with the likelihood of earning a positive annual
labor income. A one-level increase in a female respondent’s BI score is associated with a
decrease of 4.2 percentage points in the probability of a positive annual labor income at
the 5 percent significance level.
These results suggest that the gender-dependent associations between labor income
and strategic thinking skills documented in Subsection 3.1 are driven at least partly by
gender differences in the association between the extensive margin decision of labor supply
and strategic thinking skills.17
16The literature has documented that male and female labor supply has differential responsiveness tovarious factors, including the gender pay gap, marriage matching, cultural norms, and intrahousehold bar-gaining, compared with male labor supply (Chiappori, 1992; Pencavel, 1998; Blundell et al., 2007; Chiapporiand Mazzocco, 2017)
17In Appendix G, we conduct an analysis of intensive margin labor supply decisions by shutting down the
21
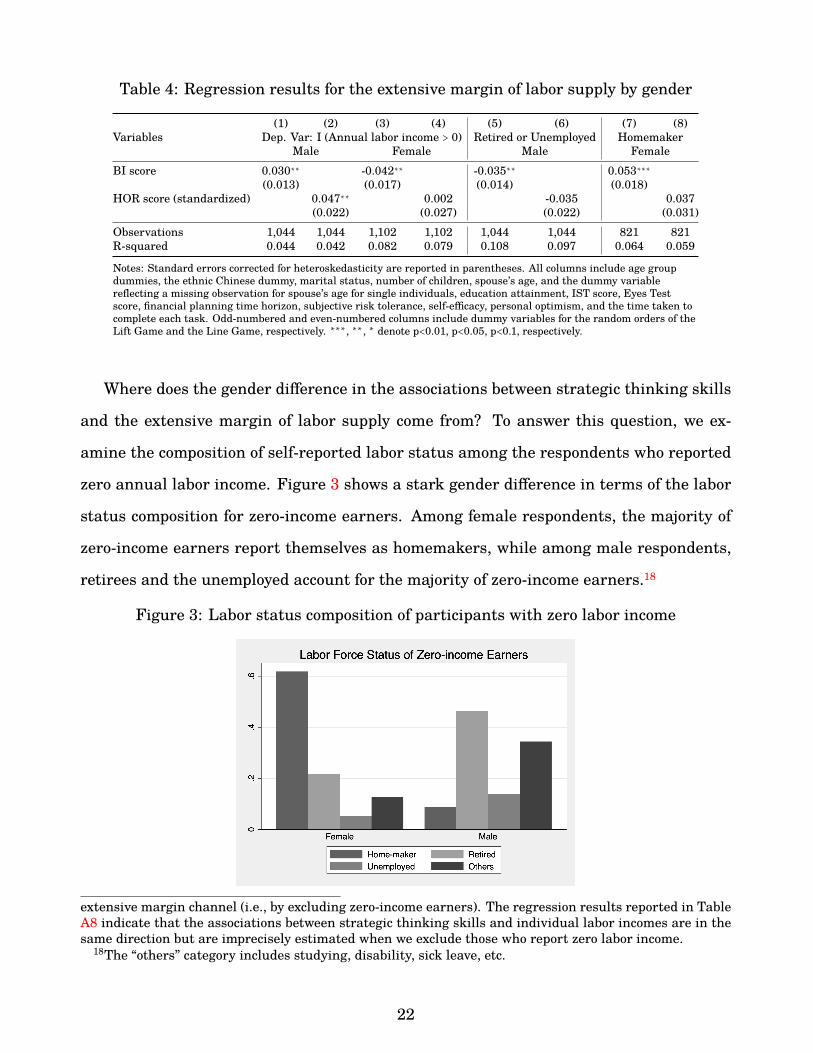
Table 4: Regression results for the extensive margin of labor supply by gender
Variables(1) (2) (3) (4) (5) (6) (7) (8)
Dep. Var: I (Annual labor income > 0) Retired or Unemployed HomemakerMale Female Male Female
BI score 0.030∗∗ -0.042∗∗ -0.035∗∗ 0.053∗∗∗(0.013) (0.017) (0.014) (0.018)
HOR score (standardized) 0.047∗∗ 0.002 -0.035 0.037(0.022) (0.027) (0.022) (0.031)
Observations 1,044 1,044 1,102 1,102 1,044 1,044 821 821R-squared 0.044 0.042 0.082 0.079 0.108 0.097 0.064 0.059
Notes: Standard errors corrected for heteroskedasticity are reported in parentheses. All columns include age groupdummies, the ethnic Chinese dummy, marital status, number of children, spouse’s age, and the dummy variablereflecting a missing observation for spouse’s age for single individuals, education attainment, IST score, Eyes Testscore, financial planning time horizon, subjective risk tolerance, self-efficacy, personal optimism, and the time taken tocomplete each task. Odd-numbered and even-numbered columns include dummy variables for the random orders of theLift Game and the Line Game, respectively. ∗∗∗, ∗∗, ∗ denote p<0.01, p<0.05, p<0.1, respectively.
Where does the gender difference in the associations between strategic thinking skills
and the extensive margin of labor supply come from? To answer this question, we ex-
amine the composition of self-reported labor status among the respondents who reported
zero annual labor income. Figure 3 shows a stark gender difference in terms of the labor
status composition for zero-income earners. Among female respondents, the majority of
zero-income earners report themselves as homemakers, while among male respondents,
retirees and the unemployed account for the majority of zero-income earners.18
Figure 3: Labor status composition of participants with zero labor income
extensive margin channel (i.e., by excluding zero-income earners). The regression results reported in TableA8 indicate that the associations between strategic thinking skills and individual labor incomes are in thesame direction but are imprecisely estimated when we exclude those who report zero labor income.
18The “others” category includes studying, disability, sick leave, etc.
22
To further examine whether the gender differences in the composition of labor status
contribute to the gender differences in the association between strategic thinking skills
and the extensive margin of labor supply, we conduct regression analyses of either being
retired or unemployed for males and the homemaker status for females on the strategic
thinking skill measures while including the full set of controls.
Columns (5)–(6) of Table 4 report the regression results for male respondents’ labor
status of being either retired or unemployed on strategic thinking skills with the full set of
controls. The dependent variable takes the value of 1 if a male respondent declares himself
to be retired or unemployed and 0 otherwise. The results show that male respondents
with higher values of the BI and HOR scores are less likely to be retired or unemployed.
Overall, the negative associations between strategic thinking skills and zero income due to
retirement and unemployment are consistent with the earlier findings, reported in Panel
A of Table 3 and Columns (1)–(2) of Table 4.
Columns (7)–(8) of Table 4 report the regression results for female respondents. The
dependent variable takes the value of 1 if a female respondent declares herself to be a
homemaker and 0 otherwise. We restrict the sample of female respondents in this analysis
to those who were married at the time of the survey. In column (7), a one-level increase in
the married female respondent’s BI score is associated with a 5.3 percent increase in the
likelihood of being a homemaker. This evidence is consistent with the earlier findings that
a female respondent’s BI score is negatively correlated with the likelihood of working and,
as a result, with her annual labor income. In column (8), we find a positive association
between a married female respondent’s HOR score and her homemaker status, but the
estimate is not statistically significant.
3.3 Heterogeneous Effects
We have thus far conducted the mean regression analysis and found a large magnitude
of the associations between strategic thinking skills and labor income. However, due to
23
the nontrivial share of the participants reporting zero labor income, small changes at
the low end of the income distribution may lead to disproportionate weights in the mean
regression analysis.
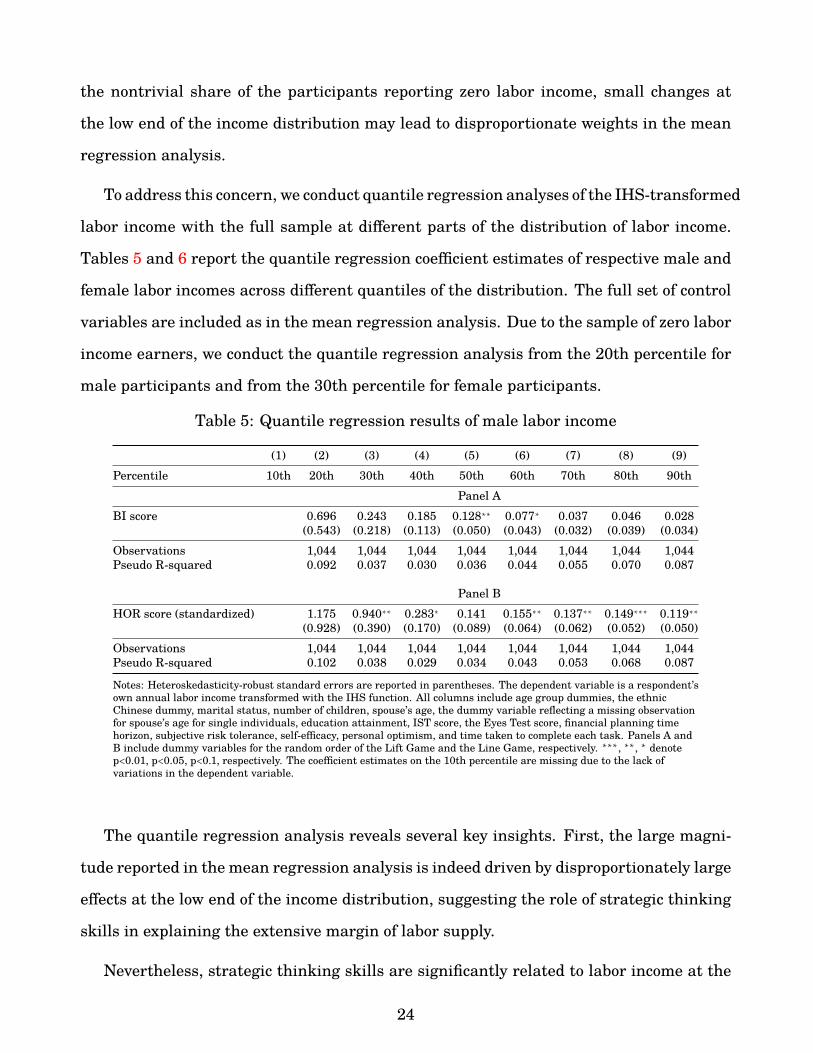
To address this concern, we conduct quantile regression analyses of the IHS-transformed
labor income with the full sample at different parts of the distribution of labor income.
Tables 5 and 6 report the quantile regression coefficient estimates of respective male and
female labor incomes across different quantiles of the distribution. The full set of control
variables are included as in the mean regression analysis. Due to the sample of zero labor
income earners, we conduct the quantile regression analysis from the 20th percentile for
male participants and from the 30th percentile for female participants.
Table 5: Quantile regression results of male labor income
(1) (2) (3) (4) (5) (6) (7) (8) (9)Percentile 10th 20th 30th 40th 50th 60th 70th 80th 90th
Panel ABI score 0.696 0.243 0.185 0.128∗∗ 0.077∗ 0.037 0.046 0.028
(0.543) (0.218) (0.113) (0.050) (0.043) (0.032) (0.039) (0.034)Observations 1,044 1,044 1,044 1,044 1,044 1,044 1,044 1,044Pseudo R-squared 0.092 0.037 0.030 0.036 0.044 0.055 0.070 0.087
Panel BHOR score (standardized) 1.175 0.940∗∗ 0.283∗ 0.141 0.155∗∗ 0.137∗∗ 0.149∗∗∗ 0.119∗∗
(0.928) (0.390) (0.170) (0.089) (0.064) (0.062) (0.052) (0.050)Observations 1,044 1,044 1,044 1,044 1,044 1,044 1,044 1,044Pseudo R-squared 0.102 0.038 0.029 0.034 0.043 0.053 0.068 0.087
Notes: Heteroskedasticity-robust standard errors are reported in parentheses. The dependent variable is a respondent’sown annual labor income transformed with the IHS function. All columns include age group dummies, the ethnicChinese dummy, marital status, number of children, spouse’s age, the dummy variable reflecting a missing observationfor spouse’s age for single individuals, education attainment, IST score, the Eyes Test score, financial planning timehorizon, subjective risk tolerance, self-efficacy, personal optimism, and time taken to complete each task. Panels A andB include dummy variables for the random order of the Lift Game and the Line Game, respectively. ∗∗∗, ∗∗, ∗ denotep<0.01, p<0.05, p<0.1, respectively. The coefficient estimates on the 10th percentile are missing due to the lack ofvariations in the dependent variable.
The quantile regression analysis reveals several key insights. First, the large magni-
tude reported in the mean regression analysis is indeed driven by disproportionately large
effects at the low end of the income distribution, suggesting the role of strategic thinking
skills in explaining the extensive margin of labor supply.
Nevertheless, strategic thinking skills are significantly related to labor income at the
24
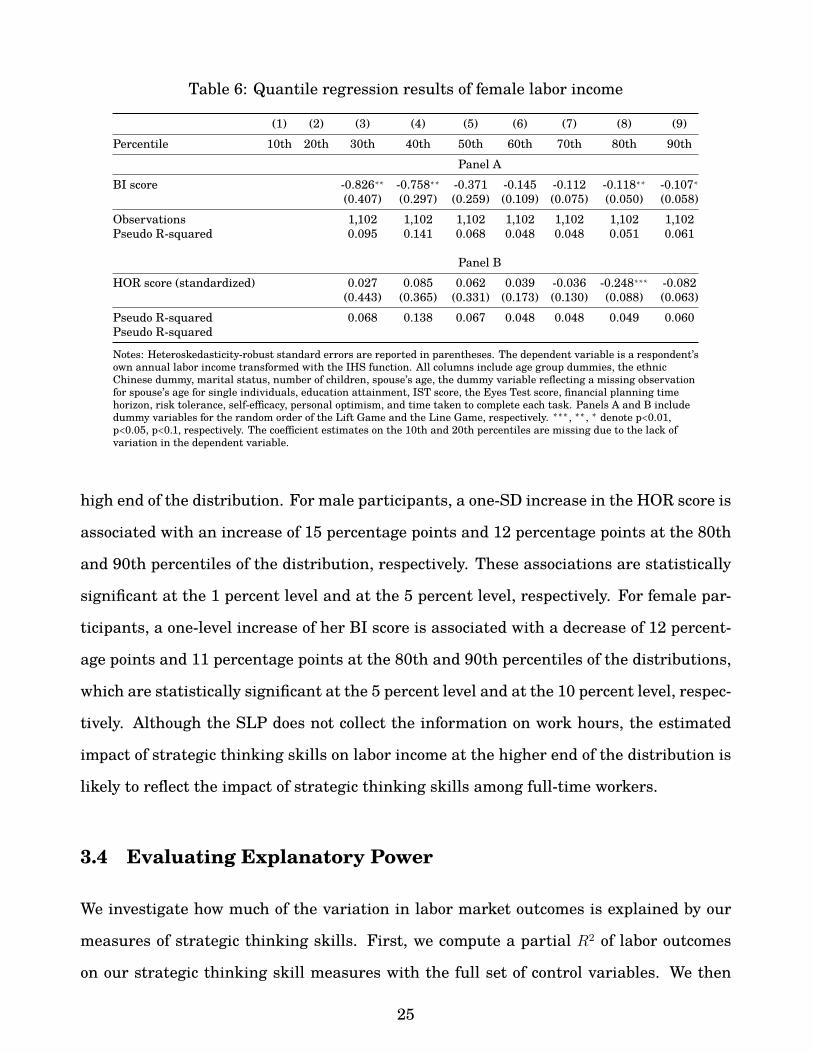
Table 6: Quantile regression results of female labor income
(1) (2) (3) (4) (5) (6) (7) (8) (9)Percentile 10th 20th 30th 40th 50th 60th 70th 80th 90th
Panel ABI score -0.826∗∗ -0.758∗∗ -0.371 -0.145 -0.112 -0.118∗∗ -0.107∗
(0.407) (0.297) (0.259) (0.109) (0.075) (0.050) (0.058)Observations 1,102 1,102 1,102 1,102 1,102 1,102 1,102Pseudo R-squared 0.095 0.141 0.068 0.048 0.048 0.051 0.061
Panel BHOR score (standardized) 0.027 0.085 0.062 0.039 -0.036 -0.248∗∗∗ -0.082
(0.443) (0.365) (0.331) (0.173) (0.130) (0.088) (0.063)Pseudo R-squared 0.068 0.138 0.067 0.048 0.048 0.049 0.060Pseudo R-squared
Notes: Heteroskedasticity-robust standard errors are reported in parentheses. The dependent variable is a respondent’sown annual labor income transformed with the IHS function. All columns include age group dummies, the ethnicChinese dummy, marital status, number of children, spouse’s age, the dummy variable reflecting a missing observationfor spouse’s age for single individuals, education attainment, IST score, the Eyes Test score, financial planning timehorizon, risk tolerance, self-efficacy, personal optimism, and time taken to complete each task. Panels A and B includedummy variables for the random order of the Lift Game and the Line Game, respectively. ∗∗∗, ∗∗, ∗ denote p<0.01,p<0.05, p<0.1, respectively. The coefficient estimates on the 10th and 20th percentiles are missing due to the lack ofvariation in the dependent variable.
high end of the distribution. For male participants, a one-SD increase in the HOR score is
associated with an increase of 15 percentage points and 12 percentage points at the 80th
and 90th percentiles of the distribution, respectively. These associations are statistically
significant at the 1 percent level and at the 5 percent level, respectively. For female par-
ticipants, a one-level increase of her BI score is associated with a decrease of 12 percent-
age points and 11 percentage points at the 80th and 90th percentiles of the distributions,
which are statistically significant at the 5 percent level and at the 10 percent level, respec-
tively. Although the SLP does not collect the information on work hours, the estimated
impact of strategic thinking skills on labor income at the higher end of the distribution is
likely to reflect the impact of strategic thinking skills among full-time workers.
3.4 Evaluating Explanatory Power
We investigate how much of the variation in labor market outcomes is explained by our
measures of strategic thinking skills. First, we compute a partial R2 of labor outcomes
on our strategic thinking skill measures with the full set of control variables. We then
25
normalize the variation in labor market outcome explained by each variable of interest
by the total variation explained by the entire set of variables in this exercise. We also
consider the cognitive ability measures (IST score and Eyes Test score) to compare with
the explanatory power of the strategic thinking skill measures.
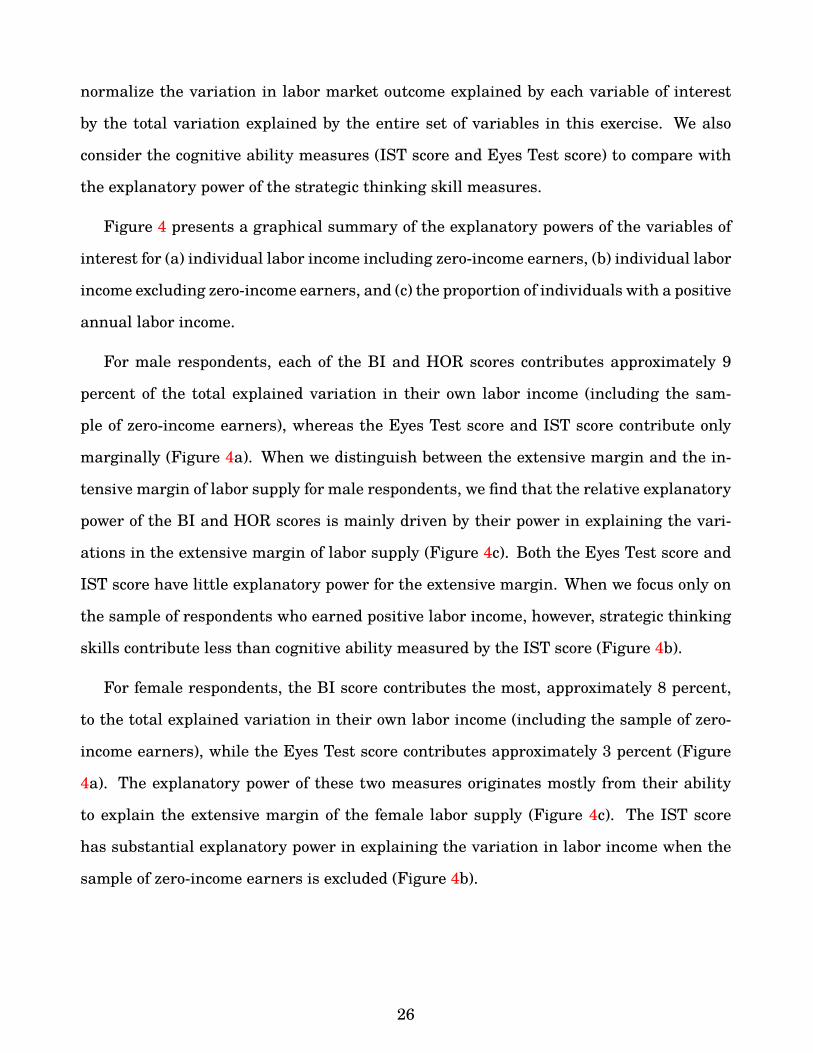
Figure 4 presents a graphical summary of the explanatory powers of the variables of
interest for (a) individual labor income including zero-income earners, (b) individual labor
income excluding zero-income earners, and (c) the proportion of individuals with a positive
annual labor income.
For male respondents, each of the BI and HOR scores contributes approximately 9
percent of the total explained variation in their own labor income (including the sam-
ple of zero-income earners), whereas the Eyes Test score and IST score contribute only
marginally (Figure 4a). When we distinguish between the extensive margin and the in-
tensive margin of labor supply for male respondents, we find that the relative explanatory
power of the BI and HOR scores is mainly driven by their power in explaining the vari-
ations in the extensive margin of labor supply (Figure 4c). Both the Eyes Test score and
IST score have little explanatory power for the extensive margin. When we focus only on
the sample of respondents who earned positive labor income, however, strategic thinking
skills contribute less than cognitive ability measured by the IST score (Figure 4b).
For female respondents, the BI score contributes the most, approximately 8 percent,
to the total explained variation in their own labor income (including the sample of zero-
income earners), while the Eyes Test score contributes approximately 3 percent (Figure
4a). The explanatory power of these two measures originates mostly from their ability
to explain the extensive margin of the female labor supply (Figure 4c). The IST score
has substantial explanatory power in explaining the variation in labor income when the
sample of zero-income earners is excluded (Figure 4b).
26
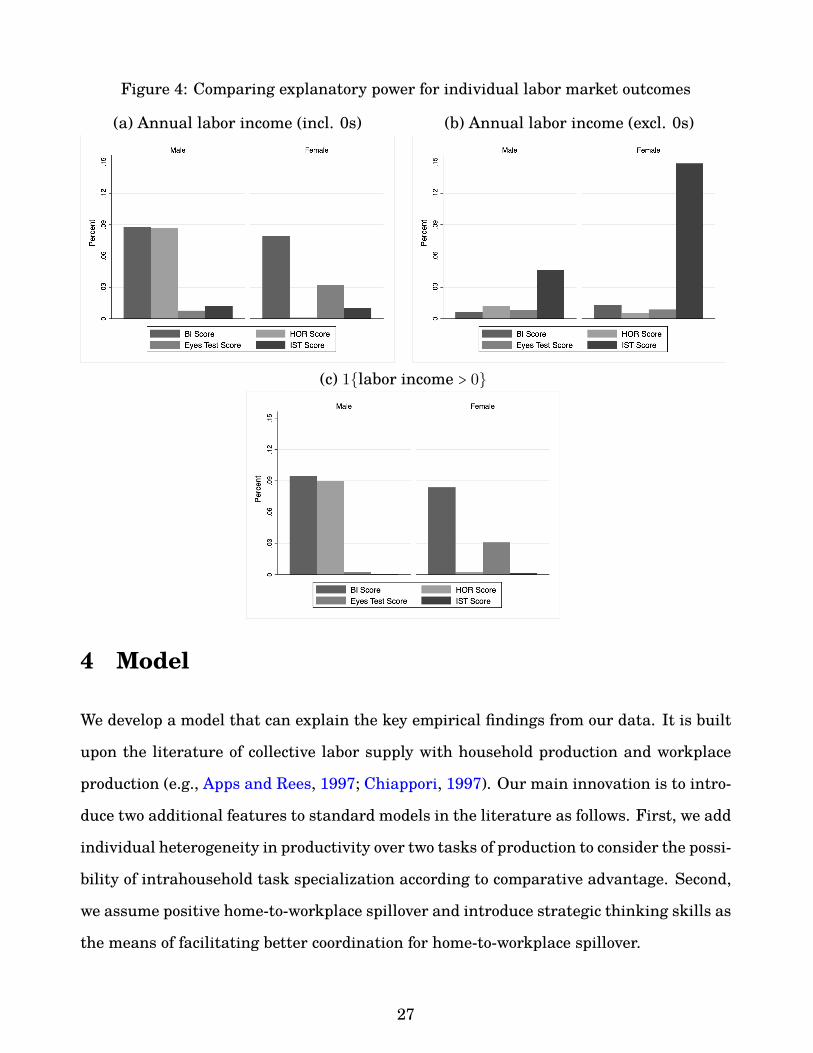
Figure 4: Comparing explanatory power for individual labor market outcomes
(a) Annual labor income (incl. 0s) (b) Annual labor income (excl. 0s)
(c) 1{labor income > 0}
4 Model
We develop a model that can explain the key empirical findings from our data. It is built
upon the literature of collective labor supply with household production and workplace
production (e.g., Apps and Rees, 1997; Chiappori, 1997). Our main innovation is to intro-
duce two additional features to standard models in the literature as follows. First, we add
individual heterogeneity in productivity over two tasks of production to consider the possi-
bility of intrahousehold task specialization according to comparative advantage. Second,
we assume positive home-to-workplace spillover and introduce strategic thinking skills as
the means of facilitating better coordination for home-to-workplace spillover.
27
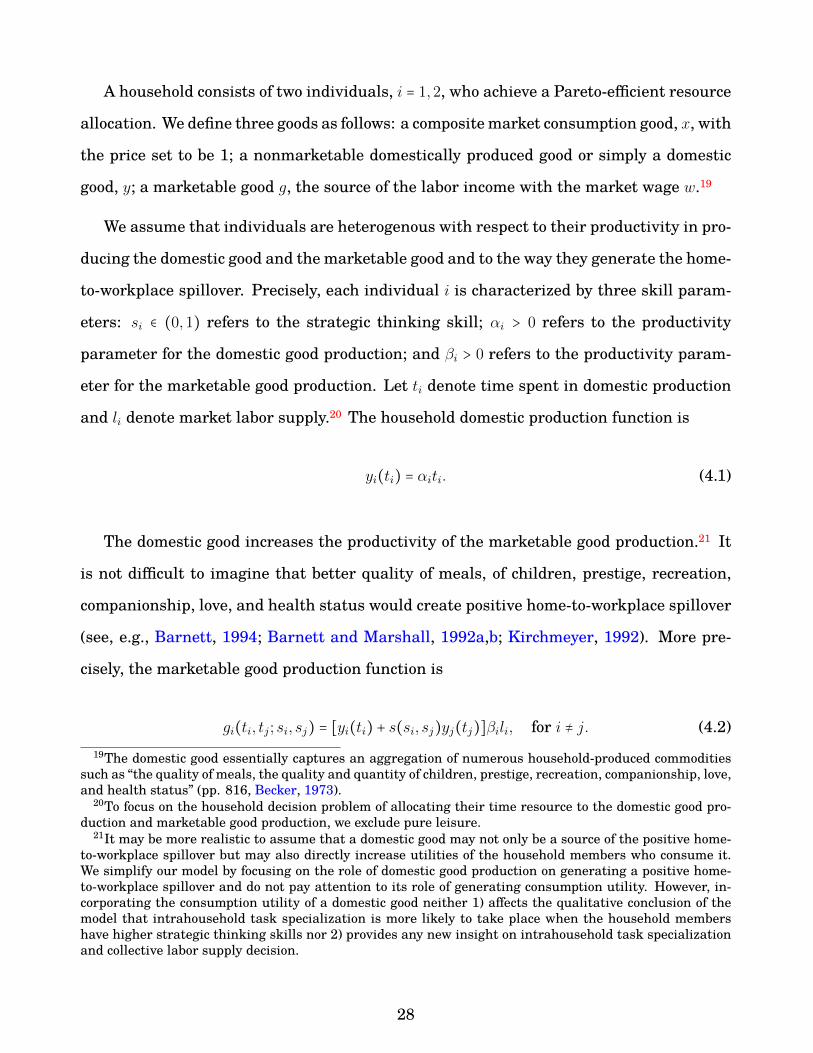
A household consists of two individuals, i = 1,2, who achieve a Pareto-efficient resource
allocation. We define three goods as follows: a composite market consumption good, x, with
the price set to be 1; a nonmarketable domestically produced good or simply a domestic
good, y; a marketable good g, the source of the labor income with the market wage w.19
We assume that individuals are heterogenous with respect to their productivity in pro-
ducing the domestic good and the marketable good and to the way they generate the home-
to-workplace spillover. Precisely, each individual i is characterized by three skill param-
eters: si ∈ (0,1) refers to the strategic thinking skill; αi > 0 refers to the productivity
parameter for the domestic good production; and βi > 0 refers to the productivity param-
eter for the marketable good production. Let ti denote time spent in domestic production
and li denote market labor supply.20 The household domestic production function is
yi(ti) = αiti. (4.1)
The domestic good increases the productivity of the marketable good production.21 It
is not difficult to imagine that better quality of meals, of children, prestige, recreation,
companionship, love, and health status would create positive home-to-workplace spillover
(see, e.g., Barnett, 1994; Barnett and Marshall, 1992a,b; Kirchmeyer, 1992). More pre-
cisely, the marketable good production function is
gi(ti, tj; si, sj) = [yi(ti) + s(si, sj)yj(tj)]βili, for i ≠ j. (4.2)19The domestic good essentially captures an aggregation of numerous household-produced commodities
such as “the quality of meals, the quality and quantity of children, prestige, recreation, companionship, love,and health status” (pp. 816, Becker, 1973).
20To focus on the household decision problem of allocating their time resource to the domestic good pro-duction and marketable good production, we exclude pure leisure.
21It may be more realistic to assume that a domestic good may not only be a source of the positive home-to-workplace spillover but may also directly increase utilities of the household members who consume it.We simplify our model by focusing on the role of domestic good production on generating a positive home-to-workplace spillover and do not pay attention to its role of generating consumption utility. However, in-corporating the consumption utility of a domestic good neither 1) affects the qualitative conclusion of themodel that intrahousehold task specialization is more likely to take place when the household membershave higher strategic thinking skills nor 2) provides any new insight on intrahousehold task specializationand collective labor supply decision.
28
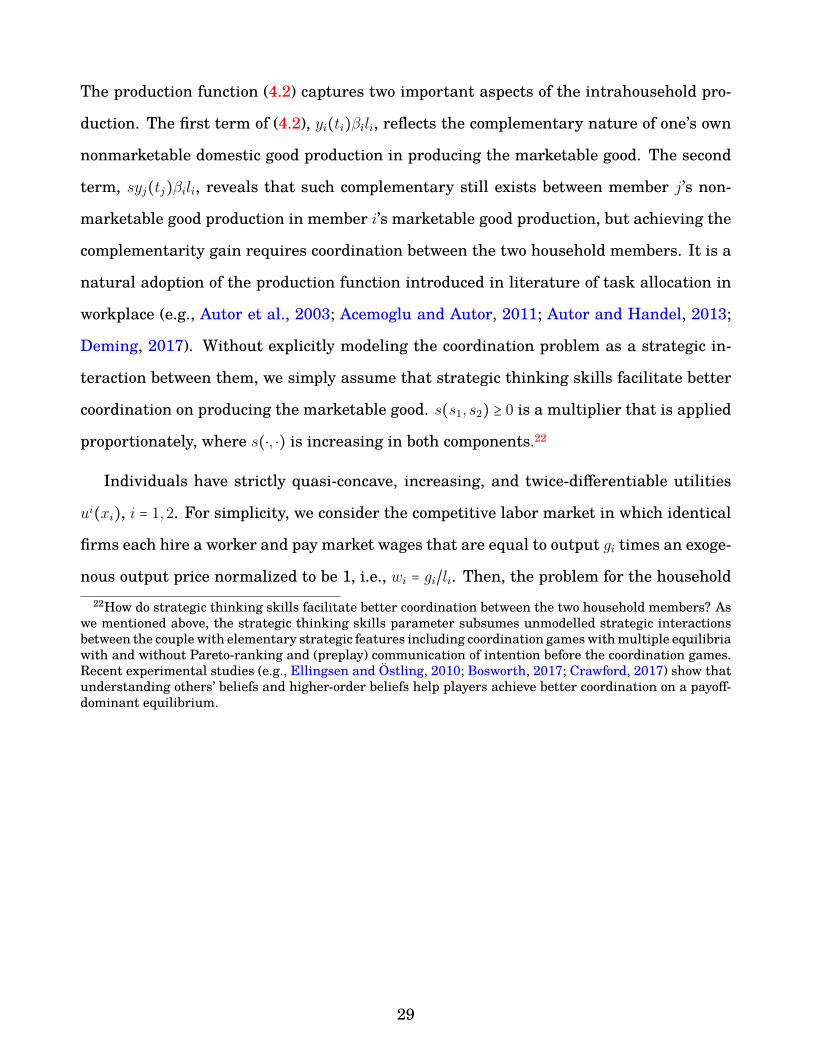
The production function (4.2) captures two important aspects of the intrahousehold pro-
duction. The first term of (4.2), yi(ti)βili, reflects the complementary nature of one’s own
nonmarketable domestic good production in producing the marketable good. The second
term, syj(tj)βili, reveals that such complementary still exists between member j’s non-
marketable good production in member i’s marketable good production, but achieving the
complementarity gain requires coordination between the two household members. It is a
natural adoption of the production function introduced in literature of task allocation in
workplace (e.g., Autor et al., 2003; Acemoglu and Autor, 2011; Autor and Handel, 2013;
Deming, 2017). Without explicitly modeling the coordination problem as a strategic in-
teraction between them, we simply assume that strategic thinking skills facilitate better
coordination on producing the marketable good. s(s1, s2) ≥ 0 is a multiplier that is applied
proportionately, where s(⋅, ⋅) is increasing in both components.22
Individuals have strictly quasi-concave, increasing, and twice-differentiable utilities
ui(xi), i = 1,2. For simplicity, we consider the competitive labor market in which identical
firms each hire a worker and pay market wages that are equal to output gi times an exoge-
nous output price normalized to be 1, i.e., wi = gi/li. Then, the problem for the household22How do strategic thinking skills facilitate better coordination between the two household members? As
we mentioned above, the strategic thinking skills parameter subsumes unmodelled strategic interactionsbetween the couple with elementary strategic features including coordination games with multiple equilibriawith and without Pareto-ranking and (preplay) communication of intention before the coordination games.Recent experimental studies (e.g., Ellingsen and Ostling, 2010; Bosworth, 2017; Crawford, 2017) show thatunderstanding others’ beliefs and higher-order beliefs help players achieve better coordination on a payoff-dominant equilibrium.
29
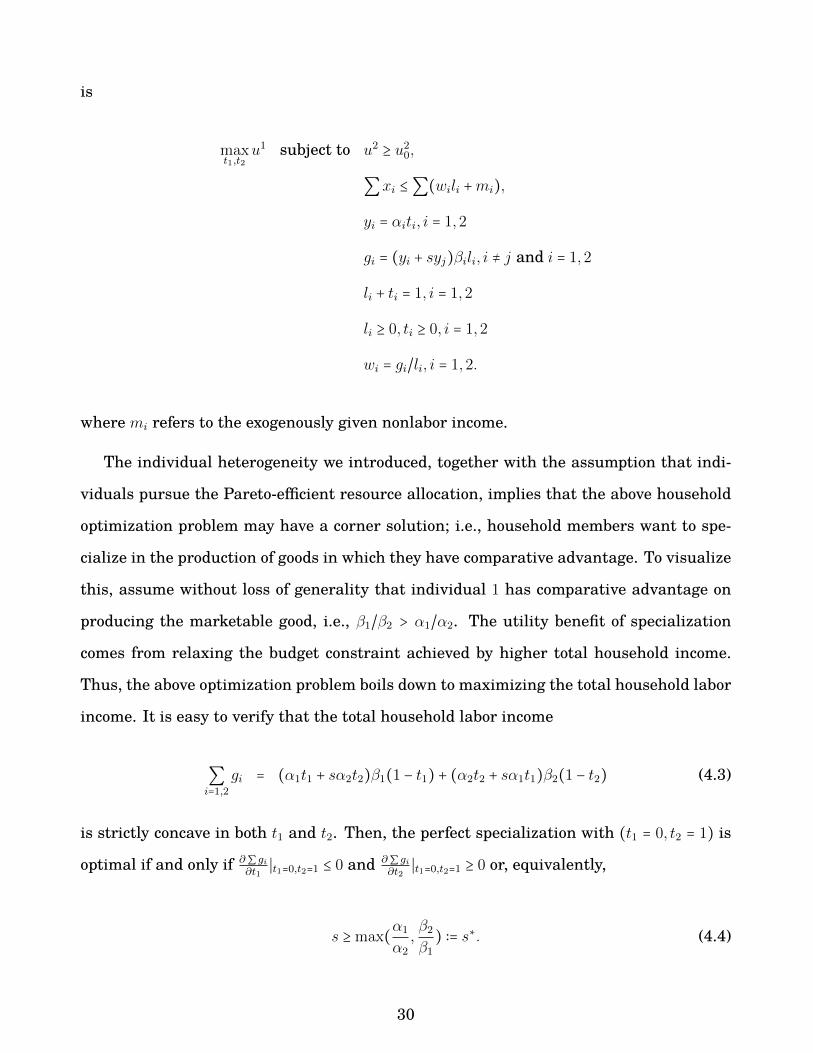
is
maxt1,t2
u1 subject to u2 ≥ u20,
∑xi ≤∑(wili +mi),
yi = αiti, i = 1,2
gi = (yi + syj)βili, i ≠ j and i = 1,2
li + ti = 1, i = 1,2
li ≥ 0, ti ≥ 0, i = 1,2
wi = gi/li, i = 1,2.
where mi refers to the exogenously given nonlabor income.
The individual heterogeneity we introduced, together with the assumption that indi-
viduals pursue the Pareto-efficient resource allocation, implies that the above household
optimization problem may have a corner solution; i.e., household members want to spe-
cialize in the production of goods in which they have comparative advantage. To visualize
this, assume without loss of generality that individual 1 has comparative advantage on
producing the marketable good, i.e., β1/β2 > α1/α2. The utility benefit of specialization
comes from relaxing the budget constraint achieved by higher total household income.
Thus, the above optimization problem boils down to maximizing the total household labor
income. It is easy to verify that the total household labor income
∑i=1,2
gi = (α1t1 + sα2t2)β1(1 − t1) + (α2t2 + sα1t1)β2(1 − t2) (4.3)
is strictly concave in both t1 and t2. Then, the perfect specialization with (t1 = 0, t2 = 1) is
optimal if and only if ∂∑ gi∂t1
∣t1=0,t2=1 ≤ 0 and ∂∑ gi∂t2
∣t1=0,t2=1 ≥ 0 or, equivalently,
s ≥max(α1
α2
,β2β1
) ∶= s∗. (4.4)
30
The following proposition summarizes this finding.23
Proposition 1 (Extensive Margin of Labor Supply). Perfect specialization is optimal for
any household with s > s∗. In this case, only one member of the household who has compar-
ative advantage on the marketable good production participates in the labor market.
From equation (4.3), it is straightforward to show that the household member i’s la-
bor income strictly increases in both si and sj, and it is still true even when the perfect
specialization takes place. Thus, we have our next proposition as follows.
Proposition 2 (Intensive Margin of Labor Supply). Conditional on intrahousehold task
specialization, the labor income of the household member who has comparative advantage
on the marketable good production increases not only in his own but also in his spouse’s
strategic thinking skills.
It is noteworthy that the predictions presented in Propositions 1 and 2 are derived with-
out making any assumption on the distributions of the primitives. We now introduce an
assumption on a joint distribution of the individual productivity parameters to obtain our
next result about gender-specific association between strategic thinking skills and labor
supply. Let Cd ∶= α2β1α1β2
denote a household d’s comparative advantage schedule. If Cd > 1,
member 1 in the household d has comparative advantage on the marketable good produc-
tion. Assume that Cd is distributed over [0,∞) where its median, denoted by M(Cd), is
larger than 1. This assumption ensures that the majority of households engaging in task
specialization has member 1 specializing on marketable good production and member 2
specializing on nonmarketable good production. It is consistent with the empirical ob-
servation that the male labor supply is the only source of labor income in the majority of
households in many countries and generates several interesting implications on gender-
specific association between strategic thinking skill and labor income if we interpret each
member role as representing each gender. First, member 1 is more likely to participate23s∗ ≤ 1 iff β1
β2≥ 1 ≥ α1
α2, i.e., when no household member has absolute advantage on both marketable good
production and domestic good production.
31
in the labor market if s1 is higher and member 2 is less likely to participate if s2 is higher.
This is because as s1 increases, the household is more likely to have task specialization in
which case member 1 is more likely to specialize on marketable good production. Second,
a positive association between member 1’s own strategic thinking skill and his labor in-
come is predicted. The positive association is stronger when his own or spouse’s strategic
thinking skill is higher. However, a negative association between member 2’s own strate-
gic thinking skill and her labor income is predicted. The negative association is stronger
when her own or spouse’s strategic thinking skill is higher. These results are summarized
in the following proposition whose proof is straightforward and thus omitted.
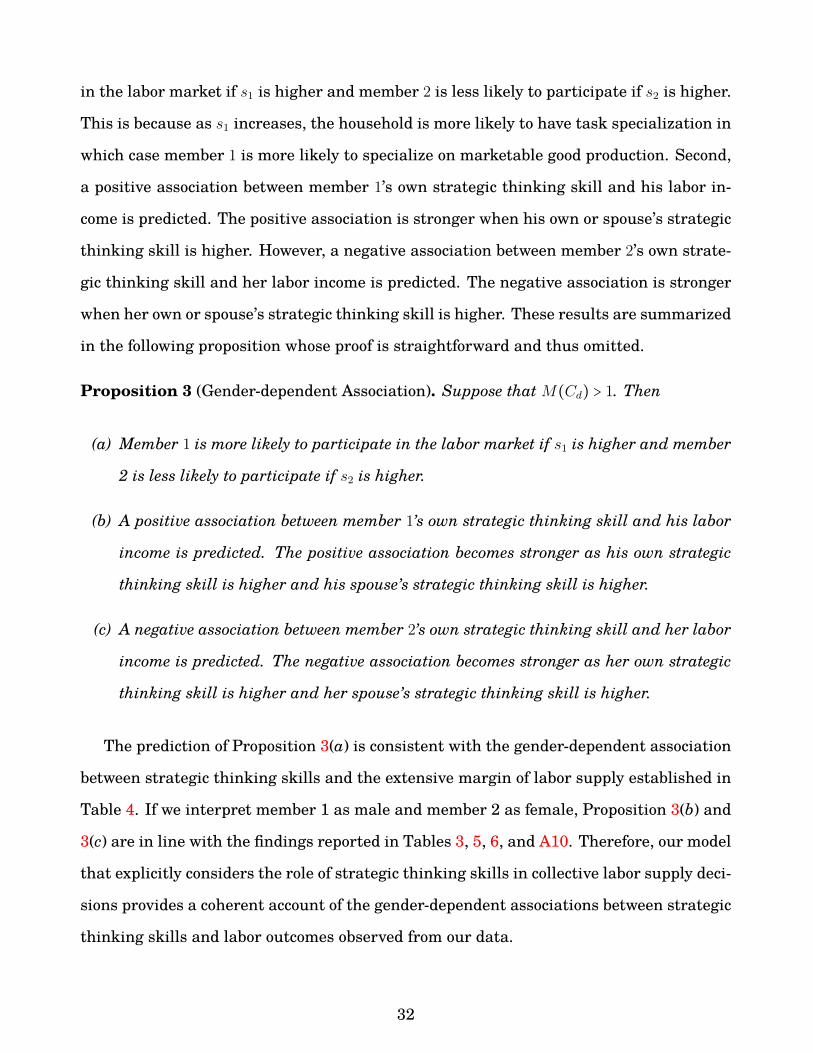
Proposition 3 (Gender-dependent Association). Suppose that M(Cd) > 1. Then
(a) Member 1 is more likely to participate in the labor market if s1 is higher and member
2 is less likely to participate if s2 is higher.
(b) A positive association between member 1’s own strategic thinking skill and his labor
income is predicted. The positive association becomes stronger as his own strategic
thinking skill is higher and his spouse’s strategic thinking skill is higher.
(c) A negative association between member 2’s own strategic thinking skill and her labor
income is predicted. The negative association becomes stronger as her own strategic
thinking skill is higher and her spouse’s strategic thinking skill is higher.
The prediction of Proposition 3(a) is consistent with the gender-dependent association
between strategic thinking skills and the extensive margin of labor supply established in
Table 4. If we interpret member 1 as male and member 2 as female, Proposition 3(b) and
3(c) are in line with the findings reported in Tables 3, 5, 6, and A10. Therefore, our model
that explicitly considers the role of strategic thinking skills in collective labor supply deci-
sions provides a coherent account of the gender-dependent associations between strategic
thinking skills and labor outcomes observed from our data.
32
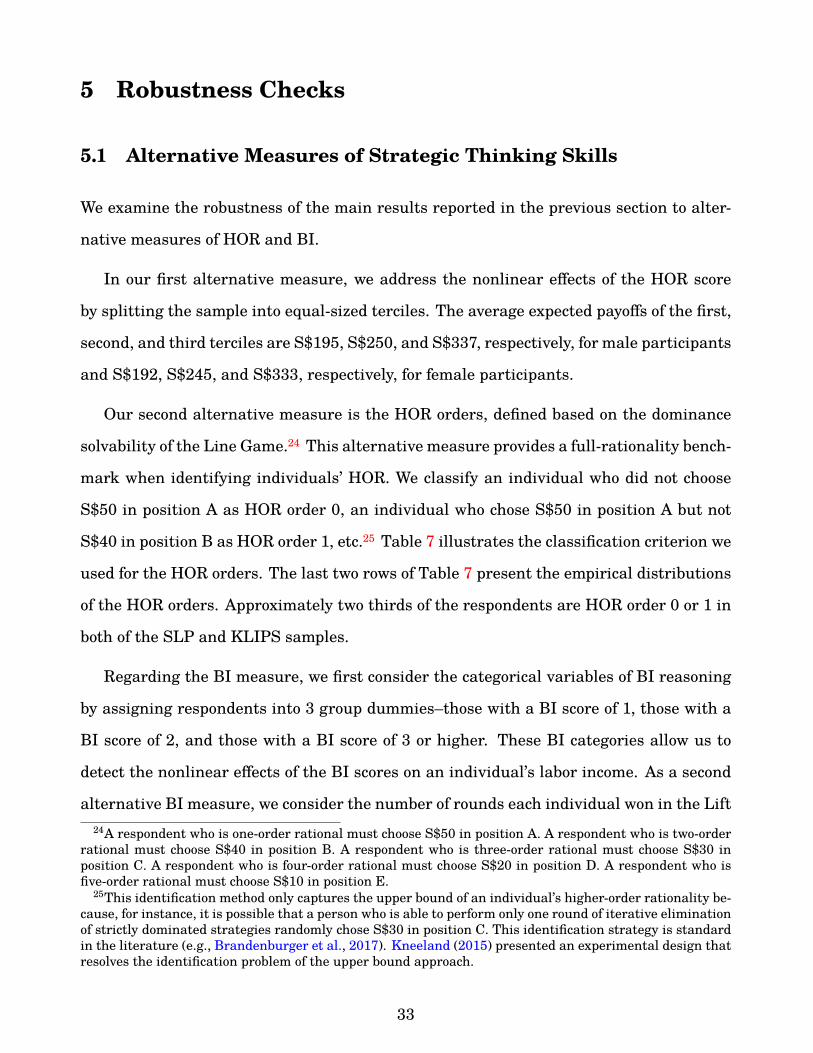
5 Robustness Checks
5.1 Alternative Measures of Strategic Thinking Skills
We examine the robustness of the main results reported in the previous section to alter-
native measures of HOR and BI.
In our first alternative measure, we address the nonlinear effects of the HOR score
by splitting the sample into equal-sized terciles. The average expected payoffs of the first,
second, and third terciles are S$195, S$250, and S$337, respectively, for male participants
and S$192, S$245, and S$333, respectively, for female participants.
Our second alternative measure is the HOR orders, defined based on the dominance
solvability of the Line Game.24 This alternative measure provides a full-rationality bench-
mark when identifying individuals’ HOR. We classify an individual who did not choose
S$50 in position A as HOR order 0, an individual who chose S$50 in position A but not
S$40 in position B as HOR order 1, etc.25 Table 7 illustrates the classification criterion we
used for the HOR orders. The last two rows of Table 7 present the empirical distributions
of the HOR orders. Approximately two thirds of the respondents are HOR order 0 or 1 in
both of the SLP and KLIPS samples.
Regarding the BI measure, we first consider the categorical variables of BI reasoning
by assigning respondents into 3 group dummies–those with a BI score of 1, those with a
BI score of 2, and those with a BI score of 3 or higher. These BI categories allow us to
detect the nonlinear effects of the BI scores on an individual’s labor income. As a second
alternative BI measure, we consider the number of rounds each individual won in the Lift24A respondent who is one-order rational must choose S$50 in position A. A respondent who is two-order
rational must choose S$40 in position B. A respondent who is three-order rational must choose S$30 inposition C. A respondent who is four-order rational must choose S$20 in position D. A respondent who isfive-order rational must choose S$10 in position E.
25This identification method only captures the upper bound of an individual’s higher-order rationality be-cause, for instance, it is possible that a person who is able to perform only one round of iterative eliminationof strictly dominated strategies randomly chose S$30 in position C. This identification strategy is standardin the literature (e.g., Brandenburger et al., 2017). Kneeland (2015) presented an experimental design thatresolves the identification problem of the upper bound approach.
33
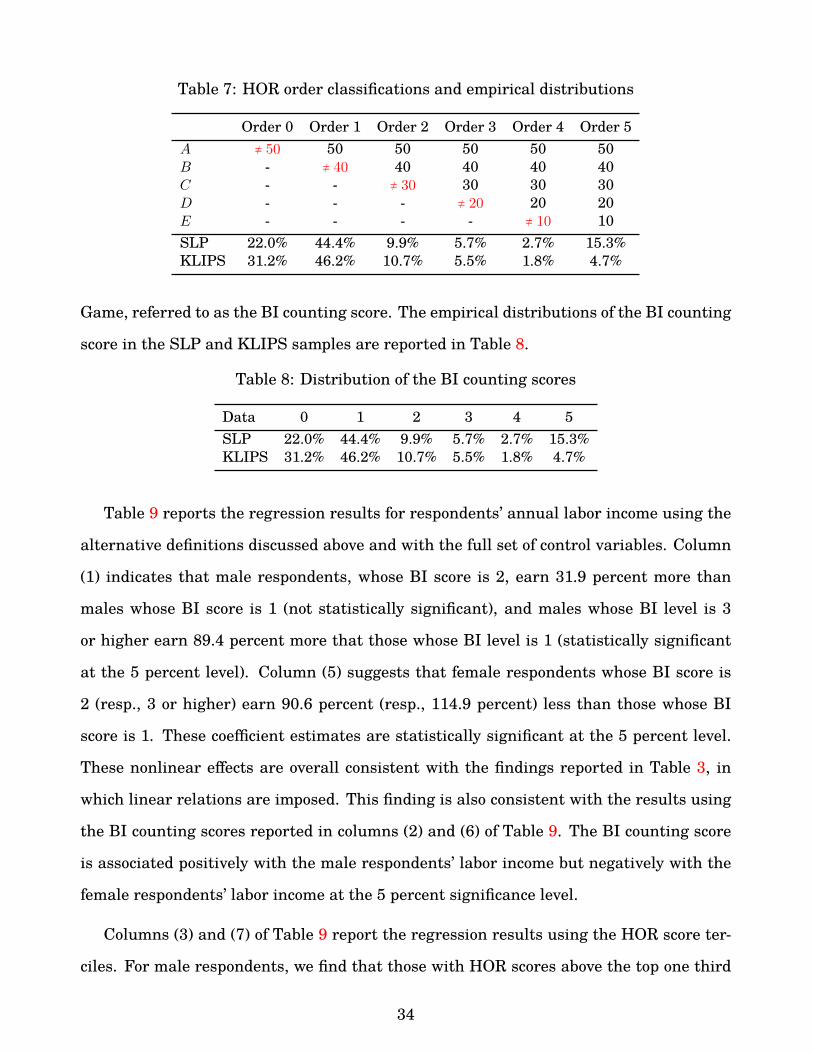
Table 7: HOR order classifications and empirical distributions
Order 0 Order 1 Order 2 Order 3 Order 4 Order 5A ≠ 50 50 50 50 50 50B - ≠ 40 40 40 40 40C - - ≠ 30 30 30 30D - - - ≠ 20 20 20E - - - - ≠ 10 10SLP 22.0% 44.4% 9.9% 5.7% 2.7% 15.3%KLIPS 31.2% 46.2% 10.7% 5.5% 1.8% 4.7%
Game, referred to as the BI counting score. The empirical distributions of the BI counting
score in the SLP and KLIPS samples are reported in Table 8.
Table 8: Distribution of the BI counting scores
Data 0 1 2 3 4 5SLP 22.0% 44.4% 9.9% 5.7% 2.7% 15.3%KLIPS 31.2% 46.2% 10.7% 5.5% 1.8% 4.7%
Table 9 reports the regression results for respondents’ annual labor income using the
alternative definitions discussed above and with the full set of control variables. Column
(1) indicates that male respondents, whose BI score is 2, earn 31.9 percent more than
males whose BI score is 1 (not statistically significant), and males whose BI level is 3
or higher earn 89.4 percent more that those whose BI level is 1 (statistically significant
at the 5 percent level). Column (5) suggests that female respondents whose BI score is
2 (resp., 3 or higher) earn 90.6 percent (resp., 114.9 percent) less than those whose BI
score is 1. These coefficient estimates are statistically significant at the 5 percent level.
These nonlinear effects are overall consistent with the findings reported in Table 3, in
which linear relations are imposed. This finding is also consistent with the results using
the BI counting scores reported in columns (2) and (6) of Table 9. The BI counting score
is associated positively with the male respondents’ labor income but negatively with the
female respondents’ labor income at the 5 percent significance level.
Columns (3) and (7) of Table 9 report the regression results using the HOR score ter-
ciles. For male respondents, we find that those with HOR scores above the top one third
34
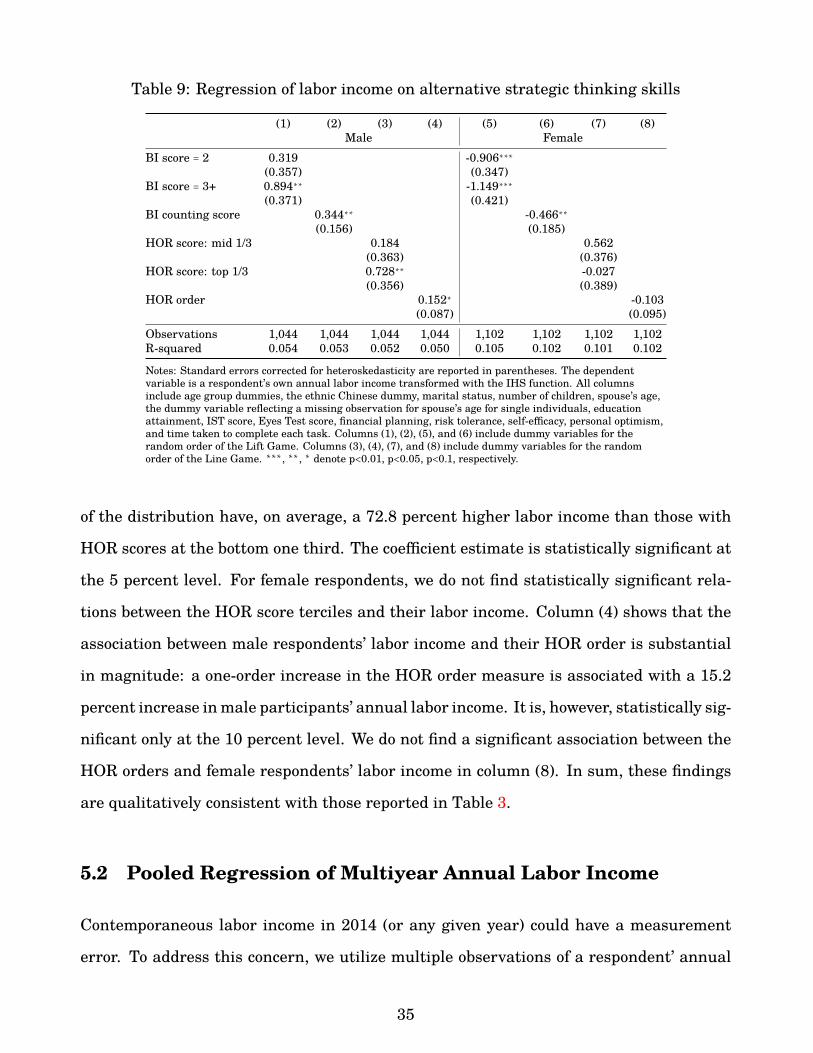
Table 9: Regression of labor income on alternative strategic thinking skills
(1) (2) (3) (4) (5) (6) (7) (8)Male Female
BI score = 2 0.319 -0.906∗∗∗(0.357) (0.347)
BI score = 3+ 0.894∗∗ -1.149∗∗∗(0.371) (0.421)
BI counting score 0.344∗∗ -0.466∗∗(0.156) (0.185)
HOR score: mid 1/3 0.184 0.562(0.363) (0.376)
HOR score: top 1/3 0.728∗∗ -0.027(0.356) (0.389)
HOR order 0.152∗ -0.103(0.087) (0.095)
Observations 1,044 1,044 1,044 1,044 1,102 1,102 1,102 1,102R-squared 0.054 0.053 0.052 0.050 0.105 0.102 0.101 0.102
Notes: Standard errors corrected for heteroskedasticity are reported in parentheses. The dependentvariable is a respondent’s own annual labor income transformed with the IHS function. All columnsinclude age group dummies, the ethnic Chinese dummy, marital status, number of children, spouse’s age,the dummy variable reflecting a missing observation for spouse’s age for single individuals, educationattainment, IST score, Eyes Test score, financial planning, risk tolerance, self-efficacy, personal optimism,and time taken to complete each task. Columns (1), (2), (5), and (6) include dummy variables for therandom order of the Lift Game. Columns (3), (4), (7), and (8) include dummy variables for the randomorder of the Line Game. ∗∗∗, ∗∗, ∗ denote p<0.01, p<0.05, p<0.1, respectively.
of the distribution have, on average, a 72.8 percent higher labor income than those with
HOR scores at the bottom one third. The coefficient estimate is statistically significant at
the 5 percent level. For female respondents, we do not find statistically significant rela-
tions between the HOR score terciles and their labor income. Column (4) shows that the
association between male respondents’ labor income and their HOR order is substantial
in magnitude: a one-order increase in the HOR order measure is associated with a 15.2
percent increase in male participants’ annual labor income. It is, however, statistically sig-
nificant only at the 10 percent level. We do not find a significant association between the
HOR orders and female respondents’ labor income in column (8). In sum, these findings
are qualitatively consistent with those reported in Table 3.
5.2 Pooled Regression of Multiyear Annual Labor Income
Contemporaneous labor income in 2014 (or any given year) could have a measurement
error. To address this concern, we utilize multiple observations of a respondent’ annual
35
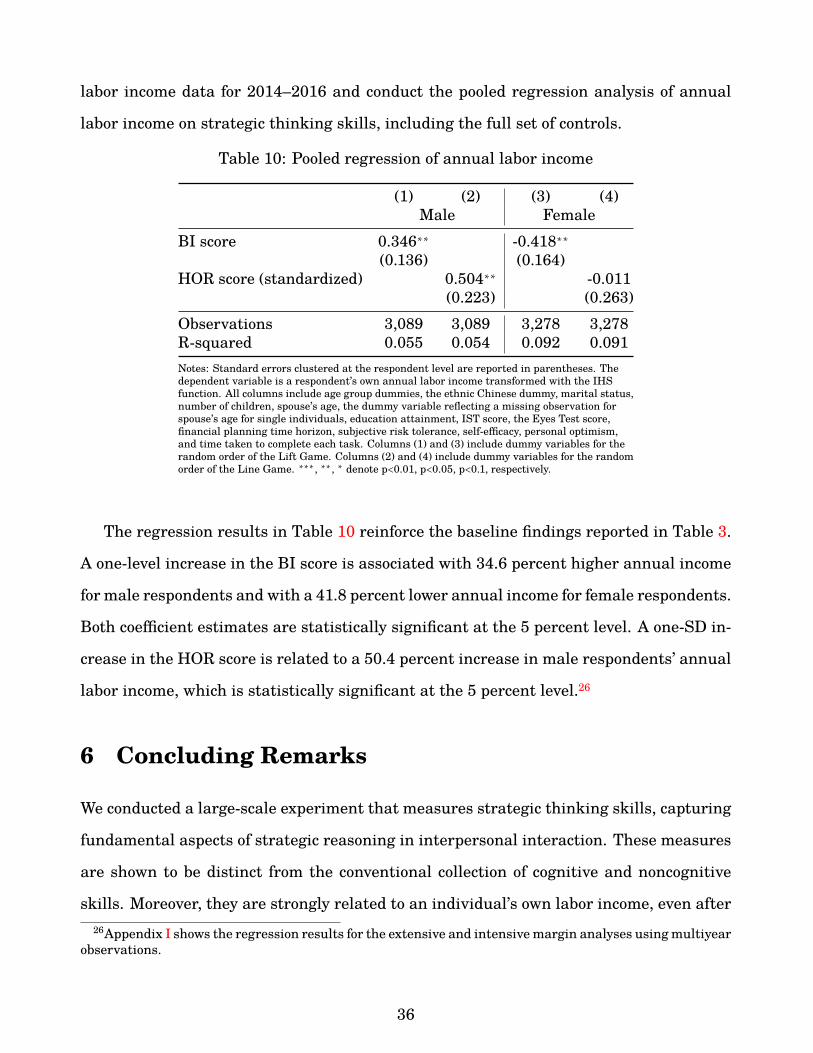
labor income data for 2014–2016 and conduct the pooled regression analysis of annual
labor income on strategic thinking skills, including the full set of controls.
Table 10: Pooled regression of annual labor income
(1) (2) (3) (4)Male Female
BI score 0.346∗∗ -0.418∗∗(0.136) (0.164)
HOR score (standardized) 0.504∗∗ -0.011(0.223) (0.263)
Observations 3,089 3,089 3,278 3,278R-squared 0.055 0.054 0.092 0.091Notes: Standard errors clustered at the respondent level are reported in parentheses. Thedependent variable is a respondent’s own annual labor income transformed with the IHSfunction. All columns include age group dummies, the ethnic Chinese dummy, marital status,number of children, spouse’s age, the dummy variable reflecting a missing observation forspouse’s age for single individuals, education attainment, IST score, the Eyes Test score,financial planning time horizon, subjective risk tolerance, self-efficacy, personal optimism,and time taken to complete each task. Columns (1) and (3) include dummy variables for therandom order of the Lift Game. Columns (2) and (4) include dummy variables for the randomorder of the Line Game. ∗∗∗, ∗∗, ∗ denote p<0.01, p<0.05, p<0.1, respectively.
The regression results in Table 10 reinforce the baseline findings reported in Table 3.
A one-level increase in the BI score is associated with 34.6 percent higher annual income
for male respondents and with a 41.8 percent lower annual income for female respondents.
Both coefficient estimates are statistically significant at the 5 percent level. A one-SD in-
crease in the HOR score is related to a 50.4 percent increase in male respondents’ annual
labor income, which is statistically significant at the 5 percent level.26
6 Concluding Remarks
We conducted a large-scale experiment that measures strategic thinking skills, capturing
fundamental aspects of strategic reasoning in interpersonal interaction. These measures
are shown to be distinct from the conventional collection of cognitive and noncognitive
skills. Moreover, they are strongly related to an individual’s own labor income, even after26Appendix I shows the regression results for the extensive and intensive margin analyses using multiyear
observations.
36
controlling for educational attainment and other cognitive and noncognitive skills. There-
fore, our findings lend strong support to the notion that strategic thinking is a skill of
significant economic importance. Motivated by these findings, we provide a model of col-
lective labor supply in which strategic thinking skills facilitate better coordination on task
specialization between home production and labor market participation.
Our game-theoretic measures of strategic thinking skills are based on subjects’ initial
play without learning opportunities. Another dimension of strategic thinking skills can
be related to subjects’ learning rules and the speed of learning. The experimental litera-
ture of learning in games has documented that human subjects are heterogeneous in the
sophistication of learning rules (e.g., Camerer and Ho, 1999). Learning capabilities in
strategic environments may be related to people’s economic and social success. Develop-
ing a measure of learning capabilities and relating it to economic performances would be
one avenue for future research.
We conclude by making two more remarks. First, because we used the sample of indi-
viduals aged 50–65, we only discovered the associations between strategic thinking skills
and labor market outcomes in the later part of the life cycle. It is worthwhile to exam-
ine whether these associations remain robust in the earlier part of the life cycle. Relat-
edly, it would be fruitful to explore the relationship between strategic thinking skills and
marriage matching/occupational choice using the sample of younger individuals. Second,
although our key findings are robust to the inclusion of a variety of individual character-
istics, a tightly controlled experiment designed to establish a causal relationship between
strategic thinking skills and economic outcomes would provide an important contribution
to the literature.
37
References
Acemoglu, Daron and David Autor (2011), “Skills, tasks and technologies: Implications for employ-
ment and earnings.” In Handbook of Labor Economics, volume 4, 1043–1171, Elsevier.
Alaoui, Larbi and Antonio Penta (2016), “Endogenous Depth of Reasoning.” Review of Economic
Studies, 83, 1297.
Almlund, Mathilde, Angela Lee Duckworth, James Heckman, and Tim Kautz (2011), “Personal-
ity psychology and economics.” In Handbook of the Economics of Education, volume 4, 1–181,
Elsevier.
Altonji, Joseph G. and Rebecca M. Blank (1999), “Chapter 48 race and gender in the labor market.”
volume 3 of Handbook of Labor Economics, 3143 – 3259, Elsevier.
Altonji, Joseph G, Todd E Elder, and Christopher R Taber (2005), “Selection on observed and unob-
served variables: Assessing the effectiveness of catholic schools.” Journal of Political Economy,
113, 151–184.
Apps, Patricia F and Ray Rees (1997), “Collective labor supply and household production.” Journal
of Political Economy, 105, 178–190.
Arad, Ayala and Ariel Rubinstein (2012), “The 1120 Money Request Game: A Level- k Reasoning
Study.” American Economic Review, 102, 3561–3573.
Astington, J., P. Harris, and D. Olson (1988), Developing theories of mind. Cambridge University
Press.
Aumann, Robert and Adam Brandenburger (1995), “Epistemic conditions for nash equilibrium.”
Econometrica, 63, 1161–1161.
Autor, David and Michael Handel (2013), “Putting tasks to the test: Human capital, job tasks, and
wages.” Journal of Labor Economics, 31, S59–S96.
Autor, David H, Frank Levy, and Richard J Murnane (2003), “The skill content of recent techno-
logical change: An empirical exploration.” Quarterly Journal of Economics, 118, 1279–1333.
38
Barnett, Rosalind, Nancy L Marshall, and Aline Sayer (1992), “Positive-spillover effects from job
to home: A closer look.” Women & Health, 19, 13–41.
Barnett, Rosalind C (1994), “Home-to-work spillover revisited: A study of full-time employed
women in dual-earner couples.” Journal of Marriage and the Family, 647–656.
Barnett, Rosalind C and Nancy L Marshall (1992a), “Men’s job and partner roles: Spillover effects
and psychological distress.” Sex Roles, 27, 455–472.
Barnett, Rosalind C and Nancy L Marshall (1992b), “Worker and mother roles, spillover effects,
and psychological distress.” Women & Health, 18, 9–40.
Baron-Cohen, Simon, Sally Wheelwright, Jacqueline Hill, Yogini Raste, and Ian Plumb (2001),
“The ”Reading the Mind in the Eyes” Test Revised Version: A Study with Normal Adults, and
Adults with Asperger Syndrome or High-functioning Autism.” Journal of Child Psychology and
Psychiatry, 42, 241–251.
Beauducel, A., D. Liepmann, S. Horn, and B. Brocke (2010), “Intelligence-structure-test. english
version of the intelligenz-struktur-test 2000 r (i-s-t 2000 r).”
Becker, Gary S (1964), “A theoretical and empirical analysis with special reference to education.”
Becker, Gary S (1973), “A theory of marriage: Part i.” Journal of Political Economy, 81, 813–846.
Bernheim, B Douglas (1984), “Rationalizable strategic behavior.” Econometrica, 1007–1028.
Bertrand, Marianne, Emir Kamenica, and Jessica Pan (2015), “Gender Identity and Relative In-
come within Households.” Quarterly Journal of Economics, 130, 571–614.
Binmore, Ken, John McCarthy, Giovanni Ponti, Larry Samuelson, and Avner Shaked (2002), “A
backward induction experiment.” Journal of Economic theory, 104, 48–88.
Blundell, Richard, Amanda Gosling, Hidehiko Ichimura, and Costas Meghir (2007), “Changes
in the distribution of male and female wages accounting for employment composition using
bounds.” Econometrica, 75, 323–363.
Blundell, Richard and Thomas Macurdy (1999), “Chapter 27 - labor supply: A review of alternative
approaches.” volume 3 of Handbook of Labor Economics, 1559 – 1695, Elsevier.
39
Bolger, Niall, Anita DeLongis, Ronald C. Kessler, and Elaine Wethington (1989), “The contagion
of stress across multiple roles.” Journal of Marriage and Family, 51, 175–183.
Borghans, Lex, Bas Ter Weel, and Bruce A Weinberg (2008), “Interpersonal styles and labor market
outcomes.” Journal of Human Resources, 43, 815–858.
Bosch-Domenech, Antoni, Jose G Montalvo, Rosemarie Nagel, and Albert Satorra (2002), “One,
two,(three), infinity,...: Newspaper and lab beauty-contest experiments.” American Economic
Review, 92, 1687–1701.
Bosworth, Steven J (2017), “The importance of higher-order beliefs to successful coordination.”
Experimental Economics, 20, 237–258.
Bowles, Samuel, Herbert Gintis, and Melissa Osborne (2001), “The determinants of earnings: A
behavioral approach.” Journal of Economic Literature, 39, 1137–1176.
Brandenburger, Adam, Alex Danieli, and Amanda Friedenberg (2017), “How many levels do players
reason? an observational challenge and solution.” Working Paper.
Burbidge, John B., Lonnie Magee, and A. Leslie Robb (1988), “Alternative transformations to han-
dle extreme values of the dependent variable.” Journal of the American Statistical Association,
83, 123–127.
Burchardi, Konrad B and Stefan P Penczynski (2014), “Out of your mind: Eliciting individual
reasoning in one shot games.” Games and Economic Behavior, 84, 39–57.
Camerer, Colin and Teck-Hua Ho (1999), “Experience-weighted attraction learning in normal form
games.” Econometrica, 67, 827–874.
Camerer, Colin F, Teck-Hua Ho, and Juin-Kuan Chong (2004), “A cognitive hierarchy model of
games.” Quarterly Journal of Economics, 119, 861–898.
Carroll, Christopher D., Karen E. Dynan, and Spencer D. Krane (2003), “Unemployment risk and
precautionary wealth: Evidence from households’ balance sheets.” Review of Economics and
Statistics, 85, 586–604.
40
Cattell, Raymond B (1963), “Theory of fluid and crystallized intelligence: A critical experiment.”
Journal of Educational Psychology, 54, 1.
Charles, Kerwin Kofi, Jonathan Guryan, and Jessica Pan (2018), “The effects of sexism on amer-
ican women: The role of norms vs. discrimination.” Working Paper 24904, National Bureau of
Economic Research.
Chiappori, Pierre-Andre (1992), “Collective labor supply and welfare.” Journal of Political Econ-
omy, 100, 437–467.
Chiappori, Pierre-Andre (1997), “Introducing household production in collective models of labor
supply.” Journal of Political Economy, 105, 191–209.
Chiappori, Pierre-Andre and Maurizio Mazzocco (2017), “Static and intertemporal household de-
cisions.” Journal of Economic Literature, 55, 985–1045.
Conti, Gabriella, Andrea Galeotti, Gerrit Muller, and Stephen Pudney (2013), “Popularity.” Jour-
nal of Human Resource, 48, 1072–1094.
Costa-Gomes, Miguel A and Georg Weizsacker (2008), “Stated beliefs and play in normal-form
games.” Review of Economic Studies, 75, 729–762.
Crawford, Vincent P (2017), “Let? s talk it over: Coordination via preplay communication with
level-k thinking.” Research in Economics, 71, 20–31.
Crawford, Vincent P, Miguel A Costa-Gomes, and Nagore Iriberri (2013), “Structural Models of
Nonequilibrium Strategic Thinking: Theory, Evidence, and Applications.” Journal of Economic
Literature, 51, 5–62.
Cunha, Flavio and James Heckman (2007), “The Technology of Skill Formation.” American Eco-
nomic Review, 97, 31–47.
Deming, David J (2017), “The Growing Importance of Social Skills in the Labor Market.” Quarterly
Journal of Economics, 132.
Dufwenberg, Martin, Ramya Sundaram, and David J Butler (2010), “Epiphany in the Game of 21.”
Journal of Economic Behavior and Organization, 75, 132–143.
41
Dufwenberg, Martin and Matt Van Essen (2018), “King of the hill: Giving backward induction its
best shot.” Games and Economic Behavior, 112, 125–138.
Ellingsen, Tore and Robert Ostling (2010), “When does communication improve coordination?”
American Economic Review, 100, 1695–1724.
Falk, Armin, Anke Becker, Thomas Dohmen, Benjamin Enke, David Huffman, and Uwe Sunde
(2018), “Global evidence on economic preferences.” Quarterly Journal of Economics, 133, 1645–
1692.
Fe, Eduardo, David Gill, and Victoria Prowse (2020), “Cognitive skills, strategic sophistication,
and life outcomes.” SSRN Working Paper No. 3285484.
Fernandez, Raquel and Alessandra Fogli (2009), “Culture: An empirical investigation of beliefs,
work, and fertility.” American Economic Journal: Macroeconomics, 1, 146–77.
Garcıa-Pola, Bernardo, Nagore Iriberri, and Jaromır Kovarık (2020), “Non-equilibrium play in
centipede games.” Games and Economic Behavior, 120, 391–433.
Gelber, Alexander M. (2011), “How do 401(k)s affect saving? evidence from changes in 401(k)
eligibility.” American Economic Journal: Economic Policy, 3, 103–22.
Gill, David and Victoria Prowse (2016), “Cognitive bility, character skills, and learning to play
equilibrium: A level-k analysis.” Journal of Political Economy, 124, 1619–1676.
Gneezy, Uri, Aldo Rustichini, and Alexander Vostroknutov (2010), “Experience and insight in the
Race game.” Journal of Economic Behavior and Organization, 75, 144–155.
Hanushek, Eric A and Ludger Woessmann (2008), “The role of cognitive skills in economic devel-
opment.” Journal of Economic Literature, 46, 607–68.
Healy, Paul J (2011), “Epistemic foundations for the failure of nash equilibrium.” Working Paper.
Heckman, James J (1995), “Lessons from the bell curve.” Journal of Political Economy, 103, 1091–
1120.
Heckman, James J, Tomas Jagelka, and Timothy D Kautz (2019), “Some contributions of economics
to the study of personality.”
42
Heckman, James J and Tim Kautz (2012), “Hard evidence on soft skills.” Labour Economics, 19,
451–464.
Heckman, James J and Yona Rubinstein (2001), “The importance of noncognitive skills: Lessons
from the ged testing program.” American Economic Review, 91, 145–149.
Heckman, James J, Jora Stixrud, and Sergio Urzua (2006a), “The effects of cognitive and noncog-
nitive abilities on labor market outcomes and social behavior.” Journal of Labor economics, 24,
411–482.
Heckman, James J., Jora Stixrud, and Sergio Urzua (2006b), “The Effects of Cognitive and Noncog-
nitive Abilities on Labor Market Outcomes and Social Behavior.” Journal of Labor Economics,
24, 411–482.
Herrnstein, Richard J and Charles Murray (1994), The bell curve: Intelligence and class structure
in American life. Simon and Schuster.
Katz, Lawrence F. and David H. Autor (1999), “Chapter 26 - changes in the wage structure and
earnings inequality.” volume 3 of Handbook of Labor Economics, 1463 – 1555, Elsevier.
Kirchmeyer, Catherine (1992), “Perceptions of nonwork-to-work spillover: Challenging the common
view of conflict-ridden domain relationships.” Basic and Applied Social Psychology, 13, 231–249.
Kneeland, Terri (2015), “Identifying Higher-Order Rationality.” Econometrica, 83, 2065–2079.
Kuziemko, Ilyana, Jessica Pan, Jenny Shen, and Ebonya Washington (2018), “The mommy effect:
Do women anticipate the employment effects of motherhood?” Working Paper 24740, National
Bureau of Economic Research.
Lindqvist, Erik and Roine Vestman (2011), “The labor market returns to cognitive and noncog-
nitive ability: Evidence from the swedish enlistment.” American Economic Journal: Applied
Economics, 3, 101–28.
Mincer, Jacob (1958), “Investment in human capital and personal income distribution.” Journal of
Political Economy, 66, 281–302.
43
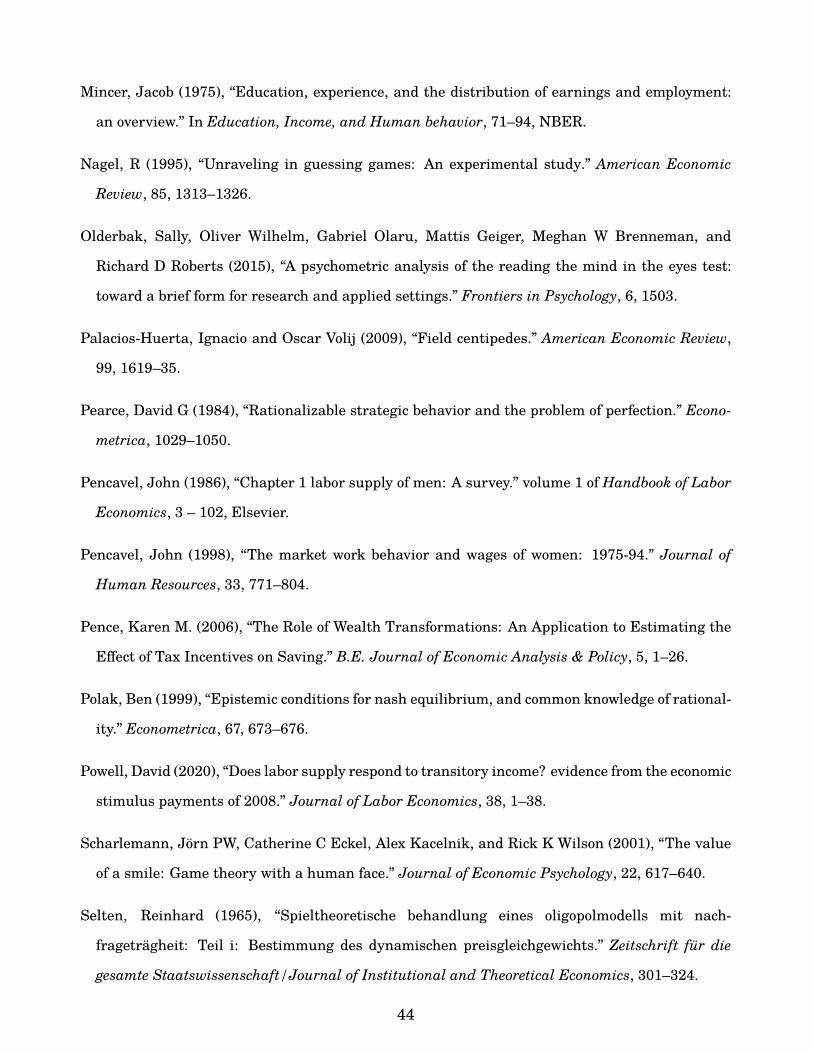
Mincer, Jacob (1975), “Education, experience, and the distribution of earnings and employment:
an overview.” In Education, Income, and Human behavior, 71–94, NBER.
Nagel, R (1995), “Unraveling in guessing games: An experimental study.” American Economic
Review, 85, 1313–1326.
Olderbak, Sally, Oliver Wilhelm, Gabriel Olaru, Mattis Geiger, Meghan W Brenneman, and
Richard D Roberts (2015), “A psychometric analysis of the reading the mind in the eyes test:
toward a brief form for research and applied settings.” Frontiers in Psychology, 6, 1503.
Palacios-Huerta, Ignacio and Oscar Volij (2009), “Field centipedes.” American Economic Review,
99, 1619–35.
Pearce, David G (1984), “Rationalizable strategic behavior and the problem of perfection.” Econo-
metrica, 1029–1050.
Pencavel, John (1986), “Chapter 1 labor supply of men: A survey.” volume 1 of Handbook of Labor
Economics, 3 – 102, Elsevier.
Pencavel, John (1998), “The market work behavior and wages of women: 1975-94.” Journal of
Human Resources, 33, 771–804.
Pence, Karen M. (2006), “The Role of Wealth Transformations: An Application to Estimating the
Effect of Tax Incentives on Saving.” B.E. Journal of Economic Analysis & Policy, 5, 1–26.
Polak, Ben (1999), “Epistemic conditions for nash equilibrium, and common knowledge of rational-
ity.” Econometrica, 67, 673–676.
Powell, David (2020), “Does labor supply respond to transitory income? evidence from the economic
stimulus payments of 2008.” Journal of Labor Economics, 38, 1–38.
Scharlemann, Jorn PW, Catherine C Eckel, Alex Kacelnik, and Rick K Wilson (2001), “The value
of a smile: Game theory with a human face.” Journal of Economic Psychology, 22, 617–640.
Selten, Reinhard (1965), “Spieltheoretische behandlung eines oligopolmodells mit nach-
fragetragheit: Teil i: Bestimmung des dynamischen preisgleichgewichts.” Zeitschrift fur die
gesamte Staatswissenschaft/Journal of Institutional and Theoretical Economics, 301–324.
44

Stirrat, Michael and David I Perrett (2010), “Valid facial cues to cooperation and trust: Male facial
width and trustworthiness.” Psychological Science, 21, 349–354.
45
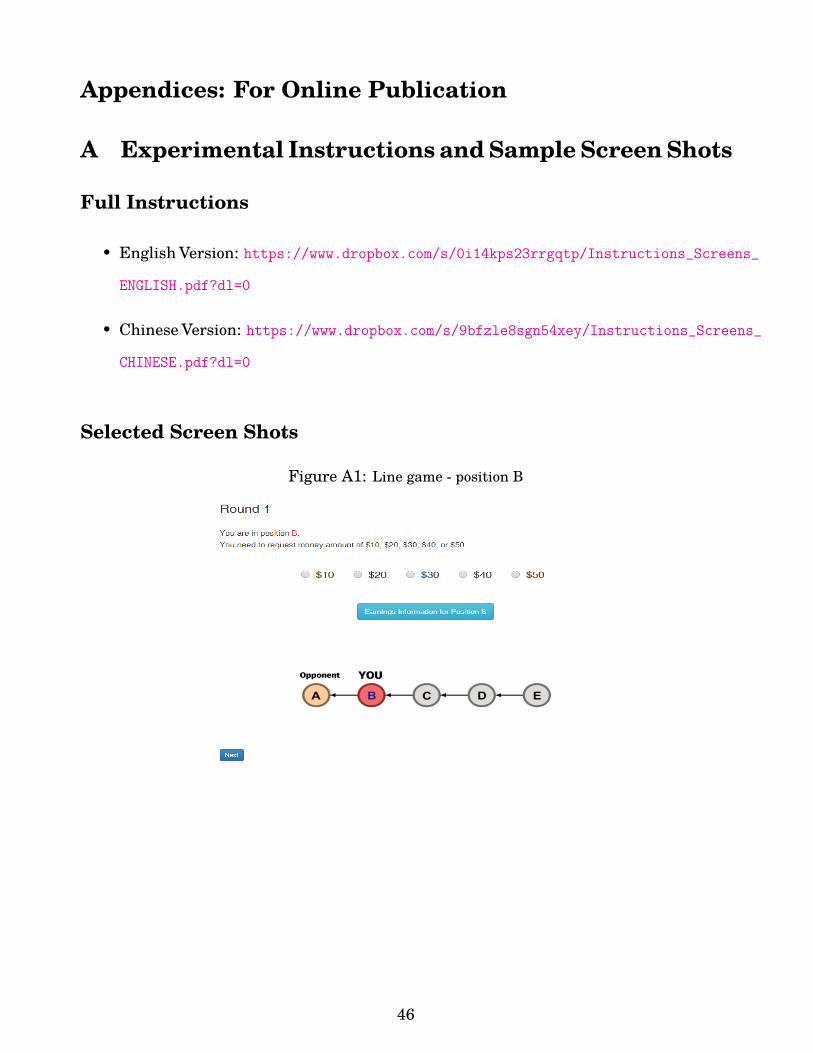
Appendices: For Online Publication
A Experimental Instructions and Sample Screen Shots
Full Instructions
• English Version: https://www.dropbox.com/s/0i14kps23rrgqtp/Instructions_Screens_
ENGLISH.pdf?dl=0
• Chinese Version: https://www.dropbox.com/s/9bfzle8sgn54xey/Instructions_Screens_
CHINESE.pdf?dl=0
Selected Screen Shots
Figure A1: Line game - position B
46
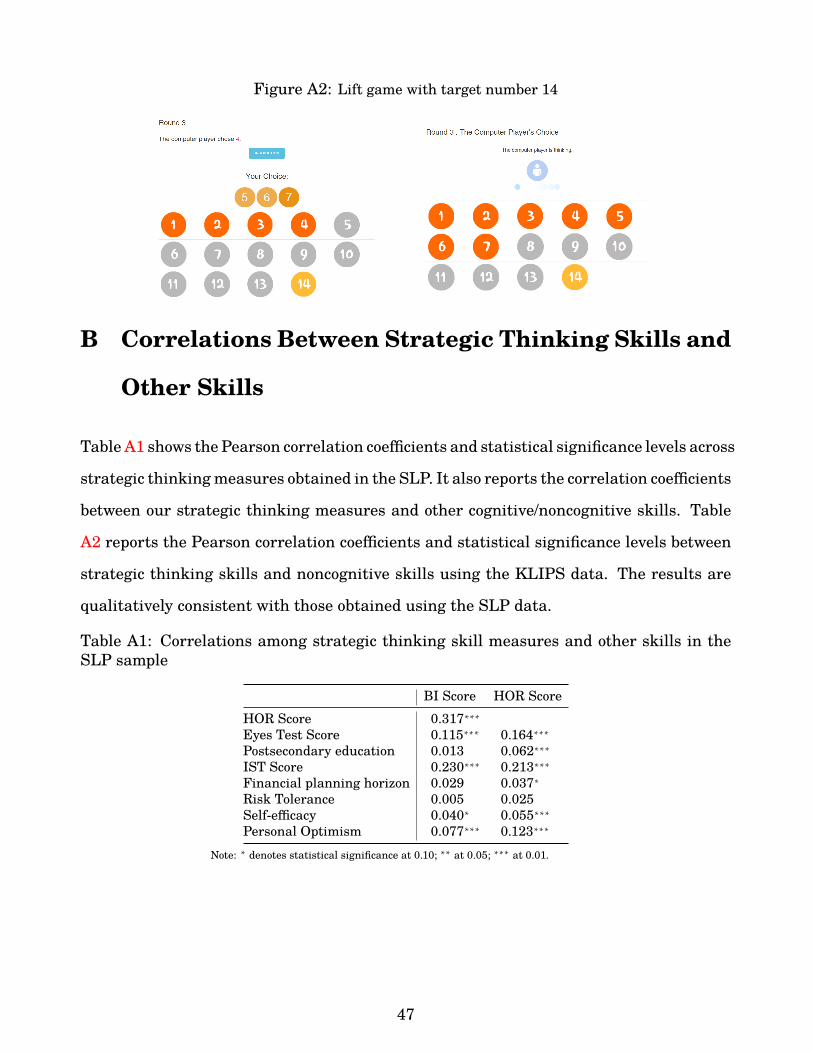
Figure A2: Lift game with target number 14
B Correlations Between Strategic Thinking Skills and
Other Skills
Table A1 shows the Pearson correlation coefficients and statistical significance levels across
strategic thinking measures obtained in the SLP. It also reports the correlation coefficients
between our strategic thinking measures and other cognitive/noncognitive skills. Table
A2 reports the Pearson correlation coefficients and statistical significance levels between
strategic thinking skills and noncognitive skills using the KLIPS data. The results are
qualitatively consistent with those obtained using the SLP data.
Table A1: Correlations among strategic thinking skill measures and other skills in theSLP sample
BI Score HOR ScoreHOR Score 0.317∗∗∗Eyes Test Score 0.115∗∗∗ 0.164∗∗∗Postsecondary education 0.013 0.062∗∗∗IST Score 0.230∗∗∗ 0.213∗∗∗Financial planning horizon 0.029 0.037∗Risk Tolerance 0.005 0.025Self-efficacy 0.040∗ 0.055∗∗∗Personal Optimism 0.077∗∗∗ 0.123∗∗∗
Note: ∗ denotes statistical significance at 0.10; ∗∗ at 0.05; ∗∗∗ at 0.01.
47
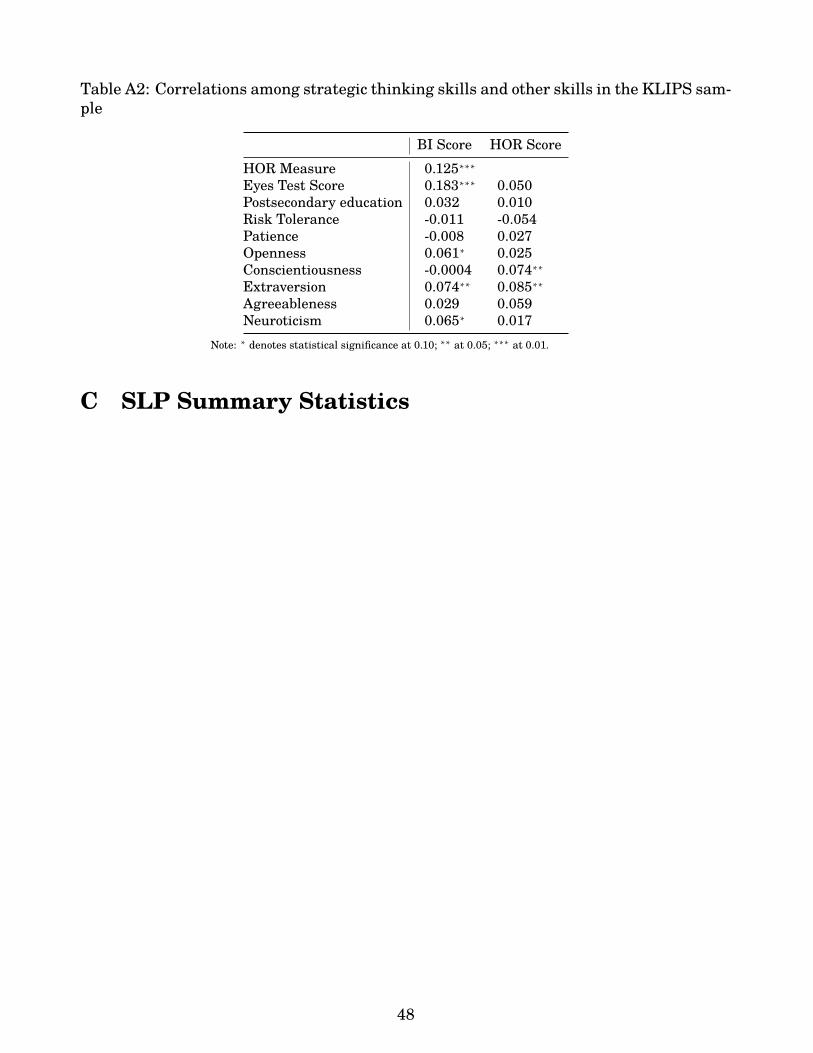
Table A2: Correlations among strategic thinking skills and other skills in the KLIPS sam-ple
BI Score HOR ScoreHOR Measure 0.125∗∗∗Eyes Test Score 0.183∗∗∗ 0.050Postsecondary education 0.032 0.010Risk Tolerance -0.011 -0.054Patience -0.008 0.027Openness 0.061∗ 0.025Conscientiousness -0.0004 0.074∗∗Extraversion 0.074∗∗ 0.085∗∗Agreeableness 0.029 0.059Neuroticism 0.065∗ 0.017
Note: ∗ denotes statistical significance at 0.10; ∗∗ at 0.05; ∗∗∗ at 0.01.
C SLP Summary Statistics
48
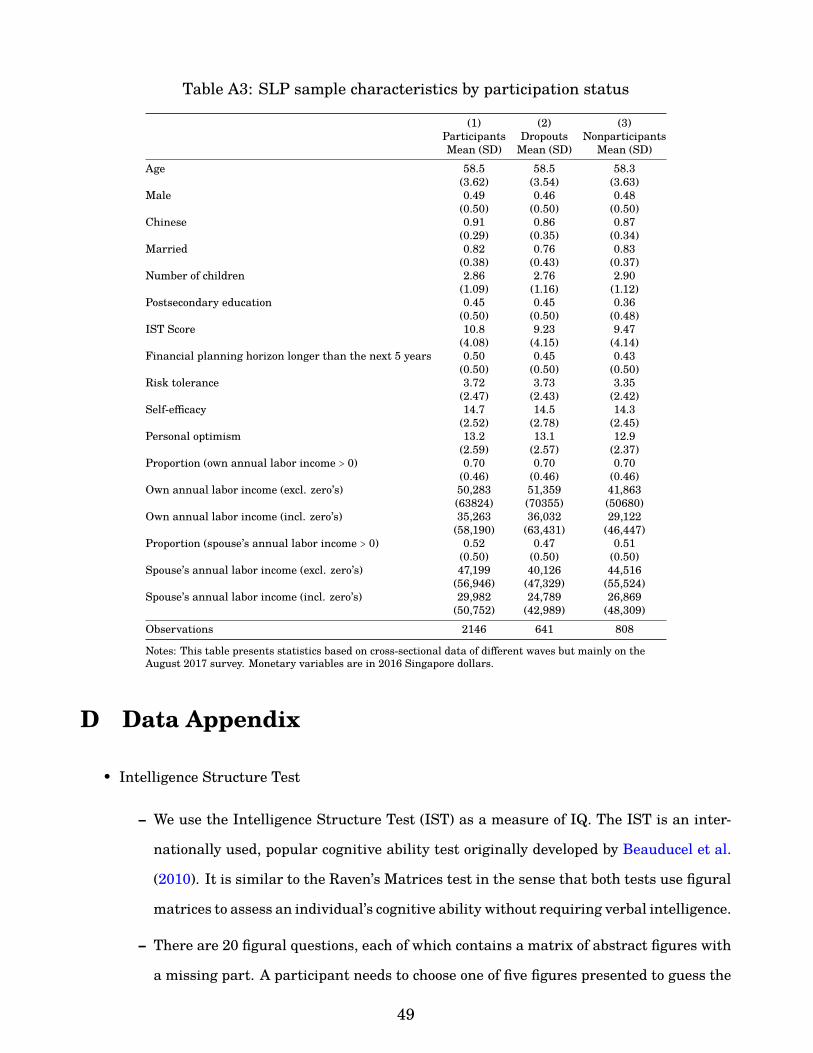
Table A3: SLP sample characteristics by participation status
(1) (2) (3)Participants Dropouts NonparticipantsMean (SD) Mean (SD) Mean (SD)
Age 58.5 58.5 58.3(3.62) (3.54) (3.63)
Male 0.49 0.46 0.48(0.50) (0.50) (0.50)
Chinese 0.91 0.86 0.87(0.29) (0.35) (0.34)
Married 0.82 0.76 0.83(0.38) (0.43) (0.37)
Number of children 2.86 2.76 2.90(1.09) (1.16) (1.12)
Postsecondary education 0.45 0.45 0.36(0.50) (0.50) (0.48)
IST Score 10.8 9.23 9.47(4.08) (4.15) (4.14)
Financial planning horizon longer than the next 5 years 0.50 0.45 0.43(0.50) (0.50) (0.50)
Risk tolerance 3.72 3.73 3.35(2.47) (2.43) (2.42)
Self-efficacy 14.7 14.5 14.3(2.52) (2.78) (2.45)
Personal optimism 13.2 13.1 12.9(2.59) (2.57) (2.37)
Proportion (own annual labor income > 0) 0.70 0.70 0.70(0.46) (0.46) (0.46)
Own annual labor income (excl. zero’s) 50,283 51,359 41,863(63824) (70355) (50680)
Own annual labor income (incl. zero’s) 35,263 36,032 29,122(58,190) (63,431) (46,447)
Proportion (spouse’s annual labor income > 0) 0.52 0.47 0.51(0.50) (0.50) (0.50)
Spouse’s annual labor income (excl. zero’s) 47,199 40,126 44,516(56,946) (47,329) (55,524)
Spouse’s annual labor income (incl. zero’s) 29,982 24,789 26,869(50,752) (42,989) (48,309)
Observations 2146 641 808
Notes: This table presents statistics based on cross-sectional data of different waves but mainly on theAugust 2017 survey. Monetary variables are in 2016 Singapore dollars.
D Data Appendix
• Intelligence Structure Test
– We use the Intelligence Structure Test (IST) as a measure of IQ. The IST is an inter-
nationally used, popular cognitive ability test originally developed by Beauducel et al.
(2010). It is similar to the Raven’s Matrices test in the sense that both tests use figural
matrices to assess an individual’s cognitive ability without requiring verbal intelligence.
– There are 20 figural questions, each of which contains a matrix of abstract figures with
a missing part. A participant needs to choose one of five figures presented to guess the
49
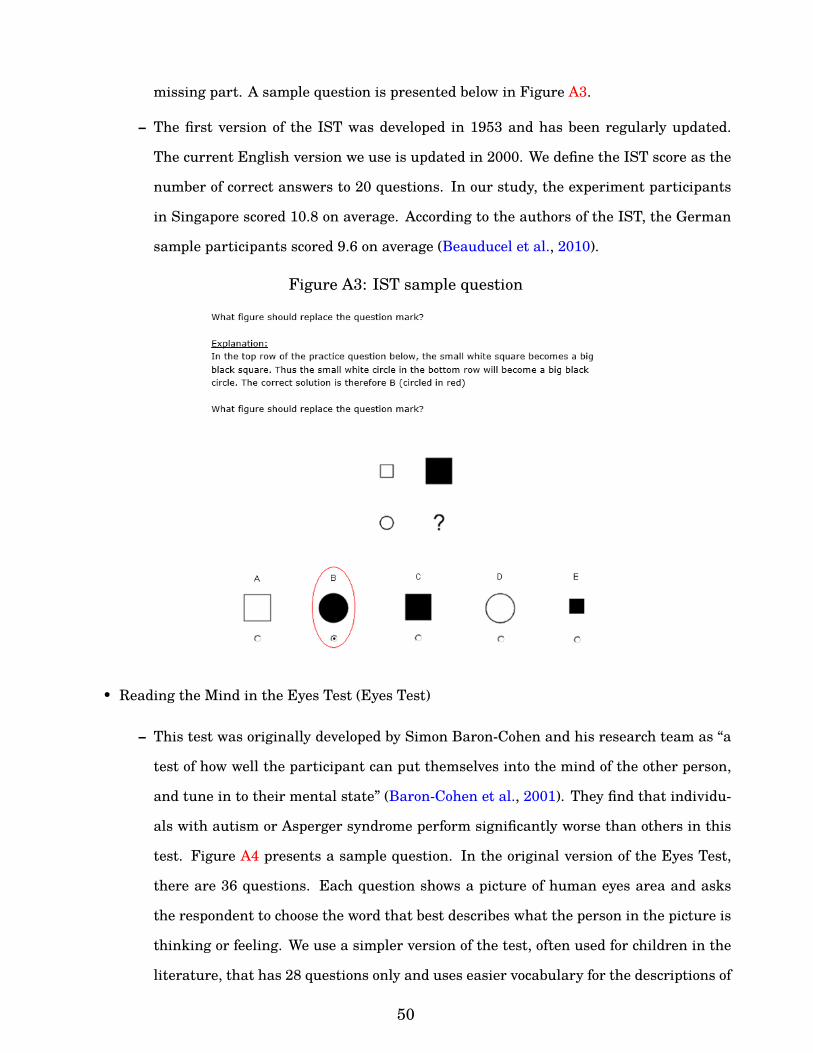
missing part. A sample question is presented below in Figure A3.
– The first version of the IST was developed in 1953 and has been regularly updated.
The current English version we use is updated in 2000. We define the IST score as the
number of correct answers to 20 questions. In our study, the experiment participants
in Singapore scored 10.8 on average. According to the authors of the IST, the German
sample participants scored 9.6 on average (Beauducel et al., 2010).
Figure A3: IST sample question
• Reading the Mind in the Eyes Test (Eyes Test)
– This test was originally developed by Simon Baron-Cohen and his research team as “a
test of how well the participant can put themselves into the mind of the other person,
and tune in to their mental state” (Baron-Cohen et al., 2001). They find that individu-
als with autism or Asperger syndrome perform significantly worse than others in this
test. Figure A4 presents a sample question. In the original version of the Eyes Test,
there are 36 questions. Each question shows a picture of human eyes area and asks
the respondent to choose the word that best describes what the person in the picture is
thinking or feeling. We use a simpler version of the test, often used for children in the
literature, that has 28 questions only and uses easier vocabulary for the descriptions of
50
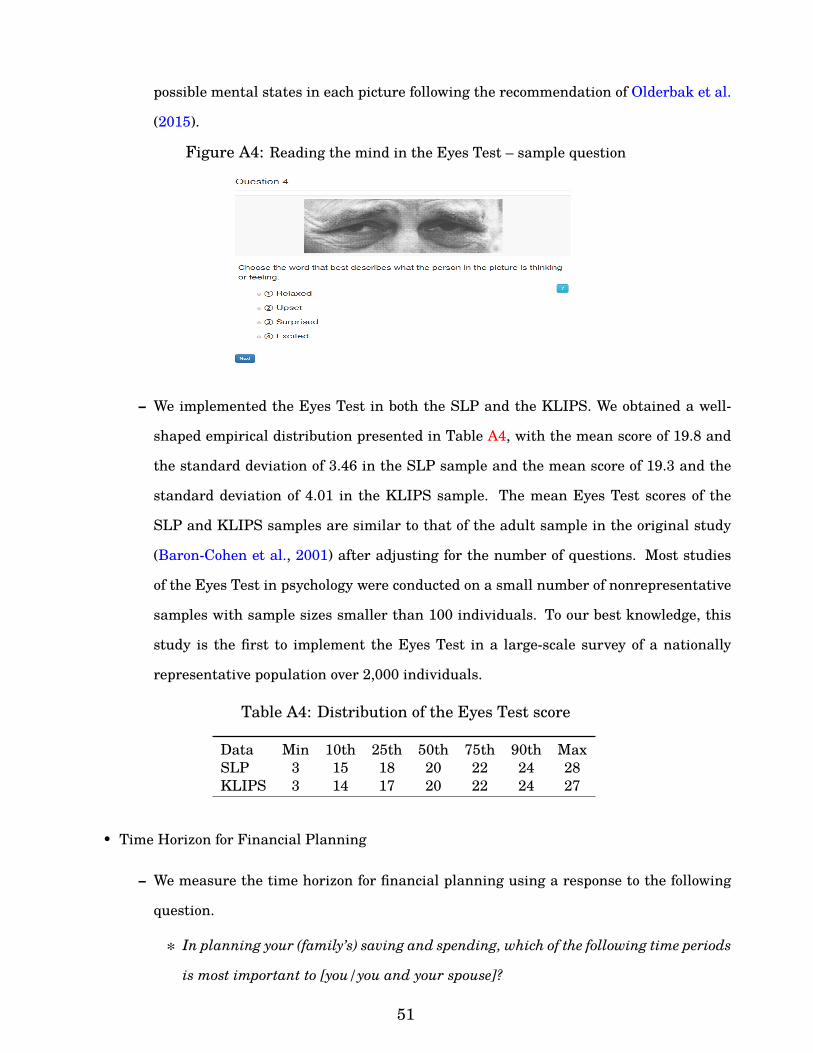
possible mental states in each picture following the recommendation of Olderbak et al.
(2015).
Figure A4: Reading the mind in the Eyes Test – sample question
– We implemented the Eyes Test in both the SLP and the KLIPS. We obtained a well-
shaped empirical distribution presented in Table A4, with the mean score of 19.8 and
the standard deviation of 3.46 in the SLP sample and the mean score of 19.3 and the
standard deviation of 4.01 in the KLIPS sample. The mean Eyes Test scores of the
SLP and KLIPS samples are similar to that of the adult sample in the original study
(Baron-Cohen et al., 2001) after adjusting for the number of questions. Most studies
of the Eyes Test in psychology were conducted on a small number of nonrepresentative
samples with sample sizes smaller than 100 individuals. To our best knowledge, this
study is the first to implement the Eyes Test in a large-scale survey of a nationally
representative population over 2,000 individuals.
Table A4: Distribution of the Eyes Test score
Data Min 10th 25th 50th 75th 90th MaxSLP 3 15 18 20 22 24 28KLIPS 3 14 17 20 22 24 27
• Time Horizon for Financial Planning
– We measure the time horizon for financial planning using a response to the following
question.
∗ In planning your (family’s) saving and spending, which of the following time periods
is most important to [you/you and your spouse]?
51

1. the next few months
2. the next year
3. the next few year
4. the next 5-10 years
5. longer than 10 years
• Risk Tolerance
– We use a subjective response to the following question as a measure of risk tolerance.
∗ Are you generally a person who tries to avoid taking risks or one who is fully prepared
to take risks? Please rate yourself from 0 to 10, where 0 means ‘not at all willing to
take risks’ and 10 means ‘very willing to take risks’.
• Personal optimism and Self-efficacy
– Personal optimism is defined as a person’s expectation that outcomes will be positive
regardless of what caused a problem or a situation. Self-efficacy is a positive belief
that a person is able to solve the problem (Gavrilov-jerkovic et al., 2014). To measure
personal optimism and self-efficacy, we use the abridged version of the Questionnaire
for the Assessment of Personal Optimism and Social Optimism - Extended (POSO-E).
The POSO-E is originally developed by Schweizer and Koch (2001). We use a shortened
version of the POSO-E scales by Gavrilov-jerkovic et al. (2014). The scales are based
on subjective responses to the following 8 items. A respondent can rate how agreeable
s/he is on a scale of 1 to 5, where 1 indicates strongly disagree and 5 indicates strongly
agree.
1. For each problem I will find a solution.
2. In difficult situations I will find a way.
3. I am facing my future in an optimistic way.
4. I can hardly think of something positive in the future.∗
5. I can master difficulties.
6. I worry about my future.∗
52

7. I always find a solution to a problem.
8. It often seems to me that everything is gloomy.∗
– Items 1, 2, 5, and 7 reflect self-efficacy. Items 3, 4, 6, and 8 reflect personal optimism. ∗
indicates reverse-coded items.
53
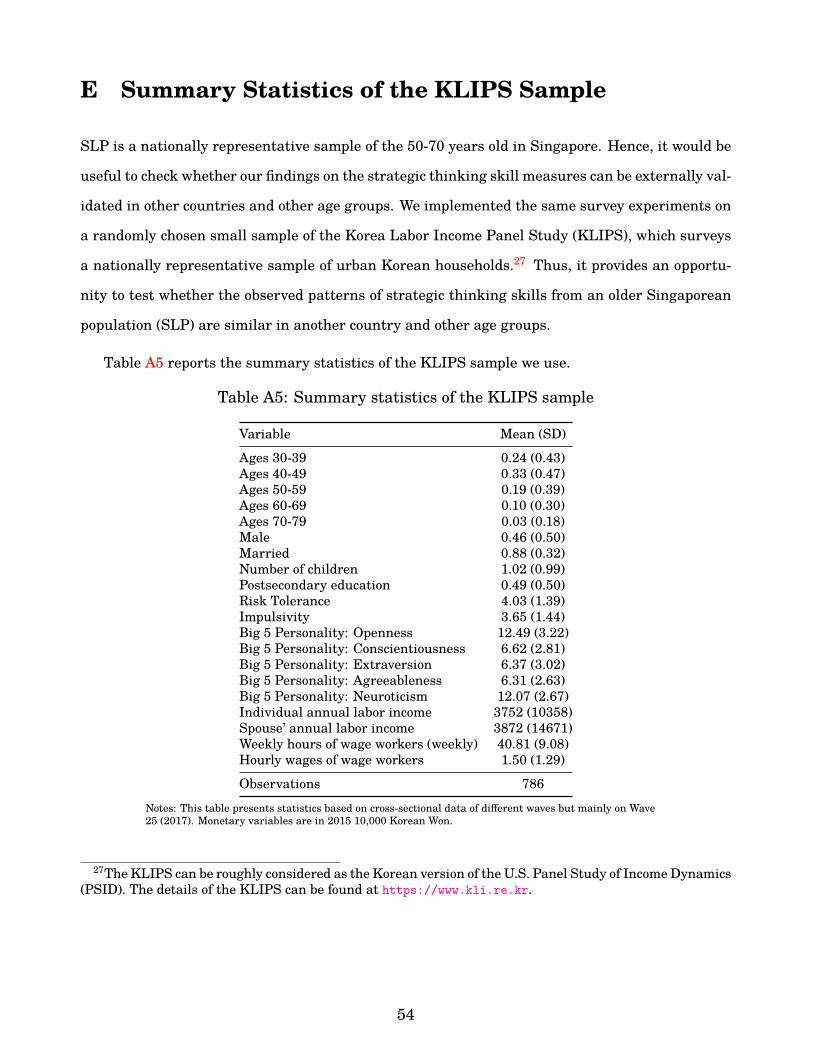
E Summary Statistics of the KLIPS Sample
SLP is a nationally representative sample of the 50-70 years old in Singapore. Hence, it would be
useful to check whether our findings on the strategic thinking skill measures can be externally val-
idated in other countries and other age groups. We implemented the same survey experiments on
a randomly chosen small sample of the Korea Labor Income Panel Study (KLIPS), which surveys
a nationally representative sample of urban Korean households.27 Thus, it provides an opportu-
nity to test whether the observed patterns of strategic thinking skills from an older Singaporean
population (SLP) are similar in another country and other age groups.
Table A5 reports the summary statistics of the KLIPS sample we use.
Table A5: Summary statistics of the KLIPS sample
Variable Mean (SD)Ages 30-39 0.24 (0.43)Ages 40-49 0.33 (0.47)Ages 50-59 0.19 (0.39)Ages 60-69 0.10 (0.30)Ages 70-79 0.03 (0.18)Male 0.46 (0.50)Married 0.88 (0.32)Number of children 1.02 (0.99)Postsecondary education 0.49 (0.50)Risk Tolerance 4.03 (1.39)Impulsivity 3.65 (1.44)Big 5 Personality: Openness 12.49 (3.22)Big 5 Personality: Conscientiousness 6.62 (2.81)Big 5 Personality: Extraversion 6.37 (3.02)Big 5 Personality: Agreeableness 6.31 (2.63)Big 5 Personality: Neuroticism 12.07 (2.67)Individual annual labor income 3752 (10358)Spouse’ annual labor income 3872 (14671)Weekly hours of wage workers (weekly) 40.81 (9.08)Hourly wages of wage workers 1.50 (1.29)Observations 786
Notes: This table presents statistics based on cross-sectional data of different waves but mainly on Wave25 (2017). Monetary variables are in 2015 10,000 Korean Won.
27The KLIPS can be roughly considered as the Korean version of the U.S. Panel Study of Income Dynamics(PSID). The details of the KLIPS can be found at https://www.kli.re.kr.
54
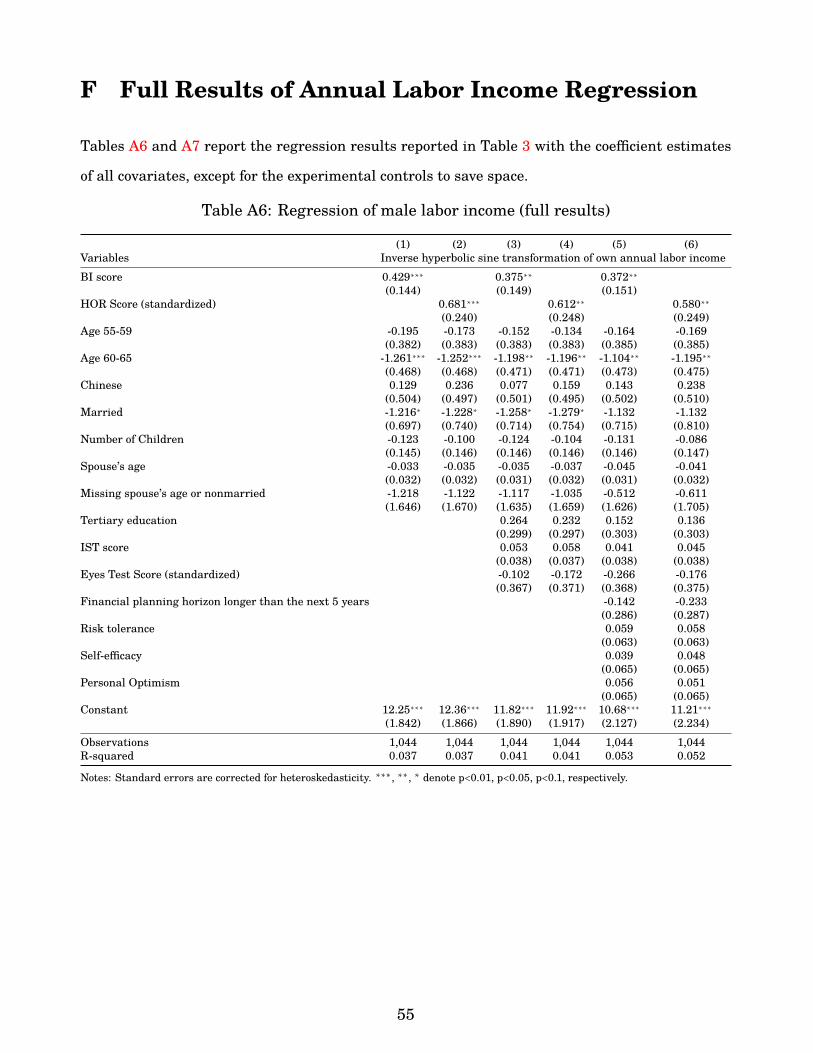
F Full Results of Annual Labor Income Regression
Tables A6 and A7 report the regression results reported in Table 3 with the coefficient estimates
of all covariates, except for the experimental controls to save space.
Table A6: Regression of male labor income (full results)
(1) (2) (3) (4) (5) (6)Variables Inverse hyperbolic sine transformation of own annual labor incomeBI score 0.429∗∗∗ 0.375∗∗ 0.372∗∗
(0.144) (0.149) (0.151)HOR Score (standardized) 0.681∗∗∗ 0.612∗∗ 0.580∗∗
(0.240) (0.248) (0.249)Age 55-59 -0.195 -0.173 -0.152 -0.134 -0.164 -0.169
(0.382) (0.383) (0.383) (0.383) (0.385) (0.385)Age 60-65 -1.261∗∗∗ -1.252∗∗∗ -1.198∗∗ -1.196∗∗ -1.104∗∗ -1.195∗∗
(0.468) (0.468) (0.471) (0.471) (0.473) (0.475)Chinese 0.129 0.236 0.077 0.159 0.143 0.238
(0.504) (0.497) (0.501) (0.495) (0.502) (0.510)Married -1.216∗ -1.228∗ -1.258∗ -1.279∗ -1.132 -1.132
(0.697) (0.740) (0.714) (0.754) (0.715) (0.810)Number of Children -0.123 -0.100 -0.124 -0.104 -0.131 -0.086
(0.145) (0.146) (0.146) (0.146) (0.146) (0.147)Spouse’s age -0.033 -0.035 -0.035 -0.037 -0.045 -0.041
(0.032) (0.032) (0.031) (0.032) (0.031) (0.032)Missing spouse’s age or nonmarried -1.218 -1.122 -1.117 -1.035 -0.512 -0.611
(1.646) (1.670) (1.635) (1.659) (1.626) (1.705)Tertiary education 0.264 0.232 0.152 0.136
(0.299) (0.297) (0.303) (0.303)IST score 0.053 0.058 0.041 0.045
(0.038) (0.037) (0.038) (0.038)Eyes Test Score (standardized) -0.102 -0.172 -0.266 -0.176
(0.367) (0.371) (0.368) (0.375)Financial planning horizon longer than the next 5 years -0.142 -0.233
(0.286) (0.287)Risk tolerance 0.059 0.058
(0.063) (0.063)Self-efficacy 0.039 0.048
(0.065) (0.065)Personal Optimism 0.056 0.051
(0.065) (0.065)Constant 12.25∗∗∗ 12.36∗∗∗ 11.82∗∗∗ 11.92∗∗∗ 10.68∗∗∗ 11.21∗∗∗
(1.842) (1.866) (1.890) (1.917) (2.127) (2.234)Observations 1,044 1,044 1,044 1,044 1,044 1,044R-squared 0.037 0.037 0.041 0.041 0.053 0.052
Notes: Standard errors are corrected for heteroskedasticity. ∗∗∗, ∗∗, ∗ denote p<0.01, p<0.05, p<0.1, respectively.
55
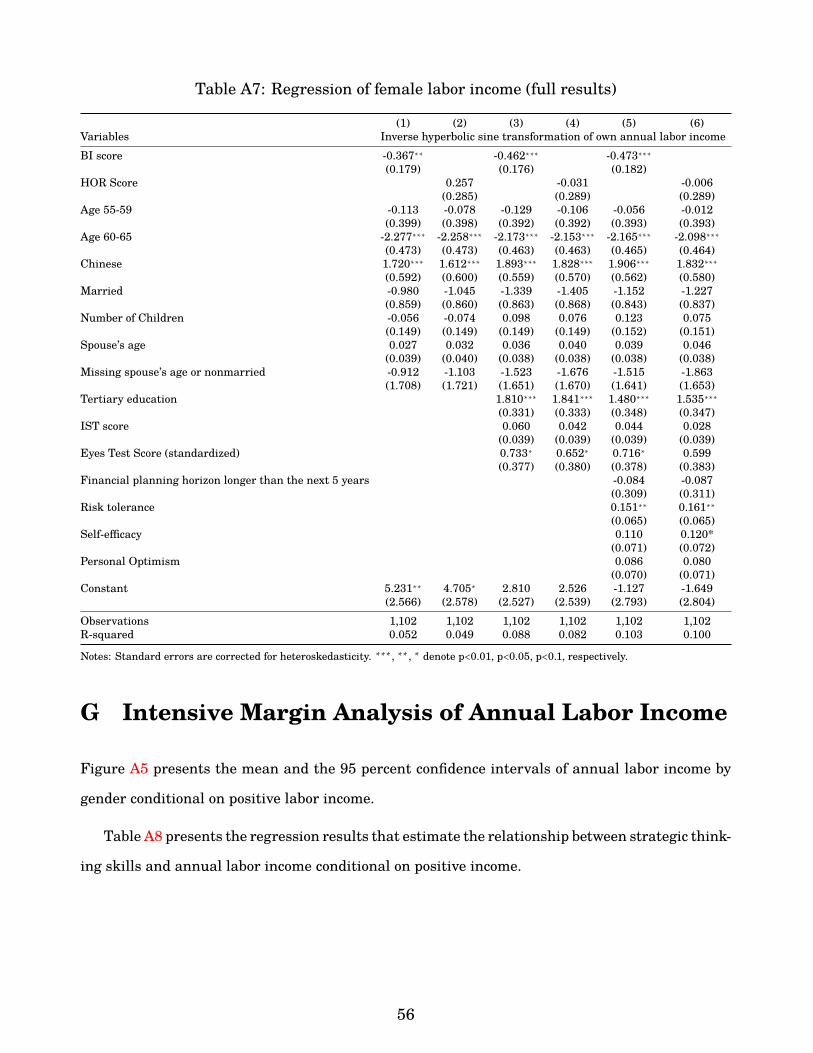
Table A7: Regression of female labor income (full results)
(1) (2) (3) (4) (5) (6)Variables Inverse hyperbolic sine transformation of own annual labor incomeBI score -0.367∗∗ -0.462∗∗∗ -0.473∗∗∗
(0.179) (0.176) (0.182)HOR Score 0.257 -0.031 -0.006
(0.285) (0.289) (0.289)Age 55-59 -0.113 -0.078 -0.129 -0.106 -0.056 -0.012
(0.399) (0.398) (0.392) (0.392) (0.393) (0.393)Age 60-65 -2.277∗∗∗ -2.258∗∗∗ -2.173∗∗∗ -2.153∗∗∗ -2.165∗∗∗ -2.098∗∗∗
(0.473) (0.473) (0.463) (0.463) (0.465) (0.464)Chinese 1.720∗∗∗ 1.612∗∗∗ 1.893∗∗∗ 1.828∗∗∗ 1.906∗∗∗ 1.832∗∗∗
(0.592) (0.600) (0.559) (0.570) (0.562) (0.580)Married -0.980 -1.045 -1.339 -1.405 -1.152 -1.227
(0.859) (0.860) (0.863) (0.868) (0.843) (0.837)Number of Children -0.056 -0.074 0.098 0.076 0.123 0.075
(0.149) (0.149) (0.149) (0.149) (0.152) (0.151)Spouse’s age 0.027 0.032 0.036 0.040 0.039 0.046
(0.039) (0.040) (0.038) (0.038) (0.038) (0.038)Missing spouse’s age or nonmarried -0.912 -1.103 -1.523 -1.676 -1.515 -1.863
(1.708) (1.721) (1.651) (1.670) (1.641) (1.653)Tertiary education 1.810∗∗∗ 1.841∗∗∗ 1.480∗∗∗ 1.535∗∗∗
(0.331) (0.333) (0.348) (0.347)IST score 0.060 0.042 0.044 0.028
(0.039) (0.039) (0.039) (0.039)Eyes Test Score (standardized) 0.733∗ 0.652∗ 0.716∗ 0.599
(0.377) (0.380) (0.378) (0.383)Financial planning horizon longer than the next 5 years -0.084 -0.087
(0.309) (0.311)Risk tolerance 0.151∗∗ 0.161∗∗
(0.065) (0.065)Self-efficacy 0.110 0.120*
(0.071) (0.072)Personal Optimism 0.086 0.080
(0.070) (0.071)Constant 5.231∗∗ 4.705∗ 2.810 2.526 -1.127 -1.649
(2.566) (2.578) (2.527) (2.539) (2.793) (2.804)Observations 1,102 1,102 1,102 1,102 1,102 1,102R-squared 0.052 0.049 0.088 0.082 0.103 0.100
Notes: Standard errors are corrected for heteroskedasticity. ∗∗∗, ∗∗, ∗ denote p<0.01, p<0.05, p<0.1, respectively.
G Intensive Margin Analysis of Annual Labor Income
Figure A5 presents the mean and the 95 percent confidence intervals of annual labor income by
gender conditional on positive labor income.
Table A8 presents the regression results that estimate the relationship between strategic think-
ing skills and annual labor income conditional on positive income.
56
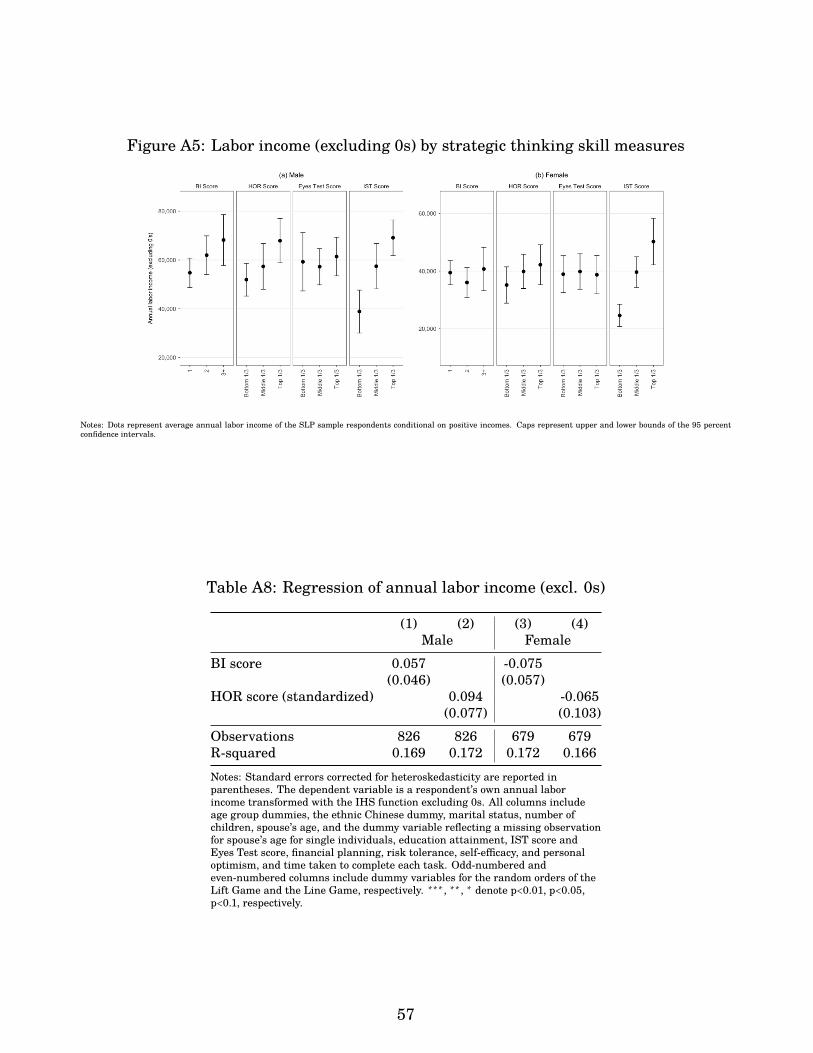
Figure A5: Labor income (excluding 0s) by strategic thinking skill measures
Notes: Dots represent average annual labor income of the SLP sample respondents conditional on positive incomes. Caps represent upper and lower bounds of the 95 percentconfidence intervals.
Table A8: Regression of annual labor income (excl. 0s)
(1) (2) (3) (4)Male Female
BI score 0.057 -0.075(0.046) (0.057)
HOR score (standardized) 0.094 -0.065(0.077) (0.103)
Observations 826 826 679 679R-squared 0.169 0.172 0.172 0.166Notes: Standard errors corrected for heteroskedasticity are reported inparentheses. The dependent variable is a respondent’s own annual laborincome transformed with the IHS function excluding 0s. All columns includeage group dummies, the ethnic Chinese dummy, marital status, number ofchildren, spouse’s age, and the dummy variable reflecting a missing observationfor spouse’s age for single individuals, education attainment, IST score andEyes Test score, financial planning, risk tolerance, self-efficacy, and personaloptimism, and time taken to complete each task. Odd-numbered andeven-numbered columns include dummy variables for the random orders of theLift Game and the Line Game, respectively. ∗∗∗, ∗∗, ∗ denote p<0.01, p<0.05,p<0.1, respectively.
57
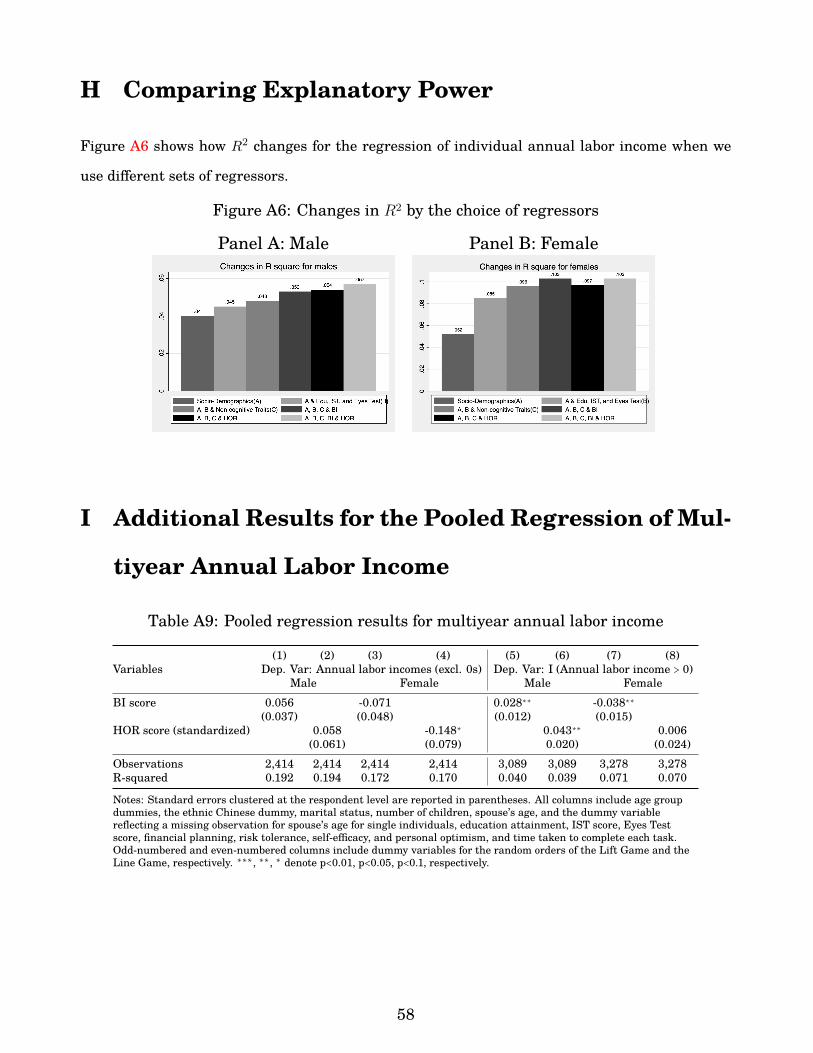
H Comparing Explanatory Power
Figure A6 shows how R2 changes for the regression of individual annual labor income when we
use different sets of regressors.
Figure A6: Changes in R2 by the choice of regressors
Panel A: Male Panel B: Female
I Additional Results for the Pooled Regression of Mul-
tiyear Annual Labor Income
Table A9: Pooled regression results for multiyear annual labor income
Variables(1) (2) (3) (4) (5) (6) (7) (8)
Dep. Var: Annual labor incomes (excl. 0s) Dep. Var: I (Annual labor income > 0)Male Female Male Female
BI score 0.056 -0.071 0.028∗∗ -0.038∗∗(0.037) (0.048) (0.012) (0.015)
HOR score (standardized) 0.058 -0.148∗ 0.043∗∗ 0.006(0.061) (0.079) 0.020) (0.024)
Observations 2,414 2,414 2,414 2,414 3,089 3,089 3,278 3,278R-squared 0.192 0.194 0.172 0.170 0.040 0.039 0.071 0.070
Notes: Standard errors clustered at the respondent level are reported in parentheses. All columns include age groupdummies, the ethnic Chinese dummy, marital status, number of children, spouse’s age, and the dummy variablereflecting a missing observation for spouse’s age for single individuals, education attainment, IST score, Eyes Testscore, financial planning, risk tolerance, self-efficacy, and personal optimism, and time taken to complete each task.Odd-numbered and even-numbered columns include dummy variables for the random orders of the Lift Game and theLine Game, respectively. ∗∗∗, ∗∗, ∗ denote p<0.01, p<0.05, p<0.1, respectively.
58
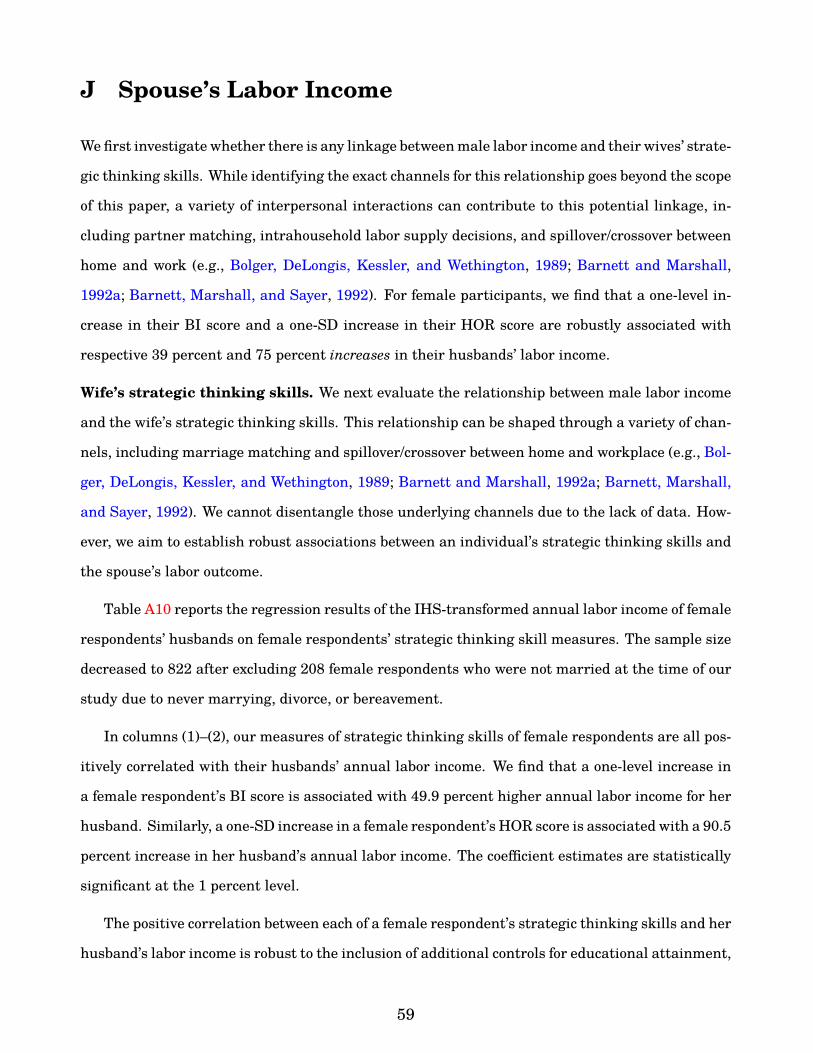
J Spouse’s Labor Income
We first investigate whether there is any linkage between male labor income and their wives’ strate-
gic thinking skills. While identifying the exact channels for this relationship goes beyond the scope
of this paper, a variety of interpersonal interactions can contribute to this potential linkage, in-
cluding partner matching, intrahousehold labor supply decisions, and spillover/crossover between
home and work (e.g., Bolger, DeLongis, Kessler, and Wethington, 1989; Barnett and Marshall,
1992a; Barnett, Marshall, and Sayer, 1992). For female participants, we find that a one-level in-
crease in their BI score and a one-SD increase in their HOR score are robustly associated with
respective 39 percent and 75 percent increases in their husbands’ labor income.
Wife’s strategic thinking skills. We next evaluate the relationship between male labor income
and the wife’s strategic thinking skills. This relationship can be shaped through a variety of chan-
nels, including marriage matching and spillover/crossover between home and workplace (e.g., Bol-
ger, DeLongis, Kessler, and Wethington, 1989; Barnett and Marshall, 1992a; Barnett, Marshall,
and Sayer, 1992). We cannot disentangle those underlying channels due to the lack of data. How-
ever, we aim to establish robust associations between an individual’s strategic thinking skills and
the spouse’s labor outcome.
Table A10 reports the regression results of the IHS-transformed annual labor income of female
respondents’ husbands on female respondents’ strategic thinking skill measures. The sample size
decreased to 822 after excluding 208 female respondents who were not married at the time of our
study due to never marrying, divorce, or bereavement.
In columns (1)–(2), our measures of strategic thinking skills of female respondents are all pos-
itively correlated with their husbands’ annual labor income. We find that a one-level increase in
a female respondent’s BI score is associated with 49.9 percent higher annual labor income for her
husband. Similarly, a one-SD increase in a female respondent’s HOR score is associated with a 90.5
percent increase in her husband’s annual labor income. The coefficient estimates are statistically
significant at the 1 percent level.
The positive correlation between each of a female respondent’s strategic thinking skills and her
husband’s labor income is robust to the inclusion of additional controls for educational attainment,
59
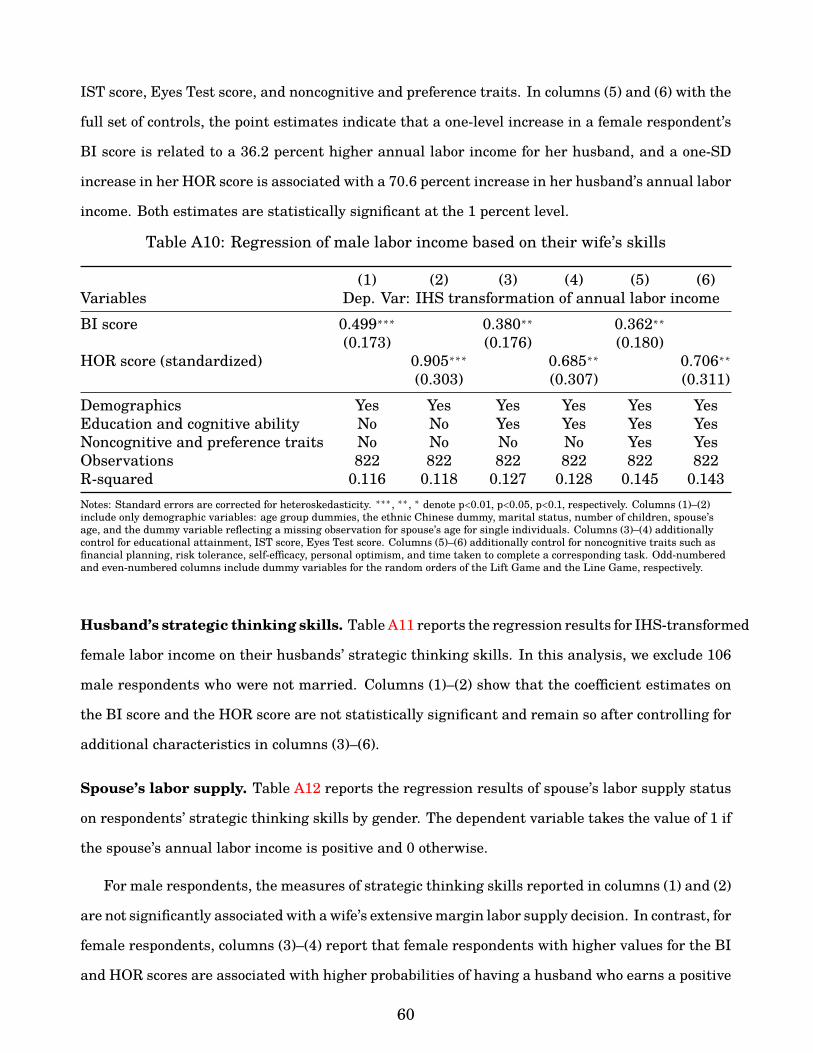
IST score, Eyes Test score, and noncognitive and preference traits. In columns (5) and (6) with the
full set of controls, the point estimates indicate that a one-level increase in a female respondent’s
BI score is related to a 36.2 percent higher annual labor income for her husband, and a one-SD
increase in her HOR score is associated with a 70.6 percent increase in her husband’s annual labor
income. Both estimates are statistically significant at the 1 percent level.
Table A10: Regression of male labor income based on their wife’s skills
(1) (2) (3) (4) (5) (6)Variables Dep. Var: IHS transformation of annual labor incomeBI score 0.499∗∗∗ 0.380∗∗ 0.362∗∗
(0.173) (0.176) (0.180)HOR score (standardized) 0.905∗∗∗ 0.685∗∗ 0.706∗∗
(0.303) (0.307) (0.311)Demographics Yes Yes Yes Yes Yes YesEducation and cognitive ability No No Yes Yes Yes YesNoncognitive and preference traits No No No No Yes YesObservations 822 822 822 822 822 822R-squared 0.116 0.118 0.127 0.128 0.145 0.143Notes: Standard errors are corrected for heteroskedasticity. ∗∗∗, ∗∗, ∗ denote p<0.01, p<0.05, p<0.1, respectively. Columns (1)–(2)include only demographic variables: age group dummies, the ethnic Chinese dummy, marital status, number of children, spouse’sage, and the dummy variable reflecting a missing observation for spouse’s age for single individuals. Columns (3)–(4) additionallycontrol for educational attainment, IST score, Eyes Test score. Columns (5)–(6) additionally control for noncognitive traits such asfinancial planning, risk tolerance, self-efficacy, personal optimism, and time taken to complete a corresponding task. Odd-numberedand even-numbered columns include dummy variables for the random orders of the Lift Game and the Line Game, respectively.
Husband’s strategic thinking skills. Table A11 reports the regression results for IHS-transformed
female labor income on their husbands’ strategic thinking skills. In this analysis, we exclude 106
male respondents who were not married. Columns (1)–(2) show that the coefficient estimates on
the BI score and the HOR score are not statistically significant and remain so after controlling for
additional characteristics in columns (3)–(6).
Spouse’s labor supply. Table A12 reports the regression results of spouse’s labor supply status
on respondents’ strategic thinking skills by gender. The dependent variable takes the value of 1 if
the spouse’s annual labor income is positive and 0 otherwise.
For male respondents, the measures of strategic thinking skills reported in columns (1) and (2)
are not significantly associated with a wife’s extensive margin labor supply decision. In contrast, for
female respondents, columns (3)–(4) report that female respondents with higher values for the BI
and HOR scores are associated with higher probabilities of having a husband who earns a positive
60
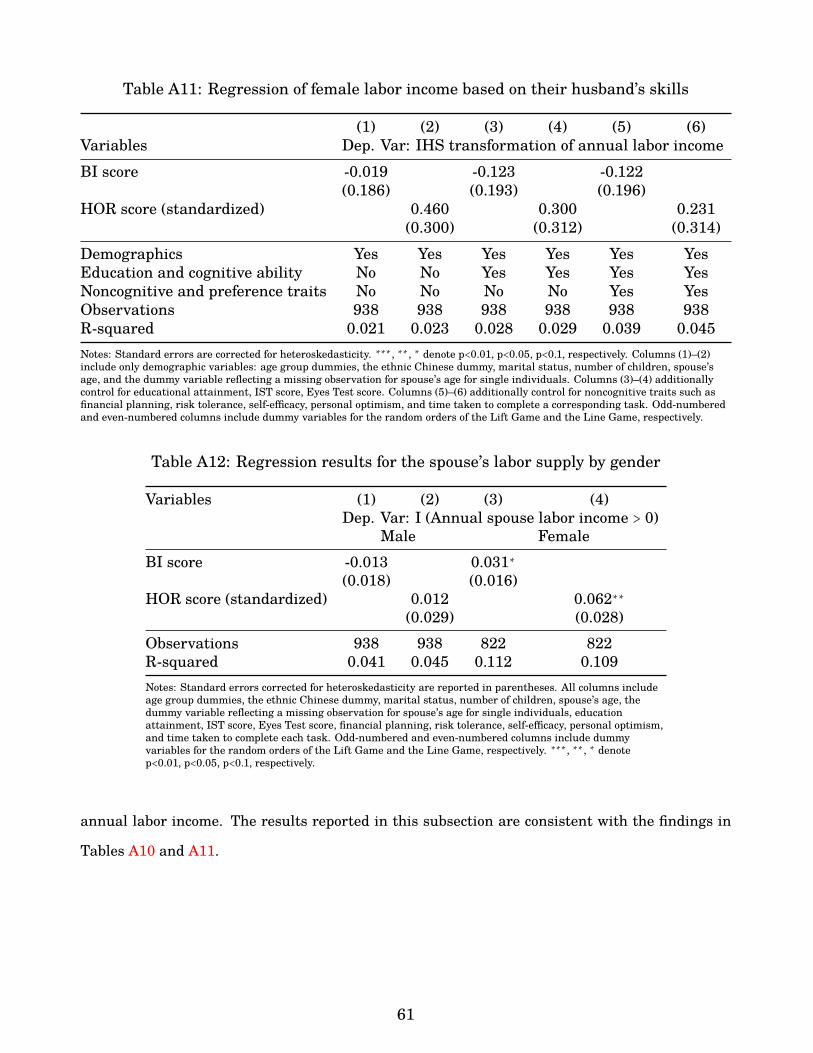
Table A11: Regression of female labor income based on their husband’s skills
(1) (2) (3) (4) (5) (6)Variables Dep. Var: IHS transformation of annual labor incomeBI score -0.019 -0.123 -0.122
(0.186) (0.193) (0.196)HOR score (standardized) 0.460 0.300 0.231
(0.300) (0.312) (0.314)Demographics Yes Yes Yes Yes Yes YesEducation and cognitive ability No No Yes Yes Yes YesNoncognitive and preference traits No No No No Yes YesObservations 938 938 938 938 938 938R-squared 0.021 0.023 0.028 0.029 0.039 0.045Notes: Standard errors are corrected for heteroskedasticity. ∗∗∗, ∗∗, ∗ denote p<0.01, p<0.05, p<0.1, respectively. Columns (1)–(2)include only demographic variables: age group dummies, the ethnic Chinese dummy, marital status, number of children, spouse’sage, and the dummy variable reflecting a missing observation for spouse’s age for single individuals. Columns (3)–(4) additionallycontrol for educational attainment, IST score, Eyes Test score. Columns (5)–(6) additionally control for noncognitive traits such asfinancial planning, risk tolerance, self-efficacy, personal optimism, and time taken to complete a corresponding task. Odd-numberedand even-numbered columns include dummy variables for the random orders of the Lift Game and the Line Game, respectively.
Table A12: Regression results for the spouse’s labor supply by gender
Variables (1) (2) (3) (4)Dep. Var: I (Annual spouse labor income > 0)
Male FemaleBI score -0.013 0.031∗
(0.018) (0.016)HOR score (standardized) 0.012 0.062∗∗
(0.029) (0.028)Observations 938 938 822 822R-squared 0.041 0.045 0.112 0.109Notes: Standard errors corrected for heteroskedasticity are reported in parentheses. All columns includeage group dummies, the ethnic Chinese dummy, marital status, number of children, spouse’s age, thedummy variable reflecting a missing observation for spouse’s age for single individuals, educationattainment, IST score, Eyes Test score, financial planning, risk tolerance, self-efficacy, personal optimism,and time taken to complete each task. Odd-numbered and even-numbered columns include dummyvariables for the random orders of the Lift Game and the Line Game, respectively. ∗∗∗, ∗∗, ∗ denotep<0.01, p<0.05, p<0.1, respectively.
annual labor income. The results reported in this subsection are consistent with the findings in
Tables A10 and A11.
61
References
Ahmed, Fayeza S and L Stephen Miller (2011), “Executive function mechanisms of theory of mind.”
Journal of autism and developmental disorders, 41, 667–678.
Baron-Cohen, Simon, Therese Jolliffe, Catherine Mortimore, and Mary Robertson (1997a), “An-
other advanced test of theory of mind: Evidence from very high functioning adults with autism
or asperger syndrome.” Journal of Child psychology and Psychiatry, 38, 813–822.
Baron-Cohen, Simon, Sally Wheelwright, Jacqueline Hill, Yogini Raste, and Ian Plumb (2001a),
“The ”Reading the Mind in the Eyes” Test Revised Version: A Study with Normal Adults, and
Adults with Asperger Syndrome or High-functioning Autism.” Journal of Child Psychology and
Psychiatry, 42, 241–251.
Baron-Cohen, Simon, Sally Wheelwright, and Therese Jolliffe (1997b), “Is there a “language of
the eyes”? evidence from normal adults, and adults with autism or asperger syndrome.” Visual
cognition, 4, 311–331.
Baron-Cohen, Simon, Sally Wheelwright, Amanda Spong, Victoria Scahill, John Lawson, et al.
(2001b), “Are intuitive physics and intuitive psychology independent? a test with children with
asperger syndrome.” Journal of Developmental and Learning Disorders, 5, 47–78.
Beauducel, A., D. Liepmann, S. Horn, and B. Brocke (2010), “Intelligence-structure-test. english
version of the intelligenz-struktur-test 2000 r (i-s-t 2000 r).”
Carroll, Julia M and Kin Yung Chiew (2006), “Sex and discipline differences in empathising, sys-
temising and autistic symptomatology: Evidence from a student population.” Journal of Autism
and Developmental Disorders, 36, 949–957.
Chapman, Emma, Simon Baron-Cohen, Bonnie Auyeung, Rebecca Knickmeyer, Kevin Taylor, and
Gerald Hackett (2006), “Fetal testosterone and empathy: evidence from the empathy quotient
(eq) and the “reading the mind in the eyes” test.” Social Neuroscience,, 1, 135–148.
Cook, Charles M and Deborah M Saucier (2010), “Mental rotation, targeting ability and baron-
cohen’s empathizing–systemizing theory of sex differences.” Personality and individual differ-
ences, 49, 712–716.
62
Dehning, Sandra, Eshetu Girma, Sarah Gasperi, Sebastian Meyer, Markos Tesfaye, and Matthias
Siebeck (2012), “Comparative cross-sectional study of empathy among first year and final year
medical students in jimma university, ethiopia: Steady state of the heart and opening of the
eyes.” BMC Medical Education, 12, 34.
Fernandez-Abascal, Enrique G, Rosario Cabello, Pablo Fernandez-Berrocal, and Simon Baron-
Cohen (2013), “Test-retest reliability of the ‘reading the mind in the eyes’ test: a one-year follow-
up study.” Molecular autism, 4, 33.
Gavrilov-jerkovic, Vesna, Veljko Jovanovic, Dragan Uljevic, and Dragana Brdaric (2014), “When
less is more: A short version of the personal optimism scale and the self-efficacy optimism scale.”
Journal of Happiness Studies, 15, 455–474.
Hallerback, Maria Unenge, Tove Lugnegard, Fredrik Hjarthag, and Christopher Gillberg (2009),
“The reading the mind in the eyes test: test–retest reliability of a swedish version.” Cognitive
neuropsychiatry, 14, 127–143.
Harkness, Kate L, Jill A Jacobson, David Duong, and Mark A Sabbagh (2010), “Mental state de-
coding in past major depression: Effect of sad versus happy mood induction.” Cognition and
Emotion, 24, 497–513.
Kaland, Nils, Kirsten Callesen, Annette Møller-Nielsen, Erik Lykke Mortensen, and Lars Smith
(2008), “Performance of children and adolescents with asperger syndrome or high-functioning
autism on advanced theory of mind tasks.” Journal of autism and developmental disorders, 38,
1112–1123.
Richell, RA, DGV Mitchell, C Newman, A Leonard, S Baron-Cohen, and RJR Blair (2003), “The-
ory of mind and psychopathy: can psychopathic individuals read the ‘language of the eyes’?”
Neuropsychologia, 41, 523–526.
Schweizer, Karl and Wolfgang Koch (2001), “The assessment of components of optimism by poso-e.”
Personality and Individual Differences, 31, 563 – 574.
Valla, Jeffrey M, Barbara L Ganzel, Keith J Yoder, Grace M Chen, Laura T Lyman, Anthony P
Sidari, Alex E Keller, Jeffrey W Maendel, Jordan E Perlman, Stephanie KL Wong, et al. (2010),
63
“More than maths and mindreading: sex differences in empathizing/systemizing covariance.”
Autism Research, 3, 174–184.
Vogindroukas, Ioannis, Evripidis-Nikolaos Chelas, and Nikolaos E Petridis (2014), “Reading the
mind in the eyes test (children’s version): a comparison study between children with typical
development, children with high-functioning autism and typically developed adults.” Folia Pho-
niatrica et Logopaedica, 66, 18–24.
Voracek, Martin and Stefan G Dressler (2006), “Lack of correlation between digit ratio (2d: 4d) and
baron-cohen’s “reading the mind in the eyes” test, empathy, systemising, and autism-spectrum
quotients in a general population sample.” Personality and Individual Differences, 41, 1481–
1491.
Yildirim, Ejder Akgun, Muzaffer Kasar, Mehmet Guduk, Elif Ates, Ilker Kucukparlak, and Er-
dem Onur Ozalmete (2011), “Investigation of the reliability of the” reading the mind in the eyes
test” in a turkish population.” Turkish Journal of Psychiatry, 22.
64
Related Documents