1 Strategic Staffing? How Performance Pressures Affect the Distribution of Teachers within Schools and Resulting Student Achievement Jason Grissom, Demetra Kalogrides, Susanna Loeb Abstract School performance pressures apply disproportionately to tested grades and subjects. Using longitudinal administrative data, including achievement data from “untested” grades, and teacher survey data from a large urban school district, we examine schools’ responses to those pressures in assigning teachers to high-stakes and low-stakes classrooms. We find that teachers with higher performance measures in both tested and untested classrooms are more likely to be placed in a tested grade-subject combination in the following year. The relationship between prior performance and assignment is stronger in schools with low state accountability grades and where principals have more influence over assignments. In elementary schools, this strategic response has the consequence of disadvantaging achievement in early grades, concentrating less effective teachers in K–2 classrooms, which in turn produces lower math and reading test score gains for those students. Further evidence suggests this lower achievement persists into tested grades as well. *** Evidence abounds that schools respond strategically to the pressures of high-stakes accountability systems in both productive and unproductive ways. Researchers have documented a long list of unintended responses to these pressures, including gaming the composition of the population by suspending low achievers during the testing window or reclassifying them as learning-disabled (e.g., Figlio, 2006; Jacob, 2005), focusing school resources away from lower achievers towards those near proficiency cutoffs (Booher-Jennings, 2005), or cheating by altering students’ responses to test items (Jacob & Levitt, 2003). More productively, accountability pressures push schools to increase instructional time, focus teacher attention on core subjects, provide supplemental educational services for struggling students, and expand time for teacher collaboration (see Dee, Jacob, & Schwartz, 2013; Hannaway & Hamilton, 2008; Jacob & Lefgren, 2004; Rouse, Hannaway, Goldhaber, & Figlio, 2007). Some recent evidence suggests that strategic behavior seeking to improve student test performance may also extend to how schools make decisions about their teacher workforce. For example, in interviews principals

Welcome message from author
This document is posted to help you gain knowledge. Please leave a comment to let me know what you think about it! Share it to your friends and learn new things together.
Transcript

1
Strategic Staffing? How Performance Pressures Affect the Distribution of
Teachers within Schools and Resulting Student Achievement
Jason Grissom, Demetra Kalogrides, Susanna Loeb
Abstract
School performance pressures apply disproportionately to tested grades and subjects. Using
longitudinal administrative data, including achievement data from “untested” grades, and teacher
survey data from a large urban school district, we examine schools’ responses to those pressures
in assigning teachers to high-stakes and low-stakes classrooms. We find that teachers with higher
performance measures in both tested and untested classrooms are more likely to be placed in a
tested grade-subject combination in the following year. The relationship between prior
performance and assignment is stronger in schools with low state accountability grades and
where principals have more influence over assignments. In elementary schools, this strategic
response has the consequence of disadvantaging achievement in early grades, concentrating less
effective teachers in K–2 classrooms, which in turn produces lower math and reading test score
gains for those students. Further evidence suggests this lower achievement persists into tested
grades as well.
***
Evidence abounds that schools respond strategically to the pressures of high-stakes
accountability systems in both productive and unproductive ways. Researchers have documented
a long list of unintended responses to these pressures, including gaming the composition of the
population by suspending low achievers during the testing window or reclassifying them as
learning-disabled (e.g., Figlio, 2006; Jacob, 2005), focusing school resources away from lower
achievers towards those near proficiency cutoffs (Booher-Jennings, 2005), or cheating by
altering students’ responses to test items (Jacob & Levitt, 2003). More productively,
accountability pressures push schools to increase instructional time, focus teacher attention on
core subjects, provide supplemental educational services for struggling students, and expand
time for teacher collaboration (see Dee, Jacob, & Schwartz, 2013; Hannaway & Hamilton, 2008;
Jacob & Lefgren, 2004; Rouse, Hannaway, Goldhaber, & Figlio, 2007). Some recent evidence
suggests that strategic behavior seeking to improve student test performance may also extend to
how schools make decisions about their teacher workforce. For example, in interviews principals

2
report engaging in strategic hiring, assignment, development, and dismissal practices with the
goal of improving their schools’ average test performance (Cohen-Vogel 2011). Research
documenting these behaviors systematically or linking them explicitly to accountability
pressures, however, is scarce.
In this article, we focus specifically on one area of strategic staffing Cohen-Vogel (2011)
identified: assignments of teachers to students and classes. While a long literature has examined
the sorting of teachers across schools—and repeatedly documented the matching of better
qualified teachers towards higher achieving students (e.g., [removed for peer review]; Clotfelter,
Ladd, & Vigdor, 2006)—a small literature has begun to consider teacher assignment decisions
within schools as well. For example, despite research demonstrating that beginning teachers are
less effective (Nye et al., 2004; Rockoff, 2004), schools systematically assign less experienced
teachers to lower performing students, though evidence also suggests that this tendency is less
pronounced in high-growth schools ([removed for peer review]). Decisions about how schools
deploy existing teacher resources likely impact student achievement levels and gaps among
students, given that matching a student to an effective teacher is a primary means whereby a
school can affect his or her outcomes (e.g., Aaronson, Barrow, & Sander, 2007). Assignment
decisions are also likely more amenable to direct influence from school leaders than some other
areas of personnel management, such as teacher hiring, which may rest more heavily on factors
(e.g., the quality of the applicant pool) that are beyond school leader control.1 Thus, by
understanding and adjusting patterns of teacher assignment across classrooms, we may be able to
improve outcomes for students and reduce gaps in access to high-quality teachers.
1 Of course, if a school has only been able to hire ineffective teachers, for example, the scope for strategic
assignment behavior will be limited as well, though we note that studies find within-school variation in teacher
quality to be substantial (e.g., Clotfelter, Ladd, & Vigdor, 2006; Hanushek, Kain, O’Brien, & Rivkin, 2005),
suggesting many school leaders have room to staff classrooms strategically.

3
Because accountability systems measure school performance using student achievement
test scores from some grades and subjects but not others, accountability pressures are felt
disproportionately in some classrooms. Under No Child Left Behind (NCLB), in most states—
including in Florida, the context for the present study—elementary schools were evaluated on the
basis of math and reading achievement performance in grades 3, 4, and 5, a requirement that
continues under the Every Student Succeeds Act (ESSA). In Cohen-Vogel’s (2011) interviews,
principals reported reassigning teachers from these “high-stakes” classrooms if their students
showed inadequate test score performance to “low-stakes” assignments in grades K–2. Such a
strategic move may improve student performance in the tested grade (and thus measured school
performance) in the short term, particularly if a more effective teacher is available to fill the
reassigned teacher’s position. Longer term effects on school performance are less clear. They
could be positive if, for example, the move results in a better match of a teacher’s skills to his or
her students or the content, or they could be negative if that match is poor, or if the move is to an
assignment that is low-stakes but that has important effects on later learning, as might be the case
for an ineffective third-grade teacher moved to an untested position in first grade (Claessens,
Duncan, & Engel, 2009; Fuller & Ladd, 2013). Evidence on the importance of early-grades
learning for later life outcomes suggests that a system that pushes schools to concentrate
ineffective teachers in the earliest grades could have serious unintended consequences (Chetty et
al., 2011; Schweinhart et. al., 2005).
Using detailed administrative and survey data from Miami-Dade County Public Schools
(M-DCPS), we begin by asking whether the test performance of a teacher’s students is associated
with the likelihood that a teacher remains in or is moved out of a tested grade or subject in a
subsequent year, and how these patterns vary by school characteristics, such as accountability
4
grade. This analysis is a replication of analysis by Chingos and West (2011), who showed that
Florida teachers with lower value-added scores were less likely to be reassigned to tested
classrooms, and Fuller and Ladd (2013), who found similar results in North Carolina. We then
significantly extend prior analyses in several important ways. First, we draw on data from a
survey that we conducted with M-DCPS teachers to characterize class assignment policies in
each school and test whether the relationship between teacher performance and where they are
subsequently assigned varies by the participants that have higher perceived influence over
assignments (e.g., the principal, parents). Second, we make use of a low-stakes test given in early
grades in M-DCPS, the Stanford Achievement Test, Version 10 (SAT-10), to estimate value-
added for early-grades teachers and test whether high performers are more likely to be moved
into grades tested for accountability purposes, a pattern suggested by Fuller and Ladd’s (2013)
analysis of reassignment of K-2 teachers by measures of teacher qualifications (e.g., licensure
exam scores). Finally, we assess whether a strategic school response to accountability pressure
that moves low-performing teachers from high- to low-stakes classrooms is likely to have
negative effects on student learning in grades in which the accountability pressures are weaker,
focusing specifically on elementary schools. We estimate achievement gains on the SAT-10 for
first and second graders taught by teachers reassigned from tested elementary grades, then
further investigate whether there are indirect consequences for achievement when these students
move into grades tested under the accountability regime.
The next section reviews what we know about strategic responses to accountability
pressures, including the small body of research on strategic personnel assignments. We then
detail our data and methods before turning to a presentation of the results. We conclude with a
discussion of the implications of the study for school and district policy and for future research.

5
Strategic Responses to Accountability Pressures
Test-based accountability systems, such as those imposed by NCLB and ESSA, create
incentives for schools to improve student outcomes and sanctions for schools that fail to do so.
Prior research has documented the effects of accountability policy on the behaviors of teachers
and school leaders. The types of strategies identified by these studies can be grouped into two
categories: behaviors that increase average test scores without improving productivity and those
that create changes in the ways that schools deliver education that generate meaningful
improvements in student achievement.
There are several examples in the literature that describe educators’ attempts to “game
the system” as a means of increasing average student test scores. Jacob and Levitt (2003), for
example, estimate that a minimum of 4–5 percent of elementary school teachers in Chicago
Public Schools cheat on state tests by systematically altering students’ responses to test items.
The frequency of cheating increased when the incentives to do so increased (via grade retention
policies tied to minimum test score cut-offs and threats to reconstitute low-performing schools).
Figlio (2006) shows that schools differentially punish low-achieving students for misbehavior,
particularly during testing periods, as a way of removing them from the testing pool. He
compares incidents involving more than one student that was suspended. He finds that schools
always tend to assign harsher punishments to low-performing students than to high-performing
students but that this gap grows during the testing period of the school year. Moreover, these
patterns are only evident in tested grades. There is also evidence that some schools respond to
accountability pressure by differentially reclassifying low-achieving students as learning-
disabled so as to exclude their scores from the formula that determines schools’ accountability

6
ratings. Figlio and Getzler (2006), for example, use student fixed-effects models and find
increases in reclassification rates for low-income and previously low-performing students to
disabled after the introduction of Florida’s testing regime. Such behaviors were concentrated
among low-income schools on the margin of failing to meet the accountability standards.
Such practices may increase schools’ average test scores—all important for high-stakes
accountability systems—but have little impact on actual student learning. Other studies,
however, suggest that schools also respond to accountability pressures in educationally
meaningful ways. Rouse et al. (2007), for example, find that student achievement increases in
response to accountability pressure and that changes to school policy explain at least some of
these increases. In their study, increased accountability pressure was associated with increased
focus on low-performing students, increasing the amount of the school day spent on instruction,
increasing the resources available to teachers and decreasing the amount of control held by the
principal. Dee, Jacob, and Schwartz (2013) similarly find that NCLB increased the allocation of
instructional time to math and language arts, which may partially account for achievement gains
associated with the law (Dee & Jacob, 2011). Cohen-Vogel’s (2011) study shows that school
leaders engage in a variety of personnel policies in hopes of increasing student achievement,
which she terms “staffing to the test.” In interviews, principals reported hiring, developing, and
dismissing teachers in an effort to improve their schools’ average test performance. For example,
principals described selecting teacher candidates in part by looking at their past student outcomes
data in hopes of ensuring that they are hiring more effective teachers.
Strategic Assignment of Personnel
7
Principals report using student test scores when making decisions to reassign teachers
within their schools ([removed for peer review]; Cohen-Vogel, 2011). This strategic approach to
human resource decisions is especially evident in lower performing schools, where some
principals report moving effective teachers to tested grades (Cohen-Vogel, 2011). In keeping
with the principals’ reports, Chingos and West (2011) find that effective teachers are more likely
to remain in grades and subjects where high stakes testing takes place and that this relationship is
strongest in schools receiving lower ratings from the state’s accountability system. Similarly,
Fuller and Ladd (2013), in an examination of the distribution of elementary teacher credentials
across grades in North Carolina, show that NCLB pushed schools to move more qualified early
grades teachers to higher grades and less qualified upper elementary teachers to early grades.
The strategic allocation of staff described by these prior studies aligns with the large body
of literature demonstrating that there is wide variability in teacher effectiveness and that teachers
are one of the most important resources available to schools to improve student learning
outcomes (Aaronson, Barrow, & Sander, 2007; Kane, Rockoff, & Staiger, 2008; Nye,
Konstantopoulos, & Hedges, 2004; Rivkin, Hanushek, & Kain, 2005; Rockoff, 2004; Sanders &
Rivers, 1996). Test-based accountability systems focus on student achievement in certain grades
and subjects while placing less emphasis on others. School leaders, therefore, have clear
incentives to keep their more effective teachers in tested grades and subjects while reassigning
less effective teachers to positions that will not influence the school’s accountability rating.
It is not clear, however, what effects on students or schools this type of strategic
reallocation of low-performing teachers to low-stakes classrooms has over the long term,
particularly if those low-stakes classrooms are in earlier grades that feed into later high-stakes
classrooms. One on hand, the skills necessary to be successful in earlier grades may not be the
8
same as those required to teach older children effectively, and reassignment may positively
impact a teacher’s performance if it leads to a better match with that teacher’s skills. In this case,
student achievement will be positively affected. On the other hand, if an ineffective teacher in
later grades is also ineffective in earlier grades, such reassignment may have negative longer-run
consequences for both students and the school, particularly if student-learning trajectories are
affected by the foundations laid in earlier grades. Certainly learning is a cumulative process, and
student learning in early grades are strong predictors of achievement in later schooling (e.g.,
Claessens, Duncan, & Engel, 2009; Perry, Guidubaldi, & Kehle, 1979; Watts et al., 2014). As
one principal in a high-growth school interviewed by Cohen-Vogel (2011) put it, “you can’t say
you want your higher achieving teachers in grades three, four, five. If you have high achieving
teachers in K, one, and two, then you are going to be okay with three, four. . . . You need strong
teachers everywhere” (494).2 Relocating an ineffective teacher to a grade prior to the onset of
high-stakes testing may allow for the placement of a more effective teacher in the tested grade,
but gains from that replacement may be undercut in subsequent years if there are deleterious
effects on student learning in the earlier grade associated with the ineffective teacher that cannot
be fully remediated. Moreover, student learning in early grades may affect post-schooling
outcomes as college attendance and earnings, even if gains made in early grades do not show up
in differences in achievement scores in later grades (Chetty et al., 2011).
Data
Our analysis of strategic assignment uses data from administrative files on all staff,
students and schools in the Miami-Dade County Public School (M-DCPS) district from the
2 To this same point, another pointed out: “if you don’t teach your children to read in first and second grade, you
cannot make that up in third, fourth and fifth grade. . . . So, I have always hired my strongest teachers and put them
in that first and second configuration” (Cohen-Vogel, 2011, 494).

9
2003-04 through the 2013-14 school years. We also use data from a web-based survey of 8,000
M-DCPS teachers we conducted in 2011.3 M-DCPS is the largest public school district in Florida
and the fourth largest in the United States, trailing only the school districts in New York City,
Los Angeles, and Chicago. In 2010, M-DCPS enrolled 347,000 students, more than 225,000 of
whom were Hispanic. Nearly 90 percent of students in the district are either black or Hispanic,
and 60 percent qualify for free or reduced priced lunches.
Administrative data come from three different files provided by the district: test score and
basic demographic information for all students in the district, course-level data that link students
to each of their teachers in each year, and a staff-level file with information on all district
employees. The student-level files include student race, gender, free/reduced price lunch
eligibility, number of times the student was absent that year, and the number of days the student
missed school due to suspensions that year. The test score data include FCAT math and reading
scores. The FCAT is given in math and reading to students in grades 3–10. We also obtained
spring SAT-10 scores for students in grades kindergarten, 1, and 2. The second grade SAT-10
scores are available from spring 2004 to 2014, but M-DCPS began administering the test to
kindergartners and first graders later; first grade scores are available from 2009 to 2014, and
kindergarten scores from 2011 to 2014. The staff database includes demographic measures, prior
experience in the district, current position, and highest degree earned for all district staff from the
2003-04 through the 2013-14 school years.
In our 2011 survey, we asked teachers which actors were involved in the assignment of
students to their classroom that year (i.e., 2010-11). We provided the teachers with a list of
possible actors, including themselves, other teachers in their grade, the principal, and parents,
and the respondents indicated involvement with a binary response of yes or no. Next, we
3 The response rate for this survey was 38%.

10
presented teachers with the same set of actors and asked how much influence each one had over
the assignment of students to their classroom that year. We recorded responses were on a scale of
1 (not involved/no influence) to 5 (a lot of influence). Note that not all survey respondents were
asked each of these assignment factor items; to reduce respondent burden, teachers were
presented with a random set of influence items (within a broader module on class assignments).
Although we still have approximately 3,000 responses to each of these items, the individual
teachers differ. Partly for this reason, in our analyses we aggregate teachers’ responses to the
school level.4
We combine the survey data with the administrative data to create a teacher-level file
with teachers’ survey responses, demographic information from administrative data, and
characteristics of the students in teachers’ courses generated by matching teachers to student
course-level data. We determine whether teachers teach tested grades and subjects by matching
students to each of their teachers via course-level data. We code a teacher as teaching in a tested
grade or subject if more than 50 percent of his or her students in a given year are in grades 3–10
and are enrolled in math or English/reading courses with that teacher. Note that in our data
elementary school students also have course-level data but their teacher is generally the same
across most subjects. Florida schools test students in grades 3 through 10. In K–5 elementary
schools, therefore, kindergarten, first, and second grades are untested grades while third, fourth
and fifth grades are tested grades. For middle and high schools, we consider math and
English/reading in grades 6 through 10 to be tested grades/subjects. We code a teacher as
4 Teachers’ perceptions of who influenced teacher-student assignments show greater within- than between-school
variation for every item. The reliabilities of the school-level means of these items varies from a low of 0.27 (parents)
to 0.88 (counselors), though all but two (parents and myself) are above 0.5, and four (teachers in the grade below,
assistant principals, principals, and counselors) are above 0.7. We also collected data on what factors teachers
perceived to be important in class assignments as part of the randomized survey module, but discovered that school
mean reliabilities for these items were low to support their use in the empirical models.

11
teaching in a tested classroom if at least half of the students they teach are in a tested grade or
grade/subject combination.
Table 1 provides the mean and standard deviations of the main variables used in our
analyses. The first three columns show descriptive statistics for teachers in the administrative
data and the final three columns show descriptive statistics for teachers that responded to our
survey. The characteristics of our survey sample looks remarkably similar to the characteristics
of the district as a whole. Survey respondents are similar to the district population of teachers in
terms of race/ethnicity, gender, highest degree earned, total years of experience, and whether
they teach in a tested grade or subject. Teachers average about 11 years of experience in the
district; they are predominately female (80 percent); roughly 45 percent are Hispanic; 25 percent
are black; and nearly 40 percent have a master’s degree or higher. The average teachers’ class is
28 percent black, 9 percent white and includes approximately 70 percent of students receiving
free/reduced priced lunches.
Table 1 also shows basic descriptive statistics for teacher reports of stakeholder
involvement in class assignments in the survey. Sixteen percent of survey respondents report that
they themselves participate in the class assignment process at their school. Teachers report more
involvement from principals, assistant principals and counselors, with 51, 64, and 38 percent,
respectively, reporting involvement from these three types of personnel. Seven percent of
teachers also report that students and parents play some role in determining class assignments.
Methods
Our analysis comprises multiple components. First, we examine whether principals
engage in strategic staffing when making teacher assignments to high-stakes classrooms. We do

12
so by estimating the relationship between teacher effectiveness and assignments to tested grades
and subjects. We test whether teachers in tested areas are more likely to be moved into a non-
tested area following a year that their students perform poorly on state tests. For teachers who
teach in a tested area in year t we predict whether they remain in a tested area in year t+1 as a
function of a measure of their performance and control variables:
Pr(𝑡𝑒𝑠𝑡𝑒𝑑 𝑐𝑙𝑎𝑠𝑠𝑟𝑜𝑜𝑚 𝑎𝑡 𝑡 + 1)𝑖𝑡 = 𝛽0 + 𝑃𝐸𝑅𝐹𝑂𝑅𝑀𝐴𝑁𝐶𝐸𝑖𝑡𝛽1 + 𝑇𝑖𝑡𝛽2 + 𝛿𝑠𝑡 + 휀𝑖𝑠𝑡 (1)
Equation (1), which we estimate as a linear probability model, models the probability of
remaining in a high-stakes classroom next year as a function of teacher performance, teacher-
level characteristics T (gender, race, highest degree, years in current school), and a school-by-
year fixed effect that isolates the association between assignment and performance to be within
school and year combinations, i.e., makes comparisons among teachers at the same school at the
same time. These models are run at the teacher level, with standard errors clustered at the teacher
level as well.
We use three measures of teacher performance: (a) the average math and reading test
scores of students in a teacher’s class(es) in year t ; (b) the proportion of students in a teacher’s
class(es) scoring proficient or higher in math and reading; and (c) teacher’s value-added to math
and reading achievement in year t.5 Each are entered separately. Correlations among the
measures are shown in Appendix Table 1. The first two sets of measures capture whether
principals consider the distribution of achievement of teachers’ students when determining class
assignments, while the third measure captures whether principals consider (adjusted)
achievement gains, which likely is a better proxy for teacher effects. Both average test
5 Teacher value-added is computed by predicting student math test scores in the current year as a function of math
and reading scores in the prior year, student, school and class-level control variables, grade and year indicators and a
teacher-by-year fixed effect. The teacher-by-year fixed effect, which we shrink to account for measurement error
using the empirical Bayes method, is our measure of value-added.

13
performance and test score gains are considered in Florida’s accountability formula, so principals
have incentives to consider both kinds of metrics in teacher placement decisions. Importantly,
however, we do not argue that principals necessarily use these particular measures when making
class assignment decisions because the measures likely are returned to schools after such
decisions are made ([removed for peer review]). Instead, we anticipate that principals make use
of a range of other information that correlates with these measures, such as benchmark
assessment results or their own classroom observations, in their decision processes.
In the second stage of our analysis, we assess whether the association between student
test performance and the probability that a teacher remains in a tested area varies across schools
with different characteristics. This analysis of heterogeneous responses is motivated by the
likelihood that school differ in both the strength of their incentives to improve test scores and
their capacity to respond to the incentives they face. In most cases, this analysis simply includes
appropriate interaction terms in the estimation of Equation 1, though in the case of one
characteristic, school level, we re-estimate Equation 1 separately for elementary, middle, and
high schools, given differences in the accountability context at each school level. For example, in
middle schools, all grades are tested, so in general the only way a middle school teacher can be
switched out of a tested area is if they change subjects or switch schools. In high schools, higher
grades with more advanced course content are generally preferred by teachers (Neild & Farley-
Ripple, 2008), so principals may feel pressured to assign their best or more experienced teachers
to those (untested) grades.
We then test interactions between teacher performance and school accountability grades,
which are assigned on a five-point scale of A (5) to F (1).6 Here, we expect that schools facing
6 School grades are determined by a formula used by the district that weighs the percentage of students meeting high
standards across various subjects tested, the percentage of students making learning gains, whether adequate

14
more accountability pressure—presumably, those with low grades—feel more compelled to
engage in strategic staffing as a means of improving their school’s performance (Chingos &
West, 2011). In a third analysis, we test for an interaction with school value-added.7 School
value-added captures the average adjusted achievement gains associated with a school in a year.
We hypothesize that schools with low value-added may have less organizational capacity,
including capacity to behave strategically. Thus, we expect that school value-added will be a
positive moderator between teacher performance and the probability of future assignment to a
tested classroom.
We next include interactions of the teachers’ student achievement level and value-added
with teacher reports of who influences their class assignments. We use school-average ratings of
the amount of influence of the following personnel over assignments (on a scale of 1 to 5): the
teacher themselves, other teachers in their grade, teachers in the grade below, other teachers,
principals, assistant principals, counselors, parents, and students. In particular, if principals’
strategic considerations are driving associations between teacher performance and future
assignments to tested grades—as opposed to, for example, a desire of low-performing teachers to
avoid high-stakes classrooms—we expect a significant positive interaction with principal
influence. Although we collected these measures in 2011, when collapsing them to the school-
level and combining them with administrative data from other years, we treat them as a time-
invariant feature of schools.
We also test whether student learning gains in early grades are affected when students are
taught by a (presumably less effective) teacher reassigned from a high-stakes grade. For this
progress is made among the lowest 25 percent of students, and the percentage of eligible students who are tested.
For more information, see: http://schoolgrades.fldoe.org/pdf/0708/2008SchoolGradesTAP.pdf
7 School value-added is estimated from student FCAT scores using a model comparable to the one used to estimate
teacher value-added, only replacing the teacher-by-year fixed effect with a school-by-year fixed effect.

15
analysis, we estimate student growth models, separately for math and reading, using student
scores on the SAT-10 in those subjects in grades 1 and 2. These models take the form:
𝐴𝑖𝑡 = 𝛽0 + 𝐴𝑖𝑡−1𝛽1 + 𝐻𝑖𝑔ℎ_𝑡𝑜_𝐿𝑜𝑤_𝑅𝑒𝑎𝑠𝑠𝑖𝑔𝑛𝑒𝑑𝑖𝑡𝛽2 + 𝐿𝑜𝑤_𝑡𝑜_𝐿𝑜𝑤_𝑅𝑒𝑎𝑠𝑠𝑖𝑔𝑛𝑒𝑑𝑖𝑡𝛽3 +
𝐹𝑖𝑟𝑠𝑡_𝑌𝑒𝑎𝑟_𝑇𝑒𝑎𝑐ℎ𝑒𝑟𝑖𝑡𝛽4 + 𝑋𝑖𝑡𝛽5 + 𝐶𝑐𝑡𝛽6 + 𝛿𝑠𝑔𝑡 + 휀𝑖𝑐𝑔𝑡 (2)
In this model, student i's achievement at time t is a function of his or her prior-year achievement
At-1 (i.e., in grades K or 1), a vector of student characteristics X (student race, gender, free lunch
eligibility, and limited English proficiency status), and the aggregate of those variables to the
classroom level (C), plus a school-by-grade-by-year fixed effect δ. The variable of interest in
Equation 2, High_to_Low_Reassigned, is set equal to 1 if the student’s teacher at time t was
reassigned from grade 3, 4, or 5 (i.e., a high-stakes classroom) to grades 1 or 2 at the end of the
prior year. Since all teachers that are new to a grade might exhibit lower student performance, we
also include Low_to_Low_Reassigned, which is set equal to 1 if the student’s teacher at time t
was teaching a different K–2 grade in the prior year, and First_Year_Teacher, which is set to 1 if
the teacher is in their first year in teaching. If teachers reassigned from high- to low-stakes
classrooms are associated with lower average learning gains, the coefficient β2 will be negative,
and potentially larger in magnitude (i.e., more negative) than β3 and β4. We cluster standard
errors at the teacher level.
Finally, we test whether students taught by a reassigned teacher in grade 2 have lower
achievement in grades 3 and 4. If reassigned teachers are less effective, then students with
reassigned teachers may learn less in second grade which may contribute to lower achievement
in later grades. For this analysis, we predict student achievement on the FCAT in third and
fourth grade, separately for math and reading. The following equation describes the model:
16
𝐴𝑖𝑘 = 𝛽0 + 𝑆𝐴𝑇10𝑖1𝛽1 + 𝐻𝑖𝑔ℎ_𝑡𝑜_𝐿𝑜𝑤_𝑅𝑒𝑎𝑠𝑠𝑖𝑔𝑛𝑒𝑑𝑖2𝛽2 + 𝐿𝑜𝑤_𝑡𝑜_𝐿𝑜𝑤_𝑅𝑒𝑎𝑠𝑠𝑖𝑔𝑛𝑒𝑑𝑖2𝛽3 +
𝐹𝑖𝑟𝑠𝑡_𝑌𝑒𝑎𝑟_𝑇𝑒𝑎𝑐ℎ𝑒𝑟𝑖2𝛽4 + 𝑋𝑖𝑡𝛽5 + 𝐶𝑐𝑡𝛽6 + 𝛿𝑠𝑔𝑡 + 휀𝑖𝑐𝑔𝑡 (3)
Similar to equation 2, in this model, student i's achievement in grade k = 3 or 4 is a function of
his or her SAT-10 test score in grade 1, a vector of student characteristics X (student race,
gender, free lunch eligibility, and limited English proficiency status), and the aggregate of those
variables to the classroom level (C), plus a school-by-grade-by-year fixed effect. The variable of
interest in Equation 2, High_to_Low_Reassigned, is set equal to 1 if the student’s teacher at in
grade 2 was reassigned from grade 3, 4, or 5 (i.e., a high-stakes classroom) at the end of the year
before the student was in their class. Again, since all teachers that are new to a grade might
exhibit lower student performance, we also include Low_to_Low Reassigned, which is set equal
to 1 if the student’s teacher in second grade was teaching grade K or 1 in the year before the
student was in their class. Finally, First_Year_Teacher is set to 1 if the student’s second grade
teacher was in their first year when the student was in their class. If having a reassigned teacher
in second grade has negative effects on third grade achievement, the coefficient β2 will be
negative and potentially larger in magnitude than β3 and β4. For these analyses, standard errors
are clustered at the second grade teacher level.
Results
Teacher Effectiveness and Assignment to Tested Students
We first examine the relationship between the test performance of a teacher’s students
and whether he or she remains in a tested area in a subsequent year. Approximately 70% of
“tested” teachers in our sample remain in a tested grade/subject in the same school in the
following year. Thirteen percent move within the same school to an untested classroom, while
17
7% move to a different school (5% to a tested classroom, 2% to an untested one). The remaining
10% exit the sample. We drop exiters from our analytic sample.
For teachers in a tested grade/subject in year t, we predict the probability that they stay in
a tested grade/subject in t+1 in three samples: all tested teachers, all tested teachers who
remained in the same school, and all tested teachers who changed schools. Comparing estimates
for the second and third samples provides suggestive evidence about whether teacher
performance is as important in determining assignments to tested/non-tested areas for teachers
that switch schools as those who do not.
Table 2 describes the results of these models.8 The first row in each panel shows average
effects across all school levels. Coefficients on covariates are omitted for brevity but shown in
Appendix Table 2.
Across different teacher performance measures, the first model in each group shows a
strong positive relationship between teacher performance and the probability that a teacher
remains in a tested area. For example, model 1 in Panel A shows that a one standard deviation
increase in students’ math test scores predicts an 8 percent increase in the probability that a
teacher remains in a tested area in the following year. For reading (model 4), the corresponding
probability is 7 percent. Results are consistent when using the proportion of their students
scoring proficient (Panel B) and teachers’ value-added (Panel C) instead of class average
achievement.9 These results suggest that principals or others may consider both status measures
8 All models employ complete-case analysis. Item-level missingness in the M-DCPS administrative data files is
minimal, so given large sample sizes, we do not impute data. Sample sizes do vary substantially across models
according to which teacher performance measure is used because value-added can only be estimated for a fraction of
teachers. A version of Table 2 that limits all estimation samples to the subsample of teachers with value-added
scores yielded very similar results. 9 Because the scales for mean achievement, value-added, and proficiency are not the same, a direct comparison of
the relative magnitudes of the results for the different performance metrics is difficult. The high correlation between
mean achievement and proficiency rate (0.9 for math and 0.8 for reading) suggests that, if rescaled, the results likely
would be quite similar.
18
(average test scores or proficiency rates of a teacher’s students) and adjusted growth measures
(teacher’s value-added) when moving teachers across grades within schools. The value-added
result holds despite the fact that the district only began providing value-added estimates to
principals as part of teacher evaluations in the last two years of the data stream, suggesting that
principals make use of other information about teachers’ impacts on students, such as informal
classroom observations, rather than on formal value-added estimates when making placement
decisions.10
Interestingly, while coefficients are systematically larger in the samples of teachers who
remain their schools, the positive relationship between the performance measures and remaining
in a tested grade generally holds up even among teachers who switch schools (value-added is the
exception, though these models have much smaller samples). This result lines up with those from
prior (qualitative) studies that find that many principals use information on the test performance
of teachers’ students when making hiring decisions and when assigning transferring teachers
([removed for peer review]; Cohen-Vogel, 2011).11
We also ran models relaxing the assumption of linearity in the association between the
performance measures and the probability of remaining in a tested classroom. In particular, if a
teacher in a tested classroom is performing at a very high level and thus is more likely to
performing significantly above his or her peers, we would it expect it to be less likely that further
increases in test scores or value-added would impact the probability of transitioning to a low-
stakes classroom. Appendix Table 4 shows the result of including a squared term in the main
10 The value-added results are largely unchanged if we limit the sample to years prior to the 2011 change to teacher
evaluation policies that formalized the use of value-added scores for summative evaluation purposes. 11 The estimates in Table 2 are from linear probability models (LPMs). We also ran a version of Table 2 using
logistic regression, shown as Appendix Table 3. Substantively, the two versions yield very similar results. We opted
to report LPMs in the main text because they more easily accommodate fixed effects and are more straightforward
to interpret in the context of interactions in subsequent tables.

19
models in Table 2. Consistent with expectations, across models this term is negative, suggesting
that the probability of staying in a tested grade increases as student performance increases but
does so at a declining rate.
Heterogeneity by School Characteristics
The secondary panels of Table 2 re-estimate Equation 1 separately by school level. In
general, the coefficients are similar across school levels, though somewhat smaller in magnitude,
on average, in middle and high schools than in elementary schools. Smaller coefficients for
middle schools make sense because middle school teachers cannot be moved away from tested
classrooms without switching subjects, which we discuss further below. While we do not know
why the results are less strong for high school, it is possible that in high schools teacher
effectiveness data is less central in assignments decisions or that effective teachers’ preferences
for teaching 11th and 12th grade students are stronger than the desire on principals’ part to keep
experienced and/or effective teachers in tested grades (9th and 10th grade). In addition, high
school students take some end-of-course exams, which, while not important for NCLB-driven
accountability, may factor into teacher assignment decisions. Still, patterns indicate that high-
performing teachers, regardless of how performance is measured, tend to be reassigned to tested
classrooms in all three school levels.
In Table 3, we examine whether the relationship between student performance and
staying in a tested area varies by school accountability grade and school value-added. School
grades of A and F are entered as indicators (with grades of B, C, and D omitted) to test for
possible nonlinearities. We show results for all teachers and for those who remained in the same
school at time t+1; we have little reason to expect accountability grade or school value-added of

20
the “sending” school to moderate the performance-assignment relationship for school-switchers,
so we omit that subsample.12
Results from Panel A provide evidence in support of the hypothesis that schools with
lower grades might feel greater external accountability pressure that leads them to keep high-
performing teachers in tested classrooms. Although among all teachers there is no evidence of an
interaction for either subject (models 1 and 3), when the sample is limited to teachers who do not
switch schools, we see that the association between student achievement and the probability of
remaining in a tested classroom is higher in F schools than other schools in both math and
reading (models 2 and 4). Results from model 2 indicate that a 1 standard deviation increase in
the mean math achievement of a teacher’s students would be associated with an 11 percent
increase in the probability of returning to a tested classroom the next year among teachers
staying in a school with a grade of B, C, or D, compared to a 10 percent increase in an A school
and a 17 percent increase in an F school. Accountability grade results for proficiency in Panel B
are similar to those in Panel A and suggest that each 10 percent of students who achieve
proficiency in either math or reading is associated with an additional increase of about 2 percent
in that teacher’s probability of remaining in a tested grade in an F school beyond what is
expected in other schools.
Panel C, in which the performance measure is teacher value-added, also shows evidence
of differential activity in F schools, at least in math (model 18). Here, a 1 s.d. increase in teacher
value-added is associated with a 12 percent increase in the probability of teaching in a tested
classroom next year in an F school, compared to just 6 percent in schools with higher grades.
12 Preliminary estimates from the school-switcher subsample indeed showed no consistent evidence that school
accountability or school value-added moderated this association.

21
Turning instead to school value-added as a moderator, Panel A shows that teachers whose
students have higher achievement (in math and reading) are even more likely to remain in a
tested classroom in schools with higher value-added, particularly when they remain in the same
school (models 5 through 8). In a school with average value-added, a 1 s.d. increase in student
math performance is associated with an 8 percent increase in the probability of teaching in a
tested classroom the following year, compared to 9.5 percent in schools whose value-added is 1
s.d. above the mean. Proficiency results (Panel B) are again very consistent with mean
achievement results.
When the performance measure is teacher value-added (Panel C), we again find that
higher school value-added moderates the association between performance and returning to a
tested classroom among school-stayers in reading but not math. The reading result may indicate
that higher value-added schools have greater capacity for strategic personnel action.
As shown in Table 4, we also find that the strength of the relationship between teacher
performance and remaining in a tested area varies across teachers’ reports of who influences
teacher-student assignments.13 In particular, the relationship consistently is magnified in schools
where teachers say principals exercise more influence; in fact, principal influence is the only
positive, statistically significant moderator in all six models. In some cases, it is also magnified
where teachers report that other teachers—particularly those in the same grade—influence
assignments. In contrast, the association between performance and likelihood of remaining in a
tested classroom is attenuated in schools where other stakeholders, especially students and
13 We also investigated how teacher reports of influence correlated with school performance measures. In general,
status measures (e.g., average performance) are only weak predictors of teacher reports, with no correlation above
0.2, though the patterns generally suggest greater involvement of parents and teachers as achievement increases and
little evidence of an association with other stakeholders. Correlations with school value-added are higher. For
example, for math value-added, higher gains are associated with greater involvement by principals (r = 0.33) and
other teachers (r ranges from 0.26 to 0.35) and less involvement by counselors (-0.47), parents (-0.18), and students
(-0.48). Results for reading are similar.
22
counselors, have more influence. The finding that principal influence moderates this association
is consistent with the expectation that strategic behavior on behalf of school administrators,
perhaps resulting from external accountability pressures, to improve measured school
performance contributes to the propensity of high-performing teachers to stay in tested
classrooms.
Reassignments of Teachers that Switch
Our next set of analyses builds on the models in Table 2 and shows descriptively how
value-added for teachers in tested classrooms at time t varies by what grade and subject they
teach at time t+1. Samples are restricted to teachers who stay in the same school from time t to
t+1.
Table 5 shows the results. For elementary school teachers, we show mean math and
reading value-added estimates for tested teachers (i.e., those in grades 3–5) who move the next
year to kindergarten, first grade, second grade, or another tested grade (i.e., moves from fourth to
fifth grade), compared to those who stay in the same grade. The asterisks indicate the results of
simple two-sided t-tests of the hypothesis that the value-added of a given group is the same as
that of teachers who do not switch grades. Note that the largest group of teachers who switch to
an untested grade move to second grade (63%), followed by first grade (22%) and kindergarten
(13%).14
For both reading and math, we find that teachers in tested classrooms who subsequently
switch to early grades have substantially lower value-added than those who remain in the same
grade. Estimates of the difference range in math from 0.43 s.d. (second grade) to 0.50 s.d. (first
14 Very few teachers move to pre-kindergarten or to another kind of untested classroom, so we do not show those
cells in the table.

23
grade) and in reading from 0.32 s.d. (first grade) to 0.45 s.d. (kindergarten). Teachers who switch
among grades 3–5 also have lower value-added than those who remain in the same grade, but the
differences in both subjects (0.06 to 0.14 s.d.) are much smaller than for those who switch to K–
2; for reading, in fact, the difference is not statistically distinguishable from zero.
In middle schools, every grade is a tested grade, so teachers remaining within the same
school can only be moved out of a tested classroom by moving to an assignment teaching an
untested subject, such as social studies. Comparing mean value-added of this small group of
teachers (N = 123) to those who stay in a tested subject in the same grade, we again find large
differences, ranging from 0.34 s.d. in reading to 0.45 s.d. in math. Teachers who continue to
teach middle school math or reading but who switch grades also have lower value-added than
non-movers, but as with elementary schools, the differences are much smaller.
In high schools, tested teachers are primarily those who teach ninth and tenth graders. We
examine teachers of math and reading courses in grades 9 and 10 at time t who at time t+1: (1)
stayed in the same subject but moved to teaching grades 11 and 12, which have few tested
students; (2) moved to grades 11–12 and switched subjects; (3) stayed in the same grade, but
switched to an untested modal subject; (4) continued to teach a tested subject but switched from
primarily teaching 9th graders to primarily teaching 10th graders (or vice versa); or (5) stayed in a
tested subject in the same grade (the comparison group). The vast majority (94%) of high school
teachers that leave a tested grade/subject switch from teaching 9th or 10th grade students to
teaching 11th and 12th grade students but remain in the same subject, which is unsurprising given
subject certification requirements for high school teachers. We again find that teachers who
switch to untested subjects, particularly those who stay in grades 9–10, have lower value-added.
The estimate of the difference is similar in math and reading (approximately 0.47 s.d.), though

24
given the small sample of teachers who fall into this group, the reading difference is not
statistically significant and the math difference is only significant at the 0.10 level. Teachers who
switch to grades 11 and 12 have similar value-added in math but somewhat lower value-added in
reading; a similar pattern holds for those who stay in tested subjects but switch from one tested
grade to the other.
Given the particularly stark patterns in teacher movement in elementary schools, we
further investigate the within-school sorting of teachers between and among high- and low-
stakes K-5 classrooms by teacher performance measures. We first use SAT-10 data to calculate
the average math achievement of early grades teachers and to estimate math value-added for
those teachers using the same modeling approach as for the high-stakes standardized tests (i.e.,
FCAT) in prior analyses. Next, we standardize average math achievement and value-added for
early grades teachers and pool teachers in early grades and those in grades 3–5. Using linear
probability models, we predict where teachers work at time t+1 as a function of their
performance at time t (based on SAT-10 or FCAT), classifying teachers as working (a) in the
same grade, (b) in a different grade but still within the same early or upper primary set (e.g., a
teacher who moves from second grade to first grade), or (c) in a different grade and not in the
same early or upper primary set (e.g., a teacher who moves from second grade to third grade).
We then run three different models for math and for reading, results of which are presented in
Table 6. The focal variables in each model are average achievement (Panel A) or value-added
(Panel B), an indicator for whether the teacher teaches in an early-grades (K–2) classroom, and
the interaction between the two.
The results are generally consistent for mean achievement and value-added. Given close
similarities between math and reading, we focus on the math results. The first column predicts

25
the probability of teaching in the same grade next year. On average, model 1 suggests that mean
achievement is strongly related to the probability of teaching the same grade next year and K–2
teachers are somewhat less likely to remain in the same grade; the interaction term is not
significant. The pattern is similar for value-added (model 7 in Panel B), except that high-
performing K–2 teachers are considerably less likely than high-performing 3–5 teachers to
remain in the same grade next year. The second column makes the binary comparison between
teachers who teach a different grade next year but still within the lower primary or upper primary
set to teachers who either remain in the same grade or switch to the opposite grade set. Here, the
average math achievement and math value-added model tell the same story, which is that high-
performing K–2 teachers are less likely to move to other low-stakes grades (models 2 and 8).
The final column compares teachers who switch to the other primary grade set (i.e., switch from
K–2 to 3–5 or vice versa) to those teachers who remain in the same set, either in the same grade
or in a different grade. Again, the results for average math achievement and math value-added
are consistent, demonstrating that teachers in high-performing K–2 classrooms are more likely to
be moved to the high-stakes, upper primary grades.
A graphical illustration of the math value-added results is provided in Figure 1. For both
K–2 and 3–5 teachers, the probability of staying in the same grade increases and the probability
of moving to another grade within the same high- or low-stakes set decreases as teacher value-
added increases. But the third panel shows the important difference between K–2 and 3–5
teachers. High value-added teachers in grades 3–5 are less likely to switch to grades K–2. In
contrast, high-value-added K–2 teachers are more likely to switch to tested classrooms. All else
held equal, a teacher K–2 teacher with math value-added 1 s.d. below the mean has a probability
of moving to grades 3–5 of about 16%, compared to 18% for a teacher 1 s.d. above the mean;

26
comparable values for upper grades teachers are 13% and 5%. Alongside our earlier results,
these findings are consistent with a general tendency of schools to reallocate effective teachers
from across classrooms into the high-stakes (later) grades, concentrating relatively less effective
teachers in classrooms with the schools’ youngest students.
Unintended Consequences of Strategic Staffing
Our final analysis considers the potential impact of shifting low-performing teachers to
untested grades. We focus on elementary schools, where we have test score data from a low-
stakes assessment that allow us to track student performance in the classrooms of tested teachers
reassigned to lower grades.
Table 7 shows the result of estimating Equation 2 for SAT-10 math and reading, pooling
first and second grade students. The primary variable of interest is whether the student’s teacher
switched from an upper elementary (tested) grade. Panel A focuses on a switch from last year to
the current year. The coefficients show that, in both subjects, being taught by a teacher recently
reassigned from a high-stakes grade is associated with learning gains that are .06 to .07 s.d. lower
than those attained by students in classrooms with teachers that were not reassigned. For
comparison, we also included indicators for having a teacher who switched from another K–2
grade and for having a first-year teacher. In both subjects point estimates suggest that the effects
of having a switcher from grades 3–5 is slightly more negative than having a switcher from
another early grade, and in reading, the effects are also more negative than having a first-year
teacher.15
15 Tests of equality among these coefficients could not reject the null hypotheses that each of the other coefficients is
the same as the one for switching from grades 3–5.
27
An alternative interpretation of the results in Panel A is that the negative impact of
having a teacher who switched from grades 3–5 is that it is transitory and simply reflects a dip in
teacher performance associated with teaching a new subject. To investigate further, Panel B
shows the results of adding indicators for switching from grades 3–5 two years ago, switching
from another K–2 grade two years ago, and being a second-year teacher. If the performance dip
is transitory rather than reflective of lower quality of grade switchers, we might expect to see a
negative coefficient for teachers who switched last year but not those who switched two years
ago and thus have had an additional year of experience in the new classroom. Results suggest
some reduction of the negative association in the second year—though we cannot reject the
hypothesis that the coefficients are the same—but still substantially lower achievement in those
classrooms than in classrooms whose teachers taught in the same grade.
Panel C provides another look at this issue. These models are similar to those in Panel A,
only with an additional covariate indicating whether the teacher ever taught grades 3–5 in the
past. The omitted group is thus K–2 teachers who did not switch grades last year and have
always taught in K–2 classrooms. Coefficients demonstrate that teachers who have ever been
reassigned from grades 3–5 see substantially lower achievement growth, on average, than those
who have not (approximately -0.07 s.d. in math and -0.05 s.d. in reading), beyond the even lower
effects they have in the first year following the switch.
Having established that having a teacher who switched from the upper primary grades is
associated with lower student achievement in the lower primary grades, in our final analysis, we
consider whether the apparently negative effect of being taught by a reassigned teacher in second
grade is associated with lower FCAT achievement as of the end of the next two years, third grade
and fourth grade, which are the first grades “counted” for accountability purposes. The results

28
are shown in Table 8. Panel A shows third grade achievement results, first for math, then for
reading. Columns 1 and 4 show results without a control for first grade SAT-10 score. Columns
2 and 5 also omit this control but limit the models to the sample with first grade scores, which is
only about one-third as large as the full sample because the first grade test has only been
administered since 2009. Columns 3 and 6 show our preferred models, which include first grade
scores in the models as a baseline achievement measure prior to second grade.
In all six columns, there is consistent evidence of a negative effect of having a second
grade teacher who switched from grades 3–5 in the prior year, and it is of similar magnitude in
math and reading. In the models that control for first grade scores, being taught by a reassigned
second grade teacher is associated with third grade scores that are approximately 0.03 s.d. lower
than for students whose teacher had taught second grade in the year prior to teaching the student
(both coefficients significant at the 0.01 level). Generally, this coefficient is much more negative
than the indicator for whether the student’s second grade teacher had switched from another K-2
(i.e., low-stakes) grade the prior year (in columns 3 and 6, equality of these coefficients can be
rejected at the 0.10 level), suggesting that the negative effects of having a teacher reassigned
from a high-stakes grade is not simply an artifact of a performance dip from any grade switch.
Instead, coefficients suggest that this effect is similar to the effect of having a first-year teacher
in second grade; equality of these two coefficients cannot be rejected in any model.
Panel B turns to fourth grade achievement. With one fewer cohort of data, sample sizes
are smaller. Across all six columns, coefficients are consistent with lower fourth grade
achievement among students with reassigned (from 3–5) second grade teachers, though standard
errors are large. Preferred results in columns 9 and 12, which include controls for first grade
SAT-10 scores, suggest that having such a reassigned teacher is associated with fourth grade

29
scores that are about 0.02 s.d. lower in math (p = 0.12) and reading (p = 0.15), though these
coefficients miss conventional cutoffs for statistical significance. These coefficients are smaller
than those shown for third grade in Panel A, which is not surprising given research on the decay
of teacher effects in future years (Jacob, Lefgren, & Sims, 2010; Rothstein, 2010). Still, overall
the results in Table 8 suggest that reassignment of low-performing teachers to early grades may
have longer term consequences for student learning trajectories.
Discussion and Conclusions
Consistent with prior studies (Chingos & West, 2011; Fuller & Ladd, 2013), our analysis
of strategic staffing in tested and non-tested classrooms in a large urban school district finds that
teacher effectiveness, as proxied by different measures of student test score performance, in one
year is a strong predictor of whether a teacher continues to teach tested students in a subsequent
year. More specifically, higher achievement levels and proficiency rates of a teacher’s students
make it more likely that a teacher returns to a tested classroom, as do higher value-added
estimates. Although we cannot say for sure the degree to which these patterns are driven by
principal strategy versus low-performing teachers seeking to avoid high-stakes classrooms, the
observation that these patterns are particularly apparent in schools with low accountability
ratings (where leaders presumably face greater pressure to improve test scores) and where
principals have more influence are consistent with the view that principals’ strategic decisions
play an important role.
We also find that schools with high test score growth generally staff more strategically by
this measure as well, which may indicate that concentrating effective teachers in tested
classrooms may pay off if the goal is to show higher gains on standardized tests that count for
30
external judgments of school performance. This result may also reflect greater organizational
capacity for strategic response, including greater awareness of teacher performance or the larger
supply of higher performing teachers available in these schools to take the place of lower
performers who are reassigned ([removed for peer review]). Also, the association between
performance and assignment is strongest among school stayers in which principals (and others)
are likely to have better performance information, though past performance often is predictive of
subsequent assignment to a high-stakes classroom even among teachers that switch schools,
suggesting that principals accepting teacher transfers utilize performance information in strategic
placement decisions as well.
Importantly, however, gains from the strategic assignment of high-performing teachers to
high-stakes grades have limits. Using data on student scores on the SAT-10, a low-stakes
assessment administered in early grades, we show that reassignment of low-performing
elementary teachers to early grades results in reduced student achievement gains in those
classrooms in both math and reading as measured by a low-stakes assessment. This result is
concerning from the perspectives of both schools and families if achievement in early grades
provides a foundation for later learning. In responding to the acute pressures of the
accountability system, schools may be disadvantaging students taught by these less effective
reassigned teachers over the longer term, opening up the possibility that, by providing incentives
to increase student learning by increasing teacher effectiveness in later grades, current test-based
accountability systems may also be perversely incenting reduced investment in students’ earliest
schooling years when returns on that investment are greatest (Heckman, 2006; Hill et al., 2008).
Consistent with the idea that a student’s achievement is influenced by the quality of his or
her past teachers, we find evidence that lower performance in second grade among reassigned
31
teachers translates into lower-than-expected student achievement at the end of third grade and
potentially in fourth grade as well, though data limitations prevent us from making strong claims
about fourth grade outcomes. Being taught by a teacher moved from the upper elementary grades
in second grade is roughly equivalent to being taught by a first-year teacher in terms of impacts
on math and reading scores at the end of third grade. These results should give pause to school
leaders aiming to boost school performance in the eyes of the accountability regime by focusing
only on teacher effectiveness in high-stakes classrooms.
Follow-up research with additional years of K–2 achievement data linked to a longer
panel of student achievement scores in tested grades may allow for a fuller investigation of the
effects of reassignment of low-performing teachers to lower grades on student performance later
in school. Studies of the persistence of teacher effects suggest that effects of this kind of
systematic reassignment on later outcomes may be substantial (Konstantopoulos & Chung,
2011). If teachers at the earliest stages of a child’s schooling career have a disproportionately
large impact on the child’s learning trajectory, but policymakers have designed an accountability
system that pushes schools to sort their best teachers away from those grades, the long-term
consequences for student outcomes are potentially large. It is also possible, however, that given
the choice between a lower quality K–2 teacher or 3–5 teacher, a school should choose the
former, if more effective teachers later are better able to remediate and position a student for
success in upper grades. Unfortunately, most accountability systems’ focus on testing beginning
in third grade further means that the kind of information on early-grades performance necessary
to investigate the link between early-grades teacher quality and later performance, or optimal
teacher allocation, is missing from most large-scale administrative data bases. Our results
underscore the importance of education researchers bringing new data to these issues.

32
Our analysis faces several limitations. First, we do not have access to the same measures
of teacher effectiveness principals have when making teacher assignment decisions. The kinds of
performance measures we create from administrative data would not be available to principals at
the time next year’s assignment decisions likely are made, so principals likely instead rely on
their own observations of teachers, results from interim assessments, or other information.
Although principals’ informal assessments of teachers tend to correlate positively with value-
added and other performance measures (Jacob & Lefgren, 2008; [removed for peer review]), a
broader range of data would be necessary to answer the question of which specific information is
driving the assignments of teachers among tested and untested grades. The study also concerns
about generalizability. M-DCPS is a very large urban district whose school settings may be very
unrepresentative of those in the typical school district. Although the accountability pressures
faced by M-DCPS are similar to those faced by other Florida school districts, Florida’s
accountability system is among the nation’s most stringent, and the pressures it applies on
schools—particularly low-performing schools—may elicit particularly strong responses from
schools (Rouse et al., 2007). Assessment of assignment practices both in general and in the
context of school accountability set in other districts or states would be useful in developing our
understanding of how schools approach human capital decision-making.
Future research might also consider whether the reassignment of low-performing teachers
to low-stakes classrooms might have implications for student outcomes beyond those associated
with moving teachers to early grades. Evidence in Table 5 suggests that high schools move many
relatively low-performing teachers to non-tested classrooms in grades 11 and 12, for example,
which may affect students’ preparation for postsecondary opportunities. Reassignment of

33
ineffective teachers to other kinds of untested classrooms (e.g., arts, non-core subjects) may
similarly have consequences for student learning beyond math and reading.

34
References
Aaronson, D., Barrow, L., & Sander, W. (2007). Teachers and student achievement in Chicago
public high schools. Journal of Labor Economics, 25(1), 95-135.
Booher-Jennings, J. (2005). Below the bubble: “Educational triage” and the Texas accountability
system. American Educational Research Journal, 42(2), 231-268.
Chingos, M. M., & West, M. R. (2011). Promotion and reassignment in public school districts:
How do schools respond to differences in teacher effectiveness? Economics of Education
Review, 30, 419-433.
Claessens, A., Duncan, G., & Engel, M. (2009). Kindergarten skills and fifth-grade achievement:
Evidence from the ECLS-K. Economics of Education Review, 28(4), 415-427.
Clotfelter, C. T., Ladd, H. F., & Vigdor, J. L. (2006). Teacher-student matching and the
assessment of teacher effectiveness. Journal of Human Resources, 41(4), 778–820.
Cohen-Vogel, L. (2011). Staffing to the test: Are today's school personnel practices evidence
based? Educational Evaluation and Policy Analysis, 33(4), 483–505.
Dee, T. & Jacob, B. (2011). The impact of No Child Left Behind on student achievement.
Journal of Policy Analysis and Management, 30(3), 418-446.
Dee, T., Jacob, B, & Schwartz, N. (2013). The effects of NCLB on school resources and
practices. Educational Evaluation and Policy Analysis, 35(2), 252-279.
Diamond, J. B., & Spillane, J. P. (2004). High-stakes accountability in urban elementary schools:
Challenging or reproducing inequality? Teachers College Record, 106, 1145-1176.
Figlio, D. N. (2006). Testing, crime, and punishment. Journal of Public Economics, 90(4-5),
837-851.
Figlio, D. N., & Getzler, L. S. (2006). Accountability, ability and disability: Gaming the system?
In T. J. Gronberg (Ed.), Advances in Microeconomics: Elsevier Science
Figlio, D. N., & Winicki, J. (2005). Food for thought: The effects of school accountability plans
on school nutrition. Journal of Public Economics, 89(2-3), 381-394.
Fuller, S. C., & Ladd, H. F. (2013). School-based accountability and the distribution of teacher
quality across grades in elementary school. Education Finance and Policy, 8(4), 528–
559.
Guskey, T. R. (2003). How classroom assessments improve learning. Educational Leadership,
60(5), 6-11.
Hannaway, J., & Hamilton, L. (2008). Performance-based accountability policies: Implications
for school and classroom practices. Washington: Urban Institute and RAND Corporation.
Hanushek, E. A., Kain, J. F., O'Brien, D. M., & Rivkin, S. G. (2005). The market for teacher
quality (No. w11154). National Bureau of Economic Research.
Heckman, J. J. (2006). Skill formation and the economics of investing in disadvantaged children.
Science, 312(5782), 1900–1902.

35
Heilig, J. V., & Darling-Hammond, L. (2008). Accountability Texas-style: The progress and
learning of urban minority students in a high-stakes testing context. Educational
Evaluation and Policy Analysis, 30(2), 75-110.
Hill, C. J., Bloom, H. S., Black, A. R., & Lipsey, M. W. (2008). Empirical benchmarks for
interpreting effect sizes in research. Child Development Perspectives, 2(3), 172–177.
Jacob, B. A. (2005). Accountability, incentives and behavior: The impact of high-stakes testing
in the Chicago Public Schools. Journal of Public Economics, 89(5–6), 761–796.
Jacob, B. A. (2010). Do principals fire the worst teachers? National Bureau of Economic
Research, Working Paper #15715.
Jacob, B. A., & Lefgren, L. (2004). Remedial education and student achievement: A regression-
discontinuity analysis. Review of Economics and Statistics, 86(1), 226–244.
Jacob, B. A., & Lefgren, L. (2008). Can principals identify effective teachers? Evidence on
subjective performance evaluation in education. Journal of Labor Economics, 26(1), 101-
136.
Jacob, B. A., Lefgren, L., & Sims, D. P. (2010). The persistence of teacher-induced learning.
Journal of Human Resources, 45(4), 915-943.
Jacob, B.A., & Levitt, S. D. (2003). Rotten apples: An investigation of the prevalence and
predictors of teacher cheating. Quarterly Journal of Economics, 118(3), 843-877.
Kane, T. J., Rockoff, J. E., & Staiger, D. O. (2008). What does certification tell us about teacher
effectiveness? Evidence from New York City. Economics of Education Review, 27(6),
615-631.
Konstantopoulos, S., & Chung, V. (2011). The persistence of teacher effects in elementary
grades. American Educational Research Journal, 48(2), 361–386.
McMurrer, J. (2007). Choices, changes, and challenges: Curriculum and instruction in the
NCLB era. Washington, DC: Center for Education Policy
McMurrer, J. (2008). Instructional time in elementary schools: A closer look at changes for
specific subjects. Washington, DC: Center for Education Policy.
Neild, R. C., & Farley-Ripple, E. (2008). Within-school variation in teacher quality: The case of
ninth grade. American Journal of Education, 114, 271-305.
Nye, B., Konstantopoulos, S., & Hedges, L. V. (2004). How large are teacher effects?
Educational Evaluation and Policy Analysis, 26(3), 237-257.
Perry, J. D., Guidubaldi, J., & Kehle, T. J. (1979). Kindergarten competencies as predictors of
third-grade classroom behavior and achievement. Journal of Educational Psychology,
71(4), 443–450. d
Rivkin, S. G., Hanushek, E. A., & Kain, J. F. (2005). Teachers, schools, and academic
achievement. Econometrica, 73(2), 417-458.
Rockoff, J. (2004). The impact of individual teachers on student achievement: Evidence from
panel data. American Economic Review, 94, 247-252.

36
Rothstein, J. (2010). Teacher quality in educational production: Tracking, decay, and student
achievement. Quarterly Journal of Economics, 125(1), 175-214.
Rouse, C. E., Hannaway, J., Goldhaber, D., & Figlio, D. (2007). Feeling the Florida heat? How
low-performing schools respond to voucher and accountability pressure. National Bureau
of Economic Research.
Sanders, W., & Rivers, J. (1996). Cumulative and residual effects of teachers on future student
academic achievement. Knoxville: University of Tennessee Value-Added Research and
Assessment Center.
Schweinhart, L. J., Montie, J., Xiang, Z., Barnett, W. S., Belfield, C. R., & Nores, M. (2005).
Lifetime effects: The HighScope Perry Preschool Study through age 40. (Monographs of
the HighScope Educational Research Foundation, 14). Ypsilanti, MI: HighScope Press.
Watts, T. W., Duncan, G. J., Siegler, R. S., & Davis-Kean, P. E. (2014). What’s past is prologue:
Relations between early mathematics knowledge and high school achievement.
Educational Researcher, 43(7), 352–360.

37
APPENDIX
APPENDIX TABLE 1: Pairwise Correlations among Teacher Performance Measures
(1) (2) (3) (4) (5) (6)
(1) Average Math Achievement of Teachers' Current Students This Year 1.00
(2) Proportion of Students Proficient or Better in Math this Year 0.86 1.00
(3) Teacher Value-Added in Math This Year 0.57 0.46 1.00
(4) Average Reading Achievement of Teachers' Current Students This Year 0.90 0.83 0.38 1.00
(5) Proportion of Students Proficient or Better in Reading this Year 0.77 0.81 0.29 0.83 1.00
(6) Teacher Value-Added in Reading This Year 0.42 0.36 0.61 0.49 0.38 1.00

38
APPENDIX TABLE 2: Predicting Staying in a Tested Classroom between Years, with Covariates Shown
MATH READING
Sample is teachers in tested classrooms at time t who:
Taught in any school at
t+1
Remained in same school
at t+1
Moved to a different
school at t+1
Taught in any school at
t+1
Remained in same school
at t+1
Moved to a different
school at t+1
Panel A: Performance Measure is Mean Achievement of Current Students This Year
Mean Achievement Scores of Teachers' Students 0.075 *** 0.079 *** 0.060 ***
0.069 *** 0.074 *** 0.041 **
(0.003) (0.003) (0.014)
(0.003) (0.003) (0.014)
Female 0.000 -0.007 -0.006
0.002 -0.004 -0.001
(0.005) (0.005) (0.021)
(0.005) (0.005) (0.021)
Black 0.046 *** 0.017 ** 0.043 +
0.042 *** 0.013 * 0.040 +
(0.006) (0.005) (0.024)
(0.006) (0.005) (0.024)
Hispanic 0.042 *** 0.003 0.054 *
0.041 *** 0.004 0.054 *
(0.005) (0.005) (0.022)
(0.005) (0.005) (0.022)
Other Race 0.039 * 0.030 + -0.005
0.034 * 0.022 -0.011
(0.015) (0.015) (0.051)
(0.015) (0.015) (0.049)
Years of Experience in District 0.003 *** 0.001 *** 0.002
0.003 *** 0.001 *** 0.002
(0.000) (0.000) (0.002)
(0.000) (0.000) (0.002)
Master's Degree or Higher -0.004 -0.005 0.018
-0.003 -0.003 0.021
(0.004) (0.004) (0.018)
(0.004) (0.004) (0.018)
Constant 0.672 *** 0.849 *** 0.646 ***
0.658 *** 0.845 *** 0.632 ***
(0.007) (0.006) (0.026)
(0.006) (0.006) (0.026)
Observations (School-Grade-Years) 3197 2876 1812
3268 2899 1832
Observations (Total) 58373 46201 4068 60384 47032 4141
Panel B: Performance Measure is Proportion of Teachers' Current Students Scoring Proficient or Better This Year
Proportion of Students Proficient or Better 0.186 *** 0.187 *** 0.155 ***
0.180 *** 0.188 *** 0.133 ***
(0.008) (0.008) (0.035)
(0.008) (0.008) (0.036)
Female -0.003 -0.010 + -0.010
0.001 -0.005 -0.001
(0.005) (0.005) (0.021)
(0.005) (0.005) (0.021)
Black 0.047 *** 0.017 ** 0.044 +
0.042 *** 0.013 * 0.042 +
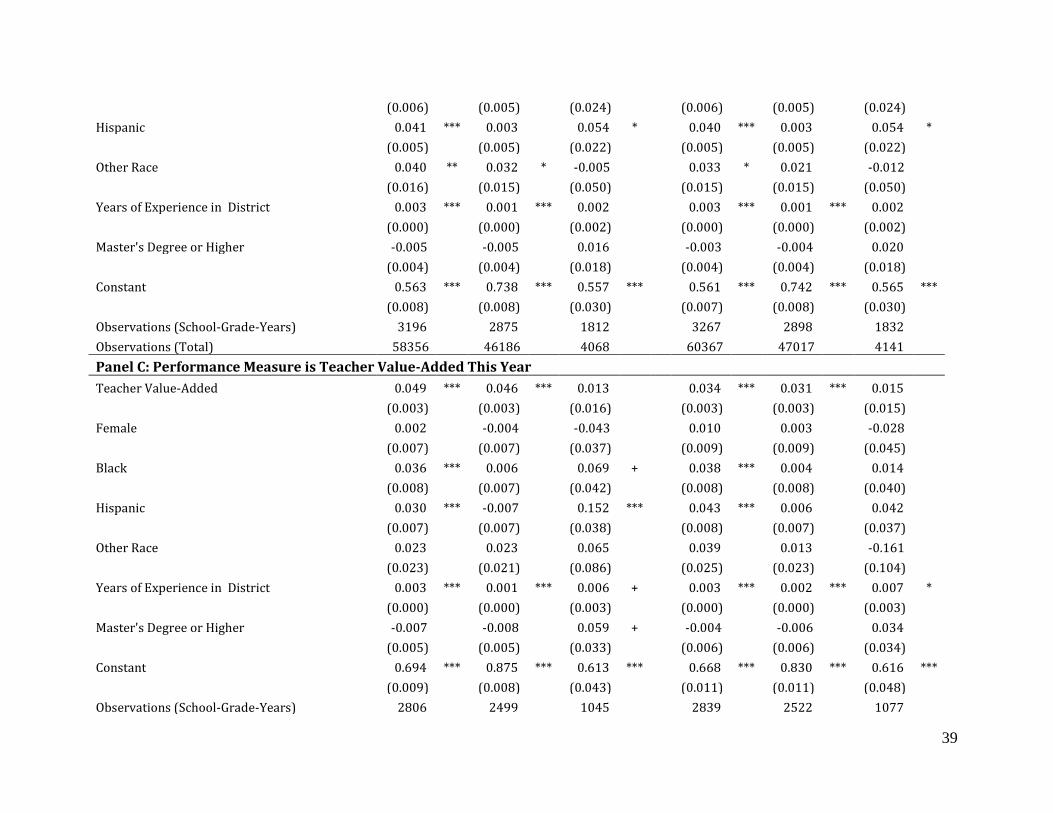
39
(0.006) (0.005) (0.024)
(0.006) (0.005) (0.024)
Hispanic 0.041 *** 0.003 0.054 *
0.040 *** 0.003 0.054 *
(0.005) (0.005) (0.022)
(0.005) (0.005) (0.022)
Other Race 0.040 ** 0.032 * -0.005
0.033 * 0.021 -0.012
(0.016) (0.015) (0.050)
(0.015) (0.015) (0.050)
Years of Experience in District 0.003 *** 0.001 *** 0.002
0.003 *** 0.001 *** 0.002
(0.000) (0.000) (0.002)
(0.000) (0.000) (0.002)
Master's Degree or Higher -0.005 -0.005 0.016
-0.003 -0.004 0.020
(0.004) (0.004) (0.018)
(0.004) (0.004) (0.018)
Constant 0.563 *** 0.738 *** 0.557 ***
0.561 *** 0.742 *** 0.565 ***
(0.008) (0.008) (0.030)
(0.007) (0.008) (0.030)
Observations (School-Grade-Years) 3196 2875 1812
3267 2898 1832
Observations (Total) 58356 46186 4068 60367 47017 4141
Panel C: Performance Measure is Teacher Value-Added This Year
Teacher Value-Added 0.049 *** 0.046 *** 0.013
0.034 *** 0.031 *** 0.015
(0.003) (0.003) (0.016)
(0.003) (0.003) (0.015)
Female 0.002 -0.004 -0.043
0.010 0.003 -0.028
(0.007) (0.007) (0.037)
(0.009) (0.009) (0.045)
Black 0.036 *** 0.006 0.069 +
0.038 *** 0.004 0.014
(0.008) (0.007) (0.042)
(0.008) (0.008) (0.040)
Hispanic 0.030 *** -0.007 0.152 ***
0.043 *** 0.006 0.042
(0.007) (0.007) (0.038)
(0.008) (0.007) (0.037)
Other Race 0.023 0.023 0.065
0.039 0.013 -0.161
(0.023) (0.021) (0.086)
(0.025) (0.023) (0.104)
Years of Experience in District 0.003 *** 0.001 *** 0.006 +
0.003 *** 0.002 *** 0.007 *
(0.000) (0.000) (0.003)
(0.000) (0.000) (0.003)
Master's Degree or Higher -0.007 -0.008 0.059 +
-0.004 -0.006 0.034
(0.005) (0.005) (0.033)
(0.006) (0.006) (0.034)
Constant 0.694 *** 0.875 *** 0.613 ***
0.668 *** 0.830 *** 0.616 ***
(0.009) (0.008) (0.043)
(0.011) (0.011) (0.048)
Observations (School-Grade-Years) 2806 2499 1045
2839 2522 1077

40
Observations (Total) 25457 20247 1621 25404 20633 1676 Notes: All models contain teacher covariates and school-by-year fixed effects. Samples are restricted to teachers who teach students tested in math or reading in a given year. The outcome is a binary indicator for whether a teacher remains in a tested grade/subject at time t+1. Standard errors are clustered at the teacher level. ***p<.001; **p<.01; *p<.05; +p<.10.
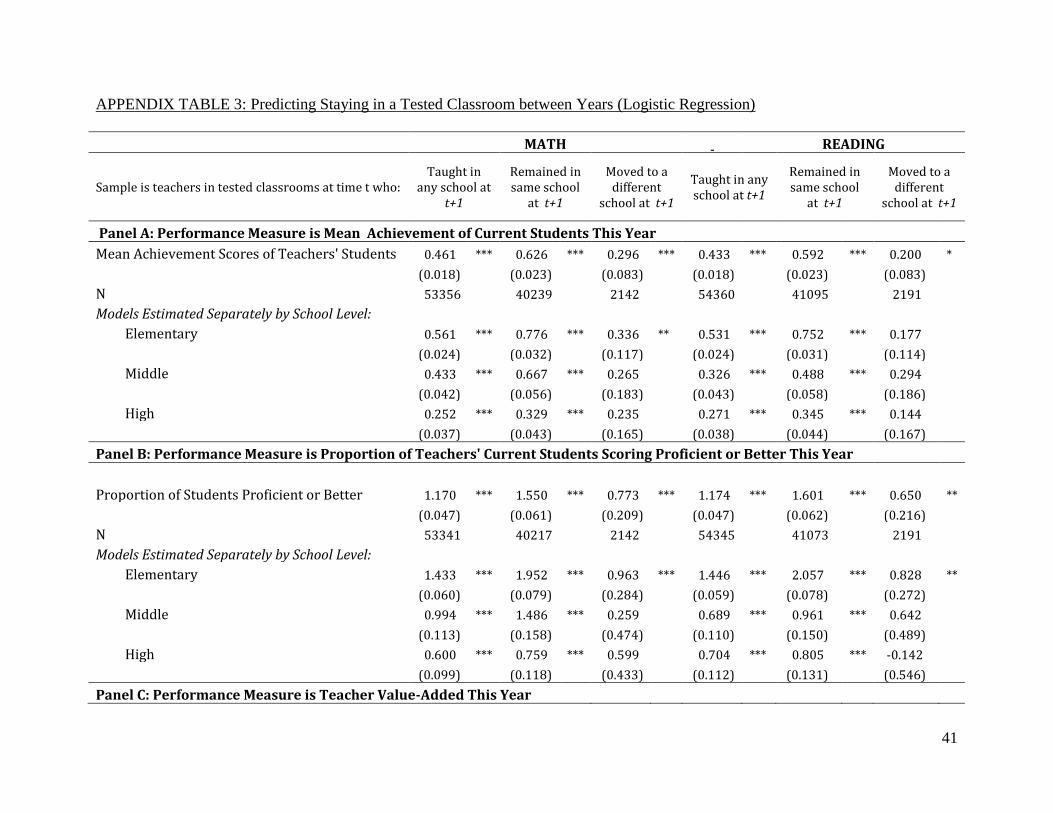
41
APPENDIX TABLE 3: Predicting Staying in a Tested Classroom between Years (Logistic Regression)
MATH READING
Sample is teachers in tested classrooms at time t who: Taught in
any school at t+1
Remained in same school
at t+1
Moved to a different
school at t+1
Taught in any school at t+1
Remained in same school
at t+1
Moved to a different
school at t+1
Panel A: Performance Measure is Mean Achievement of Current Students This Year
Mean Achievement Scores of Teachers' Students 0.461 *** 0.626 *** 0.296 *** 0.433 *** 0.592 *** 0.200 *
(0.018) (0.023) (0.083) (0.018) (0.023) (0.083)
N 53356 40239 2142 54360 41095 2191
Models Estimated Separately by School Level: Elementary 0.561 *** 0.776 *** 0.336 ** 0.531 *** 0.752 *** 0.177
(0.024) (0.032) (0.117) (0.024) (0.031) (0.114)
Middle 0.433 *** 0.667 *** 0.265 0.326 *** 0.488 *** 0.294
(0.042) (0.056) (0.183) (0.043) (0.058) (0.186)
High 0.252 *** 0.329 *** 0.235 0.271 *** 0.345 *** 0.144
(0.037) (0.043) (0.165) (0.038) (0.044) (0.167)
Panel B: Performance Measure is Proportion of Teachers' Current Students Scoring Proficient or Better This Year
Proportion of Students Proficient or Better 1.170 *** 1.550 *** 0.773 *** 1.174 *** 1.601 *** 0.650 **
(0.047) (0.061) (0.209) (0.047) (0.062) (0.216)
N 53341 40217 2142
54345 41073 2191
Models Estimated Separately by School Level: Elementary 1.433 *** 1.952 *** 0.963 *** 1.446 *** 2.057 *** 0.828 **
(0.060) (0.079) (0.284) (0.059) (0.078) (0.272)
Middle 0.994 *** 1.486 *** 0.259 0.689 *** 0.961 *** 0.642
(0.113) (0.158) (0.474) (0.110) (0.150) (0.489)
High 0.600 *** 0.759 *** 0.599 0.704 *** 0.805 *** -0.142
(0.099) (0.118) (0.433) (0.112) (0.131) (0.546)
Panel C: Performance Measure is Teacher Value-Added This Year

42
Teacher Value-Added 0.347 *** 0.466 *** 0.045 0.213 *** 0.253 *** 0.074
(0.020) (0.027) (0.110) (0.018) (0.023) (0.096)
N 20405 13055 452 21487 14713 526
Models Estimated Separately by School Level: Elementary 0.400 *** 0.527 *** 0.279 + 0.284 *** 0.356 *** 0.132
(0.025) (0.035) (0.157) (0.023) (0.030) (0.136)
Middle 0.438 *** 0.812 *** -0.003 0.040 0.038 -0.126
(0.048) (0.079) (0.242) (0.040) (0.052) (0.203)
High 0.131 ** 0.191 *** -0.481 0.180 *** 0.206 *** 0.068
(0.043) (0.053) (0.298) (0.038) (0.045) (0.216)
Notes: All models contain teacher covariates and school-by-year fixed effects. Samples are restricted to teachers who teach students tested in math or reading in a given year. The outcome is a binary indicator for whether a teacher remains in a tested grade/subject at time t+1. Standard errors are clustered at the teacher level. ***p<.001; **p<.01; *p<.05; +p<.10.

43
APPENDIX TABLE 4: Testing for Non-Linearities in the Association between Performance and Remaining in a Tested Classroom
MATH
READING
Sample is teachers in tested classrooms at time t who:
Taught in any school at t+1
Remained in same school
at t+1
Moved to a different
school at t+1
Taught in any school at t+1
Remained in same school at
t+1
Moved to a different
school at t+1
Panel A: Performance Measure is Mean Achievement of Current Students This Year
Mean Achievement Scores of Teachers' Students
0.066 *** 0.067 *** 0.035 *
0.057 *** 0.060 *** 0.017
(0.003) (0.003) (0.018)
(0.003) (0.003) (0.018)
Mean Achievement Scores of Teachers' Students2
-0.014 *** -0.019 *** -0.024 *
-0.021 *** -0.026 *** -0.026 +
(0.003) (0.003) (0.011)
(0.003) (0.003) (0.014)
N 58373 46201 4068 60384 47032 4141
Panel B: Performance Measure is Proportion of Teachers' Current Students Scoring Proficient or Better This Year
Proportion of Students Proficient or Better
0.365 *** 0.423 *** 0.448 ***
0.354 *** 0.406 *** 0.315 **
(0.027) (0.028) (0.112)
(0.025) (0.026) (0.107)
Proportion of Students Proficient or Better2
-0.171 *** -0.223 *** -0.306 **
-0.174 *** -0.216 *** -0.196 +
(0.023) (0.024) (0.107)
(0.023) (0.023) (0.106)
N 58356 46186 4068
60367 47017 4141
Panel C: Performance Measure is Teacher Value-Added This Year
Teacher Value-Added 0.048 *** 0.045 *** 0.015
0.034 *** 0.030 *** 0.014
(0.003) (0.003) (0.015)
(0.003) (0.003) (0.016)
Teacher Value-Added2 -0.005 ** -0.007 *** 0.004
-0.002 -0.004 * -0.003
(0.002) (0.002) (0.008)
(0.002) (0.002) (0.009)
N 25457 20247 1621 25404 20633 1676 Notes: All models contain teacher covariates and school-by-year fixed effects. Samples are restricted to teachers who teach students tested in math or reading in a given year. The outcome is a binary indicator for whether a teacher remains in a tested grade/subject at time t+1. Standard errors are clustered at the teacher level. ***p<.001; **p<.01; *p<.05; +p<.10.

44
FIGURE 1: Association between teacher value-added in math and probability of staying or
switching grades
.05
.15
.25
.35
.45
.55
.65
Pro
ba
bili
ty
-1 -.5 0 .5 1Teacher Value-Added
Same Grade Next Year
.05
.15
.25
.35
.45
.55
.65
Pro
ba
bili
ty
-1 -.5 0 .5 1Teacher Value-Added
New Grade Next Year, Same K-2 or 3-5 Set
.05
.15
.25
.35
.45
.55
.65
Pro
ba
bili
ty-1 -.5 0 .5 1
Teacher Value-Added
New Grade Next Year, Switches K-2 or 3-5 Set
Relationship between Teacher Value-Added and Probability of Staying or Switching Grades
3-5 Teachers K-2 Teachers

45
TABLE 1: Descriptive Statistics
Administrative Data Survey Data Mean SD N
Mean SD N
Teacher Characteristics
Female 0.77
196879
0.80
6232
White 0.27
196882
0.30
6232
Black 0.26
196882
0.25
6232
Hispanic 0.45
196882
0.43
6232
Other Race 0.02
196882
0.02
6232
MA or Higher 0.37
196882
0.40
6232
Experience in the District 10.54 9.16 196882
11.09 8.95 6232
Teaches Tested Grade 0.37
182739
0.36
5882
Switches from Tested to Non-Tested Grade Next Year1 0.14
61241
0.16
2104
Class Characteristics
Average Prior Year Math Achievement -0.13 0.71 150119
-0.11 0.71 5260
Proportion Receiving Free or Reduced Lunch 0.69 0.24 196770
0.74 0.22 6228
Proportion Black 0.28 0.32 196770
0.29 0.33 6228
Proportion White 0.09 0.12 196770
0.08 0.11 6228
Involvement in Class Assignments (Yes/No)
Me
0.16 0.36 6568
Other Teachers in My grade
0.12 0.32 6568
Teachers in the Grade Below
0.16 0.36 6568
Other Teachers in My grade
0.11 0.32 6568
Principal
0.51 0.50 6568
Assistant Principals
0.64 0.48 6568
Counselors
0.38 0.48 6568
Parents
0.07 0.26 6568
Students
0.07 0.25 6568
1Restricted to teachers in a tested grade in year t-1.

46
TABLE 2: Linear Probability Models Predicting Staying in a Tested Grade from Current Year to Next Year
MATH
READING
Sample is teachers in tested classrooms at time t who:
Taught in any school at t+1
Remained in same school
at t+1
Moved to a different
school at t+1
Taught in any school at t+1
Remained in same school at
t+1
Moved to a different
school at t+1
Panel A: Performance Measure is Mean Achievement of Current Students This Year
(1) (2) (3)
(4) (5) (6)
Mean Achievement Scores of Teachers' Students 0.075 *** 0.079 *** 0.060 ***
0.069 *** 0.074 *** 0.041 **
(0.003) (0.003) (0.014)
(0.003) (0.003) (0.014)
N 58373 46201 4068
60384 47032 4141
Models Estimated Separately by School Level: Elementary 0.082 *** 0.084 *** 0.066 ***
0.078 *** 0.082 *** 0.035 +
(0.004) (0.004) (0.019)
(0.004) (0.004) (0.018)
Middle 0.070 *** 0.078 *** 0.053 +
0.050 *** 0.055 *** 0.058 +
(0.007) (0.008) (0.029)
(0.007) (0.008) (0.031)
High 0.056 *** 0.064 *** 0.052 +
0.055 *** 0.066 *** 0.034
(0.009) (0.009) (0.031)
(0.008) (0.009) (0.033)
Panel B: Performance Measure is Proportion of Teachers' Current Students Scoring Proficient or Better This Year
(7) (8) (9)
(10) (11) (12)
Proportion of Students Proficient or Better 0.186 *** 0.187 *** 0.155 ***
0.180 *** 0.188 *** 0.133 ***
(0.008) (0.008) (0.035)
(0.008) (0.008) (0.036)
N 58356 46186 4068
60367 47017 4141
Models Estimated Separately by School Level: Elementary 0.213 *** 0.211 *** 0.189 ***
0.213 *** 0.222 *** 0.166 ***
(0.009) (0.009) (0.045)
(0.009) (0.009) (0.044)
Middle 0.150 *** 0.154 *** 0.061
0.103 *** 0.104 *** 0.124
(0.018) (0.018) (0.075)
(0.018) (0.018) (0.076)
High 0.129 *** 0.142 *** 0.133
0.133 *** 0.147 *** -0.025
(0.023) (0.024) (0.084) (0.023) (0.026) (0.110)
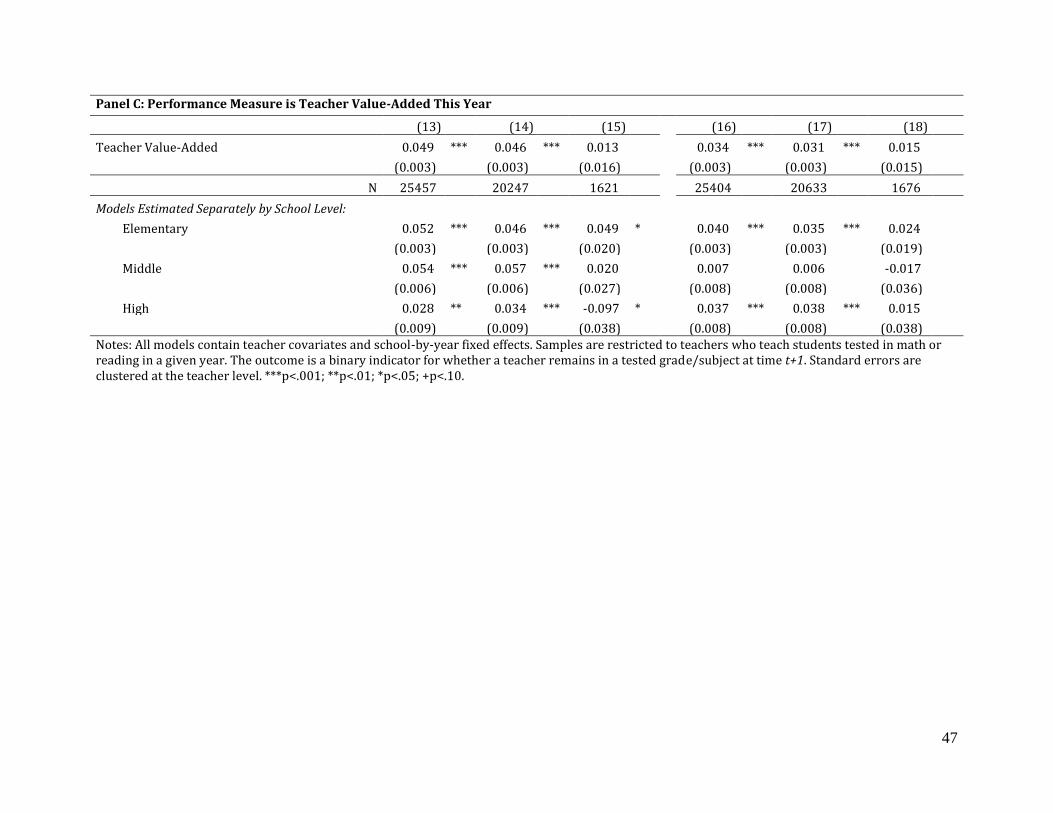
47
Panel C: Performance Measure is Teacher Value-Added This Year
(13) (14) (15)
(16) (17) (18)
Teacher Value-Added 0.049 *** 0.046 *** 0.013
0.034 *** 0.031 *** 0.015
(0.003) (0.003) (0.016)
(0.003) (0.003) (0.015)
N 25457 20247 1621
25404 20633 1676
Models Estimated Separately by School Level: Elementary 0.052 *** 0.046 *** 0.049 *
0.040 *** 0.035 *** 0.024
(0.003) (0.003) (0.020)
(0.003) (0.003) (0.019)
Middle 0.054 *** 0.057 *** 0.020
0.007 0.006 -0.017
(0.006) (0.006) (0.027)
(0.008) (0.008) (0.036)
High 0.028 ** 0.034 *** -0.097 *
0.037 *** 0.038 *** 0.015
(0.009) (0.009) (0.038)
(0.008) (0.008) (0.038)
Notes: All models contain teacher covariates and school-by-year fixed effects. Samples are restricted to teachers who teach students tested in math or reading in a given year. The outcome is a binary indicator for whether a teacher remains in a tested grade/subject at time t+1. Standard errors are clustered at the teacher level. ***p<.001; **p<.01; *p<.05; +p<.10.

48
TABLE 3: Linear Probability Models Predicting Staying in a Tested Grade between Years, By School Performance
MATH
READING
Sample is teachers in tested classrooms at time t who: Taught in any school at t+1
Remained in same school at
t+1
Taught in any school at t+1
Remained in same school
at t+1
Panel A: Performance Measure is Mean Achievement of Current Students This Year
School Accountability Grade Interaction (1) (2)
(3) (4)
Mean Achievement Scores of Teachers' Students 0.082 *** 0.111 ***
0.066 *** 0.093 ***
(0.009) (0.010)
(0.010) (0.011)
Mean Achievement Scores of Teachers' Students × A Grade
-0.000 -0.011 +
0.009 -0.003
(0.006) (0.006)
(0.006) (0.006) Mean Achievement Scores of Teachers' Students × F Grade
0.003 0.064 **
0.007 0.054 *
(0.021) (0.024)
(0.023) (0.026)
N 56430 44713
58416 45537
School Value-Added Interaction (5) (6)
(7) (8)
Mean Achievement Scores of Teachers' Students 0.071 *** 0.079 ***
0.067 *** 0.075 ***
(0.004) (0.004)
(0.004) (0.004)
Mean Achievement Scores of Teachers' Students × School Value-Added
0.011 ** 0.015 ***
0.011 ** 0.016 ***
(0.004) (0.004)
(0.004) (0.004)
N 46079 36092
46729 36622
Panel B: Performance Measure is Proportion of Teachers' Current Students Scoring Proficient or Better This Year
School Accountability Grade Interaction (9) (10)
(11) (12)
Proportion of Students Proficient or Better 0.172 *** 0.182 ***
0.159 *** 0.181 ***
(0.011) (0.012)
(0.011) (0.012)
Proportion of Students Proficient or Better × A Grade 0.028 + 0.003
0.038 * 0.010
(0.015) (0.016)
(0.015) (0.016) Proportion of Students Proficient or Better × F Grade 0.044 0.179 *
0.075 0.215 *
(0.064) (0.072)
(0.083) (0.091)
N 58356 46186
60367 47017
School Value-Added Interaction (13) (14)
(15) (16)
Proportion of Students Proficient or Better 0.181 *** 0.192 ***
0.175 *** 0.193 ***
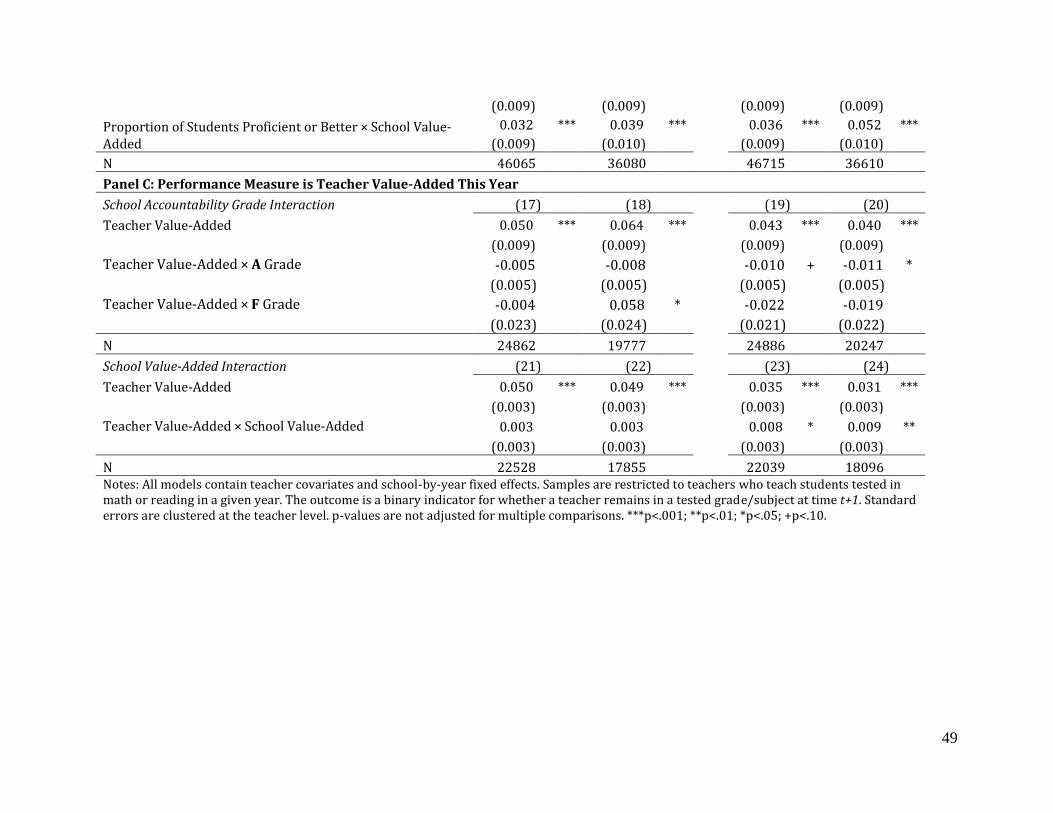
49
(0.009) (0.009)
(0.009) (0.009)
Proportion of Students Proficient or Better × School Value-Added
0.032 *** 0.039 ***
0.036 *** 0.052 ***
(0.009) (0.010)
(0.009) (0.010)
N 46065 36080
46715 36610
Panel C: Performance Measure is Teacher Value-Added This Year
School Accountability Grade Interaction (17) (18)
(19) (20)
Teacher Value-Added 0.050 *** 0.064 ***
0.043 *** 0.040 ***
(0.009) (0.009)
(0.009) (0.009)
Teacher Value-Added × A Grade -0.005 -0.008
-0.010 + -0.011 *
(0.005) (0.005)
(0.005) (0.005)
Teacher Value-Added × F Grade -0.004 0.058 *
-0.022 -0.019
(0.023) (0.024)
(0.021) (0.022)
N 24862 19777
24886 20247
School Value-Added Interaction (21) (22)
(23) (24)
Teacher Value-Added 0.050 *** 0.049 ***
0.035 *** 0.031 ***
(0.003) (0.003)
(0.003) (0.003)
Teacher Value-Added × School Value-Added 0.003 0.003
0.008 * 0.009 **
(0.003) (0.003)
(0.003) (0.003)
N 22528 17855
22039 18096 Notes: All models contain teacher covariates and school-by-year fixed effects. Samples are restricted to teachers who teach students tested in math or reading in a given year. The outcome is a binary indicator for whether a teacher remains in a tested grade/subject at time t+1. Standard errors are clustered at the teacher level. p-values are not adjusted for multiple comparisons. ***p<.001; **p<.01; *p<.05; +p<.10.

50
TABLE 4: Linear Probability Models Predicting Staying in a Tested Grade between Years, By Influence Over School Assignment
Processes
Mean Achievement Models Proficiency Models Value-Added Models
Mean Achievement
Scores of Teachers' Students
Mean Achievement
Scores of Teachers' Students ×
Assignment Factor
Proportion of Students
Proficient or Better
Proportion of Students
Proficient or Better ×
Assignment Factor
Teacher Value-Added
Teacher Value-Added × Assignment
Factor
Panel A: Math
Me 0.077 *** -0.004
0.181 *** 0.015 0.051 *** -0.005
(0.005) (0.011)
(0.013) (0.028) (0.004) (0.009) Other Teachers in My Grade 0.069 *** 0.023 *
0.162 *** 0.088 *** 0.048 *** 0.003
(0.004) (0.011)
(0.011) (0.027) (0.004) (0.009) Teachers in the Grade Below 0.070 *** 0.011
0.168 *** 0.042 * 0.050 *** -0.002
(0.005) (0.007)
(0.012) (0.019) (0.004) (0.007) Principals 0.060 *** 0.009 *
0.141 *** 0.025 ** 0.035 *** 0.008 *
(0.008) (0.004)
(0.019) (0.009) (0.007) (0.003) Assistant Principals 0.073 *** 0.001
0.179 *** 0.004 0.051 *** -0.001
(0.009) (0.004)
(0.023) (0.011) (0.007) (0.003) Counselors 0.081 *** -0.007 +
0.208 *** -0.026 ** 0.054 *** -0.005
(0.004) (0.004)
(0.011) (0.010) (0.004) (0.003) Parents 0.083 *** -0.050 **
0.207 *** -0.131 ** 0.053 *** -0.023
(0.004) (0.019)
(0.011) (0.048) (0.004) (0.016) Students 0.083 *** -0.072 ***
0.210 *** -0.234 *** 0.054 *** -0.049 *
(0.004) (0.020)
(0.009) (0.053) (0.003) (0.019) N for all models in group 58,300 58,283 25,431
Panel B: Reading
Me 0.065 *** 0.009
0.163 *** 0.045
0.034 *** -0.000
(0.005) (0.011)
(0.013) (0.028)
(0.004) (0.009) Other Teachers in My Grade 0.059 *** 0.035 **
0.145 *** 0.122 *** 0.032 *** 0.007

51
(0.004) (0.011)
(0.011) (0.027) (0.004) (0.009) Teachers in the Grade Below 0.061 *** 0.018 *
0.154 *** 0.059 ** 0.029 *** 0.010
(0.005) (0.008)
(0.012) (0.019) (0.004) (0.007) Principals 0.052 *** 0.009 *
0.130 *** 0.027 ** 0.017 * 0.009 **
(0.008) (0.004)
(0.019) (0.009) (0.007) (0.003) Assistant Principals 0.065 *** 0.002
0.154 *** 0.013 0.043 *** -0.005
(0.009) (0.004)
(0.023) (0.010) (0.008) (0.004) Counselors 0.077 *** -0.009 *
0.208 *** -0.035 *** 0.039 *** -0.007 +
(0.004) (0.004)
(0.011) (0.010) (0.004) (0.003) Parents 0.073 *** -0.026
0.191 *** -0.074
0.030 *** 0.027
(0.004) (0.019)
(0.011) (0.046)
(0.004) (0.017) Students 0.075 *** -0.062 **
0.200 *** -0.214 *** 0.037 *** -0.036 *
(0.004) (0.020)
(0.009) (0.052) (0.003) (0.018) N for all models in group 60,305 60,288 25,378
Notes: Each row reflects estimates from 3 separate models. Teacher responses to our 2011 survey items on class assignments are aggregated to the school level and then treated as a time-invariant school characteristic. All models contain teacher covariates and school-by-year fixed effects. Samples are restricted to teachers who teach students tested in math or reading in a given year. The outcome is a binary indicator for whether a teacher remains in a tested grade/subject in the same school at time t+1. Standard errors are clustered at the teacher level. ***p<.001; **p<.01; *p<.05; +p<.10.

52
TABLE 5: Mean Value-Added Among Teachers in Tested Grades in Year t, by Status in Year t+1
Math Value-Added
Reading Value-Added
Percent of those who move overall
Percent of those who
move out of tested
classroom
Percent N Elementary School
Moves to K from Grades 3-5 -0.409 *** -0.429 *** 5% 783 13%
Moves to 1st from Grades 3-5 -0.457 ** -0.293 *** 8% 1,320 22%
Moves to 2nd from Grades 3-5 -0.393 *** -0.365 *** 23% 3,725 63%
Stays in 3-5, but Changes Grades -0.100 *** -0.037
64% 10,355 Stays in 3-5, Same Grade [comparison group] 0.039
0.022
Middle School Different Subject, Grades 6-8 -0.232 *** -0.198 * 4% 123 100%
Stays in Math/Reading in Grades 6-8, but Changes Grades -0.020 *** 0.035 * 94% 3,135 Stays in Math/Reading, Same Grade [comparison group] 0.217
0.145
High School Same Subject, Grade 11-12 -0.067
-0.110 *** 51% 1,653 94%
Different Subject, Grade 11-12 -0.038
-0.123
2% 74 4%
Different Subject, Grade 9-10 -0.451 + -0.365
1% 38 2%
Stays in Math/Reading in Grades 9-10 but Changes Grade 0.009
-0.137 *** 46% 1,482 Stays in Math/Reading, Same Grade [comparison group] 0.019 0.115
Values shown are means. Asterisks indicate results of two-sided t-tests comparing value-added for teachers that switch grades/subjects to the value-added of teachers that remain in the same grade and subject in the following year. + p<.1, * p<.05, ** p<.01, *** p<.001. Analysis is restricted to teachers that teach in tested areas in year t and that stay in the same school in year t+1.
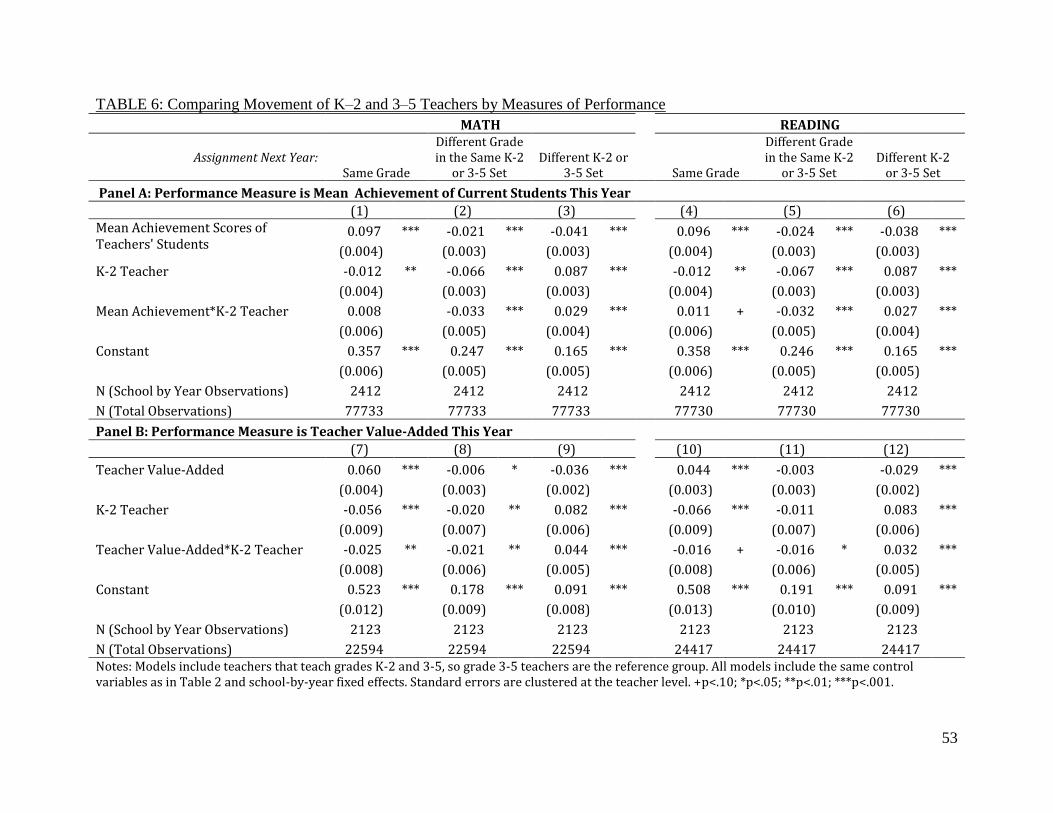
53
TABLE 6: Comparing Movement of K–2 and 3–5 Teachers by Measures of Performance
MATH
READING
Assignment Next Year: Same Grade
Different Grade in the Same K-2
or 3-5 Set Different K-2 or
3-5 Set
Same Grade
Different Grade in the Same K-2
or 3-5 Set Different K-2
or 3-5 Set
Panel A: Performance Measure is Mean Achievement of Current Students This Year (1) (2) (3)
(4) (5) (6)
Mean Achievement Scores of Teachers' Students
0.097 *** -0.021 *** -0.041 ***
0.096 *** -0.024 *** -0.038 ***
(0.004) (0.003) (0.003)
(0.004) (0.003) (0.003)
K-2 Teacher -0.012 ** -0.066 *** 0.087 ***
-0.012 ** -0.067 *** 0.087 ***
(0.004) (0.003) (0.003)
(0.004) (0.003) (0.003)
Mean Achievement*K-2 Teacher 0.008 -0.033 *** 0.029 ***
0.011 + -0.032 *** 0.027 ***
(0.006) (0.005) (0.004)
(0.006) (0.005) (0.004)
Constant 0.357 *** 0.247 *** 0.165 ***
0.358 *** 0.246 *** 0.165 ***
(0.006) (0.005) (0.005)
(0.006) (0.005) (0.005)
N (School by Year Observations) 2412 2412 2412
2412 2412 2412
N (Total Observations) 77733 77733 77733
77730 77730 77730
Panel B: Performance Measure is Teacher Value-Added This Year (7) (8) (9)
(10) (11) (12)
Teacher Value-Added 0.060 *** -0.006 * -0.036 ***
0.044 *** -0.003 -0.029 ***
(0.004) (0.003) (0.002)
(0.003) (0.003) (0.002)
K-2 Teacher -0.056 *** -0.020 ** 0.082 ***
-0.066 *** -0.011 0.083 ***
(0.009) (0.007) (0.006)
(0.009) (0.007) (0.006)
Teacher Value-Added*K-2 Teacher -0.025 ** -0.021 ** 0.044 ***
-0.016 + -0.016 * 0.032 ***
(0.008) (0.006) (0.005)
(0.008) (0.006) (0.005)
Constant 0.523 *** 0.178 *** 0.091 ***
0.508 *** 0.191 *** 0.091 ***
(0.012) (0.009) (0.008)
(0.013) (0.010) (0.009)
N (School by Year Observations) 2123 2123 2123
2123 2123 2123
N (Total Observations) 22594 22594 22594 24417 24417 24417 Notes: Models include teachers that teach grades K-2 and 3-5, so grade 3-5 teachers are the reference group. All models include the same control variables as in Table 2 and school-by-year fixed effects. Standard errors are clustered at the teacher level. +p<.10; *p<.05; **p<.01; ***p<.001.
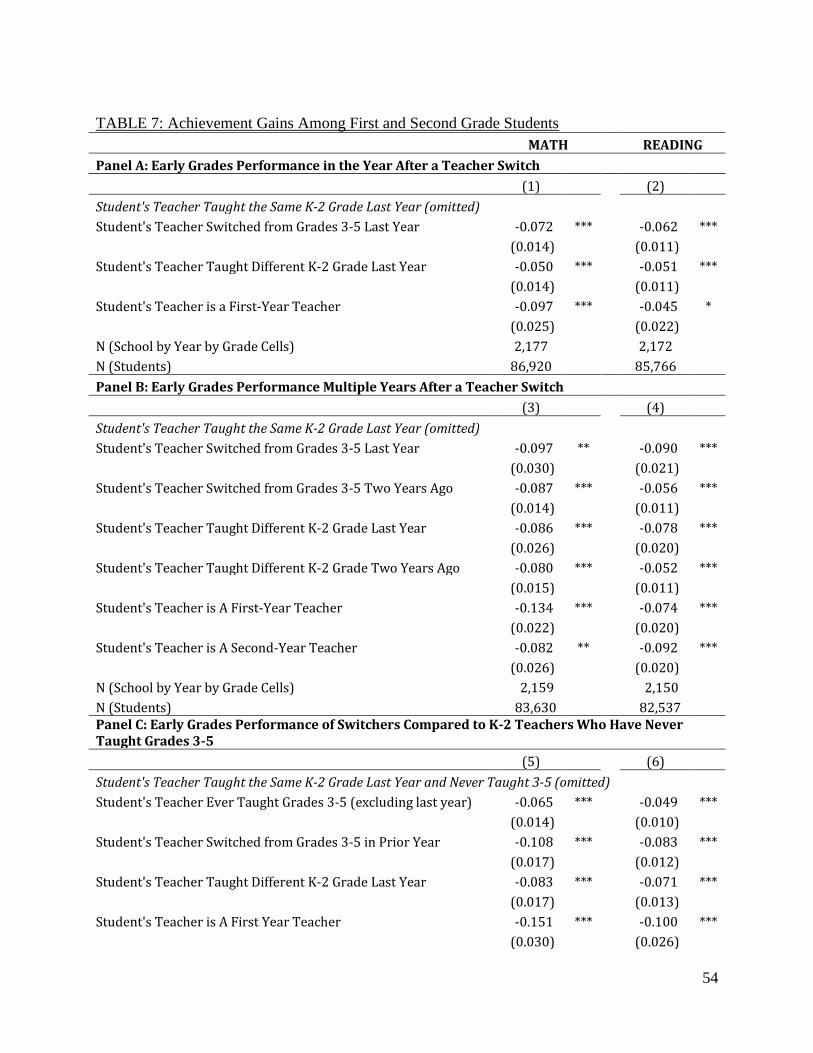
54
TABLE 7: Achievement Gains Among First and Second Grade Students
MATH READING
Panel A: Early Grades Performance in the Year After a Teacher Switch
(1) (2)
Student's Teacher Taught the Same K-2 Grade Last Year (omitted)
Student's Teacher Switched from Grades 3-5 Last Year -0.072 ***
-0.062 ***
(0.014)
(0.011)
Student's Teacher Taught Different K-2 Grade Last Year -0.050 ***
-0.051 ***
(0.014)
(0.011)
Student's Teacher is a First-Year Teacher -0.097 ***
-0.045 *
(0.025)
(0.022)
N (School by Year by Grade Cells) 2,177
2,172 N (Students) 86,920 85,766
Panel B: Early Grades Performance Multiple Years After a Teacher Switch
(3) (4)
Student's Teacher Taught the Same K-2 Grade Last Year (omitted)
Student's Teacher Switched from Grades 3-5 Last Year -0.097 **
-0.090 ***
(0.030)
(0.021)
Student's Teacher Switched from Grades 3-5 Two Years Ago -0.087 ***
-0.056 ***
(0.014)
(0.011)
Student's Teacher Taught Different K-2 Grade Last Year -0.086 ***
-0.078 ***
(0.026)
(0.020)
Student's Teacher Taught Different K-2 Grade Two Years Ago -0.080 ***
-0.052 ***
(0.015)
(0.011)
Student's Teacher is A First-Year Teacher -0.134 ***
-0.074 ***
(0.022)
(0.020)
Student's Teacher is A Second-Year Teacher -0.082 **
-0.092 ***
(0.026)
(0.020)
N (School by Year by Grade Cells) 2,159
2,150 N (Students) 83,630 82,537
Panel C: Early Grades Performance of Switchers Compared to K-2 Teachers Who Have Never Taught Grades 3-5
(5) (6)
Student's Teacher Taught the Same K-2 Grade Last Year and Never Taught 3-5 (omitted)
Student's Teacher Ever Taught Grades 3-5 (excluding last year) -0.065 ***
-0.049 ***
(0.014)
(0.010)
Student's Teacher Switched from Grades 3-5 in Prior Year -0.108 ***
-0.083 ***
(0.017)
(0.012)
Student's Teacher Taught Different K-2 Grade Last Year -0.083 ***
-0.071 ***
(0.017)
(0.013)
Student's Teacher is A First Year Teacher -0.151 ***
-0.100 ***
(0.030)
(0.026)

55
N (School by Year by Grade Cells) 2,197
2,200
N (Students) 90,005
89,916 Notes: The models include first and second grade students with valid test scores from the prior year. The outcome is student test scores in a given year with controls for the prior year test score, student race/ethnicity, gender, free lunch eligibility, and limited English proficiency as well as the aggregate of these student-level measures at the class-level. They also include school-by-year-by-grade fixed effects. The standard errors are clustered at the teacher level. Asterisks indicate significant differences from the omitted category. +p<.10; *p<.05; **p<.01; ***p<.001.

56
TABLE 8: Achievement among Third Grade Students, By Status of Second Grade Teacher
MATH READING
Panel A: 3rd Grade Achievement
(1) p (2) p (3) p
(4) p (5) p (6) p Student's 2nd Grade Teacher Switched from Grades 3-5 in Year Prior to Teaching Student
-0.023 ** ref -0.029 * ref -0.031 ** ref
-0.032 *** ref -0.032 ** ref -0.028 ** ref
(0.008)
(0.013)
(0.011)
(0.008)
(0.011)
(0.009) Student's 2nd Grade Teacher Taught
Different K-2 Grade in Year Prior to Teaching Student
-0.012 0.31 0.010 0.03 -0.006 0.10
-0.018 * 0.15 0.005 0.02 -0.005 0.08
(0.009)
(0.014)
(0.012)
(0.008)
(0.013)
(0.011) Student's 2nd Grade Teacher was a First-
Year Teacher -0.037 *** 0.25 -0.050 * 0.40 -0.027 0.83
-0.033 *** 0.97 -0.031 0.96 -0.015 0.50
(0.010)
(0.023)
(0.019)
(0.009)
(0.022)
(0.018) N (School by Year by Grade Cells) 2187
1001
1001
2191
1005
1005 N (Students) 154332 49918 49918
148779 47438 47438
Panel B: 4th Grade Achievement
(7) p (8) p (9) p (10) p (11) p (12) p Student's 2nd Grade Teacher Switched from Grades 3-5 in Year Prior to Teaching Student
-0.014 + ref -0.016 ref -0.020 ref
-0.016 * ref -0.019 ref -0.016 ref
(0.008)
(0.014)
(0.013)
(0.007)
(0.012)
(0.011) Student's 2nd Grade Teacher Taught
Different K-2 Grade in Year Prior to Teaching Student
-0.006 0.44 0.010 0.17 -0.013 0.66
-0.013 0.76 -0.009 0.55 -0.017 0.92
(0.009)
(0.015)
(0.014)
(0.008)
(0.014)
(0.013) Student's 2nd Grade Teacher was a First-
Year Teacher -0.042 *** 0.02 -0.015 0.98 -0.001 0.41
-0.043 *** 0.01 -0.053 ** 0.14 -0.039 * 0.26
(0.010)
(0.024)
(0.021)
(0.009)
(0.020)
(0.018) N (School by Year by Grade Cells) 1968
759
759
1963
758
758 N (Students) 115549 31498 31498
109408 29107 29107
Restricted to Sample with 1st Grade Scores No Yes Yes No Yes Yes Control for 1st Grade SAT-10 Scores No No Yes No No Yes
Notes: Models are restricted to 3rd and 4th grade students. Outcome is student test score in 3rd grade (Panel A) or 4th grade (Panel B). Key predictors are characteristics of students' 2nd grade teachers; the omitted category is 2nd grade teachers who also taught 2nd grade in the year prior to teaching the student. Models include controls for student race/ethnicity, gender, free lunch eligibility, and limited English proficiency, and the aggregate of these student-level measures at the class level. They also include school-by-year fixed effects. Standard errors are clustered at the 2nd grade teacher level. Values shown in the columns labeled p are p-values for a test of equality between the coefficient and the coefficient on switching from grades 3-5. +p<.10; *p<.05; **p<.01; ***p<.001.
Related Documents