Third Meeting for the Sixth Replenishment of the GEF Trust Fund December 10-12, 2013 Paris, France GEF/R.6/19 November 20, 2013 STRATEGIC POSITIONING FOR THE GEF (Prepared by GEF Secretariat)

Welcome message from author
This document is posted to help you gain knowledge. Please leave a comment to let me know what you think about it! Share it to your friends and learn new things together.
Transcript

Third Meeting for the Sixth Replenishment of the GEF Trust Fund
December 10-12, 2013
Paris, France
GEF/R.6/19
November 20, 2013
STRATEGIC POSITIONING FOR THE GEF
(Prepared by GEF Secretariat)
i
TABLE OF CONTENTS
Introduction ........................................................................................................................................ 3
Strategic Context ................................................................................................................................ 3
Differentiation .................................................................................................................................... 5
Updating the STAR ........................................................................................................................ 5
Co-financing ................................................................................................................................... 9
Non-Grant Financing .................................................................................................................... 14
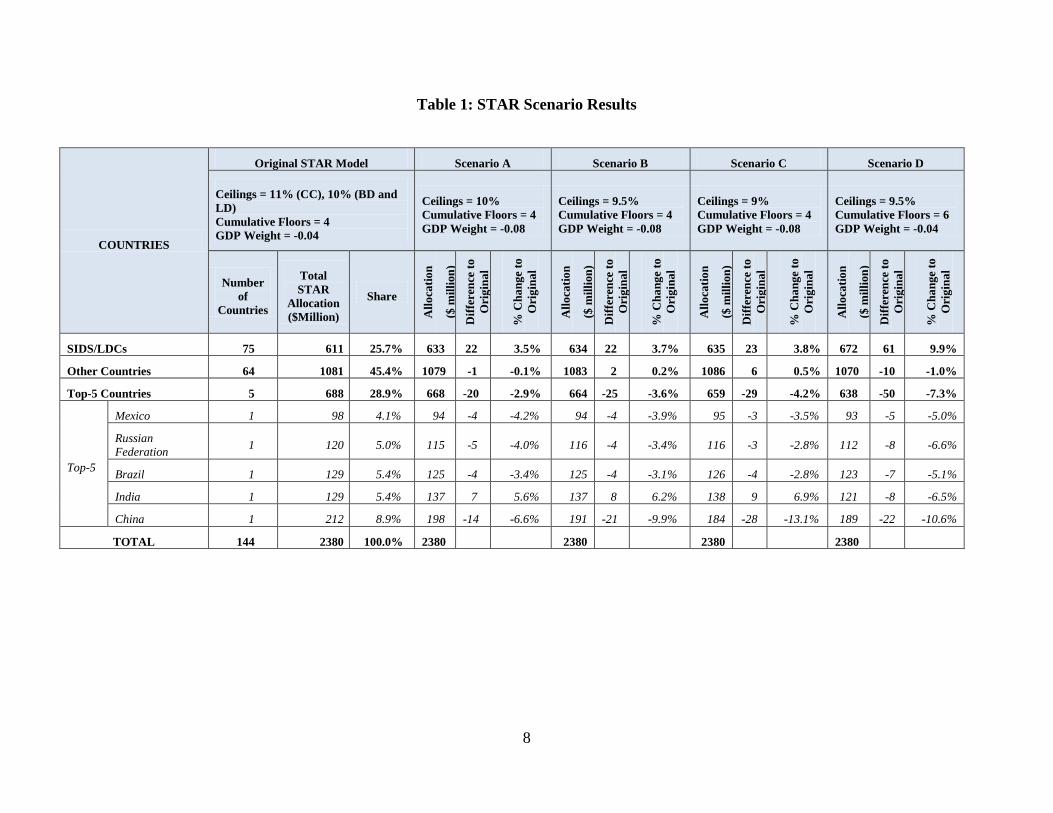
Overall Directions for Differentiation .......................................................................................... 21
Improving the Efficiency of the GEF Project Cycle ........................................................................ 21
Enhancing Private Sector Engagement ............................................................................................. 23
Private Sector Engagement in GEF-6 ........................................................................................... 23
Enhancing Gender Mainstreaming ................................................................................................... 26
Remaining Challenges and Gaps .................................................................................................. 29
GEF-6 Gender Plan of Action ...................................................................................................... 29
Key Elements of the Gender Plan of Action ................................................................................ 30
Strengthening Results and Knowledge Management ....................................................................... 34
Further Development of the Results-based Management Framework ......................................... 35
Building a Knowledge Management System ............................................................................... 37
List of Annexes
Annex I: An Overview of the STAR ................................................................................................ 41
Annex II: Status of Co-financing to Date ........................................................................................ 44
List of Figures
Figure 1: Areas for Potential Future Emphasis in GEF-6 Set-aside ................................................. 26
Figure 3: GEF Publications in 2012 ................................................................................................. 38
Figure 4: Priorities Identified in the KM Needs Assessment ........................................................... 39
Figure 5: Calculation of Country Scores .......................................................................................... 41

ii
List of Tables
Table 1: STAR Scenario Results ........................................................................................................ 8
Table 2: Co-financing Ratios by Country Income Groups, GEF-4, and GEF-5 .............................. 12
Table 3: Co-financing Rations among Top-5 Recipient Countries, GEF-4 and GEF-5 ................... 13
Table 4: Co-financing Ratios across Focal Areas in Freestanding and Blended Projects among Top-
5 Recipient Countries, GEF-4 and GEF-5 ........................................................................................ 14
Table 5: Use of Non-grant Instruments across GEF Phases ............................................................. 16
Table 6: Non-grant Instruments by Focal Area ................................................................................ 17
Table 7: Use of Non-grant Instrument Types ................................................................................... 17
Table 8: Use of Non-grant Instruments across Country Income Category ...................................... 19
Table 12: Time Taken during Different Stages of the Project Preparation Process ......................... 22
Table 10: Results Framework for Gender Mainstreaming in GEF Operations ................................ 34
Table 11: Floors and Ceilings of the STAR Model .......................................................................... 42
Table 12: STAR Flexibility Bands ................................................................................................... 43
Table 13: Full size Project Co-financing Ratios since the Pilot Phase ............................................. 44
Table 14: Co-financing by Focal Area ............................................................................................. 46
Table 15: Co-financing by Focal Area and Source – GEF-4 and GEF-5 ......................................... 46
Table 16: Co-financing by GEF Agency, GEF-4-5 only .................................................................. 47
Table 17: Co-financing Ratios by Country Income Groups, GEF-4 and GEF-5 ............................. 48
Table 18: Focal Area Contributions to Co-financing, by Country Income Groups, GEF-4 and GEF-
5 ........................................................................................................................................................ 49
Table 19: Source of Co-financing, by Country Income Groups, GEF-4 and GEF-5 ....................... 49
Table 20: Co-financing Ratios among Top-5 Recipient Countries, GEF4-5 ................................... 50
Table 21: Co-financing Ratios across Focal Areas in Freestanding and Blended Projects among
Top-5 Recipient Countries, GEF4-5 ................................................................................................. 51

3
INTRODUCTION
1. This document outlines the elements for the strategic positioning of the GEF for the sixth
replenishment period (GEF-6) covering July 01, 2014 to June 30, 2018. The document first
presents directions that have emerged from the long-term strategy development exercise
underway (GEF2020). GEF2020 will provide the overall strategic directions the GEF may take
in the longer run, with some of the first steps being feasible for implementation during GEF-6.
Second, this document proposes possible ways of addressing issues that emerged during
discussions at the first (Paris, April 2013) and second (New Delhi, September 2013)
replenishment meetings: (i) differentiation in programming resources; (ii) improving the
efficiency of the project cycle; (iii) enhancing engagement with the private sector; (iv) enhancing
gender mainstreaming; and (v) strengthening the results-based management and knowledge
management systems.
STRATEGIC CONTEXT
2. GEF2020 lays out the case for higher and more systemic impacts at scale and explores
the means to achieve those goals. What follows are the key findings that emerged from the
GEF2020 exercise so far.
3. The earth’s environmental challenges are intensifying. Ecosystems are approaching
their limits as growing human demands may be pushing them beyond their carrying capacity and
stressing natural resilience mechanisms to the extent that abrupt changes can no longer be
excluded. As a consequence, if measures to tackle the drivers of environmental degradation are
delayed, the costs of facing them in the future will become prohibitively high or simply
impossible to reverse. The pressure on resources is set to increase in the coming decades as a
result of three global megatrends, viz., a 2 billion increase in global population by 2050,
accompanied by a rapid increase in the global middle class by 3 billion in just the next two
decades, almost all of whom are likely to live in cities. These megatrends influence various
indirect drivers as the world needs to meet a doubling in demand for food, energy, human
habitat, transportation, and others.
4. Given these challenges, incremental gains in managing global environment will not
suffice. Articulating the causal chain from megatrends to the state of global environment can
bring the mandate of the GEF into a sharper focus, and by adopting a stronger focus on the
drivers that lead to unsustainable use of resources, the GEF will better be able to tackle the root
causes of environmental degradation, which will be critical to slow and eventually reverse
environmental trends. It would also help the GEF create synergies across several environmental
domains, and enable GEF to enhance its contribution to countries’ broader national development
goals consistent with country-ownership and guidance from the multilateral environmental
conventions.
5. The landscape for global environmental financing is rapidly evolving. While the last
decade has seen an increasing number of public funds directed towards environmental financing,
largely in the area of climate change, the volume of the funds do not match the scale of the
problems to be tackled. Meanwhile, global private capital flows have dramatically increased
providing significant opportunities for supporting the global environment through the
establishment of appropriate policy frameworks and incentives.
4
6. The GEF has a number of strengths upon which its future strategic positioning can
be built. Among the key strengths are: (i) more than two decades of experience of the GEF
network in implementing projects that deliver global environmental benefits focusing on
innovations; (ii) high degree of international legitimacy derived from its association with key
multilateral environmental conventions; (iii) programs and projects reviewed and guided by a
world-class Scientific and Technical Advisory Panel (STAP), and the results-on-the ground
being continuously assessed by the independent Evaluation Office; (iv) an equitable governance
structure; and (v) a strong and expanding network of implementing partners, civil society and
indigenous peoples organizations, and the private sector.
7. Ongoing international discussions on sustainable development also provide an
opportunity for the GEF to deliver its contribution by firmly integrating the key
dimensions of the environmental agenda that for the past two decades have become
increasingly fragmented and thus less relevant to the implementation of the sustainable
development agenda. These international deliberations further recognized that the GEF remains
unique among multilateral funding mechanisms in being able to more seamlessly integrate
various interrelated and reinforcing environmental objectives in its quest to promote cost-
efficiency and higher impact when using scarce resources. In order for this potential to
materialize fully, a more integrated approach to resource programming is presented as a set of
Integrated Approach pilots as an integral part of the Programming Directions Document.
8. For each intervention, GEF must carefully select the most effective way to catalyze
impact. In addition to strengthening a “driver-focused approach,” the GEF must also identify
the most effective ways to enhance the impact of its interventions. GEF2020 suggest five
complementary influencing models for the GEF, that are capable of tackling the common
barriers we see in practice, including: (i) transforming policy and regulatory environments to
support governments to put in place the policies, regulations and institutions that can change
their own investment decisions, and provide individuals and companies operating at various
levels – local, national, multinational – appropriate incentives to change their consumption and
production choices; (ii) demonstrating innovative approaches, aimed at supporting the validation
of a technology or approach, with the aim of helping unlock the market for a greener technology
or create a beacon effect for the replication of the target technology or approach; (iii)
strengthening institutional capacity and decision-making processes to improve information,
participation, and accountability in public and private decisions that have a significant impact on
the environment; (iv) convening multi-stakeholder alliances to develop and implement
sustainable resource use practices or bring them to scale through multi-country political
commitments; and finally (v) de-risking and incrementally financing investments that investors
are not willing to accept or that local development benefits would not have the incentive to
cover.
9. The proposed GEF-6 programing takes into account these key messages from the
GEF2020 exercise. In particular, each of the focal area strategies makes efforts to tackle
underlying drivers whenever appropriate, while it continues to address pressure points directly
when urgent actions are needed. Focal area strategies also seek to exploit opportunities to help
create enabling environments as important catalyzers. Furthermore, a set of Integrated
Approaches is proposed to more effectively address key underlying drivers by creating joint
upfront platforms among key stakeholders.
5
10. The GEF partnership continues to evolve and be resilient. The GEF partnership has
expanded over the years, from three to 12 Agencies.1 More regional and national agencies are
expected to complete the accreditation process in 2014. In its role as a financial mechanism to
the international environmental agreements, the GEF now serves five conventions. Civil society
organizations and indigenous peoples, the private sector, and the scientific community will
continue to play important roles in strengthening the partnership.
11. Key policy elements in GEF-6 are geared towards higher impact. Given the limited
resources available to the GEF against mounting environmental challenges, it is essential that the
programming approaches in GEF-6 are effectively and efficiently delivered by the GEF
partnership. Effectiveness and efficiency of the partnership will be further enhanced by: (i) a
differentiated approach to making resources available to recipient countries; (ii) further
streamlining the project cycle to process projects more efficiently through different stages: (iii)
developing and implementing an approach that mainstreams private sector engagement within
the GEF, while at the same time maintains GEF’s ability to develop targeted private sector
engagements; (iv) developing and implementing an action plan for enhancing gender
mainstreaming; and (v) strengthening of the results-based management and knowledge
management systems.
DIFFERENTIATION
12. As the GEF partnership aims to achieve higher impacts, countries contribute in different
ways, according to their particular country capacities and circumstances, to the generation of
global environmental benefits. There are several approaches through which countries in different
circumstances are encouraged to achieve the higher impacts, and there are modalities that are
best tailored to the different capacities. Through these, it is expected that the partnership as a
whole can produce higher impacts.
13. The various elements of differentiation could be further strengthened by employing the
following three elements, individually or in combination: (i) updating the System for Transparent
Allocation of Resources (STAR); (ii) seeking higher levels of co-financing; and (iii) emphasizing
non-grant instruments. The first two elements reflect a differentiation approach by country, while
the third element is a differentiation by source of financing – in this case, the private sector.
Updating the STAR
14. Since GEF-4, a resource allocation system has guided countries’ funding envelopes.
The overall objective of an allocation system for the GEF has not changed since it was first
introduced in GEF-4 as the Resource Allocation Framework (RAF) following the policy
recommendations for the Third Replenishment as, “… a system for allocating resources to
countries in a transparent and consistent manner based on global environmental priorities and
country capacity, policies and practices relevant to successful implementation of GEF projects.”2
The allocation system was updated to the System for Transparent Allocation of Resources
(STAR) for GEF-5. Using this system, the GEF-5 resource envelopes for climate change,
1 World Wildlife Fund – US, and Conservation International recently completed the accreditation process as GEF
Project Agencies. 2 GEF/C.27/Inf.8/Rev.1, 2005.

6
biodiversity, and land degradation are allocated to eligible countries. For an overview of the
STAR, refer to Annex 1.
15. The options presented in this document to modify the STAR are based on
discussions that took place in the first and second replenishment meetings. Specifically, at
the second replenishment meeting in September 2013, several options were presented for the
adjustments of the allocation system.3 As stated in Paragraph 6 of the Summary of the Co-
chairs:4 “Participants requested further analysis of the implications of adjustments to ceilings,
floors, and per-capita income weights, or other indices in the STAR formula.” The Secretariat
has therefore proceeded as requested with analyses along the following lines.
Increasing the Weight of the GDP per capita Index
16. In the current STAR model, the per capita GDP index is weighted to a value of -0.04.
Increases in this value would lead to reallocation of resources towards countries with lower GDP
per capita.
Increasing the Floor Allocations for each Focal Area
17. In the current STAR model, a minimum allocation amount or “floor” was set for each
focal area: $2 million for climate change, $1.5 million for biodiversity, and $0.5 million for land
degradation, leading to a cumulative floor of $4 million. This benefited many of the LDC and/or
SIDS countries that would otherwise have had allocations below these levels.5 Increases in floors
would lead to reallocation of resources towards countries that receive smaller allocations.
Lowering the Ceilings for each Focal Area
18. In the current STAR model, a maximum allocation amount or “ceiling” was set for each
focal area. This ceiling was expressed as a percentage of focal area allocations before the set
asides were removed, and set at 11 percent for climate change and 10 percent for biodiversity
and land degradation. Reductions in these values would lead to a reduction of resources to very
high allocation countries.
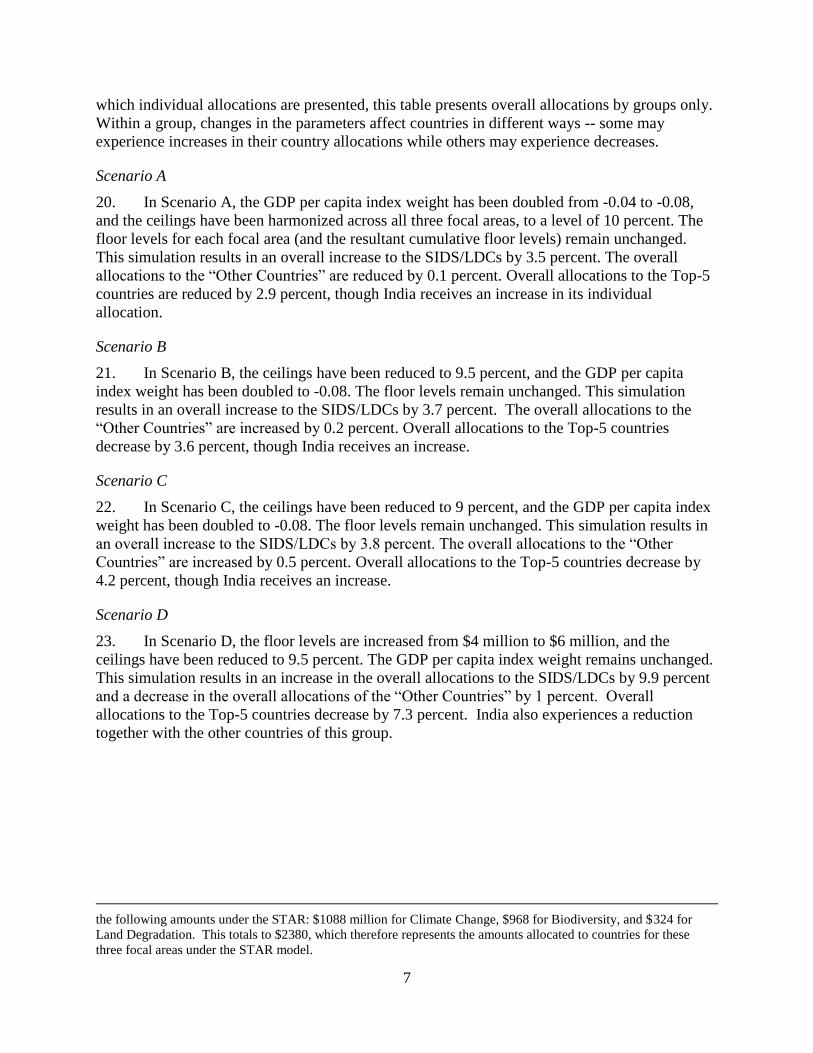
19. Varying these parameters can generate a multitude of scenarios. Four such scenarios are
presented for illustrative purposes in Table 1, which shows the parameters chosen for each
scenario, the overall allocation results across country groups,6 the individual allocations for the
five countries that received the largest STAR allocations under GEF-5 and the total STAR
allocations across all countries.7 It is important to note that apart from the five countries for
3 GEF/R.6/12, “Strategic Positioning for the GEF”, Second Meeting for the Sixth Replenishment of the GEF Trust
Fund, September 10-11, 2013 4 Summary of the Co-Chairs, Second Meeting for the Sixth Replenishment Of Resources of the GEF Trust Fund,
New Delhi, India, September 10-11, 2013 5 For the 75 countries that are SIDS and/or LDC countries, 53 received the floor allocation in Climate Change, 23
received the floor allocation in Biodiversity, and 7 received the floor allocation in Land Degradation. 6 Three mutually exclusive groupings are chosen for this presentation. The “SIDS/LDCs” are chosen due to their
vulnerability. The “Top-5” Countries refer to the five countries that received the largest STAR allocations under
GEF-5, who collectively account for 29 percent of the allocated resources. “Other Countries” refer to all the other
countries that do not fit into either of these two groups. 7 Under GEF-5, total allocations by focal area were as follows: $1360 million for Climate Change, $1210 for
Biodiversity, and $405 for Land Degradation. When the 20 percent set asides were removed, the focal areas received
7
which individual allocations are presented, this table presents overall allocations by groups only.
Within a group, changes in the parameters affect countries in different ways -- some may
experience increases in their country allocations while others may experience decreases.
Scenario A
20. In Scenario A, the GDP per capita index weight has been doubled from -0.04 to -0.08,
and the ceilings have been harmonized across all three focal areas, to a level of 10 percent. The
floor levels for each focal area (and the resultant cumulative floor levels) remain unchanged.
This simulation results in an overall increase to the SIDS/LDCs by 3.5 percent. The overall
allocations to the “Other Countries” are reduced by 0.1 percent. Overall allocations to the Top-5
countries are reduced by 2.9 percent, though India receives an increase in its individual
allocation.
Scenario B
21. In Scenario B, the ceilings have been reduced to 9.5 percent, and the GDP per capita
index weight has been doubled to -0.08. The floor levels remain unchanged. This simulation
results in an overall increase to the SIDS/LDCs by 3.7 percent. The overall allocations to the
“Other Countries” are increased by 0.2 percent. Overall allocations to the Top-5 countries
decrease by 3.6 percent, though India receives an increase.
Scenario C
22. In Scenario C, the ceilings have been reduced to 9 percent, and the GDP per capita index
weight has been doubled to -0.08. The floor levels remain unchanged. This simulation results in
an overall increase to the SIDS/LDCs by 3.8 percent. The overall allocations to the “Other
Countries” are increased by 0.5 percent. Overall allocations to the Top-5 countries decrease by
4.2 percent, though India receives an increase.
Scenario D
23. In Scenario D, the floor levels are increased from $4 million to $6 million, and the
ceilings have been reduced to 9.5 percent. The GDP per capita index weight remains unchanged.
This simulation results in an increase in the overall allocations to the SIDS/LDCs by 9.9 percent
and a decrease in the overall allocations of the “Other Countries” by 1 percent. Overall
allocations to the Top-5 countries decrease by 7.3 percent. India also experiences a reduction
together with the other countries of this group.
the following amounts under the STAR: $1088 million for Climate Change, $968 for Biodiversity, and $324 for
Land Degradation. This totals to $2380, which therefore represents the amounts allocated to countries for these
three focal areas under the STAR model.
8
Table 1: STAR Scenario Results
COUNTRIES
Original STAR Model Scenario A Scenario B Scenario C Scenario D
Ceilings = 11% (CC), 10% (BD and
LD)
Cumulative Floors = 4
GDP Weight = -0.04
Ceilings = 10%
Cumulative Floors = 4
GDP Weight = -0.08
Ceilings = 9.5%
Cumulative Floors = 4
GDP Weight = -0.08
Ceilings = 9%
Cumulative Floors = 4
GDP Weight = -0.08
Ceilings = 9.5%
Cumulative Floors = 6
GDP Weight = -0.04
Number
of
Countries
Total
STAR
Allocation
($Million)
Share
All
oca
tio
n
($ m
illi
on
)
Dif
fere
nce
to
Ori
gin
al
% C
ha
ng
e to
Ori
gin
al
All
oca
tio
n
($ m
illi
on
)
Dif
fere
nce
to
Ori
gin
al
% C
ha
ng
e to
Ori
gin
al
All
oca
tio
n
($ m
illi
on
)
Dif
fere
nce
to
Ori
gin
al
% C
ha
ng
e to
Ori
gin
al
All
oca
tio
n
($ m
illi
on
)
Dif
fere
nce
to
Ori
gin
al
% C
ha
ng
e to
Ori
gin
al
SIDS/LDCs 75 611 25.7% 633 22 3.5% 634 22 3.7% 635 23 3.8% 672 61 9.9%
Other Countries 64 1081 45.4% 1079 -1 -0.1% 1083 2 0.2% 1086 6 0.5% 1070 -10 -1.0%
Top-5 Countries 5 688 28.9% 668 -20 -2.9% 664 -25 -3.6% 659 -29 -4.2% 638 -50 -7.3%
Top-5
Mexico 1 98 4.1% 94 -4 -4.2% 94 -4 -3.9% 95 -3 -3.5% 93 -5 -5.0%
Russian
Federation 1 120 5.0% 115 -5 -4.0% 116 -4 -3.4% 116 -3 -2.8% 112 -8 -6.6%
Brazil 1 129 5.4% 125 -4 -3.4% 125 -4 -3.1% 126 -4 -2.8% 123 -7 -5.1%
India 1 129 5.4% 137 7 5.6% 137 8 6.2% 138 9 6.9% 121 -8 -6.5%
China 1 212 8.9% 198 -14 -6.6% 191 -21 -9.9% 184 -28 -13.1% 189 -22 -10.6%
TOTAL 144 2380 100.0% 2380 2380 2380 2380
9
Conclusions
24. The SIDS/LDCs receive the highest overall increases in Scenario D; the allocation to this
group increases by 9.9 percent. This is the only scenario that contains an increase in floor levels,
while the GDP per capita index weighting remains at its original levels. By comparison, in
scenario B increases in the GDP per capita weight while keeping the floor unchanged results in
the total allocation for SIDS/LDCs increasing by only 3.7 percent. The main reason for this
difference is that a relatively large number of SIDS/LDC benefits from the increases in the floor.
Therefore, any change to the floor has a direct and targeted impact on a significant number of
countries in this group. Changing the GDP per capita weight affects all countries, but given that
there is a large variation of GDP per capita within the SIDS/LDC group, the overall impact is not
significant.
25. Across scenarios A, B and C, where floor levels are held constant, changing ceiling levels
and weight of GDP per capita index have the greatest impact on the Top-5 countries compared to
other groups, and allocation to this group is progressively reduced. Lowering of ceilings by
themselves affects only one country – China. Among the Top-5 countries, the effect of increasing
weight of the GDP per capita index increases the allocation for India as a result of India’s
relatively low GDP per capita.
26. The allocations for “The Others’ across all scenarios are less sensitive to changes in the
parameters used in the simulations, with variations of one percent or less.
27. It is important to note that these simulations were undertaken with the original data and
GEF-5 focal area envelopes that were used for deriving GEF-5 initial allocations. The Secretariat
will be updating these datasets for GEF-6, for deriving allocations once the GEF-6 focal area
allocations are finalized at the conclusion of the replenishment process. Therefore, the simulations
presented here are for illustrative purposes only.
28. The Secretariat proposes to present a proposal for STAR modifications for consideration
at the May 2014 Council meeting, reflecting the policy recommendations emerging from the
replenishment discussions. When doing so, the Secretariat will take into account recommendation
made by the STAR Mid-Term Evaluation presented at the November 2013 Council meeting.8
Co-financing
29. The GEF has traditionally put a strong emphasis on leveraging resources for its
projects through co-financing, for a number of reasons. First, mobilization of co-financing is
intended to generate new and additional resources to complement GEF’s incremental project
investments directed to achieving global environmental benefits. Second, co-financing is an
indicator of the commitment of the providers of co-financing (national governments, the private
sector, or others) towards the project accomplishing its stated objectives. Third, co-financing can
help increase GEF project’s impacts, and enhance their sustainability beyond the life of the
project, sometimes by linking them to broader policy agendas focusing on sustainable
development. Building on this tradition and practice, implementing systematic variances in the
8 GEF/ME/C.45/04: Mid-Term Evaluation of the System of Transparent Allocation of Resources, 45
th GEF Council,
November 2013.
10
level of co-financing across countries can potentially become a vehicle to further enhance GEF’s
ability to generate global environmental benefits.
The Rationale for Focusing on Co-financing
30. GEF’s approach to co-financing is set out in the 2003 Council Paper “Co-financing.” In the Council Paper,
9 co-financing is defined relatively broadly as those project resources which
“are committed by the GEF Agency itself or by other non-GEF sources and which are essential
for meeting the GEF project objectives.” Specifically, finance for baseline activities is included
in the definition “only when such activities are essential for achieving the GEF objectives.”10
31. The 2003 Council Paper puts particular emphasis on efforts to “increase co-financing
levels.” Referencing discussions that took place during the GEF-3 Replenishment Negotiations,
the Council Paper noted that “increased co-financing is a key issue in GEF effort to have a
significant positive impact on the global environment”. It also noted that GEF-3 Replenishment
Participants requested “recipient countries, the Implementing Agencies and Executing Agencies,
and other donors to generate additional resources to leverage GEF funding and recommended that
co-financing levels be a key consideration in considering Work Program inclusion.”
32. Repeated Overall Performance Studies have pointed to the gains for the GEF arising
from co-financing.11
For example, the Evaluation Office’s Annual Performance Report (APR)
from 2009 concluded that “the GEF gains from mobilization of co-financing through efficiency
gains, risk reduction, synergies, and greater flexibility in terms of the types of projects it may
undertake.” Similarly, OPS-4 noted that “the role of co-financing to gain additional global
environmental benefits is important...”12
Finally, the OPS-5 report refers to “the crucial role co-
financing plays in ensuring a solid foundation for baseline funding, as well as contribution
substantially to deliver global environmental benefits.”
33. At the same time, evaluations have also cautioned against co-financing becoming “an
objective on to itself.” This caution is grounded in three observations, also repeatedly noted in
past evaluations. The first, as noted e.g., in OPS-4, is the absence of unequivocal evaluative
evidence of the relationship between co-financing levels and generation of global environmental
evidence. The second, as further illustrated by the data below, is the very variability in co-
financing ratios even within individual countries. Finally, as noted in OPS-5, the pursuit of higher
co-financing ratios and the (potential) associated higher global environmental benefits must be
weighed against “costs in terms of time and effort in mobilizing co-financing”.
34. A formal target for co-financing levels has so far not been adopted in the GEF. OPS-
5 has opened this discussion by highlighting pros and cons of seeking to increase co-financing
9 GEF/C.20/6/Rev.1
10 It should be noted that there is no globally accepted definition of “co-financing”. The 2003 Council Paper also
discussed the broader issue of ‘leverage”, and defined associated financing as “finance for other activities that are
related to the project…but which are not essential for the project’s successful implementation. Leveraged resources
are the additional resources—beyond those committed to the project itself—that are mobilized later as a direct result
of the project; as such, leverage resources do not form part of the committed financing plan at the outset. A review of
the GEF’s approach to co-financing should include revisiting these various definitions. 11
GEF/R.6/17, Fifth Overall Performance Study of the GEF. 12
OPS-4 p 142.
11
through more specific targets. OPS-5 recommends that co-financing needs to be encouraged,13
but argues that the objective should be on the “adequacy” of co-financing, instead of solely
focusing on the on “maximization” of co-financing. In its conclusion, OPS5 notes that “realistic
levels of co-financing should be established for groups of countries in specific circumstances.”14
Summary of Co-financing Trends
35. Against this background, the Secretariat has undertaken a quantitative analysis of
GEF co-financing to date. The main findings from this analysis are:
(a) Consistent with the 2003 Council Paper’s emphasis, average co-financing ratios
have increased over time, particularly since GEF-4;
(b) Average co-financing ratios mask very large underlying variations in ratios at the
project level;
(c) The climate change focal area is by far the largest source of co-financing, through
a combination of high co-financing ratios and a high share of the overall portfolio;
(d) The largest source of co-financing for GEF projects are national governments,
followed by co-financing provided by GEF Agencies;
(e) Projects financed through multilateral development banks, generally, but not
uniformly, have higher co-financing than projects financed through other agencies,
in large part due to their ability to associate GEF funding with loans;
(f) Co-financing ratios are generally higher for higher-income countries, although
differences between large group of middle-income countries (LMICs and UMICs)
are small. Further, Co-financing for climate change projects account for a higher
share of total co-financing in high-income countries compared to low income
countries.
(g) Middle-income countries mobilize a significantly larger share of co-financing from
their national governments and from the private sector compared to low income
countries; and
(h) The top five GEF recipient countries (China, India, Brazil, the Russian Federation,
and Mexico) generate a disproportionately large share of the GEF co-financing.
Differences among the top five recipients in their co-financing are in part driven by
the differences in composition of their project portfolio – focal area composition
and blending of GEF projects with loans from multilateral development banks.
36. Details of the complete co-financing analysis are presented in Annex II. From the
perspective of the prospects for a differentiated approach, presented below is the analysis with
respect to countries.
13
GEF/R.6/17, Fifth Overall Performance Study of the GEF. 14
Ibid.

12
Co-financing by Country Groups
37. Co-financing ratios are generally higher for higher-income countries, although
differences between the large group of middle-income countries (LMICs and UMICs) are
small. The average co-financing ratio for full size projects in Low Income Countries (LIC)
during GEF4-5 was 6. For Lower and Upper Middle Income Countries (LMICs and UMICs) it
was around 7.9 and 8.1 respectively (Table 2). High Income Countries (HICs) had the highest
average co-financing ratio of 12.1.15
Project outliers are influential in all income categories, as
shown by the consistently large difference between median and average co-financing ratios.
Moreover, the median is remarkably stable across income groups (in the 4-4.5 range) with the
exception of LICs where it is noticeably lower, at 3.3. This suggests that irrespective of income
category, most GEF recipient countries have a large number of projects with only modest levels
of co-financing in their portfolio.
Table 2: Co-financing Ratios by Country Income Groups, GEF-4, and GEF-5
Co-financing Ratio
Income
Category
Number of
Projects
Total GEF
Grant
Total Co-
financing Average Median Max
HIC 47 251 3,024 12.1 4.5 41.8
UMIC 280 1,509 12,236 8.1 4.5 99.3
LMIC 193 883 6,942 7.9 4.1 90.5
LIC 91 338 2,033 6.0 3.3 54.1
Grand Total 611 2,980 24,235 8.1 4.3 99.3
Source: Secretariat calculations based on PMIS
Note: Income classifications follow the most recent World Bank data as accessed via
http://data.worldbank.org/about/country-classifications
38. The top-5 GEF recipient countries generate a disproportionately large share of total
co-financing. The five countries with the largest STAR allocations are China, India, Brazil, The
Russian Federation and Mexico. While these top-5 GEF recipients programmed about 39 percent
of all full size projects during GEF4 and GEF5, they generated about 52 percent of all co-
financing. This reflects that these countries’ co-financing levels during GEF4-5, with the
exception of Brazil, were higher than the average co-financing ratios (Table 3). Among the top-5
recipient countries, the Russian federation has the highest co-financing ratio (14.9) followed by
China at 13.6, while Brazil has the lowest co-financing ratio (5.4). At the same time, the data also
show that the co-financing levels of individual projects vary considerably; as is the case for most
countries, the median co-financing ratio is significantly lower than the average. Moreover, the
ranking of countries in terms of co-financing ratio changes significantly depending on whether the
average or the median is used. For example, while Brazil has the lowest average co-financing rate
it has the highest median rate. Conversely, Mexico has the 3rd
highest average co-financing ratio
15
It should be noted that the group of HIC countries is quite small (only 11 countries) and highly diverse as it
includes both a number of small, high-income, island states and very large economies like e.g. Russia and Chile.

13
(driven in large part by a single project with a co-financing rate of 99.3), while its median rate is
the lowest.
Table 3: Co-financing Rations among Top-5 Recipient Countries, GEF-4 and GEF-5
Country
Number
of
Projects
Sum
GEF
Grant
Sum Co-
financing
Co-
financing
ratio Median Max
China 59 403 5,481 13.6 6.2 88.9
India 31 238 2,049 8.6 4.8 33.0
Brazil 19 184 992 5.4 4.8 12.9
Russian Federation 25 173 2,589 14.9 4.7 41.8
Mexico 19 163 1,569 9.6 4.0 99.3
All countries 611 2,980 24,235 8.1 4.3 99.3
Source: Secretariat calculations based on PMIS
Note: Income classifications follow the most recent World Bank data as accessed via
http://data.worldbank.org/about/country-classifications
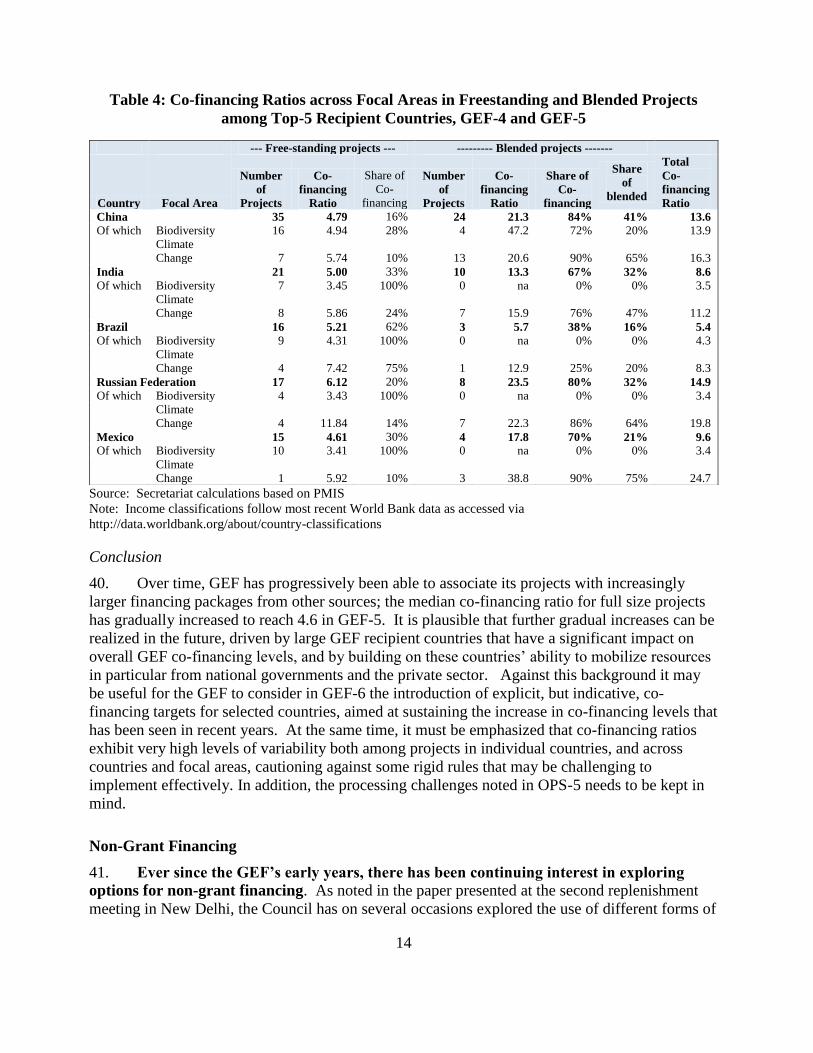
39. Differences in co-financing levels among top-5 countries are in part driven by
differences in the composition of their project portfolio. In particular, Brazil has a relatively
high share of biodiversity projects in its portfolio (only 41 percent of its STAR allocation is for
climate change, as compared to more than 70 percent for the three countries with the highest
ratios), and since biodiversity projects across the board is associated with lower levels of co-
financing, this reduces the overall measured co-financing ratio in Brazil. The extent to which
GEF projects in the top-5 recipient countries are blended with MDB loans also has a major impact
on the realized co-financing ratio. Overall, a slightly higher share (32 percent) of projects in the
top-5 recipient countries are blended than in the GEF portfolio as a whole (26 percent, see above).
The prevalence of free-standing projects in the biodiversity focal area is also much higher than
those in climate change in the top-5 countries: of the 50 full size biodiversity projects that have
been approved by Council in GEF4-5 to date, only 4 of them were blended with MDB loans. By
contrast, of the 55 climate change projects approved during the same period, 31 of them were
blended. Mexico is an illustration of how blended projects can play an exceptionally large role in
determining the overall measured co-financing ratio: its three blended climate change projects
account for 90 percent of Mexico’s total mobilized co-financing during GEF4-5.
14
Table 4: Co-financing Ratios across Focal Areas in Freestanding and Blended Projects
among Top-5 Recipient Countries, GEF-4 and GEF-5
--- Free-standing projects --- --------- Blended projects -------
Country Focal Area
Number
of
Projects
Co-
financing
Ratio
Share of
Co-
financing
Number
of
Projects
Co-
financing
Ratio
Share of
Co-
financing
Share
of
blended
Total
Co-
financing
Ratio
China
35 4.79 16% 24 21.3 84% 41% 13.6
Of which Biodiversity 16 4.94 28% 4 47.2 72% 20% 13.9
Climate
Change 7 5.74 10% 13 20.6 90% 65% 16.3
India
21 5.00 33% 10 13.3 67% 32% 8.6
Of which Biodiversity 7 3.45 100% 0 na 0% 0% 3.5
Climate
Change 8 5.86 24% 7 15.9 76% 47% 11.2
Brazil
16 5.21 62% 3 5.7 38% 16% 5.4
Of which Biodiversity 9 4.31 100% 0 na 0% 0% 4.3
Climate
Change 4 7.42 75% 1 12.9 25% 20% 8.3
Russian Federation 17 6.12 20% 8 23.5 80% 32% 14.9
Of which Biodiversity 4 3.43 100% 0 na 0% 0% 3.4
Climate
Change 4 11.84 14% 7 22.3 86% 64% 19.8
Mexico
15 4.61 30% 4 17.8 70% 21% 9.6
Of which Biodiversity 10 3.41 100% 0 na 0% 0% 3.4
Climate
Change 1 5.92 10% 3 38.8 90% 75% 24.7
Source: Secretariat calculations based on PMIS
Note: Income classifications follow most recent World Bank data as accessed via
http://data.worldbank.org/about/country-classifications
Conclusion
40. Over time, GEF has progressively been able to associate its projects with increasingly
larger financing packages from other sources; the median co-financing ratio for full size projects
has gradually increased to reach 4.6 in GEF-5. It is plausible that further gradual increases can be
realized in the future, driven by large GEF recipient countries that have a significant impact on
overall GEF co-financing levels, and by building on these countries’ ability to mobilize resources
in particular from national governments and the private sector. Against this background it may
be useful for the GEF to consider in GEF-6 the introduction of explicit, but indicative, co-
financing targets for selected countries, aimed at sustaining the increase in co-financing levels that
has been seen in recent years. At the same time, it must be emphasized that co-financing ratios
exhibit very high levels of variability both among projects in individual countries, and across
countries and focal areas, cautioning against some rigid rules that may be challenging to
implement effectively. In addition, the processing challenges noted in OPS-5 needs to be kept in
mind.
Non-Grant Financing
41. Ever since the GEF’s early years, there has been continuing interest in exploring
options for non-grant financing. As noted in the paper presented at the second replenishment
meeting in New Delhi, the Council has on several occasions explored the use of different forms of
15
GEF financing to achieve global environmental benefits, consistent with the principle of
incremental cost financing. This section responds to the Replenishment participants’ request for
the Secretariat16
to provide “further analysis of differentiated terms as well as where non-grant
instruments might be operationalized, and quantitative assessments of the tradeoffs and potential
consequences, drawing on experiences to date”.
42. Non-Grant Instruments can broadly be divided into three main categories. The term
“Non-grant instruments” in the GEF context refers to GEF projects in which GEF financing is
used in financial products and mechanisms that make financing available to the final beneficiary
on non-grant terms. It is important to note that the GEF has used non-grant instruments
exclusively in connection with its engagement with the private sector. There exists a vast variety
of non-grant instruments encompassing a large range of sophisticated, innovative financial
instruments. For convenience, these instruments are often grouped into three main categories: (i)
risk mitigation products; (ii) equity; and (iii) debt instruments (see Box 1):
Box 1: The Three Main Types of Non-Grant Instruments17
Risk mitigation products can be concessional in that they are not priced commensurate for the risk they cover.
These products can help catalyze commercial providers of funding to support activities that may be perceived as too
risky by commercial investors or lenders, and risk cover provided by commercial insurers may not be available or
affordable. Risk mitigation instruments may also include partial credit guarantees, risk-sharing facilities (pari-passu
or first-loss covers), structured debt funds, and securitizations.
Equity can be concessional if the provider of the concessional equity agrees to accept a lower return for the risk
undertaken, or buys the equity at a less favorable price than commercial investors. Equity – because of its lower rank
of security for the investor – can also leverage additional debt finance, by improving the equity-to-debt ratio for the
project. Equity is concessional only to the extent that the investor requires a lower risk-adjusted rate of return, thus
facilitating the sponsor to invest in projects that are riskier than commercial investors would normally consider for
such an expected return.
Debt instruments. Debt finance can be concessional based on price (including interest rates and/or fees), tenor,
subordination, repayment profile, and/or security. For example, concessional debt may involve interest rates that are
below commercially available market rates for the given risk profile, and/or below-market interest rates combined
with longer grace periods or tenors than available on the market.
Use of Non-Grant Instruments in GEF
43. Since its inception, the GEF has deployed non-grant instruments in 82 projects. GEF
Secretariat maintains a database which records projects that are utilizing “non-grant
instruments.”18
Since its inception, a total of 82 projects have been recorded as having utilized a
“non-grant” instrument, for a total amount of $672 million. This is equivalent to about 6 percent
of GEF’s total programmed amount. While still low, the use of non-grant instrument since the
GEF expanded through GEF3, when a record 27 projects utilizing non-grant instruments were
16
Inputs from agencies, including through written responses to a short questionnaire sent out in October 2013 is
gratefully acknowledged. 17
See DFI Guidance for Using Investment Concessional Finance in Private Sector Operations, March 12, 2013 18
GEF’s use of non-grant instruments is based on Council decisions documented in GEF/C.32/7, The Use of Non-
Grant Instruments in GEF Projects: Progress Report, November 2007, and C.33/12, Operational Policies and
Guidance for the Use of Non-Grant Instruments, March 2008.
16
approved. Usage of non-grant instruments decreased sharply in GEF4 to a large extent could be
attributed to the introduction of the Resource Allocation Framework at that time. Only six
projects using non-grant instruments were approved in GEF-4.
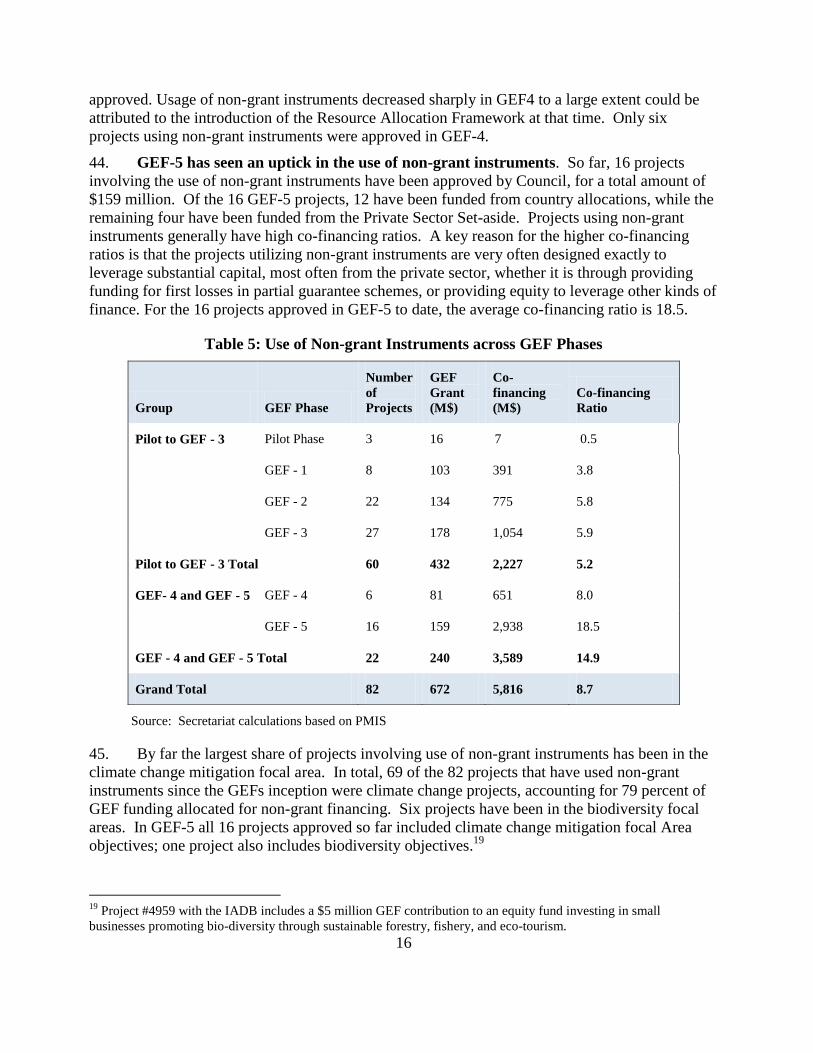
44. GEF-5 has seen an uptick in the use of non-grant instruments. So far, 16 projects
involving the use of non-grant instruments have been approved by Council, for a total amount of
$159 million. Of the 16 GEF-5 projects, 12 have been funded from country allocations, while the
remaining four have been funded from the Private Sector Set-aside. Projects using non-grant
instruments generally have high co-financing ratios. A key reason for the higher co-financing
ratios is that the projects utilizing non-grant instruments are very often designed exactly to
leverage substantial capital, most often from the private sector, whether it is through providing
funding for first losses in partial guarantee schemes, or providing equity to leverage other kinds of
finance. For the 16 projects approved in GEF-5 to date, the average co-financing ratio is 18.5.
Table 5: Use of Non-grant Instruments across GEF Phases
Group GEF Phase
Number
of
Projects
GEF
Grant
(M$)
Co-
financing
(M$)
Co-financing
Ratio
Pilot to GEF - 3 Pilot Phase 3 16 7 0.5
GEF - 1 8 103 391 3.8
GEF - 2 22 134 775 5.8
GEF - 3 27 178 1,054 5.9
Pilot to GEF - 3 Total 60 432 2,227 5.2
GEF- 4 and GEF - 5 GEF - 4 6 81 651 8.0
GEF - 5 16 159 2,938 18.5
GEF - 4 and GEF - 5 Total 22 240 3,589 14.9
Grand Total 82 672 5,816 8.7
Source: Secretariat calculations based on PMIS
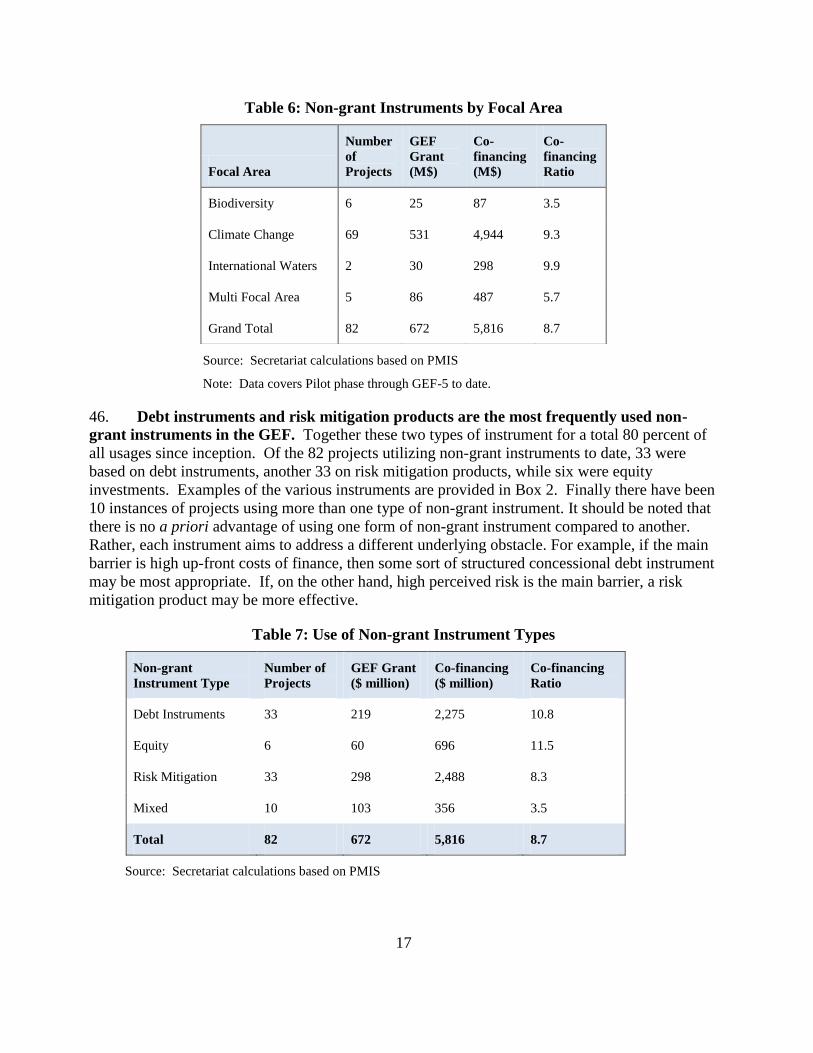
45. By far the largest share of projects involving use of non-grant instruments has been in the
climate change mitigation focal area. In total, 69 of the 82 projects that have used non-grant
instruments since the GEFs inception were climate change projects, accounting for 79 percent of
GEF funding allocated for non-grant financing. Six projects have been in the biodiversity focal
areas. In GEF-5 all 16 projects approved so far included climate change mitigation focal Area
objectives; one project also includes biodiversity objectives.19
19
Project #4959 with the IADB includes a $5 million GEF contribution to an equity fund investing in small
businesses promoting bio-diversity through sustainable forestry, fishery, and eco-tourism.
17
Table 6: Non-grant Instruments by Focal Area
Focal Area
Number
of
Projects
GEF
Grant
(M$)
Co-
financing
(M$)
Co-
financing
Ratio
Biodiversity 6 25 87 3.5
Climate Change 69 531 4,944 9.3
International Waters 2 30 298 9.9
Multi Focal Area 5 86 487 5.7
Grand Total 82 672 5,816 8.7
Source: Secretariat calculations based on PMIS
Note: Data covers Pilot phase through GEF-5 to date.
46. Debt instruments and risk mitigation products are the most frequently used non-
grant instruments in the GEF. Together these two types of instrument for a total 80 percent of
all usages since inception. Of the 82 projects utilizing non-grant instruments to date, 33 were
based on debt instruments, another 33 on risk mitigation products, while six were equity
investments. Examples of the various instruments are provided in Box 2. Finally there have been
10 instances of projects using more than one type of non-grant instrument. It should be noted that
there is no a priori advantage of using one form of non-grant instrument compared to another.
Rather, each instrument aims to address a different underlying obstacle. For example, if the main
barrier is high up-front costs of finance, then some sort of structured concessional debt instrument
may be most appropriate. If, on the other hand, high perceived risk is the main barrier, a risk
mitigation product may be more effective.
Table 7: Use of Non-grant Instrument Types
Non-grant
Instrument Type
Number of
Projects
GEF Grant
($ million)
Co-financing
($ million)
Co-financing
Ratio
Debt Instruments 33 219 2,275 10.8
Equity 6 60 696 11.5
Risk Mitigation 33 298 2,488 8.3
Mixed 10 103 356 3.5
Total 82 672 5,816 8.7
Source: Secretariat calculations based on PMIS
18
Box 2: Examples of GEF Use of Non-grant Instruments
Risk Mitigation Products. GEF has a long history of working with IFC to establish appropriate risk-sharing
facilities. Starting from a pilot funding from the GEF project with the IFC, the GEF and IFC eventually went on to
launch 12 sustainable energy finance programs supported with concessional funding, and an additional three were
established without the GEF. The total efforts includes engagements with 30 financial intermediaries resulting in
over 20 risk sharing facilities, six credit lines, and one funded mezzanine facility. These facilities are expected to
eventually support $1.4 billion of lending, of which $680 million has been achieved to date, on the basis of a total
GEF investment of $70 million accompanied by IFC exposure of $302 million. One of the most successful examples
of these risk-sharing facilities is the CHUEE20
project, initiated by GEF and IFC in 2006. The GEF funding is used to
partly fund a risk-sharing facility for Chinese local banks. Phase 1 and 2 of CHUEE used $16 million from the GEF
and $40 million from IFC to take the first loss of lending from local banks to utility companies installing the energy
efficient equipment, unleashing $800 million (as of 2012) investment. Phase 3 of CHUEE has just started, using $10
million of GEF funding21
, and could add another $100 million or more of leveraged financing.
Debt. Revolving funds are the most common type of debt instrument used in GEF projects—UNDP alone has
implemented 14 non-grant projects with revolving loan fund; other agencies using revolving funds include the IADB,
World Bank, UNEP, and UNIDO. The other common debt instrument is an MDB loan or credit-line, which can be
used to provide whole-sale loans to local financial institutions for on-lending, or direct loans to private sector
partners. Projects associated with MDB loans usually have much higher co-financing ratio than projects with
revolving funds.
Equity. A recent example is the Africa Renewable Equity Fund, in which the GEF has provided US$4.5 million that
is placed in the fund as Class A shares (with return capped at 4 percent); US$25 million is provided by other donors.
By accepting a capped return, this tranche is expected to increase net returns to other investors by 2-3%, which will
(1) increase the range of potentially investable projects by boosting the returns of the fund in circumstances where
project returns might be lower than generally acceptable, and (2) mitigate the need in certain projects to seek more
complex forms of donor or tariff support to make projects bankable, which often results in delays or project
suspension which will primarily make equity investments in focused on SMEs. A potential investment of $4.5
million of GEF resources and $25 million of AfDB resources as seed funding to attract $150 million of funding from
partners. The fund managers will actively pursue renewable energy projects across Africa with a focus on meeting the
goals of Sustainable Energy for All. These equity investments are expected to attract significant additional private
sector sources, primarily debt, for the actual projects, with a pipeline already worth half a billion ($470 million).
Another example is IADB’s MIF Public-Private Partnership Program, which is funded by a US$15 million GEF grant
and expects to raise more than $260 million in targeted equity investments in funds to promote energy efficiency,
renewable energy, and bio-diversity in Latin America. The investments will contribute to energy savings, new
renewable energy supply, reduction of greenhouse gas (GHG) emissions, preservation of natural resources, protection
of bio-diversity, and development of sustainable business models.. The IADB has identified three leading funds for
negotiation. Each fund has identified a pipeline of investments in Latin America that will address selected program
goals and has already attracted significant private sector investment interest. The GEF funding will be used along
with IADB funding and other investor funding to help projects “get to close” and begin implementation.
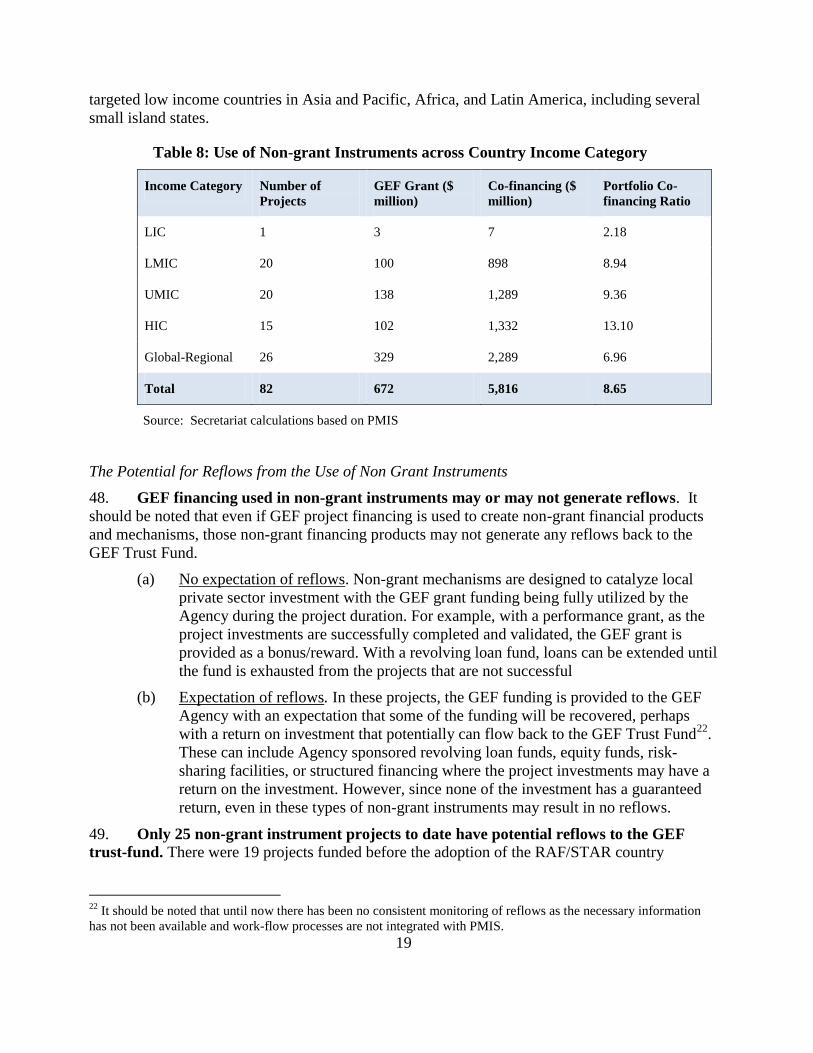
47. GEF has rarely implemented projects using non-grant instruments in Low Income
Countries (LICs). Only one project using non-grant instruments has been approved for a LIC
(Table 8). For the other country income categories, the use of non-grant instruments is spread
roughly evenly. It should be noted that there were a number of Global/Regional projects that
covered countries with different income categories, and several of these projects specifically
20
CHUEE (Energy efficiency investments in China). 21
The GEF funding for CHUEE Phase 3 comes from a 2003 GEF/IFC project called Environmental Business Finance
Program (EBFP). This fund continues to recycle the GEF fund into additional investments.
19
targeted low income countries in Asia and Pacific, Africa, and Latin America, including several
small island states.
Table 8: Use of Non-grant Instruments across Country Income Category
Income Category Number of
Projects
GEF Grant ($
million)
Co-financing ($
million)
Portfolio Co-
financing Ratio
LIC 1 3 7 2.18
LMIC 20 100 898 8.94
UMIC 20 138 1,289 9.36
HIC 15 102 1,332 13.10
Global-Regional 26 329 2,289 6.96
Total 82 672 5,816 8.65
Source: Secretariat calculations based on PMIS
The Potential for Reflows from the Use of Non Grant Instruments
48. GEF financing used in non-grant instruments may or may not generate reflows. It
should be noted that even if GEF project financing is used to create non-grant financial products
and mechanisms, those non-grant financing products may not generate any reflows back to the
GEF Trust Fund.
(a) No expectation of reflows. Non-grant mechanisms are designed to catalyze local
private sector investment with the GEF grant funding being fully utilized by the
Agency during the project duration. For example, with a performance grant, as the
project investments are successfully completed and validated, the GEF grant is
provided as a bonus/reward. With a revolving loan fund, loans can be extended until
the fund is exhausted from the projects that are not successful
(b) Expectation of reflows. In these projects, the GEF funding is provided to the GEF
Agency with an expectation that some of the funding will be recovered, perhaps
with a return on investment that potentially can flow back to the GEF Trust Fund22
.
These can include Agency sponsored revolving loan funds, equity funds, risk-
sharing facilities, or structured financing where the project investments may have a
return on the investment. However, since none of the investment has a guaranteed
return, even in these types of non-grant instruments may result in no reflows.
49. Only 25 non-grant instrument projects to date have potential reflows to the GEF
trust-fund. There were 19 projects funded before the adoption of the RAF/STAR country
22
It should be noted that until now there has been no consistent monitoring of reflows as the necessary information
has not been available and work-flow processes are not integrated with PMIS.
20
allocation system, of which 10 were global/regional projects. Reflows are also expected for six
global/regional projects in GEF-4 and GEF-5. This includes the GEF-4 Earth Fund, four GEF-5
PPPs funded through private sector set-aside funding, and one GEF-5 project funded the through
Climate Change Mitigation set-aside. Eight of these projects are associated with loans, in which
risk mitigation was used in seven projects. Of the 17 projects not associated with loans, the types
of instruments used were evenly distributed among debt, equity, and mixed, with only a couple of
projects using risk mitigation. Projects/programs with expectations of reflows are exclusively with
the MDBs. In practice they have predominantly been with IFC and the private sector windows of
other MDBs as these institutions have the capacity and standard practice to invest funds with the
expectation of returns. MDBs have found it attractive to use the GEF grant funding in these
mechanisms because it provides flexibility in application and can be used to address the specific
risks and barriers in the project.
50. Monitoring and management of reflow can be strengthened in the GEF. It is critical
to strengthen the specific procedures established by the Secretariat and the Trustee to track the
flow of non-grant financing by the implementing agencies, and the possible corresponding
reflows to the GEF Trust Fund. A strengthening of the monitoring and management of reflows
would include: (i) a review and updating as needed by the Council of the GEF policies regarding
the use of non-grant instruments, (ii) clear identification of the type of financing and non-grant
financing instrument used in the project at the Council stage, (iii) obligation by the relevant GEF
agency to report and eventually transfer principal repayments and any interest or investment
income arising from the project23
. At the same time, in view of the overall modest number of
project employing non-grant instruments, the potential additional administrative burden of such
monitoring and management needs to be considered before establishing an extensive monitoring
system.
51. To date, the GEF has not provided concessional financing in a form other than
grants to sovereign governments. The Instrument provides for both grants and concessional
financing.24
However, as noted in past Council Papers25
grants have been considered the vehicle
most appropriate for the protection of global public environmental goods, and as a complement to
the financing provided by multilateral development banks.
Conclusion
52. Three main conclusions can be drawn from the summary of the GEF’s experiences with
non-grant instruments.
53. First, non-grant instruments are important elements in GEF’s “tool box,” and can be used
advantageously in specific projects to attract private sector engagement. At the same time, non-
grant instruments are not a panacea, and must be used only when the enabling environment and
23
It should be noted that as is normal practice in Trust Fund arrangements, the GEF Agencies would have no liability
for any non-payment of either principal or interest/investment income by a counterpart entity (whether public or
private) in respect of a GEF project; any such risk is borne by the GEF Trust Fund. Similarly, the Trustee would not
have any obligation to seek payments from implementing agencies. 24
Instrument for the Establishment of the Restructured Global Environmental Facility, paragraph 2 and paragraph 9c. 25
See, for example, Operational Policies and Guidance for the Use of Non-Grant Instruments, GEF/C.33/12.
21
project design are suitable, and a specific market failure needs to be addressed.26
GEF’s
experience suggests that combining non-grant instruments with grants resources can often be
effective, for example when technical assistance or advisory services are needed to help promote
private sector engagement.
54. Second, through their potential for generating reflows, non-grant instruments can make,
even if modest, a contribution to financial sustainability of GEF. It must be emphasized, though,
that since these projects are inherently risky, reflows from these kinds of instruments will
inevitably be uncertain and variable. It should also be noted there is a need to strengthen the
GEF’s current system for tracking reflows originating from the use of non-grant instruments.
55. Third, the experience from GEF-5 shows that the private sector set-aside has contributed
substantially to the rebound in the use of non-grant instruments; forty percent of the GEF funding
committed to non-grant projects in GEF-5 originated from the set-aside. More generally, the set-
aside has enabled innovation in terms of use of specific instruments.
56. These factors create a convincing case for ensuring that sufficient resources for the use of
non-grant instruments are allocated in GEF-6.
Overall Directions for Differentiation
57. In terms of furthering country differentiation, the Secretariat is of the view that
adjustments to the allocation system provide the most feasible option in the short-run. The
replenishment participants could make recommendations regarding the characteristics they want
to see in the updated STAR, and request the Council to review proposals from the Secretariat.
58. Participants may wish to direct the GEF Council to explore ways and means of seeking
higher co-financing, including elements of country differentiation, through the introduction of
explicit, but possibly indicative, co-financing targets. Recognizing that co-financing ratios
exhibit very high levels of variability, further clarity about the definitions and approaches to
seeking co-financing would be desirable.
59. A greater emphasis on non-grant instruments in GEF-6 offers an opportunity to enhance
thematic differentiation and leveraging the private sector in the GEF. A significant share of the
GEF-6 private sector set-aside could be directed to be employed through non-grant instruments.
IMPROVING THE EFFICIENCY OF THE GEF PROJECT CYCLE
60. The project cycle has been reformed since the Evaluation Office undertook the Joint
Evaluation of GEF Activity Cycle and Modalities in 2007, and presented an analysis of the time
delays at various stages of the project cycle related to preparation and appraisal. Taking note of
the findings of the evaluation, the Council approved a new project cycle procedure in June 2007,
resulting in the current two-step process for full-sized projects with Council approval of brief
Project Identification Forms (PIFs) initiating project preparation and CEO endorsement of the full
project documents prior to Agency approval and start of implementation.
26
Moreover, an important risk associated with the use of non-grant instruments is that they inadvertently may in fact
create market distortions, rather than helping overcome market failures, which may lead to mis-allocation of
resources.
22
61. One of the key elements of the reform was the establishment of business standards: 22
months for a project to progress from Council approval of PIF to CEO endorsement of the project
document; this standard was further tightened to 18 months in GEF-5. In addition a business
standard of 10 work days for the Secretariat to respond to PIF submissions and requests for CEO
endorsement was also established.
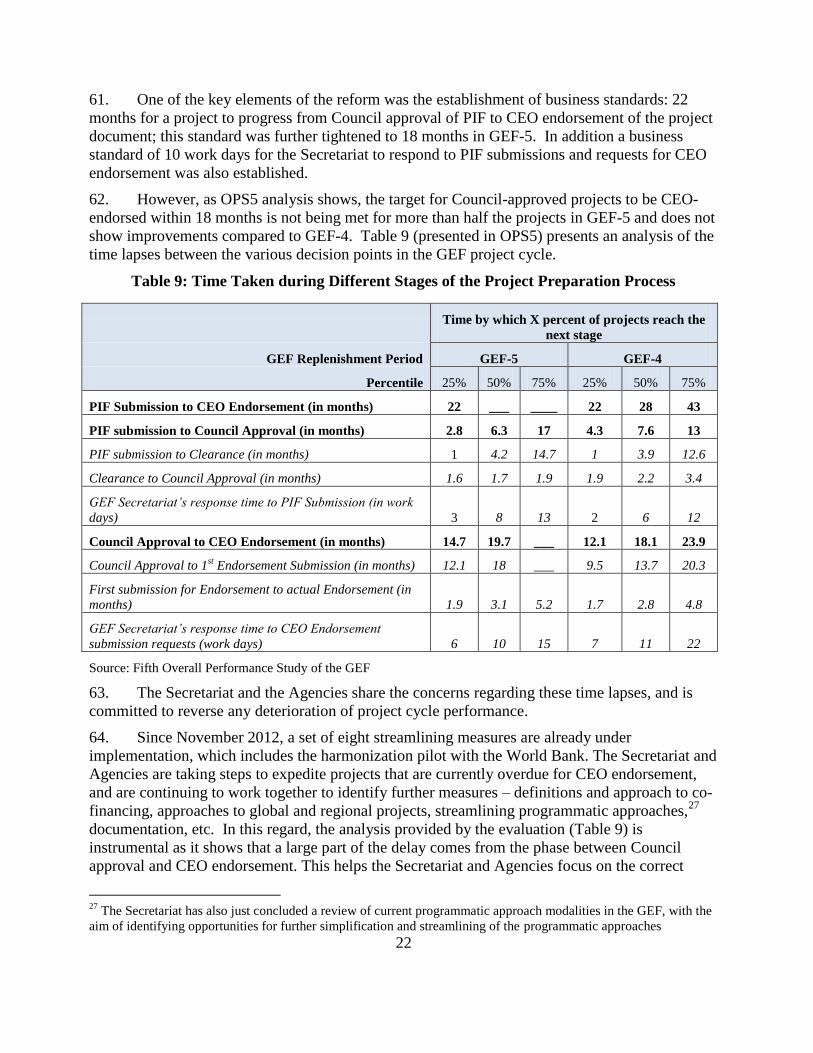
62. However, as OPS5 analysis shows, the target for Council-approved projects to be CEO-
endorsed within 18 months is not being met for more than half the projects in GEF-5 and does not
show improvements compared to GEF-4. Table 9 (presented in OPS5) presents an analysis of the
time lapses between the various decision points in the GEF project cycle.
Table 9: Time Taken during Different Stages of the Project Preparation Process
Time by which X percent of projects reach the
next stage
GEF Replenishment Period GEF-5 GEF-4
Percentile 25% 50% 75% 25% 50% 75%
PIF Submission to CEO Endorsement (in months) 22 ___ ____ 22 28 43
PIF submission to Council Approval (in months) 2.8 6.3 17 4.3 7.6 13
PIF submission to Clearance (in months) 1 4.2 14.7 1 3.9 12.6
Clearance to Council Approval (in months) 1.6 1.7 1.9 1.9 2.2 3.4
GEF Secretariat’s response time to PIF Submission (in work
days) 3 8 13 2 6 12
Council Approval to CEO Endorsement (in months) 14.7 19.7 ___ 12.1 18.1 23.9
Council Approval to 1st Endorsement Submission (in months) 12.1 18 ___ 9.5 13.7 20.3
First submission for Endorsement to actual Endorsement (in
months) 1.9 3.1 5.2 1.7 2.8 4.8
GEF Secretariat’s response time to CEO Endorsement
submission requests (work days) 6 10 15 7 11 22
Source: Fifth Overall Performance Study of the GEF
63. The Secretariat and the Agencies share the concerns regarding these time lapses, and is
committed to reverse any deterioration of project cycle performance.
64. Since November 2012, a set of eight streamlining measures are already under
implementation, which includes the harmonization pilot with the World Bank. The Secretariat and
Agencies are taking steps to expedite projects that are currently overdue for CEO endorsement,
and are continuing to work together to identify further measures – definitions and approach to co-
financing, approaches to global and regional projects, streamlining programmatic approaches,27
documentation, etc. In this regard, the analysis provided by the evaluation (Table 9) is
instrumental as it shows that a large part of the delay comes from the phase between Council
approval and CEO endorsement. This helps the Secretariat and Agencies focus on the correct
27
The Secretariat has also just concluded a review of current programmatic approach modalities in the GEF, with the
aim of identifying opportunities for further simplification and streamlining of the programmatic approaches

23
places to be tackled and streamlining measures to be employed. The Secretariat will also explore
with Agencies the feasibility of a joint portfolio management system to keep track of
project/program progress through the partnership.
ENHANCING PRIVATE SECTOR ENGAGEMENT
65. An effective engagement with the private sector has always been a high priority for
the GEF. As noted by the GEF Evaluation Office, the GEF’s engagement with the private sector
has been driven by the underlying rationale that in order to have long-term and substantive impact
on the global environment, private enterprises- which are the dominant source of economic
activity - must be encouraged to pursue commercially viable activities that also generate global
environmental benefits. Consequently, the GEF has sought engagement with a broad array of
private sector entities, ranging from multinational corporations (MNCs), through large domestic
firms and financial institutions to micro, small and medium enterprises (SMEs).
66. OPS-5 finds that GEF’s engagement with the private sector has been largely
successful. OPS5 finds that “GEF funding for a combination of improvements, both with
governments in regulatory and policy frameworks and financial intermediaries has led to market
changes for private sector participation in environmentally friendly interventions.” In terms of
outcome ratings, the private sector focused portfolio assessed for OPS5 performing on par with
the non-private sector portfolio (~80% of projects rated “moderately successful” or above). There
are no measurable differences in ratings amongst those projects that used a non-grant modality as
opposed to a grant modality. However, the Evaluation Office (EO) does report that the private
sector portfolio (whether using non-grants or not) is comparatively more successful at addressing
systemic environmental stresses that the average GEF portfolio—according to the EO’s data 44
percent of projects focusing on private sector engagement has systemic impact, as opposed to 22
percent among the remaining GEF portfolio. Projects with private sector engagement are
significantly more likely to lead to market change. 52 percent of private sector projects have led
to market changes compared to only 21 percent of the remaining GEF portfolio. More broadly,
OPS5 documents numerous instances of broader adoption of implementation strategies,
technologies, approaches and/or structural arrangements including notable instances of scaling up
and market change, particularly in the climate change focal area.
67. OPS5 also notes that GEF’s ability to engage the private sector diminished during GEF-4
as a result of the resource allocation system (the RAF), and has only slightly rebounded in GEF-5.
Private Sector Engagement in GEF-6
68. In GEF-6, the GEF will further strengthen its engagement with the private sector by (i)
mainstreaming the private sector in GEF programing and projects and (ii) further targeting the use
of the private sector set-aside.
Mainstreaming GEF’s Private Sector Engagement
69. Building on the achievements to date, the GEF’s engagement with the private sector
will be structured around four specific intervention models. (i) fostering enabling policy
environments; (ii) pioneering risk mitigation and innovative financial products; (iii) forging
corporate alliances; and (iv) providing capacity building and incubation.
24
(a) Fostering Enabling Policy Environments. The GEF has been instrumental in
several countries in working with governments to establish policy and regulatory
environments to facilitate private sector engagements, such as development of
renewable feed-in-tariffs, identification of barriers and introduction of regulatory
reforms to promote Energy Service Companies (ESCOs), support passage of
environmental legislation, etc. There are numerous opportunities to support
enabling policy environments across the focal area strategies, including the
proposed Integrated Approach Pilots. For example, in Sustainable Forest
Management, opportunities include the promotion of landscape restoration by
addressing the lack of regulatory policy and enhancing awareness in partnership
with all levels of industry. In Biodiversity, there are several opportunities including
efforts to develop payment schemes for ecosystem services, including through
water funds, which will rely on proper policy development and capacity building
for private sector actors, and similar efforts in fostering the emergence of projects
using the ABS framework.
(b) Pioneering Risk Mitigation and Innovative Financial Products. Working with
investors to identify the real and perceived risks and establishing risk sharing
facilities has been one of the pioneering contributions of the GEF in areas such as
energy efficiency and renewable energy, handling of PCBs for safe disposal. Non
grant instruments (debt instruments, risk mitigation products, and equity
investments) have been particularly effective in such interventions. In GEF-6,
opportunities within the programing strategies include for example risk reduction
for clean energy and smart grid applications the Climate Change Mitigation. There
may also be opportunities for promoting incremental financing/risk reduction
financing for adoption of sustainable land management principles in the Land
Degradation focal area through for example revolving loans for small holders or
crop insurance related to the introduction of new crops;
(c) Forging Corporate Alliances. GEF-financed investments have worked with
organizations and companies with global reach to encourage environmentally
sustainable approaches in their buying practices, such as working with major
coffee buyers to support efforts towards certified and sustainable coffee. Or
source-certified cocoa. GEF investments have also worked with leading lighting
manufacturers, has helped develop and promote polices to phase out in-efficient
lighting and help countries transition to energy efficiency lighting, including CFLs
and LEDs; there are considerable room to expand such approaches in the GEF-6
Climate Change focal area in support of corporate alliances to promote energy
efficient alliances. Such interventions would also be supportive of the Sustainable
Energy For All initiative. Corporate alliance also can be leveraged in the
International Waters focal area, e.g., working with the private sector to promote
innovative, market-based approaches fostering good fishing practices and fishery
management on Large Marine Ecosystems (LMEs) and Areas Beyond National
Jurisdiction (ABNJ).
(d) Providing Capacity building and Incubation. Capacity building for government
and private sector often need to be combined to advance private sector
25
engagement. GEF Agencies regularly combine technical assistance on energy
efficiency project design and selection, allowing the private sector partner to invest
their own equity and access credit lines (or loans) for efficiency projects. In the
Chemical and Waste focal area opportunities exist for support the development of
partnerships on green chemistry that can develop new products and processes that
reduce harmful by-products and toxic waste-streams. In Land, opportunities exist
to work with private sector partners to promote climate smart agriculture through
capacity building for smallholders and SME;
70. Mainstreaming opportunities within the programing strategies in GEF-6 would be
underpinned by support at key points in the programing phase and project preparation. OPS-5 points to the need to ensure that the GEF’s engagement with the private sector needs to be
dovetailed with efforts to increase country ownership, and notes that with an allocation system
like STAR, a strong engagement with for-profit companies needs to be incorporated in national
strategies and priorities, following guidance from the conventions. Against this background, in
GEF-6 special emphasis would be put on:
(a) Fostering enhanced awareness on private sector engagement and “private sector”
friendly project design in order to encourage countries to take private sector
engagement into account in their priority setting and portfolio identification for
GEF-6. This would include for example, enhanced support for the Operational
Focal Points, discussion of private sector issues at National Dialogues, ECWs, and
NPFEs, and sharing of best practices and design principles across agency field
networks.
(b) Seeking to facilitate countries and agencies to integrate private sector engagement
into projects, for example by reviewing the project cycle to identify possible
expedited processing of projects with private sector engagement by removing
barriers in current GEF policies such as operational focal point endorsement on a
no-objection basis for concepts that involve the private sector.
(c) Improving monitoring and knowledge sharing on private sector success stories. As
noted in OPS-5, there is room to improve the GEF Project Management Information
System (PMIS) and explore possibilities to systematically gather evidence on
elements of GEF’s private sector engagement (although the risk of further
increasing the reporting and monitoring burden in the GEF must be kept in mind).
In addition, there are opportunities to strengthen the GEF’s engagement with other
organizations, such as for example World Bank Institute, Bloomberg New Energy
Finance, Forest Trends’ Ecosystems Marketplace and World Resources Institute, to
regularly assess and report on current and potential private sector engagement.
Targeting the Private Sector Set-aside
71. In order to maximize the impact of the private sector set-aside in GEF-6, it would be
focused on two main activities:
72. First, as noted in the section on the GEF’s use of non-grant instruments, a significant share
of the private sector set-aside would be used for non-grant instruments. These include approaches
that promote innovative non-grant instruments, such as equity funds, tapping into capital markets,
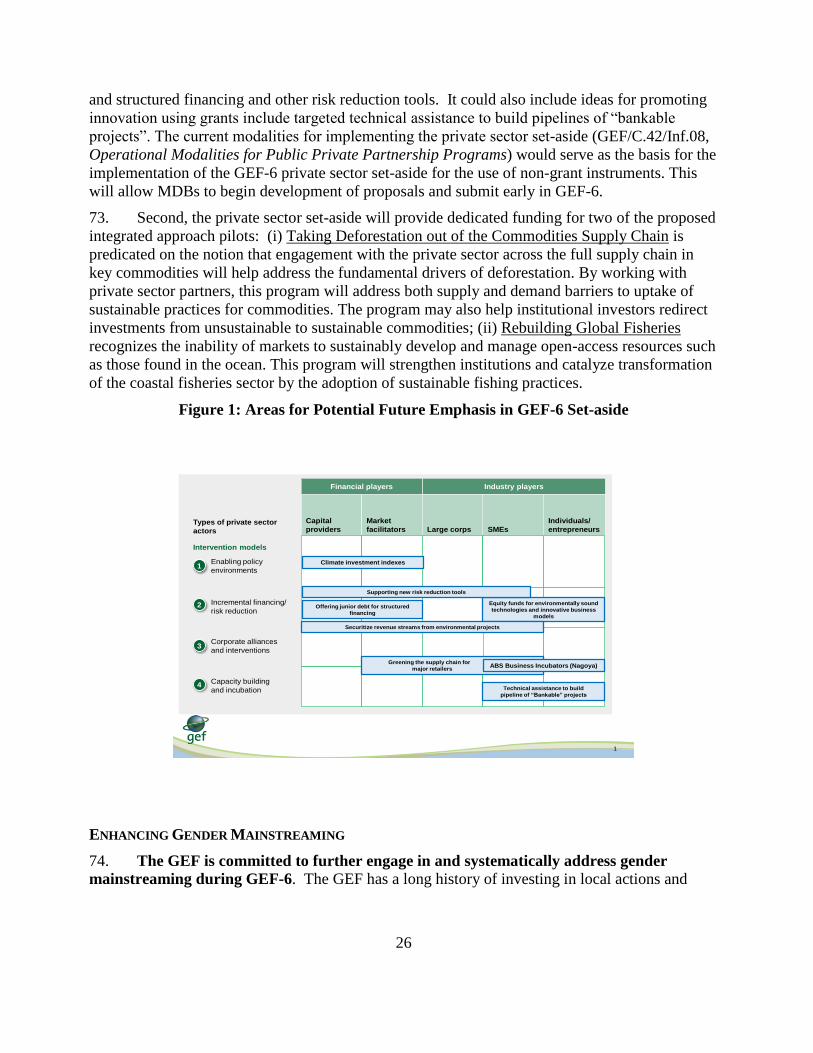
26
and structured financing and other risk reduction tools. It could also include ideas for promoting
innovation using grants include targeted technical assistance to build pipelines of “bankable
projects”. The current modalities for implementing the private sector set-aside (GEF/C.42/Inf.08,
Operational Modalities for Public Private Partnership Programs) would serve as the basis for the
implementation of the GEF-6 private sector set-aside for the use of non-grant instruments. This
will allow MDBs to begin development of proposals and submit early in GEF-6.
73. Second, the private sector set-aside will provide dedicated funding for two of the proposed
integrated approach pilots: (i) Taking Deforestation out of the Commodities Supply Chain is
predicated on the notion that engagement with the private sector across the full supply chain in
key commodities will help address the fundamental drivers of deforestation. By working with
private sector partners, this program will address both supply and demand barriers to uptake of
sustainable practices for commodities. The program may also help institutional investors redirect
investments from unsustainable to sustainable commodities; (ii) Rebuilding Global Fisheries
recognizes the inability of markets to sustainably develop and manage open-access resources such
as those found in the ocean. This program will strengthen institutions and catalyze transformation
of the coastal fisheries sector by the adoption of sustainable fishing practices.
Figure 1: Areas for Potential Future Emphasis in GEF-6 Set-aside
1
Industry players
Types of private sector
actors
Intervention models
Enabling policy
environments1
Incremental financing/
risk reduction2
Corporate alliances
and interventions3
Capacity building
and incubation4
Capital
providers
Market
facilitators Large corps SMEs
Individuals/
entrepreneurs
Financial players
Equity funds for environmentally sound
technologies and innovative business
models
Greening the supply chain for
major retailers
Supporting new risk reduction tools
Technical assistance to build
pipeline of “Bankable” projects
Offering junior debt for structured
financing
Securitize revenue streams from environmental projects
ABS Business Incubators (Nagoya)
Climate investment indexes
ENHANCING GENDER MAINSTREAMING
74. The GEF is committed to further engage in and systematically address gender
mainstreaming during GEF-6. The GEF has a long history of investing in local actions and
27
social inclusion to achieve global environmental objectives. Mainstreaming gender28
through
GEF programs and projects presents opportunities for further enhancing project value as well as
advancing gender equality and women’s empowerment. The GEF is committed to further engage
in and systematically address gender mainstreaming during GEF-6, based on the GEF Policy on
Gender Mainstreaming, which was adopted by the GEF Council in May 2011. The GEF aims to
achieve global environmental benefits and sustainable development by addressing issues related
to gender equality and women’s empowerment. The GEF recognizes that gender equality is an
important goal in the context of projects that it finances, because it advances both the GEF’s goals
for attaining global environmental benefits and the goals of gender equality and equity, and social
inclusion.
75. First comprehensive review of gender mainstreaming undertaken in 2008. Before the
Policy on Gender Mainstreaming was adopted, the Public Involvement Policy was the principal
policy that guided GEF operations on gender mainstreaming. The Public Involvement Policy calls
for public participation, including both women and men, in every step of the GEF project cycle
and operations. In 2008, the GEF renewed its commitment on gender mainstreaming by
conducting a first comprehensive review on gender mainstreaming in GEF projects through the
Mainstreaming Gender at the GEF. 29
The document highlighted the link between gender equality
and environmental sustainability; the scope, content, and depth of gender mainstreaming in GEF
projects across all focal areas; and future steps to be considered to strengthen mainstreaming
gender at the GEF.
76. Significant progress has been achieved during GEF-5. Informed by the
recommendations made by the Fourth Overall Performance Study (OPS4) and other reviews, the
GEF has made significant progress in establishing operational systems for gender mainstreaming
in its operation during GEF-5. The key actions undertaken are summarized below:
(a) Adopted a Policy on Gender Mainstreaming. Developed and adopted a policy that
clarifies GEF’s commitment and minimum standards to promote gender equality
through its operations. The Policy expresses the GEF’s commitment to enhance the
degree to which the GEF and its Agencies promote the goal of gender equality
through GEF operations. The Policy also outlines several requirements for the
GEF Secretariat and GEF Agencies on gender mainstreaming in GEF operations.
(b) Incorporated gender sensitive approaches and indicators in some focal area
strategies, including international waters and climate change adaptation.
(c) Revised project templates and review criteria. Project templates include specific
section to describe gender dimensions, benefits, and approaches. One of the
project review criteria for GEF projects is to have appropriate gender consideration
in project design and monitoring.
28
Gender mainstreaming means bringing the experience, knowledge, and interests of women and men to bear on the
development agenda. Within a project context, gender mainstreaming commonly includes: identifying gaps in
equality through the use of sex-disaggregated data, developing strategies and policies to close the gaps, devoting
resources and expertise for implementing such strategies, monitoring the results of implementation, and holding
individuals and institutions accountable for outcomes that promote gender equality.
29
2008, GEF, Mainstreaming Gender at the GEF (http://www.thegef.org/gef/node/1548).
28
(d) Incorporated gender in the Results-Based Management (RBM). Two gender
indicators, including staffing and gender analysis in projects, were incorporated in
the RBM at the institutional level.
(e) Conducted annual monitoring review of gender related portfolio. Annual reviews
of projects across focal areas are conducted to see how gender mainstreaming has
been addressed and integrated in GEF projects through the Annual Monitoring
Review.
(f) Designated gender focal point at the GEF Secretariat. A senior staff of GEF
Secretariat has been designated to coordinate and implement the work related to
gender mainstreaming internally and externally.
(g) Reviewed GEF Agencies on gender mainstreaming. Assessment was conducted
among all ten of the existing GEF Agencies on whether they meet the minimum
requirements of the Policy on Gender Mainstreaming. The report was discussed at
the 45th
GEF Council meeting in November 2013.
77. Since the Policy on Gender Mainstreaming was adopted in 2011, there has been a
notable shift and significant progress in the attention paid to gender and social concerns in
GEF projects. The GEF project templates and review criteria have been revised to describe
socio-economic benefits and gender dimensions to be delivered by the project, and how it
supports the achievement of global environmental benefits. As a result of these efforts, there has
been an increased proportion of projects that mainstreamed gender in project design.30
In
particular, enabling activities’ proposals, including ones for the development of National
Biodiversity Strategy and Action Plan, have seen significant improvement in addressing gender
dimensions in its activities.
78. Most GEF Agencies are aligned with the Policy on Gender Mainstreaming. Recently,
the GEF Secretariat undertook an assessment of the existing ten GEF Agencies on their
compliance with GEF Policy on Gender Mainstreaming. This review shows that many have
undertaken gender mainstreaming in a strategic manner (8 out of the 10 Agencies), and are able to
show some success in strengthening gender elements in GEF projects.
79. The GEF Secretariat has also been providing regular analysis and reporting on
gender mainstreaming among its projects through the Annual Monitoring Review (AMR) in
FY11 and FY12. Portfolio of projects has been analyzed across all focal areas, while
systematically reviewing gender specific information in the Project Implementation Reports, Mid-
Term Evaluation Reports and Terminal Evaluation Reports. These reports have highlighted good
practices across focal area projects in mainstreaming gender during project development and
implementation. They have also provided important information on the progress and remaining
challenges to further strengthen mainstreaming gender in GEF projects.
30
2013, GEF Evaluation Office, OPS5 Technical Document #16, Sub-Study on the GEF’s Policy on Gender
Mainstreaming.
29
Remaining Challenges and Gaps
80. The GEF recognize the need to further strengthen gender mainstreaming in its
operations. While much progress has been achieved to integrate gender in GEF projects during
the past few years, the Secretariat recognizes that increased efforts are required to further
strengthen gender mainstreaming in GEF operations.
81. Gender mainstreaming is uneven across focal areas. The earlier reviews of GEF
portfolio31
revealed that integration of gender in GEF projects varies among focal areas and its
programs and projects. The recent OPS5 technical review on gender mainstreaming notes that
while 73 percent of the gender-relevant GEF projects have mainstreamed gender in design and
implementation in different degrees, only 35 percent of them adequately addressed gender
mainstreaming with specific gender sensitive approach and indicators. Among the focal areas,
gender mainstreaming has been relatively strong in projects related to natural resources
management, compared to other focal areas. The gender mainstreaming analysis32
under the
Annual Monitoring Reviews (AMR) of FY11 and FY12 also had similar findings even through
the project samples were different. The analysis from the AMR FY12 found that about 38 percent
of the projects under biodiversity and land degradation focal areas addressed some approach to
mainstreaming gender in project implementation, while it was about 10-18 percent for other focal
areas.
82. Improvements necessary on gender-sensitive project design and indicators. Earlier
reviews of the portfolio recognized that projects proposals as well as implementation and
evaluation reports submitted by Agencies often lack gender specific information due to absence of
gender sensitive approach and indicators in project results framework. Only 13 percent of the
GEF projects included gender sensitive monitoring and evaluation processes, including gender-
sensitive indicators. 33
This makes it difficult to collect sex-disaggregated data and track progress
made on the engagement and impact of the project activities towards both women and men. It
was also recognized that the approach and information related to gender mainstreaming actions in
GEF projects varies among and within the GEF Agency. According to the OPS5 technical review
on gender mainstreaming, the GEF Agencies have considered gender in majority of the GEF
projects that they manage, however, many of them (38 percent of the total projects that were
reviewed) lacked specific gender approach, including gender sensitive actions and indicators in
projects.
GEF-6 Gender Plan of Action
83. GEF-6 Gender Plan of Action to be prepared by end of 2014. During GEF-6, based on
the Policy on Gender Mainstreaming and taking into consideration the findings from past related
31
These analysis reviewed portfolio of project documents and monitoring and evaluation reports on description
related to consideration and approaches on gender mainstreaming. This includes: gender analysis undertaken during
project preparation and/or implementation; gender-sensitive project framework (i.e. project objective, outcomes,
outputs, and activities that specifically target women and men) , including use of gender-disaggregated indicators; and
project staffing (e.g. gender specialist, target to recruit more women staff, etc.). 32 2013, GEF, Annual Monitoring Review FY12 (GEF/C.44/05, May 21, 2013) 33
2008, GEF, Mainstreaming Gender at the GEF
30
reviews, including the OPS5 technical review on gender mainstreaming,34
the Secretariat, in
consultation with the GEF Agencies and other experts, will develop a Gender Plan of Action to
further integrate gender consideration in GEF operations. In preparing the action plan, the GEF
will be in contact with and learn from experiences and lessons from other international
institutions, including the Rio Conventions, GEF Agencies, Climate Investment Funds, Green
Climate Fund, and many others that have developed or are developing similar action plans. The
GEF Gender Plan of Action will be prepared by end of 2014.
84. Action Plan will build upon existing strategies and plans of GEF Agencies. The GEF
Gender Plan of Action will provide a concrete road map to implement the GEF Policy on Gender
Mainstreaming during the coming years. An important element to be considered in identifying
the actions is that they would need to be built on the existing and planned gender strategies and
plans of the GEF Agencies and avoid duplication of efforts, and capacity of the GEF Secretariat in
addressing them. Gender mainstreaming cannot be achieved in a vacuum and requires long term
commitment and engagement, including awareness raising and capacity building of internal and
external partners. The GEF will take a step-wise approach in achieving its goal and objectives on
gender mainstreaming. Further, through the implementation of the action plan, the Secretariat and
the GEF Agencies will further explore and learn how project results and progress related to
gender could be better designed, implemented, and reported, particularly for those projects where
gender mainstreaming is highly relevant.
Key Elements of the Gender Plan of Action
85. Action Plan to be developed with an interagency working group. The Secretariat will
undertake a multi-stakeholder participatory process to identify and prioritize key actions going
forward, and prepare the Gender Plan of Action to be endorsed by the GEF Council. The GEF
plans to establish an interagency working group, consisted of GEF Agencies’ gender focal point
and other experts, to exchange ideas and practices to develop the Gender Plan of Action. Taking
into account that each agency has its own gender policy, strategy, and/or action plan35
with
varying application to GEF projects, the Plan of Action will facilitate a systematic approach and
provide practical guidance for the implementation of the GEF Policy on Gender Mainstreaming.
86. Based on initial inputs and consultation with the replenishment participants and GEF
Agencies, below are several actions that have been identified as key elements to be further
considered during the preparation of the action plan:
Mainstreaming Gender in GEF Project Cycle, including Gender Analysis, Gender Screening, and
Gender Sensitive Indicators
87. Recognizing that each GEF Agency has a different gender policy, strategy, and/or action
plan, the Secretariat, in collaboration with the Agencies, will clarify and facilitate a systematic,
consistent approach and provide practical guidance for the implementation of the GEF Policy on
34 2013, GEF Evaluation Office, OPS5 Technical Document #16 Sub-Study on the GEF’s Policy on Gender
Mainstreaming 35
In addition to agency-specific gender policies and strategies, there is also UN System-Wide Action Plan on Gender
Equality and the Empowerment of Women (UN-SWAP), which all UN agencies are mandated to meet the
performance standards.
31
Gender Mainstreaming in key steps of the GEF project cycle. This will specifically include
application of gender analysis by the GEF Agencies at the project preparation phase; development
of project frameworks with gender-sensitive outcomes and outputs; and gender-sensitive
monitoring and evaluation for relevant projects.
88. Conducting gender analysis at the early stage of project preparation to determine the
different roles, needs, and knowledge of women and men is recognized as a critical first step to set
the baseline and develop appropriate project design with a gender sensitive approach. In GEF-6,
appropriate gender analysis will be undertaken by the GEF Agencies as part of the socio-
economic assessment during project preparation, and it will be reviewed before CEO
endorsement.
89. Moreover, recognizing that not all projects require equal attention to gender issues
depending on the GEF focal area and/or type of engagement, the GEF Agencies will assess and
screen gender relevance of all GEF projects with a common categorization at entry. Building on
the practices and experiences of various GEF Agencies (e.g., UNDP's Gender Marker, ADB's
Gender Mainstreaming Categories, etc.) and other relevant partners, the Secretariat will prepare a
simple and practical gender screening criteria and system at the project concept stage, in
coordination with the GEF Agencies to avoid duplication of efforts but allow some level of
consistency in approach. With a clearly defined categorization, this system could help clarify
each GEF project’s relevance, engagement, and contribution toward the achievement of gender
equality. Once under implementation, projects under different categories would be tracked and
reported against on an annual basis through the AMR, using information provided through the
annual Project Implementation Reports and other tools. The Secretariat will also provide
additional information and analysis through its portfolio monitoring and learning missions.
90. Further guidance will be provided on the use of gender sensitive indicators for all relevant
projects. The adoption of gender-sensitive indicators and sex-disaggregated data within the
project results framework is essential in monitoring progress overtime and to lead to measurable
results. To develop and apply these tools, the Secretariat will build on and draw lessons from
good practices and practical tools that are already used by the GEF Agencies and others for
mainstreaming gender in their projects.
Mainstreaming Gender in GEF Program Strategies
91. Under GEF-6, the GEF will adopt a more comprehensive and programmatic approach
toward gender mainstreaming across GEF programs and projects. While recognizing that the
degree of relevance of gender dimensions in GEF projects differ depending on focal areas and
specific programs, the GEF will place priority on identifying and focusing its efforts to strengthen
gender mainstreaming in those programs and projects that could generate significant results and
contribute to achieving the goals on gender equality and sustainable development.
92. Opportunities may include focusing on key programs and projects related to sustainable
use of natural resources, such as agro-biodiversity, fisheries, and forest resources management
under the biodiversity, land degradation, and international waters focal areas and integrated
approaches. Within the climate change portfolio, renewable energy projects have historically
generated positive benefits, particularly towards women. The chemicals portfolio has also
generated noticeable impacts on the improvement of the health of women and children, through
32
active engagement of both women and men in awareness raising and capacity building activities
as well as the eradication of exposure to these chemicals.
93. Gender sensitive approaches and activities have been incorporated in the GEF-6 focal area
strategies and integrated approaches, along with the GEF core gender indicators at the corporate
level (refer section below). All Focal Area projects will use and incorporate the core gender
indicators, which will be monitored and aggregated at the Focal Area and Corporate levels. Based
on these strategies and programs, the Secretariat, together with the GEF Agencies, will identify
specific projects and opportunities where gender mainstreaming and empowerment of women
could be further strengthened. By focusing its efforts towards those programs and projects that
could potentially have significant improvement in project results through mainstreaming gender,
the GEF intends to take a more systematic and programmatic approach in addressing gender
issues under GEF-6.
Knowledge Management and Lessons Sharing on Gender Mainstreaming
94. The Secretariat will establish an interagency working group on gender mainstreaming
among the gender focal points of the Secretariat, GEF Agencies, and other experts to further
advance gender mainstreaming in GEF operations and projects. The working group will serve as
a platform to ensure effective operational coordination, exchange of information and experience
among the GEF focal points of the GEF Agencies in relation to the GEF portfolio. The working
group is also intended to deliver and provide advice on specific actions identified under the GEF
Gender Plan of Action. Considering that there are existing similar working groups among the
gender focal points of the Multilateral Development Banks and UN agencies, appropriate
coordination and synergy will be sought.
95. An interactive GEF webpage on gender mainstreaming will be developed to facilitate
exchange of knowledge and lessons on gender mainstreaming activities derived from specific
programs and projects. The Secretariat will also undertake portfolio reviews and learning
missions, in coordination with the GEF Agencies and other partners, and strengthen its knowledge
base and management on gender mainstreaming, while highlighting challenges and good practices
among related projects.
96. These activities will also strengthen gender-mainstreaming capacities among the
concerned GEF Secretariat staff to increase their understanding of gender mainstreaming, as well
as socio-economic aspects in general. This is also expected to lead to effective investment in
gender equality and women’s empowerment issues as staff become more aware of and interested
in gender responsive planning and budgeting. Relevant Secretariat staff will be encouraged to
make use of various capacity development opportunities, including training, to increase their
understanding on available tools and best practices on mainstreaming gender in projects.
97. Further, appropriate support and guidance will be provided to the GEF Operational Focal
Points to enhance gender mainstreaming in country-level portfolio and project management.
Knowledge and lessons sharing on gender mainstreaming will be facilitated with increased
involvement of relevant institutions at the country-level to enhance GEF operation and projects.
33
Ensure GEF Agencies’ Compliance with the GEF Policy on Gender Mainstreaming
98. GEF recently undertook an assessment of the GEF Agencies on the GEF Policy on
Gender Mainstreaming. The assessment examined each Agency to see whether, and how, its
policies are in compliance with the GEF policy. Eight of the ten GEF Agencies met all minimum
requirements, and the two GEF Agencies that have not fully met the requirements of the GEF
Policy on Gender Mainstreaming will implement a plan of action to ensure compliance with those
provisions under the Policy.36
99. The assessment was conducted to examine the GEF Agencies’ implementation capacity to
apply relevant policies, procedures, standards, and guidelines to their projects, and track-record of
their implementation experience. While most of the Agencies have met the minimum
requirement, as recognized by the OPS5 technical study and other reviews, application of these
standards vary among projects. With the development of a practical guidance on gender
mainstreaming that would apply across GEF Agencies (as noted under item (a) above), it is
expected that appropriate system and process at the GEF Agencies will be further strengthened to
ensure that relevant GEF projects will include gender sufficiently and consistently for relevant
projects.
100. For the new entities that apply for accreditation as a GEF Project Agency, the GEF
accreditation criteria require that all applicants demonstrate consistency with the minimum
requirements of the Policy with the same criteria as used to assess existing GEF Agencies.
Strengthen Results-based Management on Gender Mainstreaming
101. During GEF-6, the GEF will further strengthen GEF-wide accountability for gender
mainstreaming by enhancing gender-specific performance targets at all levels: from corporate to
project levels. At the corporate level, the GEF Results-based Management Framework will
include a set of core Gender Indicators to examine concrete progress on gender related processes
and outputs (refer below table). These Gender Indicators will be applied to all projects under the
GEF focal area and integrated approaches, and monitored and aggregated at the focal area and
corporate level.
102. At the project level, project results framework will include gender-sensitive indicators, and
sex-disaggregated data, for relevant projects. This will be monitored, analyzed, and reported
against on an annual basis through the Annual Monitoring Review (AMR) exercise, and assessed
and evaluated through the Medium-term and Terminal Evaluations. Project Implementation
Reports (PIR), Project Evaluation Reports, and other information from the GEF Agencies will
provide important inputs to the analysis and reporting.
103. In order to facilitate comprehensive project design, reporting and analysis that are gender
sensitive, the GEF will also review and mainstream gender in the Monitoring and Evaluation
Policy. The GEF will incorporate a specific section on gender mainstreaming in the templates
and/or guidelines for the Project Identification Form (PIF), CEO Endorsement Request Form,
36 The two plans of action for UNIDO and UNEP have been discussed with the GEF Secretariat, and they will report
on their progress in 2014.
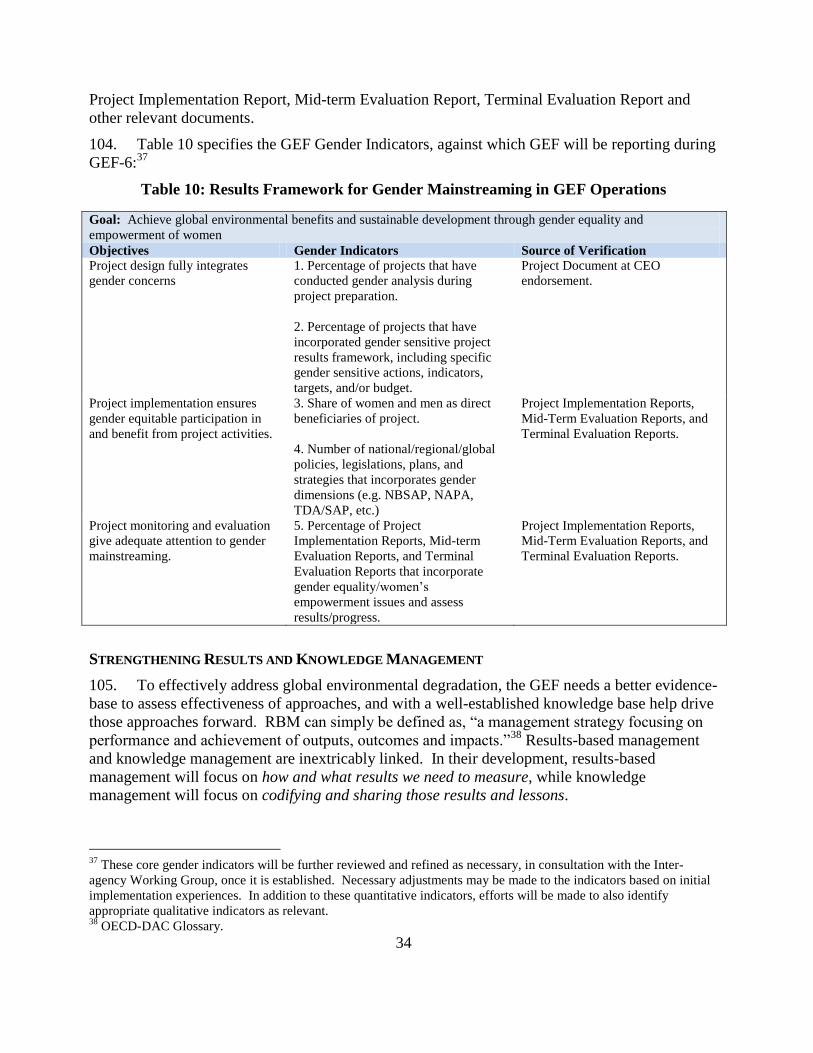
34
Project Implementation Report, Mid-term Evaluation Report, Terminal Evaluation Report and
other relevant documents.
104. Table 10 specifies the GEF Gender Indicators, against which GEF will be reporting during
GEF-6:37
Table 10: Results Framework for Gender Mainstreaming in GEF Operations
Goal: Achieve global environmental benefits and sustainable development through gender equality and
empowerment of women
Objectives Gender Indicators Source of Verification
Project design fully integrates
gender concerns
1. Percentage of projects that have
conducted gender analysis during
project preparation.
2. Percentage of projects that have
incorporated gender sensitive project
results framework, including specific
gender sensitive actions, indicators,
targets, and/or budget.
Project Document at CEO
endorsement.
Project implementation ensures
gender equitable participation in
and benefit from project activities.
3. Share of women and men as direct
beneficiaries of project.
4. Number of national/regional/global
policies, legislations, plans, and
strategies that incorporates gender
dimensions (e.g. NBSAP, NAPA,
TDA/SAP, etc.)
Project Implementation Reports,
Mid-Term Evaluation Reports, and
Terminal Evaluation Reports.
Project monitoring and evaluation
give adequate attention to gender
mainstreaming.
5. Percentage of Project
Implementation Reports, Mid-term
Evaluation Reports, and Terminal
Evaluation Reports that incorporate
gender equality/women’s
empowerment issues and assess
results/progress.
Project Implementation Reports,
Mid-Term Evaluation Reports, and
Terminal Evaluation Reports.
STRENGTHENING RESULTS AND KNOWLEDGE MANAGEMENT
105. To effectively address global environmental degradation, the GEF needs a better evidence-
base to assess effectiveness of approaches, and with a well-established knowledge base help drive
those approaches forward. RBM can simply be defined as, “a management strategy focusing on
performance and achievement of outputs, outcomes and impacts.”38
Results-based management
and knowledge management are inextricably linked. In their development, results-based
management will focus on how and what results we need to measure, while knowledge
management will focus on codifying and sharing those results and lessons.
37
These core gender indicators will be further reviewed and refined as necessary, in consultation with the Inter-
agency Working Group, once it is established. Necessary adjustments may be made to the indicators based on initial
implementation experiences. In addition to these quantitative indicators, efforts will be made to also identify
appropriate qualitative indicators as relevant. 38
OECD-DAC Glossary.

35
Further Development of the Results-based Management Framework
106. A robust results-based management (RBM) is essential for GEF effectiveness. The
robustness of the GEF’s RBM system will determine whether it is able to chart a course with its
investments and build a strong portfolio that supports synergies across focal areas. At the core of
the GEF’s role as a financial mechanism is its ability to direct investments to projects that will
achieve transformational impact, whether through setting strategy to inform project design, or
through the project appraisal and selection processes. Because “catalyzing global action” is at the
heart of the GEF’s value proposition, it must better understand which approaches best address
drivers of environmental degradation to wisely target scarce public money for global
environmental benefits
107. The GEF has made some progress in developing a RBM system. A framework for
RMB was approved by Council in 2007 (GEF/C.31/11). RBM was first implemented during GEF-
4, incorporating monitoring and reporting at three levels: institutional (organization);
programmatic (focal area); and project. Progressively, the GEF has built up its RBM capabilities:
as a first step toward measuring progress, the GEF introduced tracking tools to systematically
monitor key indicators at the project level in GEF-3 and GEF-4 for four of its focal areas. During
GEF-5, the Monitoring and Evaluation Policy was revised in 2010. Greater emphasis was given
to RBM, including establishment of monitoring baselines and ensuring project alignment with the
results frameworks of the focal areas.
108. Several good RBM practices have been institutionalized at the GEF, but more need
to be done. While RBM has been institutionalized to some degree throughout the GEF project
cycle, and tools such as an Annual Monitoring Report give some insight into GEF results, there
are several challenges preventing the GEF from utilizing RBM effectively. Perhaps most
significantly, feedback loops to adequately inform the Secretariat and Agencies of project and
portfolio results and lessons learned are not systematic, resulting in limited influence of the RBM
system on future strategy setting and project or program design. Project and portfolio level
indicators need to be more selectively chosen through a review of the existing tracking tools and
complemented with additional RBM tools such as portfolio-level reviews to understand the causes
for successes and failures at the portfolio level. There is a need for integrating GEF systems and
automating the submission of all project data, implementation reports, tracking tools, mid-term
reports, and evaluation reports.
Transforming Results Management to Scale up Impact
109. The GEF will aim to operationalize three key elements of an enhanced RBM system: (i) measure what matters: (ii) understand how GEF impact adds up; and (iii) close the feedback
loop for lessons learned to influence policies and projects. In enhancing the RBM system, it is
important to build one that reflects the networked structure of the GEF, and provides for the
comparative roles of the Secretariat, the Agencies, the Scientific and Technical Advisory Panel,
the Evaluation Office, and recipient countries.
110. Measure what matters. For effective RBM, it will be crucial for the GEF to focus on a very
select handful of core indicators that can be measured in a uniform way, allowing for aggregation
of these indicators at different levels – across countries, regions, programs and portfolios. A
36
focus on a few core indicators would help better understand GEF impact and thereby target scarce
GEF resources more effectively.
111. These core indicators must also be the measures that matter, and have the most relevance
to the GEF partnership, given mandate from the conventions and institutional goals. For example,
the GEF has moved from measuring hectares of land under protection as a proxy for impact on
biodiversity, as in GEF-5, to metrics with a more explicit focus on globally significant
biodiversity, as in the GEF-6 biodiversity focal area strategy. This shift toward measuring the
right things – things that the GEF needs to manage for – will be accelerated in GEF-6 and beyond.
The results framework for the focal area strategies in GEF-6 as presented in the programming
document have already taken the step towards being selective in choice of indicators.
112. The core indicators that will become the focus of GEF results management will also
emphasize catalytic and transformational outcomes. Some of the current metrics that try to
capture the GEF’s catalytic role – for example, the co-financing ratio of GEF investments – are
inadequate to capture the entire range of impacts, and may even sell GEF contributions short.
Evidence suggests that some of the most catalytic GEF investments may not have had particularly
high co-financing ratios.39
Ensuring that substantive core indicators also measure the GEF’s
catalytic impact will be an RBM priority.
113. Understand how the GEF impacts add up. The GEF will develop monitoring capacity that
allows for telling impact stories at a portfolio level, rather than relying on aggregation of
quantitative indicators alone.
114. The current RBM system does not allow for adequate aggregation of results information at
the portfolio level. To do this kind of analysis requires taking a step back, conducting a more in-
depth ex-post analysis of select sets of projects within a portfolio to understand what worked,
what did not, and more importantly, why – in ways that provide lessons learned to project and
program managers.
115. While the GEF Evaluation Office conducts detailed evaluations of some projects, they are
conducted mostly with a view to evaluating on a project-by-project basis. A qualitative, portfolio-
level understanding of how our impact adds up needs to be developed in a coherent manner
between the Evaluation Office and the GEF Secretariat, with an eye to how portfolio-level results
information can best flow back to Secretariat and GEF Agency program managers.
116. Close the feedback loop. Despite recent improvements, today the GEF as a network does
not have a robust system that analyses what is working and what is not at the portfolio level. The
GEF’s past performance seems not to have systematic influence on project design and the
direction of GEF investment. Basic RBM processes and systems need strengthening to ensure
that the feedback loop is closed, ensuring that the rich lessons from results inform the way the
GEF programs in the future. For this to happen, a thorough revamping of the GEF Project
Management Information System (PMIS) will be required to, among other tasks, facilitate
automated collection of information from partners and allow GEF staff and stakeholders quick
and easy access to results information. The GEF project cycle and review process will include
measures to ensure that results information is employed in project development processes.
39
E.g. Catalyzing Ocean Finance
37
117. Closing the feedback loop will require linking monitoring and evaluation capacity at the
GEF more closely to results management. Under the current organizational arrangements, the
Secretariat focuses on monitoring at the portfolio level while the Evaluation Office focuses on
evaluation. Lessons from evaluation activities need to systematically provide feedback to the
project and policy formulation processes at the Secretariat and the GEF Agencies.
118. A robust RBM system would open new opportunities for the GEF. When the GEF has
closed the results feedback loop, and is measuring what matters most through its RBM system,
two potentially game-changing opportunities arise, for which a robust RBM system is a
prerequisite.
119. RBM must be sharpened for the GEF to deliver value for money. The above steps will
help the GEF ensure that it is maximizing the impact of its investments across investments,
fulfilling the GEF’s catalytic and transformational role in environmental finance.
Building a Knowledge Management System
120. A better Knowledge Management (KM) system could enable to play a stronger catalytic
role to arrest global environmental degradation. GEF has the potential to play a role as a
knowledge facilitator, where the lessons learned through its investments can greatly multiply the
GEF’s impact by informing where other dollars flow. However, this is an area of the GEF that has
been grossly underdeveloped in the 22 years of its existence. Knowledge activities undertaken by
GEF have been so far limited with the exception of two activities – IW: LEARN and the
Adaptation Learning Mechanism. Knowledge products emerging from the GEF network are not
well-aligned with the most pressing identified user needs; nor do they align with user perceptions
of where the GEF has a comparative advantage in knowledge – at the portfolio and global levels.
Figure 2 exemplifies this through an analysis of GEF publications during 2012.
121. Only few of GEFs knowledge products meet the users’ expectations. Few of the
GEF’s current knowledge products provide the insights that users find most distinctive of the GEF
and even those that do are not having the impact they should due to constraints in the active
dissemination and management of these products, as well as their packaging for specific users.
From a knowledge systems perspective, there is limited systematic effort network-wide to capture
lessons learned from project design and performance, other than through the quick analysis done
in the context of the annual monitoring review undertaken by the Secretariat in collaboration with
the agencies.
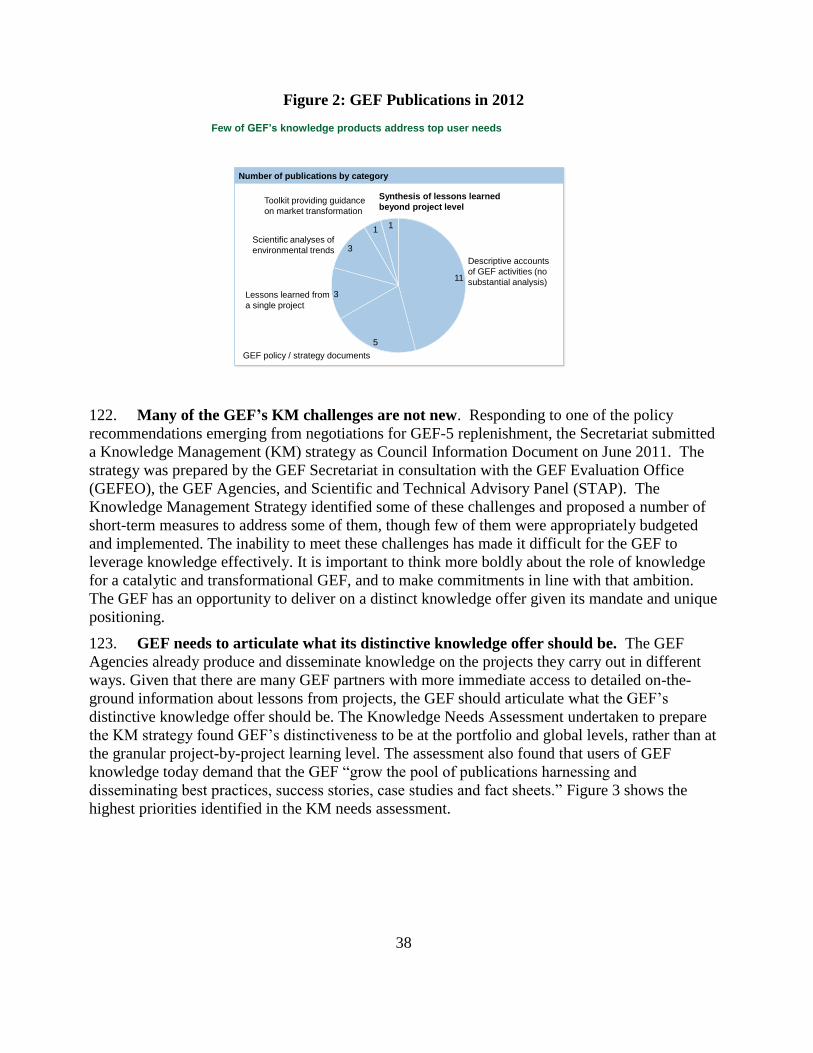
38
Figure 2: GEF Publications in 2012
122. Many of the GEF’s KM challenges are not new. Responding to one of the policy
recommendations emerging from negotiations for GEF-5 replenishment, the Secretariat submitted
a Knowledge Management (KM) strategy as Council Information Document on June 2011. The
strategy was prepared by the GEF Secretariat in consultation with the GEF Evaluation Office
(GEFEO), the GEF Agencies, and Scientific and Technical Advisory Panel (STAP). The
Knowledge Management Strategy identified some of these challenges and proposed a number of
short-term measures to address some of them, though few of them were appropriately budgeted
and implemented. The inability to meet these challenges has made it difficult for the GEF to
leverage knowledge effectively. It is important to think more boldly about the role of knowledge
for a catalytic and transformational GEF, and to make commitments in line with that ambition.
The GEF has an opportunity to deliver on a distinct knowledge offer given its mandate and unique
positioning.
123. GEF needs to articulate what its distinctive knowledge offer should be. The GEF
Agencies already produce and disseminate knowledge on the projects they carry out in different
ways. Given that there are many GEF partners with more immediate access to detailed on-the-
ground information about lessons from projects, the GEF should articulate what the GEF’s
distinctive knowledge offer should be. The Knowledge Needs Assessment undertaken to prepare
the KM strategy found GEF’s distinctiveness to be at the portfolio and global levels, rather than at
the granular project-by-project learning level. The assessment also found that users of GEF
knowledge today demand that the GEF “grow the pool of publications harnessing and
disseminating best practices, success stories, case studies and fact sheets.” Figure 3 shows the
highest priorities identified in the KM needs assessment.
Few of GEF’s knowledge products address top user needs
11
Descriptive accounts
of GEF activities (no
substantial analysis)
5
GEF policy / strategy documents
3Lessons learned from
a single project
3Scientific analyses of
environmental trends
1
Toolkit providing guidance
on market transformation
1
Synthesis of lessons learned
beyond project level
Number of publications by category

39
Figure 3: Priorities Identified in the KM Needs Assessment
Directions for the Future
124. There are three main objectives for the development of GEF’s future KM system. As
the knowledge capabilities are built from the ground-up, the system should be able to do the
following: (i) identify clear examples of strategic investments in knowledge to help drive
successful solutions to scale; (ii) active, solutions-oriented working knowledge partnerships with
focus on tackling the drivers of environmental degradation; (iii) establish the GEF as a credible
and influential voice on global environmental solutions.
125. Working Knowledge Partnerships. In sharpening its focus on underlying drivers of
environmental degradation, the GEF Partnership has a critical opportunity for knowledge
leadership. GEF-6 integrated programs provide a clear pathway to pilot such networks, targeting
where they can be most valuable. Working knowledge partnerships can be developed in ways that
build on the successful IW:Learn structure supported by the GEF, but will institute stronger links
between the GEF Secretariat and the knowledge networks to allow for complete knowledge
feedback loops. These partnerships will also have a narrower focus, targeting specific issues and
knowledge users. For example, part of the GEF’s food security program focuses on re-greening,
agroforestry and sustainable intensification practices in African drylands, where knowledge
sharing between practitioners has been identified as an underserved gap where the GEF should
play a role by supporting such knowledge networks. These partnerships will be the key plank of
the GEF knowledge offer, providing the means to both generate and disseminate lessons that are
of the highest relevance to users.
126. Portfolio-level analysis. The second flagship knowledge offer will leverage the portfolio-
level analysis highlighted in the Results-Based Management section of this strategy, leveraging
0.29
0.23
0.20
0.16
0.16
0.11
0.11
0.12
0.18 0.25
GEF Knowledge Platform with easy-to-retrieve
information, data and lessons learned both at the project-level and at...0.25
Moderated e-mail network to form a Community of Practice
to connect people across the GEF partnership…0.12
0.16
Prescriptive content such as policies, guidelines,
standard operating procedures0.13
Short-term visits/mobility/missions between GEF
partner countries for information sharing and mutual support…0.18
Induction procedures and training materials for
new comers to the GEF partnership0.16
Analytical papers on ‘topics” of interest for the GEF such as technology
transfer, environmental trust funds, etc.0.19
Expansion of the GEF website with improved and
enriched content (i.e. list of related external and internal resources…
Portal to integrate/merge the websites and databases
of the GEF and its partners0.15
Mapping/georeferencing of data
Partners
Secretariat
Knowledge Management priorities for next two years
Composite index (maximum weight of 2)
Highest priorities identified were a centralized knowledge platform
and better collection of impact metrics
Source: GEF Knowledge Needs Assessment Draft Report, March 2012
40
this knowledge to maximize impact. To address this felt knowledge need, the GEF will work with
GEF Agency partners to generate and disseminate knowledge on the most scalable and
transformational elements of their combined experience, presenting strong evidence on which
types of interventions have had the most impact and why. This knowledge will be purposefully
designed to influence investments beyond the GEF Partnership, with the potential to greatly scale
up GEF impact. The GEF will also partner with leading academic and research institutions, tying
them into the knowledge ecosystem to conduct rigorous analysis and to increase the dissemination
of GEF lessons learned.
127. Frontiers of Environmental Change. The third flagship knowledge product that could be
built up over a longer time horizon is the development of a world-leading piece of analysis
focusing on the frontiers of environmental change. As the Millennium Ecosystem Assessment
showed, the GEF has an important role to play in supporting and developing leading knowledge
on tackling drivers of environmental degradation, and will leverage STAP and partner with other
leading academics, among others, to produce such knowledge product every four years. This
product will provide analysis and insight on future frontiers of environmental change, and will
signal future areas of GEF focus. They will not aim to replicate efforts on the state of the global
environment already undertaken, such as UNEP’s GEO.
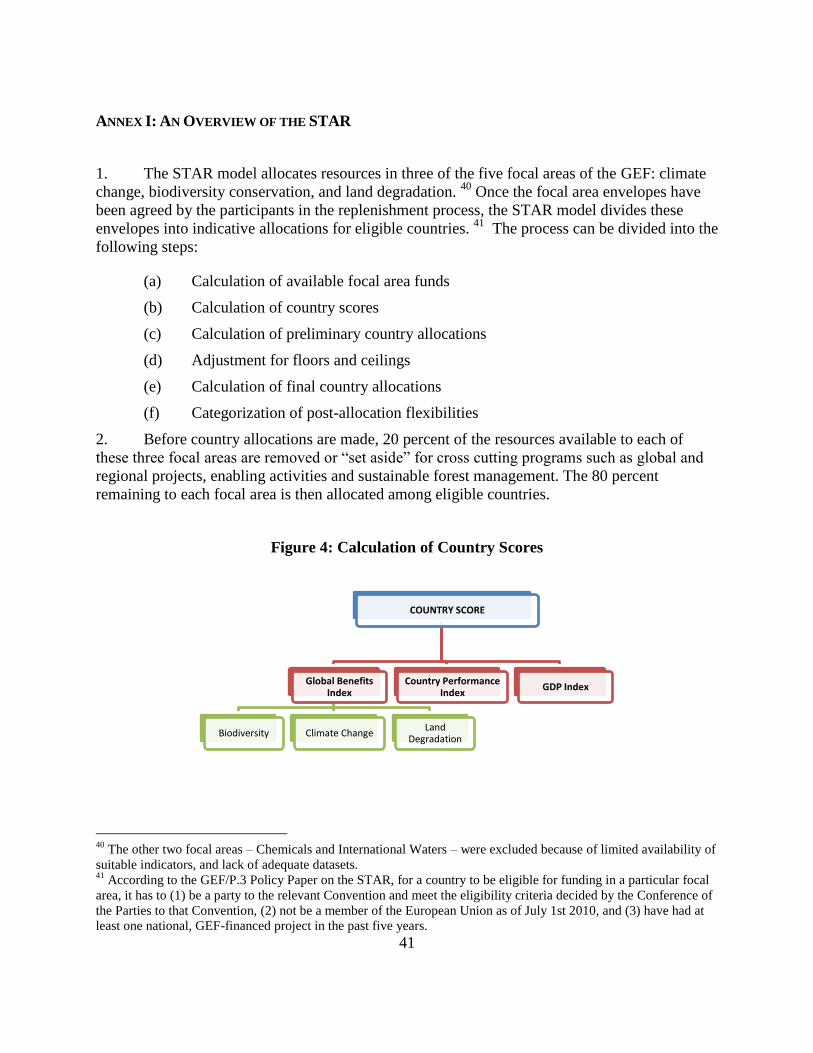
41
ANNEX I: AN OVERVIEW OF THE STAR
1. The STAR model allocates resources in three of the five focal areas of the GEF: climate
change, biodiversity conservation, and land degradation. 40
Once the focal area envelopes have
been agreed by the participants in the replenishment process, the STAR model divides these
envelopes into indicative allocations for eligible countries. 41
The process can be divided into the
following steps:
(a) Calculation of available focal area funds
(b) Calculation of country scores
(c) Calculation of preliminary country allocations
(d) Adjustment for floors and ceilings
(e) Calculation of final country allocations
(f) Categorization of post-allocation flexibilities
2. Before country allocations are made, 20 percent of the resources available to each of
these three focal areas are removed or “set aside” for cross cutting programs such as global and
regional projects, enabling activities and sustainable forest management. The 80 percent
remaining to each focal area is then allocated among eligible countries.
Figure 4: Calculation of Country Scores
40
The other two focal areas – Chemicals and International Waters – were excluded because of limited availability of
suitable indicators, and lack of adequate datasets. 41
According to the GEF/P.3 Policy Paper on the STAR, for a country to be eligible for funding in a particular focal
area, it has to (1) be a party to the relevant Convention and meet the eligibility criteria decided by the Conference of
the Parties to that Convention, (2) not be a member of the European Union as of July 1st 2010, and (3) have had at
least one national, GEF-financed project in the past five years.
COUNTRY SCORE
Global Benefits Index
Biodiversity Climate Change Land
Degradation
Country Performance Index
GDP Index
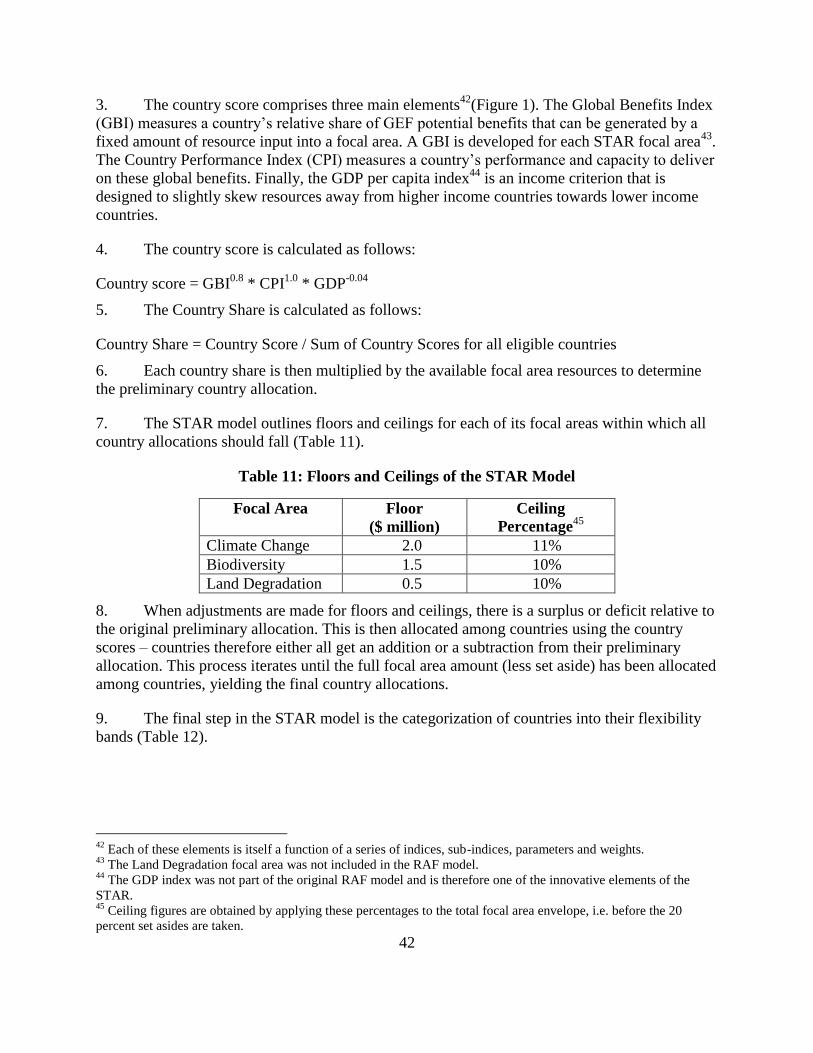
42
3. The country score comprises three main elements42
(Figure 1). The Global Benefits Index
(GBI) measures a country’s relative share of GEF potential benefits that can be generated by a
fixed amount of resource input into a focal area. A GBI is developed for each STAR focal area43
.
The Country Performance Index (CPI) measures a country’s performance and capacity to deliver
on these global benefits. Finally, the GDP per capita index44
is an income criterion that is
designed to slightly skew resources away from higher income countries towards lower income
countries.
4. The country score is calculated as follows:
Country score = GBI0.8
* CPI1.0
* GDP-0.04
5. The Country Share is calculated as follows:
Country Share = Country Score / Sum of Country Scores for all eligible countries
6. Each country share is then multiplied by the available focal area resources to determine
the preliminary country allocation.
7. The STAR model outlines floors and ceilings for each of its focal areas within which all
country allocations should fall (Table 11).
Table 11: Floors and Ceilings of the STAR Model
Focal Area Floor
($ million)
Ceiling
Percentage45
Climate Change 2.0 11%
Biodiversity 1.5 10%
Land Degradation 0.5 10%
8. When adjustments are made for floors and ceilings, there is a surplus or deficit relative to
the original preliminary allocation. This is then allocated among countries using the country
scores – countries therefore either all get an addition or a subtraction from their preliminary
allocation. This process iterates until the full focal area amount (less set aside) has been allocated
among countries, yielding the final country allocations.
9. The final step in the STAR model is the categorization of countries into their flexibility
bands (Table 12).
42
Each of these elements is itself a function of a series of indices, sub-indices, parameters and weights. 43
The Land Degradation focal area was not included in the RAF model. 44
The GDP index was not part of the original RAF model and is therefore one of the innovative elements of the
STAR. 45
Ceiling figures are obtained by applying these percentages to the total focal area envelope, i.e. before the 20
percent set asides are taken.
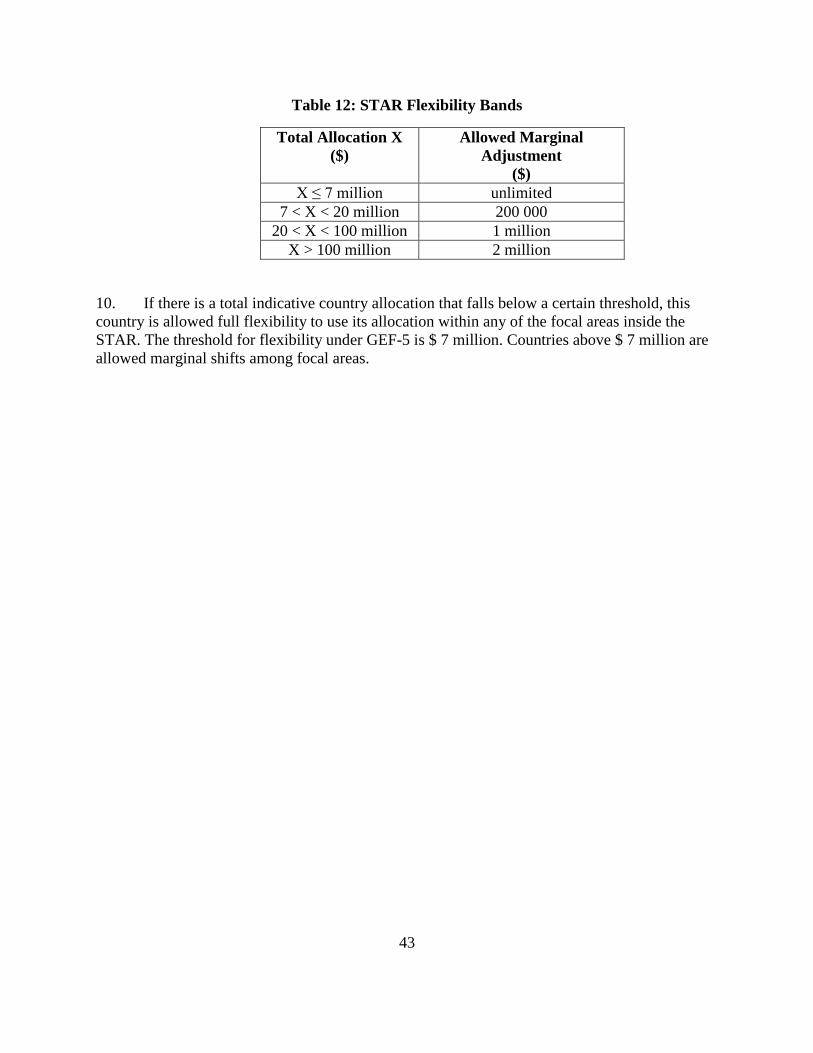
43
Table 12: STAR Flexibility Bands
Total Allocation X
($)
Allowed Marginal
Adjustment
($)
X ≤ 7 million unlimited
7 < X < 20 million 200 000
20 < X < 100 million 1 million
X > 100 million 2 million
10. If there is a total indicative country allocation that falls below a certain threshold, this
country is allowed full flexibility to use its allocation within any of the focal areas inside the
STAR. The threshold for flexibility under GEF-5 is $ 7 million. Countries above $ 7 million are
allowed marginal shifts among focal areas.
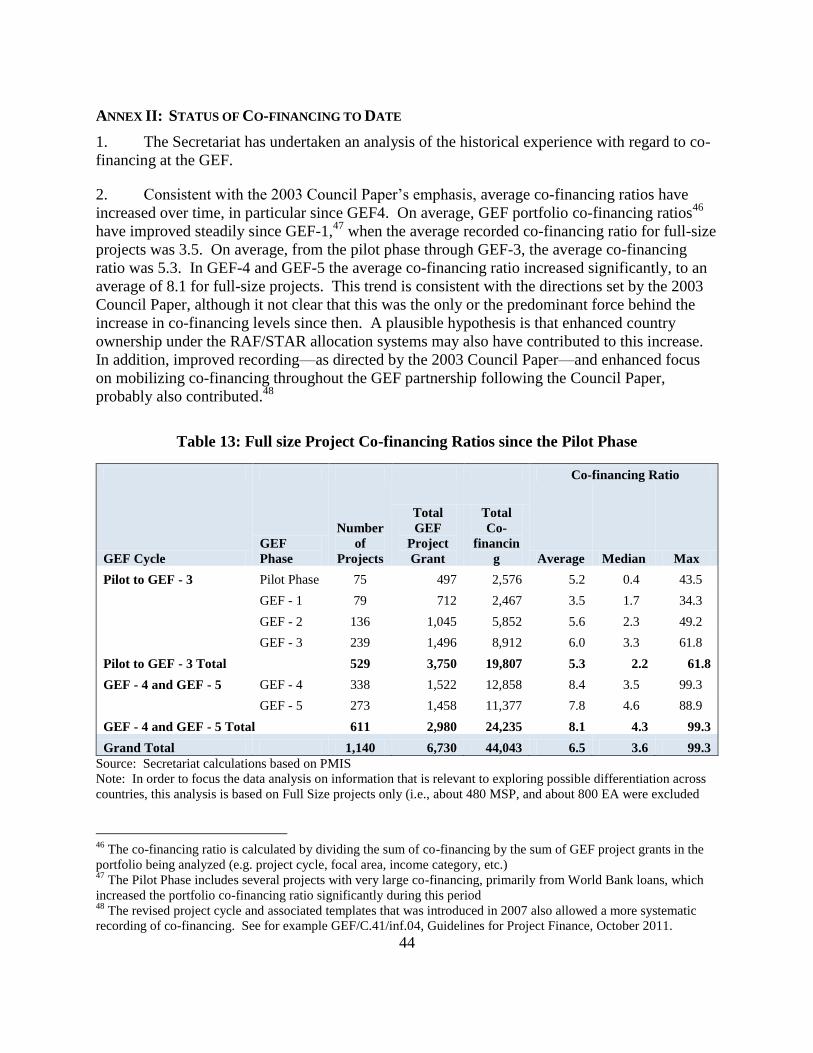
44
ANNEX II: STATUS OF CO-FINANCING TO DATE
1. The Secretariat has undertaken an analysis of the historical experience with regard to co-
financing at the GEF.
2. Consistent with the 2003 Council Paper’s emphasis, average co-financing ratios have
increased over time, in particular since GEF4. On average, GEF portfolio co-financing ratios46
have improved steadily since GEF-1,47
when the average recorded co-financing ratio for full-size
projects was 3.5. On average, from the pilot phase through GEF-3, the average co-financing
ratio was 5.3. In GEF-4 and GEF-5 the average co-financing ratio increased significantly, to an
average of 8.1 for full-size projects. This trend is consistent with the directions set by the 2003
Council Paper, although it not clear that this was the only or the predominant force behind the
increase in co-financing levels since then. A plausible hypothesis is that enhanced country
ownership under the RAF/STAR allocation systems may also have contributed to this increase.
In addition, improved recording—as directed by the 2003 Council Paper—and enhanced focus
on mobilizing co-financing throughout the GEF partnership following the Council Paper,
probably also contributed.48
Table 13: Full size Project Co-financing Ratios since the Pilot Phase
Co-financing Ratio
GEF Cycle
GEF
Phase
Number
of
Projects
Total
GEF
Project
Grant
Total
Co-
financin
g Average Median Max
Pilot to GEF - 3 Pilot Phase 75 497 2,576 5.2 0.4 43.5
GEF - 1 79 712 2,467 3.5 1.7 34.3
GEF - 2 136 1,045 5,852 5.6 2.3 49.2
GEF - 3 239 1,496 8,912 6.0 3.3 61.8
Pilot to GEF - 3 Total 529 3,750 19,807 5.3 2.2 61.8
GEF - 4 and GEF - 5 GEF - 4 338 1,522 12,858 8.4 3.5 99.3
GEF - 5 273 1,458 11,377 7.8 4.6 88.9
GEF - 4 and GEF - 5 Total 611 2,980 24,235 8.1 4.3 99.3
Grand Total 1,140 6,730 44,043 6.5 3.6 99.3
Source: Secretariat calculations based on PMIS
Note: In order to focus the data analysis on information that is relevant to exploring possible differentiation across
countries, this analysis is based on Full Size projects only (i.e., about 480 MSP, and about 800 EA were excluded
46
The co-financing ratio is calculated by dividing the sum of co-financing by the sum of GEF project grants in the
portfolio being analyzed (e.g. project cycle, focal area, income category, etc.) 47
The Pilot Phase includes several projects with very large co-financing, primarily from World Bank loans, which
increased the portfolio co-financing ratio significantly during this period 48
The revised project cycle and associated templates that was introduced in 2007 also allowed a more systematic
recording of co-financing. See for example GEF/C.41/inf.04, Guidelines for Project Finance, October 2011.
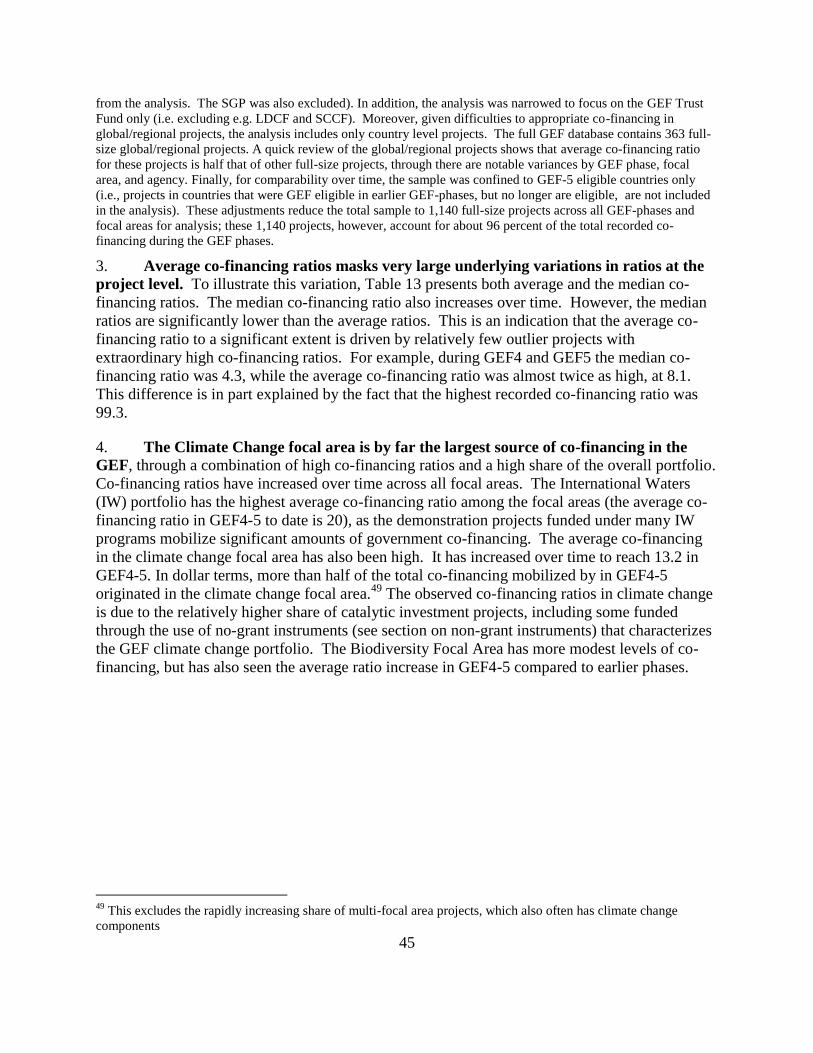
45
from the analysis. The SGP was also excluded). In addition, the analysis was narrowed to focus on the GEF Trust
Fund only (i.e. excluding e.g. LDCF and SCCF). Moreover, given difficulties to appropriate co-financing in
global/regional projects, the analysis includes only country level projects. The full GEF database contains 363 full-
size global/regional projects. A quick review of the global/regional projects shows that average co-financing ratio
for these projects is half that of other full-size projects, through there are notable variances by GEF phase, focal
area, and agency. Finally, for comparability over time, the sample was confined to GEF-5 eligible countries only
(i.e., projects in countries that were GEF eligible in earlier GEF-phases, but no longer are eligible, are not included
in the analysis). These adjustments reduce the total sample to 1,140 full-size projects across all GEF-phases and
focal areas for analysis; these 1,140 projects, however, account for about 96 percent of the total recorded co-
financing during the GEF phases.
3. Average co-financing ratios masks very large underlying variations in ratios at the
project level. To illustrate this variation, Table 13 presents both average and the median co-
financing ratios. The median co-financing ratio also increases over time. However, the median
ratios are significantly lower than the average ratios. This is an indication that the average co-
financing ratio to a significant extent is driven by relatively few outlier projects with
extraordinary high co-financing ratios. For example, during GEF4 and GEF5 the median co-
financing ratio was 4.3, while the average co-financing ratio was almost twice as high, at 8.1.
This difference is in part explained by the fact that the highest recorded co-financing ratio was
99.3.
4. The Climate Change focal area is by far the largest source of co-financing in the
GEF, through a combination of high co-financing ratios and a high share of the overall portfolio.
Co-financing ratios have increased over time across all focal areas. The International Waters
(IW) portfolio has the highest average co-financing ratio among the focal areas (the average co-
financing ratio in GEF4-5 to date is 20), as the demonstration projects funded under many IW
programs mobilize significant amounts of government co-financing. The average co-financing
in the climate change focal area has also been high. It has increased over time to reach 13.2 in
GEF4-5. In dollar terms, more than half of the total co-financing mobilized by in GEF4-5
originated in the climate change focal area.49
The observed co-financing ratios in climate change
is due to the relatively higher share of catalytic investment projects, including some funded
through the use of no-grant instruments (see section on non-grant instruments) that characterizes
the GEF climate change portfolio. The Biodiversity Focal Area has more modest levels of co-
financing, but has also seen the average ratio increase in GEF4-5 compared to earlier phases.
49
This excludes the rapidly increasing share of multi-focal area projects, which also often has climate change
components
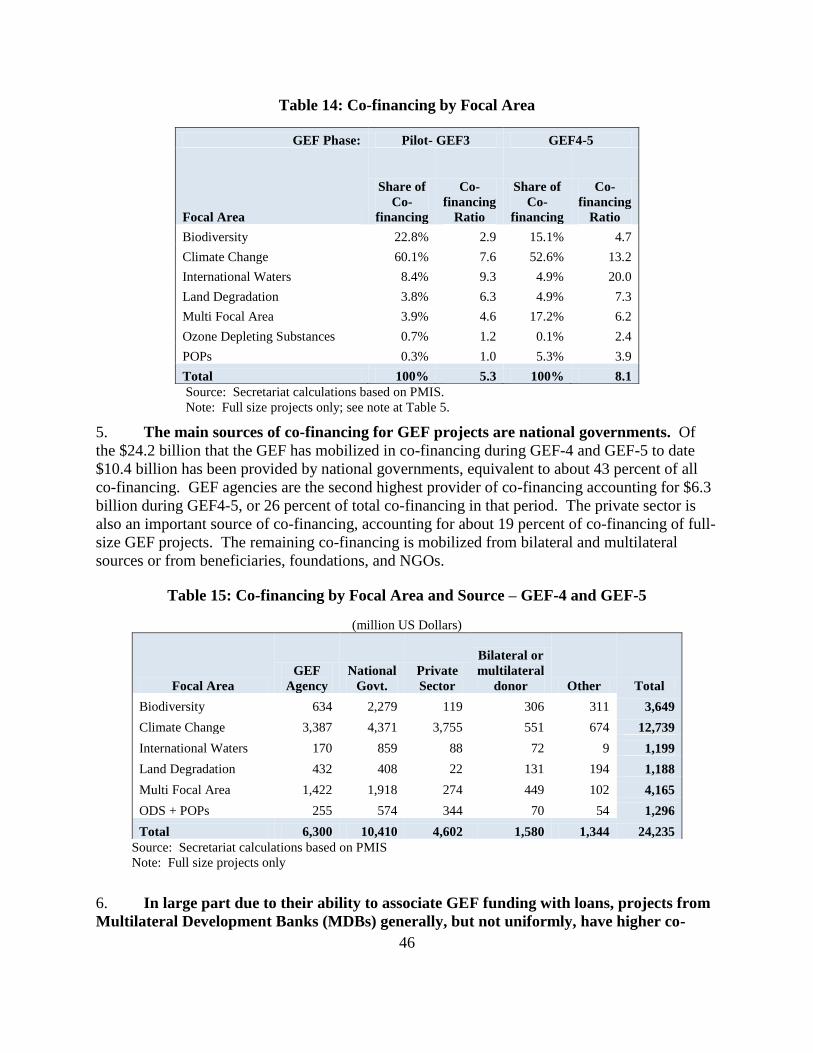
46
Table 14: Co-financing by Focal Area
GEF Phase: Pilot- GEF3 GEF4-5
Focal Area
Share of
Co-
financing
Co-
financing
Ratio
Share of
Co-
financing
Co-
financing
Ratio
Biodiversity 22.8% 2.9 15.1% 4.7
Climate Change 60.1% 7.6 52.6% 13.2
International Waters 8.4% 9.3 4.9% 20.0
Land Degradation 3.8% 6.3 4.9% 7.3
Multi Focal Area 3.9% 4.6 17.2% 6.2
Ozone Depleting Substances 0.7% 1.2 0.1% 2.4
POPs 0.3% 1.0 5.3% 3.9
Total 100% 5.3 100% 8.1
Source: Secretariat calculations based on PMIS.
Note: Full size projects only; see note at Table 5.
5. The main sources of co-financing for GEF projects are national governments. Of
the $24.2 billion that the GEF has mobilized in co-financing during GEF-4 and GEF-5 to date
$10.4 billion has been provided by national governments, equivalent to about 43 percent of all
co-financing. GEF agencies are the second highest provider of co-financing accounting for $6.3
billion during GEF4-5, or 26 percent of total co-financing in that period. The private sector is
also an important source of co-financing, accounting for about 19 percent of co-financing of full-
size GEF projects. The remaining co-financing is mobilized from bilateral and multilateral
sources or from beneficiaries, foundations, and NGOs.
Table 15: Co-financing by Focal Area and Source – GEF-4 and GEF-5
(million US Dollars)
Focal Area
GEF
Agency
National
Govt.
Private
Sector
Bilateral or
multilateral
donor Other Total
Biodiversity 634 2,279 119 306 311 3,649
Climate Change 3,387 4,371 3,755 551 674 12,739
International Waters 170 859 88 72 9 1,199
Land Degradation 432 408 22 131 194 1,188
Multi Focal Area 1,422 1,918 274 449 102 4,165
ODS + POPs 255 574 344 70 54 1,296
Total 6,300 10,410 4,602 1,580 1,344 24,235
Source: Secretariat calculations based on PMIS
Note: Full size projects only
6. In large part due to their ability to associate GEF funding with loans, projects from
Multilateral Development Banks (MDBs) generally, but not uniformly, have higher co-
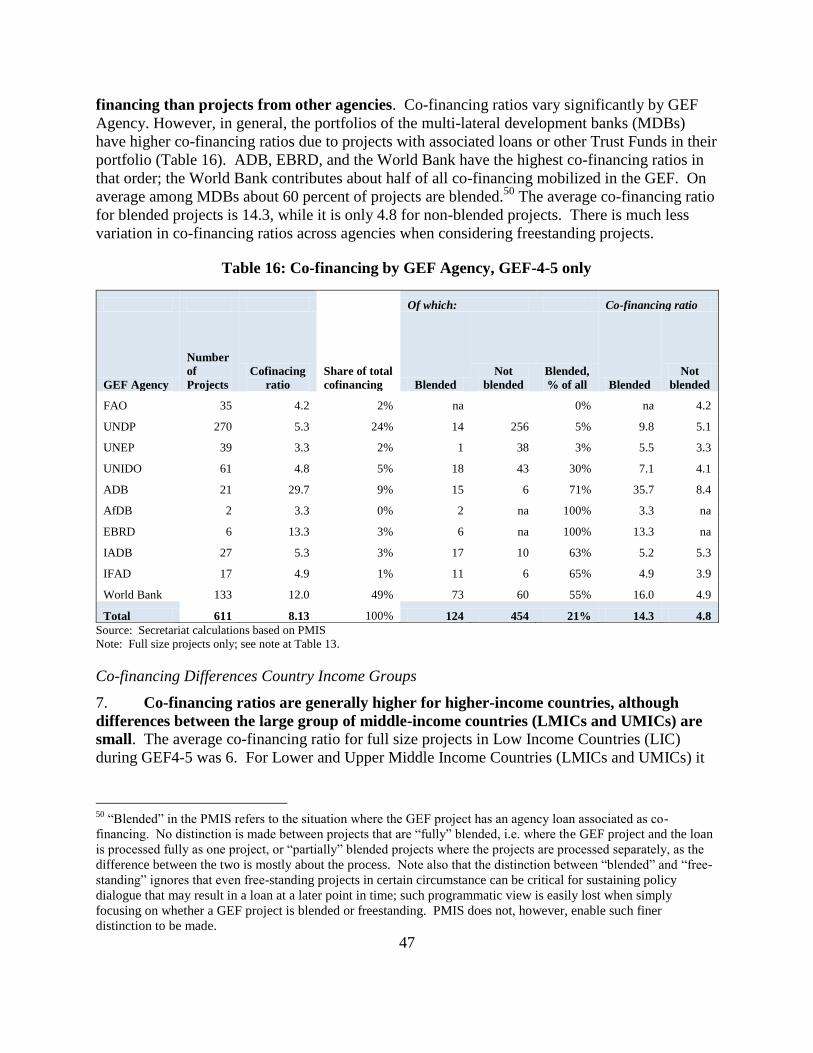
47
financing than projects from other agencies. Co-financing ratios vary significantly by GEF
Agency. However, in general, the portfolios of the multi-lateral development banks (MDBs)
have higher co-financing ratios due to projects with associated loans or other Trust Funds in their
portfolio (Table 16). ADB, EBRD, and the World Bank have the highest co-financing ratios in
that order; the World Bank contributes about half of all co-financing mobilized in the GEF. On
average among MDBs about 60 percent of projects are blended.50
The average co-financing ratio
for blended projects is 14.3, while it is only 4.8 for non-blended projects. There is much less
variation in co-financing ratios across agencies when considering freestanding projects.
Table 16: Co-financing by GEF Agency, GEF-4-5 only
Of which: Co-financing ratio
GEF Agency
Number
of
Projects
Cofinacing
ratio
Share of total
cofinancing Blended
Not
blended
Blended,
% of all Blended
Not
blended
FAO 35 4.2 2% na
0% na 4.2
UNDP 270 5.3 24% 14 256 5% 9.8 5.1
UNEP 39 3.3 2% 1 38 3% 5.5 3.3
UNIDO 61 4.8 5% 18 43 30% 7.1 4.1
ADB 21 29.7 9% 15 6 71% 35.7 8.4
AfDB 2 3.3 0% 2 na 100% 3.3 na
EBRD 6 13.3 3% 6 na 100% 13.3 na
IADB 27 5.3 3% 17 10 63% 5.2 5.3
IFAD 17 4.9 1% 11 6 65% 4.9 3.9
World Bank 133 12.0 49% 73 60 55% 16.0 4.9
Total 611 8.13 100% 124 454 21% 14.3 4.8
Source: Secretariat calculations based on PMIS
Note: Full size projects only; see note at Table 13.
Co-financing Differences Country Income Groups
7. Co-financing ratios are generally higher for higher-income countries, although
differences between the large group of middle-income countries (LMICs and UMICs) are
small. The average co-financing ratio for full size projects in Low Income Countries (LIC)
during GEF4-5 was 6. For Lower and Upper Middle Income Countries (LMICs and UMICs) it
50
“Blended” in the PMIS refers to the situation where the GEF project has an agency loan associated as co-
financing. No distinction is made between projects that are “fully” blended, i.e. where the GEF project and the loan
is processed fully as one project, or “partially” blended projects where the projects are processed separately, as the
difference between the two is mostly about the process. Note also that the distinction between “blended” and “free-
standing” ignores that even free-standing projects in certain circumstance can be critical for sustaining policy
dialogue that may result in a loan at a later point in time; such programmatic view is easily lost when simply
focusing on whether a GEF project is blended or freestanding. PMIS does not, however, enable such finer
distinction to be made.
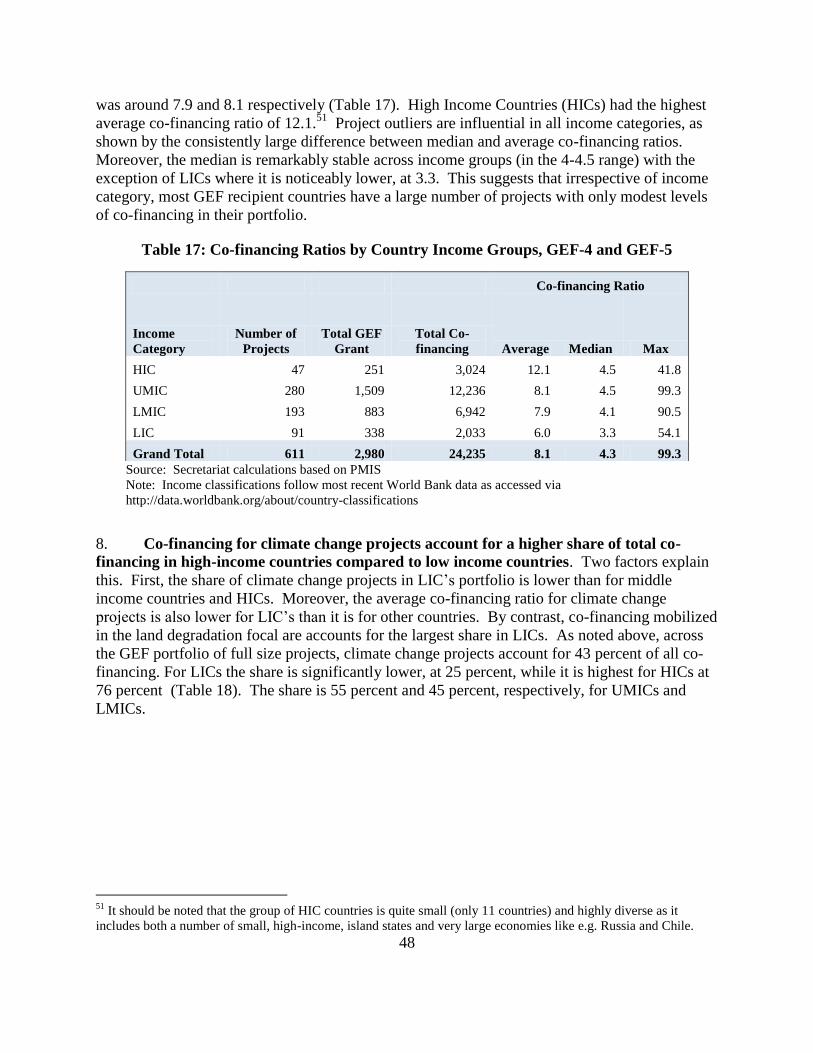
48
was around 7.9 and 8.1 respectively (Table 17). High Income Countries (HICs) had the highest
average co-financing ratio of 12.1.51
Project outliers are influential in all income categories, as
shown by the consistently large difference between median and average co-financing ratios.
Moreover, the median is remarkably stable across income groups (in the 4-4.5 range) with the
exception of LICs where it is noticeably lower, at 3.3. This suggests that irrespective of income
category, most GEF recipient countries have a large number of projects with only modest levels
of co-financing in their portfolio.
Table 17: Co-financing Ratios by Country Income Groups, GEF-4 and GEF-5
Co-financing Ratio
Income
Category
Number of
Projects
Total GEF
Grant
Total Co-
financing Average Median Max
HIC 47 251 3,024 12.1 4.5 41.8
UMIC 280 1,509 12,236 8.1 4.5 99.3
LMIC 193 883 6,942 7.9 4.1 90.5
LIC 91 338 2,033 6.0 3.3 54.1
Grand Total 611 2,980 24,235 8.1 4.3 99.3
Source: Secretariat calculations based on PMIS
Note: Income classifications follow most recent World Bank data as accessed via
http://data.worldbank.org/about/country-classifications
8. Co-financing for climate change projects account for a higher share of total co-
financing in high-income countries compared to low income countries. Two factors explain
this. First, the share of climate change projects in LIC’s portfolio is lower than for middle
income countries and HICs. Moreover, the average co-financing ratio for climate change
projects is also lower for LIC’s than it is for other countries. By contrast, co-financing mobilized
in the land degradation focal are accounts for the largest share in LICs. As noted above, across
the GEF portfolio of full size projects, climate change projects account for 43 percent of all co-
financing. For LICs the share is significantly lower, at 25 percent, while it is highest for HICs at
76 percent (Table 18). The share is 55 percent and 45 percent, respectively, for UMICs and
LMICs.
51
It should be noted that the group of HIC countries is quite small (only 11 countries) and highly diverse as it
includes both a number of small, high-income, island states and very large economies like e.g. Russia and Chile.

49
Table 18: Focal Area Contributions to Co-financing, by Country Income Groups, GEF-4
and GEF-5
Biodiversity
Climate
Change
Internation
al Waters
Land
Degradati
on
Multi
Focal
Area ODS POPs Total
HIC 6% 76% 0% 0% 16% 0% 1% 100%
UMIC 20% 55% 4% 2% 14% 0% 5% 100%
LMIC 9% 45% 11% 5% 21% 0% 9% 100%
LIC 20% 25% 0% 28% 25% 2% 0% 100%
Source: Secretariat calculations based on PMIS
Note: Income classifications follow most recent World Bank data as accessed via
http://data.worldbank.org/about/country-classifications.
9. Middle income countries mobilize a significantly larger share of co-financing from
their national governments and from the private sector than low-income countries do. The
distribution of the source of co-financing does not vary much between LMICs and UMICs.
Close to half of all co-financing in these countries originates from the national government. By
contrast, in LICs the share is only 27.3 percent, reflecting the higher availability of GEF-agency
and other donor co-financing in this category. However, the data also show that the share of
government-originated co-financing in HIC is lower than that in UMICs and LMICs. This is in
part due to a significantly higher ratio of private sector co-financing in HICs, mainly driven by
climate change projects: 29.6 percent, against slightly below 20 percent in LMICs and UMICs
and only 5.4 percent in LICs—a clear indication of the challenges of mobilizing private sector
financing in LICs compared to other groups.
Table 19: Source of Co-financing, by Country Income Groups, GEF-4 and GEF-5
Government GEF Agency
Private
Sector Donors Others
Grand
Total
HIC 29.0% 37.5% 29.6% 3.5% 0.5% 100.0%
UMIC 47.2% 21.9% 18.5% 5.0% 7.5% 100%
LMIC 46.2% 23.6% 19.3% 7.1% 3.9% 100%
LIC 27.3% 42.1% 5.4% 18.0% 7.1% 100%
Source: Secretariat calculations based on PMIS
Note: Income classifications follow most recent World Bank data as accessed via
http://data.worldbank.org/about/country-classifications.
Co-financing among the Largest GEF Recipients
10. The top-5 GEF recipient countries generate a disproportionately large share of total
co-financing. The five countries with the largest STAR allocations are China, India, Brazil, The
Russian Federation and Mexico. While these top-5 GEF recipients programmed in total about 39
percent of all full size projects during GEF4 and GEF5, they generated about 52 percent of all
co-financing. This reflects that these countries’ co-financing levels during GEF4-5, with the
exception of Brazil, were higher than the average co-financing ratios (Table 20). Among the

50
top-5 recipient countries, the Russian federation has the highest co-financing ratio (14.9)
followed by China at 13.6, while Brazil has the lowest co-financing ratio (5.4). At the same
time, the data also show that the co-financing levels of individual projects vary considerably; as
is the case for most countries, the median co-financing ratio is significantly lower than the
average. Moreover, the ranking of countries in terms of co-financing ratio changes significantly
depending on whether the average or the median is used. For example, while Brazil has the
lowest average co-financing rate it has the highest median rate. Conversely, Mexico has the 3rd
highest average co-financing ratio (driven in large part by a single project with a co-financing
ratio of 99.3), while its median rate is the lowest.
Table 20: Co-financing Ratios among Top-5 Recipient Countries, GEF4-5
Country
Number
of
Projects
Sum
GEF
Grant
Sum Co-
financing
Co-
financing
ratio Median Max
China 59 403 5,481 13.6 6.2 88.9
India 31 238 2,049 8.6 4.8 33.0
Brazil 19 184 992 5.4 4.8 12.9
Russian Federation 25 173 2,589 14.9 4.7 41.8
Mexico 19 163 1,569 9.6 4.0 99.3
All countries 611 2,980 24,235 8.1 4.3 99.3
Source: Secretariat calculations based on PMIS
Note: Income classifications follow most recent World Bank data as accessed via
http://data.worldbank.org/about/country-classifications.
11. Differences in co-financing levels among top-5 countries are in part driven by
differences in the composition of their project portfolio. In particular, Brazil has a relatively
high share of biodiversity projects in its portfolio (only 41 percent of its STAR allocation is for
climate change, as compared to more than 70 percent for the three countries with the highest
ratios), and since biodiversity projects across the board is associated with lower levels of co-
financing, this reduces the overall measured co-financing ratio in Brazil. The extent to which
GEF projects in the top-5 recipient countries are blended with MDB loans also has a major
impact on the realized co-financing ratio. Overall, a slightly higher share (32 percent) of projects
in the top-5 recipient countries are blended than in the GEF portfolio as a whole (26 percent, see
above). The prevalence of free-standing projects in the biodiversity focal area is also much
higher than those in climate change in the top-5 countries: of the 50 full size biodiversity
projects that have been approved by Council in GEF4-5 to date, only 4 of them were blended
with MDB loans. By contrast, of the 55 climate change projects approved during the same
period, 31 of them were blended. Mexico is an illustration of how blended projects can play an
exceptionally large role in determining the overall measured co-financing ratio: its three blended
climate change projects account for 90 percent of Mexico’s total mobilized co-financing during
GEF4-5.

51
Table 21: Co-financing Ratios across Focal Areas in Freestanding and Blended Projects
among Top-5 Recipient Countries, GEF4-5
--- Free-standing projects --- --------- Blended projects -------
Country Focal Area
Number
of
Projects
Co-
financing
Ratio
Share of
Co-
financing
Number
of
Projects
Co-
financing
Ratio
Share of
Co-
financing
Share
of
blended
Total
Co-
financing
Ratio
China
35 4.79 16% 24 21.3 84% 41% 13.6
Of
which Biodiversity 16 4.94 28% 4 47.2 72% 20% 13.9
Climate
Change 7 5.74 10% 13 20.6 90% 65% 16.3
India
21 5.00 33% 10 13.3 67% 32% 8.6
Of
which Biodiversity 7 3.45 100% 0 na 0% 0% 3.5
Climate
Change 8 5.86 24% 7 15.9 76% 47% 11.2
Brazil
16 5.21 62% 3 5.7 38% 16% 5.4
Of
which Biodiversity 9 4.31 100% 0 na 0% 0% 4.3
Climate
Change 4 7.42 75% 1 12.9 25% 20% 8.3
Russian Federation 17 6.12 20% 8 23.5 80% 32% 14.9
Of
which Biodiversity 4 3.43 100% 0 na 0% 0% 3.4
Climate
Change 4 11.84 14% 7 22.3 86% 64% 19.8
Mexico
15 4.61 30% 4 17.8 70% 21% 9.6
Of
which Biodiversity 10 3.41 100% 0 na 0% 0% 3.4
Climate
Change 1 5.92 10% 3 38.8 90% 75% 24.7
Source: GEF Secretariat calculations based on PMIS
Note: Income classifications follow most recent World Bank data as accessed via
http://data.worldbank.org/about/country-classifications.
Related Documents