Strategic Planning and Reporting FOURTH QUARTERLY REPORT ON THE PERFORMANCE OF THE DEPARTMENT IN MEETING ITS STRATEGIC OBJECTIVES FOR 2011/12 Presentation to the Portfolio Committee on Basic Education 12 JUNE 2012 Parliament, Cape Town. 11

Strategic Planning and Reporting FOURTH QUARTERLY REPORT ON THE PERFORMANCE OF THE DEPARTMENT IN MEETING ITS STRATEGIC OBJECTIVES FOR 2011/12 Presentation.
Jan 04, 2016
Welcome message from author
This document is posted to help you gain knowledge. Please leave a comment to let me know what you think about it! Share it to your friends and learn new things together.
Transcript
Strategic Planning and Reporting
FOURTH QUARTERLY REPORT ON THE PERFORMANCE OF THE DEPARTMENT IN MEETING ITS STRATEGIC
OBJECTIVES FOR 2011/12
Presentation to the Portfolio Committee on Basic Education
12 JUNE 2012
Parliament, Cape Town.
11
PART APresentation Context
PART BFourth Quarter Performance Report
PART CFourth Quarter Expenditure Report
PART DConclusion
22
Presentation Outline

Strategic Planning and Reporting
PART APresentation Context
33
Strategic Planning and Reporting
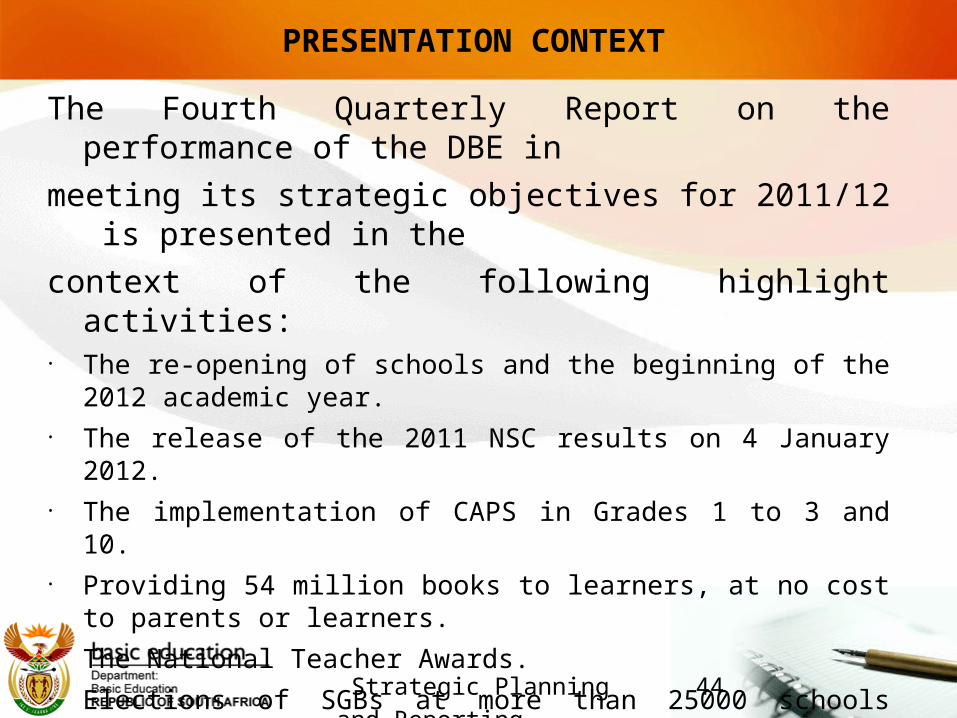
PRESENTATION CONTEXT
The Fourth Quarterly Report on the performance of the DBE inmeeting its strategic objectives for 2011/12 is presented in the context of the following highlight activities:• The re-opening of schools and the beginning of the 2012 academic year.• The release of the 2011 NSC results on 4 January 2012.• The implementation of CAPS in Grades 1 to 3 and 10.• Providing 54 million books to learners, at no cost to parents or learners.• The National Teacher Awards. • Elections of SGBs at more than 25000 schools throughout the country.• Section 100 (1) (b) interventions in Eastern Cape and Limpopo.• The launch of the Magnificent Wednesday campaign to encourage
participation in sports at all schools.• Launch of the 94 Schools for Madiba Project.
44

Strategic Planning and Reporting
PART BFourth Quarter Performance Report
55

Strategic Planning and Reporting
PROGRAMMES OF THE DBE
The Annual Performance Plan summarises the priorities of the DBE as aligned to the Delivery Agreement of OUTCOME 1: Improving the quality of Basic Education and the Action Plan to 2014: Towards the Realisation of Schooling 2025 .
The activities of the DBE have been structured into five programmes as elaborated in the Annual Performance Plan:
o PROGRAMME 1: ADMINISTRATION
o PROGRAMME 2: CURRICULUM POLICY, SUPPORT AND MONITORING
o PROGRAMME 3: TEACHERS, EDUCATION HUMAN RESOURCES AND
INSTITUTIONAL DEVELOPMENT
o PROGRAMME 4: PLANNING, INFORMATION AND ASSESSMENT
o PROGRAMME 5: EDUCATIONAL ENRICHMENT SERVICES
66

Strategic Planning and Reporting
NUMBER OF TARGETS FOR ALL DBE PROGRAMMES
77
TARGETS NUMBER PERCENTAGEQuarterly Targets 23 38%Bi-annual Targets 3 5%Annual Targets 35 57%Total No. of Programme Performance Indicators
61 100%

Strategic Planning and Reporting
PROGRAMME ONE: ADMINISTRATION
The purpose of Programme One is to manage the Department and provide strategic and administrative support services.
SUB-PROGRAMMES Legal and Legislative Services Media Liaison International Relations and Multilateral Affairs Provincial Support and Delivery
88

Strategic Planning and Reporting
PROGRAMME ONE : SIGNIFICANT EVENTS AND ACHIEVEMENTS
ORGANISATIONAL MATTERS:• Appointments have been made in the key posts of Deputy Directors-
General for Finance & Administration as well as for Planning, Information & Assessments.
• With regards to Skills Development and Training Programmes, the Department exceeded the predetermined target by providing professional development opportunities to 264 officials by the end of the financial year.
LEGAL & LEGISLATIVE SERVICES:
• The Legal Services Directorate received 12 court cases in this reporting period and managed to successfully resolve 6. The remaining cases are still in progress.
99
Strategic Planning and Reporting
PROGRAMME ONE : SIGNIFICANT EVENTS AND ACHIEVEMENTS
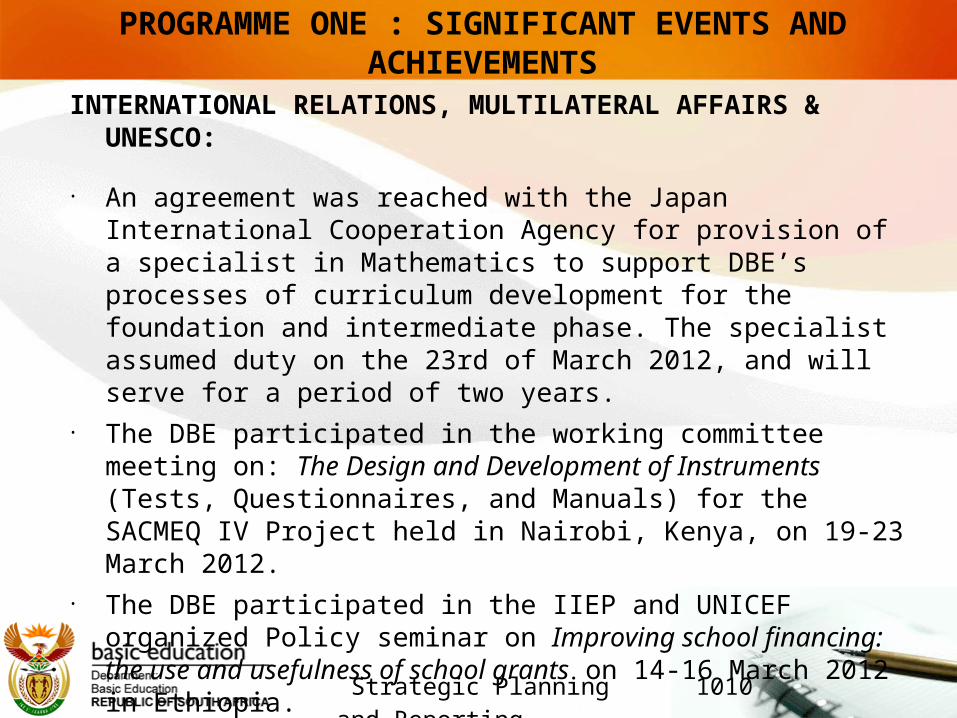
INTERNATIONAL RELATIONS, MULTILATERAL AFFAIRS & UNESCO:
• An agreement was reached with the Japan International Cooperation Agency for provision of a specialist in Mathematics to support DBE’s processes of curriculum development for the foundation and intermediate phase. The specialist assumed duty on the 23rd of March 2012, and will serve for a period of two years.
• The DBE participated in the working committee meeting on: The Design and Development of Instruments (Tests, Questionnaires, and Manuals) for the SACMEQ IV Project held in Nairobi, Kenya, on 19-23 March 2012.
• The DBE participated in the IIEP and UNICEF organized Policy seminar on Improving school financing: the use and usefulness of school grants on 14-16 March 2012 in Ethiopia.
1010
Strategic Planning and Reporting
PROGRAMME ONE : SIGNIFICANT EVENTS AND ACHIEVEMENTS
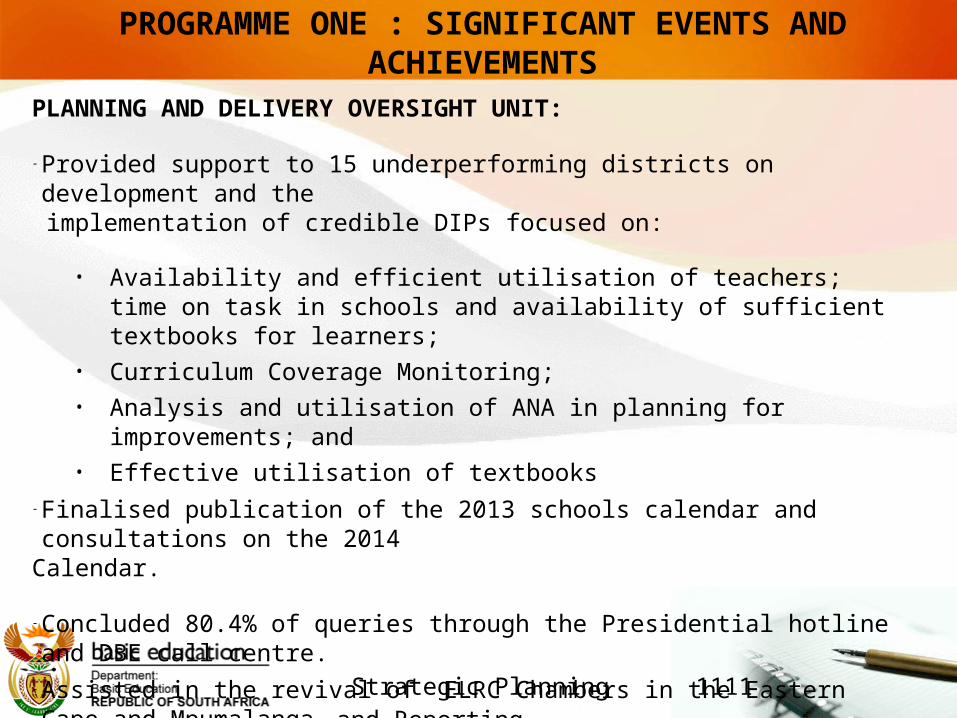
PLANNING AND DELIVERY OVERSIGHT UNIT:
- Provided support to 15 underperforming districts on development and the implementation of credible DIPs focused on:
• Availability and efficient utilisation of teachers; time on task in schools and availability of sufficient textbooks for learners;
• Curriculum Coverage Monitoring;• Analysis and utilisation of ANA in planning for improvements; and • Effective utilisation of textbooks
- Finalised publication of the 2013 schools calendar and consultations on the 2014Calendar.
- Concluded 80.4% of queries through the Presidential hotline and DBE call centre.- Assisted in the revival of ELRC Chambers in the Eastern Cape and Mpumalanga.- Assisted in the finalisation of post establishments being issued on time – ensuring labour peace.
- Finalised QLTC Resource pack to be used at school level and in the training of newlyappointed SGB members. 1111

Strategic Planning and Reporting
PROGRAMME ONE : SIGNIFICANT EVENTS AND ACHIEVEMENTS
COMMUNICATION • External publications such as Public Service Manager (2 articles) and
Vuk’uzenzele (6 articles) were utilised to communicate education issues to the public during January and February.
• The communications unit informed the public and stakeholders on an ongoing basis on the policies, programmes and interventions of the department via regular media engagements. Sixty-eight media queries and twenty-five interview requests were attended to. Nineteen media releases and eighteen speeches were published and uploaded onto the DBE website during the fourth quarter.
1212
Strategic Planning and Reporting
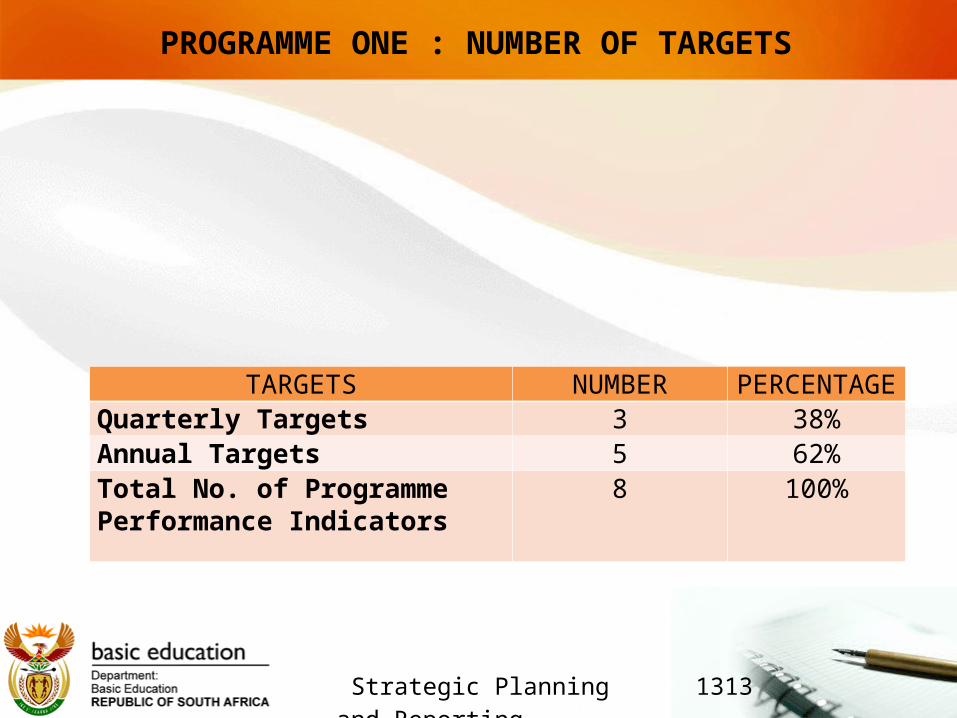
PROGRAMME ONE : NUMBER OF TARGETS
1313
TARGETS NUMBER PERCENTAGEQuarterly Targets 3 38%Annual Targets 5 62%Total No. of Programme Performance Indicators
8 100%

Strategic Planning and Reporting
PROGRAMME ONE OUTPUTS
1414
PERFORMANCE INDICATORS
Target for 2011 as per APP
1st Quarter
Target as per APP
1st Quarter Actual
output-validated
2nd Quarter Target as per APP
2nd Quarter Actual
output-validated
3rd Quarter Target as per APP
3rd Quarter Actual
output-validated
4th Quarter
Target as per APP
4th Quarter Actual
output-validated
The number of officials attendingInductionprogrammes for new entrants to the Department.
30
AnnualTarget
AnnualTarget
AnnualTarget
AnnualTarget
AnnualTarget
AnnualTarget
AnnualTarget
47
The number of internships implemented for unemployed Graduates in the Department.
50
AnnualTarget
AnnualTarget
AnnualTarget
AnnualTarget
AnnualTarget
AnnualTarget
AnnualTarget
63
The number of training/ professional development opportunities for DBE officials.
257
AnnualTarget
AnnualTarget
AnnualTarget
AnnualTarget
AnnualTarget
AnnualTarget
AnnualTarget
264
The number of multilateral cooperation agreements being implemented.
8AnnualTarget
AnnualTarget
AnnualTarget
AnnualTarget
AnnualTarget
AnnualTarget
AnnualTarget
3

Strategic Planning and Reporting
PROGRAMME ONE OUTPUTS
1515
PERFORMANCE INDICATORS
Target for 2011 as per
APP
1st Quarter Target as per APP
1st Quarter Actual
output-validated
2nd Quarter
Target as per APP
2nd Quarter Actual
output-validated
3rd Quarter
Target as per APP
3rd Quarter Actual
output-validated
4th Quarter
Target as per APP
4th Quarter Actual
output-validated
The percentage of court cases successfully resolved. 50% 50% 100% 50% 60% 50% 44% 50% 50%
The number of basic Education Legislation drafted and signed into law. 4 Annual
TargetAnnualTarget
AnnualTarget
AnnualTarget
AnnualTarget
AnnualTarget
AnnualTarget
3
The percentage of functional national and provincial communication platforms.
70% 70% 20% 70% 35% 70% 90% 70% 100%
The percentage of queries from provincial educationdepartments successfully resolved.
70% 70% 72% 70% 70% 70% 58% 70% 67%
Strategic Planning and Reporting
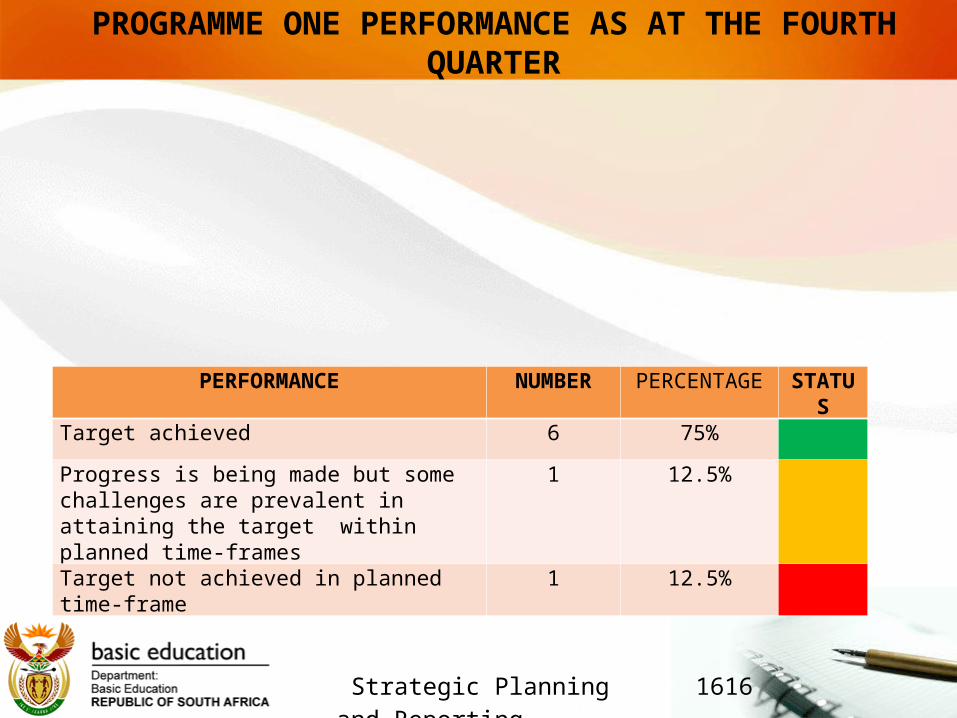
PROGRAMME ONE PERFORMANCE AS AT THE FOURTH QUARTER
1616
PERFORMANCE NUMBER PERCENTAGE STATUS
Target achieved 6 75%
Progress is being made but some challenges are prevalent in attaining the target within planned time-frames
1 12.5%
Target not achieved in planned time-frame 1 12.5%
Strategic Planning and Reporting
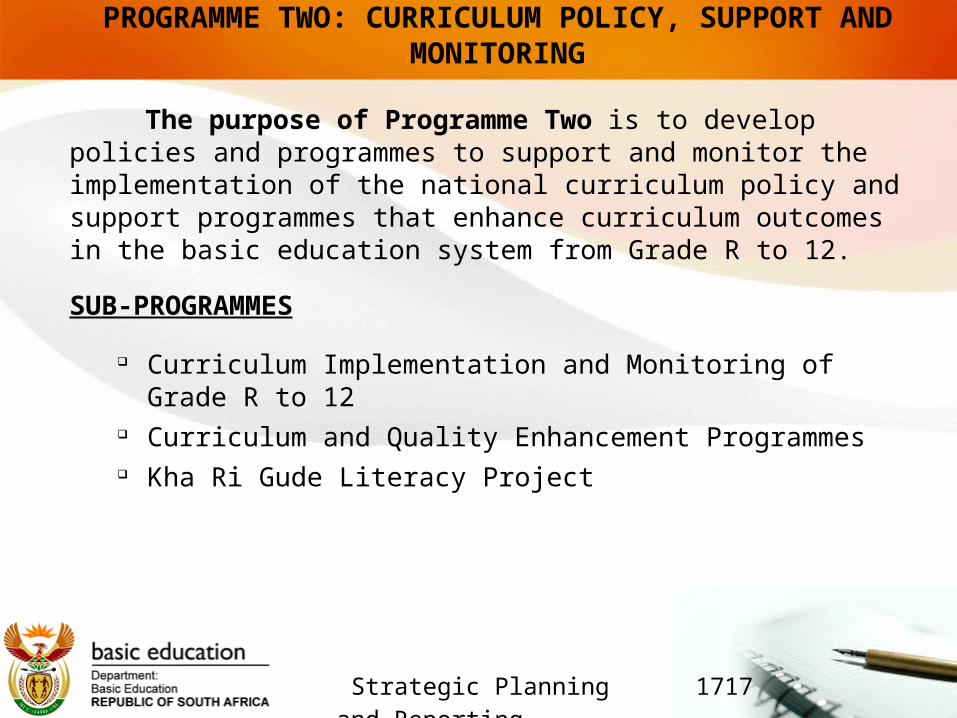
PROGRAMME TWO: CURRICULUM POLICY, SUPPORT AND MONITORING
The purpose of Programme Two is to develop policies and programmes to support and monitor the implementation of the national curriculum policy and support programmes that enhance curriculum outcomes in the basic education system from Grade R to 12.
SUB-PROGRAMMES
Curriculum Implementation and Monitoring of Grade R to 12 Curriculum and Quality Enhancement Programmes Kha Ri Gude Literacy Project
1717

Strategic Planning and Reporting
PROGRAMME TWO : SIGNIFICANT EVENTS AND ACHIEVEMENTS
CURRICULUM AND ASSESSMENT POLICY STATEMENTS : • In preparation for the implementation of CAPS in Grades 4 to 6 in 2013,
all district officials responsible for teacher training and support in these grades have been orientated to the changes in the CAPS subject statements. This took place from the 6th February until 25th March. The only province that still needs to be taken through the orientation programme is Eastern Cape, which will be done in May 2012. A total of 968 district officials were taken through the orientation programme in the Intermediate Phase.
• The Directorate: Curriculum Implementation and Quality Improvement (FET) conducted Grade 11 CAPS Orientation from February 2012 to 29 March 2012. The DBE identified Subject Advisors from different provinces to establish a National Training Team (NTT) that assisted with the Grade 11 CAPS Orientation. The Orientation started with a dry-run which took place from the 6 to 8 February 2012 in preparation for the actual orientation.
1818

Strategic Planning and Reporting
PROGRAMME TWO : SIGNIFICANT EVENTS AND ACHIEVEMENTS
LEARNING AND TEACHING SUPPORT MATERIALS :• Workbooks and Textbooks : 53 616 390 Volume 1 & 2 workbooks were
developed and printed. Proof of deliveries (PODs) for all Volume 1 & 2 were provided by the service provider and verified by an external auditor for payment is as follows:
o 98.74 percent of Grade R-9 volume 1 workbooks as per the order delivered ;o 97.25 percent of Grade 1-9 volume 2 workbooks as per order delivered; ando 97.36 percent of FET schools Physical Science & Mathematics supplementary textbooks
as per order.
• Minimum Schoolbag Specifications : CAPS documents for all subjects and grades to determine the required LTSM combinations were reviewed and draft lists of minimum LTSM for each grade and subject have been specified. The intended outcome is to establish a full model of essential resources needed for each subject and learner, which would act as a guide for school management and teachers, provide the basis for budget forecasts, and inform teacher training initiatives by making explicit what resources teachers should expect to have at their disposal.
1919

Strategic Planning and Reporting
PROGRAMME TWO : SIGNIFICANT EVENTS AND ACHIEVEMENTS
e-EDUCATION : • The DG and provincial HODs signed the Telkom Masters Services
Agreement on 27 March 2012 for the phase 1 implementation of the Connectivity Plan. This initiative will provide connectivity to 1 650 schools for a period of 3 years. The agreement will also see the development of an educational VPN hosted by Telkom and access to Britannica by all selected schools.
ASSESSMENTS : • Assessment in Grade 7 to 9 has been strengthened with the provision of
Assessment Item Banks that teachers will use either for assessment or to model their own school-based assessment.
CAPS MONITORING :• Implementation of the Foundation Phase is being monitored in a sample
of schools. Feedback from the monitoring has been used to plan support materials for Mathematics and Languages.
2020
Strategic Planning and Reporting
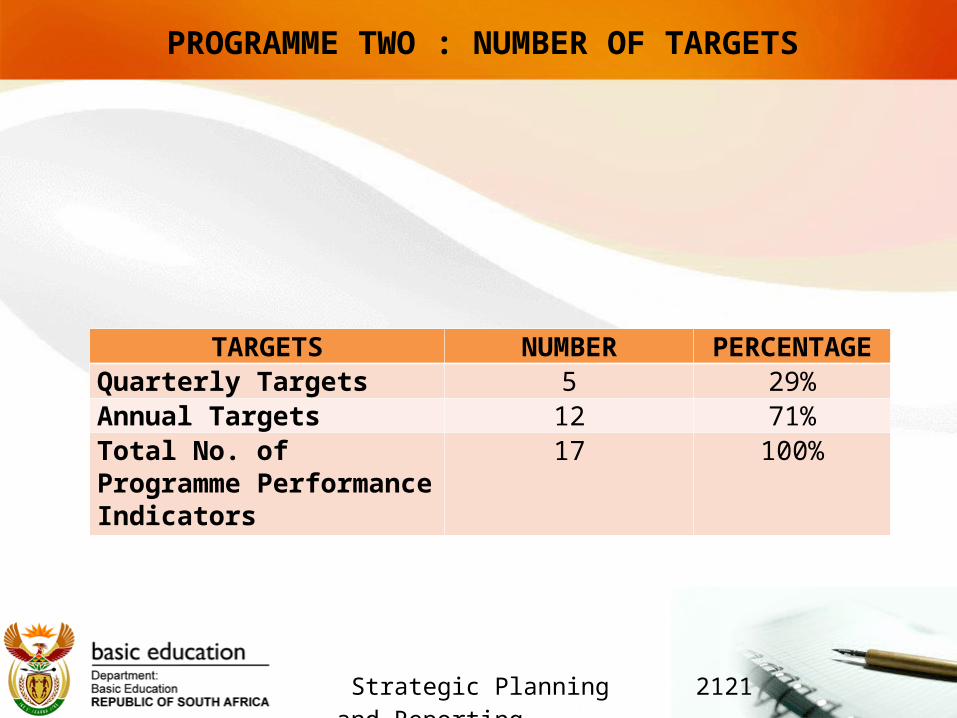
PROGRAMME TWO : NUMBER OF TARGETS
2121
TARGETS NUMBER PERCENTAGEQuarterly Targets 5 29%Annual Targets 12 71%Total No. of Programme Performance Indicators
17 100%
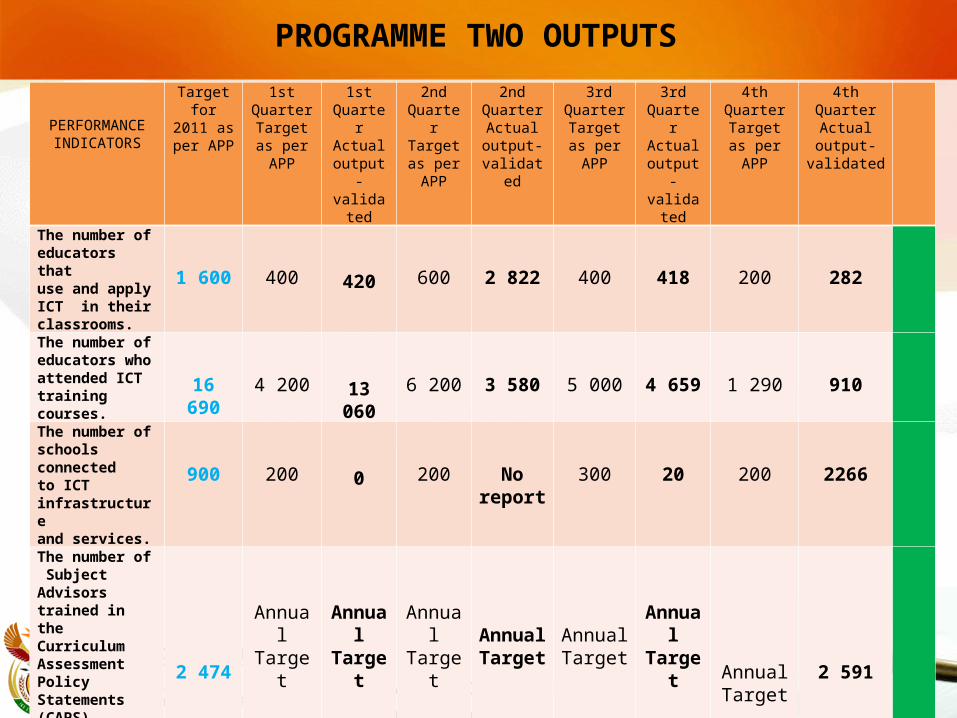
Strategic Planning and Reporting
PROGRAMME TWO OUTPUTS
2222
PERFORMANCE INDICATORS
Target for 2011 as per APP
1st Quarter
Target as per APP
1st Quarter Actual
output-validated
2nd Quarter
Target as per APP
2nd Quarter Actual
output-validated
3rd Quarter
Target as per APP
3rd Quarter Actual
output-validated
4th Quarter Target as per APP
4th Quarter Actual
output-validated
The number of educators thatuse and apply ICT in theirclassrooms.
1 600 400 420 600 2 822 400 418 200 282
The number of educators who attended ICT training courses.
16 690 4 200 13 060 6 200 3 580 5 000 4 659 1 290 910The number of schools connected to ICT infrastructure and services.
900 200 0 200 No report
300 20 200 2266
The number of Subject Advisors trained in the Curriculum Assessment Policy Statements (CAPS) Grade R – 12.
2 474
AnnualTarget
AnnualTarget
AnnualTarget
AnnualTarget
AnnualTarget
AnnualTarget
AnnualTarget
2 591
Strategic Planning and Reporting
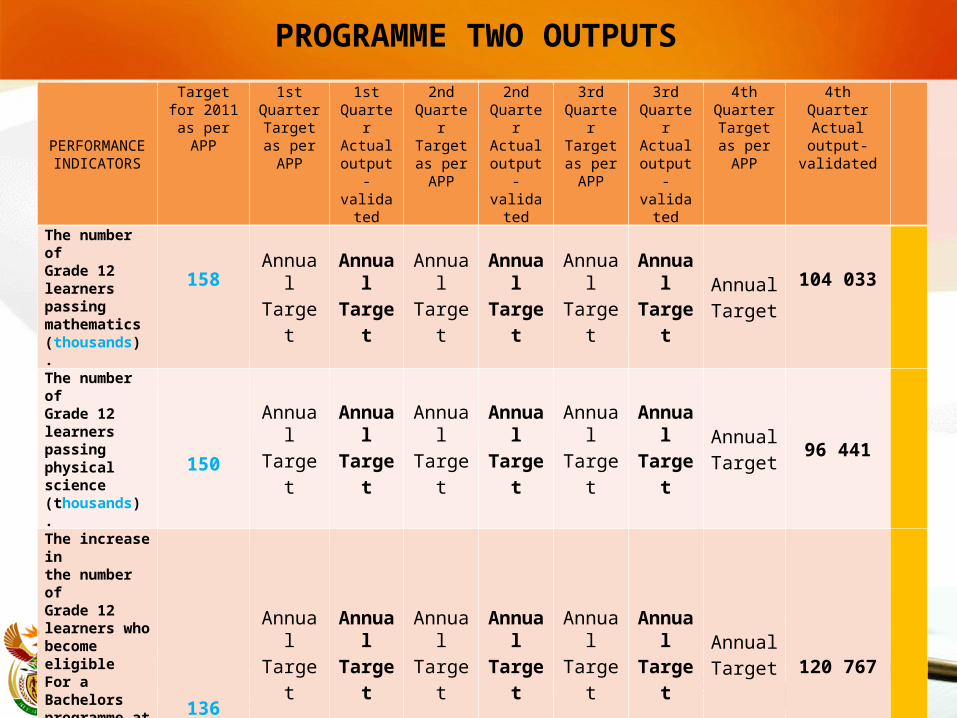
PROGRAMME TWO OUTPUTS
2323
PERFORMANCE INDICATORS
Target for 2011 as per
APP
1st Quarter
Target as per APP
1st Quarter Actual
output-validated
2nd Quarter
Target as per APP
2nd Quarter Actual
output-validated
3rd Quarter
Target as per APP
3rd Quarter Actual
output-validated
4th Quarter
Target as per APP
4th Quarter Actual output-
validated
The number of Grade 12 learners passing mathematics (thousands).
158AnnualTarget
AnnualTarget
AnnualTarget
AnnualTarget
AnnualTarget
AnnualTarget
AnnualTarget 104 033
The number of Grade 12 learners passing physical science (thousands). 150
AnnualTarget
AnnualTarget
AnnualTarget
AnnualTarget
AnnualTarget
AnnualTarget
AnnualTarget
96 441
The increase in the number of Grade 12 learners who become eligible For a Bachelors programme at university (thousands).
136
AnnualTarget
AnnualTarget
AnnualTarget
AnnualTarget
AnnualTarget
AnnualTarget
AnnualTarget
120 767
The percentageof youths who obtain a National Senior Certificate.
44%
AnnualTarget
AnnualTarget
AnnualTarget
AnnualTarget
AnnualTarget
AnnualTarget
AnnualTarget
49%

Strategic Planning and Reporting
PROGRAMME TWO OUTPUTS
2424
PERFORMANCE INDICATORS
Target for 2011 as per APP
1st Quarter
Target as per APP
1st Quarter Actual
output-validated
2nd Quarter
Target as per APP
2nd Quarter Actual
output-validated
3rd Quarter
Target as per APP
3rd Quarter Actual
output-validated
4th Quarter Target as per
APP
4th Quarter Actual
output-validated
The percentageof youths who obtain any FETqualification.
51%
AnnualTarget
AnnualTarget
AnnualTarget
AnnualTarget
AnnualTarget
AnnualTarget
AnnualTarget
This is an indicator of concern to
both DBE and DHET. The
General Household
Survey (GHS) as
administered by Statistics SA provides
the data needed for
this indicator. The FET
enrolment as recorded in the latest GHS was
very low, as a result this
indicator cannot
currently be authentically
measured.
Strategic Planning and Reporting
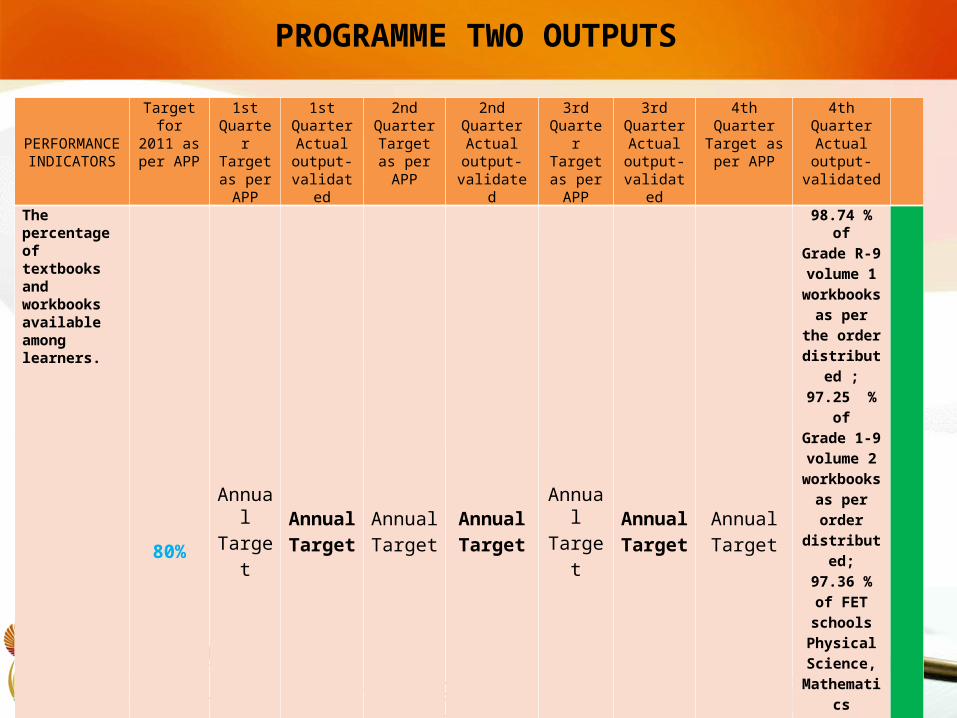
PROGRAMME TWO OUTPUTS
2525
PERFORMANCE INDICATORS
Target for 2011 as per APP
1st Quarter
Target as per APP
1st Quarter Actual
output-validated
2nd Quarter
Target as per APP
2nd Quarter Actual
output-validated
3rd Quarter
Target as per APP
3rd Quarter Actual
output-validated
4th Quarter Target as per
APP
4th Quarter Actual
output-validated
The percentage of textbooks and workbooks available among learners.
80%
AnnualTarget
AnnualTarget
AnnualTarget
AnnualTarget
AnnualTarget
AnnualTarget
AnnualTarget
98.74 % ofGrade R-9 volume 1
workbooks as per the
order distributed ;97.25 % ofGrade 1-9 volume 2
workbooks as per order distributed;97.36 % of FET schools
Physical Science,
Mathematics supplementary textbooks as per order distributed.
Strategic Planning and Reporting
PROGRAMME TWO OUTPUTS
2626
PERFORMANCE INDICATORS
Target for 2011 as per APP
1st Quarter
Target as per APP
1st Quarter Actual
output-validated
2nd Quarter
Target as per APP
2nd Quarter Actual
output-validated
3rd Quarter
Target as per APP
3rd Quarter Actual
output-validated
4th Quarter Target as per
APP
4th Quarter Actual
output-validated
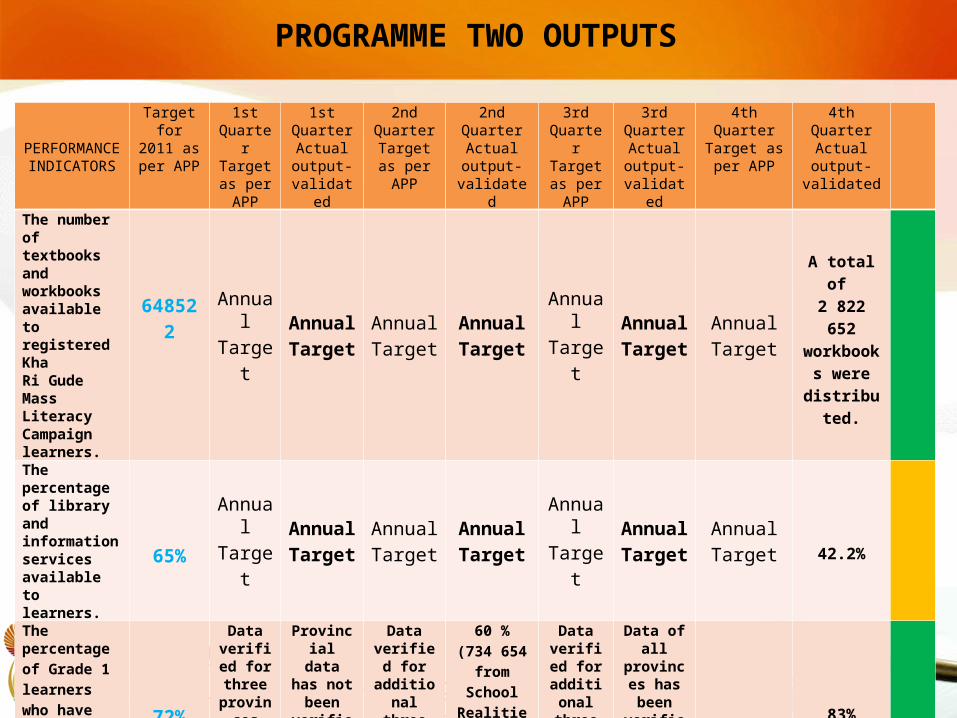
The number of textbooks and workbooks available to registered Kha Ri Gude Mass Literacy Campaign learners.
648522AnnualTarget
AnnualTarget
AnnualTarget
AnnualTarget
AnnualTarget
AnnualTarget
AnnualTarget
A total of 2 822 652
workbooks were
distributed.
The percentage of library and information services available to learners. 65%
AnnualTarget
AnnualTarget
AnnualTarget
AnnualTarget
AnnualTarget
AnnualTarget
AnnualTarget
42.2%
The percentage of Grade 1 learners who have received formal Grade R.
72%
Data verified
for three province
s
Provincial data has not been verified
yet.
Data verified for additional
three provinces
60 %(734 654
from School Realities)
Data verified
for additiona
l three provinces
Data of all provinces has been verified.
83%

Strategic Planning and Reporting
PROGRAMME TWO OUTPUTS
2727
PERFORMANCE INDICATORS
Target for 2011
as per APP
1st Quarter
Target as per APP
1st Quarter Actual
output-validated
2nd Quarter
Target as per APP
2nd Quarter Actual
output-validated
3rd Quarter
Target as per APP
3rd Quarter Actual
output-validated
4th Quarter Target as per
APP
4th Quarter Actual output-
validated
The number of districts with at least one educator who has received specialised training in the identification and support of special needs. 30
AnnualTarget
AnnualTarget
AnnualTarget
AnnualTarget
AnnualTarget
AnnualTarget
AnnualTarget
The targeted number of educators were not trained
The number of full-service schools with at least one educator who has received specialised training in the identification and support of special needs.
30
AnnualTarget
AnnualTarget
AnnualTarget
AnnualTarget
AnnualTarget
AnnualTarget
AnnualTarget
The targeted number of educators were not trained
The number of special schools with at least one educator who has Receivedspecialised training in the identification and support of special needs.
30
AnnualTarget
AnnualTarget
AnnualTarget
AnnualTarget
AnnualTarget
AnnualTarget
AnnualTarget
The targeted number of educators were not trained

Strategic Planning and Reporting
PROGRAMME TWO OUTPUTS
2828
PERFORMANCE INDICATORS
Target for 2011 as per
APP
1st Quarter
Target as per APP
1st Quarter Actual
output-validated
2nd Quarter
Target as per APP
2nd Quarter Actual
output-validated
3rd Quarter
Target as per APP
3rd Quarter Actual
output-validated
4th Quarter
Target as per APP
4th Quarter Actual
output-validated
The number of districts in which at least one full-service school complies Fully withthe Guidelines for Full- Service Schools.
30
Coordinated capacity
in 30 special
schools on SNE
Guidelines
There are 94schools in various districts which
comply fully with Guideline
for FSS
Monitor the implementation of SNE Guidelines
in 30 special schools
There are 108 full service
schools that have been physically upgraded but which need to be trained on Guidelines
for Full Service Schools
Monitor the
implementation of
SNE Guidelines
in 30 special schools
The directorate
is busy developing a training manual to train the National Training Team.
Monitor the
implementation of
SNE Guidelines
in 30 special schools
The Guidelines
for Full-Service Schools
were not implemente
d as the training
manual had not been
developed.
Strategic Planning and Reporting
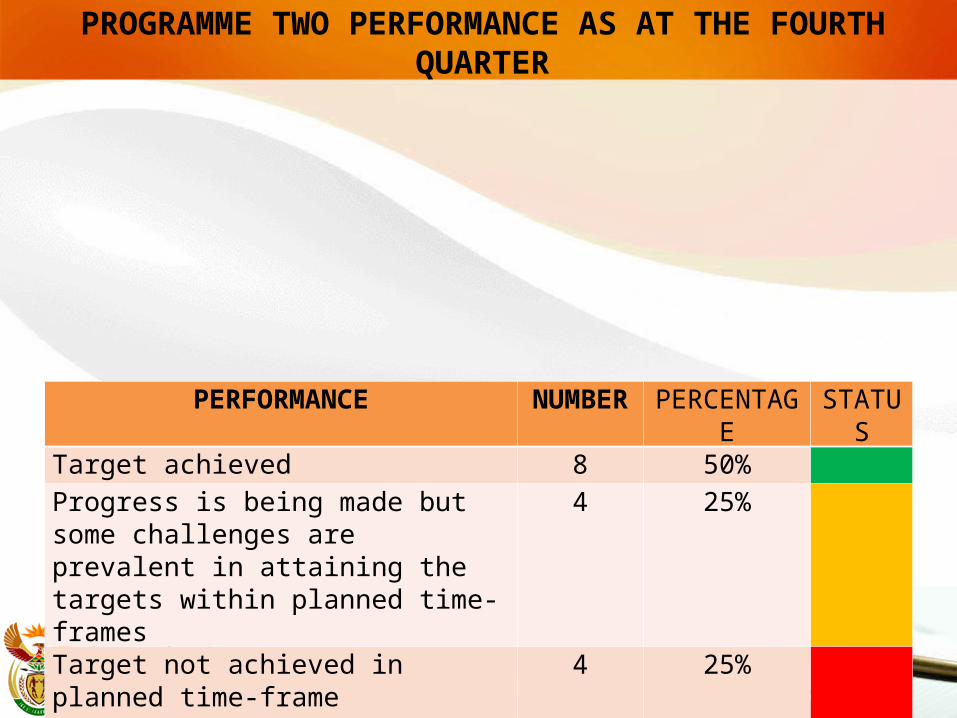
PROGRAMME TWO PERFORMANCE AS AT THE FOURTH QUARTER
2929
PERFORMANCE NUMBER PERCENTAGE STATUSTarget achieved 8 50%Progress is being made but some challenges are prevalent in attaining the targets within planned time-frames
4 25%
Target not achieved in planned time-frame
4 25%

Strategic Planning and Reporting
PROGRAMME THREE : TEACHERS, EDUCATION HUMAN RESOURCES AND INSTITUTIONAL DEVELOPMENT
The purpose of Programme Three is to promote quality teaching and institutional performance through the effective supply, development and utilisation of human resources.
SUB-PROGRAMMES
Education Human Resource Management Education Human Resource Development
3030

Strategic Planning and Reporting
PROGRAMME THREE : SIGNIFICANT EVENTS AND ACHIEVEMENTS
CONTINUING PROFESSIONAL TEACHER DEVELOPMENT : • The National Teacher Awards (NTA) gala was successfully hosted in
conjunction with provincial education departments. The event was broadcasted to viewers on SABC 2 and attended by 1 000 high profile guests. The NTA recognised and awarded substantial prizes and certificates to 75 teachers at the national event, 216 teachers at provincial functions and 3 000 teachers at regional and district events. A special category named after former Minister of Education, Kader Asmal was launched.
• A collaboration programme with teacher unions was initiated and an agreement with the PEDs of KwaZulu-Natal and Mpumalanga was agreed for orientation of 45 000 teachers by end March. A reported 21 306 teachers participated in CAPS orientation as part of this collaboration programme.
• Further teacher development programmes were co-ordinated with provincial departments in targeted priority areas for more than 70 000 teachers.
3131

Strategic Planning and Reporting
PROGRAMME THREE : SIGNIFICANT EVENTS AND ACHIEVEMENTS
SCHOOL GOVERNING BODY ELECTIONS :• Intensive planning was done to conduct the 2012 School Governing Body
elections in public schools during the month of March throughout the country. The coordination of the preparations led to a common election period and a common election system in all provinces.
• The coordination of provinces, National Consultative Forum and the SGB Elections Task Team led to the production of the following key documents to support the election process :o National Guidelines for SGB Elections. o Training manual for electoral officers. o SGB Information pamphlet.
• Senior officials of the DBE conducted radio interviews on the elections during the months of February and March. The highlight was the linking of 65 community radio stations in an interview with callers from all over the country participating by posing questions and making comments.
3232

Strategic Planning and Reporting
PROGRAMME THREE : SIGNIFICANT EVENTS AND ACHIEVEMENTS
DISTRICT DEVELOPMENT : • The Minister has approved the conversion of the Guideline on the
Organisation, Roles and Responsibilities of Education Districts into policy. A Government Gazette calling for public comments has been published.
• Through the successful and very interactive quarterly meetings of the Minister, Senior Management and District Directors, the DBE was able to align district plans to Action Plan to 2014. Districts have begun submitting District Improvement Plans in preparation for the April 2012 meeting.
• External IQMS moderators : A total of 2 631 schools were visited in all provinces for the purpose of monitoring the quality of IQMS implementation, school effectiveness as well as district engagement with the school. These visits included 1811 follow-up visits. During these visits, the lessons of 769 educators were observed and support provided where necessary. The total number of school visits exceeded the target of 2000 for the quarter by 631 (i.e. 31.5%).
3333

Strategic Planning and Reporting
PROGRAMME THREE : SIGNIFICANT EVENTS AND ACHIEVEMENTS
Teacher supply and utilisation : The number of qualified teachers aged 30 and
below entering the public service as teachers for the first time during the past
Year per province :
3434
Province January-March 2011
April-June 2011
July-September 2011
Total for Academic Year 2011
EASTERN CAPE
31 5 8 60
FREE STATE
260 257 146 873
GAUTENG
524 321 132 1090
KWAZULU/NATAL
274 161 367 886
LIMPOPO PROVINCE
191 323 44 583
MPUMALANGA
292 98 24 448
NORTH WEST
98 62 156 328
NORTHERN CAPE
276 200 358 851
WESTERN CAPE
1024 221 418 1813
Total 2970 1648 1653 6932DATA SOURCE : PERSAL

Strategic Planning and Reporting
PROGRAMME THREE : SIGNIFICANT EVENTS AND ACHIEVEMENTS
Class Size :
Percentage of learners in Classes with no more than 45 learners per province :
3535
Province Total Number of Learners in affected Schools
Total Learners in Classes of 45 and less
Percentage
EASTERN CAPE
1651979 999545 61%
FREE STATE
590533 439263 74%
GAUTENG
1570374 1220425 78%
KWAZULU/NATAL
2195811 1329590 61%
LIMPOPO PROVINCE
1516254 765822 51%
MPUMALANGA
777809 405149 52%
NORTH WEST
238998 199217 83%
NORTHERN CAPE
696892 463493 67%
WESTERN CAPE
894910 776756 87%
Grand Total 10133560 6599260 65%DATA SOURCE : EMIS 2011 SNAP Survey

Strategic Planning and Reporting
PROGRAMME THREE : SIGNIFICANT EVENTS AND ACHIEVEMENTS
Implementation of Post Provisioning Norms. For the first time in many years,
all provinces declared their staff establishment to schools in time for the start
of the 2012 academic year.
VACANCY RATE IN SCHOOLS • The vacancy rate in three critical categories of posts at school were
monitored. • These were Principal, Departmental Head (HOD) and the teacher
(classroom teacher).• In all three categories of posts an improvement in vacancy rate was
observed between January 2011 and January 2012.
3636
Vacancy rate – January 2011
Vacancy rate – January 2012
Principals 13.69 % 6.41%
HOD 14.77% 10.65%
Teachers 10.18% 4.65%Data Source : PERSAL
Strategic Planning and Reporting
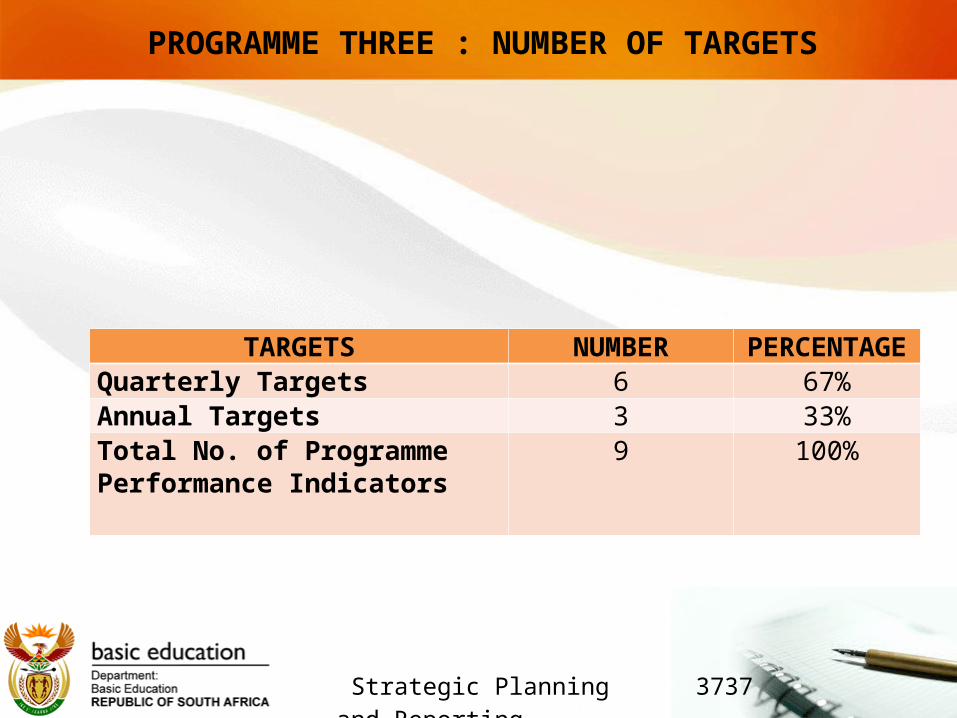
PROGRAMME THREE : NUMBER OF TARGETS
3737
TARGETS NUMBER PERCENTAGEQuarterly Targets 6 67%Annual Targets 3 33%Total No. of Programme Performance Indicators
9 100%

Strategic Planning and Reporting
PROGRAMME THREE OUTPUTS
3838
PERFORMANCE INDICATORS
Target for 2011 as per
APP
1st Quarter
Target as per APP
1st Quarter Actual
output-validated
2nd Quarter
Target as per APP
2nd Quarter Actual
output-validated
3rd Quarter
Target as per APP
3rd Quarter Actual
output-validated
4th Quarter Target as per APP
4th Quarter Actual
output-validated
Increase in the number of teachers participating in targeted priority teacher development activities with a focus on underperforming schools.
140 000 teachers participate in at least in targeted priorityteacher development activities
35000 41 611 35000 31 710 35000
23 763 FP educators
from EC, FS, MP, NC, & NW, and
14 898 Grade 10 from FS, MP and NC completed the CAPS
orientation
35000 72 225
The NICPD is established.
NICPD is set up and operational
Concept documen
t is approved
Revised concept under
discussion
First staff is
appointed
Posts have been
allocated on DBE
organogram
Institutional
arrangements
finalized and
project staff
appointed
No staff appointed.
NICPD first phase fully
operational.
Concept document
not approved yet.

Strategic Planning and Reporting
PROGRAMME THREE OUTPUTS
3939
PERFORMANCE INDICATORS
Target for 2011 as per
APP
1st Quarter
Target as per APP
1st Quarter Actual
output-validated
2nd Quarter
Target as per APP
2nd Quarter Actual
output-validated
3rd Quarter
Target as per APP
3rd Quarter Actual
output-validated
4th Quarter Target as per
APP
4th Quarter Actual output-
validated
The number of qualified teachers aged 30 and below entering the public service as teachers for the first time during the past year.
6 200 2 000 2 970 2 0001653
1 000 661 1 200 3782
The number of bursaries awarded to students enrolled for initial teacher education during the past year.
8 517 5 000 6 742 2 000 1 326 1 000 665 517 0
The percentage of schools where the allocated teaching posts were filled.
70%AnnualTarget
AnnualTarget
AnnualTarget
AnnualTarget
AnnualTarget
AnnualTarget
AnnualTarget 69%
The percentage of learners who are in classes with no More than 45 learners. 70%
AnnualTarget
AnnualTarget
AnnualTarget
AnnualTarget
AnnualTarget
AnnualTarget
AnnualTarget
65%

Strategic Planning and Reporting
PROGRAMME THREE OUTPUTS
4040
PERFORMANCE INDICATORS
Target for 2011 as per
APP
1st Quarter
Target as per APP
1st Quarter Actual
output-validated
2nd Quarter
Target as per APP
2nd Quarter Actual
output-validated
3rd Quarter
Target as per APP
3rd Quarter Actual
output-validated
4th Quarter Target as per
APP
4th Quarter Actual output-
validated
The percentage of schools producing a minimum set of management documents at a required standard.
40% 40% 26% 40% 36% 40% 72% 40% 40%
The percentage of
schools where the
School Governing
Body meets
minimum criteria in
terms of
effectiveness.
40% 40% 26% 40% 40% 40% 72% 40% 40%
The percentage of
school principals
rating the support
services of districts
as being
satisfactory.
30%
AnnualTarget
AnnualTarget
AnnualTarget
AnnualTarget
AnnualTarget
AnnualTarget
AnnualTarget 37%
Strategic Planning and Reporting
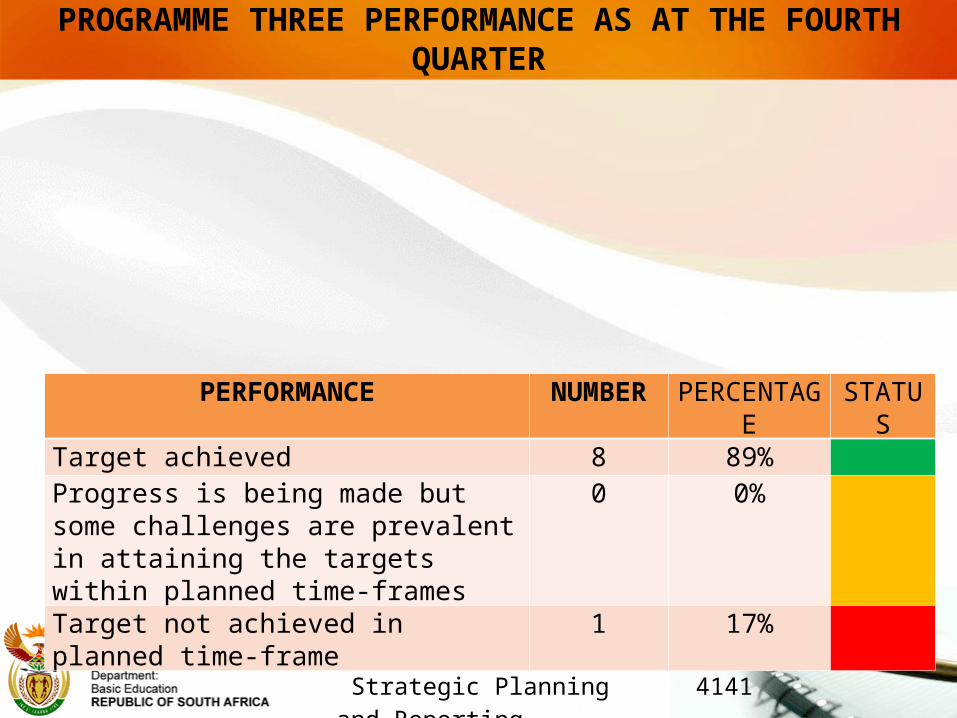
PROGRAMME THREE PERFORMANCE AS AT THE FOURTH QUARTER
4141
PERFORMANCE NUMBER PERCENTAGE STATUS
Target achieved 8 89%Progress is being made but some challenges are prevalent in attaining the targets within planned time-frames
0 0%
Target not achieved in planned time-frame 1 17%
Strategic Planning and Reporting
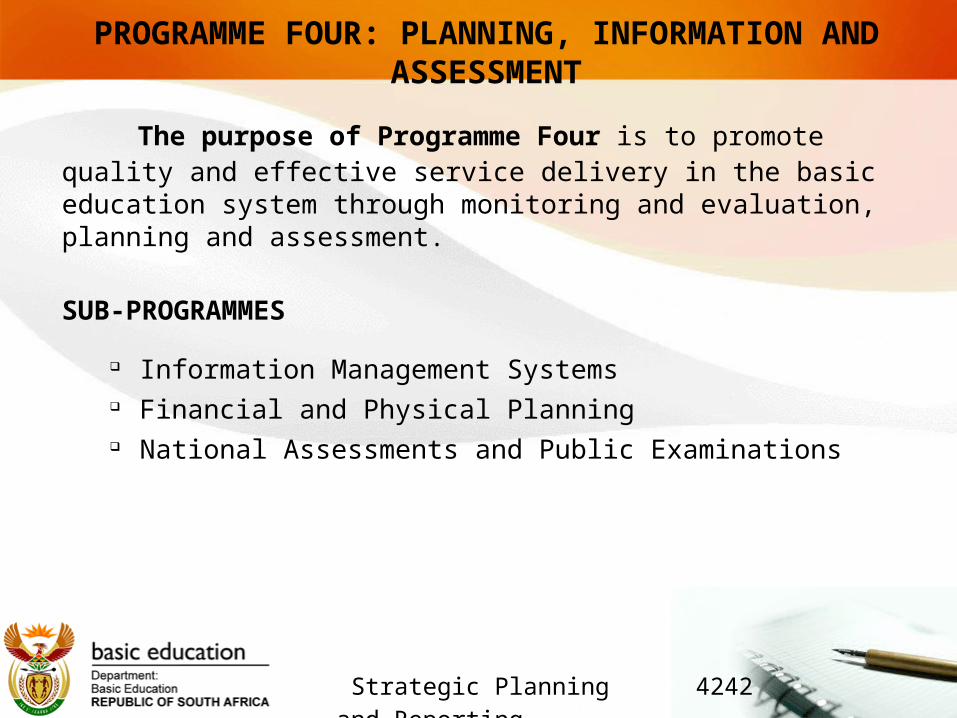
PROGRAMME FOUR: PLANNING, INFORMATION AND ASSESSMENT
The purpose of Programme Four is to promote quality and effective service delivery in the basic education system through monitoring and evaluation, planning and assessment.
SUB-PROGRAMMES
Information Management Systems Financial and Physical Planning National Assessments and Public Examinations
4242
Strategic Planning and Reporting
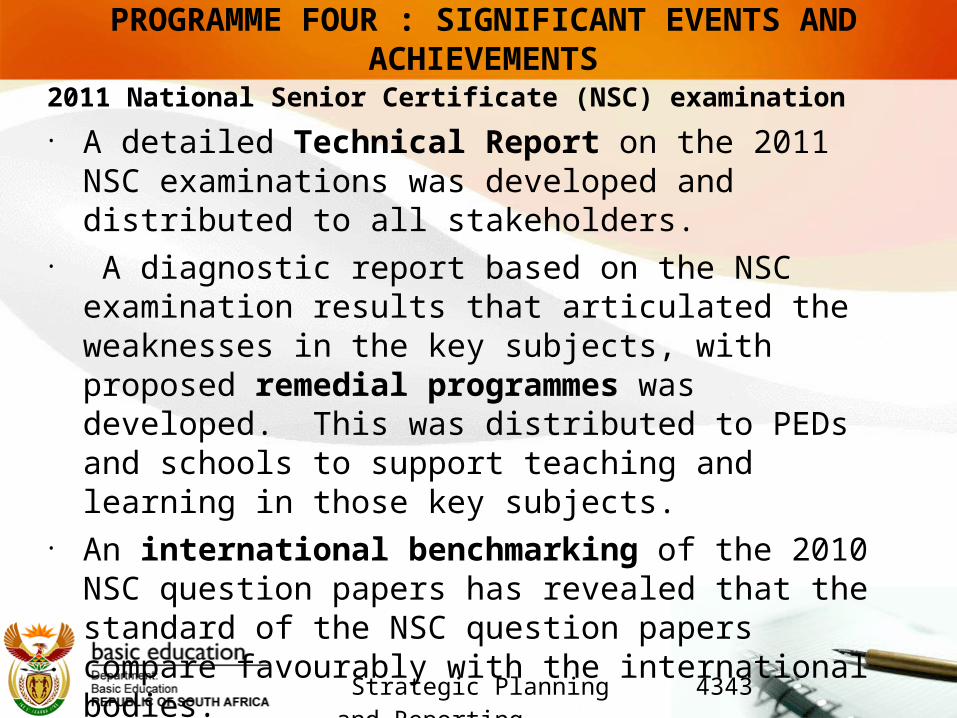
PROGRAMME FOUR : SIGNIFICANT EVENTS AND ACHIEVEMENTS
2011 National Senior Certificate (NSC) examination• A detailed Technical Report on the 2011 NSC examinations
was developed and distributed to all stakeholders.• A diagnostic report based on the NSC examination results
that articulated the weaknesses in the key subjects, with proposed remedial programmes was developed. This was distributed to PEDs and schools to support teaching and learning in those key subjects.
• An international benchmarking of the 2010 NSC question papers has revealed that the standard of the NSC question papers compare favourably with the international bodies.
4343

Strategic Planning and Reporting
PROGRAMME FOUR : SIGNIFICANT EVENTS AND ACHIEVEMENTS
2011 National Senior Certificate (NSC) examination :
The supplementary exams have been completed and the results have
been released. The overall pass rate combining the November 2011 and
March 2012 examinations is now 72.7%.
4444
PROVINCE % Achieved
Eastern Cape 60.5%
Free State 77.5%
Gauteng 83.1
KwaZulu-Natal 71.5
Limpopo 66.8
Mpumalanga 67.1
North West 79.7
Northern Cape 70.8
Western Cape 84.7
National 72.7%
Strategic Planning and Reporting
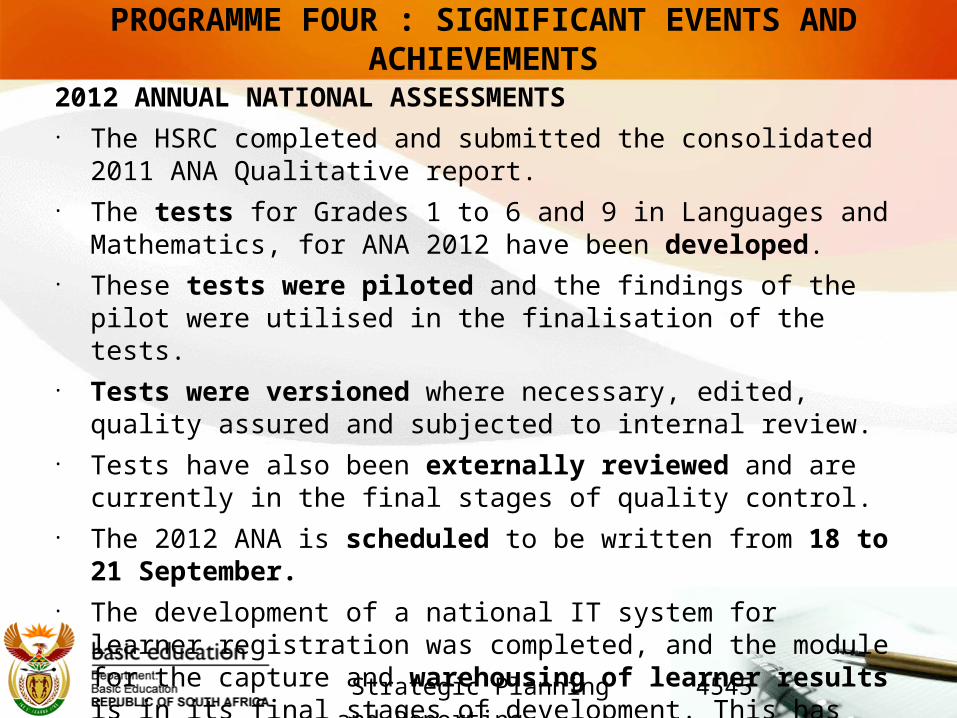
PROGRAMME FOUR : SIGNIFICANT EVENTS AND ACHIEVEMENTS
2012 ANNUAL NATIONAL ASSESSMENTS• The HSRC completed and submitted the consolidated 2011 ANA
Qualitative report.• The tests for Grades 1 to 6 and 9 in Languages and Mathematics, for ANA
2012 have been developed. • These tests were piloted and the findings of the pilot were utilised in the
finalisation of the tests. • Tests were versioned where necessary, edited, quality assured and
subjected to internal review. • Tests have also been externally reviewed and are currently in the final
stages of quality control.• The 2012 ANA is scheduled to be written from 18 to 21 September.• The development of a national IT system for learner registration was
completed, and the module for the capture and warehousing of learner results is in its final stages of development. This has been done to ensure accurate reporting of results for all learners and schools
4545
Strategic Planning and Reporting
PROGRAMME FOUR : SIGNIFICANT EVENTS AND ACHIEVEMENTS
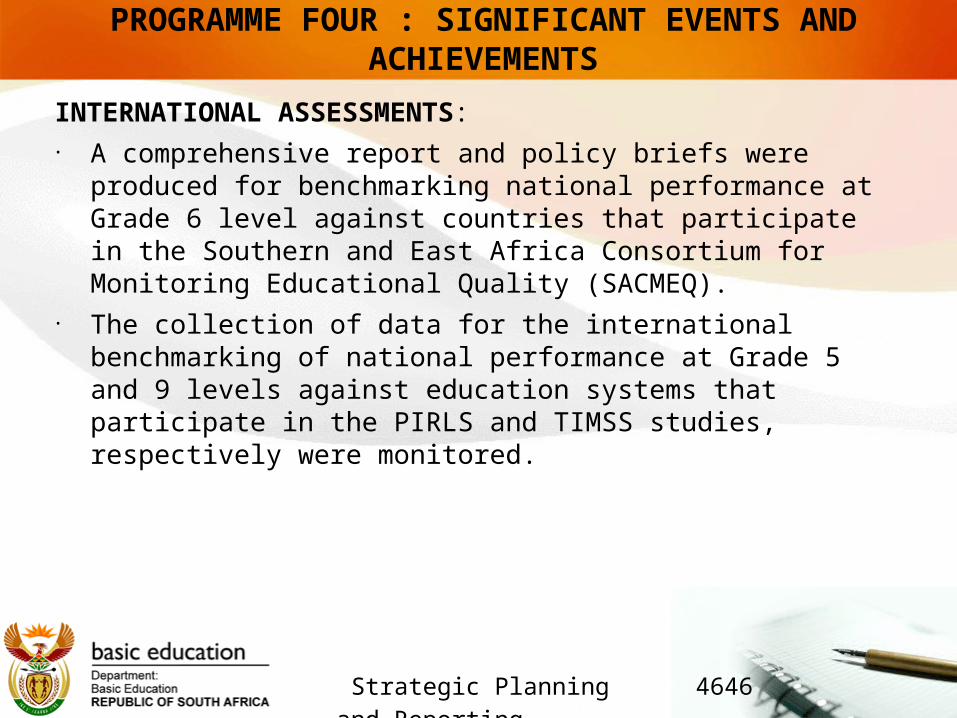
INTERNATIONAL ASSESSMENTS: • A comprehensive report and policy briefs were produced for
benchmarking national performance at Grade 6 level against countries that participate in the Southern and East Africa Consortium for Monitoring Educational Quality (SACMEQ).
• The collection of data for the international benchmarking of national performance at Grade 5 and 9 levels against education systems that participate in the PIRLS and TIMSS studies, respectively were monitored.
4646

Strategic Planning and Reporting
PROGRAMME FOUR : SIGNIFICANT EVENTS AND ACHIEVEMENTS
INFRASTRUCTURE : • The approach to the ASIDI programme was revised to supplement the
existing implementing agents with additional ones and also alternative delivery models. A mixed delivery model was adopted and several sub-programmes are adopted for the programme.
• Accomplishments reported thus far includes:o Designs finalised for 49 Schools in the Eastern Cape. o 16 Contractors appointed.o 42 Projects progress being registered. o An additional 47 Schools have been assessed in the Eastern Cape.o Assessments on the remaining projects are in progress.o The prototype designs developed by the DBE have been adopted for
implementation on the inappropriate structures, reducing design time and contain costs.
o A standard Bill of Quantities have been prepared for the prototype designs.
4747

Strategic Planning and Reporting
PROGRAMME FOUR : SIGNIFICANT EVENTS AND ACHIEVEMENTS
FINANCIAL PLANNING :• A funding request aimed at securing additional funding for implementing
an amended funding model within the revised Grade R policy framework was made to National Treasury. Funding has consequently been made available by National Treasury for the expansion of Grade R in 2013/14 and 2014/13.
• A funding request has also been made to National Treasury for funding to ensure provincial education departments will be able to fund all no-fee schools at the same level and to offer certain fee charging schools the option to be voluntarily declared and funded as no fee schools. Funding has consequently been made available by National Treasury for the equalization of the allocation to no fee schools in 2013/14 and 2014/15.
• An advertisement was placed in newspapers as part of a media campaign aimed at emphasizing when parents qualify to be automatically exempted from the payment of school fees.
4848
Strategic Planning and Reporting
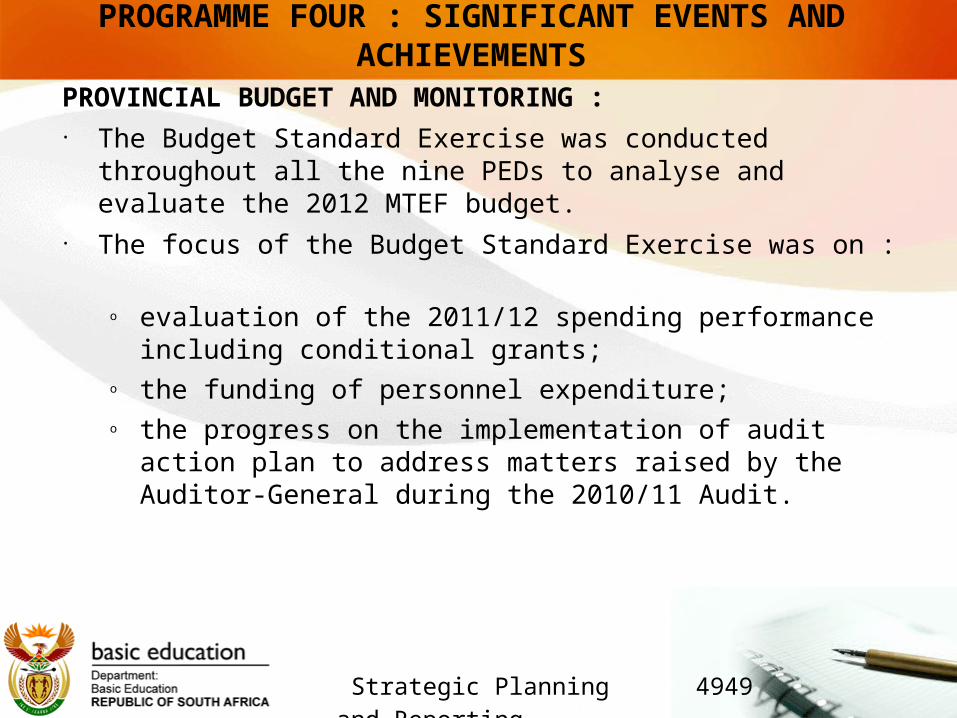
PROGRAMME FOUR : SIGNIFICANT EVENTS AND ACHIEVEMENTS
PROVINCIAL BUDGET AND MONITORING :• The Budget Standard Exercise was conducted throughout all the nine
PEDs to analyse and evaluate the 2012 MTEF budget.• The focus of the Budget Standard Exercise was on :
o evaluation of the 2011/12 spending performance including conditional grants;
o the funding of personnel expenditure;o the progress on the implementation of audit action plan to address
matters raised by the Auditor-General during the 2010/11 Audit.
4949

Strategic Planning and Reporting
PROGRAMME FOUR : NUMBER OF TARGETS
5050
TARGETS NUMBER PERCENTAGEQuarterly Targets 2 13%Annual Targets 14 87%Total No. of Programme Performance Indicators
16 100%
Strategic Planning and Reporting
PROGRAMME FOUR OUTPUTS
5151
PERFORMANCE INDICATORS
Target for 2011 as per
APP
1st Quarter
Target as per APP
1st Quarter Actual
output-validated
2nd Quarter
Target as per APP
2nd Quarter Actual
output-validated
3rd Quarter
Target as per APP
3rd Quarter Actual
output-validated
4th Quarter
Target as per APP
4th Quarter Actual output-
validated
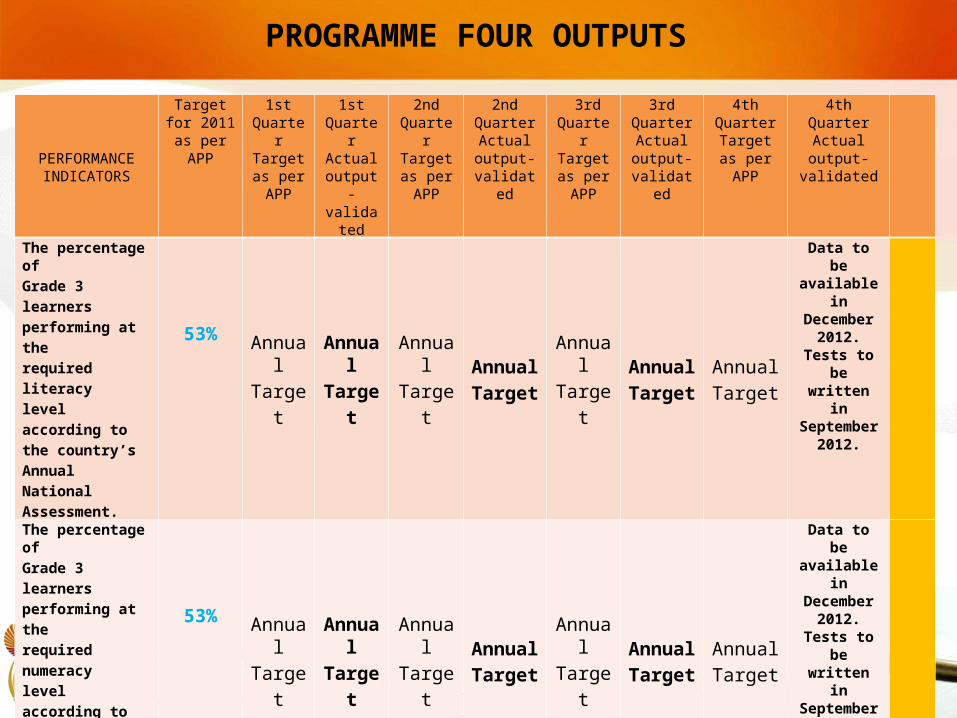
The percentage of Grade 3 learners performing at the required literacy level according to the country’s Annual National Assessment.
53%AnnualTarget
AnnualTarget
AnnualTarget
AnnualTarget
AnnualTarget
AnnualTarget
AnnualTarget
Data to be available in December
2012. Tests to be written in September
2012.
The percentage of Grade 3 learners performing at the required numeracy level according to the country’s Annual National Assessment.
53%AnnualTarget
AnnualTarget
AnnualTarget
AnnualTarget
AnnualTarget
AnnualTarget
AnnualTarget
Data to be available in December
2012. Tests to be written in September
2012.
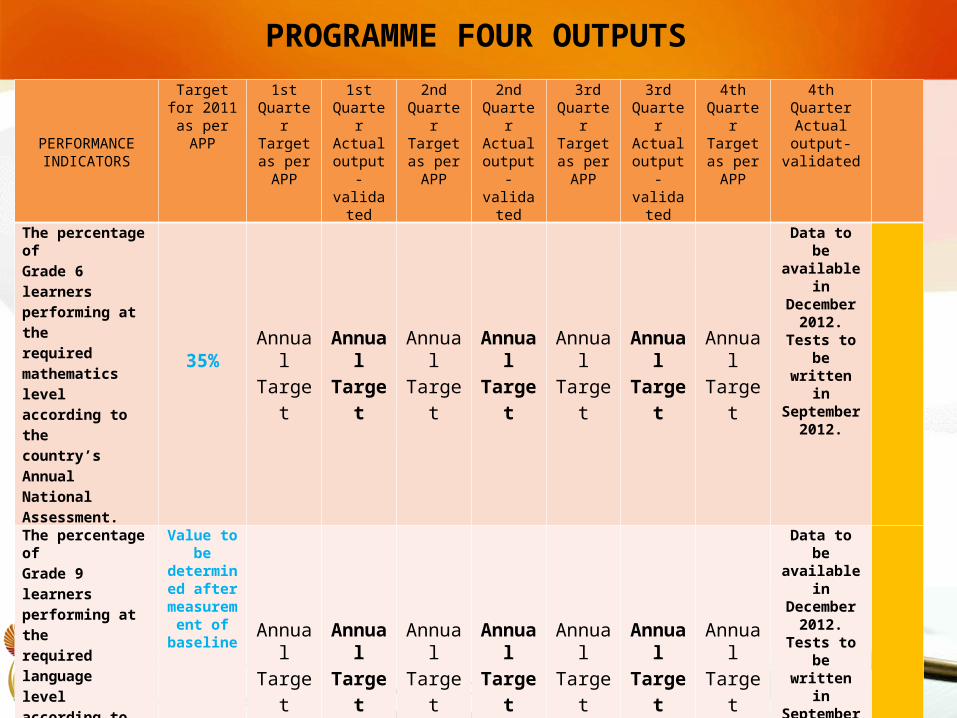
The percentage of Grade 6 learners performing at the required language level according to the country’s Annual National Assessment.
46%AnnualTarget
AnnualTarget
AnnualTarget
AnnualTarget
AnnualTarget
AnnualTarget
AnnualTarget
Data to be available in December
2012. Tests to be written in September
2012.
Strategic Planning and Reporting
PROGRAMME FOUR OUTPUTS
5252
PERFORMANCE INDICATORS
Target for 2011 as per
APP
1st Quarter
Target as per APP
1st Quarter Actual
output-validated
2nd Quarter
Target as per APP
2nd Quarter Actual
output-validated
3rd Quarter
Target as per APP
3rd Quarter Actual
output-validated
4th Quarter
Target as per APP
4th Quarter Actual output-
validated
The percentage of Grade 6 learners performing at the required mathematics level according to the country’s Annual National Assessment.
35%
AnnualTarget
AnnualTarget
AnnualTarget
AnnualTarget
AnnualTarget
AnnualTarget
AnnualTarget
Data to be available in December
2012. Tests to be written in September
2012.
The percentage of Grade 9 learners performing at the required language level according to the country’s Annual National Assessment.
Value to be determined
after measureme
nt of baseline
AnnualTarget
AnnualTarget
AnnualTarget
AnnualTarget
AnnualTarget
AnnualTarget
AnnualTarget
Data to be available in December
2012. Tests to be written in September
2012.
The percentage of Grade 9 learners performing at the required mathematics level according to the country’s Annual National Assessment.
Value to be determined
after measureme
nt of baseline
AnnualTarget
AnnualTarget
AnnualTarget
AnnualTarget
AnnualTarget
AnnualTarget
AnnualTarget
Data to be available in December
2012. Tests to be written in September
2012.
Strategic Planning and Reporting
PROGRAMME FOUR OUTPUTS
5353
PERFORMANCE INDICATORS
Target for 2011 as per
APP
1st Quarter
Target as per APP
1st Quarter Actual
output-validated
2nd Quarter
Target as per APP
2nd Quarter Actual
output-validated
3rd Quarter
Target as per APP
3rd Quarter Actual
output-validated
4th Quarter
Target as per APP
4th Quarter Actual output-
validated
The number of Gr.12 learners who become eligible for a Bachelor’s programme in the public national examinations.
136000
AnnualTarget
AnnualTarget
AnnualTarget
AnnualTarget
AnnualTarget
AnnualTarget
AnnualTarget 121 905
The percentage of Grade 1 learners who have received formal Grade R.
63%AnnualTarget
AnnualTarget
AnnualTarget
AnnualTarget
AnnualTarget
AnnualTarget
AnnualTarget 83%
The percentage of schools complying with a very basic level of school infrastructure.
88%AnnualTarget
AnnualTarget
AnnualTarget
AnnualTarget
AnnualTarget
AnnualTarget
AnnualTarget 55%
The percentage of learners in schools that are funded at the minimum level.
77%AnnualTarget
AnnualTarget
AnnualTarget
AnnualTarget
AnnualTarget
AnnualTarget
AnnualTarget 47%
Strategic Planning and Reporting
PROGRAMME FOUR OUTPUTS
5454
PERFORMANCE INDICATORS
Target for 2011 as per APP
1st Quarter
Target as per APP
1st Quarter Actual
output-validated
2nd Quarter
Target as per APP
2nd Quarter Actual
output-validated
3rd Quarter
Target as per APP
3rd Quarter Actual
output-validated
4th Quarter Target as per APP
4th Quarter Actual output-
validated
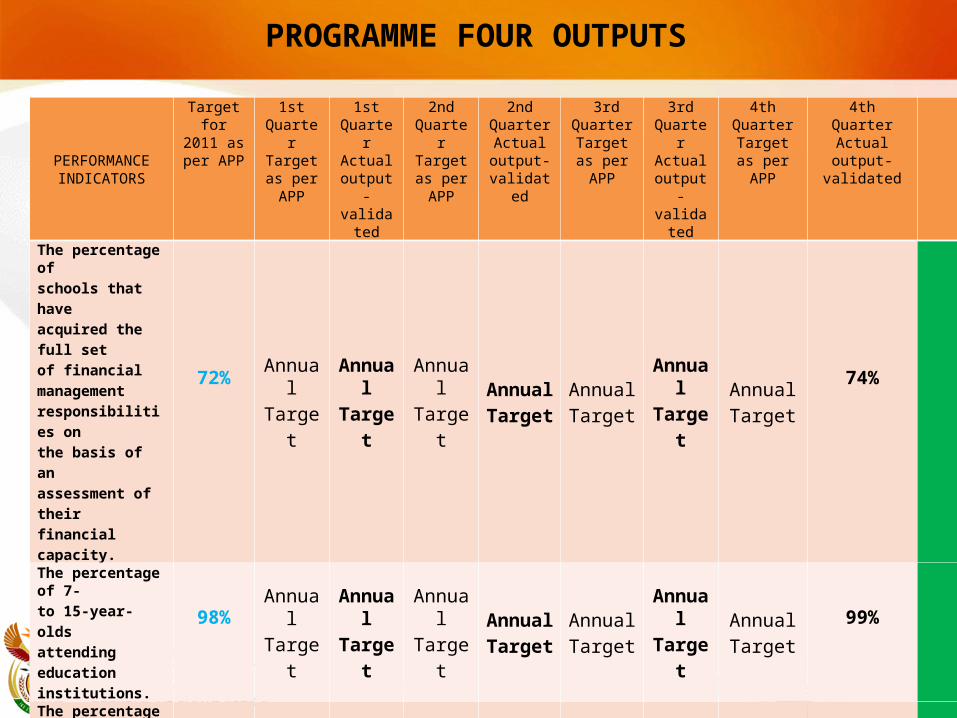
The percentage of schools that have acquired the full set of financial management responsibilities on the basis of an assessment of their financial capacity.
72%
AnnualTarget
AnnualTarget
AnnualTarget
AnnualTarget
AnnualTarget
AnnualTarget
AnnualTarget
74%
The percentage of 7- to 15-year-olds attending education institutions.
98%AnnualTarget
AnnualTarget
AnnualTarget
AnnualTarget
AnnualTarget
AnnualTarget
AnnualTarget 99%
The percentage of children who turned 9 in the previous year who are currently enrolled in Grade 4 (or a higher grade).
61%
AnnualTarget
AnnualTarget
AnnualTarget
AnnualTarget
AnnualTarget
AnnualTarget
AnnualTarget 61%
Strategic Planning and Reporting
PROGRAMME FOUR OUTPUTS
5555
PERFORMANCE INDICATORS
Target for 2011 as per
APP
1st Quarter
Target as per APP
1st Quarter Actual
output-validated
2nd Quarter
Target as per APP
2nd Quarter Actual
output-validated
3rd Quarter
Target as per APP
3rd Quarter Actual
output-validated
4th Quarter
Target as per APP
4th Quarter Actual output-
validated
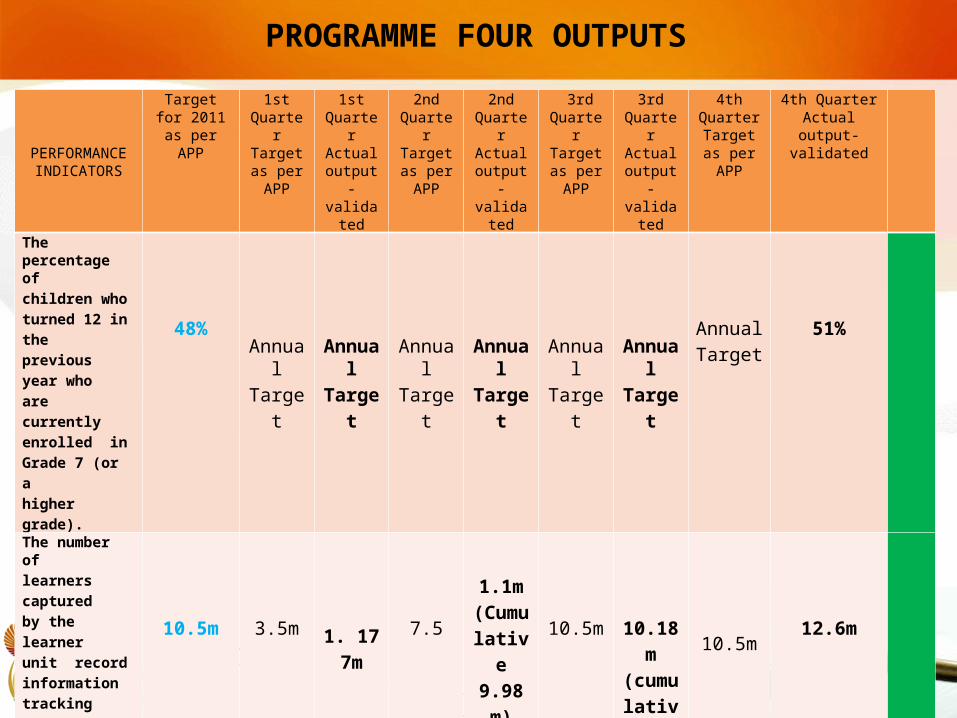
The percentage of children who turned 12 in the previous year whoare currently enrolled in Grade 7 (or a higher grade).
48%AnnualTarget
AnnualTarget
AnnualTarget
AnnualTarget
AnnualTarget
AnnualTarget Annual
Target51%
The number of learners captured by the learner unit record information tracking system (millions).
10.5m 3.5m 1. 177m
7.5
1.1m (Cumul
ative9.98 m)
10.5m 10.18m(cumulative)
10.5m12.6m
The number of public ordinary schools interacting with the learner unit record Informationtracking system.
25 000 10 000 15 629 15 000 17 083 20 000 17 176(cumulative)
25 00020 500

Strategic Planning and Reporting
PROGRAMME FOUR PERFORMANCE AS AT THE FOURTH QUARTER
5656
PERFORMANCE NUMBER PERCENTAGE STATUS
Target achieved 6 38%
Progress is being made but some challenges are prevalent in attaining the targets within planned time-frames
8 50%
Target not achieved in planned time-frame 2 12%
Strategic Planning and Reporting
PROGRAMME FIVE : EDUCATIONAL ENRICHMENT SERVICES
The purpose of Programme Five is to develop policies and programmes to improve the quality of learning in schools.
SUB-PROGRAMMES
Care and Support in Schools Partnerships in Education
5757
Strategic Planning and Reporting
PROGRAMME FIVE : SIGNIFICANT EVENTS AND ACHIEVEMENTS
INTEGRATED SCHOOL HEALTH PROGRAMME (ISHP)
• Although the statistics for the School Health Week conducted in March 2012 are not yet available from the Department of Health, the target for 2011/12 has been exceeded.
• Over the next 5 years, ISHP will extend services to all learners in primary & secondary schools. The health services package includes health screening, limited onsite services and extensive health education.
• Learners will be screened once per educational phase:o Grade 1 (Q1 & 2): Early intervention during period of rapid development.o Grade 4 (Q1): Before onset of puberty.o Grade 8 (Q1): Transition from primary to secondary school associated with increased
risk behaviours. o Grade 10 (Q1): Drop out increases significantly post grade 10 – known risk factor for
early pregnancy & HIV.o Learners repeating grades (Q1 & 2): To identify health barriers to learning.
5858
Strategic Planning and Reporting
PROGRAMME FIVE : SIGNIFICANT EVENTS AND ACHIEVEMENTS
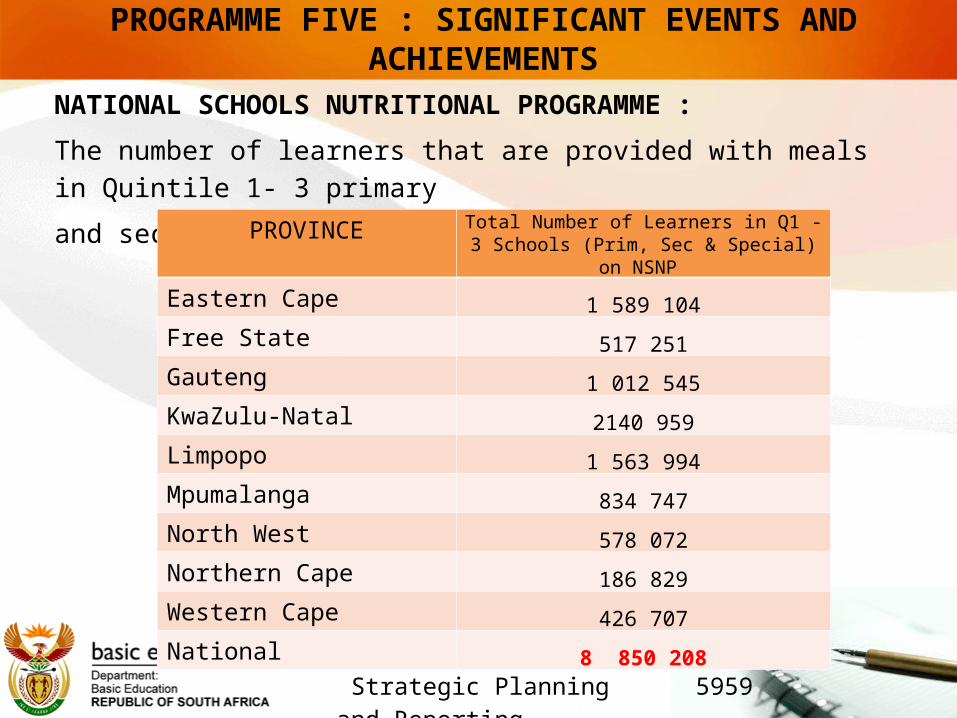
NATIONAL SCHOOLS NUTRITIONAL PROGRAMME :
The number of learners that are provided with meals in Quintile 1- 3 primary
and secondary schools per province :
5959
PROVINCE Total Number of Learners in Q1 - 3 Schools (Prim, Sec & Special) on NSNP
Eastern Cape 1 589 104
Free State 517 251
Gauteng 1 012 545
KwaZulu-Natal 2140 959
Limpopo 1 563 994
Mpumalanga 834 747
North West 578 072
Northern Cape 186 829
Western Cape 426 707
National 8 850 208

Strategic Planning and Reporting
PROGRAMME FIVE : SIGNIFICANT EVENTS AND ACHIEVEMENTS
SOUTH AFRICAN SCHOOLS CHORAL EISTEDDFOD (SASCE):• The developmental workshops for adjudicators and conductors on 2012
prescription, musical technique and the new adjudication process were conducted.
• All workshops took place in January and February 2012, 8 provinces managed to host their workshops except for Limpopo.
• A total of 1199 adjudicators and conductors were trained in 8 provinces. Limpopo has not managed to schedule their workshop due to the financial standing of the province.
SCHOOL SPORT : • The School Sport Planning Framework and the School Sport Calendars
have been completed and are being printed by the Government Printers. The two documents align schools sport programmes that are organised by school sport codes and federations to ensure common goals.
6060
Strategic Planning and Reporting
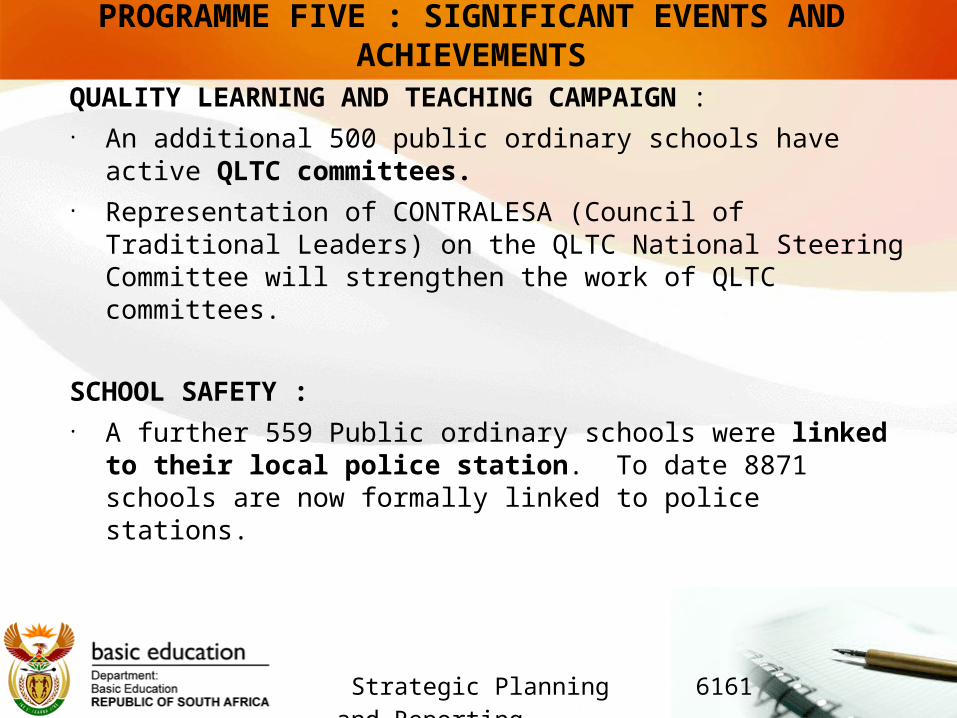
PROGRAMME FIVE : SIGNIFICANT EVENTS AND ACHIEVEMENTS
QUALITY LEARNING AND TEACHING CAMPAIGN : • An additional 500 public ordinary schools have active QLTC committees.• Representation of CONTRALESA (Council of Traditional Leaders) on the
QLTC National Steering Committee will strengthen the work of QLTC committees.
SCHOOL SAFETY :• A further 559 Public ordinary schools were linked to their local police
station. To date 8871 schools are now formally linked to police stations.
6161
Strategic Planning and Reporting
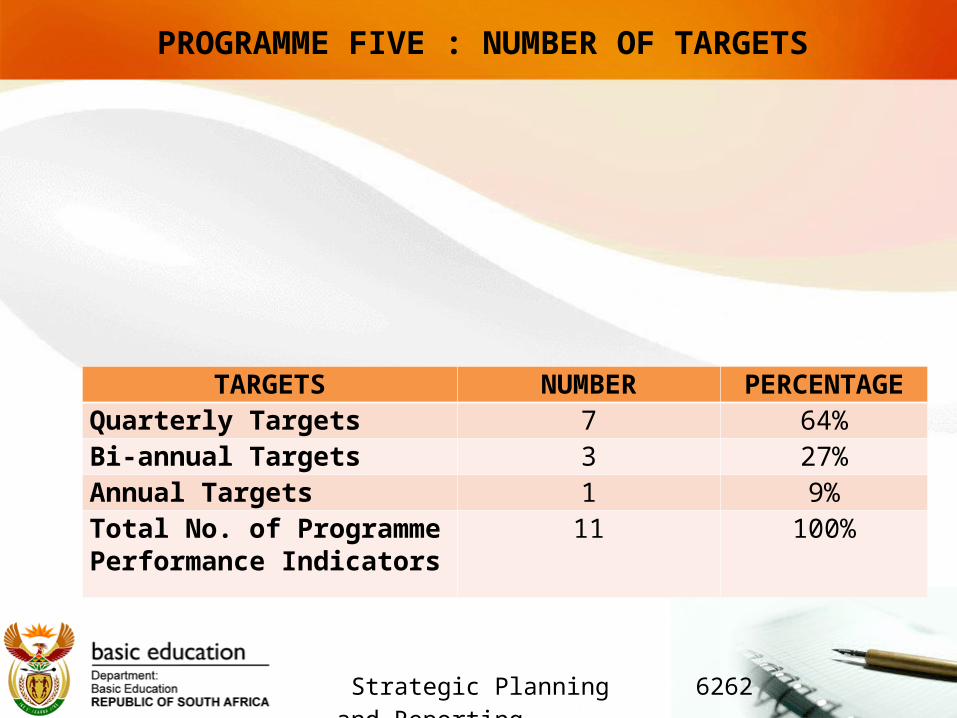
PROGRAMME FIVE : NUMBER OF TARGETS
6262
TARGETS NUMBER PERCENTAGEQuarterly Targets 7 64%Bi-annual Targets 3 27%Annual Targets 1 9%Total No. of Programme Performance Indicators
11 100%

Strategic Planning and Reporting
PROGRAMME FIVE OUTPUTS
6363
PERFORMANCE INDICATORS
Target for 2011 as per
APP
1st Quarter Target as per APP
1st Quarter Actual
output-validated
2nd Quarter
Target as per APP
2nd Quarter Actual
output-validated
3rd Quarter Target as per APP
3rd Quarter Actual
output-validated
4th Quarter Target as per
APP
4th Quarter Actual output-
validated
The number of Schoolsparticipating in the CSTL pilot programme.
225
Bi-annual Target
Bi-annual Target 100 213
Bi-annual Target
Bi-annual Target 225 235
The number of educators trained to implement sexual and reproductive health programmes for learners. 17 160
2 642 2 312 3 106 7 468 7 764 2 683 17 160 5 576
The number of LTSM on sexual and reproductive health delivered to schools.
1 154 196
Bi-annual Target
Bi-annual Target 284
663328 402
Bi-annual Target
Bi-annual Target 1 154 196 573 877
The number of Grade 1 learners in Quintile 1 primary schools undergoing health screening.
250 000
Bi-annual Target
Bi-annual Target 125
000138 201
Bi-annual Target
Bi-annual Target 250 000 118 067
Strategic Planning and Reporting
PROGRAMME FIVE OUTPUTS
6464
PERFORMANCE INDICATORS
Target for 2011 as per
APP
1st Quarter Target as per APP
1st Quarter Actual
output-validated
2nd Quarter
Target as per APP
2nd Quarter Actual
output-validated
3rd Quarter
Target as per APP
3rd Quarter Actual
output-validated
4th Quarter
Target as per APP
4th Quarter Actual
output-validated
The number of learners that are provided with meals in Quintile 1- 3 primary and secondary schools.
8633 095 8633095 No data 8633095 8 975274 8633095 8825321 8633095 8 850 208
The number of public ordinary schools with active QLTC committees.
3 000 500 1 000 1 500 1 515 500 (599) 500 500
The number of public ordinary schools that benefit from private partnerships.
200 50120
50 34350
343 as per previous quarter
due to new approach
as informed
by the NEDLAC
ACCORD.
50 134
The number of public ordinary schools linked to their local police station.
9 000 1 000 528 6 000 5563 1 000 2 221 1 000 559
Strategic Planning and Reporting
PROGRAMME FIVE OUTPUTS
6565
PERFORMANCE INDICATORS
Target for 2011 as per
APP
1st Quarter
Target as per APP
1st Quarter Actual
output-validated
2nd Quarter
Target as per APP
2nd Quarter Actual
output-validated
3rd Quarter
Target as per APP
3rd Quarter Actual
output-validated
4th Quarter Target as per
APP
4th Quarter Actual output-
validated
The number of public ordinary schools participating in school sport leagues.
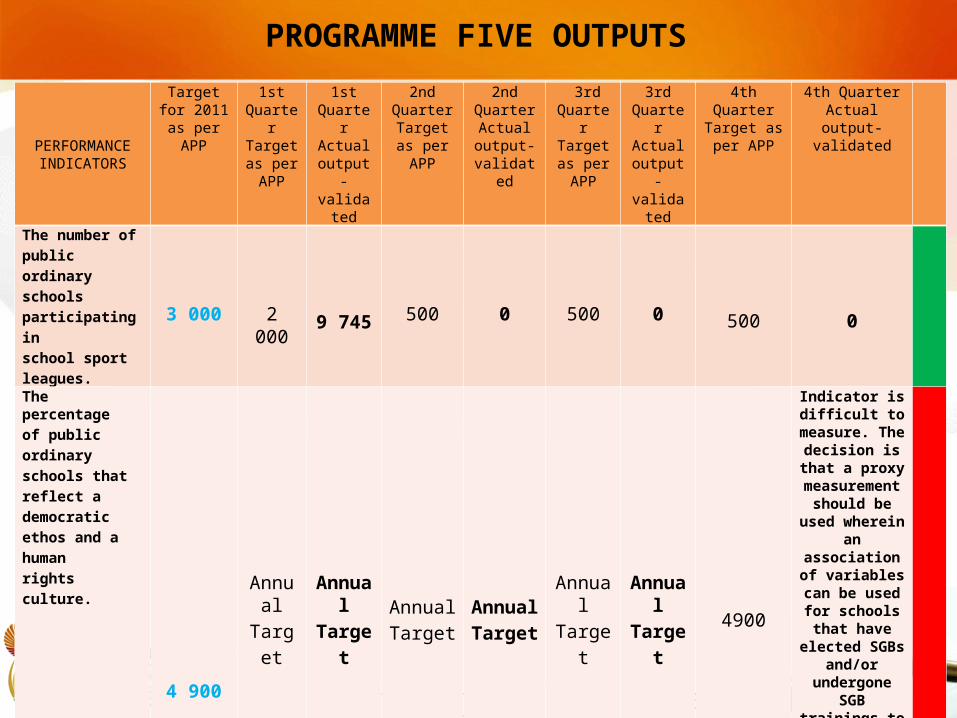
3 000 2 000 9 745 500 0 500 0 500 0
The percentageof public ordinary schools that reflect a democratic ethos and a humanrights culture.
4 900
AnnualTarget
AnnualTarget
AnnualTarget
AnnualTarget
AnnualTarget
AnnualTarget
4900
Indicator is difficult to
measure. The decision is that a
proxy measurement should be used
wherein an association of
variables can be used for schools
that have elected SGBs and/or
undergone SGB trainings to be
deemed schools that reflect a
democratic ethos and a human rights culture.
Strategic Planning and Reporting
PROGRAMME FIVE OUTPUTS
6666
PERFORMANCE INDICATORS
Target for 2011 as per
APP
1st Quarter
Target as per APP
1st Quarter Actual
output-validated
2nd Quarter
Target as per APP
2nd Quarter Actual
output-validated
3rd Quarter
Target as per APP
3rd Quarter Actual
output-validated
4th Quarter Target as per
APP
4th Quarter Actual output-
validated
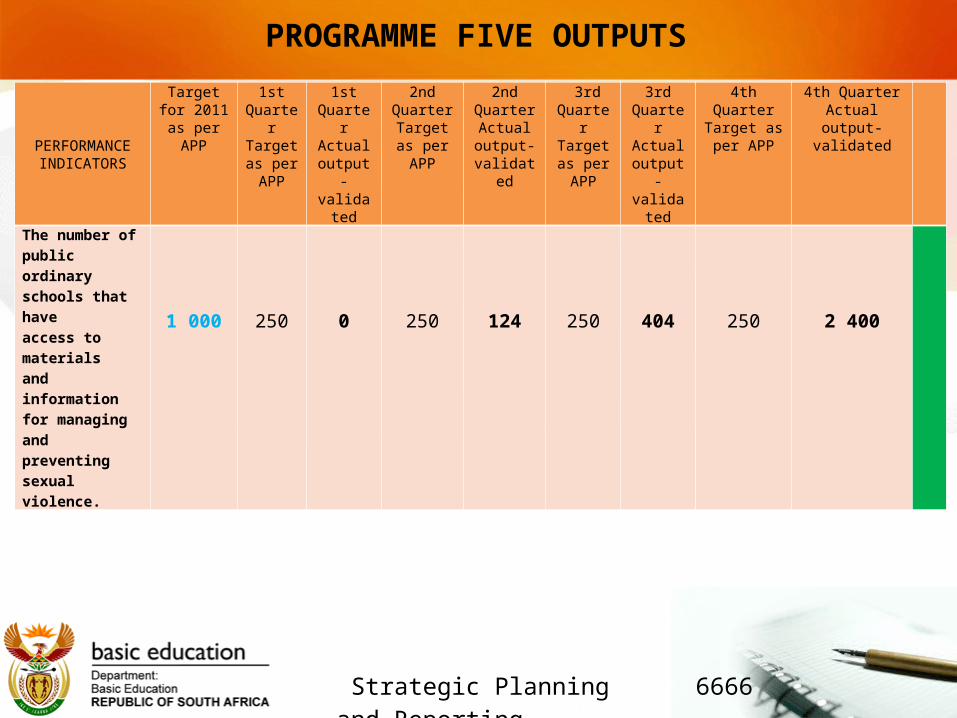
The number of public ordinary schools that have access to materials and information for managing and preventing sexualviolence.
1 000 250 0 250 124 250 404 250 2 400

Strategic Planning and Reporting
PROGRAMME FIVE PERFORMANCE AS AT THE FOURTH QUARTER
6767
PERFORMANCE NUMBER PERCENTAGE STATUS
Target achieved 9 80%Progress is being made but some challenges are prevalent in attaining the targets within planned time-frames
1 10%
Target not achieved in planned time-frame 1 10%
Strategic Planning and Reporting
PART CFourth Quarter Expenditure Report
6868

Strategic Planning and Reporting
• The total Adjusted Appropriation budget of the Department for the 2011/12 financial year amounts to R14 080.466 million.
• R11 218 127 million of the budget is an allocation for transfer payments, they are as follows:
– Conditional Grants: R10 736.898 million– Transfers to Public Entities: R467.831 million– Other Transfers: R13.398 million
• The remainder of the budget (R2 862.339 million) is made up of the following:– Compensation of Employees: R241.027 million– Examiners and Moderators: R15.660 million– Earmarked Funds: R1 564.201 million– Specifically and Exclusively Appropriated: R700.000 million– Departmental Operations: R235.725 million– Departmental Projects: R105.726 million
6969
INTRODUCTION

Strategic Planning and Reporting
• The total expenditure of the Department at the end of the fourth quarter for the 2011/12 financial year amounts to R12 884.514 million.
• R10 838.489 million of the expenditure is transfer payments and they are as follows:
– Conditional Grants: R10 357.686 million– Transfers to Public Entities: R467.831 million– Other Transfers: R12.972 million
• The remainder of the expenditure (R2 046.025 million) was spent on the following:
– Compensation of Employees: R 232.629 million– Examiners and Moderators: R10.570 million– Earmarked Funds: R1 445 566 million– Departmental Operations: R233 080 million– Departmental Projects: R64.497million– School Infrastructure Backlogs Grant R59.683 million
7070
INTRODUCTION (continued)
Click to edit Master subtitle style
Strategic Planning and Reporting
7171
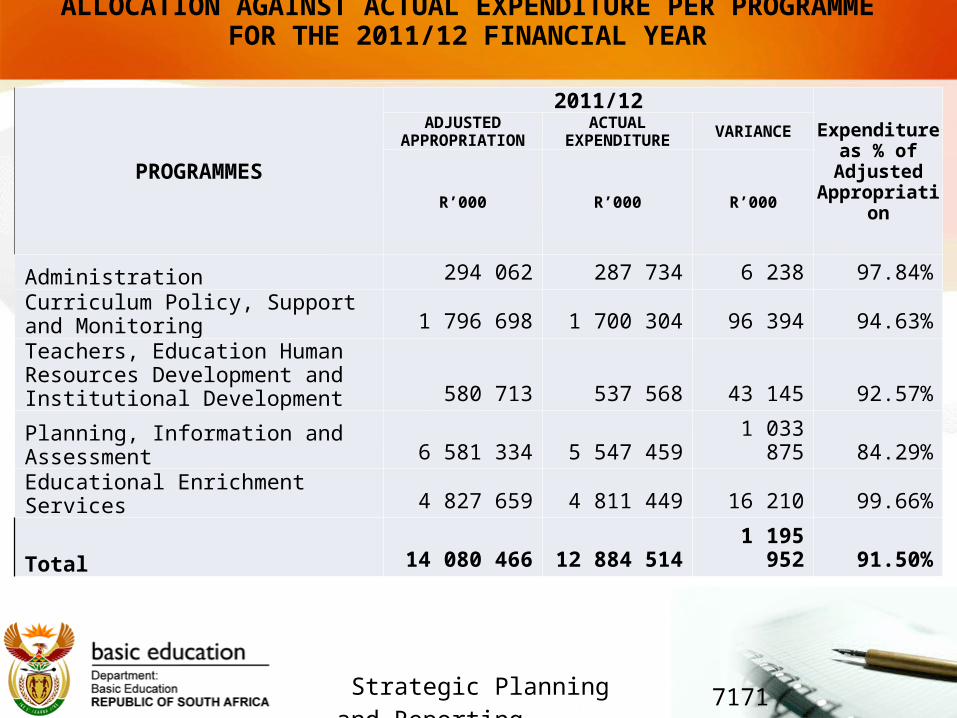
ALLOCATION AGAINST ACTUAL EXPENDITURE PER PROGRAMME FOR THE 2011/12 FINANCIAL YEAR
PROGRAMMES
2011/12Expenditure
as % of Adjusted
Appropriation
ADJUSTED APPROPRIATION
ACTUAL EXPENDITURE VARIANCE
R’000 R’000 R’000
Administration 294 062 287 734 6 238 97.84%
Curriculum Policy, Support and Monitoring 1 796 698 1 700 304 96 394 94.63%
Teachers, Education Human Resources Development and Institutional Development 580 713 537 568 43 145 92.57%
Planning, Information and Assessment 6 581 334 5 547 459 1 033 875 84.29%
Educational Enrichment Services 4 827 659 4 811 449 16 210 99.66%
Total 14 080 466 12 884 514 1 195 952 91.50%

Click to edit Master subtitle style
Strategic Planning and Reporting
7272
ALLOCATION AGAINST ACTUAL EXPENDITURE PER ITEM FOR THE 2011/12 FINANCIAL YEAR
PROGRAMMES
2011/12Expenditure
as % of Adjusted
Appropriation
ADJUSTED APPROPRIATION
ACTUAL EXPENDITURE VARIANCE
R’000 R’000 R’000
Compensation of Employees 310 784 295 423 15 361 95.0%
Goods and Services 1 778 310 1 621 191 157 119 91.1%
Interest and Rent on Land 52 519 52 519 - 100.0%
Transfers and Subsidies 11 218 234 10 838 595 379 639 96.6%
Payment for Capital Assets 720 619 76 786 643 833 10.6%
Total 14 080 466 12 884 514 1 195 952 91.5%
Click to edit Master subtitle style
Strategic Planning and Reporting
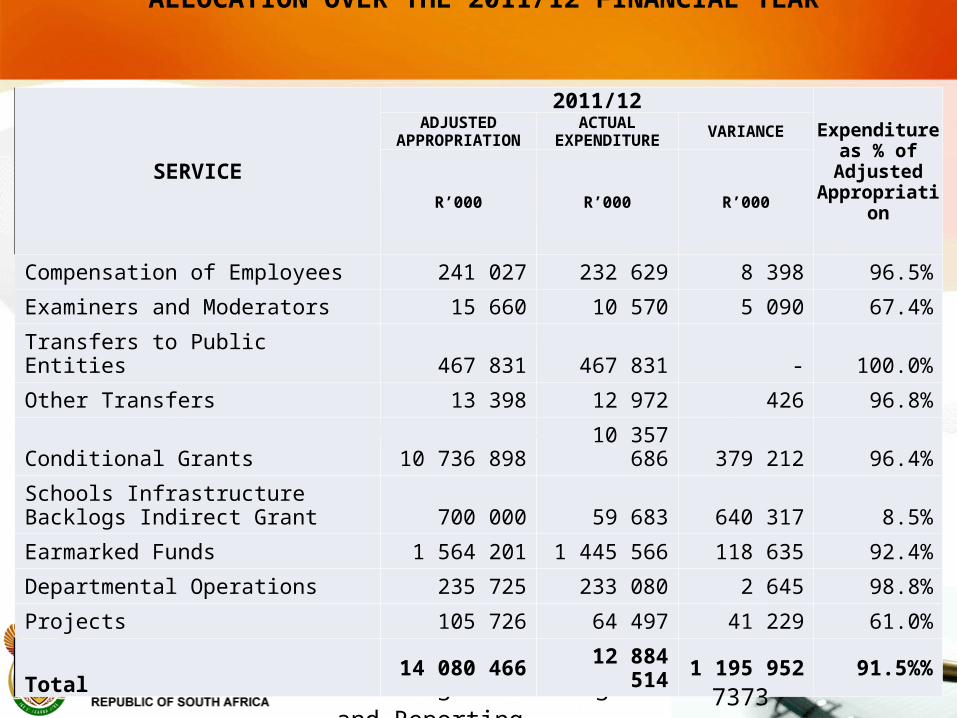
SERVICE
2011/12Expenditure
as % of Adjusted
Appropriation
ADJUSTED APPROPRIATION
ACTUAL EXPENDITURE VARIANCE
R’000 R’000 R’000
Compensation of Employees 241 027 232 629 8 398 96.5%
Examiners and Moderators 15 660 10 570 5 090 67.4%
Transfers to Public Entities 467 831 467 831 - 100.0%
Other Transfers 13 398 12 972 426 96.8%
Conditional Grants 10 736 898 10 357 686 379 212 96.4%
Schools Infrastructure Backlogs Indirect Grant 700 000 59 683 640 317 8.5%
Earmarked Funds 1 564 201 1 445 566 118 635 92.4%
Departmental Operations 235 725 233 080 2 645 98.8%
Projects 105 726 64 497 41 229 61.0%
Total 14 080 466 12 884 514 1 195 952 91.5%%
7373
ALLOCATION OVER THE 2011/12 FINANCIAL YEAR

Click to edit Master subtitle style
Strategic Planning and Reporting
SERVICE
2011/12
Expenditure as % of Adjusted
Appropriation
ADJUSTED APPROPRIATION
ACTUAL EXPENDITURE VARIANCE
R’000 R’000 R’000
Earmarked Funds: 1 564 201 1 445 566 118 635 92.4%
Kha Ri Gude Literacy Project 497 612 453 579 44 033 91.1%
EPWP: Kha Ri Gude 43 981 43 759 222 99.4%
Curriculum Review 80 000 49 709 30 291 62.1%
Workbooks 849 435 832 298 17 137 97.9%
IQMS 35 259 31 972 3 287 90.7%
Annual National Assessments: Grades 3, 6 and 9 29 563 15 553 14 010 52.6%
NEEDU 11 947 6 601 5 346 55.2%
NSNP 16 404 12 095 4 309 73.7%
Conditional Grants: 10 736 898 10 206 098 530 800 95.0%
Technical Secondary Schools Recapitalisation 210 518 151 769 58 749 72.0%
Dinaledi Schools 70 000 62 802 7 198 89.7%
Education Infrastructure 5 678 300 5 254 316 423 984 92.5%
National Schools Nutrition Programme 4 578 752 4 543 249 35 503 99.2%
HIV and AIDS (Life Skills Education) 199 328 193 962 5 366 97.3%
7474
DETAILS OF EARMARKED ALLOCATIONS/TRANSFERS OVER THE 2011/12 FINANCIAL YEAR
Click to edit Master subtitle style
Strategic Planning and Reporting
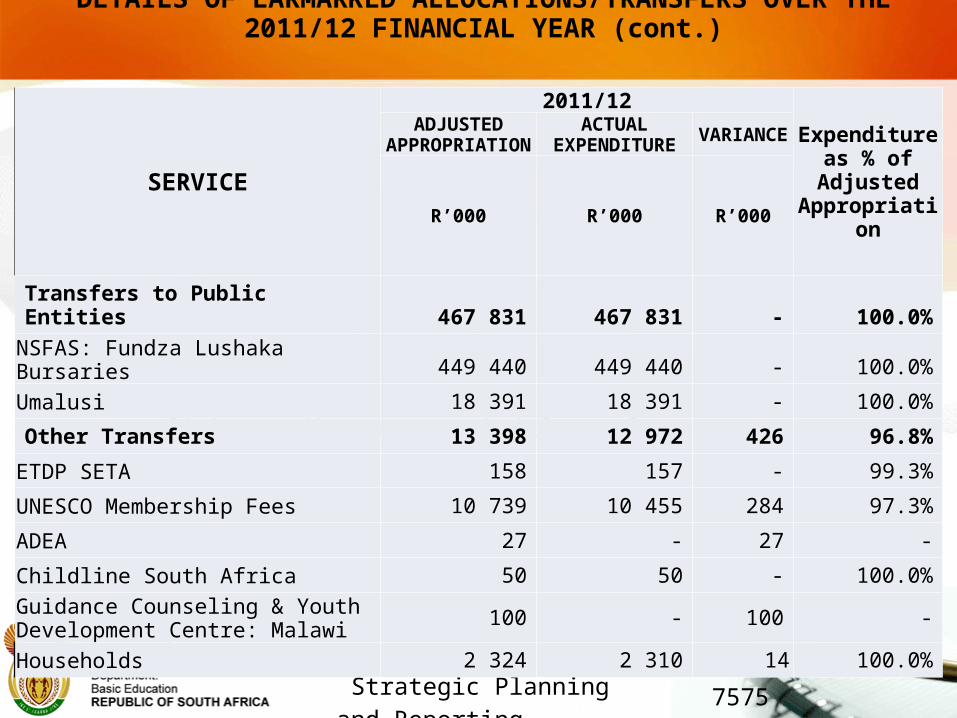
SERVICE
2011/12
Expenditure as % of
Adjusted Appropriation
ADJUSTED APPROPRIATION
ACTUAL EXPENDITURE VARIANCE
R’000 R’000 R’000
Transfers to Public Entities 467 831 467 831 - 100.0%
NSFAS: Fundza Lushaka Bursaries 449 440 449 440 - 100.0%
Umalusi 18 391 18 391 - 100.0%
Other Transfers 13 398 12 972 426 96.8%
ETDP SETA 158 157 - 99.3%
UNESCO Membership Fees 10 739 10 455 284 97.3%
ADEA 27 - 27 -
Childline South Africa 50 50 - 100.0%
Guidance Counseling & Youth Development Centre: Malawi
100 - 100 -
Households 2 324 2 310 14 100.0%
7575
DETAILS OF EARMARKED ALLOCATIONS/TRANSFERS OVER THE 2011/12 FINANCIAL YEAR (cont.)

Strategic Planning and Reporting
PART DConclusion
7676
Strategic Planning and Reporting
CONCLUSION
The interventions of the past year will be consolidated during the coming
financial year to improve learner performance with a specific FOCUS ON
LEARNING.
Working with provincial education departments this FOCUS ON LEARNING will
include : Curriculum and Assessment Policy Statements – implementation phase. Expanded distribution of Workbooks. Teacher development and accountability. LTSM quality, costs, coverage interventions Ensuring curriculum coverage and utilisation appropriately to ensure
outcomes are achieved. Use of results from Annual National Assessment and the National Senior
Certificate examination to improve learning.
7777

Strategic Planning and Reporting
THANK YOU
7878
Related Documents