Strategic Plan 2012-2018 Approved October 2012 Florida’s State Board of Education Strategic Plan For the Public School System and The Florida College System

Welcome message from author
This document is posted to help you gain knowledge. Please leave a comment to let me know what you think about it! Share it to your friends and learn new things together.
Transcript

Strategic Plan 2012-2018 Approved October 2012
Florida’s State Board of Education
Strategic Plan For the Public School System and The Florida College System

Florida’s State Board of Education
Strategic Plan
2 Approved October 2012
Contents
Introduction ......................................................................................................................................................... 3
At a Glance ......................................................................................................................................................... 4
Mission ................................................................................................................................................................ 6
Vision .................................................................................................................................................................. 6
Strategic Goals .................................................................................................................................................... 7
Strategies and Tactics ......................................................................................................................................... 9
Performance Indicators ..................................................................................................................................... 10
Appendix A: Supplemental Department Performance Indicators .................................................................... 28

Florida’s State Board of Education
Strategic Plan
3 Approved October 2012
Introduction A Roadmap for Education in Florida Education is a priority in Florida. Our state’s students and families deserve an education system that creates a culture of high expectations for present and future generations. Our great state has spent more than a decade developing cutting-edge accountability systems and quality assessments, while collecting valuable education data that prove our students’ incredible progress. In 2014-15, more than 45 states, including Florida, will move to national education standards and assessments that are built around the Common Core Standards. The Common Core will demand more from our students and they must be prepared to tackle the new material and tougher assessments that will measure how well they learn it. Advancing high-quality education for the next generation of students is the primary responsibility of the Florida State Board of Education. This Strategic Plan offers a roadmap for Florida’s education community that shows where we are, where we want to be, and how we will get there. The best interest of our children is at stake, and we must challenge them to reach higher and realize their full potential. Florida students must know that they can graduate from high school and be prepared to compete for jobs, join a global workforce, make their dreams a reality – and become the strong leaders that we know they can be. Setting objectives that will ensure the best access and opportunities for our state’s diverse student population, while increasing educator effectiveness, raising standards, and deepening the level of school curriculum, are at the forefront of Florida’s ambitious education agenda. The State Board of Education is authorized in Section 1001.02(3)(a), Florida Statute, to “adopt a strategic plan that specifies goals and objectives for the state’s public schools and Florida College System institutions.” Florida’s education system includes the Florida Public School System and The Florida College System. This Strategic Plan outlines a five-year vision to support students from prekindergarten through college so they may achieve success in their careers and life. How will we ensure this? Progress toward this vision will be measured through performance indicators included in this plan. The State Board of Education will review and approve the plan annually.
1. Highest Student Achievement
2. Seamless Articulation and Maximum Access
3. Skilled Workforce and Economic Development
4. Quality Efficient Services

Florida’s State Board of Education
Strategic Plan
4 Approved October 2012
At a Glance Who We Are In Florida, education is everything. We are fortunate to have a student-centered education system that is focused on expanding opportunities for learners at every level. Florida’s parents also have the freedom to choose the educational path that is right for their child – one that focuses on preparing students for a successful future. Our state’s innovative education system serves more than 3.5 million students, 4,200 public schools, 28 colleges, 188,000 educators, 47,000 college professors and administrators, and 318,000 full-time staff throughout the state. A national leader in school choice options, Florida is home to more than 570 charter schools, 480 magnet schools and programs, and 240 career academies. Our state operates more than 200 public virtual schools offering full- and part-time education programs to Florida’s children; and, in 2011-12, more than 160,000 students participated in virtual education. The Florida Department of Education enhances the economic independence of Floridians through educational programs and services geared toward college, workforce education, job-specific skills, and career development. Florida ranks first in the nation for teacher quality, first in the nation in advanced placement participation, and first in the southern region for graduation rate and degrees awarded by The Florida College System.

Florida’s State Board of Education
Strategic Plan
5 Approved October 2012
Mapping Florida’s Education System
Each county represents one of 67 K-12 school districts. There are also seven special school districts listed separately. The numbers on the map correspond to the 28 colleges that make up The Florida College System. Special Districts
• Florida School for the Deaf and the Blind • Florida Virtual School • FAMU Lab School • FAU Lab School • FSU Lab School • UF Lab School • Washington Special
The Florida College System Institutions
1. Brevard Community College, Cocoa 2. Broward College, Fort Lauderdale 3. Chipola College, Marianna 4. College of Central Florida, Ocala 5. Daytona State College, Daytona Beach 6. Edison State College, Fort Myers 7. Florida State College at Jacksonville, Jacksonville 8. Florida Keys Community College, Key West 9. Gulf Coast State College, Panama City 10. Hillsborough Community College, Tampa 11. Indian River State College, Fort Pierce 12. Florida Gateway College, Lake City 13. Lake-Sumter State College, Leesburg 14. State College of Florida, Manatee-Sarasota, Bradenton 15. Miami Dade College, Miami 16. North Florida Community College, Madison 17. Northwest Florida State College, Niceville 18. Palm Beach State College, Lake Worth 19. Pasco-Hernando Community College, New Port Richey 20. Pensacola State College, Pensacola 21. Polk State College, Winter Haven 22. St. Johns River State College, Palatka 23. St. Petersburg College, St. Petersburg 24. Santa Fe College, Gainesville 25. Seminole State College of Florida, Sanford 26. South Florida State College, Avon Park 27. Tallahassee Community College, Tallahassee 28. Valencia College, Orlando

Florida’s State Board of Education
Strategic Plan
6 Approved October 2012
Mission Section 1008.31, Florida Statute, establishes the mission of Florida’s education delivery system.
The mission of Florida’s K-20 education system is to increase the proficiency of all students within one seamless, efficient system, by allowing them the opportunity to expand their knowledge and skills through learning opportunities and research valued by students, parents, and communities.
Vision To achieve the mission established in statute for Florida’s education delivery system, the State Board of Education presents the following vision statement.
Florida will have an efficient world-class education system that engages and prepares all students to be globally competitive for college and careers.

Florida’s State Board of Education
Strategic Plan
7 Approved October 2012
Strategic Goals Section 1008.31, Florida Statute, establishes four goals for Florida’s education system. Each of these goals will be measured through the accountability system and progress will be documented through the performance indicators included in this Strategic Plan.
1. Highest Student Achievement
2. Seamless Articulation and Maximum Access
3. Skilled Workforce and Economic Development
4. Quality Efficient Services
The first three goals will be supported by the priorities approved by the State Board of Education that are aligned with VPK students, K-12 students in the public school system, teachers and leaders, school choice, and postsecondary students in The Florida College System. The fourth goal, Quality Efficient Services, will support each priority and create an environment of high expectations. The priorities of the Florida Department of Education are shown in the following matrix.

Florida’s State Board of Education
Strategic Plan
8 Approved October 2012
Priorities Matrix
Statutory Goals (1008.31)
Goal 1: Highest Student Achievement
Goal 2: Seamless Articulation/
Maximum Access
Goal 3: Skilled Workforce/
Economic Development
Prekindergarten Students
• Improve kindergarten readiness
K-12 Students
• Increase the percentage of students performing at grade level
• Increase high school graduation rates
• Expand STEM-related educational opportunities in high-demand areas
• Increase student participation and performance in accelerated course options
• Improve college readiness • Increase career and technical education opportunities
• Expand digital education • Improve adult education programs in school districts
Teachers & Leaders
• Increase the percentage of effective and highly-effective principals
• Increase the percentage of effective and highly-effective teachers at high-minority, high-poverty and low-performing schools
• Increase the percentage of effective and highly-effective teachers
• Reduce the number of out-of-field teachers at high-minority, high-poverty and low-performing schools
• Reduce the number of out-of-field teachers
School Choice
• Increase the percentage of charter school students performing at grade level
• Expand choice options for students
• Improve charter school performance
• Ensure Supplemental Educational Service providers are high performing
Postsecondary Students
• Increase college readiness and success
• Expand and maintain student access
• Prepare students for careers
Goal 4: Quality Efficient Services

Florida’s State Board of Education
Strategic Plan
9 Approved October 2012
Strategies and Tactics In order to organize the efforts to achieve the goals and priorities of the Strategic Plan, the Department will draft a supplemental “Strategies and Tactics Work Plan” document. The strategies and tactics will support and be aligned to the goals and priorities of this plan, while providing additional information regarding the specific activities and efforts involved.

Florida’s State Board of Education
Strategic Plan
10 Approved October 2012
Performance Indicators The following performance indicators will show the progress toward attaining each of the four goals of Florida’s education system. Each performance indicator has been categorized under one of the four goals and aligned to the most applicable priority. This plan will include the current year’s data for each performance indicator starting with 2011-12. Upon approval of the performance indicators and current year data, goals will be established and approved for each indicator. The goals and performance indicators are not static and will continue to evolve as the Strategic Plan is refined.
1. PreK-12 Students
Performance Indicator Current (2011-12 unless noted)
2017-18 Goal Notes
Priority: Improve kindergarten readiness
1.1 Percentage of VPK completers who score ready on both state Kindergarten readiness assessments
* 2010-11 data
VPK completers: 76.89% Ready
VPK non-completers: 61.70% Ready
Non-VPK participants: 52.99% Ready
VPK completers: 91%
Kindergarten readiness assessments are ECHOS and FAIR.
Priority: Increase the percentage of students performing at grade level
1.2 Percentage of students scoring at or above grade level on statewide English Language Arts, science, and mathematics assessments
Reading: 57%
Math: 58%
Science: 50%
Reading: 83%
Math: 82%
Science: TBD
Grade level is currently defined as Level 3 and above on FCAT 2.0.
2017-18 goals correspond to targets in the federal ESEA waiver that call for cutting in half the percentage of students scoring below grade level within six years. The goals will be reviewed in 2014-15 when the new statewide assessment system is implemented.
Florida’s State Board of Education
Strategic Plan
11 Approved October 2012
1. PreK-12 Students
Performance Indicator Current (2011-12 unless noted)
2017-18 Goal Notes
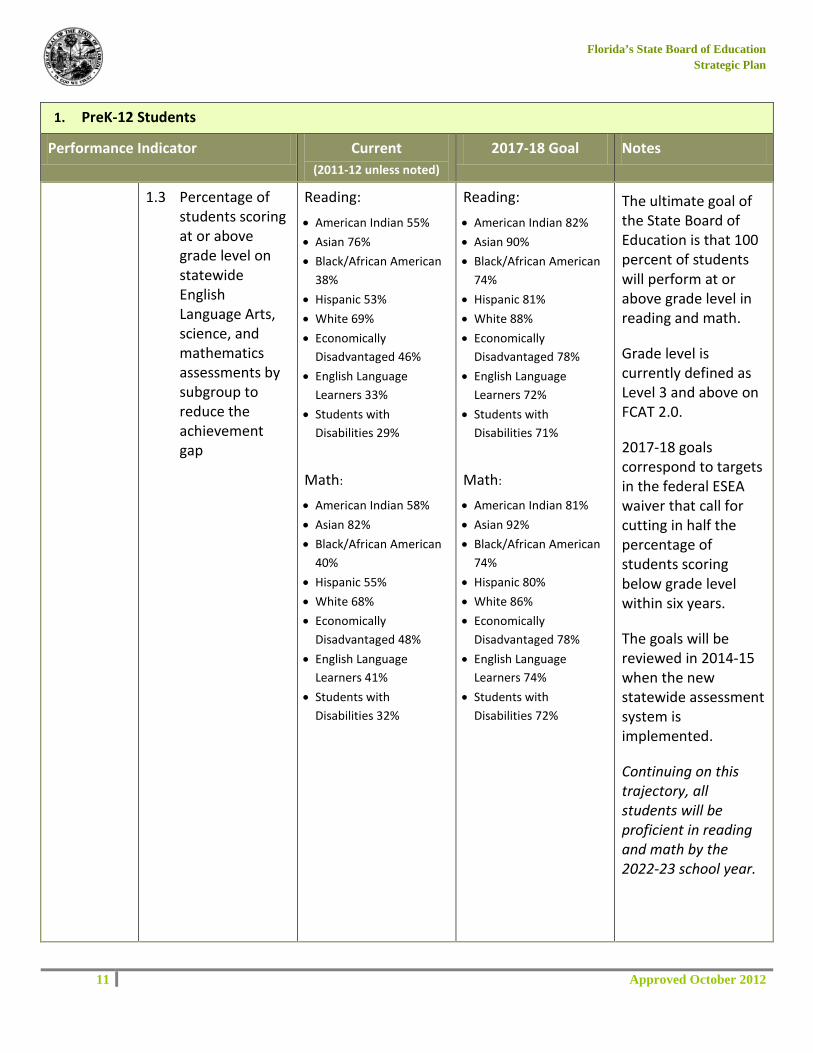
1.3 Percentage of students scoring at or above grade level on statewide English Language Arts, science, and mathematics assessments by subgroup to reduce the achievement gap
Reading: • American Indian 55% • Asian 76% • Black/African American
38% • Hispanic 53% • White 69% • Economically
Disadvantaged 46% • English Language
Learners 33% • Students with
Disabilities 29%
Math:
• American Indian 58% • Asian 82% • Black/African American
40% • Hispanic 55% • White 68% • Economically
Disadvantaged 48% • English Language
Learners 41% • Students with
Disabilities 32%
Reading: • American Indian 82% • Asian 90% • Black/African American
74% • Hispanic 81% • White 88% • Economically
Disadvantaged 78% • English Language
Learners 72% • Students with
Disabilities 71%
Math:
• American Indian 81% • Asian 92% • Black/African American
74% • Hispanic 80% • White 86% • Economically
Disadvantaged 78% • English Language
Learners 74% • Students with
Disabilities 72%
The ultimate goal of the State Board of Education is that 100 percent of students will perform at or above grade level in reading and math.
Grade level is currently defined as Level 3 and above on FCAT 2.0.
2017-18 goals correspond to targets in the federal ESEA waiver that call for cutting in half the percentage of students scoring below grade level within six years.
The goals will be reviewed in 2014-15 when the new statewide assessment system is implemented.
Continuing on this trajectory, all students will be proficient in reading and math by the 2022-23 school year.

Florida’s State Board of Education
Strategic Plan
12 Approved October 2012
1. PreK-12 Students
Performance Indicator Current (2011-12 unless noted)
2017-18 Goal Notes
1.4 Percentage of students scoring Level 4 and above on statewide assessments in reading and mathematics
* 2010-11 data
Reading: 31%
Math: 36%
Reading: 56%
Math: 61%
The goals will be reviewed in 2014-15 when the new statewide assessment system is implemented.
Priority: Increase student participation and performance in accelerated course options
1.5 Number and percentage of ninth-grade students who passed a statewide high school credit bearing end-of-course exam prior to ninth grade
19%
43,374 of 228,617
TBD Goal to be determined when more than one year of data is available
1.6 Percentage of students completing at least one accelerated mechanism (AP, IB, DE, AICE or Industry Certification)
* 2010-11 data
AP: 34%
IB: 2%
DE: 14%
AICE: 1%
Industry Certification: 12%
Any Mechanism: 45%
Any Mechanism: 66%

Florida’s State Board of Education
Strategic Plan
13 Approved October 2012
1. PreK-12 Students
Performance Indicator Current (2011-12 unless noted)
2017-18 Goal Notes
1.7 Percentage of students who completed at least one accelerated course (AP, IB, DE, AICE or Industry Certification) and were eligible for the associated postsecondary credit
* 2010-11 data
AP: 52%
IB: 94%
DE: 97%
AICE: 79%
Industry Certification: 67%
Any Mechanism: 70%
Any Mechanism 91%
To be eligible for postsecondary credit, students must earn a grade of 3 or above on AP/AICE exam, grade of C or better in DE course, or passed an industry certification exam.
Priority: Increase high school graduation rates
1.8 Graduation Rates
Standard Diploma: 70.6%
Standard, Special and 5 year Diplomas:
73.4%
Standard Diploma: 92%
Standard, Special and 5 year Diplomas:
94%
New federal graduation rate
Priority: Improve college readiness
1.9 Percentage of high school graduates meeting approved postsecondary readiness standard
* 2009-10 data Math: 53%
Reading: 62%
Writing: 63%
In all 3 subjects: 47%
In all 3 subjects: 87%
Postsecondary readiness standard means achieving a college ready score on an approved assessment. This number may be low due to some students not having a score reported.
Priority: Expand digital education
1.10 Student to computer ratio
2.87:1 1:1 This includes desktop and mobile computers combined across all grade levels (K-12)
Florida’s State Board of Education
Strategic Plan
14 Approved October 2012
1. PreK-12 Students
Performance Indicator Current (2011-12 unless noted)
2017-18 Goal Notes
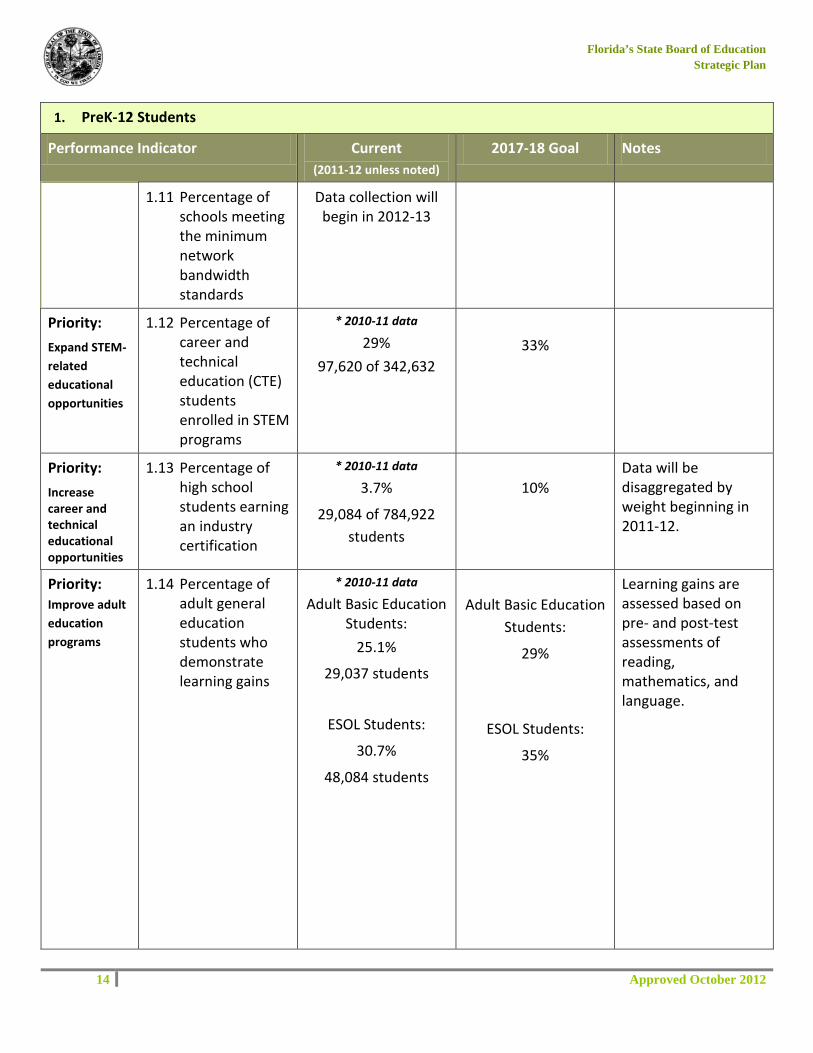
1.11 Percentage of schools meeting the minimum network bandwidth standards
Data collection will begin in 2012-13
Priority: Expand STEM-related educational opportunities
1.12 Percentage of career and technical education (CTE) students enrolled in STEM programs
* 2010-11 data
29% 97,620 of 342,632
33%
Priority: Increase career and technical educational opportunities
1.13 Percentage of high school students earning an industry certification
* 2010-11 data
3.7%
29,084 of 784,922 students
10% Data will be disaggregated by weight beginning in 2011-12.
Priority: Improve adult education programs
1.14 Percentage of adult general education students who demonstrate learning gains
* 2010-11 data Adult Basic Education
Students: 25.1%
29,037 students
ESOL Students:
30.7%
48,084 students
Adult Basic Education Students:
29%
ESOL Students:
35%
Learning gains are assessed based on pre- and post-test assessments of reading, mathematics, and language.
Florida’s State Board of Education
Strategic Plan
15 Approved October 2012
1. PreK-12 Students
Performance Indicator Current (2011-12 unless noted)
2017-18 Goal Notes
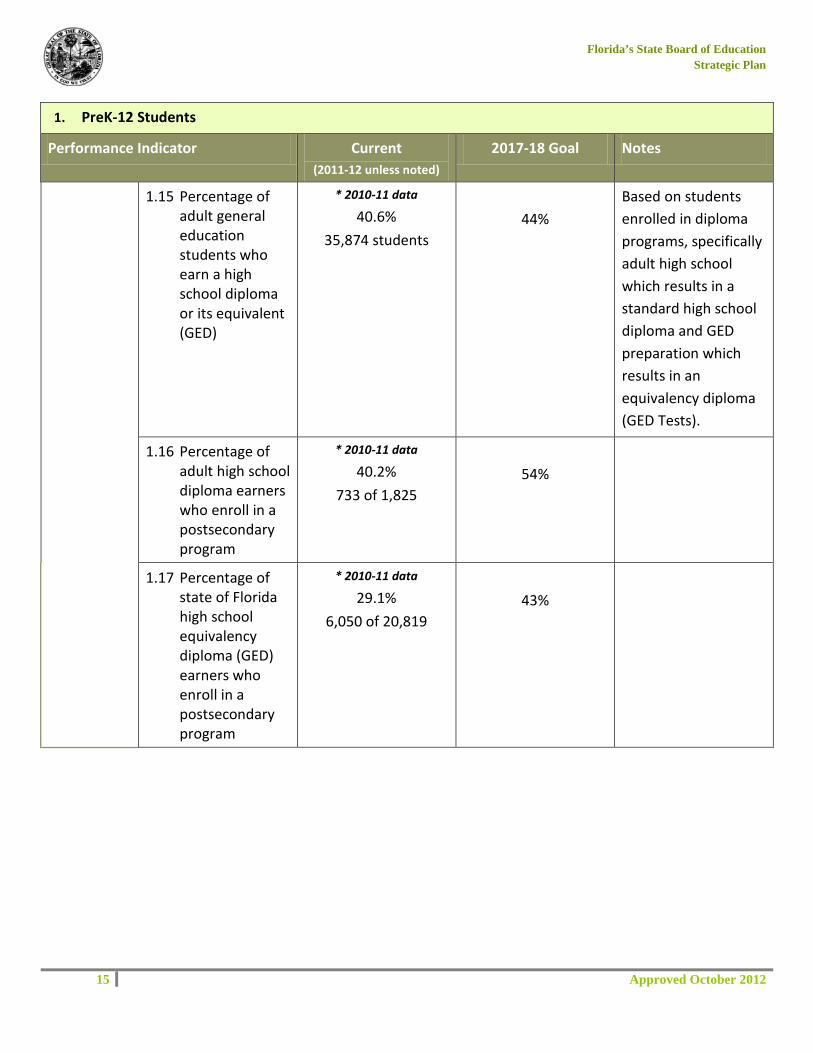
1.15 Percentage of adult general education students who earn a high school diploma or its equivalent (GED)
* 2010-11 data 40.6%
35,874 students
44% Based on students enrolled in diploma programs, specifically adult high school which results in a standard high school diploma and GED preparation which results in an equivalency diploma (GED Tests).
1.16 Percentage of adult high school diploma earners who enroll in a postsecondary program
* 2010-11 data 40.2%
733 of 1,825
54%
1.17 Percentage of state of Florida high school equivalency diploma (GED) earners who enroll in a postsecondary program
* 2010-11 data 29.1%
6,050 of 20,819
43%

Florida’s State Board of Education
Strategic Plan
16 Approved October 2012
2. Teachers and Leaders
Performance Indicator Current (2011-12 unless
noted)
2017-18 Goal Notes
Priority: Increase the percentage of effective and highly-effective principals
2.1 Number and percentage of effective and highly-effective principals at all elementary and secondary schools
TBD TBD Goal to be determined when more than one year of data is available
2.2 Number and percentage of effective and highly-effective principals at high- minority schools
TBD TBD Goal to be determined when more than one year of data is available
2.3 Number and percentage of effective and highly-effective principals at high- poverty schools
TBD TBD Goal to be determined when more than one year of data is available
2.4 The change in the percentage of classes taught by effective and highly-effective principals in D and F schools after three years
TBD TBD Goal to be determined when more than one year of data is available

Florida’s State Board of Education
Strategic Plan
17 Approved October 2012
2. Teachers and Leaders
Performance Indicator Current (2011-12 unless
noted)
2017-18 Goal Notes
Priority: Increase the percentage of effective and highly effective teachers
2.5 Number and percentage of effective and highly-effective teachers at all elementary and secondary schools
TBD TBD Goal to be determined when more than one year of data is available
2.6 Number and percentage of effective and highly-effective teachers at high- minority schools
TBD TBD Goal to be determined when more than one year of data is available
2.7 Number and percentage of effective and highly-effective teachers at high- poverty schools
TBD TBD Goal to be determined when more than one year of data is available
2.8 The change in the percentage of classes taught by effective and highly-effective teachers in D and F schools after three years
TBD TBD Goal to be determined when more than one year of data is available
2.9 Number and percentage of STEM courses taught by effective and highly-effective teachers
TBD TBD Goal to be determined when more than one year of data is available
Florida’s State Board of Education
Strategic Plan
18 Approved October 2012
2. Teachers and Leaders
Performance Indicator Current (2011-12 unless
noted)
2017-18 Goal Notes
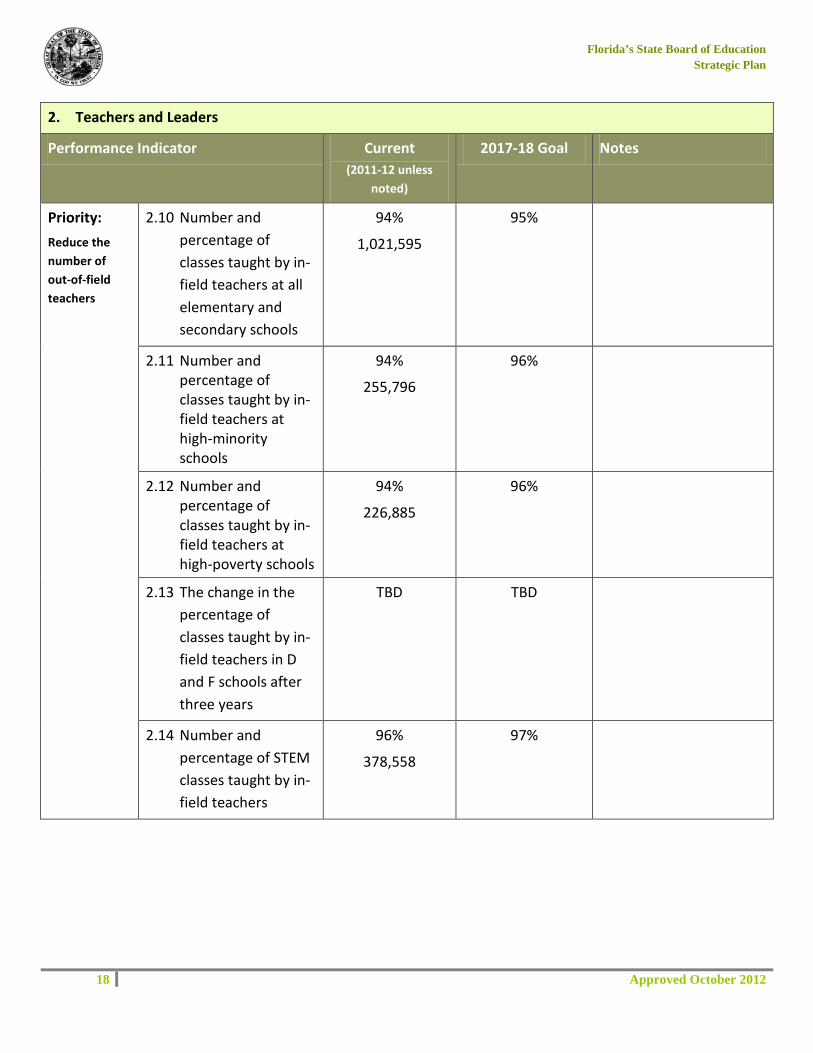
Priority: Reduce the number of out-of-field teachers
2.10 Number and percentage of classes taught by in-field teachers at all elementary and secondary schools
94%
1,021,595
95%
2.11 Number and percentage of classes taught by in-field teachers at high-minority schools
94%
255,796
96%
2.12 Number and percentage of classes taught by in-field teachers at high-poverty schools
94%
226,885
96%
2.13 The change in the percentage of classes taught by in-field teachers in D and F schools after three years
TBD TBD
2.14 Number and percentage of STEM classes taught by in-field teachers
96%
378,558
97%

Florida’s State Board of Education
Strategic Plan
19 Approved October 2012
3. School Choice
Performance Indicator Current (2011-12 unless
noted)
2017-18 Goal Notes
Priority: Increase the percentage of charter school students performing at grade level
3.1 Percentage of students attending a charter school and scoring at or above grade level on statewide assessments in English Language Arts, science and mathematics
Reading: 62%
Math: 62%
Science: 52%
Reading: 83%
Math: 82%
Science: TBD
The goals match the targets set in the federal ESEA waiver. The goals will be reviewed in 2014-15 when the new statewide assessment system is implemented.
3.2 Percentage of students attending a charter school scoring Level 4 or above on statewide assessments in English Language Arts and mathematics
Reading: 34%
Math: 29%
Reading: 56%
Math: 61%
Priority: Ensure SES providers are high performing
3.3 Number and percentage of high-performing SES providers
49%
223 out of 459 Excellent
70%
Priority: Expand choice options for students
3.4 Number of charter schools
518 schools 829 schools 8.5% increase per year for a total of 60% increase in the next six years
Florida’s State Board of Education
Strategic Plan
20 Approved October 2012
3. School Choice
Performance Indicator Current (2011-12 unless
noted)
2017-18 Goal Notes
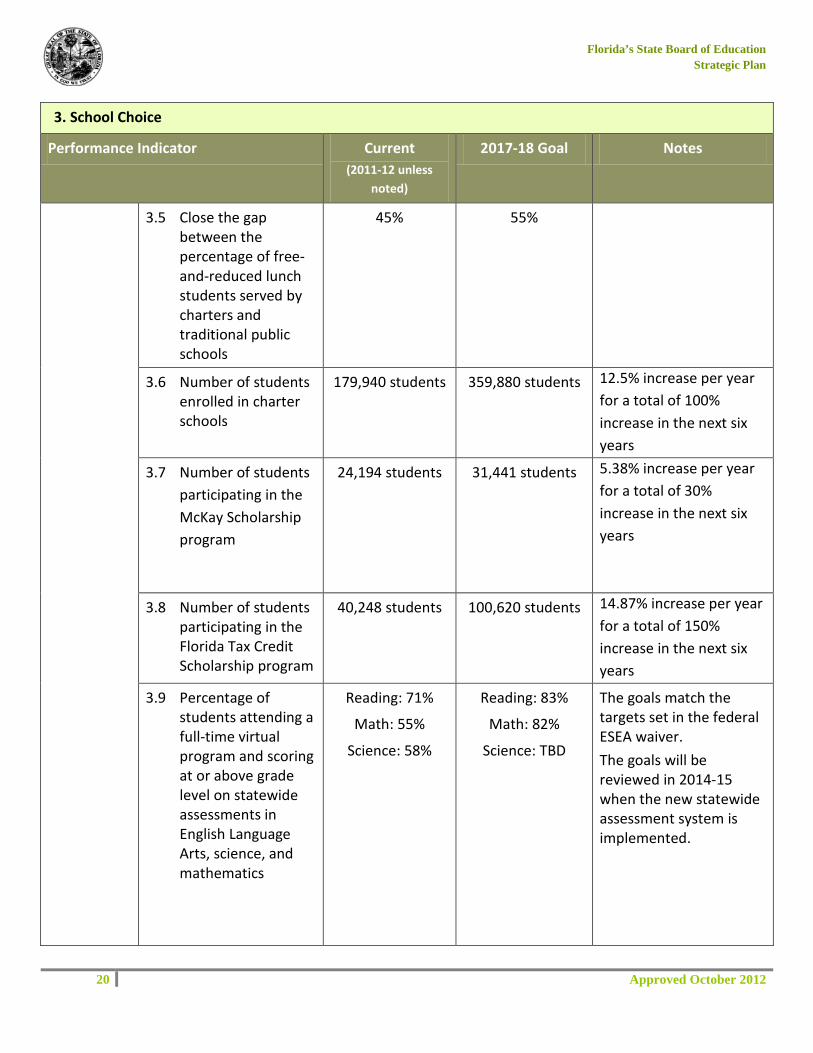
3.5 Close the gap between the percentage of free-and-reduced lunch students served by charters and traditional public schools
45% 55%
3.6 Number of students enrolled in charter schools
179,940 students 359,880 students 12.5% increase per year for a total of 100% increase in the next six years
3.7 Number of students participating in the McKay Scholarship program
24,194 students
31,441 students 5.38% increase per year for a total of 30% increase in the next six years
3.8 Number of students participating in the Florida Tax Credit Scholarship program
40,248 students
100,620 students 14.87% increase per year for a total of 150% increase in the next six years
3.9 Percentage of students attending a full-time virtual program and scoring at or above grade level on statewide assessments in English Language Arts, science, and mathematics
Reading: 71%
Math: 55%
Science: 58%
Reading: 83%
Math: 82%
Science: TBD
The goals match the targets set in the federal ESEA waiver. The goals will be reviewed in 2014-15 when the new statewide assessment system is implemented.

Florida’s State Board of Education
Strategic Plan
21 Approved October 2012
3. School Choice
Performance Indicator Current (2011-12 unless
noted)
2017-18 Goal Notes
3.10 Percentage of students enrolled in virtual education courses
* 2010-11 data
Part-time programs 3.84%
Full-time programs
0.24%
Part-time programs 5.0%
Full-time programs
1.0%

Florida’s State Board of Education
Strategic Plan
22 Approved October 2012
4. Postsecondary Students
Performance Indicator Current (2011-12 unless
noted)
2017-18 Goal Notes
Priority: Increase college readiness and success
4.1 Percentage of developmental education completers who complete college-level course in same subject with a “C” grade or above within 2 years
* 2007-08 data
Mathematics 31.8% English 62.4%
Mathematics & English 23.7%
Mathematics 33.3% English 63.9%
Mathematics & English 24.8%
FCS plan benchmark 3.1
S. 1001.03(16)(a)
4.2 Number of institutional and program rankings
Institutional rankings: 128
Program rankings: 56
Institutional rankings: 157
Program rankings: 84
FCS plan benchmark 3.2
S. 1001.03(16)(a)
4.3 Number of faculty receiving awards
743 faculty
812 faculty FCS plan benchmark 3.3
S. 1001.03(16)(a)
4.4 Percentage of students receiving federal, state, local, institutional, or other sources of grant aid
* 2010-11 data
52.7%
55.7%
FCS plan benchmark 3.4
4.5 Percentage of students receiving federal student loans and average amount of federal student loan aid received by undergraduate students
* 2010-11 data
Students Receiving Loans 19.4%
Average Amount of Loan Received
$5,418
Students Receiving Loans 17.4%
Average Amount of Loan Received
$5,924
FCS plan benchmark 3.5
S. 1001.03(16)(a)
4.6 Cohort default rate for FCS
* 2008-09 data
12.9%
10.7%
FCS plan benchmark 3.6
S. 1001.03(16)(a)

Florida’s State Board of Education
Strategic Plan
23 Approved October 2012
4. Postsecondary Students
Performance Indicator Current (2011-12 unless
noted)
2017-18 Goal Notes
4.7 Retention rates * Fall 2007-Spring 2011
AA Retention Rate: 66.7%
AAS/AS Retention Rate: 58.8%
AA Retention Rate: 70.8%
AAS/AS Retention Rate: 63.2%
FCS plan benchmark 3.7
S. 1001.03(16)(a)
4.8 Number of degrees and certificates awarded
* 2010-11 data
93,285
124,596
FCS plan benchmark 3.8
4.9 Graduation rate for first-time college students (150% time)
* 2010-11 data
35.0% of Cohort Graduate in 150%
time
36.9% of Cohort Graduate in 150%
time
FCS plan benchmark 3.9
S. 1001.03(16)(a)
4.10 Average time and credit to associate degree
* 2009-10 data
Time to Degree Accelerated
students: 2.8 years
Non-Accelerated Students: 4.4
years
Credit to Degree Accelerated students: 73
credits Non-Accelerated
Students: 78 credits
Time to Degree
Accelerated students: 2.6
years Non-Accelerated
Students: 4.2 years
Credit to Degree
Accelerated students: 68
credits Non-Accelerated
Students: 73 credits
FCS plan benchmark 3.10
S. 1001.03(16)(a)

Florida’s State Board of Education
Strategic Plan
24 Approved October 2012
4. Postsecondary Students
Performance Indicator Current (2011-12 unless
noted)
2017-18 Goal Notes
4.11 Transfer rates of associate degree graduates who transfer within two years to the upper division at a Florida College System institution or state university
* 2008-09 Completers
Transfers enrolled in SUS 50.7%
Transfers in FCS upper division
7.6%
Transfers enrolled in SUS 53.7%
Transfers in FCS upper division
15.4%
FCS plan benchmark 3.11
S. 1001.03(16)(a)
4.12 Percentage of students taking and passing licensure exams
* 2010-11 data
NCLEX-RN (Registered Nurse)
89.7% (4,214)
NCLEX-PN (Practical Nurse)
88.6% (569)
NCLEX-RN
(Registered Nurse) 90.7%
NCLEX-PN
(Practical Nurse) 90.1%
FCS plan benchmark 3.12
S. 1001.03(16)(a)
Priority: Maintain affordability and access
4.13 Number of high school students participating in dual enrollment
* 2010-11 data
46,083 students
58,782 students
FCS plan benchmark 1.1
4.14 Number of students enrolled in college credit courses in the FCS disaggregated by age range
Statewide Overall: 478,130
Under 18-21
225,951 22-29 135,187 30-39 64,014 40-64 51,777 Other 1,201
Statewide Overall: 505,532
Under 18-21,
240,573 22-29, 136,399 30-39, 71,346 40-64, 56,007 Other, 1,207
FCS plan benchmark 1.2
4.15 Percentage of students who enroll in the FCS in the year following high school graduation
* 2010-11 data
35.5%
37.6%
FCS plan benchmark 1.3.1

Florida’s State Board of Education
Strategic Plan
25 Approved October 2012
4. Postsecondary Students
Performance Indicator Current (2011-12 unless
noted)
2017-18 Goal Notes
4.16 Of students who enroll in the year following high school graduation, percentage of minority students
54.1%
59.5%
FCS plan benchmark 1.3.2
4.17 Of students who enroll in the year following high school graduation, percentage of low-income students
64.2%
65.8%
FCS plan benchmark 1.3.3
4.18 Percentage of degree-seeking students classified as non-Florida residents for tuition purposes
* 2010-11 data
3.7%
4.9%
FCS plan benchmark 1.4
4.19 Average net price of attending a FCS institution
* 2009-10 data
$6,511
$6,511
FCS plan benchmark 1.5 Tuition remains level.
State funds cover inflation and cost
increases.
4.20 Number of students enrolled in community education programs
* 2010-11 data
Continuing Workforce Education:
151,948
Recreation and Leisure: 57,761
Continuing Workforce Education:
182,992
Recreation and Leisure: 63,466
FCS plan benchmark 1.6
Florida’s State Board of Education
Strategic Plan
26 Approved October 2012
4. Postsecondary Students
Performance Indicator Current (2011-12 unless
noted)
2017-18 Goal Notes
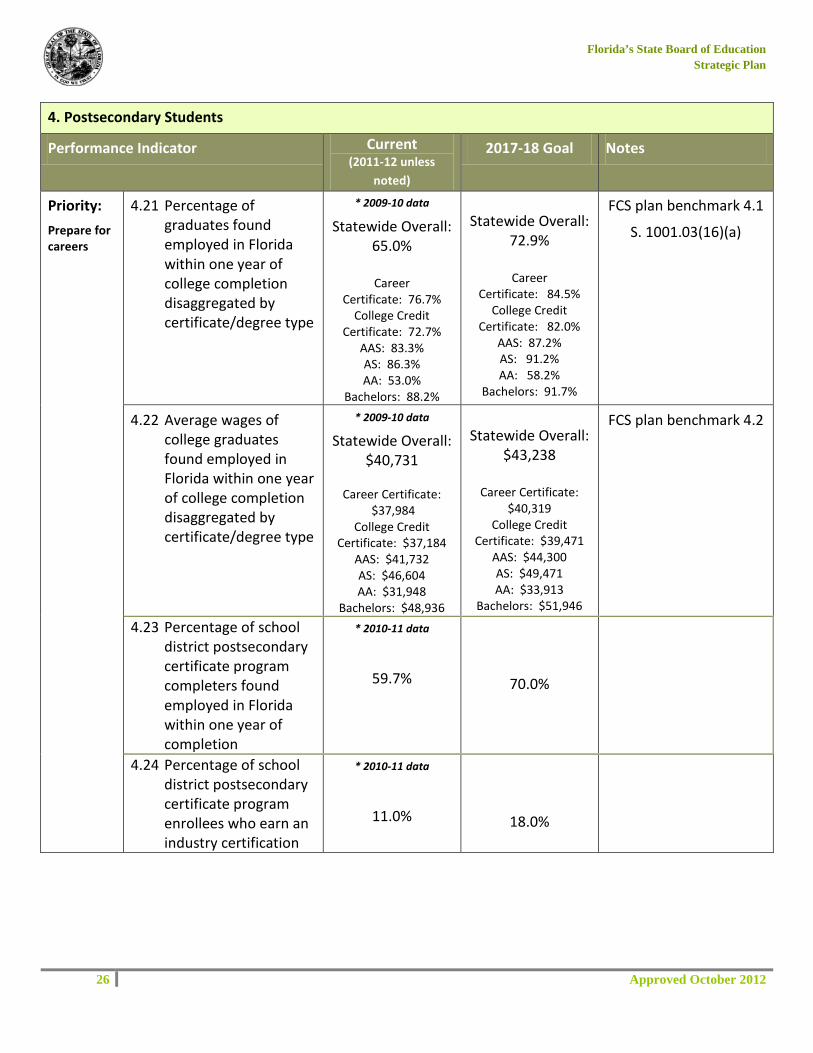
Priority: Prepare for careers
4.21 Percentage of graduates found employed in Florida within one year of college completion disaggregated by certificate/degree type
* 2009-10 data
Statewide Overall: 65.0%
Career
Certificate: 76.7% College Credit
Certificate: 72.7% AAS: 83.3% AS: 86.3% AA: 53.0%
Bachelors: 88.2%
Statewide Overall:
72.9%
Career Certificate: 84.5%
College Credit Certificate: 82.0%
AAS: 87.2% AS: 91.2% AA: 58.2%
Bachelors: 91.7%
FCS plan benchmark 4.1
S. 1001.03(16)(a)
4.22 Average wages of college graduates found employed in Florida within one year of college completion disaggregated by certificate/degree type
* 2009-10 data
Statewide Overall: $40,731
Career Certificate:
$37,984 College Credit
Certificate: $37,184 AAS: $41,732 AS: $46,604 AA: $31,948
Bachelors: $48,936
Statewide Overall:
$43,238
Career Certificate: $40,319
College Credit Certificate: $39,471
AAS: $44,300 AS: $49,471 AA: $33,913
Bachelors: $51,946
FCS plan benchmark 4.2
4.23 Percentage of school district postsecondary certificate program completers found employed in Florida within one year of completion
* 2010-11 data
59.7%
70.0%
4.24 Percentage of school district postsecondary certificate program enrollees who earn an industry certification
* 2010-11 data
11.0%
18.0%

Florida’s State Board of Education
Strategic Plan
27 Approved October 2012
5. Quality Efficient Services
The fourth goal of Florida’s education system is quality efficient services. The three main goals and corresponding priorities of this plan are supported through efforts to achieve quality efficient services. Section 1008.31, Florida Statutes, specifies that these efforts will be measured by evidence of return on investment. While a return on investment indicator for public school districts has historically been available, the methodology of this calculation is being revised to accommodate the transition to district grade points. When the revised return on investment indicator is finalized and approved by the State Board of Education, it will be added to this plan. In addition, plans are being developed to measure return on investment for all other education sectors.

Florida’s State Board of Education
Strategic Plan
28 Approved October 2012
Appendix A: Supplemental Department Performance Indicators
Performance Indicator Current (2011-12 unless noted)
2017-18 Goal Notes
Other Department of Education Functions
Priority: Increase employment outcomes for Vocational Rehabilitation and Blind Services customers
A. 1. Number of blind service customers placed in competitive employment (at or above minimum wage)
708 Individuals 766 Individuals
A. 2. Number of blind vending food service facilities supporting employed blind vendors
147 facilities 155 facilities
A. 3. Number of individuals exiting the Vocational Rehabilitation program who achieved an employment
6,071 employed customers
6,800
A. 4. Of the individuals who achieved employment from the vocational rehabilitation program, the percentage who exit with earnings equivalent to at least minimum wage
90.4% 91%
Related Documents