Strategic Placing of Field Hospitals Using Spatial Analysis Magnus Rydén Master’s of Science Thesis in Geoinformatics TRITA-GIT EX 11-002 School of Architecture and the Built Environment Royal Institute of Technology (KTH) Stockholm, Sweden May 2011

Welcome message from author
This document is posted to help you gain knowledge. Please leave a comment to let me know what you think about it! Share it to your friends and learn new things together.
Transcript

Strategic Placing of Field Hospitals
Using Spatial Analysis
Magnus Rydén
Master’s of Science Thesis in Geoinformatics
TRITA-GIT EX 11-002
School of Architecture and the Built Environment
Royal Institute of Technology (KTH)
Stockholm, Sweden
May 2011

2

3
Acknowledgments
The Author would like to thank Dr. Mats Dunkars, Emil Steuch Andreas Wladis
for their support during this master thesis research
and
Professor Yifang Ban and Bo Mao
for their suggestions and comments on the thesis.
4
Abstract
Humanitarian help organisations today may benefit on improving their location analysis when placing
field hospitals in countries hit by a disasters or catastrophe. The main objective of this thesis is to
develop and evaluate a spatial decision support method for strategic placing of field hospitals for two
time perspectives, long term (months) and short term (weeks). Specifically, the possibility of
combining existing infrastructure and satellite data is examined to derive a suitability map for placing
field hospitals. Haut-Katanga in Congo is used as test area where exists a large variety of ground
features and has been visited by aid organisations in the past due to epidemics and warzones.
The method consists of several steps including remote sensing for estimation of population density, a
Multi Criteria Evaluation (MCE) for analysis of suitability, and visualization in a webmap.
The Population density is used as a parameter for an MCE operation to create a decision support map
for locating field hospitals. Other related information such as road network, water source and landuse
is also taken into consideration in MCE. The method can generate a thematic map that highlights the
suitability value of different areas for field hospitals. By using webmap related technologies, these
suitability maps are also dynamic and accessible through the Internet.
This new approach using the technology of dasymetric mapping for population deprival together with
an MCE process, yielded a method with the result being both a standalone population distribution and
a suitability map for placing field hospitals with the population distribution taken into consideration.
The use of dasymetric mapping accounted for higher resolution and the ability to derive new
population distributions on demand due to changing conditions rather than using pre-existing methods
with coarser resolution and a more seldom update rate.
How this method can be used in other areas is also analysed. The result of the study shows that the
created maps are reasonable and can be used to support the locating of field hospitals by narrowing
down the available areas to be considered. The results from MCE are compared to a real field hospital
scenario, and it is shown that the proposed method narrows down the localisation options and shortens
the time required for planning an operation. The method is meant to be used together with other
decision methods which involves non spatial factors that are beyond the scope of this thesis.

5
Contents
1.- Introduction ........................................................................................................................................ 9
1.1- Background .................................................................................................................................. 9
1.2- Research Objectives ................................................................................................................... 11
2.- Literature Review ............................................................................................................................. 12
2.1- MCE applications ...................................................................................................................... 12
2.1.1- General applications ........................................................................................................... 12
2.1.2- MCE related applications in Crisis management ............................................................... 14
2.2- MCE related technologies .......................................................................................................... 17
2.2.1- Data collection .................................................................................................................... 17
2.2.2- Population Distribution ...................................................................................................... 19
2.2.3- Analysis methods ............................................................................................................... 22
2.2.4- Visualization of results ....................................................................................................... 29
3.- Study Area and Data Description ..................................................................................................... 30
3.1- Test Area Haut-Katanga ............................................................................................................ 30
3.2- Data ............................................................................................................................................ 31
3.2.1- Roads and villages .............................................................................................................. 32
3.2.2- Sattelite Imagery................................................................................................................. 33
3.2.3- Digital Landuse .................................................................................................................. 34
3.2.4- Elevation ............................................................................................................................. 34
4.- Methodology .................................................................................................................................... 35
4.1- Method for Population Distribution .......................................................................................... 36
4.1.1- Remote sensing analysis .................................................................................................... 36
4.1.2- Land use mapping by Supervised Classification ............................................................... 37
4.1.3- Weighting of Landuse ...................................................................................................... 38
4.1.4- Creating and weighting buffers ......................................................................................... 39
4.1.5- Overlay of weighted features............................................................................................. 42
4.1.6- Validation .......................................................................................................................... 46
4.2.- Multi Criteria Evaluation .......................................................................................................... 47

6
4.2.1- Preparing the MCE parameters ......................................................................................... 49
4.2.2- Weighting of factors .......................................................................................................... 53
4.2.3- Overlay Procedure ............................................................................................................. 54
4.3- Finalizing the Dynamic Webmap ............................................................................................. 55
5.1- Results ............................................................................................................................................ 57
6.- Conclusions, Recommendations & Future Research ....................................................................... 60
6.1- Conclusions................................................................................................................................ 60
6.1.1- Usability ............................................................................................................................. 60
6.1.2- The long and short term focus ............................................................................................ 60
6.1.3- Error Sources ...................................................................................................................... 61
6.1.4- Test Case ............................................................................................................................ 62
6.2- The problem of changing population distribution ..................................................................... 64
6.2.1- Cellular automata and Population Disaster Flow ............................................................... 64
References ............................................................................................................................................. 66
List of Figures
Fig.1.1. Reported measles cases in Niamey 2008. .................................................................................. 9
Fig.1.2. Estimated proportion of cases averted with a vaccination intervention .................................. 10
Fig.2.1. Land use allocation .................................................................................................................. 13
Fig.2.2. SDSS Structure ........................................................................................................................ 14
Fig.2.3. Moland Schematics .................................................................................................................. 15
Fig.2.4. Lumocap user interface ............................................................................................................ 16
Fig.2.5. HCDSS model .......................................................................................................................... 17
Fig.2.6. Aerial laser scanning ................................................................................................................ 18
Fig.2.7. Gridded Population of the world .............................................................................................. 19
Fig.2.8. LandScan Global Population Database, adjusted to UN figure year 2000 .............................. 20
Fig.2.9. Dasymetric mapping in population derival .............................................................................. 21
Fig.2.10. Dasymetric mapping comparizon .......................................................................................... 22
Fig.2.11. MCE flowchart model ............................................................................................................ 23
Fig.2.12. AHP approach example.......................................................................................................... 23
Fig.2.13. Example of a simple spatial overlay procedure ..................................................................... 24
Fig.2.14. Tsunami Vulnerability analysis .............................................................................................. 25
Fig.2.15. MCE process showing potential degree of threat to population ............................................ 26

7
Fig.2.16. Multiobjective Location of Hospitals ..................................................................................... 27
Fig.2.17. Suitability map ....................................................................................................................... 28
Fig.2.18. Example of a WMS browser interface ................................................................................... 29
Fig.3.1. District of Haut-Katanga .......................................................................................................... 30
Fig.3.2.Full dataset containing roads and villages/cities in Democratic Republic of the Congo .......... 32
Fig.3.3.Clipped dataset containing roads and cities/villages of work area Haut-Katanga .................... 33
Fig.3.4. Sattelite imagery-Landscan ...................................................................................................... 33
Fig.3.5. Digital landuse map ................................................................................................................. 34
Fig.4.1.Method procedure ..................................................................................................................... 35
Fig.4.2. Extraction of training Areas for supervised Classification in Erdas Imagen ........................... 37
Fig.4.3.Supervised classification on the satellite mosaic ...................................................................... 38
Fig.4.4. Buffered roads in the Lubumbashi area ................................................................................... 39
Fig.4.5. Roadbuffer parameter. ............................................................................................................. 40
Fig.4.6. Buffers around settlements and the rasterized dataset ............................................................. 41
Fig.4.7.Overlay procedure resulting in Distribution of population weights. ......................................... 42
Fig.4.8.Decision tree for the overlay weighting procedure ................................................................... 43
Fig.4.9. The population distribution parameter. .................................................................................... 45
Fig.4.10.Landscan comparizon.............................................................................................................. 46
Fig.4.11. Comparizon result .................................................................................................................. 47
Fig.4.12. MCE procedure ...................................................................................................................... 48
Fig.4.13. Neighborhood calculation, summarization of cell values at a 5km radius ............................. 50
Fig.4.14. Distance to Roads ................................................................................................................... 50
Fig.4.15. Distance to Airports ............................................................................................................... 51
Fig.4.16. Likelihood of Electricity ........................................................................................................ 51
Fig.4.17 Water sources .......................................................................................................................... 52
Fig.4.18. Elevation above 10 percent .................................................................................................... 52
Fig.4.19.Open Water ............................................................................................................................. 53
Fig.4.20.Overlay procedure for Short Term suitability ......................................................................... 55
Fig.4.21.Overlay procedure for Long Term suitability ......................................................................... 55
Fig.4.22. Dynamic webmap architecture 1 ............................................................................................ 56
Fig.5.1. Dynamic webmap .................................................................................................................... 57
Fig.5.2.Final map displaying suitability for short term placing of field hospitals ................................. 58
Fig.5.3.Final map displaying suitability for long term placing of field hospitals ................................. 59
Fig.6.1. Comparing the two focuses ...................................................................................................... 61
Fig.6.2. MSF operation comparizon ...................................................................................................... 62
Fig.6.3. Derived values .......................................................................................................................... 63
Fig.6.4. Basic interface .......................................................................................................................... 65

8
List of Tables Table.2.1. MCE and Population method summary ............................................................................... 22
Table.3.1. Dataset .................................................................................................................................. 31
Table.4.1 Parameters important for placing field hospitals ................................................................... 49
Table.4.2. Weight of importance for each parameter in the short term focus. ...................................... 53
Table.4.3. Weight of importance for each parameter in the long term focus. ....................................... 54

9
1.- Introduction
1.1- Background
Humanitarian help organisations today may benefit on improving their location analysis when placing
field hospitals in countries hit by a disasters or catastrophe. A high percentage of the population in
these countries are not accounted for at aid camps (Wladis 2009) since a large number of people
probably reside in such a way that the current placing of the aid camp is beyond their reach.
Independent help organisations today seldom use a geographic analytic perspective when considering
placing camps and the methods used previously have been based on local knowledge, previous visits
and experience from people associated with the organisation at that time. The most common problems
with methods that do not use geographic analysis are that they do not summarize scattered information
from various sources in an efficient way. This might lead to increased duration of the planning
procedure. Locations that may be ideal for placement of field hospitals might also be overlooked
without an objective geographical analysis.
The main goal of this study is to develop a toolkit for the strategic placing of aid camps using
geographic analysis to accelerate the planning process. Another purpose is to generalise some of the
methods that are used to obtain the result for the specific test area. These generalised methods may
then be used in other areas.
Early and strategic intervention is also essential in a public health perspective. For an epidemic type
catastrophe, the number of reported cases will increase exponentially until intervention with medical
care is implemented (Fig.1.1). Therefore, the proposed may be useful to improve the health conditions
of an area by accelerating the planning process of field hospitals.
Fig. 1.1. Reported measles cases in Niamey, Niger November 2003- July 2004.R. F. Grais et al, 2008.
When placing aid camps, it is necessary to know how many people it will reach approximately in
order to plan the need for food, water, medicines and other supplies. In areas with unknown or diffuse
population distributions it is difficult to estimate these needs. It is also important to be able to rule out
areas with steep terrain and lack of usable roads which might make transportation impossible. Water is

10
also important for the placing of hospitals since it is hard to transport in larger quantities. Without this
information, aid camps might lack the effectiveness if they could have with a more optimised placing.
The focuses of the problem are estimating population distribution and obtaining a useful
representation of this data at higher resolution for planning aid camps. This can be achieved by
creating a gridded population data (Jordan, 2007). The population distribution is then used as a
parameter for the placing of the camp. The possibilities with visualising different important features
needed for these camps together might be beneficial in comparison to collecting different sources of
information separately.
A study of a outbreak response in Niger 2003-2004 was conducted comparing different approaches
using simulations. It was found that found that intervening early (up to 60 days after the start of the
epidemic) and expanding the age range to all children aged 6 months to 15 years may lead to a much
larger (up to 90%) reduction in the number of cases in a West African urban setting like Niamey
(Fig.1.2). This timely intervention may save more lives if started before the exponential increase of the
epidemic.
Fig.1.2. Estimated proportion of cases averted with a vaccination intervention targeting children aged between 6 and
59 months for a vaccination intervention lasting 10 days: The blue line shows an intervention at 60 days, the red line
an intervention at 90 days and the green line an intervention at 120 days. R. F. Grais et al, 2008

11
1.2- Research Objectives
The overall objective of this thesis is to develop and evaluate a spatial decision support method for
strategic placing of field hospitals for two time perspectives, long term (months) and short term
(weeks). The specific objectives are:
Develop a method for generating field hospital suitability maps based on geographic
parameters.
Evaluate the use of the suitability map by placing field hospitals according to the demands of
running field hospitals.
Publish the suitability maps in a dynamic webmap.

12
2.- Literature Review
MCE has been used in different applications such as site allocation, land use selection and crises
management. It is a suitable tool for field hospital selection. The population distribution is important
because it is essential that field hospital placement is close proximity to a large amount of people in
need of aid. This section will start with a short summary of general uses of MCE technologies today,
following reviews of how MCE is used as a part in larger decision support systems. Part 2.2 will
discuss different types of data collection methods and different types of MCE methods related to crisis
management, especially the population distribution discovery. Finally, visualization and presentation
methods are reviewed.
2.1- MCE applications
2.1.1- General applications
Spatial MCE application has a wide area of uses and some common applications can be divided into
the following basic categories (Herwijnen et al.2005).
Site selection/allocation
Classify and rank a set of sites in priority order for a specific use. If a school or a particular type of
business is needed in a community, what site might best be suitable for that activity?
Selection between a few or many suitable areas is made. Location allocation problems means having
two or more sets of interrelated decision variables. A typical example for these location and allocation
variables is to locate a new rural health clinic so that the most of the population is within a certain
amount of traveling time from the nearest clinic. The site of the health clinic is the location variable
which is dependent on the allocation of people.
An example of this is a study of marine fish cage site selection made in Tenerife 2001 with water
quality parameters. The water quality variables identified were: temperature, turbidity (runoff soil
erosion and sewage), disease stress (sewage) and possibility of waste feedback from fish-cages
(bathymetry). These were used in a MCE model to generate the most suitable areas for sitting cage
culture. Most areas along the coastline were deemed suitable and none was identified as
unsuitable(Pérez et al. 2001).
Land use selection
Property owners might be unsure as how to utilize a specific site, and hence need to classify and rank
the uses in priority order for that site. It answers questions such as how a specific land parcel may be
used effectively in a selection between many alternatives.
In 2003 a study was made applying land use selection for rating of different agricultural alternatives in
Doiwala India. Alternatives of agriculture were rice, sugarcane, maize, vegetables, horticulture and
pulses. Parameters for the MCE model included infrastructure, population, temperature, rainfall,
irrigation and the chemical/physical qualities of the soil. Rice was found suitable for a dominant part
of the research area(Prakash T.N 2003).
13
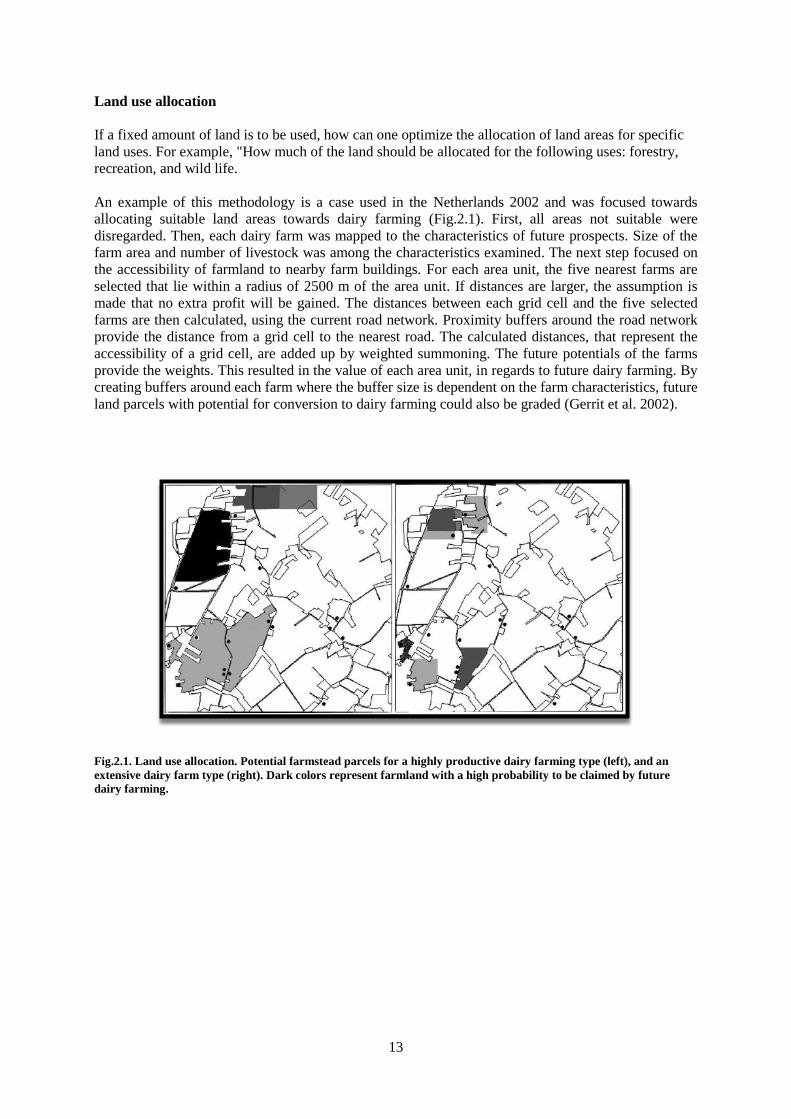
Land use allocation
If a fixed amount of land is to be used, how can one optimize the allocation of land areas for specific
land uses. For example, "How much of the land should be allocated for the following uses: forestry,
recreation, and wild life.
An example of this methodology is a case used in the Netherlands 2002 and was focused towards
allocating suitable land areas towards dairy farming (Fig.2.1). First, all areas not suitable were
disregarded. Then, each dairy farm was mapped to the characteristics of future prospects. Size of the
farm area and number of livestock was among the characteristics examined. The next step focused on
the accessibility of farmland to nearby farm buildings. For each area unit, the five nearest farms are
selected that lie within a radius of 2500 m of the area unit. If distances are larger, the assumption is
made that no extra profit will be gained. The distances between each grid cell and the five selected
farms are then calculated, using the current road network. Proximity buffers around the road network
provide the distance from a grid cell to the nearest road. The calculated distances, that represent the
accessibility of a grid cell, are added up by weighted summoning. The future potentials of the farms
provide the weights. This resulted in the value of each area unit, in regards to future dairy farming. By
creating buffers around each farm where the buffer size is dependent on the farm characteristics, future
land parcels with potential for conversion to dairy farming could also be graded (Gerrit et al. 2002).
Fig.2.1. Land use allocation. Potential farmstead parcels for a highly productive dairy farming type (left), and an
extensive dairy farm type (right). Dark colors represent farmland with a high probability to be claimed by future
dairy farming.

14
2.1.2- MCE related applications in Crisis management
MCE methods are used in various fields such as economics and other statistical branches. However,
when used in crisis management, the adding of geographically-defined objectives is beneficial
(Moamed A.AL-SHALABI et al. 2006). Spatial features which are important for Multi criteria
evaluation in crisis management will vary a lot depending on the catastrophe. Infrastructure, land-use,
elevation and population however are frequently mentioned (Moamed A.AL-SHALABI et al. 2006,
Müller et al.2010). These methods are often meant to be used in decision support systems when trying
to minimize the effect of the disaster. These so-called Spatial Decision Support Systems (SDSS) can
be seen as an umbrella for systems that integrate the MCE analysis with spatial temporal data and
other models to produce decision aid (Müller et al.2010). An SDSS is an interactive, computer-based
system designed to support a user or group of users in achieving a higher effectiveness of decision
making while solving a semi-structured spatial problem (Fig.2.2). It is designed to assist the spatial
planner with guidance in making land use or other spatial related decisions. For example, when
deciding where to build a new facility with contradicting criteria, such as noise pollution vs.
employment prospects or the knock on effect on transportation links, which make the decision
difficult. A system which models decisions could be used to help identify the most effective decision
path. The system structure is made of three key fundamental subsystems.
(1) A database management system that stores and handles geographical data. This system can in itself
be divided into a storing and management/retrieval part. A standalone system with these components
is also sometimes called GIS(Geographical Information System).
(2) Models/algorithms that can utilize this spatial data to calculate forecasts of possible decision
outcomes. These models can also utilize non-spatial together with the spatial data.
(3) The last part is an interface which a user can interact with and receive a visual interpretation of the
analysis result.
GIS Software
Engine
Decision
Support
System
Spatial
Database
User Needs
Other Data
Maps
Spatial modeling
MCE and other Algorithms
Interface
Decision
Support
Fig.2.2. SDSS structure

15
In these SDSS, the actual MCE part is contained within the model/algorithm section of the system as a
chain of the necessary consecutive process executions using spatial and sometimes non-spatial data as
well (Müller et al.2010). Following below are some examples of different SDSS systems.
MOLAND
The aim is to provide a spatial planning tool for development of urban and regional events. It was
initiated in 1998 to monitor development of urban areas and trend analytics on the European scale
(Fig.2.3.). The work includes the computation of indicators and the assessment of the impact of
anthropogenic stress factors with a focus on expanding settlements, transport and tourism both in and
around urban areas (European Commission 2011).
Fig.2.3. Moland Schematics(European Commission).
LUMOCAP
LUMOCAP aims at delivering an operational tool for assessing land use changes in Poland and
Germany/Netherlans (Fig.2.4.). These land use changes was controlled by a common agricultural
policy where the core was a land use Cellular automata model (European Commission 2011).

16
Fig.2.4. Lumocap user interface(European Commission).
HCDSS-(Health Care Decision Support System)
Methodology for a system which is designed to identify the hazardous nature of transport-related air
pollution on health(Madhuri et al. 2010). This will allow decision-makers to combine personal
judgment with computer output. It can be divided into three main parts (Fig.2.5).
(1) Database Management
With the main purpose of preparation and pre–processing of all input data, the bulk of all data
is also filtered to each needing subsystem.
(2) Knowledge-base Management subsystem
Contains all the knowledge for rule management such as retrieval,update deletion etc. It communicates
with the Data Management Sub-System via an integration interface for knowledge updating. User can
drop their latest information and knowledge in this part of the system which will then be used in the
analysis algorithms and MCE procedures.
(3) Central decision making desk
Contains a collection of programs used for the decision making process. These can furthermore be
divided into two sub-categories.
Sub Quality control program
This program selects a suitable rule from the knowledge base and extracts the needed facts along with
suggestions for decision making.
Sub Quality analysis tool shell
Contains the MCE analysis shell comprising of a model-base knowledge system which accepts the
data from the database, interacts with other health care informatics modules, calculated and presents
the result through two systems called the Central Vision Exhibit board and the Dialog management
subsystem. The first is the platform which combines all systems both internal and external while the
latter contains interface and visualization/ presentation logic.

17
Fig.2.5. HCDSS model
2.2- MCE related technologies
2.2.1- Data collection
MCE analysis makes use of several different branches of data collections depending on what spatial
problem to be solved. Some of these are listed below.
Landuse
Landuse and other ground properties are frequently used parameters for MCE analysis. Satellite
remote sensing and aerial photography are common ways to gather this data. Satellites and airplanes
often carry multispectral scanners to retrieve data across more than one electromagnetic band. This
way of gathering data makes it possible to analyse features based on their representation in multiple
electromagnetic bands. Remote sensing is often used to map land use.
Different software can then be used to classify different features on the image based on their spectral
signatures. In a method called unsupervised classification, the ranges of spectral signatures are

18
clustered into a number of classes based on their closeness to each other in each of the bands. It is then
up to the analyst to estimate what each class represents on the image.
In supervised classification, small sample areas are chosen for each of the features on the image
needed to be retrieved. The algorithms then work the entire image to find signatures close or similar to
these sample areas for categorisation. In general, one can say that supervised classification is suitable
when the analyst has knowledge of the image area and knows the common features present there
(Lillesand, et al., 2004, ch; 7).
Infrastructure- roads cities
Infrastructure such as roads, villages and cities may have a wide variety of sources and depending on
the area to be analysed, also a diversity in quality. Munipacility offices or international agencies may
provide this data which is often gathered through field measurements or sometimes through remote
sensing such as aerial photography or satellite imaging.
Topology- elevation- height
Data containing height information are often used in MCE processes. Laser scanning, or high altitude
radar scanning are common methods for large area coverage. In airborne laser scanning, the position
of the plane is tracked through a GPS(Global Positioning System) and the relative height to the ground
is calculated by the travel time of the laser beam from emitting to returning(Fig.2.6).
Fig.2.6 Aerial laser scanning
In satellite scanning, Interferometric synthetic aperture radar or ISAR uses differences in the phase of
the waves returning to the satellite to receiving topology information. The Shuttle Radar Topography
Mission (SRTM) was an international endeavor that used this technology to yield a 80% world
topology coverage with 90m resolution(SRTM, 2009).

19
2.2.2- Population Distribution
The environmental datasets today connected to population distribution are mostly consisting of course
spatial datasets. This demographic data is collected from administrative census units which only
contains approximate total population within the respective district border and thus have a very coarse
resolution. In recent years, researchers have started to develop new methods to refine the population
grid both globally and regionally, since the need for spatial allocation from the large census units into
regionally consistent population grids has increased throughout the years.
Gridded Population of the world
The first effort to obtain a globally consistent population dataset was the GPW(Gridded Population of
the World) as shown in Fig.2.7 (Balk and Yetman, 2004). It is produced at NCGIA(National Center
for Geographic Information Analysis) in 1995 and updated by CIESIN(Center for International Earth
Science Information Network ) in 2000. The data for this method was administrative boundaries and
the population estimates connected to these (Balk, et al., 2006). A recent version of this has even
included land cover and urban population calculations.
Summary
-Global Coverage and availability
- Low Resolution Connected to administrative units up to 1km
Fig.2.7. Gridded Population of the world
LandScan
Another study was the LandScan Global Population Database, produced by the Oak Ridge National
Laboratories (ORNL), which distributes national populations by land cover category, according to a

20
model with assumed coefficients for population occurrence in each type of land cover. It had a better
resolution since the distribution was more accurately calculated using this new data (Fig.2.8).
The initiatives following this incorporated satellites imagery, infrastructure and land use classification
maps. Other recent efforts include calculations to refine urban areas using the night time lights
globally (Balk, et al., 2006).
The above methods used for calculating the distribution of people is useful for large area analysis,
however the resolution is not high enough when considering areas containing a district or smaller
country.
Summary
-Global Coverage and availability
- Fixed Resolution 1km and Costly
-Only updated once a year
Fig.2.8. LandScan Global Population Database, adjusted to UN figure year 2000
Dasymetric Mapping – used in this thesis for population derival
Dasymetric Mapping was developed by Russian cartographer Semenov Tian-Shansky and the
American cartographer J.K Wright (Mennis, et al., 2006). Dasymetric Mapping uses an ancillary
dataset to reapportion data from a larger choropleth map zone into smaller units to refine the
resolution. The most common application is population distributions but it can be applied to any other
punctiform data which can be modelled as a statistical surface. In general , the data values in the new
units are based on different conditions such as other overlapping features for that specific unit. These
units receive weights, which determine how large part of the original value they receive (Holloway, et
al., 1997; Mennis, et al., 2006).A pilot study was conducted to map urban land cover by fusing GPW,
elevation, infrastructure and land cover classification. (Schneider et al. 2003). The goal was to extract
population distribution in Zimbabwe using Dasymetric mapping. The purpose of this was to get a

21
more detailed overview of where people are living compared to current estimates. It was intended to
be used in planning aid programs in countries affected by different kinds of catastrophes. The
resolution was reported increased by a factor of ten compared to Landscan data. By adding the
infrastructure e.g. roads, villages and cities to the land cover data, they distributed the population more
realistically (Fig.2.9, Fig.2.10).
Fig.2.9. Dasymetric mapping in population derival
This method used in this thesis to obtain the population distribution parameter for the Multi Criteria
Analysis has a higher resolution than previous methods and is easier to incorporate in the overall
analysis. Data for this type of method is easily retrievable than other methods while still promising
good results and high accuracy. Other population data such as LandScan that exists on a global basis,
but it is subject to defined resolution of 1km. In the Dasymetric mapping method developed in
(Schneider et al. 2003),data availability determines the final result.

22
Fig.2.10. Census unit population(Top), Landscan 1km resolution(Middle), Dasymetric mapping results(Bottom),
Stefan Schneiderbauer.
Summary
- Adjustable resolution depending on data availability
-Update on need
-Cost is dependent on data
-Data gathering might be time consuming
2.2.3- Analysis methods
General approach
The process of building models to aid problem solving involving multiple criteria problems have been
examined since the early 60:s. MCDA or Multi criteria decision aiding have many different methods
for handling multiple objectives but the most widely used one is the so-called “goal programming
technique”. Each of the objectives in this multiple objectives problem have given set goals to achieve.
The optimum solution to the problem is then defined as the state where the least deviance from these
goals occurs (Malczewski et al.1990). This method was later developed and generalized to something
called the reference point approach (RPA) introduced by Wierzbicki 1982. The RPA can be described
by this basic workflow.
(1) The decision-maker specifies his requirements and acceptable values for each given objective.
(2) The decision-maker works interactively with a computer so he can change his requirement level
during the analysis.
(3) The computer system provides the decision-maker with the most effective solution given his
objective requirements.
23
Fig.2.11. MCE flowchart model (Malczewsk, ,1999)
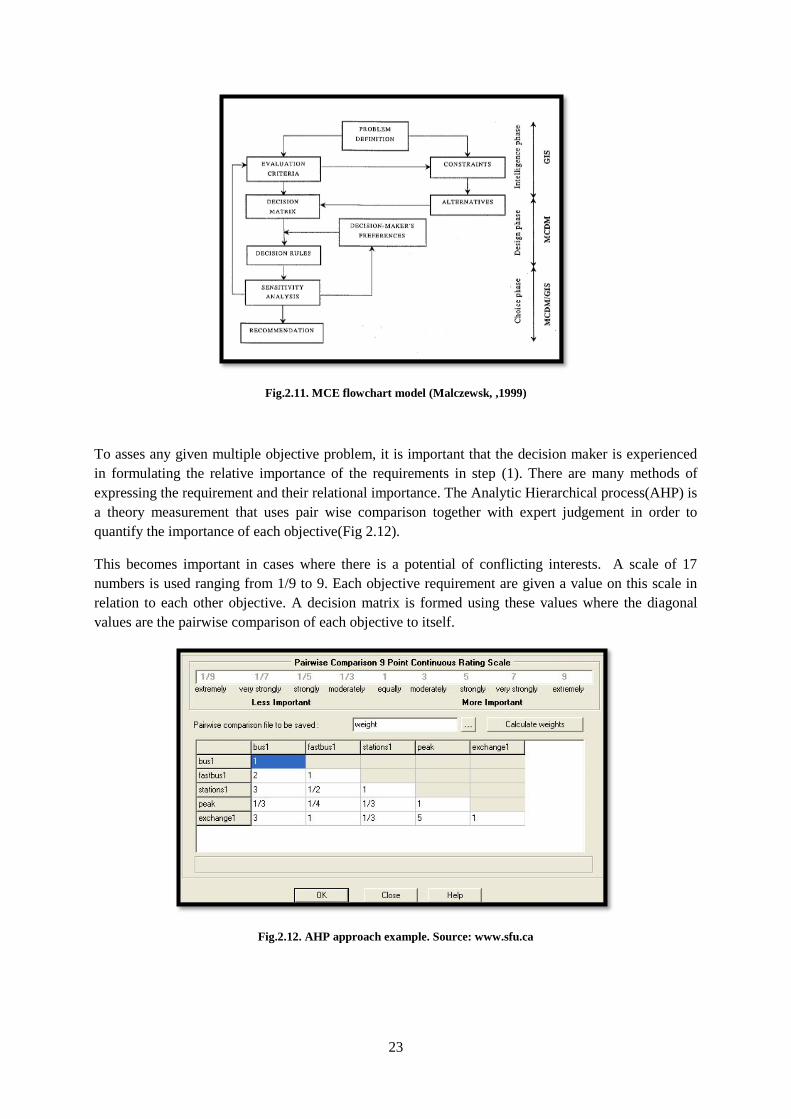
To asses any given multiple objective problem, it is important that the decision maker is experienced
in formulating the relative importance of the requirements in step (1). There are many methods of
expressing the requirement and their relational importance. The Analytic Hierarchical process(AHP) is
a theory measurement that uses pair wise comparison together with expert judgement in order to
quantify the importance of each objective(Fig 2.12).
This becomes important in cases where there is a potential of conflicting interests. A scale of 17
numbers is used ranging from 1/9 to 9. Each objective requirement are given a value on this scale in
relation to each other objective. A decision matrix is formed using these values where the diagonal
values are the pairwise comparison of each objective to itself.
Fig.2.12. AHP approach example. Source: www.sfu.ca

24
From this matrix, a consistency ratio is calculated which should not exceed 0.10 in order to be
acceptable. Another method of applying values in step one is called the MACBETH method
(Measuring attractiveness by using a categorical based evaluation technique). It is an MCDA approach
requiring only qualitative judgement of the difference of values in each objectives attractiveness over
another (Figueira et al.2005). It tries to coherently aggregate qualitative evaluations using an additive
utility model.
A more direct rating of options in MCDA is to distribute 100 “importance points” over the different
objectives (Borcherding et al. 1991).This method is suitable when the objectives do not contradict
themselves. This method requires a qualitative approximation of each objectives importance. In this
type of method, the experience of the decision-maker to quantify his objective requirements becomes
even more important. If step (1) consists of explaining these requirements to an analyst, the
communication also becomes very important. The method suggests to first defining two anchors of the
scale with their numerical importance on a scale of say 0-100. Preferably, the least attractive and the
most attractive. The other objectives are then given values between those two anchor objectives
(Carlos et al.2004). This method of assigning direct values of importance to the objectives through
communication with decision-maker was used in this thesis. Conventional MCE or MCDA methods
have largely been non-spatial. They use average or total impacts that are considered appropriate for an
entire area under consideration. Fundamental to spatial decision problems is location. Location
transcends the wide variety of spatial decision problems. A spatial overlay is often used to represent
this location part where the different parameters add or withdraw from the final result by adding their
weighted values to each unit inhabiting the same space (Fig 2.13). A spatial problem typology is based
on an interest in addressing one of the following questions.
(1) Given a desired activity, which sites might be best for that activity?
(2) Given an occurrence, which area or areas is that occurrence most influential.
(3) Given a site or sites, what kind of activity might be most suitable there?
Fig.2.13. Example of a simple spatial overlay procedure.
25
In crisis management it is possible to divide the analyze purpose of the MCE into two general
categories, Vulnerability analysis and Localization of emergency actions. The latter can be regarded as
a form of MCE Site selection.
Vulnerability analysis
Vulnerability analysis in crisis management means to assess which feature will be affected and how
strong the effect of the disaster will be and is related to Risk-assessment( Raquel Libros Rodríguez,
Yolanda Pérez Dorado, 2009). There is a variety of focuses in this part of the field but it is common to
create models based on comparison parameters. In the case of natural-disasters the following steps can
be used.
(1) Simulate the spatial extent of a disaster without any early warning system present.
(2) Compare the previous effects to if there had been an early warning system
(3) Simulate the effect if there had been an optimal warning system present.
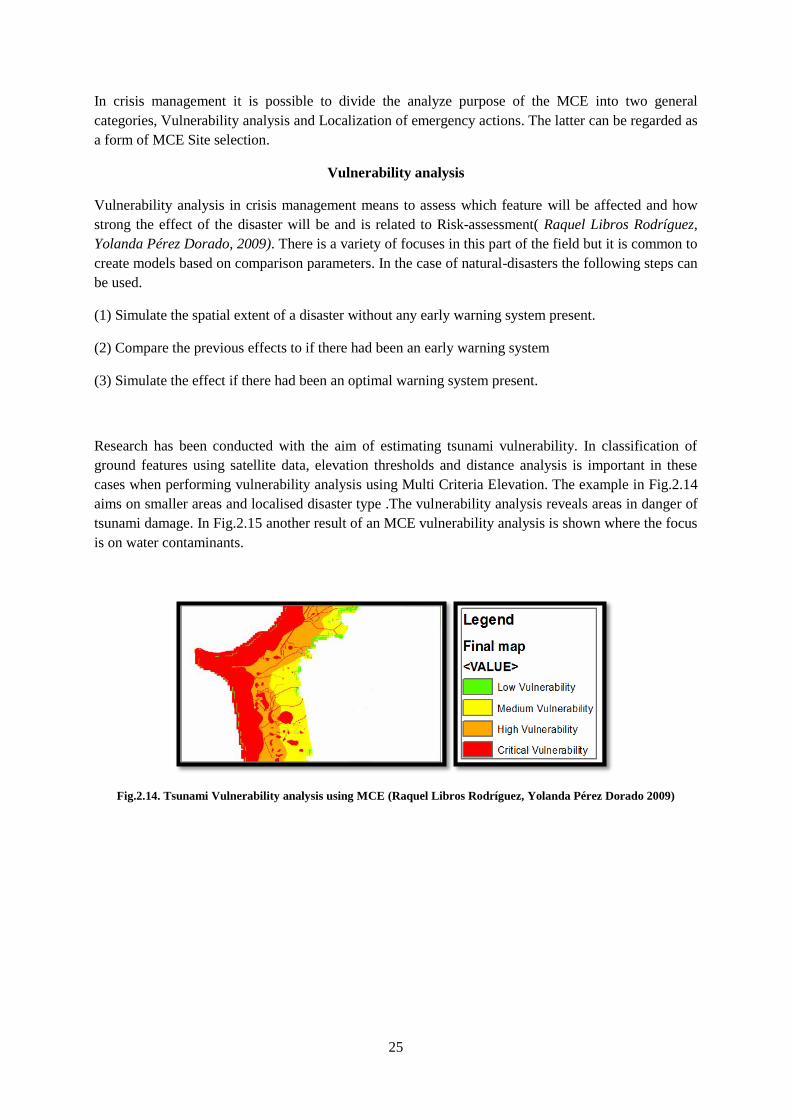
Research has been conducted with the aim of estimating tsunami vulnerability. In classification of
ground features using satellite data, elevation thresholds and distance analysis is important in these
cases when performing vulnerability analysis using Multi Criteria Elevation. The example in Fig.2.14
aims on smaller areas and localised disaster type .The vulnerability analysis reveals areas in danger of
tsunami damage. In Fig.2.15 another result of an MCE vulnerability analysis is shown where the focus
is on water contaminants.
Fig.2.14. Tsunami Vulnerability analysis using MCE (Raquel Libros Rodríguez, Yolanda Pérez Dorado 2009)

26
Fig.2.15. MCE process showing potential degree of threat to population due to contaminant exposure (Müller et
al.2010).
Localization of emergency actions - Site selection
Crisis management also so means to cope with the aftermath of a disaster. In an SDSS Localization of
emergency actions such as strategically place field-hospitals is therefore crucial to avoid unnecessary
harm (R. F. Grais et al, 2008, Schneider et al. 2003). The decision support system takes a different
focus in this case and tries to assess the needs required for an aid facility to achieve it´s goal. Previous
work regarding localization of similar facilities has focused on smaller urbanized areas in the intention
to improve effectiveness of permanent hospitals regarding cost and population load, such as the
“central facility problem “ (Fig.2.16) described in (Malczewski et al.1990). Facility placement tries to
maximize the user benefit and suppliers cost using a predefined set of suggested hospital locations as
well as the location of existing hospitals. In this case the following objectives were considered.
-Minimization of the aggregate travel cost for the population.
-Maximization of the level of users’ satisfaction for a location pattern of
hospitals.
-Minimization of the investment costs.
-Minimization of the operating costs.
-Minimization of the environmental pollution at hospital sites.

27
Each objective is minimized or maximized separately for each objective using information retrieved
for each location. The multi criteria problem yields a result for each of the locations considered for
each of the objectives.
Fig.2.16. Multiobjective Location of Hospitals (Malczewski et al.1990). 1.Administrative boundary; 2. administrative
boundary; 3.allocation of patients to hospitals; 4. administrative center of areal units; 5.size of hospitals; 6. Existing
hospitals; 7.new hospitals.
When not considering predetermined locations in multi criteria problems, more recent studies use the
method of spatial overlays to yield suitability values for different objectives according to their spatial
distribution. The method are mostly used for permanent house or facility placement but the overlay
procedure can be extended to mobile field hospitals as well.
Here, the main problem is discussed and then criterias and constraints are formulated which are
expressions of the requirements and preferences of the placement. After this, an analysis of each
criterion importance is retrieved either using an AHP approach or other method such as MACBETH or
simply distributing importance points. For house site placement, the MCE process may focus on
finding a limited amount of appropriate locations or categorizing a larger are with suitability values
which is sometimes called “Land suitability assessment”. Land suitability assessment is similar to
choosing an appropriate location, except that the goal is not to isolate the best alternatives, but to map
a suitability index for the entire study area (Senes ,Toccolini 1998). The suitability map surface can be
calculated by overlaying different layers representing each objective in the MCE process(1).
Suitability Map = Σ ( factor map(cn) * weight(wn) * constraint(b0/1)) (1)
cn = Standardized raster cell,
wn = Weight derived for the factor
b0/1 = Boolean map with values 0 or 1

28
Fig.2.17. Suitability map
This process is often used in site suitability studies where several factors affect the suitability of a site. (Esri, 2000). The GIS overlay process is calculated for each cellular value on a raster dataset which
combines the factors and constraints in the form of a Weighting Overlay process. The result is then summed up producing a suitability map as shown by Fig.2.17. This method is used in this thesis for
mapping the suitability surface for mobile field hospitals.
Title Author Used in this
thesis
Observation
An Interactive Approach to
the central Facility
Location Problem:
Locating Pediatric
Hospitals in Warsaw
Jacek Malczewski,
Wlodzimiem
Ogryczak
No Dynamic lnteractive
Network Analysis System
Gis Based Multicriteria:
Approaches to Housing Site
suitability Assessment.
Moamed A.AL-
SHALABI et al.
2006
Yes Suitability map using MCE
Reduction of a Hospital
Network as a Multiple
Criteria Optimisation
Problem
Ľudmila
Jánošíková 2009
No Optimize hospital location
in urban areas.
Multi Criteria Evaluation
for Emergency
Management in Spatial
Data Infrastructures
Müller et al.2010 No Determine areas at risk of
chemicals using MCE,
vulnerability analysis.
. Population Estimation in
Developing Countries.
Stefan
Schneiderbauer,
Daniele Ehrlich,
2005
Yes Population derival using
Dasymetric mapping
Sustainable land use
planning in protected rural
areas in Italy
Giulio
Senes,Alessandro
Toccolini , 1998
Yes Suitability maps using MCE
Tsunami Vulnerability
analysis using MCE
Raquel Libros
Rodríguez, Yolanda
Pérez Dorado 2009
No Vulnerability analysis using
MCE
Table.2.1 MCE and Population method summary

29
2.2.4- Visualization of results
When visualizing results of spatial analysis, today’s industry has gone towards physical maps to
digital maps and onwards to dynamic digital maps and web map cartography. All of the above
formats are still much in use, but when it comes to SDSS (Spatial Decision Support Systems) the
methodology often present the graphical result of an analysis such as an MCE in the form of a web
map solution(Müller et al.2010). The two main components in these web map solutions are server and
client. The server(s) are used to compute the analysis and generate images that are sent through the
OGC(Open Gis Consortium) standard called WMS(Web Map Service) to the user client. These images
are dynamic in the sense that the user can pan, zoom and also add overlapping data from both internal
and external sources. For more functionality, a WFS(Web Feature Service) can be implemented. This
OGC standard allows sending actual feature data as individual parcels for presentation. This can be
used for modifying, editing searching data that would otherwise be a view only image. As standard
physical and other static maps most likely will still have its use in many cases, there are some benefits
with using web map technologies for distributing analysis and other information in a SDSS system.
- Deliver up to date information
-They are often independent of the client system
-They integrate both the data produced with already existing data from various sources dynamically
-Easy to distribute data to all decision group participants
There are of course situations where there are they may present some problems such as bandwidth
issues, reliability issues and limited functionality compared with a standalone local application
installations. Some local applications however, include the functionality to retrieve this data through
WMS/WFS and then process data using the applications own tools.
An example of this is LST(Länsstyrelsen) in Sweden which is using this technology to visualize their
gathered data in combination with other data(Fig.2.18). It is used both internally(with extended
functionality) and as a public viewer tool for everyone. In these services data such as environmental
factors are distributed through the wms server but can also be downloaded for specific professional
user with access.
Fig.2.18. WMS browser interface. Environmantal atlas LST, Sweden(Source http://www.gis.lst.se/)
30
3.- Study Area and Data Description
3.1- Test Area Haut-Katanga
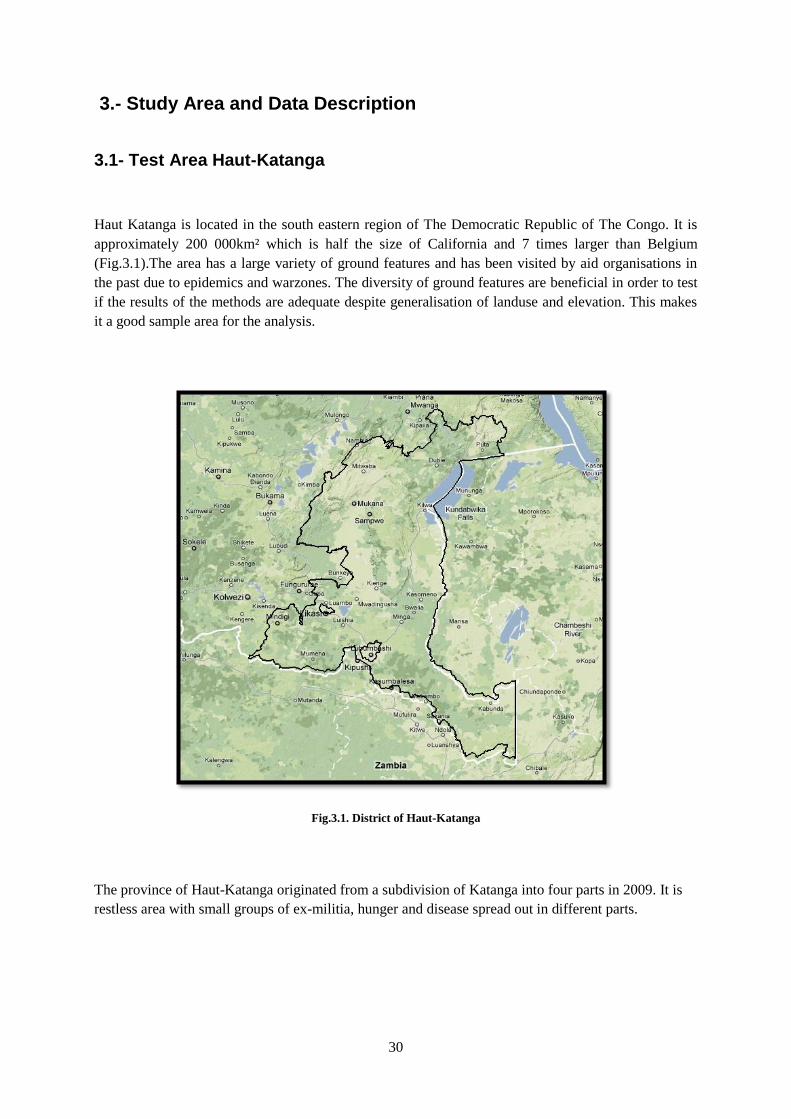
Haut Katanga is located in the south eastern region of The Democratic Republic of The Congo. It is
approximately 200 000km² which is half the size of California and 7 times larger than Belgium
(Fig.3.1).The area has a large variety of ground features and has been visited by aid organisations in
the past due to epidemics and warzones. The diversity of ground features are beneficial in order to test
if the results of the methods are adequate despite generalisation of landuse and elevation. This makes
it a good sample area for the analysis.
Fig.3.1. District of Haut-Katanga
The province of Haut-Katanga originated from a subdivision of Katanga into four parts in 2009. It is
restless area with small groups of ex-militia, hunger and disease spread out in different parts.

31
3.2- Data
Data consisted of raster, vector and statistics from various sources. Table.3.1 explains the datasets and
their origin.
Feature Type Year
accumulated
Origin/retrieval
Roads/hydrolines vector layer,
shape files
2007 Le Référentiel Géographique
Commun (www.rgc.cd)
Villages/Cities point layer,
shape files
2007 Le Référentiel Géographique
Commun (www.rgc.cd)
Distrikt Border vector layer,
shape files
2007 Le Référentiel Géographique
Commun (www.rgc.cd)
Landuse Map Digital static
map, tif file
2008 Belgian national Museum
Landsat Scenes Georeferenced
9-band multi
layer tif files
2000-2003 Landsat 7 slc-on
USGS, (U.S Geological
Survey)
(https://edcsns17.cr.usgs.gov/)
Elevation DEM, Digital
elevation
model, Grid
files
2008 Nasa(90m height grid)-
National Aeronautics and
Space Administration
(NASA)- 2002 SRTM
(Shuttle Radar Topography
Mission)
Population data Statistical 2007 Union de Congolais pour la
Defénse de la Patrié et du
31eople (UCDP) Statistical
estimate
Landscan2008
sample image
Image 2008 LandscanTM
Table.3.1. Dataset

32
3.2.1- Roads and villages
The roads and villages datasets were derived from both DCW(Digital charts of the world), interviews
with locals, and night time lights. Region border of Haut-Katanga was also derived from the same
sources. By using the ESRI Software ArcMap, the district border was used to clip both roads and
villages to limit the amount of data to the actual workspace. The data was all projected in World
Mercator with the geographic coordinate system WGS 1984. Fig.3.2 and Fig.3.3 illustrate the full
dataset and the clipped result after minimizing it to the working area Haut-Katanga Congo.
Fig.3.2.Full dataset containing roads and villages/cities in Democratic Republic of the Congo.

33
Fig.3.3.Clipped dataset containing roads and cities/villages of work area Haut-Katanga
3.2.2- Sattelite Imagery
Ten landsat scenes were used to cover the test area. They consisted of nine spectral bands which were
processed in ArcMap as a composite band tif file and then exported as an image file from ArcCatalog
for use in Erdas Imagine.
Fig.3.4. Sattelite imagery-Landscan

34
3.2.3- Digital Landuse
A digital land use map (Fig.3.4) covering a portion of the central Haut-Katanga area was used as a
crossrefence of the classification and also to retrieve to common types of land use present in the area.
It was imported into ArcGIS and georeferenced for easy comparison with the created landuse.
Fig.3.5. Digital landuse map
3.2.4- Elevation
The elevation data is consisted of two raster images with the slope represented in percentage. The
Digital elevation model originated from a 90m height grid.
No transformation was needed since it was defined in the same coordinate system as the road and
villages dataset. These two images were also put together to form a mosaic over the same extent as the
rest of the datasets.
Marschland
Moist forest
Sec. Forest
Woodlands
Wooded savanna
Shcrubland
Grassland
Moist vegetation
Permanent agricultur
Complex agricultur
Open water

35
4.- Methodology
The research involved three main steps. Firstly, a Population Distribution was created covering the
study area Haut-Katanga using dasymetric mapping. Secondly, the population distribution was used in
a Multi Criteria Evaluation to calculate a field hospital suitability map for long term(more than 6
months) and short term stay(weeks). Thirdly, these static maps where incorporated in a dynamic
webmap for increased usability and planning purposes.
Fig.4.1.Method procedure
MCE Analysis
Dynamic
Webmap
Population
Distribution
Suitability
surface
Maps
Transportation
Water
Electricity
Fig.4.1.Method procedure

36
4.1- Method for Population Distribution
The prepared data was put together for population distribution evaluation and comparison. The
following data was assembled for the analysis.
Infrastructure: Roads, Cities, Villages and Hospital
Satellite imagery
Digital Elevation Model
Hydrography
Total Population Estimates
The different datasets have been described in chapter 3. Weights presented in the chapters are based on
(Stefan Schneiderbauer, Daniele Ehrlich, 2005. Population Density estimation for Disaster
Management).
4.1.1- Remote sensing analysis
The first part of the analysis involved Remote Sensing using landsat imagery. Remote sensing is when
data are gathered using a device that is located far away from the actual feature.
It is often used when information over a wide area such as Haut-Katanga is needed. Satellite remote
sensing are common ways to gather this data. Satellites often carry multispectral scanners to retrieve
data across more than one electromagnetic band. This way of gathering data makes it possible to
analyse features based on their representation in multiple electromagnetic bands. Remote sensing is
often used to map land use. The data is gathered and refined for a Geographic Information System
Software. Some software focus on analysing multispectral images retrieved from different forms of
remote sensing such as Erdas Imagine.

37
4.1.2- Land use mapping by Supervised Classification
In remote sensing, the obtained data is often in the form of a multispectral image from a satellite or
airplane. Different software can then be used to classify different features on the image based on their
spectral signatures. In unsupervised classification, the ranges of spectral signatures are clustered into a
number of classes based on their closeness to each other. It is then up to the analyst to estimate what
each class represents on the image.
In supervised classification, small sample areas are chosen for each of the features on the image
needed to be retrieved. The algorithms then work the entire image to find signatures close or similar to
these sample areas for categorisation. In general, one can say that supervised classification is suitable
when the analyst has knowledge of the image area and knows the common features present there
(Lillesand, et al., 2004, ch; 7).
When mapping the land use in the study area, supervised classification was used and the emphasis was
placed on four essential categories that have a great importance on population distribution. These are
urban areas, bush/woodland, communal farmland and large water areas.
Signatures were created for each of these categories (Fig.4.2). These training areas were selected both
by using the digital land use map covering a portion of the test area and also by visually inspecting
GoogleMap areas with high resolution aerial photos. The test areas were chosen from each of the
different scenes to account for different contrast conditions.
Fig.4.2. Extraction of training Areas for supervised Classification in Erdas Imagen
38
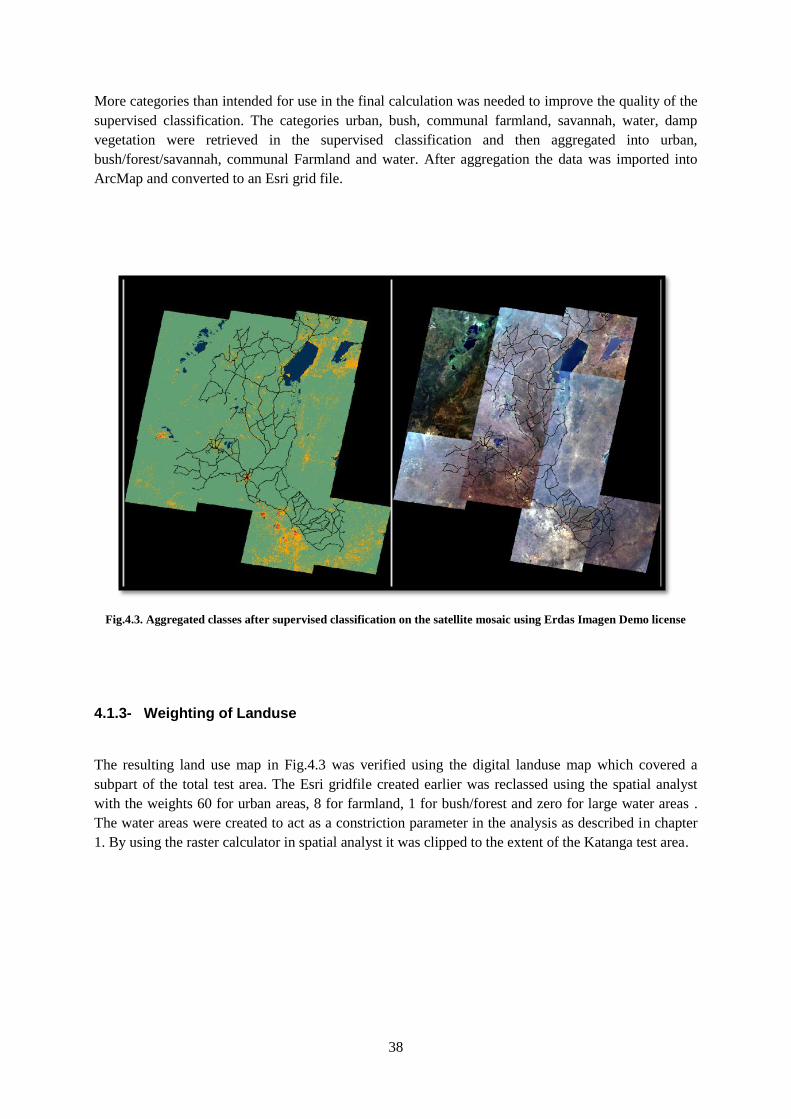
More categories than intended for use in the final calculation was needed to improve the quality of the
supervised classification. The categories urban, bush, communal farmland, savannah, water, damp
vegetation were retrieved in the supervised classification and then aggregated into urban,
bush/forest/savannah, communal Farmland and water. After aggregation the data was imported into
ArcMap and converted to an Esri grid file.
Fig.4.3. Aggregated classes after supervised classification on the satellite mosaic using Erdas Imagen Demo license
4.1.3- Weighting of Landuse
The resulting land use map in Fig.4.3 was verified using the digital landuse map which covered a
subpart of the total test area. The Esri gridfile created earlier was reclassed using the spatial analyst
with the weights 60 for urban areas, 8 for farmland, 1 for bush/forest and zero for large water areas .
The water areas were created to act as a constriction parameter in the analysis as described in chapter
1. By using the raster calculator in spatial analyst it was clipped to the extent of the Katanga test area.

39
4.1.4- Creating and weighting buffers
Roads
Roads were classified into large/medium and small by aggregating classes in the original dataset.
These consisted of national, regional priority, regional secondary and local roads. Buffers were created
with the size 300m and 100m respectively, based on the assumption that population density increases
in close perimeter to roads. (Schneiderbauer, et al., 2005)
The buffers were creating using ArcMap buffer tool. The output was a shape file which needed to be
converted into raster format for use in the overlay procedure (Fig.4.4).
Fig.4.4. Buffered roads in the Lubumbashi area, thicker national and thinner local roads.
Following the creation of buffers, different weights were assigned to the cell units in the raster layer.
Units were assigned the weight 5 if they were passing through bush/forest areas and 20 if they were
passing through areas with farming. This was done by overlay with the landuse raster. Different layers
were created that only included those areas of the roads that were intersecting farming, and bush/forest
respectively.
The part of the roads that were within the classified urban areas were assigned the weight of 60, same
weight as in urban areas The weighting values were then assigned to a value column in the attribute

40
table using the ArcMap spatial analyst reclassifier. All other areas for each layer that were outside the
intersection were given value zero for easy addition with the other layer.
The different pieces of the road buffer raster where then added together using the spatial analyst raster
calculator to form the roads parameter with different weights on the cell units according to the
underlying land use. The parameter now included a raster layer with road buffers of different weight,
depending in their intersection with the urban, communal farming, bush/forest (Fig.4.5).
Fig.4.5. The Roadbuffer parameter with different weights depending on the intersections with landuse.

41
Cities and Settlements
Since the settlements/city areas are of great importance for population density, buffers were also
created in a circular radius around these features dependent on their approximate size. The raw dataset
had more categories than needed for this analysis which is similar to the roads.
The Original categories were Head of province, head of district, head of territory, head of sector,
important village and other smaller villages. These categories were aggregated into a smaller number.
Two weight categories were set for the cities, 60 for the three larger ones and 20 for the three minor
village types.
The buffers around each original category were created as 1500m, 1000m, 600m, 300m, 200m, 100m
respectively while the weighting values were aggregated to 60 for the three larger city features and 20
for the three smaller village types to generalize the number of classes into the weighting categories
suggested by Stefan Schneiderbauer. Buffers were rasterized individually by category and set to the
same extent as the test area. The individual raster layers that represented each of the settlement
categories where added together in the ArcMap spatial analyst raster calculator to form a dataset with
all the settlements with respective weight and buffer size (Fig.4.6). All values outside the buffers were
assigned the weight zero for later addition with the other datasets.
Fig.4.6. Buffers around settlements and the rasterized dataset with assigned weights including east border feature.
Elevation
The elevation mosaic was reclassified to form a data layer that could act as a division parameter in
contrast to the other addition layers. Weighting of the different values were divided into three
categories based on the percentage of slope each cell unit represented. The slope 0-10 percentage was
given weight 1, 10-20 percentage weight was given weight ½ and 20 percentage and above was given
weight ¼. This weighting was inversely proportional to the other weights so that multiplication with
other layers would decrease the value at cell locations with step elevation.

42
4.1.5- Overlay of weighted features
ArcMap was used to integrate all different layers into a weighted density map. It was done by using
the raster calculator to add the values of each independent dataset into a combined raster. Each cell in
this raster contained a value describing the amount of importance in relation to number of people. The
cell size was 100m in accordance to the other layers for reasonable and manageable calculations.
The process for deciding which weight an individual cell would receive was decided according to a
flowchart model (Fig.4.7). First it was decided if the cell existed within a buffer. If that was the case, it
would receive the weight of the buffered feature. If it existed within several buffers the weights was
added together. The cells that were located outside a buffer were given their weight in accordance to
land use. The water areas were incorporated in the land use and were given weight 0. The elevation
datasets was used at the final stage for division with the weight values.
The ArcMap spatial analyst raster calculator was used to perform the operation and the process of
deciding which cells that was located within/without buffers was also done manually when preparing
the overlay datasets. Overlap areas, such as road buffers and city buffers were added together. When
road features existed within the boundaries of classified urban areas they were given the same weight
as the urban areas. The city buffer feature overlapping urban areas were not added together but were
explicitly treated as part of urban and received the same weight. For summarisation of the weight
procedure, see (Fig.4.8).
Roads +
Cities/Settlements +
Landuse -
Elevation -
Large Water areas
Distribution
of
Population
weights
Overlay
Process
Fig.4.7.Overlay procedure resulting in Distribution of population weights.

43
Fig.4.8.Decision tree for the overlay weighting procedure
Pixel lying
outside
buffer?
Pw = landuse
within
Roadbuffer?
Within larger
settlement
settlement
settlement
within smaller
settlement
Slope > 10% Slope >
20%
Y
N
N
Y
N
Y
N
Y
Set Road Pw
according to
landuse
Pw = Pw + value
of large
settlement
Pw = Pw + value
of small
settlement
Unsuitable
for
population
Y
N
N
Y Y
N
Final weight value
Woodland/
Bush
Farming Urban
1 8 60
5 20 60
60 60 60
20 20 60
Landuse class
No
buffer
Road
Large
Settl..
Small
Settl..
Pw = Pw/2 Pw = Pw/2
Set Pw = 0
Fig.4.8.Decision tree for the overlay weighting procedure.

44
The generated density map was used to distribute the total population in the area which was
approximately 4 million. The weight for each cell was represented in the data value column connected
to the raster set. The Formula for population allocation according to weight value presented in
(Schneiderbauer, et al., 2005) was used.
),(])[,( jipwaDjipop D (1)
In the formula (1), pop(i,j)[D] is the number of estimated people located within the area of pixel (i,j).
The symbol aD is a constant computed for the whole district as shown in formula (2) and pw(i,j) is the
weight of the current pixel.
)},({
][aD
jipw
Dpop (2)
In the formula (2), pop[D] is the total estimated population value over the test area. The symbol pw(i,j)
is the weight of pixel (i,j). The constant aD is computed by taking the total estimated population over
the area and divide it by the sum of the weights in the area. The output is the constant aD which is a
ratio between weight and number of people. This ratio is a representation of how many people each
unit of weight yields.
After this process, the resulting population distribution was reclassed to give absolute values rather
than ranges which is standard in the spatial analyst. The extent of the population was set to the extent
of the test area, Haut-katanga polygon (Fig.4.9).

45
Fig.4.9. The population distribution parameter displaying number of people per individual cell unit.

46
4.1.6- Validation
By using a sample image from Landscan 2008 covering the Lubumbashi region, the result of the
population density could be compared. The increased resolution in Fig.4.10 reveals additional details
not covered by the landscan 2008 sample.
Fig.4.10.Top- Population distribution results, 100m resolution. Fig: Bottom- Landscan 2008 sample image of 1km
resolution(Max resolution for Landscan is 1km).

47
Fig.4.11. Comparizon result. Source Kilwa:Kilwa anvil mining company; Likasi- Doctors Worldwide; Lubumbashi-
Geonames.org.
Existing approximate population counts were used to evaluate the dasymetric result. By calculating the
number of people within each sample area and compare them to the existing population count the
values in Fig.4.11 was retrieved. Since the existing data is an approximate count, comparison with the
true value becomes difficult.
4.2.- Multi Criteria Evaluation
The second step of the analysis used a MCE evaluation to combine the population distribution layer
with the previously mentioned factors that are important for field hospitals locations.
Multi Criteria Evaluation is a method where several different features are weighted together into an
analysis to present a overall outcome. In the spatial field, the location of different features and their
values present additional viewpoints which make MCE suitable when the optimum placing of a certain
feature is needed based on different factors and constraints.
Constraints are conditions which are not acceptable such as water, if it is a case where the localisation
cannot take place there. Factors are weighted features of importance to the analysis and can for
example be areas with certain distance to roads or areas lying on certain type of soil. These factors are
Likasi-region
Approx: 367 000
Calculated: 314 898
Difference: 14%
Kilwa-region
Approx: 40 000
Calculated: 45 000
Difference: 12%
Lubumbashi-region
Approx: 1 373 770
Calculated: 1 246 461
Difference: 9%
48
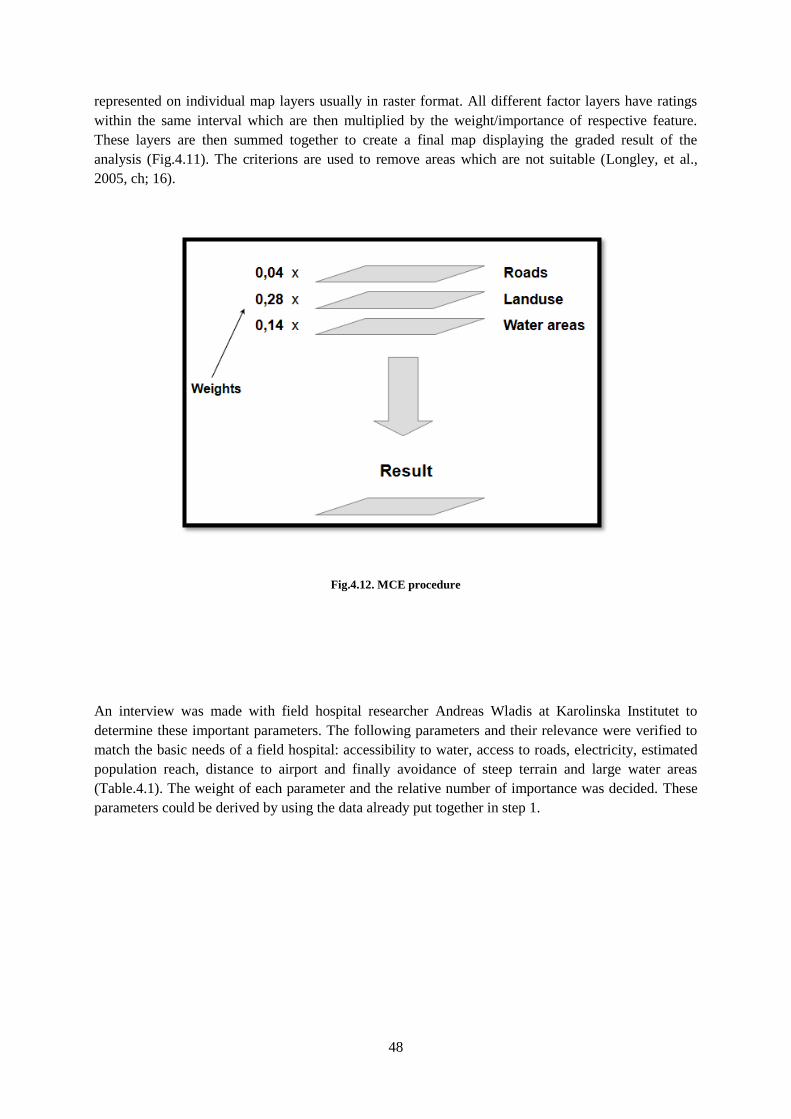
represented on individual map layers usually in raster format. All different factor layers have ratings
within the same interval which are then multiplied by the weight/importance of respective feature.
These layers are then summed together to create a final map displaying the graded result of the
analysis (Fig.4.11). The criterions are used to remove areas which are not suitable (Longley, et al.,
2005, ch; 16).
Fig.4.12. MCE procedure
An interview was made with field hospital researcher Andreas Wladis at Karolinska Institutet to
determine these important parameters. The following parameters and their relevance were verified to
match the basic needs of a field hospital: accessibility to water, access to roads, electricity, estimated
population reach, distance to airport and finally avoidance of steep terrain and large water areas
(Table.4.1). The weight of each parameter and the relative number of importance was decided. These
parameters could be derived by using the data already put together in step 1.

49
Parameter Reason
Accessibility to water using local rivers, lakes Transportation of water is expensive
Access to roads larger roads Transportation of supplies needs to be effective
Likelihood of Electricity in the area For longer durations, portable electricity is
expensive
Population reach Estimation of where the needs are
Distance to airport
Avoidance of steep terrain, large water areas
Reduce unnecessary transportation distance
Inaccessible areas are not interesting
Table.4.1 Parameters important for placing field hospitals
4.2.1- Preparing the MCE parameters
Neighbourhood layer
The population distribution parameter was used as the basis for the creation of the neighbourhood
layer. This layer was created as a representation of how many people could be reached from each cell
unit in a set radius of 5km. The neighbourhood statistics tool in the spatial analyser was used to
implement that.
The algorithm was set to summarize the cell values from the population distribution in a circular
radius around each target cell. The output cell resolution was set to 100m, same as the population
distribution layer. The produced Neighbourhood layer was then reclassed to displayed Natural breaks
for distinction between areas with small difference in population reach (Fig.4.13).

50
Fig.4.13. Neighborhood calculation, summarization of cell values at a 5km radius
Distance to Roads
A straight line distance calculation was made on
the roads using ArcGIS to obtain a representation
of road importance.
Ten classes were used and each of the steps
represented 500 meters up to a maximum of 5
kilometers from the roads. The values were set to
10 for the closest and it lowered for each step by
1 unit down to zero, above 5 kilometers
(Fig.4.14).
Fig.4.14. Distance to Roads

51
Distance to Airport
A similar procedure was used to calculate
distance to airports within the area. Ten classes
were used ranging from 10 being closest and
progressively down to zero above 200
kilometres. Each step represented 20 kilometres
(Fig.4.15).
Fig.4.15. Distance to Airports
Likelihood of Electricity
The likelihood of electricity use, including both
grid and of grid methods tend to increase in
larger and more urbanized areas in contrast to
rural and deep rural areas (Karki et al 2002, G
Prasad et al 2007). This assumption was used to
calculate a generalized map featuring likelihood
of electricity. This layer was retrieved by
extracting the cities and settlements of a large
enough urbanization having higher likelihood of
access to electricity. The categories included
head of province, head of district, head of
territory and head of sector. The rural classes of
villages and other smaller villages were ruled out
due to lesser likelihood of electricity in the area.
A straight line distance calculation was
performed on these selected cities were the
distance to each city were divided into ten
categories ranging from 10 to 1. The areas
beyond 10 kilometres were given value zero and
each step was 1 km (Fig.4.16).
Fig.4.16. Likelihood of Electricity

52
Water Sources
Small rivers and water filled areas were used to
define water sources. A straight line distance
calculation was made on these with values
between 10 and zero with a step of 100 meters.
Areas with a distance above 1 kilometer from any
water source were given the value zero
(Fig.4.17).
Fig.4.17 Water sources
Elevation
Terrain with steep conditions for temporary
hospital placement was defined as elevation
above 10 percent (Wladis-2009, pers.com). These
areas were given the value zero. All other areas
were given the value 1. This steep elevation with
above 10 percent elevation was seen as a
constriction and given the value zero to rule them
out (Fig.4.18).
Fig.4.18. Elevation above 10 percent(dark areas)
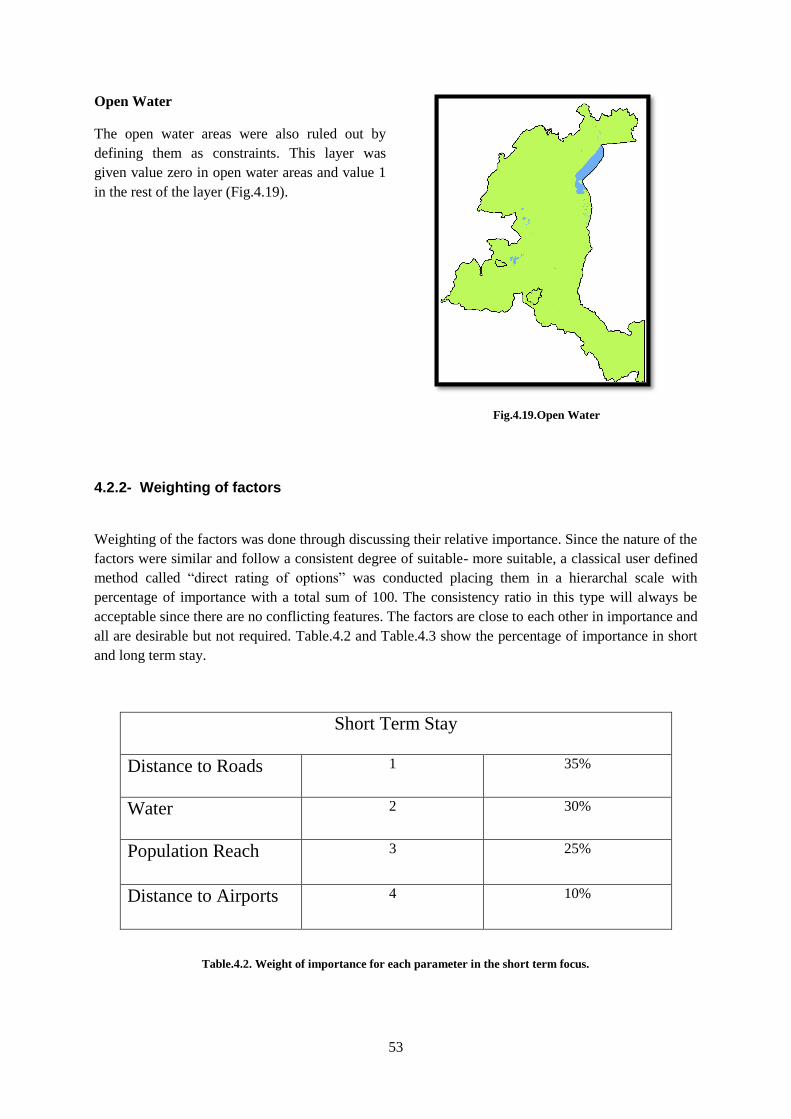
53
Open Water
The open water areas were also ruled out by
defining them as constraints. This layer was
given value zero in open water areas and value 1
in the rest of the layer (Fig.4.19).
Fig.4.19.Open Water
4.2.2- Weighting of factors
Weighting of the factors was done through discussing their relative importance. Since the nature of the
factors were similar and follow a consistent degree of suitable- more suitable, a classical user defined
method called “direct rating of options” was conducted placing them in a hierarchal scale with
percentage of importance with a total sum of 100. The consistency ratio in this type will always be
acceptable since there are no conflicting features. The factors are close to each other in importance and
all are desirable but not required. Table.4.2 and Table.4.3 show the percentage of importance in short
and long term stay.
Short Term Stay
Distance to Roads 1 35%
Water 2 30%
Population Reach 3 25%
Distance to Airports 4 10%
Table.4.2. Weight of importance for each parameter in the short term focus.

54
Long Term Stay
Distance to Roads 1 35%
Water 2 25%
Likelihood of
Electricity
3 20%
Population Reach 4 15%
Distance to Airports 5 5%
Table.4.3. Weight of importance for each parameter in the long term focus.
4.2.3- Overlay Procedure
The parameters were added together using ArcMap raster calculator. Each individual layer had eleven
classes with values from 0-10 based on the separate suitability. They where multiplied with their
respective percentage and summarized. The constriction layers, open water and elevation above 10
percent were multiplied into this sum. These layers had value zero on the highlighted feature and value
1 for the rest of the area so that the elevation and open water areas would be subtracted from the final
map (Fig.4.20 and Fig.4.21).

55
Short Term
Fig.4.20.Overlay procedure for Short Term suitability.
Long Term
Fig.4.21.Overlay procedure for Long Term suitability.
4.3- Finalizing the Dynamic Webmap
The suitability maps produced by the MCE analysis were used as layers in a mapserver wms to make
the thematic maps more dynamic and available to users in digital format. Open layers javascript
library was utilised to create the online map window and import additional wms datalayers from
google and also to create additional functions such as measurement and printing possibilities.
Microsoft Visual Studio was used to structure the html and javascript code for the website. The
mapserver is used as the mapping engine for server calls which are processed through an apache

56
server. The actual website, uses javascript to make the dynamic calls to the server when a user pan or
zoom in the map window. The server part then sends the requested map coverage as a png image. The
javascript makes it possible to send server calls requesting suitability and measurement values.
Server configuration files
End user
Mapserver
Website
Maps
Data
Apachee web
server
Fig.4.22. Dynamic webmap architecture.

57
5.1- Results
The final analysis resulted in two thematic maps illustrating suitability surfaces for placing field
hospitals in any given point within the borders of the test area. The cell resolution is 100m and the
map contains the MCE suitability map with categorization 0-9 with 9 being the most ideal areas.
Manual natural breaks classification was used for higher variation in areas with lower value without
generalising those of higher suitability. Fig.5.1 illustrates the short term map on the dynamic website
and Fig.5.2, Fig.5.3 illustrates the static maps and their legends with current known permanent
hospitals displayed as symbols.
Fig.5.1. Final map displaying suitability for short term placing of field hospitals as a dynamic webmap.

58
Fig.5.2.Final map displaying suitability for short term placing of field hospitals. Natural breaks classification.
59
Fig.5.3.Final map displaying suitability for long term placing of field hospitals. Natural breaks classification.

60
6.- Conclusions, Recommendations & Future Research
6.1- Conclusions
6.1.1- Usability
The maps are meant to be used as decision support with a certain area of focus in mind. For
catastrophes such as hunger, epidemics and other widespread catastrophes that do not alter the
population distribution too greatly, the maps can be used successfully.
Ruling out areas with low suitability is meant to save time and effort. In conjunction with these maps
it is important to have an updated knowledge of the current situation. The information should include
the security level of the area. MOSS(Minimum Operational Safety Standard) is a graded scale used by
the UN(United Nations) and can be applied as a measurement for the security level. This has to be
acquired by the individual organisation in accordance with their needs and purpose.
When mapping large areas such as Haut Katanga, some detail might be lost in order to receive a usable
map covering the whole area. One way to improve this is by mapping smaller areas where the
operation is intended to take place.
The numbers of classes in Fig.5.2 and Fig.5.3 are meant to show the subtle difference that one can find
in the areas with lower suitability. The test area is very large and the large span of suitability values
leads to not only areas with high values and large span but also areas with low values and smaller
differences. It is important to also capture these smaller differences since there might be scenarios
where the high value areas are not points of interest.
As this analysis was made using only those parameters that were considered having static importance
over the whole test area the resulting maps might be a little too logical to reveal any information that
would otherwise be hard to find such as water contamination, road block and other changing details
which are hard to derive from such large areas. In both maps the roads are an important feature when
placing field hospitals. The closest proximity to larger roads without any other contributing factor
yielded a suitability approximately (4.0). When tracing areas that also has overlays of water and denser
population including road proximity, the suitability increases to above a value of (6.0). This can be
considered a threshold value for acceptable hospital conditions and a test case was conducted to
examine these conclusions in chapter 6.1.4.
6.1.2- The long and short term focus
The difference between long term and short term stay is mostly concentrated on the areas which has
infrastructure or not (Fig.6.1). Large sparsely fields with long distance to permanent roads and larger
villages are at a disadvantage in the long term perspective while these areas in the short term
perspective have a slightly higher value. It was hoped though that the difference in these two kinds of
maps would be greater but the parameter “likelihood of electricity” has an impact that is very similar
61
to roads and cities and a small area which often already has high values due to the overlap of the roads
and cities.
Fig.6.1. Left, short term focus. Right, long term focus. Increased importance of areas with infrastructure and
electricity can be noticed for the long term stay, while other areas are more tolerable in the short stay focus.
To include a population distribution into the analysis did not have the impact originally visualised.
This parameter was overshadowed by higher ruling parameters. Some gain is to be seen in low value
areas with not so much infrastructure, but the importance of permanent roads make these areas
unattractive when transporting supplies.
It’s however possible to estimate the number of people that can be reached at a location based on a
chosen radius using the population distribution map or the neighbourhood map either as a visual
comparison or by implementing it as a web feature service in the webmap. This becomes very useful
when planning the placement of a field hospital.
Since the population distribution is sensitive to the temporal resolution and up to date information.
These maps have a timescale in which they are useful. After this the information may become out of
date dependent of change in politics, large disasters or other factors which changes the present
conditions.
6.1.3- Error Sources
Eleven landsat scenes where used to cover the test area taken between 2001 and 2003 due to cost
savings and are sources of error since they are not up to date. However, many of the features mapped
are often fairly static over time-periods of a couple of years. Rivers, larger infrastructure and elevation
are amongst these. The exception is agriculture which may vary slightly. Agricultural areas may
change location but are often moved to patches close to the previous one and then moved back when
the ground is again ready for agriculture. Some slight occurrence of this unavoidable error due to data
availability and temporal resolution can be seen on the population distribution/landscan sample
comparison.

62
Forest and semi-covered bush are sometimes mixed up in the classification. However, they were
clustered together since they ultimately would have the same weight of importance. The idea of having
a few parameters is also a way to counter errors that occur due to varying rules over larger areas. By
selecting key features that are relatively static and general over the test area, the consistency of the
map should be improved. Other features that are more detailed also have a tendency for more variation
across large areas and specifically different countries. The usability of this method is increased by
using the most basic and general features that has high consistency for other areas as well.
Parameters included in the analysis are usable with roughly the same relationships in different areas. If
more detailed information has to be retrieved, it has to be done specifically for that region.
6.1.4- Test Case
In this section, actual placing of field operation will be compared with the suitability on the thematic
map Long Term Stay (Fig.6.2).
An epidemic broke out in the Tanganyika district spanning into the northern parts of Haut-Katanga.
The goal of MSF(Doctors without borders) were to aid the local health care with vaccinations and
isolation of the contamination. Children below the age of 5 were the most vulnerable to infection and
together with acute cases these were to be prioritised. The MSF had several operations on different
spots covering the two districts which were to last for about four months (MSF vaccination-campaign,
2009).
Fig.6.2. Left, MSF operation. Right, location of the
operation on the Long Term suitability map.

63
Fig.6.3. Derived values
How does this placement correlate to the values of the Long term stay map? The area of MSF
operation is compared to the Long Term Stay Map for visualization. According to the values in the
right map of fig.6.2, the close proximity to water, roads and population makes the area highly suitable
in the general sense. Fig.6.3 shows the actual values derived from the suitability map. Higher scores
above the value of (6.0) were expected in the highlighted areas with many of the important factors
present. The main reason for the placement of the temporary hospital is localisation of the epidemic
and the goal of aiding the existing health care and surrounding population. Had the epidemic focus or
other non geographic factors changed, any of the areas with suitability above the suggested threshold
value of (6.0) might be considered for temporal hospital placement.
According to the created population distribution, the number of people living in Kilwa and the
immediate surroundings are approximately 45 000 (40000 people according to Kilwa Anvil mining
company). This information is very beneficial since it gives information usable for planning the
amount of resources needed. As stated previously though, the maps created may also help in ruling
out areas not suitable and help in narrowing down the options and also transform collections of
different data sources into a more comparable and visual format. This may also shorten the early
stages of planning an operation.
7.5 - placement
6.75
8.0 pre-
existing
hospital
6.65
0.8

64
6.2- The problem of changing population distribution
The static map is useful for widespread disaster types when there is little chance of having a moving
population due to the disaster. An example would be widespread epidemic, were the population in the
area will most likely be static. However, in the case when a disaster of a certain magnitude has a centre
point, affected radius and is of an extreme type, people cannot remain in the area and will have the
need to flee in a direction. A war zone is an example of this. Is there a way to anticipate how the
population distribution might look a certain time after the occurrence of the disaster? The Author will
in this chapter explain his continued work and ideas for calculating anticipated population distribution.
6.2.1- Cellular automata and Population Disaster Flow
Cellular automata has been developed as a technology but is not yet used on a wider scale. It is based
on the idea of giving cells in a raster set a few simple rules to follow and activate or deactivate them
according to these rules. One Example of this is “the game of life” where cells would live if they had a
certain amount of Neighbours or die if they were alone.
Experimental software has been developed by the author to initialize these ideas and test if it is
possible to apply these rules for population movement. However the algorithms presented are more
complicated and are based on the use of gravitational fields which will be explained in the this section.
PD Flow is based on the idea that different features have different appeal to a moving population. The
disaster would be something that people will want to move away from, while cities will be something
that people need for shelter and supplies. These cities/villages become more appealing the further
away from the disaster they are located.
Roads are the major means of transportation and thus are attractive for people in movement of a
certain distance to the road. Certain height differences can act as obstacles for people in movement and
are represented as constrictions. Individual cells cannot move over these predefined elevation
differences.
In the software, it is possible to define how much gravitational pull each layer of cities should have,
and also how large radius that gravitational pull should be. The same applies for the roads, and of
course the disaster itself which is placed and configured by the analyst. Each parameter added can in
fact be configured in different ways as to what type of feature it is and what impact it should have on
the simulation.
The software work in pixel image layers which have to be prepared and imported from a GIS software
like ArcMap or similar. The main layer used is the static population distribution of the area at a certain
time like the one created previously in the Haut-Katanga area. When the analyst run the simulation,
the cells(representing population units) will start to move according to the rules and weights chosen by
the analyst. The process is then stopped after a certain time interval to receive the simulation results.
The purpose of this software is to test the ideas of having features of different gravitational pull or
attraction forces and see if it resembles a real population distribution during or after a localised
disaster. Gravitational fields are represented in raster grids, one for each parameter. The cell values in

65
this grid are given a higher value, from negative and up to -1 the further away for the features they are.
Since each individual cell in the population distribution parameter checks its own neighbourhood in
each of the other parameters, the cell will know where to move next. The direction which has the
lowest value in comparison to the current cell value will be the direction the cell will move. If cell C
has value 0 and neighbour n1 and n2 has -1 and -2 respectively in another gravitational grid it will
choose the direction of n2 since the difference is greater. If there are two similar choices of movement
the direction will be the centre point with the greatest difference between them.
This process is iterated for all cells in the population grid and the image is updated when all the cells
in the grid has been calculated. The result is a live animation for the movement across the area. This
technique is still being developed as an experimental project by the author but usable test software
exists already.
Fig.6.4. Basic interface

66
References
Balk, D. and Yetman, G., 2004. The Global Distribution of Population: Evaluating the gains in
resolution refinement. Center for International Earth Science Information Network.
Balk, D., Pozzi, F., Yetman, G., Deichmann ,U. and Nelson, A., 2004. The Distribution of people and
the dimension of place: Methodologies to improve the global estimation of urban extents. CIESIN,
Columbia University. School of Geography, University of Leeds.
Borcherding, K., Eppel, T. and Winterfeldt, D., 1991. Comparison of Weighting judgement in
multiattribute utility measurement.
Britannica Online. Katanga, or Shaba province, (Democratic Republic of the Congo)–
(www.britannica.com); 15 July 2009.
Carsjens, G. and Knaap, W., 2002. Strategic land-use allocation: dealing with spatial relationships
and fragmentation of agriculture.
Costa, C. and Chagas, M., 2004. A career choice problem: An example of how to use Macbeth to build
a quantitative value model based on qualitative value judgements.
European Commission - Joint research center. Moland (http://moland.jrc.ec.europa.eu) 19 april
2011(http://www.riks.nl/projects/LUMOCAP ) 19 april 2011.
Figueira, J., Greco, S. and Ehrgott, M., 2005, Multi Criteria decision analysis: State of the art surveys.
Grais, R., Conlan, A., Ferrari, M., Djibo, A., Menach, A., Bjornstad, O. and Grenfell, B., 2008. Time is
of the Essence: Exploring a measles outbreak response vaccination in Niamey, Niger.
Herwijnen, M. and Jansen, R., 2005. The use of Muli Criteria Evaluation in Spatial Policy.
Holloway, S., Schumacher, J. and Redmond, R., 1997. People and Place: Dasymetric Mapping.
University of Montana.
International Peace Information Services (www.ipisresearch.be) 25 June 2009.
Jain, M., Saxena, A. and Singh, P., 2010. A decision support system for health effects due to
transportation pollution.
Jánošíková, L., 2009. Reduction of a Hospital Network as a Multiple Criteria Optimization Problem.
Jordan, L., 2007. Eyes from above: Remote Sensing and virtual globes in spatial demography.
Department of Geography and Centre for Demography and Population Health Florida State
University. Meeting of the Population Association of America, New York may 29 2007.
Karki, A. and Shrestha, B., 2002. Micro-Hydro Power in Nepal: Access to electricity for isolated rural
population in the hills and mountains.
Le Référentiel Géographique Commun (RGC) (www.rgc.cd); 10 June 2009.

67
Lillesand, T., Kiefer, R. and Chipman, J., 2004. Remote Sensing and Image Interpretation: Fifth
Edition; Wiley.
Longley, P., Goodchild, M., Maguire, D. And Rhind, D., 2005. Geographic Information Systems and
Science: Second Edition: Wiley.
Malczewski, J. and Ogryczak, W., 1990. An Interactive Approach to the central Facility Location
Problem: Locating Pediatric Hospitals in Warsaw.
Mennis, J. and Hultgren, T., 2006. Intelligent Dasymetric Mapping and it´s comparison to other Areal
interpolation techniques. Department of Geography and Urban studies, Temple University
Philadephia. Department of Geography, University of Colorado.
MSF vaccination-campaign (http://www.msf.org.au/from-the-field/field-news/field- news/article/msf-
launches-a-vaccination-campaign-for-688500-children-in-the-democratic-republic-of-congo-
drc.html). 20 oktober 2009.
Müller, M., Bernard, L. and Vogel, R., 2010. Multi Criteria Evaluation for Emergency Management in
Spatial Data Infrastructures.
Pérez, O., Ross, L., Telfer, T. and Campo Barquin, L., 2001. Water quality requirements for marine
fish cage site selection in Tenerife (Canary Islands): predictive modeling and analysis using GIS.
Prakash T.N 2003. Land suitability analysis for agricultural crops A fuzzy multi criteria decision
making approach.
Prasad, G. and Dieden, S., 2007. Does access to electricity enable the uptake of small and medium
enterprises in south Africa?.
Royal Museum of Central Africa, (www.africamuseum.be) 1 May 2009.
Schneiderbauer, S. And Ehrlich, D., 2005. Population Density Estimations for Disaster Management -
Case Study Rural Zimbamwe. Institute for the Protection and Security of the Citizen (IPSC).
Schneiderbauer, S. And Ehrlich, D., 2005. Population Estimation in Developing Countries.
Senes , G. and Toccolini, A. 1998. Sustainable land use planning in protected rural areas in Italy.
SHALABI, M., Mansor, S., Ahmed, N. and Shiriff, R., 2006. Gis Based Multicriteria: Approaches to
Housing Site suitability Assessment.
Shuttle Radar Topography Mission(SRTM), http://www2.jpl.nasa.gov/srtm 10 feb 2009.
Spittaels, S. and Meinen, N., 2007. Mapping interests in conflict areas: Katanga IPIS Research.
The State vs The people, governance. Mining and the Transitional Regime (www.niza.nl); 16 July
2009.
Wladis, A., 2009. Discussion on field hospital requirements. (Personal communication, Oktober
2009).

68
Reports in Geodesy and Geographic Information Technology
The TRITA-GIT Series - ISSN 1653-5227
2009
09-001 Ahmed Abdalla. Determination of a gravimetric geoid of Sudan using the KTH method. Master of
Science thesis in geodesy No.3109. Supervisor: Huaan Fan. Janaury 2009.
09-002 Hussein Mohammed Ahmed Elhadi. GIS, a tool for pavement management. Master of Science thesis
in geoinformatics. Supervisor: Hans Hauska. February 2009.
09-003 Robert Odolinski and Johan Sunna. Detaljmätning med nätverks-RTK – en
noggrannhetsundersökning (Detail surveying with network RTK – an accuracy research). Master of
Science thesis in geodesy No.3110. Supervisor: Clas-Göran Persson and Milan Horemuz. March 2009.
09-004 Jenny Illerstam och Susanna Bosrup. Restfelshantering med Natural Neighbour och TRIAD vid byte
av koordinatsystem i plan och höjd. Master of science thesis in geodesy No. 3111. Supervisor: Milan
Horemuz and Lars Engberg. March 2009.
09-005 Erik Olsson. Exporting 3D Geoinformation from Baggis Database to CityGML. Supervisors: Peter
Axelsson and Yifang Ban. April 2009.
09-006 Henrik Nilsson. Referenssystemsbyte i Oskarshamns kommun – en fallstudie (Change of reference
systems in Oskarshamn – a case study). Master’s of Science thesis in geodesy No.3112. Supervisor:
Huaan Fan. May 2009.
09-007 Chi-Hao Poon. Interaktiv Multikriteria-Analys (Interactive Multi-Criteria Evaluation). Supervisor:
Mats Dunkars and Yifang Ban. May 2009.
09-008 Emma Lundberg. Fastighetsdokumentation – en jämförelse mellan två geodetiska tekniker. Master’s
of Science thesis in geodesy No.3113. Supervisor: Milan Horemuz, Karin Klasén and Ivar Andersson.
May 2009.
09-009 Andenet Ashagrie Gedamu. Testing the Accuracy of Handheld GPS Receivers and Satellite Image for
Land Registration. Master’s of Science thesis in geodesy No.3114. Supervisor: Milan Horemuz and
Lars Palm. May 2009.
09-010 Abubeker Worake Ahmed and Workaferahu Abebe Mergia. Determination of transformation
parameters between WGS 84 and ADINDAN. Master’s of Science thesis in geodesy No.3115.
Supervisor: Huaan Fan. May 2009.
09-011 Andreas Jungner. Ground-Based Synthetic Aperture Radar Data Processing for Deformation
Measurement. Master’s of Science thesis in geodesy No.3116. Supervisors: Milan Horemuz and
Michele Crosetto. May 2009.

69
09-012 Anna Miskas and Andrea Molnar. Establishing a Reference Network in Parts of Amhara Region,
Ethiopia Using Geodetic GPS Equipment. Master’s of Science thesis in geodesy No.3117. Supervisors:
Milan Horemuz and Lars Palm. June 2009.
09-013 Shareful Hassan. Assessment of Landuse and Land Degradation in the North-Western Part of
Bangladesh Using Landsat Imagery. Supervisors: Hans Hauska. June 2009.
09–014 Qaisar Khyber. Effects of the Muzzaffarabad Earthquake 2005 - Detection and Quantification of
Changes in Landcover/Landuse. Supervisors: Hans Hauska. June 2009.
09-015 Thomas Wahlberg. Undersökning av strikta och iterativa metoder för omvandling från kartesiska till
geodetiska koordinater. Master’s of Science thesis in geodesy No.3118. Supervisor: Lars Sjöberg. June
2009.
09-016 Alfred Awotwi. Detection of Land Use and Land Cover Change in Accra, Ghana, between 1958 and
2003 using Landsat imagery. Supervisor: Hans Hauska. August 2009.
09-017 Walyeldeen Hassan Edres. Crustal motion at the permanent GPS station SVEA, Antarctica. Master’s
of Science thesis in geodesy No.3119. Supervisor: Milan Horemuz. August 2009.
09-018 Kazi Humayun Kabir. An Investigation into Geospatial Tools for a Multipurpose Digital Cadastre
Prototype in Bangladesh. Supervisor: Leif Eidenstedt. September 2009.
09-019 Raquel Libros Rodríguez and Yolanda Pérez Dorado. Assessing Tsunami Vulnerability using MCE
in Phang Nga, Thailand. Supervisors: Thuy Vu, Irene Rangel. September 2009.
09-020 Md. Tariqul Islam. Bank Erosion and Movement of River Channel: A Study of Padma and Jamuna
Rivers in Bangladesh Using Remote Sensing and GIS. Supervisors: Hans Hauska. December 2009.
09-021 Osama A Rahman Adam Yousif. Multitemporal Spaceborne SAR and Fusions of SAR
and Optical Data for Unsupervised Change Detection in Shanghai. Supervisor: Yifang Ban. December
2009.
2010
10-001 Jan Haas. Soil moisture modelling using TWI and satellite imagery in the Stockholm region. Master of Science thesis in geoinformatics. Supervisor: Ulla Mortberg and David Gustafsson. March
2010.
10-002 Elbashir Mohamed Elbashir Elhassan. The Effect of GPS Signal Quality on the Ambiguity
Resolution Using the KTH method. Master’s of Science thesis in geodesy No.3120. Supervisor: Milan
Horemuz. May 2010.
10-003 Daniya Inerbayeva. Determination of a gravimetric geoid model of Kazakhstan using the KTH-
method. Master’s of Science thesis in geodesy No.3121. Supervisor: Huaan Fan. June 2010.
10-004 Fırat Ergun and Trevor Schwartz. NCC GNSS RTK Network Accuracy Analysis. Master’s of
Science thesis in geodesy No.3122. Supervisor: Milan Horemuz. November 2010.

70
2011
11-001 Andreas Engstrand. Railway Surveying - A Case Study of the GRP 5000. Master’s of Science thesis
in geodesy No.3123. Supervisor: Milan Horemuz. March 2011.
11-002 Magnus Rydén. Strategic Placing of Field hospitals using Spatial Analysis. Master of Science thesis in
geoinformatics. Supervisor: Yifang Ban. May 2011.
TRITA-GIT EX 11-002
ISSN 1653-5227
ISRN KTH/GIT/EX--11/002-SE
Related Documents


