Welcome message from author
This document is posted to help you gain knowledge. Please leave a comment to let me know what you think about it! Share it to your friends and learn new things together.
Transcript


HD28.M414
no.
95
WORKING PAPER
ALFRED P. SLOAN SCHOOL OF MANAGEMENT
Qe^"/
strategic Management of Technology:Global Benchmarking (Initial Report)
by
Edward B. Roberts*
Working Paper #3640 December 1993
MASSACHUSETTS
INSTITUTE OF TECHNOLOGY
50 MEMORIAL DRIVE
CAMBRIDGE, MASSACHUSETTS 02139


strategic Management of Technology:Global Benchmarking (Initial Report)
by
Edward B. Roberts*
Working Paper #3640 December 1993

JAN 2 5 1994
R"

strategic Management of Technology:
Global Benchmarking (Initial Report)
by
Edward B. Roberts"
David Samoff Professor of the Management of Technology, MIT;Chairman, Management of Technology and Innovation Group,
MIT Sloan School of Management;and Chairman, Pugh-Roberts Associates,
a division of PA Consulting Group, Inc.
This research was sponsored jointly by the
Industrial Liaison Program of the Massachusetts Institute of Technologyand PA Consulting Group.
The analyses presented here were performed by a team directed by Professor
Roberts, with principal contributions by Lauri Mitchell and Mark Bamford, both
formerly of Pugh-Roberts Associates. We thank Drs. Paul Thornton and Stephen
Payne of the PA Consulting Group for providing the funding for this study, and
Thomas Moebus, MIT Director of Corporate Relations, for overall support of the
research and symposium activities.
December 6, 1993


Strategic Management of Technology: Global Benchmarking (Initial Report)
by
Edward B. Roberts
ABSTRACT
Extensive data collected from the largest R&D-performing companies in the
United States, western Europe, and Japan demonstrate broad trends and regional
differences in strategic management of technology. Japanese Chief Executive
Officers are more heavily involved in integrating technology with overall
corporate strategy. Chief Technology Officers of Japanese companies have
stronger board-level participation and greater influence on overall companystrategy. U.S. firms are rapidly decentralizing control of R&D activities to their
business units, while Japanese compaiues are moving in the opposite direction.
Companies worldwide are experiencing major shifts to acquiring technology
from outside sources, relying increasingly on universities for research and onjoint ventures and alliances for development. In carrying out product
development European companies are less involved with their customers than
are U.S. or Japanese firms, but, along with American companies, the Europeans
are improving significantiy in time required to bring new products to market.
Timeliness of technical results and newness of the company's technology
portfolio are key influences upon overall company R&D performance as well as
on new product revenues. Company sales growth is statistically related to R&Dmeeting its multiple project-level objectives of schedule, technical performance
and budgeted cost.


We report here initial results of our survey study of Strategic Managementof Technology that we launched in a unique partnership begun in 1992 between
the MIT Industrial Liaison Program and PA Consulting Group. We selected for
study all of the largest research and development (R&D) spenders in North
America, western Europe and Japan, those firms which ciamulatively in each
region expend about 80 percent of the total R&D dollars. Fewer than 250
companies spend 80% of the total R&D dollars in Europe, the U.S., and Japan,
and we had a 40% sample response with very good distribution by size of these
major R&D sf>enders in each region. The Appendix of this rep)ort provides moredetails of our study, including the methods followed, our sampling approach,
and the responses we obtained.
This report covers four topics. First is what we learned about the
technology strategy development process itself. Then we discuss changes that
have occurred globally in strategic management of technology. Third we briefly
examine what factors affect enhancement of R&D performance. Finally, wecomment on our plans for moving forward in our research studies.
The Development and Acceptance of Technology Strategy
Ten years ago, from perspectives gained in MIT research and executive
education activities, as well as from extensive consulting projects by me and mycolleagues, I believed that very few companies worldwide were doing much with
respect to developing overall strategies for the management of technology in the
firm. However, in the past decade major changes have occurred globally with
respect to formal efforts to develop and implement strategic planning andstrategy development for the technology side of the business. As indicated in
Figure 1 what we label here as moderate overall corporate level of acceptance has
occurred with respect to technology strategy development practices, although
high variance does exist among firms and between regions. One level downfrom corporate management, at the division or business or SBU level of the firm,
significantly greater acceptance and use of technology strategy dearly exist now.These findings are true overall, and for each region and industry grouping as
well. What is more important than the fact that strategy is being developed is
that the process of developing and applying technology strategy produces
results. Statistical correlations against a large number of measures of R&Dperformance demonstrate that in particular the degree of business-unit level
development of technology strategy relates to performance even across our entire
global sample of multiple regions and multiple industries. When we get down to
the much more reasonable process of investigating industry-specific information,
the development and implementation of technology strategy relates even morestrongly to many different industry indices of R&D performance.
Figure 1. Major Corporations Engage in Technology Strategy Development to
a Moderate Extent

An interesting relationship is now dear (in Figure 2) between the extent of
doing strategic development of technology at the corporate and at the typical
business-unit levels. Those compaiues that are strong in their technology
strategy development at the corporate level clearly are also strong in technology
Figure 2. Strong Corporate-Level Technology Strategy Development
Influences Strong Business-Unit Technology Strategy.
strategy development at the business-unit level. (p=.0005) If leadership exists at
corporate in developing technology strategy and understanding and trying to
bring direction and focus to technology management in the firm, either that role
example or the methodologies that are developed or the power from the top or
their combination causes the business units of the firm to move forward with
implementation of comparable strategic planiung. But weakness at the corporate
level does not necessarily mean weakness at the business-unit level of the firm.
Some business-unit general managers do an excellent job of developing and
implementing technology strategic planning and action without the leadership of
their corporate bosses. And 1 believe that the primary benefits of developing
strategic planning and strategy creation in technology presently occur at the
business-unit level.
We tried to identify the principal issues that matter in technology strategy.
As indicated in Figure 3 three perspectives are currently most important to senior
Figure 3. What is Most Important to Technology Strategy?
executives. (Most of the people who responded to our questionnaires are Chief
Technology Officers or Vice Presidents of R&D, or their immediate planning and
support staffs, a carefully selected set of respondents to be sure, the most senior
technical management in the company, and dearly a responsible group of
people.) They identify as the number one priority with respert to technology
strategy the matching of R&D to market needs. This is significantly moreimportant than the problem that has been proliferating the literature recently of
decreasing time to market for new products, which in turn is a bit moreimportant than our survey's topic for spedal study during 1992, the managementof R&D with constrained resources. No significant differences exist by region in
the relative importance of one criterion versus another for focusing technology
strategy.
A crucial question is how well tied is corporate strategy in the technology
domain to overall corporate strategy. Here we find the first of the differences
that are both important and that throughout this report cumulatively paint a
picture of how U.S. strategic management of technology differs espedally fromJapanese management of technology at the top levels of the firm. The data of
Figure 4 demonstrate that Japanese, and dose to them European, companies havefar stronger linkages at the top between technology and overall corporate
strategy than do firms in the United States.

Figxire 4. Corporate-Level Technology Strategy is More Strongly Linked to
Overall Strategies in Japan and Europe.
Now of course numerous exceptions exist to this finding of weak U.S.
strategic technology linkage. Robert Lutz, President and COO of Chrysler
Corporation, for example, in his keynote address at our MIT symposium in
December 1992, outlined how Chrysler's overall mission directs the way in whichkey aspects of its technology strategy and technology management proceed. But
most American firms have not done as good a job in providing these overall ties.
To emphasize the importance of this issue, later in this rep)ort we show that the
extent of linkage between technology and overall corporate strategy, even in as
diverse a sample of industries as we have studied, has strong statistical
relationships with a number of different measures of overall R&D performance.
The data demonstrate that if a company is trying to gain higher performancefrom research and development, a major influence is the connection betweenR&D strategy and the overall corporate strategy. Neglecting that critical tie andcritical source of direction diminishes the likelihood and magnitude of overall
benefits from the technology investment of the company.
Figiu-e 5. Who are the Keys to Linking Technology to Overall Corporate
Strategy?
A related issue is who is central in achieving this linkage. In about 60% of
the companies in all regions Chief Executive Officers (CEOs) are seen as animportant linkpin in tying technology to overall corporate strategy. But as onemight expect the primary linkpins worldwide are the R&D vice presidents andchief technology officers (CTOs). One difficulty is that many companies have nosuch person as the chief technology officer. We'll return to the CTO soon.
One observation from Figure 5 is perhaps easily explained butnevertheless deserves comment. Despite so many companies telling us that
matching R&D to market needs is their highest priority, when you look for the
roles that people play with respect to this connection, the corporate marketingvice president tends to be insignificant in relating to technology. In manycompanies the corporate marketing VP is virtually non-existent or is a weak staff
function. But many other firms do have strong marketing VPs who still do not
see technology linkage as part of their responsibilities. If indeed at the top of the
firm a most important action is to tie the market place and technology together, I
would argue that both sets of constituencies, marketing and technology, needsenior level representation for carrying out the bargaining, the communicationand the design and implementation of linkage structures.
One surprise from the survey is a role that we had not anticipated
whatsoever. In fact we had thrown in the question with respect to possible
involvement of chief financial officers (CFOs) merely for completeness, expecting
because of the bias of our own experiences primarily in the United States and

Europe, that we would not find any important observations about the CFO's role
in tying technology together with overall corporate strategy. Indeed our
anticipations were correct, so long as we looked only at the United States and
Europe. In those two regions the CFO is immaterial to the broad linkage between
technology and strategy. But this is not true in Japan. In fully a third of the
major technology-oriented companies in Japan the chief financial officer is seen
as an integral part of linkage between technology strategy and overall corporate
strategy.
These data remind me of an incident, which at the time I regarded as
totally unique, that occurred during one of my visits a few years ago to Tokyo.
At the end of discussions with the Associate Director of R&D of a major Japanese
steel company, he politely handed me another business card and suggested weget together on his next visit to the United States. As I glanced casually at his
card I was astonished to note that this one showed two business addresses, one
of them in Cambridge, Massachusetts. In response to my questioning the R&Dexecutive instantiy replied that he spent half-time in the U.S., monitoring his
company's sponsored research programs in advanced materials at eight different
major universities. My further quizzing brought out that in addition to a
secretary/translator and a part-time assistant, the only other occupant of his
company's Cambridge office was the Associate Treasurer of the firm, also half-
time. After all, he pointed out, these research programs are really long-term
investment activities! Who better to relate to investment than a senior finance
executive? Obviously the survey data indicate that many other Japanese
companies also see the CFO's office as importantly involved in the firm's R&Dinvestments, an attitude generally lacking in American and European companies.
The data reflect for Japanese firms a very different understanding andappreciation of the roles that technology plays and the fact that it must beintegrated into all levels of strategic thinking. We are going to come back to this
point later when we look at the differentiated role in Japan versus the UnitedStates of the chief executive officer as a linkpin, because the helping role of the
CFO in Japan I believe compensates and differentiates for how their CEOs see the
relationship to technology. We need to learn from what the Japanese seem to
have accomplished in the attitudes and teamwork of their senior executives
toward technology.
Figiu-e 6. Keys to Linking Technology to Business-Unit Strategy.
Let's answer the same set of questions relating to the business-unit level of
the firm. When we move down to the level of business uiuts and divisions,
where in fact most R&D money is being spent, we find appropriately that
company chief executive officers are about half as involved as they were at the
corporate strategy level. At the divisional level the corporate CEO hasdecentralized overall managerial res|X)nsibilities downward; in fact Figure 6
reveals that one of the most important people in the linkage is the business-unit
general manager, just as we should expect. The business-unit general manager is

about twice to three times as important as the CEO in providing strategic linkage
for the typical division. At the business-unit level the marketing vice president
becomes more important, reflecting where marketing has presence. TTie
marketing organization does not have broad-based coqxjrate presence in
affecting technology; it instead has focused business-unit presence, looking at the
markets of individual business units and helping to tie in technology
development. Again the chief financial officer in many Japanese companies is an
important linkpin of business-unit strategy, but non-existent again in either the
United States or Europe.
Let us now devote more attention to the Chief Executive Officer. I have a
bias. For years I have been concerned that chief executives need to be groomed,
selected, and assisted within the orgaiuzation to relate strongly to technology.
This is quite different from assuming that they themselves need to be
technologists. When we developed our study questionnaire I was determined to
treat this issue. I must confess that as an American I am rather disappointed to
Figure 7. More Japanese CEOs are Highly Involved in Technology Strategy.
find that fewer U.S. CEOs get very involved in technology content, strategy or
direction-giving generally. More Japanese chief executive officers are involved in
all the content aspects of technology strategy. For four different dimensions of
technology strategy: the process of its development, project selection andprioritization, internal resource allocation, and selection of outside technology
investments, Japanese CEOs play a more prominent role than do U.S. or
European CEOs. In only one important area do U.S. CEOs stand out, statistically
anyway. That is with respect to their involvement in setting R&D budgets.
FigTore 7 shows that the prominent differentiater between U.S. CEOs and their
European and Japanese counterparts is the bottom line on the chart, whichindicates that three-fourths of American CEOs are highly involved in overall
R&D budget control, considerably more than European and Japanese chief
executives.
I interpret this picture to mean that in Japan in particular, more chief
executive officers have identified as a critical priority of their own job the
development, enhancement and tying together of technology with the mission
and priorities of the company. The Japanese chief financial officer is often
enlisted as an aid to his boss in further facilitating the connections betweentechnology and overall strategy. In the United States, the CEO has primarily
found that keeping the R&D budget under control is the "bubble-up" fromtechnology that comes to his office. I know that there are exceptions vdthin every
industry. For example, Jamie Houghton, CEO of Coming, has always workedvery closely with his chief technology officers, first Tom MacAvoy and presently
David Duke, both of whom served as Vice-Chairman of Coming. However, in
our searching across our data base at the aggregate level we have yet to find
industries in the United States in which overall exceptions arise. Perhaps whenwe carry out more careful analyses of the pharmaceutical industry, where we

have a reasonable amount of data, we may find differences in the roles of U.S.
CEOs with respect to content and directional contributions to the area of
technology strategy.
The second key executive of interest to me is the Chief Technology Officer,
the CTO. Our first problem is to define a chief technology officer, especially
difficult given the wide variance in the roles that person plays across firms, for
example in terms of membership on the company's board of directors or main
managing board. In Japan Figure 8 points out that 95% of chief technology
Figure 8. Chief Technology Officers Have Board-Level Membership in Almost
All Japanese Companies and Over Half the European Companies.
officers are members of main boards or boards of directors. Europeans drop
significantly to 55%. But in the United States the chief technology officer is
represented on the senior managing boards of only 20% of the companies
sampled, and remember that these giant corporations are among those spending
most on R&D in the world. In my opinion this single figure presents the
strongest damnation of U.S. senior executive practice and prioritization. If U.S.
firms want to compete effectively in a technologically intense world, then the first
step toward competing should be to elevate the position of the company's senior
technology manager to a level where he or she can dialog wdth other senior
executives on overall strategic direction of the firm, on priority formulation andimplementation of company strategy. The "voice of technology" needs to be
heard on a regular basis in the executive and board suites. But similarly senior
technology managers need to hear first-hand the argtmients and concerns of their
executive colleagues from the market side, from strategy, and from finance,
among others. An elevation of importance of the role of the chief technology
officer can be a double-edged sword for some current senior R&D managers.
Indeed, chief technology officers must be selected so that that person is
appropriate to participate in main board discussion and the determination of
overall company direction. In 3M, for example, the CTO has typically advancedthrough positions of increasing general management responsibility, including
heading major business groups, prior to promotion to the Senior Vice President-
R&D post. This is true of the past three persons to hold the 3M job, Les Krogh,
Ron Mitsch and George Allen, reflecting an apparent conscious executive
development policy for grooming senior 3M officers. But the 4-to-l difference in
Figure 8 between Japan and the United States, and 2-to-l difference betweenEurope and the U.S., in the role and representation of senior technology
managers in board level discussions and debates is really shameful testimony to
the lack of American managerial appreciation of the long-term substantial
competitive differences that appropriate strategic management of technology can
ensure for the firm.
Probing the database further we seek more insights into the roles of the
CTOs. We should be having difficulties in establishing strong statistical
relationships because here, as in most cases discussed in this report, we are
8

examining overall samples, across regions and industries. So many different
industries represented in the database should blind generalizations. It would be
easier if we just took chemical industry data, for example, and did a study of that
one specific industry. But at the global level we again find Japanese chief
technology officers more involved in overall corporate strategy. This is now not
looking inward to technology, it is looking outward towards the corporation as a
whole. As Figure 9 demonstrates significant differences also are evident in the
Figure 9. U.S. Chief Technology Officers Have Far Less Influence on Business-
Unit Technology Direction.
extent to which the chief technology officer at the corporate level provides
direction for technology development at the business-unit level of the firm.
These influences include such elements as top-down perspectives about
prioritization, standards, staffing considerations, quality control for technology,
global competitive analysis on the technological dimensions of the firm. Andagain we find in ranking that in Japan more powerful CTOs are more prevalent
than in Europe, and significantly moreso than in the United States.
I believe that many firms are structured inappropriately at the top of their
own technological endeavors to provide a centrality of focus, direction andleadership particularly with respect to strategic linkage. I am not arguing here in
regard to the questions of centralized or decentralized management of R&D nor
of how technology must be tied effectively into individual product lines. I amtalking instead of how the firm creates a strategic vision of what technologies it
needs, how the technology is to meet overall corporate objectives and corporate
priorities, how the technology is to be developed and /or acquired, and howtechnology development across the firm can benefit from coordination andsynergy. Those objectives are far more likely to be fulfilled if a senior (e.g., chief)
technology officer who is capable of tying technology to overall corporate
strategy is working at or near the board level of the firm.
Trends in Global Strategic Management of TechnologyWe turn now from the issues of technology planning and strategy
development to some key aspects of strategic management of technology. Weobviously cannot talk about management v^thout talking about budgets.
Budgets critically reflect strategy. Earlier we emphasized some differences
between the corporate and the business-unit levels of the firm. Now Figure 10
presents for the overall sample the percentile breakdown of R&D spending at the
corporate level, where an orientation toward research spending is evident, versus
the business-unit level, where dominance of development spending is prevalent.
Figure 10. R&D Budgets at the Corporate Level Clearly Reflect a Longer TermView than at the Business-Unit Level.

Significant regional differences do exist, partly reflecting different industry
compositions of these regions. Japanese companies overall allocate far more of
corporate budgets to development (44% vs. U.S. 36% and Europe 33%) and far
less to research (32% vs. U.S. 42% and Europe 49%) than other regions, but this is
changing.
Corporate-level support of present product and process technology does
account for over 20 percent of its budget. Clearly as we move downward in the
firm from the corporate level to the business-unit level near-term support of both
product and process rises markedly, as does near-to-intermediate term
development spending. The percent of budget allocated to research is quite
small at the business-unit level.
Note that these numbers do not serve as a model for any particular firm to
copy because they are really averages across industries. A corporation mustanalyze industry-specific data to benchmark R&D budgets. For example, twodifferent industry breakouts are displayed in Figure 1 1 just to emphasize how
Figvire 11. RD&E Budget Allocations are Very Different Across Industries.
dramatically different these percentile scores are at the industry level. Both at the
corporate and the business-unit levels two quite different industries, chemicals
and materials on the one hand and electronics on the other, employ very
different patterns of R&D expenditures. Benchmarking how a firm ought to bespending its R&D money is inherently dangerous, especially if carried out
against dissimilar firms. Specifically a company ought to look to its ownindustrial base and on trying to develop ways of comparing what its competitors
are doing, how they are spending their money, how they are prioritizing their
expenditures. Spending patterns by industry turn out to be very different.
Beyond the issue of budget is what ought to be the related consideration of
control. Here we found quite a surprise. In the United States it is very clear that
major companies have been moving for the last five or six years heavily towards
decentralized control of both research and development. Control of both R&Dbudgets and activities has been moving from the corporate level to the divisional
and business-unit level of the firm. Much to our surprise the same pattern of
change is not occurring in Japan, nor in Europe to the same extent. Let's look at
the data shown in Figure 12. For research almost all Japanese firms
Figure 12. U.S. is Rushing Toward Decentralized Control of R&D While Japanand Europe Behave Differently.
continue to be moving control upward in the firm away from the business-unit
level toward more centralized control at the corporate level. "At Hitachi," for
example, "control over R&D is shifting from individual profit centers to
administrative divisions with broader access to market research" {Inside R&D,July 22, 1992). This is dearly not what is occurring for research in the United
States and Europe.
10

Of course, many Japanese companies are in the process of playing
"catchup" in regard to research, rapidly increasing their expenditures after years
of neglect. Rapid increases in any effort are often seen as most easily carried out
centrally, providing one possible explanation for the increasing Japanese
corporate-level control of research. But, coupled wdth other clues already
discussed, this trend may well reflect a greater Japanese sensitivity to the
corporate strategic nature of research direction.
I believe these control changes take place in R&D organizations in cycles,
especially for research, with about seven to ten years for the half-cycle. In the
U.S. my opinion is we are nearing the end of the half-cycle of decentralization of
R&D control, i.e. moving control of budgets and programs down to the divisional
or business-unit level. I expect that within a few years U.S. companies will start
to recentralize control of R&D as they find the problems of technological
blindsiding and short-term investment management begin to dominate
competitive issues at the business-unit level. American firms will again begin to
make longer-term investments, creating corporate centers of excellence in areas
of core technology, putting more money into longer-term corporate research. I
think that will begin to happen within the next three years. Whafs interesting is
that the aarrent pattern in the U.S. is not occurring elsewhere. The rest of the
world may just be out of phase or perhaps merely behaving more rationally.
Similar distinctions are arising in development. We again observe in
Figure 12 heavy momentum in the U.S. towards decentralized control of
development. In Europe and Japan it is about 50-50 as to whether control of
development work is shifting upward or downward. United States companies
are clearly differentiating themselves in moving toward the business unit. We all
know the benefits of decentralized control in terms of responsiveness to
customers and short-term ability to implement changes in current product lines.
These changes will indeed make U.S. firms more competitive in short-term
performance. But the problem of business-unit control of R&D is that firms
eventually stop investing in longer-term research and development, the
strengthening of core capabilities and the creation of new core strengths.
Consequently, the trend in the United States toward decentralized control maywell spell future technological and competitive disaster, if continued muchlonger.
In his 1992 MIT address President Lutz of Chrysler made the important
point that in its Liberty program as well as in other projects Chrysler had shifted
substantially from predominantly internal management of research anddevelopment efforts to the extensive use of outside partners. The survey data onmoving to the outside world for technology, illustrated in Figure 13, are rather
profound. The shifts have been occurring rapidly in the extent to which
Figure 13. Japanese Firms are Highly Leveraging External Sources for
Technology, with the Rest of the World Following.
II

companies see themselves as increasingly and strongly reliant on external
sources of technology. The anticipated dianges here continue over the next three
years. Note the dramatic difference in positioning among Japanese, European
and American companies with respect to their historic dependence on external
sources of technology, their current reliance and their anticipated future position.
Japanese firms dearly see themselves as reliant and dependent upon outsiders
far more than does anyone else. Mr. Lutz describes Chrysler in this domain, as
becoming more Japanese in management style, creating strong ties to outside
vendors and suppliers, even of technology. Lutz labelled this a "virtual
enterprise", with the firm's effective boundaries extended to include the
capabilities of many collaborators.
The Industrial Research Institute's aimual survey confirms this trend,
showing that 48% of the U.S. firms that replied expect increased participation in
alliances and joint ventures, with 16% expecting to increase their licensing from
others (Inside R&D, November 18, 1992, p. 2). One of the more prominent recent
examples is the announced controversial bilUon-dollar long-term research
agreement between Scripps Research Institute and Sandoz Pharma (Science, vol.
258, December 4, 1992, p. 1570), since revised in its terms. In general the OECDindicates a thirteen-fold increase in the creation of multinational inter-firm
technological agreements from 1973 to 1988, with more than half being joint
ventures and joint R&D (as dted in Inside R&D, May 13, 1992, p. 4).
This situation can be described in two very different sets of terms.
Reliance or dependence upon "others" has a dearly negative connotation.
"Others" may limit access to their best technology. Others may extract control of
you due to your dependence. Others may perform contrary to your expectations
or desires. But this situation can also be labelled by the more positive but risk-
inferring term of leveraging. Internal technological resources can be leveraged
by effective access to and use of external technology. The Japanese seem to be in
the vanguard of this leveraging movement. 60 percent of all major Japanese
companies expert to be highly dependent upon external technology sources three
years from now, compared with 25% just three years ago. European firms expect
only half as much external dependency over the next three years.
Many companies have not yet adequately dealt strurturally and from a
managerial point of view with this new situation. How does a firm manage the
acquisition of technology being supplied primarily by companies not under its
own control? It is difficult enough to try to control and manage internal research
and development staffs, but to be able to manage dependendes upon another
organization's R&D efforts is an order of magnitude more difficult. I believe that
companies are going to find themselves increasingly in trouble due to failures
arising from the management of external sources of technology. This is not to say
that firms shouldn't be moving outward. This is to argue the need for worryingabout how overall management systems and staffing are being geared up for
management and integration of external technology sources. The increasingly
central control of R&D evidenced by Japanese companies in Figure 12 may be a
response in part to requirements generated by external sourdng. Companies
12

need to develop new and critical skills inside to be able effectively to interface
with and manage technology acquisition outside. Outsourcing cannot meandenuding internal capabilities or the process v^ll fail.
Turning more broadly to the question of sources of technology, from
where does a major company's technology come? We again differentiate the
research side of the firm from development activities, with sources of both rank-
ordered in importance in Figure 14. For research work three clusters of influence
Figxu-e 14, Internal Sources are Still Primary for Both Research andDevelopment
exist. The data show that the central corporate research orgaiuzation is dearly
the primary source of supply of technological information and advance, across all
regions and in most industries. The solid line in the table under central corporate
research indicates a significant gap in perceived contribution from anything else
on the research side of the company. Number two in contribution to research is
the R&D carried out within the divisions of the firm. The budgeting patterns
shown in Figure 10 confirm that some research is being carried out even within
divisional R&D activities. Indeed, in both the aerospace and the pharmaceutical
industries, divisional R&D is perceived as an even more significant overall
contributor to research than the corporate labs.
What I find very pleasing as an academic is that number three in the
Figure 14 list of important research inputs is sponsored research at the
universities, quite close overall to the perceived value of divisional R&D. Anincreasing volume of strategy and policy discussions, at both corporate andnational levels, is focusing on whether corporations are gaining adequate benefits
from sponsoring university research. I am glad to report that overall, across all
regions, large corporations are finding sponsored research at universities to be a
primary contributor to their research knowledge acquisition. Furthermore, the
next duster of important contributors to research, shown in Figure 14, also
indudes several different university-related activities. Recruiting students is
seen by itself as a critical contributor to research knowledge acquisition, along
with membership in university liaison programs and continuing education. Thegrowing role of universities in regard to research work is supported by recent
analyses by Inside R&D (November 4, 1992, p. 2). For "several reasons ... industry
is seeking out more joint research projects with universities. Companies are
conceding that the acaderruc labs are better at the basic sdences and discovery
than industry's labs. The companies now feel that their own natural habitat is
development. ... Companies get schools involved to share the expense... Anumber of universities are seeing a rise in interest among companies to share
research projects." We'll look further at the general role of universities
momentarily. Keep in mind that many other possible sources of technology
acquisition are involved in our survey questionnaire and did not make this list of
top eight important contributors.
13

The other side of technology acquisition is development, where most R&Dmoney is spent in all regions and in all industries. Despite the rapid growth in
external sourdng, the study data underlying Figxire 14 clearly prove that the
principal source of technology acquisition for development is the company's owninternal R&D within divisions. I inserted the heavy bar under that line in Figure
14 to communicate a three-to-one difference in the perceived contribution of
divisional or business-unit R&D relative to any other source of technology.
Divisional R&D still has almost a stand-alone role with respect to its importance,
for all regions and across all industries. But now note that number two on the
development side is not internal but rather has already shifted to the outside
world, the contribution of joint ventures and alliances with outside companies.
This is clustered with the contribution of central corporate research and with a
second form of alliance, the incorporation of supplier technology. Here weevidence dear distinctions between research management versus developmentmanagement in terms of where one looks for sources of technological payoff.
Our overall findings on development work are also consistent with a recent UKstudy: "In-house R&D is seen as the most sigruficant source of technological
innovation for industry", but by the mid-1990s "customers and suppliers are
expected ... to become the most significant source". (S. Bone, "Chief Executives'
Attitudes to Technological Innovation in UK Manufacturing Industry", PAConsulting Group, Hertfordshire, UK, 1992, p. 9)
As indicated above companies are moving heavily toward the use of
external resources. In this regard we probed for further insights into the general
role of universities with these major R&D-performing companies. Figure 15
Figure 15. Japanese Firms Gain Far Greater Benefits from University
Programs.
indicates significant differences in the regional patterns of university utilization,
with Japanese companies most involved with tangible endeavors such as training
and research collaboration, while U.S. firms are least engaged in those activities
and most involved with discussions and visits that help obtain new ideas andassess technology trends. European companies display a mix of the U.S. andJapanese practices. But for all four of the key uiuversity activities dted, Japanesefirms are statistically significantly more intense in their usage. The significantly
greater Japanese appredation of and benefits from universities clearly reflect
attitude not access. Most of the universities dted are in the United States, somein Europe. The Japanese overcome far greater distance, language and cultural
barriers to take advantage of these resources. Japanese companies are no doubtusing universities to compensate in part for their historic lower internal spendingon the research side of R&D, but this fact alone does not explain their moreintensive exploitation of academic access.
The overall high company utilization of universities to determinetechnology trends evidenced in Figure 15 is also supported by our survey
14

findings on mechanisms companies have adopted for monitoring technology. Asshown in Figure 16 internal technology steering groups dominate, but uiuversity
Figure 16. Companies Use a Wide Variety of Approaches to MonitorTechnology.
liaison and research consortia, as well as other industry consortia, play a critical
role. The prominent role of university liaison programs in part reflects the
changed attitudes of many universities toward these relationships. A 1988
Federal "General Accounting Office (GAO) repxjrt found that of 107 universities
surveyed, 41 had initiated industrial liaison progranis to encourage ties with
industry" {Christian Science Monitor, November 23, 1992, p. 12), following the
leading example of MITs program launched in 1948.
We are very interested in the trend toward globalization of research and
development activities. One of the problems we discovered is that we need to be
Figure 17. R&D Based in Foreign Countries is Growing.
more careful in how we define our terms. We asked companies for data relating
to their R&D activity in foreign countries, but we really wanted information onR&D activities in regions other than the firm's "home base". Thus the "foreign"
regional efforts of North American and Japanese companies are correctly
portrayed in the data, but the activities of European firms are overstated. For
example, our respondents classify all the work that a company headquartered in
France carries out in Germany as "foreign", even though it is within the samegeographic boundaries we have defined as a region for the purposes of this
study. Correcting for the differences in baseline, all regions are tending upwardin their foreign R&D percentages. On an absolute basis Japanese companies are
still doing only a small fraction of their R&D outside of Japan, but are
accelerating somewhat more rapidly than U.S. firms, which are growing morerapidly overseas than is Europe.
OECD data support the trends shown in our survey with detailed findings
that much of the foreign R&D spending in Europe is financed by U.S. companies.
In 1988, according to the OECD, "U.S. companies spent 10.5% of their R&Dbudgets abroad, up from 7.6% in 1985 (Inside R&D, May 13, 1992, p. 3). TheNational Science Foundation reports continuation of this U.S. pattern, with R&Dexpenditures for major U.S. firms rising from 1990 to 1992 about 5.7% annually
abroad versus 3.5% domestically (Inside R&D, April 29, 1992, p. 7). Tocomplement these expenditures the OECD also reports that "foreign comparues
spend as much on R&D in the United States as U.S. firms spend abroad" (as
reported in Inside R&D, May 13, 1992, p. 3). In regard to Japan Science (vol. 258,
November 27, 1992, pp. 1428-1433) published two news commentaries about
Japanese firms' increased rate of establishing U.S. basic research labs in
electronics and biotechnology, in addition to increased Japanese-U.S. university
research and company alliances. This is paralleled in part by the rise of foreign
15

R&D centers in Japan, as reported by its Ministry of International Trade and
Industry, especially in the fields of chemicals and pharmaceuticals (R&DMagazine, May 1992, p. 21).
Enhancing R&D Performance
Our third area of research is irifluences upon technological effectiveness
and R&D performance. We had an interesting time in trying to define
performance, ending up with 16 different measures of R&D performance and
R&D contributions to the firm, clustered into three categories. First are a large
number of measures by which we attempt to assess comp>etitive advantages in
R&D efforts. Second we look at the project level of performance and identify
several evaluators of how R&D projects stack up against expectations. Third wetry to find strategic indicators that R&D performance matters and has hadcorporate impact.
We identified three key stakeholders for R&D or three key sets of
customers, only one of which is outside of the firm, its end-user/customer. Theother two R&D "customers" are (a) those senior officers of the firm who attempt
to set direction and priority for the company and (b) internal manufacturing/
operations, the customer for process change and improvement as well as cost
reduction within the company. Figure 18 shows the results of our asking
companies to benchmark themselves and to identify how they are doing in
satisfying these different stakeholders relative to their own most serious
Figure 18. Meeting the Needs of Key Stakeholders for R&D Efforts.
competition. Most companies principally emphasize satisfying end-use
customers, with about a third of the firms worldwide feeling that they surpass
competition in meeting their external customers' needs. Least important overall,
as well as for U.S. and European firms separately, in their scale of values is the
extent to which they surpass competition in satisfying manufacturing's
technological requirements. However, this slight is not true for Japanese
companies. Only 1 out of 8 U.S. and European companies self-assess superiority
in supporting manufacturing through R&D. In contrast, Japanese firms perceive
themselves significantly better than competitors in meeting the needs of their
internal manufacturing customer. This difference in orientation, the stronger
focus on manufacturing process, is a critical differentiator of strategy, as well as
budget and other aspects of implementation of priorities. Our data show that
Japanese companies are more concerned with, spend more money on, andconsequently they are more satisfied with, how they are performing in regard to
manufacturing technology. Earlier research by Edwin Mansfield provides strong
corroborating evidence that Japanese companies spend a much larger fraction of
their R&D budgets on process improvement and development than docomparable U.S. companies (Science, 30 September 1988, pp. 1970-1).
Next we examined linkages to the marketplace. Here Figure 19 indicates
that the poor performer is not the American company. I think U.S. firms have
16

Figure 19. "Voice of the Customer" in Product Development.
gotten their acts together with respect to listerung to end-customers and relating
to the market, as has Japan. But across the board in one after another measureEuropean firms seem far less connected to their markets than are American andJapanese firms. This deficiency is apparent when we look for explicit inputs bycustomers in providing data that affect the determination of technology strategy,
the setting of program objectives, the development of product concepts, and the
development of new product prototypes. I think that United States companies
have over the last four or five years, largely as a result of the Total Quality
Management (TQM) movement, shifted heavily towards understanding,
appreciating and working more closely to implement the "voice of the customer"
in all aspects of formulating and implementing technology developmentpriorities. What U.S. firms need to do next is to recognize that there is more than
an end-use customer; there are also the internal strategic customer and the
internal manufacturing customer. And clearly European companies need to
improve dramatically the connections between customer inputs and technology
outputs.
We then looked at five different overall measures of R&D performance,
listed in Figure 20. No significant regional differences exist among the sampled
Figure 20. Five Measxu-es of Overall R&D Performance.
firms on any of these aspects of overall R&D performance: effective use of
resources, efficiency, timeliness in moving products to the market, percentage of
present sales coming from new products, or even production cost reductions. I
am surprised a bit because the portfoUos of technology that are being
implemented around the world are indeed differentiated, with very different
emphases among the major corporations of the U.S., Europe and Japan.
Therefore, I had expected to see some differences in overall results that accrue
these individual company differences of priority. Projected into the future,
today's differences among R&D portfolios are expected to create important
differences in future performance.
In examining data on portfolio composition of R&D spending, U.S. senior
technology officers are much more dissatisfied than their counterparts elsewhere
in regard to several issues. Americans are uncomfortable about their R&D
Figure 21. U.S. Executives are Concerned About Imbalance in their R&DPortfolios.
portfolio balance with respect to time, that is in regard to their own short-term,
medium-term, and long-term trade-offs. The accelerating U.S. march toward the
short-term is seen as dangerous. European and Japanese technology executives
are more relaxed with respect to their time-orientation balance. American
17
executives are also less content with respect to the balance between working on
faniiliar versus unfamiliar areas. American executives feel that their technology
portfolios are overly constrained to be familiar. Our studies elsewhere
demonstrate that a company is likely to have higher success rate at the project
level from working more familiar portfolios of technology. The flip side of this
issue is that a company is not stirring up as many potential differentiators for its
future if its current portfolio of R&D projects is overly familiar. A firm must
strike some risk-based balance with linfamiliar areas of technology and market
development to nurture the furtherance of its own future change. Finally, U.S.
executives are concerned about their focus of product versus process, expressing
discomfort at the small amount of process work, while Japanese executives are
statistically more satisfied with this balance.
We also looked at the several measures of project-level performance,
shown in Figure 22. At the project level North America, Europe and Japan are
interestingly different, with European companies claiming to have higher levels
of performance in all of five dimensions that we measured, including newproduct breakeven time, meeting various project objectives, and recent
Figure 22, Project-Level Performance.
improvements in project performance. However, the back-up data on trends and
changes fail to support in any areas the claimed European advantages. This
inconsistency may reflect standards of performance for projects that are quite
different across the regions of the world. In my judgment we don't yet knowenough to understand what is really taking place in performance at the project
level.
However, both United States and European comparues do appear to be
improving dramatically with respect to all aspects of project performance,
especially in tinie to market for new products. Time to market has become the
buzz word for many people and organizations. Yet in benchmarking time-
related measures one must be very careful to avoid comparisons across
industries. For example, our data show on average a four-to-one spread across
industries in break-even times, in bringing products to market and having themgenerate enough revenues so as to merely repay their development costs.
Comparisons must be explicit by industry. In all industries but pharmaceuticals
break-even times seem to be gradually decreasing. Companies have been able to
shorten time to market and also shorten the time to bring in enough revenues
and profitability to repay the costs of development, except in pharmaceuticals.
Yet in pharmaceuticals not only is break-even time increasing but as you mightexpect the pharmaceutical industry has a far higher break-even tinne than does
any other industry in our database. The data match the complaints that the
pharmaceutical industry has had for years, not just about the length of the
technology development process, but moreover about the severe regulatory
environment, that combine to make time to market such a long, exasperating andexpensive period.
18

Further to this issue of moving products to market, we tried to identify
what matters. I am intrigued by the specific remarks of Robert Lutz, talking
about what had been done in changing Chrysler to move products to market so
much faster, more efficiently and competitively. Our overall survey data, drawnfrom around the world and across industries, demonstrate that the top three
forces that have had high impact on time to market are precisely in agreement
with Lutz's observations about his own firm. As indicated in Figure 23, the use
of multi-functional teams is seen as having the highest statistical impact overall
Fig;ure 23. Moving Products to Market.
in affecting speedup. Number 2 and a dose runner-up in worldwide importance
is having strong project managers, the kinds of high-level people that Lutz
reported are in charge of Chrysler's platform teams. Number 3 is the presence
and support of senior management sponsors, which clearly has been the case
with the kind of reorganization structure implemented from the top down at
Chrysler. Lutz did not comment on whether the QFD (Quality Functional
Deployment) project plaiming method is an important contributor, the fourth
highest cited factor in our overall studies. But since QFD was developed first byToyota, and then introduced broadly throughout the automobile industry, I
suspect that QFD too has played some part in helping Chrysler to carry out its
highly improved product planiung and implementation. These first three major
impact factors are not strongly differentiated among regions, suggesting that
companies in all regions of the world are moving in the same way to achieve
accelerated time to market.
Our last duster of measures are some strategic indicators of technological
performance. What should we look for as indicators of strategic impact of
technology management? We might look for changes in management support as
indicative of satisfaction wdth R&D impact. We might seek changes in corporate
sales and profitability, which we might hope would show up as related to
technology management. Or we might look outside the firm at a company'sreputation for R&D excellence among its peers and competitors. It turns out to
be very difficult to find at the overall sample level any measures that show that
regional differences in technology management sigiuficantly affect differences in
overall performance.
One area of interest is the level of overall support from top management.
Figure 24. Top Management Support of R&D.
Japanese technology executives believe their top corporate managers are far moresupportive than European and U.S. companies report. This may merely be a
Japanese illusion, or perhaps a higher level of Japanese politeness toward their
senior managers. But on the other hand every time I talk with Americantechnology managers about relationships with their senior corporate managers I
hear largely complaints about lack of senior level support for the pleas and
19

problems of technology within the firm. CTOs who think they are being
uniquely harassed may feel better to know that there are no global differences in
the extent to which CTOs are content with the satisfaction of their budget
requests. The level of complaints on budget satisfaction are characteristic around
the globe and not differentiated either by industry or by region. Senior
technology managers all share the same brotherhood of complaint that R&Dreally needs more money than anybody is willing to provide. Unfortunately, the
lack of R&D budget satisfaction doesn't show up as statistically sigruficantly
related to anything under the sun, in terms either of R&D performance or
corporate outcomes.
We did want to know how senior technologists evaluated each other's
performance. Rather than publishing these popularity polls by region or
industry, which our data do permit, I thought I would just indicate one overall
result, shown in Figtire 25. For the sample as a whole DuPont and IBM, despite
Figure 25. Reputation for R&D Excellence.
all of its recent problems, are still dted around the world as the most effective
R&D performers across industries. Third in line globally and for all industries is
Merck. (Incidentally, within the pharmaceutical group Merck and Glaxo comeout as equals in how highly regarded they are by other pharmaceutical
companies.) We have tried to relate this peer rating of R&D excellence overall
with the other performance measures but nothing shows up very strongly
statistically.
What aspects of R&D and technology management do impact overall
corporate performance? The fundamental problem that the academic researcher
faces is differentiating correlation from causality. We find many things that
strongly relate to each other statistically. The question is does one factor cause
the other, or do they both reflect other things that are taking place concurrently
within the firm and /or industry, or indeed is one variable merely a definition of
the other? I display in Figures 26 and 27 two brief examples of this dilemma, andat the same time indicate some dues as to what relates to effective R&Dperformance.
We have looked at how R&D meets stakeholder needs in three different
areas: end-use customers, corporate strategy, and manufacturing. Listed in
Figure 26 are the primary variables that turn out to be strongly related
statistically to each of those separate aspects of meeting stakeholder needs, and
Figure 26. Key Correlates of Meeting Stakeholder Needs.
which to me suggest causality. The data suggest that a company that is moretimely in getting out its R&D results causes a higher level of satisfaction of its
end-use customers' needs. Similarly, technology leadership, measured bycompetitive assessments of where a firm's technology stands, is also indicated as
contributing to satisfying end-use customers. But, in contrast, although revenues
20

from new products does correlate significantly with end-use customers being
satisfied, this is a measure of the result of satisfying end-use customers and not a
cause of the satisfaction. Therefore, I've indicated its correlation in italics below
the line, not in the upper text, of Figure 26. So revenues flow together with
customer satisfaction. This is the kind of puzzlement that often exists. Similarly,
let's examine the forces that help satisfy the manufacturing side. Two factors are
statistically sigiiificant correlates. Yet, that satisfying manufacttiring needs
correlates strongly with reduction of production costs is almost a definition.
Cost reduction is one of the most important features mentioned by companies
that assert they are meeting strategic needs with respect to manufactxaring. Froma causal point of view, however, the survey results suggest that a balance in the
R&D portfolio with respect to product and process emphasis is a key contributor
to satisfying the internal manufactvxring customer of R&D.In this same regard, as shown in Figure 27, revenues from new products
and processes can now be seen as influenced statistically significantly by three
forces. Timeliness of new products is likely to cause increased revenues fromthose products. Newer technology relative to competition (measured by the
degree of maturity of the product portfolio) also contributes to higher newproduct and new process revenue, as does a company's capacity to adjust to
external changes. Three other factors sort of go with the flow of having high
revenues from new products and new processes, and are listed in italics below
the line.
Figure 27. Key Correlates of Revenues from New Products/Processes.
Next are those R&D factors that influence overall sales growth. In myopinion there are no questions that all three statistically significant variables
listed in Figure 28 are causal. All are at the project level of performance and are,
in rank order of influence: meeting project objectives in regard to time to market,
technical specifications, and budgeted development costs. These are the critical
roots for having R&D contribute to and develop overall sales growth of the
company.
Figure 28. Key R&D Performance Contributors to Sales Growth.
The final level of analysis relates to overall corporate performance. Theoverall sample reveals no significant correlates of corporate profitability. That
does not surprise us. Anybody that has looked at research studies on R&D andtechnology would have to be even more brazen than I to suggest that a large
data-base analysis should be able to imcover direct linkages between technology
measures and profitability. There are too many other intervening variables,
particularly at the level of strategy development and implementation, to expect
to find clear signs of technology ties to profitability. Similarly, for the overall
sample there is no tie between R&D as a percentage of sales and anything of
consequence, not surprising to me despite the many arguments in the strategy
21
and economics literahire that research and development intensity is a critical
index.
In regard to the impact of the process of technology plarming and strategy, for the total
sample, unfortimately, the extent of development and acceptance of corporate technology
strategy does not correlate significantly with any measure of R&D or corporate
performance. Hov^ever, the degree of development of business-unit technology strategies
does correlate meaningfully with several different measures of overall techrucal project
performance, including time to market and meeting budgeted development cost, and relates
well to perceived top management support for R&D. The business unit is the level at which
technology strategy is implemented and where results should come home to roost in overall
measures of performance.
Different forces at work in the different industries tend to dimiiush all performance
correlations for the total sample of companies. This is indicated, even in our initial
somewhat casual industry analyses, by the much higher statistical correlations betweenstrategy measures and outcome measures for various industry groupings. Despite the far
smaller sample sizes of each industry relative to the total responses, the degree of
development of corporate technology strategies within given industries correlates well with
several measures of R&D results. For example, within the chemicals/materials group the
extent of a company's corporate technology strategy development correlates strongly with 9
out of 16 measures of R&D outcomes, including among them satisfying corporate strategic
needs, time to market, percent revenues from new products, and adaptability to external
change. 5 of 16 R&D performance measvu-es are strong correlates of the extent of electronics
industry technology strategy development.
Finally, the degree of linkage between technology strategy and overall corporate
strategy does correlate vsdth some measures of R&D performance. This is especially
significant at the industry level: e.g., for the chemicals/materials industry, the linkage
between technology and overall corporate strategy has strong correlates with 10 of 16 R&Dperformance measures; linkage data from the combined electronics industries correlate
significantly with 5 of 16 measures.
Moving ForwardLet me finish by telling you where we are are going next. We have at this
stage completed what is merely an initial pass at analysis, albeit an intensive andexpensive effort. Nevertheless a lot more statistical analysis even of the existing
data has to take place, especially at the industry level. We have already irutiated
a process of graduate thesis involvement in these studies. Two members of the
1993 MIT Management of Technology Program, our unique mid-career executive
development program, have recently completed theses that have expanded the
data and analyses of the chemicals and materials industry and the petroleum
industry. The chemicals/materials sample is now being further enlarged withnew information being gathered from Mexico and some Latin Americancountries. Another graduate student has carried out preliminary analyses of ourpharmaceutical industry data. We hope to encourage more graduate students to
undertake data supplementation and analysis.
22

We have already started efforts aimed at sample expansion into other regions. A joint
study is underway to cover Singaf)ore firms, where we plan to include far smaller firms onaverage than those examined in our initial probe into North America, Europe, and Japan.
We anticipate that we will broaden the database to encompass still other countries and other
sizes of industrial firms. We also expect and we look forward to opportunities to engage in
single company and single industry benchmarking studies. Finally, we are looking forward
to continuing the global survey of major R&D performers in future years, reflecting
corrections of design errors and other lessons to be learned from this year's activity, as well
as new issues in the global strategic management of technology.
Conclusions and Implications
The major industrial performers of research and development in North America,
western Europe, and Japan have become moderate adopters of technology planning andstrategy development practices. Relative to U.S. corporations, the giant technology-
intensive Japanese and European companies have more thoroughly linked their technology
strategies to overall corporate strategies, with the degree of this linkage relating strongly to
enhanced R&D performance. Globally Chief Technology Officers (CTOs) and R&D vice
presidents are the most important facilitators of the ties between technology and overall
strategy, with Chief Executive Officers (CEOs) being close in importance at the corporate
level and divisional or business-unit general managers being vital linkpins at the business
level. In many Japanese companies Chief Financial Officers (CEOs) are actively involved in
this integration, perhaps reflecting an underlying Japanese attitude that R&D needs to be
treated as long-term investment.
Chief executives in Japan are far more engaged than their European and Americancounterparts in technology strategy development and implementation. They spend moretime in assessing both internal and external technological investment opportunities. In
contrast U.S. CEOs are distinguished statistically only by their higher involvement in
controlling R&D budgets.
Nearly all Japanese Chief Technology Officers are members of the Boards of Directors
or main Managing Boards of their companies. This enables technological considerations to
enter into dialogues and debates in regard to all strategic issues of Japanese firms. Similarly,
perspectives gained from overall corporate participation inevitably influence these CTOs'insights and decisions. But of the major U.S. firms included in our study, only 20 percent of
the CTOs have these board-level positions of rank and influence. In my opinion this
deficiency acts to dismember technology from an intimacy with overall corporate strategy.
Japanese chief technologists are also perceived to be much stronger statistically than their
global colleagues in their upward influence on overall corporate strategy, and far moreinfluential as well in downward impact on the R&D programs of their firms' divisions andbusiness units.
Several major organizational developments are affecting the strategic management of
technology. U.S. firms are engaged in a headlong rush toward decentralizing the control of
their research and esp)edally their development efforts down to divisional and business-unit
levels. This represents a somewhat cyclical reaction to business pressures for moreresponsive R&D, leading almost inevitably to improvement of short-term performance in
generating new and improved products and processes. But the flight to bottom-level
23

control also predestines the erosion of support for research and longer-term development,
with predictable consequences. Of great surprise to this author, Japanese comparues are
moving precisely in the opposite direction in regard to research, moving control more
strongly upward to the corporate level. Increased corporate control of research permits
Japanese companies to develop and exercise greater strategic control over their owntechnology-dependent futures. Control of development in Japanese firms is remairung
more-or-less stationary in the aggregate, with control shifts occurring roughly evenly in
both upward and downward directions.
Companies worldwide are evolving rapidly toward increased dependence uponexternal sources of technology. This is true in research, where the university is becoming a
strong complement to internal sources. It is paralleled in development by dramatic
increases in the uses of joint ventures and alliances to provide product and process
advances. Japanese companies are already more involved with these external sources than
European and American companies, and are accelerating their movements toward outside
dependencies.
Technology executives recognize demands that they satisfy three different sets of
stakeholders: their firms' end-use customers, senior management who determine strategic
direction and priorities, and internal manufacturing. Globally they express far greater
confidence in their competitive performance with respect to meeting end-user needs than
the other two sets of "customers". Only Japanese compaiues convey relative satisfaction in
regard to providing the required technology for internal manufacturing priorities. Amongother influences these perceived differences reflect real differences between Japanese
companies and all others in regard to R&D budget allocations for process development and
improvement. In contrast U.S. senior technology managers are especially concerned that
their R&D portfolios are seriously inadequate in regard to process support. But Americans
are also worried about portfolio imbalance with respect to time orientation (i.e., too muchshort-term) as well as risk orientation (i.e., too much "familiar" technology).
But U.S. companies are performing well in some areas of strategic change. For
example, shifted practices over the past several years have brought the "voice of the
customer" into a place of critical iiifluence on many dimensions of product conceptualizing
and development. In this area many European companies appear to be lagging Americanand Japanese practice in regard to extent and intensity of customer contact and influence ontechnology. Similarly, U.S. firms are rapidly improving in regard to time-to-market, with
companies in all regions benefiting from combinations of multi-functional teams, strong
project managers, and senior corporate sponsorship. Yet Japanese companies still appear to
have the advantage in regard to considerably more top management support of overall
R&D efforts.
At the overall corporate level for our complete sample of respondents, a limited
number of key factors appear to be significantiy influencing overall R&D performance.
Timeliness of techiucal outputs affects both internal corporate strategic customers and
external end-customers, wiiile a more balanced product/process R&D portfolio generates
significant impact on internal manufacturing results. Revenues from new products and
processes are also most influenced in statistical measures by timeliness, as well as newness
of the firm's technology. And sales growth is statistically most strongly affected by R&Dmeeting its multiple project objectives in regards to time to market, targeted technical
24

performance, and budgeted costs. Not surprising to this observer, R&D intensity, as
reflected by R&D as a percentage of a company's sales, does not correlate with anyimportant outcome measure at the level of the overall sample. Of note is that the degree of
linkage between technology strategy and overall corporate strategy does correlate well with
several measures of R&D performance. This particular influence shows up far morestrongly in the few industry-level analyses carried out thus far, for example for the
chemicals and materials industry. Preliminary industry-level analyses suggest other
clusters of strong cause-and-effect relationships between technology strategy variables andoverall company performance, and even stronger results at the business-unit level of the
firm. These and other insights will need to await much more in-depth analyses.
25

Appendix: Survey MethodsThe Global Survey on the Strategic Management of Technology was developed by a
team headed by Professor Edward B. Roberts of the MIT Sloan School of Management and
Pugh-Roberts Associates, a division of PA Consulting Group, assisted by Lauri Mitchell,
formerly of Pugh-Roberts Associates. The staff of the MTT Industrial Liaison Program (ILP),
directed by Thomas Moebus, collaborated in the questiormaire development, with
coordination throughout the study provided by Wendy Elliott of the ILP. Several membersof the ILP Industrial Advisory Board pilot tested an early draft version of the questionnaire.
Consulting staff of the Technology Management Group of Pugh-Roberts Associates, as well
as members of the global technology management practice of PA Consulting Group,
commented on various questionnaire drafts. Eric Wiseman, previously of Pugh-Roberts
Associates and now of U.S. West, was very helpful in formulation of the overall
questionnaire. Professor Ralph Katz and Varghese George of the MIT Management of
Technology and Innovation Group consulted in regard to questionnaire design and
analyses.
The survey includes three sections: Part I-Benchmarking, comprising about three-
fourths of the questions in seven sections, seeks to establish measures of practice in global
strategic management of technology, as well as measures of R&D and overall companyperformance; Part Il-Special Research Topic: Managing Technology with Constrained
Resources seeks to document worldwide responses to the ciorrent economic climate in terms
of recent, current, and expected near-term actions affecting technical programs, staffing,
resources, and controls; this special research topic is likely to be changed in future surveys
to reflect critical issues perceived by seruor technology managers; Part IE-Growing
Concerns: Future Research Topics seeks to identify emerging issues that are candidates for
future Special Research Topics.
The survey was sent during 1992 to those firms performing the largest amount of
research and development work (as measured by their 1991 expenditures) in western
Europe, Japan, and North America. The list of companies sampled was determined from
data from many sources (including the US National Science Foundation, Business Week, and
Inside R&D) by starting with the largest R&D spender in North America and including all
North American firms in order of decreasing expenditures until the cumulative amountexceeded 80% of the total R&D performed in this region. This approach generated 109
firms, all but one headquartered in the United States, all spending more than $100 million
on R&D during 1991. Now using $100 million as the lower limit, all companies with R&Dexpenditures at or above that level were included from western Europe countries (including
Scandinavia), producing 80 companies, and Japan, with 55 firms. The resulting sample of
244 firms therefore accounts for approximately 80% of the R&D performed in western
Europe, Japan, and North America.
The 11 page English-language questiormaire was mailed to the highest ranked
technology-related officer of each company, as listed in the large number of directories anddata sources used in the list compilation. Approximately two months after the initial
mailing reminder letters and telephone calls were made by staff of the MIT Industrial
Liaison Program and PA Consulting Group that led to some additional replies. About one-
fourth of the replies were completed by a person whose title is Vice President or above, the
remainder coming from persons whose titles indicate senior R&D or technology line or staff
26

positions. Replies were mailed to a postal box of the MIT Industrial Liaison Program,
recorded in a master file and assigned a code number by Wendy Elliott of that office, whoremoved all company-identifying information from the questionnaire. The resulting
anonymous questionnaires were then turned over to Pugh-Roberts Associates for
comprehensive data coding and analyses, resulting in a database with identifiers that permit
sorting by principal industry and geographic location of corporate headquarters.
Of the total 244 companies sampled, useable responses were received from 95 firms, or
39%. 46 were from the United States (42% response), 27 from Europe (34%), and 22 from
Japan (40%), providing an essentially balanced response by geographic area, with slight
underrepresentation of European companies. (Among European countries the 3 replies
from the 33 solicited German firms constituted an exceptionally small response rate (9%).
Omitting Germany from the response analysis, the remaiiung western European countries
had an overall response rate of 51%.)
To further rule out apparent self-selection biases, demographic comparisons weremade of the respondents versus the survey population in terms of R&D spending.
Frequency analyses in terms of overall spending amounts, as well as cumulative spending
analyses for all respondents versus the survey population, demonstrate that the size
distribution of respondents matches almost precisely with the size distribution of companies
surveyed, for the overall global sample as well as for each of the three geographic areas.
The two largest industrial groups are chemicals /materials, with 20 replies, and a composite
electronics industry group, with 21 responses. Other large groupings are aerospace,
petroleum, and pharmaceuticals. Neither the response rates nor the completeness or
usability of the questionnaires reveal differences due to the use of English only in the survey
instrument.
Detailed statistical analyses of the data discussed in this report werecarried out by the team of Lauri Mitchell, Mark Bamford, and Edward Roberts.
27

'.^
I
o
/NS^^̂^^
C
sa
;>
QDX)
ISu
WD £
c
oauoUb«o
II
a.
i
1
o
U
o ^
<
oNO
o
s
O
^ oD.
OS
i
^4
I
if?
1
i
I
ais;

i!S ft.
^
&

m. mZMi
(DX)
c
H
e
oa
O
IS
B
haOCI.
E
>
Bv
o
6C
B
en
BT3BOD.CO
^
f

1
mmm
X
^^s^^Ob.
\o
>% Q-
^ )-^
;« .IS
O ^o 2
H 2
^oJ o
u ^o c
oU
cc3
Oh
Q
o
CO
>(73
C/3
cd
g>.
Li.
i
^"^
1:

^.
.s
A
>^

:!
s?
i
p
«:-
OX)
ISUrn
5?
c
a>
^c*^
o
>^DX)
c
Hc'2
c
o
e

8J
&l

^1
U
t.
a>
o) 2 S
o ^ o;
^ c £m ^ ^
o < is
o<Q
H0^
u
Ea>
au,wocc
OHU
o.
EoU
^
0) Ss?

1
Ii
»
#^\
C
c
(/J
O)CX)
a o
O 4>
W 3
t =0^ o
U
en
uco
-1.ItIt
® WD
.Sf ox:
CM U
O.t:H =
x: .E
^ S
CA
Eu
d)
^oCO s
^^^^^/NSTV
I:
ISii

i
^^
p.. c
o c«
£ =o «
^ WDco
OS*
u^
I
COCO
Co
CM
BCO
c3
>O
en
i
Pi
s
>
Q
oexp.
oco(D
Ho
oa.
i
JTi OnOn
^ O
OP.
00
Ido
oH(DOOVh
1
ooo
d)

C/3
a;
1/3
o
c

\i
Q
Pi
O 7^ cO O)
o s:

J
m
O
CDC
O
c« o
o
'SID'S
.2f*^
2 WDBo
cd ucd ^
cuaHb.
c2
u9Oc««ea>
X
eo0)
cn
is
en
«aEo
^
I
CO
CO•a
f2
oDO<
V>-
m1
1
i
S:
S

>s
uo
>»?^ .s
Bau-2
a;
C/3
o
U o
^
^o
3O1^3
CJc
o
e
Ea.
Ouo
03
o

VD
1

m
ouaa<
.ii P
C^^X
O
bX)
&£
^S ^c
'S
aEou
>O
o
^ ^ ^ ^ ^ ^ ^r- ^-H oo m ^ '^ t^m en cN cN ^-< ^
00
O
o
C/3
s
&O
in ^
^ o• »^O
o
HhJ
cdc/3
oGO
CoU
c3
OUo
-4-^
C/2
:3
c
o
13
PhVh
so
C/3
OPQ
o
>
<bX)
o0-)
Oc
c/3
CI.
U;:3
c/3 ^ C
U c/D >
i
I
CO
ii
i.
I:

i
.««i°L%\O
W)c
o
• ««
0^
CSouc.2f*S
o
o3
«

S^ Ox
Q
u
i

X/1
Ba
>
Q
o
X p
OX) Mc
U
p
OS00
00
o m̂ 00
00
o Ti-en
encn
00 00in
a>
&O
^
0^
'o>
IHS^
a0^I/]
c
E
>
^«—
»
oH
00
>4-J
o
O
cd
bDo
00
(D

i
^o
a;
C
Sua
Q
"IS
>o
u
C/3

m
c
13
^^'',
11

C3
Urn
u
On
I
o*u

o

I If
5^
yD07r
Pi
oaa
c
sCD
c
aoH
c
BQi01)CO
c
aoH>*^UOa.Q.3
_>>
OD
£
V3
E
^

c
Piu
c
a
"5.
ECO
o
o
'ECQ
D.
EoUQ
a.oH
^/si<^^/NS^V^

I
^XL
^/KfOA-^/NST^"^
V3
OX)
uoU
c
173
O
c
b4C
o
c
•4—
>
cd
--»
CO
-4—
»
cd
oU
O
13
1/5
(DOoCu'4-1
opO
C
e(/D
<
C/3
on
SH
I
Ci
co••A
s
a.
05
ST
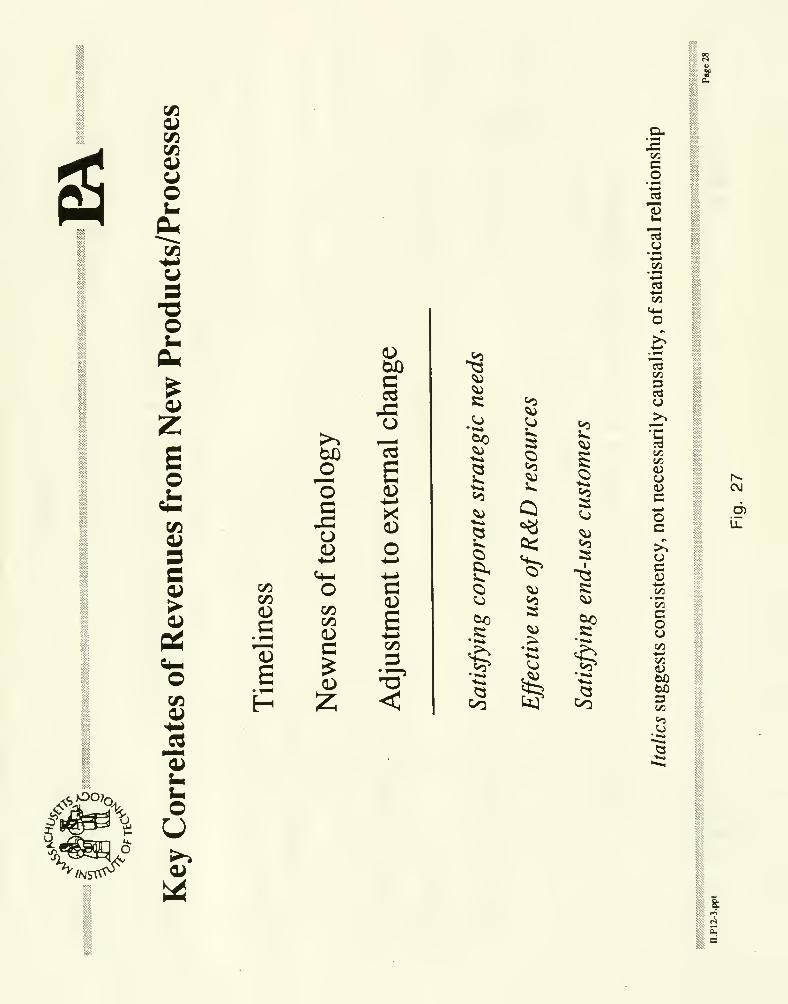
is
OU
5
cotd
1uCO
CA
^
\ o
/NS^^.^^
OUPm
zso
3C
PS
uoU
O
o13
^ E
C13
e
oco
C/5
CD
X
E
3
<
3
00
2
2
s-
C/3
03
Sto
05
I
St
CO
cdCA
O
00CAOococ
oc(U«—
>
'c/3
cou
t/2
m3CA
CVJ
u.

1
si-:
is
fcp
.SJpO'Q.
^/NST^
o
O
o
uo
ou
c
&
On
Q
V


m'Li'BMRIEs
'iiiillll3 "^060 00843154 b
2237 u2S


Date Due
AU63«nl935
OAN. 4 is 96
V";
Lib-26-67


Related Documents