Strategic management of complex projects: a case study using system dynamics James M. Lyneis, a * Kenneth G. Cooper a and Sharon A. Els a James M. Lyneis works in the Business Dynamics Practice of PA Consulting Group and is a Senior Lecturer at MIT. Prior to joining PA in 1978, he was an Assistant Professor at MIT’s Sloan School of Management. Dr Lyneis has a Ph.D. in Business Administration from the University of Michigan and undergraduate degrees in Electrical Engineering and Industrial Management from MIT. Kenneth G. Cooper is a member of the Management Group of PA Consulting and leads the Business Dynamics Practice within PA. His management consulting career spans 25 years, in which he has directed over 100 consulting engagements, among them analyses of 60 major commercial and defense development projects. His clients include AT&T, Aetna, Arizona Public Service, Hughes Aircraft, IBM, Litton, MasterCard, McDonnell-Douglas, Northrop, Rockwell, and several law firms. Mr Cooper received his bachelor’s and Abstract System dynamics models have been used extensively over the last 20 years on complex development projects and have proven their value in contributing to significantly improved project performance. System dynamics models facilitate the strategic management of projects, including planning the project (setting the initial schedule and budget, the organization structure, process model, etc.), determining measurement and reward systems, evaluating risks, and learning from past projects. The use of system dynamics for strategic project management is illustrated with a case study of the Peace Shield Air Defense System. On this project, the model was used to support the project bid, to identify and manage risks, and to assess the benefit of several process and organization changes which were implemented on the project. Upon completion, the project results were systematically compared to an earlier project to assess the management lessons — what worked and what did not, and what was the benefit. These lessons were systematized in a management learning system. Copyright 2001 John Wiley & Sons, Ltd. Syst. Dyn. Rev. 17, 237–260, (2001) Introduction The challenge— project performance problems Research, design, and development projects are the lifeblood of many organizations. This is true not only for ‘‘project-based’’ organizations such as large aerospace or civil construction companies, but also for companies that depend on a flow of new products and services to remain competitive, such as in the automotive, electronics, and software industries. Delivering new products and services on time and in budget increasingly determines success or failure. Yet most large, complex development projects experience substantial cost and schedule overruns. A review by Morris and Hough (1987; p. 7) of some 3500 projects revealed that ‘‘overruns are the norm, being typically between 40 and 200 percent.’’ A survey by Roberts (1992) of corporate R&D projects found that less than half met their time-to-market and budget objectives. Recent advances in project management techniques do not seem to have improved the situation significantly. A survey by the Defense Systems Management College at Fort Belvoir, Virginia, indicated that the average cost overrun for engineering and manufacturing development of a major system was 45 percent, and the Ł Corresponding author. a Business Dynamics Practice, PA Consulting Group, One Memorial Drive, Cambridge MA 02142, U.S.A. Business Dynamics Practice, PA Consulting Group (formerly Pugh-Roberts Associates) System Dynamics Review Vol. 17, No. 3, (Fall 2001): 237 –260 Received August 2000 DOI: 10.1002/sdr.213 Accepted April 2001 Copyright 2001 John Wiley & Sons, Ltd. 237

Welcome message from author
This document is posted to help you gain knowledge. Please leave a comment to let me know what you think about it! Share it to your friends and learn new things together.
Transcript
Strategic management of complex projects:a case study using system dynamicsJames M. Lyneis,a* Kenneth G. Coopera and Sharon A. Elsa
James M. Lyneis worksin the BusinessDynamics Practice ofPA Consulting Groupand is a SeniorLecturer at MIT. Priorto joining PA in 1978,he was an AssistantProfessor at MIT’sSloan School ofManagement.Dr Lyneis has a Ph.D.in BusinessAdministration fromthe University ofMichigan andundergraduate degreesin ElectricalEngineering andIndustrialManagementfrom MIT.
Kenneth G. Cooper is amember of theManagement Group ofPA Consulting andleads the BusinessDynamics Practicewithin PA. Hismanagementconsulting careerspans 25 years, inwhich he has directedover 100 consultingengagements, amongthem analyses of 60major commercial anddefense developmentprojects. His clientsinclude AT&T, Aetna,Arizona PublicService, HughesAircraft, IBM, Litton,MasterCard,McDonnell-Douglas,Northrop, Rockwell,and several law firms.Mr Cooper receivedhis bachelor’s and
Abstract
System dynamics models have been used extensively over the last 20 years on complexdevelopment projects and have proven their value in contributing to significantly improvedproject performance. System dynamics models facilitate the strategic management of projects,including planning the project (setting the initial schedule and budget, the organization structure,process model, etc.), determining measurement and reward systems, evaluating risks, and learningfrom past projects. The use of system dynamics for strategic project management is illustratedwith a case study of the Peace Shield Air Defense System. On this project, the model was used tosupport the project bid, to identify and manage risks, and to assess the benefit of several process andorganization changes which were implemented on the project. Upon completion, the project resultswere systematically compared to an earlier project to assess the management lessons—what workedand what did not, and what was the benefit. These lessons were systematized in a managementlearning system. Copyright 2001 John Wiley & Sons, Ltd.
Syst. Dyn. Rev. 17, 237–260, (2001)
Introduction
The challenge—project performance problems
Research, design, and development projects are the lifeblood of manyorganizations. This is true not only for ‘‘project-based’’ organizations suchas large aerospace or civil construction companies, but also for companiesthat depend on a flow of new products and services to remain competitive,such as in the automotive, electronics, and software industries. Delivering newproducts and services on time and in budget increasingly determines successor failure.
Yet most large, complex development projects experience substantial costand schedule overruns. A review by Morris and Hough (1987; p. 7) of some3500 projects revealed that ‘‘overruns are the norm, being typically between40 and 200 percent.’’ A survey by Roberts (1992) of corporate R&D projectsfound that less than half met their time-to-market and budget objectives. Recentadvances in project management techniques do not seem to have improved thesituation significantly. A survey by the Defense Systems Management Collegeat Fort Belvoir, Virginia, indicated that the average cost overrun for engineeringand manufacturing development of a major system was 45 percent, and the
Ł Corresponding author.a Business Dynamics Practice, PA Consulting Group, One Memorial Drive, Cambridge MA 02142, U.S.A.Business Dynamics Practice, PA Consulting Group (formerly Pugh-Roberts Associates)
System Dynamics Review Vol. 17, No. 3, (Fall 2001): 237–260 Received August 2000DOI: 10.1002/sdr.213 Accepted April 2001Copyright 2001 John Wiley & Sons, Ltd.
237
238 System Dynamics Review Volume 17 Number 3 Fall 2001
schedule overrun was 63 percent (Kausal 1996). In a sample of ten projectsmaster’s degrees fromMIT and BostonUniversity,respectively.
Sharon A. Els is aManaging Consultantin PA’s BusinessDynamics Practice.Since joining PA in1989, Ms Els hasmanaged andparticipated in manyconsultingassignments for clientsin the financialservices, civilconstruction andsoftware developmentindustries. Shereceived an S.B.degree in CivilEngineering and anS.M. in ManagementScience from MIT.
by Reichelt and Lyneis (1999), the average budget overrun was 86 percent (66percent when the cost of added work scope is removed), and schedule overrun55 percent. Project problems occur in the non-profit world as well. A WorldBank (1992) survey of its projects found that only 70 percent of recent projectshad been rated ‘‘satisfactory’’, with only one-third substantially achievinginstitution development goals and with delays in completion averaging 50%.
Problems of cost and schedule overrun on projects have persisted for decades,in spite of numerous advances in the field of ‘‘project management’’. In the1950s, the static network modeling approaches PERT and the critical pathmethod (CPM) were developed. These have continued to evolve with theaddition of probabilistic parameter estimates and integration with resourceloading assessments. Alternative approaches to software development suchas the waterfall and spiral methods have been adopted. Finally, teaming,concurrent engineering, and the recognition and emphasis on ‘‘soft’’ andpeople factors have emerged as methods of enhancing project performance. Theannual market for project management software has been estimated to exceed$1 billion (Shtub et al. 1994). The Project Management Institute, dedicatedto the improvement of project management, boasts a membership of 39,000worldwide.
Why do projects continue to perform poorly in spite of these advancesand the substantial effort on tools and techniques? We believe that a majorreason for continued schedule and budget performance problems is thatwhile projects are fundamentally complex dynamic systems, most projectmanagement concepts and tools either (1) view a project statically or (2)take a partial, narrow view in order to allow managers to cope mentallywith the complexity (for example, analyzing design functions individually orhaving separate focuses on soft and hard factors, when all are simultaneouslyimportant). Traditional tools and mental models are inadequate for dealingwith the dynamic complexity of projects. In addition, these tools foster theperception that each project is unique, which makes systematic learning acrossprojects difficult. As a result, managers continue to make mistakes. While somelearn from experience, these lessons are not effectively passed to subsequentgenerations of managers.
Typical project dynamics
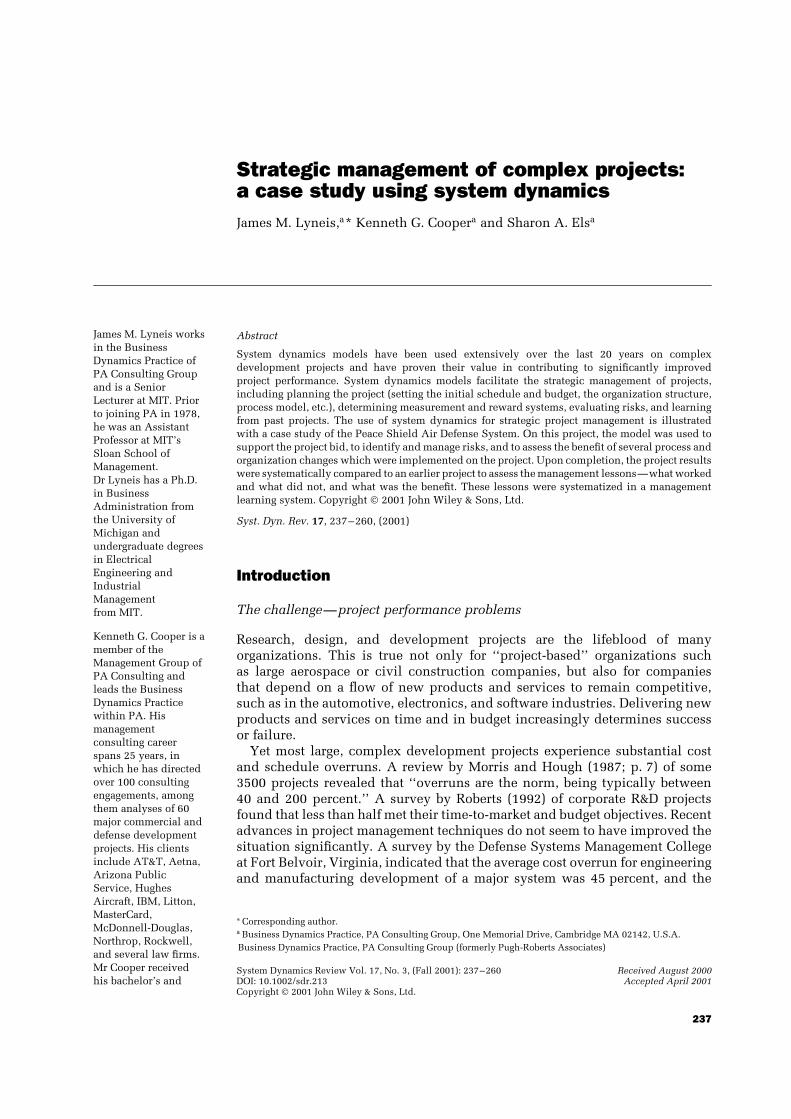
Figure 1 illustrates the nature of project dynamics. In the ideal project, staffingfollows the plan and increases to a peak, then falls off as the work is completed.In reality, however, project staffing is often slower to build up than planned(delays in getting approvals, difficulties finding staff) and frequently exceedsplanned levels for an extended period (the overrun). Often, there is a second‘‘peak’’. On most projects, managers also assume, either explicitly or implicitly,that productivity will remain constant over the duration of the project. In
J. M. Lyneis, K. G. Cooper and S. A. Els: Strategic management of complex project 239
Fig. 1. Typical projectdynamics Project Staffing
TypicalPlan
Time
Time
Productivity(Normalized)
2
1
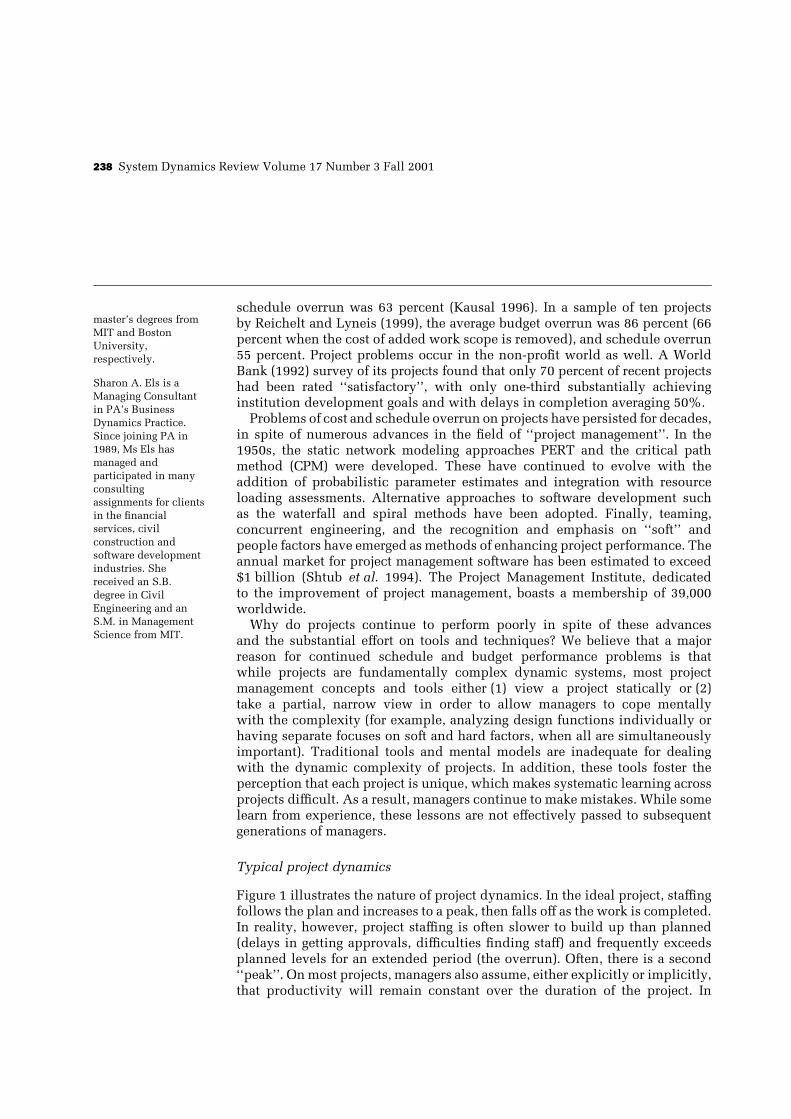
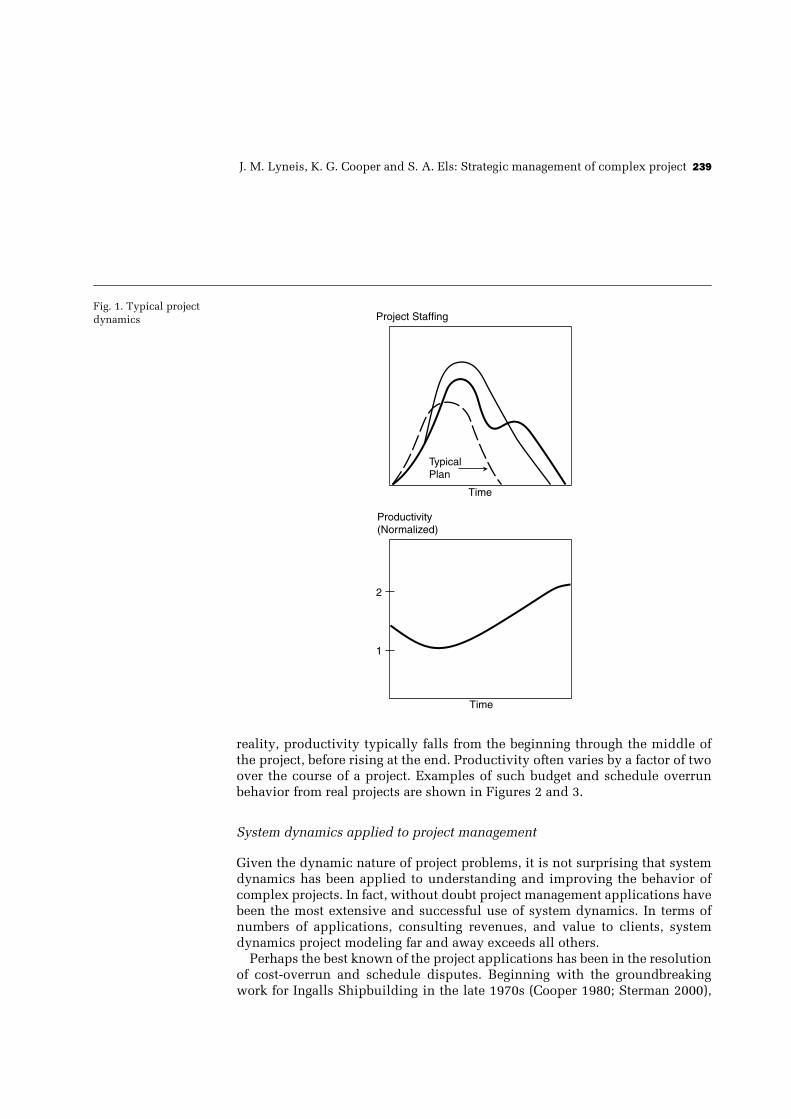
reality, productivity typically falls from the beginning through the middle ofthe project, before rising at the end. Productivity often varies by a factor of twoover the course of a project. Examples of such budget and schedule overrunbehavior from real projects are shown in Figures 2 and 3.
System dynamics applied to project management
Given the dynamic nature of project problems, it is not surprising that systemdynamics has been applied to understanding and improving the behavior ofcomplex projects. In fact, without doubt project management applications havebeen the most extensive and successful use of system dynamics. In terms ofnumbers of applications, consulting revenues, and value to clients, systemdynamics project modeling far and away exceeds all others.
Perhaps the best known of the project applications has been in the resolutionof cost-overrun and schedule disputes. Beginning with the groundbreakingwork for Ingalls Shipbuilding in the late 1970s (Cooper 1980; Sterman 2000),
240 System Dynamics Review Volume 17 Number 3 Fall 2001
Fig. 2. A typicalaerospace project witha long staffing ‘‘tail’’
00 3 6 9 12 15 18 21
100.
200.
300.
400.
ApproximateOriginalPlan
Simulated
Actual
Disguised results fromactual aerospaceproject
Design Labor (Equivalent People)
Year
Fig. 3. A typicalproduct developmentproject withsignificant overstaffingin later stages
0Year 1 Year 2 Year 3 Year 4 Year 5 Year 6
50.
100.
150.
200.
TIME
Disguised results fromactual vehicle project
Actual
SimulatedOriginalPlan
Program staff, simulated data (equivalent staff)
Pugh-Roberts/PA Consulting has applied system dynamics in more than 30contract disputes. The approximate value of these disputes is in excess of$4 billion, with an average recovery of 75 percent using system dynamicsversus 40 percent with traditional approaches. Much more extensive but lesswell known or documented, however, is the application of system dynamics to‘‘strategic’’ project management (including the avoidance of cost and scheduleoverrun and resultant disputes). Pugh-Roberts/PA Consulting alone has appliedsystem dynamics modeling in a ‘‘proactive’’ way to more than 75 differentdesign, construction, and development projects. These include projects in
J. M. Lyneis, K. G. Cooper and S. A. Els: Strategic management of complex project 241
aerospace (missiles, aircraft), civil construction (nuclear power plants, ChannelTunnel), shipbuilding (both military and commercial), software (telecomswitching systems, air traffic control, air defense systems), and productdevelopment (vehicle development). These projects have generated consultingfees in excess of $25 million, while conservatively saving clients more than$5 billion on improved project budget performance. Savings from earliercompletion and higher delivered quality further increase the benefit to clients.In addition to Pugh-Roberts/PA Consulting, many others have applied systemdynamics to improving project performance, including Abdel-Hamid andMadnick (1991), Homer et al. (1993), Ford and Sterman (1998), and Rodriguesand Williams (1998).
While some of the work by Pugh-Roberts/PA Consulting is touched on inCooper and Mullen (1993) and Reichelt and Lyneis (1999), the full breadthof system dynamics use in project management has not been described indetail. This article therefore discusses the role of system dynamics modelsin the proactive, strategic/tactical management of design, construction, anddevelopment projects, and illustrates with a case study of the Peace Shield AirDefense System.
Strategic project management
The types of decisions made on projects are often categorized as being strategic,tactical, or operational. The use of system dynamics most naturally fallsinto the strategic/tactical end of the spectrum. But what is strategic projectmanagement? In one view, strategic project management involves determiningthe fit of specific projects in achieving the strategy of the company (whatproducts and enhancements, when what technology and so on?). However,these questions are more a part of strategic company management thanstrategic project management. In our view, strategic project managementcovers decisions that are taken up front in designing the project, and thenthe guidance provided to operational decisions that considers the longer-term impact of these decisions on downstream performance of the project.Specifically, strategic project management involves:
ž Designing the project. Strategic design entails setting the initial scheduleand budget, selecting a process model (e.g., waterfall vs. spiral) andorganization structure (e.g., functional vs. integrated team), establishingappropriate buffers, and determining overlap/concurrency between phasesof work, so as to give the best chance of successfully meeting the project’scompany–strategic objectives. While the scope, schedule and budget maybe beyond the direct control of project management, the consequences ofalternatives can be communicated to company management and negotiated.
242 System Dynamics Review Volume 17 Number 3 Fall 2001
ž Determining what indicators to measure, monitor, and exert pressure on.What is measured and rewarded drives behavior. If adherence to scheduleis all that is monitored, then people are likely to make efforts to meet theschedule regardless of its impact on quality or even cost (particularly ifthe costs are hard to see, such as long hours and overtime). If too manyconflicting factors are monitored (e.g., cost, schedule, and quality), theneither staff become demoralized and ignore them all or they shift emphasisfrom one to another in response to the current crisis. Designing a rewardsystem in advance can help assure achievement of the project’s strategicobjectives.
ž Risk management. Specification or scope changes, design difficulties, riskssuch as delays in getting staff from other projects, labor shortages, late designsor material deliveries from other programs or vendors, and other similarproblems often impact a project. While decisions must ultimately be taken asactual conditions evolve, managers can more quickly and effectively handlechange if they have determined in advance which risks pose the greatestthreat to the project, what should be monitored to provide early warning ofeach risk, and the best responses to such potential changes. In some cases,actions developed for specific risks may improve performance under normalcircumstances and should be built into the project from the beginning (forexample, integrated product design and ‘‘teaming’’).
ž Incorporating learning from past projects. Based on benchmarking and otheranalyses of past projects, how can we better design and then manage this andfuture projects? This requires determining what really happened in terms ofcost, schedule, and rework on prior projects; what risks actually occurred;and what management initiatives worked and what did not.
ž Making mid-course corrections. Mid-project changes in project schedules,staffing, etc. in response to actual progress and external conditions willgenerally be required. These tactical responses need to consider the indirectand long-term impacts of the corrections in order to avoid potentiallydisastrous downward spirals (see discussion of model).
In supporting strategic project management along these dimensions, systemdynamics has been used by Pugh-Roberts/PA Consulting (and others) in thefollowing specific ways on actual projects.
Pre-project
BID OR PLAN ANALYSIS The model is used to establish and/or test the feasibilityof schedule and budget given scope and other strategic requirements. Ideally,a model of an ancestor program is first used to determine the characteristics ofa typical project in the organization, including normal productivity, rework,management practices, etc. The model is then adapted to the scope andanticipated external conditions of the proposed project, and used to assess
J. M. Lyneis, K. G. Cooper and S. A. Els: Strategic management of complex project 243
cost/schedule tradeoffs for the proposed project. If a bid has already beensubmitted, the model is used to assess the assumptions required to make thebid, e.g., productivity, rework, external conditions, and actions to bring theproject in as close as possible.
COMPETITOR ANALYSIS Publicly available information is used in conjunction withthe simulation model to estimate what the program might cost a competitor,and therefore provide a range of possible competitive bids.
RISK ANALYSIS The model is used to determine the impact of possible changesin external conditions on the performance of the project versus the bid or plan.A simulation that reflects the project plan provides a baseline against whichalternatives are measured. The direct impacts of possible changes in externalconditions (specification or scope changes, design difficulties, risks such aslabor shortages, late vendor design or material deliveries, etc.) are input tothe model (alone and in combination) and simulation results compared to thebaseline. Risks of high probability and/or those producing a significant overrunfor the project warrant careful monitoring and/or mitigating actions.
MITIGATION ANALYSIS The model is used to determine changes in program sched-ules, interim milestones, resourcing, etc., which minimize the consequencesof risks.
During the project
RISK MANAGEMENT The model is used to determine the impact of project risks thatactually materialize. First, the baseline simulation is compared to a simulationin which the direct impacts of the risks are included. Then, the model is usedto determine changes in the program that minimize the consequences of thatspecific risk (for example, changes in schedule duration, interim milestones,phase overlap, additional staff, new processes or methods).
CHANGE MANAGEMENT Change management is a subset of risk management, butwhere the changes (usually scope increases or design changes) are often at therequest of an external customer and therefore generally involve adjustmentsto the contracted cost and schedule. The model is used to determine thelikely full cost and schedule implications of specification and scope changesby comparing two simulations: the baseline simulation (or current simulationof project) and a simulation in which the direct impacts of the changes areincluded. The latter simulation determines the indirect, secondary and tertiaryeffects of the direct impact on the project. These results are used as the basis for
244 System Dynamics Review Volume 17 Number 3 Fall 2001
negotiating reasonable compensation and/or for designing actions to mitigatethe cost/schedule impact of the change.
EVALUATION OF PROCESS CHANGES The model is used to assess the total impact ofprocess or organizational changes, such as computerized design, new tools,integrated product design, and teaming. Implementation of change is oftendisruptive and involves short-term costs before long-term benefits are realized.Without an analysis of these dynamics, change programs are often abandonedbefore they have a chance to succeed. See Sterman et al. (1997) for an exampleof this.
Post-project
BENCHMARKING AND EVALUATION OF BEST PRACTICES Without a simulation model, itis very difficult to compare the performance of projects in a meaningful way.How much of the difference results from different products? From differentexternal conditions? From different management practices? With a model, itbecomes possible to answer these questions. First, models are developed andcalibrated to the different projects. Then, differences in external conditions andscope/complexity are removed. What remains can be attributed to differencesin management actions. The improvements from specific actions are furtherassessed by changing the actions in the simulation and comparing theperformance of the simulated projects.
TRAINING AND DEVELOPMENT The training and development of future projectmanagers can be enhanced through the use of simulation models of projects.First, models are used as ‘‘flight simulators’’ to allow practice and learning.Second, the lessons about what works are inferred from past projects, asdescribed above, and communicated to the next generation of managers.
Many of these model uses were performed for the Peace Shield Programdescribed in the remainder of the article.
The Peace Shield program and model
Project background
The Peace Shield Weapon System was a program undertaken by HughesAircraft Company for the U.S. Air Force on behalf of the Kingdom of SaudiArabia. Hughes, now a part of Raytheon Corporation, won a competitive bidfor the program after the Air Force terminated another contractor for default.The estimated value of the contract was more than $1 billion with finaldelivery scheduled for 3 January 1996. This schedule required a 54-month
J. M. Lyneis, K. G. Cooper and S. A. Els: Strategic management of complex project 245
design, development, and testing effort. While many people in the Air Forceconsidered this schedule to be impossible, with some estimates as high as116 months, Hughes contracted for the 54 months with a $50 million bonusshould Hughes achieve a three-months-early delivery.
The Peace Shield program involved both hardware and software. It ‘‘requireddelivery of a nationwide ground-air defense and command, control, andcommunications system to the Saudi Air Force. Key elements included 17radar installations, a central command operations center, five sector commandand operations centers, nationwide communications links, interfaces with allagencies having a role in national defense, and communications centers tocontact and control civil and military aircraft.’’ (Kausal 1996).
The Peace Shield program was not the first program of this type forHughes. During the 1980s, the company had developed similar systems forNATO (Northern European Command and Control System) and Egypt. Pugh-Roberts/PA Consulting used a system dynamics model to advise Hughes duringseveral periods on the Peace Shield project. The next section describes thePeace Shield model and the final section how the model was used in supportof the program.
Model structure
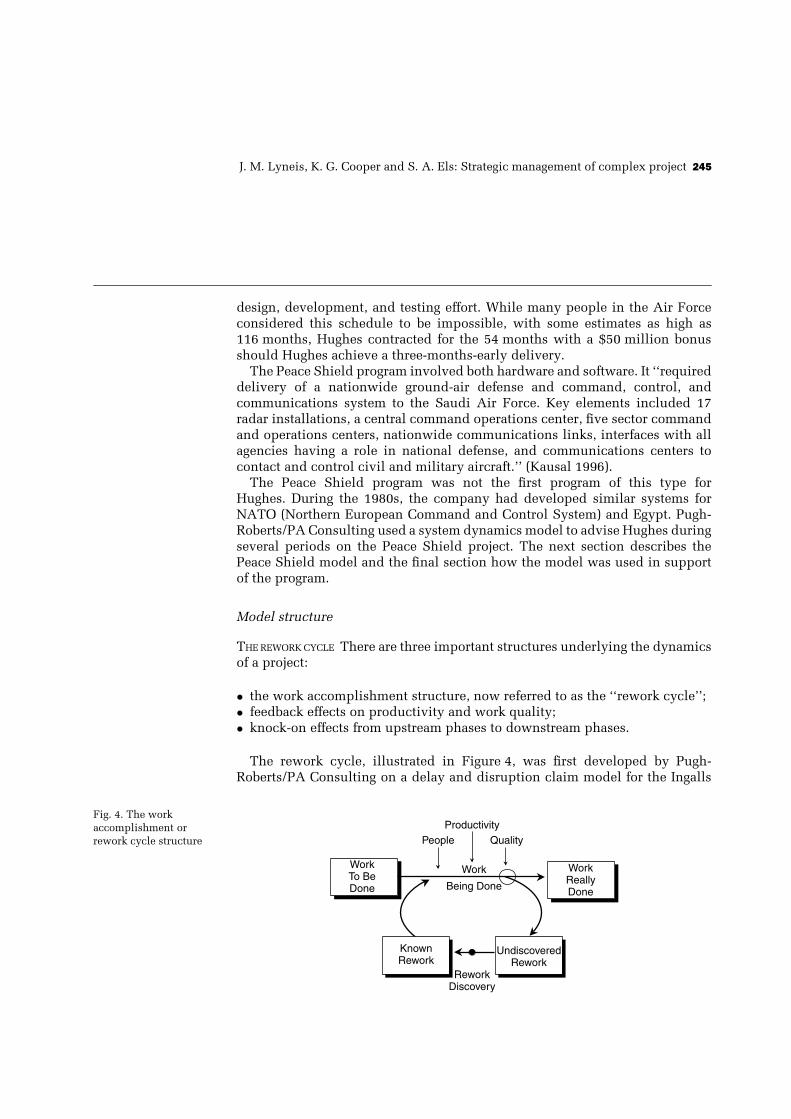
THE REWORK CYCLE There are three important structures underlying the dynamicsof a project:
ž the work accomplishment structure, now referred to as the ‘‘rework cycle’’;ž feedback effects on productivity and work quality;ž knock-on effects from upstream phases to downstream phases.
The rework cycle, illustrated in Figure 4, was first developed by Pugh-Roberts/PA Consulting on a delay and disruption claim model for the Ingalls
Fig. 4. The workaccomplishment orrework cycle structure People
Work
Being Done
WorkReallyDone
WorkTo BeDone
KnownRework
UndiscoveredRework
ProductivityQuality
ReworkDiscovery
246 System Dynamics Review Volume 17 Number 3 Fall 2001
Shipbuilding Division of Litton Industries (Cooper 1980), and refined overmany subsequent applications (Cooper 1993a; b; c). Almost all dynamic-project models have a rework cycle in some form (Abdel-Hamid, 1991; Fordand Sterman, 1998; Homer et al. 1993).
As shown in Figure 4, the rework cycle consists of four stocks of work. Atthe start of a project or project stage, all work resides in the stock Work ToBe Done. As the project progresses, changing levels of staff (People) workingat varying rates of Productivity determine the pace of Work Being Done. WorkBeing Done initially depletes the stock of Work to be Done, and later thestock of Known Rework. Work is executed at varying, but usually less thanperfect, Quality. Quality represents the fraction of the work being done atany point in time that will enter the stock Work Really Done and which willnever need re-doing. The rest will subsequently need some rework and flowsto the stock of Undiscovered Rework—work that contains as yet undetectederrors. Errors are detected in the normal course of work and as the result ofdownstream efforts or testing; Rework Discovery may occur months or evenyears after the rework was created, during which time dependent work hasincorporated these errors or technical derivations thereof. Once discovered,the stock Known Rework demands the application of resources beyond thoseneeded for executing remaining Work to be Done. Rework is executed at theproductivity and quality levels then prevailing (although the inherent level ofeffort required for rework may be more or less than that for initial work).
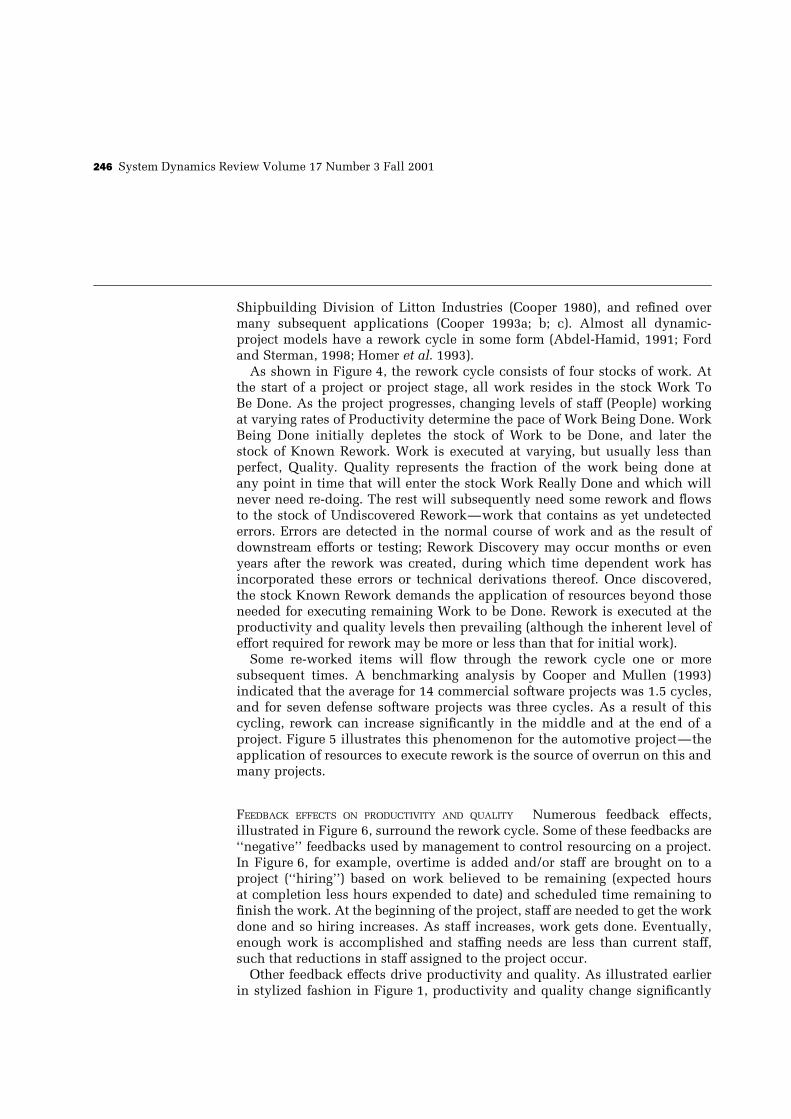
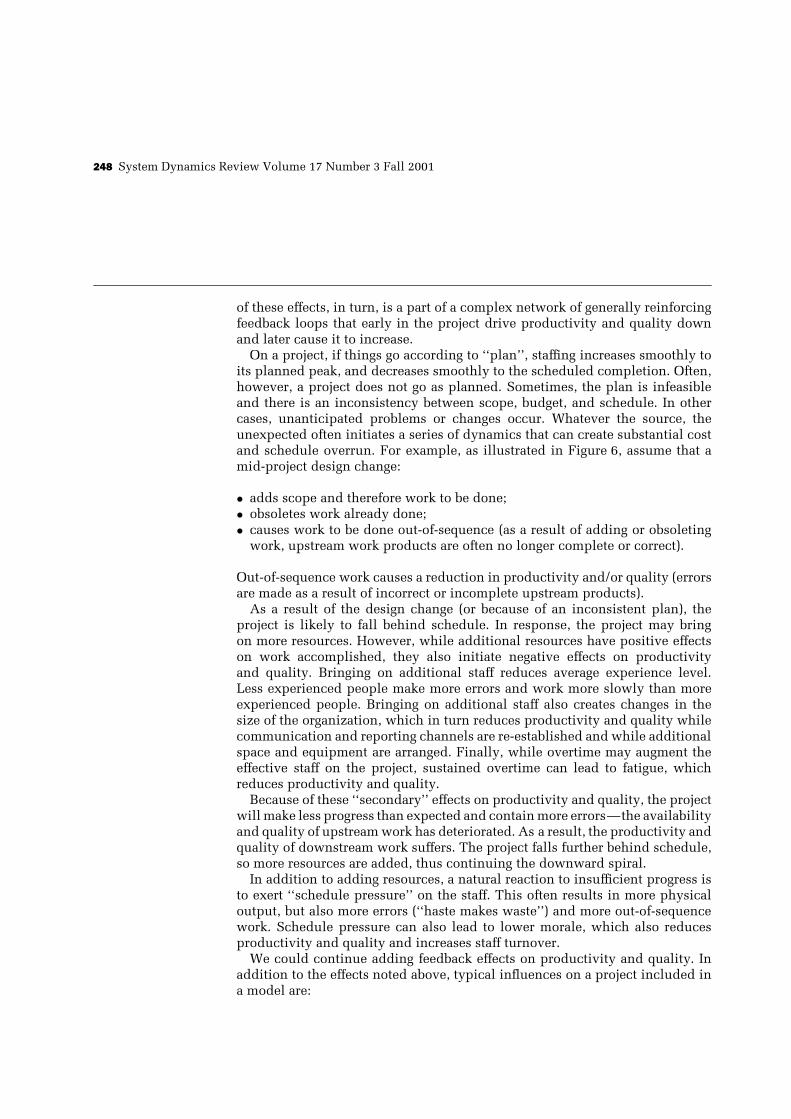
Some re-worked items will flow through the rework cycle one or moresubsequent times. A benchmarking analysis by Cooper and Mullen (1993)indicated that the average for 14 commercial software projects was 1.5 cycles,and for seven defense software projects was three cycles. As a result of thiscycling, rework can increase significantly in the middle and at the end of aproject. Figure 5 illustrates this phenomenon for the automotive project—theapplication of resources to execute rework is the source of overrun on this andmany projects.
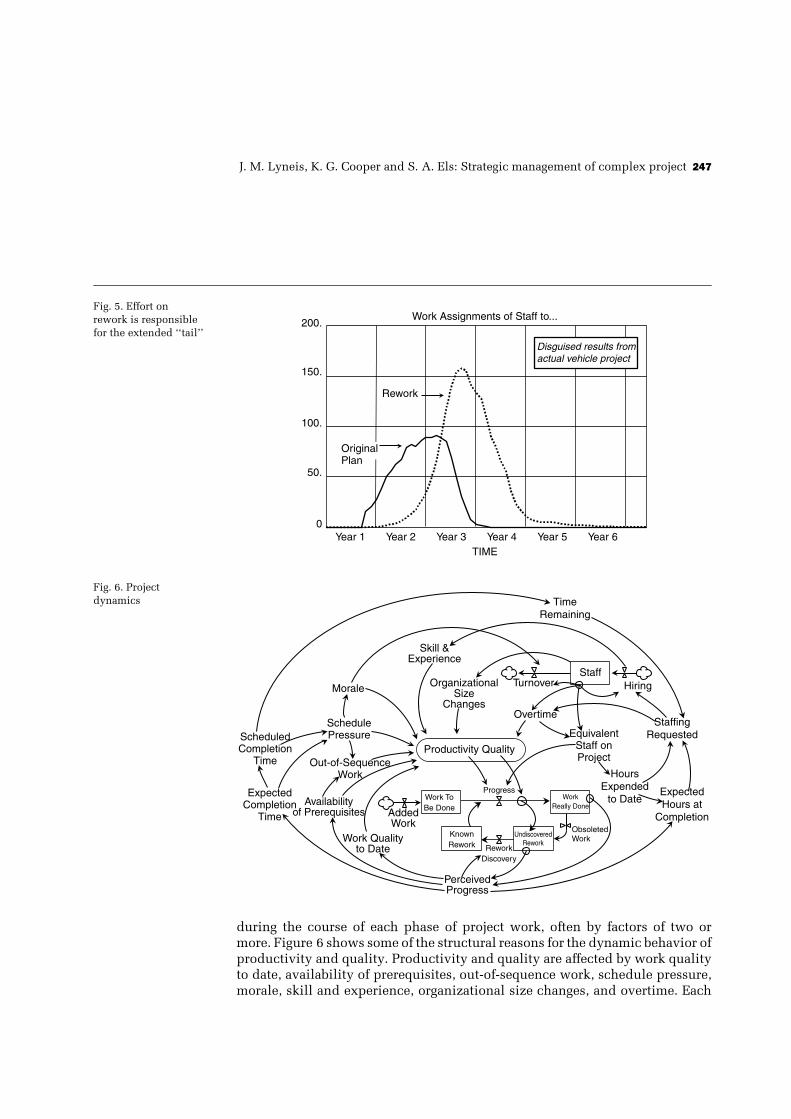
FEEDBACK EFFECTS ON PRODUCTIVITY AND QUALITY Numerous feedback effects,illustrated in Figure 6, surround the rework cycle. Some of these feedbacks are‘‘negative’’ feedbacks used by management to control resourcing on a project.In Figure 6, for example, overtime is added and/or staff are brought on to aproject (‘‘hiring’’) based on work believed to be remaining (expected hoursat completion less hours expended to date) and scheduled time remaining tofinish the work. At the beginning of the project, staff are needed to get the workdone and so hiring increases. As staff increases, work gets done. Eventually,enough work is accomplished and staffing needs are less than current staff,such that reductions in staff assigned to the project occur.
Other feedback effects drive productivity and quality. As illustrated earlierin stylized fashion in Figure 1, productivity and quality change significantly
J. M. Lyneis, K. G. Cooper and S. A. Els: Strategic management of complex project 247
Fig. 5. Effort onrework is responsiblefor the extended ‘‘tail’’
0
50.
100.
150.
200.
Year 1 Year 2 Year 3 Year 4 Year 5 Year 6TIME
OriginalPlan
Rework
Disguised results fromactual vehicle project
Work Assignments of Staff to...
Fig. 6. Projectdynamics
ScheduledCompletion
Time
ExpectedCompletion
Time
Morale
SchedulePressure
Out-of-SequenceWork
Availabilityof Prerequisites
Work Qualityto Date
AddedWork
PerceivedProgress
Skill &Experience
OrganizationalSize
Changes
Productivity Quality
ProgressWork ToBe Done
KnownRework Rework
Discovery
WorkReally Done
UndiscoveredRework
ObsoletedWork
HoursExpended
to Date
EquivalentStaff onProject
StaffingRequested
ExpectedHours at
Completion
Turnover
TimeRemaining
StaffHiring
Overtime
during the course of each phase of project work, often by factors of two ormore. Figure 6 shows some of the structural reasons for the dynamic behavior ofproductivity and quality. Productivity and quality are affected by work qualityto date, availability of prerequisites, out-of-sequence work, schedule pressure,morale, skill and experience, organizational size changes, and overtime. Each
248 System Dynamics Review Volume 17 Number 3 Fall 2001
of these effects, in turn, is a part of a complex network of generally reinforcingfeedback loops that early in the project drive productivity and quality downand later cause it to increase.
On a project, if things go according to ‘‘plan’’, staffing increases smoothly toits planned peak, and decreases smoothly to the scheduled completion. Often,however, a project does not go as planned. Sometimes, the plan is infeasibleand there is an inconsistency between scope, budget, and schedule. In othercases, unanticipated problems or changes occur. Whatever the source, theunexpected often initiates a series of dynamics that can create substantial costand schedule overrun. For example, as illustrated in Figure 6, assume that amid-project design change:
ž adds scope and therefore work to be done;ž obsoletes work already done;ž causes work to be done out-of-sequence (as a result of adding or obsoleting
work, upstream work products are often no longer complete or correct).
Out-of-sequence work causes a reduction in productivity and/or quality (errorsare made as a result of incorrect or incomplete upstream products).
As a result of the design change (or because of an inconsistent plan), theproject is likely to fall behind schedule. In response, the project may bringon more resources. However, while additional resources have positive effectson work accomplished, they also initiate negative effects on productivityand quality. Bringing on additional staff reduces average experience level.Less experienced people make more errors and work more slowly than moreexperienced people. Bringing on additional staff also creates changes in thesize of the organization, which in turn reduces productivity and quality whilecommunication and reporting channels are re-established and while additionalspace and equipment are arranged. Finally, while overtime may augment theeffective staff on the project, sustained overtime can lead to fatigue, whichreduces productivity and quality.
Because of these ‘‘secondary’’ effects on productivity and quality, the projectwill make less progress than expected and contain more errors—the availabilityand quality of upstream work has deteriorated. As a result, the productivity andquality of downstream work suffers. The project falls further behind schedule,so more resources are added, thus continuing the downward spiral.
In addition to adding resources, a natural reaction to insufficient progress isto exert ‘‘schedule pressure’’ on the staff. This often results in more physicaloutput, but also more errors (‘‘haste makes waste’’) and more out-of-sequencework. Schedule pressure can also lead to lower morale, which also reducesproductivity and quality and increases staff turnover.
We could continue adding feedback effects on productivity and quality. Inaddition to the effects noted above, typical influences on a project included ina model are:
J. M. Lyneis, K. G. Cooper and S. A. Els: Strategic management of complex project 249
ž baseline design quality (clarity of initial specifications and pre-requisitedesign);
ž availability and quality of procured design and/or products;ž availability of customer-furnished information and/or equipment;ž adequacy of supervision;ž space constraints;ž management concern for quality;ž managerial continuity and experience.
The many productivity and quality feedback effects in combination withinadequate plans, typical startup problems, and/or mid-project changes cancause productivity and quality to be low and/or deteriorate in the earlyand middle stages of a project, before increasing at the end. Minimizing thedegradation of productivity and quality on a project is the key to minimizingcost and schedule delay. This requires understanding the dynamic drivers ofproject performance.
PHASE-ON-PHASE KNOCK-ON A rework cycle and its associated productivity andquality effects form a ‘‘building block’’. Building blocks can be used torepresent an entire project or replicated to represent different phases of aproject, in which case multiple rework cycles in parallel and series mightbe included. At its most aggregate level, such building blocks might representdesign, build and test. Alternatively, building blocks might separately representdifferent design stages (e.g., conceptual vs. detail) and/or design functions(structural, electrical, power, etc.). In software, building blocks might representspecifications, detailed design, code and unit test, integration, and test.
When multiple phases are present, important additional productivity andquality effects result from interactions between the phases, specifically:
ž availability of design products from upstream phases;ž quality of design products from upstream phases.
Problems early in a project can therefore ‘‘knock-on’’ to create later problems indownstream phases. In addition, downstream progress affects upstream workby fostering the discovery of upstream rework.
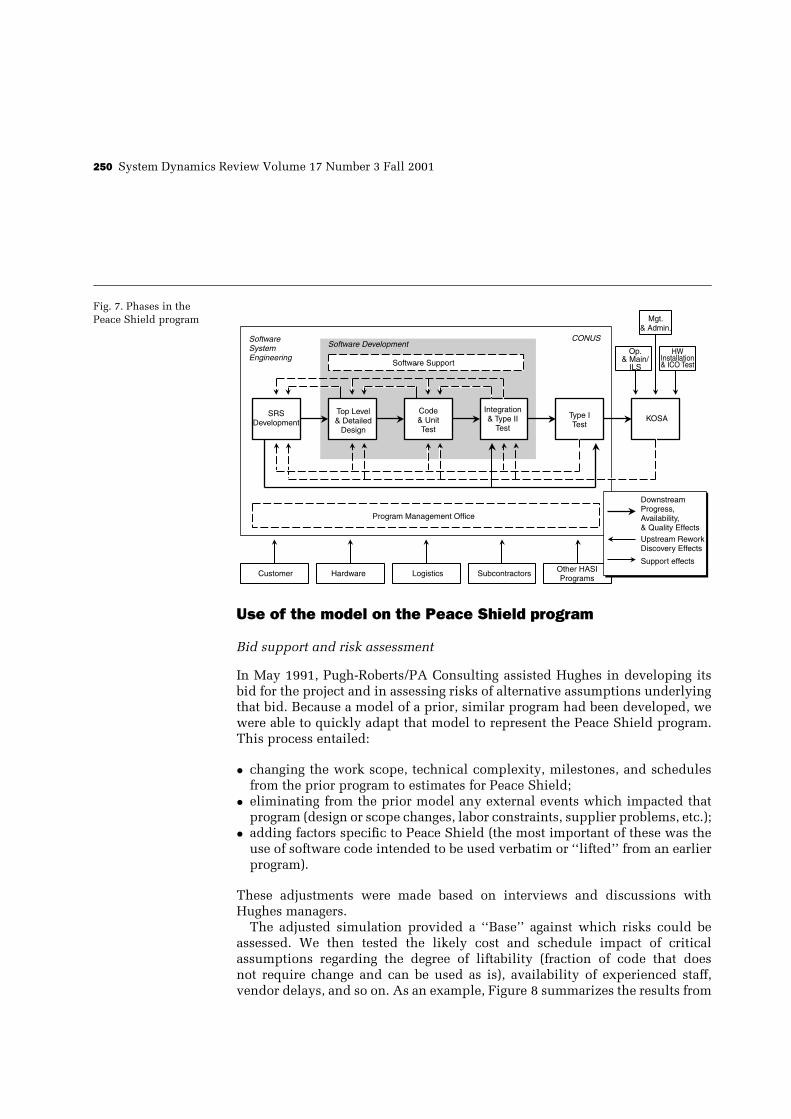
The building blocks in the Peace Shield model are illustrated in Figure 7.Because hardware was not anticipated to be a problem, the model representedonly the software development effort in six phases: SRS (specifications andrequirements), Detailed Design, Code and Unit Test, Integration and TypeII test, Type I test, and ‘‘KOSA’’ (Kingdom of Saudi Arabia) final assemblyand test.
250 System Dynamics Review Volume 17 Number 3 Fall 2001
Fig. 7. Phases in thePeace Shield program
SoftwareSystemEngineering
SRSDevelopment
Software Development
Software Support
CONUS
Mgt.& Admin.
Op.& Main/
ILS
HWInstallation& ICO Test
KOSAType ITest
Integration& Type II
Test
Code& UnitTest
Top Level& Detailed
Design
Program Management Office
Customer Hardware Logistics Subcontractors Other HASIPrograms
DownstreamProgress,Availability,& Quality EffectsUpstream ReworkDiscovery Effects
Support effects
Use of the model on the Peace Shield program
Bid support and risk assessment
In May 1991, Pugh-Roberts/PA Consulting assisted Hughes in developing itsbid for the project and in assessing risks of alternative assumptions underlyingthat bid. Because a model of a prior, similar program had been developed, wewere able to quickly adapt that model to represent the Peace Shield program.This process entailed:
ž changing the work scope, technical complexity, milestones, and schedulesfrom the prior program to estimates for Peace Shield;
ž eliminating from the prior model any external events which impacted thatprogram (design or scope changes, labor constraints, supplier problems, etc.);
ž adding factors specific to Peace Shield (the most important of these was theuse of software code intended to be used verbatim or ‘‘lifted’’ from an earlierprogram).
These adjustments were made based on interviews and discussions withHughes managers.
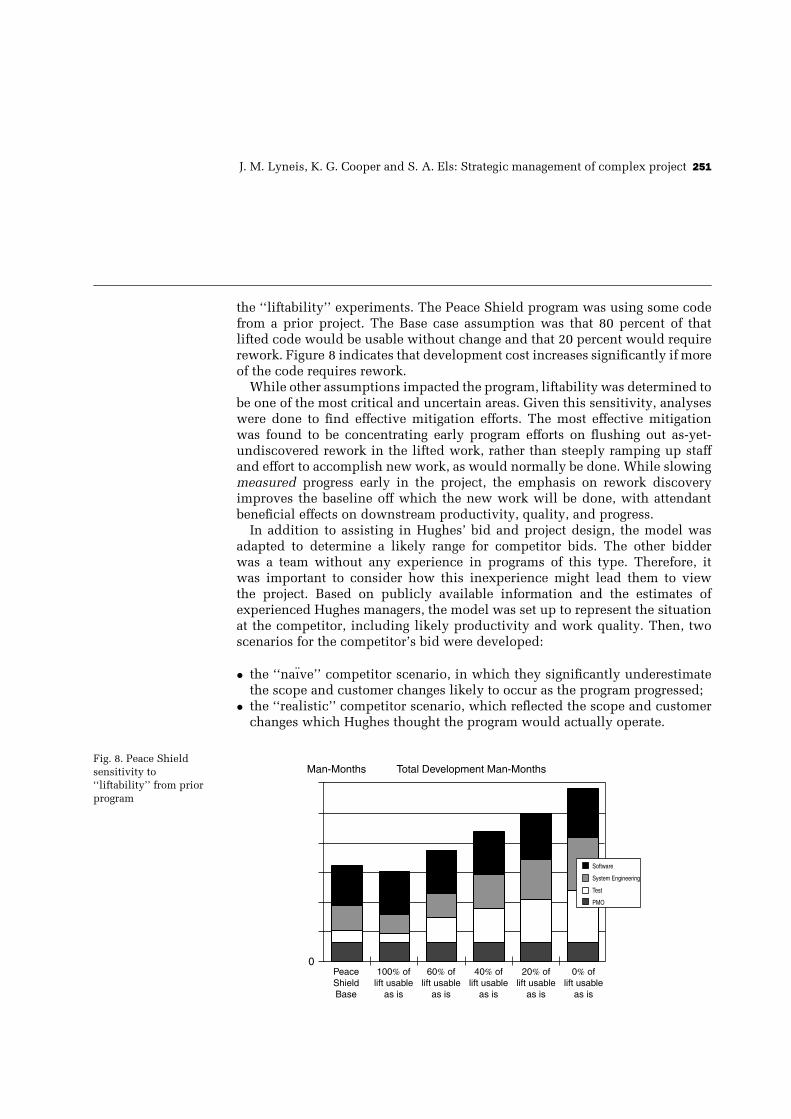
The adjusted simulation provided a ‘‘Base’’ against which risks could beassessed. We then tested the likely cost and schedule impact of criticalassumptions regarding the degree of liftability (fraction of code that doesnot require change and can be used as is), availability of experienced staff,vendor delays, and so on. As an example, Figure 8 summarizes the results from
J. M. Lyneis, K. G. Cooper and S. A. Els: Strategic management of complex project 251
the ‘‘liftability’’ experiments. The Peace Shield program was using some codefrom a prior project. The Base case assumption was that 80 percent of thatlifted code would be usable without change and that 20 percent would requirerework. Figure 8 indicates that development cost increases significantly if moreof the code requires rework.
While other assumptions impacted the program, liftability was determined tobe one of the most critical and uncertain areas. Given this sensitivity, analyseswere done to find effective mitigation efforts. The most effective mitigationwas found to be concentrating early program efforts on flushing out as-yet-undiscovered rework in the lifted work, rather than steeply ramping up staffand effort to accomplish new work, as would normally be done. While slowingmeasured progress early in the project, the emphasis on rework discoveryimproves the baseline off which the new work will be done, with attendantbeneficial effects on downstream productivity, quality, and progress.
In addition to assisting in Hughes’ bid and project design, the model wasadapted to determine a likely range for competitor bids. The other bidderwas a team without any experience in programs of this type. Therefore, itwas important to consider how this inexperience might lead them to viewthe project. Based on publicly available information and the estimates ofexperienced Hughes managers, the model was set up to represent the situationat the competitor, including likely productivity and work quality. Then, twoscenarios for the competitor’s bid were developed:
ž the ‘‘naı̈ve’’ competitor scenario, in which they significantly underestimatethe scope and customer changes likely to occur as the program progressed;
ž the ‘‘realistic’’ competitor scenario, which reflected the scope and customerchanges which Hughes thought the program would actually operate.
Fig. 8. Peace Shieldsensitivity to‘‘liftability’’ from priorprogram
PeaceShieldBase
0% oflift usable
as is
20% oflift usable
as is
40% oflift usable
as is
60% oflift usable
as is
100% oflift usable
as is
Software
System Engineering
Test
PMO
0
Man-Months Total Development Man-Months
252 System Dynamics Review Volume 17 Number 3 Fall 2001
The first scenario was likely to produce a bid by the competitor that Hugheswould find difficult to meet profitably without aggressive actions at the startof the program. However, the actual cost of the program under the more likelysecond scenario would be nearly double that of the first scenario. Hugheschallenge was to submit a winning but profitable bid and program design,under these circumstances.
Based on these analyses, our recommendations to Hughes in preparing theirbid were:
1. Submit a bid that is likely to somewhat higher than the Scenario 1 competitorbid above, but which can profitably be met by Hughes if the program ismanaged aggressively (see point 4 below);
2. Carefully define in the bid and contract Hughes’ understanding of the workscope, such that any future changes are clearly additional work that can becompensated for;
3. Stress Hughes’ experience in this type of project and therefore the likelyreliability of their bid;
4. Aggressively manage the program from day one to control costs: staff theprogram with the most experienced technical and managerial people; staffup in a controlled fashion, focusing first on discovering rework in thelifted code; and carefully manage customer expectations so as to minimizechanges.
All of these were incorporated into the bid and the design of the project.
Ongoing project management
Pugh-Roberts/PA Consulting supported management of the Peace Shieldproject on a regular basis during the execution of the work. The model wasupdated as data about program performance and external conditions evolved.In addition to decisions regarding the early emphasis on rework discoveryand the use of experienced staff, analyses supported a number of importantdecisions taken during the course of the project:
1. Implementation of a ‘‘teaming’’ structure and other improved processesfor the project. Historically, each phase of a development effort wasconducted exclusively by the staff specializing in that area, in a so-called ‘‘waterfall’’ approach. Approximately one year into the Peace Shieldproject, a new project manager took over and advocated a ‘‘teaming’’ styleof project execution along with other process changes, including detailedprogress reporting metrics (including monitoring of rework discovery) andcustomer involvement in design reviews. As it applied to Hughes, ‘‘teaming’’meant having both upstream and downstream staff specialists involved indesigning and reviewing the work in a given stage via participation in
J. M. Lyneis, K. G. Cooper and S. A. Els: Strategic management of complex project 253
project reviews and other meetings, and reviewing interim work products.The implementation of teaming and other process improvements was testedon the Peace Shield model. Teaming was assumed to have a significant short-term disruptive impact on productivity during implementation, followedby a less significant longer-term reduction in productivity (more peopleinvolved, reviews, disruption), but with resultant improvement in qualityof work and reduction in rework discovery time. These ‘‘direct impacts’’ ofteaming were estimated by Hughes staff and input to the model. The modelthen simulated the secondary and tertiary benefits that accrued later as aresult of the teaming initiative. The resultant total impact was computedby the model to be significant. In spite of initial slowing of progress dueto lower productivity, the project would finish three weeks earlier underthe most pessimistic assumptions about benefits and 18 weeks earlier underthe most optimistic. Teaming was therefore felt to be a relatively low riskmeans of improving the schedule and buffering against unforeseen futureproblems.
2. Implementation of a different staffing strategy for software engineering andsoftware coding. As completion of the initial tasks on a phase of workwinds down, the tendency is to release the staff on that phase to makethem available for other projects or for downstream activities. However, wehave continually found that a better strategy on complex projects is to slowthe staff ‘‘roll-off’’ and assign the extra staff to flushing out undiscoveredrework from the current phase of work, while delaying somewhat the startof the next phase. Analyses of software engineering roll-off and softwarecoding roll-off indicated that these changes would reduce program staffingby approximately 20 percent. More importantly, the delayed roll-off ofsoftware coding would reduce the time required for downstream workphases and total project duration.
Results
The Peace Shield project finished in month 47, six months and 13 days aheadof schedule. It was viewed by all as highly successful. To quote Ms DarleenDruyun, Acting Assistant Secretary of the Air Force for Acquisition, ‘‘In my26 years in acquisitions, this is the most successful program I’ve every beeninvolved with, and the leadership of the U.S. Air Force agrees.’’ (Kausal1996).
Post-project benchmarking and policy assessment
The on-budget, ahead-of-schedule, highly complimented Peace Shield programstood in stark contrast to a past effort to develop a different command andcontrol system in the same organization. The latter program exceeded itsoriginal cost and schedule plans by several times, and suffered a large contract
254 System Dynamics Review Volume 17 Number 3 Fall 2001
dispute with the customer. Theories abounded as to what had producedsuch significantly improved performance on Peace Shield. Naturally, theywere ‘‘different’’ systems, different customers, different program managers,different technologies and different contract terms. These and more all werecited as (partially correct) explanations of why such different performance wasachieved. Hughes executives were not satisfied that all the lessons to be learnedhad been.
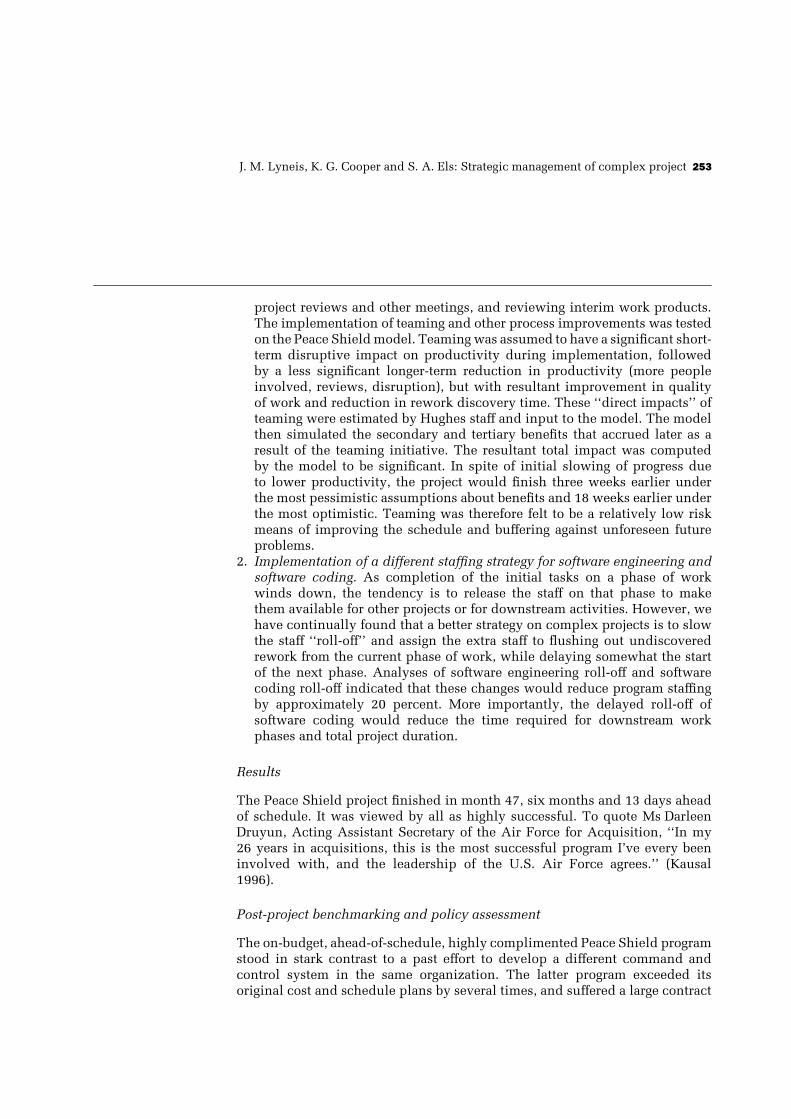
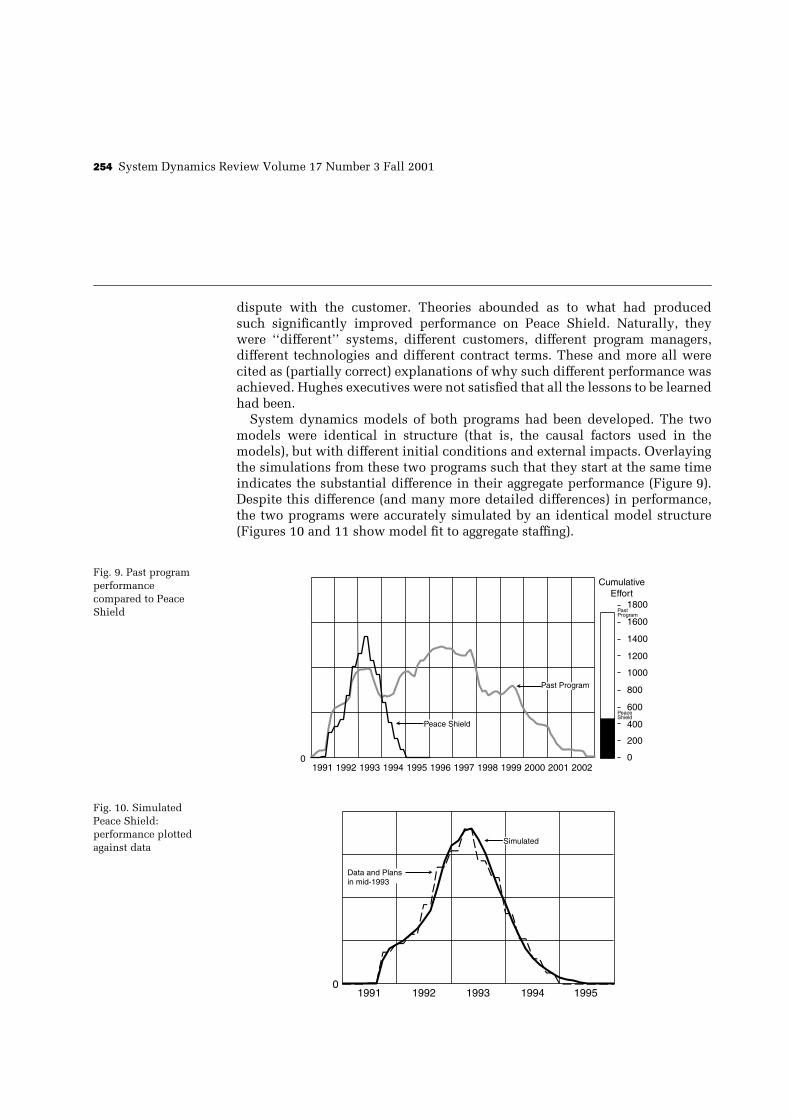
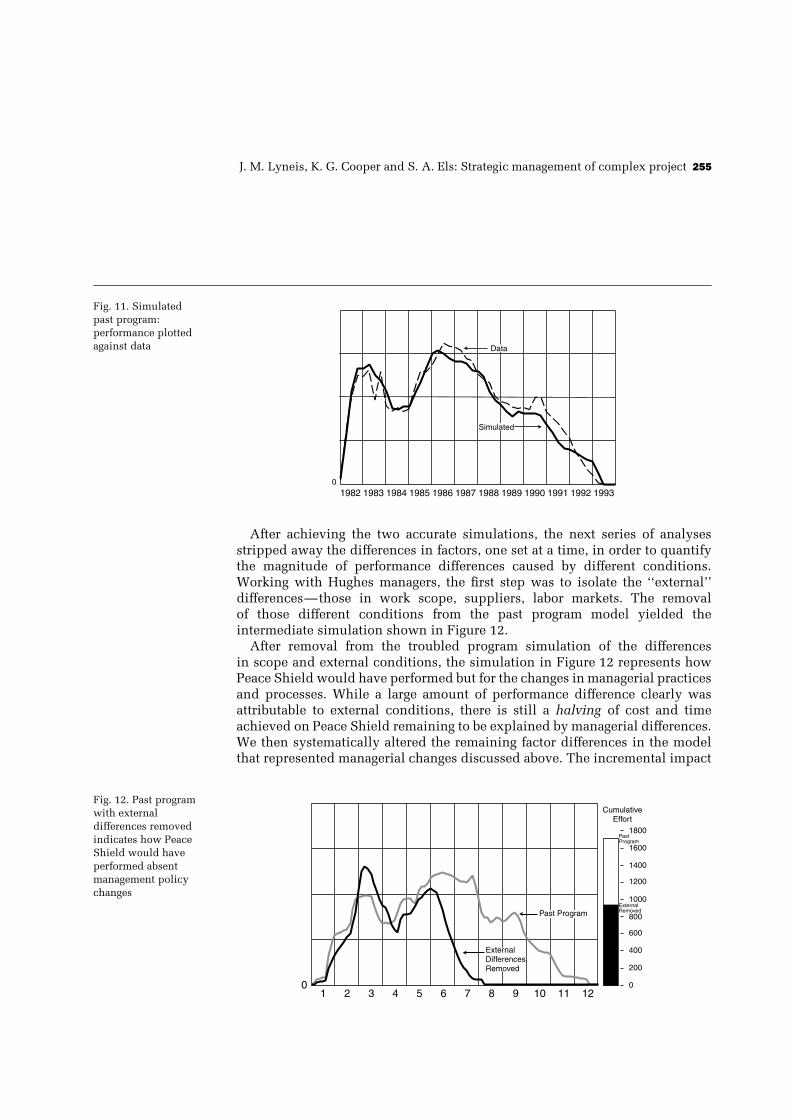
System dynamics models of both programs had been developed. The twomodels were identical in structure (that is, the causal factors used in themodels), but with different initial conditions and external impacts. Overlayingthe simulations from these two programs such that they start at the same timeindicates the substantial difference in their aggregate performance (Figure 9).Despite this difference (and many more detailed differences) in performance,the two programs were accurately simulated by an identical model structure(Figures 10 and 11 show model fit to aggregate staffing).
Fig. 9. Past programperformancecompared to PeaceShield
19910
1992 1993 1994 1995 1996 1997 1998 1999 2000 2001 2002
CumulativeEffort
1800
1600
1400
1200
1000
800
600
400
200
0
PastProgram
Past Program
Peace Shield
PeaceShield
Fig. 10. SimulatedPeace Shield:performance plottedagainst data
01992 1993 1994 19951991
Data and Plansin mid-1993
Simulated
J. M. Lyneis, K. G. Cooper and S. A. Els: Strategic management of complex project 255
Fig. 11. Simulatedpast program:performance plottedagainst data
1982 19931983 1984 1985 1986 1987 1988 1989 1990 1991 19920
Data
Simulated
After achieving the two accurate simulations, the next series of analysesstripped away the differences in factors, one set at a time, in order to quantifythe magnitude of performance differences caused by different conditions.Working with Hughes managers, the first step was to isolate the ‘‘external’’differences—those in work scope, suppliers, labor markets. The removalof those different conditions from the past program model yielded theintermediate simulation shown in Figure 12.
After removal from the troubled program simulation of the differencesin scope and external conditions, the simulation in Figure 12 represents howPeace Shield would have performed but for the changes in managerial practicesand processes. While a large amount of performance difference clearly wasattributable to external conditions, there is still a halving of cost and timeachieved on Peace Shield remaining to be explained by managerial differences.We then systematically altered the remaining factor differences in the modelthat represented managerial changes discussed above. The incremental impact
Fig. 12. Past programwith externaldifferences removedindicates how PeaceShield would haveperformed absentmanagement policychanges
1 2 3 4 5 6 7 8 9 100
11 12
ExternalDifferencesRemoved
Past Program
CumulativeEffort
1800
1600
1400
1200
1000
800
600
400
200
0
PastProgram
ExternalRemoved
256 System Dynamics Review Volume 17 Number 3 Fall 2001
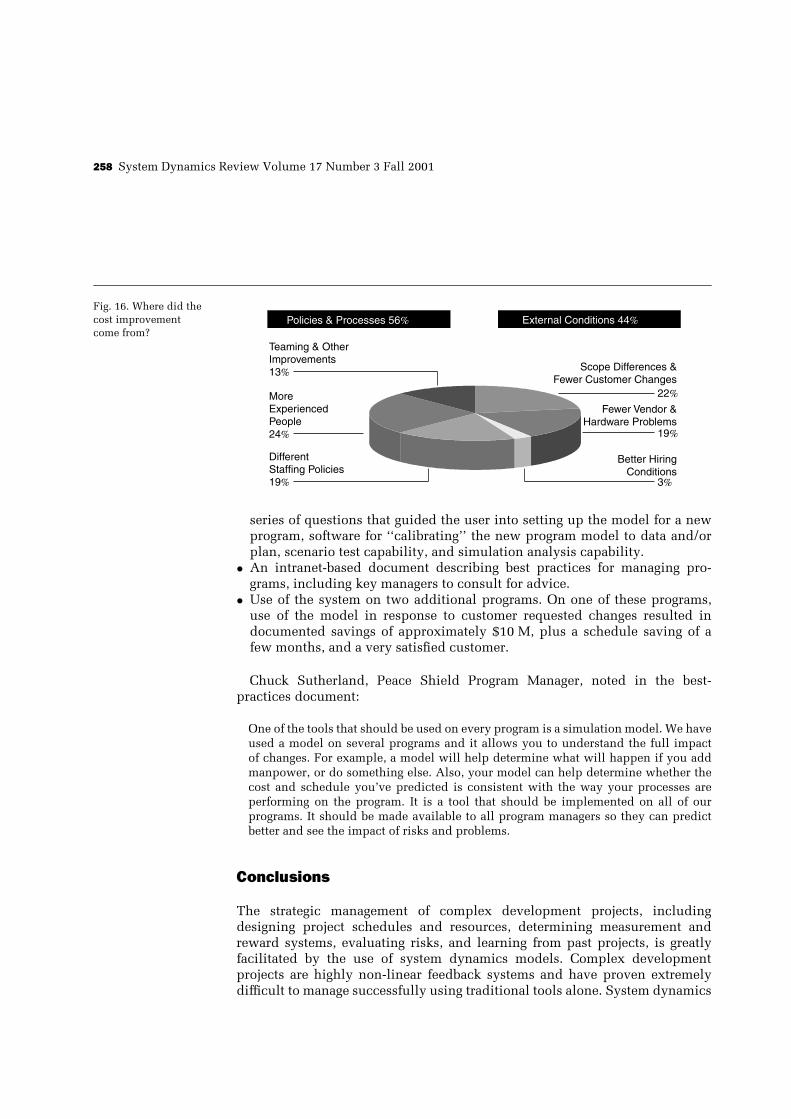
of these changes from the simulation in Figure 12, in the following order, isshown in Figure 15:
1. More aggressive Peace Shield schedules (these would have increased thecosts of the program).
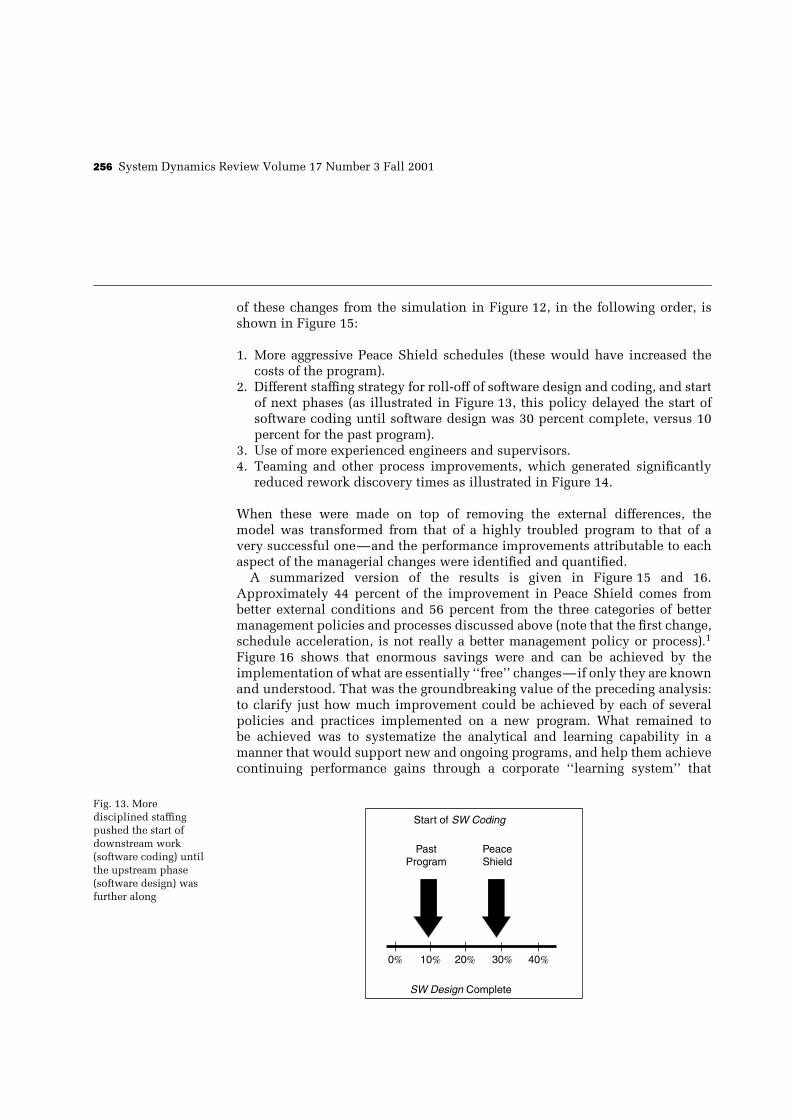
2. Different staffing strategy for roll-off of software design and coding, and startof next phases (as illustrated in Figure 13, this policy delayed the start ofsoftware coding until software design was 30 percent complete, versus 10percent for the past program).
3. Use of more experienced engineers and supervisors.4. Teaming and other process improvements, which generated significantly
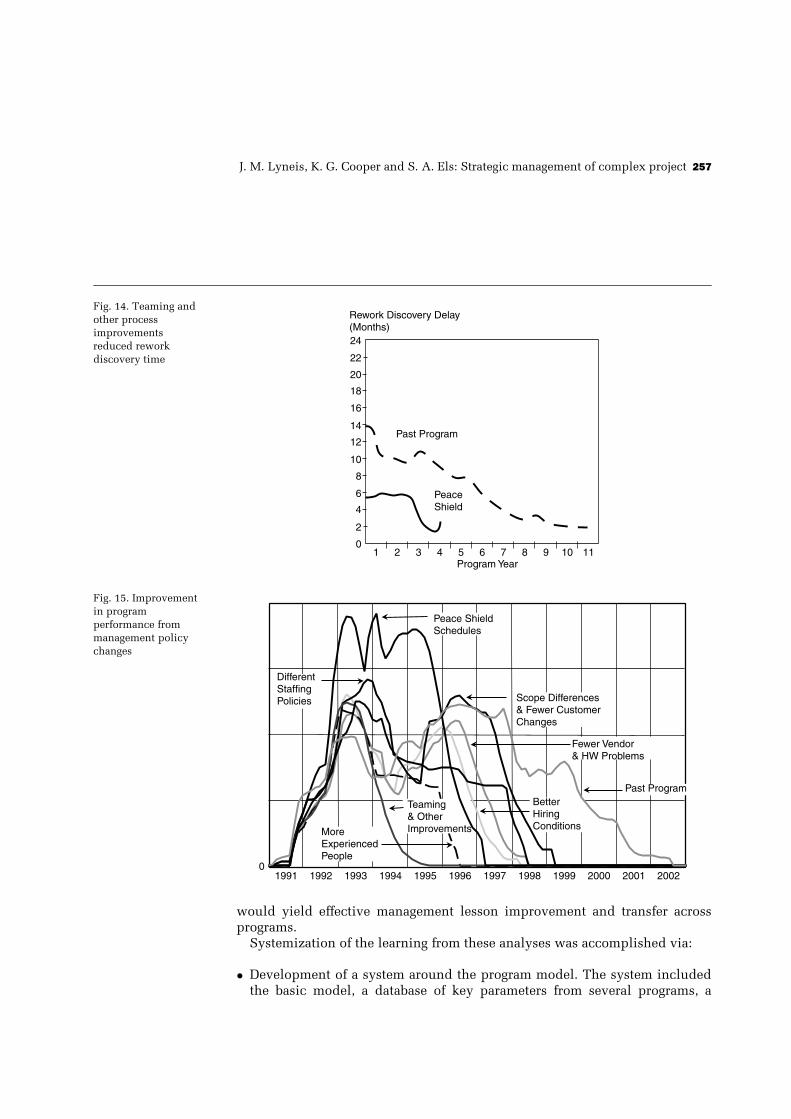
reduced rework discovery times as illustrated in Figure 14.
When these were made on top of removing the external differences, themodel was transformed from that of a highly troubled program to that of avery successful one—and the performance improvements attributable to eachaspect of the managerial changes were identified and quantified.
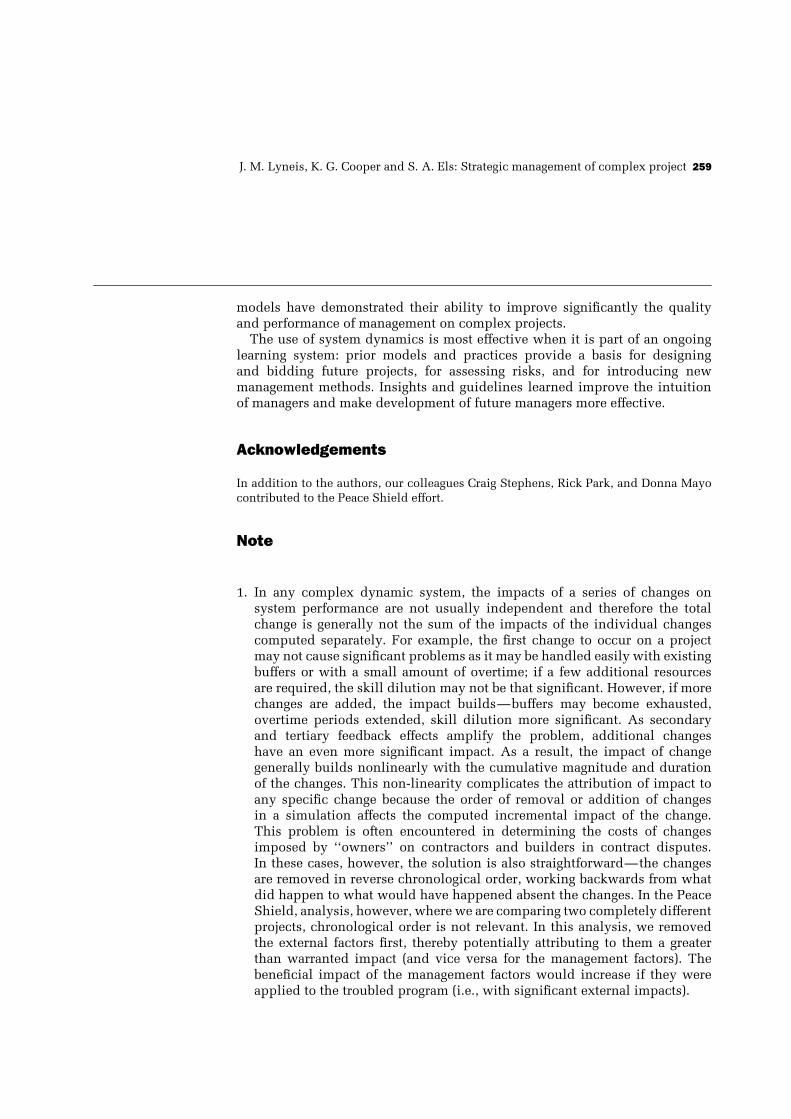
A summarized version of the results is given in Figure 15 and 16.Approximately 44 percent of the improvement in Peace Shield comes frombetter external conditions and 56 percent from the three categories of bettermanagement policies and processes discussed above (note that the first change,schedule acceleration, is not really a better management policy or process).1
Figure 16 shows that enormous savings were and can be achieved by theimplementation of what are essentially ‘‘free’’ changes—if only they are knownand understood. That was the groundbreaking value of the preceding analysis:to clarify just how much improvement could be achieved by each of severalpolicies and practices implemented on a new program. What remained tobe achieved was to systematize the analytical and learning capability in amanner that would support new and ongoing programs, and help them achievecontinuing performance gains through a corporate ‘‘learning system’’ that
Fig. 13. Moredisciplined staffingpushed the start ofdownstream work(software coding) untilthe upstream phase(software design) wasfurther along
Start of SW Coding
PastProgram
PeaceShield
0% 10% 20% 30% 40%
SW Design Complete
J. M. Lyneis, K. G. Cooper and S. A. Els: Strategic management of complex project 257
Fig. 14. Teaming andother processimprovementsreduced reworkdiscovery time
1 2 3 4 5 6 7 8 9 10 11Program Year
0
2
4
6
8
10
12
14
16
18
20
22
24
Rework Discovery Delay(Months)
Past Program
PeaceShield
Fig. 15. Improvementin programperformance frommanagement policychanges
19910
1992 1993 1994 1995 1996 1997 1998 1999 2000 2001 2002
DifferentStaffingPolicies
Peace ShieldSchedules
Scope Differences& Fewer CustomerChanges
Fewer Vendor& HW Problems
Past ProgramBetterHiringConditions
Teaming& OtherImprovementsMore
ExperiencedPeople
would yield effective management lesson improvement and transfer acrossprograms.
Systemization of the learning from these analyses was accomplished via:
ž Development of a system around the program model. The system includedthe basic model, a database of key parameters from several programs, a
258 System Dynamics Review Volume 17 Number 3 Fall 2001
Fig. 16. Where did thecost improvementcome from?
External Conditions 44%Policies & Processes 56%
Teaming & OtherImprovements13% Scope Differences &
Fewer Customer Changes
Fewer Vendor &Hardware Problems
Better HiringConditions
MoreExperiencedPeople24%
DifferentStaffing Policies19%
22%
19%
3%
series of questions that guided the user into setting up the model for a newprogram, software for ‘‘calibrating’’ the new program model to data and/orplan, scenario test capability, and simulation analysis capability.
ž An intranet-based document describing best practices for managing pro-grams, including key managers to consult for advice.
ž Use of the system on two additional programs. On one of these programs,use of the model in response to customer requested changes resulted indocumented savings of approximately $10 M, plus a schedule saving of afew months, and a very satisfied customer.
Chuck Sutherland, Peace Shield Program Manager, noted in the best-practices document:
One of the tools that should be used on every program is a simulation model. We haveused a model on several programs and it allows you to understand the full impactof changes. For example, a model will help determine what will happen if you addmanpower, or do something else. Also, your model can help determine whether thecost and schedule you’ve predicted is consistent with the way your processes areperforming on the program. It is a tool that should be implemented on all of ourprograms. It should be made available to all program managers so they can predictbetter and see the impact of risks and problems.
Conclusions
The strategic management of complex development projects, includingdesigning project schedules and resources, determining measurement andreward systems, evaluating risks, and learning from past projects, is greatlyfacilitated by the use of system dynamics models. Complex developmentprojects are highly non-linear feedback systems and have proven extremelydifficult to manage successfully using traditional tools alone. System dynamics
J. M. Lyneis, K. G. Cooper and S. A. Els: Strategic management of complex project 259
models have demonstrated their ability to improve significantly the qualityand performance of management on complex projects.
The use of system dynamics is most effective when it is part of an ongoinglearning system: prior models and practices provide a basis for designingand bidding future projects, for assessing risks, and for introducing newmanagement methods. Insights and guidelines learned improve the intuitionof managers and make development of future managers more effective.
Acknowledgements
In addition to the authors, our colleagues Craig Stephens, Rick Park, and Donna Mayocontributed to the Peace Shield effort.
Note
1. In any complex dynamic system, the impacts of a series of changes onsystem performance are not usually independent and therefore the totalchange is generally not the sum of the impacts of the individual changescomputed separately. For example, the first change to occur on a projectmay not cause significant problems as it may be handled easily with existingbuffers or with a small amount of overtime; if a few additional resourcesare required, the skill dilution may not be that significant. However, if morechanges are added, the impact builds—buffers may become exhausted,overtime periods extended, skill dilution more significant. As secondaryand tertiary feedback effects amplify the problem, additional changeshave an even more significant impact. As a result, the impact of changegenerally builds nonlinearly with the cumulative magnitude and durationof the changes. This non-linearity complicates the attribution of impact toany specific change because the order of removal or addition of changesin a simulation affects the computed incremental impact of the change.This problem is often encountered in determining the costs of changesimposed by ‘‘owners’’ on contractors and builders in contract disputes.In these cases, however, the solution is also straightforward—the changesare removed in reverse chronological order, working backwards from whatdid happen to what would have happened absent the changes. In the PeaceShield, analysis, however, where we are comparing two completely differentprojects, chronological order is not relevant. In this analysis, we removedthe external factors first, thereby potentially attributing to them a greaterthan warranted impact (and vice versa for the management factors). Thebeneficial impact of the management factors would increase if they wereapplied to the troubled program (i.e., with significant external impacts).
260 System Dynamics Review Volume 17 Number 3 Fall 2001
References
Abdel-Hamid T, Madnick SE. 1991. Software Project Dynamics: An IntegratedApproach. Prentice Hall: Englewood Cliffs, NJ.
Cooper KG. 1980. Naval ship production: a claim settled and a framework built.Interfaces 10(6): 20–36.
Cooper KG, Mullen TW. 1993. Swords & plowshares: the rework cycles of defense andcommercial software development projects. American Programmer 6(5): 41–51.
Cooper KG. 1993a. The rework cycle: why are project mismanaged. PM NetworkMagazine February 1993; 5–7.
Cooper KG. 1993b. The rework cycle: how It really works . . . and reworks . . .. PMNetwork Magazine February 1993; 25–28.
Cooper KG. 1993c. The rework cycle: benchmarks for the project manager. ProjectManagement Journal 24(1): 17–21.
Ford DN, Sterman JD. 1998. Dynamic modeling of product development processes.System Dynamics Review 14(1): 31–68.
Homer J, Sterman J, Greenwood B, Perkola M. 1993. Delivery time reduction in pulpand paper mill construction projects: a dynamic analysis of alternatives, InternationalSystem Dynamics Conference.
Kausal BAIV. 1996. Program Manager. March–April: 22–24.Morris P, Hough G. 1987. The Anatomy of Major Projects. Wiley: New York, Chichester.Reichelt KS, Lyneis JM. 1999. The dynamics of project performance: benchmarking the
drivers of cost and schedule overrun. European Management Journal 17(2): 000–000.Richardson GP, Pugh AL. 1981. Introduction to System Dynamics Modeling with
DYNAMO. Productivity Press: Cambridge, MA.Roberts EB. 1992. Strategic Management of Technology: Global Benchmarking, 10
December [Results of a survey sponsored by the Massachusetts Institute ofTechnology, Cambridge, Mass and PA Consulting Group, London, England].
Rodrigues AG, Williams TM. 1998. System dynamics in project management: assessingthe impacts of client behaviour on project performance. Journal of the OperationalResearch Society 49(1).
Shtub A, Bard JF, Globerson S. 1994. Project Management: Engineering, Technology,and Implementation. Prentice-Hall: Englewood Cliffs, NJ.
Sterman JD, Repenning NP, Kofman F. 1997. Unanticipated side effects of successfulquality programs: exploring a paradox of organizational improvement. ManagementScience 43(4).
Sterman JD. 2000. Business Dynamics: Systems Thinking and Modeling for a ComplexWorld. Irwin McGraw-Hill: New York.
The World Bank Operations Evaluation Department (OED). 1992. Evaluation Results.The World Bank: Washington, DC.
Related Documents