systems Article Strategic Management for Systems Archetypes in the Piggery Industry of Ghana—A Systems Thinking Perspective Kwamina E. Banson 1,2, * , Nam C. Nguyen 4 , Daowei Sun 3 , Daniel Kwasi Asare 1,2 , Samuel Sowah Kodia 1 , Isaac Afful 1 and Jasmine Leigh 1 1 Socio-Economic and Commercialisation Unit, BNARI/GAEC. Box LG 80, Legon, Accra, Ghana; [email protected] (D.K.A.); [email protected] (S.S.K.); [email protected] (I.A.); [email protected] (J.L.) 2 School of Nuclear and Allied Sciences, University of Ghana, Atomic Campus, Accra, Ghana 3 The New South Wales Department of Primary Industries, 21888 Wee Waa Road, Narrabri, NSW 2390, Australia; [email protected] 4 Malik Institute, Geltenwilenstrasse 16, 9000 St. Gallen, Switzerland; [email protected] * Correspondence: [email protected] Received: 18 May 2018; Accepted: 12 September 2018; Published: 26 September 2018 Abstract: Ghana is predominantly an agricultural country with a clear majority of its population depending partly or fully on agriculture for their livelihoods. Pork consumption in Ghana is on the increase and the livestock industry is a key sector of alternative agri-business for farmers looking for profitable business ventures and household income. The growth of Ghana’s domestic piggery industry has been impeded by several constraints such as inadequate information, lack of improved breeding stock, land limitations, rising feed cost and water availability. In this research, systems models provide an understanding of the interconnectedness and relationships present within the piggery industry of Ghana. The Industry’s problems were pooled together and key factors identified, whose behavior over time causes problems by developing various individual two-loop system archetypes coupled with a list of sustainable management strategies. Also, the individual variables affecting the industry were consolidated to obtain a causal loop structure and behavior-over-time graph of the piggery industry. The system archetype developed here is generic enough to explain any productivity decline and business rivalry behavior of any agribusiness industry. The proposed archetype can also help farm managers and producers to make various decisions. The system archetypes contribute effectively to understanding the root cause of challenges rather than providing quick fixes ‘now’ which gives rise to a much bigger problem to fix ‘later’. Application of CLDs models and system archetypes can help farmers and policy makers understand the behaviour of the entire complex piggery systems that will aid in more clarity and consistency in decisions and policy objectives. This will close the gap of inadequate information both to farmers and policy makers and governance. Through the archetypes and the CLDs, it has been identified that using a systemic approach in addressing the problems could lead to the provision of adequate data and management strategies for effective decision making for improving the piggery/livestock industry. Keywords: systems thinking; piggery industry; piggery management; livestock management; pork consumption; Ketu Pig Farmers; BNARI piggery Systems 2018, 6, 35; doi:10.3390/systems6040035 www.mdpi.com/journal/systems

Welcome message from author
This document is posted to help you gain knowledge. Please leave a comment to let me know what you think about it! Share it to your friends and learn new things together.
Transcript

systems
Article
Strategic Management for Systems Archetypes inthe Piggery Industry of Ghana—A SystemsThinking Perspective
Kwamina E. Banson 1,2,* , Nam C. Nguyen 4, Daowei Sun 3, Daniel Kwasi Asare 1,2,Samuel Sowah Kodia 1, Isaac Afful 1 and Jasmine Leigh 1
1 Socio-Economic and Commercialisation Unit, BNARI/GAEC. Box LG 80, Legon, Accra, Ghana;[email protected] (D.K.A.); [email protected] (S.S.K.); [email protected] (I.A.);[email protected] (J.L.)
2 School of Nuclear and Allied Sciences, University of Ghana, Atomic Campus, Accra, Ghana3 The New South Wales Department of Primary Industries, 21888 Wee Waa Road, Narrabri,
NSW 2390, Australia; [email protected] Malik Institute, Geltenwilenstrasse 16, 9000 St. Gallen, Switzerland; [email protected]* Correspondence: [email protected]
Received: 18 May 2018; Accepted: 12 September 2018; Published: 26 September 2018�����������������
Abstract: Ghana is predominantly an agricultural country with a clear majority of its populationdepending partly or fully on agriculture for their livelihoods. Pork consumption in Ghana is on theincrease and the livestock industry is a key sector of alternative agri-business for farmers lookingfor profitable business ventures and household income. The growth of Ghana’s domestic piggeryindustry has been impeded by several constraints such as inadequate information, lack of improvedbreeding stock, land limitations, rising feed cost and water availability. In this research, systemsmodels provide an understanding of the interconnectedness and relationships present within thepiggery industry of Ghana. The Industry’s problems were pooled together and key factors identified,whose behavior over time causes problems by developing various individual two-loop systemarchetypes coupled with a list of sustainable management strategies. Also, the individual variablesaffecting the industry were consolidated to obtain a causal loop structure and behavior-over-timegraph of the piggery industry. The system archetype developed here is generic enough to explainany productivity decline and business rivalry behavior of any agribusiness industry. The proposedarchetype can also help farm managers and producers to make various decisions. The systemarchetypes contribute effectively to understanding the root cause of challenges rather than providingquick fixes ‘now’ which gives rise to a much bigger problem to fix ‘later’. Application of CLDsmodels and system archetypes can help farmers and policy makers understand the behaviour ofthe entire complex piggery systems that will aid in more clarity and consistency in decisions andpolicy objectives. This will close the gap of inadequate information both to farmers and policy makersand governance. Through the archetypes and the CLDs, it has been identified that using a systemicapproach in addressing the problems could lead to the provision of adequate data and managementstrategies for effective decision making for improving the piggery/livestock industry.
Keywords: systems thinking; piggery industry; piggery management; livestock management;pork consumption; Ketu Pig Farmers; BNARI piggery
Systems 2018, 6, 35; doi:10.3390/systems6040035 www.mdpi.com/journal/systems

Systems 2018, 6, 35 2 of 25
1. Introduction
Approximately sixty percent of rural households in developing countries are partially or fullydependent on livestock for their livelihoods [1]. Livestock rearing provides the household with a widerange of benefits, such as cash income, food, manure, draft power and hauling services, savings andinsurance, and social status [2]. The livestock farming sector, including piggery remains criticallyimportant for millions of people in developing countries including Ghana and developments withinthis sector are most important in terms of attaining the sustainable development goals (SDGs), goals ofno poverty [3,4].
In Ghana, the Agriculture sector growth rates declined from 4.6 percent in 2014 to 0.0 percent in2015. Of all the agriculture activities the livestock subsector recorded the highest growth of 9.3 percentin 2015 [5]. The piggery sector which contributes to household income, is one of the fast growingsectors of the livestock industry because of increase in pork consumption [6,7]. Pork production rosefrom 11,173 MT in 1999 to 17,512 MT in 2009 with pork production index ranging from 98 to 154 withinthe same period. Pork import in Ghana rose from 358.1 MT in 2000 to its peak of 13,290.5MT in 2006and dropped to 3150.2 MT in 2009 [8]. Piggery represents a form of cash security of the livelihoodstrategies of many farmers and plays a central role in their socio-economic and cultural identity, andis a source of food, employment, food security and also assets for store or trade [6]. Livestock andcrop production contribute 66.8% to agricultural GDP in Ghana [8]. The multiple roles of pig rearingand other indigenous livestock breeds are significantly acknowledged in different farming systemsof Ghana including the intensive, semi-intensive and free range systems. The growth of Ghana’sdomestic piggery industry has been impeded by several constraints such as lack of improved breedingstock, the balance between the limitations and availability of land and water, rapid urbanisationprocesses, pollution and lack of managerial skills [7,9]. The industry is also affected by diseases causedby the PRRS virus, PCVD virus, Classical Swine Fever (CSF) Viral diarrhoea in piglets, Aujeszky’sDisease virus or pseudorabies, Foot-and-Mouth Disease (FMD) virus, and of secondary importance,bacterial diseases [10–12]. As a result, pig production in Ghana is reflected in numerous researchand development (R&D) projects, a vast number of grants, research projects and other activitiesdeveloped by the government to support the piggery industry [13–15]. Their contribution to householdfood security and income as well as their social roles is well known; however, improvement oftheir productivity through crossbreeding, improved health and nutritional management are alsoconcerns of many livestock development plans through national and international programmes [16–18].Pig production, therefore is an integral part of Ghana’s agri-business activities and a major source oflivelihood for many entrepreneurs seeking an alternative source of profitable business ventures [6,7,16].However, most Ghanaian entrepreneurs enter this business based on a survival driven motive withoutadequate knowledge and a business plan leading to subsequent business failure.
Apart from the question of competition for human staples, pigs are generally more efficientthan ruminants as converters of food into flesh. A high proportion of Ghana’s pork, up to 95%, israised by farmers in small-scale (20–100 pigs) commercial operations and backyard outfits involvinga handful (1–20) of pigs [6,19]. Large-scale private pig enterprises involve several hundreds of pigswith varieties of breeding stocks but with the Danish large white dominating. These farmers areacutely sensitive to the movements in price that determine their profit or loss margins. The twomost important variables: the price of pork (the output) to the price of corn (the input) ratio of 6:1 isenough for pig farmers to break even [6,20]. Within the food industry, pork prices are particularlyvolatile [21–23]. In March 2009, the increase in pig population rose by 35% from 332,000 in 1999, withthe pig population index rising from 96 to 150 within the same period [8,24]. During peak prices,farmers take advantage by slaughtering sows out of the breeding herd for the meat which in the shortterm results in unintended consequences of pork shortage and higher prices [24].

Systems 2018, 6, 35 3 of 25
The major and biggest challenges for entrepreneur farmers in Ghana is the attitude that theymust have hands-on control of all aspects of their business; from management, accounting systems,sales and decisions making; leading to business failure in both short or long run [25]. Delegation oroutsourcing a particular task in the livestock sector is vital for effective production; however, thiscan sometimes be a major challenge for pig farm owners who take delight in having control of allaspects of the business. These owners are more concerned about giving up control at a cost thanincurring the cost of training or building up the capacity of low standard employees. Nevertheless mostpig owners, according to the survey results, lack the technical know-how in pig management (feedformulation, heat detection, identifying and curing poor and sick animals, pricing, marketing, and drugadministration). Employing qualified or trained staff is essential to economic progress because it allowsspecialized people to deliver in their capacity. This specialization makes workers more efficient andeffectively reduces the total cost of producing the pigs. The basic infrastructure required for pig farmingincluding water source, proper feed formulation and ration, proper supervision and market access,with appropriately qualified staff is sometimes lacking [26,27]. Also, common arrangement foundin pig farms are unskilled labourers who clean and water the animals, with the rest of the activitieswhich do not require physical strength, managed by the owner. Thus, productivity and profit arehighly influenced by poor infrastructure and lack of technical skills leading to unsustainable business.Because of the complexity of many agri-business issues, where numerous interacting variables need tobe accounted for and multiple interventions and groups bring different values and concerns to bear, itis not uncommon for people to call for a holistic Systems Thinking approach.
1.1. The Major Gap of the Livestock Industry
The piggery sector, and the role that animals play in the household economy in Ghana, areanticipated to change rapidly in the coming decades. Consumers are increasingly demandinghigh-value agricultural products including pork products. In this fast-changing context, good-qualitylivestock data are needed for designing and implementing policies and investments that promotethe sector’s social and sustainable development [28]. Available livestock data, and the derivedstatistics or indicators, however, are largely considered inadequate for effective decision making.Ruling governments, agriculture advocates and livestock stakeholders including farmers have neitheradequate facts nor the essential tools essential to analyse the performance and investment decisionsaffecting the agricultural sectors [29]. Governments and research scientists are under increasingpressure to implement the right management decisions in the face of a dynamic political andsocioeconomic landscape. The domestic and worldwide challenges currently fronting the livestocksector in Africa (including Ghana) are highly complex in nature [29,30]
This research gap regarding inadequate information is likely to continue for these severalreasons: inadequate support for research, high inflation, administrative complacency, and the useof the traditional approach to addressing livestock challenges often undermine the success of itssustainability. History suggests that these problems cannot be solved with the traditional approach inisolation and with single-dimensional mindsets and tools. Livestock sustainability may benefit from asystemic approach to interventions and capacity-building based on systems thinking and complexitymanagement to address challenges holistically in order to deliver the desired sustainable outcomes.
1.2. Factors Affecting Pork in Ghana
Many factors affect pork production and price in Ghana; however, these factors are related [31].There have been many initiatives to address and modernize the agriculture sector, including thepig industry in Ghana by the Government but with a limited success [3,6,29,32]. It is clear from theearlier discussion that the challenges in Ghana’s piggery industry are complex [3]. To help addressthese, there is the need to equip policy makers, researchers and all relevant stakeholders with a newway of ‘thinking’ beyond the traditional ‘linear’ approach to solving problems, to a holistic systemsapproach that focuses on the root causes and provide a holistic view between various components of

Systems 2018, 6, 35 4 of 25
an industry [3]. Thus, this research explored these issues using systems thinking to reveal how thesecomponents affect each other and to recommend the way forward. This paper explores the applicationof system archetypes to serve as effective tools for gaining insights into patterns of behavior of thepiggery industry of Ghana and how it interacts to affect the survival of this industry. These models canbe used to assess many dimensions of the piggery industry, from pig production dynamics to economicpolicies designed to support the production venture. Identifying and understanding the varioussystem archetype in the piggery industry is crucial to building a robust and integrated productionactivity that can be managed under different production scenarios [30,33].
The trend of increasing piggery productivity in tropical and subtropical regions and an increasingpressure on tropical and subtropical livestock systems to produce food, to feed livestock, and toproduce energy crops warrants the development of systemic models to address issues such as theeconomic importance of piggery.
In this research, systems archetypes are developed to provide an understanding of the dynamics,interconnectedness and relationships present within the piggery industry. The research is conductedusing a systems thinking approach and tools such as causal loop diagrams (CLDs) to demonstrateits application in effectively addressing complex sustainability issues affecting the agriculture sector.This research seeks to address the agricultural system’s complexity by gathering the ‘mental models’of various stakeholders involved in the piggery sector in Ghana. The results and approach will helplivestock farmers, decision makers, scientists, and managers to anticipate the long-term consequences oftheir decisions and actions, as well as significant unintended consequences of decisions and strategies,and avoid the danger of ‘silo mentality’ and ‘organisational myopia’. The process aims to providea common language for diverse stakeholders, such as pig farmers, labourers, policymakers, andresearchers, for deep dialogue and consensus building. This will help build research capacity in areasneeded to improve and modernize peri urban pig production and make it more efficient and profitablewith a view to eradicating poverty and promoting the health and welfare of the people and the animals.Using a case study approach, data were collected from El-Capitano Piggery Farm at Agona-Duakwain the Central Region of Ghana, Ketu Pig Farmers association (involving 60 smallholder typicalpig farmers) in the Volta Region and the Biotechnology and Nuclear Agriculture Research Institute(BNARI) Farm Complex at Kwabenya in the Greater Accra Region.
1.3. Systems Thinking
The systems thinking approach is a transdisciplinary ‘framework’ that addresses the root causesof challenges by viewing ‘problems’ as parts of an overall system [29]. Currently, it is unusual togo through a single day without hearing the words “sustainability” or “green” applied to anythingfrom Apple products to Zinfandels [34]. Resolving today’s challenges requires moving from a “linear”way of thinking to a “systems” perspective that brings thought and behaviour in line with thenatural laws of sustainability [29,35]. Systems thinking is a trans-disciplinary “framework for seeinginterrelationships rather than things, for seeing patterns of change rather than static snapshots” [36].Systems thinking helps one develop new ways of thinking and enables one to grasp and managesituations of complexity and uncertainty in which there are no simple answers. It is a way of ‘learningyour way towards effective action’ by looking at connected wholes rather than individual componentparts [37]. The piggery industry and its sustainability may benefit from a systems thinking approachto interventions and capacity building, to address challenges holistically and deliver the desirablesustainable outcomes. This is in contrast to the linear approach of identifying ‘quick fixes’ to specificparts which leads to the danger of ‘silo mentality’ in which a fix ‘here’ simply shifts the problem to‘there’ and ‘organizational myopia’ in which a fix ‘now’ gives rise to a much bigger problem to fix‘later’ [29,38,39]. The application of systems thinking to manage complexities has generated a broadarray of tools including system archetypes and causal loop modelling.

Systems 2018, 6, 35 5 of 25
1.4. Systems Archetypes
An archetype is a well-defined structure, which exhibits distinct behavior over time, and haswell-defined strategies for dealing with the underlying structure of the system being studied [40].The system archetypes do not describe any one problem specifically. They describe a spiral of problemsgenerically [40]. Their value comes from the insights that they offer into the dynamic interaction ofcomplex systems. This approach illustrates one’s understanding of a particular system’s structureand behaviour, which foster communication and identification of high leverage interventions forproblematic complex system behaviour. The system archetypes exposed insights into the livestocksystem structure that already exist to anticipate potential problems and the problem symptoms. As partof a suite of tools, they are extremely valuable in developing broad understandings about the livestockindustries and their environments and contribute to more effectively understanding the root cause ofchallenges rather than a fix ‘now’ giving rise to a much bigger problem to fix ‘later’ [38].
1.5. Causal Loop Diagrams
A causal loop diagram (CLD) is the first-step practical approach to modelling and simplyconverting the complex components into a simple easily understandable structure [30]. CLDs arevariables connected by key causal relationships to represent reality used to display the behavior ofcause and effect from a system standpoint [41]. The model is a framework for seeing interrelationshipsbetween components in livestock systems and sustainability rather than isolated features that impactsthe productivity of the livestock sector. The word ‘causal’ refers to causes-and-effects relationships,and ‘loop’ allies with closed chain of causality that link back to each variable [42]. CLDs are variablesconnected by key causal relationships to represent reality used to display the behavior of cause andeffect from a system standpoint [41]. Causal loop diagram is simply a diagram of ‘words and arrows’ inwhich the ‘words’ represent variables (factors) in the systems and the ‘arrows’ show causal connectionsbetween the variables [43]. A variable can be a condition, a situation, an action or a decision whichcan influence and also be influenced by others variable (factors) [44]. Variables can be quantitative orqualitative. Quantitative variables are the factors that can be measured such as the value of average airtemperature, levels of rainfall, cost of feed sources and animal population; while qualitative variablesrefer to soft factors, for example, traditional culture, belief, moral and reputation [42].
1.6. Aims and Objective
In this paper, the piggery industry’s past behavior has been analyzed using a systems thinkingapproach, and the structure of the piggery industry in the form of a system archetype has beendeveloped, which explains the behavior of the industry. The system archetype developed here is genericenough to explain any productivity decline and business rivalry behavior of an agribusiness industry.The proposed archetype can also help the farm managers and producers to make various decisions.
In the following sections, the four levels of thinking model framework were used to explain thepast behavior of the piggery industry and the development of the underlying structure causing thebehaviour, to generate a list of sustainable management strategies for the industry. The industry’sproblems were pooled together, and key factors whose behavior over time caused problems wereidentified. Thereafter, we explain the past behavior of the industry by developing various individualtwo-loop system archetypes. Later, the individual variables affecting the industry were consolidatedto obtain a causal loop structure and a behavior-over-time graph of the piggery industry.

Systems 2018, 6, 35 6 of 25
2. Research Methods
Data are drawn from a variety of national data sources including: the Biotechnology andNuclear Agriculture Research Institute (BNARI) and Ministry of Food and Agriculture Directorate.These qualitative and quantitative data are collected from participants’ farm records, documents(historical and statistical records, media reports, policy documents, previous studies and publications),stakeholder’s interview, focus group discussions, and observations through participatory researchapproach. Data obtained from farm records include birth and death rate, sales, treatment, feedformulations, weaning, etc. Discussions were held with stakeholders individually and in groupswith the aid of structured and open ended questionnaires and checklists. Discussions that centred onfarmers’ views on the on-farm performance of pig production and the factors affecting performance,including benefits accrued from keeping these animals, were ascertained. The researchers’ link datasetsfrom the three study locations (Central, Greater Accra and Volta Region) thus increases the richness ofinformation available in a study. The data were analysed using Excel spreadsheet and the VentanaSoftware developed in USA. The various data obtained were consolidated to obtain the systemarchetypes, a causal loop structure, and a behaviour-over-time graph of the piggery industry.
The combination of data obtained from the study areas through literature reviews, farm data,interviews, and focus group discussions regarding the use of the four levels of thinking model (Figure 1)provide an overview of the current structure and effect of management strategies on an agriculturesystem containing multiple feedback loops. Data collection started by gathering the mental models ofall stakeholders involved in the piggery industry in Ghana during a workshop with pig farmers toanalyse the systems’ barriers and drivers to piggery sustainability.
Systems 2018, 6, x FOR PEER REVIEW 6 of 25
datasets from the three study locations (Central, Greater Accra and Volta Region) thus increases the richness of information available in a study. The data were analysed using Excel spreadsheet and the Ventana Software developed in USA. The various data obtained were consolidated to obtain the system archetypes, a causal loop structure, and a behaviour-over-time graph of the piggery industry.
The combination of data obtained from the study areas through literature reviews, farm data, interviews, and focus group discussions regarding the use of the four levels of thinking model (Figure 1) provide an overview of the current structure and effect of management strategies on an agriculture system containing multiple feedback loops. Data collection started by gathering the mental models of all stakeholders involved in the piggery industry in Ghana during a workshop with pig farmers to analyse the systems’ barriers and drivers to piggery sustainability.
Figure 1. Feedback learning laboratory [30].
The model which starts at the ‘first level of thinking’, involves a series of literature reviews and interviews with experts in the field. Data on stakeholder opinions and perceptions of how the livestock system works, the barriers to success, the system drivers and the possible strategies (solutions) to overcome these problems were obtained through focus group discussions with a group of agricultural experts (e.g., agricultural scientists and extension officers and pig farmers) to obtain their mental models of the piggery sector under deliberation. A 2-day workshop organized in “Ketu” (Volta Region) and “Agona Duakwa” (Central Region) helped identify the core issues and high leverage interventions for problematic complex system behaviour in the piggery system. Several key variables in the livestock sector were identified through the focus group (65 smallholders; 5 research scientist, 4 extension officers, 3 large scale farmers, 3 Ministry of Food and Agriculture agents, 5 input dealers) discussions and an in-depth review of literature. All farmers were males ranging from 32 to 73 years in age. Key leaders of heads of departments and some of the staff of these respondents were also interviewed. These variables are processed into loops using CLD modelling approach with the VENSIM Software program (Ventana Systems UK) for the development of the CLD of the issues under consideration. A researcher of BNARI, who has a rich experience and knowledge of the livestock industry in Ghana, provided the context and issues related to piggery to participants of the workshop. Some of the 85 workshop participants also had prior experience working in several piggery projects in Ghana. Researchers used key variables identified and integrated the different mental models into the causal-loop model using Vensim software. The outcomes of the actions and decisions that have been implemented by policymakers were also reflected upon to determine their effect and identify significant unintended consequences and new barriers generated. The research
Figure 1. Feedback learning laboratory [30].
The model which starts at the ‘first level of thinking’, involves a series of literature reviews andinterviews with experts in the field. Data on stakeholder opinions and perceptions of how the livestocksystem works, the barriers to success, the system drivers and the possible strategies (solutions) toovercome these problems were obtained through focus group discussions with a group of agriculturalexperts (e.g., agricultural scientists and extension officers and pig farmers) to obtain their mentalmodels of the piggery sector under deliberation. A 2-day workshop organized in “Ketu” (Volta Region)and “Agona Duakwa” (Central Region) helped identify the core issues and high leverage interventionsfor problematic complex system behaviour in the piggery system. Several key variables in the livestock

Systems 2018, 6, 35 7 of 25
sector were identified through the focus group (65 smallholders; 5 research scientist, 4 extension officers,3 large scale farmers, 3 Ministry of Food and Agriculture agents, 5 input dealers) discussions and anin-depth review of literature. All farmers were males ranging from 32 to 73 years in age. Key leaders ofheads of departments and some of the staff of these respondents were also interviewed. These variablesare processed into loops using CLD modelling approach with the VENSIM Software program (VentanaSystems UK) for the development of the CLD of the issues under consideration. A researcher ofBNARI, who has a rich experience and knowledge of the livestock industry in Ghana, provided thecontext and issues related to piggery to participants of the workshop. Some of the 85 workshopparticipants also had prior experience working in several piggery projects in Ghana. Researchersused key variables identified and integrated the different mental models into the causal-loop modelusing Vensim software. The outcomes of the actions and decisions that have been implemented bypolicymakers were also reflected upon to determine their effect and identify significant unintendedconsequences and new barriers generated. The research adopted an approach ‘teaching to transfer’the art of interconnected thinking with stakeholders during the workshop, and these respondents arealso involved in policy revision and formulation in Ghana. These 85 stakeholders were familiarisedwith and educated about the art of interconnected thinking. Research scientists and extension agentswere also present. It is believed that these groups will be the facilitators of the art of interconnectedthinking in policy formulations including some of the authors in Ghana who are also stakeholder ofpolicy formulation at governmental level.
Once the unintended consequences and new barriers have been identified, the ‘second level ofthinking’ is used to interpret and explore patterns and their interconnected components, and to analysethe kind of feedback loops, reinforcing loops and balancing loops that were generated.
This is followed by step three, which is the ‘third level of thinking’, in which the literaturereview was used to identify what pre-existing system archetypes were influencing the piggeryindustry. System archetypes are used to develop an understanding of interdependency and analysethe implemented strategies and/or policies that led to the intervention effect. The Vensim softwareprogram (Ventana Systems UK) was used for the development of the systems archetypes of the issuesunder consideration. A CLD is the first step to modelling and simply converting the complex elementsinto a simple, easy-to-understand structure. CLDs are variables that are connected by key causalrelationships to represent the reality used to display the behaviour of cause and effect from the system’sstandpoint [41].
Finally, the ‘fourth level of thinking’ highlights the strategies needed to overcome the issues andchallenges facing the entire complex agricultural system. Archetypes are useful for gaining insightsinto the ‘nature’ of the underlying problem and for offering a basic structure or foundation upon whicha model can be further developed and constructed. Thus, Systems theory provides a framework fortaming complexity, in other words, providing systems concepts and tools to unravel the complexity ofany system under consideration [29].
The research method used focuses on the application of the Evolutionary Learning Laboratory(ELLab) and CLDs as knowledge integration tools in sustainable agricultural management anddecision-making [39]. The ELLab is designed to equip policy makers, researchers and all relevantstakeholders with a new way of ‘thinking’ beyond the traditional ‘linear’ approach of solvingproblems, to a holistic systems approach that focuses on dealing with the root causes andinterconnectedness between various components of the agricultural system. The process involvessetting management objectives, abstract modelling to explore the effect of decisions on these objectives,identifying preferred management interventions and monitoring to track the success of implementedmanagement intervention.
The purpose of this approach is for decision support, policy assessment and prioritisation ofmanagement interventions.

Systems 2018, 6, 35 8 of 25
2.1. Systems Thinking Approach
‘Systems thinking’ approach highlights and addresses complex problems using integratedapproaches and demonstrates how to translate complex ideas into potent management tools forchange [45]. The systems analysis is guided by different levels of thinking. Generally, researchersdo analysis based on the symptoms and patterns; however, this research focuses on the systemicstructures that underlie the patterns of behaviour over time to anticipate the problem in the piggeryindustry and accommodate them [46–48]. This allows altering the source of the problem rather thanjust dealing with the symptoms.
The underlining systemic structures were shown using systems archetypes identified from theCausal Loop Diagram (CLD) to unravel the complexity of the piggery industry, where greatest leveragelies in solving problems. The CLDs have proven to be effective to unravel complexity and dynamicswithin a system [3,39,49]. Systems thinking approach also offers an opportunity for creating informallearning spaces for managing complex issues [39].
Systems archetypes and CLD modelling are key processes of using a systems approach tounderstanding the systems and identifying systemic intervention. The basic elements of any causalloop model or diagram are variables (factors) and links [29,46,50]. A “variable” is a condition, situation,action or decision that can influence and can be influenced by other variables. A variable canbe quantitative (measurable) such as profit, productivity, or it can be qualitative (soft data) suchas motivation, trust, morale, burnout and reputation. Qualitative variables do not generally lendthemselves to direct measurement. One of the strengths of causal loop methodology is its ability toincorporate qualitative variables into the systems thinking approach [48]. System archetypes providea systemic structure and storyline that can be used to diagnose or make sense of a situation [51].The relationships between these variables, represented by arrows can be labelled as positive ornegative. A link indicates a causal association between two variables or a change in the state of thesevariables of which “S” indicates a change in the same direction and an “O” indicates a change in anopposite direction [49]. Variables and links can form loops indicating feedbacks, either reinforce (R) orbalance (B). Reinforcing feedback is when changes in elements of the system are fed back and result inan amplification of the change. Balancing feedback is when changes in elements of the system are fedback opposing the original change resulting in a counteracting effect [3]. The delay mark
Systems 2018, 6, x FOR PEER REVIEW 8 of 25
situation, action or decision that can influence and can be influenced by other variables. A variable can be quantitative (measurable) such as profit, productivity, or it can be qualitative (soft data) such as motivation, trust, morale, burnout and reputation. Qualitative variables do not generally lend themselves to direct measurement. One of the strengths of causal loop methodology is its ability to incorporate qualitative variables into the systems thinking approach [48]. System archetypes provide a systemic structure and storyline that can be used to diagnose or make sense of a situation [51]. The relationships between these variables, represented by arrows can be labelled as positive or negative. A link indicates a causal association between two variables or a change in the state of these variables of which “S” indicates a change in the same direction and an “O” indicates a change in an opposite direction [49]. Variables and links can form loops indicating feedbacks, either reinforce (R) or balance (B). Reinforcing feedback is when changes in elements of the system are fed back and result in an amplification of the change. Balancing feedback is when changes in elements of the system are fed back opposing the original change resulting in a counteracting effect [3]. The delay mark (╫) on the causal arrows indicate that it will take time before the effect starts to play out.
The combination of loops can form systems archetypes which are generic systems models that represent a wide range of situations [47,52]. Systems archetypes can provide valuable indications of potential systemic interventions, normally referred to as leverages, which means actions or interventions that can have lasting impacts on the system in terms of reversing a trend or breaking a vicious cycle [51].
The increasingly complex nature of the Ghana piggery industry and other agribusiness has necessitated the use of a systemic research approach in solving operational problems. This assumes a significant role in the formulation of economic policy for both governments and businesses. The piggery industry sustainability may benefit from a systemic approach to interventions and capacity building, based on systems thinking and complexity management to address challenges holistically and deliver the desirable sustainable outcomes.
Eighty five respondents participated in the focus group discussions and all participants own or are involved in piggery businesses, from farmers, processors, wholesalers to retailers. Focus group discussion participants were asked to give their views about the problems of the piggery industry and their impact on economics in their livelihood. The mental models of participants, which included past observations and experience, were then analysed by the research team using the “four levels of thinking” model.
The research used focus study to gather the mental models of stakeholders. Given the growing complexity dynamism and instability of the pork markets, all businesses and economic factors that might influence the piggery industry were considered.
The research commenced on 23 August 2016 and involved a series of on-site visits. During the first phases of the visits, quick fixes were applied to address challenges encountered at the piggery (population capacity of over 3500 pigs at EL-Capitano Farm) which reduced its mortality rate from average of 14 per day as a result of thirst, hunger, filth, and poor leadership to average of one due to crushing of piglets by sows spanning over a period of three months. The study of the archetypes and factors affecting pig production and performance at Agona-Duakwa, Ketu and BNARI farm complex were carried out during the period August 2016–July 2017. The study adopted systemic interventions approach to address and revamp management issues encountered during this period.
The on-site review was completed using farm records data, information from the interview and focus group discussions with key individuals who are stakeholders. An audit-based methodology was applied to examine the key components of the organization and operations of the piggery. The data gathering process was both quantitative in examining records, reports and documented information (forms the basis of graphs) as well as qualitative through interviews and focus group discussions conducted in Agona-Duakwa in the Central Region, Ketu in the Volta Region and the Greater Accra Region and marketing survey through telephone interviews. The major areas analyzed included farm structures, feed formulation and measurement, weaning and sorting pigs into various sizes, employment, division of labour, access to water, breeding (identifying heat and crossing), training workers and market research for pigs. The analysis considered the unique geographic
on thecausal arrows indicate that it will take time before the effect starts to play out.
The combination of loops can form systems archetypes which are generic systems models thatrepresent a wide range of situations [47,52]. Systems archetypes can provide valuable indicationsof potential systemic interventions, normally referred to as leverages, which means actions orinterventions that can have lasting impacts on the system in terms of reversing a trend or breaking avicious cycle [51].
The increasingly complex nature of the Ghana piggery industry and other agribusiness hasnecessitated the use of a systemic research approach in solving operational problems. This assumes asignificant role in the formulation of economic policy for both governments and businesses. The piggeryindustry sustainability may benefit from a systemic approach to interventions and capacity building,based on systems thinking and complexity management to address challenges holistically and deliverthe desirable sustainable outcomes.
Eighty five respondents participated in the focus group discussions and all participants own orare involved in piggery businesses, from farmers, processors, wholesalers to retailers. Focus groupdiscussion participants were asked to give their views about the problems of the piggery industryand their impact on economics in their livelihood. The mental models of participants, which includedpast observations and experience, were then analysed by the research team using the “four levels ofthinking” model.
The research used focus study to gather the mental models of stakeholders. Given the growingcomplexity dynamism and instability of the pork markets, all businesses and economic factors thatmight influence the piggery industry were considered.

Systems 2018, 6, 35 9 of 25
The research commenced on 23 August 2016 and involved a series of on-site visits. During thefirst phases of the visits, quick fixes were applied to address challenges encountered at the piggery(population capacity of over 3500 pigs at EL-Capitano Farm) which reduced its mortality rate fromaverage of 14 per day as a result of thirst, hunger, filth, and poor leadership to average of one due tocrushing of piglets by sows spanning over a period of three months. The study of the archetypes andfactors affecting pig production and performance at Agona-Duakwa, Ketu and BNARI farm complexwere carried out during the period August 2016–July 2017. The study adopted systemic interventionsapproach to address and revamp management issues encountered during this period.
The on-site review was completed using farm records data, information from the interview andfocus group discussions with key individuals who are stakeholders. An audit-based methodologywas applied to examine the key components of the organization and operations of the piggery.The data gathering process was both quantitative in examining records, reports and documentedinformation (forms the basis of graphs) as well as qualitative through interviews and focus groupdiscussions conducted in Agona-Duakwa in the Central Region, Ketu in the Volta Region andthe Greater Accra Region and marketing survey through telephone interviews. The major areasanalyzed included farm structures, feed formulation and measurement, weaning and sorting pigsinto various sizes, employment, division of labour, access to water, breeding (identifying heatand crossing), training workers and market research for pigs. The analysis considered the uniquegeographic operating environment in which the farms operates, while fully understanding the neededbalance of specializations, and operational performance associated with competent and effectivemanagement delivery.
Many calls have been made for a systemic intervention to farm management [29,36,53,54].The approach of this research offers a methodology for systemic intervention that (1) emphasizesthe need to explore stakeholder values and boundaries for analysis, (2) challenges marginalization,and (3) draws upon a wide range of methods (from the systems literature and beyond) to create aflexible and responsive systems practice.
The key objective of this study is to identify, reduce and eliminate threat to engaging in a piggeryventure as a profitable business entity.
2.2. Participatory Research Process
Some of the researchers from BNARI were employed as consultants to address the piggerychallenges during data collection at one of the larger scale commercial pig farms. These scientistslaunched the Maslow theory of motivation in the work place to produce the drive needed to motivatestaff to satisfy the need to revamp the whole piggery sections [55]. The workforce comprehendedthe objectives stated above and most proposed ways forward through the focus group discussions.Division of labour was employed and members of staff who were ‘randomly’ assigned to any penand also those managing two pens per day (each pen contain 100–150 pigs) in the absence of waterflow were made to manage a pen per staff. This eliminated the poor cleaning and maintenanceculture and gave them a sort of ownership of the blocks and ensured their animals are well cared for.The organizational interrelatedness of staff optimizes the delivery efficiency of labour productivity tosome degree.
The Challenge Encountered
There are a lot of challenges to improving labour productivity. Insufficient and inefficient workingtools led to delays and reduced labour productivity. Also, lack of consistent water supply led tofetching water from nearby ponds to both clean and water animals. This source of water means pigsmust also be treated frequently with de-wormers. These entire challenges reduced labour efficiencyand increased the motivational needs of workers. Some quit the job while those remaining lost interestin the work. All these challenges made supervision difficult and worked against productivity.

Systems 2018, 6, 35 10 of 25
3. Results and Discussion
3.1. Development of Alternative Agribusiness: ‘Shifting the Burden’ Systems Piggery Archetype
Development of alternative agribusiness among farmers in Ghana is mainly because of failure torealise the economic benefits of their former business. Ghana’s pork production and demand exhibitsdistinct continuous phenomenon which influences pork availability. Since domestic production cannotkeep up with the demand for pork, Ghana imports processed pork to meet domestic demand as shownin Figure 2. Most crop farmers are shifting to piggery because of its fecundity and economic benefits.As domestic pig production increase, Ghana’s pork import volume remained at a low level (Figure 2).Systems 2018, 6, x FOR PEER REVIEW 10 of 25
Figure 2. Pork Production and Imports into Ghana: 2000–2016 in metric tonnes (Source MOFA).
However, it is widely discovered that these shifts based on survival driven motives have more negative impacts on profit in overall socioeconomic and household developments among these farmers as a result of lack of business plan and inadequate information in pig production [6]. The development of alternative agribusiness in Ghana and its long-term impact have been described here as an example of ‘shifting the burden’ system archetype as shown in Figure 3.
Figure 3. ‘Shifting the Burden’ System Archetype.
Findings reveal that the “Development of alternative agribusiness has taken deep root to the psyche of most entrepreneur farmers and business men without proper investigation of the cause of business failure of the former business” [6,56,57]. Some African farmers have received much more financial assistance in comparison to GDP than any other developing areas but they have grown much slower than the other parts of the world [2,29,58,59]. If they had focused on mobilizing adequate information on their own business rather than depending on finding alternatives, the countries would be independent and could develop in a faster pace and get rid of economic crisis and survival driven motive businesses. This is a case of ‘shifting the burden’ in which most market-oriented farmers opt to depend upon the development of alternative business rather than mobilizing adequate information and business plan during the financial crisis, which in long run, was unable to
10056
9653 10416
10181
9979
9744
16027
16498
17002
17506
18010
19072
20224
21432
22932
24513
26107
358 1166
7738
9882
7756 10
287 13
291
10552
5487
3150
2717
2507
1786
2065
905
1168
922
0
5000
10000
15000
20000
25000
30000
1998 2000 2002 2004 2006 2008 2010 2012 2014 2016 2018
MT
Year
Domestic Pork Production (MT) Pork Import (MT)
Developing AlternativeAgri-business
Survival DrivenMotive
AdequateKnowledge/Business Plan
Economic Crisis
S
O
S
O
S
O
B1
B2
R1
Figure 2. Pork Production and Imports into Ghana: 2000–2016 in metric tonnes (Source MOFA).
However, it is widely discovered that these shifts based on survival driven motives have morenegative impacts on profit in overall socioeconomic and household developments among these farmersas a result of lack of business plan and inadequate information in pig production [6]. The developmentof alternative agribusiness in Ghana and its long-term impact have been described here as an exampleof ‘shifting the burden’ system archetype as shown in Figure 3.
Systems 2018, 6, x FOR PEER REVIEW 10 of 25
Figure 2. Pork Production and Imports into Ghana: 2000–2016 in metric tonnes (Source MOFA).
However, it is widely discovered that these shifts based on survival driven motives have more negative impacts on profit in overall socioeconomic and household developments among these farmers as a result of lack of business plan and inadequate information in pig production [6]. The development of alternative agribusiness in Ghana and its long-term impact have been described here as an example of ‘shifting the burden’ system archetype as shown in Figure 3.
Figure 3. ‘Shifting the Burden’ System Archetype.
Findings reveal that the “Development of alternative agribusiness has taken deep root to the psyche of most entrepreneur farmers and business men without proper investigation of the cause of business failure of the former business” [6,56,57]. Some African farmers have received much more financial assistance in comparison to GDP than any other developing areas but they have grown much slower than the other parts of the world [2,29,58,59]. If they had focused on mobilizing adequate information on their own business rather than depending on finding alternatives, the countries would be independent and could develop in a faster pace and get rid of economic crisis and survival driven motive businesses. This is a case of ‘shifting the burden’ in which most market-oriented farmers opt to depend upon the development of alternative business rather than mobilizing adequate information and business plan during the financial crisis, which in long run, was unable to
10056
9653 10416
10181
9979
9744
16027
16498
17002
17506
18010
19072
20224
21432
22932
24513
26107
358 1166
7738
9882
7756 10
287 13
291
10552
5487
3150
2717
2507
1786
2065
905
1168
922
0
5000
10000
15000
20000
25000
30000
1998 2000 2002 2004 2006 2008 2010 2012 2014 2016 2018
MT
Year
Domestic Pork Production (MT) Pork Import (MT)
Developing AlternativeAgri-business
Survival DrivenMotive
AdequateKnowledge/Business Plan
Economic Crisis
S
O
S
O
S
O
B1
B2
R1
Figure 3. ‘Shifting the Burden’ System Archetype.

Systems 2018, 6, 35 11 of 25
Findings reveal that the “Development of alternative agribusiness has taken deep root to thepsyche of most entrepreneur farmers and business men without proper investigation of the cause ofbusiness failure of the former business” [6,56,57]. Some African farmers have received much morefinancial assistance in comparison to GDP than any other developing areas but they have grown muchslower than the other parts of the world [2,29,58,59]. If they had focused on mobilizing adequateinformation on their own business rather than depending on finding alternatives, the countries wouldbe independent and could develop in a faster pace and get rid of economic crisis and survival drivenmotive businesses. This is a case of ‘shifting the burden’ in which most market-oriented farmers opt todepend upon the development of alternative business rather than mobilizing adequate informationand business plan during the financial crisis, which in long run, was unable to solve the problem ofeconomic crisis (Figure 3). Nearby crop farmers seeing the initial progress of the piggery business oftheir competing neighbours also adopt this business, leading to escalation.
Effective Strategies
Focus on the fundamental solution. If necessary, use the symptomatic solution only to gaintime while working on the fundamental solution. When dealing with the development of alternativeagribusiness based on survival driven motive, a manager must ask himself whether he is treatingthe economic crises problem or addressing the root cause of the previous business failure. Often, outof expediency, the development of alternative agribusiness as a solution is essential. The mosteffective strategy for dealing with a Shifting the Burden structure is an employment of the alternativeagribusiness and development of a business plan or acquiring adequate knowledge of that business.Thus, one resolves the immediate problem and works to ensure that it does not return.
3.2. Escalating Piggery Archetype
In the escalation of the piggery archetype, actions taken by one farmer influence actions others take,but unlike physics—where every action produces an equal and opposite reaction—farmers’ actions areamplified with each round, leading to a phenomenon known as an escalation. It hypothesises that thetwo balancing loops will create a reinforcing Figure 8 effect, resulting in threatening actions by bothparties that grow exponentially over time [60].
If left unchecked, the escalation dynamic can spiral out of control, going far beyond what eitherparty may have intended. The expression, “keeping up with the Joneses” comes to mind-if the Jonesesbuy a new car, the Smiths feel compelled to replace their old vehicle with the latest model [46]. In thiscase, escalation occurs when farmers equate many alternative business establishments with success.Smith, believe they are merely “keeping up” when they buy their new car, they may choose one withbells and whistles that the Joneses do not have, triggering another round of escalating conspicuousconsumption. Escalation dynamics is erupting in the agriculture industry of Ghana leading to rivalry.Delay in information access by new entrepreneurs into the piggery industry contributes to distortionsflowing between the new and existing parties. Once delay occurs, information gets distorted alongevery link of the system, which leads to overestimation of the impact of its rival’s activities. In Figure 4,Farmer A seeks piggery as an alternative business because of low profitability of sales from vegetablesor crop farming. The results of these activities do not show up immediately in higher profits (B1 in“the structure of Escalation Dynamics”). This delay contributes to escalation dynamics because FarmerB then perceives that Farmer A’s business alternative is more profitable. Farmer B responds by settingup a piggery as well. Eventually, the results of Farmer A’s actions do become visible, but because of thedelay between relative results and feelings of being threatened, Farmer B remains complacent about itslevel of activity relative to Farmer A. In both cases, farmers were previously caught off-guard becauseof delay. The problem is that each farmer’s actions were based on extrapolations usually inflated bythe other’s activities. The challenges encountered compel the farmers to adopt quick fixes such aspromotion, value addition, etc. which worsen the situation and lead to business failure.

Systems 2018, 6, 35 12 of 25
Systems 2018, 6, x FOR PEER REVIEW 11 of 25
solve the problem of economic crisis (Figure 3). Nearby crop farmers seeing the initial progress of the piggery business of their competing neighbours also adopt this business, leading to escalation.
Effective Strategies
Focus on the fundamental solution. If necessary, use the symptomatic solution only to gain time while working on the fundamental solution. When dealing with the development of alternative agribusiness based on survival driven motive, a manager must ask himself whether he is treating the economic crises problem or addressing the root cause of the previous business failure. Often, out of expediency, the development of alternative agribusiness as a solution is essential. The most effective strategy for dealing with a Shifting the Burden structure is an employment of the alternative agribusiness and development of a business plan or acquiring adequate knowledge of that business. Thus, one resolves the immediate problem and works to ensure that it does not return.
3.2. Escalating Piggery Archetype
In the escalation of the piggery archetype, actions taken by one farmer influence actions others take, but unlike physics—where every action produces an equal and opposite reaction—farmers’ actions are amplified with each round, leading to a phenomenon known as an escalation. It hypothesises that the two balancing loops will create a reinforcing Figure 8 effect, resulting in threatening actions by both parties that grow exponentially over time [60].
If left unchecked, the escalation dynamic can spiral out of control, going far beyond what either party may have intended. The expression, “keeping up with the Joneses” comes to mind-if the Joneses buy a new car, the Smiths feel compelled to replace their old vehicle with the latest model [46]. In this case, escalation occurs when farmers equate many alternative business establishments with success. Smith, believe they are merely “keeping up” when they buy their new car, they may choose one with bells and whistles that the Joneses do not have, triggering another round of escalating conspicuous consumption. Escalation dynamics is erupting in the agriculture industry of Ghana leading to rivalry. Delay in information access by new entrepreneurs into the piggery industry contributes to distortions flowing between the new and existing parties. Once delay occurs, information gets distorted along every link of the system, which leads to overestimation of the impact of its rival’s activities. In Figure 4, Farmer A seeks piggery as an alternative business because of low profitability of sales from vegetables or crop farming. The results of these activities do not show up immediately in higher profits (B1 in “the structure of Escalation Dynamics”). This delay contributes to escalation dynamics because Farmer B then perceives that Farmer A’s business alternative is more profitable. Farmer B responds by setting up a piggery as well. Eventually, the results of Farmer A’s actions do become visible, but because of the delay between relative results and feelings of being threatened, Farmer B remains complacent about its level of activity relative to Farmer A. In both cases, farmers were previously caught off-guard because of delay. The problem is that each farmer’s actions were based on extrapolations usually inflated by the other’s activities. The challenges encountered compel the farmers to adopt quick fixes such as promotion, value addition, etc. which worsen the situation and lead to business failure.
Figure 4. Escalating Archetype (Fear of Mockery).
Piggery Establishmentof Farmer "A"
Market Share ofVegetable/Crop Farmer "A"Relative to "B" Production
Lost of Profit and Threat of"Being Lookdown" by
Farmer "B"
Farmer "A" SeekingAlternative Business
Piggery Establishmentof Farmer "B"
Farmer "B" SeekingAlternative Business
Lost of Profit and Threat of"Being Lookdown" by
Farmer "A"
S S
O
S
S
O
S
S
B2B1
Figure 4. Escalating Archetype (Fear of Mockery).
Managing the Structure
Nothing comes without a cost and there is a limit to the results that one can generate. In thisarchetype, “Farmer A” and “Farmer B” are on a mutually destructive course. A point must be reachedwhere the structure can grow no more because nothing grows forever. There are two effective strategiesfor dealing with this structure.
• One approach is to disconnect the two loops so “Farmer A” and “Farmer B” are no longercompeting with each other but competing with themselves (Figure 5). This produces tworeinforcing loops.
Systems 2018, 6, x FOR PEER REVIEW 12 of 25
Managing the Structure
Nothing comes without a cost and there is a limit to the results that one can generate. In this archetype, “Farmer A” and “Farmer B” are on a mutually destructive course. A point must be reached where the structure can grow no more because nothing grows forever. There are two effective strategies for dealing with this structure.
• One approach is to disconnect the two loops so “Farmer A” and “Farmer B” are no longer competing with each other but competing with themselves (Figure 5). This produces two reinforcing loops.
Figure 5. Disconnecting the two loops.
• The second approach is to begin evaluating the composite of “Farmer A” and “Farmer B’s” actions rather than their individual actions (Figure 6). In this way, they begin to see the value of cooperation rather than competition and the structure turns into two synergistic reinforcing loops.
Figure 6. Evaluating the composite.
Areas of Concern
As the escalation structure is equivalent to a single reinforcing loop the same concerns apply to this overall structure. The most likely situation to develop is that “Farmer A” and “Farmer B” will cease to compete and begin to cooperate.
3.3. “Fixes that Fail” Archetype
There is a paradox that asks, why don’t people have time to do things right in the first place, but have time to fix them over and over again? The fixes that fail archetype as shown in Figure 7, highlights how one can get caught up in a dynamic that reinforces the need to continually implement quick fixes to address the problem.
Piggery Establishmentof Farmer "A"
Farmer "A" SeekingAlternative Business
S
R1S
Piggery Establishmentof Farmer "B"
Farmer "B" SeekingAlternative Business
S
R2S
Piggery Establishmentof Farmer "A"
Farmer "A" SeekingAlternative Business
Piggery Establishmentof Farmer "B"
Farmer "B" SeekingAlternative Business
S S
R2R1
S S
Total Market Shareof "A" and "B"
SS
Figure 5. Disconnecting the two loops.
• The second approach is to begin evaluating the composite of “Farmer A” and “Farmer B’s”actions rather than their individual actions (Figure 6). In this way, they begin to see the value ofcooperation rather than competition and the structure turns into two synergistic reinforcing loops.
Systems 2018, 6, x FOR PEER REVIEW 12 of 25
Managing the Structure
Nothing comes without a cost and there is a limit to the results that one can generate. In this archetype, “Farmer A” and “Farmer B” are on a mutually destructive course. A point must be reached where the structure can grow no more because nothing grows forever. There are two effective strategies for dealing with this structure.
• One approach is to disconnect the two loops so “Farmer A” and “Farmer B” are no longer competing with each other but competing with themselves (Figure 5). This produces two reinforcing loops.
Figure 5. Disconnecting the two loops.
• The second approach is to begin evaluating the composite of “Farmer A” and “Farmer B’s” actions rather than their individual actions (Figure 6). In this way, they begin to see the value of cooperation rather than competition and the structure turns into two synergistic reinforcing loops.
Figure 6. Evaluating the composite.
Areas of Concern
As the escalation structure is equivalent to a single reinforcing loop the same concerns apply to this overall structure. The most likely situation to develop is that “Farmer A” and “Farmer B” will cease to compete and begin to cooperate.
3.3. “Fixes that Fail” Archetype
There is a paradox that asks, why don’t people have time to do things right in the first place, but have time to fix them over and over again? The fixes that fail archetype as shown in Figure 7, highlights how one can get caught up in a dynamic that reinforces the need to continually implement quick fixes to address the problem.
Piggery Establishmentof Farmer "A"
Farmer "A" SeekingAlternative Business
S
R1S
Piggery Establishmentof Farmer "B"
Farmer "B" SeekingAlternative Business
S
R2S
Piggery Establishmentof Farmer "A"
Farmer "A" SeekingAlternative Business
Piggery Establishmentof Farmer "B"
Farmer "B" SeekingAlternative Business
S S
R2R1
S S
Total Market Shareof "A" and "B"
SS
Figure 6. Evaluating the composite.

Systems 2018, 6, 35 13 of 25
Areas of Concern
As the escalation structure is equivalent to a single reinforcing loop the same concerns apply tothis overall structure. The most likely situation to develop is that “Farmer A” and “Farmer B” willcease to compete and begin to cooperate.
3.3. “Fixes that Fail” Archetype
There is a paradox that asks, why don’t people have time to do things right in the first place,but have time to fix them over and over again? The fixes that fail archetype as shown in Figure 7,highlights how one can get caught up in a dynamic that reinforces the need to continually implementquick fixes to address the problem.Systems 2018, 6, x FOR PEER REVIEW 13 of 25
Figure 7. “Fixes that Fail” Archetype.
In this structure, a problem symptom gets bad enough that it captures attention: for example, a slump in pig or pork sales leads to the implementation of a quick fix (a marketing promotion) that makes the symptoms go away (pig sales improved). However, that action triggers unintended consequences that make the original symptom reappear after some delay—often worse than before—thus limiting business development and growth. The systems thinking approach is a transdisciplinary ‘framework’ that addresses the root causes of challenges by viewing ‘problems’ as part of an overall system, in contrast to the linear approach of identifying ‘quick fixes’ to specific parts. ‘Quick Fixes’ lead to the danger of ‘silo mentality’ in which a fix ‘here’ simply shifts the problem to ‘there’ and ‘organizational myopia’ in which a fix ‘now’ gives rise to a much bigger problem to fix ‘later’ [38]. Therefore, a systems thinker frames a problem in terms of seeing the whole forest, instead of focusing on a particular part. They see beyond the details to the context of relationships in which they are embedded. Today, it is widely used by academics and practitioners alike to address sustainability challenges.
Effective Strategies
A “fixes that fail” structure is often part of a more elaborate structure in which the fixes that fail structure simply represents dealing with the symptoms rather than the root cause underlying the real problem. A “fixes that fail” structure often results in becoming dependent on the fix, thus applying it over and over.
The most effective strategy for dealing with this structure is advance planning. Since one can never do just one thing, as everything affects everything else, before taking action to change the current state, one has to think about what else that action is apt to affect and what the impact will be. Sometimes the unexpected consequences may be several affects away, so one does not have to stop at just one. Essentially what one seeks to do is to identify the unexpected, which means it is no longer unexpected.
A less effective strategy would be to figure out how to disconnect the unexpected consequence from influencing the current state in time. Of course, then it would not be a consequence.
3.4. “Limit to Market Growth” Archetype
In the Limit to Growth Archetype displayed in Figure 8, certain actions initially lead to growth, encouraging the company to engage in even more of those same efforts. Overtime; however, the system encounters limit that slow improvements in results. As performance declines, the company tends to focus even more on implementing the actions that initially led to growth. In the Limit to Growth Archetype, marketing is a common engine of growth. In the piggery industry, farmers allocate a certain percentage of the budget to pig or pork marketing and engage in various marketing activities that generate sales. More sales lead to increased revenue and a corresponding rise in marketing budget (R1). However, as pork sales grow, the customer base naturally expands, along
Pig/Pork ProductPromotions
Customer Attractivenessto Buy Now than Later
Sales
Falling SalesVolume
Revenue Pressure
Customer Attractiveness toBuy Pig/Pork Products without
Promotion
Awareness ofProduct Availability
S
S
SO
S
O
O
O
B1R1
Figure 7. “Fixes that Fail” Archetype.
In this structure, a problem symptom gets bad enough that it captures attention: for example, aslump in pig or pork sales leads to the implementation of a quick fix (a marketing promotion) thatmakes the symptoms go away (pig sales improved). However, that action triggers unintendedconsequences that make the original symptom reappear after some delay—often worse thanbefore—thus limiting business development and growth. The systems thinking approach is atransdisciplinary ‘framework’ that addresses the root causes of challenges by viewing ‘problems’as part of an overall system, in contrast to the linear approach of identifying ‘quick fixes’ to specificparts. ‘Quick Fixes’ lead to the danger of ‘silo mentality’ in which a fix ‘here’ simply shifts the problemto ‘there’ and ‘organizational myopia’ in which a fix ‘now’ gives rise to a much bigger problem tofix ‘later’ [38]. Therefore, a systems thinker frames a problem in terms of seeing the whole forest,instead of focusing on a particular part. They see beyond the details to the context of relationships inwhich they are embedded. Today, it is widely used by academics and practitioners alike to addresssustainability challenges.
Effective Strategies
A “fixes that fail” structure is often part of a more elaborate structure in which the fixes that failstructure simply represents dealing with the symptoms rather than the root cause underlying the realproblem. A “fixes that fail” structure often results in becoming dependent on the fix, thus applying itover and over.
The most effective strategy for dealing with this structure is advance planning. Since one cannever do just one thing, as everything affects everything else, before taking action to change thecurrent state, one has to think about what else that action is apt to affect and what the impact willbe. Sometimes the unexpected consequences may be several affects away, so one does not have to

Systems 2018, 6, 35 14 of 25
stop at just one. Essentially what one seeks to do is to identify the unexpected, which means it is nolonger unexpected.
A less effective strategy would be to figure out how to disconnect the unexpected consequencefrom influencing the current state in time. Of course, then it would not be a consequence.
3.4. “Limit to Market Growth” Archetype
In the Limit to Growth Archetype displayed in Figure 8, certain actions initially lead to growth,encouraging the company to engage in even more of those same efforts. Overtime; however, thesystem encounters limit that slow improvements in results. As performance declines, the companytends to focus even more on implementing the actions that initially led to growth. In the Limit toGrowth Archetype, marketing is a common engine of growth. In the piggery industry, farmers allocatea certain percentage of the budget to pig or pork marketing and engage in various marketing activitiesthat generate sales. More sales lead to increased revenue and a corresponding rise in marketingbudget (R1). However, as pork sales grow, the customer base naturally expands, along with followingup calls to build customer relationship marketing (B1). If the company marketing support capacitydoes not increase fast enough to meet the growing demand, the adequacy of that capacity begins todrop. This trend leads to lower customer satisfaction and downwards pressure on pig or pork sales.Farmers begin to seek alternative business or reduce investment in the piggery for other sectors.
Systems 2018, 6, x FOR PEER REVIEW 14 of 25
with following up calls to build customer relationship marketing (B1). If the company marketing support capacity does not increase fast enough to meet the growing demand, the adequacy of that capacity begins to drop. This trend leads to lower customer satisfaction and downwards pressure on pig or pork sales. Farmers begin to seek alternative business or reduce investment in the piggery for other sectors.
Figure 8. “Limit to Market Growth” Archetype.
Effective Strategies
1. The best defense is a good offense. As defined in the effective strategies for the Reinforcing Loop, if there is a Reinforcing Loop operating, start looking for what is going to become a limiting factor and remove it before it even has a chance to create a substantial impact on results.
2. If the structure is already at a stage where the limiting factor is interacting with results to limit them the options are the following:
1. Alter the limiting factor in such a way that it no longer interacts with the results to create a slowing action.
2. Find a way to disconnect the results from the slowing action so it no longer exists. 3. Disconnect the slowing action from the results so it can have no effect on results.
Areas of Concern
1. There are often multiple limits to deal with which leads to an Attractiveness Principle. 2. It is possible that limited shared resources are the source of the limiting factor leading to a
Tragedy of the Commons. 3. The limit may be insufficient capacity which leads to Growth and Underinvestment with a Fixed
Standard.
3.5. “Success to Successful” Archetype
In the Success to successful Archetype in Figure 9, the demand made by another project in comparison to the piggery for a common resource such as funds, labour, time, etc. are linked by two reinforcing loops. As the resources dedicated to ‘Project A’ and ‘Project ‘A’s success both increase, the resources invested in ‘piggery’ and in turn ‘piggery’s success decline. As resources are devoted to ‘Project A’ (which represents the more favoured project) for some time with no visible success in the beginning, the net returns for ‘Project A’ are low or even negative.
Marketing Budget
Sales
Promotion andMarketing
Customer RelationshipMarketing
Follow Up Calls
Database ofCustomers
SS
SS
S
S
O
R1 B1
CustomerSatisfaction
S
Figure 8. “Limit to Market Growth” Archetype.
Effective Strategies
1. The best defense is a good offense. As defined in the effective strategies for the Reinforcing Loop,if there is a Reinforcing Loop operating, start looking for what is going to become a limiting factorand remove it before it even has a chance to create a substantial impact on results.
2. If the structure is already at a stage where the limiting factor is interacting with results to limitthem the options are the following:
1. Alter the limiting factor in such a way that it no longer interacts with the results to create aslowing action.
2. Find a way to disconnect the results from the slowing action so it no longer exists.3. Disconnect the slowing action from the results so it can have no effect on results.

Systems 2018, 6, 35 15 of 25
Areas of Concern
1. There are often multiple limits to deal with which leads to an Attractiveness Principle.2. It is possible that limited shared resources are the source of the limiting factor leading to a Tragedy
of the Commons.3. The limit may be insufficient capacity which leads to Growth and Underinvestment with a
Fixed Standard.
3.5. “Success to Successful” Archetype
In the Success to successful Archetype in Figure 9, the demand made by another project incomparison to the piggery for a common resource such as funds, labour, time, etc. are linked by tworeinforcing loops. As the resources dedicated to ‘Project A’ and ‘Project ‘A’s success both increase, theresources invested in ‘piggery’ and in turn ‘piggery’s success decline. As resources are devoted to‘Project A’ (which represents the more favoured project) for some time with no visible success in thebeginning, the net returns for ‘Project A’ are low or even negative.Systems 2018, 6, x FOR PEER REVIEW 15 of 25
Figure 9. “Success to Successful” Archetype.
However, sustained investment leads to ‘Project A’’s success. The key here is that, if the investment is sustained in ‘Project A’ beyond a critical point, ‘Project A’ begins to generate positive returns. Beyond this critical threshold of positive returns, ‘Project A’s success is likely to be self-sustaining because continued investment brings ongoing positive net returns. In the case of ‘piggery’, we start by making the same initial investments as for ‘Project A’ but, for whatever reasons (inadequate knowledge, poor timing, external forces, lack of a business plan, etc.) ‘piggery’ takes longer than ‘Project A’ to become successful. In many cases, the reason for ‘Project A’ comparative success is that it had a head start in and is already beyond the critical threshold of positive returns. Thus, ‘piggery’s net returns stay low or negative longer than ‘Project A’, and ‘piggery’ begins to look less attractive as an alternative. Thus, less and less is invested in ‘piggery’, which delays ‘piggery’ achievement of success even further. At a certain point, resources, such as people, equipment, etc. is even taken away from ‘piggery’ because we do not want to waste resources on a “lost cause”. In turn, ‘piggery’s performance only declines further. Finally, ‘piggery’ will be considered a failed project and abandoned.
Effective Strategies
1. Investigate Historical Origins of Competencies
One warning signal that the “Success to the Successful” archetype is at work is if you hear yourself validating decisions by saying, “Project A is a good way to go, because it is clear by the progress to date that it outshines the piggery alternatives.” The Project A system has become entrenched because of the “Success to the Successful” loops and is difficult to dislodge because of the “competency trap” phenomena.
2. Identify Competency Traps
Competency traps lock us into a way of doing things simply because we are already skilled at doing it that way. Suppose, for example, you are good at managing Project A skillfully and profitably. When a new alternative business such as the piggery emerges, everyone raves and says it is superior to the first. However, you think, “I already know how to manage this one, so I’m just going to keep using it.” Each time you use it, you invest more of your time and resources to get to know it better, without gaining any skills in the alternative piggery business. Over time, your competency “traps” you into continuing to manage Project A.
Such competency traps can turn your business into a corporate dinosaur, because they disconnect you from the current progress of piggery alternatives and engender the belief that you have the way, the best way, or the only way. Even if your favored method is currently superior, once you get caught in the “Success to the Successful” loops, you will not realize it when progress passes you by.
Ability of Project A ToGenerate Positive Returns
Ability Of Project A toSurvive and Grow
Threat to PiggeryProject Success
Desire To Commit MoreInvestment To Project A instead
of Piggery Project
Ability Of PiggeryProject to Survive and
grow
Ability of Piggery ToGenerate Positive Returns
Threat of PiggeryProject Failing
S
S
S
S
S
O
S
O
R2R1
Figure 9. “Success to Successful” Archetype.
However, sustained investment leads to ‘Project A”s success. The key here is that, if the investmentis sustained in ‘Project A’ beyond a critical point, ‘Project A’ begins to generate positive returns.Beyond this critical threshold of positive returns, ‘Project A’s success is likely to be self-sustainingbecause continued investment brings ongoing positive net returns. In the case of ‘piggery’, we start bymaking the same initial investments as for ‘Project A’ but, for whatever reasons (inadequate knowledge,poor timing, external forces, lack of a business plan, etc.) ‘piggery’ takes longer than ‘Project A’ tobecome successful. In many cases, the reason for ‘Project A’ comparative success is that it had a headstart in and is already beyond the critical threshold of positive returns. Thus, ‘piggery’s net returns staylow or negative longer than ‘Project A’, and ‘piggery’ begins to look less attractive as an alternative.Thus, less and less is invested in ‘piggery’, which delays ‘piggery’ achievement of success even further.At a certain point, resources, such as people, equipment, etc. is even taken away from ‘piggery’ becausewe do not want to waste resources on a “lost cause”. In turn, ‘piggery’s performance only declinesfurther. Finally, ‘piggery’ will be considered a failed project and abandoned.
Effective Strategies
1. Investigate Historical Origins of Competencies
One warning signal that the “Success to the Successful” archetype is at work is if you hear yourselfvalidating decisions by saying, “Project A is a good way to go, because it is clear by the progressto date that it outshines the piggery alternatives.” The Project A system has become entrenchedbecause of the “Success to the Successful” loops and is difficult to dislodge because of the “competencytrap” phenomena.

Systems 2018, 6, 35 16 of 25
2. Identify Competency Traps
Competency traps lock us into a way of doing things simply because we are already skilled atdoing it that way. Suppose, for example, you are good at managing Project A skillfully and profitably.When a new alternative business such as the piggery emerges, everyone raves and says it is superiorto the first. However, you think, “I already know how to manage this one, so I’m just going to keepusing it.” Each time you use it, you invest more of your time and resources to get to know it better,without gaining any skills in the alternative piggery business. Over time, your competency “traps”you into continuing to manage Project A.
Such competency traps can turn your business into a corporate dinosaur, because they disconnectyou from the current progress of piggery alternatives and engender the belief that you have the way,the best way, or the only way. Even if your favored method is currently superior, once you get caughtin the “Success to the Successful” loops, you will not realize it when progress passes you by.
3. Evaluate Current Measurement Systems
The measurement systems you use can perpetuate your competency traps by making currentProject A successes look good and Piggery alternatives appear less favorable than they actually are.Is your current system weighing too heavily the costs that have already been invested? Does it overlydiscount the opportunity costs of not switching or not scanning for other possibilities? If you thinkyour system may be skewed in one direction, you may need to question the assumptions behind yourcurrent measurement systems and perhaps change them if necessary.
4. Map Internal View of Market Success
When you are successful in a market for a long time, you often begin to believe that your internalview of success is the same as the market’s view. The internal success loop can thus blind you to shiftsin the competitive environment that are obvious to less successful players. Mapping your internalview of success will make the operating assumptions explicit and clear.
5. Obtain External Views of Market Success
To complete the picture, you need to obtain external views of market success. This usually requiresgetting an assessment from a true “outsider” to the industry. Internal attempts to map the externalview run the danger of looking too similar to the internal view.
6. Assess Effects on the Innovative Spirit
Competency traps and inaccurate views of the marketplace indicate how the “Success to theSuccessful” archetype can erode the innovative spirit of the organization. This trap is characterizedby the old management adage, “If it ain’t broke, don’t fix it.” Instead of allowing one successful wayto predominate, use the archetype to question how you think and perceive. The challenge here is toalways entertain alternatives in a highly innovative spirit.
7. Be Your Best Competitor
By nurturing an innovative spirit and continually scanning for new alternatives, you can becomeyour own best competitor. With this mindset, you become the most critical of your own success,continually looking for gaps and areas for improvement. For example, Proctor & Gamble’s approach ofhaving multiple brands compete with each other helped the company become and remain the industryleader in many markets. By viewing your successes as if you were another company, you can findways to create a competing product or service that may be better or more successful.
“Success to the Successful” is one of the toughest structures an organization has to overcomebecause many choices are often made subconsciously, influenced by the momentum of past actions.It is easy to become trapped in your success by continuing to learn how to do the same thing better.

Systems 2018, 6, 35 17 of 25
Applying the archetype can hopefully help you design your successes to be a product of continuallearning rather than the inertia of past achievements.
There are other strategies for dealing with a Success to the Successful situation.
1. Identify the resource(s) being unequally distributed and balance the distribution.2. Disconnect the two reinforcing structures so they are not dependent on the allocation of shared
resource(s).
3.6. “Tragedy of the Commons” Archetype
The tragedy of the commons structure of Figure 10 discovers that both projects can benefitfrom using a common resource without having to pay much, if anything, in terms of direct costs.The Tragedy of the Commons structure represents a situation where two or more reinforcing structuresare contingent on some limited common resource. The more they use the resource, the more they gainfrom activity (Loops R1 and R2). Therefore, to maximise their individual benefit, they continue to takeadvantage of the commons as much as they want.Systems 2018, 6, x FOR PEER REVIEW 17 of 25
Figure 10. “Tragedy of the commons” Archetype.
The commons in the case of the piggery and vegetable production in Ghana is a resource (people, materials, space, tools, etc.) that is simultaneously made available to multiple people and/or teams. The initial rationale for creating the commons is typically economies of scale. As each person or team claims their “share” of the commons, within the context of the goals and objectives that they have set for themselves, they regard the commons as being uniquely available for their own purposes. Initially using the resource contributes to each reinforcing loops results. After some time the total activity of the reinforcing structures exceed the capacity of the resource which results in a reduction of the growing action for each of the reinforcing structures. As the Total Activity approaches the Resource Limit it begins to limit the Gain Per Individual essentially limiting the gain of both reinforcing structures. In the case of commons such as people, tools, materials or space, there is no conscious awareness of increased demand, but the concrete, physical limitations have no elasticity, and the satisfaction of people or teams placing demands on the commons erodes [60]. As aggregate performance of the commons slides, several consequences can be felt in the agribusiness. Individual or team performance declines as the erosion of the commons affects their ability to meet individual goals and objectives which in turn erodes agribusiness goals and performance. It is assumed that if the total usage of a common resource becomes too great for the system to support, the commons will become overloaded or depleted and everyone will experience diminished benefits. As long as the total activities or total draw on the resource from all players stay within the carrying capacity or limits of the commons, everything is fine. The Tragedy never gets triggered, and the players keep doing what they are doing. When consumption begins to exceed the resource’s ability to replenish itself; however, gains per individual effort will start to decline. When this happens, participants often respond by redoubling their efforts (B2 and B1). They may try to get the commons faster, initiate more request for the commons, or just outright grab more of the commons before others get to it. Of course, these kinds of tactics are quickly copied by everyone else, which further accelerates the depletion of the commons. Left unmanaged, these kinds of actions will eventually bring on the collapse of the commons. In this case, there will be no more gains for the participants, so their activities will finally cease or be greatly curtailed
Effective Strategies
This structure repeatedly appears in organizational contexts where a service organization supports the success of multiple departments who fail to support the service organization in return. There are two strategies for dealing with this structure, one being more effective than the other.
Desire to ImprovePiggery Functionality
Success of PiggeryOperation
Investment RequiredIn Piggery
Total InvestmentRequirement
Investment GainPer Project
InvestmentCapacity
Investment Requirementfor Competing Project
Desire to ImproveCompeting Project
Functionality
Sucess of CompetingProject Operation
S
S
S
O
SS
S
S
S
SS
R1
B1
B2
R2
Figure 10. “Tragedy of the commons” Archetype.
The commons in the case of the piggery and vegetable production in Ghana is a resource (people,materials, space, tools, etc.) that is simultaneously made available to multiple people and/or teams.The initial rationale for creating the commons is typically economies of scale. As each person or teamclaims their “share” of the commons, within the context of the goals and objectives that they have setfor themselves, they regard the commons as being uniquely available for their own purposes. Initiallyusing the resource contributes to each reinforcing loops results. After some time the total activity of thereinforcing structures exceed the capacity of the resource which results in a reduction of the growingaction for each of the reinforcing structures. As the Total Activity approaches the Resource Limit itbegins to limit the Gain Per Individual essentially limiting the gain of both reinforcing structures. In thecase of commons such as people, tools, materials or space, there is no conscious awareness of increaseddemand, but the concrete, physical limitations have no elasticity, and the satisfaction of people orteams placing demands on the commons erodes [60]. As aggregate performance of the commonsslides, several consequences can be felt in the agribusiness. Individual or team performance declines asthe erosion of the commons affects their ability to meet individual goals and objectives which in turn

Systems 2018, 6, 35 18 of 25
erodes agribusiness goals and performance. It is assumed that if the total usage of a common resourcebecomes too great for the system to support, the commons will become overloaded or depleted andeveryone will experience diminished benefits. As long as the total activities or total draw on theresource from all players stay within the carrying capacity or limits of the commons, everything is fine.The Tragedy never gets triggered, and the players keep doing what they are doing. When consumptionbegins to exceed the resource’s ability to replenish itself; however, gains per individual effort will startto decline. When this happens, participants often respond by redoubling their efforts (B2 and B1).They may try to get the commons faster, initiate more request for the commons, or just outright grabmore of the commons before others get to it. Of course, these kinds of tactics are quickly copied byeveryone else, which further accelerates the depletion of the commons. Left unmanaged, these kindsof actions will eventually bring on the collapse of the commons. In this case, there will be no moregains for the participants, so their activities will finally cease or be greatly curtailed
Effective Strategies
This structure repeatedly appears in organizational contexts where a service organization supportsthe success of multiple departments who fail to support the service organization in return. There aretwo strategies for dealing with this structure, one being more effective than the other.
• The most effective strategy for dealing with this structure is to wire in feedback paths from thesuccess of piggery operation and success of competing for project operation to the investmentcapacity so that piggery and competing for project use resources their results promotes for theavailability of additional resources.
• The alternative, and less effective, strategy for dealing with this structure is to add an additionalresource to control the use of resources by piggery and competing project. This strategy limits theoverall potential results of the structure to the pre-defined resource limit. It also adds additionalresource to the equation and probably results in endless disputes as to the fairness associatedwith the allocation of resources. While not really the most appropriate strategy, this is the onemost often used (out of ignorance).
4. The Current State of the Respondent’s Piggery
Death loss of growing pigs averaged about 50 pigs per week (at Agona Duakwa). Among these,preweaning mortality contributed about 60% which is attributed to lack of iron, hunger and thirst (as aresult of lactating sow starvation), poor hygienic pens, and poor supervision. Other possible causes ofpreweaning death were small piglets’ susceptibility to cold, making them lie more closely to the damto avoid hypothermia and resulting in them dying as a result of crushing. Unlike many mammals,piglets do not possess brown adipose tissue, a type of fat that enables newborn animals to generatea great deal of heat to maintain body temperature [61]. Wean-to-finish mortality was mainly due tostarvation, thirst and unhygienic pen and environment.
Figure 11 shows the conceptual model, which was developed at the workshop to broadly describethe current situation in the piggery. The model explains the sources of complexity that has given riseto pig productivity predicament. From the model it is apparent that the relationships between thekey variables are far from simple or linear [62]. An inspection of this model revealed that the currentadverse outcomes (pressure on management, high mortality rate and poor pen maintenance) could betraced back to the lack of integrated planning or decision making which affects productivity and in turnleads to business failure [63]. Ad-hoc cleaning of the pen by staff without taking charge or ownershipof a block contributed mostly to these challenges as shown in Figure 11. This, in turn, increases themortality rate and affects productivity, increasing work load and pressure on management.

Systems 2018, 6, 35 19 of 25
The strategic management which curbs these deaths were assigning staff to take charge ofthe block, assigning new experienced manager and introduce new feed formulation to over-comemalnutrition. The most important action implemented to decrease preweaning mortality was to installa manager during farrowing. Concern and vigilance during this time ensure that struggling pigletsfind the udder and can consume adequate colostrum. In addition, piglets that would be crushedcan be placed in a safe spot until they can manoeuvre well and compete for a teat. However, therequired tools (Measuring cups, shovels, wheelbarrows, cleaning brushes and brooms) to enableeffectiveness were unavailable. Other challenges were workers not paid on time (sometimes almost3 weeks over scheduled date), leading to disrespect to management instruction and putting morepressure on managers affecting the quality of work desired as shown in Figure 11.Systems 2018, 6, x FOR PEER REVIEW 19 of 25
Figure 11. Causal Loop Diagram (CLD) of interacting factors.
This approach increased the number of pigs as shown in Figure 12 and reduced death rate as shown in Figure 13 within a period of 3 months. The increase in number resulted from new birth recorded per week (Figure 12).
Figure 12. Number of pigs produced per week. (Source: data obtained from Agona Duakwa—August 2016—completed).
Productivity
Salary Delay
Division of Labour
Working Tools
Work LoadPressure onManagement
Abandoning Job
Motivation
Wait-In-Turns
Water Flow
Fetching PondWater
Farm Management
Mortality Rate
S
O
Ad-hoc PenCleaning
O
Poor Cleaning,Watering and
FeedingS S
OwnershipS
O
Quality Work
S
S
O
S
S
O
Running Capital
S
O
O
S
S
Resistance toChange
S
S
O
O
S
S
OO
SO
S OO
OOO
BusinessFailureO
S
S
S
O
S
S
S
S
R1
R2
R11 R3
B1 R4
R5
R6R7R8
R9
R10
Figure 11. Causal Loop Diagram (CLD) of interacting factors.
This approach increased the number of pigs as shown in Figure 12 and reduced death rate asshown in Figure 13 within a period of 3 months. The increase in number resulted from new birthrecorded per week (Figure 12).
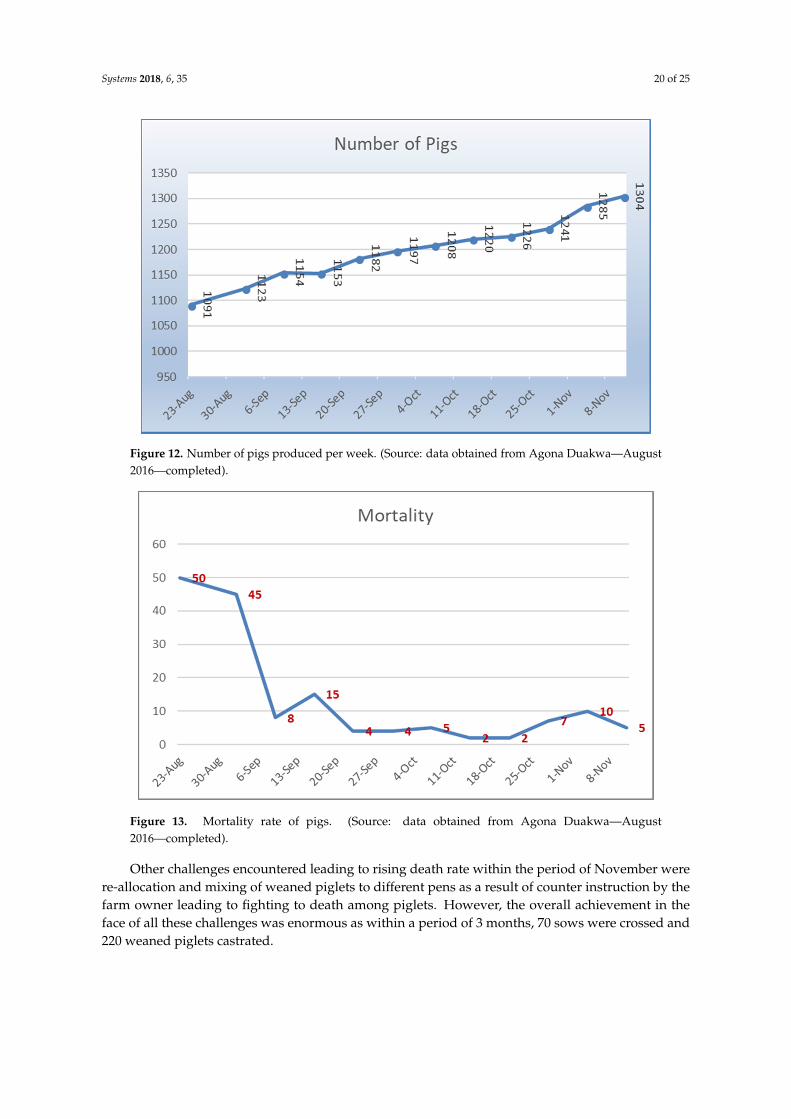
Systems 2018, 6, 35 20 of 25
Systems 2018, 6, x FOR PEER REVIEW 19 of 25
Figure 11. Causal Loop Diagram (CLD) of interacting factors.
This approach increased the number of pigs as shown in Figure 12 and reduced death rate as shown in Figure 13 within a period of 3 months. The increase in number resulted from new birth recorded per week (Figure 12).
Figure 12. Number of pigs produced per week. (Source: data obtained from Agona Duakwa—August 2016—completed).
Productivity
Salary Delay
Division of Labour
Working Tools
Work LoadPressure onManagement
Abandoning Job
Motivation
Wait-In-Turns
Water Flow
Fetching PondWater
Farm Management
Mortality Rate
S
O
Ad-hoc PenCleaning
O
Poor Cleaning,Watering and
FeedingS S
OwnershipS
O
Quality Work
S
S
O
S
S
O
Running Capital
S
O
O
S
S
Resistance toChange
S
S
O
O
S
S
OO
SO
S OO
OOO
BusinessFailureO
S
S
S
O
S
S
S
S
R1
R2
R11 R3
B1 R4
R5
R6R7R8
R9
R10
Figure 12. Number of pigs produced per week. (Source: data obtained from Agona Duakwa—August2016—completed).Systems 2018, 6, x FOR PEER REVIEW 20 of 25
Figure 13. Mortality rate of pigs. (Source: data obtained from Agona Duakwa—August 2016—completed).
Other challenges encountered leading to rising death rate within the period of November were re-allocation and mixing of weaned piglets to different pens as a result of counter instruction by the farm owner leading to fighting to death among piglets. However, the overall achievement in the face of all these challenges was enormous as within a period of 3 months, 70 sows were crossed and 220 weaned piglets castrated.
4.1. Breeding Management Adopted in Pig production
Accurate heat detection is essential for the correct timing of crossing [64]. Poor heat detection leads to higher production cost and reduced herd size as shown in the limit to growth archetype (Figure 14). This affects pork production and profit. Sows and gilts are non-seasonal and polyoestrous, with the oestrous cycle lasting 18–24 (average 21) days [65]. Sows are behaviourally anoestrous during pregnancy. Ovulatory oestrus usually is not seen during lactation except under conditions of group rearing, high feed levels, or boar contact. Partial weaning or gonadotropin treatment can induce oestrus during lactation, but the results are inconsistent and not economical [66]. Normal uterine physiology is re-established by 20–25 days postpartum. Most sows exhibit oestrus 3–7 days after weaning [67]. Oestrus lasts ~36–48 h in gilts and ≥48–72 h in sows [68]. Time to oestrus after weaning and duration of oestrus in sows can be influenced by the length of lactation, nutrition, body condition, genetics, and other management practices. Oestrus is characterized by behavioural (e.g., mounting, fence walking, vocalizing, tilted ears, kyphosis) and sometimes physical (e.g., vulvar swelling, vaginal discharge) changes. Ovulation generally occurs in mid to late oestrus. During ovulation, 15–24 ova are released over a 1 to 4-h period. Ovulation rate increases over the first four parities, so that the fourth to sixth litters tend to be the largest in number. Ovulation rate can decrease when gilts or sows are undernourished. Most gilts are on full feed, thereby averting the adverse effects of undernourishment on early reproductive performance. In circumstances in which gilts are not routinely provided with a full feed, increasing energy intake for 10 days before oestrus (i.e., “flushing”) is performed. This has optimized ovulation rate under these circumstances. To prevent undernourishment in recently weaned sows, an energy-dense diet should be fed until after oestrus and breeding.
Figure 13. Mortality rate of pigs. (Source: data obtained from Agona Duakwa—August2016—completed).
Other challenges encountered leading to rising death rate within the period of November werere-allocation and mixing of weaned piglets to different pens as a result of counter instruction by thefarm owner leading to fighting to death among piglets. However, the overall achievement in theface of all these challenges was enormous as within a period of 3 months, 70 sows were crossed and220 weaned piglets castrated.

Systems 2018, 6, 35 21 of 25
4.1. Breeding Management Adopted in Pig production
Accurate heat detection is essential for the correct timing of crossing [64]. Poor heat detectionleads to higher production cost and reduced herd size as shown in the limit to growth archetype(Figure 14). This affects pork production and profit. Sows and gilts are non-seasonal and polyoestrous,with the oestrous cycle lasting 18–24 (average 21) days [65]. Sows are behaviourally anoestrous duringpregnancy. Ovulatory oestrus usually is not seen during lactation except under conditions of grouprearing, high feed levels, or boar contact. Partial weaning or gonadotropin treatment can induceoestrus during lactation, but the results are inconsistent and not economical [66]. Normal uterinephysiology is re-established by 20–25 days postpartum. Most sows exhibit oestrus 3–7 days afterweaning [67]. Oestrus lasts ~36–48 h in gilts and ≥48–72 h in sows [68]. Time to oestrus after weaningand duration of oestrus in sows can be influenced by the length of lactation, nutrition, body condition,genetics, and other management practices. Oestrus is characterized by behavioural (e.g., mounting,fence walking, vocalizing, tilted ears, kyphosis) and sometimes physical (e.g., vulvar swelling, vaginaldischarge) changes. Ovulation generally occurs in mid to late oestrus. During ovulation, 15–24 ova arereleased over a 1 to 4-h period. Ovulation rate increases over the first four parities, so that the fourthto sixth litters tend to be the largest in number. Ovulation rate can decrease when gilts or sows areundernourished. Most gilts are on full feed, thereby averting the adverse effects of undernourishmenton early reproductive performance. In circumstances in which gilts are not routinely provided with afull feed, increasing energy intake for 10 days before oestrus (i.e., “flushing”) is performed. This hasoptimized ovulation rate under these circumstances. To prevent undernourishment in recently weanedsows, an energy-dense diet should be fed until after oestrus and breeding.Systems 2018, 6, x FOR PEER REVIEW 21 of 25
Figure 14. “Limit to Growth” Archetype.
Behavioural changes are most pronounced when the sow or gilt is exposed directly to the sight, sound, odour, and attention (nuzzling and grunting) of a mature boar [69]. A sow or gilt in standing heat normally assumes a rigid, immobile, receptive stance when exposed to a boar. Physical changes such as vulvar swelling and discharge are often unreliable; they do, however, appear to be more marked in gilts than sows and commonly develop 2–3 days before oestrus. The ultimate criterion of oestrus is either standing to the boar or a positive response to the “riding test” (an attendant applies pressure with the hands in the loin area, then gently sits on the pig’s back to elicit the standing reaction); this test is best conducted in the presence of a boar (e.g., in an adjacent pen) or, as an alternative, after exposing the sow to a synthetic boar-odour aerosol or taint rag.
4.1.1. Diseases
Atrophic rhinitis, Actinobacillus pleuropneumonia, Transmissible gastroenteritis, mange and salmonellosis were major health issues encountered. The manager was trained to administer injections and detect symptoms.
4.1.2. Feed Formulation
The ingredients included in per ton of formulated feed on the farm are 10 bags of 50 kg maize, 20 bags of 25 kg wheat bran, 3 bags of 50 kg soy meal, 10 kg salts, 25 kg oyster shells, 1 kg lysine, 1 kg broiler premix, 1 kg Methionine, and 1 kg “Top 3”. However, this feed formula is not being adhered to as a result of lack of missing ingredients leading to maize dominated feed without soybean, shells, premix, etc. This has impacted negatively on the health and nutrition of pigs but better than before the previous state.
5. Summary and Conclusions
Ghana is predominantly an agricultural country with a clear majority of its population depending partly or fully on agriculture for their livelihoods. Piggery productivity in Ghana is low by regional standards and the industry faces several challenges. The latest challenge is the rising cost of maize and corn, which are essential components in the feed formulation for pig diets as a result of the fall armyworm (Spodoptera frugiperda) infestation in Africa. In this paper, the piggery industry’s past behavior has been analyzed using a systems thinking approach and the structure of the piggery industry in the form of a system archetype has been developed, which explains the complex behavior of the industry. The four levels of thinking model framework were used to explain the past behavior of the piggery industry, develop the underlying structure causing the behavior, and generate a list of sustainable management strategies for the industry. The industry’s problems were pooled together and the key factors whose behavior over time manifests the problems by developing various individual two-loop system archetypes were identified. Furthermore, the individual variables
Profit
Herd Size
Pork Production
Poor HeatDetection
BreedingManagement
QualifiedEmployee
S
S
S
S
S
O
O
R1 B1MarketingActivities
Sales
S
S
Figure 14. “Limit to Growth” Archetype.
Behavioural changes are most pronounced when the sow or gilt is exposed directly to the sight,sound, odour, and attention (nuzzling and grunting) of a mature boar [69]. A sow or gilt in standingheat normally assumes a rigid, immobile, receptive stance when exposed to a boar. Physical changessuch as vulvar swelling and discharge are often unreliable; they do, however, appear to be moremarked in gilts than sows and commonly develop 2–3 days before oestrus. The ultimate criterion ofoestrus is either standing to the boar or a positive response to the “riding test” (an attendant appliespressure with the hands in the loin area, then gently sits on the pig’s back to elicit the standing reaction);this test is best conducted in the presence of a boar (e.g., in an adjacent pen) or, as an alternative, afterexposing the sow to a synthetic boar-odour aerosol or taint rag.

Systems 2018, 6, 35 22 of 25
4.1.1. Diseases
Atrophic rhinitis, Actinobacillus pleuropneumonia, Transmissible gastroenteritis, mange andsalmonellosis were major health issues encountered. The manager was trained to administer injectionsand detect symptoms.
4.1.2. Feed Formulation
The ingredients included in per ton of formulated feed on the farm are 10 bags of 50 kg maize,20 bags of 25 kg wheat bran, 3 bags of 50 kg soy meal, 10 kg salts, 25 kg oyster shells, 1 kg lysine, 1 kgbroiler premix, 1 kg Methionine, and 1 kg “Top 3”. However, this feed formula is not being adhered toas a result of lack of missing ingredients leading to maize dominated feed without soybean, shells,premix, etc. This has impacted negatively on the health and nutrition of pigs but better than before theprevious state.
5. Summary and Conclusions
Ghana is predominantly an agricultural country with a clear majority of its population dependingpartly or fully on agriculture for their livelihoods. Piggery productivity in Ghana is low by regionalstandards and the industry faces several challenges. The latest challenge is the rising cost of maizeand corn, which are essential components in the feed formulation for pig diets as a result of thefall armyworm (Spodoptera frugiperda) infestation in Africa. In this paper, the piggery industry’spast behavior has been analyzed using a systems thinking approach and the structure of the piggeryindustry in the form of a system archetype has been developed, which explains the complex behaviorof the industry. The four levels of thinking model framework were used to explain the past behaviorof the piggery industry, develop the underlying structure causing the behavior, and generate a list ofsustainable management strategies for the industry. The industry’s problems were pooled together andthe key factors whose behavior over time manifests the problems by developing various individualtwo-loop system archetypes were identified. Furthermore, the individual variables affecting theindustry were consolidated to obtain a causal loop structure and a behavior-over-time graph of thepiggery Industry, with the help of which a list of sustainable strategies for the industry were developed.The system archetype developed here is generic enough to explain any productivity decline andbusiness rivalry behavior of any organization or agribusiness industry. The proposed archetype canalso help farm managers and producers to make various decisions. The system archetypes revealedinsights into the livestock structure that already exist to anticipate potential problems and the problemsymptoms. In this research, systems models provide an understanding of the interconnectednessand relationships present within the piggery industry of Ghana. The system archetypes contribute toeffectively understanding the root cause of challenges rather than a fix ‘now’ giving rise to a muchbigger problem to fix ‘later’. Application of CLDs and system archetypes can help farmers and policymakers understand the behaviour of the entire complex agricultural systems that will aid in moreclarity of consistency in policy objectives. This will close the gap of inadequate information bothto farmers and policy makers and governance. Through the archetypes and the CLDs, it has beenidentified that better linear solutions do not solve the problems, but better systemic approach to theproblems could lead to the provision of the right management strategies
Inclusive of stakeholders and their knowledge, using systemic interventions can increase thechances of innovation adoption and thus improve the agricultural supply chain. Farmers must evaluatethe existing archetypes in their industry as well as evaluate its resource needs to assure that it willdeliver profitable agribusiness in the most efficacious manner possible.
The same data will be validated involving same respondents and the outcomes will be refinedinto system dynamics simulation model, which will constitute an integrated master plan with orderlydefined goals and strategies (systemic interventions). To operationalize the master plan, Bayesianbelief network (BBN) modelling will be used to determine the requirements for implementation of the

Systems 2018, 6, 35 23 of 25
management strategies, the factors that could affect the expected outcomes and the order in whichactivities should be carried out to ensure cost-effectiveness and to maximize impact.
Author Contributions: K.E.B. made contributions to the conception, design, and acquisition of data, analysisand interpretation of data. Led in drafting the article and revising it critically for important intellectual content;and gave final approval of the version to be submitted and any revised version; N.C.N. made contribution tomethodology and editing, S.D. provided software support, help in original draft of manuscript and support infunding acquisition; D.K.A. helps in validation and editing; S.S.K. helps in data collection and validation, I.A.help in farm management and data collection and J.L. helps in formal analysis and focus group survey.
Funding: The contribution of Dr. Daowei Sun to this research was funded by the National Nature ScienceFoundation of China (71473282).
Acknowledgments: First and foremost, I would like to thank God Almighty for giving me the strength,knowledge, ability and opportunity to undertake this research study and to persevere and complete it satisfactorily.Without his blessings, this achievement would not have been possible. The authors would like to express a greatgratitude to all the livestock stakeholders of Ghana and BNARI for their time, willingness and contributions tothis study.
Conflicts of Interest: The authors declare no conflict of interest.
References
1. Barrett, C.B.; Bezuneh, M.; Clay, D.C.; Reardon, T. Heterogeneous constraints, incentives and incomediversification strategies in rural Africa. Quart. J. Int. Agric. 2005, 44, 37–60. [CrossRef]
2. Banson, K.E.; Nguyen, N.C.; Bosch, O.J. A systems thinking approach: The greater push model for growthand sustainability in Africa-evidence from Ghana. Int. J. Mark. Bus. Syst. 2015, 1, 289–313. [CrossRef]
3. Banson, K.E.; Nguyen, N.C.; Bosch, O.J. A Systems Thinking Approach to the Structure, Conduct andPerformance of the Agricultural Sector in Ghana. Syst. Res. Behav. Sci. 2016, 35, 39–57. [CrossRef]
4. UNDP. Sustainable Development Goals (SDGs). 2018. Available online: http://www.undp.org/content/undp/en/home/sustainable-development-goals.html (accessed on 26 March 2018).
5. Service, G.S. Annual Gross Domestic Product 2015. Available online: http://www.statsghana.gov.gh/docfiles/GDP/GDP2015/2015_Annual_GDP_September_2015_Edition.pdf (accessed on 15 January 2018).
6. Banson, K.E.; Josephine, N.T. Economic and market analysis of swine rearing and pork production in Ghana.J. Life Sci. 2014, 8. [CrossRef]
7. Adzitey, F. Animal and Meat Production in Ghana—An Overview. J. World’s Poult. Res. 2013, 3, 1–4.8. MOFA. Pig Production. 2016. Available online: http://mofa.gov.gh/site/?page_id=14067 (accessed on
25 September 2017).9. Anane, O.K. Country Pasture/Forage Resource Profiles; FAO: Rome, Italy, 2006; Available online: https://www.
scribd.com/document/346404450/FAO-Forage-Profile-Ghana (accessed on 26 January 2018).10. Segalés, J.; Allan, G.M.; Domingo, M. Porcine Circovirus Diseases. Anim. Health Res. Rev. 2005, 6, 119–142.
[CrossRef] [PubMed]11. Sánchez-Vizcaíno, J.M.; Neira, M.A. 25 African swine fever Virus. In Diseases of Swine, 10th ed.;
Zimmerman, J.J., Karriker, L.A., Ramirez, A., Schwartz, K.J., Stevenson, G.W., Eds.; John Wiley & Sons, Inc.:Chichester, UK, 2012.
12. Ruiz-Fons, F.; Segalés, J.; Gortázar, C. A review of viral diseases of the European wild boar: Effects ofpopulation dynamics and reservoir role. Vet. J. 2008, 176, 158–169. [CrossRef] [PubMed]
13. Eggen, A. Why Producing Pigs in China is a Big Challenge. 2014. Available online: http://www.pigprogress.net/Pork-Processing/Markets/2014/3/Why-producing-pigs-in-China-is-a-big-challenge-1459702W/(accessed on 17 June 2015).
14. Horton, D. Evaluating Capacity Development: Experiences from Research and Development Organizations aroundthe World; International Development Research Centre (IDRC): Paris, France, 2003.
15. Gamser, M.S. Innovation, technical assistance, and development: The importance of technology users.World Dev. 1988, 16, 711–721. [CrossRef]
16. Apiiga, S.Y. Ghana: Genetic Livestock Improvement in Africa; The Chronicles: Accra, Ghana, 2014.17. MOFA. Mofa Steps up Effort at Improving Breeding Stock of Pigs. 2013. Available online: http://mofa.gov.
gh/site/?p=11872 (accessed on 15 January 2018).
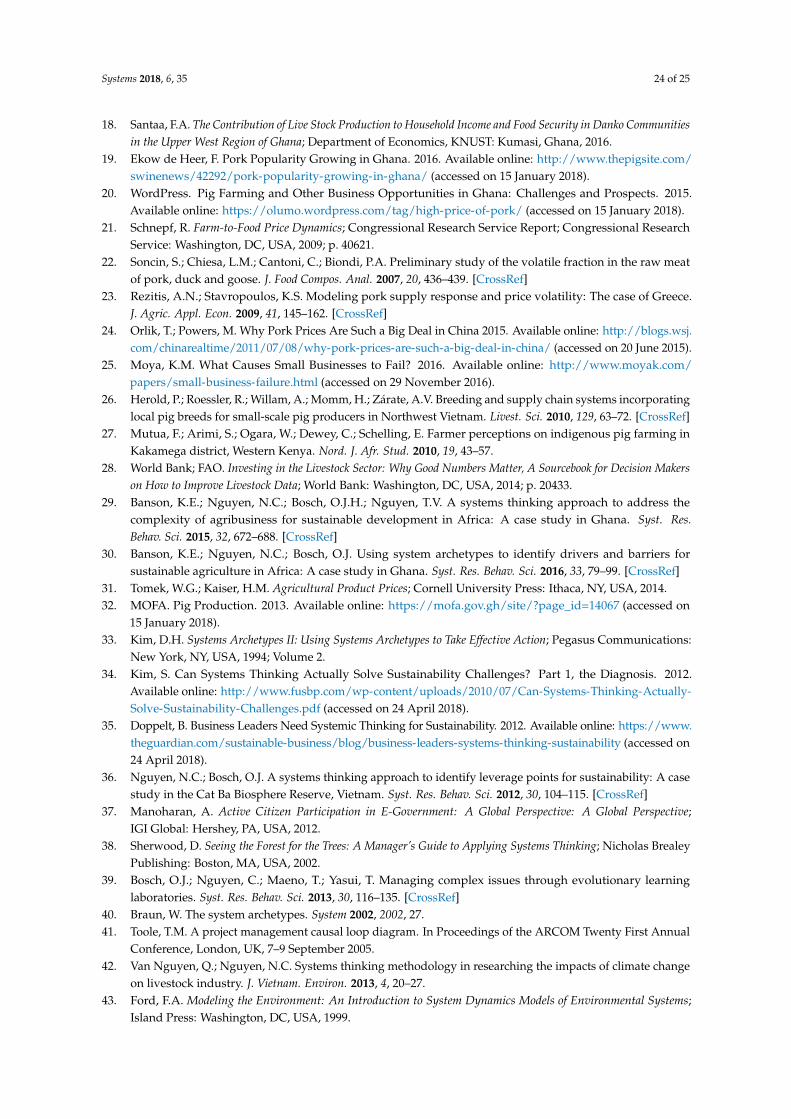
Systems 2018, 6, 35 24 of 25
18. Santaa, F.A. The Contribution of Live Stock Production to Household Income and Food Security in Danko Communitiesin the Upper West Region of Ghana; Department of Economics, KNUST: Kumasi, Ghana, 2016.
19. Ekow de Heer, F. Pork Popularity Growing in Ghana. 2016. Available online: http://www.thepigsite.com/swinenews/42292/pork-popularity-growing-in-ghana/ (accessed on 15 January 2018).
20. WordPress. Pig Farming and Other Business Opportunities in Ghana: Challenges and Prospects. 2015.Available online: https://olumo.wordpress.com/tag/high-price-of-pork/ (accessed on 15 January 2018).
21. Schnepf, R. Farm-to-Food Price Dynamics; Congressional Research Service Report; Congressional ResearchService: Washington, DC, USA, 2009; p. 40621.
22. Soncin, S.; Chiesa, L.M.; Cantoni, C.; Biondi, P.A. Preliminary study of the volatile fraction in the raw meatof pork, duck and goose. J. Food Compos. Anal. 2007, 20, 436–439. [CrossRef]
23. Rezitis, A.N.; Stavropoulos, K.S. Modeling pork supply response and price volatility: The case of Greece.J. Agric. Appl. Econ. 2009, 41, 145–162. [CrossRef]
24. Orlik, T.; Powers, M. Why Pork Prices Are Such a Big Deal in China 2015. Available online: http://blogs.wsj.com/chinarealtime/2011/07/08/why-pork-prices-are-such-a-big-deal-in-china/ (accessed on 20 June 2015).
25. Moya, K.M. What Causes Small Businesses to Fail? 2016. Available online: http://www.moyak.com/papers/small-business-failure.html (accessed on 29 November 2016).
26. Herold, P.; Roessler, R.; Willam, A.; Momm, H.; Zárate, A.V. Breeding and supply chain systems incorporatinglocal pig breeds for small-scale pig producers in Northwest Vietnam. Livest. Sci. 2010, 129, 63–72. [CrossRef]
27. Mutua, F.; Arimi, S.; Ogara, W.; Dewey, C.; Schelling, E. Farmer perceptions on indigenous pig farming inKakamega district, Western Kenya. Nord. J. Afr. Stud. 2010, 19, 43–57.
28. World Bank; FAO. Investing in the Livestock Sector: Why Good Numbers Matter, A Sourcebook for Decision Makerson How to Improve Livestock Data; World Bank: Washington, DC, USA, 2014; p. 20433.
29. Banson, K.E.; Nguyen, N.C.; Bosch, O.J.H.; Nguyen, T.V. A systems thinking approach to address thecomplexity of agribusiness for sustainable development in Africa: A case study in Ghana. Syst. Res.Behav. Sci. 2015, 32, 672–688. [CrossRef]
30. Banson, K.E.; Nguyen, N.C.; Bosch, O.J. Using system archetypes to identify drivers and barriers forsustainable agriculture in Africa: A case study in Ghana. Syst. Res. Behav. Sci. 2016, 33, 79–99. [CrossRef]
31. Tomek, W.G.; Kaiser, H.M. Agricultural Product Prices; Cornell University Press: Ithaca, NY, USA, 2014.32. MOFA. Pig Production. 2013. Available online: https://mofa.gov.gh/site/?page_id=14067 (accessed on
15 January 2018).33. Kim, D.H. Systems Archetypes II: Using Systems Archetypes to Take Effective Action; Pegasus Communications:
New York, NY, USA, 1994; Volume 2.34. Kim, S. Can Systems Thinking Actually Solve Sustainability Challenges? Part 1, the Diagnosis. 2012.
Available online: http://www.fusbp.com/wp-content/uploads/2010/07/Can-Systems-Thinking-Actually-Solve-Sustainability-Challenges.pdf (accessed on 24 April 2018).
35. Doppelt, B. Business Leaders Need Systemic Thinking for Sustainability. 2012. Available online: https://www.theguardian.com/sustainable-business/blog/business-leaders-systems-thinking-sustainability (accessed on24 April 2018).
36. Nguyen, N.C.; Bosch, O.J. A systems thinking approach to identify leverage points for sustainability: A casestudy in the Cat Ba Biosphere Reserve, Vietnam. Syst. Res. Behav. Sci. 2012, 30, 104–115. [CrossRef]
37. Manoharan, A. Active Citizen Participation in E-Government: A Global Perspective: A Global Perspective;IGI Global: Hershey, PA, USA, 2012.
38. Sherwood, D. Seeing the Forest for the Trees: A Manager’s Guide to Applying Systems Thinking; Nicholas BrealeyPublishing: Boston, MA, USA, 2002.
39. Bosch, O.J.; Nguyen, C.; Maeno, T.; Yasui, T. Managing complex issues through evolutionary learninglaboratories. Syst. Res. Behav. Sci. 2013, 30, 116–135. [CrossRef]
40. Braun, W. The system archetypes. System 2002, 2002, 27.41. Toole, T.M. A project management causal loop diagram. In Proceedings of the ARCOM Twenty First Annual
Conference, London, UK, 7–9 September 2005.42. Van Nguyen, Q.; Nguyen, N.C. Systems thinking methodology in researching the impacts of climate change
on livestock industry. J. Vietnam. Environ. 2013, 4, 20–27.43. Ford, F.A. Modeling the Environment: An Introduction to System Dynamics Models of Environmental Systems;
Island Press: Washington, DC, USA, 1999.

Systems 2018, 6, 35 25 of 25
44. Bosch, O.; Maani, K.; Smith, C. Systems thinking-Language of complexity for scientists and managers.In Improving the Triple Bottom Line Returns from Small-Scale Forestry; The University of Queensland:St Lucia, Australia, 2007.
45. Kim, D.H. Introduction to Systems Thinking; Pegasus Communications: Waltham, MA, USA, 1999; Volume 16.46. Kim, D.H. Systems Archetypes III: Understanding Patterns of Behavior and Delay; Pegasus Communications:
Waltham, MA, USA, 2000.47. Senge, P.M. The Fifth Discipline: The Art & Practice of the Learning Organization; U.S.A Crown Business:
New York, NY, USA, 2006.48. Maani, K.; Cavana, R.Y. Systems Thinking, System Dynamics: Managing Change and Complexity, 2nd ed.;
North Shore, N.Z.; Pearson Education New Zealand: Rosedale, New Zealand; Prentice Hall: Upper SaddleRiver, NJ, USA, 2007.
49. Sherwood, D. Seeing the Forest for the Trees: A Manager’s Guide to Applying Systems Thinking; Nicholas BrealeyPublishing: London, UK, 2011.
50. Banson, K.E.; Egyir-Yawson, A. Socio-economic impact of fruit flies control in mango production in Ghana,evidence from “Manya Krobo”. J. Agric. Sci. Technol. A J. Agric. Sci. Technol. B 2014, 4, 454–463.
51. Kim, D.H.; Lannon, C. Applying Systems Archetypes; Pegasus Communications: Waltham, MA, USA, 1997.52. Banson, K.E.; Nguyen, N.C.; Bosch, O.J. Systemic management to address the challenges facing the performance
of agriculture in Africa: Case study in Ghana. Syst. Res. Behav. Sci. 2016, 33, 544–574. [CrossRef]53. Kim, S. Can systems thinking actually solve sustainability challenges? Part 2, the diagnosis’. In Creating
Sustainable World through the Power of Business; University of Michigan: Ann Arbor, MI, USA, 2012.54. Meadows, D.H.; Wright, D. Thinking in Systems: A Primer; Chelsea Green Publishing: Vermont, NY, USA, 2008.55. Steers, R.M.; Mowday, R.T.; Shapiro, D.L. Introduction to special topic forum: The future of work motivation
theory. Acad. Manag. Rev. 2004, 29, 379–387. [CrossRef]56. Poulton, C.; Dorward, A.; Kydd, J. The future of small farms: New directions for services, institutions, and
intermediation. World Dev. 2010, 38, 1413–1428. [CrossRef]57. White, B. Agriculture and the generation problem: Rural youth, employment and the future of farming.
IDS Bull. 2012, 43, 9–19. [CrossRef]58. Moyo, D. Dead Aid: Why Aid Is Not Working and How There Is a Better Way for Africa; Macmillan: London, UK, 2009.59. Easterly, W.; Easterly, W.R. The White Man’s Burden: Why the West’s Efforts to Aid the Rest Have Done so Much Ill
and so Little Good; Penguin: London, UK, 2006.60. Braun, W. The Systems Archetypes. 2002. Available online: https://www.albany.edu/faculty/gpr/PAD724/
724WebArticles/sys_archetypes.pdf (accessed on 23 April 2015).61. Trayhurn, P.; Temple, N.J.; Aerde, J.V. Evidence from immunoblotting studies on uncoupling protein that
brown adipose tissue is not present in the domestic pig. Can. J. Physiol. Pharmacol. 1989, 67, 1480–1485.[CrossRef] [PubMed]
62. Boeing, G. Visual analysis of nonlinear dynamical systems: Chaos, fractals, self-similarity and the limits ofprediction. Systems 2016, 4, 37. [CrossRef]
63. Sun, D.; Hyland, P.; Cui, H. A designed framework for delivering systems thinking skills to small businessmanagers. Systems 2014, 2, 297–312. [CrossRef]
64. Fowler, V.; Bichard, M.; Pease, A. Objectives in pig breeding. Anim. Sci. 1976, 23, 365–387. [CrossRef]65. Pastwa, M.; Rejduch, B. Analysis of sexual activity in gilts in terms of their reproductive value.
Ann. Anim. Sci. 2011, 11, 241–250.66. Crighton, D. Induction of pregnancy during lactation in the sow. J. Reprod. Fert. 1970, 22, 223–231. [CrossRef]67. King, R.; Martin, G. Relationships between protein intake during lactation, LH levels and oestrous activity
in first-litter sows. Anim. Reprod. Sci. 1989, 19, 283–292. [CrossRef]68. Self, H.; Grummer, R. The rate and economy of pig gains and the reproductive behavior in sows when litters
are weaned at 10 days, 21 days, or 56 days of age. J. Anim. Sci. 1958, 17, 862–868. [CrossRef]69. Fraser, D. The role of behavior in swine production: A review of research. Appl. Anim. Ethol. 1984, 11, 317–339.
[CrossRef]
© 2018 by the authors. Licensee MDPI, Basel, Switzerland. This article is an open accessarticle distributed under the terms and conditions of the Creative Commons Attribution(CC BY) license (http://creativecommons.org/licenses/by/4.0/).
Related Documents