Welcome message from author
This document is posted to help you gain knowledge. Please leave a comment to let me know what you think about it! Share it to your friends and learn new things together.
Transcript
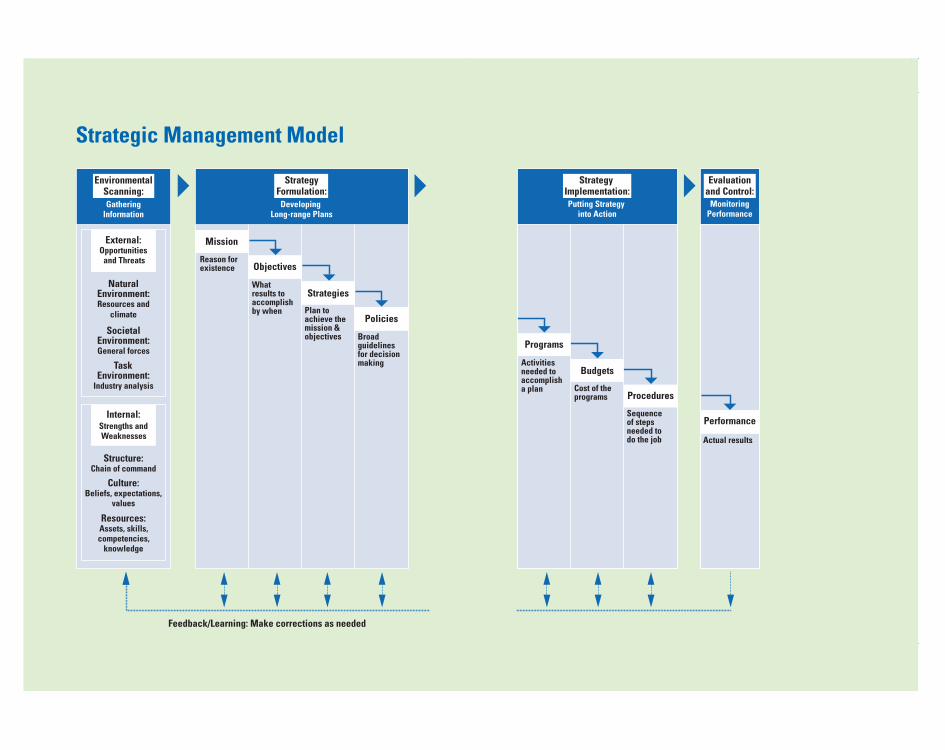
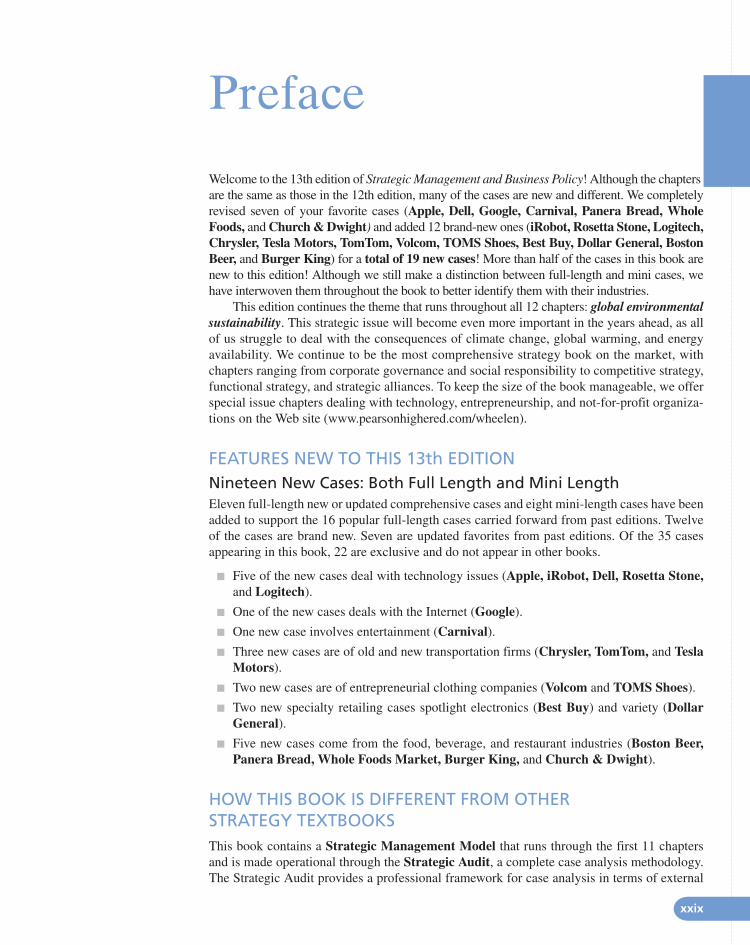
Strategic Management Model
GatheringInformation
SocietalEnvironment:General forces
NaturalEnvironment:Resources and
climate
TaskEnvironment:
Industry analysis
Internal:Strengths andWeaknesses
Structure:Chain of command
Culture:Beliefs, expectations,
values
Resources:Assets, skills,competencies,
knowledge
External:Opportunities
and Threats
Developing Long-range Plans
Mission
Reason forexistence Objectives
Whatresults to accomplishby when
Strategies
Plan toachieve themission &objectives
Policies
Broadguidelinesfor decisionmaking
EnvironmentalScanning:
StrategyFormulation:
Feedback/Learning: Make corrections as needed
Putting Strategy into Action
MonitoringPerformance
Programs
Activitiesneeded to accomplisha plan
Budgets
Cost of theprograms Procedures
Sequenceof stepsneeded to do the job
Performance
Actual results
Strategy Implementation:
Evaluationand Control:
THIRTEENTH EDITION
StrategicManagement
and BusinessPolicy
TOWARD GLOBAL SUSTAINABILITY

This page intentionally left blank
THIRTEENTH EDITION
Thomas L. WheelenFormerly with University of VirginiaTrinity College, Dublin, Ireland
J. David HungerIowa State University St. John’s University
StrategicManagement
and BusinessPolicy
TOWARD GLOBAL SUSTAINABILITY
with major contributions by
Kathryn E. Wheelen
Alan N. HoffmanBentley University
Boston Columbus Indianapolis New York San Francisco Upper Saddle RiverAmsterdam Cape Town Dubai London Madrid Milan Munich Paris Montreal
Toronto Delhi Mexico City Sa~o Paulo Sydney Hong Kong Seoul Singapore Taipei Tokyo
Editorial Director: Sally YaganEditor in Chief: Eric SvendsenSenior Acquisitions Editor: Kim NorbutaEditorial Project Manager: Claudia FernandesEditorial Assistant: Carter AndersonDirector of Marketing: Patrice Lumumba JonesSenior Marketing Manager: Nikki Ayana JonesMarketing Assistant: Ian GoldSenior Managing Editor: Judy LealeProduction Project Manager: Becca GrovesSenior Operations Supervisor: Arnold VilaOperations Specialist: Cathleen PetersenCreative Director: Blair Brown
Credits and acknowledgments borrowed from other sources and reproduced, with permission, in this textbookappear on the appropriate page within text.
Copyright © 2012, 2010, 2008, 2006, 2004 by Pearson Education, Inc., publishing as Prentice Hall. Allrights reserved. Manufactured in the United States of America. This publication is protected by Copyright, andpermission should be obtained from the publisher prior to any prohibited reproduction, storage in a retrievalsystem, or transmission in any form or by any means, electronic, mechanical, photocopying, recording, orlikewise. To obtain permission(s) to use material from this work, please submit a written request to PearsonEducation, Inc., Permissions Department, One Lake Street, Upper Saddle River, New Jersey 07458, or you mayfax your request to 201-236-3290.
Many of the designations by manufacturers and sellers to distinguish their products are claimed as trademarks.Where those designations appear in this book, and the publisher was aware of a trademark claim, the designationshave been printed in initial caps or all caps.
Library of Congress Cataloging-in-Publication DataWheelen, Thomas L.
Strategic management and business policy : toward global sustainability / Thomas L. Wheelen, J. David Hunger. — 13th ed.
p. cm.Includes bibliographical references and index.ISBN-13: 978-0-13-215322-5ISBN-10: 0-13-215322-X
1. Strategic planning. 2. Strategic planning—Case studies.3. Sustainability. I. Hunger, J. David, II. Title.
HD30.28.W43 2012658.4'012—dc22
2011013549
Senior Art Director/Supervisor: Janet SlowikCover Designer: Liz HarasymcukCover Photo: Courtesy of NASA/Shutterstock Interior Designer: Maureen EideMedia Project Manager, Editorial: Denise VaughnMedia Project Manager, Production: Lisa RinaldiFull-Service Project Management: Emily Bush,S4Carlisle Publishing ServicesComposition: S4Carlisle Publishing ServicesPrinter/Binder: Courier/KendalvilleCover Printer: Lehigh-Phoenix Color/HagerstownText Font: 10/12 Times Roman
10 9 8 7 6 5 4 3 2 1ISBN 10: 0-13-215322-XISBN 13: 978-0-13-215322-5

Dedicated to
KATHY, RICHARD, AND TOM BETTY, KARI AND JEFF, MADDIE ANDMEGAN, SUZI AND NICK, SUMMER ANDKACEY, LORI, MERRY AND DYLAN, AND WOOFIE (ARF!).
SPECIAL DEDICATION TO KATHRYN WHEELEN:
Kathryn has worked on every phase of the case section of this book. Until this edition, she also managedthe construction of the Case Instructor’s Manual. She has done every job with a high level of dedication
and concern for both the case authors and the readers of this book.

NOLA AKALA
DAVID ALEVY
TARA ALGEO
DAVID ARMSTRONG
MIKE ASKEW
LAURA BAILEY
NICK BAKER
ALICIA BARNES
ASHLEY BARNES
ALICE BARR
SHERRY BARTEL
KENDRA BASSI
JAY BECKENSTEIN
JOSH BECKENSTEIN
NICOLE BELL
CATHY BENNETT
KATIE BOLLIN
SCOTT BORDEN
JENNIFER BOYLE
AUNDREA BRIDGES
SUZANNE BROWN
ALEXANDRA BUEHLER
KYLE BURDETTE
WHITNEY CAMERON
RUTH CARDIFF
AMY CAREY
MEGAN CARRICO
MARTI CARTER
ANDREA CATULLO-LINN
MEREDITH CHANDLER
LUKE CLAEYS
KAYLEE CLAYMORE
BRIAN COBB
JENNIFER COLE
TARYLL CONNOLLY
THAYNE CONRAD
DONNA CONROY
CAITLIN COUTHEN
MEGAN JOY COWART
CYNDI CRIMMINS
KASEY CROCKETT
DAN CURRIER
KELLY DAN
MICHLENE DAOUD HEALY
STACY DAVIS
FRANK DEL CASTILLO
MEREDITH DELA ROSA
CHRIS DELANEY
GEORGE DEVENNEY
DANA DODGE (Frick)
KATE DOLDER
BARBARA DONLON
HEIDI DRESSLER
TRACY DYBALSKI
BRIAN DYK
KIM ECK
TRISH EICHHOLD
KRISTIN ELBER
KELSEY ELLIOTT
KATIE EYNON
GENEVA FARROW
MARIA FELIBERTY
MIKE FINER
MICHELLE FINNERTY
CANDAS FLETCHER
ROBERT FLORY
MARCIA FLYNN
BRAD FORRESTER
MARGARET FRENCH
STEPHANIE FRITSON
MARK GAFFNEY
MICHELLE GARCIA-JUCHTER
SYBIL GERAUD
AMBER GOECKE
CAROLYN GOGOLIN
ADAM GOLDSTEIN
BETH GRUNFELD
MICAELA HAIDLE
GREG HAITH
DEMETRIUS HALL
BRIDGET HANNENBERG
BRYAN HARRELL
TARA HARTLEY
KENNY HARVEY
ALISON HASKINS
CAROL HAWKS
JENNIFER HEILBRUNN
CHRISTINE HENRY
LYNN HICKS
JULIE HILDEBRAND
DAUNNE HINGLE
WENDI HOLLAND
CHRISTY HUMENIUK
GENE HUMENIUK
ANDREA IORIO
SUSAN JACKSON
PAM JEFFRIES
BRITTANY JUCHNOWSKI
ANJALI JUSTUS
CHERYL KABB
LAURA KAPPES
GIA KAUL
JULIE KESTENBAUM
KARTAPURKH KHALSA
KIM KIEHLER
AMANDA KILLEEN
WALT KIRBY
MARY-JO KOVACH
ROBYN KOVAR
GREG KRAMP
DANIEL KRAUSS
MICHAEL KRISANDA
GINA LaMANTIA
CHAFIKA LANDERS
DOROTHY LANDRY
DUSTIN LANGE
ALIX LaSCOLA
JOE LEE
APRIL LEMONS
KIMBERLY LENAGHAN
This book is also dedicated to the following Prentice Hall/Pearson salesrepresentatives who work so hard to promote this book:
vi

TRICIA LISCIO
BETH LUDWIG
CARY LUNA
JEMINA MACHARRY
KATIE MAHAN
LAURA MANN
PATRICIA MARTINEZ
CHRISTINA MASTROGIOVANNI
SONNY MATHARU
TONY MATHIAS
BROOK MATTHEWS
GEORGIA MAY
ALICIA MCAULIFFE
MASON McCARTNEY
KAREN McFADYEN
BRIAN McGARRY
MICHELLE McGOVERN
IRENE McGUINNESS
RYAN McHENRY
CRISTIN McMICHAEL
KEVIN MEASELLE
RAY MEDINA
KELLY MEIERHOFER
MOLLY MEINERS
MATT MESAROS
SHALON MILLER
JAMI MINARD
WILLIAM MINERICH
EMILY MITCHELL
JILINE MIX
JULIE MOREL
RAFAEL MORENO
TRACY MORSE
OLIVIA MOUG
DOLLY MUNIZ
TRICIA MURPHY
LAUREN MURROW
AMBER MYLLION (Parks)
LINDA NELSON
LYNNE NICLAIR
BOB NISBET
BETSY NIXON
TOM NIXON
LAURA NOAH
COLLEEN O’DELL
DEBBIE OGILIVE
SARI ORLANSKY
DAVE OSTROW
DARCEY PALMER
KRISTINA PARKER
TONI PAYNE
JULIANNE PETERSON
MELISSA PFISTNER
CANDACE PINATARO
BELEN POLTORAK
ELIZABETH POPIELARZ
MEGAN PRENDERGAST
NICOLE PRICE
JILL PROMESSO
LENNY ANN RAPER
JOSH RASMUSSEN
AMANDA RAY
SONYA REED
RICHARD RESCH
MARY RHODES
BRAD RITTER
DAN ROBERTSON
MATT ROBINSON
JENNIFER ROSEN
DOROTHY ROSENE
KELLEEN ROWE
RICH ROWE
PEYTON ROYTEK
SENG SAECHAO
STEVE SARTORI
LYNDA SAX
BOB SCANLON
MARCUS SCHERER
KIMBERLY SCHEYVING
HEIDI SCHICK (Miller)
BRAD SCHICK
CHRIS SCHMIDT
DEBORAH SCHMIDT
MOLLY SCHMIDT
CORRINA SCHULTZ
WHITNEY SEAGO
CHRISTIANA SERLE
MARTHA SERNAS
MARY SHAPIRO
BARBARA SHERRY
KEN SHIPBAUGH
DAVE SHULER
JESSICA SIEMINSKI
LEA SILVERMAN
AUTUMN SLAUGHTER
KRISTA SLAVICEK
SCOTT SMITH
ADRIENNE SNOW
LEE SOLOMONIDES
BEN STEPHEN
DAN SULLIVAN
JOHN SULLIVAN
LORI SULLIVAN
STEPHANIE SURFUS
AMANDA SVEC
CHRISTINA TATE
SARAH THOMAS
ABBY THORNBLADH
KATY TOWNLEY
ELIZABETH TREPKOWSKI
TARA TRIPP
CAROLYN TWIST
JOE VIRZI
AMANDA VOLZ
BRITNEY WALKER
MADELEINE WATSON
BEN WEBER
DANIEL WELLS
MARK WHEELER
LIZ WILDES
MICHELLE WILES
BRIAN WILLIAMS
ERIN WILLIAMS
CINDY WILLIAMSON
RACHEL WILLIS
SIMON WONG
KIMBERLY WOODS
JACKIE WRIGHT
HEATHER WRUBLESKY
GEORGE YOUNG
MARY ZIMMERMANN
KACIE ZIN
DEDICATION vii

This page intentionally left blank
Brief Contents
PART ONE Introduction to Strategic Management and Business Policy 1
C H A P T E R 1 Basic Concepts of Strategic Management 2
C H A P T E R 2 Corporate Governance 42
C H A P T E R 3 Social Responsibility and Ethics in Strategic Management 70
PART TWO Scanning the Environment 93
C H A P T E R 4 Environmental Scanning and Industry Analysis 94
C H A P T E R 5 Internal Scanning: Organizational Analysis 136
PART THREE Strategy Formulation 173
C H A P T E R 6 Strategy Formulation: Situation Analysis and Business Strategy 174
C H A P T E R 7 Strategy Formulation: Corporate Strategy 204
C H A P T E R 8 Strategy Formulation: Functional Strategy and Strategic Choice 236
PART FOUR Strategy Implementation and Control 269
C H A P T E R 9 Strategy Implementation: Organizing for Action 270
C H A P T E R 1 0 Strategy Implementation: Staffing and Directing 300
C H A P T E R 1 1 Evaluation and Control 328
PART FIVE Introduction to Case Analysis 363
C H A P T E R 1 2 Suggestions for Case Analysis 364
PART SIX WEB CHAPTERS Other Strategic Issues
W E B C H A P T E R A Strategic Issues in Managing Technology & Innovation
W E B C H A P T E R B Strategic Issues in Entrepreneurial Ventures & Small Businesses
W E B C H A P T E R C Strategic Issues in Not-For-Profit Organizations
PART SEVEN Cases in Strategic Management 1-1
GLOSSARY G-1
NAME INDEX I-1
SUBJECT INDEX I-7
ix

This page intentionally left blank
Contents
Preface xxix
PART ONE Introduction to Strategic Management and Business Policy 1
C H A P T E R 1 Basic Concepts of Strategic Management 2
1.1 The Study of Strategic Management 5
Phases of Strategic Management 5
Benefits of Strategic Management 6
1.2 Globalization and Environmental Sustainability: Challenges to Strategic Management 7
Impact of Globalization 8
Impact of Environmental Sustainability 8
Global Issue: REGIONAL TRADE ASSOCIATIONS REPLACE NATIONAL TRADE BARRIERS 9
Environmental Sustainability Issue: PROJECTED EFFECTS OF CLIMATE CHANGE 12
1.3 Theories of Organizational Adaptation 12
1.4 Creating a Learning Organization 13
1.5 Basic Model of Strategic Management 14
Environmental Scanning 16
Strategy Formulation 17
Strategy Highlight 1.1: DO YOU HAVE A GOOD MISSION STATEMENT? 18
Strategy Implementation 21
Evaluation and Control 22
Feedback/Learning Process 23
1.6 Initiation of Strategy: Triggering Events 23
Strategy Highlight 1.2: TRIGGERING EVENT AT UNILEVER 24
1.7 Strategic Decision Making 25
What Makes a Decision Strategic 25
Mintzberg’s Modes of Strategic Decision Making 25
Strategic Decision-Making Process: Aid to Better Decisions 27
1.8 The Strategic Audit: Aid to Strategic Decision-Making 28
1.9 End of Chapter Summary 29
APPENDIX 1.A Strategic Audit of a Corporation 34
xi
C H A P T E R 2 Corporate Governance 42
2.1 Role of the Board of Directors 45
Responsibilities of the Board 45
Members of a Board of Directors 48
Strategy Highlight 2.1: AGENCY THEORY VERSUS STEWARDSHIP THEORY IN CORPORATE GOVERNANCE 50
Nomination and Election of Board Members 53
Organization of the Board 54
Impact of the Sarbanes-Oxley Act on U.S. Corporate Governance 55
Global Issue: CORPORATE GOVERNANCE IMPROVEMENTS THROUGHOUT THE WORLD 56
Trends in Corporate Governance 57
2.2 The Role of Top Management 58
Responsibilities of Top Management 58
Environmental Sustainability Issue: CONFLICT AT THE BODY SHOP 59
2.3 End of Chapter Summary 62
C H A P T E R 3 Social Responsibility and Ethics in Strategic Management 70
3.1 Social Responsibilities of Strategic Decision Makers 72
Responsibilities of a Business Firm 72
Sustainability: More than Environmental? 75
Corporate Stakeholders 75
Environmental Sustainability Issue: THE DOW JONES SUSTAINABILITY INDEX 76
Strategy Highlight 3.1: JOHNSON & JOHNSON CREDO 78
3.2 Ethical Decision Making 79
Some Reasons for Unethical Behavior 79
Strategy Highlight 3.2: UNETHICAL PRACTICES AT ENRON AND WORLDCOM EXPOSED BY “WHISTLE-BLOWERS” 80
Global Issue: HOW RULE-BASED AND RELATIONSHIP-BASED GOVERNANCE SYSTEMSAFFECT ETHICAL BEHAVIOR 81
Encouraging Ethical Behavior 83
3.3 End of Chapter Summary 86
Ending Case for Part One: BLOOD BANANAS 90
PART TWO Scanning the Environment 93
C H A P T E R 4 Environmental Scanning and Industry Analysis 94
4.1 Environmental Scanning 98
Identifying External Environmental Variables 98
Environmental Sustainability Issue: MEASURING AND SHRINKING YOUR PERSONALCARBON FOOTPRINT 100
xii CONTENTS
Global Issue: IDENTIFYING POTENTIAL MARKETS IN DEVELOPING NATIONS 107
Identifying External Strategic Factors 108
4.2 Industry Analysis: Analyzing the Task Environment 109
Porter’s Approach to Industry Analysis 110
Industry Evolution 114
Categorizing International Industries 114
International Risk Assessment 115
Strategic Groups 115
Strategic Types 117
Hypercompetition 117
Using Key Success Factors to Create an Industry Matrix 118
Strategy Highlight 4.1: MICROSOFT IN A HYPERCOMPETITIVE INDUSTRY 118
4.3 Competitive Intelligence 120
Sources of Competitive Intelligence 121
Strategy Highlight 4.2: EVALUATING COMPETITIVE INTELLIGENCE 122
Monitoring Competitors for Strategic Planning 122
4.4 Forecasting 123
Danger of Assumptions 123
Useful Forecasting Techniques 124
4.5 The Strategic Audit: A Checklist for Environmental Scanning 125
4.6 Synthesis of External Factors—EFAS 126
4.7 End of Chapter Summary 127
APPENDIX 4.A Competitive Analysis Techniques 133
C H A P T E R 5 Internal Scanning: Organizational Analysis 136
5.1 A Resource-Based Approach to Organizational Analysis 138
Core and Distinctive Competencies 138
Using Resources to Gain Competitive Advantage 139
Determining the Sustainability of an Advantage 140
5.2 Business Models 142
5.3 Value-Chain Analysis 143
Strategy Highlight 5.1: A NEW BUSINESS MODEL AT SMARTYPIG 144
Industry Value-Chain Analysis 145
Corporate Value-Chain Analysis 146
5.4 Scanning Functional Resources and Capabilities 147
Basic Organizational Structures 147
Corporate Culture: The Company Way 149
CONTENTS xiii
Global Issue: MANAGING CORPORATE CULTURE FOR GLOBAL COMPETITIVEADVANTAGE: ABB VERSUS MATSUSHITA 150
Strategic Marketing Issues 151
Strategic Financial Issues 153
Strategic Research and Development (R&D) Issues 154
Strategic Operations Issues 156
Strategic Human Resource (HRM) Issues 158
Environmental Sustainability Issue: USING ENERGY EFFICIENCY FOR COMPETITIVEADVANTAGE AND QUALITY OF WORK LIFE 161
Strategic Information Systems/Technology Issues 162
5.5 The Strategic Audit: A Checklist for Organizational Analysis 163
5.6 Synthesis of Internal Factors 164
5.7 End of Chapter Summary 165
Ending Case for Part Two: BOEING BETS THE COMPANY 170
PART THREE Strategy Formulation 173
C H A P T E R 6 Strategy Formulation: Situation Analysis and Business Strategy 174
6.1 Situation Analysis: SWOT Analysis 176
Generating a Strategic Factors Analysis Summary (SFAS) Matrix 176
Finding a Propitious Niche 177
Global Issue: SAB DEFENDS ITS PROPITIOUS NICHE 181
6.2 Review of Mission and Objectives 181
6.3 Generating Alternative Strategies by Using a TOWS Matrix 182
6.4 Business Strategies 183
Porter’s Competitive Strategies 183
Environmental Sustainability Issue: PATAGONIA USES SUSTAINABILITY AS DIFFERENTIATION COMPETITIVE STRATEGY 187
Cooperative Strategies 195
6.5 End of Chapter Summary 199
C H A P T E R 7 Strategy Formulation: Corporate Strategy 204
7.1 Corporate Strategy 206
7.2 Directional Strategy 206
Growth Strategies 207
Strategy Highlight 7.1: TRANSACTION COST ECONOMICS ANALYZES VERTICAL GROWTH STRATEGY 210
xiv CONTENTS
Global Issue: COMPANIES LOOK TO INTERNATIONAL MARKETS FOR HORIZONTAL GROWTH 212
Strategy Highlight 7.2: SCREENING CRITERIA FOR CONCENTRIC DIVERSIFICATION 215
Controversies in Directional Growth Strategies 216
Stability Strategies 217
Retrenchment Strategies 218
7.3 Portfolio Analysis 220
BCG Growth-Share Matrix 221
Environmental Sustainability Issue: GENERAL MOTORS AND THE ELECTRIC CAR 222
GE Business Screen 223
Advantages and Limitations of Portfolio Analysis 225
Managing a Strategic Alliance Portfolio 225
7.4 Corporate Parenting 226
Developing a Corporate Parenting Strategy 227
Horizontal Strategy and Multipoint Competition 228
7.5 End of Chapter Summary 229
C H A P T E R 8 Strategy Formulation: Functional Strategy and Strategic Choice 236
8.1 Functional Strategy 238
Marketing Strategy 238
Financial Strategy 239
Research and Development (R&D) Strategy 241
Operations Strategy 242
Global Issue: INTERNATIONAL DIFFERENCES ALTER WHIRLPOOL’S OPERATIONS STRATEGY 243
Purchasing Strategy 244
Environmental Sustainability Issue: OPERATIONS NEED FRESH WATER AND LOTS OF IT! 245
Logistics Strategy 246
Human Resource Management (HRM) Strategy 246
Information Technology Strategy 247
8.2 The Sourcing Decision: Location of Functions 247
8.3 Strategies to Avoid 250
8.4 Strategic Choice: Selecting the Best Strategy 251
Constructing Corporate Scenarios 251
Process of Strategic Choice 257
CONTENTS xv
8.5 Developing Policies 258
8.6 End of Chapter Summary 259
Ending Case for Part Three: KMART AND SEARS: STILL STUCK IN THE MIDDLE? 266
PART FOUR Strategy Implementation and Control 269
C H A P T E R 9 Strategy Implementation: Organizing for Action 270
9.1 Strategy Implementation 272
9.2 Who Implements Strategy? 273
9.3 What Must Be Done? 273
Developing Programs, Budgets, and Procedures 274
Environmental Sustainability Issue: FORD’S SOYBEAN SEAT FOAM PROGRAM 274
Strategy Highlight 9.1: THE TOP TEN EXCUSES FOR BAD SERVICE 277
Achieving Synergy 278
9.4 How Is Strategy to Be Implemented? Organizing for Action 278
Structure Follows Strategy 279
Stages of Corporate Development 280
Organizational Life Cycle 283
Advanced Types of Organizational Structures 285
Reengineering and Strategy Implementation 288
Six Sigma 289
Designing Jobs to Implement Strategy 290
Strategy Highlight 9.2: DESIGNING JOBS WITH THE JOB CHARACTERISTICS MODEL 291
9.5 International Issues in Strategy Implementation 291
International Strategic Alliances 292
Stages of International Development 293
Global Issue: MULTIPLE HEADQUARTERS: A SIXTH STAGE OF INTERNATIONAL DEVELOPMENT? 294
Centralization Versus Decentralization 294
9.6 End of Chapter Summary 296
C H A P T E R 1 0 Strategy Implementation: Staffing and Directing 300
10.1 Staffing 302
Staffing Follows Strategy 303
Selection and Management Development 305
Strategy Highlight 10.1: HOW HEWLETT-PACKARD IDENTIFIES POTENTIAL EXECUTIVES 306
Problems in Retrenchment 308
International Issues in Staffing 309
xvi CONTENTS
10.2 Leading 311
Managing Corporate Culture 311
Environmental Sustainability Issue: ABBOTT LABORATORIES’ NEW PROCEDURES FOR GREENER COMPANY CARS 312
Action Planning 316
Management by Objectives 318
Total Quality Management 318
International Considerations in Leading 319
Global Issue: CULTURAL DIFFERENCES CREATE IMPLEMENTATION PROBLEMS IN MERGER 321
10.3 End of Chapter Summary 322
C H A P T E R 1 1 Evaluation and Control 328
11.1 Evaluation and Control in Strategic Management 330
11.2 Measuring Performance 332
Appropriate Measures 332
Types of Controls 332
Activity-Based Costing 334
Enterprise Risk Management 335
Primary Measures of Corporate Performance 335
Environmental Sustainability Issue: HOW GLOBAL WARMING COULD AFFECT CORPORATE VALUATION 340
Primary Measures of Divisional and Functional Performance 342
International Measurement Issues 344
Global Issue: COUNTERFEIT GOODS AND PIRATED SOFTWARE: A GLOBAL PROBLEM 346
11.3 Strategic Information Systems 347
Enterprise Resource Planning (ERP) 347
Radio Frequency Identification (RFID) 348
Divisional and Functional IS Support 348
11.4 Problems in Measuring Performance 348
Short-Term Orientation 349
Goal Displacement 350
11.5 Guidelines for Proper Control 351
Strategy Highlight 11.1: SOME RULES OF THUMB IN STRATEGY 351
11.6 Strategic Incentive Management 352
11.7 End of Chapter Summary 354
Ending Case for Part Four: HEWLETT-PACKARD BUYS EDS 360
CONTENTS xvii
PART FIVE Introduction to Case Analysis 363
C H A P T E R 1 2 Suggestions for Case Analysis 364
12.1 The Case Method 365
12.2 Researching the Case Situation 366
12.3 Financial Analysis: A Place to Begin 366
Analyzing Financial Statements 369
Environmental Sustainability Issue: IMPACT OF CARBON TRADING 370
Global Issue: FINANCIAL STATEMENTS OF MULTINATIONAL CORPORATIONS: NOT ALWAYS WHAT THEY SEEM 371
Common-Size Statements 371
Z-value and Index of Sustainable Growth 371
Useful Economic Measures 372
12.4 Format for Case Analysis: The Strategic Audit 373
12.5 End of Chapter Summary 375
APPENDIX 12.A Resources for Case Research 377
APPENDIX 12.B Suggested Case Analysis Methodology Using the Strategic Audit 380
APPENDIX 12.C Example of a Student-Written Strategic Audit 383
Ending Case for Part Five: IN THE GARDEN 391
GLOSSARY G-1
NAME INDEX I-1
SUBJECT INDEX I-1
PART SIX WEB CHAPTERS Other Strategic Issues
W E B C H A P T E R A Strategic Issues in Managing Technology and Innovation
1 The Role of Management
Strategy Highlight 1: EXAMPLES OF INNOVATION EMPHASIS IN MISSION STATEMENTS
2 Environmental Scanning
External Scanning
Internal Scanning
3 Strategy Formulation
Product vs. Process R&D
Technology Sourcing
Global Issue: USE OF INTELLECTUAL PROPERTY AT HUAWEI TECHNOLOGIES
Importance of Technological Competence
Categories of Innovation
Product Portfolio
xviii CONTENTS
4 Strategy Implementation
Developing an Innovative Entrepreneurial Culture
Organizing for Innovation: Corporate Entrepreneurship
Strategy Highlight 2: HOW NOT TO DEVELOP AN INNOVATIVE ORGANIZATION
5 Evaluation and Control
Evaluation and Control Techniques
Evaluation and Control Measures
6 End of Chapter Summary
W E B C H A P T E R B Strategic Issues in Entrepreneurial Ventures and Small Businesses
1 Importance of Small Business and Entrepreneurial Ventures
Global Issue: ENTREPRENEURSHIP: SOME COUNTRIES ARE MORE SUPPORTIVE THAN OTHERS
Definition of Small-Business Firms and Entrepreneurial Ventures
The Entrepreneur as Strategist
2 Use of Strategic Planning and Strategic Management
Degree of Formality
Usefulness of the Strategic Management Model
Usefulness of the Strategic Decision-Making Process
3 Issues in Corporate Governance
Boards of Directors and Advisory Boards
Impact of the Sarbanes-Oxley Act
4 Issues in Environmental Scanning and Strategy Formulation
Sources of Innovation
Factors Affecting a New Venture’s Success
Strategy Highlight 1: SUGGESTIONS FOR LOCATING AN OPPORTUNITY AND FORMULATING A BUSINESS STRATEGY
5 Issues in Strategy Implementation
Substages of Small Business Development
Transfer of Power and Wealth in Family Businesses
6 Issues in Evaluation and Control
7 End of Chapter Summary
W E B C H A P T E R C Strategic Issues in Not-for-Profit Organizations
1 Why Not-for-Profit?
Global Issue: WHICH IS BEST FOR SOCIETY: BUSINESS OR NOT-FOR-PROFIT?
CONTENTS xix
2 Importance of Revenue Source
Sources of Not-for-Profit Revenue
Patterns of Influence on Strategic Decision Making
Usefulness of Strategic Management Concepts and Techniques
3 Impact of Constraints on Strategic Management
Impact on Strategy Formulation
Impact on Strategy Implementation
Impact on Evaluation and Control
4 Not-for-Profit Strategies
Strategic Piggybacking
Strategy Highlight 1: RESOURCES NEEDED FOR SUCCESSFUL STRATEGIC PIGGYBACKING
Mergers
Strategic Alliances
5 End of Chapter Summary
PART SEVEN Cases in Strategic Management 1-1
S E C T I O N A Corporate Governance and Social Responsibility: Executive Leadership
CASE 1 The Recalcitrant Director at Byte Products Inc.: Corporate Legality versusCorporate Responsibility 1-7(Contributors: Dan R. Dalton, Richard A. Cosier, and Cathy A. Enz)A plant location decision forces a confrontation between the board of directors and the CEO regardingan issue in social responsibility and ethics.
CASE 2 The Wallace Group 2-1(Contributor: Laurence J. Stybel)Managers question the company’s strategic direction and how it is being managed by its founderand CEO. Company growth has resulted not only in disorganization and confusion amongemployees, but in poor overall performance. How should the board deal with the company’sfounder?
S E C T I O N B Business Ethics
CASE 3 Everyone Does It 3-1(Contributors: Steven M. Cox and Shawana P. Johnson)When Jim Willis, Marketing VP, learns that the launch date for the company’s new satellite willbe late by at least a year, he is told by the company’s president to continue using the earlierpublished date for the launch. When Jim protests that the use of an incorrect date to marketcontracts is unethical, he is told that spacecraft are never launched on time and that it is commonindustry practice to list unrealistic launch dates. If a realistic date was used, no one would contractwith the company.
xx CONTENTS
CASE 4 The Audit 4-1(Contributors: John A. Kilpatrick, Gamewell D. Gantt, and George A. Johnson)A questionable accounting practice by the company being audited puts a new CPA in a difficultposition. Although the practice is clearly wrong, she is being pressured by her manager to ignore itbecause it is common in the industry.
S E C T I O N C International Issues in Strategic Management
CASE 5 Starbucks’ Coffee Company: The Indian Dilemma 5-1(Contributors: Ruchi Mankad and Joel Sarosh Thadamalla)Starbucks is the world’s largest coffee retailer with over 11,000 stores in 36 countries and over10,000 employees. The case focuses on India as a potential market for the coffee retailer, presentinginformation on India’s societal environment and beverage industry. Profiles are provided for variousexisting coffee shop chains in India. The key issue in the case revolves around the question: Arecircumstances right for Starbucks to enter India?
CASE 6 Guajilote Cooperativo Forestal: Honduras 6-1(Contributors: Nathan Nebbe and J. David Hunger)This forestry cooperative has the right to harvest, transport, and sell fallen mahogany trees in La Muralla National Park of Honduras. Although the cooperative has been successful thus far, it isfacing some serious issues: low prices for its product, illegal logging, deforestation by poor farmers,and possible world trade restrictions on the sale of mahogany.
S E C T I O N D General Issues in Strategic Management
I N D U S T RY O N E : Information Technology CASE 7 Apple Inc.: Performance in a Zero-Sum World Economy 7-1
(Contributors: Kathryn E. Wheelen, Thomas L. Wheelen II, Richard D. Wheelen, Moustafa H.Abdelsamad, Bernard A. Morin, Lawrence C. Pettit, David B. Croll, and Thomas L. Wheelen)Apple, the first company to mass-market a personal computer, had become a minor player in anindustry dominated by Microsoft. After being expelled from the company in 1985, founder Steve Jobsreturned as CEO in 1997 to reenergize the firm. The introduction of the iPod in 2001, followed by theiPad, catapulted Apple back into the spotlight. However, in 2011 Jobs was forced to take his thirdmedical leave, leading to questions regarding his ability to lead Apple. How can Apple continue itssuccess? How dependent is the company on Steve Jobs?
CASE 8 iRobot: Finding the Right Market Mix? 8-1(Contributor: Alan N. Hoffman)Founded in 1990, iRobot was among the first companies to introduce robotic technology into theconsumer market. Employing over 500 robotic professionals, the firm planned to lead the roboticsindustry. Unfortunately, its largest revenue source, home care robots, are a luxury good and vulnerableto recessions. Many of iRobot’s patents are due to expire by 2019. The firm is highly dependent uponsuppliers to make its consumer products and the U.S. government for military sales. What is the beststrategy for its future success?
CASE 9 Dell Inc.: Changing the Business Model (Mini Case) 9-1(Contributor: J. David Hunger)Dell, once the largest PC vendor in the world, is now battling with Acer for second place in the global PCmarket. Its chief advantages—direct marketing and power over suppliers—no longer provided acompetitive advantage. The industry’s focus has shifted from desktop PCs to mobile computing, software,and technology services, areas of relative weakness for Dell. Is it time for Dell to change its strategy?
exclusive
newexclusive
newexclusive
newexclusive
CONTENTS xxi
CASE 10 Rosetta Stone Inc.: Changing the Way People Learn Languages 10-1(Contributors: Christine B. Buenafe and Joyce P. Vincelette)Rosetta Stone’s mission was to change the way people learn languages. The company blendedlanguage learning with technology at a time when globalization connected more and more individualsand institutions to each other. How should the company move forward? Would it be appropriate forRosetta Stone to offer products like audio books or services in order to increase market share? Whichinternational markets could provide the company with a successful future?
CASE 11 Logitech (Mini Case) 11-1(Contributor: Alan N. Hoffman)Logitech, the world’s leading provider of computer peripherals, was on the forefront of mouse,keyboard, and video conferencing technology. By 2010, however, Logitech’s products were threatenedby new technologies, such as touch pads, that could replace both the mouse and keyboard. As theperipherals market begins to disintegrate, Logitech is considering a change in strategy.
I N D U S T RY T W O : INTERNET COMPANIES
CASE 12 Google Inc. (2010): The Future of the Internet Search Engine 12-1(Contributor: Patricia A. Ryan)Google, an online company that provides a reliable Internet search engine, was founded in 1998 and soonreplaced Yahoo as the market leader in Internet search engines. By 2010, Google was one of the strongestbrands in the world. Nevertheless, its growth by acquisition strategy was showing signs of weakness. Its2006 acquisition of YouTube had thus far not generated significant revenue growth. Groupon, a shoppingWeb site, rebuffed Google’s acquisition attempt in 2010. Is it time for a strategic change?
CASE 13 Reorganizing Yahoo! 13-1(Contributors: P. Indu and Vivek Gupta)Yahoo! created the first successful Internet search engine, but by 2004 it was losing its identity. Was ita search engine, a portal, or a media company? On December 5, 2006, Yahoo’s CEO announced areorganization of the company into three groups. It was hoped that a new mission statement and a newstructure would make Yahoo leaner and more responsive to customers. Would this be enough to turnaround the company?
I N D U S T RY T H R E E : ENTERTAINMENT AND LEISURE
CASE 14 TiVo Inc.: TiVo vs. Cable and Satellite DVR: Can TiVo survive? 14-1(Contributors: Alan N. Hoffman, Randy Halim, Rangki Son, and Suzanne Wong)TiVo was founded to create a device capable of recording digitized video on a computer hard drive fortelevision viewing. Even though revenues had jumped from $96 million in 2003 to $259 million in2007, the company had never earned a profit. Despite many alliances, TiVo faced increasingcompetition from generic DVRs offered by satellite and cable companies. How long can the companycontinue to sell TiVo DVRs when the competition sells generic DVRs at a lower price or gives themaway for free?
CASE 15 Marvel Entertainment Inc. 15-1(Contributors: Ellie A. Fogarty and Joyce P. Vincelette)Marvel Entertainment was known for its comic book characters Captain America, Spider Man, the Fantastic Four, the Incredible Hulk, the Avengers, and the X-Men. With its 2008 self-producedfilms, Iron Man and The Incredible Hulk, Marvel had expanded out of comic books to become aleader in the entertainment industry. The company was no longer competing against other comicbook publishers like DC Comics, but was now competing against entertainment giants like WaltDisney and NBC Universal. What should Marvel’s management do to ensure the company’s futuresuccess?
newexclusive
newexclusive
newexclusive
exclusive
xxii CONTENTS
CASE 16 Carnival Corporation and plc (2010) 16-1(Contributors: Michael J. Keeffe, John K. Ross III, Sherry K. Ross, Bill J. Middlebrook, and Thomas L. Wheelen)With its “fun ship,” Carnival Cruises changed the way people think of ocean cruises. The cruisebecame more important than the destination. Through acquisition, Carnival expanded its product lineto encompass an entire range of industry offerings. How can Carnival continue to grow in the industryit now dominates?
I N D U S T RY F O U R : TRANSPORTATION
CASE 17 Chrysler in Trouble 17-1(Contributors: Barnali Chakraborty and Vivek Gupta)On April 30, 2009, Chrysler Motors, the third-largest auto manufacturer in the United States, filedfor bankruptcy protection along with its 24 wholly owned U.S. subsidiaries. As a condition of theU.S. federal government’s loan of more than $8 billion, Fiat was given 20% of the new ChryslerCorporation with the option of increasing its stake to 51% by 2016 after the new company hadrepaid the federal government’s loan. What does Chrysler need to do to ensure the success of itspartnership with Fiat?
CASE 18 Tesla Motors Inc. (Mini Case) 18-1(Contributor: J. David Hunger)Tesla Motors was founded in 2004 to produce electric automobiles. Its first car, the Tesla Roadster,sold for $101,000. It could accelerate from zero to 60 mph in 3.9 seconds and cruise for 236 miles on asingle charge. In contrast to existing automakers, Tesla sold and serviced its cars through the Internetand its own Tesla stores. With the goal of building a full line of electric vehicles, Tesla Motors facedincreasing competition from established automakers. How could Tesla Motors succeed in an industrydominated by giant global competitors?
CASE 19 Harley-Davidson Inc. 2008: Thriving through a Recession 19-1(Contributors: Patricia A. Ryan and Thomas Wheelen)Harley-Davidson 2008: Thriving Through Recession is a modern success story of a motorcyclecompany that turned itself around by emphasizing quality manufacturing and image marketing. Afterconsistently growing through the 1990s, sales were showing signs of slowing as the baby boomerscontinued to age. Safety was also becoming an issue. For the first time in recent history, sales andprofits declined in 2007 from 2006. Analysts wondered how the company would be affected in arecession. How does Harley-Davidson continue to grow at its past rate?
CASE 20 JetBlue Airways: Growing Pains? 20-1(Contributors: Shirisha Regani and S. S. George)JetBlue Airways had been founded as a “value player” in the niche between full service airlines andlow-cost carriers. Competition had recently intensified and several airlines were taking advantage ofbankruptcy protection to recapture market share through price cuts. JetBlue’s operating costs wererising as a result of increasing fuel costs, aircraft maintenance expenses, and service costs. HasJetBlue been growing too fast and was growth no longer sustainable?
CASE 21 TomTom: New Competition Everywhere! 21-1(Contributor: Alan N. Hoffman)TomTom, an Amsterdam-based company that provided navigation services and devices, led thenavigation systems market in Europe and was second in popularity in the United States. However, thecompany was facing increasing competition from other platforms using GPS technology like cellphones and Smartphones with a built-in navigation function. As its primary markets in the UnitedStates and Europe mature, how can the company ensure its future growth and success?
newexclusive
exclusive
new
newexclusive
CONTENTS xxiii
newexclusive
I N D U S T RY F I V E : CLOTHING
CASE 22 Volcom Inc.: Riding the Wave 22-1(Contributors: Christine B. Buenafe and Joyce P. Vincelette)Volcom was formed south of Los Angeles in 1991 as a clothing company rooted in the action sports ofskateboarding, surfing, and snowboarding. By 2008, Volcom-branded products were sold throughoutthe United States and in over 40 countries. It did not own any manufacturing facilities, but insteadworked with foreign contract manufacturers. As a primary competitor in the boardsports community,Volcom was committed to maintaining its brand, position, and lifestyle and needed to reassess itsstrategy.
CASE 23 TOMS Shoes (Mini Case) 23-1(Contributor: J. David Hunger)Founded in 2006 by Blake Mycoskie, TOMS Shoes is an American footwear company based in SantaMonica, California. Although TOMS Shoes is a for-profit business, its mission is more like that of anot-for-profit organization. The firm’s reason for existence is to donate to children in need one newpair of shoes for every pair of shoes sold. By 2010, the company had sold over one million pairs ofshoes. How should the company plan its future growth?
I N D U S T RY S I X : SPECIALTY RETAILING
CASE 24 Best Buy Co. Inc.: Sustainable Customer Centricity Model? 24-1(Contributor: Alan N. Hoffman)Best Buy, the largest consumer electronics retailer in the United States, operates 4,000 stores in NorthAmerica, China, and Turkey. Best Buy distinguishes itself from competitors by deploying adifferentiation strategy based on superior service rather than low price. The recent recession hasstressed its finances and the quality of its customer service. How can Best Buy continue to haveinnovative products, top-notch employees, and superior customer service while facing increasedcompetition, operational costs, and financial stress?
CASE 25 The Future of Gap Inc. 25-1(Contributor: Mridu Verma)Gap Inc. offered clothing, accessories, and personal care products under the Gap, Banana Republic,and Old Navy brands. After a new CEO introduced a turnaround strategy, sales increased briefly, thenfell. Tired of declining sales, the board of directors hired Goldman Sachs to explore strategies toimprove, ranging from the sale of its stores to spinning off a single division.
CASE 26 Rocky Mountain Chocolate Factory Inc. (2008) 26-1(Contributors: Annie Phan and Joyce P. Vincelette)Rocky Mountain Chocolate Factory had five company-owned and 329 franchised stores in 38 states,Canada, and the United Arab Emirates. Even though revenues and net income had increased from2005 through 2008, they had been increasing at a decreasing rate. Candy purchased from the factoryby the stores had actually dropped 9% in 2008 from 2007. Was the bloom off the rose at RockyMountain Chocolate?
CASE 27 Dollar General Corporation (Mini Case) 27-1(Contributor: Kathryn E. Wheelen)With annual revenues of $12.7 billion and 9,200 stores in 35 states, Dollar General is the largest of thediscount “dollar stores” in the United States. Although far smaller than its “big brothers” Wal-Martand Target, Dollar General has done very well during the recent economic recession. In 2011, it plansto open 625 new stores in three new states. Given that the company has substantial long-term debt, isthis the right time to expand the company’s operations?
newexclusive
newexclusive
exclusive
newexclusive
xxiv CONTENTS
newexclusive
I N D U S T RY S E V E N : MANUFACTURING
CASE 28 Inner-City Paint Corporation (Revised) 28-1(Contributors: Donald F. Kuratko and Norman J. Gierlasinski)Inner-City Paint makes paint for sale to contractors in the Chicago area. However, the founder’s lackof management knowledge is creating difficulties for the firm, and the company is in financialdifficulty. Unless something is done soon, it may go out of business.
CASE 29 The Carey Plant 29-1(Contributors: Thomas L. Wheelen and J. David Hunger)The Carey Plant was a profitable manufacturer of quality machine parts until it was acquired by theGardner Company. Since its acquisition, the plant has been plagued by labor problems, increasingcosts, leveling sales, and decreasing profits. Gardner Company’s top management is attempting toimprove the plant’s performance and better integrate its activities with those of the corporation byselecting a new person to manage the plant.
I N D U S T RY E I G H T: FOOD AND BEVERAGE
CASE 30 The Boston Beer Company: Brewers of Samuel Adams Boston Lager (Mini Case) 30-1(Contributor: Alan N. Hoffman)The Boston Beer Company was founded in 1984 by Jim Koch, viewed as the pioneer of the Americancraft beer revolution. Brewing over 1 million barrels of 25 different styles of beer, Boston Beer is thesixth-largest brewer in the United States. Even though overall domestic beer sales declined 1.2% in2010, sales of craft beer have increased 20% since 2002, with Boston Beer’s increasing 22% from2007 to 2009. How can the company continue its rapid growth in a mature industry?
CASE 31 Wal-Mart and Vlasic Pickles 31-1(Contributor: Karen A. Berger)A manager of Vlasic Foods International closed a deal with Wal-Mart that resulted in selling morepickles than Vlasic had ever sold to any one account. The expected profit of one to two cents per jarwas not sustainable, however, due to unplanned expenses. Vlasic’s net income plummeted and thecompany faced bankruptcy. Given that Wal-Mart was Vlasic’s largest customer, what action shouldmanagement take?
CASE 32 Panera Bread Company (2010): Still Rising Fortunes? 32-1(Contributors: Joyce Vincelette and Ellie A. Fogarty)Panera Bread is a successful bakery-café known for its quality soups and sandwiches. Even thoughPanera’s revenues and net earnings have been rising rapidly, new unit expansion throughout NorthAmerica has fueled this growth. Will revenue growth stop once expansion slows? The retirement ofCEO Ronald Shaich, the master baker who created the “starter” for the company’s phenomenalgrowth, is an opportunity to rethink Panera’s growth strategy.
CASE 33 Whole Foods Market (2010): How to Grow in an Increasingly Competitive Market?(Mini Case) 33-1(Contributors: Patricia Harasta and Alan N. Hoffman)Whole Foods Market is the world’s leading retailer of natural and organic foods. The companydifferentiates itself from competitors by focusing on innovation, quality, and service excellence,allowing it to charge premium prices. Although the company dominates the natural/organic foodscategory in North America, it is facing increasing competition from larger food retailers, such as Wal-Mart, who are adding natural/organic foods to their offerings.
exclusive
newexclusive
newexclusive
newexclusive
CONTENTS xxv
CASE 34 Burger King (Mini Case) 34-1(Contributor: J. David Hunger)Founded in Florida in 1953, Burger King has always trailed behind McDonald’s as the second-largestfast-food hamburger chain in the world. Although its total revenues dropped only slightly from 2009,its 2010 profits dropped significantly, due to high expenses. Burger King’s purchase by an investmentgroup in 2010 was an opportunity to rethink the firm’s strategy.
CASE 35 Church & Dwight: Time to Rethink the Portfolio? 35-1(Contributor: Roy A. Cook)Church & Dwight, the maker of ARM & HAMMER Baking Soda, has used brand extension tosuccessfully market multiple consumer products based on sodium bicarbonate. Searching for a newgrowth strategy, the firm turned to acquisitions. Can management successfully achieve a balancing actbased on finding growth through expanded uses of sodium bicarbonate while assimilating a divergentgroup of consumer products into an expanding international footprint?
S E C T I O N E Web Mini CasesAdditional Mini Cases Available on the Companion Web Site at www.pearsonhighered.com/wheelen.
W E B C A S E 1 Eli Lily & Company(Contributor: Maryanne M. Rouse)A leading pharmaceutical company, Eli Lilly produces a wide variety of ethical drugs and animalhealth products. Despite an array of new products, the company’s profits declined after the firm lostpatent protection for Prozac. In addition, the FDA found quality problems at several of the company’smanufacturing sites, resulting in a delay of new product approvals. How should Lily position itself ina very complex industry?
W E B C A S E 2 Tech Data Corporation(Contributor: Maryanne M. Rouse)Tech Data, a distributor of information technology and logistics management, has rapidly grown through acquisition to become the second-largest global IT distributor. Sales and profitshave been declining, however, since 2001. As computers become more like a commodity, theincreasing emphasis on direct distribution by manufacturers threaten wholesale distributors likeTech Data.
W E B C A S E 3 Stryker Corporation(Contributor: Maryanne M. Rouse)Stryker is a leading maker of specialty medical and surgical products, a market expected to showstrong sales growth. Stryker markets its products directly to hospitals and physicians in the UnitedStates and 100 other countries. Given the decline in the number of hospitals due to consolidationand cost containment efforts by government programs and health care insurers, the industryexpects continued downward pressure on prices. How can Stryker effectively deal with thesedevelopments?
W E B C A S E 4 Sykes Enterprises(Contributor: Maryanne M. Rouse)Sykes provides outsourced customer relationship management services worldwide in a highlycompetitive, fragmented industry. Like its customers, Sykes has recently been closing its callcenters in America and moving to Asia in order to reduce costs. Small towns felt betrayed by thefirm’s decision to leave—especially after providing financial incentives to attract the firm.Nevertheless, declining revenue and net income has caused the company’s stock to drop to an all-time low.
xxvi CONTENTS
newexclusive
new
W E B C A S E 5 Pfizer Inc.(Contributor: Maryanne M. Rouse)With its acquisition in 2000 of rival pharmaceutical firm Warner-Lambert for its Lipitor prescriptiondrug, Pfizer has become the world’s largest ethical pharmaceutical company in terms of sales. Alreadythe leading company in the United States, Pfizer’s purchase of Pharmacia in 2002 moved Pfizer fromfourth to first place in Europe. Will large size hurt or help the company’s future growth andprofitability in an industry facing increasing scrutiny?
W E B C A S E 6 Williams-Sonoma(Contributor: Maryanne M. Rouse)Williams-Sonoma is a specialty retailer of home products. Following a related diversificationgrowth strategy, the company operates 415 Williams-Sonoma, Pottery Barn, and Hold Everythingretail stores throughout North America. Its direct sales segment includes six retail catalogues andthree e-commerce sites. The company must deal with increasing competition in this fragmentedindustry characterized by low entry barriers.
W E B C A S E 7 Tyson Foods Inc.(Contributor: Maryanne M. Rouse)Tyson produces and distributes beef, chicken, and pork products in the United States. It acquired IBP, amajor competitor, but has been the subject of lawsuits by its employees and the EPA. How shouldmanagement deal with its poor public relations and position the company to gain and sustain competitiveadvantage in an industry characterized by increasing consolidation and intense competition?
W E B C A S E 8 Southwest Airlines Company(Contributor: Maryanne M. Rouse)The fourth-largest U.S. airline in terms of passengers carried and second-largest in scheduled domesticdepartures, Southwest was the only domestic airline to remain profitable in 2001. Emphasizing high-frequency, short-haul, point-to-point, and low-fare service, the airline has the lowest cost per availableseat mile flown of any U.S. major passenger carrier. Can Southwest continue to be successful ascompetitors increasingly imitate its competitive strategy?
W E B C A S E 9 Outback Steakhouse Inc.(Contributor: Maryanne M. Rouse)With 1,185 restaurants in 50 states and 21 foreign countries, Outback (OSI) is one of the largest casualdining restaurant companies in the world. In addition to Outback Steakhouse, the company iscomposed of Carrabba’s Italian Grill, Fleming’s Prime Steakhouse & Wine Bar, Bonefish Grill, Roy’s,Lee Roy Selmon’s, Cheeseburger in Paradise, and Paul Lee’s Kitchen. Analysts wonder how long OSIcan continue to grow by adding new types of restaurants to its portfolio.
W E B C A S E 10 Intel Corporation(Contributor: J. David Hunger)Although more than 80% of the world’s personal computers and servers use its microprocessors, Intelis facing strong competition from AMD in a maturing market. Sales growth is slowing. Profits areexpected to rise only 5% in 2006 compared to 40% annual growth previously. The new CEO decides toreinvent Intel to avoid a fate of eventual decline.
W E B C A S E 11 AirTran Holdings Inc.(Contributor: Maryanne M. Rouse)AirTran (known as ValuJet before a disastrous crash in the Everglades) is the second-largest low-fare scheduled airline (after Southwest) in the United States in terms of departures and, along withSouthwest, the only U.S. airline to post a profit in 2004. The company’s labor costs as a percentageof sales are the lowest in the industry. Will AirTran continue to be successful in this highlycompetitive industry?
CONTENTS xxvii
W E B C A S E 12 Boise Cascade/Office Max(Contributor: Maryanne M. Rouse)Boise Cascade, an integrated manufacturer and distributor of paper, packaging, and wood products,purchased OfficeMax, the third-largest office supplies catalogue retailer (after Staples and OfficeDepot), in 2003. Soon thereafter, Boise announced that it was selling its land, plants, headquarterslocation, and even its name to an equity investment firm. Upon completion of the sale in 2004, thecompany assumed the name of OfficeMax. Can this manufacturer become a successful retailer?
W E B C A S E 13 H. J. Heinz Company(Contributor: Maryanne M. Rouse)Heinz, a manufacturer and marketer of processed food products, pursued global growth via marketpenetration and acquisitions. Unfortunately, its modest sales growth was primarily from itsacquisitions. Now that the firm has divested a number of lines of businesses and brands to Del MonteFoods, analysts wonder how a 20% smaller Heinz will grow its sales and profits in this verycompetitive industry.
W E B C A S E 14 Nike Inc.(Contributor: Maryanne M. Rouse)Nike is the largest maker of athletic footwear and apparel in the world with a U.S. market shareexceeding 40%. Since almost all its products are manufactured by 700 independent contractors(99% of which are in Southeast Asia), Nike is a target of activists opposing manufacturing practicesin developing nations. Although industry sales growth in athletic footwear is slowing, Nike refusedto change its product mix in 2002 to suit Foot Locker, the dominant global footwear retailer. Is ittime for Nike to change its strategy and practices?
W E B C A S E 15 Six Flags Inc.: The 2006 Business Turnaround(Contributor: Patricia A. Ryan)Known for its fast roller coasters and adventure rides, Six Flags has successfully built a group ofregional theme and water parks in the United States. Nevertheless, the company has not turned aprofit since 1998. Long-term debt had increased to 61% of total assets by 2005. New management isimplementing a retrenchment strategy, but industry analysts are unsure if this will be enough to savethe company.
W E B C A S E 16 Lowe’s Companies Inc.(Contributor: Maryanne M. Rouse)As the second-largest U.S. “big box” home improvement retailer (behind Home Depot), Lowe’scompetes in a highly fragmented industry. The company has grown with the increase in homeownership and has no plans to expand internationally. With more than 1,000 stores in 2004, Lowe’sintended to increase its U.S. presence with 150 store openings per year in 2005 and 2006. Are therelimits to Lowe’s current growth strategy?
W E B C A S E 17 Movie Gallery Inc.(Contributor: J. David Hunger)Movie Gallery is the second-largest North American video retail rental company, specializing in therental and sale of movies and video games through its Movie Gallery and Hollywood Entertainmentstores. Growing through acquisitions, the company is heavily in debt. The recent rise of online videorental services, such as Netflix, is cutting into retail store revenues and reducing the company’s cashflow. With just $135 million in cash at the end of 2005, Movie Gallery’s management finds itself facingpossible bankruptcy.
xxviii CONTENTS
Preface
Welcome to the 13th edition of Strategic Management and Business Policy! Although the chaptersare the same as those in the 12th edition, many of the cases are new and different. We completelyrevised seven of your favorite cases (Apple, Dell, Google, Carnival, Panera Bread, WholeFoods, and Church & Dwight) and added 12 brand-new ones (iRobot, Rosetta Stone, Logitech,Chrysler, Tesla Motors, TomTom, Volcom, TOMS Shoes, Best Buy, Dollar General, BostonBeer, and Burger King) for a total of 19 new cases! More than half of the cases in this book arenew to this edition! Although we still make a distinction between full-length and mini cases, wehave interwoven them throughout the book to better identify them with their industries.
This edition continues the theme that runs throughout all 12 chapters: global environmentalsustainability. This strategic issue will become even more important in the years ahead, as allof us struggle to deal with the consequences of climate change, global warming, and energyavailability. We continue to be the most comprehensive strategy book on the market, withchapters ranging from corporate governance and social responsibility to competitive strategy,functional strategy, and strategic alliances. To keep the size of the book manageable, we offerspecial issue chapters dealing with technology, entrepreneurship, and not-for-profit organiza-tions on the Web site (www.pearsonhighered.com/wheelen).
FEATURES NEW TO THIS 13th EDITIONNineteen New Cases: Both Full Length and Mini LengthEleven full-length new or updated comprehensive cases and eight mini-length cases have beenadded to support the 16 popular full-length cases carried forward from past editions. Twelveof the cases are brand new. Seven are updated favorites from past editions. Of the 35 casesappearing in this book, 22 are exclusive and do not appear in other books.
� Five of the new cases deal with technology issues (Apple, iRobot, Dell, Rosetta Stone,and Logitech).
� One of the new cases deals with the Internet (Google).
� One new case involves entertainment (Carnival).� Three new cases are of old and new transportation firms (Chrysler, TomTom, and Tesla
Motors).
� Two new cases are of entrepreneurial clothing companies (Volcom and TOMS Shoes).
� Two new specialty retailing cases spotlight electronics (Best Buy) and variety (DollarGeneral).
� Five new cases come from the food, beverage, and restaurant industries (Boston Beer,Panera Bread, Whole Foods Market, Burger King, and Church & Dwight).
HOW THIS BOOK IS DIFFERENT FROM OTHER STRATEGY TEXTBOOKSThis book contains a Strategic Management Model that runs through the first 11 chaptersand is made operational through the Strategic Audit, a complete case analysis methodology.The Strategic Audit provides a professional framework for case analysis in terms of external
xxix
and internal factors and takes the student through the generation of strategic alternatives andimplementation programs.
To help the student synthesize the many factors in a complex strategy case, we developedthree useful techniques:
� External Factor Analysis (EFAS) Table in Chapter 4This reduces the external Opportunities and Threats to the 8 to 10 most important exter-nal factors facing management.
� Internal Factor Analysis (IFAS) Table in Chapter 5This reduces the internal Strengths and Weaknesses to the 8 to 10 most important internalfactors facing management.
� Strategic Factor Analysis Summary (SFAS) Matrix in Chapter 6This condenses the 16 to 20 factors generated in the EFAS and IFAS Tables into the 8 to 10most important (strategic) factors facing the company. These strategic factors become thebasis for generating alternatives and a recommendation for the company’s future direction.
Suggestions for Case Analysis are provided in Appendix 12.B (end of Chapter 12) andcontain step-by-step procedures for how to use the Strategic Audit in analyzing a case. Thisappendix includes an example of a student-written Strategic Audit. Thousands of studentsaround the world have applied this methodology to case analysis with great success. TheCase Instructor’s Manual contains examples of student-written Strategic Audits for each ofthe full-length comprehensive strategy cases.
FEATURES FOCUSED ON ENVIRONMENTAL SUSTAINABILITY� Each chapter contains a boxed insert dealing with an issue in environmental sustainability.
� Each chapter ends with Eco Bits, interesting tidbits of ecological information, such as thenumber of plastic bags added to landfills each year.
� Special sections on sustainability are found in Chapters 1 and 3.
� A section on the natural environment is included in the societal and task environments inChapter 4.
TIME-TESTED FEATURESThis edition contains many of the same features andcontent that helped make previous editions success-ful. Some of the features are the following:
xxx PREFACE
� A Strategic Management Model runs through-out the first 11 chapters as a unifying concept.(Explained in Chapter 1)
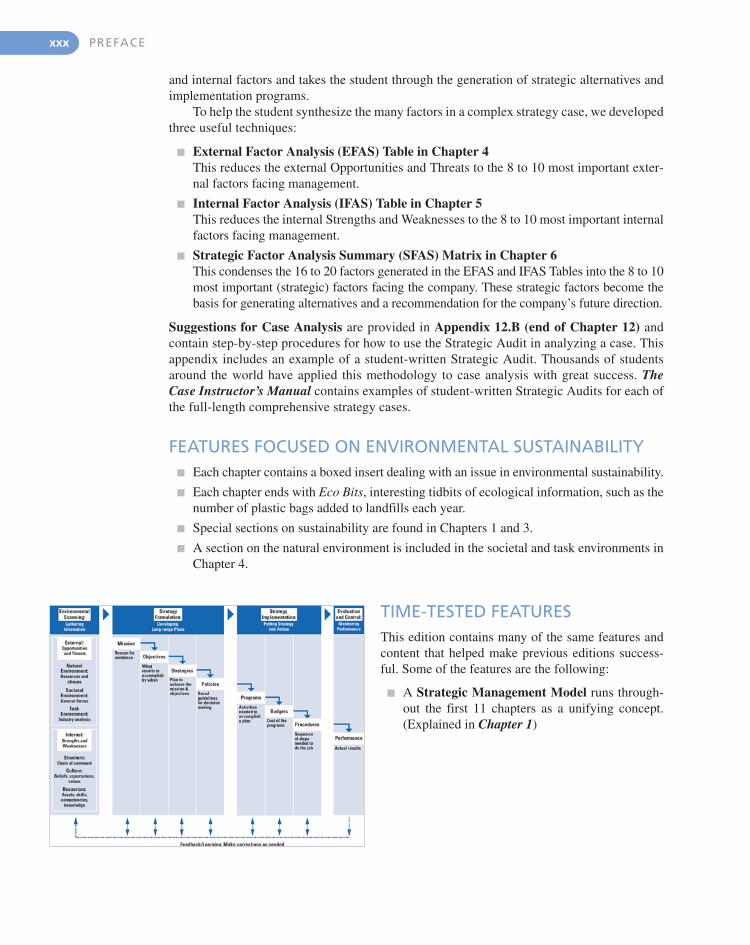
� The Strategic Audit, a way to operationalize the strategic decision-making process, serves as a checklist in case analysis. (Chapter 1)
� Corporate governance is examined in terms of the roles, re-sponsibilities, and interactions of top management and the boardof directors and includes the impact of the Sarbanes-Oxley Act.(Chapter 2)
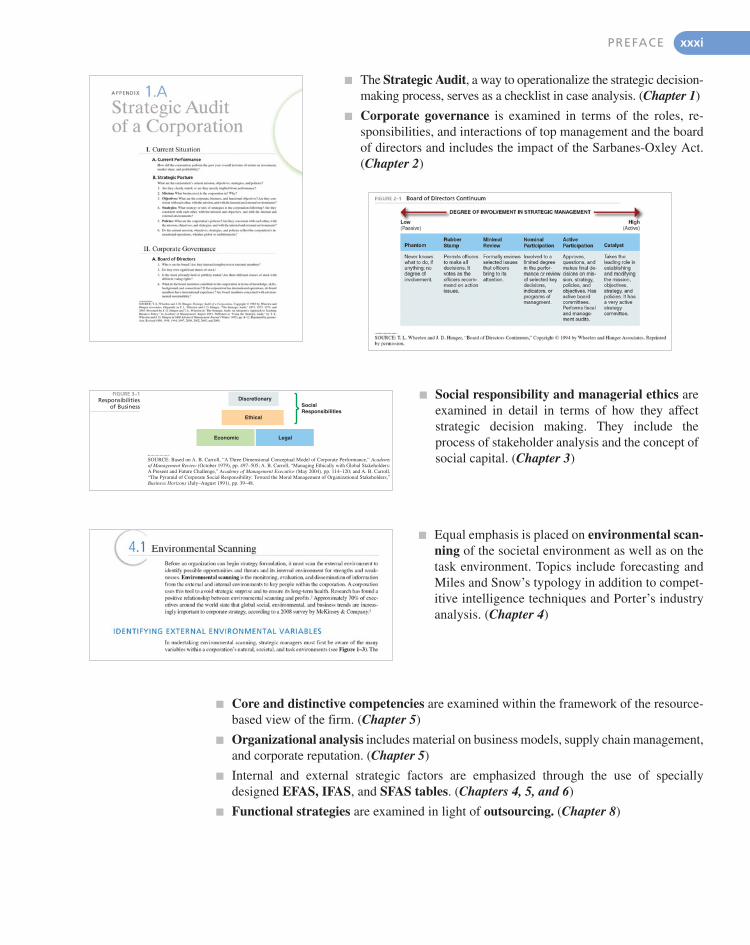
� Social responsibility and managerial ethics areexamined in detail in terms of how they affectstrategic decision making. They include theprocess of stakeholder analysis and the concept ofsocial capital. (Chapter 3)
� Equal emphasis is placed on environmental scan-ning of the societal environment as well as on thetask environment. Topics include forecasting andMiles and Snow’s typology in addition to compet-itive intelligence techniques and Porter’s industryanalysis. (Chapter 4)
Discretionary
Ethical
LegalEconomic
SocialResponsibilities
FIGURE 3–1Responsibilities
of Business
SOURCE: Based on A. B. Carroll, “A Three Dimensional Conceptual Model of Corporate Performance,” Academyof Management Review (October 1979), pp. 497–505; A. B. Carroll, “Managing Ethically with Global Stakeholders: A Present and Future Challenge,” Academy of Management Executive (May 2004), pp. 114–120; and A. B. Carroll,“The Pyramid of Corporate Social Responsibility: Toward the Moral Management of Organizational Stakeholders,”Business Horizons (July–August 1991), pp. 39–48.
� Core and distinctive competencies are examined within the framework of the resource-based view of the firm. (Chapter 5)
� Organizational analysis includes material on business models, supply chain management,and corporate reputation. (Chapter 5)
� Internal and external strategic factors are emphasized through the use of speciallydesigned EFAS, IFAS, and SFAS tables. (Chapters 4, 5, and 6)
� Functional strategies are examined in light of outsourcing. (Chapter 8)
PREFACE xxxi
� Two chapters deal with issues in strategy implementation,such as organizational and job design plus strategy-manager fit,action planning, corporate culture, and international strate-gic alliances. (Chapters 9 and 10)
� A separate chapter on evaluation and control explains the importance of measurementand incentives to organizational performance. (Chapter 11)
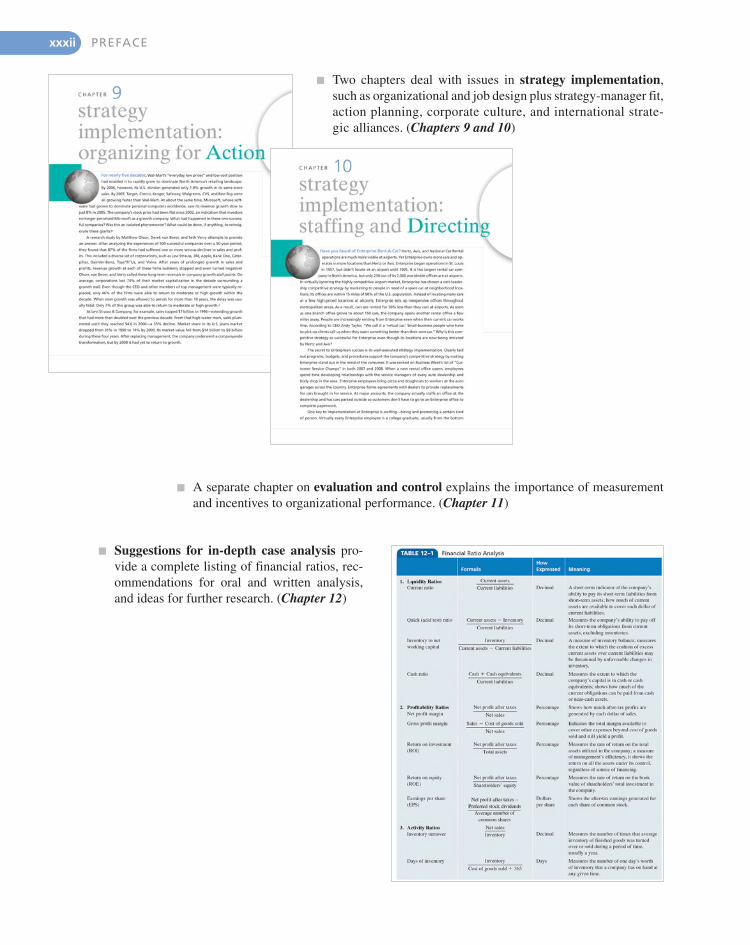
� Suggestions for in-depth case analysis pro-vide a complete listing of financial ratios, rec-ommendations for oral and written analysis,and ideas for further research. (Chapter 12)
xxxii PREFACE
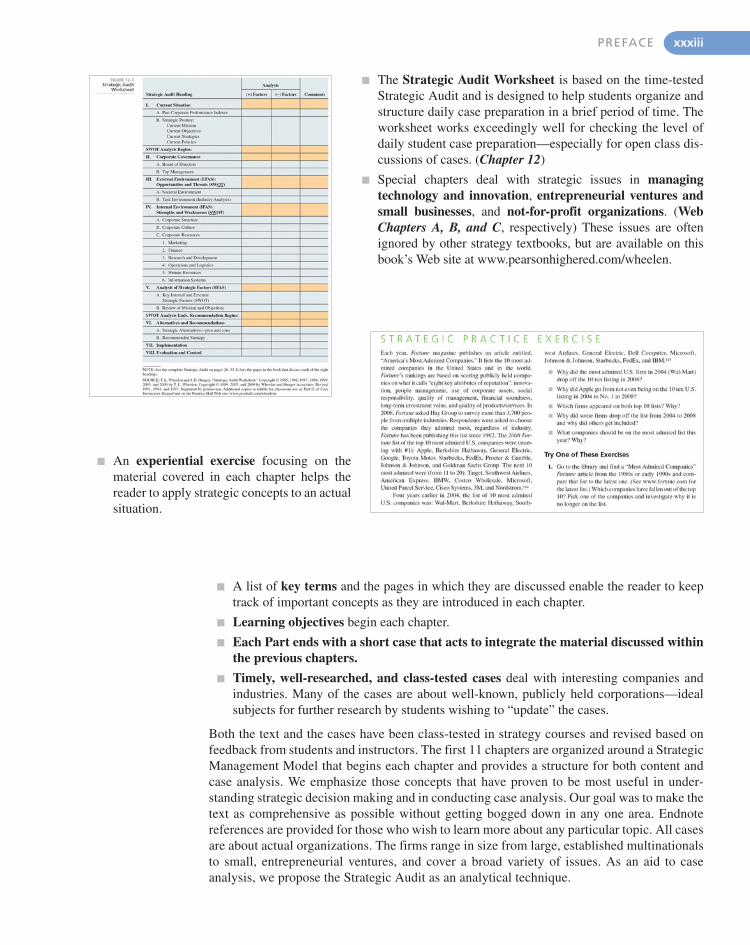
� The Strategic Audit Worksheet is based on the time-testedStrategic Audit and is designed to help students organize andstructure daily case preparation in a brief period of time. Theworksheet works exceedingly well for checking the level ofdaily student case preparation—especially for open class dis-cussions of cases. (Chapter 12)
� Special chapters deal with strategic issues in managingtechnology and innovation, entrepreneurial ventures andsmall businesses, and not-for-profit organizations. (WebChapters A, B, and C, respectively) These issues are oftenignored by other strategy textbooks, but are available on thisbook’s Web site at www.pearsonhighered.com/wheelen.
� An experiential exercise focusing on thematerial covered in each chapter helps thereader to apply strategic concepts to an actualsituation.
� A list of key terms and the pages in which they are discussed enable the reader to keeptrack of important concepts as they are introduced in each chapter.
� Learning objectives begin each chapter.
� Each Part ends with a short case that acts to integrate the material discussed withinthe previous chapters.
� Timely, well-researched, and class-tested cases deal with interesting companies andindustries. Many of the cases are about well-known, publicly held corporations—idealsubjects for further research by students wishing to “update” the cases.
Both the text and the cases have been class-tested in strategy courses and revised based onfeedback from students and instructors. The first 11 chapters are organized around a StrategicManagement Model that begins each chapter and provides a structure for both content andcase analysis. We emphasize those concepts that have proven to be most useful in under-standing strategic decision making and in conducting case analysis. Our goal was to make thetext as comprehensive as possible without getting bogged down in any one area. Endnotereferences are provided for those who wish to learn more about any particular topic. All casesare about actual organizations. The firms range in size from large, established multinationalsto small, entrepreneurial ventures, and cover a broad variety of issues. As an aid to caseanalysis, we propose the Strategic Audit as an analytical technique.
PREFACE xxxiii
SUPPLEMENTSInstructor Resource CenterAt www.pearsonhighered.com/irc, instructors can access teaching resources available withthis text in downloadable, digital format. Registration is simple and gives you immediate ac-cess to new titles and new editions. As a registered faculty member, you can download re-source files and receive immediate access and instructions for installing course managementcontent on your campus server. In case you ever need assistance, our dedicated technical sup-port team is ready to assist instructors with questions about the media supplements that ac-company this text. Visit http://247.pearsoned.com/ for answers to frequently asked questionsand toll-free user support phone numbers. The Instructor Resource Center provides the fol-lowing electronic resources.
Instructor’s ManualsTwo comprehensive Instructor’s Manuals have been carefully constructed to accompany thisbook. The first one accompanies the concepts chapters; the second one accompanies the cases.
Concepts Instructor’s ManualTo aid in discussing the 12 strategy chapters as well as the three web special issue chapters,the Concepts Instructor’s Manual includes:
� Suggestions for Teaching Strategic Management: These include various teachingmethods and suggested course syllabi.
� Chapter Notes: These include summaries of each chapter, suggested answers to discus-sion questions, and suggestions for using end-of-chapter cases/exercises and part-endingcases, plus additional discussion questions (with answers) and lecture modules.
Case Instructor’s ManualTo aid in case method teaching, the Case Instructor’s Manual includes detailed suggestionsfor use, teaching objectives, and examples of student analyses for each of the full-length com-prehensive cases. This is the most comprehensive Instructor’s Manual available in strategicmanagement. A standardized format is provided for each case:
1. Case Abstract
2. Case Issues and Subjects
3. Steps Covered in the Strategic Decision-Making Process
4. Case Objectives
5. Suggested Classroom Approaches
6. Discussion Questions
7. Case Author’s Teaching Note
8. Student-Written Strategic Audit, if appropriate
9. EFAS, IFAS, and SFAS Exhibits
10. Financial Analysis—ratios and common-size income statements, if appropriate
PowerPoint SlidesPowerPoint slides, provided in a comprehensive package of text outlines and figures corre-sponding to the text, are designed to aid the educator and supplement in-class lectures.
xxxiv PREFACE
Test Item FileThis Test Item File contains over 1,200 questions, including multiple-choice, true/false, andessay questions. Each question is followed by the correct answer, page reference, AACSBcategory, and difficulty rating.
TestGenTestGen software is preloaded with all of the Test Item File questions. It allows instructors tomanually or randomly view test questions, and to add, delete, or modify test-bank questionsas needed to create multiple tests.
Videos on DVDExciting and high-quality video clips help deliver engaging topics to the classroom to helpstudents better understand the concepts explained in the textbook. Please contact your localrepresentative to receive a copy of the DVD.
CourseSmartCourseSmart eTextbooks were developed for students looking to save on required or recom-mended textbooks. Students simply select their eText by title or author and purchase immedi-ate access to the content for the duration of the course using any major credit card. With aCourseSmart eText, students can search for specific keywords or page numbers, take notesonline, print out reading assignments that incorporate lecture notes, and bookmark importantpassages for later review. For more information or to purchase a CourseSmart eTextbook, visitwww.coursesmart.com.
AcknowledgmentsWe thank the many people at Prentice Hall/Pearson who helped to make this edition possi-ble. We thank our editor, Kim Norbuta. We are especially grateful to Kim’s project manager,Claudia Fernandes, who managed to keep everything on an even keel. We also thank Becca Groves and Emily Bush, who took the book through the production process.
We are very thankful to Jeanne McNett, Assumption College; Bob McNeal, AlabamaState University; Don Wicker, Brazosport College; Dan Kipley, Azusa Pacific University;Roxanna Wright, Plymouth State University; Kristl Davison, University of Mississippi;Francis Fabian, University of Memphis; Susan Fox-Wolfgramm, Hawaii Pacific University;Conrad Francis, Nova Southeastern University; and Gene Simko, Monmouth University fortheir constructive criticism of the 12th edition cases. They helped us to decide which of ourfavorite cases to keep and which to delete or update.
We are very grateful to Kathy Wheelen for her first-rate administrative support of thecases and to Alan N. Hoffman for helping us with the Case Instructor’s Manual. We areespecially thankful to the many students who tried out the cases we chose to include in thisbook. Their comments helped us find any flaws in the cases before the book went to theprinter.
In addition, we express our appreciation to Wendy Klepetar, Management DepartmentChair of Saint John’s University and the College of Saint Benedict, for her support andprovision of the resources so helpful to revise a textbook. Both of us acknowledge our debt to
PREFACE xxxv

Dr. William Shenkir and Dr. Frank S. Kaulback, former Deans of the McIntire School ofCommerce of the University of Virginia, for the provision of a work climate most supportiveto the original development of this book.
We offer a special thanks to the hundreds of case authors who have provided us withexcellent cases for the 13 editions of this book. We consider many of these case authors to beour friends. A special thanks to you!! The adage is true: The path to greatness is through others.
Lastly, to the many strategy instructors and students who have moaned to us about theirproblems with the strategy course: We have tried to respond to your problems and concerns asbest we could by providing a comprehensive yet usable text coupled with recent and complexcases. To you, the people who work hard in the strategy trenches, we acknowledge our debt.This book is yours.
T. L. W.Saint Petersburg, Florida
J. D. H.St. Joseph, Minnesota
xxxvi PREFACE
About the Contributors
MOUSTAFA H. ABDELSAMAD, DBA (George Washington University), is Dean of the Collegeof Business at Texas A&M University–Corpus Christi. He previously served as Dean of theCollege of Business and Industry at University of Massachusetts–Dartmouth and as Professorof Finance and Associate Dean of Graduate Studies in Business at Virginia CommonwealthUniversity. He is Editor–in-Chief of SAM Advanced Management Journal and InternationalPresident of the Society of Advancement of Management. He is author of A Guide to CapitalExpenditure Analysis and two chapters in the Dow Jones–Irwin Capital Budgeting Handbook.He is the author and coauthor of numerous articles in various publications.
Hitesh (John) P. Adhia, CPA, MS and BA (University of South Florida), is the President andChief Investment Officer of Adhia Investment Advisors, Inc. (the “Firm”). Mr. Adhia is a CPAand has been in the finace industry since 1982. Mr Adhia is the founder and Investment Man-ager for the Adhia Twenty Fund, and the Adhia Health Care Fund, the Adhia Short Term Ad-vantage Fund, the Adhia Arbitrage Fund, and the Adhia Derivative Fund. Prior to formingAdhia Investment Advisors, Mr. Adhia owned a Tampa-based public accounting practice andalso served as Acting CFO and Independent Advisor to the Well Care Group of Companies. Mr.Adhia has over twenty years experience in managing fixed income strategies.
KAREN A. BERGER, PhD (M. Phil and New York University), MBA (University of Connecticut),MA (Columbia University), and BA (S.U.N.Y. at Buffalo), is Chairperson of the MarketingDepartment and Associate Professor of Marketing at Pace University. She previously held aca-demic positions with New York University, Stern School of Business, and Mercy College. Bergerhas published literature in the field of Marketing and has won several teaching awards.
CHRISTINE B. BUENAFE, student of The College of New Jersey, co-author with JoyceVincelette of the Rosetta Stone and Volcom cases in this edition.
BARNALI CHAKRABORTY, is a faculty member at the ICFAI Center for Management Research(ICMR).
RICHARD A. COISER, PhD (University of Iowa), is Dean and Leeds Professor of Managementat Purdue University. He formerly was Dean and Fred B. Brown Chair at the University ofOklahoma and was Associate Dean for Academics and Professor of Business Administrationat Indiana University. He served as Chairperson of the Department of Management at IndianaUniversity. For seven years prior to assuming his current position, he was a Planning Engineerwith Western Electric Company and Instructor of Management and Quantitative Methods atthe University of Notre Dame. Dr. Coiser is interested in researching the managerial decision-making process, organization responses to external forces, and participative management. Hehas published in Behavior Science, Academy of Management Journal, Academy of Manage-ment Review, Organizational Behavior and Human Performance, Management Science,Strategic Management Journal, Business Horizons, Decision Sciences, Personnel Psychology,Journal of Creative Behavior, International Journal of Management, The Business Quarterly,Public Administration Quarterly, Human Relations, and other journals. In addition, Dr. Coiserhas presented numerous papers at professional meetings and has coauthored a management
xxxvii
text. He has been active in many executive development programs and has acted as management-education consultant for several organizations. Dr. Coiser is the recipient of Teaching Excellence Awards in the MBA Program at Indiana and a Richard D. Irwin Fellowship. He be-longs to the Institute of Management, Sigma Iota Epsilon, and the Decision Sciences Institute.
ROY A. COOK, DBA (Mississippi State University), is past Associate Dean of the School of Business Administration and previously a Professor at Fort Lewis College, Durango, Col-orado. He has written a best-selling textbook, Tourism: The Business of Travel, now in its2nd edition, and has two forthcoming textbooks: Cases and Experiential Exercises in Hu-man Resource Management and Guide to Business Etiquette. He has authored numerous ar-ticles, cases, and papers based on his extensive experience in the hospitality industry andresearch interests in the areas of strategy, small business management, human resource man-agement, and communication. Dr. Cook has served as the Director of Colorado’s Center forTourism Research® and Editor of The Annual Advances in Business Cases, and also on theeditorial boards of the Business Case Journal, the Journal of Business Strategies, and theJournal of Teaching and Tourism. He is a member of the Academy of Management, Societyfor Case Research (past President), and the International Society of Travel and Tourism Ed-ucators. Dr. Cook teaches courses in Strategic Management, Small Business Management,Tourism and Resort Management, and Human Resource Management.
STEVEN M. COX, PhD (University of Nebraska), is an Associate Professor of Marketing,McColl School of Business, Queens University of Charlotte. He has a 25-year career in execu-tive level marketing and sales positions with AT&T, GE, and several satellite imaging compa-nies. He owns and manages LSI, a geographic information system company. He currently servesas a case reviewer for the Business Case Journal and the Southeast Case Research Journal.
DAVID B. CROLL, PhD (Pennsylvania State University), is Professor Emeritus of Accountingat the McIntire School of Commerce, the University of Virginia. He was Visiting Associate Pro-fessor at the Graduate Business School, the University of Michigan. He is on the editorial boardof SAM Advanced Management Journal. He has published in the Accounting Review and theCase Research Journal. His cases appear in 12 accounting and management textbooks.
DAN R. DALTON, PhD (University of California, Irvine), is the Dean of the Graduate School ofBusiness, Indiana University, and Harold A. Polipl Chair of Strategic Management. He was for-merly with General Telephone & Electronics for 13 years. Widely published in business andpsychology periodicals, his articles have appeared in the Academy of Management Journal,Journal of Applied Psychology, Personnel Psychology, Academy of Management Review, andStrategic Management Journal.
CATHY A. ENZ, PhD (Ohio State University), is the Lewis G. Schaeneman Jr. Professor ofInnovation and Dynamic Management at Cornell University’s School of Hotel Administra-tion. She is also the Executive Director of the Center for Hospitality Research at that insti-tution. Her doctoral degree is in Organization Theory and Behavior. Professor Enz haswritten numerous articles, cases, and books on corporate culture, value sharing, changemanagement, and strategic human resource management effects on performance. ProfessorEnz consults extensively in the service sector and serves on the Board of Directors for twohospitality-related organizations.
ELLIE A. FOGARTY, EdD (University of Pennsylvania), MBA (Temple University), MLS(University of Pittsburgh), and BA (Immaculata University), is the Director of Compliance andEthics at The College of New Jersey (TCNJ). Previously, she served as the Associate Provostfor Planning and Resource Allocation, Executive Assistant to the Provost, and Business and
xxxviii ABOUT THE CONTRIBUTORS
Economics Librarian, all at TCNJ. She has written five cases used in earlier editions ofStrategic Management and Business Policy. She has taught management courses at both TCNJand Rutgers University.
GAMEWELL D. GANTT, JD, CPA, is Professor of Accounting and Management in the Collegeof Business at Idaho State University in Pocatello. Idaho, where he teaches a variety of legalstudies courses. He is past President of the Rocky Mountain Academy of Legal Studies in Busi-ness and a past Chair of the Idaho Endowment Investment Fund Board. His published articlesand papers have appeared in journals including Midwest Law Review, Business Law Review,Copyright World, and Intellectual Property World. His published cases have appeared in sev-eral textbooks and in Annual Advances in Business Cases.
S. S. GEORGE is a faculty associate at the ICFAI Center for Management Research (ICMR).
NORMAN J. GIERLASINSKI, DBA, CPA, CFE, CIA, is Professor of Accounting at CentralWashington University. He served as Chairman of the Small Business Division of the MidwestBusiness Administration Association. He has authored or coauthored cases for professionalassociations and the Harvard Case Study Series. He has authored various articles in profes-sional journals as well as serving as a contributing author for textbooks and as a consultant tomany organizations. He also served as a reviewer for various publications.
VIVEK GUPTA is a faculty member at the ICFAI Center for Management Research (ICMR).
RENDY HALIN, MBA and BS (Bentley University), is currently focusing on equity and com-modity trading, as well as venturing on a new startup company. Actively involved in his churchministry, he is also contributing his time and thought on how to properly manage the church’smanagement and financial report effectively.
PATRICIA HARASTA, MBA (Bentley McCallum Graduate School of Business), is Director ofQuality Assurance at CA (formerly Computer Associates). She manages a distributed teamresponsible for new development and maintenance QA activities for products that providemanagement of applications such as SAP, Microsoft Exchange, Lotus Domino, WebSphere,WebLogic, MQ, and Web Servers.
ALAN N. HOFFMAN, MBA, DBA (Indiana University), is Professor of Strategic Managementand Director of the MBA program at the McCallum Graduate School, Bentley University. Hismajor areas of interest include strategic management, global competition, investment strategy,and technology. Professor Hoffman is coauthor of The Strategic Management Casebook andSkill Builder textbook. His recent publications have appeared in the Academy of ManagementJournal, Human Relations, the Journal of Business Ethics, the Journal of Business Research,and Business Horizons. He has authored more than 20 strategic management cases includingThe Boston YWCA, Ryka Inc., Liz Claiborne, Ben & Jerry’s, Cisco Systems, Sun Microsys-tems, Palm Inc., Handspring, Ebay, AOL/Time Warner, McAfee, Apple Computer, Tivo Inc.,and Wynn Resorts. He is the recipient of the 2004 Bentley University Teaching InnovationAward for his course: “The Organizational Life Cycle—The Boston Beer Company Brewers ofSamuel Adams Lager Beer.”
J. DAVID HUNGER, PhD (Ohio State University), is currently Strategic Management Scholar inResidence at Saint John’s University in Minnesota. He is also Professor Emeritus at Iowa StateUniversity where he taught for 23 years. He previously taught at George Mason University, theUniversity of Virginia, and Baldwin-Wallace College. He worked in brand management at Proc-ter & Gamble Company, worked as a selling supervisor at Lazarus Department Store, and
ABOUT THE CONTRIBUTORS xxxix
served as a Captain in U.S. Army Military Intelligence. He has been active as a consultant andtrainer to business corporations, as well as to state and federal government agencies. He haswritten numerous articles and cases that have appeared in the Academy of Management Jour-nal, International Journal of Management, Human Resource Management, Journal of BusinessStrategies, Case Research Journal, Business Case Journal, Handbook of Business Strategy,Journal of Management Case Studies, Annual Advances in Business Cases, Journal of RetailBanking, SAM Advanced Management Journal, and Journal of Management, among others.Dr. Hunger is a member of the Academy of Management, North American Case ResearchAssociation, Society for Case Research, North American Management Society, Textbook andAcademic Authors Association, and the Strategic Management Society. He is past President ofthe North American Case Research Association, the Society for Case Research, and the IowaState University Press Board of Directors. He also served as a Vice President of the U.S. Asso-ciation for Small Business and Entrepreneurship. He was Academic Director of the PappajohnCenter for Entrepreneurship at Iowa State University. He has served on the editorial reviewboards of SAM Advanced Management Journal, Journal of Business Strategies, and Journal ofBusiness Research. He has served on the Board of Directors of the North American CaseResearch Association, the Society for Case Research, the Iowa State University Press, and theNorth American Management Society. He is coauthor with Thomas L. Wheelen of StrategicManagement and Business Policy and Essentials of Strategic Management plus Concepts inStrategic Management and Business Policy and Cases in Strategic Management and BusinessPolicy, as well as Strategic Management Cases (PIC: Preferred Individualized Cases), and amonograph assessing undergraduate business education in the United States. The 8th edition ofStrategic Management and Business Policy received the McGuffey Award for Excellence andLongevity in 1999 from the Text and Academic Authors Association. Dr. Hunger received theBest Case Award given by the McGraw-Hill Publishing Company and the Society for CaseResearch in 1991 for outstanding case development. He is listed in various versions of Who’sWho, including Who’s Who in the United States and Who’s Who in the World. He was alsorecognized in 1999 by the Iowa State University College of Business with its Innovation inTeaching Award and was elected a Fellow of the Teaching and Academic Authors Associationand of the North American Case Research Association.
P. INDU is a student of Vivek Gupta at the ICFAI Center of Management Research (ICMR).
GEORGE A. JOHNSON, PhD, is Professor of Management and Director of the Idaho StateUniversity MBA program. He has published in the fields of Management Education, Ethics,Project Management, and Simulation. He is also active in developing and publishing casematerial for educational purposes. His industry experience includes several years as a Pro-ject Manager in the development and procurement of aircraft systems.
SHAWANA P. JOHNSON, PhD (Case Western Reserve University), is president of Global Mar-keting Insights, Inc. She has 27 years of management and marketing experience in the Hi-TechInformation and Geospatial Technology Industry with companies such as Lockheed Martin andGeneral Electric Aerospace.
MICHAEL KEEFFE, PhD (University of Arkansas), is Associate Professor of Management andChair of Undergraduate Assurance of Learning in the McCoy College of Business Administra-tion, Texas State University. He was the developer and draft writer of the College of Businesspolicy and procedure system, co-director of initial AACSB-International accreditation efforts,sponsor of the Alpha Chi University Honor Society for over a decade, and developed and im-plemented the Assurance of Learning system for the McCoy College. Additionally, he has beenChair or Acting Chair of three departments in the college. With over a dozen journal articles and
xl ABOUT THE CONTRIBUTORS
numerous refereed proceedings, Dr. Keeffe is an avid case writer with over 21 cases appearingin 32 textbooks over the last 20 years.
JOHN A. KILPATRICK, PhD (University of Iowa), is Professor of Management and Interna-tional Business, Idaho State University. He has taught in the areas of business and businessethics for over 25 years. He served as Co-Chair of the management track of the Institute forBehavioral and Applied Management from its inception and continues as a board memberfor that organization. He is author of The Labor Content of American Foreign Trade, and iscoauthor of Issues in International Business. His cases have appeared in a number of orga-nizational behavior and strategy texts and casebooks, and in Annual Advances in BusinessCases.
DONALD F. KURATKO is the Jack M. Gill Chair of Entrepreneurship, Professor of Entrepreneur-ship, and Executive Director of the Johnson Center for Entrepreneurship & Innovation at TheKelley School of Business, Indiana University–Bloomington. He has published over 150 ar-ticles on aspects of entrepreneurship, new venture development, and corporate entrepreneurship.His work has been published in journals such as Strategic Management Journal, Academy ofManagement Executive, Journal of Business Venturing, Entrepreneurship Theory & Practice,Journal of Small Business Management, Journal of Small Business Strategy, Family Business Re-view, and Advanced Management Journal. Dr. Kuratko has authored 20 books,Entrepreneurship: Theory, Process, Practice, 7th edition (South-Western/Thomson Publishers,2007), as well as Strategic Entrepreneurial Growth, 2nd edition (South-Western/Thomson Pub-lishers, 2004), Corporate Entrepreneurship (South-Western/Thomson Publishers, 2007), andEffective Small Business Management, 7th edition (Wiley & Sons Publishers, 2001). In addition,Dr. Kuratko has been consultant on Corporate Entrepreneurship and Entrepreneurial Strategiesto a number of major corporations such as Anthem Blue Cross/Blue Shield, AT&T, United Tech-nologies, Ameritech, The Associated Group (Acordia), Union Carbide Corporation, Service-Master, and TruServ. Before coming to Indiana University, he was the Stoops DistinguishedProfessor of Entrepreneurship and Founding Director of the Entrepreneurship Program at BallState University. In addition, he was the Executive Director of The Midwest Entrepreneurial Ed-ucation Center.
Dr. Kuratko’s honors include earning the Ball State University College of Business Teach-ing Award 15 consecutive years as well as being the only professor in the history of Ball StateUniversity to achieve all four of the university’s major lifetime awards: Outstanding YoungFaculty (1987); Outstanding Teaching Award (1990); Outstanding Faculty Award (1996); andOutstanding Researcher Award (1999). He was also honored as the Entrepreneur of the Yearfor the state of Indiana and was inducted into the Institute of American Entrepreneurs Hall ofFame (1990). He has been honored with The George Washington Medal of Honor; the LeaveyFoundation Award for Excellence in Private Enterprise; the NFIB Entrepreneurship Excel-lence Award; and the National Model Innovative Pedagogy Award for Entrepreneurship. Inaddition, Dr. Kuratko was named the National Outstanding Entrepreneurship Educator (by theU.S. Association for Small Business and Entrepreneurship) and selected as one of the Top 3Entrepreneurship Professors in the United States by the Kauffman Foundation, Ernst & Young,Inc. magazine, and Merrill Lynch. He received the Thomas W. Binford Memorial Award forOutstanding Contribution to Entrepreneurial Development from the Indiana Health IndustryForum. Dr. Kuratko has been named a 21st Century Entrepreneurship Research Fellow by theNational Consortium of Entrepreneurship Centers as well as the U.S. Association for SmallBusiness & Entrepreneurship Scholar for Corporate Entrepreneurship in 2003. Finally, he hasbeen honored by his peers in Entrepreneur magazine as one of the Top 2 Entrepreneurship
ABOUT THE CONTRIBUTORS xli
Program Directors in the nation for three consecutive years including the #1 EntrepreneurshipProgram Director in 2003.
RUCHI MANKAD is a former faculty member at the ICFAI Center for Management Research(ICMR).
BILL J. MIDDLEBROOK, PhD (University of North Texas), is Professor of Management atSouthwest Texas State University. He served as Acting Chair of the Department of Man-agement and Marketing, published in numerous journals, served as a consultant in industry,and is currently teaching and researching in the fields of Strategic Management and HumanResources.
BERNARD A. MORIN, B.S., M.B.A., Ph.D., Professor Emeritus of Commerce at the Universityof Virginia.
NATHAN NEBBE, MBA and MA (Iowa State University), has significant interests in the in-digenous peoples of the Americas. With an undergraduate degree in Animal Ecology, heserved as a Peace Corps Volunteer in Honduras, where he worked at the Honduran nationalforestry school ESNAACIFORE (Escuela National de Ciencias Forestales). After sometime in the Peace Corps, Nathan worked for a year on a recycling project for the Town ofIgnacio and the Southern Ute Indian Tribe in southwestern Colorado. Following his expe-rience in Colorado, Nathan returned to Iowa State University where he obtained his MBA,followed by an MA in Anthropology. He is currently studying how globalization of theChilian forestry industry is affecting the culture of the indigenous Mapuche people of southcentral Chile.
LAWRENCE C. PETTIT, Jr., B.S., M.S., D.B.A., Professor Emeritus of Commerce at the McIntire School of Commerce University of Virginia.
ANNIE PHAN, BS (The College of New Jersey), is currently an associate at Goldman SachsAsset Management, and is an MBA candidate at New York University Leonard N. Stern Schoolof Business. In addition, she has assisted with research for The Global Corporate Brand Book.
SHIRISHA REGANI is a faculty associate at the ICFAI Center for Management Research(ICMR).
JOHN K. ROSS III, PhD (University of North Texas), is Associate Professor of Managementat Southwest Texas State University. He has served as SBI Director, Associate Dean, Chairof the Department of Management and Marketing, published in numerous journals, and iscurrently teaching and researching in the fields of Strategic Management and HumanResource.
SHERRY K. ROSS, CPA (Texas), MBA (Southwest Texas State University), is a Senior Lecturerat Texas State University–San Marcos, Texas. She is the core course coordinator for financialaccounting and teaches introductory financial accounting courses. Her recent work experienceis Executive Director of a not-for-profit corporation.
MARYANNE M. ROUSE, CPA, MBA (University of South Florida) was a faculty member, As-sistant Dean, and Director of Management Education and Development at the College ofBusiness Administration of the University of South Florida until her retirement.
PATRICIA A. RYAN, PhD (University of South Florida), is an Associate Professor of Finance,Colorado State University. She currently serves on the Board of Directors of the MidwestFinance Association and was the Associate Editor of the Business Case Journal. Her research
xlii ABOUT THE CONTRIBUTORS
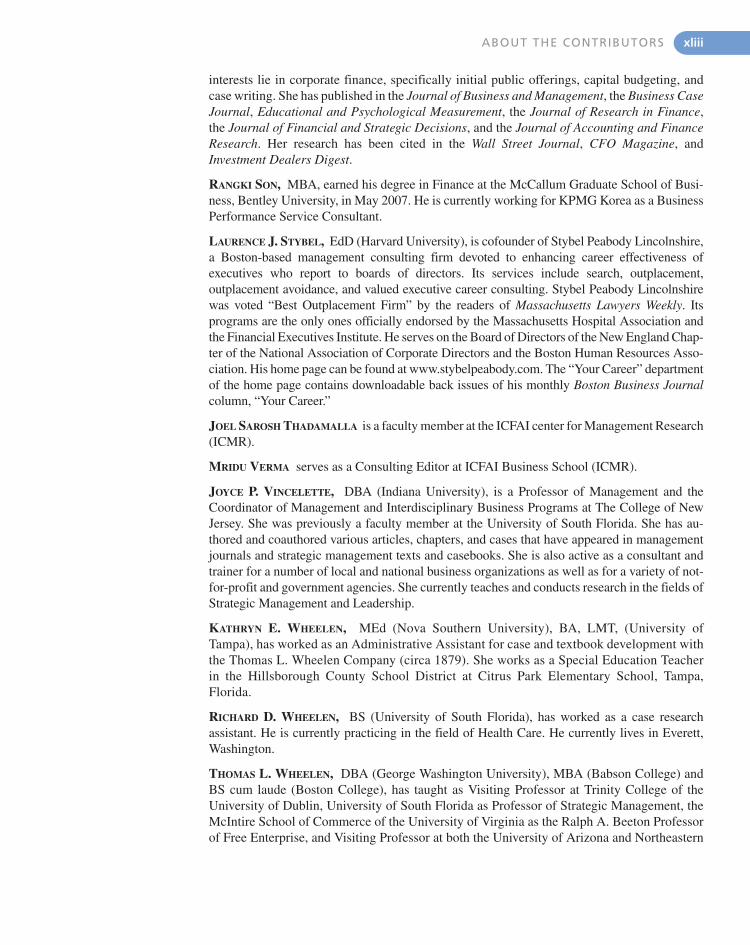
interests lie in corporate finance, specifically initial public offerings, capital budgeting, andcase writing. She has published in the Journal of Business and Management, the Business CaseJournal, Educational and Psychological Measurement, the Journal of Research in Finance,the Journal of Financial and Strategic Decisions, and the Journal of Accounting and FinanceResearch. Her research has been cited in the Wall Street Journal, CFO Magazine, andInvestment Dealers Digest.
RANGKI SON, MBA, earned his degree in Finance at the McCallum Graduate School of Busi-ness, Bentley University, in May 2007. He is currently working for KPMG Korea as a BusinessPerformance Service Consultant.
LAURENCE J. STYBEL, EdD (Harvard University), is cofounder of Stybel Peabody Lincolnshire,a Boston-based management consulting firm devoted to enhancing career effectiveness ofexecutives who report to boards of directors. Its services include search, outplacement,outplacement avoidance, and valued executive career consulting. Stybel Peabody Lincolnshirewas voted “Best Outplacement Firm” by the readers of Massachusetts Lawyers Weekly. Itsprograms are the only ones officially endorsed by the Massachusetts Hospital Association andthe Financial Executives Institute. He serves on the Board of Directors of the New England Chap-ter of the National Association of Corporate Directors and the Boston Human Resources Asso-ciation. His home page can be found at www.stybelpeabody.com. The “Your Career” departmentof the home page contains downloadable back issues of his monthly Boston Business Journalcolumn, “Your Career.”
JOEL SAROSH THADAMALLA is a faculty member at the ICFAI center for Management Research(ICMR).
MRIDU VERMA serves as a Consulting Editor at ICFAI Business School (ICMR).
JOYCE P. VINCELETTE, DBA (Indiana University), is a Professor of Management and theCoordinator of Management and Interdisciplinary Business Programs at The College of NewJersey. She was previously a faculty member at the University of South Florida. She has au-thored and coauthored various articles, chapters, and cases that have appeared in managementjournals and strategic management texts and casebooks. She is also active as a consultant andtrainer for a number of local and national business organizations as well as for a variety of not-for-profit and government agencies. She currently teaches and conducts research in the fields ofStrategic Management and Leadership.
KATHRYN E. WHEELEN, MEd (Nova Southern University), BA, LMT, (University ofTampa), has worked as an Administrative Assistant for case and textbook development withthe Thomas L. Wheelen Company (circa 1879). She works as a Special Education Teacherin the Hillsborough County School District at Citrus Park Elementary School, Tampa,Florida.
RICHARD D. WHEELEN, BS (University of South Florida), has worked as a case researchassistant. He is currently practicing in the field of Health Care. He currently lives in Everett,Washington.
THOMAS L. WHEELEN, DBA (George Washington University), MBA (Babson College) andBS cum laude (Boston College), has taught as Visiting Professor at Trinity College of theUniversity of Dublin, University of South Florida as Professor of Strategic Management, theMcIntire School of Commerce of the University of Virginia as the Ralph A. Beeton Professorof Free Enterprise, and Visiting Professor at both the University of Arizona and Northeastern
ABOUT THE CONTRIBUTORS xliii
University. He was also affiliated with the University of Virginia College of ContinuingEducation, where he served in the following capacities: (1) Coordinator for Business Educa-tion (1978–1983, 1971–1976)—approve all undergraduate courses offered at seven regionalcenters and approved faculty; (2) Liaison Faculty and Consultant to the National Academy ofthe FBI Academy (1972–1983) and; (3) developed, sold, and conducted over 200 seminars forlocal, state, and national governments, and companies for McIntire School of Commerce andContinuing Education. He worked at General Electric Company, holding various managementpositions (1961–1965); U.S. Navy Supply Corps (SC)–Lt. (SC) USNR–Assistant SupplyOfficer aboard nuclear support tender (1957–1960). He has been published in the monograph,An Assessment of Undergraduate Business Education in the United States (with J. D. Hunger),1980. He’s also authored 60 published books, with 14 books translated into eight languages(Arabic, Bahasa, Indonesia, Chinese, Chinese Simplified, Greek, Italian, Japanese, Portugueseand Thai); he is coauthor with J. D. Hunger of four active books: Strategic Management andBusiness Policy, 13th edition (2012); Concepts in Strategic Management and Business Policy,13th edition (2012); Strategic Management and Business Policy, 13th edition Internationaledition (2012); and Essentials of Strategic Management, 5th edition (2011). He is co-editor ofDevelopments in Information Systems (1974) and Collective Bargaining in the Public Sector(1977), and co-developer of the software program STrategic Financial ANalyzer (ST. FAN)(1989, 1990, 1993—different versions). He has authored over 40 articles that have appearedin such journals as the Journal of Management, Business Quarterly, Personnel Journal, SAMAdvanced Management Journal, Journal of Retailing, International Journal of Management,and the Handbook of Business Strategy. He has created roughly 280 cases appearing in over83 text and case books, as well as the Business Case Journal, Journal of Management CaseStudies, International Journal of Case Studies, and Research and Case Research Journal. Hehas won numerous awards, including the following: (1) Fellow elected by the Society for Ad-vancement of Management in 2002; (2) Fellow elected by the North American Case ResearchAssociation in 2000; (3) Fellow elected by the Text and Academic Authors Association in2000; (4) 1999 Phil Carroll Advancement of Management Award in Strategic Managementfrom the Society for Advancement of Management; (5) 1999 McGuffey Award for Excellenceand Longevity for Strategic Management and Business Policy, 6th edition from the Text andAcademic Authors Association; (6) 1996/97 Teaching Incentive Program Award for teachingundergraduate strategic management; (7) Fulbright, 1996–1997, to Ireland, which he had todecline; (8) Endowed Chair, Ralph A. Beeton Professor, at University of Virginia(1981–1985); (9) Sesquicentennial Associateship research grant from the Center for AdvancedStudies at the University of Virginia, 1979–1980; (10) Small Business Administration (SmallBusiness Institute) supervised undergraduate team that won District, Regional III, and Honor-able Mention Awards; and (11) awards for two articles. Dr. Wheelen currently serves on theBoard of Directors of Adhia Mutual Fund, Society for Advancement of Management, and onthe Editorial Board and is the Associate Editor of SAM Advanced Management Journal. Heserved on the Board of Directors of Lazer Surgical Software Inc, and Southern ManagementAssociation and on the Editorial Boards of the Journal of Management and Journal ofManagement Case Studies, Journal of Retail Banking, Case Research Journal, and BusinessCase Journal. He was Vice President of Strategic Management for the Society for theAdvancement of Management, and President of the North American Case Research Associa-tion. Dr. Wheelen is a member of the Academy of Management, Beta Gamma Sigma, SouthernManagement Association, North American Case Research Association, Society for Advance-ment of Management, Society for Case Research, Strategic Management Association, andWorld Association for Case Method Research and Application. He has been listed in Who’sWho in Finance and Industry, Who’s Who in the South and Southwest, and Who’s Who inAmerican Education.
xliv ABOUT THE CONTRIBUTORS

THOMAS L. WHEELEN II, BA (Boston College), has worked as a Case Research Assistant.
SUZANNE WONG was born and raised in Jakarta, Indonesia. She graduated with a dual BSBA degree in Finance andMarketing from Northeastern University in 2004, followed by an MBA in Finance from Bentley University in 2006.Upon graduation, Suzanne joined Fidelity Investments’ parent company FMRCo in Boston as an Analyst in Technol-ogy Risk Management–Information Security. She plans to continue the future operational success of her parents’pharmaceutical company in Indonesia.
ABOUT THE CONTRIBUTORS xlv

This page intentionally left blank

THIRTEENTH EDITION
StrategicManagement
and BusinessPolicy
TOWARD GLOBAL SUSTAINABILITY

This page intentionally left blank
PA R T1Introduction to
StrategicManagementand Business
Policy
How does a company become successful and stay successful? Certainly not
by playing it safe and following the traditional ways of doing business! Taking a
strategic risk is what General Electric (GE) did when it launched its Ecomagination
strategic initiative in 2005. According to Jeffrey Immelt, Chairman and CEO:
Ecomagination is GE’s commitment to address challenges, such as the need for cleaner,
more efficient sources of energy, reduced emissions, and abundant sources of clean water.
And we plan to make money doing it. Increasingly for business, “green” is green.1
Immelt announced in a May 9, 2005, conference call that the company planned to more
than double its spending on research and development from $700 million in 2004 to $1.5 bil-
lion by 2010 for cleaner products ranging from power generation to locomotives to water pro-
cessing. The company intended to introduce 30 to 40 new products, including more efficient
lighting and appliances, over the next two years. It also expected to double revenues from busi-
nesses that made wind turbines, treat water, and reduce greenhouse-emitting gases to at least
$20 billion by 2010. In addition to working with customers to develop more efficient power gen-
erators, the company planned to reduce its own emission of greenhouse gases by 1% by 2012
and reduce the intensity of those gases 30% by 2008.2 In 2006, GE’s top management informed
the many managers of its global business units that in the future they would be judged not only
by the usual measures, such as return on capital, but that they would also be accountable for
achieving corporate environmental objectives.
Ecomagination was a strategic change for GE, a company that had previously been con-
demned by environmentalists for its emphasis on coal and nuclear power and for polluting the
Hudson and Housatonic rivers with polychlorinated biphenyls (PCBs) in the 1980s. Over the
years, GE had been criticized for its lack of social responsibility and for its emphasis on prof-
itability and financial performance over social and environmental objectives. What caused GE’s
management to make this strategic change?
In the 18 months before launching its new environmental strategy, GE invited managers
from companies in various industries to participate in two-day “dreaming sessions” during
which they were asked to imagine life in 2015—and the products they, as customers, would
need from GE. The consensus was a future of rising fuel costs, restrictive environmental regula-
tions, and growing consumer expectations for cleaner technologies, especially in the energy in-
dustry. Based on this conclusion, GE’s management made the strategic decision to move in a new
basic concepts ofStrategic Management
C H A P T E R 1
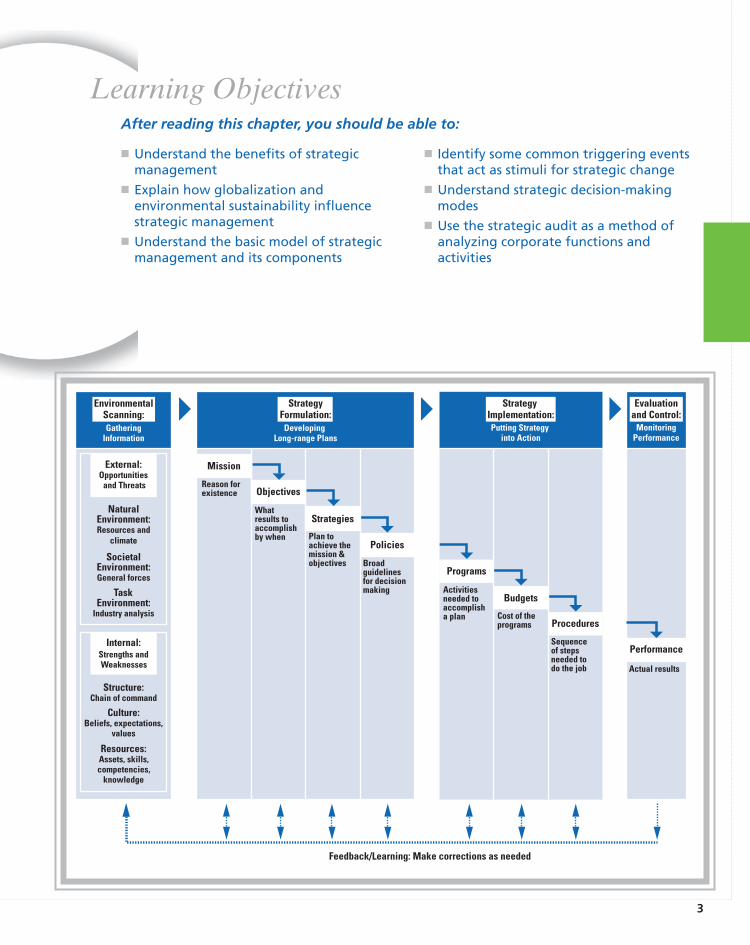
3
� Understand the benefits of strategicmanagement
� Explain how globalization andenvironmental sustainability influencestrategic management
� Understand the basic model of strategicmanagement and its components
� Identify some common triggering eventsthat act as stimuli for strategic change
� Understand strategic decision-makingmodes
� Use the strategic audit as a method ofanalyzing corporate functions andactivities
Learning Objectives
GatheringInformation
Putting Strategy into Action
MonitoringPerformance
SocietalEnvironment:General forces
NaturalEnvironment:Resources and
climate
TaskEnvironment:
Industry analysis
Internal:Strengths andWeaknesses
Structure:Chain of command
Culture:Beliefs, expectations,
values
Resources:Assets, skills,competencies,
knowledge
Programs
Activitiesneeded to accomplisha plan
Budgets
Cost of theprograms Procedures
Sequenceof stepsneeded to do the job
Performance
Actual results
External:Opportunities
and Threats
DevelopingLong-range Plans
Mission
Reason forexistence Objectives
Whatresults to accomplishby when
Strategies
Plan toachieve themission &objectives
Policies
Broadguidelinesfor decisionmaking
EnvironmentalScanning:
StrategyFormulation:
StrategyImplementation:
Evaluationand Control:
Feedback/Learning: Make corrections as needed
After reading this chapter, you should be able to:
direction. According to Vice Chairman David Calhoun, “We decided that if this is what our
customers want, let’s stop putting our heads in the sand, dodging environmental inter-
ests, and go from defense to offense.”3
Following GE’s announcement of its new strategic initiative, analysts raised questions
regarding the company’s ability to make Ecomagination successful. They not only ques-
tioned CEO Immelt’s claim that green could be profitable as well as socially responsible,
but they also wondered if Immelt could transform GE’s incremental approach to innova-
tion to one of pursuing riskier technologies, such as fuel cells, solar energy, hydrogen stor-
age, and nanotechnology.4 Other companies had made announcements of green
initiatives, only to leave them withering on the vine when they interfered with profits. For
example, FedEx had announced in 2003 that it would soon be deploying clean-burning hy-
brid trucks at a rate of 3,000 per year, eventually cutting emissions by 250,000 tons of
greenhouse gases. Four years later, FedEx had purchased fewer than 100 hybrid vehicles,
less than 1% of its fleet! With hybrid trucks costing 75% more than conventional trucks,
it would take 10 years for the fuel savings to pay for the costly vehicles. FedEx manage-
ment concluded that breaking even over a 10-year period was not the best use of com-
pany capital. As a result of this and other experiences, skeptics felt that most large
companies were only indulging in greenwash when they talked loudly about their sus-
tainability efforts, but followed through with very little actual results.5
CEO Immelt had put his reputation at risk by personally leading GE’s Ecomagination
initiative. Skeptics wondered if the environmental markets would materialize and if they
would be as profitable as demanded by GE’s shareholders. Would a corporate culture
known for its pursuit of the Six Sigma statistics-based approach to quality control be able
to create technological breakthroughs and new green businesses? If Immelt was correct,
not only would GE benefit, but other companies would soon follow GE’s lead. If, however,
he was wrong, Immelt would have led his company down a dead end where it would be
difficult to recover from the damage to its reputation and financial standing. According to
a 25-year veteran of GE, “Jeff is asking us to take a really big swing . . . . This is hard for us.”6
4 PART 1 Introduction to Strategic Management and Business Policy
CHAPTER 1 Basic Concepts of Strategic Management 5
1.1 The Study of Strategic ManagementStrategic management is a set of managerial decisions and actions that determines the long-run performance of a corporation. It includes environmental scanning (both external and in-ternal), strategy formulation (strategic or long-range planning), strategy implementation, andevaluation and control. The study of strategic management, therefore, emphasizes the moni-toring and evaluating of external opportunities and threats in light of a corporation’s strengthsand weaknesses. Originally called business policy, strategic management incorporates suchtopics as strategic planning, environmental scanning, and industry analysis.
PHASES OF STRATEGIC MANAGEMENTMany of the concepts and techniques that deal with strategic management have been developedand used successfully by business corporations such as General Electric and the Boston Con-sulting Group. Over time, business practitioners and academic researchers have expanded andrefined these concepts. Initially, strategic management was of most use to large corporations op-erating in multiple industries. Increasing risks of error, costly mistakes, and even economic ruinare causing today’s professional managers in all organizations to take strategic management se-riously in order to keep their companies competitive in an increasingly volatile environment.
As managers attempt to better deal with their changing world, a firm generally evolvesthrough the following four phases of strategic management:7
Phase 1—Basic financial planning: Managers initiate serious planning when they are re-quested to propose the following year’s budget. Projects are proposed on the basis of verylittle analysis, with most information coming from within the firm. The sales force usu-ally provides the small amount of environmental information. Such simplistic operationalplanning only pretends to be strategic management, yet it is quite time consuming. Nor-mal company activities are often suspended for weeks while managers try to cram ideasinto the proposed budget. The time horizon is usually one year.
Phase 2—Forecast-based planning: As annual budgets become less useful at stimulating long-term planning, managers attempt to propose five-year plans. At this point they consider proj-ects that may take more than one year. In addition to internal information, managers gatherany available environmental data—usually on an ad hoc basis—and extrapolate current trendsfive years into the future. This phase is also time consuming, often involving a full month ofmanagerial activity to make sure all the proposed budgets fit together. The process gets verypolitical as managers compete for larger shares of funds. Endless meetings take place to eval-uate proposals and justify assumptions. The time horizon is usually three to five years.
Phase 3—Externally oriented (strategic) planning: Frustrated with highly political yet inef-fectual five-year plans, top management takes control of the planning process by initiatingstrategic planning. The company seeks to increase its responsiveness to changing marketsand competition by thinking strategically. Planning is taken out of the hands of lower-levelmanagers and concentrated in a planning staff whose task is to develop strategic plans forthe corporation. Consultants often provide the sophisticated and innovative techniques thatthe planning staff uses to gather information and forecast future trends. Ex-military expertsdevelop competitive intelligence units. Upper-level managers meet once a year at a resort“retreat” led by key members of the planning staff to evaluate and update the current strate-gic plan. Such top-down planning emphasizes formal strategy formulation and leaves theimplementation issues to lower management levels. Top management typically developsfive-year plans with help from consultants but minimal input from lower levels.
6 PART 1 Introduction to Strategic Management and Business Policy
Phase 4—Strategic management: Realizing that even the best strategic plans are worthlesswithout the input and commitment of lower-level managers, top management forms plan-ning groups of managers and key employees at many levels, from various departmentsand workgroups. They develop and integrate a series of strategic plans aimed at achiev-ing the company’s primary objectives. Strategic plans at this point detail the implementa-tion, evaluation, and control issues. Rather than attempting to perfectly forecast the future,the plans emphasize probable scenarios and contingency strategies. The sophisticated an-nual five-year strategic plan is replaced with strategic thinking at all levels of the organi-zation throughout the year. Strategic information, previously available only centrally totop management, is available via local area networks and intranets to people throughoutthe organization. Instead of a large centralized planning staff, internal and external plan-ning consultants are available to help guide group strategy discussions. Although top man-agement may still initiate the strategic planning process, the resulting strategies may comefrom anywhere in the organization. Planning is typically interactive across levels and isno longer top down. People at all levels are now involved.
General Electric, one of the pioneers of strategic planning, led the transition from strategicplanning to strategic management during the 1980s.8 By the 1990s, most other corporationsaround the world had also begun the conversion to strategic management.
BENEFITS OF STRATEGIC MANAGEMENTStrategic management emphasizes long-term performance. Many companies can manageshort-term bursts of high performance, but only a few can sustain it over a longer period oftime. For example, of the original Forbes 100 companies listed in 1917, only 13 have survivedto the present day. To be successful in the long-run, companies must not only be able to executecurrent activities to satisfy an existing market, but they must also adapt those activities to sat-isfy new and changing markets.9
Research reveals that organizations that engage in strategic management generally out-perform those that do not.10 The attainment of an appropriate match, or “fit,” between an or-ganization’s environment and its strategy, structure, and processes has positive effects on theorganization’s performance.11 Strategic planning becomes increasingly important as the envi-ronment becomes more unstable.12 For example, studies of the impact of deregulation on theU.S. railroad and trucking industries found that companies that changed their strategies andstructures as their environment changed outperformed companies that did not change.13
A survey of nearly 50 corporations in a variety of countries and industries found the threemost highly rated benefits of strategic management to be:
� Clearer sense of strategic vision for the firm.
� Sharper focus on what is strategically important.
� Improved understanding of a rapidly changing environment.14
A recent survey by McKinsey & Company of 800 executives found that formal strategicplanning processes improve overall satisfaction with strategy development.15 To be effective,however, strategic management need not always be a formal process. It can begin with a fewsimple questions:
1. Where is the organization now? (Not where do we hope it is!)
2. If no changes are made, where will the organization be in one year? two years? five years?10 years? Are the answers acceptable?
3. If the answers are not acceptable, what specific actions should management undertake?What are the risks and payoffs involved?
CHAPTER 1 Basic Concepts of Strategic Management 7
Bain & Company’s 2007 Management Tools and Trends survey of 1,221 global executivesrevealed strategic planning to be the most used management tool—used by 88% of respon-dents. Strategic planning is particularly effective at identifying new opportunities for growthand in ensuring that all managers have the same goals.16 Other highly-ranked strategic man-agement tools were mission and vision statements (used by 79% of respondents), core compe-tencies (79%), scenario and contingency planning (69%), knowledge management (69%),strategic alliances (68%), and growth strategy tools (65%).17 A study by Joyce, Nohria, andRoberson of 200 firms in 50 subindustries found that devising and maintaining an engaged, fo-cused strategy was the first of four essential management practices that best differentiated be-tween successful and unsuccessful companies.18 Based on these and other studies, it can beconcluded that strategic management is crucial for long-term organizational success.
Research into the planning practices of companies in the oil industry concludes that thereal value of modern strategic planning is more in the strategic thinking and organizationallearning that is part of a future-oriented planning process than in any resulting written strate-gic plan.19 Small companies, in particular, may plan informally and irregularly. Nevertheless,studies of small- and medium-sized businesses reveal that the greater the level of planning in-tensity, as measured by the presence of a formal strategic plan, the greater the level of finan-cial performance, especially when measured in terms of sales increases.20
Planning the strategy of large, multidivisional corporations can be complex and time con-suming. It often takes slightly more than a year for a large company to move from situation as-sessment to a final decision agreement. For example, strategic plans in the global oil industry tendto cover four to five years. The planning horizon for oil exploration is even longer—up to 15years.21 Because of the relatively large number of people affected by a strategic decision in a largefirm, a formalized, more sophisticated system is needed to ensure that strategic planning leads tosuccessful performance. Otherwise, top management becomes isolated from developments in thebusiness units, and lower-level managers lose sight of the corporate mission and objectives.
1.2 Globalization and Environmental Sustainability:Challenges to Strategic Management
Not too long ago, a business corporation could be successful by focusing only on making andselling goods and services within its national boundaries. International considerations were min-imal. Profits earned from exporting products to foreign lands were considered frosting on thecake, but not really essential to corporate success. During the 1960s, for example, most U.S. com-panies organized themselves around a number of product divisions that made and sold goodsonly in the United States. All manufacturing and sales outside the United States were typicallymanaged through one international division. An international assignment was usually considereda message that the person was no longer promotable and should be looking for another job.
Similarly, until the later part of the 20th century, a business firm could be very successfulwithout being environmentally sensitive. Companies dumped their waste products in nearbystreams or lakes and freely polluted the air with smoke containing noxious gases. Respondingto complaints, governments eventually passed laws restricting the freedom to pollute the en-vironment. Lawsuits forced companies to stop old practices. Nevertheless, until the dawn ofthe 21st century, most executives considered pollution abatement measures to be a cost of busi-ness that should be either minimized or avoided. Rather than clean up a polluting manufac-turing site, they often closed the plant and moved manufacturing offshore to a developingnation with fewer environmental restrictions. Sustainability, as a term, was used to describecompetitive advantage, not the environment.
8 PART 1 Introduction to Strategic Management and Business Policy
IMPACT OF GLOBALIZATIONToday, everything has changed. Globalization, the integrated internationalization of marketsand corporations, has changed the way modern corporations do business. As Thomas Fried-man points out in The World Is Flat, jobs, knowledge, and capital are now able to move acrossborders with far greater speed and far less friction than was possible only a few years ago.22
For example, the inter-connected nature of the global financial community meant that themortgage lending problems of U.S. banks led to a global financial crisis in 2008. The world-wide availability of the Internet and supply-chain logistical improvements, such as con-tainerized shipping, mean that companies can now locate anywhere and work with multiplepartners to serve any market. To reach the economies of scale necessary to achieve the lowcosts, and thus the low prices, needed to be competitive, companies are now thinking of aglobal market instead of national markets. Nike and Reebok, for example, manufacture theirathletic shoes in various countries throughout Asia for sale on every continent. Many othercompanies in North America and Western Europe are outsourcing their manufacturing, soft-ware development, or customer service to companies in China, Eastern Europe, or India.Large pools of talented software programmers, English language proficiency, and lowerwages in India enables IBM to employ 75,000 people in its global delivery centers in Banga-lore, Delhi, or Kolkata to serve the needs of clients in Atlanta, Munich, or Melbourne.23 In-stead of using one international division to manage everything outside the home country, largecorporations are now using matrix structures in which product units are interwoven withcountry or regional units. International assignments are now considered key for anyone in-terested in reaching top management.
As more industries become global, strategic management is becoming an increasingly im-portant way to keep track of international developments and position a company for long-termcompetitive advantage. For example, General Electric moved a major research and develop-ment lab for its medical systems division from Japan to China in order to learn more about de-veloping new products for developing economies. Microsoft’s largest research center outsideRedmond, Washington, is in Beijing. According to Wilbur Chung, a Wharton professor,“Whatever China develops is rolled out to the rest of the world. China may have a lower GDPper-capita than developed countries, but the Chinese have a strong sense of how productsshould be designed for their market.”24
The formation of regional trade associations and agreements, such as the European Union,NAFTA, Mercosur, Andean Community, CAFTA, and ASEAN, is changing how internationalbusiness is being conducted. See the Global Issue feature to learn how regional trade associ-ations are forcing corporations to establish a manufacturing presence wherever they wish tomarket goods or else face significant tariffs. These associations have led to the increasing har-monization of standards so that products can more easily be sold and moved across nationalboundaries. International considerations have led to the strategic alliance between British Air-ways and American Airlines and to the acquisition of the Miller Brewing Company by SouthAfrican Breweries (SAB), among others.
IMPACT OF ENVIRONMENTAL SUSTAINABILITYEnvironmental sustainability refers to the use of business practices to reduce a company’s im-pact upon the natural, physical environment. Climate change is playing a growing role in busi-ness decisions. More than half of the global executives surveyed by McKinsey & Company in2007 selected “environmental issues, including climate change,” as the most important issue fac-ing them over the next five years.25 A 2005 survey of 27 large, publicly-held, multinational cor-porations based in North America revealed that 90% believed that government regulation was
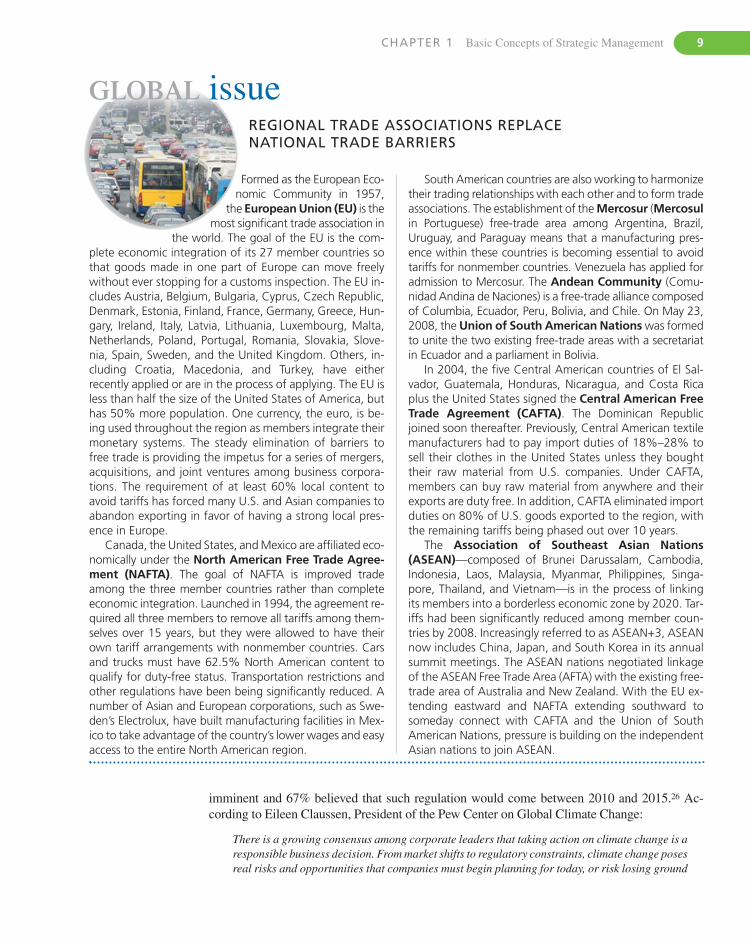
CHAPTER 1 Basic Concepts of Strategic Management 9
imminent and 67% believed that such regulation would come between 2010 and 2015.26 Ac-cording to Eileen Claussen, President of the Pew Center on Global Climate Change:
There is a growing consensus among corporate leaders that taking action on climate change is aresponsible business decision. From market shifts to regulatory constraints, climate change posesreal risks and opportunities that companies must begin planning for today, or risk losing ground
Formed as the European Eco-nomic Community in 1957,
the European Union (EU) is themost significant trade association in
the world. The goal of the EU is the com-plete economic integration of its 27 member countries sothat goods made in one part of Europe can move freelywithout ever stopping for a customs inspection. The EU in-cludes Austria, Belgium, Bulgaria, Cyprus, Czech Republic,Denmark, Estonia, Finland, France, Germany, Greece, Hun-gary, Ireland, Italy, Latvia, Lithuania, Luxembourg, Malta,Netherlands, Poland, Portugal, Romania, Slovakia, Slove-nia, Spain, Sweden, and the United Kingdom. Others, in-cluding Croatia, Macedonia, and Turkey, have eitherrecently applied or are in the process of applying. The EU isless than half the size of the United States of America, buthas 50% more population. One currency, the euro, is be-ing used throughout the region as members integrate theirmonetary systems. The steady elimination of barriers tofree trade is providing the impetus for a series of mergers,acquisitions, and joint ventures among business corpora-tions. The requirement of at least 60% local content toavoid tariffs has forced many U.S. and Asian companies toabandon exporting in favor of having a strong local pres-ence in Europe.
Canada, the United States, and Mexico are affiliated eco-nomically under the North American Free Trade Agree-ment (NAFTA). The goal of NAFTA is improved tradeamong the three member countries rather than completeeconomic integration. Launched in 1994, the agreement re-quired all three members to remove all tariffs among them-selves over 15 years, but they were allowed to have theirown tariff arrangements with nonmember countries. Carsand trucks must have 62.5% North American content toqualify for duty-free status. Transportation restrictions andother regulations have been being significantly reduced. Anumber of Asian and European corporations, such as Swe-den’s Electrolux, have built manufacturing facilities in Mex-ico to take advantage of the country’s lower wages and easyaccess to the entire North American region.
GLOBAL issueREGIONAL TRADE ASSOCIATIONS REPLACE NATIONAL TRADE BARRIERS
South American countries are also working to harmonizetheir trading relationships with each other and to form tradeassociations. The establishment of the Mercosur (Mercosulin Portuguese) free-trade area among Argentina, Brazil,Uruguay, and Paraguay means that a manufacturing pres-ence within these countries is becoming essential to avoidtariffs for nonmember countries. Venezuela has applied foradmission to Mercosur. The Andean Community (Comu-nidad Andina de Naciones) is a free-trade alliance composedof Columbia, Ecuador, Peru, Bolivia, and Chile. On May 23,2008, the Union of South American Nations was formedto unite the two existing free-trade areas with a secretariatin Ecuador and a parliament in Bolivia.
In 2004, the five Central American countries of El Sal-vador, Guatemala, Honduras, Nicaragua, and Costa Ricaplus the United States signed the Central American FreeTrade Agreement (CAFTA). The Dominican Republicjoined soon thereafter. Previously, Central American textilemanufacturers had to pay import duties of 18%–28% tosell their clothes in the United States unless they boughttheir raw material from U.S. companies. Under CAFTA,members can buy raw material from anywhere and theirexports are duty free. In addition, CAFTA eliminated importduties on 80% of U.S. goods exported to the region, withthe remaining tariffs being phased out over 10 years.
The Association of Southeast Asian Nations(ASEAN)—composed of Brunei Darussalam, Cambodia,Indonesia, Laos, Malaysia, Myanmar, Philippines, Singa-pore, Thailand, and Vietnam—is in the process of linkingits members into a borderless economic zone by 2020. Tar-iffs had been significantly reduced among member coun-tries by 2008. Increasingly referred to as ASEAN+3, ASEANnow includes China, Japan, and South Korea in its annualsummit meetings. The ASEAN nations negotiated linkageof the ASEAN Free Trade Area (AFTA) with the existing free-trade area of Australia and New Zealand. With the EU ex-tending eastward and NAFTA extending southward tosomeday connect with CAFTA and the Union of SouthAmerican Nations, pressure is building on the independentAsian nations to join ASEAN.
10 PART 1 Introduction to Strategic Management and Business Policy
to their more forward-thinking competitors. Prudent steps taken now to address climate changecan improve a company’s competitive position relative to its peers and earn it a seat at the tableto influence climate policy. With more and more action at the state level and increasing scientificclarity, it is time for businesses to craft corporate strategies that address climate change.27
Porter and Reinhardt warn that “in addition to understanding its emissions costs, everyfirm needs to evaluate its vulnerability to climate-related effects such as regional shifts in theavailability of energy and water, the reliability of infrastructures and supply chains, and theprevalence of infectious diseases.”28 Swiss Re, the world’s second-largest reinsurer, estimatedthat the overall economic costs of climate catastrophes related to climate change threatens todouble to $150 billion per year by 2014. The insurance industry’s share of this loss would be$30–$40 billion annually.29
The effects of climate change on industries and companies throughout the world can begrouped into six categories of risks: regulatory, supply chain, product and technology, litiga-tion, reputational, and physical.30
1. Regulatory Risk: Companies in much of the world are already subject to the Kyoto Pro-tocol, which requires the developed countries (and thus the companies operating withinthem) to reduce carbon dioxide and other greenhouse gases by an average of 6% from1990 levels by 2012. The European Union has an emissions trading program that allowscompanies that emit greenhouse gases beyond a certain point to buy additional allowancesfrom other companies whose emissions are lower than that allowed. Companies can alsoearn credits toward their emissions by investing in emissions abatement projects outsidetheir own firms. Although the United States withdrew from the Kyoto Protocol, variousregional, state, and local government policies affect company activities in the U.S. For ex-ample, seven Northeastern states, six Western states, and four Canadian provinces haveadopted proposals to cap carbon emissions and establish carbon-trading programs.
2. Supply Chain Risk: Suppliers will be increasingly vulnerable to government regulations—leading to higher component and energy costs as they pass along increasing carbon-relatedcosts to their customers. Global supply chains will be at risk from an increasing intensity ofmajor storms and flooding. Higher sea levels resulting from the melting of polar ice willcreate problems for seaports. China, where much of the world’s manufacturing is cur-rently being outsourced, is becoming concerned with environmental degradation. In 2006,12 Chinese ministries produced a report on global warming foreseeing a 5%–10% reduc-tion in agricultural output by 2030; more droughts, floods, typhoons, and sandstorms; anda 40% increase in population threatened by plague.31
The increasing scarcity of fossil-based fuel is already boosting transportation costs sig-nificantly. For example, Tesla Motors, the maker of an electric-powered sports car, trans-ferred assembly of battery packs from Thailand to California because Thailand’s low wageswere more than offset by the costs of shipping thousand-pound battery packs across the Pa-cific Ocean.32 Although the world production of oil had leveled off at 85 million barrels aday by 2008, the International Energy Agency predicted global demand to increase to116 million barrels by 2030. Given that output from existing fields was falling 8% annu-ally, oil companies must develop up to seven million barrels a day in additional capacity tomeet projected demand. Nevertheless, James Mulva, CEO of ConocoPhilips, estimated inlate 2007 that the output of oil will realistically stall at around 100 million barrels a day.33
3. Product and Technology Risk: Environmental sustainability can be a prerequisite to prof-itable growth. For example, worldwide investments in sustainable energy (including wind,solar, and water power) more than doubled to $70.9 billion from 2004 to 2006.34 Sixty per-cent of U.S. respondents to an Environics study stated that knowing a company is mindfulof its impact on the environment and society makes them more likely to buy their products
CHAPTER 1 Basic Concepts of Strategic Management 11
and services.35 Carbon-friendly products using new technologies are becoming increas-ingly popular with consumers. Those automobile companies, for example, that were quickto introduce hybrid or alternative energy cars gained a competitive advantage.
4. Litigation Risk: Companies that generate significant carbon emissions face the threat oflawsuits similar to those in the tobacco, pharmaceutical, and building supplies (e.g., as-bestos) industries. For example, oil and gas companies were sued for greenhouse gasemissions in the federal district court of Mississippi, based on the assertion that thesecompanies contributed to the severity of Hurricane Katrina. As of October 2006, at least16 cases were pending in federal or state courts in the U.S. “This boomlet in global warm-ing litigation represents frustration with the White House’s and Congress’ failure to cometo grips with the issue,” explained John Echeverria, executive director of GeorgetownUniversity’s Environmental Law & Policy Institute.36
5. Reputational Risk: A company’s impact on the environment can heavily affect its over-all reputation. The Carbon Trust, a consulting group, found that in some sectors the valueof a company’s brand could be at risk because of negative perceptions related to climatechange. In contrast, a company with a good record of environmental sustainability maycreate a competitive advantage in terms of attracting and keeping loyal consumers, em-ployees, and investors. For example, Wal-Mart’s pursuit of environmental sustainabilityas a core business strategy has helped soften its negative reputation as a low-wage, low-benefit employer. By setting objectives for its retail stores of reducing greenhouse gasesby 20%, reducing solid waste by 25%, increasing truck fleet efficiency by 25%, and us-ing 100% renewable energy, it is also forcing its suppliers to become more environmen-tally sustainable.37 Tools have recently been developed to measure sustainability on avariety of factors. For example, the SAM (Sustainable Asset Management) Group ofZurich, Switzerland, has been assessing and documenting the sustainability performanceof over 1,000 corporations annually since 1999. SAM lists the top 15% of firms in its Sus-tainability Yearbook and classifies them into gold, silver, and bronze categories.38
Business Week published its first list of the world’s 100 most sustainable corporations Jan-uary 29, 2007. The Dow Jones Sustainability Indexes and the KLD Broad Market SocialIndex, which evaluate companies on a range of environmental, social, and governance cri-teria are used for investment decisions.39 Financial services firms, such as GoldmanSachs, Bank of America, JPMorgan Chase, and Citigroup have adopted guidelines forlending and asset management aimed at promoting clean-energy alternatives.40
6. Physical Risk: The direct risk posed by climate change includes the physical effects ofdroughts, floods, storms, and rising sea levels. Average Arctic temperatures have risen fourto five degrees Fahrenheit (two to three degrees Celsius) in the past 50 years, leading tomelting glaciers and sea levels rising one inch per decade.41 Industries most likely to be af-fected are insurance, agriculture, fishing, forestry, real estate, and tourism. Physical riskcan also affect other industries, such as oil and gas, through higher insurance premiumspaid on facilities in vulnerable areas. Coca-Cola, for example, studies the linkages betweenclimate change and water availability in terms of how this will affect the location of its newbottling plants. The warming of the Tibetan plateau has led to a thawing of the per-mafrost—thereby threatening the newly-completed railway line between China and Ti-bet.42 (See the Environmental Sustainability Issue feature for a more complete list ofprojected effects of climate change.)
Although global warming remains a controversial topic, the best argument in favor of workingtoward environmental sustainability is a variation of Pascal’s Wager on the existence of God:
The same goes for global warming. If you accept it as reality, adapting your strategy and prac-tices, your plants will use less energy and emit fewer effluents. Your packaging will be more
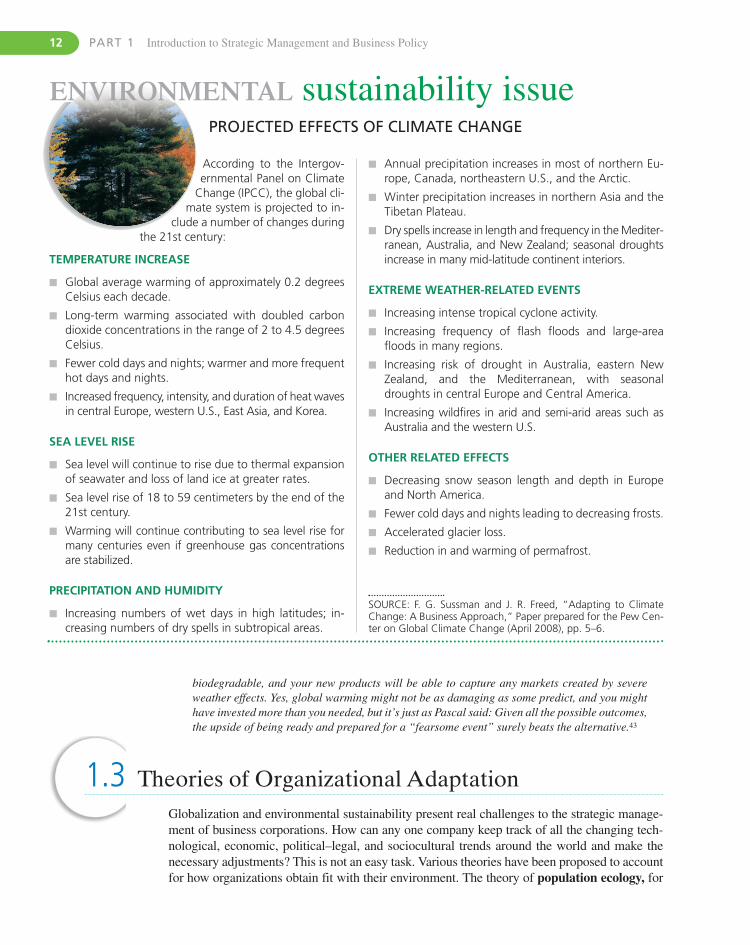
12 PART 1 Introduction to Strategic Management and Business Policy
SOURCE: F. G. Sussman and J. R. Freed, “Adapting to ClimateChange: A Business Approach,” Paper prepared for the Pew Cen-ter on Global Climate Change (April 2008), pp. 5–6.
� Annual precipitation increases in most of northern Eu-rope, Canada, northeastern U.S., and the Arctic.
� Winter precipitation increases in northern Asia and theTibetan Plateau.
� Dry spells increase in length and frequency in the Mediter-ranean, Australia, and New Zealand; seasonal droughtsincrease in many mid-latitude continent interiors.
EXTREME WEATHER-RELATED EVENTS
� Increasing intense tropical cyclone activity.� Increasing frequency of flash floods and large-area
floods in many regions.� Increasing risk of drought in Australia, eastern New
Zealand, and the Mediterranean, with seasonaldroughts in central Europe and Central America.
� Increasing wildfires in arid and semi-arid areas such asAustralia and the western U.S.
OTHER RELATED EFFECTS
� Decreasing snow season length and depth in Europeand North America.
� Fewer cold days and nights leading to decreasing frosts.� Accelerated glacier loss.� Reduction in and warming of permafrost.
According to the Intergov-ernmental Panel on Climate
Change (IPCC), the global cli-mate system is projected to in-
clude a number of changes duringthe 21st century:
TEMPERATURE INCREASE
� Global average warming of approximately 0.2 degreesCelsius each decade.
� Long-term warming associated with doubled carbondioxide concentrations in the range of 2 to 4.5 degreesCelsius.
� Fewer cold days and nights; warmer and more frequenthot days and nights.
� Increased frequency, intensity, and duration of heat wavesin central Europe, western U.S., East Asia, and Korea.
SEA LEVEL RISE
� Sea level will continue to rise due to thermal expansionof seawater and loss of land ice at greater rates.
� Sea level rise of 18 to 59 centimeters by the end of the21st century.
� Warming will continue contributing to sea level rise formany centuries even if greenhouse gas concentrationsare stabilized.
PRECIPITATION AND HUMIDITY
� Increasing numbers of wet days in high latitudes; in-creasing numbers of dry spells in subtropical areas.
PROJECTED EFFECTS OF CLIMATE CHANGE
ENVIRONMENTAL sustainability issue
biodegradable, and your new products will be able to capture any markets created by severeweather effects. Yes, global warming might not be as damaging as some predict, and you mighthave invested more than you needed, but it’s just as Pascal said: Given all the possible outcomes,the upside of being ready and prepared for a “fearsome event” surely beats the alternative.43
1.3 Theories of Organizational AdaptationGlobalization and environmental sustainability present real challenges to the strategic manage-ment of business corporations. How can any one company keep track of all the changing tech-nological, economic, political–legal, and sociocultural trends around the world and make thenecessary adjustments? This is not an easy task. Various theories have been proposed to accountfor how organizations obtain fit with their environment. The theory of population ecology, for
CHAPTER 1 Basic Concepts of Strategic Management 13
1.4 Creating a Learning OrganizationStrategic management has now evolved to the point that its primary value is in helping an or-ganization operate successfully in a dynamic, complex environment. To be competitive in dy-namic environments, corporations are becoming less bureaucratic and more flexible. In stableenvironments such as those that existed in years past, a competitive strategy simply involveddefining a competitive position and then defending it. As it takes less and less time for oneproduct or technology to replace another, companies are finding that there is no such thing asa permanent competitive advantage. Many agree with Richard D’Aveni, who says in his bookHypercompetition that any sustainable competitive advantage lies not in doggedly followinga centrally managed five-year plan but in stringing together a series of strategic short-termthrusts (as Intel does by cutting into the sales of its own offerings with periodic introductionsof new products).48 This means that corporations must develop strategic flexibility—the abil-ity to shift from one dominant strategy to another.49
Strategic flexibility demands a long-term commitment to the development and nurturingof critical resources. It also demands that the company become a learning organization—anorganization skilled at creating, acquiring, and transferring knowledge and at modifying its be-havior to reflect new knowledge and insights. Organizational learning is a critical componentof competitiveness in a dynamic environment. It is particularly important to innovation and newproduct development.50 For example, both Hewlett-Packard and British Petroleum (BP) use anextensive network of informal committees to transfer knowledge among their cross-functionalteams and to help spread new sources of knowledge quickly.51 Siemens, a major electronicscompany, created a global knowledge-sharing network, called ShareNet, in order to quicklyspread information technology throughout the firm. Based on its experience with ShareNet,Siemens established PeopleShareNet, a system that serves as a virtual expert marketplace for
example, proposes that once an organization is successfully established in a particular envi-ronmental niche, it is unable to adapt to changing conditions. Inertia prevents the organizationfrom changing. The company is thus replaced (is bought out or goes bankrupt) by otherorganizations more suited to the new environment. Although it is a popular theory in sociol-ogy, research fails to support the arguments of population ecology.44 Institution theory, incontrast, proposes that organizations can and do adapt to changing conditions by imitatingother successful organizations. To its credit, many examples can be found of companies thathave adapted to changing circumstances by imitating an admired firm’s strategies and man-agement techniques.45 The theory does not, however, explain how or by whom successful newstrategies are developed in the first place. The strategic choice perspective goes one stepfurther by proposing that not only do organizations adapt to a changing environment, but theyalso have the opportunity and power to reshape their environment. This perspective issupported by research indicating that the decisions of a firm’s management have at least asgreat an impact on firm performance as overall industry factors.46 Because of its emphasis onmanagers making rational strategic decisions, the strategic choice perspective is the dominantone taken in strategic management. Its argument that adaptation is a dynamic process fits withthe view of organizational learning theory, which says that an organization adjusts defen-sively to a changing environment and uses knowledge offensively to improve the fit betweenitself and its environment. This perspective expands the strategic choice perspective to includepeople at all levels becoming involved in providing input into strategic decisions.47
In agreement with the concepts of organizational learning theory, an increasing numberof companies are realizing that they must shift from a vertically organized, top-down type oforganization to a more horizontally managed, interactive organization. They are attempting toadapt more quickly to changing conditions by becoming “learning organizations.”
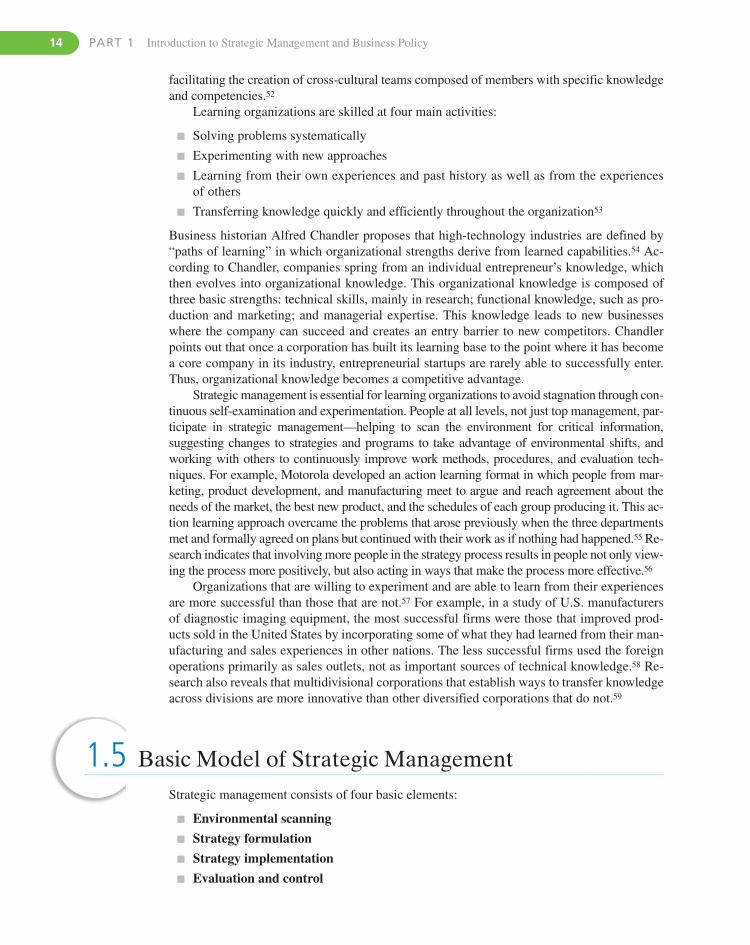
14 PART 1 Introduction to Strategic Management and Business Policy
facilitating the creation of cross-cultural teams composed of members with specific knowledgeand competencies.52
Learning organizations are skilled at four main activities:
� Solving problems systematically
� Experimenting with new approaches
� Learning from their own experiences and past history as well as from the experiencesof others
� Transferring knowledge quickly and efficiently throughout the organization53
Business historian Alfred Chandler proposes that high-technology industries are defined by“paths of learning” in which organizational strengths derive from learned capabilities.54 Ac-cording to Chandler, companies spring from an individual entrepreneur’s knowledge, whichthen evolves into organizational knowledge. This organizational knowledge is composed ofthree basic strengths: technical skills, mainly in research; functional knowledge, such as pro-duction and marketing; and managerial expertise. This knowledge leads to new businesseswhere the company can succeed and creates an entry barrier to new competitors. Chandlerpoints out that once a corporation has built its learning base to the point where it has becomea core company in its industry, entrepreneurial startups are rarely able to successfully enter.Thus, organizational knowledge becomes a competitive advantage.
Strategic management is essential for learning organizations to avoid stagnation through con-tinuous self-examination and experimentation. People at all levels, not just top management, par-ticipate in strategic management—helping to scan the environment for critical information,suggesting changes to strategies and programs to take advantage of environmental shifts, andworking with others to continuously improve work methods, procedures, and evaluation tech-niques. For example, Motorola developed an action learning format in which people from mar-keting, product development, and manufacturing meet to argue and reach agreement about theneeds of the market, the best new product, and the schedules of each group producing it. This ac-tion learning approach overcame the problems that arose previously when the three departmentsmet and formally agreed on plans but continued with their work as if nothing had happened.55 Re-search indicates that involving more people in the strategy process results in people not only view-ing the process more positively, but also acting in ways that make the process more effective.56
Organizations that are willing to experiment and are able to learn from their experiencesare more successful than those that are not.57 For example, in a study of U.S. manufacturersof diagnostic imaging equipment, the most successful firms were those that improved prod-ucts sold in the United States by incorporating some of what they had learned from their man-ufacturing and sales experiences in other nations. The less successful firms used the foreignoperations primarily as sales outlets, not as important sources of technical knowledge.58 Re-search also reveals that multidivisional corporations that establish ways to transfer knowledgeacross divisions are more innovative than other diversified corporations that do not.59
1.5 Basic Model of Strategic ManagementStrategic management consists of four basic elements:
� Environmental scanning� Strategy formulation� Strategy implementation� Evaluation and control
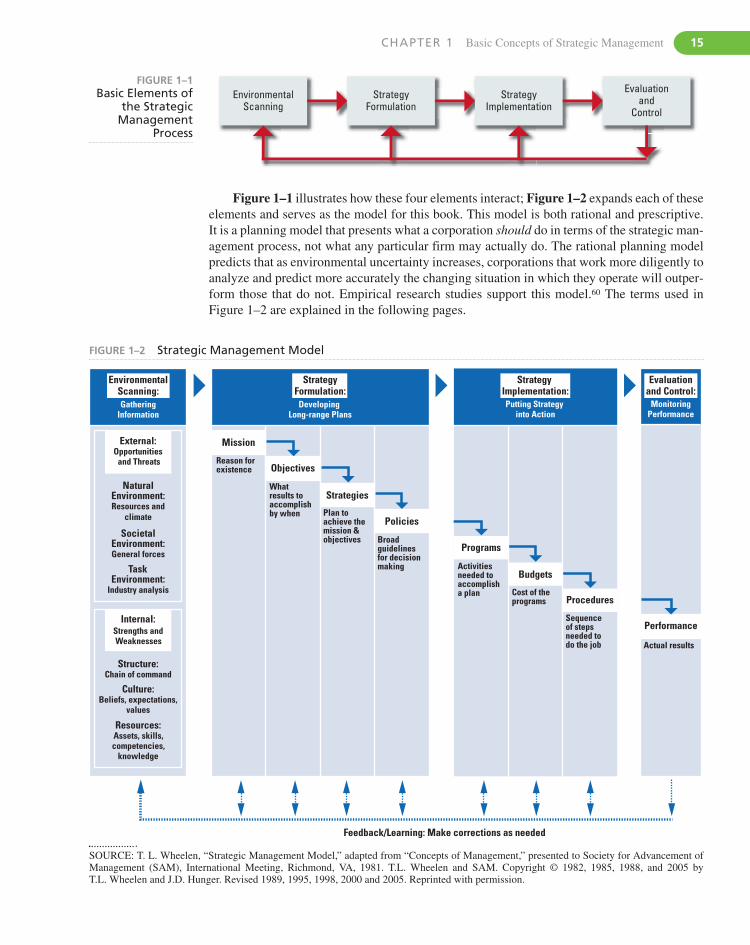
CHAPTER 1 Basic Concepts of Strategic Management 15
EnvironmentalScanning
StrategyFormulation
StrategyImplementation
Evaluationand
Control
FIGURE 1–1Basic Elements of
the StrategicManagement
Process
Figure 1–1 illustrates how these four elements interact; Figure 1–2 expands each of theseelements and serves as the model for this book. This model is both rational and prescriptive.It is a planning model that presents what a corporation should do in terms of the strategic man-agement process, not what any particular firm may actually do. The rational planning modelpredicts that as environmental uncertainty increases, corporations that work more diligently toanalyze and predict more accurately the changing situation in which they operate will outper-form those that do not. Empirical research studies support this model.60 The terms used inFigure 1–2 are explained in the following pages.
GatheringInformation
Putting Strategy into Action
MonitoringPerformance
SocietalEnvironment:General forces
NaturalEnvironment:Resources and
climate
TaskEnvironment:
Industry analysis
Internal:Strengths andWeaknesses
Structure:Chain of command
Culture:Beliefs, expectations,
values
Resources:Assets, skills,competencies,
knowledge
Programs
Activitiesneeded to accomplisha plan
Budgets
Cost of theprograms Procedures
Sequenceof stepsneeded to do the job
Performance
Actual results
External:Opportunities
and Threats
DevelopingLong-range Plans
Mission
Reason forexistence Objectives
Whatresults to accomplishby when
Strategies
Plan toachieve themission &objectives
Policies
Broadguidelinesfor decisionmaking
EnvironmentalScanning:
StrategyFormulation:
StrategyImplementation:
Evaluationand Control:
Feedback/Learning: Make corrections as needed
FIGURE 1–2 Strategic Management Model
SOURCE: T. L. Wheelen, “Strategic Management Model,” adapted from “Concepts of Management,” presented to Society for Advancement ofManagement (SAM), International Meeting, Richmond, VA, 1981. T.L. Wheelen and SAM. Copyright © 1982, 1985, 1988, and 2005 by T.L. Wheelen and J.D. Hunger. Revised 1989, 1995, 1998, 2000 and 2005. Reprinted with permission.
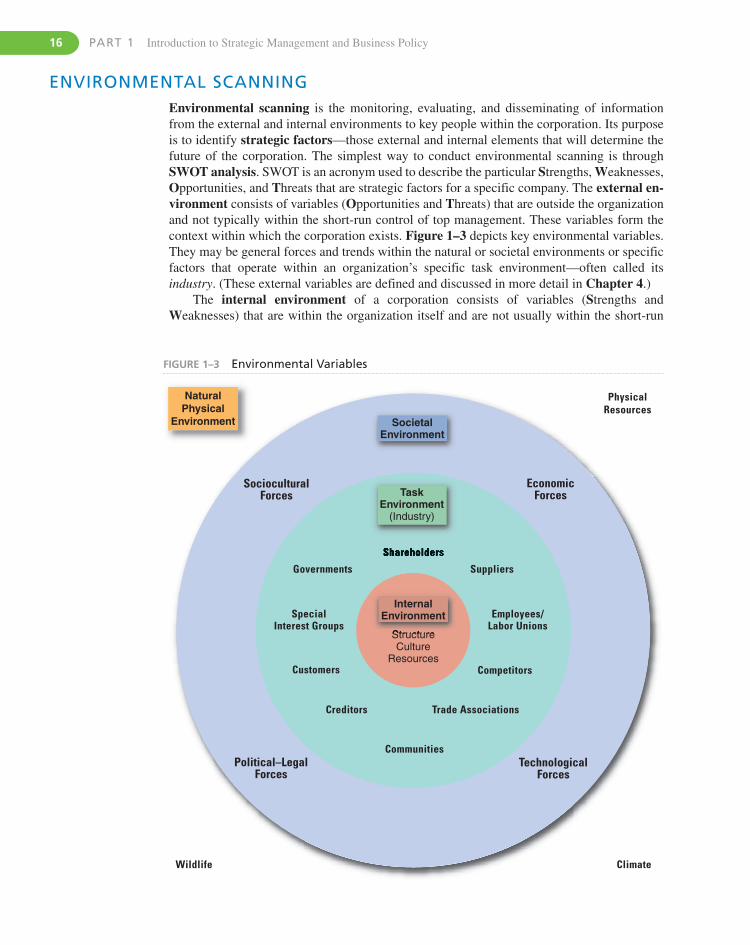
16 PART 1 Introduction to Strategic Management and Business Policy
Environmental scanning is the monitoring, evaluating, and disseminating of informationfrom the external and internal environments to key people within the corporation. Its purposeis to identify strategic factors—those external and internal elements that will determine thefuture of the corporation. The simplest way to conduct environmental scanning is throughSWOT analysis. SWOT is an acronym used to describe the particular Strengths, Weaknesses,Opportunities, and Threats that are strategic factors for a specific company. The external en-vironment consists of variables (Opportunities and Threats) that are outside the organizationand not typically within the short-run control of top management. These variables form thecontext within which the corporation exists. Figure 1–3 depicts key environmental variables.They may be general forces and trends within the natural or societal environments or specificfactors that operate within an organization’s specific task environment—often called itsindustry. (These external variables are defined and discussed in more detail in Chapter 4.)
The internal environment of a corporation consists of variables (Strengths andWeaknesses) that are within the organization itself and are not usually within the short-run
ENVIRONMENTAL SCANNING
SocioculturalForces
EconomicForces
Political–LegalForces
SocietalEnvironment
TechnologicalForces
StructureCulture
Resources
Governments
NaturalPhysical
Environment
Wildlife
PhysicalResources
Climate
Shareholders
Suppliers
Competitors
Trade Associations
Communities
Creditors
Customers
Employees/Labor Unions
SpecialInterest Groups
TaskEnvironment
(Industry)
InternalEnvironment
FIGURE 1–3 Environmental Variables
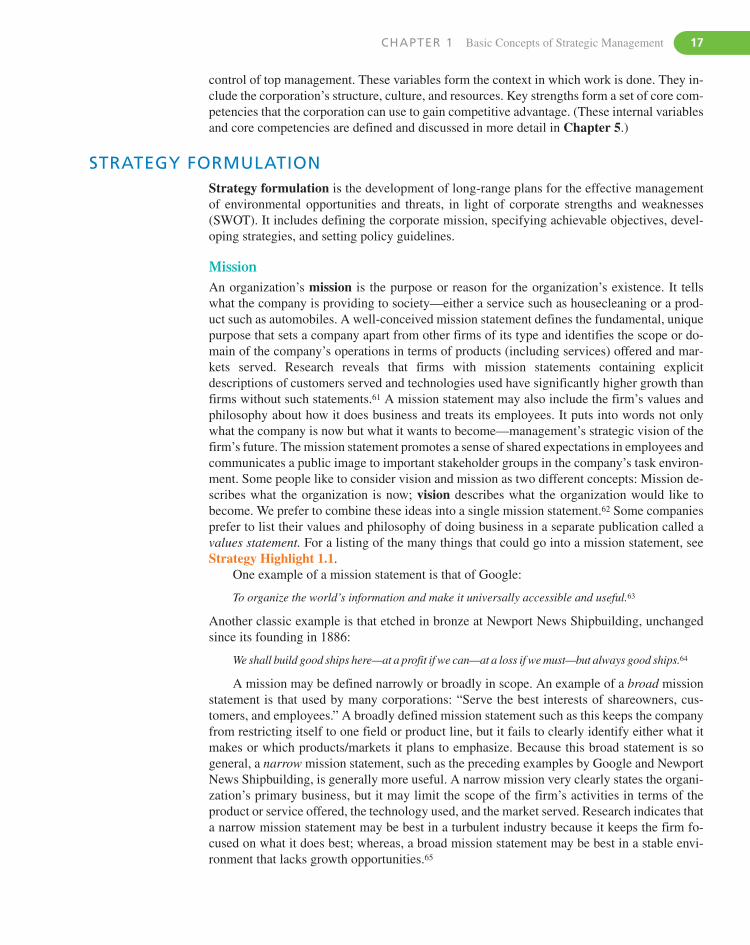
CHAPTER 1 Basic Concepts of Strategic Management 17
control of top management. These variables form the context in which work is done. They in-clude the corporation’s structure, culture, and resources. Key strengths form a set of core com-petencies that the corporation can use to gain competitive advantage. (These internal variablesand core competencies are defined and discussed in more detail in Chapter 5.)
STRATEGY FORMULATIONStrategy formulation is the development of long-range plans for the effective managementof environmental opportunities and threats, in light of corporate strengths and weaknesses(SWOT). It includes defining the corporate mission, specifying achievable objectives, devel-oping strategies, and setting policy guidelines.
MissionAn organization’s mission is the purpose or reason for the organization’s existence. It tellswhat the company is providing to society—either a service such as housecleaning or a prod-uct such as automobiles. A well-conceived mission statement defines the fundamental, uniquepurpose that sets a company apart from other firms of its type and identifies the scope or do-main of the company’s operations in terms of products (including services) offered and mar-kets served. Research reveals that firms with mission statements containing explicitdescriptions of customers served and technologies used have significantly higher growth thanfirms without such statements.61 A mission statement may also include the firm’s values andphilosophy about how it does business and treats its employees. It puts into words not onlywhat the company is now but what it wants to become—management’s strategic vision of thefirm’s future. The mission statement promotes a sense of shared expectations in employees andcommunicates a public image to important stakeholder groups in the company’s task environ-ment. Some people like to consider vision and mission as two different concepts: Mission de-scribes what the organization is now; vision describes what the organization would like tobecome. We prefer to combine these ideas into a single mission statement.62 Some companiesprefer to list their values and philosophy of doing business in a separate publication called avalues statement. For a listing of the many things that could go into a mission statement, seeStrategy Highlight 1.1.
One example of a mission statement is that of Google:
To organize the world’s information and make it universally accessible and useful.63
Another classic example is that etched in bronze at Newport News Shipbuilding, unchangedsince its founding in 1886:
We shall build good ships here—at a profit if we can—at a loss if we must—but always good ships.64
A mission may be defined narrowly or broadly in scope. An example of a broad missionstatement is that used by many corporations: “Serve the best interests of shareowners, cus-tomers, and employees.” A broadly defined mission statement such as this keeps the companyfrom restricting itself to one field or product line, but it fails to clearly identify either what itmakes or which products/markets it plans to emphasize. Because this broad statement is sogeneral, a narrow mission statement, such as the preceding examples by Google and NewportNews Shipbuilding, is generally more useful. A narrow mission very clearly states the organi-zation’s primary business, but it may limit the scope of the firm’s activities in terms of theproduct or service offered, the technology used, and the market served. Research indicates thata narrow mission statement may be best in a turbulent industry because it keeps the firm fo-cused on what it does best; whereas, a broad mission statement may be best in a stable envi-ronment that lacks growth opportunities.65
18 PART 1 Introduction to Strategic Management and Business Policy
4. Does the statement describe the strategicpositioning that the company prefers in a way thathelps to identify the sort of competitive advantage itwill look for?
5. Does the statement identify values that link with theorganization’s purpose and act as beliefs with whichemployees can feel proud?
6. Do the values resonate with and reinforce theorganization’s strategy?
7. Does the statement describe important behaviorstandards that serve as beacons of the strategy andthe values?
8. Are the behavior standards described in a way thatenables individual employees to judge whether theyare behaving correctly?
9. Does the statement give a portrait of the company,capturing the culture of the organization?
10. Is the statement easy to read?
Andrew Campbell, a direc-tor of Ashridge Strategic
Management Centre and along-time contributor to Long
Range Planning, proposes ameans for evaluating a mission state-
ment. Arguing that mission statements can be more thanjust an expression of a company’s purpose and ambition,he suggests that they can also be a company flag to rallyaround, a signpost for all stakeholders, a guide to behav-ior, and a celebration of a company’s culture. For a com-pany trying to achieve all of the above, evaluate its missionstatement using the following 10-question test. Score eachquestion 0 for no, 1 for somewhat, or 2 for yes. Accordingto Campbell, a score of over 15 is exceptional, and a scoreof less than 10 suggests that more work needs to be done.
1. Does the statement describe an inspiring purposethat avoids playing to the selfish interests of thestakeholders?
2. Does the statement describe the company’sresponsibility to its stakeholders?
3. Does the statement define a business domain andexplain why it is attractive?
DO YOU HAVE A GOOD MISSION STATEMENT?
SOURCE: Reprinted from Long Range Planning, Vol. 30, No. 6,1997, Campbell “Mission Statements”, pp. 931–932, Copyright© 1997 with permission of Elsevier.
STRATEGY highlight 1.1
ObjectivesObjectives are the end results of planned activity. They should be stated as action verbs andtell what is to be accomplished by when and quantified if possible. The achievement of cor-porate objectives should result in the fulfillment of a corporation’s mission. In effect, thisis what society gives back to the corporation when the corporation does a good job of ful-filling its mission. For example, by providing society with gums, candy, iced tea, and car-bonated drinks, Cadbury Schweppes, has become the world’s largest confectioner by sales.One of its prime objectives is to increase sales 4%–6% each year. Even though its profitmargins were lower than those of Nestlé, Kraft, and Wrigley, its rivals in confectionary, orthose of Coca-Cola or Pepsi, its rivals in soft drinks, Cadbury Schweppes’ management es-tablished the objective of increasing profit margins from around 10% in 2007 to the mid-teens by 2011.66
The term goal is often used interchangeably with the term objective. In this book, we pre-fer to differentiate the two terms. In contrast to an objective, we consider a goal as an open-ended statement of what one wants to accomplish, with no quantification of what is to beachieved and no time criteria for completion. For example, a simple statement of “increasedprofitability” is thus a goal, not an objective, because it does not state how much profit the firmwants to make the next year. A good objective should be action-oriented and begin with the wordto. An example of an objective is “to increase the firm’s profitability in 2010 by 10% over 2009.”
CHAPTER 1 Basic Concepts of Strategic Management 19
Some of the areas in which a corporation might establish its goals and objectives are:
� Profitability (net profits)
� Efficiency (low costs, etc.)
� Growth (increase in total assets, sales, etc.)
� Shareholder wealth (dividends plus stock price appreciation)
� Utilization of resources (ROE or ROI)
� Reputation (being considered a “top” firm)
� Contributions to employees (employment security, wages, diversity)
� Contributions to society (taxes paid, participation in charities, providing a needed productor service)
� Market leadership (market share)
� Technological leadership (innovations, creativity)
� Survival (avoiding bankruptcy)
� Personal needs of top management (using the firm for personal purposes, such as provid-ing jobs for relatives)
StrategiesA strategy of a corporation forms a comprehensive master plan that states how the corpo-ration will achieve its mission and objectives. It maximizes competitive advantage and min-imizes competitive disadvantage. For example, even though Cadbury Schweppes was amajor competitor in confectionary and soft drinks, it was not likely to achieve its challeng-ing objective of significantly increasing its profit margin within four years without makinga major change in strategy. Management therefore decided to cut costs by closing 33 facto-ries and reducing staff by 10%. It also made the strategic decision to concentrate on the con-fectionary business by divesting its less-profitable Dr. Pepper/Snapple soft drinks unit.Management was also considering acquisitions as a means of building on its existingstrengths in confectionary by purchasing either Kraft’s confectionary unit or the HersheyCompany.
The typical business firm usually considers three types of strategy: corporate, business,and functional.
1. Corporate strategy describes a company’s overall direction in terms of its general atti-tude toward growth and the management of its various businesses and product lines. Cor-porate strategies typically fit within the three main categories of stability, growth, andretrenchment. Cadbury Schweppes, for example, was following a corporate strategy of re-trenchment by selling its marginally profitable soft drink business and concentrating onits very successful confectionary business.
2. Business strategy usually occurs at the business unit or product level, and it emphasizesimprovement of the competitive position of a corporation’s products or services in thespecific industry or market segment served by that business unit. Business strategies mayfit within the two overall categories, competitive and cooperative strategies. For example,Staples, the U.S. office supply store chain, has used a competitive strategy to differenti-ate its retail stores from its competitors by adding services to its stores, such as copying,UPS shipping, and hiring mobile technicians who can fix computers and install networks.British Airways has followed a cooperative strategy by forming an alliance with Ameri-can Airlines in order to provide global service. Cooperative strategy may thus be used to
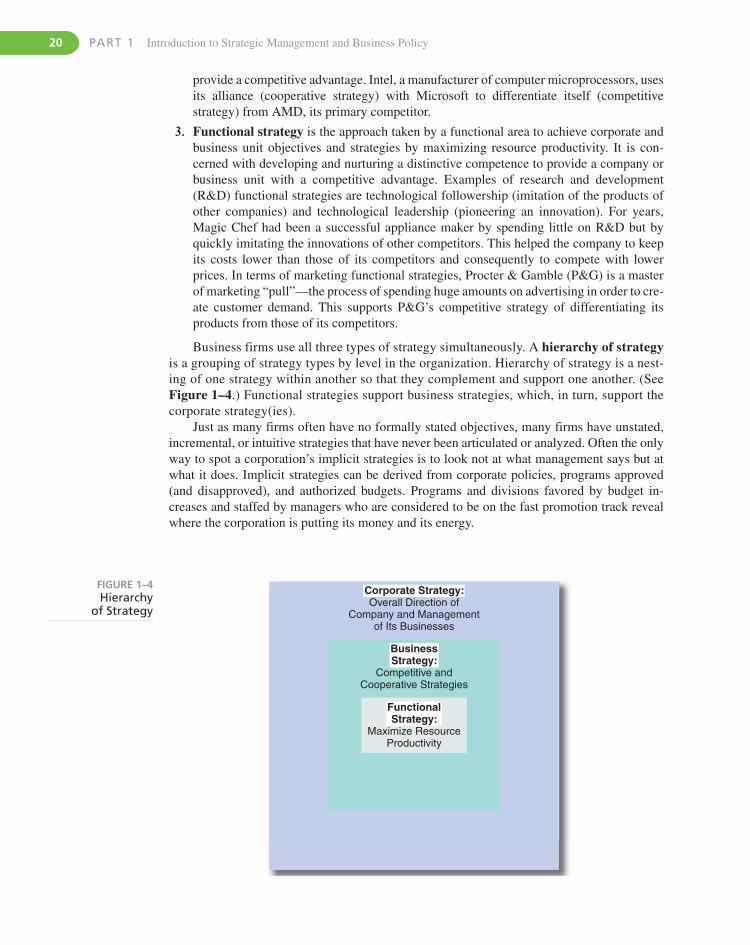
20 PART 1 Introduction to Strategic Management and Business Policy
provide a competitive advantage. Intel, a manufacturer of computer microprocessors, usesits alliance (cooperative strategy) with Microsoft to differentiate itself (competitivestrategy) from AMD, its primary competitor.
3. Functional strategy is the approach taken by a functional area to achieve corporate andbusiness unit objectives and strategies by maximizing resource productivity. It is con-cerned with developing and nurturing a distinctive competence to provide a company orbusiness unit with a competitive advantage. Examples of research and development(R&D) functional strategies are technological followership (imitation of the products ofother companies) and technological leadership (pioneering an innovation). For years,Magic Chef had been a successful appliance maker by spending little on R&D but byquickly imitating the innovations of other competitors. This helped the company to keepits costs lower than those of its competitors and consequently to compete with lowerprices. In terms of marketing functional strategies, Procter & Gamble (P&G) is a masterof marketing “pull”—the process of spending huge amounts on advertising in order to cre-ate customer demand. This supports P&G’s competitive strategy of differentiating itsproducts from those of its competitors.
Business firms use all three types of strategy simultaneously. A hierarchy of strategyis a grouping of strategy types by level in the organization. Hierarchy of strategy is a nest-ing of one strategy within another so that they complement and support one another. (SeeFigure 1–4.) Functional strategies support business strategies, which, in turn, support thecorporate strategy(ies).
Just as many firms often have no formally stated objectives, many firms have unstated,incremental, or intuitive strategies that have never been articulated or analyzed. Often the onlyway to spot a corporation’s implicit strategies is to look not at what management says but atwhat it does. Implicit strategies can be derived from corporate policies, programs approved(and disapproved), and authorized budgets. Programs and divisions favored by budget in-creases and staffed by managers who are considered to be on the fast promotion track revealwhere the corporation is putting its money and its energy.
Corporate Strategy:Overall Direction of
Company and Managementof Its Businesses
BusinessStrategy:
Competitive andCooperative Strategies
FunctionalStrategy:
Maximize ResourceProductivity
FIGURE 1–4Hierarchy
of Strategy
CHAPTER 1 Basic Concepts of Strategic Management 21
PoliciesA policy is a broad guideline for decision making that links the formulation of a strategy withits implementation. Companies use policies to make sure that employees throughout the firmmake decisions and take actions that support the corporation’s mission, objectives, and strate-gies. For example, when Cisco decided on a strategy of growth through acquisitions, it estab-lished a policy to consider only companies with no more than 75 employees, 75% of whomwere engineers.67 Consider the following company policies:
� 3M: 3M says researchers should spend 15% of their time working on something otherthan their primary project. (This supports 3M’s strong product development strategy.)
� Intel: Intel cannibalizes its own product line (undercuts the sales of its current products)with better products before a competitor does so. (This supports Intel’s objective of mar-ket leadership.)
� General Electric: GE must be number one or two wherever it competes. (This supportsGE’s objective to be number one in market capitalization.)
� Southwest Airlines: Southwest offers no meals or reserved seating on airplanes. (Thissupports Southwest’s competitive strategy of having the lowest costs in the industry.)
� Exxon: Exxon pursues only projects that will be profitable even when the price of oildrops to a low level. (This supports Exxon’s profitability objective.)
Policies such as these provide clear guidance to managers throughout the organization.(Strategy formulation is discussed in greater detail in Chapters 6, 7, and 8.)
STRATEGY IMPLEMENTATIONStrategy implementation is a process by which strategies and policies are put into actionthrough the development of programs, budgets, and procedures. This process might involvechanges within the overall culture, structure, and/or management system of the entire organi-zation. Except when such drastic corporatewide changes are needed, however, the implemen-tation of strategy is typically conducted by middle- and lower-level managers, with review bytop management. Sometimes referred to as operational planning, strategy implementation of-ten involves day-to-day decisions in resource allocation.
ProgramsA program is a statement of the activities or steps needed to accomplish a single-use plan. Itmakes a strategy action oriented. It may involve restructuring the corporation, changing thecompany’s internal culture, or beginning a new research effort. For example, Boeing’s strat-egy to regain industry leadership with its proposed 787 Dreamliner meant that the companyhad to increase its manufacturing efficiency in order to keep the price low. To significantly cutcosts, management decided to implement a series of programs:
� Outsource approximately 70% of manufacturing.
� Reduce final assembly time to three days (compared to 20 for its 737 plane) by havingsuppliers build completed plane sections.
� Use new, lightweight composite materials in place of aluminum to reduce inspection time.
� Resolve poor relations with labor unions caused by downsizing and outsourcing.
Another example is a set of programs used by automaker BMW to achieve its objectiveof increasing production efficiency by 5% each year: (a) shorten new model development timefrom 60 to 30 months, (b) reduce preproduction time from a year to no more than five months,
22 PART 1 Introduction to Strategic Management and Business Policy
and (c) build at least two vehicles in each plant so that production can shift among models de-pending upon demand.
BudgetsA budget is a statement of a corporation’s programs in terms of dollars. Used in planning andcontrol, a budget lists the detailed cost of each program. Many corporations demand a certainpercentage return on investment, often called a “hurdle rate,” before management will approvea new program. This ensures that the new program will significantly add to the corporation’sprofit performance and thus build shareholder value. The budget thus not only serves as a de-tailed plan of the new strategy in action, it also specifies through pro forma financial state-ments the expected impact on the firm’s financial future.
For example, General Motors budgeted $4.3 billion to update and expand its Cadillacline of automobiles. With this money, the company was able to increase the number of mod-els from five to nine and to offer more powerful engines, sportier handling, and edgierstyling. The company reversed its declining market share by appealing to a younger market.(The average Cadillac buyer in 2000 was 67 years old.)68 Another example is the $8 billionbudget that General Electric established to invest in new jet engine technology for regional-jet airplanes. Management decided that an anticipated growth in regional jets should be thecompany’s target market. The program paid off when GE won a $3 billion contract to pro-vide jet engines for China’s new fleet of 500 regional jets in time for the 2008 BeijingOlympics.69
ProceduresProcedures, sometimes termed Standard Operating Procedures (SOP), are a system of se-quential steps or techniques that describe in detail how a particular task or job is to be done.They typically detail the various activities that must be carried out in order to complete the cor-poration’s program. For example, when the home improvement retailer Home Depot notedthat sales were lagging because its stores were full of clogged aisles, long checkout times, andtoo few salespeople, management changed its procedures for restocking shelves and pricingthe products. Instead of requiring its employees to do these activities at the same time theywere working with customers, management moved these activities to when the stores wereclosed at night. Employees were then able to focus on increasing customer sales during theday. Both UPS and FedEx put such an emphasis on consistent, quality service that both com-panies have strict rules for employee behavior, ranging from how a driver dresses to how keysare held when approaching a customer’s door. (Strategy implementation is discussed in moredetail in Chapters 9 and 10.)
EVALUATION AND CONTROLEvaluation and control is a process in which corporate activities and performance results aremonitored so that actual performance can be compared with desired performance. Managersat all levels use the resulting information to take corrective action and resolve problems. Al-though evaluation and control is the final major element of strategic management, it can alsopinpoint weaknesses in previously implemented strategic plans and thus stimulate the entireprocess to begin again.
Performance is the end result of activities.70 It includes the actual outcomes of the strate-gic management process. The practice of strategic management is justified in terms of its abil-ity to improve an organization’s performance, typically measured in terms of profits and returnon investment. For evaluation and control to be effective, managers must obtain clear, prompt,and unbiased information from the people below them in the corporation’s hierarchy. Using
CHAPTER 1 Basic Concepts of Strategic Management 23
this information, managers compare what is actually happening with what was originallyplanned in the formulation stage.
For example, when market share (followed by profits) declined at Dell in 2007, MichaelDell, founder, returned to the CEO position and reevaluated his company’s strategy and oper-ations. Planning for continued growth, the company’s expansion of its computer product lineinto new types of hardware, such as storage, printers, and televisions, had not worked asplanned. In some areas, like televisions and printers, Dell’s customization ability did not addmuch value. In other areas, like services, lower-cost competitors were already established.Michael Dell concluded, “I think you’re going to see a more streamlined organization, with amuch clearer strategy.”71
The evaluation and control of performance completes the strategic management model.Based on performance results, management may need to make adjustments in its strategy for-mulation, in implementation, or in both. (Evaluation and control is discussed in more detail inChapter 11.)
FEEDBACK/LEARNING PROCESSNote that the strategic management model depicted in Figure 1–2 includes a feedback/learningprocess. Arrows are drawn coming out of each part of the model and taking information toeach of the previous parts of the model. As a firm or business unit develops strategies, pro-grams, and the like, it often must go back to revise or correct decisions made earlier in theprocess. For example, poor performance (as measured in evaluation and control) usually in-dicates that something has gone wrong with either strategy formulation or implementation. Itcould also mean that a key variable, such as a new competitor, was ignored during environ-mental scanning and assessment. In the case of Dell, the personal computer market had ma-tured and by 2007 there were fewer growth opportunities available within the industry. EvenJim Cramer, host of the popular television program, Mad Money, was referring to computersin 2008 as “old technology” having few growth prospects. Dell’s management needed to re-assess the company’s environment and find better opportunities to profitably apply its corecompetencies.
1.6 Initiation of Strategy: Triggering EventsAfter much research, Henry Mintzberg discovered that strategy formulation is typically not aregular, continuous process: “It is most often an irregular, discontinuous process, proceedingin fits and starts. There are periods of stability in strategy development, but also there are pe-riods of flux, of groping, of piecemeal change, and of global change.”72 This view of strategyformulation as an irregular process can be explained by the very human tendency to continueon a particular course of action until something goes wrong or a person is forced to questionhis or her actions. This period of strategic drift may result from inertia on the part of the orga-nization, or it may reflect management’s belief that the current strategy is still appropriate andneeds only some fine-tuning.
Most large organizations tend to follow a particular strategic orientation for about 15 to20 years before making a significant change in direction.73 This phenomenon, calledpunctuated equilibrium, describes corporations as evolving through relatively long periods ofstability (equilibrium periods) punctuated by relatively short bursts of fundamental change(revolutionary periods).74 After this rather long period of fine-tuning an existing strategy, somesort of shock to the system is needed to motivate management to seriously reassess the corpo-ration’s situation.
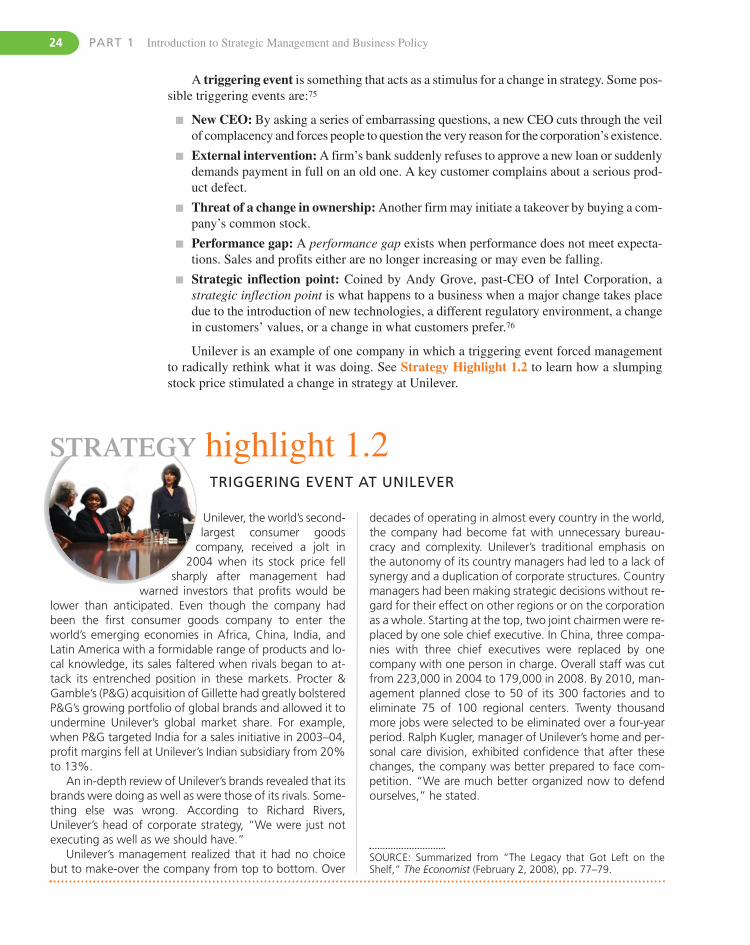
24 PART 1 Introduction to Strategic Management and Business Policy
A triggering event is something that acts as a stimulus for a change in strategy. Some pos-sible triggering events are:75
� New CEO: By asking a series of embarrassing questions, a new CEO cuts through the veilof complacency and forces people to question the very reason for the corporation’s existence.
� External intervention: A firm’s bank suddenly refuses to approve a new loan or suddenlydemands payment in full on an old one. A key customer complains about a serious prod-uct defect.
� Threat of a change in ownership: Another firm may initiate a takeover by buying a com-pany’s common stock.
� Performance gap: A performance gap exists when performance does not meet expecta-tions. Sales and profits either are no longer increasing or may even be falling.
� Strategic inflection point: Coined by Andy Grove, past-CEO of Intel Corporation, astrategic inflection point is what happens to a business when a major change takes placedue to the introduction of new technologies, a different regulatory environment, a changein customers’ values, or a change in what customers prefer.76
Unilever is an example of one company in which a triggering event forced managementto radically rethink what it was doing. See Strategy Highlight 1.2 to learn how a slumpingstock price stimulated a change in strategy at Unilever.
decades of operating in almost every country in the world,the company had become fat with unnecessary bureau-cracy and complexity. Unilever’s traditional emphasis onthe autonomy of its country managers had led to a lack ofsynergy and a duplication of corporate structures. Countrymanagers had been making strategic decisions without re-gard for their effect on other regions or on the corporationas a whole. Starting at the top, two joint chairmen were re-placed by one sole chief executive. In China, three compa-nies with three chief executives were replaced by onecompany with one person in charge. Overall staff was cutfrom 223,000 in 2004 to 179,000 in 2008. By 2010, man-agement planned close to 50 of its 300 factories and toeliminate 75 of 100 regional centers. Twenty thousandmore jobs were selected to be eliminated over a four-yearperiod. Ralph Kugler, manager of Unilever’s home and per-sonal care division, exhibited confidence that after thesechanges, the company was better prepared to face com-petition. “We are much better organized now to defendourselves,” he stated.
Unilever, the world’s second-largest consumer goods
company, received a jolt in2004 when its stock price fell
sharply after management hadwarned investors that profits would be
lower than anticipated. Even though the company hadbeen the first consumer goods company to enter theworld’s emerging economies in Africa, China, India, andLatin America with a formidable range of products and lo-cal knowledge, its sales faltered when rivals began to at-tack its entrenched position in these markets. Procter &Gamble’s (P&G) acquisition of Gillette had greatly bolsteredP&G’s growing portfolio of global brands and allowed it toundermine Unilever’s global market share. For example,when P&G targeted India for a sales initiative in 2003–04,profit margins fell at Unilever’s Indian subsidiary from 20%to 13%.
An in-depth review of Unilever’s brands revealed that itsbrands were doing as well as were those of its rivals. Some-thing else was wrong. According to Richard Rivers,Unilever’s head of corporate strategy, “We were just notexecuting as well as we should have.”
Unilever’s management realized that it had no choicebut to make-over the company from top to bottom. Over
TRIGGERING EVENT AT UNILEVER
SOURCE: Summarized from “The Legacy that Got Left on theShelf,” The Economist (February 2, 2008), pp. 77–79.
STRATEGY highlight 1.2
CHAPTER 1 Basic Concepts of Strategic Management 25
MINTZBERG’S MODES OF STRATEGIC DECISION MAKINGSome strategic decisions are made in a flash by one person (often an entrepreneur or a pow-erful chief executive officer) who has a brilliant insight and is quickly able to convince oth-ers to adopt his or her idea. Other strategic decisions seem to develop out of a series of smallincremental choices that over time push an organization more in one direction than another.
1.7 Strategic Decision MakingThe distinguishing characteristic of strategic management is its emphasis on strategic decisionmaking. As organizations grow larger and more complex, with more uncertain environments,decisions become increasingly complicated and difficult to make. In agreement with the strate-gic choice perspective mentioned earlier, this book proposes a strategic decision-makingframework that can help people make these decisions regardless of their level and function inthe corporation.
WHAT MAKES A DECISION STRATEGICUnlike many other decisions, strategic decisions deal with the long-run future of an entire or-ganization and have three characteristics:
1. Rare: Strategic decisions are unusual and typically have no precedent to follow.
2. Consequential: Strategic decisions commit substantial resources and demand a great dealof commitment from people at all levels.
3. Directive: Strategic decisions set precedents for lesser decisions and future actionsthroughout an organization.77
One example of a strategic decision with all of these characteristics was that made by Genen-tech, a biotechnology company that had been founded in 1976 to produce protein-based drugsfrom cloned genes. After building sales to $9 billion and profits to $2 billion in 2006, the com-pany’s sales growth slowed and its stock price dropped in 2007. The company’s products werereaching maturity with few new ones in the pipeline. To regain revenue growth, management de-cided to target autoimmune diseases, such as multiple sclerosis, rheumatoid arthritis, lupus, and80 other ailments for which there was no known lasting treatment. This was an enormous oppor-tunity, but also a very large risk for the company. Existing drugs in this area either weren’t effec-tive for many patients or caused side effects that were worse than the disease. Competition fromcompanies like Amgen and Novartis were already vying for leadership in this area. A number ofGenentech’s first attempts in the area had failed to do well against the competition.
The strategic decision to commit resources to this new area was based on a report from aBritish physician that the Genentech’s cancer drug Rituxan eased the agony of rheumatoid arthri-tis in five of his patients. CEO Arthur Levinson was so impressed with this report that he imme-diately informed Genentech’s board of directors. He urged them to support a full researchprogram for Rituxan in autoimmune disease. With the board’s blessing, Levinson launched a pro-gram to study the drug as a treatment for rheumatoid arthritis, MS, and lupus. The company de-ployed a third of its 1,000 researchers to pursue new drugs to fight autoimmune diseases. In 2006,Rituxan was approved to treat rheumatoid arthritis and captured 10% of the market. The com-pany was working on some completely new approaches to autoimmune disease. The researchmandate was to consider ideas others might overlook. “There’s this tremendous herd instinct outthere,” said Levinson. “That’s a great opportunity, because often the crowd is wrong.”78
26 PART 1 Introduction to Strategic Management and Business Policy
According to Henry Mintzberg, the three most typical approaches, or modes, of strategic de-cision making are entrepreneurial, adaptive, and planning (a fourth mode, logical incremen-talism, was added later by Quinn):79
� Entrepreneurial mode: Strategy is made by one powerful individual. The focus is on op-portunities; problems are secondary. Strategy is guided by the founder’s own vision of di-rection and is exemplified by large, bold decisions. The dominant goal is growth of thecorporation. Amazon.com, founded by Jeff Bezos, is an example of this mode of strategicdecision making. The company reflected Bezos’ vision of using the Internet to marketbooks and more. Although Amazon’s clear growth strategy was certainly an advantage ofthe entrepreneurial mode, Bezos’ eccentric management style made it difficult to retainsenior executives.80
� Adaptive mode: Sometimes referred to as “muddling through,” this decision-makingmode is characterized by reactive solutions to existing problems, rather than a proactivesearch for new opportunities. Much bargaining goes on concerning priorities of objec-tives. Strategy is fragmented and is developed to move a corporation forward incremen-tally. This mode is typical of most universities, many large hospitals, a large number ofgovernmental agencies, and a surprising number of large corporations. EncyclopaediaBritannica Inc., operated successfully for many years in this mode, but it continued to relyon the door-to-door selling of its prestigious books long after dual-career couples made thatmarketing approach obsolete. Only after it was acquired in 1996 did the company changeits door-to-door sales to television advertising and Internet marketing. The company nowcharges libraries and individual subscribers for complete access to Brittanica.com and of-fers CD-ROMs in addition to a small number of its 32-volume print set.81
� Planning mode: This decision-making mode involves the systematic gathering of appro-priate information for situation analysis, the generation of feasible alternative strategies,and the rational selection of the most appropriate strategy. It includes both the proactivesearch for new opportunities and the reactive solution of existing problems. IBM underCEO Louis Gerstner is an example of the planning mode. When Gerstner accepted the po-sition of CEO in 1993, he realized that IBM was in serious difficulty. Mainframe comput-ers, the company’s primary product line, were suffering a rapid decline both in sales andmarket share. One of Gerstner’s first actions was to convene a two-day meeting on corpo-rate strategy with senior executives. An in-depth analysis of IBM’s product lines revealedthat the only part of the company that was growing was services, but it was a relatively smallsegment and not very profitable. Rather than focusing on making and selling its own com-puter hardware, IBM made the strategic decision to invest in services that integrated infor-mation technology. IBM thus decided to provide a complete set of services from buildingsystems to defining architecture to actually running and managing the computers for thecustomer—regardless of who made the products. Because it was no longer important thatthe company be completely vertically integrated, it sold off its DRAM, disk-drive, and lap-top computer businesses and exited software application development. Since making thisstrategic decision in 1993, 80% of IBM’s revenue growth has come from services.82
� Logical incrementalism: A fourth decision-making mode can be viewed as a synthesisof the planning, adaptive, and, to a lesser extent, the entrepreneurial modes. In this mode,
CHAPTER 1 Basic Concepts of Strategic Management 27
STRATEGIC DECISION-MAKING PROCESS: AID TO BETTER DECISIONSGood arguments can be made for using either the entrepreneurial or adaptive modes (or logi-cal incrementalism) in certain situations.85 This book proposes, however, that in most situa-tions the planning mode, which includes the basic elements of the strategic managementprocess, is a more rational and thus better way of making strategic decisions. Research indi-cates that the planning mode is not only more analytical and less political than are the othermodes, but it is also more appropriate for dealing with complex, changing environments.86 Wetherefore propose the following eight-step strategic decision-making process to improve themaking of strategic decisions (see Figure 1–5):
1. Evaluate current performance results in terms of (a) return on investment, profitabil-ity, and so forth, and (b) the current mission, objectives, strategies, and policies.
2. Review corporate governance—that is, the performance of the firm’s board of directorsand top management.
3. Scan and assess the external environment to determine the strategic factors that poseOpportunities and Threats.
4. Scan and assess the internal corporate environment to determine the strategic factorsthat are Strengths (especially core competencies) and Weaknesses.
5. Analyze strategic (SWOT) factors to (a) pinpoint problem areas and (b) review and re-vise the corporate mission and objectives, as necessary.
6. Generate, evaluate, and select the best alternative strategy in light of the analysis con-ducted in step 5.
7. Implement selected strategies via programs, budgets, and procedures.
8. Evaluate implemented strategies via feedback systems, and the control of activities toensure their minimum deviation from plans.
This rational approach to strategic decision making has been used successfully by corpo-rations such as Warner-Lambert, Target, General Electric, IBM, Avon Products, Bechtel GroupInc., and Taisei Corporation.
top management has a reasonably clear idea of the corporation’s mission and objectives,but, in its development of strategies, it chooses to use “an interactive process in which theorganization probes the future, experiments and learns from a series of partial (incremen-tal) commitments rather than through global formulations of total strategies.”83 Thus,although the mission and objectives are set, the strategy is allowed to emerge out of debate,discussion, and experimentation. This approach appears to be useful when the environ-ment is changing rapidly and when it is important to build consensus and develop neededresources before committing an entire corporation to a specific strategy. In his analysis ofthe petroleum industry, Grant described strategic planning in this industry as “plannedemergence.” Corporate headquarters established the mission and objectives but allowedthe business units to propose strategies to achieve them.84
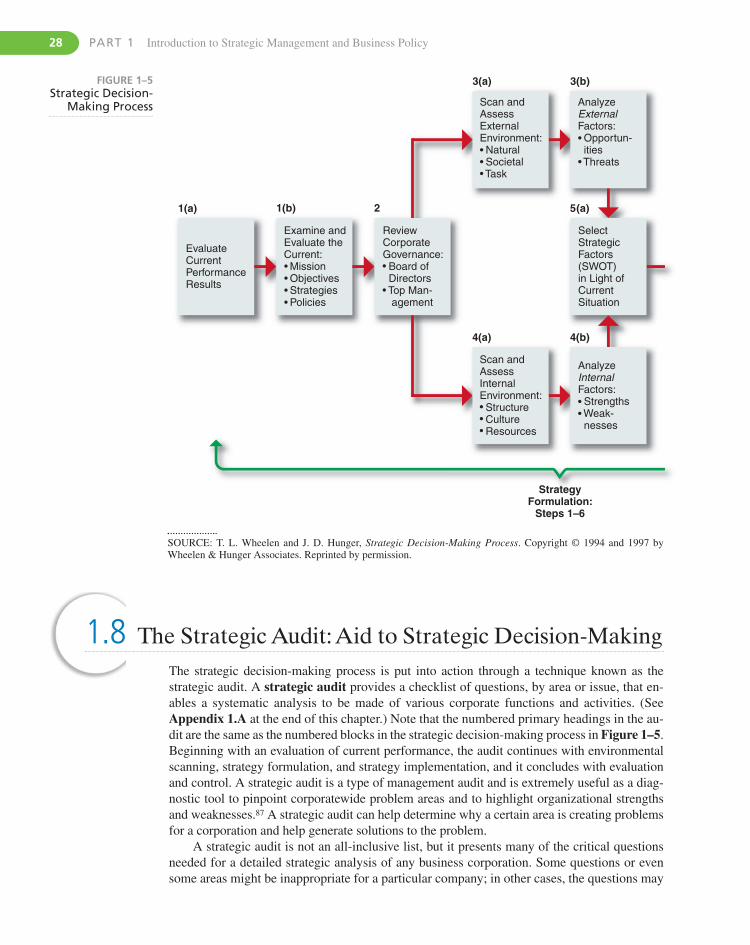
28 PART 1 Introduction to Strategic Management and Business Policy
1.8 The Strategic Audit:Aid to Strategic Decision-MakingThe strategic decision-making process is put into action through a technique known as thestrategic audit. A strategic audit provides a checklist of questions, by area or issue, that en-ables a systematic analysis to be made of various corporate functions and activities. (SeeAppendix 1.A at the end of this chapter.) Note that the numbered primary headings in the au-dit are the same as the numbered blocks in the strategic decision-making process in Figure 1–5.Beginning with an evaluation of current performance, the audit continues with environmentalscanning, strategy formulation, and strategy implementation, and it concludes with evaluationand control. A strategic audit is a type of management audit and is extremely useful as a diag-nostic tool to pinpoint corporatewide problem areas and to highlight organizational strengthsand weaknesses.87 A strategic audit can help determine why a certain area is creating problemsfor a corporation and help generate solutions to the problem.
A strategic audit is not an all-inclusive list, but it presents many of the critical questionsneeded for a detailed strategic analysis of any business corporation. Some questions or evensome areas might be inappropriate for a particular company; in other cases, the questions may
1(a)
3(a) 3(b)
StrategyFormulation:
Steps 1–6
1(b) 2
EvaluateCurrentPerformanceResults
ReviewCorporateGovernance: Board of Directors Top Man- agement
Examine andEvaluate theCurrent: Mission Objectives Strategies Policies
5(a)
4(b)
SelectStrategicFactors(SWOT)in Light ofCurrentSituation
AnalyzeInternalFactors: Strengths Weak- nesses
AnalyzeExternalFactors: Opportun- ities Threats
Scan andAssessExternalEnvironment: Natural Societal Task
4(a)
Scan andAssessInternalEnvironment: Structure Culture Resources
FIGURE 1–5Strategic Decision-
Making Process
SOURCE: T. L. Wheelen and J. D. Hunger, Strategic Decision-Making Process. Copyright © 1994 and 1997 byWheelen & Hunger Associates. Reprinted by permission.
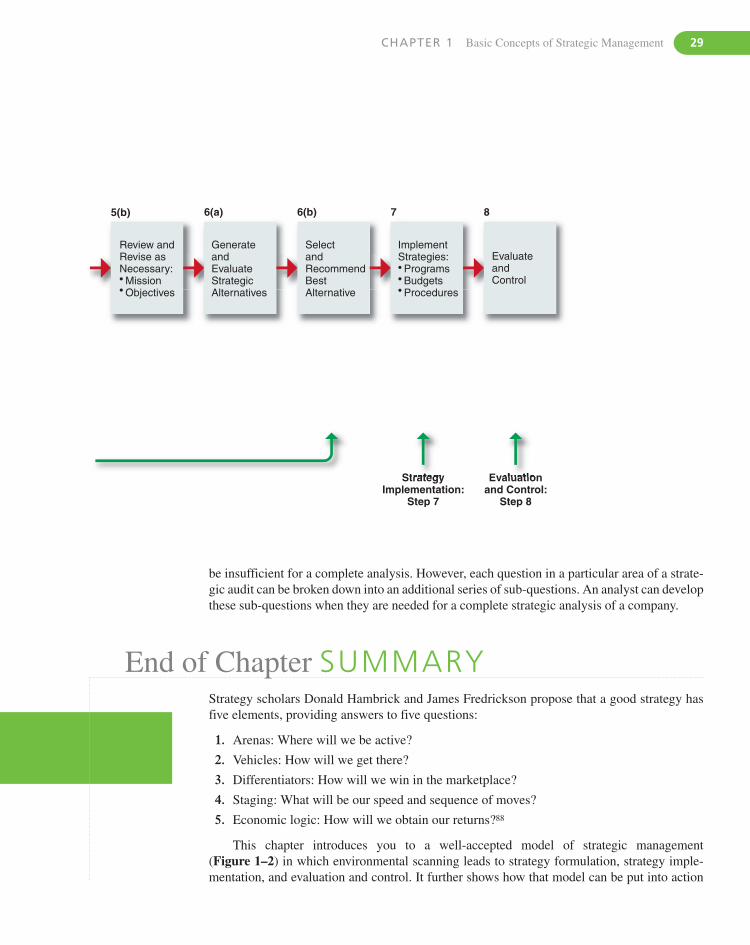
CHAPTER 1 Basic Concepts of Strategic Management 29
End of Chapter SUMMARYStrategy scholars Donald Hambrick and James Fredrickson propose that a good strategy hasfive elements, providing answers to five questions:
1. Arenas: Where will we be active?
2. Vehicles: How will we get there?
3. Differentiators: How will we win in the marketplace?
4. Staging: What will be our speed and sequence of moves?
5. Economic logic: How will we obtain our returns?88
This chapter introduces you to a well-accepted model of strategic management(Figure 1–2) in which environmental scanning leads to strategy formulation, strategy imple-mentation, and evaluation and control. It further shows how that model can be put into action
StrategyImplementation:
Step 7
Evaluationand Control:
Step 8
5(b) 6(a) 6(b)
SelectandRecommendBestAlternative
GenerateandEvaluateStrategicAlternatives
7 8
EvaluateandControl
ImplementStrategies: Programs Budgets Procedures
Review andRevise asNecessary: Mission Objectives
be insufficient for a complete analysis. However, each question in a particular area of a strate-gic audit can be broken down into an additional series of sub-questions. An analyst can developthese sub-questions when they are needed for a complete strategic analysis of a company.
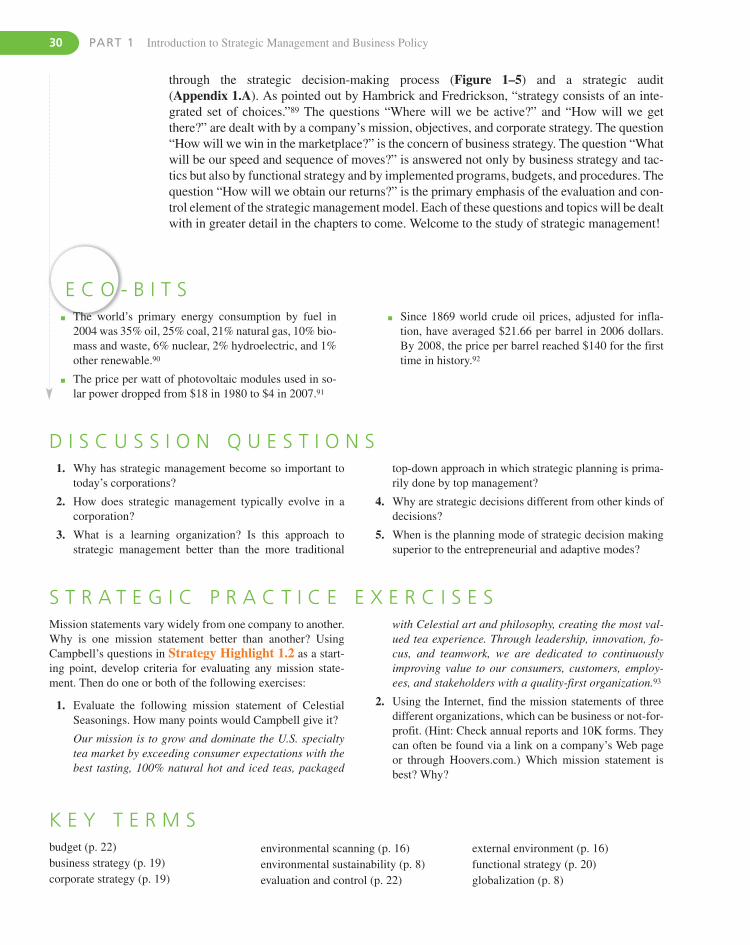
30 PART 1 Introduction to Strategic Management and Business Policy
E C O - B I T S� The world’s primary energy consumption by fuel in
2004 was 35% oil, 25% coal, 21% natural gas, 10% bio-mass and waste, 6% nuclear, 2% hydroelectric, and 1%other renewable.90
� The price per watt of photovoltaic modules used in so-lar power dropped from $18 in 1980 to $4 in 2007.91
� Since 1869 world crude oil prices, adjusted for infla-tion, have averaged $21.66 per barrel in 2006 dollars.By 2008, the price per barrel reached $140 for the firsttime in history.92
D I S C U S S I O N Q U E S T I O N S1. Why has strategic management become so important to
today’s corporations?
2. How does strategic management typically evolve in acorporation?
3. What is a learning organization? Is this approach tostrategic management better than the more traditional
top-down approach in which strategic planning is prima-rily done by top management?
4. Why are strategic decisions different from other kinds ofdecisions?
5. When is the planning mode of strategic decision makingsuperior to the entrepreneurial and adaptive modes?
S T R A T E G I C P R A C T I C E E X E R C I S E SMission statements vary widely from one company to another.Why is one mission statement better than another? UsingCampbell’s questions in Strategy Highlight 1.2 as a start-ing point, develop criteria for evaluating any mission state-ment. Then do one or both of the following exercises:
1. Evaluate the following mission statement of CelestialSeasonings. How many points would Campbell give it?
Our mission is to grow and dominate the U.S. specialtytea market by exceeding consumer expectations with thebest tasting, 100% natural hot and iced teas, packaged
with Celestial art and philosophy, creating the most val-ued tea experience. Through leadership, innovation, fo-cus, and teamwork, we are dedicated to continuouslyimproving value to our consumers, customers, employ-ees, and stakeholders with a quality-first organization.93
2. Using the Internet, find the mission statements of threedifferent organizations, which can be business or not-for-profit. (Hint: Check annual reports and 10K forms. Theycan often be found via a link on a company’s Web pageor through Hoovers.com.) Which mission statement isbest? Why?
K E Y T E R M Sbudget (p. 22)business strategy (p. 19)corporate strategy (p. 19)
environmental scanning (p. 16)environmental sustainability (p. 8)evaluation and control (p. 22)
external environment (p. 16)functional strategy (p. 20)globalization (p. 8)
through the strategic decision-making process (Figure 1–5) and a strategic audit(Appendix 1.A). As pointed out by Hambrick and Fredrickson, “strategy consists of an inte-grated set of choices.”89 The questions “Where will we be active?” and “How will we getthere?” are dealt with by a company’s mission, objectives, and corporate strategy. The question“How will we win in the marketplace?” is the concern of business strategy. The question “Whatwill be our speed and sequence of moves?” is answered not only by business strategy and tac-tics but also by functional strategy and by implemented programs, budgets, and procedures. Thequestion “How will we obtain our returns?” is the primary emphasis of the evaluation and con-trol element of the strategic management model. Each of these questions and topics will be dealtwith in greater detail in the chapters to come. Welcome to the study of strategic management!
CHAPTER 1 Basic Concepts of Strategic Management 31
N O T E S1. “GE Launches Ecomagination to Develop Environmental Tech-
nologies,” www.nema.org (May 13, 2005), in S. Regani, “‘Eco-magination’ at Work: GE’s Sustainability Initiative,” ICFAICenter for Management Research (2006).
2. R. Layne, “GE Plans to Double Spending on ‘Environmental’Products,” Des Moines Register (May 10, 2005), p. 6D.
3. “A Lean, Clean Electric Machine,” The Economist (December10, 2005), p. 78.
4. “A Lean, Clean Electric Machine,” The Economist (December10, 2005), pp. 77–79.
5. B. Elgin, “Little Green Lies,” Business Week (October 29,2007), pp. 45–52.
6. “A Lean, Clean Electric Machine,” The Economist (December10, 2005), p. 79.
7. F. W. Gluck, S. P. Kaufman, and A. S. Walleck, “The FourPhases of Strategic Management,” Journal of Business Strategy(Winter 1982), pp. 9–21.
8. M. R. Vaghefi and A. B Huellmantel, “Strategic Leadership atGeneral Electric,” Long Range Planning (April 1998),pp. 280–294. For a detailed description of the evolution ofstrategic management at GE, see W. Ocasio and J. Joseph, “Riseand Fall—or Transformation?” Long Range Planning (June2008), pp. 248–272.
9. E. D. Beinhocker, “The Adaptable Corporation,” McKinseyQuarterly (2006, Number 2), pp. 77–87.
10. B. W. Wirtz, A. Mathieu, and O. Schilke, “Strategy in High-Velocity Environments,” Long Range Planning (June 2007),pp. 295–313; L. F. Teagarden, Y. Sarason, J. S. Childers, andD. E. Hatfield, “The Engagement of Employees in the StrategyProcess and Firm Performance: The Role of Strategic Goals andEnvironment,” Journal of Business Strategies (Spring 2005),pp. 75–99; T. J. Andersen, “Strategic Planning, AutonomousActions and Corporate Performance,” Long Range Planning(April 2000), pp. 184–200; C. C. Miller and L. B. Cardinal,“Strategic Planning and Firm Performance: A Synthesis ofMore Than Two Decades of Research,” Academy of Manage-ment Journal (December 1994), pp. 1649–1665; P. Pekar Jr.,and S. Abraham, “Is Strategic Management Living Up to ItsPromise?” Long Range Planning (October 1995), pp. 32–44;W. E. Hopkins and S. A. Hopkins, “Strategic Planning—Financial Performance Relationship in Banks: A Causal Exam-ination,” Strategic Management Journal (September 1997),pp. 635–652.
11. E. J. Zajac, M. S. Kraatz, and R. F. Bresser, “Modeling the Dy-namics of Strategic Fit: A Normative Approach to StrategicChange,” Strategic Management Journal (April 2000),
pp. 429–453; M. Peteraf and R. Reed, “Managerial Discretionand Internal Alignment Under Regulatory Constraints andChange,” Strategic Management Journal (November 2007),pp. 1089–1112; C. S. Katsikeas, S. Samiee, and M. Theodosiou,“Strategy Fit and Performance Consequences of InternationalMarketing Standardization,” Strategic Management Journal(September 2006), pp. 867–890.
12. P. Brews and D. Purohit, “Strategic Planning in Unstable Envi-ronments,” Long Range Planning (February 2007), pp. 64–83.
13. K. G. Smith and C. M. Grimm, “Environmental Variation,Strategic Change and Firm Performance: A Study of RailroadDeregulation,” Strategic Management Journal (July–August1987), pp. 363–376; J. A. Nickerson and B. S. Silverman, “WhyFirms Want to Organize Efficiently and What Keeps Them fromDoing So: Inappropriate Governance, Performance, and Adap-tation in a Deregulated Industry,” Administrative Science Quar-terly (September 2003), pp. 433–465.
14. I. Wilson, “Strategic Planning Isn’t Dead—It Changed,” LongRange Planning (August 1994), p. 20.
15. R. Dye and O. Sibony, “How to Improve Strategic Planning,”McKinsey Quarterly (2007, Number 3), pp. 40–48.
16. W. M. Becker and V. M. Freeman, “Going from Global Trendsto Corporate Strategy,” McKinsey Quarterly (2006, Number 2),pp. 17–27.
17. D. Rigby and B. Bilodeau, Management Tools and Trends 2007,Bain & Company (2007).
18. W. Joyce, “What Really Works: Building the 4�2 Organiza-tion,” Organizational Dynamics (Vol. 34, Issue 2, 2005),pp. 118–129. See also W. Joyce, N. Nohria, and B. Roberson,What Really Works: The 4�2 Formula for Sustained BusinessSuccess (HarperBusiness), 2003.
19. R. M. Grant, “Strategic Planning in a Turbulent Environment:Evidence from the Oil Majors,” Strategic Management Journal(June 2003), pp. 491–517.
20. M. J. Peel and J. Bridge, “How Planning and Capital BudgetingImprove SME Performance,” Long Range Planning (December1998), pp. 848–856; L. W. Rue and N. A. Ibrahim, “The Rela-tionship Between Planning Sophistication and Performance inSmall Businesses,” Journal of Small Business Management(October 1998), pp. 24–32; J. C. Carland and J. W. Carland, “AModel of Entrepreneurial Planning and Its Effect on Perfor-mance,” paper presented to Association for Small Business andEntrepreneurship (Houston, TX, 2003).
21. R. M. Grant, “Strategic Planning in a Turbulent Environment:Evidence from the Oil Majors,” Strategic Management Journal(June 2003), pp. 491–517.
hierarchy of strategy (p. 20)institution theory (p. 13)internal environment (p. 16)learning organization (p. 13)mission (p. 17)objective (p. 18)organizational learning theory (p. 13)performance (p. 22)phases of strategic management (p. 5)
policy (p. 21)population ecology (p. 12)procedure (p. 22)program (p. 21)strategic audit (p. 28)strategic choice perspective (p. 13)strategic decision (p. 25)strategic decision-making process (p. 27)
strategic factor (p. 16)strategic management (p. 5)strategy (p. 19)strategy formulation (p. 17)strategy implementation (p. 21)SWOT analysis (p. 16)triggering event (p. 24)vision (p. 17)
22. T. L. Friedman, The World Is Flat (NY: Farrar, Strauss &Giroux), 2005.
23. A. K. Gupta,V. Govindarajan, and H. Wang, The Quest forGlobal Dominance, 2nd ed. (San Francisco: Jossey-Bass,2008).
24. Quoted in “Companies that Expand Abroad: ‘Knowledge Seek-ers’ vs. Conquerors,” Knowledge @ Wharton.com (March 24,2004), p. 1.
25. S. M. J. Bonini, G. Hintz, and L. T. Mendonca, “AddressingConsumer Concerns about Climate Change,” McKinsey Quar-terly (March 2008), pp. 1–9.
26. A. J. Hoffman, Getting Ahead of the Curve: Corporate Strate-gies that Address Climate Change (Ann Arbor: University ofMichigan, 2006), p. 1.
27. A. J. Hoffman, Getting Ahead of the Curve: Corporate Strate-gies that Address Climate Change (Ann Arbor: University ofMichigan, 2006), p. iii.
28. M. E. Porter and F. L. Reinhardt, “A Strategic Approach to Cli-mate,” Harvard Business Review (October 2007), p. 22.
29. “The Rising Costs of Global Warming,” Futurist (November–December 2005), p. 13.
30. J. Lash and F. Wellington, “Competitive Advantage on a WarmingPlanet,” Harvard Business Review (March 2007), pp. 95–102.
31. “Melting Asia,” The Economist (June 7, 2008), pp. 29–32.32. P. Engardio, “Can the U.S. Bring Jobs Back from China?”
Business Week (June 30, 2008), pp. 39–43.33. P. Roberts, “Tapped Out,” National Geographic (June 2008),
pp. 87–91.34. T. Rooselt IV and J. Llewelyn, “Investors Hunger for Clean En-
ergy,” Harvard Business Review (October 2007), p. 38.35. D. Rigby, “Growth through Sustainability,” Presentation to the
2008 Annual Meeting of the Consumer Industries Governors,World Economic Forum (January 24, 2008).
36. J. Carey and L. Woellert, “Global Warming: Here Comes theLawyers,” Business Week (October 30, 2006), pp. 34–36.
37. C. Laszlo, Sustainable Value: How the World’s Leading Com-panies Are Doing Well by Doing Good (Stanford: Stanford Uni-versity Press, 2008), pp. 89–99.
38. R. Ringger and S. A. DiPiazza, Sustainability Yearbook 2008(PricewaterhouseCoopers, 2008).
39. L. T. Mendonca and J. Oppenheim, “Investing in Sustainability:An Interview with Al Gore and David Blood,” McKinsey Quar-terly (May 2007).
40. A. J. Hoffman, Getting Ahead of the Curve: Corporate Strate-gies that Address Climate Change (Ann Arbor: University ofMichigan, 2006), p. 2.
41. J. K. Bourne, Jr., “Signs of Change,” National Geographic(Special Report on Changing Climate, 2008), pp. 7–21.
42. “Melting Asia,” The Economist (June 7, 2008), pp. 29–32.43. J. Welch and S. Welch, “The Global Warming Wager,” Business
Week (February 26, 2007), p. 130.44. J. A. C. Baum, “Organizational Ecology,” in Handbook of Or-
ganization Studies, edited by S. R. Clegg, C. Handy, andW. Nord (London: Sage, 1996), pp. 77–114.
45. B. M. Staw and L. D. Epstein, “What Bandwagons Bring: Ef-fects of Popular Management Techniques on Corporate Perfor-mance, Reputation, and CEO Pay,” Administrative ScienceQuarterly (September 2000), pp. 523–556; M. B. Liebermanand S. Asaba, “Why Do Firms Imitate Each Other?” Academyof Management Review (April 2006), pp. 366–385.
46. T. W. Ruefli and R. R. Wiggins, “Industry, Corporate, and Seg-ment Effects and Business Performance: A Non-Parametric Ap-proach,” Strategic Management Journal (September 2003),pp. 861–879; Y. E. Spanos, G. Zaralis, and S. Lioukas, “Strategyand Industry Effects on Profitability: Evidence from Greece,”Strategic Management Journal (February 2004), pp. 139–165;E. H. Bowman and C. E. Helfat, “Does Corporate Strategy Mat-ter?” Strategic Management Journal (January 2001), pp. 1–23;T. H. Brush, P. Bromiley, and M. Hendrickx, “The Relative In-fluence of Industry and Corporation on Business Segment Per-formance: An Alternative Estimate,” Strategic ManagementJournal (June 1999), pp. 519–547; K. M. Gilley, B. A. Walters,and B. J. Olson, “Top Management Team Risk Taking Propensi-ties and Firm Performance: Direct and Moderating Effects,”Journal of Business Strategies (Fall 2002), pp. 95–114.
47. For more information on these theories, see A. Y. Lewin and H. W.Voloberda, “Prolegomena on Coevolution: A Framework for Re-search on Strategy and New Organizational Forms,” OrganizationScience (October 1999), pp. 519–534, and H. Aldrich,Organizations Evolving (London: Sage, 1999), pp. 43–74.
48. R. A. D’Aveni, Hypercompetition (New York: The Free Press,1994). Hypercompetition is discussed in more detail inChapter 4.
49. R. S. M. Lau, “Strategic Flexibility: A New Reality for World-Class Manufacturing,” SAM Advanced Management Journal(Spring 1996), pp. 11–15.
50. M. A. Hitt, B. W. Keats, and S. M. DeMarie, “Navigating in theNew Competitive Landscape: Building Strategic Flexibilityand Competitive Advantage in the 21st Century,” Academy ofManagement Executive (November 1998), pp. 22–42.
51. D. Lei, J. W. Slocum, and R. A. Pitts, “Designing Organizationsfor Competitive Advantage: The Power of Unlearning andLearning,” Organizational Dynamics (Winter 1999),pp. 24–38; M. Goold, “Making Peer Groups Effective: Lessonsfrom BP’s Experience,” Long Range Planning (October 2005),pp. 429–443.
52. S. C. Voelpel, M. Dous, and T. H. Davenport, “Five Steps to Cre-ating a Global Knowledge-Sharing System: Siemens’ ShareNet,”Academy of Management Executive (May 2005), pp. 9–23.
53. D. A. Garvin, “Building a Learning Organization,” HarvardBusiness Review (July/August 1993), p. 80. See also P. M.Senge, The Fifth Discipline: The Art and Practice of the Learn-ing Organization (New York: Doubleday, 1990).
54. A. D. Chandler, Inventing the Electronic Century (New York:The Free Press, 2001).
55. T. T. Baldwin, C. Danielson, and W. Wiggenhorn, “The Evolu-tion of Learning Strategies in Organizations: From EmployeeDevelopment to Business Redefinition,” Academy of Manage-ment Executive (November 1997), pp. 47–58.
56. N. Collier, F. Fishwick, and S. W. Floyd, “Managerial Involve-ment and Perceptions of Strategy Process,” Long Range Plan-ning (February 2004), pp. 67–83; J. A. Parnell, S. Carraher, andK. Holt, “Participative Management’s Influence on EffectiveStrategic Planning,” Journal of Business Strategies (Fall 2002),pp. 161–179; M. Ketokivi and X. Castaner, “Strategic Planningas an Integrative Device,” Administrative Science Quarterly(September 2004), pp. 337–365.
57. E. W. K. Tsang, “Internationalization as a Learning Process: Sin-gapore MNCs in China,” Academy of Management Executive(February 1999), pp. 91–101; J. M. Shaver, W. Mitchell, and
32 PART 1 Introduction to Strategic Management and Business Policy
B. Yeung, “The Effect of Own-Firm and Other Firm Experienceon Foreign Direct Investment Survival in the U.S., 1987–92,”Strategic Management Journal (November 1997), pp. 811–824;P. Kale and H. Singh, “Building Firm Capabilities through Learn-ing: The Role of the Alliance Learning Process in Alliance Capa-bility and Firm-Level Alliance Success,” Strategic ManagementJournal (October 2007), pp. 981–1000; H. Barkema and M. Schi-jven, “How Do Firms Learn to Make Acquisitions? A Review ofPast Research and an Agenda for the Future,” Journal of Manage-ment (June 2008), pp. 594–634; D. D. Bergh and E. N-K Lim,“Learning How to Restructure: Absorptive Capacity and Impro-visational Views of Restructuring Actions and Performance,”Strategic Management Journal (June 2008), pp. 593–616.
58. W. Mitchell, J. M. Shaver, and B. Yeung, “Getting There in aGlobal Industry: Impacts on Performance of Changing Interna-tional Presence,” Strategic Management Journal (September1992), pp. 419–432.
59. D. J. Miller, M. J. Fern, and L. B. Cardinal, “The Use of Knowl-edge for Technological Innovation Within Diversified Firms,”Academy of Management Journal (April 2007), pp. 308–326.
60. R. Wiltbank, N. Dew, S. Read, and S. D. Sarasvathy, “What ToDo Next? The Case for Non-Predictive Strategy,” StrategicManagement Journal (October 2006), pp. 981–998; J. A. Smith,“Strategies for Start-Ups,” Long Range Planning (December1998), pp. 857–872.
61. J. S. Sidhu, “Business-Domain Definition and Performance: AnEmpirical Study,” SAM Advanced Management Journal (Au-tumn 2004), pp. 40–45.
62. See A. Campbell and S. Yeung, “Brief Case: Mission, Vision,and Strategic Intent,” Long Range Planning (August 1991),pp. 145–147; S. Cummings and J. Davies, “Mission, Vision, Fu-sion,” Long Range Planning (December 1994), pp. 147–150.
63. S. Baker, “Google and the Wisdom of Clouds,” Business Week(December 24, 2007), pp. 49–55. Courtesy of Google Inc.GOOGLE is a trademark of Google Inc.
64. J. Cosco, “Down to the Sea in Ships,” Journal of Business Strat-egy (November/December 1995), p. 48.
65. J. S. Sidhu, E. J. Nijssen, and H. R. Commandeur, “BusinessDomain Definition Practice: Does It Affect Organizational Per-formance?” Long Range Planning (June 2000), pp. 376–401.
66. “Time to Break Off a Chunk,” The Economist (December 15,2007), pp. 75–76.
67. K. M. Eisenhardt and D. N. Sull, “Strategy as Simple Rules,”Harvard Business Review (January 2001), p. 110.
68. D. Welch, “Cadillac Hits the Gas,” Business Week (Septem-ber 4, 2000), p. 50.
69. S. Holmes, “GE: Little Engines That Could,” Business Week(January 20, 2003), pp. 62–63.
70. H. A. Simon, Administrative Behavior, 2nd edition (New York:The Free Press, 1957), p. 231.
71. L. Lee and P. Burrows, “Is Dell Too Big for Michael Dell?”Business Week (February 12, 2007), p. 33.
72. H. Mintzberg, “Planning on the Left Side and Managing on theRight,” Harvard Business Review (July–August 1976), p. 56.
73. R. A. Burgelman and A. S. Grove, “Let Chaos Reign, ThenReign In Chaos—Repeatedly: Managing Strategic Dynamicsfor Corporate Longevity,” Strategic Management Journal (Oc-tober 2007), pp. 965–979.
74. See E. Romanelli and M. L. Tushman, “Organizational Transfor-mation as Punctuated Equilibrium: An Empirical Test,” Academyof Management Journal (October 1994), pp. 1141–1166.
75. S. S. Gordon, W. H. Stewart, Jr., R. Sweo, and W. A. Luker,“Convergence versus Strategic Reorientation: The Antecen-dents of Fast-Paced Organizational Change,” Journal of Man-agement, Vol. 26, No. 5 (2000), pp. 911–945.
76. Speech to the 1998 Academy of Management, reported by S. M.Puffer, “Global Executive: Intel’s Andrew Grove on Competi-tiveness,” Academy of Management Executive (February 1999),pp. 15–24.
77. D. J. Hickson, R. J. Butler, D. Cray, G. R. Mallory, and D. C.Wilson, Top Decisions: Strategic Decision Making in Organi-zations (San Francisco: Jossey-Bass, 1986), pp. 26–42.
78. A. Weintraub, “Genentech’s Gamble,” Business Week (Decem-ber 17, 2007), pp. 44–48.
79. H. Mintzberg, “Strategy-Making in Three Modes,” CaliforniaManagement Review (Winter 1973), pp. 44–53.
80. F. Vogelstein, “Mighty Amazon,” Fortune (May 26, 2003),pp. 60–74.
81. M. Wong, “Once-Prized Encyclopedias Fall into Disuse,” DesMoines Register (March 9, 2004), p. 3D.
82. L. V. Gerstner, Who Says Elephants Can’t Dance? (New York:HarperCollins, 2002).
83. J. B. Quinn, Strategies for Change: Logical Incrementalism(Homewood, IL.: Irwin, 1980), p. 58.
84. R. M. Grant, “Strategic Planning in a Turbulent Environment:Evidence from the Oil Majors,” Strategic Management Journal(June 2003), pp. 491–517.
85. G. Gavetti and J. W. Rivkin, “Seek Strategy the Right Way atthe Right Time,” Harvard Business Review (January 2008),pp. 22–23.
86. P. J. Brews and M. R. Hunt, “Learning to Plan and Planning toLearn: Resolving the Planning School/Learning School De-bate,” Strategic Management Journal (October 1999),pp. 889–913; I. Gold and A. M. A. Rasheed, “Rational Decision-Making and Firm Performance: The Moderating Role of theEnvironment,” Strategic Management Journal (August 1997),pp. 583–591; R. L. Priem, A. M. A. Rasheed, and A. G. Kotulic,“Rationality in Strategic Decision Processes, EnvironmentalDynamism and Firm Performance,” Journal of Management,Vol. 21, No. 5 (1995), pp. 913–929; J. W. Dean, Jr., and M. P.Sharfman, “Does Decision Process Matter? A Study of Strate-gic Decision-Making Effectiveness,” Academy of ManagementJournal (April 1996), pp. 368–396.
87. T. L. Wheelen and J. D. Hunger, “Using the Strategic Audit,”SAM Advanced Management Journal (Winter 1987), pp. 4–12;G. Donaldson, “A New Tool for Boards: The Strategic Audit,”Harvard Business Review (July–August 1995), pp. 99–107.
88. D. C. Hambrick and J. W. Fredrickson, “Are You Sure YouHave a Strategy?” Academy of Management Executive (No-vember, 2001), pp. 48–59.
89. Hambrick and Fredrickson, p. 49.90. “The Power and the Glory,” The Economist, Special Report on
Energy (June 21, 2008), pp. 3–6.91. “Another Silicon Valley?” The Economist, Special Report on
Energy (June 21, 2008), pp. 14–15.92. J. L. Williams, “Oil Price History and Analysis,” WTRG Econom-
ics (http://www.wtrg.com/prices.htm, accessed June 27, 2008).93. P. Jones and L. Kahaner, Say It & Live It: 50 Corporate Mission
Statements That Hit the Mark (New York: Currency Doubleday,1995), p. 53. Courtesy of Celestial Seasonings.
CHAPTER 1 Basic Concepts of Strategic Management 33
I. Current Situation
A. Current PerformanceHow did the corporation perform the past year overall in terms of return on investment,market share, and profitability?
B. Strategic PostureWhat are the corporation’s current mission, objectives, strategies, and policies?
1. Are they clearly stated, or are they merely implied from performance?
2. Mission: What business(es) is the corporation in? Why?
3. Objectives: What are the corporate, business, and functional objectives? Are they con-sistent with each other, with the mission, and with the internal and external environments?
4. Strategies: What strategy or mix of strategies is the corporation following? Are theyconsistent with each other, with the mission and objectives, and with the internal andexternal environments?
5. Policies: What are the corporation’s policies? Are they consistent with each other, withthe mission, objectives, and strategies, and with the internal and external environments?
6. Do the current mission, objectives, strategies, and policies reflect the corporation’s in-ternational operations, whether global or multidomestic?
II. Corporate Governance
A. Board of Directors1. Who is on the board? Are they internal (employees) or external members?
2. Do they own significant shares of stock?
3. Is the stock privately held or publicly traded? Are there different classes of stock withdifferent voting rights?
4. What do the board members contribute to the corporation in terms of knowledge, skills,background, and connections? If the corporation has international operations, do boardmembers have international experience? Are board members concerned with environ-mental sustainability?
Strategic Audit of a Corporation
A P P E N D I X 1.A
SOURCE: T.L. Wheelen, J.D. Hunger, Strategic Audit of a Corporation, Copyright © 1982 by Wheelen & HungerAssociates. Reprinted by permission. Revised 1988, 1991, 1994, 1997, 2000, 2002, 2005, and 2008.
34

CHAPTER 1 Basic Concepts of Strategic Management 35
5. How long have the board members served on the board?
6. What is their level of involvement in strategic management? Do they merely rubber-stamptop management’s proposals or do they actively participate and suggest future directions?Do they evaluate management’s proposals in terms of environmental sustainability?
B. Top Management1. What person or group constitutes top management?
2. What are top management’s chief characteristics in terms of knowledge, skills, back-ground, and style? If the corporation has international operations, does top managementhave international experience? Are executives from acquired companies consideredpart of the top management team?
3. Has top management been responsible for the corporation’s performance over the pastfew years? How many managers have been in their current position for less than threeyears? Were they promoted internally or externally hired?
4. Has top management established a systematic approach to strategic management?
5. What is top management’s level of involvement in the strategic management process?
6. How well does top management interact with lower-level managers and with the boardof directors?
7. Are strategic decisions made ethically in a socially responsible manner?
8. Are strategic decisions made in an environmentally sustainable manner?
9. Do top executives own significant amounts of stock in the corporation?
10. Is top management sufficiently skilled to cope with likely future challenges?
III. External Environment:Opportunities and Threats (SWOT)
A. Natural Physical Environment: Sustainability Issues1. What forces from the natural physical environmental are currently affecting the corpo-
ration and the industries in which it competes? Which present current or future threats?Opportunities?a. Climate, including global temperature, sea level, and fresh water availabilityb. Weather-related events, such as severe storms, floods, and droughtsc. Solar phenomena, such as sun spots and solar wind
2. Do these forces have different effects in other regions of the world?
B. Societal Environment1. What general environmental forces are currently affecting both the corporation and the
industries in which it competes? Which present current or future threats? Opportunities?a. Economicb. Technologicalc. Political–legald. Sociocultural
2. Are these forces different in other regions of the world?
36 PART 1 Introduction to Strategic Management and Business Policy
C. Task Environment1. What forces drive industry competition? Are these forces the same globally or do they
vary from country to country? Rate each force as high, medium, or low.a. Threat of new entrantsb. Bargaining power of buyersc. Threat of substitute products or servicesd. Bargaining power of supplierse. Rivalry among competing firmsf. Relative power of unions, governments, special interest groups, etc.
2. What key factors in the immediate environment (that is, customers, competitors, sup-pliers, creditors, labor unions, governments, trade associations, interest groups, localcommunities, and shareholders) are currently affecting the corporation? Which are cur-rent or future Threats? Opportunities?
D. Summary of External Factors(List in the EFAS Table 4–5, p. 126)Which of these forces and factors are the most important to the corporation and to the in-dustries in which it competes at the present time? Which will be important in the future?
IV. Internal Environment:Strengths and Weaknesses (SWOT)
A. Corporate Structure1. How is the corporation structured at present?
a. Is the decision-making authority centralized around one group or decentralized tomany units?
b. Is the corporation organized on the basis of functions, projects, geography, or somecombination of these?
2. Is the structure clearly understood by everyone in the corporation?
3. Is the present structure consistent with current corporate objectives, strategies, policies,and programs, as well as with the firm’s international operations?
4. In what ways does this structure compare with those of similar corporations?
B. Corporate Culture1. Is there a well-defined or emerging culture composed of shared beliefs, expectations,
and values?
2. Is the culture consistent with the current objectives, strategies, policies, and programs?
3. What is the culture’s position on environmental sustainability?
4. What is the culture’s position on other important issues facing the corporation (thatis, on productivity, quality of performance, adaptability to changing conditions, andinternationalization)?
5. Is the culture compatible with the employees’ diversity of backgrounds?
6. Does the company take into consideration the values of the culture of each nation inwhich the firm operates?
CHAPTER 1 Basic Concepts of Strategic Management 37
C. Corporate Resources1. Marketing
a. What are the corporation’s current marketing objectives, strategies, policies, andprograms?
i. Are they clearly stated or merely implied from performance and/or budgets?ii. Are they consistent with the corporation’s mission, objectives, strategies, and
policies and with internal and external environments?b. How well is the corporation performing in terms of analysis of market position and
marketing mix (that is, product, price, place, and promotion) in both domestic and in-ternational markets? How dependent is the corporation on a few customers? How bigis its market? Where is it gaining or losing market share? What percentage of salescomes from developed versus developing regions? Where are current products in theproduct life cycle?
i. What trends emerge from this analysis?ii. What impact have these trends had on past performance and how might these
trends affect future performance?iii. Does this analysis support the corporation’s past and pending strategic decisions?iv. Does marketing provide the company with a competitive advantage?
c. How well does the corporation’s marketing performance compare with that of sim-ilar corporations?
d. Are marketing managers using accepted marketing concepts and techniques to eval-uate and improve product performance? (Consider product life cycle, market seg-mentation, market research, and product portfolios.)
e. Does marketing adjust to the conditions in each country in which it operates?f. Does marketing consider environmental sustainability when making decisions?g. What is the role of the marketing manager in the strategic management process?
2. Financea. What are the corporation’s current financial objectives, strategies, and policies and
programs?i. Are they clearly stated or merely implied from performance and/or budgets?
ii. Are they consistent with the corporation’s mission, objectives, strategies, andpolicies and with internal and external environments?
b. How well is the corporation performing in terms of financial analysis? (Consider ra-tio analysis, common size statements, and capitalization structure.) How balanced,in terms of cash flow, is the company’s portfolio of products and businesses? Whatare investor expectations in terms of share price?
i. What trends emerge from this analysis?ii. Are there any significant differences when statements are calculated in con-
stant versus reported dollars?iii. What impact have these trends had on past performance and how might these
trends affect future performance?iv. Does this analysis support the corporation’s past and pending strategic decisions?v. Does finance provide the company with a competitive advantage?
c. How well does the corporation’s financial performance compare with that of simi-lar corporations?
d. Are financial managers using accepted financial concepts and techniques to evalu-ate and improve current corporate and divisional performance? (Consider financialleverage, capital budgeting, ratio analysis, and managing foreign currencies.)
e. Does finance adjust to the conditions in each country in which the company operates?f. Does finance cope with global financial issues?g. What is the role of the financial manager in the strategic management process?
38 PART 1 Introduction to Strategic Management and Business Policy
3. Research and Development (R&D)a. What are the corporation’s current R&D objectives, strategies, policies, and programs?
i. Are they clearly stated or merely implied from performance or budgets?ii. Are they consistent with the corporation’s mission, objectives, strategies and poli-
cies and with internal and external environments?iii. What is the role of technology in corporate performance?iv. Is the mix of basic, applied, and engineering research appropriate given the cor-
porate mission and strategies?v. Does R&D provide the company with a competitive advantage?
b. What return is the corporation receiving from its investment in R&D?c. Is the corporation competent in technology transfer? Does it use concurrent engi-
neering and cross-functional work teams in product and process design?d. What role does technological discontinuity play in the company’s products?e. How well does the corporation’s investment in R&D compare with the investments
of similar corporations? How much R&D is being outsourced? Is the corporation us-ing value-chain alliances appropriately for innovation and competitive advantage?
f. Does R&D adjust to the conditions in each country in which the company operates?g. Does R&D consider environmental sustainability in product development and
packaging?h. What is the role of the R&D manager in the strategic management process?
4. Operations and Logisticsa. What are the corporation’s current manufacturing/service objectives, strategies,
policies, and programs?i. Are they clearly stated or merely implied from performance or budgets?
ii. Are they consistent with the corporation’s mission, objectives, strategies, andpolicies and with internal and external environments?
b. What are the type and extent of operations capabilities of the corporation? Howmuch is done domestically versus internationally? Is the amount of outsourcing ap-propriate to be competitive? Is purchasing being handled appropriately? Are sup-pliers and distributors operating in an environmentally sustainable manner? Whichproducts have the highest and lowest profit margins?
i. If the corporation is product oriented, consider plant facilities, type of manu-facturing system (continuous mass production, intermittent job shop, or flexi-ble manufacturing), age and type of equipment, degree and role of automationand/or robots, plant capacities and utilization, productivity ratings, and avail-ability and type of transportation.
ii. If the corporation is service oriented, consider service facilities (hospital, theater,or school buildings), type of operations systems (continuous service over time tosame clientele or intermittent service over time to varied clientele), age and typeof supporting equipment, degree and role of automation and use of mass commu-nication devices (diagnostic machinery, video machines), facility capacities andutilization rates, efficiency ratings of professional and service personnel, andavailability and type of transportation to bring service staff and clientele together.
c. Are manufacturing or service facilities vulnerable to natural disasters, local or nationalstrikes, reduction or limitation of resources from suppliers, substantial cost increasesof materials, or nationalization by governments?
d. Is there an appropriate mix of people and machines (in manufacturing firms) or ofsupport staff to professionals (in service firms)?
e. How well does the corporation perform relative to the competition? Is it balancing in-ventory costs (warehousing) with logistical costs (just-in-time)? Consider costs perunit of labor, material, and overhead; downtime; inventory control management andscheduling of service staff; production ratings; facility utilization percentages; andnumber of clients successfully treated by category (if service firm) or percentage oforders shipped on time (if product firm).
CHAPTER 1 Basic Concepts of Strategic Management 39
i. What trends emerge from this analysis?ii. What impact have these trends had on past performance and how might these
trends affect future performance?iii. Does this analysis support the corporation’s past and pending strategic decisions?iv. Does operations provide the company with a competitive advantage?
f. Are operations managers using appropriate concepts and techniques to evaluate andimprove current performance? Consider cost systems, quality control and reliabil-ity systems, inventory control management, personnel scheduling, TQM, learningcurves, safety programs, and engineering programs that can improve efficiency ofmanufacturing or of service.
g. Do operations adjust to the conditions in each country in which it has facilities?h. Do operations consider environmental sustainability when making decisions?i. What is the role of the operations manager in the strategic management process?
5. Human Resources Management (HRM)a. What are the corporation’s current HRM objectives, strategies, policies, and pro-
grams?i. Are they clearly stated or merely implied from performance and/or budgets?
ii. Are they consistent with the corporation’s mission, objectives, strategies, andpolicies and with internal and external environments?
b. How well is the corporation’s HRM performing in terms of improving the fit be-tween the individual employee and the job? Consider turnover, grievances, strikes,layoffs, employee training, and quality of work life.
i. What trends emerge from this analysis?ii. What impact have these trends had on past performance and how might these
trends affect future performance?iii. Does this analysis support the corporation’s past and pending strategic decisions?iv. Does HRM provide the company with a competitive advantage?
c. How does this corporation’s HRM performance compare with that of similar cor-porations?
d. Are HRM managers using appropriate concepts and techniques to evaluate and im-prove corporate performance? Consider the job analysis program, performance ap-praisal system, up-to-date job descriptions, training and development programs,attitude surveys, job design programs, quality of relationships with unions, and use ofautonomous work teams.
e. How well is the company managing the diversity of its workforce? What is thecompany’s record on human rights? Does the company monitor the human rightsrecord of key suppliers and distributors?
f. Does HRM adjust to the conditions in each country in which the company oper-ates? Does the company have a code of conduct for HRM for itself and key sup-pliers in developing nations? Are employees receiving international assignments toprepare them for managerial positions?
g. What is the role of outsourcing in HRM planning?h. What is the role of the HRM manager in the strategic management process?
6. Information Technology (IT)a. What are the corporation’s current IT objectives, strategies, policies, and programs?
i. Are they clearly stated or merely implied from performance and/or budgets?ii. Are they consistent with the corporation’s mission, objectives, strategies, and
policies and with internal and external environments?b. How well is the corporation’s IT performing in terms of providing a useful database,
automating routine clerical operations, assisting managers in making routine deci-sions, and providing information necessary for strategic decisions?
i. What trends emerge from this analysis?ii. What impact have these trends had on past performance and how might these
trends affect future performance?
40 PART 1 Introduction to Strategic Management and Business Policy
iii. Does this analysis support the corporation’s past and pending strategic decisions?iv. Does IT provide the company with a competitive advantage?
c. How does this corporation’s IT performance and stage of development comparewith that of similar corporations? Is it appropriately using the Internet, intranet, andextranets?
d. Are IT managers using appropriate concepts and techniques to evaluate and improvecorporate performance? Do they know how to build and manage a complex data-base, establish Web sites with firewalls and virus protection, conduct system analy-ses, and implement interactive decision-support systems?
e. Does the company have a global IT and Internet presence? Does it have difficultywith getting data across national boundaries?
f. What is the role of the IT manager in the strategic management process?
D. Summary of Internal Factors(List in the IFAS Table 5–2, p.164)Which of these factors are core competencies? Which, if any, are distinctive competen-cies? Which of these factors are the most important to the corporation and to the indus-tries in which it competes at the present time? Which might be important in the future?Which functions or activities are candidates for outsourcing?
V. Analysis of Strategic Factors (SWOT)
A. Situational Analysis (List in SFAS Matrix, Figure 6–1, p. 179)Of the external (EFAS) and internal (IFAS) factors listed in III.D and IV.D, which are thestrategic (most important) factors that strongly affect the corporation’s present and futureperformance?
B. Review of Mission and Objectives1. Are the current mission and objectives appropriate in light of the key strategic factors
and problems?
2. Should the mission and objectives be changed? If so, how?
3. If they are changed, what will be the effects on the firm?
VI. Strategic Alternatives and Recommended Strategy
A. Strategic Alternatives(See the TOWS Matrix, Figure 6–3, p. 182)1. Can the current or revised objectives be met through more careful implementation of
those strategies presently in use (for example, fine-tuning the strategies)?
2. What are the major feasible alternative strategies available to the corporation? What arethe pros and cons of each? Can corporate scenarios be developed and agreed on? (Al-ternatives must fit the natural physical environment, societal environment, industry, andcorporation for the next three to five years.)a. Consider stability, growth, and retrenchment as corporate strategies.b. Consider cost leadership and differentiation as business strategies.
CHAPTER 1 Basic Concepts of Strategic Management 41
c. Consider any functional strategic alternatives that might be needed for reinforcementof an important corporate or business strategic alternative.
B. Recommended Strategy1. Specify which of the strategic alternatives you are recommending for the corporate,
business, and functional levels of the corporation. Do you recommend different busi-ness or functional strategies for different units of the corporation?
2. Justify your recommendation in terms of its ability to resolve both long- and short-termproblems and effectively deal with the strategic factors.
3. What policies should be developed or revised to guide effective implementation?
4. What is the impact of your recommended strategy on the company’s core and distinc-tive competencies?
VII. Implementation
A. What Kinds of Programs (for Example, Restructuring theCorporation or Instituting TQM) Should Be Developed toImplement the Recommended Strategy?1. Who should develop these programs?
2. Who should be in charge of these programs?
B. Are the Programs Financially Feasible? Can Pro FormaBudgets Be Developed and Agreed On? Are Prioritiesand Timetables Appropriate to Individual Programs?
C. Will New Standard Operating Procedures Need to BeDeveloped?
VIII. Evaluation and Control
A. Is the Current Information System Capable of ProvidingSufficient Feedback on Implementation Activities andPerformance? Can It Measure Strategic Factors?1. Can performance results be pinpointed by area, unit, project, or function?
2. Is the information timely?
3. Is the corporation using benchmarking to evaluate its functions and activities?
B. Are Adequate Control Measures in Place to EnsureConformance with the Recommended Strategic Plan?1. Are appropriate standards and measures being used?
2. Are reward systems capable of recognizing and rewarding good performance?
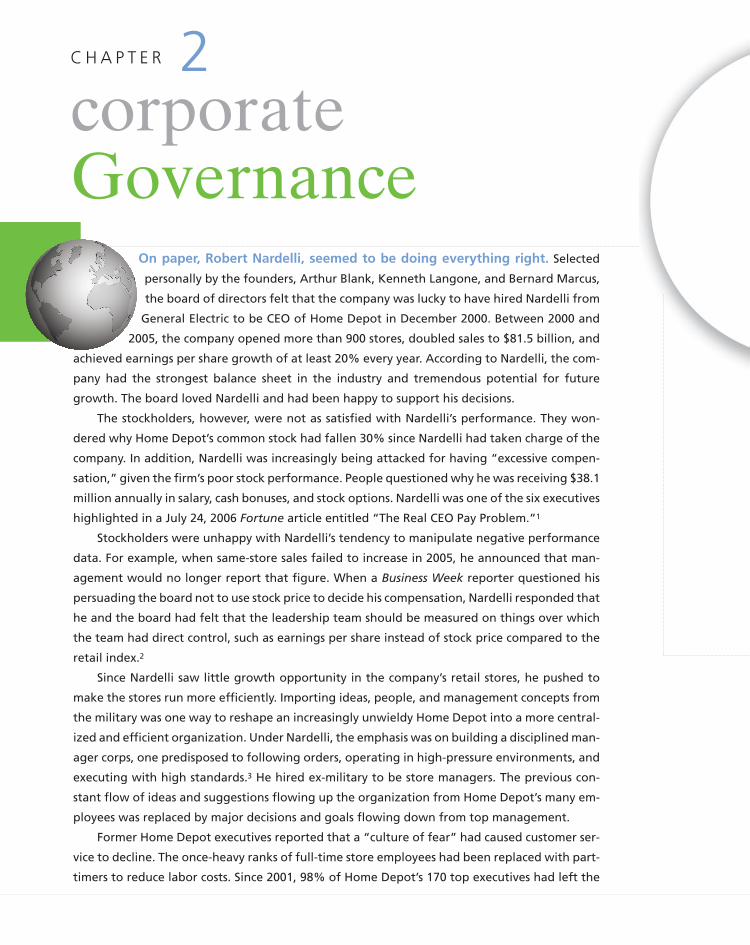
On paper, Robert Nardelli, seemed to be doing everything right. Selected
personally by the founders, Arthur Blank, Kenneth Langone, and Bernard Marcus,
the board of directors felt that the company was lucky to have hired Nardelli from
General Electric to be CEO of Home Depot in December 2000. Between 2000 and
2005, the company opened more than 900 stores, doubled sales to $81.5 billion, and
achieved earnings per share growth of at least 20% every year. According to Nardelli, the com-
pany had the strongest balance sheet in the industry and tremendous potential for future
growth. The board loved Nardelli and had been happy to support his decisions.
The stockholders, however, were not as satisfied with Nardelli’s performance. They won-
dered why Home Depot’s common stock had fallen 30% since Nardelli had taken charge of the
company. In addition, Nardelli was increasingly being attacked for having “excessive compen-
sation,” given the firm’s poor stock performance. People questioned why he was receiving $38.1
million annually in salary, cash bonuses, and stock options. Nardelli was one of the six executives
highlighted in a July 24, 2006 Fortune article entitled “The Real CEO Pay Problem.”1
Stockholders were unhappy with Nardelli’s tendency to manipulate negative performance
data. For example, when same-store sales failed to increase in 2005, he announced that man-
agement would no longer report that figure. When a Business Week reporter questioned his
persuading the board not to use stock price to decide his compensation, Nardelli responded that
he and the board had felt that the leadership team should be measured on things over which
the team had direct control, such as earnings per share instead of stock price compared to the
retail index.2
Since Nardelli saw little growth opportunity in the company’s retail stores, he pushed to
make the stores run more efficiently. Importing ideas, people, and management concepts from
the military was one way to reshape an increasingly unwieldy Home Depot into a more central-
ized and efficient organization. Under Nardelli, the emphasis was on building a disciplined man-
ager corps, one predisposed to following orders, operating in high-pressure environments, and
executing with high standards.3 He hired ex-military to be store managers. The previous con-
stant flow of ideas and suggestions flowing up the organization from Home Depot’s many em-
ployees was replaced by major decisions and goals flowing down from top management.
Former Home Depot executives reported that a “culture of fear” had caused customer ser-
vice to decline. The once-heavy ranks of full-time store employees had been replaced with part-
timers to reduce labor costs. Since 2001, 98% of Home Depot’s 170 top executives had left the
corporateGovernance
C H A P T E R 2
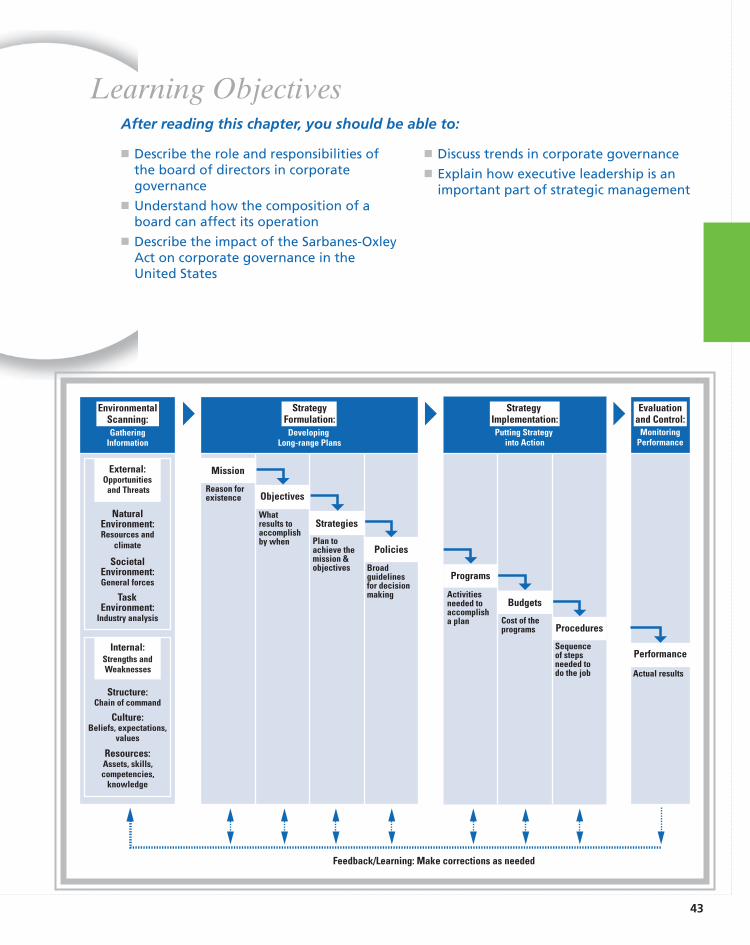
43
� Describe the role and responsibilities ofthe board of directors in corporategovernance
� Understand how the composition of aboard can affect its operation
� Describe the impact of the Sarbanes-OxleyAct on corporate governance in theUnited States
� Discuss trends in corporate governance� Explain how executive leadership is an
important part of strategic management
Learning Objectives
GatheringInformation
Putting Strategy into Action
MonitoringPerformance
SocietalEnvironment:General forces
NaturalEnvironment:Resources and
climate
TaskEnvironment:
Industry analysis
Internal:Strengths andWeaknesses
Structure:Chain of command
Culture:Beliefs, expectations,
values
Resources:Assets, skills,competencies,
knowledge
Programs
Activitiesneeded to accomplisha plan
Budgets
Cost of theprograms Procedures
Sequenceof stepsneeded to do the job
Performance
Actual results
External:Opportunities
and Threats
DevelopingLong-range Plans
Mission
Reason forexistence Objectives
Whatresults to accomplishby when
Strategies
Plan toachieve themission &objectives
Policies
Broadguidelinesfor decisionmaking
EnvironmentalScanning:
StrategyFormulation:
StrategyImplementation:
Evaluationand Control:
Feedback/Learning: Make corrections as needed
After reading this chapter, you should be able to:
company. The University of Michigan’s American Customer Satisfaction Index, compiled in
2005, revealed that Home Depot, with a score of 67, had slipped to last place among
major U.S. retailers.
Nardelli did not react well to criticism. For example, the agenda for the May 2006
shareholders meeting contained a number of shareholder proposals dealing with “exces-
sive” senior management compensation, separating the position of Chairman of the
Board from another management position, requiring a majority (instead of plurality) vote
for board member elections, shareholder approval for future “extraordinary” retirement
benefits for senior executives, and disclosure of the monetary value of executive benefits.
The votes on these proposals indicated an unusually high level of shareholder dissent,
with at least one-third of shareholders voting for every proposal—votes cast before the
meeting. Upon arriving at the annual shareholders meeting, people were surprised to
note a number of changes from previous annual meetings. For one thing, except for CEO
Nardelli, none of the members of the board of directors were present. For another, share-
holders were allowed to speak about their shareholder proposals, but each had a time
limit that was carefully tracked by a giant clock. Nardelli did not present a performance
review, refused to acknowledge comments or answer questions, and adjourned the meet-
ing after 30 minutes. Many of the shareholders were enraged by Nardelli’s arrogance.
Pushed by the shareholders to reduce the CEO’s large compensation package, the
board of directors finally asked Nardelli to accept future stock awards being tied to in-
creases in the company’s stock price. Nardelli flatly refused and instead quit the company
in January 2007—taking with him a $210 million retirement package. Observers could not
understand why the board had been so generous with a CEO who during his tenure had
been more concerned with building his own compensation than in building shareholder
wealth.4
Home Depot’s shareholders are not the only ones who are concerned with question-
able top managers and weak boards of directors. A record 1,169 shareholder resolutions
were proposed in the U.S. during 2007. Proposals on CEO pay and other governance issues
received record high support votes of 30% to 60% from investors.5 Successful shareholder
activist campaigns increased in Europe from less than 10 in 2001 to over 50 in 2007.6
Research revealing that managers at 29% of all U.S. public corporations had back-dated
stock options in order to boost executive pay led to civil charges and shareholder lawsuits
in addition to criminal indictments.7 Board members are increasingly being held account-
able for poor corporate governance. For example, 10 former directors from WorldCom
and Enron agreed to pay $18 million and $13 million, respectively, of their own money to
settle lawsuits launched by enraged stockholders over the unethical and even criminal ac-
tions of top management overseen by a passive board of directors.8
44 PART 1 Introduction to Strategic Management and Business Policy
CHAPTER 2 Corporate Governance 45
2.1 Role of the Board of DirectorsA corporation is a mechanism established to allow different parties to contribute capital, ex-pertise, and labor for their mutual benefit. The investor/shareholder participates in the profitsof the enterprise without taking responsibility for the operations. Management runs the com-pany without being responsible for personally providing the funds. To make this possible, lawshave been passed that give shareholders limited liability and, correspondingly, limited in-volvement in a corporation’s activities. That involvement does include, however, the right toelect directors who have a legal duty to represent the shareholders and protect their interests.As representatives of the shareholders, directors have both the authority and the responsibil-ity to establish basic corporate policies and to ensure that they are followed.9
The board of directors, therefore, has an obligation to approve all decisions that might af-fect the long-run performance of the corporation. This means that the corporation is fundamen-tally governed by the board of directors overseeing top management, with the concurrence ofthe shareholder. The term corporate governance refers to the relationship among these threegroups in determining the direction and performance of the corporation.10
Over the past decade, shareholders and various interest groups have seriously questionedthe role of the board of directors in corporations. They are concerned that inside board mem-bers may use their position to feather their own nests and that outside board members oftenlack sufficient knowledge, involvement, and enthusiasm to do an adequate job of monitoringand providing guidance to top management. Instances of widespread corruption and question-able accounting practices at Enron, Global Crossing, WorldCom, Tyco, and Qwest, among oth-ers, seem to justify their concerns. Home Depot’s board, for example, seemed more interestedin keeping CEO Nardelli happy than in promoting shareholder interests.
The general public has not only become more aware and more critical of many boards’apparent lack of responsibility for corporate activities, it has begun to push government to de-mand accountability. As a result, the board as a rubber stamp of the CEO or as a bastion of the“old-boy” selection system is being replaced by more active, more professional boards.
RESPONSIBILITIES OF THE BOARDLaws and standards defining the responsibilities of boards of directors vary from country tocountry. For example, board members in Ontario, Canada, face more than 100 provincial andfederal laws governing director liability. The United States, however, has no clear nationalstandards or federal laws. Specific requirements of directors vary, depending on the state inwhich the corporate charter is issued. There is, nevertheless, a developing worldwide consen-sus concerning the major responsibilities of a board. Interviews with 200 directors from eightcountries (Canada, France, Germany, Finland, Switzerland, the Netherlands, the United King-dom, and Venezuela) revealed strong agreement on the following five board of director re-sponsibilities, listed in order of importance:
1. Setting corporate strategy, overall direction, mission, or vision
2. Hiring and firing the CEO and top management
3. Controlling, monitoring, or supervising top management
4. Reviewing and approving the use of resources
5. Caring for shareholder interests11
These results are in agreement with a survey by the National Association of CorporateDirectors, in which U.S. CEOs reported that the four most important issues boards should
46 PART 1 Introduction to Strategic Management and Business Policy
address are corporate performance, CEO succession, strategic planning, and corporate gov-ernance.12 Directors in the United States must make certain, in addition to the duties justlisted, that the corporation is managed in accordance with the laws of the state in which it isincorporated. Because more than half of all publicly traded companies in the United Statesare incorporated in the state of Delaware, this state’s laws and rulings have more impact thando those of any other state.13 Directors must also ensure management’s adherence to lawsand regulations, such as those dealing with the issuance of securities, insider trading, andother conflict-of-interest situations. They must also be aware of the needs and demands ofconstituent groups so that they can achieve a judicious balance among the interests of thesediverse groups while ensuring the continued functioning of the corporation.
In a legal sense, the board is required to direct the affairs of the corporation but not to man-age them. It is charged by law to act with due care. If a director or the board as a whole failsto act with due care and, as a result, the corporation is in some way harmed, the careless direc-tor or directors can be held personally liable for the harm done. This is no small concern giventhat one survey of outside directors revealed that more than 40% had been named as part oflawsuits against corporations.14 For example, board members of Equitable Life in Britain weresued for up to $5.4 billion for failure to question the CEO’s reckless policies.15 For this rea-son, corporations have found that they need directors and officers’ liability insurance in orderto attract people to become members of boards of directors.
A 2008 global survey of directors by McKinsey & Company revealed the average amountof time boards spend on a given issue during their meetings:16
� Strategy (development and analysis of strategies)—24%
� Execution (prioritizing programs and approving mergers and acquisitions)—24%
� Performance management (development of incentives and measuring performance)—20%
� Governance and compliance (nominations, compensation, audits)—17%
� Talent management—11%
Role of the Board in Strategic ManagementHow does a board of directors fulfill these many responsibilities? The role of the board of di-rectors in strategic management is to carry out three basic tasks:
� Monitor: By acting through its committees, a board can keep abreast of developments in-side and outside the corporation, bringing to management’s attention developments itmight have overlooked. A board should at the minimum carry out this task.
� Evaluate and influence: A board can examine management’s proposals, decisions, andactions; agree or disagree with them; give advice and offer suggestions; and outline alter-natives. More active boards perform this task in addition to monitoring.
� Initiate and determine: A board can delineate a corporation’s mission and specify strate-gic options to its management. Only the most active boards take on this task in additionto the two previous ones.
Board of Directors’ ContinuumA board of directors is involved in strategic management to the extent that it carries out thethree tasks of monitoring, evaluating and influencing, and initiating and determining. Theboard of directors’ continuum shown in Figure 2–1 shows the possible degree of involve-ment (from low to high) in the strategic management process. Boards can range from phantomboards with no real involvement to catalyst boards with a very high degree of involvement.17
Research suggests that active board involvement in strategic management is positively relatedto a corporation’s financial performance and its credit rating.18
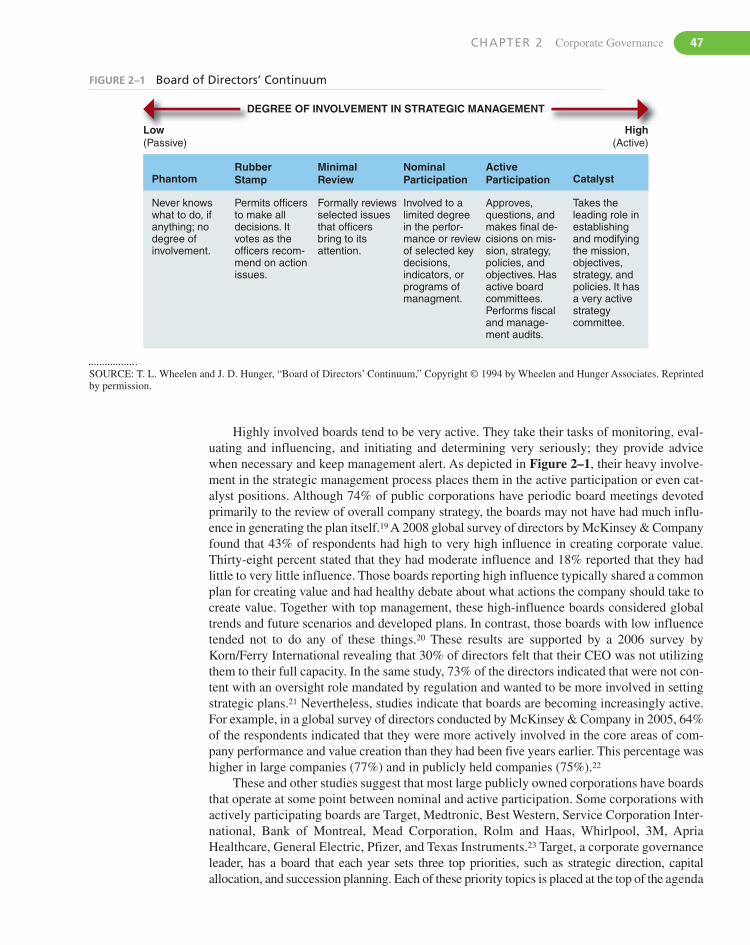
CHAPTER 2 Corporate Governance 47
DEGREE OF INVOLVEMENT IN STRATEGIC MANAGEMENT
Low(Passive)
RubberStampPhantom
Never knowswhat to do, ifanything; nodegree ofinvolvement.
Formally reviewsselected issuesthat officersbring to itsattention.
Involved to alimited degreein the perfor-mance or reviewof selected keydecisions,indicators, orprograms ofmanagment.
Approves,questions, andmakes final de-cisions on mis-sion, strategy,policies, andobjectives. Hasactive boardcommittees.Performs fiscaland manage-ment audits.
Takes theleading role inestablishingand modifyingthe mission,objectives,strategy, andpolicies. It hasa very activestrategycommittee.
Permits officersto make alldecisions. Itvotes as theofficers recom-mend on actionissues.
MinimalReview
NominalParticipation
ActiveParticipation Catalyst
High(Active)
FIGURE 2–1 Board of Directors’ Continuum
SOURCE: T. L. Wheelen and J. D. Hunger, “Board of Directors’ Continuum,” Copyright © 1994 by Wheelen and Hunger Associates. Reprintedby permission.
Highly involved boards tend to be very active. They take their tasks of monitoring, eval-uating and influencing, and initiating and determining very seriously; they provide advicewhen necessary and keep management alert. As depicted in Figure 2–1, their heavy involve-ment in the strategic management process places them in the active participation or even cat-alyst positions. Although 74% of public corporations have periodic board meetings devotedprimarily to the review of overall company strategy, the boards may not have had much influ-ence in generating the plan itself.19 A 2008 global survey of directors by McKinsey & Companyfound that 43% of respondents had high to very high influence in creating corporate value.Thirty-eight percent stated that they had moderate influence and 18% reported that they hadlittle to very little influence. Those boards reporting high influence typically shared a commonplan for creating value and had healthy debate about what actions the company should take tocreate value. Together with top management, these high-influence boards considered globaltrends and future scenarios and developed plans. In contrast, those boards with low influencetended not to do any of these things.20 These results are supported by a 2006 survey byKorn/Ferry International revealing that 30% of directors felt that their CEO was not utilizingthem to their full capacity. In the same study, 73% of the directors indicated that were not con-tent with an oversight role mandated by regulation and wanted to be more involved in settingstrategic plans.21 Nevertheless, studies indicate that boards are becoming increasingly active.For example, in a global survey of directors conducted by McKinsey & Company in 2005, 64%of the respondents indicated that they were more actively involved in the core areas of com-pany performance and value creation than they had been five years earlier. This percentage washigher in large companies (77%) and in publicly held companies (75%).22
These and other studies suggest that most large publicly owned corporations have boardsthat operate at some point between nominal and active participation. Some corporations withactively participating boards are Target, Medtronic, Best Western, Service Corporation Inter-national, Bank of Montreal, Mead Corporation, Rolm and Haas, Whirlpool, 3M, ApriaHealthcare, General Electric, Pfizer, and Texas Instruments.23 Target, a corporate governanceleader, has a board that each year sets three top priorities, such as strategic direction, capitalallocation, and succession planning. Each of these priority topics is placed at the top of the agenda
48 PART 1 Introduction to Strategic Management and Business Policy
for at least one meeting. Target’s board also devotes one meeting a year to setting the strategicdirection for each major operating division.24
As a board becomes less involved in the affairs of the corporation, it moves farther to theleft on the continuum (see Figure 2–1). On the far left are passive phantom or rubber-stampboards that typically never initiate or determine strategy unless a crisis occurs. In these situations,the CEO also serves as Chairman of the Board, personally nominates all directors, and works tokeep board members under his or her control by giving them the “mushroom treatment”—throwmanure on them and keep them in the dark!
Generally, the smaller the corporation, the less active is its board of directors in strategicmanagement.25 In an entrepreneurial venture, for example, the privately held corporation maybe 100% owned by the founders—who also manage the company. In this case, there is no needfor an active board to protect the interests of the owner-manager shareholders—the interests ofthe owners and the managers are identical. In this instance, a board is really unnecessary and onlymeets to satisfy legal requirements. If stock is sold to outsiders to finance growth, however, theboard becomes more active. Key investors want seats on the board so they can oversee their in-vestment. To the extent that they still control most of the stock, however, the founders dominatethe board. Friends, family members, and key shareholders usually become members, but theboard acts primarily as a rubber stamp for any proposals put forward by the owner-managers. Inthis type of company, the founder tends to be both CEO and Chairman of the Board and the boardincludes few people who are not affiliated with the firm or family.26 This cozy relationship be-tween the board and management should change, however, when the corporation goes publicand stock is more widely dispersed. The founders, who are still acting as management, maysometimes make decisions that conflict with the needs of the other shareholders (especially ifthe founders own less than 50% of the common stock). In this instance, problems could occurif the board fails to become more active in terms of its roles and responsibilities.
MEMBERS OF A BOARD OF DIRECTORSThe boards of most publicly owned corporations are composed of both inside and outside direc-tors. Inside directors (sometimes called management directors) are typically officers or execu-tives employed by the corporation. Outside directors (sometimes called non-managementdirectors) may be executives of other firms but are not employees of the board’s corporation. Al-though there is yet no clear evidence indicating that a high proportion of outsiders on a board re-sults in improved financial performance,27 there is a trend in the United States to increase thenumber of outsiders on boards and to reduce the total size of the board.28 The board of direc-tors of a typical large U.S. corporation has an average of 10 directors, 2 of whom are insiders.29
Outsiders thus account for 80% of the board members in large U.S. corporations (approxi-mately the same as in Canada). Boards in the UK typically have 5 inside and 5 outsidedirectors, whereas in France boards usually consist of 3 insiders and 8 outsiders. Japaneseboards, in contrast, contain 2 outsiders and 12 insiders.30 The board of directors in a typicalsmall U.S. corporation has four to five members, of whom only one or two are outsiders.31
Research from large and small corporations reveals a negative relationship between boardsize and firm profitability.32
People who favor a high proportion of outsiders state that outside directors are less biasedand more likely to evaluate management’s performance objectively than are inside directors.This is the main reason why the U.S. Securities and Exchange Commission (SEC) in 2003 re-quired that a majority of directors on the board be independent outsiders. The SEC also re-quired that all listed companies staff their audit, compensation, and nominating/corporategovernance committees entirely with independent, outside members. This view is in agree-ment with agency theory, which states that problems arise in corporations because the agents
CHAPTER 2 Corporate Governance 49
(top management) are not willing to bear responsibility for their decisions unless they own asubstantial amount of stock in the corporation. The theory suggests that a majority of a boardneeds to be from outside the firm so that top management is prevented from acting selfishly tothe detriment of the shareholders. For example, proponents of agency theory argue that man-agers in management-controlled firms (contrasted with owner-controlled firms in which thefounder or family still own a significant amount of stock) select less risky strategies with quickpayoffs in order to keep their jobs.33 This view is supported by research revealing that manager-controlled firms (with weak boards) are more likely to go into debt to diversify into unrelatedmarkets (thus quickly boosting sales and assets to justify higher salaries for themselves), thusresulting in poorer long-term performance than owner-controlled firms.34 Boards with a largerproportion of outside directors tend to favor growth through international expansion and inno-vative venturing activities than do boards with a smaller proportion of outsiders.35 Outsiderstend to be more objective and critical of corporate activities. For example, research reveals thatthe likelihood of a firm engaging in illegal behavior or being sued declines with the additionof outsiders on the board.36 Research on family businesses has found that boards with a largernumber of outsiders on the board tended to have better corporate governance and better per-formance than did boards with fewer outsiders.37
In contrast, those who prefer inside over outside directors contend that outside directorsare less effective than are insiders because the outsiders are less likely to have the necessaryinterest, availability, or competency. Stewardship theory proposes that, because of their longtenure with the corporation, insiders (senior executives) tend to identify with the corporationand its success. Rather than use the firm for their own ends, these executives are thus most in-terested in guaranteeing the continued life and success of the corporation. (See Strategy High-light 2.1 for a discussion of Agency Theory contrasted with Stewardship Theory.) Excludingall insiders but the CEO reduces the opportunity for outside directors to see potential succes-sors in action or to obtain alternate points of view of management decisions. Outside directorsmay sometimes serve on so many boards that they spread their time and interest too thin to ac-tively fulfill their responsibilities. The average board member of a U.S. Fortune 500 firmserves on three boards. Research indicates that firm performance decreases as the number ofdirectorships held by the average board member increases.38 Although only 40% of surveyedU.S. boards currently limit the number of directorships a board member may hold in other cor-porations, 60% limit the number of boards on which their CEO may be a member.39
Those who question the value of having more outside board members point out that theterm outsider is too simplistic because some outsiders are not truly objective and should beconsidered more as insiders than as outsiders. For example, there can be:
1. Affiliated directors, who, though not really employed by the corporation, handle the le-gal or insurance work for the company or are important suppliers (thus dependent on thecurrent management for a key part of their business). These outsiders face a conflict of in-terest and are not likely to be objective. As a result of recent actions by the U.S. Congress,Securities and Exchange Commission, New York Stock Exchange, and NASDAQ, affili-ated directors are being banned from U.S. corporate boardrooms. U.S. boards can no longerinclude representatives of major suppliers or customers or even professional organizationsthat might do business with the firm, even though these people could provide valuableknowledge and expertise.40 The New York Stock Exchange decided in 2004 that anyonepaid by the company during the previous three years could not be classified as an inde-pendent outside director.41
2. Retired executive directors, who used to work for the company, such as the past CEO whois partly responsible for much of the corporation’s current strategy and who probablygroomed the current CEO as his or her replacement. In the recent past, many boards of largefirms kept the firm’s recently retired CEO on the board for a year or two after retirement as
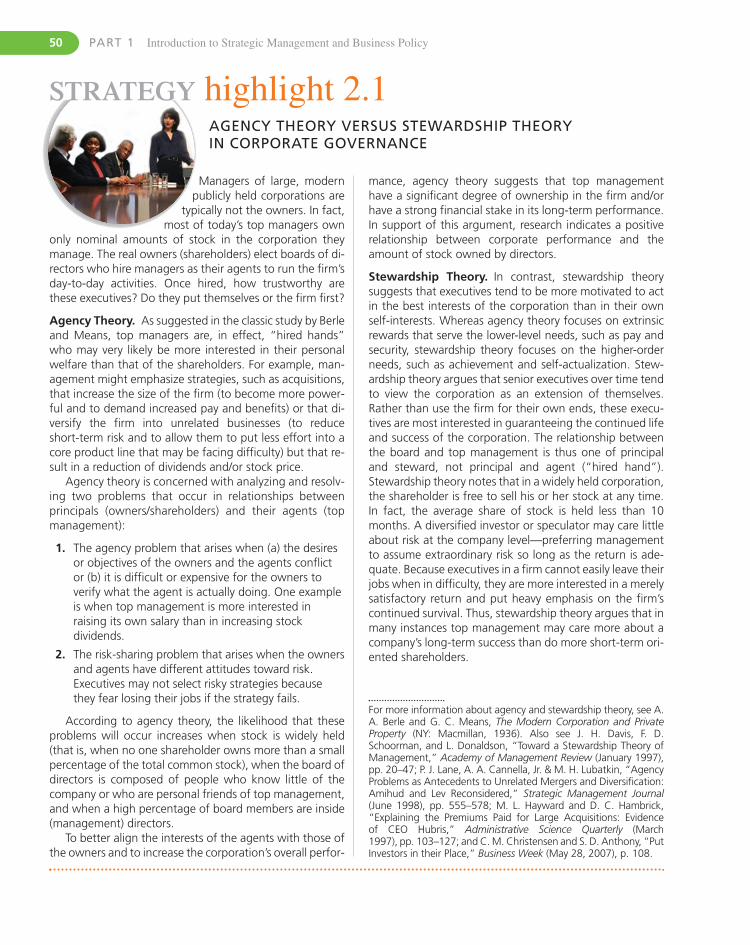
50 PART 1 Introduction to Strategic Management and Business Policy
AGENCY THEORY VERSUS STEWARDSHIP THEORY IN CORPORATE GOVERNANCE
Managers of large, modernpublicly held corporations are
typically not the owners. In fact,most of today’s top managers own
only nominal amounts of stock in the corporation theymanage. The real owners (shareholders) elect boards of di-rectors who hire managers as their agents to run the firm’sday-to-day activities. Once hired, how trustworthy arethese executives? Do they put themselves or the firm first?
Agency Theory. As suggested in the classic study by Berleand Means, top managers are, in effect, “hired hands”who may very likely be more interested in their personalwelfare than that of the shareholders. For example, man-agement might emphasize strategies, such as acquisitions,that increase the size of the firm (to become more power-ful and to demand increased pay and benefits) or that di-versify the firm into unrelated businesses (to reduceshort-term risk and to allow them to put less effort into acore product line that may be facing difficulty) but that re-sult in a reduction of dividends and/or stock price.
Agency theory is concerned with analyzing and resolv-ing two problems that occur in relationships betweenprincipals (owners/shareholders) and their agents (topmanagement):
1. The agency problem that arises when (a) the desiresor objectives of the owners and the agents conflictor (b) it is difficult or expensive for the owners toverify what the agent is actually doing. One exampleis when top management is more interested inraising its own salary than in increasing stockdividends.
2. The risk-sharing problem that arises when the ownersand agents have different attitudes toward risk.Executives may not select risky strategies becausethey fear losing their jobs if the strategy fails.
According to agency theory, the likelihood that theseproblems will occur increases when stock is widely held(that is, when no one shareholder owns more than a smallpercentage of the total common stock), when the board ofdirectors is composed of people who know little of thecompany or who are personal friends of top management,and when a high percentage of board members are inside(management) directors.
To better align the interests of the agents with those ofthe owners and to increase the corporation’s overall perfor-
mance, agency theory suggests that top managementhave a significant degree of ownership in the firm and/orhave a strong financial stake in its long-term performance.In support of this argument, research indicates a positiverelationship between corporate performance and theamount of stock owned by directors.
Stewardship Theory. In contrast, stewardship theorysuggests that executives tend to be more motivated to actin the best interests of the corporation than in their ownself-interests. Whereas agency theory focuses on extrinsicrewards that serve the lower-level needs, such as pay andsecurity, stewardship theory focuses on the higher-orderneeds, such as achievement and self-actualization. Stew-ardship theory argues that senior executives over time tendto view the corporation as an extension of themselves.Rather than use the firm for their own ends, these execu-tives are most interested in guaranteeing the continued lifeand success of the corporation. The relationship betweenthe board and top management is thus one of principaland steward, not principal and agent (“hired hand”).Stewardship theory notes that in a widely held corporation,the shareholder is free to sell his or her stock at any time.In fact, the average share of stock is held less than 10months. A diversified investor or speculator may care littleabout risk at the company level—preferring managementto assume extraordinary risk so long as the return is ade-quate. Because executives in a firm cannot easily leave theirjobs when in difficulty, they are more interested in a merelysatisfactory return and put heavy emphasis on the firm’scontinued survival. Thus, stewardship theory argues that inmany instances top management may care more about acompany’s long-term success than do more short-term ori-ented shareholders.
For more information about agency and stewardship theory, see A.A. Berle and G. C. Means, The Modern Corporation and PrivateProperty (NY: Macmillan, 1936). Also see J. H. Davis, F. D.Schoorman, and L. Donaldson, “Toward a Stewardship Theory ofManagement,” Academy of Management Review (January 1997),pp. 20–47; P. J. Lane, A. A. Cannella, Jr. & M. H. Lubatkin, “AgencyProblems as Antecedents to Unrelated Mergers and Diversification:Amihud and Lev Reconsidered,” Strategic Management Journal(June 1998), pp. 555–578; M. L. Hayward and D. C. Hambrick,“Explaining the Premiums Paid for Large Acquisitions: Evidenceof CEO Hubris,” Administrative Science Quarterly (March1997), pp. 103–127; and C. M. Christensen and S. D. Anthony, “PutInvestors in their Place,” Business Week (May 28, 2007), p. 108.
STRATEGY highlight 2.1
CHAPTER 2 Corporate Governance 51
a courtesy, especially if he/she had performed well as the CEO. It is almost certain, how-ever, that this person will not be able to objectively evaluate the corporation’s performance.Because of the likelihood of a conflict of interest, only 31% of boards in the Americas, 25%in Europe, and 20% in Australasia now include the former CEO on their boards.42
3. Family directors, who are descendants of the founder and own significant blocks of stock(with personal agendas based on a family relationship with the current CEO). The SchlitzBrewing Company, for example, was unable to complete its turnaround strategy with anon-family CEO because family members serving on the board wanted their money outof the company, forcing it to be sold.43
The majority of outside directors are active or retired CEOs and COOs of other corpora-tions. Others are major investors/shareholders, academicians, attorneys, consultants, formergovernment officials, and bankers. Given that 66% of the outstanding stock in the largest U.S.and UK corporations is now owned by institutional investors, such as mutual funds and pen-sion plans, these investors are taking an increasingly active role in board membership and ac-tivities.44 For example, TIAA-CREF’s Corporate Governance team monitors governancepractices of the 4,000 companies in which it invests its pension funds through its CorporateAssessment Program. If its analysis of a company reveals problems, TIAA-CREF first sendsletters stating its concerns, followed up by visits, and it finally sponsors a shareholder resolu-tion in opposition to management’s actions.45 Institutional investors are also powerful in manyother countries. In Germany, bankers are represented on almost every board—primarily be-cause they own large blocks of stock in German corporations. In Denmark, Sweden, Belgium,and Italy, however, investment companies assume this role. For example, the investment com-pany Investor casts 42.5% of the Electrolux shareholder votes, thus guaranteeing itself posi-tions on the Electrolux board.
Boards of directors have been working to increase the number of women and minoritiesserving on boards. Korn/Ferry International reports that of the Fortune 1000 largest U.S. firms,85% had at least one woman director in 2006 (compared to 69% in 1995), comprising 15% oftotal directors. Approximately one-half of the boards in Europe included a female director,comprising 9% of total directors. (The percentage of female directors in Europe in 2006 rangedfrom less than 1% in Portugal to almost 40% in Norway.)46 Korn/Ferry’s survey also revealedthat 76% of the U.S. boards had at least one ethnic minority in 2006 (African-American, 47%;Latino, 19%; Asian, 10%) as director compared to only 47% in 1995, comprising around 14%of total directors.47 Among the top 200 S&P companies in the U.S., however, 84% have at leastone African-American director.48 The globalization of business is having an impact on boardmembership. According to the Spencer Stuart executive recruiting firm, 33% of U.S. boardshad an international director.49 Europe was the most “globalized” region of the world, withmost companies reporting one or more non-national directors.50 Although Asian and LatinAmerican boards are still predominantly staffed by nationals, they are working to add more in-ternational directors.51
Outside directors serving on the boards of large Fortune 1000 U.S. corporations annuallyearned on average $58,217 in cash plus an average of $75,499 in stock options. Most of thecompanies (63%) paid their outside directors an annual retainer plus a fee for every meetingattended.52 Directors serving on the boards of small companies usually received much lesscompensation (around $10,000). One study found directors of a sample of large U.S. firms tohold on average 3% of their corporations’ outstanding stock.53
The vast majority of inside directors are the chief executive officer and either the chief op-erating officer (if not also the CEO) or the chief financial officer. Presidents or vice presidentsof key operating divisions or functional units sometimes serve on the board. Few, if any, in-side directors receive any extra compensation for assuming this extra duty. Very rarely does aU.S. board include any lower-level operating employees.
52 PART 1 Introduction to Strategic Management and Business Policy
Codetermination: Should Employees Serve on Boards?Codetermination, the inclusion of a corporation’s workers on its board, began only recently inthe United States. Corporations such as Chrysler, Northwest Airlines, United Airlines (UAL),and Wheeling-Pittsburgh Steel added representatives from employee associations to theirboards as part of union agreements or Employee Stock Ownership Plans (ESOPs). For exam-ple, United Airlines workers traded 15% in pay cuts for 55% of the company (through an ESOP)and 3 of the firm’s 12 board seats. In this instance, workers represent themselves on the boardnot so much as employees but primarily as owners. At Chrysler, however, the United AutoWorkers union obtained a temporary seat on the board as part of a union contract agreement inexchange for changes in work rules and reductions in benefits. This was at a time when Chryslerwas facing bankruptcy in the late 1970s. In situations like this when a director represents an in-ternal stakeholder, critics raise the issue of conflict of interest. Can a member of the board, whois privy to confidential managerial information, function, for example, as a union leader whoseprimary duty is to fight for the best benefits for his or her members? Although the movement toplace employees on the boards of directors of U.S. companies shows little likelihood of increas-ing (except through employee stock ownership), the European experience reveals an increasingacceptance of worker participation (without ownership) on corporate boards.
Germany pioneered codetermination during the 1950s with a two-tiered system: (1) a su-pervisory board elected by shareholders and employees to approve or decide corporate strat-egy and policy and (2) a management board (composed primarily of top management)appointed by the supervisory board to manage the company’s activities. Most other WesternEuropean countries have either passed similar codetermination legislation (as in Sweden,Denmark, Norway, and Austria) or use worker councils to work closely with management (asin Belgium, Luxembourg, France, Italy, Ireland, and the Netherlands).
Interlocking DirectoratesCEOs often nominate chief executives (as well as board members) from other firms to mem-bership on their own boards in order to create an interlocking directorate. A direct interlockingdirectorate occurs when two firms share a director or when an executive of one firm sits onthe board of a second firm. An indirect interlock occurs when two corporations have directorswho also serve on the board of a third firm, such as a bank.
Although the Clayton Act and the Banking Act of 1933 prohibit interlocking directoratesby U.S. companies competing in the same industry, interlocking continues to occur in almostall corporations, especially large ones. Interlocking occurs because large firms have a largeimpact on other corporations and these other corporations, in turn, have some control over thefirm’s inputs and marketplace. For example, most large corporations in the United States,Japan, and Germany are interlocked either directly or indirectly with financial institutions.54
Eleven of the 15 largest U.S. corporations have at least two board members who sit togetheron another board. Twenty percent of the 1,000 largest U.S. firms share at least one boardmember.55
Interlocking directorates are useful for gaining both inside information about an uncertainenvironment and objective expertise about potential strategies and tactics.56 For example,Kleiner Perkins, a high-tech venture capital firm, not only has seats on the boards of the com-panies in which it invests, but it also has executives (which Kleiner Perkins hired) from oneentrepreneurial venture who serve as directors on others. Kleiner Perkins refers to its networkof interlocked firms as its keiretsu, a Japanese term for a set of companies with interlockingbusiness relationships and share-holdings.57 Family-owned corporations, however, are lesslikely to have interlocking directorates than are corporations with highly dispersed stock own-ership, probably because family-owned corporations do not like to dilute their corporate con-trol by adding outsiders to boardroom discussions.
CHAPTER 2 Corporate Governance 53
There is some concern, however, when the chairs of separate corporations serve on eachother’s boards. Twenty-two such pairs of corporate chairs (who typically also served as theirfirm’s CEO) existed in 2003. In one instance, the three chairmen of Anheuser-Busch, SBCCommunications, and Emerson Electric served on all three of the boards. Typically a CEO sitson only one board in addition to his or her own—down from two additional boards in previ-ous years. Although such interlocks may provide valuable information, they are increasinglyfrowned upon because of the possibility of collusion.58 Nevertheless, evidence indicates thatwell-interlocked corporations are better able to survive in a highly competitive environment.59
NOMINATION AND ELECTION OF BOARD MEMBERSTraditionally the CEO of a corporation decided whom to invite to board membership andmerely asked the shareholders for approval in the annual proxy statement. All nomineeswere usually elected. There are some dangers, however, in allowing the CEO free rein innominating directors. The CEO might select only board members who, in the CEO’s opin-ion, will not disturb the company’s policies and functioning. Given that the average lengthof service of a U.S. board member is for three three-year terms (but can range up to 20 yearsfor some boards), CEO-friendly, passive boards are likely to result. This is especially likelygiven that only 7% of surveyed directors indicated that their company had term limits forboard members. Nevertheless, 60% of U.S. boards and 58% of European boards have amandatory retirement age—typically around 70.60 Research reveals that boards rated as leasteffective by the Corporate Library, a corporate governance research firm, tend to havemembers serving longer (an average of 9.7 years) than boards rated as most effective(7.5 years).61 Directors selected by the CEO often feel that they should go along with anyproposal the CEO makes. Thus board members find themselves accountable to the verymanagement they are charged to oversee. Because this is likely to happen, more boards areusing a nominating committee to nominate new outside board members for the shareholdersto elect. Ninety-seven percent of large U.S. corporations now use nominating committees toidentify potential directors. This practice is less common in Europe where 60% of boardsuse nominating committees.62
Many corporations whose directors serve terms of more than one year divides the boardinto classes and staggers elections so that only a portion of the board stands for election eachyear. This is called a staggered board. Sixty-three percent of U.S. boards currently have stag-gered boards.63 Arguments in favor of this practice are that it provides continuity by reducingthe chance of an abrupt turnover in its membership and that it reduces the likelihood of elect-ing people unfriendly to management (who might be interested in a hostile takeover) throughcumulative voting. An argument against staggered boards is that they make it more difficultfor concerned shareholders to curb a CEO’s power—especially when that CEO is also Chair-man of the Board. An increasing number of shareholder resolutions to replace staggered boardswith annual elections of all board members are currently being passed at annual meetings.
When nominating people for election to a board of directors, it is important that nomineeshave previous experience dealing with corporate issues. For example, research reveals that afirm makes better acquisition decisions when the firm’s outside directors have had experiencewith such decisions.64
A survey of directors of U.S. corporations revealed the following criteria in a good director:
� Willing to challenge management when necessary—95%
� Special expertise important to the company—67%
� Available outside meetings to advise management—57%
� Expertise on global business issues—41%
54 PART 1 Introduction to Strategic Management and Business Policy
� Understands the firm’s key technologies and processes—39%
� Brings external contacts that are potentially valuable to the firm—33%
� Has detailed knowledge of the firm’s industry—31%
� Has high visibility in his or her field—31%
� Is accomplished at representing the firm to stakeholders—18%65
ORGANIZATION OF THE BOARDThe size of a board in the United States is determined by the corporation’s charter and its by-laws, in compliance with state laws. Although some states require a minimum number of boardmembers, most corporations have quite a bit of discretion in determining board size. The av-erage large, publicly held U.S. firm has 10 directors on its board. The average small, privately-held company has four to five members. The average size of boards elsewhere is Japan, 14;Non-Japan Asia, 9; Germany, 16; UK, 10; and France, 11.66
Approximately 70% of the top executives of U.S. publicly held corporations hold the dualdesignation of Chairman and CEO. (Only 5% of the firms in the UK have a combinedChair/CEO.)67 The combined Chair/CEO position is being increasingly criticized because ofthe potential for conflict of interest. The CEO is supposed to concentrate on strategy, planning,external relations, and responsibility to the board. The Chairman’s responsibility is to ensure thatthe board and its committees perform their functions as stated in the board’s charter. Further, theChairman schedules board meetings and presides over the annual shareholders’ meeting.Critics of having one person in the two offices ask how the board can properly oversee topmanagement if the Chairman is also a part of top management. For this reason, the Chairmanand CEO roles are separated by law in Germany, the Netherlands, South Africa, and Finland.A similar law has been considered in the United Kingdom and Australia. Although research ismixed regarding the impact of the combined Chair/CEO position on overall corporate finan-cial performance, firm stock price and credit ratings both respond negatively to announcementsof CEOs also assuming the Chairman position.68 Research also shows that corporations with acombined Chair/CEO have a greater likelihood of fraudulent financial reporting when CEOstock options are not present.69
Many of those who prefer that the Chairman and CEO positions be combined agree thatthe outside directors should elect a lead director. This person is consulted by the Chair/CEOregarding board affairs and coordinates the annual evaluation of the CEO.70 The lead directorposition is very popular in the United Kingdom, where it originated. Of those U.S. companiescombining the Chairman and CEO positions, 96% had a lead director.71 This is one way to givethe board more power without undermining the power of the Chair/CEO. The lead director be-comes increasingly important because 94% of U.S. boards in 2006 (compared to only 41% in2002) held regular executive sessions without the CEO being present.72 Nevertheless, there aremany ways in which an unscrupulous Chair/CEO can guarantee a director’s loyalty. Researchindicates that an increase in board independence often results in higher levels of CEO ingrati-ation behavior aimed at persuading directors to support CEO proposals. Long-tenured direc-tors who support the CEO may use social pressure to persuade a new board member toconform to the group. Directors are more likely to be recommended for membership on otherboards if they “don’t rock the boat” and engage in low levels of monitoring and control behav-ior.73 Even in those situations when the board has a nominating committee composed only ofoutsiders, the committee often obtains the CEO’s approval for each new board candidate.74
The most effective boards accomplish much of their work through committees. Althoughthey do not usually have legal duties, most committees are granted full power to act with theauthority of the board between board meetings. Typical standing committees (in order of
CHAPTER 2 Corporate Governance 55
prevalence) are the audit (100%), compensation (99%), nominating (97%), corporate gover-nance (94%), stock options (84%), director compensation (52%), and executive (43%) com-mittees.75 The executive committee is usually composed of two inside and two outsidedirectors located nearby who can meet between board meetings to attend to matters that mustbe settled quickly. This committee acts as an extension of the board and, consequently, mayhave almost unrestricted authority in certain areas.76 Except for the executive, finance, and in-vestment committees, board committees are now typically staffed only by outside directors.Although each board committee typically meets four to five times annually, the average auditcommittee met nine times during 2006.77
IMPACT OF THE SARBANES-OXLEY ACT ON U.S. CORPORATE GOVERNANCE
In response to the many corporate scandals uncovered since 2000, the U.S. Congress passed theSarbanes-Oxley Act in June 2002. This act was designed to protect shareholders from the ex-cesses and failed oversight that characterized failures at Enron, Tyco, WorldCom, AdelphiaCommunications, Qwest, and Global Crossing, among other prominent firms. Several key el-ements of Sarbanes-Oxley were designed to formalize greater board independence and over-sight. For example, the act requires that all directors serving on the audit committee beindependent of the firm and receive no fees other than for services of the director. In addition,boards may no longer grant loans to corporate officers. The act has also established formal pro-cedures for individuals (known as “whistleblowers”) to report incidents of questionable ac-counting or auditing. Firms are prohibited from retaliating against anyone reportingwrongdoing. Both the CEO and CFO must certify the corporation’s financial information. Theact bans auditors from providing both external and internal audit services to the same company.It also requires that a firm identify whether it has a “financial expert” serving on the audit com-mittee who is independent from management.
Although the cost to a large corporation of implementing the provisions of the law was$8.5 million in 2004, the first year of compliance, the costs to a large firm fell to $1–$5 million annually during the following years as accounting and information processes wererefined and made more efficient.78 Pitney Bowes, for example, saved more than $500,000 in2005 simply by consolidating four accounts receivable offices into one. Similar savings wererealized at Cisco and Genentech.79 An additional benefit of the increased disclosure require-ments is more reliable corporate financial statements. Companies are now reporting numberswith fewer adjustments for unusual charges and write-offs, which in the past have been used toboost reported earnings.80 The new rules have also made it more difficult for firms to post-dateexecutive stock options. “This is an unintended consequence of disclosure,” remarked GregoryTaxin, CEO of Glass, Lewis & Company, a stock research firm.81 See the Global Issue featureto learn how corporate governance is being improved in other parts of the world.
Improving GovernanceIn implementing the Sarbanes-Oxley Act, the U.S. Securities and Exchange Commission(SEC) required in 2003 that a company disclose whether it has adopted a code of ethics thatapplies to the CEO and to the company’s principal financial officer. Among other things, theSEC requires that the audit, nominating, and compensation committees be staffed entirely byoutside directors. The New York Stock Exchange reinforced the mandates of Sarbanes-Oxleyby requiring that companies have a nominating/governance committee composed entirely ofindependent outside directors. Similarly, NASDAQ rules require that nominations for new di-rectors be made by either a nominating committee of independent outsiders or by a majorityof independent outside directors.82
56 PART 1 Introduction to Strategic Management and Business Policy
CORPORATE GOVERNANCE IMPROVEMENTS THROUGHOUT THE WORLD
Countries throughout theworld are working to im-
prove corporate governance.Provisions that are roughly equiv-
alent to Sarbanes-Oxley are in placein France and Japan, while both China and Canada are im-plementing similar rules. In the UK, the Cadbury Report hasled to revisions to the Combined Code of Conduct that haveplaced additional responsibilities on non-management di-rectors, altered board and committee composition, andmodified the roles of the CEO and Chairman. The adoptionof recommendations from the government-sponsoredCromme Commission has reduced the power of manage-ment directors and increased the transparency of Germany’stwo-tier system of governance. Italy has implemented theDraghi Law of 1998 and the Preda Code of Conduct. Sincemany corporations in non-Japan Asia are family-controlledor have stock that is at least partially owned by the state, theAnglo-American system of corporate governance does notquite fit. Nevertheless, many of the changes in other parts ofthe world, such as CEO performance reviews and executivesuccession planning, are taking place in Asian corporations.
In an attempt to make Korean businesses more attrac-tive to foreign investors, for example, the South Koreangovernment recommended that companies listed on thestock exchange introduce a two-tiered structure. Onestructure was to consist entirely of non-executive (outside)directors. One of the few companies to immediately adoptthis new system of governance was Pohang Iron & SteelCompany Ltd. (POSCO), the world’s largest steelmaker.POSCO was listed on the New York Stock Exchange andhad significant operations in the United States, plus a jointventure with U.S. Steel. According to Youn-Gil Ro, Corpo-rate Information Team Manager, “We needed professionaladvice on international business practices as well as Amer-ican practices.”
SOURCES: A. L. Nazareth, “Keeping SarbOx Is Crucial,” BusinessWeek (November 13, 2006), p. 134; 33rd Annual Board ofDirectors Study (New York: Korn/Ferry International, 2007); C. A.Mallin, editor, Handbook on International Corporate Governance(Northampton, Massachusetts: Edward Elgar Publishing, 2006).Globalizing the Board of Directors: Trends and Strategies (NewYork: Conference Board, 1999), p. 16.
Partially in response to Sarbanes-Oxley, a survey of directors of Fortune 1000 U.S. compa-nies by Mercer Delta Consulting and the University of Southern California revealed that 60% ofdirectors were spending more time on board matters than before Sarbanes-Oxley, with 85%spending more time on their company’s accounts, 83% more on governance practices, and 52%on monitoring financial performance.83 Newly elected outside directors with financial manage-ment experience increased to 10% of all outside directors in 2003 from only 1% of outsiders in1998.84 Seventy-eight percent of Fortune 1000 U.S. boards in 2006 required that directors ownstock in the corporation, compared to just 36% in Europe, and 26% in Asia.85
Evaluating GovernanceTo help investors evaluate a firm’s corporate governance, a number of independent ratingservices, such as Standard & Poor’s (S&P), Moody’s, Morningstar, The Corporate Library,Institutional Shareholder Services (ISS), and Governance Metrics International (GMI), haveestablished criteria for good governance. Business Week annually publishes a list of the bestand worst boards of U.S. corporations. Whereas rating service firms like S&P, Moody’s, andThe Corporate Library use a wide mix of research data and criteria to evaluate companies, ISSand GMI have been criticized because they primarily use public records to score firms, usingsimple checklists.86 In contrast, the S&P Corporate Governance Scoring System researchesfour major issues:
� Ownership Structure and Influence
� Financial Stakeholder Rights and Relations
GLOBAL issue
CHAPTER 2 Corporate Governance 57
� Financial Transparency and Information Disclosure
� Board Structure and Processes
Although the S&P scoring system is proprietary and confidential, independent re-search using generally accepted measures of S&P’s four issues revealed that moving fromthe poorest- to the best-governed categories nearly doubled a firm’s likelihood of receiv-ing an investment-grade credit rating.87
Avoiding Governance ImprovementsA number of corporations are concerned that various requirements to improve corporate gov-ernance will constrain top management’s ability to effectively manage the company. For ex-ample, more U.S. public corporations have gone private in the years since the passage ofSarbanes-Oxley than before its passage. Other companies use multiple classes of stock to keepoutsiders from having sufficient voting power to change the company. Insiders, usually thecompany’s founders, get stock with extra votes, while others get second-class stock with fewervotes. For example, Brian Roberts, CEO of Comcast, owns “superstock” that represents only0.4% of outstanding common stock but guarantees him one-third of the voting stock. The In-vestor Responsibility Research Center reports that 11.3% of the companies it monitored in2004 had multiple classes, up from 7.5% in 1990.88
Another approach to sidestepping new governance requirements is being used by corpora-tions such as Google, Infrasource Services, Orbitz, and W&T Offshore. If a corporation inwhich an individual group or another company controls more than 50% of the voting shares de-cides to become a “controlled company,” the firm is then exempt from requirements by the NewYork Stock Exchange and NASDAQ that a majority of the board and all members of key boardcommittees be independent outsiders. According to governance authority Jay Lorsch, this willresult in a situation in which “the majority shareholders can walk all over the minority.”89
TRENDS IN CORPORATE GOVERNANCEThe role of the board of directors in the strategic management of a corporation is likely to bemore active in the future. Although neither the composition of boards nor the board leadershipstructure has been consistently linked to firm financial performance, better governance doeslead to higher credit ratings and stock prices. A McKinsey survey reveals that investors arewilling to pay 16% more for a corporation’s stock if it is known to have good corporate gov-ernance. The investors explained that they would pay more because, in their opinion (1) goodgovernance leads to better performance over time, (2) good governance reduces the risk of thecompany getting into trouble, and (3) governance is a major strategic issue.90
Some of today’s trends in governance (particularly prevalent in the United States and theUnited Kingdom) that are likely to continue include the following:
� Boards are getting more involved not only in reviewing and evaluating company strategybut also in shaping it.
� Institutional investors, such as pension funds, mutual funds, and insurance companies,are becoming active on boards and are putting increasing pressure on top management toimprove corporate performance. This trend is supported by a U.S. SEC requirement thata mutual fund must publicly disclose the proxy votes cast at company board meetings inits portfolio. This reduces the tendency for mutual funds to rubber-stamp managementproposals.91
� Shareholders are demanding that directors and top managers own more than tokenamounts of stock in the corporation. Research indicates that boards with equity ownershipuse quantifiable, verifiable criteria (instead of vague, qualitative criteria) to evaluate theCEO.92 When compensation committee members are significant shareholders, they tend
58 PART 1 Introduction to Strategic Management and Business Policy
to offer the CEO less salary but with a higher incentive component than do compensationcommittee members who own little to no stock.93
� Non-affiliated outside (non-management) directors are increasing their numbers andpower in publicly held corporations as CEOs loosen their grip on boards. Outside mem-bers are taking charge of annual CEO evaluations.
� Women and minorities are being increasingly represented on boards.
� Boards are establishing mandatory retirement ages for board members—typically aroundage 70.
� Boards are evaluating not only their own overall performance, but also that of individualdirectors.
� Boards are getting smaller—partially because of the reduction in the number of insidersbut also because boards desire new directors to have specialized knowledge and expertiseinstead of general experience.
� Boards continue to take more control of board functions by either splitting the combinedChair/CEO into two separate positions or establishing a lead outside director position.
� Boards are eliminating 1970s anti-takeover defenses that served to entrench current man-agement. In just one year, for example, 66 boards repealed their staggered boards and25 eliminated poison pills.94
� As corporations become more global, they are increasingly looking for board memberswith international experience.
� Instead of merely being able to vote for or against directors nominated by the board’snominating committee, shareholders may eventually be allowed to nominate board mem-bers. This was originally proposed by the U.S. Securities and Exchange Commission in2004, but was not implemented. Supported by the AFL-CIO, a more open nominatingprocess would enable shareholders to vote out directors who ignore shareholderinterests.95
� Society, in the form of special interest groups, increasingly expects boards of directors tobalance the economic goal of profitability with the social needs of society. Issues dealingwith workforce diversity and environmental sustainability are now reaching the boardlevel. (See the Environmental Sustainability Issue feature for an example of a conflictbetween a CEO and the board of directors over environmental issues.)
2.2 The Role of Top ManagementThe top management function is usually conducted by the CEO of the corporation in coordi-nation with the COO (Chief Operating Officer) or president, executive vice president, and vicepresidents of divisions and functional areas.96 Even though strategic management involveseveryone in the organization, the board of directors holds top management primarily respon-sible for the strategic management of a firm.97
RESPONSIBILITIES OF TOP MANAGEMENTTop management responsibilities, especially those of the CEO, involve getting things ac-complished through and with others in order to meet the corporate objectives. Top manage-ment’s job is thus multidimensional and is oriented toward the welfare of the total
CHAPTER 2 Corporate Governance 59
CONFLICT AT THE BODY SHOP
of Roddick’s social and environmental “radicalism,” theboard forced her to resign as CEO. Roddick and her husband(with just 18% of the stock) remained on the board as co-chairmen until 2002, when they were replaced. Roddickcontinued to carry out public relations functions for thecompany and traveled the world in search of new productideas, but no longer had any control over the strategic direc-tion of the firm she had founded.
On March 17, 2006, the Body Shop’s board agreed tothe company’s sale to L’Oreal for a premium of 34.2% overthe company’s stock price. The sale was perceived by ob-servers as quite ironic, given that for years Anita Roddickhad criticized L’Oreal for its animal testing practices and forits exploitation of women in the workplace. On its Website, Naturewatch said: “We feel that the Body Shop has‘sold out’ and is not standing on its principles.” Animalrights activists and some consumers vowed to boycottBody Shop stores. Within three weeks of the announce-ment, the Body Shop’s “satisfaction” rating compiled byBrandIndex fell 11 points, to 14, its “buzz” rating fell by 10points, to �4, and its “general impression” fell by 3 points,to 19. One Body Shop customer reflected the widespreaddissatisfaction: “The Body Shop used to be my high street“safe house,” a place where I could walk into and knowthat what I bought was okay, that people were actuallybenefiting from my purchase. . . . By buying from the BodyShop, you are now no longer supporting ethical con-sumerism. If I want legitimate fair-trade, non-animal testedproducts, I can find them easily, at the same price, else-where.”
When Anita Roddickopened the first Body Shop
in 1976, she probably had noidea that she would become
one of the first “green” businessexecutives. She simply liked the idea of
selling cosmetics in small sizes that were made from natu-ral ingredients. By 1998, her entrepreneurial venture grewthrough franchising into a global business with 1,594shops in 47 countries. Roddick’s personal philosophy in fa-vor of human rights, endangered wildlife, and the environ-ment, while being strongly against the use of animals intesting cosmetics, became an inherent part of the com-pany’s philosophy of business. Reflecting an environmentalawareness far in advance of other firms, the company’s pub-lication, This Is the Body Shop, stated: “We aim to avoid ex-cessive packaging, to refill our bottles, and to recycle ourpackaging and use raw materials from renewable sourceswhen technologically and economically feasible.” The com-pany drafted the European Union’s Eco-Management andAudit Regulation in 1991 and the company’s first environ-mental statement, The Green Book, in 1992.
The Body Shop became a publicly traded corporation in1984 when it was listed on London’s Unlisted SecuritiesMarket for just 95 pence per stock. By 1986, the stock pricehad increased ten-fold in value and was listed on the Lon-don Stock Exchange. The company grew quickly to beworth 700 million British pounds in 1991. Although the in-flux of money from the sale of stock enabled the companyto expand throughout the world, there were disadvantagesto having shareholders and a board of directors. Someshareholders began to complain that the company was di-verting money into social projects instead of maximizingprofits. Roddick had used her position as CEO to join theBody Shop with Greenpeace’s “Save the Whales” cam-paign and to form alliances with Amnesty International andFriends of the Earth. Although the company continued togrow in size, its market value was declining by 1998. Tiring
SOURCES: E. A. Fogarty, J. P. Vincelette, and T. L. Wheelen, “TheBody Shop International PLC: Anita Roddick, OBE,” in T. L. Wheelenand J. D. Hunger, Strategic Management and Business Policy,8th ed. (Upper Saddle River, NJ: Prentice Hall, 2002), pp. 7.1–7.26;D. Purkayastha and R. Fernando, The Body Shop: Social Responsi-bility or Sustained Greenwashing? (Hyderabad, India: ICFAI Centerfor Management Research, 2006).
ENVIRONMENTAL sustainability issue
organization. Specific top management tasks vary from firm to firm and are developed froman analysis of the mission, objectives, strategies, and key activities of the corporation. Tasksare typically divided among the members of the top management team. A diversity of skillscan thus be very important. Research indicates that top management teams with a diversity offunctional backgrounds, experiences, and length of time with the company tend to be signifi-cantly related to improvements in corporate market share and profitability.98 In addition,highly diverse teams with some international experience tend to emphasize international
60 PART 1 Introduction to Strategic Management and Business Policy
growth strategies and strategic innovation, especially in uncertain environments, to boost fi-nancial performance.99 The CEO, with the support of the rest of the top management team,must successfully handle two primary responsibilities that are crucial to the effective strategicmanagement of the corporation: (1) provide executive leadership and a strategic vision and (2) manage the strategic planning process.
Executive Leadership and Strategic VisionExecutive leadership is the directing of activities toward the accomplishment of corporateobjectives. Executive leadership is important because it sets the tone for the entire corpora-tion. A strategic vision is a description of what the company is capable of becoming. It is of-ten communicated in the company’s mission and vision statements (as described in Chapter 1).People in an organization want to have a sense of mission, but only top management is in theposition to specify and communicate this strategic vision to the general workforce. Top man-agement’s enthusiasm (or lack of it) about the corporation tends to be contagious. The impor-tance of executive leadership is illustrated by Steve Reinemund, past-CEO of PepsiCo:“A leader’s job is to define overall direction and motivate others to get there.”100
Successful CEOs are noted for having a clear strategic vision, a strong passion for their com-pany, and an ability to communicate with others. They are often perceived to be dynamic andcharismatic leaders—which is especially important for high firm performance and investor con-fidence in uncertain environments.101 They have many of the characteristics of transformationalleaders—that is, leaders who provide change and movement in an organization by providinga vision for that change.102 For instance, the positive attitude characterizing many well-known industrial leaders—such as Bill Gates at Microsoft, Anita Roddick at the Body Shop,Richard Branson at Virgin, Steve Jobs at Apple Computer, Phil Knight at Nike, Bob Lutz atGeneral Motors, and Louis Gerstner at IBM—has energized their respective corporations.These transformational leaders have been able to command respect and to influence strategy for-mulation and implementation because they tend to have three key characteristics:103
1. The CEO articulates a strategic vision for the corporation: The CEO envisions thecompany not as it currently is but as it can become. The new perspective that the CEO’svision brings to activities and conflicts gives renewed meaning to everyone’s work andenables employees to see beyond the details of their own jobs to the functioning of the to-tal corporation.104 Louis Gerstner proposed a new vision for IBM when he proposed thatthe company change its business model from computer hardware to services: “If cus-tomers were going to look to an integrator to help them envision, design, and build end-to-end solutions, then the companies playing that role would exert tremendous influenceover the full range of technology decisions—from architecture and applications to hard-ware and software choices.”105 In a survey of 1,500 senior executives from 20 differentcountries, when asked the most important behavioral trait a CEO must have, 98% re-sponded that the CEO must convey “a strong sense of vision.”106
2. The CEO presents a role for others to identify with and to follow: The leader em-pathizes with followers and sets an example in terms of behavior, dress, and actions. TheCEO’s attitudes and values concerning the corporation’s purpose and activities are clear-cut and constantly communicated in words and deeds. For example, when design engi-neers at General Motors had problems with monitor resolution using the Windowsoperating system, Steve Ballmer, CEO of Microsoft, personally crawled under conferenceroom tables to plug in PC monitors and diagnose the problem.107 People know what to ex-pect and have trust in their CEO. Research indicates that businesses in which the generalmanager has the trust of the employees have higher sales and profits with lower turnoverthan do businesses in which there is a lesser amount of trust.108
CHAPTER 2 Corporate Governance 61
3. The CEO communicates high performance standards and also shows confidence inthe followers’ abilities to meet these standards: The leader empowers followers by rais-ing their beliefs in their own capabilities. No leader ever improved performance by set-ting easily attainable goals that provided no challenge. Communicating high expectationsto others can often lead to high performance.109 The CEO must be willing to followthrough by coaching people. As a result, employees view their work as very important andthus motivating.110 Ivan Seidenberg, chief executive of Verizon Communications, wasclosely involved in deciding Verizon’s strategic direction, and he showed his faith in hispeople by letting his key managers handle important projects and represent the companyin public forums. “All of these people could be CEOs in their own right. They are war-riors and they are on a mission,” explained Seidenberg. Grateful for his faith in them, hismanagers were fiercely loyal both to him and the company.111
The negative side of confident executive leaders is that their very confidence may lead tohubris, in which their confidence blinds them to information that is contrary to a decidedcourse of action. For example, overconfident CEOs tend to charge ahead with mergers andacquisitions even though they are aware that most acquisitions destroy shareholder value. Re-search by Tate and Malmendier found that “overconfident CEOs are more likely to conductmergers than rational CEOs at any point in time. Overconfident CEOs view their company asundervalued by outside investors who are less optimistic about the prospects of the firm.”Overconfident CEOs were most likely to make acquisitions when they could avoid sellingnew stock to finance them, and they were more likely to do deals that diversified their firm’slines of businesses.112
Managing the Strategic Planning ProcessAs business corporations adopt more of the characteristics of the learning organization, strate-gic planning initiatives can come from any part of an organization. A survey of 156 large cor-porations throughout the world revealed that, in two-thirds of the firms, strategies were firstproposed in the business units and sent to headquarters for approval.113 However, unless topmanagement encourages and supports the planning process, strategic management is not likelyto result. In most corporations, top management must initiate and manage the strategic plan-ning process. It may do so by first asking business units and functional areas to propose strate-gic plans for themselves, or it may begin by drafting an overall corporate plan within whichthe units can then build their own plans. Research suggests that bottom-up strategic planingmay be most appropriate in multidivisional corporations operating in relatively stable environ-ments but that top-down strategic planning may be most appropriate for firms operating in tur-bulent environments.114 Other organizations engage in concurrent strategic planning in whichall the organization’s units draft plans for themselves after they have been provided with theorganization’s overall mission and objectives.
Regardless of the approach taken, the typical board of directors expects top managementto manage the overall strategic planning process so that the plans of all the units and functionalareas fit together into an overall corporate plan. Top management’s job therefore includes thetasks of evaluating unit plans and providing feedback. To do this, it may require each unit tojustify its proposed objectives, strategies, and programs in terms of how well they satisfy theorganization’s overall objectives in light of available resources. If a company is not organizedinto business units, top managers may work together as a team to do strategic planning. CEOJeff Bezos tells how this is done at Amazon.com:
We have a group called the S Team—S meaning “senior” [management]—that stays abreast ofwhat the company is working on and delves into strategy issues. It meets for about four hoursevery Tuesday. Once or twice a year the S Team also gets together in a two-day meeting where
62 PART 1 Introduction to Strategic Management and Business Policy
End of Chapter SUMMARYWho determines a corporation’s performance? According to the popular press, it is the chiefexecutive officer who seems to be personally responsible for a company’s success or failure.When a company is in trouble, one of the first alternatives usually presented is to fire the CEO.That was certainly the case at the Walt Disney Company under Michael Eisner and Hewlett-Packard under Carly Fiorina. Both CEOs were first viewed as transformational leaders whomade needed strategic changes to their companies. After a few years, both were perceived tobe the primary reason for their company’s poor performance and were fired by their boards.The truth is rarely this simple.
According to research by Margarethe Wiersema, firing the CEO rarely solves a corpora-tion’s problems. In a study of CEO turnover caused by dismissals and retirements in the500 largest public U.S. companies, 71% of the departures were involuntary. In those firms in whichthe CEO was fired or asked to resign and replaced by another, Wiersema found no significantimprovement in the company’s operating earnings or stock price. She couldn’t find a singlemeasure suggesting that CEO dismissal had a positive effect on corporate performance!Wiersema placed the blame for the poor results squarely on the shoulders of the boards of di-rectors. Boards typically lack an in-depth understanding of the business and consequently relytoo heavily on executive search firms that know even less about the business. According toWiersema, boards that successfully managed the executive succession process had three thingsin common:
� The board set the criteria for candidate selection based on the strategic needs of thecompany.
� The board set realistic performance expectations rather than demanding a quick fix toplease the investment community.
� The board developed a deep understanding of the business and provided strong strategicoversight of top management, including thoughtful annual reviews of CEOperformance.118
As noted at the beginning of this chapter, corporate governance involves not just the CEOor the board of directors. It involves the combined active participation of the board, top man-agement, and shareholders. One positive result of the many corporate scandals occurring over
different ideas are explored. Homework is assigned ahead of time. . . . Eventually we have tochoose just a couple of things, if they’re big, and make bets.115
In contrast to the seemingly continuous strategic planning being done at Amazon.com,most large corporations conduct the strategic planning process just once a year—often at off-site strategy workshops attended by senior executives.116
Many large organizations have a strategic planning staff charged with supporting both topmanagement and the business units in the strategic planning process. This staff may preparethe background materials used in senior management’s off-site strategy workshop. This plan-ning staff typically consists of fewer than ten people, headed by a senior executive with the ti-tle of Director of Corporate Development or Chief Strategy Officer. The staff’s majorresponsibilities are to:
1. Identify and analyze companywide strategic issues, and suggest corporate strategic alter-natives to top management.
2. Work as facilitators with business units to guide them through the strategic planningprocess.117
CHAPTER 2 Corporate Governance 63
the past decade is the increased interest in governance. Institutional investors are no longercontent to be passive shareholders. Thanks to new regulations, boards of directors are takingtheir responsibilities more seriously and including more independent outsiders on key over-sight committees. Top managers are beginning to understand the value of working with boardsas partners, not just as adversaries or as people to be manipulated. Although there will alwaysbe passive shareholders, rubber-stamp boards, and dominating CEOs, the simple truth is thatgood corporate governance means better strategic management.
E C O - B I T S� DuPont, originally founded in 1802 to make gunpowder
and explosives, was a major producer in 1990 of nitrousoxides and fluorocarbons—gases with a global warm-ing potential 310 and 11,700 times that of carbon diox-ide, respectively.
� DuPont was the first company to phase-out CFCs andthe first to develop and commercialize CFC alternativesfor refrigeration and air conditioning.
� DuPont’s reputation changed from “Top U.S. Polluterof 1995” to Business Week’s list of “Top Green Compa-nies” in 2005; meanwhile, its earnings per share in-creased from $1 in 2003 to $3.25 in 2007.119
D I S C U S S I O N Q U E S T I O N S1. When does a corporation need a board of directors?
2. Who should and should not serve on a board of directors?What about environmentalists or union leaders?
3. Should a CEO be allowed to serve on another company’sboard of directors?
4. What would be the result if the only insider on a corpora-tion’s board were the CEO?
5. Should all CEOs be transformational leaders? Would youlike to work for a transformational leader?
S T R A T E G I C P R A C T I C E E X E R C I S EA. Think of the best manager for whom you have ever
worked. What was it about this person that made him orher such a good manager? Consider the following state-
ments as they pertain to that person. Fill in the blank infront of each statement with one of the following values:
STRONGLY AGREE � 5; AGREE � 4; NEUTRAL � 3;DISAGREE � 2; STRONGLY DISAGREE � 1.
1. ___ I respect him/her personally, and want to act in away that merits his/her respect and admiration. ___
2. ___ I respect her/his competence about thingsshe/he is more experienced about than I. ___
3. ___ He/she can give special help to those who coop-erate with him/her. ___
4. ___ He/she can apply pressure on those who coop-erate with him/her. ___
5. ___ He/she has a legitimate right, consideringhis/her position, to expect that his/her sugges-tions will be carried out. ___
6. ___ I defer to his/her judgment in areas with whichhe/she is more familiar than I. ___
7. ___ He/she can make things difficult for me if I failto follow his/her advice. ___
8. ___ Because of his/her job title and rank, I am obli-gated to follow his/her suggestions. ___
9. ___ I can personally benefit by cooperating withhim/her. ___
10. ___ Following his/her advice results in better deci-sions. ___
11. ___ I cooperate with him/her because I have high re-gard for him/her as an individual. ___
12. ___ He/she can penalize those who do not followhis/her suggestions. ___
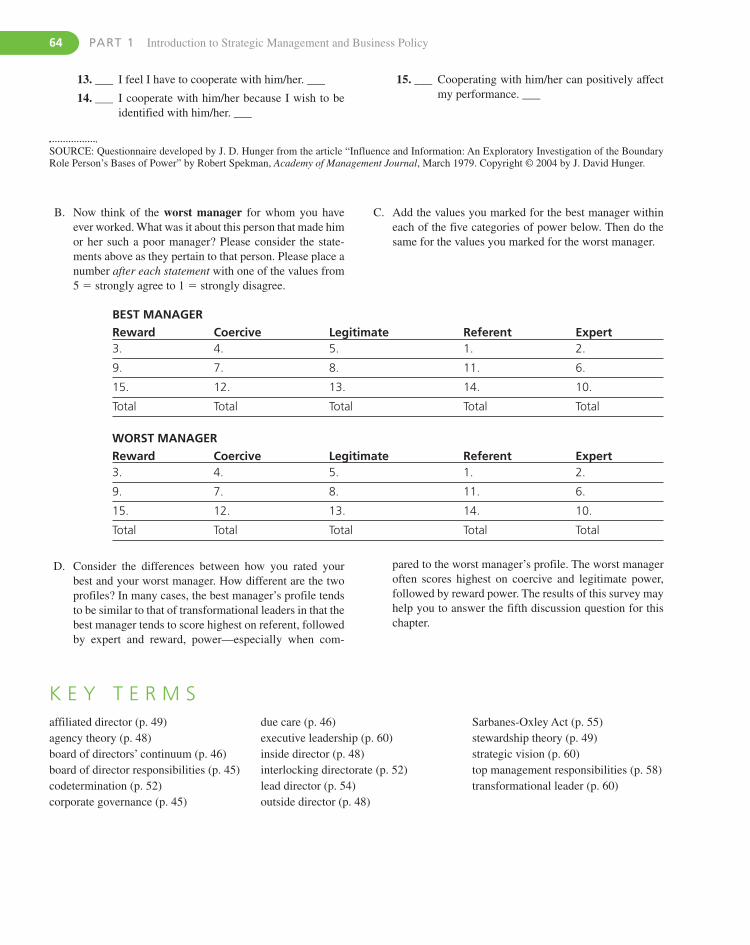
64 PART 1 Introduction to Strategic Management and Business Policy
BEST MANAGER
Reward Coercive Legitimate Referent Expert3. 4. 5. 1. 2.
9. 7. 8. 11. 6.
15. 12. 13. 14. 10.
Total Total Total Total Total
WORST MANAGER
Reward Coercive Legitimate Referent Expert3. 4. 5. 1. 2.
9. 7. 8. 11. 6.
15. 12. 13. 14. 10.
Total Total Total Total Total
K E Y T E R M Saffiliated director (p. 49)agency theory (p. 48)board of directors’ continuum (p. 46)board of director responsibilities (p. 45)codetermination (p. 52)corporate governance (p. 45)
due care (p. 46)executive leadership (p. 60)inside director (p. 48)interlocking directorate (p. 52)lead director (p. 54)outside director (p. 48)
Sarbanes-Oxley Act (p. 55)stewardship theory (p. 49)strategic vision (p. 60)top management responsibilities (p. 58)transformational leader (p. 60)
13. ___ I feel I have to cooperate with him/her. ___
14. ___ I cooperate with him/her because I wish to beidentified with him/her. ___
15. ___ Cooperating with him/her can positively affectmy performance. ___
B. Now think of the worst manager for whom you haveever worked. What was it about this person that made himor her such a poor manager? Please consider the state-ments above as they pertain to that person. Please place anumber after each statement with one of the values from5 � strongly agree to 1 � strongly disagree.
C. Add the values you marked for the best manager withineach of the five categories of power below. Then do thesame for the values you marked for the worst manager.
SOURCE: Questionnaire developed by J. D. Hunger from the article “Influence and Information: An Exploratory Investigation of the BoundaryRole Person’s Bases of Power” by Robert Spekman, Academy of Management Journal, March 1979. Copyright © 2004 by J. David Hunger.
D. Consider the differences between how you rated yourbest and your worst manager. How different are the twoprofiles? In many cases, the best manager’s profile tendsto be similar to that of transformational leaders in that thebest manager tends to score highest on referent, followedby expert and reward, power—especially when com-
pared to the worst manager’s profile. The worst manageroften scores highest on coercive and legitimate power,followed by reward power. The results of this survey mayhelp you to answer the fifth discussion question for thischapter.
CHAPTER 2 Corporate Governance 65
N O T E S1. R. Kirkland, “The Real CEO Pay Problem,” Fortune (July 10,
2006), pp. 78–81.2. M. Bartiromo, “Bob Nardelli Explains Himself,” Business Week
(July 24, 2006), pp. 98–100.3. B. Grow, “Renovating Home Depot,” Business Week (March 6,
2006), pp. 50–58.4. B. Grow, “Out at Home Depot,” Business Week (January 15,
2007), pp. 56–62.5. M. Fetterman, “Boardrooms Open Up to Investors’ Input,” USA
Today (September 7, 2007), pp. 1B–2B.6. “Raising Their Voices,” The Economist (March 22, 2008), p. 72.7. P. Burrows, “He’s Making Hay as CEOs Squirm,” Business
Week (January 15, 2007), pp. 64–65.8. “The Price of Prominence,” The Economist (January 15, 2005),
p. 69.9. A. G. Monks and N. Minow, Corporate Governance (Cam-
bridge, MA: Blackwell Business, 1995), pp. 8–32.10. Ibid., p. 1.11. A. Demb, and F. F. Neubauer, “The Corporate Board: Con-
fronting the Paradoxes,” Long Range Planning (June 1992),p. 13. These results are supported by a 1995 Korn/Ferry Inter-national survey in which chairs and directors agreed that strat-egy and management succession, in that order, are the mostimportant issues the board expects to face.
12. Reported by E. L. Biggs in “CEO Succession Planning: AnEmerging Challenge for Boards of Directors,” Academy ofManagement Executive (February 2004), pp. 105–107.
13. A. Borrus, “Less Laissez-Faire in Delaware?” Business Week(March 22, 2004), pp. 80–82.
14. L. Light, “Why Outside Directors Have Nightmares,” BusinessWeek (October 23, 1996), p. 6.
15. “Where’s All the Fun Gone?” Economist (March 20, 2004),p. 76.
16. A. Chen, J. Osofsky, and E. Stephenson, “Making the BoardMore Strategic: A McKinsey Global Survey,” McKinsey Quar-terly (March 2008), pp. 1–10.
17. Nadler proposes a similar five-step continuum for board in-volvement ranging from the least involved “passive board” tothe most involved “operating board,” plus a form for measuringboard involvement in D. A. Nadler, “Building Better Boards,”Harvard Business Review (May 2004), pp. 102–111.
18. H. Ashbaugh, D. W. Collins, and R. LaFond, “The Effects ofCorporate Governance on Firms’ Credit Ratings,” unpublishedpaper (March, 2004); W. Q. Judge Jr., and C. P. Zeithaml, “In-stitutional and Strategic Choice Perspectives on Board Involve-ment in the Strategic Choice Process,” Academy ofManagement Journal (October 1992), pp. 766–794; J. A.Pearce II, and S. A. Zahra, “Effective Power-Sharing Betweenthe Board of Directors and the CEO,” Handbook of BusinessStrategy, 1992/93 Yearbook (Boston: Warren, Gorham, andLamont, 1992), pp. 1.1–1.16.
19. Current Board Practices, American Society of CorporateSecretaries, 2002 as reported by B. Atkins in “Directors Don’t
Deserve such a Punitive Policy,”Directors & Boards (Summer2002), p. 23.
20. A. Chen, J. Osofsky, and E. Stephenson, “Making the BoardMore Strategic: A McKinsey Global Survey,” McKinsey Quar-terly (March 2008), pp. 1–10.
21. 33rd Annual Board of Directors Study (New York: Korn/FerryInternational, 2007).
22. “What Directors Know About their Companies: A McKinseySurvey,” McKinsey Quarterly Web Exclusive (March 2006).
23. D. A. Nadler, “Building Better Boards,” Harvard Business Re-view (May 2004), pp. 102–111; L. Lavelle, “The Best and WorstBoards,” Business Week (October 7, 2002), pp. 104–114.
24. Nadler, p. 109.25. M. K. Fiegener, “Determinants of Board Participation in the
Strategic Decisions of Small Corporations,”EntrepreneurshipTheory and Practice (September 2005), pp. 627–650.
26. Fiegener; A. L. Ranft and H. M. O’Neill, “Board Composi-tion and High-Flying Founders: Hints of Trouble to Come?”Academy of Management Executive (February 2001),pp. 126–138.
27. D. R. Dalton, M. A. Hitt, S. Trevis Certo, and C. M. Dalton,“The Fundamental Agency Problem and Its Mitigation,” Chap-ter One in Academy of Management Annals, edited byJ. F. Westfall and A. F. Brief (London: Rutledge, 2007);Y. Deutsch, “The Impact of Board Composition on Firms’ Crit-ical Decisions: A Meta-Analytic Review,” Journal of Manage-ment (June 2005), pp. 424–444; D. F. Larcher, S. A. Richardson,and I. Tuna, “Does Corporate Governance Really Matter?”Knowledge @ Wharton (September 8–21, 2004); J. Merritt andL. Lavelle, “A Different Kind of Governance Guru,” BusinessWeek (August 9, 2004), pp. 46–47; A. Dehaene, V. DeVuyst,and H. Ooghe, “Corporate Performance and Board Structure inBelgian Companies,” Long Range Planning (June 2001),pp. 383–398; M. W. Peng, “Outside Directors and Firm Perfor-mance During Institutional Transitions,” Strategic ManagementJournal (May 2004), pp. 453–471.
28. D. R. Dalton, M. A. Hitt, S. Trevis Certo, and C. M. Dalton,“The Fundamental Agency Problem and Its Mitigation,” Chap-ter One in Academy of Management Annals, edited by J. F.Westfall and A. F. Brief (London: Rutledge, 2007).
29. 33rd Annual Board of Directors Study (New York: Korn/FerryInternational, 2007), p. 11.
30. 30th Annual Board of Directors Study (New York: Korn/FerryInternational, 2003).
31. M. K. Fiegerer, “Determinants of Board Participation in theStrategic Decisions of Small Corporations,” EntrepreneurshipTheory and Practice (September 2005), pp. 627–650; S. K. Leeand G. Filbeck, “Board Size and Firm Performance: Case ofSmall Firms,” Proceedings of the Academy of Accounting andFinancial Studies (2006), pp. 43–46; W. S. Schulze, M. H. Lu-batkin, R. N. Dino, and A. K. Buchholtz, “Agency Relation-ships in Family Firms: Theory and Evidence,” OrganizationScience (March–April, 2001), pp. 99–116.
66 PART 1 Introduction to Strategic Management and Business Policy
32. S. K. Lee and G. Filbeck, “Board Size and Firm Performance:The Case of Small Firms,” Proceedings of the Academy of Ac-counting and Financial Studies (2006), pp. 43–46.
33. J. J. Reur and R. Ragozzino, “Agency Hazards and AlliancePortfolios,” Strategic Management Journal (January 2006),pp. 27–43.
34. M. Goranova, T. M. Alessandri, P. Brades, and R. Dharwadkar,“Managerial Ownership and Corporate Diversification: A Longi-tudinal View,” Strategic Management Journal (March 2007),pp. 211–225; B. K. Boyd, S. Gove, and M. A. Hitt, “Conse-quences of Measurement Problems in Strategic Management Re-search: The Case of Amihud and Lev,” Strategic ManagementJournal (April 2005), pp. 367–375; J. P. Katz and B. P. Niehoff,“How Owners Influence Strategy—A Comparison of Owner-Controlled and Manager-Controlled Firms,” Long Range Plan-ning (October 1998), pp. 755–761; M. Kroll, P. Wright,L. Toombs, and H. Leavell, “Form of Control: A Critical Deter-minant of Acquisition Performance and CEO Rewards,”Strategic Management Journal (February 1997), pp. 85–96.
35. L. Tihanyi, R. A. Johnson, R. E. Hoskisson, and M. A. Hitt,“Institutional Ownership Differences and International Diversification: The Effects of Boards of Directors and Tech-nological Opportunity,” Academy of Management Journal(April 2003), pp. 195–211; A. E. Ellstrand, L. Tihanyi, andJ. L. Johnson, “Board Structure and International PoliticalRisk,” Academy of Management Journal (August 2002),pp. 769–777); S. A. Zahra, D. O. Neubaum, and M. Huse,“Entrepreneurship in Medium-Size Companies: Exploringthe Effects of Ownership and Governance Systems,” Journalof Management, Vol. 26, No. 5 (2000), pp. 947–976.
36. G. Kassinis and N. Vafeas, “Corporate Boards and OutsideStakeholders as Determinants of Environmental Litigation,”Strategic Management Journal (May 2002), pp. 399–415;P. Dunn, “The Impact of Insider Power on Fraudulent FinancialReporting,” Journal of Management, Vol. 30, No. 3 (2004),pp. 397–412.
37. R. C. Anderson and D. M. Reeb, “Board Composition: Balanc-ing Family Influence in S&P 500 Firms,” Administrative Sci-ence Quarterly (June 2004), pp. 209–237; W. S. Schulze, M. H.Lubatkin, R. N. Dino, and A. K. Buckholtz, “Agency Relation-ships in Family Firms: Theory and Evidence,” OrganizationScience (March–April, 2001), pp. 99–116.
38. M. N. Young, A. K. Bushholtz, and D. Ahlstrom, “How CanBoard Members Be Empowered If They Are Spread Too Thin?”SAM Advanced Management Journal (Autumn 2003), pp. 4–11.
39. 33rd Annual Board of Directors Study (New York: Korn/FerryInternational, 2007), p. 21.
40. C. M. Daily and D. R. Dalton, “The Endangered Director,”Journal of Business Strategy, Vol. 25, No. 3 (2004), pp. 8–9.
41. I. Sager, “The Boardroom: New Rules, New Loopholes,”Business Week (November 29, 2004), p. 13.
42. 33rd Annual Board of Directors Study (New York: Korn/FerryInternational, 2007), p. 43.
43. See S. Finkelstein, and D. C. Hambrick, Strategic Leadership:Top Executives and Their Impact on Organizations (St. Paul,MN: West, 1996), p. 213.
44. D. R. Dalton, M. A. Hitt, S. Trevis Certo, and C. M. Dalton,“The Fundamental Agency Problem and Its Mitigation,” Chap-ter One in Academy of Management Annals, edited by J. F.Westfall and A. F. Brief (London: Rutledge, 2007).
45. “TIAA-CREF’s Role in Corporate Governance,” InvestmentForum (June 2003), p. 13.
46. “Jobs for the Girls,” The Economist (May 3, 2008), p. 73; “GirlPower,” The Economist (January 5, 2008), p. 54.
47. 33rd Annual Board of Directors Study (New York: Korn/FerryInternational, 2007), p. 11; T. Neff and J. H. Daum, “The EmptyBoardroom,” Strategy � Business (Summer 2007), pp. 57–61.
48. R. O. Crockett, “The Rising Stock of Black Directors,”Business Week (February 27, 2006), p. 34.
49. J. Daum, “Portrait of Boards on the Cusp of Historic Change,”Directors & Boards (Winter 2003), p. 56; J. Daum, “SSBI: Au-dit Committees Are Leading the Change,” Directors & Boards(Winter 2004), p. 59.
50. 30th Annual Board of Directors Study (New York: Korn/FerryInternational, 2003) p. 38.
51. Globalizing the Board of Directors: Trends and Strategies (NewYork: The Conference Board, 1999).
52. 33rd Annual Board of Directors Study (New York: Korn/FerryInternational, 2007), p. 15.
53. R. W. Pouder and R. S. Cantrell, “Corporate Governance Re-form: Influence on Shareholder Wealth,” Journal of BusinessStrategies (Spring 1999), pp. 48–66.
54. M. L. Gerlach, “The Japanese Corporate Network: A Block-model Analysis,” Administrative Science Quarterly (March1992), pp. 105–139.
55. W. E. Stead and J. G. Stead, Sustainable Strategic Management(Armonk, NY: M. E. Sharp, 2004), p. 47.
56. J. D. Westphal, M. L. Seidel, and K. J. Stewart, “Second-Order Imitation: Uncovering Latent Effects of Board NetworkTies,” Administrative Science Quarterly (December 2001),pp. 717–747; M. A. Geletkanycz, B. K. Boyd, and S. Finkel-stein, “The Strategic Value of CEO External Directorate Net-works: Implications for CEO Compensation,” StrategicManagement Journal (September 2001), pp. 889–898; M. A.Carpenter and J. D. Westphal, “The Strategic Context of Ex-ternal Network Ties: Examining the Impact of Director Ap-pointments on Board Involvement in Strategic DecisionMaking,” Academy of Management Journal (August 2001),pp. 639–660.
57. M. Warner, “Inside the Silicon Valley Money Machine,”Fortune (October 26, 1998), pp. 128–140.
58. D. Jones and B. Hansen, “Chairmen Still Doing Do-Si-Do,”USA Today (November 5, 2003), p. 3B; J. H. Daum and T. J.Neff, “SSBI: Audit Committees Are Leading the Charge,”Directors & Boards (Winter 2003), p. 59.
59. J. A. C. Baum and C. Oliver, “Institutional Linkages and Orga-nizational Mortality,” Administrative Science Quarterly (June1991) pp. 187–218; J. P. Sheppard, “Strategy and Bankruptcy:An Exploration into Organizational Death,” Journal of Man-agement (Winter 1994), pp. 795–833.
60. 33rd Annual Board of Directors Study (New York: Korn/FerryInternational, 2007), p. 44 and Directors’ Compensation and
Additional Board Appointments at U.S. Companies,” Academyof Management Journal (April 2007), pp. 267–288; J. D. West-phal, “Board Games: How CEOs Adapt to Increases in StructuralBoard Independence from Management,” Administrative ScienceQuarterly (September 1998), pp. 511–537; J. D. Westphal and P.Khanna, “Keeping Directors in Line: Social Distancing as a Con-trol Mechanism in the Corporate Elite,” Administrative ScienceQuarterly (September 2003), pp. 361–398.
74. H. L. Tosi, W. Shen, and R. J. Gentry, “Why Outsiders onBoards Can’t Solve the Corporate Governance Problem,”Organizational Dynamics, Vol. 32, No. 2 (2003), pp. 180–192.
75. 33rd Annual Board of Directors Study (New York: Korn/FerryInternational, 2007), p. 12. Other committees are successionplanning (39%), finance (30%), corporate responsibility (17%),and investment (15%).
76. Perhaps because of their potential to usurp the power of theboard, executive committees are being used less often.
77. 33rd Annual Board of Directors Study (New York: Korn/FerryInternational, 2007), p. 14.
78. “The Trial of Sarbanes-Oxley,” The Economist (April 22,2006), pp. 59–60; 33rd Annual Board of Directors Study (NewYork: Korn/Ferry International, 2007), p. 14; S. Wagner andL. Dittmar, “The Unexpected Benefits of Sarbanes-Oxley,”Harvard Business Review (April 2006), pp. 133–140.
79. A. Borrus, “Learning to Love Sarbanes-Oxley,” Business Week(November 21, 2005), pp. 126–128.
80. D. Henry, “Not Everyone Hates SarbOx,” Business Week (Jan-uary 29, 2007), p. 37.
81. D. Henry, “A SarbOx Surprise,” Business Week (January 12,2006), p. 38.
82. 30th Annual Board of Directors Study Supplement: GovernanceTrends of the Fortune 1000 (New York: Korn/Ferry Interna-tional, 2004), p. 5.
83. “Where’s All the Fun Gone?” Economist (March 20, 2004),pp. 75–77.
84. Daum and Neff (2004), p. 58.85. 33rd Annual Board of Directors Study (New York: Korn/Ferry
International, 2007), p. 7.86. J. Sonnenfeld, “Good Governance and the Misleading Myths of
Bad Metrics.” Academy of Management Executive (February2004), pp. 108–113.
87. H. Ashbaugh, D. W. Collins, and R. LaFond, “The Effects ofCorporate Governance on Firms’ Credit Ratings,” unpublishedpaper (March 2002).
88. I. Sager, “Access Denied: A Private Matter,” Business Week(January 26, 2004), p. 13; J. Weber, “One Share, Many Votes,”Business Week (March 29, 2004), pp. 94–95.
89. E. Thorton, “Corporate Control Freaks,” Business Week(May 31, 2004), p. 86.
90. D. R. Dalton, C. M. Daily, A. E. Ellstrand, and J. L. Johnson,“Meta-Analytic Reviews of Board Composition, LeadershipStructure, and Financial Performance,” Strategic ManagementJournal (March 1998), pp. 269–290; G. Beaver, “CompetitiveAdvantage and Corporate Governance—Shop Soiled andNeeding Attention!” Strategic Change (September–October1999), p. 330.
Board Practices in 2003, Research Report R-1339-03-RR(New York: Conference Board, 2003) Table 49, p. 38.
61. J. Canavan, B. Jones, and M. J. Potter, “Board Tenure: How LongIs Too Long?” Boards & Directors (Winter 2004), pp. 39–42.
62. 33rd Annual Board of Directors Study (New York: Korn/FerryInternational, 2007), p. 17 and 30th Annual Board of DirectorsStudy Supplement: Governance Trends of the Fortune 1000(New York: Korn/Ferry International, 2004), p. 5.
63. D. F. Larcker and S. A. Richardson, “Does Governance ReallyMatter?” Knowledge @ Wharton (September 8–21, 2004).
64. M. L. McDonald, J. D. Westphal, and M. E. Graebner, “WhatDo they Know? The Effects of Outside Director AcquisitionExperience on Firm Acquisition Experience,” Strategic Man-agement Journal (November 2008), pp. 1155–1177.
65. 26th Annual Board of Directors Study (New York: Korn/FerryInternational, 1999), p. 30.
66. 30th Annual Board of Directors Study (New York: Korn/FerryInternational, 2003), pp. 8, 31, 44.
67. D. R. Dalton, M. A. Hitt, S. Trevis Certo, and C. M. Dalton,“The Fundamental Agency Problem and Its Mitigation,” Chap-ter One in Academy of Management Annals, edited by J. F.Westfall and A. F. Brief (London: Rutledge, 2007); P. Coombesand S. C-Y Wong, “Chairman and CEO—One Job or Two?”McKinsey Quarterly (2004, No. 2), pp. 43–47.
68. A. Desai, M. Kroll, and P. Wright, “CEO Duality, Board Moni-toring, and Acquisition Performance,” Journal of BusinessStrategies (Fall 2003), pp. 147–156; D. Harris and C. E. Helfat,“CEO Duality, Succession, Capabilities and Agency Theory:Commentary and Research Agenda,” Strategic ManagementJournal (September 1998), pp. 901–904; C. M. Daily and D. R.Dalton, “CEO and Board Chair Roles Held Jointly or Sepa-rately: Much Ado About Nothing,” Academy of ManagementExecutive (August 1997), pp. 11–20; D. L. Worrell, C. Nemec,and W. N. Davidson III, “One Hat Too Many: Key ExecutivePlurality and Shareholder Wealth,” Strategic ManagementJournal (June 1997), pp. 499–507; J. W. Coles and W. S. Hes-terly, “Independence of the Chairman and Board Composition:Firm Choices and Shareholder Value,” Journal of Management,Vol. 26, No. 2 (2000), pp. 195–214; H. Ashbaugh, D. W.Collins, and R. LaFond, “The Effects of Corporate Governanceon Firms’ Credit Ratings,” unpublished paper, March 2004.
69. J. P. O’Connor, R. I. Priem, J. E. Coombs, and K. M. Gilley, “DoCEO Stock Options Prevent or Promote Fraudulent FinancialReporting?” Academy of Management Journal (June 2006),pp. 483–500.
70. N. R. Augustine, “How Leading a Role for the Lead Director?”Directors & Boards (Winter 2004), pp. 20–23.
71. D. R. Dalton, M. A. Hitt, S. Trevis Certo, and C. M. Dalton,“The Fundamental Agency Problem and Its Mitigation,” Chap-ter One in Academy of Management Annals, edited by J. F.Westfall and A. F. Brief (London: Rutledge, 2007).
72. 33rd Annual Board of Directors Study (New York: Korn/FerryInternational, 2007), p. 21.
73. J. D. Westphal and I. Stern, “Flattery Will Get You Everywhere(Especially If You Are a Male Caucasian): How Ingratiation,Boardroom Behavior, and Demographic Minority Status Affect
CHAPTER 2 Corporate Governance 67
91. A. Borrus and L. Young, “Nothing Like a Little Exposure,”Business Week (September 13, 2004), p. 92.
92. P. Silva, “Do Motivation and Equity Ownership Matter in Board of Directors’ Evaluation of CEO Performance?” Journalof Management Issues (Fall 2005), pp. 346–362.
93. L. He and M. J. Conyon, “The Role of Compensation Commit-tees in CEO and Committee Compensation Decisions,” paperpresented to Academy of Management (Seattle, WA, 2003).
94. P. Coy, E. Thornton, M. Arndt, B. Grow, and A. Park, “Shake,Rattle, and Merge,” Business Week (January 10, 2005),pp. 32–35.
95. L. Lavelle, “A Fighting Chance for Boardroom Democracy,”Business Week (June 9, 2003), p. 50; L. Lavelle, “So That’s WhyBoards Are Waking Up,” Business Week (January 19, 2004),pp. 72–73.
96. For a detailed description of the COO’s role, see N. Bennett andS. A. Miles, “Second in Command,” Harvard Business Review(May 2006), pp. 71–78.
97. S. Finkelstein and D. C. Hambrick, Strategic Leadership: TopExecutives and Their Impact on Organizations (St. Louis: West,1996).
98. H. G. Barkema and O. Shvyrkov, “Does Top Management TeamDiversity Promote or Hamper Foreign Expansion?” StrategicManagement Journal (July 2007), pp. 663–680; D. C. Ham-brick, T. S. Cho, and M-J Chen, “The Influence of Top Manage-ment Team Heterogeneity on Firms’ Competitive Moves,”Administrative Science Quarterly (December 1996),pp. 659–684.
99. P. Pitcher and A. D. Smith, “Top Management Heterogeneity:Personality, Power, and Proxies,” Organization Science(January–February 2001), pp. 1–18; M. A. Carpenter andJ. W. Fredrickson, “Top Management Teams, Global StrategicPosture, and the Moderating Role of Uncertainty,” Academy ofManagement Journal (June 2001), pp. 533–545; M. A. Carpen-ter, “The Implications of Strategy and Social Context for theRelationship Between Top Management Team Heterogeneityand Firm Performance,” Strategic Management Journal (March2002), pp. 275–284; L. Tihanyi, A. E. Ellstrand, C. M. Daily,and D. R. Dalton, “Composition of the Top Management Teamand Firm International Expansion,” Journal of Management,Vol. 26, No. 6 (2000), pp. 1157–1177.
100. “One on One with Steve Reinemund,” Business Week (Decem-ber 17, 2001), Special advertising insert on leadership by Hei-drick & Struggles, executive search firm.
101. D. A. Waldman, G. G. Ramirez, R. J. House, and P. Puranam,“Does Leadership Matter? CEO Leadership Attributes andProfitability Under Conditions of Perceived Environmental Un-certainty,” Academy of Management Journal (February 2001),pp. 134–143; F. J. Flynn and B. M. Staw, “Lend Me Your Wal-lets: The Effect of Charismatic Leadership on External Supportfor an Organization,” Strategic Management Journal (April2004), pp. 309–330.
102. J. Burns, Leadership (New York: HarperCollins, 1978);B. Bass, “From Transactional to Transformational Leadership:Learning to Share the Vision,” Organizational Dynamics,Vol. 18 (1990), pp. 19–31; W. Bennis and B. Nanus, Leaders:Strategies for Taking Charge (New York: HarperCollins, 1997).
103. Based on R. J. House, “A 1976 Theory of Charismatic Leader-ship,” in J. G. Hunt and L. L. Larson (Eds.), Leadership: TheCutting Edge (Carbondale, IL: Southern Illinois UniversityPress, 1976), pp. 189–207. Also see J. Choi, “A MotivationalTheory of Charismatic Leadership: Envisioning, Empathy, andEmpowerment,” Journal of Leadership and OrganizationalStudies (2006), Vol. 13, No. 1, pp. 24–43.
104. I. D. Colville and A. J. Murphy, “Leadership as the Enabler ofStrategizing and Organizing,” Long Range Planning (Decem-ber 2006), pp. 663–677.
105. L. V. Gerstner Jr., Who Says Elephants Can’t Dance? (NewYork: HarperCollins, 2002), p. 124.
106. M. Lipton, “Demystifying the Development of an OrganizationalVision,” Sloan Management Review (Summer 1996), p. 84.
107. S. Hahn, “Why High Tech Has to Stay Humble,” Business Week(January 19, 2004), pp. 76–77.
108. J. H. David, F. D. Schoorman, R. Mayer, and H. H. Tan, “TheTrusted General Manager and Business Unit Performance: Em-pirical Evidence of a Competitive Advantage,” Strategic Man-agement Journal (May 2000), pp. 563–576.
109. D. B. McNatt and T. A. Judge, “Boundary Conditions of theGalatea Effect: A Field Experiment and Constructive Replica-tion,” Academy of Management Journal (August 2004),pp. 550–565.
110. R. F. Piccolo and J. A. Colquitt, “Transformational Leadershipand Job Behaviors: The Mediating Role of Core Job Character-istics,” Academy of Management Journal (April 2006),pp. 327–340; J. E. Bono and T. A. Judge, “Self-Concordance atWork: Toward Understanding the Motivational Effects ofTransformational Leaders,” Academy of Management Journal(October 2003), pp. 554–571.
111. T. Lowry, R. O. Crockett, and I. M. Kunii, “Verizon’s GutsyBet,” Business Week (August 4, 2003), pp. 52–62.
112. G. Tate and U. Malmendier, “Who Makes Acquisitions? CEOOverconfidence and the Market’s Reaction,” summarized byKnowledge @ Wharton (February 25, 2004).
113. M. C. Mankins and R. Steele, “Stop Making Plans, Start Mak-ing Decisions,” Harvard Business Review (January 2006),pp. 76–84.
114. T. R. Eisenmann and J. L. Bower, “The EntrepreneurialM Form: Strategic Integration in Global Media Firms,”Organization Science (May–June 2000), pp. 348–355.
115. J. Kirby and T. A. Stewart, “The Institutional Yes,” HarvardBusiness Review (October 2007), p. 76.
116. M. C. Mankins and R. Steele, “Stop Making Plans, Start Mak-ing Decisions,” Harvard Business Review (January 2006),pp. 76–84; G. P. Hodgkinson, R. Whittington, G. Johnson,
68 PART 1 Introduction to Strategic Management and Business Policy

and M. Schwarz, “The Role of Strategy Workshops in Strategy Development Processes: Formality, Communication,Co-ordination and Inclusion,” Long Range Planning (October2006), pp. 479–496; B. Frisch and L. Chandler, “Off-SitesThat Work,” Harvard Business Review (June 2006),pp. 117–126.
117. For a description of the Chief Strategy Officer, see R. T. S.Breene, P. F. Nunes, and W. E. Shill, “The Chief Strategy
Officer,” Harvard Business Review (October 2007), pp. 84–93;R. Dye, “How Chief Strategy Officers Think about their Role:A Roundtable,” McKinsey Quarterly (May 2008), pp. 1–8.
118. M. Wiersema, “Holes at the Top: Why CEO Firings Backfire,”Harvard Business Review (December 2002), pp. 70–77.
119. C. Laszlo, Sustainable Value: How the World’s LeadingCompanies Are Doing Well by Doing Good (Stanford, CA:Stanford University Press, 2008), pp. 81–88.
CHAPTER 2 Corporate Governance 69
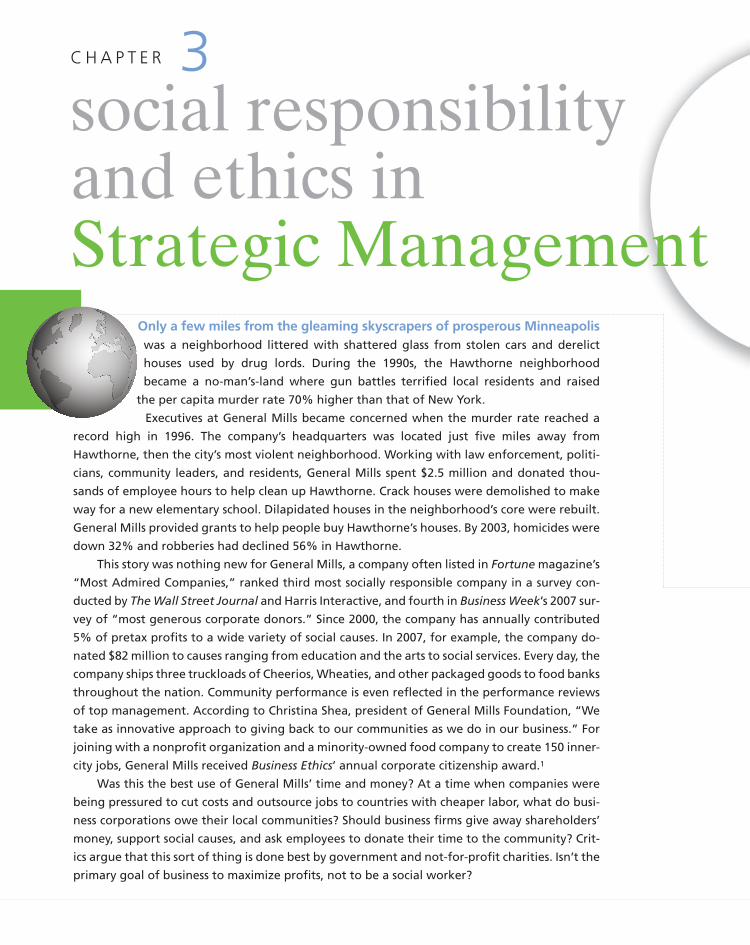
Only a few miles from the gleaming skyscrapers of prosperous Minneapoliswas a neighborhood littered with shattered glass from stolen cars and derelict
houses used by drug lords. During the 1990s, the Hawthorne neighborhood
became a no-man’s-land where gun battles terrified local residents and raised
the per capita murder rate 70% higher than that of New York.
Executives at General Mills became concerned when the murder rate reached a
record high in 1996. The company’s headquarters was located just five miles away from
Hawthorne, then the city’s most violent neighborhood. Working with law enforcement, politi-
cians, community leaders, and residents, General Mills spent $2.5 million and donated thou-
sands of employee hours to help clean up Hawthorne. Crack houses were demolished to make
way for a new elementary school. Dilapidated houses in the neighborhood’s core were rebuilt.
General Mills provided grants to help people buy Hawthorne’s houses. By 2003, homicides were
down 32% and robberies had declined 56% in Hawthorne.
This story was nothing new for General Mills, a company often listed in Fortune magazine’s
“Most Admired Companies,” ranked third most socially responsible company in a survey con-
ducted by The Wall Street Journal and Harris Interactive, and fourth in Business Week’s 2007 sur-
vey of “most generous corporate donors.” Since 2000, the company has annually contributed
5% of pretax profits to a wide variety of social causes. In 2007, for example, the company do-
nated $82 million to causes ranging from education and the arts to social services. Every day, the
company ships three truckloads of Cheerios, Wheaties, and other packaged goods to food banks
throughout the nation. Community performance is even reflected in the performance reviews
of top management. According to Christina Shea, president of General Mills Foundation, “We
take as innovative approach to giving back to our communities as we do in our business.” For
joining with a nonprofit organization and a minority-owned food company to create 150 inner-
city jobs, General Mills received Business Ethics’ annual corporate citizenship award.1
Was this the best use of General Mills’ time and money? At a time when companies were
being pressured to cut costs and outsource jobs to countries with cheaper labor, what do busi-
ness corporations owe their local communities? Should business firms give away shareholders’
money, support social causes, and ask employees to donate their time to the community? Crit-
ics argue that this sort of thing is done best by government and not-for-profit charities. Isn’t the
primary goal of business to maximize profits, not to be a social worker?
social responsibilityand ethics inStrategic Management
C H A P T E R 3
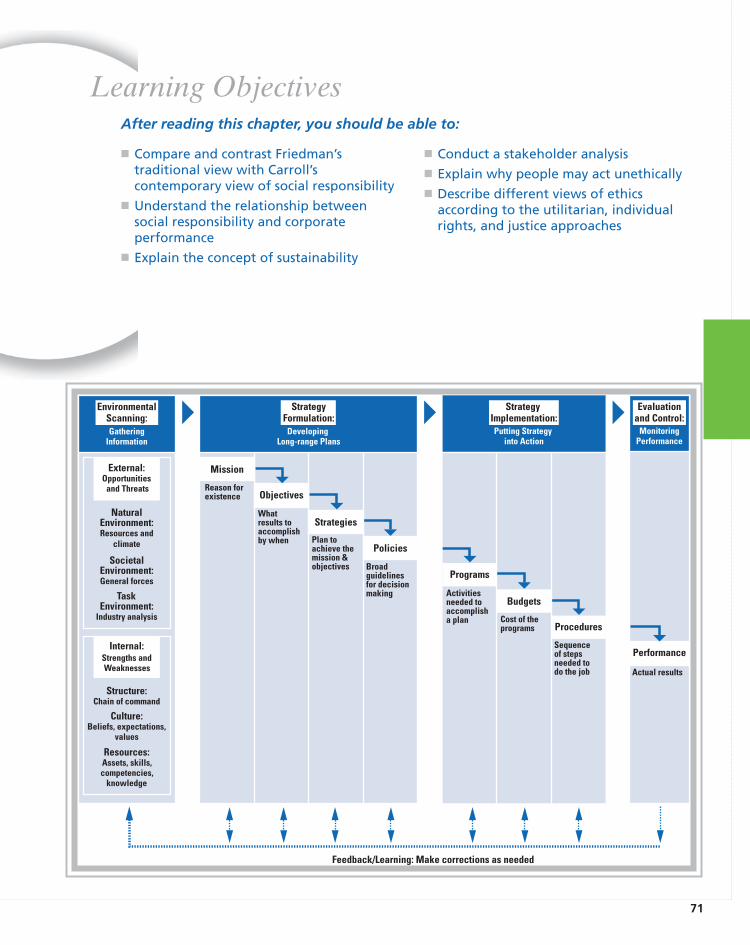
71
� Compare and contrast Friedman’straditional view with Carroll’scontemporary view of social responsibility
� Understand the relationship betweensocial responsibility and corporateperformance
� Explain the concept of sustainability
� Conduct a stakeholder analysis� Explain why people may act unethically� Describe different views of ethics
according to the utilitarian, individualrights, and justice approaches
Learning Objectives
GatheringInformation
Putting Strategy into Action
MonitoringPerformance
SocietalEnvironment:General forces
NaturalEnvironment:Resources and
climate
TaskEnvironment:
Industry analysis
Internal:Strengths andWeaknesses
Structure:Chain of command
Culture:Beliefs, expectations,
values
Resources:Assets, skills,competencies,
knowledge
Programs
Activitiesneeded to accomplisha plan
Budgets
Cost of theprograms Procedures
Sequenceof stepsneeded to do the job
Performance
Actual results
External:Opportunities
and Threats
DevelopingLong-range Plans
Mission
Reason forexistence Objectives
Whatresults to accomplishby when
Strategies
Plan toachieve themission &objectives
Policies
Broadguidelinesfor decisionmaking
EnvironmentalScanning:
StrategyFormulation:
StrategyImplementation:
Evaluationand Control:
Feedback/Learning: Make corrections as needed
After reading this chapter, you should be able to:
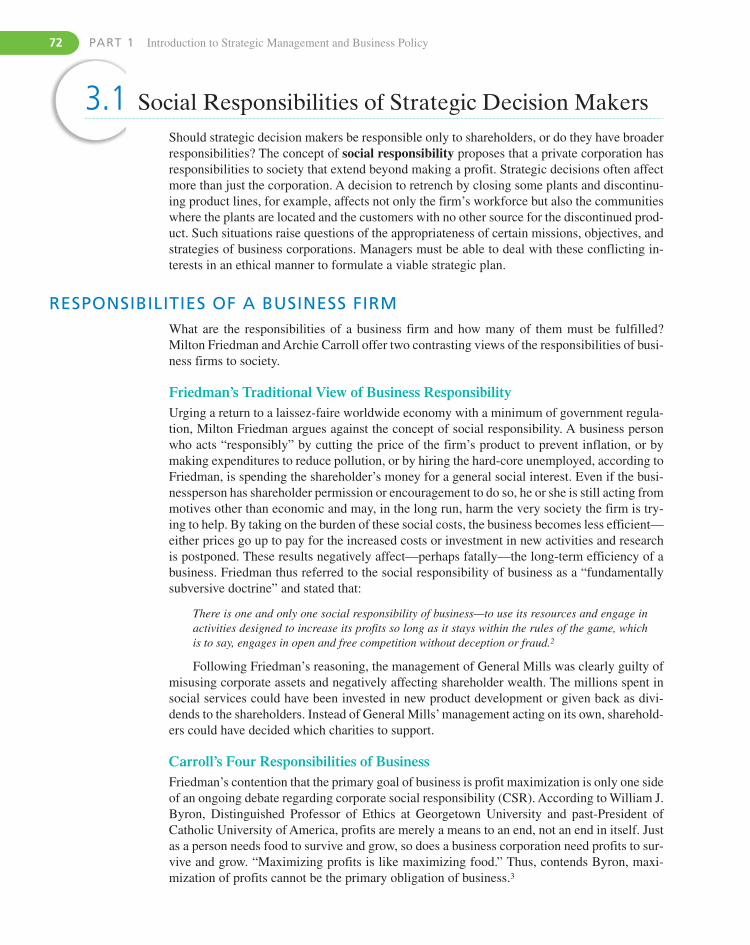
3.1 Social Responsibilities of Strategic Decision MakersShould strategic decision makers be responsible only to shareholders, or do they have broaderresponsibilities? The concept of social responsibility proposes that a private corporation hasresponsibilities to society that extend beyond making a profit. Strategic decisions often affectmore than just the corporation. A decision to retrench by closing some plants and discontinu-ing product lines, for example, affects not only the firm’s workforce but also the communitieswhere the plants are located and the customers with no other source for the discontinued prod-uct. Such situations raise questions of the appropriateness of certain missions, objectives, andstrategies of business corporations. Managers must be able to deal with these conflicting in-terests in an ethical manner to formulate a viable strategic plan.
RESPONSIBILITIES OF A BUSINESS FIRMWhat are the responsibilities of a business firm and how many of them must be fulfilled?Milton Friedman and Archie Carroll offer two contrasting views of the responsibilities of busi-ness firms to society.
Friedman’s Traditional View of Business ResponsibilityUrging a return to a laissez-faire worldwide economy with a minimum of government regula-tion, Milton Friedman argues against the concept of social responsibility. A business personwho acts “responsibly” by cutting the price of the firm’s product to prevent inflation, or bymaking expenditures to reduce pollution, or by hiring the hard-core unemployed, according toFriedman, is spending the shareholder’s money for a general social interest. Even if the busi-nessperson has shareholder permission or encouragement to do so, he or she is still acting frommotives other than economic and may, in the long run, harm the very society the firm is try-ing to help. By taking on the burden of these social costs, the business becomes less efficient—either prices go up to pay for the increased costs or investment in new activities and researchis postponed. These results negatively affect—perhaps fatally—the long-term efficiency of abusiness. Friedman thus referred to the social responsibility of business as a “fundamentallysubversive doctrine” and stated that:
There is one and only one social responsibility of business—to use its resources and engage inactivities designed to increase its profits so long as it stays within the rules of the game, whichis to say, engages in open and free competition without deception or fraud.2
Following Friedman’s reasoning, the management of General Mills was clearly guilty ofmisusing corporate assets and negatively affecting shareholder wealth. The millions spent insocial services could have been invested in new product development or given back as divi-dends to the shareholders. Instead of General Mills’ management acting on its own, sharehold-ers could have decided which charities to support.
Carroll’s Four Responsibilities of BusinessFriedman’s contention that the primary goal of business is profit maximization is only one sideof an ongoing debate regarding corporate social responsibility (CSR). According to William J.Byron, Distinguished Professor of Ethics at Georgetown University and past-President ofCatholic University of America, profits are merely a means to an end, not an end in itself. Justas a person needs food to survive and grow, so does a business corporation need profits to sur-vive and grow. “Maximizing profits is like maximizing food.” Thus, contends Byron, maxi-mization of profits cannot be the primary obligation of business.3
72 PART 1 Introduction to Strategic Management and Business Policy
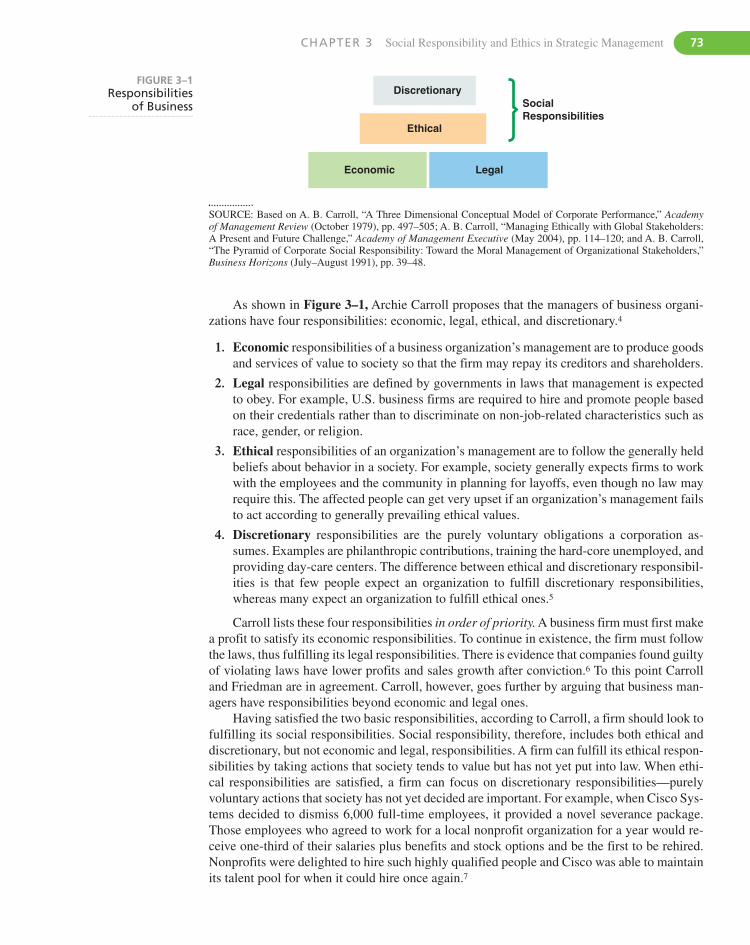
CHAPTER 3 Social Responsibility and Ethics in Strategic Management 73
Discretionary
Ethical
LegalEconomic
SocialResponsibilities
FIGURE 3–1Responsibilities
of Business
As shown in Figure 3–1, Archie Carroll proposes that the managers of business organi-zations have four responsibilities: economic, legal, ethical, and discretionary.4
1. Economic responsibilities of a business organization’s management are to produce goodsand services of value to society so that the firm may repay its creditors and shareholders.
2. Legal responsibilities are defined by governments in laws that management is expectedto obey. For example, U.S. business firms are required to hire and promote people basedon their credentials rather than to discriminate on non-job-related characteristics such asrace, gender, or religion.
3. Ethical responsibilities of an organization’s management are to follow the generally heldbeliefs about behavior in a society. For example, society generally expects firms to workwith the employees and the community in planning for layoffs, even though no law mayrequire this. The affected people can get very upset if an organization’s management failsto act according to generally prevailing ethical values.
4. Discretionary responsibilities are the purely voluntary obligations a corporation as-sumes. Examples are philanthropic contributions, training the hard-core unemployed, andproviding day-care centers. The difference between ethical and discretionary responsibil-ities is that few people expect an organization to fulfill discretionary responsibilities,whereas many expect an organization to fulfill ethical ones.5
Carroll lists these four responsibilities in order of priority. A business firm must first makea profit to satisfy its economic responsibilities. To continue in existence, the firm must followthe laws, thus fulfilling its legal responsibilities. There is evidence that companies found guiltyof violating laws have lower profits and sales growth after conviction.6 To this point Carrolland Friedman are in agreement. Carroll, however, goes further by arguing that business man-agers have responsibilities beyond economic and legal ones.
Having satisfied the two basic responsibilities, according to Carroll, a firm should look tofulfilling its social responsibilities. Social responsibility, therefore, includes both ethical anddiscretionary, but not economic and legal, responsibilities. A firm can fulfill its ethical respon-sibilities by taking actions that society tends to value but has not yet put into law. When ethi-cal responsibilities are satisfied, a firm can focus on discretionary responsibilities—purelyvoluntary actions that society has not yet decided are important. For example, when Cisco Sys-tems decided to dismiss 6,000 full-time employees, it provided a novel severance package.Those employees who agreed to work for a local nonprofit organization for a year would re-ceive one-third of their salaries plus benefits and stock options and be the first to be rehired.Nonprofits were delighted to hire such highly qualified people and Cisco was able to maintainits talent pool for when it could hire once again.7
SOURCE: Based on A. B. Carroll, “A Three Dimensional Conceptual Model of Corporate Performance,” Academyof Management Review (October 1979), pp. 497–505; A. B. Carroll, “Managing Ethically with Global Stakeholders:A Present and Future Challenge,” Academy of Management Executive (May 2004), pp. 114–120; and A. B. Carroll,“The Pyramid of Corporate Social Responsibility: Toward the Moral Management of Organizational Stakeholders,”Business Horizons (July–August 1991), pp. 39–48.
As societal values evolve, the discretionary responsibilities of today may become the eth-ical responsibilities of tomorrow. For example, in 1990, 86% of people in the U.S. believedthat obesity was caused by the individuals themselves, with only 14% blaming either corpo-rate marketing or government guidelines. By 2003, however, only 54% blamed obesity on in-dividuals and 46% put responsibility on corporate marketing and government guidelines.Thus, the offering of healthy, low-calorie food by food processors and restaurants is movingrapidly from being a discretionary to an ethical responsibility.8 One example of this change invalues is the film documentary Super Size Me, which criticizes the health benefits of eatingMcDonald’s deep-fried fast food. (McDonald’s responded by offering more healthy fooditems.)
Carroll suggests that to the extent that business corporations fail to acknowledge discre-tionary or ethical responsibilities, society, through government, will act, making them legal re-sponsibilities. Government may do this, moreover, without regard to an organization’s economicresponsibilities. As a result, the organization may have greater difficulty in earning a profit thanit would have if it had voluntarily assumed some ethical and discretionary responsibilities.
Both Friedman and Carroll argue their positions based on the impact of socially respon-sible actions on a firm’s profits. Friedman says that socially responsible actions hurt a firm’sefficiency. Carroll proposes that a lack of social responsibility results in increased governmentregulations, which reduce a firm’s efficiency.
Friedman’s position on social responsibility appears to be losing traction with business ex-ecutives. For example, a 2006 survey of business executives across the world by McKinsey &Company revealed that only 16% felt that business should focus solely on providing the highestpossible returns to investors while obeying all laws and regulations, contrasted with 84% whostated that business should generate high returns to investors but balance it with contributionsto the broader public good.9 A 2007 survey of global executives by the Economist IntelligenceUnit found that the percentage of companies giving either high or very high priority to corpo-rate social responsibility had risen from less than 40% in 2004 to over 50% in 2007 and wasexpected to increase to almost 70% by 2010.10
Empirical research now indicates that socially responsible actions may have a positive ef-fect on a firm’s financial performance. Although a number of studies in the past have found nosignificant relationship,11 an increasing number are finding a small, but positive relationship.12
A recent in-depth analysis by Margolis and Walsh of 127 studies found that “there is a posi-tive association and very little evidence of a negative association between a company’s socialperformance and its financial performance.”13 Another meta-analysis of 52 studies on socialresponsibility and performance reached this same conclusion.14
According to Porter and Kramer, “social and economic goals are not inherently conflict-ing, but integrally connected.”15 Being known as a socially responsible firm may provide acompany with social capital, the goodwill of key stakeholders, that can be used for competi-tive advantage.16 Target, for example, tries to attract socially concerned younger consumers byoffering brands from companies that can boost ethical track records and community involve-ment.17 In a 2004 study conducted by the strategic marketing firm Cone, Inc., eight in tenAmericans said that corporate support of social causes helps earn their loyalty. This was a 21%increase since 1997.18
Being socially responsible does provide a firm a more positive overall reputation.19 A sur-vey of more than 700 global companies by the Conference Board reported that 60% of themanagers state that citizenship activities had led to (1) goodwill that opened doors in localcommunities and (2) an enhanced reputation with consumers.20 Another survey of 140 U.S.firms revealed that being more socially responsible regarding environmental sustainabilityresulted not only in competitive advantages but also in cost savings.21 For example, compa-nies that take the lead in being environmentally friendly, such as by using recycled materials,preempt attacks from environmental groups and enhance their corporate image. Programs to
74 PART 1 Introduction to Strategic Management and Business Policy
CHAPTER 3 Social Responsibility and Ethics in Strategic Management 75
reduce pollution, for example, can actually reduce waste and maximize resource productivity.One study that examined 70 ecological initiatives taken by 43 companies found the averagepayback period to be 18 months.22 Other examples of benefits received from being sociallyresponsible are:23
� Their environmental concerns may enable them to charge premium prices and gain brandloyalty (for example, Ben & Jerry’s Ice Cream).
� Their trustworthiness may help them generate enduring relationships with suppliers anddistributors without requiring them to spend a lot of time and money policing contracts.
� They can attract outstanding employees who prefer working for a responsible firm (forexample, Procter & Gamble and Starbucks).
� They are more likely to be welcomed into a foreign country (for example, Levi Strauss).
� They can utilize the goodwill of public officials for support in difficult times.
� They are more likely to attract capital infusions from investors who view reputable com-panies as desirable long-term investments. For example, mutual funds investing only insocially responsible companies more than doubled in size from 1995 to 2007 and outper-formed the S&P 500 list of stocks.24
SUSTAINABILITY: MORE THAN ENVIRONMENTAL?As a term, sustainability may include more than just ecological concerns and the natural envi-ronment. Crane and Matten point out that the concept of sustainability can be broadened to in-clude economic and social as well as environmental concerns. They argue that it is sometimesimpossible to address the sustainability of the natural environment without considering the so-cial and economic aspects of relevant communities and their activities. For example, eventhough environmentalists may oppose road-building programs because of their effect onwildlife and conservation efforts, others point to the benefits to local communities of less traf-fic congestion and more jobs.25 Dow Jones & Company, a leading provider of global businessnews and information, developed a sustainability index that considers not only environmen-tal, but also economic and social factors. See the Environmental Sustainability Issue featureto learn the criteria Dow Jones uses in its index.
The broader concept of sustainability has much in common with Carroll’s list of businessresponsibilities presented earlier. In order for a business corporation to be sustainable, that is,to be successful over a long period of time, it must satisfy all of its economic, legal, ethical,and discretionary responsibilities. Sustainability thus involves many issues, concerns, andtradeoffs—leading us to an examination of corporate stakeholders.
CORPORATE STAKEHOLDERSThe concept that business must be socially responsible sounds appealing until we ask, “Re-sponsible to whom?” A corporation’s task environment includes a large number of groups withinterest in a business organization’s activities. These groups are referred to as stakeholdersbecause they affect or are affected by the achievement of the firm’s objectives.26 Should a cor-poration be responsible only to some of these groups, or does business have an equal respon-sibility to all of them?
A survey of the U.S. general public by Harris Poll revealed that 95% of the respondents feltthat U.S. corporations owe something to their workers and the communities in which they op-erate and that they should sometimes sacrifice some profit for the sake of making things betterfor their workers and communities. People were concerned that business executives seemed to
76 PART 1 Introduction to Strategic Management and Business Policy
NOTE: For more information on SAM Sustainable Asset Manage-ment, see Sustainability Yearbook 2008, available from PriceWa-terHouseCoopers (www.pwc.com).
SOURCES: Dow Jones Indexes Web site (www.djindexes.com/) asof July 15, 2008 and A. Crane and D. Matten, Business Ethics: AEuropean Perspective (Oxford: Oxford University Press, 2004),pp. 214–215.
� Environmental sustainability. This includes environ-mental reporting, eco-design and efficiency, environmen-tal management systems, and executive commitment toenvironmental issues.
� Economic sustainability. This includes codes of con-duct and compliance, anti-corruption policies, corpo-rate governance, risk and crisis management, strategicplanning, quality and knowledge management, andsupply chain management.
� Social sustainability. This includes corporate citizen-ship, philanthropy, labor practices, human capital devel-opment, social reporting, talent attraction and retention,and stakeholder dialogue.
Dow Jones & Company, aleading provider of global
business news and informa-tion, pioneered in 1999 the first
index of common stocks that ratescorporations according to their perfor-
mance on sustainability. This index has grown to includemultiple sustainability indexes, such as a World Index,North America Index, and United States Index, among oth-ers. The Dow Jones Sustainability Index (DJSI) follows a“best in class” approach that identifies sustainability lead-ers in each industry. Companies are evaluated against gen-eral and industry-specific criteria and ranked with theirpeers. Data come from questionnaires, submitted docu-mentation, corporate policies, reports, and available publicinformation. Since its inception, the Dow Jones Sustain-ability Index has slightly outperformed its well-known DowJones Industrial Index. Based on SAM (Sustainable AssetManagement AG) Research’s corporate sustainability as-sessment, Dow Jones includes not only environmental, butalso economic and social criteria in its sustainability index.
THE DOW JONES SUSTAINABILITY INDEX
ENVIRONMENTAL sustainability issue
be more interested in making profits and boosting their own pay than they were in the safety andquality of the products made by their companies.27 The percentage of the U.S. general publicthat agreed that business leaders could be trusted to do what is right “most of the time or almostalways” fell from 36% in 2002 to 28% in 2006.28 These negative feelings receive some supportfrom a study that revealed that the CEOs at the 50 U.S. companies that outsourced the greatestnumber of jobs received a greater increase in pay than did the CEOs of 365 U.S. firms overall.29
In any one strategic decision, the interests of one stakeholder group can conflict with thoseof another. For example, a business firm’s decision to use only recycled materials in its man-ufacturing process may have a positive effect on environmental groups but a negative effecton shareholder dividends. In another example, Maytag Corporation’s top management decidedto move refrigerator production from Galesburg, Illinois, to a lower-wage location in Mexico.On the one hand, shareholders were generally pleased with the decision because it would lowercosts. On the other hand, officials and local union people were very unhappy at the loss of jobswhen the Galesburg plant closed. Which group’s interests should have priority?
In order to answer this question, the corporation may need to craft an enterprisestrategy—an overarching strategy that explicitly articulates the firm’s ethical relationship withits stakeholders. This requires not only that management clearly state the firm’s key ethicalvalues, but also that it understands the firm’s societal context, and undertakes stakeholderanalysis to identify the concerns and abilities of each stakeholder.30
Stakeholder AnalysisStakeholder analysis is the identification and evaluation of corporate stakeholders. This canbe done in a three-step process.
CHAPTER 3 Social Responsibility and Ethics in Strategic Management 77
The first step in stakeholder analysis is to identify primary stakeholders, those who havea direct connection with the corporation and who have sufficient bargaining power to directlyaffect corporate activities. Primary stakeholders are directly affected by the corporation andusually include customers, employees, suppliers, shareholders, and creditors.
But who exactly are a firm’s customers or employees and what do they want? This is notalways a simple exercise. For example, Intel’s customers were clearly computer manufactur-ers because that’s to whom Intel sold its electronic chips. When a math professor found a smallflaw in Intel’s Pentium microprocessor in 1994, computer users demanded that Intel replacethe defective chips. At first Intel refused to do so because it hadn’t sold to these individuals.According to then-CEO Andy Grove, “I got irritated and angry because of user demands thatwe take back a device we didn’t sell.” Intel wanted the PC users to follow the supply chain andcomplain to the firms from whom they had bought the computers. Gradually Grove was per-suaded that Intel had a direct duty to these consumers. “Although we didn’t sell to these indi-viduals directly, we marketed to them. . . . It took me a while to understand this,” explainedGrove. In the end, Intel paid $450 million to replace the defective parts.31
Aside from the Intel example, business corporations usually know their primary stake-holders and what they want. The corporation systematically monitors these stakeholders be-cause they are important to a firm’s meeting its economic and legal responsibilities.Employees want a fair day’s pay and fringe benefits. Customers want safe products and valuefor price paid. Shareholders want dividends and stock price appreciation. Suppliers want pre-dictable orders and bills paid. Creditors want commitments to be met on time. In the normalcourse of affairs, the relationship between a firm and each of its primary stakeholders is regu-lated by written or verbal agreements and laws. Once a problem is identified, negotiation takesplace based on costs and benefits to each party. (Government is not usually considered a pri-mary stakeholder because laws apply to all in a category and usually cannot be negotiated.)
The second step in stakeholder analysis is to identify the secondary stakeholders—thosewho have only an indirect stake in the corporation but who are also affected by corporate activ-ities. These usually include nongovernmental organizations (NGOs, such as Greenpeace), ac-tivists, local communities, trade associations, competitors, and governments. Because thecorporation’s relationship with each of these stakeholders is usually not covered by any writtenor verbal agreement, there is room for misunderstanding. As in the case of NGOs and activists,there actually may be no relationship until a problem develops—usually brought up by thestakeholder. In the normal course of events, these stakeholders do not affect the corporation’sability to meet its economic or legal responsibilities. Aside from competitors, these secondarystakeholders are not usually monitored by the corporation in any systematic fashion. As a result,relationships are usually based on a set of questionable assumptions about each other’s needsand wants. Although these stakeholders may not directly affect a firm’s short-term profitability,their actions could determine a corporation’s reputation and thus its long-term performance.
The third step in stakeholder analysis is to estimate the effect on each stakeholder groupfrom any particular strategic decision. Because the primary decision criteria are typically eco-nomic, this is the point where secondary stakeholders may be ignored or discounted as unim-portant. For a firm to fulfill its ethical or discretionary responsibilities, it must seriouslyconsider the needs and wants of its secondary stakeholders in any strategic decision. For ex-ample, how much will specific stakeholder groups lose or gain? What other alternatives dothey have to replace what may be lost?
Stakeholder InputOnce stakeholder impacts have been identified, managers should decide whether stake-holder input should be invited into the discussion of the strategic alternatives. A group ismore likely to accept or even help implement a decision if it has some input into which
78 PART 1 Introduction to Strategic Management and Business Policy
ment for those qualified. We must provide competentmanagement, and their actions must be just and ethical.
We are responsible to the communities where we liveand work and to the world community as well. We must begood citizens—support good works and charities and bearour fair share of taxes. We must encourage civic improve-ments and better health and education. We must maintainin good order the property we are privileged to use, andprotecting the environment and natural resources.
Our final responsibility is to our stockholders. Businessmust make a sound profit. We must experiment with newideas. Research must be carried on, innovative programsdeveloped, and mistakes paid for. New equipment must bepurchased, new facilities provided, and new productslaunched. Reserves must be created for adverse times.When we operate according to these principles, the stock-holders should realize a fair return.
We believe our first respon-sibility is to the doctors,
nurses, and patients, tomothers and fathers and all
others who use our products andservices. In meeting their needs every-
thing we do must be of high quality. We must constantlystrive to reduce our costs in order to maintain reasonableprices. Customers’ orders must be serviced promptly andaccurately. Our suppliers and distributors must have an op-portunity to make a fair profit.
We are responsible to our employees, the men andwomen who work with us throughout the world. Everyonemust be considered as an individual. We must respect theirdignity and recognize their merit. They must have a senseof security in their jobs. Compensation must be fair and ad-equate, and working conditions clean, orderly, and safe.We must be mindful of ways to help our employees fulfilltheir family responsibilities. Employees must feel free tomake suggestions and complaints. There must be equalopportunity for employment, development, and advance-
JOHNSON & JOHNSON CREDO
SOURCE: Johnson & Johnson Company Web site, September 28,2004. (http://www.jnj.com) Copyright by Johnson & Johnson. Allrights reserved. Reprinted by permission.
STRATEGY highlight 3.1
alternative is chosen and how it is to be implemented. In the case of Maytag’s decision toclose its Galesburg, Illinois, refrigeration plant, the community was not a part of the deci-sion. Nevertheless, management decided to inform the local community of its decision threeyears in advance of the closing instead of the 60 days required by law. Although the an-nouncement created negative attention, it gave the Galesburg employees and townspeoplemore time to adjust to the eventual closing.
Given the wide range of interests and concerns present in any organization’s task environ-ment, one or more groups, at any one time, probably will be dissatisfied with an organization’sactivities—even if management is trying to be socially responsible. A company may havesome stakeholders of which it is only marginally aware. For example, when Ford Motor Com-pany extended its advertising to magazines read by gay and lesbian readers in 2005, manage-ment had no idea that the American Family Association (AFA) would argue that this wastantamount to promoting a homosexual agenda and call for a boycott of all Ford products. Inresponse, Ford pulled its ads. Gay and lesbian groups then protested Ford’s backpedaling. Fordthen placed corporate ads in many of the same publications, which gays saw as clumsy and theAFA saw as backsliding.32
Therefore, before making a strategic decision, strategic managers should consider howeach alternative will affect various stakeholder groups. What seems at first to be the best de-cision because it appears to be the most profitable may actually result in the worst set of con-sequences to the corporation. One example of a company that does its best to consider itsresponsibilities to its primary and secondary stakeholders when making strategic decisions isJohnson & Johnson. See Strategy Highlight 3.1 for the J & J Credo.
CHAPTER 3 Social Responsibility and Ethics in Strategic Management 79
3.2 Ethical Decision MakingSome people joke that there is no such thing as “business ethics.” They call it an oxymoron—a concept that combines opposite or contradictory ideas. Unfortunately, there is some truth tothis sarcastic comment. For example, a survey by the Ethics Resource Center of 1,324 employ-ees of 747 U.S. companies found that 48% of employees surveyed said that they had engagedin one or more unethical and/or illegal actions during the past year. The most common ques-tionable behaviors involved cutting corners on quality (16%), covering up incidents (14%),abusing or lying about sick days (11%), and lying to or deceiving customers (9%).33 Some 52%of workers reported observing at least one type of misconduct in the workplace, but only 55%reported it.34 From 1996 to 2005, top managers at 2,270 firms (29.2% of the firms analyzed)had backdated or otherwise manipulated stock option grants to take advantage of favorableshare-price movements.35 In a survey, 53% of employees in corporations of all sizes admittedthat they would be willing to misrepresent corporate financial statements if asked to do so bya superior.36 A survey of 141 chief financial executives (CFOs) revealed that 17% had beenpressured by their CEOs over a five-year period to misrepresent the company’s financial re-sults. Five percent admitted that they had succumbed to the request.37
Around 53,000 cases of suspected mortgage fraud were reported by banks in 2007. Themost common type of mortgage fraud was misstatement of income or assets, followed byforged documents, inflated appraisals, and misrepresentation of a buyer’s intent to occupy aproperty as a primary residence.38 In one instance, Allison Bice, office manager at LeonardFazio’s RE/MAX A-1 Best Realtors in Urbandale, Iowa, admitted that she submitted fake in-voices and copies of checks drawn on a closed account as part of a scheme to obtain moremoney from Homecoming Financial, a mortgage company that had hired Fazio’s agency to re-sell foreclosed homes. “I was directed by Mr. Fazio to have the bills be larger to Homecom-ings because we didn’t make much money on commissions,” Bice told a federal jury in DesMoines. “He told me that everybody in the business does it.”39
A study of more than 5,000 graduate students at 32 colleges and universities in the UnitedStates and Canada revealed that 56% of business students and 47% of non-business studentsadmitted to cheating at least once during the past year. Cheating was more likely when a stu-dent’s peers also cheated.40 In another example, 6,000 people paid $30 to enter a VIP sectionon ScoreTop.com’s Web site to obtain access to actual test questions posted by those who hadrecently taken the Graduate Management Admission Test (GMAT). In response, the GraduateManagement Admission Council promised to cancel the scores of anyone who posted “live”questions to the site or knowingly read them.41 Given this lack of ethical behavior among stu-dents, it is easy to understand why some could run into trouble if they obtained a job at a cor-poration having an unethical culture, such as Enron, WorldCom, or Tyco. (See StrategyHighlight 3.2 for examples of unethical practices at Enron and Worldcom.)
SOME REASONS FOR UNETHICAL BEHAVIORWhy are many business people perceived to be acting unethically? It may be that the involvedpeople are not even aware that they are doing something questionable. There is no worldwidestandard of conduct for business people. This is especially important given the global natureof business activities. Cultural norms and values vary between countries and even between dif-ferent geographic regions and ethnic groups within a country. For example, what is consideredin one country to be a bribe to expedite service is sometimes considered in another country tobe normal business practice. Some of these differences may derive from whether a country’s
80 PART 1 Introduction to Strategic Management and Business Policy
ment. None of that will protect Enron if these transac-tions are ever disclosed in the bright light of day.
At WorldCom, Cynthia Cooper, an internal auditor,noted that some of the company’s capital expendituresshould have been listed on the second-quarter financialstatements as expenses. When she mentioned this to bothWorldCom’s controller and its chief financial officer, shewas told to stop what she was doing and to delay the au-dit until the third quarter (when expensing the transactionswould not be noticed). Instead, Cooper informed theboard of directors’ audit committee. Two weeks later,WorldCom announced that it was reducing earnings by$3.9 billion, the largest restatement in history.
Corporate scandals at Enron,WorldCom, and Tyco, among
other international companies,have caused people around the
world to seriously question the ethics of business executives.Enron, in particular, has become infamous for the question-able actions of its top executives in the form of (1) off-balance sheet partnerships used to hide the company’s dete-riorating finances, (2) revenue from long-term contracts being recorded in the first year instead of being spread overmultiple years, (3) financial reports being falsified to inflateexecutive bonuses, and (4) manipulation of the electricitymarket—leading to a California energy crisis. Only SherronWatkins, an Enron accountant, was willing to speak out re-garding the questionable nature of these practices. In a now-famous memo to then-CEO Kenneth Lay, Watkins warned:
I realize that we have had a lot of smart people lookingat this and a lot of accountants including AA & Co.[Arthur Andersen] have blessed the accounting treat-
UNETHICAL PRACTICES AT ENRON AND WORLDCOMEXPOSED BY “WHISTLE-BLOWERS”
SOURCES: G. Colvin, “Wonder Women of Whistleblowers,” Fortune(August 12, 2002), p. 56; W. Zellner, “The Deadly Sins of Enron,”Business Week (October 14, 2002), pp. 26–28; M. J. Mandel, “Andthe Enron Award Goes to . . . Enron,” Business Week (May 20, 2002),p. 46.
STRATEGY highlight 3.2
governance system is rule-based or relationship-based. Relationship-based countries tend tobe less transparent and have a higher degree of corruption than do rule-based countries.42 Seethe Global Issue feature for an explanation of country governance systems and how they mayaffect business practices.
Another possible reason for what is often perceived to be unethical behavior lies in differ-ences in values between business people and key stakeholders. Some businesspeople may be-lieve profit maximization is the key goal of their firm, whereas concerned interest groups mayhave other priorities, such as the hiring of minorities and women or the safety of their neigh-borhoods. Of the six values measured by the Allport-Vernon-Lindzey Study of Values test (aes-thetic, economic, political, religious, social, and theoretical), both U.S. and UK executivesconsistently score highest on economic and political values and lowest on social and religiousones. This is similar to the value profile of managers from Japan, Korea, India, and Australia,as well as those of U.S. business school students. U.S. Protestant ministers, in contrast, scorehighest on religious and social values and very low on economic values.43
This difference in values can make it difficult for one group of people to understand an-other’s actions. For example, even though some people feel that the advertising of cigarettesand alcoholic drinks (especially to youth) is unethical, the people managing these companiescan respond that they are simply offering a product; “Let the buyer beware” is a traditionalsaying in free-market capitalism. They argue that customers in a free market democracy havethe right to choose how they spend their money and live their lives. Social progressives maycontend that business people working in tobacco, alcoholic beverages, and gambling indus-tries are acting unethically by making and advertising products with potentially dangerous andexpensive side effects, such as cancer, alcoholism, and addiction. People working in these in-dustries could respond by asking whether it is ethical for people who don’t smoke, drink, or
CHAPTER 3 Social Responsibility and Ethics in Strategic Management 81
HOW RULE-BASED AND RELATIONSHIP-BASED GOVERNANCE SYSTEMS AFFECT ETHICAL BEHAVIOR
based system in a developing nation is inherently nontrans-parent due to the local and non-verifiable nature of its in-formation. A business person needs to develop andnurture a wide network of personal relationships. Whatyou know is less important than who you know.
The investment in time and money needed to build thenecessary relationships to conduct business in a developingnation creates a high entry barrier for any newcomers to anindustry. Thus, key industries in developing nations tend tobe controlled by a small number of companies, usually pri-vately owned, family-controlled conglomerates. Becausepublic information is unreliable and insufficient for deci-sions, strategic decisions may depend more on a CEO play-ing golf with the prime minister than with questionablemarket share data. In a relationship-based system, the cul-ture of the country (and the founder’s family) strongly af-fects corporate culture and business ethics. What is “fair”depends on whether one is a family member, a closefriend, a neighbor, or a stranger. Because behavior tends tobe less controlled by laws and agreed-upon standards thanby tradition, businesspeople from a rule-based developednation perceive the relationship-based system in a develop-ing nation to be less ethical and more corrupt. Accordingto Larry Smeltzer, ethics professor at Arizona State Univer-sity: “The lack of openness and predictable business stan-dards drives companies away. Why would you want to dobusiness in, say Libya, where you don’t know the rules?”
SOURCES: S. Li, S. H. Park, and S. Li, “The Great Leap Forward:The Transition from Relation-Based Governance to Rule-BasedGovernance,” Organizational Dynamics, Vol. 33, No. 1 (2003),pp. 63–78; M. Davids, “Global Standards, Local Problems,”Journal of Business Strategy (January/February 1999), pp. 38–43;“The Opacity Index,” Economist (September 18, 2004), p. 106.
gamble to reject another person’s right to do so. One example is the recent controversy overthe marketing of “alcopops,” caffeinated malt beverages containing twice as much alcohol asmany beers in the U.S. Critics of Sparks and Tilt call them alcoholic beverages disguised asenergy drinks aimed at luring underage drinkers.44
Seventy percent of executives representing 111 diverse national and multinational corpo-rations reported that they bend the rules to attain their objectives.45 The three most commonreasons given were:
� Organizational performance required it—74%
� Rules were ambiguous or out of date—70%
� Pressure from others and everyone does it—47%
The developed nations of theworld operate under gover-
nance systems quite differentfrom those used by developing
nations. The developed nations and thebusiness firms within them follow well-recognized rules intheir dealings and financial reporting. To the extent that acountry’s rules force business corporations to publicly dis-close in-depth information about the company to potentialshareholders and others, that country’s financial and legalsystem is said to be transparent. Transparency is said tosimplify transactions and reduce the temptation to behaveillegally or unethically. Finland, the United Kingdom, HongKong, the United States, and Australia have very transpar-ent business climates. The Kurtzman Group, a consultingfirm, developed an opacity index that measures the risksassociated with unclear legal systems, regulations, eco-nomic policies, corporate governance standards, and cor-ruption in 48 countries. The countries with the mostopaque/least transparent ratings are Indonesia, Venezuela,China, Nigeria, India, Egypt, and Russia.
Developing nations tend to have relationship-basedgovernance. Transactions are based on personal and im-plicit agreements, not on formal contracts enforceable bya court. Information about a business is largely local andprivate—thus cannot be easily verified by a third party. Incontrast, rule-based governance relies on publicly verifiableinformation—the type of information that is typically notavailable in a developing country. The rule-based systemhas an infrastructure, based on accounting, auditing, rat-ings systems, legal cases, and codes, to provide and moni-tor this information. If present in a developing nation, theinfrastructure is not very sophisticated. This is why invest-ing in a developing country is very risky. The relationship-
GLOBAL issue
82 PART 1 Introduction to Strategic Management and Business Policy
The financial community’s emphasis on short-term earnings performance is a significantpressure for executives to “manage” quarterly earnings. For example, a company achieving itsforecasted quarterly earnings figure signals the investment community that its strategy and op-erations are proceeding as planned. Failing to meet its targeted objective signals that the com-pany is in trouble—thus causing the stock price to fall and shareholders to become worried.Research by Degeorge and Patel involving more than 100,000 quarterly earnings reports re-vealed that a preponderance (82%) of reported earnings exactly matched analysts’expectationsor exceeded them by 1%. The disparity between the number of earnings reports that missedestimates by a penny and the number that exceeded them by a penny suggests that executiveswho risked falling short of forecasts “borrowed” earnings from future quarters.46
In explaining why executives and accountants at Enron engaged in unethical and illegal ac-tions, former Enron vice president Sherron Watkins used the “frogs in boiling water” analogy.If, for example, one were to toss a frog into a pan of boiling water, according to the folk tale, thefrog would quickly jump out. It might be burned, but the frog would survive. However, if oneput a frog in a pan of cold water and turned up the heat very slowly, the frog would not sense theincreasing heat until it was too lethargic to jump out and would be boiled.According to Watkins:
Enron’s accounting moved from creative to aggressive, to fraudulent, like the pot of water mov-ing from cool to lukewarm to boiling; those involved with the creative transactions soon foundthemselves working on the aggressive transactions and were finally in the uncomfortable situa-tion of working on fraudulent deals.47
Moral RelativismSome people justify their seemingly unethical positions by arguing that there is no one ab-solute code of ethics and that morality is relative. Simply put, moral relativism claims thatmorality is relative to some personal, social, or cultural standard and that there is no methodfor deciding whether one decision is better than another.
At one time or another, most managers have probably used one of the four types of moralrelativism—naïve, role, social group, or cultural—to justify questionable behavior.48
Naïve relativism: Based on the belief that all moral decisions are deeply personal and that in-dividuals have the right to run their own lives, adherents of moral relativism argue thateach person should be allowed to interpret situations and act on his or her own moral val-ues. This is not so much a belief as it is an excuse for not having a belief or is a commonexcuse for not taking action when observing others lying or cheating.
Role relativism: Based on the belief that social roles carry with them certain obligations tothat role, adherents of role relativism argue that a manager in charge of a work unit mustput aside his or her personal beliefs and do instead what the role requires, that is, act inthe best interests of the unit. Blindly following orders was a common excuse provided byNazi war criminals after World War II.
Social group relativism: Based on a belief that morality is simply a matter of following thenorms of an individual’s peer group, social group relativism argues that a decision isconsidered legitimate if it is common practice, regardless of other considerations(“everyone’s doing it”). A real danger in embracing this view is that the person may in-correctly believe that a certain action is commonly accepted practice in an industry whenit is not.
Cultural relativism: Based on the belief that morality is relative to a particular culture, soci-ety, or community, adherents of cultural relativism argue that people should understandthe practices of other societies, but not judge them. This view not only suggests that oneshould not criticize another culture’s norms and customs, but also that it is acceptable topersonally follow these norms and customs (“When in Rome, do as the Romans do.”).
CHAPTER 3 Social Responsibility and Ethics in Strategic Management 83
Although these arguments make some sense, moral relativism could enable a person tojustify almost any sort of decision or action, so long as it is not declared illegal.
Kohlberg’s Levels of Moral DevelopmentAnother reason why some business people might be seen as unethical is that they may have nowell-developed personal sense of ethics. A person’s ethical behavior is affected by his or herlevel of moral development, certain personality variables, and such situational factors as thejob itself, the supervisor, and the organizational culture.49 Kohlberg proposes that a person pro-gresses through three levels of moral development.50 Similar in some ways to Maslow’s hi-erarchy of needs, in Kohlberg’s system, the individual moves from total self-centeredness to aconcern for universal values. Kohlberg’s three levels are as follows:
1. The preconventional level: This level is characterized by a concern for self. Small chil-dren and others who have not progressed beyond this stage evaluate behaviors on the ba-sis of personal interest—avoiding punishment or quid pro quo.
2. The conventional level: This level is characterized by considerations of society’s lawsand norms. Actions are justified by an external code of conduct.
3. The principled level: This level is characterized by a person’s adherence to an internalmoral code. An individual at this level looks beyond norms or laws to find universal val-ues or principles.
Kohlberg places most people in the conventional level, with fewer than 20% of U.S. adultsin the principled level of development.51 Research appears to support Kohlberg’s concept. Forexample, one study found that individuals higher in cognitive moral development, lower inMachiavellianism, with a more internal locus of control, a less-relativistic moral philosophy,and higher job satisfaction are less likely to plan and enact unethical choices.52
ENCOURAGING ETHICAL BEHAVIORFollowing Carroll’s work, if business people do not act ethically, government will be forcedto pass laws regulating their actions—and usually increasing their costs. For self-interest, iffor no other reason, managers should be more ethical in their decision making. One way to dothat is by developing codes of ethics. Another is by providing guidelines for ethical behavior.
Codes of EthicsA code of ethics specifies how an organization expects its employees to behave while on the job.Developing codes of ethics can be a useful way to promote ethical behavior, especially for peo-ple who are operating at Kohlberg’s conventional level of moral development. Such codes arecurrently being used by more than half of U.S. business corporations. A code of ethics (1) clar-ifies company expectations of employee conduct in various situations and (2) makes clear thatthe company expects its people to recognize the ethical dimensions in decisions and actions.53
Various studies indicate that an increasing number of companies are developing codes ofethics and implementing ethics training workshops and seminars. However, research also indi-cates that when faced with a question of ethics, managers tend to ignore codes of ethics and tryto solve dilemmas on their own.54 To combat this tendency, the management of a company thatwants to improve its employees’ ethical behavior should not only develop a comprehensivecode of ethics but also communicate the code in its training programs, in its performance ap-praisal system, policies and procedures, and through its own actions.55 It may even include keyvalues in its values and mission statements. According to a 2004 survey of CEOs by the Busi-ness Roundtable Institute for Corporate Ethics, 74% of CEOs confirmed that their companies
84 PART 1 Introduction to Strategic Management and Business Policy
had made changes within the previous two years in how they handled or reported ethics issues.Specific changes reported were:
� Enhanced internal reporting and communications—33%
� Ethics hotlines—17%
� Improved compliance procedures—12%
� Greater oversight by the board of directors—10%56
In addition, U.S. corporations have attempted to support whistle-blowers, those employ-ees who report illegal or unethical behavior on the part of others. The U.S. False Claims Actgives whistle-blowers 15% to 30% of any damages recovered in cases where the governmentis defrauded. Even though the Sarbanes-Oxley Act forbids firms from retaliating against any-one reporting wrongdoing, 82% of those who uncovered fraud from 1996 to 2004 reported be-ing ostracized, demoted, or pressured to quit.57
Corporations appear to benefit from well-conceived and implemented ethics programs.For example, companies with strong ethical cultures and enforced codes of conduct have fewerunethical choices available to employees—thus fewer temptations.58 A study by the OpenCompliance and Ethics Group found that no company with an ethics program in place for10 years or more experienced “reputational damage” in the last five years.59 Some of the com-panies identified in surveys as having strong moral cultures are Canon, Hewlett-Packard,Johnson & Johnson, Levi Strauss, Medtronic, Motorola, Newman’s Own, Patagonia, S. C.Johnson, Shorebank, Smucker, and Sony.60
A corporation’s management should consider establishing and enforcing a code of ethicalbehavior for those companies with which it does business—especially if it outsources its man-ufacturing to a company in another country. For example, Gap International, one of Ameri-can’s largest fashion retailers, developed one of the most rigorous codes of conduct for itssuppliers. Its suppliers must comply with all child-labor laws on hiring, working hours, over-time, and working conditions. Workers must be at least 14 years of age. Rather than simplycanceling business with suppliers using child labor, Gap requires suppliers to stop using childworkers and to provide them with schooling instead, while continuing to pay them regularlyand guaranteeing them a job once they reach legal age. In one year, Gap canceled contractswith 23 factories that did not meet its standards.61
Gap’s experience, however, may be unusual. Recent surveys of over one hundred compa-nies in the Global 2000 uncovered that 64% have some code of conduct that regulates supplierconduct, but only 40% require suppliers to actually take any action with respect to the code,such as disseminating it to employees, offering training, certifying compliance, or even read-ing or acknowledging receipt of the code.62
It is important to note that having a code of ethics for suppliers does not prevent harm toa corporation’s reputation if one of its offshore suppliers is able to conceal abuses. NumerousChinese factories, for example, keep double sets of books to fool auditors and distribute scriptsfor employees to recite if they are questioned. Consultants have found new business helpingChinese companies evade audits.63
Guidelines for Ethical BehaviorEthics is defined as the consensually accepted standards of behavior for an occupation, a trade,or a profession. Morality, in contrast, is the precepts of personal behavior based on religiousor philosophical grounds. Law refers to formal codes that permit or forbid certain behaviorsand may or may not enforce ethics or morality.64 Given these definitions, how do we arrive ata comprehensive statement of ethics to use in making decisions in a specific occupation, trade,or profession? A starting point for such a code of ethics is to consider the three basic ap-proaches to ethical behavior:65
CHAPTER 3 Social Responsibility and Ethics in Strategic Management 85
1. Utilitarian approach: The utilitarian approach proposes that actions and plans shouldbe judged by their consequences. People should therefore behave in a way that will pro-duce the greatest benefit to society and produce the least harm or the lowest cost. A prob-lem with this approach is the difficulty in recognizing all the benefits and the costs of anyparticular decision. Research reveals that only the stakeholders who have the most power(ability to affect the company), legitimacy (legal or moral claim on company resources),and urgency (demand for immediate attention) are given priority by CEOs.66 It is thereforelikely that only the most obvious stakeholders will be considered, while others are ignored.
2. Individual rights approach: The individual rights approach proposes that human be-ings have certain fundamental rights that should be respected in all decisions. A particulardecision or behavior should be avoided if it interferes with the rights of others. A problemwith this approach is in defining “fundamental rights.” The U.S. Constitution includes aBill of Rights that may or may not be accepted throughout the world. The approach canalso encourage selfish behavior when a person defines a personal need or want as a “right.”
3. Justice approach: The justice approach proposes that decision makers be equitable, fair,and impartial in the distribution of costs and benefits to individuals and groups. It followsthe principles of distributive justice (people who are similar on relevant dimensions suchas job seniority should be treated in the same way) and fairness (liberty should be equal forall persons). The justice approach can also include the concepts of retributive justice (pun-ishment should be proportional to the offense) and compensatory justice (wrongs shouldbe compensated in proportion to the offense). Affirmative action issues such as reverse dis-crimination are examples of conflicts between distributive and compensatory justice.
Cavanagh proposes that we solve ethical problems by asking the following three ques-tions regarding an act or a decision:
1. Utility: Does it optimize the satisfactions of all stakeholders?
2. Rights: Does it respect the rights of the individuals involved?
3. Justice: Is it consistent with the canons of justice?
For example, is padding an expense account ethical? Using the utility criterion, this ac-tion increases the company’s costs and thus does not optimize benefits for shareholders or cus-tomers. Using the rights approach, a person has no right to the money (otherwise, we wouldn’tcall it “padding”). Using the justice criterion, salary and commissions constitute ordinary com-pensation, but expense accounts compensate a person only for expenses incurred in doing hisor her job—expenses that the person would not normally incur except in doing the job.67
Another approach to resolving ethical dilemmas is by applying the logic of the philoso-pher Immanuel Kant. Kant presents two principles (called categorical imperatives) to guideour actions:
1. A person’s action is ethical only if that person is willing for that same action to be takenby everyone who is in a similar situation. This is the same as the Golden Rule: Treat oth-ers as you would like them to treat you. For example, padding an expense account wouldbe considered ethical if the person were also willing for everyone else to do the same ifthey were the boss. Because it is very doubtful that any manager would be pleased withexpense account padding, the action must be considered unethical.
2. A person should never treat another human being simply as a means but always as an end.This means that an action is morally wrong for a person if that person uses others merelyas means for advancing his or her own interests. To be moral, the act should not restrictother people’s actions so that they are disadvantaged in some way.68
86 PART 1 Introduction to Strategic Management and Business Policy
D I S C U S S I O N Q U E S T I O N S1. What is the relationship between corporate governance
and social responsibility?
2. What is your opinion of Gap International’s having a codeof conduct for its suppliers? What would Milton Fried-man say? Contrast his view with Archie Carroll’s view.
3. Does a company have to act selflessly to be consideredsocially responsible? For example, when building a newplant, a corporation voluntarily invested in additionalequipment that enabled it to reduce its pollution emis-sions beyond any current laws. Knowing that it would be
very expensive for its competitors to do the same, thefirm lobbied the government to make pollution regula-tions more restrictive on the entire industry. Is this com-pany socially responsible? Were its managers actingethically?
4. Are people living in a relationship-based governance sys-tem likely to be unethical in business dealings?
5. Given that people rarely use a company’s code of ethicsto guide their decision making, what good are thecodes?
In his book Defining Moments, Joseph Badaracco states that most ethics problems deal with“right versus right” problems in which neither choice is wrong. These are what he calls “dirtyhands problems” in which a person has to deal with very specific situations that are coveredonly vaguely in corporate credos or mission statements. For example, many mission state-ments endorse fairness but fail to define the term. At the personal level, fairness could meanplaying by the rules of the game, following basic morality, treating everyone alike and notplaying favorites, treating others as you would want to be treated, being sensitive to individ-ual needs, providing equal opportunity for everyone, or creating a level playing field for thedisadvantaged. According to Badaracco, codes of ethics are not always helpful because theytend to emphasize problems of misconduct and wrongdoing, not a choice between two accept-able alternatives, such as keeping an inefficient plant operating for the good of the communityor closing the plant and relocating to a more efficient location to lower costs.69
This chapter provides a framework for understanding the social responsibilities of a busi-ness corporation. Following Carroll, it proposes that a manager should consider not only theeconomic and legal responsibilities of a firm but also its ethical and discretionary responsibil-ities. It also provides a method for making ethical choices, whether they are right versus rightor some combination of right and wrong. It is important to consider Cavanaugh’s questions us-ing the three approaches of utilitarian, rights, and justice plus Kant’s categorical imperativeswhen making a strategic decision. A corporation should try to move from Kohlberg’s conven-tional to a principled level of ethical development. If nothing else, the frameworks should con-tribute to well-reasoned strategic decisions that a person can defend when interviewed byhostile media or questioned in a court room.
E C O - B I T S� An Australian nut orchard converts the shells of old
Macintosh computers into houses for pest-eating birds.
� Nike gathers old athletic shoes and turns them into rawmaterial for “sports surfaces” like tennis courts and run-ning tracks.
� The British company Ecopods sells stylish coffins madefrom hardened recycled paper.
� It takes three months for a recycled aluminum can to re-turn to the supermarket shelf in reincarnated form.70
End of Chapter SUMMARY
CHAPTER 3 Social Responsibility and Ethics in Strategic Management 87
S T R A T E G I C P R A C T I C E E X E R C I S EIt is 1982. Zombie Savings and Loan is in trouble. This is atime when many savings and loans (S&Ls) are in financial dif-ficulty. Zombie holds many 30-year mortgages at low fixed-interest rates in its loan portfolio. Interest rates have risensignificantly, and the Deregulation Act of 1980 has givenZombie and other S&Ls the right to make business loans andhold up to 20% of its assets as such. Because interest rates ingeneral have risen, but the rate that Zombie receives on its oldmortgages has not, Zombie must now pay out higher interestrates to its deposit customers or see them leave, and it has neg-ative cash flow until rates fall below the rates in its mortgageportfolio or Zombie itself fails.
In present value terms, Zombie is insolvent, but the ac-counting rules of the time do not require marking assets to mar-ket, so Zombie is allowed to continue to operate and is facedwith two choices: It can wait and hope interest rates fall beforeit is declared insolvent and is closed down, or it can raise fresh(insured) deposits and make risky loans that have high interestrates. Risky loans promise high payoffs (if they are repaid), butthe probability of loss to Zombie and being closed later withgreater loss to the Federal Savings & Loan Insurance Corpora-
tion (FSLIC) is high. Zombie stays in business if its gamblepays off, and it loses no more than it has already lost if the gam-ble does not pay off. Indeed, if not closed, Zombie will raiseincreasingly greater new deposits and make more risky loansuntil it either wins or is shut down by the regulators.
Waiting for lower interest rates and accepting early closureif lower rates do not arrive is certainly in the best interest of theFSLIC and of the taxpayers, but the manager of Zombie hasmore immediate responsibilities, such as employees’ jobs,mortgage customers, depositors, the local neighborhood, andhis or her job. As a typical S&L, Zombie’s depositors are itsshareholders and vote according to how much money they havein savings accounts with Zombie. If Zombie closes, depositorsmay lose some, but not all of their money, because their depositsare insured by the FSLIC. There is no other provider of homemortgages in the immediate area. What should the manager do?
SOURCE: Adapted from D. W. Swanton, “Teaching Students theNature of Moral Hazard: An Ethical Component for Finance Classes,”paper presented to the annual meeting of the Academy of Finance,Chicago (March 13, 2003). Reprinted with permission.
categorical imperatives (p. 85)code of ethics (p. 83)ethics (p. 84)individual rights approach (p. 85)justice approach (p. 85)
law (p. 84)levels of moral development (p. 83)morality (p. 84)moral relativism (p. 82)social responsibility (p. 72)
stakeholder analysis (p. 76)stakeholders (p. 75)utilitarian approach (p. 85)whistle-blowers (p. 84)
K E Y T E R M S
N O T E S1. 2008 Corporate Social Responsibility Report, General Mills
Inc., Minneapolis, MN; M. Conlin, J. Hempel, J. Tanzer, andD. Poole, “The Corporate Donors,” Business Week (December1, 2003), pp. 92–96; I. Sager, “The List: Angels in the Board-room,” Business Week (July 7, 2003), p. 12.
2. M. Friedman, “The Social Responsibility of Business Is to In-crease Its Profits,” New York Times Magazine (September 13,1970), pp. 30, 126–127; M. Friedman Capitalism and Freedom(Chicago: University of Chicago Press, 1963), p. 133.
3. W. J. Byron, Old Ethical Principles for the New Corporate Cul-ture, presentation to the College of Business, Iowa State Uni-versity, Ames, Iowa (March 31, 2003).
4. A. B. Carroll, “A Three-Dimensional Conceptual Model ofCorporate Performance,” Academy of Management Review(October 1979), pp. 497–505. This model of business responsi-bilities was reaffirmed in A. B. Carroll, “Managing Ethicallywith Global Stakeholders: A Present and Future Challenge,”Academy of Management Executive (May 2004), pp. 114–120.
5. Carroll refers to discretionary responsibilities as philanthropicresponsibilities in A. B. Carroll, “The Pyramid of Corporate So-cial Responsibility: Toward the Moral Management of Organi-zational Stakeholders,” Business Horizons (July–August 1991),pp. 39–48.
6. M. S. Baucus and D. A. Baucus, “Paying the Piper: An Empir-ical Examination of Longer-Term Financial Consequences ofIllegal Corporate Behavior,” Academy of Management Journal(February 1997), pp. 129–151.
7. J. Oleck, “Pink Slips with a Silver Lining,” Business Week(June 4, 2001), p. 14.
8. S. M. J. Bonini, L. T. Mendonca, and J. M. Oppenheim, “WhenSocial Issues Become Strategic,” McKinsey Quarterly (2006,Number 2), pp. 20–31.
9. “The McKinsey Global Survey of Business Executives: Businessand Society,” McKinsey Quarterly, Web edition (March 31, 2006).
10. “Just Good Business,” The Economist, Special Report on SocialResponsibility (January 19, 2008), p. 4.
11. A. McWilliams and D. Siegel, “Corporate Social Responsibil-ity and Financial Performance: Correlation or Misspecifica-tion?” Strategic Management Journal (May 2000),pp. 603–609; P. Rechner and K. Roth, “Social Responsibilityand Financial Performance: A Structural Equation Methodol-ogy,” International Journal of Management (December 1990),pp. 382–391; K. E. Aupperle, A. B. Carroll, and J. D. Hatfield,“An Empirical Examination of the Relationship Between Cor-porate Social Responsibility and Profitability,” Academy ofManagement Journal (June 1985), p. 459.
12. M. M. Arthur, “Share Price Reactions to Work-Family Initiatives:An Institutional Perspective,” Academy of Management Journal(April 2003), pp. 497–505; S. A. Waddock and S. B. Graves, “TheCorporate Social Performance—Financial Performance Link,”Strategic Management Journal (April 1997), pp. 303–319; M. V.Russo and P. A. Fouts, “Resource Based Perspective on CorporateEnvironmental Performance and Profitability” Academy of Man-agement Journal (July 1997), pp. 534–559; H. Meyer, “TheGreening of Corporate America,” Journal of Business Strategy(January/February 2000), pp. 38–43.
13. J. D. Margolis and J. P. Walsh, “Misery Loves Companies: Re-thinking Social Initiatives by Business,” Administrative ScienceQuarterly (June 2003), pp. 268–305.
14. M. F. L. Orlitzky, F. L. Schmidt, and S. L. Rynes, “CorporateSocial and Financial Performance: A Meta Analysis,”Organization Studies, Vol. 24 (2003), pp. 403–441.
15. M. Porter and M. R. Kramer, “The Competitive Advantage ofCorporate Philanthropy,” Harvard Business Review (December2002), p. 59.
16. P. S. Adler and S. W. Kwon, “Social Capital: Prospects for aNew Concept,” Academy of Management Journal (January2002), pp. 17–40. Also called “moral capital” in P. C. Godfrey,“The Relationship Between Corporate Philanthropy and Share-holder Wealth: A Risk Management Perspective,” Academy ofManagement Review (October 2005), pp. 777–799.
17. L. Gard, “We’re Good Guys, Buy from Us,” Business Week(November 22, 2004), pp. 72–74.
18. C. J. Prince, “Give and Receive,” Entrepreneur (November2005), pp. 76–78.
19. C. J. Fombrun, “Corporate Reputation as an Economic Asset,”in M. A. Hitt, E. R. Freeman, and J. S. Harrison (Eds.), TheBlackwell Handbook of Strategic Management (Oxford: Black-well Publishers, 2001), pp. 289–310.
20. S. A. Muirhead, C. J. Bennett, R. E. Berenbeim, A. Kao, andD. J. Vidal, Corporate Citizenship in the New Century (NewYork: The Conference Board, 2002), p. 6.
21. 2002 Sustainability Survey Report, PriceWaterhouseCoopers,reported in “Corporate America’s Social Conscience,” SpecialAdvertising Section, Fortune (May 26, 2003), pp. 149–157.
22. C. L. Harman and E. R. Stafford, “Green Alliances: BuildingNew Business with Environmental Groups” Long Range Plan-ning (April 1997), pp. 184–196.
23. D. B. Turner and D. W. Greening, “Corporate Social Perfor-mance and Organizational Attractiveness to Prospective Em-ployees,” Academy of Management Journal (July 1997),pp. 658–672; S. Preece, C. Fleisher, and J. Toccacelli, “Build-ing a Reputation Along the Value Chain at Levi Strauss,” LongRange Planning (December 1995), pp. 88–98; J. B. Barney andM. H. Hansen, “Trustworthiness as a Source of CompetitiveAdvantage,” Strategic Management Journal (Special Winter Is-sue, 1994), pp. 175–190: R. V. Aguilera, D. E. Rupp, C. A.
Williams, and J. Ganapathi, “Putting the S Back in CorporateSocial Responsibility: A Multilevel Theory of Social Change inOrganizations,” Academy of Management Review (July 2007),pp. 836–863; S. Bonini and S. Chenevert, “The State of Corpo-rate Philanthropy: A McKinsey Global Survey,” McKinseyQuarterly, Web edition (March 1, 2008); P. Kotler and N. Lee,eds., Corporate Social Responsibility: Doing the Most Good forYour Company and Your Cause (Hoboken, NJ: Wiley, 2005).
24. “Numbers: Do-Good Investments Are Holding Up Better,”Business Week (July 14 & 21, 2008), p. 15.
25. A. Crane and D. Matten, Business Ethics: A European Perspec-tive (Oxford: Oxford University Press, 2004), p. 22.
26. R. E. Freeman and D. R. Gilbert, Corporate Strategy and theSearch for Ethics (Upper Saddle River, NJ: Prentice Hall,1988), p. 6.
27. M. Arndt, W. Zellner, and P. Coy, “Too Much CorporatePower?” Business Week (September 11, 2000), pp. 144–158.
28. L. T. Mendonca and M. Miller, “Exploring Business’s SocialContract: An Interview with Daniel Yankellvich,” McKinseyQuarterly (2007, Number 2).
29. “Report: CEOs of Companies with Greatest Outsourcing GotBiggest Pay,” Des Moines Register (August 31, 2004), p. B5.
30. W. E. Stead and J. G. Stead, Sustainable Strategic Management(Armonk, NY: M. E. Sharpe, 2004), p. 41.
31. “Andy Grove to Corporate Boards: It’s Time to Take Charge,”Knowledge @ Wharton (September 9–October 5, 2004).
32. “Ford Flip-Flop Annoys both Gays and Fundamentalists,”Roundel (February 2006), p. 23.
33. “Nearly Half of Workers Take Unethical Actions—Survey,”Des Moines Register (April 7, 1997), p. 18B.
34. M. Hendricks, “Well, Honestly!” Entrepreneur (December2006), pp. 103–104.
35. “Dates from Hell,” The Economist (July 22, 2006), pp. 59–60.36. J. Kurlantzick, “Liar, Liar,” Entrepreneur (October 2003), p. 70.37. M. Roman, “True Confessions from CFOs,” Business Week
(August 12, 2002), p. 40.38. “Fraud Arrests Net 406,” Saint Cloud Times (June 20, 2008),
pp. 3A–4A.39. J. Eckhoff, “Realtor Faked Invoices, Ex-Employee Says,” Des
Moines Register (October 5, 2005), p. 5B.40. D. L. McCabe, K. D. Butterfield, and L. K. Trevino, “Academic
Dishonesty in Graduate Business Programs: Prevalence,Causes, and Proposed Action,” Academy of ManagementLearning & Education (September 2006), pp. 294–305.
41. L. Lavelle, “The GMAT Cheat Sheet,” Business Week(July 14 & 21, 2008), p. 34.
42. S. Li, S. H. Park, and S. Li, “The Great Leap Forward: The Tran-sition from Relation-Based Governance to Rule-Based Gover-nance,” Organizational Dynamics, Vol. 33, No. 1 (2004),pp. 63–78; M. Davids, “Global Standards, Local Problems,”Journal of Business Strategy (January/February 1999), pp. 38–43;“The Opacity Index,” Economist (September 18, 2004), p. 106.
43. K. Kumar, “Ethical Orientation of Future American Executives:What the Value Profiles of Business School Students Portend,”SAM Advanced Management Journal (Autumn 1995), pp. 32–36,47; M. Gable and P. Arlow, “A Comparative Examination of theValue Orientations of British and American Executives,”International Journal of Management (September 1986),pp. 97–106; W. D. Guth and R. Tagiuri, “Personal Values andCorporate Strategy,” Harvard Business Review (September–October 1965), pp. 126–127; G. W. England, “Managers and
88 PART 1 Introduction to Strategic Management and Business Policy
Their Value Systems: A Five Country Comparative Study,”Columbia Journal of World Business (Summer 1978), p. 35.
44. I. Penn, “Bad Buzz,” St. Petersburg Times (June 21, 2008),pp. 1A, 0A.
45. J. F. Veiga, T. D. Golden, and K. Dechant, “Why ManagersBend Company Rules,” Academy of Management Executive(May 2004), pp. 84–91.
46. H. Collingwood, “The Earnings Game,” Harvard Business Re-view (June 2001), pp. 65–74; J. Fox, “Can We Trust ThemNow?” Fortune (March 3, 2003), pp. 97–99.
47. S. Watkins, “Former Enron Vice President Sherron Watkins onthe Enron Collapse,” Academy of Management Executive (No-vember 2003), p. 122.
48. R. E. Freeman and D. R. Gilbert, Jr., Corporate Strategy and theSearch for Ethics (Englewood Cliffs, NJ: Prentice Hall, 1988),pp. 24–41.
49. L. K. Trevino, “Ethical Decision Making in Organizations: APerson-Situation Interactionist Model,” Academy of Manage-ment Review (July 1986), pp. 601–617.
50. L. Kohlberg, “Moral Stage and Moralization: The Cognitive-Development Approach,” in Moral Development and Behavior,edited by T. Lickona (New York: Holt, Rinehart & Winston,1976).
51. L. K. Trevino, “Ethical Decision Making in Organizations: APerson-Situation Interactionist Model,” Academy of Manage-ment Review (July 1986), p. 606; L. K. Trevino, G. R. Weaver,and S. J. Reynolds, “Behavioral Ethics in Organizations: A Re-view,” Journal of Management (December 2006),pp. 951–990.
52. J. K. Gephart, D. A. Harrison, and L. K. Trevino, “The Who,When, and Where of Unethical Choices: Meta-Analytic An-swers to Fundamental Ethics Questions.” Paper presented to theAcademy of Management annual meeting, Philadelphia, PA(2007).
53. J. Keogh, ed., Corporate Ethics: A Prime Business Asset (NewYork: The Business Roundtable, 1988), p. 5.
54. G. F. Kohut, and S. E. Corriher, “The Relationship of Age, Gen-der, Experience and Awareness of Written Ethics Policies toBusiness Decision Making,” SAM Advanced ManagementJournal (Winter 1994), pp. 32–39; J. C. Lere and B. R. Gau-mitz, “The Impact of Codes of Ethics on Decision Making:Some Insights from Information Economics,” Journal of Busi-ness Ethics, Vol. 48 (2003), pp. 365–379.
55. W. I. Sauser, “Business Ethics: Back to Basics,” Managementin Practice (2005, No. 2), pp. 2–3; J. M. Stevens, H. K.Steensma, D. A. Harrison, and P. L. Cochran, “Symbolic or
Substantive Document? The Influence of Ethics Codes on Fi-nancial Executives’ Decisions,” Strategic Management Journal(February 2005), pp. 181–195.
56. Business Roundtable Institute for Corporate Ethics AnnouncesKey Findings from “Mapping the Terrain” Survey of CEOs,press release (Charlottesville, VA: Business Roundtable Insti-tute for Corporate Ethics, June 10, 2004).
57. B. Levinson, “Getting More Workers to Whistle,” BusinessWeek (January 28, 2008), p. 18.
58. J. K. Gephart, D. A. Harrison, and L. K. Trevino, “The Who,When, and Where of Unethical Choices: Meta-Analytic An-swers to Fundamental Ethics Questions.” Paper presented to theAcademy of Management annual meeting, Philadelphia, PA(2007).
59. “A ‘How Am I Doing?’ Guide for Ethics Czars,” BusinessEthics (Fall 2005), p. 11.
60. S. P. Feldman, “Moral Business Cultures: The Keys to Creating and Maintaining Them,” Organizational Dynamics (2007, Vol. 36,No. 2), pp. 156–170. Also see the “World’s Most Ethical Compa-nies,” published annually by Ethisphere at http://ethisphere.com.
61. “Clean, Wholesome and American?” The Economist (Novem-ber 3, 2007), pp. 78–79.
62. M. Levin, “Building an Ethical Supply Chain,” Sarbanes-OxleyCompliance Journal (April 3, 2008).
63. A. Bernstein, S. Holmes, and X. Ji, “Secrets, Lies, and Sweat-shops,” Business Week (November 27, 2006), pp. 50–58.
64. T. J. Von der Embse, and R. A. Wagley, “Managerial Ethics:Hard Decisions on Soft Criteria,” SAM Advanced ManagementJournal (Winter 1988), p. 6.
65. G. F. Cavanagh, American Business Values, 3rd ed. (UpperSaddle River, NJ: Prentice Hall, 1990), pp. 186–199.
66. B. R. Agle, R. K. Mitchell, and J. A. Sonnenfeld, “Who MattersMost to CEOs? An Investigation of Stakeholder Attributes andSalience, Corporate Performance, and CEO Values,” Academyof Management Journal (October 1999), pp. 507–525.
67. G. F. Cavanagh, American Business Values, 3rd ed. (Upper Sad-dle River, NJ: Prentice Hall, 1990, pp. 195–196.
68. I. Kant, “The Foundations of the Metaphysic of Morals,” inEthical Theory: Classical and Contemporary Readings, 2nded., by L. P. Pojman (Belmont, CA: Wadsworth Publishing,1995), pp. 255–279.
69. J. L. Badaracco, Jr., Defining Moments (Boston: Harvard Busi-ness School Press, 1997).
70. J. Rice and A. Fields, “20 Things You Didn’t Know About Re-cycling.” Discover (May 2008), p. 80.
CHAPTER 3 Social Responsibility and Ethics in Strategic Management 89
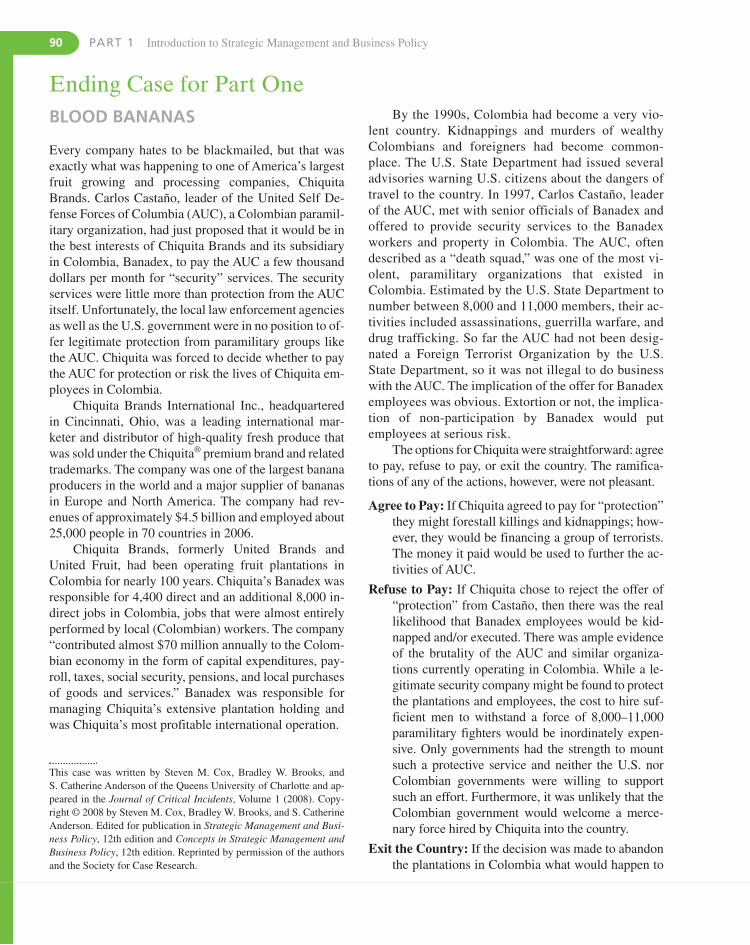
90 PART 1 Introduction to Strategic Management and Business Policy
Ending Case for Part OneBLOOD BANANAS
Every company hates to be blackmailed, but that wasexactly what was happening to one of America’s largestfruit growing and processing companies, ChiquitaBrands. Carlos Castaño, leader of the United Self De-fense Forces of Columbia (AUC), a Colombian paramil-itary organization, had just proposed that it would be inthe best interests of Chiquita Brands and its subsidiaryin Colombia, Banadex, to pay the AUC a few thousanddollars per month for “security” services. The securityservices were little more than protection from the AUCitself. Unfortunately, the local law enforcement agenciesas well as the U.S. government were in no position to of-fer legitimate protection from paramilitary groups likethe AUC. Chiquita was forced to decide whether to paythe AUC for protection or risk the lives of Chiquita em-ployees in Colombia.
Chiquita Brands International Inc., headquarteredin Cincinnati, Ohio, was a leading international mar-keter and distributor of high-quality fresh produce thatwas sold under the Chiquita® premium brand and relatedtrademarks. The company was one of the largest bananaproducers in the world and a major supplier of bananasin Europe and North America. The company had rev-enues of approximately $4.5 billion and employed about25,000 people in 70 countries in 2006.
Chiquita Brands, formerly United Brands andUnited Fruit, had been operating fruit plantations inColombia for nearly 100 years. Chiquita’s Banadex wasresponsible for 4,400 direct and an additional 8,000 in-direct jobs in Colombia, jobs that were almost entirelyperformed by local (Colombian) workers. The company“contributed almost $70 million annually to the Colom-bian economy in the form of capital expenditures, pay-roll, taxes, social security, pensions, and local purchasesof goods and services.” Banadex was responsible formanaging Chiquita’s extensive plantation holding andwas Chiquita’s most profitable international operation.
By the 1990s, Colombia had become a very vio-lent country. Kidnappings and murders of wealthyColombians and foreigners had become common-place. The U.S. State Department had issued severaladvisories warning U.S. citizens about the dangers oftravel to the country. In 1997, Carlos Castaño, leaderof the AUC, met with senior officials of Banadex andoffered to provide security services to the Banadexworkers and property in Colombia. The AUC, oftendescribed as a “death squad,” was one of the most vi-olent, paramilitary organizations that existed inColombia. Estimated by the U.S. State Department tonumber between 8,000 and 11,000 members, their ac-tivities included assassinations, guerrilla warfare, anddrug trafficking. So far the AUC had not been desig-nated a Foreign Terrorist Organization by the U.S.State Department, so it was not illegal to do businesswith the AUC. The implication of the offer for Banadexemployees was obvious. Extortion or not, the implica-tion of non-participation by Banadex would putemployees at serious risk.
The options for Chiquita were straightforward: agreeto pay, refuse to pay, or exit the country. The ramifica-tions of any of the actions, however, were not pleasant.
Agree to Pay: If Chiquita agreed to pay for “protection”they might forestall killings and kidnappings; how-ever, they would be financing a group of terrorists.The money it paid would be used to further the ac-tivities of AUC.
Refuse to Pay: If Chiquita chose to reject the offer of“protection” from Castaño, then there was the reallikelihood that Banadex employees would be kid-napped and/or executed. There was ample evidenceof the brutality of the AUC and similar organiza-tions currently operating in Colombia. While a le-gitimate security company might be found to protectthe plantations and employees, the cost to hire suf-ficient men to withstand a force of 8,000–11,000paramilitary fighters would be inordinately expen-sive. Only governments had the strength to mountsuch a protective service and neither the U.S. norColombian governments were willing to supportsuch an effort. Furthermore, it was unlikely that theColombian government would welcome a merce-nary force hired by Chiquita into the country.
Exit the Country: If the decision was made to abandonthe plantations in Colombia what would happen to
This case was written by Steven M. Cox, Bradley W. Brooks, andS. Catherine Anderson of the Queens University of Charlotte and ap-peared in the Journal of Critical Incidents, Volume 1 (2008). Copy-right © 2008 by Steven M. Cox, Bradley W. Brooks, and S. CatherineAnderson. Edited for publication in Strategic Management and Busi-ness Policy, 12th edition and Concepts in Strategic Management andBusiness Policy, 12th edition. Reprinted by permission of the authorsand the Society for Case Research.

CHAPTER 3 Social Responsibility and Ethics in Strategic Management 91
the 12,000 individuals whose livelihoods dependedupon the work or workers on the plantation? Contribut-ing $70 million annually to the economy, a rapid exitwould represent a significant loss to the Colombianpeople. Further, Banadex exports represented a
significant portion of the bananas sold by Chiquitabrands. The loss of this supply would not only affect Chiquita Brands’ profitability and share-holder value but also the profitability of numerousChiquita distributors around the world.
Study Question
1. What should Chiquita do?

This page intentionally left blank

PA R T2Scanning the
Environment
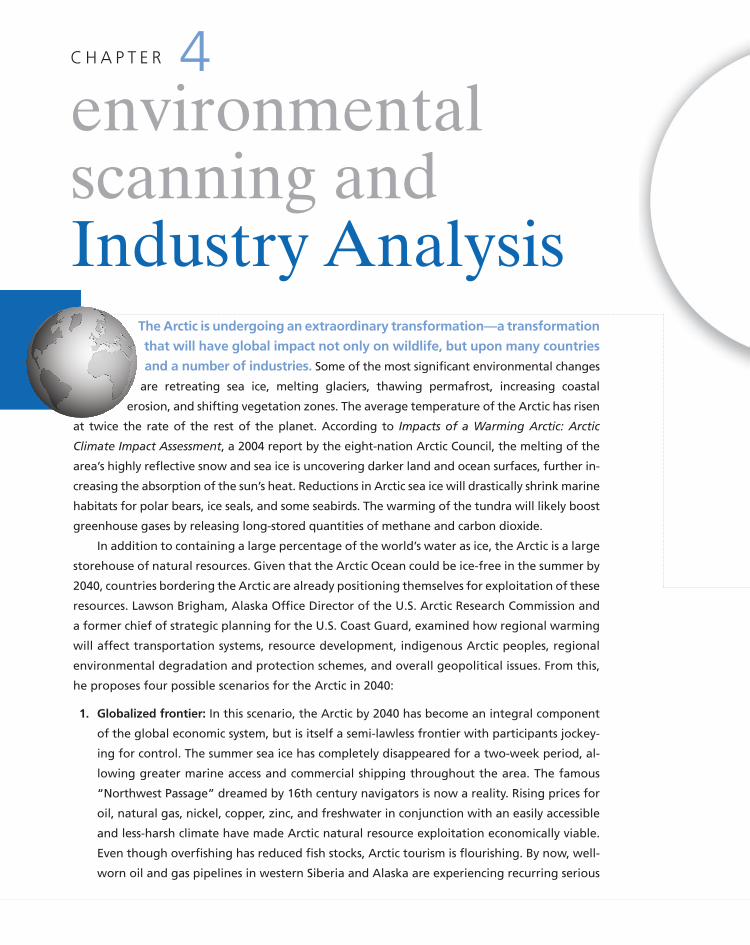
The Arctic is undergoing an extraordinary transformation—a transformation
that will have global impact not only on wildlife, but upon many countries
and a number of industries. Some of the most significant environmental changes
are retreating sea ice, melting glaciers, thawing permafrost, increasing coastal
erosion, and shifting vegetation zones. The average temperature of the Arctic has risen
at twice the rate of the rest of the planet. According to Impacts of a Warming Arctic: Arctic
Climate Impact Assessment, a 2004 report by the eight-nation Arctic Council, the melting of the
area’s highly reflective snow and sea ice is uncovering darker land and ocean surfaces, further in-
creasing the absorption of the sun’s heat. Reductions in Arctic sea ice will drastically shrink marine
habitats for polar bears, ice seals, and some seabirds. The warming of the tundra will likely boost
greenhouse gases by releasing long-stored quantities of methane and carbon dioxide.
In addition to containing a large percentage of the world’s water as ice, the Arctic is a large
storehouse of natural resources. Given that the Arctic Ocean could be ice-free in the summer by
2040, countries bordering the Arctic are already positioning themselves for exploitation of these
resources. Lawson Brigham, Alaska Office Director of the U.S. Arctic Research Commission and
a former chief of strategic planning for the U.S. Coast Guard, examined how regional warming
will affect transportation systems, resource development, indigenous Arctic peoples, regional
environmental degradation and protection schemes, and overall geopolitical issues. From this,
he proposes four possible scenarios for the Arctic in 2040:
1. Globalized frontier: In this scenario, the Arctic by 2040 has become an integral component
of the global economic system, but is itself a semi-lawless frontier with participants jockey-
ing for control. The summer sea ice has completely disappeared for a two-week period, al-
lowing greater marine access and commercial shipping throughout the area. The famous
“Northwest Passage” dreamed by 16th century navigators is now a reality. Rising prices for
oil, natural gas, nickel, copper, zinc, and freshwater in conjunction with an easily accessible
and less-harsh climate have made Arctic natural resource exploitation economically viable.
Even though overfishing has reduced fish stocks, Arctic tourism is flourishing. By now, well-
worn oil and gas pipelines in western Siberia and Alaska are experiencing recurring serious
environmentalscanning andIndustry Analysis
C H A P T E R 4
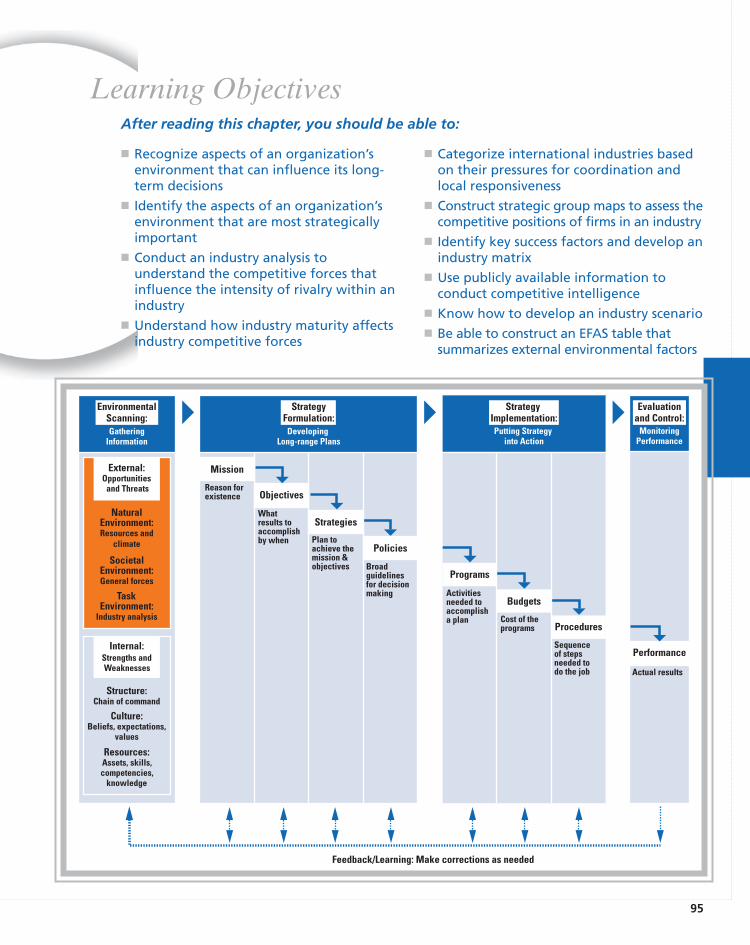
95
� Recognize aspects of an organization’senvironment that can influence its long-term decisions
� Identify the aspects of an organization’senvironment that are most strategicallyimportant
� Conduct an industry analysis tounderstand the competitive forces thatinfluence the intensity of rivalry within anindustry
� Understand how industry maturity affectsindustry competitive forces
� Categorize international industries basedon their pressures for coordination andlocal responsiveness
� Construct strategic group maps to assess thecompetitive positions of firms in an industry
� Identify key success factors and develop anindustry matrix
� Use publicly available information toconduct competitive intelligence
� Know how to develop an industry scenario� Be able to construct an EFAS table that
summarizes external environmental factors
Learning Objectives
GatheringInformation
Putting Strategy into Action
MonitoringPerformance
SocietalEnvironment:General forces
NaturalEnvironment:Resources and
climate
TaskEnvironment:
Industry analysis
Internal:Strengths andWeaknesses
Structure:Chain of command
Culture:Beliefs, expectations,
values
Resources:Assets, skills,competencies,
knowledge
Programs
Activitiesneeded to accomplisha plan
Budgets
Cost of theprograms Procedures
Sequenceof stepsneeded to do the job
Performance
Actual results
External:Opportunities
and Threats
DevelopingLong-range Plans
Mission
Reason forexistence Objectives
Whatresults to accomplishby when
Strategies
Plan toachieve themission &objectives
Policies
Broadguidelinesfor decisionmaking
EnvironmentalScanning:
StrategyFormulation:
StrategyImplementation:
Evaluationand Control:
Feedback/Learning: Make corrections as needed
After reading this chapter, you should be able to:
spills. By 2020, Canada, Denmark (Greenland), Norway, Russia, and the United States
had asserted their sovereignty over sea bed resources beyond 200 nautical miles—leav-
ing only two small regions in the central Arctic Ocean under international jurisdiction.
Environmental concerns that once fostered polar cooperation have been replaced by
economic and political interests. The protection, development, and governance of the
Svalbard Islands became a problem when Russia refused to recognize Norway’s 200-
nautical mile exclusive economic zone around the islands. Issues regarding freedom of
navigation and commercial access rights are highly contentious. The eight permanent
members of the Arctic Council have increasingly excluded outside participation in the
Council’s deliberations.
2. Adaptive frontier: In this scenario, the Arctic in 2040 is being drawn much more slowly
into the global economy. The area is viewed as an international resource. Competition
among the Arctic countries for control of the region’s resources never grew beyond a
low level and the region is the scene of international cooperation among many inter-
national stakeholders. The indigenous peoples throughout the area have organized
and now have significant influence over decisions relating to regional environmental
protection and economic development. The exploitation of Arctic oil and gas is re-
stricted to the few key areas that are most cost-competitive. Air and water transporta-
tion systems flourish throughout the area. Commercially viable fishing has continued,
thanks to stringent harvesting quotas and other bilateral agreements. The Arctic Coun-
cil is a proactive forum resolving several disputes and engaging the indigenous peoples
in all deliberations. Nevertheless, the impact of global warming on the Arctic is wide-
spread and serious. Contingency planning for manmade and natural emergencies is ad-
vanced and well coordinated. Sustainable development is widely supported by most
stakeholders. The Arctic region has become a model for habitat protection. Arctic na-
tional parks have expanded modestly and adapted to deal with increased tourism.
3. Fortress frontier: In this scenario, widespread resource exploitation and increased in-
ternational tension exist throughout the Arctic. The region is viewed by much of the
global community as a storehouse of natural resources that is being jealously guarded
by a handful of wealthy circumpolar nations. Although the Arctic is part of the global
economic system, any linkage is controlled by the most powerful Arctic countries for
their own benefit. By 2040, the Arctic is undergoing extreme environmental stress, as
global warming continues unabated. Many indigenous peoples have been displaced
from their traditional homelands due to extreme environmental events. Illegal immi-
gration becomes an issue in many subarctic regions. Although air and marine trans-
portation routes are open, foreign access has been periodically suspended for
political or security reasons. Russia and Canada, in particular, continue to tightly con-
trol marine access through the Northern Sea Route and Northwest Passage. Fishing
rights have been suspended to all but the Arctic countries. Oil and gas exploration
and production has intensified throughout the Arctic. The Svalbard Islands, claimed
96 PART 2 Scanning the Environment
by Norway, have been a source of potential conflict over access to living and nonliv-
ing resources. Norway, Russia, and the United States have increased military forces in
the region. Rather than dealing with sustainable development, the Arctic Council fo-
cuses on economic and security concerns, such as illegal immigrants and controlling
the flow of exports from the Arctic consortium. Early in the 21st century, the five
countries bordering the Arctic declared their sovereignty over resources beyond
200 nautical miles to the edge of the continental shelf extensions. By 2030, the Arctic
Council unilaterally took jurisdiction over the two small regions that remained within
international jurisdiction. Arctic tourism thrives, since many other traditional destina-
tions are experiencing turmoil and a shortage of necessities.
4. Equitable frontier: In this scenario, the Arctic is integrated with the global economic
system by 2040, but international concern for sustainable development has slowed the
region’s economic development. Mutual respect and cooperation among the circum-
polar nations allows for the development of a respected Arctic governance system.
Even though the world is working hard to reduce greenhouse gas emissions, the Arc-
tic continues to warm. Transport user fees and other eco-taxes are used to support en-
dangered wildlife and impacted indigenous communities. The growth of the Northern
Sea Route and Northwest Passage has enabled significant efficiencies in commercial
shipping. Canada and Russia have maintained stringent marine regulations that em-
phasize environmental protection. Despite differences over freedom of navigation,
the United States, Canada, and Russia have negotiated an agreement that allows a
seamless voyage around Alaska and through the routes under a uniform set of opera-
tional procedures. The Arctic Council has created regional disaster teams to respond to
maritime and other emergencies. Boundary disputes have been resolved and fishing
rights have been allocated to various nations. The University of the Arctic has brought
quality online education to easy reach of all northern citizens. The Arctic Council has
brokered an agreement to allow 30,000 environmental refugees to settle in subarctic
territories. Oil exploration and production in the Arctic has slowed considerably. Arc-
tic tourism continues its steady growth, prompting national and regional parliaments
to establish additional wilderness lands funded by tourist fees. There is low military
presence in the region, thanks to the diplomatic efforts of the Arctic Council.
The Arctic is a complex, but relatively small region. These four scenarios suggest how
climate change combined with a growing need for natural resources might impact this re-
gion and the world.1
� Which of the four preceding scenarios is most likely?
� Which industries are likely to be affected (either positively or negatively) by the
warming of the Arctic?
� If in an affected industry, how could a business corporation prepare for each of these
scenarios?
CHAPTER 4 Environmental Scanning and Industry Analysis 97
4.1 Environmental Scanning
A changing environment can help as well as hurt a company. Many pioneering com-
panies have gone out of business because of their failure to adapt to environmental
change or, even worse, because of their failure to create change. For example, Baldwin
Locomotive, the major manufacturer of steam locomotives, was very slow in making the
switch to diesel locomotives. General Electric and General Motors soon dominated the
diesel locomotive business and Baldwin went out of business. The dominant manufactur-
ers of vacuum tubes failed to make the change to transistors and consequently lost this
market. Eastman Kodak, the pioneer and market leader of chemical-based film photogra-
phy, continues to struggle with its transition to the newer digital technology. Failure to
adapt is, however, only one side of the coin. The aforementioned Arctic warming exam-
ple shows how a changing environment can create new opportunities at the same time it
destroys old ones. The lesson is simple: To be successful over time, an organization needs
to be in tune with its external environment. There must be a strategic fit between what
the environment wants and what the corporation has to offer, as well as between what
the corporation needs and what the environment can provide.
Current predictions are that the environment for all organizations will become even
more uncertain with every passing year. What is environmental uncertainty? It is the
degree of complexity plus the degree of change that exists in an organization’s external
environment. As more and more markets become global, the number of factors a company
must consider in any decision becomes huge and much more complex. With new technolo-
gies being discovered every year, markets change and products must change with them.
On the one hand, environmental uncertainty is a threat to strategic managers be-
cause it hampers their ability to develop long-range plans and to make strategic decisions
to keep the corporation in equilibrium with its external environment. On the other hand,
environmental uncertainty is an opportunity because it creates a new playing field in
which creativity and innovation can play a major part in strategic decisions.
98 PART 2 Scanning the Environment
Before an organization can begin strategy formulation, it must scan the external environment toidentify possible opportunities and threats and its internal environment for strengths and weak-nesses. Environmental scanning is the monitoring, evaluation, and dissemination of informationfrom the external and internal environments to key people within the corporation. A corporationuses this tool to avoid strategic surprise and to ensure its long-term health. Research has found apositive relationship between environmental scanning and profits.2 Approximately 70% of exec-utives around the world state that global social, environmental, and business trends are increas-ingly important to corporate strategy, according to a 2008 survey by McKinsey & Company.3
IDENTIFYING EXTERNAL ENVIRONMENTAL VARIABLESIn undertaking environmental scanning, strategic managers must first be aware of the manyvariables within a corporation’s natural, societal, and task environments (see Figure 1–3). The
CHAPTER 4 Environmental Scanning and Industry Analysis 99
natural environment includes physical resources, wildlife, and climate that are an inherentpart of existence on Earth. These factors form an ecological system of interrelated life. Thesocietal environment is mankind’s social system that includes general forces that do not di-rectly touch on the short-run activities of the organization that can, and often do, influence itslong-run decisions. These factors affect multiple industries and are as follows:
� Economic forces that regulate the exchange of materials, money, energy, and information.
� Technological forces that generate problem-solving inventions.
� Political–legal forces that allocate power and provide constraining and protecting lawsand regulations.
� Sociocultural forces that regulate the values, mores, and customs of society.
The task environment includes those elements or groups that directly affect a corporation and,in turn, are affected by it. These are governments, local communities, suppliers, competitors,customers, creditors, employees/labor unions, special-interest groups, and trade associations.A corporation’s task environment is typically the industry within which the firm operates.Industry analysis (popularized by Michael Porter) refers to an in-depth examination of keyfactors within a corporation’s task environment. The natural, societal, and task environmentsmust be monitored to detect the strategic factors that are likely in the future to have a strongimpact on corporate success or failure. Changes in the natural environment usually affect abusiness corporation first through its impact on the societal environment in terms of resourceavailability and costs and then upon the task environment in terms of the growth or decline ofparticular industries.
Scanning the Natural EnvironmentThe natural environment includes physical resources, wildlife, and climate that are an in-herent part of existence on Earth. Until the 20th century, the natural environment was gen-erally perceived by business people to be a given—something to exploit, not conserve. Itwas viewed as a free resource, something to be taken or fought over, like arable land, dia-mond mines, deep water harbors, or fresh water. Once they were controlled by a person orentity, these resources were considered assets and thus valued as part of the general eco-nomic system—a resource to be bought, sold, or sometimes shared. Side effects, such aspollution, were considered to be externalities, costs not included in a business firm’s ac-counting system, but felt by others. Eventually these externalities were identified by gov-ernments, which passed regulations to force business corporations to deal with the sideeffects of their activities.
The concept of sustainability argues that a firm’s ability to continuously renew itself forlong-term success and survival is dependent not only upon the greater economic and social sys-tem of which it is a part, but also upon the natural ecosystem in which the firm is embedded.4
A business corporation must thus scan the natural environment for factors that might previouslyhave been taken for granted, such as the availability of fresh water and clean air. Global warm-ing means that aspects of the natural environment, such as sea level, weather, and climate, arebecoming increasingly uncertain and difficult to predict. Management must therefore scan notonly the natural environment for possible strategic factors, but also include in its strategicdecision-making processes the impact of its activities upon the natural environment. In a worldconcerned with global warming, a company should measure and reduce its carbon footprint—the amount of greenhouse gases it is emitting into the air. Research reveals that scanning themarket for environmental issues is positively related to firm performance because it helps man-agement identify opportunities to fulfill future market demand based upon environmentallyfriendly products or processes.5 See the Environmental Sustainability Issue feature to learnhow individuals can also measure and shrink their personal carbon footprints.
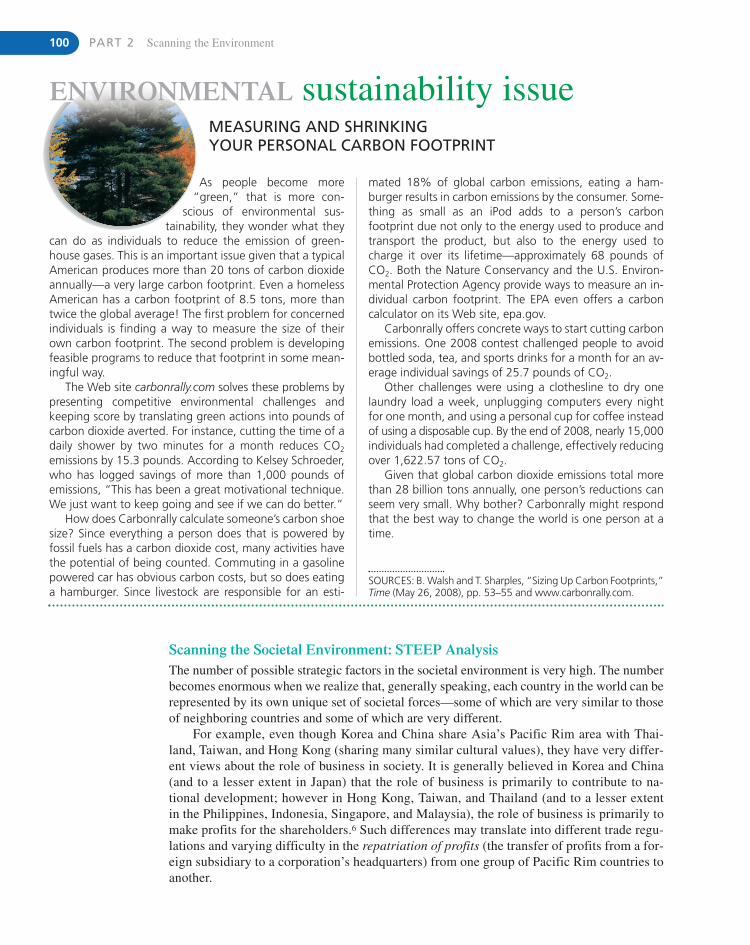
Scanning the Societal Environment: STEEP AnalysisThe number of possible strategic factors in the societal environment is very high. The numberbecomes enormous when we realize that, generally speaking, each country in the world can berepresented by its own unique set of societal forces—some of which are very similar to thoseof neighboring countries and some of which are very different.
For example, even though Korea and China share Asia’s Pacific Rim area with Thai-land, Taiwan, and Hong Kong (sharing many similar cultural values), they have very differ-ent views about the role of business in society. It is generally believed in Korea and China(and to a lesser extent in Japan) that the role of business is primarily to contribute to na-tional development; however in Hong Kong, Taiwan, and Thailand (and to a lesser extentin the Philippines, Indonesia, Singapore, and Malaysia), the role of business is primarily tomake profits for the shareholders.6 Such differences may translate into different trade regu-lations and varying difficulty in the repatriation of profits (the transfer of profits from a for-eign subsidiary to a corporation’s headquarters) from one group of Pacific Rim countries toanother.
100 PART 2 Scanning the Environment
SOURCES: B. Walsh and T. Sharples, “Sizing Up Carbon Footprints,”Time (May 26, 2008), pp. 53–55 and www.carbonrally.com.
mated 18% of global carbon emissions, eating a ham-burger results in carbon emissions by the consumer. Some-thing as small as an iPod adds to a person’s carbonfootprint due not only to the energy used to produce andtransport the product, but also to the energy used tocharge it over its lifetime—approximately 68 pounds ofCO2. Both the Nature Conservancy and the U.S. Environ-mental Protection Agency provide ways to measure an in-dividual carbon footprint. The EPA even offers a carboncalculator on its Web site, epa.gov.
Carbonrally offers concrete ways to start cutting carbonemissions. One 2008 contest challenged people to avoidbottled soda, tea, and sports drinks for a month for an av-erage individual savings of 25.7 pounds of CO2.
Other challenges were using a clothesline to dry onelaundry load a week, unplugging computers every nightfor one month, and using a personal cup for coffee insteadof using a disposable cup. By the end of 2008, nearly 15,000individuals had completed a challenge, effectively reducingover 1,622.57 tons of CO2.
Given that global carbon dioxide emissions total morethan 28 billion tons annually, one person’s reductions canseem very small. Why bother? Carbonrally might respondthat the best way to change the world is one person at atime.
As people become more“green,” that is more con-
scious of environmental sus-tainability, they wonder what they
can do as individuals to reduce the emission of green-house gases. This is an important issue given that a typicalAmerican produces more than 20 tons of carbon dioxideannually—a very large carbon footprint. Even a homelessAmerican has a carbon footprint of 8.5 tons, more thantwice the global average! The first problem for concernedindividuals is finding a way to measure the size of theirown carbon footprint. The second problem is developingfeasible programs to reduce that footprint in some mean-ingful way.
The Web site carbonrally.com solves these problems bypresenting competitive environmental challenges andkeeping score by translating green actions into pounds ofcarbon dioxide averted. For instance, cutting the time of adaily shower by two minutes for a month reduces CO2
emissions by 15.3 pounds. According to Kelsey Schroeder,who has logged savings of more than 1,000 pounds ofemissions, “This has been a great motivational technique.We just want to keep going and see if we can do better.”
How does Carbonrally calculate someone’s carbon shoesize? Since everything a person does that is powered byfossil fuels has a carbon dioxide cost, many activities havethe potential of being counted. Commuting in a gasolinepowered car has obvious carbon costs, but so does eatinga hamburger. Since livestock are responsible for an esti-
MEASURING AND SHRINKING YOUR PERSONAL CARBON FOOTPRINT
ENVIRONMENTAL sustainability issue
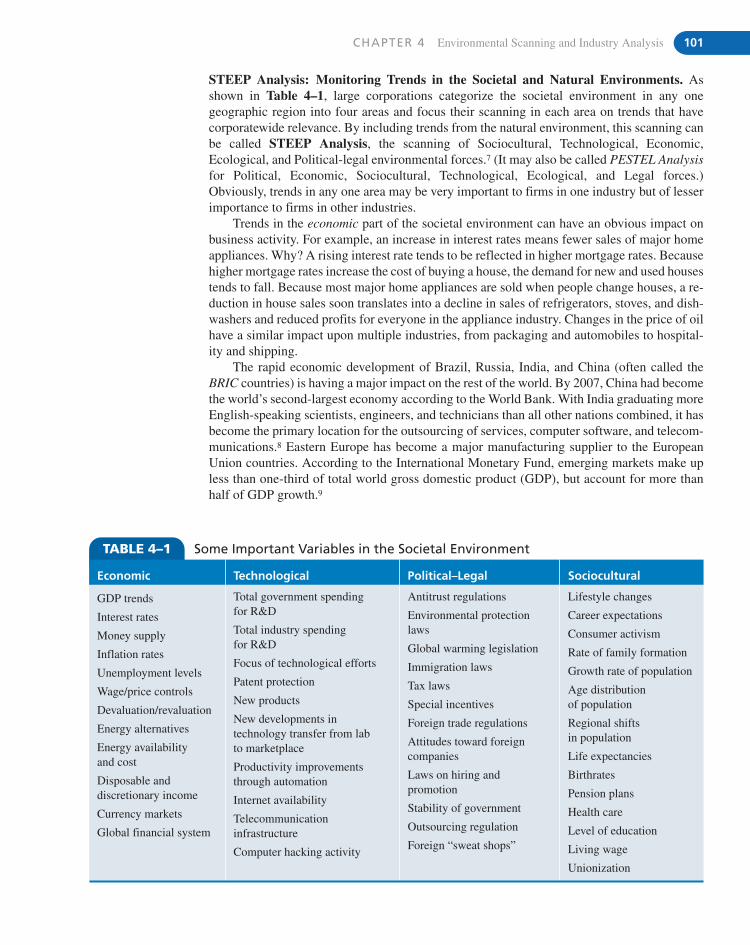
CHAPTER 4 Environmental Scanning and Industry Analysis 101
STEEP Analysis: Monitoring Trends in the Societal and Natural Environments. Asshown in Table 4–1, large corporations categorize the societal environment in any onegeographic region into four areas and focus their scanning in each area on trends that havecorporatewide relevance. By including trends from the natural environment, this scanning canbe called STEEP Analysis, the scanning of Sociocultural, Technological, Economic,Ecological, and Political-legal environmental forces.7 (It may also be called PESTEL Analysisfor Political, Economic, Sociocultural, Technological, Ecological, and Legal forces.)Obviously, trends in any one area may be very important to firms in one industry but of lesserimportance to firms in other industries.
Trends in the economic part of the societal environment can have an obvious impact onbusiness activity. For example, an increase in interest rates means fewer sales of major homeappliances. Why? A rising interest rate tends to be reflected in higher mortgage rates. Becausehigher mortgage rates increase the cost of buying a house, the demand for new and used housestends to fall. Because most major home appliances are sold when people change houses, a re-duction in house sales soon translates into a decline in sales of refrigerators, stoves, and dish-washers and reduced profits for everyone in the appliance industry. Changes in the price of oilhave a similar impact upon multiple industries, from packaging and automobiles to hospital-ity and shipping.
The rapid economic development of Brazil, Russia, India, and China (often called theBRIC countries) is having a major impact on the rest of the world. By 2007, China had becomethe world’s second-largest economy according to the World Bank. With India graduating moreEnglish-speaking scientists, engineers, and technicians than all other nations combined, it hasbecome the primary location for the outsourcing of services, computer software, and telecom-munications.8 Eastern Europe has become a major manufacturing supplier to the EuropeanUnion countries. According to the International Monetary Fund, emerging markets make upless than one-third of total world gross domestic product (GDP), but account for more thanhalf of GDP growth.9
TABLE 4–1 Some Important Variables in the Societal Environment
Economic Technological Political–Legal Sociocultural
GDP trends
Interest rates
Money supply
Inflation rates
Unemployment levels
Wage/price controls
Devaluation/revaluation
Energy alternatives
Energy availability and cost
Disposable anddiscretionary income
Currency markets
Global financial system
Total government spending for R&D
Total industry spending for R&D
Focus of technological efforts
Patent protection
New products
New developments intechnology transfer from lab to marketplace
Productivity improvementsthrough automation
Internet availability
Telecommunicationinfrastructure
Computer hacking activity
Antitrust regulations
Environmental protectionlaws
Global warming legislation
Immigration laws
Tax laws
Special incentives
Foreign trade regulations
Attitudes toward foreigncompanies
Laws on hiring andpromotion
Stability of government
Outsourcing regulation
Foreign “sweat shops”
Lifestyle changes
Career expectations
Consumer activism
Rate of family formation
Growth rate of population
Age distribution of population
Regional shifts in population
Life expectancies
Birthrates
Pension plans
Health care
Level of education
Living wage
Unionization
Changes in the technological part of the societal environment can also have a great impacton multiple industries. Improvements in computer microprocessors have not only led to thewidespread use of personal computers but also to better automobile engine performance in termsof power and fuel economy through the use of microprocessors to monitor fuel injection. Digi-tal technology allows movies and music to be available instantly over the Internet or through ca-ble service, but it also means falling fortunes for video rental shops such as the Movie Galleryand CD stores such as Tower Records. Advances in nanotechnology are enabling companies tomanufacture extremely small devices that are very energy efficient. Developing biotechnology,including gene manipulation techniques, is already providing new approaches to dealing withdisease and agriculture. Researchers at George Washington University have identified a numberof technological breakthroughs that are already having a significant impact on many industries:
� Portable information devices and electronic networking: Combining the computingpower of the personal computer, the networking of the Internet, the images of the televi-sion, and the convenience of the telephone, these appliances will soon be used by a major-ity of the population of industrialized nations to make phone calls, send e-mail, andtransmit documents and other data. Even now, homes, autos, and offices are being con-nected (via wires and wirelessly) into intelligent networks that interact with one another.This trend is being supported by the development of cloud computing, in which a personcan tap into computing power elsewhere through a Web connection.10 The traditional stand-alone desktop computer may soon join the manual typewriter as a historical curiosity.
� Alternative energy sources: The use of wind, geothermal, hydroelectric, solar, biomass,and other alternative energy sources should increase considerably. Over the past twodecades, the cost of manufacturing and installing a photovoltaic solar-power system hasdecreased by 20% with every doubling of installed capacity. The cost of generating elec-tricity from conventional sources, in contrast, has been rising along with the price of pe-troleum and natural gas.11
� Precision farming: The computerized management of crops to suit variations in landcharacteristics will make farming more efficient and sustainable. Farm equipment dealerssuch as Case and John Deere add this equipment to tractors for an additional $6,000 or so.It enables farmers to reduce costs, increase yields, and decrease environmental impact.The old system of small, low-tech farming is becoming less viable as large corporatefarms increase crop yields on limited farmland for a growing population.
� Virtual personal assistants: Very smart computer programs that monitor e-mail, faxes,and phone calls will be able to take over routine tasks, such as writing a letter, retrievinga file, making a phone call, or screening requests. Acting like a secretary, a person’s vir-tual assistant could substitute for a person at meetings or in dealing with routine actions.
� Genetically altered organisms: A convergence of biotechnology and agriculture is cre-ating a new field of life sciences. Plant seeds can be genetically modified to produce moreneeded vitamins or to be less attractive to pests and more able to survive. Animals (includ-ing people) could be similarly modified for desirable characteristics and to eliminate ge-netic disabilities and diseases.
� Smart, mobile robots: Robot development has been limited by a lack of sensory devicesand sophisticated artificial intelligence systems. Improvements in these areas mean thatrobots will be created to perform more sophisticated factory work, run errands, do house-hold chores, and assist the disabled.12
Trends in the political–legal part of the societal environment have a significant impact not onlyon the level of competition within an industry but also on which strategies might be successful.13
For example, periods of strict enforcement of U.S. antitrust laws directly affect corporate growth
102 PART 2 Scanning the Environment
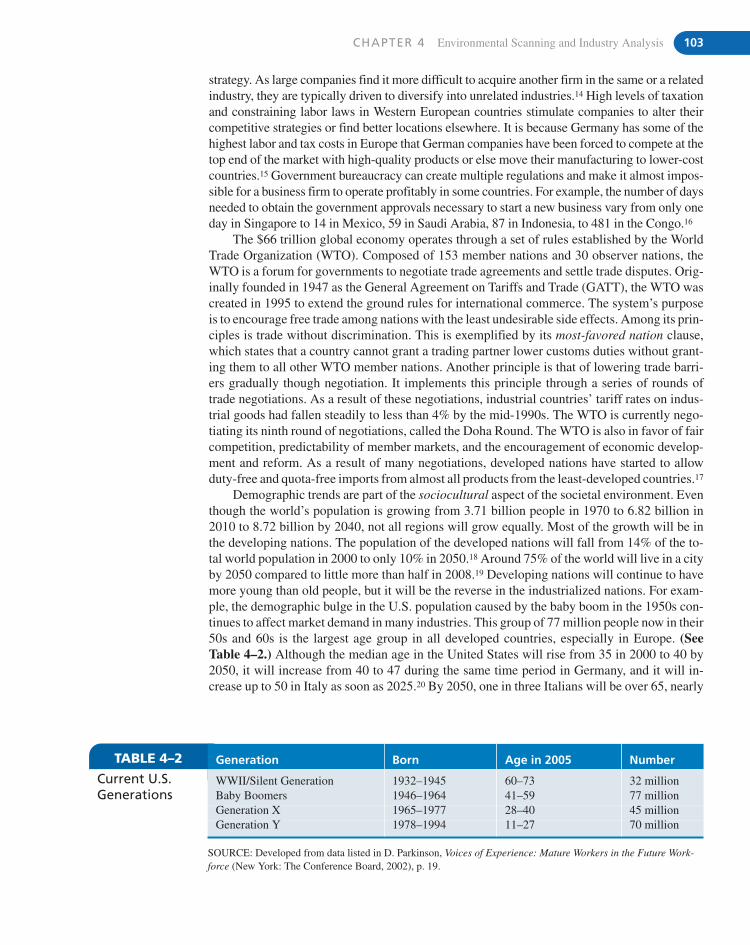
CHAPTER 4 Environmental Scanning and Industry Analysis 103
strategy. As large companies find it more difficult to acquire another firm in the same or a relatedindustry, they are typically driven to diversify into unrelated industries.14 High levels of taxationand constraining labor laws in Western European countries stimulate companies to alter theircompetitive strategies or find better locations elsewhere. It is because Germany has some of thehighest labor and tax costs in Europe that German companies have been forced to compete at thetop end of the market with high-quality products or else move their manufacturing to lower-costcountries.15 Government bureaucracy can create multiple regulations and make it almost impos-sible for a business firm to operate profitably in some countries. For example, the number of daysneeded to obtain the government approvals necessary to start a new business vary from only oneday in Singapore to 14 in Mexico, 59 in Saudi Arabia, 87 in Indonesia, to 481 in the Congo.16
The $66 trillion global economy operates through a set of rules established by the WorldTrade Organization (WTO). Composed of 153 member nations and 30 observer nations, theWTO is a forum for governments to negotiate trade agreements and settle trade disputes. Orig-inally founded in 1947 as the General Agreement on Tariffs and Trade (GATT), the WTO wascreated in 1995 to extend the ground rules for international commerce. The system’s purposeis to encourage free trade among nations with the least undesirable side effects. Among its prin-ciples is trade without discrimination. This is exemplified by its most-favored nation clause,which states that a country cannot grant a trading partner lower customs duties without grant-ing them to all other WTO member nations. Another principle is that of lowering trade barri-ers gradually though negotiation. It implements this principle through a series of rounds oftrade negotiations. As a result of these negotiations, industrial countries’ tariff rates on indus-trial goods had fallen steadily to less than 4% by the mid-1990s. The WTO is currently nego-tiating its ninth round of negotiations, called the Doha Round. The WTO is also in favor of faircompetition, predictability of member markets, and the encouragement of economic develop-ment and reform. As a result of many negotiations, developed nations have started to allowduty-free and quota-free imports from almost all products from the least-developed countries.17
Demographic trends are part of the sociocultural aspect of the societal environment. Eventhough the world’s population is growing from 3.71 billion people in 1970 to 6.82 billion in2010 to 8.72 billion by 2040, not all regions will grow equally. Most of the growth will be inthe developing nations. The population of the developed nations will fall from 14% of the to-tal world population in 2000 to only 10% in 2050.18 Around 75% of the world will live in a cityby 2050 compared to little more than half in 2008.19 Developing nations will continue to havemore young than old people, but it will be the reverse in the industrialized nations. For exam-ple, the demographic bulge in the U.S. population caused by the baby boom in the 1950s con-tinues to affect market demand in many industries. This group of 77 million people now in their50s and 60s is the largest age group in all developed countries, especially in Europe. (SeeTable 4–2.) Although the median age in the United States will rise from 35 in 2000 to 40 by2050, it will increase from 40 to 47 during the same time period in Germany, and it will in-crease up to 50 in Italy as soon as 2025.20 By 2050, one in three Italians will be over 65, nearly
TABLE 4–2 Generation Born Age in 2005 Number
WWII/Silent Generation 1932–1945 60–73 32 millionBaby Boomers 1946–1964 41–59 77 millionGeneration X 1965–1977 28–40 45 millionGeneration Y 1978–1994 11–27 70 million
SOURCE: Developed from data listed in D. Parkinson, Voices of Experience: Mature Workers in the Future Work-force (New York: The Conference Board, 2002), p. 19.
Current U.S.Generations
double the number in 2005.21 With its low birthrate, Japan’s population is expected to fall from127.6 million in 2004 to around 100 million by 2050.22 China’s stringent birth control policyis causing the ratio of workers to retirees to fall from 20 to 1 during the early 1980s to 2.5 toone by 2020.23 Companies with an eye on the future can find many opportunities to offer prod-ucts and services to the growing number of “woofies” (well-off old folks—defined as peopleover 50 with money to spend).24 These people are very likely to purchase recreational vehicles(RVs), take ocean cruises, and enjoy leisure sports, such as boating, fishing, and bowling, inaddition to needing financial services and health care. Anticipating the needs of seniors for pre-scription drugs is one reason the Walgreen Company has been opening a new corner pharmacyevery 19 hours!25
To attract older customers, retailers will need to place seats in their larger stores so agingshoppers can rest. Washrooms need to be more accessible. Signs need to be larger. Restaurantsneed to raise the level of lighting so people can read their menus. Home appliances need sim-pler and larger controls. Automobiles need larger door openings and more comfortable seats.Zimmer Holdings, an innovative manufacturer of artificial joints, is looking forward to its mar-ket growing rapidly over the next 20 years. According to J. Raymond Elliot, chair and CEO ofZimmer, “It’s simple math. Our best years are still in front of us.”26
Eight current sociocultural trends are transforming North America and the rest of the world:
1. Increasing environmental awareness: Recycling and conservation are becoming morethan slogans. Busch Gardens, for example, has eliminated the use of disposable styrofoamtrays in favor of washing and reusing plastic trays.
2. Growing health consciousness: Concerns about personal health fuel the trend towardphysical fitness and healthier living. As a result, sales growth is slowing at fast-food“burgers and fries” retailers such as McDonald’s. Changing public tastes away fromsugar-laden processed foods forced Interstate Bakeries, the maker of Twinkies and Won-der Bread, to declare bankruptcy in 2004. In 2008, the French government was consider-ing increasing sales taxes on extra-fatty, salty, or sugary products.27 The European Unionforbade the importation of genetically altered grain (“Frankenfood”) because of possibleside effects. The spread of AIDS to more than 40 million people worldwide adds even fur-ther impetus to the health movement.
3. Expanding seniors market: As their numbers increase, people over age 55 will becomean even more important market. Already some companies are segmenting the senior pop-ulation into Young Matures, Older Matures, and the Elderly—each having a different setof attitudes and interests. Both mature segments, for example, are good markets for thehealth care and tourism industries; whereas, the elderly are the key market for long-termcare facilities. The desire for companionship by people whose children are grown is caus-ing the pet care industry to grow 4.5% annually in the United States. In 2007, for exam-ple, 71.1 million households in the U.S. spent $41 billion on their pets—more than thegross domestic product of all but 16 countries in the world.28
4. Impact of Generation Y Boomlet: Born between 1978 and 1994 to the baby boom andX generations, this cohort is almost as large as the baby boom generation. In 1957, the peakyear of the postwar boom, 4.3 million babies were born. In 1990, there were 4.2 millionbirths in Generation Y’s peak year. By 2000, they were overcrowding elementary and highschools and entering college in numbers not seen since the baby boomers. Now in its teensand 20s, this cohort is expected to have a strong impact on future products and services.
5. Declining mass market: Niche markets are defining the marketers’ environment. Peoplewant products and services that are adapted more to their personal needs. For example,Estée Lauder’s “All Skin” and Maybelline’s “Shades of You” lines of cosmetic productsare specifically made for African-American women. “Mass customization”—the making
104 PART 2 Scanning the Environment
CHAPTER 4 Environmental Scanning and Industry Analysis 105
and marketing of products tailored to a person’s requirements (Dell for example, andGateway computers)—is replacing the mass production and marketing of the same prod-uct in some markets. Only 10% of the 6,200 magazines sold in the United States in 2004were aimed at the mass market, down from 30% in the 1970s.29
6. Changing pace and location of life: Instant communication via e-mail, cell phones, andovernight mail enhances efficiency, but it also puts more pressure on people. Merging thepersonal computer with the communication and entertainment industries through tele-phone lines, satellite dishes, and cable television increases consumers’ choices and allowsworkers to leave overcrowded urban areas for small towns and telecommute via personalcomputers and modems.
7. Changing household composition: Single-person households, especially those of singlewomen with children, could soon become the most common household type in the UnitedStates. Married-couple households slipped from nearly 80% in the 1950s to 50.7% of allhouseholds in 2002.30 By 2007, for the first time in U.S. history, more than half of womenwere single.31 Thirty-eight percent of U.S. children are currently being born out of wed-lock.32 A typical family household is no longer the same as it was once portrayed in TheBrady Bunch in the 1970s or The Cosby Show in the 1980s.
8. Increasing diversity of workforce and markets: Between now and 2050, minoritieswill account for nearly 90% of population growth in the United States. Over time, grouppercentages of the total United States population are expected to change as follows: Non-Hispanic Whites—from 90% in 1950 to 74% in 1995 to 53% by 2050; HispanicWhites—from 9% in 1995 to 22% in 2050; Blacks—from 13% in 1995 to 15% in 2050;Asians—from 4% in 1995 to 9% in 2050; American Indians—1%, with slight increase.33
Heavy immigration from the developing to the developed nations is increasing thenumber of minorities in all developed countries and forcing an acceptance of the value ofdiversity in races, religions, and life style. For example, 24% of the Swiss population wasborn elsewhere.34 Traditional minority groups are increasing their numbers in the work-force and are being identified as desirable target markets. For example, Sears, Roebucktransformed 97 of its stores in October 2004 into “multicultural stores” containing fash-ions for Hispanic, African-American, and Asian shoppers.35
International Societal Considerations. Each country or group of countries in which acompany operates presents a unique societal environment with a different set of economic,technological, political–legal, and sociocultural variables for the company to face.International societal environments vary so widely that a corporation’s internal environmentand strategic management process must be very flexible. Cultural trends in Germany, forexample, have resulted in the inclusion of worker representatives in corporate strategicplanning. Because Islamic law (sharia) forbids interest (riba), loans of capital in Islamiccountries must be arranged on the basis of profit-sharing instead of interest rates.36
Differences in societal environments strongly affect the ways in which a multinationalcorporation (MNC), a company with significant assets and activities in multiple countries,conducts its marketing, financial, manufacturing, and other functional activities. For example,Europe’s lower labor productivity, due to a shorter work week and restrictions on the ability tolay off unproductive workers, forces European-based MNCs to expand operations in countrieswhere labor is cheaper and productivity is higher.37 Moving manufacturing to a lower-cost lo-cation, such as China, was a successful strategy during the 1990s, but a country’s labor costs riseas it develops economically. For example, China required all firms in January 2008 to consultemployees on material work-related issues, enabling the country to achieve its stated objectiveof having trade unions in all of China’s non-state-owned enterprises. By September 2008, theAll-China Federation of Trade Unions had signed with 80% of the largest foreign companies.38
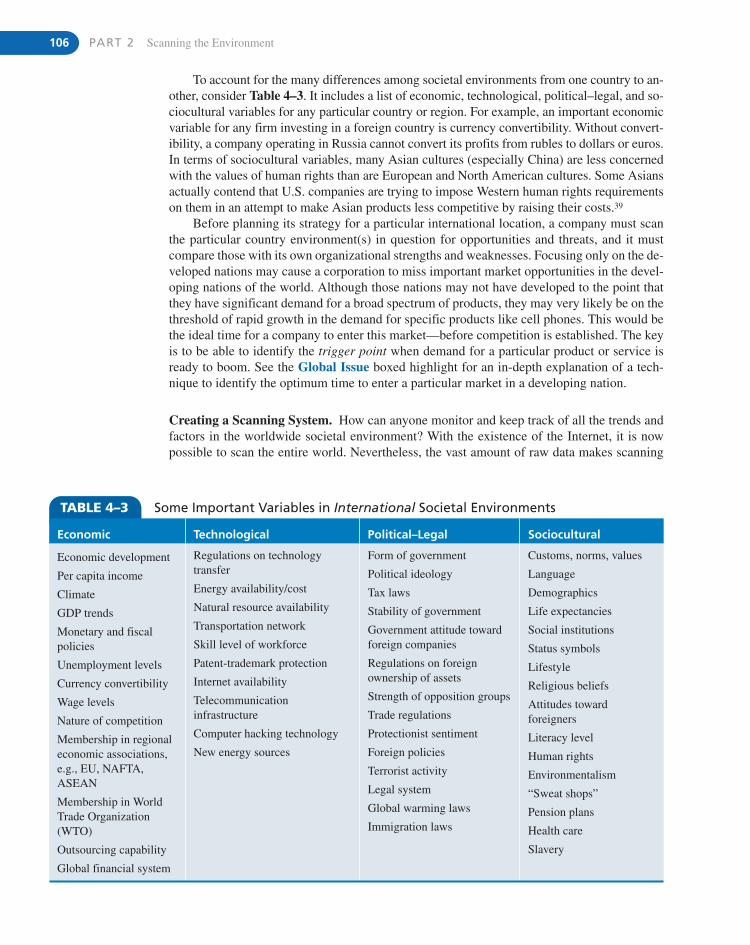
106 PART 2 Scanning the Environment
To account for the many differences among societal environments from one country to an-other, consider Table 4–3. It includes a list of economic, technological, political–legal, and so-ciocultural variables for any particular country or region. For example, an important economicvariable for any firm investing in a foreign country is currency convertibility. Without convert-ibility, a company operating in Russia cannot convert its profits from rubles to dollars or euros.In terms of sociocultural variables, many Asian cultures (especially China) are less concernedwith the values of human rights than are European and North American cultures. Some Asiansactually contend that U.S. companies are trying to impose Western human rights requirementson them in an attempt to make Asian products less competitive by raising their costs.39
Before planning its strategy for a particular international location, a company must scanthe particular country environment(s) in question for opportunities and threats, and it mustcompare those with its own organizational strengths and weaknesses. Focusing only on the de-veloped nations may cause a corporation to miss important market opportunities in the devel-oping nations of the world. Although those nations may not have developed to the point thatthey have significant demand for a broad spectrum of products, they may very likely be on thethreshold of rapid growth in the demand for specific products like cell phones. This would bethe ideal time for a company to enter this market—before competition is established. The keyis to be able to identify the trigger point when demand for a particular product or service isready to boom. See the Global Issue boxed highlight for an in-depth explanation of a tech-nique to identify the optimum time to enter a particular market in a developing nation.
Creating a Scanning System. How can anyone monitor and keep track of all the trends andfactors in the worldwide societal environment? With the existence of the Internet, it is nowpossible to scan the entire world. Nevertheless, the vast amount of raw data makes scanning
TABLE 4–3 Some Important Variables in International Societal Environments
Economic Technological Political–Legal Sociocultural
Economic development
Per capita income
Climate
GDP trends
Monetary and fiscalpolicies
Unemployment levels
Currency convertibility
Wage levels
Nature of competition
Membership in regionaleconomic associations,e.g., EU, NAFTA,ASEAN
Membership in WorldTrade Organization(WTO)
Outsourcing capability
Global financial system
Regulations on technologytransfer
Energy availability/cost
Natural resource availability
Transportation network
Skill level of workforce
Patent-trademark protection
Internet availability
Telecommunicationinfrastructure
Computer hacking technology
New energy sources
Form of government
Political ideology
Tax laws
Stability of government
Government attitude towardforeign companies
Regulations on foreignownership of assets
Strength of opposition groups
Trade regulations
Protectionist sentiment
Foreign policies
Terrorist activity
Legal system
Global warming laws
Immigration laws
Customs, norms, values
Language
Demographics
Life expectancies
Social institutions
Status symbols
Lifestyle
Religious beliefs
Attitudes towardforeigners
Literacy level
Human rights
Environmentalism
“Sweat shops”
Pension plans
Health care
Slavery
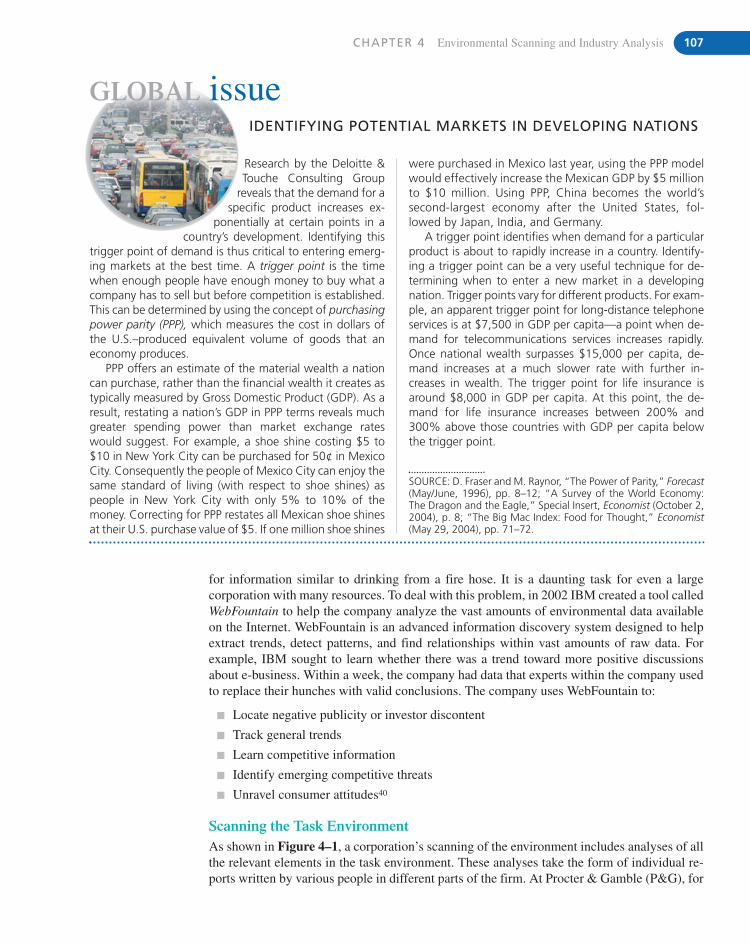
CHAPTER 4 Environmental Scanning and Industry Analysis 107
SOURCE: D. Fraser and M. Raynor, “The Power of Parity,” Forecast(May/June, 1996), pp. 8–12; “A Survey of the World Economy:The Dragon and the Eagle,” Special Insert, Economist (October 2,2004), p. 8; “The Big Mac Index: Food for Thought,” Economist(May 29, 2004), pp. 71–72.
were purchased in Mexico last year, using the PPP modelwould effectively increase the Mexican GDP by $5 millionto $10 million. Using PPP, China becomes the world’ssecond-largest economy after the United States, fol-lowed by Japan, India, and Germany.
A trigger point identifies when demand for a particularproduct is about to rapidly increase in a country. Identify-ing a trigger point can be a very useful technique for de-termining when to enter a new market in a developingnation. Trigger points vary for different products. For exam-ple, an apparent trigger point for long-distance telephoneservices is at $7,500 in GDP per capita—a point when de-mand for telecommunications services increases rapidly.Once national wealth surpasses $15,000 per capita, de-mand increases at a much slower rate with further in-creases in wealth. The trigger point for life insurance isaround $8,000 in GDP per capita. At this point, the de-mand for life insurance increases between 200% and300% above those countries with GDP per capita belowthe trigger point.
Research by the Deloitte &Touche Consulting Group
reveals that the demand for aspecific product increases ex-
ponentially at certain points in acountry’s development. Identifying this
trigger point of demand is thus critical to entering emerg-ing markets at the best time. A trigger point is the timewhen enough people have enough money to buy what acompany has to sell but before competition is established.This can be determined by using the concept of purchasingpower parity (PPP), which measures the cost in dollars ofthe U.S.–produced equivalent volume of goods that aneconomy produces.
PPP offers an estimate of the material wealth a nationcan purchase, rather than the financial wealth it creates astypically measured by Gross Domestic Product (GDP). As aresult, restating a nation’s GDP in PPP terms reveals muchgreater spending power than market exchange rateswould suggest. For example, a shoe shine costing $5 to$10 in New York City can be purchased for 50¢ in MexicoCity. Consequently the people of Mexico City can enjoy thesame standard of living (with respect to shoe shines) aspeople in New York City with only 5% to 10% of themoney. Correcting for PPP restates all Mexican shoe shinesat their U.S. purchase value of $5. If one million shoe shines
IDENTIFYING POTENTIAL MARKETS IN DEVELOPING NATIONS
GLOBAL issue
for information similar to drinking from a fire hose. It is a daunting task for even a largecorporation with many resources. To deal with this problem, in 2002 IBM created a tool calledWebFountain to help the company analyze the vast amounts of environmental data availableon the Internet. WebFountain is an advanced information discovery system designed to helpextract trends, detect patterns, and find relationships within vast amounts of raw data. Forexample, IBM sought to learn whether there was a trend toward more positive discussionsabout e-business. Within a week, the company had data that experts within the company usedto replace their hunches with valid conclusions. The company uses WebFountain to:
� Locate negative publicity or investor discontent
� Track general trends
� Learn competitive information
� Identify emerging competitive threats
� Unravel consumer attitudes40
Scanning the Task EnvironmentAs shown in Figure 4–1, a corporation’s scanning of the environment includes analyses of allthe relevant elements in the task environment. These analyses take the form of individual re-ports written by various people in different parts of the firm. At Procter & Gamble (P&G), for
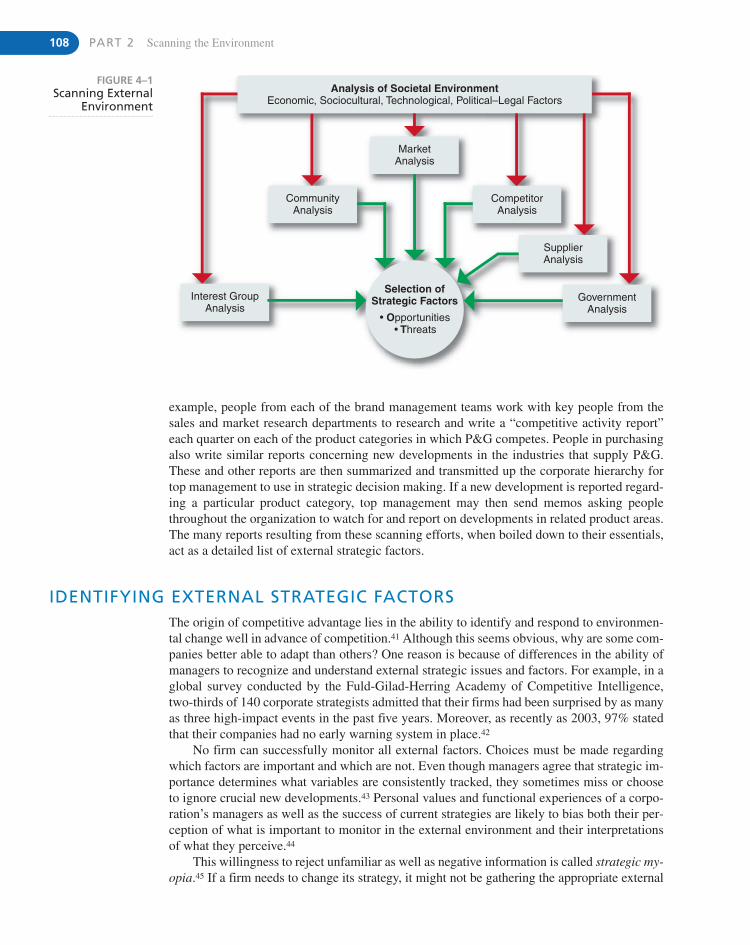
108 PART 2 Scanning the Environment
Interest GroupAnalysis
CommunityAnalysis
MarketAnalysis
CompetitorAnalysis
SupplierAnalysis
GovernmentAnalysis
Analysis of Societal EnvironmentEconomic, Sociocultural, Technological, Political–Legal Factors
Selection ofStrategic Factors
OpportunitiesThreats
FIGURE 4–1Scanning External
Environment
example, people from each of the brand management teams work with key people from thesales and market research departments to research and write a “competitive activity report”each quarter on each of the product categories in which P&G competes. People in purchasingalso write similar reports concerning new developments in the industries that supply P&G.These and other reports are then summarized and transmitted up the corporate hierarchy fortop management to use in strategic decision making. If a new development is reported regard-ing a particular product category, top management may then send memos asking peoplethroughout the organization to watch for and report on developments in related product areas.The many reports resulting from these scanning efforts, when boiled down to their essentials,act as a detailed list of external strategic factors.
IDENTIFYING EXTERNAL STRATEGIC FACTORSThe origin of competitive advantage lies in the ability to identify and respond to environmen-tal change well in advance of competition.41 Although this seems obvious, why are some com-panies better able to adapt than others? One reason is because of differences in the ability ofmanagers to recognize and understand external strategic issues and factors. For example, in aglobal survey conducted by the Fuld-Gilad-Herring Academy of Competitive Intelligence,two-thirds of 140 corporate strategists admitted that their firms had been surprised by as manyas three high-impact events in the past five years. Moreover, as recently as 2003, 97% statedthat their companies had no early warning system in place.42
No firm can successfully monitor all external factors. Choices must be made regardingwhich factors are important and which are not. Even though managers agree that strategic im-portance determines what variables are consistently tracked, they sometimes miss or chooseto ignore crucial new developments.43 Personal values and functional experiences of a corpo-ration’s managers as well as the success of current strategies are likely to bias both their per-ception of what is important to monitor in the external environment and their interpretationsof what they perceive.44
This willingness to reject unfamiliar as well as negative information is called strategic my-opia.45 If a firm needs to change its strategy, it might not be gathering the appropriate external
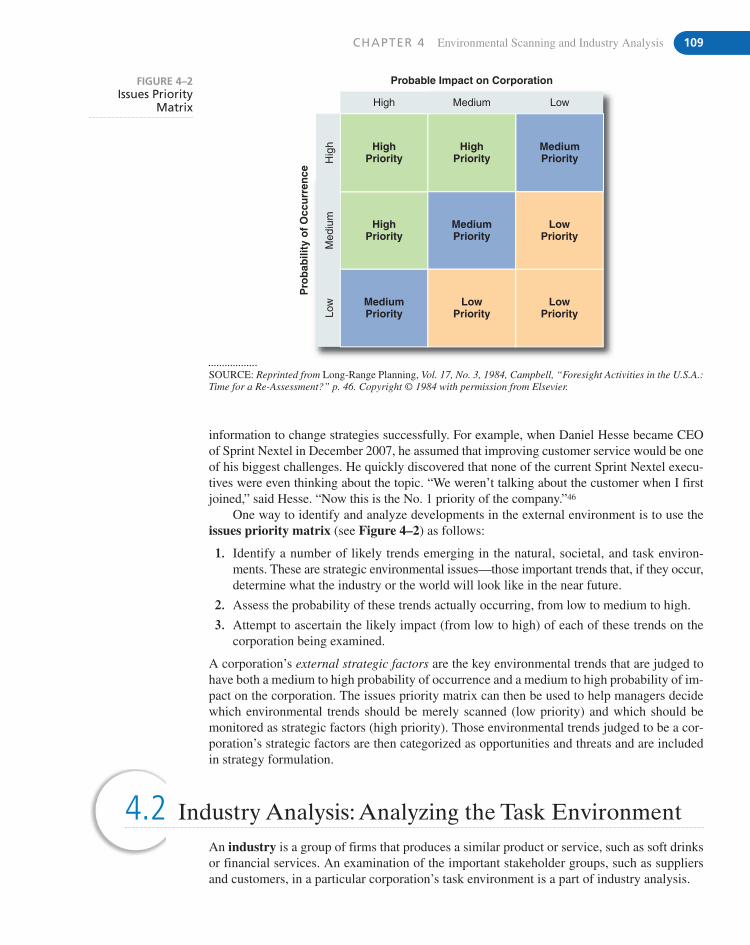
CHAPTER 4 Environmental Scanning and Industry Analysis 109
4.2 Industry Analysis: Analyzing the Task EnvironmentAn industry is a group of firms that produces a similar product or service, such as soft drinksor financial services. An examination of the important stakeholder groups, such as suppliersand customers, in a particular corporation’s task environment is a part of industry analysis.
information to change strategies successfully. For example, when Daniel Hesse became CEOof Sprint Nextel in December 2007, he assumed that improving customer service would be oneof his biggest challenges. He quickly discovered that none of the current Sprint Nextel execu-tives were even thinking about the topic. “We weren’t talking about the customer when I firstjoined,” said Hesse. “Now this is the No. 1 priority of the company.”46
One way to identify and analyze developments in the external environment is to use theissues priority matrix (see Figure 4–2) as follows:
1. Identify a number of likely trends emerging in the natural, societal, and task environ-ments. These are strategic environmental issues—those important trends that, if they occur,determine what the industry or the world will look like in the near future.
2. Assess the probability of these trends actually occurring, from low to medium to high.
3. Attempt to ascertain the likely impact (from low to high) of each of these trends on thecorporation being examined.
A corporation’s external strategic factors are the key environmental trends that are judged tohave both a medium to high probability of occurrence and a medium to high probability of im-pact on the corporation. The issues priority matrix can then be used to help managers decidewhich environmental trends should be merely scanned (low priority) and which should bemonitored as strategic factors (high priority). Those environmental trends judged to be a cor-poration’s strategic factors are then categorized as opportunities and threats and are includedin strategy formulation.
Probable Impact on Corporation
HighPriority
HighPriority
Pro
bab
ility
of
Occ
urr
ence
LowPriority
LowPriority
LowPriority
HighPriority
MediumPriority
MediumPriority
MediumPriority
High
Hig
hM
ediu
mLo
w
Medium Low
FIGURE 4–2Issues Priority
Matrix
SOURCE: Reprinted from Long-Range Planning, Vol. 17, No. 3, 1984, Campbell, “Foresight Activities in the U.S.A.:Time for a Re-Assessment?” p. 46. Copyright © 1984 with permission from Elsevier.
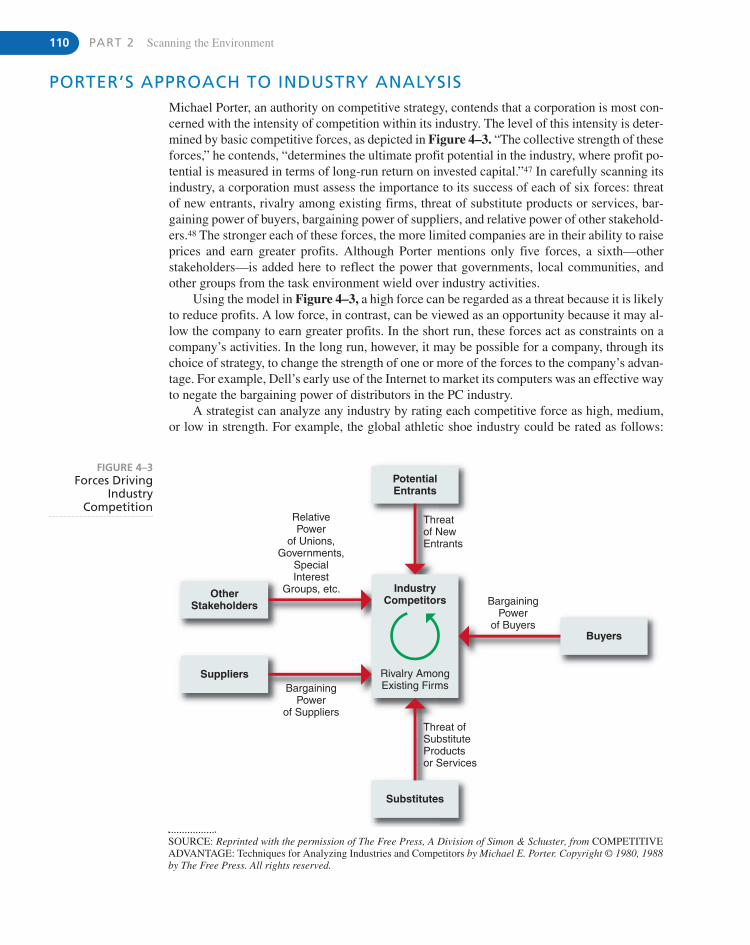
110 PART 2 Scanning the Environment
OtherStakeholders
RelativePower
of Unions,Governments,
SpecialInterest
Groups, etc.Bargaining
Powerof Buyers
Threatof NewEntrants
IndustryCompetitors
BargainingPower
of Suppliers
Rivalry AmongExisting Firms
Threat ofSubstituteProductsor Services
PotentialEntrants
Buyers
Substitutes
Suppliers
FIGURE 4–3Forces Driving
IndustryCompetition
PORTER’S APPROACH TO INDUSTRY ANALYSISMichael Porter, an authority on competitive strategy, contends that a corporation is most con-cerned with the intensity of competition within its industry. The level of this intensity is deter-mined by basic competitive forces, as depicted in Figure 4–3. “The collective strength of theseforces,” he contends, “determines the ultimate profit potential in the industry, where profit po-tential is measured in terms of long-run return on invested capital.”47 In carefully scanning itsindustry, a corporation must assess the importance to its success of each of six forces: threatof new entrants, rivalry among existing firms, threat of substitute products or services, bar-gaining power of buyers, bargaining power of suppliers, and relative power of other stakehold-ers.48 The stronger each of these forces, the more limited companies are in their ability to raiseprices and earn greater profits. Although Porter mentions only five forces, a sixth—otherstakeholders—is added here to reflect the power that governments, local communities, andother groups from the task environment wield over industry activities.
Using the model in Figure 4–3, a high force can be regarded as a threat because it is likelyto reduce profits. A low force, in contrast, can be viewed as an opportunity because it may al-low the company to earn greater profits. In the short run, these forces act as constraints on acompany’s activities. In the long run, however, it may be possible for a company, through itschoice of strategy, to change the strength of one or more of the forces to the company’s advan-tage. For example, Dell’s early use of the Internet to market its computers was an effective wayto negate the bargaining power of distributors in the PC industry.
A strategist can analyze any industry by rating each competitive force as high, medium,or low in strength. For example, the global athletic shoe industry could be rated as follows:
SOURCE: Reprinted with the permission of The Free Press, A Division of Simon & Schuster, from COMPETITIVEADVANTAGE: Techniques for Analyzing Industries and Competitors by Michael E. Porter. Copyright © 1980, 1988by The Free Press. All rights reserved.
CHAPTER 4 Environmental Scanning and Industry Analysis 111
rivalry is high (Nike, Reebok, New Balance, Converse, and Adidas are strong competitorsworldwide), threat of potential entrants is low (the industry has reached maturity/sales growthrate has slowed), threat of substitutes is low (other shoes don’t provide support for sports ac-tivities), bargaining power of suppliers is medium but rising (suppliers in Asian countries areincreasing in size and ability), bargaining power of buyers is medium but increasing (pricesare falling as the low-priced shoe market has grown to be half of the U.S. branded athletic shoemarket), and threat of other stakeholders is medium to high (government regulations and hu-man rights concerns are growing). Based on current trends in each of these competitive forces,the industry’s level of competitive intensity will continue to be high—meaning that sales in-creases and profit margins should continue to be modest for the industry as a whole.49
Threat of New EntrantsNew entrants to an industry typically bring to it new capacity, a desire to gain market share,and substantial resources. They are, therefore, threats to an established corporation. The threatof entry depends on the presence of entry barriers and the reaction that can be expected fromexisting competitors. An entry barrier is an obstruction that makes it difficult for a companyto enter an industry. For example, no new domestic automobile companies have been success-fully established in the United States since the 1930s because of the high capital requirementsto build production facilities and to develop a dealer distribution network. Some of the possi-ble barriers to entry are:
� Economies of scale: Scale economies in the production and sale of microprocessors, forexample, gave Intel a significant cost advantage over any new rival.
� Product differentiation: Corporations such as Procter & Gamble and General Mills,which manufacture products such as Tide and Cheerios, create high entry barriers throughtheir high levels of advertising and promotion.
� Capital requirements: The need to invest huge financial resources in manufacturing fa-cilities in order to produce large commercial airplanes creates a significant barrier to en-try to any competitor for Boeing and Airbus.
� Switching costs: Once a software program such as Excel or Word becomes established inan office, office managers are very reluctant to switch to a new program because of thehigh training costs.
� Access to distribution channels: Small entrepreneurs often have difficulty obtaining su-permarket shelf space for their goods because large retailers charge for space on theirshelves and give priority to the established firms who can pay for the advertising neededto generate high customer demand.
� Cost disadvantages independent of size: Once a new product earns sufficient marketshare to be accepted as the standard for that type of product, the maker has a key ad-vantage. Microsoft’s development of the first widely adopted operating system (MS-DOS) for the IBM-type personal computer gave it a significant competitive advantageover potential competitors. Its introduction of Windows helped to cement that advan-tage so that the Microsoft operating system is now on more than 90% of personal com-puters worldwide.
� Government policy: Governments can limit entry into an industry through licensing re-quirements by restricting access to raw materials, such as oil-drilling sites in protected areas.
Rivalry among Existing FirmsIn most industries, corporations are mutually dependent. A competitive move by one firm canbe expected to have a noticeable effect on its competitors and thus may cause retaliation. For
112 PART 2 Scanning the Environment
example, the entry by mail order companies such as Dell and Gateway into a PC industry previ-ously dominated by IBM, Apple, and Compaq increased the level of competitive activity to suchan extent that any price reduction or new product introduction was quickly followed by similarmoves from other PC makers. The same is true of prices in the United States airline industry. Ac-cording to Porter, intense rivalry is related to the presence of several factors, including:
� Number of competitors: When competitors are few and roughly equal in size, such as inthe auto and major home appliance industries, they watch each other carefully to makesure that they match any move by another firm with an equal countermove.
� Rate of industry growth: Any slowing in passenger traffic tends to set off price wars inthe airline industry because the only path to growth is to take sales away from a competitor.
� Product or service characteristics: A product can be very unique, with many qualitiesdifferentiating it from others of its kind or it may be a commodity, a product whose char-acteristics are the same, regardless of who sells it. For example, most people choose a gasstation based on location and pricing because they view gasoline as a commodity.
� Amount of fixed costs: Because airlines must fly their planes on a schedule, regardlessof the number of paying passengers for any one flight, they offer cheap standby fareswhenever a plane has empty seats.
� Capacity: If the only way a manufacturer can increase capacity is in a large increment bybuilding a new plant (as in the paper industry), it will run that new plant at full capacityto keep its unit costs as low as possible—thus producing so much that the selling pricefalls throughout the industry.
� Height of exit barriers: Exit barriers keep a company from leaving an industry. The brew-ing industry, for example, has a low percentage of companies that voluntarily leave the in-dustry because breweries are specialized assets with few uses except for making beer.
� Diversity of rivals: Rivals that have very different ideas of how to compete are likelyto cross paths often and unknowingly challenge each other’s position. This happens of-ten in the retail clothing industry when a number of retailers open outlets in the samelocation—thus taking sales away from each other. This is also likely to happen in somecountries or regions when multinational corporations compete in an increasingly globaleconomy.
Threat of Substitute Products or ServicesA substitute product is a product that appears to be different but can satisfy the same need asanother product. For example, e-mail is a substitute for the fax, Nutrasweet is a substitute forsugar, the Internet is a substitute for video stores, and bottled water is a substitute for a cola.According to Porter, “Substitutes limit the potential returns of an industry by placing a ceilingon the prices firms in the industry can profitably charge.”50 To the extent that switching costsare low, substitutes may have a strong effect on an industry. Tea can be considered a substitutefor coffee. If the price of coffee goes up high enough, coffee drinkers will slowly begin switch-ing to tea. The price of tea thus puts a price ceiling on the price of coffee. Sometimes a diffi-cult task, the identification of possible substitute products or services means searching forproducts or services that can perform the same function, even though they have a different ap-pearance and may not appear to be easily substitutable.
Bargaining Power of BuyersBuyers affect an industry through their ability to force down prices, bargain for higher qualityor more services, and play competitors against each other. A buyer or a group of buyers is pow-erful if some of the following factors hold true:
CHAPTER 4 Environmental Scanning and Industry Analysis 113
� A buyer purchases a large proportion of the seller’s product or service (for example, oilfilters purchased by a major auto maker).
� A buyer has the potential to integrate backward by producing the product itself (for exam-ple, a newspaper chain could make its own paper).
� Alternative suppliers are plentiful because the product is standard or undifferentiated (forexample, motorists can choose among many gas stations).
� Changing suppliers costs very little (for example, office supplies are easy to find).
� The purchased product represents a high percentage of a buyer’s costs, thus providing anincentive to shop around for a lower price (for example, gasoline purchased for resale byconvenience stores makes up half their total costs).
� A buyer earns low profits and is thus very sensitive to costs and service differences (forexample, grocery stores have very small margins).
� The purchased product is unimportant to the final quality or price of a buyer’s products orservices and thus can be easily substituted without affecting the final product adversely(for example, electric wire bought for use in lamps).
Bargaining Power of SuppliersSuppliers can affect an industry through their ability to raise prices or reduce the quality of pur-chased goods and services. A supplier or supplier group is powerful if some of the followingfactors apply:
� The supplier industry is dominated by a few companies, but it sells to many (for example,the petroleum industry).
� Its product or service is unique and/or it has built up switching costs (for example, wordprocessing software).
� Substitutes are not readily available (for example, electricity).
� Suppliers are able to integrate forward and compete directly with their present customers(for example, a microprocessor producer such as Intel can make PCs).
� A purchasing industry buys only a small portion of the supplier group’s goods and ser-vices and is thus unimportant to the supplier (for example, sales of lawn mower tires areless important to the tire industry than are sales of auto tires).
Relative Power of Other StakeholdersA sixth force should be added to Porter’s list to include a variety of stakeholder groups fromthe task environment. Some of these groups are governments (if not explicitly included else-where), local communities, creditors (if not included with suppliers), trade associations, special-interest groups, unions (if not included with suppliers), shareholders, and complemen-tors. According to Andy Grove, Chairman and past CEO of Intel, a complementor is a com-pany (e.g., Microsoft) or an industry whose product works well with a firm’s (e.g., Intel’s)product and without which the product would lose much of its value.51 An example of com-plementary industries is the tire and automobile industries. Key international stakeholders whodetermine many of the international trade regulations and standards are the World Trade Or-ganization, the European Union, NAFTA, ASEAN, and Mercosur.
The importance of these stakeholders varies by industry. For example, environmentalgroups in Maine, Michigan, Oregon, and Iowa successfully fought to pass bills outlawing dis-posable bottles and cans, and thus deposits for most drink containers are now required. Thiseffectively raised costs across the board, with the most impact on the marginal producers who
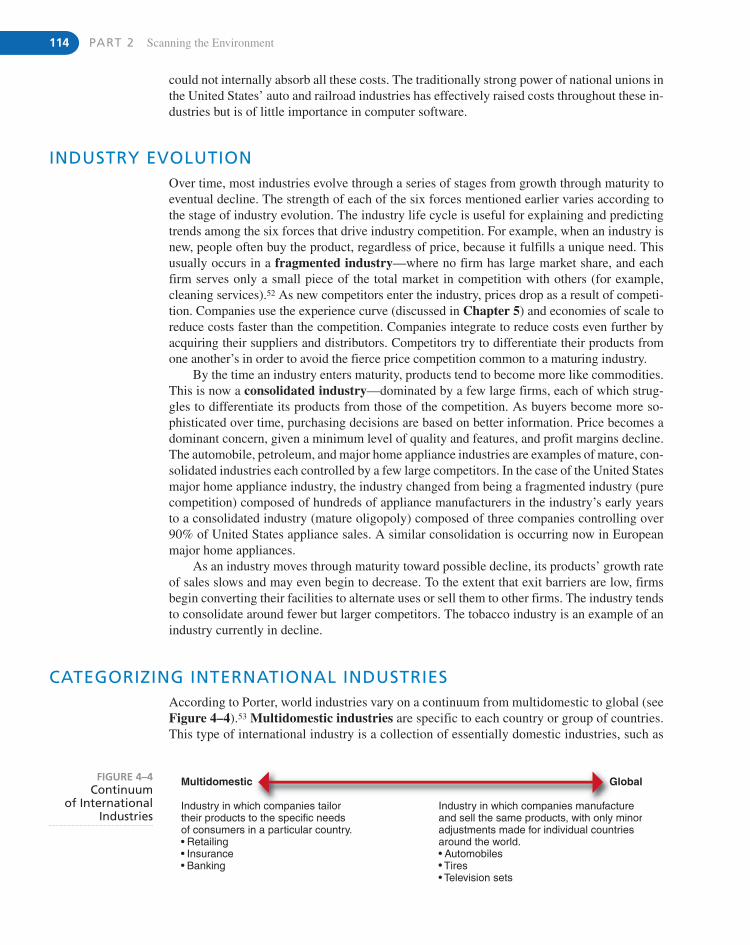
114 PART 2 Scanning the Environment
Multidomestic Global
Industry in which companies tailortheir products to the specific needsof consumers in a particular country. Retailing Insurance Banking
Industry in which companies manufactureand sell the same products, with only minoradjustments made for individual countriesaround the world. Automobiles Tires Television sets
FIGURE 4–4Continuum
of InternationalIndustries
could not internally absorb all these costs. The traditionally strong power of national unions inthe United States’ auto and railroad industries has effectively raised costs throughout these in-dustries but is of little importance in computer software.
INDUSTRY EVOLUTIONOver time, most industries evolve through a series of stages from growth through maturity toeventual decline. The strength of each of the six forces mentioned earlier varies according tothe stage of industry evolution. The industry life cycle is useful for explaining and predictingtrends among the six forces that drive industry competition. For example, when an industry isnew, people often buy the product, regardless of price, because it fulfills a unique need. Thisusually occurs in a fragmented industry—where no firm has large market share, and eachfirm serves only a small piece of the total market in competition with others (for example,cleaning services).52 As new competitors enter the industry, prices drop as a result of competi-tion. Companies use the experience curve (discussed in Chapter 5) and economies of scale toreduce costs faster than the competition. Companies integrate to reduce costs even further byacquiring their suppliers and distributors. Competitors try to differentiate their products fromone another’s in order to avoid the fierce price competition common to a maturing industry.
By the time an industry enters maturity, products tend to become more like commodities.This is now a consolidated industry—dominated by a few large firms, each of which strug-gles to differentiate its products from those of the competition. As buyers become more so-phisticated over time, purchasing decisions are based on better information. Price becomes adominant concern, given a minimum level of quality and features, and profit margins decline.The automobile, petroleum, and major home appliance industries are examples of mature, con-solidated industries each controlled by a few large competitors. In the case of the United Statesmajor home appliance industry, the industry changed from being a fragmented industry (purecompetition) composed of hundreds of appliance manufacturers in the industry’s early yearsto a consolidated industry (mature oligopoly) composed of three companies controlling over90% of United States appliance sales. A similar consolidation is occurring now in Europeanmajor home appliances.
As an industry moves through maturity toward possible decline, its products’ growth rateof sales slows and may even begin to decrease. To the extent that exit barriers are low, firmsbegin converting their facilities to alternate uses or sell them to other firms. The industry tendsto consolidate around fewer but larger competitors. The tobacco industry is an example of anindustry currently in decline.
CATEGORIZING INTERNATIONAL INDUSTRIESAccording to Porter, world industries vary on a continuum from multidomestic to global (seeFigure 4–4).53 Multidomestic industries are specific to each country or group of countries.This type of international industry is a collection of essentially domestic industries, such as
CHAPTER 4 Environmental Scanning and Industry Analysis 115
retailing and insurance. The activities in a subsidiary of a multinational corporation (MNC)in this type of industry are essentially independent of the activities of the MNC’s subsidiariesin other countries. Within each country, it has a manufacturing facility to produce goods forsale within that country. The MNC is thus able to tailor its products or services to the veryspecific needs of consumers in a particular country or group of countries having similar soci-etal environments.
Global industries, in contrast, operate worldwide, with MNCs making only small adjust-ments for country-specific circumstances. In a global industry an MNC’s activities in onecountry are significantly affected by its activities in other countries. MNCs in global industriesproduce products or services in various locations throughout the world and sell them, makingonly minor adjustments for specific country requirements. Examples of global industries arecommercial aircraft, television sets, semiconductors, copiers, automobiles, watches, and tires.The largest industrial corporations in the world in terms of sales revenue are, for the most part,MNCs operating in global industries.
The factors that tend to determine whether an industry will be primarily multidomestic orprimarily global are:
1. Pressure for coordination within the MNCs operating in that industry
2. Pressure for local responsiveness on the part of individual country markets
To the extent that the pressure for coordination is strong and the pressure for local responsive-ness is weak for MNCs within a particular industry, that industry will tend to become global. Incontrast, when the pressure for local responsiveness is strong and the pressure for coordinationis weak for multinational corporations in an industry, that industry will tend to be multidomes-tic. Between these two extremes lie a number of industries with varying characteristics of bothmultidomestic and global industries. These are regional industries, in which MNCs primarilycoordinate their activities within regions, such as the Americas or Asia.54 The major home ap-pliance industry is a current example of a regional industry becoming a global industry. Japa-nese appliance makers, for example, are major competitors in Asia, but only minor players inEurope or America. The dynamic tension between the pressure for coordination and the pres-sure for local responsiveness is contained in the phrase, “Think globally but act locally.”
INTERNATIONAL RISK ASSESSMENTSome firms develop elaborate information networks and computerized systems to evaluateand rank investment risks. Small companies may hire outside consultants, such as Boston’sArthur D. Little Inc., to provide political-risk assessments. Among the many systems that ex-ist to assess political and economic risks are the Business Environment Risk Index, the Econ-omist Intelligence Unit, and Frost and Sullivan’s World Political Risk Forecasts. TheEconomist Intelligence Unit, for example, provides a constant flow of analysis and forecastson more than 200 countries and eight key industries. Regardless of the source of data, a firmmust develop its own method of assessing risk. It must decide on its most important risk fac-tors and then assign weights to each.
STRATEGIC GROUPSA strategic group is a set of business units or firms that “pursue similar strategies with simi-lar resources.”55 Categorizing firms in any one industry into a set of strategic groups is veryuseful as a way of better understanding the competitive environment.56 Research shows thatsome strategic groups in the same industry are more profitable than others.57 Because a corpo-ration’s structure and culture tend to reflect the kinds of strategies it follows, companies or
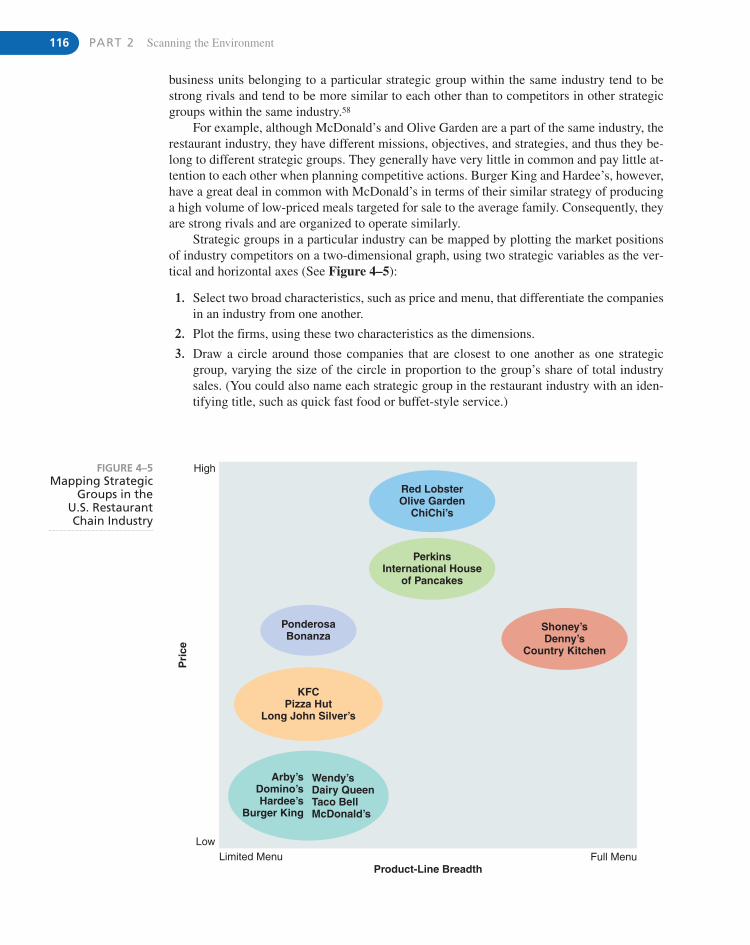
116 PART 2 Scanning the Environment
Red LobsterOlive Garden
ChiChi’s
High
Shoney’sDenny’s
Country Kitchen
PerkinsInternational House
of Pancakes
PonderosaBonanza
KFCPizza Hut
Long John Silver’s
Arby’sDomino’sHardee’s
Burger King
Wendy’sDairy QueenTaco BellMcDonald’s
Pri
ce
LowLimited Menu
Product-Line BreadthFull Menu
FIGURE 4–5Mapping Strategic
Groups in the U.S. RestaurantChain Industry
business units belonging to a particular strategic group within the same industry tend to bestrong rivals and tend to be more similar to each other than to competitors in other strategicgroups within the same industry.58
For example, although McDonald’s and Olive Garden are a part of the same industry, therestaurant industry, they have different missions, objectives, and strategies, and thus they be-long to different strategic groups. They generally have very little in common and pay little at-tention to each other when planning competitive actions. Burger King and Hardee’s, however,have a great deal in common with McDonald’s in terms of their similar strategy of producinga high volume of low-priced meals targeted for sale to the average family. Consequently, theyare strong rivals and are organized to operate similarly.
Strategic groups in a particular industry can be mapped by plotting the market positionsof industry competitors on a two-dimensional graph, using two strategic variables as the ver-tical and horizontal axes (See Figure 4–5):
1. Select two broad characteristics, such as price and menu, that differentiate the companiesin an industry from one another.
2. Plot the firms, using these two characteristics as the dimensions.
3. Draw a circle around those companies that are closest to one another as one strategicgroup, varying the size of the circle in proportion to the group’s share of total industrysales. (You could also name each strategic group in the restaurant industry with an iden-tifying title, such as quick fast food or buffet-style service.)
CHAPTER 4 Environmental Scanning and Industry Analysis 117
STRATEGIC TYPESIn analyzing the level of competitive intensity within a particular industry or strategic group,it is useful to characterize the various competitors for predictive purposes. A strategic type isa category of firms based on a common strategic orientation and a combination of structure,culture, and processes consistent with that strategy. According to Miles and Snow, competingfirms within a single industry can be categorized into one of four basic types on the basis oftheir general strategic orientation.59 This distinction helps explain why companies facing sim-ilar situations behave differently and why they continue to do so over long periods of time.60
These general types have the following characteristics:
� Defenders are companies with a limited product line that focus on improving the effi-ciency of their existing operations. This cost orientation makes them unlikely to inno-vate in new areas. With its emphasis on efficiency, Lincoln Electric is an example of adefender.
� Prospectors are companies with fairly broad product lines that focus on product innova-tion and market opportunities. This sales orientation makes them somewhat inefficient.They tend to emphasize creativity over efficiency. Rubbermaid’s emphasis on new prod-uct development makes it an example of a prospector.
� Analyzers are corporations that operate in at least two different product-market areas,one stable and one variable. In the stable areas, efficiency is emphasized. In the variableareas, innovation is emphasized. Multidivisional firms, such as IBM and Procter & Gamble, which operate in multiple industries, tend to be analyzers.
� Reactors are corporations that lack a consistent strategy-structure-culture relationship.Their (often ineffective) responses to environmental pressures tend to be piecemeal strate-gic changes. Most major U.S. airlines have recently tended to be reactors—given the waythey have been forced to respond to new entrants such as Southwest and JetBlue.
Dividing the competition into these four categories enables the strategic manager not only tomonitor the effectiveness of certain strategic orientations, but also to develop scenarios of fu-ture industry developments (discussed later in this chapter).
Other dimensions, such as quality, service, location, or degree of vertical integration,could also be used in additional graphs of the restaurant industry to gain a better understand-ing of how the various firms in the industry compete. Keep in mind, however, that the two di-mensions should not be highly correlated; otherwise, the circles on the map will simply liealong the diagonal, providing very little new information other than the obvious.
HYPERCOMPETITIONMost industries today are facing an ever-increasing level of environmental uncertainty. Theyare becoming more complex and more dynamic. Industries that used to be multidomestic arebecoming global. New flexible, aggressive, innovative competitors are moving into estab-lished markets to rapidly erode the advantages of large previously dominant firms. Distribu-tion channels vary from country to country and are being altered daily through the use ofsophisticated information systems. Closer relationships with suppliers are being forged to re-duce costs, increase quality, and gain access to new technology. Companies learn to quicklyimitate the successful strategies of market leaders, and it becomes harder to sustain any com-petitive advantage for very long. Consequently, the level of competitive intensity is increasingin most industries.
118 PART 2 Scanning the Environment
from current products. Microsoft was one of the first com-panies to disprove this argument against cannibalization.
Bill Gates, Microsoft’s co-founder, chair, and CEO, real-ized that if his company didn’t replace its own DOS prod-uct line with a better product, someone else would (suchas Linux or IBM’s OS/2 Warp). He knew that success in thesoftware industry depends not so much on company sizeas on moving aggressively to the next competitive advan-tage before a competitor does. “This is a hypercompetitivemarket,” explained Gates. “Scale is not all positive in thisbusiness. Cleverness is the position in this business.” By2008, Microsoft still controlled over 90% of operating sys-tems software and had achieved a dominant position inapplications software as well.
Microsoft is a hypercompet-itive firm operating in a hy-
percompetitive industry. It hasused its dominance in operating
systems (DOS and Windows) tomove into a very strong position in appli-
cation programs such as word processing and spread-sheets (Word and Excel). Even though Microsoft held 90%of the market for personal computer operating systems in1992, it still invested millions in developing the next gen-eration—Windows 95 and Windows NT. These were soonfollowed by Windows Me, XP, and Vista. Instead of tryingto protect its advantage in the profitable DOS operatingsystem, Microsoft actively sought to replace DOS with var-ious versions of Windows. Before hypercompetition, mostexperts argued against cannibalization of a company’s ownproduct line because it destroys a very profitable productinstead of harvesting it like a “cash cow.” According to thisline of thought, a company would be better off defendingits older products. New products would be introduced onlyif it could be proven that they would not take sales away
MICROSOFT IN A HYPERCOMPETITIVE INDUSTRY
SOURCE: Richard A. D’Aveni, “Hypercompetition: Managing theDynamics of Strategic Maneuvering.” Copyright © 1994 byRichard A. D’Aveni. All rights reserved.
STRATEGY highlight 4.1
USING KEY SUCCESS FACTORS TO CREATE AN INDUSTRY MATRIXWithin any industry there are usually certain variables—key success factors—that a com-pany’s management must understand in order to be successful. Key success factors are vari-ables that can significantly affect the overall competitive positions of companies within anyparticular industry. They typically vary from industry to industry and are crucial to determin-ing a company’s ability to succeed within that industry. They are usually determined by the
Richard D’Aveni contends that as this type of environmental turbulence reaches more in-dustries, competition becomes hypercompetition. According to D’Aveni:
In hypercompetition the frequency, boldness, and aggressiveness of dynamic movement by theplayers accelerates to create a condition of constant disequilibrium and change. Market stabil-ity is threatened by short product life cycles, short product design cycles, new technologies, fre-quent entry by unexpected outsiders, repositioning by incumbents, and tactical redefinitions ofmarket boundaries as diverse industries merge. In other words, environments escalate towardhigher and higher levels of uncertainty, dynamism, heterogeneity of the players and hostility.61
In hypercompetitive industries such as computers, competitive advantage comes from an up-to-date knowledge of environmental trends and competitive activity coupled with a willing-ness to risk a current advantage for a possible new advantage. Companies must be willing tocannibalize their own products (that is, replace popular products before competitors do so) in or-der to sustain their competitive advantage. See Strategy Highlight 4.1 to learn how Microsoft isoperating in the hypercompetitive industry of computer software. (Hypercompetition is dis-cussed in more detail in Chapter 6.)
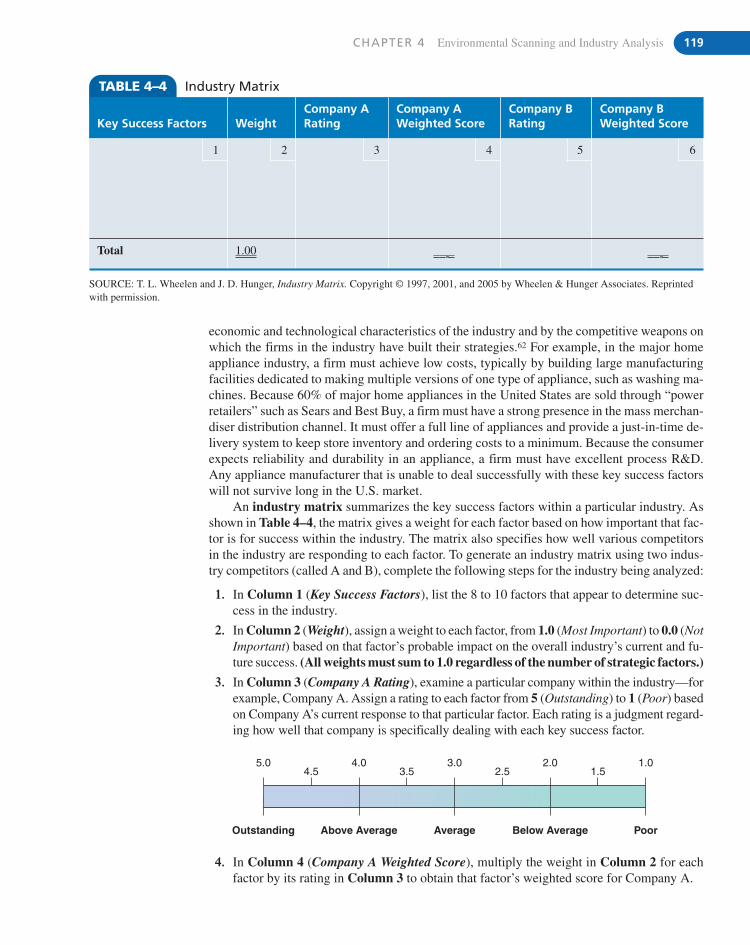
CHAPTER 4 Environmental Scanning and Industry Analysis 119
economic and technological characteristics of the industry and by the competitive weapons onwhich the firms in the industry have built their strategies.62 For example, in the major homeappliance industry, a firm must achieve low costs, typically by building large manufacturingfacilities dedicated to making multiple versions of one type of appliance, such as washing ma-chines. Because 60% of major home appliances in the United States are sold through “powerretailers” such as Sears and Best Buy, a firm must have a strong presence in the mass merchan-diser distribution channel. It must offer a full line of appliances and provide a just-in-time de-livery system to keep store inventory and ordering costs to a minimum. Because the consumerexpects reliability and durability in an appliance, a firm must have excellent process R&D.Any appliance manufacturer that is unable to deal successfully with these key success factorswill not survive long in the U.S. market.
An industry matrix summarizes the key success factors within a particular industry. Asshown in Table 4–4, the matrix gives a weight for each factor based on how important that fac-tor is for success within the industry. The matrix also specifies how well various competitorsin the industry are responding to each factor. To generate an industry matrix using two indus-try competitors (called A and B), complete the following steps for the industry being analyzed:
1. In Column 1 (Key Success Factors), list the 8 to 10 factors that appear to determine suc-cess in the industry.
2. In Column 2 (Weight), assign a weight to each factor, from 1.0 (Most Important) to 0.0 (NotImportant) based on that factor’s probable impact on the overall industry’s current and fu-ture success. (All weights must sum to 1.0 regardless of the number of strategic factors.)
3. In Column 3 (Company A Rating), examine a particular company within the industry—forexample, Company A. Assign a rating to each factor from 5 (Outstanding) to 1 (Poor) basedon Company A’s current response to that particular factor. Each rating is a judgment regard-ing how well that company is specifically dealing with each key success factor.
TABLE 4–4 Industry Matrix
Key Success Factors WeightCompany ARating
Company AWeighted Score
Company BRating
Company BWeighted Score
1 2 3 4 5 6
Total 1.00
SOURCE: T. L. Wheelen and J. D. Hunger, Industry Matrix. Copyright © 1997, 2001, and 2005 by Wheelen & Hunger Associates. Reprintedwith permission.
5.0
Outstanding Above Average Average Below Average Poor
4.54.0
3.53.0
2.52.0
1.51.0
4. In Column 4 (Company A Weighted Score), multiply the weight in Column 2 for eachfactor by its rating in Column 3 to obtain that factor’s weighted score for Company A.
120 PART 2 Scanning the Environment
5. In Column 5 (Company B Rating), examine a second company within the industry - inthis case, Company B. Assign a rating to each key success factor from 5.0 (Outstanding)to 1.0 (Poor), based on Company B’s current response to each particular factor.
6. In Column 6 (Company B Weighted Score), multiply the weight in Column 2 foreach factor times its rating in Column 5 to obtain that factor’s weighted score forCompany B.
7. Finally, add the weighted scores for all the factors in Columns 4 and 6 to determine thetotal weighted scores for companies A and B. The total weighted score indicates howwell each company is responding to current and expected key success factors in theindustry’s environment. Check to ensure that the total weighted score truly reflects thecompany’s current performance in terms of profitability and market share. (An averagecompany should have a total weighted score of 3.)
The industry matrix can be expanded to include all the major competitors within an industrythrough the addition of two additional columns for each additional competitor.
4.3 Competitive IntelligenceMuch external environmental scanning is done on an informal and individual basis. Informa-tion is obtained from a variety of sources—suppliers, customers, industry publications, em-ployees, industry experts, industry conferences, and the Internet.63 For example, scientists andengineers working in a firm’s R&D lab can learn about new products and competitors’ ideasat professional meetings; someone from the purchasing department, speaking with supplier-representatives’ personnel, may also uncover valuable bits of information about a competitor.A study of product innovation found that 77% of all product innovations in scientific instru-ments and 67% in semiconductors and printed circuit boards were initiated by the customer inthe form of inquiries and complaints.64 In these industries, the sales force and service depart-ments must be especially vigilant.
A recent survey of global executives by McKinsey & Company found that the single fac-tor contributing most to the increasing competitive intensity in their industries was the im-proved capabilities of competitors.65 Yet, without competitive intelligence, companies run therisk of flying blind in the marketplace. In a 2008 survey of global executives, the majority re-vealed that their companies typically learned about a competitor’s price change or significantinnovation too late to respond before it was introduced into the market.66 According to workby Ryall, firms can have competitive advantages simply because their rivals have erroneousbeliefs about them.67 This is why competitive intelligence has become an important part of en-vironmental scanning in most companies.
Competitive intelligence is a formal program of gathering information on a company’scompetitors. Often called business intelligence, it is one of the fastest growing fields withinstrategic management. Research indicates that there is a strong association between corporateperformance and competitive intelligence activities.68 According to a survey of competitive in-telligence professionals, the primary reasons for practicing competitive intelligence are tobuild industry awareness (90.6%), support the strategic planning process (79.2%), developnew products (73.6%), and create new marketing strategies and tactics.69 As early as the 1990s,78% of large U.S. corporations conducted competitive intelligence activities.70 In about a thirdof the firms, the competitive/business intelligence function is housed in its own unit, with theremainder being housed within marketing, strategic planning, information services, businessdevelopment (merger & acquisitions), product development, or other units.71 According to a
CHAPTER 4 Environmental Scanning and Industry Analysis 121
2007 survey of 141 large American corporations, spending on competitive intelligence activ-ities was rising from $1 billion in 2007 to $10 billion by 2012.72 At General Mills, for exam-ple, all employees have been trained to recognize and tap sources of competitive information.Janitors no longer simply place orders with suppliers of cleaning materials; they also ask aboutrelevant practices at competing firms!
SOURCES OF COMPETITIVE INTELLIGENCEMost corporations use outside organizations to provide them with environmental data. Firmssuch as A. C. Nielsen Co. provide subscribers with bimonthly data on brand share, retail prices,percentages of stores stocking an item, and percentages of stock-out stores. Strategists can usethis data to spot regional and national trends as well as to assess market share. Information onmarket conditions, government regulations, industry competitors, and new products can bebought from “information brokers” such as Market Research.com (Findex), LexisNexis (com-pany and country analyses), and Finsbury Data Services. Company and industry profiles aregenerally available from the Hoover’s Web site, at www.hoovers.com. Many business corpo-rations have established their own in-house libraries and computerized information systems todeal with the growing mass of available information.
The Internet has changed the way strategists engage in environmental scanning. It providesthe quickest means to obtain data on almost any subject. Although the scope and quality of In-ternet information is increasing geometrically, it is also littered with “noise,” misinformation,and utter nonsense. For example, a number of corporate Web sites are sending unwanted gueststo specially constructed bogus Web sites.73 Unlike the library, the Internet lacks the tight bibli-ographic control standards that exist in the print world. There is no ISBN or Dewey DecimalSystem to identify, search, and retrieve a document. Many Web documents lack the name of theauthor and the date of publication. A Web page providing useful information may be accessibleon the Web one day and gone the next. Unhappy ex-employees, far-out environmentalists, andprank-prone hackers create “blog” Web sites to attack and discredit an otherwise reputable cor-poration. Rumors with no basis in fact are spread via chat rooms and personal Web sites. Thiscreates a serious problem for researchers. How can one evaluate the information found on theInternet? For a way to evaluate intelligence information, see Strategy Highlight 4.2.
Some companies choose to use industrial espionage or other intelligence-gathering tech-niques to get their information straight from their competitors. According to a survey by theAmerican Society for Industrial Security, PricewaterhouseCoopers, and the United StatesChamber of Commerce, Fortune 1000 companies lost an estimated $59 billion in one yearalone due to the theft of trade secrets.74 By using current or former competitors’ employees andprivate contractors, some firms attempt to steal trade secrets, technology, business plans, andpricing strategies. For example, Avon Products hired private investigators to retrieve from apublic dumpster documents (some of them shredded) that Mary Kay Corporation had thrownaway. Oracle Corporation also hired detectives to obtain the trash of a think tank that had de-fended the pricing practices of its rival Microsoft. Studies reveal that 32% of the trash typi-cally found next to copy machines contains confidential company data, in addition to personaldata (29%) and gossip (39%).75 Even P&G, which defends itself like a fortress from informa-tion leaks, is vulnerable. A competitor was able to learn the precise launch date of a concen-trated laundry detergent in Europe when one of its people visited the factory where machinerywas being made. Simply asking a few questions about what a certain machine did, whom itwas for, and when it would be delivered was all that was necessary.
Some of the firms providing investigatory services are Kroll Inc. with 4,000 employeesin 25 countries, Fairfax, Security Outsourcing Solutions, Trident Group, and Diligence Inc.76
Trident, for example, specializes in helping American companies enter the Russian market and
122 PART 2 Scanning the Environment
is a U.S.-based corporate intelligence firm founded and managed by former veterans of Rus-sian intelligence services, like the KGB.77
To combat the increasing theft of company secrets, the United States government passedthe Economic Espionage Act in 1996. The law makes it illegal (with fines up to $5 million and10 years in jail) to steal any material that a business has taken “reasonable efforts” to keep se-cret and that derives its value from not being known.78 The Society of Competitive IntelligenceProfessionals (www.scip.org) urges strategists to stay within the law and to act ethically whensearching for information. The society states that illegal activities are foolish because the vastmajority of worthwhile competitive intelligence is available publicly via annual reports, Websites, and libraries. Unfortunately, a number of firms hire “kites,” consultants with question-able reputations, who do what is necessary to get information when the selected methods donot meet SPIC ethical standards or are illegal. This allows the company that initiated the ac-tion to deny that it did anything wrong.79
MONITORING COMPETITORS FOR STRATEGIC PLANNINGThe primary activity of a competitive intelligence unit is to monitor competitors—organiza-tions that offer same, similar, or substitutable products or services in the business area in whicha particular company operates. To understand a competitor, it is important to answer the fol-lowing 10 questions:
found through library research in sources such as Moody’sIndustrials, Standard & Poor’s, or Value Line can generallybe evaluated as having a reliability of A. The correctness ofthe data can still range anywhere from 1 to 5, but in mostinstances is likely to be either 1 or 2, but probably no worsethan 3 or 4. Web sites are quite different.
Web sites, such as those sponsored by the U.S. Securi-ties and Exchange Commission (www.sec.gov), the Econo-mist (www.economist.com), or Hoovers Online (www.hoovers.com) are extremely reliable. Company-sponsoredWeb sites are generally reliable, but are not the place to gofor trade secrets, strategic plans, or proprietary informa-tion. For one thing, many firms think of their Web sites pri-marily in terms of marketing and provide little data asidefrom product descriptions and distributors. Other compa-nies provide their latest financial statements and links toother useful Web sites. Nevertheless, some companies invery competitive industries may install software on theirWeb site to ascertain a visitor’s web address. Visitors froma competitor’s domain name are thus screened before theyare allowed to access certain Web sites. They may not beallowed beyond the product information page or they maybe sent to a bogus Web site containing misinformation.Cisco Systems, for example, uses its Web site to send visi-tors from other high-tech firms to a special Web page ask-ing if they would like to apply for a job at Cisco!
A basic rule in intelligencegathering is that before a
piece of information can beused in any report or briefing, it
must first be evaluated in twoways. First, the source of the information
should be judged in terms of its truthfulness and reliability.How trustworthy is the source? How well can a researcherrely upon it for truthful and correct information? One ap-proach is to rank the reliability of the source on a scale fromA (extremely reliable), B (reliable), C (unknown reliability),D (probably unreliable), to E (very questionable reliability).The reliability of a source can be judged on the basis of theauthor’s credentials, the organization sponsoring the infor-mation, and past performance, among other factors.Second, the information or data should be judged in termsof its likelihood of being correct. The correctness of thedata may be ranked on a scale from 1 (correct), 2 (proba-bly correct), 3 (unknown), 4 (doubtful), to 5 (extremelydoubtful). The correctness of a piece of data or informationcan be judged on the basis of its agreement with other bitsof separately-obtained information or with a general trendsupported by previous data. For every piece of informationfound on the Internet, for example, list not only the URL ofthe Web page, but also the evaluation of the informationfrom A1 (good stuff) to E5 (bad doodoo). Information
EVALUATING COMPETITIVE INTELLIGENCE
STRATEGY highlight 4.2
CHAPTER 4 Environmental Scanning and Industry Analysis 123
1. Why do your competitors exist? Do they exist to make profits or just to support another unit?
2. Where do they add customer value—higher quality, lower price, excellent credit terms, orbetter service?
3. Which of your customers are the competitors most interested in? Are they cherry-pickingyour best customers, picking the ones you don’t want, or going after all of them?
4. What is their cost base and liquidity? How much cash do they have? How do they get theirsupplies?
5. Are they less exposed with their suppliers than your firm? Are their suppliers betterthan yours?
6. What do they intend to do in the future? Do they have a strategic plan to target your mar-ket segments? How committed are they to growth? Are there any succession issues?
7. How will their activity affect your strategies? Should you adjust your plans and operations?
8. How much better than your competitor do you need to be in order to win customers? Doeither of you have a competitive advantage in the marketplace?
9. Will new competitors or new ways of doing things appear over the next few years? Whois a potential new entrant?
10. If you were a customer, would you choose your product over those offered by your com-petitors? What irritates your current customers? What competitors solve these particularcustomer complaints?80
To answer these and other questions, competitive intelligence professionals utilize a number ofanalytical techniques. In addition to the previously discussed SWOT analysis, Michael Porter’sindustry forces analysis, and strategic group analysis, some of these techniques are Porter’s four-corner exercise, Treacy and Wiersema’s value disciplines, Gilad’s blind spot analysis, and wargaming.81 See Appendix 4.A for more information about these competitive analysis techniques.
Done right, competitive intelligence is a key input to strategic planning. Avnet Inc., oneof the world’s largest distributors of electronic components, uses competitive intelligence inits growth by acquisition strategy. According to John Hovis, Avnet’s senior vice president ofcorporate planning and investor relations:
Our competitive intelligence team has a significant responsibility in tracking all of the variedcompetitors, not just our direct competitors, but all the peripheral competitors that have a po-tential to impact our ability to create value. . . . One of the things we are about is finding newacquisition candidates, and our competitive intelligence unit is very much involved with our ac-quisition team, in helping to profile potential acquisition candidates.82
4.4 ForecastingEnvironmental scanning provides reasonably hard data on the present situation and currenttrends, but intuition and luck are needed to accurately predict whether these trends will con-tinue. The resulting forecasts are, however, usually based on a set of assumptions that may ormay not be valid.
DANGER OF ASSUMPTIONSFaulty underlying assumptions are the most frequent cause of forecasting errors. Neverthe-less, many managers who formulate and implement strategic plans rarely consider that theirsuccess is based on a series of basic assumptions. Many strategic plans are simply based on
124 PART 2 Scanning the Environment
USEFUL FORECASTING TECHNIQUESVarious techniques are used to forecast future situations. They do not tell the future; they merelystate what can be, not what will be. As such, they can be used to form a set of reasonable assump-tions about the future. Each technique has its proponents and its critics. A study of nearly 500 ofthe world’s largest corporations revealed trend extrapolation to be the most widely practicedform of forecasting—over 70% use this technique either occasionally or frequently.83 Simplystated, extrapolation is the extension of present trends into the future. It rests on the assumptionthat the world is reasonably consistent and changes slowly in the short run. Time-series meth-ods are approaches of this type; they attempt to carry a series of historical events forward intothe future. The basic problem with extrapolation is that a historical trend is based on a series ofpatterns or relationships among so many different variables that a change in any one can drasti-cally alter the future direction of the trend. As a rule of thumb, the further back into the past youcan find relevant data supporting the trend, the more confidence you can have in the prediction.
Brainstorming, expert opinion, and statistical modeling are also very popular forecastingtechniques. Brainstorming is a non-quantitative approach that requires simply the presence ofpeople with some knowledge of the situation to be predicted. The basic ground rule is to pro-pose ideas without first mentally screening them. No criticism is allowed. “Wild” ideas are en-couraged. Ideas should build on previous ideas until a consensus is reached.84 This is a goodtechnique to use with operating managers who have more faith in “gut feel” than in more quan-titative number-crunching techniques. Expert opinion is a nonquantitative technique in whichexperts in a particular area attempt to forecast likely developments. This type of forecast isbased on the ability of a knowledgeable person(s) to construct probable future developmentsbased on the interaction of key variables. One application, developed by the RAND Corpora-tion, is the Delphi technique, in which separated experts independently assess the likelihoodsof specified events. These assessments are combined and sent back to each expert for fine-tuning until agreement is reached. These assessments are most useful if they are shaped intoseveral possible scenarios that allow decision makers to more fully understand their implica-tion.85 Statistical modeling is a quantitative technique that attempts to discover causal or atleast explanatory factors that link two or more time series together. Examples of statisticalmodeling are regression analysis and other econometric methods. Although very useful in thegrasping of historic trends, statistical modeling, such as trend extrapolation, is based on his-torical data. As the patterns of relationships change, the accuracy of the forecast deteriorates.
Prediction markets is a recent forecasting technique enabled by easy access to the Inter-net. As emphasized by James Surowiecki in The Wisdom of Crowds, the conclusions of largegroups can often be better than those of experts because such groups can aggregate a largeamount of dispersed wisdom.86 Prediction markets are small-scale electronic markets, fre-quently open to any employee, that tie payoffs to measurable future events, such as sales data
projections of the current situation. For example, few people in 2007 expected the price of oil(light, sweet crude, also called West Texas intermediate) to rise above $80 per barrel and wereextremely surprised to see the price approach $150 by July 2008, especially since the pricehad been around $20 per barrel in 2002. U.S. auto companies, in particular, had continued todesign and manufacture large cars, pick-up trucks, and SUVs under the assumption of gaso-line being available for around $2.00 a gallon. Market demand for these types of cars col-lapsed when the price of gasoline passed $3.00 to reach $4.00 a gallon in July 2008. Inanother example, many banks made a number of questionable mortgages based on the as-sumption that housing prices would continue to rise as they had in the past. When housingprices fell in 2007, these “sub-prime” mortgages were almost worthless—causing a numberof banks to sell out or fail in 2008. Assumptions like these can be dangerous to your health!
for a computer workstation, the number of bugs in an application, or a product usage patterns.These markets yield prices on prediction contracts—prices that can be interpreted as market-aggregated forecasts.87 Companies including Microsoft, Google, and Eli Lilly have asked theiremployees to participate in prediction markets by betting on whether products will sell, whennew offices will open, and whether profits will be high in the next quarter. Early predictionshave been exceedingly accurate.88 Intrade.com offers a free Web site in which people can buyor sell various predictions in a manner similar to buying or selling common stock. On May 26,2008, for example, Intrade.com listed the buying price for democratic presidential candidateBarack Obama as $91.50 compared to $8.00 for Hillary Clinton, and $37.70 for John McCain.Thus far, prediction markets have not been documented for long-term forecasting, so its valuein strategic planning has not yet been established. Other forecasting techniques, such as cross-impact analysis (CIA) and trend-impact analysis (TIA), have not established themselves suc-cessfully as regularly employed tools.89
Scenario writing is the most widely used forecasting technique after trend extrapolation.Originated by Royal Dutch Shell, scenarios are focused descriptions of different likely futurespresented in a narrative fashion. A scenario thus may be merely a written description of somefuture state, in terms of key variables and issues, or it may be generated in combination withother forecasting techniques. Often called scenario planning, this technique has been success-fully used by 3M, Levi-Strauss, General Electric, United Distillers, Electrolux, British Air-ways, and Pacific Gas and Electricity, among others.90 According to Mike Eskew, Chairmanand CEO of United Parcel Service, UPS uses scenario writing to envision what its customersmight need five to ten years in the future.91 The four Arctic scenarios that began this chapterare an example of scenario writing that should be an input to a transportation company’s strate-gic planning.
An industry scenario is a forecasted description of a particular industry’s likely future.Such a scenario is developed by analyzing the probable impact of future societal forces on keygroups in a particular industry. The process may operate as follows:92
1. Examine possible shifts in the natural environment and in societal variables globally.
2. Identify uncertainties in each of the six forces of the task environment (that is, potentialentrants, competitors, likely substitutes, buyers, suppliers, and other key stakeholders).
3. Make a range of plausible assumptions about future trends.
4. Combine assumptions about individual trends into internally consistent scenarios.
5. Analyze the industry situation that would prevail under each scenario.
6. Determine the sources of competitive advantage under each scenario.
7. Predict competitors’ behavior under each scenario.
8. Select the scenarios that are either most likely to occur or most likely to have a strong impacton the future of the company. Use these scenarios as assumptions in strategy formulation.
CHAPTER 4 Environmental Scanning and Industry Analysis 125
4.5 The Strategic Audit:A Checklist for Environmental Scanning
One way of scanning the environment to identify opportunities and threats is by using theStrategic Audit found in Appendix 1.A at the end of Chapter 1. The audit provides a check-list of questions by area of concern. For example, Part III of the audit examines the natural,societal, and task environments. It looks at the societal environment in terms of economic,technological, political-legal, and sociocultural forces. It also considers the task environment
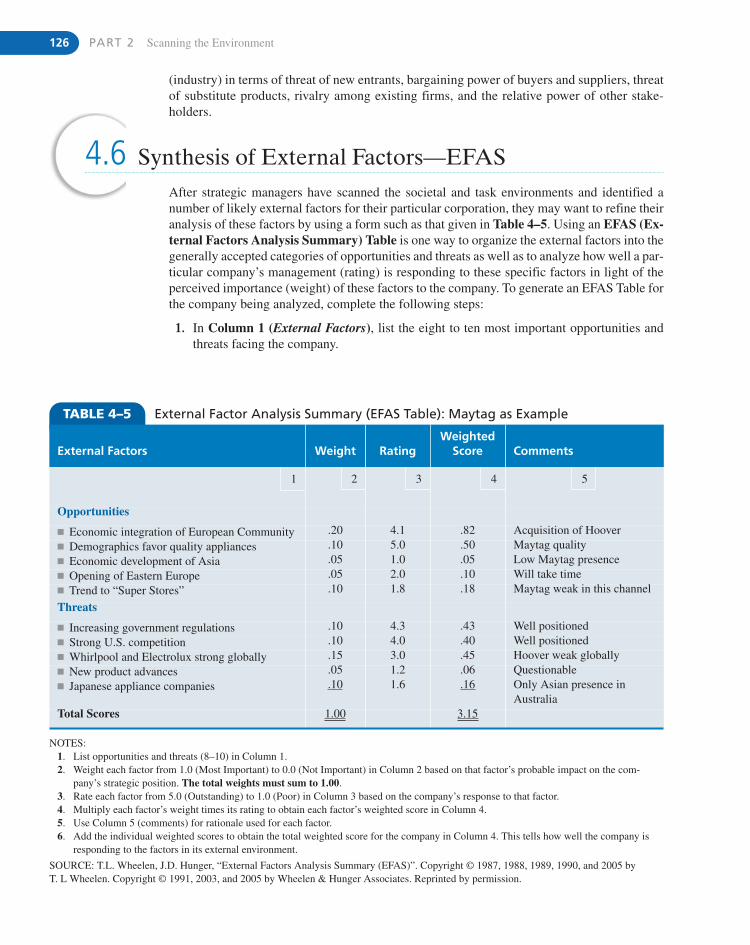
126 PART 2 Scanning the Environment
4.6 Synthesis of External Factors—EFASAfter strategic managers have scanned the societal and task environments and identified anumber of likely external factors for their particular corporation, they may want to refine theiranalysis of these factors by using a form such as that given in Table 4–5. Using an EFAS (Ex-ternal Factors Analysis Summary) Table is one way to organize the external factors into thegenerally accepted categories of opportunities and threats as well as to analyze how well a par-ticular company’s management (rating) is responding to these specific factors in light of theperceived importance (weight) of these factors to the company. To generate an EFAS Table forthe company being analyzed, complete the following steps:
1. In Column 1 (External Factors), list the eight to ten most important opportunities andthreats facing the company.
(industry) in terms of threat of new entrants, bargaining power of buyers and suppliers, threatof substitute products, rivalry among existing firms, and the relative power of other stake-holders.
TABLE 4–5 External Factor Analysis Summary (EFAS Table): Maytag as Example
External Factors Weight RatingWeighted
Score Comments
1 2 3 4 5
Opportunities
� Economic integration of European Community .20 4.1 .82 Acquisition of Hoover� Demographics favor quality appliances .10 5.0 .50 Maytag quality� Economic development of Asia .05 1.0 .05 Low Maytag presence� Opening of Eastern Europe .05 2.0 .10 Will take time� Trend to “Super Stores” .10 1.8 .18 Maytag weak in this channel
Threats
� Increasing government regulations .10 4.3 .43 Well positioned� Strong U.S. competition .10 4.0 .40 Well positioned� Whirlpool and Electrolux strong globally .15 3.0 .45 Hoover weak globally� New product advances .05 1.2 .06 Questionable� Japanese appliance companies .10 1.6 .16 Only Asian presence in
AustraliaTotal Scores 1.00 3.15
NOTES:1. List opportunities and threats (8–10) in Column 1.2. Weight each factor from 1.0 (Most Important) to 0.0 (Not Important) in Column 2 based on that factor’s probable impact on the com-
pany’s strategic position. The total weights must sum to 1.00.3. Rate each factor from 5.0 (Outstanding) to 1.0 (Poor) in Column 3 based on the company’s response to that factor.4. Multiply each factor’s weight times its rating to obtain each factor’s weighted score in Column 4.5. Use Column 5 (comments) for rationale used for each factor.6. Add the individual weighted scores to obtain the total weighted score for the company in Column 4. This tells how well the company is
responding to the factors in its external environment.
SOURCE: T.L. Wheelen, J.D. Hunger, “External Factors Analysis Summary (EFAS)”. Copyright © 1987, 1988, 1989, 1990, and 2005 by T. L Wheelen. Copyright © 1991, 2003, and 2005 by Wheelen & Hunger Associates. Reprinted by permission.
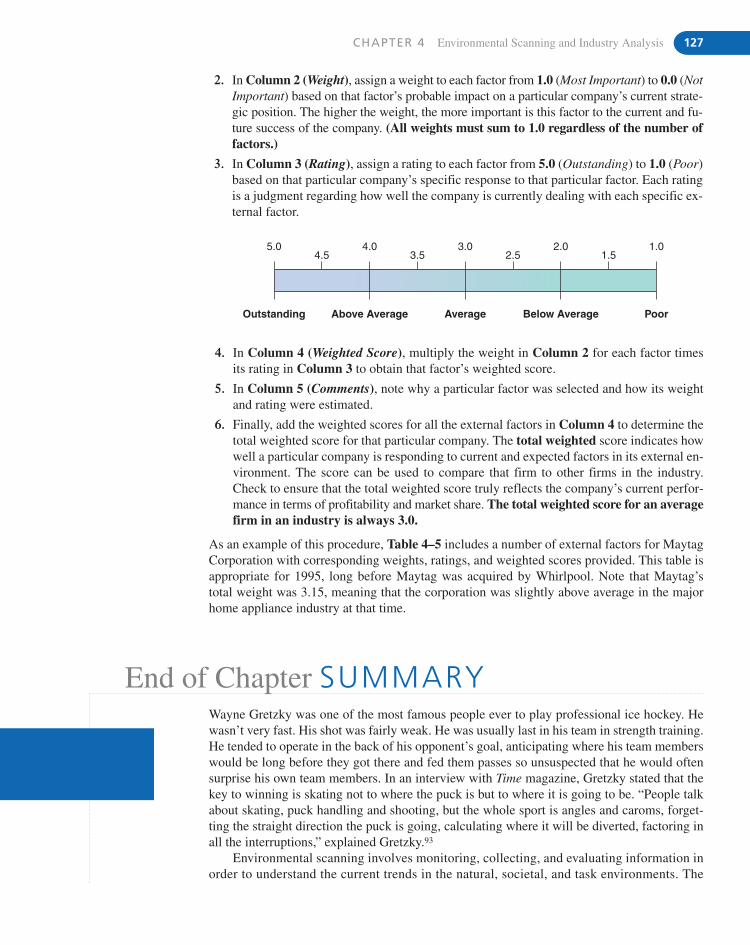
CHAPTER 4 Environmental Scanning and Industry Analysis 127
5.0
Outstanding Above Average Average Below Average Poor
4.54.0
3.53.0
2.52.0
1.51.0
4. In Column 4 (Weighted Score), multiply the weight in Column 2 for each factor timesits rating in Column 3 to obtain that factor’s weighted score.
5. In Column 5 (Comments), note why a particular factor was selected and how its weightand rating were estimated.
6. Finally, add the weighted scores for all the external factors in Column 4 to determine thetotal weighted score for that particular company. The total weighted score indicates howwell a particular company is responding to current and expected factors in its external en-vironment. The score can be used to compare that firm to other firms in the industry.Check to ensure that the total weighted score truly reflects the company’s current perfor-mance in terms of profitability and market share. The total weighted score for an averagefirm in an industry is always 3.0.
As an example of this procedure, Table 4–5 includes a number of external factors for MaytagCorporation with corresponding weights, ratings, and weighted scores provided. This table isappropriate for 1995, long before Maytag was acquired by Whirlpool. Note that Maytag’s total weight was 3.15, meaning that the corporation was slightly above average in the majorhome appliance industry at that time.
2. In Column 2 (Weight), assign a weight to each factor from 1.0 (Most Important) to 0.0 (NotImportant) based on that factor’s probable impact on a particular company’s current strate-gic position. The higher the weight, the more important is this factor to the current and fu-ture success of the company. (All weights must sum to 1.0 regardless of the number offactors.)
3. In Column 3 (Rating), assign a rating to each factor from 5.0 (Outstanding) to 1.0 (Poor)based on that particular company’s specific response to that particular factor. Each ratingis a judgment regarding how well the company is currently dealing with each specific ex-ternal factor.
End of Chapter SUMMARYWayne Gretzky was one of the most famous people ever to play professional ice hockey. Hewasn’t very fast. His shot was fairly weak. He was usually last in his team in strength training.He tended to operate in the back of his opponent’s goal, anticipating where his team memberswould be long before they got there and fed them passes so unsuspected that he would oftensurprise his own team members. In an interview with Time magazine, Gretzky stated that thekey to winning is skating not to where the puck is but to where it is going to be. “People talkabout skating, puck handling and shooting, but the whole sport is angles and caroms, forget-ting the straight direction the puck is going, calculating where it will be diverted, factoring inall the interruptions,” explained Gretzky.93
Environmental scanning involves monitoring, collecting, and evaluating information inorder to understand the current trends in the natural, societal, and task environments. The
128 PART 2 Scanning the Environment
E C O - B I T S� The International Panel on Climate Change reports that
carbon dioxide emissions are rising faster than itsworst-case scenario and that without new governmentaction greenhouse gases will rise 25% to 90% over2000 levels by 2030.
� China surpassed the United States in carbon emissionsin 2006 by producing 6.6 billion tons of carbon dioxide,24% of the world’s annual production of CO2.
� The total number of people affected by natural disastershas tripled over the past decade to two billion people.
� By 2025, 1.8 billion people could be living in water-scarce areas with the likely result being mass migra-tions out of these areas.94
D I S C U S S I O N Q U E S T I O N S1. Discuss how a development in a corporation’s natural and
societal environments can affect the corporation throughits task environment.
2. According to Porter, what determines the level of com-petitive intensity in an industry?
3. According to Porter’s discussion of industry analysis, isPepsi Cola a substitute for Coca-Cola?
4. How can a decision maker identify strategic factors in acorporation’s external international environment?
5. Compare and contrast trend extrapolation with the writ-ing of scenarios as forecasting techniques.
S T R A T E G I C P R A C T I C E E X E R C I S EHow far should people in a business firm go in gathering com-petitive intelligence? Where do you draw the line?
Evaluate each of the following approaches that a personcould use to gather information about competitors. For eachapproach, mark your feeling about its appropriateness:
1 (DEFINITELY NOT APPROPRIATE), 2 (PROBABLY NOT APPROPRIATE), 3 (UNDECIDED), 4 (PROBABLY APPROPRIATE), OR 5 (DEFINITELY APPROPRIATE).
The business firm should try to get useful information aboutcompetitors by:
_____ Carefully studying trade journals
_____ Wiretapping the telephones of competitors
_____ Posing as a potential customer to competitors
_____ Getting loyal customers to put out a phony “requestfor proposal” soliciting competitors’ bids
_____ Buying competitors’ products and taking them apart
_____ Hiring management consultants who have worked forcompetitors
_____ Rewarding competitors’ employees for useful “tips”
_____ Questioning competitors’ customers and/or suppliers
_____ Buying and analyzing competitors’ garbage
_____ Advertising and interviewing for nonexistent jobs
information is then used to forecast whether these trends will continue or whether others willtake their place. How will developments in the natural environment affect the world? Whatkind of developments can we expect in the societal environment to affect our industry? Whatwill an industry look like in 10 to 20 years? Who will be the key competitors? Who is likelyto fall by the wayside? We use this information to make certain assumptions about the future—assumptions that are then used in strategic planning. In many ways, success in the businessworld is like ice hockey: The key to winning is not to assume that your industry will continueas it is now but to assume that the industry will change and to make sure that your companywill be in position to take advantage of those changes.
CHAPTER 4 Environmental Scanning and Industry Analysis 129
_____ Taking public tours of competitors’ facilities
_____ Releasing false information about the company inorder to confuse competitors
_____ Questioning competitors’ technical people at tradeshows and conferences
_____ Hiring key people away from competitors
_____ Analyzing competitors’ labor union contracts
_____ Having employees date persons who work forcompetitors
_____ Studying aerial photographs of competitors’ facilities
After marking each of the preceding approaches, compareyour responses to those of other people in your class. For eachapproach, the people marking 4 or 5 should say why theythought this particular act would be appropriate. Those whomarked 1 or 2 should then state why they thought this actwould be inappropriate.
Go to the Web site of the Society for CompetitiveIntelligence Professionals (www.scip.org). What does SCIPsay about these approaches?
K E Y T E R M Scompetitive intelligence (p. 120)competitors (p. 122)complementor (p. 113)consolidated industry (p. 114)EFAS Table (p. 126)entry barrier (p. 111)environmental scanning (p. 98)environmental uncertainty (p. 98)exit barrier (p. 112)fragmented industry (p. 114)global industry (p. 115)
hypercompetition (p. 118)industry (p. 109)industry analysis (p. 99)industry matrix (p. 119)industry scenario (p. 125)issues priority matrix (p. 109)key success factor (p. 118)multidomestic industry (p. 114)multinational corporation (MNC)
(p. 105)
natural environment (p. 99)new entrant (p. 111)regional industries (p. 115)societal environment (p. 99)STEEP analysis (p. 101)strategic group (p. 115)strategic type (p. 117)substitute product (p. 112)task environment (p. 99)
N O T E S1. L. W. Brigham, “Thinking about the Arctic’s Future: Scenarios
for 2040,” The Futurist (September–October 2007), pp. 27–34.2. J. B. Thomas, S. M. Clark, and D. A. Gioia, “Strategic Sense-
making and Organizational Performance: Linkages AmongScanning, Interpretation, Action, Outcomes,” Academy of Man-agement Journal (April 1993), pp. 239–270; J. A. Smith,“Strategies for Start-Ups,” Long Range Planning (December1998), pp. 857–872.
3. E. Stephenson and A. Pandit, “How Companies Act on GlobalTrends: A McKinsey Global Survey,” McKinsey Quarterly(April 2008).
4. W. E. Stead and J. G. Stead, Sustainable Strategic Management(Armonk, NY: M. E. Sharpe, 2004), p. 6.
5. F. Montabon, R. Sroufe, and R. Narasimhan, “An Examinationof Corporate Reporting, Environmental Management Practicesand Firm Performance,” Journal of Operations Management(August 2007), pp. 998–1014.
6. P. Lasserre and J. Probert, “Competing on the Pacific Rim: HighRisks and High Returns,” Long Range Planning (April 1994),pp. 12–35.
7. J. J. McGonagle, “Mapping and Anticipating the CompetitiveLandscape,” Competitive Intelligence Magazine (March–April2007), p. 49.
8. M. J. Cetron, “Economics: Prospects for the ‘Dragon’ and the‘Tiger,’” Futurist (July–August 2004), pp. 10–11; “A LessFiery Dragon,” The Economist (December 1, 2007), p. 92.
9. “Investing Without Borders: A Different Approach to GlobalInvesting,” T. Rowe Price Report (Fall 2007), p. 1.
10. S. Hamm, “Cloud Computing Made Clear,” Business Week(May 5, 2008), p. 59.
11. P. Lorenz, D. Pinner, and T. Seitz, “The Economics of SolarPower,” McKinsey Quarterly (June 2008), p. 2.
12. W. E. Halal, “The Top 10 Emerging Technologies,” Special Re-port (World Future Society, 2000).
13. F. Dobbin and T. J. Dowd, “How Policy Shapes Competition:Early Railroad Foundings in Massachusetts,” AdministrativeScience Quarterly (September 1997), pp. 501–529.
14. A. Shleifer and R. W. Viskny, “Takeovers in the 1960s and the1980s: Evidence and Implications,” in Fundamental Issues inStrategy: A Research Agenda, edited by R. P. Rumelt, D. E.
SOURCE: Developed from W. A. Jones, Jr., and N. B. Bryan, Jr.,“Business Ethics and Business Intelligence: An Empirical Study of Information-Gathering Alternatives,” International Journal of Man-agement (June 1995), pp. 204–208. For actual examples of some ofthese activities, see J. Kerstetter, P. Burrows, J. Greene, G. Smith,and M. Conlin, “The Dark Side of the Valley,” Business Week(July 17, 2000), pp. 42–43.
130 PART 2 Scanning the Environment
Schendel, and D. J. Teece (Boston: Harvard Business SchoolPress, 1994), pp. 403–418.
15. “The Problem with Solid Engineering,” The Economist (May20, 2006), pp. 71–73.
16. “Doing Business,” The Economist (September 9, 2006), p. 98.17. Web site, World Trade Organization, www.wto.org (accessed
July 31, 2008).18. M. J. Cetron and O. Davies, “Trends Now Shaping the Future,”
The Futurist (March–April 2005), pp. 28–29; M. Cetron andO. Davies, “Trends Shaping Tomorrow’s World,” The Futurist(March–April 2008), pp. 35–52.
19. “Trend: Urbane Urban Portraits,” Business Week (April 28,2008), p. 57.
20. “Old Europe,” Economist (October 2, 2004), pp. 49–50.21. M. J. Cetron and O. Davies, “Trends Now Shaping the Future,”
The Futurist (March–April 2005), p. 30.22. “The Incredible Shrinking Country,” Economist (November 13,
2004), pp. 45–46.23. D. Levin, “Tradition Under Stress,” AARP Bulletin (July–August
2008), pp. 16–18.24. J. Wyatt, “Playing the Woofie Card,” Fortune (February 6,
1995), pp. 130–132.25. D. Carpenter, “Walgreen Pursues 12,000 Corners of Market,”
Des Moines Register (May 9, 2004), pp. 1D, 5D.26. M. Arndt, “Zimmer: Growing Older Gracefully,” Business
Week (June 9, 2003), pp. 82–84.27. “France Considering Raising Tax on Fatty, Sugary Foods,”
(Minneapolis) Star Tribune (August 7, 2008), p. A7.28. H. Yen, “Empty Nesters Push Growth of Pet Health Care Busi-
nesses,” The (Ames, IA) Tribune (September 27, 2003), p. C8;D. Brady and C. Palmeri, “The Pet Economy,” Business Week(August 6, 2007), pp. 45–54; “Pampering Your Pet,” St. Cloud(MN) Times (September 8, 2007), p. 3A.
29. A. Bianco, “The Vanishing Mass Market,” Business Week(July 12, 2004), pp. 61–68.
30. M. Conlin, “UnMarried America,” Business Week (October 20,2003), pp. 106–116.
31. “The Power of One,” Entrepreneur (June 2007), p. 28.32. “BGSU Is Leader in Marriage Research,” BGSU Magazine
(Spring 2008), p. 18.33. N. Irvin, II, “The Arrival of the Thrivals,” Futurist
(March–April 2004), pp. 16–23.34. “The Trouble with Migrants,” The Economist (November 24,
2007), pp. 56–57.35. “Multicultural Retailing,” Arizona Republic (October 10,
2004), p. D4.36. “Islamic Finance: West Meets East,” Economist (October 25,
2003), p. 69.37. “Giants Forced to Dance,” The Economist (May 26, 2007),
pp. 67–68.38. “Membership Required,” The Economist (August 2, 2008),
p. 66.39. J. Naisbitt, Megatrends Asia (New York: Simon & Schuster,
1996), p. 79.40. A. Menon and A. Tomkins, “Learning About the Market’s Pe-
riphery: IBM’s WebFountain,” Long Range Planning (April2004), pp. 153–162.
41. I. M. Cockburn, R. M. Henderson, and S. Stern, “Untangling theOrigins of Competitive Advantage,” Strategic Management Jour-nal (October–November, 2000), Special Issue, pp. 1123–1145.
42. L. Fuld, “Be Prepared,” Harvard Business Review (November2003), pp. 20–21.
43. H. Wissema, “Driving through Red Lights,” Long Range Plan-ning (October 2002), pp. 521–539; B. K. Boyd and J. Fulk, “Ex-ecutive Scanning and Perceived Uncertainty: AMultidimensional Model,” Journal of Management, Vol. 22,No. 1 (1996), pp. 1–21.
44. P. G. Audia, E. A. Locke, and K. G. Smith, “The Paradox ofSuccess: An Archival and a Laboratory Study of Strategic Per-sistence Following Radical Environmental Change,” Academyof Management Journal (October 2000), pp. 837–853; M. L.McDonald and J. D. Westphal, “Getting By with the Advice ofTheir Friends” CEOs Advice Networks and Firms’ StrategicResponses to Poor Performance,” Administrative ScienceQuarterly (March 2003), pp. 1–32; R. A. Bettis and C. K. Pra-halad, “The Dominant Logic: Retrospective and Extension,”Strategic Management Journal (January 1995), pp. 5–14; J. M.Stofford and C. W. F. Baden-Fuller, “Creating Corporate Entre-preneurship,” Strategic Management Journal (September1994), pp. 521–536; J. M. Beyer, P. Chattopadhyay, E. George,W. H. Glick, and D. Pugliese, “The Selective Perception ofManagers Revisited,” Academy of Management Journal (June1997), pp. 716–737.
45. H. I. Ansoff, “Strategic Management in a Historical Perspec-tive,” in International Review of Strategic Management, Vol. 2,No. 1 (1991), edited by D. E. Hussey (Chichester, England: Wi-ley, 1991), p. 61.
46. S. E. Ante, “Sprint’s Wake-Up Call,” Business Week (March 3,2008), p. 54.
47. M. E. Porter, Competitive Strategy (New York: The Free Press,1980), p. 3.
48. This summary of the forces driving competitive strategy istaken from Porter, Competitive Strategy, pp. 7–29.
49. M. McCarthy, “Rivals Scramble to Topple Nike’s Sneaker Su-premacy,” USA Today (April 3, 2003), pp. B1–B2; S. Holmes,“Changing the Game on Nike,” Business Week (January 22,2007), p. 80.
50. Porter, Competitive Strategy, (New York: The Free Press,1980), p. 23.
51. A. S. Grove, “Surviving a 10x Force,” Strategy & Leadership(January/February 1997), pp. 35–37.
52. A fragmented industry is defined as one whose market share forthe leading four firms is equal to or less than 40% of total indus-try sales. See M. J. Dollinger, “The Evolution of CollectiveStrategies in Fragmented Industries,” Academy of ManagementReview (April 1990), pp. 266–285.
53. M. E. Porter, “Changing Patterns of International Competition,”California Management Review (Winter 1986), pp. 9–40.
54. A. M. Rugman, The Regional Multinationals: MNEs andGlobal Strategic Management (Cambridge: Cambridge Univer-sity Press, 2005).
55. K. J. Hatten and M. L. Hatten, “Strategic Groups, Asymmetri-cal Mobility Barriers, and Contestability,” Strategic Manage-ment Journal (July–August 1987), p. 329.
56. J. C. Short, D. J. Ketchen Jr., T. B. Palmer, and G. T. M. Hult,“Firm, Strategic Group, and Industry Influences on Perfor-mance,” Strategic Management Journal (February 2007),pp. 147–167; J. D. Osborne, C. I. Stubbart, and A. Ramaprasad,“Strategic Groups and Competitive Enactment: A Studyof Dynamic Relationships Between Mental Models and
CHAPTER 4 Environmental Scanning and Industry Analysis 131
Performance,” Strategic Management Journal (May 2001),pp. 435–454; A. Fiegenbaum and H. Thomas, “StrategicGroups as Reference Groups: Theory, Modeling and EmpiricalExamination of Industry and Competitive Strategy,” StrategicManagement Journal (September 1995), pp. 461–476;H. R. Greve, “Managerial Cognition and the Mimities Adoptionof Market Positions: What You See Is What You Do,” StrategicManagement Journal (October 1998), pp. 967–988.
57. G. Leask and D. Parker, “Strategic Groups, Competitive Groupsand Performance Within the U.K. Pharmaceutical Industry:Improving Our Understanding of the Competitive Process,”Strategic Management Journal (July 2007), pp. 723–745.
58. C. C. Pegels, Y. I. Song, and B. Yang, “Management Hetero-geneity, Competitive Interaction Groups, and Firm Perfor-mance,” Strategic Management Journal (September 2000),pp. 911–923; W. S. Desarbo and R. Grewal, “Hybrid StrategicGroups,” Strategic Management Journal (March 2008),pp. 293–317.
59. R. E. Miles and C. C. Snow, Organizational Strategy, Structure,and Process (New York: McGraw-Hill, 1978). See also D. J.Ketchen, Jr., “An Interview with Raymond E. Miles andCharles C. Snow,” Academy of Management Executive (Novem-ber 2003), pp. 97–104.
60. B. Kabanoff and S. Brown, “Knowledge Structures of Prospec-tors, Analyzers, and Defenders: Content, Structure, Stability,and Performance,” Strategic Management Journal (February2008), pp. 149–171.
61. R. A. D’Aveni, Hypercompetition (New York: The Free Press,1994), pp. xiii–xiv.
62. C. W. Hofer and D. Schendel, Strategy Formulation: AnalyticalConcepts (St. Paul: West Publishing Co., 1978), p. 77.
63. “Information Overload,” Journal of Business Strategy(January–February 1998), p. 4.
64. E. Von Hipple, Sources of Innovation (New York: Oxford Uni-versity Press, 1988), p. 4.
65. “An Executive Takes on the Top Business Trends: A McKinseyGlobal Survey,” McKinsey Quarterly (April 2006).
66. K. Coyne and J. Horn, “How Companies Respond to Competi-tors: A McKinsey Global Survey,” McKinsey Quarterly (Au-gust 2008).
67. M. D. Ryall, “Subjective Rationality, Self-Confirming Equilib-rium, and Corporate Strategy”, Management Science (Vol. 49,2003), pp. 936–949.
68. C. H. Wee and M. L. Leow, “Competitive Business Intelligencein Singapore,” Journal of Strategic Marketing (Vol. 2, 1994),pp. 112–139.
69. A. Badr, E. Madden, and S. Wright, “The Contributions of CI tothe Strategic Decision Making Process: Empirical Study of theEuropean Pharmaceutical Industry,” Journal of Competitive In-telligence and Management (Vol. 3, No. 4, 2006), pp. 15–35.
70. R. G. Vedder, “CEO and CIO Attitudes about Competitive In-telligence,” Competitive Intelligence Magazine (October–December 1999), pp. 39–41.
71. D. Fehringer, B. Hohhof, and T. Johnson, “State of the Art:Competitive Intelligence,” Research Report of the CompetitiveIntelligence Foundation (2006), p. 6.
72. “Competitive Intelligence Spending ‘to Rise Tenfold’ in5 Years,” Daily Research News (June 19, 2007).
73. S. H. Miller, “Beware Rival’s Web Site Subterfuge,” CompetitiveIntelligence Magazine (January–March 2000), p. 8.
74. E. Iwata, “More U.S. Trade Secrets Walk Out Door with For-eign Spies,” USA Today (February 13, 2003), pp. B1, B2.
75. Twenty-nine Percent Spy on Co-Workers,” USA Today (Au-gust 19, 2003), p. B1.
76. M. Orey, “Corporate Snoops,” Business Week (October 9,2006), pp. 46–49; E. Javers, “Spies, Lies, & KPMG,” BusinessWeek (February 26, 2007), pp. 86–88.
77. E. Javers, “I Spy—For Capitalism,” Business Week (August 13,2007), pp. 54–56.
78. B. Flora, “Ethical Business Intelligence in NOT Mission Im-possible,” Strategy & Leadership (January/February 1998),pp. 40–41.
79. A. L. Penenberg and M. Berry, Spooked: Espionage in Corpo-rate America (Cambridge, MA: Perseus Publishing, 2000).
80. T. Kendrick and J. Blackmore, “Ten Things You Really Need toKnow About Competitors,” Competitive Intelligence Magazine(September–October 2001), pp. 12–15.
81. For the percentage of CI professionals using each analyticaltechnique, see A. Badr, E. Madden, and S. Wright, “The Contri-butions of CI to the Strategic Decision Making Process: Empir-ical Study of the European Pharmaceutical Industry,” Journal ofCompetitive Intelligence and Management (Vol. 3, No. 4,2006), pp. 15–35; and D. Fehringer, B. Hohhof, and T. Johnson,“State of the Art: Competitive Intelligence,” Research Report ofthe Competitive Intelligence Foundation (2006).
82. “CI at Avnet: A Bottom-Line Impact,” Competitive IntelligenceMagazine (July–September 2000), p. 5. For further information oncompetitive intelligence, see C. S. Fleisher and D. L. Blenkhorn,Controversies in Competitive Intelligence: The Enduring Issues(Westport, CT: Praeger Publishers, 2003); C. Vibert, CompetitiveIntelligence: A Framework for Web-Based Analysis and DecisionMaking (Mason, OH: Thomson/Southwestern, 2004); and C. S.Fleisher and B. E. Bensoussan, Strategic and Competitive Analysis(Upper Saddle River, NJ: Prentice Hall, 2003).
83. H. E. Klein and R. E. Linneman, “Environmental Assessment:An International Study of Corporate Practices,” Journal ofBusiness Strategy (Summer 1984), p. 72.
84. A. F. Osborn, Applied Imagination (NY: Scribner, 1957); R. C.Litchfield, “Brainstorming Reconsidered: A Goal-BasedView,” Academy of Management Review (July 2008), pp. 649–668; R. I. Sutton, “The Truth About Brainstorming,” InsideInnovation, insert to Business Week (September 26, 2006),pp. 17–21.
85. R. S. Duboff, “The Wisdom of Expert Crowds,” Harvard Busi-ness Review (September 2007), p. 28.
86. J. Surowiecki, The Wisdom of Crowds (NY: Doubleday, 2004).87. R. Dye, “The Promise of Prediction Markets: A Roundtable,”
McKinsey Quarterly (April 2008), pp. 83–93.88. C. R. Sunstein, “When Crowds Aren’t Wise,” Harvard Business
Review (September 2006), pp. 20–21.89. See L. E. Schlange and U. Juttner, “Helping Managers to Iden-
tify the Key Strategic Issues,” Long Range Planning (October1997), pp. 777–786, for an explanation and application of thecross-impact matrix.
90. G. Ringland, Scenario Planning: Managing for the Future(Chichester, England: Wiley, 1998); N. C. Georgantzas andW. Acar, Scenario-Driven Planning: Learning to Manage Strate-gic Uncertainty (Westport, CN: Quorum Books, 1995); L. Faheyand R. M. Randall (eds), Learning from the Future: CompetitiveForesight Scenarios (New York: John Wiley & Sons, 1998).
132 PART 2 Scanning the Environment
91. M. Eskew, “Stick with Your Vision,” Harvard Business Review(July–August 2007), pp. 56–57.
92. This process of scenario development is adapted from M. E.Porter, Competitive Advantage (New York: The Free Press,1985), pp. 448–470.
93. H. C. Sashittal and A. R. Jassawalla, “Learning from WayneGretzky,” Organizational Dynamics (Spring 2002),pp. 341–355.
94. J. C. Glenn, “Scanning the Global Situation and Prospects forthe Future,” The Futurist (January–February 2008), pp. 41–46.
95. M. E. Porter, Competitive Strategy: Techniques for AnalyzingIndustries and Competitors (New York: The Free Press, 1980),pp. 47–75.
96. M. Treacy and F. Wiersema, The Discipline of Market Leaders(Reading, MA: Addison-Wesley, 1995).
97. Presentation by W. A. Rosenkrans, Jr., to the Iowa Chapter ofthe Society of Competitive Intelligence Professionals, DesMoines, IA (August 5, 2004).
98. B. Gilad, Early Warning (New York: AMACOM, 2004),pp. 97–103. Also see C. S. Fleisher and B. E. Bensoussan,Strategic and Competitive Analysis (Upper Saddle River, NJ:Prentice Hall, 2003), pp. 122–143.
99. Presentation by W. A. Rosenkrans, Jr., to the Iowa Chapter ofthe Society of Competitive Intelligence Professionals, DesMoines, IA (August 5, 2004). See also S. M. Shaker and M. P.Gembicki, War Room Guide to Competitive Intelligence (NewYork: McGraw-Hill, 1999).
100. L. Fahey, “Invented Competitors: A New Competitor AnalysisMethodology,” Strategy & Leadership, Vol. 30, No. 6 (2002),pp. 5–12.
101. A. Beurschgens, “Using Business War Gaming to Generate Actionable Intelligence,” Competitive Intelligence Magazine(January–February 2008), pp. 43–45.
Analytical techniques commonly used in competitive intelligence are SWOT analysis, Porter’s industryforces, ratio analysis, and strategic group analysis (also called competitive cluster analysis). In additionto these are Porter’s four-corner exercise, Treacy and Wiersema’s value disciplines, and Gilad’s blindspot analysis. These can be used in a war game simulation in which people role-play different competitorsand their possible future strategies.
Porter’s four-corner exercise involves analyzing a specific competitor’s future goals, assumptions,current strategies, and capabilities in order to compile a competitor’s response profile. See Figure 4–6.Having knowledge of a competitor’s goals allows predictions about how likely the competitor is to changestrategy and respond to changing conditions. Identifying a competitor’s assumptions about itself and theindustry can reveal blind spots about how management perceives its environment. Considering a com-petitor’s current strategy and how long it has been in place may indicate whether the company is likely tocontinue in its current direction. If a strategy is not stated explicitly, one should consider its actions andpolicies in order to note its implicit strategy. The last step is to objectively evaluate a competitor’s capa-bilities in terms of strengths and weaknesses. The competitor’s goals, assumptions, and current strategyinfluence the likelihood, timing, nature, and intensity of a competitor’s reactions. Its strengths and weak-nesses determine its ability to initiate or react to strategic moves and to deal with environmental changes.95
Treacy and Wiersema’s value disciplines involves the evaluation of a competitor in terms of three di-mensions: product leadership, operational excellence, and customer intimacy. (See Figure 4–7.) After an-alyzing 80 market-leading companies, Treacy and Wiersema noted that each of these firms developed acompelling and unmatched value proposition on one dimension but was able to maintain acceptable stan-dards on the other two dimensions. Operationally excellent companies deliver a combination of quality,price, and ease of purchase that no other can match in their market. An example is Dell Computer, a mas-ter of operational excellence. A product leader consistently strives to provide its market with leading-edgeproducts or new applications of existing products or services. Johnson & Johnson is an example of a prod-uct leader that finds new ideas, develops them quickly, and then looks for ways to improve them. A com-pany that delivers value through customer intimacy bonds with its customers and develops high customerloyalty. IBM is an example of a company that pursues excellence in customer intimacy. IBM’s currentstrategy is to provide a total information technology service to its customers so that customers can totallyrely on IBM to take care of any Information Technology (IT) problems.96 According to WayneRosenkrans, past president of SCIP, it is possible to mark a spot on each of the three value dimensionsshown in Figure 4–7 for each competitor being analyzed. Then one can draw lines connecting each of themarks, resulting in a triangle that reveals that competitor’s overall value proposition.97
Gilad’s blind spot analysis is based on the premise that the assumptions held by decision makers re-garding their own company and their industry may act as perceptual biases or blind spots. As a result,(1) the firm may not be aware of strategically important developments, (2) the firm may inaccurately per-ceive strategically important developments, or (3) even if the firm is aware of important developments,it may learn too slowly to allow for a timely response. It is important to gather sufficient informationabout a competitor and its executives to be able to list top management’s assumptions about buyers’ pref-erences, the nature of the supply chain, the industry’s key success factors, barriers to entry, and the threatappeal of substitutes to customers. One should analyze the industry objectively without regard to theseassumptions. Any gap between an objective industry analysis and a competitor’s top management as-sumptions is a potential blind spot. One should include these blind spots when considering how this com-petitor might respond to environmental change.98
CompetitiveAnalysis Techniques
A P P E N D I X 4.A
133
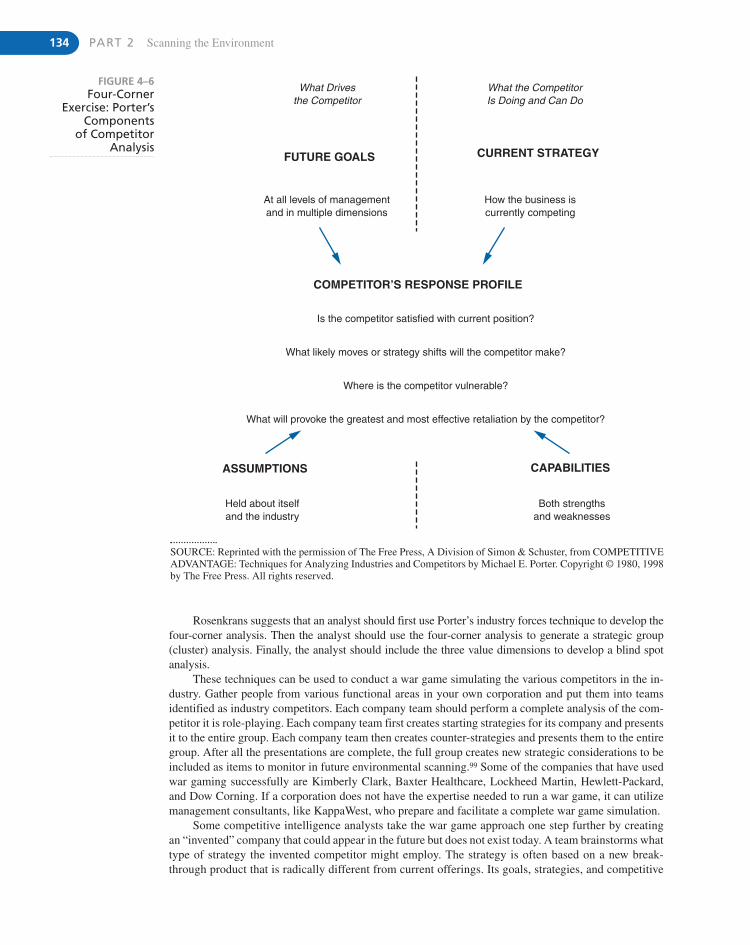
134 PART 2 Scanning the Environment
What Drivesthe Competitor
What the CompetitorIs Doing and Can Do
FUTURE GOALS
COMPETITOR’S RESPONSE PROFILE
At all levels of managementand in multiple dimensions
Is the competitor satisfied with current position?
What likely moves or strategy shifts will the competitor make?
Where is the competitor vulnerable?
What will provoke the greatest and most effective retaliation by the competitor?
How the business iscurrently competing
Held about itselfand the industry
Both strengthsand weaknesses
CURRENT STRATEGY
ASSUMPTIONS CAPABILITIES
FIGURE 4–6Four-Corner
Exercise: Porter’sComponents
of CompetitorAnalysis
SOURCE: Reprinted with the permission of The Free Press, A Division of Simon & Schuster, from COMPETITIVEADVANTAGE: Techniques for Analyzing Industries and Competitors by Michael E. Porter. Copyright © 1980, 1998by The Free Press. All rights reserved.
Rosenkrans suggests that an analyst should first use Porter’s industry forces technique to develop thefour-corner analysis. Then the analyst should use the four-corner analysis to generate a strategic group(cluster) analysis. Finally, the analyst should include the three value dimensions to develop a blind spotanalysis.
These techniques can be used to conduct a war game simulating the various competitors in the in-dustry. Gather people from various functional areas in your own corporation and put them into teamsidentified as industry competitors. Each company team should perform a complete analysis of the com-petitor it is role-playing. Each company team first creates starting strategies for its company and presentsit to the entire group. Each company team then creates counter-strategies and presents them to the entiregroup. After all the presentations are complete, the full group creates new strategic considerations to beincluded as items to monitor in future environmental scanning.99 Some of the companies that have usedwar gaming successfully are Kimberly Clark, Baxter Healthcare, Lockheed Martin, Hewlett-Packard,and Dow Corning. If a corporation does not have the expertise needed to run a war game, it can utilizemanagement consultants, like KappaWest, who prepare and facilitate a complete war game simulation.
Some competitive intelligence analysts take the war game approach one step further by creatingan “invented” company that could appear in the future but does not exist today. A team brainstorms whattype of strategy the invented competitor might employ. The strategy is often based on a new break-through product that is radically different from current offerings. Its goals, strategies, and competitive
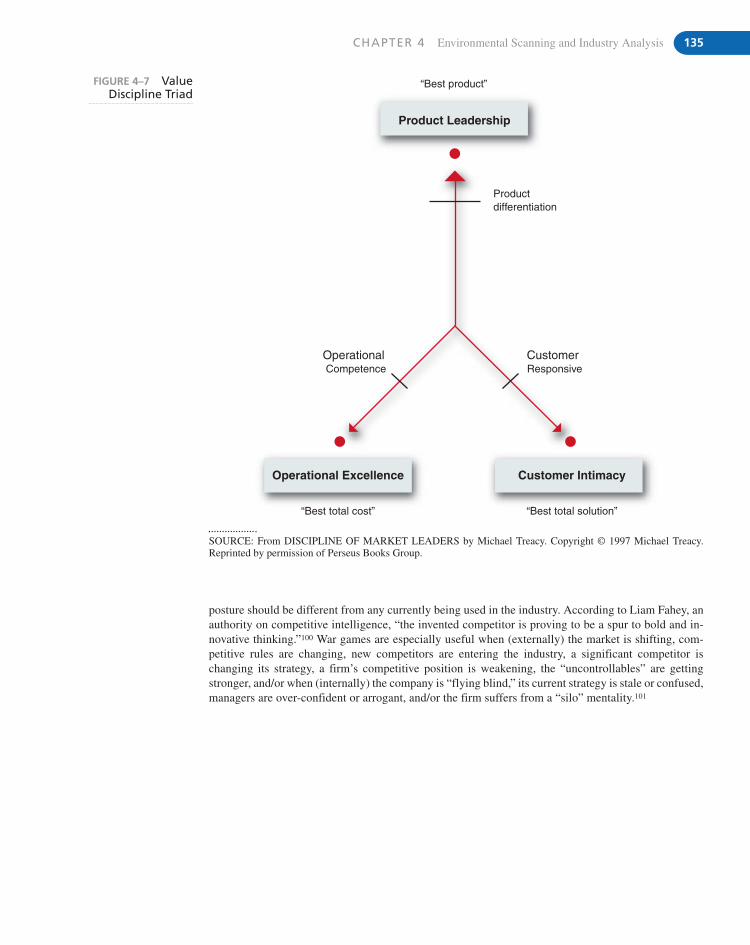
CHAPTER 4 Environmental Scanning and Industry Analysis 135
“Best product”
Productdifferentiation
Product Leadership
OperationalCompetence
CustomerResponsive
Operational Excellence
“Best total cost”
Customer Intimacy
“Best total solution”
FIGURE 4–7 ValueDiscipline Triad
SOURCE: From DISCIPLINE OF MARKET LEADERS by Michael Treacy. Copyright © 1997 Michael Treacy.Reprinted by permission of Perseus Books Group.
posture should be different from any currently being used in the industry. According to Liam Fahey, anauthority on competitive intelligence, “the invented competitor is proving to be a spur to bold and in-novative thinking.”100 War games are especially useful when (externally) the market is shifting, com-petitive rules are changing, new competitors are entering the industry, a significant competitor ischanging its strategy, a firm’s competitive position is weakening, the “uncontrollables” are gettingstronger, and/or when (internally) the company is “flying blind,” its current strategy is stale or confused,managers are over-confident or arrogant, and/or the firm suffers from a “silo” mentality.101
On January 10, 2008, a new automobile from Tata Motors was introduced to
the world at the Indian Auto Show in New Delhi. Called the People’s Car, the
new auto was planned to sell for $2,500 in India. Even though many manufactur-
ers were hoping to introduce cheap small cars into India and other developing na-
tions, Tata Motors seemed to have significant advantages that other companies
lacked. India’s low labor costs meant that Tata could engineer a new model for 20%
of the $350 million it would cost in developed nations. A factory worker in Mumbai
earned just $1.20 per hour, less than auto workers earned in China. The car was kept very sim-
ple. The company would save about $900 per car by skipping equipment that the U.S., Europe,
and Japan required for emissions control. The People’s Car did not have features like antilock
brakes, air bags, or support beams to protect passengers in case of a crash. The dashboard con-
tained just a speedometer, fuel gauge, and oil light. It lacked a radio, reclining seats, or power
steering. It came with a small 650 cc engine that generated only 70 horsepower, but obtained
50 to 60 miles per gallon. The car’s suspension system used old technology that was cheap, but
resulted in a rougher ride than in more expensive cars. More importantly, Tata Motors would
save money by using an innovative distribution strategy. Instead of selling completed cars to
dealers, Tata planned to supply kits that would then be assembled by the dealers. By eliminat-
ing large, centralized assembly plants, Tata could cut the car’s retail price by 20%.
Although Tata Motors intended to initially sell the people’s car in India and then offer it in
other developing markets, management felt that they could build a car that would meet U.S. or
European specifications for around $6,000—still a low price for an automobile. Given that Tata
Motors was able to acquire Jaguar and Land Rover from Ford later in the year, other auto com-
panies had to admit that Tata was on its way to becoming a major competitor in the industry.1
internal scanning:OrganizationalAnalysis
C H A P T E R 5
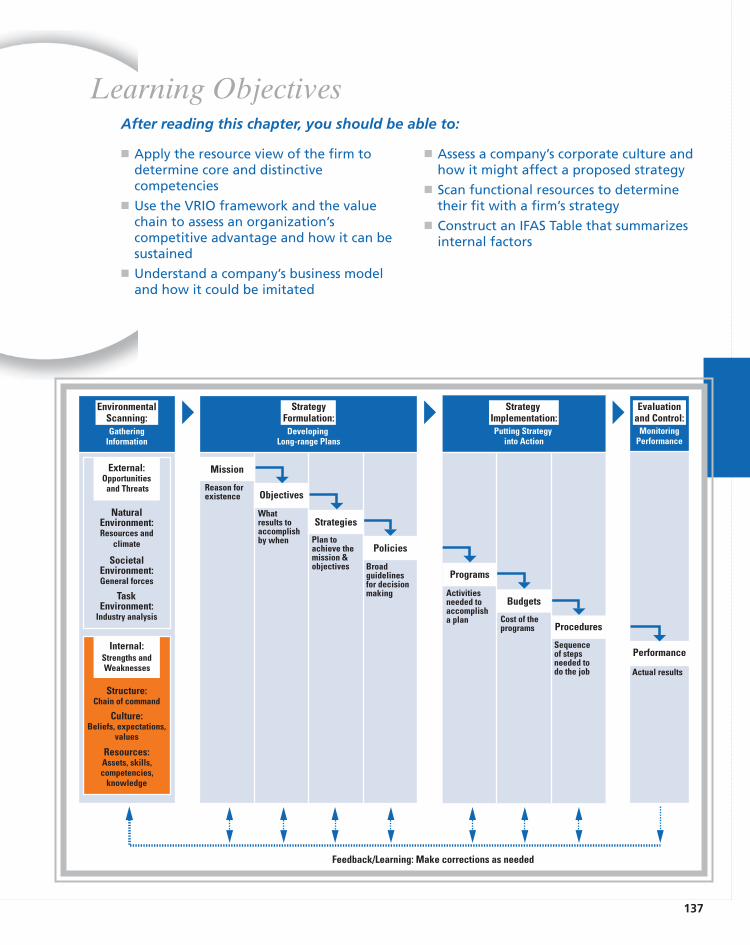
137
� Apply the resource view of the firm todetermine core and distinctivecompetencies
� Use the VRIO framework and the valuechain to assess an organization’scompetitive advantage and how it can besustained
� Understand a company’s business modeland how it could be imitated
Learning Objectives
GatheringInformation
Putting Strategy into Action
MonitoringPerformance
SocietalEnvironment:General forces
NaturalEnvironment:Resources and
climate
TaskEnvironment:
Industry analysis
Internal:Strengths andWeaknesses
Structure:Chain of command
Culture:Beliefs, expectations,
values
Resources:Assets, skills,competencies,
knowledge
Programs
Activitiesneeded to accomplisha plan
Budgets
Cost of theprograms Procedures
Sequenceof stepsneeded to do the job
Performance
Actual results
External:Opportunities
and Threats
DevelopingLong-range Plans
Mission
Reason forexistence Objectives
Whatresults to accomplishby when
Strategies
Plan toachieve themission &objectives
Policies
Broadguidelinesfor decisionmaking
EnvironmentalScanning:
StrategyFormulation:
StrategyImplementation:
Evaluationand Control:
Feedback/Learning: Make corrections as needed
After reading this chapter, you should be able to:
� Assess a company’s corporate culture andhow it might affect a proposed strategy
� Scan functional resources to determinetheir fit with a firm’s strategy
� Construct an IFAS Table that summarizesinternal factors
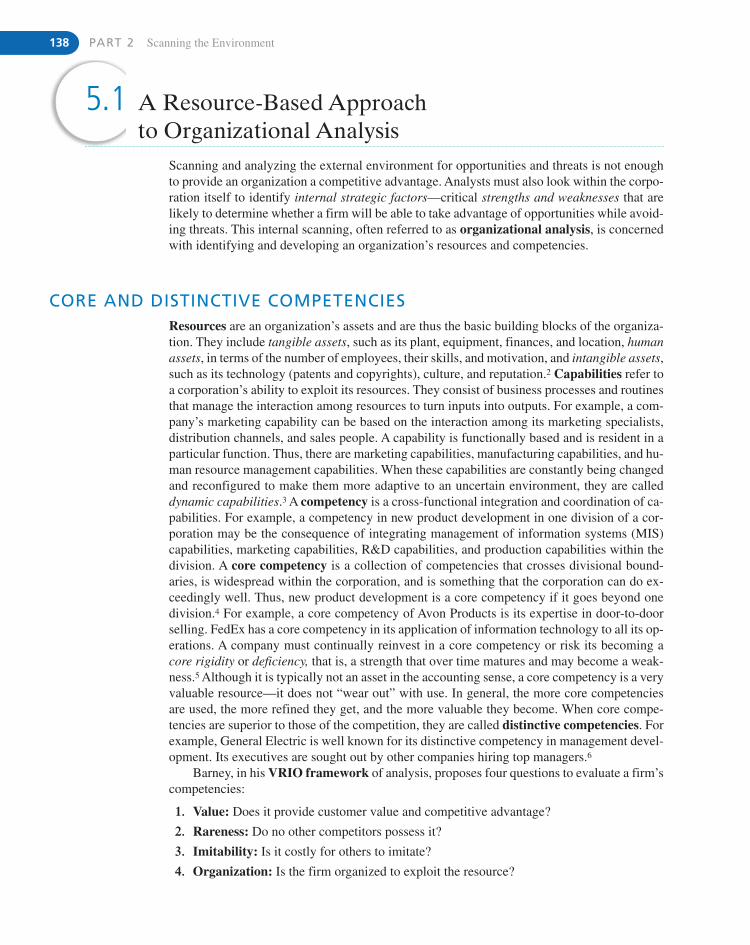
5.1 A Resource-Based Approach to Organizational Analysis
Scanning and analyzing the external environment for opportunities and threats is not enoughto provide an organization a competitive advantage. Analysts must also look within the corpo-ration itself to identify internal strategic factors—critical strengths and weaknesses that arelikely to determine whether a firm will be able to take advantage of opportunities while avoid-ing threats. This internal scanning, often referred to as organizational analysis, is concernedwith identifying and developing an organization’s resources and competencies.
CORE AND DISTINCTIVE COMPETENCIESResources are an organization’s assets and are thus the basic building blocks of the organiza-tion. They include tangible assets, such as its plant, equipment, finances, and location, humanassets, in terms of the number of employees, their skills, and motivation, and intangible assets,such as its technology (patents and copyrights), culture, and reputation.2 Capabilities refer toa corporation’s ability to exploit its resources. They consist of business processes and routinesthat manage the interaction among resources to turn inputs into outputs. For example, a com-pany’s marketing capability can be based on the interaction among its marketing specialists,distribution channels, and sales people. A capability is functionally based and is resident in aparticular function. Thus, there are marketing capabilities, manufacturing capabilities, and hu-man resource management capabilities. When these capabilities are constantly being changedand reconfigured to make them more adaptive to an uncertain environment, they are calleddynamic capabilities.3 A competency is a cross-functional integration and coordination of ca-pabilities. For example, a competency in new product development in one division of a cor-poration may be the consequence of integrating management of information systems (MIS)capabilities, marketing capabilities, R&D capabilities, and production capabilities within thedivision. A core competency is a collection of competencies that crosses divisional bound-aries, is widespread within the corporation, and is something that the corporation can do ex-ceedingly well. Thus, new product development is a core competency if it goes beyond onedivision.4 For example, a core competency of Avon Products is its expertise in door-to-doorselling. FedEx has a core competency in its application of information technology to all its op-erations. A company must continually reinvest in a core competency or risk its becoming acore rigidity or deficiency, that is, a strength that over time matures and may become a weak-ness.5 Although it is typically not an asset in the accounting sense, a core competency is a veryvaluable resource—it does not “wear out” with use. In general, the more core competenciesare used, the more refined they get, and the more valuable they become. When core compe-tencies are superior to those of the competition, they are called distinctive competencies. Forexample, General Electric is well known for its distinctive competency in management devel-opment. Its executives are sought out by other companies hiring top managers.6
Barney, in his VRIO framework of analysis, proposes four questions to evaluate a firm’scompetencies:
1. Value: Does it provide customer value and competitive advantage?
2. Rareness: Do no other competitors possess it?
3. Imitability: Is it costly for others to imitate?
4. Organization: Is the firm organized to exploit the resource?
138 PART 2 Scanning the Environment
CHAPTER 5 Internal Scanning: Organizational Analysis 139
If the answer to each of these questions is yes for a particular competency, it is consideredto be a strength and thus a distinctive competence.7 This should give the company a competi-tive advantage and lead to higher performance.8
It is important to evaluate the importance of a company’s resources, capabilities, and com-petencies to ascertain whether they are internal strategic factors—that is, particular strengthsand weaknesses that will help determine the future of the company. This can be done by com-paring measures of these factors with measures of (1) the company’s past performance, (2) thecompany’s key competitors, and (3) the industry as a whole. To the extent that a resource (suchas a firm’s cash situation), capability, or competency is significantly different from the firm’sown past, its key competitors, or the industry average, that resource is likely to be a strategicfactor and should be considered in strategic decisions.
Even though a distinctive competency is certainly considered to be a corporation’s keystrength, a key strength may not always be a distinctive competency. As competitors attemptto imitate another company’s competency (especially during hypercompetition), what wasonce a distinctive competency becomes a minimum requirement to compete in the industry.9
Even though the competency may still be a core competency and thus a strength, it is no longerunique. For example, when Maytag Company alone made high-quality home appliances, thisability was a distinctive competency. As other appliance makers imitated Maytag’s qualitycontrol and design processes, this continued to be a key strength (that is, a core competency)of Maytag, but it was less and less a distinctive competency.
USING RESOURCES TO GAIN COMPETITIVE ADVANTAGEProposing that a company’s sustained competitive advantage is primarily determined by its re-source endowments, Grant proposes a five-step, resource-based approach to strategy analysis.
1. Identify and classify the firm’s resources in terms of strengths and weaknesses.
2. Combine the firm’s strengths into specific capabilities and core competencies.
3. Appraise the profit potential of these capabilities and competencies in terms of their po-tential for sustainable competitive advantage and the ability to harvest the profits result-ing from their use. Are there any distinctive competencies?
4. Select the strategy that best exploits the firm’s capabilities and competencies relative toexternal opportunities.
5. Identify resource gaps and invest in upgrading weaknesses.10
Where do these competencies come from? A corporation can gain access to a distinctive com-petency in four ways:
� It may be an asset endowment, such as a key patent, coming from the founding of the com-pany. For example, Xerox grew on the basis of its original copying patent.
� It may be acquired from someone else. For example, Whirlpool bought a worldwide dis-tribution system when it purchased Philips’s appliance division.
� It may be shared with another business unit or alliance partner. For example, Apple Computerworked with a design firm to create the special appeal of its personal computers and iPods.
� It may be carefully built and accumulated over time within the company. For example,Honda carefully extended its expertise in small motor manufacturing from motorcycles toautos and lawnmowers.11
There is some evidence that the best corporations prefer organic internal growth over acquisi-tions. One study of large global companies identified firms that outperformed their peers on
140 PART 2 Scanning the Environment
both revenue growth and profitability over a decade. These excellent performers generatedvalue from knowledge-intensive intangibles, such as copyrights, trade secrets, or strongbrands, not from acquisitions.12
The desire to build or upgrade a core competency is one reason entrepreneurial and otherfast-growing firms often tend to locate close to their competitors. They form clusters—geographic concentrations of interconnected companies and industries. Examples in theUnited States are computer technology in Silicon Valley in northern California; light aircraftin Wichita, Kansas; financial services in New York City; agricultural equipment in Iowa andIllinois; and home furniture in North Carolina. According to Michael Porter, clusters provideaccess to employees, suppliers, specialized information, and complementary products.13 Be-ing close to one’s competitors makes it easier to measure and compare performance againstrivals. Capabilities may thus be formed externally through a firm’s network resources. Anexample is the presence of many venture capitalists located in Silicon Valley who provide fi-nancial support and assistance to high-tech startup firms in the region. Employees from com-petitive firms in these clusters often socialize. As a result, companies learn from each otherwhile competing with each other. Interestingly, research reveals that companies with corecompetencies have little to gain from locating in a cluster with other firms and therefore do notdo so. In contrast, firms with the weakest technologies, human resources, training programs,suppliers, and distributors are strongly motivated to cluster. They have little to lose and a lotto gain from locating close to their competitors.14
DETERMINING THE SUSTAINABILITY OF AN ADVANTAGEJust because a firm is able to use its resources, capabilities, and competencies to develop acompetitive advantage does not mean it will be able to sustain it. Two characteristics deter-mine the sustainability of a firm’s distinctive competency(ies): durability and imitability.
Durability is the rate at which a firm’s underlying resources, capabilities, or core com-petencies depreciate or become obsolete. New technology can make a company’s core com-petency obsolete or irrelevant. For example, Intel’s skills in using basic technologydeveloped by others to manufacture and market quality microprocessors was a crucial capa-bility until management realized that the firm had taken current technology as far as possiblewith the Pentium chip. Without basic R&D of its own, it would slowly lose its competitiveadvantage to others. It thus formed a strategic alliance with HP to gain access to a neededtechnology.
Imitability is the rate at which a firm’s underlying resources, capabilities, or core com-petencies can be duplicated by others. To the extent that a firm’s distinctive competency givesit competitive advantage in the marketplace, competitors will do what they can to learn andimitate that set of skills and capabilities. Competitors’ efforts may range from reverse engi-neering (which involves taking apart a competitor’s product in order to find out how it works),to hiring employees from the competitor, to outright patent infringement. A core competencycan be easily imitated to the extent that it is transparent, transferable, and replicable.
� Transparency is the speed with which other firms can understand the relationship of re-sources and capabilities supporting a successful firm’s strategy. For example, Gillette hasalways supported its dominance in the marketing of razors with excellent R&D. A com-petitor could never understand how the Sensor or Mach 3 razor was produced simply bytaking one apart. Gillette’s razor design was very difficult to copy, partially because themanufacturing equipment needed to produce it was so expensive and complicated.
� Transferability is the ability of competitors to gather the resources and capabilities nec-essary to support a competitive challenge. For example, it may be very difficult for a wine
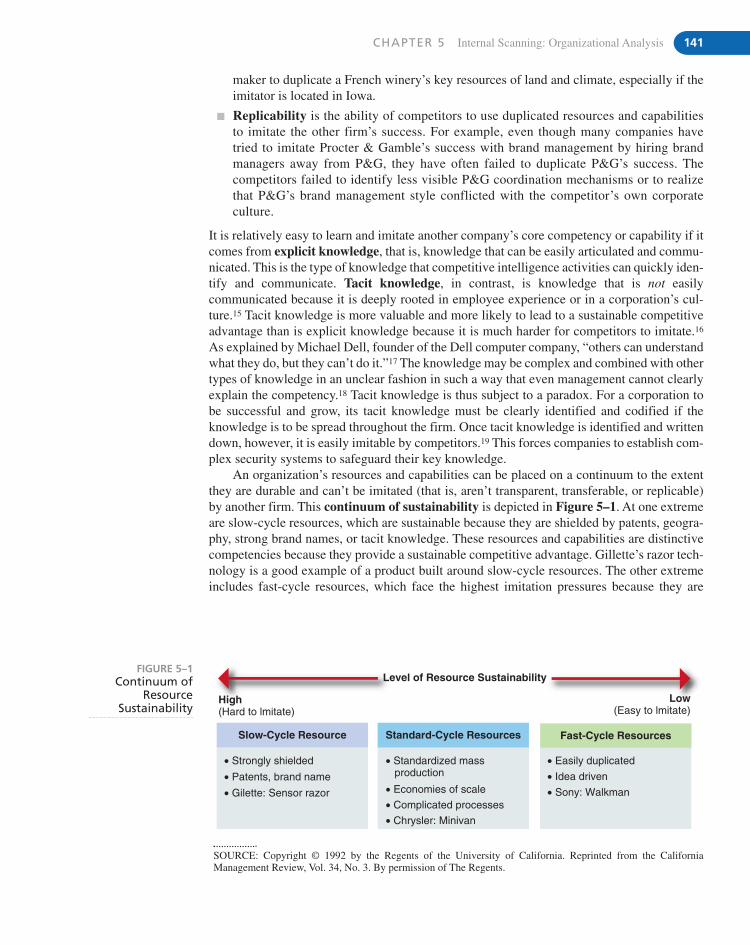
CHAPTER 5 Internal Scanning: Organizational Analysis 141
maker to duplicate a French winery’s key resources of land and climate, especially if theimitator is located in Iowa.
� Replicability is the ability of competitors to use duplicated resources and capabilitiesto imitate the other firm’s success. For example, even though many companies havetried to imitate Procter & Gamble’s success with brand management by hiring brandmanagers away from P&G, they have often failed to duplicate P&G’s success. Thecompetitors failed to identify less visible P&G coordination mechanisms or to realizethat P&G’s brand management style conflicted with the competitor’s own corporateculture.
It is relatively easy to learn and imitate another company’s core competency or capability if itcomes from explicit knowledge, that is, knowledge that can be easily articulated and commu-nicated. This is the type of knowledge that competitive intelligence activities can quickly iden-tify and communicate. Tacit knowledge, in contrast, is knowledge that is not easilycommunicated because it is deeply rooted in employee experience or in a corporation’s cul-ture.15 Tacit knowledge is more valuable and more likely to lead to a sustainable competitiveadvantage than is explicit knowledge because it is much harder for competitors to imitate.16
As explained by Michael Dell, founder of the Dell computer company, “others can understandwhat they do, but they can’t do it.”17 The knowledge may be complex and combined with othertypes of knowledge in an unclear fashion in such a way that even management cannot clearlyexplain the competency.18 Tacit knowledge is thus subject to a paradox. For a corporation tobe successful and grow, its tacit knowledge must be clearly identified and codified if theknowledge is to be spread throughout the firm. Once tacit knowledge is identified and writtendown, however, it is easily imitable by competitors.19 This forces companies to establish com-plex security systems to safeguard their key knowledge.
An organization’s resources and capabilities can be placed on a continuum to the extentthey are durable and can’t be imitated (that is, aren’t transparent, transferable, or replicable)by another firm. This continuum of sustainability is depicted in Figure 5–1. At one extremeare slow-cycle resources, which are sustainable because they are shielded by patents, geogra-phy, strong brand names, or tacit knowledge. These resources and capabilities are distinctivecompetencies because they provide a sustainable competitive advantage. Gillette’s razor tech-nology is a good example of a product built around slow-cycle resources. The other extremeincludes fast-cycle resources, which face the highest imitation pressures because they are
High(Hard to lmitate)
Level of Resource Sustainability
Slow-Cycle Resource
• Strongly shielded • Standardized mass production
• Easily duplicated
• Idea driven
• Sony: Walkman• Economies of scale
• Complicated processes
• Chrysler: Minivan
• Patents, brand name
• Gilette: Sensor razor
Standard-Cycle Resources Fast-Cycle Resources
Low(Easy to lmitate)
FIGURE 5–1Continuum of
ResourceSustainability
SOURCE: Copyright © 1992 by the Regents of the University of California. Reprinted from the CaliforniaManagement Review, Vol. 34, No. 3. By permission of The Regents.
142 PART 2 Scanning the Environment
based on a concept or technology that can be easily duplicated, such as Sony’s walkman. Tothe extent that a company has fast-cycle resources, the primary way it can compete success-fully is through increased speed from lab to marketplace. Otherwise, it has no real sustainablecompetitive advantage.
With its low-cost position and innovative marketing strategy, Tata Motors appeared tohave a competitive advantage in making and selling its new People’s Car at the lowest pricein the industry. Would this low-cost competitive advantage be sustainable? In terms of dura-bility, the car’s lack of safety or emissions equipment could be a disadvantage when India andother developing nations begin to require such technology. Given that most developing na-tions also have low labor costs, Tata’s low wages could be easily imitated—probably fairlyquickly. For example, the Renault—Nissan auto firm had already formed an alliance in 2008with Indian motorcycle maker Bajal Auto to launch a $3,000 car in India in 2009.20 Tata Motor’s strategy of selling its new car in kit form was highly imitable, assuming that a com-petitor’s car could be kept simple enough for dealers to assemble easily. Overall, the sustain-ability of Tata Motors’ competitive advantage seemed fairly low, given the fast-cycle natureof its resources.
5.2 Business ModelsWhen analyzing a company, it is helpful to learn what sort of business model it is following.This is especially important when analyzing Internet-based companies. A business model is acompany’s method for making money in the current business environment. It includes the keystructural and operational characteristics of a firm—how it earns revenue and makes a profit.A business model is usually composed of five elements:
� Who it serves
� What it provides
� How it makes money
� How it differentiates and sustains competitive advantage
� How it provides its product/service21
The simplest business model is to provide a good or service that can be sold so that revenuesexceed costs and expenses. Other models can be much more complicated. Some of the manypossible business models are:
� Customer solutions model: IBM uses this model to make money not by selling IBMproducts, but by selling its expertise to improve its customers’ operations. This is a con-sulting model.
� Profit pyramid model: General Motors offers a full line of automobiles in order to closeout any niches where a competitor might find a position. The key is to get customers tobuy in at the low-priced, low-margin entry point (Saturn’s basic sedans) and move themup to high-priced, high-margin products (SUVs and pickup trucks) where the companymakes its money.
� Multi-component system/installed base model: Gillette invented this classic model tosell razors at break-even pricing in order to make money on higher-margin razor blades.HP does the same with printers and printer cartridges. The product is thus a system, notjust one product, with one component providing most of the profits.
� Advertising model: Similar to the multi-component system/installed base model, thismodel offers its basic product free in order to make money on advertising. Originating in
CHAPTER 5 Internal Scanning: Organizational Analysis 143
the newspaper industry, this model is used heavily in commercial radio and television.Internet-based firms, such as Google, offer free services to users in order to expose themto the advertising that pays the bills. This model is analogous to Mary Poppins’ “spoon-ful of sugar (content) helps the medicine (advertising) go down.”
� Switchboard model: In this model a firm acts as an intermediary to connect multiple sell-ers to multiple buyers. Financial planners juggle a wide range of products for sale to mul-tiple customers with different needs. This model has been successfully used by eBay andAmazon.com.
� Time model: Product R&D and speed are the keys to success in the time model. Beingthe first to market with a new innovation allows a pioneer like Sony to earn high margins.Once others enter the market with process R&D and lower margins, it’s time to move on.
� Efficiency model: In this model a company waits until a product becomes standardizedand then enters the market with a low-priced, low-margin product that appeals to the massmarket. This model is used by Wal-Mart, Dell, and Southwest Airlines.
� Blockbuster model: In some industries, such as pharmaceuticals and motion picture stu-dios, profitability is driven by a few key products. The focus is on high investment in afew products with high potential payoffs—especially if they can be protected by patents.
� Profit multiplier model: The idea of this model is to develop a concept that may or maynot make money on its own but, through synergy, can spin off many profitable products.Walt Disney invented this concept by using cartoon characters to develop high-margintheme parks, merchandise, and licensing opportunities.
� Entrepreneurial model: In this model, a company offers specialized products/servicesto market niches that are too small to be worthwhile to large competitors but have the po-tential to grow quickly. Small, local brew pubs have been very successful in a mature in-dustry dominated by Anheuser-Busch. This model has often been used by small high-techfirms that develop innovative prototypes in order to sell off the companies (without everselling a product) to Microsoft or DuPont.
� De Facto industry standard model: In this model, a company offers products free or ata very low price in order to saturate the market and become the industry standard. Onceusers are locked in, the company offers higher-margin products using this standard. Forexample, Microsoft packaged Internet Explorer free with its Windows software in orderto take market share from Netscape’s Web browser.22
In order to understand how some of these business models work, it is important to learn whereon the value chain the company makes its money. Although a company might offer a largenumber of products and services, one product line might contribute most of the profits. For ex-ample, ink and toner supplies for Hewlett-Packard’s printers make up more than half of thecompany’s profits while accounting for less than 25% of its sales.23 For an example of a newbusiness model at SmartyPig, see Strategy Highlight 5.1.
5.3 Value-Chain AnalysisA value chain is a linked set of value-creating activities that begin with basic raw materials com-ing from suppliers, moving on to a series of value-added activities involved in producing andmarketing a product or service, and ending with distributors getting the final goods into the handsof the ultimate consumer. See Figure 5–2 for an example of a typical value chain for a manufac-tured product. The focus of value-chain analysis is to examine the corporation in the context ofthe overall chain of value-creating activities, of which the firm may be only a small part.
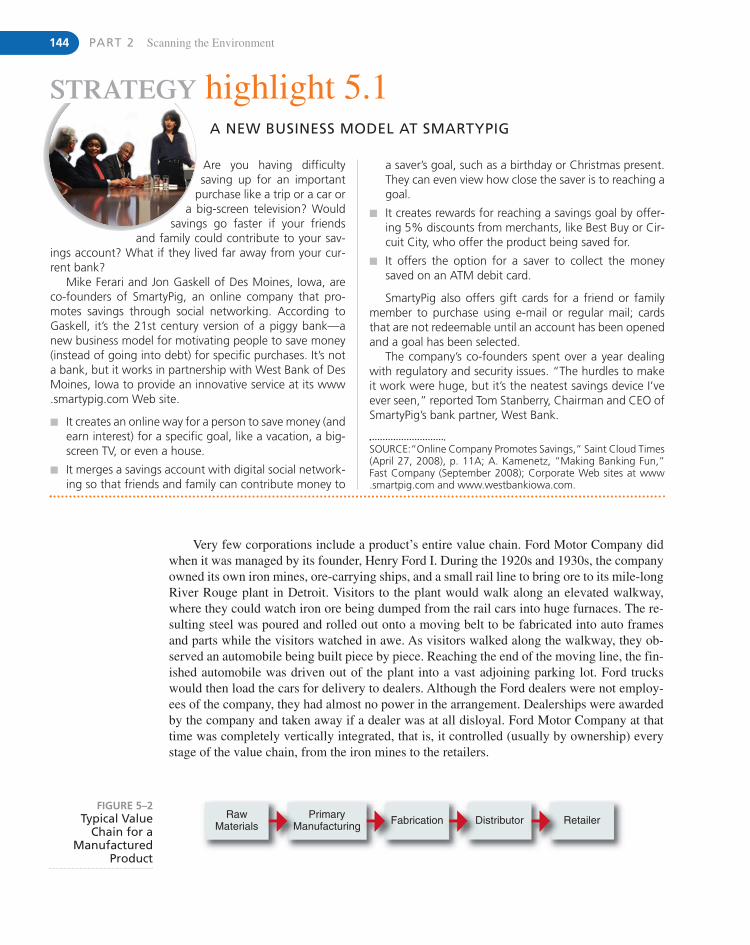
144 PART 2 Scanning the Environment
a saver’s goal, such as a birthday or Christmas present.They can even view how close the saver is to reaching agoal.
� It creates rewards for reaching a savings goal by offer-ing 5% discounts from merchants, like Best Buy or Cir-cuit City, who offer the product being saved for.
� It offers the option for a saver to collect the moneysaved on an ATM debit card.
SmartyPig also offers gift cards for a friend or familymember to purchase using e-mail or regular mail; cardsthat are not redeemable until an account has been openedand a goal has been selected.
The company’s co-founders spent over a year dealingwith regulatory and security issues. “The hurdles to makeit work were huge, but it’s the neatest savings device I’veever seen,” reported Tom Stanberry, Chairman and CEO ofSmartyPig’s bank partner, West Bank.
Are you having difficultysaving up for an important
purchase like a trip or a car ora big-screen television? Would
savings go faster if your friendsand family could contribute to your sav-
ings account? What if they lived far away from your cur-rent bank?
Mike Ferari and Jon Gaskell of Des Moines, Iowa, areco-founders of SmartyPig, an online company that pro-motes savings through social networking. According toGaskell, it’s the 21st century version of a piggy bank—anew business model for motivating people to save money(instead of going into debt) for specific purchases. It’s nota bank, but it works in partnership with West Bank of DesMoines, Iowa to provide an innovative service at its www.smartypig.com Web site.
� It creates an online way for a person to save money (andearn interest) for a specific goal, like a vacation, a big-screen TV, or even a house.
� It merges a savings account with digital social network-ing so that friends and family can contribute money to
A NEW BUSINESS MODEL AT SMARTYPIG
SOURCE:“Online Company Promotes Savings,” Saint Cloud Times(April 27, 2008), p. 11A; A. Kamenetz, “Making Banking Fun,”Fast Company (September 2008); Corporate Web sites at www.smartpig.com and www.westbankiowa.com.
STRATEGY highlight 5.1
RawMaterials
PrimaryManufacturing Fabrication Distributor Retailer
FIGURE 5–2Typical Value
Chain for aManufactured
Product
Very few corporations include a product’s entire value chain. Ford Motor Company didwhen it was managed by its founder, Henry Ford I. During the 1920s and 1930s, the companyowned its own iron mines, ore-carrying ships, and a small rail line to bring ore to its mile-longRiver Rouge plant in Detroit. Visitors to the plant would walk along an elevated walkway,where they could watch iron ore being dumped from the rail cars into huge furnaces. The re-sulting steel was poured and rolled out onto a moving belt to be fabricated into auto framesand parts while the visitors watched in awe. As visitors walked along the walkway, they ob-served an automobile being built piece by piece. Reaching the end of the moving line, the fin-ished automobile was driven out of the plant into a vast adjoining parking lot. Ford truckswould then load the cars for delivery to dealers. Although the Ford dealers were not employ-ees of the company, they had almost no power in the arrangement. Dealerships were awardedby the company and taken away if a dealer was at all disloyal. Ford Motor Company at thattime was completely vertically integrated, that is, it controlled (usually by ownership) everystage of the value chain, from the iron mines to the retailers.
CHAPTER 5 Internal Scanning: Organizational Analysis 145
INDUSTRY VALUE-CHAIN ANALYSISThe value chains of most industries can be split into two segments, upstream and downstreamsegments. In the petroleum industry, for example, upstream refers to oil exploration, drilling,and moving of the crude oil to the refinery, and downstream refers to refining the oil plustransporting and marketing gasoline and refined oil to distributors and gas station retailers.Even though most large oil companies are completely integrated, they often vary in theamount of expertise they have at each part of the value chain. Amoco, for example, had strongexpertise downstream in marketing and retailing. British Petroleum, in contrast, was moredominant in upstream activities like exploration. That’s one reason the two companies mergedto form BP Amoco.
An industry can be analyzed in terms of the profit margin available at any point along thevalue chain. For example, the U.S. auto industry’s revenues and profits are divided among manyvalue-chain activities, including manufacturing, new and used car sales, gasoline retailing, in-surance, after-sales service and parts, and lease financing. From a revenue standpoint, automanufacturers dominate the industry, accounting for almost 60% of total industry revenues.Profits, however, are a different matter. Auto leasing has been the most profitable activity in thevalue chain, followed by insurance and auto loans. The core activities of manufacturing and dis-tribution, however, earn significantly smaller shares of the total industry profits than they do oftotal revenues. For example, because auto sales have become marginally profitable, dealershipsare now emphasizing service and repair. As a result of various differences along the industryvalue chain, manufacturers have moved aggressively into auto financing.24 Ford, for example,generated $1.2 billion in profits from financial services in 2007 compared to a loss of $5 billionfrom automobiles, even though financing accounted for only 10.5% of the company’s revenues!
In analyzing the complete value chain of a product, note that even if a firm operates upand down the entire industry chain, it usually has an area of expertise where its primary activ-ities lie. A company’s center of gravity is the part of the chain that is most important to thecompany and the point where its greatest expertise and capabilities lie—its core competencies.According to Galbraith, a company’s center of gravity is usually the point at which the com-pany started. After a firm successfully establishes itself at this point by obtaining a competi-tive advantage, one of its first strategic moves is to move forward or backward along the valuechain in order to reduce costs, guarantee access to key raw materials, or to guarantee distribu-tion.25 This process, called vertical integration, is discussed in more detail in Chapter 7.
In the paper industry, for example, Weyerhauser’s center of gravity is in the raw materi-als and primary manufacturing parts of the value chain as shown in Figure 5–2. Weyerhauser’sexpertise is in lumbering and pulp mills, which is where the company started. It integrated for-ward by using its wood pulp to make paper and boxes, but its greatest capability still lay ingetting the greatest return from its lumbering activities. In contrast, P&G is primarily a con-sumer products company that also owned timberland and operated pulp mills. Its expertise isin the fabrication and distribution parts of the Figure 5–2 value chain. P&G purchased theseassets to guarantee access to the large quantities of wood pulp it needed to expand its dispos-able diaper, toilet tissue, and napkin products. P&G’s strongest capabilities have always beenin the downstream activities of product development, marketing, and brand management. Ithas never been as efficient in upstream paper activities as Weyerhauser. It had no real distinc-tive competency on that part of the value chain. When paper supplies became more plentiful(and competition got rougher), P&G gladly sold its land and mills to focus more on the part ofthe value chain where it could provide the greatest value at the lowest cost—creating and mar-keting innovative consumer products. As was the case with P&G’s experience in the paper in-dustry, it makes sense for a company to outsource any weak areas it may control internally onthe industry value chain.
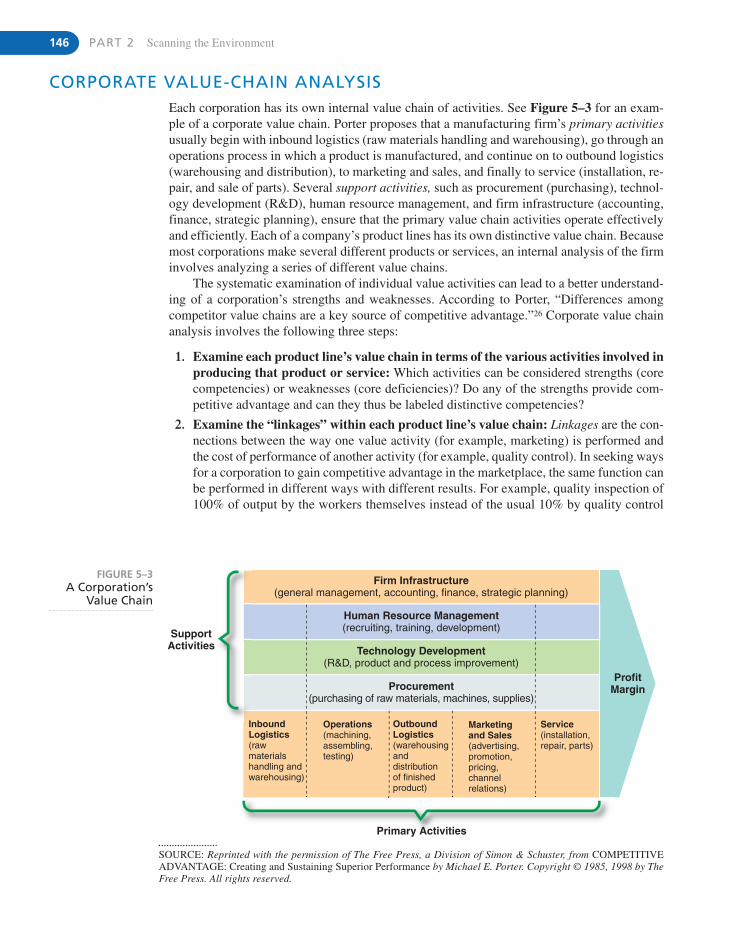
146 PART 2 Scanning the Environment
CORPORATE VALUE-CHAIN ANALYSISEach corporation has its own internal value chain of activities. See Figure 5–3 for an exam-ple of a corporate value chain. Porter proposes that a manufacturing firm’s primary activitiesusually begin with inbound logistics (raw materials handling and warehousing), go through anoperations process in which a product is manufactured, and continue on to outbound logistics(warehousing and distribution), to marketing and sales, and finally to service (installation, re-pair, and sale of parts). Several support activities, such as procurement (purchasing), technol-ogy development (R&D), human resource management, and firm infrastructure (accounting,finance, strategic planning), ensure that the primary value chain activities operate effectivelyand efficiently. Each of a company’s product lines has its own distinctive value chain. Becausemost corporations make several different products or services, an internal analysis of the firminvolves analyzing a series of different value chains.
The systematic examination of individual value activities can lead to a better understand-ing of a corporation’s strengths and weaknesses. According to Porter, “Differences amongcompetitor value chains are a key source of competitive advantage.”26 Corporate value chainanalysis involves the following three steps:
1. Examine each product line’s value chain in terms of the various activities involved inproducing that product or service: Which activities can be considered strengths (corecompetencies) or weaknesses (core deficiencies)? Do any of the strengths provide com-petitive advantage and can they thus be labeled distinctive competencies?
2. Examine the “linkages” within each product line’s value chain: Linkages are the con-nections between the way one value activity (for example, marketing) is performed andthe cost of performance of another activity (for example, quality control). In seeking waysfor a corporation to gain competitive advantage in the marketplace, the same function canbe performed in different ways with different results. For example, quality inspection of100% of output by the workers themselves instead of the usual 10% by quality control
SupportActivities
Firm Infrastructure(general management, accounting, finance, strategic planning)
Human Resource Management(recruiting, training, development)
Technology Development(R&D, product and process improvement)
InboundLogistics(rawmaterialshandling andwarehousing)
OutboundLogistics(warehousinganddistributionof finishedproduct)
Marketingand Sales(advertising,promotion,pricing,channelrelations)
Service(installation,repair, parts)
Primary Activities
ProfitMargin
Operations(machining,assembling,testing)
Procurement(purchasing of raw materials, machines, supplies)
FIGURE 5–3A Corporation’s
Value Chain
SOURCE: Reprinted with the permission of The Free Press, a Division of Simon & Schuster, from COMPETITIVEADVANTAGE: Creating and Sustaining Superior Performance by Michael E. Porter. Copyright © 1985, 1998 by TheFree Press. All rights reserved.
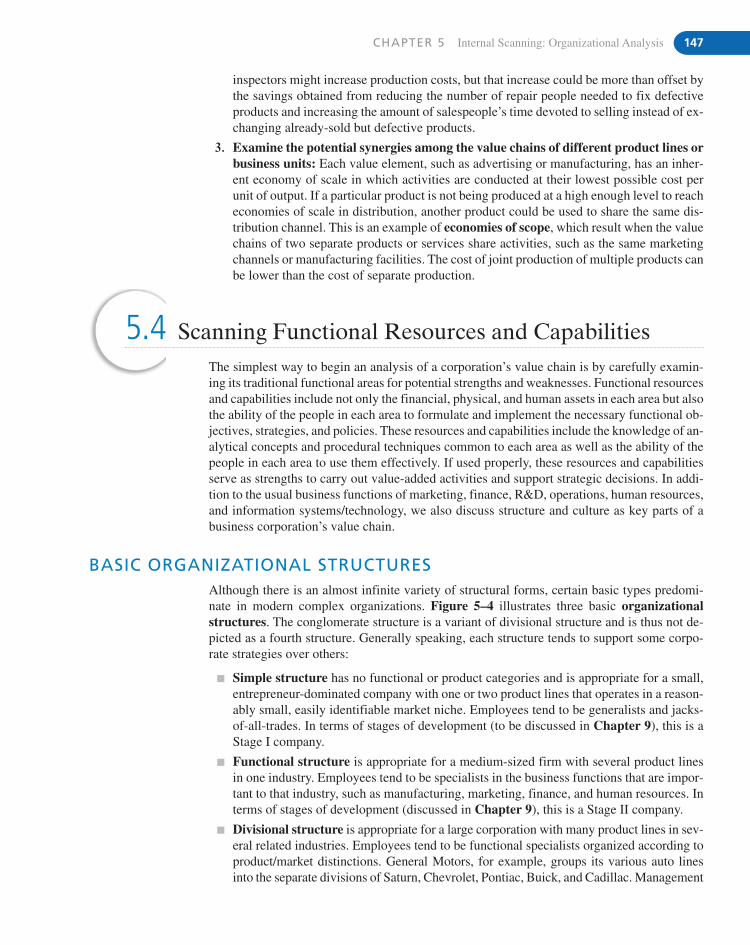
CHAPTER 5 Internal Scanning: Organizational Analysis 147
inspectors might increase production costs, but that increase could be more than offset bythe savings obtained from reducing the number of repair people needed to fix defectiveproducts and increasing the amount of salespeople’s time devoted to selling instead of ex-changing already-sold but defective products.
3. Examine the potential synergies among the value chains of different product lines orbusiness units: Each value element, such as advertising or manufacturing, has an inher-ent economy of scale in which activities are conducted at their lowest possible cost perunit of output. If a particular product is not being produced at a high enough level to reacheconomies of scale in distribution, another product could be used to share the same dis-tribution channel. This is an example of economies of scope, which result when the valuechains of two separate products or services share activities, such as the same marketingchannels or manufacturing facilities. The cost of joint production of multiple products canbe lower than the cost of separate production.
5.4 Scanning Functional Resources and CapabilitiesThe simplest way to begin an analysis of a corporation’s value chain is by carefully examin-ing its traditional functional areas for potential strengths and weaknesses. Functional resourcesand capabilities include not only the financial, physical, and human assets in each area but alsothe ability of the people in each area to formulate and implement the necessary functional ob-jectives, strategies, and policies. These resources and capabilities include the knowledge of an-alytical concepts and procedural techniques common to each area as well as the ability of thepeople in each area to use them effectively. If used properly, these resources and capabilitiesserve as strengths to carry out value-added activities and support strategic decisions. In addi-tion to the usual business functions of marketing, finance, R&D, operations, human resources,and information systems/technology, we also discuss structure and culture as key parts of abusiness corporation’s value chain.
BASIC ORGANIZATIONAL STRUCTURESAlthough there is an almost infinite variety of structural forms, certain basic types predomi-nate in modern complex organizations. Figure 5–4 illustrates three basic organizationalstructures. The conglomerate structure is a variant of divisional structure and is thus not de-picted as a fourth structure. Generally speaking, each structure tends to support some corpo-rate strategies over others:
� Simple structure has no functional or product categories and is appropriate for a small,entrepreneur-dominated company with one or two product lines that operates in a reason-ably small, easily identifiable market niche. Employees tend to be generalists and jacks-of-all-trades. In terms of stages of development (to be discussed in Chapter 9), this is aStage I company.
� Functional structure is appropriate for a medium-sized firm with several product linesin one industry. Employees tend to be specialists in the business functions that are impor-tant to that industry, such as manufacturing, marketing, finance, and human resources. Interms of stages of development (discussed in Chapter 9), this is a Stage II company.
� Divisional structure is appropriate for a large corporation with many product lines in sev-eral related industries. Employees tend to be functional specialists organized according toproduct/market distinctions. General Motors, for example, groups its various auto linesinto the separate divisions of Saturn, Chevrolet, Pontiac, Buick, and Cadillac. Management
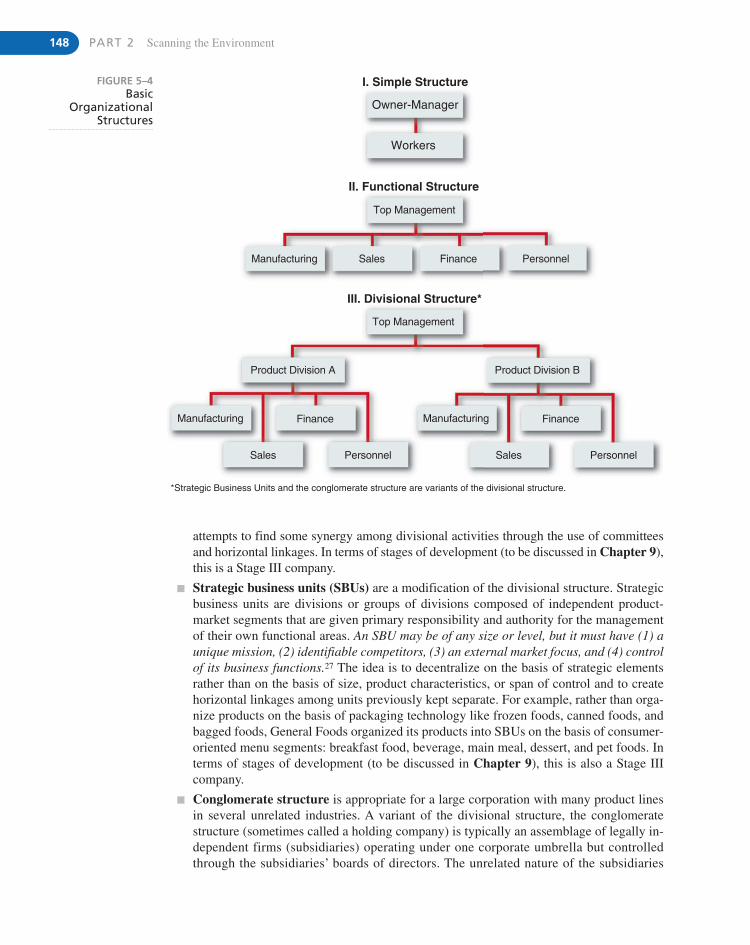
148 PART 2 Scanning the Environment
I. Simple Structure
II. Functional Structure
III. Divisional Structure*
Owner-Manager
Workers
Top Management
Manufacturing
Top Management
Product Division A
Manufacturing
Sales
*Strategic Business Units and the conglomerate structure are variants of the divisional structure.
Personnel
Finance Manufacturing
Sales Personnel
Finance
Product Division B
Sales Finance Personnel
FIGURE 5–4Basic
OrganizationalStructures
attempts to find some synergy among divisional activities through the use of committeesand horizontal linkages. In terms of stages of development (to be discussed in Chapter 9),this is a Stage III company.
� Strategic business units (SBUs) are a modification of the divisional structure. Strategicbusiness units are divisions or groups of divisions composed of independent product-market segments that are given primary responsibility and authority for the managementof their own functional areas. An SBU may be of any size or level, but it must have (1) aunique mission, (2) identifiable competitors, (3) an external market focus, and (4) controlof its business functions.27 The idea is to decentralize on the basis of strategic elementsrather than on the basis of size, product characteristics, or span of control and to createhorizontal linkages among units previously kept separate. For example, rather than orga-nize products on the basis of packaging technology like frozen foods, canned foods, andbagged foods, General Foods organized its products into SBUs on the basis of consumer-oriented menu segments: breakfast food, beverage, main meal, dessert, and pet foods. Interms of stages of development (to be discussed in Chapter 9), this is also a Stage IIIcompany.
� Conglomerate structure is appropriate for a large corporation with many product linesin several unrelated industries. A variant of the divisional structure, the conglomeratestructure (sometimes called a holding company) is typically an assemblage of legally in-dependent firms (subsidiaries) operating under one corporate umbrella but controlledthrough the subsidiaries’ boards of directors. The unrelated nature of the subsidiaries
CHAPTER 5 Internal Scanning: Organizational Analysis 149
prevents any attempt at gaining synergy among them. In terms of stages of development(discussed in Chapter 9), this is also a Stage III company.
If the current basic structure of a corporation does not easily support a strategy under con-sideration, top management must decide whether the proposed strategy is feasible or whetherthe structure should be changed to a more advanced structure such as a matrix or network. (Ad-vanced structural designs such as the matrix and network are discussed in Chapter 9.)
CORPORATE CULTURE: THE COMPANY WAYThere is an oft-told story of a person new to a company asking an experienced co-worker whatan employee should do when a customer calls. The old-timer responded: “There are three waysto do any job—the right way, the wrong way, and the company way. Around here, we always dothings the company way.” In most organizations, the “company way” is derived from the corpo-ration’s culture. Corporate culture is the collection of beliefs, expectations, and values learnedand shared by a corporation’s members and transmitted from one generation of employees to an-other. The corporate culture generally reflects the values of the founder(s) and the mission of thefirm.28 It gives a company a sense of identity: “This is who we are. This is what we do. This iswhat we stand for.” The culture includes the dominant orientation of the company, such as R&Dat HP, high productivity at Nucor, customer service at Nordstrom, innovation at Google, or prod-uct quality at BMW. It often includes a number of informal work rules (forming the “companyway”) that employees follow without question. These work practices over time become part ofa company’s unquestioned tradition. The culture, therefore, reflects the company’s values.
Corporate culture has two distinct attributes, intensity and integration.29 Cultural inten-sity is the degree to which members of a unit accept the norms, values, or other culture con-tent associated with the unit. This shows the culture’s depth. Organizations with strong normspromoting a particular value, such as quality at BMW, have intensive cultures, whereas newfirms (or those in transition) have weaker, less intensive cultures. Employees in an intensiveculture tend to exhibit consistent behavior, that is, they tend to act similarly over time.Cultural integration is the extent to which units throughout an organization share a commonculture. This is the culture’s breadth. Organizations with a pervasive dominant culture may behierarchically controlled and power-oriented, such as a military unit, and have highly inte-grated cultures. All employees tend to hold the same cultural values and norms. In contrast, acompany that is structured into diverse units by functions or divisions usually exhibits somestrong subcultures (for example, R&D versus manufacturing) and a less integrated corporateculture.
Corporate culture fulfills several important functions in an organization:
1. Conveys a sense of identity for employees.
2. Helps generate employee commitment to something greater than themselves.
3. Adds to the stability of the organization as a social system.
4. Serves as a frame of reference for employees to use to make sense of organizational ac-tivities and to use as a guide for appropriate behavior.30
Corporate culture shapes the behavior of people in a corporation, thus affecting corporateperformance. For example, corporate cultures that emphasize the socialization of new employ-ees have less employee turnover, leading to lower costs.31 Because corporate cultures have apowerful influence on the behavior of people at all levels, they can strongly affect a corpora-tion’s ability to shift its strategic direction. A strong culture should not only promote survival,but it should also create the basis for a superior competitive position by increasing motivation
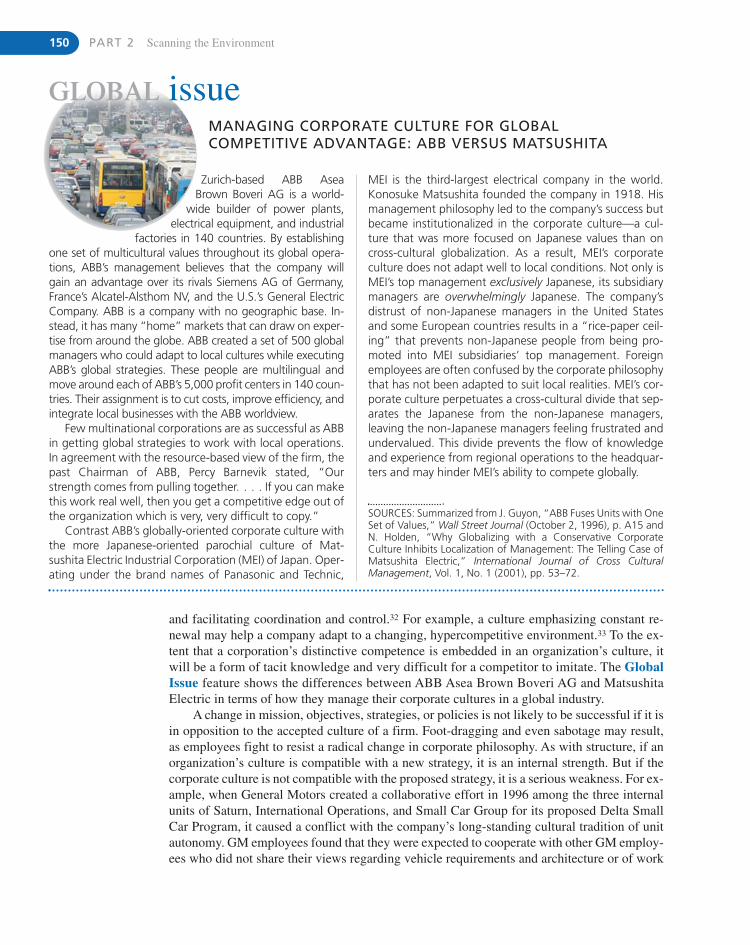
150 PART 2 Scanning the Environment
and facilitating coordination and control.32 For example, a culture emphasizing constant re-newal may help a company adapt to a changing, hypercompetitive environment.33 To the ex-tent that a corporation’s distinctive competence is embedded in an organization’s culture, itwill be a form of tacit knowledge and very difficult for a competitor to imitate. The GlobalIssue feature shows the differences between ABB Asea Brown Boveri AG and MatsushitaElectric in terms of how they manage their corporate cultures in a global industry.
A change in mission, objectives, strategies, or policies is not likely to be successful if it isin opposition to the accepted culture of a firm. Foot-dragging and even sabotage may result,as employees fight to resist a radical change in corporate philosophy. As with structure, if anorganization’s culture is compatible with a new strategy, it is an internal strength. But if thecorporate culture is not compatible with the proposed strategy, it is a serious weakness. For ex-ample, when General Motors created a collaborative effort in 1996 among the three internalunits of Saturn, International Operations, and Small Car Group for its proposed Delta SmallCar Program, it caused a conflict with the company’s long-standing cultural tradition of unitautonomy. GM employees found that they were expected to cooperate with other GM employ-ees who did not share their views regarding vehicle requirements and architecture or of work
SOURCES: Summarized from J. Guyon, “ABB Fuses Units with OneSet of Values,” Wall Street Journal (October 2, 1996), p. A15 andN. Holden, “Why Globalizing with a Conservative CorporateCulture Inhibits Localization of Management: The Telling Case ofMatsushita Electric,” International Journal of Cross CulturalManagement, Vol. 1, No. 1 (2001), pp. 53–72.
MEI is the third-largest electrical company in the world.Konosuke Matsushita founded the company in 1918. Hismanagement philosophy led to the company’s success butbecame institutionalized in the corporate culture—a cul-ture that was more focused on Japanese values than oncross-cultural globalization. As a result, MEI’s corporateculture does not adapt well to local conditions. Not only isMEI’s top management exclusively Japanese, its subsidiarymanagers are overwhelmingly Japanese. The company’sdistrust of non-Japanese managers in the United Statesand some European countries results in a “rice-paper ceil-ing” that prevents non-Japanese people from being pro-moted into MEI subsidiaries’ top management. Foreignemployees are often confused by the corporate philosophythat has not been adapted to suit local realities. MEI’s cor-porate culture perpetuates a cross-cultural divide that sep-arates the Japanese from the non-Japanese managers,leaving the non-Japanese managers feeling frustrated andundervalued. This divide prevents the flow of knowledgeand experience from regional operations to the headquar-ters and may hinder MEI’s ability to compete globally.
Zurich-based ABB AseaBrown Boveri AG is a world-
wide builder of power plants,electrical equipment, and industrial
factories in 140 countries. By establishingone set of multicultural values throughout its global opera-tions, ABB’s management believes that the company willgain an advantage over its rivals Siemens AG of Germany,France’s Alcatel-Alsthom NV, and the U.S.’s General ElectricCompany. ABB is a company with no geographic base. In-stead, it has many “home” markets that can draw on exper-tise from around the globe. ABB created a set of 500 globalmanagers who could adapt to local cultures while executingABB’s global strategies. These people are multilingual andmove around each of ABB’s 5,000 profit centers in 140 coun-tries. Their assignment is to cut costs, improve efficiency, andintegrate local businesses with the ABB worldview.
Few multinational corporations are as successful as ABBin getting global strategies to work with local operations.In agreement with the resource-based view of the firm, thepast Chairman of ABB, Percy Barnevik stated, “Ourstrength comes from pulling together. . . . If you can makethis work real well, then you get a competitive edge out ofthe organization which is very, very difficult to copy.”
Contrast ABB’s globally-oriented corporate culture withthe more Japanese-oriented parochial culture of Mat-sushita Electric Industrial Corporation (MEI) of Japan. Oper-ating under the brand names of Panasonic and Technic,
MANAGING CORPORATE CULTURE FOR GLOBAL COMPETITIVE ADVANTAGE: ABB VERSUS MATSUSHITA
GLOBAL issue
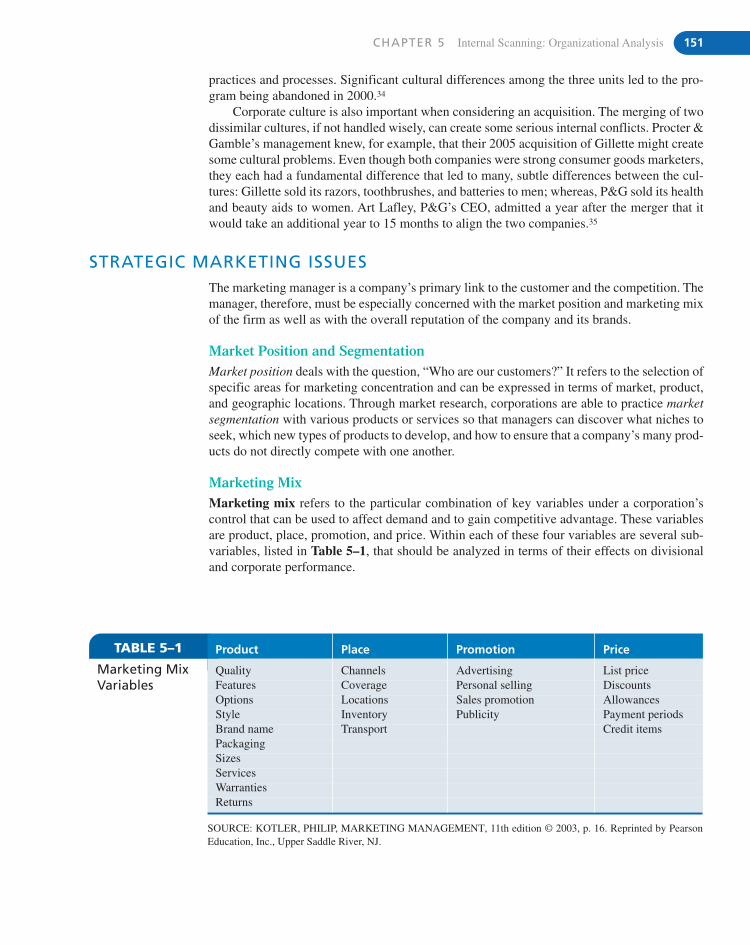
CHAPTER 5 Internal Scanning: Organizational Analysis 151
STRATEGIC MARKETING ISSUESThe marketing manager is a company’s primary link to the customer and the competition. Themanager, therefore, must be especially concerned with the market position and marketing mixof the firm as well as with the overall reputation of the company and its brands.
Market Position and SegmentationMarket position deals with the question, “Who are our customers?” It refers to the selection ofspecific areas for marketing concentration and can be expressed in terms of market, product,and geographic locations. Through market research, corporations are able to practice marketsegmentation with various products or services so that managers can discover what niches toseek, which new types of products to develop, and how to ensure that a company’s many prod-ucts do not directly compete with one another.
Marketing MixMarketing mix refers to the particular combination of key variables under a corporation’scontrol that can be used to affect demand and to gain competitive advantage. These variablesare product, place, promotion, and price. Within each of these four variables are several sub-variables, listed in Table 5–1, that should be analyzed in terms of their effects on divisionaland corporate performance.
practices and processes. Significant cultural differences among the three units led to the pro-gram being abandoned in 2000.34
Corporate culture is also important when considering an acquisition. The merging of twodissimilar cultures, if not handled wisely, can create some serious internal conflicts. Procter &Gamble’s management knew, for example, that their 2005 acquisition of Gillette might createsome cultural problems. Even though both companies were strong consumer goods marketers,they each had a fundamental difference that led to many, subtle differences between the cul-tures: Gillette sold its razors, toothbrushes, and batteries to men; whereas, P&G sold its healthand beauty aids to women. Art Lafley, P&G’s CEO, admitted a year after the merger that itwould take an additional year to 15 months to align the two companies.35
TABLE 5–1 Product Place Promotion Price
Marketing MixVariables
Quality Channels Advertising List priceFeatures Coverage Personal selling DiscountsOptions Locations Sales promotion AllowancesStyle Inventory Publicity Payment periodsBrand name Transport Credit itemsPackagingSizesServicesWarrantiesReturns
SOURCE: KOTLER, PHILIP, MARKETING MANAGEMENT, 11th edition © 2003, p. 16. Reprinted by PearsonEducation, Inc., Upper Saddle River, NJ.
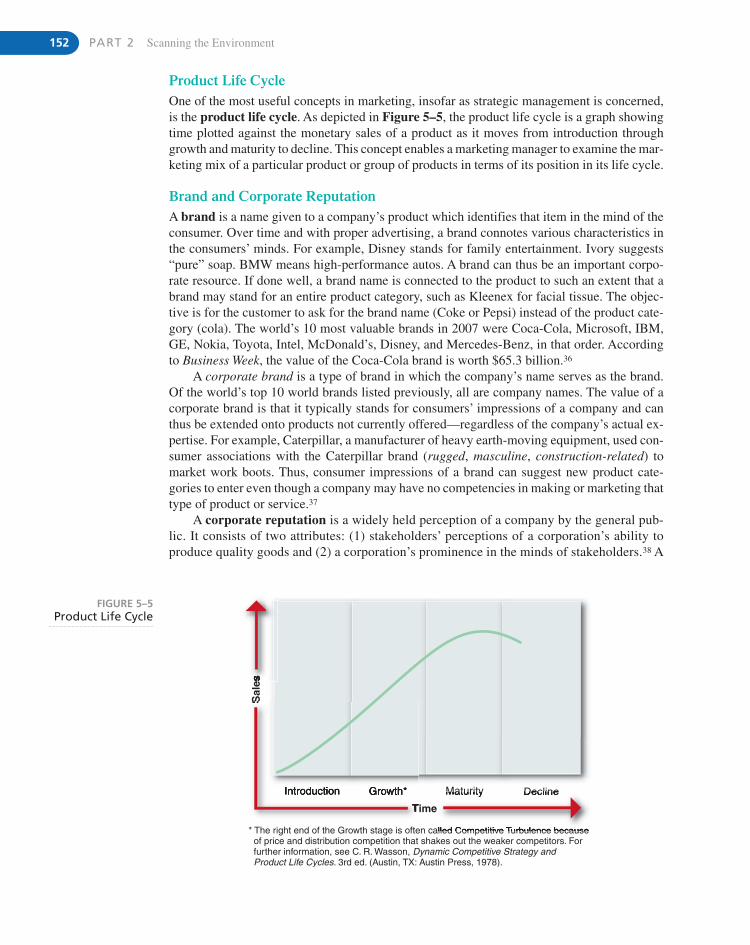
152 PART 2 Scanning the Environment
Introduction
* The right end of the Growth stage is often called Competitive Turbulence because of price and distribution competition that shakes out the weaker competitors. For further information, see C. R. Wasson, Dynamic Competitive Strategy and Product Life Cycles. 3rd ed. (Austin, TX: Austin Press, 1978).
Growth* Maturity
Time
Sal
es
Decline
FIGURE 5–5Product Life Cycle
Product Life CycleOne of the most useful concepts in marketing, insofar as strategic management is concerned,is the product life cycle. As depicted in Figure 5–5, the product life cycle is a graph showingtime plotted against the monetary sales of a product as it moves from introduction throughgrowth and maturity to decline. This concept enables a marketing manager to examine the mar-keting mix of a particular product or group of products in terms of its position in its life cycle.
Brand and Corporate ReputationA brand is a name given to a company’s product which identifies that item in the mind of theconsumer. Over time and with proper advertising, a brand connotes various characteristics inthe consumers’ minds. For example, Disney stands for family entertainment. Ivory suggests“pure” soap. BMW means high-performance autos. A brand can thus be an important corpo-rate resource. If done well, a brand name is connected to the product to such an extent that abrand may stand for an entire product category, such as Kleenex for facial tissue. The objec-tive is for the customer to ask for the brand name (Coke or Pepsi) instead of the product cate-gory (cola). The world’s 10 most valuable brands in 2007 were Coca-Cola, Microsoft, IBM,GE, Nokia, Toyota, Intel, McDonald’s, Disney, and Mercedes-Benz, in that order. Accordingto Business Week, the value of the Coca-Cola brand is worth $65.3 billion.36
A corporate brand is a type of brand in which the company’s name serves as the brand.Of the world’s top 10 world brands listed previously, all are company names. The value of acorporate brand is that it typically stands for consumers’ impressions of a company and canthus be extended onto products not currently offered—regardless of the company’s actual ex-pertise. For example, Caterpillar, a manufacturer of heavy earth-moving equipment, used con-sumer associations with the Caterpillar brand (rugged, masculine, construction-related) tomarket work boots. Thus, consumer impressions of a brand can suggest new product cate-gories to enter even though a company may have no competencies in making or marketing thattype of product or service.37
A corporate reputation is a widely held perception of a company by the general pub-lic. It consists of two attributes: (1) stakeholders’ perceptions of a corporation’s ability toproduce quality goods and (2) a corporation’s prominence in the minds of stakeholders.38 A
CHAPTER 5 Internal Scanning: Organizational Analysis 153
good corporate reputation can be a strategic resource. It can serve in marketing as both a sig-nal and an entry barrier. It contributes to its goods having a price premium.39 Reputation is es-pecially important when the quality of a company’s product or service is not directlyobservable and can be learned only through experience. For example, retail stores are willingto stock a new product from P&G or Anheuser-Busch because they know that both companiesmarket only good-quality products that are highly advertised. Like tacit knowledge, reputationtends to be long-lasting and hard for others to duplicate—thus providing sustainable compet-itive advantage.40 It can have a significant impact on a firm’s stock price.41 Research reveals apositive relationship between corporate reputation and financial performance.42
STRATEGIC FINANCIAL ISSUESA financial manager must ascertain the best sources of funds, uses of funds, and control offunds. All strategic issues have financial implications. Cash must be raised from internal or ex-ternal (local and global) sources and allocated for different uses. The flow of funds in the op-erations of an organization must be monitored. To the extent that a corporation is involved ininternational activities, currency fluctuations must be dealt with to ensure that profits aren’twiped out by the rise or fall of the dollar versus the yen, euro, or other currencies. Benefits inthe form of returns, repayments, or products and services must be given to the sources of out-side financing. All these tasks must be handled in a way that complements and supports over-all corporate strategy. A firm’s capital structure (amounts of debt and equity) can influence itsstrategic choices. For example, increased debt tends to increase risk aversion and decrease thewillingness of management to invest in R&D.43
Financial LeverageThe mix of externally generated short-term and long-term funds in relation to the amount andtiming of internally generated funds should be appropriate to the corporate objectives, strate-gies, and policies. The concept of financial leverage (the ratio of total debt to total assets) ishelpful in describing how debt is used to increase the earnings available to common sharehold-ers. When the company finances its activities by sales of bonds or notes instead of throughstock, the earnings per share are boosted: the interest paid on the debt reduces taxable income,but fewer shareholders share the profits than if the company had sold more stock to finance itsactivities. The debt, however, does raise the firm’s break-even point above what it would havebeen if the firm had financed from internally generated funds only. High leverage may there-fore be perceived as a corporate strength in times of prosperity and ever-increasing sales, or asa weakness in times of a recession and falling sales. This is because leverage acts to magnifythe effect on earnings per share of an increase or decrease in dollar sales. Research indicatesthat greater leverage has a positive impact on performance for firms in stable environments,but a negative impact for firms in dynamic environments.44
Capital BudgetingCapital budgeting is the analyzing and ranking of possible investments in fixed assets suchas land, buildings, and equipment in terms of the additional outlays and additional receipts thatwill result from each investment. A good finance department will be able to prepare such cap-ital budgets and to rank them on the basis of some accepted criteria or hurdle rate (for exam-ple, years to pay back investment, rate of return, or time to break-even point) for the purposeof strategic decision making. Most firms have more than one hurdle rate and vary it as a func-tion of the type of project being considered. Projects with high strategic significance, such asentering new markets or defending market share, will often have low hurdle rates.45
154 PART 2 Scanning the Environment
STRATEGIC RESEARCH AND DEVELOPMENT (R&D) ISSUESThe R&D manager is responsible for suggesting and implementing a company’s technologi-cal strategy in light of its corporate objectives and policies. The manager’s job, therefore, in-volves (1) choosing among alternative new technologies to use within the corporation,(2) developing methods of embodying the new technology in new products and processes, and(3) deploying resources so that the new technology can be successfully implemented.
R&D Intensity, Technological Competence, and Technology TransferThe company must make available the resources necessary for effective research and devel-opment. A company’s R&D intensity (its spending on R&D as a percentage of sales revenue)is a principal means of gaining market share in global competition. The amount spent onR&D often varies by industry. For example, the U.S. computer software industry tradition-ally spends 13.5% of its sales dollar for R&D, whereas the paper and forest products indus-try spends only 1.0%.46 A good rule of thumb for R&D spending is that a corporation shouldspend at a “normal” rate for that particular industry unless its strategic plan calls for unusualexpenditures.
Simply spending money on R&D or new projects does not mean, however, that the moneywill produce useful results. For example, Pharmacia Upjohn spent more of its revenues on re-search than any other company in any industry (18%), but it was ranked low in innovation.47
A company’s R&D unit should be evaluated for technological competence in both the devel-opment and the use of innovative technology. Not only should the corporation make a consis-tent research effort (as measured by reasonably constant corporate expenditures that result inusable innovations), it should also be proficient in managing research personnel and integrat-ing their innovations into its day-to-day operations. A company should also be proficient intechnology transfer, the process of taking a new technology from the laboratory to the mar-ketplace. Aerospace parts maker Rockwell Collins, for example, is a master of developing newtechnology, such as the “heads-up display” (transparent screens in an airplane cockpit that tellpilots speed, altitude, and direction), for the military and then using it in products built for thecivilian market.48
R&D MixBasic R&D is conducted by scientists in well-equipped laboratories where the focus is on the-oretical problem areas. The best indicators of a company’s capability in this area are its patentsand research publications. Product R&D concentrates on marketing and is concerned withproduct or product-packaging improvements. The best measurements of ability in this area arethe number of successful new products introduced and the percentage of total sales and prof-its coming from products introduced within the past five years. Engineering (or process) R&Dis concerned with engineering, concentrating on quality control, and the development of de-sign specifications and improved production equipment. A company’s capability in this areacan be measured by consistent reductions in unit manufacturing costs and by the number ofproduct defects.
Most corporations will have a mix of basic, product, and process R&D, which variesby industry, company, and product line. The balance of these types of research is known asthe R&D mix and should be appropriate to the strategy being considered and to each prod-uct’s life cycle. For example, it is generally accepted that product R&D normally dominatesthe early stages of a product’s life cycle (when the product’s optimal form and features arestill being debated), whereas process R&D becomes especially important in the later stages(when the product’s design is solidified and the emphasis is on reducing costs and improv-ing quality).
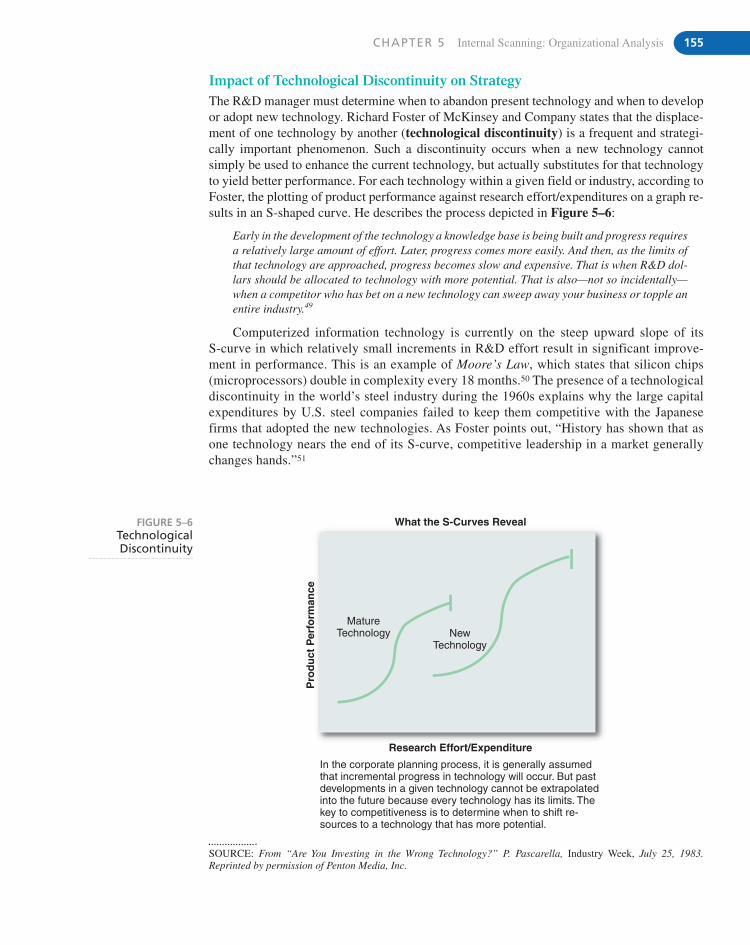
CHAPTER 5 Internal Scanning: Organizational Analysis 155
Impact of Technological Discontinuity on StrategyThe R&D manager must determine when to abandon present technology and when to developor adopt new technology. Richard Foster of McKinsey and Company states that the displace-ment of one technology by another (technological discontinuity) is a frequent and strategi-cally important phenomenon. Such a discontinuity occurs when a new technology cannotsimply be used to enhance the current technology, but actually substitutes for that technologyto yield better performance. For each technology within a given field or industry, according toFoster, the plotting of product performance against research effort/expenditures on a graph re-sults in an S-shaped curve. He describes the process depicted in Figure 5–6:
Early in the development of the technology a knowledge base is being built and progress requiresa relatively large amount of effort. Later, progress comes more easily. And then, as the limits ofthat technology are approached, progress becomes slow and expensive. That is when R&D dol-lars should be allocated to technology with more potential. That is also—not so incidentally—when a competitor who has bet on a new technology can sweep away your business or topple anentire industry.49
Computerized information technology is currently on the steep upward slope of its S-curve in which relatively small increments in R&D effort result in significant improve-ment in performance. This is an example of Moore’s Law, which states that silicon chips(microprocessors) double in complexity every 18 months.50 The presence of a technologicaldiscontinuity in the world’s steel industry during the 1960s explains why the large capitalexpenditures by U.S. steel companies failed to keep them competitive with the Japanesefirms that adopted the new technologies. As Foster points out, “History has shown that asone technology nears the end of its S-curve, competitive leadership in a market generallychanges hands.”51
What the S-Curves Reveal
Research Effort/Expenditure
In the corporate planning process, it is generally assumedthat incremental progress in technology will occur. But pastdevelopments in a given technology cannot be extrapolatedinto the future because every technology has its limits. Thekey to competitiveness is to determine when to shift re-sources to a technology that has more potential.
MatureTechnology New
Technology
Pro
du
ct P
erfo
rman
ce
FIGURE 5–6TechnologicalDiscontinuity
SOURCE: From “Are You Investing in the Wrong Technology?” P. Pascarella, Industry Week, July 25, 1983.Reprinted by permission of Penton Media, Inc.
156 PART 2 Scanning the Environment
Christensen explains in The Innovator’s Dilemma why this transition occurs when a “dis-ruptive technology” enters an industry. In a study of computer disk drive manufacturers, he ex-plains that established market leaders are typically reluctant to move in a timely manner to anew technology. This reluctance to switch technologies (even when the firm is aware of thenew technology and may have even invented it!) is because the resource allocation process inmost companies gives priority to those projects (typically based on the old technology) withthe greatest likelihood of generating a good return on investment—those projects appealing tothe firm’s current customers (whose products are also based on the characteristics of the oldtechnology). For example, in the 1980s a disk drive manufacturer’s customers (PC manufac-turers) wanted a better (faster) 5 1/4� drive with greater capacity. These PC makers were notinterested in the new 3 1/2� drives based on the new technology because (at that time) thesmaller drives were slower and had less capacity. Smaller size was irrelevant since these com-panies primarily made desk top personal computers which were designed to hold large drives.
The new technology is generally riskier and of little appeal to the current customers of es-tablished firms. Products derived from the new technology are more expensive and do notmeet the customers’ requirements—requirements based on the old technology. New entrepre-neurial firms are typically more interested in the new technology because it is one way to ap-peal to a developing market niche in a market currently dominated by established companies.Even though the new technology may be more expensive to develop, it offers performance im-provements in areas that are attractive to this small niche, but of no consequence to the cus-tomers of the established competitors.
This was the case with the entrepreneurial manufacturers of 3 1/2� disk drives. Thesesmaller drives appealed to the PC makers who were trying to increase their small PC marketshare by offering laptop computers. Size and weight were more important to these customersthan were capacity and speed. By the time the new technology was developed to the point thatthe 31/2� drive matched and even surpassed the 51/4� drive in terms of speed and capacity (inaddition to size and weight), it was too late for the established 5 1/4� disk drive firms to switchto the new technology. Once their customers begin demanding smaller products using the newtechnology, the established firms were unable to respond quickly and lost their leadership po-sition in the industry. They were able to remain in the industry (with a much reduced marketshare) only if they were able to utilize the new technology to be competitive in the new prod-uct line.52
The same phenomenon can be seen in many product categories ranging from flat-paneldisplay screens to railroad locomotives to digital photography to musical recordings. For ex-ample, George Heilmeier created the first practical liquid-crystal display (LCD) in 1964 atRCA Labs. RCA unveiled the new display in 1968 with much fanfare about LCDs being thefuture of TV sets, but then refused to fund further development of the new technology. In con-trast, Japanese television and computer manufacturers invested in long-term development ofLCDs. Today, Japanese, Korean, and Taiwanese companies dominate the $39 billion LCDbusiness and RCA no longer makes televisions. Interestingly, Heilmeier received the KyotoPrize in 2005 for his LCD invention.53
STRATEGIC OPERATIONS ISSUESThe primary task of the operations (manufacturing or service) manager is to develop and op-erate a system that will produce the required number of products or services, with a certainquality, at a given cost, within an allotted time. Many of the key concepts and techniques pop-ularly used in manufacturing can be applied to service businesses.
In very general terms, manufacturing can be intermittent or continuous. In intermittentsystems (job shops), the item is normally processed sequentially, but the work and sequence
CHAPTER 5 Internal Scanning: Organizational Analysis 157
of the process vary. An example is an auto body repair shop. At each location, the tasks deter-mine the details of processing and the time required for them. These job shops can be very la-bor intensive. For example, a job shop usually has little automated machinery and thus a smallamount of fixed costs. It has a fairly low break-even point, but its variable cost line (composedof wages and costs of special parts) has a relatively steep slope. Because most of the costs as-sociated with the product are variable (many employees earn piece-rate wages), a job shop’svariable costs are higher than those of automated firms. Its advantage over other firms is thatit can operate at low levels and still be profitable. After a job shop’s sales reach break-even,however, the huge variable costs as a percentage of total costs keep the profit per unit at a rel-atively low level. In terms of strategy, this firm should look for a niche in the marketplace forwhich it can produce and sell a reasonably small quantity of custom-made goods.
In contrast, continuous systems are those laid out as lines on which products can be con-tinuously assembled or processed. An example is an automobile assembly line. A firm usingcontinuous systems invests heavily in fixed investments such as automated processes andhighly sophisticated machinery. Its labor force, relatively small but highly skilled, earnssalaries rather than piece-rate wages. Consequently, this firm has a high amount of fixed costs.It also has a relatively high break-even point, but its variable cost line rises slowly. This is anexample of operating leverage, the impact of a specific change in sales volume on net operat-ing income. The advantage of high operating leverage is that once the firm reaches break-even,its profits rise faster than do those of less automated firms having lower operating leverage.Continuous systems reap benefits from economies of scale. In terms of strategy, this firm needsto find a high-demand niche in the marketplace for which it can produce and sell a large quan-tity of goods. However, a firm with high operating leverage is likely to suffer huge losses dur-ing a recession. During an economic downturn, the firm with less automation and thus lessleverage is more likely to survive comfortably because a drop in sales primarily affects vari-able costs. It is often easier to lay off labor than to sell off specialized plants and machines.
Experience CurveA conceptual framework that many large corporations have used successfully is the experiencecurve (originally called the learning curve). The experience curve suggests that unit produc-tion costs decline by some fixed percentage (commonly 20%–30%) each time the total accu-mulated volume of production in units doubles. The actual percentage varies by industry and isbased on many variables: the amount of time it takes a person to learn a new task, scaleeconomies, product and process improvements, and lower raw materials cost, among others.For example, in an industry with an 85% experience curve, a corporation might expect a 15%reduction in unit costs for every doubling of volume. The total costs per unit can be expected todrop from $100 when the total production is 10 units, to $85 ($100 x 85%) when production in-creases to 20 units, and to $72.25 ($85 x 85%) when it reaches 40 units. Achieving these resultsoften means investing in R&D and fixed assets; higher fixed costs and less flexibility thus re-sult. Nevertheless the manufacturing strategy is one of building capacity ahead of demand inorder to achieve the lower unit costs that develop from the experience curve. On the basis ofsome future point on the experience curve, the corporation should price the product or servicevery low to preempt competition and increase market demand. The resulting high number ofunits sold and high market share should result in high profits, based on the low unit costs.
Management commonly uses the experience curve in estimating the production costsof (1) a product never before made with the present techniques and processes or (2) currentproducts produced by newly introduced techniques or processes. The concept was first ap-plied in the airframe industry and can be applied in the service industry as well. For exam-ple, a cleaning company can reduce its costs per employee by having its workers use thesame equipment and techniques to clean many adjacent offices in one office building rather
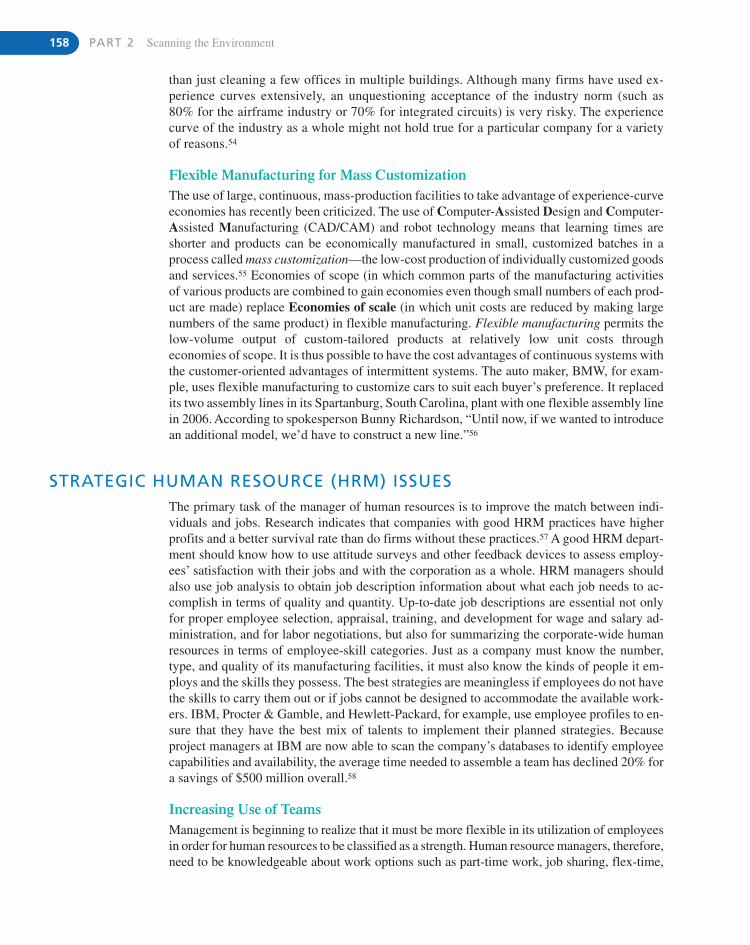
158 PART 2 Scanning the Environment
STRATEGIC HUMAN RESOURCE (HRM) ISSUESThe primary task of the manager of human resources is to improve the match between indi-viduals and jobs. Research indicates that companies with good HRM practices have higherprofits and a better survival rate than do firms without these practices.57 A good HRM depart-ment should know how to use attitude surveys and other feedback devices to assess employ-ees’ satisfaction with their jobs and with the corporation as a whole. HRM managers shouldalso use job analysis to obtain job description information about what each job needs to ac-complish in terms of quality and quantity. Up-to-date job descriptions are essential not onlyfor proper employee selection, appraisal, training, and development for wage and salary ad-ministration, and for labor negotiations, but also for summarizing the corporate-wide humanresources in terms of employee-skill categories. Just as a company must know the number,type, and quality of its manufacturing facilities, it must also know the kinds of people it em-ploys and the skills they possess. The best strategies are meaningless if employees do not havethe skills to carry them out or if jobs cannot be designed to accommodate the available work-ers. IBM, Procter & Gamble, and Hewlett-Packard, for example, use employee profiles to en-sure that they have the best mix of talents to implement their planned strategies. Becauseproject managers at IBM are now able to scan the company’s databases to identify employeecapabilities and availability, the average time needed to assemble a team has declined 20% fora savings of $500 million overall.58
Increasing Use of TeamsManagement is beginning to realize that it must be more flexible in its utilization of employeesin order for human resources to be classified as a strength. Human resource managers, therefore,need to be knowledgeable about work options such as part-time work, job sharing, flex-time,
than just cleaning a few offices in multiple buildings. Although many firms have used ex-perience curves extensively, an unquestioning acceptance of the industry norm (such as80% for the airframe industry or 70% for integrated circuits) is very risky. The experiencecurve of the industry as a whole might not hold true for a particular company for a varietyof reasons.54
Flexible Manufacturing for Mass CustomizationThe use of large, continuous, mass-production facilities to take advantage of experience-curveeconomies has recently been criticized. The use of Computer-Assisted Design and Computer-Assisted Manufacturing (CAD/CAM) and robot technology means that learning times areshorter and products can be economically manufactured in small, customized batches in aprocess called mass customization—the low-cost production of individually customized goodsand services.55 Economies of scope (in which common parts of the manufacturing activities of various products are combined to gain economies even though small numbers of each prod-uct are made) replace Economies of scale (in which unit costs are reduced by making largenumbers of the same product) in flexible manufacturing. Flexible manufacturing permits thelow-volume output of custom-tailored products at relatively low unit costs througheconomies of scope. It is thus possible to have the cost advantages of continuous systems withthe customer-oriented advantages of intermittent systems. The auto maker, BMW, for exam-ple, uses flexible manufacturing to customize cars to suit each buyer’s preference. It replacedits two assembly lines in its Spartanburg, South Carolina, plant with one flexible assembly linein 2006. According to spokesperson Bunny Richardson, “Until now, if we wanted to introducean additional model, we’d have to construct a new line.”56
CHAPTER 5 Internal Scanning: Organizational Analysis 159
extended leaves, and contract work, and especially about the proper use of teams. Over two-thirds of large U.S. companies are successfully using autonomous (self-managing) work teamsin which a group of people work together without a supervisor to plan, coordinate, and evaluatetheir own work.59 Northern Telecom found productivity and quality to increase with work teamsto such an extent that it was able to reduce the number of quality inspectors by 40%.60
As a way to move a product more quickly through its development stage, companies likeMotorola, Chrysler, NCR, Boeing, and General Electric are using cross-functional work teams.Instead of developing products in a series of steps—beginning with a request from sales, whichleads to design, then to engineering and on to purchasing, and finally to manufacturing (and of-ten resulting in a costly product rejected by the customer)—companies are tearing down the tra-ditional walls separating the departments so that people from each discipline can get involvedin projects early on. In a process called concurrent engineering, the once-isolated specialistsnow work side by side and compare notes constantly in an effort to design cost-effective prod-ucts with features customers want. Taking this approach enabled Chrysler Corporation to reduceits product development cycle from 60 to 36 months.61 For such cross-functional work teams tobe successful, the groups must receive training and coaching. Otherwise, poorly implementedteams may worsen morale, create divisiveness, and raise the level of cynicism among workers.62
Virtual teams are groups of geographically and/or organizationally dispersed coworkersthat are assembled using a combination of telecommunications and information technologiesto accomplish an organizational task.63 In the U.S. alone, more than half of companies havingover 5,000 employees use virtual teams involving around 8.4 million people.64 According tothe Gartner Group, more than 60% of professional employees now work in virtual teams.65 In-ternet, intranet, and extranet systems are combining with other new technologies, such as desk-top video conferencing and collaborative software, to create a new workplace in which teamsof workers are no longer restrained by geography, time, or organizational boundaries. Thistechnology allows about 12% of the U.S. workforce, who have no permanent office at theircompanies, to do team projects over the Internet and report to a manager thousands of milesaway. More than 20 million people in the U.S. are engaged in telecommuting.66 CharlesGrantham of Work Design Collaborative predicts that 40% of the workforce will be workingremotely by 2012.67
As more companies outsource some of the activities previously conducted internally, thetraditional organizational structure is being replaced by a series of virtual teams, which rarely,if ever, meet face-to-face. Such teams may be established as temporary groups to accomplish aspecific task or may be more permanent to address continuing issues such as strategic planning.Membership on these teams is often fluid, depending upon the task to be accomplished. Theymay include not only employees from different functions within a company, but also membersof various stakeholder groups, such as suppliers, customers, and law or consulting firms. Theuse of virtual teams to replace traditional face-to-face work groups is being driven by five trends:
1. Flatter organizational structures with increasing cross-functional coordination need
2. Turbulent environments requiring more inter-organizational cooperation
3. Increasing employee autonomy and participation in decision making
4. Higher knowledge requirements derived from a greater emphasis on service
5. Increasing globalization of trade and corporate activity68
Union Relations and Temporary/Part-Time WorkersIf the corporation is unionized, a good human resource manager should be able to work closelywith the union. Even though union membership had dropped to only 12.1% of the U.S. work-force by 2007 compared to 20.1% in 1983, it still included 15.7 million people. Nevertheless,
160 PART 2 Scanning the Environment
only 7.5% of the 108,714 million private sector employees belonged to a union (compared to35.9% of public sector employees).69 To save jobs, U.S. unions are increasingly willing to sup-port new strategic initiatives and employee involvement programs. For example, United SteelWorkers hired Ron Bloom, an investment banker, to propose a strategic plan to makeGoodyear Tire & Rubber globally competitive in a way that would preserve as many jobs aspossible. In a recent contract, the union gave up $1.15 billion in wage and benefit concessionsover three years in return for a promise by Goodyear’s top management to invest in 12 of its14 U.S. factories, to limit imports from its factories in Brazil and Asia, and to maintain 85%of its 19,000-person workforce. The company also agreed to aggressively restructure thefirm’s $5 billion debt. According to Bloom, “We told Goodyear, ‘We’ll make you profitable,but you’re going to adopt this strategy.’. . . We think the company should be a patient, long-term builder of value for the employees and shareholders.”70
Outside the United States, the average proportion of unionized workers among major in-dustrialized nations is around 50%. European unions tend to be militant, politically oriented,and much less interested in working with management to increase efficiency. Nationwidestrikes can occur quickly. In contrast, Japanese unions are typically tied to individual compa-nies and are usually supportive of management. These differences among countries have sig-nificant implications for the management of multinational corporations.
To increase flexibility, avoid layoffs, and reduce labor costs, corporations are using moretemporary (also known as contingent) workers. Over 90% of U.S. and European firms use tem-porary workers in some capacity; 43% use them in professional and technical functions.71 Ap-proximately 13% of the U.S. workforce are part-time workers. The percentage is even higherin Japan, where 26% of workers are part-time, and in the Netherlands, where 36% of all em-ployees work part-time.72 Labor unions are concerned that companies use temps to avoid hir-ing costlier unionized workers. At United Parcel Service, for example, 80% of the jobs createdfrom 1993 to 1997 were staffed by part-timers, whose pay rates hadn’t changed since 1982.Fully 10% of the company’s 128,000 part-timers worked 30 hours or more per week, but werestill paid at a lower rate than were full-time employees.73
Quality of Work Life and Human DiversityHuman resource departments have found that to reduce employee dissatisfaction and union-ization efforts (or, conversely, to improve employee satisfaction and existing union relations),they must consider the quality of work life in the design of jobs. Partially a reaction to the tra-ditionally heavy emphasis on technical and economic factors in job design, quality of work lifeemphasizes improving the human dimension of work. The knowledgeable human resourcemanager, therefore, should be able to improve the corporation’s quality of work life by (1) in-troducing participative problem solving, (2) restructuring work, (3) introducing innovative re-ward systems, and (4) improving the work environment. It is hoped that these improvementswill lead to a more participative corporate culture and thus higher productivity and qualityproducts. Ford Motor Company, for example, rebuilt and modernized its famous River Rougeplant using flexible equipment and new processes. Employees work in teams and use Internet-connected PCs on the shop floor to share their concerns instantly with suppliers or product en-gineers. Workstations were redesigned to make them more ergonomic and reducerepetitive-strain injuries. “If you feel good while you’re working, I think quality and produc-tivity will increase, and Ford thinks that too, otherwise, they wouldn’t do this,” observed JerrySullivan, president of United Auto Workers Local 600.74
Companies are also discovering that by redesigning their plants and offices for improvedenergy efficiency, they can receive a side effect of improving their employees’ quality of worklife—thus raising labor productivity. See the Environmental Sustainability Issue feature tolearn how improved energy efficiency can not only cut costs, but also boost employee morale.
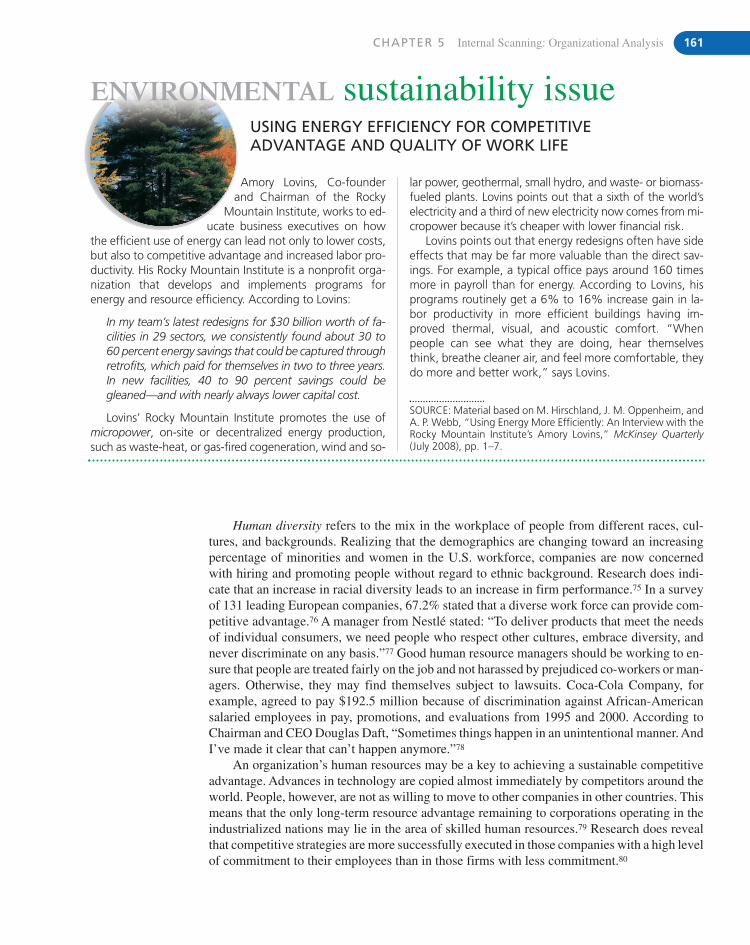
CHAPTER 5 Internal Scanning: Organizational Analysis 161
SOURCE: Material based on M. Hirschland, J. M. Oppenheim, andA. P. Webb, “Using Energy More Efficiently: An Interview with theRocky Mountain Institute’s Amory Lovins,” McKinsey Quarterly(July 2008), pp. 1–7.
lar power, geothermal, small hydro, and waste- or biomass-fueled plants. Lovins points out that a sixth of the world’selectricity and a third of new electricity now comes from mi-cropower because it’s cheaper with lower financial risk.
Lovins points out that energy redesigns often have sideeffects that may be far more valuable than the direct sav-ings. For example, a typical office pays around 160 timesmore in payroll than for energy. According to Lovins, hisprograms routinely get a 6% to 16% increase gain in la-bor productivity in more efficient buildings having im-proved thermal, visual, and acoustic comfort. “Whenpeople can see what they are doing, hear themselvesthink, breathe cleaner air, and feel more comfortable, theydo more and better work,” says Lovins.
Amory Lovins, Co-founderand Chairman of the Rocky
Mountain Institute, works to ed-ucate business executives on how
the efficient use of energy can lead not only to lower costs,but also to competitive advantage and increased labor pro-ductivity. His Rocky Mountain Institute is a nonprofit orga-nization that develops and implements programs forenergy and resource efficiency. According to Lovins:
In my team’s latest redesigns for $30 billion worth of fa-cilities in 29 sectors, we consistently found about 30 to60 percent energy savings that could be captured throughretrofits, which paid for themselves in two to three years.In new facilities, 40 to 90 percent savings could begleaned—and with nearly always lower capital cost.
Lovins’ Rocky Mountain Institute promotes the use ofmicropower, on-site or decentralized energy production,such as waste-heat, or gas-fired cogeneration, wind and so-
USING ENERGY EFFICIENCY FOR COMPETITIVE ADVANTAGE AND QUALITY OF WORK LIFE
ENVIRONMENTAL sustainability issue
Human diversity refers to the mix in the workplace of people from different races, cul-tures, and backgrounds. Realizing that the demographics are changing toward an increasingpercentage of minorities and women in the U.S. workforce, companies are now concernedwith hiring and promoting people without regard to ethnic background. Research does indi-cate that an increase in racial diversity leads to an increase in firm performance.75 In a surveyof 131 leading European companies, 67.2% stated that a diverse work force can provide com-petitive advantage.76 A manager from Nestlé stated: “To deliver products that meet the needsof individual consumers, we need people who respect other cultures, embrace diversity, andnever discriminate on any basis.”77 Good human resource managers should be working to en-sure that people are treated fairly on the job and not harassed by prejudiced co-workers or man-agers. Otherwise, they may find themselves subject to lawsuits. Coca-Cola Company, forexample, agreed to pay $192.5 million because of discrimination against African-Americansalaried employees in pay, promotions, and evaluations from 1995 and 2000. According toChairman and CEO Douglas Daft, “Sometimes things happen in an unintentional manner. AndI’ve made it clear that can’t happen anymore.”78
An organization’s human resources may be a key to achieving a sustainable competitiveadvantage. Advances in technology are copied almost immediately by competitors around theworld. People, however, are not as willing to move to other companies in other countries. Thismeans that the only long-term resource advantage remaining to corporations operating in theindustrialized nations may lie in the area of skilled human resources.79 Research does revealthat competitive strategies are more successfully executed in those companies with a high levelof commitment to their employees than in those firms with less commitment.80
162 PART 2 Scanning the Environment
STRATEGIC INFORMATION SYSTEMS/TECHNOLOGY ISSUESThe primary task of the manager of information systems/technology is to design and managethe flow of information in an organization in ways that improve productivity and decisionmaking. Information must be collected, stored, and synthesized in such a manner that it willanswer important operating and strategic questions. A corporation’s information system can bea strength or a weakness in multiple areas of strategic management. It can not only aid in en-vironmental scanning and in controlling a company’s many activities, it can also be used as astrategic weapon in gaining competitive advantage.
Impact on PerformanceInformation systems/technology offers four main contributions to corporate performance. First,(beginning in the 1970s with mainframe computers) it is used to automate existing back-officeprocesses, such as payroll, human resource records, accounts payable and receivable, and to estab-lish huge databases. Second, (beginning in the 1980s) it is used to automate individual tasks, suchas keeping track of clients and expenses, through the use of personal computers with word process-ing and spreadsheet software. Corporate databases are accessed to provide sufficient data to ana-lyze the data and create what-if scenarios. These first two contributions tend to focus on reducingcosts. Third, (beginning in the 1990s) it is used to enhance key business functions, such as market-ing and operations. This third contribution focuses on productivity improvements. The system pro-vides customer support and help in distribution and logistics. For example, Federal Express foundthat by allowing customers to directly access its package-tracking database via its Internet Web siteinstead of their having to ask a human operator, the company saved up to $2 million annually.81
Business processes are analyzed to increase efficiency and productivity via reengineering. Enter-prise resource planning (ERP) application software, such as SAP, PeopleSoft, Oracle, Baan, andJ.D. Edwards, (discussed further in Chapter 10) is used to integrate worldwide business activitiesso that employees need to enter information only once and that information is available to all cor-porate systems (including accounting) around the world. Fourth, (beginning in 2000) it is used todevelop competitive advantage. For example, American Hospital Supply (AHS), a leading manu-facturer and distributor of a broad line of products for doctors, laboratories, and hospitals, devel-oped an order entry distribution system that directly linked the majority of its customers to AHScomputers. The system was successful because it simplified ordering processes for customers, re-duced costs for both AHS and the customer, and allowed AHS to provide pricing incentives to thecustomer. As a result, customer loyalty was high and AHS’s share of the market became large.
A current trend in corporate information systems/technology is the increasing use of theInternet for marketing, intranets for internal communication, and extranets for logistics anddistribution. An intranet is an information network within an organization that also has accessto the external worldwide Internet. Intranets typically begin as ways to provide employeeswith company information such as lists of product prices, fringe benefits, and company poli-cies. They are then converted into extranets for supply chain management. An extranet is aninformation network within an organization that is available to key suppliers and customers.The key issue in building an extranet is the creation of “fire walls” to block extranet users fromaccessing the firm’s or other users’ confidential data. Once this is accomplished, companiescan allow employees, customers, and suppliers to access information and conduct business onthe Internet in a completely automated manner. By connecting these groups, companies hopeto obtain a competitive advantage by reducing the time needed to design and bring new prod-ucts to market, slashing inventories, customizing manufacturing, and entering new markets.82
A recent development in information systems/technology is Web 2.0. Web 2.0 refers to theuse of wikis, blogs, RSS (Really Simple Syndication), social networks (e.g., MySpace andFacebook), podcasts, and mash-ups through company Web sites to forge tighter links with cus-tomers and suppliers and to engage employees more successfully. A 2008 survey by McKinsey
CHAPTER 5 Internal Scanning: Organizational Analysis 163
revealed the percentage of companies using individual Web 2.0 technologies to be Web ser-vices (58%), blogs (34%), RSS (33%), wikis (32%), podcasts (29%), social networking (28%),peer-to-peer (18%), and mash-ups (10%). The most heavily used tool is Web services, soft-ware that makes it easier to exchange information and conduct transactions. Wikis and blogsare being increasingly used in companies throughout the world. Satisfied users of these infor-mation technologies report that they are using these tools to interact with their customers, sup-pliers, and outside experts in product development efforts known as co-creation. For example,LEGO invited customers to suggest new models interactively and then financially rewardedthe people whose ideas proved marketable.83
Supply Chain ManagementThe expansion of the marketing-oriented Internet into intranets and extranets is making sig-nificant contributions to organizational performance through supply chain management.Supply chain management is the forming of networks for sourcing raw materials, manufac-turing products or creating services, storing and distributing the goods, and delivering them tocustomers and consumers.84 Research indicates that supplier network resources have a signif-icant impact on firm performance.85 A survey of global executives revealed that their interestin supply chains was first to reduce costs, and then to improve customer service and get newproducts to market faster.86 More than 85% of senior executives stated that improving theirfirm’s supply-chain performance was a top priority. Companies, like Wal-Mart, Dell, and Toy-ota, who are known to be exemplars in supply-chain management, spend only 4% of their rev-enues on supply chain costs compared to 10% by the average firm.87
Industry leaders are integrating modern information systems into their corporate valuechains to harmonize companywide efforts and to achieve competitive advantage. For example,Heineken beer distributors input actual depletion figures and replenishment orders to the Nether-lands brewer through their linked Web pages. This interactive planning system generates time-phased orders based on actual usage rather than on projected demand. Distributors are then ableto modify plans based on local conditions or changes in marketing. Heineken uses these modifi-cations to adjust brewing and supply schedules. As a result of this system, lead times have beenreduced from the traditional 10–12 weeks to 4–6 weeks. This time savings is especially useful inan industry competing on product freshness. In another example, Procter & Gamble participatesin an information network to move the company’s line of consumer products through Wal-Mart’smany stores. Radio-frequency identification (RFID) tags containing product information is usedto track goods through inventory and distribution channels. As part of the network with Wal-Mart, P&G knows by cash register and by store what products have passed through the systemevery hour of each day. The network is linked by satellite communications on a real-time basis.With actual point-of-sale information, products are replenished to meet current demand and min-imize stockouts while maintaining exceptionally low inventories.88
5.5 The Strategic Audit:A Checklist for Organizational Analysis
One way of conducting an organizational analysis to ascertain a company’s strengths andweakness is by using the Strategic Audit found in Appendix 1.A at the end of Chapter 1. Theaudit provides a checklist of questions by area of concern. For example, Part IV of the auditexamines corporate structure, culture, and resources. It looks at organizational resources andcapabilities in terms of the functional areas of marketing, finance, R&D, operations, humanresources, and information systems, among others.
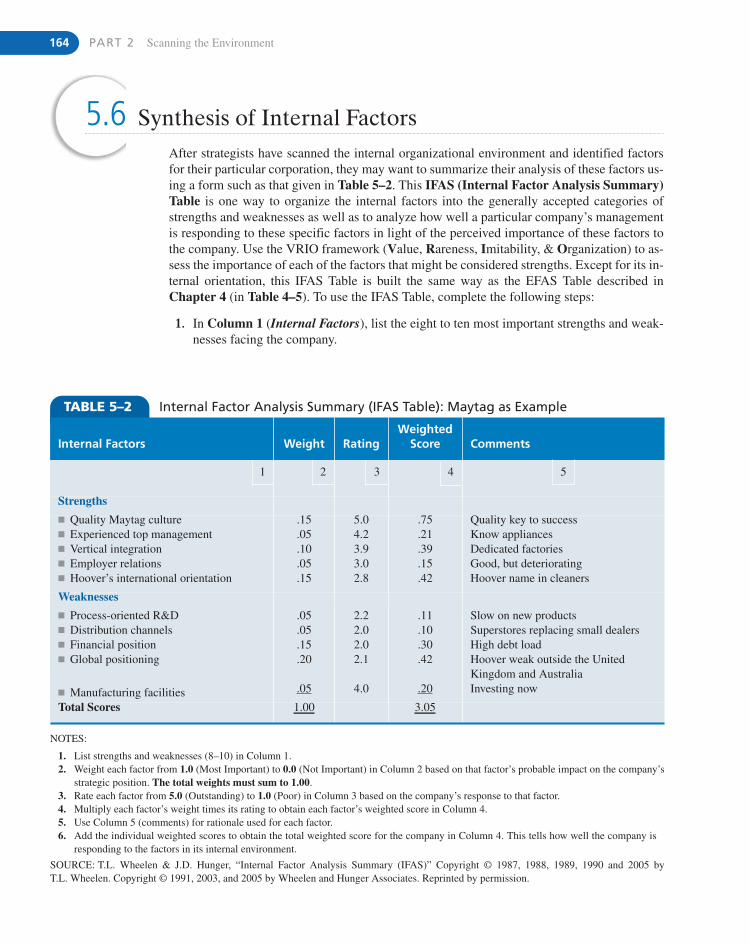
164 PART 2 Scanning the Environment
TABLE 5–2 Internal Factor Analysis Summary (IFAS Table): Maytag as Example
Internal Factors Weight RatingWeighted
Score Comments
1 2 3 4 5
Strengths� Quality Maytag culture� Experienced top management� Vertical integration� Employer relations� Hoover’s international orientation
.15
.05
.10
.05
.15
5.04.23.93.02.8
.75
.21
.39
.15
.42
Quality key to successKnow appliancesDedicated factoriesGood, but deterioratingHoover name in cleaners
Weaknesses� Process-oriented R&D� Distribution channels� Financial position� Global positioning
� Manufacturing facilities
.05
.05
.15
.20
.05
2.22.02.02.1
4.0
.11
.10
.30
.42
.20
Slow on new productsSuperstores replacing small dealersHigh debt loadHoover weak outside the UnitedKingdom and AustraliaInvesting now
Total Scores 1.00 3.05
NOTES:
1. List strengths and weaknesses (8–10) in Column 1.2. Weight each factor from 1.0 (Most Important) to 0.0 (Not Important) in Column 2 based on that factor’s probable impact on the company’s
strategic position. The total weights must sum to 1.00.3. Rate each factor from 5.0 (Outstanding) to 1.0 (Poor) in Column 3 based on the company’s response to that factor.4. Multiply each factor’s weight times its rating to obtain each factor’s weighted score in Column 4.5. Use Column 5 (comments) for rationale used for each factor.6. Add the individual weighted scores to obtain the total weighted score for the company in Column 4. This tells how well the company is
responding to the factors in its internal environment.
SOURCE: T.L. Wheelen & J.D. Hunger, “Internal Factor Analysis Summary (IFAS)” Copyright © 1987, 1988, 1989, 1990 and 2005 by T.L. Wheelen. Copyright © 1991, 2003, and 2005 by Wheelen and Hunger Associates. Reprinted by permission.
5.6 Synthesis of Internal FactorsAfter strategists have scanned the internal organizational environment and identified factorsfor their particular corporation, they may want to summarize their analysis of these factors us-ing a form such as that given in Table 5–2. This IFAS (Internal Factor Analysis Summary)Table is one way to organize the internal factors into the generally accepted categories ofstrengths and weaknesses as well as to analyze how well a particular company’s managementis responding to these specific factors in light of the perceived importance of these factors tothe company. Use the VRIO framework (Value, Rareness, Imitability, & Organization) to as-sess the importance of each of the factors that might be considered strengths. Except for its in-ternal orientation, this IFAS Table is built the same way as the EFAS Table described inChapter 4 (in Table 4–5). To use the IFAS Table, complete the following steps:
1. In Column 1 (Internal Factors), list the eight to ten most important strengths and weak-nesses facing the company.
CHAPTER 5 Internal Scanning: Organizational Analysis 165
2. In Column 2 (Weight), assign a weight to each factor from 1.0 (Most Important) to0.0 (Not Important) based on that factor’s probable impact on a particular company’scurrent strategic position. The higher the weight, the more important is this factor to thecurrent and future success of the company. All weights must sum to 1.0 regardless ofthe number of factors.
3. In Column 3 (Rating), assign a rating to each factor from 5.0 (Outstanding) to 1.0 (Poor)based on management’s specific response to that particular factor. Each rating is a judg-ment regarding how well the company’s management is currently dealing with each spe-cific internal factor.
4. In Column 4 (Weighted Score), multiply the weight in Column 2 for each factor timesits rating in Column 3 to obtain that factor’s weighted score.
5. In Column 5 (Comments), note why a particular factor was selected and/or how itsweight and rating were estimated.
6. Finally, add the weighted scores for all the internal factors in Column 4 to determine thetotal weighted score for that particular company. The total weighted score indicates howwell a particular company is responding to current and expected factors in its internal en-vironment. The score can be used to compare that firm to other firms in its industry. Checkto ensure that the total weighted score truly reflects the company’s current performancein terms of profitability and market share. The total weighted score for an average firmin an industry is always 3.0.
As an example of this procedure, Table 5–2 includes a number of internal factors for May-tag Corporation in 1995 (before Maytag was acquired by Whirlpool) with correspondingweights, ratings, and weighted scores provided. Note that Maytag’s total weighted score is3.05, meaning that the corporation is about average compared to the strengths and weaknessesof others in the major home appliance industry.
End of Chapter SUMMARYEvery day, about 17 truckloads of used diesel engines and other parts are dumped at a receiving facility at Caterpillar’s remanufacturing plant in Corinth, Mississippi. The filthyiron engines are then broken down by two workers, who manually hammer and drill forhalf a day until they have taken every bolt off the engine and put each component into itsown bin. The engines are then cleaned and re-made at a half the cost of a new engine andsold for a tidy profit. This system works at Caterpillar because as a general rule, 70% ofthe cost to build something new is in the materials and 30% is in the labor. Remanufactur-ing simply starts the manufacturing process over again with materials that are essentiallyfree and which already contain most of the energy costs needed to make them. The would-be discards become fodder for the next product, eliminating waste, and cutting costs. Caterpillar’s management was so impressed by the remanufacturing operation that theymade the business a separate division in 2005. The unit earned more than $1 billion in salesin 2005 and expects 15% growth for many more years—given the steadily increasing costof oil and raw materials.
Caterpillar’s remanufacturing unit was successful not only because of its capability ofwringing productivity out of materials and labor, but also because it designed its products forre-use. Before they are built new, remanufactured products must be designed for disassembly.In order to achieve this, Caterpillar asks its designers to check a “Reman” box on Caterpillar’s
166 PART 2 Scanning the Environment
E C O - B I T S� The average number of plastic bottles used each year in
the U.S. per person: 200
� The average number of plastic bottles recycled eachyear in the U.S. per person: 40
� Revenue produced in 2007 by recycling and ancillaryindustries: $236 billion
� Share of electronic waste that is hauled overseas,stripped unsafely, and dumped: 80%90
D I S C U S S I O N Q U E S T I O N S1. What is the relevance of the resource-based view of the
firm to strategic management in a global environment?
2. How can value-chain analysis help identify a company’sstrengths and weaknesses?
3. In what ways can a corporation’s structure and culture beinternal strengths or weaknesses?
4. What are the pros and cons of management’s using theexperience curve to determine strategy?
5. How might a firm’s management decide whether itshould continue to invest in current known technology orin new, but untested technology? What factors might en-courage or discourage such a shift?
S T R A T E G I C P R A C T I C E E X E R C I S E SCan you analyze a corporation using the Internet? Try the fol-lowing exercise.
1. Form into teams of around three to five people. Select awell-known publicly owned company to research. Informthe instructor of your choice.
2. Assign each person a separate task. One task might be tofind the latest financial statements. Another would be tolearn as much as possible about its top management andboard of directors.Another might be to identify its businessmodel. Another might be to identify its key competitors.
3. Conduct research on the company using the Internet only.
4. Meet with your team members to discuss what you havefound. What are the company’s opportunities, threats,strengths, and weaknesses? Go back to the Internet formore information, if needed.
5. Prepare a 3- to-5 page typed report of the company. Thereport should include the following:a. Does the firm have any core competencies? Are any
of these distinctive (better than the competition)competencies? Does the firm have any competitive
product development checklist. The company also needs to know where its products are beingused in order to take them back—known as the art of reverse logistics. This is achieved byCaterpillar’s excellent relationship with its dealers throughout the world as well as through fi-nancial incentives. For example, when a customer orders a crankshaft, that customer is offereda remanufactured one for half the cost of a new one—assuming the customer turns in the oldcrankshaft to Caterpillar. The products also should be built for performance with little regardfor changing fashion. Since diesel engines change little from year to year, a remanufacturedengine is very similar to a new engine and might perform even better.
Monitoring the external environment is only one part of environmental scanning. Strate-gists also need to scan a corporation’s internal environment to identify its resources, capabili-ties, and competencies. What are its strengths and weaknesses? At Caterpillar, managementclearly noted that the environment was changing in a way to make its remanufactured productmore desirable. It took advantage of its strengths in manufacturing and distribution to offer arecycling service for its current customers and a low-cost alternative product for those whocould not afford a new Caterpillar engine. It also happened to be an environmentally friendly,sustainable business model. Caterpillar’s management felt that remanufacturing thus providedthem with a strategic advantage over competitors who don’t remanufacture. This is an exam-ple of a company using its capabilities in key functional areas to expand its business by mov-ing into a new profitable position on its value chain.89
CHAPTER 5 Internal Scanning: Organizational Analysis 167
K E Y T E R M Sbrand (p. 152)business model (p. 142)capabilities (p. 138)capital budgeting (p. 153)competency (p. 138)conglomerate structure (p. 148)continuum of sustainability (p. 141)core competencies (p. 138)corporate culture (p. 149)corporate reputation (p. 152)distinctive competencies (p. 138)divisional structure (p. 147)durability (p. 140)economies of scale (p. 158)economies of scope (p. 147)
experience curve (p. 157)explicit knowledge (p. 141)financial leverage (p. 153)functional structure (p. 147)IFAS Table (p. 164)imitability (p. 140)marketing mix (p. 151)operating leverage (p. 157)organizational analysis (p. 138)organizational structures (p. 147)product life cycle (p. 152)R&D intensity (p. 154)R&D mix (p. 154)replicability (p. 141)
resource (p. 138)simple structure (p. 147)strategic business units (SBUs) (p. 148)supply chain management (p. 163)tacit knowledge (p. 141)technological competence (p. 154)technological discontinuity (p. 155)technology transfer (p. 154)transferability (p. 140)transparency (p. 140)value chain (p. 143)virtual teams (p. 159)VRIO framework (p. 138)
advantage? Provide a SWOT analysis using EFASand IFAS Tables.
b. What is the likely future of this firm if it continues onits current path?
c. Would you buy stock in this company? Assume thatyour team has $25,000 to invest. Allocate the money
among the four to five primary competitors in this in-dustry. List the companies, the number of shares pur-chased of each, the cost of each share as of a givendate, and the total cost for each purchase assuming atypical commission used by an Internet broker, suchas E-Trade or Scottrade.
N O T E S1. D. Welch and N. Lakshman, “My Other Car Is a Tata,” Business
Week (January 14, 2008), pp. 33–34.2. R. M. Grant, Contemporary Strategy Analysis, 6th edition
(Malden, MA: Blackwell Publishing, 2008), pp. 130–131.3. G. Schreyogg and M. Kliesch-Eberl, “How Dynamic Can Or-
ganizational Capabilities Be? Towards a Dual-Process Model ofCapability Dynamization,” Strategic Management Journal(September 2007), pp. 913–933.
4. M. Javidan, “Core Competence: What Does It Mean in Prac-tice?” Long Range Planning (February 1998), pp. 60–71.
5. M. A. Hitt, B. W. Keats, and S. M. DeMarie, “Navigating in theNew Competitive Landscape: Building Strategic Flexibilityand Competitive Advantage in the 21st Century,” Academy ofManagement Executive (November 1998), pp. 22–42; C. E.Helfat and M. A. Peteraf, “The Dynamic Resources-BasedView: Capability Life Cycles,” Strategic Management Journal(October 2003), pp. 997–1010.
6. D. Brady and K. Capell, “GE Breaks the Mold to Spur Innova-tion,” Business Week (April 26, 2004), pp. 88–89.
7. J. B. Barney, Gaining and Sustaining Competitive Advantage. 2nded. (Upper Saddle River, NJ: Prentice Hall, 2002), pp. 159–172.Barney’s VRIO questions are very similar to those proposed byG. Hamel and S. K. Prahalad in their book, Competing for the Fu-ture (Boston: Harvard Business School Press, 1994) onpages 202–207 in which they state that to be distinctive, a compe-tency must (a) provide customer value, (b) be competitor unique,and (c) be extendable to develop new products and/or markets.
8. S. L. Newbert, “Value, Rareness, Competitive Advantage, andPerformance: A Conceptual-Level Empirical Investigation of
the Resource-Based View of the Firm,” Strategic ManagementJournal (July 2008), pp. 745–768.
9. Barney, p. 161.10. R. M. Grant, “The Resource-Based Theory of Competitive Ad-
vantage: Implications for Strategy Formulation,” CaliforniaManagement Review (Spring 1991), pp. 114–135.
11. P. J. Verdin, and P. J. Williamson, “Core Competencies, Com-petitive Advantage and Market Analysis: Forging the Links,” inCompetence-Based Competition, edited by G. Hamel andA. Heene (New York: John Wiley and Sons, 1994), pp. 83–84;S. K. Ethiraj, P. Kale, M. S. Krishnan, and J. V. Singh, “WhereDo Capabilities Come From and How Do They Matter? A Studyin the Software Services Industry,” Strategic ManagementJournal (January 2005), pp. 701–719.
12. J. Devan, M. B. Klusas, and T. W. Ruefli, “The Elusive Goal of Cor-porate Outperformance,” McKinsey Quarterly Online (April 2007).
13. M. E. Porter, “Clusters and the New Economics of Competi-tion,” Harvard Business Review (November–December 1998),pp. 77–90.
14. J. M. Shaver and F. Flyer, “Agglomeration Economies, FirmHeterogeneity, and Foreign Direct Investment in the UnitedStates,” Strategic Management Journal (December 2000),pp. 1175–1193; W. Chung and A. Kalnins, “Agglomeration Ef-fects and Performance: A Test of the Texas Lodging Industry,”Strategic Management Journal (October 2001), pp. 969–988.
15. M. Polanyi, The Tacit Dimension (London: Routledge & KeganPaul, 1966).
16. S. K. McEvily and B. Chakravarthy, “The Persistence ofKnowledge-Based Advantage: An Empirical Test for Product
Performance and Technological Knowledge,” Strategic Man-agement Journal (April 2002), pp. 285–305.
17. K. Maney, “Dell Business Model Turns to Muscle as RivalsStruggle,” USA Today (January 20, 2003), p. 2B.
18. P. E. Bierly III, “Development of a Generic Knowledge StrategyTypology,” Journal of Business Strategies (Spring 1999), p. 3.
19. R. W. Coff, D. C. Coff, and R. Eastvold, “The Knowledge-Leveraging Paradox: How to Achieve Scale Without MakingKnowledge Imitable,” Academy of Management Review (April2006), pp. 452–465.
20. D. Welch and N. Lakshman, p. 33.21. S. Abraham, “Experiencing Strategic Conversations about the
Central Forces of our Time,” Strategy & Leadership, Vol. 31,No. 2 (2003), pp. 61–62.
22. C. A. de Kluyver and J. A. Pearce II, Strategy: A View from theTop (Upper Saddle River, NJ: Prentice Hall, 2003), pp. 63–66.
23. P. Burrows, “Ever Wonder Why Ink Costs So Much?” BusinessWeek (November 14, 2005), pp. 42–44.
24. O. Gadiesh and J. L. Gilbert, “Profit Pools: A Fresh Look at Strat-egy,” Harvard Business Review (May–June, 1998). pp. 139–147.
25. J. R. Galbraith, “Strategy and Organization Planning,” in TheStrategy Process: Concepts, Contexts, and Cases, 2nd ed., ed-ited by H. Mintzberg and J. B. Quinn (Englewood Cliffs, N.J.:Prentice Hall, 1991), pp. 315–324.
26. M. Porter, Competitive Advantage: Creating and Sustaining Su-perior Performance (New York: The Free Press, 1985), p. 36.
27. M. Leontiades, “A Diagnostic Framework for Planning,”Strategic Management Journal (January–March 1983), p. 14.
28. E. H. Schein, The Corporate Culture Survival Guide (San Fran-cisco: Jossey-Bass, 1999), p. 12; L. C. Harris and E. Ogbonna,“The Strategic Legacy of Company Founders,” Long RangePlanning (June 1999), pp. 333–343.
29. D. M. Rousseau, “Assessing Organizational Culture: The Case forMultiple Methods,” in Organizational Climate and Culture, editedby B. Schneider (San Francisco: Jossey-Bass, 1990), pp. 153–192.
30. L. Smircich, “Concepts of Culture and Organizational Analysis,”Administrative Science Quarterly (September 1983), pp. 345–346;D. Ravasi and M. Schultz, “Responding to Organizational IdentityThreats: Exploring the Role of Organizational Culture,” Academyof Management Journal (June 2006), pp. 433–458.
31. D. G. Allen, “Do Organizational Socialization Tactics InfluenceNewcomer Embeddedness and Turnover?” Journal of Manage-ment (April 2006), pp. 237–256.
32. J. B. Sorensen, “The Strength of Corporate Culture and the Re-liability of Firm Performance,” Administrative Science Quar-terly (March 2002), pp. 70–91; R. E. Smerek and D. R.Denison, “Social Capital in Organizations: Understanding theLink to Firm Performance,” presentation to the Academy ofManagement (Philadelphia, 2007).
33. K. E. Aupperle, “Spontaneous Organizational Reconfiguration:A Historical Example Based on Xenophon’s Anabasis,”Organization Science (July–August 1996), pp. 445–460.
34. E. K. Briody, S. T. Cavusgil, and S. R. Miller, “Turning ThreeSides into a Delta at General Motors: Enhancing Partnership In-tegration on Corporate Ventures,” Long Range Planning (Octo-ber 2004), pp. 421–434.
35. “Face Value: A Post-Modern Proctoid,” The Economist(April 15, 2006), p. 68.
36. D. Kiley, B. Helm, L. Lee, G. Edmundson, C. Edwards, andM. Scott, “Best Global Brands,” Business Week (August 6,2007), pp. 56–64.
37. R. T. Wilcox, “The Hidden Potential of Powerful Brands,”Batten Briefings (Summer 2003), pp. 1, 4–5.
38. V. P. Rindova, I. O. Williamson, A. P. Petkova, and J. M. Sever,“Being Good or Being Known: An Empirical Examination ofthe Dimensions, Antecedents, and Consequences of Organiza-tional Reputation,” Academy of Management Journal (Decem-ber 2005), pp. 1033–1049.
39. V. P. Rindova, I. O. Williamson, A. P. Petkova, and J. M. Sever,“Being Good or Being Known: An Empirical Examination ofthe Dimensions, Antecedents, and Consequences of Organiza-tional Reputation,” Academy of Management Journal (Decem-ber 2005), pp. 1033–1049.
40. C. Fombrun and C. Van Riel, “The Reputational Landscape,” Cor-porate Reputation Review, Vol. 1, Nos. 1&2 (1997), pp. 5–13.
41. P. Engardio and M. Arndt, “What Price Reputation?” BusinessWeek (July 9 & 16, 2007), pp. 70–79.
42. P. W. Roberts and G. R. Dowling, “Corporate Reputation andSustained Financial Performance,” Strategic ManagementJournal (December 2002), pp. 1077–1093; J. Shamsie, “TheContext of Dominance: An Industry-Driven Framework for Ex-ploiting Reputation,” Strategic Management Journal (March2003), pp. 199–215; M. D. Michalisin, D. M. Kline, and R. D.Smith, “Intangible Strategic Assets and Firm Performance: AMulti-Industry Study of the Resource-Based View,” Journal ofBusiness Strategies (Fall 2000), pp. 91–117; S. S. Standifird,“Reputation and E-Commerce: eBay Auctions and the Asym-metrical Impact of Positive and Negative Ratings,” Journal ofManagement, Vol. 27, No. 3 (2001), pp. 279–295.
43. R. L. Simerly and M. Li, “Environmental Dynamism, CapitalStructure and Performance: A Theoretical Integration and anEmpirical Test,” Strategic Management Journal (January2000), pp. 31–49.
44. R. L. Simerly and M. Li, “Environmental Dynamism, CapitalStructure and Performance: A Theoretical Integration and anEmpirical Test,” Strategic Management Journal (January2000), pp. 31–49; A. Heisz and S. LaRochelle-Cote, “CorporateFinancial Leverage in Canadian Manufacturing: Consequencesfor Employment and Inventories,” Canadian Journal of Admin-istrative Science (June 2004), pp. 111–128.
45. J. M. Poterba and L. H. Summers, “A CEO Survey of U.S.Companies’ Time Horizons and Hurdle Rates,” Sloan Manage-ment Review (Fall 1995), pp. 43–53.
46. “R&D Scoreboard,” Business Week (June 27, 1994), pp. 81–103.47. B. O’Reilly, “The Secrets of America’s Most Admired Corpo-
rations: New Ideas and New Products,” Fortune (March 3,1997), p. 62.
48. C. Palmeri, “Swords to Plowshares—And Back Again,”Business Week (February 11, 2008), p. 66.
49. P. Pascarella, “Are You Investing in the Wrong Technology?”Industry Week (July 25, 1983), p. 37.
50. D. J. Yang, “Leaving Moore’s Law in the Dust,” U.S. News &World Report (July 10, 2000), pp. 37–38; R. Fishburne andM. Malone, “Laying Down the Laws: Gordon Moore and BobMetcalfe in Conversation,” Forbes ASAP (February 21, 2000),pp. 97–100.
51. Pascarella, p. 38.52. C. M. Christensen, The Innovator’s Dilemma (Boston: Harvard
Business School Press, 1997).53. O. Port, “Flat-Panel Pioneer,” Business Week (December 12,
2005), p. 22. This phenomenon has also been discussed in termsof paradigm shifts in which a new development makes the old
168 PART 2 Scanning the Environment
CHAPTER 5 Internal Scanning: Organizational Analysis 169
game obsolete—See Joel A. Barker, Future Edge (New York:William Morrow and Company, 1992).
54. For examples of experience curves for various products, seeM. Gottfredson, S. Schaubert, and H. Saenz, “The NewLeader’s Guide to Diagnosing the Business,” Harvard BusinessReview (February 2008), pp. 63–73.
55. B. J. Pine, Mass Customization: The New Frontier in BusinessCompetition (Boston: Harvard Business School Press, 1993).
56. D. Coates, “The Art of Assembly,” Sports Car International(September 2007), p. 14; “One Line for Two: Spartanburg Re-vamps Assembly Process,” Roundel (January 2006), p. 31.
57. S. L Rynes, K. G. Brown, and A. E. Colbert, “Seven CommonMisconceptions about Human Resource Practices: ResearchFindings Versus Practitioner Belief,” Academy of ManagementExecutive (August 2002), pp. 92–103; R. S. Schuler and S. E.Jackson, “A Quarter-Century Review of Human Resource Man-agement in the U.S.: The Growth in Importance of the Interna-tional Perspective,” in Strategic Human Resource Management,2nd ed., edited by R. S. Schuler and S. E. Jackson (Malden,MA: Blackwell Publishing, 2007), pp. 214–240; M. Guthridgeand A. B. Komm, “Why Multinationals Struggle to ManageTalent,” McKinsey Quarterly (May 2008), pp. 1–5.
58. J. McGregor and S. Hamm, “Managing the Global Workforce,”Business Week (January 28, 2008), pp. 34–48; D. A. Ready andJ. A. Conger, “Make Your Company a Talent Factory,” HarvardBusiness Review (June 2007), pp. 68–77.
59. E. E. Lawler, S. A. Mohrman, and G. E. Ledford, Jr., CreatingHigh Performance Organizations (San Francisco: Jossey-Bass,1995), p. 29.
60. A. Versteeg, “Self-Directed Work Teams Yield Long-Term Ben-efits,” Journal of Business Strategy (November/December1990), pp. 9–12.
61. R. Sanchez, “Strategic Flexibility in Product Competition,”Strategic Management Journal (Summer 1995), p. 147.
62. A. R. Jassawalla and H. C. Sashittal, “Building CollaborativeCross-Functional New Product Teams,” Academy of Manage-ment Executive (August 1999), pp. 50–63.
63. A. M. Townsend, S. M. DeMarie, and A. R. Hendrickson, “Vir-tual Teams’ Technology and the Workplace of the Future,”Academy of Management Executive (August 1998), pp. 17–29.
64. S. A. Furst, M. Reeves, B. Rosen, and R. S. Blackburn, “Man-aging the Life Cycle of Virtual Teams,” Academy of Manage-ment Executive (May 2004), pp. 6–20; L. L. Martins, L. L.Gilson, and M. T. Maynard, “Virtual Teams: What Do WeKnow and Where Do We Go From Here?” Journal of Manage-ment, Vol. 30, No. 6 (2004), pp. 805–835.
65. C. B. Gibson and J. L. Gibbs, “Unpacking the Concept of Vir-tuality: The Effects of Geographic Dispersion, Electronic De-pendence, Dynamic Structure, and National Diversity on TeamInnovation,” Administrative Science Quarterly (September2006), pp. 451–495.
66. T. D. Golden and J. F. Veiga, “The Impact of Extent of Telecom-muting on Job Satisfaction: Resolving Inconsistent Findings,”Journal of Management (April 2005), pp. 301–318.
67. M. Conlin, “The Easiest Commute of All,” Business Week (De-cember 12, 2005), pp. 78–80.
68. Townsend, DeMarie, and Hendrickson, p. 18.69. “News,” Bureau of Labor Statistics, U.S. Department of Labor
(January 25, 2008).70. D. Welsh, “What Goodyear Got from Its Union,” Business Week
(October 20, 2003), pp. 148–149.
71. S. F. Matusik and C. W. L. Hill, “The Utilization of ContingentWork, Knowledge Creation, and Competitive Advantage,”Academy of Management Executive (October 1998),pp. 680–697; W. Mayrhofer and C. Brewster, “European Hu-man Resource Management: Researching Developments OverTime,” in Strategic Human Resource Management, 2nd ed.(Malden, MA: Blackwell Publishing, 2007), pp. 241–269.
72. “Part-time Work,” The Economist (June 24, 2006), p. 112.73. A. Bernstein, “At UPS, Part-Time Work Is a Full-Time Issue,”
Business Week (June 16, 1997), pp. 88–90.74. J. Muller, “A Ford Redesign,” Business Week (November 13,
2000), Special Report.75. O. C. Richard, B. P. S. Murthi, and K. Ismail, “The Impact of
Racial Diversity on Intermediate and Long-Term Performance:The Moderating Role of Environmental Context,” StrategicManagement Journal (December 2007), pp. 1213–1233;G. Colvin, “The 50 Best Companies for Asians, Blacks, andHispanics,” Fortune (July 19, 1999), pp. 53–58.
76. V. Singh and S. Point, “Strategic Responses by European Com-panies to the Diversity Challenge: An Online Comparison,”Long Range Planning (August 2004), pp. 295–318.
77. Singh and Point, p. 310.78. J. Bachman, “Coke to Pay $192.5 Million to Settle Lawsuit,”
The (Ames) Tribune (November 20, 2000), p. D4.79. O. Gottschalg and M. Zollo, “Interest Alignment and Competi-
tive Advantage,” Academy of Management Review (April2007), pp. 418–437.
80. J. Lee and D. Miller, “People Matter: Commitment to Employ-ees, Strategy, and Performance in Korean Firms,” StrategicManagement Journal (June 1999), pp. 579–593.
81. A. Cortese, “Here Comes the Intranet,” Business Week (Febru-ary 26, 1996), p. 76.
82. D. Bartholomew, “Blue-Collar Computing,” Information Week(June 19, 1995), pp. 34–43.
83. J. Bughin, J. Manyika, A. Miller, and M. Cjhui, “Building theWeb 2.0 Enterprise,” McKinsey Quarterly Online (July 2008);J. Bughin, M. Chui, and B. Johnson, “The Next Step in OpenInnovation,” McKinsey Quarterly Online (June 2008), pp. 1–8.
84. C. C. Poirier, Advanced Supply Chain Management (San Fran-cisco: Berrett-Koehler Publishers, 1999), p. 2.
85. J. H. Dyer and N. W. Hatch, “Relation-Specific Capabilities andBarriers to Knowledge Transfers: Creating Advantage throughNetwork Relationships,” Strategic Management Journal (Au-gust 2006), pp. 701–719.
86. D. Paulonis and S. Norton, “Managing Global Supply Chains,”McKinsey Quarterly Online (August 2008).
87. M. Cook and R. Hagey, “Why Companies Flunk Supply-Chain101: Only 33 Percent Correctly Measure Supply-Chain Perfor-mance; Few Use the Right Incentives,” Journal of BusinessStrategy, Vol. 24, No. 4 (2003), pp. 35–42.
88. C. C. Poirer, pp. 3–5. For further information on RFID technol-ogy, see F. Taghaboni-Dutta and B. Velthouse, “RFID Technol-ogy is Revolutionary: Who Should Be Involved in This Gameof Tag?” Academy of Management Perspectives (November2006), pp. 65–78.
89. M. Arndt, “Everything Old Is New Again,” Business Week (Sep-tember 25, 2006), pp. 64–70.
90. R. Farzad, “Cash for Trash,” Business Week (August 4, 2008),pp. 36–46.
170 PART 2 Scanning the Environment
Ending Case for Part TwoBOEING BETS THE COMPANY
The Boeing Company, a well-known U.S.-based manu-facturer of commercial and military aircraft, faced adilemma in 2004. Long the leader of the global airframemanufacturing industry, Boeing had been slowly losingmarket share since the 1990s to the European-based Air-bus Industrie—now incorporated as the European Aero-nautic & Space Company (EADS). In December 2001,the EADS board of directors had committed the corpo-ration to an objective it had never before achieved—tak-ing from Boeing the leadership of the commercialaviation industry by building the largest commercial jetplane in the world, the Airbus 380. The A380 wouldcarry 481 passengers in a normal multiple-class seatingconfiguration compared to the 416 passengers carriedby Boeing’s 747—400 in a similar seating configura-tion. The A380 would not only fly 621 miles farther thanthe 747, but it would cost airlines 15%–20% less perpassenger to operate. With orders for 50 A380 aircraft inhand, the EADS board announced that the new planewould be ready for delivery during 2006. The proposedA380 program decimated the sales of Boeing’s jumbojet. Since 2000, airlines had ordered only 10 Boeing747s configured for passengers.
Boeing was clearly a company in difficulty in 2004.Distracted by the 1996 acquisitions of McDonnell Douglas and Rockwell Aerospace, Boeing’s top man-agement had spent the next few years strengthening thecorporation’s historically weak position in aerospaceand defense and had allowed its traditional competencyin commercial aviation to deteriorate. Boeing, once themanufacturing marvel of the world, was now spending10%–20% more than EADS (Airbus) to build a plane.The prices it asked for its planes were thus also higher.As a result, Boeing’s estimated market share of the com-mercial market slid from nearly 70% in 1996 to less thanhalf that by the end of 2003. EADS claimed to have de-livered 300 aircraft to Boeing’s 285 and to have won56% of the 396 orders placed by airlines in 2003—quitean improvement from 1994, when EADS controlledonly one-fifth of the market! This was quite an
accomplishment, given that the A380 was so large thatthe modifications needed to accommodate it at airportswould cost $80 to $100 million.
Even though defense sales now accounted for morethan half of the company’s revenues, Boeing’s CEO re-alized that he needed to quickly act to regain Boeing’sleadership of the commercial part of the industry. InDecember 2003, the board approved the strategic deci-sion to promote a new commercial airplane, the Boeing787, for sale to airlines. The 787 was a midrange air-craft, not a jumbo jet such as the A380. The 787 wouldcarry between 220 and 250 passengers but consume20% less fuel and be 10% cheaper to operate than itscompetitor, EADS’ current midrange plane, the smallerwide-body A330-200. It was to be made from a graphite/epoxy resin instead of aluminum. It was designed to flyfaster, higher, farther, cleaner, more quietly, and moreefficiently than any other medium-sized jet. This wasthe first time since approving the 777 jet in 1990 that thecompany had launched an all-new plane program. De-velopment costs were estimated at $8 billion over fiveyears. Depending on the results of these sales efforts, theboard would decide sometime during 2004 to either be-gin or cancel the 787 construction program. If approved,the planes could be delivered in 2008—two years afterthe delivery of the A380.
The Boeing 787 decision was based on a completelydifferent set of assumptions from those used by the EADSboard to approve the A380. EADS top management be-lieved that the commercial market wanted even largerjumbo jets to travel long international routes. Airports inAsia, the Middle East, and Europe were becoming heavilycongested. In these locations, the “hub-and-spoke”method of creating major airline hubs was flourishing.Using larger planes was a way of dealing with that con-gestion by flying more passengers per plane out of thesehubs. EADS management believed that over the next20 years, airlines and freight carriers would need a mini-mum of 1,500 more aircraft at least as big as the B747.EADS management had concluded that the key to con-trolling the future commercial market was by using larger,more expensive planes. The A380 was a very large bet onthat future scenario. TheA380 program would cost EADSalmost $13 million before the first plane was delivered.
In contrast, Boeing’s management believed in a verydifferent future scenario. Noting the success of Southwestand JetBlue, among other airlines in NorthAmerica, it con-cluded that no more than 320 extra-large planes would be
This case was written by J. David Hunger for Strategic Management andBusiness Policy, 12th edition and for Concepts in Strategic Managementand Business Policy, 12th edition. Copyright © 2008 by J. DavidHunger. Reprinted by permission. References available upon request.
CHAPTER 5 Internal Scanning: Organizational Analysis 171
sold in the future as the airline industry moved away fromhub-and-spoke networks toward more direct flights be-tween smaller airports. The fragmentation of the airline in-dustry, with its emphasis on competing through lowercosts was the primary rationale for Boeing’s fuel-efficient787. A secondary reason was to deal with increasingpassenger complaints about shrinking legroom and seatroom on current planes flown by cost-conscious airlines.The 787 was designed with larger windows, seats, lava-tories, and overhead bins. The plane was being designedin both short- and long-range versions. Boeing’s manage-ment predicted a market for 2,000 to 3,000 such planes.Additional support for the midrange plane came fromsome industry analysts who predicted that the huge A380would give new meaning to the term “cattle class.” Toreach necessary economies of scale, the A380 wouldlikely devote a large portion of both of its decks to econ-omy class, with passengers sitting three or four across,the same configuration as most of Boeing’s 747s.
Boeing’s strategy to regain industry leadership withits proposed 787 airplane meant that the company wouldhave to increase its manufacturing efficiency in order tokeep the price low. To significantly cut costs, managementwould be forced to implement a series of new programs:
� Outsource approximately 70% of manufacturing.Could it find suppliers who could consistently makethe high-quality parts needed by Boeing?
� Reduce final assembly time to three days (comparedto 20 for its 737 plane) by having suppliers buildcompleted plane sections. Could this manysuppliers meet Boeing’s exacting deadlines?
� Use new, lightweight composite materials in placeof aluminum to reduce inspection time. Would theplane be as dependable and as easy to maintain asBoeing’s aluminum airplanes?
� Resolve poor relations with labor unions caused bydownsizing and outsourcing. The machinists’ unionwould have to be given a greater voice in specifyingmanufacturing procedures. Would Boeing’s middlemanagers be willing to share power with an antago-nistic union?
Which vision of the future was correct? The long-term fortunes of both Boeing and EADS depended ontwo contrasting strategic decisions, based on two verydifferent assessments of the market. If EADS was cor-rect, the market would continue to demand ever-largerairplanes. If Boeing was correct, the current wave ofjumbo jets had crested, and a new wave of fuel-savingmidrange jets would soon replace them. Which com-pany’s strategy had the best chance of succeeding?

This page intentionally left blank

PA R T3
Strategy
Formulation
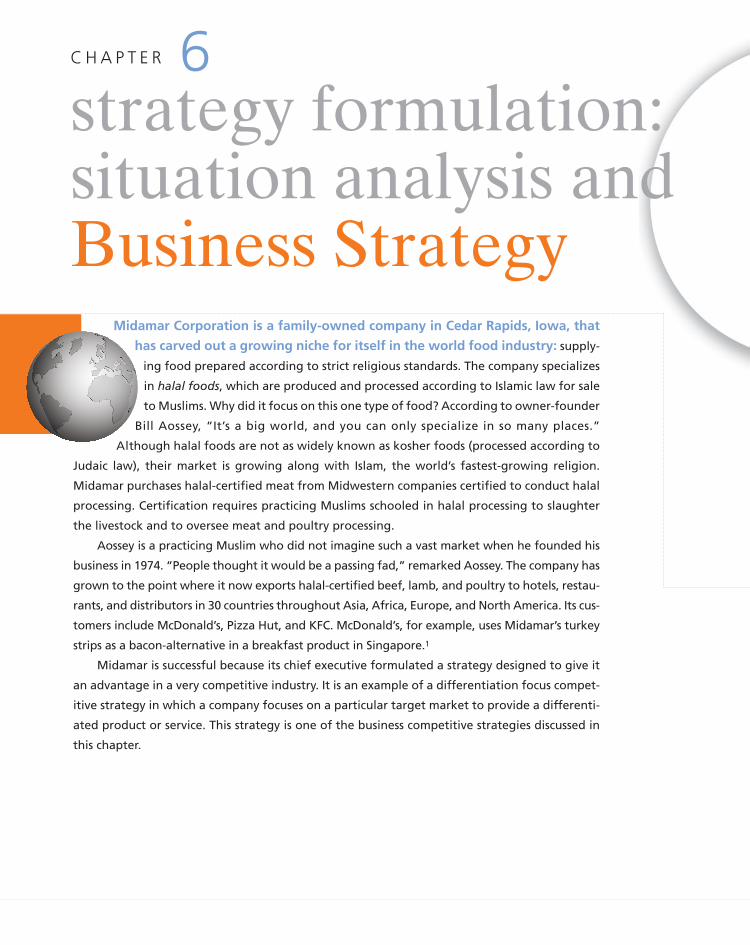
Midamar Corporation is a family-owned company in Cedar Rapids, Iowa, that
has carved out a growing niche for itself in the world food industry: supply-
ing food prepared according to strict religious standards. The company specializes
in halal foods, which are produced and processed according to Islamic law for sale
to Muslims. Why did it focus on this one type of food? According to owner-founder
Bill Aossey, “It’s a big world, and you can only specialize in so many places.”
Although halal foods are not as widely known as kosher foods (processed according to
Judaic law), their market is growing along with Islam, the world’s fastest-growing religion.
Midamar purchases halal-certified meat from Midwestern companies certified to conduct halal
processing. Certification requires practicing Muslims schooled in halal processing to slaughter
the livestock and to oversee meat and poultry processing.
Aossey is a practicing Muslim who did not imagine such a vast market when he founded his
business in 1974. “People thought it would be a passing fad,” remarked Aossey. The company has
grown to the point where it now exports halal-certified beef, lamb, and poultry to hotels, restau-
rants, and distributors in 30 countries throughout Asia, Africa, Europe, and North America. Its cus-
tomers include McDonald’s, Pizza Hut, and KFC. McDonald’s, for example, uses Midamar’s turkey
strips as a bacon-alternative in a breakfast product in Singapore.1
Midamar is successful because its chief executive formulated a strategy designed to give it
an advantage in a very competitive industry. It is an example of a differentiation focus compet-
itive strategy in which a company focuses on a particular target market to provide a differenti-
ated product or service. This strategy is one of the business competitive strategies discussed in
this chapter.
strategy formulation:situation analysis andBusiness Strategy
C H A P T E R 6
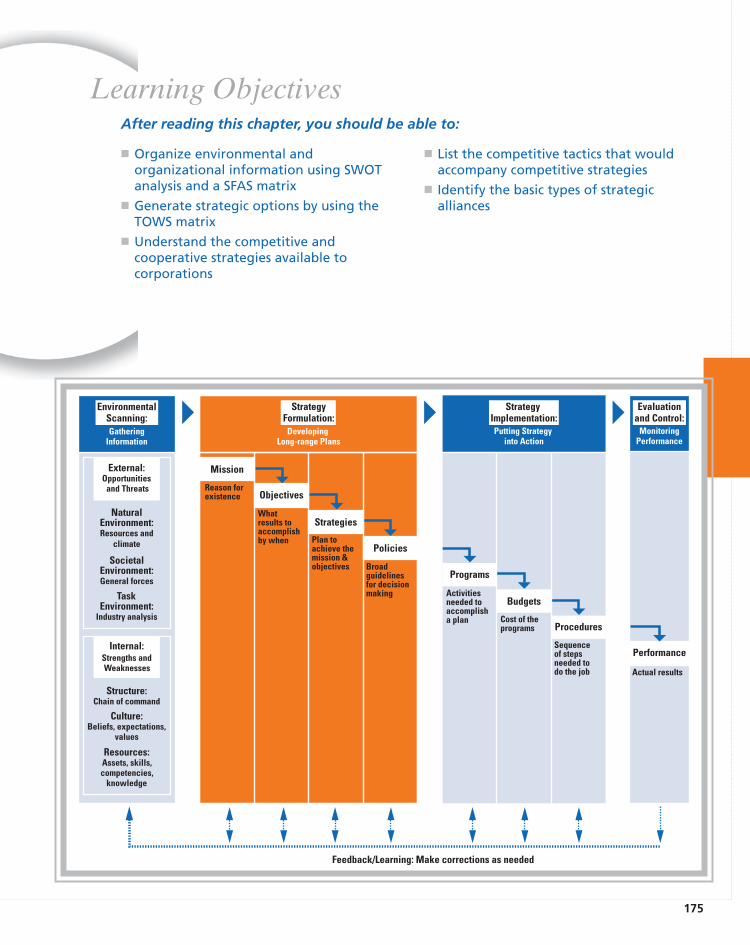
175
GatheringInformation
Putting Strategy into Action
MonitoringPerformance
SocietalEnvironment:General forces
NaturalEnvironment:Resources and
climate
TaskEnvironment:
Industry analysis
Internal:Strengths andWeaknesses
Structure:Chain of command
Culture:Beliefs, expectations,
values
Resources:Assets, skills,competencies,
knowledge
Programs
Activitiesneeded to accomplisha plan
Budgets
Cost of theprograms Procedures
Sequenceof stepsneeded to do the job
Performance
Actual results
External:Opportunities
and Threats
DevelopingLong-range Plans
Mission
Reason forexistence Objectives
Whatresults to accomplishby when
Strategies
Plan toachieve themission &objectives
Policies
Broadguidelinesfor decisionmaking
EnvironmentalScanning:
StrategyFormulation:
StrategyImplementation:
Evaluationand Control:
Feedback/Learning: Make corrections as needed
� Organize environmental andorganizational information using SWOTanalysis and a SFAS matrix
� Generate strategic options by using theTOWS matrix
� Understand the competitive andcooperative strategies available tocorporations
� List the competitive tactics that wouldaccompany competitive strategies
� Identify the basic types of strategicalliances
Learning ObjectivesAfter reading this chapter, you should be able to:
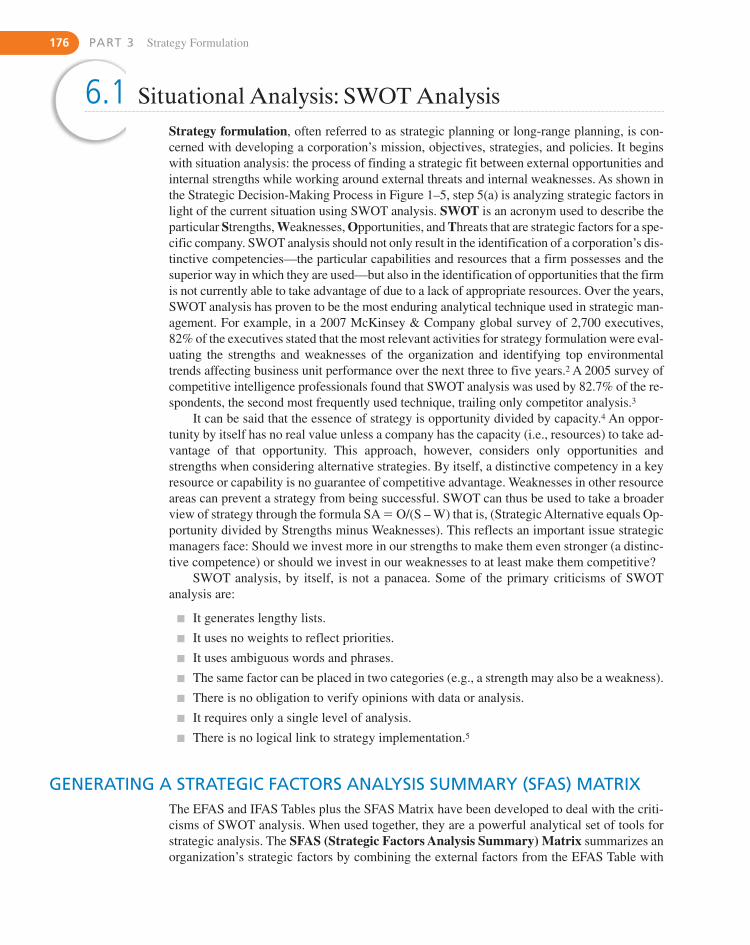
176 PART 3 Strategy Formulation
Strategy formulation, often referred to as strategic planning or long-range planning, is con-cerned with developing a corporation’s mission, objectives, strategies, and policies. It beginswith situation analysis: the process of finding a strategic fit between external opportunities andinternal strengths while working around external threats and internal weaknesses. As shown inthe Strategic Decision-Making Process in Figure 1–5, step 5(a) is analyzing strategic factors inlight of the current situation using SWOT analysis. SWOT is an acronym used to describe theparticular Strengths, Weaknesses, Opportunities, and Threats that are strategic factors for a spe-cific company. SWOT analysis should not only result in the identification of a corporation’s dis-tinctive competencies—the particular capabilities and resources that a firm possesses and thesuperior way in which they are used—but also in the identification of opportunities that the firmis not currently able to take advantage of due to a lack of appropriate resources. Over the years,SWOT analysis has proven to be the most enduring analytical technique used in strategic man-agement. For example, in a 2007 McKinsey & Company global survey of 2,700 executives,82% of the executives stated that the most relevant activities for strategy formulation were eval-uating the strengths and weaknesses of the organization and identifying top environmentaltrends affecting business unit performance over the next three to five years.2 A 2005 survey ofcompetitive intelligence professionals found that SWOT analysis was used by 82.7% of the re-spondents, the second most frequently used technique, trailing only competitor analysis.3
It can be said that the essence of strategy is opportunity divided by capacity.4 An oppor-tunity by itself has no real value unless a company has the capacity (i.e., resources) to take ad-vantage of that opportunity. This approach, however, considers only opportunities andstrengths when considering alternative strategies. By itself, a distinctive competency in a keyresource or capability is no guarantee of competitive advantage. Weaknesses in other resourceareas can prevent a strategy from being successful. SWOT can thus be used to take a broaderview of strategy through the formula SA � O/(S – W) that is, (Strategic Alternative equals Op-portunity divided by Strengths minus Weaknesses). This reflects an important issue strategicmanagers face: Should we invest more in our strengths to make them even stronger (a distinc-tive competence) or should we invest in our weaknesses to at least make them competitive?
SWOT analysis, by itself, is not a panacea. Some of the primary criticisms of SWOTanalysis are:
� It generates lengthy lists.
� It uses no weights to reflect priorities.
� It uses ambiguous words and phrases.
� The same factor can be placed in two categories (e.g., a strength may also be a weakness).
� There is no obligation to verify opinions with data or analysis.
� It requires only a single level of analysis.
� There is no logical link to strategy implementation.5
GENERATING A STRATEGIC FACTORS ANALYSIS SUMMARY (SFAS) MATRIXThe EFAS and IFAS Tables plus the SFAS Matrix have been developed to deal with the criti-cisms of SWOT analysis. When used together, they are a powerful analytical set of tools forstrategic analysis. The SFAS (Strategic Factors Analysis Summary) Matrix summarizes anorganization’s strategic factors by combining the external factors from the EFAS Table with
6.1 Situational Analysis: SWOT Analysis
CHAPTER 6 Strategy Formulation: Situation Analysis and Business Strategy 177
the internal factors from the IFAS Table. The EFAS and IFAS examples given of Maytag Cor-poration (as it was in 1995) in Tables 4–5 and 5–2 list a total of 20 internal and external fac-tors. These are too many factors for most people to use in strategy formulation. The SFASMatrix requires a strategic decision maker to condense these strengths, weaknesses, opportu-nities, and threats into fewer than 10 strategic factors. This is done by reviewing and revisingthe weight given each factor. The revised weights reflect the priority of each factor as a deter-minant of the company’s future success. The highest-weighted EFAS and IFAS factors shouldappear in the SFAS Matrix.
As shown in Figure 6–1, you can create an SFAS Matrix by following these steps:
1. In Column 1 (Strategic Factors), list the most important EFAS and IFAS items. Aftereach factor, indicate whether it is a Strength (S), Weakness (W), an Opportunity (O), or aThreat (T).
2. In Column 2 (Weight), assign weights for all of the internal and external strategic factors.As with the EFAS and IFAS Tables presented earlier, the weight column must total 1.00.This means that the weights calculated earlier for EFAS and IFAS will probably have tobe adjusted.
3. In Column 3 (Rating), assign a rating of how the company’s management is respondingto each of the strategic factors. These ratings will probably (but not always) be the sameas those listed in the EFAS and IFAS Tables.
4. In Column 4 (Weighted Score), multiply the weight in Column 2 for each factor by itsrating in Column 3 to obtain the factor’s rated score.
5. In Column 5 (Duration), depicted in Figure 6–1, indicate short-term (less thanone year), intermediate-term (one to three years), or long-term (three years andbeyond).
6. In Column 6 (Comments), repeat or revise your comments for each strategic factor fromthe previous EFAS and IFAS Tables. The total weighted score for the average firm inan industry is always 3.0.
The resulting SFAS Matrix is a listing of the firm’s external and internal strategic factorsin one table. The example given in Figure 6–1 is for Maytag Corporation in 1995, before thefirm sold its European and Australian operations and it was acquired by Whirlpool. The SFASMatrix includes only the most important factors gathered from environmental scanning andthus provides information that is essential for strategy formulation. The use of EFAS and IFASTables together with the SFAS Matrix deals with some of the criticisms of SWOT analysis. For example, the use of the SFAS Matrix reduces the list of factors to a manageable number,puts weights on each factor, and allows one factor to be listed as both a strength and a weak-ness (or as an opportunity and a threat).
FINDING A PROPITIOUS NICHEOne desired outcome of analyzing strategic factors is identifying a niche where an organiza-tion can use its core competencies to take advantage of a particular market opportunity. A nicheis a need in the marketplace that is currently unsatisfied. The goal is to find a propitiousniche—an extremely favorable niche—that is so well suited to the firm’s internal and exter-nal environment that other corporations are not likely to challenge or dislodge it.6 A niche ispropitious to the extent that it currently is just large enough for one firm to satisfy its demand.After a firm has found and filled that niche, it is not worth a potential competitor’s time ormoney to also go after the same niche. Such a niche may also be called a strategic sweet spot
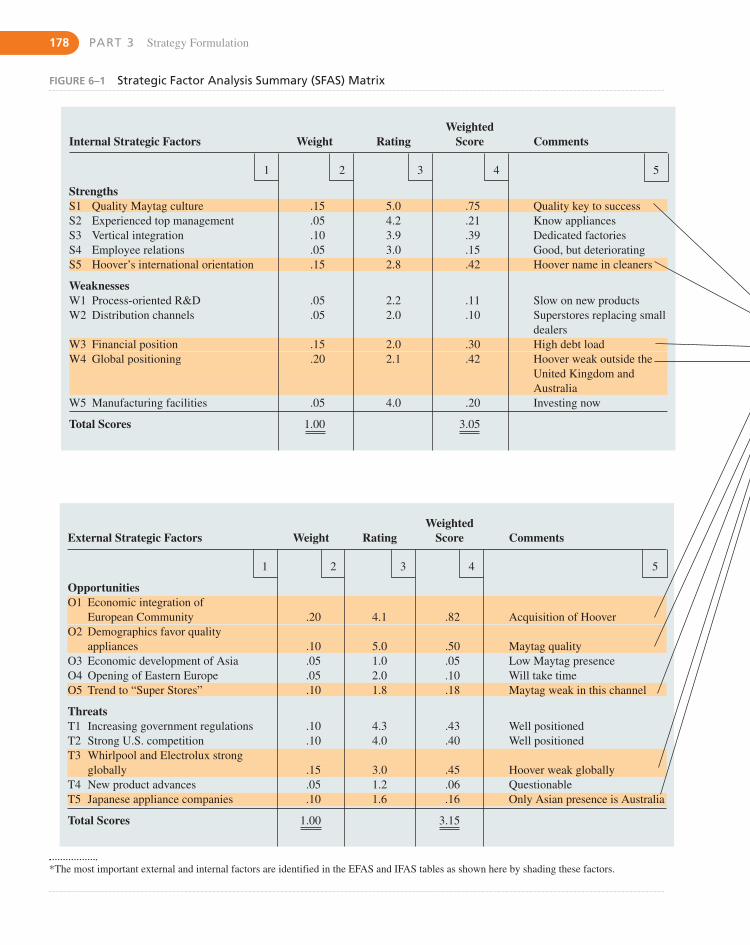
178 PART 3 Strategy Formulation
FIGURE 6–1 Strategic Factor Analysis Summary (SFAS) Matrix
*The most important external and internal factors are identified in the EFAS and IFAS tables as shown here by shading these factors.
WeightedExternal Strategic Factors Weight Rating Score Comments
1 2 3 4 5
OpportunitiesO1 Economic integration of
European Community .20 4.1 .82 Acquisition of HooverO2 Demographics favor quality
appliances .10 5.0 .50 Maytag qualityO3 Economic development of Asia .05 1.0 .05 Low Maytag presenceO4 Opening of Eastern Europe .05 2.0 .10 Will take timeO5 Trend to “Super Stores” .10 1.8 .18 Maytag weak in this channel
ThreatsT1 Increasing government regulations .10 4.3 .43 Well positionedT2 Strong U.S. competition .10 4.0 .40 Well positionedT3 Whirlpool and Electrolux strong
globally .15 3.0 .45 Hoover weak globallyT4 New product advances .05 1.2 .06 QuestionableT5 Japanese appliance companies .10 1.6 .16 Only Asian presence is Australia
Total Scores 1.00 3.15
WeightedInternal Strategic Factors Weight Rating Score Comments
1 2 3 4 5
StrengthsS1 Quality Maytag culture .15 5.0 .75 Quality key to successS2 Experienced top management .05 4.2 .21 Know appliancesS3 Vertical integration .10 3.9 .39 Dedicated factoriesS4 Employee relations .05 3.0 .15 Good, but deterioratingS5 Hoover’s international orientation .15 2.8 .42 Hoover name in cleaners
WeaknessesW1 Process-oriented R&D .05 2.2 .11 Slow on new productsW2 Distribution channels .05 2.0 .10 Superstores replacing small
dealersW3 Financial position .15 2.0 .30 High debt loadW4 Global positioning .20 2.1 .42 Hoover weak outside the
United Kingdom andAustralia
W5 Manufacturing facilities .05 4.0 .20 Investing now
Total Scores 1.00 3.05
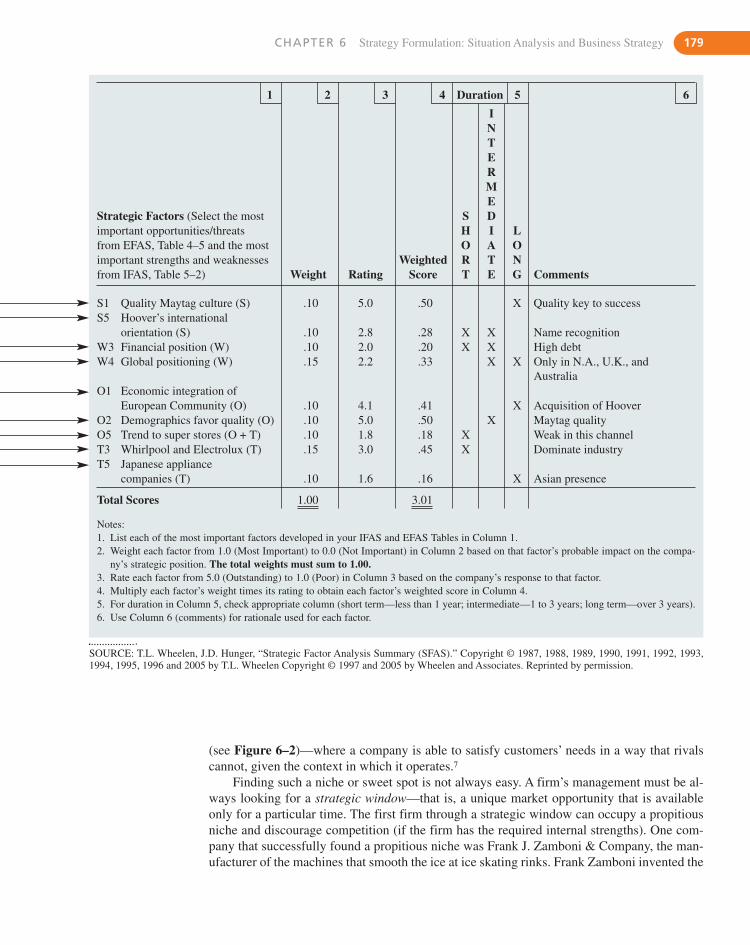
CHAPTER 6 Strategy Formulation: Situation Analysis and Business Strategy 179
1 2 3 4 Duration 5 6
INTERME
Strategic Factors (Select the most S Dimportant opportunities/threats H I Lfrom EFAS, Table 4–5 and the most O A Oimportant strengths and weaknesses Weighted R T Nfrom IFAS, Table 5–2) Weight Rating Score T E G Comments
S1 Quality Maytag culture (S) .10 5.0 .50 X Quality key to successS5 Hoover’s international
orientation (S) .10 2.8 .28 X X Name recognitionW3 Financial position (W) .10 2.0 .20 X X High debtW4 Global positioning (W) .15 2.2 .33 X X Only in N.A., U.K., and
AustraliaO1 Economic integration of
European Community (O) .10 4.1 .41 X Acquisition of HooverO2 Demographics favor quality (O) .10 5.0 .50 X Maytag qualityO5 Trend to super stores (O + T) .10 1.8 .18 X Weak in this channelT3 Whirlpool and Electrolux (T) .15 3.0 .45 X Dominate industryT5 Japanese appliance
companies (T) .10 1.6 .16 X Asian presence
Total Scores 1.00 3.01
Notes:1. List each of the most important factors developed in your IFAS and EFAS Tables in Column 1.2. Weight each factor from 1.0 (Most Important) to 0.0 (Not Important) in Column 2 based on that factor’s probable impact on the compa-
ny’s strategic position. The total weights must sum to 1.00.3. Rate each factor from 5.0 (Outstanding) to 1.0 (Poor) in Column 3 based on the company’s response to that factor.4. Multiply each factor’s weight times its rating to obtain each factor’s weighted score in Column 4. 5. For duration in Column 5, check appropriate column (short term—less than 1 year; intermediate—1 to 3 years; long term—over 3 years). 6. Use Column 6 (comments) for rationale used for each factor.
SOURCE: T.L. Wheelen, J.D. Hunger, “Strategic Factor Analysis Summary (SFAS).” Copyright © 1987, 1988, 1989, 1990, 1991, 1992, 1993,1994, 1995, 1996 and 2005 by T.L. Wheelen Copyright © 1997 and 2005 by Wheelen and Associates. Reprinted by permission.
(see Figure 6–2)—where a company is able to satisfy customers’ needs in a way that rivalscannot, given the context in which it operates.7
Finding such a niche or sweet spot is not always easy. A firm’s management must be al-ways looking for a strategic window—that is, a unique market opportunity that is availableonly for a particular time. The first firm through a strategic window can occupy a propitiousniche and discourage competition (if the firm has the required internal strengths). One com-pany that successfully found a propitious niche was Frank J. Zamboni & Company, the man-ufacturer of the machines that smooth the ice at ice skating rinks. Frank Zamboni invented the
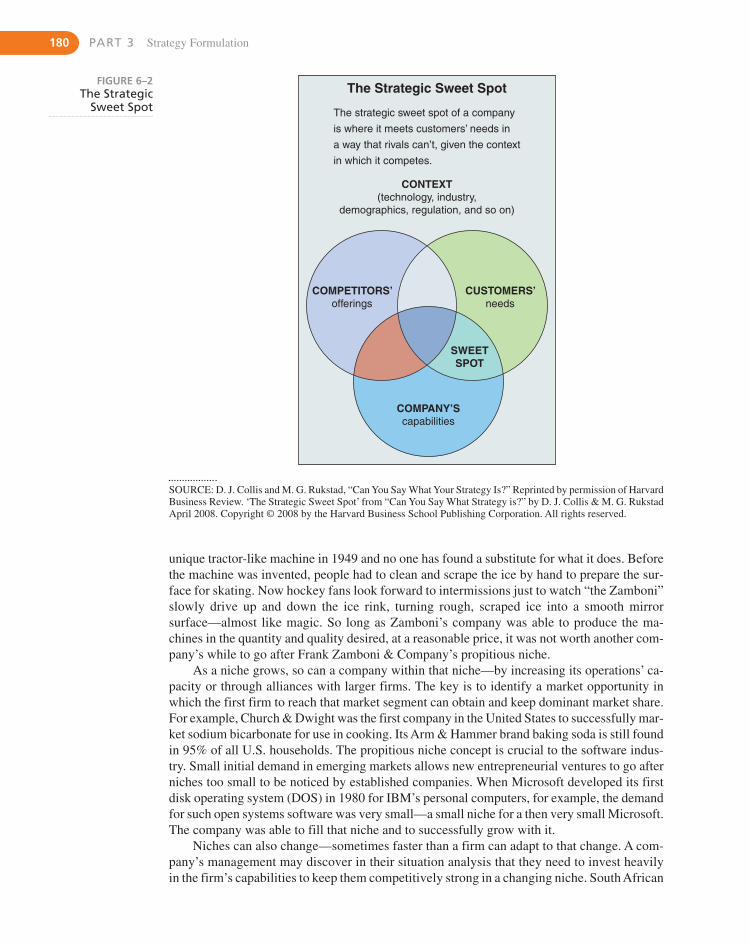
180 PART 3 Strategy Formulation
The Strategic Sweet Spot
The strategic sweet spot of a company
is where it meets customers’ needs in
a way that rivals can’t, given the context
in which it competes.
COMPANY’Scapabilities
CONTEXT(technology, industry,
demographics, regulation, and so on)
COMPETITORS’offerings
CUSTOMERS’needs
SWEETSPOT
FIGURE 6–2The Strategic
Sweet Spot
unique tractor-like machine in 1949 and no one has found a substitute for what it does. Beforethe machine was invented, people had to clean and scrape the ice by hand to prepare the sur-face for skating. Now hockey fans look forward to intermissions just to watch “the Zamboni”slowly drive up and down the ice rink, turning rough, scraped ice into a smooth mirror surface—almost like magic. So long as Zamboni’s company was able to produce the ma-chines in the quantity and quality desired, at a reasonable price, it was not worth another com-pany’s while to go after Frank Zamboni & Company’s propitious niche.
As a niche grows, so can a company within that niche—by increasing its operations’ ca-pacity or through alliances with larger firms. The key is to identify a market opportunity inwhich the first firm to reach that market segment can obtain and keep dominant market share.For example, Church & Dwight was the first company in the United States to successfully mar-ket sodium bicarbonate for use in cooking. Its Arm & Hammer brand baking soda is still foundin 95% of all U.S. households. The propitious niche concept is crucial to the software indus-try. Small initial demand in emerging markets allows new entrepreneurial ventures to go afterniches too small to be noticed by established companies. When Microsoft developed its firstdisk operating system (DOS) in 1980 for IBM’s personal computers, for example, the demandfor such open systems software was very small—a small niche for a then very small Microsoft.The company was able to fill that niche and to successfully grow with it.
Niches can also change—sometimes faster than a firm can adapt to that change. A com-pany’s management may discover in their situation analysis that they need to invest heavilyin the firm’s capabilities to keep them competitively strong in a changing niche. South African
SOURCE: D. J. Collis and M. G. Rukstad, “Can You Say What Your Strategy Is?” Reprinted by permission of HarvardBusiness Review. ‘The Strategic Sweet Spot’ from “Can You Say What Strategy is?” by D. J. Collis & M. G. RukstadApril 2008. Copyright © 2008 by the Harvard Business School Publishing Corporation. All rights reserved.
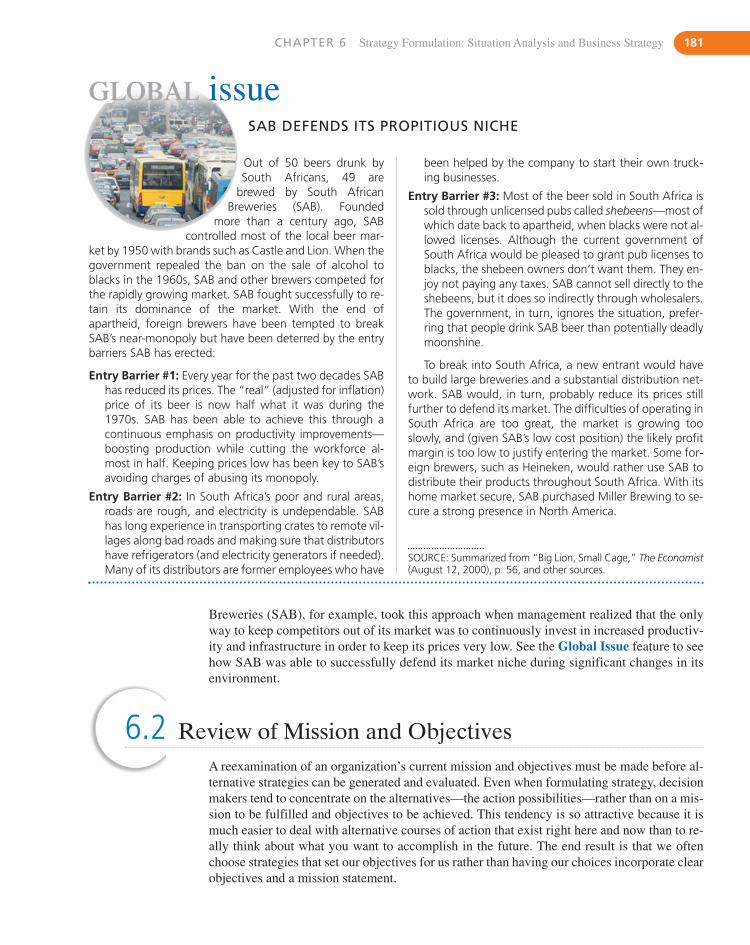
Out of 50 beers drunk bySouth Africans, 49 are
brewed by South AfricanBreweries (SAB). Founded
more than a century ago, SABcontrolled most of the local beer mar-
ket by 1950 with brands such as Castle and Lion. When thegovernment repealed the ban on the sale of alcohol toblacks in the 1960s, SAB and other brewers competed forthe rapidly growing market. SAB fought successfully to re-tain its dominance of the market. With the end ofapartheid, foreign brewers have been tempted to breakSAB’s near-monopoly but have been deterred by the entrybarriers SAB has erected:
Entry Barrier #1: Every year for the past two decades SABhas reduced its prices. The “real” (adjusted for inflation)price of its beer is now half what it was during the1970s. SAB has been able to achieve this through acontinuous emphasis on productivity improvements—boosting production while cutting the workforce al-most in half. Keeping prices low has been key to SAB’savoiding charges of abusing its monopoly.
Entry Barrier #2: In South Africa’s poor and rural areas,roads are rough, and electricity is undependable. SABhas long experience in transporting crates to remote vil-lages along bad roads and making sure that distributorshave refrigerators (and electricity generators if needed).Many of its distributors are former employees who have
Breweries (SAB), for example, took this approach when management realized that the onlyway to keep competitors out of its market was to continuously invest in increased productiv-ity and infrastructure in order to keep its prices very low. See the Global Issue feature to seehow SAB was able to successfully defend its market niche during significant changes in itsenvironment.
CHAPTER 6 Strategy Formulation: Situation Analysis and Business Strategy 181
GLOBAL issueSAB DEFENDS ITS PROPITIOUS NICHE
been helped by the company to start their own truck-ing businesses.
Entry Barrier #3: Most of the beer sold in South Africa issold through unlicensed pubs called shebeens—most ofwhich date back to apartheid, when blacks were not al-lowed licenses. Although the current government ofSouth Africa would be pleased to grant pub licenses toblacks, the shebeen owners don’t want them. They en-joy not paying any taxes. SAB cannot sell directly to theshebeens, but it does so indirectly through wholesalers.The government, in turn, ignores the situation, prefer-ring that people drink SAB beer than potentially deadlymoonshine.
To break into South Africa, a new entrant would haveto build large breweries and a substantial distribution net-work. SAB would, in turn, probably reduce its prices stillfurther to defend its market. The difficulties of operating inSouth Africa are too great, the market is growing tooslowly, and (given SAB’s low cost position) the likely profitmargin is too low to justify entering the market. Some for-eign brewers, such as Heineken, would rather use SAB todistribute their products throughout South Africa. With itshome market secure, SAB purchased Miller Brewing to se-cure a strong presence in North America.
SOURCE: Summarized from “Big Lion, Small Cage,” The Economist(August 12, 2000), p. 56, and other sources.
6.2 Review of Mission and ObjectivesA reexamination of an organization’s current mission and objectives must be made before al-ternative strategies can be generated and evaluated. Even when formulating strategy, decisionmakers tend to concentrate on the alternatives—the action possibilities—rather than on a mis-sion to be fulfilled and objectives to be achieved. This tendency is so attractive because it ismuch easier to deal with alternative courses of action that exist right here and now than to re-ally think about what you want to accomplish in the future. The end result is that we oftenchoose strategies that set our objectives for us rather than having our choices incorporate clearobjectives and a mission statement.
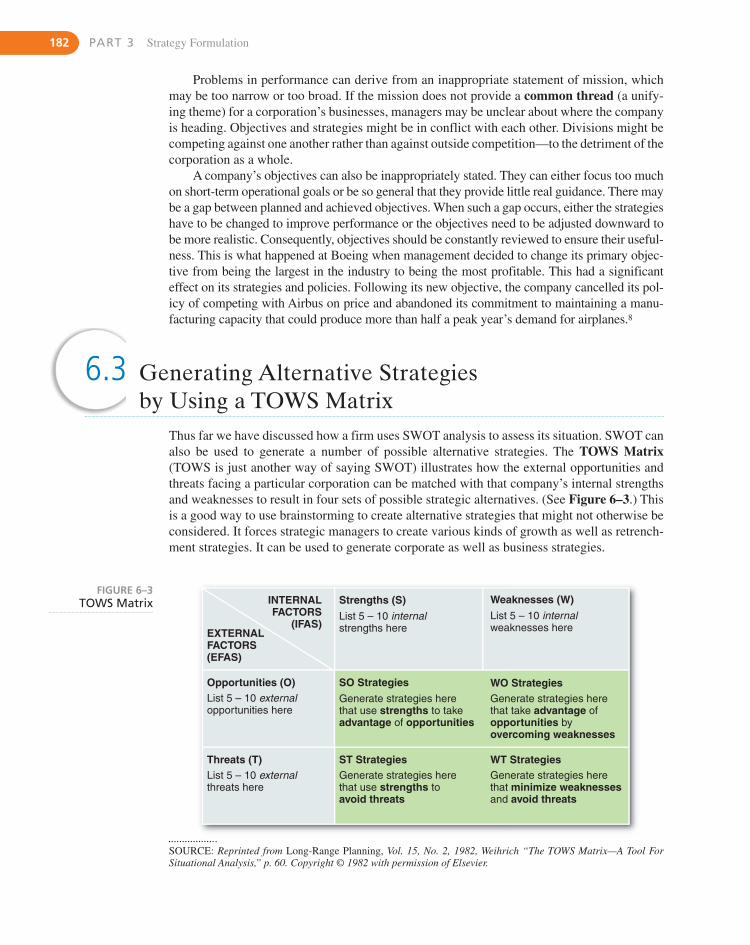
182 PART 3 Strategy Formulation
6.3 Generating Alternative Strategiesby Using a TOWS Matrix
Thus far we have discussed how a firm uses SWOT analysis to assess its situation. SWOT canalso be used to generate a number of possible alternative strategies. The TOWS Matrix(TOWS is just another way of saying SWOT) illustrates how the external opportunities andthreats facing a particular corporation can be matched with that company’s internal strengthsand weaknesses to result in four sets of possible strategic alternatives. (See Figure 6–3.) Thisis a good way to use brainstorming to create alternative strategies that might not otherwise beconsidered. It forces strategic managers to create various kinds of growth as well as retrench-ment strategies. It can be used to generate corporate as well as business strategies.
INTERNALFACTORS
(IFAS)EXTERNALFACTORS(EFAS)
Strengths (S) Weaknesses (W)
Opportunities (O)
Threats (T)
SO Strategies WO Strategies
ST Strategies
List 5 – 10 internalstrengths here
List 5 – 10 internalweaknesses here
List 5 – 10 externalopportunities here
List 5 – 10 externalthreats here
Generate strategies herethat use strengths to takeadvantage of opportunities
Generate strategies herethat use strengths toavoid threats
Generate strategies herethat minimize weaknessesand avoid threats
Generate strategies herethat take advantage ofopportunities by overcoming weaknesses
WT Strategies
FIGURE 6–3TOWS Matrix
Problems in performance can derive from an inappropriate statement of mission, whichmay be too narrow or too broad. If the mission does not provide a common thread (a unify-ing theme) for a corporation’s businesses, managers may be unclear about where the companyis heading. Objectives and strategies might be in conflict with each other. Divisions might becompeting against one another rather than against outside competition—to the detriment of thecorporation as a whole.
A company’s objectives can also be inappropriately stated. They can either focus too muchon short-term operational goals or be so general that they provide little real guidance. There maybe a gap between planned and achieved objectives. When such a gap occurs, either the strategieshave to be changed to improve performance or the objectives need to be adjusted downward tobe more realistic. Consequently, objectives should be constantly reviewed to ensure their useful-ness. This is what happened at Boeing when management decided to change its primary objec-tive from being the largest in the industry to being the most profitable. This had a significanteffect on its strategies and policies. Following its new objective, the company cancelled its pol-icy of competing with Airbus on price and abandoned its commitment to maintaining a manu-facturing capacity that could produce more than half a peak year’s demand for airplanes.8
SOURCE: Reprinted from Long-Range Planning, Vol. 15, No. 2, 1982, Weihrich “The TOWS Matrix—A Tool ForSituational Analysis,” p. 60. Copyright © 1982 with permission of Elsevier.
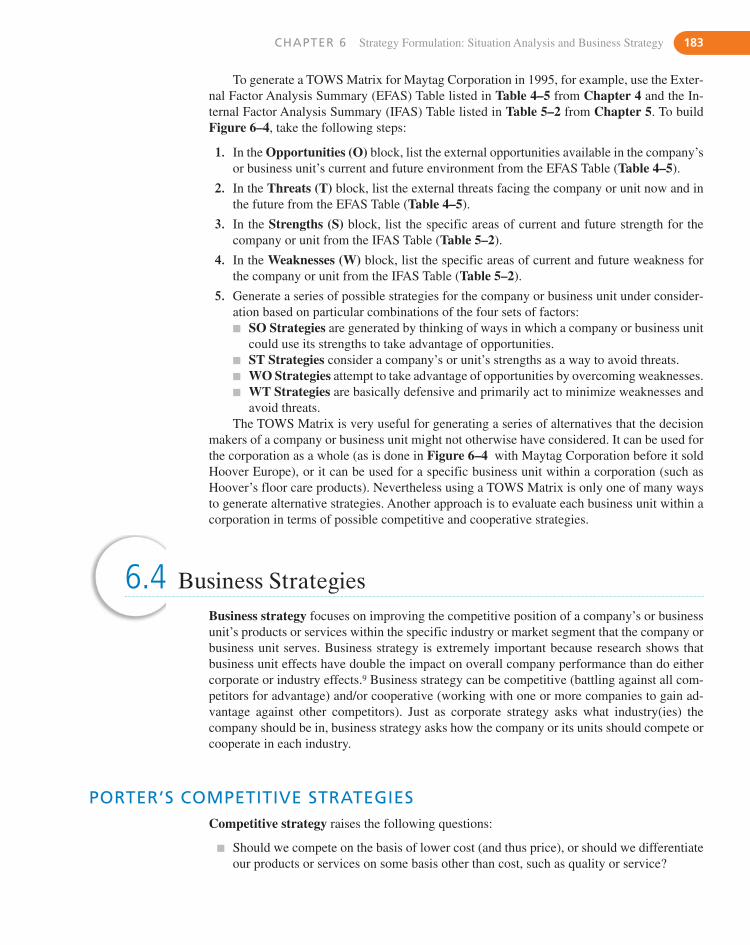
To generate a TOWS Matrix for Maytag Corporation in 1995, for example, use the Exter-nal Factor Analysis Summary (EFAS) Table listed in Table 4–5 from Chapter 4 and the In-ternal Factor Analysis Summary (IFAS) Table listed in Table 5–2 from Chapter 5. To buildFigure 6–4, take the following steps:
1. In the Opportunities (O) block, list the external opportunities available in the company’sor business unit’s current and future environment from the EFAS Table (Table 4–5).
2. In the Threats (T) block, list the external threats facing the company or unit now and inthe future from the EFAS Table (Table 4–5).
3. In the Strengths (S) block, list the specific areas of current and future strength for thecompany or unit from the IFAS Table (Table 5–2).
4. In the Weaknesses (W) block, list the specific areas of current and future weakness forthe company or unit from the IFAS Table (Table 5–2).
5. Generate a series of possible strategies for the company or business unit under consider-ation based on particular combinations of the four sets of factors:� SO Strategies are generated by thinking of ways in which a company or business unit
could use its strengths to take advantage of opportunities.� ST Strategies consider a company’s or unit’s strengths as a way to avoid threats.� WO Strategies attempt to take advantage of opportunities by overcoming weaknesses.� WT Strategies are basically defensive and primarily act to minimize weaknesses and
avoid threats.The TOWS Matrix is very useful for generating a series of alternatives that the decision
makers of a company or business unit might not otherwise have considered. It can be used forthe corporation as a whole (as is done in Figure 6–4 with Maytag Corporation before it soldHoover Europe), or it can be used for a specific business unit within a corporation (such asHoover’s floor care products). Nevertheless using a TOWS Matrix is only one of many waysto generate alternative strategies. Another approach is to evaluate each business unit within acorporation in terms of possible competitive and cooperative strategies.
CHAPTER 6 Strategy Formulation: Situation Analysis and Business Strategy 183
6.4 Business StrategiesBusiness strategy focuses on improving the competitive position of a company’s or businessunit’s products or services within the specific industry or market segment that the company orbusiness unit serves. Business strategy is extremely important because research shows thatbusiness unit effects have double the impact on overall company performance than do eithercorporate or industry effects.9 Business strategy can be competitive (battling against all com-petitors for advantage) and/or cooperative (working with one or more companies to gain ad-vantage against other competitors). Just as corporate strategy asks what industry(ies) thecompany should be in, business strategy asks how the company or its units should compete orcooperate in each industry.
PORTER’S COMPETITIVE STRATEGIESCompetitive strategy raises the following questions:
� Should we compete on the basis of lower cost (and thus price), or should we differentiateour products or services on some basis other than cost, such as quality or service?
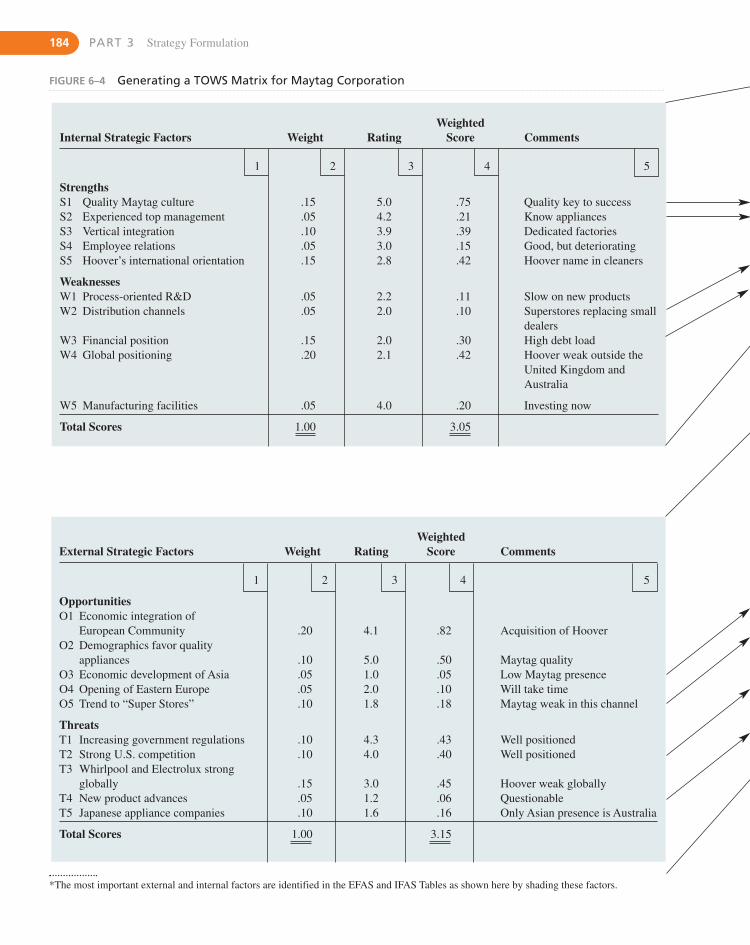
184 PART 3 Strategy Formulation
FIGURE 6–4 Generating a TOWS Matrix for Maytag Corporation
*The most important external and internal factors are identified in the EFAS and IFAS Tables as shown here by shading these factors.
WeightedInternal Strategic Factors Weight Rating Score Comments
1 2 3 4 5
StrengthsS1 Quality Maytag culture .15 5.0 .75 Quality key to successS2 Experienced top management .05 4.2 .21 Know appliancesS3 Vertical integration .10 3.9 .39 Dedicated factoriesS4 Employee relations .05 3.0 .15 Good, but deterioratingS5 Hoover’s international orientation .15 2.8 .42 Hoover name in cleaners
WeaknessesW1 Process-oriented R&D .05 2.2 .11 Slow on new productsW2 Distribution channels .05 2.0 .10 Superstores replacing small
dealersW3 Financial position .15 2.0 .30 High debt loadW4 Global positioning .20 2.1 .42 Hoover weak outside the
United Kingdom andAustralia
W5 Manufacturing facilities .05 4.0 .20 Investing now
Total Scores 1.00 3.05
WeightedExternal Strategic Factors Weight Rating Score Comments
1 2 3 4 5
OpportunitiesO1 Economic integration of
European Community .20 4.1 .82 Acquisition of HooverO2 Demographics favor quality
appliances .10 5.0 .50 Maytag qualityO3 Economic development of Asia .05 1.0 .05 Low Maytag presenceO4 Opening of Eastern Europe .05 2.0 .10 Will take timeO5 Trend to “Super Stores” .10 1.8 .18 Maytag weak in this channel
ThreatsT1 Increasing government regulations .10 4.3 .43 Well positionedT2 Strong U.S. competition .10 4.0 .40 Well positionedT3 Whirlpool and Electrolux strong
globally .15 3.0 .45 Hoover weak globallyT4 New product advances .05 1.2 .06 QuestionableT5 Japanese appliance companies .10 1.6 .16 Only Asian presence is Australia
Total Scores 1.00 3.15
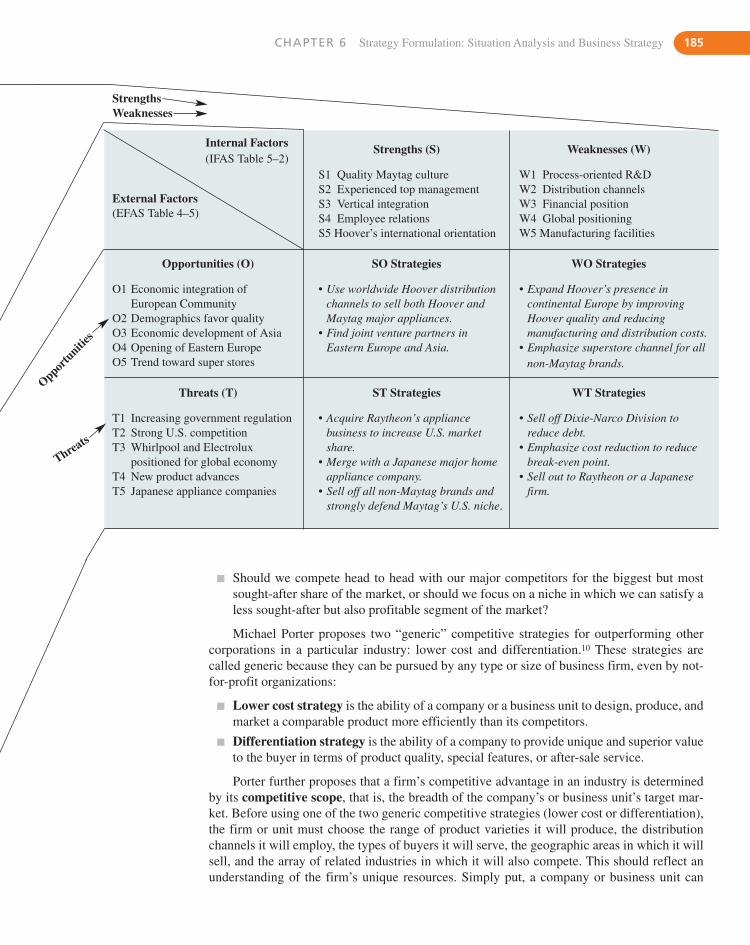
Internal Factors(IFAS Table 5–2)
Strengths (S) Weaknesses (W)
S1 Quality Maytag culture W1 Process-oriented R&D
External FactorsS2 Experienced top management W2 Distribution channels
(EFAS Table 4–5)S3 Vertical integration W3 Financial positionS4 Employee relations W4 Global positioningS5 Hoover’s international orientation W5 Manufacturing facilities
Opportunities (O) SO Strategies WO Strategies
O1 Economic integration of • Use worldwide Hoover distribution • Expand Hoover’s presence inEuropean Community channels to sell both Hoover and continental Europe by improving
O2 Demographics favor quality Maytag major appliances. Hoover quality and reducingO3 Economic development of Asia • Find joint venture partners in manufacturing and distribution costs.O4 Opening of Eastern Europe Eastern Europe and Asia. • Emphasize superstore channel for allO5 Trend toward super stores non-Maytag brands.
Threats (T) ST Strategies WT Strategies
T1 Increasing government regulation • Acquire Raytheon’s appliance • Sell off Dixie-Narco Division toT2 Strong U.S. competition business to increase U.S. market reduce debt.T3 Whirlpool and Electrolux share. • Emphasize cost reduction to reduce
positioned for global economy • Merge with a Japanese major home break-even point.T4 New product advances appliance company. • Sell out to Raytheon or a JapaneseT5 Japanese appliance companies • Sell off all non-Maytag brands and firm.
strongly defend Maytag’s U.S. niche.
StrengthsWeaknesses
Opportu
nities
Threats
� Should we compete head to head with our major competitors for the biggest but mostsought-after share of the market, or should we focus on a niche in which we can satisfy aless sought-after but also profitable segment of the market?
Michael Porter proposes two “generic” competitive strategies for outperforming othercorporations in a particular industry: lower cost and differentiation.10 These strategies arecalled generic because they can be pursued by any type or size of business firm, even by not-for-profit organizations:
� Lower cost strategy is the ability of a company or a business unit to design, produce, andmarket a comparable product more efficiently than its competitors.
� Differentiation strategy is the ability of a company to provide unique and superior valueto the buyer in terms of product quality, special features, or after-sale service.
Porter further proposes that a firm’s competitive advantage in an industry is determinedby its competitive scope, that is, the breadth of the company’s or business unit’s target mar-ket. Before using one of the two generic competitive strategies (lower cost or differentiation),the firm or unit must choose the range of product varieties it will produce, the distributionchannels it will employ, the types of buyers it will serve, the geographic areas in which it willsell, and the array of related industries in which it will also compete. This should reflect anunderstanding of the firm’s unique resources. Simply put, a company or business unit can
CHAPTER 6 Strategy Formulation: Situation Analysis and Business Strategy 185
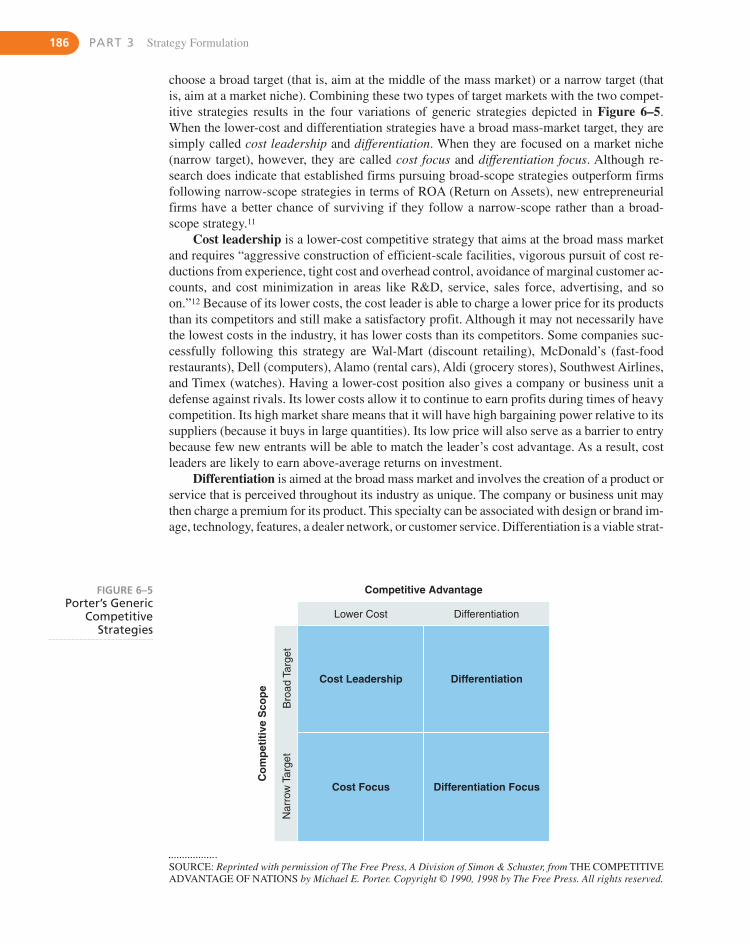
choose a broad target (that is, aim at the middle of the mass market) or a narrow target (thatis, aim at a market niche). Combining these two types of target markets with the two compet-itive strategies results in the four variations of generic strategies depicted in Figure 6–5.When the lower-cost and differentiation strategies have a broad mass-market target, they aresimply called cost leadership and differentiation. When they are focused on a market niche(narrow target), however, they are called cost focus and differentiation focus. Although re-search does indicate that established firms pursuing broad-scope strategies outperform firmsfollowing narrow-scope strategies in terms of ROA (Return on Assets), new entrepreneurialfirms have a better chance of surviving if they follow a narrow-scope rather than a broad-scope strategy.11
Cost leadership is a lower-cost competitive strategy that aims at the broad mass marketand requires “aggressive construction of efficient-scale facilities, vigorous pursuit of cost re-ductions from experience, tight cost and overhead control, avoidance of marginal customer ac-counts, and cost minimization in areas like R&D, service, sales force, advertising, and so on.”12 Because of its lower costs, the cost leader is able to charge a lower price for its productsthan its competitors and still make a satisfactory profit. Although it may not necessarily havethe lowest costs in the industry, it has lower costs than its competitors. Some companies suc-cessfully following this strategy are Wal-Mart (discount retailing), McDonald’s (fast-foodrestaurants), Dell (computers), Alamo (rental cars), Aldi (grocery stores), Southwest Airlines,and Timex (watches). Having a lower-cost position also gives a company or business unit a defense against rivals. Its lower costs allow it to continue to earn profits during times of heavycompetition. Its high market share means that it will have high bargaining power relative to itssuppliers (because it buys in large quantities). Its low price will also serve as a barrier to entrybecause few new entrants will be able to match the leader’s cost advantage. As a result, costleaders are likely to earn above-average returns on investment.
Differentiation is aimed at the broad mass market and involves the creation of a product orservice that is perceived throughout its industry as unique. The company or business unit maythen charge a premium for its product. This specialty can be associated with design or brand im-age, technology, features, a dealer network, or customer service. Differentiation is a viable strat-
186 PART 3 Strategy Formulation
Competitive Advantage
Lower Cost Differentiation
Nar
row
Tar
get
Bro
ad T
arge
t
Cost Leadership Differentiation
Cost Focus Differentiation Focus
Co
mp
etit
ive
Sco
pe
FIGURE 6–5Porter’s Generic
CompetitiveStrategies
SOURCE: Reprinted with permission of The Free Press, A Division of Simon & Schuster, from THE COMPETITIVEADVANTAGE OF NATIONS by Michael E. Porter. Copyright © 1990, 1998 by The Free Press. All rights reserved.
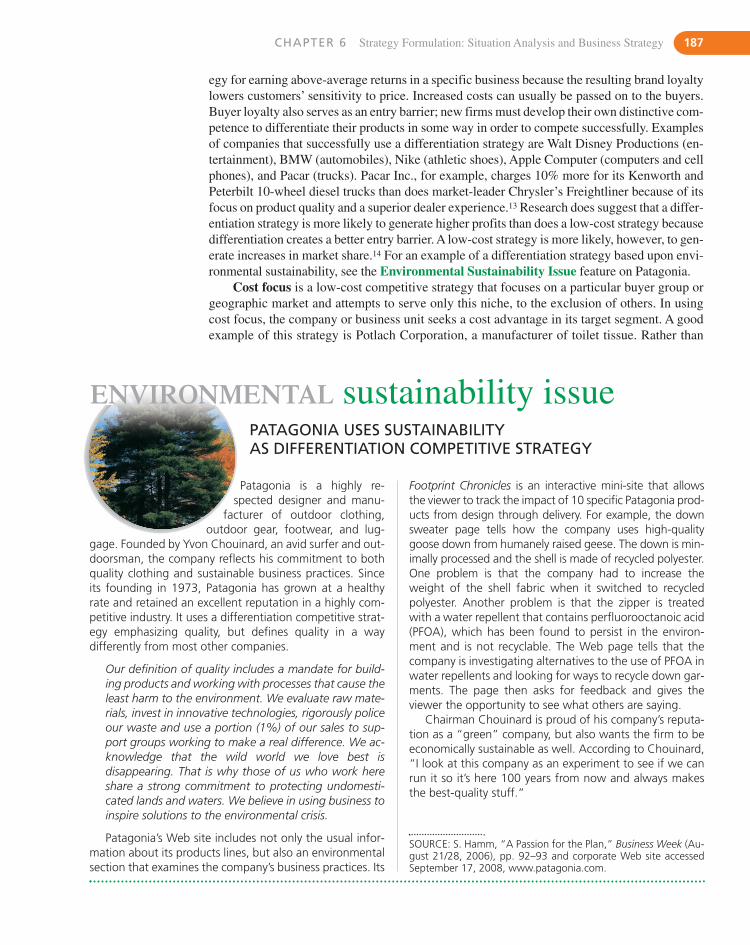
CHAPTER 6 Strategy Formulation: Situation Analysis and Business Strategy 187
egy for earning above-average returns in a specific business because the resulting brand loyaltylowers customers’ sensitivity to price. Increased costs can usually be passed on to the buyers.Buyer loyalty also serves as an entry barrier; new firms must develop their own distinctive com-petence to differentiate their products in some way in order to compete successfully. Examplesof companies that successfully use a differentiation strategy are Walt Disney Productions (en-tertainment), BMW (automobiles), Nike (athletic shoes), Apple Computer (computers and cellphones), and Pacar (trucks). Pacar Inc., for example, charges 10% more for its Kenworth andPeterbilt 10-wheel diesel trucks than does market-leader Chrysler’s Freightliner because of itsfocus on product quality and a superior dealer experience.13 Research does suggest that a differ-entiation strategy is more likely to generate higher profits than does a low-cost strategy becausedifferentiation creates a better entry barrier. A low-cost strategy is more likely, however, to gen-erate increases in market share.14 For an example of a differentiation strategy based upon envi-ronmental sustainability, see the Environmental Sustainability Issue feature on Patagonia.
Cost focus is a low-cost competitive strategy that focuses on a particular buyer group orgeographic market and attempts to serve only this niche, to the exclusion of others. In usingcost focus, the company or business unit seeks a cost advantage in its target segment. A goodexample of this strategy is Potlach Corporation, a manufacturer of toilet tissue. Rather than
Patagonia is a highly re-spected designer and manu-
facturer of outdoor clothing,outdoor gear, footwear, and lug-
gage. Founded by Yvon Chouinard, an avid surfer and out-doorsman, the company reflects his commitment to bothquality clothing and sustainable business practices. Sinceits founding in 1973, Patagonia has grown at a healthyrate and retained an excellent reputation in a highly com-petitive industry. It uses a differentiation competitive strat-egy emphasizing quality, but defines quality in a waydifferently from most other companies.
Our definition of quality includes a mandate for build-ing products and working with processes that cause theleast harm to the environment. We evaluate raw mate-rials, invest in innovative technologies, rigorously policeour waste and use a portion (1%) of our sales to sup-port groups working to make a real difference. We ac-knowledge that the wild world we love best isdisappearing. That is why those of us who work hereshare a strong commitment to protecting undomesti-cated lands and waters. We believe in using business toinspire solutions to the environmental crisis.
Patagonia’s Web site includes not only the usual infor-mation about its products lines, but also an environmentalsection that examines the company’s business practices. Its
PATAGONIA USES SUSTAINABILITY AS DIFFERENTIATION COMPETITIVE STRATEGY
ENVIRONMENTAL sustainability issue
Footprint Chronicles is an interactive mini-site that allowsthe viewer to track the impact of 10 specific Patagonia prod-ucts from design through delivery. For example, the downsweater page tells how the company uses high-qualitygoose down from humanely raised geese. The down is min-imally processed and the shell is made of recycled polyester.One problem is that the company had to increase theweight of the shell fabric when it switched to recycledpolyester. Another problem is that the zipper is treatedwith a water repellent that contains perfluorooctanoic acid(PFOA), which has been found to persist in the environ-ment and is not recyclable. The Web page tells that thecompany is investigating alternatives to the use of PFOA inwater repellents and looking for ways to recycle down gar-ments. The page then asks for feedback and gives theviewer the opportunity to see what others are saying.
Chairman Chouinard is proud of his company’s reputa-tion as a “green” company, but also wants the firm to beeconomically sustainable as well. According to Chouinard,“I look at this company as an experiment to see if we canrun it so it’s here 100 years from now and always makesthe best-quality stuff.”
SOURCE: S. Hamm, “A Passion for the Plan,” Business Week (Au-gust 21/28, 2006), pp. 92–93 and corporate Web site accessedSeptember 17, 2008, www.patagonia.com.
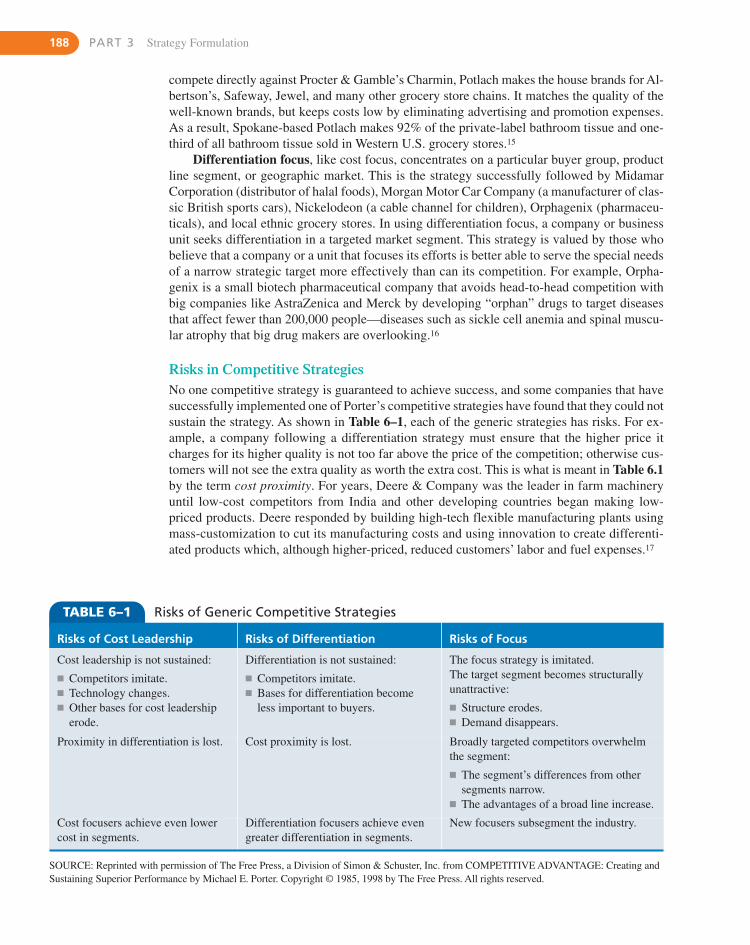
188 PART 3 Strategy Formulation
compete directly against Procter & Gamble’s Charmin, Potlach makes the house brands for Al-bertson’s, Safeway, Jewel, and many other grocery store chains. It matches the quality of thewell-known brands, but keeps costs low by eliminating advertising and promotion expenses.As a result, Spokane-based Potlach makes 92% of the private-label bathroom tissue and one-third of all bathroom tissue sold in Western U.S. grocery stores.15
Differentiation focus, like cost focus, concentrates on a particular buyer group, productline segment, or geographic market. This is the strategy successfully followed by MidamarCorporation (distributor of halal foods), Morgan Motor Car Company (a manufacturer of clas-sic British sports cars), Nickelodeon (a cable channel for children), Orphagenix (pharmaceu-ticals), and local ethnic grocery stores. In using differentiation focus, a company or businessunit seeks differentiation in a targeted market segment. This strategy is valued by those whobelieve that a company or a unit that focuses its efforts is better able to serve the special needsof a narrow strategic target more effectively than can its competition. For example, Orpha-genix is a small biotech pharmaceutical company that avoids head-to-head competition withbig companies like AstraZenica and Merck by developing “orphan” drugs to target diseasesthat affect fewer than 200,000 people—diseases such as sickle cell anemia and spinal muscu-lar atrophy that big drug makers are overlooking.16
Risks in Competitive StrategiesNo one competitive strategy is guaranteed to achieve success, and some companies that havesuccessfully implemented one of Porter’s competitive strategies have found that they could notsustain the strategy. As shown in Table 6–1, each of the generic strategies has risks. For ex-ample, a company following a differentiation strategy must ensure that the higher price itcharges for its higher quality is not too far above the price of the competition; otherwise cus-tomers will not see the extra quality as worth the extra cost. This is what is meant in Table 6.1by the term cost proximity. For years, Deere & Company was the leader in farm machineryuntil low-cost competitors from India and other developing countries began making low-priced products. Deere responded by building high-tech flexible manufacturing plants usingmass-customization to cut its manufacturing costs and using innovation to create differenti-ated products which, although higher-priced, reduced customers’ labor and fuel expenses.17
TABLE 6–1 Risks of Generic Competitive Strategies
Risks of Cost Leadership Risks of Differentiation Risks of Focus
Cost leadership is not sustained:� Competitors imitate.� Technology changes.� Other bases for cost leadership
erode.
Differentiation is not sustained:� Competitors imitate.� Bases for differentiation become
less important to buyers.
The focus strategy is imitated.The target segment becomes structurallyunattractive:� Structure erodes.� Demand disappears.
Proximity in differentiation is lost. Cost proximity is lost. Broadly targeted competitors overwhelmthe segment:� The segment’s differences from other
segments narrow.� The advantages of a broad line increase.
Cost focusers achieve even lowercost in segments.
Differentiation focusers achieve evengreater differentiation in segments.
New focusers subsegment the industry.
SOURCE: Reprinted with permission of The Free Press, a Division of Simon & Schuster, Inc. from COMPETITIVE ADVANTAGE: Creating andSustaining Superior Performance by Michael E. Porter. Copyright © 1985, 1998 by The Free Press. All rights reserved.
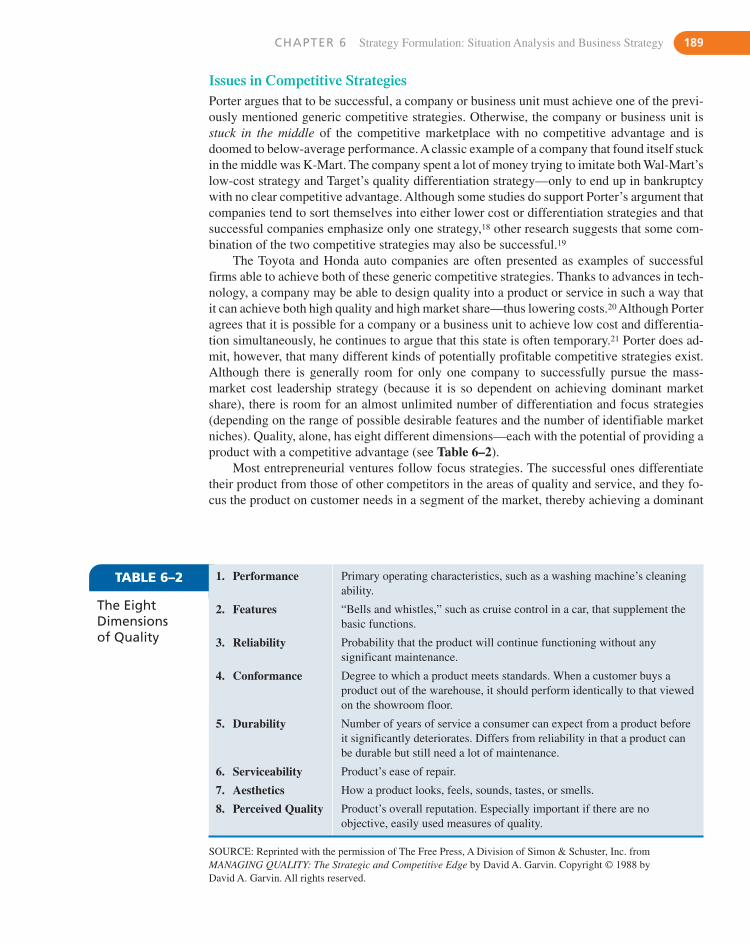
CHAPTER 6 Strategy Formulation: Situation Analysis and Business Strategy 189
Issues in Competitive StrategiesPorter argues that to be successful, a company or business unit must achieve one of the previ-ously mentioned generic competitive strategies. Otherwise, the company or business unit isstuck in the middle of the competitive marketplace with no competitive advantage and isdoomed to below-average performance. A classic example of a company that found itself stuckin the middle was K-Mart. The company spent a lot of money trying to imitate both Wal-Mart’slow-cost strategy and Target’s quality differentiation strategy—only to end up in bankruptcywith no clear competitive advantage. Although some studies do support Porter’s argument thatcompanies tend to sort themselves into either lower cost or differentiation strategies and thatsuccessful companies emphasize only one strategy,18 other research suggests that some com-bination of the two competitive strategies may also be successful.19
The Toyota and Honda auto companies are often presented as examples of successfulfirms able to achieve both of these generic competitive strategies. Thanks to advances in tech-nology, a company may be able to design quality into a product or service in such a way thatit can achieve both high quality and high market share—thus lowering costs.20 Although Porteragrees that it is possible for a company or a business unit to achieve low cost and differentia-tion simultaneously, he continues to argue that this state is often temporary.21 Porter does ad-mit, however, that many different kinds of potentially profitable competitive strategies exist.Although there is generally room for only one company to successfully pursue the mass-market cost leadership strategy (because it is so dependent on achieving dominant marketshare), there is room for an almost unlimited number of differentiation and focus strategies (depending on the range of possible desirable features and the number of identifiable marketniches). Quality, alone, has eight different dimensions—each with the potential of providing aproduct with a competitive advantage (see Table 6–2).
Most entrepreneurial ventures follow focus strategies. The successful ones differentiatetheir product from those of other competitors in the areas of quality and service, and they fo-cus the product on customer needs in a segment of the market, thereby achieving a dominant
TABLE 6–2 1. Performance
2. Features
3. Reliability
4. Conformance
5. Durability
6. Serviceability
7. Aesthetics
8. Perceived Quality
Primary operating characteristics, such as a washing machine’s cleaningability.
“Bells and whistles,” such as cruise control in a car, that supplement thebasic functions.
Probability that the product will continue functioning without anysignificant maintenance.
Degree to which a product meets standards. When a customer buys aproduct out of the warehouse, it should perform identically to that viewedon the showroom floor.
Number of years of service a consumer can expect from a product beforeit significantly deteriorates. Differs from reliability in that a product canbe durable but still need a lot of maintenance.
Product’s ease of repair.
How a product looks, feels, sounds, tastes, or smells.
Product’s overall reputation. Especially important if there are noobjective, easily used measures of quality.
SOURCE: Reprinted with the permission of The Free Press, A Division of Simon & Schuster, Inc. fromMANAGING QUALITY: The Strategic and Competitive Edge by David A. Garvin. Copyright © 1988 by David A. Garvin. All rights reserved.
The EightDimensionsof Quality
190 PART 3 Strategy Formulation
share of that part of the market. Adopting guerrilla warfare tactics, these companies go afteropportunities in market niches too small to justify retaliation from the market leaders.
Industry Structure and Competitive StrategyAlthough each of Porter’s generic competitive strategies may be used in any industry, certainstrategies are more likely to succeed than others in some instances. In a fragmented industry,for example, where many small- and medium-sized local companies compete for relativelysmall shares of the total market, focus strategies will likely predominate. Fragmented indus-tries are typical for products in the early stages of their life cycles. If few economies are to begained through size, no large firms will emerge and entry barriers will be low—allowing astream of new entrants into the industry. Chinese restaurants, veterinary care, used-car sales,ethnic grocery stores, and funeral homes are examples. Even though P.F. Chang’s and thePanda Restaurant Group have firmly established themselves as chains in the United States, lo-cal, family-owned restaurants still comprise 87% of Asian casual dining restaurants.22
If a company is able to overcome the limitations of a fragmented market, however, it canreap the benefits of a broadly targeted cost-leadership or differentiation strategy. Until PizzaHut was able to use advertising to differentiate itself from local competitors, the pizza fast-food business was a fragmented industry composed primarily of locally owned pizza parlors,each with its own distinctive product and service offering. Subsequently Domino’s used thecost-leader strategy to achieve U.S. national market share.
As an industry matures, fragmentation is overcome, and the industry tends to become aconsolidated industry dominated by a few large companies. Although many industries startout being fragmented, battles for market share and creative attempts to overcome local or nichemarket boundaries often increase the market share of a few companies. After product standardsbecome established for minimum quality and features, competition shifts to a greater empha-sis on cost and service. Slower growth, overcapacity, and knowledgeable buyers combine toput a premium on a firm’s ability to achieve cost leadership or differentiation along the dimen-sions most desired by the market. R&D shifts from product to process improvements. Overallproduct quality improves, and costs are reduced significantly.
The strategic rollup was developed in the mid-1990s as an efficient way to quickly consoli-date a fragmented industry. With the aid of money from venture capitalists, an entrepreneur ac-quires hundreds of owner-operated small businesses. The resulting large firm creates economiesof scale by building regional or national brands, applies best practices across all aspects of mar-keting and operations, and hires more sophisticated managers than the small businesses could pre-viously afford. Rollups differ from conventional mergers and acquisitions in three ways: (1) theyinvolve large numbers of firms, (2) the acquired firms are typically owner operated, and (3) theobjective is not to gain incremental advantage, but to reinvent an entire industry.23 Rollups are cur-rently under way in the funeral industry led by Service Corporation International, Stewart Enter-prises, and the Loewen Group; and in the veterinary care industries by VCA (Veterinary Centersof America ) Antech Inc. Of the 22,000 pet hospitals in the U.S., VCA Antech had acquired 465by July 2008 with plans to continue acquisitions for the foreseeable future.24
Once consolidated, an industry has become one in which cost leadership and differentia-tion tend to be combined to various degrees, even though one competitive strategy may be pri-marily emphasized. A firm can no longer gain and keep high market share simply through lowprice. The buyers are more sophisticated and demand a certain minimum level of quality forprice paid. For example, low-cost office supplies retailer Staples introduced in 2007 a line ofpremium office supplies called “My Style, My Way” in order to halt sliding sales.25 Even Mc-Donald’s, long the leader in low-cost fast-food restaurants, has been forced to add healthierand more upscale food items, such as Asian chicken salad, comfortable chairs, and Wi-Fi In-ternet access in order to keep its increasingly sophisticated customer base.26 The same is truefor firms emphasizing high quality. Either the quality must be high enough and valued by the
CHAPTER 6 Strategy Formulation: Situation Analysis and Business Strategy 191
customer enough to justify the higher price or the price must be dropped (through loweringcosts) to compete effectively with the lower priced products. Hewlett-Packard, for example,spent years restructuring its computer business in order to cut Dell’s cost advantage from 20%to just 10%.27 Consolidation is taking place worldwide in the automobile, airline, computer,and home appliance industries.
Hypercompetition and Competitive Advantage SustainabilitySome firms are able to sustain their competitive advantage for many years,28 but most find thatcompetitive advantage erodes over time. In his book Hypercompetition, D’Aveni proposes thatit is becoming increasingly difficult to sustain a competitive advantage for very long. “Marketstability is threatened by short product life cycles, short product design cycles, new technolo-gies, frequent entry by unexpected outsiders, repositioning by incumbents, and tactical redef-initions of market boundaries as diverse industries merge.”29 Consequently, a company orbusiness unit must constantly work to improve its competitive advantage. It is not enough tobe just the lowest-cost competitor. Through continuous improvement programs, competitorsare usually working to lower their costs as well. Firms must find new ways not only to reducecosts further but also to add value to the product or service being provided.
The same is true of a firm or unit that is following a differentiation strategy. Maytag Cor-poration, for example, was successful for many years by offering the most reliable brand inNorth American major home appliances. It was able to charge the highest prices for Maytagbrand washing machines. When other competitors improved the quality of their products, how-ever, it became increasingly difficult for customers to justify Maytag’s significantly higher price.Consequently Maytag Corporation was forced not only to add new features to its products butalso to reduce costs through improved manufacturing processes so that its prices were no longerout of line with those of the competition. D’Aveni’s theory of hypercompetition is supported bydeveloping research on the importance of building dynamic capabilities to better cope with un-certain environments (discussed previously in Chapter 5 in the resource-based view of the firm).
D’Aveni contends that when industries become hypercompetitive, they tend to go throughescalating stages of competition. Firms initially compete on cost and quality, until an abun-dance of high-quality, low-priced goods result. This occurred in the U.S. major home appli-ance industry by 1980. In a second stage of competition, the competitors move into untappedmarkets. Others usually imitate these moves until the moves become too risky or expensive.This epitomized the major home appliance industry during the 1980s and 1990s, as strong U.S.and European firms like Whirlpool, Electrolux, and Bosch-Siemens established presences inboth Europe and the Americas and then moved into Asia. Strong Asian firms like LG and Haierlikewise entered Europe and the Americas in the late 1990s.
According to D’Aveni, firms then raise entry barriers to limit competitors. Economies ofscale, distribution agreements, and strategic alliances made it all but impossible for a new firmto enter the major home appliance industry by the end of the 20th century. After the establishedplayers have entered and consolidated all new markets, the next stage is for the remaining firms to attack and destroy the strongholds of other firms. Maytag’s inability to hold onto itsNorth American stronghold led to its acquisition by Whirlpool in 2006. Eventually, accordingto D’Aveni, the remaining large global competitors work their way to a situation of perfectcompetition in which no one has any advantage and profits are minimal.
Before hypercompetition, strategic initiatives provided competitive advantage for manyyears, perhaps for decades. Except for a few stable industries, this is no longer the case. Ac-cording to D’Aveni, as industries become hypercompetitive, there is no such thing as a sus-tainable competitive advantage. Successful strategic initiatives in this type of industrytypically last only months to a few years. According to D’Aveni, the only way a firm in thiskind of dynamic industry can sustain any competitive advantage is through a continuous se-ries of multiple short-term initiatives aimed at replacing a firm’s current successful products
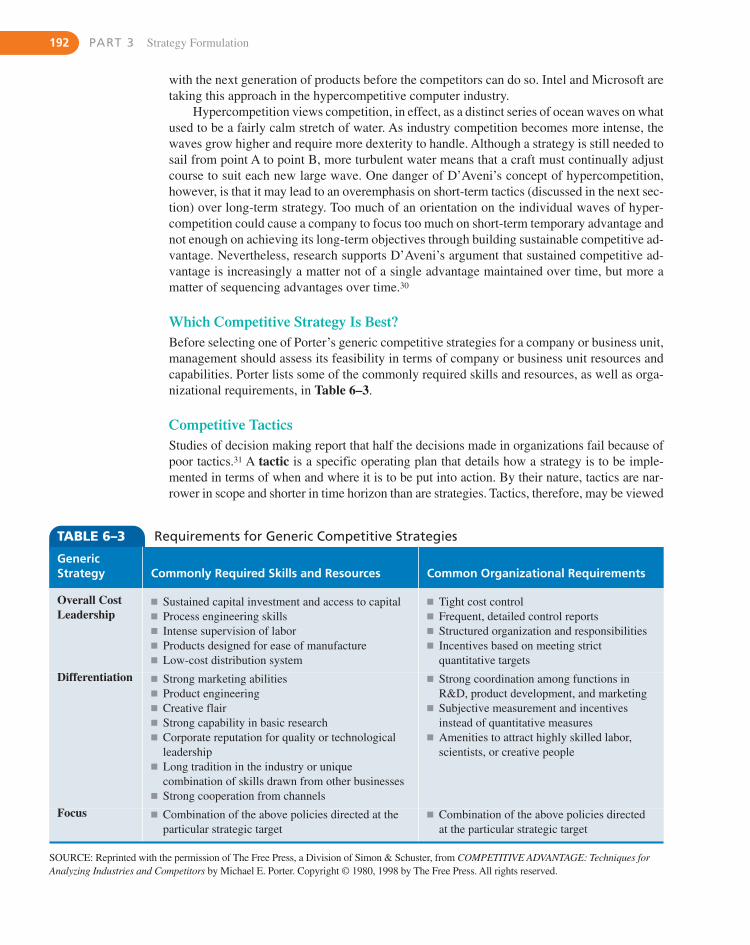
192 PART 3 Strategy Formulation
with the next generation of products before the competitors can do so. Intel and Microsoft aretaking this approach in the hypercompetitive computer industry.
Hypercompetition views competition, in effect, as a distinct series of ocean waves on whatused to be a fairly calm stretch of water. As industry competition becomes more intense, thewaves grow higher and require more dexterity to handle. Although a strategy is still needed tosail from point A to point B, more turbulent water means that a craft must continually adjustcourse to suit each new large wave. One danger of D’Aveni’s concept of hypercompetition,however, is that it may lead to an overemphasis on short-term tactics (discussed in the next sec-tion) over long-term strategy. Too much of an orientation on the individual waves of hyper-competition could cause a company to focus too much on short-term temporary advantage andnot enough on achieving its long-term objectives through building sustainable competitive ad-vantage. Nevertheless, research supports D’Aveni’s argument that sustained competitive ad-vantage is increasingly a matter not of a single advantage maintained over time, but more amatter of sequencing advantages over time.30
Which Competitive Strategy Is Best?Before selecting one of Porter’s generic competitive strategies for a company or business unit,management should assess its feasibility in terms of company or business unit resources andcapabilities. Porter lists some of the commonly required skills and resources, as well as orga-nizational requirements, in Table 6–3.
Competitive TacticsStudies of decision making report that half the decisions made in organizations fail because ofpoor tactics.31 A tactic is a specific operating plan that details how a strategy is to be imple-mented in terms of when and where it is to be put into action. By their nature, tactics are nar-rower in scope and shorter in time horizon than are strategies. Tactics, therefore, may be viewed
TABLE 6–3 Requirements for Generic Competitive Strategies
GenericStrategy Commonly Required Skills and Resources Common Organizational Requirements
Overall CostLeadership
� Sustained capital investment and access to capital� Process engineering skills� Intense supervision of labor� Products designed for ease of manufacture� Low-cost distribution system
� Tight cost control� Frequent, detailed control reports� Structured organization and responsibilities� Incentives based on meeting strict
quantitative targets
Differentiation � Strong marketing abilities� Product engineering� Creative flair� Strong capability in basic research� Corporate reputation for quality or technological
leadership� Long tradition in the industry or unique
combination of skills drawn from other businesses� Strong cooperation from channels
� Strong coordination among functions inR&D, product development, and marketing
� Subjective measurement and incentivesinstead of quantitative measures
� Amenities to attract highly skilled labor,scientists, or creative people
Focus � Combination of the above policies directed at theparticular strategic target
� Combination of the above policies directedat the particular strategic target
SOURCE: Reprinted with the permission of The Free Press, a Division of Simon & Schuster, from COMPETITIVE ADVANTAGE: Techniques forAnalyzing Industries and Competitors by Michael E. Porter. Copyright © 1980, 1998 by The Free Press. All rights reserved.
CHAPTER 6 Strategy Formulation: Situation Analysis and Business Strategy 193
(like policies) as a link between the formulation and implementation of strategy. Some of the tac-tics available to implement competitive strategies are timing tactics and market location tactics.
Timing Tactics: When to CompeteA timing tactic deals with when a company implements a strategy. The first company to man-ufacture and sell a new product or service is called the first mover (or pioneer). Some of theadvantages of being a first mover are that the company is able to establish a reputation as anindustry leader, move down the learning curve to assume the cost-leader position, and earntemporarily high profits from buyers who value the product or service very highly. A success-ful first mover can also set the standard for all subsequent products in the industry. A companythat sets the standard “locks in” customers and is then able to offer further products based onthat standard.32 Microsoft was able to do this in software with its Windows operating system,and Netscape garnered over an 80% share of the Internet browser market by being first to com-mercialize the product successfully. Research does indicate that moving first or second into anew industry or foreign country results in greater market share and shareholder wealth thandoes moving later.33 Being first provides a company profit advantages for about 10 years inconsumer goods and about 12 years in industrial goods.34 This is true, however, only if the firstmover has sufficient resources to both exploit the new market and to defend its position againstlater arrivals with greater resources.35 Gillette, for example, has been able to keep its leader-ship of the razor category (70% market share) by continuously introducing new products.36
Being a first mover does, however, have its disadvantages. These disadvantages can be, con-versely, advantages enjoyed by late-mover firms. Late movers may be able to imitate the tech-nological advances of others (and thus keep R&D costs low), keep risks down by waiting until a new technological standard or market is established, and take advantage of the first mover’s natural inclination to ignore market segments.37 Research indicates that successful late moverstend to be large firms with considerable resources and related experience.38 Microsoft is one ex-ample. Once Netscape had established itself as the standard for Internet browsers in the 1990s,Microsoft used its huge resources to directly attack Netscape’s position with its Internet Explorer.It did not want Netscape to also set the standard in the developing and highly lucrative intranetmarket inside corporations. By 2004, Microsoft’s Internet Explorer dominated Web browsers,and Netscape was only a minor presence. Nevertheless, research suggests that the advantages and disadvantages of first and late movers may not always generalize across industries becauseof differences in entry barriers and the resources of the specific competitors.39
Market Location Tactics: Where to CompeteA market location tactic deals with where a company implements a strategy. A company orbusiness unit can implement a competitive strategy either offensively or defensively. Anoffensive tactic usually takes place in an established competitor’s market location. A defensivetactic usually takes place in the firm’s own current market position as a defense against possi-ble attack by a rival.40
Offensive Tactics. Some of the methods used to attack a competitor’s position are:
� Frontal assault: The attacking firm goes head to head with its competitor. It matches thecompetitor in every category from price to promotion to distribution channel. To be success-ful, the attacker must have not only superior resources, but also the willingness to persevere.This is generally a very expensive tactic and may serve to awaken a sleeping giant, depress-ing profits for the whole industry. This is what Kimberly-Clark did when it introduced Hug-gies disposable diapers against P&G’s market-leading Pampers. The resulting competitivebattle between the two firms depressed Kimberly-Clark’s profits.41
194 PART 3 Strategy Formulation
� Flanking maneuver: Rather than going straight for a competitor’s position of strengthwith a frontal assault, a firm may attack a part of the market where the competitor is weak.Texas Instruments, for example, avoided competing directly with Intel by developing mi-croprocessors for consumer electronics, cell phones, and medical devices instead of com-puters. Taken together, these other applications are worth more in terms of dollars andinfluence than are computers, where Intel dominates.42
� Bypass attack: Rather than directly attacking the established competitor frontally or onits flanks, a company or business unit may choose to change the rules of the game. Thistactic attempts to cut the market out from under the established defender by offering a newtype of product that makes the competitor’s product unnecessary. For example, instead ofcompeting directly against Microsoft’s Pocket PC and Palm Pilot for the handheld com-puter market, Apple introduced the iPod as a personal digital music player. It was the mostradical change to the way people listen to music since the Sony Walkman. By redefiningthe market, Apple successfully sidestepped both Intel and Microsoft, leaving them to play“catch-up.”43
� Encirclement: Usually evolving out of a frontal assault or flanking maneuver, encir-clement occurs as an attacking company or unit encircles the competitor’s position interms of products or markets or both. The encircler has greater product variety (e.g., acomplete product line, ranging from low to high price) and/or serves more markets (e.g.,it dominates every secondary market). For example, Steinway was a major manufacturerof pianos in the United States until Yamaha entered the market with a broader range of pi-anos, keyboards, and other musical instruments. Although Steinway still dominates con-cert halls, it has only a 2% share of the U.S. market.44 Oracle is using this strategy in itsbattle against market leader SAP for enterprise resource planning (ERP) software by “sur-rounding” SAP with acquisitions.45
� Guerrilla warfare: Instead of a continual and extensive resource-expensive attack on acompetitor, a firm or business unit may choose to “hit and run.” Guerrilla warfare is char-acterized by the use of small, intermittent assaults on different market segments held bythe competitor. In this way, a new entrant or small firm can make some gains without se-riously threatening a large, established competitor and evoking some form of retaliation.To be successful, the firm or unit conducting guerrilla warfare must be patient enough toaccept small gains and to avoid pushing the established competitor to the point that it mustrespond or else lose face. Microbreweries, which make beer for sale to local customers,use this tactic against major brewers such as Anheuser-Busch.
Defensive Tactics. According to Porter, defensive tactics aim to lower the probability ofattack, divert attacks to less threatening avenues, or lessen the intensity of an attack. Instead of increasing competitive advantage per se, they make a company’s or business unit’scompetitive advantage more sustainable by causing a challenger to conclude that an attack isunattractive. These tactics deliberately reduce short-term profitability to ensure long-termprofitability:46
� Raise structural barriers. Entry barriers act to block a challenger’s logical avenues ofattack. Some of the most important, according to Porter, are to:1. Offer a full line of products in every profitable market segment to close off any entry
points (for example, Coca Cola offers unprofitable noncarbonated beverages to keepcompetitors off store shelves);
2. Block channel access by signing exclusive agreements with distributors;3. Raise buyer switching costs by offering low-cost training to users;4. Raise the cost of gaining trial users by keeping prices low on items new users are most
likely to purchase;
CHAPTER 6 Strategy Formulation: Situation Analysis and Business Strategy 195
5. Increase scale economies to reduce unit costs;6. Foreclose alternative technologies through patenting or licensing;7. Limit outside access to facilities and personnel;8. Tie up suppliers by obtaining exclusive contracts or purchasing key locations;9. Avoid suppliers that also serve competitors; and
10. Encourage the government to raise barriers, such as safety and pollution standards orfavorable trade policies.
� Increase expected retaliation: This tactic is any action that increases the perceived threatof retaliation for an attack. For example, management may strongly defend any erosion ofmarket share by drastically cutting prices or matching a challenger’s promotion through a policy of accepting any price-reduction coupons for a competitor’s product. This coun-terattack is especially important in markets that are very important to the defending com-pany or business unit. For example, when Clorox Company challenged P&G in thedetergent market with Clorox Super Detergent, P&G retaliated by test marketing its liq-uid bleach, Lemon Fresh Comet, in an attempt to scare Clorox into retreating from the de-tergent market. Research suggests that retaliating quickly is not as successful in slowingmarket share loss as a slower, but more concentrated and aggressive response.47
� Lower the inducement for attack: A third type of defensive tactic is to reduce a chal-lenger’s expectations of future profits in the industry. Like Southwest Airlines, a companycan deliberately keep prices low and constantly invest in cost-reducing measures. Withprices kept very low, there is little profit incentive for a new entrant.48
COOPERATIVE STRATEGIESA company uses competitive strategies and tactics to gain competitive advantage within an industry by battling against other firms. These are not, however, the only business strategy options available to a company or business unit for competing successfully within an industry.A company can also use cooperative strategies to gain competitive advantage within an industry by working with other firms. The two general types of cooperative strategies are collusion and strategic alliances.
CollusionCollusion is the active cooperation of firms within an industry to reduce output and raise prices in order to get around the normal economic law of supply and demand. Collusion maybe explicit, in which case firms cooperate through direct communication and negotiation, ortacit, in which case firms cooperate indirectly through an informal system of signals. Explicitcollusion is illegal in most countries and in a number of regional trade associations, such asthe European Union. For example, Archer Daniels Midland (ADM), the large U.S. agriculturalproducts firm, conspired with its competitors to limit the sales volume and raise the price ofthe food additive lysine. Executives from three Japanese and South Korean lysine manufac-turers admitted meeting in hotels in major cities throughout the world to form a “lysine tradeassociation.” The three companies were fined more than $20 million by the U.S. federal gov-ernment.49 In another example, Denver-based Qwest signed agreements favoring competitorsthat agreed not to oppose Qwest’s merger with U.S. West or its entry into the long-distancebusiness in its 14-state region. In one agreement, Qwest agreed to pay McLeodUSA almost$30 million to settle a billing dispute in return for McLeod’s withdrawing its objections toQwest’s purchase of U.S. West.50
Collusion can also be tacit, in which case there is no direct communication among com-peting firms. According to Barney, tacit collusion in an industry is most likely to be success-ful if (1) there are a small number of identifiable competitors, (2) costs are similar among
196 PART 3 Strategy Formulation
firms, (3) one firm tends to act as the price leader, (4) there is a common industry culture thataccepts cooperation, (5) sales are characterized by a high frequency of small orders, (6) largeinventories and order backlogs are normal ways of dealing with fluctuations in demand, and(7) there are high entry barriers to keep out new competitors.51
Even tacit collusion can, however, be illegal. For example, when General Electricwanted to ease price competition in the steam turbine industry, it widely advertised its pricesand publicly committed not to sell below those prices. Customers were even told that if GEreduced turbine prices in the future, it would give customers a refund equal to the price re-duction. GE’s message was not lost on Westinghouse, the major competitor in steam tur-bines. Both prices and profit margins remained stable for the next 10 years in this industry.The U.S. Department of Justice then sued both firms for engaging in “conscious paral-lelism” (following each other’s lead to reduce the level of competition) in order to reducecompetition.
Strategic AlliancesA strategic alliance is a long-term cooperative arrangement between two or more independentfirms or business units that engage in business activities for mutual economic gain.52 Alliancesbetween companies or business units have become a fact of life in modern business. In theU.S. software industry, for example, the percentage of publicly traded firms that engaged in al-liances increased from 32% in 1990 to 95% in 2001. During the same time period, the averagenumber of alliances grew from four to more than 30 per firm.53 Each of the top 500 global busi-ness firms now averages 60 major alliances.54 Some alliances are very short term, only lastinglong enough for one partner to establish a beachhead in a new market. Over time, conflicts overobjectives and control often develop among the partners. For these and other reasons, aroundhalf of all alliances (including international alliances) perform unsatisfactorily.55 Others aremore long lasting and may even be preludes to full mergers between companies.
Many alliances do increase profitability of the members and have a positive effect on firmvalue.56 A study by Cooper & Lybrand found that firms involved in strategic alliances had 11%higher revenue and 20% higher growth rate than did companies not involved in alliances.57
Forming and managing strategic alliances is a capability that is learned over time. Research reveals that the more experience a firm has with strategic alliances, the more likely that its al-liances will be successful.58 (There is some evidence, however, that too much partnering ex-perience with the same partners generates diminishing returns over time and leads to reducedperformance.)59 Consequently, leading firms are making investments in building and develop-ing their partnering capabilities.60
Companies or business units may form a strategic alliance for a number of reasons, in-cluding:
1. To obtain or learn new capabilities: For example, General Motors and Chrysler formedan alliance in 2004 to develop new fuel-saving hybrid engines for their automobiles.61 Al-liances are especially useful if the desired knowledge or capability is based on tacitknowledge or on new poorly-understood technology.62 A study found that firms withstrategic alliances had more modern manufacturing technologies than did firms withoutalliances.63
2. To obtain access to specific markets: Rather than buy a foreign company or build brew-eries of its own in other countries, Anheuser-Busch chose to license the right to brew andmarket Budweiser to other brewers, such as Labatt in Canada, Modelo in Mexico, and Kirinin Japan. As another example, U.S. defense contractors and aircraft manufacturers selling toforeign governments are typically required by these governments to spend a percentage ofthe contract/purchase value, either by purchasing parts or obtaining sub-contractors, in that
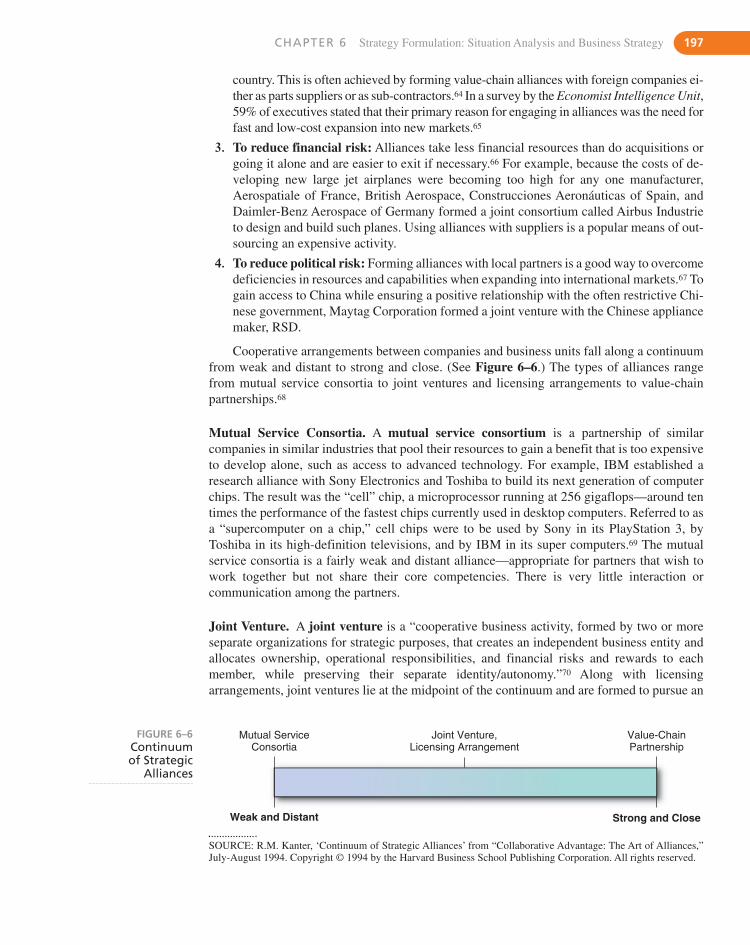
CHAPTER 6 Strategy Formulation: Situation Analysis and Business Strategy 197
country. This is often achieved by forming value-chain alliances with foreign companies ei-ther as parts suppliers or as sub-contractors.64 In a survey by the Economist Intelligence Unit,59% of executives stated that their primary reason for engaging in alliances was the need forfast and low-cost expansion into new markets.65
3. To reduce financial risk: Alliances take less financial resources than do acquisitions orgoing it alone and are easier to exit if necessary.66 For example, because the costs of de-veloping new large jet airplanes were becoming too high for any one manufacturer,Aerospatiale of France, British Aerospace, Construcciones Aeronáuticas of Spain, andDaimler-Benz Aerospace of Germany formed a joint consortium called Airbus Industrieto design and build such planes. Using alliances with suppliers is a popular means of out-sourcing an expensive activity.
4. To reduce political risk: Forming alliances with local partners is a good way to overcomedeficiencies in resources and capabilities when expanding into international markets.67 Togain access to China while ensuring a positive relationship with the often restrictive Chi-nese government, Maytag Corporation formed a joint venture with the Chinese appliancemaker, RSD.
Cooperative arrangements between companies and business units fall along a continuumfrom weak and distant to strong and close. (See Figure 6–6.) The types of alliances rangefrom mutual service consortia to joint ventures and licensing arrangements to value-chainpartnerships.68
Mutual Service Consortia. A mutual service consortium is a partnership of similarcompanies in similar industries that pool their resources to gain a benefit that is too expensiveto develop alone, such as access to advanced technology. For example, IBM established aresearch alliance with Sony Electronics and Toshiba to build its next generation of computerchips. The result was the “cell” chip, a microprocessor running at 256 gigaflops—around tentimes the performance of the fastest chips currently used in desktop computers. Referred to asa “supercomputer on a chip,” cell chips were to be used by Sony in its PlayStation 3, byToshiba in its high-definition televisions, and by IBM in its super computers.69 The mutualservice consortia is a fairly weak and distant alliance—appropriate for partners that wish towork together but not share their core competencies. There is very little interaction orcommunication among the partners.
Joint Venture. A joint venture is a “cooperative business activity, formed by two or moreseparate organizations for strategic purposes, that creates an independent business entity andallocates ownership, operational responsibilities, and financial risks and rewards to eachmember, while preserving their separate identity/autonomy.”70 Along with licensingarrangements, joint ventures lie at the midpoint of the continuum and are formed to pursue an
Weak and Distant
Mutual ServiceConsortia
Joint Venture,Licensing Arrangement
Value-ChainPartnership
Strong and Close
FIGURE 6–6Continuumof Strategic
Alliances
SOURCE: R.M. Kanter, ‘Continuum of Strategic Alliances’ from “Collaborative Advantage: The Art of Alliances,”July-August 1994. Copyright © 1994 by the Harvard Business School Publishing Corporation. All rights reserved.
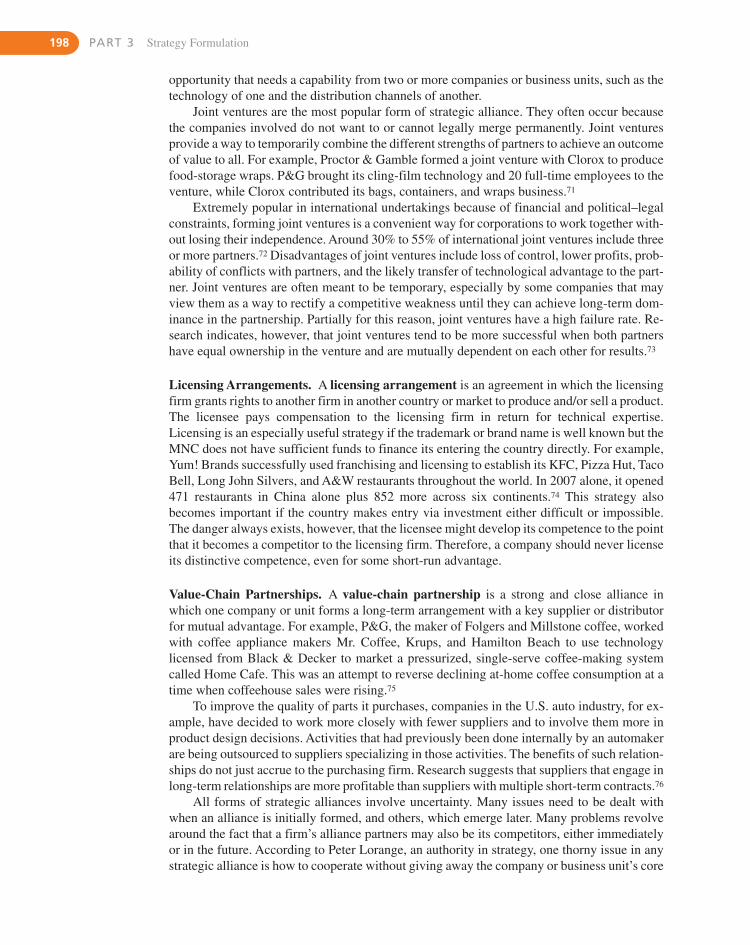
198 PART 3 Strategy Formulation
opportunity that needs a capability from two or more companies or business units, such as thetechnology of one and the distribution channels of another.
Joint ventures are the most popular form of strategic alliance. They often occur becausethe companies involved do not want to or cannot legally merge permanently. Joint venturesprovide a way to temporarily combine the different strengths of partners to achieve an outcomeof value to all. For example, Proctor & Gamble formed a joint venture with Clorox to producefood-storage wraps. P&G brought its cling-film technology and 20 full-time employees to theventure, while Clorox contributed its bags, containers, and wraps business.71
Extremely popular in international undertakings because of financial and political–legalconstraints, forming joint ventures is a convenient way for corporations to work together with-out losing their independence. Around 30% to 55% of international joint ventures include threeor more partners.72 Disadvantages of joint ventures include loss of control, lower profits, prob-ability of conflicts with partners, and the likely transfer of technological advantage to the part-ner. Joint ventures are often meant to be temporary, especially by some companies that mayview them as a way to rectify a competitive weakness until they can achieve long-term dom-inance in the partnership. Partially for this reason, joint ventures have a high failure rate. Re-search indicates, however, that joint ventures tend to be more successful when both partnershave equal ownership in the venture and are mutually dependent on each other for results.73
Licensing Arrangements. A licensing arrangement is an agreement in which the licensingfirm grants rights to another firm in another country or market to produce and/or sell a product.The licensee pays compensation to the licensing firm in return for technical expertise.Licensing is an especially useful strategy if the trademark or brand name is well known but theMNC does not have sufficient funds to finance its entering the country directly. For example,Yum! Brands successfully used franchising and licensing to establish its KFC, Pizza Hut, TacoBell, Long John Silvers, and A&W restaurants throughout the world. In 2007 alone, it opened471 restaurants in China alone plus 852 more across six continents.74 This strategy alsobecomes important if the country makes entry via investment either difficult or impossible.The danger always exists, however, that the licensee might develop its competence to the pointthat it becomes a competitor to the licensing firm. Therefore, a company should never licenseits distinctive competence, even for some short-run advantage.
Value-Chain Partnerships. A value-chain partnership is a strong and close alliance inwhich one company or unit forms a long-term arrangement with a key supplier or distributorfor mutual advantage. For example, P&G, the maker of Folgers and Millstone coffee, workedwith coffee appliance makers Mr. Coffee, Krups, and Hamilton Beach to use technologylicensed from Black & Decker to market a pressurized, single-serve coffee-making systemcalled Home Cafe. This was an attempt to reverse declining at-home coffee consumption at atime when coffeehouse sales were rising.75
To improve the quality of parts it purchases, companies in the U.S. auto industry, for ex-ample, have decided to work more closely with fewer suppliers and to involve them more inproduct design decisions. Activities that had previously been done internally by an automakerare being outsourced to suppliers specializing in those activities. The benefits of such relation-ships do not just accrue to the purchasing firm. Research suggests that suppliers that engage inlong-term relationships are more profitable than suppliers with multiple short-term contracts.76
All forms of strategic alliances involve uncertainty. Many issues need to be dealt withwhen an alliance is initially formed, and others, which emerge later. Many problems revolvearound the fact that a firm’s alliance partners may also be its competitors, either immediatelyor in the future. According to Peter Lorange, an authority in strategy, one thorny issue in anystrategic alliance is how to cooperate without giving away the company or business unit’s core
CHAPTER 6 Strategy Formulation: Situation Analysis and Business Strategy 199
TABLE 6–4
StrategicAlliance SuccessFactors
� Have a clear strategic purpose. Integrate the alliance with each partner’s strategy. Ensure thatmutual value is created for all partners.
� Find a fitting partner with compatible goals and complementary capabilities.� Identify likely partnering risks and deal with them when the alliance is formed.� Allocate tasks and responsibilities so that each partner can specialize in what it does best.� Create incentives for cooperation to minimize differences in corporate culture or organization fit.� Minimize conflicts among the partners by clarifying objectives and avoiding direct competition
in the marketplace.� In an international alliance, ensure that those managing it have comprehensive cross-cultural
knowledge.� Exchange human resources to maintain communication and trust. Don’t allow individual egos to
dominate.� Operate with long-term time horizons. The expectation of future gains can minimize short-term
conflicts.� Develop multiple joint projects so that any failures are counterbalanced by successes.� Agree on a monitoring process. Share information to build trust and keep projects on target.
Monitor customer responses and service complaints.� Be flexible in terms of willingness to renegotiate the relationship in terms of environmental
changes and new opportunities.� Agree on an exit strategy for when the partners’ objectives are achieved or the alliance is judged
a failure.
SOURCE: Compiled from B. Gomes-Casseres, “Do You Really Have an Alliance Strategy?” Strategy & Leadership(September/October 1998), pp. 6–11; L. Segil, “Strategic Alliances for the 21st Century,” Strategy & Leadership(September/October 1998), pp. 12–16; and A. C. Inkpen and K-Q Li, “Joint Venture Formation: Planning andKnowledge Gathering for Success,” Organizational Dynamics (Spring 1999), pp. 33–47. Inkpen and Li provide achecklist of 17 questions on p. 46.
competence: “Particularly when advanced technology is involved, it can be difficult for part-ners in an alliance to cooperate and openly share strategic know-how, but it is mandatory if thejoint venture is to succeed.”77 It is therefore important that a company or business unit that isinterested in joining or forming a strategic alliance consider the strategic alliance success fac-tors listed in Table 6–4.
End of Chapter SUMMARYOnce environmental scanning is completed, situational analysis calls for the integration ofthis information. SWOT analysis is the most popular method for examining external and in-ternal information. We recommend using the SFAS Matrix as one way to identify a corpo-ration’s strategic factors. Using the TOWS Matrix to identify a propitious niche is one wayto develop a sustainable competitive advantage using those strategic factors.
Business strategy is composed of both competitive and cooperative strategy. As the ex-ternal environment becomes more uncertain, an increasing number of corporations arechoosing to simultaneously compete and cooperate with their competitors. These firmsmay cooperate to obtain efficiency in some areas, while each firm simultaneously tries todifferentiate itself for competitive purposes. Raymond Noorda, Novell’s founder and
200 PART 3 Strategy Formulation
E C O - B I T S� Target became a certified organic produce retailer in
2006 and now offers more than 500 choices of organiccertified food. The company reduces waste by givingaway 7 million pounds of food annually.
� Home Depot offers more than 2,500 environmentallyfriendly products, ranging from all-natural insect repel-
lants to front-loading washing machines, speciallytagged as Eco Options.
� Vowing to become “carbon neutral” by 2010, Timber-land introduced Green Index tags, which rate its prod-ucts on the use of greenhouse gas emissions, solvents,and organic materials.81
D I S C U S S I O N Q U E S T I O N S1. What industry forces might cause a propitious niche to
disappear?
2. Is it possible for a company or business unit to follow acost leadership strategy and a differentiation strategy si-multaneously? Why or why not?
3. Is it possible for a company to have a sustainable com-petitive advantage when its industry becomes hyper-competitive?
4. What are the advantages and disadvantages of being afirst mover in an industry? Give some examples of firstmover and late mover firms. Were they successful?
5. Why are many strategic alliances temporary?
S T R A T E G I C P R A C T I C E E X E R C I S ESelect an industry to analyze. Identify companies for each of Porter’s four competitive strategies. How many different kinds ofdifferentiation strategies can you find?
INDUSTRY: ___________________________________________________________________________________________
Cost Leadership: ________________________________________________________________________________________
Differentiation: _________________________________________________________________________________________
Cost Focus: ____________________________________________________________________________________________
Differentiation Focus: ____________________________________________________________________________________
former CEO, coined the term co-opetition to describe such simultaneous competition andcooperation among firms.78 One example is the collaboration between competitors DHLand UPS in the express delivery market. DHL’s American delivery business was losingmoney and UPS’ costly airfreight network had excess capacity. Under the terms of a 10-year agreement signed in 2008, UPS carried DHL packages in its American airfreight net-work for a fee. The agreement covered only air freight, leaving both firms free to competein the rest of the express-parcel business.79 A careful balancing act, co-opetition involvesthe careful management of alliance partners so that each partner obtains sufficient benefitsto keep the alliance together. A long-term view is crucial. An unintended transfer of knowl-edge could be enough to provide one partner a significant competitive advantage over theothers.80 Unless that company forebears from using that knowledge against its partners, thealliance will be doomed.
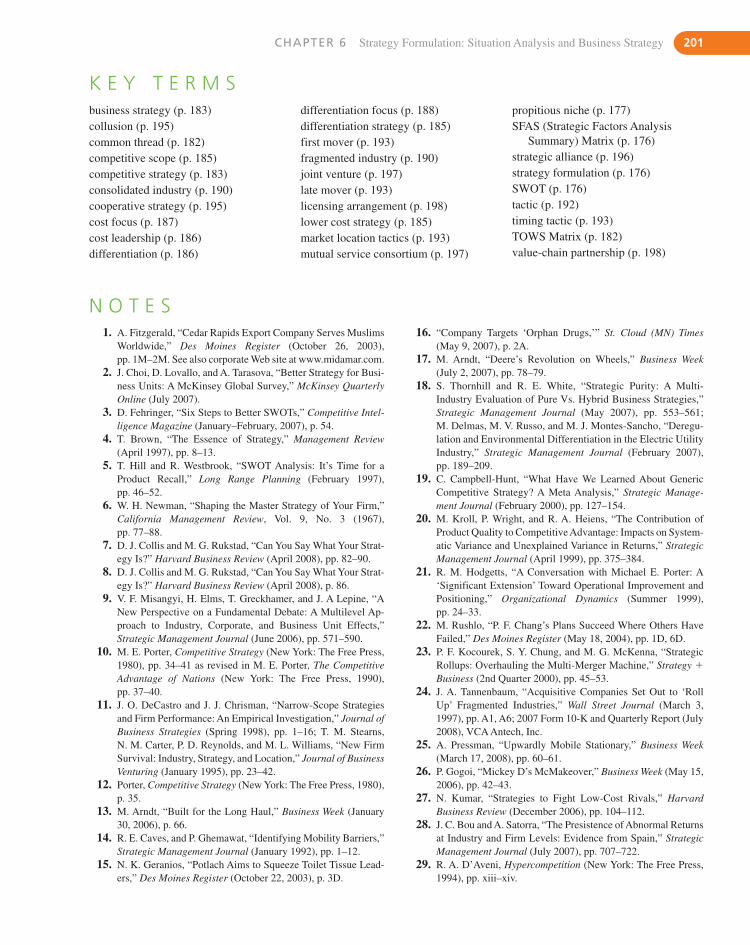
CHAPTER 6 Strategy Formulation: Situation Analysis and Business Strategy 201
K E Y T E R M Sbusiness strategy (p. 183)collusion (p. 195)common thread (p. 182)competitive scope (p. 185)competitive strategy (p. 183)consolidated industry (p. 190)cooperative strategy (p. 195)cost focus (p. 187)cost leadership (p. 186)differentiation (p. 186)
differentiation focus (p. 188)differentiation strategy (p. 185)first mover (p. 193)fragmented industry (p. 190)joint venture (p. 197)late mover (p. 193)licensing arrangement (p. 198)lower cost strategy (p. 185)market location tactics (p. 193)mutual service consortium (p. 197)
propitious niche (p. 177)SFAS (Strategic Factors Analysis
Summary) Matrix (p. 176)strategic alliance (p. 196)strategy formulation (p. 176)SWOT (p. 176)tactic (p. 192)timing tactic (p. 193)TOWS Matrix (p. 182)value-chain partnership (p. 198)
N O T E S1. A. Fitzgerald, “Cedar Rapids Export Company Serves Muslims
Worldwide,” Des Moines Register (October 26, 2003),pp. 1M–2M. See also corporate Web site at www.midamar.com.
2. J. Choi, D. Lovallo, and A. Tarasova, “Better Strategy for Busi-ness Units: A McKinsey Global Survey,” McKinsey QuarterlyOnline (July 2007).
3. D. Fehringer, “Six Steps to Better SWOTs,” Competitive Intel-ligence Magazine (January–February, 2007), p. 54.
4. T. Brown, “The Essence of Strategy,” Management Review(April 1997), pp. 8–13.
5. T. Hill and R. Westbrook, “SWOT Analysis: It’s Time for aProduct Recall,” Long Range Planning (February 1997),pp. 46–52.
6. W. H. Newman, “Shaping the Master Strategy of Your Firm,”California Management Review, Vol. 9, No. 3 (1967),pp. 77–88.
7. D. J. Collis and M. G. Rukstad, “Can You Say What Your Strat-egy Is?” Harvard Business Review (April 2008), pp. 82–90.
8. D. J. Collis and M. G. Rukstad, “Can You Say What Your Strat-egy Is?” Harvard Business Review (April 2008), p. 86.
9. V. F. Misangyi, H. Elms, T. Greckhamer, and J. A Lepine, “ANew Perspective on a Fundamental Debate: A Multilevel Ap-proach to Industry, Corporate, and Business Unit Effects,”Strategic Management Journal (June 2006), pp. 571–590.
10. M. E. Porter, Competitive Strategy (New York: The Free Press,1980), pp. 34–41 as revised in M. E. Porter, The CompetitiveAdvantage of Nations (New York: The Free Press, 1990),pp. 37–40.
11. J. O. DeCastro and J. J. Chrisman, “Narrow-Scope Strategiesand Firm Performance: An Empirical Investigation,” Journal ofBusiness Strategies (Spring 1998), pp. 1–16; T. M. Stearns,N. M. Carter, P. D. Reynolds, and M. L. Williams, “New FirmSurvival: Industry, Strategy, and Location,” Journal of BusinessVenturing (January 1995), pp. 23–42.
12. Porter, Competitive Strategy (New York: The Free Press, 1980),p. 35.
13. M. Arndt, “Built for the Long Haul,” Business Week (January30, 2006), p. 66.
14. R. E. Caves, and P. Ghemawat, “Identifying Mobility Barriers,”Strategic Management Journal (January 1992), pp. 1–12.
15. N. K. Geranios, “Potlach Aims to Squeeze Toilet Tissue Lead-ers,” Des Moines Register (October 22, 2003), p. 3D.
16. “Company Targets ‘Orphan Drugs,’” St. Cloud (MN) Times(May 9, 2007), p. 2A.
17. M. Arndt, “Deere’s Revolution on Wheels,” Business Week(July 2, 2007), pp. 78–79.
18. S. Thornhill and R. E. White, “Strategic Purity: A Multi-Industry Evaluation of Pure Vs. Hybrid Business Strategies,”Strategic Management Journal (May 2007), pp. 553–561;M. Delmas, M. V. Russo, and M. J. Montes-Sancho, “Deregu-lation and Environmental Differentiation in the Electric UtilityIndustry,” Strategic Management Journal (February 2007),pp. 189–209.
19. C. Campbell-Hunt, “What Have We Learned About GenericCompetitive Strategy? A Meta Analysis,” Strategic Manage-ment Journal (February 2000), pp. 127–154.
20. M. Kroll, P. Wright, and R. A. Heiens, “The Contribution ofProduct Quality to Competitive Advantage: Impacts on System-atic Variance and Unexplained Variance in Returns,” StrategicManagement Journal (April 1999), pp. 375–384.
21. R. M. Hodgetts, “A Conversation with Michael E. Porter: A‘Significant Extension’ Toward Operational Improvement andPositioning,” Organizational Dynamics (Summer 1999),pp. 24–33.
22. M. Rushlo, “P. F. Chang’s Plans Succeed Where Others HaveFailed,” Des Moines Register (May 18, 2004), pp. 1D, 6D.
23. P. F. Kocourek, S. Y. Chung, and M. G. McKenna, “StrategicRollups: Overhauling the Multi-Merger Machine,” Strategy �Business (2nd Quarter 2000), pp. 45–53.
24. J. A. Tannenbaum, “Acquisitive Companies Set Out to ‘RollUp’ Fragmented Industries,” Wall Street Journal (March 3,1997), pp. A1, A6; 2007 Form 10-K and Quarterly Report (July2008), VCA Antech, Inc.
25. A. Pressman, “Upwardly Mobile Stationary,” Business Week(March 17, 2008), pp. 60–61.
26. P. Gogoi, “Mickey D’s McMakeover,” Business Week (May 15,2006), pp. 42–43.
27. N. Kumar, “Strategies to Fight Low-Cost Rivals,” HarvardBusiness Review (December 2006), pp. 104–112.
28. J. C. Bou and A. Satorra, “The Presistence of Abnormal Returnsat Industry and Firm Levels: Evidence from Spain,” StrategicManagement Journal (July 2007), pp. 707–722.
29. R. A. D’Aveni, Hypercompetition (New York: The Free Press,1994), pp. xiii–xiv.
30. R. R. Wiggins and T. W. Ruefli, “Schumpeter’s Ghost: Is Hy-percompetition Making the Best of Times Shorter?” StrategicManagement Journal (October 2005), pp. 887–911.
31. P. C. Nutt, “Surprising But True: Half the Decisions in Organi-zations Fail,” Academy of Management Executive (November1999), pp. 75–90.
32. Some refer to this as the economic concept of “increasing re-turns.” Instead of the curve leveling off when the companyreaches a point of diminishing returns when a product saturatesa market, the curve continues to go up as the company takes ad-vantage of setting the standard to spin off new products that usethe new standard to achieve higher performance than competi-tors. See J. Alley, “The Theory That Made Microsoft,” Fortune(April 29, 1996), pp. 65–66.
33. H. Lee, K. G. Smith, C. M. Grimm and A. Schomburg, “Tim-ing, Order and Durability of New Product Advantages with Im-itation,” Strategic Management Journal (January 2000),pp. 23–30; Y. Pan and P. C. K. Chi, “Financial Performance andSurvival of Multinational Corporations in China,” StrategicManagement Journal (April 1999), pp. 359–374; R. Makadok,“Can First-Mover and Early-Mover Advantages Be Sustainedin an Industry with Low Barriers to Entry/Imitation?” StrategicManagement Journal (July 1998), pp. 683–696); B. Mascaren-has, “The Order and Size of Entry into International Markets,”Journal of Business Venturing (July 1997), pp. 287–299.
34. At these respective points, cost disadvantages vis-à-vis later en-trants fully eroded the earlier returns to first movers. SeeW. Boulding and M. Christen, “Idea—First Mover Disadvan-tage,” Harvard Business Review, Vol. 79, No. 9 (2001),pp. 20–21 as reported by D. J. Ketchen, Jr., C. C. Snow, andV. L. Hoover, “Research on Competitive Dynamics: Recent Ac-complishments and Future Challenges,” Journal of Manage-ment, Vol. 30, No. 6 (2004), pp. 779–804.
35. M. B. Lieberman and D. B. Montgomery, “First-Mover (Dis)Advantages: Retrospective and Link with the Resource-BasedView,” Strategic Management Journal (December, 1998),pp. 1111–1125; G. J. Tellis and P. N. Golder, “First to Market,First to Fail? Real Causes of Enduring Market Leadership,”Sloan Management Review (Winter 1996), pp. 65–75.
36. J. Pope, “Schick Entry May Work Industry into a Lather,” DesMoines Register (May 15, 2003), p. 6D.
37. S. K. Ethiraj and D. H. Zhu, “Performance Effects of ImitativeEntry,” Strategic Management Journal (August 2008),pp. 797–817; G. Dowell and A. Swaminathan, “Entry Timing,Exploration, and Firm Survival in the Early U.S. Bicycle Indus-try,” Strategic Management Journal (December 2006),pp. 1159–1182. For an in-depth discussion of first and latemover advantages and disadvantages, see D. S. Cho, D. J. Kim,and D. K. Rhee, “Latecomer Strategies: Evidence from theSemiconductor Industry in Japan and Korea,” Organization Science (July–August 1998), pp. 489–505.
38. J. Shamsie, C. Phelps, and J. Kuperman, “Better Late Than Never:A Study of Late Entrants in Household Electrical Equipment,”Strategic Management Journal (January 2004), pp. 69–84.
39. T. S. Schoenecker and A. C. Cooper, “The Role of Firm Re-sources and Organizational Attributes in Determining EntryTiming: A Cross-Industry Study,” Strategic Management Jour-nal (December 1998), pp. 1127–1143.
40. Summarized from various articles by L. Fahey in The StrategicManagement Reader, edited by L. Fahey (Englewood Cliffs,NJ: Prentice Hall, 1989), pp. 178–205.
41. M. Boyle, “Dueling Diapers,” Fortune (February 17, 2003),pp. 115–116.
42. C. Edwards, “To See Where Tech Is Headed, Watch TI,”Business Week (November 6, 2006), p. 74.
43. P. Burrows, “Show Time,” Business Week (February 2, 2004),pp. 56–64.
44. A. Serwer, “Happy Birthday, Steinway,” Fortune (March 17,2003), pp. 94–97.
45. “Programmed for a Fight,” The Economist (October 20, 2007),p. 85.
46. This information on defensive tactics is summarized from M. E.Porter, Competitive Advantage (New York: The Free Press,1985), pp. 482–512.
47. H. D. Hopkins, “The Response Strategies of Dominant U.S.Firms to Japanese Challengers,” Journal of Management,Vol. 29, No. 1 (2003), pp. 5–25.
48. For additional information on defensive competitive tactics, seeG. Stalk, “Curveball Strategies to Fool the Competition,”Harvard Business Review (September 2006), pp. 115–122.
49. T. M. Burton, “Archer-Daniels Faces a Potential Blow As ThreeFirms Admit Price-Fixing Plot,” Wall Street Journal (August28, 1996), pp. A3, A6; R. Henkoff, “The ADM Tale Gets EvenStranger,” Fortune (May 13, 1996), pp. 113–120.
50. B. Gordon, “Qwest Defends Pacts with Competitors,” DesMoines Register (April 30, 2002), p. 1D.
51. Much of the content on cooperative strategies was summarizedfrom J. B. Barney, Gaining and Sustaining Competitive Advan-tage (Reading, MA: Addison-Wesley, 1997), pp. 255–278.
52. A. C. Inkpen and E. W. K. Tsang, “Learning and Strategic Al-liances,” Academy of Management Annals, Vol. 1, edited by J. F.Walsh and A. F. Brief (December 2007), pp. 479–511.
53. D. Lavie, “Alliance Portfolios and Firm Performance: A Studyof Value Creation and Appropriation in the U.S. Software In-dustry.” Strategic Management Journal (December 2007),pp. 1187–1212.
54. R. D. Ireland, M. A. Hitt, and D. Vaidyanath, “Alliance Man-agement as a Source of Competitive Advantage,” Journal ofManagement, Vol. 28, No. 3 (2002), pp. 413–446.
55. S. H. Park and G. R. Ungson, “Interfirm Rivalry and Manage-rial Complexity: A Conceptual Framework of Alliance Failure,”Organization Science (January–February 2001), pp. 37–53.;D. C. Hambrick, J. Li, K. Xin, and A. S. Tsui, “CompositionalGaps and Downward Spirals in International Joint VentureManagement Groups,” Strategic Management Journal(November 2001), pp. 1033–1053; T. K. Das and B. S. Teng,“Instabilities of Strategic Alliances: An Internal Tensions Per-spective,” Organization Science (January–February 2000),pp. 77–101; J. F. Hennart, D. J. Kim, and M. Zeng, “The Impactof Joint Venture Status on the Longevity of Japanese Stakes inU.S. Manufacturing Affiliates,” Organization Science(May–June 1998), pp. 382–395.
56. N. K. Park, J. M. Mezias, and J. Song, “A Resource-based Viewof Strategic Alliances and Firm Value in the Electronic Market-place,” Journal of Management, Vol. 30, No. 1 (2004),pp. 7–27; T. Khanna and J. W. Rivkin, “Estimating the Perfor-mance Effects of Business Groups in Emerging Markets,”Strategic Management Journal (January 2001), pp. 45–74;G. Garai, “Leveraging the Rewards of Strategic Alliances,”Journal of Business Strategy (March–April 1999), pp. 40–43.
57. L. Segil, “Strategic Alliances for the 21st Century,” Strategy &Leadership (September/October 1998), pp. 12–16.
202 PART 3 Strategy Formulation
CHAPTER 6 Strategy Formulation: Situation Analysis and Business Strategy 203
58. R. C. Sampson, “Experience Effects and Collaborative Returnsin R&D Alliances,” Strategic Management Journal (November2005), pp. 1009–1031; J. Draulans, A-P deMan, and H. W. Vol-berda, “Building Alliance Capability: Management Techniquesfor Superior Alliance Performance,” Long Range Planning(April 2003), pp. 151–166; P. Kale, J. H. Dyer, and H. Singh,“Alliance Capability, Stock Market Response, and Long-TermAlliance Success: The Role of the Alliance Function,” StrategicManagement Journal (August 2002), pp. 747–767.
59. H. Hoang and F. T. Rothaermel, “The Effect of General andPartner-Specific Alliance Experience on Joint R&D ProjectPerformance,” Academy of Management Journal (April 2005),pp. 332–345; A. Goerzen, “Alliance Networks and Firm Perfor-mance: The Impact of Repeated Partnerships,” Strategic Man-agement Journal (May 2007), pp. 487–509.
60. A. MacCormack and T. Forbath, “Learning the Fine Art ofGlobal Collaboration,” Harvard Business Review (January2008), pp. 24–26.
61. J. Porretto, “Rival Automakers Team Up to Catch Up,” DesMoines Register (December 14, 2004), pp. 1D–2D.
62. H. Bapuji and M. Crossan, “Knowledge Types and KnowledgeManagement Strategies,” in Strategic Networks: Learning toCompete, M. Gibbert and T. Durand, eds. (Malden, MA: Black-well Publishing, 2007), pp. 8–25; F. T. Rothaermel andW. Boeker, “Old Technology Meets New Technology: Comple-mentarities, Similarities, and Alliance Formation,” StrategicManagement Journal (January 2008), pp. 47–77.
63. M. M. Bear, “How Japanese Partners Help U.S. Manufacturersto Raise Productivity,” Long Range Planning (December1998), pp. 919–926.
64. According to M. J. Thome of Rockwell Collins in a June 26,2008, e-mail, these are called “international offsets.”
65. P. Anslinger and J. Jenk, “Creating Successful Alliances,”Journal of Business Strategy, Vol. 25, No. 2 (2004), p. 18.
66. X. Yin and M. Shanley, “Industry Determinants of the ‘MergerVersus Alliance’ Decision,” Academy of Management Review(April 2008), pp. 473–491.
67. J. W. Lu and P. W. Beamish, “The Internationalization and Per-formance of SMEs,” Strategic Management Journal (June–July2001), pp. 565–586.
68. R. M. Kanter, “Collaborative Advantage: The Art of Alliances,”Harvard Business Review (July–August 1994), pp. 96–108.
69. “The Cell of the New Machine,” The Economist (February 12,2005), pp. 77–78.
70. R. P. Lynch, The Practical Guide to Joint Ventures and Corpo-rate Alliances (New York: John Wiley and Sons, 1989), p. 7.
71. “Will She, Won’t She? The Economist (August 11, 2007),pp. 61–63.
72. Y Gong, O Shenkar, Y. Luo, and M-K Nyaw, “Do Multiple Par-ents Help or Hinder International Joint Venture Performance?The Mediating Roles of Contract Completeness and Partner Co-operation,” Strategic Management Journal (October 2007),pp. 1021–1034.
73. L. L. Blodgett, “Factors in the Instability of International JointVentures: An Event History Analysis,” Strategic ManagementJournal (September 1992), pp. 475–481; J. Bleeke andD. Ernst, “The Way to Win in Cross-Border Alliances,”Harvard Business Review (November–December 1991),pp. 127–135; J. M. Geringer, “Partner Selection Criteria for De-veloped Country Joint Ventures,” in International ManagementBehavior, 2nd ed., edited by H. W. Lane and J. J. DiStephano(Boston: PWS-Kent, 1992), pp. 206–216.
74. 2007 Annual Report, Yum! Brands.75. B. Horovitz, “New Coffee Maker May Jolt Industry,” USA To-
day (February 18, 2004), pp. 1E–2E.76. K. Z. Andrews, “Manufacturer/Supplier Relationships: The
Supplier Payoff,” Harvard Business Review (September–October 1995), pp. 14–15.
77. P. Lorange, “Black-Box Protection of Your Core Competenciesin Strategic Alliances,” in Cooperative Strategies: EuropeanPerspectives, edited by P. W. Beamish and J. P. Killing (SanFrancisco: The New Lexington Press, 1997), pp. 59–99.
78. E. P. Gee, “Co-opetition: The New Market Milieu,” Journal ofHealthcare Management, Vol. 45 (2000), pp. 359–363.
79. “Make Love—and War,” The Economist (August 9, 2008),pp. 57–58.
80. D. J. Ketchen, Jr., C. C. Snow, and V. L. Hoover, “Research onCompetitive Dynamics: Recent Accomplishments and FutureChallenges,” Journal of Management, Vol. 30, No. 6 (2004),pp. 779–804.
81. J. O’Donnell and C. Dugas, “More Retailers Go for Green—theEco Kind,” USA Today (April 18, 2007), p. 3B.
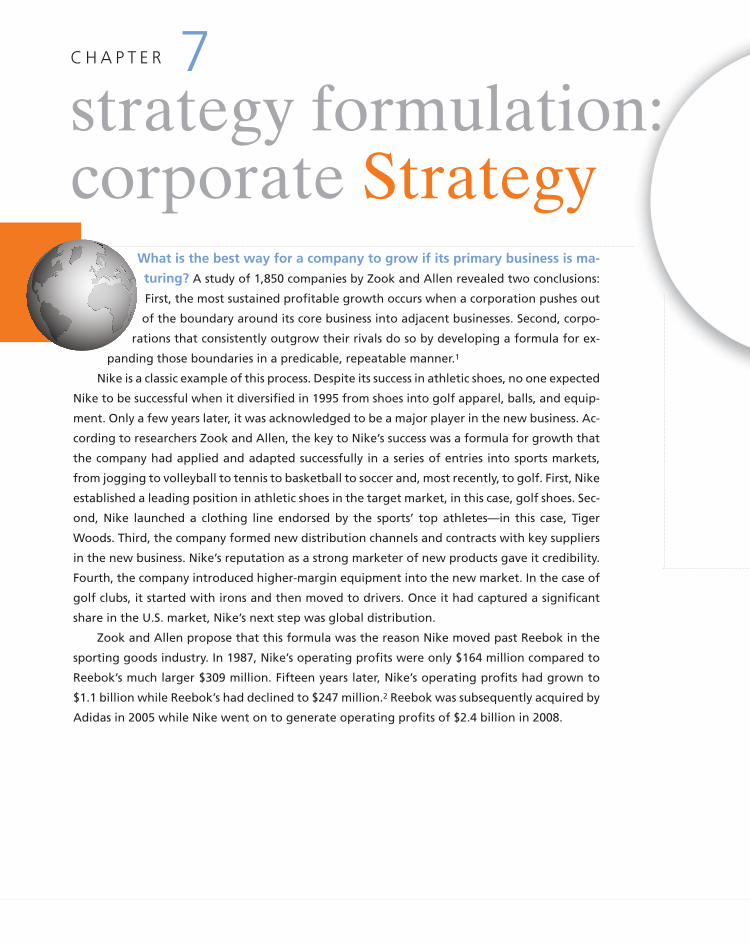
What is the best way for a company to grow if its primary business is ma-
turing? A study of 1,850 companies by Zook and Allen revealed two conclusions:
First, the most sustained profitable growth occurs when a corporation pushes out
of the boundary around its core business into adjacent businesses. Second, corpo-
rations that consistently outgrow their rivals do so by developing a formula for ex-
panding those boundaries in a predicable, repeatable manner.1
Nike is a classic example of this process. Despite its success in athletic shoes, no one expected
Nike to be successful when it diversified in 1995 from shoes into golf apparel, balls, and equip-
ment. Only a few years later, it was acknowledged to be a major player in the new business. Ac-
cording to researchers Zook and Allen, the key to Nike’s success was a formula for growth that
the company had applied and adapted successfully in a series of entries into sports markets,
from jogging to volleyball to tennis to basketball to soccer and, most recently, to golf. First, Nike
established a leading position in athletic shoes in the target market, in this case, golf shoes. Sec-
ond, Nike launched a clothing line endorsed by the sports’ top athletes—in this case, Tiger
Woods. Third, the company formed new distribution channels and contracts with key suppliers
in the new business. Nike’s reputation as a strong marketer of new products gave it credibility.
Fourth, the company introduced higher-margin equipment into the new market. In the case of
golf clubs, it started with irons and then moved to drivers. Once it had captured a significant
share in the U.S. market, Nike’s next step was global distribution.
Zook and Allen propose that this formula was the reason Nike moved past Reebok in the
sporting goods industry. In 1987, Nike’s operating profits were only $164 million compared to
Reebok’s much larger $309 million. Fifteen years later, Nike’s operating profits had grown to
$1.1 billion while Reebok’s had declined to $247 million.2 Reebok was subsequently acquired by
Adidas in 2005 while Nike went on to generate operating profits of $2.4 billion in 2008.
C H A P T E R 7strategy formulation:corporate Strategy
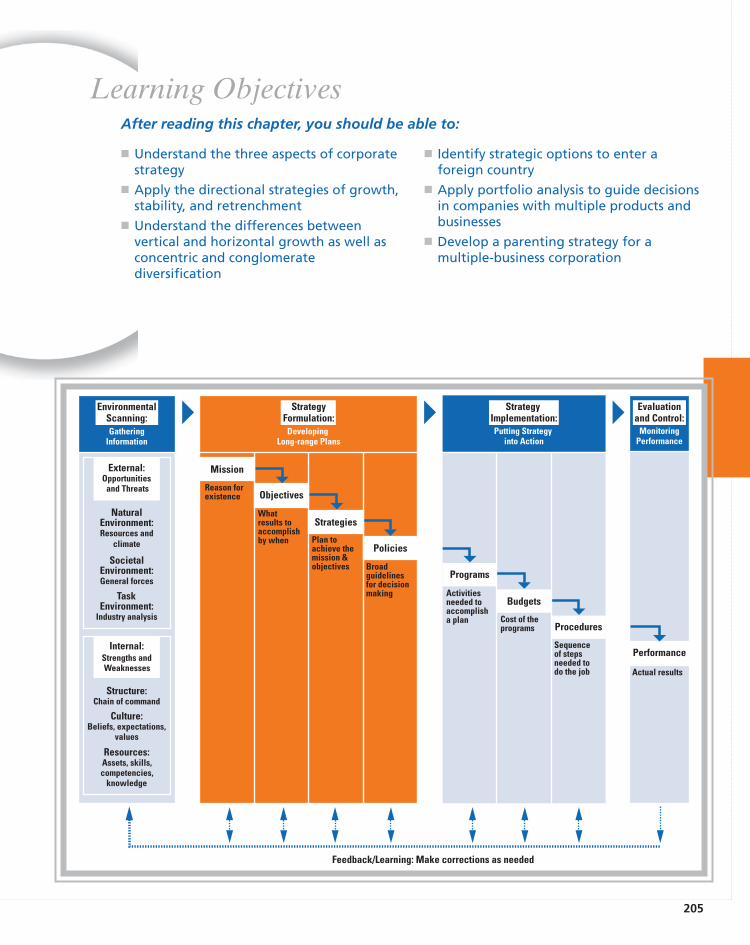
205
� Understand the three aspects of corporatestrategy
� Apply the directional strategies of growth,stability, and retrenchment
� Understand the differences betweenvertical and horizontal growth as well asconcentric and conglomeratediversification
Learning Objectives
GatheringInformation
Putting Strategy into Action
MonitoringPerformance
SocietalEnvironment:General forces
NaturalEnvironment:Resources and
climate
TaskEnvironment:
Industry analysis
Internal:Strengths andWeaknesses
Structure:Chain of command
Culture:Beliefs, expectations,
values
Resources:Assets, skills,competencies,
knowledge
Programs
Activitiesneeded to accomplisha plan
Budgets
Cost of theprograms Procedures
Sequenceof stepsneeded to do the job
Performance
Actual results
External:Opportunities
and Threats
DevelopingLong-range Plans
Mission
Reason forexistence Objectives
Whatresults to accomplishby when
Strategies
Plan toachieve themission &objectives
Policies
Broadguidelinesfor decisionmaking
EnvironmentalScanning:
StrategyFormulation:
StrategyImplementation:
Evaluationand Control:
Feedback/Learning: Make corrections as needed
After reading this chapter, you should be able to:
� Identify strategic options to enter aforeign country
� Apply portfolio analysis to guide decisionsin companies with multiple products andbusinesses
� Develop a parenting strategy for amultiple-business corporation
206 PART 3 Strategy Formulation
7.1 Corporate StrategyThe vignette about Nike illustrates the importance of corporate strategy to a firm’s survivaland success. Corporate strategy deals with three key issues facing the corporation as a whole:
1. The firm’s overall orientation toward growth, stability, or retrenchment (directional strategy)
2. The industries or markets in which the firm competes through its products and businessunits (portfolio analysis)
3. The manner in which management coordinates activities and transfers resources and cul-tivates capabilities among product lines and business units (parenting strategy)
Corporate strategy is primarily about the choice of direction for a firm as a whole and the man-agement of its business or product portfolio.3 This is true whether the firm is a small companyor a large multinational corporation (MNC). In a large multiple-business company, in particu-lar, corporate strategy is concerned with managing various product lines and business units formaximum value. In this instance, corporate headquarters must play the role of the organizational“parent,” in that it must deal with various product and business unit “children.” Even thougheach product line or business unit has its own competitive or cooperative strategy that it uses toobtain its own competitive advantage in the marketplace, the corporation must coordinate thesedifferent business strategies so that the corporation as a whole succeeds as a “family.”4
Corporate strategy, therefore, includes decisions regarding the flow of financial and otherresources to and from a company’s product lines and business units. Through a series of coor-dinating devices, a company transfers skills and capabilities developed in one unit to otherunits that need such resources. In this way, it attempts to obtain synergy among numerousproduct lines and business units so that the corporate whole is greater than the sum of its indi-vidual business unit parts.5 All corporations, from the smallest company offering one productin only one industry to the largest conglomerate operating in many industries with many prod-ucts, must at one time or another consider one or more of these issues.
To deal with each of the key issues, this chapter is organized into three parts that examinecorporate strategy in terms of directional strategy (orientation toward growth), portfolioanalysis (coordination of cash flow among units), and corporate parenting (the building ofcorporate synergies through resource sharing and development).6
7.2 Directional StrategyJust as every product or business unit must follow a business strategy to improve its compet-itive position, every corporation must decide its orientation toward growth by asking the fol-lowing three questions:
1. Should we expand, cut back, or continue our operations unchanged?
2. Should we concentrate our activities within our current industry, or should we diversifyinto other industries?
3. If we want to grow and expand nationally and/or globally, should we do so through inter-nal development or through external acquisitions, mergers, or strategic alliances?
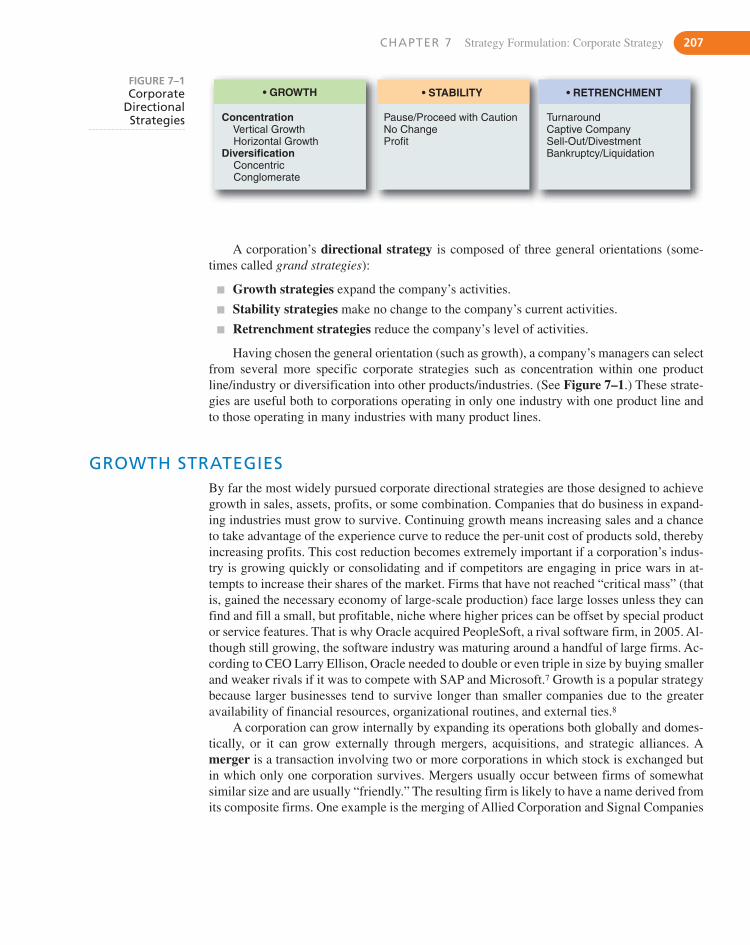
GROWTH STRATEGIES
CHAPTER 7 Strategy Formulation: Corporate Strategy 207
By far the most widely pursued corporate directional strategies are those designed to achievegrowth in sales, assets, profits, or some combination. Companies that do business in expand-ing industries must grow to survive. Continuing growth means increasing sales and a chanceto take advantage of the experience curve to reduce the per-unit cost of products sold, therebyincreasing profits. This cost reduction becomes extremely important if a corporation’s indus-try is growing quickly or consolidating and if competitors are engaging in price wars in at-tempts to increase their shares of the market. Firms that have not reached “critical mass” (thatis, gained the necessary economy of large-scale production) face large losses unless they canfind and fill a small, but profitable, niche where higher prices can be offset by special productor service features. That is why Oracle acquired PeopleSoft, a rival software firm, in 2005. Al-though still growing, the software industry was maturing around a handful of large firms. Ac-cording to CEO Larry Ellison, Oracle needed to double or even triple in size by buying smallerand weaker rivals if it was to compete with SAP and Microsoft.7 Growth is a popular strategybecause larger businesses tend to survive longer than smaller companies due to the greateravailability of financial resources, organizational routines, and external ties.8
A corporation can grow internally by expanding its operations both globally and domes-tically, or it can grow externally through mergers, acquisitions, and strategic alliances. Amerger is a transaction involving two or more corporations in which stock is exchanged butin which only one corporation survives. Mergers usually occur between firms of somewhatsimilar size and are usually “friendly.” The resulting firm is likely to have a name derived fromits composite firms. One example is the merging of Allied Corporation and Signal Companies
Concentration Vertical Growth Horizontal GrowthDiversification Concentric Conglomerate
Pause/Proceed with CautionNo ChangeProfit
TurnaroundCaptive CompanySell-Out/DivestmentBankruptcy/Liquidation
GROWTH STABILITY RETRENCHMENTFIGURE 7–1Corporate
DirectionalStrategies
A corporation’s directional strategy is composed of three general orientations (some-times called grand strategies):
� Growth strategies expand the company’s activities.
� Stability strategies make no change to the company’s current activities.
� Retrenchment strategies reduce the company’s level of activities.
Having chosen the general orientation (such as growth), a company’s managers can selectfrom several more specific corporate strategies such as concentration within one productline/industry or diversification into other products/industries. (See Figure 7–1.) These strate-gies are useful both to corporations operating in only one industry with one product line andto those operating in many industries with many product lines.
to form Allied Signal. An acquisition is the purchase of a company that is completely absorbedas an operating subsidiary or division of the acquiring corporation. Procter & Gamble’s(P&G’s) purchase of Gillette is an example of a recent acquisition. Acquisitions usually occurbetween firms of different sizes and can be either friendly or hostile. Hostile acquisitions areoften called takeovers.
Growth is a very attractive strategy for two key reasons:
� Growth based on increasing market demand may mask flaws in a company—flaws thatwould be immediately evident in a stable or declining market. A growing flow of revenueinto a highly leveraged corporation can create a large amount of organization slack (un-used resources) that can be used to quickly resolve problems and conflicts between de-partments and divisions. Growth also provides a big cushion for turnaround in case astrategic error is made. Larger firms also have more bargaining power than do small firmsand are more likely to obtain support from key stakeholders in case of difficulty.
� A growing firm offers more opportunities for advancement, promotion, and interestingjobs. Growth itself is exciting and ego-enhancing for CEOs. The marketplace and poten-tial investors tend to view a growing corporation as a “winner” or “on the move.” Exec-utive compensation tends to get bigger as an organization increases in size. Large firmsare also more difficult to acquire than are smaller ones; thus an executive’s job in a largefirm is more secure.
The two basic growth strategies are concentration on the current product line(s) in oneindustry and diversification into other product lines in other industries.
ConcentrationIf a company’s current product lines have real growth potential, concentration of resources onthose product lines makes sense as a strategy for growth. The two basic concentration strate-gies are vertical growth and horizontal growth. Growing firms in a growing industry tend tochoose these strategies before they try diversification.
Vertical Growth. Vertical growth can be achieved by taking over a function previouslyprovided by a supplier or by a distributor. The company, in effect, grows by making its ownsupplies and/or by distributing its own products. This may be done in order to reduce costs,gain control over a scarce resource, guarantee quality of a key input, or obtain access topotential customers. This growth can be achieved either internally by expanding currentoperations or externally through acquisitions. Henry Ford, for example, used internal companyresources to build his River Rouge plant outside Detroit. The manufacturing process wasintegrated to the point that iron ore entered one end of the long plant, and finished automobilesrolled out the other end, into a huge parking lot. In contrast, Cisco Systems, a maker of Internethardware, chose the external route to vertical growth by purchasing Scientific-Atlanta Inc., amaker of set-top boxes for television programs and movies-on-demand. This acquisition gaveCisco access to technology for distributing television to living rooms through the Internet.9
Vertical growth results in vertical integration—the degree to which a firm operates ver-tically in multiple locations on an industry’s value chain from extracting raw materials to man-ufacturing to retailing. More specifically, assuming a function previously provided by asupplier is called backward integration (going backward on an industry’s value chain). Thepurchase of Carroll’s Foods for its hog-growing facilities by Smithfield Foods, the world’slargest pork processor, is an example of backward integration.10 Assuming a function previ-ously provided by a distributor is labeled forward integration (going forward on an industry’svalue chain). FedEx, for example, used forward integration when it purchased Kinko’s in orderto provide store-front package drop-off and delivery services for the small-business market.11
208 PART 3 Strategy Formulation
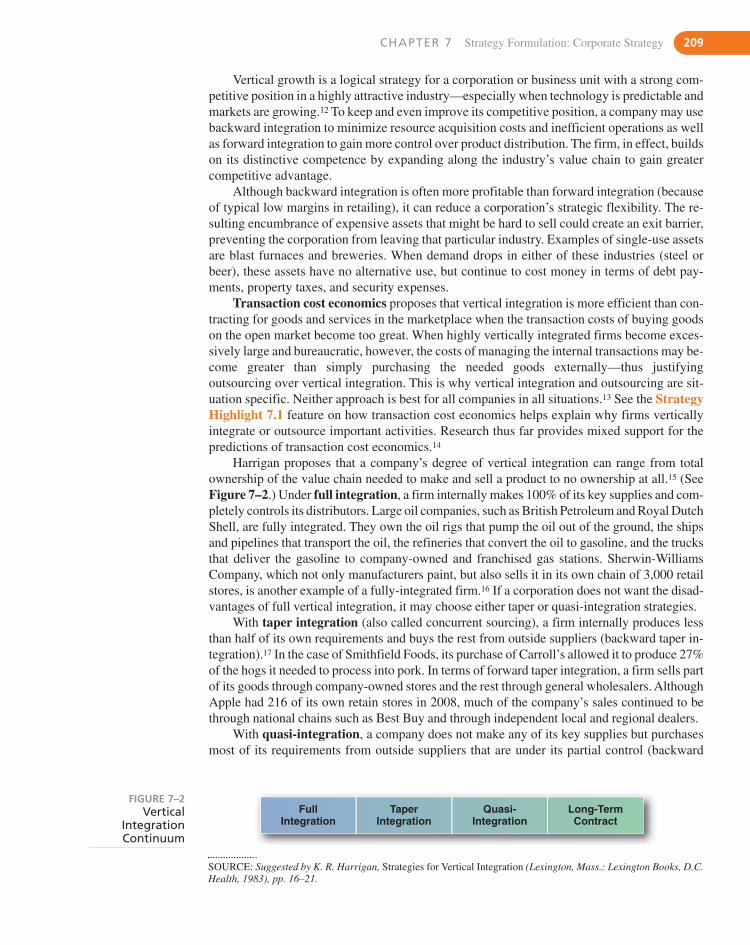
CHAPTER 7 Strategy Formulation: Corporate Strategy 209
Vertical growth is a logical strategy for a corporation or business unit with a strong com-petitive position in a highly attractive industry—especially when technology is predictable andmarkets are growing.12 To keep and even improve its competitive position, a company may usebackward integration to minimize resource acquisition costs and inefficient operations as wellas forward integration to gain more control over product distribution. The firm, in effect, buildson its distinctive competence by expanding along the industry’s value chain to gain greatercompetitive advantage.
Although backward integration is often more profitable than forward integration (becauseof typical low margins in retailing), it can reduce a corporation’s strategic flexibility. The re-sulting encumbrance of expensive assets that might be hard to sell could create an exit barrier,preventing the corporation from leaving that particular industry. Examples of single-use assetsare blast furnaces and breweries. When demand drops in either of these industries (steel orbeer), these assets have no alternative use, but continue to cost money in terms of debt pay-ments, property taxes, and security expenses.
Transaction cost economics proposes that vertical integration is more efficient than con-tracting for goods and services in the marketplace when the transaction costs of buying goodson the open market become too great. When highly vertically integrated firms become exces-sively large and bureaucratic, however, the costs of managing the internal transactions may be-come greater than simply purchasing the needed goods externally—thus justifyingoutsourcing over vertical integration. This is why vertical integration and outsourcing are sit-uation specific. Neither approach is best for all companies in all situations.13 See the StrategyHighlight 7.1 feature on how transaction cost economics helps explain why firms verticallyintegrate or outsource important activities. Research thus far provides mixed support for thepredictions of transaction cost economics.14
Harrigan proposes that a company’s degree of vertical integration can range from totalownership of the value chain needed to make and sell a product to no ownership at all.15 (SeeFigure 7–2.) Under full integration, a firm internally makes 100% of its key supplies and com-pletely controls its distributors. Large oil companies, such as British Petroleum and Royal DutchShell, are fully integrated. They own the oil rigs that pump the oil out of the ground, the shipsand pipelines that transport the oil, the refineries that convert the oil to gasoline, and the trucksthat deliver the gasoline to company-owned and franchised gas stations. Sherwin-WilliamsCompany, which not only manufacturers paint, but also sells it in its own chain of 3,000 retailstores, is another example of a fully-integrated firm.16 If a corporation does not want the disad-vantages of full vertical integration, it may choose either taper or quasi-integration strategies.
With taper integration (also called concurrent sourcing), a firm internally produces lessthan half of its own requirements and buys the rest from outside suppliers (backward taper in-tegration).17 In the case of Smithfield Foods, its purchase of Carroll’s allowed it to produce 27%of the hogs it needed to process into pork. In terms of forward taper integration, a firm sells partof its goods through company-owned stores and the rest through general wholesalers. AlthoughApple had 216 of its own retain stores in 2008, much of the company’s sales continued to bethrough national chains such as Best Buy and through independent local and regional dealers.
With quasi-integration, a company does not make any of its key supplies but purchasesmost of its requirements from outside suppliers that are under its partial control (backward
FullIntegration
TaperIntegration
Quasi-Integration
Long-TermContract
FIGURE 7–2Vertical
IntegrationContinuum
SOURCE: Suggested by K. R. Harrigan, Strategies for Vertical Integration (Lexington, Mass.: Lexington Books, D.C.Health, 1983), pp. 16–21.
Why do corporations use ver-tical growth to permanently
own suppliers or distributorswhen they could simply purchase in-
dividual items when needed on the open market? Transac-tion cost economics is a branch of institutional economicsthat attempts to answer this question. Transaction cost eco-nomics proposes that owning resources through verticalgrowth is more efficient than contracting for goods andservices in the marketplace when the transaction costs ofbuying goods on the open market become too great. Trans-action costs include the basic costs of drafting, negotiating,and safeguarding a market agreement (a contract) as wellas the later managerial costs when the agreement is creat-ing problems (goods aren’t being delivered on time or qual-ity is lower than needed), renegotiation costs (e.g., costs ofmeetings and phone calls), and the costs of settling dis-putes (e.g., lawyers’ fees and court costs).
According to Williamson, three conditions must be metbefore a corporation will prefer internalizing a verticaltransaction through ownership over contracting for thetransaction in the marketplace: (1) a high level of uncer-tainty must surround the transaction, (2) assets involved inthe transaction must be highly specialized to the transac-tion, and (3) the transaction must occur frequently. If thereis a high level of uncertainty, it will be impossible to writea contract covering all contingencies, and it is likely thatthe contractor will act opportunistically to exploit any gapsin the written agreement—thus creating problems and in-creasing costs. If the assets being contracted for are highly
210 PART 3 Strategy Formulation
STRATEGY highlight 7.1TRANSACTION COST ECONOMICS ANALYZES VERTICAL GROWTH STRATEGY
specialized (e.g., goods or services with few alternateuses), there are likely to be few alternative suppliers—thusallowing the contractor to take advantage of the situationand increase costs. The more frequent the transactions, themore opportunity for the contractor to demand specialtreatment and thus increase costs further.
Vertical integration is not always more efficient than themarketplace, however. When highly vertically integratedfirms become excessively large and bureaucratic, the costsof managing the internal transactions may become greaterthan simply purchasing the needed goods externally—thusjustifying outsourcing over ownership. The usually hiddenmanagement costs (e.g., excessive layers of management,endless committee meetings needed for interdepartmentalcoordination, and delayed decision making due to exces-sively detailed rules and policies) add to the internal trans-action costs—thus reducing the effectiveness andefficiency of vertical integration. The decision to own or tooutsource is, therefore, based on the particular situationsurrounding the transaction and the ability of the corpora-tion to manage the transaction internally both effectivelyand efficiently.
SOURCES: O. E. Williamson and S. G. Winter, eds., The Nature ofthe Firm: Origins, Evolution, and Development (New York: OxfordUniversity Press, 1991); E. Mosakowski, “Organizational Bound-aries and Economic Performance: An Empirical Study of Entrepre-neurial Computer Firms,” Strategic Management Journal(February 1991), pp. 115–133; P. S. Ring and A. H. Van de Ven,“Structuring Cooperative Relationships Between Organizations,”Strategic Management Journal (October 1992), pp. 483–498.
quasi-integration). A company may not want to purchase outright a supplier or distributor, butit still may want to guarantee access to needed supplies, new products, technologies, or distri-bution channels. For example, the pharmaceutical company Bristol-Myers Squibb purchased17% of the common stock of ImClone in order to gain access to new drug products being de-veloped through biotechnology. An example of forward quasi-integration would be a papercompany acquiring part interest in an office products chain in order to guarantee that its prod-ucts had access to the distribution channel. Purchasing part interest in another company usu-ally provides a company with a seat on the other firm’s board of directors, thus guaranteeingthe acquiring firm both information and control. As in the case of Bristol-Myers Squibb andImClone, a quasi-integrated firm may later decide to buy the rest of a key supplier that it didnot already own.18
Long-term contracts are agreements between two firms to provide agreed-upon goodsand services to each other for a specified period of time. This cannot really be considered tobe vertical integration unless it is an exclusive contract that specifies that the supplier or dis-tributor cannot have a similar relationship with a competitive firm. In that case, the supplier
CHAPTER 7 Strategy Formulation: Corporate Strategy 211
or distributor is really a captive company that, although officially independent, does most ofits business with the contracted firm and is formally tied to the other company through a long-term contract.
Recently there has been a movement away from vertical growth strategies (and thus ver-tical integration) toward cooperative contractual relationships with suppliers and even withcompetitors.19 These relationships range from outsourcing, in which resources are purchasedfrom outsiders through long-term contracts instead of being made in-house (for example,Hewlett-Packard bought its laser engines from Canon for HP’s laser jet printers), to strategicalliances, in which partnerships, technology licensing agreements, and joint ventures supple-ment a firm’s capabilities (for example, Toshiba has used strategic alliances with GE, Siemens,Motorola, and Ericsson to become one of the world’s leading electronic companies).20
Horizontal Growth. A firm can achieve horizontal growth by expanding its operations intoother geographic locations and/or by increasing the range of products and services offered tocurrent markets. Research indicates that firms that grow horizontally by broadening theirproduct lines have high survival rates.21 Horizontal growth results in horizontalintegration—the degree to which a firm operates in multiple geographic locations at the samepoint on an industry’s value chain. For example, Procter & Gamble (P&G) continually addsadditional sizes and multiple variations to its existing product lines to reduce possible nichescompetitors may enter. In addition, it introduces successful products from one part of the worldto other regions. P&G has been introducing into China a steady stream of popular Americanbrands, such as Head & Shoulders, Crest, Olay, Tide, Pampers, and Whisper. By 2007, it had6,300 employees in China and the extensive distribution network it needed to prosper in theworld’s fastest growing market.22
Horizontal growth can be achieved through internal development or externally throughacquisitions and strategic alliances with other firms in the same industry. For example, DeltaAirlines acquired Northwest Airlines in 2008 to obtain access to Northwest’s Asian marketsand those American markets that Delta was not then serving. In contrast, many small com-muter airlines engage in long-term contracts with major airlines in order to offer a completearrangement for travelers. For example, the regional carrier Mesa Airlines arranged contrac-tual agreements with United Airlines, U.S. Airways, and America West to be listed on theircomputer reservations, respectively, as United Express, U.S. Airways Express, and AmericaWest Express.
Horizontal growth is increasingly being achieved in today’s world through internationalexpansion. American’s Wal-Mart, France’s Carrefour, and Britain’s Tesco are examples of na-tional supermarket discount chains expanding horizontally throughout the world. This type ofgrowth can be achieved internationally through many different strategies.
International Entry Options for Horizontal GrowthResearch indicates that growing internationally is positively associated with firm profitability.23
A corporation can select from several strategic options the most appropriate method for enteringa foreign market or establishing manufacturing facilities in another country. The options varyfrom simple exporting to acquisitions to management contracts. See the Global Issue feature tosee how U.S.-based firms are using international entry options in a horizontal growth strategy toexpand throughout the world.
Some of the most popular options for international entry are as follows:
� Exporting: A good way to minimize risk and experiment with a specific product isexporting, shipping goods produced in the company’s home country to other countries formarketing. The company could choose to handle all critical functions itself, or it could con-tract these functions to an export management company. Exporting is becoming increasingly
What do Wal-Mart, Star-bucks, and International Pa-
per have in common? For onething, they are successful U.S.
companies that grew to the point thateventually their products saturated the domestic market—resulting in slower growth in domestic sales and profits. Foranother, all are companies that have chosen the corporategrowth strategy of concentrating in one industry. A thirdthing in common is that all of them are using internationalmarkets as a key growth opportunity.
From its humble beginnings in Bentonville, Arkansas,Wal-Mart has successfully grown such that its discountstores can now be found in most every corner of the nation.Knowing that Wal-Mart had fewer locations left in theUnited States on which to build stores, the company’s man-agement knew that the company’s domestic growth couldnot be sustained past 2007. Consequently, the company be-gan acquiring retail chains in other countries to eventuallybecome the largest company in the world in terms of sales.
Growing from its base in Seattle, Washington, Star-bucks expanded its coffee shops to every city in the coun-
212 PART 3 Strategy Formulation
GLOBAL issueCOMPANIES LOOK TO INTERNATIONAL MARKETS FOR HORIZONTAL GROWTH
try in only a few years. Soon imitators began opening theirown versions until the U.S. market was completely satu-rated with coffee shops. Facing slow growth in its domes-tic market, Starbucks’ management made the strategicdecision to add fewer U.S. stores and to make internationalexpansion its top priority.
Until recently, International Paper (IP) was internationalin name only. Founded in 1898, the company had oncesupplied 60% of the newsprint for American newspapers.After years of slow growth and weak financial perfor-mance, IP’s management decided to divest unrelated busi-nesses and to branch out from its North American roots todeveloping international markets. Acquisitions in Russiaand green-field development in Brazil now positioned thecompany within low-cost, high-growth markets. IP’s man-agement hoped to soon control about half the office pa-per market in Latin America.
SOURCES: B. Helm and J. McGregor, “Howard Schultz’s GrandeChallenge,” Business Week (January 21, 2008), p. 28; J. Bush,“Now It’s Really International Paper,” Business Week (December17, 2007).
popular for small businesses because of the Internet, fax machines, toll-free numbers, andovernight express services, which reduce the once-formidable costs of going international.
� Licensing: Under a licensing agreement, the licensing firm grants rights to another firmin the host country to produce and/or sell a product. The licensee pays compensation tothe licensing firm in return for technical expertise. This is an especially useful strategy ifthe trademark or brand name is well known, but the company does not have sufficientfunds to finance its entering the country directly. Anheuser-Busch used this strategy toproduce and market Budweiser beer in the United Kingdom, Japan, Israel, Australia,Korea, and the Philippines. This strategy is also important if the country makes entryvia investment either difficult or impossible.
� Franchising: Under a franchising agreement, the franchiser grants rights to anothercompany to open a retail store using the franchiser’s name and operating system. In ex-change, the franchisee pays the franchiser a percentage of its sales as a royalty. Franchis-ing provides an opportunity for a firm to establish a presence in countries where thepopulation or per capita spending is not sufficient for a major expansion effort.24 Fran-chising accounts for 40% of total U.S. retail sales. Close to half of U.S. franchisers, suchas Yum! Brands, franchise internationally.25
� Joint Ventures: Forming a joint venture between a foreign corporation and a domesticcompany is the most popular strategy used to enter a new country.26 Companies often formjoint ventures to combine the resources and expertise needed to develop new products ortechnologies. A joint venture may be an association between a company and a firm in thehost country or a government agency in that country. A quick method of obtaining local

CHAPTER 7 Strategy Formulation: Corporate Strategy 213
management, it also reduces the risks of expropriation and harassment by host country of-ficials. A joint venture may also enable a firm to enter a country that restricts foreign own-ership. The corporation can enter another country with fewer assets at stake and thus lowerrisk. Under Indian law, for example, foreign retailers are permitted to own no more than51% of shops selling single-brand products, or to sell to others on a wholesale basis. Theseand other restrictions deterred supermarket giants Tesco and Carrefour from entering In-dia. As a result, 97% of Indian retailing is composed of small, family-run stores. Eager toenter India, Wal-Mart’s management formed an equal partnership joint venture in 2007with Bharti Enterprises to start wholesale operations. Under the name Bharti-Mart, thenew company planned to open a dozen small retail stores by 2015.27
� Acquisitions: A relatively quick way to move into an international area is through acquisi-tions—purchasing another company already operating in that area. Synergistic benefits canresult if the company acquires a firm with strong complementary product lines and a gooddistribution network. For example, Belgium’s InBev purchased Anheuser-Busch in 2008for $52 billion to obtain a solid position in the profitable North American beer market. Be-fore the acquisition, InBev had only a small presence in the U.S., but a strong one in Europeand Latin American, where Anheuser-Busch was weak.28 Research suggests that whollyowned subsidiaries are more successful in international undertakings than are strategic al-liances, such as joint ventures.29 This is one reason why firms more experienced in interna-tional markets take a higher ownership position when making a foreign investment.30
Cross-border acquisitions now account for 19% of all acquisitions in the United States—upfrom only 6% in 1985.31 In some countries, however, acquisitions can be difficult to arrangebecause of a lack of available information about potential candidates. Government restric-tions on ownership, such as the U.S. requirement that limits foreign ownership of U.S. air-lines to 49% of nonvoting and 25% of voting stock, can also discourage acquisitions.
� Green-Field Development: If a company doesn’t want to purchase another company’sproblems along with its assets, it may choose green-field development and build its ownmanufacturing plant and distribution system. Research indicates that firms possessinghigh levels of technology, multinational experience, and diverse product lines prefergreen-field development to acquisitions.32 This is usually a far more complicated and ex-pensive operation than acquisition, but it allows a company more freedom in designingthe plant, choosing suppliers, and hiring a workforce. For example, Nissan, Honda, andToyota built auto factories in rural areas of Great Britain and then hired a young work-force with no experience in the industry. BMW did the same thing when it built its autoplant in Spartanburg, South Carolina, to make its Z3 and Z4 sports cars.
� Production Sharing: Coined by Peter Drucker, the term production sharing means theprocess of combining the higher labor skills and technology available in developed coun-tries with the lower-cost labor available in developing countries. Often called outsourcing,one example is Maytag’s moving some of its refrigeration production to a new plant inReynosa, Mexico, in order to reduce labor costs. Many companies have moved data pro-cessing, programming, and customer service activities “offshore” to Ireland, India, Barba-dos, Jamaica, the Philippines, and Singapore, where wages are lower, English is spoken,and telecommunications are in place. As the number of technology services employees inIndia grew to be 15% of IBM’s total tech services employees by 2007, the company hasbeen able to eliminate 20,000 jobs in high-cost locations in the U.S., Europe, and Japan.33
� Turnkey Operations: Turnkey operations are typically contracts for the construction ofoperating facilities in exchange for a fee. The facilities are transferred to the host countryor firm when they are complete. The customer is usually a government agency of, for ex-ample, a Middle Eastern country that has decreed that a particular product must be pro-duced locally and under its control. For example, Fiat built an auto plant in Tagliatti,
214 PART 3 Strategy Formulation
Russia, for the Soviet Union in the late 1960s to produce an older model of Fiat under thebrand name of Lada. MNCs that perform turnkey operations are frequently industrialequipment manufacturers that supply some of their own equipment for the project and thatcommonly sell replacement parts and maintenance services to the host country. Theythereby create customers as well as future competitors. Interestingly, Renault purchased in2008 a 25% stake in the same Tagliatti factory built by Fiat to help the Russian carmakermodernize, using Renault’s low cost Logan as the base for the plant’s new Lada model.34
� BOT Concept: The BOT (Build, Operate, Transfer) concept is a variation of theturnkey operation. Instead of turning the facility (usually a power plant or toll road) overto the host country when completed, the company operates the facility for a fixed periodof time during which it earns back its investment plus a profit. It then turns the facilityover to the government at little or no cost to the host country.35
� Management Contracts: A large corporation operating throughout the world is likely tohave a large amount of management talent at its disposal. Management contracts offera means through which a corporation can use some of its personnel to assist a firm in ahost country for a specified fee and period of time. Management contracts are commonwhen a host government expropriates part or all of a foreign-owned company’s holdingsin its country. The contracts allow the firm to continue to earn some income from its in-vestment and keep the operations going until local management is trained.36
Diversification StrategiesAccording to strategist Richard Rumelt, companies begin thinking about diversification whentheir growth has plateaued and opportunities for growth in the original business have been de-pleted.37 This often occurs when an industry consolidates, becomes mature, and most of thesurviving firms have reached the limits of growth using vertical and horizontal growth strate-gies. Unless the competitors are able to expand internationally into less mature markets, theymay have no choice but to diversify into different industries if they want to continue growing.The two basic diversification strategies are concentric and conglomerate.
Concentric (Related) Diversification. Growth through concentric diversification into arelated industry may be a very appropriate corporate strategy when a firm has a strongcompetitive position but industry attractiveness is low.
Research indicates that the probability of succeeding by moving into a related business is afunction of a company’s position in its core business. For companies in leadership positions, thechances for success are nearly three times higher than those for followers.38 By focusing on thecharacteristics that have given the company its distinctive competence, the company uses thosevery strengths as its means of diversification. The firm attempts to secure strategic fit in a newindustry where the firm’s product knowledge, its manufacturing capabilities, and the marketingskills it used so effectively in the original industry can be put to good use.39 The corporation’sproducts or processes are related in some way: they possess some common thread.
The search is for synergy, the concept that two businesses will generate more profits to-gether than they could separately. The point of commonality may be similar technology, cus-tomer usage, distribution, managerial skills, or product similarity. This is the rationale takenby Quebec-based Bombardier, the world’s third-largest aircraft manufacturer. In the 1980s, thecompany expanded beyond snowmobiles into making light rail equipment. Defining itself asa transportation company, it entered the aircraft business in 1986, with its purchase ofCanadair, then best known for its fire-fighting airplanes. It later bought Learjet, a well-knownmaker of business jets. Over a 14-year period, Bombardier launched 14 new aircraft. In July2008, the company announced its C Series Aircraft Program to manufacture a 110–130-seat“green” single-aisle family of airplanes to directly compete with Airbus and Boeing.40
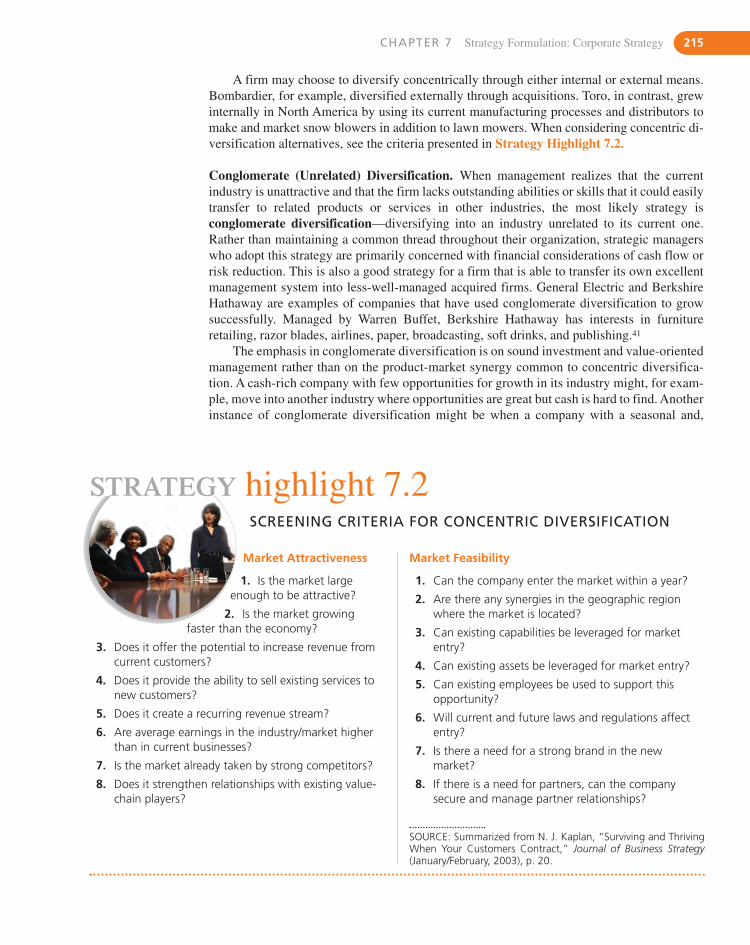
Market Attractiveness
1. Is the market largeenough to be attractive?
2. Is the market growingfaster than the economy?
3. Does it offer the potential to increase revenue fromcurrent customers?
4. Does it provide the ability to sell existing services tonew customers?
5. Does it create a recurring revenue stream?
6. Are average earnings in the industry/market higherthan in current businesses?
7. Is the market already taken by strong competitors?
8. Does it strengthen relationships with existing value-chain players?
CHAPTER 7 Strategy Formulation: Corporate Strategy 215
A firm may choose to diversify concentrically through either internal or external means.Bombardier, for example, diversified externally through acquisitions. Toro, in contrast, grewinternally in North America by using its current manufacturing processes and distributors tomake and market snow blowers in addition to lawn mowers. When considering concentric di-versification alternatives, see the criteria presented in Strategy Highlight 7.2.
Conglomerate (Unrelated) Diversification. When management realizes that the currentindustry is unattractive and that the firm lacks outstanding abilities or skills that it could easilytransfer to related products or services in other industries, the most likely strategy isconglomerate diversification—diversifying into an industry unrelated to its current one.Rather than maintaining a common thread throughout their organization, strategic managerswho adopt this strategy are primarily concerned with financial considerations of cash flow orrisk reduction. This is also a good strategy for a firm that is able to transfer its own excellentmanagement system into less-well-managed acquired firms. General Electric and BerkshireHathaway are examples of companies that have used conglomerate diversification to growsuccessfully. Managed by Warren Buffet, Berkshire Hathaway has interests in furnitureretailing, razor blades, airlines, paper, broadcasting, soft drinks, and publishing.41
The emphasis in conglomerate diversification is on sound investment and value-orientedmanagement rather than on the product-market synergy common to concentric diversifica-tion. A cash-rich company with few opportunities for growth in its industry might, for exam-ple, move into another industry where opportunities are great but cash is hard to find. Anotherinstance of conglomerate diversification might be when a company with a seasonal and,
STRATEGY highlight 7.2SCREENING CRITERIA FOR CONCENTRIC DIVERSIFICATION
Market Feasibility
1. Can the company enter the market within a year?
2. Are there any synergies in the geographic regionwhere the market is located?
3. Can existing capabilities be leveraged for marketentry?
4. Can existing assets be leveraged for market entry?
5. Can existing employees be used to support thisopportunity?
6. Will current and future laws and regulations affectentry?
7. Is there a need for a strong brand in the newmarket?
8. If there is a need for partners, can the companysecure and manage partner relationships?
SOURCE: Summarized from N. J. Kaplan, “Surviving and ThrivingWhen Your Customers Contract,” Journal of Business Strategy(January/February, 2003), p. 20.
216 PART 3 Strategy Formulation
therefore, uneven cash flow purchases a firm in an unrelated industry with complementingseasonal sales that will level out the cash flow. CSX management considered the purchase ofa natural gas transmission business (Texas Gas Resources) by CSX Corporation (a railroad-dominated transportation company) to be a good fit because most of the gas transmission rev-enue was realized in the winter months—the lean period in the railroad business.
CONTROVERSIES IN DIRECTIONAL GROWTH STRATEGIESIs vertical growth better than horizontal growth? Is concentration better than diversifica-tion? Is concentric diversification better than conglomerate diversification? Research re-veals that companies following a related diversification strategy appear to be higherperformers and survive longer than do companies with narrower scope following a pure con-centration strategy.42 Although the research is not in complete agreement, growth into areasrelated to a company’s current product lines is generally more successful than is growth intocompletely unrelated areas.43 For example, one study of various growth projects examinedhow many were considered successful, that is, still in existence after 22 years. The resultswere vertical growth, 80%; horizontal growth, 50%; concentric diversification, 35%; andconglomerate diversification, 28%.44 This supports the conclusion from a study of 40 suc-cessful European companies that companies should first exploit their existing assets and ca-pabilities before exploring for new ones, but that they should also diversify their portfolioof products.45
In terms of diversification strategies, research suggests that the relationship between re-latedness and performance is curvilinear in the shape of an inverted U-shaped curve. If a newbusiness is very similar to that of the acquiring firm, it adds little new to the corporation andonly marginally improves performance. If the new business is completely different from theacquiring company’s businesses, there may be very little potential for any synergy. If, how-ever, the new business provides new resources and capabilities in a different, but similar, busi-ness, the likelihood of a significant performance improvement is high.46
Is internal growth better than external growth? Corporations can follow the growth strate-gies of either concentration or diversification through the internal development of new productsand services, or through external acquisitions, mergers, and strategic alliances. The valueof global acquisitions and mergers has steadily increased from less than $1 trillion in 1990 to$3.5 trillion in 2000.47 According to a McKinsey & Company survey, managers are primarilymotivated to purchase other companies in order to add capabilities, expand geographically, andbuy growth.48 Research generally concludes, however, that firms growing through acquisitionsdo not perform financially as well as firms that grow through internal means.49 For example, onSeptember 3, 2001, the day before HP announced that it was purchasing Compaq, HP’s stockwas selling at $23.11. After the announcement, the stock price fell to $18.87. Three years later,on September 21, 2004, the shares sold at $18.70.50 One reason for this poor performance maybe that acquiring firms tend to spend less on R&D than do other firms.51 Another reason maybe the typically high price of the acquisition itself. Studies reveal that over half to two-thirds ofacquisitions are failures primarily because the premiums paid were too high for them to earntheir cost of capital.52 Another reason for the poor stock performance is that 50% of the cus-tomers of a merged firm are less satisfied with the combined company’s service two years af-ter the merger.53 It is likely that neither strategy is best by itself and that some combination ofinternal and external growth strategies is better than using one or the other.54
What can improve acquisition performance? For one thing, the acquisition should belinked to strategic objectives and support corporate strategy. In addition, a corporation mustbe prepared to identify roughly 100 candidates and conduct due diligence investigation onaround 40 companies in order to ultimately purchase 10 companies. This kind of effort requires
CHAPTER 7 Strategy Formulation: Corporate Strategy 217
the capacity to sift through many candidates while simultaneously integrating previous acqui-sitions.55 A study by Bain & Company of more than 11,000 acquisitions by companiesthroughout the world concluded that successful acquirers make small, low-risk acquisitionsbefore moving on to larger ones.56 Previous experience between an acquirer and a target firmin terms of R&D, manufacturing, or marketing alliances improves the likelihood of a success-ful acquisition.57 Realizing that an acquired company must be carefully assimilated into theacquiring firm’s operations, Cisco uses three criteria to judge whether a company is a suitablecandidate for takeover:
� It must be relatively small.
� It must be comparable in organizational culture.
� It must be physically close to one of the existing affiliates.58
STABILITY STRATEGIESA corporation may choose stability over growth by continuing its current activities without anysignificant change in direction. Although sometimes viewed as a lack of strategy, the stabilityfamily of corporate strategies can be appropriate for a successful corporation operating in areasonably predictable environment.59 They are very popular with small business owners whohave found a niche and are happy with their success and the manageable size of their firms.Stability strategies can be very useful in the short run, but they can be dangerous if followedfor too long. Some of the more popular of these strategies are the pause/proceed-with-caution,no-change, and profit strategies.
Pause/Proceed with Caution StrategyA pause/proceed-with-caution strategy is, in effect, a timeout—an opportunity to rest be-fore continuing a growth or retrenchment strategy. It is a very deliberate attempt to makeonly incremental improvements until a particular environmental situation changes. It is typ-ically conceived as a temporary strategy to be used until the environment becomes more hos-pitable or to enable a company to consolidate its resources after prolonged rapid growth. Thiswas the strategy Dell followed after its growth strategy had resulted in more growth than itcould handle. Explained CEO Michael Dell, “We grew 285% in two years, and we’re hav-ing some growing pains.” Selling personal computers by mail enabled Dell to underpricecompetitors, but it could not keep up with the needs of a $2 billion, 5,600-employee com-pany selling PCs in 95 countries. Dell did not give up on its growth strategy; it merely put ittemporarily in limbo until the company was able to hire new managers, improve the struc-ture, and build new facilities.60 This was a popular strategy in late-2008 during a U.S. finan-cial crisis when banks were freezing their lending and awaiting a rescue package from thefederal government.
No-Change StrategyA no-change strategy is a decision to do nothing new—a choice to continue current opera-tions and policies for the foreseeable future. Rarely articulated as a definite strategy, a no-change strategy’s success depends on a lack of significant change in a corporation’s situation.The relative stability created by the firm’s modest competitive position in an industry facinglittle or no growth encourages the company to continue on its current course, making onlysmall adjustments for inflation in its sales and profit objectives. There are no obvious oppor-tunities or threats, nor is there much in the way of significant strengths or weaknesses. Few ag-gressive new competitors are likely to enter such an industry. The corporation has probably
218 PART 3 Strategy Formulation
found a reasonably profitable and stable niche for its products. Unless the industry is under-going consolidation, the relative comfort a company in this situation experiences is likely toencourage the company to follow a no-change strategy in which the future is expected to con-tinue as an extension of the present. Many small-town businesses followed this strategy beforeWal-Mart moved into their areas and forced them to rethink their strategy.
Profit StrategyA profit strategy is a decision to do nothing new in a worsening situation but instead to act asthough the company’s problems are only temporary. The profit strategy is an attempt to artifi-cially support profits when a company’s sales are declining by reducing investment and short-term discretionary expenditures. Rather than announce the company’s poor position toshareholders and the investment community at large, top management may be tempted to fol-low this very seductive strategy. Blaming the company’s problems on a hostile environment(such as anti-business government policies, unethical competitors, finicky customers, and/orgreedy lenders), management defers investments and/or cuts expenses (such as R&D, mainte-nance, and advertising) to stabilize profits during this period. It may even sell one of its prod-uct lines for the cash-flow benefits.
The profit strategy is useful only to help a company get through a temporary difficulty. Itmay also be a way to boost the value of a company in preparation for going public via an ini-tial public offering (IPO). Unfortunately, the strategy is seductive and if continued longenough it will lead to a serious deterioration in a corporation’s competitive position. The profitstrategy is typically top management’s passive, short-term, and often self-serving response toa difficult situation. In such situations, it is often better to face the problem directly by choos-ing a retrenchment strategy.
RETRENCHMENT STRATEGIESA company may pursue retrenchment strategies when it has a weak competitive position insome or all of its product lines resulting in poor performance—sales are down and profits arebecoming losses. These strategies impose a great deal of pressure to improve performance. Inan attempt to eliminate the weaknesses that are dragging the company down, management mayfollow one of several retrenchment strategies, ranging from turnaround or becoming a captivecompany to selling out, bankruptcy, or liquidation.
Turnaround StrategyTurnaround strategy emphasizes the improvement of operational efficiency and is probablymost appropriate when a corporation’s problems are pervasive but not yet critical. Researchshows that poorly performing firms in mature industries have been able to improve their per-formance by cutting costs and expenses and by selling off assets.61 Analogous to a weight-reduction diet, the two basic phases of a turnaround strategy are contraction and consolidation.62
Contraction is the initial effort to quickly “stop the bleeding” with a general, across-the-board cutback in size and costs. For example, when Howard Stringer was selected to be CEOof Sony Corporation in 2005, he immediately implemented the first stage of a turnaround planby eliminating 10,000 jobs, closing 11 of 65 plants, and divesting many unprofitable electron-ics businesses. 63 The second phase, consolidation, implements a program to stabilize the now-leaner corporation. To streamline the company, plans are developed to reduce unnecessaryoverhead and to make functional activities cost-justified. This is a crucial time for the organiza-tion. If the consolidation phase is not conducted in a positive manner, many of the best peopleleave the organization. An overemphasis on downsizing and cutting costs coupled with a heavy
CHAPTER 7 Strategy Formulation: Corporate Strategy 219
hand by top management is usually counterproductive and can actually hurt performance.64 If,however, all employees are encouraged to get involved in productivity improvements, the firmis likely to emerge from this retrenchment period a much stronger and better-organized com-pany. It has improved its competitive position and is able once again to expand the business.65
Captive Company StrategyA captive company strategy involves giving up independence in exchange for security. A com-pany with a weak competitive position may not be able to engage in a full-blown turnaround strat-egy. The industry may not be sufficiently attractive to justify such an effort from either the currentmanagement or investors. Nevertheless, a company in this situation faces poor sales and increas-ing losses unless it takes some action. Management desperately searches for an “angel” by offer-ing to be a captive company to one of its larger customers in order to guarantee the company’scontinued existence with a long-term contract. In this way, the corporation may be able to reducethe scope of some of its functional activities, such as marketing, thus significantly reducing costs.The weaker company gains certainty of sales and production in return for becoming heavily de-pendent on another firm for at least 75% of its sales. For example, to become the sole supplier ofan auto part to General Motors, Simpson Industries of Birmingham, Michigan, agreed to let aspecial team from GM inspect its engine parts facilities and books and interview its employees.In return, nearly 80% of the company’s production was sold to GM through long-term contracts.66
Sell-Out/Divestment StrategyIf a corporation with a weak competitive position in an industry is unable either to pull itself upby its bootstraps or to find a customer to which it can become a captive company, it may haveno choice but to sell out. The sell-out strategy makes sense if management can still obtain agood price for its shareholders and the employees can keep their jobs by selling the entire com-pany to another firm. The hope is that another company will have the necessary resources anddetermination to return the company to profitability. Marginal performance in a troubled indus-try was one reason Northwest Airlines was willing to be acquired by Delta Airlines in 2008.
If the corporation has multiple business lines and it chooses to sell off a division with lowgrowth potential, this is called divestment. This was the strategy Ford used when it sold itsstruggling Jaguar and Land Rover units to Tata Motors in 2008 for $2 billion. Ford had spent$10 billion trying to turn around Jaguar after spending $2.5 billion to buy it in 1990. In addi-tion, Ford had paid $2.8 billion for Land Rover in 2000. Ford’s management hoped to use theproceeds of the sale to help the company reach profitability in 2009.67 General Electric’s man-agement used the same reasoning when it decided to sell or spin off its slow-growth appliancebusiness in 2008.
Divestment is often used after a corporation acquires a multi-unit corporation in order toshed the units that do not fit with the corporation’s new strategy. This is why Whirlpool soldMaytag’s Hoover vacuum cleaner unit after Whirlpool purchased Maytag. Divestment wasalso a key part of Lego’s turnaround strategy when management decided to divest its themeparks to concentrate more on its core business of making toys.68
Bankruptcy/Liquidation StrategyWhen a company finds itself in the worst possible situation with a poor competitive positionin an industry with few prospects, management has only a few alternatives—all of them dis-tasteful. Because no one is interested in buying a weak company in an unattractive industry,the firm must pursue a bankruptcy or liquidation strategy. Bankruptcy involves giving upmanagement of the firm to the courts in return for some settlement of the corporation’s obli-gations. Top management hopes that once the court decides the claims on the company, the
220 PART 3 Strategy Formulation
company will be stronger and better able to compete in a more attractive industry. Faced witha recessionary economy and falling market demand for casual dining, restaurants like Benni-gan’s Grill & Tavern and Steak & Ale, that once thrived by offering mid-priced menus with po-tato skins and thick hamburgers, filed for bankruptcy in July 2008. Within the troubled airlineindustry, at least 30 airlines went bankrupt during just the first half of 2008 with 30 more bank-ruptcies expected by the end of the year.69 A controversial approach was used by Delphi Cor-poration when it filed for Chapter 11 bankruptcy only for its U.S. operations, which employed32,000 high-wage union workers, but not for its foreign factories in low-wage countries.70
In contrast to bankruptcy, which seeks to perpetuate a corporation, liquidation is the ter-mination of the firm. When the industry is unattractive and the company too weak to be soldas a going concern, management may choose to convert as many saleable assets as possible tocash, which is then distributed to the shareholders after all obligations are paid. Liquidation isa prudent strategy for distressed firms with a small number of choices, all of which are prob-lematic.71 This was Circuit City’s situation in 2008, when it liquidated its retail stores. The ben-efit of liquidation over bankruptcy is that the board of directors, as representatives of theshareholders, together with top management make the decisions instead of turning them overto the bankruptcy court, which may choose to ignore shareholders completely.
At times, top management must be willing to select one of these less desirable retrench-ment strategies. Unfortunately, many top managers are unwilling to admit that their companyhas serious weaknesses for fear that they may be personally blamed. Even worse, top manage-ment may not even perceive that crises are developing. When these top managers eventuallynotice trouble, they are prone to attribute the problems to temporary environmental distur-bances and tend to follow profit strategies. Even when things are going terribly wrong, topmanagement is greatly tempted to avoid liquidation in the hope of a miracle. Top managemententers a cycle of decline, in which it goes through a process of secrecy and denial, followed byblame and scorn, avoidance and turf protection, ending with passivity and helplessness.72
Thus, a corporation needs a strong board of directors who, to safeguard shareholders’ inter-ests, can tell top management when to quit.
7.3 Portfolio AnalysisChapter 6 dealt with how individual product lines and business units can gain competitive ad-vantage in the marketplace by using competitive and cooperative strategies. Companies withmultiple product lines or business units must also ask themselves how these various productsand business units should be managed to boost overall corporate performance:
� How much of our time and money should we spend on our best products and businessunits to ensure that they continue to be successful?
� How much of our time and money should we spend developing new costly products, mostof which will never be successful?
One of the most popular aids to developing corporate strategy in a multiple-business cor-poration is portfolio analysis. Although its popularity has dropped since the 1970s and 1980s,when more than half of the largest business corporations used portfolio analysis, it is still usedby around 27% of Fortune 500 firms in corporate strategy formulation.73 Portfolio analysisputs corporate headquarters into the role of an internal banker. In portfolio analysis, top man-agement views its product lines and business units as a series of investments from which it ex-pects a profitable return. The product lines/business units form a portfolio of investments thattop management must constantly juggle to ensure the best return on the corporation’s investedmoney. A McKinsey & Company study of the performance of the 200 largest U.S. corporations
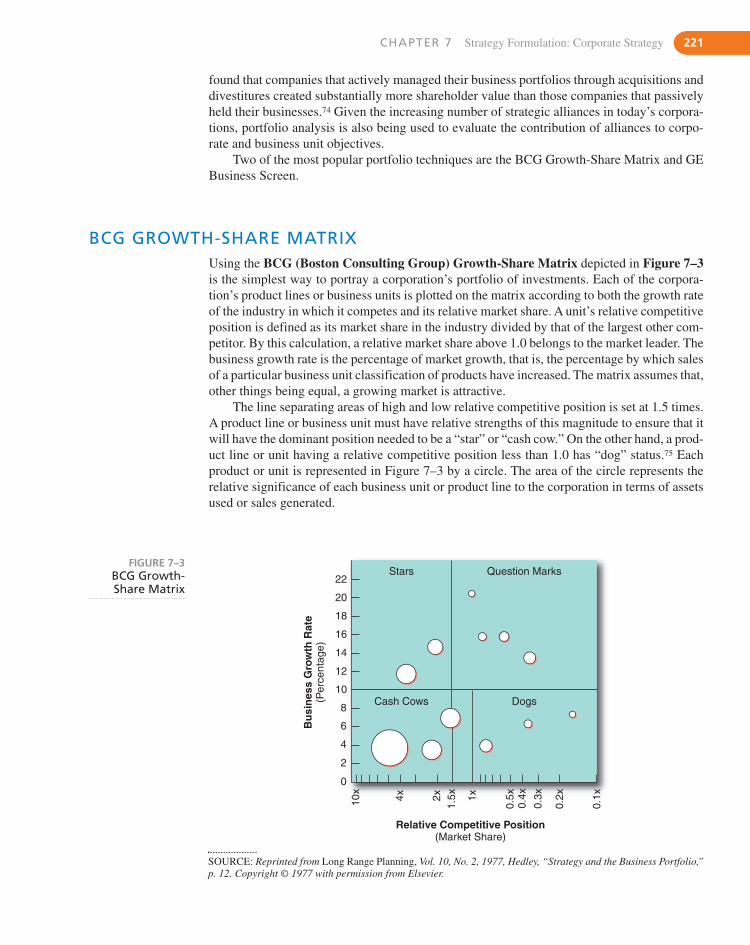
CHAPTER 7 Strategy Formulation: Corporate Strategy 221
BCG GROWTH-SHARE MATRIXUsing the BCG (Boston Consulting Group) Growth-Share Matrix depicted in Figure 7–3is the simplest way to portray a corporation’s portfolio of investments. Each of the corpora-tion’s product lines or business units is plotted on the matrix according to both the growth rateof the industry in which it competes and its relative market share. A unit’s relative competitiveposition is defined as its market share in the industry divided by that of the largest other com-petitor. By this calculation, a relative market share above 1.0 belongs to the market leader. Thebusiness growth rate is the percentage of market growth, that is, the percentage by which salesof a particular business unit classification of products have increased. The matrix assumes that,other things being equal, a growing market is attractive.
The line separating areas of high and low relative competitive position is set at 1.5 times.A product line or business unit must have relative strengths of this magnitude to ensure that itwill have the dominant position needed to be a “star” or “cash cow.” On the other hand, a prod-uct line or unit having a relative competitive position less than 1.0 has “dog” status.75 Eachproduct or unit is represented in Figure 7–3 by a circle. The area of the circle represents therelative significance of each business unit or product line to the corporation in terms of assetsused or sales generated.
found that companies that actively managed their business portfolios through acquisitions anddivestitures created substantially more shareholder value than those companies that passivelyheld their businesses.74 Given the increasing number of strategic alliances in today’s corpora-tions, portfolio analysis is also being used to evaluate the contribution of alliances to corpo-rate and business unit objectives.
Two of the most popular portfolio techniques are the BCG Growth-Share Matrix and GEBusiness Screen.
Stars
Cash Cows Dogs
22
20
18
16
14
12
10
8
6
4
2
0
10x
4x
Relative Competitive Position(Market Share)
Bu
sin
ess
Gro
wth
Rat
e(P
erce
ntag
e)
2x 1x
0.5x
0.4x
0.3x
0.2x
0.1x
1.5x
Question MarksFIGURE 7–3
BCG Growth-Share Matrix
SOURCE: Reprinted from Long Range Planning, Vol. 10, No. 2, 1977, Hedley, “Strategy and the Business Portfolio,”p. 12. Copyright © 1977 with permission from Elsevier.
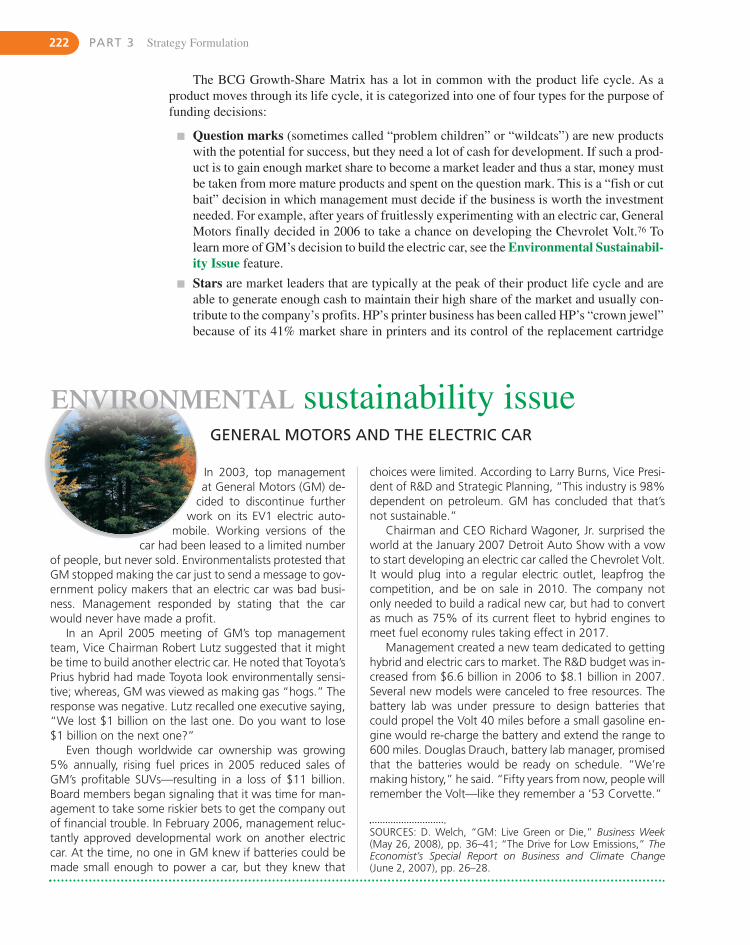
In 2003, top managementat General Motors (GM) de-
cided to discontinue furtherwork on its EV1 electric auto-
mobile. Working versions of thecar had been leased to a limited number
of people, but never sold. Environmentalists protested thatGM stopped making the car just to send a message to gov-ernment policy makers that an electric car was bad busi-ness. Management responded by stating that the carwould never have made a profit.
In an April 2005 meeting of GM’s top managementteam, Vice Chairman Robert Lutz suggested that it mightbe time to build another electric car. He noted that Toyota’sPrius hybrid had made Toyota look environmentally sensi-tive; whereas, GM was viewed as making gas “hogs.” Theresponse was negative. Lutz recalled one executive saying,“We lost $1 billion on the last one. Do you want to lose$1 billion on the next one?”
Even though worldwide car ownership was growing5% annually, rising fuel prices in 2005 reduced sales ofGM’s profitable SUVs—resulting in a loss of $11 billion.Board members began signaling that it was time for man-agement to take some riskier bets to get the company outof financial trouble. In February 2006, management reluc-tantly approved developmental work on another electriccar. At the time, no one in GM knew if batteries could bemade small enough to power a car, but they knew that
222 PART 3 Strategy Formulation
The BCG Growth-Share Matrix has a lot in common with the product life cycle. As aproduct moves through its life cycle, it is categorized into one of four types for the purpose offunding decisions:
� Question marks (sometimes called “problem children” or “wildcats”) are new productswith the potential for success, but they need a lot of cash for development. If such a prod-uct is to gain enough market share to become a market leader and thus a star, money mustbe taken from more mature products and spent on the question mark. This is a “fish or cutbait” decision in which management must decide if the business is worth the investmentneeded. For example, after years of fruitlessly experimenting with an electric car, GeneralMotors finally decided in 2006 to take a chance on developing the Chevrolet Volt.76 Tolearn more of GM’s decision to build the electric car, see the Environmental Sustainabil-ity Issue feature.
� Stars are market leaders that are typically at the peak of their product life cycle and areable to generate enough cash to maintain their high share of the market and usually con-tribute to the company’s profits. HP’s printer business has been called HP’s “crown jewel”because of its 41% market share in printers and its control of the replacement cartridge
GENERAL MOTORS AND THE ELECTRIC CAR
ENVIRONMENTAL sustainability issue
choices were limited. According to Larry Burns, Vice Presi-dent of R&D and Strategic Planning, “This industry is 98%dependent on petroleum. GM has concluded that that’snot sustainable.”
Chairman and CEO Richard Wagoner, Jr. surprised theworld at the January 2007 Detroit Auto Show with a vowto start developing an electric car called the Chevrolet Volt.It would plug into a regular electric outlet, leapfrog thecompetition, and be on sale in 2010. The company notonly needed to build a radical new car, but had to convertas much as 75% of its current fleet to hybrid engines tomeet fuel economy rules taking effect in 2017.
Management created a new team dedicated to gettinghybrid and electric cars to market. The R&D budget was in-creased from $6.6 billion in 2006 to $8.1 billion in 2007.Several new models were canceled to free resources. Thebattery lab was under pressure to design batteries thatcould propel the Volt 40 miles before a small gasoline en-gine would re-charge the battery and extend the range to600 miles. Douglas Drauch, battery lab manager, promisedthat the batteries would be ready on schedule. “We’remaking history,” he said. “Fifty years from now, people willremember the Volt—like they remember a ‘53 Corvette.”
SOURCES: D. Welch, “GM: Live Green or Die,” Business Week(May 26, 2008), pp. 36–41; “The Drive for Low Emissions,” TheEconomist’s Special Report on Business and Climate Change(June 2, 2007), pp. 26–28.
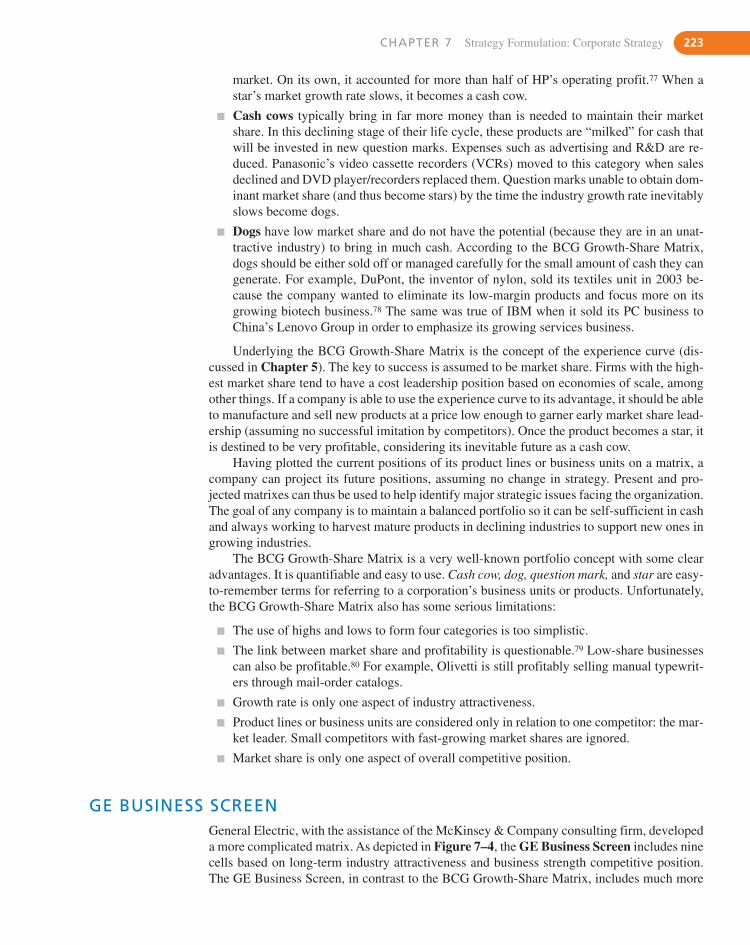
CHAPTER 7 Strategy Formulation: Corporate Strategy 223
market. On its own, it accounted for more than half of HP’s operating profit.77 When astar’s market growth rate slows, it becomes a cash cow.
� Cash cows typically bring in far more money than is needed to maintain their marketshare. In this declining stage of their life cycle, these products are “milked” for cash thatwill be invested in new question marks. Expenses such as advertising and R&D are re-duced. Panasonic’s video cassette recorders (VCRs) moved to this category when salesdeclined and DVD player/recorders replaced them. Question marks unable to obtain dom-inant market share (and thus become stars) by the time the industry growth rate inevitablyslows become dogs.
� Dogs have low market share and do not have the potential (because they are in an unat-tractive industry) to bring in much cash. According to the BCG Growth-Share Matrix,dogs should be either sold off or managed carefully for the small amount of cash they cangenerate. For example, DuPont, the inventor of nylon, sold its textiles unit in 2003 be-cause the company wanted to eliminate its low-margin products and focus more on itsgrowing biotech business.78 The same was true of IBM when it sold its PC business toChina’s Lenovo Group in order to emphasize its growing services business.
Underlying the BCG Growth-Share Matrix is the concept of the experience curve (dis-cussed in Chapter 5). The key to success is assumed to be market share. Firms with the high-est market share tend to have a cost leadership position based on economies of scale, amongother things. If a company is able to use the experience curve to its advantage, it should be ableto manufacture and sell new products at a price low enough to garner early market share lead-ership (assuming no successful imitation by competitors). Once the product becomes a star, itis destined to be very profitable, considering its inevitable future as a cash cow.
Having plotted the current positions of its product lines or business units on a matrix, acompany can project its future positions, assuming no change in strategy. Present and pro-jected matrixes can thus be used to help identify major strategic issues facing the organization.The goal of any company is to maintain a balanced portfolio so it can be self-sufficient in cashand always working to harvest mature products in declining industries to support new ones ingrowing industries.
The BCG Growth-Share Matrix is a very well-known portfolio concept with some clearadvantages. It is quantifiable and easy to use. Cash cow, dog, question mark, and star are easy-to-remember terms for referring to a corporation’s business units or products. Unfortunately,the BCG Growth-Share Matrix also has some serious limitations:
� The use of highs and lows to form four categories is too simplistic.
� The link between market share and profitability is questionable.79 Low-share businessescan also be profitable.80 For example, Olivetti is still profitably selling manual typewrit-ers through mail-order catalogs.
� Growth rate is only one aspect of industry attractiveness.
� Product lines or business units are considered only in relation to one competitor: the mar-ket leader. Small competitors with fast-growing market shares are ignored.
� Market share is only one aspect of overall competitive position.
GE BUSINESS SCREENGeneral Electric, with the assistance of the McKinsey & Company consulting firm, developeda more complicated matrix. As depicted in Figure 7–4, the GE Business Screen includes ninecells based on long-term industry attractiveness and business strength competitive position.The GE Business Screen, in contrast to the BCG Growth-Share Matrix, includes much more
224 PART 3 Strategy Formulation
WinnersA
Winners
B
C
AverageBusinesses
F
WinnersE
ProfitProducers
Low
LosersG
AverageStrong
Medium
High
Ind
ust
ry A
ttra
ctiv
enes
s
H
Losers
Losers
Weak
QuestionMarks
D
Business Strength/Competitive Position
FIGURE 7–4General Electric’s
Business Screen
data in its two key factors than just business growth rate and comparable market share. For ex-ample, at GE, industry attractiveness includes market growth rate, industry profitability, size,and pricing practices, among other possible opportunities and threats. Business strength orcompetitive position includes market share as well as technological position, profitability, andsize, among other possible strengths and weaknesses.81
The individual product lines or business units are identified by a letter and plotted as cir-cles on the GE Business Screen. The area of each circle is in proportion to the size of the in-dustry in terms of sales. The pie slices within the circles depict the market shares of the productlines or business units.
To plot product lines or business units on the GE Business Screen, follow these four steps:
1. Select criteria to rate the industry for each product line or business unit. Assess overall in-dustry attractiveness for each product line or business unit on a scale from 1 (very unat-tractive) to 5 (very attractive).
2. Select the key factors needed for success in each product line or business unit. Assessbusiness strength/competitive position for each product line or business unit on a scale of1 (very weak) to 5 (very strong).
3. Plot each product line’s or business unit’s current position on a matrix as that depicted inFigure 7–4.
4. Plot the firm’s future portfolio, assuming that present corporate and business strategies re-main unchanged. Is there a performance gap between projected and desired portfolios? Ifso, this gap should serve as a stimulus to seriously review the corporation’s current mis-sion, objectives, strategies, and policies.
Overall, the nine-cell GE Business Screen is an improvement over the BCG Growth-Share Matrix. The GE Business Screen considers many more variables and does not lead to
SOURCE: Adapted from Strategic Management in GE, Corporate Planning and Development, General ElectricCorporation, Reprinted by permission of General Electric Company.
CHAPTER 7 Strategy Formulation: Corporate Strategy 225
such simplistic conclusions. It recognizes, for example, that the attractiveness of an industrycan be assessed in many different ways (other than simply using growth rate), and it thus al-lows users to select whatever criteria they feel are most appropriate to their situation. This port-folio matrix, however, does have some shortcomings:
� It can get quite complicated and cumbersome.
� The numerical estimates of industry attractiveness and business strength/competitive po-sition give the appearance of objectivity, but they are in reality subjective judgments thatmay vary from one person to another.
� It cannot effectively depict the positions of new products or business units in developingindustries.
ADVANTAGES AND LIMITATIONS OF PORTFOLIO ANALYSISPortfolio analysis is commonly used in strategy formulation because it offers certainadvantages:
� It encourages top management to evaluate each of the corporation’s businesses individu-ally and to set objectives and allocate resources for each.
� It stimulates the use of externally oriented data to supplement management’s judgment.
� It raises the issue of cash-flow availability for use in expansion and growth.
� Its graphic depiction facilitates communication.
Portfolio analysis does, however, have some very real limitations that have caused somecompanies to reduce their use of this approach:
� Defining product/market segments is difficult.
� It suggests the use of standard strategies that can miss opportunities or be impractical.
� It provides an illusion of scientific rigor when in reality positions are based on subjectivejudgments.
� Its value-laden terms such as cash cow and dog can lead to self-fulfilling prophecies.
� It is not always clear what makes an industry attractive or where a product is in its life cycle.
� Naively following the prescriptions of a portfolio model may actually reduce corporateprofits if they are used inappropriately. For example, General Mills’ Chief Executive H.Brewster Atwater cited his company’s Bisquick brand of baking mix as a product thatwould have been written off years ago based on portfolio analysis. “This product is57 years old. By all rights it should have been overtaken by newer products. But with theproper research to improve the product and promotion to keep customers excited, it’s do-ing very well.”82
MANAGING A STRATEGIC ALLIANCE PORTFOLIOJust as product lines/business units form a portfolio of investments that top management mustconstantly juggle to ensure the best return on the corporation’s invested money, strategic al-liances can also be viewed as a portfolio of investments—investments of money, time, and en-ergy. The way a company manages these intertwined relationships can significantly influencecorporate competitiveness. Alliances are thus recognized as an important source of competi-tive advantage and superior performance.83
Managing groups of strategic alliances is primarily the job of the business unit. Its deci-sions may escalate, however, to the corporate level. Toman Corporation, for example, has
226 PART 3 Strategy Formulation
7.4 Corporate ParentingCampbell, Goold, and Alexander, authors of Corporate-Level Strategy: Creating Value in theMultibusiness Company, contend that corporate strategists must address two crucial questions:
� What businesses should this company own and why?
� What organizational structure, management processes, and philosophy will foster supe-rior performance from the company’s business units?86
195 international joint ventures containing 422 alliance partners. According to a Toman exec-utive, “If headquarters is trying to bring us and some other company closer together, theyshould understand not only our business unit, but also other business units. Sometimes thewhole of our company may benefit (from an alliance) but it may not be good for one of ourbusiness units. And if it proceeds, headquarters must give some credit to our business unit sothat we can agree. But it is not acceptable if they say to us that we are to lose something as aresult of the alliance and now we have to make up the difference in one of our other busi-nesses.” In this instance the stage is set for negotiations across business units at the corporatelevel to achieve a broadly supported alliance network management system.84
A study of 25 leading European corporations found four tasks of multi-alliance manage-ment that are necessary for successful alliance portfolio management:
1. Developing and implementing a portfolio strategy for each business unit and a cor-porate policy for managing all the alliances of the entire company: Alliances are pri-marily determined by business units. The corporate level develops general rulesconcerning when, how, and with whom to cooperate. The task of alliance policy is tostrategically align all of the corporation’s alliance activities with corporate strategy andcorporate values. Every new alliance is thus checked against corporate policy before it isapproved.
2. Monitoring the alliance portfolio in terms of implementing business unit strategiesand corporate strategy and policies: Each alliance is measured in terms of achievementof objectives (e.g., market share), financial measures (e.g., profits and cash flow), con-tributed resource quality and quantity, and the overall relationship. The more a firm is di-versified, the less the need for monitoring at the corporate level.
3. Coordinating the portfolio to obtain synergies and avoid conflicts among alliances:Because the interdependencies among alliances within a business unit are usually greaterthan among different businesses, the need for coordination is greater at the business levelthan at the corporate level. The need for coordination increases as the number of alliancesin one business unit and the company as a whole increases, the average number of part-ners per alliance increases, and/or the overlap of the alliances increases.
4. Establishing an alliance management system to support other tasks of multi-alliancemanagement: This infrastructure consists of formalized processes, standardized toolsand specialized organizational units. All but two of the 25 companies established centersof competence for alliance management. The centers were often part of a department forcorporate development or a department of alliance management at the corporate level.In other corporations, specialized positions for alliance management were created at boththe corporate and business unit levels or only at the business unit level. Most corporationsprefer a system in which the corporate level provides the methods and tools to supportalliances centrally, but decentralizes day-to-day alliance management to the businessunits.85

CHAPTER 7 Strategy Formulation: Corporate Strategy 227
Portfolio analysis typically attempts to answer these questions by examining the at-tractiveness of various industries and by managing business units for cash flow, that is, byusing cash generated from mature units to build new product lines. Unfortunately, portfo-lio analysis fails to deal with the question of what industries a corporation should enter orwith how a corporation can attain synergy among its product lines and business units. Assuggested by its name, portfolio analysis tends to primarily view matters financially, re-garding business units and product lines as separate and independent investments.
Corporate parenting, in contrast, views a corporation in terms of resources and ca-pabilities that can be used to build business unit value as well as generate synergies acrossbusiness units. According to Campbell, Goold, and Alexander:
Multibusiness companies create value by influencing—or parenting—the businesses theyown. The best parent companies create more value than any of their rivals would if theyowned the same businesses. Those companies have what we call parenting advantage.87
Corporate parenting generates corporate strategy by focusing on the core competen-cies of the parent corporation and on the value created from the relationship between theparent and its businesses. In the form of corporate headquarters, the parent has a greatdeal of power in this relationship. According to Campbell, Goold, and Alexander, if thereis a good fit between the parent’s skills and resources and the needs and opportunities ofthe business units, the corporation is likely to create value. If, however, there is not a goodfit, the corporation is likely to destroy value.88 Research indicates that companies thathave a good fit between their strategy and their parenting roles are better performers thanthose companies that do not have a good fit.89 This approach to corporate strategy is use-ful not only in deciding what new businesses to acquire but also in choosing how eachexisting business unit should be best managed. This appears to have been the secret to thesuccess of General Electric under CEO Jack Welch. According to one analyst in 2000,“He and his managers really add value by imposing tough standards of profitability andby disseminating knowledge and best practice quickly around the GE empire. If somemanufacturing trick cuts costs in GE’s aero-engine repair shops in Wales, he insists it beapplied across the group.”90
The primary job of corporate headquarters is, therefore, to obtain synergy among thebusiness units by providing needed resources to units, transferring skills and capabilitiesamong the units, and coordinating the activities of shared unit functions to attaineconomies of scope (as in centralized purchasing).91 This is in agreement with the con-cept of the learning organization discussed in Chapter 1 in which the role of a large firmis to facilitate and transfer the knowledge assets and services throughout thecorporation.92 This is especially important given that 75% or more of a modern com-pany’s market value stems from its intangible assets—the organization’s knowledge andcapabilities.93 At Proctor & Gamble, for example, the various business units are expectedto work together to develop innovative products. Crest Whitestrips, which controls 68%of the at-home tooth-whitening market, was based on the P&G laundry division’s knowl-edge of whitening agents.94
DEVELOPING A CORPORATE PARENTING STRATEGYCampbell, Goold, and Alexander recommend that the search for appropriate corporate strat-egy involves three analytical steps:
1. Examine each business unit (or target firm in the case of acquisition) in terms of itsstrategic factors: People in the business units probably identified the strategic factorswhen they were generating business strategies for their units. One popular approach is to
228 PART 3 Strategy Formulation
HORIZONTAL STRATEGY AND MULTIPOINT COMPETITIONA horizontal strategy is a corporate strategy that cuts across business unit boundaries to buildsynergy across business units and to improve the competitive position of one or more businessunits.96 When used to build synergy, it acts like a parenting strategy. When used to improve thecompetitive position of one or more business units, it can be thought of as a corporate compet-itive strategy. In multipoint competition, large multi-business corporations compete againstother large multi-business firms in a number of markets. These multipoint competitors are firmsthat compete with each other not only in one business unit, but also in a number of businessunits. At one time or another, a cash-rich competitor may choose to build its own market sharein a particular market to the disadvantage of another corporation’s business unit. Although eachbusiness unit has primary responsibility for its own business strategy, it may sometimes needsome help from its corporate parent, especially if the competitor business unit is getting heavyfinancial support from its corporate parent. In this instance, corporate headquarters develops ahorizontal strategy to coordinate the various goals and strategies of related business units.
For example, P&G, Kimberly-Clark, Scott Paper, and Johnson & Johnson (J&J) competewith one another in varying combinations of consumer paper products, from disposable dia-pers to facial tissue. If (purely hypothetically) J&J had just developed a toilet tissue with whichit chose to challenge Procter & Gamble’s high-share Charmin brand in a particular district, itmight charge a low price for its new brand to build sales quickly. P&G might not choose to re-spond to this attack on its share by cutting prices on Charmin. Because of Charmin’s high mar-ket share, P&G would lose significantly more sales dollars in a price war than J&J would withits initially low-share brand. To retaliate, P&G might thus challenge J&J’s high-share baby
establish centers of excellence throughout the corporation. According to Frost, Birkin-shaw, and Ensign, a center of excellence is “an organizational unit that embodies a set ofcapabilities that has been explicitly recognized by the firm as an important source of valuecreation, with the intention that these capabilities be leveraged by and/or disseminated toother parts of the firm.”95
2. Examine each business unit (or target firm) in terms of areas in which performancecan be improved: These are considered to be parenting opportunities. For example, twobusiness units might be able to gain economies of scope by combining their sales forces.In another instance, a unit may have good, but not great, manufacturing and logisticsskills. A parent company having world-class expertise in these areas could improve thatunit’s performance. The corporate parent could also transfer some people from one busi-ness unit who have the desired skills to another unit that is in need of those skills. Peopleat corporate headquarters may, because of their experience in many industries, spot areaswhere improvements are possible that even people in the business unit may not have no-ticed. Unless specific areas are significantly weaker than the competition, people in thebusiness units may not even be aware that these areas could be improved, especially ifeach business unit monitors only its own particular industry.
3. Analyze how well the parent corporation fits with the business unit (or target firm):Corporate headquarters must be aware of its own strengths and weaknesses in terms of re-sources, skills, and capabilities. To do this, the corporate parent must ask whether it hasthe characteristics that fit the parenting opportunities in each business unit. It must alsoask whether there is a misfit between the parent’s characteristics and the critical successfactors of each business unit.
CHAPTER 7 Strategy Formulation: Corporate Strategy 229
shampoo with P&G’s own low-share brand of baby shampoo in a different district. Once J&Jhad perceived P&G’s response, it might choose to stop challenging Charmin so that P&Gwould stop challenging J&J’s baby shampoo.
Multipoint competition and the resulting use of horizontal strategy may actually slow thedevelopment of hypercompetition in an industry. The realization that an attack on a marketleader’s position could result in a response in another market leads to mutual forbearance inwhich managers behave more conservatively toward multimarket rivals and competitive ri-valry is reduced.97 In one industry, for example, multipoint competition resulted in firms be-ing less likely to exit a market. “Live and let live” replaced strong competitive rivalry.98
Multipoint competition is likely to become even more prevalent in the future, as corporationsbecome global competitors and expand into more markets through strategic alliances.99
End of Chapter SUMMARYCorporate strategy is primarily about the choice of direction for the firm as a whole. It dealswith three key issues that a corporation faces: (1) the firm’s overall orientation towardgrowth, stability, or retrenchment; (2) the industries or markets in which the firm competesthrough its products and business units; and (3) the manner in which management coordi-nates activities and transfers resources and cultivates capabilities among product lines andbusiness units. These issues are dealt with through directional strategy, portfolio analysis,and corporate parenting.
Managers must constantly examine their corporation’s entire portfolio of products, busi-nesses, and opportunities as if they were planning to reinvest all of its capital.100 One exampleis Cummins, Inc. in 2003 when management decided to invest heavily in the firm’s power gen-eration business. Management realized at the time that the global appetite for power was grow-ing far faster than local power grids could provide, especially in the fast-growing developingcountries. Unfortunately, power generation was the only one of Cummins’ four business unitsto lose money. Tom Linebarger, Cummins’ CFO, took over the power generation unit, cutcosts, and reorganized the division around product lines rather than territories. Over the nextfour years, sales of the company’s power generators, ranging from portables for RVs to house-sized machines for factories, more than tripled to $3 billion—20% of the company’s totalsales. Cummins achieved second place, behind Caterpillar, in the global power generator mar-ket. Management decided to grow horizontally by building plants in China and India and mak-ing small home generators to sell through mass merchandisers.101
E C O - B I T S� Bosch Appliances, the German multinational corpora-
tion, was the only U.S. appliance manufacturer whoseentire line of major appliances in 2008 was Energy Starqualified in the categories that the program rates. Ac-cording to Bosch, if the more than 8 million U.S. con-sumers who purchased a new dishwasher in 2007 had
bought a Bosch 800 model instead of a conventionalunit, the lifetime energy savings would be equal to pre-venting 21 billion pounds of CO2 emissions.102
� The green building industry is projected to grow from$2.2 billion in 2006 to $4.7 billion by 2011.103

230 PART 3 Strategy Formulation
S T R A T E G I C P R A C T I C E E X E R C I S EOn March 14, 2000, Stephen King, the horror writer, publishedhis new book, Riding the Bullet, on the Internet before it ap-peared in print. Within 24 hours, around 400,000 people haddownloaded the book—even though most of them needed todownload software in order to read the book. The unexpecteddemand crashed servers. According to Jack Romanos, presi-dent of Simon & Schuster, “I don’t think anybody could haveanticipated how many people were out there who are willingto accept the written word in a paperless format.” To many, thisannounced the coming of the electronic novel. Environmental-ists applauded that e-books would soon replace paper booksand newspapers, thus reducing pollution coming from papermills and landfills. The King book was easy to download andtook less time than a trip to the bookstore. Critics argued thatthe King book used the Internet because at 66 pages, it was tooshort to be a standard printed novel. It was also free, so therewas nothing to discourage natural curiosity. Some people inthe industry estimated that 75% of those who downloaded thebook did not read it.104
By 2008, HarperCollins and Random House were offer-ing free online book content. Amazon was selling a $399 Kin-dle e-book reader for downloadable books costing $10 each,but Apple CEO Steve Jobs described the Kindle as somethingthat filled no void and would “go nowhere.” Sales in electronictrade books increased from $5.8 million in 2002 to $20 millionin 2006 compared to total 2006 book sales of $25–$30 billion.Borders was market testing the downloading of digital pur-chases. Tim O’Reilly, coiner of the term Web 2.0, had beenurging publishers to go digital since the early 1980s, but pub-
lishers and authors were still concerned with how they wouldbe paid for the intellectual property they created. Om Malik,senior writer for Business 2.0 magazine reported that themoney earned from advertising clicks related to their blog con-tent was barely enough to cover the costs of blogging. FlatWorld Knowledge, a new entrepreneurial digital textbook pub-lisher, announced that in 2009 it planned to offer free onlinetextbooks with the hope that the firm would make money sell-ing supplementary materials like study guides. Publisherswondered how an industry built on a 15th century paper tech-nology could make a profitable transition to a 21st century pa-perless electronic technology.105
1. Form into small groups in the class to discuss the futureof Internet publishing.
2. Consider the following questions as discussion guides:� What are the pros and cons of electronic publishing?� What is the impact of electronic publishing on the
environment?� Should newspaper and book publishers completely
convert to electronic publishing over paper? (TheWall Street Journal and others publish in both paperand electronic formats. Is this a success?)
� Would you prefer this textbook and others in an elec-tronic format? How would you prefer to read thebook?
� What business model should publishers use to makemoney publishing on the Internet?
3. Present your group’s conclusions to the class.
D I S C U S S I O N Q U E S T I O N S1. How does horizontal growth differ from vertical growth
as a corporate strategy? From concentric diversification?
2. What are the tradeoffs between an internal and an exter-nal growth strategy? Which approach is best as an inter-national entry strategy?
3. Is stability really a strategy or just a term for no strategy?
4. Compare and contrast SWOT analysis with portfolioanalysis.
5. How is corporate parenting different from portfolioanalysis? How is it alike? Is it a useful concept in a globalindustry?
CHAPTER 7 Strategy Formulation: Corporate Strategy 231
K E Y T E R M Sacquisition (p. 208)backward integration (p. 208)bankruptcy (p. 219)BCG (Boston Consulting Group)
Growth-Share Matrix (p. 221)BOT (Build, Operate, Transfer)
concept (p. 214)captive company strategy (p. 219)cash cows (p. 223)concentration (p. 208)concentric diversification (p. 214)conglomerate diversification (p. 215)corporate parenting (p. 227)corporate strategy (p. 206)directional strategy (p. 207)diversification (p. 208)divestment (p. 219)dogs (p. 223)exporting (p. 211)
forward integration (p. 208)franchising (p. 212)full integration (p. 209)GE business screen (p. 223)green-field development (p. 213)growth strategy (p. 207)horizontal growth (p. 211)horizontal integration (p. 211)horizontal strategy (p. 228)joint venture (p. 212)licensing (p. 212)liquidation (p. 220)long-term contracts (p. 210)management contracts (p. 214)merger (p. 207)multipoint competition (p. 228)no-change strategy (p. 217)parenting strategy (p. 206)
pause/proceed with caution strategy(p. 217)
portfolio analysis (p. 220)production sharing (p. 213)profit strategy (p. 218)quasi-integration (p. 209)question marks (p. 222)retrenchment strategies (p. 207)sell-out strategy (p. 219)stability strategy (p. 207)stars (p. 222)synergy (p. 214)taper integration (p. 209)transaction cost economics (p. 209)turnaround strategy (p. 218)turnkey operations (p. 213)vertical growth (p. 208)vertical integration (p. 208)
N O T E S1. C. Zook and J. Allen, “Growth Outside the Core,” Harvard
Business Review (December 2003), pp. 66–73.2. Ibid., p. 67.3. R. P. Rumelt, D. E. Schendel, and D. J. Teece, “Fundamental Is-
sues in Strategy,” in Fundamental Issues in Strategy: A Re-search Agenda, edited by R. P. Rumelt, D. E. Schendel, andD. J. Teece (Boston: HBS Press, 1994), p. 42.
4. This analogy of corporate parent and business unit children wasinitially proposed by A. Campbell, M. Goold, and M. Alexander.See “Corporate Strategy: The Quest for Parenting Advantage,”Harvard Business Review (March–April, 1995), pp. 120–132.
5. M. E. Porter, “From Competitive Strategy to Corporate Strategy,”in International Review of Strategic Management, Vol. 1, editedby D. E. Husey (Chicester, UK: John Wiley & Sons, 1990), p. 29.
6. This is in agreement with Toyohiro Kono when he proposes thatcorporate headquarters has three main functions: formulate cor-porate strategy, identify and develop the company’s core com-petencies, and provide central resources. See T. Kono, “A
Strong Head Office Makes a Strong Company,” Long RangePlanning (April 1999), pp. 225–236.
7. “Larry Ups the Ante,” Economist (February 7, 2004), pp. 59–60.8. J. Bercovitz and W. Mitchell, “When Is More Better? The Impact
of Business Scale and Scope on Long-Term Business Survival,While Controlling for Profitability,” Strategic Management Jour-nal (January 2007), pp. 61–79.
9. “Cisco Inc. Buys Top Technology Innovator,” St. Cloud (MN)Times (November 19, 2005), p. 6A.
10. J. Perkins, “It’s a Hog Predicament,” Des Moines Register(April 11, 1999), pp. J1–J2.
11. C. Woodyard, “FedEx Ponies Up $2.4B for Kinko’s,” USA To-day (December 31, 2003), p. B1.
12. J. W. Slocum, Jr., M. McGill, and D. T. Lei, “The New Learn-ing Strategy: Anytime, Anything, Anywhere,” OrganizationalDynamics (Autumn 1994), p. 36.
13. M. J. Leiblein, J. J. Reuer, and F. Dalsace, “Do Make or BuyDecisions Matter? The Influence of Organizational Governance
on Technological Performance,” Strategic Management Jour-nal (September 2002), pp. 817–833.
14. I. Geyskens, J-B. E. M. Steenkamp, and N. Kumar, “Make,Buy, or Ally: A Transaction Cost Theory Meta-Analysis,”Academy of Management Journal (June 2006), pp. 519–543;R. Carter and G. M. Hodgson, “The Impact of EmpiricalTests of Transaction Cost Economics on the Debate on theNature of the Firm,” Strategic Management Journal (May2006), pp. 461–476; T. A. Shervani, G. Frazier, and G. Challa-galla, “The Moderating Influence of Firm Market Power on theTransaction Cost Economics Model: An Empirical Test in a For-ward Channel Integration Context,” Strategic Management Jour-nal (June 2007), pp. 635–652; K. J. Mayer and R. M. Solomon,“Capabilities, Contractual Hazards, and Governance: IntegratingResource-Based and Transaction Cost Perspectives,” Academy ofManagement Journal (October 2006), pp. 942–959.
15. K. R. Harrigan, Strategies for Vertical Integration (Lexington,MA.: Lexington Books, 1983), pp. 16–21.
16. M. Arndt, “Who’s Afraid of a Housing Slump?” Business Week(April 30, 2007), p. 76.
17. A. Parmigiani, “Why Do Firms Both Make and Buy? An In-vestigation of Concurrent Sourcing,” Strategic ManagementJournal (March 2007), pp. 285–311; F. T. Rothaermel, M. A.Hitt, and L. A. Jobe, “Balancing Vertical Integration andStrategic Outsourcing: Effects on Product Portfolio, ProductSuccess, and Firm Performance,” Strategic ManagementJournal (November 2006), pp. 1033–1056.
18. “Converge or Conflict?” The Economist (August 30, 2008),pp. 61–62.
19. M. G. Jacobides, “Industry Change Through Vertical Disintegra-tion: How and Why Markets Emerged in Mortgage Banking,”Academy of Management Journal (June 2005), pp. 465–498.
20. For a discussion of the pros and cons of contracting versus ver-tical integration, see J. T. Mahoney, “The Choice of Organiza-tional Form: Vertical Financial Ownership Versus OtherMethods of Vertical Integration,” Strategic ManagementJournal (November 1992), pp. 559–584.
21. G. Dowell, “Product Line Strategies of New Entrants in an Es-tablished Industry: Evidence from the U.S. Bicycle Industry,”Strategic Management Journal (October 2006), pp. 959–979;C. Sorenson, S. McEvily, C. R. Ren, and R. Roy, “NicheWidth Revisited: Organizational Scope, Behavior and Per-formance,” Strategic Management Journal (October 2006),pp. 915–936.
22. D. Roberts, “Scrambling to Bring Crest to the Masses,”Business Week (June 25, 2007), pp. 72–73.
23. A. Delios and P. W. Beamish, “Geographic Scope, Product Diver-sification, and the Corporate Performance of Japanese Firms,”Strategic Management Journal (August 1999), pp. 711–727.
24. E. Elango and V. H. Fried, “Franchising Research: A LiteratureReview and Synthesis,” Journal of Small Business Manage-ment (July 1997), pp. 68–81.
25. T. Thilgen, “Corporate Clout Replaces ‘Small Is Beautiful,’”Wall Street Journal (March 27, 1997), p. B14.
26. J. E. McCann III, “The Growth of Acquisitions in Services,”Long Range Planning (December 1996), pp. 835–841.
27. “Gently Does It,” The Economist (August 11, 2007), p. 59.28. “A Bid for Bud,” The Economist (June 21, 2008), p. 77.
29. B. Voss, “Strategic Federations Frequently Falter in Far East,”Journal of Business Strategy (July/August 1993), p. 6; S. Douma,“Success and Failure in New Ventures,” Long Range Planning(April 1991), pp. 54–60.
30. A. Delios and P. W. Beamish, “Ownership Strategy of Japa-nese Firms: Transactional, Institutional, and Experience Ap-proaches,” Strategic Management Journal (October 1999),pp. 915–933.
31. A. Seth, K. P. Song, and R. R. Pettit, “Value Creation and De-struction in Cross-Border Acquisitions: An Empirical Analysisof Foreign Acquisitions of U.S. Firms,” Strategic ManagementJournal (October 2002), pp. 921–940.
32. K. D. Brouthers and L. E. Brouthers, “Acquisition or GreenfieldStart-up? Institutional, Cultural, and Transaction Cost Influences,”Strategic Management Journal (January 2000), pp. 89–97.
33. M. Kripalani, “A Red-Hot Big Blue in India,” Business Week(September 3, 2007), p. 52.
34. C. Matlack, “Carlos Ghosn’s Russian Gambit,” Business Week(March 17, 2008), pp. 57–58.
35. J. Naisbitt, Megatrends Asia (New York: Simon & Schuster,1996), p. 143.
36. For additional information on international entry modes, seeD. F. Spulber, Global Competitive Strategy (Cambridge, UK:Cambridge University Press, 2007) and K. D. Brouthers andJ-F Hennart, “Boundaries of the Firm: Insights from Interna-tional Entry Mode Research,” Journal of Management (June2007), pp. 395–425.
37. D. P. Lovallo and L. T. Mendonca, “Strategy’s Strategist: An In-terview with Richard Rumelt,” McKinsey Quarterly Online(2007, No. 4).
38. C. Zook, “Increasing the Odds of Successful Growth: The Crit-ical Prelude to Moving ‘Beyond the Core.’” Strategy & Lead-ership, Vol. 32, No. 4 (2004), pp. 17–23.
39. A. Y. Ilinich and C. P. Zeithaml, “Operationalizing and Test-ing Galbraith’s Center of Gravity Theory,” Strategic Man-agement Journal (June 1995), pp. 401–410; H. Tanriverdiand N. Venkatraman, “Knowledge Relatedness and the Per-formance of Multibusiness Firms,” Strategic ManagementJournal (February 2005), pp. 97–119.
40. “Flying into Battle,” Economist (May 8, 2004), p. 60 andCorporate Web site (www.bombardier.com) accessed Sep-tember 27, 2008.
41. R. F. Bruner, “Corporation Diversification May Be Okay AfterAll,” Batten Briefings (Spring 2003), pp. 2–3, 12.
42. J. Bercovitz and W. Mitchell, “When Is More Better? The Im-pact of Business Scale and Scope on Long-Term Business Sur-vival, While Controlling for Profitability,” StrategicManagement Journal (January 2007), pp. 61–79; D. J.Miller, “Technological Diversity, Related Diversification,and Firm Performance,” Strategic Management Journal(July 2006), pp. 601–619; C. Stadler, “The Four Principlesof Enduring Success,” Harvard Business Review (July–August 2007), pp. 62–72.
43. K. Carow, R. Heron, and T. Saxton, “Do Early Birds Get the Re-turns? An Empirical Investigation of Early-Mover Advantagesin Acquisitions,” Strategic Management Journal (June 2004),pp. 563–585; K. Ramaswamy, “The Performance Impact ofStrategic Similarity in Horizontal Mergers: Evidence from the
232 PART 3 Strategy Formulation
U.S. Banking Industry,” Academy of Management Journal(July 1997), pp. 697–715; D. J. Flanagan, “Announcements ofPurely Related and Purely Unrelated Mergers and ShareholderReturns: Reconciling the Relatedness Paradox,” Journal ofManagement, Vol. 22, No. 6 (1996), pp. 823–835; D. D. Bergh,“Predicting Diversification of Unrelated Acquisitions: An Inte-grated Model of Ex Ante Conditions,” Strategic ManagementJournal (October 1997), pp. 715–731.
44. J. M. Pennings, H. Barkema, and S. Douma, “OrganizationalLearning and Diversification,” Academy of Management Jour-nal (June 1994), pp. 608–640.
45. C. Stadler, “The Four Principles of Enduring Success,”Harvard Business Review (July–August 2007), pp. 62–72.
46. L. E. Palich, L. B. Cardinal, and C. C. Miller, “Curvilinearity inthe Diversification-Performance Linkage: An Examination ofover Three Decades of Research,” Strategic Management Jour-nal (February 2000), pp. 155–174; M. S. Gary, “Implementa-tion Strategy and Performance Outcomes in RelatedDiversification,” Strategic Management Journal (July 2005),pp. 643–664; G. Yip and G. Johnson, “Transforming Strategy,”Business Strategy Review (Spring 2007), pp. 11–15.
47. “The Great Merger Wave Breaks,” The Economist (January 27,2001), pp. 59–60.
48. R. N. Palter and D. Srinivasan, “Habits of Busiest Acquirers,”McKinsey on Finance (Summer 2006), pp. 8–13.
49. D. R. King, D. R. Dalton, C. M. Daily, and J. G. Covin, “Meta-Analyses of Post-Acquisition Performance: Indications ofUnidentified Moderators,” Strategic Management Journal (Feb-ruary 2004), pp. 187–200; W. B. Carper, “Corporate Acquisitionsand Shareholder Wealth: A Review and Exploratory Analysis”Journal of Management (December 1990), pp. 807–823; P. G.Simmonds, “Using Diversification as a Tool for Effective Perfor-mance,” Handbook of Business Strategy, 1992/93 Yearbook, ed-ited by H. E. Glass and M. A. Hovde (Boston: Warren, Gorham& Lamont, 1992), pp. 3.1–3.7; B. T. Lamont and C. A. Anderson,“Mode of Corporate Diversification and Economic Perfor-mance,” Academy of Management Journal (December 1985),pp. 926–936.
50. “The HP–Compaq Merger Two Years Out: Still Waiting for theUpside,” Knowledge @Wharton (October 6–19, 2004).
51. D. J. Miller, “Firms’ Technological Resources and the Perfor-mance Effects of Diversification: A Longitudinal Study,”Strategic Management Journal (November 2004), pp. 1097–1119.
52. A. Hinterhuber, “When Two Companies Become One,” inFinancial Times Handbook of Management, 3rd ed., S. Crainerand D. Dearlove, Eds. (Harlow, UK: Pearson Education, 2004),pp. 824–833; D. L. Laurie, Y. L. Doz, and C. P. Sheer, “CreatingNew Growth Platforms,” Harvard Business Review (May 2006),pp. 80–90; R. Langford and C. Brown III, “Making M&A Pay:Lessons from the World’s Most Successful Acquirers,” Strategy& Leadership, Vol. 32, No. 1 (2004), pp. 5–14; J. G. Lynch andB. Lind, “Escaping Merger and Acquisition Madness,” Strategy& Leadership, Vol. 30, No. 2 (2002), pp. 5–12; M. L. Sirower,The Synergy Trap (New York: Free Press, 1997); B. Jensen,“Make It Simple! How Simplicity Could Become Your UltimateStrategy,” Strategy & Leadership (March/April 1997), p. 35.
53. E. Thornton, “Why Consumers Hate Mergers,” Business Week(December 6, 2004), pp. 58–64.
54. S. Karim and W. Mitchell, “Innovating through Acquisition andInternal Development: A Quarter-century of Boundary Evolu-tion at Johnson & Johnson,” Long Range Planning (December2004), pp. 525–547; L. Selden and G. Colvin, “M&A Needn’tBe a Loser’s Game,” Harvard Business Review (June 2003), pp.70–79; E. C. Busija, H. M. O’Neill, and C. P. Zeithaml, “Diver-sification Strategy, Entry Mode, and Performance: Evidence ofChoice and Constraints,” Strategic Management Journal (April1997), pp. 321–327; A. Sharma, “Mode of Entry and Ex-PostPerformance,” Strategic Management Journal (September1998), pp. 879–900.
55. R. T. Uhlaner and A. S. West, “Running a Winning M&AShop,” McKinsey Quarterly (March 2008), pp.1–7.
56. S. Rovitt, D. Harding, and C. Lemire, “A Simple M&A Modelfor All Seasons,” Strategy & Leadership, Vol. 32, No. 5 (2004),pp. 18–24.
57. P. Porrini, “Can a Previous Alliance Between an Acquirer and aTarget Affect Acquisition Performance?” Journal of Manage-ment, Vol. 30, No. 4 (2004), pp. 545–562; L. Wang and E. J.Zajac, “Alliance or Acquisition? A Dyadic Perspective on Inter-firm Resource Combinations,” Strategic Management Journal(December 2007), pp. 1291–1317.
58. F. Vermeulen, “Controlling International Expansion,” BusinessStrategy Review (September 2001), pp. 29–36.
59. A. Inkpen and N. Choudhury, “The Seeking of Strategy WhereIt Is Not: Towards a Theory of Strategy Absence,” StrategicManagement Journal (May 1995), pp. 313–323.
60. P. Burrows and S. Anderson, “Dell Computer Goes Into theShop,” Business Week (July 12, 1993), pp. 138–140.
61. M. Brauer, “What Have We Acquired and What Should We Ac-quire in Divestiture Research? AReview and Research Agenda,”Journal of Management (December 2006), pp. 751–785; J. L.Morrow, Jr., R. A. Johnson, and L. W. Busenitz, “The Effects ofCost and Asset Retrenchment on Firm Performance: The Over-looked Role of a Firm’s Competitive Environment,” Journal ofManagement, Vol. 30, No. 2 (2004), pp. 189–208.
62. J. A. Pearce II and D. K. Robbins, “Retrenchment Remains theFoundation of Business Turnaround,” Strategic ManagementJournal (June 1994), pp. 407–417.
63. Y. Kageyama, “Sony Turnaround Plan Draws Yawns,” DesMoines Register (September 23, 2005), p. 3D.
64. F. Gandolfi, “Reflecting on Downsizing: What Have WeLearned?” SAM Advanced Management Journal (Spring2008), pp. 46–55; C. Chadwick, L. W. Hunter, and S. L. Wal-ston, “Effects of Downsizing Practices on the Performance ofHospitals,” Strategic Management Journal (May 2004), pp.405–427; J. R. Morris, W. F. Cascio, and C. E. Young, “Down-sizing After All These Years,” Organizational Dynamics(Winter 1999), pp. 78–87; P. H. Mirvis, “Human ResourceManagement: Leaders, Laggards, and Followers,” Academy ofManagement Executive (May 1997), pp. 43–56; J. K. DeDeeand D. W. Vorhies, “Retrenchment Activities of Small FirmsDuring Economic Downturn: An Empirical Investigation,”Journal of Small Business Management (July 1998),pp. 46–61.
65. C. Chadwick, L. W. Hunter, and S. L Walston, “Effects ofDownsizing Practices on the Performance of Hospitals,”Strategic Management Journal (May 2004), pp. 405–427.
CHAPTER 7 Strategy Formulation: Corporate Strategy 233
234 PART 3 Strategy Formulation
66. J. B. Treece, “U.S. Parts Makers Just Won’t Say ‘Uncle,’”Business Week (August 10, 1987), pp. 76–77.
67. S. S. Carty, “Ford Plans to Park Jaguar, Land Rover with TataMotors,” USA Today (March 26, 2008), p. 1B–2B.
68. For more on divestment, see C. Dexter and T. Mellewight,“Thirty Years After Michael E. Porter: What Do We Knowabout Business Exit?” Academy of Management Perspectives(May 2007), pp. 41–55.
69. “Shredding Money,” The Economist (September 20, 2008),pp. 77–78.
70. D. Welch, “Go Bankrupt, Then Go Overseas,” Business Week(April 24, 2006), pp. 52–55.
71. D. D. Dawley, J. J. Hoffman, and B. T. Lamont, “Choice Situa-tion, Refocusing, and Post-Bankruptcy Performance,” Journalof Management, Vol. 28, No. 5 (2002), pp. 695–717.
72. R. M. Kanter, “Leadership and the Psychology of Turn-arounds,” Harvard Business Review (June 2003), pp. 58–67.
73. B. C. Reimann and A. Reichert, “Portfolio Planning Methodsfor Strategic Capital Allocation: A Survey of Fortune 500Firms,” International Journal of Management (March 1996),pp. 84–93; D. K. Sinha, “Strategic Planning in the Fortune500,” Handbook of Business Strategy, 1991/92 Yearbook, editedby H. E. Glass and M. A. Hovde (Boston: Warren, Gorham &Lamont, 1991), p. 9.6.
74. L. Dranikoff, T. Koller, and A. Schneider, “Divestiture: Strat-egy’s Missing Link,” Harvard Business Review (May 2002),pp. 74–83.
75. B. Hedley, “Strategy and the Business Portfolio,” Long RangePlanning (February 1977), p. 9.
76. D. Welch, “GM: Live Green or Die,” Business Week (May 26,2008), pp. 36–41.
77. P. Burrows and S. Hamm, “Tech Has a New Top Dog,” BusinessWeek (June 19, 2006), p. 60.
78. A. Fitzgerald, “Going Global,” Des Moines Register (March 14,2004), pp. 1M, 3M.
79. C. Anterasian, J. L. Graham, and R. B. Money, “Are U.S. Man-agers Superstitious About Market Share?” Sloan ManagementReview (Summer 1996), pp. 67–77.
80. D. Rosenblum, D. Tomlinson, and L. Scott, “Bottom-Feedingfor Blockbuster Businesses,” Harvard Business Review (March2003), pp. 52–59.
81. R. G. Hamermesh, Making Strategy Work (New York: JohnWiley & Sons, 1986), p. 14.
82. J. J. Curran, “Companies That Rob the Future,” Fortune (July 4,1988), p. 84.
83. W. H. Hoffmann, “Strategies for Managing a Portfolio ofAlliances,” Strategic Management Journal (August 2007),pp. 827–856; D. Lavie, “Alliance Portfolios and Firm Perfor-mance: A Study of Value Creation and Appropriation in the U.S.Software Industry,” Strategic Management Journal (December2007), pp. 1187–1212.
84. A. Goerzen, “Managing Alliance Networks: Emerging Prac-tices of Multinational Corporations,” Academy of ManagementExecutive (May 2005), pp. 94–107; S. Lazzarini, “The Impactof Membership in Competing Alliance Constellations: Evi-dence on the Operational Performance of Global Airlines,”Strategic Management Journal (April 2007), pp. 345–367.
85. W. H. Hoffmann, “How to Manage a Portfolio of Alliances,”Long Range Planning (April 2005), pp. 121–143.
86. A. Campbell, M. Goold, and M. Alexander, Corporate-LevelStrategy: Creating Value in the Multibusiness Company (NewYork: John Wiley & Sons, 1994). See also M. Goold, A.Campbell, and M. Alexander, “Corporate Strategy and Parent-ing Theory,” Long Range Planning (April 1998), pp. 308–318,and M. Goold and A. Campbell, “Parenting in Complex Struc-tures,” Long Range Planning (June 2002), pp. 219–243.
87. A. Campbell, M. Goold, and M. Alexander, “Corporate Strat-egy: The Quest for Parenting Advantage,” Harvard BusinessReview (March–April 1995), p. 121.
88. Ibid., p. 122.89. A. van Oijen and S. Douma, “Diversification Strategy and the
Roles of the Centre,” Long Range Planning (August 2000),pp. 560–578.
90. “Jack’s Gamble,” The Economist (October 28, 2000), pp. 13–14.91. D. J. Collis, “Corporate Strategy in Multibusiness Firms,” Long
Range Planning (June 1996), pp. 416–418; D. Lei, M. A. Hitt,and R. Bettis, “Dynamic Core Competencies Through Meta-Learning and Strategic Context,” Journal of Management, Vol.22, No. 4 (1996), pp. 549–569.
92. D. J. Teece, “Strategies for Managing Knowledge Assets: TheRole of Firm Structure and Industrial Context,” Long RangePlanning (February 2000), pp. 35–54.
93. R. S. Kaplan and D. P. Norton, “The Strategy Map: Guide toAligning Intangible Assets,” Strategy & Leadership, Vol. 32,No. 5 (2004), pp. 10–17; L. Edvinsson, “The New KnowledgeEconomics,” Business Strategy Review (September 2002),pp. 72–76; C. Havens and E. Knapp, “Easing into KnowledgeManagement,” Strategy & Leadership (March/April 1999),pp. 4–9.
94. J. Scanlon, “Cross-Pollinators,” Business Week’s Inside Innova-tion (September 2007), pp. 8–11.
95. T. S. Frost, J. M. Birkinshaw, and P. C. Ensign, “Centers of Ex-cellence in Multinational Corporations,” Strategic ManagementJournal (November 2002), pp. 997–1018.
96. M. E. Porter, Competitive Advantage (New York: The FreePress, 1985), pp. 317–382.
97. H. R. Greve, “Multimarket Contact and Sales Growth: Evi-dence from Insurance,” Strategic Management Journal(March 2008), pp. 229–249; L. Fuentelsaz and J. Gomez,“Multipoint Competition, Strategic Similarity and Entry IntoGeographic Markets,” Strategic Management Journal (May2006), pp. 477–499; J. Gimeno, “Reciprocal Threats in Multi-market Rivalry: Staking Out ‘Spheres of Influence’ in the U.S.Airline Industry,” Strategic Management Journal (February1999), pp. 101–128; J. Baum and H. J. Korn, “Dynamics ofDyadic Competitive Interaction,” Strategic ManagementJournal (March 1999), pp. 251–278; J. Gimeno and C. Y.Woo, “Hypercompetition in a Multimarket Environment: TheRole of Strategic Similarity and Multimarket Contact in Com-petitive De-escalation,” Organization Science (May/June1996), pp. 322–341.
98. W. Boeker, J. Goodstein, J. Stephan, and J. P. Murmann, “Com-petition in a Multimarket Environment: The Case of MarketExit,” Organization Science (March/April 1997), pp. 126–142.

CHAPTER 7 Strategy Formulation: Corporate Strategy 235
99. J. Gimeno and C. Y. Woo, “Multimarket Contact, Economies ofScope, and Firm Performance,” Academy of Management Jour-nal (June 1999), pp. 239–259.
100. L. Carlesi, B. Verster, and F. Wenger, “The New Dynamics ofManaging the Corporate Portfolio,” McKinsey Quarterly On-line (April 2007).
101. B. Hindo, “Generating Power for Cummins,” Business Week(September 24, 2007), p. 90.
102. “Energy Efficiency Update,” Appliance Magazine Online(April 2008).
103. “Sustainability Living Grows Up,” St. Cloud (MN) Times(July 11, 2008), p. 5C.
104. “Learning to E-Read,” The Economist Survey E-Entertainment(October 7, 2000), p. 22.
105. P. Tucker, “The 21st-Century Writer,” The Futurist (July–August 2008), pp. 25–31; M. J. Perenson, “Amazon KindlesInterest in E-Books,” PC World (February 2008), p. 64; M. R.Nelson, “E-Books in Higher Education: Nearing the End ofthe Era of Hype?” EDUCAUSE Review (March/April 2008),pp. 40–56.

For almost 150 years, the Church & Dwight Company has been building
market share on a brand name whose products are in 95% of all U.S.
households. Yet if you asked the average person what products this company
makes, few would know. Although Church & Dwight may not be a household
name, the company’s ubiquitous orange box of Arm & Hammer1 brand baking
soda is common throughout North America. Church & Dwight provides a classic
example of a marketing functional strategy called market development—finding new uses/
markets for an existing product. Shortly after its introduction in 1878, Arm & Hammer Baking
Soda became a fundamental item on the pantry shelf as people found many uses for sodium
bicarbonate other than baking, such as cleaning, deodorizing, and tooth brushing. Hearing of
the many uses people were finding for its product, the company advertised that its baking soda
was good not only for baking but also for deodorizing refrigerators—simply by leaving an open
box in the refrigerator. In a brilliant marketing move, the firm then suggested that consumers
buy the product and throw it away—deodorize a kitchen sink by dumping Arm & Hammer
baking soda down the drain!
The company did not stop there. It initiated a product development strategy by looking for
other uses of its sodium bicarbonate in new products. Church & Dwight has achieved consistent
growth in sales and earnings through the use of brand extensions, putting the Arm & Hammer
brand first on baking soda and then on laundry detergents, toothpaste, and deodorants. By the
beginning of the 21st century, Church & Dwight had become a significant competitor in mar-
kets previously dominated only by giants such as Procter & Gamble, Unilever, and Colgate-
Palmolive—using only one brand name. Was there a limit to this growth? Was there a point at
which these continuous line extensions would begin to eat away at the integrity of the Arm &
Hammer name?
strategy formulation:functional strategy andStrategic Choice
C H A P T E R 8
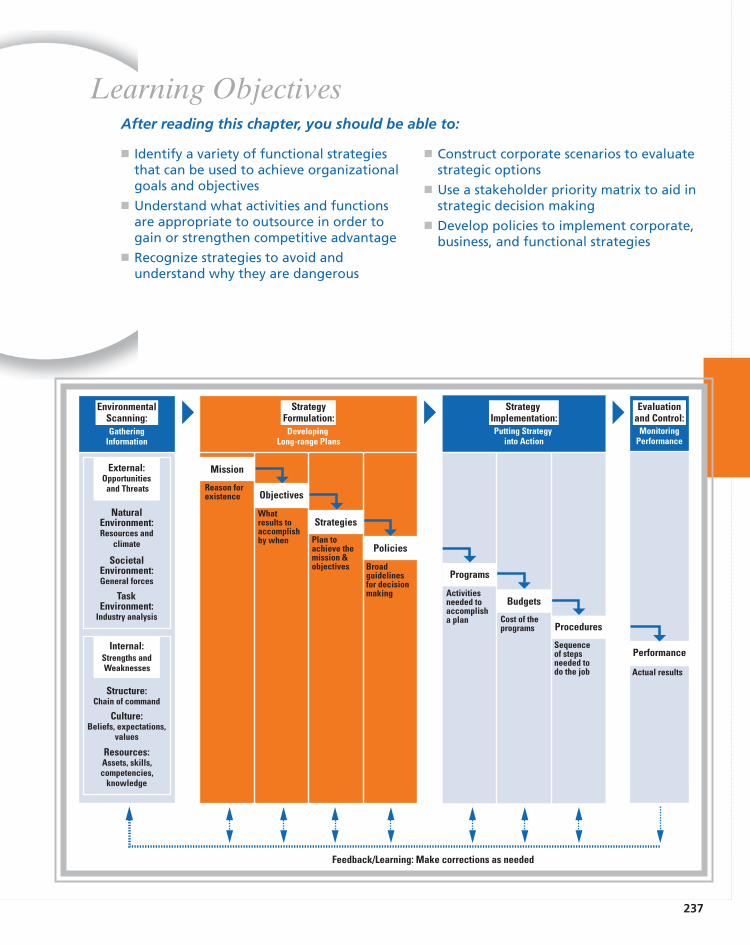
237
� Identify a variety of functional strategiesthat can be used to achieve organizationalgoals and objectives
� Understand what activities and functionsare appropriate to outsource in order togain or strengthen competitive advantage
� Recognize strategies to avoid andunderstand why they are dangerous
� Construct corporate scenarios to evaluatestrategic options
� Use a stakeholder priority matrix to aid instrategic decision making
� Develop policies to implement corporate,business, and functional strategies
Learning Objectives
GatheringInformation
Putting Strategy into Action
MonitoringPerformance
SocietalEnvironment:General forces
NaturalEnvironment:Resources and
climate
TaskEnvironment:
Industry analysis
Internal:Strengths andWeaknesses
Structure:Chain of command
Culture:Beliefs, expectations,
values
Resources:Assets, skills,competencies,
knowledge
Programs
Activitiesneeded to accomplisha plan
Budgets
Cost of theprograms Procedures
Sequenceof stepsneeded to do the job
Performance
Actual results
External:Opportunities
and Threats
DevelopingLong-range Plans
Mission
Reason forexistence Objectives
Whatresults to accomplishby when
Strategies
Plan toachieve themission &objectives
Policies
Broadguidelinesfor decisionmaking
EnvironmentalScanning:
StrategyFormulation:
StrategyImplementation:
Evaluationand Control:
Feedback/Learning: Make corrections as needed
After reading this chapter, you should be able to:
238 PART 3 Strategy Formulation
8.1 Functional StrategyFunctional strategy is the approach a functional area takes to achieve corporate and businessunit objectives and strategies by maximizing resource productivity. It is concerned with devel-oping and nurturing a distinctive competence to provide a company or business unit with acompetitive advantage. Just as a multidivisional corporation has several business units, eachwith its own business strategy, each business unit has its own set of departments, each with itsown functional strategy.
The orientation of a functional strategy is dictated by its parent business unit’s strategy.2
For example, a business unit following a competitive strategy of differentiation through highquality needs a manufacturing functional strategy that emphasizes expensive quality assuranceprocesses over cheaper, high-volume production; a human resource functional strategy thatemphasizes the hiring and training of a highly skilled, but costly, workforce; and a marketingfunctional strategy that emphasizes distribution channel “pull,” using advertising to increaseconsumer demand, over “push,” using promotional allowances to retailers. If a business unitwere to follow a low-cost competitive strategy, however, a different set of functional strategieswould be needed to support the business strategy.
Just as competitive strategies may need to vary from one region of the world to another,functional strategies may need to vary from region to region. When Mr. Donut expanded intoJapan, for example, it had to market donuts not as breakfast, but as snack food. Because theJapanese had no breakfast coffee-and-donut custom, they preferred to eat the donuts in the af-ternoon or evening. Mr. Donut restaurants were thus located near railroad stations and super-markets. All signs were in English to appeal to the Western interests of the Japanese.
MARKETING STRATEGYMarketing strategy deals with pricing, selling, and distributing a product. Using a marketdevelopment strategy, a company or business unit can (1) capture a larger share of an existingmarket for current products through market saturation and market penetration or (2) developnew uses and/or markets for current products. Consumer product giants such as P&G, Colgate-Palmolive, and Unilever are experts at using advertising and promotion to implement a mar-ket saturation/penetration strategy to gain the dominant market share in a product category. Asseeming masters of the product life cycle, these companies are able to extend product life al-most indefinitely through “new and improved” variations of product and packaging that ap-peal to most market niches. A company, such as Arm & Hammer, follows the second marketdevelopment strategy by finding new uses for its successful current product, baking soda.
Using the product development strategy, a company or unit can (1) develop new prod-ucts for existing markets or (2) develop new products for new markets. Church & Dwight hashad great success by following the first product development strategy developing new prod-ucts to sell to its current customers in its existing markets. Acknowledging the widespread ap-peal of its Arm & Hammer brand baking soda, the company has generated new uses for itssodium bicarbonate by reformulating it as toothpaste, deodorant, and detergent. In another ex-ample, Ocean Spray developed craisans, mock berries, light cranberry juices, and juice boxesin order to market its cranberries to current customers.3 Using a successful brand name to mar-ket other products is called brand extension, and it is a good way to appeal to a company’s cur-rent customers. Smith & Wesson, famous for its handguns, has taken this approach by usinglicensing to put its name on men’s cologne and other products like the Smith & Wesson357 Magnum Wood Pellet Smoker (for smoking meats).4 Arm & Hammer has successfullyfollowed the second product development strategy (new products for new markets) by
CHAPTER 8 Strategy Formulation: Functional Strategy and Strategic Choice 239
developing new pollution-reduction products (using sodium bicarbonate compounds) for saleto coal-fired electric utility plants—a very different market from grocery stores.
There are numerous other marketing strategies. For advertising and promotion, for exam-ple, a company or business unit can choose between “push” and “pull” marketing strategies.Many large food and consumer products companies in the United States and Canada follow apush strategy by spending a large amount of money on trade promotion in order to gain or holdshelf space in retail outlets. Trade promotion includes discounts, in-store special offers, and ad-vertising allowances designed to “push” products through the distribution system. The KelloggCompany decided a few years ago to change its emphasis from a push to a pull strategy, in whichadvertising “pulls” the products through the distribution channels. The company now spendsmore money on consumer advertising designed to build brand awareness so that shoppers willask for the products. Research has found that a high level of advertising (a key part of a pull strat-egy) is beneficial to leading brands in a market.5 Strong brands provide a competitive advantageto a firm because they act as entry barriers and usually generate high market share.6
Other marketing strategies deal with distribution and pricing. Should a company use distrib-utors and dealers to sell its products, or should it sell directly to mass merchandisers or use thedirect marketing model by selling straight to the consumers via the Internet? Using multiple chan-nels simultaneously can lead to problems. In order to increase the sales of its lawn tractors andmowers, for example, John Deere decided to sell the products not only through its current dealernetwork but also through mass merchandisers such as Home Depot. Deere’s dealers, however,were furious. They considered Home Depot to be a key competitor. The dealers were concernedthat Home Depot’s ability to underprice them would eventually lead to their becoming little morethan repair facilities for their competition and left with insufficient sales to stay in business.7
When pricing a new product, a company or business unit can follow one of two strategies.For new-product pioneers, skim pricing offers the opportunity to “skim the cream” from thetop of the demand curve with a high price while the product is novel and competitors are few.Penetration pricing, in contrast, attempts to hasten market development and offers the pioneerthe opportunity to use the experience curve to gain market share with a low price and then dominate the industry. Depending on corporate and business unit objectives and strategies, ei-ther of these choices may be desirable to a particular company or unit. Penetration pricing is,however, more likely than skim pricing to raise a unit’s operating profit in the long term.8 Theuse of the Internet to market goods directly to consumers allows a company to use dynamicpricing, a practice in which prices vary frequently based upon demand, market segment, andproduct availability.9
FINANCIAL STRATEGYFinancial strategy examines the financial implications of corporate and business-level strate-gic options and identifies the best financial course of action. It can also provide competitiveadvantage through a lower cost of funds and a flexible ability to raise capital to support a busi-ness strategy. Financial strategy usually attempts to maximize the financial value of a firm.
The trade-off between achieving the desired debt-to-equity ratio and relying on internallong-term financing via cash flow is a key issue in financial strategy. Many small- and medium-sized family-owned companies such as Urschel Laboratories try to avoid all external sources offunds in order to avoid outside entanglements and to keep control of the company within thefamily. Few large publicly-held firms have no long-term debt and instead keep a large amountof money in cash and short-term investments. One of these is Apple, Inc. According to Apple’sChief Financial Officer, Peter Oppenheimer, “Our preference is to maintain a strong balancesheet in order to preserve our flexibility.”10 Many financial analysts believe, however, that onlyby financing through long-term debt can a corporation use financial leverage to boost earnings
240 PART 3 Strategy Formulation
per share—thus raising stock price and the overall value of the company. Research indicates that higher debt levels not only deter takeover by other firms (by making the company less at-tractive) but also lead to improved productivity and improved cash flows by forcing manage-ment to focus on core businesses.11 High debt can be a problem, however, when the economyfalters and a company’s cash flow drops.
Research reveals that a firm’s financial strategy is influenced by its corporate diversifica-tion strategy. Equity financing, for example, is preferred for related diversification, whereasdebt financing is preferred for unrelated diversification.12 The trend away from unrelated to re-lated acquisitions explains why the number of acquisitions being paid for entirely with stockincreased from only 2% in 1988 to 50% in 1998.13
A very popular financial strategy is the leveraged buyout (LBO). During 2006 and 2007, forexample, the total value of LBOs was $1.4 trillion, about one-third of all the buyouts ever done.14
In a leveraged buyout, a company is acquired in a transaction financed largely by debt, usuallyobtained from a third party, such as an insurance company or an investment banker. Ultimatelythe debt is paid with money generated from the acquired company’s operations or by sales of itsassets. The acquired company, in effect, pays for its own acquisition. Management of the LBO isthen under tremendous pressure to keep the highly leveraged company profitable. Unfortunately,the huge amount of debt on the acquired company’s books may actually cause its eventual de-cline by focusing management’s attention on short-term matters. For example, one year after thebuyout, the cash flow of eight of the largest LBOs made during 2006–2007 was barely enoughto cover interest payments.15 One study of LBOs (also called MBOs—Management BuyOuts)revealed that the financial performance of the typical LBO usually falls below the industry aver-age in the fourth year after the buyout. The firm declines because of inflated expectations, uti-lization of all slack, management burnout, and a lack of strategic management.16 Often the onlysolutions are to sell the company or to again go public by selling stock to finance growth.17
The management of dividends and stock price is an important part of a corporation’s fi-nancial strategy. Corporations in fast-growing industries such as computers and computer soft-ware often do not declare dividends. They use the money they might have spent on dividendsto finance rapid growth. If the company is successful, its growth in sales and profits is reflectedin a higher stock price, eventually resulting in a hefty capital gain when shareholders sell theircommon stock. Other corporations, such as Whirlpool Corporation, that do not face rapidgrowth, must support the value of their stock by offering consistent dividends. Instead of rais-ing dividends when profits are high, a popular financial strategy is to use excess cash (or evenuse debt) to buy back a company’s own shares of stock. During 2005, for example, 1,012 U.S.-based publicly traded companies declared $446 billion worth of stock repurchase plans. Be-cause stock buybacks increase earnings per share, they typically increase a firm’s stock priceand make unwanted takeover attempts more difficult. Such buybacks do signal, however, thateither management may not have been able to find any profitable investment opportunities forthe company or that it is anticipating reduced future earnings.18
A number of firms have been supporting the price of their stock by using reverse stocksplits. Contrasted with a typical forward 2-for-1 stock split in which an investor receives an additional share for every share owned (with each share being worth only half as much), in areverse 1-for-2 stock split, an investor’s shares are split in half for the same total amount ofmoney (with each share now being worth twice as much). Thus, 100 shares of stock worth $10each are exchanged for 50 shares worth $20 each. A reverse stock split may successfully raisea company’s stock price, but it does not solve underlying problems. A study by Credit SuisseFirst Boston revealed that almost all 800 companies that had reverse stock splits in a five-yearperiod underperformed their peers over the long term.19
A rather novel financial strategy is the selling of a company’s patents. Companies such asAT&T, Bellsouth, American Express, Kimberly Clark, and 3Com have been selling patents forproducts that they no longer wish to commercialize or are not a part of their core business.
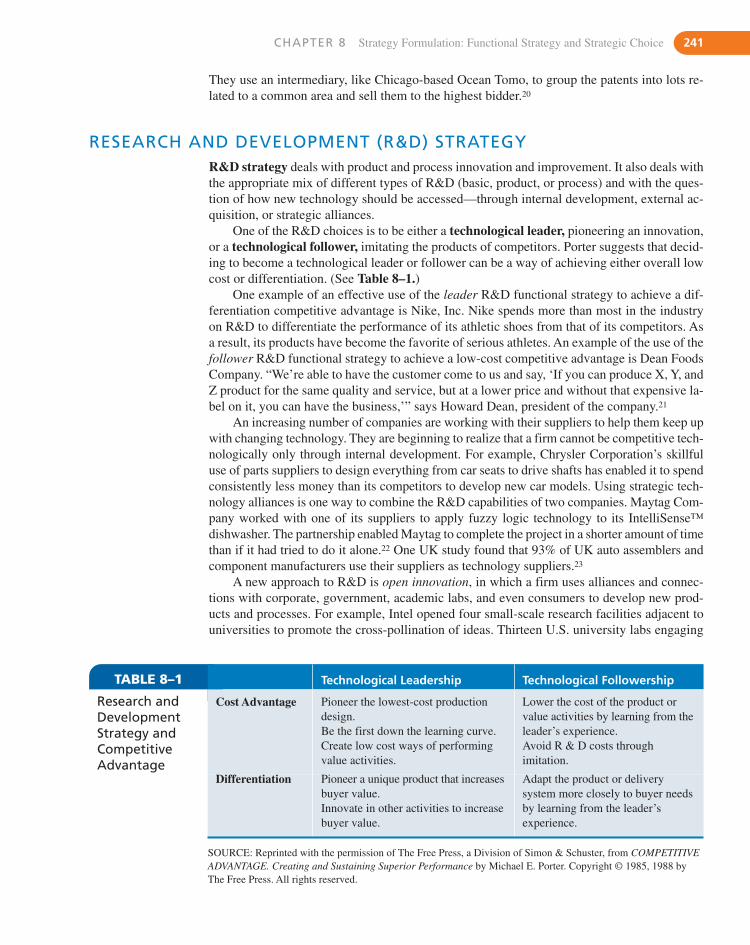
CHAPTER 8 Strategy Formulation: Functional Strategy and Strategic Choice 241
TABLE 8–1 Technological Leadership Technological Followership
Research andDevelopmentStrategy andCompetitiveAdvantage
Cost Advantage Pioneer the lowest-cost productiondesign.Be the first down the learning curve.Create low cost ways of performingvalue activities.
Lower the cost of the product orvalue activities by learning from the leader’s experience.Avoid R & D costs throughimitation.
Differentiation Pioneer a unique product that increasesbuyer value.Innovate in other activities to increasebuyer value.
Adapt the product or deliverysystem more closely to buyer needsby learning from the leader’sexperience.
SOURCE: Reprinted with the permission of The Free Press, a Division of Simon & Schuster, from COMPETITIVEADVANTAGE. Creating and Sustaining Superior Performance by Michael E. Porter. Copyright © 1985, 1988 byThe Free Press. All rights reserved.
They use an intermediary, like Chicago-based Ocean Tomo, to group the patents into lots re-lated to a common area and sell them to the highest bidder.20
RESEARCH AND DEVELOPMENT (R&D) STRATEGYR&D strategy deals with product and process innovation and improvement. It also deals withthe appropriate mix of different types of R&D (basic, product, or process) and with the ques-tion of how new technology should be accessed—through internal development, external ac-quisition, or strategic alliances.
One of the R&D choices is to be either a technological leader, pioneering an innovation,or a technological follower, imitating the products of competitors. Porter suggests that decid-ing to become a technological leader or follower can be a way of achieving either overall lowcost or differentiation. (See Table 8–1.)
One example of an effective use of the leader R&D functional strategy to achieve a dif-ferentiation competitive advantage is Nike, Inc. Nike spends more than most in the industry on R&D to differentiate the performance of its athletic shoes from that of its competitors. Asa result, its products have become the favorite of serious athletes. An example of the use of thefollower R&D functional strategy to achieve a low-cost competitive advantage is Dean FoodsCompany. “We’re able to have the customer come to us and say, ‘If you can produce X, Y, andZ product for the same quality and service, but at a lower price and without that expensive la-bel on it, you can have the business,’” says Howard Dean, president of the company.21
An increasing number of companies are working with their suppliers to help them keep upwith changing technology. They are beginning to realize that a firm cannot be competitive tech-nologically only through internal development. For example, Chrysler Corporation’s skillfuluse of parts suppliers to design everything from car seats to drive shafts has enabled it to spendconsistently less money than its competitors to develop new car models. Using strategic tech-nology alliances is one way to combine the R&D capabilities of two companies. Maytag Com-pany worked with one of its suppliers to apply fuzzy logic technology to its IntelliSense™dishwasher. The partnership enabled Maytag to complete the project in a shorter amount of timethan if it had tried to do it alone.22 One UK study found that 93% of UK auto assemblers andcomponent manufacturers use their suppliers as technology suppliers.23
A new approach to R&D is open innovation, in which a firm uses alliances and connec-tions with corporate, government, academic labs, and even consumers to develop new prod-ucts and processes. For example, Intel opened four small-scale research facilities adjacent touniversities to promote the cross-pollination of ideas. Thirteen U.S. university labs engaging
242 PART 3 Strategy Formulation
in nanotechnology research have formed the National Nanotechnology Infrastructure Networkin order to offer their resources to businesses for a fee.24 Mattel, Wal-Mart, and other toy man-ufacturers and retailers use idea brokers such as Big Idea Group to scout for new toy ideas. BigIdea Group invites inventors to submit ideas to its Web site (www.bigideagroup.net). It thenrefines and promotes to its clients the most promising ideas.25 IBM adopted the open operat-ing system Linux for some of its computer products and systems, drawing on a core code basethat is continually improved and enhanced by a massive global community of software devel-opers, of whom only a fraction work for IBM.26 To open its own labs to ideas being generatedelsewhere, P&G’s CEO Art Lafley decreed that half of the company’s ideas must come fromoutside, up from 10% in 2000. P&G instituted the use of technology scouts to search beyondthe company for promising innovations. By 2007, the objective was achieved: 50% of the company’s innovations originated outside P&G.27
A slightly different approach to technology development is for a large firm such as IBMor Microsoft to purchase minority stakes in relatively new high-tech entrepreneurial venturesthat need capital to continue operation. Investing corporate venture capital is one way to gainaccess to promising innovations at a lower cost than by developing them internally.28
OPERATIONS STRATEGYOperations strategy determines how and where a product or service is to be manufactured,the level of vertical integration in the production process, the deployment of physical re-sources, and relationships with suppliers. It should also deal with the optimum level of tech-nology the firm should use in its operations processes. See the Global Issue feature to see howdifferences in national conditions can lead to differences in product design and manufacturingfacilities from one country to another.
Advanced Manufacturing Technology (AMT) is revolutionizing operations worldwideand should continue to have a major impact as corporations strive to integrate diverse busi-ness activities by using computer assisted design and manufacturing (CAD/CAM) principles.The use of CAD/CAM, flexible manufacturing systems, computer numerically controlled sys-tems, automatically guided vehicles, robotics, manufacturing resource planning (MRP II), op-timized production technology, and just-in-time techniques contribute to increased flexibility,quick response time, and higher productivity. Such investments also act to increase the com-pany’s fixed costs and could cause significant problems if the company is unable to achieveeconomies of scale or scope. Baldor Electric Company, the largest maker of industrial electricmotors in the United States, built a new factory by using the new technology to eliminateundesirable jobs with high employee turnover. With one-tenth the employees of its foreignplants, the plant was cost-competitive with motors produced in Mexico or China.29
A firm’s manufacturing strategy is often affected by a product’s life cycle. As the sales ofa product increase, there will be an increase in production volume ranging from lot sizes aslow as one in a job shop (one-of-a-kind production using skilled labor) through connected linebatch flow (components are standardized; each machine functions such as a job shop but is po-sitioned in the same order as the parts are processed) to lot sizes as high as 100,000 or moreper year for flexible manufacturing systems (parts are grouped into manufacturing families toproduce a wide variety of mass-produced items) and dedicated transfer lines (highly auto-mated assembly lines making one mass-produced product using little human labor). Accord-ing to this concept, the product becomes standardized into a commodity over time inconjunction with increasing demand. Flexibility thus gives way to efficiency.30
Increasing competitive intensity in many industries has forced companies to switch fromtraditional mass production using dedicated transfer lines to a continuous improvement pro-duction strategy. A mass-production system was an excellent method to produce a large num-ber of low-cost, standard goods and services. Employees worked on narrowly defined,
CHAPTER 8 Strategy Formulation: Functional Strategy and Strategic Choice 243
SOURCE: WHEELEN, TOM; HUNGER, J. DAVID, STRATEGIC MAN-AGEMENT AND BUSINESS POLICY, 9th Edition, © 2004, p. 172.Reprinted by permission of Pearson Education, Inc. Upper SaddleRiver, NJ.
ple, material costs may run as much as 200% to 800%higher than elsewhere, while labor and overhead costs arecomparatively minimal,” added Kremer. Another consider-ation was the garments to be washed in each country. Forexample, saris—the 18-foot lengths of cotton or silk withwhich Indian women drape themselves—needed specialtreatment in an Indian washing machine, forcing addi-tional modifications.
Manufacturing facilities also varied from country tocountry. Brastemp, Whirlpool’s Brazilian partner, built itsplant of precast concrete to address the problems of highhumidity. In India, however, the construction crew cast theconcrete, allowed it to cure, and then using chain, block,and tackle, five or six men raised each three-ton slab intoplace. Instead of using one building, Mexican operationsused two, one housing the flexible assembly lines andstamping operations, and an adjacent facility housing theinjection molding and extrusion processes.
INTERNATIONAL DIFFERENCES ALTER WHIRLPOOL’SOPERATIONS STRATEGY
To better penetrate thegrowing markets in develop-
ing nations, Whirlpool decidedto build a “world washer.” This
new type of washing machine was to beproduced in Brazil, Mexico, and India. Lightweight, withsubstantially fewer parts than its U.S. counterpart, its per-formance was to be equal to or better than anything onthe world market while being competitive in price with themost popular models in these markets. The goal was to de-velop a complete product, process, and facility designpackage that could be used in different countries with lowinitial investment. Originally the plan had been to make thesame low-cost washer in identical plants in each of thethree countries.
Significant differences in each of the three countriesforced Whirlpool to change its product design to adapt toeach nation’s situation. According to Lawrence Kremer, Se-nior Vice President of Global Technology and Operations,“Our Mexican affiliate, Vitromatic, has porcelain and glass-making capabilities. Porcelain baskets made sense forthem. Stainless steel became the preferred material for theothers.” Costs also affected decisions. “In India, for exam-
GLOBAL issue
repetitious tasks under close supervision in a bureaucratic and hierarchical structure. Quality,however, often tended to be fairly low. Learning how to do something better was the preroga-tive of management; workers were expected only to learn what was assigned to them. This sys-tem tended to dominate manufacturing until the 1970s. Under the continuous improvementsystem developed by Japanese firms, empowered cross-functional teams strive constantly toimprove production processes. Managers are more like coaches than like bosses. The result isa large quantity of low-cost, standard goods and services, but with high quality. The key to continuous improvement is the acknowledgment that workers’ experience and knowledge canhelp managers solve production problems and contribute to tightening variances and reducingerrors. Because continuous improvement enables firms to use the same low-cost competitivestrategy as do mass-production firms but at a significantly higher level of quality, it is rapidlyreplacing mass production as an operations strategy.
The automobile industry is currently experimenting with the strategy of modular manu-facturing in which preassembled subassemblies are delivered as they are needed (i.e., Just-in-Time) to a company’s assembly-line workers, who quickly piece the modules together intoa finished product. For example, General Motors built a new automotive complex in Brazil to make its new subcompact, the Celta. Sixteen of the 17 buildings were occupied by suppli-ers, including Delphi, Lear, and Goodyear. These suppliers delivered preassembled modules(which comprised 85% of the final value of each car) to GM’s building for assembly. In aprocess new to the industry, the suppliers acted as a team to build a single module compris-ing the motor, transmission, fuel lines, rear axle, brake-fluid lines, and exhaust system, whichwas then installed as one piece. GM hoped that this manufacturing strategy would enable it
244 PART 3 Strategy Formulation
to produce 100 vehicles annually per worker compared to the standard rate of 30 to 50 autosper worker.31 Ford and Chrysler have also opened similar modular facilities in Brazil.
The concept of a product’s life cycle eventually leading to one-size-fits-all mass produc-tion is being increasingly challenged by the new concept of mass customization. Appropriatefor an ever-changing environment, mass customization requires that people, processes, units,and technology reconfigure themselves to give customers exactly what they want, when theywant it. In the case of Dell Computer, customers use the Internet to design their own comput-ers. In contrast to continuous improvement, mass customization requires flexibility and quickresponsiveness. Managers coordinate independent, capable individuals. An efficient linkagesystem is crucial. The result is low-cost, high-quality, customized goods and services appro-priate for a large number of market niches.
A contentious issue for manufacturing companies throughout the world is the availabilityof resources needed to operate a modern factory. The increasing cost of oil during 2007 and2008 drastically boosted costs, only some of which could be passed on to the customers in acompetitive environment. The likelihood that fresh water could become an equally scarce re-source is causing many companies to rethink water-intensive manufacturing processes. Tolearn how companies are beginning to deal with increasing fresh water scarcity, see theEnvironmental Sustainability Issue feature.
PURCHASING STRATEGYPurchasing strategy deals with obtaining the raw materials, parts, and supplies needed to per-form the operations function. Purchasing strategy is important because materials and compo-nents purchased from suppliers comprise 50% of total manufacturing costs of manufacturingcompanies in the United Kingdom, United States, Australia, Belgium, and Finland.32 The ba-sic purchasing choices are multiple, sole, and parallel sourcing. Under multiple sourcing, thepurchasing company orders a particular part from several vendors. Multiple sourcing has tra-ditionally been considered superior to other purchasing approaches because (1) it forces sup-pliers to compete for the business of an important buyer, thus reducing purchasing costs, and(2) if one supplier cannot deliver, another usually can, thus guaranteeing that parts and sup-plies are always on hand when needed. Multiple sourcing has been one way for a purchasingfirm to control the relationship with its suppliers. So long as suppliers can provide evidencethat they can meet the product specifications, they are kept on the purchaser’s list of accept-able vendors for specific parts and supplies. Unfortunately, the common practice of acceptingthe lowest bid often compromises quality.
W. Edward Deming, a well-known management consultant, strongly recommended solesourcing as the only manageable way to obtain high supplier quality. Sole sourcing relies on onlyone supplier for a particular part. Given his concern with designing quality into a product in itsearly stages of development, Deming argued that the buyer should work closely with the sup-plier at all stages. This reduces both cost and time spent on product design and it also improvesquality. It can also simplify the purchasing company’s production process by using the Just-In-Time (JIT) concept of having the purchased parts arrive at the plant just when they are neededrather than keeping inventories. The concept of sole sourcing is taken one step further in JIT II,in which vendor sales representatives actually have desks next to the purchasing company’s fac-tory floor, attend production status meetings, visit the R&D lab, and analyze the purchasing com-pany’s sales forecasts. These in-house suppliers then write sales orders for which the purchasingcompany is billed. Developed by Lance Dixon at Bose Corporation, JIT II is also being used atIBM, Honeywell, and Ingersoll-Rand. Karen Dale, purchasing manager for Honeywell’s officesupplies, said she was very concerned about confidentiality when JIT II was first suggested toher. Soon she had five suppliers working with her 20 buyers and reported few problems.33
CHAPTER 8 Strategy Formulation: Functional Strategy and Strategic Choice 245
Sole sourcing reduces transaction costs and builds quality by having the purchaser andsupplier work together as partners rather than as adversaries. With sole sourcing, more com-panies will have longer relationships with fewer suppliers. Research has found that buyer-supplier collaboration and joint problem solving with both parties dependent upon the otherresults in the development of competitive capabilities, higher quality, lower costs, and betterscheduling.34 Sole sourcing does, however, have limitations. If a supplier is unable to delivera part, the purchaser has no alternative but to delay production. Multiple suppliers can providethe purchaser with better information about new technology and performance capabilities. Thelimitations of sole sourcing have led to the development of parallel sourcing. In parallel sourc-ing, two suppliers are the sole suppliers of two different parts, but they are also backup sup-pliers for each other’s parts. If one vendor cannot supply all of its parts on time, the othervendor is asked to make up the difference.35
SOURCE: K. Kube, “Into the Wild Brown Yonder,” Trains (Novem-ber 2008), pp. 68–73; “Running Dry,” The Economist (August 23,2008), pp. 53–54.
“Water is the oil of the 21st century,” contends AndrewLiveris, CEO of the chemical company Dow. Like oil, sup-plies of clean, easily accessible fresh water are under agrowing strain because of the growing population andwidespread improvements in living standards. Industrial-ization in developing nations is contaminating rivers andaquifers. Climate change is altering the patterns of freshwater availability so that droughts are more likely in manyparts of the world. According to a survey by the MarshCenter for Risk Insights, 40% of Fortune 1000 companiesstated that the impact of a water shortage on their busi-ness would be “severe” or “catastrophic,” but only 17%said that they were prepared for such a crisis. Of Nestlé’s481 factories worldwide, 49 are located in water-scarce re-gions. Environmental activists have attacked PepsiCo andCoca-Cola for allegedly depleting groundwater in India tomake bottled drinks.
There are a number of companies that are taking actionto protect their future supply of freshwater. Dow has re-duced the amount of water it uses by over a third since1995. During 1997–2006, when Nestle almost doubledthe volume of food it produced, it reduced the amount ofwater used by 29%. By 2008, Coca-Cola had achieved85% of its objective to clean all of the wastewater gener-ated at its bottling plants by 2010. China’s Elion Chemicalis working with General Electric to recycle 90% of itswastewater to comply with the government’s new “zero-liquid” discharge rules.
The U.S. Department of En-ergy (DOE) plans to build a rail
line more than 300 miles longthrough the Nevada wilderness
to move spent nuclear fuel from121 sites in 39 states to a geologic repos-
itory at Yucca Mountain. One of the biggest issues to over-come will be water supply. The DOE estimates that theconstruction phase would require 5,500 acre feet of waterfor earthwork compaction, 370 acre-feet for constructionpersonnel, 200 acre-feet for dust control along access roads,and 30 acre-feet for quarry operations, totaling 6,100 acre-feet, or two billion gallons, of water to support a four-yearconstruction period. To meet this need, DOE wants to drill150 to 176 new wells. The state of Nevada, however, has re-jected a permit request to use water for drilling on the YuccaMountain site, stating that water has to be used for the ben-efit of the public. Negotiations continue.
This is just one of the ways that organizations needfresh water for their operations. Nestlé, Unilever, Coca-Cola, Anheuser-Busch, and Danone consume almost575 billion liters of water a year, enough to satisfy the dailywater needs of every person on the planet. It takes about13 cubic meters of freshwater to produce a single 200 mmsemiconductor wafer. As a result, chip making is believed toaccount for 25% of the water consumption in Silicon Valley.According to Jose Lopez, Nestlé’s COO, it takes four liters ofwater to make one liter of product in Nestlé’s factories, but3,000 liters of water are needed to grow the agriculturalproduce that supplies them. Each year, around 40% of thefreshwater withdrawn from lakes and aquifers in America isused to cool power plants. Separating one liter of oil fromCanada’s tar sands requires up to five liters of water!
OPERATIONS NEED FRESH WATER AND LOTS OF IT!
ENVIRONMENTAL sustainability issue
246 PART 3 Strategy Formulation
The Internet is being increasingly used both to find new sources of supply and to keep in-ventories replenished. For example, Hewlett-Packard introduced a Web-based procurementsystem to enable its 84,000 employees to buy office supplies from a standard set of suppliers.The new system enabled the company to save $60 to $100 million annually in purchasingcosts.36 Research indicates that companies using Internet-based technologies are able to loweradministrative costs and purchase prices.37
LOGISTICS STRATEGYLogistics strategy deals with the flow of products into and out of the manufacturing process.Three trends related to this strategy are evident: centralization, outsourcing, and the use of theInternet. To gain logistical synergies across business units, corporations began centralizing lo-gistics in the headquarters group. This centralized logistics group usually contains specialistswith expertise in different transportation modes such as rail or trucking. They work to aggregateshipping volumes across the entire corporation to gain better contracts with shippers. Compa-nies such as Georgia-Pacific, Marriott, and Union Carbide view the logistics function as an im-portant way to differentiate themselves from the competition, to add value, and to reduce costs.
Many companies have found that outsourcing logistics reduces costs and improves deliv-ery time. For example, HP contracted with Roadway Logistics to manage its inbound raw ma-terials warehousing in Vancouver, Canada. Nearly 140 Roadway employees replaced 250 HPworkers, who were transferred to other HP activities.38
Many companies are using the Internet to simplify their logistical system. For example,Ace Hardware created an online system for its retailers and suppliers. An individual hardwarestore can now see on the Web site that ordering 210 cases of wrenches is cheaper than order-ing 200 cases. Because a full pallet is composed of 210 cases of wrenches, an order for a fullpallet means that the supplier doesn’t have to pull 10 cases off a pallet and repackage themfor storage. There is less chance that loose cases will be lost in delivery, and the paperworkdoesn’t have to be redone. As a result, Ace’s transportation costs are down 18%, and ware-house costs have been cut 28%.39
HUMAN RESOURCE MANAGEMENT (HRM) STRATEGYHRM strategy, among other things, addresses the issue of whether a company or business unitshould hire a large number of low-skilled employees who receive low pay, perform repetitivejobs, and are most likely quit after a short time (the McDonald’s restaurant strategy) or hireskilled employees who receive relatively high pay and are cross-trained to participate in self-managing work teams. As work increases in complexity, the more suited it is for teams, espe-cially in the case of innovative product development efforts. Multinational corporations areincreasingly using self-managing work teams in their foreign affiliates as well as in home-country operations.40 Research indicates that the use of work teams leads to increased qualityand productivity as well as to higher employee satisfaction and commitment.41
Companies following a competitive strategy of differentiation through high quality use in-put from subordinates and peers in performance appraisals to a greater extent than do firmsfollowing other business strategies.42 A complete 360-degree appraisal, in which input is gath-ered from multiple sources, is now being used by more than 10% of U.S. corporations and hasbecome one of the most popular and effective tools in developing employees and new man-agers.43 One Indian company, HCL Technologies, publishes the appraisal ratings for the top 20 managers on the company’s intranet for all to see.44
Companies are finding that having a diverse workforce can be a competitive advantage.Research reveals that firms with a high degree of racial diversity following a growth strategy
CHAPTER 8 Strategy Formulation: Functional Strategy and Strategic Choice 247
have higher productivity than do firms with less racial diversity.45 Avon Company, for exam-ple, was able to turn around its unprofitable inner-city markets by putting African-Americanand Hispanic managers in charge of marketing to these markets.46 Diversity in terms of ageand national origin also offers benefits. DuPont’s use of multinational teams has helped thecompany develop and market products internationally. McDonald’s has discovered that olderworkers perform as well as, if not better than, younger employees. According to Edward Rensi,CEO of McDonald’s USA, “We find these people to be particularly well motivated, with a sortof discipline and work habits hard to find in younger employees.”47
INFORMATION TECHNOLOGY STRATEGYCorporations are increasingly using information technology strategy to provide business unitswith competitive advantage. When FedEx first provided its customers with PowerShip computersoftware to store addresses, print shipping labels, and track package location, its sales jumpedsignificantly. UPS soon followed with its own MaxiShips software. Viewing its information sys-tem as a distinctive competency, FedEx continued to push for further advantage over UPS by us-ing its Web site to enable customers to track their packages. FedEx uses this competency in itsadvertisements by showing how customers can track the progress of their shipments. Soon there-after, UPS provided the same service.Although it can be argued that information technology hasnow become so pervasive that it no longer offers companies a competitive advantage, corpora-tions worldwide continue to spend over $2 trillion annually on information technology.48
Multinational corporations are finding that having a sophisticated intranet allows employ-ees to practice follow-the-sun management, in which project team members living in one coun-try can pass their work to team members in another country in which the work day is justbeginning. Thus, night shifts are no longer needed.49 The development of instant translationsoftware is also enabling workers to have online communication with co-workers in othercountries who use a different language.50 For example, Mattel has cut the time it takes to de-velop new products by 10% by enabling designers and licensees in other countries to collabo-rate on toy design. IBM uses its intranet to allow its employees to collaborate and improve their skills, thus reducing its training and travel expenses.51
Many companies, such as Lockheed Martin, General Electric, and Whirlpool, use informa-tion technology to form closer relationships with both their customers and suppliers through so-phisticated extranets. For example, General Electric’s Trading Process Network allows suppliersto electronically download GE’s requests for proposals, view diagrams of parts specifications,and communicate with GE purchasing managers. According to Robert Livingston, GE’s head ofworldwide sourcing for the Lighting Division, going on the Web reduces processing time byone-third.52 Thus, the use of information technology through extranets makes it easier for a com-pany to buy from others (outsource) rather than make it themselves (vertically integrate).53
8.2 The Sourcing Decision: Location of FunctionsFor a functional strategy to have the best chance of success, it should be built on a distinc-tive competency residing within that functional area. If a corporation does not have a distinc-tive competency in a particular functional area, that functional area could be a candidate foroutsourcing.
Outsourcing is purchasing from someone else a product or service that had been previouslyprovided internally. Thus, it is the reverse of vertical integration. Outsourcing is becoming an in-creasingly important part of strategic decision making and an important way to increase effi-ciency and often quality. In a study of 30 firms, outsourcing resulted on average in a 9% reduction
248 PART 3 Strategy Formulation
in costs and a 15% increase in capacity and quality.54 For example, Boeing used outsourcing asa way to reduce the cost of designing and manufacturing its new 787 Dreamliner. Up to 70% ofthe plane was outsourced. In a break from past practice, suppliers make large parts of the fuse-lage, including plumbing, electrical, and computer systems, and ship them to Seattle for assem-bly by Boeing. Outsourcing enabled Boeing to build a 787 in 4 months instead of the usual 12.55
According to an American Management Association survey of member companies, 94%of the responding firms outsource at least one activity. The outsourced activities are generaland administrative (78%), human resources (77%), transportation and distribution (66%), in-formation systems (63%), manufacturing (56%), marketing (51%), and finance and account-ing (18%). The survey also reveals that 25% of the respondents have been disappointed in theiroutsourcing results. Fifty-one percent of the firms reported bringing an outsourced activityback in-house. Nevertheless, authorities not only expect the number of companies engaging inoutsourcing to increase, they also expect companies to outsource an increasing number offunctions, especially those in customer service, bookkeeping, financial/clerical, sales/telemar-keting, and the mailroom.56 It is estimated that 50% of U.S. manufacturing will be outsourcedto firms in 28 developing countries by 2015.57
Offshoring is the outsourcing of an activity or a function to a wholly owned company oran independent provider in another country. Offshoring is a global phenomenon that has beensupported by advances in information and communication technologies, the development ofstable, secure, and high-speed data transmission systems, and logistical advances like con-tainerized shipping. According to Bain & Company, 51% of large firms in North America,Europe, and Asia outsource offshore.58 Although India currently has 70% of the offshoringmarket, countries such as Brazil, China, Russia, the Phillipines, Malaysia, Hungary, the CzechRepublic, and Israel are growing in importance. These countries have low-cost qualified la-bor and an educated workforce. These are important considerations because more than 93%of offshoring companies do so to reduce costs.59 For example, Mexican assembly line work-ers average $3.50 an hour plus benefits compared to $27 an hour plus benefits at a GM or Fordplant in the U.S. Less skilled Mexican workers at auto parts makers earn as little as $1.50 perhour with fewer benefits.60
Software programming and customer service, in particular, are being outsourced to India. For example, General Electric’s back-office services unit, GE Capital InternationalServices, is one of the oldest and biggest of India’s outsourcing companies. From only$26 million in 1999, its annual revenues grew to over $420 million by 2004.61 As part of thistrend, IBM acquired Daksh eServices Ltd., one of India’s biggest suppliers of remote busi-ness services.62
Outsourcing, including offshoring, has significant disadvantages. For example, mount-ing complaints forced Dell Computer to stop routing corporate customers to a technical sup-port call center in Bangalore, India.63 GE’s introduction of a new washing machine wasdelayed three weeks because of production problems at a supplier’s company to which it hadcontracted out key work. Some companies have found themselves locked into long-term con-tracts with outside suppliers that were no longer competitive.64 Some authorities propose thatthe cumulative effects of continued outsourcing steadily reduces a firm’s ability to learn newskills and to develop new core competencies.65 One survey of 129 outsourcing firms revealedthat half the outsourcing projects undertaken in one year failed to deliver anticipated savings.This is in agreement with a survey by Bain & Company in which 51% of large North Amer-ican, European, and Asian firms stated that outsourcing (including offshoring) did not meettheir expectations.66 Another survey of software projects, by MIT, found that the median In-dian project had 10% more software bugs than did comparable U.S. projects.67 During2007–2008, tainted goods made by Chinese manufacturers, ranging from lead paint on toys,contaminated heparin, and melamine-laced milk caused their customers to reevaluate the
CHAPTER 8 Strategy Formulation: Functional Strategy and Strategic Choice 249
manner in which they engaged in offshore outsourcing.68 The increasing cost of oil was mak-ing offshoring less economical. Since 2003, crude oil increased in price from $28 to over$100 a barrel in 2008, causing the cost to ship a standard 40-foot container to triple. By 2008it cost about $100 to ship a ton of iron from Brazil to China, more than the cost of the min-eral itself.69
A study of 91 outsourcing efforts conducted by European and North American firms foundseven major errors that should be avoided:
1. Outsourcing activities that should not be outsourced: Companies failed to keep coreactivities in-house.
2. Selecting the wrong vendor: Vendors were not trustworthy or lacked state-of-the-artprocesses.
3. Writing a poor contract: Companies failed to establish a balance of power in the relationship.
4. Overlooking personnel issues: Employees lost commitment to the firm.
5. Losing control over the outsourced activity: Qualified managers failed to manage theoutsourced activity.70
6. Overlooking the hidden costs of outsourcing: Transaction costs overwhelmed othersavings.
7. Failing to plan an exit strategy: Companies failed to build reversibility clauses into thecontract.71
The key to outsourcing is to purchase from outside only those activities that are not keyto the company’s distinctive competencies. Otherwise, the company may give up the very ca-pabilities that made it successful in the first place—thus putting itself on the road to eventualdecline. This is supported by research reporting that companies that have more experience witha particular manufacturing technology tend to keep manufacturing in-house.72 J. P. MorganChase & Company terminated a seven-year technology outsourcing agreement with IBM be-cause the bank’s management realized that information technology (IT) was too importantstrategically to be outsourced.73
In determining functional strategy, the strategist must:
� Identify the company’s or business unit’s core competencies
� Ensure that the competencies are continually being strengthened
� Manage the competencies in such a way that best preserves the competitive advantagethey create
An outsourcing decision depends on the fraction of total value added that the activity un-der consideration represents and on the amount of potential competitive advantage in that ac-tivity for the company or business unit. See the outsourcing matrix in Figure 8–1. A firmshould consider outsourcing any activity or function that has low potential for competitive ad-vantage. If that activity constitutes only a small part of the total value of the firm’s products orservices, it should be purchased on the open market (assuming that quality providers of the ac-tivity are plentiful). If, however, the activity contributes highly to the company’s products orservices, the firm should purchase it through long-term contracts with trusted suppliers or dis-tributors. A firm should always produce at least some of the activity or function (i.e., taper ver-tical integration) if that activity has the potential for providing the company some competitiveadvantage. However, full vertical integration should be considered only when that activity orfunction adds significant value to the company’s products or services in addition to providingcompetitive advantage.74
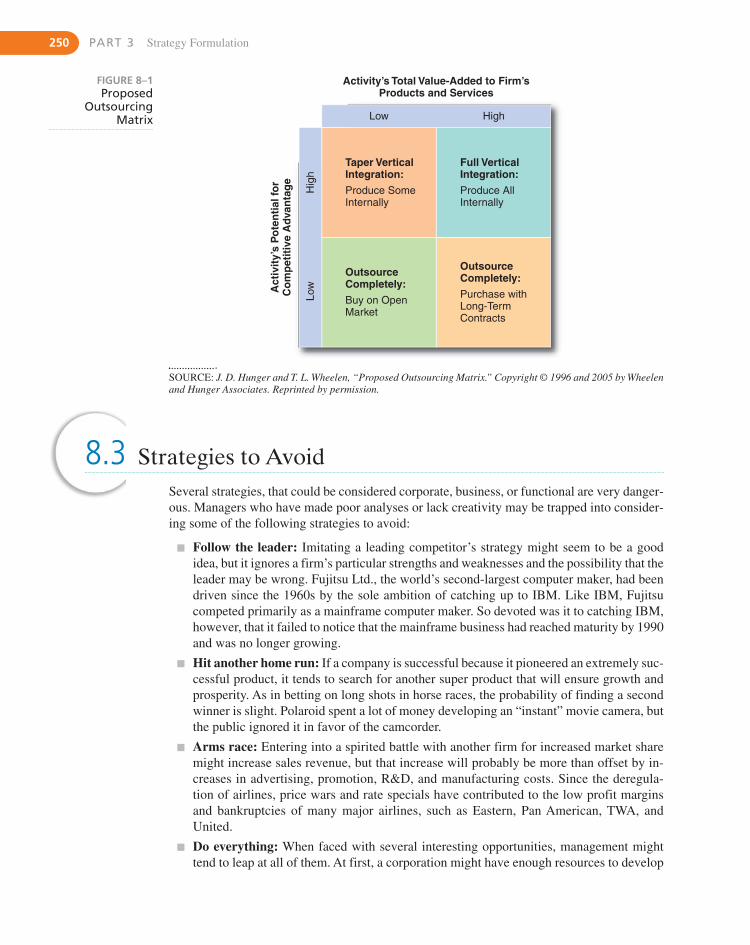
250 PART 3 Strategy Formulation
Activity’s Total Value-Added to Firm’sProducts and Services
Act
ivit
y’s
Po
ten
tial
for
Co
mp
etit
ive
Ad
van
tag
e
Low
Taper VerticalIntegration:
Produce SomeInternally
Full VerticalIntegration:
Produce AllInternally
OutsourceCompletely:
Buy on OpenMarket
OutsourceCompletely:
Purchase withLong-TermContracts
Low
High
Hig
h
FIGURE 8–1Proposed
OutsourcingMatrix
8.3 Strategies to AvoidSeveral strategies, that could be considered corporate, business, or functional are very danger-ous. Managers who have made poor analyses or lack creativity may be trapped into consider-ing some of the following strategies to avoid:
� Follow the leader: Imitating a leading competitor’s strategy might seem to be a goodidea, but it ignores a firm’s particular strengths and weaknesses and the possibility that theleader may be wrong. Fujitsu Ltd., the world’s second-largest computer maker, had beendriven since the 1960s by the sole ambition of catching up to IBM. Like IBM, Fujitsucompeted primarily as a mainframe computer maker. So devoted was it to catching IBM,however, that it failed to notice that the mainframe business had reached maturity by 1990and was no longer growing.
� Hit another home run: If a company is successful because it pioneered an extremely suc-cessful product, it tends to search for another super product that will ensure growth andprosperity. As in betting on long shots in horse races, the probability of finding a secondwinner is slight. Polaroid spent a lot of money developing an “instant” movie camera, butthe public ignored it in favor of the camcorder.
� Arms race: Entering into a spirited battle with another firm for increased market sharemight increase sales revenue, but that increase will probably be more than offset by in-creases in advertising, promotion, R&D, and manufacturing costs. Since the deregula-tion of airlines, price wars and rate specials have contributed to the low profit marginsand bankruptcies of many major airlines, such as Eastern, Pan American, TWA, andUnited.
� Do everything: When faced with several interesting opportunities, management mighttend to leap at all of them. At first, a corporation might have enough resources to develop
SOURCE: J. D. Hunger and T. L. Wheelen, “Proposed Outsourcing Matrix.” Copyright © 1996 and 2005 by Wheelenand Hunger Associates. Reprinted by permission.
CHAPTER 8 Strategy Formulation: Functional Strategy and Strategic Choice 251
each idea into a project, but money, time, and energy are soon exhausted as the many proj-ects demand large infusions of resources. The Walt Disney Company’s expertise in the en-tertainment industry led it to acquire the ABC network. As the company churned out newmotion pictures and television programs such as Who Wants to Be a Millionaire? it spent$750 million to build new theme parks and buy a cruise line and a hockey team. By 2000,even though corporate sales had continued to increase, net income was falling.75
� Losing hand: A corporation might have invested so much in a particular strategy that topmanagement is unwilling to accept its failure. Believing that it has too much invested toquit, management may continue to throw “good money after bad.” Pan American Airlines,for example, chose to sell its Pan Am Building and Intercontinental Hotels, the most prof-itable parts of the corporation, to keep its money-losing airline flying. Continuing to suf-fer losses, the company followed this profit strategy of shedding assets for cash until it had sold off everything and went bankrupt.
8.4 Strategic Choice: Selecting the Best StrategyAfter the pros and cons of the potential strategic alternatives have been identified and evalu-ated, one must be selected for implementation. By now, it is likely that many feasible alterna-tives will have emerged. How is the best strategy determined?
Perhaps the most important criterion is the capability of the proposed strategy to deal withthe specific strategic factors developed earlier, in the SWOT analysis. If the alternative doesn’ttake advantage of environmental opportunities and corporate strengths/competencies, and leadaway from environmental threats and corporate weaknesses, it will probably fail.
Another important consideration in the selection of a strategy is the ability of each alter-native to satisfy agreed-on objectives with the least resources and the fewest negative side ef-fects. It is, therefore, important to develop a tentative implementation plan in order to addressthe difficulties that management is likely to face. This should be done in light of societal trends, the industry, and the company’s situation based on the construction of scenarios.
CONSTRUCTING CORPORATE SCENARIOSCorporate scenarios are pro forma (estimated future) balance sheets and income statementsthat forecast the effect each alternative strategy and its various programs will likely have ondivision and corporate return on investment. (Pro forma financial statements are discussed inChapter 12.) In a survey of Fortune 500 firms, 84% reported using computer simulation mod-els in strategic planning. Most of these were simply spreadsheet-based simulation models dealing with what-if questions.76
The recommended scenarios are simply extensions of the industry scenarios discussed inChapter 4. If, for example, industry scenarios suggest the probable emergence of a strongmarket demand in a specific country for certain products, a series of alternative strategy sce-narios can be developed. The alternative of acquiring another firm having these products inthat country can be compared with the alternative of a green-field development (e.g., buildingnew operations in that country). Using three sets of estimated sales figures (Optimistic, Pes-simistic, and Most Likely) for the new products over the next five years, the two alternativescan be evaluated in terms of their effect on future company performance as reflected in thecompany’s probable future financial statements. Pro forma balance sheets and income state-ments can be generated with spreadsheet software, such as Excel, on a personal computer. Proforma statements are based on financial and economic scenarios.
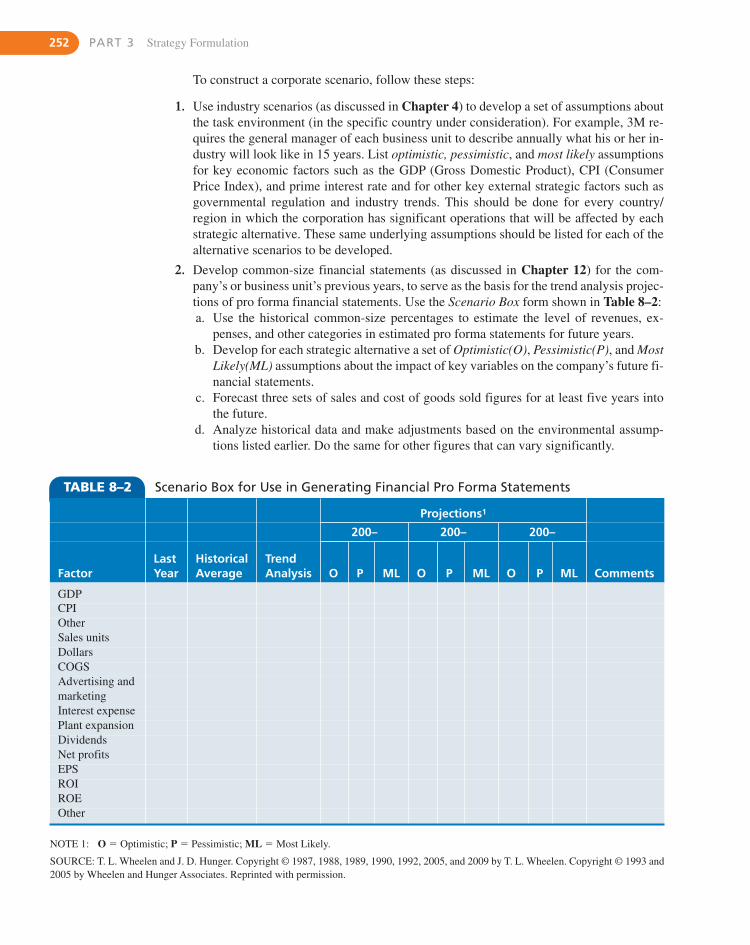
252 PART 3 Strategy Formulation
TABLE 8–2 Scenario Box for Use in Generating Financial Pro Forma Statements
Projections1
200– 200– 200–
FactorLastYear
HistoricalAverage
TrendAnalysis O P ML O P ML O P ML Comments
GDPCPIOtherSales unitsDollarsCOGSAdvertising andmarketingInterest expensePlant expansionDividendsNet profitsEPSROIROEOther
NOTE 1: O � Optimistic; P � Pessimistic; ML � Most Likely.
SOURCE: T. L. Wheelen and J. D. Hunger. Copyright © 1987, 1988, 1989, 1990, 1992, 2005, and 2009 by T. L. Wheelen. Copyright © 1993 and2005 by Wheelen and Hunger Associates. Reprinted with permission.
To construct a corporate scenario, follow these steps:
1. Use industry scenarios (as discussed in Chapter 4) to develop a set of assumptions aboutthe task environment (in the specific country under consideration). For example, 3M re-quires the general manager of each business unit to describe annually what his or her in-dustry will look like in 15 years. List optimistic, pessimistic, and most likely assumptionsfor key economic factors such as the GDP (Gross Domestic Product), CPI (ConsumerPrice Index), and prime interest rate and for other key external strategic factors such asgovernmental regulation and industry trends. This should be done for every country/region in which the corporation has significant operations that will be affected by eachstrategic alternative. These same underlying assumptions should be listed for each of thealternative scenarios to be developed.
2. Develop common-size financial statements (as discussed in Chapter 12) for the com-pany’s or business unit’s previous years, to serve as the basis for the trend analysis projec-tions of pro forma financial statements. Use the Scenario Box form shown in Table 8–2:a. Use the historical common-size percentages to estimate the level of revenues, ex-
penses, and other categories in estimated pro forma statements for future years.b. Develop for each strategic alternative a set of Optimistic(O), Pessimistic(P), and Most
Likely(ML) assumptions about the impact of key variables on the company’s future fi-nancial statements.
c. Forecast three sets of sales and cost of goods sold figures for at least five years intothe future.
d. Analyze historical data and make adjustments based on the environmental assump-tions listed earlier. Do the same for other figures that can vary significantly.
CHAPTER 8 Strategy Formulation: Functional Strategy and Strategic Choice 253
e. Assume for other figures that they will continue in their historical relationship to salesor some other key determining factor. Plug in expected inventory levels, accounts re-ceivable, accounts payable, R&D expenses, advertising and promotion expenses, cap-ital expenditures, and debt payments (assuming that debt is used to finance thestrategy), among others.
f. Consider not only historical trends but also programs that might be needed to imple-ment each alternative strategy (such as building a new manufacturing facility or ex-panding the sales force).
3. Construct detailed pro forma financial statements for each strategic alternative:a. List the actual figures from this year’s financial statements in the left column of the
spreadsheet.b. List to the right of this column the optimistic figures for years 1 through 5.c. Go through this same process with the same strategic alternative, but now list the pes-
simistic figures for the next five years.d. Do the same with the most likely figures.e. Develop a similar set of optimistic (O), pessimistic (P), and most likely (ML) pro
forma statements for the second strategic alternative. This process generates six dif-ferent pro forma scenarios reflecting three different situations (O, P, and ML) for twostrategic alternatives.
f. Calculate financial ratios and common-size income statements, and create balancesheets to accompany the pro forma statements.
g. Compare the assumptions underlying the scenarios with the financial statements andratios to determine the feasibility of the scenarios. For example, if cost of goods solddrops from 70% to 50% of total sales revenue in the pro forma income statements,this drop should result from a change in the production process or a shift to cheaperraw materials or labor costs rather than from a failure to keep the cost of goods soldin its usual percentage relationship to sales revenue when the predicted statement wasdeveloped.
The result of this detailed scenario construction should be anticipated net profits, cashflow, and net working capital for each of three versions of the two alternatives for five yearsinto the future. A strategist might want to go further into the future if the strategy is expectedto have a major impact on the company’s financial statements beyond five years. The result ofthis work should provide sufficient information on which forecasts of the likely feasibility andprobable profitability of each of the strategic alternatives could be based.
Obviously, these scenarios can quickly become very complicated, especially if three setsof acquisition prices and development costs are calculated. Nevertheless, this sort of detailedwhat-if analysis is needed to realistically compare the projected outcome of each reasonablealternative strategy and its attendant programs, budgets, and procedures. Regardless of thequantifiable pros and cons of each alternative, the actual decision will probably be influencedby several subjective factors such as those described in the following sections.
Management’s Attitude Toward RiskThe attractiveness of a particular strategic alternative is partially a function of the amount of risk it entails. Risk is composed not only of the probability that the strategy will be effective but also of the amount of assets the corporation must allocate to that strategy and the length oftime the assets will be unavailable for other uses. Because of variation among countries in termsof customs, regulations, and resources, companies operating in global industries must deal witha greater amount of risk than firms operating only in one country.77 The greater the assets in-volved and the longer they are committed, the more likely top management is to demand a highprobability of success. Managers with no ownership position in a company are unlikely to have
254 PART 3 Strategy Formulation
much interest in putting their jobs in danger with risky decisions. Research indicates that man-agers who own a significant amount of stock in their firms are more likely to engage in risk-taking actions than are managers with no stock.78
A high level of risk was why Intel’s board of directors found it difficult to vote for a pro-posal in the early 1990s to commit $5 billion to making the Pentium microprocessor chip—five times the amount of money needed for its previous chip. In looking back on that boardmeeting, then-CEO Andy Grove remarked, “I remember people’s eyes looking at that chartand getting big. I wasn’t even sure I believed those numbers at the time.” The proposal com-mitted the company to building new factories—something Intel had been reluctant to do. Awrong decision would mean that the company would end up with a killing amount of overca-pacity. Based on Grove’s presentation, the board decided to take the gamble. Intel’s resultingmanufacturing expansion eventually cost $10 billion but resulted in Intel’s obtaining 75% ofthe microprocessor business and huge cash profits.79
Risk might be one reason that significant innovations occur more often in small firms thanin large, established corporations. A small firm managed by an entrepreneur is often willing toaccept greater risk than is a large firm of diversified ownership run by professional managers.80
It is one thing to take a chance if you are the primary shareholder and are not concerned withperiodic changes in the value of the company’s common stock. It is something else if the cor-poration’s stock is widely held and acquisition-hungry competitors or takeover artists surroundthe company like sharks every time the company’s stock price falls below some external as-sessment of the firm’s value.
Anew approach to evaluating alternatives under conditions of high environmental uncertaintyis to use real-options theory. According to the real-options approach, when the future is highly uncertain, it pays to have a broad range of options open. This is in contrast to using net present value(NPV) to calculate the value of a project by predicting its payouts, adjusting them for risk, and subtracting the amount invested. By boiling everything down to one scenario, NPV doesn’t provideany flexibility in case circumstances change. NPV is also difficult to apply to projects in which thepotential payoffs are currently unknown. The real-options approach, however, deals with these issues by breaking the investment into stages. Management allocates a small amount of funding toinitiate multiple projects, monitors their development, and then cancels the projects that aren’t suc-cessful and funds those that are doing well.81 This approach is very similar to the way venture cap-italists fund an entrepreneurial venture in stages of funding based on the venture’s performance.
A survey of 4,000 CFOs found that 27% of them always or almost always used some sortof options approach to evaluating and deciding upon growth opportunities.82 Research indi-cates that the use of the real-options approach does improve organizational performance.83
Some of the corporations using the real-options approach are Chevron for bidding on petro-leum reserves, Airbus for calculating the costs of airlines changing their orders at the lastminute, and the Tennessee Valley Authority for outsourcing electricity generation instead ofbuilding its own plant. Because of its complexity, the real-options approach is not worthwhilefor minor decisions or for projects requiring a full commitment at the beginning.84
Pressures from StakeholdersThe attractiveness of a strategic alternative is affected by its perceived compatibility with thekey stakeholders in a corporation’s task environment. Creditors want to be paid on time.Unions exert pressure for comparable wage and employment security. Governments and inter-est groups demand social responsibility. Shareholders want dividends. All these pressuresmust be given some consideration in the selection of the best alternative.
Stakeholders can be categorized in terms of their (1) interest in the corporation’s activities and(2) relative power to influence the corporation’s activities. As shown in Figure 8–2, each stake-holder group can be shown graphically based on its level of interest (from low to high) in a corpo-ration’s activities and on its relative power (from low to high) to influence a corporation’s activities.
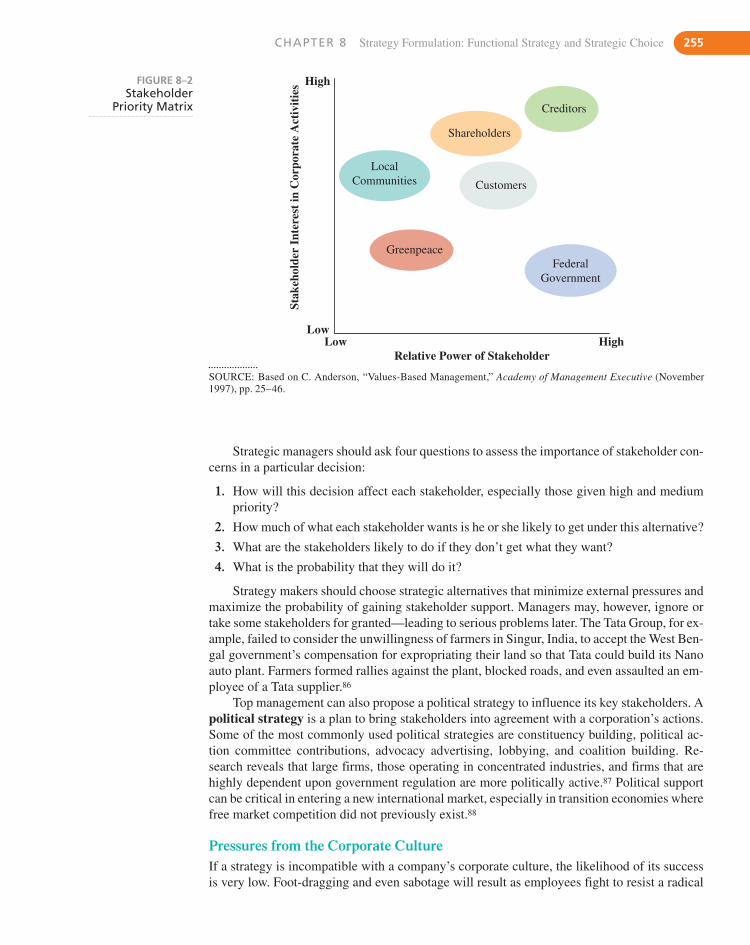
CHAPTER 8 Strategy Formulation: Functional Strategy and Strategic Choice 255
High
LocalCommunities
Creditors
Shareholders
Stak
ehol
der
Inte
rest
in C
orpo
rate
Act
ivit
ies
Customers
GreenpeaceFederal
Government
LowLow High
Relative Power of Stakeholder
FIGURE 8–2Stakeholder
Priority Matrix
Strategic managers should ask four questions to assess the importance of stakeholder con-cerns in a particular decision:
1. How will this decision affect each stakeholder, especially those given high and mediumpriority?
2. How much of what each stakeholder wants is he or she likely to get under this alternative?
3. What are the stakeholders likely to do if they don’t get what they want?
4. What is the probability that they will do it?
Strategy makers should choose strategic alternatives that minimize external pressures andmaximize the probability of gaining stakeholder support. Managers may, however, ignore ortake some stakeholders for granted—leading to serious problems later. The Tata Group, for ex-ample, failed to consider the unwillingness of farmers in Singur, India, to accept the West Ben-gal government’s compensation for expropriating their land so that Tata could build its Nanoauto plant. Farmers formed rallies against the plant, blocked roads, and even assaulted an em-ployee of a Tata supplier.86
Top management can also propose a political strategy to influence its key stakeholders. Apolitical strategy is a plan to bring stakeholders into agreement with a corporation’s actions.Some of the most commonly used political strategies are constituency building, political ac-tion committee contributions, advocacy advertising, lobbying, and coalition building. Re-search reveals that large firms, those operating in concentrated industries, and firms that arehighly dependent upon government regulation are more politically active.87 Political supportcan be critical in entering a new international market, especially in transition economies wherefree market competition did not previously exist.88
Pressures from the Corporate CultureIf a strategy is incompatible with a company’s corporate culture, the likelihood of its successis very low. Foot-dragging and even sabotage will result as employees fight to resist a radical
SOURCE: Based on C. Anderson, “Values-Based Management,” Academy of Management Executive (November1997), pp. 25–46.
256 PART 3 Strategy Formulation
change in corporate philosophy. Precedents from the past tend to restrict the kinds of objectivesand strategies that are seriously considered.89 The “aura” of the founders of a corporation canlinger long past their lifetimes because their values are imprinted on a corporation’s members.
In evaluating a strategic alternative, strategy makers must consider pressures from the cor-porate culture and assess a strategy’s compatibility with that culture. If there is little fit, man-agement must decide if it should:
� Take a chance on ignoring the culture
� Manage around the culture and change the implementation plan
� Try to change the culture to fit the strategy
� Change the strategy to fit the culture
Further, a decision to proceed with a particular strategy without a commitment to changethe culture or manage around the culture (both very tricky and time consuming) is dangerous.Nevertheless, restricting a corporation to only those strategies that are completely compatiblewith its culture might eliminate from consideration the most profitable alternatives. (SeeChapter 10 for more information on managing corporate culture.)
Needs and Desires of Key ManagersEven the most attractive alternative might not be selected if it is contrary to the needs and desiresof important top managers. Personal characteristics and experience affect a person’s assessmentof an alternative’s attractiveness.90 For example, one study found that narcissistic (self-absorbedand arrogant) CEOs favor bold actions that attract attention, like many large acquisitions—re-sulting in either big wins or big losses.91 A person’s ego may be tied to a particular proposal tothe extent that all other alternatives are strongly lobbied against.As a result, the person may haveunfavorable forecasts altered so that they are more in agreement with the desired alternative.92
In a study by McKinsey & Company of 2,507 executives from around the world, 36% respondedthat managers hide, restrict, or misrepresent information at least “somewhat” frequently whensubmitting capital-investment proposals. In addition, an executive might influence other peoplein top management to favor a particular alternative so that objections to it are overruled. In thesame McKinsey study of global executives, more than 60% of the managers reported that busi-ness unit and divisional heads form alliances with peers or lobby someone more senior in the or-ganization at least “somewhat” frequently when resource allocation decisions are being made.93
Industry and cultural backgrounds affect strategic choice. For example, executives withstrong ties within an industry tend to choose strategies commonly used in that industry. Otherexecutives who have come to the firm from another industry and have strong ties outside theindustry tend to choose different strategies from what is being currently used in theirindustry.94 Country of origin often affects preferences. For example, Japanese managers pre-fer a cost-leadership strategy more than do United States managers.95 Research reveals that ex-ecutives from Korea, the U.S., Japan, and Germany tend to make different strategic choices insimilar situations because they use different decision criteria and weights. For example, Ko-rean executives emphasize industry attractiveness, sales, and market share in their decisions;whereas, U.S. executives emphasize projected demand, discounted cash flow, and ROI.96
There is a tendency to maintain the status quo, which means that decision makers con-tinue with existing goals and plans beyond the point when an objective observer would rec-ommend a change in course.97 Some executives show a self-serving tendency to attribute thefirm’s problems not to their own poor decisions but to environmental events out of their con-trol, such as government policies or a poor economic climate.98 For example, a CEO is morelikely to divest a poorly performing unit when its poor performance does not incriminate thatsame CEO who had acquired it.99 Negative information about a particular course of actionto which a person is committed may be ignored because of a desire to appear competent or
CHAPTER 8 Strategy Formulation: Functional Strategy and Strategic Choice 257
PROCESS OF STRATEGIC CHOICEThere is an old story told at General Motors:
At a meeting with his key executives, CEO Alfred Sloan proposed a controversial strategic deci-sion. When asked for comments, each executive responded with supportive comments and praise.After announcing that they were all in apparent agreement, Sloan stated that they were not goingto proceed with the decision. Either his executives didn’t know enough to point out potential down-sides of the decision, or they were agreeing to avoid upsetting the boss and disrupting the cohe-sion of the group. The decision was delayed until a debate could occur over the pros and cons.101
Strategic choice is the evaluation of alternative strategies and selection of the best alterna-tive.According to Paul Nutt, an authority in decision making, half of the decisions made by man-agers are failures.102 After analyzing 400 decisions, Nutt found that failure almost always stemsfrom the actions of the decision maker, not from bad luck or situational limitations. In these in-stances, managers commit one or more key blunders: (1) their desire for speedy actions leads toa rush to judgment, (2) they apply failure-prone decision-making practices such as adopting theclaim of an influential stakeholder, and (3) they make poor use of resources by investigatingonly one or two options. These three blunders cause executives to limit their search for feasiblealternatives and look for quick consensus. Only 4% of the 400 managers set an objective andconsidered several alternatives. The search for innovative options was attempted in only 24%of the decisions studied.103 Another study of 68 divestiture decisions found a strong tendencyfor managers to rely heavily on past experience when developing strategic alternatives.104
There is mounting evidence that when an organization is facing a dynamic environment,the best strategic decisions are not arrived at through consensus when everyone agrees on onealternative. They actually involve a certain amount of heated disagreement, and evenconflict.105 Many diverse opinions are presented, participants trust in one another’s abilities andcompetences, and conflict is task-oriented, not personal.106 This is certainly the case for firmsoperating in global industries. Because unmanaged conflict often carries a high emotional cost,authorities in decision making propose that strategic managers use “programmed conflict” toraise different opinions, regardless of the personal feelings of the people involved.107 Two tech-niques help strategic managers avoid the consensus trap that Alfred Sloan found:
1. Devil’s advocate: The idea of the devil’s advocate originated in the medieval RomanCatholic Church as a way of ensuring that impostors were not canonized as saints. Onetrusted person was selected to find and present all the reasons why a person should not becanonized. When this process is applied to strategic decision making, a devil’s advocate(who may be an individual or a group) is assigned to identify potential pitfalls and prob-lems with a proposed alternative strategy in a formal presentation.
2. Dialectical inquiry: The dialectical philosophy, which can be traced back to Plato andAristotle and more recently to Hegel, involves combining two conflicting views—thethesis and the antithesis—into a synthesis. When applied to strategic decision making,dialectical inquiry requires that two proposals using different assumptions be generatedfor each alternative strategy under consideration. After advocates of each position presentand debate the merits of their arguments before key decision makers, either one of the al-ternatives or a new compromise alternative is selected as the strategy to be implemented.
because of strongly held values regarding consistency. It may take a crisis or an unlikely eventto cause strategic decision makers to seriously consider an alternative they had previously ig-nored or discounted.100 For example, it wasn’t until the CEO of ConAgra, a multinational foodproducts company, had a heart attack that ConAgra started producing the Healthy Choice lineof low-fat, low-cholesterol, low-sodium frozen-food entrees.

258 PART 3 Strategy Formulation
Research generally supports the conclusion that the devil’s advocate and dialectical in-quiry methods are equally superior to consensus in decision making, especially when thefirm’s environment is dynamic. The debate itself, rather than its particular format, appears toimprove the quality of decisions by formalizing and legitimizing constructive conflict and byencouraging critical evaluation. Both lead to better assumptions and recommendations and toa higher level of critical thinking among the people involved.108
Regardless of the process used to generate strategic alternatives, each resulting alternativemust be rigorously evaluated in terms of its ability to meet four criteria:
1. Mutual Exclusivity: Doing any one alternative would preclude doing any other.
2. Success: It must be feasible and have a good probability of success.
3. Completeness: It must take into account all the key strategic issues.
4. Internal Consistency: It must make sense on its own as a strategic decision for the entirefirm and not contradict key goals, policies, and strategies currently being pursued by thefirm or its units.109
8.5 Developing PoliciesThe selection of the best strategic alternative is not the end of strategy formulation. The orga-nization must then engage in developing policies. Policies define the broad guidelines for im-plementation. Flowing from the selected strategy, policies provide guidance for decisionmaking and actions throughout the organization. They are the principles under which the cor-poration operates on a day-to-day basis. At General Electric, for example, Chairman JackWelch initiated the policy that any GE business unit must be Number One or Number Two inwhatever market it competes. This policy gave clear guidance to managers throughout the or-ganization. Another example of such a policy is Casey’s General Stores’ policy that a new ser-vice or product line may be added to its stores only when the product or service can be justifiedin terms of increasing store traffic.
When crafted correctly, an effective policy accomplishes three things:
� It forces trade-offs between competing resource demands.
� It tests the strategic soundness of a particular action.
� It sets clear boundaries within which employees must operate while granting them free-dom to experiment within those constraints.110
Policies tend to be rather long lived and can even outlast the particular strategy that cre-ated them. These general policies—such as “The customer is always right” (Nordstrom) or“Low prices, every day” (Wal-Mart)—can become, in time, part of a corporation’s culture.Such policies can make the implementation of specific strategies easier. They can also restricttop management’s strategic options in the future. Thus a change in strategy should be fol-lowed quickly by a change in policies. Managing policy is one way to manage the corporateculture.
CHAPTER 8 Strategy Formulation: Functional Strategy and Strategic Choice 259
This chapter completes the part of this book on strategy formulation and sets the stage for strat-egy implementation. Functional strategies must be formulated to support business and corpo-rate strategies; otherwise, the company will move in multiple directions and eventually pullitself apart. For a functional strategy to have the best chance of success, it should be built on a distinctive competency residing within that functional area. If a corporation does not have adistinctive competency in a particular functional area, that functional area could be a candi-date for outsourcing.
When evaluating a strategic alternative, the most important criterion is the ability of theproposed strategy to deal with the specific strategic factors developed earlier, in the SWOTanalysis. If the alternative doesn’t take advantage of environmental opportunities and corpo-rate strengths/competencies, and lead away from environmental threats and corporate weak-nesses, it will probably fail. Developing corporate scenarios and pro forma projections for eachalternative are rational aids for strategic decision making. This logical approach fitsMintzberg’s planning mode of strategic decision making, as discussed earlier in Chapter 1.Nevertheless, some strategic decisions are inherently risky and may be resolved on the basisof one person’s “gut feel.” This is an aspect of the entrepreneurial mode and may be used inlarge established corporations as well as in new venture startups. Various management studieshave found that executives routinely rely on their intuition to solve complex problems. The ef-fective use of intuition has been found to differentiate successful top executives and boardmembers from lower-level managers and dysfunctional boards.111 According to Ralph Larsen,Chair and CEO of Johnson & Johnson, “Often there is absolutely no way that you could havethe time to thoroughly analyze every one of the options or alternatives available to you. So youhave to rely on your business judgment.”112 For managerial intuition to be effective, however,it requires years of experience in problem solving and is founded upon a complete understand-ing of the details of the business.113
For example, when Bob Lutz, President of Chrysler Corporation, was enjoying a fast drivein his Cobra roadster one weekend in 1988, he wondered why Chrysler’s cars were so dull. “Ifelt guilty: there I was, the president of Chrysler, driving this great car that had such a strongFord association,” said Lutz, referring to the original Cobra’s Ford V-8 engine. That Monday,Lutz enlisted allies at Chrysler to develop a muscular, outrageous sports car that would turnheads and stop traffic. Others in management argued that the $80 million investment would bebetter spent elsewhere. The sales force warned that no U.S. auto maker had ever succeeded inselling a $50,000 car. With only his gut instincts to support him, he pushed the project forwardwith unwavering commitment. The result was the Dodge Viper—a car that single-handedlychanged the public’s perception of Chrysler. Years later, Lutz had trouble describing exactlyhow he had made this critical decision. “It was this subconscious, visceral feeling. And it justfelt right,” explained Lutz.114
End of Chapter SUMMARY
260 PART 3 Strategy Formulation
D I S C U S S I O N Q U E S T I O N S1. Are functional strategies interdependent, or can they be
formulated independently of other functions?
2. Why is penetration pricing more likely than skim pricingto raise a company’s or a business unit’s operating profitin the long run?
3. How does mass customization support a business unit’scompetitive strategy?
4. When should a corporation or business unit outsource afunction or an activity?
5. What is the relationship of policies to strategies?
S T R A T E G I C P R A C T I C E E X E R C I S EPierre Omidyar founded a sole proprietorship in September1995 called Auction Web to allow people to buy and sell goodsover the Internet. The new venture was based on the idea of de-veloping a community-driven process, where an organic,evolving, self-organizing web of individual relationships,formed around shared interests, would handle tasks that othercompanies handle with customer service operations. By May1996, Omidyar had added Jeff Skoll as a partner and the ven-ture was incorporated as eBay. Two years later, Omidyar askedMeg Whitman to direct corporate strategy to continue the ac-celerated growth rate of the company. Whitman brought to thecompany global management and marketing experience andsoon became President and CEO. In almost no time, the com-pany became one of the Web’s most successful sites, with233 million registered users. By 2007, the average eBay userspent nearly two hours a month on the site—more than fivetimes the time spent on Amazon.com.117
Whitman expanded the company’s operations and spentmore than $6 billion to acquire companies, such as Internet-phone operation Skype, online payments service PayPal,ticket reseller StubHub, property rental and roommate searchfirm Rent.com, comparison shopping site Shopping.com,Web site recommender Stumbleupon, and 25% interest inCraigslist. Expansion and diversification provided revenueand profit growth plus stock price appreciation. Although fi-nancial analysts wondered how all these businesses would fittogether, Whitman argued that she wanted eBay to be every-where users wanted to be. At developer conferences, com-pany representatives unveiled new services that let buyers
shop for and purchase eBay items outside of the coreeBay.com site.
By 2008, eBay was in trouble. Its stock price had lost halfits value over the past three years. The core auction and retailbusinesses, which accounted for the majority of revenue, wereshowing signs of weakness. The number of active users hadbeen flat for three quarters, at 83 million. The number of newproducts listed on the site had increased only 4% from the pre-vious year. The number of stores selling goods at fixed priceson eBay declined from a year earlier to 532,000. The companyhad not done a good job of integrating Skype with its mainbusiness. Since its acquisition, Skype’s service had actuallydeteriorated.118 Competition had increased as rival Web sites,particularly Amazon, now provided similar Web services anderoded eBay’s competitive advantage.
On January 23, 2008, CEO Whitman announced thatJohn Donahoe would take over as the company’s CEO. Dona-hoe stated that his first priority would be to revitalize eBay’score business, even at the expense of investors. “We need toaggressively change our product, our customer approach, andour business model,” announced the new CEO.119
1. What is eBay’s problem?
2. Which marketing strategy was eBay following: market de-velopment or product development? Do you agree with it?
3. What decision-making process should CEO Donahoe uti-lize to make the decisions necessary to change the com-pany’s product, customer approach, and business model?
E C O - B I T S� In the two-day period after joining the U.S. Environ-
mental Protection Agency’s voluntary Climate Leader’sinitiative, which requires members to reduce or offsetemissions over the next 5 to 10 years, the average com-pany’s stock price dropped 0.9% more than it wouldhave from normal market factors.115
� General Motors states that its facilities recycle 89% ofthe waste they generate and that GM is one of theworld’s largest industrial users of solar power.116
CHAPTER 8 Strategy Formulation: Functional Strategy and Strategic Choice 261
K E Y T E R M Sconsensus (p. 257)corporate scenarios (p. 251)devil’s advocate (p. 257)dialectical inquiry (p. 257)financial strategy (p. 239)functional strategy (p. 238)HRM strategy (p. 246)information technology strategy (p. 247)leveraged buyout (p. 240)
logistics strategy (p. 246)market development (p. 238)marketing strategy (p. 238)offshoring (p. 248)operations strategy (p. 242)outsourcing (p. 247)political strategy (p. 255)product development (p. 238)purchasing strategy (p. 244)
R&D strategy (p. 241)real-options (p. 254)risk (p. 253)Stakeholder Priority Matrix (p. 255)strategic choice (p. 257)technological follower (p. 241)technological leader (p. 241)
N O T E S1. Arm & Hammer is a registered trademark of Church & Dwight
Company, Inc.2. S. F. Slater and E. M. Olson, “Market’s Contribution to the Im-
plementation of Business Strategy: An Empirical Analysis,”Strategic Management Journal (November 2001),pp. 1055–1067; B. C. Skaggs and T. R. Huffman, “A CustomerInteraction Approach to Strategy and Production ComplexityAlignment in Service Firms,” Academy of Management Journal(December 2003), pp. 775–786.
3. A. Pressman, “Ocean Spray’s Creative Juices,” Business Week(May 15, 2006), pp. 88–89.
4. A. Pressman, “Smith & Wesson: A Gunmaker Loaded with Off-shoots,” Business Week (June 4, 2007), p. 66. A line extension,in contrast to brand extension, is the introduction of additionalitems in the same category under the same brand name, such asnew flavors, added ingredients, or package sizes.
5. S. M. Oster, Modern Competitive Analysis, 2nd ed. (New York:Oxford University Press, 1994), p. 93.
6. J. M. de Figueiredo and M. K. Kyle, “Surviving the Gales ofCreative Destruction: The Determinants of Product Turnover,”Strategic Management Journal (March 2006), pp. 241–264.
7. M. Springer, “Plowed Under,” Forbes (February 21, 2000), p. 56.8. W. Redmond, “The Strategic Pricing of Innovative Products,”
Handbook of Business Strategy, 1992/1993 Yearbook, edited by H. E. Glass and M. A. Hovde (Boston: Warren, Gorham & Lamont,1992), pp. 16.1–16.13; A. Hinterhuber, “Towards Value-BasedPricing—An Integrative Framework for Decision Making,”Industrial Marketing Management, Vol. 33 (2004), pp. 765–778.
9. A. Kambil, H. J. Wilson III, and V. Agrawal, “Are You LeavingMoney on the Table?” Journal of Business Strategy(January/February 2002), pp. 40–43.
10. P. Burrows, “Apple’s Cash Conundrum,” Business Week(August 11, 2008), p. 32.
11. A. Safieddine and S. Titman in April 1999 Journal of Finance,as summarized by D. Champion, “The Joy of Leverage,”Harvard Business Review (July–August 1999), pp. 19–22.
12. R. Kochhar and M. A. Hitt, “Linking Corporate Strategy toCapital Structure: Diversification Strategy, Type and Source
of Financing,” Strategic Management Journal (June 1998),pp. 601–610.
13. A. Rappaport and M. L. Sirower, “Stock or Cash?” HarvardBusiness Review (November–December 1999), pp. 147–158.
14. “Private Investigations,” The Economist (July 5, 2008), pp. 84–85.15. “Private Investigations,” The Economist (July 5, 2008), pp. 84–85.16. D. Angwin and I. Contardo, “Unleashing Cerberus: Don’t Let
Your MBOs Turn on Themselves,” Long Range Planning(October 1999), pp. 494–504.
17. For information on different types of LBOs, see M. Wright,R. E. Hoskisson, and L. W. Busenitz, “Firm Rebirth: Buyouts asFacilitators of Strategic Growth and Entrepreneurship,” Academyof Management Executive (February 2001), pp. 111–125.
18. D. N. Hurtt, J. G. Kreuze, and S. A. Langsam, “Stock Buybacksand Their Association with Stock Options Exercised in the ITIndustry,” American Journal of Business (Spring 2008),pp. 13–21.
19. B. Deener, “Back Up and Look at Reasons for Reverse StockSplit,” The (St. Petersburg, FL) Times (December 29, 2002), p. 3H.
20. M. Orey, “A Sotheby’s for Investors,” Business Week (February13, 2006), p. 39.
21. T. Due, “Dean Foods Thrives on Regional Off-Brand Prod-ucts,” Wall Street Journal (September 17, 1987), p. A6.
22. S. Stevens, “Speeding the Signals of Change,” Appliance(February 1995), p. 7.
23. L-E. Gadde and H. Hakansson, “Teaching in Supplier Net-works,” in Strategic Networks: Learning to Compete, byM. Gibbert and T. Durand, eds. (Malden, MA: Blackwell Pub-lishing, 2007), pp. 40–57.
24. “Schools Rent Out Labs to Businesses,” St. Cloud (MN) Times(December 11, 2007), p. 3A.
25. H. W. Chesbrough, “A Better Way to Innovate,” Harvard Busi-ness Review (July 2003), pp. 12–13.
26. J. Bughin, M. Chui, and B. Johnson, “The Next Step in OpenInnovation,” McKinsey Quarterly (June 2008), pp. 1–8.
27. J. Greene, J. Carey, M. Arndt, and O. Port, “Reinventing Cor-porate R&D,” Business Week (September 22, 2003),pp. 74–76; J. Birkinshaw, S. Crainer, and M. Mol, “From
R&D to Connect � Develop at P&G,” Business StrategyReview (Spring 2007), pp. 66–69; L. Huston and N. Sakkab,“Connect and Develop: Inside Proctor & Gamble’s NewModel for Innovation,” Harvard Business Review (March2006), pp. 58–66.
28. G. Dushnitsky and M. J. Lenox, “When Do Firms UndertakeR&D by Investing in New Ventures?” Paper presented to annualmeeting of the Academy of Management, Seattle, WA (August2003).
29. A. Aston and M. Arndt, “The Flexible Factory,” Business Week(May 5, 2003), pp. 90–91.
30. J. R. Williams and R. S. Novak, “Aligning CIM Strategies toDifferent Markets,” Long Range Planning (February 1990),pp. 126–135.
31. J. Wheatley, “Super Factory—or Super Headache,” BusinessWeek (July 31, 2000), p. 66.
32. M. Tayles and C. Drury, “Moving from Make/Buy to StrategicSourcing: The Outsource Decision Process,” Long Range Plan-ning (October 2001), pp. 605–622.
33. F. R. Bleakley, “Some Companies Let Supplies Work on Siteand Even Place Orders,” Wall Street Journal (January 13, 1995),pp. A1, A6.
34. M. Hoegl and S. M. Wagner, “Buyer-Supplier Collaboration inProduct Development Projects,” Journal of Management(August 2005), pp. 530–548; B. McEvily and A. Marcus, “Em-bedded Ties and the Acquisition of Competitive Capabilities,”Strategic Management Journal (November 2005), pp. 1033–1055;R. Gulati and M. Sytch, “Dependence Asymmetry and Joint De-pendence in Interorganizational Relationships: Effects of Em-beddedness on a Manufacturer’s Performance in ProcurementRelationships,” Administrative Science Quarterly (March 2007),pp. 32–69.
35. J. Richardson, “Parallel Sourcing and Supplier Performance inthe Japanese Automobile Industry,” Strategic ManagementJournal (July 1993), pp. 339–350.
36. S. Roberts-Witt, “Procurement: The HP Way,” PC Magazine(November 21, 2000), pp. 21–22.
37. D. H. Pearcy, D. B. Parker, and L. C. Giunipero, “Using Elec-tronic Procurement to Facilitate Supply Chain Integration: AnExploratory Study of U.S.-based Firms,” American Journal ofBusiness (Spring 2008), pp. 23–35.
38. J. Bigness, “In Today’s Economy, There Is Big Money to BeMade in Logistics,” Wall Street Journal (September 6, 1995),pp. A1, A9.
39. F. Keenan, “Logistics Gets a Little Respect,” Business Week(November 20, 2000), pp. 112–116.
40. B. L. Kirkman and Debra L. Shapiro, “The Impact of CulturalValues on Employee Resistance to Teams: Toward a Modelof Globalized Self-Managing Work Team Effectiveness,”Academy of Management Review (July 1997), pp. 730–757.
41. R. D. Banker, J. M. Field, R. G. Schroeder, and K. K. Sinha,“Impact of Work Teams on Manufacturing Performance: ALongitudinal Field Study,” Academy of Management Journal
(August 1996), pp. 867–890; B. L. Kirkman and B. Rosen, “Be-yond Self-Management: Antecedents and Consequences ofTeam Empowerment,” Academy of Management Journal(February 1999), pp. 58–74.
42. V. Y. Haines III, S. St. Onge, and A. Marcoux, “PerformanceManagement Design and Effectiveness in Quality-Driven Or-ganizations,” Canadian Journal of Administrative Sciences(June 2004), pp. 146–160.
43. A. S. DeNisi and A. N. Kluger, “Feedback Effectiveness: Can360-Degree Appraisals Be Improved?” Academy of Manage-ment Executive (February 2000), pp. 129–139; G. Toegel andJ. A. Conger, “360-Degree Assessment: Time for Reinven-tion,” Academy of Management Learning and Education(September 2003), pp. 297–311; F. Shipper, R. C. Hoffman,and D. M. Rotondo, “Does the 360 Feedback Process Create Actionable Knowledge Equally Across Cultures?” Academyof Management Learning & Education (March 2007), pp. 33–50.
44. J. McGregor, “The Employee Is Always Right,” Business Week(November 19, 2007), pp. 80–82.
45. O. C. Richard, “Racial Diversity, Business Strategy, and FirmPerformance: A Resource-Based View,” Academy of Manage-ment Journal (April 2000), pp. 164–177.
46. G. Robinson and K. Dechant, “Building a Business Case for Di-versity,” Academy of Management Executive (August 1997),pp. 21–31.
47. K. Labich, “Making Diversity Pay,” Fortune (September 9,1996), pp. 177–180.
48. N. G. Carr, “IT Doesn’t Matter,” Harvard Business Review(May 2003), pp. 41–50.
49. J. Greco, “Good Day Sunshine,” Journal of Business Strategy(July/August 1998), pp. 4–5.
50. W. Howard, “Translate Now,” PC Magazine (September 19,2000), p. 81.
51. H. Green, “The Web Smart 50,” Business Week (November 24,2003), p. 84.
52. T. Smart, “Jack Welch’s Cyber-Czar,” Business Week (August 5,1996), p. 83.
53. S. M. Kim and J. T. Mahoney, “Mutual Commitment to SupportExchange: Relation-Specific IT System as a Substitute forManagerial Hierarchy,” Strategic Management Journal (May2006), pp. 401–423.
54. B. Kelley, “Outsourcing Marches On,” Journal of BusinessStrategy (July/August 1995), p. 40.
55. S. Holmes and M. Arndt, “A Plane that Could Change theGame,” Business Week (August 9, 2004), p. 33.
56. J. Greco, “Outsourcing: The New Partnership,” Journal of Busi-ness Strategy (July/August 1997), pp. 48–54.
57. W. M. Fitzpatrick and S. A. DiLullo, “Outsourcing and the Per-sonnel Paradox,” SAM Advanced Management Journal (Sum-mer 2007), pp. 4–12.
58. Outsourcing: Time to Bring It Back Home?” The Economist(March 5, 2005), p. 63.
262 PART 3 Strategy Formulation
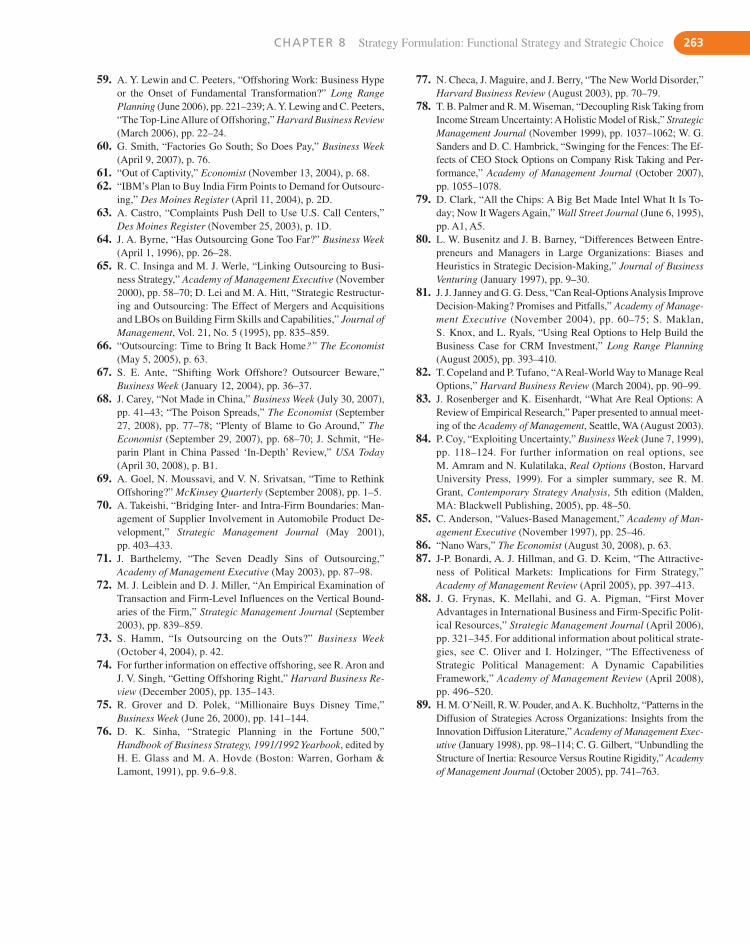
59. A. Y. Lewin and C. Peeters, “Offshoring Work: Business Hypeor the Onset of Fundamental Transformation?” Long RangePlanning (June 2006), pp. 221–239; A. Y. Lewing and C. Peeters,“The Top-Line Allure of Offshoring,” Harvard Business Review(March 2006), pp. 22–24.
60. G. Smith, “Factories Go South; So Does Pay,” Business Week(April 9, 2007), p. 76.
61. “Out of Captivity,” Economist (November 13, 2004), p. 68.62. “IBM’s Plan to Buy India Firm Points to Demand for Outsourc-
ing,” Des Moines Register (April 11, 2004), p. 2D.63. A. Castro, “Complaints Push Dell to Use U.S. Call Centers,”
Des Moines Register (November 25, 2003), p. 1D.64. J. A. Byrne, “Has Outsourcing Gone Too Far?” Business Week
(April 1, 1996), pp. 26–28.65. R. C. Insinga and M. J. Werle, “Linking Outsourcing to Busi-
ness Strategy,” Academy of Management Executive (November2000), pp. 58–70; D. Lei and M. A. Hitt, “Strategic Restructur-ing and Outsourcing: The Effect of Mergers and Acquisitionsand LBOs on Building Firm Skills and Capabilities,” Journal ofManagement, Vol. 21, No. 5 (1995), pp. 835–859.
66. “Outsourcing: Time to Bring It Back Home?” The Economist(May 5, 2005), p. 63.
67. S. E. Ante, “Shifting Work Offshore? Outsourcer Beware,”Business Week (January 12, 2004), pp. 36–37.
68. J. Carey, “Not Made in China,” Business Week (July 30, 2007),pp. 41–43; “The Poison Spreads,” The Economist (September27, 2008), pp. 77–78; “Plenty of Blame to Go Around,” TheEconomist (September 29, 2007), pp. 68–70; J. Schmit, “He-parin Plant in China Passed ‘In-Depth’ Review,” USA Today(April 30, 2008), p. B1.
69. A. Goel, N. Moussavi, and V. N. Srivatsan, “Time to RethinkOffshoring?” McKinsey Quarterly (September 2008), pp. 1–5.
70. A. Takeishi, “Bridging Inter- and Intra-Firm Boundaries: Man-agement of Supplier Involvement in Automobile Product De-velopment,” Strategic Management Journal (May 2001),pp. 403–433.
71. J. Barthelemy, “The Seven Deadly Sins of Outsourcing,”Academy of Management Executive (May 2003), pp. 87–98.
72. M. J. Leiblein and D. J. Miller, “An Empirical Examination ofTransaction and Firm-Level Influences on the Vertical Bound-aries of the Firm,” Strategic Management Journal (September2003), pp. 839–859.
73. S. Hamm, “Is Outsourcing on the Outs?” Business Week(October 4, 2004), p. 42.
74. For further information on effective offshoring, see R. Aron andJ. V. Singh, “Getting Offshoring Right,” Harvard Business Re-view (December 2005), pp. 135–143.
75. R. Grover and D. Polek, “Millionaire Buys Disney Time,”Business Week (June 26, 2000), pp. 141–144.
76. D. K. Sinha, “Strategic Planning in the Fortune 500,”Handbook of Business Strategy, 1991/1992 Yearbook, edited byH. E. Glass and M. A. Hovde (Boston: Warren, Gorham &Lamont, 1991), pp. 9.6–9.8.
77. N. Checa, J. Maguire, and J. Berry, “The New World Disorder,”Harvard Business Review (August 2003), pp. 70–79.
78. T. B. Palmer and R. M. Wiseman, “Decoupling Risk Taking fromIncome Stream Uncertainty: A Holistic Model of Risk,” StrategicManagement Journal (November 1999), pp. 1037–1062; W. G.Sanders and D. C. Hambrick, “Swinging for the Fences: The Ef-fects of CEO Stock Options on Company Risk Taking and Per-formance,” Academy of Management Journal (October 2007),pp. 1055–1078.
79. D. Clark, “All the Chips: A Big Bet Made Intel What It Is To-day; Now It Wagers Again,” Wall Street Journal (June 6, 1995),pp. A1, A5.
80. L. W. Busenitz and J. B. Barney, “Differences Between Entre-preneurs and Managers in Large Organizations: Biases andHeuristics in Strategic Decision-Making,” Journal of BusinessVenturing (January 1997), pp. 9–30.
81. J. J. Janney and G. G. Dess, “Can Real-Options Analysis ImproveDecision-Making? Promises and Pitfalls,” Academy of Manage-ment Executive (November 2004), pp. 60–75; S. Maklan,S. Knox, and L. Ryals, “Using Real Options to Help Build theBusiness Case for CRM Investment,” Long Range Planning(August 2005), pp. 393–410.
82. T. Copeland and P. Tufano, “A Real-World Way to Manage RealOptions,” Harvard Business Review (March 2004), pp. 90–99.
83. J. Rosenberger and K. Eisenhardt, “What Are Real Options: AReview of Empirical Research,” Paper presented to annual meet-ing of the Academy of Management, Seattle, WA (August 2003).
84. P. Coy, “Exploiting Uncertainty,” Business Week (June 7, 1999),pp. 118–124. For further information on real options, seeM. Amram and N. Kulatilaka, Real Options (Boston, HarvardUniversity Press, 1999). For a simpler summary, see R. M.Grant, Contemporary Strategy Analysis, 5th edition (Malden,MA: Blackwell Publishing, 2005), pp. 48–50.
85. C. Anderson, “Values-Based Management,” Academy of Man-agement Executive (November 1997), pp. 25–46.
86. “Nano Wars,” The Economist (August 30, 2008), p. 63.87. J-P. Bonardi, A. J. Hillman, and G. D. Keim, “The Attractive-
ness of Political Markets: Implications for Firm Strategy,”Academy of Management Review (April 2005), pp. 397–413.
88. J. G. Frynas, K. Mellahi, and G. A. Pigman, “First Mover Advantages in International Business and Firm-Specific Polit-ical Resources,” Strategic Management Journal (April 2006),pp. 321–345. For additional information about political strate-gies, see C. Oliver and I. Holzinger, “The Effectiveness ofStrategic Political Management: A Dynamic CapabilitiesFramework,” Academy of Management Review (April 2008),pp. 496–520.
89. H. M. O’Neill, R. W. Pouder, and A. K. Buchholtz, “Patterns in theDiffusion of Strategies Across Organizations: Insights from theInnovation Diffusion Literature,” Academy of Management Exec-utive (January 1998), pp. 98–114; C. G. Gilbert, “Unbundling theStructure of Inertia: Resource Versus Routine Rigidity,” Academyof Management Journal (October 2005), pp. 741–763.
CHAPTER 8 Strategy Formulation: Functional Strategy and Strategic Choice 263
90. B. B. Tyler and H. K. Steensma. “Evaluating TechnologicalCollaborative Opportunities: A Cognitive Modeling Perspec-tive,” Strategic Management Journal (Summer 1995), pp. 43–70;D. Duchan, D. P. Ashman, and M. Nathan, “Mavericks, Vision-aries, Protestors, and Sages: Toward a Typology of CognitiveStructures for Decision Making in Organizations,” Journal ofBusiness Strategies (Fall 1997), pp. 106–125; P. Chattopad-hyay, W. H. Glick, C. C. Miller, and G. P. Huber, “Determinantsof Executive Beliefs: Comparing Functional Conditioning andSocial Influence,” Strategic Management Journal (August1999), pp. 763–789; B. Katey and G. G. Meredith, “Relation-ship Among Owner/Manager Personal Values, Business Strate-gies, and Enterprise Performance,” Journal of Small BusinessManagement (April 1997), pp. 37–64.
91. A. Chatterjee and D. C. Hambrick, “It’s All About Me: Narcis-sistic Executive Officers and Their Effects on Company Strat-egy and Performance,” Administrative Science Quarterly(September 2007), pp. 351–386.
92. C. S. Galbraith and G. B. Merrill, “The Politics of Forecasting:Managing the Truth,” California Management Review (Winter1996), pp. 29–43.
93. M. Garbuio, D. Lovallo, and P. Viguerie, “How CompaniesSpend Their Money: A McKinsey Global Survey,” McKinseyQuarterly Online (June 2007).
94. M. A. Geletkanycz and D. C. Hambrick, “The External Ties ofTop Executives: Implications for Strategic Choice and Perfor-mance,” Administrative Science Quarterly (December 1997),pp. 654–681.
95. M. Song, R. J. Calantone, and C. A. Di Benedetto, “Competi-tive Forces and Strategic Choice Decisions: An ExperimentalInvestigation in the United States and Japan,” Strategic Man-agement Journal (October 2002), pp. 969–978.
96. M. A. Hitt, M. T. Dacin, B. B. Tyler, and D. Park, “Understand-ing the Differences in Korean and U.S. Executives’ StrategicOrientation,” Strategic Management Journal (February 1997),pp. 159–167; L. G. Thomas III and G. Waring, “CompetingCapitalisms: Capital Investment in American, German, and Jap-anese Firms,” Strategic Management Journal (August 1999),pp. 729–748.
97. M. H. Bazerman and D. Chugh, “Decisions Without Blinders,”Harvard Business Review (January 2006), pp. 88–97.
98. J. A. Wagner III and R. Z. Gooding, “Equivocal Informationand Attribution: An Investigation of Patterns of ManagerialSensemaking,” Strategic Management Journal (April 1997),pp. 275–286; K. Shimizu and M. A. Hitt, “Strategic Flexibility:Organizational Preparedness to Reverse Ineffective StrategicDecisions,” Academy of Management Executive (November2004), pp. 44–59.
99. M. L. A. Hayward and K. Shimizu, “De-Commitment to Los-ing Strategic Action: Evidence from the Divestiture of PoorlyPerforming Acquisitions,” Strategic Management Journal(June 2006), pp. 541–557.
100. J. Ross and B. M. Staw, “Organizational Escalation and Exit:Lessons from the Shoreham Nuclear Power Plant,” Academy of
Management Journal (August 1993), pp. 701–732; P. W. Mulvey,J. F. Veiga, and P. M. Elsass, “When Teammates Raise a WhiteFlag,” Academy of Management Executive (February 1996),pp. 40–49.
101. R. A. Cosier and C. R. Schwenk, “Agreement and ThinkingAlike: Ingredients for Poor Decisions,” Academy of Manage-ment Executive (February 1990), p. 69.
102. P. C. Nutt, Why Decisions Fail (San Francisco: Berrett-Koehler,2002).
103. P. C. Nutt, “Expanding the Search for Alternatives DuringStrategic Decision-Making,” Academy of Management Execu-tive (November 2004), pp. 13–28.
104. K. Shimizu, “Prospect Theory, Behavioral Theory, and theThreat-Rigidity Thesis: Combinative Effects on OrganizationalDecisions to Divest Formerly Acquired Units,” Academy ofManagement Journal (December 2007), pp. 1495–1514.
105. G. P. West III and G. D. Meyer, “To Agree or Not to Agree?Consensus and Performance in New Ventures,” Journal of Busi-ness Venturing (September 1998), pp. 395–422; L. Markoczy,“Consensus Formation During Strategic Change,” StrategicManagement Journal (November 2001), pp. 1013–1031.
106. B. J. Olson, S. Parayitam, and Y. Bao, “Strategic Decision Mak-ing: The Effects of Cognitive Diversity, Conflict, and Trust onDecision Outcomes,” Journal of Management (April 2007),pp. 196–222.
107. A. C. Amason, “Distinguishing the Effects of Functional andDysfunctional Conflict on Strategic Decision Making: Resolv-ing a Paradox for Top Management Teams,” Academy of Man-agement Journal (February 1996), pp. 123–148; A. C. Amasonand H. J. Sapienza, “The Effects of Top Management TeamSize and Interaction Norms on Cognitive and Affective Con-flict,” Journal of Management, Vol. 23, No. 4 (1997),pp. 495–516.
108. D. M. Schweiger, W. R. Sandberg, and P. L. Rechner, “Ex-periential Effects of Dialectical Inquiry, Devil’s Advocacy,and Consensus Approaches to Strategic Decision Making,”Academy of Management Journal (December 1989), pp. 745–772; G. Whyte, “Decision Failures: Why They Occurand How to Prevent Them,” Academy of Management Execu-tive (August 1991), pp. 23–31; R. L. Priem, D. A. Harrison, andN. K. Muir, “Structured Conflict and Consensus Outcomes inGroup Decision Making,” Journal of Management, Vol. 21,No. 4 (1995), pp. 691–710.
109. S. C. Abraham, “Using Bundles to Find the Best Strategy,”Strategy & Leadership (July/August/September 1999),pp. 53–55.
110. O. Gadiesh and J. L Gilbert, “Transforming Corner-OfficeStrategy into Frontline Action,” Harvard Business Review (May2001), pp. 73–79.
111. E. Dane and M. G. Pratt, “Exploring Intuition and Its Role inManagerial Decision Making,” Academy of Management Re-view (January 2007), pp. 33–54.
112. A. M. Hayashi, “When to Trust Your Gut,” Harvard BusinessReview (February 2001), pp. 59–65.
264 PART 3 Strategy Formulation

113. E. Dane and M. G. Pratt, “Exploring Intuition and Its Role inManagerial Decision Making,” Academy of Management Re-view (January 2007), pp. 33–54.
114. A. M. Hayashi, pp. 59–60.115. “Losing Green By Going Green,” Business Week (June 30,
2008), p. 61.116. Advertisement by General Motors appearing in National Geo-
graphic Magazine (June 2008).
117. C. Holahan, “Going, Going...Everywhere,” Business Week(June 18, 2007), pp. 62–64.
118. “The Skype Hyper,” The Economist (October 6, 2007), p. 80.119. C. Holahan, “EBay’s New Tough Love CEO,” Business Week
(February 4, 2008), pp. 58–59.
CHAPTER 8 Strategy Formulation: Functional Strategy and Strategic Choice 265
266 PART 3 Strategy Formulation
KMART AND SEARS: STILL STUCK IN THE MIDDLE?
On January 22, 2002, Kmart Corporation became thelargest retailer in U.S. history to seek bankruptcy protec-tion. In Kmart’s petition for reorganization underChapter 11 of the U.S. Bankruptcy Code, Kmart man-agement announced that they would outline a plan forrepaying Kmart’s creditors, reducing its size, and re-structuring its business so that it could leave court pro-tection as a viable competitor in discount mass-marketretailing. Emerging from bankruptcy in May 2003,Kmart still lacked a business strategy to succeed in anextremely competitive marketplace.
The U.S. discount department store industry hadreached maturity by 2004 and Kmart no longer pos-sessed a clearly-defined position within that industry. Itsprimary competitors were Wal-Mart, Sears, Target,Kohl’s, and J.C. Penney, with secondary competitors incertain categories. Wal-Mart, an extremely efficient re-tailer, was known for consistently having the lowestcosts (reflected in low prices) and the highest sales in theindustry. Having started in rural America, Wal-Mart wasnow actively growing internationally. Sears, with thesecond-highest annual sales, had a strong position inhard goods, such as home appliances and tools. Around40% of all major home appliance sales continued to becontrolled by Sears. Nevertheless, Sears was strugglingwith slumping sales as customers turned from Searsmall stores to stand-alone, big-box retailers, such asLowe’s and Home Depot, to buy their hard goods. Tar-get, third in sales but second in profits, behind Wal-Mart, had distinguished itself as a merchandiser ofstylish upscale products. Along with Wal-Mart, Targethad flourished to such an extent that Dayton-Hudson, itsparent company, had changed its corporate name to Tar-get. Kohl’s, a relatively new entrant to the industry, op-erated 420 family-oriented stores in 32 states. J.C.Penney operated more than 1,000 stores in all 50 states.Both Kohl’s and J.C. Penney emphasized soft goods,such as clothing and related items.
Ending Case for Part ThreeKmart was also challenged by “category killers”
that competed in only one or a few industry categories,but in greater depth within any category than could anydepartment store. Some of these were Toys “R” Us,Home Depot, Lowe’s, and drug stores such as Rite Aid,CVS, Eckerd, and Walgreens.
Kmart had been established in 1962 by its parentcompany S.S. Kresge as a discount department store of-fering the most variety of goods at the lowest prices. Un-like Sears, the company chose not to locate in largeshopping malls but to establish its discount stores inhighly visible corner locations. During the 1960s, ’70s,and ’80s, Kmart prospered. By 1990, however, whenWal-Mart first surpassed Kmart in annual sales, Kmart’sstores had become dated and lost their appeal. Otherwell-known discount stores, such as Korvette’s, Grant’s,Woolco, Ames, Bradlees, and Montgomery Ward, hadgone out of business as the industry had consolidated andreached maturity. Attempting to avoid this fate, Kmartmanagement updated and enlarged the stores, addedname brands, and hired Martha Stewart as its lifestyleconsultant. None of these changes improved Kmart’s fi-nancial situation. By the time it declared bankruptcy, ithad lost money in five of the past 10 years.
Out of bankruptcy, Kmart became profitable—pri-marily by closing or selling (to Sears and Home Depot)around 600 of its retail stores. Management had been un-able to invigorate sales in its stores. Declared guilty of in-sider trading, Martha Stewart went to prison just beforethe 2004 Christmas season. In a surprise move, EdwardLampert, Kmart’s Chairman of the Board and a control-ling shareholder of Kmart, initiated the acquisition ofSears by Kmart for $11 billion in November 2004. Thenew company was to be called Sears Holdings Corpora-tion. Even though management predicted that the com-bined company’s costs could be reduced by $500 millionannually within three years through supplier and admin-istrative economies, analysts wondered how these twostruggling firms could ever be successful.
By the end of 2007, the stock of Sears Holdings hadfallen to 111 from its peak of 195 earlier in the year. Likemany retailers, both Sears and Kmart struggled to attractshoppers in an overcrowded industry and a slumpingeconomy. Sears Holdings did, however, have $1.5 bil-lion in cash, a significant advantage during lean times,and more than its rivals J.C. Penney, Kohl’s, and Macy’scombined. The company’s debt load was only 25% of
This case was written by J. David Hunger for Strategic Management andBusiness Policy, 12th edition and for Concepts in Strategic Managementand Business Policy, 12th edition. Copyright © 2008 by J. DavidHunger. Reprinted by permission. References available upon request.

CHAPTER 8 Strategy Formulation: Functional Strategy and Strategic Choice 267
the total capital on its balance sheet, compared to 46%for Penney’s and 53% for Macy’s. It also had significantreal estate assets on its balance sheet. For example,Sears owned outright 518 of its 816 locations and manyof the Kmart stores were located in strip malls close tolarge cities. Since fewer shopping malls were now beingbuilt, it was becoming harder to find space for “big-box”retailers in metropolitan areas.
The most recent quarterly results for 2007 of SearsHoldings reported the third straight quarter of deteriorating
profit margins and same-store sales. After months ofcutting the number of employees and reducing otherexpenses, industry analysts felt that there was little left tocut. They were also concerned that management had failedto invest in store improvements. Sears Holdings had justlaunched a bid in November 2007 to purchase RestorationHardware, a home-goods retailer. Even though Restora-tion Hardware was also facing sluggish sales, it wasthought that Sears’ management could use the acquisitionto create an upscale boutique within its stores.

This page intentionally left blank
PA R T4
Strategy
Implementationand
Control

For nearly five decades, Wal-Mart’s “everyday low prices” and low cost position
had enabled it to rapidly grow to dominate North America’s retailing landscape. By
2006, however, its U.S. division generated only 1.9% growth in its same-store sales.
By 2007, Target, Costco, Kroger, Safeway, Walgreens, CVS, and Best Buy were all
growing faster than Wal-Mart. At about the same time, Microsoft, whose software
had grown to dominate personal computers worldwide, saw its revenue growth slow to
just 8% in 2005. The company’s stock price had been flat since 2002, an indication that investors
no longer perceived Microsoft as a growth company. What had happened to these two success-
ful companies? Was this an isolated phenomenon? What could be done, if anything, to reinvig-
orate these giants?1
A research study by Matthew Olson, Derek van Bever, and Seth Verry attempts to provide
an answer. After analyzing the experiences of 500 successful companies over a 50-year period,
they found that 87% of the firms had suffered one or more serious declines in sales and prof-
its. This included a diverse set of corporations, such as Levi Strauss, 3M, Apple, Bank One, Cater-
pillar, Daimler-Benz, Toys“R”Us, and Volvo. After years of prolonged growth in sales and
profits, revenue growth at each of these firms suddenly stopped and even turned negative!
Olson, van Bever, and Verry called these long-term reversals in company growth stall points. On
average, corporations lost 74% of their market capitalization in the decade surrounding a
growth stall. Even though the CEO and other members of top management were typically re-
placed, only 46% of the firms were able to return to moderate or high growth within the
decade. When slow growth was allowed to persist for more than 10 years, the delay was usu-
ally fatal. Only 7% of this group was able to return to moderate or high growth.2
At Levi Strauss & Company, for example, sales topped $7 billion in 1996—extending growth
that had more than doubled over the previous decade. From that high-water mark, sales plum-
meted until they reached $4.6 in 2000—a 35% decline. Market share in its U.S. jeans market
dropped from 31% in 1990 to 14% by 2000. Its market value fell from $14 billion to $8 billion
during these four years. After replacing management, the company underwent a companywide
transformation, but by 2008 it had yet to return to growth.
strategyimplementation:organizing for Action
C H A P T E R 9
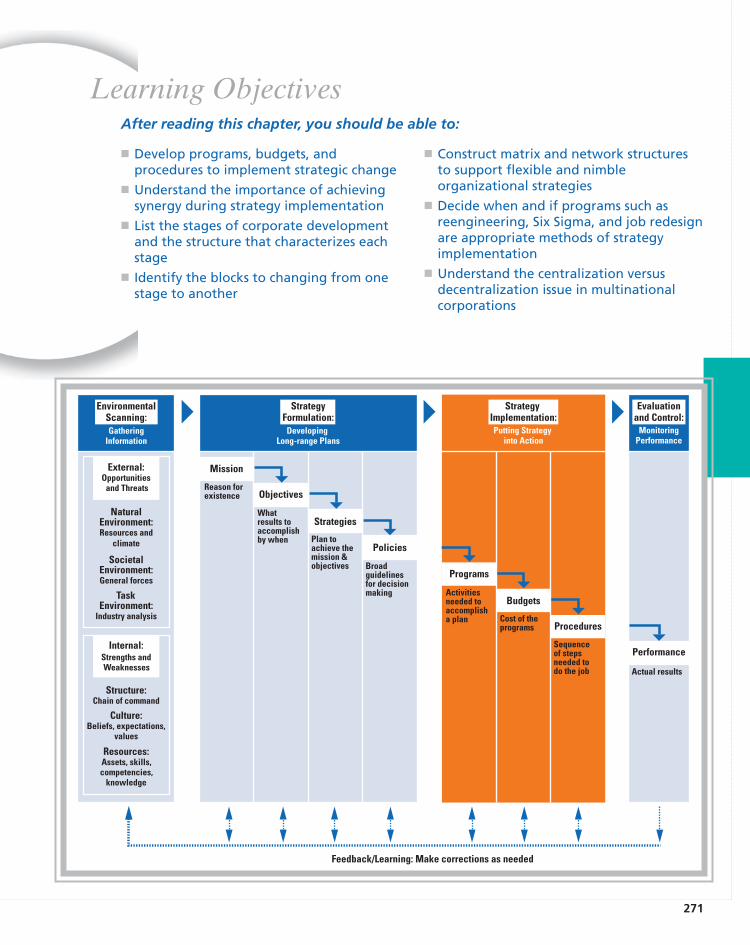
271
� Develop programs, budgets, andprocedures to implement strategic change
� Understand the importance of achievingsynergy during strategy implementation
� List the stages of corporate developmentand the structure that characterizes eachstage
� Identify the blocks to changing from onestage to another
� Construct matrix and network structuresto support flexible and nimbleorganizational strategies
� Decide when and if programs such asreengineering, Six Sigma, and job redesignare appropriate methods of strategyimplementation
� Understand the centralization versusdecentralization issue in multinationalcorporations
Learning ObjectivesAfter reading this chapter, you should be able to:
GatheringInformation
Putting Strategy into Action
MonitoringPerformance
SocietalEnvironment:General forces
NaturalEnvironment:Resources and
climate
TaskEnvironment:
Industry analysis
Internal:Strengths andWeaknesses
Structure:Chain of command
Culture:Beliefs, expectations,
values
Resources:Assets, skills,competencies,
knowledge
Programs
Activitiesneeded to accomplisha plan
Budgets
Cost of theprograms Procedures
Sequenceof stepsneeded to do the job
Performance
Actual results
External:Opportunities
and Threats
DevelopingLong-range Plans
Mission
Reason forexistence Objectives
Whatresults to accomplishby when
Strategies
Plan toachieve themission &objectives
Policies
Broadguidelinesfor decisionmaking
EnvironmentalScanning:
StrategyFormulation:
StrategyImplementation:
Evaluationand Control:
Feedback/Learning: Make corrections as needed
272 PART 4 Strategy Implementation and Control
According to Olson, van Bever, and Verry, these stall points occurred primarily be-
cause of a poor choice in strategy or organizational design. The root causes fell into four
categories:
1. Premium position backfires: This happens to a firm that has developed a premium po-
sition in the market, but is unable to respond effectively to new, low-cost competitors
or a shift in customer valuation of product features. Management teams go through
a process of disdain, denial, and rationalization that precedes the fall.
2. Innovation management breaks down: Management processes for updating existing
products and creating new ones falter and become systemic inefficiencies.
3. Core business abandoned: Management fails to exploit growth opportunities in ex-
isting core businesses and instead engages in growth initiatives in areas remote from
existing customers, products, and distribution channels.
4. Talent and capabilities run short: Strategies are not executed properly because of a
lack of managers and staff with the skills and capabilities needed for strategy imple-
mentation. Often supported by promote-from-within policies, top management has a
narrow experience base, which too often replicates the skill set of past top managers.3
9.1 Strategy ImplementationStrategy implementation is the sum total of the activities and choices required for the execu-tion of a strategic plan. It is the process by which objectives, strategies, and policies are putinto action through the development of programs, budgets, and procedures. Although imple-mentation is usually considered after strategy has been formulated, implementation is a keypart of strategic management. Strategy formulation and strategy implementation should thusbe considered as two sides of the same coin.
Poor implementation has been blamed for a number of strategic failures. For example,studies show that half of all acquisitions fail to achieve what was expected of them, and oneout of four international ventures does not succeed.4 The most-mentioned problems reportedin post-merger integration were poor communication, unrealistic synergy expectations, struc-tural problems, missing master plan, lost momentum, lack of top management commitment,and unclear strategic fit. A study by A. T. Kearney found that a company has just two years inwhich to make an acquisition perform. After the second year, the window of opportunity forforging synergies has mostly closed. Kearney’s study was supported by further independentresearch by Bert, MacDonald, and Herd. Among the most successful acquirers studied, 70%to 85% of all merger synergies were realized within the first 12 months, with the remainderbeing realized in year two.5
To begin the implementation process, strategy makers must consider these questions:
� Who are the people who will carry out the strategic plan?
� What must be done to align the company’s operations in the new intended direction?
� How is everyone going to work together to do what is needed?
CHAPTER 9 Strategy Implementation: Organizing for Action 273
These questions and similar ones should have been addressed initially when the pros andcons of strategic alternatives were analyzed. They must also be addressed again before appro-priate implementation plans can be made. Unless top management can answer these basic ques-tions satisfactorily, even the best planned strategy is unlikely to provide the desired outcome.
A survey of 93 Fortune 500 firms revealed that more than half of the corporations expe-rienced the following 10 problems when they attempted to implement a strategic change.These problems are listed in order of frequency:
1. Implementation took more time than originally planned.
2. Unanticipated major problems arose.
3. Activities were ineffectively coordinated.
4. Competing activities and crises took attention away from implementation.
5. The involved employees had insufficient capabilities to perform their jobs.
6. Lower-level employees were inadequately trained.
7. Uncontrollable external environmental factors created problems.
8. Departmental managers provided inadequate leadership and direction.
9. Key implementation tasks and activities were poorly defined.
10. The information system inadequately monitored activities.6
9.2 Who Implements Strategy?Depending on how a corporation is organized, those who implement strategy will probably bea much more diverse set of people than those who formulate it. In most large, multi-industrycorporations, the implementers are everyone in the organization. Vice presidents of functionalareas and directors of divisions or strategic business units (SBUs) work with their subordinatesto put together large-scale implementation plans. Plant managers, project managers, and unitheads put together plans for their specific plants, departments, and units. Therefore, every op-erational manager down to the first-line supervisor and every employee is involved in someway in the implementation of corporate, business, and functional strategies.
Many of the people in the organization who are crucial to successful strategy implemen-tation probably had little to do with the development of the corporate and even business strat-egy. Therefore, they might be entirely ignorant of the vast amount of data and work that wentinto the formulation process. Unless changes in mission, objectives, strategies, and policiesand their importance to the company are communicated clearly to all operational managers,there can be a lot of resistance and foot-dragging. Managers might hope to influence top man-agement into abandoning its new plans and returning to its old ways. This is one reason whyinvolving people from all organizational levels in the formulation and implementation of strat-egy tends to result in better organizational performance.7
9.3 What Must Be Done?The managers of divisions and functional areas work with their fellow managers to developprograms, budgets, and procedures for the implementation of strategy. They also work toachieve synergy among the divisions and functional areas in order to establish and maintain acompany’s distinctive competence.
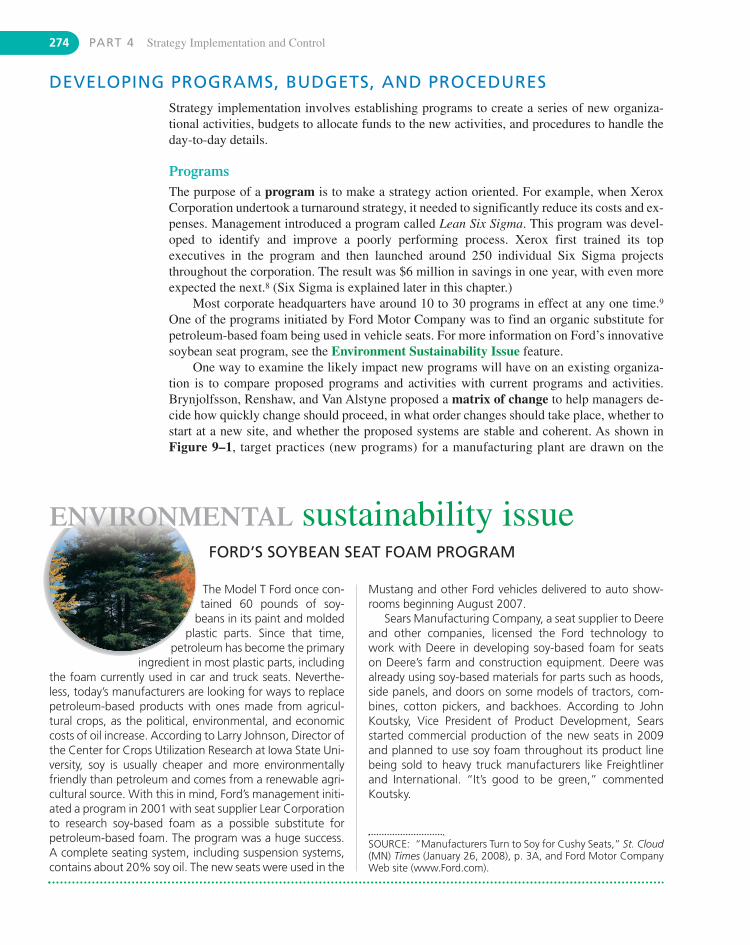
274 PART 4 Strategy Implementation and Control
DEVELOPING PROGRAMS, BUDGETS, AND PROCEDURESStrategy implementation involves establishing programs to create a series of new organiza-tional activities, budgets to allocate funds to the new activities, and procedures to handle theday-to-day details.
ProgramsThe purpose of a program is to make a strategy action oriented. For example, when XeroxCorporation undertook a turnaround strategy, it needed to significantly reduce its costs and ex-penses. Management introduced a program called Lean Six Sigma. This program was devel-oped to identify and improve a poorly performing process. Xerox first trained its top executives in the program and then launched around 250 individual Six Sigma projectsthroughout the corporation. The result was $6 million in savings in one year, with even moreexpected the next.8 (Six Sigma is explained later in this chapter.)
Most corporate headquarters have around 10 to 30 programs in effect at any one time.9
One of the programs initiated by Ford Motor Company was to find an organic substitute forpetroleum-based foam being used in vehicle seats. For more information on Ford’s innovativesoybean seat program, see the Environment Sustainability Issue feature.
One way to examine the likely impact new programs will have on an existing organiza-tion is to compare proposed programs and activities with current programs and activities.Brynjolfsson, Renshaw, and Van Alstyne proposed a matrix of change to help managers de-cide how quickly change should proceed, in what order changes should take place, whether tostart at a new site, and whether the proposed systems are stable and coherent. As shown inFigure 9–1, target practices (new programs) for a manufacturing plant are drawn on the
SOURCE: “Manufacturers Turn to Soy for Cushy Seats,” St. Cloud(MN) Times (January 26, 2008), p. 3A, and Ford Motor CompanyWeb site (www.Ford.com).
Mustang and other Ford vehicles delivered to auto show-rooms beginning August 2007.
Sears Manufacturing Company, a seat supplier to Deereand other companies, licensed the Ford technology towork with Deere in developing soy-based foam for seatson Deere’s farm and construction equipment. Deere wasalready using soy-based materials for parts such as hoods,side panels, and doors on some models of tractors, com-bines, cotton pickers, and backhoes. According to JohnKoutsky, Vice President of Product Development, Searsstarted commercial production of the new seats in 2009and planned to use soy foam throughout its product linebeing sold to heavy truck manufacturers like Freightlinerand International. “It’s good to be green,” commentedKoutsky.
The Model T Ford once con-tained 60 pounds of soy-
beans in its paint and moldedplastic parts. Since that time,
petroleum has become the primaryingredient in most plastic parts, including
the foam currently used in car and truck seats. Neverthe-less, today’s manufacturers are looking for ways to replacepetroleum-based products with ones made from agricul-tural crops, as the political, environmental, and economiccosts of oil increase. According to Larry Johnson, Director ofthe Center for Crops Utilization Research at Iowa State Uni-versity, soy is usually cheaper and more environmentallyfriendly than petroleum and comes from a renewable agri-cultural source. With this in mind, Ford’s management initi-ated a program in 2001 with seat supplier Lear Corporationto research soy-based foam as a possible substitute forpetroleum-based foam. The program was a huge success.A complete seating system, including suspension systems,contains about 20% soy oil. The new seats were used in the
FORD’S SOYBEAN SEAT FOAM PROGRAM
ENVIRONMENTAL sustainability issue
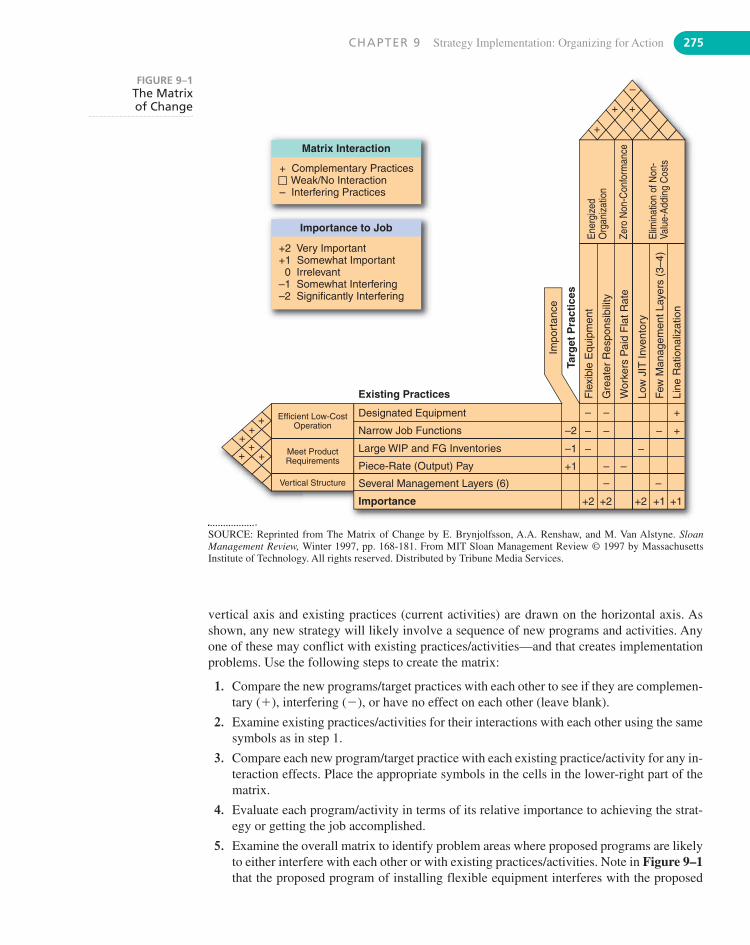
CHAPTER 9 Strategy Implementation: Organizing for Action 275
vertical axis and existing practices (current activities) are drawn on the horizontal axis. Asshown, any new strategy will likely involve a sequence of new programs and activities. Anyone of these may conflict with existing practices/activities—and that creates implementationproblems. Use the following steps to create the matrix:
1. Compare the new programs/target practices with each other to see if they are complemen-tary (�), interfering (�), or have no effect on each other (leave blank).
2. Examine existing practices/activities for their interactions with each other using the samesymbols as in step 1.
3. Compare each new program/target practice with each existing practice/activity for any in-teraction effects. Place the appropriate symbols in the cells in the lower-right part of thematrix.
4. Evaluate each program/activity in terms of its relative importance to achieving the strat-egy or getting the job accomplished.
5. Examine the overall matrix to identify problem areas where proposed programs are likelyto either interfere with each other or with existing practices/activities. Note in Figure 9–1that the proposed program of installing flexible equipment interferes with the proposed
Existing Practices
Targ
et P
ract
ices
Efficient Low-CostOperation
Meet ProductRequirements
Vertical Structure
Designated Equipment
Narrow Job Functions
Piece-Rate (Output) Pay
Several Management Layers (6)
Importance
Impo
rtan
ce
Fle
xibl
e E
quip
men
t
Gre
ater
Res
pons
ibili
ty
Wor
kers
Pai
d F
lat R
ate
Low
JIT
Inve
ntor
y
Few
Man
agem
ent L
ayer
s (3
–4)
Line
Rat
iona
lizat
ion
Large WIP and FG Inventories
Matrix Interaction
+ Complementary Practices Weak/No Interaction– Interfering Practices
++
++
++
++
+
–
–2
+2 +2 +2 +1 +1
+
+
–
–
–
–
–
–
–
––
–
––1
+1
Importance to Job
+2 Very Important+1 Somewhat Important 0 Irrelevant–1 Somewhat Interfering–2 Significantly Interfering
Ener
gize
dO
rgan
izat
ion
Zero
Non
-Con
form
ance
Elim
inat
ion
of N
on-
Valu
e-Ad
ding
Cos
ts
FIGURE 9–1The Matrix of Change
SOURCE: Reprinted from The Matrix of Change by E. Brynjolfsson, A.A. Renshaw, and M. Van Alstyne. SloanManagement Review, Winter 1997, pp. 168-181. From MIT Sloan Management Review © 1997 by MassachusettsInstitute of Technology. All rights reserved. Distributed by Tribune Media Services.
276 PART 4 Strategy Implementation and Control
program of assembly line rationalization. The two new programs need to be changed sothat they no longer conflict with each other. Note also that the amount of change neces-sary to carry out the proposed implementation programs (target practices) is a function ofthe number of times each program interferes with existing practices/activities. That is, themore minus signs and the fewer plus signs in the matrix, the more implementation prob-lems can be expected.
The matrix of change can be used to address the following types of questions:
� Feasibility: Do the proposed programs and activities constitute a coherent, stable system?Are the current activities coherent and stable? Is the transition likely to be difficult?
� Sequence of execution: Where should the change begin? How does the sequence affectsuccess? Are there reasonable stopping points?
� Location: Are we better off instituting the new programs at a new site, or can we reorga-nize the existing facilities at a reasonable cost?
� Pace and nature of change: Should the change be slow or fast, incremental or radical?Which blocks of current activities must be changed at the same time?
� Stakeholder evaluations: Have we overlooked any important activities or interactions?Should we get further input from interested stakeholders? Which new programs and cur-rent activities offer the greatest sources of value?
The matrix offers useful guidelines on where, when, and how fast to implement change.10
BudgetsAfter programs have been developed, the budget process begins. Planning a budget is the lastreal check a corporation has on the feasibility of its selected strategy. An ideal strategy mightbe found to be completely impractical only after specific implementation programs are costedin detail. As an example, once Cadbury Schweppes’ management realized how dependent thecompany was on cocoa from Ghana to continue the company’s growth strategy, it developed a program to show cocoa farmers how to increase yields using fertilizers and by working witheach other. Ghana produced 70% of Cadbury’s worldwide supply of the high-quality cocoanecessary to provide the distinctive taste of Dairy Milk, Crème Egg, and other treats. Manage-ment introduced the “Cadbury Cocoa Partnership” on January 28, 2008, and budgeted $87 mil-lion for this program over a 10-year period.11
ProceduresAfter the program, divisional, and corporate budgets are approved, procedures must be devel-oped. Often called Standard Operating Procedures (SOPs), they typically detail the variousactivities that must be carried out to complete a corporation’s programs. Also known asorganizational routines, procedures are the primary means by which organizations accomplishmuch of what they do.12 Once in place, procedures must be updated to reflect any changes intechnology as well as in strategy. For example, a company following a differentiation compet-itive strategy manages its sales force more closely than does a firm following a low-cost strat-egy. Differentiation requires long-term customer relationships created out of close interactionwith the sales force. An in-depth understanding of the customer’s needs provides the founda-tion for product development and improvement.13
In a retail store, procedures ensure that the day-to-day store operations will be consistentover time (that is, next week’s work activities will be the same as this week’s) and consistentamong stores (that is, each store will operate in the same manner as the others). Properlyplanned procedures can help eliminate poor service by making sure that employees do use not
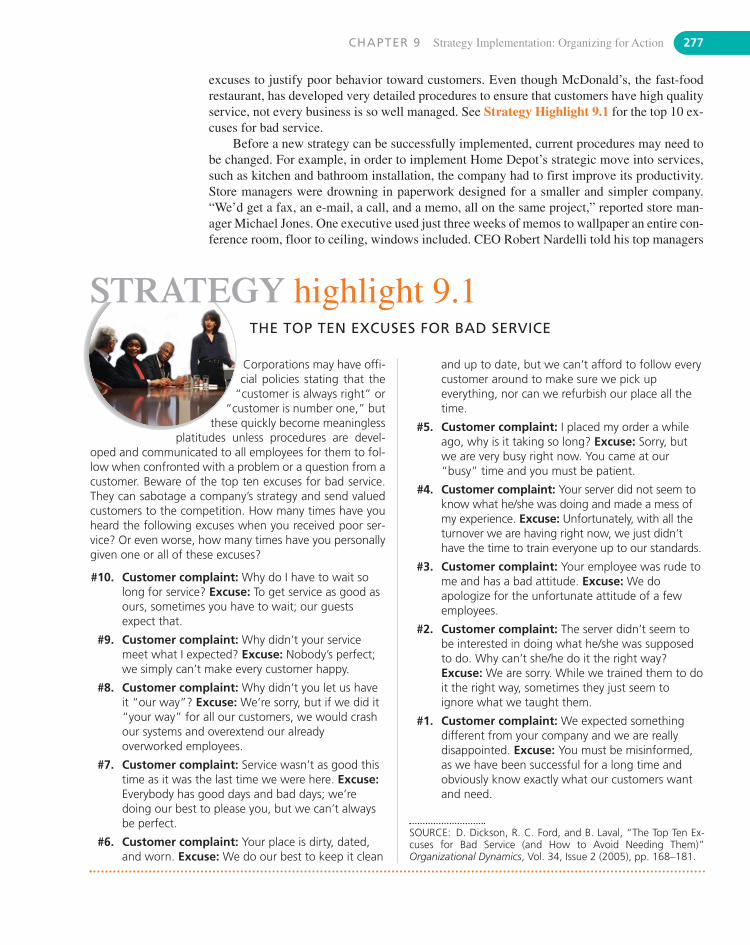
CHAPTER 9 Strategy Implementation: Organizing for Action 277
excuses to justify poor behavior toward customers. Even though McDonald’s, the fast-foodrestaurant, has developed very detailed procedures to ensure that customers have high qualityservice, not every business is so well managed. See Strategy Highlight 9.1 for the top 10 ex-cuses for bad service.
Before a new strategy can be successfully implemented, current procedures may need tobe changed. For example, in order to implement Home Depot’s strategic move into services,such as kitchen and bathroom installation, the company had to first improve its productivity.Store managers were drowning in paperwork designed for a smaller and simpler company.“We’d get a fax, an e-mail, a call, and a memo, all on the same project,” reported store man-ager Michael Jones. One executive used just three weeks of memos to wallpaper an entire con-ference room, floor to ceiling, windows included. CEO Robert Nardelli told his top managers
and up to date, but we can’t afford to follow everycustomer around to make sure we pick upeverything, nor can we refurbish our place all thetime.
#5. Customer complaint: I placed my order a whileago, why is it taking so long? Excuse: Sorry, butwe are very busy right now. You came at our“busy” time and you must be patient.
#4. Customer complaint: Your server did not seem toknow what he/she was doing and made a mess ofmy experience. Excuse: Unfortunately, with all theturnover we are having right now, we just didn’thave the time to train everyone up to our standards.
#3. Customer complaint: Your employee was rude tome and has a bad attitude. Excuse: We doapologize for the unfortunate attitude of a fewemployees.
#2. Customer complaint: The server didn’t seem tobe interested in doing what he/she was supposedto do. Why can’t she/he do it the right way?Excuse: We are sorry. While we trained them to doit the right way, sometimes they just seem toignore what we taught them.
#1. Customer complaint: We expected somethingdifferent from your company and we are reallydisappointed. Excuse: You must be misinformed,as we have been successful for a long time andobviously know exactly what our customers wantand need.
Corporations may have offi-cial policies stating that the
“customer is always right” or“customer is number one,” but
these quickly become meaninglessplatitudes unless procedures are devel-
oped and communicated to all employees for them to fol-low when confronted with a problem or a question from acustomer. Beware of the top ten excuses for bad service.They can sabotage a company’s strategy and send valuedcustomers to the competition. How many times have youheard the following excuses when you received poor ser-vice? Or even worse, how many times have you personallygiven one or all of these excuses?
#10. Customer complaint: Why do I have to wait solong for service? Excuse: To get service as good asours, sometimes you have to wait; our guestsexpect that.
#9. Customer complaint: Why didn’t your servicemeet what I expected? Excuse: Nobody’s perfect;we simply can’t make every customer happy.
#8. Customer complaint: Why didn’t you let us haveit “our way”? Excuse: We’re sorry, but if we did it“your way” for all our customers, we would crashour systems and overextend our alreadyoverworked employees.
#7. Customer complaint: Service wasn’t as good thistime as it was the last time we were here. Excuse:Everybody has good days and bad days; we’redoing our best to please you, but we can’t alwaysbe perfect.
#6. Customer complaint: Your place is dirty, dated,and worn. Excuse: We do our best to keep it clean
THE TOP TEN EXCUSES FOR BAD SERVICE
SOURCE: D. Dickson, R. C. Ford, and B. Laval, “The Top Ten Ex-cuses for Bad Service (and How to Avoid Needing Them)”Organizational Dynamics, Vol. 34, Issue 2 (2005), pp. 168–181.
STRATEGY highlight 9.1
278 PART 4 Strategy Implementation and Control
ACHIEVING SYNERGYOne of the goals to be achieved in strategy implementation is synergy between and amongfunctions and business units. This is the reason corporations commonly reorganize after an ac-quisition. Synergy is said to exist for a divisional corporation if the return on investment (ROI)of each division is greater than what the return would be if each division were an independentbusiness. According to Goold and Campbell, synergy can take place in one of six forms:
� Shared know-how: Combined units often benefit from sharing knowledge or skills. Thisis a leveraging of core competencies. One reason that Procter & Gamble purchasedGillette was to combine P&G’s knowledge of the female consumer with Gillette’s knowl-edge of the male consumer.
� Coordinated strategies: Aligning the business strategies of two or more business unitsmay provide a corporation significant advantage by reducing inter-unit competition anddeveloping a coordinated response to common competitors (horizontal strategy). Themerger between Arcelor and Mittal Steel, for example, gave the combined company en-hanced R&D capabilities and wider global coverage while presenting a common face tothe market.
� Shared tangible resources: Combined units can sometimes save money by sharing re-sources, such as a common manufacturing facility or R&D lab. The alliance betweenRenault and Nissan allowed it to build new factories that would build both Nissan andRenault vehicles.
� Economies of scale or scope: Coordinating the flow of products or services of one unitwith that of another unit can reduce inventory, increase capacity utilization, and improvemarket access. This was a reason Delta Airlines bought Northwest Airlines.
� Pooled negotiating power: Combined units can combine their purchasing to gain bar-gaining power over common suppliers to reduce costs and improve quality. The same canbe done with common distributors. The acquisitions of Macy’s and the May Company en-abled Federated Department Stores (which changed its name to Macy’s in 2007) to gainpurchasing economies for all of its stores.
� New business creation: Exchanging knowledge and skills can facilitate new products orservices by extracting discrete activities from various units and combining them in a newunit or by establishing joint ventures among internal business units. Oracle, for example,purchased a number of software companies in order to create a suite of software code-named “Project Fusion” to help corporations run everything from accounting and sales tocustomer relations and supply-chain management.15
9.4 How Is Strategy to Be Implemented?Organizing for Action
Before plans can lead to actual performance, a corporation should be appropriately organized,programs should be adequately staffed, and activities should be directed toward achieving de-sired objectives. (Organizing activities are reviewed briefly in this chapter; staffing, directing,and control activities are discussed in Chapters 10 and 11.)
to eliminate duplicate communications and streamline work projects. Directives not related towork orders had to be sent separately and only once a month. The company also spent $2 mil-lion on workload-management software.14
CHAPTER 9 Strategy Implementation: Organizing for Action 279
STRUCTURE FOLLOWS STRATEGYIn a classic study of large U.S. corporations such as DuPont, General Motors, Sears, and Stan-dard Oil, Alfred Chandler concluded that structure follows strategy—that is, changes in cor-porate strategy lead to changes in organizational structure.16 He also concluded thatorganizations follow a pattern of development from one kind of structural arrangement to an-other as they expand. According to Chandler, these structural changes occur because the oldstructure, having been pushed too far, has caused inefficiencies that have become too obvi-ously detrimental to bear. Chandler, therefore, proposed the following as the sequence of whatoccurs:
1. New strategy is created.
2. New administrative problems emerge.
3. Economic performance declines.
4. New appropriate structure is invented.
5. Profit returns to its previous level.
Chandler found that in their early years, corporations such as DuPont tend to have a cen-tralized functional organizational structure that is well suited to producing and selling a lim-ited range of products. As they add new product lines, purchase their own sources of supply,and create their own distribution networks, they become too complex for highly centralizedstructures. To remain successful, this type of organization needs to shift to a decentralizedstructure with several semiautonomous divisions (referred to in Chapter 5 as divisionalstructure).
Alfred P. Sloan, past CEO of General Motors, detailed how GM conducted such structuralchanges in the 1920s.17 He saw decentralization of structure as “centralized policy determina-tion coupled with decentralized operating management.” After top management had devel-oped a strategy for the total corporation, the individual divisions (Chevrolet, Buick, and so on)were free to choose how to implement that strategy. Patterned after DuPont, GM found the de-centralized multidivisional structure to be extremely effective in allowing the maximumamount of freedom for product development. Return on investment was used as a financialcontrol. (ROI is discussed in more detail in Chapter 11.)
Research generally supports Chandler’s proposition that structure follows strategy (as wellas the reverse proposition that structure influences strategy).18 As mentioned earlier, changes inthe environment tend to be reflected in changes in a corporation’s strategy, thus leading tochanges in a corporation’s structure. In 2008, Arctic Cat, the recreational vehicles firm, reorga-nized its ATV (all terrain vehicles), snowmobile and parts, and garments and accessories product
Any change in corporate strategy is very likely to require some sort of change in the wayan organization is structured and in the kind of skills needed in particular positions. Managersmust, therefore, closely examine the way their company is structured in order to decide what,if any, changes should be made in the way work is accomplished. Should activities be groupeddifferently? Should the authority to make key decisions be centralized at headquarters or de-centralized to managers in distant locations? Should the company be managed like a “tightship” with many rules and controls, or “loosely” with few rules and controls? Should the cor-poration be organized into a “tall” structure with many layers of managers, each having a nar-row span of control (that is, few employees per supervisor) to better control his or hersubordinates; or should it be organized into a “flat” structure with fewer layers of managers,each having a wide span of control (that is, more employees per supervisor) to give more free-dom to his or her subordinates?
280 PART 4 Strategy Implementation and Control
lines into three separate business units, each led by a general manager focused on expanding thebusiness. True to Chandler’s findings, the restructuring of Arctic Cat came after seven consecu-tive years of record growth followed by its first loss in 25 years.
Strategy, structure, and the environment need to be closely aligned; otherwise, organiza-tional performance will likely suffer.19 For example, a business unit following a differentiationstrategy needs more freedom from headquarters to be successful than does another unit fol-lowing a low-cost strategy.20
Although it is agreed that organizational structure must vary with different environmen-tal conditions, which, in turn, affect an organization’s strategy, there is no agreement about anoptimal organizational design. What was appropriate for DuPont and General Motors in the1920s might not be appropriate today. Firms in the same industry do, however, tend to orga-nize themselves similarly to one another. For example, automobile manufacturers tend to em-ulate General Motors’ divisional concept, whereas consumer-goods producers tend to emulatethe brand-management concept (a type of matrix structure) pioneered by Procter & GambleCompany. The general conclusion seems to be that firms following similar strategies in simi-lar industries tend to adopt similar structures.
STAGES OF CORPORATE DEVELOPMENTSuccessful corporations tend to follow a pattern of structural development as they grow andexpand. Beginning with the simple structure of the entrepreneurial firm (in which everybodydoes everything), successful corporations usually get larger and organize along functionallines, with marketing, production, and finance departments. With continuing success, the com-pany adds new product lines in different industries and organizes itself into interconnected di-visions. The differences among these three structural stages of corporate development interms of typical problems, objectives, strategies, reward systems, and other characteristics arespecified in detail in Table 9–1.
Stage I: Simple StructureStage I is typified by the entrepreneur, who founds a company to promote an idea (a productor a service). The entrepreneur tends to make all the important decisions personally and is in-volved in every detail and phase of the organization. The Stage I company has little formalstructure, which allows the entrepreneur to directly supervise the activities of every employee(see Figure 5–4 for an illustration of the simple, functional, and divisional structures). Plan-ning is usually short range or reactive. The typical managerial functions of planning, orga-nizing, directing, staffing, and controlling are usually performed to a very limited degree, if atall. The greatest strengths of a Stage I corporation are its flexibility and dynamism. The driveof the entrepreneur energizes the organization in its struggle for growth. Its greatest weaknessis its extreme reliance on the entrepreneur to decide general strategies as well as detailed pro-cedures. If the entrepreneur falters, the company usually flounders. This is labeled by Greineras a crisis of leadership.21
Stage I describes Oracle Corporation, the computer software firm, under the managementof its co-founder and CEO Lawrence Ellison. The company adopted a pioneering approach toretrieving data, called Structured Query Language (SQL). When IBM made SQL its standard,Oracle’s success was assured. Unfortunately, Ellison’s technical wizardry was not sufficient tomanage the company. Often working at home, he lost sight of details outside his technical in-terests. Although the company’s sales were rapidly increasing, its financial controls were soweak that management had to restate an entire year’s results to rectify irregularities. After thecompany recorded its first loss, Ellison hired a set of functional managers to run the companywhile he retreated to focus on new product development.
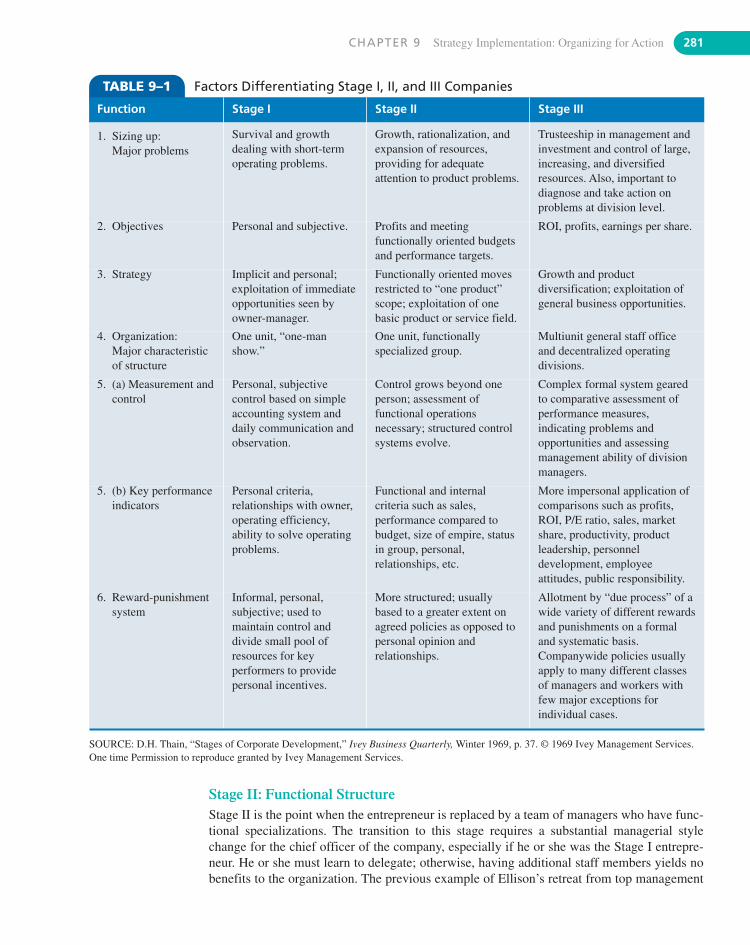
CHAPTER 9 Strategy Implementation: Organizing for Action 281
Stage II: Functional StructureStage II is the point when the entrepreneur is replaced by a team of managers who have func-tional specializations. The transition to this stage requires a substantial managerial stylechange for the chief officer of the company, especially if he or she was the Stage I entrepre-neur. He or she must learn to delegate; otherwise, having additional staff members yields nobenefits to the organization. The previous example of Ellison’s retreat from top management
TABLE 9–1 Factors Differentiating Stage I, II, and III Companies
Function Stage I Stage II Stage III
1. Sizing up: Major problems
Survival and growthdealing with short-termoperating problems.
Growth, rationalization, andexpansion of resources,providing for adequateattention to product problems.
Trusteeship in management andinvestment and control of large,increasing, and diversifiedresources. Also, important todiagnose and take action onproblems at division level.
2. Objectives Personal and subjective. Profits and meetingfunctionally oriented budgetsand performance targets.
ROI, profits, earnings per share.
3. Strategy Implicit and personal;exploitation of immediateopportunities seen byowner-manager.
Functionally oriented movesrestricted to “one product”scope; exploitation of onebasic product or service field.
Growth and productdiversification; exploitation ofgeneral business opportunities.
4. Organization: Major characteristicof structure
One unit, “one-manshow.”
One unit, functionallyspecialized group.
Multiunit general staff office and decentralized operatingdivisions.
5. (a) Measurement andcontrol
Personal, subjectivecontrol based on simpleaccounting system anddaily communication andobservation.
Control grows beyond oneperson; assessment offunctional operationsnecessary; structured controlsystems evolve.
Complex formal system gearedto comparative assessment ofperformance measures,indicating problems andopportunities and assessingmanagement ability of divisionmanagers.
5. (b) Key performanceindicators
Personal criteria,relationships with owner,operating efficiency,ability to solve operatingproblems.
Functional and internalcriteria such as sales,performance compared tobudget, size of empire, statusin group, personal,relationships, etc.
More impersonal application ofcomparisons such as profits,ROI, P/E ratio, sales, marketshare, productivity, productleadership, personneldevelopment, employeeattitudes, public responsibility.
6. Reward-punishmentsystem
Informal, personal,subjective; used tomaintain control anddivide small pool ofresources for keyperformers to providepersonal incentives.
More structured; usuallybased to a greater extent onagreed policies as opposed topersonal opinion andrelationships.
Allotment by “due process” of awide variety of different rewardsand punishments on a formaland systematic basis.Companywide policies usuallyapply to many different classesof managers and workers withfew major exceptions forindividual cases.
SOURCE: D.H. Thain, “Stages of Corporate Development,” Ivey Business Quarterly, Winter 1969, p. 37. © 1969 Ivey Management Services.One time Permission to reproduce granted by Ivey Management Services.
282 PART 4 Strategy Implementation and Control
at Oracle Corporation to new product development manager is one way that technically bril-liant founders are able to get out of the way of the newly empowered functional managers. InStage II, the corporate strategy favors protectionism through dominance of the industry, oftenthrough vertical and horizontal growth. The great strength of a Stage II corporation lies in itsconcentration and specialization in one industry. Its great weakness is that all its eggs are inone basket.
By concentrating on one industry while that industry remains attractive, a Stage II com-pany, such as Oracle Corporation in computer software, can be very successful. Once a func-tionally structured firm diversifies into other products in different industries, however, theadvantages of the functional structure break down. A crisis of autonomy can now develop, inwhich people managing diversified product lines need more decision-making freedom thantop management is willing to delegate to them. The company needs to move to a differentstructure.
Stage III: Divisional StructureStage III is typified by the corporation’s managing diverse product lines in numerous indus-tries; it decentralizes the decision-making authority. Stage III organizations grow by diversi-fying their product lines and expanding to cover wider geographical areas. They move to adivisional structure with a central headquarters and decentralized operating divisions—witheach division or business unit a functionally organized Stage II company. They may also usea conglomerate structure if top management chooses to keep its collection of Stage II sub-sidiaries operating autonomously. A crisis of control can now develop, in which the variousunits act to optimize their own sales and profits without regard to the overall corporation,whose headquarters seems far away and almost irrelevant.
Recently, divisions have been evolving into SBUs to better reflect product-market consid-erations. Headquarters attempts to coordinate the activities of its operating divisions or SBUsthrough performance- and results-oriented control and reporting systems and by stressing cor-porate planning techniques. The units are not tightly controlled but are held responsible fortheir own performance results. Therefore, to be effective, the company has to have a decen-tralized decision process. The greatest strength of a Stage III corporation is its almost unlim-ited resources. Its most significant weakness is that it is usually so large and complex that ittends to become relatively inflexible. General Electric, DuPont, and General Motors are ex-amples of Stage III corporations.
Stage IV: Beyond SBUsEven with its evolution into SBUs during the 1970s and 1980s, the divisional structure is notthe last word in organization structure. The use of SBUs may result in a red tape crisis in whichthe corporation has grown too large and complex to be managed through formal programs andrigid systems, and procedures take precedence over problem solving.22 For example, Pfizer’sacquisitions of Warner-Lambert and Pharmacia resulted in 14 layers of management betweenscientists and top executives and forced researchers to spend most of their time in meetings.23
Under conditions of (1) increasing environmental uncertainty, (2) greater use of sophisticatedtechnological production methods and information systems, (3) the increasing size and scopeof worldwide business corporations, (4) a greater emphasis on multi-industry competitive strat-egy, and (5) a more educated cadre of managers and employees, new advanced forms of orga-nizational structure are emerging. These structures emphasize collaboration over competitionin the managing of an organization’s multiple overlapping projects and developing businesses.
The matrix and the network are two possible candidates for a fourth stage in corporate de-velopment—a stage that not only emphasizes horizontal over vertical connections betweenpeople and groups but also organizes work around temporary projects in which sophisticated
CHAPTER 9 Strategy Implementation: Organizing for Action 283
information systems support collaborative activities. According to Greiner, it is likely that thisstage of development will have its own crisis as well—a sort of pressure-cooker crisis. He pre-dicts that employees in these collaborative organizations will eventually grow emotionallyand physically exhausted from the intensity of teamwork and the heavy pressure for innova-tive solutions.24
Blocks to Changing StagesCorporations often find themselves in difficulty because they are blocked from moving intothe next logical stage of development. Blocks to development may be internal (such as lack ofresources, lack of ability, or refusal of top management to delegate decision making to others)or external (such as economic conditions, labor shortages, and lack of market growth). For ex-ample, Chandler noted in his study that the successful founder/CEO in one stage was rarelythe person who created the new structure to fit the new strategy, and as a result, the transitionfrom one stage to another was often painful. This was true of General Motors Corporation un-der the management of William Durant, Ford Motor Company under Henry Ford I, PolaroidCorporation under Edwin Land, Apple Computer under Steven Jobs, and Sun Microsystemsunder Scott McNealy.
Entrepreneurs who start businesses generally have four tendencies that work very well forsmall new ventures but become Achilles’ heels for these same individuals when they try tomanage a larger firm with diverse needs, departments, priorities, and constituencies:
� Loyalty to comrades: This is good at the beginning but soon becomes a liability as“favoritism.”
� Task oriented: Focusing on the job is critical at first but then becomes excessive atten-tion to detail.
� Single-mindedness: A grand vision is needed to introduce a new product but can becometunnel vision as the company grows into more markets and products.
� Working in isolation: This is good for a brilliant scientist but disastrous for a CEO withmultiple constituencies.25
This difficulty in moving to a new stage is compounded by the founder’s tendency to ma-neuver around the need to delegate by carefully hiring, training, and grooming his or her ownteam of managers. The team tends to maintain the founder’s influence throughout the organi-zation long after the founder is gone. This is what happened at Walt Disney Productions whenthe family continued to emphasize Walt’s policies and plans long after he was dead. Althoughthis may often be an organization’s strength, it may also be a weakness—to the extent that theculture supports the status quo and blocks needed change.
ORGANIZATIONAL LIFE CYCLEInstead of considering stages of development in terms of structure, the organizational life cy-cle approach places the primary emphasis on the dominant issue facing the corporation. Orga-nizational structure is only a secondary concern. The organizational life cycle describes howorganizations grow, develop, and eventually decline. It is the organizational equivalent of theproduct life cycle in marketing. These stages are Birth (Stage I), Growth (Stage II), Maturity(Stage III), Decline (Stage IV), and Death (Stage V). The impact of these stages on corporatestrategy and structure is summarized in Table 9–2. Note that the first three stages of the orga-nizational life cycle are similar to the three commonly accepted stages of corporate develop-ment mentioned previously. The only significant difference is the addition of the Decline andDeath stages to complete the cycle. Even though a company’s strategy may still be sound, its
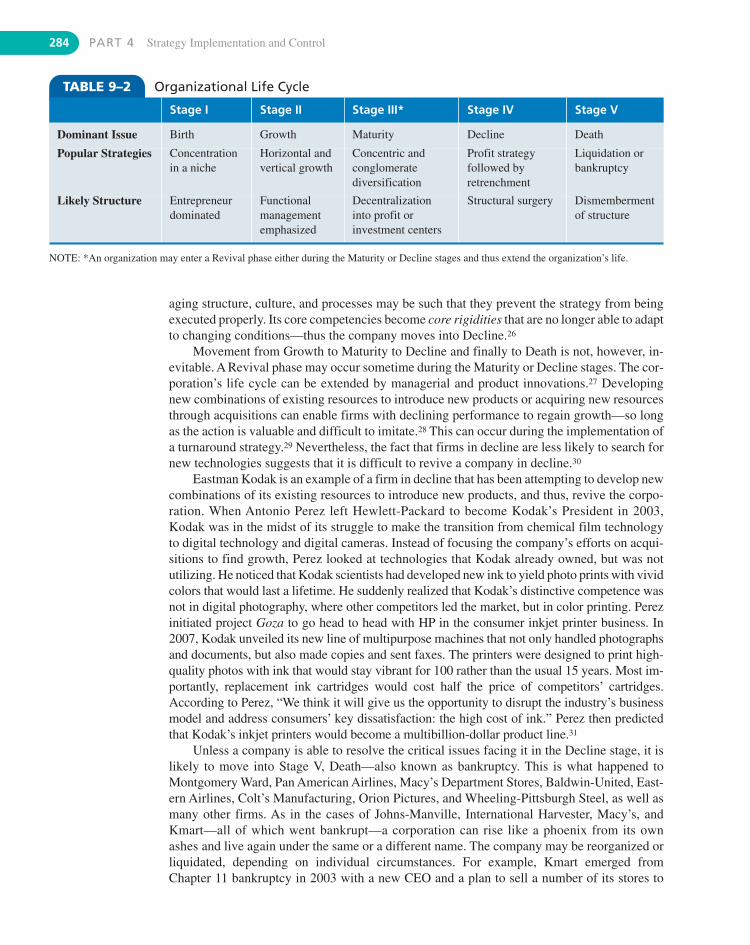
284 PART 4 Strategy Implementation and Control
aging structure, culture, and processes may be such that they prevent the strategy from beingexecuted properly. Its core competencies become core rigidities that are no longer able to adaptto changing conditions—thus the company moves into Decline.26
Movement from Growth to Maturity to Decline and finally to Death is not, however, in-evitable. A Revival phase may occur sometime during the Maturity or Decline stages. The cor-poration’s life cycle can be extended by managerial and product innovations.27 Developingnew combinations of existing resources to introduce new products or acquiring new resourcesthrough acquisitions can enable firms with declining performance to regain growth—so longas the action is valuable and difficult to imitate.28 This can occur during the implementation ofa turnaround strategy.29 Nevertheless, the fact that firms in decline are less likely to search fornew technologies suggests that it is difficult to revive a company in decline.30
Eastman Kodak is an example of a firm in decline that has been attempting to develop newcombinations of its existing resources to introduce new products, and thus, revive the corpo-ration. When Antonio Perez left Hewlett-Packard to become Kodak’s President in 2003,Kodak was in the midst of its struggle to make the transition from chemical film technologyto digital technology and digital cameras. Instead of focusing the company’s efforts on acqui-sitions to find growth, Perez looked at technologies that Kodak already owned, but was not utilizing. He noticed that Kodak scientists had developed new ink to yield photo prints with vividcolors that would last a lifetime. He suddenly realized that Kodak’s distinctive competence wasnot in digital photography, where other competitors led the market, but in color printing. Perezinitiated project Goza to go head to head with HP in the consumer inkjet printer business. In2007, Kodak unveiled its new line of multipurpose machines that not only handled photographsand documents, but also made copies and sent faxes. The printers were designed to print high-quality photos with ink that would stay vibrant for 100 rather than the usual 15 years. Most im-portantly, replacement ink cartridges would cost half the price of competitors’ cartridges.According to Perez, “We think it will give us the opportunity to disrupt the industry’s businessmodel and address consumers’ key dissatisfaction: the high cost of ink.” Perez then predictedthat Kodak’s inkjet printers would become a multibillion-dollar product line.31
Unless a company is able to resolve the critical issues facing it in the Decline stage, it islikely to move into Stage V, Death—also known as bankruptcy. This is what happened toMontgomery Ward, Pan American Airlines, Macy’s Department Stores, Baldwin-United, East-ern Airlines, Colt’s Manufacturing, Orion Pictures, and Wheeling-Pittsburgh Steel, as well asmany other firms. As in the cases of Johns-Manville, International Harvester, Macy’s, andKmart—all of which went bankrupt—a corporation can rise like a phoenix from its ownashes and live again under the same or a different name. The company may be reorganized orliquidated, depending on individual circumstances. For example, Kmart emerged fromChapter 11 bankruptcy in 2003 with a new CEO and a plan to sell a number of its stores to
TABLE 9–2 Organizational Life Cycle
Stage I Stage II Stage III* Stage IV Stage V
Dominant Issue Birth Growth Maturity Decline Death
Popular Strategies Concentrationin a niche
Horizontal andvertical growth
Concentric andconglomeratediversification
Profit strategyfollowed byretrenchment
Liquidation orbankruptcy
Likely Structure Entrepreneurdominated
Functionalmanagementemphasized
Decentralizationinto profit orinvestment centers
Structural surgery Dismembermentof structure
NOTE: *An organization may enter a Revival phase either during the Maturity or Decline stages and thus extend the organization’s life.
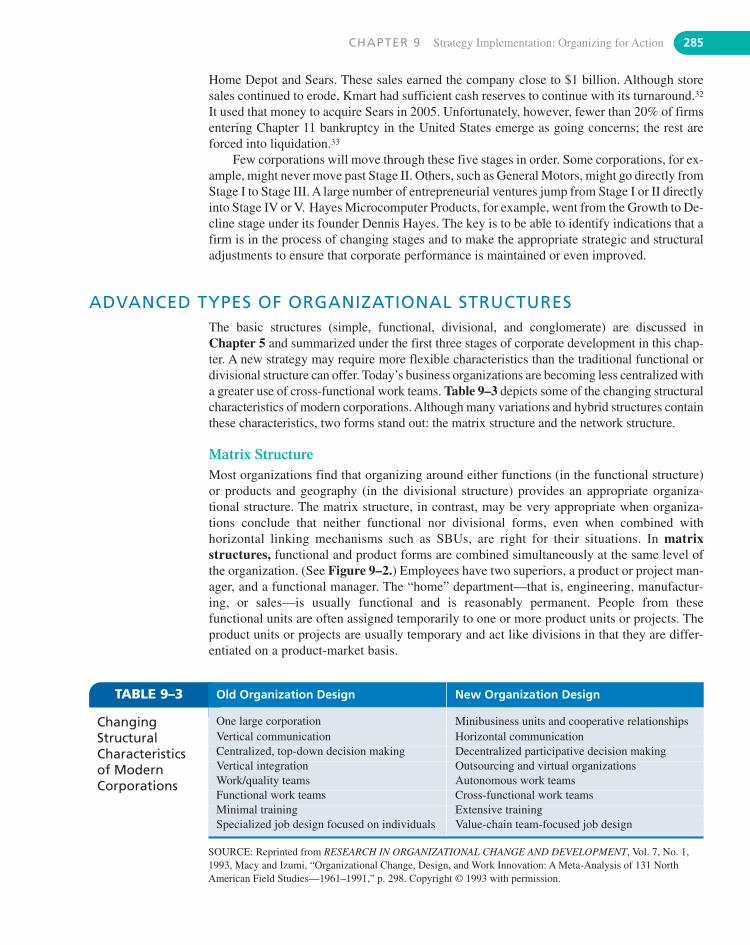
CHAPTER 9 Strategy Implementation: Organizing for Action 285
Home Depot and Sears. These sales earned the company close to $1 billion. Although storesales continued to erode, Kmart had sufficient cash reserves to continue with its turnaround.32
It used that money to acquire Sears in 2005. Unfortunately, however, fewer than 20% of firmsentering Chapter 11 bankruptcy in the United States emerge as going concerns; the rest areforced into liquidation.33
Few corporations will move through these five stages in order. Some corporations, for ex-ample, might never move past Stage II. Others, such as General Motors, might go directly fromStage I to Stage III. A large number of entrepreneurial ventures jump from Stage I or II directlyinto Stage IV or V. Hayes Microcomputer Products, for example, went from the Growth to De-cline stage under its founder Dennis Hayes. The key is to be able to identify indications that afirm is in the process of changing stages and to make the appropriate strategic and structuraladjustments to ensure that corporate performance is maintained or even improved.
ADVANCED TYPES OF ORGANIZATIONAL STRUCTURESThe basic structures (simple, functional, divisional, and conglomerate) are discussed inChapter 5 and summarized under the first three stages of corporate development in this chap-ter. A new strategy may require more flexible characteristics than the traditional functional ordivisional structure can offer. Today’s business organizations are becoming less centralized witha greater use of cross-functional work teams. Table 9–3 depicts some of the changing structuralcharacteristics of modern corporations. Although many variations and hybrid structures containthese characteristics, two forms stand out: the matrix structure and the network structure.
Matrix StructureMost organizations find that organizing around either functions (in the functional structure)or products and geography (in the divisional structure) provides an appropriate organiza-tional structure. The matrix structure, in contrast, may be very appropriate when organiza-tions conclude that neither functional nor divisional forms, even when combined withhorizontal linking mechanisms such as SBUs, are right for their situations. In matrixstructures, functional and product forms are combined simultaneously at the same level ofthe organization. (See Figure 9–2.) Employees have two superiors, a product or project man-ager, and a functional manager. The “home” department—that is, engineering, manufactur-ing, or sales—is usually functional and is reasonably permanent. People from thesefunctional units are often assigned temporarily to one or more product units or projects. Theproduct units or projects are usually temporary and act like divisions in that they are differ-entiated on a product-market basis.
TABLE 9–3 Old Organization Design New Organization Design
ChangingStructuralCharacteristicsof ModernCorporations
One large corporation Minibusiness units and cooperative relationshipsVertical communication Horizontal communicationCentralized, top-down decision making Decentralized participative decision makingVertical integration Outsourcing and virtual organizationsWork/quality teams Autonomous work teamsFunctional work teams Cross-functional work teamsMinimal training Extensive trainingSpecialized job design focused on individuals Value-chain team-focused job design
SOURCE: Reprinted from RESEARCH IN ORGANIZATIONAL CHANGE AND DEVELOPMENT, Vol. 7, No. 1,1993, Macy and Izumi, “Organizational Change, Design, and Work Innovation: A Meta-Analysis of 131 NorthAmerican Field Studies—1961–1991,” p. 298. Copyright © 1993 with permission.
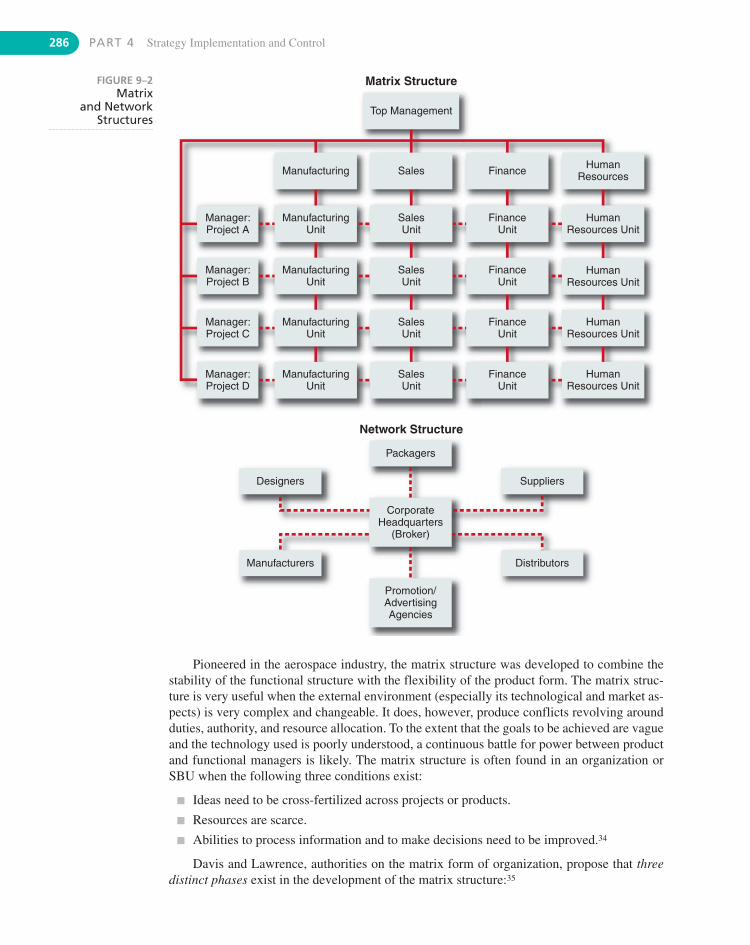
286 PART 4 Strategy Implementation and Control
Top Management
Manufacturing
ManufacturingUnit
Manager:Project A
Manager:Project B
Manager:Project C
Manager:Project D
ManufacturingUnit
ManufacturingUnit
ManufacturingUnit
Sales
SalesUnit
SalesUnit
SalesUnit
SalesUnit
Finance
FinanceUnit
FinanceUnit
FinanceUnit
FinanceUnit
HumanResources
Matrix Structure
Network Structure
Designers Suppliers
Manufacturers Distributors
Packagers
Promotion/AdvertisingAgencies
CorporateHeadquarters
(Broker)
HumanResources Unit
HumanResources Unit
HumanResources Unit
HumanResources Unit
FIGURE 9–2Matrix
and NetworkStructures
Pioneered in the aerospace industry, the matrix structure was developed to combine thestability of the functional structure with the flexibility of the product form. The matrix struc-ture is very useful when the external environment (especially its technological and market as-pects) is very complex and changeable. It does, however, produce conflicts revolving aroundduties, authority, and resource allocation. To the extent that the goals to be achieved are vagueand the technology used is poorly understood, a continuous battle for power between productand functional managers is likely. The matrix structure is often found in an organization orSBU when the following three conditions exist:
� Ideas need to be cross-fertilized across projects or products.
� Resources are scarce.
� Abilities to process information and to make decisions need to be improved.34
Davis and Lawrence, authorities on the matrix form of organization, propose that threedistinct phases exist in the development of the matrix structure:35
1. Temporary cross-functional task forces: These are initially used when a new productline is being introduced. A project manager is in charge as the key horizontal link. J&J’sexperience with cross-functional teams in its drug group led it to emphasize teams cross-ing multiple units.
2. Product/brand management: If the cross-functional task forces become more perma-nent, the project manager becomes a product or brand manager and a second phase be-gins. In this arrangement, function is still the primary organizational structure, but productor brand managers act as the integrators of semi-permanent products or brands. Consid-ered by many a key to the success of P&G, brand management has been widely imitatedby other consumer products firms around the world.
3. Mature matrix: The third and final phase of matrix development involves a true dual-authority structure. Both the functional and product structures are permanent. All employ-ees are connected to both a vertical functional superior and a horizontal product manager.Functional and product managers have equal authority and must work well together to re-solve disagreements over resources and priorities. Boeing, Philips, and TRW Systems areexample of companies that use a mature matrix.
Network Structure–The Virtual OrganizationA newer and somewhat more radical organizational design, the network structure (seeFigure 9–2) is an example of what could be termed a “non-structure” because of its virtualelimination of in-house business functions. Many activities are outsourced. A corporation or-ganized in this manner is often called a virtual organization because it is composed of a se-ries of project groups or collaborations linked by constantly changing nonhierarchical,cobweb-like electronic networks.36
The network structure becomes most useful when the environment of a firm is unstable andis expected to remain so.37 Under such conditions, there is usually a strong need for innovation and quick response. Instead of having salaried employees, the company may contract with people for a specific project or length of time. Long-term contracts with suppliers and distributors replaceservices that the company could provide for itself through vertical integration. Electronic marketsand sophisticated information systems reduce the transaction costs of the marketplace, thus justi-fying a “buy” over a “make” decision. Rather than being located in a single building or area, theorganization’s business functions are scattered worldwide. The organization is, in effect, only ashell, with a small headquarters acting as a “broker,” electronically connected to some completelyowned divisions, partially owned subsidiaries, and other independent companies. In its ultimateform, a network organization is a series of independent firms or business units linked together bycomputers in an information system that designs, produces, and markets a product or service.38
Entrepreneurial ventures often start out as network organizations. For example, Randyand Nicole Wilburn of Dorchester, Massachusetts, run real estate, consulting, design, and babyfood companies out of their home. Nicole, a stay-at-home mom and graphic designer, farmsout design work to freelancers and cooks her own line of organic baby food. For $300, an In-dian artist designed the logo for Nicole’s “Baby Fresh Organic Baby Foods.” A London free-lancer wrote promotional materials. Instead of hiring a secretary, Randy hired “virtualassistants” in Jerusalem to transcribe voice mail, update his Web site, and design PowerPointgraphics. Retired brokers in Virginia and Michigan deal with his real estate paperwork.39
Large companies such as Nike, Reebok, and Benetton use the network structure in their op-erations function by subcontracting (outsourcing) manufacturing to other companies in low-costlocations around the world. For control purposes, the Italian-based Benetton maintains what itcalls an “umbilical cord” by assuring production planning for all its subcontractors, planning ma-terials requirements for them, and providing them with bills of labor and standard prices andcosts, as well as technical assistance to make sure their quality is up to Benetton’s standards.
CHAPTER 9 Strategy Implementation: Organizing for Action 287
288 PART 4 Strategy Implementation and Control
The network organizational structure provides an organization with increased flexibilityand adaptability to cope with rapid technological change and shifting patterns of internationaltrade and competition. It allows a company to concentrate on its distinctive competencies,while gathering efficiencies from other firms that are concentrating their efforts in their ar-eas of expertise. The network does, however, have disadvantages. Some believe that the net-work is really only a transitional structure because it is inherently unstable and subject totensions.40 The availability of numerous potential partners can be a source of trouble. Con-tracting out individual activities to separate suppliers/distributors may keep the firm from dis-covering any internal synergies by combining these activities. If a particular firmoverspecializes on only a few functions, it runs the risk of choosing the wrong functions andthus becoming noncompetitive.
Cellular/Modular Organization: A New Type of Structure?Some authorities in the field propose that the evolution of organizational forms is leading fromthe matrix and the network to the cellular (also called modular) organizational form. Accord-ing to Miles and Snow et al., “a cellular organization is composed of cells (self-managingteams, autonomous business units, etc.) which can operate alone but which can interact withother cells to produce a more potent and competent business mechanism.” This combinationof independence and interdependence allows the cellular/modular organizational form to gen-erate and share the knowledge and expertise needed to produce continuous innovation. Thecellular/modular form includes the dispersed entrepreneurship of the divisional structure, cus-tomer responsiveness of the matrix, and self-organizing knowledge and asset sharing of thenetwork.41 Bombardier, for example, broke up the design of its Continental business jet into12 parts provided by internal divisions and external contractors. The cockpit, center, and for-ward fuselage were produced in-house, but other major parts were supplied by manufacturersspread around the globe. The cellular/modular structure is used when it is possible to break upa company’s products into self-contained modules or cells and where interfaces can be speci-fied such that the cells/modules work when they are joined together.42 The cellular/modularstructure is similar to a current trend in industry of using internal joint ventures to temporar-ily combine specialized expertise and skills within a corporation to accomplish a task whichindividual units alone could not accomplish.43
The impetus for such a new structure is the pressure for a continuous process of innova-tion in all industries. Each cell/module has an entrepreneurial responsibility to the larger orga-nization. Beyond knowledge creation and sharing, the cellular/modular form adds value bykeeping the firm’s total knowledge assets more fully in use than any other type of structure.44
It is beginning to appear in firms that are focused on rapid product and service innovation—providing unique or state-of-the-art offerings in industries such as automobile manufacture, bi-cycle production, consumer electronics, household appliances, power tools, computingproducts, and software.45
REENGINEERING AND STRATEGY IMPLEMENTATIONReengineering is the radical redesign of business processes to achieve major gains in cost, service, or time. It is not in itself a type of structure, but it is an effective program to imple-ment a turnaround strategy.
Business process reengineering strives to break away from the old rules and proceduresthat develop and become ingrained in every organization over the years. They may be a com-bination of policies, rules, and procedures that have never been seriously questioned becausethey were established years earlier. These may range from “Credit decisions are made by thecredit department” to “Local inventory is needed for good customer service.” These rules of
CHAPTER 9 Strategy Implementation: Organizing for Action 289
organization and work design may have been based on assumptions about technology, people,and organizational goals that may no longer be relevant. Rather than attempting to fix existingproblems through minor adjustments and fine-tuning of existing processes, the key to reengi-neering is asking “If this were a new company, how would we run this place?”
Michael Hammer, who popularized the concept of reengineering, suggests the followingprinciples for reengineering:
� Organize around outcomes, not tasks: Design a person’s or a department’s job aroundan objective or outcome instead of a single task or series of tasks.
� Have those who use the output of the process perform the process: With computer-based information systems, processes can now be reengineered so that the people whoneed the result of the process can do it themselves.
� Subsume information-processing work into the real work that produces the informa-tion: People or departments that produce information can also process it for use insteadof just sending raw data to others in the organization to interpret.
� Treat geographically dispersed resources as though they were centralized: With mod-ern information systems, companies can provide flexible service locally while keeping theactual resources in a centralized location for coordination purposes.
� Link parallel activities instead of integrating their results: Instead of having separateunits perform different activities that must eventually come together, have them commu-nicate while they work so that they can do the integrating.
� Put the decision point where the work is performed and build control into theprocess: The people who do the work should make the decisions and be self-controlling.
� Capture information once and at the source: Instead of having each unit develop itsown database and information processing activities, the information can be put on a net-work so that all can access it.46
Studies of the performance of reengineering programs show mixed results. Several com-panies have had success with business process reengineering. For example, the Mossville En-gine Center, a business unit of Caterpillar Inc., used reengineering to decrease process cycletimes by 50%, reduce the number of process steps by 45%, reduce human effort by 8%, andimprove cross-divisional interactions and overall employee decision making.47
One study of North American financial firms found that “the average reengineering proj-ect took 15 months, consumed 66 person-months of effort, and delivered cost savings of24%.”48 In a survey of 782 corporations using reengineering, 75% of the executives said theircompanies had succeeded in reducing operating expenses and increasing productivity.49 Astudy of 134 large and small Canadian companies found that reengineering programs resultedin (1) an increase in productivity and product quality, (2) cost reductions, and (3) an increasein overall organization quality, for both large and small firms.50 Other studies report, however,that anywhere from 50% to 70% of reengineering programs fail to achieve their objectives.51
Reengineering thus appears to be more useful for redesigning specific processes like order en-try, than for changing an entire organization.52
SIX SIGMAOriginally conceived by Motorola as a quality improvement program in the mid-1980s, SixSigma has become a cost-saving program for all types of manufacturers. Briefly, Six Sigma isan analytical method for achieving near-perfect results on a production line. Although the em-phasis is on reducing product variance in order to boost quality and efficiency, it is increas-ingly being applied to accounts receivable, sales, and R&D. In statistics, the Greek letter sigma
290 PART 4 Strategy Implementation and Control
DESIGNING JOBS TO IMPLEMENT STRATEGYOrganizing a company’s activities and people to implement strategy involves more than simply redesigning a corporation’s overall structure; it also involves redesigning the wayjobs are done. With the increasing emphasis on reengineering, many companies are begin-ning to rethink their work processes with an eye toward phasing unnecessary people and ac-tivities out of the process. Process steps that have traditionally been performed sequentiallycan be improved by performing them concurrently using cross-functional work teams.Harley-Davidson, for example, has managed to reduce total plant employment by 25% while reducing by 50% the time needed to build a motorcycle. Restructuring through need-ing fewer people requires broadening the scope of jobs and encouraging teamwork. The de-sign of jobs and subsequent job performance are, therefore, increasingly being consideredas sources of competitive advantage.
Job design refers to the study of individual tasks in an attempt to make them more rele-vant to the company and to the employee(s). To minimize some of the adverse consequencesof task specialization, corporations have turned to new job design techniques: job enlargement(combining tasks to give a worker more of the same type of duties to perform), job rotation(moving workers through several jobs to increase variety), and job enrichment (altering thejobs by giving the worker more autonomy and control over activities). The job characteristics
denotes variation in the standard bell-shaped curve. One sigma equals 690,000 defects per1 million. Most companies are able to achieve only three sigma, or 66,000 errors per million.Six Sigma reduces the defects to only 3.4 per million—thus saving money by preventingwaste. The process of Six Sigma encompasses five steps.
1. Define a process where results are poorer than average.
2. Measure the process to determine exact current performance.
3. Analyze the information to pinpoint where things are going wrong.
4. Improve the process and eliminate the error.
5. Establish controls to prevent future defects from occurring.53
Savings attributed to Six Sigma programs have ranged from 1.2% to 4.5% of annual revenuefor a number of Fortune 500 firms. Firms that have successfully employed Six Sigma are Gen-eral Electric, Allied Signal, ABB, and Ford Motor Company.54 About 35% of U.S. companiesnow have a Six Sigma program in place.55 At Dow Chemical, each Six Sigma project has resultedin cost savings of $500,000 in the first year.According to Jack Welch, GE’s past CEO, Six Sigmais an appropriate change program for the entire organization.56 Six Sigma experts at 3M havebeen able to speed up R&D and analyze why its top sales people sold more than others. A disad-vantage of the program is that training costs in the beginning may outweigh any savings. The ex-pense of compiling and analyzing data, especially in areas where a process cannot be easilystandardized, may exceed what is saved.57 Another disadvantage is that Six Sigma can lead toless-risky incremental innovation based on previous work than on riskier “blue-sky” projects.58
A new program called Lean Six Sigma is becoming increasingly popular in companies.This program incorporates the statistical approach of Six Sigma with the lean manufacturingprogram originally developed by Toyota. Like reengineering, it includes the removal of un-necessary steps in any process and fixing those that remain. This is the “lean” addition to SixSigma. Xerox used Lean Six Sigma to resolve a problem with a $500,000 printing press it hadjust introduced. Teams from supply, manufacturing, and R&D used Lean Six Sigma to find thecause of the problem and to resolve it by working with a supplier to change the chemistry ofthe oil on a roller.59
CHAPTER 9 Strategy Implementation: Organizing for Action 291
model is a good example of job enrichment. (See Strategy Highlight 9.2.) Although each ofthese methods has its adherents, no one method seems to work in all situations.
A good example of modern job design is the introduction of team-based production by theglass manufacturer Corning Inc., in its Blacksburg, Virginia, plant. With union approval, Corn-ing reduced job classifications from 47 to 4 to enable production workers to rotate jobs afterlearning new skills. The workers were divided into 14-member teams that, in effect, managedthemselves. The plant had only two levels of management: Plant Manager Robert Hoover andtwo line leaders who only advised the teams. Employees worked demanding 12 1⁄2-hour shifts, al-ternating three-day and four-day weeks. The teams made managerial decisions, imposed disci-pline on fellow workers, and were required to learn three “skill modules” within two years or elselose their jobs. As a result of this new job design, a Blacksburg team, made up of workers withinterchangeable skills, can retool a line to produce a different type of filter in only 10 minutes—six times faster than workers in a traditionally designed filter plant. The Blacksburg plant earneda $2 million profit in its first eight months of production instead of losing the $2.3 million pro-jected for the startup period. The plant performed so well that Corning’s top management actedto convert the company’s 27 other factories to team-based production.60
4. Vertically load the job by giving workers increasedauthority and responsibility over their activities.
5. Open feedback channels by providing workers withinformation on how they are performing.
Research supports the job characteristics model as away to improve job performance through job enrichment.Although there are several other approaches to job design,practicing managers seem increasingly to follow the pre-scriptions of this model as a way of improving productivityand product quality.
The job characteristics modelis an advanced approach to
job design based on the beliefthat tasks can be described in
terms of certain objective character-istics and that these characteristics affect
employee motivation. In order for a job to be motivating,(1) the worker needs to feel a sense of responsibility, feel thetask to be meaningful, and receive useful feedback on his orher performance, and (2) the job has to satisfy needs that areimportant to the worker. The model proposes that managersfollow five principles for redesigning work:
1. Combine tasks to increase task variety and to enableworkers to identify with what they are doing.
2. Form natural work units to make a worker moreresponsible and accountable for the performance ofthe job.
3. Establish client relationships so the worker will knowwhat performance is required and why.
DESIGNING JOBS WITH THE JOB CHARACTERISTICS MODEL
SOURCE: J. R. Hackman and G. R. Oldham, Work Redesign (Read-ing, MA: Addison-Wesley, 1980), pp. 135–141; G. Johns, J. L. Xie,and Y. Fang, “Mediating and Moderating Effects in Job Design,”Journal of Management (December 1992), pp. 657–676; R. W.Griffin, “Effects of Work Redesign on Employee Perceptions, Atti-tudes, and Behaviors: A Long-Term Investigation,” Academy ofManagement Journal (June 1991), pp. 425–435.
STRATEGY highlight 9.2
9.5 International Issues in Strategy ImplementationAn international company is one that engages in any combination of activities, from export-ing/importing to full-scale manufacturing, in foreign countries. A multinational corporation(MNC), in contrast, is a highly developed international company with a deep involvementthroughout the world, plus a worldwide perspective in its management and decision making.
292 PART 4 Strategy Implementation and Control
INTERNATIONAL STRATEGIC ALLIANCESStrategic alliances, such as joint ventures and licensing agreements, between an MNC and alocal partner in a host country are becoming increasingly popular as a means by which a cor-poration can gain entry into other countries, especially less developed countries. The key tothe successful implementation of these strategies is the selection of the local partner. Eachparty needs to assess not only the strategic fit of each company’s project strategy but also thefit of each company’s respective resources. A successful joint venture may require as much astwo years of prior contacts between the parties. A prior relationship helps to develop a level oftrust, which facilitates openness in sharing knowledge and a reduced fear of opportunistic be-havior by the alliance partners. This is especially important when the environmental uncer-tainty is high.62 Research reveals that firms favor past partners when forming new alliances.63
Key drivers for strategic fit between alliance partners are the following:
� Partners must agree on fundamental values and have a shared vision about the potentialfor joint value creation.
� Alliance strategy must be derived from business, corporate, and functional strategy.
� The alliance must be important to both partners, especially to top management.
� Partners must be mutually dependent for achieving clear and realistic objectives.
For an MNC to be considered global, it must manage its worldwide operations as if they weretotally interconnected. This approach works best when the industry has moved from beingmultidomestic (each country’s industry is essentially separate from the same industry in othercountries) to global (each country is a part of one worldwide industry).
The global MNC faces the dual challenge of achieving scale economies through standard-ization while at the same time responding to local customer differences. According to Spulberin his book, Global Competitive Strategy, the forces pushing for standardization are:
� Convergence in customer preferences and income across target countries.
� Competition from successful global products.
� Growing customer awareness of international brands.
� Economies of scale.
� Falling trading costs across countries.
� Cultural exchange and business interactions among countries.
The forces pushing for customization to local markets are:
� Persistent differences in customer preferences.
� Persistent differences in customer incomes.
� The need to build local brand reputation.
� Competition from successful, innovative domestic companies.
� Variations in trading costs across countries.
� Local regulatory requirements.61
The design of an organization’s structure is strongly affected by the company’s stage ofdevelopment in international activities and the types of industries in which the company is in-volved. Strategic alliances may complement or even substitute for an internal functional ac-tivity. The issue of centralization versus decentralization becomes especially important for anMNC operating in both multidomestic and global industries.
CHAPTER 9 Strategy Implementation: Organizing for Action 293
� Joint activities must have added value for customers and the partners.
� The alliance must be accepted by key stakeholders.
� Partners contribute key strengths but protect core competencies.64
STAGES OF INTERNATIONAL DEVELOPMENTCorporations operating internationally tend to evolve through five common stages, both intheir relationships with widely dispersed geographic markets and in the manner in which theystructure their operations and programs. These stages of international development are:
� Stage 1 (Domestic company): The primarily domestic company exports some of its prod-ucts through local dealers and distributors in the foreign countries. The impact on the or-ganization’s structure is minimal because an export department at corporate headquartershandles everything.
� Stage 2 (Domestic company with export division): Success in Stage 1 leads the com-pany to establish its own sales company with offices in other countries to eliminate themiddlemen and to better control marketing. Because exports have now become more im-portant, the company establishes an export division to oversee foreign sales offices.
� Stage 3 (Primarily domestic company with international division): Success in earlierstages leads the company to establish manufacturing facilities in addition to sales and ser-vice offices in key countries. The company now adds an international division with re-sponsibilities for most of the business functions conducted in other countries.
� Stage 4 (Multinational corporation with multidomestic emphasis): Now a full-fledgedMNC, the company increases its investments in other countries. The company establishes alocal operating division or company in the host country, such as Ford of Britain, to better servethe market. The product line is expanded, and local manufacturing capacity is established.Managerial functions (product development, finance, marketing, and so on) are organizedlocally. Over time, the parent company acquires other related businesses, broadening the baseof the local operating division. As the subsidiary in the host country successfully develops astrong regional presence, it achieves greater autonomy and self-sufficiency. The operations ineach country are, nevertheless, managed separately as if each is a domestic company.
� Stage 5 (MNC with global emphasis): The most successful MNCs move into a fifth stagein which they have worldwide human resources, R&D, and financing strategies. Typicallyoperating in a global industry, the MNC denationalizes its operations and plans productdesign, manufacturing, and marketing around worldwide considerations. Global consid-erations now dominate organizational design. The global MNC structures itself in a ma-trix form around some combination of geographic areas, product lines, and functions. Allmanagers are responsible for dealing with international as well as domestic issues.
Research provides some support for stages of international development, but it does notnecessarily support the preceding sequence of stages. For example, a company may initiateproduction and sales in multiple countries without having gone through the steps of exportingor having local sales subsidiaries. In addition, any one corporation can be at different stagessimultaneously, with different products in different markets at different levels. Firms may alsoleapfrog across stages to a global emphasis. In addition, most firms that are considered to bestage 5 global MNCs are actually regional. Around 88% of the world’s biggest MNCs deriveat least half of their sales from their home regions. Just 2% (a total of nine firms) derive 20%or more of their sales from each of the North American, European, and Asian regions.65
Developments in information technology are changing the way business is being done inter-nationally. See the Global Issue feature for a possible sixth stage of international development, in
294 PART 4 Strategy Implementation and Control
which an MNC locates its headquarters and key functions at multiple locations around the world.66
Nevertheless, the stages concept provides a useful way to illustrate some of the structural changescorporations undergo when they increase their involvement in international activities.
SOURCES: S. Hamm, “Borders Are So 20th Century,” BusinessWeek (January 22, 2003), pp. 68–70; “Globalization from the TopDown,” Futurist (November–December 2003), p. 13.
what is a multinational company. Does it have a homecountry? What does headquarters mean? Can you frag-ment your corporate functions globally?” Corporate head-quarters are now becoming virtual with executives andcore corporate functions dispersed throughout variousworld regions. These primarily technology companies areusing geography to obtain competitive advantage throughthe availability of talent or capital, low costs, or proximityto most important customers. Logitech, for example, hasits manufacturing headquarters in Taiwan to capitalize onlow-cost Asian manufacturing, its business-developmentheadquarters in Switzerland where it has a series of strate-gic technology partnerships, and a third headquarters inFremont, California.
In what could be a sixthstage of international devel-
opment, an increasing numberof MNCs are relocating their head-
quarters and headquarters functions atmultiple locations around the world. Of the 800 corporateheadquarters established in 2002, 200 of them were in de-veloping nations. The antivirus software company TrendMicro, for example, spreads its top executives, engineers,and support staff throughout the world to improve its abil-ity to respond to new virus threats. “With the Internet,viruses became global. To fight them, we had to become aglobal company,” explained Chairman Steve Chang. TrendMicro’s financial headquarters is in Tokyo, where it wentpublic. Its product development is in Taiwan, and its salesheadquarters is in America’s Silicon Valley.
C. K. Prahalad, strategy professor at the University ofMichigan, proposes that this is a new stage of internationaldevelopment. “There is a fundamental rethinking about
MULTIPLE HEADQUARTERS: A SIXTH STAGE OF INTERNATIONAL DEVELOPMENT?
GLOBAL issue
CENTRALIZATION VERSUS DECENTRALIZATIONA basic dilemma an MNC faces is how to organize authority centrally so that it operates as avast interlocking system that achieves synergy and at the same time decentralize authority sothat local managers can make the decisions necessary to meet the demands of the local mar-ket or host government.67 To deal with this problem, MNCs tend to structure themselves eitheralong product groups or geographic areas. They may even combine both in a matrix struc-ture—the design chosen by 3M Corporation, Philips, and Asea Brown Boveri (ABB), amongothers.68 One side of 3M’s matrix represents the company’s product divisions; the other sideincludes the company’s international country and regional subsidiaries.
Two examples of the usual international structure are Nestlé and American Cyanamid.Nestlé’s structure is one in which significant power and authority have been decentralized togeographic entities. This structure is similar to that depicted in Figure 9–3, in which each ge-ographic set of operating companies has a different group of products. In contrast, AmericanCyanamid has a series of centralized product groups with worldwide responsibilities. To de-pict Cyanamid’s structure, the geographical entities in Figure 9–3 would have to be replacedby product groups or SBUs.
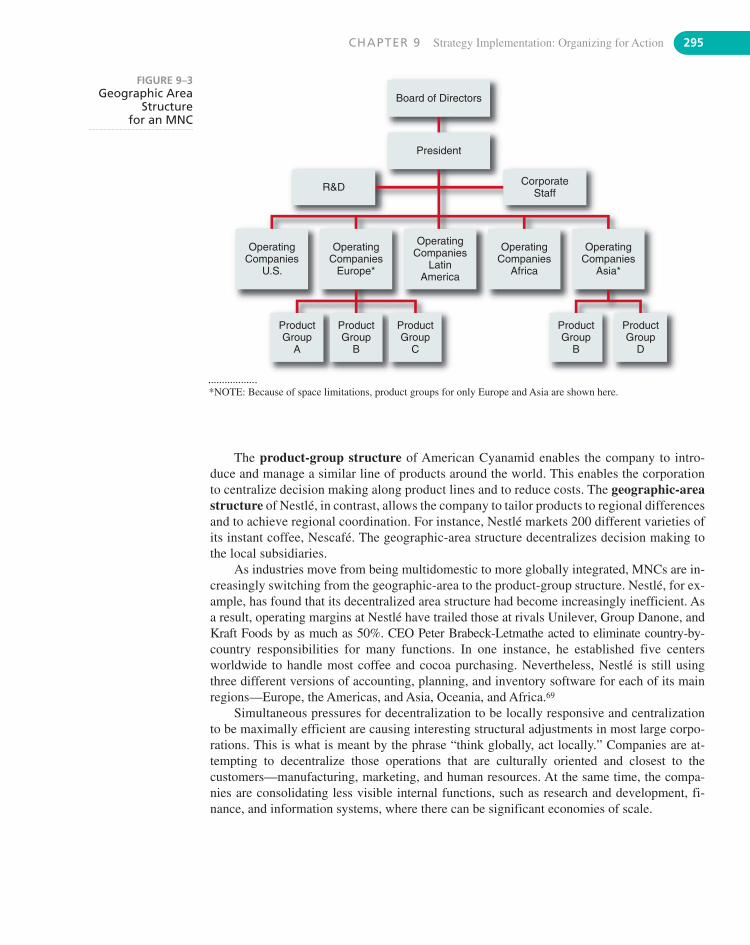
CHAPTER 9 Strategy Implementation: Organizing for Action 295
The product-group structure of American Cyanamid enables the company to intro-duce and manage a similar line of products around the world. This enables the corporationto centralize decision making along product lines and to reduce costs. The geographic-areastructure of Nestlé, in contrast, allows the company to tailor products to regional differencesand to achieve regional coordination. For instance, Nestlé markets 200 different varieties ofits instant coffee, Nescafé. The geographic-area structure decentralizes decision making tothe local subsidiaries.
As industries move from being multidomestic to more globally integrated, MNCs are in-creasingly switching from the geographic-area to the product-group structure. Nestlé, for ex-ample, has found that its decentralized area structure had become increasingly inefficient. Asa result, operating margins at Nestlé have trailed those at rivals Unilever, Group Danone, andKraft Foods by as much as 50%. CEO Peter Brabeck-Letmathe acted to eliminate country-by-country responsibilities for many functions. In one instance, he established five centersworldwide to handle most coffee and cocoa purchasing. Nevertheless, Nestlé is still using three different versions of accounting, planning, and inventory software for each of its mainregions—Europe, the Americas, and Asia, Oceania, and Africa.69
Simultaneous pressures for decentralization to be locally responsive and centralizationto be maximally efficient are causing interesting structural adjustments in most large corpo-rations. This is what is meant by the phrase “think globally, act locally.” Companies are at-tempting to decentralize those operations that are culturally oriented and closest to thecustomers—manufacturing, marketing, and human resources. At the same time, the compa-nies are consolidating less visible internal functions, such as research and development, fi-nance, and information systems, where there can be significant economies of scale.
Board of Directors
President
OperatingCompanies
U.S.
OperatingCompanies
Europe*
OperatingCompanies
LatinAmerica
OperatingCompanies
Africa
OperatingCompanies
Asia*
ProductGroup
B
ProductGroup
D
CorporateStaff
ProductGroup
A
ProductGroup
B
ProductGroup
C
R&D
FIGURE 9–3Geographic Area
Structurefor an MNC
*NOTE: Because of space limitations, product groups for only Europe and Asia are shown here.
296 PART 4 Strategy Implementation and Control
End of Chapter SUMMARYStrategy implementation is where “the rubber hits the road.” Environmental scanning andstrategy formulation are crucial to strategic management but are only the beginning of theprocess. The failure to carry a strategic plan into the day-to-day operations of the workplaceis a major reason why strategic planning often fails to achieve its objectives. It is discour-aging to note that in one study nearly 70% of the strategic plans were never successfullyimplemented.70
For a strategy to be successfully implemented, it must be made action oriented. This is donethrough a series of programs that are funded through specific budgets and contain new detailedprocedures. This is what Sergio Marchionne did when he implemented a turnaround strategy asthe new Fiat Group CEO in 2004. He attacked the lethargic, bureaucratic system by flatteningFiat’s structure and giving younger managers a larger amount of authority and responsibility. Heand other managers worked to reduce the number of auto platforms from 19 to six by 2012. Thetime from the completion of the design process to new car production was cut from 26 to18 months. By 2008, the Fiat auto unit was again profitable. Marchionne’s next step was to revive the other two underperforming units of Lancia and Alfa Romeo.71
This chapter explains how jobs and organizational units can be designed to support achange in strategy. We will continue with staffing and directing issues in strategy implemen-tation in the next chapter.
E C O - B I T S� Only 5% of the 30 million tons of annual plastic waste
in the U.S. is currently being recycled.72
� Cargill is building the first large-scale manufacturingplant to make soybean-based “polyols,” the building
blocks of polyurethane. The company says that the useof polyols is a more sustainable option for manufactur-ers of plastic and ultimately for consumers interested inreducing their environmental footprint.73
D I S C U S S I O N Q U E S T I O N S1. How should a corporation attempt to achieve synergy
among functions and business units?
2. How should an owner-manager prepare a company for itsmovement from Stage I to Stage II?
3. How can a corporation keep from sliding into the Declinestage of the organizational life cycle?
4. Is reengineering just another management fad, or does itoffer something of lasting value?
5. How is the cellular/modular structure different from thenetwork structure?
S T R A T E G I C P R A C T I C E E X E R C I S EThe Synergy GameYolanda Sarason and Catherine Banbury
Setup
Put three to five chairs on either side of a room, facing eachother, in the front of the class. Put a table in the middle, with abell in the middle of the table.
Procedure
The instructor/moderator divides the class into teams of three tofive people. Each team selects a name for itself. The instructor/moderator lists the team names on the board. The first twoteams come to the front and sit in the chairs facing each other.The instructor/moderator reads a list of products or servicesbeing provided by an actual company. The winning team must
CHAPTER 9 Strategy Implementation: Organizing for Action 297
identify (1) possible sources of synergy and (2) the actual com-pany being described. For example, if the products/serviceslisted are family restaurants, airline catering, hotels, and retire-ment centers, the synergy is standardized food service andhospitality settings and the company is The Marriott Corpo-ration. The first team to successfully name the company andthe synergy wins the round.
After one practice session, the game begins. Each of theteams is free to discuss the question with other team mem-bers. When one of the two teams thinks that it has the answerto both parts of the question, it must be the first to ring the bellin order to announce its answer. If it gives the correct answer,it is deemed the winner of round one. Both parts of the answermust be given for a team to have the correct answer. If a teamcorrectly provides only one part, that answer is still wrong—no partial credit. The instructor/moderator does not say whichpart of the answer, if either, was correct. The second teamthen has the opportunity to state the answer. If the secondteam is wrong, both teams may try once more. If neitherchooses to try again, the instructor/moderator may (1) declare
no round winner and both teams sit down, (2) allow the nexttwo teams to provide the answer to round one, or (3) go on tothe next round with the same two teams. Two new teams thencome to the front for the next round. Once all groups haveplayed once, the winning teams play each other. Rounds con-tinue until there is a grand champion. The instructor shouldprovide a suitable prize, such as candy bars, for the winningteam.
Note from Wheelen and HungerThe Instructors’ Manual for this book contains a list of prod-ucts and services with their synergy and the name of the com-pany. In case your instructor does not use this exercise, try thefollowing examples:
Example 1: Motorcycles, autos, lawn mowers, generators
Example 2: Athletic footwear, Rockport shoes, GregNorman clothing, sportswear
For each example, did you guess the company providingthese products/services and the synergy obtained? The answersare printed here, upside-down:
K E Y T E R M Sbudget (p. 276)cellular organization (p. 288)geographic-area structure (p. 295)job design (p. 290)matrix of change (p. 274)matrix structure (p. 285)multinational corporation (MNC) (p. 291)network structure (p. 287)
organizational life cycle (p. 283)procedure (p. 276)product-group structure (p. 295)program (p. 274)reengineering (p. 288)Six Sigma (p. 289)stages of corporate development (p. 280)
stages of international development(p. 293)
strategy implementation (p. 272)structure follows strategy (p. 279)synergy (p. 278)virtual organization (p. 287)
N O T E S1. A. Bianco, M. Der Hovanesian, L. Young, and P. Gogoi, “Wal-
Mart’s Midlife Crisis,” Business Week (April 30, 2007),pp. 46–56; “The Bulldozer of Bentonville Slows,” The Econo-mist (February 17, 2007), p. 64; D. Kirkpatrick, “Microsoft’sNew Brain,” Fortune (May 1, 2006), pp. 56–68; “Spot the Di-nosaur,” The Economist (April 1, 2006), pp. 53–54; J. Greene,“Microsoft’s Midlife Crisis,” Business Week (April 19, 2004),pp. 88–98.
2. M. S. Olson, D. van Bever, and S. Verry, “When Growth Stalls,”Harvard Business Review (March 2008), pp. 50–61. This phe-nomenon was called the “burnout syndrome” by G. Probst andS. Raisch in “Organizational Crisis: The Logic of Failure,”Academy of Management Executive (February 2005),pp. 90–105.
3. Ibid.4. J. W. Gadella, “Avoiding Expensive Mistakes in Capital Invest-
ment,” Long Range Planning (April 1994), pp. 103–110; B. Voss,“World Market Is Not for Everyone,” Journal of Business Strat-egy (July/August 1993), p. 4.
5. A. Bert, T. MacDonald, and T. Herd, “Two Merger IntegrationImperatives: Urgency and Execution,” Strategy & Leadership,Vol. 31, No. 3 (2003), pp. 42–49.
6. L. D. Alexander, “Strategy Implementation: Nature of the Prob-lem,” International Review of Strategic Management, Vol. 2, No. 1,edited by D. E. Hussey (New York: John Wiley & Sons, 1991),pp. 73–113. See also L. G. Hrebiniak, “Obstacles to Effective Strat-egy Implementation,” Organizational Dynamics, Vol. 35, Issue 1(2006), pp. 12–31 for six obstacles to implementation.
SOURCE: This exercise was developed by Professors YolandaSarason of Colorado State University and Catherine Banbury of St.Mary’s College and Purdue University and presented at theOrganizational Behavior Teaching Conference, June 1999. Copyright© 1999 by Yolanda Sarason and Catherine Banbury. Adapted withpermission.
Example 1: Engine technology by Honda
Example 2: Marketing and distribution for the athletically-oriented by Reebok
7. L. G. Hrebiniak (2006).8. F. Arner and A. Aston, “How Xerox Got Up to Speed,” Business
Week (May 3, 2004), pp. 103–104.9. J. Darragh and A. Campbell, “Why Corporate Initiatives Get
Stuck?” Long Range Planning (February 2001), pp. 33–52.10. E. Brynjolfsson, A. A. Renshaw, and M. Van Alstyne, “The Ma-
trix of Change,” Sloan Management Review (Winter 1997),pp. 37–54.
11. “Cocoa Farming: Fair Enough?” The Economist (February 2,2008), p. 74.
12. M. S. Feldman and B. T. Pentland, “Reconceptualizing Organi-zational Routines as a Source of Flexibility and Change,”Administrative Science Quarterly (March 2003), pp. 94–118.
13. S. F. Slater and E. M. Olson, “Strategy Type and Performance:The Influence of Sales Force Management,” Strategic Manage-ment Journal (August 2000), pp. 813–829.
14. B. Grow, “Thinking Outside the Box,” Business Week (October25, 2004), pp. 70–72.
15. M. Goold and A. Campbell, “Desperately Seeking Synergy,”Harvard Business Review (September–October 1998),pp. 131–143.
16. A. D. Chandler, Strategy and Structure (Cambridge, MA: MITPress, 1962).
17. A. P. Sloan, Jr., My Years with General Motors (Garden City,NY: Doubleday, 1964).
18. T. L. Amburgey and T. Dacin, “As the Left Foot Follows the Right?The Dynamics of Strategic and Structural Change,” Academy ofManagement Journal (December 1994), pp. 1427–1452; M.Ollinger, “The Limits of Growth of the Multidivisional Firm: ACase Study of the U.S. Oil Industry from 1930–90,” Strategic Man-agement Journal (September 1994), pp. 503–520.
19. D. F. Jennings and S. L. Seaman, “High and Low Levels of Or-ganizational Adaptation: An Empirical Analysis of Strategy,Structure, and Performance,” Strategic Management Journal(July 1994), pp. 459–475; L. Donaldson, “The Normal Scienceof Structured Contingency Theory,” in Handbook of Organiza-tion Studies, edited by S. R. Clegg, C. Hardy, and W. R. Nord(London: Sage Publications, 1996), pp. 57–76.
20. A. K. Gupta, “SBU Strategies, Corporate-SBU Relations, andSBU Effectiveness in Strategy Implementation,” Academy ofManagement Journal (September 1987), pp. 477–500.
21. L. E. Greiner, “Evolution and Revolution As OrganizationsGrow,” Harvard Business Review (May–June 1998), pp. 55–67.This is an updated version of Greiner’s classic 1972 article.
22. K. Shimizu and M. A. Hitt, “What Constrains or Facilitates Di-vestitures of Formerly Acquired Firms? The Effects of Organiza-tional Inertia,” Journal of Management (February 2005),pp. 50–72.
23. A. Weintraub, “Can Pfizer Prime the Pipeline?” Business Week(December 31, 2007), pp. 90–91.
24. Ibid, p. 64. Although Greiner simply labeled this as the “?” cri-sis, the term pressure-cooker seems apt.
25. J. Hamm, “Why Entrepreneurs Don’t Scale,” Harvard BusinessReview (December 2002), pp. 110–115. See also C. B. Gibsonand R. M. Rottner, “The Social Foundations for Building aCompany Around an Inventor,” Organizational Dynamics,Vol. 37, Issue 1 ( January–March 2008), pp. 21–34.
26. W. P. Barnett, “The Dynamics of Competitive Intensity,”Administrative Science Quarterly (March 1997), pp. 128–160; D.Miller, The Icarus Paradox: How Exceptional Companies BringAbout Their Own Downfall (New York: Harper Business, 1990).
27. D. Miller and P. H. Friesen, “A Longitudinal Study of the Cor-porate Life Cycle,” Management Science (October 1984),pp. 1161–1183.
28. J. L. Morrow, Jr., D. G. Sirmon, M. A. Hitt, and T. R. Holcomb,“Creating Value in the Face of Declining Performance: FirmStrategies and Organizational Recovery,” Strategic Manage-ment Journal (March 2007), pp. 271–283; C. Zook, “FindingYour Next Core Business,” Harvard Business Review(April 2007), pp. 66–75.
29. J. P. Sheppard and S. D. Chowdhury, “Riding the Wrong Wave:Organizational Failure as a Failed Turnaround,” Long RangePlanning (June 2005), pp. 239–260.
30. W-R. Chen and K. D. Miller, “Situational and Institutional De-terminants of Firms’R&D Search Intensity,” Strategic Manage-ment Journal (April 2007), pp. 369–381.
31. S. Hamm, “Kodak’s Moment of Truth,” Business Week(February 19, 2007), pp. 42–49.
32. R. Berner, “Turning Kmart into a Cash Cow,” Business Week(July 12, 2004), p. 81.
33. H. Tavakolian, “Bankruptcy: An Emerging Corporate Strat-egy,” SAM Advanced Management Journal (Spring 1995),p. 19.
34. L. G. Hrebiniak and W. F. Joyce, Implementing Strategy (NewYork: Macmillan, 1984), pp. 85–86.
35. S. M. Davis and P. R. Lawrence, Matrix (Reading, MA:Addison-Wesley, 1977), pp. 11–24.
36. J. G. March, “The Future Disposable Organizations and theRigidities of Imagination,” Organization (August/November1995), p. 434.
37. M. A. Schilling and H. K. Steensma, “The Use of Modular Or-ganizational Forms: An Industry-Level Analysis,” Academy ofManagement Journal (December 2001), pp. 1149–1168.
38. M. P. Koza and A. Y. Lewin, “The Coevolution of Network Al-liances: A Longitudinal Analysis of an International Profes-sional Service Network,” Organization Science (September/October 1999), pp. 638–653.
39. P. Engardio, “Mom-and-Pop Multinationals,” Business Week(July 14 & 21, 2008), pp. 77–78.
40. For more information on managing a network organization, seeG. Lorenzoni and C Baden-Fuller, “Creating a Strategic Centerto Manage a Web of Partners,” California Management Review(Spring 1995), pp. 146–163.
41. R. E. Miles, C. C. Snow, J. A. Mathews, G. Miles, and H. J.Coleman, Jr., “Organizing in the Knowledge Age: Anticipatingthe Cellular Form,” Academy of Management Executive(November 1997), pp. 7–24.
42. N. Anand and R. L. Daft, “What Is the Right Organization De-sign?” Organizational Dynamics, Vol. 36, No. 4 (2007),pp. 329–344.
43. J. Naylor and M. Lewis, “Internal Alliances: Using Joint Ven-tures in a Diversified Company,” Long Range Planning(October 1997), pp. 678–688.
44. G. Hoetker, “Do Modular Products Lead to Modular Organiza-tions?” Strategic Management Journal (June 2006),pp. 501–518.
45. Anand and Daft, pp. 336–338.46. Summarized from M. Hammer, “Reengineering Work: Don’t
Automate, Obliterate,” Harvard Business Review (July–August1990), pp. 104–112.
47. D. Paper, “BPR: Creating the Conditions for Success,” LongRange Planning (June 1998), pp. 426–435.
298 PART 4 Strategy Implementation and Control
CHAPTER 9 Strategy Implementation: Organizing for Action 299
48. S. Drew, “BPR in Financial Services: Factors for Success,”Long Range Planning (October 1994), pp. 25–41.
49. “Do As I Say, Not As I Do,” Journal of Business Strategy(May/June 1997), pp. 3–4.
50. L. Raymond and S. Rivard, “Determinants of Business ProcessReengineering Success in Small and Large Enterprises: An Em-pirical Study in the Canadian Context,” Journal of Small Busi-ness Management (January 1998), pp. 72–85.
51. K. Grint, “Reengineering History: Social Resonances and Busi-ness Process Reengineering,” Organization (July 1994),pp. 179–201; A. Kleiner, “Revisiting Reengineering,”Strategy � Business (3rd Quarter 2000), pp. 27–31.
52. E. A. Hall, J. Rosenthal, and J. Wade, “How to Make Reengi-neering Really Work,” McKinsey Quarterly (1994, No.2),pp. 107–128.
53. M. Arndt, “Quality Isn’t Just for Widgets,” Business Week(July 22, 2002), pp. 72–73.
54. T. M. Box, “Six Sigma Quality: Experiential Learning,” SAMAdvanced Management Journal (Winter 2006), pp. 20–23.
55. R. O. Crockett, “Six Sigma Still Pays Off at Motorola,”Business Week (December 4, 2006), p. 50.
56. J. Welch and S. Welch, “The Six Sigma Shotgun,” BusinessWeek (May 21, 2007), p. 110.
57. Arndt, p. 73.58. B. Hindo, “At 3M, A Struggle Between Efficiency and Creativ-
ity,” Business Week IN (June 11, 2007), pp. 8–16.59. F. Arner and A. Aston, “How Xerox Got Up to Speed,” Business
Week (May 3, 2004), pp. 103–104.60. J. Hoerr, “Sharpening Minds for a Competitive Edge,” Business
Week (December 17, 1990), pp. 72–78.61. D. Spulberg, Global Competitive Strategy (Cambridge, UK:
Cambridge University Press, 2007), p. 257; See also A. K.Gupta, V. Govindarajan, and H. Wang, The Quest for GlobalDominance, 2nd ed. (San Francisco: Jossey-Bass, 2007) for asimilar set of forces.
62. R. Krishnan, X. Martin, and N. G. Noorderhaven, “When DoesTrust Matter to Alliance Performance,” Academy of Manage-ment Journal (October 2006), pp. 894–917.
63. S. X. Li and T. J. Rowley, “Inertia and Evaluation Mechanismsin Interorganizational Partner Selection: Syndicate FormationAmong U.S. Investment Banks,” Academy of ManagementJournal (December 2002), pp. 1104–1119.
64. M. U. Douma, J. Bilderbeek, P. J. Idenburg, and J. K. Loise,“Strategic Alliances: Managing the Dynamics of Fit,” LongRange Planning (August 2000), pp. 579–598; W. Hoffmann andR. Schlosser, “Success Factors of Strategic Alliances in Smalland Medium-Sized Enterprises—An Empirical Survey,” LongRange Planning (June 2001), pp. 357–381; Y. Luo, “How Im-portant Are Shared Perceptions of Procedural Justice in Coop-erative Alliances?” Academy of Management Journal (August2005), pp. 695–709.
65. Alan M. Rugman, The Regional Multinationals (Cambridge,UK: Cambridge University Press, 2005); P. Ghemawat, “Re-gional Strategies for Global Leadership,” Harvard Business Re-view (December 2005), pp. 98–108.
66. J. Birkinshaw, P. Braunerhjelm, U. Holm, and S. Terjesen,“Why Do Some Multinational Corporations Relocate TheirHeadquarters Overseas?” Strategic Management Journal (July2006), pp. 681–700.
67. J. H. Taggart, “Strategy Shifts in MNC Subsidiaries,” StrategicManagement Journal (July 1998), pp. 663–681.
68. C. A. Bartlett and S. Ghoshal, “Beyond the M-Form: Toward aManagerial Theory of the Firm,” Strategic Management Jour-nal (Winter 1993), pp. 23–46.
69. C. Matlack, “Nestle Is Starting to Slim Down at Last,” BusinessWeek (October 27, 2003), pp. 56–57; “Daring, Defying toGrow,” Economist (August 7, 2004), pp. 55–58.
70. J. Sterling, “Translating Strategy into Effective Implementa-tion: Dispelling the Myths and Highlighting What Works,”Strategy & Leadership, Vol. 31, No. 3 (2003), pp. 27–34.
71. “Rebirth of a Carmaker,” The Economist (April 26, 2008),pp. 87–89.
72. M. Der Hovanesian, “I Have One Word for You: Bioplastics,”Business Week (June 30, 2008), pp. 44–47.
73. “Cargill Begins to Build Chicago Plant,” St. Cloud (MN) Times(July 9, 2008), p. 3A.
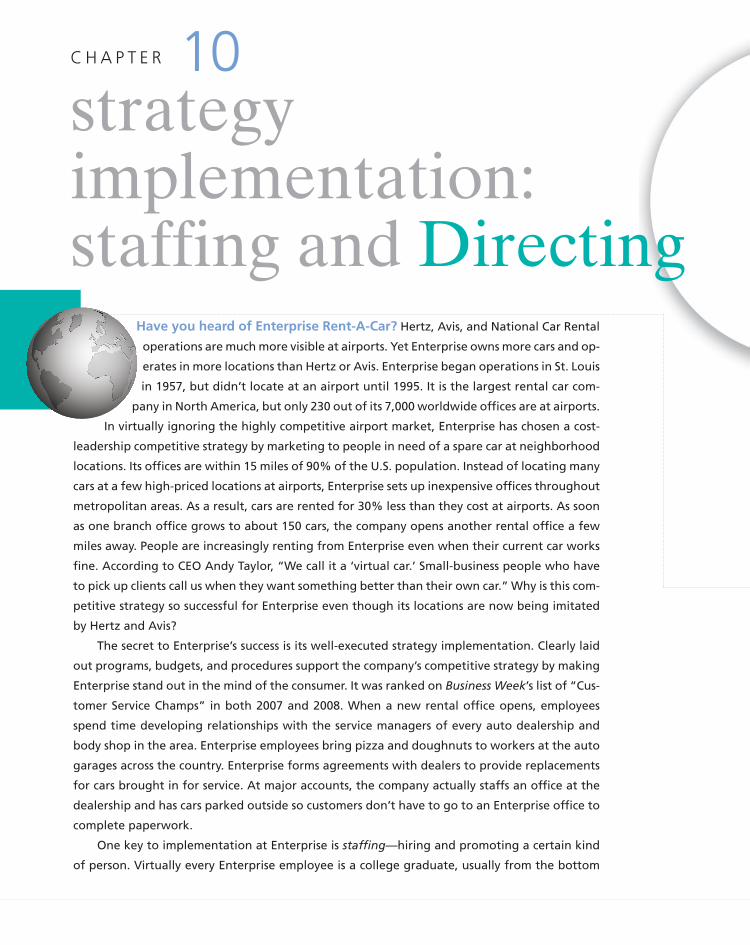
Have you heard of Enterprise Rent-A-Car? Hertz, Avis, and National Car Rental
operations are much more visible at airports. Yet Enterprise owns more cars and op-
erates in more locations than Hertz or Avis. Enterprise began operations in St. Louis
in 1957, but didn’t locate at an airport until 1995. It is the largest rental car com-
pany in North America, but only 230 out of its 7,000 worldwide offices are at airports.
In virtually ignoring the highly competitive airport market, Enterprise has chosen a cost-
leadership competitive strategy by marketing to people in need of a spare car at neighborhood
locations. Its offices are within 15 miles of 90% of the U.S. population. Instead of locating many
cars at a few high-priced locations at airports, Enterprise sets up inexpensive offices throughout
metropolitan areas. As a result, cars are rented for 30% less than they cost at airports. As soon
as one branch office grows to about 150 cars, the company opens another rental office a few
miles away. People are increasingly renting from Enterprise even when their current car works
fine. According to CEO Andy Taylor, “We call it a ‘virtual car.’ Small-business people who have
to pick up clients call us when they want something better than their own car.” Why is this com-
petitive strategy so successful for Enterprise even though its locations are now being imitated
by Hertz and Avis?
The secret to Enterprise’s success is its well-executed strategy implementation. Clearly laid
out programs, budgets, and procedures support the company’s competitive strategy by making
Enterprise stand out in the mind of the consumer. It was ranked on Business Week’s list of “Cus-
tomer Service Champs” in both 2007 and 2008. When a new rental office opens, employees
spend time developing relationships with the service managers of every auto dealership and
body shop in the area. Enterprise employees bring pizza and doughnuts to workers at the auto
garages across the country. Enterprise forms agreements with dealers to provide replacements
for cars brought in for service. At major accounts, the company actually staffs an office at the
dealership and has cars parked outside so customers don’t have to go to an Enterprise office to
complete paperwork.
One key to implementation at Enterprise is staffing—hiring and promoting a certain kind
of person. Virtually every Enterprise employee is a college graduate, usually from the bottom
strategyimplementation:staffing and Directing
C H A P T E R 10
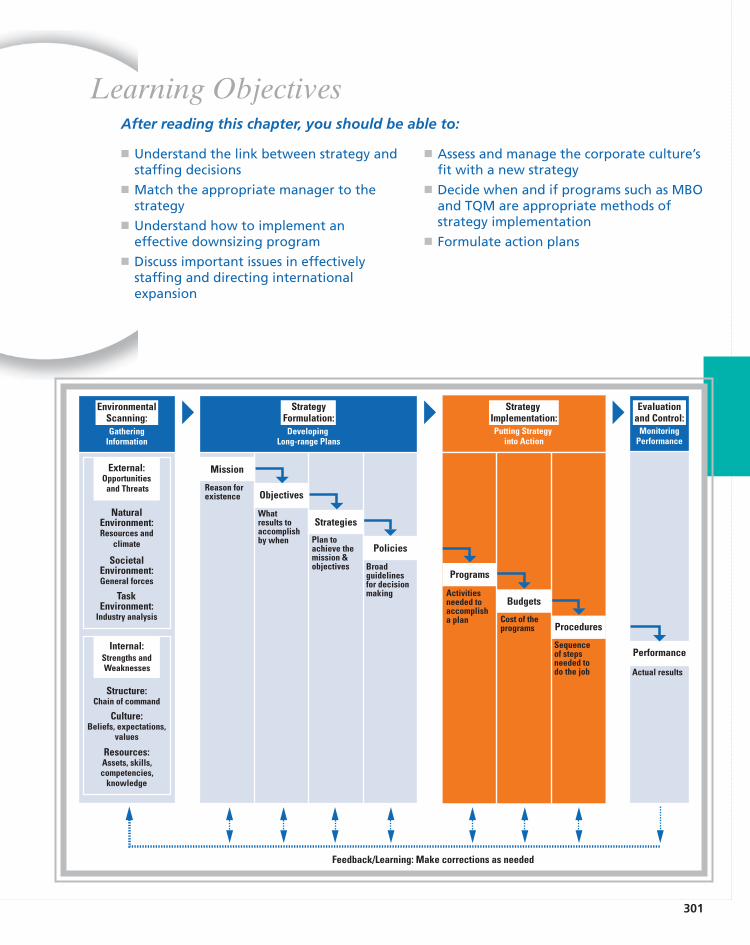
301
� Understand the link between strategy andstaffing decisions
� Match the appropriate manager to thestrategy
� Understand how to implement aneffective downsizing program
� Discuss important issues in effectivelystaffing and directing internationalexpansion
� Assess and manage the corporate culture’sfit with a new strategy
� Decide when and if programs such as MBOand TQM are appropriate methods ofstrategy implementation
� Formulate action plans
Learning Objectives
GatheringInformation
Putting Strategy into Action
MonitoringPerformance
SocietalEnvironment:General forces
NaturalEnvironment:Resources and
climate
TaskEnvironment:
Industry analysis
Internal:Strengths andWeaknesses
Structure:Chain of command
Culture:Beliefs, expectations,
values
Resources:Assets, skills,competencies,
knowledge
Programs
Activitiesneeded to accomplisha plan
Budgets
Cost of theprograms Procedures
Sequenceof stepsneeded to do the job
Performance
Actual results
External:Opportunities
and Threats
DevelopingLong-range Plans
Mission
Reason forexistence Objectives
Whatresults to accomplishby when
Strategies
Plan toachieve themission &objectives
Policies
Broadguidelinesfor decisionmaking
EnvironmentalScanning:
StrategyFormulation:
StrategyImplementation:
Evaluationand Control:
Feedback/Learning: Make corrections as needed
After reading this chapter, you should be able to:
10.1 StaffingThe implementation of new strategies and policies often calls for new human resource man-agement priorities and a different use of personnel. Such staffing issues can involve hiring newpeople with new skills, firing people with inappropriate or substandard skills, and/or trainingexisting employees to learn new skills. Research demonstrates that companies with enlight-ened talent-management policies and programs have higher returns on sales, investments,assets, and equity.2 This is especially important given that it takes an average of 48 days for anAmerican company to fill a job vacancy at an average cost per hire of $3,270.3
If growth strategies are to be implemented, new people may need to be hired and trained.Experienced people with the necessary skills need to be found for promotion to newly createdmanagerial positions. When a corporation follows a growth through acquisition strategy, itmay find that it needs to replace several managers in the acquired company. The percentageof an acquired company’s top management team that either quit or was asked to leave isaround 25% after the first year, 35% after the second year, 48% after the third year, 55% afterthe fourth year, and 61% after five years.4 In addition, executives who join an acquired com-pany after the acquisition quit at significantly higher-than-normal rates beginning in their sec-ond year. Executives continue to depart at higher-than-normal rates for nine years after the
half of the class. According to COO Donald Ross, “We hire from the half of the college class
that makes the upper half possible. We want athletes, fraternity types—especially frater-
nity presidents and social directors. People people.” These new employees begin as man-
agement trainees. Instead of regular raises, their pay is tied to branch office profits.
Another key to implementation at Enterprise is leading—specifying clear perfor-
mance objectives and promoting a team-oriented corporate culture. The company stresses
promotion from within and advancement based on performance. Every Enterprise em-
ployee, including top executives, starts at the bottom. As a result, a bond of shared expe-
rience connects all employees and managers. Enterprise was included in Business Week’s
“50 Best Places to Launch a Career” three years in a row. To reinforce a cohesive culture
of camaraderie, senior executives routinely do “grunt work” at branch offices. Even Andy
Taylor, the CEO, joins the work. “We were visiting an office in Berkeley and it was mobbed,
so I started cleaning cars,” says Taylor. “As it was happening, I wondered if it was a good
use of my time, but the effect on morale was tremendous.” Because the financial results
of every branch office and every region are available to all, the collegial culture stimulates
good-natured competition. “We’re this close to beating out Middlesex,” grins Woody
Erhardt, an area manager in New Jersey. “I want to pound them into the ground. If they
lose, they have to throw a party for us, and we get to decide what they wear.”1
This example from Enterprise Rent-A-Car illustrates how a strategy must be imple-
mented with carefully considered programs in order to succeed. This chapter discusses
strategy implementation in terms of staffing and leading. Staffing focuses on the selec-
tion and use of employees. Leading emphasizes the use of programs to better align em-
ployee interests and attitudes with a new strategy.
302 PART 4 Strategy Implementation and Control
CHAPTER 10 Strategy Implementation: Staffing and Directing 303
acquisition.5 Turnover rates of executives in firms acquired by foreign firms are significantlyhigher than for firms acquired by domestic firms, primarily in the fourth and fifth years afterthe acquisition.6
It is one thing to lose excess employees after a merger, but it is something else to losehighly skilled people who are difficult to replace. In a study of 40 mergers, 90% of the acquir-ing companies in the 15 successful mergers identified key employees and targeted them forretention within 30 days after the announcement. In contrast, this task was carried out only inone-third of the unsuccessful acquisitions.7 To deal with integration issues such as these, somecompanies are appointing special integration managers to shepherd companies through the im-plementation process. The job of the integrator is to prepare a competitive profile of the com-bined company in terms of its strengths and weaknesses, draft an ideal profile of what thecombined company should look like, develop action plans to close the gap between the actu-ality and the ideal, and establish training programs to unite the combined company and to makeit more competitive.8 To be a successful integration manager, a person should have (1) a deepknowledge of the acquiring company, (2) a flexible management style, (3) an ability to workin cross-functional project teams, (4) a willingness to work independently, and (5) sufficientemotional and cultural intelligence to work well with people from all backgrounds.9
If a corporation adopts a retrenchment strategy, however, a large number of people mayneed to be laid off or fired (in many instances, being laid off is the same as being fired); andtop management, as well as the divisional managers, needs to specify the criteria to be used inmaking these personnel decisions. Should employees be fired on the basis of low seniority oron the basis of poor performance? Sometimes corporations find it easier to close or sell off anentire division than to choose which individuals to fire.
As in the case of structure, staffing requirements are likely to follow a change in strategy. Forexample, promotions should be based not only on current job performance but also on whethera person has the skills and abilities to do what is needed to implement the new strategy.
Changing Hiring and Training RequirementsHaving formulated a new strategy, a corporation may find that it needs to either hire differentpeople or retrain current employees to implement the new strategy. Consider the introductionof team-based production at Corning’s filter plant mentioned in Chapter 9. Employee selec-tion and training were crucial to the success of the new manufacturing strategy. Plant ManagerRobert Hoover sorted through 8,000 job applications before hiring 150 people with the bestproblem-solving ability and a willingness to work in a team setting. Those selected receivedextensive training in technical and interpersonal skills. During the first year of production,25% of all hours worked were devoted to training, at a cost of $750,000.10
One way to implement a company’s business strategy, such as overall low cost, is throughtraining and development. According to the American Society of Training and Development,the average annual expenditure per employee on corporate training and development is $1,000per employee.11 A study of 51 corporations in the UK found that 71% of “leading” companiesrated staff learning and training as important or very important compared to 62% of the othercompanies.12 Another study of 155 U. S. manufacturing firms revealed that those with train-ing programs had 19% higher productivity than did those without such programs. Anotherstudy found that a doubling of formal training per employee resulted in a 7% reduction inscrap.13 Training is especially important for a differentiation strategy emphasizing quality orcustomer service. For example, Motorola, with annual sales of $17 billion, spends 4% of itspayroll on training by providing at least 40 hours of training a year to each employee. There
STAFFING FOLLOWS STRATEGY
304 PART 4 Strategy Implementation and Control
is a very strong connection between strategy and training at Motorola. For example, after set-ting a goal to reduce product development cycle time, Motorola created a two-week course toteach its employees how to accomplish that goal. It brought together marketing, product de-velopment, and manufacturing managers to create an action learning format in which the man-agers worked together instead of separately. The company is especially concerned withattaining the highest quality possible in all its operations. Realizing that it couldn’t hit qualitytargets with poor parts, Motorola developed a class for its suppliers on statistical process con-trol. The company estimates that every $1 it spends on training delivers $30 in productivitygains within three years.14
Training is also important when implementing a retrenchment strategy. As suggested ear-lier, successful downsizing means that a company has to invest in its remaining employees.General Electric’s Aircraft Engine Group used training to maintain its share of the market eventhough it had cut its workforce from 42,000 to 33,000 in the 1990s.15
Matching the Manager to the StrategyExecutive characteristics influence strategic outcomes for a corporation.16 It is possible that acurrent CEO may not be appropriate to implement a new strategy. Research indicates that theremay be a career life cycle for top executives. During the early years of executives’ tenure, forexample, they tend to experiment intensively with product lines to learn about their business.This is their learning stage. Later, their accumulated knowledge allows them to reduce exper-imentation and increase performance. This is their harvest stage. They enter a decline stage intheir later years, when they reduce experimentation still further, and performance declines.Thus, there is an inverted U-shaped relationship between top executive tenure and the firm’sfinancial performance. Some executives retire before any decline occurs. Others stave off de-cline longer than their counterparts. Because the length of time spent in each stage variesamong CEOs, it is up to the board to decide when a top executive should be replaced.17
The most appropriate type of general manager needed to effectively implement a new cor-porate or business strategy depends on the desired strategic direction of that firm or businessunit. Executives with a particular mix of skills and experiences may be classified as anexecutive type and paired with a specific corporate strategy. For example, a corporation fol-lowing a concentration strategy emphasizing vertical or horizontal growth would probablywant an aggressive new chief executive with a great deal of experience in that particular in-dustry—a dynamic industry expert. A diversification strategy, in contrast, might call for some-one with an analytical mind who is highly knowledgeable in other industries and can managediverse product lines—an analytical portfolio manager. A corporation choosing to follow astability strategy would probably want as its CEO a cautious profit planner, a person with aconservative style, a production or engineering background, and experience with controllingbudgets, capital expenditures, inventories, and standardization procedures.
Weak companies in a relatively attractive industry tend to turn to a type of challenge-oriented executive known as a turnaround specialist to save the company. For example, whenformer IHOP (International House of Pancakes) waitress Julia Stewart left Applebee’s restau-rant chain to become CEO of IHOP, she worked to rebuild the company with better food,better ads, and better atmosphere. Six years later, a much improved IHOP acquired the strug-gling Applebee’s restaurant chain. CEO Stewart vowed to turnaround Applebee’s within a yearby improving service, food quality and focusing the menu on what the restaurant does best:riblets, burgers, and salads. She wanted Applebee’s to again be the friendly, neighborhood barand grill that it once was.18
If a company cannot be saved, a professional liquidator might be called on by a bankruptcycourt to close the firm and liquidate its assets. This is what happened to Montgomery Ward, Inc.,the nation’s first catalog retailer, which closed its stores for good in 2001, after declaring
CHAPTER 10 Strategy Implementation: Staffing and Directing 305
bankruptcy for the second time.19 Research tends to support the conclusion that as a firm’s en-vironment changes, it tends to change the type of top executive to implement a new strategy.20
For example, during the 1990s when the emphasis was on growth in a company’s coreproducts/services, the most desired background for a U.S. CEO was either in marketing or in-ternational experience. With the current decade’s emphasis on mergers, acquisitions, and di-vestitures, the most desired background is finance. Currently, one out of five American and UKCEOs are former Chief Financial Officers, twice the percentage during the previous decade.21
This approach is in agreement with Chandler, who proposes (see Chapter 9) that the mostappropriate CEO of a company changes as a firm moves from one stage of development to an-other. Because priorities certainly change over an organization’s life, successful corporationsneed to select managers who have skills and characteristics appropriate to the organization’sparticular stage of development and position in its life cycle. For example, founders of firmstend to have functional backgrounds in technological specialties, whereas successors tend tohave backgrounds in marketing and administration.22 A change in the environment leading toa change in a company’s strategy also leads to a change in the top management team. For ex-ample, a change in the U.S. utility industry’s environment in 1992 supporting internally fo-cused, efficiency-oriented strategies, led to top management teams being dominated by oldermanagers with longer company and industry tenure, with efficiency-oriented backgrounds inoperations, engineering, and accounting.23 Research reveals that executives having a specificpersonality characteristic (external locus of control) are more effective in regulated industriesthan are executives with a different characteristic (internal locus of control).24
Other studies have found a link between the type of CEO and a firm’s overall strategictype. (Strategic types were presented in Chapter 4). For example, successful prospector firmstended to be headed by CEOs from research/engineering and general management back-grounds. High performance defenders tended to have CEOs with accounting/finance, manu-facturing/production, and general management experience. Analyzers tended to have CEOswith a marketing/sales background.25
A study of 173 firms over a 25-year period revealed that CEOs in these companies tendedto have the same functional specialization as the former CEO, especially when the past CEO’sstrategy continued to be successful. This may be a pattern for successful corporations.26 In par-ticular, it explains why so many prosperous companies tend to recruit their top executives fromone particular area. At Procter & Gamble (P&G)—a good example of an analyzer firm—forexample, the route to the CEO’s position has traditionally been through brand management,with a strong emphasis on marketing—and more recently international experience. In otherfirms, the route may be through manufacturing, marketing, accounting, or finance—depend-ing on what the corporation has always considered its core capability (and its overall strategicorientation).
SELECTION AND MANAGEMENT DEVELOPMENTSelection and development are important not only to ensure that people with the right mix ofskills and experiences are initially hired but also to help them grow on the job so that theymight be prepared for future promotions.
Executive Succession: Insiders versus OutsidersExecutive succession is the process of replacing a key top manager. The average tenure of achief executive of a large U.S. company declined from nearly nine years in 1980 to six years in2006.27 Given that two-thirds of all major corporations worldwide replace their CEO at leastonce in a five-year period, it is important that the firm plan for this eventuality.28 It is especiallyimportant for a company that usually promotes from within to prepare its current managers for
Hewlett-Packard identifiesthose with high potential for
executive leadership by look-ing for six broad competencies
that the company believes arenecessary:
1. Practice the HP Way by building trust and respect,focusing on achievement, demonstrating integrity,being innovative with customers, contributing to thecommunity, and developing organizational decisionmaking.
2. Lead change and learning by recognizing and actingon signals for change, leading organizationalchange, learning from organizational experience,removing barriers to change, developing self, andchallenging and developing others.
3. Know the internal and external environments byanticipating global trends, acting on trends, andlearning from others.
STRATEGY highlight 10.1HOW HEWLETT-PACKARD IDENTIFIES POTENTIAL EXECUTIVES
4. Lead strategy setting by inspiring breakthroughbusiness strategy, leading the strategy-makingprocess, committing to business vision, creatinglong-range strategies, building financial strategies,and defining a business-planning system.
5. Align the organization by working acrossboundaries, implementing competitive coststructures, developing alliances and partnerships,planning and managing core business, and designingthe organization.
6. Achieve results by building a track record,establishing accountability, supporting calculatedrisks, making tough individual decisions, andresolving performance problems.
SOURCE: Summarized from R. M. Fulmer, P. A. Gibbs, andM. Goldsmith, “The New HP Way: Leveraging Strategy with Diver-sity, Leadership Development and Decentralization,” Strategy &Leadership (October/November/December, 1999), pp. 21–29.
promotion. For example, companies using relay executive succession, in which a candidate isgroomed to take over the CEO position, have significantly higher performance than those thathire someone from the outside or hold a competition between internal candidates.29 These “heirsapparent” are provided special assignments including membership on other firms’ boards of di-rectors.30 Nevertheless, only half of large U.S. companies have CEO succession plans in place.31
Companies known for being excellent training grounds for executive talent are AlliedSig-nal, Bain & Company, Bankers Trust, Bristol Myers Squibb, Cititcorp, General Electric,Hewlett-Packard, McDonald’s, McKinsey & Company, Microsoft, Nike, PepsiCo, Pfizer, andP&G. For example, one study showed that hiring 19 GE executives into CEO positions added$24.5 billion to the share prices of the companies that hired them. One year after people fromGE started their new jobs, 11 of the 19 companies they joined were outperforming their com-petitors and the overall market.32
Some of the best practices for top management succession are encouraging boards to helpthe CEO create a succession plan, identifying succession candidates below the top layer, mea-suring internal candidates against outside candidates to ensure the development of a comprehen-sive set of skills, and providing appropriate financial incentives.33 Succession planning hasbecome the most important topic discussed by boards of directors.34 See Strategy Highlight 10.1to see how Hewlett-Packard identifies those with potential for executive leadership positions.
Prosperous firms tend to look outside for CEO candidates only if they have no obviousinternal candidates.35 For example, 85% of the CEOs selected to run S&P 500 companies in2006 were insiders, according to executive search firm Spencer Stuart.36 Hiring an outsider tobe a CEO is a risky gamble. CEOs from the outside tend to introduce significant change andhigh turnover among the current top management.37 For example, in one study, the percentageof senior executives that left a firm after a new CEO took office was 20% when the new CEO
306 PART 4 Strategy Implementation and Control
CHAPTER 10 Strategy Implementation: Staffing and Directing 307
was an insider, but increased to 34% when the new CEO was an outsider.38 CEOs hired fromoutside the firm tend to have a low survival rate. According to RHR International, 40% to60% of high-level executives brought in from outside a company failed within two years.39 Astudy of 392 large U.S. firms revealed that only 16.6% of them had hired outsiders to be theirCEOs. The outsiders tended to perform slightly worse than insiders but had a very high vari-ance in performance. Compared to that of insiders, the performance of outsiders tended to beeither very good or very poor. Although outsiders performed much better (in terms of share-holder returns) than insiders in the first half of their tenures, they did much worse in their sec-ond half. As a result, the average tenure of an outsider was significantly less than for insiders.40
Firms in trouble, however, overwhelmingly choose outsiders to lead them.41 For example,one study of 22 firms undertaking turnaround strategies over a 13-year period found that theCEO was replaced in all but two companies. Of 27 changes of CEO (several firms had morethan one CEO during this period), only seven were insiders—20 were outsiders.42 The proba-bility of an outsider being chosen to lead a firm in difficulty increases if there is no internal heirapparent, if the last CEO was fired, and if the board of directors is composed of a large percent-age of outsiders.43 Boards realize that the best way to force a change in strategy is to hire a newCEO who has no connections to the current strategy.44 For example, outsiders have been foundto be very effective in leading strategic change for firms in Chapter 11 bankruptcy.45
Identifying Abilities and PotentialA company can identify and prepare its people for important positions in several ways. Oneapproach is to establish a sound performance appraisal system to identify good performerswith promotion potential. A survey of 34 corporate planners and human resource executivesfrom 24 large U.S. corporations revealed that approximately 80% made some attempt to iden-tify managers’ talents and behavioral tendencies so that they could place a manager with alikely fit to a given competitive strategy.46 Companies select those people with promotion po-tential to be in their executive development training program. Approximately 10,000 of GE’s276,000 employees take at least one class at the company’s famous Leadership DevelopmentCenter in Crotonville, New York.47 Doug Pelino, chief talent officer at Xerox, keeps a list ofabout 100 managers in middle management and at the vice presidential levels who have beenselected to receive special training, leadership experience, and mentorship to become the nextgeneration of top management.48
A company should examine its human resource system to ensure not only that people arebeing hired without regard to their racial, ethnic, or religious background, but also that theyare being identified for training and promotion in the same manner. Management diversitycould be a competitive advantage in a multi-ethnic world. With more women in the workplace,an increasing number are moving into top management, but are demanding more flexible ca-reer ladders to allow for family responsibilities.
Many large organizations are using assessment centers to evaluate a person’s suitabilityfor an advanced position. Corporations such as AT&T, Standard Oil, IBM, Sears, and GE havesuccessfully used assessment centers. Because each is specifically tailored to its corporation,these assessment centers are unique. They use special interviews, management games, in-basketexercises, leaderless group discussions, case analyses, decision-making exercises, and oralpresentations to assess the potential of employees for specific positions. Promotions into thesepositions are based on performance levels in the assessment center. Assessment centers havegenerally been able to accurately predict subsequent job performance and career success.49
Job rotation—moving people from one job to another—is also used in many large corpo-rations to ensure that employees are gaining the appropriate mix of experiences to preparethem for future responsibilities. Rotating people among divisions is one way that a corpora-tion can improve the level of organizational learning. General Electric, for example, routinely
308 PART 4 Strategy Implementation and Control
rotates its executives from one sector to a completely different one to learn the skills of man-aging in different industries. Jeffrey Immelt, who took over as CEO from Jack Welch, hadmanaged businesses in plastics, appliances, and medical systems.50 Companies that pursue re-lated diversification strategies through internal development make greater use of interdivi-sional transfers of people than do companies that grow through unrelated acquisitions.Apparently, the companies that grow internally attempt to transfer important knowledge andskills throughout the corporation in order to achieve some sort of synergy.51
PROBLEMS IN RETRENCHMENTOn January 28, 2009, Starbucks announced that it was closing 300 stores in addition to the 600closures it had announced earlier and thus reduce its workforce by 7,000 people. Meanwhile,Hershey Foods closed six plants in the U.S. and Canada and eliminated 3,000 U.S. jobs. Likeother companies at the time, both firms were experiencing declining sales and profits and at-tempting to cut costs. Due to a poor economy, more than 2.1 million U.S. workers were laidoff in 2008. Downsizing (sometimes called “rightsizing” or “resizing”) refers to the plannedelimination of positions or jobs. This program is often used to implement retrenchment strate-gies. Because the financial community is likely to react favorably to announcements of down-sizing from a company in difficulty, such a program may provide some short-term benefitssuch as raising the company’s stock price. If not done properly, however, downsizing may re-sult in less, rather than more, productivity. One study found that a 10% reduction in people re-sulted in only a 1.5% reduction in costs, profits increased in only half the firms downsizing,and the stock prices of downsized firms increased over three years, but not as much as didthose of firms that did not downsize.52 Why were the results so marginal?
A study of downsizing at automobile-related U.S. industrial companies revealed that at 20out of 30 companies, either the wrong jobs were eliminated or blanket offers of early retirementprompted managers, even those considered invaluable, to leave. After the layoffs, the remain-ing employees had to do not only their work but also the work of the people who had gone. Be-cause the survivors often didn’t know how to do the departeds’ work, morale and productivityplummeted.53 Downsizing can seriously damage the learning capacity of organizations.54 Cre-ativity drops significantly (affecting new product development), and it becomes very difficultto keep high performers from leaving the company.55 In addition, cost-conscious executives tendto defer maintenance, skimp on training, delay new product introductions, and avoid risky newbusinesses—all of which leads to lower sales and eventually to lower profits.56 These are someof the reasons why layoffs worry customers and have a negative effect on a firm’s reputation.57
A good retrenchment strategy can thus be implemented well in terms of organizing butpoorly in terms of staffing. A situation can develop in which retrenchment feeds on itself andacts to further weaken instead of strengthen the company. Research indicates that companiesundertaking cost-cutting programs are four times more likely than others to cut costs again,typically by reducing staff.58 This happened at Eastman Kodak, Xerox, Ford, and General Mo-tors during the 1990s, but 10 years later the companies were still downsizing and working toregain their profitable past performance. In contrast, successful downsizing firms undertake astrategic reorientation, not just a bloodletting of employees. Research shows that when com-panies use downsizing as part of a larger restructuring program to narrow company focus, theyenjoy better performance.59
Consider the following guidelines that have been proposed for successful downsizing:
� Eliminate unnecessary work instead of making across-the-board cuts: Spend the timeto research where money is going and eliminate the task, not the workers, if it doesn’t addvalue to what the firm is producing. Reduce the number of administrative levels rather
CHAPTER 10 Strategy Implementation: Staffing and Directing 309
than the number of individual positions. Look for interdependent relationships beforeeliminating activities. Identify and protect core competencies.
� Contract out work that others can do cheaper: For example, Bankers Trust of NewYork contracted out its mailroom and printing services and some of its payroll and ac-counts payable activities to a division of Xerox. Outsourcing may be cheaper than verti-cal integration.
� Plan for long-run efficiencies: Don’t simply eliminate all postponable expenses, suchas maintenance, R&D, and advertising, in the unjustifiable hope that the environmentwill become more supportive. Continue to hire, grow, and develop—particularly in crit-ical areas.
� Communicate the reasons for actions: Tell employees not only why the company isdownsizing but also what the company is trying to achieve. Promote educational programs.
� Invest in the remaining employees: Because most “survivors” in a corporate downsizingwill probably be doing different tasks from what they were doing before the change, firmsneed to draft new job specifications, performance standards, appraisal techniques, andcompensation packages. Additional training is needed to ensure that everyone has theproper skills to deal with expanded jobs and responsibilities. Empower key individuals/groups and emphasize team building. Identify, protect, and mentor people who have lead-ership talent.
� Develop value-added jobs to balance out job elimination: When no other jobs are cur-rently available within the organization to transfer employees to, management must con-sider other staffing alternatives. For example, Harley-Davidson worked with thecompany’s unions to find other work for surplus employees by moving into Harley plantswork that had previously been done by suppliers.60
INTERNATIONAL ISSUES IN STAFFINGImplementing a strategy of international expansion takes a lot of planning and can be very ex-pensive. Nearly 80% of midsize and larger companies send their employees abroad, and 45%plan to increase the number they have on foreign assignment. A complete package for one ex-ecutive working in another country costs from $300,000 to $1 million annually. Nevertheless,between 10% and 20% of all U.S. managers sent abroad returned early because of job dissat-isfaction or difficulties in adjusting to a foreign country. Of those who stayed for the durationof their assignment, nearly one-third did not perform as well as expected. One-fourth of thosecompleting an assignment left their company within one year of returning home—often leav-ing to join a competitor.61 One common mistake is failing to educate the person about the cus-toms and values in other countries.
Because of cultural differences, managerial style and human resource practices must betailored to fit the particular situations in other countries. Because only 11% of human resourcemanagers have ever worked abroad, most have little understanding of a global assignment’sunique personal and professional challenges and thus fail to develop the training necessary forsuch an assignment.62 Ninety percent of companies select employees for an international as-signment based on their technical expertise while ignoring other areas.63 A lack of knowledgeof national and ethnic differences can make managing an international operation extremelydifficult. For example, the three ethnic groups living in Malaysia (Malay, Chinese, and Indian)share different religions, attend different schools, and do not like to work in the same factorieswith each other. Because of the importance of cultural distinctions such as these, multinationalcorporations (MNCs) are now putting more emphasis on intercultural training for managers
310 PART 4 Strategy Implementation and Control
being sent on an assignment to a foreign country. This type of training is one of the commonlycited reasons for the lower expatriate failure rates—6% or less—for European and JapaneseMNCs, which have emphasized cross-cultural experiences, compared with a 35% failure ratefor U.S.-based MNCs.64
To improve organizational learning, many MNCs are providing their managers with in-ternational assignments lasting as long as five years. Upon their return to headquarters, theseexpatriates have an in-depth understanding of the company’s operations in another part of theworld. This has value to the extent that these employees communicate this understanding toothers in decision-making positions. Research indicates that an MNC performs at a higherlevel when its CEO has international experience.65 Global MNCs, in particular, emphasize in-ternational experience, have a greater number of senior managers who have been expatriates,and have a strong focus on leadership development through the expatriate experience.66
Unfortunately, not all corporations appropriately manage international assignments. While outof the country, a person may be overlooked for an important promotion (out of sight, out ofmind). Upon his or her return to the home country, co-workers may deprecate the out-ofcountry experience as a waste of time. The perceived lack of organizational support for interna-tional assignments increases the likelihood that an expatriate will return home early.67
From their study of 750 U.S., Japanese, and European companies, Black and Gregersenfound that the companies that do a good job of managing foreign assignments follow threegeneral practices:
� When making international assignments, they focus on transferring knowledge and devel-oping global leadership.
� They make foreign assignments to people whose technical skills are matched or exceededby their cross-cultural abilities.
� They end foreign assignments with a deliberate repatriation process, with career guidanceand jobs where the employees can apply what they learned in their assignments.68
Once a corporation has established itself in another country, it hires and promotes peoplefrom the host country into higher-level positions. For example, most large MNCs attempt tofill managerial positions in their subsidiaries with well-qualified citizens of the host countries.Unilever and IBM have traditionally taken this approach to international staffing. This policyserves to placate nationalistic governments and to better attune management practices to thehost country’s culture. The danger in using primarily foreign nationals to staff managerial po-sitions in subsidiaries is the increased likelihood of suboptimization (the local subsidiary ig-nores the needs of the larger parent corporation). This makes it difficult for an MNC to meetits long-term, worldwide objectives. To a local national in an MNC subsidiary, the corporationas a whole is an abstraction. Communication and coordination across subsidiaries becomemore difficult. As it becomes harder to coordinate the activities of several international sub-sidiaries, an MNC will have serious problems operating in a global industry.
Another approach to staffing the managerial positions of MNCs is to use people with an“international” orientation, regardless of their country of origin or host country assignment.This is a widespread practice among European firms. For example, Electrolux, a Swedish firm,had a French director in its Singapore factory. Using third-country “nationals” can allow formore opportunities for promotion than does Unilever’s policy of hiring local people, but it canalso result in more misunderstandings and conflicts with the local employees and with the hostcountry’s government.
Some corporations take advantage of immigrants and their children to staff key positionswhen negotiating entry into another country and when selecting an executive to manage thecompany’s new foreign operations. For example, when General Motors wanted to learn moreabout business opportunities in China, it turned to Shirley Young, a Vice President of Marketing
CHAPTER 10 Strategy Implementation: Staffing and Directing 311
at GM. Born in Shanghai and fluent in Chinese language and customs, Young was instrumen-tal in helping GM negotiate a $1 billion joint venture with Shanghai Automotive to build aBuick plant in China. With other Chinese-Americans, Young formed a committee to adviseGM on relations with China. Although just a part of a larger team of GM employees workingon the joint venture, Young coached GM employees on Chinese customs and traditions.69
MNCs with a high level of international interdependence among activities need to pro-vide their managers with significant international assignments and experiences as part of theirtraining and development. Such assignments provide future corporate leaders with a series ofvaluable international contacts in additional to a better personal understanding of internationalissues and global linkages among corporate activities.70 Research reveals that corporations us-ing cross-national teams, whose members have international experience and communicate fre-quently with overseas managers, have greater product development capabilities than others.71
Executive recruiters report that more major corporations are now requiring candidates to haveinternational experience.72 To increase its own top management’s global expertise, Cisco Sys-tems introduced a staffing program in 2007 with the objective of locating 20% of its seniormanagers at its new Bangalore, India, Globalization Center by 2010.73
Since an increasing number of multinational corporations are primarily organized aroundbusiness units and product lines instead of geographic areas, product and SBU managers whoare based at corporate headquarters are often traveling around the world to work personallywith country managers. These managers and other mobile workers are being called stealth ex-patriates because they are either cross-border commuters (especially in the EU) or the acci-dental expatriate who goes on many business trips or temporary assignments due to offshoringand/or international joint ventures.74
10.2 LeadingImplementation also involves leading through coaching people to use their abilities and skillsmost effectively and efficiently to achieve organizational objectives. Without direction, peo-ple tend to do their work according to their personal view of what tasks should be done, how,and in what order. They may approach their work as they have in the past or emphasize thosetasks that they most enjoy—regardless of the corporation’s priorities. This can create real prob-lems, particularly if the company is operating internationally and must adjust to customs andtraditions in other countries. This direction may take the form of management leadership, com-municated norms of behavior from the corporate culture, or agreements among workers in au-tonomous work groups. It may be accomplished more formally through action planning orthrough programs, such as Management By Objectives and Total Quality Management. Pro-cedures can be changed to provide incentives to motivate employees to align their behaviorwith corporate objectives. For an example of Abbott Laboratories’ new procedures to motivateemployees to drive carbon neutral autos, see the Environmental Sustainability Issue feature.
MANAGING CORPORATE CULTUREBecause an organization’s culture can exert a powerful influence on the behavior of all em-ployees, it can strongly affect a company’s ability to shift its strategic direction. A problem fora strong culture is that a change in mission, objectives, strategies, or policies is not likely to besuccessful if it is in opposition to the accepted culture of the company. Corporate culture hasa strong tendency to resist change because its very reason for existence often rests on preserv-ing stable relationships and patterns of behavior. For example, when Robert Nardelli became
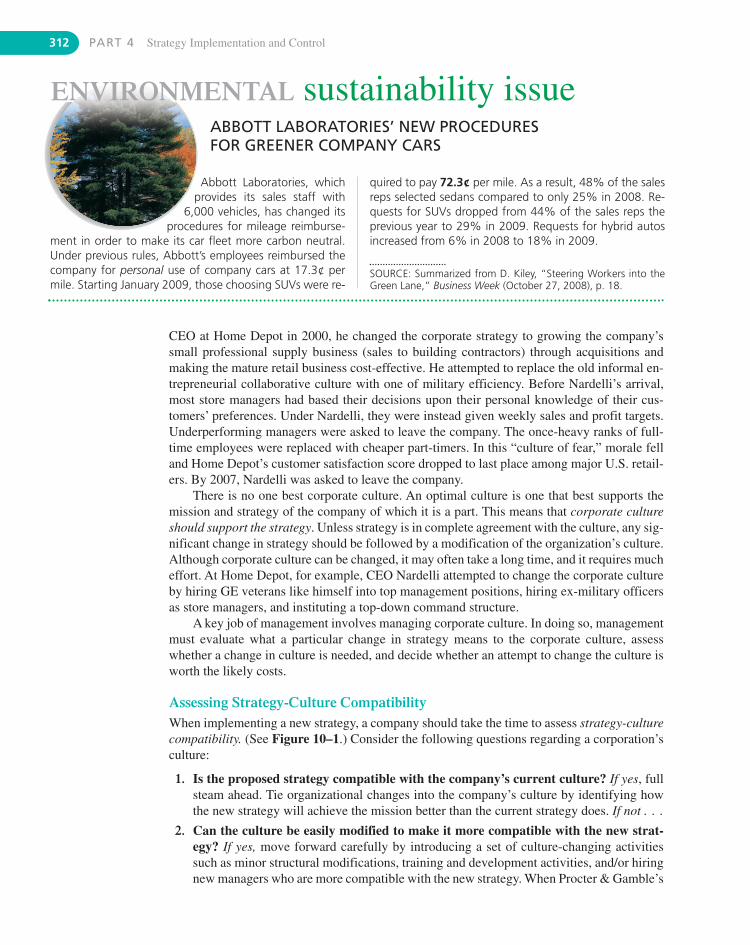
Abbott Laboratories, whichprovides its sales staff with
6,000 vehicles, has changed itsprocedures for mileage reimburse-
ment in order to make its car fleet more carbon neutral.Under previous rules, Abbott’s employees reimbursed thecompany for personal use of company cars at 17.3¢ permile. Starting January 2009, those choosing SUVs were re-
312 PART 4 Strategy Implementation and Control
ABBOTT LABORATORIES’ NEW PROCEDURES FOR GREENER COMPANY CARS
ENVIRONMENTAL sustainability issue
quired to pay 72.3¢ per mile. As a result, 48% of the salesreps selected sedans compared to only 25% in 2008. Re-quests for SUVs dropped from 44% of the sales reps theprevious year to 29% in 2009. Requests for hybrid autosincreased from 6% in 2008 to 18% in 2009.
SOURCE: Summarized from D. Kiley, “Steering Workers into theGreen Lane,” Business Week (October 27, 2008), p. 18.
CEO at Home Depot in 2000, he changed the corporate strategy to growing the company’ssmall professional supply business (sales to building contractors) through acquisitions andmaking the mature retail business cost-effective. He attempted to replace the old informal en-trepreneurial collaborative culture with one of military efficiency. Before Nardelli’s arrival,most store managers had based their decisions upon their personal knowledge of their cus-tomers’ preferences. Under Nardelli, they were instead given weekly sales and profit targets.Underperforming managers were asked to leave the company. The once-heavy ranks of full-time employees were replaced with cheaper part-timers. In this “culture of fear,” morale felland Home Depot’s customer satisfaction score dropped to last place among major U.S. retail-ers. By 2007, Nardelli was asked to leave the company.
There is no one best corporate culture. An optimal culture is one that best supports themission and strategy of the company of which it is a part. This means that corporate cultureshould support the strategy. Unless strategy is in complete agreement with the culture, any sig-nificant change in strategy should be followed by a modification of the organization’s culture.Although corporate culture can be changed, it may often take a long time, and it requires mucheffort. At Home Depot, for example, CEO Nardelli attempted to change the corporate cultureby hiring GE veterans like himself into top management positions, hiring ex-military officersas store managers, and instituting a top-down command structure.
A key job of management involves managing corporate culture. In doing so, managementmust evaluate what a particular change in strategy means to the corporate culture, assesswhether a change in culture is needed, and decide whether an attempt to change the culture isworth the likely costs.
Assessing Strategy-Culture CompatibilityWhen implementing a new strategy, a company should take the time to assess strategy-culturecompatibility. (See Figure 10–1.) Consider the following questions regarding a corporation’sculture:
1. Is the proposed strategy compatible with the company’s current culture? If yes, fullsteam ahead. Tie organizational changes into the company’s culture by identifying howthe new strategy will achieve the mission better than the current strategy does. If not . . .
2. Can the culture be easily modified to make it more compatible with the new strat-egy? If yes, move forward carefully by introducing a set of culture-changing activitiessuch as minor structural modifications, training and development activities, and/or hiringnew managers who are more compatible with the new strategy. When Procter & Gamble’s
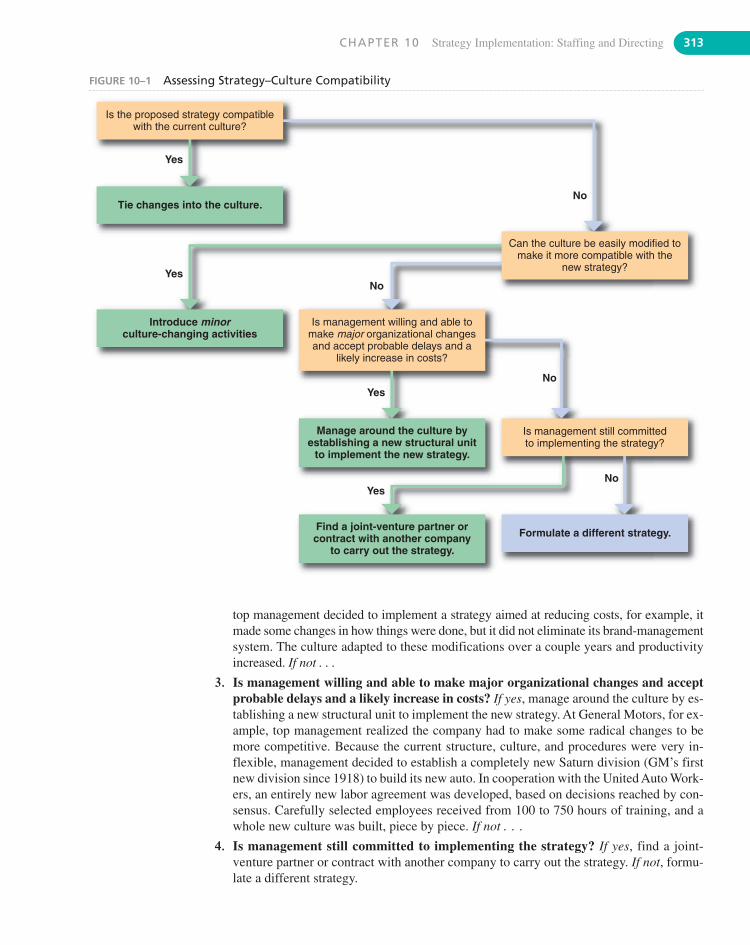
CHAPTER 10 Strategy Implementation: Staffing and Directing 313
No
No
No
Is the proposed strategy compatiblewith the current culture?
Tie changes into the culture.
Introduce minorculture-changing activities
Yes
Yes
No
Find a joint-venture partner orcontract with another company
to carry out the strategy.
Manage around the culture byestablishing a new structural unit
to implement the new strategy.
Is management willing and able tomake major organizational changesand accept probable delays and a
likely increase in costs?
Yes
Yes
Is management still committedto implementing the strategy?
Formulate a different strategy.
Can the culture be easily modified tomake it more compatible with the
new strategy?
FIGURE 10–1 Assessing Strategy–Culture Compatibility
top management decided to implement a strategy aimed at reducing costs, for example, itmade some changes in how things were done, but it did not eliminate its brand-managementsystem. The culture adapted to these modifications over a couple years and productivityincreased. If not . . .
3. Is management willing and able to make major organizational changes and acceptprobable delays and a likely increase in costs? If yes, manage around the culture by es-tablishing a new structural unit to implement the new strategy. At General Motors, for ex-ample, top management realized the company had to make some radical changes to bemore competitive. Because the current structure, culture, and procedures were very in-flexible, management decided to establish a completely new Saturn division (GM’s firstnew division since 1918) to build its new auto. In cooperation with the United Auto Work-ers, an entirely new labor agreement was developed, based on decisions reached by con-sensus. Carefully selected employees received from 100 to 750 hours of training, and awhole new culture was built, piece by piece. If not . . .
4. Is management still committed to implementing the strategy? If yes, find a joint-venture partner or contract with another company to carry out the strategy. If not, formu-late a different strategy.
314 PART 4 Strategy Implementation and Control
Based on Robert Nardelli’s decisions when he initially started as Home Depot’s CEO, heprobably answered “no” to the first question and “yes” to the second question—thus justifyinghis many changes in staffing and leading. Unfortunately, these changes didn’t work very well.Instead, he should have replied “no” to the first and second questions and stopped at the thirdquestion. As suggested by this question, he should have considered a different corporate strat-egy, such as growing the professional side of the business without changing the collegial cultureof the retail stores. Not surprisingly, once Nardelli was replaced by a new CEO, the companydivested the professional supply companies that Nardelli had spent so much time and money ac-quiring and returned to its previous strategy of concentrating on Home Depot retail stores.
Managing Cultural Change Through CommunicationCommunication is key to the effective management of change.Asurvey of 3,199 world-wide ex-ecutives by McKinsey & Company revealed that ongoing communication and involvement wasthe approach most used by companies that successfully transformed themselves.75 Rationale forstrategic changes should be communicated to workers not only in newsletters and speeches, butalso in training and development programs. This is especially important in decentralized firmswhere a large number of employees work in far-flung business units.76 Companies in which ma-jor cultural changes have successfully taken place had the following characteristics in common:
� The CEO and other top managers had a strategic vision of what the company could be-come and communicated that vision to employees at all levels. The current performanceof the company was compared to that of its competition and constantly updated.
� The vision was translated into the key elements necessary to accomplish that vision. For ex-ample, if the vision called for the company to become a leader in quality or service, aspectsof quality and service were pinpointed for improvement, and appropriate measurement sys-tems were developed to monitor them. These measures were communicated widely throughcontests, formal and informal recognition, and monetary rewards, among other devices.77
For example, when Pizza Hut, Taco Bell, and KFC were purchased by Tricon GlobalRestaurants (now Yum! Brands) from PepsiCo, the new management knew that it had to cre-ate a radically different culture than the one at PepsiCo if the company was to succeed. To be-gin, management formulated a statement of shared values—“How We Work Together”principles. They declared their differences with the “mother country” (PepsiCo) and wrote a“Declaration of Independence” stating what the new company would stand for. Restaurantmanagers participated in team-building activities at the corporate headquarters and finished bysigning the company’s “Declaration of Independence” as “founders” of the company. Sincethen, “Founder’s Day” has become an annual event celebrating the culture of the company.Headquarters was renamed the “Restaurant Support Center,” signifying the cultural value thatthe restaurants were the central focus of the company. People measures were added to finan-cial measures and customer measures, reinforcing the “putting people first” value. In an un-precedented move in the industry, restaurant managers were given stock options and added tothe list of performance incentives. The company created values-focused 360-degree perfor-mance reviews, which were eventually pushed to the restaurant manager level.78
Managing Diverse Cultures Following an AcquisitionWhen merging with or acquiring another company, top management must give some consid-eration to a potential clash of corporate cultures. According to a Hewitt Associates survey of218 major U.S. corporations, integrating culture was a top challenge for 69% of the reportingcompanies.79 Cultural differences are even more problematic when a company acquires afirm in another country. DaimlerChrysler’s purchase of a controlling interest in MitsubishiMotors in 2001 was insufficient to overcome Mitsubishi’s resistance to change. After investing
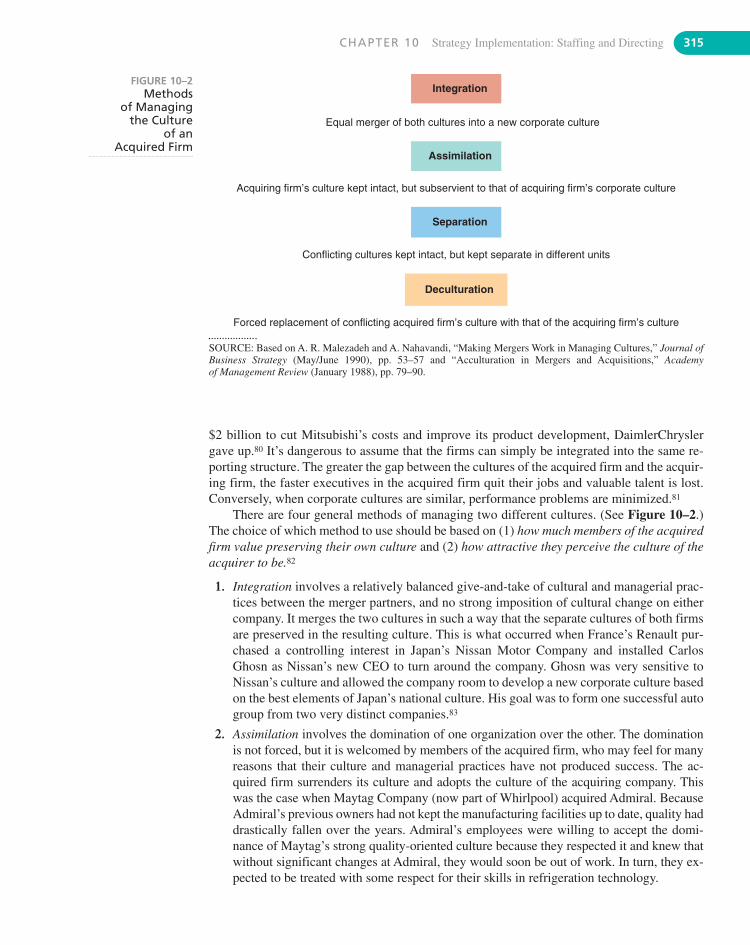
CHAPTER 10 Strategy Implementation: Staffing and Directing 315
Integration
Equal merger of both cultures into a new corporate culture
Assimilation
Acquiring firm’s culture kept intact, but subservient to that of acquiring firm’s corporate culture
Separation
Conflicting cultures kept intact, but kept separate in different units
Deculturation
Forced replacement of conflicting acquired firm’s culture with that of the acquiring firm’s culture
FIGURE 10–2Methods
of Managing the Culture
of an Acquired Firm
SOURCE: Based on A. R. Malezadeh and A. Nahavandi, “Making Mergers Work in Managing Cultures,” Journal ofBusiness Strategy (May/June 1990), pp. 53–57 and “Acculturation in Mergers and Acquisitions,” Academyof Management Review (January 1988), pp. 79–90.
$2 billion to cut Mitsubishi’s costs and improve its product development, DaimlerChryslergave up.80 It’s dangerous to assume that the firms can simply be integrated into the same re-porting structure. The greater the gap between the cultures of the acquired firm and the acquir-ing firm, the faster executives in the acquired firm quit their jobs and valuable talent is lost.Conversely, when corporate cultures are similar, performance problems are minimized.81
There are four general methods of managing two different cultures. (See Figure 10–2.)The choice of which method to use should be based on (1) how much members of the acquiredfirm value preserving their own culture and (2) how attractive they perceive the culture of theacquirer to be.82
1. Integration involves a relatively balanced give-and-take of cultural and managerial prac-tices between the merger partners, and no strong imposition of cultural change on eithercompany. It merges the two cultures in such a way that the separate cultures of both firmsare preserved in the resulting culture. This is what occurred when France’s Renault pur-chased a controlling interest in Japan’s Nissan Motor Company and installed CarlosGhosn as Nissan’s new CEO to turn around the company. Ghosn was very sensitive toNissan’s culture and allowed the company room to develop a new corporate culture basedon the best elements of Japan’s national culture. His goal was to form one successful autogroup from two very distinct companies.83
2. Assimilation involves the domination of one organization over the other. The dominationis not forced, but it is welcomed by members of the acquired firm, who may feel for manyreasons that their culture and managerial practices have not produced success. The ac-quired firm surrenders its culture and adopts the culture of the acquiring company. Thiswas the case when Maytag Company (now part of Whirlpool) acquired Admiral. BecauseAdmiral’s previous owners had not kept the manufacturing facilities up to date, quality haddrastically fallen over the years. Admiral’s employees were willing to accept the domi-nance of Maytag’s strong quality-oriented culture because they respected it and knew thatwithout significant changes at Admiral, they would soon be out of work. In turn, they ex-pected to be treated with some respect for their skills in refrigeration technology.
316 PART 4 Strategy Implementation and Control
3. Separation is characterized by a separation of the two companies’cultures. They are struc-turally separated, without cultural exchange. When Boeing acquired McDonnell-Douglas,known for its expertise in military aircraft and missiles, Boeing created a separate unit tohouse both McDonnell’s operations and Boeing’s own military business. McDonnell ex-ecutives were given top posts in the new unit and other measures were taken to protect thestrong McDonnell culture. On the commercial side, where Boeing had the most expertise,McDonnell’s commercial operations were combined with Boeing’s in a separate unitmanaged by Boeing executives.84
4. Deculturation involves the disintegration of one company’s culture resulting from unwantedand extreme pressure from the other to impose its culture and practices. This is the mostcommon and most destructive method of dealing with two different cultures. It is often ac-companied by much confusion, conflict, resentment, and stress. This is a primary reasonwhy so many executives tend to leave after their firm is acquired. Such a merger typicallyresults in poor performance by the acquired company and its eventual divestment. This iswhat happened when AT&T acquired NCR Corporation in 1990 for its computer business.It replaced NCR managers with an AT&T management team, reorganized sales, forced em-ployees to adhere to the AT&T code of values (called the “Common Bond”), and evendropped the proud NCR name (successor to National Cash Register) in favor of a sterile GIS(Global Information Solutions) nonidentity. By 1995, AT&T was forced to take a $1.2 bil-lion loss and lay off 10,000 people.85 The NCR unit was consequently sold.
ACTION PLANNINGActivities can be directed toward accomplishing strategic goals through action planning. At aminimum, an action plan states what actions are going to be taken, by whom, during whattime frame, and with what expected results. After a program has been selected to implement aparticular strategy, an action plan should be developed to put the program in place. Table 10–1shows an example of an action plan for a new advertising and promotion program.
Take the example of a company choosing forward vertical integration through the acqui-sition of a retailing chain as its growth strategy. Once it owns its own retail outlets, it must in-tegrate the stores into the company. One of the many programs it would have to develop is anew advertising program for the stores. The resulting action plan to develop a new advertisingprogram should include much of the following information:
1. Specific actions to be taken to make the program operational: One action might be tocontact three reputable advertising agencies and ask them to prepare a proposal for a newradio and newspaper ad campaign based on the theme “Jones Surplus is now a part of AjaxContinental. Prices are lower. Selection is better.”
2. Dates to begin and end each action: Time would have to be allotted not only to selectand contact three agencies, but to allow them sufficient time to prepare a detailed pro-posal. For example, allow one week to select and contact the agencies plus three monthsfor them to prepare detailed proposals to present to the company’s marketing director.Also allow some time to decide which proposal to accept.
3. Person (identified by name and title) responsible for carrying out each action: List some-one—such as Jan Lewis, advertising manager—who can be put in charge of the program.
4. Person responsible for monitoring the timeliness and effectiveness of each action:Indicate that Jan Lewis is responsible for ensuring that the proposals are of good qualityand are priced within the planned program budget. She will be the primary company con-tact for the ad agencies and will report on the progress of the program once a week to thecompany’s marketing director.
CHAPTER 10 Strategy Implementation: Staffing and Directing 317
TABLE 10–1 Example of an Action Plan
Action Plan for Jan Lewis, Advertising Manager, and Rick Carter, Advertising Assistant, Ajax Continental
Program Objective: To Run a New Advertising and Promotion Campaign for the Combined Jones Surplus/AjaxContinental Retail Stores for the Coming Christmas Season within a Budget of $XX.
Program Activities:1. Identify Three Best Ad Agencies for New Campaign.2. Ask Three Ad Agencies to Submit a Proposal for a New Advertising and Promotion Campaign for Combined Stores.3. Agencies Present Proposals to Marketing Manager.4. Select Best Proposal and Inform Agencies of Decision.5. Agency Presents Winning Proposal to Top Management.6. Ads Air on TV and Promotions Appear in Stores.7. Measure Results of Campaign in Terms of Viewer Recall and Increase in Store Sales.
Action Steps Responsibility Start–End
1. A. Review previous programsB. Discuss with bossC. Decide on three agencies
Lewis & CarterLewis & SmithLewis
1/1–2/12/1–2/32/4
2. A. Write specifications for adB. Assistant writes ad requestC. Contact ad agenciesD. Send request to three agenciesE. Meet with agency acct. execs
LewisCarterLewisCarterLewis & Carter
1/15–1/201/20–1/302/5–2/82/102/16–2/20
3. A. Agencies work on proposalsB. Agencies present proposals
Acct. ExecsCarter
2/23–5/15/1–5/15
4. A. Select best proposalB. Meet with winning agencyC. Inform losers
LewisLewisCarter
5/15–5/205/22–5/306/1
5. A. Fine-tune proposalB. Presentation to management
Acct. ExecLewis
6/1–7/17/1–7/3
6. A. Ads air on TVB. Floor displays in stores
LewisCarter
9/1–12/248/20–8/30
7. A. Gather recall measures of adsB. Evaluate sales dataC. Prepare analysis of campaign
CarterCarterCarter
9/1–12/241/1–1/101/10–2/15
5. Expected financial and physical consequences of each action: Estimate when a com-pleted ad campaign will be ready to show top management and how long it will take af-ter approval to begin to air the ads. Estimate also the expected increase in store sales overthe six-month period after the ads are first aired. Indicate whether “recall” measures willbe used to help assess the ad campaign’s effectiveness plus how, when, and by whom therecall data will be collected and analyzed.
6. Contingency plans: Indicate how long it will take to get an acceptable ad campaign toshow top management if none of the initial proposals is acceptable.
Action plans are important for several reasons. First, action plans serve as a link betweenstrategy formulation and evaluation and control. Second, the action plan specifies what needsto be done differently from the way operations are currently carried out. Third, during the eval-uation and control process that comes later, an action plan helps in both the appraisal of per-formance and in the identification of any remedial actions, as needed. In addition, the explicit
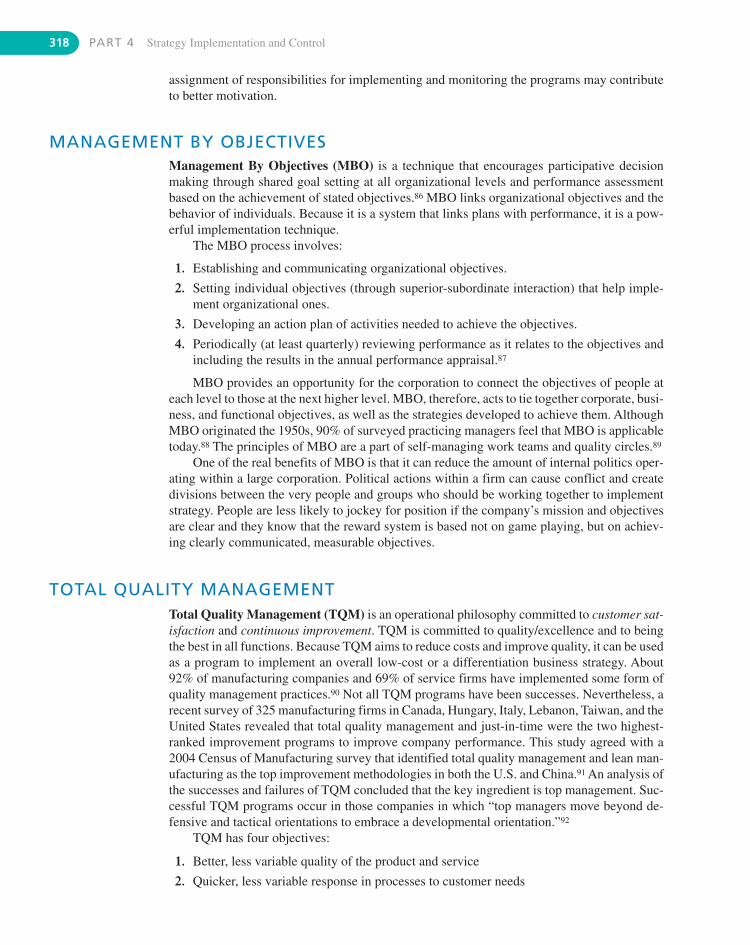
318 PART 4 Strategy Implementation and Control
assignment of responsibilities for implementing and monitoring the programs may contributeto better motivation.
MANAGEMENT BY OBJECTIVESManagement By Objectives (MBO) is a technique that encourages participative decisionmaking through shared goal setting at all organizational levels and performance assessmentbased on the achievement of stated objectives.86 MBO links organizational objectives and thebehavior of individuals. Because it is a system that links plans with performance, it is a pow-erful implementation technique.
The MBO process involves:
1. Establishing and communicating organizational objectives.
2. Setting individual objectives (through superior-subordinate interaction) that help imple-ment organizational ones.
3. Developing an action plan of activities needed to achieve the objectives.
4. Periodically (at least quarterly) reviewing performance as it relates to the objectives andincluding the results in the annual performance appraisal.87
MBO provides an opportunity for the corporation to connect the objectives of people ateach level to those at the next higher level. MBO, therefore, acts to tie together corporate, busi-ness, and functional objectives, as well as the strategies developed to achieve them. AlthoughMBO originated the 1950s, 90% of surveyed practicing managers feel that MBO is applicabletoday.88 The principles of MBO are a part of self-managing work teams and quality circles.89
One of the real benefits of MBO is that it can reduce the amount of internal politics oper-ating within a large corporation. Political actions within a firm can cause conflict and createdivisions between the very people and groups who should be working together to implementstrategy. People are less likely to jockey for position if the company’s mission and objectivesare clear and they know that the reward system is based not on game playing, but on achiev-ing clearly communicated, measurable objectives.
TOTAL QUALITY MANAGEMENTTotal Quality Management (TQM) is an operational philosophy committed to customer sat-isfaction and continuous improvement. TQM is committed to quality/excellence and to beingthe best in all functions. Because TQM aims to reduce costs and improve quality, it can be usedas a program to implement an overall low-cost or a differentiation business strategy. About92% of manufacturing companies and 69% of service firms have implemented some form ofquality management practices.90 Not all TQM programs have been successes. Nevertheless, arecent survey of 325 manufacturing firms in Canada, Hungary, Italy, Lebanon, Taiwan, and theUnited States revealed that total quality management and just-in-time were the two highest-ranked improvement programs to improve company performance. This study agreed with a2004 Census of Manufacturing survey that identified total quality management and lean man-ufacturing as the top improvement methodologies in both the U.S. and China.91 An analysis ofthe successes and failures of TQM concluded that the key ingredient is top management. Suc-cessful TQM programs occur in those companies in which “top managers move beyond de-fensive and tactical orientations to embrace a developmental orientation.”92
TQM has four objectives:
1. Better, less variable quality of the product and service
2. Quicker, less variable response in processes to customer needs
CHAPTER 10 Strategy Implementation: Staffing and Directing 319
3. Greater flexibility in adjusting to customers’ shifting requirements
4. Lower cost through quality improvement and elimination of non-value-adding work93
According to TQM, faulty processes, not poorly motivated employees, are the cause ofdefects in quality. The program involves a significant change in corporate culture, requiringstrong leadership from top management, employee training, empowerment of lower-level em-ployees (giving people more control over their work), and teamwork in order to succeed in acompany. TQM emphasizes prevention, not correction. Inspection for quality still takes place,but the emphasis is on improving the process to prevent errors and deficiencies. Thus, qualitycircles or quality improvement teams are formed to identify problems and to suggest how toimprove the processes that may be causing the problems.
TQM’s essential ingredients are:
� An intense focus on customer satisfaction: Everyone (not just people in the sales andmarketing departments) understands that their jobs exist only because of customer needs.Thus all jobs must be approached in terms of how they will affect customer satisfaction.
� Internal as well as external customers: An employee in the shipping department may bethe internal customer of another employee who completes the assembly of a product, just asa person who buys the product is a customer of the entire company. An employee must bejust as concerned with pleasing the internal customer as in satisfying the external customer.
� Accurate measurement of every critical variable in a company’s operations: Thismeans that employees have to be trained in what to measure, how to measure, and how tointerpret the data. A rule of TQM is that you only improve what you measure.
� Continuous improvement of products and services: Everyone realizes that operationsneed to be continuously monitored to find ways to improve products and services.
� New work relationships based on trust and teamwork: Important is the idea of empowerment—giving employees wide latitude in how they go about achieving thecompany’s goals. Research indicates that the keys to TQM success lie in executive com-mitment, an open organizational culture, and employee empowerment.94
INTERNATIONAL CONSIDERATIONS IN LEADINGIn a study of 53 different national cultures, Hofstede found that each nation’s unique culture couldbe identified using five dimensions. He found that national culture is so influential that it tends tooverwhelm even a strong corporate culture. (See the numerous sociocultural societal variablesthat compose another country’s culture that are listed in Table 4–3.) In measuring the differencesamong these dimensions of national culture from country to country, he was able to explain whya certain management practice might be successful in one nation but fail in another:95
1. Power distance (PD) is the extent to which a society accepts an unequal distribution ofpower in organizations. Malaysia and Mexico scored highest, whereas Germany andAustria scored lowest. People in those countries scoring high on this dimension tend toprefer autocratic to more participative managers.
2. Uncertainty avoidance (UA) is the extent to which a society feels threatened by uncertainand ambiguous situations. Greece and Japan scored highest on disliking ambiguity, whereasthe United States and Singapore scored lowest. People in those nations scoring high on thisdimension tend to want career stability, formal rules, and clear-cut measures of performance.
3. Individualism-collectivism (I-C) is the extent to which a society values individual free-dom and independence of action compared with a tight social framework and loyalty to thegroup. The United States and Canada scored highest on individualism, whereas Mexico
320 PART 4 Strategy Implementation and Control
and Guatemala scored lowest. People in nations scoring high on individualism tend tovalue individual success through competition, whereas people scoring low on individual-ism (thus high on collectivism) tend to value group success through collective cooperation.
4. Masculinity-femininity (M-F) is the extent to which society is oriented toward moneyand things (which Hofstede labels masculine) or toward people (which Hofstede labelsfeminine). Japan and Mexico scored highest on masculinity, whereas France and Swedenscored lowest (thus highest on femininity). People in nations scoring high on masculinitytend to value clearly defined sex roles where men dominate, and to emphasize perfor-mance and independence, whereas people scoring low on masculinity (and thus high onfemininity) tend to value equality of the sexes where power is shared, and to emphasizethe quality of life and interdependence.
5. Long-term orientation (LT) is the extent to which society is oriented toward the long-versus the short-term. Hong Kong and Japan scored highest on long-term orientation,whereas Pakistan scored the lowest. A long-term time orientation emphasizes the impor-tance of hard work, education, and persistence as well as the importance of thrift. Nationswith a long-term time orientation tend to value strategic planning and other managementtechniques with a long-term payback.
Hofstede’s work was extended by Project GLOBE, a team of 150 researchers who collecteddata on cultural values and practices and leadership attributes from 18,000 managers in 62 coun-tries. The project studied the nine cultural dimensions of assertiveness, future orientation, gen-der differentiation, uncertainty avoidance, power distance, institutional emphasis on collectivismversus individualism, in-group collectivism, performance orientation, and humane orientation.96
The dimensions of national culture help explain why some management practices workwell in some countries but not in others. For example, MBO, which originated in the UnitedStates, succeeded in Germany, according to Hofstede, because the idea of replacing the arbi-trary authority of the boss with the impersonal authority of mutually agreed-upon objectivesfits the low power distance that is a dimension of the German culture. It failed in France, how-ever, because the French are used to high power distances; they are used to accepting ordersfrom a highly personalized authority. In countries with high levels of uncertainty avoidance,such as Switzerland and Austria, communication should be clear and explicit, based onfacts. Meetings should be planned in advance and have clear agendas. In contrast, in low-uncertainty-avoidance countries such as Greece or Russia, people are not used to structuredcommunication and prefer more open-ended meetings. Because Thailand has a high level ofpower distance, Thai managers feel that communication should go from the top to the bottomof a corporation. As a result, 360-degree performance appraisals are seen as dysfunctional.97
Some of the difficulties experienced by U.S. companies in using Japanese-style quality circlesin TQM may stem from the extremely high value U.S. culture places on individualism. Thedifferences between the United States and Mexico in terms of the power distance (Mexico 104vs. U.S. 46) and individualism-collectivism (U.S. 91 vs. Mexico 30) dimensions may help ex-plain why some companies operating in both countries have difficulty adapting to the differ-ences in customs.98 In addition, research has found that technology alliance formation isstrongest in countries that value cooperation and avoid uncertainty.99
When one successful company in one country merges with another successful companyin another country, the clash of corporate cultures is compounded by the clash of national cul-tures. For example, when two companies, one from a high-uncertainty-avoidance society andone from a low-uncertainty-avoidance country, are considering a merger, they should investi-gate each other’s management practices to determine potential areas of conflict. Given thegrowing number of cross-border mergers and acquisitions, the management of cultures is be-coming a key issue in strategy implementation. See the Global Issue feature to learn how
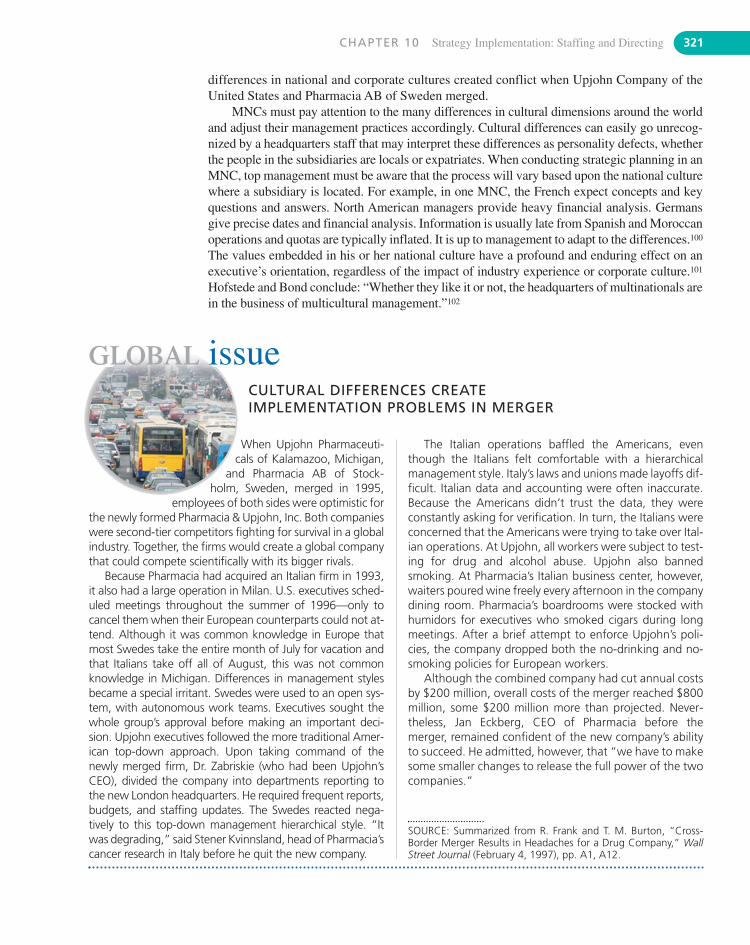
CHAPTER 10 Strategy Implementation: Staffing and Directing 321
When Upjohn Pharmaceuti-cals of Kalamazoo, Michigan,
and Pharmacia AB of Stock-holm, Sweden, merged in 1995,
employees of both sides were optimistic forthe newly formed Pharmacia & Upjohn, Inc. Both companieswere second-tier competitors fighting for survival in a globalindustry. Together, the firms would create a global companythat could compete scientifically with its bigger rivals.
Because Pharmacia had acquired an Italian firm in 1993,it also had a large operation in Milan. U.S. executives sched-uled meetings throughout the summer of 1996—only tocancel them when their European counterparts could not at-tend. Although it was common knowledge in Europe thatmost Swedes take the entire month of July for vacation andthat Italians take off all of August, this was not commonknowledge in Michigan. Differences in management stylesbecame a special irritant. Swedes were used to an open sys-tem, with autonomous work teams. Executives sought thewhole group’s approval before making an important deci-sion. Upjohn executives followed the more traditional Amer-ican top-down approach. Upon taking command of thenewly merged firm, Dr. Zabriskie (who had been Upjohn’sCEO), divided the company into departments reporting tothe new London headquarters. He required frequent reports,budgets, and staffing updates. The Swedes reacted nega-tively to this top-down management hierarchical style. “Itwas degrading,” said Stener Kvinnsland, head of Pharmacia’scancer research in Italy before he quit the new company.
differences in national and corporate cultures created conflict when Upjohn Company of theUnited States and Pharmacia AB of Sweden merged.
MNCs must pay attention to the many differences in cultural dimensions around the worldand adjust their management practices accordingly. Cultural differences can easily go unrecog-nized by a headquarters staff that may interpret these differences as personality defects, whetherthe people in the subsidiaries are locals or expatriates. When conducting strategic planning in anMNC, top management must be aware that the process will vary based upon the national culturewhere a subsidiary is located. For example, in one MNC, the French expect concepts and keyquestions and answers. North American managers provide heavy financial analysis. Germansgive precise dates and financial analysis. Information is usually late from Spanish and Moroccanoperations and quotas are typically inflated. It is up to management to adapt to the differences.100
The values embedded in his or her national culture have a profound and enduring effect on anexecutive’s orientation, regardless of the impact of industry experience or corporate culture.101
Hofstede and Bond conclude: “Whether they like it or not, the headquarters of multinationals arein the business of multicultural management.”102
GLOBAL issueCULTURAL DIFFERENCES CREATE IMPLEMENTATION PROBLEMS IN MERGER
The Italian operations baffled the Americans, eventhough the Italians felt comfortable with a hierarchicalmanagement style. Italy’s laws and unions made layoffs dif-ficult. Italian data and accounting were often inaccurate.Because the Americans didn’t trust the data, they wereconstantly asking for verification. In turn, the Italians wereconcerned that the Americans were trying to take over Ital-ian operations. At Upjohn, all workers were subject to test-ing for drug and alcohol abuse. Upjohn also bannedsmoking. At Pharmacia’s Italian business center, however,waiters poured wine freely every afternoon in the companydining room. Pharmacia’s boardrooms were stocked withhumidors for executives who smoked cigars during longmeetings. After a brief attempt to enforce Upjohn’s poli-cies, the company dropped both the no-drinking and no-smoking policies for European workers.
Although the combined company had cut annual costsby $200 million, overall costs of the merger reached $800million, some $200 million more than projected. Never-theless, Jan Eckberg, CEO of Pharmacia before themerger, remained confident of the new company’s abilityto succeed. He admitted, however, that “we have to makesome smaller changes to release the full power of the twocompanies.”
SOURCE: Summarized from R. Frank and T. M. Burton, “Cross-Border Merger Results in Headaches for a Drug Company,” WallStreet Journal (February 4, 1997), pp. A1, A12.
322 PART 4 Strategy Implementation and Control
End of Chapter SUMMARYStrategy is implemented by modifying structure (organizing), selecting the appropriate peopleto carry out the strategy (staffing), and communicating clearly how the strategy can be put intoaction (leading). A number of programs, such as organizational and job design, reengineering,Six Sigma, MBO, TQM, and action planning, can be used to implement a new strategy. Exec-utives must manage the corporate culture and find the right mix of qualified people to put astrategy in place.
Research on executive succession reveals that it is very risky to hire new top managersfrom outside the corporation. Although this is often done when a company is in trouble, it canbe dangerous for a successful firm. This is also true when hiring people for non-executivepositions. An in-depth study of 1,052 stock analysts at 78 investment banks revealed that hir-ing a star (an outstanding performer) from another company did not improve the hiring com-pany’s performance. When a company hires a star, the star’s performance plunges, there is asharp decline in the functioning of the team the person works with, and the company’s marketvalue declines. Their performance dropped about 20% and did not return to the level beforethe job change—even after five years. Interestingly, around 36% of the stars left the invest-ment banks that hired them within 36 months. Another 29% quit in the next 24 months.
This phenomenon occurs not because a star doesn’t suddenly become less intelligentwhen switching firms, but because the star cannot take to the new firm the firm-specific re-sources that contributed to her or his achievements at the previous company. As a result, thestar is unable to repeat the high performance in another company until he/she learns the newsystem. This may take years, but only if the new company has a good support system in place.Otherwise, the performance may never improve. For these reasons, companies cannot obtaincompetitive advantage by hiring stars from the outside. Instead, they should emphasize grow-ing their own talent and developing the infrastructure necessary for high performance.103
It is important to not ignore the 75% of the workforce who, while not being stars, are thesolid performers that keep a company going over the years. An undue emphasis on attractingstars wastes money and destroys morale. The CEO of McKesson, a pharmaceutical wholesaler,calls these B players “performers in place. . . .They are happy living in Dubuque. I have moretime and admiration for them than the A player who is at my desk every six months asking forthe next promotion.” Coaches who try to forge a sports team composed of stars court disaster.According to Karen Freeman, former head coach of women’s basketball at Wake Forest Uni-versity, “During my coaching days, the most dysfunctional teams were the ones who had norespect for the B players.” In basketball or business, when the team goes into a slump, the starsare the first to whine, Freeman reports.104
E C O - B I T S� The U.S. Climate Action Partnership (USCAP), com-
posed of General Electric, Caterpillar, Alcoa, GeneralMotors, Chrysler, and Duke Energy plus 21 other majorcorporations, endorses reducing greenhouse gas emis-sions by 10% to 30% within 15 years and 60% to 80%by 2050 to avert the severest consequences of globalwarming.
� General Electric, Caterpillar, and Alcoa also sit on theboard of the Center for Energy & Economic Develop-ment (CEED), an organization that opposes a federal cli-
mate bill requiring a 65% reduction in emissions by2050.
� USCAP members General Motors and Chrysler are alsomembers of the Heartland Institute, an organization thatdisputes humanity’s role in global warming.
� Duke Energy, a USCAP member, is currently buildingtwo coal-burning power plants and also belongs toAmericans for Balanced Energy Choices, a group thatadvocates expanded coal use.105
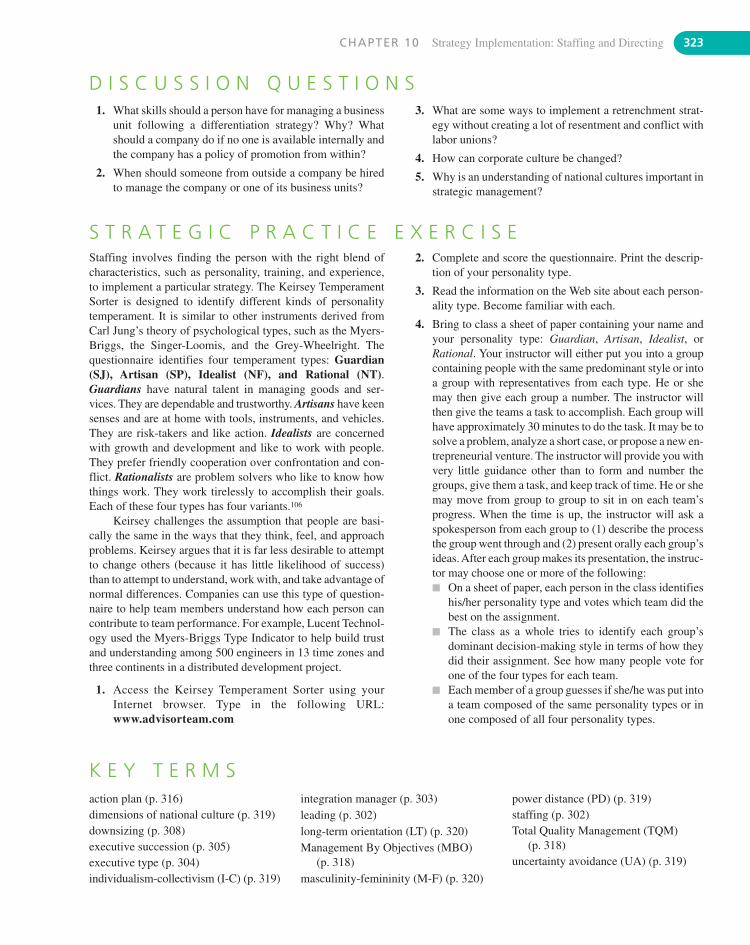
CHAPTER 10 Strategy Implementation: Staffing and Directing 323
D I S C U S S I O N Q U E S T I O N S1. What skills should a person have for managing a business
unit following a differentiation strategy? Why? Whatshould a company do if no one is available internally andthe company has a policy of promotion from within?
2. When should someone from outside a company be hiredto manage the company or one of its business units?
3. What are some ways to implement a retrenchment strat-egy without creating a lot of resentment and conflict withlabor unions?
4. How can corporate culture be changed?
5. Why is an understanding of national cultures important instrategic management?
S T R A T E G I C P R A C T I C E E X E R C I S EStaffing involves finding the person with the right blend ofcharacteristics, such as personality, training, and experience,to implement a particular strategy. The Keirsey TemperamentSorter is designed to identify different kinds of personalitytemperament. It is similar to other instruments derived fromCarl Jung’s theory of psychological types, such as the Myers-Briggs, the Singer-Loomis, and the Grey-Wheelright. Thequestionnaire identifies four temperament types: Guardian(SJ), Artisan (SP), Idealist (NF), and Rational (NT).Guardians have natural talent in managing goods and ser-vices. They are dependable and trustworthy. Artisans have keensenses and are at home with tools, instruments, and vehicles.They are risk-takers and like action. Idealists are concernedwith growth and development and like to work with people.They prefer friendly cooperation over confrontation and con-flict. Rationalists are problem solvers who like to know howthings work. They work tirelessly to accomplish their goals.Each of these four types has four variants.106
Keirsey challenges the assumption that people are basi-cally the same in the ways that they think, feel, and approachproblems. Keirsey argues that it is far less desirable to attemptto change others (because it has little likelihood of success)than to attempt to understand, work with, and take advantage ofnormal differences. Companies can use this type of question-naire to help team members understand how each person cancontribute to team performance. For example, Lucent Technol-ogy used the Myers-Briggs Type Indicator to help build trustand understanding among 500 engineers in 13 time zones andthree continents in a distributed development project.
1. Access the Keirsey Temperament Sorter using yourInternet browser. Type in the following URL:www.advisorteam.com
2. Complete and score the questionnaire. Print the descrip-tion of your personality type.
3. Read the information on the Web site about each person-ality type. Become familiar with each.
4. Bring to class a sheet of paper containing your name andyour personality type: Guardian, Artisan, Idealist, orRational. Your instructor will either put you into a groupcontaining people with the same predominant style or intoa group with representatives from each type. He or shemay then give each group a number. The instructor willthen give the teams a task to accomplish. Each group willhave approximately 30 minutes to do the task. It may be tosolve a problem, analyze a short case, or propose a new en-trepreneurial venture. The instructor will provide you withvery little guidance other than to form and number thegroups, give them a task, and keep track of time. He or shemay move from group to group to sit in on each team’sprogress. When the time is up, the instructor will ask aspokesperson from each group to (1) describe the processthe group went through and (2) present orally each group’sideas. After each group makes its presentation, the instruc-tor may choose one or more of the following:� On a sheet of paper, each person in the class identifies
his/her personality type and votes which team did thebest on the assignment.
� The class as a whole tries to identify each group’sdominant decision-making style in terms of how theydid their assignment. See how many people vote forone of the four types for each team.
� Each member of a group guesses if she/he was put intoa team composed of the same personality types or inone composed of all four personality types.
K E Y T E R M Saction plan (p. 316)dimensions of national culture (p. 319)downsizing (p. 308)executive succession (p. 305)executive type (p. 304)individualism-collectivism (I-C) (p. 319)
integration manager (p. 303)leading (p. 302)long-term orientation (LT) (p. 320)Management By Objectives (MBO)
(p. 318)masculinity-femininity (M-F) (p. 320)
power distance (PD) (p. 319)staffing (p. 302)Total Quality Management (TQM)
(p. 318)uncertainty avoidance (UA) (p. 319)
324 PART 4 Strategy Implementation and Control
N O T E S1. B. O’Reilly, “The Rent-A-Car Jocks Who Made Enterprise #1,”
Fortune (October 28, 1996), pp. 125–128; J. Schlereth, “PuttingPeople First,” an interview with Andrew Taylor, BizEd(July/August 2003), pp. 16–20; P. Lehman, “A Clear Road tothe Top,” Business Week (September 18, 2006), p. 72; CompanyWeb site at www.enterprise.com.
2. S. Caudron, “How HR Drives Profits,” Workforce Management(December 2001), pp. 26–31 as reported by L. L. Bryan, C. I.Joyce, and L. M. Weiss in “Making a Market in Talent,”McKinsey Quarterly (2006, No. 2), pp. 1–7.
3. “The Stat,” Business Week (October 24, 2005), p. 16.4. The numbers are approximate averages from three separate stud-
ies of top management turnover after mergers. See M. Lubatkin,D. Schweiger, and Y. Weber, “Top Management Turnover in Related M&Ss: An Additional Test of the Theory of RelativeStanding,” Journal of Management, Vol. 25, No. 1 (1999),pp. 55–73.
5. J. A. Krug, “Executive Turnover in Acquired Firms: A Longitu-dinal Analysis of Long-Term Interaction Effects,” paper pre-sented to annual meeting of Academy of Management, Seattle,WA (2003).
6. J. A. Krug and W. H. Hegarty, “Post-Acquisition Turnover AmongU.S. Top Management Teams: An Analysis of the Effects of For-eign vs. Domestic Acquisitions of U.S. Targets,” Strategic Man-agement Journal (September 1997), pp. 667–675; J. A. Jrug andW. H. Hegarty, “Predicting Who Stays and Leaves After an Acqui-sition: A Study of Top Managers in Multinational Firms,”Strategic Management Journal (February 2001), pp. 185–196.
7. D. Harding and T. Rouse, “Human Due Diligence,” HarvardBusiness Review (April 2007), pp. 124–131.
8. A. Hinterhuber, “Making M&A Work,” Business Strategy Re-view (September 2002), pp. 7–9.
9. R. N. Ashkenas and S. C. Francis, “Integration Managers: Spe-cial Leaders for Special Times,” Harvard Business Review(November–December 2000), pp. 108–116.
10. J. Hoerr, “Sharpening Minds for a Competitive Edge,” BusinessWeek (December 17, 1990), pp. 72–78.
11. K. Hess and N. J. Nentl, “Strategic Training for Managers,”SAM Management in Practice (2006, No. 4).
12. “Training and Human Resources,” Business Strategy News Re-view (July 2000), p. 6.
13. High Performance Work Practices and Firm Performance(Washington, DC: U.S. Department of Labor, Office of theAmerican Workplace, 1993), pp. i, 4.
14. T. T. Baldwin, C. Danielson, and W. Wiggenhorn, “The Evolu-tion of Learning Strategies in Organizations: From EmployeeDevelopment to Business Redefinition,” Academy of Manage-ment Executive (November 1997), pp. 47–58; K. Kelly, “Mo-torola: Training for the Millennium,” Business Week (March 28,1996), pp. 158–161.
15. R. Henkoff, “Companies That Train Best,” Fortune (March 22,1993), pp. 62–75.
16. D. C. Hambrick, “Upper Echelons Theory: An Update,”Academy of Management Review (April 2007), pp. 334–343.
17. D. Miller and J. Shamsie, “Learning Across the Life Cycle: Ex-perimentation and Performance Among the Hollywood StudioHeads,” Strategic Management Journal (August 2001),pp. 725–745). An exception to these findings may be the com-puter software industry in which CEOs are at their best when
they start their jobs and steadily decline during their tenures.See A. D. Henderson, D. Miller, and D. C. Hambrick, “HowQuickly Do CEOs Become Obsolete? Industry Dynamism,CEO Tenure, and Company Performance,” Strategic Manage-ment Journal (May 2006), pp. 447–460.
18. B. Hrowvitz, “New CEO Puts Comeback on the Menu atApplebee’s,” USA Today (April 28, 2008), pp. 1B, 2B.
19. A study of former General Electric executives who becameCEOs categorized them as cost controllers, growers, or cyclemanagers on the basis of their line experience at GE. SeeB. Groysberg, A. N. McLean, and N. Nohria, “Are LeadersPortable?” Harvard Business Review (May 2006), pp. 92–100.
20. D. K. Datta and N. Rajagopalan, “Industry Structure and CEOCharacteristics: An Empirical Study of Succession Events,”Strategic Management Journal (September 1998),pp. 833–852; A. S. Thomas and K. Ramaswamy, “Environmen-tal Change and Management Staffing: A Comment,” Journal ofManagement (Winter 1993), pp. 877–887; J. P. Guthrie, C. M.Grimm, and K. G. Smith, “Environmental Change and Manage-ment Staffing: An Empirical Study,” Journal of Management(December 1991), pp. 735–748.
21. J. Greco, “The Search Goes On,” Journal of Business Strategy(September/October 1997), pp. 22–25; W. Ocasio and H. Kim,“The Circulation of Corporate Control: Selection of Func-tional Backgrounds on New CEOs in Large U.S. Manufactur-ing Firms, 1981–1992,” Administrative Science Quarterly(September 1999), pp. 532–562; R. Dobbs, D. Harris, andA. Rasmussen, “When Should CFOs Take the Helm?”McKinsey Quarterly Online (November 2006); “How to Getto the Top,” The Economist (May 31, 2008), p. 70.
22. R. Drazin and R. K. Kazanjian, “Applying the Del Technique tothe Analysis of Cross-Classification Data: A Test of CEO Suc-cession and Top Management Team Development,” Academy ofManagement Journal (December 1993), pp. 1374–1399; W. E.Rothschild, “A Portfolio of Strategic Leaders,” Planning Re-view (January/February 1996), pp. 16–19.
23. R. Subramanian and C. M. Sanchez, “Environmental Changeand Management Staffing: An Empirical Examination of theElectric Utilities Industry,” Journal of Business Strategies(Spring 1998), pp. 17–34.
24. M. A. Carpenter and B. R. Golden, “Perceived Managerial Dis-cretion: A Study of Cause and Effect,” Strategic ManagementJournal (March 1997), pp. 187–206.
25. J. A. Parnell, “Functional Background and Business Strategy:The Impact of Executive-Strategy Fit on Performance,” Journalof Business Strategies (Spring 1994), pp. 49–62.
26. M. Smith and M. C. White, “Strategy, CEO Specialization,and Succession,” Administrative Science Quarterly (June1987), pp. 263–280.
27. “Making Companies Work,” Economist (October 25, 2003),p. 14; C. H. Mooney, C. M. Dalton, D. R. Dalton, and S. T.Certo, “CEO Succession as a Funnel: The Critical, and Chang-ing Role of Inside Directors,” Organizational Dynamics,Vol. 36, No. 4 (2007), pp. 418–428. Note, however, that thetenures of CEOs of family firms typically exceed 15 years. SeeI. Le Breton-Miller and D. Miller, “Why Do Some Family Busi-nesses Out-Compete? Governance, Long-Term Orientations,and Sustainable Capability,” Entrepreneurship Theory andPractice (November 2006), pp. 731–746.
42. C. Gopinath, “Turnaround: Recognizing Decline and InitiatingIntervention,” Long Range Planning (December 1991),pp. 96–101.
43. K. B. Schwartz and K. Menon, “Executive Succession in Fail-ing Firms,” Academy of Management Journal (September1985), pp. 680–686; A. A. Cannella Jr., and M. Lubatkin, “Suc-cession as a Sociopolitical Process: Internal Impediments toOutsider Selection,” Academy of Management Journal (August1993), pp. 763–793; W. Boeker and J. Goodstein, “Performanceand Succession Choice: The Moderating Effects of Governanceand Ownership,” Academy of Management Journal (February1993), pp. 172–186.
44. W. Boeker, “Executive Migration and Strategic Change: TheEffect of Top Manager Movement on Product-Market Entry,”Administrative Science Quarterly (June 1997), pp. 213–236.
45. E. Brockmann, J. J. Hoffman, and D. Dawley, “A ContingencyTheory of CEO Successor Choice and Post-Bankruptcy Strate-gic Change,” Paper presented to annual meeting of Academy ofManagement, Seattle, WA (2003).
46. P. Lorange, and D. Murphy, “Bringing Human Resources IntoStrategic Planning: System Design Characteristics,” inStrategic Human Resource Management, edited by C. J.Fombrun, N. M. Tichy, and M. A. Devanna (New York: JohnWiley & Sons, 1984), pp. 281–283.
47. M. Leuchter, “Management Farm Teams,” Journal of BusinessStrategy (May/June 1998), pp. 29–32.
48. S. Armour, “Playing the Succession Game,” USA Today(November 24, 2003), p. 3B.
49. D. A. Waldman and T. Korbar, “Student Assessment Center Per-formance in the Prediction of Early Career Success,” Academy ofManagement Learning and Education (June 2004), pp. 151–167.
50. “Coming and Going,” Survey of Corporate Leadership, Econo-mist (October 25, 2003), pp. 12–14.
51. R. A. Pitts, “Strategies and Structures for Diversification,”Academy of Management Journal (June 1997), pp. 197–208.
52. K. E. Mishra, G. M. Spreitzer, and A. K. Mishra, “PreservingEmployee Morale During Downsizing,” Sloan ManagementReview (Winter 1998), pp. 83–95.
53. B. O’Reilly, “Is Your Company Asking Too Much?” Fortune(March 12, 1990), p. 41. For more information on the emotionalreactions of survivors of downsizing, see C. R. Stoner andR. I. Hartman, “Organizational Therapy: Building SurvivorHealth & Competitiveness,” SAM Advanced Management Jour-nal (Summer 1997), pp. 15–31, 41.
54. S. R. Fisher and M. A. White, “Downsizing in a Learning Orga-nization: Are There Hidden Costs?” Academy of ManagementReview (January 2000), pp. 244–251.
55. T. M. Amabile and R. Conti, “Changes in the Work Environ-ment for Creativity During Downsizing,” Academy of Manage-ment Journal (December 1999), pp. 630–640; A. G. Bedeianand A. A. Armenakis, “The Cesspool Syndrome: How DreckFloats to the Top of Declining Organizations,” Academy ofManagement Executive (February 1998), pp. 58–67.
56. For a more complete listing of the psychological and behavioralreactions to downsizing, see M. L. Marks and K. P. De Meuse,“Resizing the Organization: Maximizing the Gain While Mini-mizing the Pain of Layoffs, Divestitures, and Closings,”Organizational Dynamics, Vol. 34, No. 1 (2005), pp. 19–35.
57. D. J. Flanagan and K. C. O’Shaughnessy, “The Effect of Lay-offs on Firm Reputation,” Journal of Management (June 2005),pp. 445–463.
28. A. Bianco, L. Lavelle, J. Merrit, and A. Barrett, “The CEOTrap,” Business Week (December 11, 2000), pp. 86–92.
29. Y. Zhang and N. Rajagopalan, “When the Known Devil Is BetterThan an Unknown God: An Empirical Study of the Antecedentsand Consequences of Relay CEO Succession,” Academy ofManagement Journal (August 2004), pp. 483–500; W. Shen andA. A. Cannella, Jr., “Will Succession Planning Increase Share-holder Wealth? Evidence from Investor Reactions to Relay CEOSuccessions,” Strategic Management Journal (February 2003),pp. 191–198.
30. G. A. Bigley and M. F. Wiersema, “New CEOs and CorporateStrategic Refocusing: How Experience as Heir Apparent Influ-ences the Use of Power,” Administrative Science Quarterly(December 2002), pp. 707–727.
31. J. L. Bower, “Solve the Succession Crisis by Growing Inside-Outside Leaders,” Harvard Business Review (November 2007),pp. 91–96; Y. Zhang and N. Rajagopalan, “Grooming for theTop Post and Ending the CEO Succession Crisis,”Organizational Dynamics, Vol. 35, Issue 1 (2006), pp. 96–105.
32. “Coming and Going,” Survey of Corporate Leadership, Econo-mist (October 25, 2003), pp. 12–14.
33. D. C. Carey and D. Ogden, CEO Succession: A Window on HowBoards Do It Right When Choosing a New Chief Executive(New York: Oxford University Press, 2000).
34. “The King Lear Syndrome,” Economist (December 13, 2003),p. 65.
35. Y. Zang and N. Rajagopalan, “Grooming for the Top Post andEnding the CEO Succession Crisis,” Organizational Dynamics,Vol. 35, Issue 1 (2006), pp. 96–105.
36. J. Weber, “The Accidental CEO,” Business Week (April 23,2007), pp. 64–72.
37. M. S. Kraatz and J. H. Moore, “Executive Migration and Insti-tutional Change,” Academy of Management Journal (February2002), pp. 120–143; Y. Zhang and N. Rajagopalan, “When theKnown Devil Is Better Than an Unknown God: An EmpiricalStudy of the Antecedents and Consequences of Relay CEO Suc-cession,” Academy of Management Journal (August 2004),pp. 483–500; W. Shen and A. A. Cannella, Jr., “Revisiting thePerformance Consequences of CEO Succession: The Impactsof Successor Type, Post-Succession Senior ExecutiveTurnover, and Departing CEO Tenure,” Academy of Manage-ment Journal (August 2002), pp. 717–733.
38. K. P. Coyne and E. J. Coyne, Sr., “Surviving Your New CEO,”Harvard Business Review (May 2007), pp. 62–69.
39. N. Byrnes and D. Kiley, “Hello, You Must Be Going,” BusinessWeek (February 12, 2007), pp. 30–32.
40. C. Lucier and J. Dyer, “Hiring an Outside CEO: A Board’s BestMoves,” Directors & Boards (Winter 2004), pp. 36–38. Thesefindings are supported by a later study by Booz Allen Hamiltonin which 1,595 worldwide companies during 1995 to 2005showed the same results. See J. Webber, “The AccidentalCEO,” Business Week (April 23, 2007), pp. 64–72.
41. Q. Yue, “Antecedents of Top Management Successor Origin inChina,” paper presented to the annual meeting of the Academy ofManagement, Seattle, WA (2003); A. A. Buchko and D. DiVerde,“Antecedents, Moderators, and Consequences of CEO Turnover:A Review and Reconceptualization,” Paper presented to MidwestAcademy of Management (Lincoln, NE: 1997), p. 10; W. Ocasio,“Institutionalized Action and Corporate Governance: The Re-liance on Rules of CEO Succession,” Administrative ScienceQuarterly (June 1999), pp. 384–416.
CHAPTER 10 Strategy Implementation: Staffing and Directing 325
326 PART 4 Strategy Implementation and Control
58. Wall Street Journal (December 22, 1992), p. B1.59. R. D. Nixon, M. A. Hitt, H. Lee, and E. Jeong, “Market Reac-
tions to Announcements of Corporate Downsizing Actions andImplementation Strategies,” Strategic Management Journal(November 2004), pp. 1121–1129; G. D. Bruton, J. K. Keels,and C. L. Shook, “Downsizing the Firm: Answering the Strate-gic Questions,” Academy of Management Executive (May1996), pp. 38–45; E. G. Love and N. Nohria, “Reducing Slack:The Performance Consequences of Downsizing by Large In-dustrial Firms, 1977–93,” Strategic Management Journal(December 2005), pp. 1087–1108; C. D. Zatzick and R. D. Iver-son, “High-Involvement Management and Workforce Reduc-tion: Competitive Advantage or Disadvantage?” Academy ofManagement Journal (October 2006), pp. 999–1015.
60. M. A. Hitt, B. W. Keats, H. F. Harback, and R. D. Nixon,“Rightsizing: Building and Maintaining Strategic Leadershipand Long-Term Competitiveness,” Organizational Dynamics(Autumn 1994), pp. 18–32. For additional suggestions, seeW. F. Cascio, “Strategies for Responsible Restructuring,”Academy of Management Executive (August 2002), pp. 80–91,and T. Mroczkowski and M. Hanaoka, “Effective RightsizingStrategies in Japan and America: Is There a Convergence ofEmployment Practices?” Academy of Management Executive(May 1997), pp. 57–67. For an excellent list of cost-reductionprograms for use in short, medium, and long-term time hori-zons, see F. Gandolfi, “Cost Reductions, Downsizing-relatedLayoffs, and HR Practices,” SAM Advanced Management Jour-nal (Spring 2008), pp. 52–58.
61. J. S. Black and H. B. Gregersen, “The Right Way to Manage Ex-pats,” Harvard Business Review (March–April 1999),pp. 52–61.
62. Ibid, p. 54.63. J. I. Sanchez, P. E. Spector, and C. L. Cooper, “Adapting to a
Boundaryless World: A Developmental Expatriate Model,”Academy of Management Executive (May 2000), pp. 96–106.
64. R. L. Tung, The New Expatriates (Cambridge, MA.: Ballinger,1988); J. S. Black, M. Mendenhall, and G. Oddou, “Toward aComprehensive Model of International Adjustment: An Inte-gration of Multiple Theoretical Perspectives,” Academy ofManagement Review (April 1991), pp. 291–317.
65. M. A. Carpenter, W. G. Sanders, and H. B. Gregersen,“Bundling Human Capital with Organizational Context: TheImpact of International Assignment Experience on Multina-tional Firm Performance and CEO Pay,” Academy of Manage-ment Journal (June 2001), pp. 493–511.
66. P. M. Caligiuri and S. Colakoglu, “A Strategic Contingency Ap-proach to Expatriate Assignment Management,” Human Re-source Management Journal, Vol. 17, No. 4 (2007), pp. 393–410.
67. M. A. Shaffer, D. A. Harrison, K. M. Gilley, and D. M. Luk,“Struggling for Balance Amid Turbulence on International As-signments: Work-Family Conflict, Support, and Commitment,”Journal of Management, Vol. 27, No. 1 (2001), pp. 99–121.
68. J. S. Black and H. B. Gregersen, “The Right Way to Manage Ex-pats,” Harvard Business Review (March–April 1999), p. 54.
69. G. Stern, “GM Executive’s Ties to Native Country Help AutoMaker Clinch Deal in China,” Wall Street Journal (November 2,1995), p. B7.
70. K. Roth, “Managing International Interdependence: CEO Char-acteristics in a Resource-Based Framework,” Academy of Man-agement Journal (February 1995), pp. 200–231.
71. M. Subramaniam and N. Venkatraman, “Determinants ofTransnational New Product Development Capability: Testingthe Influence of Transferring and Deploying Tacit OverseasKnowledge,” Strategic Management Journal (April 2001),pp. 359–378.
72. J. S. Lublin, “An Overseas Stint Can Be a Ticket to the Top,”Wall Street Journal (January 29, 1996), pp. B1, B2.
73. “Cisco Shifts Senior Executives to India,” St. Cloud (MN)Times (January 13, 2007), p. 6A.
74. “Expatriate Employees: In Search of Stealth,” The Economist(April 23, 2005), pp. 62–64.
75. M. Meaney, C. Pung, and S. Kamath, “Creating OrganizationalTransformations,” McKinsey Quarterly Online (September 10,2008).
76. L. G. Love, R. L. Priem, and G. T. Lumpkin, “Explicitly Artic-ulated Strategy and Firm Performance Under Alternative Lev-els of Centralization,” Journal of Management, Vol. 28, No. 5(2002), pp. 611–627.
77. G. G. Gordon, “The Relationship of Corporate Culture to Indus-try Sector and Corporate Performance,” in Gaining Control ofthe Corporate Culture, edited by R. H. Kilmann, M. J. Saxton,R. Serpa, and Associates (San Francisco: Jossey-Bass, 1985),p. 123; T. Kono, “Corporate Culture and Long-Range Plan-ning,” Long Range Planning (August 1990), pp. 9–19.
78. B. Mike and J. W. Slocum, Jr., “Changing Culture at Pizza Hutand Yum! Brands,” Organizational Dynamics, Vol. 32, No. 4(2003), pp. 319–330.
79. T. J. Tetenbaum, “Seven Key Practices That Improve theChance for Expected Integration and Synergies,”Organizational Dynamics (Autumn 1999), pp. 22–35.
80. B. Bremner and G. Edmondson, “Japan: A Tale of Two Merg-ers,” Business Week (May 10, 2004), p. 42.
81. P. Very, M. Lubatkin, R. Calori, and J. Veiga, “Relative Standingand the Performance of Recently Acquired European Firms,”Strategic Management Journal (September 1997), pp. 593–614.
82. A. R. Malekzadeh and A. Nahavandi, “Making Mergers Workby Managing Cultures,” Journal of Business Strategy(May/June 1990), pp. 53–57; A. Nahavandi, and A. R.Malekzadeh, “Acculturation in Mergers and Acquisitions,”Academy of Management Review (January 1988), pp. 79–90.
83. C. Ghosn, “Saving the Business Without Losing the Company,”Harvard Business Review (January 2002), pp. 37–45; B. Bremner,G. Edmondson, C. Dawson, D. Welch, and K. Kerwin, “Nissan’sBoss,” Business Week (October 4, 2004), pp. 50–60.
84. D. Harding and T. Rouse, “Human Due Diligence,” HarvardBusiness Review (April 2007), pp. 124–131.
85. J. J. Keller, “Why AT&T Takeover of NCR Hasn’t Been aReal Bell Ringer,” Wall Street Journal (September 19, 1995),pp. A1, A5.
86. J. W. Gibson and D. V. Tesone, “Management Fads: Emergence,Evolution, and Implications for Managers,” Academy of Man-agement Executive (November 2001), pp. 122–133.
87. For additional information, see S. J. Carroll, Jr., and M. L.Tosi, Jr., Management by Objectives: Applications and Re-search (New York: Macmillan, 1973), and A. P. Raia, Managingby Objectives (Glenview, IL: Scott, Foresman, and Company,1974).
88. J. W. Gibson, D. V. Tesone, and C. W. Blackwell, “ManagementFads: Here Yesterday, Gone Today?” SAM Advanced Manage-ment Journal (Autumn 2003), pp. 12–17.
CHAPTER 10 Strategy Implementation: Staffing and Directing 327
89. J. W. Gibson and D. V. Tesone, “Management Fads: Emergence,Evolution, and Implications fdor Managers,” Academy of Man-agement Executive (November 2001), p. 125.
90. S. S. Masterson, and M. S. Taylor, “Total Quality Managementand Performance Appraisal: An Integrative Perspective,” Journalof Quality Management, Vol. 1, No. 1 (1996), pp. 67–89.
91. R. J. Vokurka, R. R. Lummus, and D. Krumwiede, “ImprovingManufacturing Flexibility: The Enduring Value of JIT and TQM,”SAM Advanced Management Journal (Winter 2007), pp. 14–21.
92. T. Y. Choi and O. C. Behling, “Top Managers and TQM Suc-cess: One More Look After All These Years,” Academy of Man-agement Executive (February 1997), pp. 37–47.
93. R. J. Schonberger, “Total Quality Management Cuts a BroadSwath—Through Manufacturing and Beyond,” OrganizationalDynamics (Spring 1992), pp. 16–28.
94. T. C. Powell, “Total Quality Management as Competitive Ad-vantage: A Review and Empirical Study,” Strategic Manage-ment Journal (January 1995), pp. 15–37.
95. G. Hofstede, “Culture’s Recent Consequences: Using Dimen-sional Scores in Theory and Research,” International Journal ofCross Cultural Management, Vol. 1, No. 1 (2001), pp. 11–17;G. Hofstede, Cultures and Organizations: Software of the Mind(London: McGraw-Hill, 1991); G. Hofstede and M. H. Bond,“The Confucius Connection: From Cultural Roots to EconomicGrowth,” Organizational Dynamics (Spring 1988), pp. 5–21;R. Hodgetts, “A Conversation with Geert Hofstede,”Organizational Dynamics (Spring 1993), pp. 53–61.
96. M. Javidan and R. J. House, “Cultural Acumen for the GlobalManager: Lessons from Project GLOBE,” Organizational Dy-namics, Vol. 29, No. 4 (2001), pp. 289–305; R. J. House, P. J.Hanges, M. Javidan, P. W. Dorfman, and V. Gupta, eds.,
Culture, Leadership and Organizations: The GLOBE Study of62 Societies (Thousand Oaks, CA: Sage, 2004).
97. M. Javidan and R. J. House, “Cultural Acumen for the GlobalManager: Lessons from Project GLOBE,” Organizational Dy-namics, Vol. 29, No. 4 (2001), p. 303.
98. See G. Hofstede and M. H. Bond, “The Confucius Connection,From Cultural Roots to Economic Growth,” OrganizationalDynamics, (Spring 1988), pp. 12–13.
99. H. K. Steensma, L. Marino, K. M. Weaver, and P. H. Dickson,“The Influence of National Culture on the Formation of Tech-nology Alliances by Entrepreneurial Firms,” Academy of Man-agement Journal (October 2000), pp. 951–973.
100. T. T. Herbert, “Multinational Strategic Planning: MatchingCentral Expectations to Local Realities,” Long Range Planning(February 1999), pp. 81–87.
101. M. A. Geletkancz, “The Salience of ‘Culture’s Consequences’:The Effects of Cultural Values on Top Executive Commitmentto the Status Quo,” Strategic Management Journal (September1997), pp. 615–634.
102. G. Hofstede and M. H. Bond, “The Confucius Connection,From Cultural Roots to Economic Growth,” OrganizationalDynamics, (Spring 1988), p. 20.
103. B. Groysberg, A. Nanda, and N. Nohria, “The Risky Businessof Hiring Stars,” Harvard Business Review (May 2004),pp. 92–100.
104. D. Jones, “Employers Learning That ‘B Players’ Hold theCards,” USA Today (September 9, 2003), pp. 1B–2B.
105. B. Elgin, “Green—Up to a Point,” Business Week (March 3,2008), pp. 25–26.
106. D. Keirsey, Please Understand Me II (Del Mar, CA:Prometheus Nemesis Book Co., 1998).
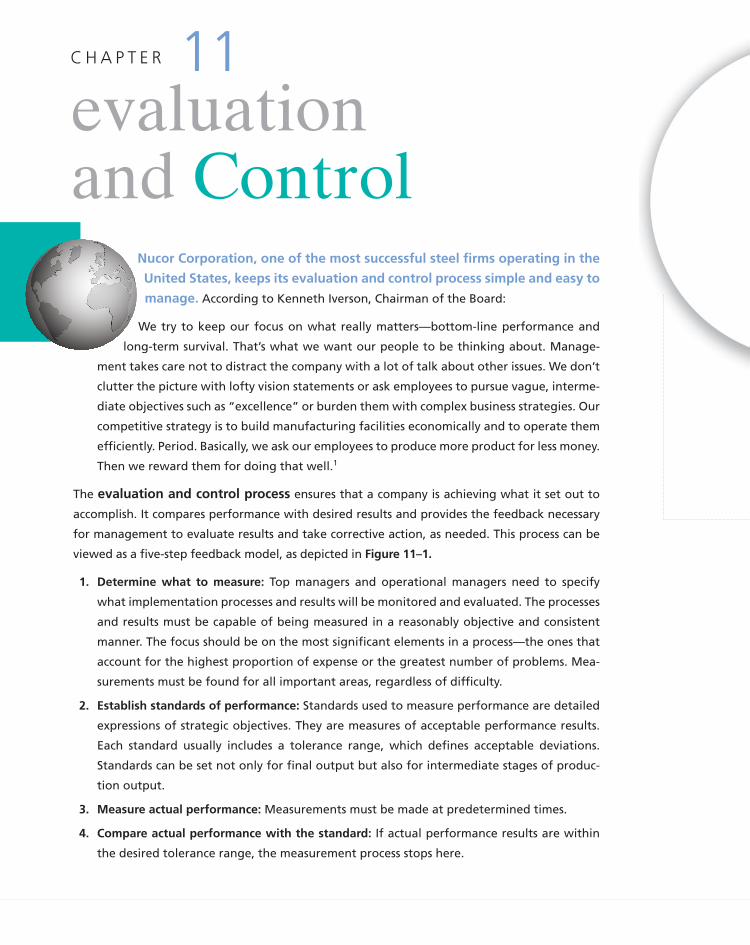
Nucor Corporation, one of the most successful steel firms operating in the
United States, keeps its evaluation and control process simple and easy to
manage. According to Kenneth Iverson, Chairman of the Board:
We try to keep our focus on what really matters—bottom-line performance and
long-term survival. That’s what we want our people to be thinking about. Manage-
ment takes care not to distract the company with a lot of talk about other issues. We don’t
clutter the picture with lofty vision statements or ask employees to pursue vague, interme-
diate objectives such as “excellence” or burden them with complex business strategies. Our
competitive strategy is to build manufacturing facilities economically and to operate them
efficiently. Period. Basically, we ask our employees to produce more product for less money.
Then we reward them for doing that well.1
The evaluation and control process ensures that a company is achieving what it set out to
accomplish. It compares performance with desired results and provides the feedback necessary
for management to evaluate results and take corrective action, as needed. This process can be
viewed as a five-step feedback model, as depicted in Figure 11–1.
1. Determine what to measure: Top managers and operational managers need to specify
what implementation processes and results will be monitored and evaluated. The processes
and results must be capable of being measured in a reasonably objective and consistent
manner. The focus should be on the most significant elements in a process—the ones that
account for the highest proportion of expense or the greatest number of problems. Mea-
surements must be found for all important areas, regardless of difficulty.
2. Establish standards of performance: Standards used to measure performance are detailed
expressions of strategic objectives. They are measures of acceptable performance results.
Each standard usually includes a tolerance range, which defines acceptable deviations.
Standards can be set not only for final output but also for intermediate stages of produc-
tion output.
3. Measure actual performance: Measurements must be made at predetermined times.
4. Compare actual performance with the standard: If actual performance results are within
the desired tolerance range, the measurement process stops here.
evaluationand Control
C H A P T E R 11
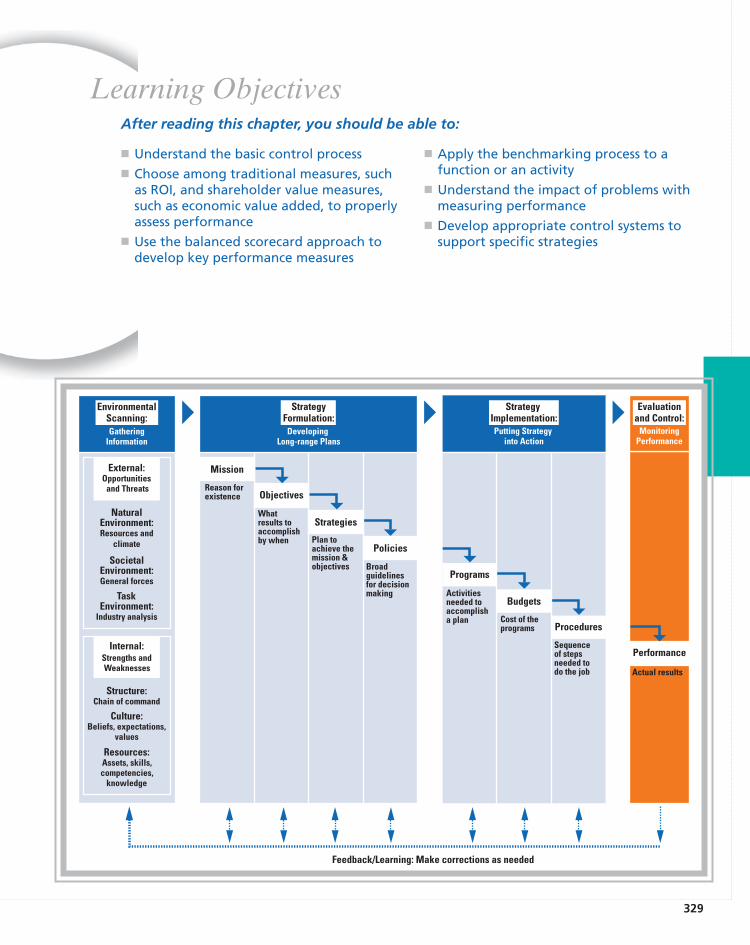
329
� Understand the basic control process� Choose among traditional measures, such
as ROI, and shareholder value measures,such as economic value added, to properlyassess performance
� Use the balanced scorecard approach todevelop key performance measures
� Apply the benchmarking process to afunction or an activity
� Understand the impact of problems withmeasuring performance
� Develop appropriate control systems tosupport specific strategies
Learning Objectives
GatheringInformation
Putting Strategy into Action
MonitoringPerformance
SocietalEnvironment:General forces
NaturalEnvironment:Resources and
climate
TaskEnvironment:
Industry analysis
Internal:Strengths andWeaknesses
Structure:Chain of command
Culture:Beliefs, expectations,
values
Resources:Assets, skills,competencies,
knowledge
Programs
Activitiesneeded to accomplisha plan
Budgets
Cost of theprograms Procedures
Sequenceof stepsneeded to do the job
Performance
Actual results
External:Opportunities
and Threats
DevelopingLong-range Plans
Mission
Reason forexistence Objectives
Whatresults to accomplishby when
Strategies
Plan toachieve themission &objectives
Policies
Broadguidelinesfor decisionmaking
EnvironmentalScanning:
StrategyFormulation:
StrategyImplementation:
Evaluationand Control:
Feedback/Learning: Make corrections as needed
After reading this chapter, you should be able to:
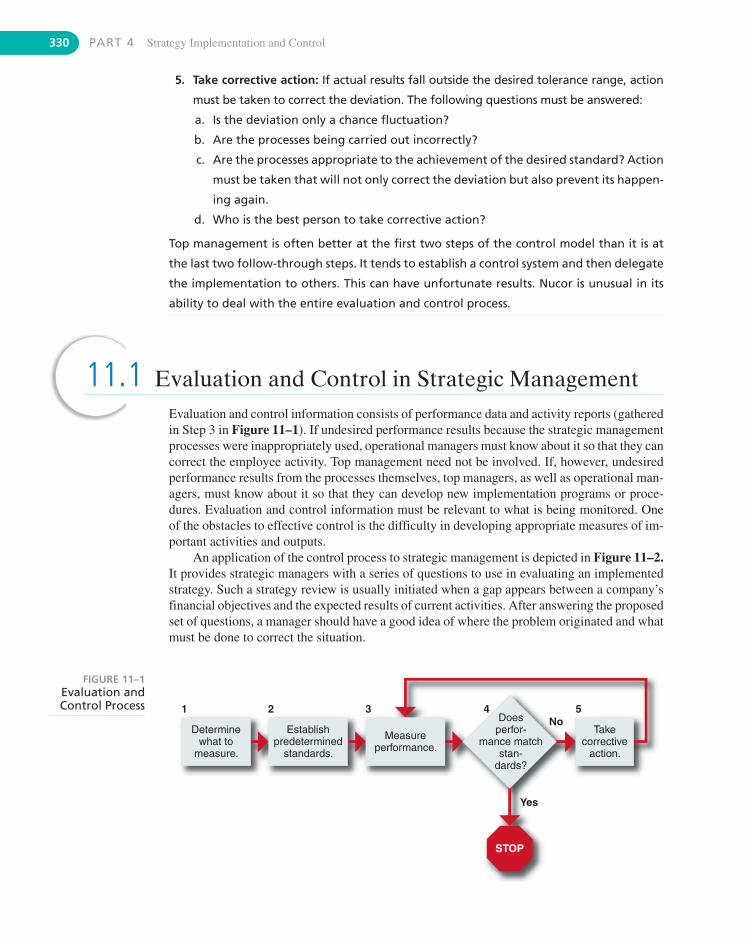
330 PART 4 Strategy Implementation and Control
1
Determinewhat to
measure.
Establishpredetermined
standards.
Measureperformance.
No5432
Yes
STOP
Doesperfor-
mance matchstan-
dards?
Takecorrective
action.
FIGURE 11–1Evaluation andControl Process
5. Take corrective action: If actual results fall outside the desired tolerance range, action
must be taken to correct the deviation. The following questions must be answered:
a. Is the deviation only a chance fluctuation?
b. Are the processes being carried out incorrectly?
c. Are the processes appropriate to the achievement of the desired standard? Action
must be taken that will not only correct the deviation but also prevent its happen-
ing again.
d. Who is the best person to take corrective action?
Top management is often better at the first two steps of the control model than it is at
the last two follow-through steps. It tends to establish a control system and then delegate
the implementation to others. This can have unfortunate results. Nucor is unusual in its
ability to deal with the entire evaluation and control process.
11.1 Evaluation and Control in Strategic ManagementEvaluation and control information consists of performance data and activity reports (gatheredin Step 3 in Figure 11–1). If undesired performance results because the strategic managementprocesses were inappropriately used, operational managers must know about it so that they cancorrect the employee activity. Top management need not be involved. If, however, undesiredperformance results from the processes themselves, top managers, as well as operational man-agers, must know about it so that they can develop new implementation programs or proce-dures. Evaluation and control information must be relevant to what is being monitored. Oneof the obstacles to effective control is the difficulty in developing appropriate measures of im-portant activities and outputs.
An application of the control process to strategic management is depicted in Figure 11–2.It provides strategic managers with a series of questions to use in evaluating an implementedstrategy. Such a strategy review is usually initiated when a gap appears between a company’sfinancial objectives and the expected results of current activities. After answering the proposedset of questions, a manager should have a good idea of where the problem originated and whatmust be done to correct the situation.
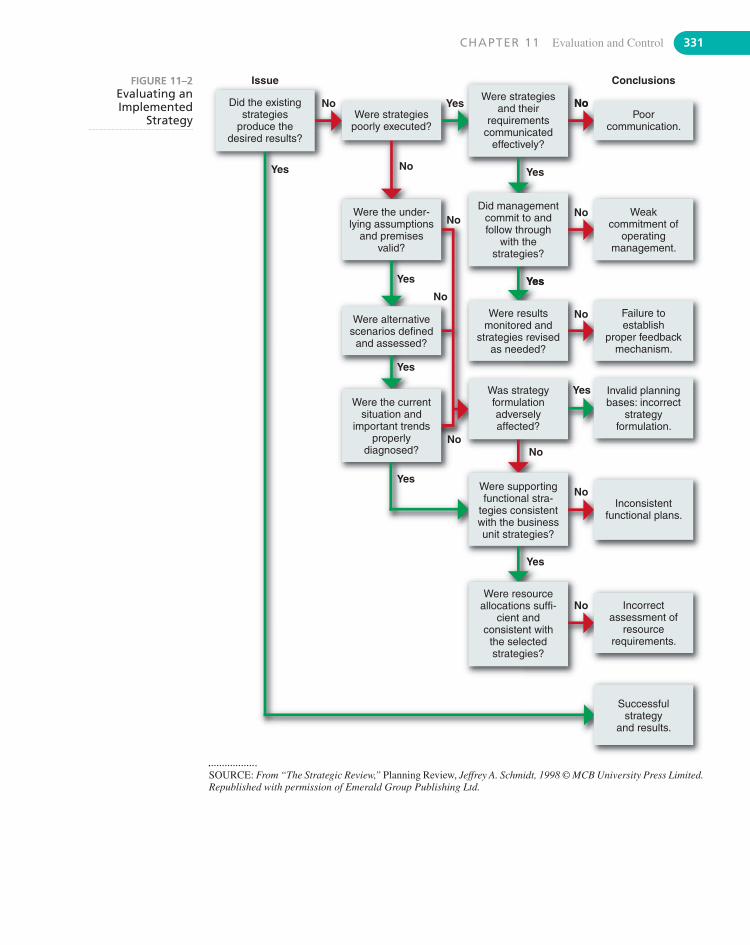
CHAPTER 11 Evaluation and Control 331
Issue
No
No
No
No
No
No
No
No
No
No
NoYes
Yes
YesYesYes
Yes
Yes
Yes
Yes
No
Conclusions
Yes
Did the existingstrategies
produce thedesired results?
Were the under-lying assumptions
and premisesvalid?
Were alternativescenarios defined
and assessed?
Were the currentsituation and
important trendsproperly
diagnosed?
Was strategyformulationadverselyaffected?
Were supportingfunctional stra-
tegies consistentwith the businessunit strategies?
Inconsistentfunctional plans.
Were resourceallocations suffi-
cient andconsistent with
the selectedstrategies?
Incorrectassessment of
resourcerequirements.
Successfulstrategy
and results.
Were resultsmonitored and
strategies revisedas needed?
Did managementcommit to andfollow through
with thestrategies?
Weakcommitment of
operatingmanagement.
Failure toestablish
proper feedbackmechanism.
Invalid planningbases: incorrect
strategyformulation.
Were strategiespoorly executed?
Were strategiesand their
requirementscommunicated
effectively?
Poorcommunication.
FIGURE 11–2Evaluating anImplemented
Strategy
SOURCE: From “The Strategic Review,” Planning Review, Jeffrey A. Schmidt, 1998 © MCB University Press Limited.Republished with permission of Emerald Group Publishing Ltd.
332 PART 4 Strategy Implementation and Control
TYPES OF CONTROLSControls can be established to focus on actual performance results (output), the activities thatgenerate the performance (behavior), or on resources that are used in performance (input).Output controls specify what is to be accomplished by focusing on the end result of the be-haviors through the use of objectives and performance targets or milestones. Behaviorcontrols specify how something is to be done through policies, rules, standard operating
11.2 Measuring PerformancePerformance is the end result of activity. Select measures to assess performance based on theorganizational unit to be appraised and the objectives to be achieved. The objectives that wereestablished earlier in the strategy formulation part of the strategic management process (deal-ing with profitability, market share, and cost reduction, among others) should certainly be usedto measure corporate performance once the strategies have been implemented.
APPROPRIATE MEASURESSome measures, such as return on investment (ROI) and earnings per share (EPS), are appro-priate for evaluating a corporation’s or a division’s ability to achieve a profitability objective.This type of measure, however, is inadequate for evaluating additional corporate objectivessuch as social responsibility or employee development. Even though profitability is a corpo-ration’s major objective, ROI and EPS can be computed only after profits are totaled for a pe-riod. It tells what happened after the fact—not what is happening or what will happen. A firm,therefore, needs to develop measures that predict likely profitability. These are referred to assteering controls because they measure variables that influence future profitability. Every in-dustry has its own set of key metrics which tend to predict profits. Airlines, for example,closely monitor cost per passenger mile. In the 1990s, Southwest’s cost per passenger mile was6.43¢, the lowest in the industry, contrasted with American’s 12.95¢, the highest in the indus-try.2 Its low costs gave Southwest a significant competitive advantage.
An example of a steering control used by retail stores is the inventory turnover ratio, inwhich a retailer’s cost of goods sold is divided by the average value of its inventories. Thismeasure shows how hard an investment in inventory is working; the higher the ratio, the bet-ter. Not only does quicker moving inventory tie up less cash in inventories, it also reduces therisk that the goods will grow obsolete before they’re sold—a crucial measure for computersand other technology items. For example, Office Depot increased its inventory turnover ratiofrom 6.9 in one year to 7.5 the next year, leading to improved annual profits.3
Another steering control is customer satisfaction. Research reveals that companies thatscore high on the American Customer Satisfaction Index (ACSI), a measure developed by theUniversity of Michigan’s National Research Center, have higher stock returns and better cashflows than do those companies that score low on the ACSI. A change in a firm’s customer sat-isfaction typically works its way through a firm’s value chain and is eventually reflected inquarterly profits.4 Other approaches to measuring customer satisfaction include Oracle’s useof the ratio of quarterly sales divided by customer service requests and the total number ofhours that technicians spend on the phone solving customer problems. To help executives keeptrack of important steering controls, Netsuite developed dashboard software that displays crit-ical information in easy-to-read computer graphics assembled from data pulled from other cor-porate software programs.5
CHAPTER 11 Evaluation and Control 333
procedures, and orders from a superior. Input controls emphasize resources, such as knowl-edge, skills, abilities, values, and motives of employees.6
Output, behavior, and input controls are not interchangeable. Output controls (such assales quotas, specific cost-reduction or profit objectives, and surveys of customer satisfac-tion) are most appropriate when specific output measures have been agreed on but thecause–effect connection between activities and results is not clear. Behavior controls (such asfollowing company procedures, making sales calls to potential customers, and getting to workon time) are most appropriate when performance results are hard to measure, but thecause–effect connection between activities and results is clear. Input controls (such as num-ber of years of education and experience) are most appropriate when output is difficult tomeasure and there is no clear cause–effect relationship between behavior and performance(such as in college teaching). Corporations following the strategy of conglomerate diversifi-cation tend to emphasize output controls with their divisions and subsidiaries (presumably be-cause they are managed independently of each other), whereas, corporations followingconcentric diversification use all three types of controls (presumably because synergy is de-sired).7 Even if all three types of control are used, one or two of them may be emphasizedmore than another depending on the circumstances. For example, Muralidharan and Hamiltonpropose that as a multinational corporation moves through its stages of development, its em-phasis on control should shift from being primarily output at first, to behavioral, and finallyto input control.8
Examples of increasingly popular behavior controls are the ISO 9000 and 14000 Stan-dards Series on quality and environmental assurance, developed by the International StandardsAssociation of Geneva, Switzerland. Using the ISO 9000 Standards Series (composed of fivesections from 9000 to 9004) is a way of objectively documenting a company’s high level ofquality operations. Using the ISO 14000 Standards Series is a way to document the com-pany’s impact on the environment. A company wanting ISO 9000 certification would docu-ment its process for product introductions, among other things. ISO 9001 would require thisfirm to separately document design input, design process, design output, and design verification—a large amount of work. ISO 14001 would specify how companies should establish, maintainand continually improve an environmental management system. Although the average totalcost for a company to be ISO 9000 certified is close to $250,000, the annual savings are around$175,000 per company.9 Overall, ISO 14001-related savings are about equal to the costs,reports Tim Delawder, Vice President of SWD, Inc., a metal finishing company in Addison,Illinois.10
Many corporations view ISO 9000 certification as assurance that a supplier sells qualityproducts. Firms such as DuPont, Hewlett-Packard, and 3M have facilities registered to ISOstandards. Companies in more than 60 countries, including Canada, Mexico, Japan, the UnitedStates (including the entire U.S. auto industry), and the European Union, require ISO 9000 cer-tification of their suppliers.11 The same is happening for ISO 14000. Both Ford and GeneralMotors require their suppliers to follow ISO 14001. In a survey of manufacturing executives,51% of the executives found that ISO 9000 certification increased their international compet-itiveness. Other executives noted that it signaled their commitment to quality and gave thema strategic advantage over noncertified competitors.12
Since its ISO 14000 certification, SWD Inc. has become a showplace for environmentalawareness. According to SWD’s Delawder, ISO 14000 certification improves environmentalawareness among employees, reduces risks of violating regulations, and improves the firm’simage among customers and the local community.13
Another example of a behavior control is a company’s monitoring of employee phonecalls and PCs to ensure that employees are behaving according to company guidelines. In astudy by the American Management Association, nearly 75% of U.S. companies actively mon-itored their workers’ communications and on-the-job activities. Around 54% tracked individual
334 PART 4 Strategy Implementation and Control
employees’ Internet connections and 38% admitted storing and reviewing their employees’e-mail. About 45% of the companies surveyed had disciplined workers (16% had fired them).For example, Xerox fired 40 employees for visiting pornographic Web sites.14
ACTIVITY-BASED COSTINGActivity-based costing (ABC) is a recently developed accounting method for allocating indi-rect and fixed costs to individual products or product lines based on the value-added activitiesgoing into that product.15 This accounting method is thus very useful in doing a value-chainanalysis of a firm’s activities for making outsourcing decisions. Traditional cost accounting,in contrast, focuses on valuing a company’s inventory for financial reporting purposes. To ob-tain a unit’s cost, cost accountants typically add direct labor to the cost of materials. Then theycompute overhead from rent to R&D expenses, based on the number of direct labor hours ittakes to make a product. To obtain unit cost, they divide the total by the number of items madeduring the period under consideration.
Traditional cost accounting is useful when direct labor accounts for most of total costs anda company produces just a few products requiring the same processes. This may have been trueof companies during the early part of the twentieth century, but it is no longer relevant today,when overhead may account for as much as 70% of manufacturing costs. According to BobVan Der Linde, CEO of a contract manufacturing services firm in San Diego, California:“Overhead is 80% to 90% in our industry, so allocation errors lead to pricing errors, whichcould easily bankrupt the company.”16 The appropriate allocation of indirect costs and over-head has thus become crucial for decision making. The traditional volume-based cost-drivensystem systematically understates the cost per unit of products with low sales volumes andproducts with a high degree of complexity. Similarly, it overstates the cost per unit of productswith high sales volumes and a low degree of complexity.17 When Chrysler used ABC, it dis-covered that the true cost of some of the parts used in making cars was 30 times what the com-pany had previously estimated.18
ABC accounting allows accountants to charge costs more accurately than the traditionalmethod because it allocates overhead far more precisely. For example, imagine a productionline in a pen factory where black pens are made in high volume and blue pens in low volume.Assume that it takes eight hours to retool (reprogram the machinery) to shift production fromone kind of pen to the other. The total costs include supplies (the same for both pens), the di-rect labor of the line workers, and factory overhead. In this instance, a very significant part ofthe overhead cost is the cost of reprogramming the machinery to switch from one pen to an-other. If the company produces 10 times as many black pens as blue pens, 10 times the cost ofthe reprogramming expenses will be allocated to the black pens as to the blue pens under tra-ditional cost accounting methods. This approach underestimates, however, the true cost ofmaking the blue pens.
ABC accounting, in contrast, first breaks down pen manufacturing into its activities. It isthen very easy to see that it is the activity of changing pens that triggers the cost of retooling.The ABC accountant calculates an average cost of setting up the machinery and charges itagainst each batch of pens that requires retooling, regardless of the size of the run. Thus a prod-uct carries only those costs for the overhead it actually consumes. Management is now able todiscover that its blue pens cost almost twice as much as do the black pens. Unless the com-pany is able to charge a higher price for its blue pens, it cannot make a profit on these pens.Unless there is a strategic reason why it must offer blue pens (such as a key customer who musthave a small number of blue pens with every large order of black pens or a marketing trendaway from black to blue pens), the company will earn significantly greater profits if it com-pletely stops making blue pens.19
CHAPTER 11 Evaluation and Control 335
ENTERPRISE RISK MANAGEMENTEnterprise Risk Management (ERM) is a corporatewide, integrated process for managingthe uncertainties that could negatively or positively influence the achievement of the corpora-tion’s objectives. In the past, managing risk was done in a fragmented manner within func-tions or business units. Individuals would manage process risk, safety risk, and insurance,financial, and other assorted risks. As a result of this fragmented approach, companies wouldtake huge risks in some areas of the business while over-managing substantially smaller risksin other areas. ERM is being adopted because of the increasing amount of environmental un-certainty that can affect an entire corporation. As a result, the position Chief Risk Officer isone of the fastest growing executive positions in U.S. corporations.20 Microsoft uses scenarioanalysis to identify key business risks. According to Microsoft’s treasurer, Brent Callinicos,“The scenarios are really what we’re trying to protect against.”21 The scenarios were the pos-sibility of an earthquake in the Seattle region and a major downturn in the stock market.
The process of rating risks involves three steps:
1. Identify the risks using scenario analysis or brainstorming or by performing risk self-assessments.
2. Rank the risks, using some scale of impact and likelihood.
3. Measure the risks, using some agreed-upon standard.
Some companies are using value at risk, or VAR (effect of unlikely events in normal mar-kets), and stress testing (effect of plausible events in abnormal markets) methodologies tomeasure the potential impact of the financial risks they face. DuPont uses earnings at risk(EAR) measuring tools to measure the effect of risk on reported earnings. It can then managerisk to a specified earnings level based on the company’s “risk appetite.” With this integratedview, DuPont can view how risks affect the likelihood of achieving certain earnings targets.22
Research has shown that companies with integrative risk management capabilities achieve su-perior economic performance.23
PRIMARY MEASURES OF CORPORATE PERFORMANCEThe days when simple financial measures such as ROI or EPS were used alone to assess over-all corporate performance are coming to an end. Analysts now recommend a broad range ofmethods to evaluate the success or failure of a strategy. Some of these methods are stakeholdermeasures, shareholder value, and the balanced scorecard approach. Even though each of thesemethods has supporters as well as detractors, the current trend is clearly toward more compli-cated financial measures and an increasing use of non-financial measures of corporate perfor-mance. For example, research indicates that companies pursuing strategies founded oninnovation and new product development now tend to favor non-financial over financialmeasures.24
Traditional Financial MeasuresThe most commonly used measure of corporate performance (in terms of profits) is ReturnOn Investment (ROI). It is simply the result of dividing net income before taxes by the totalamount invested in the company (typically measured by total assets). Although using ROI hasseveral advantages, it also has several distinct limitations. (See Table 11–1.) Although ROIgives the impression of objectivity and precision, it can be easily manipulated.
Earnings Per Share (EPS), which involves dividing net earnings by the amount of com-mon stock, also has several deficiencies as an evaluation of past and future performance. First,because alternative accounting principles are available, EPS can have several different but
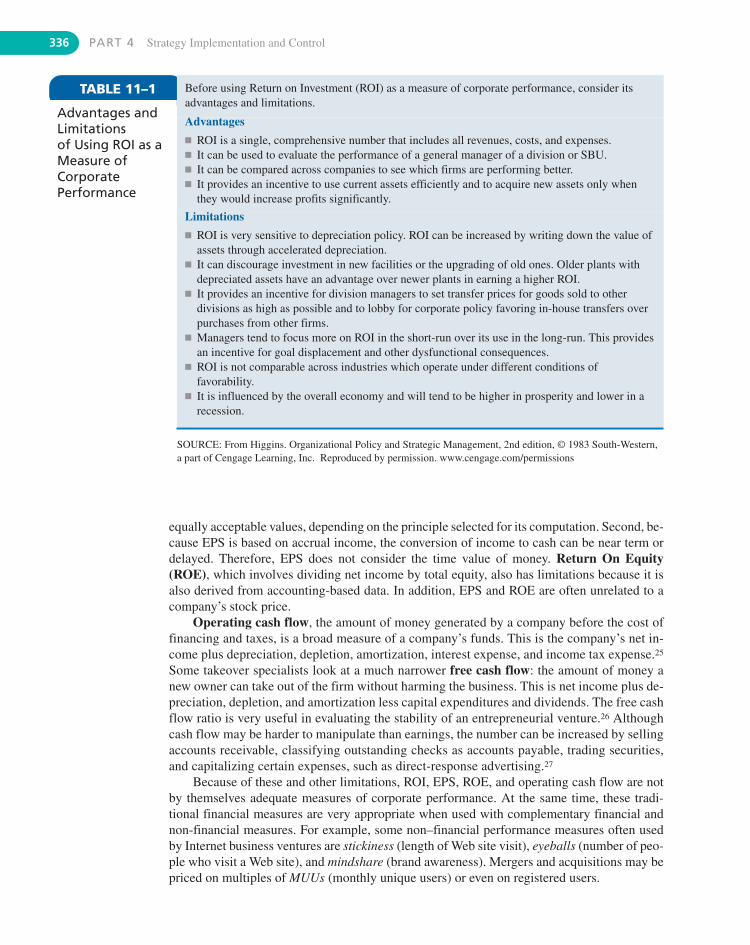
336 PART 4 Strategy Implementation and Control
TABLE 11–1 Before using Return on Investment (ROI) as a measure of corporate performance, consider itsadvantages and limitations.
Advantages� ROI is a single, comprehensive number that includes all revenues, costs, and expenses.� It can be used to evaluate the performance of a general manager of a division or SBU.� It can be compared across companies to see which firms are performing better.� It provides an incentive to use current assets efficiently and to acquire new assets only when
they would increase profits significantly.
Limitations� ROI is very sensitive to depreciation policy. ROI can be increased by writing down the value of
assets through accelerated depreciation.� It can discourage investment in new facilities or the upgrading of old ones. Older plants with
depreciated assets have an advantage over newer plants in earning a higher ROI.� It provides an incentive for division managers to set transfer prices for goods sold to other
divisions as high as possible and to lobby for corporate policy favoring in-house transfers overpurchases from other firms.
� Managers tend to focus more on ROI in the short-run over its use in the long-run. This providesan incentive for goal displacement and other dysfunctional consequences.
� ROI is not comparable across industries which operate under different conditions offavorability.
� It is influenced by the overall economy and will tend to be higher in prosperity and lower in arecession.
SOURCE: From Higgins. Organizational Policy and Strategic Management, 2nd edition, © 1983 South-Western,a part of Cengage Learning, Inc. Reproduced by permission. www.cengage.com/permissions
equally acceptable values, depending on the principle selected for its computation. Second, be-cause EPS is based on accrual income, the conversion of income to cash can be near term ordelayed. Therefore, EPS does not consider the time value of money. Return On Equity(ROE), which involves dividing net income by total equity, also has limitations because it isalso derived from accounting-based data. In addition, EPS and ROE are often unrelated to acompany’s stock price.
Operating cash flow, the amount of money generated by a company before the cost offinancing and taxes, is a broad measure of a company’s funds. This is the company’s net in-come plus depreciation, depletion, amortization, interest expense, and income tax expense.25
Some takeover specialists look at a much narrower free cash flow: the amount of money anew owner can take out of the firm without harming the business. This is net income plus de-preciation, depletion, and amortization less capital expenditures and dividends. The free cashflow ratio is very useful in evaluating the stability of an entrepreneurial venture.26 Althoughcash flow may be harder to manipulate than earnings, the number can be increased by sellingaccounts receivable, classifying outstanding checks as accounts payable, trading securities,and capitalizing certain expenses, such as direct-response advertising.27
Because of these and other limitations, ROI, EPS, ROE, and operating cash flow are notby themselves adequate measures of corporate performance. At the same time, these tradi-tional financial measures are very appropriate when used with complementary financial andnon-financial measures. For example, some non–financial performance measures often usedby Internet business ventures are stickiness (length of Web site visit), eyeballs (number of peo-ple who visit a Web site), and mindshare (brand awareness). Mergers and acquisitions may bepriced on multiples of MUUs (monthly unique users) or even on registered users.
Advantages andLimitationsof Using ROI as aMeasure ofCorporatePerformance
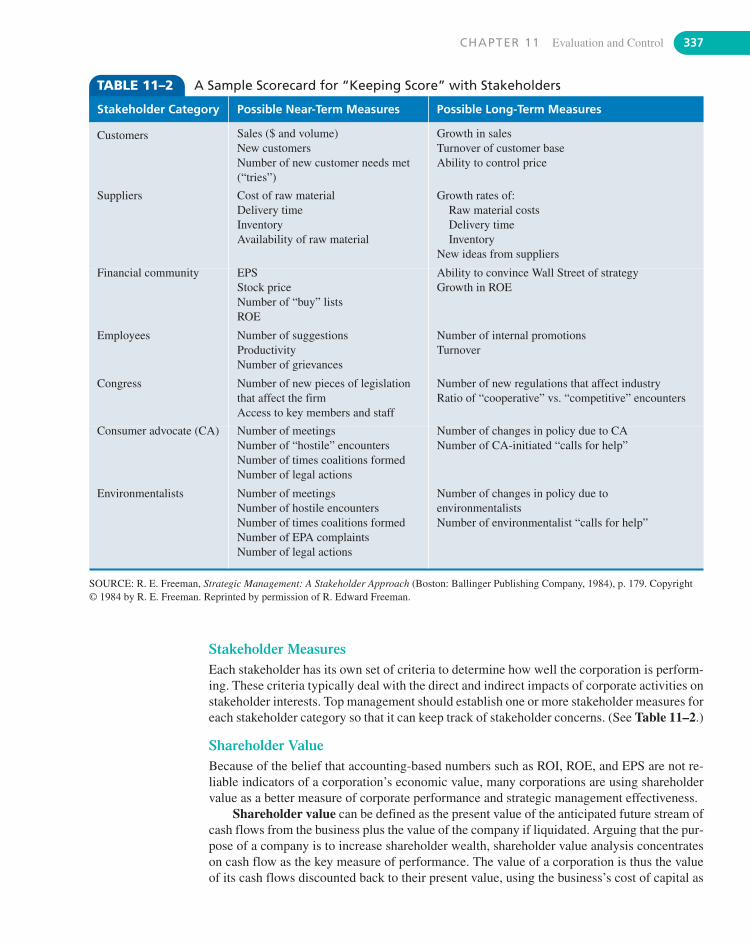
CHAPTER 11 Evaluation and Control 337
TABLE 11–2 A Sample Scorecard for “Keeping Score” with Stakeholders
Stakeholder Category Possible Near-Term Measures Possible Long-Term Measures
Customers Sales ($ and volume)New customersNumber of new customer needs met(“tries”)
Growth in salesTurnover of customer baseAbility to control price
Suppliers Cost of raw materialDelivery timeInventoryAvailability of raw material
Growth rates of:Raw material costsDelivery timeInventory
New ideas from suppliers
Financial community EPSStock priceNumber of “buy” listsROE
Ability to convince Wall Street of strategyGrowth in ROE
Employees Number of suggestionsProductivityNumber of grievances
Number of internal promotionsTurnover
Congress Number of new pieces of legislationthat affect the firmAccess to key members and staff
Number of new regulations that affect industryRatio of “cooperative” vs. “competitive” encounters
Consumer advocate (CA) Number of meetingsNumber of “hostile” encountersNumber of times coalitions formedNumber of legal actions
Number of changes in policy due to CANumber of CA-initiated “calls for help”
Environmentalists Number of meetingsNumber of hostile encountersNumber of times coalitions formedNumber of EPA complaintsNumber of legal actions
Number of changes in policy due toenvironmentalistsNumber of environmentalist “calls for help”
SOURCE: R. E. Freeman, Strategic Management: A Stakeholder Approach (Boston: Ballinger Publishing Company, 1984), p. 179. Copyright © 1984 by R. E. Freeman. Reprinted by permission of R. Edward Freeman.
Stakeholder MeasuresEach stakeholder has its own set of criteria to determine how well the corporation is perform-ing. These criteria typically deal with the direct and indirect impacts of corporate activities onstakeholder interests. Top management should establish one or more stakeholder measures foreach stakeholder category so that it can keep track of stakeholder concerns. (See Table 11–2.)
Shareholder ValueBecause of the belief that accounting-based numbers such as ROI, ROE, and EPS are not re-liable indicators of a corporation’s economic value, many corporations are using shareholdervalue as a better measure of corporate performance and strategic management effectiveness.
Shareholder value can be defined as the present value of the anticipated future stream ofcash flows from the business plus the value of the company if liquidated. Arguing that the pur-pose of a company is to increase shareholder wealth, shareholder value analysis concentrateson cash flow as the key measure of performance. The value of a corporation is thus the valueof its cash flows discounted back to their present value, using the business’s cost of capital as
338 PART 4 Strategy Implementation and Control
the discount rate. As long as the returns from a business exceed its cost of capital, the businesswill create value and be worth more than the capital invested in it. For example, Deere andCompany charges each business unit a cost of capital of 1% of assets a month. Each businessunit is required to earn a shareholder value-added profit margin of 20% on average over thebusiness cycle. Financial rewards are linked to this measure.28
The New York consulting firm Stern Stewart & Company devised and popularized twoshareholder value measures: economic value added (EVA) and market value added (MVA). Abasic tenet of EVA and MVA is that businesses should not invest in projects unless they cangenerate a profit above the cost of capital. Stern Stewart argues that a deficiency of traditionalaccounting-based measures is that they assume the cost of capital to be zero.29 Well-knowncompanies, such as Coca-Cola, General Electric, AT&T, Whirlpool, Quaker Oats, Eli Lilly,Georgia-Pacific, Polaroid, Sprint, Teledyne, and Tenneco have adopted MVA and/or EVA asthe best yardstick for corporate performance.
Economic Value Added (EVA) has become an extremely popular shareholder valuemethod of measuring corporate and divisional performance and may be on its way to replac-ing ROI as the standard performance measure. EVA measures the difference between the pre-strategy and post-strategy values for the business. Simply put, EVA is after-tax operatingincome minus the total annual cost of capital. The formula to measure EVA is:
EVA � after tax operating income � (investment in assets �weighted average cost of capital)30
The cost of capital combines the cost of debt and equity. The annual cost of borrowed capitalis the interest charged by the firm’s banks and bondholders. To calculate the cost of equity, as-sume that shareholders generally earn about 6% more on stocks than on government bonds. Iflong-term treasury bills are selling at 7.5%, the firm’s cost of equity should be 13.5%—moreif the firm is in a risky industry. A corporation’s overall cost of capital is the weighted-averagecost of the firm’s debt and equity capital. The investment in assets is the total amount of cap-ital invested in the business, including buildings, machines, computers, and investments inR&D and training (allocating costs annually over their useful life). Because the typical bal-ance sheet understates the investment made in a company, Stern Stewart has identified 150possible adjustments, before EVA is calculated.31 Multiply the firm’s total investment in assetsby the weighted-average cost of capital. Subtract that figure from after-tax operating income.If the difference is positive, the strategy (and the management employing it) is generatingvalue for the shareholders. If it is negative, the strategy is destroying shareholder value.32
Roberto Goizueta, past-CEO of Coca-Cola, explained, “We raise capital to make concentrate,and sell it at an operating profit. Then we pay the cost of that capital. Shareholders pocket the dif-ference.”33 Managers can improve their company’s or business unit’s EVA by: (1) earning moreprofit without using more capital, (2) using less capital, and (3) investing capital in high-return proj-ects. Studies have found that companies using EVA outperform their median competitor by an av-erage of 8.43% of total return annually.34 EVA does, however, have some limitations. For one thing,it does not control for size differences across plants or divisions. As with ROI, managers can ma-nipulate the numbers. As with ROI, EVA is an after-the-fact measure and cannot be used like a steer-ing control.35 Although proponents of EVA argue that EVA (unlike Return on Investment, Equity,or Sales) has a strong relationship to stock price, other studies do not support this contention.36
Market Value Added (MVA) is the difference between the market value of a corporationand the capital contributed by shareholders and lenders. Like net present value, it measures thestock market’s estimate of the net present value of a firm’s past and expected capital invest-ment projects. As such, MVA is the present value of future EVA.37 To calculate MVA,
1. Add all the capital that has been put into a company—from shareholders, bondholders,and retained earnings.
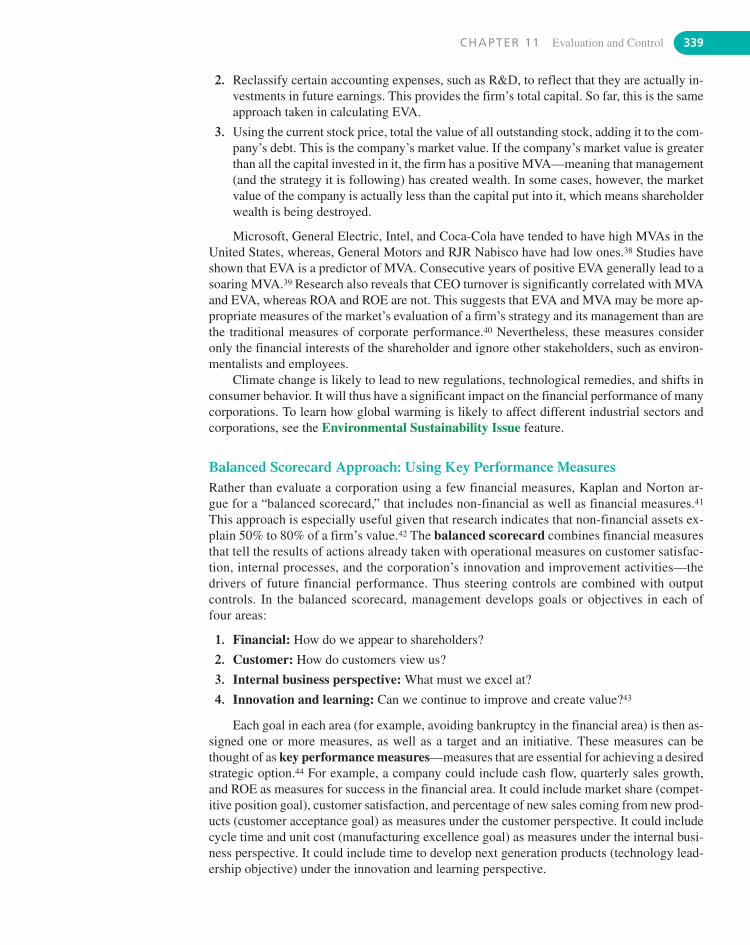
CHAPTER 11 Evaluation and Control 339
2. Reclassify certain accounting expenses, such as R&D, to reflect that they are actually in-vestments in future earnings. This provides the firm’s total capital. So far, this is the sameapproach taken in calculating EVA.
3. Using the current stock price, total the value of all outstanding stock, adding it to the com-pany’s debt. This is the company’s market value. If the company’s market value is greaterthan all the capital invested in it, the firm has a positive MVA—meaning that management(and the strategy it is following) has created wealth. In some cases, however, the marketvalue of the company is actually less than the capital put into it, which means shareholderwealth is being destroyed.
Microsoft, General Electric, Intel, and Coca-Cola have tended to have high MVAs in theUnited States, whereas, General Motors and RJR Nabisco have had low ones.38 Studies haveshown that EVA is a predictor of MVA. Consecutive years of positive EVA generally lead to asoaring MVA.39 Research also reveals that CEO turnover is significantly correlated with MVAand EVA, whereas ROA and ROE are not. This suggests that EVA and MVA may be more ap-propriate measures of the market’s evaluation of a firm’s strategy and its management than arethe traditional measures of corporate performance.40 Nevertheless, these measures consideronly the financial interests of the shareholder and ignore other stakeholders, such as environ-mentalists and employees.
Climate change is likely to lead to new regulations, technological remedies, and shifts inconsumer behavior. It will thus have a significant impact on the financial performance of manycorporations. To learn how global warming is likely to affect different industrial sectors andcorporations, see the Environmental Sustainability Issue feature.
Balanced Scorecard Approach: Using Key Performance MeasuresRather than evaluate a corporation using a few financial measures, Kaplan and Norton ar-gue for a “balanced scorecard,” that includes non-financial as well as financial measures.41
This approach is especially useful given that research indicates that non-financial assets ex-plain 50% to 80% of a firm’s value.42 The balanced scorecard combines financial measuresthat tell the results of actions already taken with operational measures on customer satisfac-tion, internal processes, and the corporation’s innovation and improvement activities—thedrivers of future financial performance. Thus steering controls are combined with outputcontrols. In the balanced scorecard, management develops goals or objectives in each offour areas:
1. Financial: How do we appear to shareholders?
2. Customer: How do customers view us?
3. Internal business perspective: What must we excel at?
4. Innovation and learning: Can we continue to improve and create value?43
Each goal in each area (for example, avoiding bankruptcy in the financial area) is then as-signed one or more measures, as well as a target and an initiative. These measures can bethought of as key performance measures—measures that are essential for achieving a desiredstrategic option.44 For example, a company could include cash flow, quarterly sales growth,and ROE as measures for success in the financial area. It could include market share (compet-itive position goal), customer satisfaction, and percentage of new sales coming from new prod-ucts (customer acceptance goal) as measures under the customer perspective. It could includecycle time and unit cost (manufacturing excellence goal) as measures under the internal busi-ness perspective. It could include time to develop next generation products (technology lead-ership objective) under the innovation and learning perspective.
How will global warming af-fect the value of a corpora-
tion’s stock? To answer thisquestion, the U.S.-based consulting
firm McKinsey & Company undertook a joint project withthe Carbon Trust, a UK research organization. The result-ing research found that the large reductions in greenhousegas emissions needed to stop climate change will createsignificant opportunities and risks for most companies.Well-positioned, forward-thinking corporations could, forexample, increase company value (stock price � number ofshares outstanding) by up to 80%. The research found thatas much as 65% of company value was at risk in some in-dustrial sectors.
340 PART 4 Strategy Implementation and Control
HOW GLOBAL WARMING COULD AFFECT CORPORATE VALUATION
ENVIRONMENTAL sustainability issue
The joint study investigated the industrial sectors of alu-minum, automotive, oil and gas, consumer electronics,building materials, and beer. It quantified the impacts oneach industrial sector and found that the impact of climatechange will vary by sector. The resulting report lists boththe maximum value creation opportunity for a preparedcompany and the maximum company value at risk for acompany that fails to adapt.
Note that the oil and gas sectors will have very few op-portunities (especially in exploration and production), butmany risks. This overall negative impact will mean fallingcash flows and stock prices for the companies in those sec-tors. In contrast, the building materials sector will benefitfrom rising demand for improved energy efficiency and in-sulation products, leading to increasing cash flows andstock prices. The consumer electronics sector is also in agood position. Using current technology, consumer elec-tronics companies can make their products significantlymore energy efficient (by reducing active and standbypower consumption) at low and diminishing costs. Auto-mobile companies, in contrast, face both a high level of op-portunities and threats. The better prepared companiesshould do well, but the laggards will likely face serious cashflow problems and falling stock prices.
Tom Delay, Carbon Trust’s CEO warns: “We have a shortwindow of opportunity to act but at present business andinvestor actions are way out of step with the need to tackleclimate change. They must be urgently re-aligned by devel-oping new business and investment strategies and byworking with governments to develop policy frameworksthat reward early and effective action to rapidly reduce car-bon emissions.”
SOURCES: M. W. Brinkman, N. Hoffman, J. M. Oppenheim, “HowClimate Change Could Affect Corporate Valuations,” McKinseyQuarterly (Autumn 2008), pp. 1–7; “Climate Change: The TrillionDollar Wake-Up Call,” Carbon Trust Web site (September 22,2008), www.carbontrust.com.
IndustrialSector
MaximumCompanyValue CreationOpportunityfor PreparedCompany
MaximumCompanyValue at Riskfor a CompanyFailing toAdapt
Aluminum 30% 65%
Automotive 60% 65%
Oil & Gas(Exploration &Production)
0% 35%
Oil & Gas (Refining) 7% 30%
Consumer Electronics 35% 7%
Building Materials 80% 20%
Beer 0% 15%
A survey by Bain & Company reported that 50% of Fortune 1,000 companies in NorthAmerica and about 40% in Europe use a version of the balanced scorecard.45 Another survey re-ported that the balanced scorecard is used by over half of Fortune’s Global 1000 companies.46
A study of the Fortune 500 firms in the U.S. and the Post 300 firms in Canada revealed the mostpopular non-financial measures to be customer satisfaction, customer service, product quality,market share, productivity, service quality, and core competencies. New product development,corporate culture, and market growth were not far behind.47 DuPont’s Engineering Polymers Di-vision uses the balanced scorecard to align employees, business units, and shared services
CHAPTER 11 Evaluation and Control 341
around a common strategy involving productivity improvements and revenue growth.48 Corpo-rate experience with the balanced scorecard reveals that a firm should tailor the system to suitits situation, not just adopt it as a cookbook approach. When the balanced scorecard comple-ments corporate strategy, it improves performance. Using the method in a mechanistic fashionwithout any link to strategy hinders performance and may even decrease it.49
Evaluating Top Management and the Board of DirectorsThrough its strategy, audit, and compensation committees, a board of directors closely evalu-ates the job performance of the CEO and the top management team. The vast majority ofAmerican (91%), European (75%), and Asian (75%) boards review the CEO’s performanceusing a formalized process.50 Objective evaluations of the CEO by the board are very impor-tant given that CEOs tend to evaluate senior management’s performance significantly morepositively than do other executives.51 The board is concerned primarily with overall corporateprofitability as measured quantitatively by ROI, ROE, EPS, and shareholder value. The ab-sence of short-run profitability certainly contributes to the firing of any CEO. The board, how-ever, is also concerned with other factors.
Members of the compensation committees of today’s boards of directors generally agreethat a CEO’s ability to establish strategic direction, build a management team, and provide lead-ership are more critical in the long run than are a few quantitative measures. The board shouldevaluate top management not only on the typical output-oriented quantitative measures, butalso on behavioral measures—factors relating to its strategic management practices. Accord-ing to a survey by Korn/Ferry International, the criteria used by American boards are financial(81%), ethical behavior (63%), thought leadership (58%), corporate reputation (32%), stockprice performance (22%), and meeting participation (10%).52 The specific items that a boarduses to evaluate its top management should be derived from the objectives that both the boardand top management agreed on earlier. If better relations with the local community and im-proved safety practices in work areas were selected as objectives for the year (or for five years),these items should be included in the evaluation. In addition, other factors that tend to lead toprofitability might be included, such as market share, product quality, or investment intensity.
Performance evaluations of the overall board’s performance are standard practice for 87%of directors in the Americas, 72% in Europe, and 62% in Asia.53 Evaluations of individual di-rectors are less common. According to a PriceWaterhouseCoopers survey of 1,100 directors,77% of the directors agreed that individual directors should be appraised regularly on their per-formance, but only 37% responded that they actually do so.54 Corporations that have success-fully used board performance appraisal systems are Target, Radio Shack, Eastman ChemicalCompany, Bell South, Raytheon, and Gillette.55
Chairman-CEO Feedback Instrument. An increasing number of companies are evaluatingtheir CEO by using a 17-item questionnaire developed by Ram Charan, an authority oncorporate governance. The questionnaire focuses on four key areas: (1) company per-formance, (2) leadership of the organization, (3) team-building and management succession,and (4) leadership of external constituencies.56 After taking an hour to complete thequestionnaire, the board of KeraVision, Inc., used it as a basis for a lengthy discussion withthe CEO, Thomas Loarie. The board criticized Loarie for “not tempering enthusiasm withreality” and urged Loarie to develop a clear management succession plan. The evaluationcaused Loarie to more closely involve the board in setting the company’s primary objectivesand discussing “where we are, where we want to go, and the operating environment.”57
Management Audit. Management audits are very useful to boards of directors in evaluatingmanagement’s handling of various corporate activities. Management audits have beendeveloped to evaluate activities such as corporate social responsibility, functional areas such
342 PART 4 Strategy Implementation and Control
as the marketing department, and divisions such as the international division. These can behelpful if the board has selected particular functional areas or activities for improvement.
Strategic Audit. The strategic audit, presented in the Chapter 1 Appendix 1.A, is a type ofmanagement audit. The strategic audit provides a checklist of questions, by area or issue, thatenables a systematic analysis of various corporate functions and activities to be made. It is atype of management audit and is extremely useful as a diagnostic tool to pinpoint corporate-wide problem areas and to highlight organizational strengths and weaknesses.58 A strategicaudit can help determine why a certain area is creating problems for a corporation and helpgenerate solutions to the problem. As such, it can be very useful in evaluating the performanceof top management.
PRIMARY MEASURES OF DIVISIONAL AND FUNCTIONAL PERFORMANCE
Companies use a variety of techniques to evaluate and control performance in divisions, strate-gic business units (SBUs), and functional areas. If a corporation is composed of SBUs or di-visions, it will use many of the same performance measures (ROI or EVA, for instance) that ituses to assess overall corporate performance. To the extent that it can isolate specific func-tional units such as R&D, the corporation may develop responsibility centers. It will also usetypical functional measures, such as market share and sales per employee (marketing), unitcosts and percentage of defects (operations), percentage of sales from new products and num-ber of patents (R&D), and turnover and job satisfaction (HRM). For example, FedEx uses En-hanced Tracker software with its COSMOS database to track the progress of its 2.5 to 3.5million shipments daily. As a courier is completing her or his day’s activities, the EnhancedTracker asks whether the person’s package count equals the Enhanced Tracker’s count. If thecount is off, the software helps reconcile the differences.59
During strategy formulation and implementation, top management approves a series ofprograms and supporting operating budgets from its business units. During evaluation andcontrol, actual expenses are contrasted with planned expenditures, and the degree of varianceis assessed. This is typically done on a monthly basis. In addition, top management will prob-ably require periodic statistical reports summarizing data on such key factors as the numberof new customer contracts, the volume of received orders, and productivity figures.
Responsibility CentersControl systems can be established to monitor specific functions, projects, or divisions. Bud-gets are one type of control system that is typically used to control the financial indicators ofperformance. Responsibility centers are used to isolate a unit so that it can be evaluated sep-arately from the rest of the corporation. Each responsibility center, therefore, has its ownbudget and is evaluated on its use of budgeted resources. It is headed by the manager respon-sible for the center’s performance. The center uses resources (measured in terms of costs orexpenses) to produce a service or a product (measured in terms of volume or revenues). Thereare five major types of responsibility centers. The type is determined by the way the corpora-tion’s control system measures these resources and services or products.
1. Standard cost centers: Standard cost centers are primarily used in manufacturing fa-cilities. Standard (or expected) costs are computed for each operation on the basis of his-torical data. In evaluating the center’s performance, its total standard costs are multipliedby the units produced. The result is the expected cost of production, which is then com-pared to the actual cost of production.
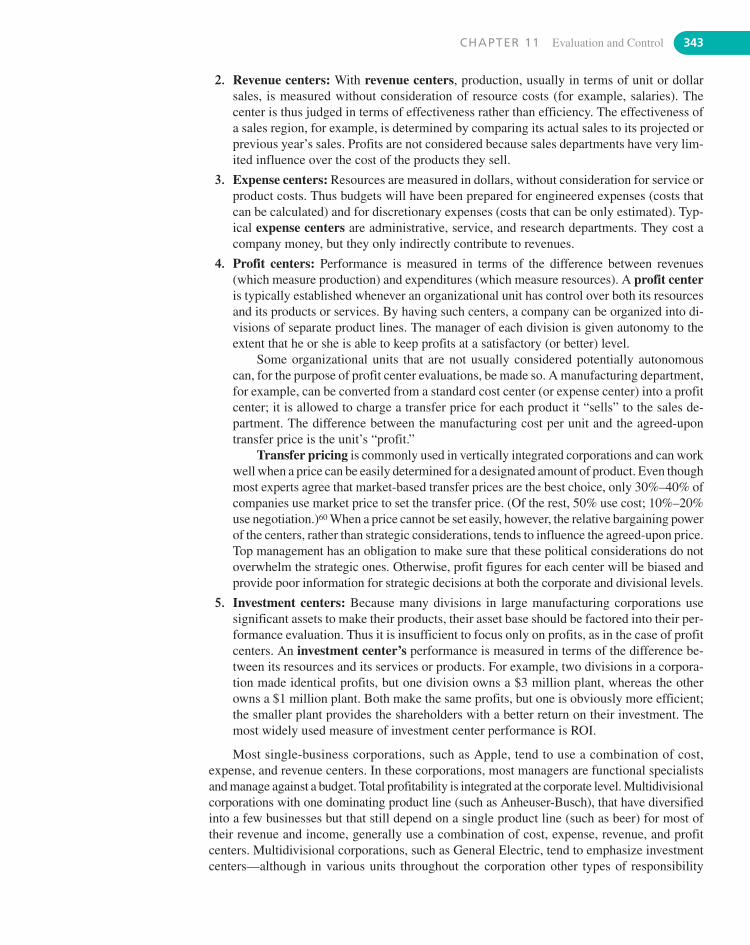
CHAPTER 11 Evaluation and Control 343
2. Revenue centers: With revenue centers, production, usually in terms of unit or dollarsales, is measured without consideration of resource costs (for example, salaries). Thecenter is thus judged in terms of effectiveness rather than efficiency. The effectiveness ofa sales region, for example, is determined by comparing its actual sales to its projected orprevious year’s sales. Profits are not considered because sales departments have very lim-ited influence over the cost of the products they sell.
3. Expense centers: Resources are measured in dollars, without consideration for service orproduct costs. Thus budgets will have been prepared for engineered expenses (costs thatcan be calculated) and for discretionary expenses (costs that can be only estimated). Typ-ical expense centers are administrative, service, and research departments. They cost acompany money, but they only indirectly contribute to revenues.
4. Profit centers: Performance is measured in terms of the difference between revenues(which measure production) and expenditures (which measure resources). A profit centeris typically established whenever an organizational unit has control over both its resourcesand its products or services. By having such centers, a company can be organized into di-visions of separate product lines. The manager of each division is given autonomy to theextent that he or she is able to keep profits at a satisfactory (or better) level.
Some organizational units that are not usually considered potentially autonomouscan, for the purpose of profit center evaluations, be made so. A manufacturing department,for example, can be converted from a standard cost center (or expense center) into a profitcenter; it is allowed to charge a transfer price for each product it “sells” to the sales de-partment. The difference between the manufacturing cost per unit and the agreed-upontransfer price is the unit’s “profit.”
Transfer pricing is commonly used in vertically integrated corporations and can workwell when a price can be easily determined for a designated amount of product. Even thoughmost experts agree that market-based transfer prices are the best choice, only 30%–40% ofcompanies use market price to set the transfer price. (Of the rest, 50% use cost; 10%–20%use negotiation.)60 When a price cannot be set easily, however, the relative bargaining powerof the centers, rather than strategic considerations, tends to influence the agreed-upon price.Top management has an obligation to make sure that these political considerations do notoverwhelm the strategic ones. Otherwise, profit figures for each center will be biased andprovide poor information for strategic decisions at both the corporate and divisional levels.
5. Investment centers: Because many divisions in large manufacturing corporations usesignificant assets to make their products, their asset base should be factored into their per-formance evaluation. Thus it is insufficient to focus only on profits, as in the case of profitcenters. An investment center’s performance is measured in terms of the difference be-tween its resources and its services or products. For example, two divisions in a corpora-tion made identical profits, but one division owns a $3 million plant, whereas the otherowns a $1 million plant. Both make the same profits, but one is obviously more efficient;the smaller plant provides the shareholders with a better return on their investment. Themost widely used measure of investment center performance is ROI.
Most single-business corporations, such as Apple, tend to use a combination of cost,expense, and revenue centers. In these corporations, most managers are functional specialistsand manage against a budget. Total profitability is integrated at the corporate level. Multidivisionalcorporations with one dominating product line (such as Anheuser-Busch), that have diversifiedinto a few businesses but that still depend on a single product line (such as beer) for most oftheir revenue and income, generally use a combination of cost, expense, revenue, and profitcenters. Multidivisional corporations, such as General Electric, tend to emphasize investmentcenters—although in various units throughout the corporation other types of responsibility
344 PART 4 Strategy Implementation and Control
centers are also used. One problem with using responsibility centers, however, is that the sep-aration needed to measure and evaluate a division’s performance can diminish the level of co-operation among divisions that is needed to attain synergy for the corporation as a whole. (Thisproblem is discussed later in this chapter, under “Suboptimization.”)
Using Benchmarking to Evaluate PerformanceAccording to Xerox Corporation, the company that pioneered this concept in the United States,benchmarking is “the continual process of measuring products, services, and practicesagainst the toughest competitors or those companies recognized as industry leaders.”61 Bench-marking, an increasingly popular program, is based on the concept that it makes no sense toreinvent something that someone else is already using. It involves openly learning how othersdo something better than one’s own company so that the company not only can imitate, butperhaps even improve on its techniques. The benchmarking process usually involves the fol-lowing steps:
1. Identify the area or process to be examined. It should be an activity that has the potentialto determine a business unit’s competitive advantage.
2. Find behavioral and output measures of the area or process and obtain measurements.
3. Select an accessible set of competitors and best-in-class companies against which tobenchmark. These may very often be companies that are in completely different indus-tries, but perform similar activities. For example, when Xerox wanted to improve its or-der fulfillment, it went to L. L. Bean, the successful mail order firm, to learn how itachieved excellence in this area.
4. Calculate the differences among the company’s performance measurements and those ofthe best-in-class and determine why the differences exist.
5. Develop tactical programs for closing performance gaps.
6. Implement the programs and then compare the resulting new measurements with those ofthe best-in-class companies.
Benchmarking has been found to produce best results in companies that are already wellmanaged. Apparently poorer performing firms tend to be overwhelmed by the discrepancy be-tween their performance and the benchmark—and tend to view the benchmark as too difficultto reach.62 Nevertheless, a survey by Bain & Company of 460 companies of various sizesacross all U.S. industries indicated that more than 70% were using benchmarking in either amajor or limited manner.63 Cost reductions range from 15% to 45%.64 Benchmarking can alsoincrease sales, improve goal setting, and boost employee motivation.65 The average cost of abenchmarking study is around $100,000 and involves 30 weeks of effort.66 Manco, Inc., asmall Cleveland-area producer of duct tape regularly benchmarks itself against Wal-Mart,Rubbermaid, and Pepsico to enable it to better compete with giant 3M. APQC (American Pro-ductivity & Quality Center), a Houston research group, established the Open Standards Bench-marking Collaborative database, composed of more than 1,200 commonly used measures andindividual benchmarks, to track the performance of core operational functions. Firms can sub-mit their performance data to this online database to learn how they compare to top perform-ers and industry peers (see www.apqc.org).
INTERNATIONAL MEASUREMENT ISSUESThe three most widely used techniques for international performance evaluation are ROI,budget analysis, and historical comparisons. In one study, 95% of the corporate officers inter-viewed stated that they use the same evaluation techniques for foreign and domestic operations.
CHAPTER 11 Evaluation and Control 345
Rate of return was mentioned as the single most important measure.67 However, ROI can causeproblems when it is applied to international operations: Because of foreign currencies, differ-ent accounting systems, different rates of inflation, different tax laws, and the use of transferpricing, both the net income figure and the investment base may be seriously distorted.68 Todeal with different accounting systems throughout the world, the London-based InternationalAccounting Standards Board developed International Financial Reporting Standards (IFRS) toharmonize accounting practices. Over 100 countries have thus far adopted the rules. Foreign-based companies operating in the U.S. have a choice starting 2009 of using IFRS accountingstandards or continuing the costly process translating their accounts using America’s Gener-ally Accepted Accounting Principles (GAAP). Nevertheless, enforcement and cultural inter-pretations of the international rules can still vary by country and may undercut what is hopedto be a uniform accounting system.69
A study of 79 MNCs revealed that international transfer pricing from one country unit toanother is primarily used not to evaluate performance but to minimize taxes.70 Taxes are an im-portant issue for MNCs, given that corporate tax rates vary from 55% in Kuwait, 41% in Japan,40% in the United States, and 34% in Canada and India, to 28% in the UK, South Korea, andMexico, 25% in China, 18% in Singapore, 10% in Albania, and 0% in Bahrain and the CaymanIslands.71 For example, the U.S. Internal Revenue Service contended in the early 1990s thatmany Japanese firms doing business in the United States artificially inflated the value of U.S.deliveries in order to reduce the profits and thus the taxes of their American subsidiaries.72
Parts made in a subsidiary of a Japanese MNC in a low-tax country such as Singapore couldbe shipped to its subsidiary in a high-tax country such as the United States at such a high pricethat the U.S. subsidiary reports very little profit (and thus pays few taxes), while the Singaporesubsidiary reports a very high profit (but also pays few taxes because of the lower tax rate). A Japanese MNC could, therefore, earn more profit worldwide by reporting less profit in high-tax countries and more profit in low-tax countries. Transfer pricing can thus be one way theparent company can reduce taxes and “capture profits” from a subsidiary. Other common waysof transferring profits to the parent company (often referred to as the repatriation of profits)are through dividends, royalties, and management fees.73
Among the most important barriers to international trade are the different standards forproducts and services. There are at least three categories of standards: safety/environmental, en-ergy efficiency, and testing procedures. Existing standards have been drafted by such bodies asthe British Standards Institute (BSI-UK) in the United Kingdom, Japanese Industrial StandardsCommittee (JISC), AFNOR in France, DIN in Germany, CSA in Canada, and American Stan-dards Institute in the United States. These standards traditionally created entry barriers thatserved to fragment various industries, such as major home appliances, by country. The Interna-tional Electrotechnical Commission (IEC) standards were created to harmonize standards in theEuropean Union and eventually to serve as worldwide standards, with some national deviationsto satisfy specific needs. Because the European Union (EU) was the first to harmonize the manydifferent standards of its member countries, the EU is shaping standards for the rest of the world.In addition, the International Organization for Standardization (ISO) is preparing and publish-ing international standards. These standards provide a foundation for regional associations tobuild upon. CANENA, the Council for Harmonization of Electrotechnical Standards of the Na-tions of the Americas, was created in 1992 to further coordinate the harmonization of standardsin North and South America. Efforts are also under way in Asia to harmonize standards.74
An important issue in international trade is counterfeiting/piracy. Firms in developing na-tions around the world make money by making counterfeit/pirated copies of well-knownname-brand products and selling them globally as well as locally. See the Global Issue fea-ture to learn how this is being done.
Authorities in international business recommend that the control and reward systems usedby a global MNC be different from those used by a multidomestic MNC.75 A multidomestic
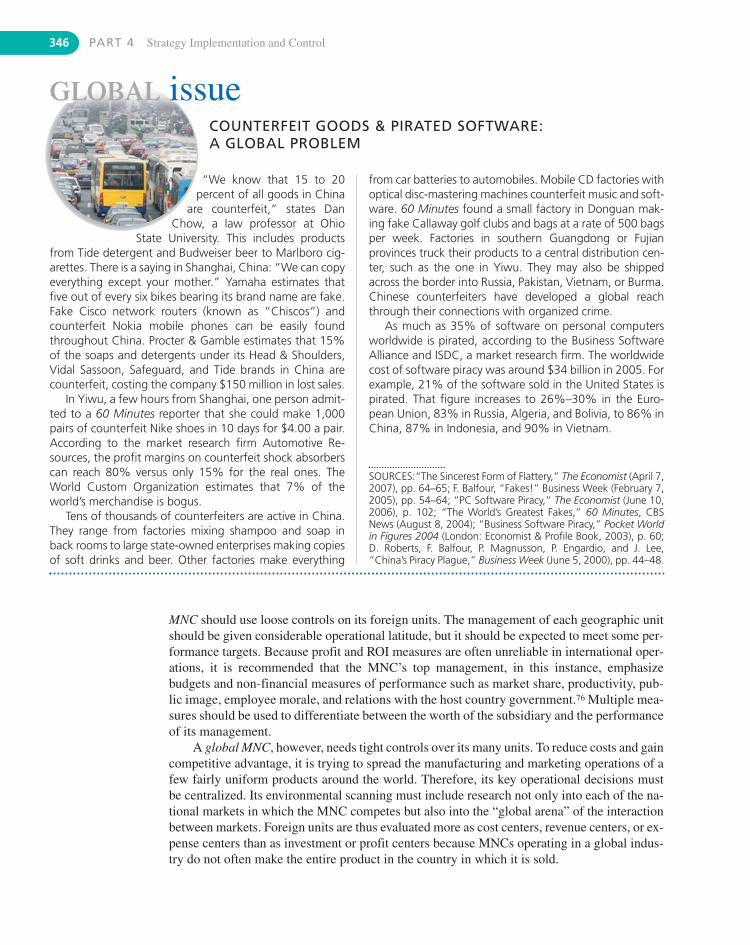
“We know that 15 to 20percent of all goods in China
are counterfeit,” states DanChow, a law professor at Ohio
State University. This includes productsfrom Tide detergent and Budweiser beer to Marlboro cig-arettes. There is a saying in Shanghai, China: “We can copyeverything except your mother.” Yamaha estimates thatfive out of every six bikes bearing its brand name are fake.Fake Cisco network routers (known as “Chiscos”) andcounterfeit Nokia mobile phones can be easily foundthroughout China. Procter & Gamble estimates that 15%of the soaps and detergents under its Head & Shoulders,Vidal Sassoon, Safeguard, and Tide brands in China arecounterfeit, costing the company $150 million in lost sales.
In Yiwu, a few hours from Shanghai, one person admit-ted to a 60 Minutes reporter that she could make 1,000pairs of counterfeit Nike shoes in 10 days for $4.00 a pair.According to the market research firm Automotive Re-sources, the profit margins on counterfeit shock absorberscan reach 80% versus only 15% for the real ones. TheWorld Custom Organization estimates that 7% of theworld’s merchandise is bogus.
Tens of thousands of counterfeiters are active in China.They range from factories mixing shampoo and soap inback rooms to large state-owned enterprises making copiesof soft drinks and beer. Other factories make everything
346 PART 4 Strategy Implementation and Control
GLOBAL issueCOUNTERFEIT GOODS & PIRATED SOFTWARE: A GLOBAL PROBLEM
from car batteries to automobiles. Mobile CD factories withoptical disc-mastering machines counterfeit music and soft-ware. 60 Minutes found a small factory in Donguan mak-ing fake Callaway golf clubs and bags at a rate of 500 bagsper week. Factories in southern Guangdong or Fujianprovinces truck their products to a central distribution cen-ter, such as the one in Yiwu. They may also be shippedacross the border into Russia, Pakistan, Vietnam, or Burma.Chinese counterfeiters have developed a global reachthrough their connections with organized crime.
As much as 35% of software on personal computersworldwide is pirated, according to the Business SoftwareAlliance and ISDC, a market research firm. The worldwidecost of software piracy was around $34 billion in 2005. Forexample, 21% of the software sold in the United States ispirated. That figure increases to 26%–30% in the Euro-pean Union, 83% in Russia, Algeria, and Bolivia, to 86% inChina, 87% in Indonesia, and 90% in Vietnam.
SOURCES:“The Sincerest Form of Flattery,” The Economist (April 7,2007), pp. 64–65; F. Balfour, “Fakes!” Business Week (February 7,2005), pp. 54–64; “PC Software Piracy,” The Economist (June 10,2006), p. 102; “The World’s Greatest Fakes,” 60 Minutes, CBSNews (August 8, 2004); “Business Software Piracy,” Pocket Worldin Figures 2004 (London: Economist & Profile Book, 2003), p. 60;D. Roberts, F. Balfour, P. Magnusson, P. Engardio, and J. Lee,“China’s Piracy Plague,” Business Week (June 5, 2000), pp. 44–48.
MNC should use loose controls on its foreign units. The management of each geographic unitshould be given considerable operational latitude, but it should be expected to meet some per-formance targets. Because profit and ROI measures are often unreliable in international oper-ations, it is recommended that the MNC’s top management, in this instance, emphasizebudgets and non-financial measures of performance such as market share, productivity, pub-lic image, employee morale, and relations with the host country government.76 Multiple mea-sures should be used to differentiate between the worth of the subsidiary and the performanceof its management.
A global MNC, however, needs tight controls over its many units. To reduce costs and gaincompetitive advantage, it is trying to spread the manufacturing and marketing operations of afew fairly uniform products around the world. Therefore, its key operational decisions mustbe centralized. Its environmental scanning must include research not only into each of the na-tional markets in which the MNC competes but also into the “global arena” of the interactionbetween markets. Foreign units are thus evaluated more as cost centers, revenue centers, or ex-pense centers than as investment or profit centers because MNCs operating in a global indus-try do not often make the entire product in the country in which it is sold.
CHAPTER 11 Evaluation and Control 347
11.3 Strategic Information SystemsBefore performance measures can have any impact on strategic management, they must firstbe communicated to the people responsible for formulating and implementing strategic plans.Strategic information systems can perform this function. They can be computer based or man-ual, formal or informal. One of the key reasons given for the bankruptcy of International Har-vester was the inability of the corporation’s top management to precisely determine income bymajor class of similar products. Because of this inability, management kept trying to fix ailingbusinesses and was unable to respond flexibly to major changes and unexpected events. Incontrast, one of the key reasons for the success of Wal-Mart has been management’s use of thecompany’s sophisticated information system to control purchasing decisions. Cash registers inWal-Mart retail stores transmit information hourly to computers at company headquarters.Consequently, managers know every morning exactly how many of each item were sold theday before, how many have been sold so far in the year, and how this year’s sales compare tolast year’s. The information system allows all reordering to be done automatically by comput-ers, without any managerial input. It also allows the company to experiment with new prod-ucts without committing to big orders in advance. In effect, the system allows the customersto decide through their purchases what gets reordered.
ENTERPRISE RESOURCE PLANNING (ERP)Many corporations around the world have adopted enterprise resource planning (ERP) soft-ware. ERP unites all of a company’s major business activities, from order processing to pro-duction, within a single family of software modules. The system provides instant access tocritical information to everyone in the organization, from the CEO to the factory floor worker.Because of the ability of ERP software to use a common information system throughout a com-pany’s many operations around the world, it is becoming the business information systems’global standard. The major providers of this software are SAP AG, Oracle (including People-Soft), J. D. Edwards, Baan, and SSA.
The German company SAP AG originated the concept with its R/3 software system. Mi-crosoft, for example, used R/3 to replace a tangle of 33 financial tracking systems in 26 sub-sidiaries. Even though it cost the company $25 million and took 10 months to install, R/3annually saves Microsoft $18 million. Coca-Cola uses the R/3 system to enable a manager inAtlanta to use her personal computer to check the latest sales of 20-ounce bottles of CokeClassic in India. Owens-Corning envisioned that its R/3 system allowed salespeople to learnwhat was available at any plant or warehouse and to quickly assemble orders for customers.
ERP may not fit every company, however. The system is extremely complicated and de-mands a high level of standardization throughout a corporation. Its demanding nature oftenforces companies to change the way they do business. There are three reasons ERP could fail:(1) insufficient tailoring of the software to fit the company, (2) inadequate training, and (3) in-sufficient implementation support.77 Over the two-year period of installing R/3, Owens- Corning had to completely overhaul its operations. Because R/3 was incompatible with Apple’svery organic corporate culture, the company was able to apply it only to its order manage-ment and financial operations, but not to manufacturing. Other companies that had diffi-culty installing and using ERP are Whirlpool, Hershey Foods, Volkswagen, and StanleyWorks. At Whirlpool, SAP’s software led to missed and delayed shipments, causing HomeDepot to cancel its agreement for selling Whirlpool products.78 One survey found that 65% ofexecutives believed that ERP had a moderate chance of hurting their business because of
348 PART 4 Strategy Implementation and Control
RADIO FREQUENCY IDENTIFICATION (RFID)Radio frequency identification (RFID) is an electronic tagging technology used in a numberof companies to improve supply-chain efficiency. By tagging containers and items with tinychips, companies use the tags as wireless bar-codes to track inventory more efficiently. BothWal-Mart and the U.S. Department of Defense began requiring their largest suppliers to incor-porate RFID tags in their goods in 2003. Although Tesco has experimented with RFID in Eu-rope, full-scale use of the technology proved unfeasible because of incompatible standards.Nevertheless, some suppliers and retailers of expensive consumer products view the cost ofthe tag as worthwhile because it reduces losses from counterfeiting and theft. RFID technol-ogy is currently in wide use as wireless commuter passes for toll roads, tunnels, and bridges.Even though RFID standards may vary among companies, individual firms like Audi, Sony,and Dole Food use the tags to track goods within their own factories and warehouses.80 Ac-cording to Dan Mullen of AIM Global, “RFID will go through a process similar to what hap-pened in bar code technology 20 years ago. . . . As companies implement the technology deeperwithin their operations, the return on investment will grow and applications will expand.”81
DIVISIONAL AND FUNCTIONAL IS SUPPORTAt the divisional or SBU level of a corporation, the information system should be used to sup-port, reinforce, or enlarge its business-level strategy through its decision support system. AnSBU pursuing a strategy of overall cost leadership could use its information system to reducecosts either by improving labor productivity or improving the use of other resources such asinventory or machinery. Merrill Lynch took this approach when it developed PRISM softwareto provide its 500 U.S. retail offices with quick access to financial information in order to boostbrokers’ efficiency. Another SBU, in contrast, might want to pursue a differentiation strategy.It could use its information system to add uniqueness to the product or service and contributeto quality, service, or image through the functional areas. FedEx wanted to use superior ser-vice to gain a competitive advantage. It invested significantly in several types of informationsystems to measure and track the performance of its delivery service. Together, these informa-tion systems gave FedEx the fastest error-response time in the overnight delivery business.
11.4 Problems in Measuring PerformanceThe measurement of performance is a crucial part of evaluation and control. The lack of quantifi-able objectives or performance standards and the inability of the information system to providetimely and valid information are two obvious control problems. According to Meg Whitman, past-CEO of eBay, “If you can’t measure it, you can’t control it.” That’s why eBay has a multitude ofmeasures, from total revenues and profits to take rate, the ratio of revenues to the value of goodstraded on the site.82 Without objective and timely measurements, it would be extremely difficultto make operational, let alone strategic, decisions. Nevertheless, the use of timely, quantifiablestandards does not guarantee good performance. The very act of monitoring and measuring per-formance can cause side effects that interfere with overall corporate performance. Among the mostfrequent negative side effects are a short-term orientation and goal displacement.
implementation problems. Nevertheless, the payoff from ERP software is likely to be worththe effort. ERP is a key ingredient for gaining competitive advantage, streamlining operations,and managing a lean manufacturing system.79
CHAPTER 11 Evaluation and Control 349
SHORT-TERM ORIENTATIONTop executives report that in many situations, they analyze neither the long-term implicationsof present operations on the strategy they have adopted nor the operational impact of a strategyon the corporate mission. Long-run evaluations may not be conducted because executives(1) don’t realize their importance, (2) believe that short-run considerations are more impor-tant than long-run considerations, (3) aren’t personally evaluated on a long-term basis, or(4) don’t have the time to make a long-run analysis.83 There is no real justification for the firstand last reasons. If executives realize the importance of long-run evaluations, they make thetime needed to conduct them. Even though many chief executives point to immediate pressuresfrom the investment community and to short-term incentive and promotion plans to support thesecond and third reasons, evidence does not always support their claims.84
At one international heavy-equipment manufacturer, managers were so strongly moti-vated to achieve their quarterly revenue target that they shipped unfinished products from theirplant in England to a warehouse in the Netherlands for final assembly. By shipping the incom-plete products, they were able to realize the sales before the end of the quarter—thus fulfillingtheir budgeted objective and making their bonuses. Unfortunately, the high cost of assemblingthe goods at a distant location (requiring not only the renting the warehouse but also payingadditional labor) ended up reducing the company’s overall profit.85
Many accounting-based measures, such as EPS and ROI, encourage a short-termorientation in which managers consider only current tactical or operational issues and ignorelong-term strategic ones. Because growth in EPS (earnings per share) is an important driver ofnear-term stock price, top managers are biased against investments that might reduce short-term EPS.86 This is compounded by pressure from financial analysts and investors for quar-terly earnings guidance, that is, estimates of future corporate earnings.87 For example, in a$303 million law suit settled in 2008, General Motors admitted that its top managers and au-ditor had misstated its revenue, earnings, and cash flow in order to artificially inflate the com-pany’s stock price and debt securities.88
Table 11.1 indicates that one of the limitations of ROI as a performance measure is itsshort-term nature. In theory, ROI is not limited to the short run, but in practice it is often diffi-cult to use this measure to realize long-term benefits for a company. Because managers can of-ten manipulate both the numerator (earnings) and the denominator (investment), the resultingROI figure can be meaningless. Advertising, maintenance, and research efforts can be reduced.Estimates of pension-fund profits, unpaid receivables, and old inventory, are easy to adjust. Op-timistic estimates of returned products, bad debts, and obsolete inventory inflate the presentyear’s sales and earnings.89 Expensive retooling and plant modernization can be delayed as longas a manager can manipulate figures on production defects and absenteeism. In a recent surveyof financial executives, 80% of the managers stated that they would decrease spending on re-search and development, advertising, maintenance, and hiring in order to meet earnings targets.More than half said that they would delay a new project even if it meant sacrificing value.90
Mergers can be undertaken that will do more for the present year’s earnings (and the nextyear’s paycheck) than for the division’s or corporation’s future profits. For example, research on55 firms that engaged in major acquisitions revealed that even though the firms performed poorlyafter the acquisition, the acquiring firms’ top management still received significant increases in com-pensation.91 Determining CEO compensation on the basis of firm size rather than performance istypical and is particularly likely for firms that are not monitored closely by independent analysts.92
Research supports the conclusion that many CEOs and their friends on the board of direc-tors’ compensation committee manipulate information to provide themselves a pay raise.93 Forexample, CEOs tend to announce bad news—thus reducing the company’s stock price—justbefore the issuance of stock options. Once the options are issued, the CEOs tend to announcegood news—thus raising the stock price and making their options more valuable.94 Board
350 PART 4 Strategy Implementation and Control
GOAL DISPLACEMENTIf not carefully done, monitoring and measuring of performance can actually result in a de-cline in overall corporate performance. Goal displacement is the confusion of means withends and occurs when activities originally intended to help managers attain corporate objec-tives become ends in themselves—or are adapted to meet ends other than those for which theywere intended. Two types of goal displacement are behavior substitution and suboptimization.
Behavior SubstitutionBehavior substitution refers to a phenomenon when people substitute activities that do notlead to goal accomplishment for activities that do lead to goal accomplishment because thewrong activities are being rewarded. Managers, like most other people, tend to focus more oftheir attention on behaviors that are clearly measurable than on those that are not. Employeesoften receive little or no reward for engaging in hard-to-measure activities such as cooperationand initiative. However, easy-to-measure activities might have little or no relationship to thedesired good performance. Rational people, nevertheless, tend to work for the rewards that thesystem has to offer. Therefore, people tend to substitute behaviors that are recognized and re-warded for behaviors that are ignored, without regard to their contribution to goal accomplish-ment. A research study of 157 corporations revealed that most of the companies made littleattempt to identify areas of non-financial performance that might advance their chosen strat-egy. Only 23% consistently built and verified cause-and-effect relationships between interme-diate controls (such as number of patents filed or product flaws) and company performance.96
A U.S. Navy quip sums up this situation: “What you inspect (or reward) is what you get.”If the reward system emphasizes quantity while merely asking for quality and cooperation, thesystem is likely to produce a large number of low-quality products and unsatisfied customers.97
A proposed law governing the effect of measurement on behavior is that quantifiable measuresdrive out non-quantifiable measures.
A classic example of behavior substitution happened a few years ago at Sears. Sears’ man-agement thought that it could improve employee productivity by tying performance to re-wards. It, therefore, paid commissions to its auto shop employees as a percentage of eachrepair bill. Behavior substitution resulted as employees altered their behavior to fit the rewardsystem. The results were over-billed customers, charges for work never done, and a scandalthat tarnished Sears’ reputation for many years.98
SuboptimizationSuboptimization refers to the phenomenon of a unit optimizing its goal accomplishment to thedetriment of the organization as a whole. The emphasis in large corporations on developingseparate responsibility centers can create some problems for the corporation as a whole. To theextent that a division or functional unit views itself as a separate entity, it might refuse to coop-erate with other units or divisions in the same corporation if cooperation could in some waynegatively affect its performance evaluation. The competition between divisions to achieve ahigh ROI can result in one division’s refusal to share its new technology or work process im-provements. One division’s attempt to optimize the accomplishment of its goals can cause otherdivisions to fall behind and thus negatively affect overall corporate performance. One commonexample of suboptimization occurs when a marketing department approves an early shipmentdate to a customer as a means of getting an order and forces the manufacturing department into
compensation committees tend to expand the peer group comparison outside their industry toinclude lower-performing firms to justify a high raise to the CEO. They tend to do this whenthe company performs poorly, the industry performs well, the CEO is already highly paid, andshareholders are powerful and active.95
CHAPTER 11 Evaluation and Control 351
11.5 Guidelines for Proper ControlIn designing a control system, top management should remember that controls should followstrategy. Unless controls ensure the use of the proper strategy to achieve objectives, there is astrong likelihood that dysfunctional side effects will completely undermine the implementa-tion of the objectives. The following guidelines are recommended:
1. Control should involve only the minimum amount of information needed to give a re-liable picture of events: Too many controls create confusion. Focus on the strategic factorsby following the 80/20 rule: Monitor those 20% of the factors that determine 80% of the re-sults. See Strategy Highlight 11.1 for some additional rules of thumb used by strategists.
2. Controls should monitor only meaningful activities and results, regardless of mea-surement difficulty: If cooperation between divisions is important to corporate perfor-mance, some form of qualitative or quantitative measure should be established to monitorcooperation.
3. Controls should be timely so that corrective action can be taken before it is too late:Steering controls, controls that monitor or measure the factors influencing performance,should be stressed so that advance notice of problems is given.
Managers use many rules ofthumb, such as the 80/20
rule, in making strategic deci-sions. These “rules” are prima-
rily approximations based on yearsof practical experience by many managers.
Although most of these rules have no objective data tosupport them, they are often accepted by practicing man-agers as a way of estimating the cost or time necessary toconduct certain activities. They may be useful because theycan help narrow the number of alternatives into a shorterlist for more detailed analysis. Some of the rules of thumbused by experienced strategists are described here.
INDIRECT COSTS OF STRATEGIC INITIATIVES
� The R&D Rule of Sevens is that for every $1 spent in de-veloping a new prototype, $7 will be needed to get aproduct ready for market, and $7 additional dollars willbe required to get to the first sale. These estimatesdon’t cover working capital requirements for stockingdistributor inventories.
STRATEGY highlight 11.1SOME RULES OF THUMB IN STRATEGY
� First-year costs for promoting a new consumer goodsproduct are 33% of anticipated first-year sales. Second-year costs should be 20%, and third-year costs 15%.
� A reasonably successful patent-based innovation willrequire $2 million in legal defense costs.
SAFETY MARGINS FOR NEW BUSINESS INITIATIVES
� A new manufacturing business should have sufficientstartup capital to cover one year of costs.
� A new consumer goods business should have sufficientcapital to cover two years of business.
� A new professional services business should have suffi-cient capital to cover three years of costs.
SOURCE: R. West and F. Wolek, “Rules of Thumb in Strategic Think-ing,” Strategy & Leadership (March/April 1999), p. 34. Copyright ©1999 by Emerald Group Publishing Ltd. Reprinted by permission.
overtime production for that one order. Production costs are raised, which reduces the manu-facturing department’s overall efficiency. The end result might be that, although marketingachieves its sales goal, the corporation as a whole fails to achieve its expected profitability.99
352 PART 4 Strategy Implementation and Control
11.6 Strategic Incentive ManagementTo ensure congruence between the needs of a corporation as a whole and the needs of the em-ployees as individuals, management and the board of directors should develop an incentiveprogram that rewards desired performance. This reduces the likelihood of the agency problems(when employees act to feather their own nests instead of building shareholder value) men-tioned earlier in Chapter 2. Incentive plans should be linked in some way to corporate and di-visional strategy. Research reveals that firm performance is affected by its compensationpolicies.102 Companies using different strategies tend to adopt different pay policies. For ex-ample, a survey of 600 business units indicates that the pay mix associated with a growth strat-egy emphasizes bonuses and other incentives over salary and benefits, whereas the pay mixassociated with a stability strategy has the reverse emphasis.103 Research indicates that SBUmanagers having long-term performance elements in their compensation program favor along-term perspective and thus greater investments in R&D, capital equipment, and employeetraining.104 Although the typical CEO pay package is composed of 21% salary, 27% short-termannual incentives, 16% long-term incentives, and 36% stock options,105 there is some evidencethat stock options are being replaced by greater emphasis on performance-related pay.106
The following three approaches are tailored to help match measurements and rewardswith explicit strategic objectives and time frames:107
1. Weighted-factor method: The weighted-factor method is particularly appropriate formeasuring and rewarding the performance of top SBU managers and group-level executiveswhen performance factors and their importance vary from one SBU to another. Using port-folio analysis, one corporation's measurements might contain the following variations: theperformance of high-performing (star) SBUs is measured equally in terms of ROI, cashflow, market share, and progress on several future-oriented strategic projects; the perfor-mance of low-growth, but strong (cash cow) SBUs, in contrast, is measured in terms of ROI,market share, and cash generation; and the performance of developing (question marks)SBUs is measured in terms of development and market share growth with no weight on ROIor cash flow. (Refer to Figure 11.3.)
2. Long-term evaluation method: The long-term evaluation method compensates man-agers for achieving objectives set over a multiyear period. An executive is promised somecompany stock or “performance units” (convertible into money or stock) in amounts to be
4. Long-term and short-term controls should be used: If only short-term measures areemphasized, a short-term managerial orientation is likely.
5. Controls should aim at pinpointing exceptions: Only activities or results that fall out-side a predetermined tolerance range should call for action.
6. Emphasize the reward of meeting or exceeding standards rather than punishmentfor failing to meet standards: Heavy punishment of failure typically results in goal dis-placement. Managers will “fudge” reports and lobby for lower standards.
If corporate culture complements and reinforces the strategic orientation of a firm, thereis less need for an extensive formal control system. In their book In Search of Excellence,Peters and Waterman state that “the stronger the culture and the more it was directed towardthe marketplace, the less need was there for policy manuals, organization charts, or detailedprocedures and rules. In these companies, people way down the line know what they are sup-posed to do in most situations because the handful of guiding values is crystal clear.”100 Forexample, at Eaton Corporation, the employees are expected to enforce the rules themselves. Ifsomeone misses too much work or picks fights with co-workers, other members of the produc-tion team point out the problem. According to Randy Savage, a long-time Eaton employee,“They say there are no bosses here, but if you screw up, you find one pretty fast.”101
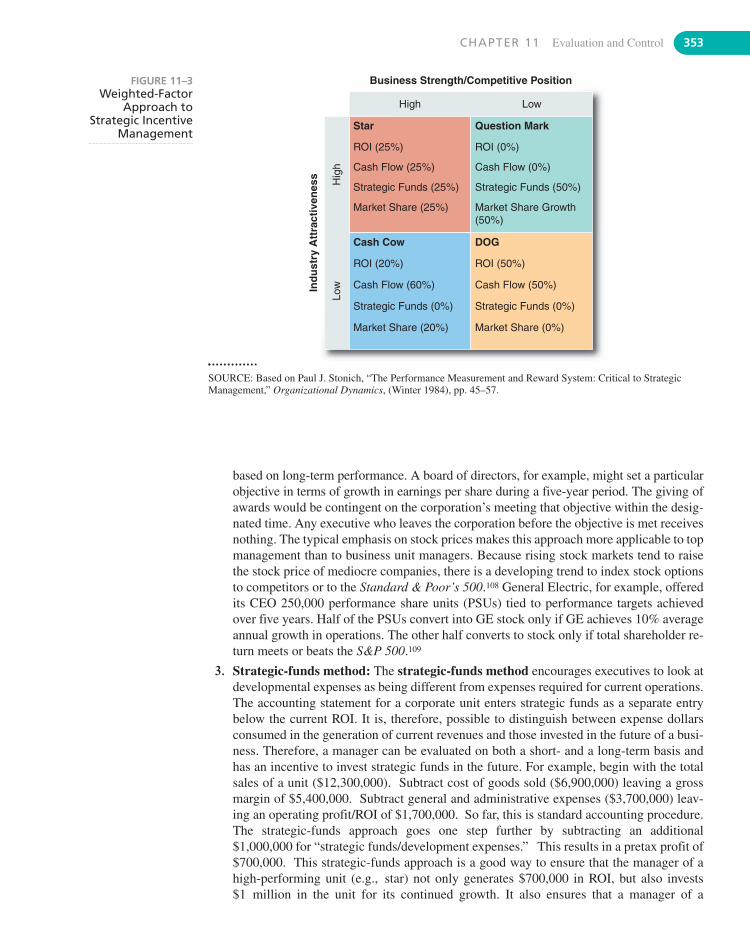
CHAPTER 11 Evaluation and Control 353
based on long-term performance. A board of directors, for example, might set a particularobjective in terms of growth in earnings per share during a five-year period. The giving ofawards would be contingent on the corporation’s meeting that objective within the desig-nated time. Any executive who leaves the corporation before the objective is met receivesnothing. The typical emphasis on stock prices makes this approach more applicable to topmanagement than to business unit managers. Because rising stock markets tend to raisethe stock price of mediocre companies, there is a developing trend to index stock optionsto competitors or to the Standard & Poor’s 500.108 General Electric, for example, offeredits CEO 250,000 performance share units (PSUs) tied to performance targets achievedover five years. Half of the PSUs convert into GE stock only if GE achieves 10% averageannual growth in operations. The other half converts to stock only if total shareholder re-turn meets or beats the S&P 500.109
3. Strategic-funds method: The strategic-funds method encourages executives to look atdevelopmental expenses as being different from expenses required for current operations.The accounting statement for a corporate unit enters strategic funds as a separate entrybelow the current ROI. It is, therefore, possible to distinguish between expense dollarsconsumed in the generation of current revenues and those invested in the future of a busi-ness. Therefore, a manager can be evaluated on both a short- and a long-term basis andhas an incentive to invest strategic funds in the future. For example, begin with the totalsales of a unit ($12,300,000). Subtract cost of goods sold ($6,900,000) leaving a grossmargin of $5,400,000. Subtract general and administrative expenses ($3,700,000) leav-ing an operating profit/ROI of $1,700,000. So far, this is standard accounting procedure.The strategic-funds approach goes one step further by subtracting an additional$1,000,000 for “strategic funds/development expenses.” This results in a pretax profit of$700,000. This strategic-funds approach is a good way to ensure that the manager of ahigh-performing unit (e.g., star) not only generates $700,000 in ROI, but also invests$1 million in the unit for its continued growth. It also ensures that a manager of a
Ind
ust
ry A
ttra
ctiv
enes
s
High
Hig
hLo
w
Low
ROI (25%)
Cash Flow (25%)
Strategic Funds (25%)
Market Share (25%)
ROI (20%)
Cash Flow (60%)
Strategic Funds (0%)
Market Share (20%)
ROI (50%)
Cash Flow (50%)
Market Share (0%)
Strategic Funds (0%)
ROI (0%)
Cash Flow (0%)
Strategic Funds (50%)
Market Share Growth(50%)
Star Question Mark
Cash Cow DOG
Business Strength/Competitive Position
SOURCE: Based on Paul J. Stonich, “The Performance Measurement and Reward System: Critical to StrategicManagement,” Organizational Dynamics, (Winter 1984), pp. 45–57.
FIGURE 11–3Weighted-Factor
Approach toStrategic Incentive
Management
354 PART 4 Strategy Implementation and Control
developing unit is appropriately evaluated on the basis of market share growth and prod-uct development and not on ROI or cash flow.
An effective way to achieve the desired strategic results through a reward system is tocombine the three approaches:
1. Segregate strategic funds from short-term funds, as is done in the strategic-funds method.
2. Develop a weighted-factor chart for each SBU.
3. Measure performance on three bases: The pretax profit indicated by the strategic-fundsapproach, the weighted factors, and the long-term evaluation of the SBUs’ and the corpo-ration’s performance.
Genentech, General Electric, Adobe, IBM, and Textron are some firms in which top man-agement compensation is contingent upon the company’s achieving strategic objectives.110
The board of directors and top management must be careful to develop a compensation planthat achieves the appropriate objectives. One reason why top executives are often criticized forbeing overpaid (the ratio of CEO to average worker pay is currently 400 to 1)111 is that in a largenumber of corporations the incentives for sales growth exceed those for shareholder wealth,resulting in too many executives pursuing growth to the detriment of shareholder value.112
End of Chapter SUMMARYHaving strategic management without evaluation and control is like playing football with-out any goalposts. Unless strategic management improves performance, it is only an exer-cise. In business, the bottom-line measure of performance is making a profit. If people aren’twilling to pay more than what it costs to make a product or provide a service, that businesswill not continue to exist. Chapter 1 explains that organizations engaging in strategic man-agement outperform those that do not. The sticky issue is: How should we measure perfor-mance? Is measuring profits sufficient? Does an income statement tell us what we need toknow? The accrual method of accounting enables us to count a sale even when the cash hasnot yet been received. Therefore, a firm might be profitable, but still go bankrupt because itcan’t pay its bills. Is profit the amount of cash on hand at the end of the year after payingcosts and expenses? But what if you made a big sale in December and must wait untilJanuary to get paid? Like retail stores, perhaps we need to use a fiscal year ending January 31(to include returned Christmas items that were bought in December) instead of a calendaryear ending December 31. Should two managers receive the same bonus when their divi-sions earn the same profit, even though one division is much smaller than the other? Whatof the manager who is managing a new product introduction that won’t make a profit foranother two years?
Evaluation and control is one of the most difficult parts of strategic management. No onemeasure can tell us what we need to know. That’s why we need to use not only the traditionalmeasures of financial performance, such as net earnings, ROI, and EPS, but we need to con-sider using EVA or MVA and a balanced scorecard, among other possibilities. On top of that,science informs us that just attempting to measure something changes what is being measured.The measurement of performance can and does result in short-term oriented actions and goaldisplacement. That’s why experts suggest that we use multiple measures of only those thingsthat provide a meaningful and reliable picture of events: Measure those 20% of the factors that
CHAPTER 11 Evaluation and Control 355
determine 80% of the results. Once the appropriate performance measurements are taken, it ispossible to learn whether the strategy was successful. As shown in the model of strategic man-agement depicted at the beginning this chapter, the measured results of corporate performanceallow us to decide whether we need to reformulate the strategy, improve its implementation,or gather more information about our competition.
E C O - B I T S� In 2007, 64% of the Fortune Global 100 published a
Corporate Social Responsibility report explaining theireconomic, environmental, and social performance.
� More than 4,000 organizations from over 100 countriesare members of the United Nations Global Compact.Three of the 10 principles are:� Support a precautionary approach to environmental
challenges.
� Undertake initiatives to promote greater environ-mental responsibility.
� Encourage the development and diffusion of envi-ronmentally friendly technologies.113
D I S C U S S I O N Q U E S T I O N S1. Is Figure 11–1 a realistic model of the evaluation and
control process?
2. What are some examples of behavior controls? Outputcontrols? Input controls?
3. Is EVA an improvement over ROI, ROE, or EPS?
4. How much faith can a manager place in a transfer priceas a substitute for a market price in measuring a profitcenter’s performance?
5. Is the evaluation and control process appropriate for acorporation that emphasizes creativity? Are control andcreativity compatible?
S T R A T E G I C P R A C T I C E E X E R C I S EEach year, Fortune magazine publishes an article entitled,“America’s Most Admired Companies.” It lists the 10 most ad-mired companies in the United States and in the world.Fortune’s rankings are based on scoring publicly held compa-nies on what it calls “eight key attributes of reputation”: innova-tion, people management, use of corporate assets, socialresponsibility, quality of management, financial soundness,long-term investment value, and quality of products/services. In2008, Fortune asked Hay Group to survey more than 3,700 peo-ple from multiple industries. Respondents were asked to choosethe companies they admired most, regardless of industry.Fortune has been publishing this list since 1982. The 2008 For-tune list of the top 10 most admired U.S. companies were (start-ing with #1): Apple, Berkshire Hathaway, General Electric,Google, Toyota Motor, Starbucks, FedEx, Procter & Gamble,Johnson & Johnson, and Goldman Sachs Group. The next 10most admired were (from 11 to 20): Target, Southwest Airlines,American Express, BMW, Costco Wholesale, Microsoft,United Parcel Service, Cisco Systems, 3M, and Nordstrom.114
Four years earlier in 2004, the list of 10 most admiredU.S. companies was: Wal-Mart, Berkshire Hathaway, South-
west Airlines, General Electric, Dell Computer, Microsoft,Johnson & Johnson, Starbucks, FedEx, and IBM.115
� Why did the most admired U.S. firm in 2004 (Wal-Mart)drop off the 10 listing in 2008?
� Why did Apple go from not even being on the 10 U.S.listing in 2004 to No. 1 in 2008?
� Which firms appeared on both top 10 lists? Why?
� Why did some firms drop off the list from 2004 to 2008and why did others get included?
� What companies should be on the most admired list thisyear? Why?
Try One of These Exercises
1. Go to the library and find a “Most Admired Companies”Fortune article from the 1980s or early 1990s and com-pare that list to the latest one. (See www.fortune.com forthe latest list.) Which companies have fallen out of the top10? Pick one of the companies and investigate why it isno longer on the list.
356 PART 4 Strategy Implementation and Control
K E Y T E R M S80/20 rule (p. 351)activity-based costing (ABC) (p. 334)balanced scorecard (p. 339)behavior control (p. 332)behavior substitution (p. 350)benchmarking (p. 344)earnings per share (EPS) (p. 335)economic value added (EVA) (p. 338)enterprise resource planning (ERP)
(p. 347)enterprise risk management (ERM)
(p. 335)evaluation and control process (p. 328)expense center (p. 343)
free cash flow (p. 336)goal displacement (p. 350)input control (p. 333)investment center (p. 343)ISO 9000 Standards Service (p. 333)ISO 14000 Standards Service (p. 333)key performance measures (p. 339)long-term evaluation method (p. 352)management audit (p. 341)market value added (MVA) (p. 338)operating cash flow (p. 336)output control (p. 332)performance (p. 332)
profit center (p. 343)responsibility center (p. 342)return on equity (ROE) (p. 336)return on investment (ROI) (p. 335)revenue center (p. 343)shareholder value (p. 337)short-term orientation (p. 349)standard cost center (p. 342)steering control (p. 332)strategic-funds method (p. 353)suboptimization (p. 350)transfer pricing (p. 343)weighted-factor method (p. 352)
N O T E S1. K. F. Iverson with T. Varian, “Plain Talk,” Inc. (October 1997),
p. 81. Excerpted from Iverson’s book, Plain Talk: Lessons froma Business Maverick, (New York: John Wiley & Sons, 1997).
2. R. Roach & Associates, cited in Air Transport World (June1996), p. 1.
3. R. Barker, “A Surprise in Office Depot’s In-Box,” BusinessWeek (October 25, 2004), p. 122.
4. C. W. Hart, “Customer Service: Beating the Market with Cus-tomer Satisfaction,” Harvard Business Review (March 2007),pp. 30–32.
5. S. E. Ante, “Giving the Boss the Big Picture,” Business Week(February 13, 2006), pp. 48–51.
6. R. Muralidharan and R. D. Hamilton III, “Aligning Multina-tional Control Systems,” Long Range Planning (June 1999),pp. 352–361. These types are based on W. G. Ouchi, “The Re-lationship Between Organizational Structure and Organiza-tional Control,” Administrative Science Quarterly, Vol. 20(1977), pp. 95–113 and W. G. Ouchi, “A Conceptual Frame-work for the Design of Organizational Control Mechanisms,”Management Science, Vol. 25 (1979), pp. 833–848. Muralid-hara and Hamilton refer to Ouchi’s clan control as input control.
7. W. G. Rowe and P. M. Wright, “Related and Unrelated Diversi-fication and Their Effect on Human Resource ManagementControls,” Strategic Management Journal (April 1997), pp. 329–338.
8. R. Muralidharan and R. D. Hamilton III, “Aligning Multina-tional Control Systems,” Long Range Planning (June 1999)pp. 356–359.
9. F. C. Barnes, “ISO 9000 Myth and Reality: A Reasonable Ap-proach to ISO 9000,” SAM Advanced Management Journal(Spring 1998), pp. 23–30.
10. M. Henricks, “A New Standard,” Entrepreneur (October 2002),pp. 83–84.
11. M. V. Uzumeri, “ISO 9000 and Other Metastandards: Principlesfor Management Practice?” Academy of Management Execu-tive (February 1997), pp. 21–36.
12. A. M. Hormozi, “Understanding and Implementing ISO 9000:A Manager’s Guide,” SAM Advanced Management Journal(Autumn 1995), pp. 4–11.
13. M. Henricks, “A New Standard,” Entrepreneur (October 2002)p. 84.
14. L. Armstrong, “Someone to Watch Over You,” Business Week(July 10, 2000), pp. 189–190.
15. J. K. Shank and V. Govindarajan, Strategic Cost Management(New York: The Free Press, 1993).
16. S. S. Rao, “ABCs of Cost Control,” Inc. Technology, No. 2(1997), pp. 79–81.
17. R. Gruber, “Why You Should Consider Activity-Based Cost-ing,” Small Business Forum (Spring 1994), pp. 20–36.
18. “Easier Than ABC,” Economist (October 25, 2003), p. 56.19. T. P. Pare, “A New Tool for Managing Costs,” Fortune (June 14,
1993), pp. 124–129. For further information on the use of ABC withEVA, see T. L. Pohlen and B. J. Coleman, “Evaluating Internal Op-erations and Supply Chain Performance Using EVA and ABC,”SAM Advanced Management Journal (Spring 2005), pp. 45–58.
20. K. Hopkins, “The Risk Agenda,” Business Week, Special Ad-vertising Section (November 22, 2004), pp. 166–170.
21. T. L. Barton, W. G. Shenkir, and P. L. Walker, “Managing Risk:An Enterprise-wide Approach,” Financial Executive(March/April 2001), p. 51.
22. T. L. Barton, W. G. Shenkir, and P. L. Walker, “Managing Risk:An Enterprise-Wide Approach,” Financial Executive
2. Given the likely impact of global warming on various in-dustrial sectors, which companies are likely to be onFortune’s “Most Admired Companies” in 10 years?
3. Compare Fortune’s list to that compiled by the Reputa-tion Institute (www.reputationinstitute.com). Why isthere a difference between the ratings?
CHAPTER 11 Evaluation and Control 357
(March/April 2001), pp. 48–51; P. L. Walker, W. G. Shenkir,and T. L. Barton, “Enterprise Risk Management: Putting It AllTogether,” Internal Auditor (August 2003), pp. 50–55.
23. T. J. Andersen, “The Performance Relationship of EffectiveRisk Management: Exploring the Firm-Specific Investment Ra-tionale,” Long Range Planning (April 2008), pp. 155–176.
24. C. K. Brancato, New Corporate Performance Measures (NewYork: Conference Board, 1995); C. D. Ittner, D. F. Larcker, andM. V. Rajan, “The Choice of Performance Measures in AnnualBonus Contracts,” working paper reported by K. Z. Andrews in“Executive Bonuses,” Harvard Business Review (January–February 1996), pp. 8–9; J. Low and T. Siesfeld, “MeasuresThat Matter: Wall Street Considers Non-Financial PerformanceMore Than You Think,” Startegy & Leadership (March/April1998), pp. 24–30.
25. A similar measure, EBITDA (Earnings Before Interest, Taxes,Depreciation, and Amortization), is sometimes used, but is notdetermined in accordance with generally accepted accountingprinciples and is thus subject to varying calculations.
26. J. M. Laderman, “Earnings, Schmernings: Look at the Cash,”Business Week (July 24, 1989), pp. 56–57.
27. H. Greenberg, “Don’t Count on Cash Flow,” Fortune (May 13,2002), p. 176; A. Tergesen, “Cash-Flow Hocus-Pocus,”Business Week (July 15, 2002), pp. 130–132.
28. “Green Revolutionary,” The Economist (April 7, 2007), p. 66.29. E. H. Hall, Jr., and J. Lee, “Diversification Strategies: Creat-
ing Value of Generating Profits?” paper presented to the an-nual meeting of the Decision Sciences Institute, Orlando, FL(November 18–21, 2000).
30. P. C. Brewer, G. Chandra, and C. A. Hock, “Economic ValueAdded (EVA): Its Uses and Limitations,” SAM Advanced Man-agement Journal (Spring 1999), pp. 4–11.
31. D. J. Skyrme and D. M. Amidon, “New Measures of Success,”Journal of Business Strategy (January/February 1998), p. 23.
32. G. B. Stewart III, “EVA Works—But Not if You Make TheseCommon Mistakes,” Fortune (May 1, 1995), pp. 117–118.
33. S. Tully, “The Real Key to Creating Wealth,” Fortune (Septem-ber 20, 1993), p. 38.
34. A. Ehrbar, “Using EVA to Measure Performance and AssessStrategy,” Strategy & Leadership (May/June 1999), pp. 20–24.
35. P. C. Brewer, G. Chandra, and C. A. Hock, “Economic ValueAdded (EVA): Its Uses and Limitations,” SAM Advanced Man-agement Journal (Spring 1999), pp. 7–9.
36. Pro: K. Lehn, and A. K. Makhija, “EVA & MVA As PerformanceMeasures and Signals for Strategic Change,” Strategy & Leader-ship (May/June 1996), pp. 34–38. Con: D. I. Goldberg, “Share-holder Value Debunked,” Strategy & Leadership (January/February 2000), pp. 30–36.
37. A. Ehrbar, “Using EVA to Measure Performance and AssessStrategy,” Strategy & Leadership (May/June 1999), p. 21.
38. S. Tully, “America’s Wealth Creators,” Fortune (November 22,1999), pp. 275–284; A. B. Fisher, “Creating Stockholder Wealth:Market Value Added,” Fortune (December 11, 1995), pp. 105–116.
39. A. B. Fisher, “Creating Stockholder Wealth: Market ValueAdded,” Fortune (December 11, 1995), pp. 105–116.
40. K. Lehn and A. K. Makhija, “EVA & MVA As PerformanceMeasures and Signals for Strategic Change,” Strategy & Lead-ership (May/June, 1996), p. 37.
41. R. S. Kaplan and D. P. Norton, “Using the Balanced Scorecard asa Strategic Management System,” Harvard Business Review
(January–February 1996), pp. 75–85; R. S. Kaplan and D. P. Nor-ton, “The Balanced Scorecard—Measures That Drive Perfor-mance,” Harvard Business Review (January–February, 1992),pp. 71–79.
42. D. I. Goldenberg, “Shareholder Value Debunked,” Strategy &Leadership (January/February 2000), p. 34.
43. In later work, Kaplan and Norton used the term “perspectives”and replaced “internal business perspective” with “process per-spective” and “innovation and learning” to “learning andgrowth perspective.” See R. S. Norton and D. P. Norton, “Howto Implement a New Strategy Without Disrupting Your Organi-zation,” Harvard Business Review (March 2006), pp. 100–109.
44. C. K. Brancato, New Performance Measures (New York: Con-ference Board, 1995).
45. A. Gumpus and B. Lyons, “The Balanced Scorecard at PhilipsElectronics,” Strategic Finance, Vol. 84 (2002), pp. 92–101.
46. P. D. Heaney, “Can Performance Be Measured?” ProgressiveGrocer, Vol. 82 (2003), pp. 11–13.
47. B. P. Stivers and T. Joyce, “Building a Balanced PerformanceManagement System,” SAM Advanced Management Journal(Spring 2000), pp. 22–29.
48. Kaplan and Norton (March, 2006), p. 107.49. G. J. M. Braam and E. Nijssen, “Performance Effects of Using
the Balanced Scorecard: A Note on the Dutch Experience,”Long Range Planning (August 2004), pp. 335–349; H. Ahn,“Applying the Balanced Scorecard Concept: An ExperienceReport,” Long Range Planning (August 2001), pp. 441–461.
50. S. P. Mader, D. Vuchot, and S. Fukushima of Korn/Ferry Inter-national, 33rd Annual Board of Directors Study (2006), p. 9.
51. R. M. Rosen and F. Adair, “CEOs Misperceive Top Teams’ Per-formance,” Harvard Business Review (September 2007), p. 30.
52. S. P. Mader, D. Vuchot, and S. Fukushima of Korn/Ferry Inter-national, 33rd Annual Board of Directors Study (2006), p. 33.
53. Ibid., p. 9.54. J. L. Kerr and W. B. Werther, Jr., “The Next Frontier in Corpo-
rate Governance: Engaging the Board in Strategy,”Organizational Dynamics, Vol. 37, No. 2 (2008), pp. 112–124.This agrees with figures (73% and 38%, respectively) reportedby Korn/Ferry International in its 33rd Annual Board of Direc-tors Study from data gathered in 2006, p. 8.
55. J. M. Ivancevich, T. N. Duening, J. A. Gilbert, andR. Konopaske, “Deterring White-Collar Crime,” Academy ofManagement Executive (May 2003), pp. 114–127. Also Kerrand Werther (2008).
56. R. Charan, Boards at Work (San Francisco: Jossey-Bass, 1998),pp. 176–177.
57. T. D. Schellhardt, “Directors Get Tough: Inside a CEO Perfor-mance Review,” Wall Street Journal Interactive Edition(April 27, 1998).
58. T. L. Wheelen and J. D. Hunger, “Using the Strategic Audit,”SAM Advanced Management Journal (Winter 1987), pp. 4–12;G. Donaldson, “A New Tool for Boards: The Strategic Audit,”Harvard Business Review (July–August 1995), pp. 99–107.
59. H. Threat, “Measurement Is Free,” Strategy & Leadership(May/June 1999), pp. 16–19.
60. Z. U. Khan, S. K. Chawla, M. F. Smith, and M. F. Sharif,“Transfer Pricing Policy Issues in Europe 1992,” InternationalJournal of Management (September 1992), pp. 230–241.
61. H. Rothman, “You Need Not Be Big to Benchmark,” Nation’sBusiness (December 1992), p. 64.
62. C. W. Von Bergen and B. Soper, “A Problem with Benchmark-ing: Using Shaping as a Solution,” SAM Advanced ManagementJournal (Autumn 1995), pp. 16–19.
63. “Tool Usage Rates,” Journal of Business Strategy (March/April1995), p. 12.
64. R. J. Kennedy, “Benchmarking and Its Myths,” Competitive In-telligence Magazine (April–June 2000), pp. 28–33.
65. “Just the Facts: Numbers Runners,” Journal of Business Strat-egy (July/August 2002), p. 3; L. Mann, D. Samson, and D. Dow,“A Field Experiment on the Effects of Benchmarking & GoalSetting on Company Sales Performance,” Journal of Manage-ment, Vol. 24, No. 1 (1998), pp. 73–96.
66. S. A. W. Drew, “From Knowledge to Action: The Impact ofBenchmarking on Organizational Performance,” Long RangePlanning (June 1997), pp. 427–441.
67. S. M. Robbins and R. B. Stobaugh, “The Bent Measuring Stick forForeign Subsidiaries,” Harvard Business Review (September–October 1973), p. 82.
68. J. D. Daniels and L. H. Radebaugh, International Business,5th ed. (Reading, MA: Addison-Wesley, 1989), pp. 673–674.
69. D. Henry, “A Better Way to Keep the Books,” Business Week(September 15, 2008), p. 35; “International Accounting: Speak-ing in Tongues,” The Economist (May 19, 2007), pp. 77–78.
70. W. A. Johnson and R. J. Kirsch, “International Transfer Pricingand Decision Making in United States Multinationals,”International Journal of Management (June 1991), pp. 554–561.
71. L. Hickey, KPMG’s Corporate and Indirect Tax Rate Survey2008, pp. 11 & 13.
72. “Fixing the Bottom Line,” Time (November 23, 1992), p. 20.73. J. M. L. Poon, R. Ainuddin, and H. Affrim, “Management Poli-
cies and Practices of American, British, European, and JapaneseSubsidiaries in Malaysia: A Comparative Study,” InternationalJournal of Management (December 1990), pp. 467–474.
74. M. Egan, “Setting Standards: Strategic Advantages in Interna-tional Trade,” Business Strategy Review, Vol. 13, No. 1 (2002),pp. 51–64; L. Swatkowski, “Building Towards InternationalStandards,” Appliance (December 1999), p. 30.
75. C. W. L. Hill, P. Hwang, and W. C. Kim, “An Eclectic Theory ofthe Choice of International Entry Mode,” Strategic ManagementJournal (February 1990), pp. 117–128; D. Lei, J. W. Slocum, Jr.,and R. W. Slater, “Global Strategy and Reward Systems: The KeyRoles of Management Development and Corporate Culture,”Organizational Dynamics (Autumn 1990), pp. 27–41; W. R.Fannin, and A. F. Rodriques, “National or Global?—Control vs.Flexibility,” Long Range Planning (October 1986), pp. 84–188.
76. A. V. Phatak, International Dimensions of Management,2nd ed. (Boston: Kent, 1989), pp. 155–157.
77. S. McAlary, “Three Pitfalls in ERP Implementation,” Strategy &Leadership (October/November/December 1999), pp. 49–50.
78. J. B. White, D. Clark, and S. Ascarelli, “This German SoftwareIs Complex, Expensive—And Wildly Popular,” Wall StreetJournal (March 14, 1997), pp. A1, A8; D. Ward, “WhirlpoolTakes a Dive with Software Snarl,” Des Moines Register(April 29, 2000), p. 8D.
79. J. Verville, R. Palanisamy, C. Bernadas, and A. Halingten, “ERPAcquisition Planning: A Critical Dimension for Making the RightChoice,” Long Range Planning (February 2007), pp. 45–63.
80. “Radio Silence,” The Economist (June 9, 2007), pp. 20–21.81. C. Krivda, “RFID After Compliance: Integration and Payback,”
Special Advertising Section, Business Week (December 20,2004), pp. 91–98.
82. A. Lashinsky, “Meg and the Machine,” Fortune (September 1,2003), pp. 68–78.
83. R. M. Hodgetts and M. S. Wortman, Administrative Policy,2nd ed. (New York: John Wiley & Sons, 1980), p. 128.
84. J. R. Wooldridge and C. C. Snow, “Stock Market Reaction toStrategic Investment Decisions,” Strategic Management Jour-nal (September 1990), pp. 353–363.
85. M. C. Jensen, “Corporate Budgeting Is Broken—Let’s Fix It,”Harvard Business Review (November 2001), pp. 94–101.
86. C. M. Christensen, S. P. Kaufman, and W. C. Smith, “InnovationKillers: How Financial Tools Destroy Your Capacity to Do NewThings,” Harvard Business Review (January 2008), pp. 98–105.
87. P. Hsieh, T. Koller, and S. R. Rajan, “The Misguided Practice ofEarnings Guidance,” McKinsey Quarterly (Spring 2006), pp. 1–5.
88. “GM, Auditor Will Pay $303 Million in Suit,” Saint Cloud(MN) Times (August 9, 2008), p. 3A.
89. D. Henry “Fuzzy Numbers,” Business Week (October 4, 2004),pp. 79–88.
90. A. Rappaport, “10 Ways to Create Shareholder Value,” HarvardBusiness Review (September 2006), pp. 66–77.
91. D. R. Schmidt and K. L. Fowler, “Post-Acquisition FinancialPerformance and Executive Compensation,” Strategic Manage-ment Journal (November–December 1990), pp. 559–569.
92. H. L. Tosi, S. Werner, J. P. Katz, and L. R. Gomez-Mejia, “HowMuch Does Performance Matter? A Meta-Analysis of CEO PayStudies,” Journal of Management, Vol. 26, No. 2 (2000),pp. 301–339.; P. Wright, M. Kroll, and D. Elenkov, “Acquisi-tion Returns, Increase in Firm Size, and Chief Executive Offi-cer Compensation: The Moderating Role of Monitoring,”Academy of Management Journal (June 2002), pp. 599–608;S. Werner, H. L. Tosi, and L. Gomez-Mejia, “OrganizationalGovernance and Employee Pay: How Ownership Structure Af-fects the Firm’s Compensation Strategy,” Strategic Manage-ment Journal (April 2005), pp. 377–384.
93. X. Zhang, K. M. Bartol, K. G. Smith, M. D. Pfarrer, and D. M.Khanin, “CEOs on the Edge: Earnings Manipulation and Stock-based Incentive Misalignment,” Academy of Management Jour-nal (April 2008), pp. 241–258; L. Bebchuk and J. Fried, PayWithout Performance: The Unfulfilled Promise of ExecutiveCompensation (Boston: Harvard University Press, 2004); L. A.Benchuk and J. M. Fried, “Pay Without Performance: Overviewof the Issues,” Academy of Management Perspectives (February2006), pp. 5–24.
94. D. Jones, “Bad News Can Enrich Executives,” Des Moines Reg-ister (November 26, 1999), p. 8S.
95. J. F. Porac, J. B. Wade, and T. G. Pollock, “Industry Categoriesand the Politics of the Comparable Firm in CEO Compensation,”Administrative Science Quarterly (March 1999), pp. 112–144.For summaries of current research on executive compensationand performance, see C. E. Devers, A. A. Cannella Jr., G. P.Reilly, and M. E. Yoder, “Executive Compensation: A Multidis-ciplinary Review of Recent Developments,” Journal of Manage-ment (December 2007), pp. 1016–1072; M. Chan, “ExecutiveCompensation,” Business and Society Review (March 2008),pp. 129–161; and S. N. Kaplan, “Are CEOs Overpaid?” Academyof Management Perspective (May 2008), pp. 5–20.
96. C. D. Ittner and D. F. Larcker, “Coming Up Short,” HarvardBusiness Review (November 2003), pp. 88–95.
97. See the classic article by S. Kerr, “On the Folly of RewardingA, While Hoping for B,” Academy of Management Journal,Vol. 18 (December 1975), 769–783.
358 PART 4 Strategy Implementation and Control
CHAPTER 11 Evaluation and Control 359
98. W. Zellner, E. Schine, and G. Smith, “Trickle-Down Is Trick-ling Down at Work,” Business Week (March 18, 1996), p. 34.
99. For more information on how goals can have dysfunctional sideeffects, see D. C. Kayes, “The Destructive Pursuit of IdealizedGoals,” Organizational Dynamics, Vol. 34, Issue 4 (2005),pp. 391–401.
100. T. J. Peters and R. H. Waterman, In Search of Excellence (NewYork: HarperCollins, 1982), pp. 75–76.
101. T. Aeppel, “Not All Workers Find Idea of Empowerment asNeat as It Sounds,” Wall Street Journal (September 8, 1997),pp. A1, A13.
102. R. S. Allen and M. M. Helms, “Employee Perceptions of theRelationship Between Strategy, Rewards, and OrganizationalPerformance,” Journal of Business Strategies (Fall 2002),pp. 115–140; M. A. Carpenter, “The Price of Change: The Roleof CEO Compensation in Strategic Variation and Deviationfrom Industry Strategy Norms,” Journal of Management,Vol. 26, No. 6 (2000), pp. 1179–1198; M. A. Carpenter andW. G. Sanders, “The Effects of Top Management Team Pay andFirm Internationalization on MNC Performance,” Journal ofManagement, Vol. 30, No. 4 (2004), pp. 509–528; J. D. Shaw,N. Gupta, and J. E. Delery, “Congruence Between Technologyand Compensation Systems: Implications for Strategy Implemen-tation,” Strategic Management Journal (April 2001),pp. 379–386; E. F. Montemazon, “Congruence Between PayPolicy and Competitive Strategy in High-Performing Organiza-tions,” Journal of Management, Vol. 22, No. 6 (1996), pp. 889–908.
103. D. B. Balkin and L. R. Gomez-Mejia, “Matching Compensationand Organizational Strategies,” Strategic Management Journal(February 1990), pp. 153–169.
104. C. S. Galbraith, “The Effect of Compensation Programs andStructure on SBU Competitive Strategy: A Study of Technology-Intensive Firms,” Strategic Management Journal (July 1991),pp. 353–370.
105. T. A. Stewart, “CEO Pay: Mom Wouldn’t Approve,” Fortune(March 31, 1997), pp. 119–120.
106. “The Politics of Pay,” The Economist (March 24, 2007),pp. 71–72.
107. P. J. Stonich, “The Performance Measurement and Reward Sys-tem: Critical to Strategic Management,” Organizational Dy-namics (Winter 1984), pp. 45–57.
108. A. Rappaport, “New Thinking on How to Link Executive Paywith Performance,” Harvard Business Review (March–April1999), pp. 91–101.
109. Motley Fool, “Fool’s School: Hooray for GE,” The (Ames, IA)Tribune (October 27, 2003), p. 1D.
110. E. Iwata and B. Hansen, “Pay, Performance Don’t Always AddUp,” USA Today (April 30, 2004), pp. 1B–2B; W. Grossmanand R. E. Hoskisson, “CEO Pay at the Crossroads of Wall Streetand Main: Toward the Strategic Design of Executive Compen-sation,” Academy of Management Executive (February 1998),pp. 43–57.
111. M. Chan, “Executive Compensation,” Business and Society Re-view (March 2008), pp. 129–161.
112. S. E. O’Byrne and S. D. Young, “Why Executive Pay Is Fail-ing,” Harvard Business Review (June 2006), p. 28.
113. P. A. Heslin and J. D. Ochoa, “Understanding and DevelopingStrategic Corporate Social Responsibility,” Organizational Dy-namics (April–June 2008), pp. 125–144.
114. Fortune magazine Web site accessed on November 7, 2008 athttp://money.cnn.com/magazines/fortune/mostadmired/2008/top20/index.html.
115. A. Harrington, “America’s Most Admired Companies,” Fortune(March 8, 2004), pp. 80–81.
360 PART 4 Strategy Implementation and Control
Ending Case for Part FourHEWLETT-PACKARD BUYS EDS
On May 13, 2008, Hewlett-Packard (HP) announced its$13.9 billion acquisition of Electronic Data Systems(EDS), a technology services company. Together, HPand EDS formed a formidable tech services providerwith $38 billion in revenues. It enabled HP to bettercompete with IBM, which controlled more than 7% mar-ket share of the $748 billion market for services. Techservices included managing the data centers of largecompanies and governments, or handling entire func-tions such as personnel or claims processing. At the timeof the acquisition, IBM was the leading firm in the area,with EDS in second place with much lower profit mar-gins, and HP following in fifth place.
Founded by Ross Perot in 1962, EDS pioneered thebusiness of outsourced data management. Perot soldEDS to General Motors (GM) in 1984, but GM was un-able to obtain any synergy with the purchase and spunoff the company in 1996. EDS profits turned to lossesduring the technology downturn in 2000. The companyeventually became profitable once again, but withsmaller margins. EDS had been slow to respond to thethreat of Indian rivals offering services at sharply lowerprices. The company did increase its overseas hiring andbought control of MphasiS, an Indian services company.Since MphasiS was allowed to operate independently,with its own sales force and customer base, EDS did notgain much synergy from the acquisition. By 2008, EDShad 45,000 people working offshore and planned to hiremore. Nevertheless, the best services companies had alarge, low-cost workforce with tightly integrated opera-tions so that employees with diverse skills could collab-orate smoothly. This was the case with IBM, Accenture,and Indian companies like Tata Consultancy Services,but not with EDS or HP. Commenting on HP’s purchaseof EDS, N. Venkat Venktraman, chair of the InformationSystems Department at Boston University’s School ofManagement said, “The services sector is going througha shift, and this merger doesn’t address the global service-delivery challenges that HP faces.”
Founded in 1940 by Dave Packard and Bill Hewlettin a garage in Palo Alto, California, Hewlett-Packardsoon developed a reputation for making high-qualitytesting and measurement devices. Emphasizing their en-gineering roots, the two founders worked hard to de-velop the company’s strong corporate culture. Theirphilosophy of managing became known as the “HPWay,” composed of five basic values:
� We have trust and respect for individuals.� We focus on a high level of achievement and
contribution.� We focus on a high level of business with
uncompromising integrity.� We achieve our common objectives through
teamwork.� We encourage flexibility and innovation.
These values continued to be emphasized by theCEOs following in the founder’s footsteps. UntilCarleton (Carly) Fiorina was hired as CEO in 1999, HPhad been primarily known for its engineering excel-lence, but not for its marketing. For example, it devel-oped the first handheld calculator, a quality product longcherished by engineers, but never developed or pricedfor the mass market. Fiorina lamented that Dell offeredinformation technology products that were “low-techand low cost; and IBM offered “high-tech and highcost,” but HP was stuck somewhere in between them.She wanted to offer customers “high-tech and low cost”by improving the marketing of the company’s outstand-ing products. During her tenure, HP acquired Compaq,the personal computer company. She also tried to buythe computer services unit of PriceWaterhouseCoopersin 2000, but lost out to IBM. Problems with integratingCompaq’s middle-market orientation with HP’s top-endorientation led to her firing by the board in 2005.
Fiorina was replaced by Mark Hurd, known to be adisciplined operations manager, who vowed to focus onimplementation. Hurd had come to the company fromDayton, Ohio’s NCR, where he had been President andCEO. Hurd dumped the matrix management structureinitiated by Fiorina and gave responsibility back to thebusiness unit managers. According to Hurd, “the moreaccountable I can make you, the easier it is for you toshow you’re a great performer. The more I use a matrix,the easier I make it to blame someone else.” He also
This case was written by J. David Hunger for Strategic Managementand Business Policy, 12th edition and for Concepts in StrategicManagement and Business Policy, 12th edition. Copyright © 2008by J. David Hunger. Reprinted by permission.
CHAPTER 11 Evaluation and Control 361
broke up the centralized sales force and assigned salespeople to each business unit. The SBUs now controlledover 70% of their own budget expenses, up from just30% under Fiorina. Among other changes, Hurd hiredexecutives from outside the company and cut costs bylaying off 14,500 workers from a workforce of 150,000.Prith Banerjee, HP’s new director of R&D, worked tomake HP’s famed research lab more efficient by cuttingthe number of projects from 150 to 20 or 30. Re-searchers would now be competing for money and man-power by proposing projects, complete with businessplans to a central review board. Hurd knew that he hadto make further changes to improve HP’s competitiveposition. HP’s corporate computing business seemed in-capable of competing against IBM and Dell. Marginswere slipping in the printer business, the source of 85%of HP’s profits.
Hewlett-Packard was organized into three maingroups: Imaging & Printing (27% of revenues), PersonalSystems (35%), and Technology Solutions, which wascomposed of the Enterprise Storage & Servers segment(18%), HP Services segment (16%), and HP Softwaresegment (2%). An additional business segment was Fi-nancial Services & Other (2% of revenues).
Even though Hurd was working hard to change thecompany by tightening up HP’s operations, many of
HP’s middle managers still subscribed to the gentle, col-legiate “HP Way.” This culture fit the relaxed and casualstyle common to California’s Silicon Valley and waspart of the company’s soul. People ate ahi tuna in thecafeteria. In contrast, EDS was founded in Plano, Texas,by the hard-charging entrepreneur, Ross Perot, who ranfor U.S. president as an independent in 1992 and 1996.Reflecting Perot’s no-nonsense style, the EDS corporateculture was military, buttoned-down, and staid. Peoplewore ties and ate steak and fries in the EDS cafeteria.
One advantage of EDS was that it was the largestservices firm that was independent of any hardware orsoftware vendor. According to CEO Hurd, even thoughEDS would continue to advise clients to buy systemsfrom all vendors, those clients would now be morelikely to pay more attention when the boxes came fromHP. Nevertheless, one disadvantage of the acquisitionwas the likely culture clash that would result from inte-grating EDS into HP’s operations. Even though one an-alyst commented that Hurd’s operations style made him“an EDS guy sitting on top of the HP Way,” others won-dered if the EDS acquisition would be as problematic aswas the Compaq merger.

This page intentionally left blank

Introduction to
Case Analysis
PA R T5
Howard Schilit, founder of the Center for Financial Research & Analysis
(CFRA), works with a staff of 15 analysts to screen financial databases and analyze
public financial filings of 3,600 companies, looking for inconsistencies and aggres-
sive accounting methods. Schilit calls this search for hidden weaknesses in a com-
pany’s performance forensic accounting. “I’m like an investigative reporter,” explains
Schilit. “I’m interested in finding companies where the conventional wisdom is that they’re
very healthy, but if you dig a bit deeper, you find the emperor is not wearing the clothes you
thought.”1 He advises anyone interested in analyzing a company to look deeply into its financial
statements. For example, when the CFRA noticed that Kraft Foods made $122 million in acquisi-
tions in 2002, but claimed $539 million as “goodwill” assets related to the purchases, it concluded
that Kraft was padding its earnings with one-time gains. According to Schilit, unusually high
goodwill gains related to recent acquisitions is a red flag that suggests an underlying problem.
Schilit proposes a short checklist of items to examine for red flags:
� Cash flow from operations should exceed net income: If cash flow from operations drops
below net income, it could mean that the company is propping up its earnings by selling as-
sets, borrowing cash, or shuffling numbers. Says Schilit, “You could have spotted the prob-
lems at Enron by just doing this.”2
� Accounts receivable should not grow faster than sales: A firm facing slowing sales can
make itself look better by inflating accounts receivable with expected future sales and by
making sales to customers who are not credit worthy. “It’s like mailing a contract to a dead
person and then counting it as a sale,” says Schilit.3
� Gross margins should not fluctuate over time: A change of more than 2% in either direc-
tion from year to year is worth a closer look. It could mean that the company is using other
revenue, such as sales of assets or write-offs to boost profits. Sunbeam reported an increase
of 10% in gross margins just before it was investigated by the SEC.
� Examine carefully information about top management and the board: When Schilit learned
that the chairman of Checkers Restaurants had put his two young sons on the board, he
warned investors of nepotism. Two years later, Checkers’ huge debt caused its stock to fall
85% and all three family members were forced out of the company.
suggestions for Case Analysis
C H A P T E R 12
365
� Research the case situation as needed� Analyze financial statements by using
ratios and common-size statements
� Use the strategic audit as a method oforganizing and analyzing case information
Learning ObjectivesAfter reading this chapter, you should be able to:
12.1 The Case MethodThe analysis and discussion of case problems has been the most popular method of teachingstrategy and policy for many years. The case method provides the opportunity to move froma narrow, specialized view that emphasizes functional techniques to a broader, less preciseanalysis of the overall corporation. Cases present actual business situations and enable you toexamine both successful and unsuccessful corporations. In case analysis, you might be askedto critically analyze a situation in which a manager had to make a decision of long-term cor-porate importance. This approach gives you a feel for what it is like to face making and imple-menting strategic decisions.
� Footnotes are important: When companies change their accounting assumptions to
make the statements more attractive, they often bury their rationale in the footnotes.
Schilit dislikes companies that extend the depreciable life of their assets. “There’s only
one reason to do that—to add a penny or two to earnings—and it makes me very mis-
trustful of management.”4
Schilit makes his living analyzing companies and selling his reports to investors. Annual re-
ports and financial statements provide a lot of information about a company’s health, but
it’s hard to find problem areas when management is massaging the numbers to make the
company appear more attractive than it is. That’s why Michelle Leder created her Web site,
www.footnoted.org. She likes to highlight “the things that companies bury in their rou-
tine SEC filings.”5 This type of in-depth, investigative analysis is a key part of analyzing
strategy cases. This chapter provides various analytical techniques and suggestions for
conducting this kind of case analysis.
12.2 Researching the Case Situation
366 PART 5 Introduction to Case Analysis
You should not restrict yourself only to the information written in the case unless your instruc-tor states otherwise. You should, if possible, undertake outside research about the environmen-tal setting. Check the decision date of each case (typically the latest date mentioned in the case)to find out when the situation occurred and then screen the business periodicals for that timeperiod. An understanding of the economy during that period will help you avoid making a se-rious error in your analysis, for example, suggesting a sale of stock when the stock market isat an all-time low or taking on more debt when the prime interest rate is over 15%. Informa-tion about the industry will provide insights into its competitive activities. Important Note:Don’t go beyond the decision date of the case in your research unless directed to do so by yourinstructor.
Use computerized company and industry information services such as Compustat, Com-pact Disclosure, and CD/International, available on CD-ROM or online at the library. On theInternet, Hoover’s OnLine Corporate Directory (www.hoovers.com) and the Security Ex-change Commission’s Edgar database (www.sec.gov) provide access to corporate annual re-ports and 10-K forms. This background will give you an appreciation for the situation as it wasexperienced by the participants in the case. Use a search engine such as Google to find addi-tional information about the industry and the company.
A company’s annual report and SEC 10-K form from the year of the case can be veryhelpful. According to the Yankelovich Partners survey firm, 8 out of 10 portfolio managers and75% of security analysts use annual reports when making decisions.6 They contain not onlythe usual income statements and balance sheets, but also cash flow statements and notes to thefinancial statements indicating why certain actions were taken. 10-K forms include detailedinformation not usually available in an annual report. SEC 10-Q forms include quarterly fi-nancial reports. SEC 14-A forms include detailed information on members of a company’sboard of directors and proxy statements for annual meetings. Some resources available for re-search into the economy and a corporation’s industry are suggested in Appendix 12.A.
A caveat: Before obtaining additional information about the company profiled in a par-ticular case, ask your instructor if doing so is appropriate for your class assignment. Your strat-egy instructor may want you to stay within the confines of the case information provided inthe book. In this case, it is usually acceptable to at least learn more about the societal environ-ment at the time of the case.
12.3 Financial Analysis: A Place to BeginOnce you have read a case, a good place to begin your analysis is with the financial statements.Ratio analysis is the calculation of ratios from data in these statements. It is done to identifypossible financial strengths or weaknesses. Thus it is a valuable part of SWOT analysis. A re-view of key financial ratios can help you assess a company’s overall situation and pinpointsome problem areas. Ratios are useful regardless of firm size and enable you to compare acompany’s ratios with industry averages. Table 12–1 lists some of the most important finan-cial ratios, which are (1) liquidity ratios, (2) profitability ratios, (3) activity ratios, and(4) leverage ratios.
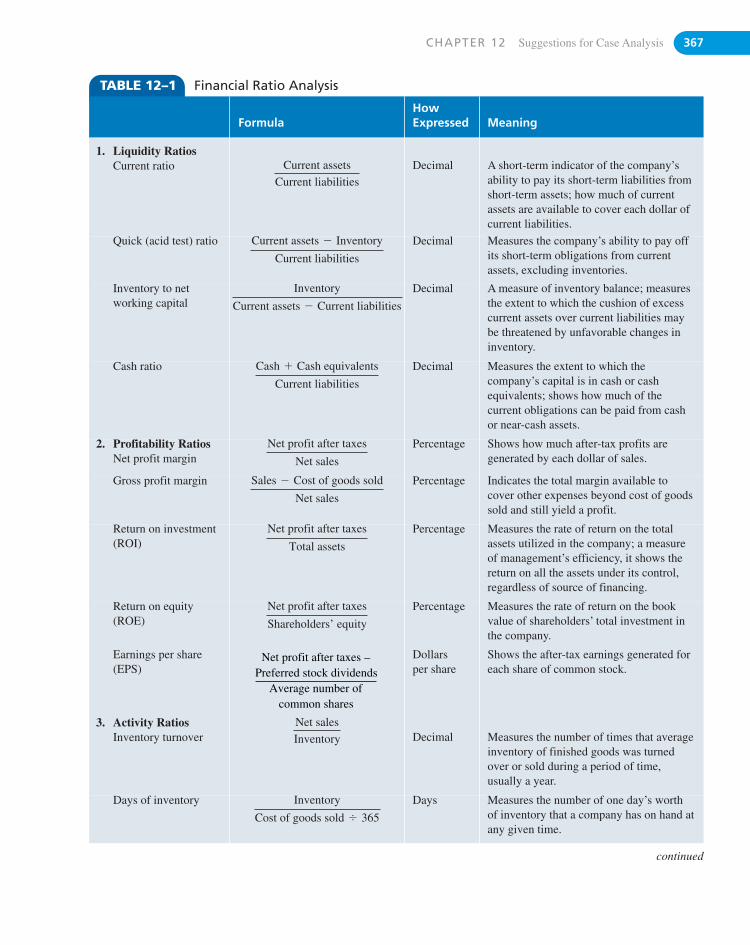
CHAPTER 12 Suggestions for Case Analysis 367
TABLE 12–1 Financial Ratio Analysis
FormulaHowExpressed Meaning
1. Liquidity RatiosCurrent ratio Current assets
Current liabilitiesDecimal A short-term indicator of the company’s
ability to pay its short-term liabilities fromshort-term assets; how much of currentassets are available to cover each dollar ofcurrent liabilities.
Quick (acid test) ratio Current assets � Inventory
Current liabilities
Decimal Measures the company’s ability to pay offits short-term obligations from currentassets, excluding inventories.
Inventory to networking capital
Inventory
Current assets � Current liabilities
Decimal A measure of inventory balance; measuresthe extent to which the cushion of excesscurrent assets over current liabilities maybe threatened by unfavorable changes ininventory.
Cash ratio Cash � Cash equivalents
Current liabilities
Decimal Measures the extent to which thecompany’s capital is in cash or cashequivalents; shows how much of thecurrent obligations can be paid from cashor near-cash assets.
2. Profitability RatiosNet profit margin
Net profit after taxes
Net sales
Percentage Shows how much after-tax profits aregenerated by each dollar of sales.
Gross profit margin Sales � Cost of goods sold
Net sales
Percentage Indicates the total margin available tocover other expenses beyond cost of goodssold and still yield a profit.
Return on investment(ROI)
Net profit after taxes
Total assets
Percentage Measures the rate of return on the totalassets utilized in the company; a measureof management’s efficiency, it shows thereturn on all the assets under its control,regardless of source of financing.
Return on equity(ROE)
Net profit after taxes
Shareholders’ equity
Percentage Measures the rate of return on the bookvalue of shareholders’ total investment inthe company.
Earnings per share(EPS)
Net profit after taxes –Preferred stock dividends
Average number ofcommon shares
Dollarsper share
Shows the after-tax earnings generated foreach share of common stock.
3. Activity RatiosInventory turnover
Net sales
Inventory Decimal Measures the number of times that averageinventory of finished goods was turnedover or sold during a period of time,usually a year.
Days of inventory Inventory
Cost of goods sold � 365
Days Measures the number of one day’s worthof inventory that a company has on hand atany given time.
continued
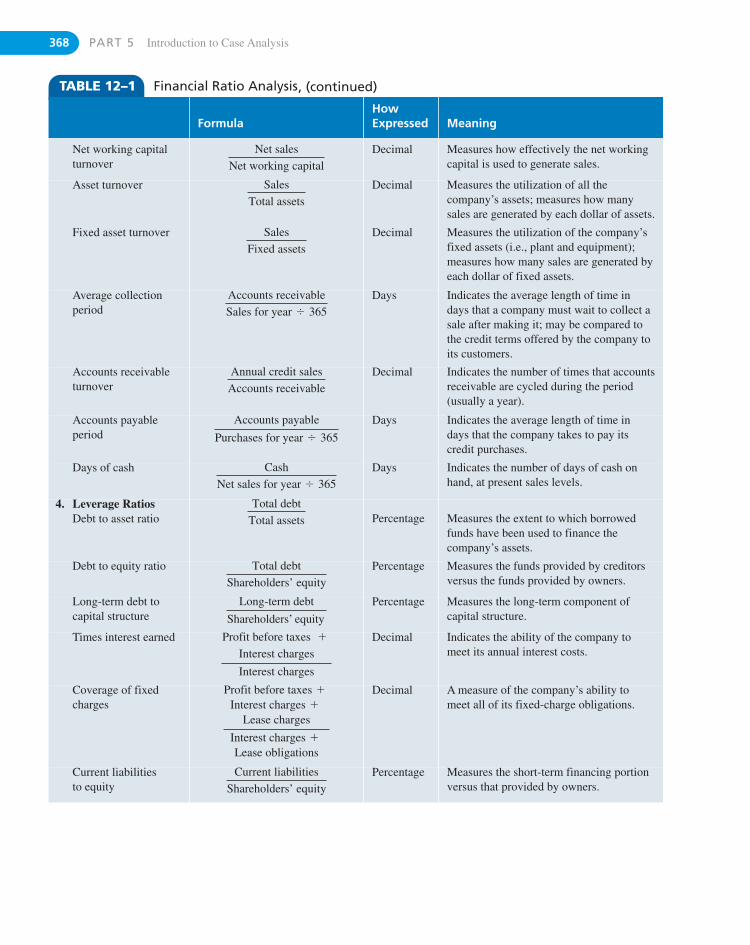
368 PART 5 Introduction to Case Analysis
TABLE 12–1 Financial Ratio Analysis
FormulaHowExpressed Meaning
Net working capitalturnover
Net sales
Net working capitalDecimal Measures how effectively the net working
capital is used to generate sales.
Asset turnover Sales
Total assetsDecimal Measures the utilization of all the
company’s assets; measures how manysales are generated by each dollar of assets.
Fixed asset turnover Sales
Fixed assetsDecimal Measures the utilization of the company’s
fixed assets (i.e., plant and equipment);measures how many sales are generated byeach dollar of fixed assets.
Average collectionperiod
Accounts receivable
Sales for year � 365Days Indicates the average length of time in
days that a company must wait to collect asale after making it; may be compared tothe credit terms offered by the company toits customers.
Accounts receivableturnover
Annual credit sales
Accounts receivableDecimal Indicates the number of times that accounts
receivable are cycled during the period(usually a year).
Accounts payableperiod
Accounts payable
Purchases for year � 365
Days Indicates the average length of time indays that the company takes to pay itscredit purchases.
Days of cash Cash
Net sales for year � 365Days Indicates the number of days of cash on
hand, at present sales levels.
4. Leverage RatiosDebt to asset ratio
Total debt
Total assets Percentage Measures the extent to which borrowedfunds have been used to finance thecompany’s assets.
Debt to equity ratio Total debt
Shareholders’ equityPercentage Measures the funds provided by creditors
versus the funds provided by owners.
Long-term debt tocapital structure
Percentage Measures the long-term component ofcapital structure.
Times interest earned Profit before taxes �
Interest charges
Interest charges
Decimal Indicates the ability of the company tomeet its annual interest costs.
Coverage of fixedcharges
Profit before taxes �
Interest charges �
Lease charges
Interest charges �
Lease obligations
Decimal A measure of the company’s ability tomeet all of its fixed-charge obligations.
Current liabilities to equity
Current liabilities
Shareholders’ equityPercentage Measures the short-term financing portion
versus that provided by owners.
, (continued)
Long-term debt
Shareholders’ equity
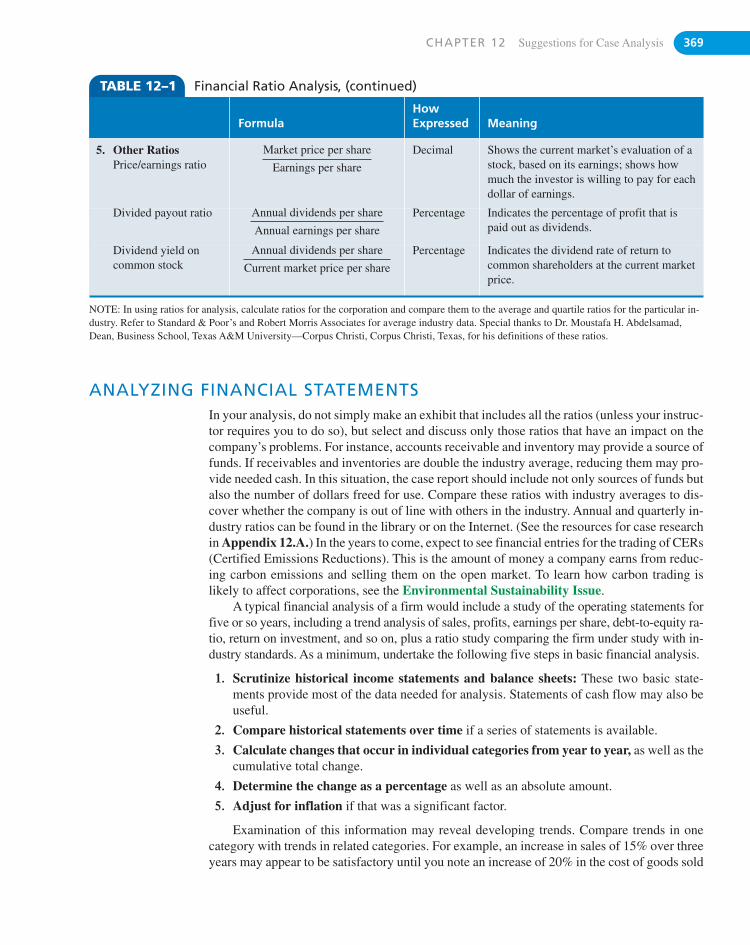
CHAPTER 12 Suggestions for Case Analysis 369
TABLE 12–1 Financial Ratio Analysis
FormulaHowExpressed Meaning
5. Other RatiosPrice/earnings ratio
Market price per share
Earnings per share
Decimal Shows the current market’s evaluation of astock, based on its earnings; shows howmuch the investor is willing to pay for eachdollar of earnings.
Divided payout ratio Annual dividends per share
Annual earnings per share
Percentage Indicates the percentage of profit that ispaid out as dividends.
Dividend yield oncommon stock
Annual dividends per share
Current market price per share
Percentage Indicates the dividend rate of return tocommon shareholders at the current marketprice.
NOTE: In using ratios for analysis, calculate ratios for the corporation and compare them to the average and quartile ratios for the particular in-dustry. Refer to Standard & Poor’s and Robert Morris Associates for average industry data. Special thanks to Dr. Moustafa H. Abdelsamad,Dean, Business School, Texas A&M University—Corpus Christi, Corpus Christi, Texas, for his definitions of these ratios.
ANALYZING FINANCIAL STATEMENTSIn your analysis, do not simply make an exhibit that includes all the ratios (unless your instruc-tor requires you to do so), but select and discuss only those ratios that have an impact on thecompany’s problems. For instance, accounts receivable and inventory may provide a source offunds. If receivables and inventories are double the industry average, reducing them may pro-vide needed cash. In this situation, the case report should include not only sources of funds butalso the number of dollars freed for use. Compare these ratios with industry averages to dis-cover whether the company is out of line with others in the industry. Annual and quarterly in-dustry ratios can be found in the library or on the Internet. (See the resources for case researchin Appendix 12.A.) In the years to come, expect to see financial entries for the trading of CERs(Certified Emissions Reductions). This is the amount of money a company earns from reduc-ing carbon emissions and selling them on the open market. To learn how carbon trading islikely to affect corporations, see the Environmental Sustainability Issue.
A typical financial analysis of a firm would include a study of the operating statements forfive or so years, including a trend analysis of sales, profits, earnings per share, debt-to-equity ra-tio, return on investment, and so on, plus a ratio study comparing the firm under study with in-dustry standards. As a minimum, undertake the following five steps in basic financial analysis.
1. Scrutinize historical income statements and balance sheets: These two basic state-ments provide most of the data needed for analysis. Statements of cash flow may also beuseful.
2. Compare historical statements over time if a series of statements is available.
3. Calculate changes that occur in individual categories from year to year, as well as thecumulative total change.
4. Determine the change as a percentage as well as an absolute amount.
5. Adjust for inflation if that was a significant factor.
Examination of this information may reveal developing trends. Compare trends in onecategory with trends in related categories. For example, an increase in sales of 15% over threeyears may appear to be satisfactory until you note an increase of 20% in the cost of goods sold
, (continued)
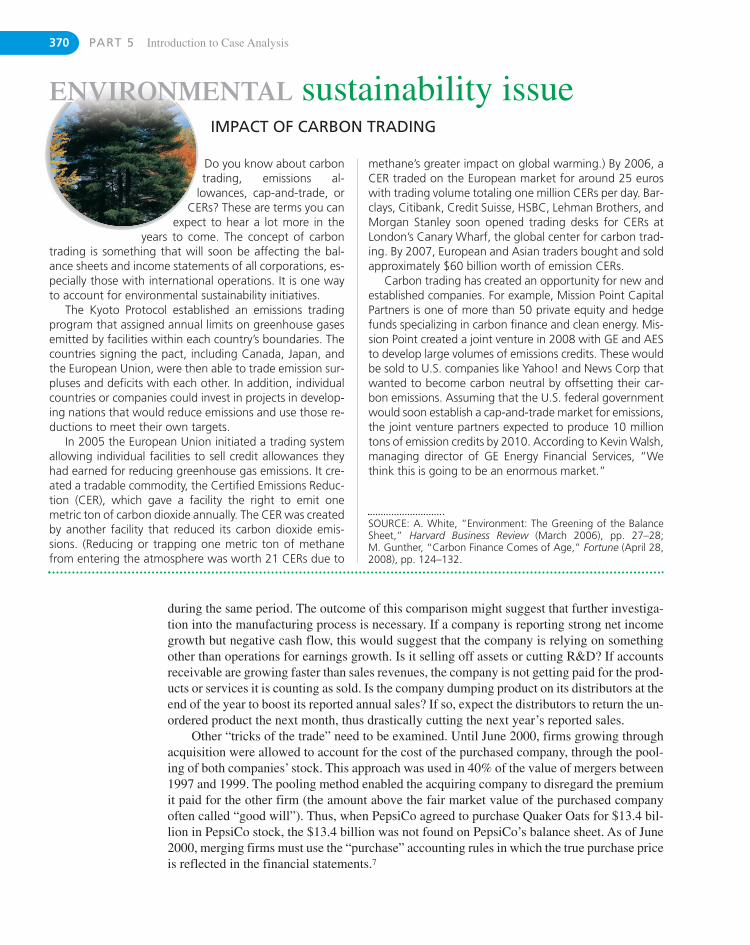
370 PART 5 Introduction to Case Analysis
Do you know about carbontrading, emissions al-
lowances, cap-and-trade, orCERs? These are terms you can
expect to hear a lot more in theyears to come. The concept of carbon
trading is something that will soon be affecting the bal-ance sheets and income statements of all corporations, es-pecially those with international operations. It is one wayto account for environmental sustainability initiatives.
The Kyoto Protocol established an emissions tradingprogram that assigned annual limits on greenhouse gasesemitted by facilities within each country’s boundaries. Thecountries signing the pact, including Canada, Japan, andthe European Union, were then able to trade emission sur-pluses and deficits with each other. In addition, individualcountries or companies could invest in projects in develop-ing nations that would reduce emissions and use those re-ductions to meet their own targets.
In 2005 the European Union initiated a trading systemallowing individual facilities to sell credit allowances theyhad earned for reducing greenhouse gas emissions. It cre-ated a tradable commodity, the Certified Emissions Reduc-tion (CER), which gave a facility the right to emit onemetric ton of carbon dioxide annually. The CER was createdby another facility that reduced its carbon dioxide emis-sions. (Reducing or trapping one metric ton of methanefrom entering the atmosphere was worth 21 CERs due to
IMPACT OF CARBON TRADING
ENVIRONMENTAL sustainability issue
methane’s greater impact on global warming.) By 2006, aCER traded on the European market for around 25 euroswith trading volume totaling one million CERs per day. Bar-clays, Citibank, Credit Suisse, HSBC, Lehman Brothers, andMorgan Stanley soon opened trading desks for CERs atLondon’s Canary Wharf, the global center for carbon trad-ing. By 2007, European and Asian traders bought and soldapproximately $60 billion worth of emission CERs.
Carbon trading has created an opportunity for new andestablished companies. For example, Mission Point CapitalPartners is one of more than 50 private equity and hedgefunds specializing in carbon finance and clean energy. Mis-sion Point created a joint venture in 2008 with GE and AESto develop large volumes of emissions credits. These wouldbe sold to U.S. companies like Yahoo! and News Corp thatwanted to become carbon neutral by offsetting their car-bon emissions. Assuming that the U.S. federal governmentwould soon establish a cap-and-trade market for emissions,the joint venture partners expected to produce 10 milliontons of emission credits by 2010. According to Kevin Walsh,managing director of GE Energy Financial Services, “Wethink this is going to be an enormous market.”
SOURCE: A. White, “Environment: The Greening of the BalanceSheet,” Harvard Business Review (March 2006), pp. 27–28;M. Gunther, “Carbon Finance Comes of Age,” Fortune (April 28,2008), pp. 124–132.
during the same period. The outcome of this comparison might suggest that further investiga-tion into the manufacturing process is necessary. If a company is reporting strong net incomegrowth but negative cash flow, this would suggest that the company is relying on somethingother than operations for earnings growth. Is it selling off assets or cutting R&D? If accountsreceivable are growing faster than sales revenues, the company is not getting paid for the prod-ucts or services it is counting as sold. Is the company dumping product on its distributors at theend of the year to boost its reported annual sales? If so, expect the distributors to return the un-ordered product the next month, thus drastically cutting the next year’s reported sales.
Other “tricks of the trade” need to be examined. Until June 2000, firms growing throughacquisition were allowed to account for the cost of the purchased company, through the pool-ing of both companies’ stock. This approach was used in 40% of the value of mergers between1997 and 1999. The pooling method enabled the acquiring company to disregard the premiumit paid for the other firm (the amount above the fair market value of the purchased companyoften called “good will”). Thus, when PepsiCo agreed to purchase Quaker Oats for $13.4 bil-lion in PepsiCo stock, the $13.4 billion was not found on PepsiCo’s balance sheet. As of June2000, merging firms must use the “purchase” accounting rules in which the true purchase priceis reflected in the financial statements.7
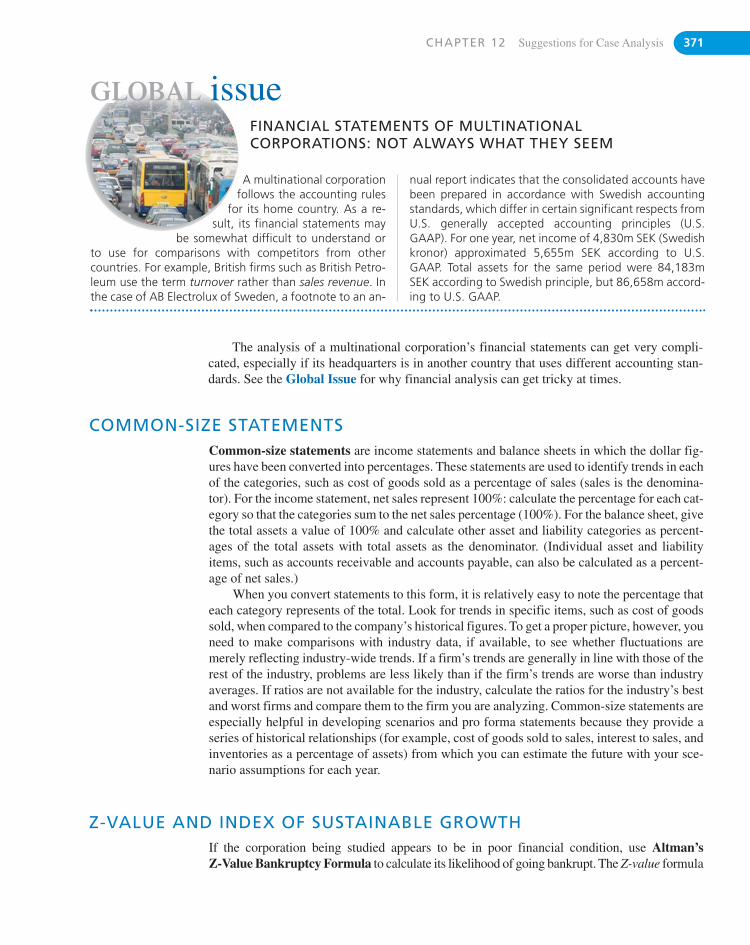
CHAPTER 12 Suggestions for Case Analysis 371
The analysis of a multinational corporation’s financial statements can get very compli-cated, especially if its headquarters is in another country that uses different accounting stan-dards. See the Global Issue for why financial analysis can get tricky at times.
A multinational corporationfollows the accounting rules
for its home country. As a re-sult, its financial statements may
be somewhat difficult to understand orto use for comparisons with competitors from othercountries. For example, British firms such as British Petro-leum use the term turnover rather than sales revenue. Inthe case of AB Electrolux of Sweden, a footnote to an an-
GLOBAL issueFINANCIAL STATEMENTS OF MULTINATIONALCORPORATIONS: NOT ALWAYS WHAT THEY SEEM
nual report indicates that the consolidated accounts havebeen prepared in accordance with Swedish accountingstandards, which differ in certain significant respects fromU.S. generally accepted accounting principles (U.S.GAAP). For one year, net income of 4,830m SEK (Swedishkronor) approximated 5,655m SEK according to U.S.GAAP. Total assets for the same period were 84,183mSEK according to Swedish principle, but 86,658m accord-ing to U.S. GAAP.
COMMON-SIZE STATEMENTSCommon-size statements are income statements and balance sheets in which the dollar fig-ures have been converted into percentages. These statements are used to identify trends in eachof the categories, such as cost of goods sold as a percentage of sales (sales is the denomina-tor). For the income statement, net sales represent 100%: calculate the percentage for each cat-egory so that the categories sum to the net sales percentage (100%). For the balance sheet, givethe total assets a value of 100% and calculate other asset and liability categories as percent-ages of the total assets with total assets as the denominator. (Individual asset and liabilityitems, such as accounts receivable and accounts payable, can also be calculated as a percent-age of net sales.)
When you convert statements to this form, it is relatively easy to note the percentage thateach category represents of the total. Look for trends in specific items, such as cost of goodssold, when compared to the company’s historical figures. To get a proper picture, however, youneed to make comparisons with industry data, if available, to see whether fluctuations aremerely reflecting industry-wide trends. If a firm’s trends are generally in line with those of therest of the industry, problems are less likely than if the firm’s trends are worse than industryaverages. If ratios are not available for the industry, calculate the ratios for the industry’s bestand worst firms and compare them to the firm you are analyzing. Common-size statements areespecially helpful in developing scenarios and pro forma statements because they provide aseries of historical relationships (for example, cost of goods sold to sales, interest to sales, andinventories as a percentage of assets) from which you can estimate the future with your sce-nario assumptions for each year.
Z-VALUE AND INDEX OF SUSTAINABLE GROWTHIf the corporation being studied appears to be in poor financial condition, use Altman’s Z-Value Bankruptcy Formula to calculate its likelihood of going bankrupt. The Z-value formula
372 PART 5 Introduction to Case Analysis
USEFUL ECONOMIC MEASURESIf you are analyzing a company over many years, you may want to adjust sales and net incomefor inflation to arrive at “true” financial performance in constant dollars. Constant dollars aredollars adjusted for inflation to make them comparable over various years. One way to adjustfor inflation in the United States is to use the Consumer Price Index (CPI), as given inTable 12–2. Dividing sales and net income by the CPI factor for that year will change the fig-ures to 1982–1984 U.S. constant dollars (when the CPI was 1.0). Adjusting for inflation is es-pecially important for companies operating in the emerging economies, like China and Russia,where inflation in 2008 rose to 6.6%, the highest in 10 years. In that same year, Zimbabwe’sinflation rate was the highest in the world at 2.2 million%!11
Another helpful analytical aid provided in Table 12–2 is the prime interest rate, the rateof interest banks charge on their lowest-risk loans. For better assessments of strategic deci-sions, it can be useful to note the level of the prime interest rate at the time of the case. A de-cision to borrow money to build a new plant would have been a good one in 2003 at 4.1% butless practical in 2007 when the average rate was 8.1%.
combines five ratios by weighting them according to their importance to a corporation’s finan-cial strength. The formula is:
Z � 1.2x1 � 1.4x2 � 3.3x3 � 0.6x4 � 1.0x5
where:
x1 � Working capital/Total assets (%)
x2 � Retained earnings/Total assets (%)
x3 � Earnings before interest and taxes/Total assets (%)
x4 � Market value of equity/Total liabilities (%)
x5 � Sales/Total assets (number of times)
A score below 1.81 indicates significant credit problems, whereas a score above 3.0 indi-cates a healthy firm. Scores between 1.81 and 3.0 indicate question marks.8 The Altman Zmodel has achieved a remarkable 94% accuracy in predicting corporate bankruptcies. Its ac-curacy is excellent in the two years before financial distress, but diminishes as the lead timeincreases.9
The index of sustainable growth is useful to learn whether a company embarking on agrowth strategy will need to take on debt to fund this growth. The index indicates how muchof the growth rate of sales can be sustained by internally generated funds. The formula is:
where:
P � (Net profit before tax/Net sales)�100
D � Target dividends/Profit after tax
L � Total liabilities/Net worth
T � (Total assets/Net sales)�100
If the planned growth rate calls for a growth rate higher than its g*, external capital will beneeded to fund the growth unless management is able to find efficiencies, decrease dividends,increase the debt-equity ratio, or reduce assets through renting or leasing arrangements.10
g* =3P11 - D211 + L24
3T - P11 - D211 + L24
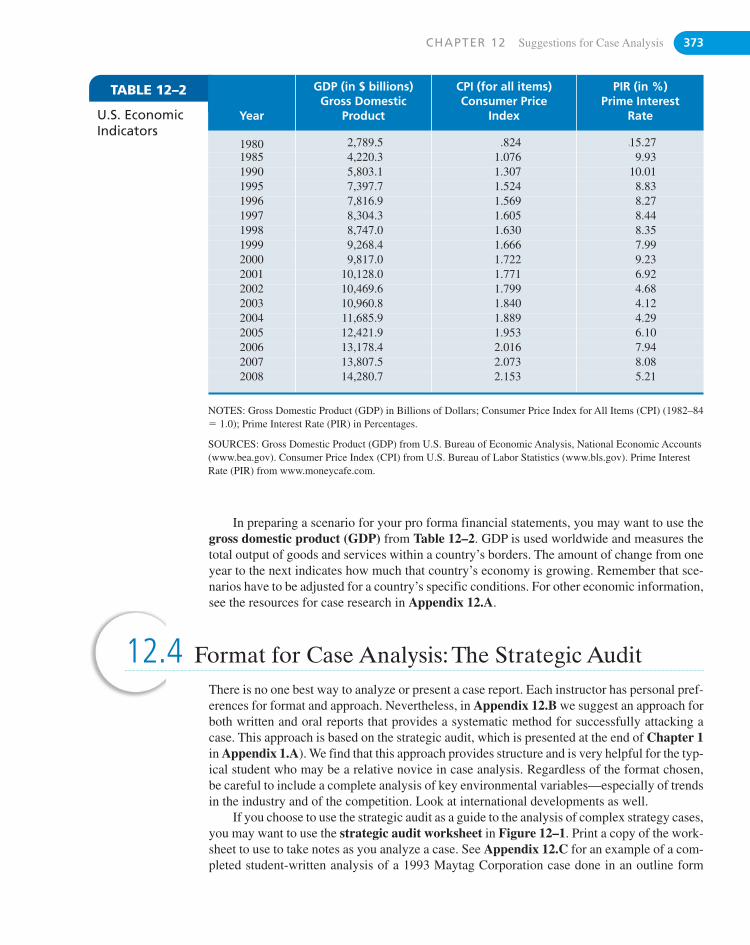
CHAPTER 12 Suggestions for Case Analysis 373
TABLE 12–2
Year
GDP (in $ billions)Gross Domestic
Product
CPI (for all items)Consumer Price
Index
PIR (in %)Prime Interest
Rate
1980 2,789.5 .824 Ï15.271985 4,220.3 1.076 9.931990 5,803.1 1.307 10.011995 7,397.7 1.524 8.831996 7,816.9 1.569 8.271997 8,304.3 1.605 8.441998 8,747.0 1.630 8.351999 9,268.4 1.666 7.992000 9,817.0 1.722 9.232001 10,128.0 1.771 6.922002 10,469.6 1.799 4.682003 10,960.8 1.840 4.122004 11,685.9 1.889 4.292005 12,421.9 1.953 6.102006 13,178.4 2.016 7.942007 13,807.5 2.073 8.082008 14,280.7 2.153 5.21
NOTES: Gross Domestic Product (GDP) in Billions of Dollars; Consumer Price Index for All Items (CPI) (1982–84� 1.0); Prime Interest Rate (PIR) in Percentages.
SOURCES: Gross Domestic Product (GDP) from U.S. Bureau of Economic Analysis, National Economic Accounts(www.bea.gov). Consumer Price Index (CPI) from U.S. Bureau of Labor Statistics (www.bls.gov). Prime InterestRate (PIR) from www.moneycafe.com.
U.S. EconomicIndicators
In preparing a scenario for your pro forma financial statements, you may want to use thegross domestic product (GDP) from Table 12–2. GDP is used worldwide and measures thetotal output of goods and services within a country’s borders. The amount of change from oneyear to the next indicates how much that country’s economy is growing. Remember that sce-narios have to be adjusted for a country’s specific conditions. For other economic information,see the resources for case research in Appendix 12.A.
12.4 Format for Case Analysis: The Strategic AuditThere is no one best way to analyze or present a case report. Each instructor has personal pref-erences for format and approach. Nevertheless, in Appendix 12.B we suggest an approach forboth written and oral reports that provides a systematic method for successfully attacking acase. This approach is based on the strategic audit, which is presented at the end of Chapter 1in Appendix 1.A). We find that this approach provides structure and is very helpful for the typ-ical student who may be a relative novice in case analysis. Regardless of the format chosen,be careful to include a complete analysis of key environmental variables—especially of trendsin the industry and of the competition. Look at international developments as well.
If you choose to use the strategic audit as a guide to the analysis of complex strategy cases,you may want to use the strategic audit worksheet in Figure 12–1. Print a copy of the work-sheet to use to take notes as you analyze a case. See Appendix 12.C for an example of a com-pleted student-written analysis of a 1993 Maytag Corporation case done in an outline form
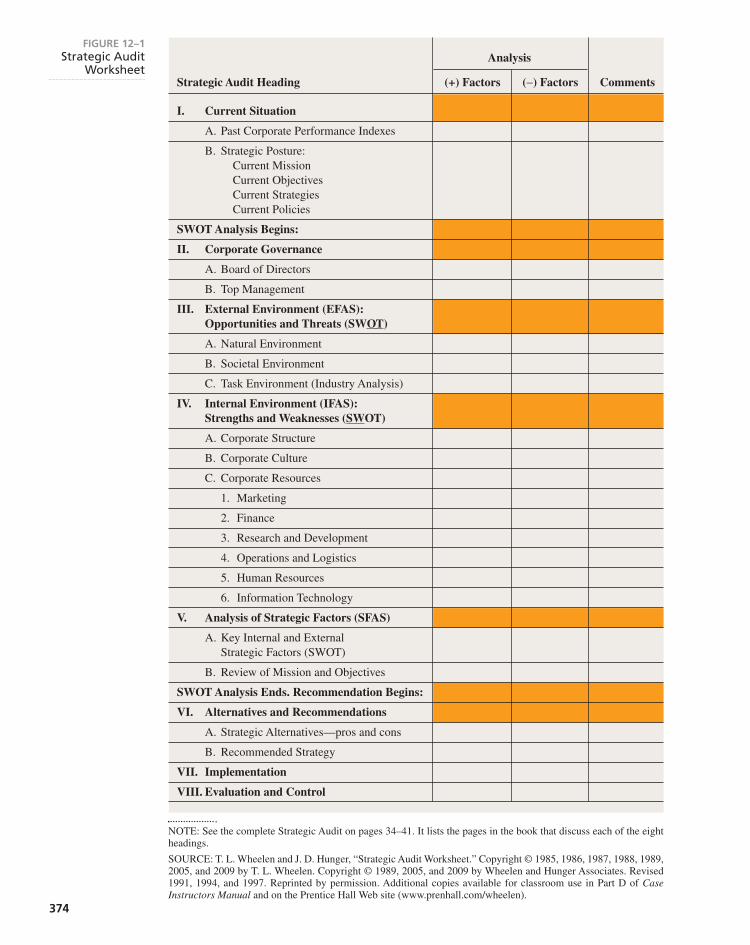
Analysis
Strategic Audit Heading (+) Factors (−) Factors Comments
I. Current Situation
A. Past Corporate Performance Indexes
B. Strategic Posture:Current MissionCurrent ObjectivesCurrent StrategiesCurrent Policies
SWOT Analysis Begins:
II. Corporate Governance
A. Board of Directors
B. Top Management
III. External Environment (EFAS):Opportunities and Threats (SWOT)
A. Natural Environment
B. Societal Environment
C. Task Environment (Industry Analysis)
IV. Internal Environment (IFAS):Strengths and Weaknesses (SWOT)
A. Corporate Structure
B. Corporate Culture
C. Corporate Resources
1. Marketing
2. Finance
3. Research and Development
4. Operations and Logistics
5. Human Resources
6. Information Technology
V. Analysis of Strategic Factors (SFAS)
A. Key Internal and ExternalStrategic Factors (SWOT)
B. Review of Mission and Objectives
SWOT Analysis Ends. Recommendation Begins:
VI. Alternatives and Recommendations
A. Strategic Alternatives—pros and cons
B. Recommended Strategy
VII. Implementation
VIII. Evaluation and Control
FIGURE 12–1Strategic Audit
Worksheet
NOTE: See the complete Strategic Audit on pages 34–41. It lists the pages in the book that discuss each of the eightheadings.
SOURCE: T. L. Wheelen and J. D. Hunger, “Strategic Audit Worksheet.” Copyright © 1985, 1986, 1987, 1988, 1989,2005, and 2009 by T. L. Wheelen. Copyright © 1989, 2005, and 2009 by Wheelen and Hunger Associates. Revised1991, 1994, and 1997. Reprinted by permission. Additional copies available for classroom use in Part D of CaseInstructors Manual and on the Prentice Hall Web site (www.prenhall.com/wheelen).
374
CHAPTER 12 Suggestions for Case Analysis 375
End of Chapter SUMMARYUsing case analysis is one of the best ways to understand and remember the strategic manage-ment process. By applying to cases the concepts and techniques you have learned, you will beable to remember them long past the time when you have forgotten other memorized bits ofinformation. The use of cases to examine actual situations brings alive the field of strategicmanagement and helps build your analytic and decision-making skills. These are just some ofthe reasons why the use of cases in disciplines from agribusiness to health care is increasingthroughout the world.
E C O - B I T S� A 2007 McKinsey & Company survey of 7,751 people
in eight countries found that 87% of consumers worryabout the environment and the social impact of theproducts they buy.
� The same 2007 survey found that only 33% of the con-sumers said that they were ready to buy green productsor had already done so.
� In a 2007 Chain Store Age survey of U.S. consumers,only 25% of them had bought any green products otherthan organic food or energy-efficient lighting.12
D I S C U S S I O N Q U E S T I O N S1. Why should you begin a case analysis with a financial
analysis? When are other approaches appropriate?
2. What are common-size financial statements? What istheir value to case analysis? How are they calculated?
3. When should you gather information outside a case bygoing to the library or using the Internet? What shouldyou look for?
4. When is inflation an important issue in conducting caseanalysis? Why bother?
5. How can you learn what date a case took place?
using the strategic audit format. This is one example of what a case analysis in outline formmay look like.
Case discussion focuses on critical analysis and logical development of thought. A solu-tion is satisfactory if it resolves important problems and is likely to be implemented success-fully. How the corporation actually dealt with the case problems has no real bearing on theanalysis because management might have analyzed its problems incorrectly or implemented aseries of flawed solutions.
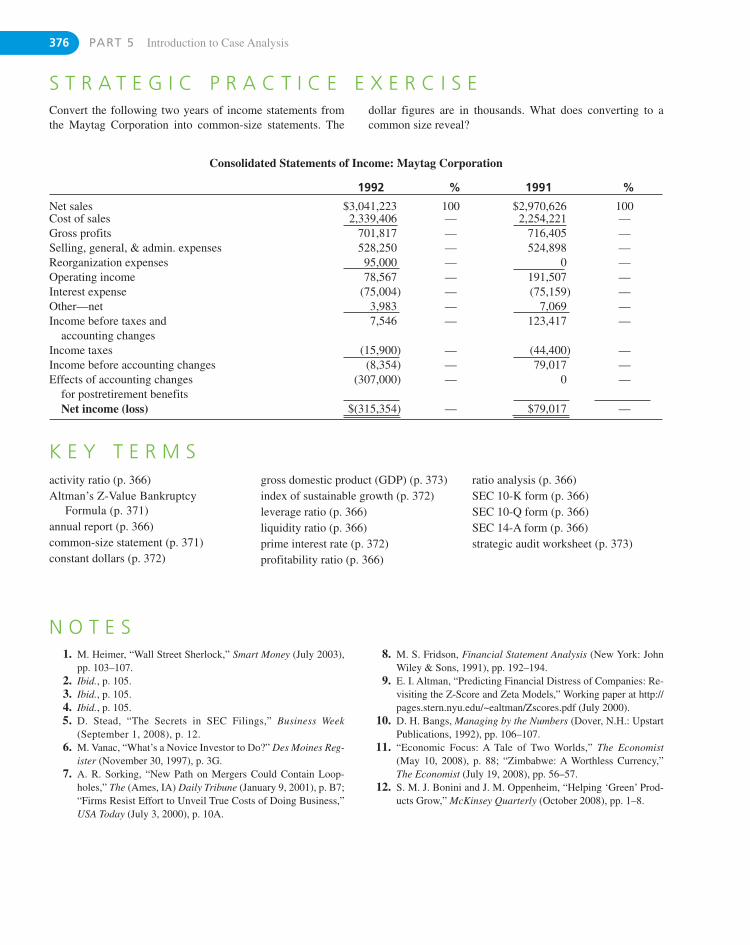
376 PART 5 Introduction to Case Analysis
S T R A T E G I C P R A C T I C E E X E R C I S EConvert the following two years of income statements fromthe Maytag Corporation into common-size statements. The
dollar figures are in thousands. What does converting to acommon size reveal?
K E Y T E R M Sactivity ratio (p. 366)Altman’s Z-Value Bankruptcy
Formula (p. 371)annual report (p. 366)common-size statement (p. 371)constant dollars (p. 372)
gross domestic product (GDP) (p. 373)index of sustainable growth (p. 372)leverage ratio (p. 366)liquidity ratio (p. 366)prime interest rate (p. 372)profitability ratio (p. 366)
ratio analysis (p. 366)SEC 10-K form (p. 366)SEC 10-Q form (p. 366)SEC 14-A form (p. 366)strategic audit worksheet (p. 373)
Consolidated Statements of Income: Maytag Corporation
1992 % 1991 %
Net sales $3,041,223 100 $2,970,626 100Cost of sales 2,339,406 — 2,254,221 —Gross profits 701,817 — 716,405 —Selling, general, & admin. expenses 528,250 — 524,898 —Reorganization expenses 95,000 — 0 —Operating income 78,567 — 191,507 —Interest expense (75,004) — (75,159) —Other—net 3,983 — 7,069 —Income before taxes and
accounting changes7,546 — 123,417 —
Income taxes (15,900) — (44,400) —Income before accounting changes (8,354) — 79,017 —Effects of accounting changes
for postretirement benefits(307,000) — 0 —
Net income (loss) $(315,354) — $79,017 —
N O T E S1. M. Heimer, “Wall Street Sherlock,” Smart Money (July 2003),
pp. 103–107.2. Ibid., p. 105.3. Ibid., p. 105.4. Ibid., p. 105.5. D. Stead, “The Secrets in SEC Filings,” Business Week
(September 1, 2008), p. 12.6. M. Vanac, “What’s a Novice Investor to Do?” Des Moines Reg-
ister (November 30, 1997), p. 3G.7. A. R. Sorking, “New Path on Mergers Could Contain Loop-
holes,” The (Ames, IA) Daily Tribune (January 9, 2001), p. B7;“Firms Resist Effort to Unveil True Costs of Doing Business,”USA Today (July 3, 2000), p. 10A.
8. M. S. Fridson, Financial Statement Analysis (New York: JohnWiley & Sons, 1991), pp. 192–194.
9. E. I. Altman, “Predicting Financial Distress of Companies: Re-visiting the Z-Score and Zeta Models,” Working paper at http://pages.stern.nyu.edu/~ealtman/Zscores.pdf (July 2000).
10. D. H. Bangs, Managing by the Numbers (Dover, N.H.: UpstartPublications, 1992), pp. 106–107.
11. “Economic Focus: A Tale of Two Worlds,” The Economist(May 10, 2008), p. 88; “Zimbabwe: A Worthless Currency,”The Economist (July 19, 2008), pp. 56–57.
12. S. M. J. Bonini and J. M. Oppenheim, “Helping ‘Green’ Prod-ucts Grow,” McKinsey Quarterly (October 2008), pp. 1–8.
Company Information
1. Annual reports
2. Moody’s Manuals on Investment (a listing of companies within certain industries that contains abrief history and a five-year financial statement of each company)
3. Securities and Exchange Commission Annual Report Form 10-K (annually) and 10-Q (quarterly)
4. Standard & Poor’s Register of Corporations, Directors, and Executives
5. Value Line’s Investment Survey
6. Findex’s Directory of Market Research Reports, Studies and Surveys (a listing by Find/SVP of morethan 11,000 studies conducted by leading research firms)
7. Compustat, Compact Disclosure, CD/International, and Hoover’s Online Corporate Directory(computerized operating and financial information on thousands of publicly held corporations)
8. Shareholders meeting notices in SEC Form 14-A (proxy notices)
Economic Information
1. Regional statistics and local forecasts from large banks
2. Business Cycle Development (Department of Commerce)
3. Chase Econometric Associates’ publications
4. U.S. Census Bureau publications on population, transportation, and housing
5. Current Business Reports (U.S. Department of Commerce)
6. Economic Indicators (U.S. Joint Economic Committee)
7. Economic Report of the President to Congress
8. Long-Term Economic Growth (U.S. Department of Commerce)
9. Monthly Labor Review (U.S. Department of Labor)
10. Monthly Bulletin of Statistics (United Nations)
11. Statistical Abstract of the United States (U.S. Department of Commerce)
12. Statistical Yearbook (United Nations)
13. Survey of Current Business (U.S. Department of Commerce)
14. U.S. Industrial Outlook (U.S. Department of Defense)
15. World Trade Annual (United Nations)
16. Overseas Business Reports (by country, published by the U.S. Department of Commerce)
Industry Information
1. Analyses of companies and industries by investment brokerage firms
2. Business Week (provides weekly economic and business information, as well as quarterly profit andsales rankings of corporations)
377
Resourcesfor Case Research
A P P E N D I X 12.A
3. Fortune (each April publishes listings of financial information on corporations within certain industries)
4. Industry Survey (published quarterly by Standard & Poor’s)
5. Industry Week (late March/early April issue provides information on 14 industry groups)
6. Forbes (mid-January issue provides performance data on firms in various industries)
7. Inc. (May and December issues give information on fast-growing entrepreneurial companies)
Directory and Index Information on Companies and Industries
1. Business Periodical Index (on computers in many libraries)
2. Directory of National Trade Associations
3. Encyclopedia of Associations
4. Funk and Scott’s Index of Corporations and Industries
5. Thomas’ Register of American Manufacturers
6. Wall Street Journal Index
Ratio Analysis Information
1. Almanac of Business and Industrial Financial Ratios (Prentice Hall)
2. Annual Statement Studies (Risk Management Associates; also Robert Morris Associates)
3. Dun’s Review (Dun & Bradstreet; published annually in September–December issues)
4. Industry Norms and Key Business Ratios (Dun & Bradstreet)
Online Information
1. Hoover’s Online—financial statements and profiles of public companies (www.hoovers.com)
2. U.S. Securities and Exchange Commission—official filings of public companies in Edgar database(www.sec.gov)
3. Fortune 500—statistics for largest U.S. corporations (www.fortune.com)
4. Dun & Bradstreet’s Online—short reports on 10 million public and private U.S. companies(smallbusiness.dnb.com)
5. Ecola’s 24-Hour Newsstand—links to Web sites of 2,000 newspapers, journals, and magazines(www.ecola.com)
6. Competitive Intelligence Guide—information on company resources (www.fuld.com)
7. Society of Competitive Intelligence Professionals (www.scip.org)
8. The Economist—provides international information and surveys (www.economist.com)
9. CIA World Fact Book—international information by country (http://www.cia.gov)
10. Bloomberg—information on interest rates, stock prices, currency conversion rates, and other gen-eral financial information (www.bloomberg.com)
11. The Scannery—information on international companies (www.thescannery.com)
12. CEOExpress—links to many valuable sources of business information (www.ceoexpress.com)
13. Wall Street Journal—business news (www.wsj.com)
14. Forbes—America’s largest private companies (http://www.forbes.com/lists/)
15. CorporateInformation.com—subscription service for company profiles (www.corporateinformation.com)
16. Kompass International—industry information (www.kompass.com)
17. CorpTech—database of technology companies (www.corptech.com)
18. ADNet—information technology industry (www.companyfinder.com)
19. CNN company research—provides company information (http://money.cnn.com/news/crc/)
378 PART 5 Introduction to Case Analysis

CHAPTER 12 Suggestions for Case Analysis 379
20. Paywatch—database of executive compensation (http://www.aflcio.org/corporatewatch/paywatch/)
21. Global Edge Global Resources—international resources (http://globaledge.msu.edu/resourceDesk/)
22. Google Finance—data on North American stocks (http://finance.google.com/finance)
23. World Federation of Exchanges—international stock exchanges (www.world-exchanges.org/)
24. SEC International Registry—data on international corporations (http://www.sec.gov/divisions/corpfin/internatl/companies.shtml)
25. Yahoo Finance—data on North American companies (http://finance.yahoo.com)
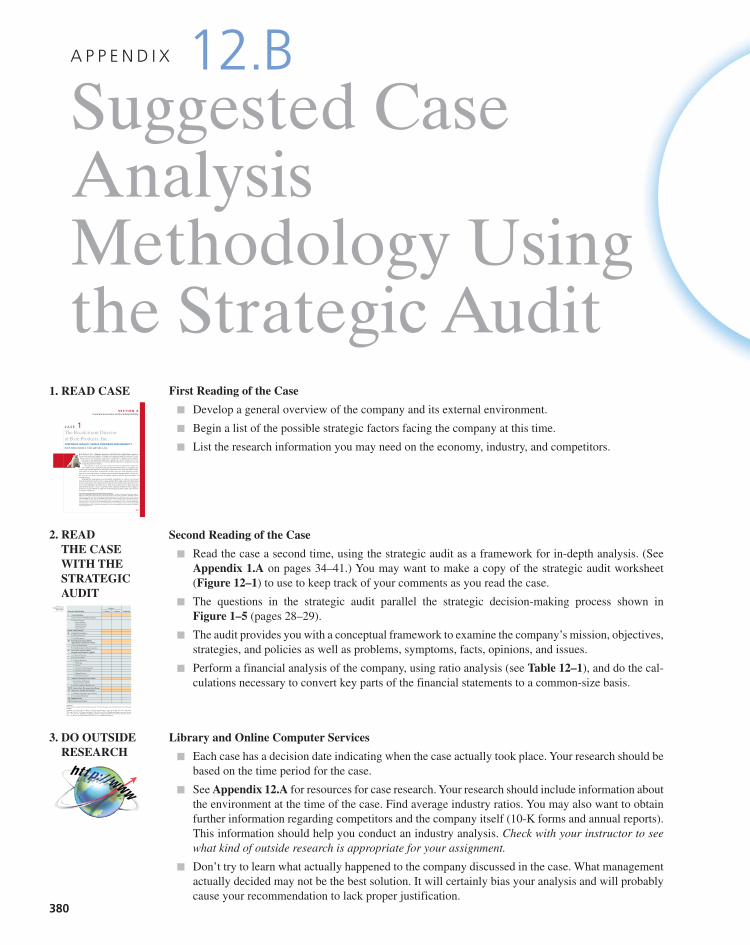
First Reading of the Case
� Develop a general overview of the company and its external environment.
� Begin a list of the possible strategic factors facing the company at this time.
� List the research information you may need on the economy, industry, and competitors.
Suggested CaseAnalysisMethodology Usingthe Strategic Audit
A P P E N D I X 12.B
1. READ CASE
2. READ THE CASEWITH THESTRATEGICAUDIT
3. DO OUTSIDERESEARCH
Second Reading of the Case
� Read the case a second time, using the strategic audit as a framework for in-depth analysis. (SeeAppendix 1.A on pages 34–41.) You may want to make a copy of the strategic audit worksheet(Figure 12–1) to use to keep track of your comments as you read the case.
� The questions in the strategic audit parallel the strategic decision-making process shown inFigure 1–5 (pages 28–29).
� The audit provides you with a conceptual framework to examine the company’s mission, objectives,strategies, and policies as well as problems, symptoms, facts, opinions, and issues.
� Perform a financial analysis of the company, using ratio analysis (see Table 12–1), and do the cal-culations necessary to convert key parts of the financial statements to a common-size basis.
Library and Online Computer Services
� Each case has a decision date indicating when the case actually took place. Your research should bebased on the time period for the case.
� See Appendix 12.A for resources for case research. Your research should include information aboutthe environment at the time of the case. Find average industry ratios. You may also want to obtainfurther information regarding competitors and the company itself (10-K forms and annual reports).This information should help you conduct an industry analysis. Check with your instructor to seewhat kind of outside research is appropriate for your assignment.
� Don’t try to learn what actually happened to the company discussed in the case. What managementactually decided may not be the best solution. It will certainly bias your analysis and will probablycause your recommendation to lack proper justification.
BYTE PRODUCTS, INC., IS PRIMARILY INVOLVED IN THE PRODUCTION OF ELECTRONIC componentsthat are used in personal computers. Although such components might be found in a few com-puters in home use, Byte products are found most frequently in computers used for sophisti-cated business and engineering applications. Annual sales of these products have been
steadily increasing over the past several years; Byte Products, Inc., currently has total salesof approximately $265 million.
Over the past six years, increases in yearly revenues have consistently reached 12%.Byte Products, Inc., headquartered in the midwestern United States, is regarded as one
of the largest-volume suppliers of specialized components and is easily the industry leader,with some 32% market share. Unfortunately for Byte, many new firms—domestic and for-eign—have entered the industry. A dramatic surge in demand, high profitability, and the rela-tive ease of a new firm’s entry into the industry explain in part the increased number ofcompeting firms.
Although Byte management—and presumably shareholders as well—is very pleasedabout the growth of its markets, it faces a major problem: Byte simply cannot meet the demandfor these components. The company currently operates three manufacturing facilities in vari-ous locations throughout the United States. Each of these plants operates three productionshifts (24 hours per day), 7 days a week. This activity constitutes virtually all of the company’sproduction capacity. Without an additional manufacturing plant, Byte simply cannot increaseits output of components.
This case was prepared by Professors Dan R. Dalton and Richard A. Cosier of the Graduate School of Business atIndiana University and Cathy A. Enz of Cornell University. The names of the organization, individual, location,and/or financial information have been disguised to preserve the organization’s desire for anonymity. This case wasedited for SMBP–9th, 10th, 11th, and 12th Editions. Reprint permission is solely granted to the publisher, PrenticeHall, for the book, Strategic Management and Business Policy – 12th Edition and cases in Strategic Managementand Business Policy, 12th Edition by copyright holders Dan R. Dalton, Richard A. Cosier, and Cathy A. Enz. Anyother publication of this case (translation, any form of electronic or other media), or sold (any form of partnership)to another publisher will be in violation of copyright laws, unless the copyright holders have granted an additionalwritten reprint permission.
401
C A S E 1The Recalcitrant Director at Byte Products, Inc.:CORPORATE LEGALITY VERSUS CORPORATE RESPONSIBILITYDan R. Dalton, Richard A. Cosier, and Cathy A. Enz
S E C T I O N ACorporate Governance and Social Responsibility
Analysis
Strategic Audit Heading (+) Factors (−) Factors Comments
I. Current Situation
A. Past Corporate Performance Indexes
B. Strategic Posture:Current MissionCurrent ObjectivesCurrent StrategiesCurrent Policies
SWOT Analysis Begins:
II. Corporate Governance
A. Board of Directors
B. Top Management
III. External Environment (EFAS):Opportunities and Threats (SWOT)
A. Societal Environment
B. Task Environment (Industry Analysis)
IV. Internal Environment (IFAS):Strengths and Weaknesses (SWOT)
A. Corporate Structure
B. Corporate Culture
C. Corporate Resources
1. Marketing
2. Finance
3. Research and Development
4. Operations and Logistics
5. Human Resources
6. Information Systems
V. Analysis of Strategic Factors (SFAS)
A. Key Internal and ExternalStrategic Factors (SWOT)
B. Review of Mission and Objectives
SWOT Analysis Ends. Recommendation Begins:
VI. Alternatives and Recommendations
A. Strategic Alternatives—pros and cons
B. Recommended Strategy
VII. Implementation
VIII. Evaluation and Control
FIGURE 12–1Strategic Audit
Worksheet
NOTE: See the complete Strategic Audit on pages 26–33. It lists the pages in the book that discuss each of the eightheadings.
SOURCE: T. L. Wheelen and J. D. Hunger, “Strategic Audit Worksheet.” Copyright © 1985, 1986, 1987, 1988, 1989,2005, and 2009 by T. L. Wheelen. Copyright © 1989, 2005, and 2009 by Wheelen and Hunger Associates. Revised1991, 1994, and 1997. Reprinted by permission. Additional copies available for classroom use in Part D of CaseInstructors Manual and on the Prentice Hall Web site (www.prenhall.com/wheelen).
380
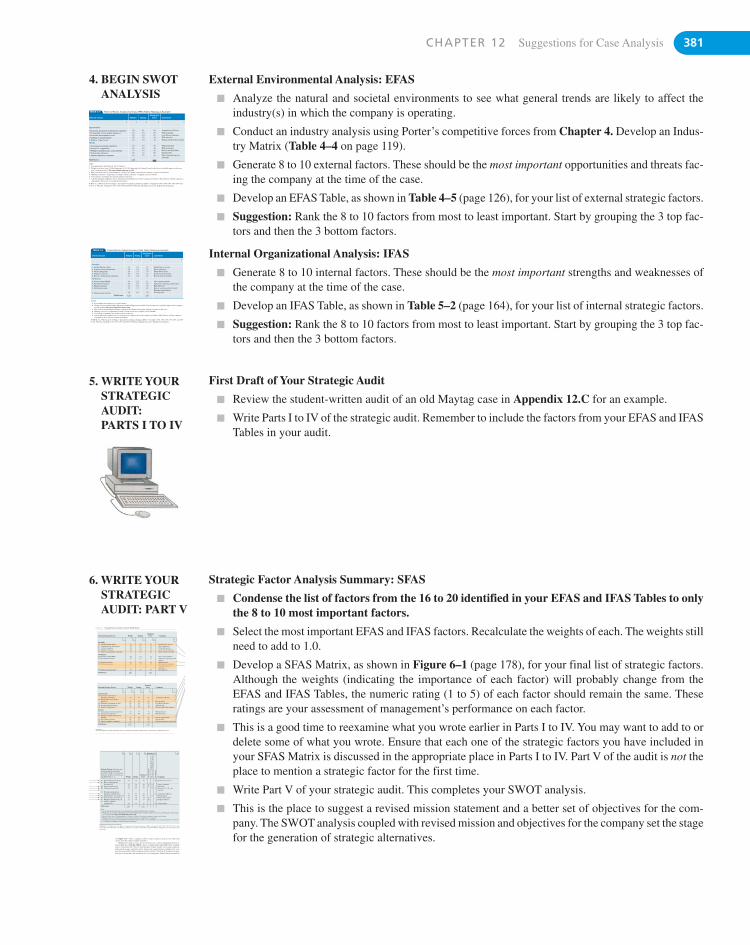
CHAPTER 12 Suggestions for Case Analysis 381
External Environmental Analysis: EFAS
� Analyze the natural and societal environments to see what general trends are likely to affect theindustry(s) in which the company is operating.
� Conduct an industry analysis using Porter’s competitive forces from Chapter 4. Develop an Indus-try Matrix (Table 4–4 on page 119).
� Generate 8 to 10 external factors. These should be the most important opportunities and threats fac-ing the company at the time of the case.
� Develop an EFAS Table, as shown in Table 4–5 (page 126), for your list of external strategic factors.
� Suggestion: Rank the 8 to 10 factors from most to least important. Start by grouping the 3 top fac-tors and then the 3 bottom factors.
Internal Organizational Analysis: IFAS
� Generate 8 to 10 internal factors. These should be the most important strengths and weaknesses ofthe company at the time of the case.
� Develop an IFAS Table, as shown in Table 5–2 (page 164), for your list of internal strategic factors.
� Suggestion: Rank the 8 to 10 factors from most to least important. Start by grouping the 3 top fac-tors and then the 3 bottom factors.
TABLE 4–5 External Factor Analysis Summary (EFAS Table): Maytag as Example
External Factors Weight RatingWeighted
Score Comments
1 2 3 4 5
Opportunities
� Economic integration of European Community .20 4.1 .82 Acquisition of Hoover� Demographics favor quality appliances .10 5.0 .50 Maytag quality� Economic development of Asia .05 1.0 .05 Low Maytag presence� Opening of Eastern Europe .05 2.0 .10 Will take time� Trend to “Super Stores” .10 1.8 .18 Maytag weak in this channel
Threats
� Increasing government regulations .10 4.3 .43 Well positioned� Strong U.S. competition .10 4.0 .40 Well positioned� Whirlpool and Electrolux strong globally .15 3.0 .45 Hoover weak globally� New product advances .05 1.2 .06 Questionable� Japanese appliance companies .10 1.6 .16 Only Asian presence in
AustraliaTotal Scores 1.00 3.15
OTES:1. List opportunities and threats (8–10) in Column 1.2. Weight each factor from 1.0 (Most Important) to 0.0 (Not Important) in Column 2 based on that factor’s probable impact on the com-
pany’s strategic position. The total weights must sum to 1.00.3. Rate each factor from 5.0 (Outstanding) to 1.0 (Poor) in Column 3 based on the company’s response to that factor.4. Multiply each factor’s weight times its rating to obtain each factor’s weighted score in Column 4.5. Use Column 5 (comments) for rationale used for each factor.6. Add the individual weighted scores to obtain the total weighted score for the company in Column 4. This tells how well the company is
responding to the factors in its external environment.
OURCE: T. L. Wheelen and J. D. Hunger, “External Factors Analysis Summary (EFAS).” Copyright © 1987, 1988, 1989, 1990, 2005 and07 by T. L. Wheelen. Copyright © 1991, 2003, 2005 and 2009 by Wheelen and Hunger Associates. Reprinted by permission.
4. BEGIN SWOTANALYSIS
5. WRITE YOURSTRATEGICAUDIT:PARTS I TO IV
First Draft of Your Strategic Audit
� Review the student-written audit of an old Maytag case in Appendix 12.C for an example.
� Write Parts I to IV of the strategic audit. Remember to include the factors from your EFAS and IFASTables in your audit.
6. WRITE YOURSTRATEGICAUDIT: PART V
FIGURE 6–1 Strategic Factor Analysis Summary (SFAS) Matrix
*The most important external and internal factors are identified in the EFAS and IFAS tables as shown here by shading these factors.
WeightedExternal Strategic Factors Weight Rating Score Comments
1 2 3 4 5
OpportunitiesO1 Economic integration of
European Community .20 4.1 .82 Acquisition of HooverO2 Demographics favor quality
appliances .10 5.0 .50 Maytag qualityO3 Economic development of Asia .05 1.0 .05 Low Maytag presenceO4 Opening of Eastern Europe .05 2.0 .10 Will take timeO5 Trend to “Super Stores” .10 1.8 .18 Maytag weak in this channel
ThreatsT1 Increasing government regulations .10 4.3 .43 Well positionedT2 Strong U.S. competition .10 4.0 .40 Well positionedT3 Whirlpool and Electrolux strong
globally .15 3.0 .45 Hoover weak globallyT4 New product advances .05 1.2 .06 QuestionableT5 Japanese appliance companies .10 1.6 .16 Only Asian presence is Australia
Total Scores 1.00 3.15
WeightedInternal Strategic Factors Weight Rating Score Comments
1 2 3 4 5
StrengthsS1 Quality Maytag culture .15 5.0 .75 Quality key to successS2 Experienced top management .05 4.2 .21 Know appliancesS3 Vertical integration .10 3.9 .39 Dedicated factoriesS4 Employee relations .05 3.0 .15 Good, but deterioratingS5 Hoover’s international orientation .15 2.8 .42 Hoover name in cleaners
WeaknessesW1 Process-oriented R&D .05 2.2 .11 Slow on new productsW2 Distribution channels .05 2.0 .10 Superstores replacing small
dealersW3 Financial position .15 2.0 .30 High debt loadW4 Global positioning .20 2.1 .42 Hoover weak outside the
United Kingdom andAustralia
W5 Manufacturing facilities .05 4.0 .20 Investing now
Total Scores 1.00 3.05
1 2 3 4 Duration 5 6
INTERME
Strategic Factors (Select the most S Dimportant opportunities/threats H I Lfrom EFAS, Table 4–5 and the most O A Oimportant strengths and weaknesses Weighted R T Nfrom IFAS, Table 5–2) Weight Rating Score T E G Comments
S1 Quality Maytag culture (S) .10 5.0 .50 X Quality key to successS5 Hoover’s international
orientation (S) .10 2.8 .28 X X Name recognitionW3 Financial position (W) .10 2.0 .20 X X High debtW4 Global positioning (W) .15 2.2 .33 X X Only in N.A., U.K., and
AustraliaO1 Economic integration of
European Community (O) .10 4.1 .41 X Acquisition of HooverO2 Demographics favor quality (O) .10 5.0 .50 X Maytag qualityO5 Trend to super stores (O + T) .10 1.8 .18 X Weak in this channelT3 Whirlpool and Electrolux (T) .15 3.0 .45 X Dominate industryT5 Japanese appliance
companies (T) .10 1.6 .16 X Asian presence
Total Scores 1.00 3.01
Notes:1. List each of the most important factors developed in your IFAS and EFAS Tables in Column 1.2. Weight each factor from 1.0 (Most Important) to 0.0 (Not Important) in Column 2 based on that factor’s probable impact on the compa-
ny’s strategic position. The total weights must sum to 1.00.3. Rate each factor from 5.0 (Outstanding) to 1.0 (Poor) in Column 3 based on the company’s response to that factor.4. Multiply each factor’s weight times its rating to obtain each factor’s weighted score in Column 4. 5. For duration in Column 5, check appropriate column (short term—less than 1 year; intermediate—1 to 3 years; long term—over 3 years). 6. Use Column 6 (comments) for rationale used for each factor.
SOURCE: T. L. Wheelen and J. D. Hunger, “Strategic Factors Analysis Summary (SFAS).” Copyright © 1987, 1988, 1989, 1990, 1991, 1992,1993, 1994, 1995, 1996, 2005, and 2009, by T. L. Wheelen. Copyright © 1997, 2005, and 2009 by Wheelen and Hunger Associates. Reprinted bypermission.
(see Figure 6–2)—where a company is able to satisfy customers’ needs in a way that rivalscannot, given the context in which it operates.7
Finding such a niche or sweet spot is not always easy. A firm’s management must be al-ways looking for a strategic window—that is, a unique market opportunity that is availableonly for a particular time. The first firm through a strategic window can occupy a propitiousniche and discourage competition (if the firm has the required internal strengths). One com-pany that successfully found a propitious niche was Frank J. Zamboni & Company, the man-ufacturer of the machines that smooth the ice at ice skating rinks. Frank Zamboni invented the
Strategic Factor Analysis Summary: SFAS
� Condense the list of factors from the 16 to 20 identified in your EFAS and IFAS Tables to onlythe 8 to 10 most important factors.
� Select the most important EFAS and IFAS factors. Recalculate the weights of each. The weights stillneed to add to 1.0.
� Develop a SFAS Matrix, as shown in Figure 6–1 (page 178), for your final list of strategic factors.Although the weights (indicating the importance of each factor) will probably change from theEFAS and IFAS Tables, the numeric rating (1 to 5) of each factor should remain the same. Theseratings are your assessment of management’s performance on each factor.
� This is a good time to reexamine what you wrote earlier in Parts I to IV. You may want to add to ordelete some of what you wrote. Ensure that each one of the strategic factors you have included inyour SFAS Matrix is discussed in the appropriate place in Parts I to IV. Part V of the audit is not theplace to mention a strategic factor for the first time.
� Write Part V of your strategic audit. This completes your SWOT analysis.
� This is the place to suggest a revised mission statement and a better set of objectives for the com-pany. The SWOT analysis coupled with revised mission and objectives for the company set the stagefor the generation of strategic alternatives.
TABLE 5–2 Internal Factor Analysis Summary (IFAS Table): Maytag as Example
Internal Factors Weight RatingWeighted
Score Comments
1 2 3 4 5
Strengths� Quality Maytag culture� Experienced top management� Vertical integration� Employer relations� Hoover’s international orientation
.15
.05
.10
.05
.15
5.04.23.93.02.8
.75
.21
.39
.15
.42
Quality key to successKnow appliancesDedicated factoriesGood, but deterioratingHoover name in cleaners
Weaknesses� Process-oriented R&D� Distribution channels� Financial position� Global positioning
� Manufacturing facilities
.05
.05
.15
.20
.05
2.22.02.02.1
4.0
.11
.10
.30
.42
.20
Slow on new productsSuperstores replacing small dealersHigh debt loadHoover weak outside the UnitedKingdom and AustraliaInvesting now
Total Scores 1.00 3.05
NOTES:
1. List strengths and weaknesses (8–10) in Column 1.2. Weight each factor from 1.0 (Most Important) to 0.0 (Not Important) in Column 2 based on that factor’s probable impact on the company’s
strategic position. The total weights must sum to 1.00.3. Rate each factor from 5.0 (Outstanding) to 1.0 (Poor) in Column 3 based on the company’s response to that factor.4. Multiply each factor’s weight times its rating to obtain each factor’s weighted score in Column 4.5. Use Column 5 (comments) for rationale used for each factor.6. Add the individual weighted scores to obtain the total weighted score for the company in Column 4. This tells how well the company is
responding to the factors in its internal environment.
SOURCE: T. L. Wheelen and J. D. Hunger, “Internal Factor Analysis Summary (IFAS).” Copyright © 1987, 1988, 1989, 1990, 2005, and 2009by T. L. Wheelen. Copyright © 1991, 2003, 2005, and 2009 by Wheelen and Hunger Associates. Reprinted by permission.
382 PART 5 Introduction to Case Analysis
8. WRITE YOURSTRATEGICAUDIT: PART VII
Implementation
� Develop programs to implement your recommended strategy.
� Specify who is to be responsible for implementing each program and how long each program willtake to complete.
� Refer to the pro forma financial statements you developed earlier for your recommended strategy.Use common-size historical income statements as the basis for the pro forma statement. Do thenumbers still make sense? If not, this may be a good time to rethink the budget numbers to reflectyour recommended programs.
9. WRITE YOURSTRATEGICAUDIT: PART VIII
Evaluation and Control
� Specify the type of evaluation and controls that you need to ensure that your recommendation is car-ried out successfully. Specify who is responsible for monitoring these controls.
� Indicate whether sufficient information is available to monitor how the strategy is being imple-mented. If not, suggest a change to the information system.
TABLE 10–1 Example of an Action Plan
Action Plan for Jan Lewis, Advertising Manager, and Rick Carter, Advertising Assistant, Ajax Continental
Program Objective: To Run a New Advertising and Promotion Campaign for the Combined Jones Surplus/AjaxContinental Retail Stores for the Coming Christmas Season Within a Budget of $XX.
Program Activities:1. Identify Three Best Ad Agencies for New Campaign.2. Ask Three Ad Agencies to Submit a Proposal for a New Advertising and Promotion Campaign for Combined Stores.3. Agencies Present Proposals to Marketing Manager.4. Select Best Proposal and Inform Agencies of Decision.5. Agency Presents Winning Proposal to Top Management.6. Ads Air on TV and Promotions Appear in Stores.7. Measure Results of Campaign in Terms of Viewer Recall and Increase in Store Sales.
Action Steps Responsibility Start–End
1. A. Review previous programsB. Discuss with bossC. Decide on three agencies
Lewis & CarterLewis & SmithLewis
1/1–2/12/1–2/32/4
2. A. Write specifications for adB. Assistant writes ad requestC. Contact ad agenciesD. Send request to three agenciesE. Meet with agency acct. execs
LewisCarterLewisCarterLewis & Carter
1/15–1/201/20–1/302/5–2/82/102/16–2/20
3. A. Agencies work on proposalsB. Agencies present proposals
Acct. ExecsCarter
2/23–5/15/1–5/15
4. A. Select best proposalB. Meet with winning agencyC. Inform losers
LewisLewisCarter
5/15–5/205/22–5/306/1
5. A. Fine-tune proposalB. Presentation to management
Acct. ExecLewis
6/1–7/17/1–7/3
6. A. Ads air on TVB. Floor displays in stores
LewisCarter
9/1–12/248/20–8/30
7. A. Gather recall measures of adsB. Evaluate sales dataC. Prepare analysis of campaign
CarterCarterCarter
9/1–12/241/1–1/101/10–2/15
10. PROOF ANDFINE-TUNEYOUR AUDIT
Final Draft of Your Strategic Audit
� Check to ensure that your audit is within the page limits of your professor. You may need to cut someparts and expand others.
� Make sure that your recommendation clearly deals with the strategic factors.
� Attach your EFAS and IFAS Tables, and SFAS Matrix, plus your ratio analysis and pro formastatements. Label them as numbered exhibits and refer to each of them within the body of the audit.
� Proof your work for errors. If on a computer, use a spell checker.
SPECIAL NOTE: Depending on your assignment, it is relatively easy to use the strategic audit you havejust developed to write a written case analysis in essay form or to make an oral presentation. The strate-gic audit is just a detailed case analysis in an outline form and can be used as the basic framework forany sort of case analysis and presentation.
1
Determinewhat to
measure.
Establishpredetermined
standards.
Measureperformance.
No5432
Yes
STOP
Doesperfor-
mance matchstan-
dards?
Takecorrective
action.
FIGURE 11–1Evaluation andControl Process
5. Take corrective action: If actual results fall outside the desired tolerance range, action
must be taken to correct the deviation. The following questions must be answered:
a. Is the deviation only a chance fluctuation?
b. Are the processes being carried out incorrectly?
c. Are the processes appropriate to the achievement of the desired standard? Action
must be taken that will not only correct the deviation but also prevent its happen-
ing again.
d. Who is the best person to take corrective action?
Top management is often better at the first two steps of the control model than it is at
the last two follow-through steps. It tends to establish a control system and then delegate
the implementation to others. This can have unfortunate results. Nucor is unusual in its
ability to deal with the entire evaluation and control process.
11.1 Evaluation and Control in Strategic ManagementEvaluation and control information consists of performance data and activity reports (gatheredin Step 3 in Figure 11–1). If undesired performance results because the strategic managementprocesses were inappropriately used, operational managers must know about it so that they cancorrect the employee activity. Top management need not be involved. If, however, undesiredperformance results from the processes themselves, top managers, as well as operational man-agers, must know about it so that they can develop new implementation programs or proce-dures. Evaluation and control information must be relevant to what is being monitored. Oneof the obstacles to effective control is the difficulty in developing appropriate measures of im-portant activities and outputs.
An application of the control process to strategic management is depicted in Figure 11–2.It provides strategic managers with a series of questions to use in evaluating an implementedstrategy. Such a strategy review is usually initiated when a gap appears between a company’sfinancial objectives and the expected results of current activities. After answering the proposedset of questions, a manager should have a good idea of where the problem originated and whatmust be done to correct the situation.
Strategic Alternatives and RecommendationA. Alternatives
� Develop around three mutually exclusive strategic alternatives. If appropriate to the case you are an-alyzing, you might propose one alternative for growth, one for stability, and one for retrenchment.Within each corporate strategy, you should probably propose an appropriate business/competitivestrategy. You may also want to include some functional strategies where appropriate.
� Construct a corporate scenario for each alternative. Use the data from your outside research to pro-ject general societal trends (GDP, inflation, and etc.) and industry trends. Use these as the basis ofyour assumptions to write pro forma financial statements (particularly income statements) for eachstrategic alternative for the next five years.
� List pros and cons for each alternative based on your scenarios.
B. Recommendation
� Specify which one of your alternative strategies you recommend. Justify your choice in terms ofdealing with the strategic factors you listed in Part V of the strategic audit.
� Develop policies to help implement your strategies.
7. WRITE YOURSTRATEGICAUDIT: PART VI
GROWTH STRATEGIES
CHAPTER 7 Strategy Formulation: Corporate Strategy 207
By far the most widely pursued corporate directional strategies are those designed to achievegrowth in sales, assets, profits, or some combination. Companies that do business in expand-ing industries must grow to survive. Continuing growth means increasing sales and a chanceto take advantage of the experience curve to reduce the per-unit cost of products sold, therebyincreasing profits. This cost reduction becomes extremely important if a corporation’s indus-try is growing quickly or consolidating and if competitors are engaging in price wars in at-tempts to increase their shares of the market. Firms that have not reached “critical mass” (thatis, gained the necessary economy of large-scale production) face large losses unless they canfind and fill a small, but profitable, niche where higher prices can be offset by special productor service features. That is why Oracle acquired PeopleSoft, a rival software firm, in 2005. Al-though still growing, the software industry was maturing around a handful of large firms. Ac-cording to CEO Larry Ellison, Oracle needed to double or even triple in size by buying smallerand weaker rivals if it was to compete with SAP and Microsoft.7 Growth is a popular strategybecause larger businesses tend to survive longer than smaller companies due to the greateravailability of financial resources, organizational routines, and external ties.8
A corporation can grow internally by expanding its operations both globally and domes-tically, or it can grow externally through mergers, acquisitions, and strategic alliances. Amerger is a transaction involving two or more corporations in which stock is exchanged butin which only one corporation survives. Mergers usually occur between firms of somewhatsimilar size and are usually “friendly.” The resulting firm is likely to have a name derived fromits composite firms. One example is the merging of Allied Corporation and Signal Companies
Concentration Vertical Growth Horizontal GrowthDiversification Concentric Conglomerate
Pause/Proceed with CautionNo ChangeProfit
TurnaroundCaptive CompanySell-Out/DivestmentBankruptcy/Liquidation
GROWTH STABILITY RETRENCHMENTFIGURE 7–1Corporate
DirectionalStrategies
A corporation’s directional strategy is composed of three general orientations (some-times called grand strategies):
� Growth strategies expand the company’s activities.
� Stability strategies make no change to the company’s current activities.
� Retrenchment strategies reduce the company’s level of activities.
Having chosen the general orientation (such as growth), a company’s managers can selectfrom several more specific corporate strategies such as concentration within one productline/industry or diversification into other products/industries. (See Figure 7–1.) These strate-gies are useful both to corporations operating in only one industry with one product line andto those operating in many industries with many product lines.
I. Current Situation
A. Current PerformancePoor financials, high debt load, first losses since 1920s, price/earnings ratio negative.� First loss since 1920s.� Laid off 4,500 employees at Magic Chef.� Hoover Europe still showing losses.
B. Strategic Posture1. Mission
� Developed in 1989 for the Maytag Company: “To provide our customers with prod-ucts of unsurpassed performance that last longer, need fewer repairs, and are pro-duced at the lowest possible cost.”
� Updated in 1991: “Our collective mission is world class quality.” Expands Maytag’sbelief in product quality to all aspects of operations.
2. Objectives� “To be profitability leader in industry for every product line Maytag manufactures.”
Selected profitability rather than market share.� “To be number one in total customer satisfaction.” Doesn’t say how to measure
satisfaction.� “To grow the North American appliance business and become the third largest ap-
pliance manufacturer (in unit sales) in North America.”� To increase profitable market share growth in North American appliance and floor
care business, 6.5% return on sales, 10% return on assets, 20% return on equity, beatcompetition in satisfying customers, dealer, builder and endorser, move into thirdplace in total units shipped per year. Nicely quantified objectives.
3. Strategies� Global growth through acquisition, and alliance with Bosch-Siemens.� Differentiate brand names for competitive advantage.� Create synergy between companies, product improvement, investment in plant and
equipment.
383
A P P E N D I X 12.CExample of Student-WrittenStrategic Audit(For the 1993 Maytag Corporation Case)
4. Policies� Cost reduction is secondary to high quality.� Promotion from within.� Slow but sure R&D: Maytag slow to respond to changes in market.
II. Strategic Managers
A. Board of Directors1. Fourteen members—eleven are outsiders.
2. Well-respected Americans, most on board since 1986 or earlier.
3. No international or marketing backgrounds.
4. Time for a change?
B. Top Management1. Top management promoted from within Maytag Company. Too inbred?
2. Very experienced in the industry.
3. Responsible for current situation.
4. May be too parochial for global industry. May need new blood.
III. External Environment(EFAS Table; see Exhibit 1)
A. Natural Environment1. Growing water scarcity
2. Energy availability a growing problem
B. Societal Environment1. Economic
a. Unstable economy but recession ending, consumer confidence growing—could in-crease spending for big ticket items like houses, cars, and appliances. (O)
b. Individual economies becoming interconnected into a world economy. (O)
2. Technologicala. Fuzzy logic technology being applied to sense and measure activities. (O)b. Computers and information technology increasingly important. (O)
3. Political–Legala. NAFTA, European Union, other regional trade pacts opening doors to markets in
Europe, Asia, and Latin America that offer enormous potential. (O)b. Breakdown of communism means less chance of world war. (O)c. Environmentalism being reflected in laws on pollution and energy usage. (T)
4. Socioculturala. Developing nations desire goods seen on TV. (O)b. Middle-aged baby boomers want attractive, high-quality products, like BMWs and
Maytag. (O)c. Dual-career couples increases need for labor-saving appliances, second cars, and
day care. (O)d. Divorce and career mobility means need for more houses and goods to fill them. (O)
384 PART 5 Introduction to Case Analysis
C. Task Environment1. North American market mature and extremely competitive—vigilant consumers de-
mand high quality with low price in safe, environmentally sound products. (T)
2. Industry going global as North American and European firms expand internationally. (T)
3. European design popular and consumer desire for technologically advanced appliances. (O)
4. Rivalry High. Whirlpool, Electrolux, GE have enormous resources & developingglobal presence. (T)
5. Buyers’ Power Low. Technology and materials can be sourced worldwide. (O)
6. Power of Other Stakeholders Medium. Quality, safety, environmental regulationsincreasing. (T)
7. Distributors’Power High. Super retailers more important: mom and pop dealers less. (T)
8. Threat of Substitutes Low. (O)
9. Entry Barriers High. New entrants unlikely except for large international firms. (T)
IV. Internal Environment(IFAS Table; see Exhibit 2)
A. Corporate Structure1. Divisional structure: appliance manufacturing and vending machines. Floor care man-
aged separately. (S)
2. Centralized major decisions by Newton corporate staff, with a time line of about threeyears. (S)
B. Corporate Culture1. Quality key ingredient—commitment to quality shared by executives and workers. (S)
2. Much of corporate culture is based on founder F. L. Maytag’s personal philosophy, includ-ing concern for quality, employees, local community, innovation, and performance. (S)
3. Acquired companies, except for European, seem to accept dominance of Maytagculture. (S)
C. Corporate Resources1. Marketing
a. Maytag brand lonely repairman advertising successful but dated. (W)b. Efforts focus on distribution—combining three sales forces into two, concentrating
on major retailers. (Cost $95 million for this restructuring.) (S)c. Hoover’s well-publicized marketing fiasco involving airline tickets. (W)
2. Finance (see Exhibits 4 and 5)a. Revenues are up slightly, operating income is down significantly. (W)b. Some key ratios are troubling, such as a 57% debt/asset ratio, 132% long-term
debt/equity ratio. No room for more debt to grow company. (W)c. Net income is 400% less than 1988, based on common-size income statements. (W)
3. R&Da. Process-oriented with focus on manufacturing process and durability. (S)b. Maytag becoming a technology follower, taking too long to get product innovations to
market (competitors put out more in last 6 months than prior 2 years combined), lag-ging in fuzzy logic and other technological areas. (W)
CHAPTER 12 Suggestions for Case Analysis 385
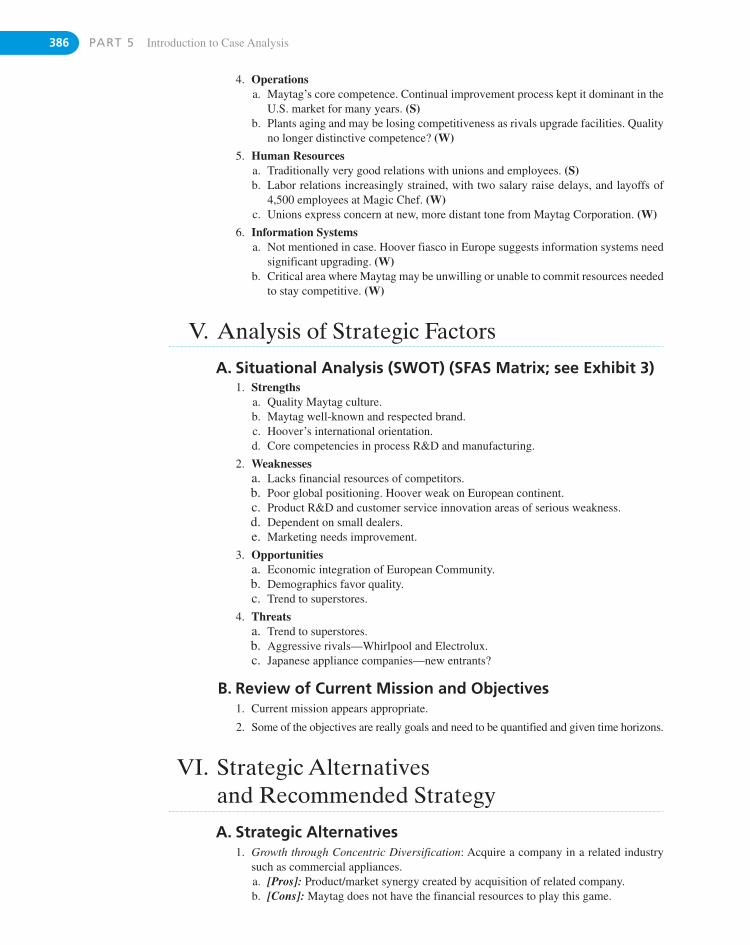
4. Operationsa. Maytag’s core competence. Continual improvement process kept it dominant in the
U.S. market for many years. (S)b. Plants aging and may be losing competitiveness as rivals upgrade facilities. Quality
no longer distinctive competence? (W)
5. Human Resourcesa. Traditionally very good relations with unions and employees. (S)b. Labor relations increasingly strained, with two salary raise delays, and layoffs of
4,500 employees at Magic Chef. (W)c. Unions express concern at new, more distant tone from Maytag Corporation. (W)
6. Information Systemsa. Not mentioned in case. Hoover fiasco in Europe suggests information systems need
significant upgrading. (W)b. Critical area where Maytag may be unwilling or unable to commit resources needed
to stay competitive. (W)
V. Analysis of Strategic Factors
A. Situational Analysis (SWOT) (SFAS Matrix; see Exhibit 3)1. Strengths
a. Quality Maytag culture.b. Maytag well-known and respected brand.c. Hoover’s international orientation.d. Core competencies in process R&D and manufacturing.
2. Weaknessesa. Lacks financial resources of competitors.b. Poor global positioning. Hoover weak on European continent.c. Product R&D and customer service innovation areas of serious weakness.d. Dependent on small dealers.e. Marketing needs improvement.
3. Opportunitiesa. Economic integration of European Community.b. Demographics favor quality.c. Trend to superstores.
4. Threatsa. Trend to superstores.b. Aggressive rivals—Whirlpool and Electrolux.c. Japanese appliance companies—new entrants?
B. Review of Current Mission and Objectives1. Current mission appears appropriate.
2. Some of the objectives are really goals and need to be quantified and given time horizons.
VI. Strategic Alternatives and Recommended Strategy
A. Strategic Alternatives1. Growth through Concentric Diversification: Acquire a company in a related industry
such as commercial appliances.a. [Pros]: Product/market synergy created by acquisition of related company.b. [Cons]: Maytag does not have the financial resources to play this game.
386 PART 5 Introduction to Case Analysis
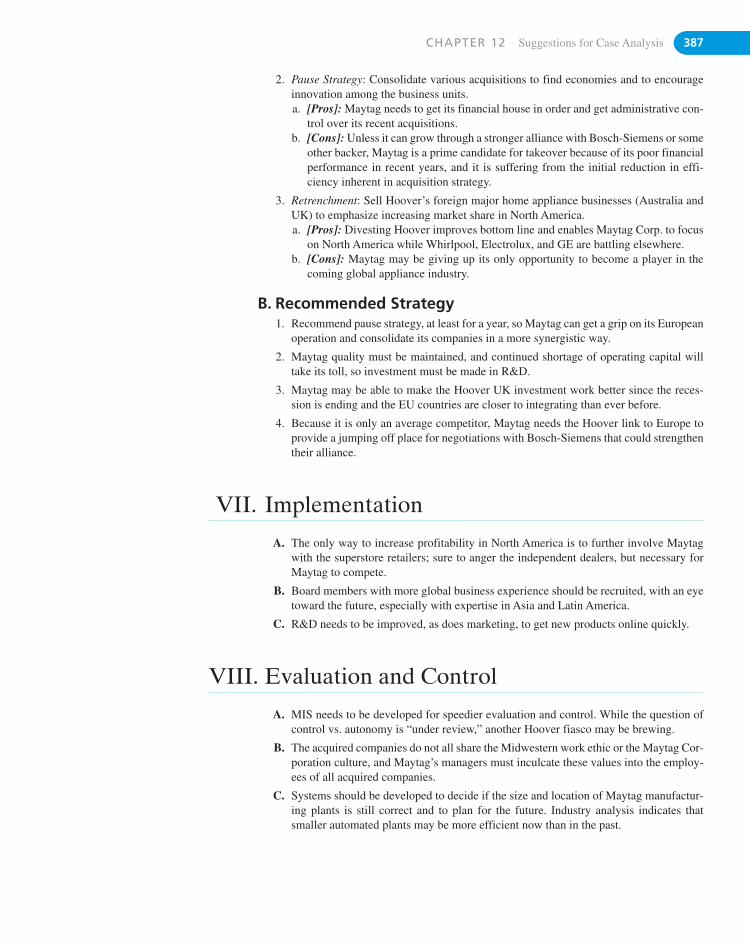
2. Pause Strategy: Consolidate various acquisitions to find economies and to encourageinnovation among the business units.a. [Pros]: Maytag needs to get its financial house in order and get administrative con-
trol over its recent acquisitions.b. [Cons]: Unless it can grow through a stronger alliance with Bosch-Siemens or some
other backer, Maytag is a prime candidate for takeover because of its poor financialperformance in recent years, and it is suffering from the initial reduction in effi-ciency inherent in acquisition strategy.
3. Retrenchment: Sell Hoover’s foreign major home appliance businesses (Australia andUK) to emphasize increasing market share in North America.a. [Pros]: Divesting Hoover improves bottom line and enables Maytag Corp. to focus
on North America while Whirlpool, Electrolux, and GE are battling elsewhere.b. [Cons]: Maytag may be giving up its only opportunity to become a player in the
coming global appliance industry.
B. Recommended Strategy1. Recommend pause strategy, at least for a year, so Maytag can get a grip on its European
operation and consolidate its companies in a more synergistic way.
2. Maytag quality must be maintained, and continued shortage of operating capital willtake its toll, so investment must be made in R&D.
3. Maytag may be able to make the Hoover UK investment work better since the reces-sion is ending and the EU countries are closer to integrating than ever before.
4. Because it is only an average competitor, Maytag needs the Hoover link to Europe toprovide a jumping off place for negotiations with Bosch-Siemens that could strengthentheir alliance.
VII. Implementation
A. The only way to increase profitability in North America is to further involve Maytagwith the superstore retailers; sure to anger the independent dealers, but necessary forMaytag to compete.
B. Board members with more global business experience should be recruited, with an eyetoward the future, especially with expertise in Asia and Latin America.
C. R&D needs to be improved, as does marketing, to get new products online quickly.
VIII. Evaluation and Control
A. MIS needs to be developed for speedier evaluation and control. While the question ofcontrol vs. autonomy is “under review,” another Hoover fiasco may be brewing.
B. The acquired companies do not all share the Midwestern work ethic or the Maytag Cor-poration culture, and Maytag’s managers must inculcate these values into the employ-ees of all acquired companies.
C. Systems should be developed to decide if the size and location of Maytag manufactur-ing plants is still correct and to plan for the future. Industry analysis indicates thatsmaller automated plants may be more efficient now than in the past.
CHAPTER 12 Suggestions for Case Analysis 387
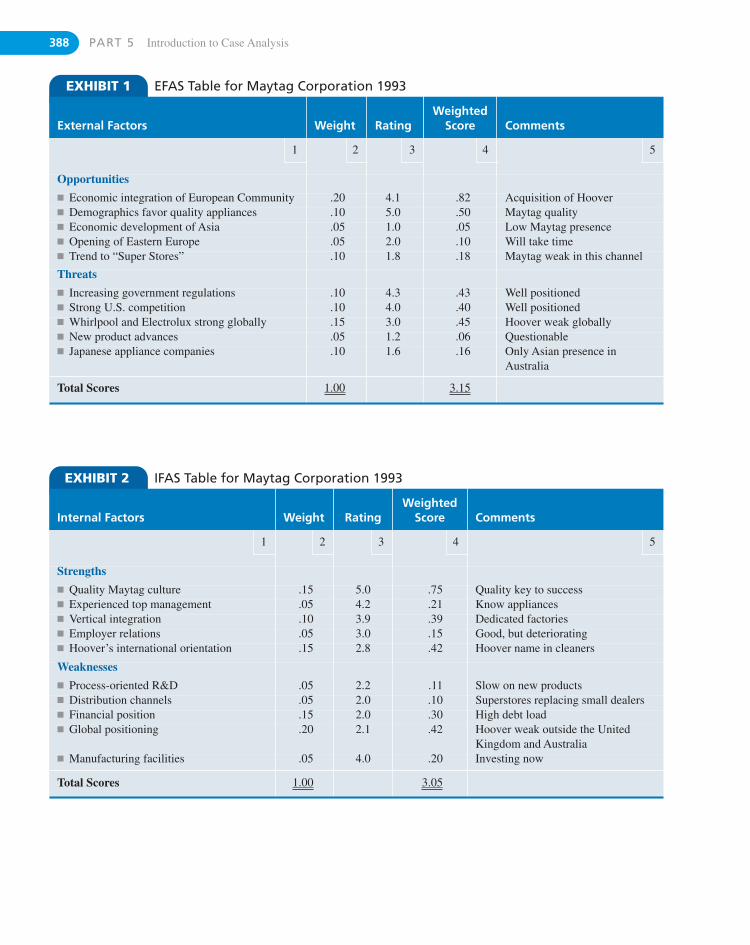
388 PART 5 Introduction to Case Analysis
EXHIBIT 1 EFAS Table for Maytag Corporation 1993
External Factors Weight RatingWeighted
Score Comments
1 2 3 4 5
Opportunities� Economic integration of European Community .20 4.1 .82 Acquisition of Hoover� Demographics favor quality appliances .10 5.0 .50 Maytag quality� Economic development of Asia .05 1.0 .05 Low Maytag presence� Opening of Eastern Europe .05 2.0 .10 Will take time� Trend to “Super Stores” .10 1.8 .18 Maytag weak in this channel
Threats� Increasing government regulations .10 4.3 .43 Well positioned� Strong U.S. competition .10 4.0 .40 Well positioned� Whirlpool and Electrolux strong globally .15 3.0 .45 Hoover weak globally� New product advances .05 1.2 .06 Questionable� Japanese appliance companies .10 1.6 .16 Only Asian presence in
Australia
Total Scores 1.00 3.15
EXHIBIT 2 IFAS Table for Maytag Corporation 1993
Internal Factors Weight RatingWeighted
Score Comments
1 2 3 4 5
Strengths� Quality Maytag culture .15 5.0 .75 Quality key to success� Experienced top management .05 4.2 .21 Know appliances� Vertical integration .10 3.9 .39 Dedicated factories� Employer relations .05 3.0 .15 Good, but deteriorating� Hoover’s international orientation .15 2.8 .42 Hoover name in cleaners
Weaknesses� Process-oriented R&D .05 2.2 .11 Slow on new products� Distribution channels .05 2.0 .10 Superstores replacing small dealers� Financial position .15 2.0 .30 High debt load� Global positioning .20 2.1 .42 Hoover weak outside the United
Kingdom and Australia� Manufacturing facilities .05 4.0 .20 Investing now
Total Scores 1.00 3.05
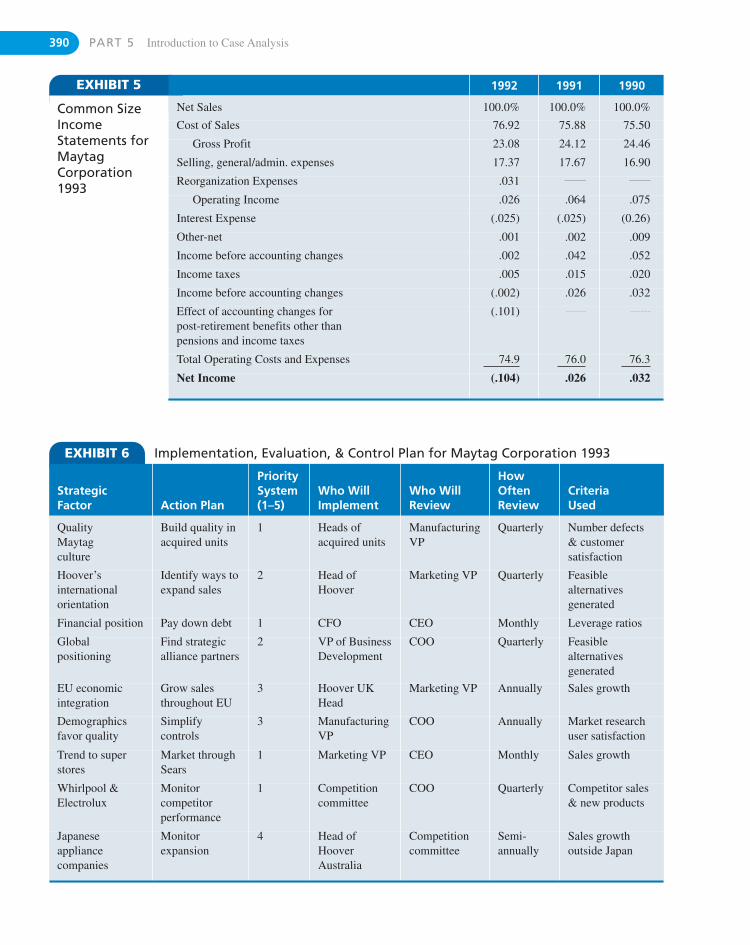
Common SizeIncomeStatements forMaytagCorporation1993
390 PART 5 Introduction to Case Analysis
EXHIBIT 5 1992 1991 1990
Net Sales 100.0% 100.0% 100.0%
Cost of Sales 76.92 75.88 75.50
Gross Profit 23.08 24.12 24.46
Selling, general/admin. expenses 17.37 17.67 16.90
Reorganization Expenses .031 ———————— ————————
Operating Income .026 .064 .075
Interest Expense (.025) (.025) (0.26)
Other-net .001 .002 .009
Income before accounting changes .002 .042 .052
Income taxes .005 .015 .020
Income before accounting changes (.002) .026 .032
Effect of accounting changes for post-retirement benefits other than pensions and income taxes
(.101) — — — — — — — — — — — —
Total Operating Costs and Expenses 74.9 76.0 76.3
Net Income (.104) .026 .032
EXHIBIT 6 Implementation, Evaluation, & Control Plan for Maytag Corporation 1993
StrategicFactor Action Plan
PrioritySystem(1–5)
Who WillImplement
Who WillReview
HowOftenReview
CriteriaUsed
QualityMaytagculture
Build quality inacquired units
1 Heads ofacquired units
ManufacturingVP
Quarterly Number defects& customersatisfaction
Hoover’sinternationalorientation
Identify ways toexpand sales
2 Head ofHoover
Marketing VP Quarterly Feasiblealternativesgenerated
Financial position Pay down debt 1 CFO CEO Monthly Leverage ratios
Globalpositioning
Find strategicalliance partners
2 VP of BusinessDevelopment
COO Quarterly Feasiblealternativesgenerated
EU economicintegration
Grow salesthroughout EU
3 Hoover UKHead
Marketing VP Annually Sales growth
Demographicsfavor quality
Simplifycontrols
3 ManufacturingVP
COO Annually Market researchuser satisfaction
Trend to superstores
Market throughSears
1 Marketing VP CEO Monthly Sales growth
Whirlpool &Electrolux
Monitorcompetitorperformance
1 Competitioncommittee
COO Quarterly Competitor sales& new products
Japaneseappliancecompanies
Monitorexpansion
4 Head ofHooverAustralia
Competitioncommittee
Semi-annually
Sales growthoutside Japan
CHAPTER 12 Suggestions for Case Analysis 391
Ending Case for Part FiveIN THE GARDEN
Walking with my watering can underneath the cherrytree, the apricot tree, the plum tree, and the nectarinetree, strawberry vines and raspberry canes at my feet,I gazed at my hedge and thought what would it take toavoid disease in the garden this year? I was amazedhow this garden, so similar and different from previ-ous seasons, had evolved from two saplings, pur-chased by chance, placed by happenstance, butplanted with care. Now I wondered at the wild order.
Was this the fruit I should be growing? How could Iend up with the sweetest fruit, and what about themost fruit and the largest fruit? How would I set my-self up for more success next year, and what of theyears after that? And, I sadly thought, what shall I dowith the wonderful apple tree I climbed as a child thatnow yielded so little fruit?
All these thoughts I had walking with my wateringcan under the cherry tree, the apricot tree, the plum tree,and the nectarine tree, strawberry vines and raspberrycanes at my feet.
This case was written by Mark Meckler, University of Portland andpresented to the North American Case Research Association at its2006 annual meeting. Copyright © 2006 by Mark Meckler. Edited forpublication in Strategic Management and Business Policy, 12thedition and Concepts in Strategic Management and Business Policy,12th edition. Reprinted by permission of Mark Meckler and the NorthAmerican Case Research Association.
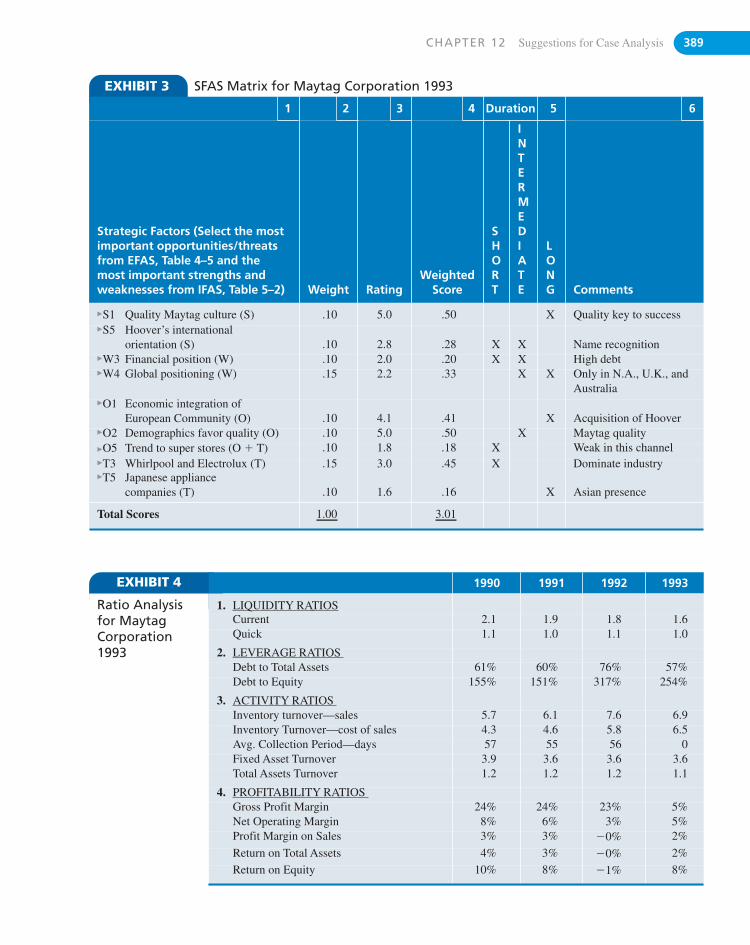
Ratio Analysisfor MaytagCorporation1993
CHAPTER 12 Suggestions for Case Analysis 389
EXHIBIT 3 SFAS Matrix for Maytag Corporation 1993
1 2 3 4 Duration 5 6
Strategic Factors (Select the mostimportant opportunities/threats from EFAS, Table 4–5 and themost important strengths andweaknesses from IFAS, Table 5–2) Weight Rating
WeightedScore
SHORT
INTERMEDIATE
LONG Comments
�S1 Quality Maytag culture (S) .10 5.0 .50 X Quality key to success�S5 Hoover’s international
orientation (S) .10 2.8 .28 X X Name recognition�W3 Financial position (W) .10 2.0 .20 X X High debt�W4 Global positioning (W) .15 2.2 .33 X X Only in N.A., U.K., and
Australia�O1 Economic integration of
European Community (O) .10 4.1 .41 X Acquisition of Hoover�O2 Demographics favor quality (O) .10 5.0 .50 X Maytag quality�O5 Trend to super stores (O � T) .10 1.8 .18 X Weak in this channel�T3 Whirlpool and Electrolux (T) .15 3.0 .45 X Dominate industry�T5 Japanese appliance
companies (T) .10 1.6 .16 X Asian presence
Total Scores 1.00 3.01
EXHIBIT 4 1990 1991 1992 1993
1. LIQUIDITY RATIOSCurrent 2.1 1.9 1.8 1.6Quick 1.1 1.0 1.1 1.0
2. LEVERAGE RATIOSDebt to Total Assets 61% 60% 76% 57%Debt to Equity 155% 151% 317% 254%
3. ACTIVITY RATIOSInventory turnover—sales 5.7 6.1 7.6 6.9Inventory Turnover—cost of sales 4.3 4.6 5.8 6.5Avg. Collection Period—days 57 55 56 0Fixed Asset Turnover 3.9 3.6 3.6 3.6Total Assets Turnover 1.2 1.2 1.2 1.1
4. PROFITABILITY RATIOSGross Profit Margin 24% 24% 23% 5%Net Operating Margin 8% 6% 3% 5%Profit Margin on Sales 3% 3% �0% 2%
Return on Total Assets 4% 3% �0% 2%
Return on Equity 10% 8% �1% 8%

This page intentionally left blank

StrategicManagement
Cases in

This page intentionally left blank
CONTENTSS E C T I O N A
Corporate Governance and Social Responsibility: Executive Leadership
S E C T I O N BBusiness Ethics
S E C T I O N CInternational Issues in Strategic Management
S E C T I O N DGeneral Issues in Strategic Management
Industry One—Information Technology
Industry Two—Internet Companies
Industry Three—Entertainment and Leisure
Industry Four—Transportation
Industry Five—Clothing
Industry Six—Specialty Retailing
Industry Seven—Manufacturing
Industry Eight—Food and Beverage
cases in strategic management

This page intentionally left blank
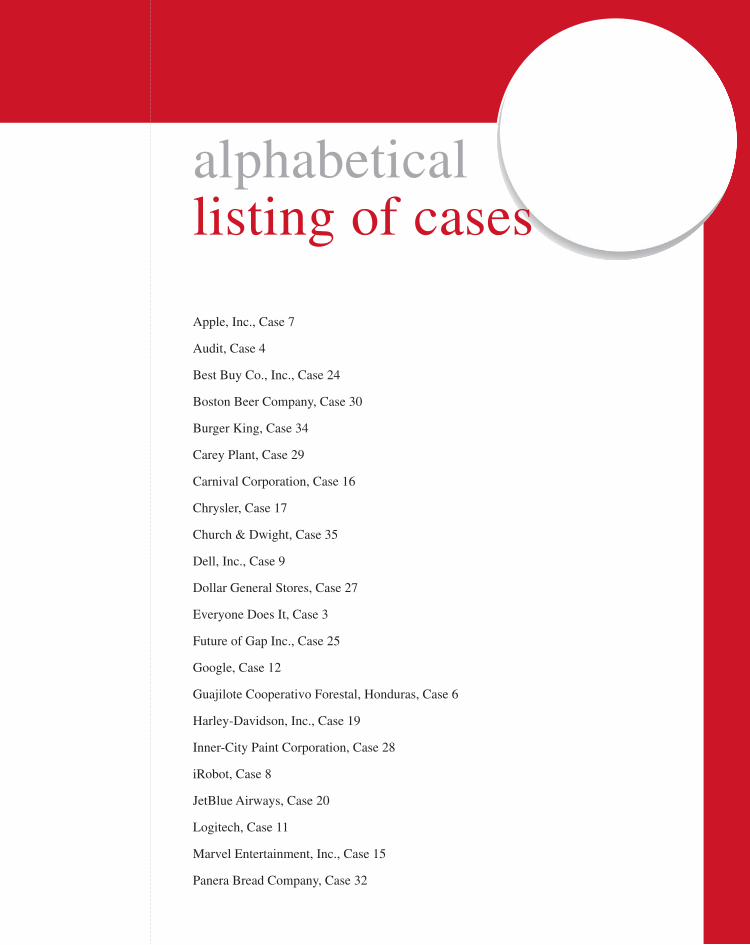
Apple, Inc., Case 7
Audit, Case 4
Best Buy Co., Inc., Case 24
Boston Beer Company, Case 30
Burger King, Case 34
Carey Plant, Case 29
Carnival Corporation, Case 16
Chrysler, Case 17
Church & Dwight, Case 35
Dell, Inc., Case 9
Dollar General Stores, Case 27
Everyone Does It, Case 3
Future of Gap Inc., Case 25
Google, Case 12
Guajilote Cooperativo Forestal, Honduras, Case 6
Harley-Davidson, Inc., Case 19
Inner-City Paint Corporation, Case 28
iRobot, Case 8
JetBlue Airways, Case 20
Logitech, Case 11
Marvel Entertainment, Inc., Case 15
Panera Bread Company, Case 32
alphabeticallisting of cases
Recalcitrant Director at Byte Products, Inc., Case 1
Reorganizing Yahoo!, Case 13
Rosetta Stone Inc., Case 10
Rocky Mountain Chocolate Factory, Inc., Case 26
Starbucks’ Coffee Company, Case 5
Tesla Motors, Inc., Case 18
TiVo, Inc., Case 14
TOMS Shoes, Case 23
Tom-Tom, Case 21
Volcom Inc., Case 22
Wallace Group, Case 2
Wal-Mart and Vlasic Pickles, Case 31
Whole Foods Market, Case 33
L I S T I N G O F C A S E S
BYTE PRODUCTS, INC., IS PRIMARILY INVOLVED IN THE PRODUCTION OF ELECTRONIC componentsthat are used in personal computers. Although such components might be found in a few com-
puters in home use, Byte products are found most frequently in computers used for sophis-ticated business and engineering applications. Annual sales of these products have beensteadily increasing over the past several years; Byte Products, Inc., currently has total salesof approximately $265 million.
Over the past six years, increases in yearly revenues have consistently reached12%. Byte Products, Inc., headquartered in the midwestern United States, is regarded as
one of the largest-volume suppliers of specialized components and is easily the industryleader, with some 32% market share. Unfortunately for Byte, many new firms—domesticand foreign—have entered the industry. A dramatic surge in demand, high profitability, andthe relative ease of a new firm’s entry into the industry explain in part the increased num-ber of competing firms.
Although Byte management—and presumably shareholders as well—is very pleasedabout the growth of its markets, it faces a major problem: Byte simply cannot meet the demandfor these components. The company currently operates three manufacturing facilities in vari-ous locations throughout the United States. Each of these plants operates three productionshifts (24 hours per day), 7 days a week. This activity constitutes virtually all of the company’sproduction capacity. Without an additional manufacturing plant, Byte simply cannot increaseits output of components.
This case was prepared by Professors Dan R. Dalton and Richard A. Cosier of the Graduate School of Business atIndiana University and Cathy A. Enz of Cornell University. The names of the organization, individual, location,and/or financial information have been disguised to preserve the organization’s desire for anonymity. This case wasedited for SMBP–9th, 10th, 11th, 12th, and 13th Editions. Reprint permission is solely granted to the publisher,Prentice Hall, for the book, Strategic Management and Business Policy – 13th Edition by copyright holders Dan R.Dalton, Richard A. Cosier, and Cathy A. Enz. Any other publication of this case (translation, any form of electronicor other media), or sold (any form of partnership) to another publisher will be in violation of copyright laws, unlessthe copyright holders have granted an additional written reprint permission.
1-7
C A S E 1The Recalcitrant Director at Byte Products, Inc.:CORPORATE LEGALITY VERSUS CORPORATE RESPONSIBILITYDan R. Dalton, Richard A. Cosier, and Cathy A. Enz
S E C T I O N ACorporate Governance and Social Responsibility: Executive Leadership
1-8 SECTION A Corporate Governance and Social Responsibility: Executive Leadership
James M. Elliott, Chief Executive Officer and Chairman of the Board, recognizes thegravity of the problem. If Byte Products cannot continue to manufacture components in suffi-cient numbers to meet the demand, buyers will go elsewhere. Worse yet is the possibility thatany continued lack of supply will encourage others to enter the market. As a long-term solu-tion to this problem, the Board of Directors unanimously authorized the construction of a new,state-of-the-art manufacturing facility in the southwestern United States. When the plannedcapacity of this plant is added to that of the three current plants, Byte should be able to meetdemand for many years to come. Unfortunately, an estimated three years will be required tocomplete the plant and bring it online.
Jim Elliott believes very strongly that this three-year period is far too long and has insistedthat there also be a shorter-range, stopgap solution while the plant is under construction. Theinstability of the market and the pressure to maintain leader status are two factors contributingto Elliott’s insistence on a more immediate solution. Without such a move, Byte managementbelieves that it will lose market share and, again, attract competitors into the market.
Several SolutionsA number of suggestions for such a temporary measure were offered by various staff specialistsbut rejected by Elliott. For example, licensing Byte’s product and process technology to othermanufacturers in the short run to meet immediate demand was possible. This licensing authori-zation would be short term, or just until the new plant could come online. Top management, aswell as the board, was uncomfortable with this solution for several reasons. They thought it un-likely that any manufacturer would shoulder the fixed costs of producing appropriate componentsfor such a short term. Any manufacturer that would do so would charge a premium to recover itscosts. This suggestion, obviously, would make Byte’s own products available to its customers atan unacceptable price. Nor did passing any price increase to its customers seem sensible, for thistoo would almost certainly reduce Byte’s market share as well as encourage further competition.
Overseas facilities and licensing also were considered but rejected. Before it became apublicly traded company, Byte’s founders had decided that its manufacturing facilities wouldbe domestic. Top management strongly felt that this strategy had served Byte well; moreover,Byte’s majority stockholders (initial owners of the then privately held Byte) were not likely toendorse such a move. Beyond that, however, top management was reluctant to foreign li-cense—or make available by any means the technologies for others to produce Byte products—as they could not then properly control patents. Top management feared that foreign licensingwould essentially give away costly proprietary information regarding the company’s highly ef-ficient means of product development. There also was the potential for initial low product qual-ity—whether produced domestically or otherwise—especially for such a short-run operation.Any reduction in quality, however brief, would threaten Byte’s share of this sensitive market.
The Solution!One recommendation that has come to the attention of the Chief Executive Officer could helpsolve Byte’s problem in the short run. Certain members of his staff have notified him that anabandoned plant currently is available in Plainville, a small town in the northeastern UnitedStates. Before its closing eight years before, this plant was used primarily for the manufac-ture of electronic components. As is, it could not possibly be used to produce Byte products,but it could be inexpensively refitted to do so in as few as three months. Moreover, this plantis available at a very attractive price. In fact, discreet inquiries by Elliott’s staff indicate thatthis plant could probably be leased immediately from its present owners because the build-ing has been vacant for some eight years.
CASE 1 The Recalcitrant Director at Byte Products, Inc. 1-9
All the news about this temporary plant proposal, however, is not nearly so positive.Elliott’s staff concedes that this plant will never be efficient and its profitability will be low. Inaddition, the Plainville location is a poor one in terms of high labor costs (the area is highlyunionized), warehousing expenses, and inadequate transportation links to Byte’s major marketsand suppliers. Plainville is simply not a candidate for a long-term solution. Still, in the shortrun, a temporary plant could help meet the demand and might forestall additional competition.
The staff is persuasive and notes that this option has several advantages: (1) there is noneed for any licensing, foreign or domestic, (2) quality control remains firmly in the com-pany’s hands, and (3) an increase in the product price will be unnecessary. The temporaryplant, then, would be used for three years or so until the new plant could be built. Then the temporary plant would be immediately closed.
CEO Elliott is convinced.
Taking the Plan to the BoardThe quarterly meeting of the Board of Directors is set to commence at 2:00 P.M. Jim Elliotthas been reviewing his notes and agenda for the meeting most of the morning. The issue ofthe temporary plant is clearly the most important agenda item. Reviewing his detailed pre-sentation of this matter, including the associated financial analyses, has occupied much of histime for several days. All the available information underscores his contention that the tem-porary plant in Plainville is the only responsible solution to the demand problems. No otheroption offers the same low level of risk and ensures Byte’s status as industry leader.
At the meeting, after the board has dispensed with a number of routine matters, JimElliott turns his attention to the temporary plant. In short order, he advises the 11-memberboard (himself, 3 additional inside members, and 7 outside members) of his proposal to obtainand refit the existing plant to ameliorate demand problems in the short run, authorizes the con-struction of the new plant (the completion of which is estimated to take some three years), andplans to switch capacity from the temporary plant to the new one when it is operational. Healso briefly reviews additional details concerning the costs involved, advantages of this pro-posal versus domestic or foreign licensing, and so on.
All the board members except one are in favor of the proposal. In fact, they are most en-thusiastic; the overwhelming majority agree that the temporary plant is an excellent—even in-spired—stopgap measure. Ten of the eleven board members seem relieved because the boardwas most reluctant to endorse any of the other alternatives that had been mentioned.
The single dissenter—T. Kevin Williams, an outside director—is, however, steadfast inhis objections. He will not, under any circumstances, endorse the notion of the temporary plantand states rather strongly that “I will not be party to this nonsense, not now, not ever.”
T. Kevin Williams, the senior executive of a major nonprofit organization, is normally areserved and really quite agreeable person. This sudden, uncharacteristic burst of emotionclearly startles the remaining board members into silence. The following excerpt captures theensuing, essentially one-on-one conversation between Williams and Elliott:
Williams: How many workers do your people estimate will be employed in the temporary plant?
Elliott: Roughly 1,200, possibly a few more.
Williams: I presume it would be fair, then, to say that, including spouses and children, some-thing on the order of 4,000 people will be attracted to the community.
Elliott: I certainly would not be surprised.
Williams: If I understand the situation correctly, this plant closed just over eight years ago,and that closing had a catastrophic effect on Plainville. Isn’t it true that a large portion ofthe community was employed by this plant?
Elliott: Yes, it was far and away the majority employer.
Williams: And most of these people have left the community, presumably to find employmentelsewhere.
Elliott: Definitely, there was a drastic decrease in the area’s population.
Williams: Are you concerned, then, that our company can attract the 1,200 employees toPlainville from other parts of New England?
Elliott: Not in the least. We are absolutely confident that we will attract 1,200—even more,for that matter virtually any number we need. That, in fact, is one of the chief advantagesof this proposal. I would think that the community would be very pleased to have us there.
Williams: On the contrary, I would suspect that the community will rue the day we arrived.Beyond that, though, this plan is totally unworkable if we are candid. On the other hand, ifwe are less than candid, the proposal will work for us, but only at great cost to Plainville.In fact, quite frankly, the implications are appalling. Once again, I must enter my seriousobjections.
Elliott: I don’t follow you.
Williams: The temporary plant would employ some 1,200 people. Again, this means the in-fusion of over 4,000 to the community and surrounding areas. Byte Products, however,intends to close this plant in three years or less. If Byte informs the community or the em-ployees that the jobs are temporary, the proposal simply won’t work. When the new peo-ple arrive in the community, there will be a need for more schools, instructors, utilities,housing, restaurants, and so forth. Obviously, if the banks and local government know thatthe plant is temporary, no funding will be made available for these projects and certainlyno credit for the new employees to buy homes, appliances, automobiles, and so forth.
If, on the other hand, Byte Products does not tell the community of its “temporary”plans, the project can go on. But, in several years when the plant closes (and we here haveagreed today that it will close), we will have created a ghost town. The tax base of the com-munity will have been destroyed; property values will decrease precipitously; practicallythe whole town will be unemployed. This proposal will place Byte Products in an unten-able position and in extreme jeopardy.
Elliott: Are you suggesting that this proposal jeopardizes us legally? If so, it should be notedthat the legal department has reviewed this proposal in its entirety and has indicated noproblem.
Williams: No! I don’t think we are dealing with an issue of legality here. In fact, I don’t doubtfor a minute that this proposal is altogether legal. I do, however, resolutely believe that thisproposal constitutes gross irresponsibility.
I think this decision has captured most of my major concerns. These along with a hostof collateral problems associated with this project lead me to strongly suggest that you andthe balance of the board reconsider and not endorse this proposal. Byte Products must findanother way.
The DilemmaAfter a short recess, the board meeting reconvened. Presumably because of some discussionduring the recess, several other board members indicated that they were no longer inclined tosupport the proposal. After a short period of rather heated discussion, the following exchangetook place:
1-10 SECTION A Corporate Governance and Social Responsibility: Executive Leadership

Elliott: It appears to me that any vote on this matter is likely to be very close. Given the grav-ity of our demand capacity problem, I must insist that the stockholders’ equity be protected.We cannot wait three years; that is clearly out of the question. I still feel that licensing—domestic or foreign—is not in our long-term interests for any number of reasons, some ofwhich have been discussed here. On the other hand, I do not want to take this project for-ward on the strength of a mixed vote. A vote of 6–5 or 7–4, for example, does not indicatethat the board is remotely close to being of one mind. Mr. Williams, is there a compromiseto be reached?
Williams: Respectfully, I have to say no. If we tell the truth—namely, the temporary natureof our operations—the proposal is simply not viable. If we are less than candid in this re-spect, we do grave damage to the community as well as to our image. It seems to me thatwe can only go one way or the other. I don’t see a middle ground.
CASE 1 The Recalcitrant Director at Byte Products, Inc. 1-11

This page intentionally left blank
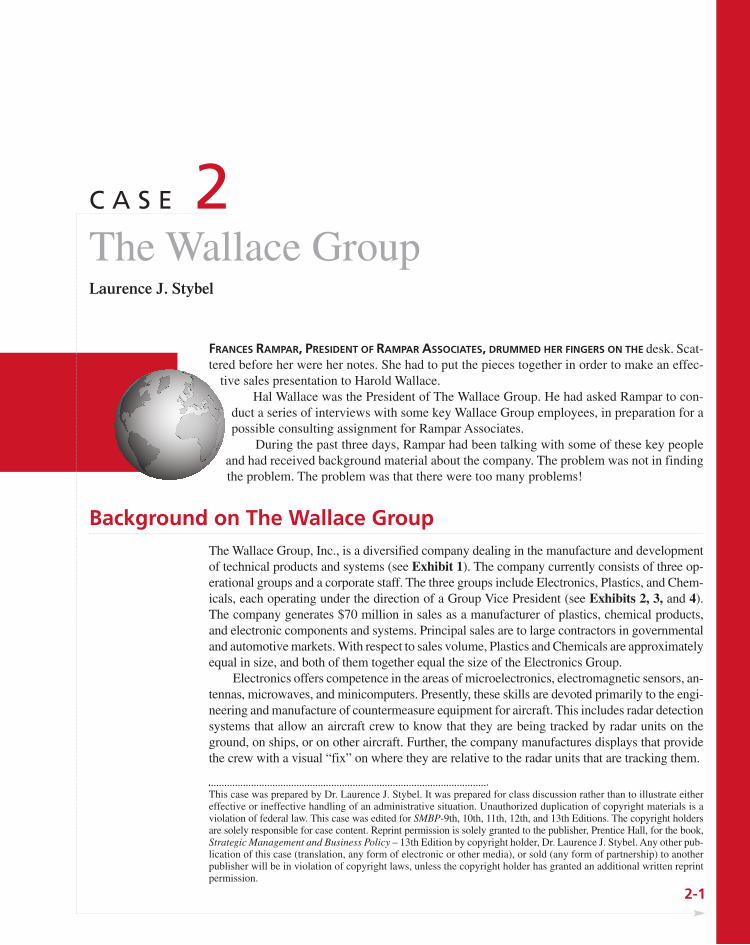
FRANCES RAMPAR, PRESIDENT OF RAMPAR ASSOCIATES, DRUMMED HER FINGERS ON THE desk. Scat-tered before her were her notes. She had to put the pieces together in order to make an effec-
tive sales presentation to Harold Wallace.Hal Wallace was the President of The Wallace Group. He had asked Rampar to con-
duct a series of interviews with some key Wallace Group employees, in preparation for apossible consulting assignment for Rampar Associates.
During the past three days, Rampar had been talking with some of these key peopleand had received background material about the company. The problem was not in findingthe problem. The problem was that there were too many problems!
2-1
C A S E 2The Wallace GroupLaurence J. Stybel
Background on The Wallace GroupThe Wallace Group, Inc., is a diversified company dealing in the manufacture and developmentof technical products and systems (see Exhibit 1). The company currently consists of three op-erational groups and a corporate staff. The three groups include Electronics, Plastics, and Chem-icals, each operating under the direction of a Group Vice President (see Exhibits 2, 3, and 4).The company generates $70 million in sales as a manufacturer of plastics, chemical products,and electronic components and systems. Principal sales are to large contractors in governmentaland automotive markets. With respect to sales volume, Plastics and Chemicals are approximatelyequal in size, and both of them together equal the size of the Electronics Group.
Electronics offers competence in the areas of microelectronics, electromagnetic sensors, an-tennas, microwaves, and minicomputers. Presently, these skills are devoted primarily to the engi-neering and manufacture of countermeasure equipment for aircraft. This includes radar detectionsystems that allow an aircraft crew to know that they are being tracked by radar units on theground, on ships, or on other aircraft. Further, the company manufactures displays that providethe crew with a visual “fix” on where they are relative to the radar units that are tracking them.
This case was prepared by Dr. Laurence J. Stybel. It was prepared for class discussion rather than to illustrate eithereffective or ineffective handling of an administrative situation. Unauthorized duplication of copyright materials is aviolation of federal law. This case was edited for SMBP-9th, 10th, 11th, 12th, and 13th Editions. The copyright holdersare solely responsible for case content. Reprint permission is solely granted to the publisher, Prentice Hall, for the book,Strategic Management and Business Policy – 13th Edition by copyright holder, Dr. Laurence J. Stybel. Any other pub-lication of this case (translation, any form of electronic or other media), or sold (any form of partnership) to anotherpublisher will be in violation of copyright laws, unless the copyright holder has granted an additional written reprintpermission.
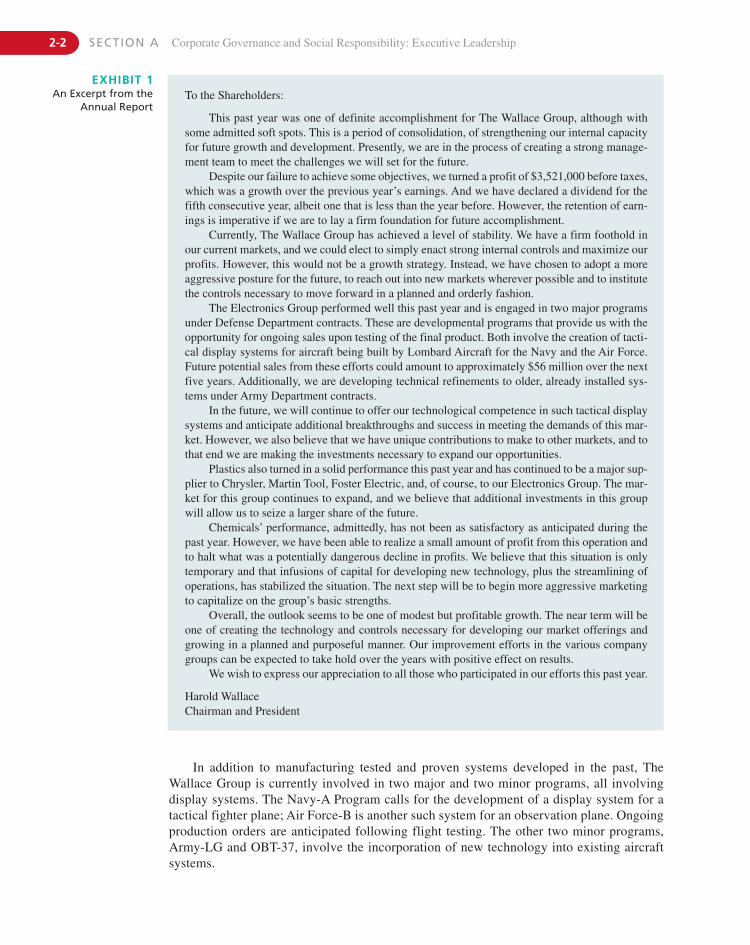
EXHIBIT 1An Excerpt from the
Annual ReportTo the Shareholders:
This past year was one of definite accomplishment for The Wallace Group, although withsome admitted soft spots. This is a period of consolidation, of strengthening our internal capacityfor future growth and development. Presently, we are in the process of creating a strong manage-ment team to meet the challenges we will set for the future.
Despite our failure to achieve some objectives, we turned a profit of $3,521,000 before taxes,which was a growth over the previous year’s earnings. And we have declared a dividend for thefifth consecutive year, albeit one that is less than the year before. However, the retention of earn-ings is imperative if we are to lay a firm foundation for future accomplishment.
Currently, The Wallace Group has achieved a level of stability. We have a firm foothold inour current markets, and we could elect to simply enact strong internal controls and maximize ourprofits. However, this would not be a growth strategy. Instead, we have chosen to adopt a moreaggressive posture for the future, to reach out into new markets wherever possible and to institutethe controls necessary to move forward in a planned and orderly fashion.
The Electronics Group performed well this past year and is engaged in two major programsunder Defense Department contracts. These are developmental programs that provide us with theopportunity for ongoing sales upon testing of the final product. Both involve the creation of tacti-cal display systems for aircraft being built by Lombard Aircraft for the Navy and the Air Force.Future potential sales from these efforts could amount to approximately $56 million over the nextfive years. Additionally, we are developing technical refinements to older, already installed sys-tems under Army Department contracts.
In the future, we will continue to offer our technological competence in such tactical displaysystems and anticipate additional breakthroughs and success in meeting the demands of this mar-ket. However, we also believe that we have unique contributions to make to other markets, and tothat end we are making the investments necessary to expand our opportunities.
Plastics also turned in a solid performance this past year and has continued to be a major sup-plier to Chrysler, Martin Tool, Foster Electric, and, of course, to our Electronics Group. The mar-ket for this group continues to expand, and we believe that additional investments in this groupwill allow us to seize a larger share of the future.
Chemicals’ performance, admittedly, has not been as satisfactory as anticipated during thepast year. However, we have been able to realize a small amount of profit from this operation andto halt what was a potentially dangerous decline in profits. We believe that this situation is onlytemporary and that infusions of capital for developing new technology, plus the streamlining ofoperations, has stabilized the situation. The next step will be to begin more aggressive marketingto capitalize on the group’s basic strengths.
Overall, the outlook seems to be one of modest but profitable growth. The near term will beone of creating the technology and controls necessary for developing our market offerings andgrowing in a planned and purposeful manner. Our improvement efforts in the various companygroups can be expected to take hold over the years with positive effect on results.
We wish to express our appreciation to all those who participated in our efforts this past year.
Harold Wallace Chairman and President
In addition to manufacturing tested and proven systems developed in the past, TheWallace Group is currently involved in two major and two minor programs, all involvingdisplay systems. The Navy-A Program calls for the development of a display system for atactical fighter plane; Air Force-B is another such system for an observation plane. Ongoingproduction orders are anticipated following flight testing. The other two minor programs,Army-LG and OBT-37, involve the incorporation of new technology into existing aircraftsystems.
2-2 SECTION A Corporate Governance and Social Responsibility: Executive Leadership
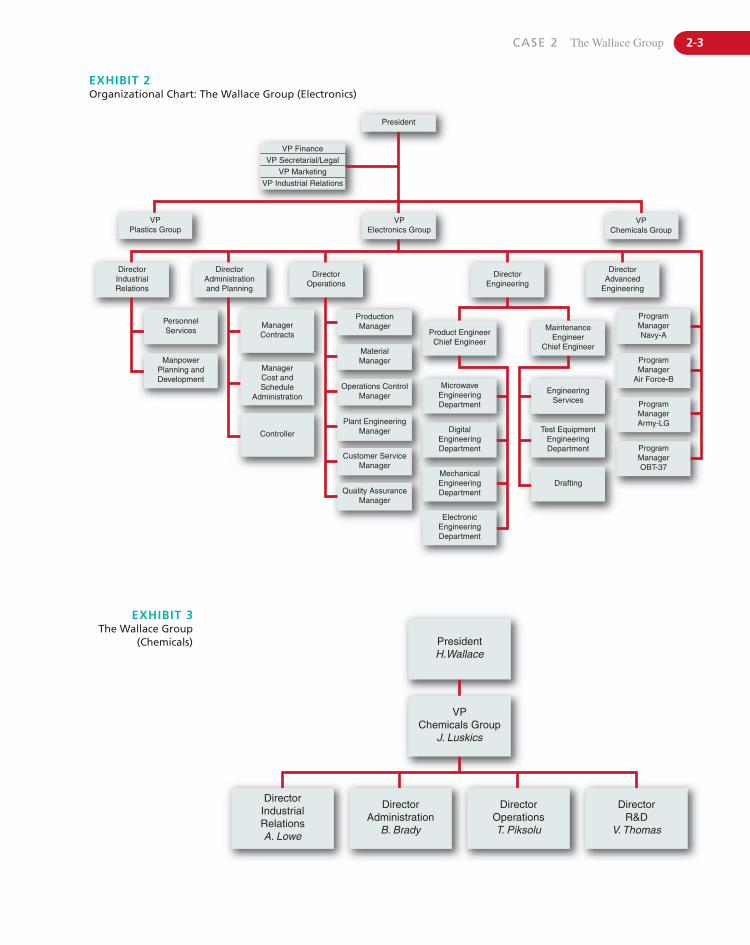
CASE 2 The Wallace Group 2-3
President
VPElectronics Group
VP Industrial RelationsVP Marketing
VPPlastics Group
DirectorIndustrialRelations
PersonnelServices
ManpowerPlanning andDevelopment
DirectorAdministrationand Planning
DirectorOperations
ProductionManager
DirectorEngineering
MaintenanceEngineer
Chief Engineer
VPChemicals Group
DirectorAdvanced
Engineering
ProgramManagerNavy-A
ProgramManager
Air Force-B
ProgramManagerOBT-37
ProgramManagerArmy-LG
Product EngineerChief Engineer
MicrowaveEngineeringDepartment
DigitalEngineeringDepartment
MechanicalEngineeringDepartment
ElectronicEngineeringDepartment
Drafting
Test EquipmentEngineeringDepartment
EngineeringServices
MaterialManager
Plant EngineeringManager
Customer ServiceManager
Quality AssuranceManager
ManagerContracts
ManagerCost andSchedule
Administration
Controller
VP Secretarial/LegalVP Finance
Operations ControlManager
EXHIBIT 2Organizational Chart: The Wallace Group (Electronics)
PresidentH.Wallace
VPChemicals Group
J. Luskics
DirectorIndustrialRelationsA. Lowe
DirectorR&D
V. Thomas
DirectorOperationsT. Piksolu
DirectorAdministration
B. Brady
EXHIBIT 3The Wallace Group
(Chemicals)
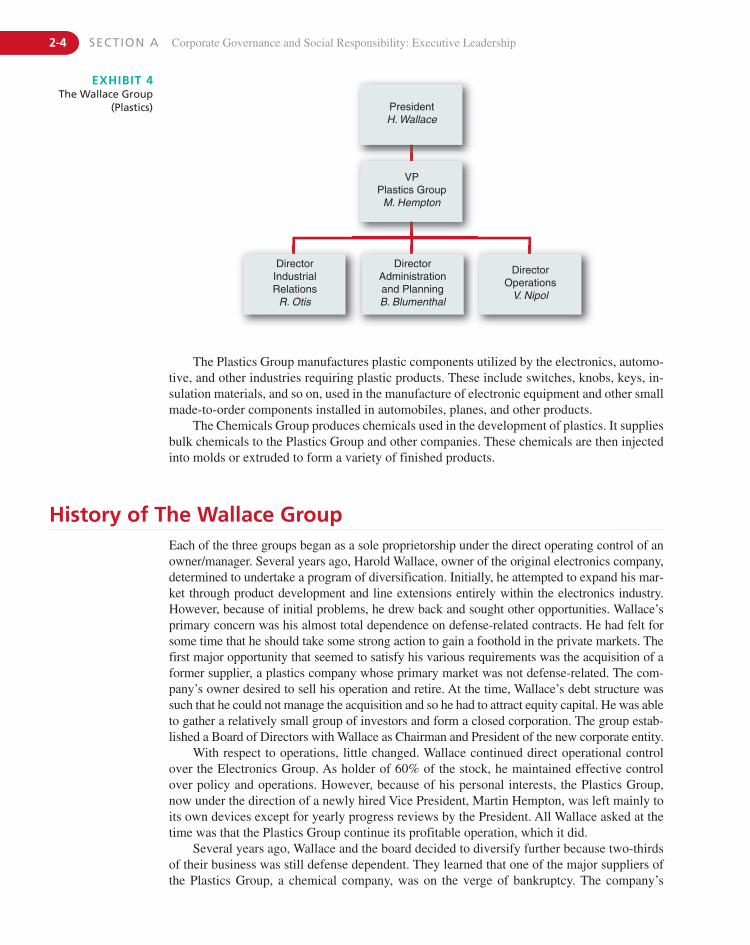
The Plastics Group manufactures plastic components utilized by the electronics, automo-tive, and other industries requiring plastic products. These include switches, knobs, keys, in-sulation materials, and so on, used in the manufacture of electronic equipment and other smallmade-to-order components installed in automobiles, planes, and other products.
The Chemicals Group produces chemicals used in the development of plastics. It suppliesbulk chemicals to the Plastics Group and other companies. These chemicals are then injectedinto molds or extruded to form a variety of finished products.
History of The Wallace GroupEach of the three groups began as a sole proprietorship under the direct operating control of anowner/manager. Several years ago, Harold Wallace, owner of the original electronics company,determined to undertake a program of diversification. Initially, he attempted to expand his mar-ket through product development and line extensions entirely within the electronics industry.However, because of initial problems, he drew back and sought other opportunities. Wallace’sprimary concern was his almost total dependence on defense-related contracts. He had felt forsome time that he should take some strong action to gain a foothold in the private markets. Thefirst major opportunity that seemed to satisfy his various requirements was the acquisition of aformer supplier, a plastics company whose primary market was not defense-related. The com-pany’s owner desired to sell his operation and retire. At the time, Wallace’s debt structure wassuch that he could not manage the acquisition and so he had to attract equity capital. He was ableto gather a relatively small group of investors and form a closed corporation. The group estab-lished a Board of Directors with Wallace as Chairman and President of the new corporate entity.
With respect to operations, little changed. Wallace continued direct operational controlover the Electronics Group. As holder of 60% of the stock, he maintained effective controlover policy and operations. However, because of his personal interests, the Plastics Group,now under the direction of a newly hired Vice President, Martin Hempton, was left mainly toits own devices except for yearly progress reviews by the President. All Wallace asked at thetime was that the Plastics Group continue its profitable operation, which it did.
Several years ago, Wallace and the board decided to diversify further because two-thirdsof their business was still defense dependent. They learned that one of the major suppliers ofthe Plastics Group, a chemical company, was on the verge of bankruptcy. The company’s
PresidentH. Wallace
VPPlastics Group
M. Hempton
DirectorIndustrialRelations
R. Otis
DirectorAdministrationand PlanningB. Blumenthal
DirectorOperations
V. Nipol
EXHIBIT 4The Wallace Group
(Plastics)
2-4 SECTION A Corporate Governance and Social Responsibility: Executive Leadership
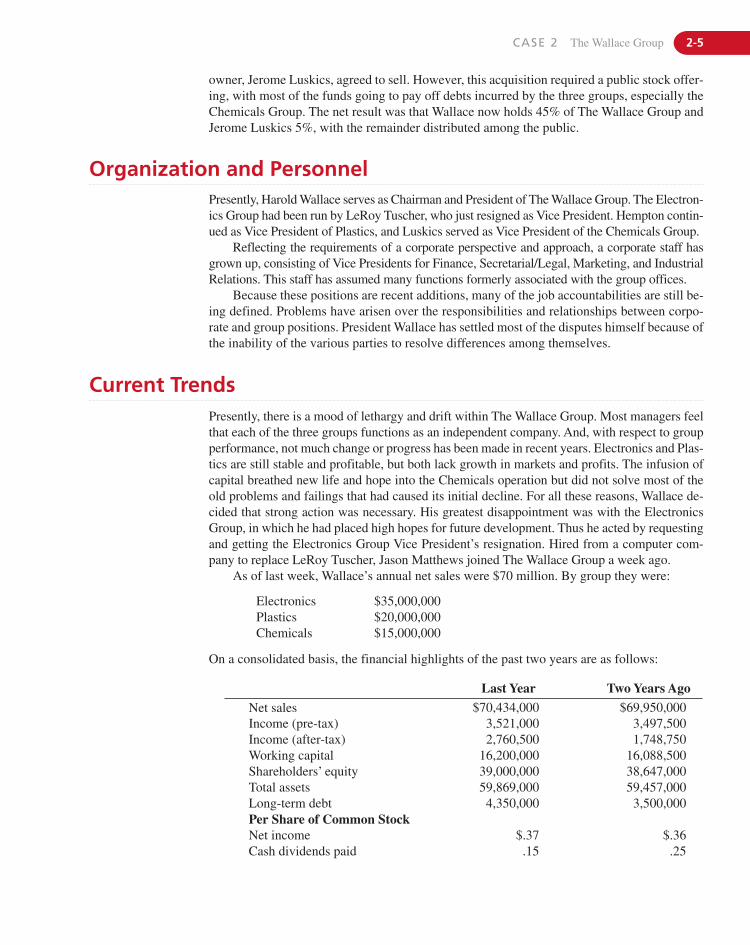
CASE 2 The Wallace Group 2-5
owner, Jerome Luskics, agreed to sell. However, this acquisition required a public stock offer-ing, with most of the funds going to pay off debts incurred by the three groups, especially theChemicals Group. The net result was that Wallace now holds 45% of The Wallace Group andJerome Luskics 5%, with the remainder distributed among the public.
Organization and PersonnelPresently, Harold Wallace serves as Chairman and President of The Wallace Group. The Electron-ics Group had been run by LeRoy Tuscher, who just resigned as Vice President. Hempton contin-ued as Vice President of Plastics, and Luskics served as Vice President of the Chemicals Group.
Reflecting the requirements of a corporate perspective and approach, a corporate staff hasgrown up, consisting of Vice Presidents for Finance, Secretarial/Legal, Marketing, and IndustrialRelations. This staff has assumed many functions formerly associated with the group offices.
Because these positions are recent additions, many of the job accountabilities are still be-ing defined. Problems have arisen over the responsibilities and relationships between corpo-rate and group positions. President Wallace has settled most of the disputes himself because ofthe inability of the various parties to resolve differences among themselves.
Current TrendsPresently, there is a mood of lethargy and drift within The Wallace Group. Most managers feelthat each of the three groups functions as an independent company. And, with respect to groupperformance, not much change or progress has been made in recent years. Electronics and Plas-tics are still stable and profitable, but both lack growth in markets and profits. The infusion ofcapital breathed new life and hope into the Chemicals operation but did not solve most of theold problems and failings that had caused its initial decline. For all these reasons, Wallace de-cided that strong action was necessary. His greatest disappointment was with the ElectronicsGroup, in which he had placed high hopes for future development. Thus he acted by requestingand getting the Electronics Group Vice President’s resignation. Hired from a computer com-pany to replace LeRoy Tuscher, Jason Matthews joined The Wallace Group a week ago.
As of last week, Wallace’s annual net sales were $70 million. By group they were:
Electronics $35,000,000Plastics $20,000,000Chemicals $15,000,000
On a consolidated basis, the financial highlights of the past two years are as follows:
Last Year Two Years Ago
Net sales $70,434,000 $69,950,000Income (pre-tax) 3,521,000 3,497,500Income (after-tax) 2,760,500 1,748,750Working capital 16,200,000 16,088,500Shareholders’ equity 39,000,000 38,647,000Total assets 59,869,000 59,457,000Long-term debt 4,350,000 3,500,000Per Share of Common StockNet income $.37 $.36Cash dividends paid .15 .25
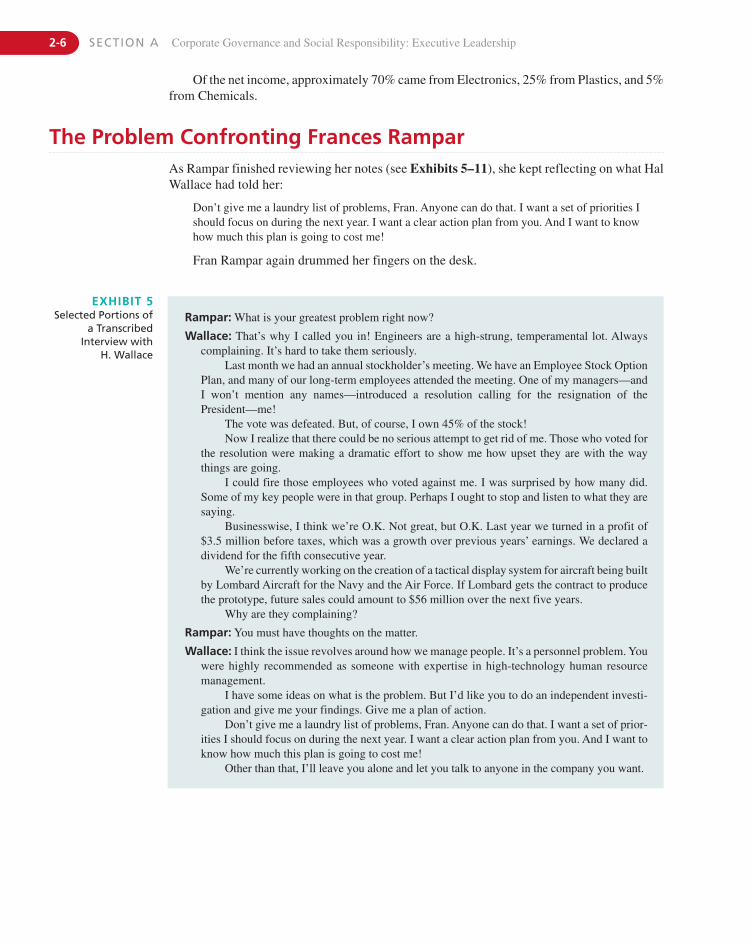
The Problem Confronting Frances RamparAs Rampar finished reviewing her notes (see Exhibits 5–11), she kept reflecting on what HalWallace had told her:
Don’t give me a laundry list of problems, Fran. Anyone can do that. I want a set of priorities Ishould focus on during the next year. I want a clear action plan from you. And I want to knowhow much this plan is going to cost me!
Fran Rampar again drummed her fingers on the desk.
EXHIBIT 5Selected Portions of
a TranscribedInterview with
H. Wallace
Rampar: What is your greatest problem right now?
Wallace: That’s why I called you in! Engineers are a high-strung, temperamental lot. Alwayscomplaining. It’s hard to take them seriously.
Last month we had an annual stockholder’s meeting. We have an Employee Stock OptionPlan, and many of our long-term employees attended the meeting. One of my managers—andI won’t mention any names—introduced a resolution calling for the resignation of thePresident—me!
The vote was defeated. But, of course, I own 45% of the stock!Now I realize that there could be no serious attempt to get rid of me. Those who voted for
the resolution were making a dramatic effort to show me how upset they are with the waythings are going.
I could fire those employees who voted against me. I was surprised by how many did.Some of my key people were in that group. Perhaps I ought to stop and listen to what they aresaying.
Businesswise, I think we’re O.K. Not great, but O.K. Last year we turned in a profit of$3.5 million before taxes, which was a growth over previous years’ earnings. We declared adividend for the fifth consecutive year.
We’re currently working on the creation of a tactical display system for aircraft being builtby Lombard Aircraft for the Navy and the Air Force. If Lombard gets the contract to producethe prototype, future sales could amount to $56 million over the next five years.
Why are they complaining?
Rampar: You must have thoughts on the matter.
Wallace: I think the issue revolves around how we manage people. It’s a personnel problem. Youwere highly recommended as someone with expertise in high-technology human resourcemanagement.
I have some ideas on what is the problem. But I’d like you to do an independent investi-gation and give me your findings. Give me a plan of action.
Don’t give me a laundry list of problems, Fran. Anyone can do that. I want a set of prior-ities I should focus on during the next year. I want a clear action plan from you. And I want toknow how much this plan is going to cost me!
Other than that, I’ll leave you alone and let you talk to anyone in the company you want.
Of the net income, approximately 70% came from Electronics, 25% from Plastics, and 5%from Chemicals.
2-6 SECTION A Corporate Governance and Social Responsibility: Executive Leadership
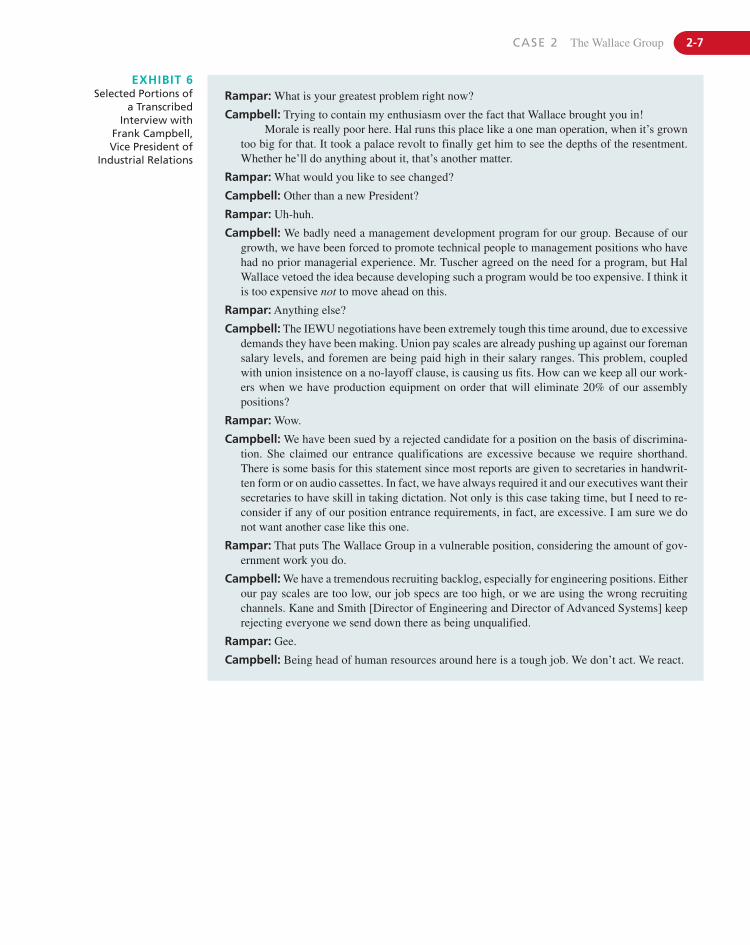
CASE 2 The Wallace Group 2-7
EXHIBIT 6Selected Portions of
a TranscribedInterview with
Frank Campbell,Vice President of
Industrial Relations
Rampar: What is your greatest problem right now?
Campbell: Trying to contain my enthusiasm over the fact that Wallace brought you in!Morale is really poor here. Hal runs this place like a one man operation, when it’s grown
too big for that. It took a palace revolt to finally get him to see the depths of the resentment.Whether he’ll do anything about it, that’s another matter.
Rampar: What would you like to see changed?
Campbell: Other than a new President?
Rampar: Uh-huh.
Campbell: We badly need a management development program for our group. Because of ourgrowth, we have been forced to promote technical people to management positions who havehad no prior managerial experience. Mr. Tuscher agreed on the need for a program, but HalWallace vetoed the idea because developing such a program would be too expensive. I think itis too expensive not to move ahead on this.
Rampar: Anything else?
Campbell: The IEWU negotiations have been extremely tough this time around, due to excessivedemands they have been making. Union pay scales are already pushing up against our foremansalary levels, and foremen are being paid high in their salary ranges. This problem, coupledwith union insistence on a no-layoff clause, is causing us fits. How can we keep all our work-ers when we have production equipment on order that will eliminate 20% of our assemblypositions?
Rampar: Wow.
Campbell: We have been sued by a rejected candidate for a position on the basis of discrimina-tion. She claimed our entrance qualifications are excessive because we require shorthand.There is some basis for this statement since most reports are given to secretaries in handwrit-ten form or on audio cassettes. In fact, we have always required it and our executives want theirsecretaries to have skill in taking dictation. Not only is this case taking time, but I need to re-consider if any of our position entrance requirements, in fact, are excessive. I am sure we donot want another case like this one.
Rampar: That puts The Wallace Group in a vulnerable position, considering the amount of gov-ernment work you do.
Campbell: We have a tremendous recruiting backlog, especially for engineering positions. Eitherour pay scales are too low, our job specs are too high, or we are using the wrong recruitingchannels. Kane and Smith [Director of Engineering and Director of Advanced Systems] keeprejecting everyone we send down there as being unqualified.
Rampar: Gee.
Campbell: Being head of human resources around here is a tough job. We don’t act. We react.
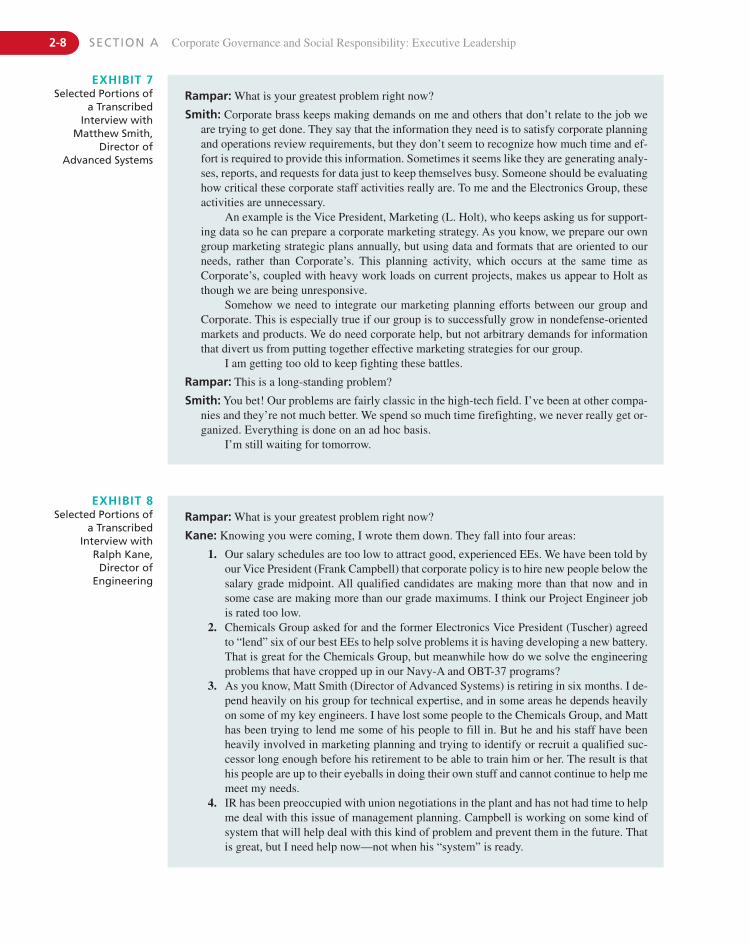
EXHIBIT 7Selected Portions of
a TranscribedInterview with
Matthew Smith,Director of
Advanced Systems
Rampar: What is your greatest problem right now?
Smith: Corporate brass keeps making demands on me and others that don’t relate to the job weare trying to get done. They say that the information they need is to satisfy corporate planningand operations review requirements, but they don’t seem to recognize how much time and ef-fort is required to provide this information. Sometimes it seems like they are generating analy-ses, reports, and requests for data just to keep themselves busy. Someone should be evaluatinghow critical these corporate staff activities really are. To me and the Electronics Group, theseactivities are unnecessary.
An example is the Vice President, Marketing (L. Holt), who keeps asking us for support-ing data so he can prepare a corporate marketing strategy. As you know, we prepare our owngroup marketing strategic plans annually, but using data and formats that are oriented to ourneeds, rather than Corporate’s. This planning activity, which occurs at the same time asCorporate’s, coupled with heavy work loads on current projects, makes us appear to Holt asthough we are being unresponsive.
Somehow we need to integrate our marketing planning efforts between our group andCorporate. This is especially true if our group is to successfully grow in nondefense-orientedmarkets and products. We do need corporate help, but not arbitrary demands for informationthat divert us from putting together effective marketing strategies for our group.
I am getting too old to keep fighting these battles.
Rampar: This is a long-standing problem?
Smith: You bet! Our problems are fairly classic in the high-tech field. I’ve been at other compa-nies and they’re not much better. We spend so much time firefighting, we never really get or-ganized. Everything is done on an ad hoc basis.
I’m still waiting for tomorrow.
EXHIBIT 8Selected Portions of
a TranscribedInterview with
Ralph Kane,Director of
Engineering
Rampar: What is your greatest problem right now?
Kane: Knowing you were coming, I wrote them down. They fall into four areas:
1. Our salary schedules are too low to attract good, experienced EEs. We have been told byour Vice President (Frank Campbell) that corporate policy is to hire new people below thesalary grade midpoint. All qualified candidates are making more than that now and insome case are making more than our grade maximums. I think our Project Engineer jobis rated too low.
2. Chemicals Group asked for and the former Electronics Vice President (Tuscher) agreedto “lend” six of our best EEs to help solve problems it is having developing a new battery.That is great for the Chemicals Group, but meanwhile how do we solve the engineeringproblems that have cropped up in our Navy-A and OBT-37 programs?
3. As you know, Matt Smith (Director of Advanced Systems) is retiring in six months. I de-pend heavily on his group for technical expertise, and in some areas he depends heavilyon some of my key engineers. I have lost some people to the Chemicals Group, and Matthas been trying to lend me some of his people to fill in. But he and his staff have beenheavily involved in marketing planning and trying to identify or recruit a qualified suc-cessor long enough before his retirement to be able to train him or her. The result is thathis people are up to their eyeballs in doing their own stuff and cannot continue to help memeet my needs.
4. IR has been preoccupied with union negotiations in the plant and has not had time to helpme deal with this issue of management planning. Campbell is working on some kind ofsystem that will help deal with this kind of problem and prevent them in the future. Thatis great, but I need help now—not when his “system” is ready.
2-8 SECTION A Corporate Governance and Social Responsibility: Executive Leadership
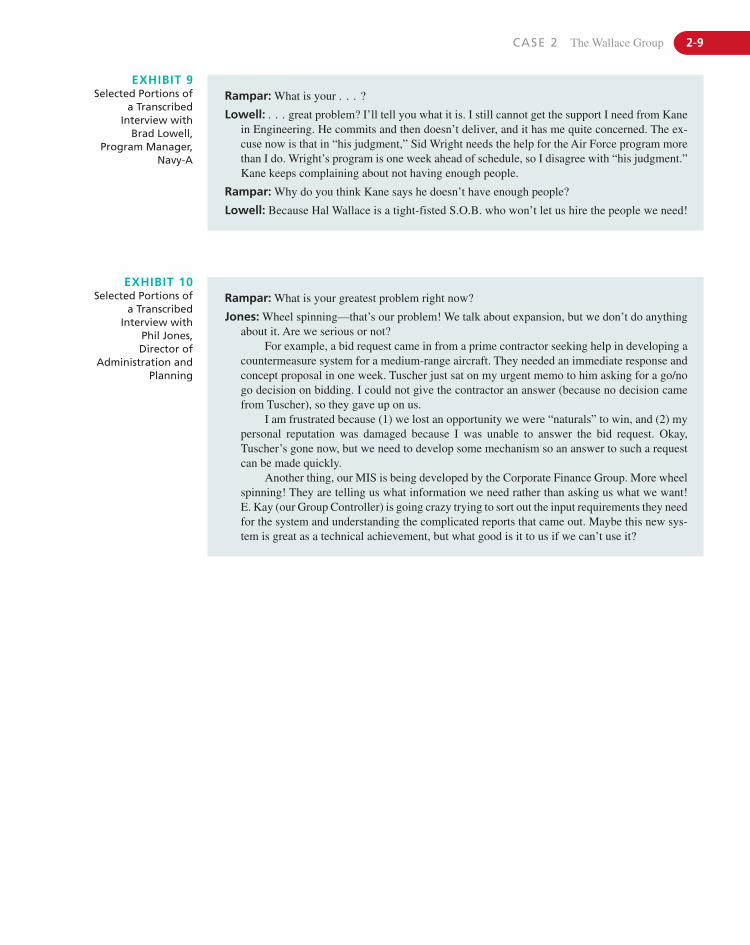
CASE 2 The Wallace Group 2-9
EXHIBIT 10Selected Portions of
a TranscribedInterview with
Phil Jones,Director of
Administration andPlanning
Rampar: What is your greatest problem right now?
Jones: Wheel spinning—that’s our problem! We talk about expansion, but we don’t do anythingabout it. Are we serious or not?
For example, a bid request came in from a prime contractor seeking help in developing acountermeasure system for a medium-range aircraft. They needed an immediate response andconcept proposal in one week. Tuscher just sat on my urgent memo to him asking for a go/nogo decision on bidding. I could not give the contractor an answer (because no decision camefrom Tuscher), so they gave up on us.
I am frustrated because (1) we lost an opportunity we were “naturals” to win, and (2) mypersonal reputation was damaged because I was unable to answer the bid request. Okay,Tuscher’s gone now, but we need to develop some mechanism so an answer to such a requestcan be made quickly.
Another thing, our MIS is being developed by the Corporate Finance Group. More wheelspinning! They are telling us what information we need rather than asking us what we want!E. Kay (our Group Controller) is going crazy trying to sort out the input requirements they needfor the system and understanding the complicated reports that came out. Maybe this new sys-tem is great as a technical achievement, but what good is it to us if we can’t use it?
EXHIBIT 9Selected Portions of
a TranscribedInterview with
Brad Lowell,Program Manager,
Navy-A
Rampar: What is your . . . ?
Lowell: . . . great problem? I’ll tell you what it is. I still cannot get the support I need from Kanein Engineering. He commits and then doesn’t deliver, and it has me quite concerned. The ex-cuse now is that in “his judgment,” Sid Wright needs the help for the Air Force program morethan I do. Wright’s program is one week ahead of schedule, so I disagree with “his judgment.”Kane keeps complaining about not having enough people.
Rampar: Why do you think Kane says he doesn’t have enough people?
Lowell: Because Hal Wallace is a tight-fisted S.O.B. who won’t let us hire the people we need!
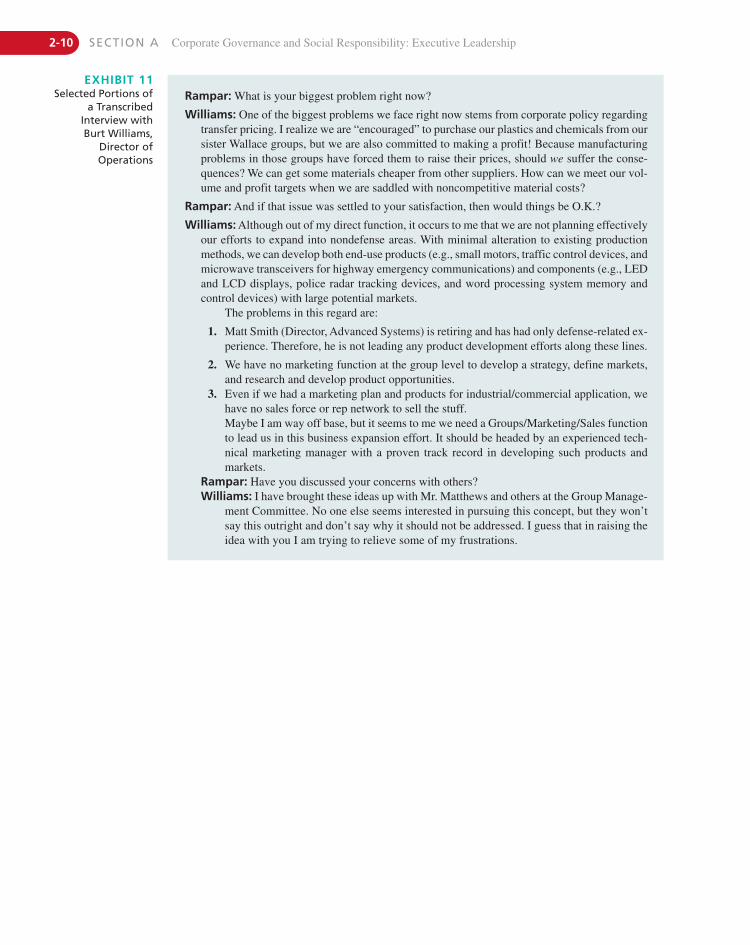
EXHIBIT 11Selected Portions of
a TranscribedInterview with Burt Williams,
Director ofOperations
Rampar: What is your biggest problem right now?
Williams: One of the biggest problems we face right now stems from corporate policy regardingtransfer pricing. I realize we are “encouraged” to purchase our plastics and chemicals from oursister Wallace groups, but we are also committed to making a profit! Because manufacturingproblems in those groups have forced them to raise their prices, should we suffer the conse-quences? We can get some materials cheaper from other suppliers. How can we meet our vol-ume and profit targets when we are saddled with noncompetitive material costs?
Rampar: And if that issue was settled to your satisfaction, then would things be O.K.?
Williams: Although out of my direct function, it occurs to me that we are not planning effectivelyour efforts to expand into nondefense areas. With minimal alteration to existing productionmethods, we can develop both end-use products (e.g., small motors, traffic control devices, andmicrowave transceivers for highway emergency communications) and components (e.g., LEDand LCD displays, police radar tracking devices, and word processing system memory andcontrol devices) with large potential markets.
The problems in this regard are:
1. Matt Smith (Director, Advanced Systems) is retiring and has had only defense-related ex-perience. Therefore, he is not leading any product development efforts along these lines.
2. We have no marketing function at the group level to develop a strategy, define markets,and research and develop product opportunities.
3. Even if we had a marketing plan and products for industrial/commercial application, wehave no sales force or rep network to sell the stuff.Maybe I am way off base, but it seems to me we need a Groups/Marketing/Sales functionto lead us in this business expansion effort. It should be headed by an experienced tech-nical marketing manager with a proven track record in developing such products andmarkets.
Rampar: Have you discussed your concerns with others?Williams: I have brought these ideas up with Mr. Matthews and others at the Group Manage-
ment Committee. No one else seems interested in pursuing this concept, but they won’tsay this outright and don’t say why it should not be addressed. I guess that in raising theidea with you I am trying to relieve some of my frustrations.
2-10 SECTION A Corporate Governance and Social Responsibility: Executive Leadership
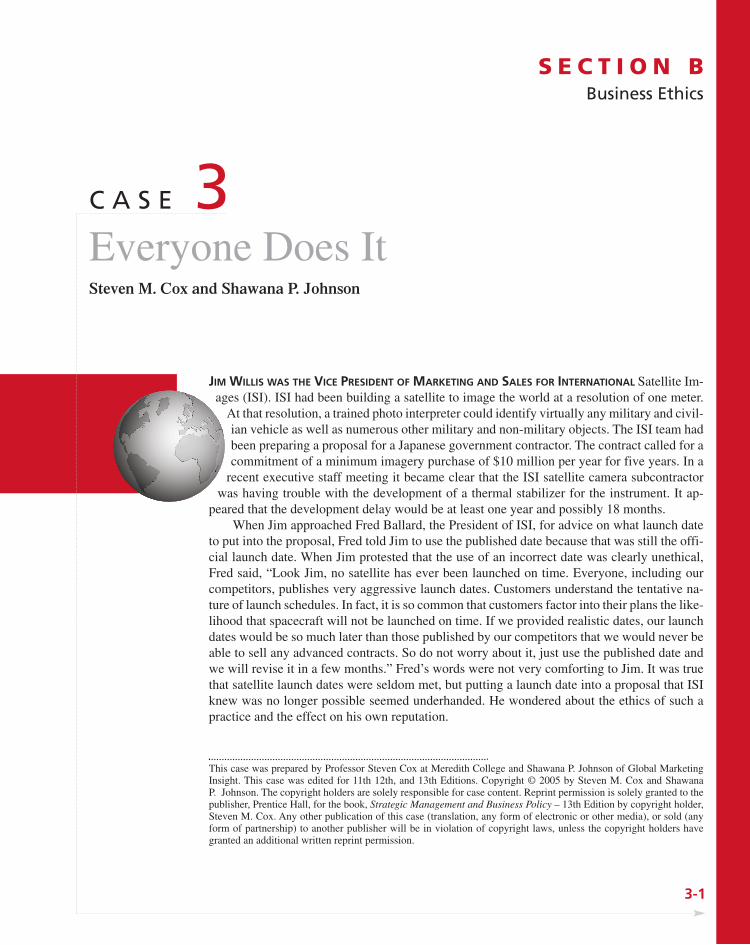
JIM WILLIS WAS THE VICE PRESIDENT OF MARKETING AND SALES FOR INTERNATIONAL Satellite Im-ages (ISI). ISI had been building a satellite to image the world at a resolution of one meter.
At that resolution, a trained photo interpreter could identify virtually any military and civil-ian vehicle as well as numerous other military and non-military objects. The ISI team hadbeen preparing a proposal for a Japanese government contractor. The contract called for acommitment of a minimum imagery purchase of $10 million per year for five years. In a
recent executive staff meeting it became clear that the ISI satellite camera subcontractorwas having trouble with the development of a thermal stabilizer for the instrument. It ap-
peared that the development delay would be at least one year and possibly 18 months.When Jim approached Fred Ballard, the President of ISI, for advice on what launch date
to put into the proposal, Fred told Jim to use the published date because that was still the offi-cial launch date. When Jim protested that the use of an incorrect date was clearly unethical,Fred said, “Look Jim, no satellite has ever been launched on time. Everyone, including ourcompetitors, publishes very aggressive launch dates. Customers understand the tentative na-ture of launch schedules. In fact, it is so common that customers factor into their plans the like-lihood that spacecraft will not be launched on time. If we provided realistic dates, our launchdates would be so much later than those published by our competitors that we would never beable to sell any advanced contracts. So do not worry about it, just use the published date andwe will revise it in a few months.” Fred’s words were not very comforting to Jim. It was truethat satellite launch dates were seldom met, but putting a launch date into a proposal that ISIknew was no longer possible seemed underhanded. He wondered about the ethics of such apractice and the effect on his own reputation.
3-1
C A S E 3Everyone Does ItSteven M. Cox and Shawana P. Johnson
This case was prepared by Professor Steven Cox at Meredith College and Shawana P. Johnson of Global MarketingInsight. This case was edited for 11th 12th, and 13th Editions. Copyright © 2005 by Steven M. Cox and ShawanaP. Johnson. The copyright holders are solely responsible for case content. Reprint permission is solely granted to thepublisher, Prentice Hall, for the book, Strategic Management and Business Policy – 13th Edition by copyright holder,Steven M. Cox. Any other publication of this case (translation, any form of electronic or other media), or sold (anyform of partnership) to another publisher will be in violation of copyright laws, unless the copyright holders havegranted an additional written reprint permission.
S E C T I O N BBusiness Ethics
3-2 SECTION B Business Ethics
The IndustryCompanies from four nations, the United States, France, Russia, and Israel, controlled thesatellite imaging industry. The U.S. companies had a clear advantage in technology and im-agery clarity. In the United States, three companies dominated: Lockart, Global Sciences, andISI. Each of these companies had received a license from the U.S. government to build andlaunch a satellite able to identify objects as small as one square meter. However, none had yetbeen able to successfully launch a commercial satellite with such a fine resolution. Currently,all of the companies had announced a launch date within six months of the ISI publishedlaunch date. Further, each company had to revise its launch date at least once, and in the caseof Global Sciences, twice. Each time a company had revised its launch date, ongoing inter-national contract negotiations with that company had been either stalled or terminated.
Financing a Satellite ProgramThe construction and ongoing operations of each of the programs was financed by venturecapitalists. The venture capitalists relied heavily on advance contract acquisition to ensure thesuccess of their investment. As a result, if any company was unable to acquire sufficient ad-vance contracts, or if one company appeared to be gaining a lead on the others, there was areal possibility that the financiers would pull the plug on the other projects and the losingcompanies would be forced to stop production and possibly declare bankruptcy. The typicaladvance contract target was 150% of the cost of building and launching a satellite. Since thecost to build and launch was $200 million, each company was striving to acquire $300 mil-lion in advance contracts.
Advance contracts were typically written like franchise licensing agreements. Each fran-chisee guaranteed to purchase a minimum amount of imagery per year for five years, the en-gineered life of the satellite. In addition, each franchisee agreed to acquire the capability toreceive, process, and archive the images sent to them from the satellite. Typically, the hard-ware and software cost was between $10 million and $15 million per installation. Because thedata from each satellite was different, much of the software could not be used for multiple pro-grams. In exchange, the franchisee was granted an exclusive reception and selling territory.The amount of each contract was dependent on the anticipated size of the market, the numberof possible competitors in the market, and the readiness of the local military and civilian agen-cies to use the imagery. Thus, a contract in Africa would sell for as little as $1 million per year,whereas in several European countries $5–$10 million was not unreasonable. The problemwas complicated by the fact that in each market there were usually only one or two companieswith the financial strength and market penetration to become a successful franchisee. There-fore, each of the U.S. companies had targeted these companies as their prime prospects.
The Current ProblemJapan was expected to be the third largest market for satellite imagery after the United Statesand Europe. Imagery sales in Japan were estimated to be from $20 million to $30 million peryear. Although the principal user would be the Japanese government, for political reasons thegovernment had made it clear that they would be purchasing data through a local Japanesecompany. One Japanese company, Higashi Trading Company (HTC), had provided most ofthe imagery for civilian and military use to the Japanese government.
ISI had been negotiating with HTC for the past six months. It was no secret that HTC hadalso been meeting with representatives from Lockart and Global Sciences. HTC had sent
CASE 3 Everyone Does It 3-3
several engineers to ISI to evaluate the satellite and its construction progress. Jim Willis be-lieved that ISI was currently the front-runner in the quest to sign HTC to a $10 million annualcontract. Over five years, that one contract would represent one sixth of the contracts neces-sary to ensure sufficient venture capital to complete the satellite.
Jim was concerned that if a new launch date was announced, HTC would delay signing acontract. Jim was equally concerned that if HTC learned that Jim and his team knew of thecamera design problems and knowingly withheld announcement of a new launch date until af-ter completing negotiations, not only his personal reputation but that of ISI would be damaged.Furthermore, as with any franchise arrangement, mutual trust was critical to the success ofeach party. Jim was worried that even if only a 12-month delay in launch occurred, trust wouldbe broken between ISI and the Japanese.
Jim’s boss, Fred Ballard, had specifically told Jim that launch date information was com-pany proprietary and that Jim was to use the existing published date when talking with clients.Fred feared that if HTC became aware of the delay, they would begin negotiating with one ofISI’s competitors, who in Fred’s opinion were not likely to meet their launch dates either. Thischange in negotiation focus by the Japanese would then have ramifications with the venturecapitalists whom Fred had assured that a contract with the Japanese would soon be signed.
Jim knew that with the presentation date rapidly approaching, it was time to make a decision.

This page intentionally left blank
SUE WAS PUZZLED AS TO WHAT COURSE OF ACTION TO TAKE. SHE HAD RECENTLY STARTED her jobwith a national CPA firm, and she was already confronted with a problem that could affect
her future with the firm. On an audit, she encountered a client who had been treating pay-ments to a large number, but by no means a majority, of its workers as payments to inde-pendent contractors. This practice saves the client the payroll taxes that would otherwisebe due on the payments if the workers were classified as employees. In Sue’s judgment
this was improper as well as illegal and should have been noted in the audit. She raised theissue with John, the senior accountant to whom she reported. He thought it was a possible
problem but did not seem willing to do anything about it. He encouraged her to talk to the part-ner in charge if she didn’t feel satisfied.
She thought about the problem for a considerable time before approaching the partner incharge. The ongoing professional education classes she had received from her employer em-phasized the ethical responsibilities that she had as a CPA and the fact that her firm endorsedadherence to high ethical standards. This finally swayed her to pursue the issue with the part-ner in charge of the audit. The visit was most unsatisfactory. Paul, the partner, virtually con-firmed her initial reaction that the practice was wrong, but he said that many other companiesin the industry follow such a practice. He went on to say that if an issue was made of it, Suewould lose the account, and he was not about to take such action. She came away from themeeting with the distinct feeling that had she chosen to pursue the issue, she would have cre-ated an enemy.
Sue still felt disturbed and decided to discuss the problem with some of her co-workers.She approached Bill and Mike, both of whom had been working for the firm for a couple ofyears. They were familiar with the problem because they had encountered the same issue whendoing the audit the previous year. They expressed considerable concern that if she went overthe head of the partner in charge of the audit, they could be in big trouble since they had failedto question the practice during the previous audit. They said that they realized it was probablywrong, but they went ahead because it had been ignored in previous years, and they knew theirsupervisor wanted them to ignore it again this year. They didn’t want to cause problems. Theyencouraged Sue to be a “team player” and drop the issue.
This case was prepared by Professors John A. Kilpatrick, Gamewell D. Gantt, and George A. Johnson of the Collegeof Business, Idaho State University. The names of the organization, individual, location, and/or financial informationhave been disguised to preserve the organization’s desire for anonymity. This case was edited for SMBP-9th, 10th,11th, 12th, and 13th Editions. Presented to and accepted by the refereed Society for Case Research. All rights reservedto the authors and the SCR. Copyright © 1995 by John A. Kilpatrick, Gamewell D. Gantt, and George A. Johnson.This case may not be reproduced without written permission of the copyright holders. Reprinted by permission.
4-1
C A S E 4The AuditGamewell D. Gantt, George A. Johnson, and John A. Kilpatrick

This page intentionally left blank
IN 2006, STARBUCKS COFFEE COMPANY (STARBUCKS), the world’s No.1 specialty coffee re-tailer had over 11,000 stores in 36 countries of the world and employed over 10,000 peo-
ple (see Exhibit 1). Every week over 40 million customers visited Starbuckscoffeehouses. The company had over 7,600 retail locations in the United States, whichwas its home country and its biggest market. After phenomenal success in the UnitedStates, Starbucks entered one country after another and popularized its specialty coffee
worldwide.During the 1990s, Starbucks concentrated its expansion efforts mainly in Asia. In 1995 it
entered Japan and by late 1990s Japan had became the second-most-profitable market for Starbucks. In 1999, Starbucks entered China and by 2006 Starbucks had become the leader inspecialty coffee in China and had moved China up to the No. 1 priority.3
After Japan and China, Starbucks expressed its intentions to enter India. In 2002, Star-bucks announced for the first time that it was planning to enter India.4 Later it postponed its entry as it had entered China recently and was facing problems in Japan. In 2003, there wasnews again that Starbucks was reviving its plans to enter India. In 2004, Starbucks
5-1
C A S E 5Starbucks Coffee Company:THE INDIAN DILEMMARuchi Mankad and Joel Sarosh Thadamalla
As the world’s second most populous country, with more than 1 billion people and growing at 6% per year,we see unique and great opportunity for bringing the Starbucks experience to this market (India).1
HOWARD SCHULTZ, CHAIRMAN, STARBUCKS CORPORATION
India is an important long-term growth opportunity in the Asia Pacific region. We’re looking at our own strategy . . .We believe there is a growing affinity for global brands.2
MARTIN COLES, PRESIDENT, STARBUCKS COFFEE INTERNATIONAL
Copyright © 2008, ICFAI. Reprinted by permission of ICFAI Center for Management Research (ICMR), Hyderbad,India. Website: www.icmrindia.org. The authors are Ruchi Mankad and Joel Sarosh Thadamalla. This case cannot bereproduced in any form without the written permission of the copyright holder, ICFAI Center for ManagementResearch (ICMR). Reprint permission is solely granted by the publisher, Prentice Hall, for the books, StrategicManagement and Business Policy–13th Edition (and the International version of this book) by copyright holder, ICFAI Center for Management Research (ICMR). This case was edited for SM&BP-13th edition. The copyrightholder is solely responsible for case content. Any other publication of the case (translation, any form of electronics orother media) or sold (any form of partnership) to another publisher will be in violation of copyright law, unless ICFAICenter for Management Research (ICMR) has granted an additional written reprint permission.
S E C T I O N CInternational Issues in Strategic Management
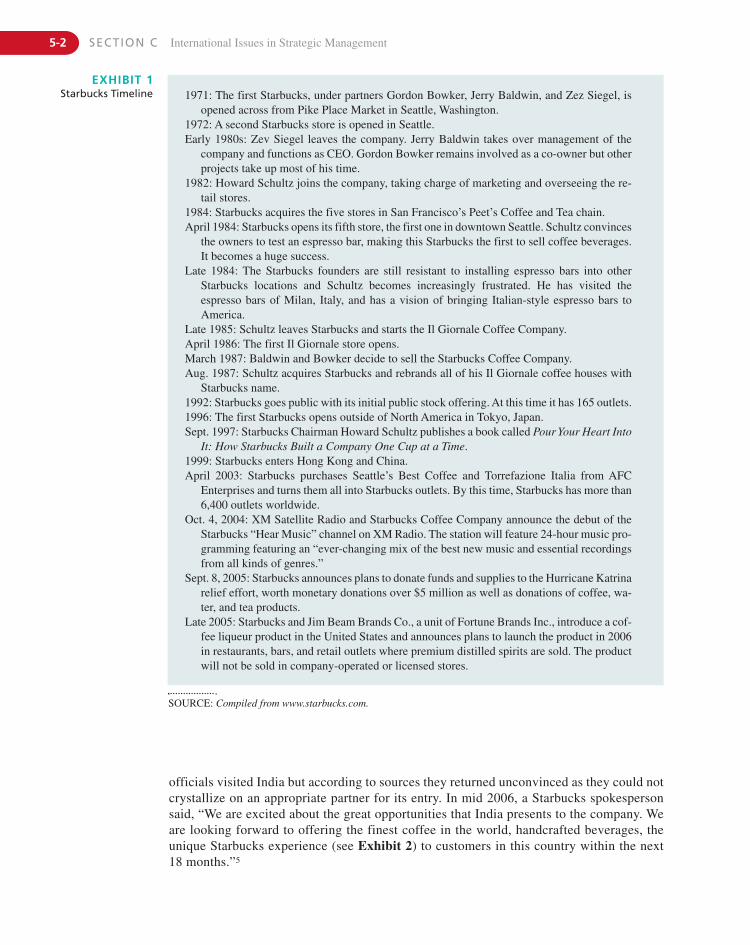
5-2 SECTION C International Issues in Strategic Management
EXHIBIT 1Starbucks Timeline 1971: The first Starbucks, under partners Gordon Bowker, Jerry Baldwin, and Zez Siegel, is
opened across from Pike Place Market in Seattle, Washington.1972: A second Starbucks store is opened in Seattle.Early 1980s: Zev Siegel leaves the company. Jerry Baldwin takes over management of the
company and functions as CEO. Gordon Bowker remains involved as a co-owner but otherprojects take up most of his time.
1982: Howard Schultz joins the company, taking charge of marketing and overseeing the re-tail stores.
1984: Starbucks acquires the five stores in San Francisco’s Peet’s Coffee and Tea chain.April 1984: Starbucks opens its fifth store, the first one in downtown Seattle. Schultz convinces
the owners to test an espresso bar, making this Starbucks the first to sell coffee beverages.It becomes a huge success.
Late 1984: The Starbucks founders are still resistant to installing espresso bars into otherStarbucks locations and Schultz becomes increasingly frustrated. He has visited theespresso bars of Milan, Italy, and has a vision of bringing Italian-style espresso bars toAmerica.
Late 1985: Schultz leaves Starbucks and starts the Il Giornale Coffee Company.April 1986: The first Il Giornale store opens.March 1987: Baldwin and Bowker decide to sell the Starbucks Coffee Company.Aug. 1987: Schultz acquires Starbucks and rebrands all of his Il Giornale coffee houses with
Starbucks name.1992: Starbucks goes public with its initial public stock offering. At this time it has 165 outlets.1996: The first Starbucks opens outside of North America in Tokyo, Japan.Sept. 1997: Starbucks Chairman Howard Schultz publishes a book called Pour Your Heart Into
It: How Starbucks Built a Company One Cup at a Time.1999: Starbucks enters Hong Kong and China.April 2003: Starbucks purchases Seattle’s Best Coffee and Torrefazione Italia from AFC
Enterprises and turns them all into Starbucks outlets. By this time, Starbucks has more than6,400 outlets worldwide.
Oct. 4, 2004: XM Satellite Radio and Starbucks Coffee Company announce the debut of theStarbucks “Hear Music” channel on XM Radio. The station will feature 24-hour music pro-gramming featuring an “ever-changing mix of the best new music and essential recordingsfrom all kinds of genres.”
Sept. 8, 2005: Starbucks announces plans to donate funds and supplies to the Hurricane Katrinarelief effort, worth monetary donations over $5 million as well as donations of coffee, wa-ter, and tea products.
Late 2005: Starbucks and Jim Beam Brands Co., a unit of Fortune Brands Inc., introduce a cof-fee liqueur product in the United States and announces plans to launch the product in 2006in restaurants, bars, and retail outlets where premium distilled spirits are sold. The productwill not be sold in company-operated or licensed stores.
SOURCE: Compiled from www.starbucks.com.
officials visited India but according to sources they returned unconvinced as they could notcrystallize on an appropriate partner for its entry. In mid 2006, a Starbucks spokespersonsaid, “We are excited about the great opportunities that India presents to the company. Weare looking forward to offering the finest coffee in the world, handcrafted beverages, theunique Starbucks experience (see Exhibit 2) to customers in this country within the next18 months.”5
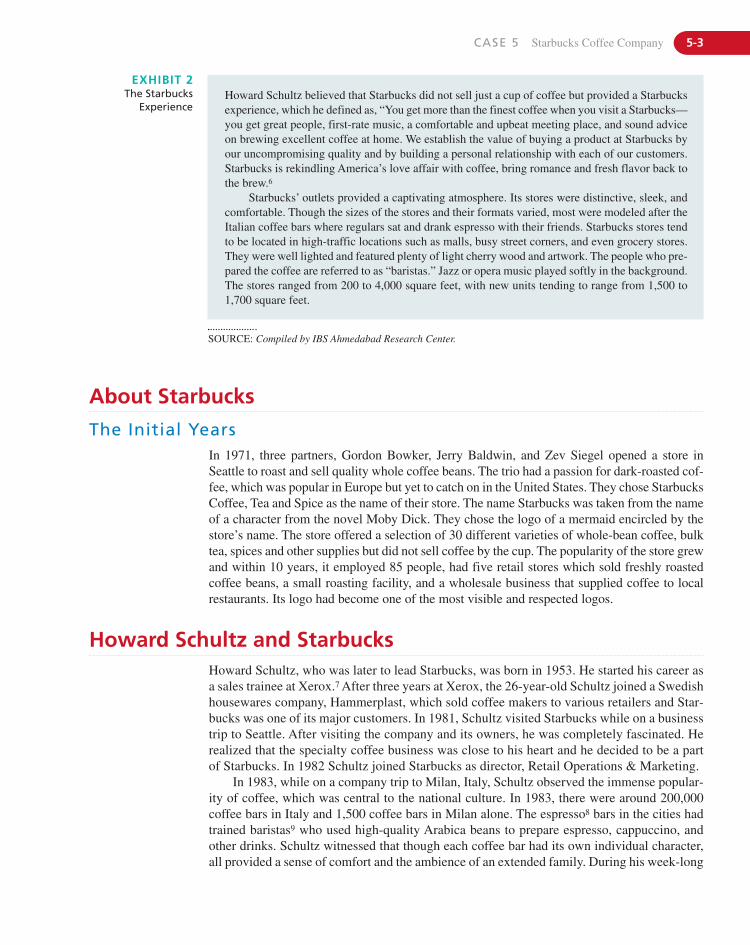
CASE 5 Starbucks Coffee Company 5-3
EXHIBIT 2The Starbucks
ExperienceHoward Schultz believed that Starbucks did not sell just a cup of coffee but provided a Starbucksexperience, which he defined as, “You get more than the finest coffee when you visit a Starbucks—you get great people, first-rate music, a comfortable and upbeat meeting place, and sound adviceon brewing excellent coffee at home. We establish the value of buying a product at Starbucks byour uncompromising quality and by building a personal relationship with each of our customers.Starbucks is rekindling America’s love affair with coffee, bring romance and fresh flavor back tothe brew.6
Starbucks’ outlets provided a captivating atmosphere. Its stores were distinctive, sleek, andcomfortable. Though the sizes of the stores and their formats varied, most were modeled after theItalian coffee bars where regulars sat and drank espresso with their friends. Starbucks stores tendto be located in high-traffic locations such as malls, busy street corners, and even grocery stores.They were well lighted and featured plenty of light cherry wood and artwork. The people who pre-pared the coffee are referred to as “baristas.” Jazz or opera music played softly in the background.The stores ranged from 200 to 4,000 square feet, with new units tending to range from 1,500 to1,700 square feet.
SOURCE: Compiled by IBS Ahmedabad Research Center.
About Starbucks
The Initial YearsIn 1971, three partners, Gordon Bowker, Jerry Baldwin, and Zev Siegel opened a store inSeattle to roast and sell quality whole coffee beans. The trio had a passion for dark-roasted cof-fee, which was popular in Europe but yet to catch on in the United States. They chose StarbucksCoffee, Tea and Spice as the name of their store. The name Starbucks was taken from the nameof a character from the novel Moby Dick. They chose the logo of a mermaid encircled by thestore’s name. The store offered a selection of 30 different varieties of whole-bean coffee, bulktea, spices and other supplies but did not sell coffee by the cup. The popularity of the store grewand within 10 years, it employed 85 people, had five retail stores which sold freshly roastedcoffee beans, a small roasting facility, and a wholesale business that supplied coffee to localrestaurants. Its logo had become one of the most visible and respected logos.
Howard Schultz and StarbucksHoward Schultz, who was later to lead Starbucks, was born in 1953. He started his career asa sales trainee at Xerox.7 After three years at Xerox, the 26-year-old Schultz joined a Swedishhousewares company, Hammerplast, which sold coffee makers to various retailers and Star-bucks was one of its major customers. In 1981, Schultz visited Starbucks while on a businesstrip to Seattle. After visiting the company and its owners, he was completely fascinated. Herealized that the specialty coffee business was close to his heart and he decided to be a partof Starbucks. In 1982 Schultz joined Starbucks as director, Retail Operations & Marketing.
In 1983, while on a company trip to Milan, Italy, Schultz observed the immense popular-ity of coffee, which was central to the national culture. In 1983, there were around 200,000coffee bars in Italy and 1,500 coffee bars in Milan alone. The espresso8 bars in the cities hadtrained baristas9 who used high-quality Arabica beans to prepare espresso, cappuccino, andother drinks. Schultz witnessed that though each coffee bar had its own individual character,all provided a sense of comfort and the ambience of an extended family. During his week-long
stay in Milan, he made frequent visits to espresso bars. These visits were a revelation toSchultz, which he described in his book10 thus:
As I watched, I had a revelation: Starbucks had missed the point, completely missed it... The con-nection to the people who loved coffee did not have to take place only in their homes, where theyground and brewed whole-bean coffee. What we had to do was unlock the romance and mysteryof coffee, firsthand, in coffee bars. The Italians understood the personal relationship that peoplecould have to coffee, its social aspect. Starbucks sold great coffee beans, but we didn’t serve cof-fee by the cup. We treated coffee as produce, something to be bagged and sent home with the gro-ceries. We stayed one big step away from the heart and soul of what coffee has meant throughoutthe centuries.11
Schultz was convinced that he could recreate the Italian coffee culture in the UnitedStates through Starbucks and differentiate it from other specialty coffee suppliers. After re-turning, he tried to convince the owners to build Starbucks into a chain of Italian styleespresso bars, but they refused. In 1985, Schultz left Starbucks and launched his own coffeebar; Il Giornale12 coffee bar chain. The first Il Giornale store was opened in mid-1986 in awell-known office building in Seattle. The décor of the store resembled an Italian style cof-fee bar. The baristas wore white shirts and bow ties. All service was stand-up and no seatingwas provided. National and international newspapers were hung on stands. Only Italian operawas played. The store offered high-quality coffee in whole beans and in espresso drinks, suchas cappuccino and caffe lattes.13 It also offered salads and sandwiches. The menu was cov-ered with Italian words. With the passage of time, many changes were done in the store décorbased on feedback from customers. Chairs were added for those customers who wanted tostay longer in the store. Carryout business constituted a large part of the revenues, so papercups for serving carryout customers were introduced. The store gained popularity and withinsix months the store was serving more than 1,000 customers a day. A second store opened inSeattle, six months after the first store. For the third store, Giornale went international andopened a store in Vancouver, British Columbia, in mid-1987. By this time, the sales in eachstore had reached around $500,000 a year.14
5-4 SECTION C International Issues in Strategic Management
The New StarbucksIn early 1987 the founders of Starbucks decided to sell the assets of Starbucks, including itsname. As soon as Schultz came to know about the decision, he decided to buy Starbucks. InAugust 1987, Schultz with the help of investors bought Starbucks, including its name, for$3.8 million.15 All the stores were consolidated under the name Starbucks. Schultz promisedthe investors that Starbucks would open 125 stores in the next five years.
Starbucks first always gained a foothold in the market it entered and then moved on to thenext market. Starbucks entered Chicago in 1987. Chicago proved a difficult market and pre-sented several challenges to the company, initially. It took around three years for Starbucks tobecome successful in Chicago and by 1990 it was able to build a critical mass of loyal cus-tomers. Starbucks entered Los Angles in 1991 and achieved success without much struggle.As in other markets, Starbucks did not advertise its locations heavily but relied on the word-of-mouth promotions by the consumers.
Between 1990 and 1992 sales at Starbucks increased almost 300% and reached $103 million.Earnings reached to $4.4 million in 1992. Starbucks came out with an IPO16 in 1992, whichwas very successful and raised $29 million for the company.
In 1993, Starbucks opened its first store in Washington, D.C. After succeeding in Wash-ington, Starbucks opened stores in New York and Boston in 1994. Starbucks opened stores atplaces that were home to many opinion makers. Within a short duration, Starbucks was rated
as the best coffee in New York. In Boston after opening a few company-owned stores, Star-bucks acquired the leading competitor, The Coffee Connection. The Coffee Connection wasfounded in 1975 and had around 24 stores in Boston in 1994. It specialized in light-roastedgourmet coffee and had a loyal customer base in Boston. After the acquisition, Starbucks be-came the leading player in Boston overnight.
Hot drinks at Starbucks were available in four cup sizes: Venti containing 20 oz.,17 Grandecontaining 16 oz., Tall containing 12 oz., and Short containing 8 oz. Cold drinks were avail-able in three cup sizes; Iced Venti–24 oz., Iced Grande–16 oz., and Iced Tall–12 oz.18 In 1994,Starbucks launched Frappuccino, a cold drink made from coffee, sugar, low-fat milk, and ice.It became an instant hit and drew many non–coffee drinkers also to the store. In 1995, morethan three million people visited Starbucks stores each week.19
Over time and with experience, Starbucks developed a sophisticated store-developmentprocess based on a six-month opening schedule. The process enabled it to open a store everyday. In 1996 alone, Starbucks opened 330 outlets. It also refined its expansion strategy. Schultzsaid, “For each region we targeted a large city to serve as a hub where we located teams of pro-fessionals to support new stores. We entered large markets quickly, with the goal of opening20 or more stores in the first two years. Then from that core we branched out, entering nearbyspoke markets, including smaller cities and suburban locations with demographics similar toour typical customer mix.”20
Starbucks was opposed to the concept of franchising. Schultz believed that, “If we hadfranchised, Starbucks would have lost the common culture that made us strong. We teachbaristas not only how to handle the coffee properly but also how to impart to customers ourpassions for our products. They understand the vision and value system of the company, whichis seldom the case when someone else’s employees are serving Starbucks coffee.”21
Starbucks initially believed in selling coffee only through its own outlets. But with the pas-sage of time, to broaden its distribution channels and product line, it started to enter into strate-gic alliances. Schultz said, “When we enter into any partnership, we first assess the quality ofthe candidate. We look for a company that has brand name recognition and a good reputation inits field, be it hotels or airlines or cruise ships. It must be committed to quality and customer ser-vice. We look for people who understand the value of Starbucks and promise to protect our brandand the quality of our coffee. All these factors are weighted before financial considerations.”22
The first strategic alliance Starbucks entered was with the real estate company HostMarriott wherein Starbucks licensed Marriott to open Starbucks outlets at select airport loca-tions. Starbucks licensed Aramark23 to open Starbucks stores at a few college campuses. Otherpartnerships were with the department store Nordstrom, the specialty retailer Barnes & Noble,the Holland America cruise lines, Starwood hotels, Dreyer’s Grand Ice Cream, and United Air-lines. Under a joint venture with PepsiCo Inc.,24 a new version of Frappuccino was bottled andsold through grocery stores.
Starbucks maintained a non-smoking policy at all its outlets worldwide. It believed thatthe smoke could adversely affect the aroma of its coffee. For similar reasons, its employeeswere required to refrain from using strong perfumes.
CASE 5 Starbucks Coffee Company 5-5
Focusing on AsiaIn 1994, Starbucks International was formed and Howard Behar became its president. Starbuckspursued international expansion with three objectives in mind: to prevent competitors from get-ting a head start, to build upon the growing desire for Western brands, and to take advantage ofhigher coffee consumption rates in different countries.25 Starbucks entered new markets outsidethe United States either through joint ventures, licenses, or by company-owned operations. In
5-6 SECTION C International Issues in Strategic Management
Starbucks in JapanAs its first international destination, Starbucks chose Japan because it was the third-largestcoffee importer in the world after the United States and Germany and the largest economyin the Pacific Rim. Japan originally was a tea-drinking country and the per capita consump-tion of coffee in Japan in 1965 was only 300 grams per year.27 Owing to the decade-longpromotional activities of coffee companies and coffee associations, coffee became im-mensely popular in Japan and by 1990s the per capita consumption of coffee had reached3.17 kilograms.28
In the Japanese coffee industry, specialty blends were the fastest growing segment.Gourmet coffee accounted for 2.5% of the 1.2 billion pounds of coffee imported by Japan an-nually. The average per capita consumption among gourmet coffee drinkers had doubled from1990 to 1.5 cups a day in 1997.29 An industry analyst said, “The Japanese have taken to cof-fee like a baby to milk.”30
In 1995, Starbucks entered Japan with a joint venture—Starbucks Coffee Japan, Ltd. witha leading Japanese retailer and restaurant operator, Sazaby Inc. In 1996, Starbucks opened itsfirst shop in the upscale Ginza shopping district, Tokyo, Japan. The décor and logo of the storeswere similar to its U.S. stores. The menu remained the same but with slight variations. Thestore also offered Starbucks coffee beans and coffee-making equipment as well as fresh pas-tries and sandwiches. The store gathered a huge crowd on the opening day and Japanese linedaround the block to get a taste of the Starbucks coffee.
The initial sales volume in Japan was twice as that in the United States. Starbucks rapidlyexpanded and by 1997 it had 10 stores at prime locations. Despite the slump in economicgrowth in Japan in the late 1990s, Starbucks remained profitable. Japan had become the mostprofitable market for Starbucks outside North America. The success of Starbucks and thegrowing popularity of coffee propelled other players to enter Japan.
By 2002, Starbucks had opened over 360 stores in Japan. But in the same year, Star-bucks incurred huge losses in its Japanese operations. According to analysts, Starbuckswas opening stores too close to each other, which affected its brand image. Food menuwas another reason, for Japanese consumers, food was a major part of the coffee experi-ence. The no-smoking policy of Starbucks also displeased many. As a result many com-petitors took advantage and included an elaborate food menu with coffee and had separatesmoking areas. Other challenges that Japan presented to Starbucks were high rent and costof labor. The land rent rate in Tokyo was more than double that of Seattle. Moreover, Star-bucks did not have a roasting facility in Japan; it had to ship coffee from its roastingfacility in Kent.
After cost-cutting exercises and introduction of new products based on consumerresearch, Starbucks Japan returned to profitability in 2004. By 2006, Starbucks had over 600retail locations in Japan.31
1996, Starbucks entered Japan, Hawaii, and Singapore. In 1998, it entered Taiwan, Thailand,New Zealand, and Malaysia, and in 1999, it opened stores in Kuwait, Korea, Lebanon, andChina. During the 1990s Starbucks concentrated its expansion efforts mainly in Asia. Schultzsaid, “The maturity of the coffee market in Europe was very strong and was not going to changemuch over the years. The Asian market share was in its developmental stage and we had anopportunity to position Starbucks as a leader in a new industry, and in a sense, educate a marketabout the quality of coffee, the experience, and the idea of Starbucks becoming the third placebetween home and work in those countries.”26
CASE 5 Starbucks Coffee Company 5-7
Starbucks in China32
A key component of our development in the China market was finding the right business partner who un-derstands the marketplace, and, more importantly, share similar values, vision, and business philosophy.33
Howard Schultz
Starbucks had begun its groundwork for entering China since 1994 and entered China in1999. Starbucks decided to first enter Hong Kong. In Hong Kong, Starbucks created a jointventure, Coffee Concepts (Hong Kong) Ltd., with Maxim’s Caterer, a food and beveragecompany that had 46 years of experience in Hong Kong. Maxim had a thorough know-howof establishing and running businesses in China. Maxim was also the business partner ofHong Kong Land Company, which had cornered a lot of real estate market in Hong Kong.Maxim provided Starbucks with valuable insights about Chinese preferences.
After Hong Kong, Starbucks opened a store at Beijing through a joint venture with BeijingMei Da Coffee Co. Ltd.34 The first Starbucks store opened in 1999 at the China World Trade Center, Beijing. The store opening was celebrated according to Chinese traditions. Thestore offered a complete menu of Starbucks internationally acclaimed coffee beverages, a se-lection of more than 15 varieties and blends of the finest Arabica coffee beans, freshly bakedlocal pastries and desserts, and a wide selection of coffee brewing equipment, accessories, andservice-ware. The ambience and décor of the store were kept similar to its stores in the UnitedStates. After Beijing, Starbucks opened stores in Shanghai. As in other markets, Starbucks didnot market, advertise, or promote its stores in China and relied mainly on word-of-mouth pro-motion. Starbucks selected high visibility, high traffic locations to open its stores.
By 2002 Starbucks had expanded to 50 outlets in China. Pedro Man, the then-presidentof Starbucks Asia Pacific said, “These are still early days of our expansion in the China mar-ket. Our approach is very focused. We plan to open one store at a time, serve one customerat a time.”35
In 2003, Starbucks raised its stake in its joint venture operations in Shanghai to 50%. Inmid-2005, Starbucks became the majority owner of its operations in Southern China. The firstwholly owned and operated Starbucks store opened in Qingdao36 in 2005 and by mid-2006,there were nine wholly owned stores in Qingdao, Dalian, and Shenyang.37
Starbucks had to face many challenges in China. In its initial years, many were op-posed to the opening of a Western coffee chain in China, which was traditionally a teadrinking country. Another challenge it faced was the dominance of instant coffee amongcoffee drinkers. Specialty coffee was limited to mainly urban consumers. Competition hadalso grown intense and many domestic and foreign players were setting up specialty cof-fee shops. Despite the challenges, Starbucks achieved significant success in China and be-came the leader in specialty coffee. By 2005, China contributed to little less than 10% ofthe global sales of Starbucks and by 2008, Starbucks expected to derive 20% of its revenuefrom Chinese locations.38
The Next DestinationIn 2006, Schultz said,39 “We are equally excited about two other major markets we intend toenter during 2007—India and Russia (see Exhibit 3). We are in discussions with potential jointventure partners. Meanwhile, we are scouting locations, meeting with government officials—all toward gaining additional market knowledge and building critical relationships to makeour market entries a success.”40
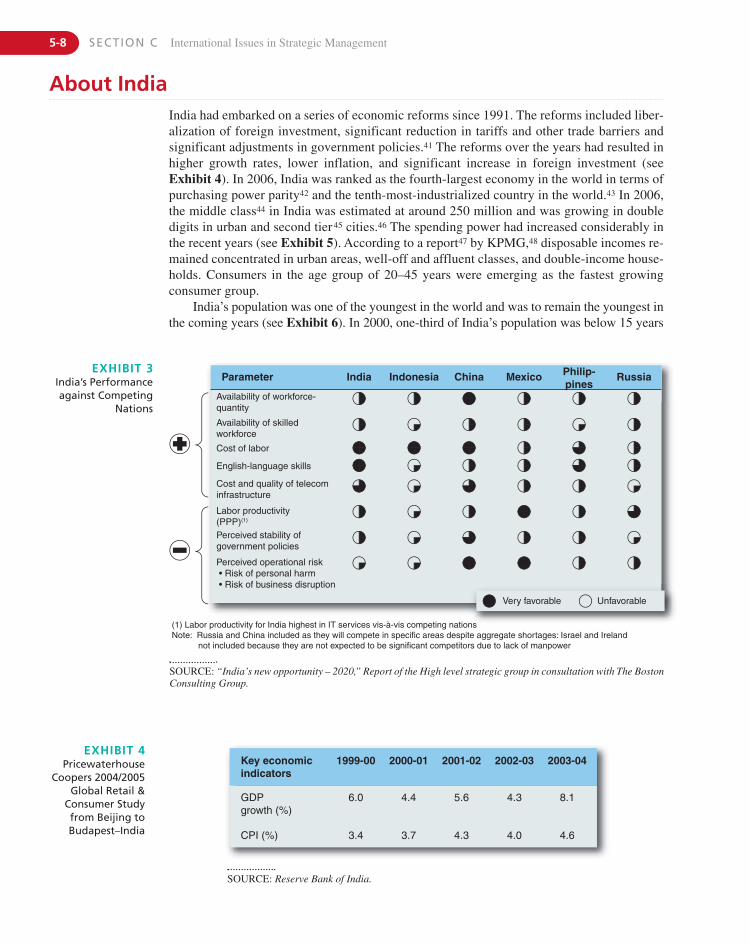
5-8 SECTION C International Issues in Strategic Management
About IndiaIndia had embarked on a series of economic reforms since 1991. The reforms included liber-alization of foreign investment, significant reduction in tariffs and other trade barriers andsignificant adjustments in government policies.41 The reforms over the years had resulted inhigher growth rates, lower inflation, and significant increase in foreign investment (seeExhibit 4). In 2006, India was ranked as the fourth-largest economy in the world in terms ofpurchasing power parity42 and the tenth-most-industrialized country in the world.43 In 2006,the middle class44 in India was estimated at around 250 million and was growing in doubledigits in urban and second tier 45 cities.46 The spending power had increased considerably inthe recent years (see Exhibit 5). According to a report47 by KPMG,48 disposable incomes re-mained concentrated in urban areas, well-off and affluent classes, and double-income house-holds. Consumers in the age group of 20–45 years were emerging as the fastest growingconsumer group.
India’s population was one of the youngest in the world and was to remain the youngest inthe coming years (see Exhibit 6). In 2000, one-third of India’s population was below 15 years
Very favorable
Parameter
Availability of workforce-quantity
Availability of skilledworkforce
Cost of labor
English-language skills
Cost and quality of telecominfrastructure
(1) Labor productivity for India highest in IT services vis-à-vis competing nationsNote: Russia and China included as they will compete in specific areas despite aggregate shortages: Israel and Ireland not included because they are not expected to be significant competitors due to lack of manpower
Labor productivity(PPP)(1)
Perceived stability ofgovernment policies
Perceived operational risk • Risk of personal harm • Risk of business disruption
India Indonesia China Mexico RussiaPhilip-pines
Unfavorable
EXHIBIT 3India’s Performanceagainst Competing
Nations
SOURCE: Reserve Bank of India.
Key economicindicators
GDPgrowth (%)
CPI (%)
6.0
3.4
4.4
3.7
5.6
4.3
4.3
4.0
8.1
4.6
1999-00 2000-01 2001-02 2002-03 2003-04EXHIBIT 4
PricewaterhouseCoopers 2004/2005
Global Retail &Consumer Studyfrom Beijing toBudapest–India
SOURCE: “India’s new opportunity – 2020,” Report of the High level strategic group in consultation with The BostonConsulting Group.
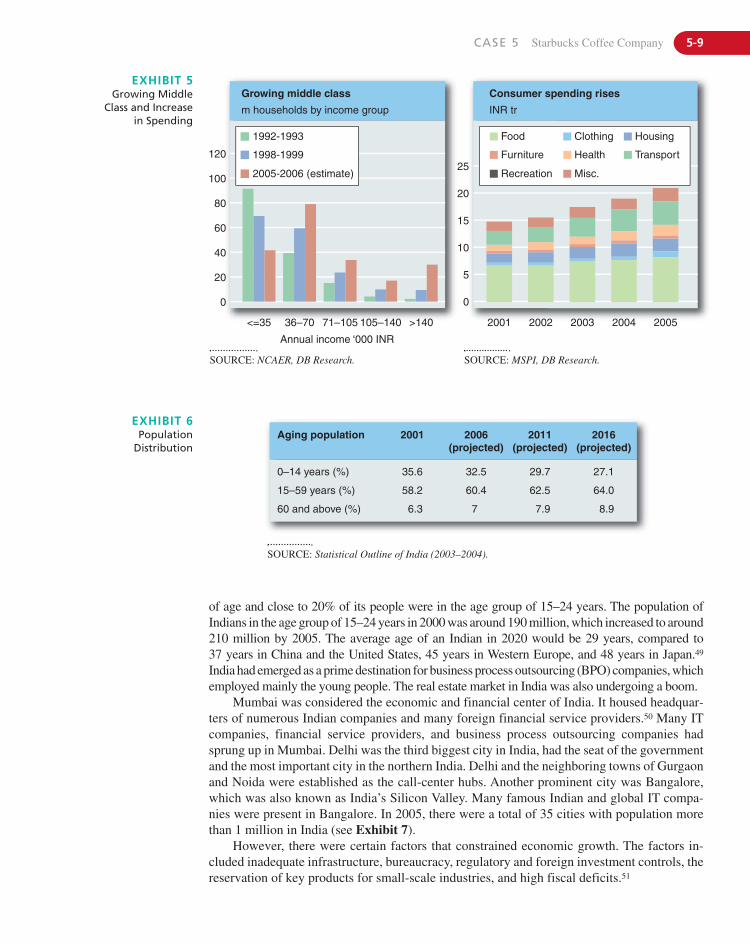
CASE 5 Starbucks Coffee Company 5-9
Consumer spending rises
INR tr
25
20
15
10
5
2001 2002 2003 2004 2005
0
Growing middle class
m households by income group
120
100
80
60
40
20
<=35
0
36–70 71–105
Annual income ‘000 INR
105–140 >140
1992-1993
1998-1999
2005-2006 (estimate)
Food
Furniture
Recreation
Clothing
Health
Misc.
Housing
Transport
EXHIBIT 5Growing Middle
Class and Increasein Spending
SOURCE: NCAER, DB Research.
Aging population
0–14 years (%)
15–59 years (%)
60 and above (%)
35.6
58.2
6.3
32.5
60.4
7
29.7
62.5
7.9
27.1
64.0
8.9
2001 2006(projected)
2011(projected)
2016(projected)
EXHIBIT 6Population
Distribution
SOURCE: Statistical Outline of India (2003–2004).
SOURCE: MSPI, DB Research.
of age and close to 20% of its people were in the age group of 15–24 years. The population ofIndians in the age group of 15–24 years in 2000 was around 190 million, which increased to around210 million by 2005. The average age of an Indian in 2020 would be 29 years, compared to37 years in China and the United States, 45 years in Western Europe, and 48 years in Japan.49
India had emerged as a prime destination for business process outsourcing (BPO) companies, whichemployed mainly the young people. The real estate market in India was also undergoing a boom.
Mumbai was considered the economic and financial center of India. It housed headquar-ters of numerous Indian companies and many foreign financial service providers.50 Many ITcompanies, financial service providers, and business process outsourcing companies hadsprung up in Mumbai. Delhi was the third biggest city in India, had the seat of the governmentand the most important city in the northern India. Delhi and the neighboring towns of Gurgaonand Noida were established as the call-center hubs. Another prominent city was Bangalore,which was also known as India’s Silicon Valley. Many famous Indian and global IT compa-nies were present in Bangalore. In 2005, there were a total of 35 cities with population morethan 1 million in India (see Exhibit 7).
However, there were certain factors that constrained economic growth. The factors in-cluded inadequate infrastructure, bureaucracy, regulatory and foreign investment controls, thereservation of key products for small-scale industries, and high fiscal deficits.51
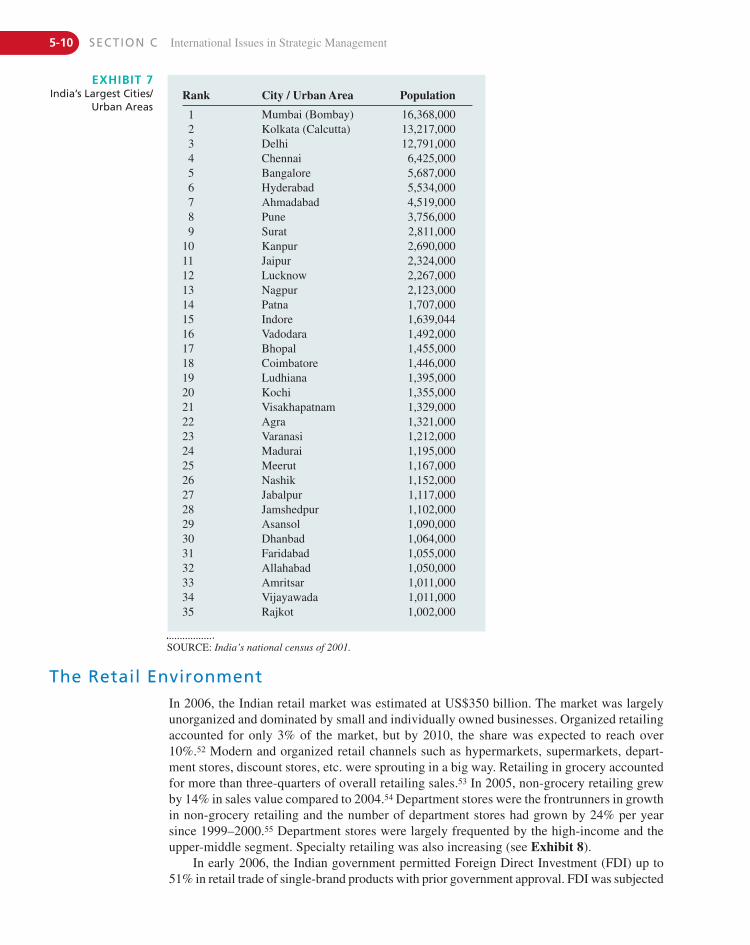
5-10 SECTION C International Issues in Strategic Management
The Retail Environment
EXHIBIT 7India’s Largest Cities/
Urban AreasRank City / Urban Area Population
1 Mumbai (Bombay) 16,368,0002 Kolkata (Calcutta) 13,217,0003 Delhi 12,791,0004 Chennai 6,425,0005 Bangalore 5,687,0006 Hyderabad 5,534,0007 Ahmadabad 4,519,0008 Pune 3,756,0009 Surat 2,811,000
10 Kanpur 2,690,00011 Jaipur 2,324,00012 Lucknow 2,267,00013 Nagpur 2,123,00014 Patna 1,707,00015 Indore 1,639,04416 Vadodara 1,492,00017 Bhopal 1,455,00018 Coimbatore 1,446,00019 Ludhiana 1,395,00020 Kochi 1,355,00021 Visakhapatnam 1,329,00022 Agra 1,321,00023 Varanasi 1,212,00024 Madurai 1,195,00025 Meerut 1,167,00026 Nashik 1,152,00027 Jabalpur 1,117,00028 Jamshedpur 1,102,00029 Asansol 1,090,00030 Dhanbad 1,064,00031 Faridabad 1,055,00032 Allahabad 1,050,00033 Amritsar 1,011,00034 Vijayawada 1,011,00035 Rajkot 1,002,000
In 2006, the Indian retail market was estimated at US$350 billion. The market was largelyunorganized and dominated by small and individually owned businesses. Organized retailingaccounted for only 3% of the market, but by 2010, the share was expected to reach over10%.52 Modern and organized retail channels such as hypermarkets, supermarkets, depart-ment stores, discount stores, etc. were sprouting in a big way. Retailing in grocery accountedfor more than three-quarters of overall retailing sales.53 In 2005, non-grocery retailing grewby 14% in sales value compared to 2004.54 Department stores were the frontrunners in growthin non-grocery retailing and the number of department stores had grown by 24% per yearsince 1999–2000.55 Department stores were largely frequented by the high-income and theupper-middle segment. Specialty retailing was also increasing (see Exhibit 8).
In early 2006, the Indian government permitted Foreign Direct Investment (FDI) up to51% in retail trade of single-brand products with prior government approval. FDI was subjected
SOURCE: India’s national census of 2001.
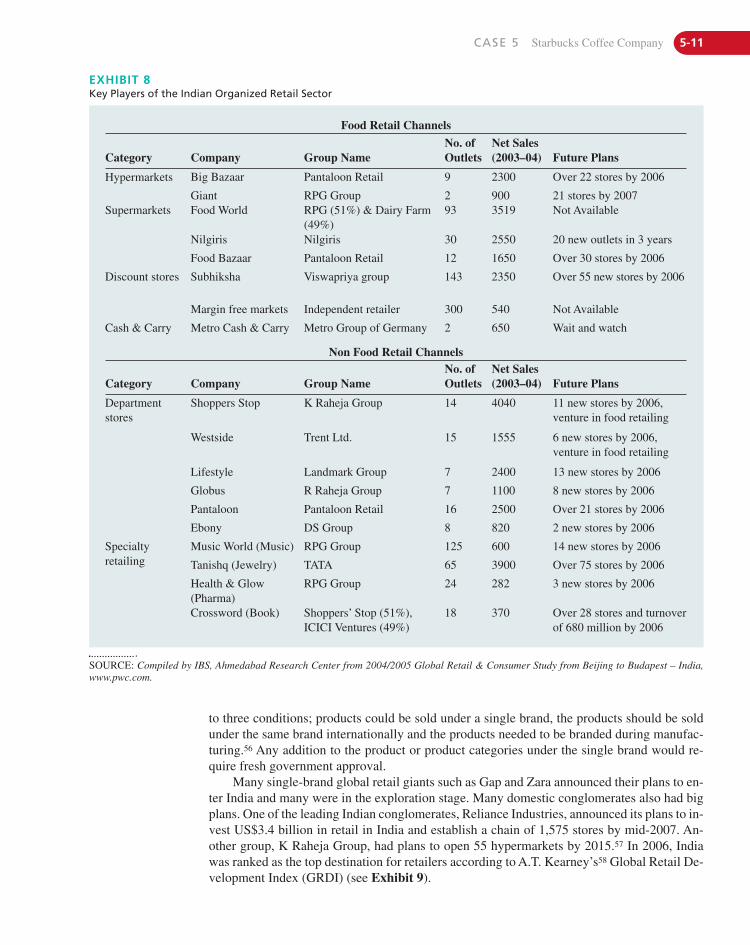
CASE 5 Starbucks Coffee Company 5-11
to three conditions; products could be sold under a single brand, the products should be soldunder the same brand internationally and the products needed to be branded during manufac-turing.56 Any addition to the product or product categories under the single brand would re-quire fresh government approval.
Many single-brand global retail giants such as Gap and Zara announced their plans to en-ter India and many were in the exploration stage. Many domestic conglomerates also had bigplans. One of the leading Indian conglomerates, Reliance Industries, announced its plans to in-vest US$3.4 billion in retail in India and establish a chain of 1,575 stores by mid-2007. An-other group, K Raheja Group, had plans to open 55 hypermarkets by 2015.57 In 2006, Indiawas ranked as the top destination for retailers according to A.T. Kearney’s58 Global Retail De-velopment Index (GRDI) (see Exhibit 9).
EXHIBIT 8Key Players of the Indian Organized Retail Sector
Food Retail Channels
Category Company Group NameNo. ofOutlets
Net Sales(2003–04) Future Plans
Hypermarkets Big Bazaar Pantaloon Retail 9 2300 Over 22 stores by 2006
Giant RPG Group 2 900 21 stores by 2007Supermarkets Food World RPG (51%) & Dairy Farm
(49%)93 3519 Not Available
Nilgiris Nilgiris 30 2550 20 new outlets in 3 years
Food Bazaar Pantaloon Retail 12 1650 Over 30 stores by 2006
Discount stores Subhiksha Viswapriya group 143 2350 Over 55 new stores by 2006
Margin free markets Independent retailer 300 540 Not Available
Cash & Carry Metro Cash & Carry Metro Group of Germany 2 650 Wait and watch
Non Food Retail Channels
Category Company Group NameNo. ofOutlets
Net Sales(2003–04) Future Plans
Departmentstores
Shoppers Stop K Raheja Group 14 4040 11 new stores by 2006,venture in food retailing
Westside Trent Ltd. 15 1555 6 new stores by 2006,venture in food retailing
Lifestyle Landmark Group 7 2400 13 new stores by 2006
Globus R Raheja Group 7 1100 8 new stores by 2006
Pantaloon Pantaloon Retail 16 2500 Over 21 stores by 2006
Ebony DS Group 8 820 2 new stores by 2006
Specialtyretailing
Music World (Music) RPG Group 125 600 14 new stores by 2006
Tanishq (Jewelry) TATA 65 3900 Over 75 stores by 2006
Health & Glow(Pharma)
RPG Group 24 282 3 new stores by 2006
Crossword (Book) Shoppers’ Stop (51%), ICICI Ventures (49%)
18 370 Over 28 stores and turnoverof 680 million by 2006
SOURCE: Compiled by IBS, Ahmedabad Research Center from 2004/2005 Global Retail & Consumer Study from Beijing to Budapest – India,www.pwc.com.
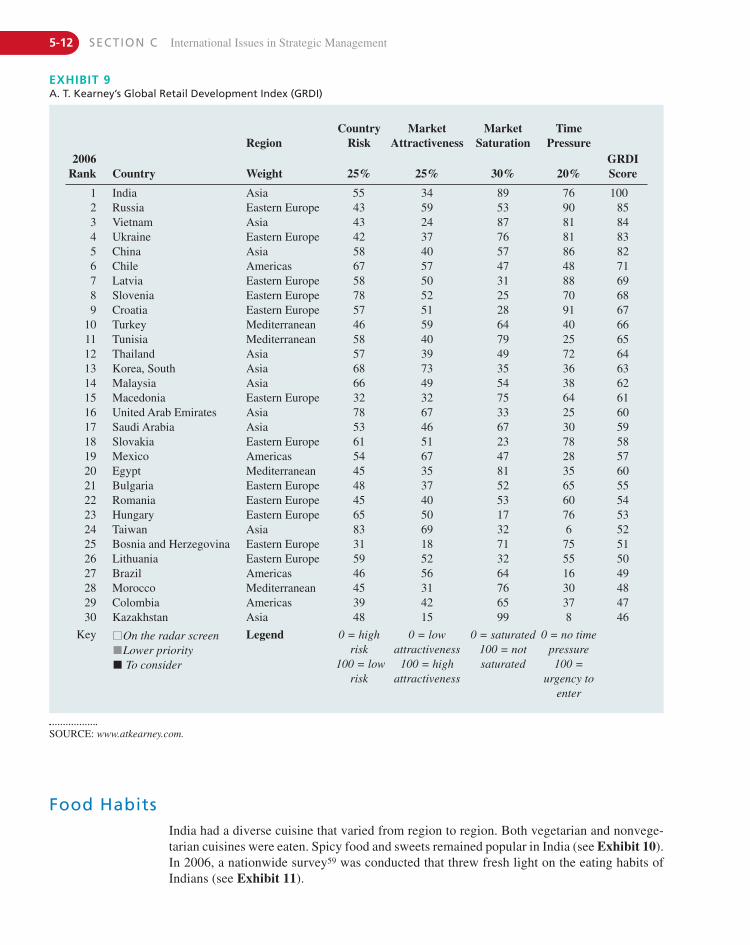
5-12 SECTION C International Issues in Strategic Management
Food Habits
RegionCountry
RiskMarket
AttractivenessMarket
SaturationTime
Pressure2006
Rank Country Weight 25% 25% 30% 20%GRDIScore
1 India Asia 55 34 89 76 1002 Russia Eastern Europe 43 59 53 90 853 Vietnam Asia 43 24 87 81 844 Ukraine Eastern Europe 42 37 76 81 835 China Asia 58 40 57 86 826 Chile Americas 67 57 47 48 717 Latvia Eastern Europe 58 50 31 88 698 Slovenia Eastern Europe 78 52 25 70 689 Croatia Eastern Europe 57 51 28 91 67
10 Turkey Mediterranean 46 59 64 40 6611 Tunisia Mediterranean 58 40 79 25 6512 Thailand Asia 57 39 49 72 6413 Korea, South Asia 68 73 35 36 6314 Malaysia Asia 66 49 54 38 6215 Macedonia Eastern Europe 32 32 75 64 6116 United Arab Emirates Asia 78 67 33 25 6017 Saudi Arabia Asia 53 46 67 30 5918 Slovakia Eastern Europe 61 51 23 78 5819 Mexico Americas 54 67 47 28 5720 Egypt Mediterranean 45 35 81 35 6021 Bulgaria Eastern Europe 48 37 52 65 5522 Romania Eastern Europe 45 40 53 60 5423 Hungary Eastern Europe 65 50 17 76 5324 Taiwan Asia 83 69 32 6 5225 Bosnia and Herzegovina Eastern Europe 31 18 71 75 5126 Lithuania Eastern Europe 59 52 32 55 5027 Brazil Americas 46 56 64 16 4928 Morocco Mediterranean 45 31 76 30 4829 Colombia Americas 39 42 65 37 4730 Kazakhstan Asia 48 15 99 8 46
Key On the radar screenLower priorityTo consider
Legend 0 = highrisk
100 = lowrisk
0 = lowattractiveness
100 = highattractiveness
0 = saturated100 = notsaturated
0 = no timepressure100 =
urgency toenter
EXHIBIT 9A. T. Kearney’s Global Retail Development Index (GRDI)
SOURCE: www.atkearney.com.
India had a diverse cuisine that varied from region to region. Both vegetarian and nonvege-tarian cuisines were eaten. Spicy food and sweets remained popular in India (see Exhibit 10).In 2006, a nationwide survey59 was conducted that threw fresh light on the eating habits ofIndians (see Exhibit 11).
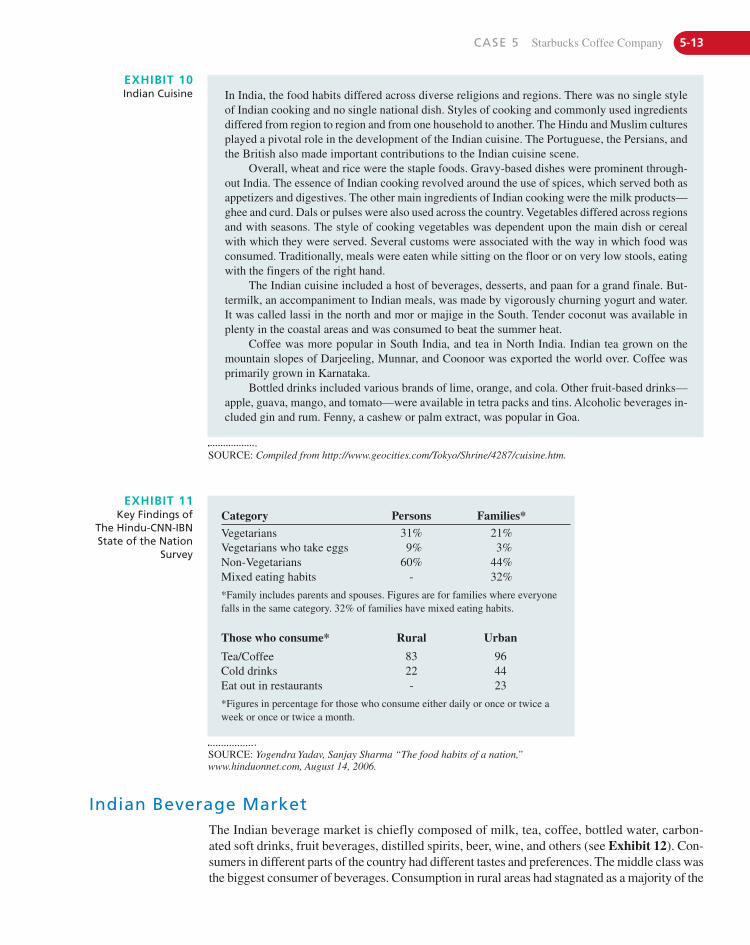
CASE 5 Starbucks Coffee Company 5-13
EXHIBIT 10Indian Cuisine In India, the food habits differed across diverse religions and regions. There was no single style
of Indian cooking and no single national dish. Styles of cooking and commonly used ingredientsdiffered from region to region and from one household to another. The Hindu and Muslim culturesplayed a pivotal role in the development of the Indian cuisine. The Portuguese, the Persians, andthe British also made important contributions to the Indian cuisine scene.
Overall, wheat and rice were the staple foods. Gravy-based dishes were prominent through-out India. The essence of Indian cooking revolved around the use of spices, which served both asappetizers and digestives. The other main ingredients of Indian cooking were the milk products—ghee and curd. Dals or pulses were also used across the country. Vegetables differed across regionsand with seasons. The style of cooking vegetables was dependent upon the main dish or cerealwith which they were served. Several customs were associated with the way in which food wasconsumed. Traditionally, meals were eaten while sitting on the floor or on very low stools, eatingwith the fingers of the right hand.
The Indian cuisine included a host of beverages, desserts, and paan for a grand finale. But-termilk, an accompaniment to Indian meals, was made by vigorously churning yogurt and water.It was called lassi in the north and mor or majige in the South. Tender coconut was available inplenty in the coastal areas and was consumed to beat the summer heat.
Coffee was more popular in South India, and tea in North India. Indian tea grown on themountain slopes of Darjeeling, Munnar, and Coonoor was exported the world over. Coffee wasprimarily grown in Karnataka.
Bottled drinks included various brands of lime, orange, and cola. Other fruit-based drinks—apple, guava, mango, and tomato—were available in tetra packs and tins. Alcoholic beverages in-cluded gin and rum. Fenny, a cashew or palm extract, was popular in Goa.
SOURCE: Compiled from http://www.geocities.com/Tokyo/Shrine/4287/cuisine.htm.
EXHIBIT 11Key Findings of
The Hindu-CNN-IBNState of the Nation
Survey
SOURCE: Yogendra Yadav, Sanjay Sharma “The food habits of a nation,”www.hinduonnet.com, August 14, 2006.
Category Persons Families*
Vegetarians 31% 21%Vegetarians who take eggs 9% 3%Non-Vegetarians 60% 44%Mixed eating habits - 32%
*Family includes parents and spouses. Figures are for families where everyonefalls in the same category. 32% of families have mixed eating habits.
Those who consume* Rural Urban
Tea/Coffee 83 96Cold drinks 22 44Eat out in restaurants - 23
*Figures in percentage for those who consume either daily or once or twice aweek or once or twice a month.
Indian Beverage MarketThe Indian beverage market is chiefly composed of milk, tea, coffee, bottled water, carbon-ated soft drinks, fruit beverages, distilled spirits, beer, wine, and others (see Exhibit 12). Con-sumers in different parts of the country had different tastes and preferences. The middle class wasthe biggest consumer of beverages. Consumption in rural areas had stagnated as a majority of the
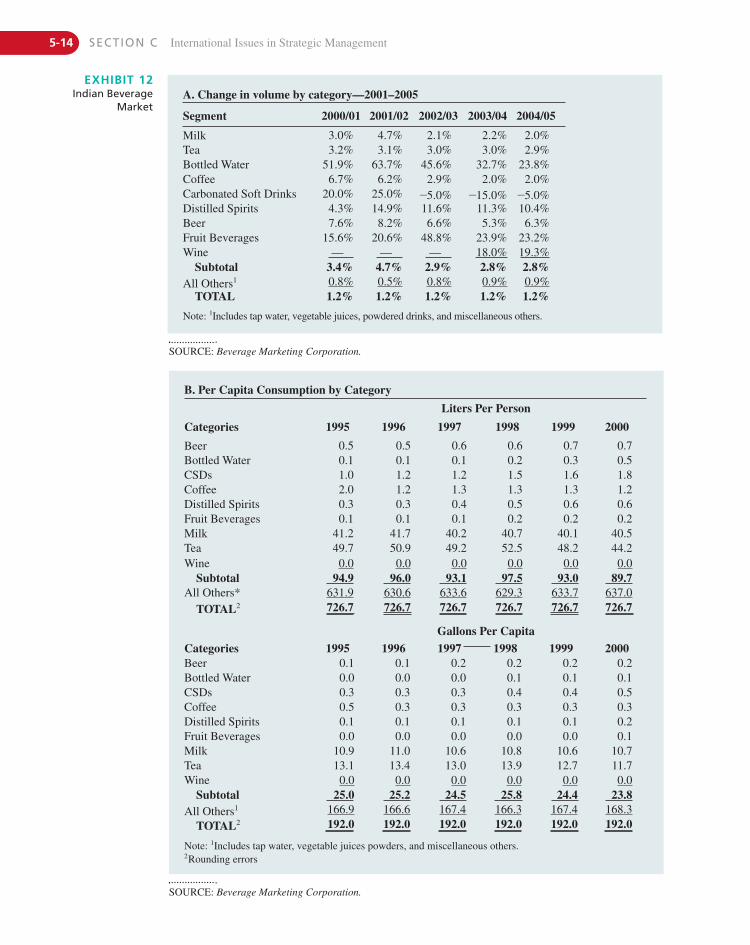
5-14 SECTION C International Issues in Strategic Management
EXHIBIT 12Indian Beverage
MarketA. Change in volume by category—2001–2005
Segment 2000/01 2001/02 2002/03 2003/04 2004/05
Milk 3.0% 4.7% 2.1% 2.2% 2.0%Tea 3.2% 3.1% 3.0% 3.0% 2.9%Bottled Water 51.9% 63.7% 45.6% 32.7% 23.8%Coffee 6.7% 6.2% 2.9% 2.0% 2.0%Carbonated Soft Drinks 20.0% 25.0% -5.0% -15.0% -5.0%Distilled Spirits 4.3% 14.9% 11.6% 11.3% 10.4%Beer 7.6% 8.2% 6.6% 5.3% 6.3%Fruit Beverages 15.6% 20.6% 48.8% 23.9% 23.2%Wine — — — 18.0% 19.3%
Subtotal 3.4% 4.7% 2.9% 2.8% 2.8%All Others1 0.8% 0.5% 0.8% 0.9% 0.9%
TOTAL 1.2% 1.2% 1.2% 1.2% 1.2%
Note: 1Includes tap water, vegetable juices, powdered drinks, and miscellaneous others.
SOURCE: Beverage Marketing Corporation.
B. Per Capita Consumption by Category
Liters Per Person
Categories 1995 1996 1997 1998 1999 2000
Beer 0.5 0.5 0.6 0.6 0.7 0.7Bottled Water 0.1 0.1 0.1 0.2 0.3 0.5CSDs 1.0 1.2 1.2 1.5 1.6 1.8Coffee 2.0 1.2 1.3 1.3 1.3 1.2Distilled Spirits 0.3 0.3 0.4 0.5 0.6 0.6Fruit Beverages 0.1 0.1 0.1 0.2 0.2 0.2Milk 41.2 41.7 40.2 40.7 40.1 40.5Tea 49.7 50.9 49.2 52.5 48.2 44.2Wine 0.0 0.0 0.0 0.0 0.0 0.0
Subtotal 94.9 96.0 93.1 97.5 93.0 89.7All Others* 631.9 630.6 633.6 629.3 633.7 637.0
TOTAL2 726.7 726.7 726.7 726.7 726.7 726.7
Gallons Per Capita
Categories 1995 1996 1997 1998 1999 2000Beer 0.1 0.1 0.2 0.2 0.2 0.2Bottled Water 0.0 0.0 0.0 0.1 0.1 0.1CSDs 0.3 0.3 0.3 0.4 0.4 0.5Coffee 0.5 0.3 0.3 0.3 0.3 0.3Distilled Spirits 0.1 0.1 0.1 0.1 0.1 0.2Fruit Beverages 0.0 0.0 0.0 0.0 0.0 0.1Milk 10.9 11.0 10.6 10.8 10.6 10.7Tea 13.1 13.4 13.0 13.9 12.7 11.7Wine 0.0 0.0 0.0 0.0 0.0 0.0
Subtotal 25.0 25.2 24.5 25.8 24.4 23.8All Others1 166.9 166.6 167.4 166.3 167.4 168.3
TOTAL2 192.0 192.0 192.0 192.0 192.0 192.0
Note: 1Includes tap water, vegetable juices powders, and miscellaneous others.2Rounding errors
SOURCE: Beverage Marketing Corporation.
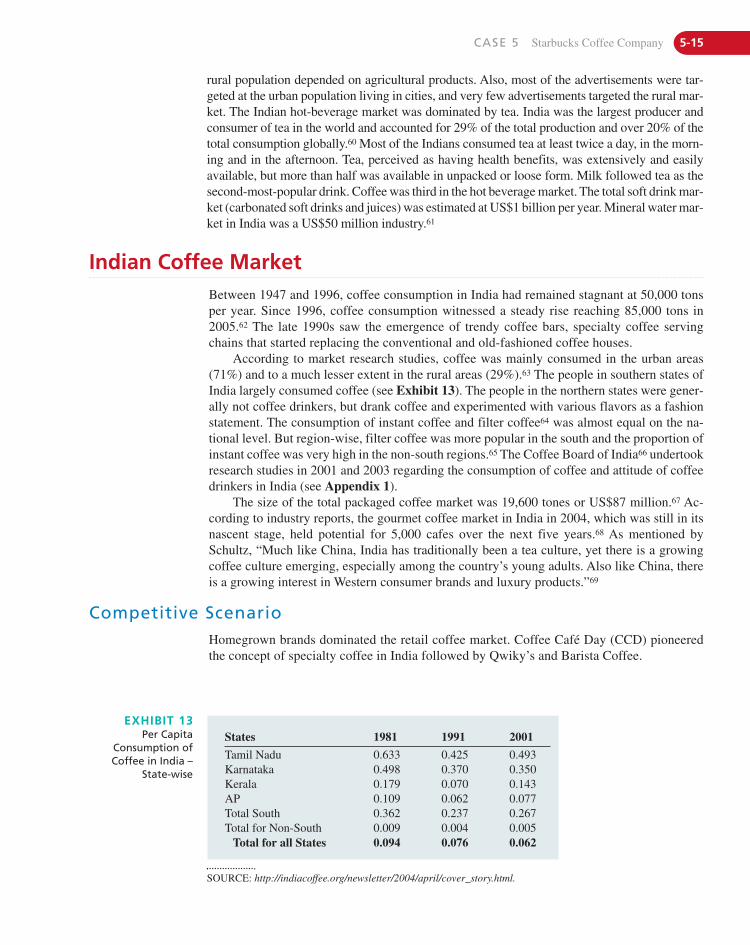
CASE 5 Starbucks Coffee Company 5-15
Indian Coffee MarketBetween 1947 and 1996, coffee consumption in India had remained stagnant at 50,000 tonsper year. Since 1996, coffee consumption witnessed a steady rise reaching 85,000 tons in2005.62 The late 1990s saw the emergence of trendy coffee bars, specialty coffee servingchains that started replacing the conventional and old-fashioned coffee houses.
According to market research studies, coffee was mainly consumed in the urban areas(71%) and to a much lesser extent in the rural areas (29%).63 The people in southern states ofIndia largely consumed coffee (see Exhibit 13). The people in the northern states were gener-ally not coffee drinkers, but drank coffee and experimented with various flavors as a fashionstatement. The consumption of instant coffee and filter coffee64 was almost equal on the na-tional level. But region-wise, filter coffee was more popular in the south and the proportion ofinstant coffee was very high in the non-south regions.65 The Coffee Board of India66 undertookresearch studies in 2001 and 2003 regarding the consumption of coffee and attitude of coffeedrinkers in India (see Appendix 1).
The size of the total packaged coffee market was 19,600 tones or US$87 million.67 Ac-cording to industry reports, the gourmet coffee market in India in 2004, which was still in itsnascent stage, held potential for 5,000 cafes over the next five years.68 As mentioned bySchultz, “Much like China, India has traditionally been a tea culture, yet there is a growingcoffee culture emerging, especially among the country’s young adults. Also like China, thereis a growing interest in Western consumer brands and luxury products.”69
EXHIBIT 13Per Capita
Consumption ofCoffee in India –
State-wise
States 1981 1991 2001
Tamil Nadu 0.633 0.425 0.493Karnataka 0.498 0.370 0.350Kerala 0.179 0.070 0.143AP 0.109 0.062 0.077Total South 0.362 0.237 0.267Total for Non-South 0.009 0.004 0.005
Total for all States 0.094 0.076 0.062
SOURCE: http://indiacoffee.org/newsletter/2004/april/cover_story.html.
Competitive ScenarioHomegrown brands dominated the retail coffee market. Coffee Café Day (CCD) pioneeredthe concept of specialty coffee in India followed by Qwiky’s and Barista Coffee.
rural population depended on agricultural products. Also, most of the advertisements were tar-geted at the urban population living in cities, and very few advertisements targeted the rural mar-ket. The Indian hot-beverage market was dominated by tea. India was the largest producer andconsumer of tea in the world and accounted for 29% of the total production and over 20% of thetotal consumption globally.60 Most of the Indians consumed tea at least twice a day, in the morn-ing and in the afternoon. Tea, perceived as having health benefits, was extensively and easilyavailable, but more than half was available in unpacked or loose form. Milk followed tea as thesecond-most-popular drink. Coffee was third in the hot beverage market. The total soft drink mar-ket (carbonated soft drinks and juices) was estimated at US$1 billion per year. Mineral water mar-ket in India was a US$50 million industry.61
5-16 SECTION C International Issues in Strategic Management
Qwiky’sTwo software engineers, Shashi Chimala and Shyam, opened the first Qwiky’s outlet in Chennai in 1999. They were inspired by the specialty coffee bars in the United States. Themenu at Qwiky’s included varieties in hot Italian coffee, Indian coffee, specialty hot coffee,cold coffee, frappes, milk shakes, tea, other beverages, desserts, and snacks. It targeted youths in the age group of 18 to 30 years. By 2002, the annual revenues of Qwiky’s were43 million INR.
Qwiky’s had three types of formats; Qwiky’s Coffee Pubs were stand-alone coffee bars,Qwiky’s Coffee Islands were outlets within big stores, multiplexes, and movie theatres, andQwiky’s Coffee Xpress were coffee kiosks. By 2006 it had over 20 outlets in nine cities in Indiaand one franchise in Sri Lanka. Qwiky’s had plans to open more outlets in metropolitan and
To be the best café chain in the country by offering a world class coffee experience at affordable prices.70
CCD Mission statement
CCD, India’s first coffee bar was established in 1996 in Bangalore by the largest exporter ofcoffee in India, the Amalgamated Bean Coffee Trading Company (ABCTCL). By 2002, CCDhad 50 outlets in 9 cities, which increased to 326 outlets in 65 cities by 2006.71 CCD offereda wide variety of Indian and international flavors of hot and cold coffee, hot chocolate, colddrinks, ice creams, pastries, sundaes, quick snacks, and powder coffee.
Customer Profile at CCDThe best-selling item at CCD in summer was Frappe72 and Cappuccino in winters. In north-ern states, hot coffee was the most popular. Country-wise, on an average, the sales of coldcoffee exceeded the sales of hot coffee.73
CCD also sold merchandise such as caps, T-shirts, bags, mugs, mints, and coffee filters atits outlets. Other brands were also promoted in a CCD outlet through innovative and interac-tive use of posters, cards, danglers, leaflets, contest forms, etc. CCD had tied up with populartelevision serials and also ran promotion contests for many brands. It had also tied up withsome popular Indian movies where CCD was featured in some of the scenes.
By 2006, CCD had six café formats; Music Cafés, Book Cafés, Highway Cafés, LoungeCafés, Garden Cafés & Cyber Cafés. Music Cafés provided customers with the choice of playingtheir favorite music tracks on the digital audio jukeboxes installed in the café. CCD had 85 MusicCafés out of which 32 cafés also allowed the customers to watch their favorite music videos throughvideo jukeboxes. Book Cafés offered the customers bestsellers and classic books to read while en-joying coffee. CCD had allied with a leading Indian book distributor for supplying books thatwould appeal to the customers. There were 15 Book Cafés in 12 cities. There were highway caféson two important highways in the country that provided coffee and clean restrooms to relax. CCDhad three Lounge Cafés at Delhi, Kolkata, and Hyderabad, which provided exquisite interiors, anexotic menu, and theme music. It had hostesses to assist who were looked upon as fashion icons.There were two Garden Cafés at Bangalore and Delhi amidst famous gardens. Cyber Cafés at Bangalore and Delhi allowed the customer to surf while enjoying coffee. CCD had plans to comeout with more formats like sports Café, singles café, and fashion café.
In 2006, ABCTCL earned revenues of 3.5 billion INR.74 It had plans to increase its outletsto 500 by June 2007 by opening 3–4 shops per week and increase its revenue to 10 billion INR.75
Speaking on competition with other players, Sudipta SenGupta, marketing head, CCDsaid: We don’t have any competition because we are not competing with the others. In fact weare aiding each other in creating and growing the coffee culture. All of us have a distinct iden-tity. We sure do!76
Café Coffee Day
CASE 5 Starbucks Coffee Company 5-17
BaristaThe first outlet of Barista Coffee Company Limited (Barista) was established in 2000 in Delhiby an investment company,77 promoted by Amit Judge. Barista offered a range of hot coffee,international coffee, cold coffee, ice cream, cold non-coffee, ice cream sundaes, add-ons,other beverages, and fast food in their outlets. Coffee and other products at Barista werepriced high and its target audiences were youth from the upper-middle-class segment. Thecoffee at Barista was made with high-quality Arabica coffee beans and baristas (brew mas-ters) were invited from Italy to make new blends. Brotin Banerjee, vice president of market-ing, Barista, said, “Our inspiration was the traditional Italian Espresso bars where the idea isto create a ‘home away from home.’”78 In 2001, Barista entered into a strategic alliance withTata Coffee Ltd. (Tata), the largest coffee producer in India. Tata later acquired a 35% stakein Barista. The alliance allowed Barista to enlarge its distribution network and set up outletsin the Taj Group of hotels owned by Tata and its other allied businesses.
The outlets also offered many merchandise such as mugs, flasks, coffee-made candles,coffee filters, coffee cup miniatures, soft toys, and chocolates.79 The outlets also gave awaygift certificates that could be redeemed at any Barista outlet. By 2003, Barista became a chainof over 100 cafés (mainly in the northern cities), had sales of 650 million INR, and served35,000 customers daily.80 It had surpassed CCD in sales, which had over 50 outlets by 2003.In 2004, Amit sold 65.4% stake of the company to an NRI81 businessman, Sivasankaran (Siva),who later in 2004 bought the remaining stakes from Tata as well. After the acquisition, Sivarevamped the chain, opened more Barista outlets in Southern cities, and began franchising itsoutlets. It started opening up a new outlet every 10 days. A new look was given to its outletsby making changes in its seating arrangements, in-store merchandise, and providing a betteryouthful ambience of the store.82 The brew masters maintained friendly relations with the cus-tomers and called them by their first names.
Barista joined with specialty retailers such as the music retailer Planet M, the book retailerCrossword, and the Taj Group of hotels for setting up espresso corners in their premises. It alsolaunched a concept called Bancafe, a coffee shop within the bank premises and joined with thebank ABN AMRO.83 By 2006, Barista had over 130 café chains.
OthersCosta Coffee, owned by the UK-based Whitbread plc, opened its first coffee retail chain inDelhi in late 2005.84 It entered India through a joint venture agreement with RK JaipuriaGroup of India. It had plans to open 300 outlets in India by 2010. Costa coffee, which had100 outlets in nine countries, was the first international coffee, chain to enter India. In Indiait priced its coffee, which was locally competitive.
After Costa Coffee, Orlando-based coffee chain Barnie’s entered India through a franchis-ing agreement with an Indian company and set up its first outlet at Delhi.85 The company hadplans to invest around 750 million INR and open 300 stores across the country in the next fiveyears. The world’s second-largest specialty coffee company, Australia-based Gloria Jean’s alsodisclosed its plans to enter India and set up 20 outlets in seven large cities in India by 2006.86
Illy, an Italian-based coffee chain, was also in exploration stages to enter India.87
The Road AheadIn 2004, Starbucks had signed an agreement with Tata to source premium coffee beans. Tatahad won a gold medal for the best Robusta88 coffee in the world at the international cupping
large cities in India and abroad through franchising its business. It had joined with retailerssuch as Lifestyle, Music World, and Ebony to open store-in-store outlets.
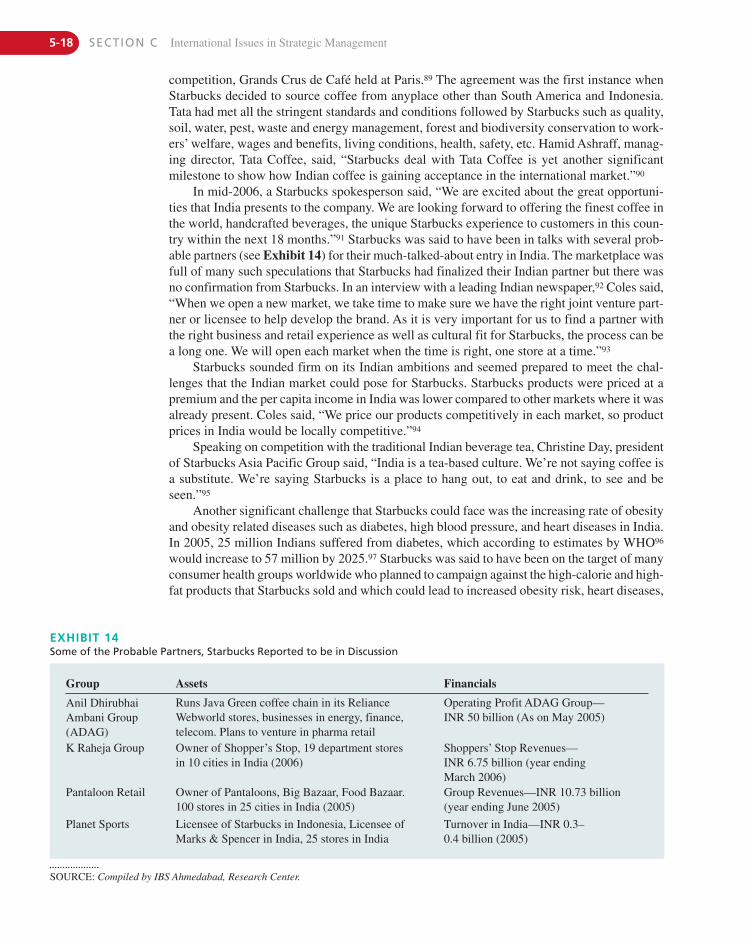
5-18 SECTION C International Issues in Strategic Management
competition, Grands Crus de Café held at Paris.89 The agreement was the first instance whenStarbucks decided to source coffee from anyplace other than South America and Indonesia.Tata had met all the stringent standards and conditions followed by Starbucks such as quality,soil, water, pest, waste and energy management, forest and biodiversity conservation to work-ers’ welfare, wages and benefits, living conditions, health, safety, etc. Hamid Ashraff, manag-ing director, Tata Coffee, said, “Starbucks deal with Tata Coffee is yet another significantmilestone to show how Indian coffee is gaining acceptance in the international market.”90
In mid-2006, a Starbucks spokesperson said, “We are excited about the great opportuni-ties that India presents to the company. We are looking forward to offering the finest coffee inthe world, handcrafted beverages, the unique Starbucks experience to customers in this coun-try within the next 18 months.”91 Starbucks was said to have been in talks with several prob-able partners (see Exhibit 14) for their much-talked-about entry in India. The marketplace wasfull of many such speculations that Starbucks had finalized their Indian partner but there wasno confirmation from Starbucks. In an interview with a leading Indian newspaper,92 Coles said,“When we open a new market, we take time to make sure we have the right joint venture part-ner or licensee to help develop the brand. As it is very important for us to find a partner withthe right business and retail experience as well as cultural fit for Starbucks, the process can bea long one. We will open each market when the time is right, one store at a time.”93
Starbucks sounded firm on its Indian ambitions and seemed prepared to meet the chal-lenges that the Indian market could pose for Starbucks. Starbucks products were priced at apremium and the per capita income in India was lower compared to other markets where it wasalready present. Coles said, “We price our products competitively in each market, so productprices in India would be locally competitive.”94
Speaking on competition with the traditional Indian beverage tea, Christine Day, presidentof Starbucks Asia Pacific Group said, “India is a tea-based culture. We’re not saying coffee isa substitute. We’re saying Starbucks is a place to hang out, to eat and drink, to see and beseen.”95
Another significant challenge that Starbucks could face was the increasing rate of obesityand obesity related diseases such as diabetes, high blood pressure, and heart diseases in India.In 2005, 25 million Indians suffered from diabetes, which according to estimates by WHO96
would increase to 57 million by 2025.97 Starbucks was said to have been on the target of manyconsumer health groups worldwide who planned to campaign against the high-calorie and high-fat products that Starbucks sold and which could lead to increased obesity risk, heart diseases,
EXHIBIT 14Some of the Probable Partners, Starbucks Reported to be in Discussion
SOURCE: Compiled by IBS Ahmedabad, Research Center.
Group Assets Financials
Anil DhirubhaiAmbani Group(ADAG)
Runs Java Green coffee chain in its RelianceWebworld stores, businesses in energy, finance,telecom. Plans to venture in pharma retail
Operating Profit ADAG Group—INR 50 billion (As on May 2005)
K Raheja Group Owner of Shopper’s Stop, 19 department storesin 10 cities in India (2006)
Shoppers’ Stop Revenues—INR 6.75 billion (year ending March 2006)
Pantaloon Retail Owner of Pantaloons, Big Bazaar, Food Bazaar.100 stores in 25 cities in India (2005)
Group Revenues—INR 10.73 billion(year ending June 2005)
Planet Sports Licensee of Starbucks in Indonesia, Licensee ofMarks & Spencer in India, 25 stores in India
Turnover in India—INR 0.3–0.4 billion (2005)
CASE 5 Starbucks Coffee Company 5-19
Appendix 1: Salient Results of the Studies Undertaken by The Coffee Board of India
Consumption of Coffee in India� Consumption of coffee was 19% when compared to tea at
85%. Consumption was the highest in the South at 31%while it ranged between 35% in the weak coffee zones:North, East, and South.
� Per capita consumption of coffee (among all respondents—both drinkers and non-drinkers) was 0.33 cups against1.77 cups for tea. However, coffee consumption amongdrinkers was at 1.76 cups compared with that of tea at2.1 cups.
� About 41% of the respondents were non-drinkers of cof-fee and 40% were occasional drinkers.
� Consumption was the highest among the age groups of15–24 and 35–44 years. The proportion of non-drinkerswas the highest in the age group of 55+ years.
� Coffee consumption dipped from 11% at home to6% outside.
� Coffee was consumed as the first cup only by 23% of cof-fee drinkers, including in the South.
� Penetration level was found to decrease from highersocioeconomic class (SEC) to the lower socioeconomicclass. Penetration of filter coffee was highest in SouthIndia. In the rural areas of South India, instant coffee hada higher level of penetration than filter coffee.
� Visiting cafes was not a frequent habit. Of all respondentssurveyed, about 12% visited cafes and there was a greatertendency among the upper SECs to visit cafes. About 10%have ever visited cafes; the highest proportion was higheramong men and the younger age groups (15–34 years).
� The average number of cups of coffee consumed in-creased marginally from summer to winter.
� The North had an increased consumption of cold coffeein summer, showing 60% consuming cold coffee at leastonce a week in summer.
� Around 65% of households bought instant coffee and 18%bought filter coffee. Among filter coffee drinking house-holds, 49% were branded coffee drinkers and 51% wereunbranded coffee drinkers. In the South, filter coffee wasbought mostly from R&G (Roast & Ground) outlets.
� Amongst coffee consumers in the rural areas, a majoritywere light drinkers, consuming 1–2 cups every day. Abouta fifth of rural consumers consumed coffee occasionally.
� A majority of the rural households (71%) bought pack-aged and branded coffee powder. Of those, 47% boughtinstant coffee, and 53% filter coffee.
Attitude Toward Coffee Consumption� Coffee at home was significantly different to coffee out-
side. Rating for coffee outside home was better than teaoutside home, specifically in the North and the East.
� Coffee from vending machines rated significantly moresatisfactory in the North as compared to the East or theWest. Consumers in the North believed that making filtercoffee was time-consuming.
� In the weak coffee markets, the key barriers to coffee ap-peared to be its bitter taste (East) and its inconsistent tasteoutside. High price of coffee was also felt as a barrier inthe South and the North.
and cancer.98 For instance, Banana Mocha Frappuccino with whipped cream, offered by Star-bucks, contained 720 calories and 11 grams of saturated fat.99 According to the consumergroups, Starbucks should use healthier shortenings100 and publicize its smallest cup size, short,which was available but did not appear on the menu card. Starbucks provided informationabout the nutritional value of each of its offerings on its Web site and in-store brochures. Thehealth groups insisted that the information should also be provided on its menu card.101 A Star-bucks official said they were actively researching alternatives to high-fat products.
Starbucks had expressed its interest in entering India several times in recent history. In2002, Starbucks announced for the first time that it was planning to enter India.102 Later it post-poned its entry as it had entered China recently and was facing problems in Japan. In 2003,there was news again that Starbucks was reviving its plans to enter India. In 2004, Starbucksofficials visited India but according to sources they returned unconvinced as they could notagree on an appropriate partner for its entry. Banerjee of Barista said, “We’ve been hearingabout them [Starbucks] coming for the last 3 to 4 years. We don’t know why they are not hereyet. If they do come, we still believe we have a number of factors to our advantage.” Cole com-mented: Without sounding arrogant, we are looking at our own strategy. There is nothing thatkeeps us doing business in India.”103
5-20 SECTION C International Issues in Strategic Management
R E F E R E N C E SSource: www.starbucks.comChaitali Chakravarty, Sabarinath, Starbucks brews success
recipe for Indian palate, www.indiacoffee.org, July 15,2005.
Starbucks seeks partner for India tour, www.economictimes.com, April 8, 2005.
Starbucks sees big opportunity in China, www.msnbc.com,February 14, 2006.
Sudha Menon, Starbucks coffee firms up India plans, www.blonnet.com, May 26, 2006.
Howard Schultz, Dori Jones Yang, Pour your heart into it:How Starbucks built a company one cup at a time.
A V Vedpuriswar, Starbucks, www.vedpuriswar.org.Jen-Lin Hwang, Coffee goes to China: An examination of
Starbucks Market Entry Strategy, www.clas.ufl.edu,July/August 2005.
Starbucks Coffee: Expansion in Asia, www.interscience.wiley.com.
www.starbucks.com.Ruchi Mankad, Anand Rao, Aspiration of Starbucks in China:
Popularizing coffee among tea-drinkers, www.ecch.com.Allen Liao, Starbucks brings in coffee culture to China, www
.teacoffeeasia.com.Starbucks brews a business in tea-drinking China, www
.siamfuture.com, March 25, 2002.Starbucks soars in China, www.atimes.com, June 15, 2005.Joseph Pratt, Starbucks-China blend: A Slam Dunk Grande,
www.dailyindia.com, March 12, 2006.Investing in India, www.ibef.org, June 18, 2005.
Rules laid out for FDI in branded retail, www.economictimes.com, February 15, 2006.
Jayati Ghosh, India’s potential demographic dividend, www.blonnet.com, January 17, 2006.
Parija Bhatnagar, After caffeinating China, the coffee chainhas its sights set on yet another tea-drinking nation, www.cnn.com, November 1, 2004.
Starbucks Q3 2006 Earnings Conference Call Transcript,http://retail.seekingalpha.com/article/14895, August 2,2006.
www.economictimes.com.Starbucks seeks partner for India tour, www.economictimes
.com, April 8, 2005.India’s new opportunity 2020, Report of the High level strate-
gic group in consultation with The Boston ConsultingGroup.
www.ibef.orgStarbucks to source premium coffee beans from Tata coffee,
www.tata.com, October 18, 2004.www.google.comwww.pantaloon.comwww.shoppersstop.comwww.starbucks.comwww.cia.govwww.ficci.comwww.finmin.nic.inwww.indiastat.comwww.wikipedia.org
N O T E S1. ‘Starbucks Q3 2006 Earnings Conference Call Transcript,’
http://retail.seekingalpha.com/article/14895, 2 August 2006.2. Chaitali Chakravarty, Sabarinath ‘Starbucks brews success
recipe for Indian palate,’ www.indiacoffee.org, 15 July 2005.
3. ‘Starbucks sees big opportunity in China,’ www.msnbc.com,February 14th 2006.
4. ‘Starbucks looks for Indian entry early next year,’ www.helplinelaw.com.
� The knowledge levels on coffee appeared to be relativelyweak in the North and East.
� While consumers in the North believed that instant coffeewas convenient and tasted good, the seasoned coffee con-sumer in the South believed that all instant coffee con-tains chicory and that filter coffee is the gold standard incoffee.
� Respondents in the North, followed by East, appeared tobe most positively inclined to consume more coffee athome if the price was less, they were reassured on health,and they could try different recipes.
� Respondents in the North, followed by West and East, ap-peared to be most positively inclined to consume more
coffee outside if the price was less, consistently good cof-fee was more easily available outside, and they were re-assured on health.
� In South, consumers believed that they would consumemore coffee at home if their family & friends consumedcoffee.
� In the East, there appeared to be a certain level of eagernessto learn about making “just right” coffee and theywould make filter coffee if they knew how to make it well.
SOURCE: S. Radhakrishnan “Coffee consumption in India—Perspectives and Prospects,” www.indiacoffee.org, April 2004.
CASE 5 Starbucks Coffee Company 5-21
5. Sudha Menon ‘Starbucks coffee firms up India plans,’ www.bIonnet.com, May 26th 2006.
6. Allen Liao, ‘Starbucks brings in coffee culture to China,’ www.teacoffeeasia.com.
7. A global company providing office solutions such as copiers,fax machines, etc.
8. Espresso is a strong, flavorful coffee beverage brewed by forc-ing hot water through finely ground roasted coffee beans. InItalian, espresso means “to press,” and refers to the pressure ap-plied to the water as it is forced through the grinds.
9. A person who made coffee drinks as a profession.10. Howard Schultz, Dori Jones Yang ‘Pour your heart into it: How
Starbucks built a company one cup at a time,’ Hyperion, 1997.11. Ibid., Pg. 52.12. Giornale was the name of the largest newspaper company in
Italy and also meant ‘daily’ in general.13. A shot of coffee mixed with hot steamed milk and up to a half
inch of foamed milk on top.14. Op cit ‘Pour your heart into it: How Starbucks built a company
one cup at a time,’ Pg. 90.15. ‘Planet Starbucks (A),’ www.thunderbird.edu, 2003.16. Initial Public Offering is the first sale of stock by a private com-
pany to the public. IPOs are often done when smaller, youngercompanies seek capital to expand their business.
17. Oz is abbreviation for Ounce. 1 Ounce = 28.349 grams.18. www.wikipedia.org.19. ‘Starbucks Corporation,’ http://www.referenceforbusiness.com/
businesses/M-Z/Starbucks-Corporation.html.20. Op cit ‘Pour your heart into it: How Starbucks built a company
one cup at a time,’ Pg. 195–196.21. Ibid., Pg. 173.22. Ibid., Pg. 273.23. Aramark is an international company based in US, specializing
in food services for stadiums, campuses, businesses, andschools.
24. The global food and beverage company.25. A V Vedpuriswar ‘Starbucks,’ www.vedpuriswar.org.26. Jen-Lin Hwang ‘Coffee goes to China: An examination of Star-
bucks’ Market Entry Strategy,’ www.clas.ufl.edu, July/August2005.
27. ‘Analysis: The Chinese Coffee Market,’ www.friedlnet.com,16 September 2003.
28. Ibid.29. ‘Starbucks Coffee: Expansion in Asia,’ www3.interscience
.wiley.com.30. Ibid.31. www.starbucks.com.32. Information adapted from the case “Aspiration of Starbucks in
China: Popularizing coffee among tea-drinkers,’ authored byRuchi Mankad under the supervision of Prof. Anand Rao,ICFAI Business School, Ahmedabad.
33. Allen Liao ‘Starbucks brings in coffee culture to China,’ www.teacoffeeasia.com.
34. Beijing Mei Da Coffee Co. was the distribution agent for Star-bucks wholesale operations in Beijing since 1994. It was set upby the Beijing General Corp, of Agriculture, Industry, andCommerce and the Borderless Investment Group. BorderlessInvestment Group was headed by a former Starbucks executive.
35. ‘Starbucks brews a business in tea-drinking China,’ www.siamfuture.com, March 25th 2002.
36. Qingdao is situated in Eastern China’s Shandong province.
37. Dalian and Shenyang are located northeastern China’s Liaoningprovince.
38. Joseph Pratt ‘Starbucks-China blend: A Slam Dunk Grande,’www.dailyindia.com, March 12th 2006.
39. Starbucks Q3 2006 Earnings Conference.40. ‘Starbucks Q3 2006 Earnings Conference Call Transcript,’ http://
retail.seekingalpha.com/article/14895, August 2nd 2006.41. ‘Economy of India,’ http://dictionary.laborlawtalk.com/
Economy_of_India.42. Purchasing Power Parity (PPP) is a method of measuring the
relative purchasing power of different countries’ currenciesover the same types of goods and services. As goods and ser-vices may cost more in one country than in another, PPP providesmore accurate comparisons of standards of living across coun-tries. PPP estimates use price comparisons of comparable items.
43. ‘Investing in India,’ www.ibef.org, June 18th 2005.44. In India middle income was defined as income between 5,000
and 20,000 INR or approximately US$110 to US$450 permonth.
45. Tier 1 cities included Delhi, Mumbai, & Bangalore. Tier 2 citiesincluded Hyderabad, Pune, & Chennai. Tier 3 cities includedKolkata, Nagpur, Ahmedabad, Chandigarh, Indore, Kochi,Trivandrum, Mangalore, and 30 other cities.
46. ‘The multiple beverage marketplace in India-2006 edition,’Data taken from the sample text of the report, accessible to all.
47. Consumer Markets in India: the next big thing?48. KPMG is a global network of professional firms providing Au-
dit, Tax and Advisory services.49. Jayati Ghosh ‘India’s potential demographic dividend,’ www
.blonnet.com, January 17th 2006.50. ‘Building up India-Outlook for India’s real estate markets,’
www.dbresearch.com, May 8th 2006.51. ‘Background note: India,’ http://www.state.gov/r/pa/ei/bgn/
3454.htm, December 2005.52. Op Cit ‘Building up India-Outlook for India’s real estate
markets.’53. ‘Retailing in India,’ www.euromonitor.com, July 2006, Data
taken from the sample text of the report, accessible to all.54. Op Cit ‘Retailing in India.’55. ‘2004/2005 Global Retail & Consumer Study from Beijing to
Budapest – India,’ www.pwc.com.56. ‘Rules laid out for FDI in branded retail,’ www.economictimes
.com, February 15th 2006.57. ‘Emerging market priorities for global retailers—The 2006
Global Retail Development Index,’ www.atkearney.com.58. A.T Kearney headquartered in Chicago is a management con-
sulting firm.59. ‘State of the Nation’ survey was conducted by The Hindu-
CNN-IBN between August 1st and 6th 2006 whereby14,680 respondents spread across 883 villages and urban areasin 19 states were interviewed.
60. ‘Agricultural commodities: Profiles and relevant WTO negoti-ating issues -Sugar and beverages,’ http://www.fao.org/DOCREP/006/Y4343E/y4343e05.htm#bm05.
61. www.beveragemarketing.com.62. ‘Foreign brands to flavour Indian coffee cuppa!,’ www.hindu
.com, August 22nd 2006.63. S. Radhakrishnan ‘Coffee consumption in India-Perspectives
and Prospects,’ www.indiacoffee.org, April 2004.64. Filter Coffee is a sweet milky coffee made from dark roasted
coffee beans (70%–80%) and chicory (20%–30%), especially
5-22 SECTION C International Issues in Strategic Management
popular in the southern states of India. Outside India, a cof-fee drink prepared using a filter is known as Filter Coffee oras Drip Coffee as the water passes through the grounds solelyby gravity and not under pressure or in longer-term contact.
65. S. Radhakrishnan ‘Coffee consumption in India—Perspectivesand Prospects,’ www.indiacoffee.org, April 2004.
66. The Coffee Board of India is an autonomous body functioningunder the Ministry of Commerce and Industry, Government ofIndia. The Board set up in the year 1942 focuses on research,development, extension, quality up-gradation, market infor-mation, and the domestic and external promotion of Indiancoffee.
67. ‘The great Indian bazaar,’ www.ibef.org.68. Parija Bhatnagar ‘After caffeinating China, the coffee chain has
its sights set on yet another tea-drinking nation,’ www.cnn.com,1 November 2004.
69. ‘Starbucks Q3 2006 Earnings Conference Call Transcript,’http://retail.seekingalpha.com/article/14895, 2 August 2006.
70. www.cafecoffeeday.com.71. Ibid.72. Frappe is coffee and ice-cream blended together.73. ‘Interview with Café Coffee Day marketing head Sudipta Sen
Gupta,’ www.indiantelevision.com, May 27th 2004.74. As on September 6th 2006, 1 US $ was equal to 46.19 INR.75. Arthur Cundy ‘Coffee Day parent brews plans to double pres-
ence,’ www.cafelist.blogpost.com, May 17th 2006.76. ‘Interview with Café Coffee Day marketing head Sudipta Sen
Gupta,’ www.indiantelevision.com, May 27th 2004.77. Turner Morrison.78. Parija Bhatnagar ‘Starbucks: A passage to India,’ www.money
.cnn.com, 1 November 2004.79. www.barista.co.in.80. ‘Acoffee-man’s ‘circle of influence,’www.rediff.com, 4 February
2003.81. Non Resident Indian.82. ‘More Barista cafes,’ www.chennaionline.com, 27 August 2004.
83. Ratna Bhushan ‘Keeping the coffee hot,’ www.thehindubusi-nessline.com, 22 May 2003.
84. ‘Costa Coffee launch in India,’ www.news.yahoo.com, 8 September, 2005.
85. ‘Barnie’s gourmet coffee enters India,’www.thehindubusinessline.com, 17 August 2006.
86. ‘Gloria Jeans plans first outlet in Delhi by July,’ http://franchise.business-opportunities.biz, 24 April 2006.
87. Sravanthi Challapalli ‘There’s deep interest in coffee here,’www.thehindubusinessline.com, 1 June 2006.
88. The two main types of coffee traded internationally are Arabics andRobusta. Robusta coffee is a milder variety compared to Arabica.
89. ‘Starbucks to source premium coffee beans from Tata coffee,’www.tata.com, October 18th 2004.
90. Ibid.91. Sudha Menon ‘Starbucks coffee firms up India plans,’ www
.blonnet.com. May 26th 2006.92. The Economic Times.93. ‘Starbucks seeks partner for India tour,’ www.economictimes
.com, 8 April 2005.94. Ibid.95. Op Cit ‘After caffeinating China, the coffee chain has its sights
set on yet another tea-drinking nation.’96. World Health Association.97. Amelia Gentleman ‘India’s newly rich battle with obesity,’
www.indiaresource.org, 4 December 2005.98. ‘Starbucks may be next target of fatty-fighting group,’ www
.foxnews.com, 19 June 2006.99. www.starbucks.com.
100. Shortening is a fat used in food preparation specially bakedgoods. It has 100% fat content.
101. Op Cit ‘Starbucks may be next target of fatty-fighting group.’102. ‘Starbucks looks for Indian entry early next year,’ www
.helplinelaw.com.103. Op Cit ‘After caffeinating China, the coffee chain has its sights
set on yet another tea-drinking nation.’
GUAJILOTE (PRONOUNCED WA-HEE-LOW-TAY) COOPERATIVO FORESTAL WAS A FORESTRY coopera-tive that operated out of Chaparral, a small village located in the buffer zone of La Muralla
National Park in Honduras’ Olancho province. Olancho was one of 18 Honduran provincesand was located inland, bordering Nicaragua. The cooperative was one result of a rela-tively new movement among international donor agencies promoting sustainable eco-nomic development of developing countries’ natural resources.1 A cooperative in
Honduras was similar to a cooperative in the United States: It was an enterprise jointlyowned and operated by members who used its facilities and services.
Guajilote was founded in 1991 as a component of a USAID (United States Agency for In-ternational Development) project. The project attempted to develop La Muralla National Parkas an administrative and socioeconomic model that COHDEFOR (the Honduran forestry de-velopment service) could transfer to Honduras’ other national parks. The Guajilote Coopera-tivo Forestal was given the right to exploit naturally fallen (not chopped down) mahoganytrees in La Muralla’s buffer zone. Thus far, it was the only venture in Honduras with this right.A buffer zone was the designated area within a park’s boundaries but outside its core protectedzone. People were allowed to live and engage in economically sustainable activities within thisbuffer zone.
In 1998, Guajilote was facing some important issues and concerns that could affect notonly its future growth but its very survival. For one thing, the amount of mahogany wood waslimited and was increasingly being threatened by forest fires, illegal logging, and slash-and-burn agriculture. If the total number of mahogany trees continued to decline, trade in its woodcould be restricted internationally. For another, the cooperative had no way to transport itswood to market and was thus forced to accept low prices for its wood from the only distribu-tor in the area. What could be done to guarantee the survival of the cooperative?
6-1
C A S E 6Guajilote Cooperativo Forestal, HondurasNathan Nebbe and J. David Hunger
This case was prepared by Nathan Nebbe and Professor J. David Hunger of Iowa State University. Copyright © 1999and 2005 by Nathan Nebbe and J. David Hunger. This case was edited for SMBP 9th, 10th, 11th, 12th, and 13th editions.Presented to the Society for Case Research and published in Annual Advances in Business Case 1999. The copyrightholders are solely responsible for its content. Further use or reproduction of this material is strictly subject to theexpress permission of copyright holders. Reprinted by permission of the copyright holders, Nathan Nebbe andJ. David Hunger, for the 13th Edition of SMBP.
6-2 SECTION C International Issues in Strategic Management
OperationsGuajilote’s work activities included three operations using very simple technologies. First,members searched the area to locate appropriate fallen trees. This, in itself, could be very dif-ficult since mahogany trees were naturally rare. These trees were found at elevations up to1,800 meters (5,400 feet) and normally were found singly or in small clusters of no more thanfour to eight trees per hectare (2.2 acres).2
Finding fallen mahogany in La Muralla’s buffer zone was hampered due to the area’ssteep and sometimes treacherous terrain. (La Muralla means “steep wall of rock” in Spanish.)The work was affected by the weather. For example, more downed trees were available dur-ing the wet season due to storms and higher soil moisture—leading to the uprooting of trees.
Second, the cooperative set up a temporary hand-sawmill as close as possible to a fallentree. Due to the steep terrain, it was often difficult to find a suitable location nearby to operatethe hand-sawmill. Once a suitable work location was found, men used a large cross-cut saw todisassemble the tree into various components. The disassembling process was a long and ar-duous process that could take weeks for an especially large tree. The length of time it took toprocess a tree depended on the tree’s size—mature mahogany trees could be gigantic. Tree sizethus affected how many trees Guajilote was able to process in a year.
Third, after a tree was disassembled, the wood was either carried out of the forest using acombination of mule and human power or floated down a stream or river. Even if a stream hap-pened to be near a fallen tree, it was typically usable only during the wet season. The woodwas then sold to a distributor who, in turn, transported it via trucks to the cities to sell to fur-niture makers for a profit.
Guajilote’s permit to use fallen mahogany was originally granted in 1991 for a 10-yearperiod by COHDEFOR. The permit was simply written, and stated that if Guajilote restricteditself to downed mahogany, its permit renewal should be granted automatically. The adminis-trator of the area’s COHDEFOR office indicated that if things remained as they were,Guajilote should not have any problem obtaining renewal in 2001. Given the nature of Hon-duran politics, however, nothing could be completely assured.
In 1998, Guajilote’s mahogany was still sold as a commodity. The cooperative did verylittle to add value to its product. Nevertheless, the continuing depletion of mahogany treesaround the world meant that the remaining wood should increase in value over time.
Management and Human ResourcesSantos Munguia, 29 years old, had been Guajilote’s leader since 1995. Although Munguiahad only a primary school education, he was energetic and intelligent and had proven to be avery skillful politician. In addition to directing Guajilote, Munguia farmed a small parcel ofland and raised a few head of cattle. He was also involved in local politics.
Munguia had joined the cooperative in 1994. Although he had not been one of Guajilote’soriginal members, he quickly became its de facto leader in 1995, when he renegotiated a bet-ter price for the sale of the cooperative’s wood.
Before Munguia joined the cooperative, Guajilote had been receiving between 3 and4 lempiras ($0.37, or 11 lempiras to the dollar) per foot of cut mahogany from its sole distrib-utor, Juan Suazo. No other distributors were available in this remote location. The distributortransported the wood to Tegucigalpa or San Pedro Sula and sold it for 16 to 18 lempiras perfoot. Believing that Suazo was taking advantage of the cooperative, Munguia negotiated aprice increase to 7 to 8 lempiras per foot ($0.60 to $0.62 per foot at the July 15, 1998, exchangerate) by putting political pressure on Suazo. The distributor agreed to the price increase onlyafter a police investigation had been launched to investigate his business dealings. (Rumors
CASE 9 Guajilote Cooperativo Forestal, Honduras 6-3
Munguia: El CaudilloAfter renegotiating successfully with the cooperative’s distributor, Munguia quickly becamethe group’s caudillo (strong man). The caudillo was a Latin American political and social in-stitution. A caudillo was a (typically male) purveyor of patronage. All decisions went through,and were usually made by, him. A caudillo was often revered, feared, and hated at the sametime because of the power he wielded. Munguia was viewed by many in the area as an as-cending caudillo because of his leadership of Guajilote.
Guajilote did not operate in a democratic fashion. Munguia made all the decisions—sometimes with input from his second in command and nephew, Miguel Flores Munguia—andhandled all of Guajilote’s financial matters. Guajilote’s members did not seem to have a prob-lem with this management style. The prevailing opinion seemed to be that Guajilote was a lotbetter off with Munguia running the show by himself than with more involvement by the mem-bers. One man put the members’ view very succinctly: “Santos, he saved us (from Suazo, fromCOHDEFOR, from ourselves).”
Guajilote’s organizational structure emphasized Munguia’s importance. He was alone atthe top in his role as decision maker. If, in the future, Munguia became more involved in pol-itics and other ventures that could take him out of Chaparral (possibly for long periods oftime), he would very likely be forced to spend less time with Guajilote’s operations. Munguia’sleadership has been of key importance to Guajilote’s maturing as both a work group and as abusiness. In 1998, there did not seem to be another person in the cooperative that could takeMunguia’s place.
Guajilote’s MembersWhen founded, the cooperative had been composed of 15 members. Members were initiallyselected for the cooperative by employees of USAID and COHDEFOR. The number of em-ployees has held steady over time. Since the cooperative’s founding, 3 original members havequit; 4 others were allowed to join. Although no specific reasons were given for membersleaving, they appeared to be because of personality differences, family problems, or differ-ences of opinion. No money had been paid to them when they left the cooperative. In 1998there were 16 members in the cooperative.
None of Guajilote’s members had any education beyond primary school. Many of themembers had no schooling at all and were illiterate. As a whole, the group knew little of mar-kets or business practices.
Guajilote’s existence has had an important impact on its members. One member stated thatbefore he had joined Guajilote, he was lucky to have made 2,000 lempiras in a year, whereashe made around 1,000 to 1,500 in one month as a member of the cooperative. He stated thatall five of his children were in school, something that he could not have afforded previously.Before joining the cooperative, he had been involved in subsistence farming and other activi-ties that brought in a small amount of money and food. He said that his children had been re-quired previously to work as soon as they were able. As a simple farmer, he often had to leave hisfamily to find work, mostly migrant farm work, to help his family survive. Because of Guajilote,his family now had enough to eat, and he was able to be home with his family.
This was a common story among Guajilote’s members. The general improvement in itsmembers’ quality of life also appeared to have strengthened the cooperative members’ per-sonal bonds with each other.
circulated that Suazo was transporting and selling illegally logged mahogany by mixing it withthat purchased from Guajilote.)
6-4 SECTION C International Issues in Strategic Management
Financial SituationNo formal public financial records were available. As head of the cooperative, Munguia keptinformal records. Guajilote’s 1997 revenues were approximately 288,000 lempiras(US$22,153). (Revenues for 1996 were not available.) Guajilote processed around 36,000feet of wood during 1997. Very little of the money was held back for capital improvementpurchases due to the operation’s simple material needs. Capital expenditures for 1997 in-cluded a mule plus materials needed to maintain Guajilote’s large cross-cut saws.
Each of Guajilote’s 16 members was paid an average of about 1,500 lempiras (US$113)per month in 1997 and 1,300 lempiras (US$100) per month in 1996. 1998 payments per monthhad been similar to 1997’s payments, according to Guajilote’s members. Money was paid tomembers based on their participation in Guajilote’s operations.
There was conjecture, among some workers, that Munguia and his second in charge werepaying themselves more than the other members were receiving. When Munguia was asked ifhe received a higher wage than the others because of his administrative position in the group,he responded that everything was distributed evenly. An employee of COHDEFOR indicated,however, that Munguia had purchased a house in La Union—the largest town in the area. Thatperson conjectured, based on this evidence, that Munguia was likely receiving more from thecooperative than were the other members.
Issues Facing the CooperativeGuajilote’s size and growth potential were limited by the amount of mahogany it could pro-duce in a year. Mahogany was fairly rare in the forest, and Guajilote was legally restricted todowned trees. Moreover, with the difficulties of finding, processing by hand, and then mov-ing the wood out of the forest, Guajilote was further restricted in the quantity of wood it couldhandle.
Lack of transportation was a major problem for Guajilote. The cooperative had been un-able to secure the capital needed to buy its own truck; lending through legitimate sources wasvery tight in Honduras and enterprises like Guajilote did not typically have access to lines ofcredit. Although the prices the cooperative was receiving for its wood had improved, the menstill thought that the distributor, Juan Suazo, was not paying them what the wood was worth.It was argued that when demand was high for mahogany, the cooperative gave up as much as10 lempiras per foot in sales to Suazo. Guajilote could conceivably double its revenues if itcould somehow haul its wood to Honduras’ major market centers and sell it without use of adistributor. The closest market center was Tegucigalpa—three to four hours from Chaparral ondangerous, often rain soaked, mountain roads.
A PossibilitySome of the members of Guajilote wondered if the cooperative could do better financially byskipping the distributor completely. It was possible that some specialty shops (chains and in-dependents) and catalogs throughout the world might be interested in selling high-quality ma-hogany furniture, i.e., chests or chairs, that were produced in an environmentally friendlymanner. Guajilote, unfortunately, had no highly skilled carpenters or furniture makers in itsmembership. There were, however, a couple towns in Honduras with highly skilled furnituremakers who worked on a contract basis.
A U.S. citizen with a furniture export business in Honduras worked with a number of in-dependent furniture makers on contract to make miniature ornamental chairs. This exporter re-
CASE 9 Guajilote Cooperativo Forestal, Honduras 6-5
ConcernsIn spite of Guajilote’s improved outlook, there were many concerns that could affect the co-operative’s future. A serious concern was the threat of deforestation through fires, illegal log-ging (i.e., poaching of mahogany as well as clear cutting), and slash-and-burn agriculture.
Small fires were typically set to prepare soils for planting and to help clear new areas forcultivation. Often these fires were either not well supervised or burned out of the control of thepeople starting them. Due to the 1998 drought, the number of out-of-control forest fires hadbeen far greater than normal. There seemed to be a consensus among Hondurans that 1998would be one of the worst years for forest fires. Mahogany and tropical deciduous forests arenot fire resistant. Fires not only kill adult and young mahogany trees, but they also destroy theirseeds.3 Mahogany could therefore be quickly eliminated from a site. Each year, Guajilote lostmore area from which it could take mahogany.
To make matters worse, many Hondurans considered the area around La Muralla NationalPark to be a frontier open to settlement by landless campesinos (peasant farmers). In fleeingpoverty and desertification, people were migrating to the Olancho province in large numbers.4
Not only did they clear the forests for cultivation, but they also cut wood for fuel and for usein building their homes. Most of the new settlements were being established in the area’s bestmahogany growing habitats.
Another concern was that of potential restrictions by CITIES (the international conven-tion on trade in endangered species). Although trade in mahogany was still permitted, it wassupposed to be monitored very closely. If the populations of the 12 mahogany species contin-ued to decrease, it was possible that mahogany would be given even greater protection underthe CITIES framework. This could include even tighter restrictions on the trade in mahoganyor could even result in an outright ban similar to the worldwide ban on ivory trading.
N O T E S
viewed Guajilote’s situation and concluded that the cooperative might be able to make andmarket furniture very profitably—even if it had to go through an exporter to find suitable mar-kets. Upon studying Guajilote’s operations, he estimated that Guajilote might be able to morethan treble its revenues. In order to do this, however, the exporter felt that Guajilote wouldhave to overcome problems with transportation and upgrade its administrative competence.Guajilote would need to utilize the talents of its members more if it were to widen its opera-tional scope. It would have to purchase trucks and hire drivers to transport the wood overtreacherous mountain roads. The role of administrator would become much more demanding,thus forcing Munguia to delegate some authority to others in the cooperative.
1. K. Norsworthy, Inside Honduras (Albuquerque, NM: Inter-Hemispheric Education Resource, 1993), pp. 133–138.
2. H. Lamprecht, Silviculture in the Tropics (Hamburg, Germany:Verlag, 1989), pp. 245–246.
3. Ibid.4. K. Norsworthy, Inside Honduras (Albuquerque, NM: Inter-
Hemispheric Education Resource, 1993), pp. 133–138.

This page intentionally left blank
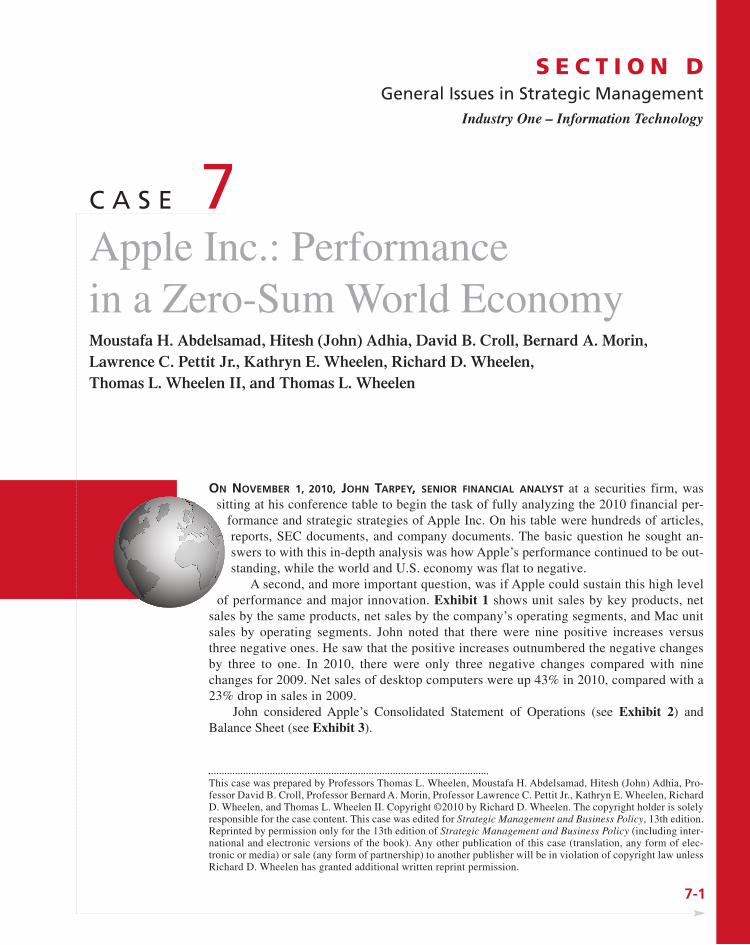
7-1
C A S E 7Apple Inc.: Performance in a Zero-Sum World EconomyMoustafa H. Abdelsamad, Hitesh (John) Adhia, David B. Croll, Bernard A. Morin,Lawrence C. Pettit Jr., Kathryn E. Wheelen, Richard D. Wheelen, Thomas L. Wheelen II, and Thomas L. Wheelen
S E C T I O N DGeneral Issues in Strategic Management
Industry One – Information Technology
ON NOVEMBER 1, 2010, JOHN TARPEY, SENIOR FINANCIAL ANALYST at a securities firm, wassitting at his conference table to begin the task of fully analyzing the 2010 financial per-
formance and strategic strategies of Apple Inc. On his table were hundreds of articles,reports, SEC documents, and company documents. The basic question he sought an-swers to with this in-depth analysis was how Apple’s performance continued to be out-standing, while the world and U.S. economy was flat to negative.
A second, and more important question, was if Apple could sustain this high levelof performance and major innovation. Exhibit 1 shows unit sales by key products, net
sales by the same products, net sales by the company’s operating segments, and Mac unitsales by operating segments. John noted that there were nine positive increases versusthree negative ones. He saw that the positive increases outnumbered the negative changesby three to one. In 2010, there were only three negative changes compared with ninechanges for 2009. Net sales of desktop computers were up 43% in 2010, compared with a23% drop in sales in 2009.
John considered Apple’s Consolidated Statement of Operations (see Exhibit 2) andBalance Sheet (see Exhibit 3).
This case was prepared by Professors Thomas L. Wheelen, Moustafa H. Abdelsamad, Hitesh (John) Adhia, Pro-fessor David B. Croll, Professor Bernard A. Morin, Professor Lawrence C. Pettit Jr., Kathryn E. Wheelen, RichardD. Wheelen, and Thomas L. Wheelen II. Copyright ©2010 by Richard D. Wheelen. The copyright holder is solelyresponsible for the case content. This case was edited for Strategic Management and Business Policy, 13th edition.Reprinted by permission only for the 13th edition of Strategic Management and Business Policy (including inter-national and electronic versions of the book). Any other publication of this case (translation, any form of elec-tronic or media) or sale (any form of partnership) to another publisher will be in violation of copyright law unlessRichard D. Wheelen has granted additional written reprint permission.
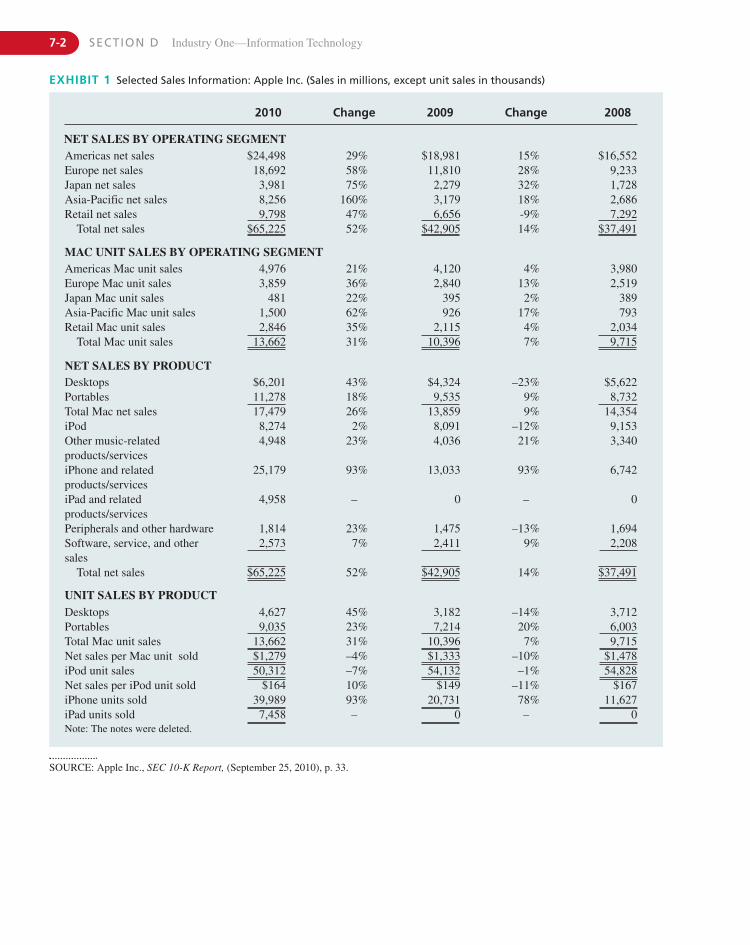
7-2 SECTION D Industry One—Information Technology
2010 Change 2009 Change 2008
NET SALES BY OPERATING SEGMENTAmericas net sales $24,498 29% $18,981 15% $16,552 Europe net sales 18,692 58% 11,810 28% 9,233Japan net sales 3,981 75% 2,279 32% 1,728Asia-Pacific net sales 8,256 160% 3,179 18% 2,686Retail net sales 9,798 47% 6,656 -9% 7,292
Total net sales $65,225 52% $42,905 14% $37,491
MAC UNIT SALES BY OPERATING SEGMENTAmericas Mac unit sales 4,976 21% 4,120 4% 3,980Europe Mac unit sales 3,859 36% 2,840 13% 2,519Japan Mac unit sales 481 22% 395 2% 389Asia-Pacific Mac unit sales 1,500 62% 926 17% 793Retail Mac unit sales 2,846 35% 2,115 4% 2,034
Total Mac unit sales 13,662 31% 10,396 7% 9,715
NET SALES BY PRODUCTDesktops $6,201 43% $4,324 –23% $5,622 Portables 11,278 18% 9,535 9% 8,732Total Mac net sales 17,479 26% 13,859 9% 14,354iPod 8,274 2% 8,091 –12% 9,153Other music-relatedproducts/services
4,948 23% 4,036 21% 3,340
iPhone and relatedproducts/services
25,179 93% 13,033 93% 6,742
iPad and relatedproducts/services
4,958 – 0 – 0
Peripherals and other hardware 1,814 23% 1,475 –13% 1,694Software, service, and othersales
2,573 7% 2,411 9% 2,208
Total net sales $65,225 52% $42,905 14% $37,491
UNIT SALES BY PRODUCTDesktops 4,627 45% 3,182 –14% 3,712Portables 9,035 23% 7,214 20% 6,003Total Mac unit sales 13,662 31% 10,396 7% 9,715Net sales per Mac unit sold $1,279 –4% $1,333 –10% $1,478 iPod unit sales 50,312 –7% 54,132 –1% 54,828Net sales per iPod unit sold $164 10% $149 –11% $167 iPhone units sold 39,989 93% 20,731 78% 11,627iPad units sold 7,458 – 0 – 0Note: The notes were deleted.
EXHIBIT 1 Selected Sales Information: Apple Inc. (Sales in millions, except unit sales in thousands)
SOURCE: Apple Inc., SEC 10-K Report, (September 25, 2010), p. 33.
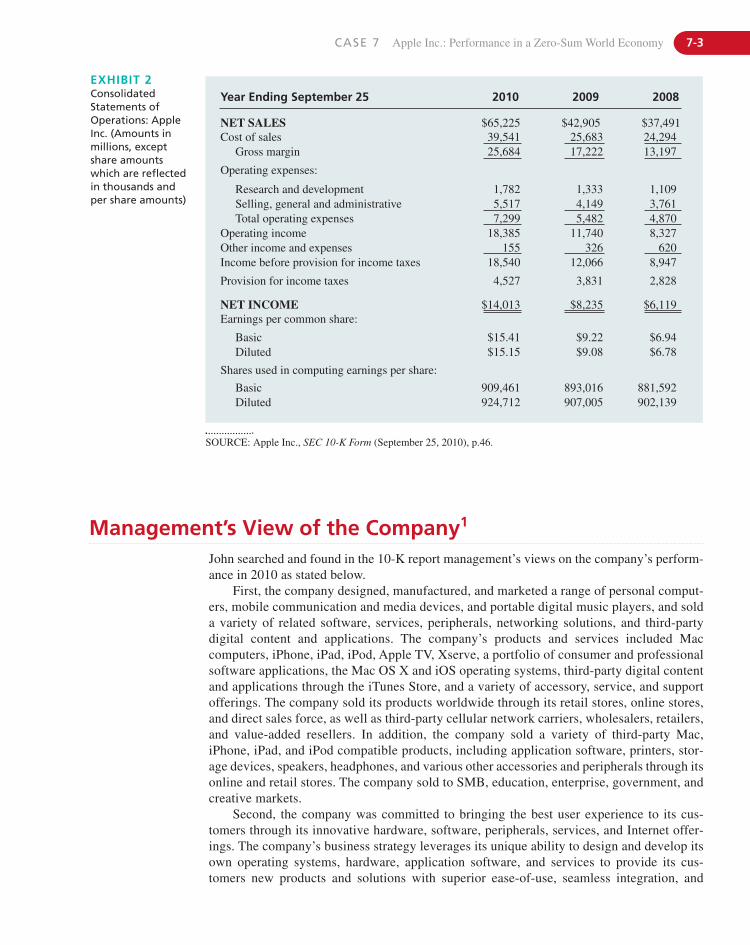
CASE 7 Apple Inc.: Performance in a Zero-Sum World Economy 7-3
Year Ending September 25 2010 2009 2008
NET SALES $65,225 $42,905 $37,491Cost of sales 39,541 25,683 24,294
Gross margin 25,684 17,222 13,197
Operating expenses:
Research and development 1,782 1,333 1,109Selling, general and administrative 5,517 4,149 3,761Total operating expenses 7,299 5,482 4,870
Operating income 18,385 11,740 8,327Other income and expenses 155 326 620Income before provision for income taxes 18,540 12,066 8,947
Provision for income taxes 4,527 3,831 2,828
NET INCOME $14,013 $8,235 $6,119Earnings per common share:
Basic $15.41 $9.22 $6.94 Diluted $15.15 $9.08 $6.78
Shares used in computing earnings per share:
Basic 909,461 893,016 881,592Diluted 924,712 907,005 902,139
EXHIBIT 2ConsolidatedStatements ofOperations: AppleInc. (Amounts inmillions, exceptshare amountswhich are reflectedin thousands andper share amounts)
SOURCE: Apple Inc., SEC 10-K Form (September 25, 2010), p.46.
Management’s View of the Company1
John searched and found in the 10-K report management’s views on the company’s perform-ance in 2010 as stated below.
First, the company designed, manufactured, and marketed a range of personal comput-ers, mobile communication and media devices, and portable digital music players, and solda variety of related software, services, peripherals, networking solutions, and third-partydigital content and applications. The company’s products and services included Maccomputers, iPhone, iPad, iPod, Apple TV, Xserve, a portfolio of consumer and professionalsoftware applications, the Mac OS X and iOS operating systems, third-party digital contentand applications through the iTunes Store, and a variety of accessory, service, and supportofferings. The company sold its products worldwide through its retail stores, online stores,and direct sales force, as well as third-party cellular network carriers, wholesalers, retailers,and value-added resellers. In addition, the company sold a variety of third-party Mac,iPhone, iPad, and iPod compatible products, including application software, printers, stor-age devices, speakers, headphones, and various other accessories and peripherals through itsonline and retail stores. The company sold to SMB, education, enterprise, government, andcreative markets.
Second, the company was committed to bringing the best user experience to its cus-tomers through its innovative hardware, software, peripherals, services, and Internet offer-ings. The company’s business strategy leverages its unique ability to design and develop itsown operating systems, hardware, application software, and services to provide its cus-tomers new products and solutions with superior ease-of-use, seamless integration, and
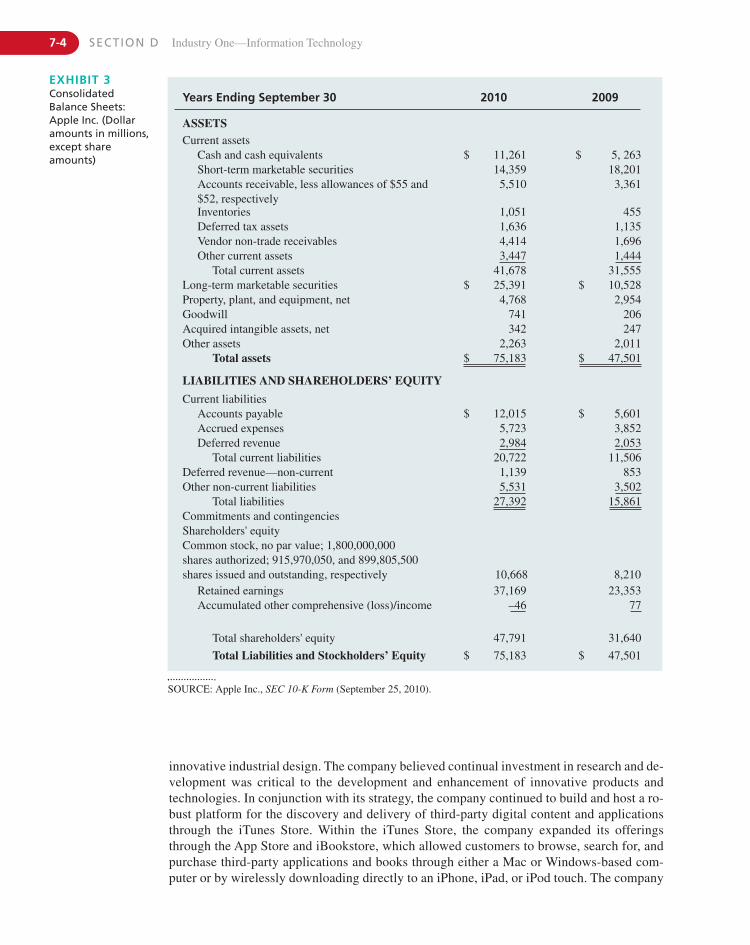
7-4 SECTION D Industry One—Information Technology
Years Ending September 30 2010 2009
ASSETSCurrent assets
Cash and cash equivalents $ 11,261 $ 5, 263Short-term marketable securities 14,359 18,201Accounts receivable, less allowances of $55 and$52, respectively
5,510 3,361
Inventories 1,051 455Deferred tax assets 1,636 1,135Vendor non-trade receivables 4,414 1,696Other current assets 3,447 1,444
Total current assets 41,678 31,555Long-term marketable securities $ 25,391 $ 10,528Property, plant, and equipment, net 4,768 2,954Goodwill 741 206Acquired intangible assets, net 342 247Other assets 2,263 2,011
Total assets $ 75,183 $ 47,501
LIABILITIES AND SHAREHOLDERS’ EQUITY
Current liabilities Accounts payable $ 12,015 $ 5,601Accrued expenses 5,723 3,852Deferred revenue 2,984 2,053
Total current liabilities 20,722 11,506Deferred revenue—non-current 1,139 853Other non-current liabilities 5,531 3,502
Total liabilities 27,392 15,861Commitments and contingenciesShareholders' equityCommon stock, no par value; 1,800,000,000 shares authorized; 915,970,050, and 899,805,500 shares issued and outstanding, respectively 10,668 8,210
Retained earnings 37,169 23,353Accumulated other comprehensive (loss)/income –46 77
Total shareholders' equity 47,791 31,640
Total Liabilities and Stockholders’ Equity $ 75,183 $ 47,501
EXHIBIT 3ConsolidatedBalance Sheets:Apple Inc. (Dollaramounts in millions,except shareamounts)
SOURCE: Apple Inc., SEC 10-K Form (September 25, 2010).
innovative industrial design. The company believed continual investment in research and de-velopment was critical to the development and enhancement of innovative products andtechnologies. In conjunction with its strategy, the company continued to build and host a ro-bust platform for the discovery and delivery of third-party digital content and applicationsthrough the iTunes Store. Within the iTunes Store, the company expanded its offeringsthrough the App Store and iBookstore, which allowed customers to browse, search for, andpurchase third-party applications and books through either a Mac or Windows-based com-puter or by wirelessly downloading directly to an iPhone, iPad, or iPod touch. The company
CASE 7 Apple Inc.: Performance in a Zero-Sum World Economy 7-5
also worked to support a community for the development of third-party software and hard-ware products and digital content that complement the company’s offerings. Additionally,the company’s strategy included expanding its distribution network to effectively reach morecustomers and provide them with a high-quality sales and post-sales support experience. Thecompany was therefore uniquely positioned to offer superior and well-integrated digitallifestyle and productivity solutions.
Third, the company participated in several highly competitive markets, including personalcomputers with its Mac computers; mobile communications and media devices with its iPhone,iPad, and iPod product families; and distribution of third-party digital content and applicationswith its online iTunes Store. While the company was widely recognized as a leading innovatorin the markets where it competes, these markets were highly competitive and subject to aggres-sive pricing. To remain competitive, the company believed that increased investment in researchand development, marketing, and advertising was necessary to maintain or expand its positionin these markets. The company’s research and development spending was focused on further de-veloping its existing Mac line of personal computers; the Mac OS X and iOS operating systems;application software for the Mac; iPhone, iPad, and iPod and related software; development ofnew digital lifestyle consumer and professional software applications; and investments in newproduct areas and technologies. The company also believed increased investment in marketingand advertising programs was critical to increasing product and brand awareness.
The company utilized a variety of direct and indirect distribution channels, including its re-tail stores, online stores, and direct sales force, as well as third-party cellular network carriers,wholesalers, retailers, and value-added resellers. The company believed that sales of its inno-vative and differentiated products were enhanced by knowledgeable salespersons who couldconvey the value of the hardware, software, and peripheral integration; demonstrate the uniquedigital lifestyle solutions that were available on its products; and demonstrate the compatibilityof the Mac with the Windows platform and networks. The company further believed providingdirect contact with its targeted customers was an effective way to demonstrate the advantagesof its products over those of its competitors, and that providing a high-quality sales and after-sales support experience is critical to attracting new—and retaining existing—customers. Toensure a high-quality buying experience for its products in which service and education wereemphasized, the company continued to expand and improve its distribution capabilities by ex-panding the number of its own retail stores worldwide. Additionally, the company invested inprograms to enhance reseller sales by placing high-quality Apple fixtures, merchandising ma-terials, and other resources within selected third-party reseller locations. Through the ApplePremium Reseller Program, certain third-party resellers focused on the Apple platform by pro-viding a high level of integration and support services, as well as product expertise.
History of Apple Inc.2
The history of Apple can be broken into five separate time periods, each with its own strate-gic issues and concerns.
1976–1984: The Founders Build a CompanyFounded in a California garage on April 1, 1976, Apple created the personal computer revo-lution with powerful yet easy-to-use machines for the desktop. Steve Jobs sold hisVolkswagen bus and Steve Wozniak hocked his HP programmable calculator to raise $1,300in seed money to start their new company. Not long afterward, a mutual friend helped recruitA. C. “Mike” Markkula to help market the company and give it a million-dollar image. Even
7-6 SECTION D Industry One—Information Technology
1985–1997: Professional Managers Fail to Extend the CompanyIn 1985, amid a slumping market, Apple saw the departure of its founders, Jobs and Wozniak. As Chairman of the Board, Jobs had recruited John Sculley, an experienced exec-utive from PepsiCo, to replace him as Apple’s CEO in 1983. Jobs had challenged Sculleywhen recruiting him by saying, “Do you want to spend the rest of your life selling sugaredwater, or do you want to change the world?” Jobs willingly gave up his title as CEO so thathe could have Sculley as his mentor. In 1985, a power struggle took place between Sculleyand Jobs. With his entrepreneurial orientation, Jobs wanted to continue taking the companyin risky new directions. Sculley, in contrast, felt that Apple had grown to the point where itneeded not only to be more careful in its strategic moves, but also better organized and rationally managed. The board of directors supported Sculley’s request to strip Jobs of hisduties, since it felt that the company needed an experienced executive to lead Apple into its next stage of development.
Jobs then resigned from the company he had founded and sold all but one share of hisApple stock. Under the leadership of John Sculley, CEO and Chairman, the company engi-neered a remarkable turnaround. He instituted a massive reorganization to streamline opera-tions and expenses. During this time Wozniak left the company. Macintosh sales gainedmomentum throughout 1986 and 1987. Sales increased 40% from $1.9 billion to $2.7 billionin fiscal 1987, and earnings jumped 41% to $217 million.
In the early 1990s, Apple sold more personal computers than any other computer company.Net sales grew to over $7 billion, net income to over $540 million, and earnings per share to$4.33. The period from 1993 to 1995 was, however, a time of considerable change in the man-agement of Apple. The industry was rapidly changing. Personal computers using Microsoft’sWindows operating system and Office software plus Intel microprocessors began to dominatethe personal computer marketplace. (The alliance between Microsoft and Intel was known in thetrade as Wintel.) Dell, Hewlett-Packard, Compaq, and Gateway replaced both IBM and Apple as
though all three founders had left the company’s management team during the 1980s,Markkula continued serving on Apple’s Board of Directors until August 1997.
The early success of Apple was attributed largely to marketing and technological inno-vation. In the high-growth industry of personal computers in the early 1980s, Apple grewquickly, staying ahead of competitors by contributing key products that stimulated the de-velopment of software for the computer. Landmark programs such as Visicalc (forerunnerto Lotus 1-2-3 and other spreadsheet programs) were developed first for the Apple II. Applealso secured early dominance in the education and consumer markets by awarding hundredsof thousands of dollars in grants to schools and individuals for the development of educa-tion software.
Even with enormous competition, Apple revenues continued to grow at an unprece-dented rate, reaching $583.3 million by fiscal 1982. The introduction of the Macintoshgraphical user interface in 1984, which included icons, pull-down menus, and windows, be-came the catalyst for desktop publishing and instigated the second technological revolutionattributable to Apple. Apple kept the architecture of the Macintosh proprietary; that is, itcould not be cloned like the “open system” IBM PC. This allowed the company to charge apremium for its distinctive “user-friendly” features.
A shakeout in the personal computer industry began in 1983 when IBM entered the PCmarket, initially affecting companies selling low-priced machines to consumers. Companiesthat made strategic blunders or that lacked sufficient distribution or brand awareness of theirproducts disappeared.
CASE 7 Apple Inc.: Performance in a Zero-Sum World Economy 7-7
the primary makers of PCs. The new Windows system had successfully imitated the user-friendly“look and feel” of Apple’s Macintosh operating system. As a result, Apple lost its competitiveedge. In June 1993, Sculley was forced to resign and Michael H. Spindler was appointed CEOof the company. At this time, Apple was receiving a number of offers to acquire the company.Many of the company’s executives advocated Apple’s merging with another company. However,when no merger took place, many executives chose to resign.
Unable to reverse the company’s falling sales, Spindler was soon forced out and GilbertAmelio was hired from outside Apple to serve as CEO. Amelio’s regime presided over anaccelerated loss of market share, deteriorating earnings, and stock that had lost half of itsvalue. Apple’s refusal to license the Mac operating system to other manufacturers had givenMicrosoft the opening it needed to take the market with its Windows operating system. WintelPCs now dominated the market—pushing Apple into a steadily declining market niche composed primarily of artisans and teachers. By 1996, Apple’s management seemed to be inutter disarray.
Looking for a new product with which Apple could retake the initiative in personal computers, the company bought NeXT for $402 million on December 20, 1996. Steve Jobs, whoformed the NeXT computer company when he left Apple, had envisioned his new company asthe developer of the “next generation” in personal computers. Part of the purchase agreementwas that Jobs would return to Apple as a consultant. In July of 1997, Amelio resigned and wasreplaced by Steve Jobs as Apple’s interim CEO (iCEO). This ended Steve Jobs’ 14-year exilefrom the company that he and Wozniak had founded. In addition to being iCEO of Apple, Jobsalso served as CEO of Pixar, a company he had personally purchased from Lucasfilm for $5 million. Receiving only $1.00 a year as CEO of both Pixar and Apple, Jobs held the GuinnessWorld Record as the “Lowest Paid Chief Executive Officer.”
1998–2001: Jobs Leads Apple “Back to the Future”Once in position as Apple’s CEO, Steve Jobs terminated many of the company’s existingprojects. Dropped were the iBook and the AirPort products series, which had helped popu-larize the use of wireless LAN technology to connect a computer to a network.
In May 2001, the company announced the reopening of Apple Retail Stores. LikeIBM and Xerox, Apple had opened its own retail stores to market its computers duringthe 1980s. All such stores had been closed however, when Wintel-type computers beganbeing sold by mass merchandisers, such as Sears and Circuit City, as well as through cor-porate websites.
Apple introduced the iPod portable digital audio player, and the company opened its owniTunes music store to provide downloaded music to iPod users. Given the thorny copyright issuesinherent in the music business, analysts doubted if the new product would be successful.
2002–2006: A Corporate Renaissance?In 2002, Apple introduced a redesigned iMac using a 64-bit processor. The iMac had a hemi-spherical base and a flat-panel all-digital display. Although it received a lot of press, the iMacfailed to live up to the company’s sales expectations.
In 2004 and 2005, Apple opened its first retail stores in Europe and Canada. By November2006, the company had 149 stores in the United States, 4 stores in Canada, 7 stores in the UnitedKingdom, and 7 stores in Japan.
In 2006, Jobs announced that Apple would sell an Intel-based Macintosh. Previously,Microsoft had purchased all of its microprocessors from Motorola. By this time, Microsoft’s
7-8 SECTION D Industry One—Information Technology
2007–Present: Mobile Consumer Electronics EraWhile delivering his keynote speech at the Macworld Expo on January 9, 2007, Jobsannounced that Apple Computer, Inc. would from that point on be known as Apple Inc., dueto the fact that computers were no longer the singular focus for the company. This changereflected the company’s shift of emphasis to mobile electronic devices from personal com-puters. The event also saw the announcement of the iPhone and the Apple TV. The follow-ing day, Apple shares hit $97.80, an all-time high at that point. In May, Apple’s share pricepassed the $100 mark. In an article posted on Apple’s website on February 6, 2007, SteveJobs wrote that Apple would be willing to sell music on the iTunes Store with DRM (whichwould allow tracks to be played on third-party players) if record labels would agree to dropthe technology. On April 2, 2007, Apple and EMI jointly announced the removal of DMRtechnology from EMI’s catalog in the iTunes Store, effective in May. Other record labelsfollowed later that year.
In July of the following year, Apple launched the App Store to sell third-party applica-tions for the iPhone and iPod Touch. Within a month, the store sold 60 million applicationsand brought in $1 million daily on average, with Jobs speculating that the App Store couldbecome a billion-dollar business for Apple. Three months later, it was announced that Apple had become the third-largest mobile handset supplier in the world due to the popular-ity of the iPhone.
On December 16, 2008, Apple announced that, after over 20 years, 2009 would be thelast year Steve Jobs would be attending the Macworld Expo, and that Phil Schiller woulddeliver the 2009 keynote speech in lieu of the expected Jobs. Almost exactly one monthlater, on January 14, 2009, an internal Apple memo from Jobs announced that he would betaking a six-month leave of absence, until the end of June 2009, to allow him to better focuson his health and to allow the company to better focus on its products without having therampant media speculating about his health. Despite Jobs’ absence, Apple recorded its bestnon-holiday quarter (q1 FY 2009) during the recession with revenue of $8.16 billion and aprofit of $1.21 billion.
After years of speculation and multiple rumored “leaks,” Apple announced a large screen,tablet-like media device known as the iPad on January 27, 2010. The iPad ran the same touch-based operating system that the iPhone used and many of the same iPhone apps were compat-ible with the iPad. This gave the iPad a large app catalog on launch even with very littledevelopment time before the release. Later that year on April 3, 2010, the iPad was launchedin the United States and sold more than 300,000 units on that day, reaching 500,000 by the endof the first week. In May 2010, Apple’s market cap exceeded that of competitor Microsoft forthe first time since 1989.
operating system with Intel microprocessors was running on 97.5% of the personal computerssold, with Apple having only a 2.5% share of the market. The company also introduced its firstIntel-based machines, the iMac and MacBook Pro.
By this time, Apple’s iPod had emerged as the market leader of a completely new industrycategory, which it had created. In 2006, Apple controlled 75.6% of the market, followed bySunDisk with 9.7%, and Creative Technology in third place with 4.3%. Although one analyst pre-dicted that more than 30 million iPods would be sold in fiscal 2006, Apple actually sold41,385,000. Taking advantage of its lead in music downloading, the company’s next strategicmove was to extend its iTunes music stores by offering movies for $9.99 each. An analyst review-ing this strategic move said that Apple was able to create a $1 billion-a-year market for the legalsale of music. Apple may be able to provide the movie industry with a similar formula.

CASE 7 Apple Inc.: Performance in a Zero-Sum World Economy 7-9
In June 2010, Apple released the fourth generation iPhone, which introduced videocalling, multitasking, and a new insulated stainless steel design which served as the phone’santenna. Because of this antenna implementation, some iPhone 4 users reported a reduction insignal strength when the phone was held in specific ways. Apple offered buyers a free rubber“bumper” case until September 30, 2010, as cases had been developed to solve/improve the signal strength issue.
In September 2010, Apple refreshed its iPod line of MP3 players, introducing a multi-touch iPod Nano, iPod Touch with FaceTime, and iPod Shuffle with buttons. In October 2010,Apple shares hit an all-time high, eclipsing $300. Additionally, on October 20, Apple updatedits MacBook Air laptop, iLife suite of applications, and unveiled Mac OS X Lion, the latestinstallment in its Mac OS X operating system. On November 16, 2010, Apple Inc., after yearsof negotiations, finalized a deal to allow iTunes to sell The Beatles’ music at $1.29 per song.The five major Web-TV boxes were (1) Apple TV, (2) Boxee, (3) Google TV, (4) WD TV Hub,and (5) Roku.
Steven P. Jobs: Entrepreneur and Corporate Executive3
In 2010, Steve Jobs was chosen as “Executive of the Decade” by Fortune magazine. He has alsobeen referred to as the “Henry Ford” of the current world business market. Steven P. Jobs wasborn on February 24, 1955, in San Francisco. He was adopted by Paul and Clara Jobs inFebruary 1955. In 1972, Jobs graduated from Homestead High School in Los Altos, California.His high school electronics teacher said, “He was somewhat of a loner and always had a differ-ent way of looking at things.” After graduation, Jobs was hired by Hewlett-Packard as a sum-mer employee. This is where he met Steve Wozniak, a recent dropout from The University ofCalifornia at Berkeley. Wozniak had a genius IQ and was an engineering whiz with a passionfor inventing electronic gadgets. At this time, Wozniak was perfecting his “blue box,” an illegal pocket-size telephone attachment that allowed the user to make free long-distance calls.Jobs helped Wozniak sell this device to customers.4
In 1972, Jobs enrolled at Reed College in Portland, Oregon, but dropped out after onesemester. He remained around Reed for a year and became involved in the counterculture.During that year, he enrolled in various classes in philosophy and other topics. In a laterspeech at Stanford University, Jobs explained, “If I had never dropped in on that singlecourse (calligraphy), that Mac would have never had multiple typefaces or proportionallyspaced fonts.”5
In early 1974, Jobs took a job as a video-game designer for Atari, a pioneer in electronicarcade games. After earning enough money, Jobs went to India in search of personal spiritualenlightenment. Later that year, Jobs returned to California and began attending meetings ofSteve Wozniak’s “Homebrew Computer Club.” Wozniak converted his TV monitor into whatwould become a computer. Wozniak was a very good engineer and extremely interested increating new electronic devices. Although Jobs was not interested in developing new devices,he realized the marketability of Wozniak’s converted TV. Together they designed the Apple Icomputer in Jobs’ bedroom and built the first prototype in Jobs’ garage. Jobs showed theApple I to a local electronics retailer, the Byte Shop, and received a $25,000 order for50 computers. Jobs took this purchase order to Cramer Electronics to order the componentsneeded to assemble the 50 computers.
The local credit manager asked Jobs how he was going to pay for the parts and he replied,“I have this purchase order from the Byte Shop chain of computer stores for 50 of my comput-ers and the payment terms are COD. If you give me the parts on net 30 day terms, I can buildand deliver the computers in that time frame, collect my money from Turrell at the Byte Shop
7-10 SECTION D Industry One—Information Technology
and pay you.” With that, the credit manager called Paul Turrell, who was attending an IEEEcomputer conference, and verified the validity of the purchase order. Amazed at the tenacity ofJobs, Turrell assured the credit manager that if the computers showed up in his stores Jobswould be paid and would have more than enough money to pay for the parts order. The twoSteves and their small crew spent day and night building and testing the computers anddelivered them to Turrell on time to pay his suppliers and have a tidy profit left over for theircelebration and next order. Steve Jobs had found a way to finance his soon-to-be multimilliondollar company without giving away one share of stock or ownership.6
Jobs and Wozniak decided to start a computer company to manufacture and sell personalcomputers. They contributed $1,300 of their own money to start the business. Jobs selected thename Apple for the company based on his memories of a summer job as an orchard worker.On April 1, 1976, Apple Computer company was formed as a partnership.
During Jobs’ early tenure at Apple, he was a persuasive and charismatic evangelist for thecompany. Some of his employees have described him at that time as an erratic and tempestu-ous manager.An analyst said that many persons who look at Jobs’management style forget thathe was 30 years old in 1985 and he received his management and leadership education on thejob. Jobs guided the company’s revenues to $1,515,616,000 and profits of $64,055,000 in1984. Jobs was cited in several articles as having a demanding and aggressive personality. Oneanalyst said that these two attributes described most of the successful entrepreneurs. Jobs strate-gically managed the company through a period of new product introduction, rapidly changingtechnology, and intense competition—a time during which many companies have failed.
In 1985, after leaving Apple, Jobs formed a new computer company, NeXT Computer Inc.Jobs served as Chairman and CEO.7 NeXT was a computer company that built machines withfuturistic designs and ran the UNIX-derived NeXT step operating system. It was marketed toacademic and scientific organizations. NeXT was not a commercial success, however, in partbecause of its high price.
In 1986, Jobs purchased Pixar Animation from Lucasfilm for $5 million. He providedanother $5 million in capital, owned 50.6% of the stock, and served as Chairman and CEO.Pixar created three of the six highest grossing domestic (gross revenues) animated films ofall time—Toy Story (1995), A Bug’s Life (1998), and Toy Story 2 (1999). Each of these films,released under a partnership with the Walt Disney Company, was the highest grossing animatedfilm for the year in which it was released. During this period, Jobs delegated more to his executives. Many analysts felt that the excellent executive staff and animators were primereasons that Disney management subsequently wanted to acquire Pixar. Jobs served as CEOof NeXT and Pixar from 1985 to 1997. Jobs ultimately sold NeXT in 1996 to Apple for $402 million and became iCEO of Apple in July 1997.8
At Pixar, Jobs focused on business duties, which was different than his earlier managementstyle at Apple. The creative staff was given a great deal of autonomy. Sources say he spent lessthan one day a week at the Pixar campus in Emeryville, just across the San Francisco Bay fromApple’s headquarters. A Pixar employee said, “Steve did not tell us what to do.” He furtherstated, “Steve’s our benevolent benefactor.”9
Michael D. Eisner, CEO of the Walt Disney Company, did not have a smooth relation-ship with Jobs during the years of the Pixar/Disney partnership. Critics explained that Eisnerwas unable to work with Jobs because both men were supremely confident (some saidarrogant) that their own judgment was correct—regardless of what others said. In 2005, inresponse to Eisner’s unwillingness to modify Disney’s movie distribution agreement withPixar, Jobs refused to renew the contract. At the time, Disney’s own animation unit wasfaltering and unable to match Pixar’s new computer technology and creativity. Concernedwith Eisner’s leadership style and his inability to support the company’s distinctive compe-tence in animation, Roy Disney led a shareholders’ revolt. On October 1, 2005, Eisner wasreplaced by Robert A. Iger as CEO of Disney.10
CASE 7 Apple Inc.: Performance in a Zero-Sum World Economy 7-11
On January 24, 2006, CEO Iger announced that Disney had agreed to pay $7.4 billion instock to acquire Pixar Animation Studios. Since this deal made Jobs the largest stockholder(6.67%) in Disney, he was appointed to Disney’s board of directors.11
Edward S. Woodward Jr., former chairman of Apple Computer, told Apple’s board ofdirectors, “He (Jobs) has a good relationship with you; there is nobody better with you; thereis nobody better in the world to work with. Iger made a very wise move, and two years fromnow everyone will be saying that.”12
Peter Burrows and Ronald Grover stated in an article: “The alliance between Jobs and Disney is full of promise. If he can bring to Disney the same kind of industry-sharing, boundary-busting energy that has lifted Apple and Pixar sky-high, he could help the staid company becomethe leading laboratory for media convergences. It’s not hard to imagine a day when you couldfire up your Apple TV and watch net-only spin-offs of popular TV shows from Disney’s ABCInc. (DIS). Or use your Apple iPhone to watch Los Angeles Lakers superstar Kobe Bryant’svideo blog delivered via Disney’s ESPN Inc. ‘We’ve been talking about a lot of things,’said Jobs.‘It’s going to be a pretty exciting world looking ahead over the next five years’.”13
An expert on Jobs asked, “So what is Jobs’ secret?” His answer: “There are many, but itstarts with focus and a non-religious faith in his strategy.” In his return to Apple, he took aproprietary approach as he cut dozens of projects and products. Many on Wall Street were notinitially happy with Jobs’new directions for the company, but soon were impressed by Apple’ssuccessful turnaround.14
Jim Cramer, host of Mad Money, has said several times on his television program that SteveJobs is the “Henry Ford” of this period of America’s industry. Others claim Steve is the presentThomas Edison. Steve Jobs over the years has received many honors, such as the NationalMedal of Technology (with Steve Wozniak) from President Reagan in 1985. Jobs was amongthe first people to ever receive the honor, and a Jefferson Award for Public Service in thecategory “Greatest Public Service by an Individual 35 Years or Under” (a.k.a. the Samuel S.Beard Award) in 1987. On November 27, 2007, California Governor Arnold Schwarzeneggerand First Lady Maria Shriver inducted Jobs into the California Hall of Fame, located at the Cal-ifornia Museum for History, Women and the Arts. In August 2009, Jobs was selected the mostadmired entrepreneur among teenagers on a survey by Junior Achievement. On November 5,2009, Jobs was named the CEO of the decade by Fortune Magazine. On November 22, 2010,Forbes Magazine named Steve Jobs the “17th Most Powerful Person on Earth.” The list hadonly 68 individuals out of the world population of 6.8 billion people.15
Health ConcernsIn mid-2004, Jobs announced to his employees that he had been diagnosed with a canceroustumor in his pancreas. The prognosis for pancreatic cancer was usually very grim; Jobs,however, stated that he had a rare, far less aggressive type known as islet cell neuro-endocrinetumor. After initially resisting the idea of conventional medical intervention and embarking ona special diet to thwart the disease, Jobs underwent a pancreaticoduodenectomy (or “Whippleprocedure”) in July 2004 that appeared to successfully remove the tumor. Jobs apparently didnot require nor receive chemotherapy or radiation therapy. During Jobs’ absence, Timothy D.Cook, head of worldwide sales and operations at Apple, ran the company.
In early August 2006, Jobs delivered the keynote speech for Apple’s annual WorldwideDevelopers Conference. His “thin, almost gaunt” appearance and unusually “listless” delivery,together with his choice to delegate significant portions of his keynote speech to other presenters,inspired a flurry of media and Internet speculation about his health. In contrast, according toan Ars Technica journal report, WWDC attendees who saw Jobs in person said he “lookedfine”; following the keynote, an Apple spokesperson said that “Steve’s health is robust.”
7-12 SECTION D Industry One—Information Technology
Two years later, similar concerns followed Jobs’ 2008 WWDC keynote address; Appleofficials stated Jobs was victim to a “common bug” and that he was taking antibiotics, whileothers surmised his cachectic appearance was due to the Whipple procedure. During a July con-ference call discussing Apple earnings, participants responded to repeated questions aboutSteve Jobs’health by insisting that it was a “private matter.” Others, however, opined that share-holders had a right to know more, given Jobs’ hands-on approach to running his company. TheNew York Times published an article based on an off-the-record phone conversation with Jobs,noting that “while his health issues have amounted to a good deal more than ‘a common bug,’they weren’t life-threatening and he doesn’t have a recurrence of cancer.”
On August 28, 2008, Bloomberg mistakenly published a 2,500-word obituary of Jobs in itscorporate news service, containing blank spaces for his age and cause of death. (News carriers cus-tomarily stockpile up-to-date obituaries to facilitate news delivery in the event of a well-knownfigure’s untimely death.) Although the error was promptly rectified, many news carriers and blogsreported on it, intensifying rumors concerning Jobs’ health. Jobs responded at Apple’s September2008 Let’s Rock keynote by quoting Mark Twain: “Reports of my death are greatly exaggerated”;at a subsequent media event, Jobs concluded his presentation with a slide reading “110 / 70,” re-ferring to his blood pressure, stating he would not address further questions about his health.
On December 16, 2008, Apple announced that Marketing Vice-President Phil Schillerwould deliver the company’s final keynote address at the Macworld Conference and Expo2009, again reviving questions about Jobs’ health. In a statement given on January 5, 2009,on Apple.com, Jobs said that he had been suffering from a “hormone imbalance” for severalmonths. On January 14, 2009, in an internal Apple memo, Jobs wrote that in the previousweek he had “learned that my health-related issues are more complex than I originallythought” and announced a six-month leave of absence until the end of June 2009 to allow himto better focus on his health. Tim Cook, who had previously acted as CEO in Jobs’ 2004 ab-sence, became acting CEO of Apple, with Jobs still involved with “major strategic decisions.”
In April 2009, Jobs underwent a liver transplant at Methodist University Hospital Trans-plant Institute in Memphis, Tennessee. Jobs’ prognosis was “excellent.”16
On June 29, 2010, Steve Jobs returned to his position as leader at Apple. Jobs had about10 serious discussions with associates about the possibility of him not returning to active man-agement at Apple, and what impact his decision would have on Apple’s future success. Mostfelt that if Steve departed Apple, “Apple’s future success was in question.”17
Surprised Leave of Absence Announced—2011
Team,At my request, the board of directors has granted me a medical leave of absence so
I can focus on my health. I will continue as CEO and be involved in major strategic de-cisions for the company.
I have asked Tim Cook to be responsible for all of Apple’s day to day operations. Ihave great confidence that Tim and the rest of the executive management team will doa terrific job executing plans we have in place for 2011.
I love Apple so much and hope to be back as soon as I can. In the meantime, myfamily and I would deeply appreciate respect for our privacy.
Steve
On January 17, 2011, Steve Jobs sent the following e-mail to all Apple employees:
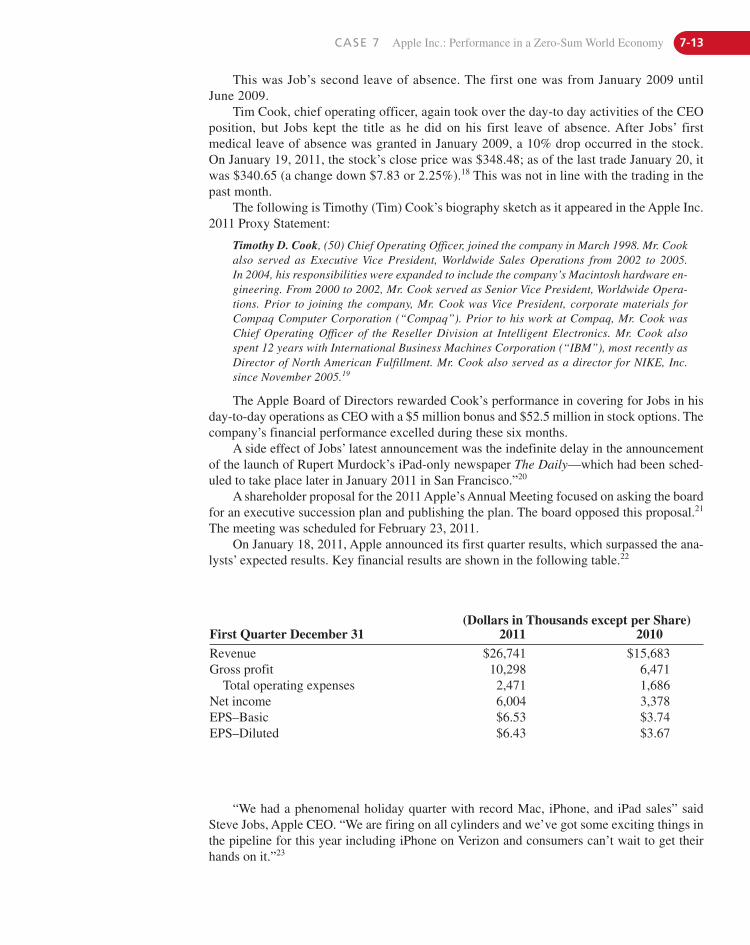
CASE 7 Apple Inc.: Performance in a Zero-Sum World Economy 7-13
This was Job’s second leave of absence. The first one was from January 2009 untilJune 2009.
Tim Cook, chief operating officer, again took over the day-to day activities of the CEOposition, but Jobs kept the title as he did on his first leave of absence. After Jobs’ firstmedical leave of absence was granted in January 2009, a 10% drop occurred in the stock.On January 19, 2011, the stock’s close price was $348.48; as of the last trade January 20, itwas $340.65 (a change down $7.83 or 2.25%).18 This was not in line with the trading in thepast month.
The following is Timothy (Tim) Cook’s biography sketch as it appeared in the Apple Inc.2011 Proxy Statement:
Timothy D. Cook, (50) Chief Operating Officer, joined the company in March 1998. Mr. Cookalso served as Executive Vice President, Worldwide Sales Operations from 2002 to 2005.In 2004, his responsibilities were expanded to include the company’s Macintosh hardware en-gineering. From 2000 to 2002, Mr. Cook served as Senior Vice President, Worldwide Opera-tions. Prior to joining the company, Mr. Cook was Vice President, corporate materials forCompaq Computer Corporation (“Compaq”). Prior to his work at Compaq, Mr. Cook wasChief Operating Officer of the Reseller Division at Intelligent Electronics. Mr. Cook alsospent 12 years with International Business Machines Corporation (“IBM”), most recently asDirector of North American Fulfillment. Mr. Cook also served as a director for NIKE, Inc.since November 2005.19
The Apple Board of Directors rewarded Cook’s performance in covering for Jobs in hisday-to-day operations as CEO with a $5 million bonus and $52.5 million in stock options. Thecompany’s financial performance excelled during these six months.
A side effect of Jobs’ latest announcement was the indefinite delay in the announcementof the launch of Rupert Murdock’s iPad-only newspaper The Daily—which had been sched-uled to take place later in January 2011 in San Francisco.”20
A shareholder proposal for the 2011 Apple’s Annual Meeting focused on asking the boardfor an executive succession plan and publishing the plan. The board opposed this proposal.21
The meeting was scheduled for February 23, 2011.On January 18, 2011, Apple announced its first quarter results, which surpassed the ana-
lysts’ expected results. Key financial results are shown in the following table.22
(Dollars in Thousands except per Share)First Quarter December 31 2011 2010Revenue $26,741 $15,683Gross profit 10,298 6,471
Total operating expenses 2,471 1,686Net income 6,004 3,378EPS–Basic $6.53 $3.74EPS–Diluted $6.43 $3.67
“We had a phenomenal holiday quarter with record Mac, iPhone, and iPad sales” saidSteve Jobs, Apple CEO. “We are firing on all cylinders and we’ve got some exciting things inthe pipeline for this year including iPhone on Verizon and consumers can’t wait to get theirhands on it.”23
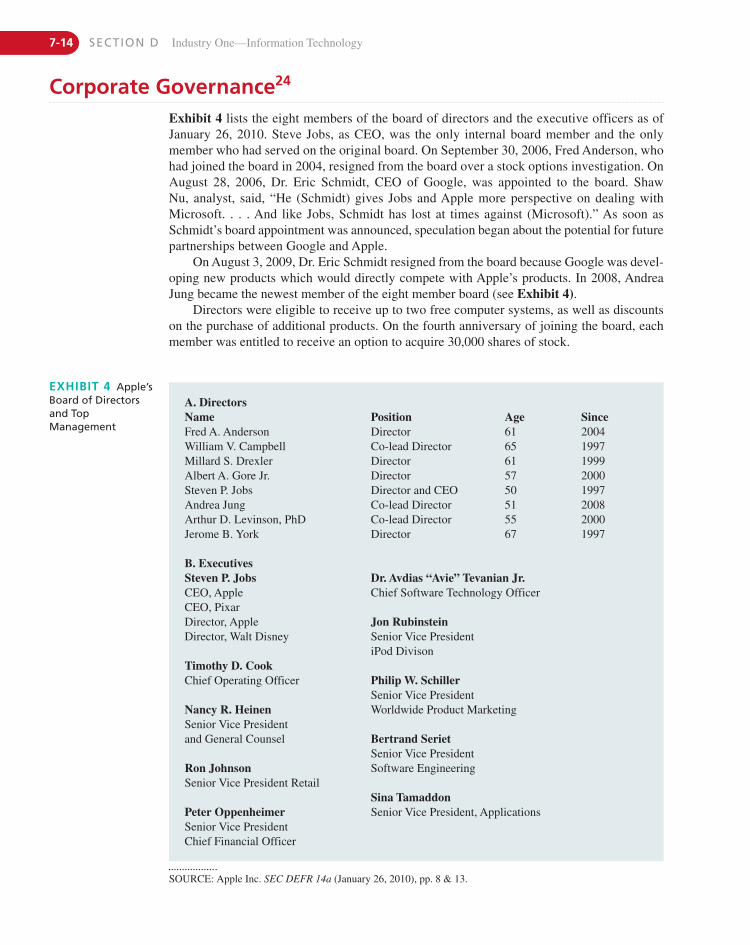
7-14 SECTION D Industry One—Information Technology
Corporate Governance24
Exhibit 4 lists the eight members of the board of directors and the executive officers as of January 26, 2010. Steve Jobs, as CEO, was the only internal board member and the onlymember who had served on the original board. On September 30, 2006, Fred Anderson, whohad joined the board in 2004, resigned from the board over a stock options investigation. OnAugust 28, 2006, Dr. Eric Schmidt, CEO of Google, was appointed to the board. Shaw Nu, analyst, said, “He (Schmidt) gives Jobs and Apple more perspective on dealing with Microsoft. . . . And like Jobs, Schmidt has lost at times against (Microsoft).” As soon asSchmidt’s board appointment was announced, speculation began about the potential for futurepartnerships between Google and Apple.
On August 3, 2009, Dr. Eric Schmidt resigned from the board because Google was devel-oping new products which would directly compete with Apple’s products. In 2008, AndreaJung became the newest member of the eight member board (see Exhibit 4).
Directors were eligible to receive up to two free computer systems, as well as discountson the purchase of additional products. On the fourth anniversary of joining the board, eachmember was entitled to receive an option to acquire 30,000 shares of stock.
A. DirectorsName Position Age SinceFred A. Anderson Director 61 2004William V. Campbell Co-lead Director 65 1997Millard S. Drexler Director 61 1999Albert A. Gore Jr. Director 57 2000Steven P. Jobs Director and CEO 50 1997Andrea Jung Co-lead Director 51 2008Arthur D. Levinson, PhD Co-lead Director 55 2000Jerome B. York Director 67 1997
B. ExecutivesSteven P. JobsCEO, AppleCEO, PixarDirector, AppleDirector, Walt Disney
Timothy D. CookChief Operating Officer
Nancy R. HeinenSenior Vice Presidentand General Counsel
Ron JohnsonSenior Vice President Retail
Peter OppenheimerSenior Vice PresidentChief Financial Officer
Dr. Avdias “Avie” Tevanian Jr.Chief Software Technology Officer
Jon RubinsteinSenior Vice PresidentiPod Divison
Philip W. SchillerSenior Vice PresidentWorldwide Product Marketing
Bertrand SerietSenior Vice PresidentSoftware Engineering
Sina TamaddonSenior Vice President, Applications
EXHIBIT 4 Apple’sBoard of Directorsand TopManagement
SOURCE: Apple Inc. SEC DEFR 14a (January 26, 2010), pp. 8 & 13.
CASE 7 Apple Inc.: Performance in a Zero-Sum World Economy 7-15
Business Strategy25
The company was committed to bringing the best user experience to its customers through itsinnovative hardware, software, peripherals, services, and Internet offerings. The company’sbusiness strategy leveraged its unique ability to design and develop its own operating systems,hardware, application software, and services to provide its customers new products and solu-tions with superior ease-of-use, seamless integration, and innovative industrial design. Thecompany believed continual investment in research and development was critical to the de-velopment and enhancement of innovative products and technologies. In conjunction with itsstrategy, the company continued to build and host a robust platform for the discovery and de-livery of third-party digital content and applications through the iTunes Store. The iTunesStore included theApp Store and iBookstore, which allowed customers to discover and down-load third-party applications and books through either a Mac or Windows-based computer orwirelessly through an iPhone, iPad, or iPod touch. The company also worked to support acommunity for the development of third-party software and hardware products and digitalcontent that complemented the company’s offerings.Additionally, the company’s strategy in-cluded expanding its distribution to effectively reach more customers and provided them witha high-quality sales and post-sales support experience. The company was therefore uniquelypositioned to offer superior and well-integrated digital lifestyle and productivity solutions.
Although Steve Jobs’ annual salary was only $1.00 as CEO of Apple, the board gave Jobsa bonus of $84 million in 2001, consisting of $43.5 million for a private jet, a Gulfstream V; aswell as $40.5 million to pay Jobs’ income taxes on this bonus. Jobs owned 10,200,004 shares(1.25%) of Apple’s stock. The closing price on November 8, 2010, was $318.62 per share.
Consumer and Small and Mid-Sized BusinessThe company believed a high-quality buying experience with knowledgeable salespersonswho could convey the value of the company’s products and services greatly enhanced its abil-ity to attract and retain customers. The company sold many of its products and resells certainthird-party products in most of its major markets directly to consumers and businessesthrough its retail and online stores. The company has also invested in programs to enhancereseller sales by placing high-quality Apple fixtures, merchandising materials, and other resources within selected third-party reseller locations. Through the Apple Premium ResellerProgram, certain third-party resellers focused on the Apple platform by providing a high levelof integration and support services, as well as product expertise.
As of September 25, 2010, the company had opened a total of 317 retail stores—233stores in the United States and 84 stores internationally. The company typically located its stores at high-traffic locations in quality shopping malls and urban shopping districts. Byoperating its own stores and locating them in desirable high traffic locations, the companywas better positioned to control the customer buying experience and attract new customers.The stores were designed to simplify and enhance the presentation and marketing of the com-pany’s products and related solutions. To that end, retail store configurations had evolved intovarious sizes to accommodate market-specific demands. The company believed providing direct contact with its targeted customers was an effective way to demonstrate the advantagesof its products over those of its competitors. The stores employed experienced and knowl-edgeable personnel who provided product advice, service, and training. The stores offered awide selection of third-party hardware, software, and various other accessories and peripher-als that complemented the company’s products.
7-16 SECTION D Industry One—Information Technology
EducationThroughout its history, the company focused on the use of technology in education and wascommitted to delivering tools to help educators teach and students learn. The companybelieved effective integration of technology into classroom instruction can result in higherlevels of student achievement, especially when used to support collaboration, informationaccess, and the expression and representation of student thoughts and ideas. The companydesigned a range of products, services, and programs to address the needs of educationcustomers, including individual laptop programs and education road shows. In addition, thecompany supported mobile learning and real-time distribution and accessibility of education-related materials through iTunes U, which allowed students and teachers to share and distrib-ute educational media directly through their computers and mobile communication andmedia devices. The company sold its products to the education market through its direct salesforce, select third-party resellers, and its online and retail stores.
Enterprise, Government, and CreativeThe company also sold its hardware and software products to customers in enterprise,government, and creative markets in each of its geographic segments. These markets werealso important to many third-party developers who provided Mac-compatible hardware andsoftware solutions. Customers in these markets utilized the company’s products because oftheir high-powered computing performance and expansion capabilities, networking function-ality, and seamless integration with complementary products. The company designed itshigh-end hardware solutions to incorporate the power, expandability, compatibility, and otherfeatures desired by these markets.
OtherIn addition to consumer, SMB, education, enterprise, government, and creative markets, thecompany provided hardware and software products and solutions for customers in the infor-mation technology and scientific markets.
Business Organization26
The company managed its business primarily on a geographic basis. The company’s reportable operating segments consisted of the Americas, Europe, Japan, Asia-Pacific, andRetail. The Americas, Europe, Japan, and Asia-Pacific reportable segments did not includeactivities related to the Retail segment. The Americas segment included both North and SouthAmerica. The Europe segment included European countries, as well as the Middle East andAfrica. The Asia-Pacific segment included Australia and Asia, but did not include Japan. TheRetail segment operated Apple-owned retail stores in the United States and in internationalmarkets. Each reportable operating segment provided similar hardware and software prod-ucts and similar services.
Each of the five operating centers is discussed below.
1. AmericasDuring 2010, net sales in the Americas segment increased $5.5 billion or 29% compared to2009. This increase in net sales was driven by increased iPhone revenue, strong demand for
CASE 7 Apple Inc.: Performance in a Zero-Sum World Economy 7-17
2. EuropeDuring 2010, net sales in Europe increased $6.9 billion or 58% compared to 2009. Thegrowth in net sales was due mainly to a significant increase in iPhone revenue attributableto continued growth from existing carriers and country and carrier expansion, increasedsales of Mac desktop and portable systems, and strong demand for the iPad, partially offsetby a stronger U.S. dollar. Europe Mac net sales and unit sales increased 32% and 36%,respectively, during the year due to strong demand for MacBook Pro and iMac. The Europesegment represented 29% and 28% of the company’s total net sales in 2010 and 2009,respectively.
During 2009, net sales in Europe increased $2.6 billion or 28% compared to 2008. Theincrease in net sales was due mainly to increased iPhone revenue and strong sales of Macportable systems, offset partially by lower net sales of Mac desktop systems, iPods, and astronger U.S. dollar. Mac unit sales increased 13% in 2009 compared to 2008, which wasdriven primarily by increased sales of Mac portable systems, particularly MacBook Pro, whiletotal Mac net sales declined as a result of lower average selling prices across all Mac products.iPod net sales decreased year-over-year as a result of lower average selling prices, partiallyoffset by increased unit sales of the higher priced iPod touch. The Europe segment represented28% and 25% of total net sales in 2009 and 2008, respectively.
the iPad, continued demand for Mac desktop and portable systems, and higher sales of third-party digital content and applications from the iTunes Store. Americas Mac net sales and unitsales increased 18% and 21%, respectively, during 2010 compared to 2009, largely due tostrong demand for MacBook Pro. The Americas segment represented 37% and 44% of thecompany’s total net sales in 2010 and 2009, respectively.
During 2009, net sales in the Americas segment increased $2.4 billion or 15% compared to2008. The increase in net sales during 2009 was attributable to the significant year-over-year in-crease in iPhone revenue, higher sales of third-party digital content and applications from theiTunes Store, and increased sales of Mac portable systems, partially offset by a decrease in salesof Mac desktop systems and iPods. Americas Mac net sales decreased 6% due primarily to loweraverage selling prices, while Mac unit sales increased by 4% on a year-over-year basis. The in-crease in Mac unit sales was due primarily to strong demand for the MacBook Pro. The Americassegment represented approximately 44% of the company’s total net sales in both 2009 and 2008.
3. JapanDuring 2010, Japan’s net sales increased $1.7 billion or 75% compared to 2009. The primary con-tributors to this growth were significant year-over-year increases in iPhone revenue, strong demandfor iPad, and to a lesser extent strength in the Japanese Yen. Mac net sales increased by 8% drivenby a 22% increase in unit sales due primarily to strong demand for MacBook Pro and iMac, partiallyoffset by lower average selling prices in Japan on a year-over-year basis. The Japan segment repre-sented 6% and 5% of the company’s total net sales for 2010 and 2009, respectively.
Japan’s net sales increased $551 million or 32% in 2009 compared to 2008. The primarycontributors to this growth were increased iPhone revenue, stronger demand for certain Macportable systems and iPods, and strength in the Japanese Yen, partially offset by decreasedsales of Mac desktop systems. Net sales and unit sales of Mac portable systems increasedduring 2009 compared to 2008, driven primarily by stronger demand for MacBook Pro. Netsales and unit sales of iPods increased during 2009 compared to 2008, driven by strongdemand for iPod touch and iPod nano. The Japan segment represented approximately 5% ofthe company’s total net sales in both 2009 and 2008.
7-18 SECTION D Industry One—Information Technology
4. Asia-PacificNet sales in Asia-Pacific increased $5.1 billion or 160% during 2010 compared to 2009. Thesignificant growth in Asia-Pacific net sales was due mainly to increased iPhone revenue, whichwas primarily attributable to country and carrier expansion and continued growth from exist-ing carriers. Asia-Pacific net sales were also favorably affected by strong demand for Macportable and desktop systems and for the iPad. Particularly strong year-over-year growth wasexperienced in China, Korea, and Australia. The Asia-Pacific segment represented 13% and7% of the company’s total net sales for 2010 and 2009, respectively. Net sales in Asia-Pacificincreased $493 million or 18% during 2009 compared to 2008, reflecting strong growth in salesof iPhone and Mac portable systems, offset partially by a decline in sales of iPods and Macdesktop systems, as well as a strengthening of the U.S. dollar against the Australian dollar andother Asian currencies. Mac net sales and unit sales grew in the Asia-Pacific region by 4% and17%, respectively, due to increased sales of the MacBook Pro. The Asia-Pacific segmentrepresented approximately 7% of the company’s total net sales in both 2009 and 2008.
5. RetailRetail net sales increased $3.1 billion or 47% during 2010 compared to 2009. The increase in netsales was driven primarily by strong demand for iPad, increased sales of Mac desktop andportable systems, and a significant year-over-year increase in iPhone revenue. Mac net sales andunit sales grew in the retail segment by 25% and 35%, respectively, during 2010. The companyopened 44 new retail stores during the year, 28 of which were international stores, ending the yearwith 317 stores open compared to 273 stores at the end of 2009. With an average of 288 storesand 254 stores opened during 2010 and 2009, respectively, average revenue per store increasedto $34.1 million in 2010, compared to $26.2 million in 2009. The Retail segment represented 15%and 16% of the company’s total net sales in 2010 and 2009, respectively.
Retail net sales decreased $636 million or 9% during 2009 compared to 2008. The declinein net sales was driven largely by a decrease in net sales of iPhones, iPods, and Mac desktop sys-tems, offset partially by strong demand for Mac portable systems. The year-over-year decline inRetail net sales was attributable to continued third-party channel expansion, particularly in theUnited States where most of the company’s stores were located, and also reflects the challeng-ing consumer-spending environment in 2009. The company opened 26 new retail stores during2009, including 14 international stores, ending the year with 273 stores open. This compared to247 stores open as of September 27, 2008. With an average of 254 stores and 211 stores openedduring 2009 and 2008, respectively, average revenue per store decreased to $26.2 million for2009 from $34.6 million in 2008.
The Retail segment reported operating income of $2.4 billion during 2010 and $1.7 billionduring both 2009 and 2008. The increase in Retail operating income during 2010 compared to2009 was attributable to higher overall net sales. Despite the decline in Retail net sales during2009 compared to 2008, the Retail segment’s operating income was flat at $1.7 billion in 2009compared to 2008, due primarily to a higher gross margin percentage in 2009 consistent withthat experienced by the overall company.
Expansion of the Retail segment has required, and will continue to require, a substantialinvestment in fixed assets and related infrastructure, operating lease commitments, personnel,and other operating expenses. Capital asset purchases associated with the Retail segment sinceits inception totaled $2.2 billion through the end of 2010. As of September 25, 2010, the Retailsegment had approximately 26,500 full-time equivalent employees and had outstanding leasecommitments associated with retail space and related facilities of $1.7 billion. The companywould incur substantial costs if it were to close multiple retail stores, and such costs couldadversely affect the company’s financial condition and operating results.
CASE 7 Apple Inc.: Performance in a Zero-Sum World Economy 7-19
Product Support and Services27
AppleCare® offered a range of support options for the company’s customers. These optionsincluded assistance that was built into software products, printed and electronic productmanuals, online support including comprehensive product information as well as technicalassistance, and the AppleCare Protection Plan (“APP”). APP was a fee-based service thattypically included two to three years of phone support and hardware repairs, dedicated web-based support resources, and user diagnostic tools.
Markets and Distribution28
The company’s customers were primarily in the consumer, SMB, education, enterprise, gov-ernment, and creative markets. The company utilized a variety of direct and indirect distribu-tion channels, such as its retail stores, online stores, and direct sales force, as well asthird-party cellular network carriers, wholesalers, retailers, and value-added resellers. Thecompany believed that sales of its innovative and differentiated products were enhanced by knowledgeable salespersons who could convey the value of the hardware, software, andperipheral integration; demonstrate the unique digital lifestyle solutions that were availableon its products; and demonstrate the compatibility of the Mac with the Windows platform andnetworks. The company further believed providing direct contact with its targeted customers wasan effective way to demonstrate the advantages of its products over those of its competitorsand providing a high-quality sales and after-sales support experience was critical to attract-ing new—and retaining existing—customers. To ensure a high-quality buying experience forits products in which service and education were emphasized, the company continued to expand and improve its distribution capabilities by expanding the number of its own retailstores worldwide. Additionally, the company invested in programs to enhance reseller salesby placing high-quality Apple fixtures, merchandising materials, and other resources withinselected third-party reseller locations. Through the Apple Premium Reseller Program, certainthird-party resellers focused on the Apple platform by providing a high level of integrationand support services, as well as product expertise. One of the company’s customers accountedfor 11% of net sales in 2009; there was no single customer that accounted for more than 10%of net sales in 2010 or 2008.
Competition29
The company was confronted by aggressive competition in all areas of its business. The mar-kets for the company’s products and services were highly competitive. These markets werecharacterized by frequent product introductions and rapid technological advances that hadsubstantially increased the capabilities and use of personal computers, mobile communica-tion and media devices, and other digital electronic devices. The company’s competitors whosold personal computers based on other operating systems had aggressively cut prices andlowered their product margins to gain or maintain market share. The company’s financialcondition and operating results could be adversely affected by these and other industry-widedownward pressures on gross margins. The principal competitive factors included price,product features, relative price/performance, product quality and reliability, design innova-tion, availability of software and peripherals, marketing and distribution capability, serviceand support, and corporate reputation.
The company was focused on expanding its market opportunities related to mobile com-munication and media devices, including iPhone and iPad. The mobile communications and
7-20 SECTION D Industry One—Information Technology
Supply of Components30
Although most components essential to the company’s business were generally available frommultiple sources, certain key components including but not limited to microprocessors, enclo-sures,certainliquidcrystaldisplays(“LCDs”),certainopticaldrives,andapplication-specific in-tegrated circuits (“ASICs”) were currently obtained by the company from single or limitedsources, which subjected the company to significant supply and pricing risks. Many of these andother key components that were available from multiple sources, including but not limited toNANDflashmemory,dynamicrandomaccessmemory(“DRAM”),andcertainLCDs,weresub-ject at times to industry-wide shortages and significant commodity pricing fluctuations. In addi-tion, thecompanyenteredintocertainagreementsfor thesupplyofkeycomponents includingbutnot limited to microprocessors, NAND flash memory, DRAM, and LCDs at favorable pricing.However, therewasnoguaranteethecompanywouldbeable toextendorrenewtheseagreementson similar favorable terms, or at all, upon expiration or otherwise obtain favorable pricing in thefuture. Therefore, the company remained subject to significant risks of supply shortages and/orprice increases thatcouldmateriallyadverselyaffect its financialconditionandoperatingresults.
The company and other participants in the personal computer and mobile communicationand media device industries also competed for various components with other industries thatexperienced increased demand for their products. In addition, the company used some customcomponents that were not common to the rest of these industries, and introduced new prod-ucts that often utilized custom components available from only one source. When a compo-nent or product used new technologies, initial capacity constraints existed until the suppliers’yields had matured or manufacturing capacity had increased. If the company’s supply of a keysingle-sourced component for a new or existing product was delayed or constrained, if suchcomponents were available only at significantly higher prices, or if a key manufacturing
media device industries were highly competitive and included several large, well-funded, andexperienced participants. The company expected competition in these industries to intensifysignificantly as competitors attempted to imitate some of the iPhone and iPad features andapplications within their own products or, alternatively, collaborate with each other to offersolutions that were more competitive than those they currently offered. These industries werecharacterized by aggressive pricing practices, frequent product introductions, evolving designapproaches and technologies, rapid adoption of technological and product advancements bycompetitors, and price sensitivity on the part of consumers and businesses.
The company’s iPod and digital content services faced significant competition from othercompanies promoting their own digital music and content products and services, includingthose offering free peer-to-peer music and video services. The company believed it offeredsuperior innovation and integration of the entire solution including the hardware (personalcomputer, iPhone, iPad, and iPod), software (iTunes), and distribution of digital content andapplications (iTunes Store, App Store, and iBookstore). Some of the company’s current andpotential competitors had substantial resources and may have been able to provide such prod-ucts and services at little or no profit or even at a loss to compete with the company’s offer-ings. Alternatively, these competitors may have collaborated with each other to offer solutionsthat were more integrated than those they currently offered.
The company’s future financial condition and operating results were substantially depen-dent on the company’s ability to continue to develop and offer new innovative products andservices in each of the markets it competed in. In 2010, only AT&T was the carrier for theiPhone. Verizon began selling a version of the iPhone in early 2011. AT&T activated 11 millioniPhone accounts in the first nine months of 2010. Before Verizon, the iPhone had been exclu-sive to AT&T since its launch in 2007.
CASE 7 Apple Inc.: Performance in a Zero-Sum World Economy 7-21
vendor delayed shipments of completed products to the company, the company’s financialcondition and operating results could be materially adversely affected. The company’s busi-ness and financial performance could also be adversely affected depending on the time re-quired to obtain sufficient quantities from the original source, or to identify and obtainsufficient quantities from an alternative source. Continued availability of these components atacceptable prices, or at all, may be affected if those suppliers decided to concentrate on theproduction of common components instead of components customized to meet the company’srequirements.
Substantially all of the company’s Macs, iPhones, iPads, iPods, logic boards, and otherassembled products were manufactured by outsourcing partners, primarily in various parts ofAsia. A significant concentration of this outsourced manufacturing was performed by only afew outsourcing partners of the company, including Hon Hai Precision Industry Co. Ltd. andQuanta Computer Inc. The company’s outsourced manufacturing was often performed in sin-gle locations. Among these outsourcing partners were the sole-sourced supplier of componentsand manufacturing outsourcing for many of the company’s key products, including but notlimited to final assembly of substantially all of the company’s Macs, iPhones, iPads, and iPods.Although the company worked closely with its outsourcing partners on manufacturing sched-ules, the company’s operating results would be adversely affected if its outsourcing partnerswere unable to meet their production commitments. The company’s purchase commitmentstypically covered the company’s requirements for periods ranging from 30 to 150 days.
The company sources components from a number of suppliers and manufacturing vendors.The loss of supply from any of these suppliers or vendors, whether temporary or permanent,would materially adversely affect the company’s business and financial condition.
Research and Development31
Because the industries in which the company competed were characterized by rapid techno-logical advances, the company’s ability to compete successfully was heavily dependent uponits ability to ensure a continual and timely flow of competitive products, services, and tech-nologies to the marketplace. The company continued to develop new products and technolo-gies and to enhance existing products that expanded the range of its product offerings andintellectual property through licensing and acquisition of third-party business and technology.Total research and development expense were $1.8 billion, $1.3 billion, and $1.1 billion in2010, 2009, and 2008, respectively.
Patents, Trademarks, Copyrights, and Licenses32
The company currently held rights to patents and copyrights relating to certain aspects of itsMacs; iPhone, iPad, and iPod devices; peripherals; software; and services. In addition, thecompany registered and/or applied to register trademarks and service marks in the UnitedStates and a number of foreign countries for “Apple,” the Apple logo, “Macintosh,” “Mac,”“iPhone,” “iPad,” “iPod,” “iTunes,” “iTunes Store,” “Apple TV,” “MobileMe,” and numerousother trademarks, and service marks. Although the company believed the ownership of suchpatents, copyrights, trademarks, and service marks was an important factor in its business andthat its success depended in part on the ownership thereof, the company relied primarily on theinnovative skills, technical competence, and marketing abilities of its personnel.
The company regularly filed patent applications to protect inventions arising from itsresearch and development, and was currently pursuing thousands of patent applicationsaround the world. Over time, the company had accumulated a portfolio of several thousand
7-22 SECTION D Industry One—Information Technology
Foreign and Domestic Operations and Geographic Data33
The United States represented the company’s largest geographic marketplace. Approximately44% of the company’s net sales in 2010 came from sales to customers inside the United States.Final assembly of the company’s products was performed in the company’s manufacturing fa-cility in Ireland, and by external vendors in California, Texas, the People’s Republic, of China(“China”), the Czech Republic, and the Republic of Korea (“Korea”). The supply and manu-facture of many critical components was performed by sole-sourced third-party vendors in theUnited States, China, Germany, Ireland, Israel, Japan, Korea, Malaysia, the Netherlands, thePhilippines, Taiwan, Thailand, and Singapore. Sole-sourced third-party vendors in China per-formed final assembly of substantially all of the company’s Macs, iPhones, iPads, and iPods.Margins on sales of the company’s products in foreign countries, and on sales of products thatinclude components obtained from foreign suppliers, can be adversely affected by foreign cur-rency exchange rate fluctuations and by international trade regulations, including tariffs andantidumping penalties.
Seasonal Business34
The company historically experienced increased net sales in its first and fourth fiscal quar-ters compared to other quarters in its fiscal year due to the seasonal demand of consumermarkets related to the holiday season and the beginning of the school year; however, this pattern was less pronounced following the introductions of the iPhone and iPad. Thishistorical pattern should not be considered a reliable indicator of the company’s future net salesor financial performance.
Warranty35
The company offered a basic limited parts and labor warranty on most of its hardware products,including Macs, iPhones, iPads, and iPods. The basic warranty period was typically one year
issued patents in the United States and worldwide. In addition, the company held copyrightsrelating to certain aspects of its products and services. No single patent or copyright wassolely responsible for protecting the company’s products. The company believed the durationof the applicable patents it had been granted was adequate relative to the expected lives of itsproducts. Due to the fast pace of innovation and product development, the company’s prod-ucts were often obsolete before the patents related to them expired—and sometimes wereobsolete before the patents related to them were even granted.
Many of the company’s products were designed to include intellectual property obtainedfrom third parties. While it may be necessary in the future to seek or renew licenses relatingto various aspects of its products and business methods, the company believed, based uponpast experience and industry practice, that such licenses generally could be obtained on com-mercially reasonable terms; however, there was no guarantee such licenses could be obtainedat all. Because of technological changes in the industries in which the company competed,current extensive patent coverage, and the rapid rate of issuance of new patents, it was pos-sible certain components of the company’s products and business methods may unknowinglyinfringe upon existing patents or the intellectual property rights of others. From time to time,the company had been notified that it may be infringing upon certain patents or other intel-lectual property rights of third parties.
CASE 7 Apple Inc.: Performance in a Zero-Sum World Economy 7-23
Backlog36
In the company’s experience, the actual amount of product backlog at any particular timewas not a meaningful indication of its future business prospects. In particular, backlog often increased in anticipation of or immediately following new product introductions asdealers anticipated shortages. Backlog was often reduced once dealers and customers be-lieved they were able to obtain sufficient supply. Because of the foregoing, backlog shouldnot be considered a reliable indicator of the company’s ability to achieve any particular levelof revenue or financial performance.
Environmental LawsCompliance with federal, state, local, and foreign laws enacted for the protection of the
environment has to date had no significant effect on the company’s capital expenditures, earn-ings, or competitive position. In the future, however, compliance with environmental lawscould materially adversely affect the company.
Production and marketing of products in certain states and countries may subject the com-pany to environmental and other regulations including, in some instances, the requirement toprovide customers with the ability to return a product at the end of its useful life, as well asplace responsibility for environmentally safe disposal or recycling with the company. Suchlaws and regulations had been passed in several jurisdictions in which the company operatesincluding various countries within Europe and Asia and certain states and provinces withinNorth America. Although the company did not anticipate any material adverse effects in thefuture based on the nature of its operations and the thrust of such laws, there was no assurancethat such existing laws or future laws will not materially adversely affect the company’s finan-cial condition or operating results.
EmployeesAs of September 25, 2010, the company had approximately 46,600 full-time equivalent employees and an additional 2,800 full-time equivalent temporary employees and contractors.
Legal ProceedingsAs of September 25, 2010, the company was subject to the various legal proceedings andclaims as well as certain other legal proceedings and claims that had not been fully resolvedand that had arisen in the ordinary course of business. In the opinion of management, the com-pany did not have a potential liability related to any current legal proceeding or claim thatwould individually or in the aggregate materially adversely affect its financial condition or op-erating results. However, the results of legal proceedings could not be predicted with certainty.Should the company fail to prevail in any of these legal matters or should several of these le-gal matters be resolved against the company in the same reporting period, the operating results
from the date of purchase by the original end-user. The company also offered a 90-day basicwarranty for its service parts used to repair the company’s hardware products. In addition, con-sumers may purchase the APP, which extended service coverage on many of the company’shardware products in most of its major markets.
7-24 SECTION D Industry One—Information Technology
PropertiesThe company’s headquarters were located in Cupertino, California. As of September 25,2010, the company owned or leased approximately 10.6 million square feet of building space,primarily in the United States and, to a lesser extent, in Europe, Japan, Canada, and the Asia-Pacific regions. Of that amount, approximately 5.6 million square feet was leased, ofwhich approximately 2.5 million square feet was retail building space. Additionally, the com-pany owned a total of 480 acres of land in various locations.
As of September 25, 2010, the company owned a manufacturing facility in Cork, Ireland, thatalso housed a customer support call center and facilities in Elk Grove, California, that includedwarehousing and distribution operations and a customer support call center. In addition, thecompany owned facilities for research and development and corporate functions in Cupertino,California, including land for the future development of the company’s second corporate campus.The company also owned a data center in Newark, California, and land in North Carolina for anew data center facility currently under construction. Outside the United States, the companyowned additional facilities for various purposes.
John Tarpey’s DecisionAfter analyzing Apple’s most recent balance sheets and income statements and integratingthat information with his knowledge of the company, John Tarpey was unsure of his nextmove. As a senior financial analyst of a securities firm, he was obligated to make a recom-mendation. Should he tell his clients to buy, hold, or sell Apple’s common stock?
He had a number of concerns about the company’s future. For example, how dependentwas Apple on Steve Jobs? The shareholder proposal at the most recent shareholder meetingasking the board to develop an executive succession plan indicated that current shareholderswere certainly worried about Jobs’ health and ability to lead the company. In addition, howlong would it take for Apple’s competitors to catch up with the company’s lead in productdevelopment and perhaps even surpass Apple? There was no doubt in John’s mind that Apple’sstock price had done very well over the past few years. Even Mad Money’s Jim Cramer wasstill touting Apple as the industry’s leader and “best of breed.” Was this a good time to be
of a particular reporting period could be materially adversely affected. The company settledcertain matters during the fourth quarter of 2010 that did not individually or in the aggregatehave a material impact on the company’s financial condition and results of operations.
Software Development CostsResearch and development costs were expensed as incurred. Development costs of computersoftware to be sold, leased, or otherwise marketed were subject to capitalization beginningwhen a product’s technological feasibility has been established and ending when a productwas available for general release to customers. In most instances, the company’s productswere released soon after technological feasibility had been established. Therefore, costs in-curred subsequent to achievement of technological feasibility were usually not significant,and generally most software development costs have been expensed as incurred.
The company did not capitalize any software development costs during 2010. In 2009 and2008, the company capitalized $71 million and $11 million, respectively, of costs associatedwith the development of Mac OS X.
CASE 7 Apple Inc.: Performance in a Zero-Sum World Economy 7-25
buying more Apple stock or was the smarter move to sell the stock and take some profit whileit was still a solid performer?
Given Apple’s history of boom-and-bust performance over its lifetime, what should thecompany be doing to cement its market leadership in this constantly evolving industry?
N O T E S
1. This section was directly quoted from Apple Inc., “SEC 10-K,”p. 22, September 25, 2010, p. 32.
2. This section, History of Apple, is a combination of informationfrom previous revisions of the Apple Case in this book,Strategic Management and Business Policy, over the past 20years, Wikipedia, the free encyclopedia, “History of Apple,Inc., pp. 1–20.
3. This section was directly quoted from “Steve Jobs,” Wikipedia,the free encyclopedia, pp. 1–8.
4. Ibid., pp. 1–2.5. Ibid.6. “History of Apple, Inc.,” pp. 2–3.7. Previous Apple Case.8. Pixar, “Corporate Overview,” p. 1.9. “Steve Jobs Magic Kingdom,” Business Week, p. 3.
10. Ibid., pp. 1–5, and Vandana Sinna, “Disney, Pixar Give Mar-riage Second Chance,” pp. 1–3.
11. ”Steve Jobs Magic Kingdom,” p. 1.12. Ibid., p. 2.13. Ibid.14. Ibid.15. “The Most Powerful People on Earth,” Forbes, November 22,
2010, p. 88, and Peter Newcomb, “Business-Person of theYear,” pp. 136–137.
16. This section was directly quoted from “Steve Jobs—HealthConcerns,” Wikipedia, the free encyclopedia, p. 11.
17. This section was directly quoted from Apple Inc., “SEC 10-K,”September 23, 2010.
18. These five sections below were directly quoted from Apple Inc.,“SEC 10-K,” September 25, 2010, p. 1.
19. This section and its five subsections below are directly quotedfrom Apple Inc., “SEC 10-K,” September 25, 2010, pp. 36–37.
20. Ibid., p. 5.21. Ibid., p. 6.22. Ibid., pp. 6–7.23. Ibid., p. 7.24. Ibid., pp. 7–8.25. Ibid., p. 8.26. Ibid., pp. 8–9.27. Ibid., p. 9.28. Ibid.29. Ibid.30. Ibid.31. Ibid., p. 10.32. Ibid., p. 10.33. Ibid., p. 22.34. Ibid., p. 8.35. Ibid., p. 21.
Note: Footnotes 20–35 were directly quoted from Apple, Inc.,“SEC 10-K,” September 25, 2010.
36. Peter Oppenheimer (Chief Financial Officer of Apple Inc.),“Live Update: Apple 4Q Financial Report.” Presented at Mac-world live conference. www.macworld.com

This page intentionally left blank
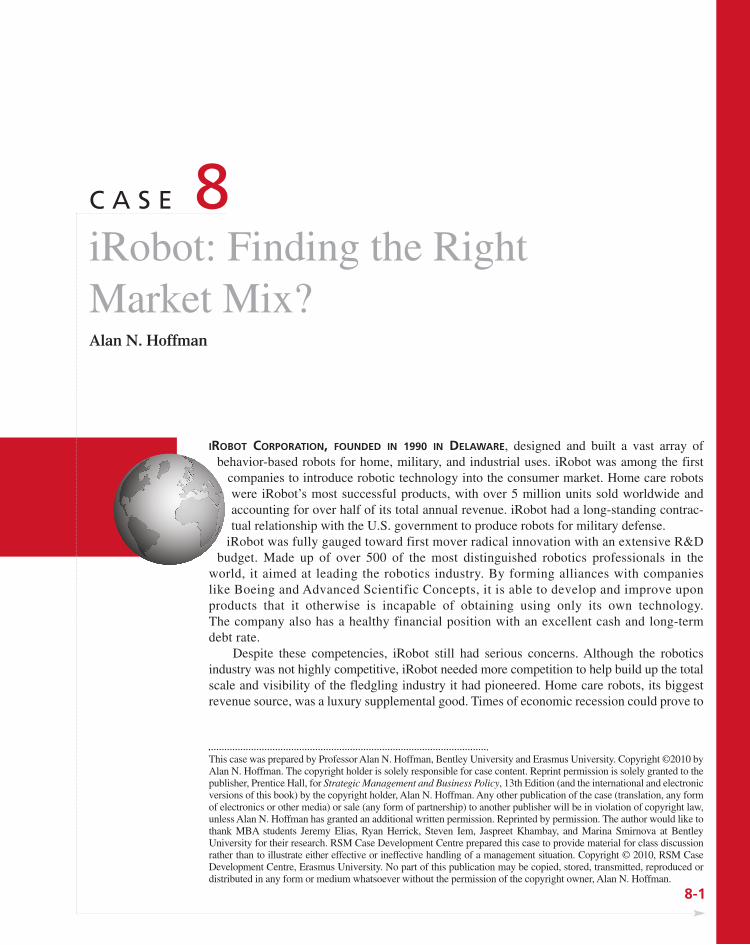
IROBOT CORPORATION, FOUNDED IN 1990 IN DELAWARE, designed and built a vast array ofbehavior-based robots for home, military, and industrial uses. iRobot was among the first
companies to introduce robotic technology into the consumer market. Home care robotswere iRobot’s most successful products, with over 5 million units sold worldwide andaccounting for over half of its total annual revenue. iRobot had a long-standing contrac-tual relationship with the U.S. government to produce robots for military defense.
iRobot was fully gauged toward first mover radical innovation with an extensive R&Dbudget. Made up of over 500 of the most distinguished robotics professionals in the
world, it aimed at leading the robotics industry. By forming alliances with companieslike Boeing and Advanced Scientific Concepts, it is able to develop and improve uponproducts that it otherwise is incapable of obtaining using only its own technology. The company also has a healthy financial position with an excellent cash and long-termdebt rate.
Despite these competencies, iRobot still had serious concerns. Although the roboticsindustry was not highly competitive, iRobot needed more competition to help build up the totalscale and visibility of the fledgling industry it had pioneered. Home care robots, its biggestrevenue source, was a luxury supplemental good. Times of economic recession could prove to
8-1
C A S E 8iRobot: Finding the Right Market Mix?Alan N. Hoffman
This case was prepared by Professor Alan N. Hoffman, Bentley University and Erasmus University. Copyright ©2010 byAlan N. Hoffman. The copyright holder is solely responsible for case content. Reprint permission is solely granted to thepublisher, Prentice Hall, for Strategic Management and Business Policy, 13th Edition (and the international and electronicversions of this book) by the copyright holder, Alan N. Hoffman. Any other publication of the case (translation, any formof electronics or other media) or sale (any form of partnership) to another publisher will be in violation of copyright law,unless Alan N. Hoffman has granted an additional written permission. Reprinted by permission. The author would like tothank MBA students Jeremy Elias, Ryan Herrick, Steven Iem, Jaspreet Khambay, and Marina Smirnova at BentleyUniversity for their research. RSM Case Development Centre prepared this case to provide material for class discussionrather than to illustrate either effective or ineffective handling of a management situation. Copyright © 2010, RSM CaseDevelopment Centre, Erasmus University. No part of this publication may be copied, stored, transmitted, reproduced ordistributed in any form or medium whatsoever without the permission of the copyright owner, Alan N. Hoffman.
be a problem for the sales of iRobot’s consumer goods given that discretionary budgets arelikely decreased. In addition, iRobot had over 70 patents, many of which will begin to expirein 2019. In a rapidly advancing industry, technology can also become obsolete quickly andrender patents useless. Additionally, iRobot was highly dependent on several third-party sup-pliers to manufacture its consumer products. It also depends on the U.S. government for thesales of its military products. Any volatility in its supply chain or government fiscal policy hasgrave consequences for the company’s future.
8-2 SECTION D Industry One—Information Technology
Company History
In the late 1980s, the coolest robots in the world were being developed at the MIT ArtificialIntelligence Lab. These robots, modeled on insects, captured the imagination of researchers,explorers, military, and dreamers alike. iRobot cofounders, MIT professor Rodney Brooksand graduates Colin Angle and Helen Greiner, saw this technology as the basis for a wholenew class of robots that could make people’s lives easier and more fun. So, in 1990, the threedecided to work full time on fulfilling this promise and incorporated iRobot in Delaware.1
After leaving the MIT extraterrestrial labs, the three entrepreneurs focused their businesson extraterrestrial exploration, introducing the Genghis for robotic researchers in 1990. In 1998,the founders shifted their focus onto military tactile robots and consumer robots after landing apivotal contract with the U.S. Defense Advanced Research Project Agency (DARPA). This con-tract provided the funding for necessary R&D to develop new technologies. As a direct result,iRobot delivered the PacBot to the government in 2001 to assist in the search at the NYC WorldTrade Center. In 2010, thousands of PacBots were serving the country on the war front.
In 2002, iRobot began selling its first practical and affordable home robot, the Roombavacuuming robot. With millions of Roomba vacuums sold, iRobot has continued to developand unveil new consumer robots such as a robotic gutter cleaner and pool vacuum. In 2005,iRobot raised US$120 million in its IPO and began trading on the NASDAQ stock exchange.
iRobot’s Products and DistributioniRobot designed and built robots for consumer, government, and industrial use, as shown inExhibit 1. On the consumer robots front, the company offered floor cleaning robots, poolcleaning robots, gutter cleaning robots, and programmable robots. iRobot sold its homerobots through a network of over 30 national retailers. Internationally, iRobot relies on anetwork of in-country distributors to sell these products to retail stores in their respectivecountries. iRobot also sold its products through its own online store and other online storeslike Amazon and Wal-Mart.
Home robots have been the company’s most successful products with over 5 million unitssold worldwide. Sales of home robots accounted for 55.5% and 56.4% of iRobot’s totalrevenue in 2009 and 2008, respectively.2 Currently, iRobot is exploring new technologicalopportunities, including those that can automatically clean windows, showers, and toilets. Thepotential to fully clean one’s house using automated robots is appealing to customers.
On the government and industrial robotics front, iRobot offered both ground andmaritime unmanned vehicles, selling the vehicles directly to end-users or through primecontractors and distributors.3 Its government customers included the U.S. Army, U.S. MarineCorp, U.S. Army and Marine Corps Robotic Systems Joint Program office, U.S. NavyEOD Technical Division, U.S. Air Force, and Domestic Police and First Responders. For2009 and 2008, 36.9% and 40.3% (respectively) of iRobot total revenue came from theU.S. government.
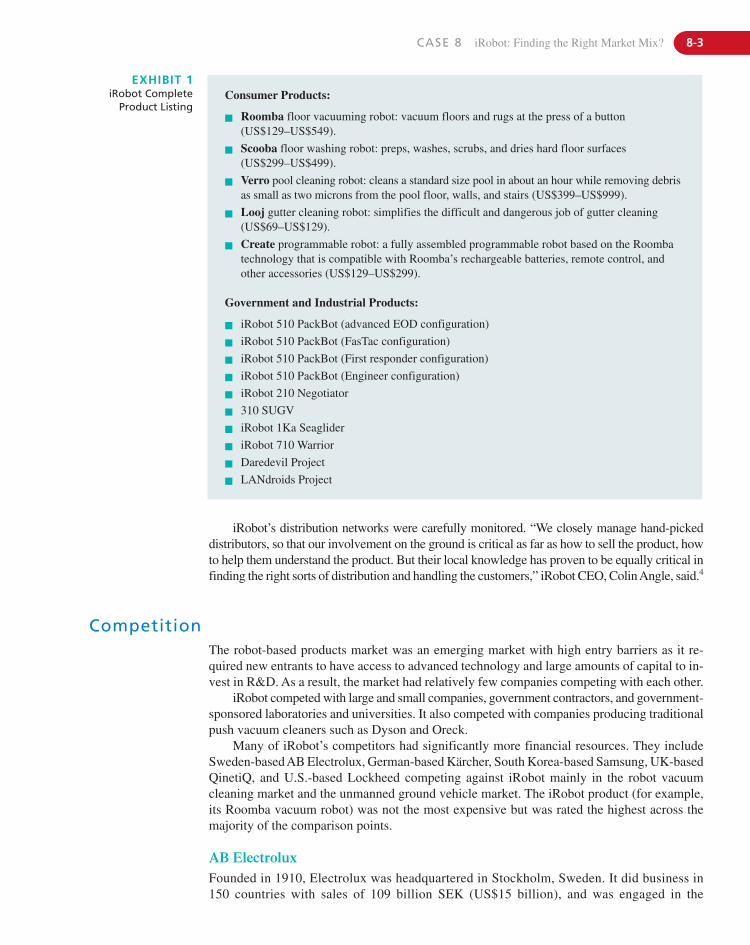
CASE 8 iRobot: Finding the Right Market Mix? 8-3
Consumer Products:
� Roomba floor vacuuming robot: vacuum floors and rugs at the press of a button(US$129–US$549).
� Scooba floor washing robot: preps, washes, scrubs, and dries hard floor surfaces(US$299–US$499).
� Verro pool cleaning robot: cleans a standard size pool in about an hour while removing debrisas small as two microns from the pool floor, walls, and stairs (US$399–US$999).
� Looj gutter cleaning robot: simplifies the difficult and dangerous job of gutter cleaning(US$69–US$129).
� Create programmable robot: a fully assembled programmable robot based on the Roombatechnology that is compatible with Roomba’s rechargeable batteries, remote control, andother accessories (US$129–US$299).
Government and Industrial Products:
� iRobot 510 PackBot (advanced EOD configuration)
� iRobot 510 PackBot (FasTac configuration)
� iRobot 510 PackBot (First responder configuration)
� iRobot 510 PackBot (Engineer configuration)
� iRobot 210 Negotiator
� 310 SUGV
� iRobot 1Ka Seaglider
� iRobot 710 Warrior
� Daredevil Project
� LANdroids Project
EXHIBIT 1iRobot Complete
Product Listing
iRobot’s distribution networks were carefully monitored. “We closely manage hand-pickeddistributors, so that our involvement on the ground is critical as far as how to sell the product, howto help them understand the product. But their local knowledge has proven to be equally critical infinding the right sorts of distribution and handling the customers,” iRobot CEO, Colin Angle, said.4
CompetitionThe robot-based products market was an emerging market with high entry barriers as it re-quired new entrants to have access to advanced technology and large amounts of capital to in-vest in R&D. As a result, the market had relatively few companies competing with each other.
iRobot competed with large and small companies, government contractors, and government-sponsored laboratories and universities. It also competed with companies producing traditionalpush vacuum cleaners such as Dyson and Oreck.
Many of iRobot’s competitors had significantly more financial resources. They includeSweden-based AB Electrolux, German-based Kärcher, South Korea-based Samsung, UK-basedQinetiQ, and U.S.-based Lockheed competing against iRobot mainly in the robot vacuumcleaning market and the unmanned ground vehicle market. The iRobot product (for example,its Roomba vacuum robot) was not the most expensive but was rated the highest across themajority of the comparison points.
AB ElectroluxFounded in 1910, Electrolux was headquartered in Stockholm, Sweden. It did business in 150 countries with sales of 109 billion SEK (US$15 billion), and was engaged in the
8-4 SECTION D Industry One—Information Technology
manufacture and sales of household and professional appliances. Its Electrolux Trilobitevacuum cleaner competed with the iRobot’s Roomba vacuum cleaner in the internationalmarkets. Although Electrolux Trilobite is currently unavailable in the United States it wasanticipated to be sold on the company’s website. An Electrolux Trilobite was priced at aboutUS$1,800, much more than a Roomba, which retailed between US$200 and US$500.
Alfred Kärcher GmbH & Co.Founded in 1935, Kärcher was a German manufacturer of cleaning systems and equipment,and was known for its high-pressure cleaners. Kärcher did business worldwide, with sales of€1.3 billion (US$1.7 billion). In 2003, it launched Kärcher RC 3000, the world’s first au-tonomous cleaning system that competed with the iRobot Roomba vacuum cleaner in the in-ternational markets. Kärcher RC 3000 is not currently sold in the United States but can bepurchased and shipped directly from Germany for approximately US$1,500.
Samsung Electronics Co., LtdFounded in 1969, Samsung was headquartered in South Korea. Samsung was the world’slargest electronics company with revenue of US$117.4 billion in 2009. It was a prominentplayer in the world market for more than 60 products including home appliances such aswashing machines, refrigerators, ovens, and vacuum cleaners. In November 2009, Samsunglaunched Tango, its autonomous vacuum cleaner robot, which was available in South Korea.In March 2010, the company launched the Samsung NaviBot, an autonomous vacuumcleaner, in Europe. It was priced at €400 to €600 (US$516 to US$774).
QinetiQFounded in 2001, QinetiQ was a defense technology company headquartered in the UK withrevenues of £1.6 billion (US$2.4 billion). It produced aircraft, unmanned aerial vehicles, andenergy products. iRobot’s stiffest competitor in the unmanned aerial vehicles market wasQinetiQ, which had 2,500 Talon robots deployed in Iraq and Afghanistan. iRobot haddelivered more than 3,000 PackBot robots worldwide.
Lockheed Martin CorporationBased in Maryland, the U.S.-based Lockheed was the world’s second largest defensecontractor by revenue and employed 140,000 people worldwide. It was formed by the mergerof Lockheed and Martin Marietta in 1995, and competed with iRobot in the unmanned groundvehicle market.
Research and Development at iRobot
Research and development (R&D) was a critical part of iRobot’s success. The company spentnearly 6% of its revenue on R&D. In 2009, its total R&D costs were US$45.5 million, ofwhich US$14.7 million was internally funded while the remaining amount was funded bygovernment-sponsored research and development contracts. iRobot believed that by utilizingR&D capital it would be able to respond and stay ahead of customer needs by bringing new,innovative products to the market. iRobot had 538 full-time employees, 254 of which werein R&D.5
The company’s core technology areas were collaborative systems, semi-autonomousoperations, advanced platforms, and human-robot interaction. Each area provided a uniquebenefit to the development and advancement of robot technology. Research in these fields was
CASE 8 iRobot: Finding the Right Market Mix? 8-5
Financial ResultsSales, Net Income, and Gross MarginsFrom 2005 through 2009, iRobot total revenue more than doubled from US$142 million toUS$299 million. Revenues received from products accounted for nearly 88% of total rev-enue, far greater than the remaining 12% received from contract revenue, though contractrevenue showed a record high of US$36 million by the end of 2009. (See Exhibit 2).
Revenues from 2009 showed a decline of US$9 million from 2008 that was mainly attrib-utable to a 6.3% decrease in home robots shipped. This decrease resulted from softeningdemand in the domestic market. On a more positive note, the total US$30.9 million decreasein domestic sales was partially offset by an increase in international sales (US$23.2 million).Even though revenues declined in 2009, iRobot was able to control its costs and operatingexpenses, resulting in an increase in net income of over four-fold from US$756,000 in 2008to US$3.3 million in 2009.
Cash and Long-Term DebtiRobot was in a strong financial position as it related to cash and long-term debt. In 2009,iRobot increased its cash position by over US$31 million while decreasing the amount of long-term debt by about US$400,000. Its cash position by the end of 2009 was US$72 millionversus US$41 million in 2010, an increase of over 77%. This put iRobot in a good position tocontinue investing in research and development even if sales began to slow. At the end of 2009,iRobot’s long-term debt was just over US$4 million (see Exhibit 3). iRobot’s financial statusgives it a competitive edge as it should be able to withstand both current and future unforeseenswings in sales, supplier issues, and cancellation of government contracts.
done in three different methods: team organization, spiral development, and the leveragedmodel.
Team organization revolved around small teams that focused on certain specific projectsor robots. They worked together with all different lines of the business to ensure that a prod-uct was well integrated. Primary locations for these teams were Bedford, Massachusetts;Durham, North Carolina; and San Luis Obispo, California.
Spiral development was used for military products. Newly creatd products were sent intothe field and tested by soldiers with an in-field engineer nearby to receive feedback from thesoldiers on the product’s performance. Updates and improvements were made in a timely man-ner, and the product was sent back to the field for retesting. This method of in-field testing hasallowed iRobot to quickly improve its technology and design so it can truly fulfill the needs ofthe end-users.
The leveraged model used other organizations for funding, research, and product devel-opment. iRobot’s next generation of military products were supported by various U.S. govern-ment organizations. Although the government had certain rights to these products, iRobot did“retain ownership of patents and know-how and are generally free to develop other commer-cial products, including consumer and industrial products, utilizing the technologies developedduring these projects.”6 The same methodology holds true when designing consumer products.If expertise was developed that would assist in governmental projects, then it is transferred tothe appropriate team.
iRobot’s continued success depended on its proprietary technology, intellectual skills ofthe employees, and the ability to innovate. The company held 71 U.S. patents, 150 pendingU.S. patents, 34 international patents, and more than 108 pending foreign applications. Thepatents held, however, will start to expire in 2019.
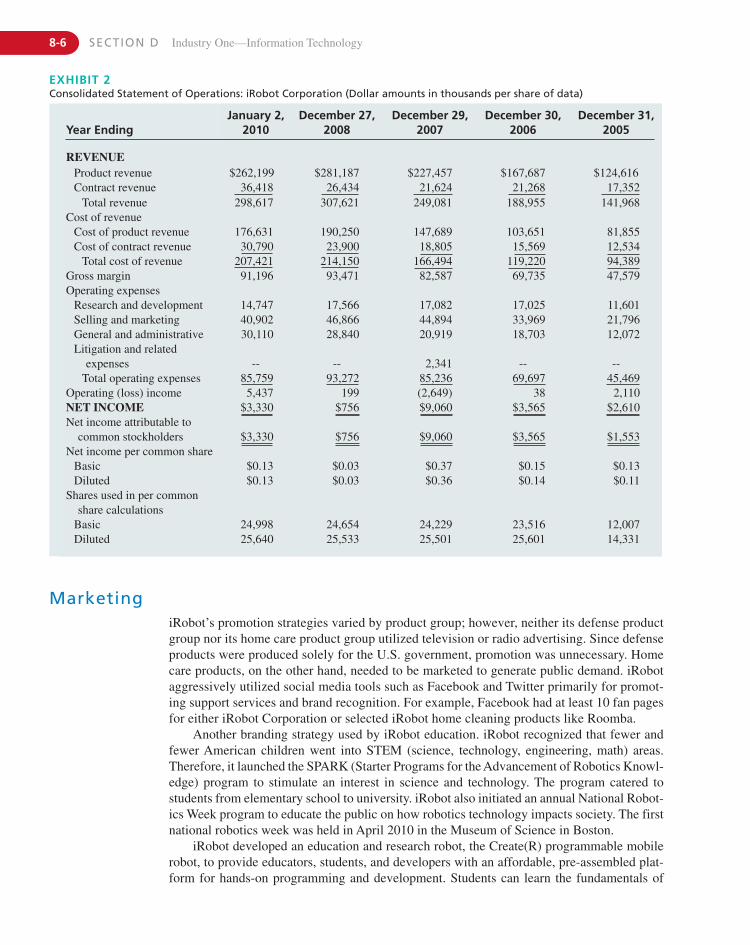
8-6 SECTION D Industry One—Information Technology
Year EndingJanuary 2,
2010December 27,
2008December 29,
2007December 30,
2006December 31,
2005
REVENUEProduct revenue $262,199 $281,187 $227,457 $167,687 $124,616Contract revenue 36,418 26,434 21,624 21,268 17,352
Total revenue 298,617 307,621 249,081 188,955 141,968Cost of revenue
Cost of product revenue 176,631 190,250 147,689 103,651 81,855Cost of contract revenue 30,790 23,900 18,805 15,569 12,534
Total cost of revenue 207,421 214,150 166,494 119,220 94,389Gross margin 91,196 93,471 82,587 69,735 47,579Operating expenses
Research and development 14,747 17,566 17,082 17,025 11,601Selling and marketing 40,902 46,866 44,894 33,969 21,796General and administrative 30,110 28,840 20,919 18,703 12,072Litigation and related
expenses -- -- 2,341 -- --Total operating expenses 85,759 93,272 85,236 69,697 45,469
Operating (loss) income 5,437 199 (2,649) 38 2,110NET INCOME $3,330 $756 $9,060 $3,565 $2,610Net income attributable to
common stockholders $3,330 $756 $9,060 $3,565 $1,553Net income per common share
Basic $0.13 $0.03 $0.37 $0.15 $0.13Diluted $0.13 $0.03 $0.36 $0.14 $0.11
Shares used in per common share calculations
Basic 24,998 24,654 24,229 23,516 12,007Diluted 25,640 25,533 25,501 25,601 14,331
EXHIBIT 2Consolidated Statement of Operations: iRobot Corporation (Dollar amounts in thousands per share of data)
MarketingiRobot’s promotion strategies varied by product group; however, neither its defense productgroup nor its home care product group utilized television or radio advertising. Since defenseproducts were produced solely for the U.S. government, promotion was unnecessary. Homecare products, on the other hand, needed to be marketed to generate public demand. iRobotaggressively utilized social media tools such as Facebook and Twitter primarily for promot-ing support services and brand recognition. For example, Facebook had at least 10 fan pagesfor either iRobot Corporation or selected iRobot home cleaning products like Roomba.
Another branding strategy used by iRobot education. iRobot recognized that fewer andfewer American children went into STEM (science, technology, engineering, math) areas.Therefore, it launched the SPARK (Starter Programs for the Advancement of Robotics Knowl-edge) program to stimulate an interest in science and technology. The program catered tostudents from elementary school to university. iRobot also initiated an annual National Robot-ics Week program to educate the public on how robotics technology impacts society. The firstnational robotics week was held in April 2010 in the Museum of Science in Boston.
iRobot developed an education and research robot, the Create(R) programmable mobilerobot, to provide educators, students, and developers with an affordable, pre-assembled plat-form for hands-on programming and development. Students can learn the fundamentals of
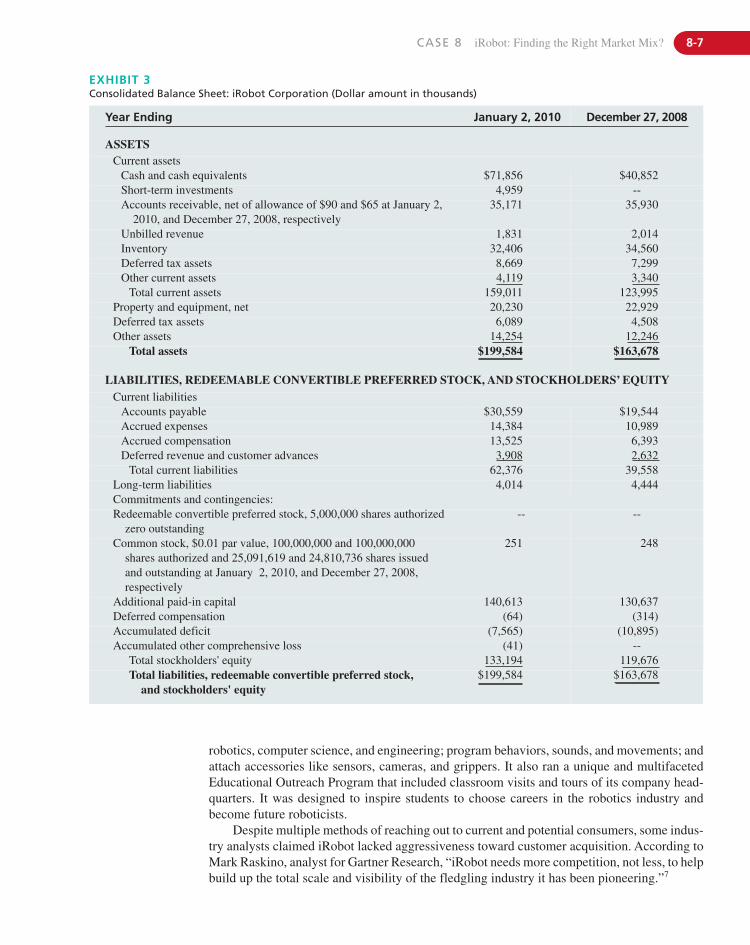
CASE 8 iRobot: Finding the Right Market Mix? 8-7
Year Ending January 2, 2010 December 27, 2008
ASSETSCurrent assets
Cash and cash equivalents $71,856 $40,852Short-term investments 4,959 --Accounts receivable, net of allowance of $90 and $65 at January 2,
2010, and December 27, 2008, respectively35,171 35,930
Unbilled revenue 1,831 2,014Inventory 32,406 34,560Deferred tax assets 8,669 7,299Other current assets 4,119 3,340
Total current assets 159,011 123,995Property and equipment, net 20,230 22,929Deferred tax assets 6,089 4,508Other assets 14,254 12,246
Total assets $199,584 $163,678
LIABILITIES, REDEEMABLE CONVERTIBLE PREFERRED STOCK, AND STOCKHOLDERS’ EQUITYCurrent liabilities
Accounts payable $30,559 $19,544Accrued expenses 14,384 10,989Accrued compensation 13,525 6,393Deferred revenue and customer advances 3,908 2,632
Total current liabilities 62,376 39,558Long-term liabilities 4,014 4,444Commitments and contingencies:Redeemable convertible preferred stock, 5,000,000 shares authorized
zero outstanding-- --
Common stock, $0.01 par value, 100,000,000 and 100,000,000 shares authorized and 25,091,619 and 24,810,736 shares issued and outstanding at January 2, 2010, and December 27, 2008, respectively
251 248
Additional paid-in capital 140,613 130,637Deferred compensation (64) (314)Accumulated deficit (7,565) (10,895)Accumulated other comprehensive loss (41) --
Total stockholders' equity 133,194 119,676Total liabilities, redeemable convertible preferred stock,
and stockholders' equity$199,584 $163,678
EXHIBIT 3Consolidated Balance Sheet: iRobot Corporation (Dollar amount in thousands)
robotics, computer science, and engineering; program behaviors, sounds, and movements; andattach accessories like sensors, cameras, and grippers. It also ran a unique and multifacetedEducational Outreach Program that included classroom visits and tours of its company head-quarters. It was designed to inspire students to choose careers in the robotics industry andbecome future roboticists.
Despite multiple methods of reaching out to current and potential consumers, some indus-try analysts claimed iRobot lacked aggressiveness toward customer acquisition. According toMark Raskino, analyst for Gartner Research, “iRobot needs more competition, not less, to helpbuild up the total scale and visibility of the fledgling industry it has been pioneering.”7
8-8 SECTION D Industry One—Information Technology
The Robotic IndustryRobots serve a wide variety of industries such as consumer, automotive, military, construc-tion, agricultural, space, renewable energy, medical, law enforcement, utilities, manufactur-ing, entertainment, mining, transportation, space, and warehouse industries.
In 2008, before the economic downturn, the global market for industry robot systems wasestimated to be about US$19 billion.9 Industrial robots sold worldwide in 2009 slumped byabout 50% compared to 2008. The sales started to improve from the third quarter of 2009onward with the slow recovery coming from emerging markets in Asia and especially fromChina. In North America and Europe, sales were also seen slowly improving from late 2009.10
The sales of professional services robots, including military and defense robots, wereabout US$11 billon at the end of 2008 and were expected to grow by US$10 billion for theperiod of 2009 to 2012.11
Twelve million units of household and entertainment robots were expected to be sold from2009 to 2012 in the mass market, with an estimated value of US$3 billion.12
New MarketsThe 2009 economic recession had negative impacts on consumer spending. iRobot domestic
sales of robot vacuum cleaners, predominantly the Roomba, were down comparable to otherUS$400 discretionary purchases, and its international sales also experienced a slowdown.13 Inaddition to lower consumer demand, the national and international credit crunches led to ascarcity of credit, tighter lending standards, and higher interest rates on consumer and businessloans. Continued disruptions in credit markets may limit consumer credit availability and impacthome robot sales.
If the robot market does not experience significant growth, the entire industry may notsurvive. “Fallout has forced the robotics industry to look outside of its comfort zone and moveinto emerging energy technologies like batteries, wind, and solar power,” said Roger Christian,Vice President of Marketing and International Groups at Motoman Inc. He also predictedgrowing demand for robotics in healthcare and the food and beverage industry.14 Under theObama administration, there were economic incentives devoted to R&D in alternative energyindustries. For example, “the Stimulus Act passed by Congress in early 2009, a US$787 billionpackage of tax cuts, state aid, and government contracts, has made some impact on the alter-native energy market in favor of robotics.”15
In addition to its home care and military markets, iRobot hoped to expand into the civillaw enforcement market and the maritime market. It also explored possibilities in the
OperationsiRobot was not a manufacturing company, nor did it claim to be. Its core competency wasto design, develop, and market robots, not manufacture them. All non-core activities wereoutsourced to third parties skilled in manufacturing. While third-party manufacturers pro-vided raw materials and labor, iRobot concentrated on developing and optimizing prototypes.
Until April 2010, iRobot used only two third-party manufacturers for its consumer prod-ucts: Jetta Co. Ltd. and Kin Yat Industrial Co. Ltd., both located in China. iRobot did not havea long-term contract with either company, and the manufacturing was done on a purchase order basis. This changed in April 2010, when iRobot entered a multi-year manufacturingagreement with electronic parts maker Jabil Circuit Inc., which would make, test, and supplyiRobot’s consumer products, including the Roomba.8
CASE 8 iRobot: Finding the Right Market Mix? 8-9
Challenges AheadConsumer MarketplaceiRobot was competing in a new and emerging market. Although the industry had relativelylow competition, analysts believed iRobot needed “more competition, not less, to help buildup the total scale and visibility of the fledgling industry it had been pioneering.”18 If thedemand for the home robots became stagnant or declined, this would greatly impact thevitality of iRobot and put it under pressure to remain innovative and adaptive to consumerneeds in the event that it did gain widespread popularity.
iRobot’s consumer products were primarily a luxury supplemental good gauged towardthe middle and upper class. iRobot’s home cleaning robots were reasonably priced fromUS$129 to US$1,000, depending on the model and accessories. Such a price range was com-parable with luxury brands of vacuum machines. However, times of economic recession couldprove to be a problem for iRobot’s consumer goods sales given that discretionary budgets havecontracted. To save money, iRobot’s base customers may revert to manual labor.
Supply ChainFor many years, iRobot had only two China-based manufacturers to produce its home clean-ing robots and had no long-term contract with either of those companies. Its best-sellingRoomba 400 series and Scooba series, for example, were both produced by Jetta at a singleplant in China. This put iRobot in a high-risk situation if Jetta was unable to deliver productsfor any unforeseen reason, or if quality started to dip below standards.
Fortunately, iRobot was aware of the problem and signed a new manufacturing agree-ment with U.S.-based Jabil Circuit. This relationship would provide iRobot with numerousbenefits, including diversifying key elements of its supply chain, providing geographic flexibility to address new markets, and expanding overall capacity to meet growing demands,explained Jeffrey Beck, president of iRobot’s Home Robots Division. Whether this attemptto diversify its supply chain with a new partnership will work out is of crucial importance foriRobot.
Intellectual PropertyAlthough iRobot had over 70 patents and over 150 patents pending, finding ways to continueto protect this intellectual property in the long run will be a challenge. The patents iRobotholds will begin to expire in 2019. In a rapidly advancing industry, technology can alsobecome obsolete quickly and render patents useless.
Continued development of products that were difficult to duplicate through reverse engi-neering will be the key to success in this area. By maintaining strong relationships and givingsuperior service to customers such as government agencies, iRobot can create an advantageeven if they are unable to ultimately protect their technology from being duplicated. At thesame time, iRobot also needs to ensure that its employees will continue to be innovative andcreate new technologies to keep iRobot competitive for years to come.
healthcare market.16 It partnered with the toy company Hasbro to enter the toy market withMy Real Baby—an evolutionary doll that has animatronics and emotional response software.
iRobot continued to grow its international presence by entering new markets. The percent-age of its international sales rose from 38% in 2008 to 53.8% in 2009.17 Its growing focus oninternational sales resulted in an increase of US$23.2 million in international home robotsrevenue for 2009 compared to 2008. iRobot also sold its military products overseas in compli-ance with the International Traffic in Arms Regulations.
8-10 SECTION D Industry One—Information Technology
Government ContractsNearly 40% of iRobot’s revenues were from government-contracted military robots. As acontractor or a subcontractor to the U.S. government, iRobot was subject to federal regula-tions. Fiscal policy and expenditure can be volatile, not only through a single presidency, butcertainly during the transition from one presidency to the next. The volatility and unknowndemand of the U.S. government presented a problem. The economic fallout from the reces-sion also impacted U.S. federal budgetary considerations. Emphasis and focus had beenplaced on larger, more troubled industries, with large bailout packages made available tofinancial and automotive companies. It remains to be seen how these large outlays will affectthe federal government’s ability to continue to fund contracts for robotics.
Strategic AlliancesiRobot relied on strategic alliances to provide technology, complementary product offerings, andbetter and quicker access to markets. It entered an agreement with The Boeing Company to de-velop and market a commercial version of the SUGV that was being developed under the Army’sBCTM (formerly FCS) program. It also formed an alliance with Advanced Scientific ConceptsInc. for exclusive rights to use the latter’s LADAR technology of unmanned ground vehicles. Inexchange, iRobot commited itself to purchase units from Advanced Scientific Concepts.
iRobot’s ChallengeiRobot’s focus on home cleaning products differentiates iRobot from all the other manufac-turers in the robotics industry, which are mainly focused on manufacturing robots for theautomotive sector. iRobot’s focus on two entirely different markets—consumer and military—allowed it (1) the ability to leverage its core capabilities and diversification, and (2) providedit with a hedge against slower demand in one sector. By introducing robotics to the consumermarket, iRobot created a “blue ocean of new opportunities.” However, iRobot had numerouscompetitors with more experience in the consumer marketplace.
An analyst wondered if the long-term success in the consumer market would require iRobotto develop more “blue oceans.” Also, did it make sense for iRobot to continue to develop new con-sumer products or would it be better off focusing on the military and aerospace marketplace?
1. http://www.irobot.com/uk/about_irobot_story.cfm.2. iRobot 2009 Annual Report, Form 10K, filed February 19, 2010.3. Ibid.4. M. Raskino, (a), 2010, “Insights on a Future Growth Industry.”
An interview with Colin Angle, CEO, iRobot. http://my.gartner.com/portal/server.pt?open=512&objID=260&mode=2&PageID=3460702&resId=1275816&ref=QuickSearch&sthkw=irobot.
5. iRobot 2009 Annual Report, 2010.6. Ibid.7. M. Raskino, (b), 2010, “Cool Vendors in Emerging Technologies,”
2010. http://my.gartner.com/portal/server.pt?open=512&objID=260&mode=2&PageID=3460702&resId=133843&ref=QuickSearch&sthkw=irobot.
8. “iRobot Enters Manufacturing Deal with Jabil,” The LowellSun, (April 28, 2010). http://www.lowellsun.com/latestnews/ci_ 14830219.
9. Press information, World Robotics 2009—Industrial Robots.http://worldrobotics.org/downloads/PR_Industrial_Robots_30.09.2009_EN(1).pdf.
N O T E S10. Gudrun Litzenberger, IFR Statistical Department, “The Robot-
ics Industry Is Looking Ahead with Confidence to 2010,” �http:// www.worldrobotics.org/downloads/IFR_Press_release_18_ Feb_2010.pdf.
11. Ibid.12. Ibid.13. M. Raskino, (a), 2010.14. B. Brumson, 2010, “Robotics Market Cautiously Optimistic for
2010.” Robotic Industries Association. http://www.robotics.org/content-detail.cfm/Industrial-Robotics-Feature-Article/Robotics-Market-Cautiously-Optimistic-for-2010/content_id/1936.
15. Ibid.16. Robotreviews, 2010, “iRobot Celebrates Two Decades of Inno-
vation in Robotics,” http://www.robotreviews.com/news/its-national-robotics-week.
17. iRobot 2009 Annual Report, 2010.18. M. Raskino, (b), 2010.
DELL INC. was founded in 1984 by Michael Dell at age 19 while he was a student living in adormitory at the University of Texas. As a college freshman, he bought personal computers
(PCs) from the excess inventory of local retailers, added features such as more memoryand disk drives, and sold them out of the trunk of his car. He withdrew $1,000 in personalsavings, used his car as collateral for a bank loan, hired a few friends, and placed ads inthe local newspaper offering computers at 10%–15% below retail price. Soon he was sell-
ing $50,000 worth of PCs a month to local businesses. Sales during the first year reached$600,000 and doubled almost every year thereafter. After his freshman year, Dell left schoolto run the business full time.
Michael Dell began assembling his own computers in 1985 and marketed them throughads in computer trade publications. Two years later, his company witnessed tremendouschange: It launched its first catalog, initiated a field sales force to reach large corporate ac-counts, went public, changed its name from PCs Limited to Dell Computer Corporation, andestablished its first international subsidiary in Britain. Michael Dell was selected “Entrepre-neur of the Year” by Inc. in 1989, “Man of the Year” by PC Magazine in 1992, and “CEO ofthe Year” by Financial World in 1993. In 1992, the company was included for the first timeamong the Fortune 500 roster of the world’s largest companies.
By 1995, with sales of nearly $3.5 billion, the company was the world’s leading directmarketer of personal computers and one of the top five PC vendors in the world. In 1996, Dellsupplemented its direct mail and telephone sales by offering its PCs via the Internet at dell.com.By 2001, Dell ranked first in global market share and number one in the United States forshipments of standard Intel architecture servers. The company changed its name to Dell Inc.
9-1
C A S E 9Dell Inc.: Changing the BusinessModel (Mini Case)J. David Hunger
This case was prepared by Professor J. David Hunger, Iowa State University and St. John’s University. Copyright ©2010by J. David Hunger. The copyright holder is solely responsible for case content. Reprint permission is solely granted tothe publisher, Prentice Hall, for Strategic Management and Business Policy, 13th Edition (and the international andelectronic versions of this book) by the copyright holder, J. David Hunger. Any other publication of the case (translation,any form of electronics or other media) or sale (any form of partnership) to another publisher will be in violation ofcopyright law, unless J. David Hunger has granted an additional written permission. Reprinted by permission.
in 2003 as a way of reflecting the evolution of the company into a diverse supplier of technol-ogy products and services. In 2005, Dell topped Fortune’s list of “Most Admired Companies.”Fiscal year 2005 (Dell’s fiscal year ended in early February or late January of the same calen-dar year) was an outstanding year in which the company earned $3.6 billion in net income on$55.8 billion in net revenue.
Soon, however, increasing competition and cost pressures began to erode Dell’s margins.Even though the company’s net revenue continued to increase to $57.4 billion in fiscal year2007 and $61.1 billion during fiscal year 2008, its net income dropped to $2.6 billion in 2007with a slight increase to $2.9 billion in 2008. The “great recession” of 2008–2009 took its tollon both Dell and the computer industry. Dell’s fiscal 2010 (ending January 29, 2010) net income fell further to $1.4 billion on $52.9 billion in net revenue. Sales improved during calendar year 2010 as the global economy showed signs of recovery. Net revenue for Februarythrough July 2010 increased to $30.4 billion compared to only $25.1 billion during the firsthalf of 2009, while first half net income rose to $886 million in 2010 compared to $762 millionduring the same period in 2009. Nevertheless, Dell’s net income was only 2.91% of net revenueduring the first half of 2010 contrasted with a much rosier 6.45% during 2006. (Note: Dell’sfinancial reports are available via the company’s website at www.dell.com.)
9-2 SECTION D Industry One—Information Technology
Problems of Early GrowthThe company’s early rapid growth resulted in disorganization. Sales jumped from $546 millionin fiscal 1991 to $3.4 billion in 1995. Growth had been pursued to the exclusion of all else,but no one seemed to know how the numbers really added up. When Michael Dell saw thatthe wheels were beginning to fly off his nine-year-old entrepreneurial venture, he soughtolder, outside management help. He temporarily slowed the corporation’s growth strategywhile he worked to assemble and integrate a team of experienced executives from companieslike Motorola, Hewlett-Packard, and Apple.
The new executive team worked to get Dell’s house in order so that the company couldcontinue its phenomenal sales growth. Management decided in 1995 to abandon distributionof Dell’s products through U.S. retail stores and return solely to direct distribution. This enabled the company to refocus Dell’s efforts in areas that matched its philosophy of high emphasis on customer support and service. In July 2004, Kevin Rollins replaced Michael Dellas Chief Executive Officer, allowing the founder to focus on being Chairman of the Board. Thissituation did not last long, however. Rising sales coupled with rapidly falling net incomecaused Michael Dell to rethink his retirement and resume his role as CEO in January 2007. Although Michael Dell in 2010 owned only 11.7% of the corporation’s stock, at age 45, he ownedthe largest block of stock and continued to be the “heart and soul” of the firm. The rest of thedirectors and executive officers owned less than 1% of the stock.
Business ModelDell’s original business model was very simple: Dell machines were made to order and delivered directly to the customer. The company had no distributors or retail stores. Dell PCshad consistently been listed among the best PCs on the market by PC World and PCMagazine. Cash flow was never a problem because Dell was paid by customers long beforeDell paid its suppliers. The company held virtually no parts inventory. As a result, Dell madecomputers more quickly and cheaply than any other company.
Dell became the master of process engineering and supply chain management. It spentless on R&D than did Apple or Hewlett-Packard, but focused its spending on improving
CASE 9 Dell Inc.: Changing the Business Model (Mini Case) 9-3
its manufacturing process. (Dell spent 1% of sales on R&D versus the 5% typically investedby other large computer firms.) Instead of spending its money on new computer technology,Dell waited until a new technology became a standard. Michael Dell explained that soon after a technology product arrived on the market, it was a high-priced, high-margin item made differently by each company. Over time, the technology standardized—the way PCsstandardized around Intel microprocessors and Microsoft operating systems. At a certain pointbetween the development of the standard and its becoming a commodity, that technology became ripe for Dell. When the leaders were earning 40% or 50% profit margins, they werevulnerable to Dell making a profit on far smaller margins. Dell drove down costs further by perfecting its manufacturing processes and using its buying power to obtain cheaper parts.Its reduction of overhead expenses to only 9.6% of revenue meant that Dell earned nearly$1 million in revenue per employee—three times the revenue per employee at IBM and almosttwice HP’s rate.
Although the company outsourced some operations, such as component production andexpress shipping, it had its own assembly lines in the United States, Malaysia, China, Brazil,India, and Poland. A North Carolina plant had been opened in 2005 as Dell’s third Americandesktop plant. Cost pressures had, however, caused management to rethink its manufacturingstrategy. They closed the company’s desktop plants in Texas and Tennessee in 2008 and 2009respectively, and were planning to close the firm’s last desktop assembly plant in North Carolinain January 2011. From then on, desktop assembly for the North American market would takeplace in Dell’s factories in other countries and by contract manufacturers in Asia and Mexico.In Europe, the company closed its Ireland plant and sold its plant in Poland to FoxconnTechnology, a unit of Hon Hai, the world’s largest contract manufacturer. They then contractedwith Foxconn for manufacturing services. In contrast to its global desktop manufacturingstrategy, 95% of Dell’s notebook computers were assembled in Dell’s plants in Malaysiaand China.
After its failed experiment with distribution through U.S. retail stores in the 1990s,management again changed its mind regarding its reliance on direct marketing. Over time,Dell’s competitors had imitated Dell’s direct marketing model, but were also successfully sellingthrough retail outlets. A presence in retail was becoming especially important in countries outsideNorth America. Sales in these countries were often based on the advice of sales staff, puttingDell’s “direct only” business model at a disadvantage. In response, Dell began shippingits products in 2007 to major U.S. and Canadian retailers, such as Wal-Mart, Sam’s Club, Staples,and Best Buy. This was soon followed by sales elsewhere in the world through DSGI, GOME,and Carrefour, among others, to number over 56,000 outlets worldwide.
Product Line and StructureOver the years, Dell Inc. has broadened its product line to include not only desktop and lap-top (listed under mobility) computers, but also servers, storage systems, printers, software,peripherals, and services, such as infrastructure services. By 2010, net revenue by productline was composed of desktop PCs (25%), mobility (31%), software and peripherals (18%),servers and networking (11%), services (11%), and storage (4%). Desktop PCs’ net revenuedropped from 38% in 2006, with each of the other product lines (especially mobility) increas-ing as a percentage of total revenue. Although the 2010 gross margin for all Dell products wasonly 14.1% of sales, due to a lower average selling price, the gross margin for services, in-cluding software, was a much fatter 33.7%.
Dell’s corporate headquarters was located in Round Rock, Texas, near Austin. In 2009, thecompany was reorganized from a geographic structure into four global business units based on
9-4 SECTION D Industry One—Information Technology
The Industry MaturesBy 2006, the once torrid growth in PC sales had slowed to about 5% a year. Sales fell signif-icantly during the “great recession” of 2008–2009 as companies and consumers deferredcomputer purchases. With the economy improving, the output of U.S. computer manufacturerswas forecast to grow at an annual compounded rate of 7% between 2010 and 2015. Nevertheless, margins were getting progressively smaller for the desktop PC, Dell’s flagshipproduct. Competitors were becoming increasingly competitive in both desktop and mobilecomputers.
Gateway, for example, found ways to reduce its costs and fight its way back to prof-itability. The same was true for Hewlett-Packard (HP) once it had digested its acquisition ofCompaq. Asian manufacturers, such as Acer, Toshiba, and Lenovo, with strengths in laptopswere becoming major global competitors. Ironically, by driving down supplier costs, Dellalso reduced its rivals’ costs. In addition, the sales growth in the computer industry was inthe consumer market and in emerging countries rather than in the corporate market and developed countries in which Dell sold most of its products. Between 2006 and 2010, HP replaced Dell as the company with the largest global market share in personal computers.Using price reductions, Dell was now battling with Acer for second place in global PC market share.
As the personal computer became more like a commodity, consumers were no longer interested in paying top dollar for a computer unless it was “unique.” Wal-Mart and Best Buywere selling basic laptop computers for less than $300 in 2010 and intended to maintain thispricing so long as manufacturers continued to supply low-cost products. PC notebook saleshad been falling during 2010, primarily due to the introduction of Apple’s highly featured iPadand the consequent rise in “tablet” PC sales. According to Morgan Stanley, Apple’s iPad cannibalized about 25% of PC notebook sales since its introduction in April through August, 2010.Dell countered the iPad with a tablet computer called Streak in May 2010, but failed to generatemuch enthusiasm or sales for this product.
As corporate buyers increasingly purchased their computer equipment as part of a pack-age of services to address specific problems, service-oriented rivals like IBM, HP, and Oraclehad an advantage over Dell. All of these competitors had made large commitments to servers,software, and consulting—all having higher margins than personal computers. IBM had soldits laptop, hard drive, and printer businesses to focus on building its services business.Hewlett-Packard acquired Electronic Data Systems in 2008 to boost its expertise in services.By offering customers a package of servers, software, and storage, HP dominated the serverbusiness with 32% market share, with IBM closely following with 28% share of the market.Oracle’s acquisition of Sun Microsystems gave it 8% of the server market. IBM and Oracle offered proprietary server platforms in enterprise accounts. In contrast, Dell (along with HP)offered x86 open-system servers. In order to better compete in the large enterprise market segment, Dell purchased Perot Systems, an IT services company, in 2009. Even after this acquisition, however, services accounted for only 13% of Dell’s sales. In 2010, Dell attemptedto acquire 2PAR, a data storage firm, but was outbid by HP.
customers: Large Enterprise, Public, Small & Medium Business, and Consumer. Its 2010 revenueby segment was 27% from Large Enterprise, 27% from Public, 23% from Small & Medium Business, and 23% from the Consumer unit. Interestingly, operating income as a percentage of total revenue totaled 9% for both Public and Small & Medium Business units, 6% from Large Enterprise, and only 1% from the Consumer unit. Commercial customers accounted for 77% oftotal revenue. Dell was dependent upon the U.S. market for 53% of its total 2010 revenues.
CASE 9 Dell Inc.: Changing the Business Model (Mini Case) 9-5
Issues and StrategySince 2007, when Michael Dell resumed being the company’s CEO, Dell has made more than10 acquisitions, cut about 10,000 jobs, and hired executives from Motorola and Nike to add moreexcitement to its product line. Its $3.6 billion purchase of Perot Systems allowed it to expandinto higher-margin computing services. Nevertheless, Dell’s stock fell 42% since January 2007,during a period in which Hewlett-Packard’s stock gained 11% and IBM gained 31%.
The industry’s focus shifted from desktop PCs to mobile computing, software, andtechnology services—areas of relative weakness at Dell. Due to a changing industry, the com-pany’s original business model based on direct sales and value chain efficiencies had beenabandoned. It was now using the same distribution channels, component providers, and assem-bly contractors as its competitors. Unfortunately, Dell’s emphasis on cost reduction and com-petitive pricing meant that it was no longer perceived as providing high-quality personalcomputers or the quality service to go with them. Previously a strength of the company, itscustomer service rating in 2005 fell to a score of 74 (average for the industry) in a survey bythe University of Michigan. Complaints about Dell’s service more than doubled in 2005 to1,533. Although the company successfully worked to improve customer satisfaction by addingmore service people, more people meant increased costs and smaller margins.
In order to improve the company’s competitive position, Dell’s management initiated athree-pronged strategy:
� Improve the core business by profitably growing the desktop and mobile computer businessand enhancing the online experience for customers. This involved cost-savings initiativesand simplifying product offerings.
� Shift the portfolio to higher-margin and recurring revenue offerings by expanding the customer solutions business in servers, storage, services, and software. This involvedgrowing organically as well as through acquisitions.
� Balance liquidity, profitability, and growth by maintaining a strong balance sheet with sufficient liquidity to respond to the changing industry. This provided the capability to develop and acquire more capabilities in enterprise products and solutions.
Future ProspectsA number of industry analysts felt that Dell was not well positioned either for a future of low-priced, commodity-like personal computers or one of highly featured innovative digitalproducts like the iPad and iPod. To continue as a major player in the industry, they argued thatDell needed an acquisition similar to HP’s $13.2 billion purchase of EDS in order to competein business information services. Overall, analysts were ambivalent about the firm’s prospectsin a changing industry. Should Dell continue with its current strategy of following the consumermarket down in price and adjusting its costs accordingly or, like IBM, should it change its focus to more profitable business services, or, like HP, should it try to do both?

This page intentionally left blank
ROSETTA STONE’S MISSION WAS TO CHANGE the way people learn languages. The companyblended language learning with technology at a time when globalization connected more and
more individuals and institutions to each other.The potential for profit in the language-learning industry encouraged management to
become more proactive and aggressive about Rosetta Stone’s growth. In 2007, an industryanalysis commissioned from The Nielsen Company, a market research firm, found that thelanguage-learning industry produced over $83 billion in consumer spending.1 Of this
amount, $32 billion, or 39% of the total, was spent on self-study options. In the United States,the industry generated $5 billion in consumer spending in 2007, of which $2 billion was for self-study.2 Over 90% of the $83 billion was spent outside the United States.
The company’s debut on the New York Stock Exchange brought capital and resources thatplaced Rosetta Stone in an exciting and promising position. Tom Adams, President and ChiefExecutive Officer, said, “We are excited about hardware trends and the potential of educationaltechnology in general. We are working in new ways with online socialization. We see our pri-mary opportunity as growing through our own innovation. . . (W)ith added financial resourceswe can entertain mergers and acquisitions down the line.”3
How should the company move forward in order to sustain its momentum? Would it be ap-propriate for Rosetta Stone to offer products like audio books or services such as language class-rooms in order to increase market share? Which international markets would provide the companya strategic and guaranteed return? Could changes in the company’s advertising and financialstrategies improve Rosetta Stone’s position? Should the company maintain anti-piracy initiatives
10-1
C A S E 10Rosetta Stone Inc.:CHANGING THE WAY PEOPLE LEARN LANGUAGESChristine B. Buenafe and Joyce P. Vincelette
Introduction
This case was prepared by Christine B. Buenafe, a student, and Professor Joyce P. Vincelette of the College of New Jersey. Copyright © 2010 by Christine B. Buenafe and Professor Joyce P. Vincelette. This case cannot be reproducedin any form without the written permission of the copyright holders, Christine B. Buenafe and ProfessorJoyce P. Vincelette. Reprint permission is solely granted by the publisher, Prentice Hall, for the books, StrategicManagement and Business Policy, 13th Edition (and the international and electronic versions of this book) by thecopyright holders, Christine B. Buenafe and Professor Joyce P. Vincelette. This case was edited for SMBP, 13th Edition.The copyright holders are solely responsible for case content. Any other publication of the case (translation, any formof electronic or other media) or sale (any form of partnership) to another publisher will be in violation of copyrightlaw, unless Christine B. Buenafe and Professor Joyce P. Vincelette have granted additional written reprint permission.Reprinted by permission.
10-2 SECTION D Industry One—Information Technology
Business SummaryRosetta Stone Inc. provided technology-based, self-study language-learning solutions prima-rily under the Rosetta Stone brand. It developed, marketed, and sold software, online services,and audio practice tools to individuals, educational institutions, the armed forces, governmentagencies, and corporations. The company presented the language-learning market with atrusted name-brand solution that was more convenient and affordable than classroomcourses, and more effective, interactive, and engaging than other self-study options.5
Although other programs and services claimed to teach through immersion, the companyasserted that it provided the only solution that did not utilize classic teaching tools like trans-lations, explicit grammar explanations, or extensive vocabulary lists.6 The company believedthese elements delayed and impeded achieving language proficiency. Rosetta Stone’s ap-proach sought to replicate the innate, natural language-learning ability that children use tolearn their first language.7 It referred to its teaching method as Dynamic Immersion.
The business model developed for Rosetta Stone distinguished the firm from other language-learning companies. The company was able to offer many languages on personal computers, on lo-cal networks, and online using its proprietary content as a result of its scalable technology platform.8
Marketing, sales, and distribution efforts were highly integrated and focused on customer interactionwith Rosetta Stone products.9 Each marketing and distribution channel was meant to complementand support the others. This ensured greater awareness across channels, cost-effective consumer ac-quisition and education, premium brand building, and improved convenience for customers.10
The company’s executive offices were in Washington, DC. It also had offices in London, Mu-nich, Tokyo, Seoul, and Boulder, Colorado. As of December 31, 2009, the company employed 1,738individuals: 922 full-time and 816 part-time employees.11 Its personnel consisted of 266 employeesin sales and marketing, 333 employees in research and development, 190 in general and administra-tive, and 894 kiosk sales employees. The company’s website is www.RosettaStone.com.
History12
The idea for Rosetta Stone originated in the 1980s, when Allen Stoltzfus set out to learn Russian. Stoltzfus was having a difficult time with the language and he attributed his slow progressto his study methods. Years earlier, he lived and studied in Germany. His control of Germanwas facilitated by the language immersion he experienced while abroad. To learn Russian,Stoltzfus realized that he needed to create an environment conducive to learning a languagenaturally, rather than sit in a classroom reviewing grammar rules and translating texts.
Stoltzfus turned to computer technology, along with contextualized inputs like picturesand conversations, to simulate the way people acquired their first language. He discussed hisidea with his brother-in-law, John Fairfield, who had a PhD in Computer Science. They believedthat technology was not yet ready for their ambitions.
By 1992 technology had improved. Allen Stoltzfus founded Fairfield Language Technologiesin Harrisonburg, Virginia, and became the company’s Chairman and President. He recruitedhis brother, Eugene Stoltzfus, to be Fairfield’s Executive Vice President. Eugene had a back-ground in architecture and he contributed his expertise in designing the program’s appearanceand organization. Allen and Eugene Stoltzfus, along with John Fairfield, named their product
as a priority or could its efforts be better allocated elsewhere? Companies that depend on technol-ogy face environmental risks which include economic conditions; federal, state, and local regula-tions; and taxes and supplier or vendor concerns.4 To effectively compete, Rosetta Stone will haveto push product and service development as well as attract and retain talented personnel.
CASE 10 Rosetta Stone Inc. 10-3
Rosetta Stone, after the artifact that served as the key to understanding Egyptian hieroglyphics.Like the artifact, their product was meant to unlock language-learning success.
Allen Stoltzfus passed away in 2002 and Eugene filled the role of President and Chairmanuntil the end of 2005. In 2003, Tom Adams was named CEO and began guiding the company’sexpansionary strategies. In 2005, the company opened an office in the United Kingdom.13 In2006, investment firms ABS Capital Partners and Northwest Equity Partners bought FairfieldLanguage Technologies, renaming the company Rosetta Stone.
At the end of that year, the company paid an up-front fee for a perpetual, irrevocable, andworldwide license allowing Rosetta Stone Inc. to use speech recognition technology devel-oped at the University of Colorado.14 The University of Colorado, Boulder, was ranked 24thand 25th on U.S. News & World Report’s lists of Top Speech–Language Pathology Programsand Top Audiology Programs, respectively.15 The company also hired some of the technol-ogy’s original developers to build on its speech recognition expertise. Rosetta Stone openedan office in Japan in 2007 and in Korea in 2009.16
The company sold its products in more than 30 different languages and in more than150 countries when it had its initial public offering. Rosetta Stone Inc. (RST) began publictrading on the New York Stock Exchange in April 2009. Its shares were priced at $18, abovethe estimated $15 to $17 range. The price for RST jumped 42% from $18 to $25.55 in late-morning trading.17 Rosetta Stone sold 6.25 million shares for a total of $112.5 million. Ana-lysts tied the company’s success to a lack of publicly held competitors.18
In November 2009, Rosetta Stone acquired assets from SGLC International Co. Ltd., asoftware reseller in Seoul, South Korea. The purchase price consisted of an initial cash payment of $100,000 followed by three annual cash installment payments, based on revenueperformance in South Korea.19 Rosetta Stone’s total revenue for the year ended December 31,2009, was $252.3 million.
Corporate Governance20
Management TeamTom Adams was the Chief Executive Officer of Rosetta Stone; he joined the company in 2003.
In 2009, he was named the Ernst & Young Entrepreneur of the Year® overall national win-ner, the Executive of the Year by the American Business Awards (Stevies), and SmartCEOCEO of the Year. He was fluent in French, Swedish, English, and Spanish. He had a work-ing knowledge of German and Chinese and was learning Russian.
Brian Helman acted as Chief Financial Officer. Prior to joining Rosetta Stone, he was CFOfor NEON Systems, a publicly held provider of mainframe integration software.
Greg Keim was the head of the company’s technology labs and was responsible for innovationacross all products. He joined Rosetta Stone in 1992, leading technical design and devel-opment. In 1999, Keim returned to Rosetta Stone as the company’s Chief Technical Officer.
Gregory Long was responsible for product development functions. He also oversaw the con-tent team, the software development group, and the product management organization.Prior to joining Rosetta Stone, Long was Vice President of Product Development forLeapFrog SchoolHouse.
Michael Wu was responsible for all legal, corporate governance, government affairs, andcompliance matters at Rosetta Stone. He joined the company in 2006 and establishedthe firm’s corporate compliance and corporate governance functions as well as its anti-piracy and anti-fraud enforcement program. He was fluent in English and MandarinChinese.
10-4 SECTION D Industry One—Information Technology
Mike Fulkerson led the advanced research and development group, which drove innovationfor all language-learning technologies related to future products. Before joining RosettaStone, he was a technical director for Serco, a provider of managerial and technologicalconsulting services.
Pamela Mulder led the international development team in charge of new market expansionand sharing best practices across markets outside the United States. Mulder joined thecompany in 2004 as the head of Consumer Sales and Marketing and later built up theglobal brand team. She was fluent in English and Spanish and was learning Italian.
Jay Topper was responsible for the Customer Success organization within Rosetta Stone,which included the support departments, language-learning coaches and the customersuccess team. Topper joined the Company in 2007 as Chief Information Officer.
Pete Rumpel led the company’s institutional sales and marketing efforts. Before RosettaStone, Rumpel was Vice President and leader of SAPAmericas business development. Hewas learning French.
Eric Duehring led global brand marketing and all United States consumer efforts including onlineand offline marketing, creative services, public relations, retail sales, and kiosk sales and oper-ations. Prior to Rosetta Stone, Duehring was with AOL as senior Vice President of Marketing.
Michaela Oliver was the senior Vice President of Human Resources for Rosetta Stone. Shehad served as the senior Vice President of Human Resources at AOL. Oliver was conver-sational in Russian and French.
International LeadershipTak Shiohama acted as President of Rosetta Stone Japan Inc., a subsidiary of Rosetta
Stone Inc. Shiohama previously worked as a strategic consultant of Accenture andA.T. Kearney. He was fluent in Japanese and English and was learning Spanish, French,and Chinese.
Steven Cho was responsible for the company’s business and operations in South Korea. Priorto joining Rosetta Stone, Cho was a managing partner at SGLC International. He was fluentin English and Korean and was learning French.
Sylke Riester was Managing Director of Rosetta Stone, Europe. Riester had a strong back-ground in telecommunications and expertise in business growth. A native Dutch speaker,Riester was also fluent in German and English. She was also learning Swedish.
Oskar Handrick was the Country Manager for Germany. Handrick had worked in researchand development for the BMW Group in Germany. He spoke English, French, and Germanfluently and was learning Spanish.
Board of DirectorsPhil Clough was a managing general partner at ABS Capital Partners; his investment interests
and experience included business services companies.
John Coleman was President and Chief Operating Officer of Massachusetts-based Bose Corporation until he retired in July 2005.
Laurence Franklin was the CEO of Tumi, the leading international brand of luxury travel,business, and lifestyle accessories.
Patrick Gross was Chairman of The Lovell Group, a private advisory and investment firm.
John Lindahl was a managing general partner at Norwest Equity Partners, a private equity firm.
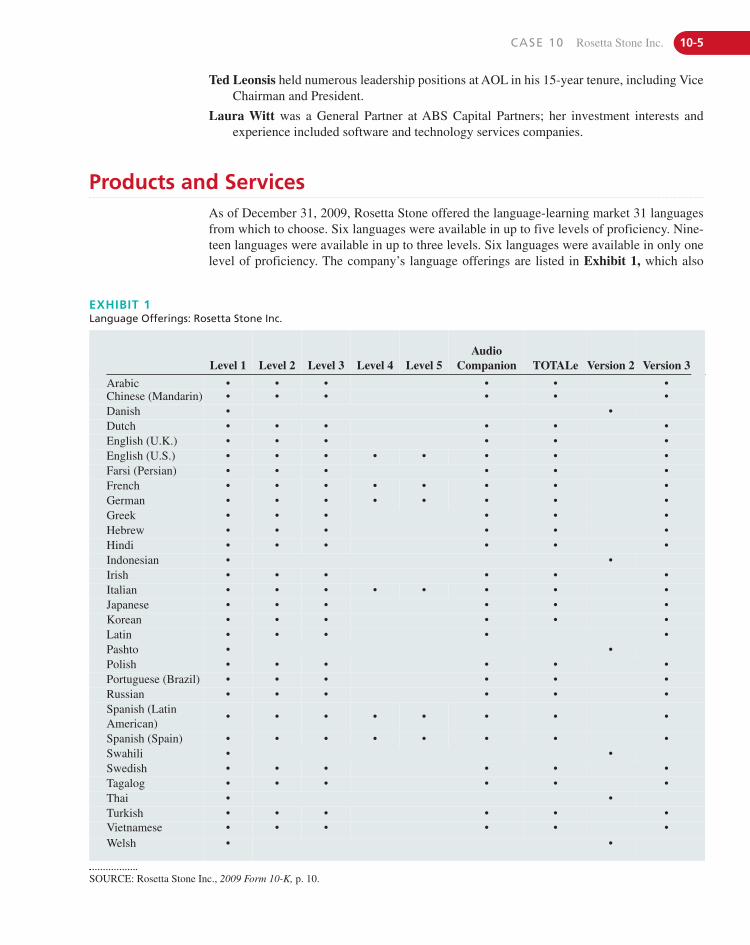
CASE 10 Rosetta Stone Inc. 10-5
Products and ServicesAs of December 31, 2009, Rosetta Stone offered the language-learning market 31 languagesfrom which to choose. Six languages were available in up to five levels of proficiency. Nine-teen languages were available in up to three levels. Six languages were available in only onelevel of proficiency. The company’s language offerings are listed in Exhibit 1, which also
Level 1 Level 2 Level 3 Level 4 Level 5Audio
Companion TOTALe Version 2 Version 3
Arabic • • • • • •Chinese (Mandarin) • • • • • •Danish • •Dutch • • • • • •English (U.K.) • • • • • •English (U.S.) • • • • • • • •Farsi (Persian) • • • • • •French • • • • • • • •German • • • • • • • •Greek • • • • • •Hebrew • • • • • •Hindi • • • • • •Indonesian • •Irish • • • • • •Italian • • • • • • • •Japanese • • • • • •Korean • • • • • •Latin • • • • •Pashto • •Polish • • • • • •Portuguese (Brazil) • • • • • •Russian • • • • • •Spanish (LatinAmerican)
• • • • • • • •
Spanish (Spain) • • • • • • • •Swahili • •Swedish • • • • • •Tagalog • • • • • •Thai • •Turkish • • • • • •Vietnamese • • • • • •Welsh • •
EXHIBIT 1Language Offerings: Rosetta Stone Inc.
SOURCE: Rosetta Stone Inc., 2009 Form 10-K, p. 10.
Ted Leonsis held numerous leadership positions at AOL in his 15-year tenure, including ViceChairman and President.
Laura Witt was a General Partner at ABS Capital Partners; her investment interests and experience included software and technology services companies.
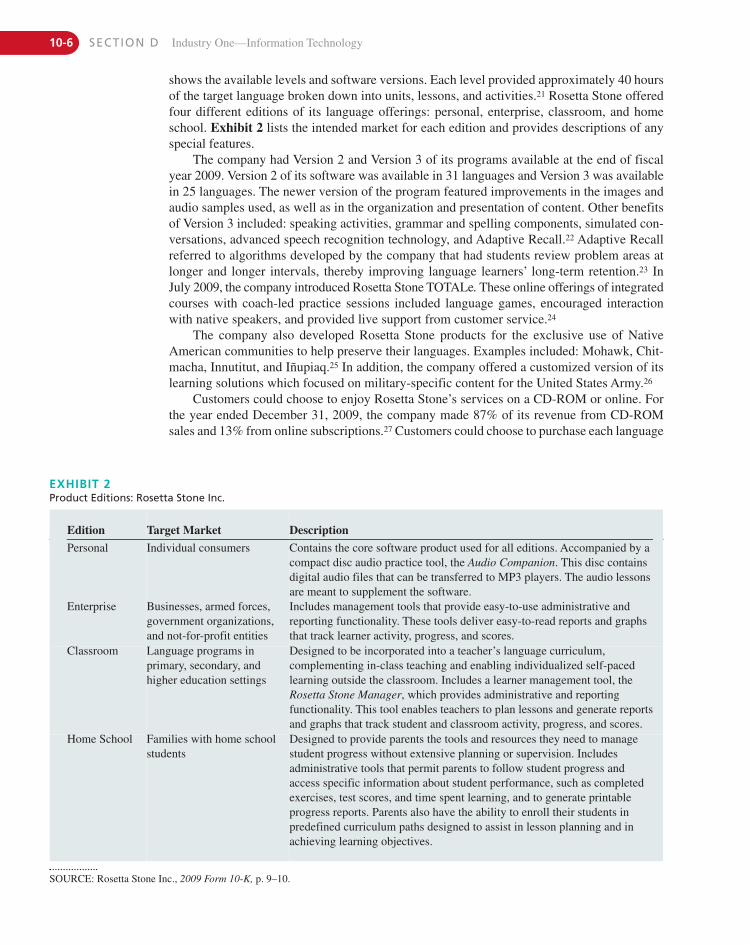
10-6 SECTION D Industry One—Information Technology
Edition Target Market Description
Personal Individual consumers Contains the core software product used for all editions. Accompanied by acompact disc audio practice tool, the Audio Companion. This disc containsdigital audio files that can be transferred to MP3 players. The audio lessonsare meant to supplement the software.
Enterprise Businesses, armed forces,government organizations,and not-for-profit entities
Includes management tools that provide easy-to-use administrative andreporting functionality. These tools deliver easy-to-read reports and graphsthat track learner activity, progress, and scores.
Classroom Language programs inprimary, secondary, andhigher education settings
Designed to be incorporated into a teacher’s language curriculum,complementing in-class teaching and enabling individualized self-pacedlearning outside the classroom. Includes a learner management tool, theRosetta Stone Manager, which provides administrative and reportingfunctionality. This tool enables teachers to plan lessons and generate reportsand graphs that track student and classroom activity, progress, and scores.
Home School Families with home schoolstudents
Designed to provide parents the tools and resources they need to managestudent progress without extensive planning or supervision. Includesadministrative tools that permit parents to follow student progress andaccess specific information about student performance, such as completedexercises, test scores, and time spent learning, and to generate printableprogress reports. Parents also have the ability to enroll their students inpredefined curriculum paths designed to assist in lesson planning and inachieving learning objectives.
EXHIBIT 2Product Editions: Rosetta Stone Inc.
SOURCE: Rosetta Stone Inc., 2009 Form 10-K, p. 9–10.
shows the available levels and software versions. Each level provided approximately 40 hoursof the target language broken down into units, lessons, and activities.21 Rosetta Stone offeredfour different editions of its language offerings: personal, enterprise, classroom, and homeschool. Exhibit 2 lists the intended market for each edition and provides descriptions of anyspecial features.
The company had Version 2 and Version 3 of its programs available at the end of fiscalyear 2009. Version 2 of its software was available in 31 languages and Version 3 was availablein 25 languages. The newer version of the program featured improvements in the images andaudio samples used, as well as in the organization and presentation of content. Other benefitsof Version 3 included: speaking activities, grammar and spelling components, simulated con-versations, advanced speech recognition technology, and Adaptive Recall.22 Adaptive Recallreferred to algorithms developed by the company that had students review problem areas atlonger and longer intervals, thereby improving language learners’ long-term retention.23 InJuly 2009, the company introduced Rosetta Stone TOTALe. These online offerings of integratedcourses with coach-led practice sessions included language games, encouraged interactionwith native speakers, and provided live support from customer service.24
The company also developed Rosetta Stone products for the exclusive use of NativeAmerican communities to help preserve their languages. Examples included: Mohawk, Chit-macha, Innutitut, and Iñupiaq.25 In addition, the company offered a customized version of itslearning solutions which focused on military-specific content for the United States Army.26
Customers could choose to enjoy Rosetta Stone’s services on a CD-ROM or online. Forthe year ended December 31, 2009, the company made 87% of its revenue from CD-ROMsales and 13% from online subscriptions.27 Customers could choose to purchase each language
CASE 10 Rosetta Stone Inc. 10-7
Content and Curriculum30
Rosetta Stone’s curriculum encouraged students to progress from seeing and recognizing pictures and vocabulary and hearing native speakers to actually speaking the target language.Language learners reviewed the alphabet, vocabulary, and intuitive grammar as well as theskills of reading, listening, pronunciation, and conversation without the use of translation exercises or detailed explanations. Lessons combined the introduction of new concepts, a reviewof recent material, and the production of key phrases. The curriculum was designed to be flexibleso that learners could focus on meeting particular goals or developing certain abilities.
The company’s products relied on a library of more than 25,000 photographic images and400,000 professionally recorded sound files. The images, along with their combinations,aimed to convey a universal meaning. This enabled the company to apply the same curriculumacross multiple languages and conveniently sped up the rate at which the company could addnew languages to its product line. Rosetta Stone implemented a specific sequencing methoddevised to teach the user the most important and relevant language skills. It also incorporatedlanguages’ specific nuances, such as dual forms for parts of speech in Arabic. Any localizationtailored by the company was minimal because Rosetta Stone did not rely on translations fromthe target language to the learner’s native language.
Technology31
Rosetta Stone developed most of its own technology. It created content development tools thatallowed curriculum specialists to write, edit, manage, and publish course materials. Thesetools allowed authors, translators, voicers, photographers, and editors to work efficiently andcooperatively across multiple locations. The company developed the software’s intuitive userinterface which assisted in the learner’s transition from listening comprehension to speaking.Rosetta Stone established a student management system designed to allow teachers and ad-ministrators to configure lesson plans and to review student progress reports. The company,with the help of software firm Parature Inc., offered customer service via Facebook.32
The technology supporting Rosetta Stone’s programs was specially designed to handle the complexities of languages. For example, the company’s software was able to support languages written from right-to-left such as Arabic and Hebrew, along with languages withcharacters such as Chinese and Japanese. Rosetta Stone’s speech recognition technology was
level separately or pay a discounted price by purchasing all available levels of a language together. Prices ranged from $219 for Level 1 of Indonesian to $1,199 for TOTALe Korean.
The company also supported an online peer-to-peer practice environment calledSharedTalk at www.SharedTalk.com.28 Anyone was able to register on the website for free inorder to find language partners across the world and acquire pen pals for e-mail exchange.SharedTalk had more than 125,000 active users in 2009.
The company’s growth strategies centered on expanding its offerings and target market.Rosetta Stone planned to develop advanced course levels and add new languages. The com-pany also recognized that adding skill development and remediation courses to its product linecould attract advanced language learners to the brand. In addition, the company could developcustomized versions of its programs for industries like healthcare, business, real estate, and re-tail. Rosetta Stone Version 4 TOTALe was planned for release in September 2010.29 It wouldintegrate the Version 3 language-learning software solution with the online features of RosettaStone TOTALe.
10-8 SECTION D Industry One—Information Technology
included in Version 3. This technology targeted the different challenges language learners encountered when speaking. For example, this technology recognized non-native speech un-derstanding and highlighted pronunciation feedback, reinforcing correct pronunciation. Thespeech recognition models used by the program also included languages and dialects that hadnot been supported by speech recognition software in the past, such as Irish.
For the year ended December 31, 2009, the company’s research and development expenses were $26.2 million, or 10.4% of total revenue. Rosetta Stone intended to advance itssoftware platform and its speech recognition technology. The company also sought to build onits success with www.SharedTalk.com. The company was evaluating opportunities to extendits offerings to mobile technology. For example, it was developing a mobile application calledRosetta Stone Mini for release during the second half of 2010.
Manufacturing and Fulfillment33
Rosetta Stone focused on minimizing costs and achieving efficiency as it met its productiongoals. It obtained most of its products and packaging components from third-party contractmanufacturers. It also had alternative sources to turn to in the event that its main manufacturersand suppliers were unavailable.
The company’s fulfillment facility in Harrisonburg, Virginia, was its primary facility forpackaging and distributing products. Rosetta Stone also contracted with third-party vendors inMunich for fulfillment services such as order processing, inventory control, and e-commerce;the Netherlands for consumer orders in Europe; and Tokyo, Japan, for orders in Japan.
Language-Learning Success34
In 2009, Rosetta Stone Inc. commissioned Roumen Vesselinov, PhD, a visiting professor atQueens College, City University of New York, as well as Rockman et al., an independentevaluation research and consulting firm, to study the effectiveness of Rosetta Stone’s offerings.Their results, along with the numerous awards and recognition the company received, supported the company’s initiatives and accomplishments.
Vesselinov discovered that after 55 hours of study using the company’s Spanishprogram, a student would be able to achieve a WebCAPE score at a level sufficient to fulfillthe requirements for one semester of Spanish in a college that offered six semesters of thelanguage, with 95% confidence. WebCAPE, or the Web-based Computer Adaptive PlacementExam, was a standardized test which was used by over 500 colleges and universities for language-level placement. Sixty-four percent of the students from this study improved their oral profi-ciency by at least one level on a seven-level scale based on the American Council on theTeaching of Foreign Languages (ACTFL) OPIc test. This test was used worldwide by academicinstitutions, government agencies, and private corporations for evaluating oral languageproficiency.
Rockman’s study showed that after 64 hours of study with Rosetta Stone Spanish (LatinAmerican) and six hours of Rosetta Stone Studio sessions, 78% of the students participatingin its study increased their oral proficiency by at least one level on the seven-level scale developed by ACTFL. Rosetta Stone Studio provided an interactive online environment inreal-time where learners communicated with students and native-speaking coaches.
In 2009, the company placed #14 on the Inc. 5000 list for the education industry. It alsoreceived the National Parenting Publications Awards (NAPPA) Honors Award for RosettaStone Version 3 Personal Edition, four classroom-specific awards for Classroom Version 3,
CASE 10 Rosetta Stone Inc. 10-9
Marketing, Sales, and Distribution35
The company’s growth and profitability were dependent upon the effectiveness and effi-ciency of Rosetta Stone’s direct marketing expenditures. In 2009, 82% of Rosetta Stone’srevenue was generated through the company’s direct sales channels, which included its callcenters, websites, institutional sales force, and kiosks.
Rosetta Stone’s advertising campaigns encompassed radio, television, and print. Thecompany had advertisements in national publications such as Time, The Economist, TheNew Yorker, and National Geographic. The company’s strategy was to purchase “remnant”advertising segments.36 These segments were random time slots and publication dates thathad remained unsold and were offered at discounts. There was a limited supply of this typeof advertising, and it was not guaranteed that the company would be able to stay within itsmarketing budget if these discounted slots were unavailable. Past Rosetta Stone advertise-ments featured U.S. Olympic gold medal swimmer Michael Phelps. Another marketingcampaign depicted a farmer hoping to impress a supermodel with his Italian-speaking abilities.37
The company’s online media advertising strategy included banner and paid search adver-tising, as well as affiliate relationships. Rosetta Stone worked with online agencies to buy impression-based and performance-based traffic. The company tracked the effectiveness of itsadvertising by asking customers to indicate the marketing campaigns that caught their attention.The company’s website provided a space for users to leave testimonials and reviews. Positivestories and comments served as free word-of-mouth advertising favoring Rosetta Stone’sproducts and services.
Marketing research supported the success of the company’s advertising programs. According to an August 2008 survey commissioned from Global Market Insite Inc., a marketresearch services firm, Rosetta Stone was the most recognized language-learning brand in theUnited States. Of those surveyed who had an opinion of the brand, over 80% had associated itwith high quality and effective products and services for teaching foreign languages. In addition,internal studies from January and February 2009 showed that aided brand awareness forRosetta Stone in the United States was approximately 74%–79%, based on general populationsurveys. Aided brand awareness refers to customers’ recollection of a particular brand nameafter seeing or hearing about the product.
Sales and marketing expenses were 46% of total revenue for the year ended December 31,2009.38 That year, Rosetta Stone expanded its direct marketing activities, and sales and mar-keting expenses increased by $21.5 million, or by 23%, to $114.9 million. During 2009, thecompany increased direct advertising expenses by 25% to $42.4 million. Advertising expensesrelated to television and radio media and Internet marketing grew by $8.6 million. RosettaStone Inc. also increased its number of kiosks from 150 to 242 in 2009, which resulted in$6.2 million of additional kiosk operating expenses, which included rent and sales compensation-related expenses. Personnel costs related to growth in the institutional sales channel and marketing and sales support activities increased by $6.4 million since 2008.
as well as two enterprise-specific awards for its products. In 2008, it received the CODiEawards for best corporate learning solution and best instructional solution in other curricu-lum areas from the Software & Information Industry Association. In 2007, the company won the EDDIE multilevel foreign language award for Chinese levels 1 and 2 and a multi-level English-as-a-second-language, or ESL, award for English levels 1, 2, and 3 fromComputED Gazette.
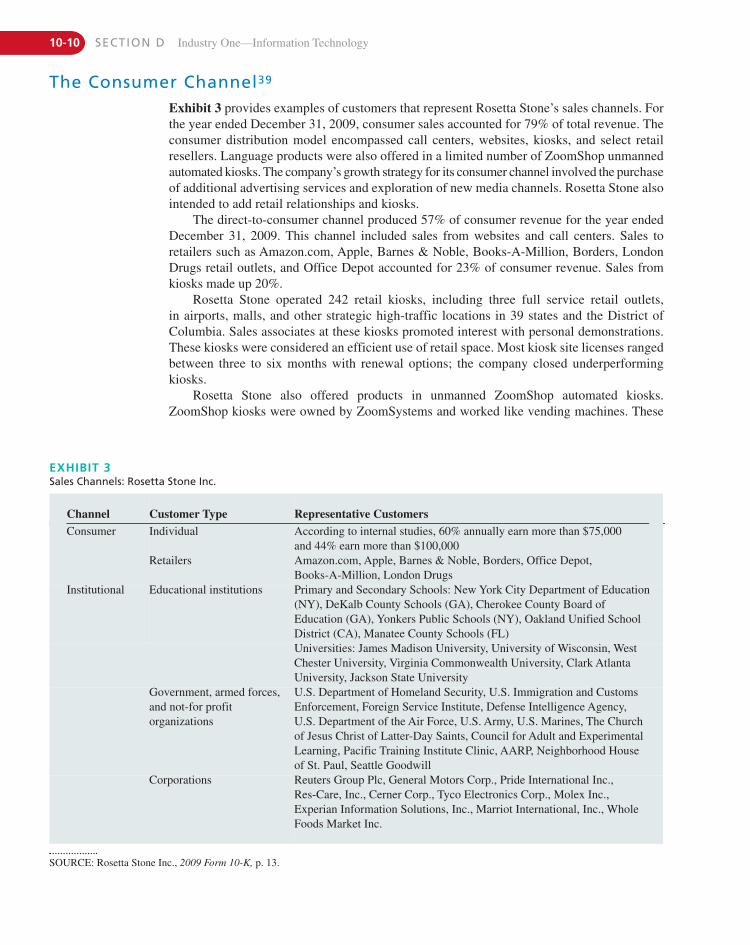
Channel Customer Type Representative CustomersConsumer Individual According to internal studies, 60% annually earn more than $75,000
and 44% earn more than $100,000Retailers Amazon.com, Apple, Barnes & Noble, Borders, Office Depot,
Books-A-Million, London DrugsInstitutional Educational institutions Primary and Secondary Schools: New York City Department of Education
(NY), DeKalb County Schools (GA), Cherokee County Board of Education (GA), Yonkers Public Schools (NY), Oakland Unified SchoolDistrict (CA), Manatee County Schools (FL)Universities: James Madison University, University of Wisconsin, WestChester University, Virginia Commonwealth University, Clark AtlantaUniversity, Jackson State University
Government, armed forces,and not-for profitorganizations
U.S. Department of Homeland Security, U.S. Immigration and CustomsEnforcement, Foreign Service Institute, Defense Intelligence Agency, U.S. Department of the Air Force, U.S. Army, U.S. Marines, The Church of Jesus Christ of Latter-Day Saints, Council for Adult and ExperimentalLearning, Pacific Training Institute Clinic, AARP, Neighborhood House of St. Paul, Seattle Goodwill
Corporations Reuters Group Plc, General Motors Corp., Pride International Inc., Res-Care, Inc., Cerner Corp., Tyco Electronics Corp., Molex Inc., Experian Information Solutions, Inc., Marriot International, Inc., WholeFoods Market Inc.
EXHIBIT 3Sales Channels: Rosetta Stone Inc.
SOURCE: Rosetta Stone Inc., 2009 Form 10-K, p. 13.
The Consumer Channel39
Exhibit 3 provides examples of customers that represent Rosetta Stone’s sales channels. Forthe year ended December 31, 2009, consumer sales accounted for 79% of total revenue. Theconsumer distribution model encompassed call centers, websites, kiosks, and select retail resellers. Language products were also offered in a limited number of ZoomShop unmannedautomated kiosks. The company’s growth strategy for its consumer channel involved the purchaseof additional advertising services and exploration of new media channels. Rosetta Stone alsointended to add retail relationships and kiosks.
The direct-to-consumer channel produced 57% of consumer revenue for the year ended December 31, 2009. This channel included sales from websites and call centers. Sales to retailers such as Amazon.com, Apple, Barnes & Noble, Books-A-Million, Borders, LondonDrugs retail outlets, and Office Depot accounted for 23% of consumer revenue. Sales fromkiosks made up 20%.
Rosetta Stone operated 242 retail kiosks, including three full service retail outlets,in airports, malls, and other strategic high-traffic locations in 39 states and the District ofColumbia. Sales associates at these kiosks promoted interest with personal demonstrations.These kiosks were considered an efficient use of retail space. Most kiosk site licenses rangedbetween three to six months with renewal options; the company closed underperformingkiosks.
Rosetta Stone also offered products in unmanned ZoomShop automated kiosks.ZoomShop kiosks were owned by ZoomSystems and worked like vending machines. These
10-10 SECTION D Industry One—Information Technology
kiosks provided interactive demonstrations on their touch screens with audio that helped illus-trate teaching techniques. These devices required low capital commitment and allowedRosetta Stone to quickly establish a presence in retail locations. Other retailers that relied onZoomSystems to sell their products from kiosks included Apple, Best Buy, Proactive Solution,Sephora, and the Body Shop.
The Institutional Channel40
For the year ended December 31, 2009, institutional sales accounted for 21% of total revenue.Rosetta Stone’s institutional distribution model served four markets: primary and secondaryschools, colleges, and universities; the U.S. armed forces and federal government agencies;corporations; and not-for-profit organizations.
Sales to educational institutions represented 44% of institutional sales for the year endedDecember 31, 2009. Sales to governmental agencies, the armed forces, and not-for-profit or-ganizations accounted for 25% of institutional sales. Examples of not-for-profit groups pur-chasing Rosetta Stone products included those that trained volunteers to teach ESL students,sent members overseas for work, and established literacy programs. Home school sales repre-sented 19% and corporations 12% of institutional revenue.
Regional sales managers were assigned to sales territories and supervised account man-agers who maintained the customer base. The company expanded its sales force to keep upwith its institutional marketing activities. Rosetta Stone promoted interest within this channelwith onsite visits, speaking engagements, trade show and conference demonstrations, seminarattendance, direct mailings, advertising in institutional publications, and responses to request-for-proposals and to calls based on recommendations from existing customers. Request-for-proposals were statements seeking certain services through a bidding process that were madeto vendors.
InternationalInternational sales accounted for 8% of revenue for the year ended December 31, 2009. In ad-dition to its international subsidiaries in the United Kingdom, Germany, South Korea, andJapan, the company operated nine kiosks in the United Kingdom, 12 in Japan, and 20 in SouthKorea.41 To facilitate growth, the company planned to develop its international businessthrough its subsidiaries and to explore opportunities in additional markets in Europe, Asia, andLatin America.
Protecting Rosetta StoneThe company relied on patents, trade secrets, trademarks, copyrights, and nondisclosure andother contractual arrangements to protect its intellectual property.42 Exhibit 4 lists the com-pany’s intangible assets. Rosetta Stone also protected its trade dress, or the visual appearanceof its products and its packaging. The company believed that its yellow box and blue logoswere important in building Rosetta Stone’s brand image and distinguishing its solutions fromthose of its competitors.43 In addition, individuals who worked for Rosetta Stone were re-quired to sign agreements that prohibited the unauthorized disclosure of the company’s pro-prietary rights, information, and technology.44
Each CD-ROM came with a product key that verified that the disc was not illegallycopied. The key activated the program after installation and prevented multiple accesses to the
CASE 10 Rosetta Stone Inc. 10-11
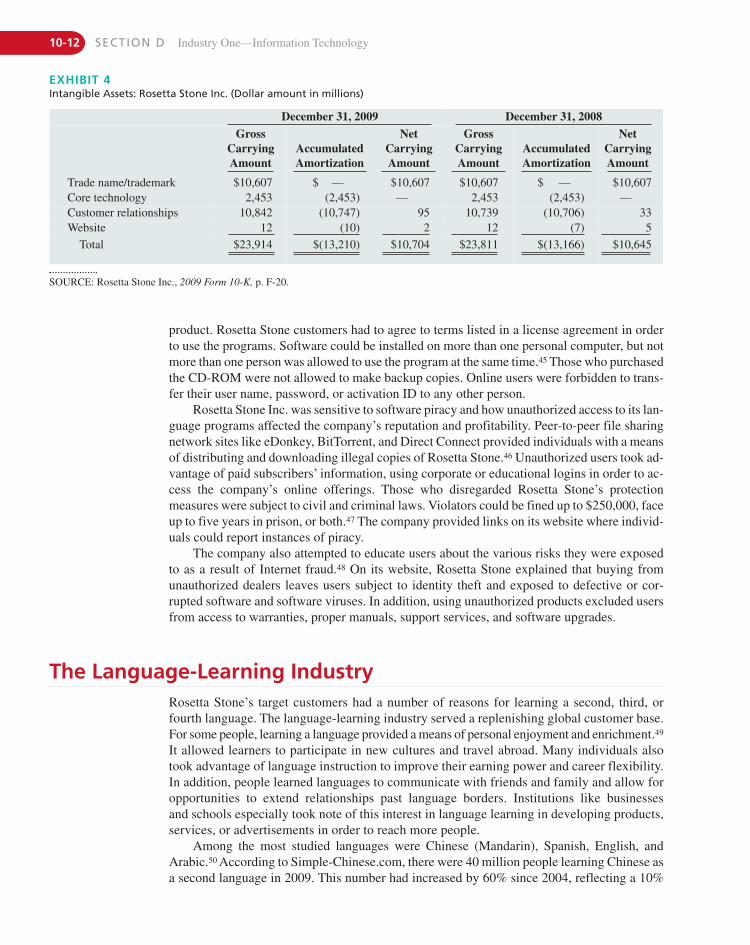
10-12 SECTION D Industry One—Information Technology
product. Rosetta Stone customers had to agree to terms listed in a license agreement in orderto use the programs. Software could be installed on more than one personal computer, but notmore than one person was allowed to use the program at the same time.45 Those who purchasedthe CD-ROM were not allowed to make backup copies. Online users were forbidden to trans-fer their user name, password, or activation ID to any other person.
Rosetta Stone Inc. was sensitive to software piracy and how unauthorized access to its lan-guage programs affected the company’s reputation and profitability. Peer-to-peer file sharingnetwork sites like eDonkey, BitTorrent, and Direct Connect provided individuals with a meansof distributing and downloading illegal copies of Rosetta Stone.46 Unauthorized users took ad-vantage of paid subscribers’ information, using corporate or educational logins in order to ac-cess the company’s online offerings. Those who disregarded Rosetta Stone’s protectionmeasures were subject to civil and criminal laws. Violators could be fined up to $250,000, faceup to five years in prison, or both.47 The company provided links on its website where individ-uals could report instances of piracy.
The company also attempted to educate users about the various risks they were exposedto as a result of Internet fraud.48 On its website, Rosetta Stone explained that buying fromunauthorized dealers leaves users subject to identity theft and exposed to defective or cor-rupted software and software viruses. In addition, using unauthorized products excluded usersfrom access to warranties, proper manuals, support services, and software upgrades.
The Language-Learning IndustryRosetta Stone’s target customers had a number of reasons for learning a second, third, orfourth language. The language-learning industry served a replenishing global customer base.For some people, learning a language provided a means of personal enjoyment and enrichment.49
It allowed learners to participate in new cultures and travel abroad. Many individuals alsotook advantage of language instruction to improve their earning power and career flexibility.In addition, people learned languages to communicate with friends and family and allow foropportunities to extend relationships past language borders. Institutions like businesses and schools especially took note of this interest in language learning in developing products,services, or advertisements in order to reach more people.
Among the most studied languages were Chinese (Mandarin), Spanish, English, and Arabic.50 According to Simple-Chinese.com, there were 40 million people learning Chinese asa second language in 2009. This number had increased by 60% since 2004, reflecting a 10%
December 31, 2009 December 31, 2008
Gross CarryingAmount
AccumulatedAmortization
NetCarryingAmount
Gross CarryingAmount
AccumulatedAmortization
NetCarryingAmount
Trade name/trademark $10,607 $ — $10,607 $10,607 $ — $10,607Core technology 2,453 (2,453) — 2,453 (2,453) —Customer relationships 10,842 (10,747) 95 10,739 (10,706) 33Website 12 (10) 2 12 (7) 5
Total $23,914 $(13,210) $10,704 $23,811 $(13,166) $10,645
EXHIBIT 4Intangible Assets: Rosetta Stone Inc. (Dollar amount in millions)
SOURCE: Rosetta Stone Inc., 2009 Form 10-K, p. F-20.

CASE 10 Rosetta Stone Inc. 10-13
increase in Chinese learners every year.51 The growth in the Spanish-speaking population inthe United States influenced the popularity of the language. In 2009, the Pew Hispanic Research Center estimated that there were 44 million Hispanics living in the United States. Itprojected that this number would grow exponentially to over 100 million people by 2050,when Hispanics would be 25% of the total population.52
There were 328 million native English speakers in 2009.53 English was the predomi-nant language for careers in business, science, and technology. According to Asiaone.com,33% of the world’s population would be learning English by 2016.54 British Prime MinisterGordon Brown estimated that 300 million people from China and 350 million people fromIndia spoke English. The demand for Arabic speakers in the United States increased afterthe September 11, 2001, attacks and the movement of American troops into Afghanistanand Iraq.55 Companies like Sakhr Software took advantage of this demand and their technology to market services to the U.S. government. Sakhr Software was an Egyptiancompany that developed a mobile application that could transmit audio translations of spoken phrases.56
The demand for language-learning products and services created a fragmented industryinfluenced by trends and consumer preferences. The industry provided language studentswith many alternative educational materials and environments in which to practice. Studentscould seek language lessons from textbook publishers, audio CD and MP3 downloadproviders, schools and universities, language centers like Berlitz and Inlingua, and online tutoring services.57 Students also relied on online dictionaries, translation services, and onlinesocial environments for language aid. Some services required students to pay, and others provided their offerings for free. Students could pay anywhere from $1.99 for a mobile application to $54,410 for one year of undergraduate education at Sarah Lawrence Collegein Bronxville, New York.58
Students differentiated language references and instruction by their teaching methods, effectiveness, convenience, fun and likelihood of continued practice, advertising, reputation,and price.59 The industry took advantage of trends such as increased online accessibility anddependence, interactive games, social networking, and the use of mobile applications. Accordingto a 2008 report by Euromonitor International Inc., a market research firm, there were morethan one billion personal computers in use and 1.7 billion people using the Internet by 2009.60
According to a 2007 report by Global Industry Analysts Inc., a market research firm, the globaldemand for the delivery of instructional content through the use of electronic technology, oreLearning, would grow an average of 21% annually between 2007 and 2010, reaching a totalestimated value of $53 billion by 2010.61
CompetitorsRosetta Stone’s primary competitors, most of which were privately held and divisions oflarger corporations, included Berlitz International Inc., Simon & Schuster, Inc. (Pimsleur),Random House Ventures LLC (Living Language), Disney Publishing Worldwide, McGraw-HillEducation, and Pearson. These companies differentiated their products and services by meansof the following features: teaching methods, effectiveness, convenience, fun and likelihoodof continued practice, advertising, reputation, and price.62
Berlitz International Inc. presented the Berlitz Method® as a teaching style that contextu-alized vocabulary and grammar in real-life situations and simulated natural conversations.63
The Berlitz School of Language was founded in 1878 and marketed to individuals, businesses,and institutions. The company had over 500 locations in 70 countries and provided access tomore than 50 languages. Examples of Berlitz’s offerings included online courses, study abroad
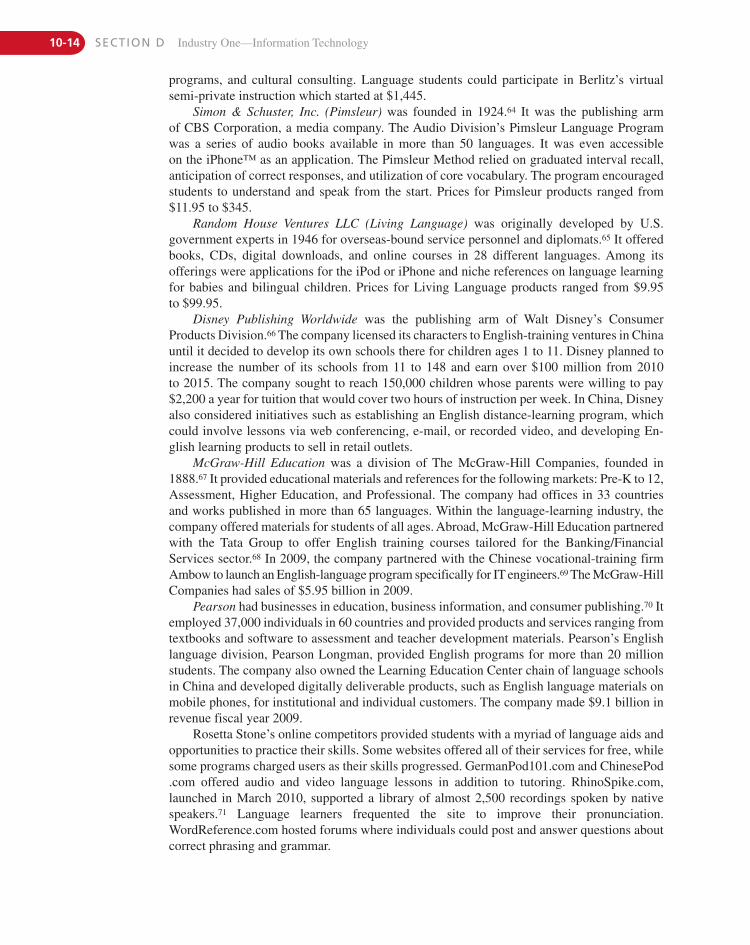
programs, and cultural consulting. Language students could participate in Berlitz’s virtualsemi-private instruction which started at $1,445.
Simon & Schuster, Inc. (Pimsleur) was founded in 1924.64 It was the publishing armof CBS Corporation, a media company. The Audio Division’s Pimsleur Language Programwas a series of audio books available in more than 50 languages. It was even accessibleon the iPhone™ as an application. The Pimsleur Method relied on graduated interval recall,anticipation of correct responses, and utilization of core vocabulary. The program encouragedstudents to understand and speak from the start. Prices for Pimsleur products ranged from$11.95 to $345.
Random House Ventures LLC (Living Language) was originally developed by U.S.government experts in 1946 for overseas-bound service personnel and diplomats.65 It offeredbooks, CDs, digital downloads, and online courses in 28 different languages. Among itsofferings were applications for the iPod or iPhone and niche references on language learningfor babies and bilingual children. Prices for Living Language products ranged from $9.95to $99.95.
Disney Publishing Worldwide was the publishing arm of Walt Disney’s Consumer Products Division.66 The company licensed its characters to English-training ventures in Chinauntil it decided to develop its own schools there for children ages 1 to 11. Disney planned toincrease the number of its schools from 11 to 148 and earn over $100 million from 2010 to 2015. The company sought to reach 150,000 children whose parents were willing to pay$2,200 a year for tuition that would cover two hours of instruction per week. In China, Disneyalso considered initiatives such as establishing an English distance-learning program, whichcould involve lessons via web conferencing, e-mail, or recorded video, and developing En-glish learning products to sell in retail outlets.
McGraw-Hill Education was a division of The McGraw-Hill Companies, founded in1888.67 It provided educational materials and references for the following markets: Pre-K to 12,Assessment, Higher Education, and Professional. The company had offices in 33 countries and works published in more than 65 languages. Within the language-learning industry, thecompany offered materials for students of all ages. Abroad, McGraw-Hill Education partneredwith the Tata Group to offer English training courses tailored for the Banking/Financial Services sector.68 In 2009, the company partnered with the Chinese vocational-training firmAmbow to launch an English-language program specifically for IT engineers.69 The McGraw-HillCompanies had sales of $5.95 billion in 2009.
Pearson had businesses in education, business information, and consumer publishing.70 Itemployed 37,000 individuals in 60 countries and provided products and services ranging fromtextbooks and software to assessment and teacher development materials. Pearson’s Englishlanguage division, Pearson Longman, provided English programs for more than 20 millionstudents. The company also owned the Learning Education Center chain of language schoolsin China and developed digitally deliverable products, such as English language materials onmobile phones, for institutional and individual customers. The company made $9.1 billion inrevenue fiscal year 2009.
Rosetta Stone’s online competitors provided students with a myriad of language aids andopportunities to practice their skills. Some websites offered all of their services for free, whilesome programs charged users as their skills progressed. GermanPod101.com and ChinesePod.com offered audio and video language lessons in addition to tutoring. RhinoSpike.com,launched in March 2010, supported a library of almost 2,500 recordings spoken by nativespeakers.71 Language learners frequented the site to improve their pronunciation.WordReference.com hosted forums where individuals could post and answer questions aboutcorrect phrasing and grammar.
10-14 SECTION D Industry One—Information Technology
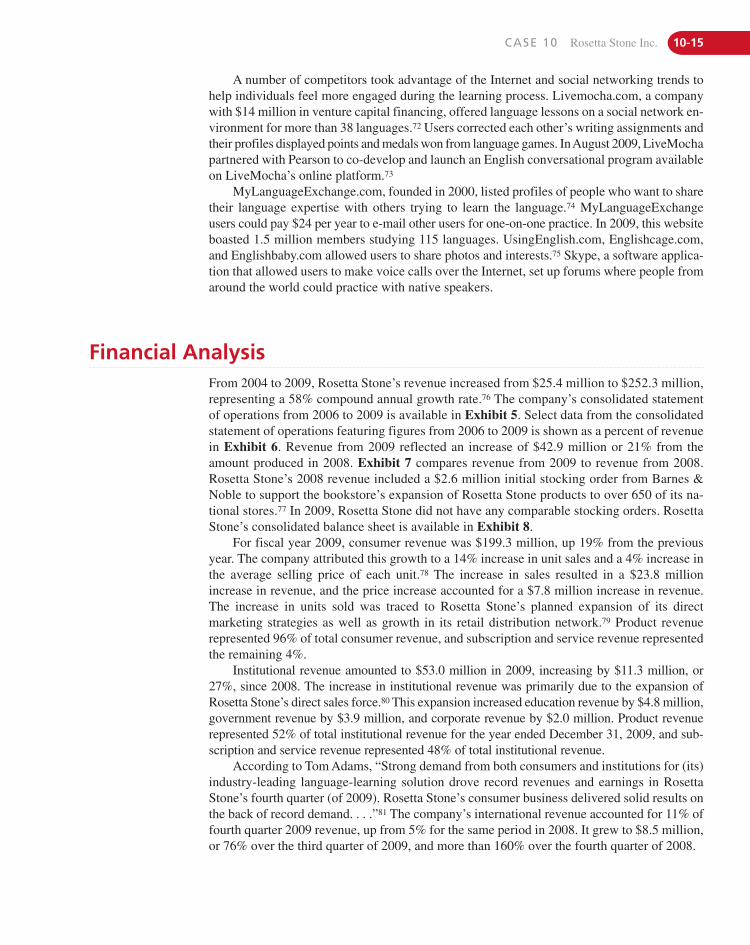
Financial AnalysisFrom 2004 to 2009, Rosetta Stone’s revenue increased from $25.4 million to $252.3 million,representing a 58% compound annual growth rate.76 The company’s consolidated statementof operations from 2006 to 2009 is available in Exhibit 5. Select data from the consolidatedstatement of operations featuring figures from 2006 to 2009 is shown as a percent of revenuein Exhibit 6. Revenue from 2009 reflected an increase of $42.9 million or 21% from theamount produced in 2008. Exhibit 7 compares revenue from 2009 to revenue from 2008.Rosetta Stone’s 2008 revenue included a $2.6 million initial stocking order from Barnes &Noble to support the bookstore’s expansion of Rosetta Stone products to over 650 of its na-tional stores.77 In 2009, Rosetta Stone did not have any comparable stocking orders. RosettaStone’s consolidated balance sheet is available in Exhibit 8.
For fiscal year 2009, consumer revenue was $199.3 million, up 19% from the previousyear. The company attributed this growth to a 14% increase in unit sales and a 4% increase inthe average selling price of each unit.78 The increase in sales resulted in a $23.8 million increase in revenue, and the price increase accounted for a $7.8 million increase in revenue.The increase in units sold was traced to Rosetta Stone’s planned expansion of its direct marketing strategies as well as growth in its retail distribution network.79 Product revenue represented 96% of total consumer revenue, and subscription and service revenue representedthe remaining 4%.
Institutional revenue amounted to $53.0 million in 2009, increasing by $11.3 million, or27%, since 2008. The increase in institutional revenue was primarily due to the expansion ofRosetta Stone’s direct sales force.80 This expansion increased education revenue by $4.8 million,government revenue by $3.9 million, and corporate revenue by $2.0 million. Product revenuerepresented 52% of total institutional revenue for the year ended December 31, 2009, and sub-scription and service revenue represented 48% of total institutional revenue.
According to Tom Adams, “Strong demand from both consumers and institutions for (its)industry-leading language-learning solution drove record revenues and earnings in RosettaStone’s fourth quarter (of 2009). Rosetta Stone’s consumer business delivered solid results onthe back of record demand. . . .”81 The company’s international revenue accounted for 11% offourth quarter 2009 revenue, up from 5% for the same period in 2008. It grew to $8.5 million,or 76% over the third quarter of 2009, and more than 160% over the fourth quarter of 2008.
A number of competitors took advantage of the Internet and social networking trends tohelp individuals feel more engaged during the learning process. Livemocha.com, a companywith $14 million in venture capital financing, offered language lessons on a social network en-vironment for more than 38 languages.72 Users corrected each other’s writing assignments andtheir profiles displayed points and medals won from language games. In August 2009, LiveMochapartnered with Pearson to co-develop and launch an English conversational program availableon LiveMocha’s online platform.73
MyLanguageExchange.com, founded in 2000, listed profiles of people who want to sharetheir language expertise with others trying to learn the language.74 MyLanguageExchangeusers could pay $24 per year to e-mail other users for one-on-one practice. In 2009, this websiteboasted 1.5 million members studying 115 languages. UsingEnglish.com, Englishcage.com,and Englishbaby.com allowed users to share photos and interests.75 Skype, a software applica-tion that allowed users to make voice calls over the Internet, set up forums where people fromaround the world could practice with native speakers.
CASE 10 Rosetta Stone Inc. 10-15
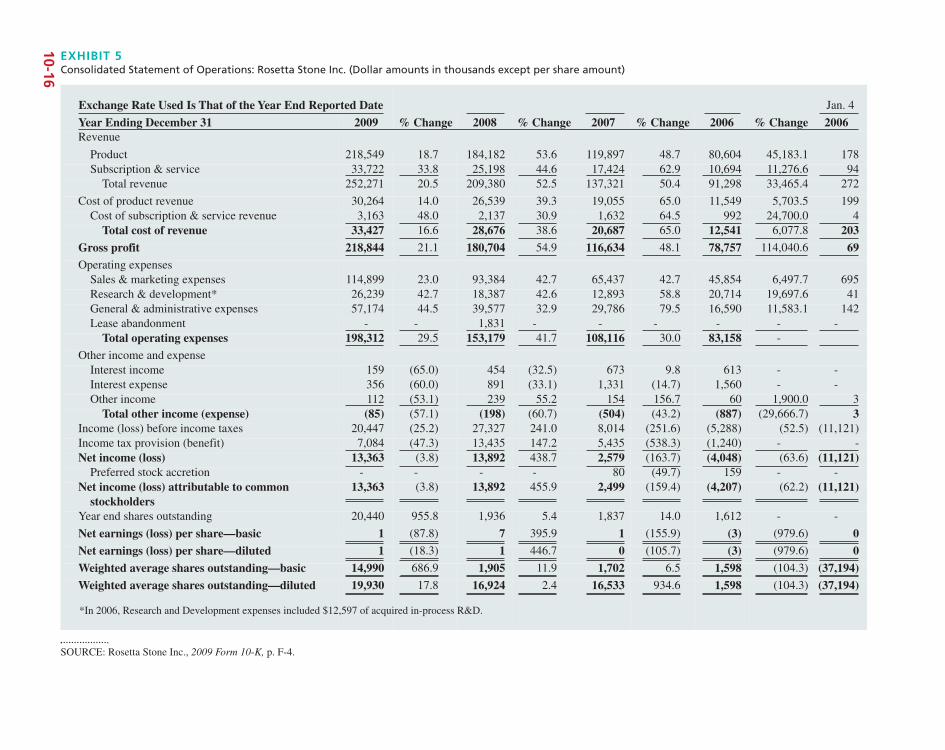
Exchange Rate Used Is That of the Year End Reported Date Jan. 4
Year Ending December 31 2009 % Change 2008 % Change 2007 % Change 2006 % Change 2006Revenue
Product 218,549 18.7 184,182 53.6 119,897 48.7 80,604 45,183.1 178Subscription & service 33,722 33.8 25,198 44.6 17,424 62.9 10,694 11,276.6 94
Total revenue 252,271 20.5 209,380 52.5 137,321 50.4 91,298 33,465.4 272
Cost of product revenue 30,264 14.0 26,539 39.3 19,055 65.0 11,549 5,703.5 199Cost of subscription & service revenue 3,163 48.0 2,137 30.9 1,632 64.5 992 24,700.0 4
Total cost of revenue 33,427 16.6 28,676 38.6 20,687 65.0 12,541 6,077.8 203
Gross profit 218,844 21.1 180,704 54.9 116,634 48.1 78,757 114,040.6 69Operating expenses
Sales & marketing expenses 114,899 23.0 93,384 42.7 65,437 42.7 45,854 6,497.7 695Research & development* 26,239 42.7 18,387 42.6 12,893 58.8 20,714 19,697.6 41General & administrative expenses 57,174 44.5 39,577 32.9 29,786 79.5 16,590 11,583.1 142Lease abandonment - - 1,831 - - - - - -
Total operating expenses 198,312 29.5 153,179 41.7 108,116 30.0 83,158 -
Other income and expenseInterest income 159 (65.0) 454 (32.5) 673 9.8 613 - -Interest expense 356 (60.0) 891 (33.1) 1,331 (14.7) 1,560 - -Other income 112 (53.1) 239 55.2 154 156.7 60 1,900.0 3
Total other income (expense) (85) (57.1) (198) (60.7) (504) (43.2) (887) (29,666.7) 3Income (loss) before income taxes 20,447 (25.2) 27,327 241.0 8,014 (251.6) (5,288) (52.5) (11,121)Income tax provision (benefit) 7,084 (47.3) 13,435 147.2 5,435 (538.3) (1,240) - -Net income (loss) 13,363 (3.8) 13,892 438.7 2,579 (163.7) (4,048) (63.6) (11,121)
Preferred stock accretion - - - - 80 (49.7) 159 - -Net income (loss) attributable to common
stockholders13,363 (3.8) 13,892 455.9 2,499 (159.4) (4,207) (62.2) (11,121)
Year end shares outstanding 20,440 955.8 1,936 5.4 1,837 14.0 1,612 - -
Net earnings (loss) per share—basic 1 (87.8) 7 395.9 1 (155.9) (3) (979.6) 0
Net earnings (loss) per share—diluted 1 (18.3) 1 446.7 0 (105.7) (3) (979.6) 0
Weighted average shares outstanding—basic 14,990 686.9 1,905 11.9 1,702 6.5 1,598 (104.3) (37,194)
Weighted average shares outstanding—diluted 19,930 17.8 16,924 2.4 16,533 934.6 1,598 (104.3) (37,194)
*In 2006, Research and Development expenses included $12,597 of acquired in-process R&D.
EXHIBIT 5Consolidated Statement of Operations: Rosetta Stone Inc. (Dollar amounts in thousands except per share amount)
SOURCE: Rosetta Stone Inc., 2009 Form 10-K, p. F-4.
10-16
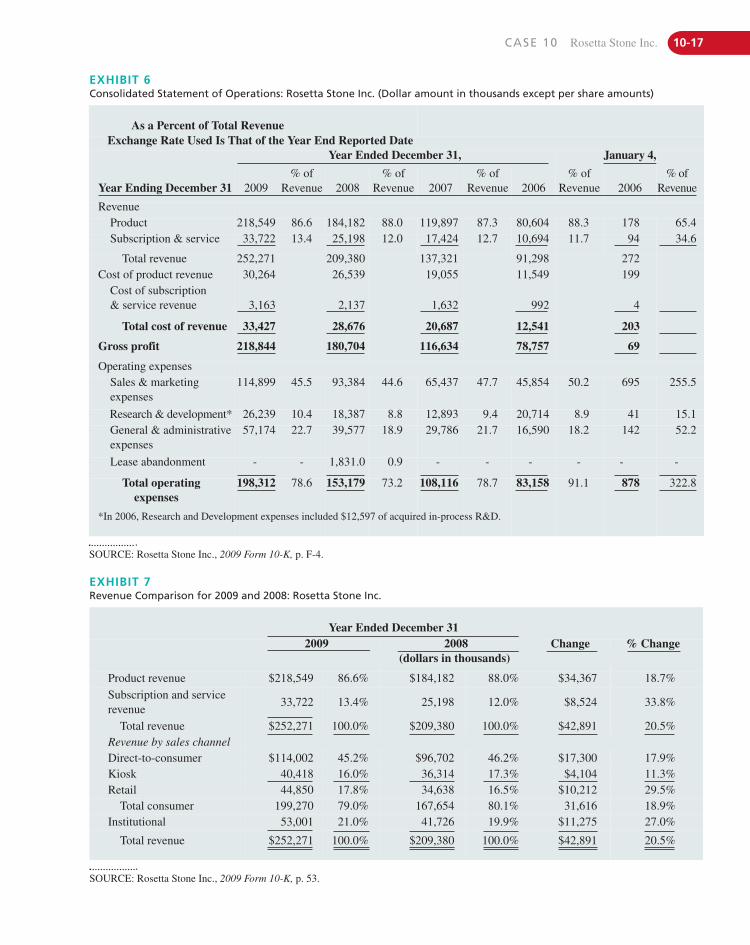
As a Percent of Total RevenueExchange Rate Used Is That of the Year End Reported Date
Year Ended December 31, January 4,
Year Ending December 31 2009% of
Revenue 2008% of
Revenue 2007% of
Revenue 2006% of
Revenue 2006% of
Revenue
RevenueProduct 218,549 86.6 184,182 88.0 119,897 87.3 80,604 88.3 178 65.4Subscription & service 33,722 13.4 25,198 12.0 17,424 12.7 10,694 11.7 94 34.6
Total revenue 252,271 209,380 137,321 91,298 272Cost of product revenue 30,264 26,539 19,055 11,549 199
Cost of subscription & service revenue 3,163 2,137 1,632 992 4
Total cost of revenue 33,427 28,676 20,687 12,541 203
Gross profit 218,844 180,704 116,634 78,757 69
Operating expensesSales & marketing expenses
114,899 45.5 93,384 44.6 65,437 47.7 45,854 50.2 695 255.5
Research & development* 26,239 10.4 18,387 8.8 12,893 9.4 20,714 8.9 41 15.1General & administrative expenses
57,174 22.7 39,577 18.9 29,786 21.7 16,590 18.2 142 52.2
Lease abandonment - - 1,831.0 0.9 - - - - - -
Total operating expenses
198,312 78.6 153,179 73.2 108,116 78.7 83,158 91.1 878 322.8
*In 2006, Research and Development expenses included $12,597 of acquired in-process R&D.
EXHIBIT 6Consolidated Statement of Operations: Rosetta Stone Inc. (Dollar amount in thousands except per share amounts)
SOURCE: Rosetta Stone Inc., 2009 Form 10-K, p. F-4.
Year Ended December 312009 2008
(dollars in thousands)Change % Change
Product revenue $218,549 86.6% $184,182 88.0% $34,367 18.7%Subscription and servicerevenue
33,722 13.4% 25,198 12.0% $8,524 33.8%
Total revenue $252,271 100.0% $209,380 100.0% $42,891 20.5%Revenue by sales channelDirect-to-consumer $114,002 45.2% $96,702 46.2% $17,300 17.9%Kiosk 40,418 16.0% 36,314 17.3% $4,104 11.3%Retail 44,850 17.8% 34,638 16.5% $10,212 29.5%
Total consumer 199,270 79.0% 167,654 80.1% 31,616 18.9%Institutional 53,001 21.0% 41,726 19.9% $11,275 27.0%
Total revenue $252,271 100.0% $209,380 100.0% $42,891 20.5%
EXHIBIT 7Revenue Comparison for 2009 and 2008: Rosetta Stone Inc.
SOURCE: Rosetta Stone Inc., 2009 Form 10-K, p. 53.
CASE 10 Rosetta Stone Inc. 10-17
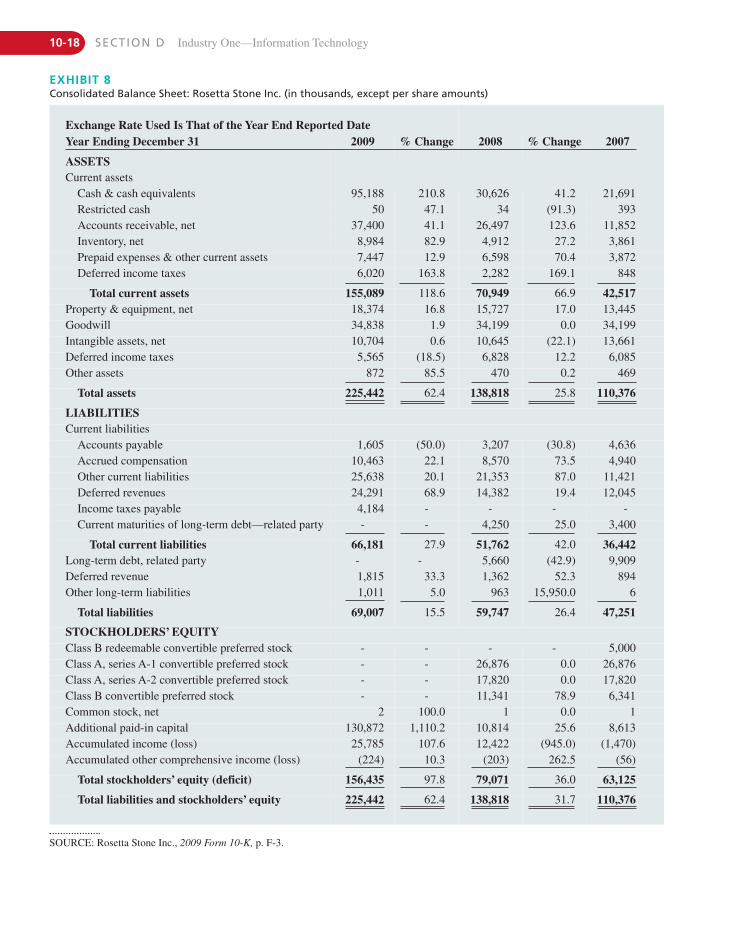
Exchange Rate Used Is That of the Year End Reported DateYear Ending December 31 2009 % Change 2008 % Change 2007
ASSETSCurrent assets
Cash & cash equivalents 95,188 210.8 30,626 41.2 21,691Restricted cash 50 47.1 34 (91.3) 393Accounts receivable, net 37,400 41.1 26,497 123.6 11,852Inventory, net 8,984 82.9 4,912 27.2 3,861Prepaid expenses & other current assets 7,447 12.9 6,598 70.4 3,872Deferred income taxes 6,020 163.8 2,282 169.1 848
Total current assets 155,089 118.6 70,949 66.9 42,517Property & equipment, net 18,374 16.8 15,727 17.0 13,445Goodwill 34,838 1.9 34,199 0.0 34,199Intangible assets, net 10,704 0.6 10,645 (22.1) 13,661Deferred income taxes 5,565 (18.5) 6,828 12.2 6,085Other assets 872 85.5 470 0.2 469
Total assets 225,442 62.4 138,818 25.8 110,376
LIABILITIESCurrent liabilities
Accounts payable 1,605 (50.0) 3,207 (30.8) 4,636Accrued compensation 10,463 22.1 8,570 73.5 4,940Other current liabilities 25,638 20.1 21,353 87.0 11,421Deferred revenues 24,291 68.9 14,382 19.4 12,045Income taxes payable 4,184 - - - -Current maturities of long-term debt—related party - - 4,250 25.0 3,400
Total current liabilities 66,181 27.9 51,762 42.0 36,442Long-term debt, related party - - 5,660 (42.9) 9,909Deferred revenue 1,815 33.3 1,362 52.3 894Other long-term liabilities 1,011 5.0 963 15,950.0 6
Total liabilities 69,007 15.5 59,747 26.4 47,251
STOCKHOLDERS’ EQUITYClass B redeemable convertible preferred stock - - - - 5,000Class A, series A-1 convertible preferred stock - - 26,876 0.0 26,876Class A, series A-2 convertible preferred stock - - 17,820 0.0 17,820Class B convertible preferred stock - - 11,341 78.9 6,341Common stock, net 2 100.0 1 0.0 1Additional paid-in capital 130,872 1,110.2 10,814 25.6 8,613Accumulated income (loss) 25,785 107.6 12,422 (945.0) (1,470)Accumulated other comprehensive income (loss) (224) 10.3 (203) 262.5 (56)
Total stockholders’ equity (deficit) 156,435 97.8 79,071 36.0 63,125
Total liabilities and stockholders’ equity 225,442 62.4 138,818 31.7 110,376
EXHIBIT 8Consolidated Balance Sheet: Rosetta Stone Inc. (in thousands, except per share amounts)
SOURCE: Rosetta Stone Inc., 2009 Form 10-K, p. F-3.
10-18 SECTION D Industry One—Information Technology
N O T E S1. Rosetta Stone, Inc., 2009 Form 10-K, p. 3.2. Ibid.3. Lora Kolodny, “Going Public in the Throes of a Recession,” The
New York Times (January 30, 2009), http://www.nytimes.com/2009/07/01/business/smallbusiness/01public.html (September 7,2010).
4. “Top 20 Risks Facing U.S. Tech Companies—IT Managementfrom EWeek,” EWeek, http://www.eweek.com/c/a/IT-Management/Top-20-Risks-Facing-US-Tech-Companies-879264/ (September 7,2010).
5. Rosetta Stone, Inc., 2009 Form 10-K, p. 5.6. Ibid., p. 1.7. Bill Simpson, “Customer Satisfaction Drives Rosetta Stone’s
Strong Growth—Seeking Alpha,” Stock Market News, Opinion& Analysis, Investing Ideas—Seeking Alpha (April 17, 2009),http://seekingalpha.com/article/131398-customer-satisfaction-drives-rosetta-stone-s-strong-growth (September 7, 2010).
8. Rosetta Stone, Inc., 2009 Form 10-K, p. 5.9. Ibid., p. 7.
10. Ibid., 13.11. Ibid., p. 17. This section was directly quoted, except for minor
editing.12. History | Rosetta Stone, http://www.rosettastone.com/ (August 21,
2010).13. Rosetta Stone, Inc., 2009 Form 10-K, p. 15.14. Ibid.15. “Best Graduate Schools 2008,” US News, http://grad-schools
.usnews.rankingsandreviews.com/best-graduate-schools/ (Sep-tember 6, 2010).
16. Rosetta Stone, Inc., 2009 Form 10-K, p. 15.17. Phil Wahba, “Rosetta Stone IPO Prices Above Estimate Range |
Reuters,” Reuters.co.uk (April 16, 2009), http://uk.reuters.com/article/idUKTRE53E7GP20090416 (September 7, 2010).
18. Ibid.19. Rosetta Stone, Inc., 2009 Form 10-K, p. 18.20. Corporate Governance | Rosetta Stone, http://www.rosettastone
.com/ (August 21, 2010). This section was directly quoted, exceptfor minor editing.
21. Rosetta Stone, Inc., 2009 Form 10-K, p. 6.22. Language Learning | Rosetta Stone, http://www.rosettastone
.com/ (August 21, 2010).23. Rosetta Stone, Inc., 2009 Form 10-K, p. 5.24. Language Learning | Rosetta Stone, http://www.rosettastone
.com/ (August 21, 2010).25. Rosetta Stone, Inc., 2009 Form 10-K, p. 11.26. Ibid., p. 12.27. Ibid., p. 10.28. Ibid., p. 11.29. Ibid., p. 8.30. Ibid., p. 12.31. Ibid., p. 11. This section was directly quoted, except for minor
editing.32. Susan J. Campbell, “Rosetta Stone Now Offering Dedicated
Customer Support on Facebook via ‘Parature for Facebook,’”TMCnet.com (August 13, 2010), http://www.tmcnet.com/channels/customer-support-software/articles/95152-rosetta-stone-now-offering-dedicated-customer-support-facebook.htm(August 21, 2010).
33. Rosetta Stone, Inc., 2009 Form 10-K, p. 16.
34. Ibid., pp. 7–8. This section was directly quoted, except for minorediting.
35. Ibid., pp. 3, 13–15. This section was directly quoted, except forminor editing.
36. Ibid., p. 21.37. Phil Wahba, “Rosetta Stone IPO Prices Above Estimate Range |
Reuters,” Reuters.co.uk (April 16, 2009), http://uk.reuters.com/article/idUKTRE53E7GP20090416 (September 7, 2010).
38. Rosetta Stone, Inc., 2009 Form 10-K, p. 45. This section was di-rectly quoted, except for minor editing.
39. Rosetta Stone, Inc., 2009 Form 10-K., pp. 3, 13–14. This sectionwas directly quoted, except for minor editing.
40. Ibid., pp. 14–15.41. Ibid., p. 14.42. Rosetta Stone, Inc., 2009 Form 10-K., p. 17.43. Ibid.44. Ibid.45. “Global End User Agreement,” Rosetta Stone. (Septem-
ber 6, 2010). http://www.rosettastone.com/us_assets/eulas/eula-global-eng.pdf.
46. “Rosetta Stone Continues Strong Stand on Piracy and Distribu-tion of Counterfeit Products | Rosetta Stone | Rosetta Stone,”Rosetta Stone (February 13, 2009), http://www.rosettastone.co.uk/global/press/releases/20090213-rosetta-stone-continues-strong-stand-on-piracy-and-distribution-of-counterfeit-products(September 7, 2010).
47. “Anti Piracy,” Rosetta Stone, http://www.rosettastone.com/global/anti-piracy (September 7, 2010).
48. Ibid.49. Rosetta Stone, Inc., 2009 Form 10-K, p. 3.50. “Most Popular Languages in the World by Number of Speakers—
Infoplease.com,” Infoplease: Encyclopedia, Almanac, Atlas,Biographies, Dictionary, Thesaurus. Free Online Reference,Research & Homework Help—Infoplease.com, http://www.infoplease.com/ipa/A0775272.html (September 7, 2010).
51. “Chinese Language Becomes More Popular Worldwide,”Simple-Chinese.com, http://www.simple-chinese.com/china-blog/chinese-language-becomes-more-popular-worldwide/(September 7, 2010).
52. “Why Is It Important to Learn Spanish?” Learn Spanish Abroad:IMAC Spanish Language Schools | Spanish Language Courses,http://www.spanish-school.com.mx/learnspanish.php (September 7,2010).
53. “State of Global Translation Industry (2009),” MyGengo.com,http://www.slideshare.net/dmc500hats/mygengocom-state-of-global-translation-industry-2009 (September 7, 2010).
54. “India Falling behind China in English,” Asiaone, http://www.asiaone.com/News/Education/Story/A1Story20091120-181251.html (September 6, 2010).
55. “US Scrambles to Find Linguists for Afghan Surge,” The Jour-nal of Turkish Weekly, http://www.turkishweekly.net/news/78751/-us-scrambles-to-find-linguists-for-afghan-surge.html(September 5, 2010).
56. “Now, Smartphones That Translate Languages—The EconomicTimes,” The Economic Times: Business News, Personal Finance,Financial News, India Stock Market Investing, Economy News,SENSEX, NIFTY, NSE, BSE Live, IPO News, http://economictimes.indiatimes.com/Now-smartphones-that-translate-languages/articleshow/4724646.cms (September 7, 2010).
CASE 10 Rosetta Stone Inc. 10-19
http://economictimes.indiatimes.com/Now-smartphones-that-translate-languages/articleshow/4724646.cms
http://economictimes.indiatimes.com/Now-smartphones-that-translate-languages/articleshow/4724646.cms
57. Jane L. Levere, “As Many Software Choices as Languages toLearn,” The New York Times (November 26, 2006).http://www.nytimes.com/2006/11/26/business/yourmoney/26language.html?_r�1&scp�3&sq�rosetta stone, languages&st�
nyt (August 21, 2010).58. Lindsay Dittman, “The Most EXPENSIVE Colleges and Univer-
sities (PHOTOS),” The Huffington Post (March 29, 2010), http://www.huffingtonpost.com/2010/03/29/the-most-expensive-colleg_n_517861.html (September 7, 2007).
59. Rosetta Stone, Inc., 2009 Form 10-K, pp. 16–17.60. Ibid., p. 5. This section was directly quoted, except for minor
editing.61. Ibid. This section was directly quoted, except for minor editing.62. Rosetta Stone, Inc., 2009 Form 10-K, p. 16.63. Berlitz Home, http://www.berlitz.com/ (September 7, 2010).64. Foreign Language Learning Programs from Pimsleur, http://
www.pimsleur.com/ (September 7, 2010).65. Living Language, http://www.randomhouse.com/livinglanguage/
(September 6, 2010).66. Matthew Garrahan and Annie Saperstein, “Disney to Expand
Language Schools in China,” Financial Times [Los Angeles](July 6, 2010).
67. “About Us,” The McGraw-Hill Companies, http://www.mcgraw-hill.com/site/about-us (September 7, 2010).
68. “McGraw-Hill Education and Tata Expand Partnership in Edu-cation and Professional Training,” Investor Relations—The
McGraw-Hill Companies (March 17, 2010), http://investor. mcgraw-hill.com/phoenix.zhtml?c=96562&p=irol-newsArticle&ID=1403377&highlight= (August 21, 2010).
69. “McGraw-Hill Deepens Commitment to China’s $4 Billion Professional Development Education Market through New Relationship with Ambow Education,” Investor Relations—TheMcGraw-Hill Companies (November 11, 2009), http:// investor.mcgraw-hill.com/phoenix.zhtml?c�96562&p�irol-newsArticle&ID�1354199&highlight� (September 7, 2010).
70. Pearson, http://www.pearson.com/ (September 7, 2010).71. Peter Wayner, “Learning a Language From an Expert, on the
Web,” The New York Times (July 28, 2010).72. Ibid.73. Ibid.74. Ibid.75. Ibid.76. Rosetta Stone, Inc., 2009 Form 10-K, p. 3.77. Ibid., p. 53.78. Ibid.79. Ibid.80. Ibid.81. “Rosetta Stone Inc. Reports Fourth Quarter 2009 Results,”
Rosetta Stone (February 25, 2010), http://pr.rosettastone.com/phoenix.zhtml?c�228009&p�irol-newsArticle&ID�
1395780&highlight� (September 7, 2010).
10-20 SECTION D Industry One—Information Technology
11-1
C A S E 11Logitech (Mini Case)Alan N. Hoffman
Company BackgroundLOGITECH, HEADQUARTERED IN ROMANEL-SUR-MORGES, SWITZERLAND, was the world’s leadingprovider of computer peripherals in 2010. Personal computer peripherals were input and
interface devices that were used for navigation, Internet communications, digital music,home-entertainment control, gaming, and wireless devices. Derived from the French wordlogiciel, meaning software, Logitech was originally established as a software developmentand hardware architecture company by two Stanford graduate students in Apples, Switzer-
land. Shortly after establishing itself as a quality software development company, Logitechsaw a new hardware product opportunity that was emerging in the mid 1980s, the computer
mouse. The mouse was standard equipment on the original Macintosh computer launched inJanuary 1984. Logitech viewed the mouse as a growth opportunity and it became a turningpoint for the company’s future. Logitech introduced its first hardware device, the P4 mouse,for users of graphics software. An OEM sales contract with HP followed, and in 1985 it en-tered the retail market, selling 800 units in the first month.
In July of 1988, Logitech’s executives decided to take the company public to help finance itsrapid growth. Then, in the early 1990s, while facing increasingly strong competition in the mousebusiness, Logitech identified a larger market opportunity for computer peripherals and begangrowing its business beyond the mouse. In the next few years, Logitech introduced products suchas (1) computer keyboards, (2) a digital still camera, (3) a headphone/microphone, (4) a joystickgaming peripheral, and (5) a web camera on a flexible arm. While these new products were beingintroduced under the Logitech name, the company also continued innovation in its core mouse
This case was prepared by Professor Alan N. Hoffman, Rotterdam School of Management, Erasmus University andBentley University. Copyright © 2010 by Alan N. Hoffman. The copyright holder is solely responsible for case content.Reprint permission is solely granted to the publisher, Prentice Hall, for Strategic Management and Business Policy, 13thEdition (and the international and electronic versions of this book) by the copyright holder, Alan N. Hoffman. Any otherpublication of the case (translation, any form of electronics or other media) or sale (any form of partnership) to anotherpublisher will be in violation of copyright law, unless Alan N. Hoffman has granted an additional written permission.Reprinted by permission. RSM Case Development Centre prepared this case to provide material for class discussionrather than to illustrate either effective or ineffective handling of a management situation. Copyright © 2010, RSM CaseDevelopment Centre, Erasmus University. No part of this publication may be copied, stored, transmitted, reproduced,or distributed in any form or medium whatsoever without the permission of the copyright owner, Alan N. Hoffman.
11-2 SECTION D Industry One—Information Technology
CompetitorsWithin the specialized personal peripherals industry, Logitech had three major competitors:Creative Technology Ltd., Microsoft Corporation, and Royal Philips Electronics N.V.
Creative Technology Ltd. was one of the worldwide leaders in digital entertainment prod-ucts for the personal computer (PC) and the Internet. Creative Technology was founded in Singapore in 1981, with the vision that multimedia would revolutionize the way people inter-act with their PCs. The product line offered by Creative Technology included MP3 players,portable media centers, multimedia speakers and headphones, digital and web cameras, graphicssolutions, revolutionary music keyboards, and PC peripherals. Creative had a net profit margin of (�29.58%) in FY 2009 and (�32.82%) in the first quarter of 2010.
Microsoft Corporation provided software and hardware products and solutions world-wide. Founded in 1975 by Bill Gates and Paul Allen, Microsoft’s core business was to createoperating systems and computer software applications. Microsoft expanded into markets suchas mice, keyboards, video game consoles, customer relationship management applications,server and storage software, and digital music players. In FY 2009, Microsoft Corporation hadannual sales of $58.4 billion and a net income of $14.5 billion.
Royal Philips Electronics was a Netherlands-based company that focused on improvingpeople’s lives through innovation. Philips was a well-diversified company with products inmany different businesses: consumer electronics, televisions, VCRs, DVD players, and faxmachines, as well as light bulbs, electric shavers and other personal care appliances, medicalsystems, and silicon systems solutions. With this diversified portfolio of products, RoyalPhilips had FY 2009 revenues of $30.76 billion and a gross profit of $11.59 billion.
Logitech was the only company exclusively focused on personal computer peripheralproducts, whereas all of its competitors had products and resources invested in a variety ofother industries as well.
business. New and revolutionary technologies that were being developed by Logitech allowed itto continue to be an industry leader in the mouse and keyboard business.
In the mid-1990s, the PC market exploded due to the popularity of the Internet and newhome/office software applications. This growth of the PC industry created demand for the peripheral products that Logitech produced. The Internet allowed computer users to accessnew areas such as music, video, communications, and gaming. From this point forward, Logitechcontinued to grow both organically and through acquisition as new opportunities arose to expandits portfolio of products.
Between 1998 and 2006, Logitech made a number of significant acquisitions to expandits product portfolio. It acquired companies such as Connectix for its line of webcams, Labtecfor its audio business presence, Intrigue Technologies for its “Harmony” remote controls, andSlim Devices for its music systems. All of these acquisitions were done strategically to helpLogitech position itself in all aspects of the personal computer peripherals world.
In addition to growing significantly through strategic acquisitions, Logitech also continuedto innovate and grow its core business. Logitech made significant innovations in the area ofcordless mice and keyboards. It also introduced the industry’s first retail pointing device withBluetooth wireless technology. Logitech then expanded its Bluetooth technology to many otherproducts in the digital world such as cordless gaming controllers and a personal digital pen.
Logitech provided consumers with cutting-edge innovation while maintaining its productquality. Logitech maintained its product leadership by combining continued innovation,award-winning industrial design, and excellent price performance with core technologies suchas wireless, media-rich communications and digital entertainment.
CASE 11 Logitech (Mini Case) 11-3
TrendsLogitech implemented a strategy of innovation, mixed with strategic acquisitions, to enhanceits products with the technologies and software of other companies in order to create the mostadvanced, safest, and most innovative and collaborative experience for its customers. AsLogitech had always been on the forefront of mouse and keyboard technology, it had alsobeen a leader in video conferencing technology since the early stages of the Logitech mount-able computer camera.
From 1998–2004, Logitech made many important strategic acquisitions in order to enhance future portfolios and expand the depth of the peripheral product lines. Its first acqui-sition was the video camera division, QuickCam PC, of Connectix Corporation. This led to aninflux of peripherals such as cameras and wireless cameras, and served as a very early intro-duction to the current video conferencing division of Logitech. The second successful acqui-sition for Logitech was Labtec Inc., an audio peripheral maker, in 2001. Following thisacquisition, with a hunger to expand product focus, Logitech acquired Intrigue TechnologiesInc. in 2004. This acquisition positioned Logitech as a leader in advanced remote control-making,allowing peripherals to accommodate more than just computer and video game uses. This po-sitioned it for its next acquisition—Slim Devices, a manufacturer of music systems—in 2006.Logitech used these acquisitions to expand its multibusiness unit corporation into a diverse andspecialized company appealing to a large group of technology users. Finally, with its acquisi-tion of Paradial AS, Logitech was able to combine its peripheral products with the software,video effects, and security features of Paradial. This allowed Logitech to deliver a completeand intuitive HD video conferencing experience for companies of any size.
Future industry trends revolved around content strategy and consumer expectations of themobile web and smartphone applications. Content strategy involved the decisions about whatinformation/features to include in a product, including those that provided the most benefit orfulfill the most needs; anything else was just noise and diluted the product. In terms of the mobile web and smartphone application trends, Logitech had three options: (1) develop closedpartnerships with specific platforms (iPhone or Blackberry); (2) produce apps (applications)for each platform; or (3) produce “platform-neutral” apps by using the mobile web.
Global PresenceAs the global economy has expanded and become more reliant on technology, Logitech has seenan increase in the desire for ease of use when it comes to portable computers, games, and videoconferencing technology. Logitech has consistently expanded its product offerings to satisfy thisgrowing demand for computer peripherals. In FY 2009, 85% of its revenue came from retailsales of peripheral products such as mice, keyboards, speakers, webcams, headsets, headphones,and notebook stands. Logitech has also seen global demand sharpen for devices designed forspecific purposes such as gaming, digital music, multimedia, audio and visual communicationover the Internet, and PC-based video security. The company’s products combined essentialcore technologies, continued innovation, award-winning industrial design, and excellent valuethat were necessary to come out on top of a rapidly changing and evolving technological industry.Since its inception in 1981 in Apples, Switzerland, Logitech has been a growing player in thetechnological product market and distributed products to over 100 different countries.
For Logitech, opportunities arose as the desire for global communication has risen. Thetrend of wireless and portable communication, such as Skype and Apple’s Facetime, has opened up a window of opportunity for new and more advanced products to enable videocommunication and conferencing.
11-4 SECTION D Industry One—Information Technology
FinanceThe recession in 2008–2009 hit hard on Logitech’s business: for the full fiscal year 2010,sales were $2.0 billion, down from $2.2 billion in fiscal 2009. Operating income was $78 million,down from $110 million the previous year. Net income was $65 million ($0.36 per share),compared to $107 million ($0.59 per share) in the prior year. Gross margin for fiscal 2010was 31.9% compared to 31.3% in fiscal 2009. As a result of the economic downturn, Logitechfound it necessary to restructure its workforce. In early 2009 Logitech reduced its salariedworkforce globally by 15%.
Logitech’s stock price spiked to $40 in late 2007, as a result of record sales and profitsfrom its successful launch of iPod-capable peripherals. Its iPod peripherals—speakers, docks,and headphones—made the increasingly popular iPod easier to use.
In 2009, Logitech’s operating margin was 5.15%, far below its 2007 high of 12% due toincreasing price competition.
Logitech did not issue dividends to shareholders so that it could reinvest its net incomeback into research and development and product advertising, as well as have it available forstrategic acquisitions, causing a continuous cycle.
Logitech outlined specific financial objectives that it sought to achieve. It wanted toachieve sales growth between 13%–19% and a gross margin between 32%–34%. Logitechalso intended to invest 5% of its sales revenue in R&D and 12%–14% in marketing. By con-tinuously investing resources in research and development, Logitech took a strategic approachto maintaining long-term growth and profitability.
OperationsOne of the initial weaknesses that Logitech faced regarding operations was that it had numerousmanufacturing locations dispersed throughout the world. The problem with having so manylocations was that these facilities were not cost effective. Many of its plants were located incountries where it was expensive to operate and the labor costs for qualified employees washigh. Logitech saw that, in the early 1990s, the personal computer industry was becoming increasingly competitive. Having recognized this, Logitech made two primary operations decisions that allowed it to increase its competitiveness. First, Logitech consolidated manufacturing, which was once widely dispersed in China. This allowed the company to
As computers age, Logitech has been able to sell add-on peripherals to users that want toadd newer applications to their older computers. Logitech has been able to sell products at theend of the product life cycle such as mice and keyboards and generate profits to fund new prod-uct development such as the new Logitech Revue with Google TV. As its consumers becamemore globally conscious and connected, Logitech was able to tailor its products toward themany uses of video communication and high speed Internet capabilities.
Logitech created a global presence and reputation for its brand and products. In 2009,Logitech’s sales were distributed globally with 45.3% in the Eastern Europe, Middle East, andNorth Africa regions; 35.6% in the Americas; and 19.1% in Asia Pacific. By expanding itspresence globally, Logitech became the leading provider of personal peripherals in the world.In addition to being an innovator in its industry, Logitech has also maintained reasonablypriced products as well. In 2009, 67% of its sales stemmed from products that were priced lessthan $60. This innovative mindset, in addition to reasonable prices, has also contributed tolarge sales and, in the end, Logitech’s good financial health as a company.
CASE 11 Logitech (Mini Case) 11-5
The Changing Landscape AheadLogitech became a leader in computer peripherals by developing innovative products and focusing on the consumer’s experience. Between 2007 and 2010 alone, Logitech received 11 different awards for 19 products in 14 categories. In a market that was saturated with deep-pocketed competitors such as Microsoft and Philips, Logitech used innovation as its meansof survival.
In 2010, Logitech faced a significant challenge in that the way that people interacted withits devices was changing. The iPhone and iPad used touch-screen technology with built-in accelerometers, eliminating the need for mice and trackpads. Secondly, cameras and higherquality speakers became standard equipment built into the iPhone, iPad, and Windows laptopcomputers. Apple introduced the “magic pad” to replace the mouse altogether. The need forconsumers to buy add-on peripherals was slowly evaporating as more of the peripherals became standard equipment designed into new mobile technologies.
Logitech could see its peripherals market someday disintegrate before its own eyes. Logitech needed to decide if it should invest more in video conferencing and television all-in-one remote controls and/or focus on developing partnerships with computer and telecommanufacturers and mobile carriers such as AT&T, Verizon, T-Mobile, and Sprint. Once again,the computer industry was changing and Logitech needed to formulate diversification strategiesto ensure its long-term survival.
maintain lower prices on its products and increase its competitiveness. In addition to its Chinamanufacturing facilities, Logitech established a second center for R&D, located in Cork, Ireland, a prime location for innovation in the technology and IT sectors. This resolved theissue of Logitech having several expensive locations by moving into fewer, more cost effectivefacilities. In addition to moving manufacturing, Logitech also knew its category was changingand that it would no longer be able to compete by only manufacturing computer mice. Therefore,Logitech expanded its product line beyond the mouse and introduced a variety of productsincluding a handheld scanner, Fotoman (a digital camera), Audioman (a speaker/microphone),and Wingman (the first gaming peripheral).
These operational decisions not only helped Logitech remain innovative and competitivewithin the industry, but also positioned it for success during the personal computing industryboom in the mid- to late 1990s, when the Internet and online industries took off. Logitech,known as a leading personal peripheral provider, was both innovative, with more than 130 personalcomputer peripheral products, and reasonably priced. When the PC industry took off, Logitechwas already established as an industry leader and its sales soared.
Logitech was also a leader in the wireless peripherals sector. By following consumertrends, Logitech saw the personal peripherals sector was moving into a new digital era, wherewireless peripherals was a new trend. Logitech created an entirely new product category withthe Logitech Cordless Desktop, a wireless mouse and keyboard bundle. By staying on top ofconsumer trends, Logitech sold over 100 million cordless mice and keyboards.

This page intentionally left blank
12-1
C A S E 12Google Inc. (2010): The Future of the Internet Search EnginePatricia A. Ryan
This case was prepared by Professor Patricia A. Ryan of Colorado State University with the research assistance ofRyanA. Neff. Copyright ©2010 by Patricia A. Ryan. The copyright holder is solely responsible for the case content. Thiscase was edited for Strategic Management and Business Policy, 13th Edition. Reprinted by permission only for the 13th edi-tion of Strategic Management and Business Policy (including international and electronic versions of the book).Any otherpublication of this case (translation, any form of electronic or media) or sale (any form of partnership) to anotherpublisher will be in violation of copyright law unless Patricia A. Ryan has granted additional written reprint permission.
Background2
Google was founded in a garage in 1998 by Larry Page and Sergey Brin, two Stanford com-puter science graduate students, based on ideas generated in 1995. The name Google was cho-sen as a play on googol, a mathematical term for the number one followed by one hundred zeros.It is thought the term was appealing to the founders as it related to their mission to organize anexponentially growing web. Founded on $100,000 from Sun Microsystems, Brin and Page wereon their way to creating an Internet engine giant. Google immediately gained the attention ofthe Internet sector for being a better search engine than its competitors, including Yahoo!
Industry Two—Internet Companies
Google began with a mission: to create the ultimate search engine to help users tamethe unruly and exponentially growing repository of information that is the Internet.And most would agree that when the word “Google” became a verb, that mission waslargely accomplished.1
IT HAD BEEN NEARLY SIX YEARS SINCE GOOGLE’S ATTENTION-grabbing initial public offeringand, despite overall stock market weakness, Google remained strong. Although the stock
moved with the market in general, the company returned significantly higher returns to itsshareholders than did the S&P 500 (Exhibit 1). Founders Sergey Brin and Larry Page had cre-ated a huge empire in which they now faced challenges of continued growth and innovation.These challenges would carry them through the second decade of the new millennium.
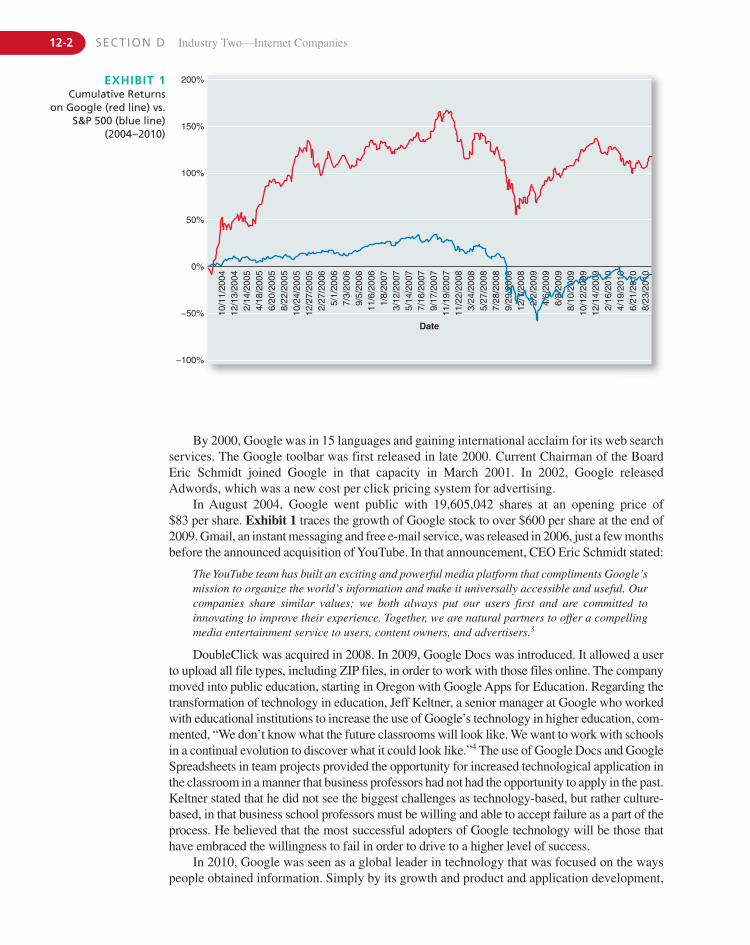
12-2 SECTION D Industry Two—Internet Companies
By 2000, Google was in 15 languages and gaining international acclaim for its web searchservices. The Google toolbar was first released in late 2000. Current Chairman of the BoardEric Schmidt joined Google in that capacity in March 2001. In 2002, Google releasedAdwords, which was a new cost per click pricing system for advertising.
In August 2004, Google went public with 19,605,042 shares at an opening price of $83 per share. Exhibit 1 traces the growth of Google stock to over $600 per share at the end of2009. Gmail, an instant messaging and free e-mail service, was released in 2006, just a few monthsbefore the announced acquisition of YouTube. In that announcement, CEO Eric Schmidt stated:
The YouTube team has built an exciting and powerful media platform that compliments Google’smission to organize the world’s information and make it universally accessible and useful. Ourcompanies share similar values; we both always put our users first and are committed toinnovating to improve their experience. Together, we are natural partners to offer a compellingmedia entertainment service to users, content owners, and advertisers.3
DoubleClick was acquired in 2008. In 2009, Google Docs was introduced. It allowed a userto upload all file types, including ZIP files, in order to work with those files online. The companymoved into public education, starting in Oregon with Google Apps for Education. Regarding thetransformation of technology in education, Jeff Keltner, a senior manager at Google who workedwith educational institutions to increase the use of Google’s technology in higher education, com-mented, “We don’t know what the future classrooms will look like. We want to work with schoolsin a continual evolution to discover what it could look like.”4 The use of Google Docs and GoogleSpreadsheets in team projects provided the opportunity for increased technological application inthe classroom in a manner that business professors had not had the opportunity to apply in the past.Keltner stated that he did not see the biggest challenges as technology-based, but rather culture-based, in that business school professors must be willing and able to accept failure as a part of theprocess. He believed that the most successful adopters of Google technology will be those thathave embraced the willingness to fail in order to drive to a higher level of success.
In 2010, Google was seen as a global leader in technology that was focused on the wayspeople obtained information. Simply by its growth and product and application development,
200%
150%
100%
50%
0%
−50%
−100%
10/1
1/20
04
Date
12/1
3/20
042/
14/2
005
4/18
/200
56/
20/2
005
8/22
/200
510
/24/
2005
12/2
7/20
052/
27/2
006
5/1/
2006
7/3/
2006
9/5/
2006
11/6
/200
61/
8/20
073/
12/2
007
5/14
/200
77/
16/2
007
9/17
/200
711
/19/
2007
11/2
2/20
083/
24/2
008
5/27
/200
87/
28/2
008
9/29
/200
812
/1/2
008
2/2/
2009
4/6/
2009
6/8/
2009
8/10
/200
910
/12/
2009
12/1
4/20
092/
16/2
010
4/19
/201
06/
21/2
010
8/23
/201
0
EXHIBIT 1Cumulative Returns
on Google (red line) vs.S&P 500 (blue line)
(2004–2010)
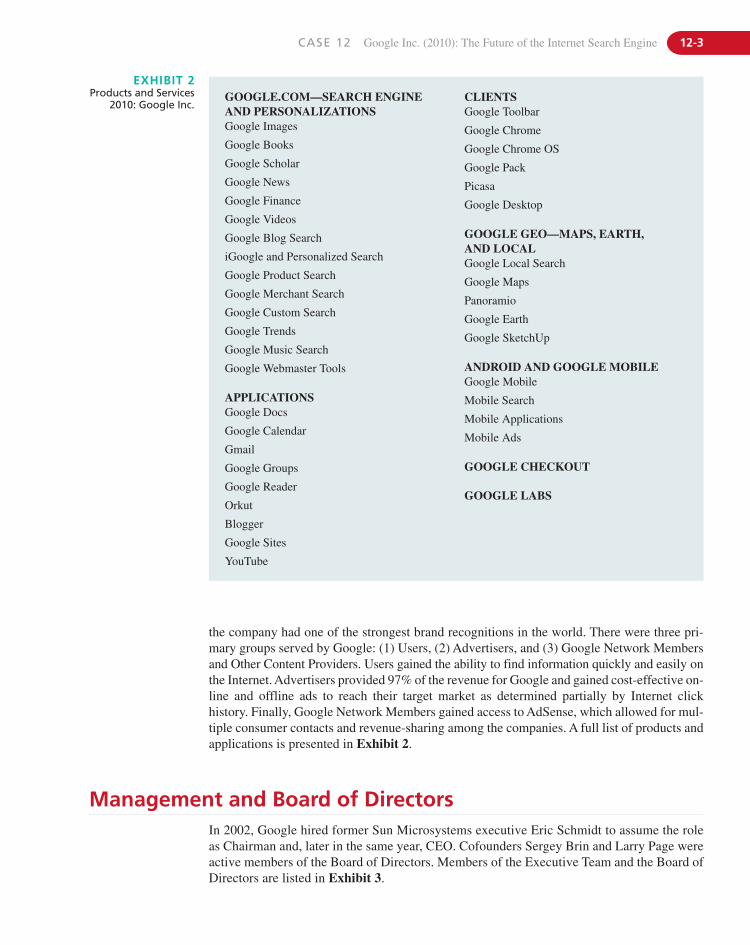
CASE 12 Google Inc. (2010): The Future of the Internet Search Engine 12-3
GOOGLE.COM—SEARCH ENGINE AND PERSONALIZATIONSGoogle Images
Google Books
Google Scholar
Google News
Google Finance
Google Videos
Google Blog Search
iGoogle and Personalized Search
Google Product Search
Google Merchant Search
Google Custom Search
Google Trends
Google Music Search
Google Webmaster Tools
APPLICATIONSGoogle Docs
Google Calendar
Gmail
Google Groups
Google Reader
Orkut
Blogger
Google Sites
YouTube
CLIENTSGoogle Toolbar
Google Chrome
Google Chrome OS
Google Pack
Picasa
Google Desktop
GOOGLE GEO—MAPS, EARTH, AND LOCALGoogle Local Search
Google Maps
Panoramio
Google Earth
Google SketchUp
ANDROID AND GOOGLE MOBILEGoogle Mobile
Mobile Search
Mobile Applications
Mobile Ads
GOOGLE CHECKOUT
GOOGLE LABS
EXHIBIT 2Products and Services
2010: Google Inc.
the company had one of the strongest brand recognitions in the world. There were three pri-mary groups served by Google: (1) Users, (2) Advertisers, and (3) Google Network Membersand Other Content Providers. Users gained the ability to find information quickly and easily onthe Internet. Advertisers provided 97% of the revenue for Google and gained cost-effective on-line and offline ads to reach their target market as determined partially by Internet click history. Finally, Google Network Members gained access to AdSense, which allowed for mul-tiple consumer contacts and revenue-sharing among the companies. A full list of products andapplications is presented in Exhibit 2.
Management and Board of DirectorsIn 2002, Google hired former Sun Microsystems executive Eric Schmidt to assume the roleas Chairman and, later in the same year, CEO. Cofounders Sergey Brin and Larry Page wereactive members of the Board of Directors. Members of the Executive Team and the Board ofDirectors are listed in Exhibit 3.
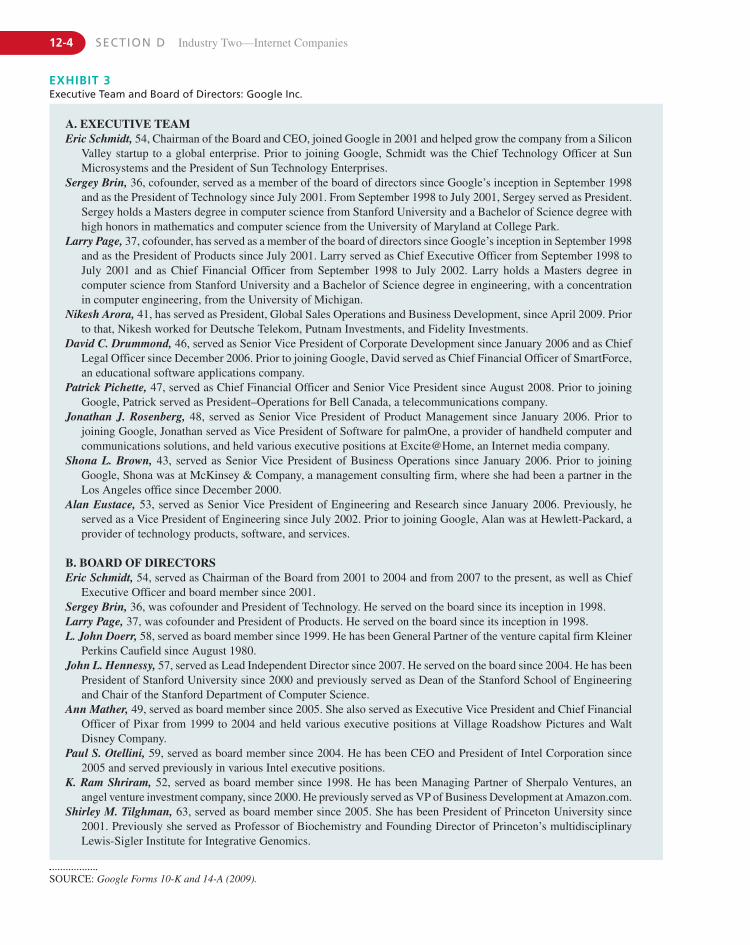
12-4 SECTION D Industry Two—Internet Companies
A. EXECUTIVE TEAMEric Schmidt, 54, Chairman of the Board and CEO, joined Google in 2001 and helped grow the company from a Silicon
Valley startup to a global enterprise. Prior to joining Google, Schmidt was the Chief Technology Officer at SunMicrosystems and the President of Sun Technology Enterprises.
Sergey Brin, 36, cofounder, served as a member of the board of directors since Google’s inception in September 1998and as the President of Technology since July 2001. From September 1998 to July 2001, Sergey served as President.Sergey holds a Masters degree in computer science from Stanford University and a Bachelor of Science degree withhigh honors in mathematics and computer science from the University of Maryland at College Park.
Larry Page, 37, cofounder, has served as a member of the board of directors since Google’s inception in September 1998and as the President of Products since July 2001. Larry served as Chief Executive Officer from September 1998 toJuly 2001 and as Chief Financial Officer from September 1998 to July 2002. Larry holds a Masters degree incomputer science from Stanford University and a Bachelor of Science degree in engineering, with a concentrationin computer engineering, from the University of Michigan.
Nikesh Arora, 41, has served as President, Global Sales Operations and Business Development, since April 2009. Priorto that, Nikesh worked for Deutsche Telekom, Putnam Investments, and Fidelity Investments.
David C. Drummond, 46, served as Senior Vice President of Corporate Development since January 2006 and as ChiefLegal Officer since December 2006. Prior to joining Google, David served as Chief Financial Officer of SmartForce,an educational software applications company.
Patrick Pichette, 47, served as Chief Financial Officer and Senior Vice President since August 2008. Prior to joiningGoogle, Patrick served as President–Operations for Bell Canada, a telecommunications company.
Jonathan J. Rosenberg, 48, served as Senior Vice President of Product Management since January 2006. Prior tojoining Google, Jonathan served as Vice President of Software for palmOne, a provider of handheld computer andcommunications solutions, and held various executive positions at Excite@Home, an Internet media company.
Shona L. Brown, 43, served as Senior Vice President of Business Operations since January 2006. Prior to joiningGoogle, Shona was at McKinsey & Company, a management consulting firm, where she had been a partner in theLos Angeles office since December 2000.
Alan Eustace, 53, served as Senior Vice President of Engineering and Research since January 2006. Previously, heserved as a Vice President of Engineering since July 2002. Prior to joining Google, Alan was at Hewlett-Packard, aprovider of technology products, software, and services.
B. BOARD OF DIRECTORSEric Schmidt, 54, served as Chairman of the Board from 2001 to 2004 and from 2007 to the present, as well as Chief
Executive Officer and board member since 2001.Sergey Brin, 36, was cofounder and President of Technology. He served on the board since its inception in 1998.Larry Page, 37, was cofounder and President of Products. He served on the board since its inception in 1998.L. John Doerr, 58, served as board member since 1999. He has been General Partner of the venture capital firm Kleiner
Perkins Caufield since August 1980.John L. Hennessy, 57, served as Lead Independent Director since 2007. He served on the board since 2004. He has been
President of Stanford University since 2000 and previously served as Dean of the Stanford School of Engineeringand Chair of the Stanford Department of Computer Science.
Ann Mather, 49, served as board member since 2005. She also served as Executive Vice President and Chief FinancialOfficer of Pixar from 1999 to 2004 and held various executive positions at Village Roadshow Pictures and WaltDisney Company.
Paul S. Otellini, 59, served as board member since 2004. He has been CEO and President of Intel Corporation since2005 and served previously in various Intel executive positions.
K. Ram Shriram, 52, served as board member since 1998. He has been Managing Partner of Sherpalo Ventures, an angel venture investment company, since 2000. He previously served as VP of Business Development at Amazon.com.
Shirley M. Tilghman, 63, served as board member since 2005. She has been President of Princeton University since2001. Previously she served as Professor of Biochemistry and Founding Director of Princeton’s multidisciplinaryLewis-Sigler Institute for Integrative Genomics.
EXHIBIT 3Executive Team and Board of Directors: Google Inc.
SOURCE: Google Forms 10-K and 14-A (2009).
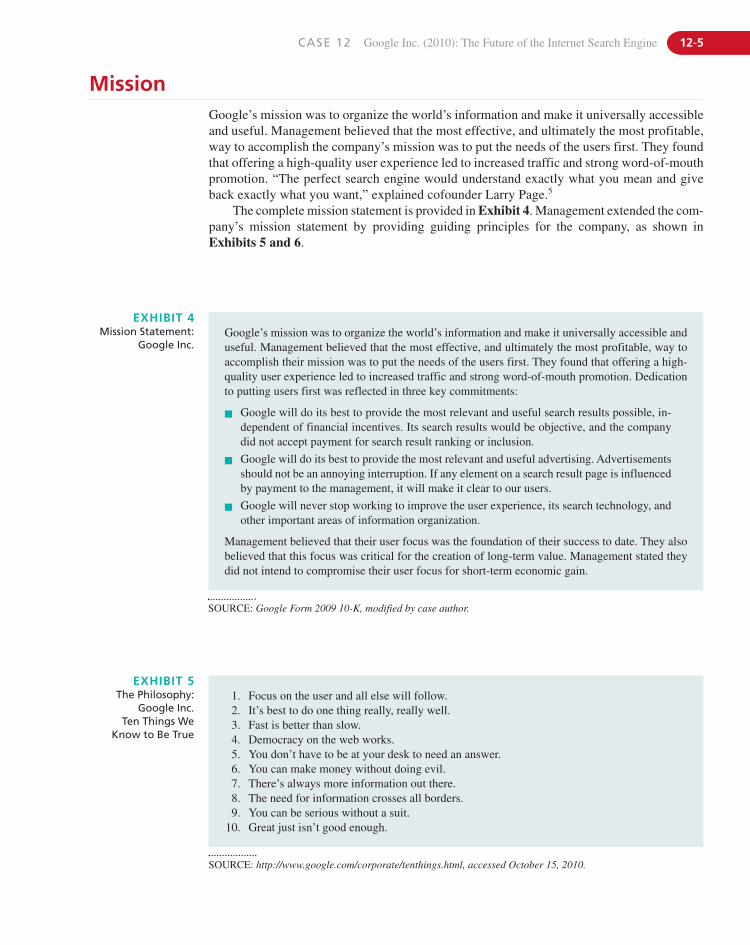
CASE 12 Google Inc. (2010): The Future of the Internet Search Engine 12-5
MissionGoogle’s mission was to organize the world’s information and make it universally accessibleand useful. Management believed that the most effective, and ultimately the most profitable,way to accomplish the company’s mission was to put the needs of the users first. They foundthat offering a high-quality user experience led to increased traffic and strong word-of-mouthpromotion. “The perfect search engine would understand exactly what you mean and giveback exactly what you want,” explained cofounder Larry Page.5
The complete mission statement is provided in Exhibit 4. Management extended the com-pany’s mission statement by providing guiding principles for the company, as shown inExhibits 5 and 6.
Google’s mission was to organize the world’s information and make it universally accessible anduseful. Management believed that the most effective, and ultimately the most profitable, way toaccomplish their mission was to put the needs of the users first. They found that offering a high-quality user experience led to increased traffic and strong word-of-mouth promotion. Dedicationto putting users first was reflected in three key commitments:
� Google will do its best to provide the most relevant and useful search results possible, in-dependent of financial incentives. Its search results would be objective, and the companydid not accept payment for search result ranking or inclusion.
� Google will do its best to provide the most relevant and useful advertising. Advertisementsshould not be an annoying interruption. If any element on a search result page is influencedby payment to the management, it will make it clear to our users.
� Google will never stop working to improve the user experience, its search technology, andother important areas of information organization.
Management believed that their user focus was the foundation of their success to date. They alsobelieved that this focus was critical for the creation of long-term value. Management stated theydid not intend to compromise their user focus for short-term economic gain.
EXHIBIT 4Mission Statement:
Google Inc.
SOURCE: Google Form 2009 10-K, modified by case author.
EXHIBIT 5The Philosophy:
Google Inc. Ten Things We
Know to Be True
SOURCE: http://www.google.com/corporate/tenthings.html, accessed October 15, 2010.
1. Focus on the user and all else will follow.2. It’s best to do one thing really, really well.3. Fast is better than slow.4. Democracy on the web works.5. You don’t have to be at your desk to need an answer.6. You can make money without doing evil.7. There’s always more information out there.8. The need for information crosses all borders.9. You can be serious without a suit.
10. Great just isn’t good enough.
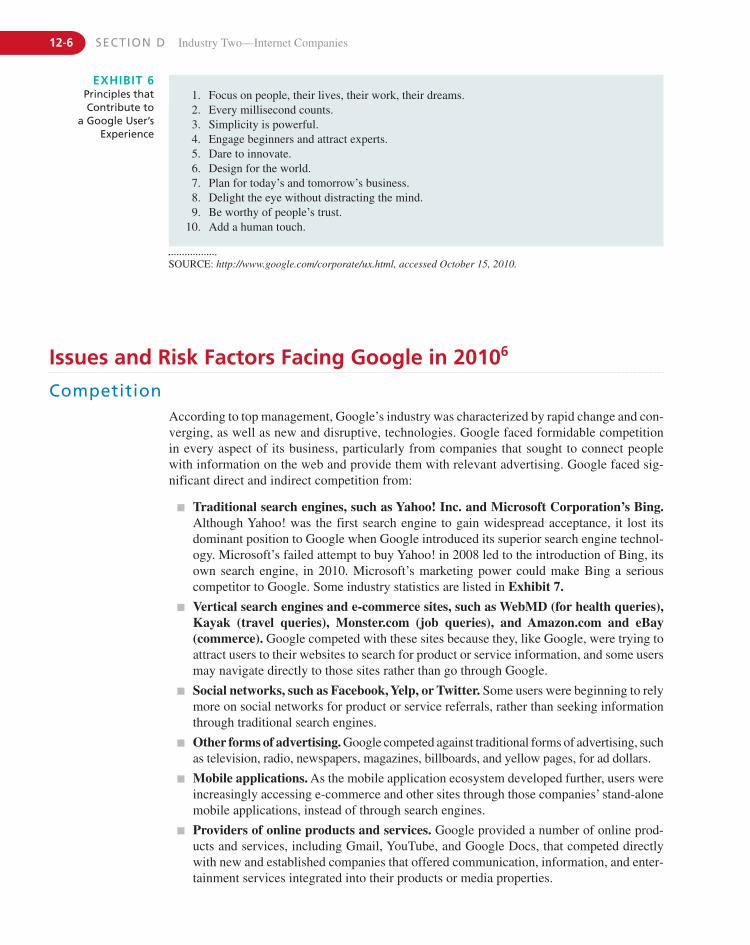
12-6 SECTION D Industry Two—Internet Companies
1. Focus on people, their lives, their work, their dreams.2. Every millisecond counts.3. Simplicity is powerful.4. Engage beginners and attract experts.5. Dare to innovate.6. Design for the world.7. Plan for today’s and tomorrow’s business.8. Delight the eye without distracting the mind.9. Be worthy of people’s trust.
10. Add a human touch.
EXHIBIT 6Principles thatContribute to
a Google User’sExperience
Issues and Risk Factors Facing Google in 20106
CompetitionAccording to top management, Google’s industry was characterized by rapid change and con-verging, as well as new and disruptive, technologies. Google faced formidable competitionin every aspect of its business, particularly from companies that sought to connect peoplewith information on the web and provide them with relevant advertising. Google faced sig-nificant direct and indirect competition from:
� Traditional search engines, such as Yahoo! Inc. and Microsoft Corporation’s Bing.Although Yahoo! was the first search engine to gain widespread acceptance, it lost itsdominant position to Google when Google introduced its superior search engine technol-ogy. Microsoft’s failed attempt to buy Yahoo! in 2008 led to the introduction of Bing, itsown search engine, in 2010. Microsoft’s marketing power could make Bing a seriouscompetitor to Google. Some industry statistics are listed in Exhibit 7.
� Vertical search engines and e-commerce sites, such as WebMD (for health queries),Kayak (travel queries), Monster.com (job queries), and Amazon.com and eBay(commerce). Google competed with these sites because they, like Google, were trying toattract users to their websites to search for product or service information, and some usersmay navigate directly to those sites rather than go through Google.
� Social networks, such as Facebook, Yelp, or Twitter. Some users were beginning to relymore on social networks for product or service referrals, rather than seeking informationthrough traditional search engines.
� Other forms of advertising. Google competed against traditional forms of advertising, suchas television, radio, newspapers, magazines, billboards, and yellow pages, for ad dollars.
� Mobile applications. As the mobile application ecosystem developed further, users wereincreasingly accessing e-commerce and other sites through those companies’ stand-alonemobile applications, instead of through search engines.
� Providers of online products and services. Google provided a number of online prod-ucts and services, including Gmail, YouTube, and Google Docs, that competed directlywith new and established companies that offered communication, information, and enter-tainment services integrated into their products or media properties.
SOURCE: http://www.google.com/corporate/ux.html, accessed October 15, 2010.
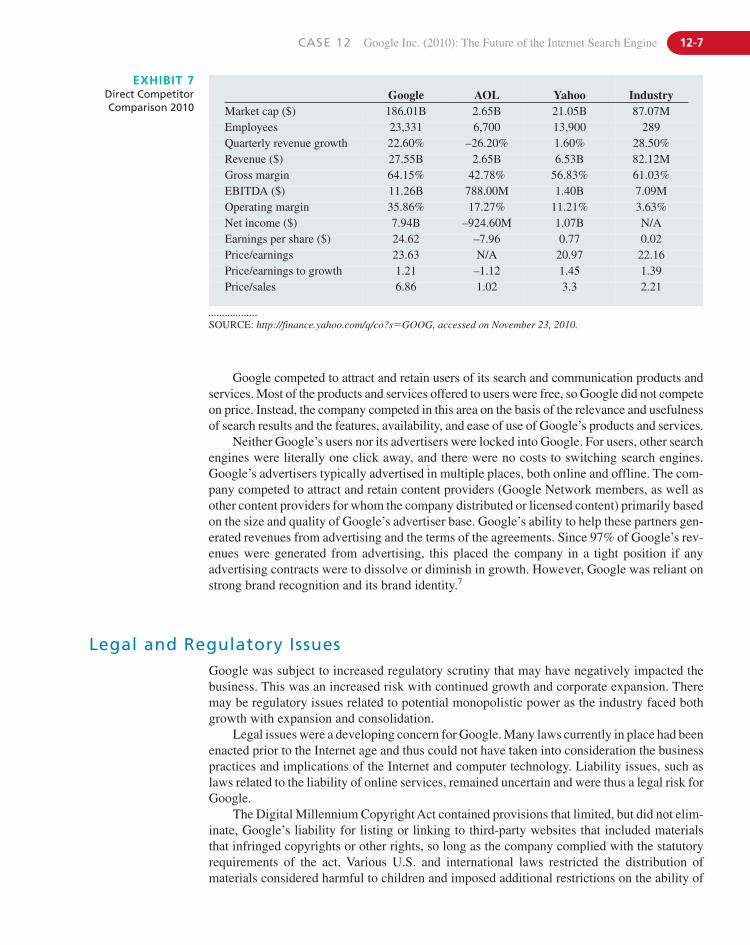
CASE 12 Google Inc. (2010): The Future of the Internet Search Engine 12-7
Google AOL Yahoo IndustryMarket cap ($) 186.01B 2.65B 21.05B 87.07MEmployees 23,331 6,700 13,900 289Quarterly revenue growth 22.60% –26.20% 1.60% 28.50%Revenue ($) 27.55B 2.65B 6.53B 82.12MGross margin 64.15% 42.78% 56.83% 61.03%EBITDA ($) 11.26B 788.00M 1.40B 7.09MOperating margin 35.86% 17.27% 11.21% 3.63%Net income ($) 7.94B –924.60M 1.07B N/AEarnings per share ($) 24.62 –7.96 0.77 0.02Price/earnings 23.63 N/A 20.97 22.16Price/earnings to growth 1.21 –1.12 1.45 1.39Price/sales 6.86 1.02 3.3 2.21
EXHIBIT 7Direct CompetitorComparison 2010
SOURCE: http://finance.yahoo.com/q/co?s�GOOG, accessed on November 23, 2010.
Google competed to attract and retain users of its search and communication products andservices. Most of the products and services offered to users were free, so Google did not competeon price. Instead, the company competed in this area on the basis of the relevance and usefulnessof search results and the features, availability, and ease of use of Google’s products and services.
Neither Google’s users nor its advertisers were locked into Google. For users, other searchengines were literally one click away, and there were no costs to switching search engines.Google’s advertisers typically advertised in multiple places, both online and offline. The com-pany competed to attract and retain content providers (Google Network members, as well asother content providers for whom the company distributed or licensed content) primarily basedon the size and quality of Google’s advertiser base. Google’s ability to help these partners gen-erated revenues from advertising and the terms of the agreements. Since 97% of Google’s rev-enues were generated from advertising, this placed the company in a tight position if anyadvertising contracts were to dissolve or diminish in growth. However, Google was reliant onstrong brand recognition and its brand identity.7
Legal and Regulatory IssuesGoogle was subject to increased regulatory scrutiny that may have negatively impacted thebusiness. This was an increased risk with continued growth and corporate expansion. Theremay be regulatory issues related to potential monopolistic power as the industry faced bothgrowth with expansion and consolidation.
Legal issues were a developing concern for Google. Many laws currently in place had beenenacted prior to the Internet age and thus could not have taken into consideration the businesspractices and implications of the Internet and computer technology. Liability issues, such aslaws related to the liability of online services, remained uncertain and were thus a legal risk forGoogle.
The Digital Millennium Copyright Act contained provisions that limited, but did not elim-inate, Google’s liability for listing or linking to third-party websites that included materialsthat infringed copyrights or other rights, so long as the company complied with the statutoryrequirements of the act. Various U.S. and international laws restricted the distribution ofmaterials considered harmful to children and imposed additional restrictions on the ability of
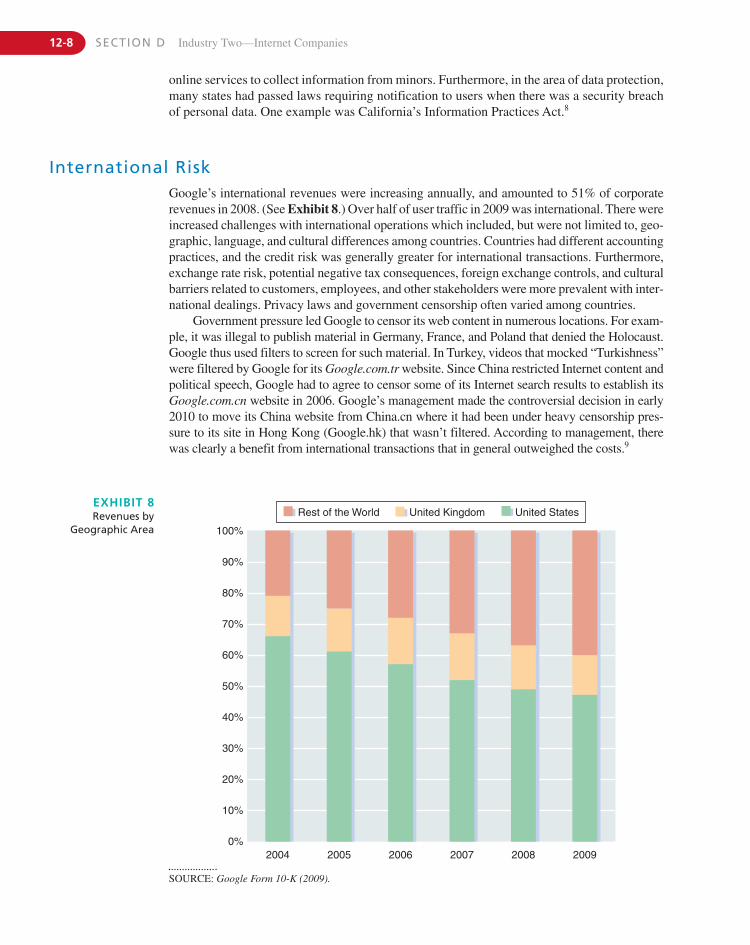
12-8 SECTION D Industry Two—Internet Companies
International RiskGoogle’s international revenues were increasing annually, and amounted to 51% of corporaterevenues in 2008. (See Exhibit 8.) Over half of user traffic in 2009 was international. There wereincreased challenges with international operations which included, but were not limited to, geo-graphic, language, and cultural differences among countries. Countries had different accountingpractices, and the credit risk was generally greater for international transactions. Furthermore,exchange rate risk, potential negative tax consequences, foreign exchange controls, and culturalbarriers related to customers, employees, and other stakeholders were more prevalent with inter-national dealings. Privacy laws and government censorship often varied among countries.
Government pressure led Google to censor its web content in numerous locations. For exam-ple, it was illegal to publish material in Germany, France, and Poland that denied the Holocaust.Google thus used filters to screen for such material. In Turkey, videos that mocked “Turkishness”were filtered by Google for its Google.com.tr website. Since China restricted Internet content andpolitical speech, Google had to agree to censor some of its Internet search results to establish itsGoogle.com.cn website in 2006. Google’s management made the controversial decision in early2010 to move its China website from China.cn where it had been under heavy censorship pres-sure to its site in Hong Kong (Google.hk) that wasn’t filtered. According to management, therewas clearly a benefit from international transactions that in general outweighed the costs.9
20040%
10%
20%
30%
40%
50%
60%
70%
80%
90%
100%
2005 2006 2007 2008 2009
Rest of the World United Kingdom United States
online services to collect information from minors. Furthermore, in the area of data protection,many states had passed laws requiring notification to users when there was a security breachof personal data. One example was California’s Information Practices Act.8
EXHIBIT 8Revenues by
Geographic Area
SOURCE: Google Form 10-K (2009).
CASE 12 Google Inc. (2010): The Future of the Internet Search Engine 12-9
Internet Security IssuesInternet security was an issue that plagued the industry, as a security breach would be poten-tially harmful to Google. Sophisticated software could already track users’ Internet activitywhile they shopped for goods and services on the web. Skilled hackers from around the worldwere now able to enter supposedly “secure” websites to obtain user records and credit cardinformation. Identity theft was becoming a major problem for the general population.Security/privacy issues were likely to become even more important as the amount of data andapplications available on the Internet increased.
Revenue Growth and SustainabilityGoogle had experienced remarkable revenue growth in the past six years as evidenced by itsfinancial statements. See Exhibits 9 and 10 for balance sheets, and income statements for2004–2009. Google’s management recognized that the firm’s revenue growth rate may soondecrease due to stronger direct and indirect competition, the developing maturity of the on-line advertising market, and the growing size of the firm. This could put pressure on operat-ing margins and profits in the future, thus lowering the free cash flow available to investors.Google’s management recognized that future profit margins may be tightened further bylower profit margins on revenues received from Google Network members. Furthermore,since 97% of revenue came from advertising, any blockage of online advertising would havea negative effect on operating profits.
Intellectual PropertyGoogle, YouTube, DoubleClick, DART, AdSense, AdWords, Gmail, I’m Feeling Lucky,PageRank, Blogger, orkut, Picassa, SketchUp, and Postini were registered trademarks in theUnited States. Google also had unregistered trademarks, such as Blog*Spot, Jaiku, Android,Open Handset Alliance, OpenSocial, Panoramio, and Knol. The first version of the PageRanktechnology was created while Google’s cofounders attended Stanford University—thus, Stan-ford owned a patent to PageRank which was due to expire in 2017. Although Google owned aperpetual license to this patent, the license was due to become non-exclusive at the end of 2011.
Google must fend off threats to their trademarks and secrets. Mainly, the company runs therisk of the name Google becoming commonly used by the public to describe “searching” the Internet. Google could actually lose its trademark on the name, as it would become part ofthe public domain. Trade secrets are also something Google defended, as an internal leak woulddiminish the value of these secrets.
Furthermore, intellectual property rights claims were costly to defend in the legal system.Litigations challenging the IP rights of companies within the technology industry were fre-quent, and as Google expanded its business, it had experienced more claims against it. Com-panies had filed trademark infringements against Google, usually over advertisements.Companies have also filed claims against Google for copyright infringement on the featuresof its website and its products. Examples include the class action settlement with the AuthorsGuild and the Association of the American Publishers, which will end up costing the company.In addition, some of Google’s products have been attacked for patent infringements, for whichGoogle could be required to pay damages or licensing fees. Patent infringement settlementswould lead to higher costs and prevent the ability of Google to produce certain services orproducts, leading to lost profits.
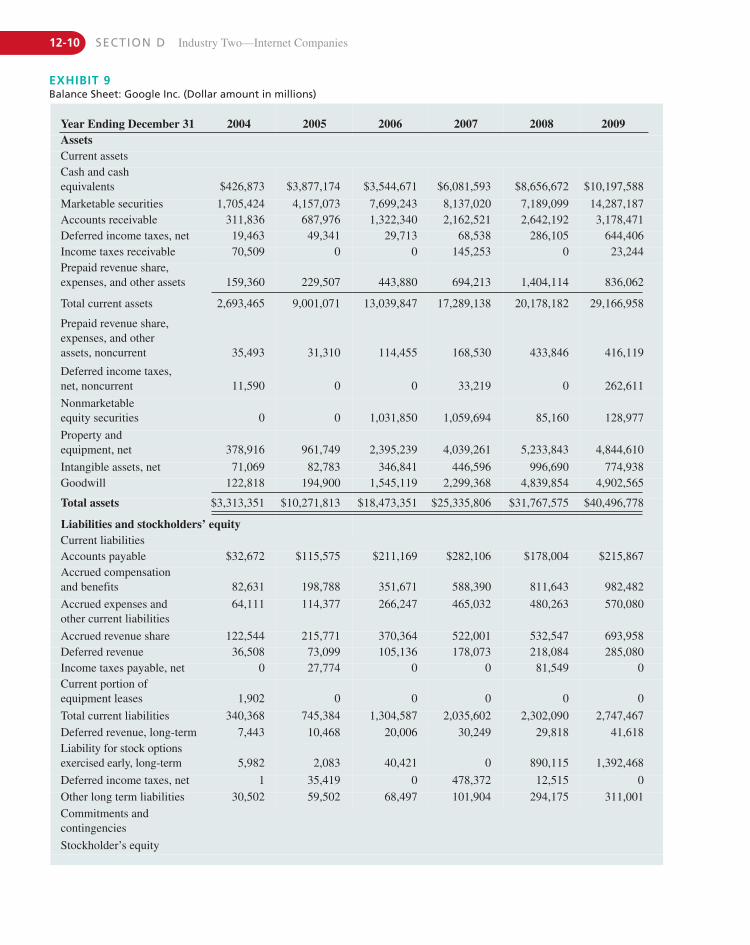
12-10 SECTION D Industry Two—Internet Companies
EXHIBIT 9Balance Sheet: Google Inc. (Dollar amount in millions)
Year Ending December 31 2004 2005 2006 2007 2008 2009AssetsCurrent assetsCash and cash equivalents $426,873 $3,877,174 $3,544,671 $6,081,593 $8,656,672 $10,197,588
Marketable securities 1,705,424 4,157,073 7,699,243 8,137,020 7,189,099 14,287,187Accounts receivable 311,836 687,976 1,322,340 2,162,521 2,642,192 3,178,471Deferred income taxes, net 19,463 49,341 29,713 68,538 286,105 644,406Income taxes receivable 70,509 0 0 145,253 0 23,244Prepaid revenue share, expenses, and other assets 159,360 229,507 443,880 694,213 1,404,114 836,062
Total current assets 2,693,465 9,001,071 13,039,847 17,289,138 20,178,182 29,166,958
Prepaid revenue share, expenses, and other assets, noncurrent 35,493 31,310 114,455 168,530 433,846 416,119
Deferred income taxes, net, noncurrent 11,590 0 0 33,219 0 262,611
Nonmarketable equity securities 0 0 1,031,850 1,059,694 85,160 128,977
Property and equipment, net 378,916 961,749 2,395,239 4,039,261 5,233,843 4,844,610
Intangible assets, net 71,069 82,783 346,841 446,596 996,690 774,938Goodwill 122,818 194,900 1,545,119 2,299,368 4,839,854 4,902,565
Total assets $3,313,351 $10,271,813 $18,473,351 $25,335,806 $31,767,575 $40,496,778
Liabilities and stockholders’ equityCurrent liabilitiesAccounts payable $32,672 $115,575 $211,169 $282,106 $178,004 $215,867Accrued compensation and benefits 82,631 198,788 351,671 588,390 811,643 982,482
Accrued expenses and other current liabilities
64,111 114,377 266,247 465,032 480,263 570,080
Accrued revenue share 122,544 215,771 370,364 522,001 532,547 693,958Deferred revenue 36,508 73,099 105,136 178,073 218,084 285,080Income taxes payable, net 0 27,774 0 0 81,549 0Current portion of equipment leases 1,902 0 0 0 0 0
Total current liabilities 340,368 745,384 1,304,587 2,035,602 2,302,090 2,747,467Deferred revenue, long-term 7,443 10,468 20,006 30,249 29,818 41,618Liability for stock options exercised early, long-term 5,982 2,083 40,421 0 890,115 1,392,468
Deferred income taxes, net 1 35,419 0 478,372 12,515 0Other long term liabilities 30,502 59,502 68,497 101,904 294,175 311,001Commitments andcontingencies
Stockholder’s equity
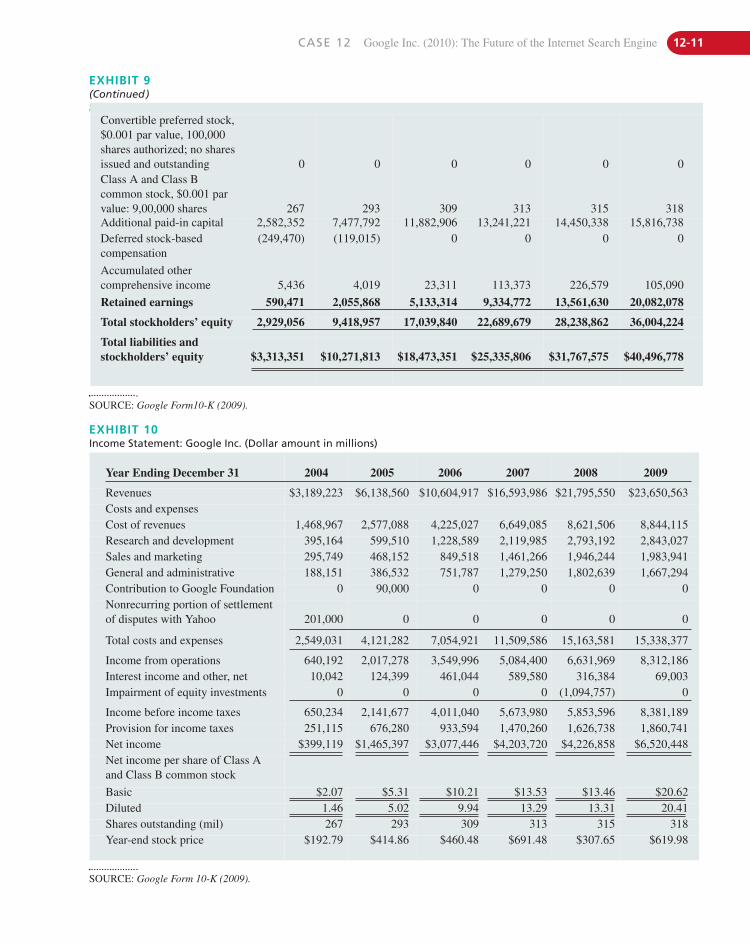
CASE 12 Google Inc. (2010): The Future of the Internet Search Engine 12-11
EXHIBIT 9(Continued)SOURCE: Google Form10-K (2009).
SOURCE: Google Form10-K (2009).
Year Ending December 31 2004 2005 2006 2007 2008 2009
Revenues $3,189,223 $6,138,560 $10,604,917 $16,593,986 $21,795,550 $23,650,563Costs and expensesCost of revenues 1,468,967 2,577,088 4,225,027 6,649,085 8,621,506 8,844,115Research and development 395,164 599,510 1,228,589 2,119,985 2,793,192 2,843,027Sales and marketing 295,749 468,152 849,518 1,461,266 1,946,244 1,983,941General and administrative 188,151 386,532 751,787 1,279,250 1,802,639 1,667,294Contribution to Google Foundation 0 90,000 0 0 0 0Nonrecurring portion of settlement of disputes with Yahoo 201,000 0 0 0 0 0
Total costs and expenses 2,549,031 4,121,282 7,054,921 11,509,586 15,163,581 15,338,377
Income from operations 640,192 2,017,278 3,549,996 5,084,400 6,631,969 8,312,186Interest income and other, net 10,042 124,399 461,044 589,580 316,384 69,003Impairment of equity investments 0 0 0 0 (1,094,757) 0
Income before income taxes 650,234 2,141,677 4,011,040 5,673,980 5,853,596 8,381,189Provision for income taxes 251,115 676,280 933,594 1,470,260 1,626,738 1,860,741Net income $399,119 $1,465,397 $3,077,446 $4,203,720 $4,226,858 $6,520,448Net income per share of Class A and Class B common stock
Basic $2.07 $5.31 $10.21 $13.53 $13.46 $20.62Diluted 1.46 5.02 9.94 13.29 13.31 20.41Shares outstanding (mil) 267 293 309 313 315 318Year-end stock price $192.79 $414.86 $460.48 $691.48 $307.65 $619.98
EXHIBIT 10Income Statement: Google Inc. (Dollar amount in millions)
SOURCE: Google Form 10-K (2009).
Convertible preferred stock,$0.001 par value, 100,000shares authorized; no sharesissued and outstanding 0 0 0 0 0 0Class A and Class Bcommon stock, $0.001 parvalue: 9,00,000 shares 267 293 309 313 315 318Additional paid-in capital 2,582,352 7,477,792 11,882,906 13,241,221 14,450,338 15,816,738Deferred stock-basedcompensation
(249,470) (119,015) 0 0 0 0
Accumulated other comprehensive income 5,436 4,019 23,311 113,373 226,579 105,090
Retained earnings 590,471 2,055,868 5,133,314 9,334,772 13,561,630 20,082,078
Total stockholders’ equity 2,929,056 9,418,957 17,039,840 22,689,679 28,238,862 36,004,224
Total liabilities and stockholders’ equity $3,313,351 $10,271,813 $18,473,351 $25,335,806 $31,767,575 $40,496,778
12-12 SECTION D Industry Two—Internet Companies
Culture and EmployeesLike many successful technology firms, Google provided its employees with an open and col-laborative culture in which ideas were exchanged and new products and application ideaswere developed. Google’s management strived to be transparent in their workings, makingsure that employees knew about company announcements and new product or applicationdevelopment before the public. The company used both technology and standard processesto convey information. For example, “Tech Talks” blogs and weekly “TGIF” meetings wereused to convey information and to communicate with employees.
On December 31, 2009, Google had 19,835 employees, consisting of 7,443 in research anddevelopment, 7,338 in sales and marketing, 2,941 in general and administrative, and 2,113 inoperations. Given that Google relied on highly skilled workers, its continued success wasstrongly related to its ability to maintain and grow its strong talent pool. Once the current reces-sion ends, it may become more difficult to attract and maintain skilled, talented employees.10
Google experienced rapid and strong growth with strong employee satisfaction. Thecompany worked to gain a globally diverse workforce with different perspectives in which
Information Technology IssuesGoogle was susceptible to threats from false or invalid visits to the ads it displayed, and hashad to refund fees charged for advertising due to fraudulent clicks. If Google failed to detectclick fraud or other invalid clicks, it could lose the confidence of its advertisers, which wouldharm the company’s image and viability.
Additionally, interruption or failure of the information technology and communicationssystems the company used could hurt its ability to effectively provide products and services,damaging the reputation Google worked to maintain, as well as harming its operating income.Its IT system was exposed to impairment from numerous sources, such as natural disasters,infrastructure failures, and computer hackers. Although management had contingency plansfor many of these situations, such plans could not cover every possibility.
Index spammers could harm the integrity of Google’s web service by falsifying users’ search attempts. This could damage the company’s reputation and lead to users becomingunhappy with Google’s products and services, leading to a decline in website visits. This couldresult in lower advertising revenues from its Google Network partners. Google relied greatly onthese members for a significant portion of its revenues, and both parties benefited from their as-sociation with each other. The loss of these associates could adversely affect the business.
The future of the business depended upon continued and unimpeded access to the Inter-net for both the company and its users. Internet access providers may be able to block, degrade,or charge for access to certain Google products and services, which could lead to additionalexpenses and the loss of users and advertisers.
As Google spread its operations across the globe, more and more of its receivables werebeing denominated in foreign currencies. If currency exchange rates become unfavorable, thecompany could lose some revenues in U.S. dollar terms. Although many multinational corpo-rations used hedging strategies to lower or negate the risk of doing business overseas, Googlehad limited experience with many of these financial strategies. Hedging strategies also hadhigh costs, reducing the company’s overall profitability.
Alternative TechnologyEach day, more individuals were using devices other than personal computers to access the Internet.If users of these devices did not widely adopt versions of Google’s web search technology, products,or operating systems developed for these devices, the business could be adversely affected. These al-ternative devices may make it problematic to use the services provided by Google, and make it chal-lenging for the company to produce products which capture customers’ imaginations and loyalties.
CASE 12 Google Inc. (2010): The Future of the Internet Search Engine 12-13
SeasonalityWhile there were some seasonal effects on Google’s business, it was generally not as significantas in retail stores, which earned much of their revenue in the last quarter of the calendar year.In Google’s case, there had generally been an increase in business in the last quarter of thecalendar year, as represented by commercial queries. Likewise, the summer months tendedto be the slowest time of the year. While seasonality might be an issue for Google’s businessand revenue, it was generally not perceived by management to be a major issue.
employees were rewarded for performance. Google had historically worked hard to maintaina corporate culture of innovation and performance that aligned the interests of the corporationwith those of employees. The company’s $1,000 cash bonus and 10% raise paid to all of itsemployees in 2010 were examples of the lengths to which the company acted to retain toptalent. This was important since Google’s stock price had dropped 4.7% in 2010. According toPaul Kedrosky, a venture capitalist, “It used to be people were fine taking Google’s money andstock, because they believed it would appreciate rapidly. Not it’s not as attractive.”11
The company considered cofounders Brin and Page to be a key corporate resource, eventhough their spending $15 million for a former Qantas Boeing 767 jet airplane in 2006 to use asa company plane was listed by Bloomberg Business Week as an example of “executive excess.”12
As the company continues to grow, management will be challenged to find new and inno-vative ways to maintain a strong corporate culture.
Google’s FutureGoogle had thus far thrived in the Internet search engine industry, garnishing a name that, formany, was synonymous with “Internet search.” Up to now, growth had been strong, suggest-ing a bright future. Google appeared to be poised to take advantage of what the future had to offer in new technology by creating new products. In order to continue doing this, it will needto retain the best and brightest minds. For example, one of Google’s new concepts was arti-ficial intelligence software for use in automobiles that could drive themselves.13 The com-pany’s stock price had climbed tremendously in the past, but some analysts now felt thatGoogle was maturing as a corporation and that its stock value was leveling off.14
As Google continued to grow, it continued purchasing other companies, such as itsacquisitions of YouTube, DoubleClick, and Postini.15 Nevertheless, growth by acquisition maynot necessarily lead to increasing growth in revenues or profits. For example, YouTube was an$1.6 billion 2006 acquisition that as of 2010 had not generated significant additional revenuefor Google, despite its growth potential.
There were some indications that acquisitions might become an increasingly difficultstrategy in the future. In 2010, Google failed in an attempt to purchase Groupon, a website spe-cializing in local shopping promotions. Google’s offer of $6 billion for Groupon was almostdouble what it had paid for DoubleClick in 2008. Groupon’s rejection of the offer reflected afear common to web entrepreneurs that their small ventures might get lost inside Google’svastness. For example, several other startups, such as Yelp, that had also been pursued byGoogle had opted to stay privately owned.16
Google’s top management needed to consider these and other factors in order to planstrategically. Legal issues will likely continue, such as allegations that Google used Wi-Fi net-works to take personal information. Google’s management had moved on this quickly withcorrective action and similar future responses to legal challenges will be important.17 Thefuture of mobile computing was an open, uncharted area.18
All of these considerations and more were relevant as CEO Schmidt and his executive teampondered the second decade of the new millennium and discussed Google’s future strategies.
12-14 SECTION D Industry Two—Internet Companies
N O T E S1. Trish, Bisoux, “First Adopters” BizEd (November/December
2010), p. 20.2. Much of this section was developed from http://www.google
.com/corporate/milestones.html (November 30, 2010).3. Eric Schmidt, chief executive officer of Google.4. Trish, Bisoux, “First Adopters,” BizEd (November/December
2010), p. 22.5. http://www.google.com/corporate.tenthings.html (October 15,
2010).6. Much of this information is from Google 10-K, 2009, filed with
the SEC.7. Google Form 10-K, 2009, filed with the SEC.8. This paragraph was paraphrased from Google’s Form 19-K,
2009, filed with the SEC.9. Peter Burrows, “Apple vs. Google: How the Battle Between
Silicon Valley’s Superstars will Shape the Future of MobileComputing,” Bloomberg Business Week (January 25, 2010), pp. 28–34; and Lawrence Carrel, “Apple, Google, and Microsoft:Buy or Avoid?” Kiplinger Personal Finance http://www.kiplinger.com/printstory.php?pid�20382 (September 24, 2010).
10. Google Form 10-K, 2009, filed with the SEC.11. Brad Stone and Douglas MacMillan, “Groupon’s $6 Billion
Snub,” Bloomberg Business Week (December 13–19, 2010), p. 7.
12. “A Century of Executive Excess,” Bloomberg Business Week(December 13–19, 2010), p. 99.
13. “Cars Drive Themselves: Google Is Testing Artificial-Intelligence Software in Cars in California,” St. PetersburgTimes (October 10, 2010), p.1a.
14. “Google: Time to Take Profits? S&P Downgrades on Valuation,”http://blogs.barrons.com/techtraderdaily/2010/11/08 (Novem-ber 8, 2010); and Lawrence Carrel, “Apple, Google, and Microsoft:Buy or Avoid?” Kiplinger Personal Finance, http://www.kiplinger.com/printstory.php?pid�20382 (September 24, 2010).
15. “Google to Acquire YouTube for $1.65 Billion in Stock,” http://www.google.com/intl/en/press/pressrel/google_youtube.html(November 8, 2010).
16. Brad Stone and Douglas MacMillan, “Groupon’s $6 Billion Snub,”Bloomberg Business Week (December 13–19, 2010), pp. 6–7.
17. “Google Grabs Personal Info Off of Wi-Fi Networks,” http://finance.yahoo.com/news/Google-grabs-personal-info-apf-2162289993.html (November 8, 2010).
18. Peter Burrows, “Apple vs. Google: How the Battle Between Silicon Valley’s Superstars will Shape the Future of Mobile Com-puting, Bloomberg BusinessWeek (January 25, 2010), pp. 28–34.
R E F E R E N C E SByron Acohido, Kathy Chu, and Calum MacLeod, “Google
Clash Highlights How China Does Business: ForeignCompanies Have Jumped Through China’s Hoops forYears,” USA Today (January 25, 2010), pp. 1b–2b.
Associated Press. “China Says Dispute Is with Google, notU.S.,” St. Petersburg Times (2010, January 22), pp. 4b–5b.
Tricia Bisoux, “First Adopters,” BizEd (November/December,2010), pp. 20–26.
Peter Burrows, “Apple vs. Google: How the Battle BetweenSilicon Valley’s Superstars will Shape the Future of Mo-bile Computing,” Bloomberg BusinessWeek (January 25,2010), pp. 28–34.
Lawrence Carrel, “Apple, Google, and Microsoft: Buy orAvoid?” Kiplinger Personal Finance, http://www.kiplinger.com/printstory.php?pid�20382 (September 24, 2010).
Simon Dumenco, “Can We Trust Google to Avoid ChronicAOL-ism?” Advertising Age, http://adage.com/print?article_id�48584 (February 26, 2006).
Bruce Einhorn, “Google and China: A Win for Liberty—andStrategy,” Bloomberg BusinessWeek (January 25, 2010),p. 35.
“Exclusive: How Google’s Algorithm Rules the Web,” http://www.wired.com/magazine/2010/02/ff_google_algorithm/(November 8, 2010).
“Frequently Asked Questions—Investor Relations—Google,”http://investor.google.com/corporate/faq.html (Novem-ber 18, 2010).
Steven Goldberg, “Tech Titans Are Cheap,” Kiplinger Personal Finance (September 28, 2010).
Google 10-K form for the year ended December 31, 2009,filed with the SEC.
Google 10-Q form for the third quarter ended on September 30,2010, filed with the SEC.
“Google: Time to Take Profits? S&P Downgrades on Valuation,”http://blogs.barrons.com/techtraderdaily/2010/11/08(November 8, 2010).
“Google Grabs Personal Info Off of Wi-Fi Networks,” http://finance.yahoo.com/news/Google-grabs-personal-info-apf-2162289993.html (November 8, 2010).
“Google to Acquire YouTube for $1.65 Billion in Stock,” http://www.google.com/intl/en/press/pressrel/google_youtube.html (November 8, 2010).
“Google User Experience—Google Corporate Information,”http://www.google.com/corporate/ex.html (November 18,2010).
“In Search of the Real Google,” Time Magazine, http://www/time.com/time/printout/0,8816,1158961,00.html(February 12, 2006).
“Management Team—Google Corporate Information,” http://www.google.com/corporate/execs.html (November 18,2010).
“Cars Drive Themselves: Google Is Testing Artificial-Intelligence Software in Cars in California. St. PetersburgTimes (October 10, 2010), p. 1a.
“Our Philosophy—Google Corporate Information,” http://www.google.com/corporate/tenthings.html (November 18,2010).
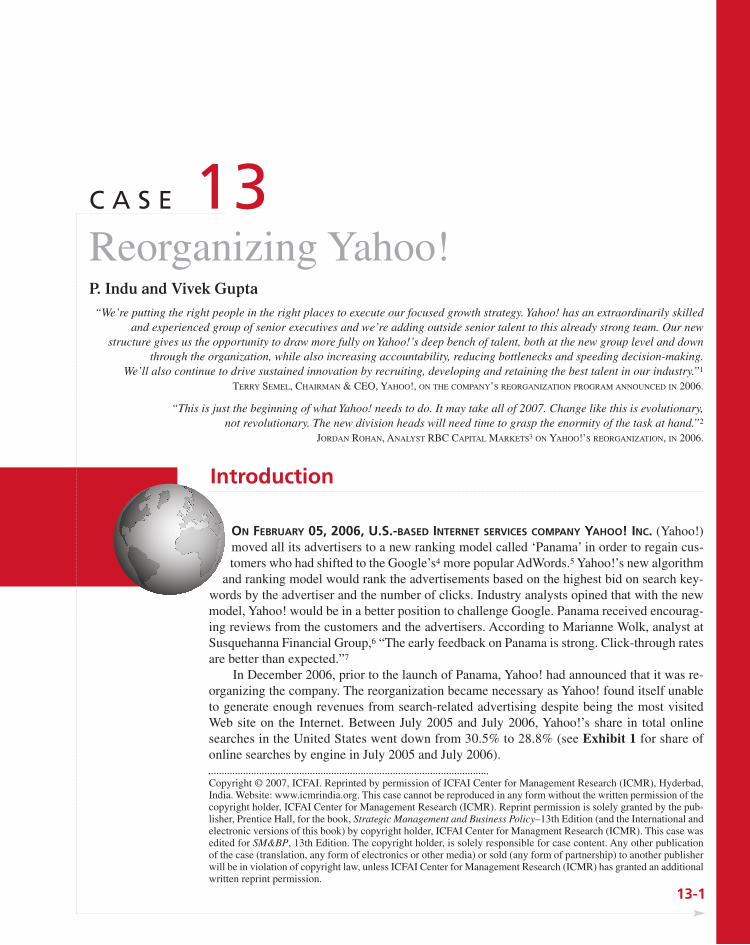
Introduction
ON FEBRUARY 05, 2006, U.S.-BASED INTERNET SERVICES COMPANY YAHOO! INC. (Yahoo!)moved all its advertisers to a new ranking model called ‘Panama’ in order to regain cus-tomers who had shifted to the Google’s4 more popular AdWords.5 Yahoo!’s new algorithm
and ranking model would rank the advertisements based on the highest bid on search key-words by the advertiser and the number of clicks. Industry analysts opined that with the newmodel, Yahoo! would be in a better position to challenge Google. Panama received encourag-ing reviews from the customers and the advertisers. According to Marianne Wolk, analyst atSusquehanna Financial Group,6 “The early feedback on Panama is strong. Click-through ratesare better than expected.”7
In December 2006, prior to the launch of Panama, Yahoo! had announced that it was re-organizing the company. The reorganization became necessary as Yahoo! found itself unableto generate enough revenues from search-related advertising despite being the most visited Web site on the Internet. Between July 2005 and July 2006, Yahoo!’s share in total onlinesearches in the United States went down from 30.5% to 28.8% (see Exhibit 1 for share ofonline searches by engine in July 2005 and July 2006).
13-1
C A S E 13Reorganizing Yahoo!P. Indu and Vivek Gupta“We’re putting the right people in the right places to execute our focused growth strategy. Yahoo! has an extraordinarily skilled
and experienced group of senior executives and we’re adding outside senior talent to this already strong team. Our newstructure gives us the opportunity to draw more fully on Yahoo!’s deep bench of talent, both at the new group level and down
through the organization, while also increasing accountability, reducing bottlenecks and speeding decision-making. We’ll also continue to drive sustained innovation by recruiting, developing and retaining the best talent in our industry.”1
TERRY SEMEL, CHAIRMAN & CEO, YAHOO!, ON THE COMPANY’S REORGANIZATION PROGRAM ANNOUNCED IN 2006.
“This is just the beginning of what Yahoo! needs to do. It may take all of 2007. Change like this is evolutionary,not revolutionary. The new division heads will need time to grasp the enormity of the task at hand.”2
JORDAN ROHAN, ANALYST RBC CAPITAL MARKETS3 ON YAHOO!’S REORGANIZATION, IN 2006.
Copyright © 2007, ICFAI. Reprinted by permission of ICFAI Center for Management Research (ICMR), Hyderbad,India. Website: www.icmrindia.org. This case cannot be reproduced in any form without the written permission of thecopyright holder, ICFAI Center for Management Research (ICMR). Reprint permission is solely granted by the pub-lisher, Prentice Hall, for the book, Strategic Management and Business Policy–13th Edition (and the International andelectronic versions of this book) by copyright holder, ICFAI Center for Managment Research (ICMR). This case wasedited for SM&BP, 13th Edition. The copyright holder, is solely responsible for case content. Any other publicationof the case (translation, any form of electronics or other media) or sold (any form of partnership) to another publisherwill be in violation of copyright law, unless ICFAI Center for Management Research (ICMR) has granted an additionalwritten reprint permission.
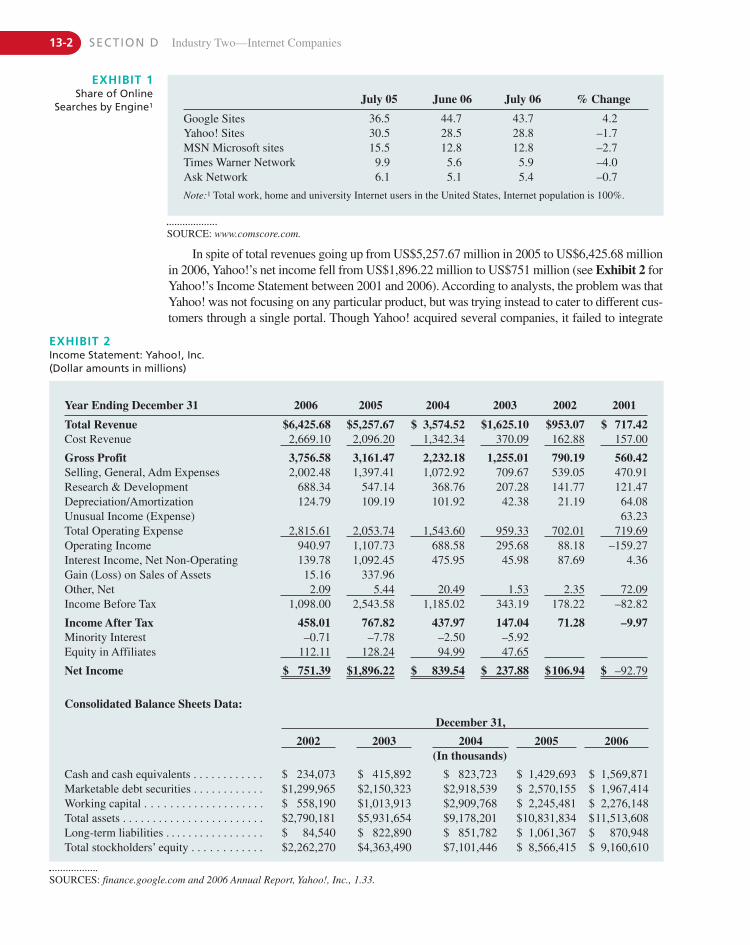
13-2 SECTION D Industry Two—Internet Companies
EXHIBIT 2Income Statement: Yahoo!, Inc. (Dollar amounts in millions)
Year Ending December 31 2006 2005 2004 2003 2002 2001
Total Revenue $6,425.68 $5,257.67 $ 3,574.52 $1,625.10 $953.07 $ 717.42Cost Revenue 2,669.10 2,096.20 1,342.34 370.09 162.88 157.00
Gross Profit 3,756.58 3,161.47 2,232.18 1,255.01 790.19 560.42Selling, General, Adm Expenses 2,002.48 1,397.41 1,072.92 709.67 539.05 470.91Research & Development 688.34 547.14 368.76 207.28 141.77 121.47Depreciation/Amortization 124.79 109.19 101.92 42.38 21.19 64.08Unusual Income (Expense) 63.23Total Operating Expense 2,815.61 2,053.74 1,543.60 959.33 702.01 719.69Operating Income 940.97 1,107.73 688.58 295.68 88.18 –159.27Interest Income, Net Non-Operating 139.78 1,092.45 475.95 45.98 87.69 4.36Gain (Loss) on Sales of Assets 15.16 337.96Other, Net 2.09 5.44 20.49 1.53 2.35 72.09Income Before Tax 1,098.00 2,543.58 1,185.02 343.19 178.22 –82.82
Income After Tax 458.01 767.82 437.97 147.04 71.28 –9.97Minority Interest –0.71 –7.78 –2.50 –5.92Equity in Affiliates 112.11 128.24 94.99 47.65
Net Income $ 751.39 $1,896.22 $ 839.54 $ 237.88 $106.94 $ –92.79
Consolidated Balance Sheets Data:
December 31,
2002 2003 2004 2005 2006(In thousands)
Cash and cash equivalents . . . . . . . . . . . . $ 234,073 $ 415,892 $ 823,723 $ 1,429,693 $ 1,569,871Marketable debt securities . . . . . . . . . . . . $1,299,965 $2,150,323 $2,918,539 $ 2,570,155 $ 1,967,414Working capital . . . . . . . . . . . . . . . . . . . . $ 558,190 $1,013,913 $2,909,768 $ 2,245,481 $ 2,276,148Total assets . . . . . . . . . . . . . . . . . . . . . . . . $2,790,181 $5,931,654 $9,178,201 $10,831,834 $11,513,608Long-term liabilities . . . . . . . . . . . . . . . . . $ 84,540 $ 822,890 $ 851,782 $ 1,061,367 $ 870,948Total stockholders’ equity . . . . . . . . . . . . $2,262,270 $4,363,490 $7,101,446 $ 8,566,415 $ 9,160,610
EXHIBIT 1Share of Online
Searches by Engine1July 05 June 06 July 06 % Change
Google Sites 36.5 44.7 43.7 4.2Yahoo! Sites 30.5 28.5 28.8 –1.7MSN Microsoft sites 15.5 12.8 12.8 –2.7Times Warner Network 9.9 5.6 5.9 –4.0Ask Network 6.1 5.1 5.4 –0.7
Note:1 Total work, home and university Internet users in the United States, Internet population is 100%.
SOURCE: www.comscore.com.
SOURCES: finance.google.com and 2006 Annual Report, Yahoo!, Inc., 1.33.
In spite of total revenues going up from US$5,257.67 million in 2005 to US$6,425.68 millionin 2006, Yahoo!’s net income fell from US$1,896.22 million to US$751 million (see Exhibit 2 forYahoo!’s Income Statement between 2001 and 2006). According to analysts, the problem was thatYahoo! was not focusing on any particular product, but was trying instead to cater to different cus-tomers through a single portal. Though Yahoo! acquired several companies, it failed to integrate
CASE 13 Reorganizing Yahoo! 13-3
Background NoteYahoo! was founded by Jerry Yang and David Filo, who began exploring the Internet as ahobby after finishing their doctoral theses in electrical engineering at Stanford University. InApril 1994, they created a directory to keep track of their personal interests on the Internet.Gradually, they began to spend more and more time on their directory. Later, Yang and Filostarted categorizing Web sites as a way to keep track of all the sites they had visited. Theyposted this list on the Web as “Jerry and David’s Guide to the Worldwide Web.”
The guide became very popular and became the first choice of people browsing the Webto find sites intelligently. It helped people to discover useful, interesting, and entertaining con-tent on the Internet. In late 1994, the duo changed the name of the guide to Yahoo!,11 position-ing it as a customized database designed to serve different users. They developed customizedsoftware to help locate, identify, and edit material stored on the Internet. Yahoo! rapidly be-came popular and attracted a lot of media attention.
Yahoo! was formally incorporated in March 1995, and by mid-1995 it had implementeda business plan modeled on traditional broadcast media companies. Through its IPO in April1996, Yahoo! sold 2.6 million shares, raising US$38.8 million.
Yahoo! generated its revenues mainly from online advertisements, primarily banner ads12 andad placement fees, promotions,13 sponsorships, direct marketing,14 and merchandising. It also gen-erated revenues from monthly hosting fees and commissions on online sales from its merchantpartners. These included transaction fees generated from the sale of merchandise on its site.
Within the four years from 1997 to 2000, Yahoo! reported substantial growth in its revenues.More than 85% of its revenues came from the sale of banners and sponsorship advertising whilethe remaining came from business services and e-commerce transactions. By mid-2000, Yahoo!was drawing more than 180 million unique visitors,15 which made Yahoo! a leading Internet brand.
In late 2000, Yahoo! faced several problems owing to the internal rivalry between PresidentJeffrey Mallett and CEO Timothy A Koogle (Koogle). Its troubles were compounded by the factthat the company had grown complacent and did not adapt to the rapidly changing business envi-ronment. Yahoo! was heavily dependent on the advertising revenues generated through dotcoms.Once the dotcoms began going out of business, Yahoo!’s ad revenues declined sharply. The
them. Even in search-related advertising, which had emerged as a major revenue generator in theInternet business, Yahoo! fell behind its competitor Google, which was generating twice as muchrevenue on each search ad. The challenges that Yahoo! was facing externally were further com-pounded by the internal turmoil in the company brought about by the complex organization struc-ture and slow decision-making process.
Yahoo! delayed several product launches as it wanted to focus on Panama, which had beendelayed by more than two quarters. Panama was to be launched in the second quarter of2006 but was not launched even at the end of 2006. Yahoo!’s problems were reported widelyin the media. At the same time, the Wall Street Journal8 published an internal memo that wascirculated by a senior vice president at Yahoo!, about the lack of focus in the company due towhich its resources were thinly spread across several business segments.
Within a month, Yahoo! introduced a new organization structure, under which the com-pany was reorganized into three operating units, namely the Audience Group, the Advertiser &Publisher Group, and the Technology Group with the focus on the customers, advertisers, andtechnology, respectively. The heads of the three units reported directly to Terry Semel (Semel),chairman & CEO of Yahoo!.
Analysts opined that with the reorganization and Panama in place, Yahoo! could well beon its way to regaining its lost glory. According to Martin Pyykkonen, analyst, Global CrownCapital,9 “I’m not forecasting any kind of wholesale shift here, that all of a sudden Google isgoing to fall by the wayside ... but I do think they (Yahoo!) will narrow the gap.”10
13-4 SECTION D Industry Two—Internet Companies
online advertising market was going through major changes, and the advertisers were lookingbeyond the banner ads, toward ads that integrated the Internet, television, and radio. Yahoo!,however, did not understand what kind of advertising would work for the customers. It failed tomake any improvements in its business models, which would have allowed it to cater to a widerange of customers. Several key personnel also left the company during the time.
In the first quarter of 2001, with a sharp decline in online advertisement sales, Yahoo! re-duced its revenue forecast from US$230 million to US$175 million. At a board meeting con-vened in February 2001, it was decided that Koogle should step down, making way for Semel.Semel brought in several changes in the company and the number of business units was re-duced from 44 to just five. He also announced the layoff of 400 people from Yahoo!’s 3,500workforce. Several new services, including subscription-based services were introduced.
In order to consolidate its position, Yahoo! entered into several partnership deals. Onesuch deal was with Overture, a paid search services16 provider. The acquisitions made by Yahoo! included Hotjobs.com, an online careers site, in February 2002 for US$435 million,and Inktomi Corporation17 in March 2003 for US$257 million. Yahoo! also entered into a licensing agreement with Google to use its search engine technology.
At the end of 2003, Yahoo! acquired Overture for around US$1.6 billion. At the time, Over-ture dominated search-related advertising, and its revenues were almost double that of Google.Through Overture’s advertising platform, advertisers could select words and search phrases andbid for them. This enabled their advertisements to be shown along with the regular search results.As Overture was highly successful, analysts opined that Yahoo! was making the right moves andcould consolidate its position in the rapidly growing online advertising market by acquiringOverture. With Inktomi and Overture,18 Yahoo! was expected to become a domination force inthe search advertising market (see Exhibit 3 for online advertising market in the United States).
The ProblemsThough Yahoo! possessed search engine and search advertising technology, integrating bothproved to be a difficult task. The engineers in the company had to be convinced that, ratherthan build the new technology from scratch, it was better to use the acquired technology fromInktomi and Overture. In order to convince the engineers, Semel announced the integrationof Yahoo!, Inktomi, and Overture to create the best search technology consumers and an ef-fective advertising platform for the advertisers.
However, even until early 2004, Yahoo! continued using Google’s search engine. InFebruary 2004, Yahoo! launched a Web crawler–based19 search engine, based on Yahoo!Slurp.20 With the prevailing optimism about Yahoo!, its stock hit US$36.42 by mid-2004.
Through Overture, advertisements were placed depending on the amount the advertiserhad agreed to pay per click. So the advertisements of the highest bidder were placed on thetop, irrespective of their relevance. The technology used in Overture could not handle the hightraffic expected out of a Yahoo! search. Overture required each advertisement to be reviewedand placed with human intervention, and this required a lot of time. To display advertise-ments based on relevance, Yahoo! needed to create new ranking software and a database tomeasure the clicks the advertisements were receiving. The company planned to spruce uptechnology and call the project Panama. However, the project ran into trouble with execu-tives from Yahoo! and Overture not being able to work together. Meanwhile, by 2004,Google had surpassed Overture in terms of revenues. There were several other areas inwhich Yahoo! faced problems. According to analysts, Yahoo! had become a victim of it ownsuccess. The company had adopted the model of being a one-stop portal, offering all the serv-ices on its website. Over the years, Yahoo!’s home page grew highly cluttered. The differencewas quite stark when compared to Google’s home page. Google’s home page was simple anduser-friendly while Yahoo!’s homepage had links to a host of products and services, such as
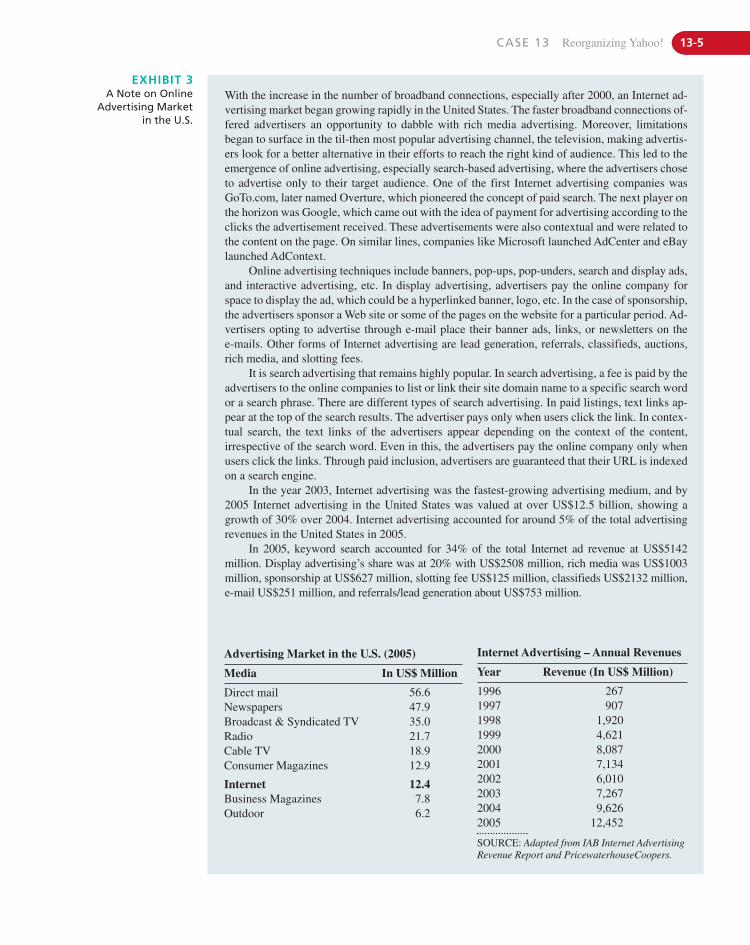
CASE 13 Reorganizing Yahoo! 13-5
EXHIBIT 3A Note on Online
Advertising Marketin the U.S.
With the increase in the number of broadband connections, especially after 2000, an Internet ad-vertising market began growing rapidly in the United States. The faster broadband connections of-fered advertisers an opportunity to dabble with rich media advertising. Moreover, limitationsbegan to surface in the til-then most popular advertising channel, the television, making advertis-ers look for a better alternative in their efforts to reach the right kind of audience. This led to theemergence of online advertising, especially search-based advertising, where the advertisers choseto advertise only to their target audience. One of the first Internet advertising companies wasGoTo.com, later named Overture, which pioneered the concept of paid search. The next player onthe horizon was Google, which came out with the idea of payment for advertising according to theclicks the advertisement received. These advertisements were also contextual and were related tothe content on the page. On similar lines, companies like Microsoft launched AdCenter and eBaylaunched AdContext.
Online advertising techniques include banners, pop-ups, pop-unders, search and display ads,and interactive advertising, etc. In display advertising, advertisers pay the online company forspace to display the ad, which could be a hyperlinked banner, logo, etc. In the case of sponsorship,the advertisers sponsor a Web site or some of the pages on the website for a particular period. Ad-vertisers opting to advertise through e-mail place their banner ads, links, or newsletters on the e-mails. Other forms of Internet advertising are lead generation, referrals, classifieds, auctions,rich media, and slotting fees.
It is search advertising that remains highly popular. In search advertising, a fee is paid by theadvertisers to the online companies to list or link their site domain name to a specific search wordor a search phrase. There are different types of search advertising. In paid listings, text links ap-pear at the top of the search results. The advertiser pays only when users click the link. In contex-tual search, the text links of the advertisers appear depending on the context of the content,irrespective of the search word. Even in this, the advertisers pay the online company only whenusers click the links. Through paid inclusion, advertisers are guaranteed that their URL is indexedon a search engine.
In the year 2003, Internet advertising was the fastest-growing advertising medium, and by2005 Internet advertising in the United States was valued at over US$12.5 billion, showing agrowth of 30% over 2004. Internet advertising accounted for around 5% of the total advertisingrevenues in the United States in 2005.
In 2005, keyword search accounted for 34% of the total Internet ad revenue at US$5142million. Display advertising’s share was at 20% with US$2508 million, rich media was US$1003million, sponsorship at US$627 million, slotting fee US$125 million, classifieds US$2132 million,e-mail US$251 million, and referrals/lead generation about US$753 million.
Internet Advertising – Annual Revenues
Year Revenue (In US$ Million)
1996 2671997 9071998 1,9201999 4,6212000 8,0872001 7,1342002 6,0102003 7,2672004 9,6262005 12,452
SOURCE: Adapted from IAB Internet AdvertisingRevenue Report and PricewaterhouseCoopers.
Advertising Market in the U.S. (2005)
Media In US$ Million
Direct mail 56.6Newspapers 47.9Broadcast & Syndicated TV 35.0 Radio 21.7Cable TV 18.9Consumer Magazines 12.9
Internet 12.4Business Magazines 7.8Outdoor 6.2
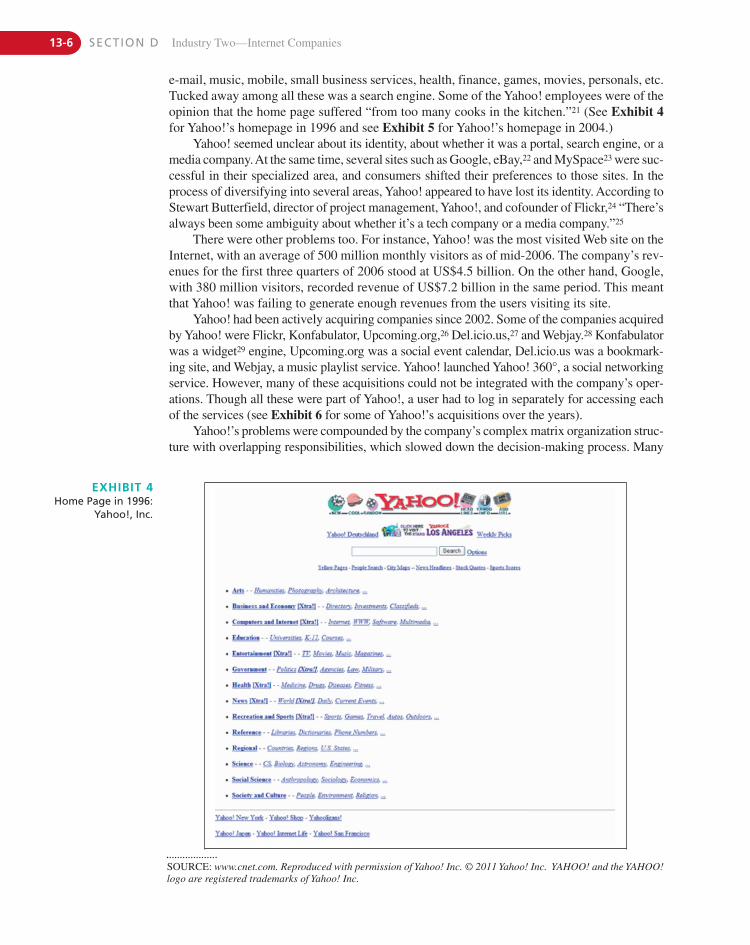
13-6 SECTION D Industry Two—Internet Companies
EXHIBIT 4Home Page in 1996:
Yahoo!, Inc.
e-mail, music, mobile, small business services, health, finance, games, movies, personals, etc.Tucked away among all these was a search engine. Some of the Yahoo! employees were of theopinion that the home page suffered “from too many cooks in the kitchen.”21 (See Exhibit 4for Yahoo!’s homepage in 1996 and see Exhibit 5 for Yahoo!’s homepage in 2004.)
Yahoo! seemed unclear about its identity, about whether it was a portal, search engine, or amedia company.At the same time, several sites such as Google, eBay,22 and MySpace23 were suc-cessful in their specialized area, and consumers shifted their preferences to those sites. In theprocess of diversifying into several areas, Yahoo! appeared to have lost its identity. According toStewart Butterfield, director of project management, Yahoo!, and cofounder of Flickr,24 “There’salways been some ambiguity about whether it’s a tech company or a media company.”25
There were other problems too. For instance, Yahoo! was the most visited Web site on theInternet, with an average of 500 million monthly visitors as of mid-2006. The company’s rev-enues for the first three quarters of 2006 stood at US$4.5 billion. On the other hand, Google,with 380 million visitors, recorded revenue of US$7.2 billion in the same period. This meantthat Yahoo! was failing to generate enough revenues from the users visiting its site.
Yahoo! had been actively acquiring companies since 2002. Some of the companies acquiredby Yahoo! were Flickr, Konfabulator, Upcoming.org,26 Del.icio.us,27 and Webjay.28 Konfabulatorwas a widget29 engine, Upcoming.org was a social event calendar, Del.icio.us was a bookmark-ing site, and Webjay, a music playlist service. Yahoo! launched Yahoo! 360°, a social networkingservice. However, many of these acquisitions could not be integrated with the company’s oper-ations. Though all these were part of Yahoo!, a user had to log in separately for accessing eachof the services (see Exhibit 6 for some of Yahoo!’s acquisitions over the years).
Yahoo!’s problems were compounded by the company’s complex matrix organization struc-ture with overlapping responsibilities, which slowed down the decision-making process. Many
SOURCE: www.cnet.com. Reproduced with permission of Yahoo! Inc. © 2011 Yahoo! Inc. YAHOO! and the YAHOO!logo are registered trademarks of Yahoo! Inc.
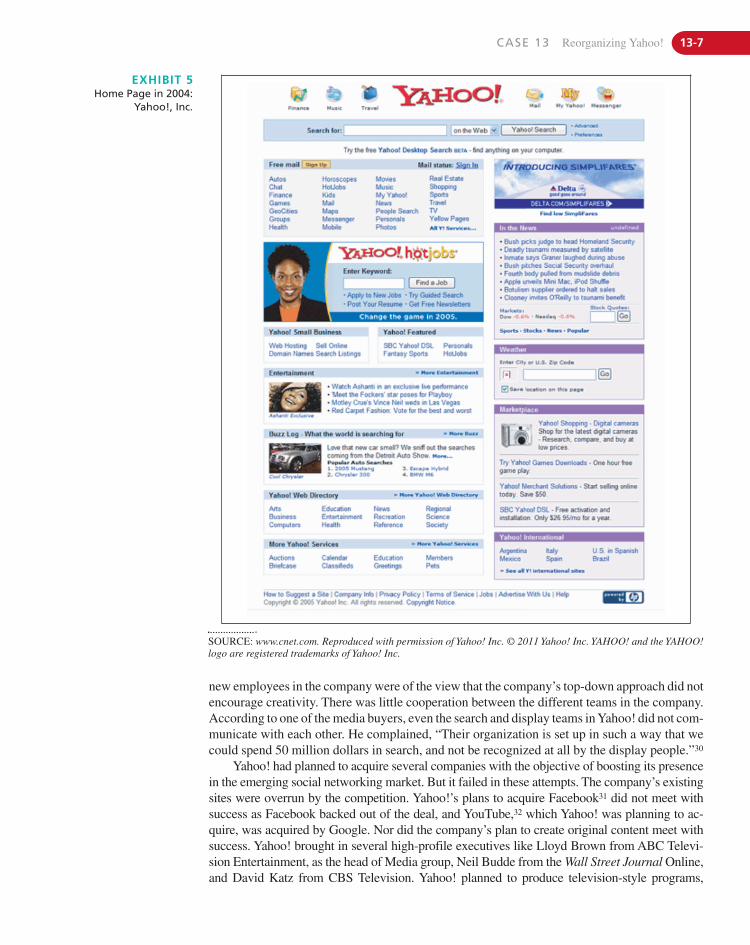
CASE 13 Reorganizing Yahoo! 13-7
EXHIBIT 5Home Page in 2004:
Yahoo!, Inc.
new employees in the company were of the view that the company’s top-down approach did notencourage creativity. There was little cooperation between the different teams in the company.According to one of the media buyers, even the search and display teams in Yahoo! did not com-municate with each other. He complained, “Their organization is set up in such a way that wecould spend 50 million dollars in search, and not be recognized at all by the display people.”30
Yahoo! had planned to acquire several companies with the objective of boosting its presencein the emerging social networking market. But it failed in these attempts. The company’s existingsites were overrun by the competition. Yahoo!’s plans to acquire Facebook31 did not meet withsuccess as Facebook backed out of the deal, and YouTube,32 which Yahoo! was planning to ac-quire, was acquired by Google. Nor did the company’s plan to create original content meet withsuccess. Yahoo! brought in several high-profile executives like Lloyd Brown from ABC Televi-sion Entertainment, as the head of Media group, Neil Budde from the Wall Street Journal Online,and David Katz from CBS Television. Yahoo! planned to produce television-style programs,
SOURCE: www.cnet.com. Reproduced with permission of Yahoo! Inc. © 2011 Yahoo! Inc. YAHOO! and the YAHOO!logo are registered trademarks of Yahoo! Inc.
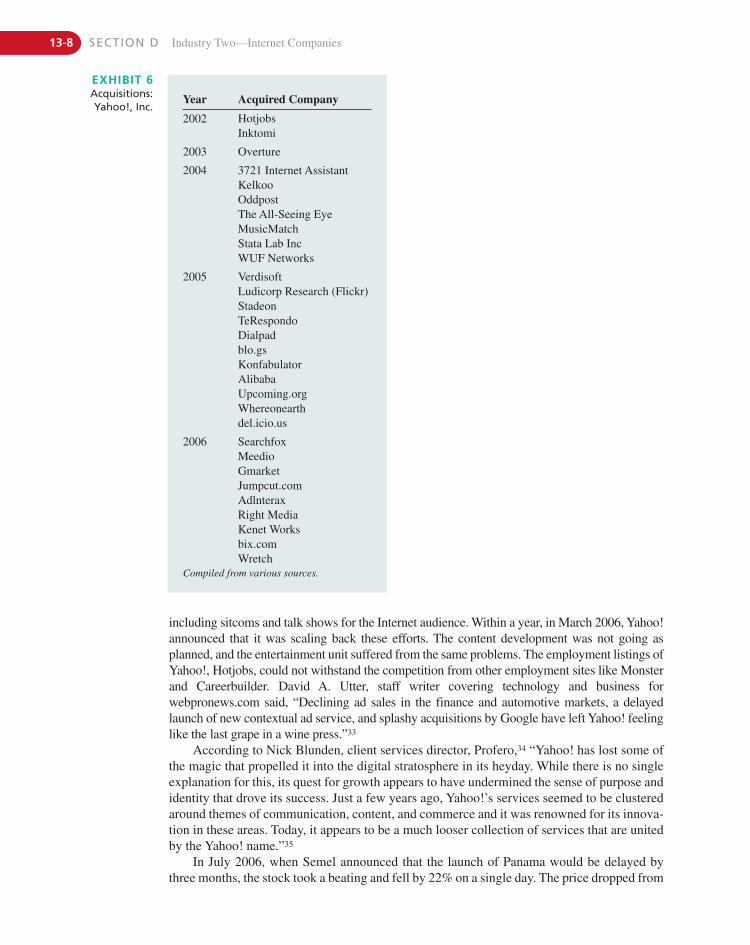
13-8 SECTION D Industry Two—Internet Companies
EXHIBIT 6Acquisitions:Yahoo!, Inc.
Year Acquired Company
2002 HotjobsInktomi
2003 Overture
2004 3721 Internet AssistantKelkooOddpostThe All-Seeing EyeMusicMatchStata Lab IncWUF Networks
2005 VerdisoftLudicorp Research (Flickr)StadeonTeRespondoDialpadblo.gsKonfabulatorAlibabaUpcoming.orgWhereonearthdel.icio.us
2006 SearchfoxMeedioGmarketJumpcut.comAdlnteraxRight MediaKenet Worksbix.comWretch
Compiled from various sources.
including sitcoms and talk shows for the Internet audience. Within a year, in March 2006, Yahoo!announced that it was scaling back these efforts. The content development was not going asplanned, and the entertainment unit suffered from the same problems. The employment listings ofYahoo!, Hotjobs, could not withstand the competition from other employment sites like Monsterand Careerbuilder. David A. Utter, staff writer covering technology and business forwebpronews.com said, “Declining ad sales in the finance and automotive markets, a delayedlaunch of new contextual ad service, and splashy acquisitions by Google have left Yahoo! feelinglike the last grape in a wine press.”33
According to Nick Blunden, client services director, Profero,34 “Yahoo! has lost some ofthe magic that propelled it into the digital stratosphere in its heyday. While there is no singleexplanation for this, its quest for growth appears to have undermined the sense of purpose andidentity that drove its success. Just a few years ago, Yahoo!’s services seemed to be clusteredaround themes of communication, content, and commerce and it was renowned for its innova-tion in these areas. Today, it appears to be a much looser collection of services that are unitedby the Yahoo! name.”35
In July 2006, when Semel announced that the launch of Panama would be delayed bythree months, the stock took a beating and fell by 22% on a single day. The price dropped from
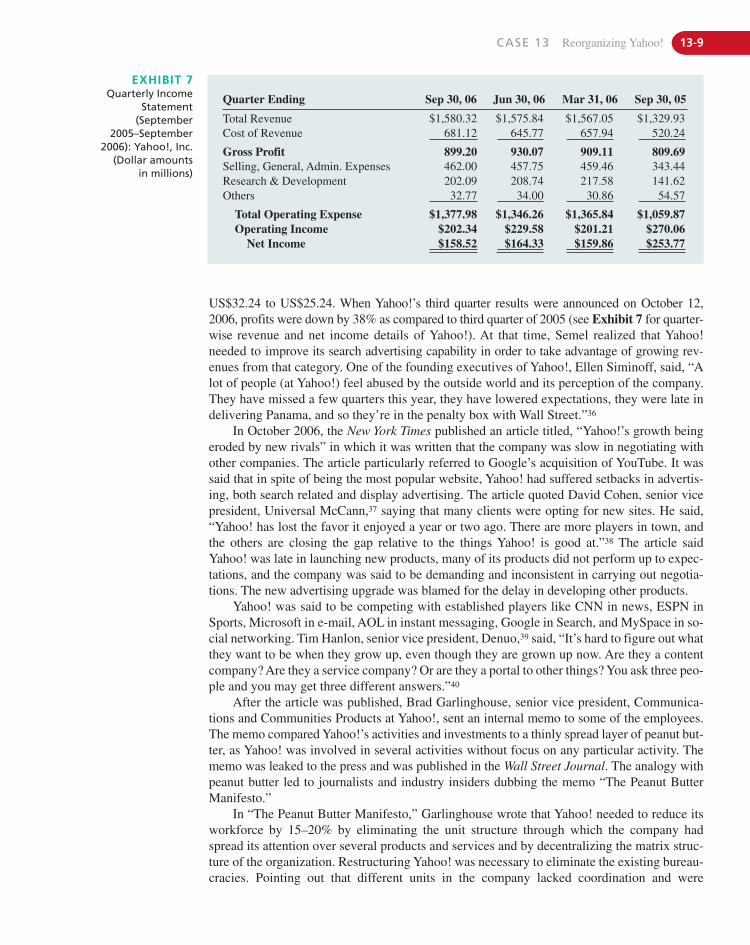
CASE 13 Reorganizing Yahoo! 13-9
US$32.24 to US$25.24. When Yahoo!’s third quarter results were announced on October 12,2006, profits were down by 38% as compared to third quarter of 2005 (see Exhibit 7 for quarter-wise revenue and net income details of Yahoo!). At that time, Semel realized that Yahoo!needed to improve its search advertising capability in order to take advantage of growing rev-enues from that category. One of the founding executives of Yahoo!, Ellen Siminoff, said, “Alot of people (at Yahoo!) feel abused by the outside world and its perception of the company.They have missed a few quarters this year, they have lowered expectations, they were late indelivering Panama, and so they’re in the penalty box with Wall Street.”36
In October 2006, the New York Times published an article titled, “Yahoo!’s growth beingeroded by new rivals” in which it was written that the company was slow in negotiating withother companies. The article particularly referred to Google’s acquisition of YouTube. It wassaid that in spite of being the most popular website, Yahoo! had suffered setbacks in advertis-ing, both search related and display advertising. The article quoted David Cohen, senior vicepresident, Universal McCann,37 saying that many clients were opting for new sites. He said,“Yahoo! has lost the favor it enjoyed a year or two ago. There are more players in town, andthe others are closing the gap relative to the things Yahoo! is good at.”38 The article saidYahoo! was late in launching new products, many of its products did not perform up to expec-tations, and the company was said to be demanding and inconsistent in carrying out negotia-tions. The new advertising upgrade was blamed for the delay in developing other products.
Yahoo! was said to be competing with established players like CNN in news, ESPN inSports, Microsoft in e-mail, AOL in instant messaging, Google in Search, and MySpace in so-cial networking. Tim Hanlon, senior vice president, Denuo,39 said, “It’s hard to figure out whatthey want to be when they grow up, even though they are grown up now. Are they a contentcompany? Are they a service company? Or are they a portal to other things? You ask three peo-ple and you may get three different answers.”40
After the article was published, Brad Garlinghouse, senior vice president, Communica-tions and Communities Products at Yahoo!, sent an internal memo to some of the employees.The memo compared Yahoo!’s activities and investments to a thinly spread layer of peanut but-ter, as Yahoo! was involved in several activities without focus on any particular activity. Thememo was leaked to the press and was published in the Wall Street Journal. The analogy withpeanut butter led to journalists and industry insiders dubbing the memo “The Peanut ButterManifesto.”
In “The Peanut Butter Manifesto,” Garlinghouse wrote that Yahoo! needed to reduce itsworkforce by 15–20% by eliminating the unit structure through which the company hadspread its attention over several products and services and by decentralizing the matrix struc-ture of the organization. Restructuring Yahoo! was necessary to eliminate the existing bureau-cracies. Pointing out that different units in the company lacked coordination and were
EXHIBIT 7Quarterly Income
Statement(September
2005–September2006): Yahoo!, Inc.
(Dollar amounts in millions)
Quarter Ending Sep 30, 06 Jun 30, 06 Mar 31, 06 Sep 30, 05
Total Revenue $1,580.32 $1,575.84 $1,567.05 $1,329.93Cost of Revenue 681.12 645.77 657.94 520.24
Gross Profit 899.20 930.07 909.11 809.69Selling, General, Admin. Expenses 462.00 457.75 459.46 343.44Research & Development 202.09 208.74 217.58 141.62Others 32.77 34.00 30.86 54.57
Total Operating Expense $1,377.98 $1,346.26 $1,365.84 $1,059.87Operating Income $202.34 $229.58 $201.21 $270.06
Net Income $158.52 $164.33 $159.86 $253.77
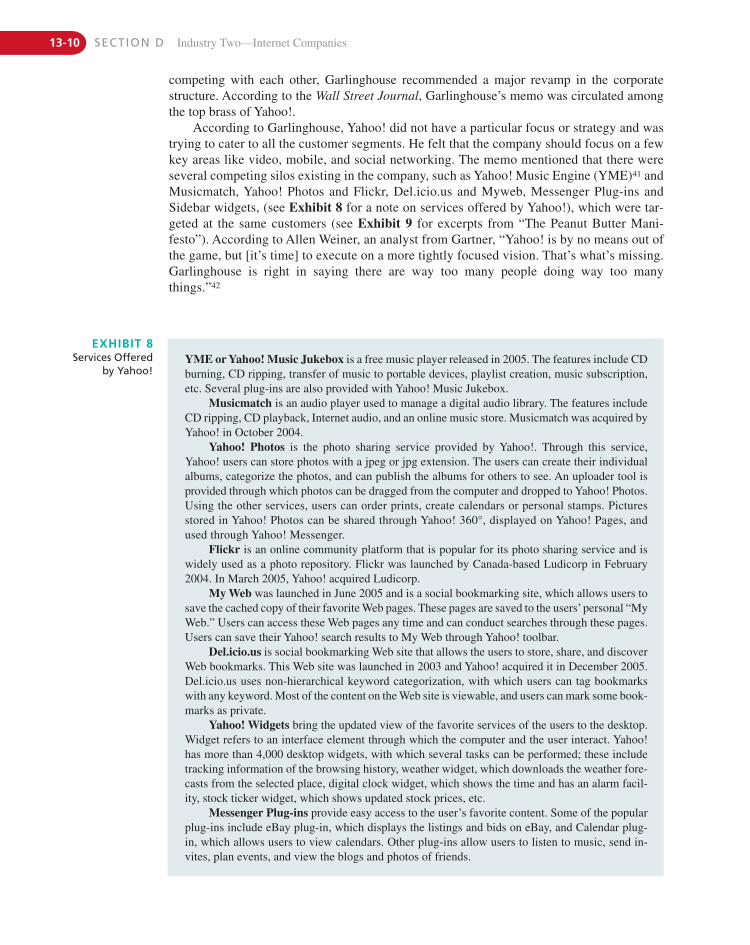
13-10 SECTION D Industry Two—Internet Companies
EXHIBIT 8Services Offered
by Yahoo!YME or Yahoo! Music Jukebox is a free music player released in 2005. The features include CDburning, CD ripping, transfer of music to portable devices, playlist creation, music subscription,etc. Several plug-ins are also provided with Yahoo! Music Jukebox.
Musicmatch is an audio player used to manage a digital audio library. The features includeCD ripping, CD playback, Internet audio, and an online music store. Musicmatch was acquired byYahoo! in October 2004.
Yahoo! Photos is the photo sharing service provided by Yahoo!. Through this service, Yahoo! users can store photos with a jpeg or jpg extension. The users can create their individualalbums, categorize the photos, and can publish the albums for others to see. An uploader tool isprovided through which photos can be dragged from the computer and dropped to Yahoo! Photos.Using the other services, users can order prints, create calendars or personal stamps. Picturesstored in Yahoo! Photos can be shared through Yahoo! 360°, displayed on Yahoo! Pages, andused through Yahoo! Messenger.
Flickr is an online community platform that is popular for its photo sharing service and iswidely used as a photo repository. Flickr was launched by Canada-based Ludicorp in February2004. In March 2005, Yahoo! acquired Ludicorp.
My Web was launched in June 2005 and is a social bookmarking site, which allows users tosave the cached copy of their favorite Web pages. These pages are saved to the users’personal “MyWeb.” Users can access these Web pages any time and can conduct searches through these pages.Users can save their Yahoo! search results to My Web through Yahoo! toolbar.
Del.icio.us is social bookmarking Web site that allows the users to store, share, and discoverWeb bookmarks. This Web site was launched in 2003 and Yahoo! acquired it in December 2005.Del.icio.us uses non-hierarchical keyword categorization, with which users can tag bookmarkswith any keyword. Most of the content on the Web site is viewable, and users can mark some book-marks as private.
Yahoo! Widgets bring the updated view of the favorite services of the users to the desktop.Widget refers to an interface element through which the computer and the user interact. Yahoo!has more than 4,000 desktop widgets, with which several tasks can be performed; these includetracking information of the browsing history, weather widget, which downloads the weather fore-casts from the selected place, digital clock widget, which shows the time and has an alarm facil-ity, stock ticker widget, which shows updated stock prices, etc.
Messenger Plug-ins provide easy access to the user’s favorite content. Some of the popularplug-ins include eBay plug-in, which displays the listings and bids on eBay, and Calendar plug-in, which allows users to view calendars. Other plug-ins allow users to listen to music, send in-vites, plan events, and view the blogs and photos of friends.
competing with each other, Garlinghouse recommended a major revamp in the corporatestructure. According to the Wall Street Journal, Garlinghouse’s memo was circulated amongthe top brass of Yahoo!.
According to Garlinghouse, Yahoo! did not have a particular focus or strategy and wastrying to cater to all the customer segments. He felt that the company should focus on a fewkey areas like video, mobile, and social networking. The memo mentioned that there wereseveral competing silos existing in the company, such as Yahoo! Music Engine (YME)41 andMusicmatch, Yahoo! Photos and Flickr, Del.icio.us and Myweb, Messenger Plug-ins andSidebar widgets, (see Exhibit 8 for a note on services offered by Yahoo!), which were tar-geted at the same customers (see Exhibit 9 for excerpts from “The Peanut Butter Mani-festo”). According to Allen Weiner, an analyst from Gartner, “Yahoo! is by no means out ofthe game, but [it’s time] to execute on a more tightly focused vision. That’s what’s missing.Garlinghouse is right in saying there are way too many people doing way too manythings.”42
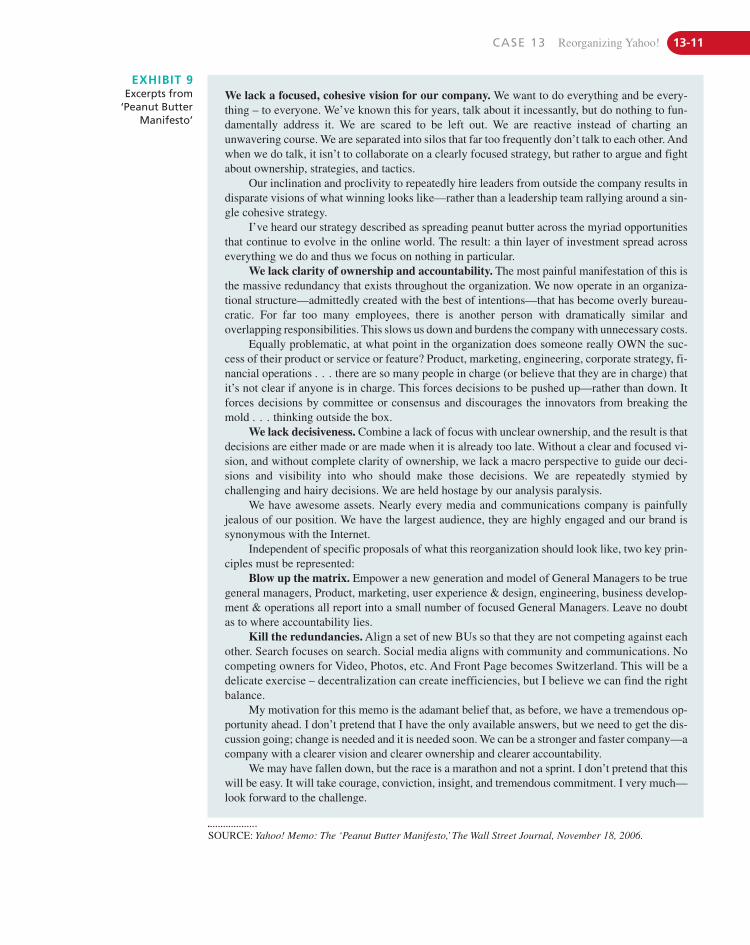
CASE 13 Reorganizing Yahoo! 13-11
EXHIBIT 9Excerpts from
‘Peanut ButterManifesto’
We lack a focused, cohesive vision for our company. We want to do everything and be every-thing – to everyone. We’ve known this for years, talk about it incessantly, but do nothing to fun-damentally address it. We are scared to be left out. We are reactive instead of charting anunwavering course. We are separated into silos that far too frequently don’t talk to each other. Andwhen we do talk, it isn’t to collaborate on a clearly focused strategy, but rather to argue and fightabout ownership, strategies, and tactics.
Our inclination and proclivity to repeatedly hire leaders from outside the company results indisparate visions of what winning looks like—rather than a leadership team rallying around a sin-gle cohesive strategy.
I’ve heard our strategy described as spreading peanut butter across the myriad opportunitiesthat continue to evolve in the online world. The result: a thin layer of investment spread acrosseverything we do and thus we focus on nothing in particular.
We lack clarity of ownership and accountability. The most painful manifestation of this isthe massive redundancy that exists throughout the organization. We now operate in an organiza-tional structure—admittedly created with the best of intentions—that has become overly bureau-cratic. For far too many employees, there is another person with dramatically similar andoverlapping responsibilities. This slows us down and burdens the company with unnecessary costs.
Equally problematic, at what point in the organization does someone really OWN the suc-cess of their product or service or feature? Product, marketing, engineering, corporate strategy, fi-nancial operations . . . there are so many people in charge (or believe that they are in charge) thatit’s not clear if anyone is in charge. This forces decisions to be pushed up—rather than down. Itforces decisions by committee or consensus and discourages the innovators from breaking themold . . . thinking outside the box.
We lack decisiveness. Combine a lack of focus with unclear ownership, and the result is thatdecisions are either made or are made when it is already too late. Without a clear and focused vi-sion, and without complete clarity of ownership, we lack a macro perspective to guide our deci-sions and visibility into who should make those decisions. We are repeatedly stymied bychallenging and hairy decisions. We are held hostage by our analysis paralysis.
We have awesome assets. Nearly every media and communications company is painfullyjealous of our position. We have the largest audience, they are highly engaged and our brand issynonymous with the Internet.
Independent of specific proposals of what this reorganization should look like, two key prin-ciples must be represented:
Blow up the matrix. Empower a new generation and model of General Managers to be truegeneral managers, Product, marketing, user experience & design, engineering, business develop-ment & operations all report into a small number of focused General Managers. Leave no doubtas to where accountability lies.
Kill the redundancies. Align a set of new BUs so that they are not competing against eachother. Search focuses on search. Social media aligns with community and communications. Nocompeting owners for Video, Photos, etc. And Front Page becomes Switzerland. This will be adelicate exercise – decentralization can create inefficiencies, but I believe we can find the rightbalance.
My motivation for this memo is the adamant belief that, as before, we have a tremendous op-portunity ahead. I don’t pretend that I have the only available answers, but we need to get the dis-cussion going; change is needed and it is needed soon. We can be a stronger and faster company—acompany with a clearer vision and clearer ownership and clearer accountability.
We may have fallen down, but the race is a marathon and not a sprint. I don’t pretend that thiswill be easy. It will take courage, conviction, insight, and tremendous commitment. I very much—look forward to the challenge.
SOURCE: Yahoo! Memo: The ‘Peanut Butter Manifesto,’The Wall Street Journal, November 18, 2006.
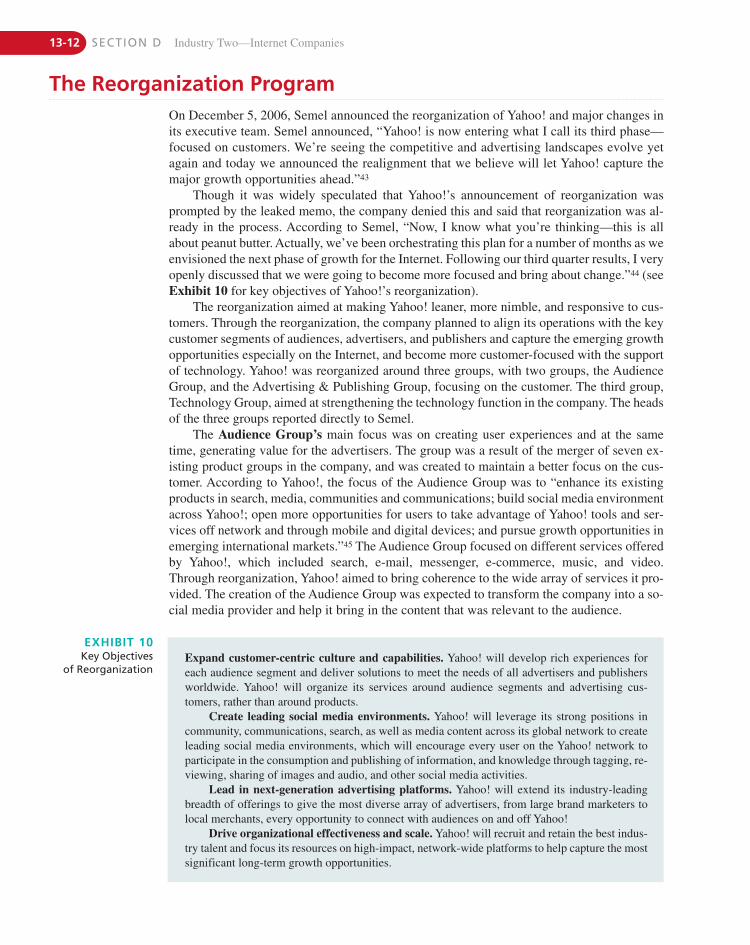
13-12 SECTION D Industry Two—Internet Companies
EXHIBIT 10Key Objectives
of ReorganizationExpand customer-centric culture and capabilities. Yahoo! will develop rich experiences foreach audience segment and deliver solutions to meet the needs of all advertisers and publishersworldwide. Yahoo! will organize its services around audience segments and advertising cus-tomers, rather than around products.
Create leading social media environments. Yahoo! will leverage its strong positions incommunity, communications, search, as well as media content across its global network to createleading social media environments, which will encourage every user on the Yahoo! network toparticipate in the consumption and publishing of information, and knowledge through tagging, re-viewing, sharing of images and audio, and other social media activities.
Lead in next-generation advertising platforms. Yahoo! will extend its industry-leadingbreadth of offerings to give the most diverse array of advertisers, from large brand marketers tolocal merchants, every opportunity to connect with audiences on and off Yahoo!
Drive organizational effectiveness and scale. Yahoo! will recruit and retain the best indus-try talent and focus its resources on high-impact, network-wide platforms to help capture the mostsignificant long-term growth opportunities.
The Reorganization ProgramOn December 5, 2006, Semel announced the reorganization of Yahoo! and major changes inits executive team. Semel announced, “Yahoo! is now entering what I call its third phase—focused on customers. We’re seeing the competitive and advertising landscapes evolve yetagain and today we announced the realignment that we believe will let Yahoo! capture themajor growth opportunities ahead.”43
Though it was widely speculated that Yahoo!’s announcement of reorganization wasprompted by the leaked memo, the company denied this and said that reorganization was al-ready in the process. According to Semel, “Now, I know what you’re thinking—this is allabout peanut butter. Actually, we’ve been orchestrating this plan for a number of months as weenvisioned the next phase of growth for the Internet. Following our third quarter results, I veryopenly discussed that we were going to become more focused and bring about change.”44 (seeExhibit 10 for key objectives of Yahoo!’s reorganization).
The reorganization aimed at making Yahoo! leaner, more nimble, and responsive to cus-tomers. Through the reorganization, the company planned to align its operations with the keycustomer segments of audiences, advertisers, and publishers and capture the emerging growthopportunities especially on the Internet, and become more customer-focused with the supportof technology. Yahoo! was reorganized around three groups, with two groups, the AudienceGroup, and the Advertising & Publishing Group, focusing on the customer. The third group,Technology Group, aimed at strengthening the technology function in the company. The headsof the three groups reported directly to Semel.
The Audience Group’s main focus was on creating user experiences and at the sametime, generating value for the advertisers. The group was a result of the merger of seven ex-isting product groups in the company, and was created to maintain a better focus on the cus-tomer. According to Yahoo!, the focus of the Audience Group was to “enhance its existingproducts in search, media, communities and communications; build social media environmentacross Yahoo!; open more opportunities for users to take advantage of Yahoo! tools and ser-vices off network and through mobile and digital devices; and pursue growth opportunities inemerging international markets.”45 The Audience Group focused on different services offeredby Yahoo!, which included search, e-mail, messenger, e-commerce, music, and video.Through reorganization, Yahoo! aimed to bring coherence to the wide array of services it pro-vided. The creation of the Audience Group was expected to transform the company into a so-cial media provider and help it bring in the content that was relevant to the audience.
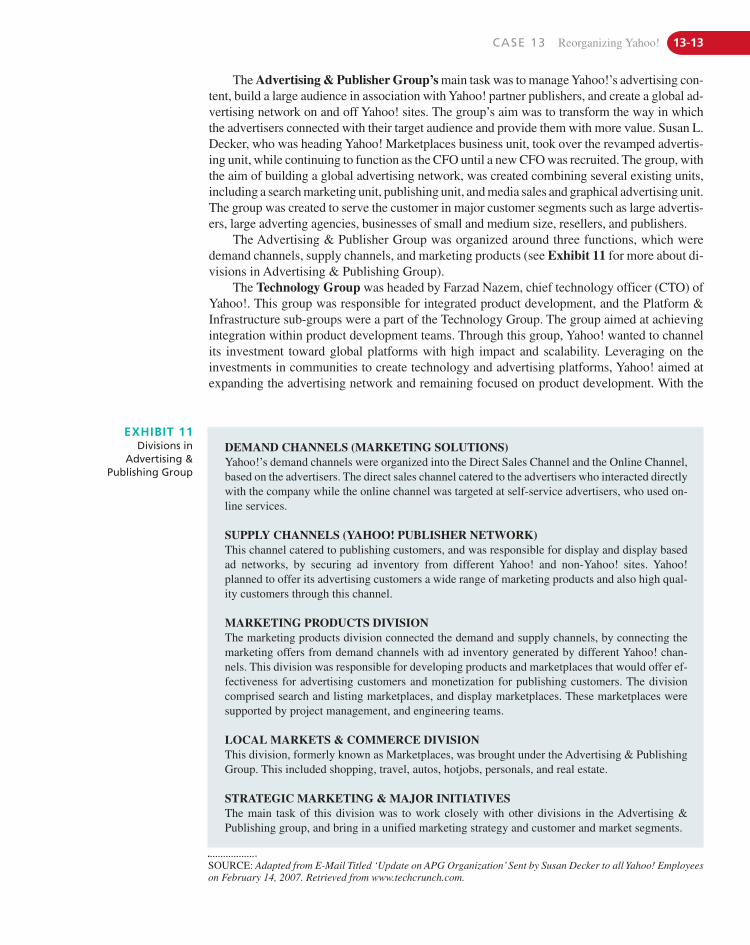
The Advertising & Publisher Group’s main task was to manage Yahoo!’s advertising con-tent, build a large audience in association with Yahoo! partner publishers, and create a global ad-vertising network on and off Yahoo! sites. The group’s aim was to transform the way in whichthe advertisers connected with their target audience and provide them with more value. Susan L.Decker, who was heading Yahoo! Marketplaces business unit, took over the revamped advertis-ing unit, while continuing to function as the CFO until a new CFO was recruited. The group, withthe aim of building a global advertising network, was created combining several existing units,including a search marketing unit, publishing unit, and media sales and graphical advertising unit.The group was created to serve the customer in major customer segments such as large advertis-ers, large adverting agencies, businesses of small and medium size, resellers, and publishers.
The Advertising & Publisher Group was organized around three functions, which weredemand channels, supply channels, and marketing products (see Exhibit 11 for more about di-visions in Advertising & Publishing Group).
The Technology Group was headed by Farzad Nazem, chief technology officer (CTO) ofYahoo!. This group was responsible for integrated product development, and the Platform &Infrastructure sub-groups were a part of the Technology Group. The group aimed at achievingintegration within product development teams. Through this group, Yahoo! wanted to channelits investment toward global platforms with high impact and scalability. Leveraging on theinvestments in communities to create technology and advertising platforms, Yahoo! aimed atexpanding the advertising network and remaining focused on product development. With the
EXHIBIT 11Divisions in
Advertising &Publishing Group
DEMAND CHANNELS (MARKETING SOLUTIONS)Yahoo!’s demand channels were organized into the Direct Sales Channel and the Online Channel,based on the advertisers. The direct sales channel catered to the advertisers who interacted directlywith the company while the online channel was targeted at self-service advertisers, who used on-line services.
SUPPLY CHANNELS (YAHOO! PUBLISHER NETWORK)This channel catered to publishing customers, and was responsible for display and display basedad networks, by securing ad inventory from different Yahoo! and non-Yahoo! sites. Yahoo!planned to offer its advertising customers a wide range of marketing products and also high qual-ity customers through this channel.
MARKETING PRODUCTS DIVISIONThe marketing products division connected the demand and supply channels, by connecting themarketing offers from demand channels with ad inventory generated by different Yahoo! chan-nels. This division was responsible for developing products and marketplaces that would offer ef-fectiveness for advertising customers and monetization for publishing customers. The divisioncomprised search and listing marketplaces, and display marketplaces. These marketplaces weresupported by project management, and engineering teams.
LOCAL MARKETS & COMMERCE DIVISIONThis division, formerly known as Marketplaces, was brought under the Advertising & PublishingGroup. This included shopping, travel, autos, hotjobs, personals, and real estate.
STRATEGIC MARKETING & MAJOR INITIATIVESThe main task of this division was to work closely with other divisions in the Advertising &Publishing group, and bring in a unified marketing strategy and customer and market segments.
SOURCE: Adapted from E-Mail Titled ‘Update on APG Organization’Sent by Susan Decker to all Yahoo! Employeeson February 14, 2007. Retrieved from www.techcrunch.com.
CASE 13 Reorganizing Yahoo! 13-13
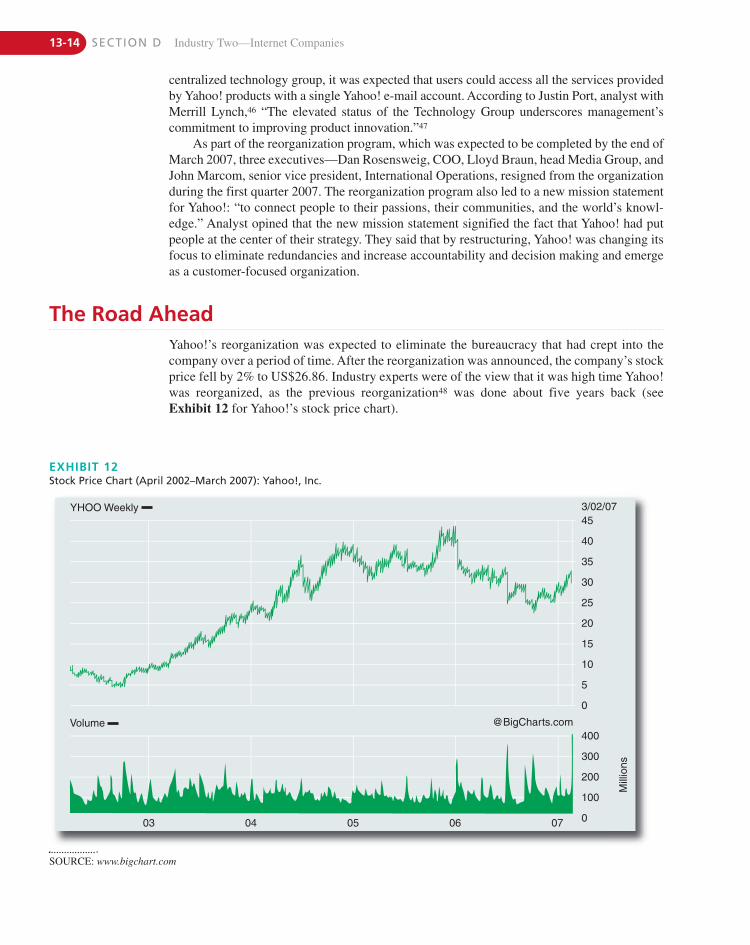
13-14 SECTION D Industry Two—Internet Companies
EXHIBIT 12Stock Price Chart (April 2002–March 2007): Yahoo!, Inc.
SOURCE: www.bigchart.com
453/02/07
40
35
30
25
20
15
10
5
Mill
ions
0
400
300
200
100
0
YHOO Weekly
Volume @BigCharts.com
03 04 05 06 07
The Road AheadYahoo!’s reorganization was expected to eliminate the bureaucracy that had crept into thecompany over a period of time. After the reorganization was announced, the company’s stockprice fell by 2% to US$26.86. Industry experts were of the view that it was high time Yahoo!was reorganized, as the previous reorganization48 was done about five years back (seeExhibit 12 for Yahoo!’s stock price chart).
centralized technology group, it was expected that users could access all the services providedby Yahoo! products with a single Yahoo! e-mail account. According to Justin Port, analyst withMerrill Lynch,46 “The elevated status of the Technology Group underscores management’scommitment to improving product innovation.”47
As part of the reorganization program, which was expected to be completed by the end ofMarch 2007, three executives—Dan Rosensweig, COO, Lloyd Braun, head Media Group, andJohn Marcom, senior vice president, International Operations, resigned from the organizationduring the first quarter 2007. The reorganization program also led to a new mission statementfor Yahoo!: “to connect people to their passions, their communities, and the world’s knowl-edge.” Analyst opined that the new mission statement signified the fact that Yahoo! had putpeople at the center of their strategy. They said that by restructuring, Yahoo! was changing itsfocus to eliminate redundancies and increase accountability and decision making and emergeas a customer-focused organization.
Another strategy that Yahoo! adopted was “Brand Universe” through which it planned todevelop sites dedicated to high-profile entertainment brands, including television shows likeLost 49 and The Office,50 video games like Halo51 and The Sims,52 and movies like HarryPotter.53 Through Brand Universe, Yahoo! planned to link entertainment content across differ-ent Yahoo! services and Web sites. All the entertainment partners would also be informedabout the traffic their content was attracting, the reach of the brands, and other such details.The fact the YouTube was planning to include short advertisements before each video clip wasexpected to boost Yahoo!’s ability to attract visitors, as visitors who wished to skip the adver-tisements would opt for other alternatives, such as Yahoo!.
To spruce up Yahoo! News, which was accessed by 34 million unique users every monthas of 2006, Yahoo! launched video content in association with CBS owned stations. Yahoo!News served over 60 million video streams per month as of February 2007.
In November 2006, Yahoo! entered into an agreement with a consortium of nine companies,representing more than 170 newspapers in the United States. The consortium included HearstNewspapers, MediaNews Group, Cox Newspapers, Lee Enterprises, Journal Register, and EWScripps.As per the agreement, the newspapers started usingYahoo! HotJobs from December 2006onward. Both the parties were expected to benefit from the deal, as Yahoo! would get regional ex-posure while advertisements from local newspapers would acquire a wider reach. Over a periodof time, other content such as local news and advertisements were also planned to be included.
In the first week of December 2006, Yahoo! released a mobile social networking servicecalled Mixd with which customers could coordinate outings and meetings with friends usingtext messages and photo messages. The activities were simultaneously posted on the Webpage. The service was targeted at young users of 18–25 years of age and Yahoo! started mar-keting the service in some university campuses in the United States.
According to industry experts, Yahoo! was on the right path in proposing a restructuringplan; however, what mattered most was how the plan was executed. They said Yahoo! shouldbe careful in executing the reorganization program. Analysts also opined that the reorganiza-tion might take some time to show results. Meanwhile, Yahoo! had to face competition notonly from existing players but also from new ones, which were making their presence felt inthe market. Yahoo! needed to generate more revenues from social media and user-generatedcontent. There were suggestions that Yahoo! could consider a merger with AOL or Microsoft,as neither of these companies was strong in search engine technology. Any such deal, accord-ing to analysts, would help Yahoo! compete with Google effectively.
Analysts were of the opinion that as Yahoo! was one of the most popular sites attractingmillions of unique visitors, through Panama, it could increase the number of clicks on the ads,and thus generate more revenues. Commenting on Panama, Paul Kedrosky, partner, VenturesWest,54 said, “It doesn’t have to be as good as Google, Yahoo! has this bazooka. It stompsGoogle in page views. And Yahoo! is still the king of audience. There is a huge upside forthem.”55 Yahoo! also had another advantage of having specialized sites like Yahoo! Finance,Yahoo! Real Estate, Yahoo! Tech, etc. through which it could charge a premium from adver-tisers who were targeting a particular set of audience.
Yahoo! itself considered 2007 to be a year of transition with many challenges to face. Ana-lysts too were of the same view, as Imran Khan, analyst at JP Morgan Chase,56 said, “The comingyear will be challenging, in terms of numbers. The management change doesn’t fix the problem.There are lots of new competitors and Yahoo! is not as well-positioned in search as Google.”57
Within one month of the launch of Panama, Yahoo! experienced better click-through ratesfor sponsored search ads. comScore58 analyzed the click-through rates before and after thelaunch of Panama, by dividing the total clicks on sponsored search ads by the total search ads.It was found that after the launch of Panama, in the first week the click-through ads grew by 5%compared to a week before the launch. By the second week, the click-through rates rose to 9%.
CASE 13 Reorganizing Yahoo! 13-15
13-16 SECTION D Industry Two—Internet Companies
Some analysts were of the view that Yahoo!’s wide array of service had attracted millionsof users to the portal. These users did not need to go to different Web sites to access differentservices. They said that Yahoo! should continue to provide all these services, and should onlylook at revamping its advertising services and better search engine.
Industry experts also opined that the problem lay not with Yahoo! but with advertisers,who were highly optimistic about search-based advertising and its prospects. They felt that Yahoo!, even if it came up with the best in terms of search engine, would not be able to com-pete with Google. Yahoo! remained strong in financial forums and community sites like Flickrand del.icio.us. Instead of trying to attract customers from Google, Yahoo! could target com-petitors like MSN and ask.com, opined an analyst from Standard & Poor’s.
However, industry experts remained optimistic about Yahoo!’s future prospects after itsreorganization and the launch of Panama. According to comScore Media Networks, Google’sshare in the Internet search market in the United States stood at 47.5% in January 2007, whileYahoo!’s share was at 28.1%. According to Nick Blunden, client services director, Profero,“Despite recent challenges, the Yahoo! business has a lot going for it. The brand is a fantasticasset with extraordinary levels of awareness. Yahoo! also retains one of the single biggest on-line audiences worldwide. Finally, while it may not have outright market leadership in all ofits services, many of them are extremely competitive.”59
N O T E S1. “Yahoo! Re-Aligns Organization to More Effectively Focus on
Key Customer Segments and Capture Future Growth Opportu-nities,” Yahoo! press release, December 05, 2006.
2. “Yahoo! Shake-up to Take on Rivals,” http://news.bbc.co.uk,December 6, 2006.
3. RBC Capital Markets, a part of Royal Bank of Canada, is a cor-porate and investment bank providing a wide range of servicesand products catering to institutions, corporations, and govern-ments across the world.
4. U.S.-based Google has specialized in Internet search and onlineadvertising. As of December 2006, the company’s revenue wasat US$10.604 billion and net income stood at US$3.077 billion.
5. Adwords allows advertisers to place their advertisements onGoogle’s search results. It provides pay-per-click advertisingand site-targeted advertising for text and banner ads.
6. The Susquehanna Financial Group is a part of Susquehanna In-ternational Group of companies of SIG, which comprises severaltrading and investment related companies. The company’s pri-mary focus is on investment banking, trading, and institutionalsales and research.
7. Paul R. La Monica, “Yahoo! Thumps Google on Wall Street,”CNNMoney.com, March 05, 2007.
8. Dow Jones & Company-owned Wall Street Journal is a dailynewspaper published from New York, with a circulation ofaround 2 million per day.
9. Global Crown Capital is a San Francisco–based boutique invest-ment firm, specializing in objective and actionable research, in-stitutional sales and trading, hedge funds, wealth management,and asset management.
10. Michele Gershberg, “Yahoo!’s New Ad System Could BoostGrowth: Analysts,” Reuters, January 24, 2007.
11. Yahoo! is the abbreviation for Yet Another Hierarchical Offi-cious Oracle.
12. Banner advertisements appear on Web pages within various Yahoo! channels. Hypertext links were embedded in each banner
advertisement to give users instant access to the advertiser’sWeb site, to obtain additional information, or to purchase prod-ucts and services.
13. Promotional sponsorships were typically focused on a particularevent, such as sweepstakes. The merchant sponsorship icon ad-vertised products. Users had to click on the icon to complete atransaction.
14. Direct marketing revenues came through e-mail campaigns tar-geted at Yahoo!’s registered users who had indicated their will-ingness to receive such promotions.
15. While tracking the number of visitors on a Web site, unique visi-tor refers to a person who visits a Web site more than once withina specified period of time. Through the use of software, a com-pany can track and count Web site visitors and can also distin-guish between visitors who visit the site only once and uniquevisitors who return to the site.
16. Pioneered by Overture, the “paid search” advertising model isalso know as “pay-per-click” model. In this model, Overture pro-vided an auction room for online advertisers, whose bidding de-termined how prominently their link will be displayed. Overturethen provided a list of these advertisers to customers, includingYahoo! and shared with them the advertising revenues once thevisitors on Yahoo!’s site clicked on those ads.
17. Based in California, Inktomi is a pioneer in Web search technol-ogy. The company was a leading provider of Web search andpaid inclusion services.
18. Yahoo! renamed Overture as Yahoo! Search Marketing.19. Web Crawler, also known as Spider, is a program that visits
Web sites and reads their pages and other information in order tocreate entries for search engine index.
20. Yahoo! Slurp, a Web crawler, is used to put content into thesearch engine. Yahoo! Slurp was based on the Web search tech-nology of Inktomi.
21. Robert Hof, “Five Steps to Get Yahoo! Back on Track,” Busi-nessWeek, December 7, 2006.
22. eBay.com is an online auction and shopping Web site managedby the U.S.-based Internet company eBay Inc. In 2005, eBay Inc.recorded revenues of US$4.55 billion.
23. MySpace is a social networking Web site and its content includespersonal profiles, blogs, groups, photos, music, and videos. Theparent company of MySpace is News Corporation.
24. Flickr is a photo sharing Web site and an online community plat-form. It was launched by Ludicorp in 2004. In March 2005, Yahoo!acquired Ludicorp and Flickr.
25. Jeremy Caplan, Jeffrey Ressner, “How Yahoo! Aims to Reboot,”Time South Pacific, February 12, 2007.
26. Upcoming.org is a social events calendar that used user-generatedcontent and social media to capture event information. Yahoo! ac-quired the company in October 2005.
27. Del.icio.us is a social bookmarking Web service used for stor-ing and sharing bookmarks. Yahoo! acquired the company inDecember 2005.
28. Webjay is a Web-based playlist service, containing links to au-dio files on the Web. Yahoo! acquired Webjay in January 2006.
29. Widget is a small application with a graphical interface compo-nent that can be used to perform a variety of functions likesearch, photo, and mapping services. Widgets run on the desk-tops without use of browsers. Through the widgets the portalscan draw visitors directly from the desktop.
30. Gavin O’Malley, “Madison Ave: Yahoo! Overhaul Might FallShort,” Online Media Daily, December 8, 2006.
31. Facebook is a social networking Web site, focused on collegeand university students. It is the seventh most visited Web site inthe United States and boasts of several photo uploads. The Web sitewas founded by Mark Zuckerberg, a sophomore at HarvardUniversity, in February 2004.
32. YouTube is a video sharing Web site that allows the users to up-load, share, and view video clips, and was founded in February2005. YouTube was named Time Magazine’s Invention of theYear for 2006. In October 2006, Google acquired YouTube forUS$1.65 billion.
33. David A. Utter, “Yahoo! Pressed from All Sides,” www.webpronews.com, October 13, 2006.
34. London-based Profero, is a digital marketing agency that pro-vides services like Web development, search and affiliate mar-keting, advertising, media planning and buying, and relationshipmarketing. The clients of Profero include CNN, Sky TV, BBCWorld, Black & Decker, Singapore Airlines, Johnson & Johnson,and Merrill Lynch.
35. Gemma Charles, “Yahoo!” Marketing, January 3, 2007.36. Jeremy Caplan, Jeffrey Ressner, “How Yahoo! Aims to Reboot,”
Time South Pacific, February 12, 2007.37. Universal McCann was created in 1999 through the consolidation
of the media operations of McCann Erickson. The company’sworldwide billings stood at US$13 billion in 2006.
38. Saul Hansell, “Yahoo!’s Growth Being Eroded by New Rivals,”New York Times, October 11, 2006.
39. Denuo is the media futures consulting arm of the PublicisGroupe, the fourth largest communications company. The com-pany has a presence in 104 countries across the world. Denuo isactively involved in strategic consulting, ventures and partner-ships, and catalyst and activation.
40. Saul Hansell, “Yahoo!’s Growth Being Eroded by New Rivals,”New York Times, October 11, 2006.
41. In August 2006, the Yahoo! Music Engine was renamed Yahoo!Music Jukebox.
42. “Peanut Butter Sticks to Yahoo!,” www.infoworld.com, November 27, 2006.
43. Terry Semel, “Taking Yahoo! Forward,” http://yodel.yahoo.com,December 5, 2006.
44. Terry Semel, “Taking Yahoo! Forward,” http://yodel.yahoo.com,December 5, 2006.
45. “Yahoo! Re-Aligns Organization to More Effectively Focus onKey Customer Segments and Capture Future Growth Opportu-nities,” Yahoo! press release, December 5, 2006.
46. Merrill Lynch is one of the world’s leading financial manage-ment and advisory companies, with offices in 36 countries andterritories and total client assets of approximately $1.8 trillion.The services provided by Merrill Lynch, its subsidiaries, and af-filiates are capital market services, investment banking and ad-visory, wealth management, asset management, and insuranceand banking. In 2005, the company recorded revenue ofUS$47.78 billion and net income of US$5.046 billion.
47. Robert Hof, “Five Steps to Get Yahoo! Back on Track,” BusinessWeek, December 7, 2006.
48. A detailed description of Yahoo!’s previous reorganization iscovered in the ICMR case study, “reviving Yahoo!—Strategiesthat Turned the Leading Internet Portal Around,” Reference No.BSTR064 (www.icmr.icfai.org).
49. Lost is a highly popular television drama series aired on ABCnetwork in the United States. Lost has won several awards, in-cluding Golden Globes and Emmys. The series depicts the livesof plane crash survivors.
50. After the success of the BBC series The Office in the UK, NBCcreated a U.S. version of the popular show, which premiered inMarch 2005. This situation comedy series is set in the office ofa paper supply company.
51. Halo is a video game from Bungie Studios, which featured Mas-ter Chief, a soldier with superhuman strength and technologi-cally advanced armor.
52. Sims is a computer game published by Maxis. It is a strategic lifesimulation computer game, about the day-to-day activities ofpeople in a household in fictional SimCity. The game was re-leased in February 2000 and went on to become one of the bestselling PC games.
53. Harry Potter is a series of novels written by JK Rowling, featur-ing Harry Potter and his fight against an evil wizard. The moviesbased on the Harry Potter series were distributed by WarnerBrothers.
54. Ventures West is a Canada-based Venture Capital partner, whichhas invested in more than 150 companies.
55. Catherine Holahan, “Why Yahoo!’s Panama Won’t be Enough,”BusinessWeek, December 26, 2006.
56. Incorporated in 1800s by Janius S. Morgan, a merchant banker, JPMorgan is one of the leading banks in the United States. In 2001,JP Morgan merged with Chase Manhattan to create the secondlargest bank in the United States. In July 2004, JP Morgan boughtBank One Corporation, which created an entity with combined as-sets of US$1.1 trillion. In 2006, the revenues of the merged entitystood at US$61.437 billion and net income at US$14.44 billion.
57. Jefferson Graham, “Yahoo!’s Shake-up: Too Little, Too Late?”USA Today, December 7, 2006.
58. comScore provided marketing and data services to several largebusinesses and is one of the leading Internet market research com-panies. comScore provides insight into the online behavior of con-sumers by tracking the Internet data on the surveyed computers.
59. Gemma Charles, “Yahoo!” Marketing, January 3, 2007.
CASE 13 Reorganizing Yahoo! 13-17

This page intentionally left blank

Background
“With TiVo, TV fits into your busy life, NOT the other way around.”
THE HISTORY OF TELEVISION BEGAN IN 1939 with the purpose of providing people withentertainment in their homes. It was followed in 1950 by the invention of the remote
control—an extraordinarily successful invention. Forty years later, two creative Silicon Val-ley veterans, Mike Ramsey and Jim Barton, invented an innovative and advanced technolog-ical development, a digital video recorder (DVR) called the TiVo. They created TiVo to be “TVYour Way.” According to its founders, “With TiVo, TV fits into your busy life, NOT the otherway around.”
By now, many people may have heard of TiVo from its being mentioned in popular TVshows and motion pictures. Even Oprah Winfrey wondered in the September 2005 issue of her“O” magazine: “Why can’t life be like TiVo?” Unfortunately, even by 2007, not very manypeople knew what TiVo did or how it did it.
14-1
C A S E 14TiVo Inc.:TIVO VS. CABLE AND SATELLITE DVR; CAN TIVO SURVIVE?Alan N. Hoffman, Rendy Halim, Rangki Son, and Suzanne Wong
Industry Three—Entertainment and Leisure
This case was prepared by Rendy Halim, Rangki Son, and Suzanne Wong, MBA graduate, and Professor and MBADirector Alan N. Hoffman of Bentley College. This case cannot be reproduced in any form without the written permission of the copyright holder, Rendy Halim, Rangki Son, Suzanne Wong, and Alan N. Hoffman. Reprint permission is solely granted to the publisher, Prentice Hall, for the book Strategic Management and Business Policy—13th (and the International and electronic version of these books) by copyright holders, Rendy Halim, Rangki Son,Suzanne Wong, and Alan N. Hoffman. This case was edited for SMBP-13th Edition. Copyright © 2008 by Alan N.Hoffman. The copyright holders are solely responsible for the case content. Any other publication of the case (transla-tion, any form of electronics or other media), or sold (any form of partnership) to another publisher will be in viola-tion of copyrights. Rendy Halim, Rangki Son, Suzanne Wong and Alan N. Hoffman have granted an additional writtenreprint permission.
Once Upon a TiVo ...Pioneered by Mike Ramsay and Jim Barton, TiVo redefined television entertainment by de-livering the promise of technologies that up until then had only been promised. Incorporatedin Delaware and originally named Teleworld, TiVo was founded as a company on August 4,1997. As proposed, the original concept was to create a home network–based multimedia
14-2 SECTION D Industry Three—Entertainment and Leisure
From the Server Room to the Living RoomDeparting slightly from their original idea to create a home network device, the founders de-veloped the idea of recording digitized video on a computer hard drive. Inside TiVo’s SiliconValley headquarters in Alviso, California, the founders created what they called a “fantasyliving room” that they hoped would serve as a prototype for 100 million living rooms acrossNorth America. The fantasy living room was composed of an oval coffee table and a com-fortable chair. The only objects on the table surface were a telephone and TiVo’s distinctivepeanut-shaped remote control. The sofa and chairs all faced an entertainment center contain-ing a big-screen television that was linked to several TiVo boxes.
At the time, Ramsey and Barton both knew it would be fun to exploit and develop theirconcept into an actual product with a promising future—the dream of most start-ups compa-nies. In the early days of the company, Mike Ramsay commented that they used to think:“Wow, you know, you can pause live television—isn’t that a cool thing?” Jim Barton workedto store a live TV signal on a computer and play it back. That was the start of TiVo—an inven-tion to create the world’s first interactive entertainment network, in which the luxury of enter-tainment and control was firmly in the viewers’own hands. TiVo shipped its first unit on March 31,1999. Since that date was considered to be a blue moon (second full moon in a month), theengineering staff code-named TiVo’s first version as the “Blue Moon.” Both Jim Barton andMike Ramsay were excited by the market introduction of their innovative product. Teleworldwas renamed TiVo in July 1999.
TiVo AcclamationWith the success of on-demand programs and online streaming catering to people’s viewinghabits, many people have found the DVR to be an essential part of their digital home enter-tainment center. Salespeople at big box retailers, such as Best Buy, Circuit City, Target, andWal-Mart, often referred to any DVR as a TiVo even though TiVo was not the only DVR onthe market. Both ReplayTV and TiVo launched DVRs at the 1999 Consumer ElectronicsShow in Las Vegas. ReplayTV won the “Best of Show” award in the video category and waslater acquired by SonicBlue and D&M Holdings. Surprisingly, ReplayTV’s version of theDVR failed to attract customers. TiVo, in contrast, became widely known and succeeded atbecoming the only stand-alone DVR company in the industry. According to the research firm,Forrester, TiVo’s brand trust among regular users scored 4.2 (out of 5 possible), while itsbrand potential among aspiring users scored an “A” with 11.1 million potential users.
Spending approximately 13 months to develop the first TiVo unit, the company found thewait to be worthwhile. TiVo received an Emmy award in August 19, 2006, in recognition of
server in which content to “thin” clients would be streamed throughout the home. In order tomarket such a product, a solid software foundation was first needed. The device had to oper-ate flawlessly, be reliable, and handle power failure gracefully for the users. At the time, bothfounders were working at Silicon Graphics (SGI) and were very much involved in the enter-tainment industry. Jim Barton was then involved with an on-demand video system and wasthe executive sponsor of an effort to port an open source system called Linux to the SGI Indyworkstation. Mike Ramsay was responsible at that time for products that created movies’ spe-cial effects for such companies as ILM and Pixar. These two SGI veterans thought Linux soft-ware would serve TiVo well as its operating system foundation. The hardware was designedsolely by TiVo Inc., but manufactured by other companies, including Philips, Sony, Hughes,Pioneer, Toshiba, and Humax. They created a product that was interactive, delivering a ser-vice that allowed people to assume greater control of their television viewing.
CASE 14 TiVo Inc. 14-3
The Brain Inside the Box
The Surf and TurfAs people’s daily life became busier and they demanded more convenience in watching TV,digital video recorders became the tool to satisfy that need. DVRs were far easier to use thanVCRs (video cassette recorders) and provided more capabilities, such as replaying a programin slow motion or temporarily putting a TV program on hold while answering the door ormaking a phone call. The DVR platform created a massive opportunity for TiVo to continuedeveloping creative and sophisticated applications, features, and services. As a digital videorecorder, TiVo used Linux-based software to allow users to capture any TV program andrecord it onto internal hard disk storage for later viewing.
The TiVo device also allowed users to watch their programs without having to watch thecommercials. This feature was very attractive to consumers, but not to television networks andadvertising agencies. However, unlike ReplayTV, which allowed users to automatically skipadvertisements (causing it to be the target of several lawsuits from ad agencies and TV net-works), TiVo took a different approach. As with a VCR, viewers using TiVo could either watchthe commercials or fast-forward through them.
With an inventive advertising feature, TiVo created a business opportunity. Knowingthat advertising could be a source of revenue, TiVo’s management tested a “pop-up” feature.While recording or watching a program, advertisements popped up at the bottom of the TVscreen. If a customer was interested in any of these advertisements, he/she had the ability to
TiVo’s providing innovative and interactive services that greatly enhanced television viewing.Other finalists for that Emmy award included AOL Music on Demand, CNN Enhanced, and Di-recTV Interactive Sports. TiVo established a well-known brand that became extremely popularamong fiercely loyal customers and even non-users. Becoming a cult-like product, TiVo wastransformed into a verb. Celebrities like Regis Philbin would say “TiVo it,” meaning to record aprogram.Aworking wife, who had an important business dinner meeting that night and was rush-ing through the door, would ask her husband: “Could you TiVo Desperate Housewives for metonight, dear?” On the other hand, TiVo felt that this verb transformation might jeopardize theTiVo brand and associate its products with the generic DVR. People might say, “I want twoTiVos,” when they meant DVRs. Nevertheless, thanks to TiVo’s product acceptance, TiVo be-came publicly listed September 30, 1999, on the NASDAQ at an opening price of $16 per sharewith 5.5 million shares being offered. On its way to the IPO (initial product offering), TiVo es-tablished one of the most rapid adoption rates in the history of consumer electronics. Accordingto the April 2007 issue of PC World, TiVo was third on its list of 50 best technology products ofall time.
As of 2007, TiVo was available in four countries: the United States, United Kingdom,Canada, and Taiwan. Although TiVo was not yet being sold in Australia, New Zealand, Nether-lands, or South Africa, its technology was informally being modified by end users so it couldfit their systems. Nevertheless, TiVo had not generated a profit since its launching in 1997.Considered to be the best DVR system in use by a variety of top-notch publications, such asBusiness Week, New York Times, and Popular Science, TiVo achieved a 3 million subscribermilestone on February 18, 2005. TiVo’s subscribers included well-known loyal subscribers,such as Oprah Winfrey, Brad Pitt, Regis Philbin, and entrepreneur Craig Newmark (the ownerof Craigslist). TiVo’s mission was simple: Connect consumers to the digital entertainment theywant, where and when they want it.
“It’s not TiVo unless it’s a TiVo”
click to get more information about the product being advertised. People thus had the choiceto get advertisers’ information or not, depending on their interests. “Product Watch” let userschoose the products, services, or even brands that interested them and would automaticallyfind and deliver the requested products straight to a viewer’s list. Surprisingly, during the2002 Super Bowl, TiVo tracked the viewing patterns of 10,000 of its subscribers and foundthat TiVo’s instant replay feature was used more on certain commercials, notably the Pepsiad with Britney Spears, than on the game itself. TiVo included 70 “showcase” advertisingcampaigns in its TiVo platforms for companies such as Acura, Best Buy, BMW, Buick, Cadil-lac, Charles Schwab, Coca-Cola, Dell, General Motors, GMC, New Line Cinema, Nissan,Pioneer, Porsche, and Target.
In addition to the features previously mentioned, there was much more for users to expe-rience. A “Season Pass Manager” avoided conflicts, such as one recording canceling another.A “Wish List” platform allowed viewers to store their search accordingly to their interests,such as actor, keyword, director, etc. No other company had yet been able to match these twoTiVo recording features. In addition, the easy-to-use remote control with its distinctive“Thumbs Up and Down” feature allowed users to rate the shows they had watched so that TiVocould assist and provide users with programs similar to what they had rated positively. Thisfeature also provided TiVo with some useful market research data. The remote control had wondesign awards from the Consumer Electronics Association. Jakob Nielsen, a technology con-sultant of the Nielsen Norman Group, called the oversize yellow pause button in the middle ofthe remote “the most beautiful pause button I’ve ever seen.” Steve Wozniak, the co-founder ofApple Computer, stated that “TiVo adjusts to my tastes. Its remote has been the most er-gonomic and easy to use one that I have had encountered in many years.”
“TiVoToGo,” a feature launched in January 2005, allowed users to connect their TiVo toa computer with an Internet or a home network, transferring recorded shows from TiVo boxesto users’ PCs. Through a software program developed with Sonic, customers were able to editand save their TiVo files. In August 2005, TiVo released a software program that allowed cus-tomers to transfer MPEG2 video files from their PC to their TiVo boxes in order to play thevideo on the TiVo DVR.
The TiVoToGo feature included TiVo’s “Central Online,” which allowed users to schedulerecordings on its Web site, “MultiRoom Viewing,” and allowed them to transfer recordings be-tween TiVo units in multiple rooms, download any programs in any format into the TiVo box andtransfer them into other devices, such as an IPOD, laptop, or other mobile device, such as cellu-lar phones. This provided users with the opportunity to view recordings anytime and anywherethe users desired. With various partnerships that TiVo had established regarding third-party net-work content, viewers could access weather, traffic condition, and even purchase a last-minutemovie ticket at Fandango.com. Viewers could also use “Amazon Unbox” to buy or rent the lat-est movies and TV shows that would be downloaded into the TiVo box. By early 2007, Amazonhad 1,500 TiVo-compatible movies listed for rent and 2,300 available for purchase.
“Behind The Box”—The Hardware Anatomy of TiVo 101TiVo units can be installed fairly easily because they had been designed for anyone to installand operate. Parts that went into the device and its internal architecture had been made lesscomplex. An online self-installation guide with step-by-step pictured instruction was used tocomplete the installation request. It was possible, however, to have professional installationservice through a retailer, such as Best Buy or a customer’s cable provider.
In reality, TiVo was simply a cable box with a hard drive that provided the ability to recordusing a fancy user interface. The main idea at the beginning was to free people from a TV net-work’s schedule. With TiVo, the viewer could watch programs at any time using features suchas pause, rewind, fast forward, and slow motion.
14-4 SECTION D Industry Three—Entertainment and Leisure
CASE 14 TiVo Inc. 14-5
What the Hack!Where technology was involved, there were always incentives for hackers to challenge thesystem. Some people hacked into the TiVo boxes to improve the service and expand itsrecording and/or storage capacity. Others tried to make TiVo available in countries whereTiVo was not currently available. In the latest version of TiVo, improved encryption of thehardware and software made it more difficult for people to hack the systems.
The Tivo Operation – Behind the Scenes ...
TiVo’s model Series 2 was supported with USB ports that had been integrated into theTiVo system to support network adapters that included wired Ethernet and WiFi capabilities.It received its signal from the cable or satellite box. It also provided the ability to record a pro-gram over-the-air. The next generation, TiVo Series 3, had been built with two internal cable-ready tuners and supported a single external cable or satellite box. As a result, the Series 3 TiVoprovided the ability to record two shows at once, unlike other DVRs available at that time.Moreover, the latest version of the TiVo box had a 10/1000 Ethernet connection port and aSATA port which could support external storage hardware. It also had an HDMI plug, whichprovided an interface between any compatible digital audio/video source, such as a DVDplayer, a PC, or a video game system. With the new Series 3 TiVo box, customers no longerneeded their cable box. Some recent models contained DVD-R/RW drives that transferredrecordings from the TiVo box to a DVD disc.
TiVo hardware could also work alone as a normal DVR. It was thus possible for TiVo usersto keep the TiVo hardware but cancel their TiVo subscription. This, of course, could seriouslydamage TiVo’s revenue stream.
“. . . .and I never miss an episode. TiVo takes care of the details”
Manufacturing and Supply ChainTiVo outsourced the manufacturing of its products to third-party manufacturers. This out-sourcing extended from prototyping to volume manufacturing and included activities such asmaterial procurement, final assembly, test, quality control, and shipment to distribution cen-ters. The majority of the company’s products were assembled in Mexico. TiVo’s primary dis-tribution center was operated on an outsourced basis in Texas.
Several consumer electronics manufacturers, including Toshiba, Humax, and Pioneer,manufactured and distributed TiVo-enabled stand-alone DVRs during the last three years. Thecompany also engaged contract manufacturers to build TiVo-enabled stand-alone DVRs.
The components that made up TiVo’s products were purchased from various vendors, in-cluding key suppliers such as Broadcom, which supplied microprocessors. Some of TiVo’scomponents, including microprocessors, chassis, remote controls, and certain discrete compo-nents were currently supplied by sole source suppliers.
Marketing
Feel the Buzzzzzz—Hail Thy TiVoWhen it came to new technology, penetrating existing consumer markets was usually diffi-cult. Customers were often slower to embrace new product than forecasters predicted andopted to choose an older and more familiar technology, like that used by VCRs. TiVo founder
Mike Ramsay would often get upset in TiVo’s early days when someone said, “Oh, that’s justlike a VCR.” He would then retort, “No, no, no, no, no. It’s much more than a VCR. It doesthis. . . . It does that. . . . Let’s personalize it and all that stuff.” At that point, Ramsey foundthat it became difficult to describe what TiVo actually was, leading to a five- to 10-minute con-versation instead of a 30-second TiVo advertisement.
In its early years, TiVo tried the standard approach of explaining the product via ads—resulting in a series of stumbles in marketing. Millions of dollars spent on advertising did nothelp consumers understand what TiVo actually did. A customer claimed, “I personally remem-ber seeing TiVo ads on TV before I even knew what a TiVo was, and it took seven years forme to finally see one ‘in the flesh.’”
What made TiVo DVRs different from generic DVRs could not be grasped by most peo-ple by simply seeing the differences listed in Exhibit 1. As a true “experience good,” it couldonly be felt and experienced by using the product itself. TiVo’s interface was vastly superiorto that used by most competitive DVRs. According to Gartner analyst Van Baker, “For cableand satellite DVRs, the interface stinks. They do a really bad job of it.” Once people used aTiVo, many told others about the product and how it had improved their enjoyment of televi-sion. According to a survey reported on the TiVo Web site, 98% of users said that they couldnot live without their TiVo.
Between 1999 and 2000, TiVo’s subscriptions increased by 86%. In addition to capitaliz-ing on its thousands of customer evangelists to move the product into the mainstream, TiVo’sword-of-mouth strategy focused on celebrity endorsements and television show product place-ment. The firm began giving its product away to such celebrities as Oprah Winfrey, Jay Leno,Sarah Michelle Gellar, Rosie O’Donnell, and Drew Bledsoe, turning them into high-profilemembers of the cult of satisfied TiVo users. Total subscriptions increased from 3.3 million(1.2 million TiVo-owned plus 2.1 million DirecTV-controlled) in early 2005 to 4.4 million(1.7 million TiVo-owned plus 2.7 million DirecTV-controlled) at end-2006.
Sales and marketing expenses consisted primarily of employee salaries and related ex-penses, media advertising (including print, online, radio, and television), public relations ac-tivities, special promotions, trade shows, and the production of product-related items,including collateral and videos. Advertising expenses were $15.9 million, $10.4 million, and$16.1 million for the fiscal years ended January 31, 2007, 2006, and 2005, respectively.
The TiVo-owned churn rate per month was 1.0% for the fiscal year ended January 31,2007, compared to .9% and .7% for the fiscal years ended January 31, 2006, and 2005, re-spectively. The churn rate measure was composed of total TiVo-owned subscription cancel-lations during a period divided by the average TiVo-owned subscriptions for that perioddivided by the number of months in the period. Management anticipated that the TiVo-owned churn rate per month would increase in future periods as a result of increased com-petition in the marketplace, competitive pricing issues, the growing importance of offeringcompetitive service features such as high definition television recording capabilities, and in-creased churn from product lifetime subscriptions. TiVo had previously offered lifetime ser-vice subscriptions to initially attract people to purchase TiVo DVRs, but was no longermaking this offer. It had been replaced by one- to three-year service contracts containingmonthly fees.
Subscription acquisition costs (SAC) totaled $267 million in 2006, $196 in 2005, and$182 in 2004. Management defined SAC as the company’s total acquisition costs for a givenperiod divided by TiVo-owned subscription gross additions for the same period. Total acqui-sition costs were the sum of sales and marketing expenses, rebates, revenue share, and otherpayments to channel, minus hardware gross margin (defined as hardware revenues less cost ofhardware revenues). This included all fixed costs, including headcount-related expense, suchas stock-based compensation, marketing not directly associated with subscription acquisition,operating expenses for the advertising sales business, and allocations.
14-6 SECTION D Industry Three—Entertainment and Leisure
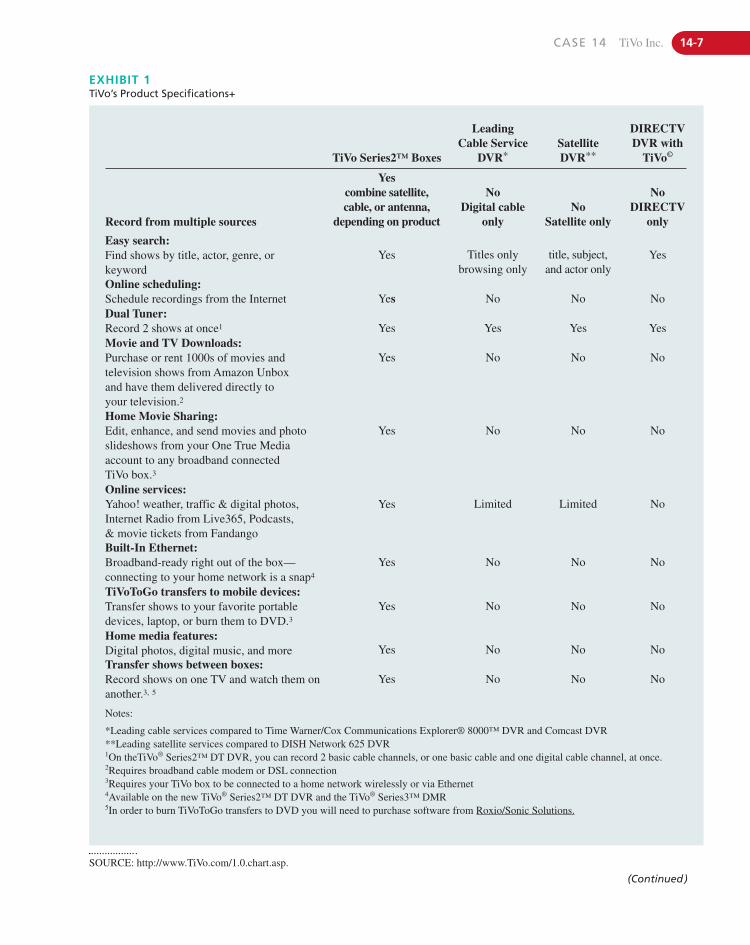
CASE 14 TiVo Inc. 14-7
EXHIBIT 1TiVo’s Product Specifications+
SOURCE: http://www.TiVo.com/1.0.chart.asp.
TiVo Series2™ Boxes
LeadingCable Service
DVR*SatelliteDVR**
DIRECTVDVR with
TiVo©
Record from multiple sources
Yescombine satellite,cable, or antenna,
depending on product
NoDigital cable
onlyNo
Satellite only
NoDIRECTV
only
Easy search:Find shows by title, actor, genre, orkeyword
Yes Titles onlybrowsing only
title, subject,and actor only
Yes
Online scheduling:Schedule recordings from the Internet Yes No No NoDual Tuner:Record 2 shows at once1 Yes Yes Yes YesMovie and TV Downloads:Purchase or rent 1000s of movies andtelevision shows from Amazon Unbox and have them delivered directly to your television.2
Yes No No No
Home Movie Sharing:Edit, enhance, and send movies and photoslideshows from your One True Mediaaccount to any broadband connected TiVo box.3
Yes No No No
Online services:Yahoo! weather, traffic & digital photos,Internet Radio from Live365, Podcasts,& movie tickets from Fandango
Yes Limited Limited No
Built-In Ethernet:Broadband-ready right out of the box—connecting to your home network is a snap4
Yes No No No
TiVoToGo transfers to mobile devices:Transfer shows to your favorite portabledevices, laptop, or burn them to DVD.3
Yes No No No
Home media features:Digital photos, digital music, and more Yes No No NoTransfer shows between boxes:Record shows on one TV and watch them onanother.3, 5
Yes No No No
Notes:
*Leading cable services compared to Time Warner/Cox Communications Explorer® 8000™ DVR and Comcast DVR**Leading satellite services compared to DISH Network 625 DVR1On theTiVo® Series2™ DT DVR, you can record 2 basic cable channels, or one basic cable and one digital cable channel, at once.2Requires broadband cable modem or DSL connection3Requires your TiVo box to be connected to a home network wirelessly or via Ethernet4Available on the new TiVo® Series2™ DT DVR and the TiVo® Series3™ DMR5In order to burn TiVoToGo transfers to DVD you will need to purchase software from Roxio/Sonic Solutions.
(Continued)
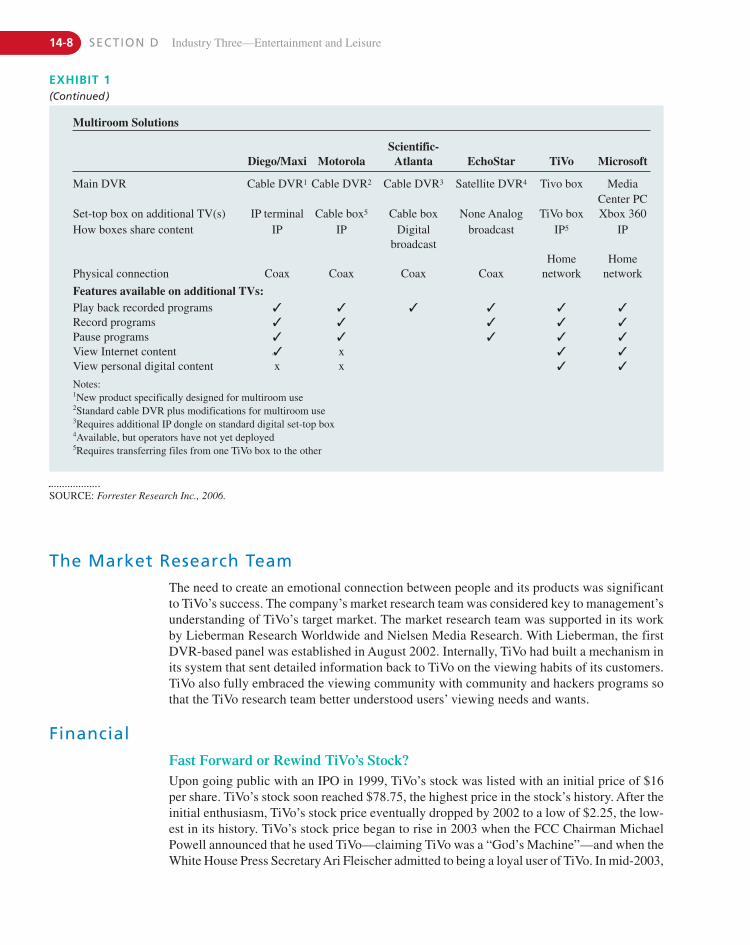
The Market Research TeamThe need to create an emotional connection between people and its products was significantto TiVo’s success. The company’s market research team was considered key to management’sunderstanding of TiVo’s target market. The market research team was supported in its workby Lieberman Research Worldwide and Nielsen Media Research. With Lieberman, the firstDVR-based panel was established in August 2002. Internally, TiVo had built a mechanism inits system that sent detailed information back to TiVo on the viewing habits of its customers.TiVo also fully embraced the viewing community with community and hackers programs sothat the TiVo research team better understood users’ viewing needs and wants.
Financial
Fast Forward or Rewind TiVo’s Stock?Upon going public with an IPO in 1999, TiVo’s stock was listed with an initial price of $16per share. TiVo’s stock soon reached $78.75, the highest price in the stock’s history. After theinitial enthusiasm, TiVo’s stock price eventually dropped by 2002 to a low of $2.25, the low-est in its history. TiVo’s stock price began to rise in 2003 when the FCC Chairman MichaelPowell announced that he used TiVo—claiming TiVo was a “God’s Machine”—and when theWhite House Press Secretary Ari Fleischer admitted to being a loyal user of TiVo. In mid-2003,
14-8 SECTION D Industry Three—Entertainment and Leisure
EXHIBIT 1(Continued)
Multiroom Solutions
Diego/Maxi MotorolaScientific-
Atlanta EchoStar TiVo Microsoft
Main DVR Cable DVR1 Cable DVR2 Cable DVR3 Satellite DVR4 Tivo box Media
Set-top box on additional TV(s) IP terminal Cable box5 Cable box None Analog TiVo boxCenter PCXbox 360
How boxes share content IP IP Digital broadcast IP5 IP
Physical connection Coax Coax
broadcast
Coax CoaxHome
networkHome
network
Features available on additional TVs:Play back recorded programs ✓ ✓ ✓ ✓ ✓ ✓
Record programs ✓ ✓ ✓ ✓ ✓
Pause programs ✓ ✓ ✓ ✓ ✓
View Internet content 3✓ x ✓ ✓
View personal digital content x x ✓ ✓
Notes:1New product specifically designed for multiroom use2Standard cable DVR plus modifications for multiroom use3Requires additional IP dongle on standard digital set-top box4Available, but operators have not yet deployed5Requires transferring files from one TiVo box to the other
SOURCE: Forrester Research Inc., 2006.
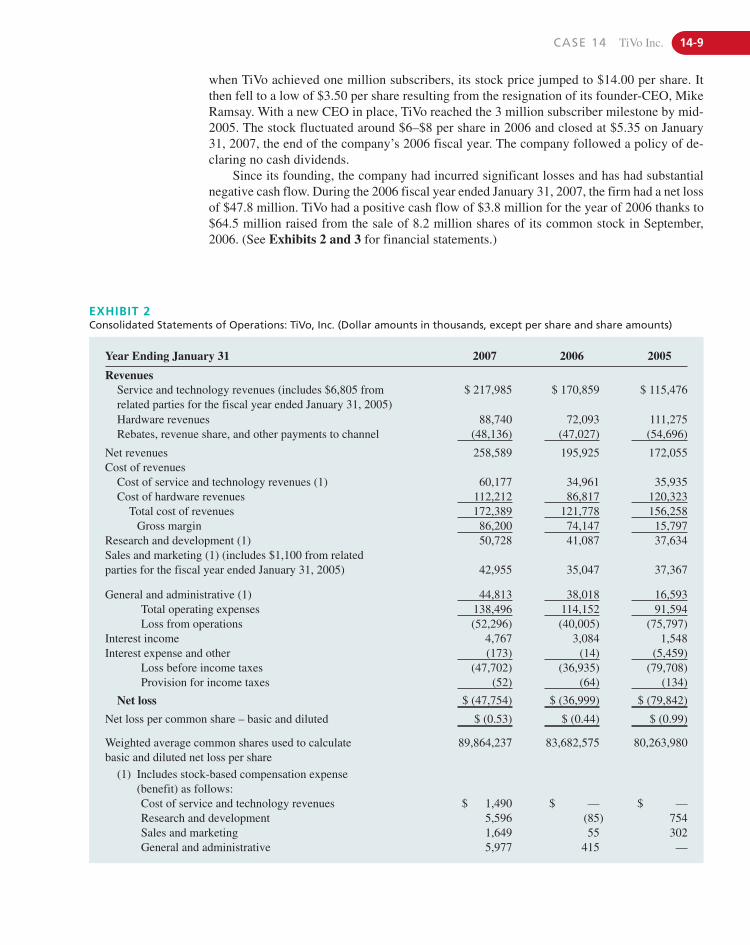
when TiVo achieved one million subscribers, its stock price jumped to $14.00 per share. Itthen fell to a low of $3.50 per share resulting from the resignation of its founder-CEO, MikeRamsay. With a new CEO in place, TiVo reached the 3 million subscriber milestone by mid-2005. The stock fluctuated around $6–$8 per share in 2006 and closed at $5.35 on January31, 2007, the end of the company’s 2006 fiscal year. The company followed a policy of de-claring no cash dividends.
Since its founding, the company had incurred significant losses and has had substantialnegative cash flow. During the 2006 fiscal year ended January 31, 2007, the firm had a net lossof $47.8 million. TiVo had a positive cash flow of $3.8 million for the year of 2006 thanks to$64.5 million raised from the sale of 8.2 million shares of its common stock in September,2006. (See Exhibits 2 and 3 for financial statements.)
EXHIBIT 2Consolidated Statements of Operations: TiVo, Inc. (Dollar amounts in thousands, except per share and share amounts)
Year Ending January 31 2007 2006 2005
RevenuesService and technology revenues (includes $6,805 from related parties for the fiscal year ended January 31, 2005)
$ 217,985 $ 170,859 $ 115,476
Hardware revenues 88,740 72,093 111,275Rebates, revenue share, and other payments to channel (48,136) (47,027) (54,696)
Net revenues 258,589 195,925 172,055Cost of revenues
Cost of service and technology revenues (1) 60,177 34,961 35,935Cost of hardware revenues 112,212 86,817 120,323
Total cost of revenues 172,389 121,778 156,258Gross margin 86,200 74,147 15,797
Research and development (1) 50,728 41,087 37,634Sales and marketing (1) (includes $1,100 from related parties for the fiscal year ended January 31, 2005) 42,955 35,047 37,367
General and administrative (1) 44,813 38,018 16,593Total operating expenses 138,496 114,152 91,594Loss from operations (52,296) (40,005) (75,797)
Interest income 4,767 3,084 1,548Interest expense and other (173) (14) (5,459)
Loss before income taxes (47,702) (36,935) (79,708)Provision for income taxes (52) (64) (134)
Net loss $ (47,754) $ (36,999) $ (79,842)
Net loss per common share – basic and diluted $ (0.53) $ (0.44) $ (0.99)
Weighted average common shares used to calculate basic and diluted net loss per share
89,864,237 83,682,575 80,263,980
(1) Includes stock-based compensation expense (benefit) as follows:Cost of service and technology revenues $ 1,490 $ — $ —Research and development 5,596 (85) 754Sales and marketing 1,649 55 302General and administrative 5,977 415 —
CASE 14 TiVo Inc. 14-9
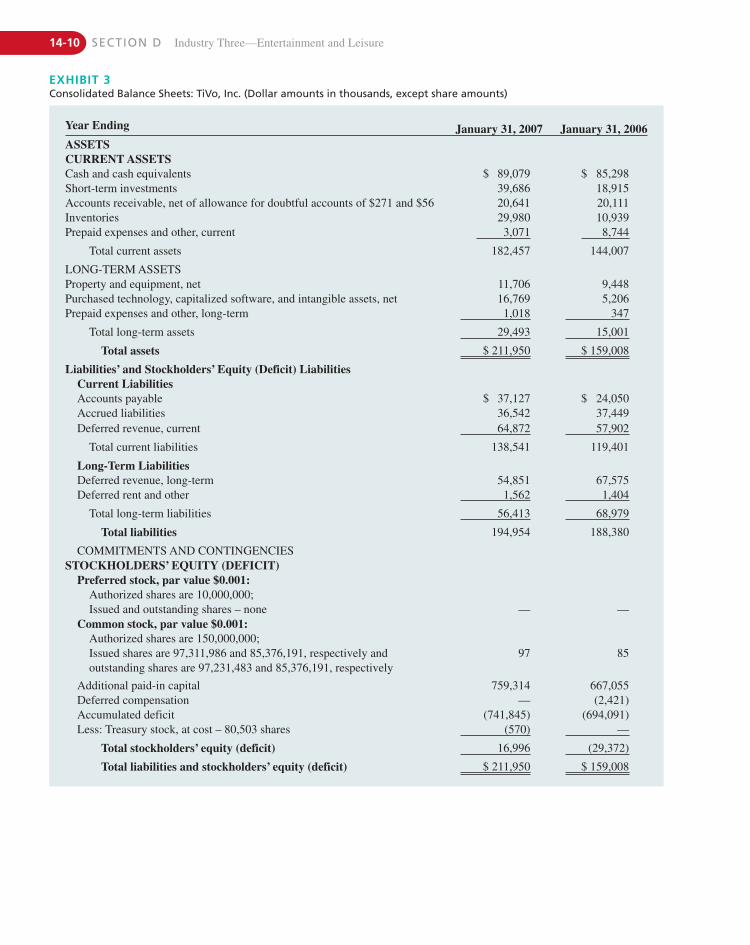
EXHIBIT 3Consolidated Balance Sheets: TiVo, Inc. (Dollar amounts in thousands, except share amounts)
Year Ending January 31, 2007 January 31, 2006ASSETSCURRENT ASSETSCash and cash equivalents $ 89,079 $ 85,298Short-term investments 39,686 18,915Accounts receivable, net of allowance for doubtful accounts of $271 and $56 20,641 20,111Inventories 29,980 10,939Prepaid expenses and other, current 3,071 8,744
Total current assets 182,457 144,007
LONG-TERM ASSETSProperty and equipment, net 11,706 9,448Purchased technology, capitalized software, and intangible assets, net 16,769 5,206Prepaid expenses and other, long-term 1,018 347
Total long-term assets 29,493 15,001
Total assets $ 211,950 $ 159,008
Liabilities’ and Stockholders’ Equity (Deficit) LiabilitiesCurrent LiabilitiesAccounts payable $ 37,127 $ 24,050Accrued liabilities 36,542 37,449Deferred revenue, current 64,872 57,902
Total current liabilities 138,541 119,401
Long-Term LiabilitiesDeferred revenue, long-term 54,851 67,575Deferred rent and other 1,562 1,404
Total long-term liabilities 56,413 68,979
Total liabilities 194,954 188,380
COMMITMENTS AND CONTINGENCIESSTOCKHOLDERS’ EQUITY (DEFICIT)
Preferred stock, par value $0.001:Authorized shares are 10,000,000;Issued and outstanding shares – none — —
Common stock, par value $0.001:Authorized shares are 150,000,000;Issued shares are 97,311,986 and 85,376,191, respectively andoutstanding shares are 97,231,483 and 85,376,191, respectively
97 85
Additional paid-in capital 759,314 667,055Deferred compensation — (2,421)Accumulated deficit (741,845) (694,091)Less: Treasury stock, at cost – 80,503 shares (570) —
Total stockholders’ equity (deficit) 16,996 (29,372)
Total liabilities and stockholders’ equity (deficit) $ 211,950 $ 159,008
14-10 SECTION D Industry Three—Entertainment and Leisure
CASE 14 TiVo Inc. 14-11
Decontructing TiVoSince its founding in 1997, TiVo had accumulated $741.8 million in losses. Looking at TiVo’srevenue and cost structures in Exhibit 2, the company recorded its revenues under serviceand technology and hardware. In order to become profitable, the company’s managementneeded to find ways to increase revenues faster than costs increased. In terms of service andtechnology revenues, for example, TiVo needed to know the actual value of TiVo-owned sub-scribers and not just TiVo’s partnership subscribers of DirectTV and Comcast. Deconstruct-ing the value of just this one particular matter led to larger questions, which included, howlong did a TiVo subscriber remain a subscriber, how much did each of them they pay, howmuch were they willing to pay, and how much advertising revenue did users produce forevery tag they clicked? Moreover, how long and how could TiVo maintain its subscribers asTiVo-owned subscribers?
TiVo’s hardware revenue was subject to a chicken and egg problem. If managementdropped the price of TiVo hardware, more people would buy TiVo DVRs and subscribe to theTiVo service. It would then, however, be selling hardware at a significant loss. Even thoughrebates were offered, TiVo’s management in 2007 had not yet found a price point that wouldattract a significantly larger number of buyers. In early 2007, TiVo offered three types of boxesdepending on the hours of programming storage capacity. These ranged from an 80-hour TiVoSeries 2 to a 300-hour TiVo Series 3. The basic TiVo Series 2 box of 80 hours and 180 hourshad a one-time price of $99.99 and $199.99, respectively, while the TiVo Series 3 box with300-hour storage capacity was priced at $799.99. TiVo customers then needed to pay amonthly subscription fee to obtain TiVo service.
The company had been a heavy user of mail-in rebates, which were reflected on the in-come statement as negative revenue. According to Business Week, $5 million in additional pos-itive revenue was recognized because nearly half of TiVo’s 100,000 new subscribers failed toapply for a $100 rebate. This slippage, known to marketers as the “shoebox effect,” was veryhelpful to TiVo’s revenues.
Research and DevelopmentThe word “interactive” was the slogan of R&D. TiVo’s R&D team made sure that they builtTiVo from the user’s perspective and his/her viewing habits. There was a TiVo Forum com-posed of communication through TiVo Community.com and TiVo hackers. In this forum, crit-icism was allowed and even encouraged, so long as it was constructive and helped TiVo togrow. Ideas generated through this forum helped TiVo’s R&D team and developers to be in-novative by continuous adjusting to people’s ever-changing lifestyles. TiVo’s managementwas also concerned with how TiVo’s platform could be used inappropriately by children. Asa result, TiVo had collaborated with parents to build a new feature called the TiVo ParentalZone that allowed parents to control what their kids watched. TiVo protected its users’ pri-vacy by storing personal information on a computer behind its “firewall” in a secure locationand by restricting the number of employees internally who could access this data.
In its early years, TiVo’s R&D staff consisted only of contract-based engineers. As thecompany grew, management expanded its R&D team to consist of a diverse and creative groupof on-staff engineers. It had an R&D policy stating that new benefits must extend people’s ex-isting behaviors. The design team had a very detailed list of steps to follow to ensure the fit ofTiVo products to user needs. As an example of TiVo’s meticulous product design process, TiVocreated a remote control that combined personalization and interconnectivity. TiVo’s remotehad a feature of thumbs up and down to be clicked by users to rate shows so that the TiVo boxwould know what to record. In addition, TiVo enabled Braille on its remote for vision-impaired
14-12 SECTION D Industry Three—Entertainment and Leisure
Corporate Governance
Top ManagementIn its early years, TiVo’s top management had been personally involved in operations andmarketing. Founder Mike Ramsay often made overseas trips to conduct meetings and semi-nars with consumer electronics manufacturers. This was as an attempt to convince the man-ufacturers to embed TiVo’s software into their products. In order to make sure everythingwent well and accordingly to plan, Ramsey focused on maintaining partnerships. He wouldrarely be in his office. He would instead be on the road talking to companies that could helpTiVo build software and subscribers. During his tenure as TiVo’s CEO, Ramsey did commita number of managerial errors. For example, instead of re-doubling marketing efforts whentwo distribution contracts were lost during 2001, he laid-off 80 employees (approx 25% ofits workforce at the time) in April, 2001, plus 40 more employees (approx 20% of its remain-ing workforce) in the following October. Ramsay was an engineer and knew how to be cre-ative and build great machines, but didn’t truly understand the industry or how to manage thecompany’s growth. By 2005, the company was drowning in red ink and its future was indoubt. As a result, Mike Ramsay was forced to resign in July 2005 and a change of CEO wasimplemented by the board of directors. The board hired as TiVo’s new CEO the former pres-ident of NBC Cable, Tom Rogers.
Mike Ramsey continued to serve on TiVo’s board of directors after his resignation. Theboard agreed to a transition agreement with Ramsey in which Ramsay agreed to provide ser-vices to TiVo that included assistance with executive transition matters, service as chairman ofthe Technology Advisory Committee of TiVo’s Board and TiVo’s beta test program, coopera-tion with existing or future litigation, and the provision of other advice and assistance that fellwithin Mr. Ramsay’s knowledge and expertise in exchange for a salary of $100,000 annuallyplus stock options. Ramsay’s transition employment agreement had been renewed and was ineffect through September 8, 2007.
In early 2007, TiVo’s current top managers were:
Thomas S. Rogers, 52, was appointed by TiVo’s board to serve as a director in September2003 and was named president and chief executive officer of TiVo, effective July 1, 2005.From 2004 until July 2005, he served as the senior operating executive for media and
users. Other R&D processes included product testing and development of software and plat-forms, integration of software to satellite systems, and product integration, such as with theDVD burner and TiVo recorder. Besides developing its main products, the TiVo R&D teamalso designed platforms and technology that could be used with other products to enhance theperformance of TiVo’s main products, such as the ability to connect with computers, otherhome theater technologies, and especially with cable and satellites.
Since competition was increasing in the DVR industry, TiVo’s management decided topatent the company’s advanced software and technology platforms. TiVo licensed its TiVo-ToGo software to chip maker AMD and digital media software, such as Sonic Solutions, toMicrosoft in order to enable video playback on pocket PCs and smart phones. As of end-2006,TiVo had 85 patents granted and 117 patents pending, including both domestic and foreignpatents. TiVo licensed its patents through several of its trusted partners, including Sony,Toshiba, Pioneer, and Direct TV. TiVo’s management believed that licensing its technology tothird parties was an excellent revenue generator.
Although total company employee headcount had increased by approximately 7% in fiscalyear 2007, the company increased the number of its regular, temporary, and part-time employ-ees engaged in research and development by 9% from a total of 264 to 288 as of January 31, 2007,compared to January 31, 2006.
CASE 14 TiVo Inc. 14-13
entertainment for Cerberus Capital Management, a large private equity firm. From Octo-ber 1999 until April 2003, Rogers had been chairman and CEO of Primedia Inc., a print,video, and online media company. From January 1987 until October 1999, Rogers heldpositions with National Broadcast Company Inc., including president of NBC Cable andexecutive vice president. Rogers held a B.A. degree in Government from WesleyanUniversity and a J.D. degree from Columbia Law School. In 2006, he earned $504,583in salary and $294,521 in bonuses plus $4,282,000 in stock options tied to long-termperformance.
Steve Sordello, 37, was named senior vice president and chief financial officer in August2006. He replaced David H. Courtney, who had resigned from TiVo in April 2006. Prior tojoining TiVo, Sordello had served as executive vice president and chief financial officer atAsk Jeeves from April 2001 until October 2005, when the company was acquired byIAC/InterActiveCorp. Prior to Ask Jeeves, Sordello held senior positions at Adobe SystemsInc. and Syntex Corporation. Sordello held a B.S. degree in Management/Accounting andan M.B.A. degree from Santa Clara University.
James Barton, 48, was a co-founder of TiVo and served as TiVo’s vice president of Researchand Development, chief technical officer and director since the company’s inception toJanuary 2004, and was currently chief technical officer and senior vice president. FromJune 1996 to August 1997, Barton had been president and chief executive officer of Net-work Age Software Inc., a company that he founded to develop software products targetedat managed electronic distribution. From November 1994 to May 1996, Barton had servedas chief technical officer of Interactive Digital Solutions Company, a joint venture of Sil-icon Graphics Incorporated (SGI) and AT&T Network Systems created to develop inter-active television systems. From June 1993 to November 1994, Barton had served as vicepresident and general manager of the Media Systems Division of SGI. From January 1990to May 1991, Barton had served as vice president and general manager for the SystemsSoftware Division of Silicon Graphics. Prior to joining SGI, Barton held technical andmanagement positions with Hewlett-Packard and Bell Laboratories. Mr. Barton held aB.S. degree in Electrical Engineering and an M.S. degree in Computer Science from theUniversity of Colorado at Boulder. In 2006, Barton earned $275,000 in salary and$133,100 in bonuses plus $151,694 in stock options tied to long-term performance.
Jeffrey Klugman, 46, was named senior vice president and general manager, Service Providerand Media and Advertising Services Division, in April 2005. Klugman had served as vicepresident of Technology Licensing from December 2001 until February 2004 and vicepresident, TiVo Platform Business, from February 2004 until April 2005. Prior to joiningTiVo, Klugman had been CEO of PointsBeyond.com, an Internet-portal start-up focusedon outdoor activities and adventures. In 1999, Klugman served as vice president of Mar-keting and Business Development for Quantum Corporation’s Consumer ElectronicsBusiness Unit. Klugman held a B.S. degree in engineering from Carnegie Mellon Universityand an M.B.A. degree from the Stanford Business School. In 2006, he earned $225,000in salary and $108,419 in bonuses plus $238,315 in stock options tied to long-termperformance.
Mark A. Roberts, 46, was named senior vice president of Consumer Products and Operationsin October 2005 responsible for Consumer Products Engineering and Product Strategy,Manufacturing, Distribution, Call Center, Service Operations, Information Technology,Facilities and Broadcast Center Operations. He had served as senior vice president ofEngineering since December 2002 until October 2005 and chief information officer ofTiVo from March 1999 until December 2002. Prior to joining TiVo, he had served as vicepresident of Information Technology atAcuson Corporation, a medical ultrasound company,
14-14 SECTION D Industry Three—Entertainment and Leisure
from March 1996 to March 1999. From July 1990 to March 1996, Roberts was director ofInformation Systems at SGI. Roberts held a B.S. degree in Economics from Santa ClaraUniversity. In 2006, he earned $255,000 in salary and $148,717 in bonuses plus $222,395in stock options based on long-term performance.
Matthew Zinn, 42, was named senior vice president, general counsel, secretary, and chief pri-vacy officer in April 2006. Zinn had served as vice president, general counsel, and chiefprivacy officer since July 2000 and as corporate secretary since November 2003. FromMay 1998 to July 2000, Zinn was the senior attorney, Broadband Law and Policy, for theMediaOne Group, a global communications company. From August 1995 to May 1998,Zinn served as corporate counsel for Continental Cablevision, the third largest cable tel-evision operator in the United States. From November 1993 to August 1995, he was anassociate with the Washington, D.C., law firm of Cole, Raywid & Braverman, where herepresented cable operators in federal, state, and local matters. Zinn held a B.A. degree inPolitical Science from the University of Vermont and a J.D. degree from the GeorgeWashington University National Law Center.
Nancy Kato, 52, was named senior vice president of Human Resources in April 2006. Katohad served as vice president, Human Resources, since January 2005. From January 2003to January 2005 Kato was vice president of Global Compensation at Hewlett-Packard.From December 2000 to October 2002 Kato was senior vice president of Human Re-sources for Ariba. She has also held senior roles at Compaq and Tandem. Kato held a B.S.in Health Sciences and M.A. in Education and Counseling from San Jose State University.
Joe Miller, 40, was named senior vice president, Consumer Sales and Distribution, inSeptember 2006 and was responsible for all aspects of the company’s TiVo-Owned salesand distribution efforts. Miller had served as TiVo’s vice president, Consumer Sales andDistribution, from May 1999 to August 2006. Prior to joining TiVo. Miller was with U.S.Satellite Broadcasting from February 1994 to May 1999 as general manager of RetailSales and prior to that Miller was a national sales manager for Cox Satellite Program-ming. Miller held a B.A. degree in Public Relations from Southwest Texas State.
Individual senior executives who owned shares of the company’s stock in 2006 were:CEO Thomas Rogers, 960,816 shares (1.1% of total shares outstanding), Sr. VP & Chief Tech-nical Officer James Barton, 1,135,928 shares (1.3% of total shares outstanding), Sr. VP & Gen-eral Manager of Service Provider & Media Advertising Services Jeffrey Klugman, 115,887shares (less than 1% of total shares outstanding), and Sr. VP of Consumer Products & Opera-tions Mark Roberts, 151,173 shares (less than 1%).
Board of DirectorsTiVo’s board of directors consisted of three executives from the venture capital firms ofKleiner Perkins Caufield & Byers, Redpoint Ventures, and New Enterprise Associates, threesenior executives from NBC, Coca-Cola, and Univision Communications, an independentconsultant who had been CFO at Univision Communications, plus TiVo’s current and pastCEO, for a total of nine members of the board. The board selected Jeffrey Hinson as its ninthmember on January 26, 2007, for his financial experience as an ex-CFO to join the board andserve as chairman of its audit committee. See Exhibit 4 for a list of the members of the boardof directors, their backgrounds, and committee assignments.
Individual non-management directors owned the following amounts of stock in 2006 (%of total in parentheses): Michael Ramsey, 3,020,102 shares (3.5%), David Zaslav, 3,777,151shares (4.4%), Geoffrey Y. Yang, 2,663,295 shares (3.1%), Mark Perry, 849,063 shares (lessthan 1%), Randy Komisar, 333,963 shares (less than 1%), Joseph Uva, 75,000 shares (less than
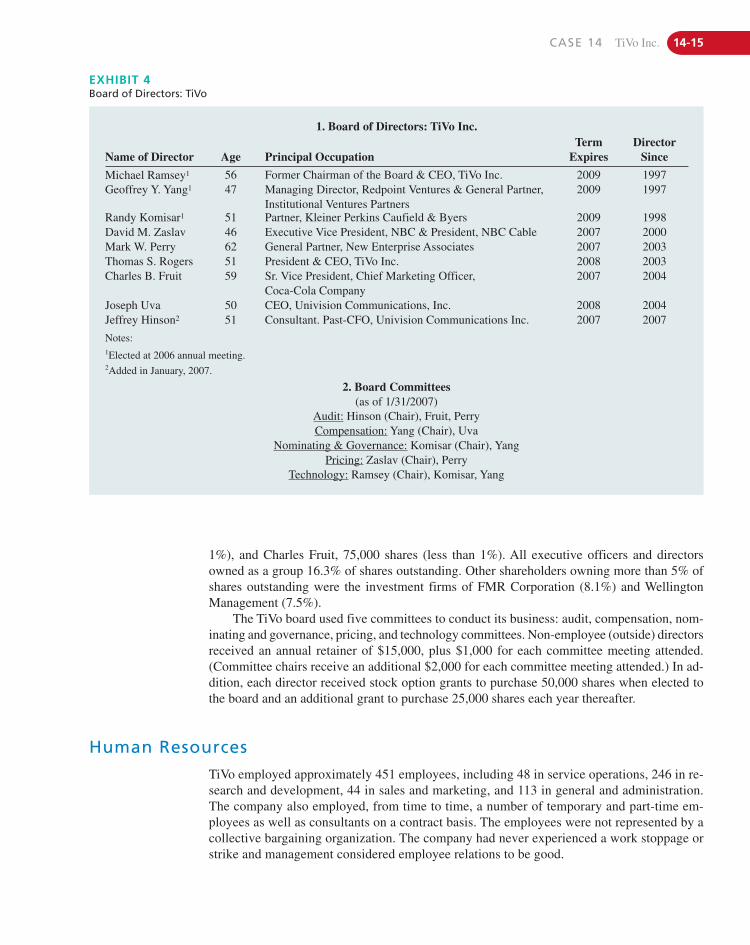
CASE 14 TiVo Inc. 14-15
1%), and Charles Fruit, 75,000 shares (less than 1%). All executive officers and directorsowned as a group 16.3% of shares outstanding. Other shareholders owning more than 5% ofshares outstanding were the investment firms of FMR Corporation (8.1%) and WellingtonManagement (7.5%).
The TiVo board used five committees to conduct its business: audit, compensation, nom-inating and governance, pricing, and technology committees. Non-employee (outside) directorsreceived an annual retainer of $15,000, plus $1,000 for each committee meeting attended.(Committee chairs receive an additional $2,000 for each committee meeting attended.) In ad-dition, each director received stock option grants to purchase 50,000 shares when elected tothe board and an additional grant to purchase 25,000 shares each year thereafter.
EXHIBIT 4Board of Directors: TiVo
1. Board of Directors: TiVo Inc.
Name of Director Age Principal OccupationTerm
ExpiresDirector
Since
Michael Ramsey1 56 Former Chairman of the Board & CEO, TiVo Inc. 2009 1997Geoffrey Y. Yang1 47 Managing Director, Redpoint Ventures & General Partner,
Institutional Ventures Partners2009 1997
Randy Komisar1 51 Partner, Kleiner Perkins Caufield & Byers 2009 1998David M. Zaslav 46 Executive Vice President, NBC & President, NBC Cable 2007 2000Mark W. Perry 62 General Partner, New Enterprise Associates 2007 2003Thomas S. Rogers 51 President & CEO, TiVo Inc. 2008 2003Charles B. Fruit 59 Sr. Vice President, Chief Marketing Officer,
Coca-Cola Company2007 2004
Joseph Uva 50 CEO, Univision Communications, Inc. 2008 2004Jeffrey Hinson2 51 Consultant. Past-CFO, Univision Communications Inc. 2007 2007
Notes:1Elected at 2006 annual meeting.2Added in January, 2007.
2. Board Committees(as of 1/31/2007)
Audit: Hinson (Chair), Fruit, PerryCompensation: Yang (Chair), Uva
Nominating & Governance: Komisar (Chair), YangPricing: Zaslav (Chair), Perry
Technology: Ramsey (Chair), Komisar, Yang
Human Resources
TiVo employed approximately 451 employees, including 48 in service operations, 246 in re-search and development, 44 in sales and marketing, and 113 in general and administration.The company also employed, from time to time, a number of temporary and part-time em-ployees as well as consultants on a contract basis. The employees were not represented by acollective bargaining organization. The company had never experienced a work stoppage orstrike and management considered employee relations to be good.
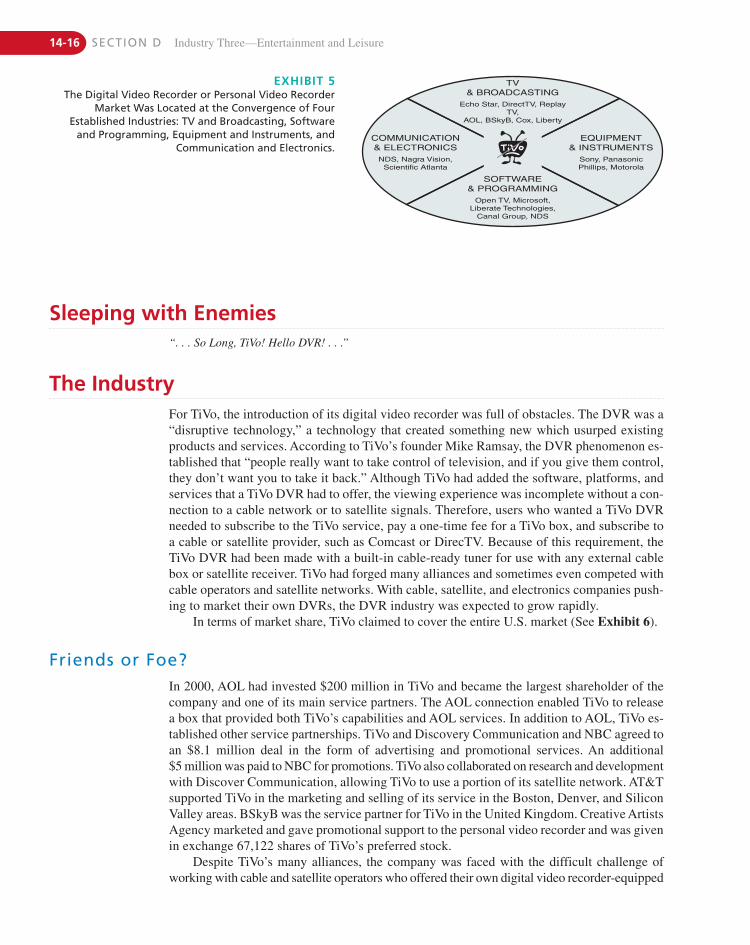
14-16 SECTION D Industry Three—Entertainment and Leisure
Sleeping with Enemies
The Industry
SOFTWARE& PROGRAMMING
Open TV, Microsoft,Liberate Technologies,
Canal Group, NDS
COMMUNICATION& ELECTRONICSNDS, Nagra Vision,
Scientific Atlanta
EQUIPMENT& INSTRUMENTS
Sony, PanasonicPhillips, Motorola
TV& BROADCASTING
Echo Star, DirectTV, ReplayTV,
AOL, BSkyB, Cox, Liberty
For TiVo, the introduction of its digital video recorder was full of obstacles. The DVR was a“disruptive technology,” a technology that created something new which usurped existingproducts and services. According to TiVo’s founder Mike Ramsay, the DVR phenomenon es-tablished that “people really want to take control of television, and if you give them control,they don’t want you to take it back.” Although TiVo had added the software, platforms, andservices that a TiVo DVR had to offer, the viewing experience was incomplete without a con-nection to a cable network or to satellite signals. Therefore, users who wanted a TiVo DVRneeded to subscribe to the TiVo service, pay a one-time fee for a TiVo box, and subscribe toa cable or satellite provider, such as Comcast or DirecTV. Because of this requirement, theTiVo DVR had been made with a built-in cable-ready tuner for use with any external cablebox or satellite receiver. TiVo had forged many alliances and sometimes even competed withcable operators and satellite networks. With cable, satellite, and electronics companies push-ing to market their own DVRs, the DVR industry was expected to grow rapidly.
In terms of market share, TiVo claimed to cover the entire U.S. market (See Exhibit 6).
EXHIBIT 5The Digital Video Recorder or Personal Video Recorder
Market Was Located at the Convergence of FourEstablished Industries: TV and Broadcasting, Software
and Programming, Equipment and Instruments, andCommunication and Electronics.
“. . . So Long, TiVo! Hello DVR! . . .”
Friends or Foe?In 2000, AOL had invested $200 million in TiVo and became the largest shareholder of thecompany and one of its main service partners. The AOL connection enabled TiVo to releasea box that provided both TiVo’s capabilities and AOL services. In addition to AOL, TiVo es-tablished other service partnerships. TiVo and Discovery Communication and NBC agreed toan $8.1 million deal in the form of advertising and promotional services. An additional$5 million was paid to NBC for promotions. TiVo also collaborated on research and developmentwith Discover Communication, allowing TiVo to use a portion of its satellite network. AT&Tsupported TiVo in the marketing and selling of its service in the Boston, Denver, and SiliconValley areas. BSkyB was the service partner for TiVo in the United Kingdom. Creative ArtistsAgency marketed and gave promotional support to the personal video recorder and was givenin exchange 67,122 shares of TiVo’s preferred stock.
Despite TiVo’s many alliances, the company was faced with the difficult challenge ofworking with cable and satellite operators who offered their own digital video recorder-equipped
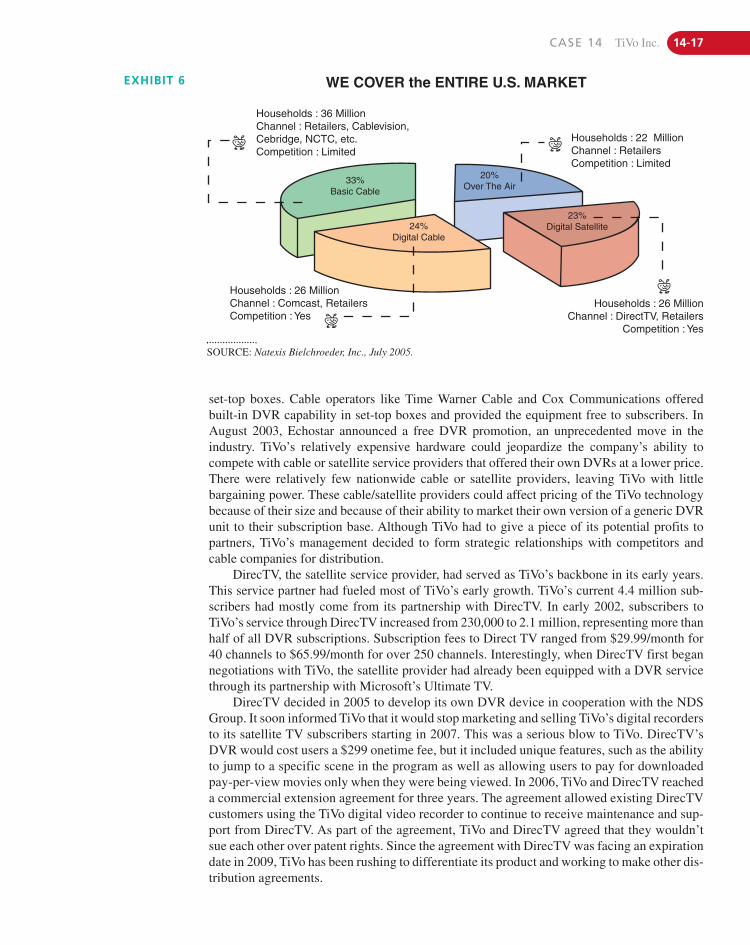
CASE 14 TiVo Inc. 14-17
set-top boxes. Cable operators like Time Warner Cable and Cox Communications offeredbuilt-in DVR capability in set-top boxes and provided the equipment free to subscribers. InAugust 2003, Echostar announced a free DVR promotion, an unprecedented move in theindustry. TiVo’s relatively expensive hardware could jeopardize the company’s ability tocompete with cable or satellite service providers that offered their own DVRs at a lower price.There were relatively few nationwide cable or satellite providers, leaving TiVo with littlebargaining power. These cable/satellite providers could affect pricing of the TiVo technologybecause of their size and because of their ability to market their own version of a generic DVRunit to their subscription base. Although TiVo had to give a piece of its potential profits topartners, TiVo’s management decided to form strategic relationships with competitors andcable companies for distribution.
DirecTV, the satellite service provider, had served as TiVo’s backbone in its early years.This service partner had fueled most of TiVo’s early growth. TiVo’s current 4.4 million sub-scribers had mostly come from its partnership with DirecTV. In early 2002, subscribers toTiVo’s service through DirecTV increased from 230,000 to 2.1 million, representing more thanhalf of all DVR subscriptions. Subscription fees to Direct TV ranged from $29.99/month for40 channels to $65.99/month for over 250 channels. Interestingly, when DirecTV first begannegotiations with TiVo, the satellite provider had already been equipped with a DVR servicethrough its partnership with Microsoft’s Ultimate TV.
DirecTV decided in 2005 to develop its own DVR device in cooperation with the NDSGroup. It soon informed TiVo that it would stop marketing and selling TiVo’s digital recordersto its satellite TV subscribers starting in 2007. This was a serious blow to TiVo. DirecTV’sDVR would cost users a $299 onetime fee, but it included unique features, such as the abilityto jump to a specific scene in the program as well as allowing users to pay for downloadedpay-per-view movies only when they were being viewed. In 2006, TiVo and DirecTV reacheda commercial extension agreement for three years. The agreement allowed existing DirecTVcustomers using the TiVo digital video recorder to continue to receive maintenance and sup-port from DirecTV. As part of the agreement, TiVo and DirecTV agreed that they wouldn’tsue each other over patent rights. Since the agreement with DirecTV was facing an expirationdate in 2009, TiVo has been rushing to differentiate its product and working to make other dis-tribution agreements.
WE COVER the ENTIRE U.S. MARKET
20%Over The Air
Households : 26 MillionChannel : Comcast, RetailersCompetition : Yes
Households : 26 MillionChannel : DirectTV, Retailers
Competition : Yes
Households : 22 MillionChannel : RetailersCompetition : Limited
23%Digital Satellite
33%Basic Cable
24%Digital Cable
Households : 36 MillionChannel : Retailers, Cablevision,Cebridge, NCTC, etc.Competition : Limited
EXHIBIT 6
SOURCE: Natexis Bielchroeder, Inc., July 2005.
14-18 SECTION D Industry Three—Entertainment and Leisure
In July 2000, Comcast, the nation’s leading cable operator, agreed to a trial offering ofTiVo boxes to its subscribers. TiVo’s management hoped that the trial would lead to a big-ger deal in which Comcast would integrate TiVo software into Comcast cable boxes. Unfor-tunately, Comcast balked and was unwilling to agree to this extension of the agreement. InApril 2001, when another trial failed to lead to a larger deal, TiVo laid off approximately25% of its staff. In November 2001, after AT&T Broadband had just agreed to offer TiVoDVRs to its customers, Comcast acquired the cable provider and its 14 million customers,and canceled the agreement. In 2002, cable operators such as Comcast ended up developingtheir own DVR boxes with makers such as Motorola and Scientific-Atlanta. Even thoughthe DVR was similar to that offered by DirecTV, Comcast announced in March 2005 that itwould offer its customers a video recorder service from TiVo and even would allow TiVo todevelop its software for Comcast’s DVR platform. Comcast and TiVo agreed to make TiVo’sDVR service and interactive advertising capability (ad management system) availablethrough Comcast’s cable network and its set-top DVR boxes. This agreement also includedthat the first of their co-developed products would be available in mid- to late-2006 underthe TiVo brand name.
Subscriptions to Comcast’s basic or standard cable cost users $8.63 or $52.55, respec-tively. Adding a DVR feature cost an additional $13.94 with Comcast in addition to theTiVo subscription, which ranged from $12.95 to $16.95 per month depending on the lengthof the plan (from one to three years). Following this agreement with Comcast, TiVo’sshares closed up nearly 75%, or $2.87 per share, to $6.70. Investment analysts were posi-tive about the news, some upgrading TiVo’s investment rating from a sell to a hold. SinceDirecTV had started using a second company, NDS, to provide DVR service, the deal withComcast put to rest some of these concerns by opening up a large new potential audiencefor TiVo’s service. According to a TiVo filing with the SEC, TiVo received an upfront pay-ment from Comcast for creating a new DVR that worked with Comcast’s current service.TiVo also received a recurring monthly fee for each Comcast subscriber who used TiVothrough Comcast.
Offering new technology-driven products, such as a DVR, was easier for satellite broad-casters because changes could be made in a central location. For cable operators, however, newtechnologies and products needed to be deployed gradually as the operators had differentequipment in different areas.
TiVo and BellSouth FastAccess DSL recently agreed on a variety of co-marketingarrangements. With its strong presence and high level of customer satisfaction in the South-eastern United States, BellSouth could provide a DSL Internet pipeline for TiVo to send videocontent directly to the television. To expand program recording to a cellular phone, its latestTiVo Mobile feature, TiVo made an agreement with Verizon. The agreement brought the dig-ital video recording pioneer’s capabilities beyond its set-top-boxes and the television directlyto cell phones for the first time. In terms of content, TiVo also had engaged in new partnershipswith CBS Corp, Reuters Group PLC, Forbes magazine, New York Times Co., and the NationalBasketball Association, among others. This would make news and entertainment programsavailable for downloading onto TiVos. International Creative Management recommendedfilms, television shows, and Internet videos that TiVo users could download onto their boxes.In addition, TiVo’s management decided to offer amateur videos through an agreement withOne True Media Inc., an Internet start-up that operated a Web service designed to help userseasily edit their raw footage into quality home movies.
The TALKA TiVo“. . . Bring ‘em on! We are talking the HD language now . . . Yeah!.”
CASE 14 TiVo Inc. 14-19
TiVo Series 2 DTThe company’s basic DVR was its TiVo Series 2 DT unit. It included dual tuners (DT) so thata viewer could record two programs at the same time (but only one digital signal) or watchone program while recording another. Customers could choose between two versions: the ba-sic 80-hour unit or the 180-hour unit. The selling price for an 80-hour unit with a one-yearservice commitment was $16.95 a month or $179 prepaid plus $99.99 for the box. Themonthly service fee was reduced by $2 for each additional year on the service commitment.The Series 2 DT DVR could record from multiple sources, such as cable, satellite, or antenna.See Exhibit 1 for product specifications.
High Definition TelevisionHigh definition (HD) was the most important new consumer electronic development in tele-vision. HD products radically increased the quality of the viewing and listening experience.High definition sets included HD TV, HD broadcasting, HD DVD, HD Radio, HD Photo, andeven HD Audio.
High definition TV (HD TV) was first introduced in the United States during the 1990s.It was a digital television broadcasting system using a significantly higher resolution than thetraditional formats, such as NTSC, PAL, and SECAM. The technology during the 1990s wasvery expensive. With increasing production levels, prices decreased and HD TV was beingoffered in an increasing number of televisions. As of 2007, HD TVs were being used in 24 millionU.S. households. It was predicted that by 2009, high definition would replace standard defini-tion television. With the price of computer hard drives becoming lower and the increasingavailability of HD TV broadcasting, demand for the HD products was increasing rapidly.Compared to standard definition television, HD TV offered viewers greater screen clarity andsmoother motion with richer, more natural colors, and surround sound.
TiVo Series 3TiVo recently introduced the TiVo Series 3 to allow customers to record high definition tele-vision and digital cable. Since TiVo’s management realized that great quality video needed tobe supported by great quality audio, the company put a lot of effort in the audio developmentand received the certification of being the first digital media recorder to meet the THX perfor-mance standard in HD TV. THX was known to have developed the highest standard of audio—mainly the surround-sound systems in the entertainment as well as the media industry.
The new high definition TiVo Series 3, which was being sold for $799.000, had two tuners,giving it the ability to record two HD programs simultaneously while playing back a third pre-viously recorded program. (This required two CableCARDS for dual-function capabilitythrough cable or antenna, but did not support satellite service.) Its larger storage capacity allowedit to record up to 300 hours of standard definition programming or 32 hours of high-definitionprogramming. It also had two signal inputs and it accepted cable TV and over-the-air signals. De-spite TiVo’s ability to record and playback at high definition quality, a downside was its relativelyhigh price—especially when some cable companies were offering non-HD DVRs free to theirsubscribers. The monthly service fee was, however, the same as that for the Series 2.
TiVo HDThe company was developing a new version of the TiVo box, which would be available forsale in 2007. The TiVo HD had most of the features of the Series 3, but would be sold foronly $300. The new TiVo contained a 160 GB hard drive good for recording 180 hours of
14-20 SECTION D Industry Three—Entertainment and Leisure
HD TiVENemiesThe cable operator, Comcast, did not sell DVRs, but allowed its subscribers to rent DVRboxes for $13.94 per month (in addition to their cable subscription fee). Its HD DVR boxeswere manufactured by Motorola and Scientific Atlanta. Users of these DVRs were able tonavigate their own preferences as they would with TiVo, except that TiVo offered better andmore features built into its boxes.
The satellite operator, DirecTV, allowed subscribers to add an additional DVR subscrip-tion service for $4.99 monthly on top of the chosen monthly subscription service package toDirecTV cable channels (ranging in cost from $29.99 to $65.99 per month). DirecTV offeredits subscribers the opportunity to buy a standard definition DVR for $99.99 and an HD DVRbox for $299 with a $100 rebate.
Looking to the FutureAs CEO Tom Rogers looked at TiVo’s financial statements for the 2006 fiscal year endingJanuary 31, 2007, he pondered TiVo’s future prospects. In some ways, the future looked verypromising. Approximately 16 million households had DVRs and this number was expectedto increase to 56 million by 2010 according to The Carmel Group. Given its user-friendlysoftware interface and celebrity endorsements, TiVo should be able to obtain a large piece ofthat growth. Although there were many versions of the generic DVR, the TiVo DVR had per-ceived sex appeal. TiVo had been successful in creating a unique set of technologies, prod-ucts, and services that were meeting the needs of consumers, television distributors, and theadvertising community. TiVo’s advantages were clear:
� Compelling, easy-to-use consumer DVR offerings
� Differentiated features
� Integrated broadband and broadcast capabilities (download movies, etc.)
� Portable technology platform
� Advanced advertising and promotion solutions
The company’s current strategy included a number of key elements:
� Offer an increasingly differentiated service
� Diversify our sources of revenue to include more advertising
� Integrate TiVo technology with third-party DVR platforms to provide TiVo service
� Extend and protect TiVo’s intellectual property
� Promote and leverage the TiVo brand through multiple advertising and marketing channels
� Extend the TiVo product beyond the U.S. market into countries such as China and Mexico
There were also a number of challenges to consider. During the past fiscal year, the com-pany experienced growth in its TiVo-owned subscription base and subscription revenues.
standard-definition programming or 20 hours of high-definition programming. Both Series 3and HD models used the same architecture and had dual tuners, two slots for CableCARDS,and the same ports. (Like the Series 3 DVR, the TiVo HD required two CableCARDS fordual-function capability through antenna or cable, but did not support satellite service.) TheTiVo HD did come with a cheaper remote control and, contrasted with the Series 3 remote,was not backlit or capable of controlling other components. The monthly service fee was thesame as that for the Series 2 or 3 DVRs.
CASE 14 TiVo Inc. 14-21
However, this subscription growth was largely offset by the loss of a portion of TiVo’s Di-recTV installed subscription base. Even though management decided to invest in subscriptionacquisition activities in an effort to expand TiVo’s subscription base and promote the TiVobrand for future partnerships, TiVo-owned subscription gross additions for the fiscal year 2007were 429,000—down 13% from fiscal year 2006. Although it was not unusual for entrepre-neurial ventures to generate losses for their first few years of operation, TiVo had not earned aprofit in the 10 years since it had been founded or in the eight years since it went public. It hadn’thad a profitable quarter in the past two years!
As with any publicly held U.S. company, TiVo had to list risk factors that might affect itsfuture performance. Compared to the list of risks found in the SEC Form 10-K Report of mostpublicly held companies, TiVo’s list of risks was extremely long—over 17 pages! Some ofthese risk factors were:
� We face intense competition from a number of sources, which may impair our revenues, in-crease our subscription acquisition cost, and hinder our ability to generate new subscriptions.
� We depend upon a limited number of third parties to manufacture, distribute, and supplycritical components, assemblies, and services for the DVRs that enable the TiVo service. Wemay not be able to operate our business if these parties do not perform their obligations.
� DVRs could be the subject of future regulations relating to copyright law or evolving in-dustry standards and practices that could adversely impact our business.
� A significant part of our installed subscription base results from our relationship withDirecTV which we expect to decrease in the future due to DirecTV’s support of a com-peting DVR by NDS.
� We face a number of challenges in the sale and marketing of the TiVo service and productsthat enable that service. Even when consumers are aware of the benefits of our products,they may not be willing to pay for them, especially when competitors under price us.
� If we are unable to create or maintain multiple revenue streams, such as licensing, adver-tising, audience research measurement, revenues from programmers, and electroniccommerce, we may not be able to recover our expenses and this could cause our revenuesto suffer.
� The product lifetime subscriptions we offered in the past obligate the company for an in-definite period and may not be large enough to cover future increases in costs.
� If there is increased use of switched technologies to transmit television programs by ca-ble operators (also known as switched digital) in the future, the desirability and competi-tiveness of our current products could be reduced.
� We need to safeguard the security and privacy of our subscribers’ confidential data, andany inability to do so may harm our reputation and brand and expose us to legal action.
� Product defects, system failures or interruptions to the TiVo service may have a negativeimpact on our revenues, damage our reputation and decrease our ability to attract newcustomers.
� We have limited experience in providing service and operations internationally that aresubject to different laws, regulations, and requirements than those in the U.S. and our in-ability to comply with such could harm our reputation, brand, and have a negative impacton revenues.
� If we are unable to raise additional capital through the issuance of equity, debt, or otherfinancing activities on acceptable terms, our ability to effectively manage growth andbuild a strong brand could be harmed.
� We expect continued volatility in our stock price.
14-22 SECTION D Industry Three—Entertainment and Leisure
The full list of TiVo’s risks was daunting, but nothing terribly unusual for a fast-growingentrepreneurial venture. The big issue facing top management was how to make the companyprofitable without slowing its growth. Investors have a limited amount of patience. A no-dividend policy made sense for a fast-growing entrepreneurial company, but a low, volatilestock price was not going to be acceptable for long. How long can the company continue tosell TiVo DVRs when the competition was selling DVRs at a lower price or even offering themfor free? What should Rogers do?
R E F E R E N C E Shttp://www.TiVo.com/http://en.wikipedia.org/wiki/TiVohttp://en.wikipedia.org/wiki/High-definition_televisionhttp://egotron.com/ptv/ptvintro.htmhttp://news.com.com/TiVo,�Comcast�reach�DVR�deal/
2100-1041_3-5616961.htmlhttp://news.com.com/TiVo�and�DirecTV�extend�contract/
2100-1038_3-6060475.htmlhttp://www.technologyreview.comhttp://www.fastcompany.com/magazine/61/TiVo.htmlhttp://iinnovate.blogspot.com/2006/09/mike-ramsay-co-
founder-of-TiVo.htmlhttp://www.acmqueue.org/modules.php?name�Content&pa
�showpage&pid�53&page�7
http://www.internetnews.com/stats/article.php/3655331http://thomashawk.com/2006/04/TiVo-history-101-how-
TiVo-built-pvr_24.htmlhttp://www.tvpredictions.com/TiVohd030807.htmhttp://www.TiVocommunity.com/TiVo-
vb/showthread.php?threadid�1514432006 Form 10-K, TiVo, Inc. (filed 4/16/2007)2006 Form 14A, TiVo, Inc. (filed 5/31/2006)“Jeffrey Hinson Elected to TiVo Board of Directors,” press re-
lease, TiVo, Inc. (January 26, 2007).Stafford, A., “Bargain TiVo Records HD Video Without a Ca-
ble Box,” PC World (October, 2007), p. 62.
Introduction
POW! BAM! ZAP! IN 2008, MARVEL MAN’S ENTIRE UNIVERSE SHIFTED. After 70 years of fe-rocious struggle, Marvel Man’s domination of the printed page was strong, with occa-sional swipes by his long-time nemesis DC Man and some puny domestic and foreign
rivals. With no longer the need to fight on every frontier to protect his formidable assets frombeing exploited, Marvel Man was able to share his super strengths through lucrative licensingagreements with other trusted big-name heroes who understood the ins and outs of their owncompetitive worlds. Marvel Man was growing up and leaving toys behind. The new skirmisheswould be fought online and on the big screen. What surprises await Marvel Man in these newmedia worlds? Which Hollywood villains might strike first—the writers or the actors? Howcan Marvel Man stay fresh and relevant in these changing times? What superhuman strengthwill be needed to triumph over sinister intellectual property thieves? What nefarious plotwould the unpredictable Wall Street Woman concoct and would it involve battling a bear or abull? Keep alert, loyal followers, and welcome to a brand new day!
15-1
C A S E 15Marvel Entertainment Inc.:IRON MAN TO THE RESCUEEllie A. Fogarty and Joyce P. Vincelette
This case was prepared by Ellie A. Fogarty, Ed.D., and Professor Joyce P. Vincelette of the College of New Jersey.Copyright © 2008 by Ellie A. Fogarty and Joyce P. Vincelette. This case cannot be reproduced in any form withoutthe written permission of the copyright holders, Ellie A. Fogarty and Joyce P. Vincelette. Reprint permission is solelygranted to the publisher, Prentice Hall, for the book, Strategic Management and Business Policy—13th Edition (andthe International and electronic versions of this book) by the copyright holder, Ellie A. Fogarty and Joyce P. Vincelette.This case was edited for SMBP 13th Edition. The copyright holders, are solely responsible for case content. Any otherpublication of the case (translation, any form of electronic or other media) or sale (any form of partnership) to anotherpublisher will be in violation of copyright law, unless Ellie A. Fogarty and Joyce P. Vincelette have granted additionalwritten reprint permission. Reprinted by permission.
HistoryToday’s Marvel Entertainment Inc. traces its long, complicated history back to a small comicbook company, Timely Comics, which was owned by Martin Goodman in the 1930s. A NewYork publisher of pulp magazines, Goodman’s selections featured stories about detectives,
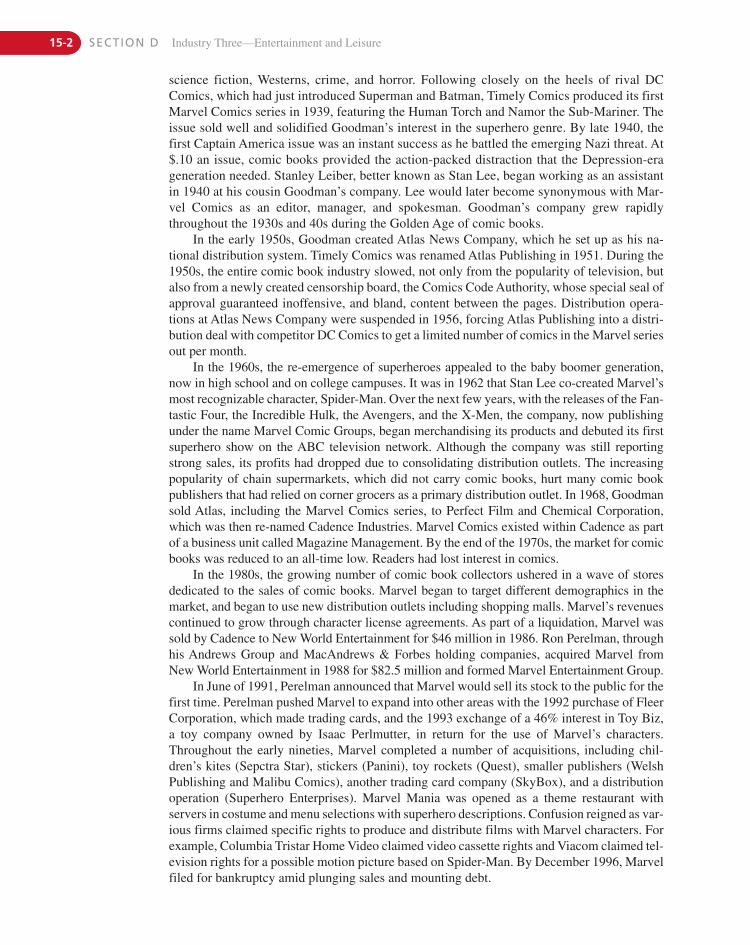
15-2 SECTION D Industry Three—Entertainment and Leisure
science fiction, Westerns, crime, and horror. Following closely on the heels of rival DCComics, which had just introduced Superman and Batman, Timely Comics produced its firstMarvel Comics series in 1939, featuring the Human Torch and Namor the Sub-Mariner. Theissue sold well and solidified Goodman’s interest in the superhero genre. By late 1940, thefirst Captain America issue was an instant success as he battled the emerging Nazi threat. At$.10 an issue, comic books provided the action-packed distraction that the Depression-erageneration needed. Stanley Leiber, better known as Stan Lee, began working as an assistantin 1940 at his cousin Goodman’s company. Lee would later become synonymous with Mar-vel Comics as an editor, manager, and spokesman. Goodman’s company grew rapidlythroughout the 1930s and 40s during the Golden Age of comic books.
In the early 1950s, Goodman created Atlas News Company, which he set up as his na-tional distribution system. Timely Comics was renamed Atlas Publishing in 1951. During the1950s, the entire comic book industry slowed, not only from the popularity of television, butalso from a newly created censorship board, the Comics Code Authority, whose special seal ofapproval guaranteed inoffensive, and bland, content between the pages. Distribution opera-tions at Atlas News Company were suspended in 1956, forcing Atlas Publishing into a distri-bution deal with competitor DC Comics to get a limited number of comics in the Marvel seriesout per month.
In the 1960s, the re-emergence of superheroes appealed to the baby boomer generation,now in high school and on college campuses. It was in 1962 that Stan Lee co-created Marvel’smost recognizable character, Spider-Man. Over the next few years, with the releases of the Fan-tastic Four, the Incredible Hulk, the Avengers, and the X-Men, the company, now publishingunder the name Marvel Comic Groups, began merchandising its products and debuted its firstsuperhero show on the ABC television network. Although the company was still reportingstrong sales, its profits had dropped due to consolidating distribution outlets. The increasingpopularity of chain supermarkets, which did not carry comic books, hurt many comic bookpublishers that had relied on corner grocers as a primary distribution outlet. In 1968, Goodmansold Atlas, including the Marvel Comics series, to Perfect Film and Chemical Corporation,which was then re-named Cadence Industries. Marvel Comics existed within Cadence as partof a business unit called Magazine Management. By the end of the 1970s, the market for comicbooks was reduced to an all-time low. Readers had lost interest in comics.
In the 1980s, the growing number of comic book collectors ushered in a wave of storesdedicated to the sales of comic books. Marvel began to target different demographics in themarket, and began to use new distribution outlets including shopping malls. Marvel’s revenuescontinued to grow through character license agreements. As part of a liquidation, Marvel wassold by Cadence to New World Entertainment for $46 million in 1986. Ron Perelman, throughhis Andrews Group and MacAndrews & Forbes holding companies, acquired Marvel fromNew World Entertainment in 1988 for $82.5 million and formed Marvel Entertainment Group.
In June of 1991, Perelman announced that Marvel would sell its stock to the public for thefirst time. Perelman pushed Marvel to expand into other areas with the 1992 purchase of FleerCorporation, which made trading cards, and the 1993 exchange of a 46% interest in Toy Biz,a toy company owned by Isaac Perlmutter, in return for the use of Marvel’s characters.Throughout the early nineties, Marvel completed a number of acquisitions, including chil-dren’s kites (Sepctra Star), stickers (Panini), toy rockets (Quest), smaller publishers (WelshPublishing and Malibu Comics), another trading card company (SkyBox), and a distributionoperation (Superhero Enterprises). Marvel Mania was opened as a theme restaurant withservers in costume and menu selections with superhero descriptions. Confusion reigned as var-ious firms claimed specific rights to produce and distribute films with Marvel characters. Forexample, Columbia Tristar Home Video claimed video cassette rights and Viacom claimed tel-evision rights for a possible motion picture based on Spider-Man. By December 1996, Marvelfiled for bankruptcy amid plunging sales and mounting debt.
CASE 15 Marvel Entertainment Inc. 15-3
In 1997, Perelman was accused of helping to divert over $553 million from Marvel to hisother companies before the bankruptcy. The suit was finally settled when Perelman agreed topay former shareholders $80 million in 2008.1 Perelman was ousted by the board, and Carl Icahn, a major bondholder, won control of the company for about a year until the courts ap-pointed a Chapter 11 trustee at the end of 1997. After Icahn’s failed attempts at a plan of reor-ganization, the company merged and became a wholly-owned subsidiary of Toy Biz in 1998.Toy Biz became known as Marvel Enterprises Inc. and changed the trading symbol for ToyBiz stock on the New York Stock Exchange to MVL. Additional legal issues were resolvedwith movie studios and Marvel entered into a joint venture with Sony Pictures to develop theSpider-Man movie franchise. Also during the late nineties, the company streamlined publish-ing efforts, diversified with licensing agreements that would help restore Marvel’s image, andexpanded into foreign markets hungry for Marvel superheroes. To signal its move into the en-tertainment industry, Marvel Enterprises changed its name to Marvel Entertainment Inc. inSeptember 2005. After signing a master toy licensing agreement with Hasbro in 2006, Marvelbegan its exit from its toy manufacturing and distributing businesses. Marvel made some of itscomic book archives available online through its Digital Comics division in 2007. By the endof the decade, Marvel was well on its way to becoming a leader in the entertainment industry,with two self-produced feature films in 2008 (Iron Man and the Incredible Hulk) and the fund-ing and creative ideas for many more.
Marvel Entertainment Inc.’s history bears a striking resemblance to one of its down-trodden superheroes that battles rivals and fights injustices. As it transitioned from a tradi-tional publisher and toy maker into a new media and entertainment company, would Marvelemerge triumphant over the forces of intense competition and flagrant disregard for the prin-ciples of intellectual property?
Corporate Governance
Board of DirectorsExhibit 1 lists the company’s board of directors and the compensation received by each in2007. The 8 directors were:2
Isaac Perlmutter, 65, had been Marvel’s Chief Executive Officer since January 1, 2005,and was employed by Marvel as vice chairman of the board of directors since November 2001.Mr. Perlmutter was a director since April 1993 and served as chairman of the board of direc-tors until March 1995. Perlmutter held over 37% of the company’s common stock outstanding
EXHIBIT 1Board of Directors: Marvel Entertainment Inc.
SOURCE: Marvel Entertainment, Inc. Proxy Statement (May 5, 2008), pp. 4–5, 7.
Name Age Title Compensation
Handel, Morton E. 72 Chairman of the Board $868,160Perlmutter, Isaac 65 Vice Chairman of the Board, Chief Executive Officer $3,872,797Breyer, James W. 46 Director $273,210Charney, Laurence N. 60 Director $192,180Cuneo, F. Peter 63 Vice Chairman of the Board (Non-Executive) $387,984Ganis, Sid 68 Director $435,710Halpin, James F. 57 Director $298,210Solar, Richard L. 68 Director $312,984
15-4 SECTION D Industry Three—Entertainment and Leisure
as of March 2008.3 Under the terms of a share disposition agreement in February 2008,Perlmutter agreed not to sell any of his Marvel stock until the company’s share repurchase pro-gram ended in March 2010.4
F. Peter Cuneo, 63, was Marvel’s president and chief executive officer from July 1999through December 2002 and served as the part-time special advisor to Marvel’s chief execu-tive officer from January 2003 through December 2004. Mr. Cuneo had been a Marvel direc-tor since July 1999, and since June 2003 he served as a non-executive vice chairman of theboard of directors. Mr. Cuneo was a senior advisor to Plainfield Asset Management LLC, ahedge fund based in Greenwich, CT, that specialized in special and distressed situations. Mr.Cuneo was a director of Iconix Brands Inc.
Sid Ganis, 68, had been a Marvel director since October 1999. Mr. Ganis was the presi-dent of the Academy of Motion Picture Arts and Sciences, the organization that awards the Os-cars. Mr. Ganis had been president of Out of the Blue . . . Entertainment, a company that hefounded, since September 1996. Out of the Blue . . . Entertainment was a provider of motion pic-tures, television and musical entertainment for Sony Pictures Entertainment and others. FromJanuary 1991 until September 1996, Mr. Ganis held various executive positions with Sony Pic-tures Entertainment, including vice chairman of Columbia Pictures and president of World-wide Marketing for Columbia/TriStar Motion Picture Companies.
James F. Halpin, 57, had been a Marvel director since March 1995. Mr. Halpin retired inMarch 2000 as president and chief executive officer and a director of CompUSA Inc., a retailerof computer hardware, software, accessories and related products, with which he had been em-ployed since May 1993. Mr. Halpin was a director of Life Time Fitness Inc.
James W. Breyer, 46, had been a Marvel director since June 2006. Mr. Breyer had servedas a partner of the Silicon Valley-based venture capital firm, Accel Partners, since 1995. Mr.Breyer was a director of Wal-Mart Stores Inc. and RealNetworks Inc. Mr. Breyer also servedon the boards of various privately held companies. Mr. Breyer was a member of the board ofdean’s advisors to Harvard Business School and was chairman of the Stanford EngineeringVenture Fund.
Laurence N. Charney, 60, had been a Marvel director since July 10, 2007. Mr. Charneyretired from his position as a partner of Ernst & Young LLP in 2007, having served that firmfor over thirty-five years. At Ernst & Young, Mr. Charney most recently served as the Ameri-cas director of conflict management. In that role he had oversight and responsibility in ensur-ing compliance with global and local conflict of interest policies for client and engagementacceptance across all service lines. Mr. Charney previously served as an audit partner and wasMarvel’s audit partner for its 1999 through 2003 audits.
Morton E. Handel, 72, had been the chairman of the board of directors of Marvel sinceOctober 1998 and was first appointed as a director in June 1997. Mr. Handel was a director ofTrump Entertainment Resorts Inc. and served from 2000 until February 2006 as a director ofLinens ’N Things Inc. Mr. Handel was also a regent of the University of Hartford and wasactive on the boards of several not-for-profit organizations in the Hartford, CT, area.
Richard L. Solar, 68, had been a Marvel director since December 2002. Since Febru-ary 2003, Mr. Solar had been a management consultant and investor. From June 2002 toFebruary 2003, Mr. Solar acted as a consultant for Gerber Childrenswear Inc., a marketerof popular-priced licensed apparel sold under the Gerber name, as well as under licensesfrom Baby Looney Tunes, Wilson, Converse and Coca-Cola. From 1996 to June 2002(when Gerber Childrenswear was acquired by the Kellwood Company), Mr. Solar was sen-ior vice president, director and chief financial officer of Gerber Childrenswear. Mr. Solarwas also vice president and treasurer of Barrington Stage Company Inc., which producedplays, developed experimental musicals and provided a program for at-risk high school stu-dents in the Berkshires.
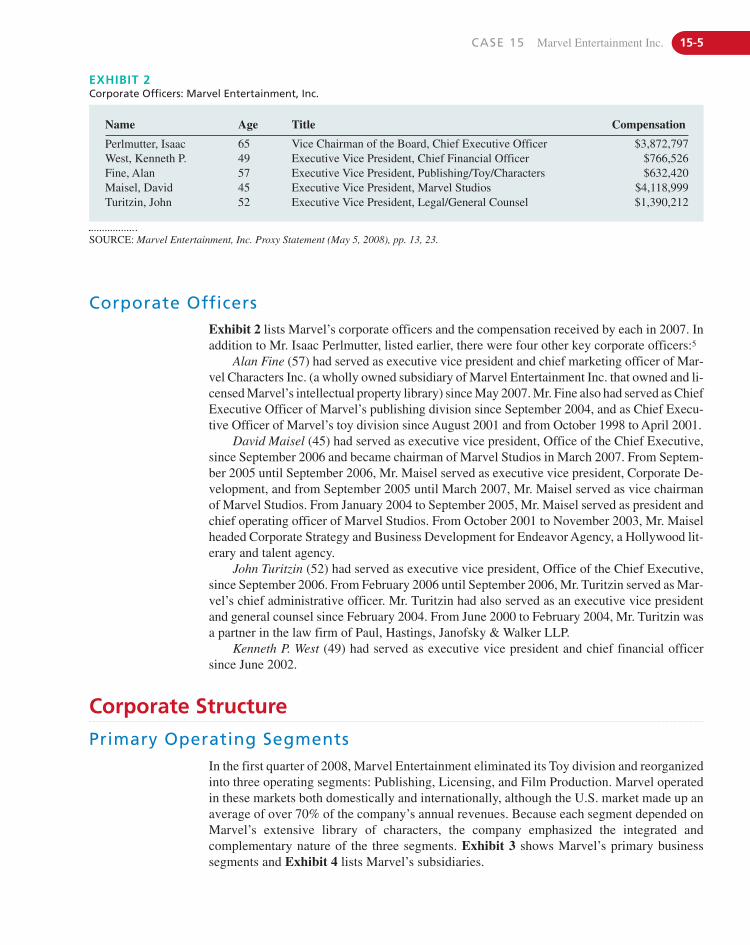
CASE 15 Marvel Entertainment Inc. 15-5
Corporate OfficersExhibit 2 lists Marvel’s corporate officers and the compensation received by each in 2007. Inaddition to Mr. Isaac Perlmutter, listed earlier, there were four other key corporate officers:5
Alan Fine (57) had served as executive vice president and chief marketing officer of Mar-vel Characters Inc. (a wholly owned subsidiary of Marvel Entertainment Inc. that owned and li-censed Marvel’s intellectual property library) since May 2007. Mr. Fine also had served as ChiefExecutive Officer of Marvel’s publishing division since September 2004, and as Chief Execu-tive Officer of Marvel’s toy division since August 2001 and from October 1998 to April 2001.
David Maisel (45) had served as executive vice president, Office of the Chief Executive,since September 2006 and became chairman of Marvel Studios in March 2007. From Septem-ber 2005 until September 2006, Mr. Maisel served as executive vice president, Corporate De-velopment, and from September 2005 until March 2007, Mr. Maisel served as vice chairmanof Marvel Studios. From January 2004 to September 2005, Mr. Maisel served as president andchief operating officer of Marvel Studios. From October 2001 to November 2003, Mr. Maiselheaded Corporate Strategy and Business Development for Endeavor Agency, a Hollywood lit-erary and talent agency.
John Turitzin (52) had served as executive vice president, Office of the Chief Executive,since September 2006. From February 2006 until September 2006, Mr. Turitzin served as Mar-vel’s chief administrative officer. Mr. Turitzin had also served as an executive vice presidentand general counsel since February 2004. From June 2000 to February 2004, Mr. Turitzin wasa partner in the law firm of Paul, Hastings, Janofsky & Walker LLP.
Kenneth P. West (49) had served as executive vice president and chief financial officersince June 2002.
EXHIBIT 2Corporate Officers: Marvel Entertainment, Inc.
SOURCE: Marvel Entertainment, Inc. Proxy Statement (May 5, 2008), pp. 13, 23.
Name Age Title Compensation
Perlmutter, Isaac 65 Vice Chairman of the Board, Chief Executive Officer $3,872,797West, Kenneth P. 49 Executive Vice President, Chief Financial Officer $766,526Fine, Alan 57 Executive Vice President, Publishing/Toy/Characters $632,420Maisel, David 45 Executive Vice President, Marvel Studios $4,118,999Turitzin, John 52 Executive Vice President, Legal/General Counsel $1,390,212
Primary Operating SegmentsIn the first quarter of 2008, Marvel Entertainment eliminated its Toy division and reorganizedinto three operating segments: Publishing, Licensing, and Film Production. Marvel operatedin these markets both domestically and internationally, although the U.S. market made up anaverage of over 70% of the company’s annual revenues. Because each segment depended onMarvel’s extensive library of characters, the company emphasized the integrated andcomplementary nature of the three segments. Exhibit 3 shows Marvel’s primary businesssegments and Exhibit 4 lists Marvel’s subsidiaries.
Corporate Structure
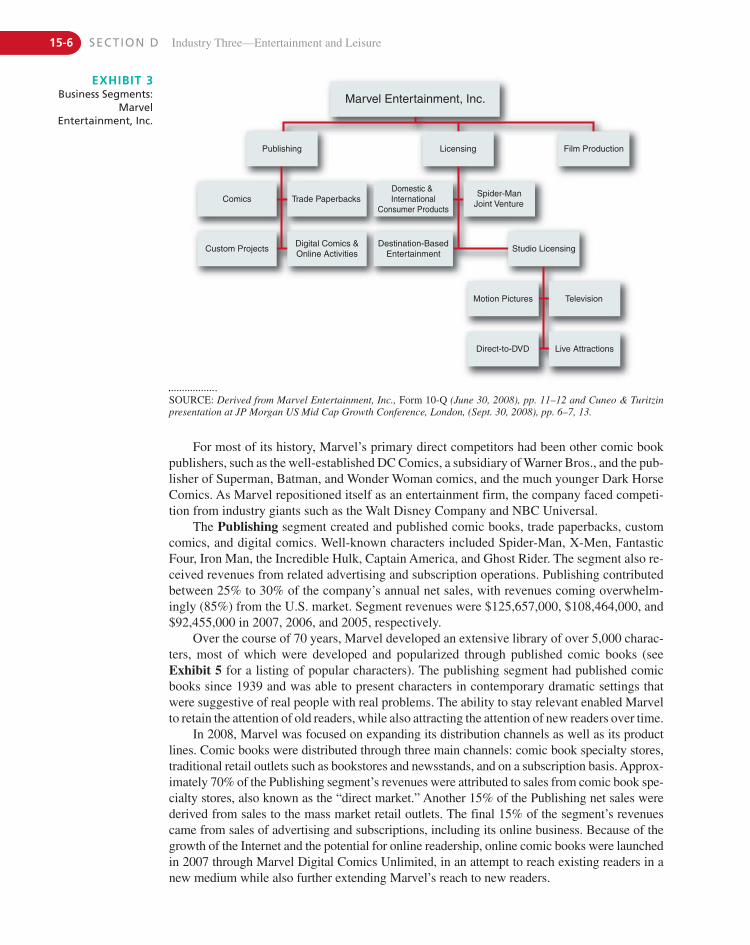
15-6 SECTION D Industry Three—Entertainment and Leisure
Motion Pictures Television
Marvel Entertainment, Inc.
Publishing
Comics Trade Paperbacks
Custom ProjectsDigital Comics &Online Activities
Destination-BasedEntertainment
Domestic & International
Consumer Products
Spider-ManJoint Venture
Direct-to-DVD Live Attractions
Studio Licensing
Licensing Film Production
EXHIBIT 3Business Segments:
MarvelEntertainment, Inc.
SOURCE: Derived from Marvel Entertainment, Inc., Form 10-Q (June 30, 2008), pp. 11–12 and Cuneo & Turitzinpresentation at JP Morgan US Mid Cap Growth Conference, London, (Sept. 30, 2008), pp. 6–7, 13.
For most of its history, Marvel’s primary direct competitors had been other comic bookpublishers, such as the well-established DC Comics, a subsidiary of Warner Bros., and the pub-lisher of Superman, Batman, and Wonder Woman comics, and the much younger Dark HorseComics. As Marvel repositioned itself as an entertainment firm, the company faced competi-tion from industry giants such as the Walt Disney Company and NBC Universal.
The Publishing segment created and published comic books, trade paperbacks, customcomics, and digital comics. Well-known characters included Spider-Man, X-Men, FantasticFour, Iron Man, the Incredible Hulk, Captain America, and Ghost Rider. The segment also re-ceived revenues from related advertising and subscription operations. Publishing contributedbetween 25% to 30% of the company’s annual net sales, with revenues coming overwhelm-ingly (85%) from the U.S. market. Segment revenues were $125,657,000, $108,464,000, and$92,455,000 in 2007, 2006, and 2005, respectively.
Over the course of 70 years, Marvel developed an extensive library of over 5,000 charac-ters, most of which were developed and popularized through published comic books (seeExhibit 5 for a listing of popular characters). The publishing segment had published comicbooks since 1939 and was able to present characters in contemporary dramatic settings thatwere suggestive of real people with real problems. The ability to stay relevant enabled Marvelto retain the attention of old readers, while also attracting the attention of new readers over time.
In 2008, Marvel was focused on expanding its distribution channels as well as its productlines. Comic books were distributed through three main channels: comic book specialty stores,traditional retail outlets such as bookstores and newsstands, and on a subscription basis. Approx-imately 70% of the Publishing segment’s revenues were attributed to sales from comic book spe-cialty stores, also known as the “direct market.” Another 15% of the Publishing net sales werederived from sales to the mass market retail outlets. The final 15% of the segment’s revenuescame from sales of advertising and subscriptions, including its online business. Because of thegrowth of the Internet and the potential for online readership, online comic books were launchedin 2007 through Marvel Digital Comics Unlimited, in an attempt to reach existing readers in anew medium while also further extending Marvel’s reach to new readers.
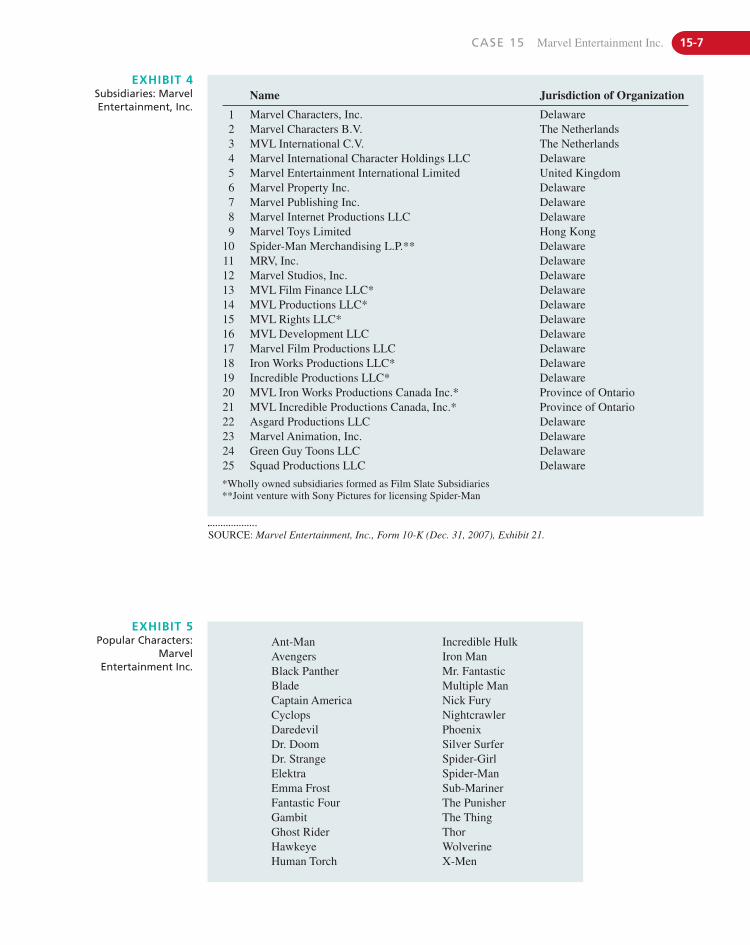
CASE 15 Marvel Entertainment Inc. 15-7
EXHIBIT 4Subsidiaries: MarvelEntertainment, Inc.
SOURCE: Marvel Entertainment, Inc., Form 10-K (Dec. 31, 2007), Exhibit 21.
Name Jurisdiction of Organization
1 Marvel Characters, Inc. Delaware2 Marvel Characters B.V. The Netherlands3 MVL International C.V. The Netherlands4 Marvel International Character Holdings LLC Delaware5 Marvel Entertainment International Limited United Kingdom6 Marvel Property Inc. Delaware7 Marvel Publishing Inc. Delaware8 Marvel Internet Productions LLC Delaware9 Marvel Toys Limited Hong Kong
10 Spider-Man Merchandising L.P.** Delaware11 MRV, Inc. Delaware12 Marvel Studios, Inc. Delaware13 MVL Film Finance LLC* Delaware14 MVL Productions LLC* Delaware15 MVL Rights LLC* Delaware16 MVL Development LLC Delaware17 Marvel Film Productions LLC Delaware18 Iron Works Productions LLC* Delaware19 Incredible Productions LLC* Delaware20 MVL Iron Works Productions Canada Inc.* Province of Ontario21 MVL Incredible Productions Canada, Inc.* Province of Ontario22 Asgard Productions LLC Delaware23 Marvel Animation, Inc. Delaware24 Green Guy Toons LLC Delaware25 Squad Productions LLC Delaware
*Wholly owned subsidiaries formed as Film Slate Subsidiaries**Joint venture with Sony Pictures for licensing Spider-Man
EXHIBIT 5Popular Characters:
MarvelEntertainment Inc.
Ant-ManAvengersBlack PantherBladeCaptain AmericaCyclopsDaredevilDr. DoomDr. StrangeElektraEmma FrostFantastic FourGambitGhost RiderHawkeyeHuman Torch
Incredible HulkIron ManMr. FantasticMultiple ManNick FuryNightcrawlerPhoenixSilver SurferSpider-GirlSpider-ManSub-MarinerThe PunisherThe ThingThorWolverineX-Men
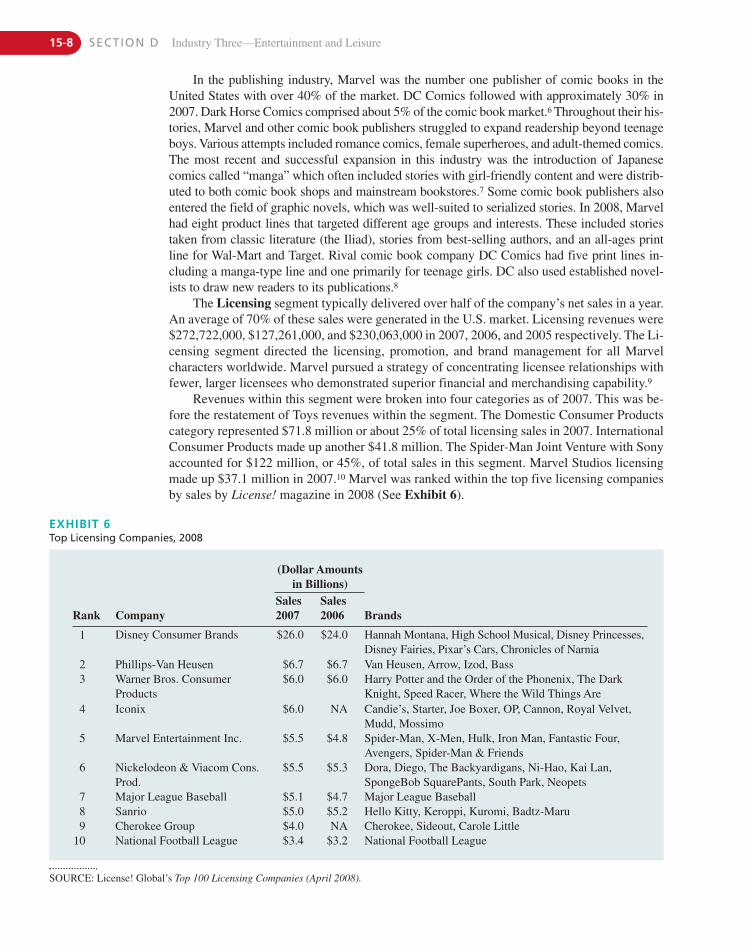
15-8 SECTION D Industry Three—Entertainment and Leisure
In the publishing industry, Marvel was the number one publisher of comic books in theUnited States with over 40% of the market. DC Comics followed with approximately 30% in2007. Dark Horse Comics comprised about 5% of the comic book market.6 Throughout their his-tories, Marvel and other comic book publishers struggled to expand readership beyond teenageboys. Various attempts included romance comics, female superheroes, and adult-themed comics.The most recent and successful expansion in this industry was the introduction of Japanesecomics called “manga” which often included stories with girl-friendly content and were distrib-uted to both comic book shops and mainstream bookstores.7 Some comic book publishers alsoentered the field of graphic novels, which was well-suited to serialized stories. In 2008, Marvelhad eight product lines that targeted different age groups and interests. These included storiestaken from classic literature (the Iliad), stories from best-selling authors, and an all-ages printline for Wal-Mart and Target. Rival comic book company DC Comics had five print lines in-cluding a manga-type line and one primarily for teenage girls. DC also used established novel-ists to draw new readers to its publications.8
The Licensing segment typically delivered over half of the company’s net sales in a year.An average of 70% of these sales were generated in the U.S. market. Licensing revenues were$272,722,000, $127,261,000, and $230,063,000 in 2007, 2006, and 2005 respectively. The Li-censing segment directed the licensing, promotion, and brand management for all Marvelcharacters worldwide. Marvel pursued a strategy of concentrating licensee relationships withfewer, larger licensees who demonstrated superior financial and merchandising capability.9
Revenues within this segment were broken into four categories as of 2007. This was be-fore the restatement of Toys revenues within the segment. The Domestic Consumer Productscategory represented $71.8 million or about 25% of total licensing sales in 2007. InternationalConsumer Products made up another $41.8 million. The Spider-Man Joint Venture with Sonyaccounted for $122 million, or 45%, of total sales in this segment. Marvel Studios licensingmade up $37.1 million in 2007.10 Marvel was ranked within the top five licensing companiesby sales by License! magazine in 2008 (See Exhibit 6).
EXHIBIT 6Top Licensing Companies, 2008
SOURCE: License! Global’s Top 100 Licensing Companies (April 2008).
(Dollar Amountsin Billions)
Rank CompanySales2007
Sales2006 Brands
1 Disney Consumer Brands $26.0 $24.0 Hannah Montana, High School Musical, Disney Princesses,Disney Fairies, Pixar’s Cars, Chronicles of Narnia
2 Phillips-Van Heusen $6.7 $6.7 Van Heusen, Arrow, Izod, Bass3 Warner Bros. Consumer
Products$6.0 $6.0 Harry Potter and the Order of the Phonenix, The Dark
Knight, Speed Racer, Where the Wild Things Are4 Iconix $6.0 NA Candie’s, Starter, Joe Boxer, OP, Cannon, Royal Velvet,
Mudd, Mossimo5 Marvel Entertainment Inc. $5.5 $4.8 Spider-Man, X-Men, Hulk, Iron Man, Fantastic Four,
Avengers, Spider-Man & Friends6 Nickelodeon & Viacom Cons.
Prod.$5.5 $5.3 Dora, Diego, The Backyardigans, Ni-Hao, Kai Lan,
SpongeBob SquarePants, South Park, Neopets7 Major League Baseball $5.1 $4.7 Major League Baseball8 Sanrio $5.0 $5.2 Hello Kitty, Keroppi, Kuromi, Badtz-Maru9 Cherokee Group $4.0 NA Cherokee, Sideout, Carole Little
10 National Football League $3.4 $3.2 National Football League
CASE 15 Marvel Entertainment Inc. 15-9
Marvel shifted its toy business to Hasbro during the first quarter of 2008. According to thecompany:
We also completed a change in the focus of the support that we provide to Hasbro, which resultedin changes to our internal organizational structure and staff reductions. These events altered ourinternal reporting of segment performance, with the result that we are now including revenuesearned from Hasbro (associated with toys manufactured and sold by Hasbro) and related ex-penses (associated with royalties that we owe on our Hasbro revenue) within our Licensing seg-ment. Those revenues and expenses were formerly included in our Toy segment.11
Seeking a strategic partnership with a recognized industry giant, Marvel entered a 5-yearmaster toy license with Hasbro for the period January 1, 2007, to December 31, 2011. Theagreement gave Hasbro the exclusive right to make action figures, plush toys, and certain role-play toys, and non-exclusive rights for several other types of toys, using Marvel’s characters.The Hasbro agreement was reached after the early termination of a prior 5 1/2-year agreementwith Toy Biz Worldwide Limited (TBW) in December 2005, for which Marvel took a $12.5million non-recurring expense. The agreement with TBW, a Hong Kong toy maker totally un-related to the Toy Biz company previously owned by Perlmutter, began in 2001 and gave TBWthe right to use Marvel characters, except for Spider-Man, in producing and selling action fig-ures and accessories. During the interim year (2006), Marvel produced and sold its own toys,with TBW serving as a sourcing agent to help Marvel locate factories in China.
Marvel faced intense competition in the toy industry and relied on the expertise of Hasbro toreach two main target markets: boys, primarily ages four through 13, and collectors aged 18–44.For 2007, the last time that the company would report revenues in the Toy segment, U.S. toy saleswere responsible for about 60% of Marvel’s Toy segment sales. Beginning in 2008, domestic andinternational licensing revenues from toy sales were reflected in the licensing segment.
With such an extensive catalog of characters, Marvel partnered with numerous companiessuch as Activision and Sega for video games, Leapfrog for electronics, Hallmark for party sup-plies, General Mills and 7-11 for food and beverages, and Johnson & Johnson for health &beauty products. Footwear deals included an exclusive collection of children’s sneakers forReebok featuring Iron Man and the Incredible Hulk and sold only at Foot Locker and KidsFoot Locker, as well as another deal with Crocs Inc. Fruit of the Loom held the licensing agree-ment for children’s underwear printed with Marvel characters. As part of the licensing agree-ments, Marvel received a flat fee for access to any proprietary character in addition to per unitfees for every Marvel licensed item sold.
In 2007, Marvel began to enhance the product development and merchandising of its con-sumer product categories. In addition to its mass market mainstays, Wal-Mart and Target, Mar-vel was moving into new distribution channels such as Pottery Barn Kids with Spider-Manroom furnishings and accessories designed exclusively for the retailer and its more upscaleconsumers. Additional deals were in place with Nordstrom, Fred Segal, and H&M.12
Although Marvel created its own film production business unit, there were a number ofoutstanding licensing agreements with 20th Century Fox to produce major motion picturesfeaturing X-Men and the Fantastic Four. Under this agreement Marvel retained more than 50%of merchandising-based royalty revenue. Marvel also partnered with Lionsgate EntertainmentCorp. for animated DVDs for the home video market and with FX, a cable network from FOX,to distribute Marvel’s self-produced movies on cable.13
Marvel licensed its characters for use at Universal Studios theme parks in Orlando,Florida, and Osaka, Japan. In 2008, characters had been licensed for the development of a ma-jor theme park in Dubai, two theme parks in South Korea, and a Broadway musical of Spider-Man with director Julie Taymor (The Lion King) and music by U2’s Bono and The Edge.Characters were licensed by other companies for short-term promotions of products and ser-vices, and were used in foreign-language comic books, paperbacks, and coloring books.
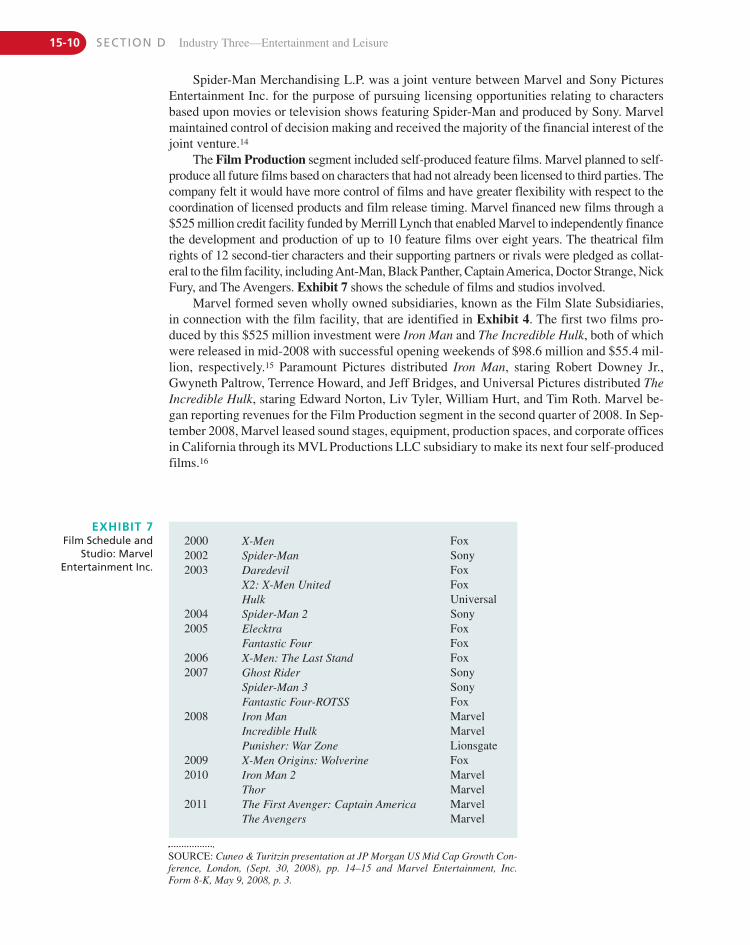
15-10 SECTION D Industry Three—Entertainment and Leisure
Spider-Man Merchandising L.P. was a joint venture between Marvel and Sony PicturesEntertainment Inc. for the purpose of pursuing licensing opportunities relating to charactersbased upon movies or television shows featuring Spider-Man and produced by Sony. Marvelmaintained control of decision making and received the majority of the financial interest of thejoint venture.14
The Film Production segment included self-produced feature films. Marvel planned to self-produce all future films based on characters that had not already been licensed to third parties. Thecompany felt it would have more control of films and have greater flexibility with respect to thecoordination of licensed products and film release timing. Marvel financed new films through a$525 million credit facility funded by Merrill Lynch that enabled Marvel to independently financethe development and production of up to 10 feature films over eight years. The theatrical filmrights of 12 second-tier characters and their supporting partners or rivals were pledged as collat-eral to the film facility, including Ant-Man, Black Panther, Captain America, Doctor Strange, NickFury, and The Avengers. Exhibit 7 shows the schedule of films and studios involved.
Marvel formed seven wholly owned subsidiaries, known as the Film Slate Subsidiaries,in connection with the film facility, that are identified in Exhibit 4. The first two films pro-duced by this $525 million investment were Iron Man and The Incredible Hulk, both of whichwere released in mid-2008 with successful opening weekends of $98.6 million and $55.4 mil-lion, respectively.15 Paramount Pictures distributed Iron Man, staring Robert Downey Jr.,Gwyneth Paltrow, Terrence Howard, and Jeff Bridges, and Universal Pictures distributed TheIncredible Hulk, staring Edward Norton, Liv Tyler, William Hurt, and Tim Roth. Marvel be-gan reporting revenues for the Film Production segment in the second quarter of 2008. In Sep-tember 2008, Marvel leased sound stages, equipment, production spaces, and corporate officesin California through its MVL Productions LLC subsidiary to make its next four self-producedfilms.16
EXHIBIT 7Film Schedule and
Studio: MarvelEntertainment Inc.
SOURCE: Cuneo & Turitzin presentation at JP Morgan US Mid Cap Growth Con-ference, London, (Sept. 30, 2008), pp. 14–15 and Marvel Entertainment, Inc.Form 8-K, May 9, 2008, p. 3.
2000 X-Men Fox2002 Spider-Man Sony2003 Daredevil Fox
X2: X-Men United FoxHulk Universal
2004 Spider-Man 2 Sony2005 Elecktra Fox
Fantastic Four Fox2006 X-Men: The Last Stand Fox2007 Ghost Rider Sony
Spider-Man 3 SonyFantastic Four-ROTSS Fox
2008 Iron Man MarvelIncredible Hulk MarvelPunisher: War Zone Lionsgate
2009 X-Men Origins: Wolverine Fox2010 Iron Man 2 Marvel
Thor Marvel2011 The First Avenger: Captain America Marvel
The Avengers Marvel
CASE 15 Marvel Entertainment Inc. 15-11
Cross-Segment OperationsOperating across segments was the company’s Global Digital Media Group, established in2008 to coordinate Marvel’s expanding digital distribution strategy. This included MarvelDigital Comics Unlimited, part of the Publishing segment, as well as digital video, animatedcontent, mobile games, and strategic partnerships.19 In late 2007, Marvel launched its Digi-tal Comics online subscription service, providing high-resolution Internet access and searchcapabilities to thousands of classic comic book titles from its archives as well as contempo-rary issues. Special features on the Web site included the first 100 issues of the AmazingSpider-Man, first-time appearances of specific super heroes, and series designed for youngreaders. Rival publisher DC Comics pushed technology beyond static, digitized versions ofprint materials by offering a hybrid of comic books and animation called “motion comics.”DC’s first motion comic series featured the Dark Knight and coincided with the release of the2008 Batman movie. The series could be downloaded for game consoles, mobile phones, andvideo on demand.20 Following DC’s lead, Marvel partnered with thriller/horror authorStephen King to develop a 25-episode animated video of King’s short-story “N,” from hiscollection “Just After Sunset.” Marvel created the episodes specifically for small screens andoffered them via online and mobile channels prior to the book’s release.21
Serious legal considerations influenced all of Marvel’s operations, domestically and in-ternationally. Marvel worked diligently to protect the most valuable assets of the company, itsglobally-recognized characters and stories. In addition to the company’s registered trademarksand copyrights within the United States, Marvel attempted to protect its intellectual propertyabroad by registering trademarks in Africa, Asia, Latin America, the Middle East, and West-ern Europe.22 According to the International Intellectual Property Alliance, over $18 billion inrevenue was lost in 2007 by U.S. firms due to copyright piracy of software, music, and books.23
Another $5 billion was lost by major U.S. motion picture studios.24 Marvel’s legal challengesalso extend to the virtual world, including its fights to protect its intellectual property by chal-lenging the superhero avatars designed by players of massively multiplayer online role-playinggames (MMORPG). In a recent case against NCsoft, Marvel accused the videogame develop-ers of infringement of copyright and trademarks. The case was dismissed and Marvel later set-tled with the NCsoft, leaving many important questions about copyright and the boundaries offair use in game playing to be settled in the future.25
Marvel relied on hundreds of gifted individuals to conceive of, design, and deliver thewide-ranging and ever-changing adventures of Marvel characters. Legal issues related to tal-ent included claims of copyright ownership made by freelance writers, disputes with formeremployees, and labor agreements with writers and actors. For example, Marvel faced a chal-lenge during the 100-day strike in 2007–2008 of the Writers Guild of America (WGA), whichrepresents writers in the motion picture, broadcast, cable, and new media industries. Progresson its ambitious film development slate stopped until Marvel negotiated an interim agreement
The move to self-produced films came as a result of hard learning experiences. Previousfailed attempts in Hollywood and unfavorable movie deals left Marvel with nothing to showfor its long history of investment in character and story development. In past arrangements,the company did not bear the production risks and in exchange it reaped a small percentage ofthe profits.17 Sometimes Marvel would receive only 2 to 10 percent of profits of a feature film.For example, licensing mishandled during Ron Perelman’s era brought Marvel only one mil-lion dollars from 1997’s Men in Black, a film that generated close to $600 million worldwide.Another lesson was learned when Marvel made $25,000 from 1998’s Blade, which brought in$133 million worldwide.18 However, popular films produced by other companies using Mar-vel characters continued to generate increased licensing revenues for Marvel from toys andconsumer products, and often reignited interest in the comic books themselves.
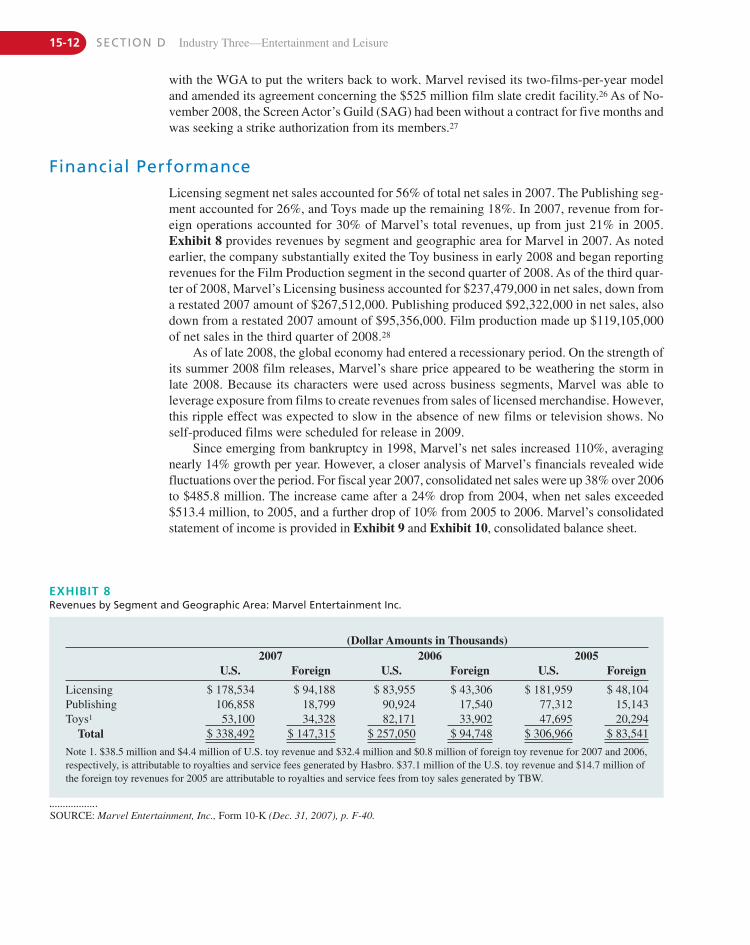
EXHIBIT 8Revenues by Segment and Geographic Area: Marvel Entertainment Inc.
SOURCE: Marvel Entertainment, Inc., Form 10-K (Dec. 31, 2007), p. F-40.
(Dollar Amounts in Thousands)2007 2006 2005
U.S. Foreign U.S. Foreign U.S. Foreign
Licensing $ 178,534 $ 94,188 $ 83,955 $ 43,306 $ 181,959 $ 48,104Publishing 106,858 18,799 90,924 17,540 77,312 15,143Toys1 53,100 34,328 82,171 33,902 47,695 20,294
Total $ 338,492 $ 147,315 $ 257,050 $ 94,748 $ 306,966 $ 83,541
Note 1. $38.5 million and $4.4 million of U.S. toy revenue and $32.4 million and $0.8 million of foreign toy revenue for 2007 and 2006,respectively, is attributable to royalties and service fees generated by Hasbro. $37.1 million of the U.S. toy revenue and $14.7 million ofthe foreign toy revenues for 2005 are attributable to royalties and service fees from toy sales generated by TBW.
with the WGA to put the writers back to work. Marvel revised its two-films-per-year modeland amended its agreement concerning the $525 million film slate credit facility.26 As of No-vember 2008, the Screen Actor’s Guild (SAG) had been without a contract for five months andwas seeking a strike authorization from its members.27
Financial PerformanceLicensing segment net sales accounted for 56% of total net sales in 2007. The Publishing seg-ment accounted for 26%, and Toys made up the remaining 18%. In 2007, revenue from for-eign operations accounted for 30% of Marvel’s total revenues, up from just 21% in 2005.Exhibit 8 provides revenues by segment and geographic area for Marvel in 2007. As notedearlier, the company substantially exited the Toy business in early 2008 and began reportingrevenues for the Film Production segment in the second quarter of 2008. As of the third quar-ter of 2008, Marvel’s Licensing business accounted for $237,479,000 in net sales, down froma restated 2007 amount of $267,512,000. Publishing produced $92,322,000 in net sales, alsodown from a restated 2007 amount of $95,356,000. Film production made up $119,105,000of net sales in the third quarter of 2008.28
As of late 2008, the global economy had entered a recessionary period. On the strength ofits summer 2008 film releases, Marvel’s share price appeared to be weathering the storm inlate 2008. Because its characters were used across business segments, Marvel was able toleverage exposure from films to create revenues from sales of licensed merchandise. However,this ripple effect was expected to slow in the absence of new films or television shows. Noself-produced films were scheduled for release in 2009.
Since emerging from bankruptcy in 1998, Marvel’s net sales increased 110%, averagingnearly 14% growth per year. However, a closer analysis of Marvel’s financials revealed widefluctuations over the period. For fiscal year 2007, consolidated net sales were up 38% over 2006to $485.8 million. The increase came after a 24% drop from 2004, when net sales exceeded$513.4 million, to 2005, and a further drop of 10% from 2005 to 2006. Marvel’s consolidatedstatement of income is provided in Exhibit 9 and Exhibit 10, consolidated balance sheet.
15-12 SECTION D Industry Three—Entertainment and Leisure
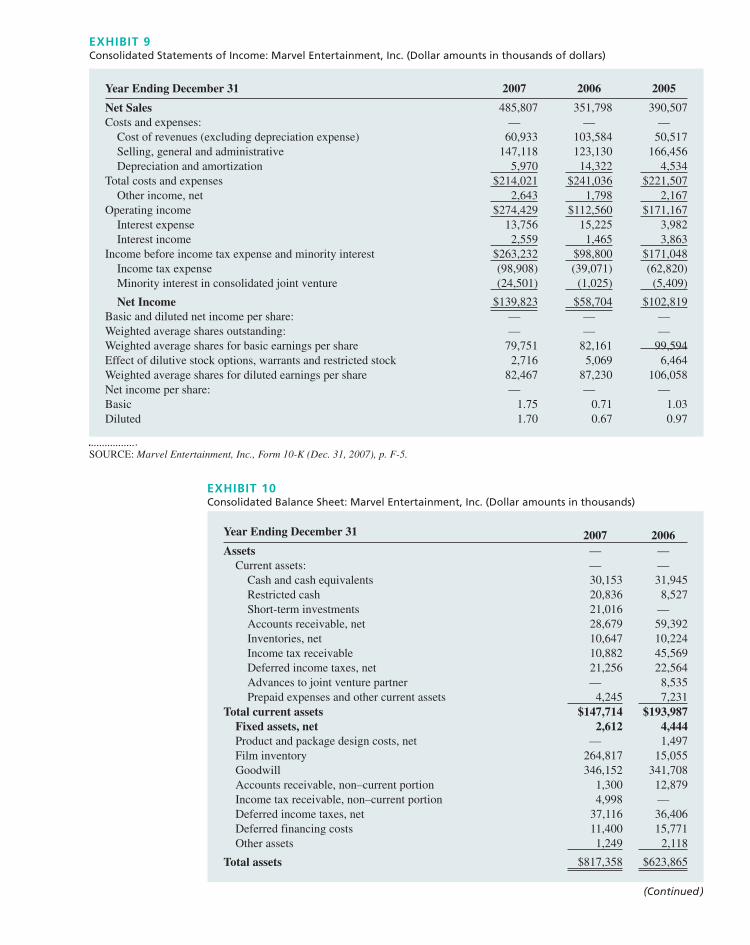
EXHIBIT 9Consolidated Statements of Income: Marvel Entertainment, Inc. (Dollar amounts in thousands of dollars)
Year Ending December 31 2007 2006 2005
Net Sales 485,807 351,798 390,507Costs and expenses: — — —
Cost of revenues (excluding depreciation expense) 60,933 103,584 50,517Selling, general and administrative 147,118 123,130 166,456Depreciation and amortization 5,970 14,322 4,534
Total costs and expenses $214,021 $241,036 $221,507Other income, net 2,643 1,798 2,167
Operating income $274,429 $112,560 $171,167Interest expense 13,756 15,225 3,982Interest income 2,559 1,465 3,863
Income before income tax expense and minority interest $263,232 $98,800 $171,048Income tax expense (98,908) (39,071) (62,820)Minority interest in consolidated joint venture (24,501) (1,025) (5,409)
Net Income $139,823 $58,704 $102,819Basic and diluted net income per share: — — —Weighted average shares outstanding: — — —Weighted average shares for basic earnings per share 79,751 82,161 99,594Effect of dilutive stock options, warrants and restricted stock 2,716 5,069 6,464Weighted average shares for diluted earnings per share 82,467 87,230 106,058Net income per share: — — —Basic 1.75 0.71 1.03Diluted 1.70 0.67 0.97
SOURCE: Marvel Entertainment, Inc., Form 10-K (Dec. 31, 2007), p. F-5.
EXHIBIT 10Consolidated Balance Sheet: Marvel Entertainment, Inc. (Dollar amounts in thousands)
Year Ending December 31 2007 2006Assets — —
Current assets: — —Cash and cash equivalents 30,153 31,945Restricted cash 20,836 8,527Short-term investments 21,016 —Accounts receivable, net 28,679 59,392Inventories, net 10,647 10,224Income tax receivable 10,882 45,569Deferred income taxes, net 21,256 22,564Advances to joint venture partner — 8,535Prepaid expenses and other current assets 4,245 7,231
Total current assets $147,714 $193,987Fixed assets, net 2,612 4,444Product and package design costs, net — 1,497Film inventory 264,817 15,055Goodwill 346,152 341,708Accounts receivable, non–current portion 1,300 12,879Income tax receivable, non–current portion 4,998 —Deferred income taxes, net 37,116 36,406Deferred financing costs 11,400 15,771Other assets 1,249 2,118
Total assets $817,358 $623,865
(Continued)
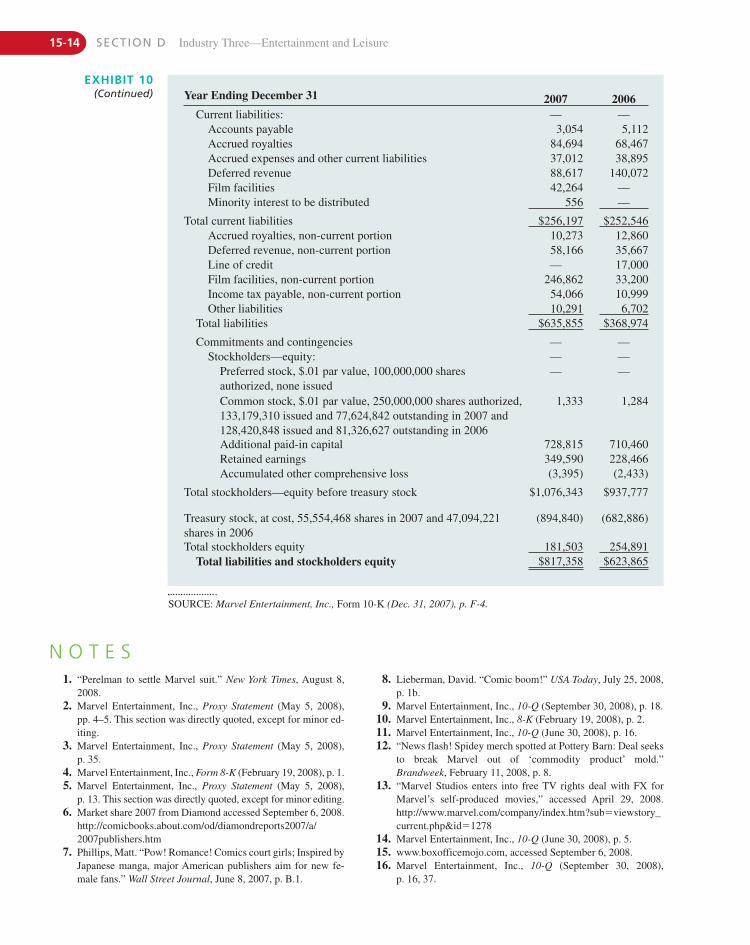
SOURCE: Marvel Entertainment, Inc., Form 10-K (Dec. 31, 2007), p. F-4.
N O T E S1. “Perelman to settle Marvel suit.” New York Times, August 8,
2008.2. Marvel Entertainment, Inc., Proxy Statement (May 5, 2008),
pp. 4–5. This section was directly quoted, except for minor ed-iting.
3. Marvel Entertainment, Inc., Proxy Statement (May 5, 2008),p. 35.
4. Marvel Entertainment, Inc., Form 8-K (February 19, 2008), p. 1.5. Marvel Entertainment, Inc., Proxy Statement (May 5, 2008),
p. 13. This section was directly quoted, except for minor editing.6. Market share 2007 from Diamond accessed September 6, 2008.
http://comicbooks.about.com/od/diamondreports2007/a/2007publishers.htm
7. Phillips, Matt. “Pow! Romance! Comics court girls; Inspired byJapanese manga, major American publishers aim for new fe-male fans.” Wall Street Journal, June 8, 2007, p. B.1.
8. Lieberman, David. “Comic boom!” USA Today, July 25, 2008,p. 1b.
9. Marvel Entertainment, Inc., 10-Q (September 30, 2008), p. 18.10. Marvel Entertainment, Inc., 8-K (February 19, 2008), p. 2.11. Marvel Entertainment, Inc., 10-Q (June 30, 2008), p. 16.12. “News flash! Spidey merch spotted at Pottery Barn: Deal seeks
to break Marvel out of ‘commodity product’ mold.”Brandweek, February 11, 2008, p. 8.
13. “Marvel Studios enters into free TV rights deal with FX forMarvel’s self-produced movies,” accessed April 29, 2008.http://www.marvel.com/company/index.htm?sub�viewstory_current.php&id�1278
14. Marvel Entertainment, Inc., 10-Q (June 30, 2008), p. 5.15. www.boxofficemojo.com, accessed September 6, 2008.16. Marvel Entertainment, Inc., 10-Q (September 30, 2008),
p. 16, 37.
Year Ending December 31 2007 2006Current liabilities: — —
Accounts payable 3,054 5,112Accrued royalties 84,694 68,467Accrued expenses and other current liabilities 37,012 38,895Deferred revenue 88,617 140,072Film facilities 42,264 —Minority interest to be distributed 556 —
Total current liabilities $256,197 $252,546Accrued royalties, non-current portion 10,273 12,860Deferred revenue, non-current portion 58,166 35,667Line of credit — 17,000Film facilities, non-current portion 246,862 33,200Income tax payable, non-current portion 54,066 10,999Other liabilities 10,291 6,702
Total liabilities $635,855 $368,974
Commitments and contingencies — —Stockholders—equity: — —
Preferred stock, $.01 par value, 100,000,000 shares authorized, none issued
— —
Common stock, $.01 par value, 250,000,000 shares authorized,133,179,310 issued and 77,624,842 outstanding in 2007 and128,420,848 issued and 81,326,627 outstanding in 2006
1,333 1,284
Additional paid-in capital 728,815 710,460Retained earnings 349,590 228,466Accumulated other comprehensive loss (3,395) (2,433)
Total stockholders—equity before treasury stock $1,076,343 $937,777
Treasury stock, at cost, 55,554,468 shares in 2007 and 47,094,221 shares in 2006
(894,840) (682,886)
Total stockholders equity 181,503 254,891Total liabilities and stockholders equity $817,358 $623,865
EXHIBIT 10(Continued)
15-14 SECTION D Industry Three—Entertainment and Leisure
17. Marr, Merissa. “In new film venture, Marvel hopes to be its ownsuperhero.” Wall Street Journal, April 28, 2005, p. B1.
18. Hamner, Susanna. “Is Marvel ready for its close-up?” Business2.0, May 2006, p. 112.
19. “Marvel appoints Ira Rubenstein Executive Vice President of itsnewly launched Global Digital Media Group,” accessed April29, 2008. http://www.marvel.com/company/index.htm?sub�
viewstory_current.php&id�128120. McBride, Sarah. “Web draws on comics: Online shorts boost
Batman.” Wall Street Journal, July 18, 2008, p. B.10.21. Trachtenberg, Jeffrey A. “Author King enlists Marvel in video
plot.” Wall Street Journal, July 25, 2008, p. B.1.22. Marvel Entertainment, Inc., 10-K (December 31, 2007), p. 8.23. International Intellectual Property Alliance, “2008 ‘Special
301’ USTR decisions,” accessed September 6, 2008. http://
www.iipa.com/pdf/USTRdecisions2008Special301TableofEstimatedLossesandPiracyLevels2007Final061708.pdf
24. Motion Picture Association of American, “The cost of moviepiracy.” Dated 2005, accessed September 6, 2008. http://www.mpaa.org/leksummaryMPA%20revised.pdf
25. Louie, Andrea W. M. “Designing avatars in virtual worlds: Howfree are we to play Superman?” Journal of Internet Law, No-vember 2007, pp. 3–12.
26. Marvel Entertainment, Inc., Form 8-K (January 18, 2008), p. 1.27. Simmons, Leslie. “Actors will vote on strike.” Adweek, Novem-
ber 24, 2008, accessed November 24, 2008. http://www.adweek.com/aw/content_display/news/media/e3i550533f2636cdbd1ff5fc3bd8f91a1ad
28. Marvel Entertainment, Inc., 10-Q (September 30, 2008), p. 13.
CASE 15 Marvel Entertainment Inc. 15-15

This page intentionally left blank
IT WAS EARLY MORNING IN NOVEMBER 2010 AS MICKEY ARISON, Chairman and CEO, drove upthe palm-lined entryway to the headquarters of Carnival Corporation. In front of the build-
ing, the large Carnival red, white, and blue logo (shaped like a ship’s funnel) reminded himthat his ships were not only still afloat, but doing well in this down economy.
As he reflected back on the year, he was delighted that the company had weathered theglobal recession. Despite reduced leisure travel demand, the U.S. government’s advisory
against travel to Mexico as a result of the flu virus, terrorist fears, fuel price uncertainty, anda host of other factors, Carnival managed to carry a record 8.5 million guests. Although 2009
sales were below the 2008 record, the company still posted a $1.8 billion net income. Quick re-sponses by management offset the revenue declines through cost containment efforts, most no-tably a 5% reduction in fuel consumption, and through expansion in its European market. Thisexpansion represented 39% of the company’s operations.
Third-quarter results (through August 31, 2010) showed improvement over the sameperiod in 2009, nearing the record levels of 2008. In the Western Hemisphere, the gulf oil spillhad not materially affected cruise operations and the hurricane season had not been as bad aspredicted. European expansion proceeded smoothly and expansion initiatives in Australia andAsia produced positive results. Given a global economic recovery, the company should see areturn to the historical growth patterns it experienced in previous years.
The strategic outlook through 2012 and beyond was projected to be highly favorable.Carnival Corporation’s management believed that only 20% of the U.S. population, 9%–10%of the UK population, and 4%–5% of the continental European population had ever taken acruise. This left a large number of potential cruise guests. European growth potential wasconsistent with the North American market 12 years ago. Anticipating this growth, CarnivalCorporation intended to continue average annual capacity growth in North America at a 3% rateand European capacity growth at 9% through 2012.
16-1
C A S E 16Carnival Corporation & plc (2010)Michael J. Keeffe, John K. Ross III, Sherry K. Ross, Bill J. Middlebrook, and Thomas L. Wheelen
This case was prepared by Michael J. Keefe, John K. Ross III, Sherry K. Ross, Bill J. Middlebrook, and Thomas L.Wheelen. Copyright © 2010 by Kathryn E. Wheelen, Michael J. Keeffe, John K. Ross III, Sherry K. Ross, Bill J. Middlebrook, and Thomas L. Wheelen. Reprinted by permission only for the 13th edition of Strategic Managementand Business Policy (including international and electronic versions of the book). Any other publication of this case(translation, any form of electronic or media) or sale (any form of partnership) to another publisher will be in viola-tion of copyright law unless Kathryn E. Wheelen, Michael J. Keeffe, John K. Ross III, Sherry K. Ross, Bill Middle-brook, and Thomas L. Wheelen have granted additional written reprint permission.
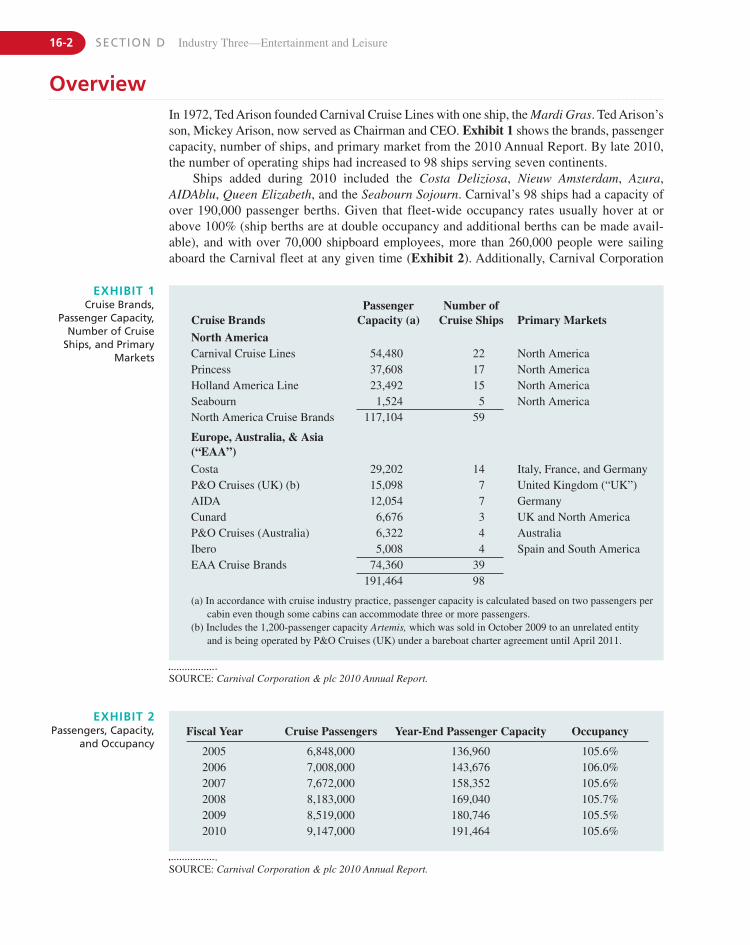
16-2 SECTION D Industry Three—Entertainment and Leisure
OverviewIn 1972, Ted Arison founded Carnival Cruise Lines with one ship, the Mardi Gras. Ted Arison’sson, Mickey Arison, now served as Chairman and CEO. Exhibit 1 shows the brands, passengercapacity, number of ships, and primary market from the 2010 Annual Report. By late 2010,the number of operating ships had increased to 98 ships serving seven continents.
Ships added during 2010 included the Costa Deliziosa, Nieuw Amsterdam, Azura,AIDAblu, Queen Elizabeth, and the Seabourn Sojourn. Carnival’s 98 ships had a capacity ofover 190,000 passenger berths. Given that fleet-wide occupancy rates usually hover at orabove 100% (ship berths are at double occupancy and additional berths can be made avail-able), and with over 70,000 shipboard employees, more than 260,000 people were sailingaboard the Carnival fleet at any given time (Exhibit 2). Additionally, Carnival Corporation
Cruise BrandsPassenger
Capacity (a)Number of
Cruise Ships Primary Markets
North AmericaCarnival Cruise Lines 54,480 22 North AmericaPrincess 37,608 17 North AmericaHolland America Line 23,492 15 North AmericaSeabourn 1,524 5 North AmericaNorth America Cruise Brands 117,104 59
Europe, Australia, & Asia (“EAA”)
Costa 29,202 14 Italy, France, and GermanyP&O Cruises (UK) (b) 15,098 7 United Kingdom (“UK”)AIDA 12,054 7 GermanyCunard 6,676 3 UK and North AmericaP&O Cruises (Australia) 6,322 4 AustraliaIbero 5,008 4 Spain and South AmericaEAA Cruise Brands 74,360 39
191,464 98
(a) In accordance with cruise industry practice, passenger capacity is calculated based on two passengers percabin even though some cabins can accommodate three or more passengers.
(b) Includes the 1,200-passenger capacity Artemis, which was sold in October 2009 to an unrelated entityand is being operated by P&O Cruises (UK) under a bareboat charter agreement until April 2011.
EXHIBIT 1Cruise Brands,
Passenger Capacity,Number of Cruise
Ships, and PrimaryMarkets
SOURCE: Carnival Corporation & plc 2010 Annual Report.
SOURCE: Carnival Corporation & plc 2010 Annual Report.
Fiscal Year Cruise Passengers Year-End Passenger Capacity Occupancy
2005 6,848,000 136,960 105.6%2006 7,008,000 143,676 106.0%2007 7,672,000 158,352 105.6%2008 8,183,000 169,040 105.7%2009 8,519,000 180,746 105.5%2010 9,147,000 191,464 105.6%
EXHIBIT 2Passengers, Capacity,
and Occupancy
CASE 16 Carnival Corporation & plc (2010) 16-3
expected delivery of nine ships by the end of 2014 (Carnival–2; Costa–2; AIDA–2;Seabourn–1; Princess–2).
In a letter to stockholders, Arison stated that, “. . . While our targeted brands and strategicgrowth initiatives remain important ingredients for success, and entrepreneurial spirit is whatour company thrives on. . . . Our culture empowers our brand managers to make daily deci-sions to the best interest of building their respective operating companies. Each brand is accountable for its individual performance.”
Carnival not only owned ships but also owned a chain of 16 hotels and lodges in Alaskaand the Canadian Yukon with 3,000 guest rooms to complement Alaska cruises. For“Alaskan cruise tours,” Carnival operated two luxury day trips to the glaciers in Alaska and the Yukon River and owned 30 domed rail cars operated by the Alaska Railroad as sight-seeing trains.
The Evolution of Cruising
When aircraft replaced ocean liners as the primary means of transoceanic travel during the1960s, the opportunity for developing the modern cruise industry was created. Ships thatwere no longer required to ferry passengers from destination to destination became avail-able to investors who envisioned new alternative vacations that complemented the increas-ing affluence of Americans. Ted and Mickey Arison envisioned travelers experiencingclassical cruise elegance, along with the latest modern conveniences, at a price comparableto land-based vacation packages sold by travel agents. Carnival’s all-inclusive package,when compared to packages at resorts or theme parks such as Walt Disney World, often werepriced below those destinations, especially when the array of activities, entertainment, andmeals were considered. Once the purview of the rich and leisure class, cruising was now tar-geted to the middle class, with service and amenities similar to the grand days of first-classocean travel.
According to Cruise Travel magazine, the increasing popularity of taking a cruise as avacation can be traced to two serendipitously timed events. First, television’s Love Boat se-ries dispelled many myths associated with cruising and depicted people of all ages and back-grounds enjoying the cruise experience. During the 1970s, this show was among the top 10television programs and provided extensive publicity for cruise operators. Second, the in-creasing affluence of Americans and the increased participation of women in the workforcegave couples and families more disposable income for discretionary purposes, especiallyvacations. As the myths were dispelled and disposable income grew, younger couples andfamilies realized the benefits of cruising as a vacation alternative, creating a large new targetmarket for the cruise product and accelerating growth in the number of Americans takingcruises as a vacation.
Over the last 20 years the cruise industry and cruise vacation have matured with the de-velopment of ships designed specifically for cruise vacations and varied itineraries world-wide. Current cruise liners bear little resemblance to early industry cruise liners and are trulya floating vacation resort. Modern cruise ships are much larger than previous ships, have lit-tle motion due to computer-controlled stabilization systems, are environmentally friendlywith full recycling capabilities, and have a multitude of activities, entertainment, clubs, anddeck spaces for guests to explore. The common misconception of being perpetually seasickor bored on a ship would be hard to fathom given the evolution and development of moderncruise ships and the many and varied ports of call.
16-4 SECTION D Industry Three—Entertainment and Leisure
Carnival HistoryIn 1972 Ted Arison, backed by the American Travel Services Inc. (AITS) purchased an ag-ing ocean liner from Canadian Pacific Empress Lines for $6.5 million. The new AITS sub-sidiary, Carnival Cruise Lines, refurbished the vessel from bow to stern and renamed it theMardi Gras to capture the party spirit. (Also included in the deal was another ship later re-named the Carnivale.) The company’s beginning was less than promising when the MardiGras ran aground in Miami Harbor with more than 300 invited travel agents aboard. The shipwas slow and guzzled expensive fuel, which limited the number of ports of call and length-ened the minimum stay of passengers on the ship needed to reach break-even. Arison thenbought another older vessel from the Union Castle Lines to complement the Mardi Gras andthe Carnivale and named it the Festivale. To attract customers, Arison began adding onboarddiversions such as planned activities, a casino, discos, and other forms of entertainment de-signed to enhance the shipboard experience.
Carnival lost money for the next three years, and in late 1974 Ted Arison bought out theCarnival Cruise subsidiary from AITS Inc. for $1 cash and the assumption of $5 million indebt. One month later, the Mardi Gras began showing a profit and, through the remainder of1975, operated at more than 100% capacity. (Normal ship capacity was determined by thenumber of fixed berths [referred to as lower berths available]. Ships, like hotels, operatebeyond this fixed capacity by using rollaway beds, pullmans, and upper bunks.)
Ted Arison, Chairman, along with his son Mickey Arison, President, and Bob Dickinson, VicePresident of Sales and Marketing, began to alter the current approach to cruise vacations.Carnival targeted first-time cruisers and young people with a moderately priced vacation pack-age that included airfare to the port of embarkation and airfare home after the cruise. Per-diemrates were very competitive with other vacation packages. Carnival offered passage to multi-ple exotic Caribbean ports, several meals served daily with premier restaurant service, and allforms of entertainment and activities included in the base fare. The only items not included in the fare were items of a personal nature, liquor purchases, gambling, and tips for the cabinsteward, table waiter, and busboy. Carnival continued to add to the shipboard experience witha greater variety of activities, nightclubs, and other forms of entertainment. It also used mul-timedia-advertising promotions and established the theme of “Fun Ship” cruises, primarily promoting the ship as the destination and ports of call as secondary. Carnival told the public itwas throwing a shipboard party and everyone was invited. Today, the “Fun Ship” theme stillpermeates all Carnival Cruise brand ships.
Throughout the 1980s, Carnival was able to maintain a growth rate of approximately 30%,about three times that of the industry as a whole. Between 1982 and 1988, its ships sailed withan average capacity of 104%. Targeting younger, first-time passengers by promoting the shipas a destination proved to be extremely successful. Carnival’s customer profile showed that approximately 30% of passengers at that time were between the ages of 25 and 39, with household incomes of $25,000 to $50,000.
In 1987, Ted Arison sold 20% of his shares of Carnival Cruise Lines and immediatelygenerated over $400 million for further expansion. In 1988, Carnival acquired the HollandAmerica Line, which had four cruise ships with 4,500 berths. Holland America was positionedto appeal to higher-income travelers with cruise prices averaging 25%–35% more than similarCarnival cruises. The deal included two Holland America subsidiaries, Windstar Sail Cruisesand Holland America Westours. This purchase allowed Carnival to begin an aggressive“superliner” building campaign for its core subsidiary. By 1989, the cruise segments of Carni-val Corporation carried more than 75,000 passengers in one year, a “first” in the cruise industry.
Ted Arison relinquished the role of Chairman to his son Mickey in 1990, a time when theexplosive growth of the industry began to subside. Higher fuel prices and increased airlinecosts began to affect the industry as a whole. The first Persian Gulf War caused many cruise
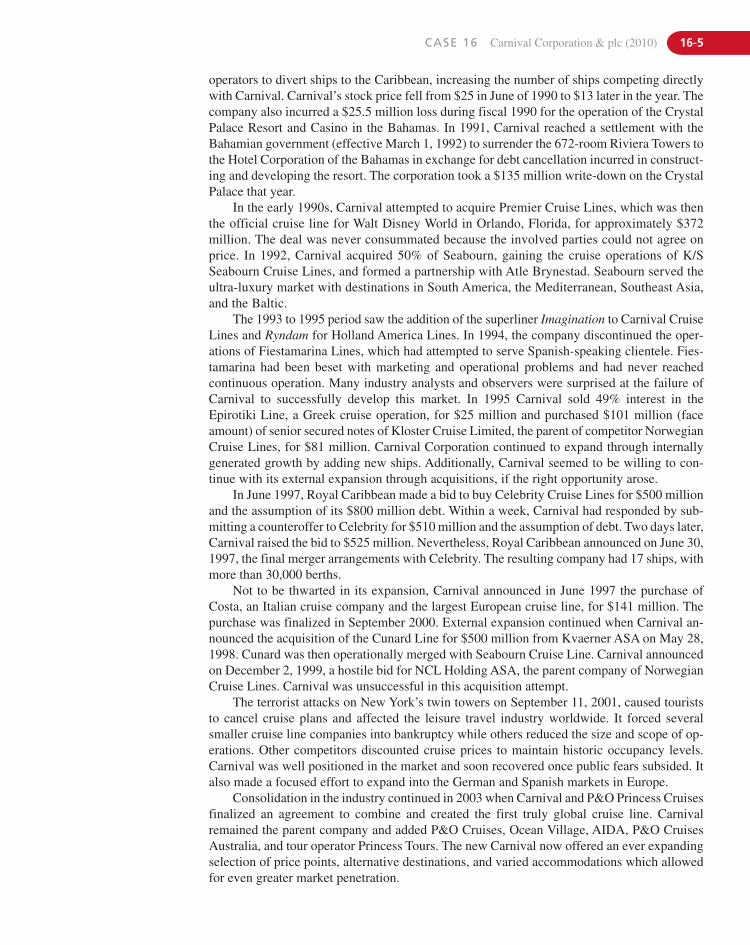
CASE 16 Carnival Corporation & plc (2010) 16-5
operators to divert ships to the Caribbean, increasing the number of ships competing directlywith Carnival. Carnival’s stock price fell from $25 in June of 1990 to $13 later in the year. Thecompany also incurred a $25.5 million loss during fiscal 1990 for the operation of the CrystalPalace Resort and Casino in the Bahamas. In 1991, Carnival reached a settlement with theBahamian government (effective March 1, 1992) to surrender the 672-room Riviera Towers tothe Hotel Corporation of the Bahamas in exchange for debt cancellation incurred in construct-ing and developing the resort. The corporation took a $135 million write-down on the CrystalPalace that year.
In the early 1990s, Carnival attempted to acquire Premier Cruise Lines, which was thenthe official cruise line for Walt Disney World in Orlando, Florida, for approximately $372million. The deal was never consummated because the involved parties could not agree onprice. In 1992, Carnival acquired 50% of Seabourn, gaining the cruise operations of K/SSeabourn Cruise Lines, and formed a partnership with Atle Brynestad. Seabourn served theultra-luxury market with destinations in South America, the Mediterranean, Southeast Asia,and the Baltic.
The 1993 to 1995 period saw the addition of the superliner Imagination to Carnival CruiseLines and Ryndam for Holland America Lines. In 1994, the company discontinued the oper-ations of Fiestamarina Lines, which had attempted to serve Spanish-speaking clientele. Fies-tamarina had been beset with marketing and operational problems and had never reachedcontinuous operation. Many industry analysts and observers were surprised at the failure ofCarnival to successfully develop this market. In 1995 Carnival sold 49% interest in theEpirotiki Line, a Greek cruise operation, for $25 million and purchased $101 million (faceamount) of senior secured notes of Kloster Cruise Limited, the parent of competitor NorwegianCruise Lines, for $81 million. Carnival Corporation continued to expand through internallygenerated growth by adding new ships. Additionally, Carnival seemed to be willing to con-tinue with its external expansion through acquisitions, if the right opportunity arose.
In June 1997, Royal Caribbean made a bid to buy Celebrity Cruise Lines for $500 millionand the assumption of its $800 million debt. Within a week, Carnival had responded by sub-mitting a counteroffer to Celebrity for $510 million and the assumption of debt. Two days later,Carnival raised the bid to $525 million. Nevertheless, Royal Caribbean announced on June 30,1997, the final merger arrangements with Celebrity. The resulting company had 17 ships, withmore than 30,000 berths.
Not to be thwarted in its expansion, Carnival announced in June 1997 the purchase ofCosta, an Italian cruise company and the largest European cruise line, for $141 million. Thepurchase was finalized in September 2000. External expansion continued when Carnival an-nounced the acquisition of the Cunard Line for $500 million from Kvaerner ASA on May 28,1998. Cunard was then operationally merged with Seabourn Cruise Line. Carnival announcedon December 2, 1999, a hostile bid for NCL Holding ASA, the parent company of NorwegianCruise Lines. Carnival was unsuccessful in this acquisition attempt.
The terrorist attacks on New York’s twin towers on September 11, 2001, caused touriststo cancel cruise plans and affected the leisure travel industry worldwide. It forced severalsmaller cruise line companies into bankruptcy while others reduced the size and scope of op-erations. Other competitors discounted cruise prices to maintain historic occupancy levels.Carnival was well positioned in the market and soon recovered once public fears subsided. Italso made a focused effort to expand into the German and Spanish markets in Europe.
Consolidation in the industry continued in 2003 when Carnival and P&O Princess Cruisesfinalized an agreement to combine and created the first truly global cruise line. Carnivalremained the parent company and added P&O Cruises, Ocean Village, AIDA, P&O CruisesAustralia, and tour operator Princess Tours. The new Carnival now offered an ever expandingselection of price points, alternative destinations, and varied accommodations which allowedfor even greater market penetration.
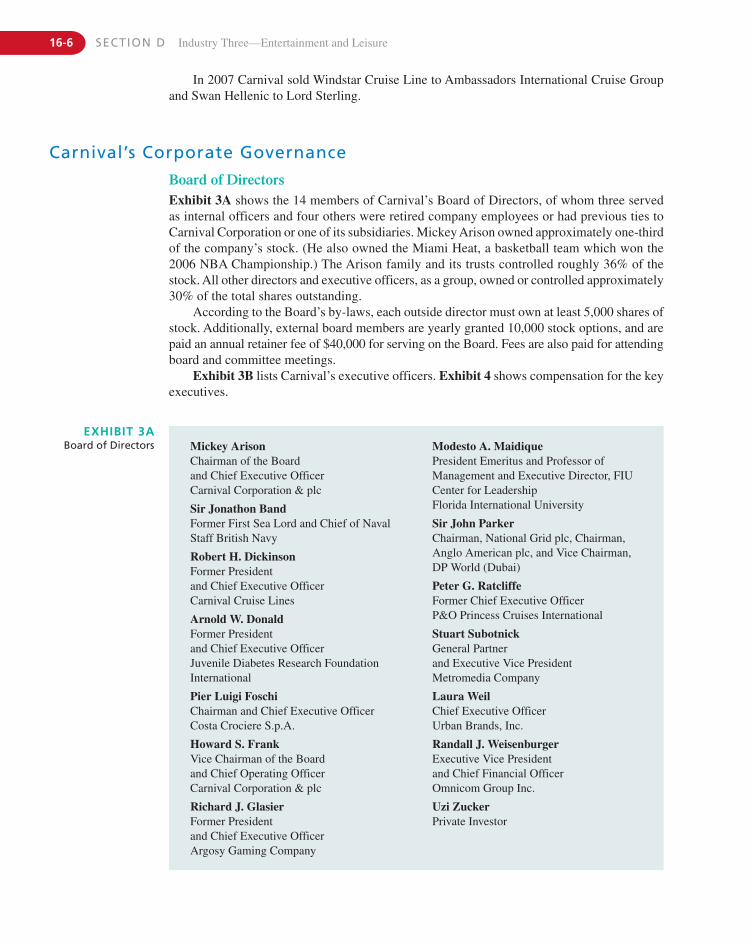
16-6 SECTION D Industry Three—Entertainment and Leisure
Carnival’s Corporate Governance
Board of DirectorsExhibit 3A shows the 14 members of Carnival’s Board of Directors, of whom three servedas internal officers and four others were retired company employees or had previous ties toCarnival Corporation or one of its subsidiaries. Mickey Arison owned approximately one-thirdof the company’s stock. (He also owned the Miami Heat, a basketball team which won the2006 NBA Championship.) The Arison family and its trusts controlled roughly 36% of thestock. All other directors and executive officers, as a group, owned or controlled approximately30% of the total shares outstanding.
According to the Board’s by-laws, each outside director must own at least 5,000 shares ofstock. Additionally, external board members are yearly granted 10,000 stock options, and arepaid an annual retainer fee of $40,000 for serving on the Board. Fees are also paid for attendingboard and committee meetings.
Exhibit 3B lists Carnival’s executive officers. Exhibit 4 shows compensation for the keyexecutives.
In 2007 Carnival sold Windstar Cruise Line to Ambassadors International Cruise Groupand Swan Hellenic to Lord Sterling.
Mickey ArisonChairman of the Board and Chief Executive OfficerCarnival Corporation & plc
Sir Jonathon BandFormer First Sea Lord and Chief of NavalStaff British Navy
Robert H. DickinsonFormer President and Chief Executive OfficerCarnival Cruise Lines
Arnold W. DonaldFormer President and Chief Executive OfficerJuvenile Diabetes Research FoundationInternational
Pier Luigi FoschiChairman and Chief Executive OfficerCosta Crociere S.p.A.
Howard S. Frank Vice Chairman of the Board and Chief Operating OfficerCarnival Corporation & plc
Richard J. GlasierFormer President and Chief Executive OfficerArgosy Gaming Company
Modesto A. MaidiquePresident Emeritus and Professor ofManagement and Executive Director, FIUCenter for LeadershipFlorida International University
Sir John ParkerChairman, National Grid plc, Chairman,Anglo American plc, and Vice Chairman,DP World (Dubai)
Peter G. RatcliffeFormer Chief Executive OfficerP&O Princess Cruises International
Stuart SubotnickGeneral Partner and Executive Vice PresidentMetromedia Company
Laura WeilChief Executive OfficerUrban Brands, Inc.
Randall J. WeisenburgerExecutive Vice President and Chief Financial OfficerOmnicom Group Inc.
Uzi ZuckerPrivate Investor
EXHIBIT 3ABoard of Directors
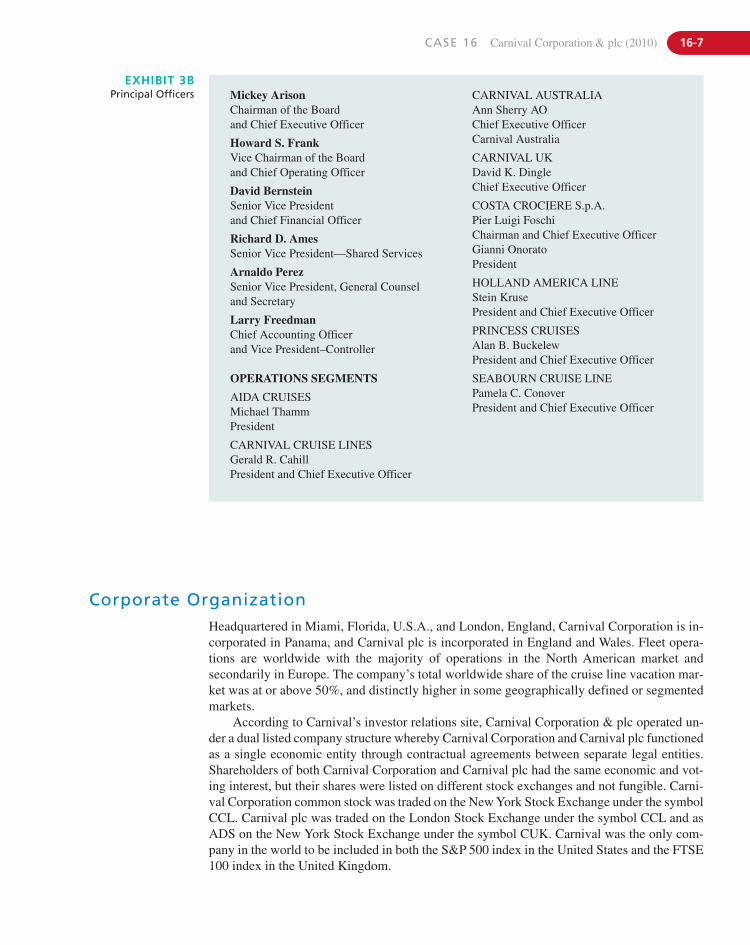
CASE 16 Carnival Corporation & plc (2010) 16-7
Mickey ArisonChairman of the Board and Chief Executive Officer
Howard S. FrankVice Chairman of the Board and Chief Operating Officer
David BernsteinSenior Vice President and Chief Financial Officer
Richard D. AmesSenior Vice President—Shared Services
Arnaldo PerezSenior Vice President, General Counsel and Secretary
Larry FreedmanChief Accounting Officer and Vice President–Controller
OPERATIONS SEGMENTS
AIDA CRUISESMichael ThammPresident
CARNIVAL CRUISE LINESGerald R. CahillPresident and Chief Executive Officer
CARNIVAL AUSTRALIAAnn Sherry AOChief Executive OfficerCarnival Australia
CARNIVAL UKDavid K. DingleChief Executive Officer
COSTA CROCIERE S.p.A.Pier Luigi FoschiChairman and Chief Executive OfficerGianni OnoratoPresident
HOLLAND AMERICA LINEStein KrusePresident and Chief Executive Officer
PRINCESS CRUISESAlan B. BuckelewPresident and Chief Executive Officer
SEABOURN CRUISE LINEPamela C. ConoverPresident and Chief Executive Officer
EXHIBIT 3BPrincipal Officers
Corporate OrganizationHeadquartered in Miami, Florida, U.S.A., and London, England, Carnival Corporation is in-corporated in Panama, and Carnival plc is incorporated in England and Wales. Fleet opera-tions are worldwide with the majority of operations in the North American market andsecondarily in Europe. The company’s total worldwide share of the cruise line vacation mar-ket was at or above 50%, and distinctly higher in some geographically defined or segmentedmarkets.
According to Carnival’s investor relations site, Carnival Corporation & plc operated un-der a dual listed company structure whereby Carnival Corporation and Carnival plc functionedas a single economic entity through contractual agreements between separate legal entities.Shareholders of both Carnival Corporation and Carnival plc had the same economic and vot-ing interest, but their shares were listed on different stock exchanges and not fungible. Carni-val Corporation common stock was traded on the New York Stock Exchange under the symbolCCL. Carnival plc was traded on the London Stock Exchange under the symbol CCL and asADS on the New York Stock Exchange under the symbol CUK. Carnival was the only com-pany in the world to be included in both the S&P 500 index in the United States and the FTSE100 index in the United Kingdom.
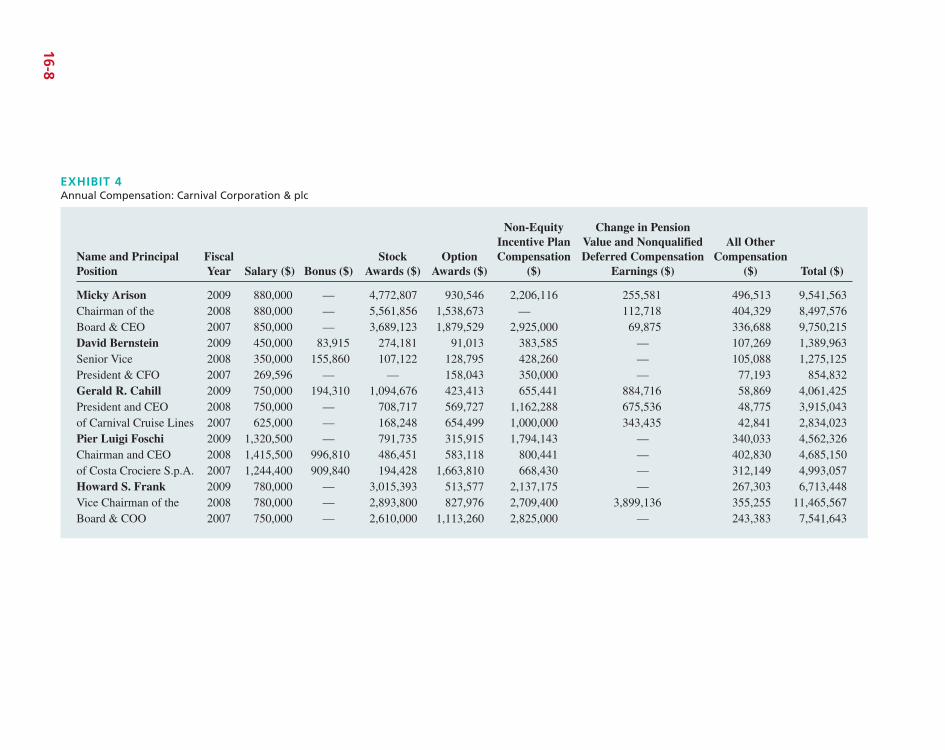
Name and PrincipalPosition
FiscalYear Salary ($) Bonus ($)
StockAwards ($)
OptionAwards ($)
Non-EquityIncentive PlanCompensation
($)
Change in Pension Value and NonqualifiedDeferred Compensation
Earnings ($)
All OtherCompensation
($) Total ($)
Micky Arison 2009 880,000 — 4,772,807 930,546 2,206,116 255,581 496,513 9,541,563Chairman of the 2008 880,000 — 5,561,856 1,538,673 — 112,718 404,329 8,497,576Board & CEO 2007 850,000 — 3,689,123 1,879,529 2,925,000 69,875 336,688 9,750,215David Bernstein 2009 450,000 83,915 274,181 91,013 383,585 — 107,269 1,389,963Senior Vice 2008 350,000 155,860 107,122 128,795 428,260 — 105,088 1,275,125President & CFO 2007 269,596 — — 158,043 350,000 — 77,193 854,832Gerald R. Cahill 2009 750,000 194,310 1,094,676 423,413 655,441 884,716 58,869 4,061,425President and CEO 2008 750,000 — 708,717 569,727 1,162,288 675,536 48,775 3,915,043of Carnival Cruise Lines 2007 625,000 — 168,248 654,499 1,000,000 343,435 42,841 2,834,023Pier Luigi Foschi 2009 1,320,500 — 791,735 315,915 1,794,143 — 340,033 4,562,326Chairman and CEO 2008 1,415,500 996,810 486,451 583,118 800,441 — 402,830 4,685,150of Costa Crociere S.p.A. 2007 1,244,400 909,840 194,428 1,663,810 668,430 — 312,149 4,993,057Howard S. Frank 2009 780,000 — 3,015,393 513,577 2,137,175 — 267,303 6,713,448Vice Chairman of the 2008 780,000 — 2,893,800 827,976 2,709,400 3,899,136 355,255 11,465,567Board & COO 2007 750,000 — 2,610,000 1,113,260 2,825,000 — 243,383 7,541,643
EXHIBIT 4Annual Compensation: Carnival Corporation & plc
16-8
CASE 16 Carnival Corporation & plc (2010) 16-9
MissionAccording to management, “Our mission is to deliver exceptional vacation experiencesthrough the world’s best-known cruise brands that cater to a variety of different lifestyle andbudgets, all at an outstanding value unrivaled on land or at sea.”
The 11 cruise lines competed in all of the three operational sectors of the cruise market(contemporary, premium, and luxury).
Operating Segments and Corporate BrandsCarnival Cruise Lines (www.carnival.com)Carnival Cruise Lines was the most popular and most profitable cruise line in the world. Op-erating in the contemporary cruise sector, as of late 2010, Carnival operated 22 ships with atotal passenger capacity of 54,480. Occupancy rates typically exceeded 100% on average,and the brand was the market leader in the contemporary segment of the industry. Carnivalstill utilized the theme of the “Fun Ships,” and had embarked on a $250 million enhancementprogram of its eight fantasy-class ships. Carnival ships cruised to destinations in the Bahamas,Canada, the Caribbean, the Mexican Riviera, New England, the Panama Canal, Alaska, and Hawaii, as well as limited operations in Europe, with most cruises ranging from three toseven days.
Princess Cruises (www.princesscruises.com)Princess Cruises offered a “complete escape” from daily routine. This segment operated 17 ships with a total passenger capacity of 37,588. Princess treated its passengers to world-classcuisine, exceptional service, and a myriad of resort-like amenities onboard, including the LotusSpa, Movies Under the Stars, lavish casinos, nightclubs, and lounges. Princess was a pioneerin offering a choice of dining experiences so guests could dine when and where it was conven-ient. The Princess fleet cruised to all seven continents and boasted more than 280 destinations.Princess was classified in the industry as contemporary to premium. The company offeredcruises ranging in length principally from 7 to 14 days.
Holland America Line (www.hollandamerica.com)The Holland America Line was a leader in the premium cruise sector. Holland America oper-ated a five-star fleet of 15 ships, with 23,484 passenger capacity. Holland America consistentlyset a standard in the premium segment with feature programs and amenities such as culinaryarts demonstrations, greenhouse spas, and cabins with flat-panel TVs and Sealy plush-topMariner’s Dream beds. The company offered cruises from 7 to 21 days. Its ships sailed to morethan 300 ports of call on all seven continents with more than 500 cruises per year.
Seabourn Cruises (www.seabourn.com)Seabourn Cruise Line epitomized luxury cruising aboard each of its five intimate all-suiteships. The Yachts of Seabourn were lavishly appointed with virtually one staff member forevery guest, to ensure the highest quality service. Typical cruises were from 7 to 14 days.
Costa Cruises (www.costacruises.com)Costa Cruises was the leading cruise company in Europe and South America. Headquarteredin Genoa, Italy, Costa offered guests on its 14 ships a multiethnic, multicultural, and multi-lingual ambiance. A Costa cruise was distinguished by its “Cruising Italian Style” shipboardambiance. Costa’s fleet cruised the Caribbean, the Mediterranean, Northern Europe, SouthAmerica, Dubai, the Far East, and transoceanic crossings.
16-10 SECTION D Industry Three—Entertainment and Leisure
P&O Cruises (www.pocruises.com)P&O Cruises was the largest cruise operator and the best-known contemporary cruise brandin the United Kingdom, and has cruised Australia for 78 years. The seven-ship main fleet andthe three-ship Australian fleet offered cruises to the Mediterranean, the Baltic, the NorwegianFjords, the Caribbean, and the Atlantic Islands, as well as Australia and the Far East. Totalpassenger capacity was approaching 20,000 for both operational fleets, and its principalmarket was the United Kingdom.
AIDA (www.aida.com)AIDA was the best-known cruise brand in the fast-growing German cruise market. With itsseven club ships and a capacity of over 12,000, AIDA offered cruises to the Mediterranean,the Baltic, the Norwegian Fjords, the Canary Islands, and the Caribbean. AIDA emphasizedelements of the upmarket clubs and resorts in the premium and four-star range, and its facilities and activities attracted younger, more active vacationers.
Cunard Line (www.cunard.com)The Cunard Line offered the only regular transatlantic crossing service aboard the world-famous ocean liner Queen Mary 2 and the brand new Queen Elizabeth. Her equally famousretired sister, Queen Elizabeth 2, sailed on unique itineraries worldwide serving both U.S.and U.K. guests and still evoked memories of the grand days of ocean travel. The passengercapacity of the three Cunard ships was 6,700 (double occupancy), and Cunard’s primarymarket was the United Kingdom and North America. The line proudly carried the legacy ofthe era of sophisticated floating palaces into the 21st century. These ships were classified inthe luxury sector of the cruise market.
Ocean Village (http://www.oceanvillageholidays.co.uk)Ocean Village was founded in 2004 in the United Kingdom. Its one ship sailed throughoutthe Mediterranean and the Caribbean, and targeted individuals in the 30 to 50 age range wholiked to explore and wanted a change from traditional cruising. Although performance hadbeen good, there have been indications that the ship may be transferred to the P&O brand atsome future date.
IberoCruceros (www.iberocruceros.com/)IberoCruceros was one of the top operators in the fast-growing Spanish and Portugueselanguage cruise markets. The company operated four ships with a berth capacity of 5,010.Ibero vessels operated in Mediterranean, Brazilian, Northern Europe, and Caribbean waters.
Industry ProjectionsThe leisure cruise vacation industry has fared very well over the last 25 years, originating fromtransatlantic crossings and leisure cruises for the wealthy to being a staple vacation alternative forthe middle class. Cruise Market Watch, a cruise vacation research company, estimated that allcruise lines will carry an annualized total passenger count worldwide of 18.4 million in 2010 andprojected an increase to 21.3 million in 2013, a 15.7% increase from 2010. Giving perspective tothe 2010 numbers, cruise travel accounted for less than half (50%) of all visitors to Las Vegas,when including all cruise ships, from all lines, filled to capacity all year long. Cruise companiescan move ships to match demand patterns over the globe, while Las Vegas was a fixed destination.
CASE 16 Carnival Corporation & plc (2010) 16-11
According to Cruise Lines International Association’s 2010 Cruise Market Overview,growth in the number of North American passengers (95% U.S. and 5% Canadian) was cur-rently flat. Mickey Arison estimated the number of people in the United States that have takena cruise at 20%. He based his estimate on the total U.S. population. Arison’s estimate did notreflect the core market, the number of people who fit the cruiser potential profile: over 25, suffi-cient income, leisure time, and other factors. Cruise Market Watch estimated the core market at130 million, and approximately 60 million individuals in the core market had taken a cruise.The North American market was a more mature market than other geographic markets inter-nationally. Still, as of 2009, the North American market was the largest and was valued at$15.95 billion with Carnival holding a commanding 55% market share.
Despite the 2008–2009 current economic slump, industry growth worldwide had been be-tween 5% and 8% per year due to the growth in the number of international passengers. Thisannual growth was expected to exceed that of the U.S. and Canadian market for the next sev-eral years. Europe’s market was valued at $7.2 billion and the Asia/Australian markets com-bined was valued at $2.9 billion. Faster market growth combined with a weakening U.S. dollarwould strengthen overseas earnings and create a greater focus to capture the fast growing markets. In these two market areas, as of 2009, Carnival held a 52% market share.
Industry capacity continued to increase (up 6.9% over 2009 capacity) and should continuethrough 2013. Industry occupancy (per ship) hovered between 102% and 104% in 2008–2009,depending on the market. Ticket prices and onboard spending should improve slightly in 2010when compared to 2009, but still remain below 2008 levels. Cruise Market Watch estimatedthat average cruise revenue, per passenger, per diem for all cruise lines worldwide was pro-jected to be approximately $208, of which $157 would be attributed to ticket price and $51 inonboard spending.
AdvertisingAccording to the Nielsen Company, hospitality and total travel advertising expendituresshowed a slight increase for the industry in 2009 over 2008 levels. Total industry advertisingin 2008 of $3.89 billion was roughly a 4% increase over 2007. While hospitality firms suchas Intercontinental Hotels, the Blackstone Group, and Southwest Airlines all increased ad-vertising expenditures, Carnival Corporation decreased U.S. advertising expenditures as ofJanuary 2009 to $89.3 million, a 21% decrease from the previous calendar year. The brandwith the greatest reduction in ad spending in the Carnival portfolio was Princess Cruises.Hoover’s reported that, beginning in 2009, Carnival increased online and social media adver-tising utilizing Facebook, YouTube, Twitter, Flickr, and Podcasts, to allow for two-way con-versations with consumers and also create brand fans.
Human Resources ManagementCarnival Corporation’s shore operations had approximately 10,000 full-time and 5,000 part-time/seasonal employees. Carnival also employed approximately 70,000 officers, crew, andstaff onboard the 98 ships at any one time. Because of the highly seasonal nature of theAlaskan and Canadian operations, Holland America Tours and Princess Tours increased theirworkforce during the late spring and summer months in connection with the Alaskan cruiseseason, employing additional seasonal personnel. Carnival had entered into agreements withunions covering certain employee categories, and union relations were considered to be gen-erally good. Nonetheless, the American Maritime union had cited Carnival (and other cruiseoperators) several times for exploitation of its crews.
16-12 SECTION D Industry Three—Entertainment and Leisure
SuppliersThe company’s largest purchases were for travel agency services, fuel, advertising, food andbeverages, hotel and restaurant supplies and products, airfare, repairs and maintenance, dry-docking, port facility utilization, and communication services. Most capital outlays were forthe construction of new ships as well as upgrades and refurbishment of current ships. AlthoughCarnival utilized a select number of suppliers for most of its food and beverages and hotel andrestaurant supplies, most of these items were available from numerous sources at competitiveprices. The use of a select number of suppliers enabled management to, among other things,obtain volume discounts. The company purchased fuel and port facility services at some of itsports of call from a limited number of suppliers. To better manage price fluctuations, the com-pany hedged the price of fuel oil. In addition, the company performed major dry-dock and shipimprovement work at dry-dock facilities in the Bahamas, British Columbia, Canada, theCaribbean, Europe, and the United States. Management believed there were sufficient dry-dockand shipbuilding facilities to meet the company’s anticipated requirements.
Government RegulationsAll of Carnival’s ships were registered in a country outside the United States and each ship flewthe flag of its country of registration. Carnival’s ships were regulated by various international,national, state, and local port authorities’ laws, regulations, and treaties in force in the jurisdic-tions in which the ships operated. Internationally, all ships and operations conformed to the SOLAS (Safety of Life at Sea) regulations adopted by most seafaring nations. In U.S. waters andports, the ships had to comply with U.S. Coast Guard and U.S. Public Health regulations, theMaritime Transportation Security Act, International Ship and Port Facility Security Code, U.S.Oil Pollution Act of 1990, U.S. Maritime Commission, local port authorities, local and federallaw enforcement agencies, and all laws pertaining to the hiring of foreign workers. All cruiseships were inspected for health issues and received a rating which was published on the Centerfor Disease Control (CDC) website for potential cruisers to review. Terrorist threats had tight-ened U.S. security of ports regarding docking facilities, cargo containers and storage areas, andcrews requiring compliance with various Homeland Security agencies.
Sustainability
Carnival Corporation had adopted the requirements of International Standard ISO 14001:2004for the environmental management systems of all subsidiary lines. It had internal policies con-cerning the reduction of the carbon and environmental footprint, energy reduction, shipboardwaste management, environmental training of crew members, health, safety and security, andcorporate social responsibility. The following excerpt from the Carnival Corporation investorrelations website illustrates the commitment of Carnival Management.
“. . . Carnival senior management maintains a continuing commitment to be responsible corporatecitizens, especially when it comes to protecting the environment. We have made great strides in this
Onboard service was labor intensive, employing help from almost 100 nations, many fromthird-world countries, with reasonable returns to employees. For example, waiters on a Carni-val Cruise Lines ship could earn approximately $18,000 to $27,000 per year (base salary andtips), significantly greater than could be earned in their home countries for similar employ-ment. Waiters typically worked 10 hours per day, 6–7 days per week, and had tenure of ap-proximately eight years with the company. Even with these work parameters, applicantsexceeded demand for all cruise positions.
CASE 16 Carnival Corporation & plc (2010) 16-13
area and will continue to dedicate our efforts toward even more progress. In 2009, we published ourfourth annual Environmental Management Report. This action continues the expansion of our trans-parency in publicly reporting the details of our ongoing commitment to the environment. We havealso begun to broaden the scope of our transparency to include sustainability reporting. Sustainabil-ity reports have been published by two of our brands, Costa and AIDA. We are planning to use thesereports as models for similar sustainability reports by all of our brands, beginning in 2010.”
Legal IssuesCarnival Corporation, like all cruise companies and hospitality providers, usually had severallawsuits pending at any point in time. Although consuming the time of corporate officers andsometimes requiring substantial financial remuneration, the principal danger of lawsuits results from the negative media publicity that may influence current and potential guests.
Some of the more publicized personal lawsuits came from passengers injured while on-board a Carnival vessel, sexual assaults by crewmembers or other passengers, negligence ofthe onboard medical staff, food contamination lawsuits, pay and working conditions lawsuitsbrought by crewmembers, and a host of other related court filings.
Legal issues for the company also tarnished its corporate image and reputation. Carnivalhad been sued by various entities for pollution, ship dumping of bilge and other waste contam-inants in international and jurisdictional waters, and filing false statements with the U.S. CoastGuard. Fuel surcharges for passengers that were not part of the stated cruise fare and variousother class-actions have also led to legal proceedings. The company had also been sued overcopyright infringement in its production of entertainment shows and materials onboard ship.
Carnival attempted to aggressively protect its corporate reputation and brand image byattempting to minimize damage while ensuring that violations and actions were promptly cor-rected. Management wanted the company to be perceived as a responsible corporate citizen forguests, workers, and the world community.
CompetitorsAccording to Cruise Lines International Association, there were several large cruise linecompanies worldwide and a host of smaller companies totaling more than 100 ships compet-ing with the Carnival fleet. Carnival’s primary competitors were Royal Caribbean, Disney,and Norwegian Cruise Line, although several other companies competed with Carnivalbrands in selected geographical markets and specific targeted cruise segments.
Royal Caribbean Cruises Ltd. operated five brands—Royal Caribbean International,Celebrity Cruises, Pullmantur, Azamara Cruises, and CDF Croisieres de France—and had a50% joint venture with TUI cruises. Royal Caribbean operated 38 cruise ships with a passen-ger capacity of over 84,000. The company planned to add four new ships by 2012, bringingthe capacity to 100,000 berths. The fleet visited approximately 400 destinations worldwide.The Royal Caribbean brand competed with the Carnival Cruise Lines brand and was perceivedas being slightly more upscale than Carnival ships. It competed secondarily with Costa andother Carnival brands. Celebrity cruises competed in the premium segment against Carnival’sPrincess and Holland America brands. The Royal Caribbean company had a 27% market sharein North America and a 22% share in the remaining world markets.
Disney Cruise Line, had two cruise ships, each having 877 staterooms (3,508 berths). Disney had its own private island, Castaway Bay, exclusive for Disney Cruise Line passengers,and catered primarily to family vacations. One analyst said, “Carnival should thank Disney for taking children off their ships.” Specific areas of the ships were designated for activitiespreferred by adults, families, teens, and children. Disney Cruise Line used its ships primarilyas a complement to its theme park vacations, and had a 2% market share in North America.
16-14 SECTION D Industry Three—Entertainment and Leisure
Other Competitive ConcernsCarnival’s management described the firm’s competitors in the following manner:
First. Carnival competed with land-based vacation alternatives throughout the world includ-ing resorts, hotels, theme parks, and vacation ownership properties located in Las Vegas,Nevada, Orlando, Florida, various parts of the Caribbean and Mexico, Bahamian andHawaiian Island destination resorts, and numerous other vacation destinations throughoutEurope and the rest of the world.
Second. Carnival’s primary cruise competitors in the contemporary and/or premium cruisesegments for North American passengers were Royal Caribbean Cruise Ltd., NorwegianCruise Line, and Disney Cruise Line. The three primary cruise competitors for Europeanpassengers were: (1) My Travel’s Sun Cruises, Fred Olsen, Saga and Thomson in theUnited Kingdom; (2), Festival Cruises, Hapag-Lloyd, Peter Deilmann, Phoenix Reisen,and Tranocean Cruises in Germany; and (3) Mediterranean Shipping Cruises, LouisCruise Line, Festival Cruises, and Spanish Cruise Line in Southern Europe. Carnival alsocompeted for passengers throughout Europe with Norwegian Cruise Line, Orient Lines,Royal Caribbean International, and Celebrity Cruises.
Third. The company’s primary competitors in the luxury cruise segment for the Cunard and Seabourn brands included Crystal Cruises, Radisson Seven Seas Cruise Line, and Silversea Cruises.
Fourth. Carnival brands also competed with similar or overlapping product offerings acrossall segments.
Financials
StockLike most corporations in the last five years, Carnival (CCL) stock had been a rollercoasterride ranging from approximately $55 per share common to $17 and back to $42 as of the thirdquarter, 2010. With a beta of 1.51 the stock has moved parallel to both the DOW and S&P 500but had underperformed both indexes. However, with a market cap of $33.51 billion and aforward P/E of 14.59, market analysts were generally recommending Carnival as a “hold” inOctober, 2010.
In 2006 the Board of Directors authorized the repurchase of $1 billion (maximum) of Carnival Corporation common stock and Carnival plc. A repurchase authorization of approx-imately $787 million was still in effect.
Because Carnival Corporation & plc operated under a dual listed company structure, anunusual “Stock Swap” arrangement had been created. Each year the Boards of Directors au-thorized the repurchase of a set dollar amount of Carnival plc ordinary shares and a set dollaramount of Carnival Corporation common stock shares under the “Stock Swap” program. Theboards then used the “Stock Swap” program in situations where an economic benefit can beobtained because either Carnival Corporation common stock or Carnival plc ordinary shareswere trading at a price that was at a premium or discount to the price of Carnival plc ordinary
Norwegian Cruise Line had 11 ships with a berth capacity of over 23,000, and marketed“Freestyle Cruising,” which allowed guests freedom of choice with regard to a multiplicity of dining venues and times. The atmosphere in the ships was “resort casual”; the fleet competed withRoyal Caribbean and Carnival ships, and, to a lesser extent, brands targeted to the premium segment.The company was Hawaii’s cruise leader. NCL had a market share of 10% of the North AmericanMarket and its affiliated companies had a small market share primarily in European markets.
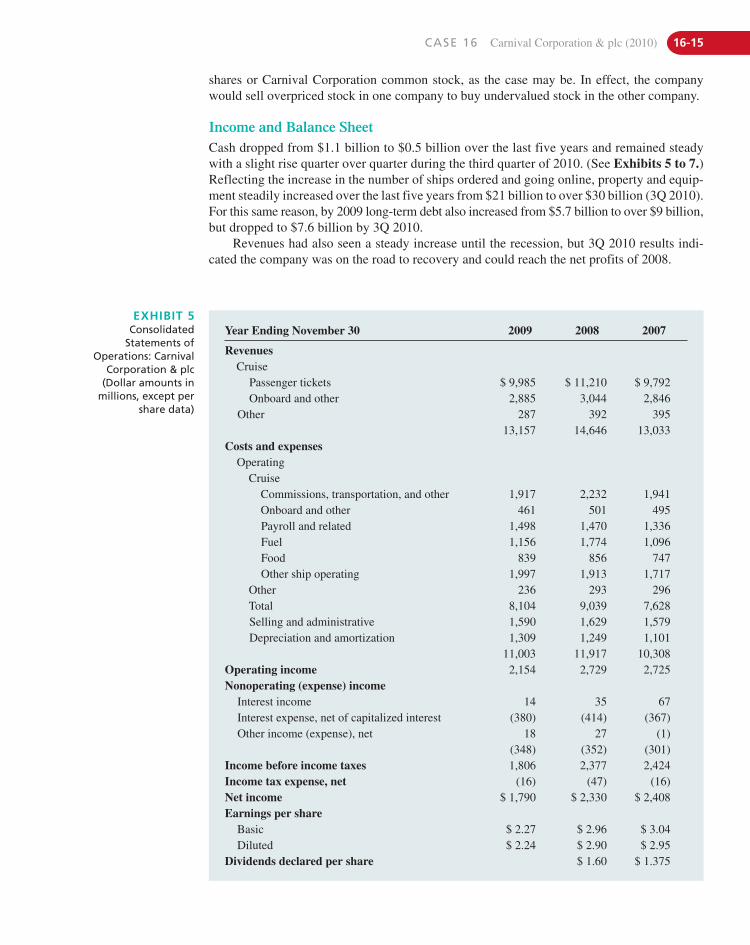
CASE 16 Carnival Corporation & plc (2010) 16-15
shares or Carnival Corporation common stock, as the case may be. In effect, the companywould sell overpriced stock in one company to buy undervalued stock in the other company.
Income and Balance SheetCash dropped from $1.1 billion to $0.5 billion over the last five years and remained steadywith a slight rise quarter over quarter during the third quarter of 2010. (See Exhibits 5 to 7.)Reflecting the increase in the number of ships ordered and going online, property and equip-ment steadily increased over the last five years from $21 billion to over $30 billion (3Q 2010).For this same reason, by 2009 long-term debt also increased from $5.7 billion to over $9 billion,but dropped to $7.6 billion by 3Q 2010.
Revenues had also seen a steady increase until the recession, but 3Q 2010 results indi-cated the company was on the road to recovery and could reach the net profits of 2008.
Year Ending November 30 2009 2008 2007
RevenuesCruise
Passenger tickets $ 9,985 $ 11,210 $ 9,792Onboard and other 2,885 3,044 2,846
Other 287 392 39513,157 14,646 13,033
Costs and expensesOperating
CruiseCommissions, transportation, and other 1,917 2,232 1,941Onboard and other 461 501 495Payroll and related 1,498 1,470 1,336Fuel 1,156 1,774 1,096Food 839 856 747Other ship operating 1,997 1,913 1,717
Other 236 293 296Total 8,104 9,039 7,628Selling and administrative 1,590 1,629 1,579Depreciation and amortization 1,309 1,249 1,101
11,003 11,917 10,308Operating income 2,154 2,729 2,725Nonoperating (expense) income
Interest income 14 35 67Interest expense, net of capitalized interest (380) (414) (367)Other income (expense), net 18 27 (1)
(348) (352) (301)Income before income taxes 1,806 2,377 2,424Income tax expense, net (16) (47) (16)Net income $ 1,790 $ 2,330 $ 2,408Earnings per share
Basic $ 2.27 $ 2.96 $ 3.04Diluted $ 2.24 $ 2.90 $ 2.95
Dividends declared per share $ 1.60 $ 1.375
EXHIBIT 5Consolidated
Statements ofOperations: Carnival
Corporation & plc(Dollar amounts in
millions, except pershare data)
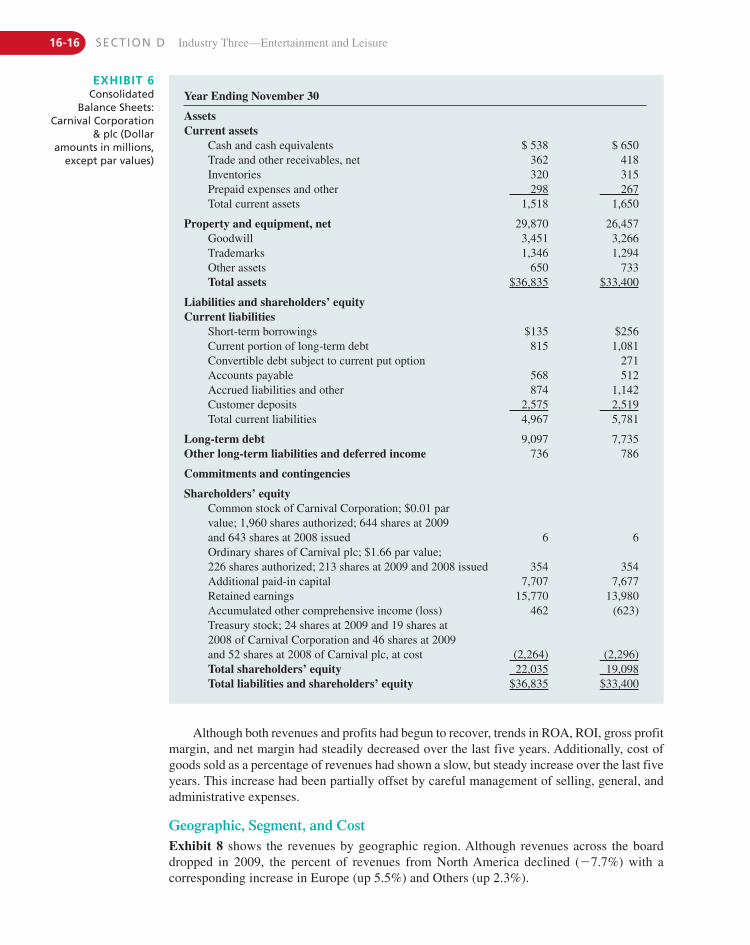
16-16 SECTION D Industry Three—Entertainment and Leisure
Year Ending November 30
AssetsCurrent assets
Cash and cash equivalents $ 538 $ 650Trade and other receivables, net 362 418Inventories 320 315Prepaid expenses and other 298 267Total current assets 1,518 1,650
Property and equipment, net 29,870 26,457Goodwill 3,451 3,266Trademarks 1,346 1,294Other assets 650 733Total assets $36,835 $33,400
Liabilities and shareholders’ equityCurrent liabilities
Short-term borrowings $135 $256Current portion of long-term debt 815 1,081Convertible debt subject to current put option 271Accounts payable 568 512Accrued liabilities and other 874 1,142Customer deposits 2,575 2,519Total current liabilities 4,967 5,781
Long-term debt 9,097 7,735Other long-term liabilities and deferred income 736 786
Commitments and contingencies
Shareholders’ equityCommon stock of Carnival Corporation; $0.01 par value; 1,960 shares authorized; 644 shares at 2009 and 643 shares at 2008 issued 6 6Ordinary shares of Carnival plc; $1.66 par value; 226 shares authorized; 213 shares at 2009 and 2008 issued 354 354Additional paid-in capital 7,707 7,677Retained earnings 15,770 13,980Accumulated other comprehensive income (loss) 462 (623)Treasury stock; 24 shares at 2009 and 19 shares at 2008 of Carnival Corporation and 46 shares at 2009 and 52 shares at 2008 of Carnival plc, at cost (2,264) (2,296)Total shareholders’ equity 22,035 19,098Total liabilities and shareholders’ equity $36,835 $33,400
EXHIBIT 6Consolidated
Balance Sheets:Carnival Corporation
& plc (Dollaramounts in millions,
except par values)
Although both revenues and profits had begun to recover, trends in ROA, ROI, gross profitmargin, and net margin had steadily decreased over the last five years. Additionally, cost ofgoods sold as a percentage of revenues had shown a slow, but steady increase over the last fiveyears. This increase had been partially offset by careful management of selling, general, andadministrative expenses.
Geographic, Segment, and CostExhibit 8 shows the revenues by geographic region. Although revenues across the boarddropped in 2009, the percent of revenues from North America declined (�7.7%) with a corresponding increase in Europe (up 5.5%) and Others (up 2.3%).
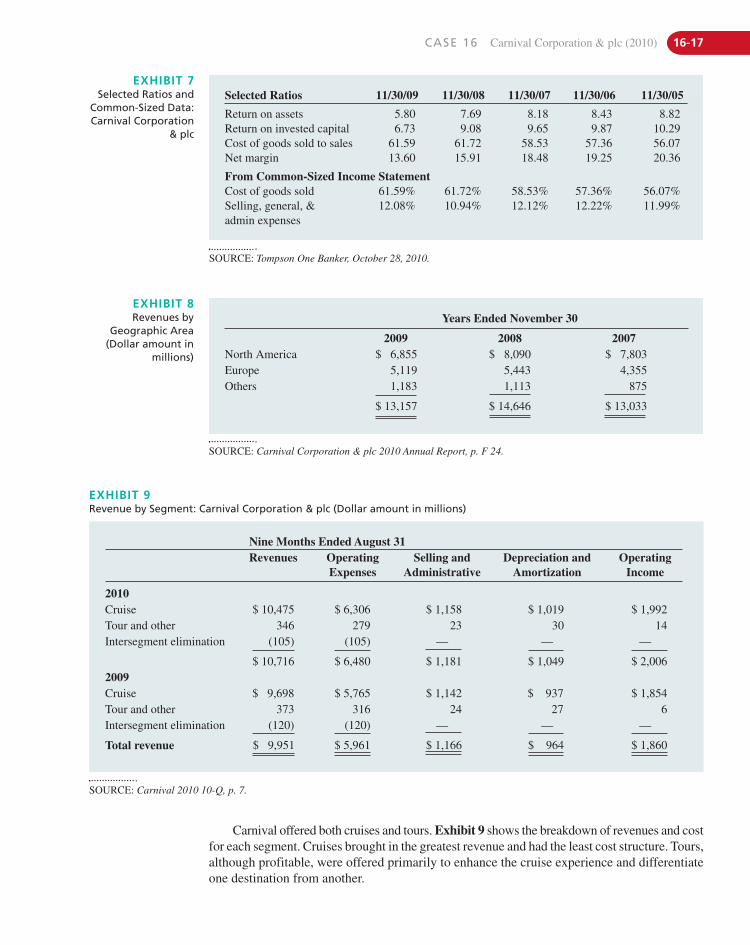
CASE 16 Carnival Corporation & plc (2010) 16-17
Carnival offered both cruises and tours. Exhibit 9 shows the breakdown of revenues and costfor each segment. Cruises brought in the greatest revenue and had the least cost structure. Tours,although profitable, were offered primarily to enhance the cruise experience and differentiateone destination from another.
Selected Ratios 11/30/09 11/30/08 11/30/07 11/30/06 11/30/05
Return on assets 5.80 7.69 8.18 8.43 8.82Return on invested capital 6.73 9.08 9.65 9.87 10.29Cost of goods sold to sales 61.59 61.72 58.53 57.36 56.07Net margin 13.60 15.91 18.48 19.25 20.36
From Common-Sized Income StatementCost of goods sold 61.59% 61.72% 58.53% 57.36% 56.07%Selling, general, & admin expenses
12.08% 10.94% 12.12% 12.22% 11.99%
EXHIBIT 7Selected Ratios and
Common-Sized Data:Carnival Corporation
& plc
SOURCE: Tompson One Banker, October 28, 2010.
Years Ended November 30
2009 2008 2007North America $ 6,855 $ 8,090 $ 7,803Europe 5,119 5,443 4,355Others 1,183 1,113 875
$ 13,157 $ 14,646 $ 13,033
EXHIBIT 8Revenues by
Geographic Area(Dollar amount in
millions)
SOURCE: Carnival Corporation & plc 2010 Annual Report, p. F 24.
Nine Months Ended August 31Revenues Operating
ExpensesSelling and
AdministrativeDepreciation and
AmortizationOperating
Income
2010Cruise $ 10,475 $ 6,306 $ 1,158 $ 1,019 $ 1,992Tour and other 346 279 23 30 14Intersegment elimination (105) (105) — — —
$ 10,716 $ 6,480 $ 1,181 $ 1,049 $ 2,0062009Cruise $ 9,698 $ 5,765 $ 1,142 $ 937 $ 1,854Tour and other 373 316 24 27 6Intersegment elimination (120) (120) — — —
Total revenue $ 9,951 $ 5,961 $ 1,166 $ 964 $ 1,860
EXHIBIT 9Revenue by Segment: Carnival Corporation & plc (Dollar amount in millions)
SOURCE: Carnival 2010 10-Q, p. 7.
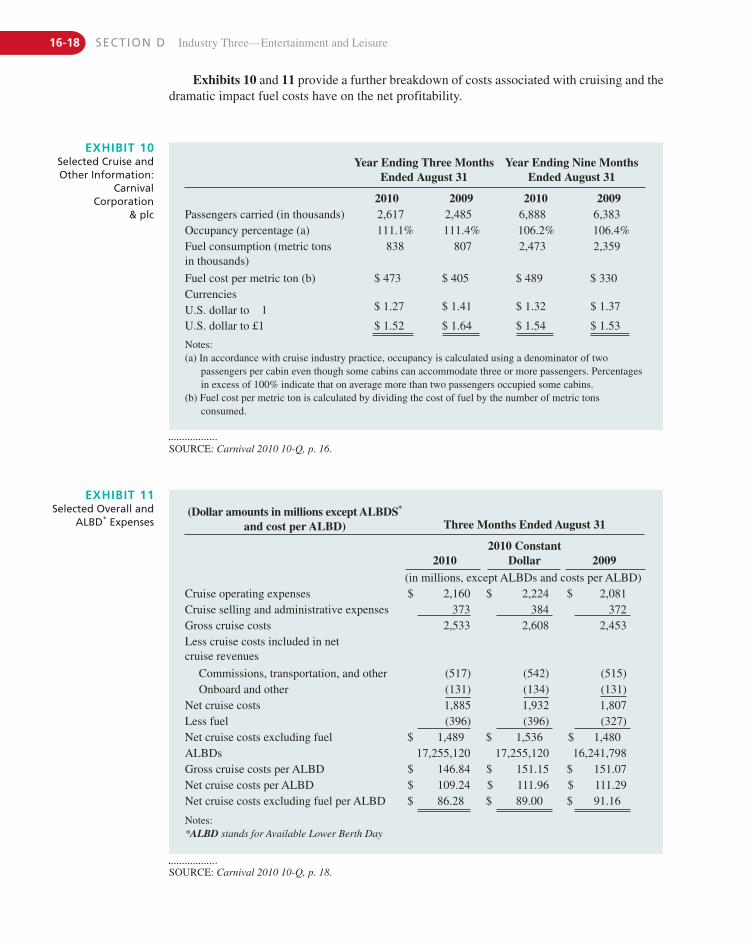
16-18 SECTION D Industry Three—Entertainment and Leisure
Exhibits 10 and 11 provide a further breakdown of costs associated with cruising and thedramatic impact fuel costs have on the net profitability.
Year Ending Three Months Ended August 31
Year Ending Nine Months Ended August 31
2010 2009 2010 2009Passengers carried (in thousands) 2,617 2,485 6,888 6,383Occupancy percentage (a) 111.1% 111.4% 106.2% 106.4%Fuel consumption (metric tons in thousands)
838 807 2,473 2,359
Fuel cost per metric ton (b) $ 473 $ 405 $ 489 $ 330CurrenciesU.S. dollar to €1 $ 1.27 $ 1.41 $ 1.32 $ 1.37
U.S. dollar to £1 $ 1.52 $ 1.64 $ 1.54 $ 1.53
Notes:(a) In accordance with cruise industry practice, occupancy is calculated using a denominator of two
passengers per cabin even though some cabins can accommodate three or more passengers. Percentagesin excess of 100% indicate that on average more than two passengers occupied some cabins.
(b) Fuel cost per metric ton is calculated by dividing the cost of fuel by the number of metric tonsconsumed.
EXHIBIT 10Selected Cruise andOther Information:
CarnivalCorporation
& plc
SOURCE: Carnival 2010 10-Q, p. 16.
(Dollar amounts in millions except ALBDS*
and cost per ALBD) Three Months Ended August 31
20102010 Constant
Dollar 2009(in millions, except ALBDs and costs per ALBD)
Cruise operating expenses $ 2,160 $ 2,224 $ 2,081Cruise selling and administrative expenses 373 384 372Gross cruise costs 2,533 2,608 2,453Less cruise costs included in net cruise revenues
Commissions, transportation, and other (517) (542) (515)Onboard and other (131) (134) (131)
Net cruise costs 1,885 1,932 1,807Less fuel (396) (396) (327)Net cruise costs excluding fuel $ 1,489 $ 1,536 $ 1,480ALBDs 17,255,120 17,255,120 16,241,798Gross cruise costs per ALBD $ 146.84 $ 151.15 $ 151.07Net cruise costs per ALBD $ 109.24 $ 111.96 $ 111.29Net cruise costs excluding fuel per ALBD $ 86.28 $ 89.00 $ 91.16
Notes:*ALBD stands for Available Lower Berth Day
EXHIBIT 11Selected Overall and
ALBD* Expenses
SOURCE: Carnival 2010 10-Q, p. 18.

CASE 16 Carnival Corporation & plc (2010) 16-19
Carnival in the FutureCarnival currently held approximately 50% of the cruising market. The company’s strategyof “do one thing and do it better than anyone else” had been very successful. This concentra-tion strategy had been so successful, in fact, that continued expansion in the cruise market waslikely to become increasingly competitive and additional market share difficult to capture.
However, improving economic conditions may release pent-up demand for vacations withcorresponding increase in the entire cruising market. An improving economy may be offset byincreased terrorist activity in Europe and North America, a double dip recession, or rising fuelprices.
Carnival seemed to be positioned to take advantage of changes in the cruising industry byfocusing more on Europe and differentiating with destinations, shipboard activities, and shipsize. As Mickey Arison pondered the future of Carnival, his vision must extend many yearsinto the future (ships must be ordered five or more years in advance) and attempt to forecastthe world of 2016 and beyond to be successful.

This page intentionally left blank
17-1
C A S E 17Chrysler in TroubleBarnali Chakraborty, under the direction of Vivek Gupta
“For too long, Chrysler moved too slowly to adapt to the future, designing and building cars that were less popular, less reliable and less fuel efficient than foreign competitors.”1
BARACK HUSSAIN OBAMA
PRESIDENT OF THE UNITED STATES, IN APRIL 2009
“More than anything the consumers are very hesitant to do business with a manufacturer in bankruptcy.”2
PETER GRADY
EXECUTIVE AT CHRYSLER, IN MAY 2009
“This partnership (with Fiat SpA) transforms Chrysler into a vibrant new company with a wealth of strategic advantages. It enables us to better serve our customers and dealers with a broader and more competitive line-up
of environmentally friendly, fuel-efficient high-quality vehicles.”3
BOB NARDELLI
CHAIRMAN AND CEO OF CHRYSLER LLC, IN MAY 2009
Chrysler Files for BankruptcyON APRIL 30, 2009, CHRYSLER MOTORS LLC (CHRYSLER), the third largest automobilemanufacturer in the United States, filed for bankruptcy protection under Section 3634 of
Chapter 115 of the U.S. bankruptcy code in the Manhattan Bankruptcy Court along with its24 wholly-owned U.S. subsidiaries. As part of its bankruptcy filing, Chrysler announced thatit would establish a global strategic alliance with Fiat SpA (Fiat).6 It would create a new com-pany in which Fiat would initially have a 20% stake, which would later be increased up to35%. The Voluntary Employees’ Benefit Association (VEBA)7 would have a 55% stake in itand the U.S. Treasury Department (U.S. Treasury) an 8% stake. The Canadian and Ontariogovernments would have a combined 2% stake, with the Canadian government holding 1.33%and the Ontario government holding the remaining 0.67% stake.
This case was written by Barnali Chackraborty, under the direction of Vivek Gupta, ICMR Management Research. It was compiled from published sources, and is intended to be used as a basis for class discussion rather than to illustrate either effective or ineffective handling of a management situation. © 2009, ICMR Center for ManagementResearch. This case cannot be reproduced in any form without the written permission of the copyright holders, VivekGupta and ICMR Management Research. Reprint permission is solely granted by the publisher, Prentice Hall, for thebook Strategic Management and Business Policy, 13th Edition (and the international and electronic versions of thisbook) by the copyright holders, Vivek Gupta and ICMR Management Research. This case was edited for SMBP, 13thEdition. The copyright holders are solely responsible for case content. Any other publication of the case (translation,any form of electronic or other media) or sale (any form of partnership) to another publisher will be in violation ofcopyright law, unless Vivek Gupta and ICMR Management Research have granted additional written reprint permission.Reprinted by permission.
Industry Four—Transportation
17-2 SECTION D Industry Four—Transportation
Chrysler was struggling to stay afloat even after receiving financial aid in the form of a fed-eral loan of US$4 billion in January 2009, out of the requested amount of US$7 billion. However,with declining sales, it had become increasingly difficult for Chrysler to continue with its opera-tions. Therefore, in its Restructuring Plan for Long-Term Viability, submitted on February 17,2009, the company asked for another US$2 billion federal loan over and above the US$7 billionloan it had requested earlier. For Chrysler to get an additional federal loan, the U.S. governmenthad made it a condition that the company should establish an alliance with Fiat on or beforeApril 30, 2009. The company was also required to restructure its debt and negotiate with UAW(United Auto Workers)8 and CAW (Canadian Auto Workers)9 to reduce costs. Although Chryslerwas able to reach an agreement with Fiat and had convinced UAW and CAW to reduce costs, itfailed to get all its creditors to agree to debt restructuring. The company finally had to file forbankruptcy protection. Commenting on the company’s bankruptcy filing, Bob Nardelli (Nardelli),Chairman and CEO of Chrysler, said, “Even though total agreement was not possible, I am trulygrateful for all that has been sacrificed, on the part of many of Chrysler’s stakeholders to reach anagreement in principle with Fiat. My number one priority has been to preserve Chrysler and thethousands of people who depend on its success. While I am excited about the creation of theglobal alliance, I am personally disappointed that today Chrysler has filed for Chapter 11. Thiswas not my first choice.”10
While some analysts were apprehensive about Chrysler’s viability, others were of theview that Chrysler would come out of the bankruptcy soon. According to Lee Iacocca (Iacocca), former Chairman and Chief Executive Officer (CEO) of Chrysler, “It pains me tosee my old company, which has meant so much to America, on the ropes. But Chrysler hasbeen in trouble before, and we got through it, and I believe they can do it again.”11
About ChryslerThe history of Chrysler can be traced back to the 1920s. In 1921, Walter P. Chrysler (Walter)joined as Chairman of Maxwell Motor Corporation (Maxwell).12 During that time, Maxwellhad high debts because of its declining sales after World War I.
In 1923, the production of automobiles under the brand name of Maxwell was stopped. In 1924, a new vehicle named Chrysler Six, which had a light, powerful, high-compression six-cylinder engine and the first ever four-wheel hydraulic brakes, was launched in the U.S. automobile market. The vehicle was available for US$1,565.
In 1928, the company acquired the Dodge Brothers firm and became the third largest automaker in the United States. The company also started the DeSoto and Plymouth divisions.The company positioned the Plymouth brand as a low priced car, while DeSoto was introducedin the medium price segment.
In 1934, the company introduced the Chrysler Airflow, one of the first cars to be aerody-namically designed. However, it was not able to generate much interest among the public.Nunetheless, the company was able to survive during the Great Depression13 because of thestrong sales generated by the entry-level Dodge and Plymouth brands.
In 1951, Chrysler developed the Firepower, the first hemispherical-head V8 engine,which later became popular as the HEMI® engine.14 By the end of the 1950s, the company hadbecome famous for creating power steering, power windows, the alternator, electronic fuel injection, and many other automotive innovations.
In the 1960s, Chrysler expanded into Europe and formed Chrysler Europe by acquiringthe UK-based Rootes Group,15 Simca,16 and Barreiros.17 In the 1970s, the company had to facenew challenges such as issues related to environmental pollution and rising gas prices. It alsostarted facing competition from foreign car manufacturers such as Honda Motor Company(Honda) and Toyota Motor Corporation (Toyota).
CASE 17 Chrysler in Trouble 17-3
The oil crisis of the 1970s18 resulted in a high demand for fuel-efficient cars. Americancustomers started preferring small, fuel-efficient Japanese cars as compared to the U.S.-madebigger cars. Moreover, as the performance of the Japanese cars was superior to the cars madein the United States and their prices were competitive compared to the American cars, therewas an increase in their sales.
In the 1970s, Chrysler’s sales started declining. In 1978, the company hired Iacocca as theChief Operating Officer (COO) of Chrysler Corporation. In September 1979, Iacocca was pro-moted to Chairman and CEO. Soon after, he carried out a revamping exercise in the companyand set up a new management team.
Iacocca initiated several cost-cutting measures including scaling down nonproductive opera-tions, closing down plants, stopping some employee benefits, initiating temporary layoffs, and soon. In the late 1970s, the company had a debt of approximately US$4.75 million and was in deepfinancial trouble. It had to ask for financial help from the U.S. government. In 1979, U.S. PresidentJimmy Carter signed a bill through which the U.S. government provided a US$1.5 billion federalloan to Chrysler Corporation. The federal loan helped the company restructure itself.
During the restructuring, Chrysler’s product line was substantially expanded. Iacocca em-phasized manufacturing passenger cars, like the Dodge Caravan and Plymouth Voyager, whichreceived a good response from consumers. Apart from that, the company also focused on design-ing fuel-efficient K Cars.
By the early 1980s, Chrysler had started recovering from the crisis. In 1983, seven yearsahead of schedule, the company repaid the federal loan. In 1984, the company reported a profitof US$2.4 billion.
Between 1984 and 1988, Chrysler acquired many companies including Gulfstream Aerospace Corporation, a corporate jet manufacturer; Lamborghini, the Italian luxury carmanufacturer; Finance America; E. F. Hutton Credit Corporation; American Motors Corpora-tion; and so on. Through the acquisition of American Motors Corporation, the world famousJeep® brand came into the company fold. In 1987, the company increased its shareholding inMitsubishi Motors Corporation and entered into a strategic alliance with Samsung, a SouthKorean electronics company.
In the late 1980s, the financial condition of Chrysler Corporation started deteriorating.The company began taking cost-cutting measures and introduced fuel-efficient vehicles likethe Dodge Shadow and the Plymouth Sundance. In 1989, it started a US$1 billion cost-cuttingand restructuring program. On December 31, 1992, Iacocca retired as the CEO of the com-pany. In 1996, the company shifted to its new headquarters in Auburn Hills, Michigan, in theUnited States.
The Failed Merger with Daimler-BenzIn May 1998, Chrysler Corporation and Daimler-Benz AG (Daimler), a German automobilemanufacturing company founded in 1926, agreed to combine their businesses in what theycalled a “merger of equals.” On November 12, 1998, the merger process was completed.Through a deal worth US$37 billion, the new company was named DaimlerChrysler AG(DaimlerChrysler). Under DaimlerChrysler, Chrysler Corporation assumed its new name asDaimlerChrysler Motors Company LLC and its U.S. operations started being referred to asthe Chrysler Group. The merger resulted in the world’s third19 largest automobile companyin terms of revenues, market capitalization, and earnings and the fifth20 largest in terms ofnumber of units produced.
To avoid a clash between the German and American management styles, the ChryslerGroup continued to manufacture mass market passenger cars and Daimler to build its luxurymarquee Mercedes. In the third quarter of 2000–2001, the Chrysler Group reported a loss of
US$512 million, which resulted in a decline of share value to US$40 in September 2000 fromUS$108 in January 1999. After the merger, the market share of the Chrysler Group also fellfrom 16.2% to 13.5%. After the bad performance reported by the company, its two successiveAmerican presidents, James P. Holden and Thomas Stallkamp, were fired within a span of 19 months. Dieter Zetsche, a Daimler executive, was appointed as CEO of Chrysler and he appointed another Daimler executive, Wolfgang Bernhard, as the Chief Operating Officer(COO). According to the analysts, the sequence of events demoralized the employees of theChrysler Group, which became a division of DaimlerChrysler and did not have any representa-tive on the DaimlerChrysler board of management.
The merged entity started facing problems mainly because of the significantly differentcultures of the two companies. While the Americans valued efficiency, empowerment, creativ-ity, and informal relationships among the employees, the Germans followed more of a bureau-cratic culture. Apart from cultural differences, other factors like differences in pay structures,different working styles, and so on, also played a critical role in creating a rift between the twocompanies.
For example, in Daimler, high disparities in pay package were discouraged and top man-agement employees did not receive high incentives. In the American pay structure, however,the top executives were paid higher salaries and incentives.
The working styles of both the companies also differed significantly. While the Germans were used to having long meetings and submitting lengthy reports, the Americanspreferred to spend less time on discussions. While the Americans preferred experimenting byfollowing a trial and error method, the Germans had a comprehensive plan that they followedexactly.
In early 2007, DaimlerChrysler AG engaged in talks with Cerberus Capital ManagementL.P. (Cerberus)21 to sell the Chrysler Group. In May 2007, it announced that it would sell an80.1% stake of Chrysler to Cerberus for US$7.4 billion.
On May 21, 2007, Daimler announced that, as part of the deal of selling Chrysler to Cer-berus, it would provide US$1 billion for Chrysler’s pension plan, if the pension plan would beterminated within five years. Daimler assumed the responsibility of the pension payment as perthe agreement between Chrysler and the U.S. Pension Benefit Guaranty Corporation (PBGC).22
Commenting on Daimler’s announcement, Vince Snowbarger, Interim Director of PBGC, said,“I commend both Daimler and Cerberus on their willingness to work with the PBGC to protectthe retirement security of Chrysler workers and retirees. Both Daimler and Cerberus have madesignificant financial commitments to strengthen Chrysler pensions. Daimler has agreed toprovide a guarantee of $1 billion to be paid into the Chrysler plans if the plans terminate withinfive years.”23
In July 2007, the European Commission approved the pension deal. On August 6, 2007,Daimler sold off the majority stake to Cerberus. Chrysler became Chrysler Motors LLC(Chrysler) and DaimlerChrysler AG changed its name to Daimler AG. Nardelli was appointedas Chrysler’s Chairman and CEO. Commenting on the deal, John Snow, the Chairman of Cer-berus, said, “We are aware that Chrysler faces significant challenges, but we are confident thatthey can and will be overcome. A private investment firm like Cerberus will provide manage-ment with the opportunity to focus on their long-term plans rather than the pressures of short-term earnings expectations.”24
In fiscal 2007, Chrysler reported an 8% growth in sales in markets outside the UnitedStates as compared to that of 2006. However, the sales in the U.S. market in 2007 declined by3% compared to the previous year. Commenting on the strong growth in international sales,Jim Press (Press), Vice Chairman and President of Chrysler, said, “This is a revitalized orga-nization, moving in the right directions, with a renewed emphasis on putting the global cus-tomer first at every step in the process—anxious to serve, proud of the value and quality of ourproducts. I am pleased to say that our global results are beginning to show this.”25
17-4 SECTION D Industry Four—Transportation
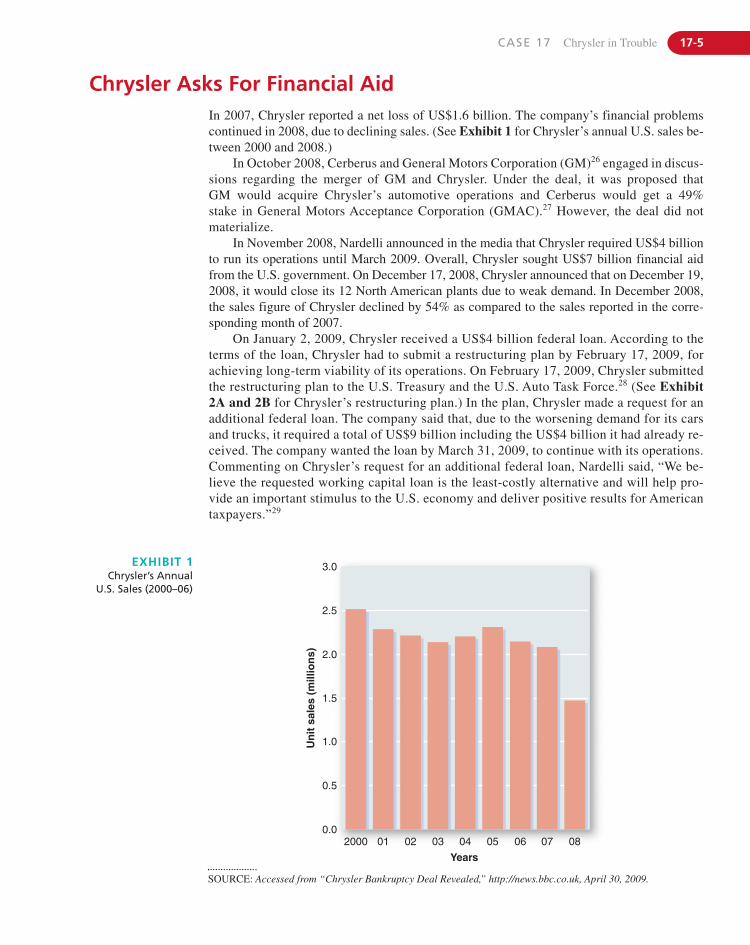
CASE 17 Chrysler in Trouble 17-5
Chrysler Asks For Financial AidIn 2007, Chrysler reported a net loss of US$1.6 billion. The company’s financial problemscontinued in 2008, due to declining sales. (See Exhibit 1 for Chrysler’s annual U.S. sales be-tween 2000 and 2008.)
In October 2008, Cerberus and General Motors Corporation (GM)26 engaged in discus-sions regarding the merger of GM and Chrysler. Under the deal, it was proposed that GM would acquire Chrysler’s automotive operations and Cerberus would get a 49% stake in General Motors Acceptance Corporation (GMAC).27 However, the deal did notmaterialize.
In November 2008, Nardelli announced in the media that Chrysler required US$4 billionto run its operations until March 2009. Overall, Chrysler sought US$7 billion financial aidfrom the U.S. government. On December 17, 2008, Chrysler announced that on December 19,2008, it would close its 12 North American plants due to weak demand. In December 2008,the sales figure of Chrysler declined by 54% as compared to the sales reported in the corre-sponding month of 2007.
On January 2, 2009, Chrysler received a US$4 billion federal loan. According to theterms of the loan, Chrysler had to submit a restructuring plan by February 17, 2009, forachieving long-term viability of its operations. On February 17, 2009, Chrysler submittedthe restructuring plan to the U.S. Treasury and the U.S. Auto Task Force.28 (See Exhibit2A and 2B for Chrysler’s restructuring plan.) In the plan, Chrysler made a request for anadditional federal loan. The company said that, due to the worsening demand for its carsand trucks, it required a total of US$9 billion including the US$4 billion it had already re-ceived. The company wanted the loan by March 31, 2009, to continue with its operations.Commenting on Chrysler’s request for an additional federal loan, Nardelli said, “We be-lieve the requested working capital loan is the least-costly alternative and will help pro-vide an important stimulus to the U.S. economy and deliver positive results for Americantaxpayers.”29
3.0
2.5
2.0
1.5
1.0
0.5
0.02000 01 02 03 04 05 06 07 08
Years
Un
it s
ales
(m
illio
ns)
EXHIBIT 1Chrysler’s Annual
U.S. Sales (2000–06)
SOURCE: Accessed from “Chrysler Bankruptcy Deal Revealed,” http://news.bbc.co.uk, April 30, 2009.
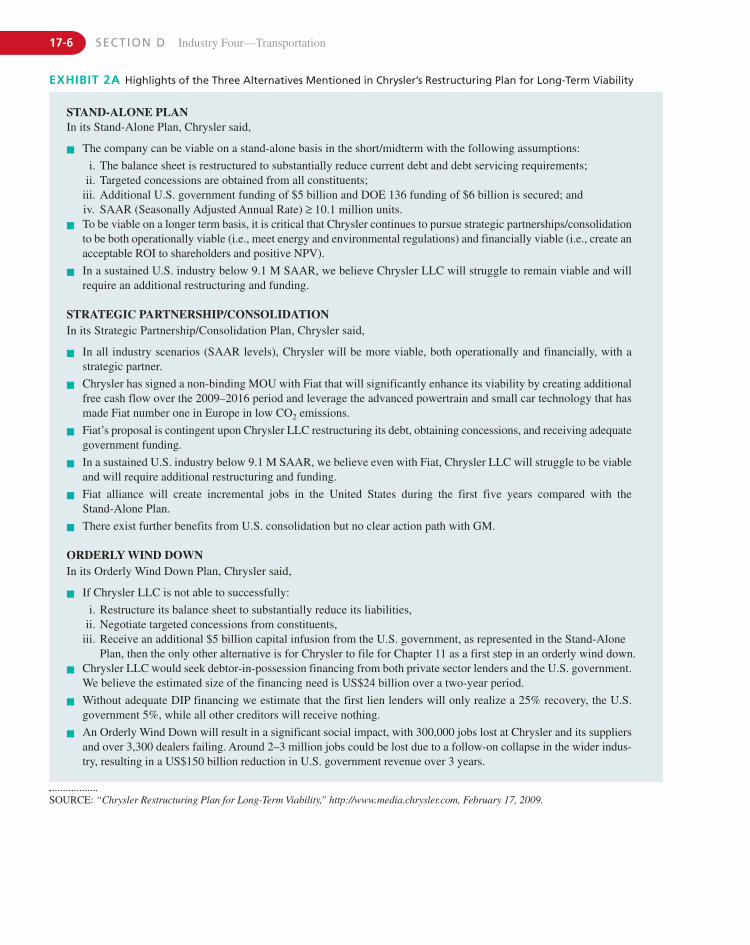
STAND-ALONE PLANIn its Stand-Alone Plan, Chrysler said,
� The company can be viable on a stand-alone basis in the short/midterm with the following assumptions:
i. The balance sheet is restructured to substantially reduce current debt and debt servicing requirements;ii. Targeted concessions are obtained from all constituents;
iii. Additional U.S. government funding of $5 billion and DOE 136 funding of $6 billion is secured; andiv. SAAR (Seasonally Adjusted Annual Rate) ≥ 10.1 million units.
� To be viable on a longer term basis, it is critical that Chrysler continues to pursue strategic partnerships/consolidationto be both operationally viable (i.e., meet energy and environmental regulations) and financially viable (i.e., create anacceptable ROI to shareholders and positive NPV).
� In a sustained U.S. industry below 9.1 M SAAR, we believe Chrysler LLC will struggle to remain viable and willrequire an additional restructuring and funding.
STRATEGIC PARTNERSHIP/CONSOLIDATIONIn its Strategic Partnership/Consolidation Plan, Chrysler said,
� In all industry scenarios (SAAR levels), Chrysler will be more viable, both operationally and financially, with astrategic partner.
� Chrysler has signed a non-binding MOU with Fiat that will significantly enhance its viability by creating additionalfree cash flow over the 2009–2016 period and leverage the advanced powertrain and small car technology that hasmade Fiat number one in Europe in low CO2 emissions.
� Fiat’s proposal is contingent upon Chrysler LLC restructuring its debt, obtaining concessions, and receiving adequategovernment funding.
� In a sustained U.S. industry below 9.1 M SAAR, we believe even with Fiat, Chrysler LLC will struggle to be viableand will require additional restructuring and funding.
� Fiat alliance will create incremental jobs in the United States during the first five years compared with the Stand-Alone Plan.
� There exist further benefits from U.S. consolidation but no clear action path with GM.
ORDERLY WIND DOWNIn its Orderly Wind Down Plan, Chrysler said,
� If Chrysler LLC is not able to successfully:
i. Restructure its balance sheet to substantially reduce its liabilities,ii. Negotiate targeted concessions from constituents,
iii. Receive an additional $5 billion capital infusion from the U.S. government, as represented in the Stand-AlonePlan, then the only other alternative is for Chrysler to file for Chapter 11 as a first step in an orderly wind down.
� Chrysler LLC would seek debtor-in-possession financing from both private sector lenders and the U.S. government.We believe the estimated size of the financing need is US$24 billion over a two-year period.
� Without adequate DIP financing we estimate that the first lien lenders will only realize a 25% recovery, the U.S.government 5%, while all other creditors will receive nothing.
� An Orderly Wind Down will result in a significant social impact, with 300,000 jobs lost at Chrysler and its suppliersand over 3,300 dealers failing. Around 2–3 million jobs could be lost due to a follow-on collapse in the wider indus-try, resulting in a US$150 billion reduction in U.S. government revenue over 3 years.
EXHIBIT 2A Highlights of the Three Alternatives Mentioned in Chrysler’s Restructuring Plan for Long-Term Viability
SOURCE: “Chrysler Restructuring Plan for Long-Term Viability,” http://www.media.chrysler.com, February 17, 2009.
17-6 SECTION D Industry Four—Transportation
STRATEGIC ALLIANCEChrysler has signed a non-binding agreement to pursue a strategic alliance with Fiat that represents significant strategic andfinancial benefits to the stakeholders. The written and oral testimony Chrysler submitted to the U.S. House and Senate in2008 stated the company’s intent to seek the benefits of global partnerships and alliances. The proposed Fiat Alliance wouldenhance Chrysler’s viability plan and would provide the company with access to competitive fuel-efficient vehicle plat-forms, distribution capabilities in key growth markets, and substantial cost-saving opportunities.
PRODUCTSChrysler’s product line is a key component of its Viability Plan. In 2010, the company will launch four highly successfulplatforms: a new Jeep Grand Cherokee, a new Dodge Charger, a new Dodge Durango, and a new Chrysler 300 (the mostawarded car in automotive history since its launch in 2005). The Chrysler 300 launch will be followed by a new, bolderDodge Charger and an all-new unibody Dodge Durango.
In 2008, Chrysler offered six vehicles with highway fuel economy of 28 miles per gallon or better. For 2009, 73% ofChrysler LLC’s vehicles showed improved fuel economy compared with the previous year’s models. Fuel economy willcontinue to improve in 2010 with the introduction of the all-new Phoenix V6 engine, which will provide fuel-efficiency im-provements of between 6% to 8% over the engines it replaces. A two-mode hybrid version of the company’s best-sellingvehicle, the Dodge Ram, is scheduled for 2010. The first Chrysler electric-drive vehicle is also scheduled to reach the mar-ket in 2010. It will be followed by other electric-drive vehicles, including Range-extended Electric Vehicles, in the follow-ing years in order to further reduce fuel consumption.
The proposed Fiat alliance would further help the company achieve these standards as Chrysler gains access to Fiat’ssmaller, fuel-efficient platforms and powertrain technologies. The alliance would enable Chrysler to reduce its capitalexpenditures while supporting the company’s commitment to develop a portfolio of vehicles that support the country’senergy security and environmental objectives.
RESTRUCTURING ACTIONSChrysler LLC has aggressively restructured operations to significantly improve cost competitiveness while improving qual-ity and productivity. Through year end 2008, Chrysler has
� Reduced fixed costs by US$3.1 billion
� Reduced its workforce by 32,000 (a 37% reduction since January 2007)
� Eliminated 12 production shifts
� Eliminated 1.2 million units (more than 30%) of production capacity
� Discontinued four vehicle models
� Disposed of US$700 million in non-earning assets
� Improved manufacturing productivity to equal Toyota as the best in the industry as measured by assembly hours pervehicle according to the Harbour Report
� Achieved the lowest warranty claim rate in Chrysler’s history
� Recorded the fewest product recalls among leading automakers in 2008
The following additional restructuring actions are planned in 2009:
� Reduce fixed costs by US$700 million
� Reduce one shift of manufacturing
� Discontinue three vehicle models
� Sell US$300 million additional non-earning assets
MANAGEMENT CONCESSIONS� Chrysler will fully comply with the restrictions established under section 111 of EESA relative to executive privi-
leges and compensation. In addition, the company has suspended the 401k match, incentive bonuses, and meritincreases, and has eliminated retiree life insurance benefits.
EXHIBIT 2B Highlights of Chrysler Restructuring for Long-Term Viability
(Continued )
CASE 17 Chrysler in Trouble 17-7
17-8 SECTION D Industry Four—Transportation
On March 30, 2009, the U.S. Treasury and the U.S. Auto Task Force rejected Chrysler’sstand-alone Viability Plan. The U.S. Auto Task Force announced that it would provide anotherUS$6 billion federal loan to Chrysler. However, in order to get the additional loan, Chryslerwould have to form an alliance with Fiat by April 30, 2009. In addition, the company wouldhave to restructure its debt and would have to negotiate with the UAW and CAW unions to re-duce employee benefits and increase productivity.
In order to form an alliance with Fiat, in April 2009, Chrysler started the process of gettingapproval from its 45 lending institutions to surrender the first lien debt30 of US$6.9 billion. It alsoentered into negotiations with UAW for it to accept a 55% equity stake in the new company inlieu of Chrysler’s contribution to UAW’s retiree health care trust fund, VEBA. The negotiationsalso included some adjustments to the UAW’s 2007 collective bargaining agreement.
On April 21, 2009, the U.S. Treasury announced that it would give Chrysler US$500 millionover and above the US$4 billion it had already given to continue its operations.
Meanwhile, on April 26, 2009, the CAW ratified an agreement it had reached withChrysler in early April 2009. The agreement helped Chrysler to save US$240 million in an-nual costs. Giving details, Ken Lewenza, President of CAW, said, “Some of it comes from re-duced compensation, some of it comes from lower legacy costs, some of it comes fromincreased productivity and efficiencies in the workplace.”31
On April 28, 2009, the four largest creditor banks—JPMorgan Chase & Company,32 Gold-man Sachs Group Inc.,33 Morgan Stanley,34 and the Citigroup Inc.,35 which collectively held70% of Chrysler’s total debt—approved the U.S. Treasury’s offer of US$2 billion given toChrysler’s first lien debtors.
On April 29, 2009, the UAW also ratified the agreement it had reached with Chrysler. Inthe agreement, UAW agreed to have a 55% equity stake in the company after an alliance with
DEALER CONCESSIONS� Chrysler will achieve cost savings/improved cash flow through a number of initiatives including reduced dealer
margins, elimination of fuel fill, and reduction of service contract margins.
UNION CONCESSIONS� The signed term sheets for the UAW Labor Modifications and VEBA modifications fundamentally comply with the
requirements set forth in the U.S. Treasury Loan and once realized would provide Chrysler with a workforce coststructure that is competitive with the transplant automotive manufacturers. This agreement is subject to ratification.
SUPPLIER CONCESSIONS� The company has initiated the dialogue with its suppliers and believes that it will be able to obtain substantial cost
reductions from suppliers that will result in achieving targeted savings. Chrysler supports the supplier associations’proposals, which would provide a government guarantee of OEM accounts payables.
SECOND LIEN DEBT HOLDERS CONCESSIONS� Chrysler anticipates that the holders of the Second Lien Debt will agree to convert 100% of their debt to equity.
Chrysler’s Viability Plan includes expectations to further reduce its outstanding debt by US$5 billion. In addition tostrengthening the company’s balance sheet for the long term, this reduction will provide immediate cash flow viainterest savings of between US$350 million and US$400 million annually.
EXHIBIT 2B Highlights of Chrysler Restructuring for Long-Term Viability (continued)
SOURCE: “Chrysler LLC Viability Plan Submitted Today to the U.S. Treasury Department,” http://www.chryslerllc.com, February 17, 2009.
Fiat, instead of Chrysler’s contribution in VEBA. UAW would also have a representative onthe board of the new company.
However, the attempt to gain support from all the creditors was unsuccessful. About 20financial firms including Oppenheimer Funds and Stairway Capital, who collectively heldUS$1 billion, declined to agree to the terms of the proposed debt restructuring. Analystsopined that the creditors might be better off after bankruptcy filing and liquidation ofChrysler’s assets. They also opined that, in case of a bankruptcy filing by Chrysler, the credi-tors would have no choice but to accept the US$2 billion offered by the U.S. Treasury.
The U.S. government later offered the creditors another US$250 million, which made thetotal offering US$2.25 billion. However, the deal did not materialize. Criticizing the creditors,President Barack Obama said, “A group of investment firms and hedge funds decided to holdout for the prospect of an unjustified taxpayer-funded bailout. They were hoping that every-body else would make sacrifices and they would have to make none. Some demanded twicethe return that other lenders were getting. I don’t stand with them.”36
CASE 17 Chrysler in Trouble 17-9
The BankruptcyOn April 30, 2009, Chrysler and its 24 wholly-owned U.S. subsidiaries filed for bankruptcy.However, Chrysler’s Mexican, Canadian, and other international operations were not part ofthe bankruptcy filing. The company filed the bankruptcy under Section 363 so that it wouldbe able to emerge from bankruptcy within 30 to 60 days. According to Obama, “It would bea very quick type of bankruptcy and they could continue operating and emerge on the otherside in a much stronger position.”37
As part of the bankruptcy filing, the U.S. Treasury was to give Chrysler a total of US$8billion in additional aid including up to US$3.3 billion in debtor-in-possession (DIP)38 financ-ing and up to US$4.7 billion in exit financing.39 Chrysler would have to repay the loan amountwithin the next eight years.
The financial arm of Chrysler was to be merged with GMAC, the finance arm of GM. Dur-ing the bankruptcy period, the U.S. government was to back the warranty on Chrysler vehi-cles. Encouraging consumers to buy Chrysler products, Obama said, “No one should beconfused about what a bankruptcy process means. This is not a sign of weakness, but ratherone more step on a clearly charted path to Chrysler’s revival.”40
The new company would retain the Chrysler corporate name and would be run by a boardof nine members including six members appointed by the U.S. government and three by Fiat.Nardelli was to resign as the CEO of Chrysler after the company emerged from bankruptcyand a new chief executive would be appointed.
As part of the bankruptcy, Cerberus and Daimler were to give up their respective equitystakes of 80.1% and 19.9% in Chrysler. In the new company, VEBA would have a 55% stakeand Fiat a 35% stake. Of the remaining 10% equity stake in the new company, the U.S. Trea-sury would have 8% for the US$4.5 billion loan it had provided Chrysler. The Canadian andOntario governments would have a combined 2% stake for the US$3.8 million provided toChrysler—US$1.5 billion from the Ontario government and the remaining from the Canadiangovernment. The creditors would receive US$2 billion for the US$6.9 billion they had lent toChrysler.
On May 5, 2009, the company’s bankruptcy was approved by the Manhattan BankruptcyCourt. Analysts welcomed Chrysler’s decision to file for Chapter 11 bankruptcy. According toAaron Bragman, Automotive Analyst at IHS Global Insight, “With all the major stakeholdersaccounted for and in agreement, such a bankruptcy could be theoretically accomplished muchmore easily than it otherwise would have been.”41
17-10 SECTION D Industry Four—Transportation
The Chrysler-Fiat AllianceOn May 5, 2009, Chrysler filed for bankruptcy. The company announced that it had reached anagreement to establish a global strategic alliance with Fiat. (See Exhibit 3 for logos of Chryslerand Fiat.) The company also made a reference to all its efforts to enter into partnerships withdifferent automobile companies, including GM, Volkswagen, Toyota, Honda, Nissan, andHyundai. However, except for Fiat, no other options had been viable for it, the company said.Thomas LaSorda, Vice Chairman of Chrysler, said, “Despite continual efforts over the courseof approximately two and a half years, no party except Fiat has emerged as a viable and willingalliance partner for us.”42
As part of the alliance, Chrysler decided to sell all its assets to Fiat except eight factories: asedan plant in Sterling Heights, Michigan; a St. Louis-area pickup-truck plant; a Dodge Vipersports car plant in Detroit; factories in St. Louis and Newark, Delaware; a metal stamping plantin Twinsburg, Ohio; an engine plant in Kenosha, Wisconsin; and an axle plant in Detroit. Com-menting on the decision, Max Gates, spokesperson from Chrysler, said, “While some facilitiesmay eventually close, none other than Newark and St. Louis South are scheduled for closure inthe near term. Virtually all of the labor associated with these facilities will be offered employ-ment with the new company.”43
After the alliance was formed, the new company would be the world’s sixth-largest carmanufacturer. Commenting on the alliance with Fiat, Nardelli said, “Our viability for the longterm would be enhanced even more by global strategic alliances and partnerships. The proposedFiat alliance provides significant benefits to Chrysler. Fiat would make available to us its entireproduct portfolio and powertrain technology, worldwide distribution capabilities for vehicleswe produce today, and synergies in the areas of purchasing and engineering, among others. Weestimate the cash value of Fiat’s contribution to be between eight and ten billion dollars consid-ering the cost to develop these vehicles, platforms, and power trains from scratch.”44
In the new company, Fiat was to initially have a 20% stake. Later, it could increase itsstake by 15% in three stages of 5% each. Fiat was to increase the first 5% stake in the newcompany for providing a 40 mpg (miles per gallon) vehicle platform (i.e, assisting the newcompany to manufacture a vehicle which would give a mileage of 40 mpg.) The new vehiclewould be produced in the United States. Fiat could increase its stake in the new company byanother 5% after providing Chrysler a “fuel-efficient engine family” which would be producedin the United States and would be used in Chrysler vehicles. The third increase of a 5% stakewould be for giving Chrysler access to Fiat’s global distribution network. Fiat would not haveto pay anything for its stake in Chrysler. It thus could increase its stake to 51% by 2016, afterthe new company had repaid the U.S. government’s loan. Commenting on Chrysler’s alliance
EXHIBIT 3Logo of Chrysler
and Fiat
SOURCE: Tim O’Brien, “Bankrupt Chrysler U.S. Announces Alliance with Fiat,” http://www.motorreport.com.au,May 01, 2009.
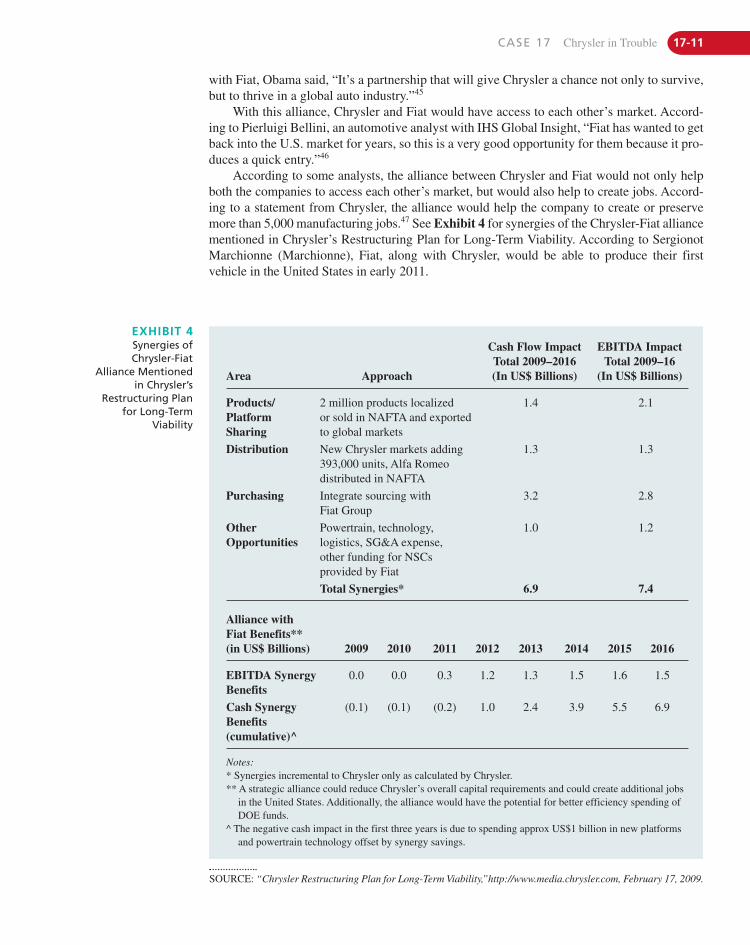
with Fiat, Obama said, “It’s a partnership that will give Chrysler a chance not only to survive,but to thrive in a global auto industry.”45
With this alliance, Chrysler and Fiat would have access to each other’s market. Accord-ing to Pierluigi Bellini, an automotive analyst with IHS Global Insight, “Fiat has wanted to getback into the U.S. market for years, so this is a very good opportunity for them because it pro-duces a quick entry.”46
According to some analysts, the alliance between Chrysler and Fiat would not only helpboth the companies to access each other’s market, but would also help to create jobs. Accord-ing to a statement from Chrysler, the alliance would help the company to create or preservemore than 5,000 manufacturing jobs.47 See Exhibit 4 for synergies of the Chrysler-Fiat alliancementioned in Chrysler’s Restructuring Plan for Long-Term Viability. According to SergionotMarchionne (Marchionne), Fiat, along with Chrysler, would be able to produce their first vehicle in the United States in early 2011.
CASE 17 Chrysler in Trouble 17-11
Cash Flow Impact EBITDA ImpactTotal 2009–2016 Total 2009–16
Area Approach (In US$ Billions) (In US$ Billions)
Products/ 2 million products localized 1.4 2.1Platform or sold in NAFTA and exported Sharing to global markets
Distribution New Chrysler markets adding 1.3 1.3393,000 units, Alfa Romeo distributed in NAFTA
Purchasing Integrate sourcing with 3.2 2.8Fiat Group
Other Powertrain, technology, 1.0 1.2Opportunities logistics, SG&A expense,
other funding for NSCs provided by Fiat
Total Synergies* 6.9 7.4
Alliance with Fiat Benefits** (in US$ Billions) 2009 2010 2011 2012 2013 2014 2015 2016
EBITDA Synergy 0.0 0.0 0.3 1.2 1.3 1.5 1.6 1.5Benefits
Cash Synergy (0.1) (0.1) (0.2) 1.0 2.4 3.9 5.5 6.9Benefits (cumulative)^
Notes:* Synergies incremental to Chrysler only as calculated by Chrysler.** A strategic alliance could reduce Chrysler’s overall capital requirements and could create additional jobs
in the United States. Additionally, the alliance would have the potential for better efficiency spending ofDOE funds.
^ The negative cash impact in the first three years is due to spending approx US$1 billion in new platformsand powertrain technology offset by synergy savings.
EXHIBIT 4Synergies ofChrysler-Fiat
Alliance Mentionedin Chrysler’s
Restructuring Planfor Long-Term
Viability
SOURCE: “Chrysler Restructuring Plan for Long-Term Viability,”http://www.media.chrysler.com, February 17, 2009.
17-12 SECTION D Industry Four—Transportation
What Went Wrong?According to the analysts, the major reasons for Chrysler’s present financial problems wereits poor business strategy, lack of innovation, and the global financial crisis. According toDavid Lewis, professor at the University of Michigan’s Ross School of Business, “In recentdecades, it’s had a more turbulent time, with more ups and downs than other automakers.Each decade, it seemed that Chrysler had a crisis.”48
Chrysler failed to bring out new vehicles that met changing customer needs ahead of thecompetition. The global financial crisis49 in 2008 only resulted in further deterioration of the company’s financial health.
Poor Business StrategyAnalysts attributed Chrysler’s financial problems to its poor business management. In the early1970s, when fuel prices were going up and consumers in the United States started preferringfuel-efficient vehicles, Japanese companies like Toyota and Honda began coming out withcompact and fuel-efficient cars to cater to these needs. However, Chrysler’s focus remainedmore on SUVs and trucks, leaving the Asian carmakers to capitalize on this change in con-sumer preferences.
Other analysts criticized Chrysler’s decision to merge with Daimler. According to Iacocca, “Eaton50 panicked. We were making $1 billion a quarter and had $12 billion in cash,and while he said it was a merger of equals, he sold Chrysler to Daimler-Benz, when we shouldhave bought them.”51
Similar analysts also criticized Daimler’s decision to run Chrysler as a stand-alone division. They opined that Daimler wanted to keep Chrysler separate from its luxury Mercedes-Benz marquee. By doing this, it did not take advantage of the benefits of develop-ing vehicles together.
Lack of InnovationAccording to analysts, Chrysler’s sluggishness in launching innovative models when itsJapanese competitors kept coming out with new designs resulted in the company’s decliningsales. Japanese companies continued to offer fuel-efficient vehicles, while Chrysler contin-ued to produce fuel-guzzling trucks.
Chrysler, which had been the innovator of automatic transmission, power steering, andbrakes, just did not live up to the consumer’s expectations. Although it came up with some in-novative products in the early 1980s, quality-related issues dented the brand image of its cars.
After the merger with Daimler, Chrysler introduced some new models. However, thosemodels did not get much consumer attention. According to Jim Hall, Managing Director of2953 Analytics of Birmingham, Michigan, “The truth is Daimler did them no favors. They ap-proved products that previous Chrysler management wouldn’t have approved if they werecompletely drunk and beaten crazy.”52
Even after Cerberus bought a majority stake in Chrysler, the company could not investenough money in research and development because of the declining sales of Chrysler’svehicles. The U.S. Auto Task Force also commented in March 2009 that “Chrysler’s productshave also historically underperformed in terms of quality, which remains a significant chal-lenge. Unlike GM, which has had a number of successful recent product introductions and hasdeveloped a new global product development process that has promise, there are few tangiblesigns that Chrysler can reverse its share erosion.”53
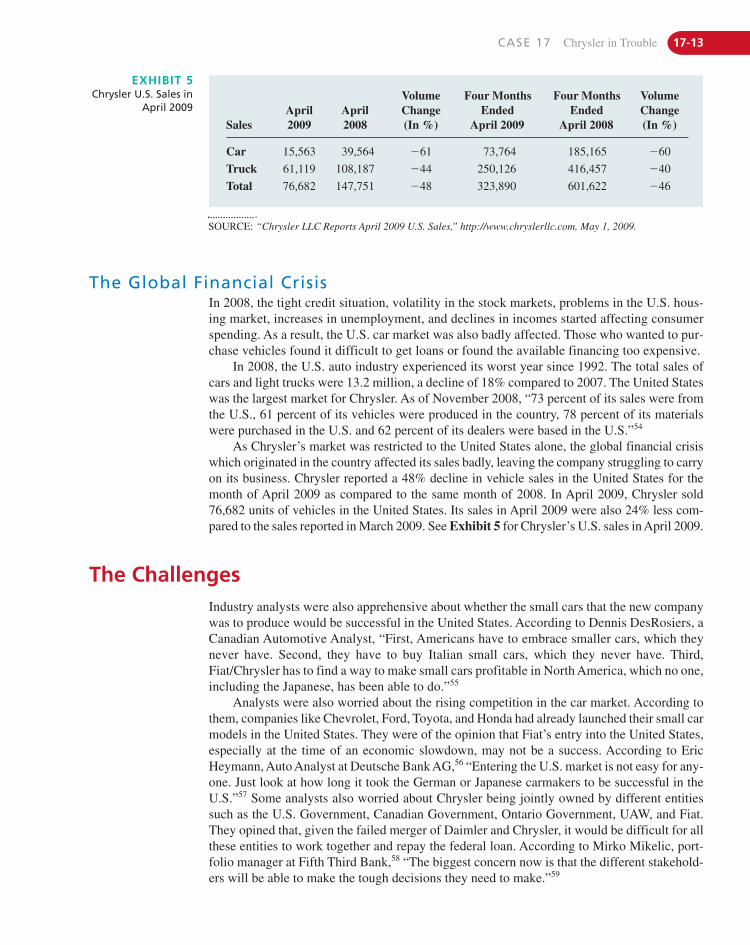
CASE 17 Chrysler in Trouble 17-13
The Global Financial CrisisIn 2008, the tight credit situation, volatility in the stock markets, problems in the U.S. hous-ing market, increases in unemployment, and declines in incomes started affecting consumerspending. As a result, the U.S. car market was also badly affected. Those who wanted to pur-chase vehicles found it difficult to get loans or found the available financing too expensive.
In 2008, the U.S. auto industry experienced its worst year since 1992. The total sales ofcars and light trucks were 13.2 million, a decline of 18% compared to 2007. The United Stateswas the largest market for Chrysler. As of November 2008, “73 percent of its sales were fromthe U.S., 61 percent of its vehicles were produced in the country, 78 percent of its materialswere purchased in the U.S. and 62 percent of its dealers were based in the U.S.”54
As Chrysler’s market was restricted to the United States alone, the global financial crisiswhich originated in the country affected its sales badly, leaving the company struggling to carryon its business. Chrysler reported a 48% decline in vehicle sales in the United States for themonth of April 2009 as compared to the same month of 2008. In April 2009, Chrysler sold76,682 units of vehicles in the United States. Its sales in April 2009 were also 24% less com-pared to the sales reported in March 2009. See Exhibit 5 for Chrysler’s U.S. sales in April 2009.
Volume Four Months Four Months Volume April April Change Ended Ended Change
Sales 2009 2008 (In %) April 2009 April 2008 (In %)
Car 15,563 39,564 �61 73,764 185,165 �60
Truck 61,119 108,187 �44 250,126 416,457 �40
Total 76,682 147,751 �48 323,890 601,622 �46
EXHIBIT 5Chrysler U.S. Sales in
April 2009
The ChallengesIndustry analysts were also apprehensive about whether the small cars that the new companywas to produce would be successful in the United States. According to Dennis DesRosiers, aCanadian Automotive Analyst, “First, Americans have to embrace smaller cars, which theynever have. Second, they have to buy Italian small cars, which they never have. Third,Fiat/Chrysler has to find a way to make small cars profitable in North America, which no one,including the Japanese, has been able to do.”55
Analysts were also worried about the rising competition in the car market. According tothem, companies like Chevrolet, Ford, Toyota, and Honda had already launched their small carmodels in the United States. They were of the opinion that Fiat’s entry into the United States,especially at the time of an economic slowdown, may not be a success. According to Eric Heymann, Auto Analyst at Deutsche Bank AG,56 “Entering the U.S. market is not easy for any-one. Just look at how long it took the German or Japanese carmakers to be successful in theU.S.”57 Some analysts also worried about Chrysler being jointly owned by different entitiessuch as the U.S. Government, Canadian Government, Ontario Government, UAW, and Fiat.They opined that, given the failed merger of Daimler and Chrysler, it would be difficult for allthese entities to work together and repay the federal loan. According to Mirko Mikelic, port-folio manager at Fifth Third Bank,58 “The biggest concern now is that the different stakehold-ers will be able to make the tough decisions they need to make.”59
SOURCE: “Chrysler LLC Reports April 2009 U.S. Sales,” http://www.chryslerllc.com, May 1, 2009.
17-14 SECTION D Industry Four—Transportation
Although analysts were apprehensive about Chrysler’s survival after the Fiat alliance, theywere of the view that the alliance was still a better option than Chrysler trying to survive aloneas this would just not be possible. According to Bob Corker, a Republican Senator from the U.S.state of Tennessee, “I have not seen a way that Chrysler makes it as a standalone entity. It’s re-ally a merger of two weaker entities, though I think it’s better than Chrysler being on its own.”60
On May 8, 2009, it was announced that Sergio Marchionne would be the chief of the newcompany after its alliance with Fiat was completed. Analysts were concerned about whethercultural issues would crop up after an Italian took charge of an American company. In April2009, when asked about whether he would be the head of Chrysler after its alliance withFiat, Marchionne said, “It’s possible that I will have to divide my time between running Fiatand running Chrysler. Fundamentally, that’s possible, but the title isn’t important. What’simportant is that they hear me at Chrysler.61 Analysts also wondered whether Marchionnecould successfully run the new company or not. According to Karl Brauer, Editor In Chief ofEdmunds.com,62 “No matter how capable a businessman you are, taking on another car com-pany that’s been losing money for years and at the same time taking a bigger stake in an indus-try that’s in freefall and has an uncertain future is a huge gamble.”63 Citing the poor performanceof Chrysler, analysts expressed concern about the company’s viability in the future. Accordingto Capstone Advisory Group (Capstone),64 Chrysler, which had lost US$16.8 billion in 2008,was expected to lose US$4.7 billion in 2009. Jeremy Anwyl, the Chief Executive of Edmunds.com, said, “The challenge is going to be for Chrysler to communicate some sort of a compellingreason to buy their products. What’s the reason to consciously pick a Chrysler, Jeep, or Dodgeover a competitive vehicle with all of this stuff (bankruptcy) going on?”65
However, Chrysler was optimistic about its future. Press said, “The industry appears tohave stabilized, as it’s been fairly level for the past four months. We know where the bottom isand, as the economy struggles to recover, vehicle sales should follow.66 On May 7, 2009,Chrysler started a global corporate advertising campaign to restore confidence in the companyamong consumers. The campaign created by BBDO Detroit had TV ads with the tagline, “We’rebuilding a better car company . . . come see what we’re building for you.” The print ad hadalready started appearing in newspapers from May 3, 2009, under the headline, “We’re build-ing a better car company.” From May 11, 2009, the ad was shown on network primetime tele-vision. The first 30-second spot, called “Bright Future,” showed the strength of Chrysler andhow it was restructuring itself and had finalized its alliance with Fiat. The second 30-secondspot, called “Open Road,” showed its products and their features.
Commenting on the advertisement campaign, Steve Landry, Chief of Chrysler Sales andMarketing, said, “We want to establish a level of trust and confidence that customers can stillbuy cars and trucks from us and it is business as usual. We are working to exit bankruptcy asfast as we can.”67 He added, “When we asked consumers what they wanted to know aboutChrysler, they told us to tell them about our products, tell them why they should buy our ve-hicles, and give them a reason why they should be confident in the future of this company. Webelieve this campaign delivers on all of those objectives.”68
R E F E R E N C E S A N D S U G G E S T E D R E A D I N G SZack Stoval, “Dealer Challenges Chrysler Closure Order in
Bankruptcy Court,” http://arkansas.com (May 22, 2009).Justin Hyde, “Chrysler Dealers Prepare Legal Flight,”
http://www.freep.com (May 18, 2009).“Chrysler LLC Files Papers to Retain Majority of U.S.
Dealer Network as Part of Company’s Sales Process,”http://www.chryslerrestructuring.com (May 14, 2009).
“Chrysler LLC Launches New Global Corporate Advertis-ing Campaign,” http://www.chryslerrestructuring.com(May 7, 2009).
“U.S. Treasury Says Chrysler DIP Financing Reduced,”http://in.reuters.com (May 07, 2009).
“–In Fiat, Chrysler Has a Simpatico Dance Partner,” http://www.mydigitaltc.com (May 05, 2009).

CASE 17 Chrysler in Trouble 17-15
Emily Chasan and Chelsea Emery, “Chrysler BankruptcyHas Dealers on “Razor’s Edge,” http://in.reuters.com(May 5, 2009).
“Chrysler to Launch Ad Campaign to Reassure NervousBuyers,” http://www.domain-b.com (May 4, 2009).
Nick Bunkley, “Sick Chrysler Optimistic Despite Crash,”http://business.theage.com.au (May 3, 2009).
Linda Sandler and Christopher Scinta, “Chrysler LawyersMay Get $200 Million from Bankruptcy Case Work,”http://www.bloomberg.com (May 2, 2009).
“Chrysler Motors on: Bankruptcy Process Won’t Halt Op-erations,” http://www.nydailynews.com (May 2, 2009).
John Ivison, “Chrysler’s Key Problem Remains,” http://www.nationalpost.com (May 2,2009).
Christine Tierney, “Chrysler’s History Full of Crisis, Come-backs,” http://www.detnews.com (May 1, 2009).
Ronald Jones, “Can Marchionne’s Magic Work at Chrysler?”http://www.msnbc.msn.com (May 1, 2009).
“Chrysler LLC Reports April 2009 U.S. Sales,” http://www.chryslerllc.com, (May 1, 2009).
Jorn Madslien, “Can Fiat Put Chrysler on Road toRecovery?” http://news.bbc.co.uk ( May 1, 2009).
Rick Newman, “5 Reasons Chrysler May Still Die,” http://www.msn.com (May 1, 2009).
Mike Ramsey, “Chrysler Plans to Leave 8 Factories in Bank-ruptcy,” http://www.bloomberg.com (May 1, 2009).
Tim O’Brien, “Bankrupt Chrysler U.S. Announces Alliancewith Fiat,” http://www.motorreport.com.au(May 1, 2009).
“Chrysler LLC and Fiat Group Announce Global Strate-gic Alliance to Form a Vibrant New Company,” http://www.chryslerllc.com (April 30, 2009).
Tom Krisher and Stephen Manning, “Chrysler Succumbs toBankruptcy After Struggle,” http://news.yahoo.com(April 30, 2009).
Clare Trapasso and Larry Mcshane, “Despite Bankruptcy,Chrysler Still Has Fans Who Say Car Company WillSurvive,” http://www.nydailynews.com (April 30, 2009).
Larry Mcshane, “Obama Administration Official: Big 3 Au-tomaker Chrysler LLC Will File for Chapter 11 Bank-ruptcy,” http://www.nydailynews.com (April 30, 2009).
Jimmy Peterson, “U.S. Government Gives Chrysler April 30Deadline to Strike Fiat Deal,” http://www.topnews.in(April 30, 2009).
“Chrysler Has 30 Days to Reach Deal with Fiat: Report,”http://economictimes.indiatimes.com (April 30, 2009).
“Chrysler Bankruptcy Deal Revealed,” http://news.bbc.co.uk (April 30, 2009).
Kabir Chibber, “Chrysler’s Highway to Hell,” http://news.bbc.co.uk (April 30, 2009).
“Chrysler Approaches Key Deadline,” http://news.bbc.co.uk (April 30, 2009).
“Chrysler Files for Bankruptcy | CEO to Quit,” http://ibnlive.in.com (April 30, 2009).
“Chrysler, CAW Reach Deal to Save Company $240m aYear,” http://www.cbc.ca (April 24, 2009).
“Chrysler Lenders Make New Debt Restructuring Offer,”http://in.reuters.com (April 24, 2009).
“Chrysler Lenders Offer to Cut Debt, Take Stock,” http;//www.zeenews.com (April 2, 2009).
“Chrysler Optimistic About Fiat Alliance,” http://en.ce.cn(April 9, 2009).
“Chrysler Faces Challenging Future: White House,” http://www.livemint.com (March 30, 2009).
“Chrysler Chiefs Battle to Avoid Bankruptcy,” http://www.mydigitalfc.com (March 17, 2009).
Chris Isidore, “GM, Chrysler Ask for $ 21.6 Billion More,”http://money.cnn.com (February 18, 2009).
“Chrysler Restructuring Plan for Long-Term Viability,”http://www.media.chrysler.com (February 17, 2009).
“Chrysler LLC Viability Plan Submitted Today to the U.S.Treasury Department,” http://www.chryslerllc.com(February 17, 2009).
“Cerberus Wants to Sell Back Chrysler; Asks Daimler toRepay $7.2 Billion News,” http://www.domain-b.com(November 27, 2008).
Tom Krisher, “Without a Big-Selling Design in Works,Chrysler in Trouble,” http://www.bnet.com (November 2,2008).
“Testimony of Robert Nardelli to the U.S. Senate” http://www.chryslerllc.com (November, 2008).
“Chrysler in Car Production Deal with Nissan,” http://www.domain-b.com (January 11, 2008).
“Daimler Assumes $1 Billion Chrysler Pension Plan Risk”http://in.reuters.com (May 21, 2007).
“How Daimler, Chrysler Merger Failed,” http://www.pressbox.co.uk (May 18, 2007).
Chris Isidore, “Daimler Pays to Dump Chrysler,” http://money.cnn.com (May 14, 2007).
“Chrysler LLC Announces 2007 Global Sales; Interna-tional Markets’ Results Best in Company’s History;Minivan Reign Continues,” http://www.chryslerllc.com(January, 2007).http://www.chryslerllc.com.
N O T E S1. Larry McShane. “Obama Administration Official: Big 3
Automaker Chrysler LLC Will File for Chapter 11 Bank-ruptcy.” http://www.nydailynews.com, April 30, 2009.
2. Emily Chasan and Chelsea Emery, “Chrysler BankruptcyHas Dealers on “Razor’s Edge.” http://in.reuters.com, May 5,2009.
3. Tim O’Brien, “Bankrupt Chrysler U.S. Announces Alliance withFiat,” http://www.motorreport.com.au, May 1, 2009.
4. Section 363 refers to the section of the U.S. Bankruptcy Codethat allows a company to enter a court supervised process to sellassets quickly as the best means to protect value for the benefitof its stakeholders. Unlike a typical bankruptcy proceeding,
17-16 SECTION D Industry Four—Transportation
which can often take a few years to resolve, the advantage of363 bankruptcy is speed. Through the 363 process, a companyis able to emerge from bankruptcy in approximately 30 to 60 days (Source: http://www.chryslerrestructuring.com).
5. Chapter 11 of the United States Bankruptcy Code permits reor-ganization under the bankruptcy laws of the U.S. It can be filedby any business, whether a corporation or a sole proprietorship,although it is mostly used by corporate entities. A Chapter 11debtor usually proposes a plan of reorganization to keep itsbusiness alive and pay creditors over time.
6. Founded in 1899, Fiat SpA is an Italian automobile manufac-turer headquartered in Turin, Italy. For the fiscal 2008, the com-pany earned revenues of €59.4 billion.
7. The Voluntary Employees’ Beneficiary Association (VEBA)under Internal Revenue Code section 501(c)(9) of InternalRevenue Service of the United States Department of the Trea-sury is an organization organized to pay life, sick, accident, andsimilar benefits to members or their dependents, or designatedbeneficiaries. Members of this organization must be individu-als who are employees who have an employment-relatedcommon bond. This common bond may be a common em-ployer (or affiliated employers), coverage under one or morecollective bargaining agreements, membership in a laborunion, or membership in one or more locals of a national or in-ternational labor union. VEBA allowed a company to make taxfree contributions into the fund, which is later used to pay ben-efits to its employees. The main aim of setting up this organi-zation was to ensure the employees continued to get benefitseven if the company got into financial trouble. (Source: http://www.irs.gov)
8. UAW was founded in 1935. As of 2008, it was one of the largestlabor unions in North America.
9. CAW, one of the largest labor unions in Canada, was foundedin 1985.
10. “Chrysler LLC and Fiat Group Announce Global StrategicAlliance to Form a Vibrant New Company,” http://www.chryslerllc.com, April 30, 2009.
11. Tom Krisher and Stephen Manning, “Chrysler Succumbs to Bank-ruptcy After Struggle,” http://news.yahoo.com, April 30, 2009.
12. Maxwell Motor Corporation was founded in 1904.13. The Great Depression that started in 1929 refers to the economic
slump in North America and Europe. The effects of the depres-sion were felt across the world and it lasted till the late 1930s.The Great Depression resulted in a major fall in stock prices,which adversely affected individuals, financial institutions, andbanks, leading to the closure and insolvency of several banks.This led to reduced demand, spending, and production, and to in-creased unemployment.
14. A Chrysler Hemi engine, known by the trademark Hemi, is aninternal combustion engine built by Chrysler that utilizes ahemispherical combustion chamber. A hemispherical (i.e.,bowl-shaped) combustion chamber allows the valves of a twovalve-per-cylinder engine to be angled rather than side-by-side.This creates more space in the combustion chamber roof for theuse of larger valves and also straightens the airflow passagesthrough the cylinder head (Source: http://en.wikipedia.org).
15. The Rootes Group is a British automobile manufacturer. It wasfounded in 1913. Chrysler acquired the Rootes Group in 1967.
16. Simca was a French automaker and marquee, founded in 1934.In 1958, Chrysler bought a 15 percent stake in it. Later, in 1970,the company was acquired by Chrysler.
17. Barreiros was a Spanish manufacturer of engines, trucks, buses,tractors, and automobiles. The company was founded in 1954. Itwas acquired by Chrysler in 1969 (Source: http://en.wikipedia.org).
18. In 1973, the Yom-Kippur war also known as The October War,broke out between Israel and some of its Arab neighbors, whenIsrael attacked Egypt and Syria. Oil supply was disrupted be-cause of the war and the oil prices jumped from US$ 3 to US$12 per barrel. The rise in oil prices resulted in an increase ingasoline prices in the U.S. from 38.5 cents per gallon in May1973 to 53.1 cents per gallon in June 1974. In order to reducefuel consumption, the U.S. government imposed a 55 miles perhour speed restriction on vehicles.
19. In 1998. the world’s first two largest automobile companies interms of revenues were General Motors and Ford Motor Company.
20. In 1998, the world’s four largest automobile company in termsof number of units produced were General Motors, Ford MotorCompany, Toyota, and Volkswagen respectively.
21. Cerberus Capital Management is a private equity firm; head-quartered in New York, the U.S. It was founded in 1992.
22. The Pension Benefit Guaranty Corporation (or PBGC) is an in-dependent agency of the U.S. government that was created bythe Employee Retirement Income Security Act of 1974 (ERISA)to encourage the continuation and maintenance of voluntaryprivate defined benefit pension plans, provide timely and unin-terrupted payment of pension benefits, and keep pension insur-ance premiums at the lowest level necessary to carry out itsoperations (Source: http://en.wikipedia.org).
23. “Daimler Assumes $1 Billion Chrysler Pension Plan Risk.”http://in.reuters.com, May 21, 2007.
24. Chris Isidore, “Daimler Pays to Dump Chrysler,” http://money.cnn.com, May 14, 2007.
25. “Chrysler LLC Announces 2007 Global Sales; InternationalMarkets Results Best in Company’s History: Minivan ReignContinues,” http://www.chryslerllc.com, January 2009.
26. General Motors Corporation (GM), a multinational automobilemanufacturer, was founded in 1908. It is headquartered inDetroit, Michigan, the U.S. In the fiscal 2008, it reported a rev-enue of US$ 148.979 billion and a net loss of US$ 30.9 billion.
27. General Motors Acceptance Corporation (GMAC) was startedin 1919 to finance car buyers. It sold commercial and automo-tive financing, real estate services, and insurance and mortgageproducts. In 2006, GM sold 51 percent stake of GMAC toCerberus Capital Management in 2006.
28. On February 16, 2009, Barack Hussein Obama, the President ofthe U.S., launched the U.S. Auto Task Force, to oversee therestructuring of the U.S. auto industry.
29. Chris Isidore, “GM, Chrysler Ask For $ 21.6 Billion More,”http://money.cnn.com, February 18, 2009.
30. First lien debt is the highest priority debt in the case of default.If a property or other type of collateral is used to back a debt,first lien debt holders are paid before all other debt holders.(Source: http://www.investorwords.com)
31. “Chrysler, CAW Reach Deal To Save Company $240m AYear,”http://www.cbc.ca, April 24, 2009.
32. JPMorgan Chase & Company is a U.S.-based, leading globalfinancial services firm. It was formed in 2000, after the mergerwhen Chase Manhattan Corporation acquired JP Morgan &Company. As of December 31, 2008, it reported a net revenueof US$ 67,252 million and a net profit of US$ 5,605 million.
33. Goldman Sachs Group, Inc is a bank holding company thatis engaged in investment banking, securities services, and
CASE 17 Chrysler in Trouble 17-17
investment management. For the fiscal year 2008, the com-pany reported revenues of US$ 53.579 billion and net incomeof US$ 2.322 billion (Source: http://en.wikipedia.org).
34. Morgan Stanley is a US-based global financial services provider.It acts as a financial advisor to companies, governments, andinvestors from across the world. For the fiscal year 2008, itreported a net revenue of US$ 62.262 billion and a net income ofUS$ 1.707 billion (Source: http://www.morganstanley.com).
35. Citigroup Inc. is an international financial conglomerate withoperations in consumer, corporate, investment banking and in-surance. For the fiscal 2008, it reported total revenues of US$52.793 billion and net loss of US$ 27,684. (Source: http://www.citigroup.com).
36. “Chrysler Bankruptcy Deal Revealed.” http://news.bbc.co.uk,April 30, 2009.
37. “Chrysler Approaches Key Deadline,” http://news.bbc.co.uk,April 30, 2009.
38. Debtor-in-possession (DIP), under the United States bank-ruptcy law, is a person or corporation who has field a bank-ruptcy petition, but remains in possession of property uponwhich a creditor has a lien or similar security interest. DIP fi-nancing is a special form of financing provided for companiesin financial distress or under Chapter 11 bankruptcy process.The specialty of DIP financing is that it gets priority over exist-ing debt, equity, and other claims (http://en.wikipedia.org).
39. Exit financing in bankruptcy is the funding that is given to abankrupt company to come out of bankruptcy. In order to getexit financing, the company requires to prepare a plan of reor-ganization which has to be supported by all of its creditors. Ifthe bankruptcy court also agrees to the plan, then the companycan come out of bankruptcy with the exit financing.
40. Clare Trapasso and Larry Mcshane, “Despite Bankruptcy,Chrysler Still Has Fans Who Say Car Company Will Survive.”http://www.nydailynews.com, April 30, 2009.
41. IHS Global Insight is the global leader in economic and finan-cial analysis forecasting and market intelligence. As of 2008, ithad more than 3,800 clients in industry, finance, and govern-ment. (Source: http://www.globalinsight.com)
42. “In Fiat, Chrysler Has a Simpatico Dance Partner,” http://www.mydigitaltc.com. May 5, 2009.
43. Mike Ramsey, “Chrysler Plans to Leave Eight Factories inBankruptcy,” http:www.bloomberg.com. May 1, 2009.
44. “Chrysler Has 30 Days to Reach Deal with Fiat: Report,” http://economictimes.indiatimes.com, April 30, 2009.
45. “Chrysler Bankruptey Deal Revealed,” http://news.bbc.co.uk,April 30, 2009.
46. Ronald Jones, “Can Marchionne’s Magic Work At Chrysler?”http://www.msnbc.msn.com, May 1, 2009.
47. Mike Ramsey, “Chrysler Plans to Leave Eight Factories inBankruptcy,” http://www.bloomberg.com, May 1, 2009.
48. Christine Tierney, “Chrysler’s History Full of Crisis, Come-backs,” http://www.detnews.com. May 1, 2009.
49. The global financial crisis of 2008–09 was an ongoing majorfinancial crisis that affected all countries across the world. The
crisis was triggered when sub-prime mortgages were offeredto borrowers without a proper check being done on whetherthey would be able to repay the loan or not. When severalof these borrowers defaulted, there was a ripple effect in theU.S. economy. The financial crisis became prominent frommid-2008 with the failures of several large U.S.-based financialfirms. Soon, it started affecting financial markets of other coun-tries also.
50. Robert Eaton was the Chairman and CEO of Chrysler Corpora-tion between 1993 and 1999.
51. “How Daimler, Chrysler Merger Failed,” http://www.pressbox.co.uk, May 18, 2007.
52. Tom Krisher, “Without a Big-Selling Design in Works. Chryslerin Trouble,” http://www.bnet.com, November 2, 2008.
53. “Chrysler Faces Challenging Future: White House,” http://www.livemint.com, March 30, 2009.
54. “Testimony of Robert Nardelli to the U.S. Senate,” http://www.chryslerllo.com, November, 2008.
55. John Ivison, “Chrysler’s Key Problem Remains,” http://www.nationalpost.com, May 2, 2009.
56. Deutsche Bank AG was founded in 1870. It is a Germany-basedfinancial services provider. As of 2008, it reported revenue ofUS$ 13.490 billion and net loss of US$ 3.896 billion.
57. Jorn Madslien, “Can Fiat Put Chrysler on Road to Recovery?”http://news.bbc.co.uk, May 1, 2009.
58. Fifth Third Bank was incorporated as Bank of the Ohio Valleyin 1858. It is a U.S.regional banking corporation, headquarteredin Cincinnati, Ohio (Source: http://en.wikipedia.org).
59. “Chrysler Files for Bankruptcy. CEO To Quit,” http://ibnlive.in.com. (April 30, 2009.)
60. “Chrysler Chiefs Battle to Avoid Bankruptcy,” http://www.mydigitalfc.com, March 17, 2009.
61. “Fiat Chief Marchionne Will Head Chrysler,” http://timesofindia.indiatimes.com, May 8, 2009.
62. Edmunds.com, headquartered in Santa Monica, California,was founded in 1966. It is a provider of automotive informa-tion via websites, books, and other media (Source: http://en.wikipedia.org).
63. Ronald Jones, “Can Marchionne’s Magic Work At Chrysler?”http://www.msnbc.msn.com, May 1, 2009.
64. Capstone Advisory Group, LLC provides solutions for stake-holders, lenders and investors dealing with distressed and fraudsituations, for parties in commercial disputes, and for lendersand investors evaluating capital transactions. (Source: http://www.capstonecr.com)
65. Nick Bunkley, “Sick Chrysler Optimistic Despite Crash,” http://business.theage.com.au, May 3, 2009.
66. “Chrysler LLC Reports April 2009 U.S. Sales,” http://www.chryslerllc.com, May 1, 2009.
67. “Chrysler to Launch Ad Campaign to Reassure Nervous Buy-ers,” http://www.domain-b.com, May 4, 2009.
68. “Chrysler LLC Launches New Global Corporate AdvertisingCampaign.” http://www.chryslerrestructuring.com, May 7, 2009.

This page intentionally left blank
THUS BEGAN THE INVESTORS OVERVIEW PAGE OF TESLA MOTORS’ website in September 2010.(See www.teslamotors.com.) The company had just completed an initial public offering
(IPO) of 11,880,600 shares of its common stock plus a private sale of an additional2,941,176 shares to Toyota Motor Corporation at the initial price of $17.00 per share.Management intended to use the proceeds to purchase an existing automobile factory inFremont, California, from NUMMI, the joint venture between Toyota and Tesla Motors
Liquidation Company, the owner of General Motors’ interest in this plant, and to fund theexpansion of retail stores. With Elon Musk, the founder of PayPal, as its CEO, the company
had developed and successfully sold over 1,200 electric-powered Roadsters as of July 1, 2010.Advertising Age had named Tesla one of America’s Hottest Brands in 2009—even though thecompany did no advertising and relied instead on the Internet, word-of-mouth, and presenta-tions by CEO Musk.
Selling at $101,000 in the United States, the Tesla Roadster had become the darling ofcelebrities like Jay Leno and David Letterman. Introduced in 2008, this electrically poweredauto could accelerate from 0 to 60 miles per hour (mph) in 3.9 seconds and cruise for 236 mileson a single charge. Motor Trend found in its December 2009 road test that the Roadsterrecorded 0 to 60 mph in 3.70 seconds and completed the quarter mile in 12.6 seconds, reach-ing 102.6 mph. Engineering Editor Kim Reynolds called the acceleration “breathtaking.” The
18-1
C A S E 18Tesla Motors Inc. (Mini Case)J. David HungerWe believe that more than 100 years after the invention of the internal combustion engine, incumbent automobile manufacturers
are at a crossroads and face significant industry-wide challenges. The reliance on the gasoline-powered internal combustionengine as the principal automobile powertrain technology has raised environmental concerns, created dependence amongindustrialized and developing nations on oil largely imported from foreign nations and exposed consumers to volatile fuel
prices. In addition, we believe the legacy investments made by incumbent automobile manufacturers in manufacturing andtechnology related to the internal combustion engine have to date inhibited rapid innovation in alternative fuel powertrain
technologies. We believe these challenges offer an historic opportunity for companies with innovative electric powertraintechnologies and that are unencumbered with legacy investments in the internal combustion engine to lead the next
technological era of the automotive industry.
This case was prepared by Professor J. David Hunger, Iowa State University and St. John’s University. Copyright©2010 by J. David Hunger. The copyright holder is solely responsible for case content. Reprint permission is solelygranted to the publisher, Prentice Hall, for Strategic Management and Business Policy, 13th Edition (and the interna-tional version and electronic versions of this book) by the copyright holder, J. David Hunger. Any other publicationof the case (translation, any form of electronics or other media) or sale (any form of partnership) to another publisherwill be in violation of copyright law, unless J. David Hunger has granted an additional written permission. Reprintedby permission.
December 14, 2008, episode of the British television program Top Gear found that the Roadsterwas not only “biblically quick,” but also that it completed the test track with a score similar tothat recorded by the Porsche 911 GT3. According to Top Gear’s Jeremy Clarkson, the car wasan “astonishing technical achievement.”
The air-cooled electric motor weighed less than 70 pounds, but generated 248 horsepowerwith no engine noise and no exhaust emissions. Instead of gasoline, it required electricitystored in 6,831 lithium-ion batteries that were recharged by plugging them into an electric out-let. It was a true green machine. The Roadster’s battery-to-wheel motor efficiency was 92%on average and 85% at peak power, contrasted with the gas tank-to-wheel efficiency of inter-nal combustion engines at about 15%. Tesla’s management reported an energy cost of approx-imately one U.S. cent per mile when charging the car at night. A full-recharge of the batterysystem required 3 1/2 hours using Tesla’s 70 amp, 240 volt electrical connection. The TeslaRoadster set a new world distance record of 313 miles on a single charge for a production elec-tric car in a rally across Australia as part of the 2009 Global Green Challenge. Based on the attractive Lotus Elise sports car, the Tesla Roadster single-handedly destroyed the notionheld by many people at the time that electric cars had to be slow in acceleration and awkwardin appearance.
18-2 SECTION D Industry Four—Transportation
History
Originally conceived by Martin Eberhard and Marc Tarpenning, the Tesla Roadster began totake shape when Elon Musk took an active role in the company starting in early 2004. He over-saw the Roadster’s product design and expanded the company’s strategic goals to include mar-keting mainstream vehicles. The company originally licensed AC Propulsion’s EV PowerSystem design and Reductive Charging patent. Tesla then re-designed and built its ownadvanced battery pack, power electronics module, high efficiency motor, and extensive con-trol software so that its powertrain was unique and no longer required a license from ACPropulsion. The electric powertrain had fewer moving parts than an internal combustion en-gine. In July 2005, Tesla signed an agreement with British sports car maker Lotus for help inchassis development. Body panels were made from resin transfer molded carbon fiber com-posite to minimize weight.
The company signed a production contract in 2007 with Group Lotus to produce a totalof 2,400 “gliders” (partially assembled vehicles) in its plant in Hethel, England. For Roadstersbound for customers in North America, the gliders were sent to Tesla’s plant in Menlo Park,California, for final assembly with the powertrain. For Roadsters being sold elsewhere in theworld, the gliders received their powertrain at a facility near the Lotus Hethel plant. As ofMarch 2010, Tesla had purchased 1,200 gliders. The contract with Lotus was scheduled to runout in December 2011, but the Roadsters would continue being made in 2012 until the supplyof gliders from Lotus was exhausted. The next generation of the Tesla Roadster was to be man-ufactured in Tesla’s new Fremont, California, facilities.
In August 2007, Martin Eberhard was replaced as CEO by interim CEO Michael Marks,who was then replaced in December 2007 by Ze’ev Drori as CEO. In October 2008, ElonMusk succeeded Drori as CEO and Chairman of the Board. Even though Musk was a keypart of Tesla’s progress, he was not a full-time CEO. Musk also served as CEO and ChiefTechnology Officer of Space Exploration Technologies, a developer and manufacturer ofspace launch vehicles, and as Chairman of SolarCity, a solar equipment installation com-pany. Tesla’s top management team was quite new. Three of the five members of senior man-agement, including the CFO and VP of Manufacturing, had joined the company between2008 and 2010.
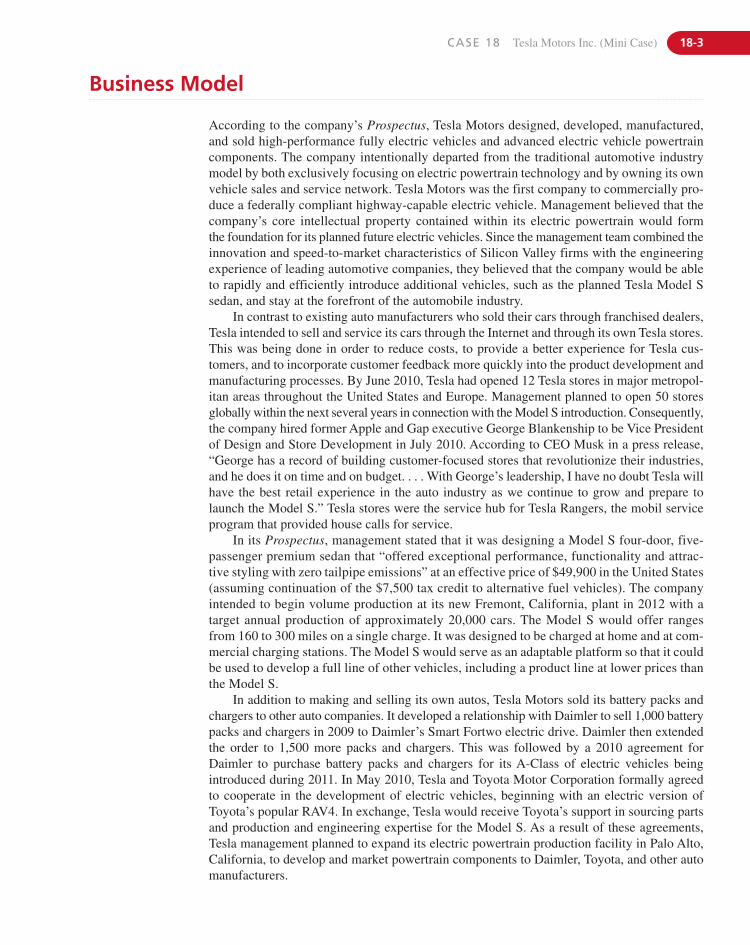
CASE 18 Tesla Motors Inc. (Mini Case) 18-3
Business Model
According to the company’s Prospectus, Tesla Motors designed, developed, manufactured,and sold high-performance fully electric vehicles and advanced electric vehicle powertraincomponents. The company intentionally departed from the traditional automotive industrymodel by both exclusively focusing on electric powertrain technology and by owning its ownvehicle sales and service network. Tesla Motors was the first company to commercially pro-duce a federally compliant highway-capable electric vehicle. Management believed that thecompany’s core intellectual property contained within its electric powertrain would form the foundation for its planned future electric vehicles. Since the management team combined theinnovation and speed-to-market characteristics of Silicon Valley firms with the engineeringexperience of leading automotive companies, they believed that the company would be ableto rapidly and efficiently introduce additional vehicles, such as the planned Tesla Model Ssedan, and stay at the forefront of the automobile industry.
In contrast to existing auto manufacturers who sold their cars through franchised dealers,Tesla intended to sell and service its cars through the Internet and through its own Tesla stores.This was being done in order to reduce costs, to provide a better experience for Tesla cus-tomers, and to incorporate customer feedback more quickly into the product development andmanufacturing processes. By June 2010, Tesla had opened 12 Tesla stores in major metropol-itan areas throughout the United States and Europe. Management planned to open 50 storesglobally within the next several years in connection with the Model S introduction. Consequently,the company hired former Apple and Gap executive George Blankenship to be Vice Presidentof Design and Store Development in July 2010. According to CEO Musk in a press release,“George has a record of building customer-focused stores that revolutionize their industries,and he does it on time and on budget. . . . With George’s leadership, I have no doubt Tesla willhave the best retail experience in the auto industry as we continue to grow and prepare tolaunch the Model S.” Tesla stores were the service hub for Tesla Rangers, the mobil serviceprogram that provided house calls for service.
In its Prospectus, management stated that it was designing a Model S four-door, five-passenger premium sedan that “offered exceptional performance, functionality and attrac-tive styling with zero tailpipe emissions” at an effective price of $49,900 in the United States(assuming continuation of the $7,500 tax credit to alternative fuel vehicles). The companyintended to begin volume production at its new Fremont, California, plant in 2012 with atarget annual production of approximately 20,000 cars. The Model S would offer rangesfrom 160 to 300 miles on a single charge. It was designed to be charged at home and at com-mercial charging stations. The Model S would serve as an adaptable platform so that it couldbe used to develop a full line of other vehicles, including a product line at lower prices thanthe Model S.
In addition to making and selling its own autos, Tesla Motors sold its battery packs andchargers to other auto companies. It developed a relationship with Daimler to sell 1,000 batterypacks and chargers in 2009 to Daimler’s Smart Fortwo electric drive. Daimler then extendedthe order to 1,500 more packs and chargers. This was followed by a 2010 agreement for Daimler to purchase battery packs and chargers for its A-Class of electric vehicles being introduced during 2011. In May 2010, Tesla and Toyota Motor Corporation formally agreedto cooperate in the development of electric vehicles, beginning with an electric version of Toyota’s popular RAV4. In exchange, Tesla would receive Toyota’s support in sourcing partsand production and engineering expertise for the Model S. As a result of these agreements,Tesla management planned to expand its electric powertrain production facility in Palo Alto,California, to develop and market powertrain components to Daimler, Toyota, and other automanufacturers.
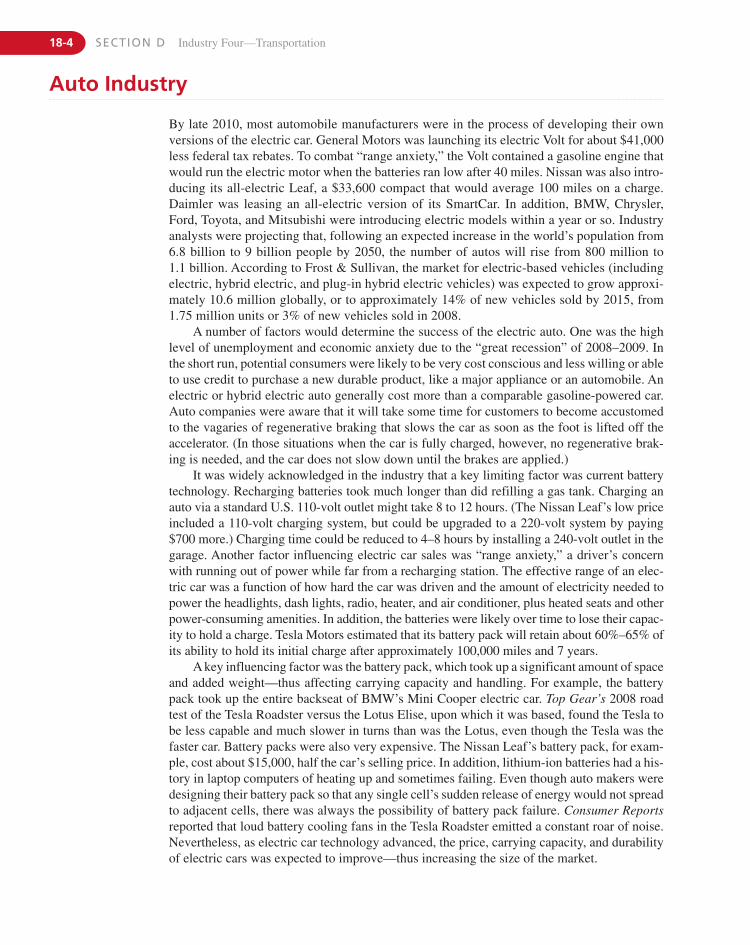
18-4 SECTION D Industry Four—Transportation
Auto Industry
By late 2010, most automobile manufacturers were in the process of developing their ownversions of the electric car. General Motors was launching its electric Volt for about $41,000less federal tax rebates. To combat “range anxiety,” the Volt contained a gasoline engine thatwould run the electric motor when the batteries ran low after 40 miles. Nissan was also intro-ducing its all-electric Leaf, a $33,600 compact that would average 100 miles on a charge.Daimler was leasing an all-electric version of its SmartCar. In addition, BMW, Chrysler,Ford, Toyota, and Mitsubishi were introducing electric models within a year or so. Industryanalysts were projecting that, following an expected increase in the world’s population from6.8 billion to 9 billion people by 2050, the number of autos will rise from 800 million to1.1 billion. According to Frost & Sullivan, the market for electric-based vehicles (includingelectric, hybrid electric, and plug-in hybrid electric vehicles) was expected to grow approxi-mately 10.6 million globally, or to approximately 14% of new vehicles sold by 2015, from1.75 million units or 3% of new vehicles sold in 2008.
A number of factors would determine the success of the electric auto. One was the highlevel of unemployment and economic anxiety due to the “great recession” of 2008–2009. Inthe short run, potential consumers were likely to be very cost conscious and less willing or ableto use credit to purchase a new durable product, like a major appliance or an automobile. Anelectric or hybrid electric auto generally cost more than a comparable gasoline-powered car.Auto companies were aware that it will take some time for customers to become accustomedto the vagaries of regenerative braking that slows the car as soon as the foot is lifted off the accelerator. (In those situations when the car is fully charged, however, no regenerative brak-ing is needed, and the car does not slow down until the brakes are applied.)
It was widely acknowledged in the industry that a key limiting factor was current batterytechnology. Recharging batteries took much longer than did refilling a gas tank. Charging anauto via a standard U.S. 110-volt outlet might take 8 to 12 hours. (The Nissan Leaf’s low priceincluded a 110-volt charging system, but could be upgraded to a 220-volt system by paying$700 more.) Charging time could be reduced to 4–8 hours by installing a 240-volt outlet in thegarage. Another factor influencing electric car sales was “range anxiety,” a driver’s concernwith running out of power while far from a recharging station. The effective range of an elec-tric car was a function of how hard the car was driven and the amount of electricity needed topower the headlights, dash lights, radio, heater, and air conditioner, plus heated seats and otherpower-consuming amenities. In addition, the batteries were likely over time to lose their capac-ity to hold a charge. Tesla Motors estimated that its battery pack will retain about 60%–65% ofits ability to hold its initial charge after approximately 100,000 miles and 7 years.
A key influencing factor was the battery pack, which took up a significant amount of spaceand added weight—thus affecting carrying capacity and handling. For example, the batterypack took up the entire backseat of BMW’s Mini Cooper electric car. Top Gear’s 2008 roadtest of the Tesla Roadster versus the Lotus Elise, upon which it was based, found the Tesla tobe less capable and much slower in turns than was the Lotus, even though the Tesla was thefaster car. Battery packs were also very expensive. The Nissan Leaf’s battery pack, for exam-ple, cost about $15,000, half the car’s selling price. In addition, lithium-ion batteries had a his-tory in laptop computers of heating up and sometimes failing. Even though auto makers weredesigning their battery pack so that any single cell’s sudden release of energy would not spreadto adjacent cells, there was always the possibility of battery pack failure. Consumer Reportsreported that loud battery cooling fans in the Tesla Roadster emitted a constant roar of noise.Nevertheless, as electric car technology advanced, the price, carrying capacity, and durabilityof electric cars was expected to improve—thus increasing the size of the market.
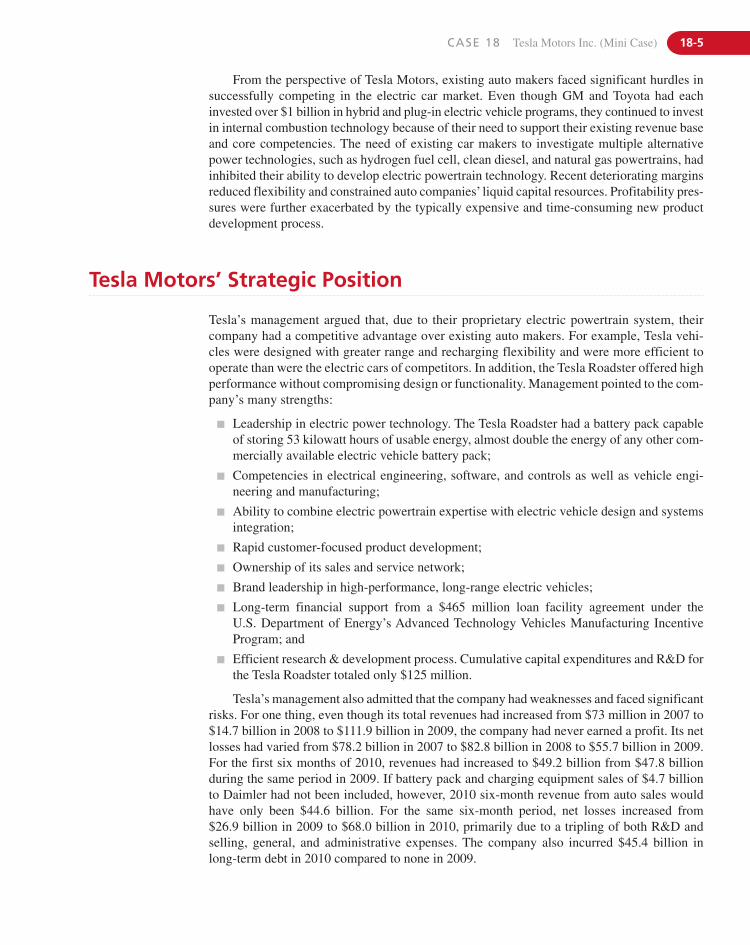
CASE 18 Tesla Motors Inc. (Mini Case) 18-5
From the perspective of Tesla Motors, existing auto makers faced significant hurdles insuccessfully competing in the electric car market. Even though GM and Toyota had each invested over $1 billion in hybrid and plug-in electric vehicle programs, they continued to investin internal combustion technology because of their need to support their existing revenue baseand core competencies. The need of existing car makers to investigate multiple alternativepower technologies, such as hydrogen fuel cell, clean diesel, and natural gas powertrains, hadinhibited their ability to develop electric powertrain technology. Recent deteriorating marginsreduced flexibility and constrained auto companies’ liquid capital resources. Profitability pres-sures were further exacerbated by the typically expensive and time-consuming new productdevelopment process.
Tesla Motors’ Strategic Position
Tesla’s management argued that, due to their proprietary electric powertrain system, theircompany had a competitive advantage over existing auto makers. For example, Tesla vehi-cles were designed with greater range and recharging flexibility and were more efficient tooperate than were the electric cars of competitors. In addition, the Tesla Roadster offered highperformance without compromising design or functionality. Management pointed to the com-pany’s many strengths:
� Leadership in electric power technology. The Tesla Roadster had a battery pack capableof storing 53 kilowatt hours of usable energy, almost double the energy of any other com-mercially available electric vehicle battery pack;
� Competencies in electrical engineering, software, and controls as well as vehicle engi-neering and manufacturing;
� Ability to combine electric powertrain expertise with electric vehicle design and systemsintegration;
� Rapid customer-focused product development;
� Ownership of its sales and service network;
� Brand leadership in high-performance, long-range electric vehicles;
� Long-term financial support from a $465 million loan facility agreement under the U.S. Department of Energy’s Advanced Technology Vehicles Manufacturing IncentiveProgram; and
� Efficient research & development process. Cumulative capital expenditures and R&D forthe Tesla Roadster totaled only $125 million.
Tesla’s management also admitted that the company had weaknesses and faced significantrisks. For one thing, even though its total revenues had increased from $73 million in 2007 to$14.7 billion in 2008 to $111.9 billion in 2009, the company had never earned a profit. Its netlosses had varied from $78.2 billion in 2007 to $82.8 billion in 2008 to $55.7 billion in 2009.For the first six months of 2010, revenues had increased to $49.2 billion from $47.8 billionduring the same period in 2009. If battery pack and charging equipment sales of $4.7 billionto Daimler had not been included, however, 2010 six-month revenue from auto sales wouldhave only been $44.6 billion. For the same six-month period, net losses increased from$26.9 billion in 2009 to $68.0 billion in 2010, primarily due to a tripling of both R&D and selling, general, and administrative expenses. The company also incurred $45.4 billion in long-term debt in 2010 compared to none in 2009.
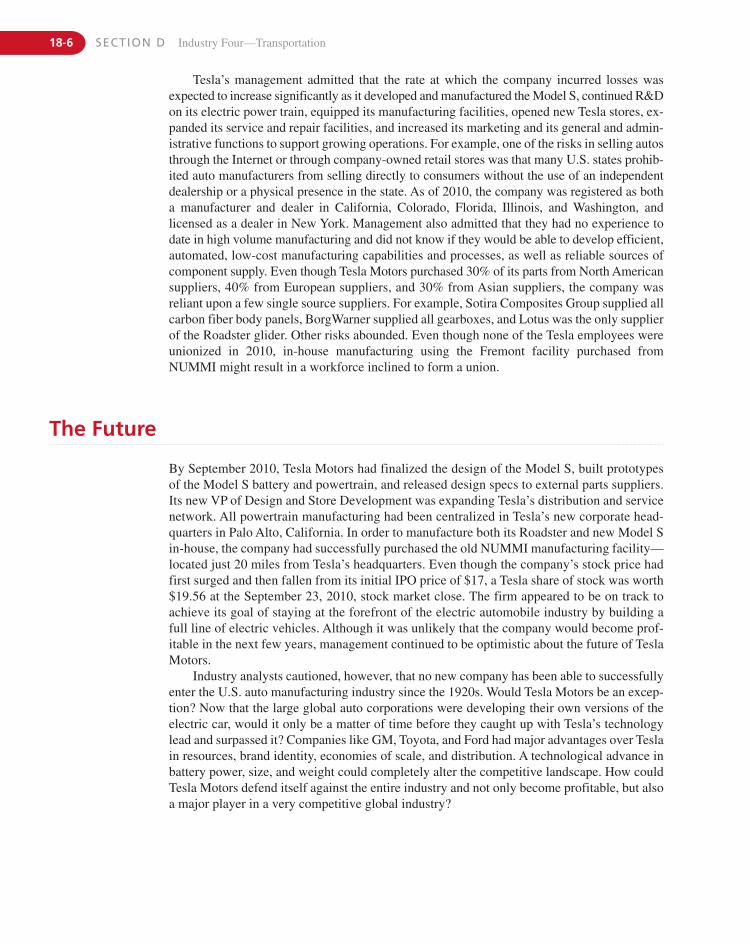
18-6 SECTION D Industry Four—Transportation
Tesla’s management admitted that the rate at which the company incurred losses was expected to increase significantly as it developed and manufactured the Model S, continued R&Don its electric power train, equipped its manufacturing facilities, opened new Tesla stores, ex-panded its service and repair facilities, and increased its marketing and its general and admin-istrative functions to support growing operations. For example, one of the risks in selling autosthrough the Internet or through company-owned retail stores was that many U.S. states prohib-ited auto manufacturers from selling directly to consumers without the use of an independentdealership or a physical presence in the state. As of 2010, the company was registered as botha manufacturer and dealer in California, Colorado, Florida, Illinois, and Washington, and licensed as a dealer in New York. Management also admitted that they had no experience todate in high volume manufacturing and did not know if they would be able to develop efficient,automated, low-cost manufacturing capabilities and processes, as well as reliable sources ofcomponent supply. Even though Tesla Motors purchased 30% of its parts from North Americansuppliers, 40% from European suppliers, and 30% from Asian suppliers, the company wasreliant upon a few single source suppliers. For example, Sotira Composites Group supplied allcarbon fiber body panels, BorgWarner supplied all gearboxes, and Lotus was the only supplierof the Roadster glider. Other risks abounded. Even though none of the Tesla employees wereunionized in 2010, in-house manufacturing using the Fremont facility purchased fromNUMMI might result in a workforce inclined to form a union.
The Future
By September 2010, Tesla Motors had finalized the design of the Model S, built prototypesof the Model S battery and powertrain, and released design specs to external parts suppliers.Its new VP of Design and Store Development was expanding Tesla’s distribution and servicenetwork. All powertrain manufacturing had been centralized in Tesla’s new corporate head-quarters in Palo Alto, California. In order to manufacture both its Roadster and new Model Sin-house, the company had successfully purchased the old NUMMI manufacturing facility—located just 20 miles from Tesla’s headquarters. Even though the company’s stock price hadfirst surged and then fallen from its initial IPO price of $17, a Tesla share of stock was worth$19.56 at the September 23, 2010, stock market close. The firm appeared to be on track toachieve its goal of staying at the forefront of the electric automobile industry by building afull line of electric vehicles. Although it was unlikely that the company would become prof-itable in the next few years, management continued to be optimistic about the future of TeslaMotors.
Industry analysts cautioned, however, that no new company has been able to successfullyenter the U.S. auto manufacturing industry since the 1920s. Would Tesla Motors be an excep-tion? Now that the large global auto corporations were developing their own versions of theelectric car, would it only be a matter of time before they caught up with Tesla’s technologylead and surpassed it? Companies like GM, Toyota, and Ford had major advantages over Teslain resources, brand identity, economies of scale, and distribution. A technological advance inbattery power, size, and weight could completely alter the competitive landscape. How couldTesla Motors defend itself against the entire industry and not only become profitable, but alsoa major player in a very competitive global industry?
IT WAS A PRETTY AMAZING SIGHT, DOZENS AT A TIME, THOUSANDS IN A DAY DESCENDING ON THE
Sinclair gas station and Western café in Lusk, Wyoming, on their way to the 2008 Sturgisrally in the blistering heat of early August. Lusk, a town of 1,348 people that lies 147 milessouthwest of Sturgis, saw bikers from all walks of life, needing fuel and small supplies,some with tattoos, some with leather to protect themselves from the winds as they cruisedat 60 miles per hour along Highway 18 toward Sturgis. Some clearly were businessmen
on a weeklong reprieve, others were rougher in appearance. The one thing they all had incommon was the love of the ride . . . the ride of the Harley-Davidson motorcycle.
There were new issues facing Harley-Davidson in their 105th year of operation. Considerthe weak dollar, the probability that retail sales would continue a downward spiral, which inturn would cause excess inventory of high priced motorcycles. Then there was the customerbase: the rockers who grew up in the sixties and seventies are graying and this threatens thegrowth of Harley-Davidson. As riders approach sixty, it is important for Harley-Davidson torecruit new riders of the younger generations. Their emphasis on recruiting women has beeninstrumental in recent years. They were faced with an aging baby boomer population andneeded to focus on growing smaller segments of their business—women bikers and youngerbikers, the latter who could not traditionally afford a Harley-Davidson motorbike.
Many things were looking good for the 105-year-old motorcycle manufacturer; however,President and CEO James Ziemer needed to continue the company’s strong growth as manyeconomists felt the economy was heading into a recession. Harley-Davidson had opened theirfirst dealership in mainland China, and named Beijing Feng Huo Lun as the first authorizeddealer. A Harley-Davidson museum was due to open in 2008 and sought to attract upwards of
19-1
C A S E 19Harley-Davidson Inc. 2008:THRIVING THROUGH A RECESSIONPatricia A. Ryan and Thomas L. Wheelen
We fulfill dreams through the experience of motorcycling by providing to motorcyclists and to the general public an expanding line of motorcycles, branded products and services in selected market segments.1
HARLEY-DAVIDSON MISSION STATEMENT
Copyright ©2008 by Professor Patricia A. Ryan of Colorado State University and Thomas L. Wheelen, WheelenStrategic Audit. This case cannot be reproduced in any form without the written permission of the copyright holder,Patricia A. Ryan. This case was edited for SMBP-13th Edition. The copyright holder is solely responsible for the casecontent. Reprint permission is solely granted to the publisher, Prentice Hall, for the book Strategic Management andBusiness Policy—13th Edition (and the International and electronic versions of this book) by the copyright holder,Patricia A. Ryan. Any other publication of the case (translation, any form of electronics or other media) or sale (anyform of partnership) to another publisher will be in violation of copyright law, unless Patricia A. Ryan has grantedadditional written reprint permission. Reprinted by permission.
History3
In 1901, William Harley (age 21), a draftsman, and his friend, Arthur R. Davidson, began ex-perimenting with ideas to design and build their own motorcycles. They were joined byArthur’s brothers, William, a machinist, and Walter, a skilled mechanic. The Harley-DavidsonMotor Company started in a 10 � 15 foot shed in the Davidson family’s backyard in Milwaukee,Wisconsin.
In 1903, three motorcycles were built and sold. The production increased to eight in 1904.The company then moved to Juneau Avenue, which is the site of the company’s present of-fices. In 1907, the company was incorporated.
Ownership by AMFIn 1969, AMF Inc., a leisure and industrial product conglomerate, acquired Harley-Davidson.The management team expanded production from 15,000 in 1969 to 40,000 motorcycles in1974. AMF favored short-term profits instead of investing in research and development andretooling. During this time, Japanese competitors continued to improve the quality of theirmotorcycles, while Harley-Davidson began to turn out noisy, oil-leaking, heavy vibrating,poorly finished, and hard-to-handle machines. AMF ignored the Japanese competition. In1975, Honda Motor Company introduced its “Gold Wing,” which became the standard forlarge touring motorcycles. Harley-Davidson had controlled this segment of the market foryears. There was a $2,000 price difference between Harley’s top-of-the-line motorcycles andHonda’s comparable Gold Wing. This caused American buyers of motorcycles to startswitching to Japanese motorcycles. The Japanese companies (Suzuki and Yamaha) from thistime until the middle 1980s continued to enter the heavyweight custom market with Harleylook-alikes.
During AMF’s ownership of the company, sales of motorcycles were strong, but profitswere weak. The company had serious problems with poor quality manufacturing and strongJapanese competition. In 1981, Vaughn Beals, then head of the Harley Division, and 13 othermanagers conducted a leveraged buyout of the company for $65 million.
Under New ManagementNew management installed a Materials As Needed (MAN) system to reduce inventories andstabilize the production schedule. Also, this system forced production to work with market-ing for more accurate forecasts. This led to precise production schedules for each month, al-lowing only a 10% variance. The company forced its suppliers to increase their quality inorder to reduce customer complaints.
Citicorp, Harley’s main lender, refused to lend any more money in 1985. On New Year’sEve, four hours before a midnight that would have meant Harley’s demise, the company inked
350,000 tourists per year. CEO and President Ziemer worked his way up the ranks, starting38 years ago as a freight elevator operator and most recently serving a 14-year stint at CFO,but now at the driver’s seat, he faced a different set of responsibilities. As noted by one analyst,
There are indications that Harley-Davidson is at a turning point. “It’s a well managedcompany with still one of the strongest brand names in consumer products, but I just ques-tion whether the company can grow its production 7 to 9 percent in an environment wheredemand doesn’t seem to be growing at that rate”
Ed Aaron, analyst with BRC Capital Markets2
19-2 SECTION D Industry Four—Transportation
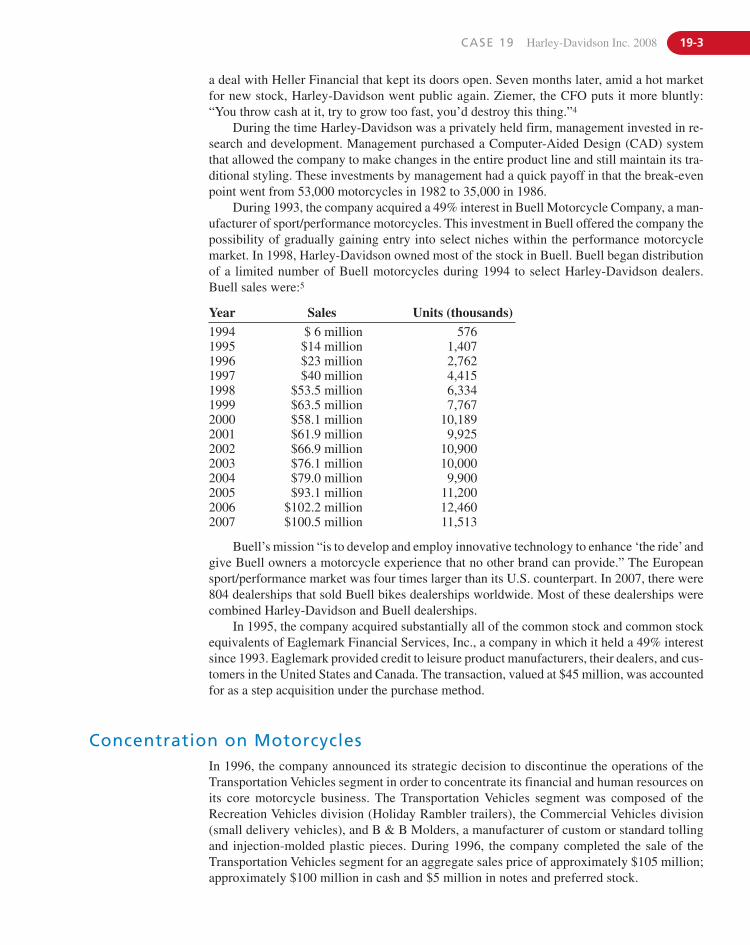
CASE 19 Harley-Davidson Inc. 2008 19-3
Year Sales Units (thousands)1994 $ 6 million 5761995 $14 million 1,4071996 $23 million 2,7621997 $40 million 4,4151998 $53.5 million 6,3341999 $63.5 million 7,7672000 $58.1 million 10,1892001 $61.9 million 9,9252002 $66.9 million 10,9002003 $76.1 million 10,0002004 $79.0 million 9,9002005 $93.1 million 11,2002006 $102.2 million 12,4602007 $100.5 million 11,513
a deal with Heller Financial that kept its doors open. Seven months later, amid a hot marketfor new stock, Harley-Davidson went public again. Ziemer, the CFO puts it more bluntly:“You throw cash at it, try to grow too fast, you’d destroy this thing.”4
During the time Harley-Davidson was a privately held firm, management invested in re-search and development. Management purchased a Computer-Aided Design (CAD) systemthat allowed the company to make changes in the entire product line and still maintain its tra-ditional styling. These investments by management had a quick payoff in that the break-evenpoint went from 53,000 motorcycles in 1982 to 35,000 in 1986.
During 1993, the company acquired a 49% interest in Buell Motorcycle Company, a man-ufacturer of sport/performance motorcycles. This investment in Buell offered the company thepossibility of gradually gaining entry into select niches within the performance motorcyclemarket. In 1998, Harley-Davidson owned most of the stock in Buell. Buell began distributionof a limited number of Buell motorcycles during 1994 to select Harley-Davidson dealers.Buell sales were:5
Buell’s mission “is to develop and employ innovative technology to enhance ‘the ride’andgive Buell owners a motorcycle experience that no other brand can provide.” The Europeansport/performance market was four times larger than its U.S. counterpart. In 2007, there were804 dealerships that sold Buell bikes dealerships worldwide. Most of these dealerships werecombined Harley-Davidson and Buell dealerships.
In 1995, the company acquired substantially all of the common stock and common stockequivalents of Eaglemark Financial Services, Inc., a company in which it held a 49% interestsince 1993. Eaglemark provided credit to leisure product manufacturers, their dealers, and cus-tomers in the United States and Canada. The transaction, valued at $45 million, was accountedfor as a step acquisition under the purchase method.
Concentration on MotorcyclesIn 1996, the company announced its strategic decision to discontinue the operations of theTransportation Vehicles segment in order to concentrate its financial and human resources onits core motorcycle business. The Transportation Vehicles segment was composed of theRecreation Vehicles division (Holiday Rambler trailers), the Commercial Vehicles division(small delivery vehicles), and B & B Molders, a manufacturer of custom or standard tollingand injection-molded plastic pieces. During 1996, the company completed the sale of theTransportation Vehicles segment for an aggregate sales price of approximately $105 million;approximately $100 million in cash and $5 million in notes and preferred stock.
19-4 SECTION D Industry Four—Transportation
Internal Makeover and New ProductsIn 1997, Harley-Davidson created an internal makeover. The unsung hero of Harley-Davidson’ssupply-chain makeover was an intense procurement expert named Garry Berryman, vice pres-ident of Materials Management/Product Cost from 1995 to 2003 at Honda. When Berrymanjoined Harley-Davidson, he found the supply-chain management neglected. There were ninedifferent purchasing departments operating from different plant locations, fourteen separatesets of representative terms and conditions, and nearly 4,000 suppliers. Engineers with littleor no expertise in supply management were doing the bulk of the buying. To top it off, “thevoice of supply management was buried three layers deep in the corporate hierarchy,” saidBerryman.
While at Honda, Berryman studied Japanese keiretsu—huge, vertically integrated com-panies that foster deep, trusting relationships with suppliers. He wanted to form similar strate-gic alliances with Harley’s top suppliers, bringing them into the design and planning process.Berryman felt that new technology and the Internet would make it easier than ever to formthese bonds and collaborate. He made it clear that relationship and strategy should drive ap-plications, not vice versa. As Dave Cotteleer, the company’s manager of planning and control,explained, “We’re using technology to cut back on communication times and administrativetrivia, like invoice tracking, so we can focus the relationships on more strategic issues. We’renot saying, ‘Here’s a neat piece of technology. Let’s jam it into our model.”6
Also, in the 1990s, Harley-Davidson saw the need to build a motorcycle to appeal to theyounger and international markets who preferred sleeker, faster bikes. Harley-Davidson spentan undisclosed amount of research and development dollars over several years to develop the$17,000 V-Rod motorcycle. The V-Rod, introduced in 2001, had 110 horsepower, nearly dou-ble that of the standard Harley Bike. The V-Rod was the quickest and fastest production modelthe company had ever built, capable of reaching 60 miles an hour in 3.5 seconds and 100 mphin a little over 8 seconds. Its top speed is about 140 mph. All in all, the V-Rod was faster andhandled better than the traditional bulky Harley bikes.
All other Harley models are powered by 45-degree V-twin air-cooled engines withcamshafts in the block; the new V-Rod has a 1,130-cc 60-degree engine with double overheadcams and four values for each cylinder. The V-Rod has a very long 67.5-inch wheelbase, andit handles better than other Harleys because it is so much lighter. Furthermore, the V-Rod is only26 inches off the ground, so it will accommodate a wide range of rides.7 Harley-Davidson hopedto gain some of the younger markets with this new bike.
In 2000, a new Softail model was introduced and all Softail models were outfitted withthe twin Cam 88B engine. Fuel injection was introduced for the Softails in 2001 and in 2000;Buell introduced the Buell Blast, which was a single-cylinder bike. Along with the Buell Blast,Harley-Davidson introduced a new beginner rider’s course aimed at the first time Harleyowner and rider. The course was offered in Harley-Davidson and Buell dealerships. TheVRSCA V-Rod in 2002 was the first Harley bike to combine fuel injection, overhead cams,and liquid cooling along with new 115 horsepower.
In an attempt to gain further female support, Harley-Davidson announced the introduc-tion of 17-year-old Jennifer Snyder, a champion dirt bike racer as the newest member of theHarley-Davidson racing team. Female racers were starting to enter this predominantly malesport and Harley-Davidson would not miss this opportunity to challenge market perceptionsof a Harley-Davidson rider.
In 2003, Harley-Davidson introduced the Lightning XBS9. In 2004, the Sportsters wererefitted with rubber engine mounting, a new frame and a wider rear tire. The FLHRSI RoadKing was introduced with low rear suspension and wide handlebars for a beach appearance.In 2005, the XL 883 Sportster 883 Low, featuring a lowered seating position aimed at agingbaby boomers, was added to the Sportster line. The FLSTNI Softail Deluxe was added to the
Softail line with a new sleek appearance reminiscent of the 1939 Harley-Davidson bike. In thesame year, the FLSTSC/I Softail Springer-Classic revived the late 1940s bike in appearance.
In 2006, the Dyna motorcycle line was developed with the first 6-speed transmission. Thenew FLHX/I Street Glide was introduced as a lower profile touring bike. Scheduled for open-ing in 2008 was the Harley-Davidson museum in Milwaukee, Wisconsin. In the area of inter-national development, the first dealership was opened in mainland China. In 2008, thecompany introduced four new bikes aimed at two markets—aging baby boomers and thegrowing female market.
CASE 19 Harley-Davidson Inc. 2008 19-5
Corporate Governance
Board of DirectorsThe Board of Directors consisted of 11 members, of which only two were internal members—James L. Ziemer, President and Chief Executive Officer (CEO), and Thomas E. Bergman, theChief Financial Officer. Exhibit 1 highlights board members in 2008.
The Board of Directors serve three-year staggered terms. Each of the nine non-employeedirectors are compensated $100,000 per year. At least half of this amount is to be paid in com-mon stock.
Since 2005, the board has authorized a stock repurchase. In 2007, 2006, and 2005, theCompany repurchased 20.4 million, 19.3 million, and 21.4 million shares of its common stockat weighted-average prices of $56, $55, and $49, respectively. As of February 2008, all of the20 million shares authorized in 2007 remained to be repurchased. Each of the prior two yearsauthorizations were fully repurchased by the end of the next year.
Top ManagementJames C. Ziemer started with Harley-Davidson 38 years ago as a freight elevator operator andserved as the CFO from 1991 to 2005. In 2005, upon the retirement of Harley veteran JeffreyBluestein, Ziemer assumed the top role of President and CEO. He commented, “Harley-Davidson is strong and well-positioned for the road ahead.”8 Ziemer further commented:
I believe there are three constants in our success as a company: 1. Our passion for this business,for riding, and for relating to and being one with our customers; 2. Our sense of purpose—inother words, our focus on growing demand by offering great products and unique experiences;and 3. Operational Excellence—which is the continuous, relentless drive to eliminate waste inall aspects of our operations and to run Harley-Davidson better and more efficiently with eachpassing day. And I believe these three things—being close to our customers, growth and Opera-tional Excellence—hold the keys to the future.9
Exhibit 2 shows the corporate officers for Harley-Davidson and its business segments—motor company leadership, Buell leadership, and financial services leadership.
Through 2006, Harley-Davidson received positive attention from the popular press interms of rankings. In 2006, Business Week/Interbrand Annual Rankings Top 100 Global Brandsplaced Harley-Davidson at #45, up 1 from 2005. Fortune also placed Harley-Davidson in its2004 list of “Most Admired Companies.”10 Previously, Forbes named Harley Davidson its“Company of the Year” for 2001. Harley-Davidson did not make Fortune’s list in 2008.
In 2007, Harley-Davidson experienced its first decline in 20 years. Motorcycle revenue was down 1.27% over 2006, total revenue was down 0.69% and, perhaps most importantly, op-erating income suffered a 10.74% decline. Harley-Davidson, which had fought back from neardemise in the 1980s was to face new rivals in the competitive market, an aging customer base,and the recession. Given the recession in 2008, what did the future hold for Harley-Davidson?These were issues management wrestled with as they planned for the future. One possible so-lution was to gain new, younger customers as the future as their current customers aged.
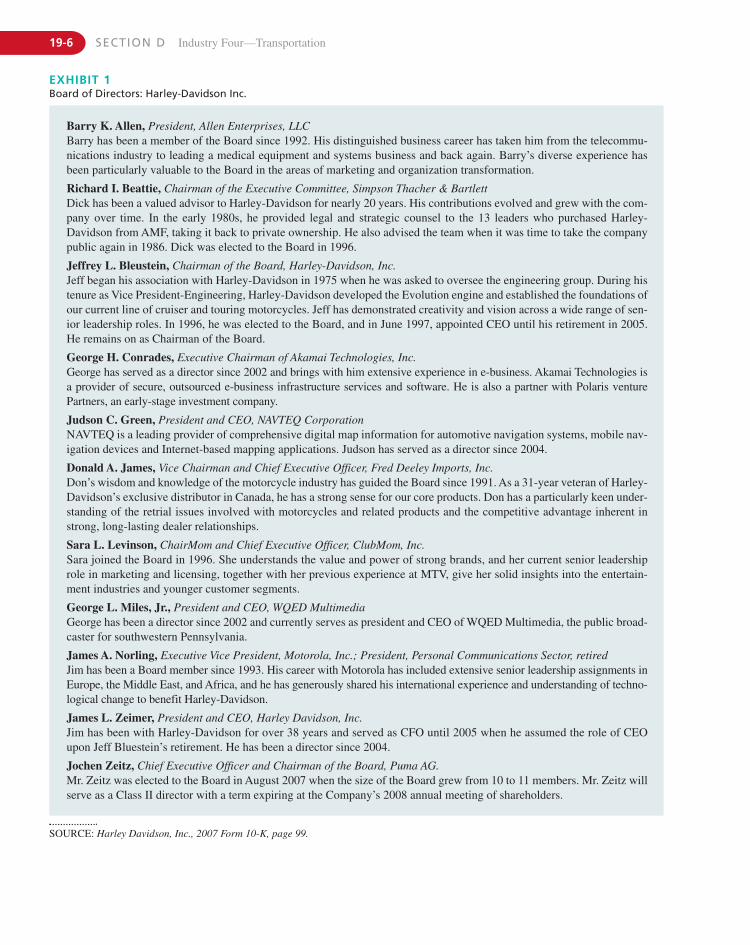
19-6 SECTION D Industry Four—Transportation
EXHIBIT 1Board of Directors: Harley-Davidson Inc.
Barry K. Allen, President, Allen Enterprises, LLCBarry has been a member of the Board since 1992. His distinguished business career has taken him from the telecommu-nications industry to leading a medical equipment and systems business and back again. Barry’s diverse experience hasbeen particularly valuable to the Board in the areas of marketing and organization transformation.
Richard I. Beattie, Chairman of the Executive Committee, Simpson Thacher & BartlettDick has been a valued advisor to Harley-Davidson for nearly 20 years. His contributions evolved and grew with the com-pany over time. In the early 1980s, he provided legal and strategic counsel to the 13 leaders who purchased Harley-Davidson from AMF, taking it back to private ownership. He also advised the team when it was time to take the companypublic again in 1986. Dick was elected to the Board in 1996.
Jeffrey L. Bleustein, Chairman of the Board, Harley-Davidson, Inc.Jeff began his association with Harley-Davidson in 1975 when he was asked to oversee the engineering group. During histenure as Vice President-Engineering, Harley-Davidson developed the Evolution engine and established the foundations ofour current line of cruiser and touring motorcycles. Jeff has demonstrated creativity and vision across a wide range of sen-ior leadership roles. In 1996, he was elected to the Board, and in June 1997, appointed CEO until his retirement in 2005.He remains on as Chairman of the Board.
George H. Conrades, Executive Chairman of Akamai Technologies, Inc.George has served as a director since 2002 and brings with him extensive experience in e-business. Akamai Technologies isa provider of secure, outsourced e-business infrastructure services and software. He is also a partner with Polaris venturePartners, an early-stage investment company.
Judson C. Green, President and CEO, NAVTEQ CorporationNAVTEQ is a leading provider of comprehensive digital map information for automotive navigation systems, mobile nav-igation devices and Internet-based mapping applications. Judson has served as a director since 2004.
Donald A. James, Vice Chairman and Chief Executive Officer, Fred Deeley Imports, Inc.Don’s wisdom and knowledge of the motorcycle industry has guided the Board since 1991. As a 31-year veteran of Harley-Davidson’s exclusive distributor in Canada, he has a strong sense for our core products. Don has a particularly keen under-standing of the retrial issues involved with motorcycles and related products and the competitive advantage inherent instrong, long-lasting dealer relationships.
Sara L. Levinson, ChairMom and Chief Executive Officer, ClubMom, Inc.Sara joined the Board in 1996. She understands the value and power of strong brands, and her current senior leadershiprole in marketing and licensing, together with her previous experience at MTV, give her solid insights into the entertain-ment industries and younger customer segments.
George L. Miles, Jr., President and CEO, WQED MultimediaGeorge has been a director since 2002 and currently serves as president and CEO of WQED Multimedia, the public broad-caster for southwestern Pennsylvania.
James A. Norling, Executive Vice President, Motorola, Inc.; President, Personal Communications Sector, retiredJim has been a Board member since 1993. His career with Motorola has included extensive senior leadership assignments inEurope, the Middle East, and Africa, and he has generously shared his international experience and understanding of techno-logical change to benefit Harley-Davidson.
James L. Zeimer, President and CEO, Harley Davidson, Inc.Jim has been with Harley-Davidson for over 38 years and served as CFO until 2005 when he assumed the role of CEOupon Jeff Bluestein’s retirement. He has been a director since 2004.
Jochen Zeitz, Chief Executive Officer and Chairman of the Board, Puma AG.Mr. Zeitz was elected to the Board in August 2007 when the size of the Board grew from 10 to 11 members. Mr. Zeitz willserve as a Class II director with a term expiring at the Company’s 2008 annual meeting of shareholders.
SOURCE: Harley Davidson, Inc., 2007 Form 10-K, page 99.
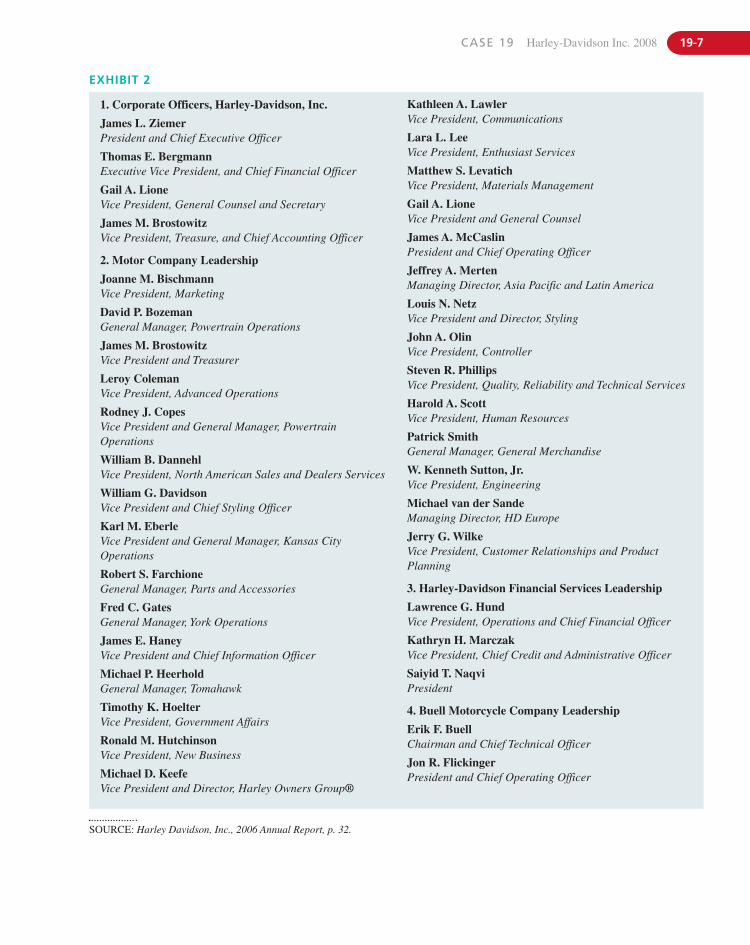
CASE 19 Harley-Davidson Inc. 2008 19-7
EXHIBIT 2
SOURCE: Harley Davidson, Inc., 2006 Annual Report, p. 32.
Kathleen A. LawlerVice President, Communications
Lara L. LeeVice President, Enthusiast Services
Matthew S. LevatichVice President, Materials Management
Gail A. LioneVice President and General Counsel
James A. McCaslinPresident and Chief Operating Officer
Jeffrey A. MertenManaging Director, Asia Pacific and Latin America
Louis N. NetzVice President and Director, Styling
John A. OlinVice President, Controller
Steven R. PhillipsVice President, Quality, Reliability and Technical Services
Harold A. ScottVice President, Human Resources
Patrick SmithGeneral Manager, General Merchandise
W. Kenneth Sutton, Jr.Vice President, Engineering
Michael van der SandeManaging Director, HD Europe
Jerry G. WilkeVice President, Customer Relationships and ProductPlanning
3. Harley-Davidson Financial Services Leadership
Lawrence G. HundVice President, Operations and Chief Financial Officer
Kathryn H. MarczakVice President, Chief Credit and Administrative Officer
Saiyid T. NaqviPresident
4. Buell Motorcycle Company Leadership
Erik F. BuellChairman and Chief Technical Officer
Jon R. FlickingerPresident and Chief Operating Officer
1. Corporate Officers, Harley-Davidson, Inc.
James L. ZiemerPresident and Chief Executive Officer
Thomas E. BergmannExecutive Vice President, and Chief Financial Officer
Gail A. LioneVice President, General Counsel and Secretary
James M. BrostowitzVice President, Treasure, and Chief Accounting Officer
2. Motor Company Leadership
Joanne M. BischmannVice President, Marketing
David P. BozemanGeneral Manager, Powertrain Operations
James M. BrostowitzVice President and Treasurer
Leroy ColemanVice President, Advanced Operations
Rodney J. CopesVice President and General Manager, PowertrainOperations
William B. DannehlVice President, North American Sales and Dealers Services
William G. DavidsonVice President and Chief Styling Officer
Karl M. EberleVice President and General Manager, Kansas CityOperations
Robert S. FarchioneGeneral Manager, Parts and Accessories
Fred C. GatesGeneral Manager, York Operations
James E. HaneyVice President and Chief Information Officer
Michael P. HeerholdGeneral Manager, Tomahawk
Timothy K. HoelterVice President, Government Affairs
Ronald M. HutchinsonVice President, New Business
Michael D. KeefeVice President and Director, Harley Owners Group®
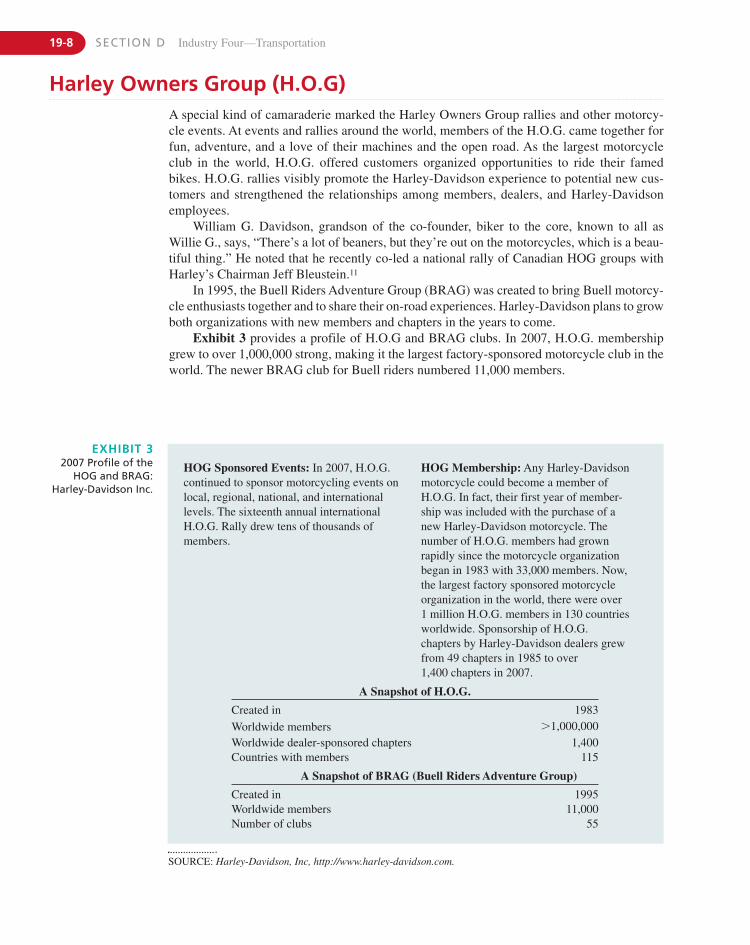
19-8 SECTION D Industry Four—Transportation
EXHIBIT 32007 Profile of the
HOG and BRAG:Harley-Davidson Inc.
SOURCE: Harley-Davidson, Inc, http://www.harley-davidson.com.
HOG Sponsored Events: In 2007, H.O.G.continued to sponsor motorcycling events onlocal, regional, national, and internationallevels. The sixteenth annual internationalH.O.G. Rally drew tens of thousands ofmembers.
HOG Membership: Any Harley-Davidsonmotorcycle could become a member ofH.O.G. In fact, their first year of member-ship was included with the purchase of anew Harley-Davidson motorcycle. Thenumber of H.O.G. members had grownrapidly since the motorcycle organizationbegan in 1983 with 33,000 members. Now,the largest factory sponsored motorcycleorganization in the world, there were over 1 million H.O.G. members in 130 countriesworldwide. Sponsorship of H.O.G.chapters by Harley-Davidson dealers grewfrom 49 chapters in 1985 to over1,400 chapters in 2007.
A Snapshot of H.O.G.
Created in 1983
Worldwide members 1,000,000Worldwide dealer-sponsored chapters 1,400Countries with members 115
A Snapshot of BRAG (Buell Riders Adventure Group)
Created in 1995Worldwide members 11,000Number of clubs 55
Harley Owners Group (H.O.G)A special kind of camaraderie marked the Harley Owners Group rallies and other motorcy-cle events. At events and rallies around the world, members of the H.O.G. came together forfun, adventure, and a love of their machines and the open road. As the largest motorcycleclub in the world, H.O.G. offered customers organized opportunities to ride their famedbikes. H.O.G. rallies visibly promote the Harley-Davidson experience to potential new cus-tomers and strengthened the relationships among members, dealers, and Harley-Davidsonemployees.
William G. Davidson, grandson of the co-founder, biker to the core, known to all asWillie G., says, “There’s a lot of beaners, but they’re out on the motorcycles, which is a beau-tiful thing.” He noted that he recently co-led a national rally of Canadian HOG groups withHarley’s Chairman Jeff Bleustein.11
In 1995, the Buell Riders Adventure Group (BRAG) was created to bring Buell motorcy-cle enthusiasts together and to share their on-road experiences. Harley-Davidson plans to growboth organizations with new members and chapters in the years to come.
Exhibit 3 provides a profile of H.O.G and BRAG clubs. In 2007, H.O.G. membershipgrew to over 1,000,000 strong, making it the largest factory-sponsored motorcycle club in theworld. The newer BRAG club for Buell riders numbered 11,000 members.
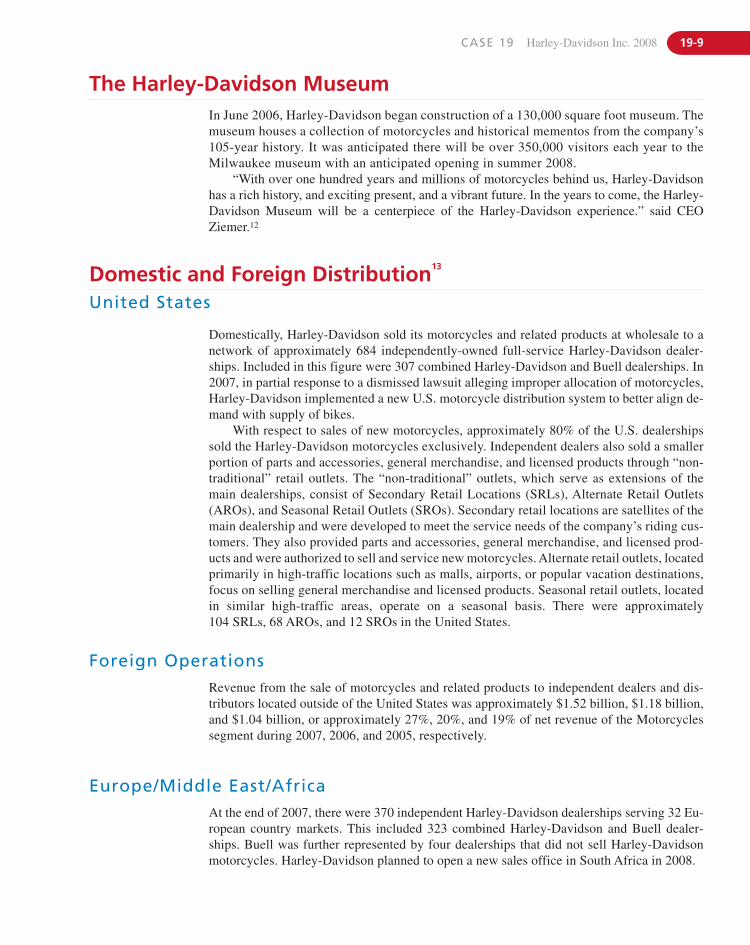
CASE 19 Harley-Davidson Inc. 2008 19-9
The Harley-Davidson MuseumIn June 2006, Harley-Davidson began construction of a 130,000 square foot museum. Themuseum houses a collection of motorcycles and historical mementos from the company’s105-year history. It was anticipated there will be over 350,000 visitors each year to theMilwaukee museum with an anticipated opening in summer 2008.
“With over one hundred years and millions of motorcycles behind us, Harley-Davidsonhas a rich history, and exciting present, and a vibrant future. In the years to come, the Harley-Davidson Museum will be a centerpiece of the Harley-Davidson experience.” said CEOZiemer.12
Domestic and Foreign Distribution13
United States
Domestically, Harley-Davidson sold its motorcycles and related products at wholesale to anetwork of approximately 684 independently-owned full-service Harley-Davidson dealer-ships. Included in this figure were 307 combined Harley-Davidson and Buell dealerships. In2007, in partial response to a dismissed lawsuit alleging improper allocation of motorcycles,Harley-Davidson implemented a new U.S. motorcycle distribution system to better align de-mand with supply of bikes.
With respect to sales of new motorcycles, approximately 80% of the U.S. dealershipssold the Harley-Davidson motorcycles exclusively. Independent dealers also sold a smallerportion of parts and accessories, general merchandise, and licensed products through “non-traditional” retail outlets. The “non-traditional” outlets, which serve as extensions of themain dealerships, consist of Secondary Retail Locations (SRLs), Alternate Retail Outlets(AROs), and Seasonal Retail Outlets (SROs). Secondary retail locations are satellites of themain dealership and were developed to meet the service needs of the company’s riding cus-tomers. They also provided parts and accessories, general merchandise, and licensed prod-ucts and were authorized to sell and service new motorcycles. Alternate retail outlets, locatedprimarily in high-traffic locations such as malls, airports, or popular vacation destinations,focus on selling general merchandise and licensed products. Seasonal retail outlets, locatedin similar high-traffic areas, operate on a seasonal basis. There were approximately104 SRLs, 68 AROs, and 12 SROs in the United States.
Foreign OperationsRevenue from the sale of motorcycles and related products to independent dealers and dis-tributors located outside of the United States was approximately $1.52 billion, $1.18 billion,and $1.04 billion, or approximately 27%, 20%, and 19% of net revenue of the Motorcyclessegment during 2007, 2006, and 2005, respectively.
Europe/Middle East/AfricaAt the end of 2007, there were 370 independent Harley-Davidson dealerships serving 32 Eu-ropean country markets. This included 323 combined Harley-Davidson and Buell dealer-ships. Buell was further represented by four dealerships that did not sell Harley-Davidsonmotorcycles. Harley-Davidson planned to open a new sales office in South Africa in 2008.
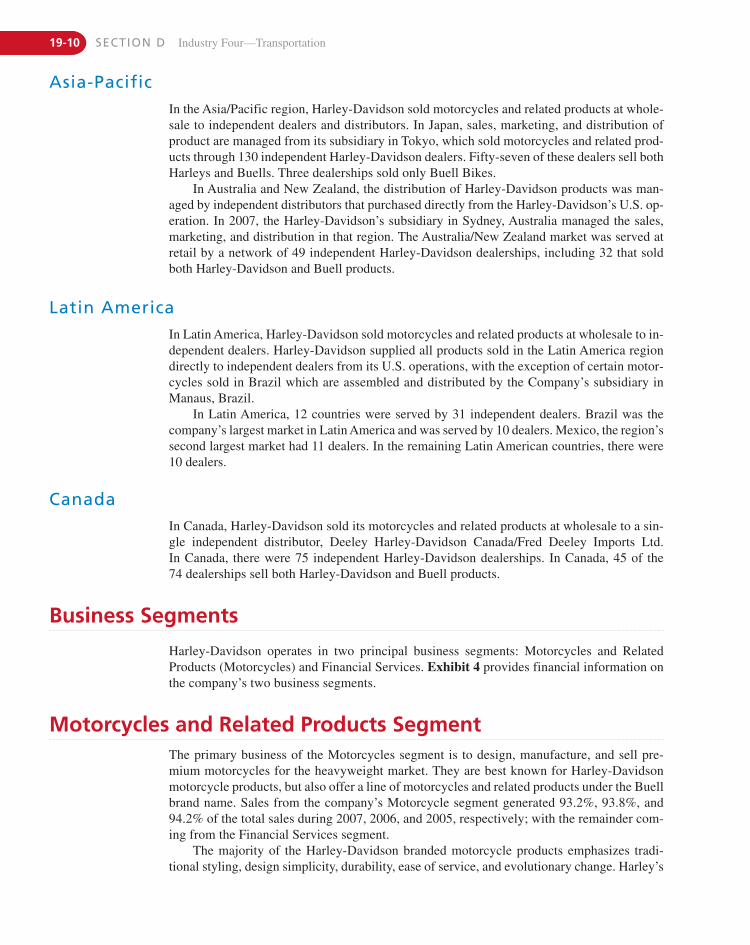
19-10 SECTION D Industry Four—Transportation
Asia-PacificIn the Asia/Pacific region, Harley-Davidson sold motorcycles and related products at whole-sale to independent dealers and distributors. In Japan, sales, marketing, and distribution ofproduct are managed from its subsidiary in Tokyo, which sold motorcycles and related prod-ucts through 130 independent Harley-Davidson dealers. Fifty-seven of these dealers sell bothHarleys and Buells. Three dealerships sold only Buell Bikes.
In Australia and New Zealand, the distribution of Harley-Davidson products was man-aged by independent distributors that purchased directly from the Harley-Davidson’s U.S. op-eration. In 2007, the Harley-Davidson’s subsidiary in Sydney, Australia managed the sales,marketing, and distribution in that region. The Australia/New Zealand market was served atretail by a network of 49 independent Harley-Davidson dealerships, including 32 that soldboth Harley-Davidson and Buell products.
Latin AmericaIn Latin America, Harley-Davidson sold motorcycles and related products at wholesale to in-dependent dealers. Harley-Davidson supplied all products sold in the Latin America regiondirectly to independent dealers from its U.S. operations, with the exception of certain motor-cycles sold in Brazil which are assembled and distributed by the Company’s subsidiary inManaus, Brazil.
In Latin America, 12 countries were served by 31 independent dealers. Brazil was thecompany’s largest market in Latin America and was served by 10 dealers. Mexico, the region’ssecond largest market had 11 dealers. In the remaining Latin American countries, there were10 dealers.
CanadaIn Canada, Harley-Davidson sold its motorcycles and related products at wholesale to a sin-gle independent distributor, Deeley Harley-Davidson Canada/Fred Deeley Imports Ltd.In Canada, there were 75 independent Harley-Davidson dealerships. In Canada, 45 of the74 dealerships sell both Harley-Davidson and Buell products.
Business Segments
Harley-Davidson operates in two principal business segments: Motorcycles and RelatedProducts (Motorcycles) and Financial Services. Exhibit 4 provides financial information onthe company’s two business segments.
Motorcycles and Related Products SegmentThe primary business of the Motorcycles segment is to design, manufacture, and sell pre-mium motorcycles for the heavyweight market. They are best known for Harley-Davidsonmotorcycle products, but also offer a line of motorcycles and related products under the Buellbrand name. Sales from the company’s Motorcycle segment generated 93.2%, 93.8%, and94.2% of the total sales during 2007, 2006, and 2005, respectively; with the remainder com-ing from the Financial Services segment.
The majority of the Harley-Davidson branded motorcycle products emphasizes tradi-tional styling, design simplicity, durability, ease of service, and evolutionary change. Harley’s
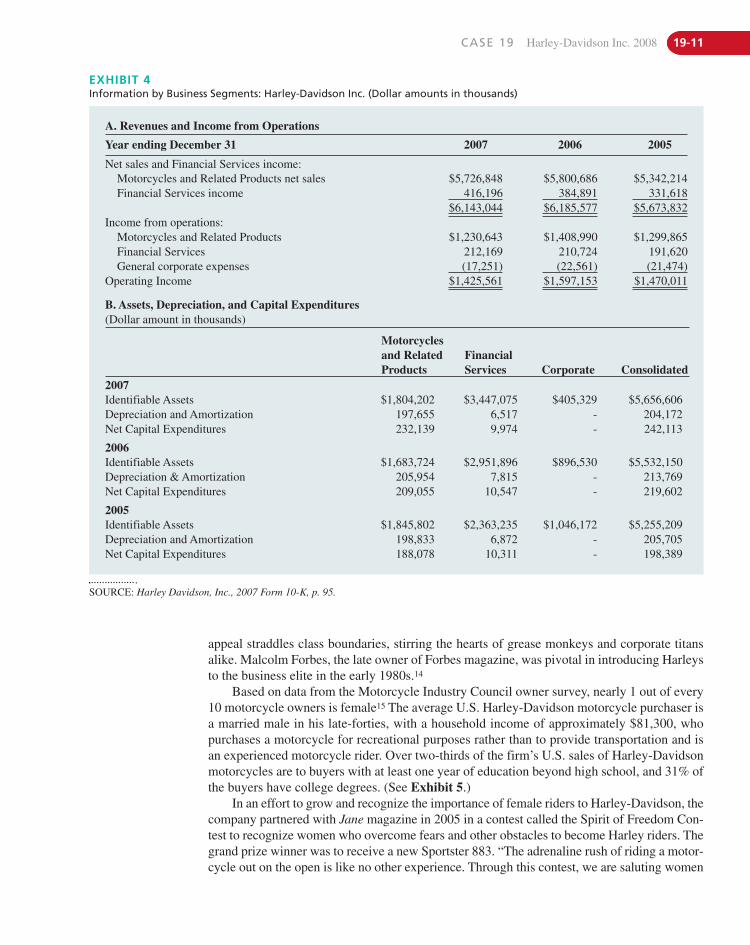
CASE 19 Harley-Davidson Inc. 2008 19-11
EXHIBIT 4Information by Business Segments: Harley-Davidson Inc. (Dollar amounts in thousands)
A. Revenues and Income from Operations
Year ending December 31 2007 2006 2005
Net sales and Financial Services income:Motorcycles and Related Products net sales $5,726,848 $5,800,686 $5,342,214Financial Services income 416,196 384,891 331,618
$6,143,044 $6,185,577 $5,673,832Income from operations:
Motorcycles and Related Products $1,230,643 $1,408,990 $1,299,865Financial Services 212,169 210,724 191,620General corporate expenses (17,251) (22,561) (21,474)
Operating Income $1,425,561 $1,597,153 $1,470,011
B. Assets, Depreciation, and Capital Expenditures (Dollar amount in thousands)
Motorcycles and Related Products
FinancialServices Corporate Consolidated
2007Identifiable Assets $1,804,202 $3,447,075 $405,329 $5,656,606Depreciation and Amortization 197,655 6,517 - 204,172Net Capital Expenditures 232,139 9,974 - 242,113
2006Identifiable Assets $1,683,724 $2,951,896 $896,530 $5,532,150Depreciation & Amortization 205,954 7,815 - 213,769Net Capital Expenditures 209,055 10,547 - 219,602
2005Identifiable Assets $1,845,802 $2,363,235 $1,046,172 $5,255,209Depreciation and Amortization 198,833 6,872 - 205,705Net Capital Expenditures 188,078 10,311 - 198,389
appeal straddles class boundaries, stirring the hearts of grease monkeys and corporate titansalike. Malcolm Forbes, the late owner of Forbes magazine, was pivotal in introducing Harleysto the business elite in the early 1980s.14
Based on data from the Motorcycle Industry Council owner survey, nearly 1 out of every10 motorcycle owners is female15 The average U.S. Harley-Davidson motorcycle purchaser isa married male in his late-forties, with a household income of approximately $81,300, whopurchases a motorcycle for recreational purposes rather than to provide transportation and isan experienced motorcycle rider. Over two-thirds of the firm’s U.S. sales of Harley-Davidsonmotorcycles are to buyers with at least one year of education beyond high school, and 31% ofthe buyers have college degrees. (See Exhibit 5.)
In an effort to grow and recognize the importance of female riders to Harley-Davidson, thecompany partnered with Jane magazine in 2005 in a contest called the Spirit of Freedom Con-test to recognize women who overcome fears and other obstacles to become Harley riders. Thegrand prize winner was to receive a new Sportster 883. “The adrenaline rush of riding a motor-cycle out on the open is like no other experience. Through this contest, we are saluting women
SOURCE: Harley Davidson, Inc., 2007 Form 10-K, p. 95.
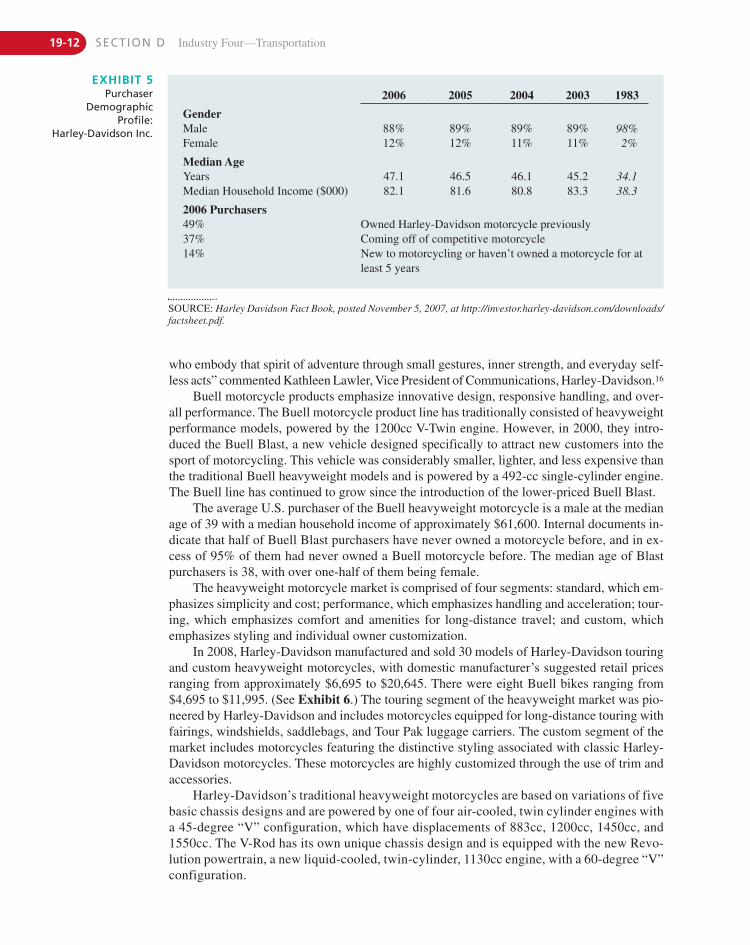
19-12 SECTION D Industry Four—Transportation
EXHIBIT 5Purchaser
DemographicProfile:
Harley-Davidson Inc.
SOURCE: Harley Davidson Fact Book, posted November 5, 2007, at http://investor.harley-davidson.com/downloads/factsheet.pdf.
2006 2005 2004 2003 1983
GenderMale 88% 89% 89% 89% 98%Female 12% 12% 11% 11% 2%
Median AgeYears 47.1 46.5 46.1 45.2 34.1Median Household Income ($000) 82.1 81.6 80.8 83.3 38.3
2006 Purchasers49% Owned Harley-Davidson motorcycle previously37% Coming off of competitive motorcycle14% New to motorcycling or haven’t owned a motorcycle for at
least 5 years
who embody that spirit of adventure through small gestures, inner strength, and everyday self-less acts” commented Kathleen Lawler, Vice President of Communications, Harley-Davidson.16
Buell motorcycle products emphasize innovative design, responsive handling, and over-all performance. The Buell motorcycle product line has traditionally consisted of heavyweightperformance models, powered by the 1200cc V-Twin engine. However, in 2000, they intro-duced the Buell Blast, a new vehicle designed specifically to attract new customers into thesport of motorcycling. This vehicle was considerably smaller, lighter, and less expensive thanthe traditional Buell heavyweight models and is powered by a 492-cc single-cylinder engine.The Buell line has continued to grow since the introduction of the lower-priced Buell Blast.
The average U.S. purchaser of the Buell heavyweight motorcycle is a male at the medianage of 39 with a median household income of approximately $61,600. Internal documents in-dicate that half of Buell Blast purchasers have never owned a motorcycle before, and in ex-cess of 95% of them had never owned a Buell motorcycle before. The median age of Blastpurchasers is 38, with over one-half of them being female.
The heavyweight motorcycle market is comprised of four segments: standard, which em-phasizes simplicity and cost; performance, which emphasizes handling and acceleration; tour-ing, which emphasizes comfort and amenities for long-distance travel; and custom, whichemphasizes styling and individual owner customization.
In 2008, Harley-Davidson manufactured and sold 30 models of Harley-Davidson touringand custom heavyweight motorcycles, with domestic manufacturer’s suggested retail pricesranging from approximately $6,695 to $20,645. There were eight Buell bikes ranging from$4,695 to $11,995. (See Exhibit 6.) The touring segment of the heavyweight market was pio-neered by Harley-Davidson and includes motorcycles equipped for long-distance touring withfairings, windshields, saddlebags, and Tour Pak luggage carriers. The custom segment of themarket includes motorcycles featuring the distinctive styling associated with classic Harley-Davidson motorcycles. These motorcycles are highly customized through the use of trim andaccessories.
Harley-Davidson’s traditional heavyweight motorcycles are based on variations of fivebasic chassis designs and are powered by one of four air-cooled, twin cylinder engines witha 45-degree “V” configuration, which have displacements of 883cc, 1200cc, 1450cc, and1550cc. The V-Rod has its own unique chassis design and is equipped with the new Revo-lution powertrain, a new liquid-cooled, twin-cylinder, 1130cc engine, with a 60-degree “V”configuration.
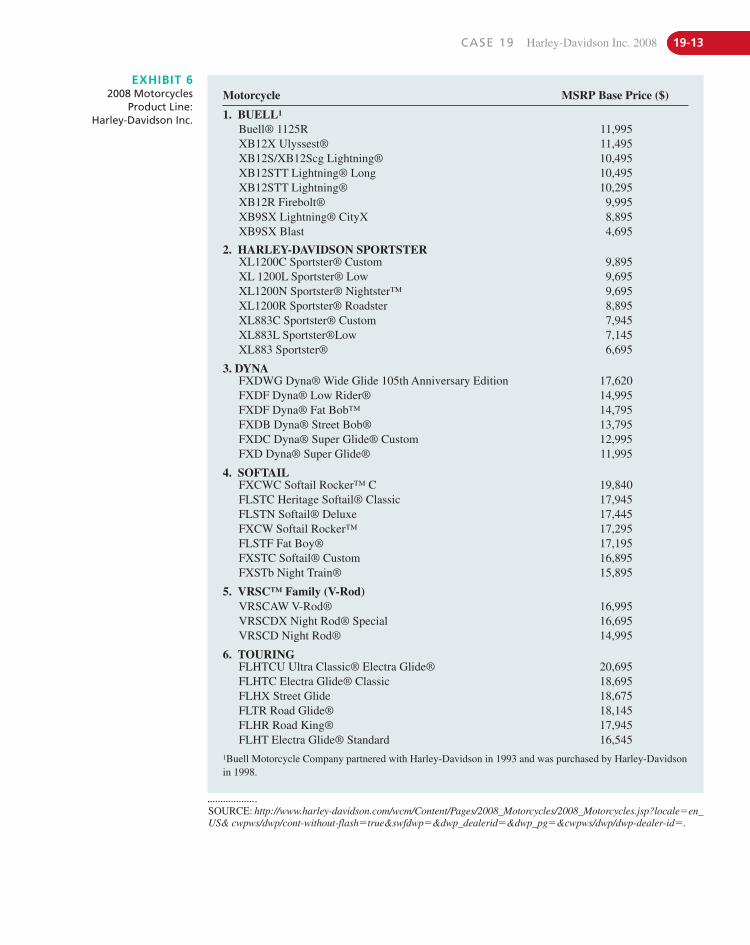
CASE 19 Harley-Davidson Inc. 2008 19-13
EXHIBIT 62008 Motorcycles
Product Line: Harley-Davidson Inc.
SOURCE: http://www.harley-davidson.com/wcm/Content/Pages/2008_Motorcycles/2008_Motorcycles.jsp?locale�en_US& cwpws/dwp/cont-without-flash�true&swfdwp�&dwp_dealerid�&dwp_pg�&cwpws/dwp/dwp-dealer-id�.
Motorcycle MSRP Base Price ($)
1. BUELL1
Buell® 1125RXB12X Ulyssest®XB12S/XB12Scg Lightning®XB12STT Lightning® LongXB12STT Lightning®XB12R Firebolt®XB9SX Lightning® CityXXB9SX Blast
11,99511,49510,49510,49510,2959,9958,8954,695
2. HARLEY-DAVIDSON SPORTSTERXL1200C Sportster® CustomXL 1200L Sportster® LowXL1200N Sportster® Nightster™XL1200R Sportster® RoadsterXL883C Sportster® CustomXL883L Sportster®LowXL883 Sportster®
9,8959,6959,6958,8957,9457,1456,695
3. DYNAFXDWG Dyna® Wide Glide 105th Anniversary EditionFXDF Dyna® Low Rider®FXDF Dyna® Fat Bob™FXDB Dyna® Street Bob®FXDC Dyna® Super Glide® CustomFXD Dyna® Super Glide®
17,62014,99514,79513,79512,99511,995
4. SOFTAILFXCWC Softail Rocker™ CFLSTC Heritage Softail® ClassicFLSTN Softail® DeluxeFXCW Softail Rocker™FLSTF Fat Boy®FXSTC Softail® CustomFXSTb Night Train®
19,84017,94517,44517,29517,19516,89515,895
5. VRSC™ Family (V-Rod)VRSCAW V-Rod®VRSCDX Night Rod® SpecialVRSCD Night Rod®
16,99516,69514,995
6. TOURINGFLHTCU Ultra Classic® Electra Glide®FLHTC Electra Glide® ClassicFLHX Street GlideFLTR Road Glide®FLHR Road King®FLHT Electra Glide® Standard
20,69518,69518,67518,14517,94516,545
1Buell Motorcycle Company partnered with Harley-Davidson in 1993 and was purchased by Harley-Davidsonin 1998.
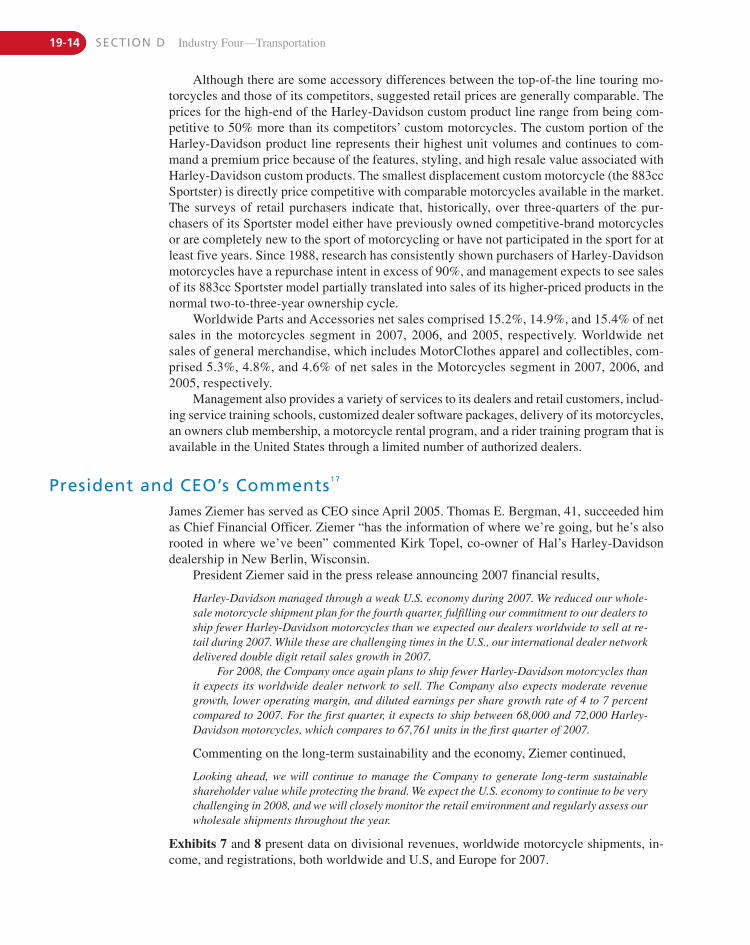
19-14 SECTION D Industry Four—Transportation
President and CEO’s Comments1 7
James Ziemer has served as CEO since April 2005. Thomas E. Bergman, 41, succeeded himas Chief Financial Officer. Ziemer “has the information of where we’re going, but he’s alsorooted in where we’ve been” commented Kirk Topel, co-owner of Hal’s Harley-Davidsondealership in New Berlin, Wisconsin.
President Ziemer said in the press release announcing 2007 financial results,
Harley-Davidson managed through a weak U.S. economy during 2007. We reduced our whole-sale motorcycle shipment plan for the fourth quarter, fulfilling our commitment to our dealers toship fewer Harley-Davidson motorcycles than we expected our dealers worldwide to sell at re-tail during 2007. While these are challenging times in the U.S., our international dealer networkdelivered double digit retail sales growth in 2007.
For 2008, the Company once again plans to ship fewer Harley-Davidson motorcycles thanit expects its worldwide dealer network to sell. The Company also expects moderate revenuegrowth, lower operating margin, and diluted earnings per share growth rate of 4 to 7 percentcompared to 2007. For the first quarter, it expects to ship between 68,000 and 72,000 Harley-Davidson motorcycles, which compares to 67,761 units in the first quarter of 2007.
Commenting on the long-term sustainability and the economy, Ziemer continued,
Looking ahead, we will continue to manage the Company to generate long-term sustainableshareholder value while protecting the brand. We expect the U.S. economy to continue to be verychallenging in 2008, and we will closely monitor the retail environment and regularly assess ourwholesale shipments throughout the year.
Exhibits 7 and 8 present data on divisional revenues, worldwide motorcycle shipments, in-come, and registrations, both worldwide and U.S, and Europe for 2007.
Although there are some accessory differences between the top-of-the line touring mo-torcycles and those of its competitors, suggested retail prices are generally comparable. Theprices for the high-end of the Harley-Davidson custom product line range from being com-petitive to 50% more than its competitors’ custom motorcycles. The custom portion of theHarley-Davidson product line represents their highest unit volumes and continues to com-mand a premium price because of the features, styling, and high resale value associated withHarley-Davidson custom products. The smallest displacement custom motorcycle (the 883ccSportster) is directly price competitive with comparable motorcycles available in the market.The surveys of retail purchasers indicate that, historically, over three-quarters of the pur-chasers of its Sportster model either have previously owned competitive-brand motorcyclesor are completely new to the sport of motorcycling or have not participated in the sport for atleast five years. Since 1988, research has consistently shown purchasers of Harley-Davidsonmotorcycles have a repurchase intent in excess of 90%, and management expects to see salesof its 883cc Sportster model partially translated into sales of its higher-priced products in thenormal two-to-three-year ownership cycle.
Worldwide Parts and Accessories net sales comprised 15.2%, 14.9%, and 15.4% of netsales in the motorcycles segment in 2007, 2006, and 2005, respectively. Worldwide netsales of general merchandise, which includes MotorClothes apparel and collectibles, com-prised 5.3%, 4.8%, and 4.6% of net sales in the Motorcycles segment in 2007, 2006, and2005, respectively.
Management also provides a variety of services to its dealers and retail customers, includ-ing service training schools, customized dealer software packages, delivery of its motorcycles,an owners club membership, a motorcycle rental program, and a rider training program that isavailable in the United States through a limited number of authorized dealers.
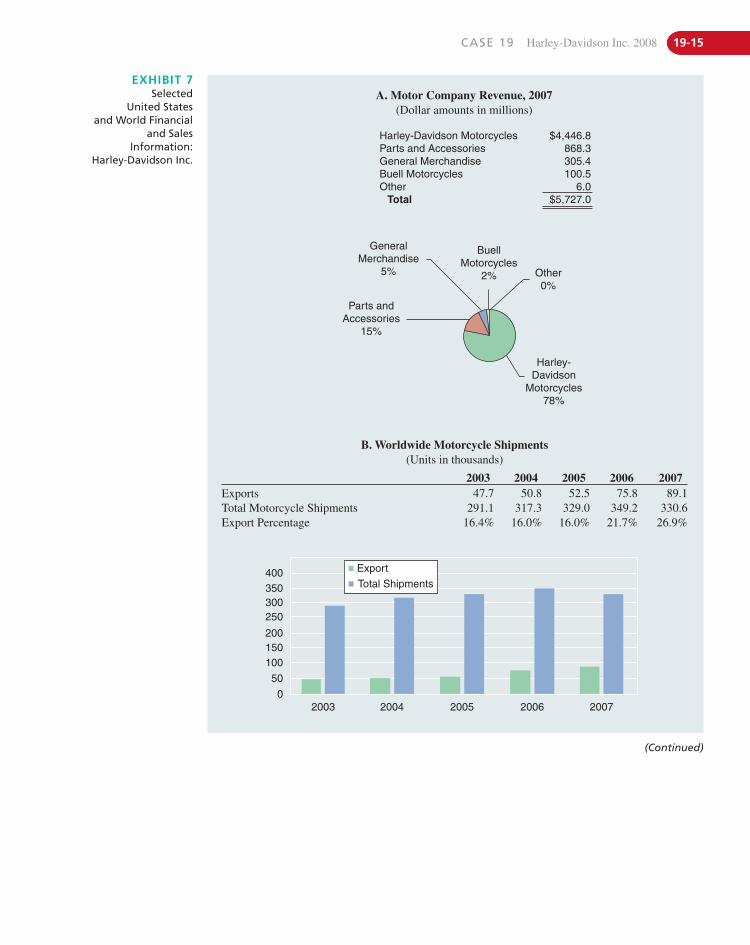
CASE 19 Harley-Davidson Inc. 2008 19-15
EXHIBIT 7Selected
United States and World Financial
and SalesInformation:
Harley-Davidson Inc.
B. Worldwide Motorcycle Shipments (Units in thousands)
2003 2004 2005 2006 2007Exports 47.7 50.8 52.5 75.8 89.1Total Motorcycle Shipments 291.1 317.3 329.0 349.2 330.6Export Percentage 16.4% 16.0% 16.0% 21.7% 26.9%
GeneralMerchandise
5%
Harley-Davidson MotorcyclesParts and AccessoriesGeneral MerchandiseBuell MotorcyclesOther Total
$4,446.8868.3305.4100.5
6.0$5,727.0
Parts andAccessories
15%
Other0%
Harley-Davidson
Motorcycles78%
BuellMotorcycles
2%
A. Motor Company Revenue, 2007 (Dollar amounts in millions)
400350300250
200150100
50
02003 2004 2005 2006 2007
Export
Total Shipments
(Continued)
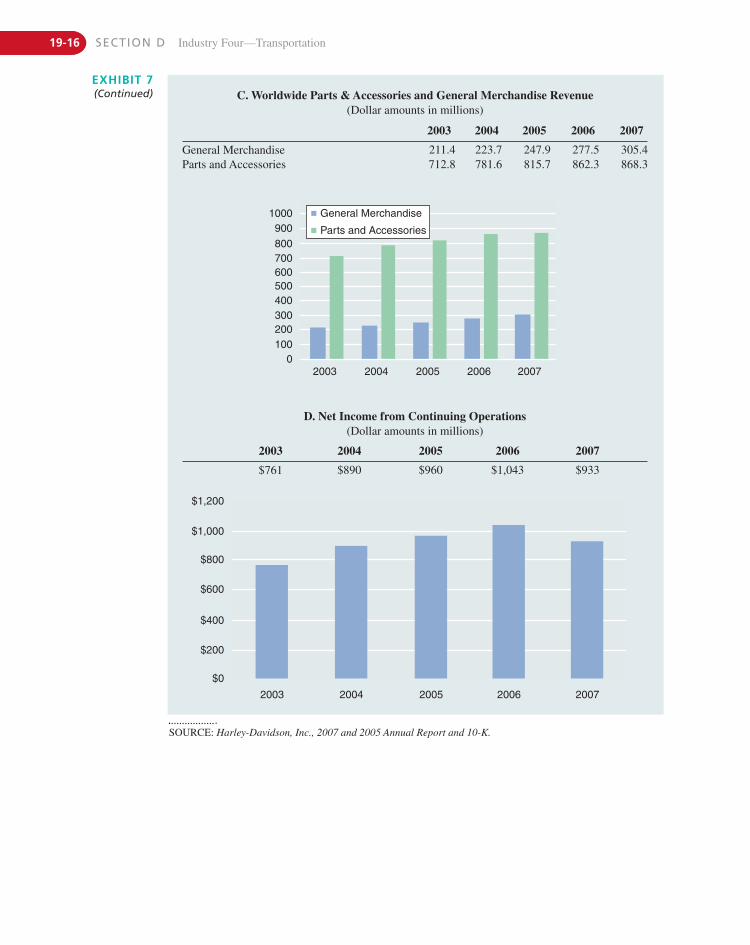
EXHIBIT 7(Continued)
19-16 SECTION D Industry Four—Transportation
D. Net Income from Continuing Operations (Dollar amounts in millions)
2003 2004 2005 2006 2007
$761 $890 $960 $1,043 $933
C. Worldwide Parts & Accessories and General Merchandise Revenue (Dollar amounts in millions)
2003 2004 2005 2006 2007
General Merchandise 211.4 223.7 247.9 277.5 305.4Parts and Accessories 712.8 781.6 815.7 862.3 868.3
1000900
800700600500400300200100
02003 2004 2005 2006 2007
General Merchandise
Parts and Accessories
$1,200
$1,000
$800
$600
$400
$200
$0
2003 2004 2005 2006 2007
SOURCE: Harley-Davidson, Inc., 2007 and 2005 Annual Report and 10-K.
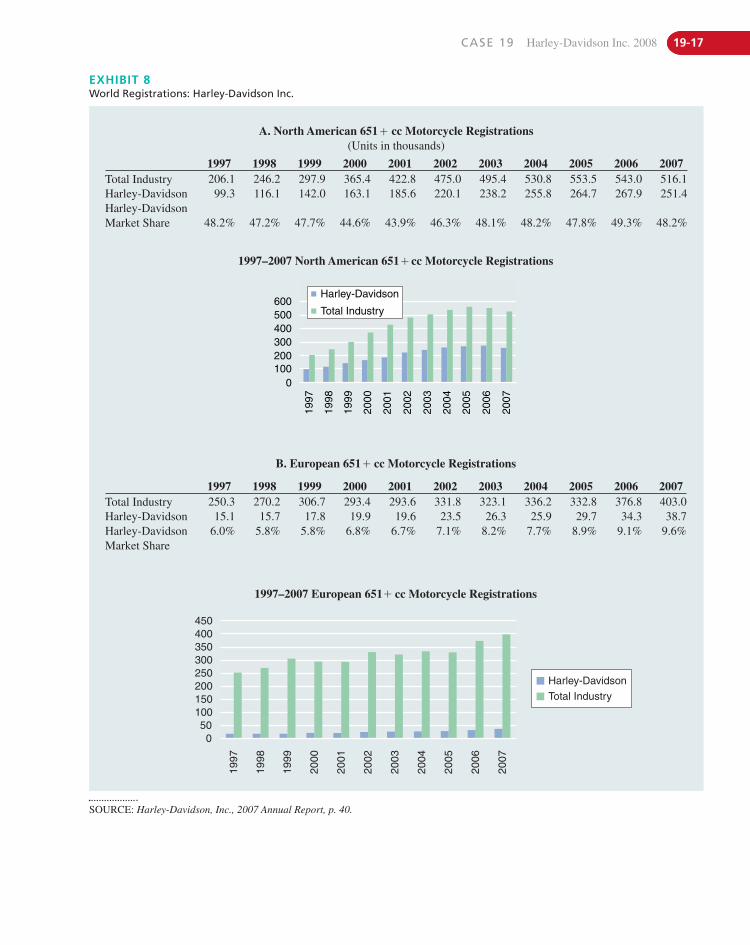
CASE 19 Harley-Davidson Inc. 2008 19-17
EXHIBIT 8World Registrations: Harley-Davidson Inc.
SOURCE: Harley-Davidson, Inc., 2007 Annual Report, p. 40.
600500400300200100
0
1997
1998
1999
2000
2001
2002
2003
2004
2005
2006
2007
Harley-Davidson
Total Industry
450400350300250200150100500
1997
1998
1999
2000
2001
2002
2003
2004
2005
2006
2007
Harley-Davidson
Total Industry
A. North American 651 cc Motorcycle Registrations (Units in thousands)
1997 1998 1999 2000 2001 2002 2003 2004 2005 2006 2007Total Industry 206.1 246.2 297.9 365.4 422.8 475.0 495.4 530.8 553.5 543.0 516.1Harley-Davidson 99.3 116.1 142.0 163.1 185.6 220.1 238.2 255.8 264.7 267.9 251.4Harley-DavidsonMarket Share 48.2% 47.2% 47.7% 44.6% 43.9% 46.3% 48.1% 48.2% 47.8% 49.3% 48.2%
B. European 651 cc Motorcycle Registrations
1997 1998 1999 2000 2001 2002 2003 2004 2005 2006 2007Total Industry 250.3 270.2 306.7 293.4 293.6 331.8 323.1 336.2 332.8 376.8 403.0Harley-Davidson 15.1 15.7 17.8 19.9 19.6 23.5 26.3 25.9 29.7 34.3 38.7Harley-DavidsonMarket Share
6.0% 5.8% 5.8% 6.8% 6.7% 7.1% 8.2% 7.7% 8.9% 9.1% 9.6%
1997–2007 North American 651 cc Motorcycle Registrations
1997–2007 European 651 cc Motorcycle Registrations
�
�
�
�
19-18 SECTION D Industry Four—Transportation
New Millennium Bikes: The Buell and the V-RodHarley’s new V-Rod was introduced in the Los Angeles Convention Center on July 12, 2001.More than 4,000 packed into the center for the company’s long-awaited announcement. Thecavernous room went black. The engines roared in the darkness. Spotlights clicked on andfollowed two glinting new hot-rods as they roared onto center stage.18
Harley-Davidson deviated from its traditional approach to styling, with the introductionof the V-Rod motorcycle. The new, liquid cooled V-Rod, inspired by Harley-Davidson’s dragracing heritage, combines the characteristics of a performance motorcycle with the styling ofa custom.19 Liquid cooling allows riders to rev a little higher and hotter in each gear, boostingacceleration. It doesn’t sound like a big deal, but it was a giant step for a company so stub-bornly conservative that it has made only air-cooled engines for 100 years; its designers justcouldn’t bear the idea of placing a radiator on the front of the bike.20
The V-Rod is Milwaukee-based Harley-Davison Inc.’s first truly new motorcycle inmore than 50 years. A sleek machine in the making for more than six years, the V-Rod isdesigned more for speed and handling, unlike the company’s immensely popular touringbikes.21
As it ramped up production, premiums on many models disappeared. Chief Executive Of-ficer James L. Ziemer says Harley wants to “narrow the gap” between supply and demand inorder to curb the long-standing—but fast-diminishing—practice of selling bikes at a pre-mium.22 The V-Rod’s $17,000 price tag has also failed to win younger buyers.23 To that end,Harley has poured money into developing new, youth-oriented models. The V-Rod—a low-slung, high-powered number known formally as a sport performance vehicle and colloquiallyas a crotch rocket—was meant for hard-charging youths. Harley has also tried to go youngwith the Buell Firebolt ($10,000), its answer to Japanese sport bikes, and the Buell Blast($4,400), a starter motorcycle.
At the Detroit Harley-Davidson/Buell dealership in Center Line, owner Jim Loduca com-mented: “This is the first time in 10 years that I’ve actually had product on the floor available,but our sales are also up by 14 percent this year. The company has watched this demand curvevery carefully. They are simply riding the wave. They know full well that it would be cata-strophic to saturate the market.” He is also encouraged by Harley’s biggest product departurein recent decades—the V-Rod muscle bike.24
Clay Wilwert, whose family has owned a dealership in Dubuque since 1959, “But guesswhat, as they rode it, they loved it.” They said, “Hey, this is really cool that it doesn’t shakemy hands asleep.”25
Some Harley traditionalists say the V-Rod, styled to compete with super-fast Europeanbikes, strays too far from the company’s all-American roots, which tend to favor heavier cruis-ing machines.26
Licensing2 7
Harley-Davidson endeavored to create an awareness of the “Harley-Davidson” brand amongthe non-riding public and provides a wide range of product for enthusiasts by licensing thename “Harley-Davidson” and numerous related trademarks. Harley-Davidson had licensedthe production and sale of a broad range of consumer items, including T-shirts, jewelry, smallleather goods, toys, and numerous other products (licensed products). Although the majorityof licensing activity occurs in the United States, Harley-Davidson continues to expand theseactivities in international markets. Royalty revenues from licensing, included in Motorcyclessegment net revenue, were approximately $46 million, $45.5 million, and $43 million in2007, 2006, and 2005, respectively.
CASE 19 Harley-Davidson Inc. 2008 19-19
Marketing and Distribution2 8
Marketing efforts are divided among dealer promotions, customer events, magazine and directmail advertising, public relations, cooperative programs with Harley-Davidson/Buell dealers,and national television advertising. Harley-Davidson also sponsors racing activities and specialpromotional events and participates in all major motorcycle consumer shows and rallies.
E-Commerce2 9
Since 2001, Harley-Davidson utilized a highly interactive Web site at www.harley-davidson.com. Their model is unique in the industry in that, while the online catalog is viewed fromthe Harley-Davidson Web site, orders are actually distributed to the participating authorizedHarley-Davidson dealer that the customer selects. In turn, those dealers fill the order and han-dle any after-sale services that the customer may require. In addition to purchasing, customersactively browse the site, create and share product wish lists, and utilize the dealer locator.
Harley-Davidson Customer BaseHarley-Davidson’s customers are not what some people might expect. They see the rough andtumble riders and do not expect that a good proportion of Harley-Davidson riders are white-collar workers and executives taking the weekend relaxation on their bike. Selected quotesfrom customers follow:
� “It’s about an image—freedom of the road, hop on your bike and go, independent living,the loosing of the chains,” said Dave Sarnowski, a teacher and Harley rider from La Farge,Wisconsin.30
� “The Harley people I know go to church, have jobs, shop at the mall, just like everyoneelse,” says Angie Robison, 68, of Daytona Beach, who helps her husband, Joe, run a mo-torcycle repair shop and Harley memorabilia/accessories store. “I can wear my silks overhere and my leathers over there, and I’m still the same person.”31
� “I worked at a computer all day for the city, and for me it’s pure relaxation. I wear theleathers because they’re protective.”32
� “I love the feeling of being out on that bike on the roads—especially in the mountains.You just can’t beat it, the feeling you get,” says Rob Barnett, Harley-Davidson owner.
� “In general, the motorcycle industry has increased for 12 years straight, and we’re expect-ing another increase—especially in Harley-Davidson sales—this year,” says Don Brown,motorcycle analyst with DJB Associates.33
� “A Harley is a rolling sculpture. A piece of artwork,” commented Matt Chase, sales man-ager of N.F. Sheldon, Harley store. “You work all week, then on the weekends you put onleathers and everyone’s equal . . . all the same, brothers and sisters.”34
Recession Resistance?Ziemer recognized that 2008 would be a challenging year for Harley-Davidson given thepending recession. How will this affect Harley-Davidson? Harley has seen tremendous salesand stock price growth since 1986 until a slowdown in 2007. Some analysts question howHarley-Davidson will be hit in a deep recession. “For years, Harley-Davidson and the ana-lysts that covered the company have reported that the business is recession-resistant. Giventhe recent changes in the economic and political landscape, this assertion is being put to the
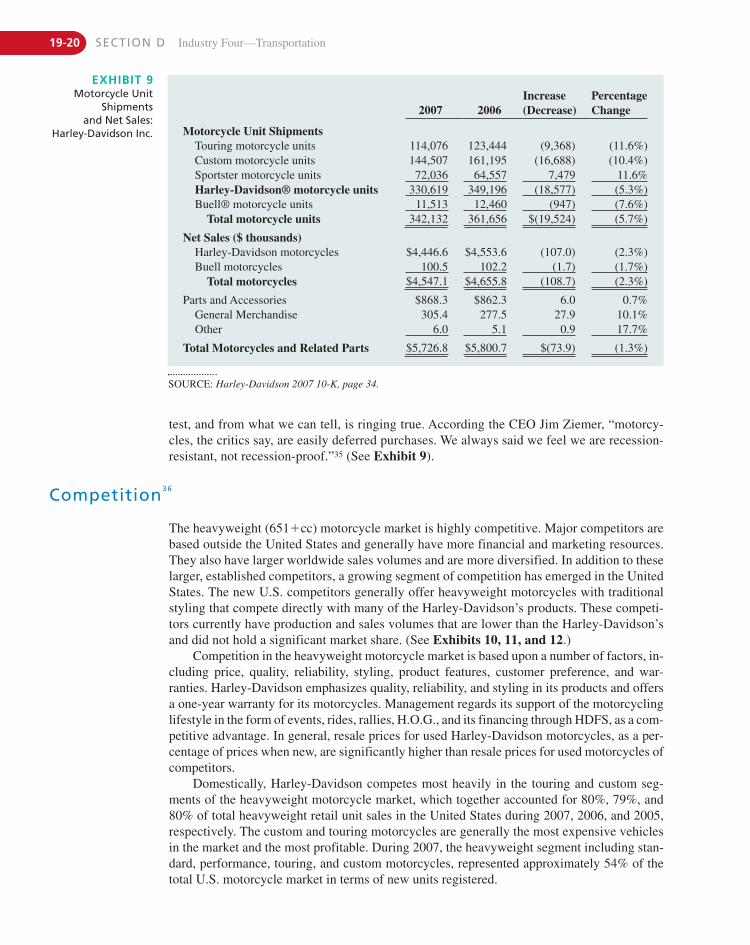
19-20 SECTION D Industry Four—Transportation
EXHIBIT 9Motorcycle Unit
Shipmentsand Net Sales:
Harley-Davidson Inc.
SOURCE: Harley-Davidson 2007 10-K, page 34.
2007 2006Increase (Decrease)
Percentage Change
Motorcycle Unit ShipmentsTouring motorcycle units 114,076 123,444 (9,368) (11.6%)Custom motorcycle units 144,507 161,195 (16,688) (10.4%)Sportster motorcycle units 72,036 64,557 7,479 11.6%Harley-Davidson® motorcycle units 330,619 349,196 (18,577) (5.3%)Buell® motorcycle units 11,513 12,460 (947) (7.6%)
Total motorcycle units 342,132 361,656 $(19,524) (5.7%)
Net Sales ($ thousands)Harley-Davidson motorcycles $4,446.6 $4,553.6 (107.0) (2.3%)Buell motorcycles 100.5 102.2 (1.7) (1.7%)
Total motorcycles $4,547.1 $4,655.8 (108.7) (2.3%)
Parts and Accessories $868.3 $862.3 6.0 0.7%General Merchandise 305.4 277.5 27.9 10.1%Other 6.0 5.1 0.9 17.7%
Total Motorcycles and Related Parts $5,726.8 $5,800.7 $(73.9) (1.3%)
Competition3 6
The heavyweight (651�cc) motorcycle market is highly competitive. Major competitors arebased outside the United States and generally have more financial and marketing resources.They also have larger worldwide sales volumes and are more diversified. In addition to theselarger, established competitors, a growing segment of competition has emerged in the UnitedStates. The new U.S. competitors generally offer heavyweight motorcycles with traditionalstyling that compete directly with many of the Harley-Davidson’s products. These competi-tors currently have production and sales volumes that are lower than the Harley-Davidson’sand did not hold a significant market share. (See Exhibits 10, 11, and 12.)
Competition in the heavyweight motorcycle market is based upon a number of factors, in-cluding price, quality, reliability, styling, product features, customer preference, and war-ranties. Harley-Davidson emphasizes quality, reliability, and styling in its products and offersa one-year warranty for its motorcycles. Management regards its support of the motorcyclinglifestyle in the form of events, rides, rallies, H.O.G., and its financing through HDFS, as a com-petitive advantage. In general, resale prices for used Harley-Davidson motorcycles, as a per-centage of prices when new, are significantly higher than resale prices for used motorcycles ofcompetitors.
Domestically, Harley-Davidson competes most heavily in the touring and custom seg-ments of the heavyweight motorcycle market, which together accounted for 80%, 79%, and80% of total heavyweight retail unit sales in the United States during 2007, 2006, and 2005,respectively. The custom and touring motorcycles are generally the most expensive vehiclesin the market and the most profitable. During 2007, the heavyweight segment including stan-dard, performance, touring, and custom motorcycles, represented approximately 54% of thetotal U.S. motorcycle market in terms of new units registered.
test, and from what we can tell, is ringing true. According the CEO Jim Ziemer, “motorcy-cles, the critics say, are easily deferred purchases. We always said we feel we are recession-resistant, not recession-proof.”35 (See Exhibit 9).
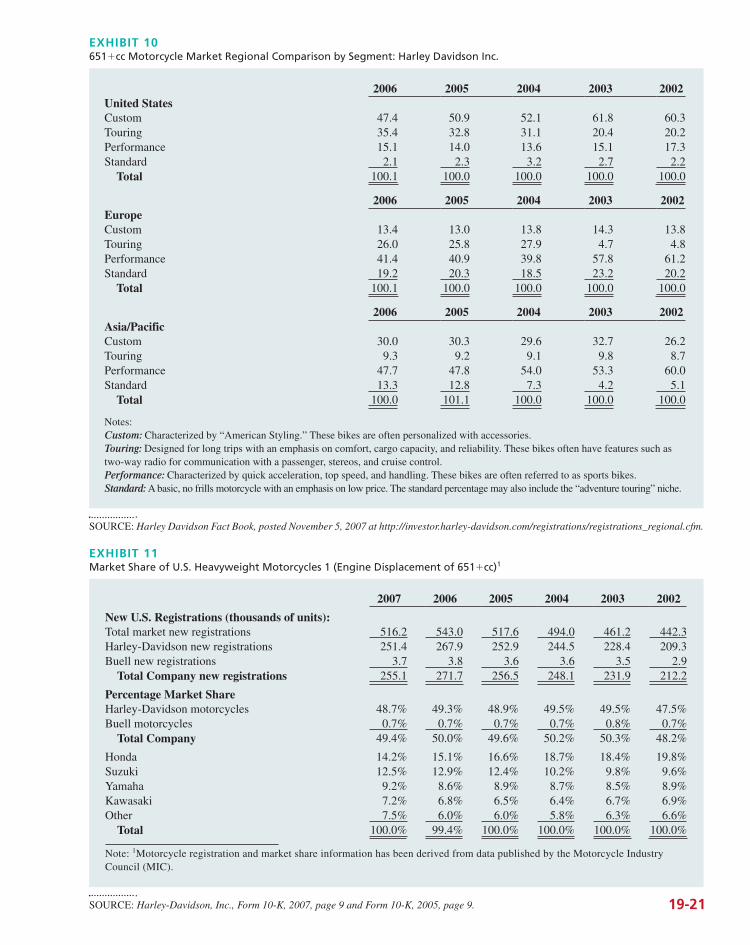
EXHIBIT 10651�cc Motorcycle Market Regional Comparison by Segment: Harley Davidson Inc.
SOURCE: Harley Davidson Fact Book, posted November 5, 2007 at http://investor.harley-davidson.com/registrations/registrations_regional.cfm.
2006 2005 2004 2003 2002United StatesCustom 47.4 50.9 52.1 61.8 60.3Touring 35.4 32.8 31.1 20.4 20.2Performance 15.1 14.0 13.6 15.1 17.3Standard 2.1 2.3 3.2 2.7 2.2
Total 100.1 100.0 100.0 100.0 100.0
2006 2005 2004 2003 2002EuropeCustom 13.4 13.0 13.8 14.3 13.8Touring 26.0 25.8 27.9 4.7 4.8Performance 41.4 40.9 39.8 57.8 61.2Standard 19.2 20.3 18.5 23.2 20.2
Total 100.1 100.0 100.0 100.0 100.0
2006 2005 2004 2003 2002Asia/PacificCustom 30.0 30.3 29.6 32.7 26.2Touring 9.3 9.2 9.1 9.8 8.7Performance 47.7 47.8 54.0 53.3 60.0Standard 13.3 12.8 7.3 4.2 5.1
Total 100.0 101.1 100.0 100.0 100.0
Notes:Custom: Characterized by “American Styling.” These bikes are often personalized with accessories.Touring: Designed for long trips with an emphasis on comfort, cargo capacity, and reliability. These bikes often have features such astwo-way radio for communication with a passenger, stereos, and cruise control.Performance: Characterized by quick acceleration, top speed, and handling. These bikes are often referred to as sports bikes.Standard: A basic, no frills motorcycle with an emphasis on low price. The standard percentage may also include the “adventure touring” niche.
EXHIBIT 11Market Share of U.S. Heavyweight Motorcycles 1 (Engine Displacement of 651�cc)1
SOURCE: Harley-Davidson, Inc., Form 10-K, 2007, page 9 and Form 10-K, 2005, page 9.
2007 2006 2005 2004 2003 2002
New U.S. Registrations (thousands of units):Total market new registrations 516.2 543.0 517.6 494.0 461.2 442.3Harley-Davidson new registrations 251.4 267.9 252.9 244.5 228.4 209.3Buell new registrations 3.7 3.8 3.6 3.6 3.5 2.9
Total Company new registrations 255.1 271.7 256.5 248.1 231.9 212.2
Percentage Market ShareHarley-Davidson motorcycles 48.7% 49.3% 48.9% 49.5% 49.5% 47.5%Buell motorcycles 0.7% 0.7% 0.7% 0.7% 0.8% 0.7%
Total Company 49.4% 50.0% 49.6% 50.2% 50.3% 48.2%
Honda 14.2% 15.1% 16.6% 18.7% 18.4% 19.8%Suzuki 12.5% 12.9% 12.4% 10.2% 9.8% 9.6%Yamaha 9.2% 8.6% 8.9% 8.7% 8.5% 8.9%Kawasaki 7.2% 6.8% 6.5% 6.4% 6.7% 6.9%Other 7.5% 6.0% 6.0% 5.8% 6.3% 6.6%
Total 100.0% 99.4% 100.0% 100.0% 100.0% 100.0%
Note: 1Motorcycle registration and market share information has been derived from data published by the Motorcycle IndustryCouncil (MIC).
19-21
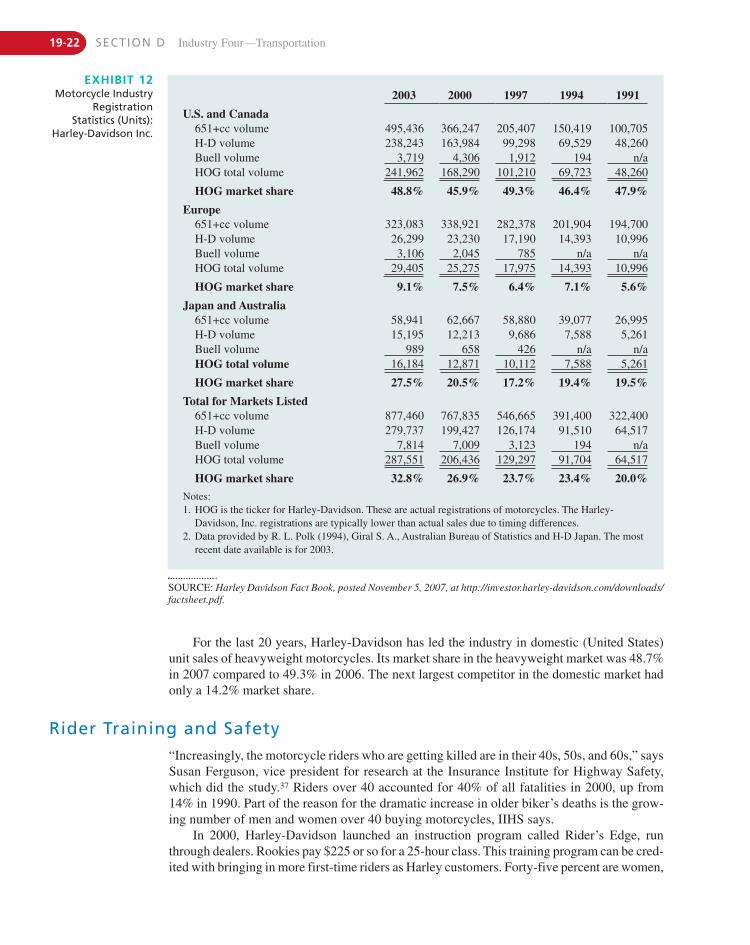
19-22 SECTION D Industry Four—Transportation
EXHIBIT 12Motorcycle Industry
RegistrationStatistics (Units):
Harley-Davidson Inc.
SOURCE: Harley Davidson Fact Book, posted November 5, 2007, at http://investor.harley-davidson.com/downloads/factsheet.pdf.
2003 2000 1997 1994 1991
U.S. and Canada651+cc volume 495,436 366,247 205,407 150,419 100,705H-D volume 238,243 163,984 99,298 69,529 48,260Buell volume 3,719 4,306 1,912 194 n/aHOG total volume 241,962 168,290 101,210 69,723 48,260
HOG market share 48.8% 45.9% 49.3% 46.4% 47.9%
Europe651+cc volume 323,083 338,921 282,378 201,904 194,700H-D volume 26,299 23,230 17,190 14,393 10,996Buell volume 3,106 2,045 785 n/a n/aHOG total volume 29,405 25,275 17,975 14,393 10,996
HOG market share 9.1% 7.5% 6.4% 7.1% 5.6%
Japan and Australia651+cc volume 58,941 62,667 58,880 39,077 26,995H-D volume 15,195 12,213 9,686 7,588 5,261Buell volume 989 658 426 n/a n/aHOG total volume 16,184 12,871 10,112 7,588 5,261
HOG market share 27.5% 20.5% 17.2% 19.4% 19.5%
Total for Markets Listed651+cc volume 877,460 767,835 546,665 391,400 322,400H-D volume 279,737 199,427 126,174 91,510 64,517Buell volume 7,814 7,009 3,123 194 n/aHOG total volume 287,551 206,436 129,297 91,704 64,517
HOG market share 32.8% 26.9% 23.7% 23.4% 20.0%
Notes:1. HOG is the ticker for Harley-Davidson. These are actual registrations of motorcycles. The Harley-
Davidson, Inc. registrations are typically lower than actual sales due to timing differences.2. Data provided by R. L. Polk (1994), Giral S. A., Australian Bureau of Statistics and H-D Japan. The most
recent date available is for 2003.
For the last 20 years, Harley-Davidson has led the industry in domestic (United States)unit sales of heavyweight motorcycles. Its market share in the heavyweight market was 48.7%in 2007 compared to 49.3% in 2006. The next largest competitor in the domestic market hadonly a 14.2% market share.
Rider Training and Safety“Increasingly, the motorcycle riders who are getting killed are in their 40s, 50s, and 60s,” saysSusan Ferguson, vice president for research at the Insurance Institute for Highway Safety,which did the study.37 Riders over 40 accounted for 40% of all fatalities in 2000, up from14% in 1990. Part of the reason for the dramatic increase in older biker’s deaths is the grow-ing number of men and women over 40 buying motorcycles, IIHS says.
In 2000, Harley-Davidson launched an instruction program called Rider’s Edge, runthrough dealers. Rookies pay $225 or so for a 25-hour class. This training program can be cred-ited with bringing in more first-time riders as Harley customers. Forty-five percent are women,
CASE 19 Harley-Davidson Inc. 2008 19-23
86% buy something, and 25% buy a Harley-Davidson or a Buell within three months. “Goinginto a Harley dealership can be intimidating,” says Lara Lee, who runs the program. “We givethem a home base and get them riding.”38
In March 2008, Harley-Davidson announced the company was moving the Rider’s Edgeprogram into California. There was hope the program would encourage more motorcyclesales. Julie Chichlowski, the director of Rider Services stated, “One distinct advantage of theRider’s Edge New Rider Course is that feeling of being part of something bigger. Rider’s Edgeteaches the skills necessary to ride a motorcycle but in an environment that is pure Harley-Davidson.39
Motorcycle Manufacturing4 0
Harley-Davidson designed its manufacturing process to increase capacity, improve product qual-ity, reduce costs, and increase flexibility to respond to market changes. Harley-Davidson incor-porated manufacturing techniques focused on the continuous improvement of its operationsdesigned to control costs and maintain quality. Included in these techniques were employee in-volvement, just-in-time inventory principles, partnering agreements with the local unions, highperformance work organizations, and statistical process control, all designed to improve productquality, productivity, and asset utilization in the production of Harley-Davidson motorcycles.
Harley-Davidson uses just-in-time inventory to minimize inventories of raw materials andwork in process, as well as scrap and rework costs. This system also allows quicker reactionto engineering design changes, quality improvements, and market demands.
Raw Material and Purchase Components4 1
Harley-Davidson worked hard to establish and/or reinforce long-term, mutually beneficial re-lationships with its suppliers. Through these collaborative relationships, it has gained accessto technical and commercial resources for application directly to product design and devel-opment. Management anticipates the focus on collaboration and strong supplier manufactur-ing initiatives to lead to increased commitment from suppliers. This strategy has resulted inimproved product quality, technical integrity, application of new features and innovations, re-duced lead times for product development, and smoother/faster manufacturing ramp-up ofnew vehicle introductions. Harley’s initiative to improve supplier productivity and compo-nent cost has been instrumental in delivering improvements in cost and in offsetting raw ma-terial price increases.
Harley-Davidson purchased all of its raw materials, principally steel and aluminum cast-ings, forgings, sheets and bars, and certain motorcycle components, including carburetors, bat-teries, tires, seats, electrical components, and instruments. Given current economic conditionsin certain raw material commodity markets, and pressure on certain suppliers due to difficul-ties in the automotive industry, Harley-Davidson monitors supply, availability, and pricing forboth its suppliers and in-house operations.
Research and Development4 2
Harley-Davidson views research and development as a significant factor in its ability to lead thecustom and touring motorcycling market and to develop products for the performance segment.The company’s Product Development Center (PDC) brings employees from styling, purchasing,and manufacturing together with regulatory professionals and supplier representatives to create aconcurrent product and process development team. Research and development expenses were$185.5 million, $177.7 million, and $178.5 million in 2007, 2006, and 2005, respectively.
Patents and Trademarks4 3
Harley-Davidson owns patents that relate to its motorcycles and related products andprocesses for their production. Harley-Davidson has increased its efforts to patent its technol-ogy and certain motorcycle-related designs and to enforce those patents. Management seessuch actions as important as it moves forward with new products, designs, and technologies.
Trademarks are important to the Harley-Davidson’s motorcycle business and licensingactivities. It has a vigorous global program of trademark registration and enforcement tostrengthen the value of the trademarks associated with its products and services, prevent theunauthorized use of those trademarks, and enhance its image and customer goodwill. It be-lieves the HARLEY-DAVIDSON trademark and its Bar and Shield trademark are eachhighly recognizable by the public and are very valuable assets. The BUELL trademark iswell known in performance motorcycle circles, as is the associated Pegasus logo. The com-pany is making efforts to ensure that each of these brands will become better known as theBuell business expands.
Seasonality4 4
In general, Harley-Davidson has not experienced significant seasonal fluctuations in its sales.This has been primarily the result of a strong demand for the Harley-Davidson motorcyclesand related products, as well as the availability of floor plan financing arrangements for itsNorth American and European independent dealers. Floor plan financing allows dealers tobuild their inventory levels in anticipation of the spring and summer selling seasons. Harley-Davidson expressed its belief that efforts to increase the availability of its motorcycles hasresulted in an increase in seasonality at its independent dealers. Over the last several yearsthey have been working to increase the availability of its motorcycles at dealers to improvethe customer experience.
Regulations4 5
Federal, state, and local authorities have various environmental control requirements relatingto air, water, and noise pollution that affect the business and operations. Harley-Davidson en-deavors to ensure that its facilities and products comply with all applicable environmentalregulations and standards.
The motorcycles are subject to certification by the U.S. Environmental ProtectionAgency (EPA) for compliance with applicable emissions and noise standards and by theState of California Air Resources Board (CARB) with respect to CARB’s more stringentemissions standards. Motorcycles sold in California are also subject to certain tailpipe andevaporative emissions standards that are unique to California. The EPA finalized a newtailpipe emissions standard for 2006 and 2010 respectively which are harmonized with theCalifornia emission standards. Additionally, Harley-Davidson motorcycles must complywith the emissions, noise, and safety standards of the European Union, Japan, and other in-ternational markets.
Harley-Davidson, as a manufacturer of motorcycle products, is subject to the NationalTraffic and Motor Vehicle Safety Act, which are administered by the National HighwayTraffic Safety Administration (NHTSA). They have certified to NHTSA that their motorcy-cle products comply fully with all applicable federal motor vehicle safety standards and re-lated regulations. Harley-Davidson has, from time to time, initiated certain voluntaryrecalls. During the last three years, Harley-Davidson initiated 15 voluntary recalls at a totalcost of $10.8 million.
19-24 SECTION D Industry Four—Transportation
CASE 19 Harley-Davidson Inc. 2008 19-25
Employees4 6
As of December 31, 2007, the Motorcycles segment had approximately 9,000 employees.Unionized employees at the motorcycle manufacturing and distribution facilities inWauwatosa, Menomonee Falls, Franklin, and Tomahawk, Wisconsin, and Kansas City,Missouri, are represented principally by the Paper Allied-Industrial Chemical and EnergyWorkers International Union (PACE) of the AFL-CIO, as well as the International Associa-tion of Machinist and Aerospace Workers (IAM). Production workers at the motorcyclemanufacturing facility in York, Pennsylvania, are represented principally by the IAM. Thecollective bargaining agreement with the Pennsylvania-IAM will expire on February 2,2010, the collective bargaining agreement with the Kansas City-USW and IAM will expireon July 30, 2012, and the collective bargaining agreement with the Wisconsin-USW andIAM will expire on March 31, 2008.
Approximately 50% of Harley-Davidson’s 9,000 employees ride a Harley-Davidson. Allemployees, including Ziemer and Bluestein, go through a dealer to purchase their bike. Thisway, the employees see the customer experience firsthand.
Properties4 7
The following is a summary of the principal operating properties of Harley-Davidson as ofDecember 31, 2007. Seven facilities that perform manufacturing operations: Wauwatosa andMenomonee Falls, Wisconsin, suburbs of Milwaukee (motorcycle powertrain production);Tomahawk, Wisconsin (fiberglass parts production and painting); York, Pennsylvania (mo-torcycle parts fabrication, painting and big-twin assembly); Kansas City, Missouri (Sportsterassembly); East Troy, Wisconsin (Buell motorcycles assembly); Manaus, Brazil (assembly ofselect models for Brazilian market). (See Exhibit 13.)
Financial Services Segment48
The Financial Services segment has office facilities in Carson City, Nevada. Wholesale, in-surance, and retail operations are in Plano, Texas, and European wholesale operations inOxford, England. Ownership and lease structures are outlined in Exhibit 13.
Harley-Davidson and Buell4 9
Harley-Davidson Financial Services HDFS, operating under the trade name Harley-DavidsonCredit, provides wholesale financial services to Harley-Davidson and Buell dealers and retailfinancing to consumers. HDFS, operating under the trade name Harley-Davidson Insurance,is an agent for the sale of motorcycle insurance policies and also sells extended service war-ranty agreements, gap contracts, and debt protection products.
Wholesale financial services include floor plan and open account financing of motorcy-cles and motorcycle parts and accessories, real estate loans, computer loans, and showroomremodeling loans. HDFS offers wholesale financial services to Harley-Davidson dealers in theUnited States, Canada, and Europe and during 2007; approximately 96% of such dealers uti-lized those services. The wholesale finance operations of HDFS are located in Plano, Texas,and Oxford, England.
Retail financial services include installment lending for new and used Harley-Davidsonand Buell motorcycles. HDFS’ retail financial services are available through most Harley-Davidson and Buell dealers in the United States and Canada. HDFS’ retail finance operationsare located in Carson City, Nevada, and Plano, Texas.
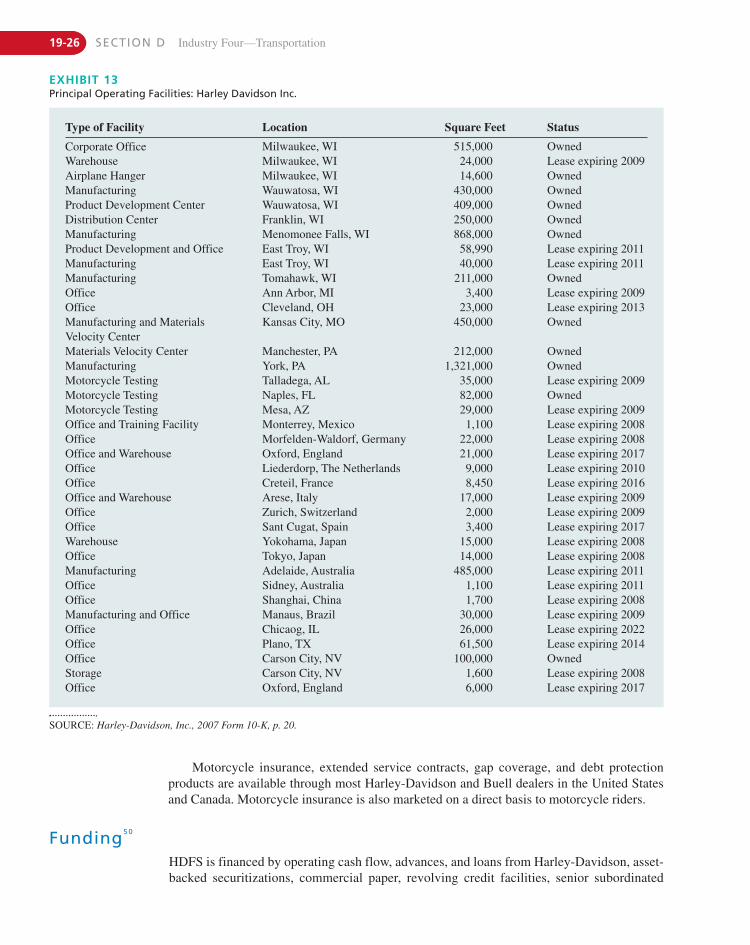
19-26 SECTION D Industry Four—Transportation
EXHIBIT 13Principal Operating Facilities: Harley Davidson Inc.
SOURCE: Harley-Davidson, Inc., 2007 Form 10-K, p. 20.
Type of Facility Location Square Feet Status
Corporate Office Milwaukee, WI 515,000 OwnedWarehouse Milwaukee, WI 24,000 Lease expiring 2009Airplane Hanger Milwaukee, WI 14,600 OwnedManufacturing Wauwatosa, WI 430,000 OwnedProduct Development Center Wauwatosa, WI 409,000 OwnedDistribution Center Franklin, WI 250,000 OwnedManufacturing Menomonee Falls, WI 868,000 OwnedProduct Development and Office East Troy, WI 58,990 Lease expiring 2011Manufacturing East Troy, WI 40,000 Lease expiring 2011Manufacturing Tomahawk, WI 211,000 OwnedOffice Ann Arbor, MI 3,400 Lease expiring 2009Office Cleveland, OH 23,000 Lease expiring 2013Manufacturing and MaterialsVelocity Center
Kansas City, MO 450,000 Owned
Materials Velocity Center Manchester, PA 212,000 OwnedManufacturing York, PA 1,321,000 OwnedMotorcycle Testing Talladega, AL 35,000 Lease expiring 2009Motorcycle Testing Naples, FL 82,000 OwnedMotorcycle Testing Mesa, AZ 29,000 Lease expiring 2009Office and Training Facility Monterrey, Mexico 1,100 Lease expiring 2008Office Morfelden-Waldorf, Germany 22,000 Lease expiring 2008Office and Warehouse Oxford, England 21,000 Lease expiring 2017Office Liederdorp, The Netherlands 9,000 Lease expiring 2010Office Creteil, France 8,450 Lease expiring 2016Office and Warehouse Arese, Italy 17,000 Lease expiring 2009Office Zurich, Switzerland 2,000 Lease expiring 2009Office Sant Cugat, Spain 3,400 Lease expiring 2017Warehouse Yokohama, Japan 15,000 Lease expiring 2008Office Tokyo, Japan 14,000 Lease expiring 2008Manufacturing Adelaide, Australia 485,000 Lease expiring 2011Office Sidney, Australia 1,100 Lease expiring 2011Office Shanghai, China 1,700 Lease expiring 2008Manufacturing and Office Manaus, Brazil 30,000 Lease expiring 2009Office Chicaog, IL 26,000 Lease expiring 2022Office Plano, TX 61,500 Lease expiring 2014Office Carson City, NV 100,000 OwnedStorage Carson City, NV 1,600 Lease expiring 2008Office Oxford, England 6,000 Lease expiring 2017
Motorcycle insurance, extended service contracts, gap coverage, and debt protectionproducts are available through most Harley-Davidson and Buell dealers in the United Statesand Canada. Motorcycle insurance is also marketed on a direct basis to motorcycle riders.
Funding5 0
HDFS is financed by operating cash flow, advances, and loans from Harley-Davidson, asset-backed securitizations, commercial paper, revolving credit facilities, senior subordinated
CASE 19 Harley-Davidson Inc. 2008 19-27
debt, and redeemable preferred stock. HDFS also retains an interest in the excess cash flowsfrom receivables and recognizes income on this retained interest. After the sale, HDFS per-forms billing and portfolio management services for these loans and receives a servicing feefor providing these services.
Competition5 1
The ability to offer a package of wholesale and retail financial services is a significant com-petitive advantage for HDFS. Competitors compete for business based largely on price and,to a lesser extent, service. HDFS competes based on convenience, service, brand association,strong dealer relations, industry experience, terms, and price.
During 2007, HDFS financed 55% of the new Harley-Davidson motorcycles retailed byindependent dealers in the United States, as compared to 48% in 2006. Competitors for retailmotorcycle finance business are primarily banks, credit unions, other financial institutions. Inthe motorcycle insurance business, competition primarily comes from national insurance com-panies and from insurance agencies serving local or regional markets. For insurance-relatedproducts such as extended service warranty agreements, HDFS faces competition from certainregional and national industry participants.
Seasonality5 2
In the northern United States and Canada, motorcycles are primarily used during warmermonths, generally March through August. Accordingly, HDFS experiences significant sea-sonal variations. Retail customers typically do not buy motorcycles until they can ride them.From mid-March through August, retail financing volume increases and wholesale financingvolume decreases as dealers deplete their inventories. From September through mid-March,there is a decrease in retail financing volume while dealer inventories build and turn overmore slowly, substantially increasing wholesale financing volume.
EmployeesAt the end of 2007, the Financial Services segment had 755 employees, none of which wereunionized.
Corporate Financial and Stock Price Performance
It appeared as though the weakened U.S. economy would stifle growth for Harley-Davidson.(Exhibits 14 and 15 provide the company’s income statement and balance sheet for the most re-cent five years. Exhibit 16 provides a geographic breakdown of sales.) Since Harley went pub-lic, its shares have risen over 23,000% (through the end of 2006) but declined in 2007. As ofFebruary18, 2008, there were 90,748 shareholders of record of Harley-Davidson common stock(Exhibit 17 provides a comparison of Harley-Davidson stock and the Standard and Poor’s 500since the 1986 initial public offering.) What does the future hold for Harley-Davidson? Whiletrading near its five-year low, analysts considered two aspects of the Harley-Davidson product.
“It’s an upper-middle-class toy,” says Chad Hudson of the Prudent Bear fund, one of anumber of prominent short-sellers convinced that Harley will skid. “As people run out of dis-posable income, that’s going to hurt.”53
“The risk is that retail trends may continue to weaken at Harley-Davidson, causing in-ventories to build. Harley-Davidson may then lower its production numbers,” says analystGregory Badishkanian.54
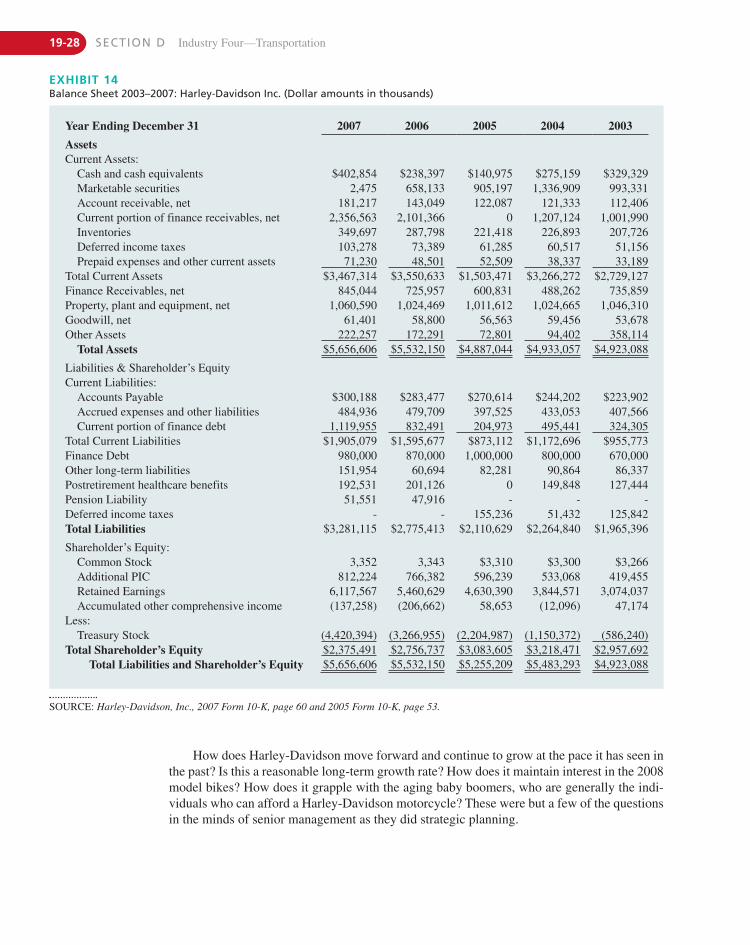
19-28 SECTION D Industry Four—Transportation
EXHIBIT 14Balance Sheet 2003–2007: Harley-Davidson Inc. (Dollar amounts in thousands)
SOURCE: Harley-Davidson, Inc., 2007 Form 10-K, page 60 and 2005 Form 10-K, page 53.
Year Ending December 31 2007 2006 2005 2004 2003
AssetsCurrent Assets:
Cash and cash equivalents $402,854 $238,397 $140,975 $275,159 $329,329Marketable securities 2,475 658,133 905,197 1,336,909 993,331Account receivable, net 181,217 143,049 122,087 121,333 112,406Current portion of finance receivables, net 2,356,563 2,101,366 0 1,207,124 1,001,990Inventories 349,697 287,798 221,418 226,893 207,726Deferred income taxes 103,278 73,389 61,285 60,517 51,156Prepaid expenses and other current assets 71,230 48,501 52,509 38,337 33,189
Total Current Assets $3,467,314 $3,550,633 $1,503,471 $3,266,272 $2,729,127Finance Receivables, net 845,044 725,957 600,831 488,262 735,859Property, plant and equipment, net 1,060,590 1,024,469 1,011,612 1,024,665 1,046,310Goodwill, net 61,401 58,800 56,563 59,456 53,678Other Assets 222,257 172,291 72,801 94,402 358,114
Total Assets $5,656,606 $5,532,150 $4,887,044 $4,933,057 $4,923,088
Liabilities & Shareholder’s EquityCurrent Liabilities:
Accounts Payable $300,188 $283,477 $270,614 $244,202 $223,902Accrued expenses and other liabilities 484,936 479,709 397,525 433,053 407,566Current portion of finance debt 1,119,955 832,491 204,973 495,441 324,305
Total Current Liabilities $1,905,079 $1,595,677 $873,112 $1,172,696 $955,773Finance Debt 980,000 870,000 1,000,000 800,000 670,000Other long-term liabilities 151,954 60,694 82,281 90,864 86,337Postretirement healthcare benefits 192,531 201,126 0 149,848 127,444Pension Liability 51,551 47,916 - - -Deferred income taxes - - 155,236 51,432 125,842Total Liabilities $3,281,115 $2,775,413 $2,110,629 $2,264,840 $1,965,396
Shareholder’s Equity:Common Stock 3,352 3,343 $3,310 $3,300 $3,266Additional PIC 812,224 766,382 596,239 533,068 419,455Retained Earnings 6,117,567 5,460,629 4,630,390 3,844,571 3,074,037Accumulated other comprehensive income (137,258) (206,662) 58,653 (12,096) 47,174
Less:Treasury Stock (4,420,394) (3,266,955) (2,204,987) (1,150,372) (586,240)
Total Shareholder’s Equity $2,375,491 $2,756,737 $3,083,605 $3,218,471 $2,957,692Total Liabilities and Shareholder’s Equity $5,656,606 $5,532,150 $5,255,209 $5,483,293 $4,923,088
How does Harley-Davidson move forward and continue to grow at the pace it has seen inthe past? Is this a reasonable long-term growth rate? How does it maintain interest in the 2008model bikes? How does it grapple with the aging baby boomers, who are generally the indi-viduals who can afford a Harley-Davidson motorcycle? These were but a few of the questionsin the minds of senior management as they did strategic planning.
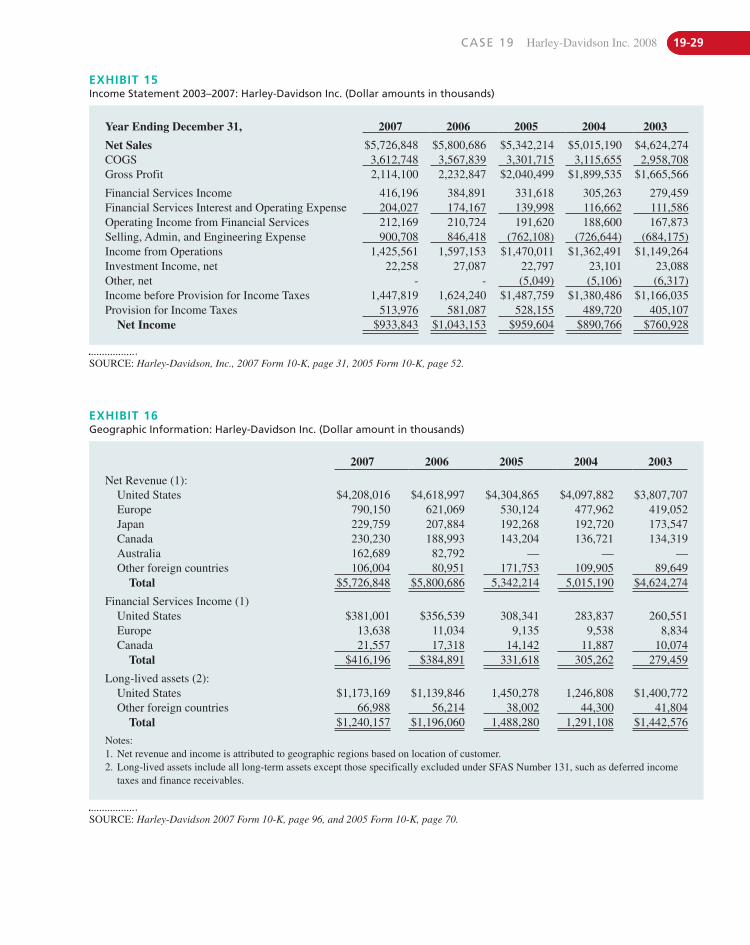
CASE 19 Harley-Davidson Inc. 2008 19-29
EXHIBIT 15Income Statement 2003–2007: Harley-Davidson Inc. (Dollar amounts in thousands)
SOURCE: Harley-Davidson, Inc., 2007 Form 10-K, page 31, 2005 Form 10-K, page 52.
Year Ending December 31, 2007 2006 2005 2004 2003
Net Sales $5,726,848 $5,800,686 $5,342,214 $5,015,190 $4,624,274COGS 3,612,748 3,567,839 3,301,715 3,115,655 2,958,708Gross Profit 2,114,100 2,232,847 $2,040,499 $1,899,535 $1,665,566
Financial Services Income 416,196 384,891 331,618 305,263 279,459Financial Services Interest and Operating Expense 204,027 174,167 139,998 116,662 111,586Operating Income from Financial Services 212,169 210,724 191,620 188,600 167,873Selling, Admin, and Engineering Expense 900,708 846,418 (762,108) (726,644) (684,175)Income from Operations 1,425,561 1,597,153 $1,470,011 $1,362,491 $1,149,264Investment Income, net 22,258 27,087 22,797 23,101 23,088Other, net - - (5,049) (5,106) (6,317)Income before Provision for Income Taxes 1,447,819 1,624,240 $1,487,759 $1,380,486 $1,166,035Provision for Income Taxes 513,976 581,087 528,155 489,720 405,107
Net Income $933,843 $1,043,153 $959,604 $890,766 $760,928
EXHIBIT 16Geographic Information: Harley-Davidson Inc. (Dollar amount in thousands)
SOURCE: Harley-Davidson 2007 Form 10-K, page 96, and 2005 Form 10-K, page 70.
2007 2006 2005 2004 2003
Net Revenue (1):United States $4,208,016 $4,618,997 $4,304,865 $4,097,882 $3,807,707Europe 790,150 621,069 530,124 477,962 419,052Japan 229,759 207,884 192,268 192,720 173,547Canada 230,230 188,993 143,204 136,721 134,319Australia 162,689 82,792 — — —Other foreign countries 106,004 80,951 171,753 109,905 89,649
Total $5,726,848 $5,800,686 5,342,214 5,015,190 $4,624,274
Financial Services Income (1)United States $381,001 $356,539 308,341 283,837 260,551Europe 13,638 11,034 9,135 9,538 8,834Canada 21,557 17,318 14,142 11,887 10,074
Total $416,196 $384,891 331,618 305,262 279,459
Long-lived assets (2):United States $1,173,169 $1,139,846 1,450,278 1,246,808 $1,400,772Other foreign countries 66,988 56,214 38,002 44,300 41,804
Total $1,240,157 $1,196,060 1,488,280 1,291,108 $1,442,576
Notes:1. Net revenue and income is attributed to geographic regions based on location of customer.2. Long-lived assets include all long-term assets except those specifically excluded under SFAS Number 131, such as deferred income
taxes and finance receivables.
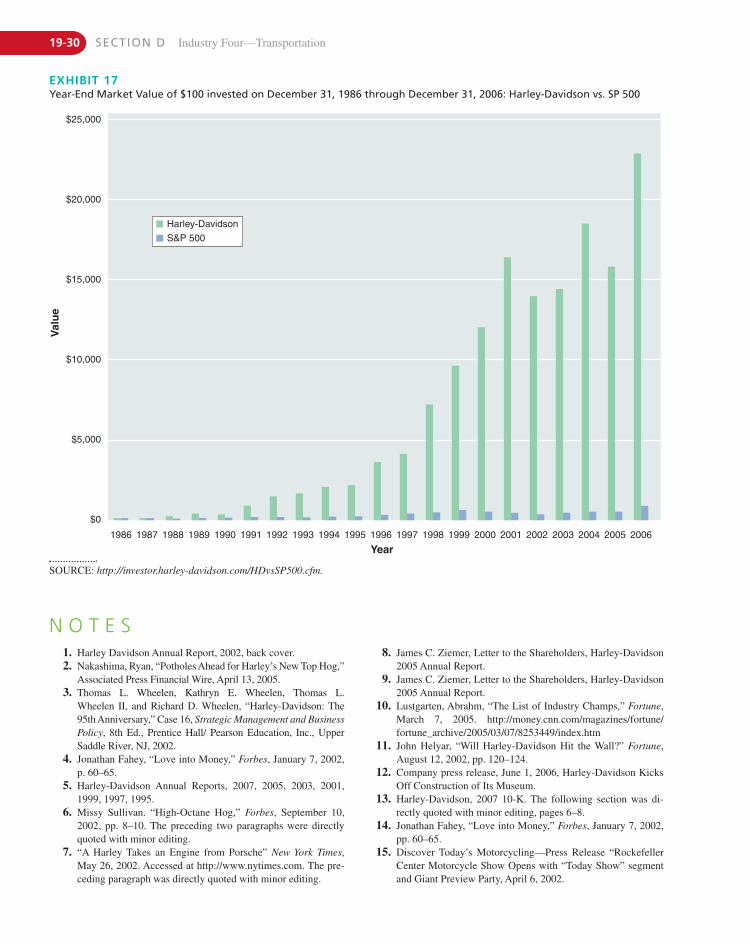
19-30 SECTION D Industry Four—TransportationV
alu
e
Year
$25,000
$20,000
$15,000
$10,000
$5,000
$0
1986 1987 1988 1989 1990 1991 1992 1993 1994 1995 1996 1997 1998 1999 2000 2001 2002 2003 2004 2005 2006
S&P 500
Harley-Davidson
EXHIBIT 17Year-End Market Value of $100 invested on December 31, 1986 through December 31, 2006: Harley-Davidson vs. SP 500
SOURCE: http://investor.harley-davidson.com/HDvsSP500.cfm.
N O T E S1. Harley Davidson Annual Report, 2002, back cover.2. Nakashima, Ryan, “Potholes Ahead for Harley’s New Top Hog,”
Associated Press Financial Wire, April 13, 2005.3. Thomas L. Wheelen, Kathryn E. Wheelen, Thomas L.
Wheelen II, and Richard D. Wheelen, “Harley-Davidson: The95th Anniversary,” Case 16, Strategic Management and BusinessPolicy, 8th Ed., Prentice Hall/ Pearson Education, Inc., UpperSaddle River, NJ, 2002.
4. Jonathan Fahey, “Love into Money,” Forbes, January 7, 2002, p. 60–65.
5. Harley-Davidson Annual Reports, 2007, 2005, 2003, 2001,1999, 1997, 1995.
6. Missy Sullivan. “High-Octane Hog,” Forbes, September 10,2002, pp. 8–10. The preceding two paragraphs were directlyquoted with minor editing.
7. “A Harley Takes an Engine from Porsche” New York Times,May 26, 2002. Accessed at http://www.nytimes.com. The pre-ceding paragraph was directly quoted with minor editing.
8. James C. Ziemer, Letter to the Shareholders, Harley-Davidson2005 Annual Report.
9. James C. Ziemer, Letter to the Shareholders, Harley-Davidson2005 Annual Report.
10. Lustgarten, Abrahm, “The List of Industry Champs,” Fortune,March 7, 2005. http://money.cnn.com/magazines/fortune/fortune_archive/2005/03/07/8253449/index.htm
11. John Helyar, “Will Harley-Davidson Hit the Wall?” Fortune,August 12, 2002, pp. 120–124.
12. Company press release, June 1, 2006, Harley-Davidson KicksOff Construction of Its Museum.
13. Harley-Davidson, 2007 10-K. The following section was di-rectly quoted with minor editing, pages 6–8.
14. Jonathan Fahey, “Love into Money,” Forbes, January 7, 2002,pp. 60–65.
15. Discover Today’s Motorcycling—Press Release “RockefellerCenter Motorcycle Show Opens with “Today Show” segmentand Giant Preview Party, April 6, 2002.
CASE 19 Harley-Davidson Inc. 2008 19-31
16. Harley-Davidson and Jane magazine roll out contest to honorwomen with an unquenchable Spirit of Freedom, Market Wire,June 7, 2005.
17. Harley-Davidson Reports Fourth Quarter and Full Year Resultsfor 2007. January 25, 2008. www.harley-davidson.com. Muchof this section was directly quoted from President Ziemer’scomments with minor editing.
18. Missy Sullivan, “High-Octane Hog,” Forbes, September 10,2002, pp. 8–10.
19. Harley-Davidson 10-K, 2005.20. Jonathan Fahey, “Love into Money,” Forbes, January 7, 2002,
pp. 60–65.21. Rich Rovito, “No Revving Needed for Sales of Harley’s V-Rod
Motorcycle,” The Business Journal Serving Greater Milwaukee,January 14, 2002. Accessed at http://milwaukee.bizjournals.com/milwaukee/stories/2002/01/14/story8.html
22. Joseph Weber, “Harley Investors May Get a Wobbly Ride,”Business Week, February 11, 2002, p. 65.
23. The Business Week 50 Ranking, Business Week, Spring 2002,p. 54.
24. James V. Higgins, “All Hail, Harley-Davidson” The DetroitNews, February 22, 2002. Accessed at http://detnews.com/2002.
25. Jonathan Fahey, “Love into Money,” Forbes, January 7, 2002,pp. 60–65.
26. Jerry Shiver, “Richer, Older Harley Riders ‘Like EveryoneElse,’” USA Today, March 8, 2002, pp. 1A–2A.
27. Harley-Davidson, 2007 10-K. The following paragraph was di-rectly quoted with minor editing.
28. Harley-Davidson, 2007 10-K. The following two paragraphswere directly quoted with minor editing.
29. Harley-Davidson, 2007 10-K. The paragraph was directlyquoted with minor editing.
30. “Harley Roars into Its Second Century,” The Tribune, AmesIowa, July 26, 2002, p. A2.
31. Jerry Shiver, “Richer, Older Harley Riders ‘Like EveryoneElse,’” USA Today, March 8, 2002, pp. 1A–2A.
32. Jerry Shiver, “Richer, Older Harley Riders ‘Like EveryoneElse,’” USA Today, March 8, 2002, pp. 1A–2A.
33. Ridley, Amanda, Spartanburg, S.C., “Harley-Davidson dealermoving to expanded showroom,” Herald-Journal, July 11,2004.
34. Pisinski, Tonya M., “Me and my Harley: Hawg riders are down-right passionate about their bike riding and hitting the trail,”Worcester Telegram and Gazette, May 25, 2005.
35. David Wells, “Lehman’s Kantor Bets on Harley-Davidson: Callof Day,” Bloomberg, November 14, 2001.
36. Harley-Davidson, Form 10-K, 2007. The following four para-graphs were directly quoted with minor editing.
37. Earle Eldrige, “More Over-40 Motorcyclists Die in Crashes”USA Today, January 10, 2002, p. 1B.
38. Jonathan Fahey, “Love into Money,” Forbes, January 7, 2002,pp. 60–65.
39. “Rider’s Edge, the Harley-Davidson Academy of Motorcy-cling, moves into California,” press release, March 11, 2008,www.harley-davidson.com.
40. Harley-Davidson, Form 10-K, 2007. The following paragraphwas directly quoted with minor editing.
41. Harley-Davidson, Form 10-K, 2007. The following paragraphwas directly quoted with minor editing.
42. Harley-Davidson, Form 10-K, 2007. The following paragraphwas directly quoted with minor editing.
43. Harley-Davidson, Form 10-K, 2007. The first three paragraphswere directly quoted with minor editing.
44. Harley-Davidson, Form 10-K, 2007. The first paragraph wasdirectly quoted with minor editing.
45. Harley-Davidson, Form 10-K, 2007. The first paragraph wasdirectly quoted with minor editing.
46. Harley-Davidson, Form 10-K, 2007. The first paragraph wasdirectly quoted with minor editing.
47. Harley-Davidson, Form 10-K, 2007, the following paragraphwas directly quoted with minor editing.
48. Harley-Davidson, Form 10-K, 2007, the following paragraphwas directly quoted with minor editing.
49. Harley-Davidson, Form 10-K, 2007, the following three para-graphs were directly quoted with minor editing.
50. Harley-Davidson, Form 10-K, 2007, the following paragraphwas directly quoted with minor editing.
51. Harley-Davidson, Form 10-K, 2007, the following two para-graphs were directly quoted with minor editing.
52. Harley-Davidson, Form 10-K, 2007, the following paragraphwas directly quoted with minor editing.
53. John Helyar, “Will Harley-Davidson hit the Wall?” Fortune,August 12, 2002, pp. 120–124.
54. “Harley-Davidson Cut From Citi List,” Associated Press,March 14, 2008.

This page intentionally left blank
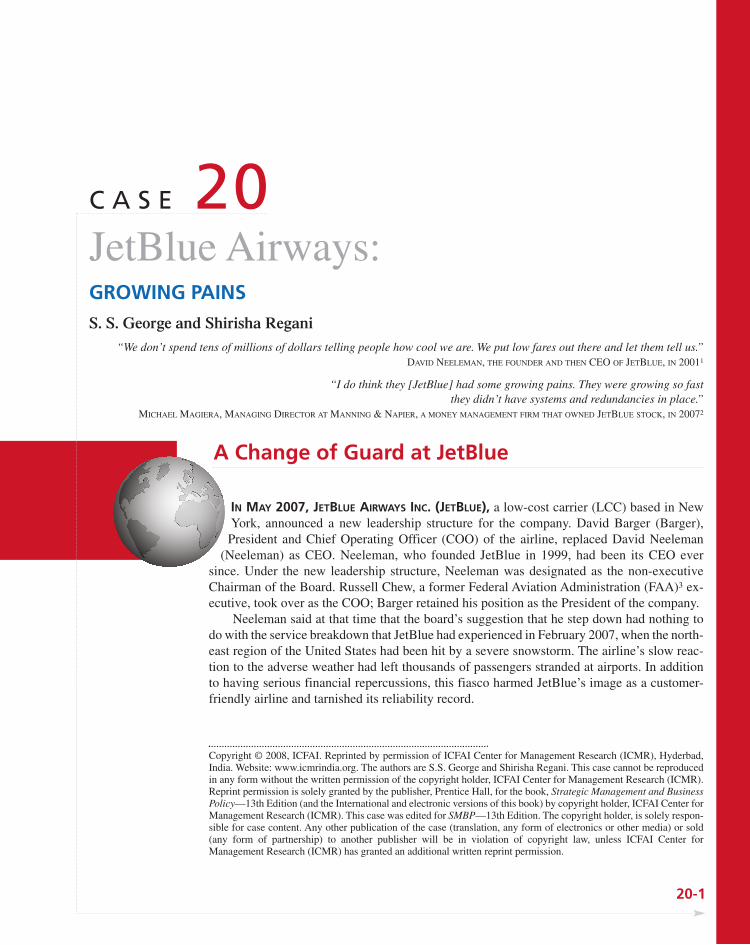
A Change of Guard at JetBlue
IN MAY 2007, JETBLUE AIRWAYS INC. (JETBLUE), a low-cost carrier (LCC) based in NewYork, announced a new leadership structure for the company. David Barger (Barger), President and Chief Operating Officer (COO) of the airline, replaced David Neeleman
(Neeleman) as CEO. Neeleman, who founded JetBlue in 1999, had been its CEO eversince. Under the new leadership structure, Neeleman was designated as the non-executiveChairman of the Board. Russell Chew, a former Federal Aviation Administration (FAA)3 ex-ecutive, took over as the COO; Barger retained his position as the President of the company.
Neeleman said at that time that the board’s suggestion that he step down had nothing todo with the service breakdown that JetBlue had experienced in February 2007, when the north-east region of the United States had been hit by a severe snowstorm. The airline’s slow reac-tion to the adverse weather had left thousands of passengers stranded at airports. In additionto having serious financial repercussions, this fiasco harmed JetBlue’s image as a customer-friendly airline and tarnished its reliability record.
20-1
C A S E 20JetBlue Airways:GROWING PAINSS. S. George and Shirisha Regani
“We don’t spend tens of millions of dollars telling people how cool we are. We put low fares out there and let them tell us.”DAVID NEELEMAN, THE FOUNDER AND THEN CEO OF JETBLUE, IN 20011
“I do think they [JetBlue] had some growing pains. They were growing so fast they didn’t have systems and redundancies in place.”
MICHAEL MAGIERA, MANAGING DIRECTOR AT MANNING & NAPIER, A MONEY MANAGEMENT FIRM THAT OWNED JETBLUE STOCK, IN 20072
Copyright © 2008, ICFAI. Reprinted by permission of ICFAI Center for Management Research (ICMR), Hyderbad,India. Website: www.icmrindia.org. The authors are S.S. George and Shirisha Regani. This case cannot be reproducedin any form without the written permission of the copyright holder, ICFAI Center for Management Research (ICMR).Reprint permission is solely granted by the publisher, Prentice Hall, for the book, Strategic Management and BusinessPolicy—13th Edition (and the International and electronic versions of this book) by copyright holder, ICFAI Center forManagement Research (ICMR). This case was edited for SMBP—13th Edition. The copyright holder, is solely respon-sible for case content. Any other publication of the case (translation, any form of electronics or other media) or sold(any form of partnership) to another publisher will be in violation of copyright law, unless ICFAI Center forManagement Research (ICMR) has granted an additional written reprint permission.
Analysts greeted the leadership change positively. For several years after it was set up, Jet-Blue had been one of the most successful airlines in the United States, rivaling Southwest Air-lines (Southwest)4 in profitability and growth. However, it began facing various problems, bothinternal and external, in 2005–2006. Several analysts were of the opinion that JetBlue’s growthin its early years had been too fast and unsustainable in the longer term, and that it was becauseof this that things started to come undone at the airline when the business environment changed.
20-2 SECTION D Industry Four—Transportation
BackgroundBusiness plans for setting up JetBlue were developed by Neeleman, along with lawyer TomKelly, in 1998. Neeleman raised $160 million5 in capital from top investors such as WestonPresidio Capital, J.P. Morgan Partners, and Soros Private Equity Partners, and founded theairline in February 1999.
In September 1999, JetBlue was awarded 75 landing and takeoff slots at the John F.Kennedy International Airport (JFK) in New York, which was to serve as its base. The airlinestarted commercial operations on February 11, 2000, with an inaugural flight from JFK to FortLauderdale airport in Florida.
Business ModelJetBlue’s business was guided by five key values—safety, caring, integrity, fun, and passion.From its inception, it was “anti-establishment” and went against many of the accepted normsof the aviation industry. One example of this was its choice of New York, the biggest avia-tion market in the United States, as its base. LCCs in the United States typically avoided op-erating from New York because flying out of LaGuardia and Newark, the city’s two domesticairports, was very expensive. Most domestic operators avoided JFK, as it mainly servedinternational flights, and was also farther from Manhattan than the other two airports.Neeleman, however, reasoned that because JFK handled mostly international flights, JetBluewould face very little competition from domestic flights at that airport.
PositioningFrom the beginning, JetBlue was positioned as a colorful and fun airline. Although it was des-ignated as an LCC; it was in fact a “value player.” The airline combined low fares with sev-eral value-added services that improved customer service without adding to operating costs.
All the planes operated at JetBlue were fitted with leather seats instead of cloth ones.Leather furnishings cost twice as much as cloth ones, but also lasted twice as long. Unlike typ-ical LCCs, JetBlue provided assigned seating and allowed passengers to choose their seat onthe plane whenever possible.
JetBlue served light snacks such as chips, cookies, and crackers, and coffee and canneddrinks, which cost a fraction of a regular meal. The snacks were complimentary, unlike inLCCs that sold food to passengers. JetBlue estimated that it saved about $3 per passenger bychoosing to serve sacks instead of regular food.
JetBlue provided free personal satellite television to all the passengers. The television setsreportedly cost only about $1 per passenger per flight—one-fourth the cost of a meal.
OperationsJetBlue’s operations were the key to its low costs. JetBlue did not use old planes, but oper-ated a fleet of new Airbus A-3206 aircraft. The Airbus A-320s were chosen over the more pop-ular Boeing-737s7 (which Southwest used) because although they cost more initially, they
CASE 20 JetBlue Airways 20-3
would be easier to maintain and were more fuel-efficient. The planes also came with a five-year warranty. Operating a uniform fleet of planes was also economical, as it reduced costssignificantly in the areas of pilot training, maintenance, and spare parts.
All the aircraft were configured in a single class, with a uniform level of service. This alsoallowed JetBlue to put in the maximum number of seats possible in its planes.
Initially JetBlue did not try to fly too many routes, concentrating instead on the Northeast,the West Coast, and Florida—routes for which demand was high, and it was easy to undercutthe fares of rivals. In addition, JetBlue also flew to secondary cities that were neglected by ma-jor carriers.
JetBlue flew mainly to secondary airports that did not handle too much air traffic. In thisway, the airline was able to avoid congestion to a great extent and to establish a good on-timerecord. (In 2001–2002, JetBlue had an on-time performance record of 80 percent, as againstthe 72 percent for the top ten airlines in the United States.) Besides, secondary airports offeredbetter business terms than the main ones.
JetBlue tried to operate the maximum possible number of flights per day. Its average turn-around time was 35 minutes, which was comparable to Southwest and much lower than thatof full service airlines (FSAs), which took an hour or more to turn around. JetBlue also oper-ated several “red-eye” flights.8
JetBlue flew only point-to-point flights, avoiding the hub-and-spoke model used by ma-jor carriers. This helped it avoid the complications that resulted from connecting flights andpassenger transfers, and the airline was also able to operate with far fewer airport staff.
JetBlue used electronic ticketing extensively. Typically, more than 70 percent of the tick-ets were booked through the airline’s Web site. JetBlue also cut down on the costs of back-endoperations by allowing its call-center operators and customer service executives to work fromhome, using voice-over-Internet protocol.
Automation and the effective harnessing of technology further helped cut costs. JetBluewas the first airline to introduce paperless cockpits, where the pilots were equipped with lap-tops to access flight manuals and make the requisite calculations before takeoff. This saved be-tween 15 and 20 minutes in takeoff. JetBlue was also one of the first airlines in the UnitedStates to allow automatic check-in and electronic baggage tagging. Automation helped JetBluemaintain a lean workforce (labor costs were historically the highest component of an airline’soperating costs). In 2002, JetBlue’s cost per available seat mile was 7 cents, which was 25 per-cent less than the average of the major carriers. JetBlue was thus able to offer fares that weretypically 30 to 40 percent lower than other airlines.9
JetBlue was also one of the few airlines in the U.S. airline industry that had a non-unionizedworkforce. All the employees from the CEO down to the lowest ranking ones were called“crewmembers.” The top management tried to create a family-like atmosphere at the airline.
JetBlue looked for a positive attitude in its employees, as they were often called on to dothings that were outside their job descriptions. For instance, JetBlue did not employ cleaningcrews to clean the flights—the flight attendants and sometimes the pilots were expected topitch in to get the flight ready for the next takeoff. Airport ground staff also loaded or unloadedbaggage from the flight. However JetBlue rewarded employees frequently with bonuses andprofit sharing programs. Initiative was encouraged, and all employees were free to suggestideas to cut costs and improve operations.
Because of the positive work culture, when customers flew JetBlue, they were impressedby the energy and attitude of the employees.
JetBlue also went out of its way to avoid inconveniencing customers. The airline hada policy of never canceling flights, (all through the early 2000s, JetBlue had an average
Culture
20-4 SECTION D Industry Four—Transportation
Growth and ExpansionJetBlue was founded during one of the most turbulent times in the history of civil aviation inthe United States. September 11, 2001, terrorist attacks had hit the industry hard and any ofthe major airlines had either gone into bankruptcy protection, or were on the verge of doingso. In 2001, JetBlue planned to launch an IPO to fund its expansion plans.11 The IPO had tobe postponed in light of the terrorist attacks, but JetBlue continued with its expansion plansusing its share of the $15 billion bailout ($5 billion in direct compensation and another$10 billion in loan guarantees)12 the U.S. government granted the aviation industry, and afresh infusion of funds from its original investors.
JetBlue was one of the first airlines to take a proactive approach to increase safety on air-craft. It was the first national carrier to install bulletproof, deadbolted cockpit doors on its air-craft, even before the FAA mandated their use. The airline also installed screens in the cockpitso that pilots could see what was happening in the passenger cabins.
JetBlue’s message to customers after September 11 also set it apart from other airlines. Itran a newspaper advertisement that said: “We know you need time to heal. JetBlue will be herewhen you’re ready to fly again.”13 For a few weeks after flights resumed, JetBlue aircraft flewalmost empty from New York to the 17 destinations it served at that time, but the airline didnot scale back operations.
Soon after the September 11 attacks, JetBlue’s management identified the routes on whichother airlines had cut capacity. For instance, most of the major airlines had cut down theirflights from New York to Florida. JetBlue boosted its services to Florida, adding seven newflights per week on this route within a few months. JetBlue also ordered three new A-320 air-craft in 2001. JetBlue was one among only three airlines in the United States (the other twobeing Southwest and AirTran Airways [AirTran]) to post a profit in 2001 (The company posteda profit of $38.5 million, up from a loss of $21.3 million in 2000.)14 (See Exhibit 1 for Jet-Blue’s annual income statements from 2002 to 2006.)
In April 2002, JetBlue launched an IPO of 5.87 million shares, raising $158 million.15 Thatyear, JetBlue started expanding operations on the West Coast, using LosAngeles as a second hub.
In late 2002, JetBlue acquired 100 percent ownership of LiveTV, the company that main-tained its in-flight satellite TV channels, for $41 million in cash and the retirement of $39 mil-lion in debt.16 It also started a customer loyalty program, TrueBlue, in mid-2002, collectingnearly 40,000 members by the end of the year. In 2002, JetBlue’s cost per available seat mile(CASM)17 was 6.43 cents, lower than all the other major U.S. airlines, which reported an av-erage CASM of 9.58 cents.18 (See Exhibit 2 for JetBlue’s key operating statistics from 2002to 2006.)
In 2003, JetBlue placed an order for 100 Embraer-19019 regional jets for a price of$3 billion, with options for another 100 planes20 to serve more regional routes as a part of itsexpansion plans. (This was in addition to the 16 A-320 aircraft added to the fleet that year,with an order for 65 more, and options on another 50.21) The A-320 aircraft were configuredin a 162-seat arrangement, while the Embraer aircraft, which were configured with 100 seats,were a more suitable size for regional routes. The first Embraer planes entered service inOctober 2005.
completion factor10 of 99.5 percent). JetBlue also avoided overbooking flights. When therewas a delay, passengers were informed well in advance. During extreme delays, JetBluewould hand out gift vouchers that could be redeemed for a future flight. All this was doneeven when the delay was because of uncontrollable factors.
JetBlue’s passenger complaint numbers and baggage handling errors were among the low-est in the industry.
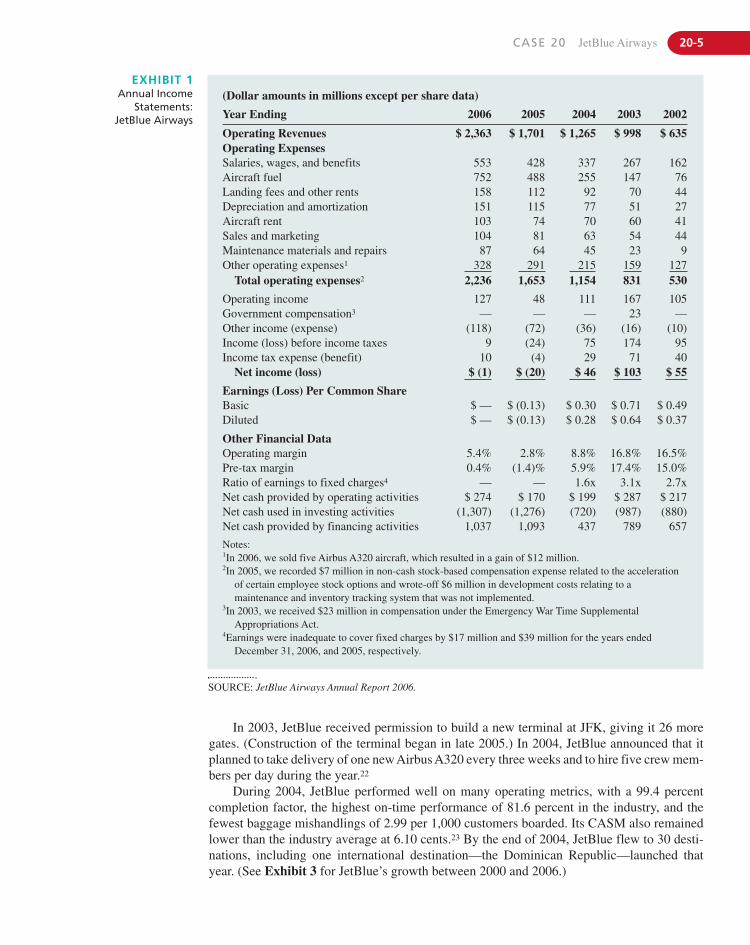
CASE 20 JetBlue Airways 20-5
EXHIBIT 1Annual Income
Statements:JetBlue Airways
SOURCE: JetBlue Airways Annual Report 2006.
(Dollar amounts in millions except per share data)
Year Ending 2006 2005 2004 2003 2002
Operating Revenues $ 2,363 $ 1,701 $ 1,265 $ 998 $ 635Operating ExpensesSalaries, wages, and benefits 553 428 337 267 162Aircraft fuel 752 488 255 147 76Landing fees and other rents 158 112 92 70 44Depreciation and amortization 151 115 77 51 27Aircraft rent 103 74 70 60 41Sales and marketing 104 81 63 54 44Maintenance materials and repairs 87 64 45 23 9Other operating expenses1 328 291 215 159 127
Total operating expenses2 2,236 1,653 1,154 831 530
Operating income 127 48 111 167 105Government compensation3 — — — 23 —Other income (expense) (118) (72) (36) (16) (10)Income (loss) before income taxes 9 (24) 75 174 95Income tax expense (benefit) 10 (4) 29 71 40
Net income (loss) $ (1) $ (20) $ 46 $ 103 $ 55
Earnings (Loss) Per Common ShareBasic $ — $ (0.13) $ 0.30 $ 0.71 $ 0.49Diluted $ — $ (0.13) $ 0.28 $ 0.64 $ 0.37
Other Financial DataOperating margin 5.4% 2.8% 8.8% 16.8% 16.5%Pre-tax margin 0.4% (1.4)% 5.9% 17.4% 15.0%Ratio of earnings to fixed charges4 — — 1.6x 3.1x 2.7xNet cash provided by operating activities $ 274 $ 170 $ 199 $ 287 $ 217Net cash used in investing activities (1,307) (1,276) (720) (987) (880)Net cash provided by financing activities 1,037 1,093 437 789 657
Notes:1In 2006, we sold five Airbus A320 aircraft, which resulted in a gain of $12 million.2In 2005, we recorded $7 million in non-cash stock-based compensation expense related to the acceleration
of certain employee stock options and wrote-off $6 million in development costs relating to amaintenance and inventory tracking system that was not implemented.
3In 2003, we received $23 million in compensation under the Emergency War Time SupplementalAppropriations Act.
4Earnings were inadequate to cover fixed charges by $17 million and $39 million for the years endedDecember 31, 2006, and 2005, respectively.
In 2003, JetBlue received permission to build a new terminal at JFK, giving it 26 moregates. (Construction of the terminal began in late 2005.) In 2004, JetBlue announced that itplanned to take delivery of one new Airbus A320 every three weeks and to hire five crew mem-bers per day during the year.22
During 2004, JetBlue performed well on many operating metrics, with a 99.4 percentcompletion factor, the highest on-time performance of 81.6 percent in the industry, and thefewest baggage mishandlings of 2.99 per 1,000 customers boarded. Its CASM also remainedlower than the industry average at 6.10 cents.23 By the end of 2004, JetBlue flew to 30 desti-nations, including one international destination—the Dominican Republic—launched thatyear. (See Exhibit 3 for JetBlue’s growth between 2000 and 2006.)
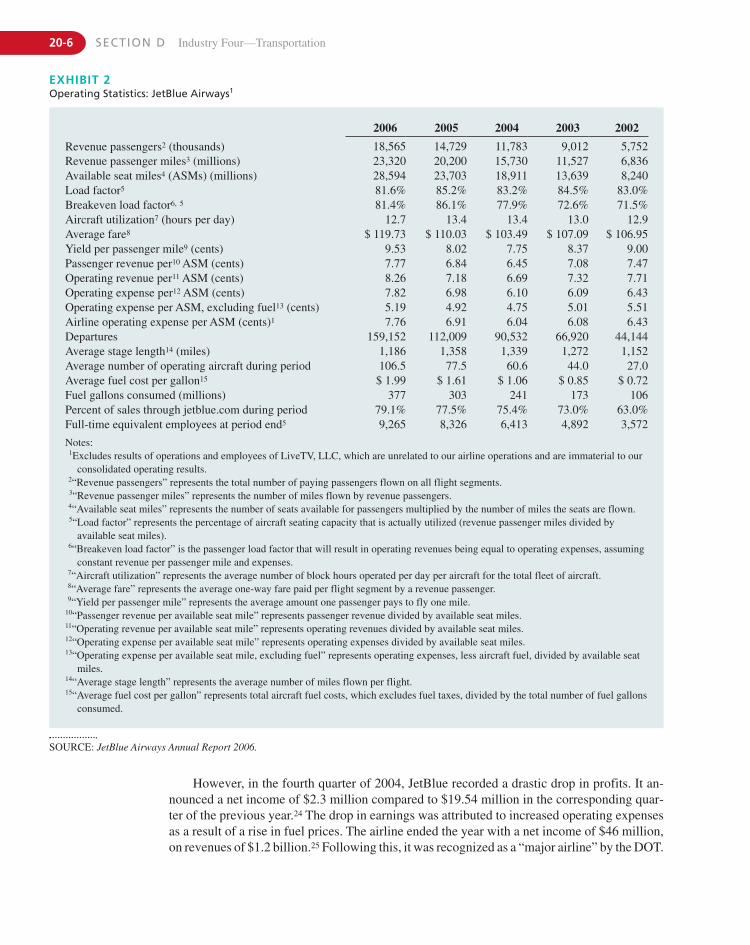
EXHIBIT 2Operating Statistics: JetBlue Airways1
SOURCE: JetBlue Airways Annual Report 2006.
20-6 SECTION D Industry Four—Transportation
2006 2005 2004 2003 2002
Revenue passengers2 (thousands) 18,565 14,729 11,783 9,012 5,752Revenue passenger miles3 (millions) 23,320 20,200 15,730 11,527 6,836Available seat miles4 (ASMs) (millions) 28,594 23,703 18,911 13,639 8,240Load factor5 81.6% 85.2% 83.2% 84.5% 83.0%Breakeven load factor6, 5 81.4% 86.1% 77.9% 72.6% 71.5%Aircraft utilization7 (hours per day) 12.7 13.4 13.4 13.0 12.9Average fare8 $ 119.73 $ 110.03 $ 103.49 $ 107.09 $ 106.95Yield per passenger mile9 (cents) 9.53 8.02 7.75 8.37 9.00Passenger revenue per10 ASM (cents) 7.77 6.84 6.45 7.08 7.47Operating revenue per11 ASM (cents) 8.26 7.18 6.69 7.32 7.71Operating expense per12 ASM (cents) 7.82 6.98 6.10 6.09 6.43Operating expense per ASM, excluding fuel13 (cents) 5.19 4.92 4.75 5.01 5.51Airline operating expense per ASM (cents)1 7.76 6.91 6.04 6.08 6.43Departures 159,152 112,009 90,532 66,920 44,144Average stage length14 (miles) 1,186 1,358 1,339 1,272 1,152Average number of operating aircraft during period 106.5 77.5 60.6 44.0 27.0Average fuel cost per gallon15 $ 1.99 $ 1.61 $ 1.06 $ 0.85 $ 0.72Fuel gallons consumed (millions) 377 303 241 173 106Percent of sales through jetblue.com during period 79.1% 77.5% 75.4% 73.0% 63.0%Full-time equivalent employees at period end5 9,265 8,326 6,413 4,892 3,572
Notes:1Excludes results of operations and employees of LiveTV, LLC, which are unrelated to our airline operations and are immaterial to our
consolidated operating results.2“Revenue passengers” represents the total number of paying passengers flown on all flight segments.3“Revenue passenger miles” represents the number of miles flown by revenue passengers.4“Available seat miles” represents the number of seats available for passengers multiplied by the number of miles the seats are flown.5“Load factor” represents the percentage of aircraft seating capacity that is actually utilized (revenue passenger miles divided by
available seat miles).6“Breakeven load factor” is the passenger load factor that will result in operating revenues being equal to operating expenses, assuming
constant revenue per passenger mile and expenses.7“Aircraft utilization” represents the average number of block hours operated per day per aircraft for the total fleet of aircraft.8“Average fare” represents the average one-way fare paid per flight segment by a revenue passenger.9“Yield per passenger mile” represents the average amount one passenger pays to fly one mile.
10“Passenger revenue per available seat mile” represents passenger revenue divided by available seat miles.11“Operating revenue per available seat mile” represents operating revenues divided by available seat miles.12“Operating expense per available seat mile” represents operating expenses divided by available seat miles.13“Operating expense per available seat mile, excluding fuel” represents operating expenses, less aircraft fuel, divided by available seat
miles.14“Average stage length” represents the average number of miles flown per flight.15“Average fuel cost per gallon” represents total aircraft fuel costs, which excludes fuel taxes, divided by the total number of fuel gallons
consumed.
However, in the fourth quarter of 2004, JetBlue recorded a drastic drop in profits. It an-nounced a net income of $2.3 million compared to $19.54 million in the corresponding quar-ter of the previous year.24 The drop in earnings was attributed to increased operating expensesas a result of a rise in fuel prices. The airline ended the year with a net income of $46 million,on revenues of $1.2 billion.25 Following this, it was recognized as a “major airline” by the DOT.
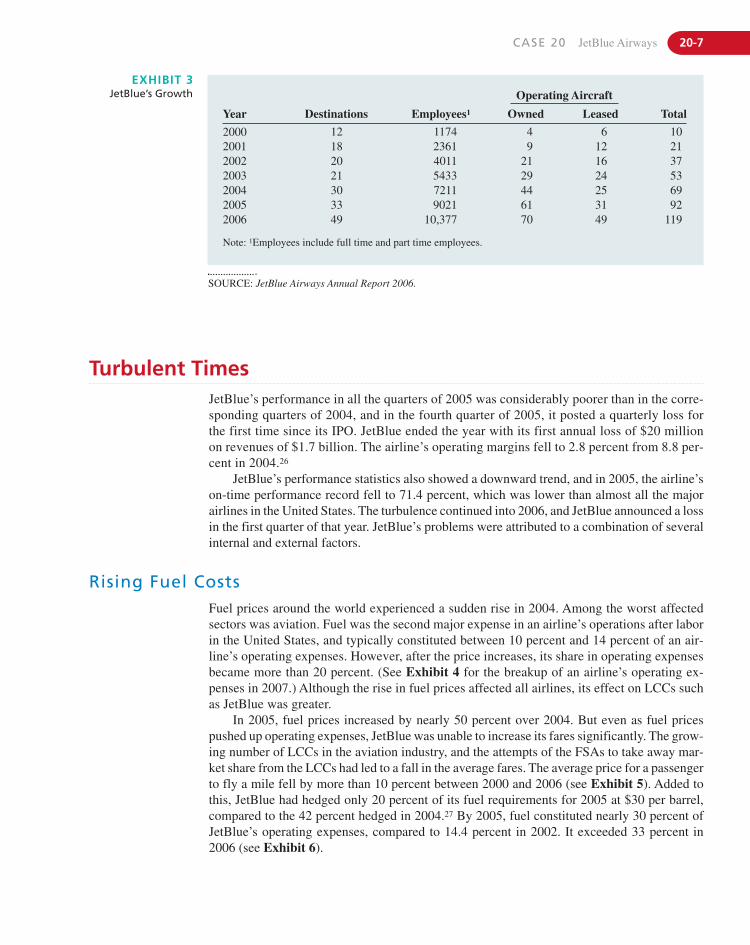
CASE 20 JetBlue Airways 20-7
EXHIBIT 3JetBlue’s Growth
SOURCE: JetBlue Airways Annual Report 2006.
Turbulent Times
Rising Fuel CostsFuel prices around the world experienced a sudden rise in 2004. Among the worst affectedsectors was aviation. Fuel was the second major expense in an airline’s operations after laborin the United States, and typically constituted between 10 percent and 14 percent of an air-line’s operating expenses. However, after the price increases, its share in operating expensesbecame more than 20 percent. (See Exhibit 4 for the breakup of an airline’s operating ex-penses in 2007.) Although the rise in fuel prices affected all airlines, its effect on LCCs suchas JetBlue was greater.
In 2005, fuel prices increased by nearly 50 percent over 2004. But even as fuel pricespushed up operating expenses, JetBlue was unable to increase its fares significantly. The grow-ing number of LCCs in the aviation industry, and the attempts of the FSAs to take away mar-ket share from the LCCs had led to a fall in the average fares. The average price for a passengerto fly a mile fell by more than 10 percent between 2000 and 2006 (see Exhibit 5). Added tothis, JetBlue had hedged only 20 percent of its fuel requirements for 2005 at $30 per barrel,compared to the 42 percent hedged in 2004.27 By 2005, fuel constituted nearly 30 percent ofJetBlue’s operating expenses, compared to 14.4 percent in 2002. It exceeded 33 percent in2006 (see Exhibit 6).
Operating Aircraft
Year Destinations Employees1 Owned Leased Total
2000 12 1174 4 6 102001 18 2361 9 12 212002 20 4011 21 16 372003 21 5433 29 24 532004 30 7211 44 25 692005 33 9021 61 31 922006 49 10,377 70 49 119
Note: 1Employees include full time and part time employees.
JetBlue’s performance in all the quarters of 2005 was considerably poorer than in the corre-sponding quarters of 2004, and in the fourth quarter of 2005, it posted a quarterly loss forthe first time since its IPO. JetBlue ended the year with its first annual loss of $20 millionon revenues of $1.7 billion. The airline’s operating margins fell to 2.8 percent from 8.8 per-cent in 2004.26
JetBlue’s performance statistics also showed a downward trend, and in 2005, the airline’son-time performance record fell to 71.4 percent, which was lower than almost all the majorairlines in the United States. The turbulence continued into 2006, and JetBlue announced a lossin the first quarter of that year. JetBlue’s problems were attributed to a combination of severalinternal and external factors.
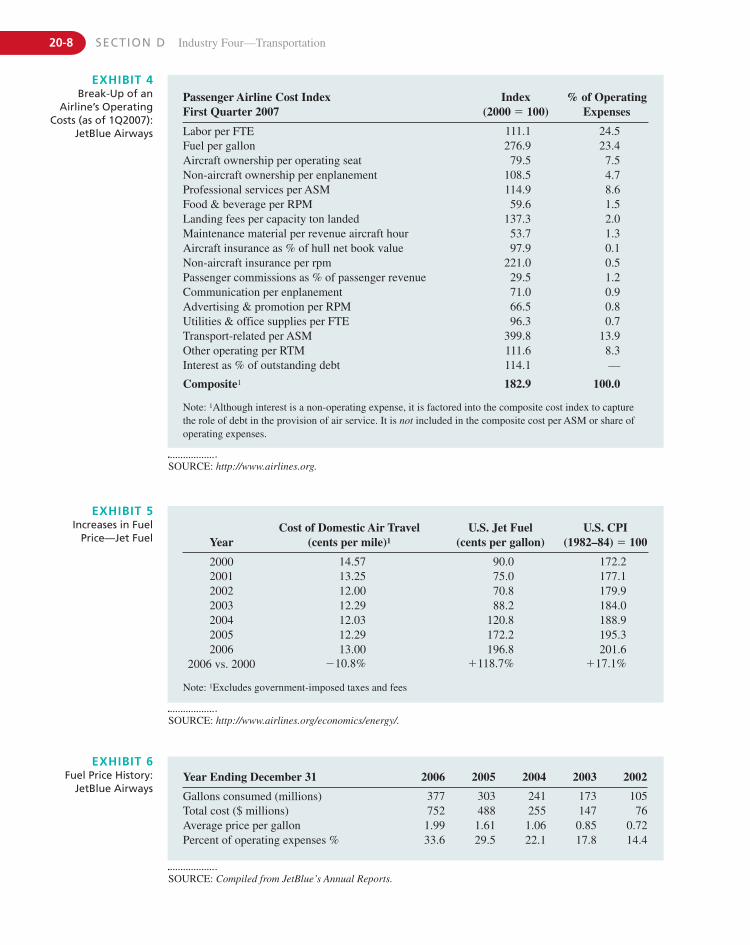
20-8 SECTION D Industry Four—Transportation
EXHIBIT 4Break-Up of an
Airline’s OperatingCosts (as of 1Q2007):
JetBlue Airways
SOURCE: http://www.airlines.org.
Passenger Airline Cost Index First Quarter 2007
Index(2000 � 100)
% of OperatingExpenses
Labor per FTE 111.1 24.5Fuel per gallon 276.9 23.4Aircraft ownership per operating seat 79.5 7.5Non-aircraft ownership per enplanement 108.5 4.7Professional services per ASM 114.9 8.6Food & beverage per RPM 59.6 1.5Landing fees per capacity ton landed 137.3 2.0Maintenance material per revenue aircraft hour 53.7 1.3Aircraft insurance as % of hull net book value 97.9 0.1Non-aircraft insurance per rpm 221.0 0.5Passenger commissions as % of passenger revenue 29.5 1.2Communication per enplanement 71.0 0.9Advertising & promotion per RPM 66.5 0.8Utilities & office supplies per FTE 96.3 0.7Transport-related per ASM 399.8 13.9Other operating per RTM 111.6 8.3Interest as % of outstanding debt 114.1 —
Composite1 182.9 100.0
Note: 1Although interest is a non-operating expense, it is factored into the composite cost index to capturethe role of debt in the provision of air service. It is not included in the composite cost per ASM or share ofoperating expenses.
EXHIBIT 5Increases in Fuel
Price—Jet Fuel
SOURCE: http://www.airlines.org/economics/energy/.
YearCost of Domestic Air Travel
(cents per mile)1
U.S. Jet Fuel (cents per gallon)
U.S. CPI (1982–84) � 100
2000 14.57 90.0 172.22001 13.25 75.0 177.12002 12.00 70.8 179.92003 12.29 88.2 184.02004 12.03 120.8 188.92005 12.29 172.2 195.32006 13.00 196.8 201.6
2006 vs. 2000 �10.8% �118.7% �17.1%
Note: 1Excludes government-imposed taxes and fees
EXHIBIT 6Fuel Price History:
JetBlue Airways
SOURCE: Compiled from JetBlue’s Annual Reports.
Year Ending December 31 2006 2005 2004 2003 2002
Gallons consumed (millions) 377 303 241 173 105Total cost ($ millions) 752 488 255 147 76Average price per gallon 1.99 1.61 1.06 0.85 0.72Percent of operating expenses % 33.6 29.5 22.1 17.8 14.4
CASE 20 JetBlue Airways 20-9
Industry FactorsIn the period between 2001 and 2003, when JetBlue’s growth was at a peak, most of the ma-jor airlines in the United States were suffering from the adverse effects of the September 11attacks. JetBlue had taken advantage of its competitors’ weakened state to boost its owngrowth. However, by 2004–2005, many of the airlines that were operating under Chapter 1128
began to recapture market share. These airlines were able to undercut competition by offer-ing very low fares, taking advantage of the protection of the bankruptcy laws. “It’s too muchcompetition from companies that are purposely allowing themselves to lose money. Compa-nies in bankruptcy right now, such as United and US Air, have been significantly slashingtheir own fares,” said Rick DiLisi, a spokesman for Independence Air, a low-cost airlinebased in Virginia.29 JetBlue was also affected by the low fares offered by United Airlines(United) and Delta Air Lines (Delta), both of which were operating under bankruptcy protec-tion at the time, on transcontinental routes, American Airlines (American) and ContinentalAirlines (Continental), which had escaped Chapter 11, also become aggressive about defend-ing market share, and launched several new transcontinental flights at low prices.
In 2003, JetBlue launched flights from Atlanta to Los Angeles, one of the busiest routesin the United States. Atlanta was Delta’s hub, and when JetBlue entered the market, Delta re-sponded by instantly adding capacity and lowering prices on this route. It also added routes toother destinations in California, quickly establishing its dominance in the region. AirTran, an-other LCC that operated from Atlanta, also responded aggressively by leasing new planes toincrease capacity. Eventually, JetBlue was forced to withdraw from Atlanta in December 2003,just seven months after it started its operations there.
Legacy carriers also launched low-cost subsidiaries of their own, in an effort to competewith the growing number of LCCs. Delta launched an LCC called Song in April 2003, to com-pete directly with JetBlue. Song was also based at JFK, and flew many of the same routes asJetBlue. Like JetBlue, Song also offered amenities such as leather seats, and a free personalentertainment system at every seat. It also served beverages, but charged for meals and liquor.The airline was promoted heavily, and for a few months was successful in capturing a largepart of JetBlue’s business on the New York to Florida route. However, its financial perfor-mance was not satisfactory and it was eventually integrated into Delta’s mainline service inApril 2006.
United also launched an LCC called “Ted” in February 2004. Although Ted was designedmore along the lines of the traditional LCC model and did not serve food, it provided in-flightentertainment in the form of inflight music and videos. Ted operated mainly on central andwestern routes in the United States. According to analysts, the success of Ted was one of themain reasons why United was able to emerge from bankruptcy in February 2006.
Song and Ted had an advantage over the other LCCs, in that they allowed passengers toconnect to the flights of their parent airlines, which had far bigger route networks than any ofthe LCCs. They also shared the frequent flier programs of their parents, and had access to thegates and landing/takeoff slots of their parents in large airports.
JetBlue also faced competition from LCCs such as Southwest, AirTran, America West,Spirit Airlines (Spirit), and Frontier Airlines (Frontier). Although none of these airlines offeredthe same kind of service as JetBlue, all of them were well established in their home markets,and had loyal customer bases. Southwest especially had the lowest cost even among the LCCs,and was very popular among passengers who were willing to give up in-flight services forcheap tickets. AirTran and Spirit operated two classes on their flights and targeted businesspassengers successfully with their low-fare Business Classes. With the exception of Southwestand Spirit, all the LCCs also offered some form of in-flight entertainment, although AirTranwas the only other airline that offered it free.
20-10 SECTION D Industry Four—Transportation
Internal FactorsWhen JetBlue had first started operations, it had used new planes and fittings, which did notcost much in terms of maintenance. However, a few years later, as the fleet aged, maintenancecosts began to rise. Further, JetBlue had to employ more people to meet its requirements, andalso give pay increases to people who had been with the airlines for several years. In an ef-fort to differentiate itself from its competitors, JetBlue had also kept adding new in-flightservices. In 2003, the airline changed the configuration of its A-320 aircraft, removing onerow of seats from the plane, in order to improve legroom for passengers (the number of seatswas brought down to 156, from 16230). While this made the aircraft more comfortable for pas-sengers, it also lowered JetBlue’s revenue earning capacity. However, the move was expectedto cut fuel costs, due to the lower weight of the aircraft.
In 2005, JetBlue upgraded its seatback televisions.All the new aircraft were fitted with largerTVs, and all the old aircraft were retrofitted. At the same time, the airline also equipped all itsplanes with XM Satellite radio, and increased the size of the overhead bins on the aircraft.
Most LCCs gave complimentary beverages and sold food, or served complimentary re-freshments in strictly measured quantities. But JetBlue offered a range of complimentarysnacks and beverages in unlimited quantities. Although the airline started out serving chips,cookies, and coffee, over the years it added several items to its line of in-flight refreshments.As of 2007, the airline offered a range of hot and cold beverages and several varieties ofsnacks. It also sold a variety of cocktails at $5 each.
Passengers traveling on red-eye flights were given complimentary spa amenity kits con-taining mint lip balm, body butter, an eyeshade, and ear plugs. JetBlue also set up a compli-mentary snack bar in the plane for overnight flights, and passengers were given complimentaryhot towels, Dunkin Donuts coffee or tea, orange juice or bottled spring water, just before theylanded the next morning.
Another issue was the problems that JetBlue experienced with its new Embraer-190 air-craft that entered service in late 2005. JetBlue faced a lot of glitches in integrating the new air-craft into its operations. To begin with, Embraer delivered the planes two weeks behindschedule, which caused several flight delays and cancellations. Second, JetBlue’s employeeslacked familiarity with the planes. Third, the Embraer-190 had some technical issues thatcaused several delayed flights and significantly lowered JetBlue’s aircraft utilization rates. Inthe opinion of some analysts, JetBlue had been too optimistic in placing such a large order forthe untried Embraer planes. After two consecutive losses in the last quarter of 2005 and thefirst quarter of 2006, several analysts started comparing JetBlue to People Express Airlines,31
a low-cost airline operated in the United States between 1981 and 1987.
The Return to Profitability Plan
In April 2006, soon after announcing the first quarter loss, Neeleman and Barger announceda recovery plan for JetBlue called the “Return to Profitability” plan (RTP). The main aims ofthe RTP were revenue optimization, improved capacity management, cost reduction, and re-taining the commitment to deliver high-quality service on every flight.
As a part of the revenue optimization goal, JetBlue announced that it would reduce thenumber of long-haul flights and shift its focus back to short-to-medium routes. The companysaid that it planned to reduce the ratio of long-haul to non–long-haul flights from 1.5:1 in 2005,to 1.2:1 during 2006. JetBlue also said that it would offer fewer tickets at very low fares andmore tickets at mid-level fares on all its routes to improve the mix of fares in its revenues. Theaverage fare was expected to rise to at least partly reflect the increased fuel prices. During2006, JetBlue increased its lowest transcontinental fare from $349 to $399.
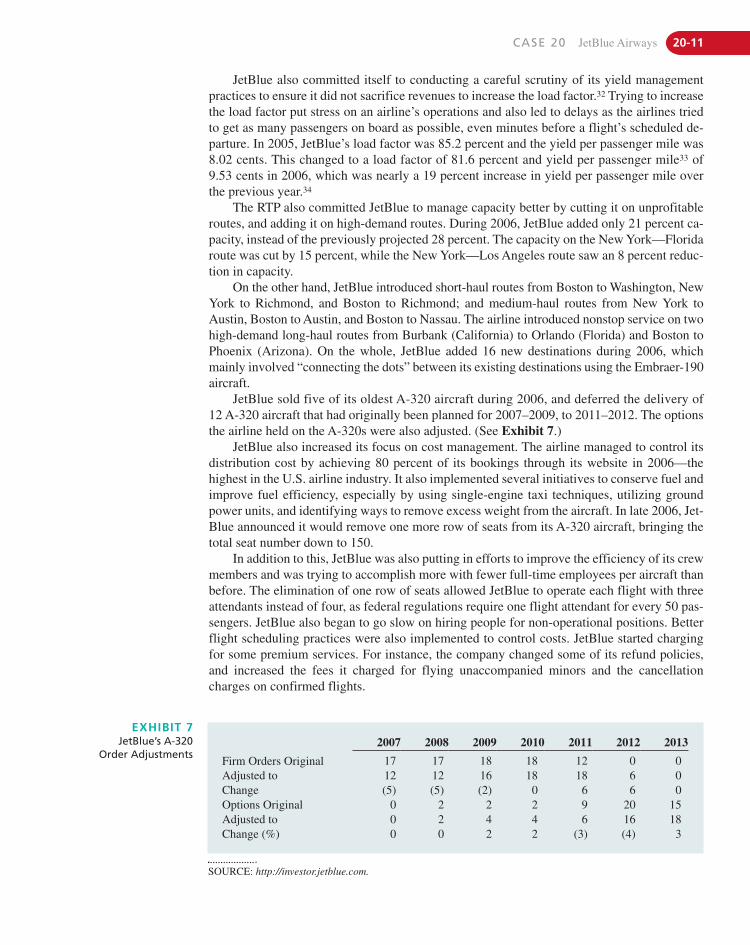
CASE 20 JetBlue Airways 20-11
JetBlue also committed itself to conducting a careful scrutiny of its yield managementpractices to ensure it did not sacrifice revenues to increase the load factor.32 Trying to increasethe load factor put stress on an airline’s operations and also led to delays as the airlines triedto get as many passengers on board as possible, even minutes before a flight’s scheduled de-parture. In 2005, JetBlue’s load factor was 85.2 percent and the yield per passenger mile was8.02 cents. This changed to a load factor of 81.6 percent and yield per passenger mile33 of9.53 cents in 2006, which was nearly a 19 percent increase in yield per passenger mile overthe previous year.34
The RTP also committed JetBlue to manage capacity better by cutting it on unprofitableroutes, and adding it on high-demand routes. During 2006, JetBlue added only 21 percent ca-pacity, instead of the previously projected 28 percent. The capacity on the New York—Floridaroute was cut by 15 percent, while the New York—Los Angeles route saw an 8 percent reduc-tion in capacity.
On the other hand, JetBlue introduced short-haul routes from Boston to Washington, NewYork to Richmond, and Boston to Richmond; and medium-haul routes from New York toAustin, Boston to Austin, and Boston to Nassau. The airline introduced nonstop service on twohigh-demand long-haul routes from Burbank (California) to Orlando (Florida) and Boston toPhoenix (Arizona). On the whole, JetBlue added 16 new destinations during 2006, whichmainly involved “connecting the dots” between its existing destinations using the Embraer-190aircraft.
JetBlue sold five of its oldest A-320 aircraft during 2006, and deferred the delivery of12 A-320 aircraft that had originally been planned for 2007–2009, to 2011–2012. The optionsthe airline held on the A-320s were also adjusted. (See Exhibit 7.)
JetBlue also increased its focus on cost management. The airline managed to control itsdistribution cost by achieving 80 percent of its bookings through its website in 2006—thehighest in the U.S. airline industry. It also implemented several initiatives to conserve fuel andimprove fuel efficiency, especially by using single-engine taxi techniques, utilizing groundpower units, and identifying ways to remove excess weight from the aircraft. In late 2006, Jet-Blue announced it would remove one more row of seats from its A-320 aircraft, bringing thetotal seat number down to 150.
In addition to this, JetBlue was also putting in efforts to improve the efficiency of its crewmembers and was trying to accomplish more with fewer full-time employees per aircraft thanbefore. The elimination of one row of seats allowed JetBlue to operate each flight with threeattendants instead of four, as federal regulations require one flight attendant for every 50 pas-sengers. JetBlue also began to go slow on hiring people for non-operational positions. Betterflight scheduling practices were also implemented to control costs. JetBlue started chargingfor some premium services. For instance, the company changed some of its refund policies,and increased the fees it charged for flying unaccompanied minors and the cancellationcharges on confirmed flights.
EXHIBIT 7JetBlue’s A-320
Order Adjustments
SOURCE: http://investor.jetblue.com.
2007 2008 2009 2010 2011 2012 2013
Firm Orders Original 17 17 18 18 12 0 0Adjusted to 12 12 16 18 18 6 0Change (5) (5) (2) 0 6 6 0Options Original 0 2 2 2 9 20 15Adjusted to 0 2 4 4 6 16 18Change (%) 0 0 2 2 (3) (4) 3
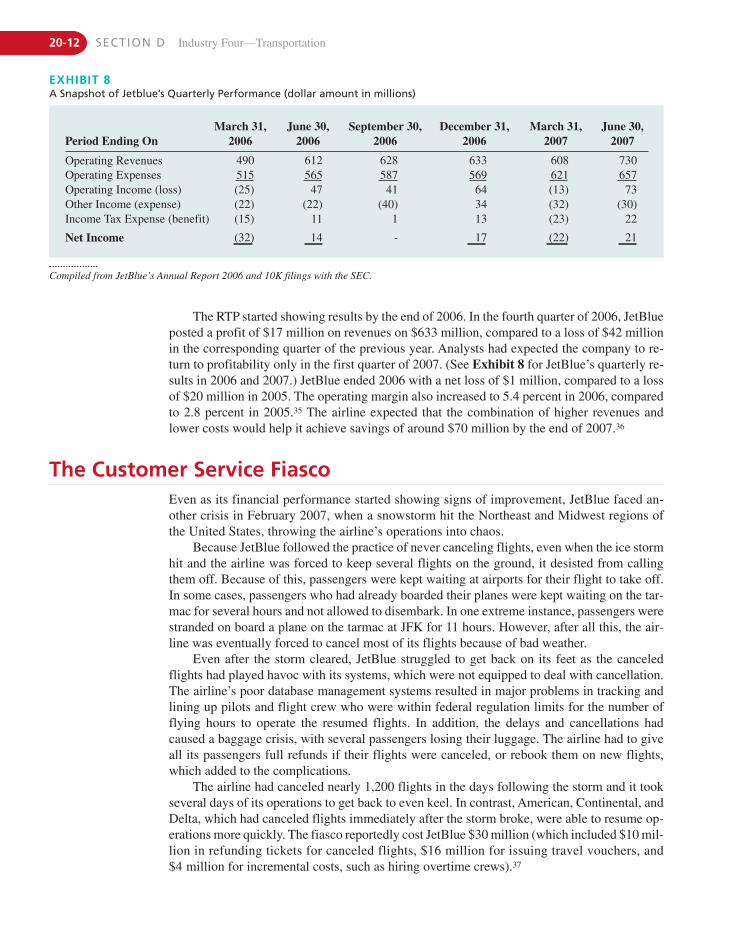
20-12 SECTION D Industry Four—Transportation
The RTP started showing results by the end of 2006. In the fourth quarter of 2006, JetBlueposted a profit of $17 million on revenues on $633 million, compared to a loss of $42 millionin the corresponding quarter of the previous year. Analysts had expected the company to re-turn to profitability only in the first quarter of 2007. (See Exhibit 8 for JetBlue’s quarterly re-sults in 2006 and 2007.) JetBlue ended 2006 with a net loss of $1 million, compared to a lossof $20 million in 2005. The operating margin also increased to 5.4 percent in 2006, comparedto 2.8 percent in 2005.35 The airline expected that the combination of higher revenues andlower costs would help it achieve savings of around $70 million by the end of 2007.36
EXHIBIT 8A Snapshot of Jetblue’s Quarterly Performance (dollar amount in millions)
Compiled from JetBlue’s Annual Report 2006 and 10K filings with the SEC.
Period Ending OnMarch 31,
2006June 30,
2006September 30,
2006December 31,
2006March 31,
2007June 30,
2007
Operating Revenues 490 612 628 633 608 730Operating Expenses 515 565 587 569 621 657Operating Income (loss) (25) 47 41 64 (13) 73Other Income (expense) (22) (22) (40) 34 (32) (30)Income Tax Expense (benefit) (15) 11 1 13 (23) 22
Net Income (32) 14 - 17 (22) 21
The Customer Service FiascoEven as its financial performance started showing signs of improvement, JetBlue faced an-other crisis in February 2007, when a snowstorm hit the Northeast and Midwest regions ofthe United States, throwing the airline’s operations into chaos.
Because JetBlue followed the practice of never canceling flights, even when the ice stormhit and the airline was forced to keep several flights on the ground, it desisted from callingthem off. Because of this, passengers were kept waiting at airports for their flight to take off.In some cases, passengers who had already boarded their planes were kept waiting on the tar-mac for several hours and not allowed to disembark. In one extreme instance, passengers werestranded on board a plane on the tarmac at JFK for 11 hours. However, after all this, the air-line was eventually forced to cancel most of its flights because of bad weather.
Even after the storm cleared, JetBlue struggled to get back on its feet as the canceledflights had played havoc with its systems, which were not equipped to deal with cancellation.The airline’s poor database management systems resulted in major problems in tracking andlining up pilots and flight crew who were within federal regulation limits for the number offlying hours to operate the resumed flights. In addition, the delays and cancellations hadcaused a baggage crisis, with several passengers losing their luggage. The airline had to giveall its passengers full refunds if their flights were canceled, or rebook them on new flights,which added to the complications.
The airline had canceled nearly 1,200 flights in the days following the storm and it tookseveral days of its operations to get back to even keel. In contrast, American, Continental, andDelta, which had canceled flights immediately after the storm broke, were able to resume op-erations more quickly. The fiasco reportedly cost JetBlue $30 million (which included $10 mil-lion in refunding tickets for canceled flights, $16 million for issuing travel vouchers, and$4 million for incremental costs, such as hiring overtime crews).37
CASE 20 JetBlue Airways 20-13
Notwithstanding the financial loss, the loss of goodwill was expected to be much more se-rious for JetBlue. Traditionally, JetBlue had had one of the lowest rates of consumer com-plaints filed with the DOT.38 It also usually ranked high on customer service.39 But followingthe fiasco, BusinessWeek, a prominent business magazine, pulled JetBlue off its list of Cus-tomer Service Champs, published early in 2007. JetBlue was to have held the #4 spot on thelist compiled from consumer responses from the first half of 2006.
Some analysts felt that JetBlue had taken its low-cost philosophy too far in having failedto set up the necessary systems to support its rapid growth. Following the fiasco, JetBlue pub-lished apology letters in the New York Times and USA Today, among other places. Neelemanalso apologized during his appearances on the Late Show with David Letterman on the CBSNetwork, and on YouTube. “We should have acted quicker,” said Neeleman. “We should havecalled the Port Authority quicker. These were all lessons learned from that experience.”40
In late February 2007, Neeleman unveiled a “Customer Bill of Rights,” which laid out theairline’s policy on compensating passengers for delays and cancellations (see Exhibit 9). Ad-ditionally, JetBlue launched a new database management system to help it track crew and bag-gage better, and upgraded its Web site to allow online re-bookings. Employees at the airline’sheadquarters were being trained to help out with operations at the airport in emergency situa-tions. JetBlue also became more proactive during bad weather conditions in the months fol-lowing the storm. In March 2007, when bad weather hit the East Coast once again, JetBlue wasone of the first airlines to cancel flights to and from airports on the East Coast. The airline re-portedly canceled nearly 230 flights during this time.
According to analysts, JetBlue’s handling of the events following the crisis was likely togo a long way in redeeming it in the eyes of the public. “The single most important thing acompany needs to show in a crisis is that it cares. That’s not a feeling. It’s a behavior,” saidBruce Blythe, the CEO of Crisis Management International41, 42. Several consumer polls con-ducted after the February 2007 crisis also showed that JetBlue’s popularity with passengerscontinued to remain high. The crisis and its repercussions were expected to put a burden onJetBlue’s already strained finances. But JetBlue managed to return to profitability in the sec-ond quarter of 2007, after a first quarter loss of $22 million.
More Turbulence Ahead?Analysts felt that the appointment of Barger as the new CEO was likely to benefit JetBlue.According to them, the fresh leadership was likely to help JetBlue through its growing painsand provide it with a positive direction for the future. They also pointed out that Barger dif-fered considerably from Neeleman in his leadership style. (Barger was thought to be more or-ganized than Neeleman, and much more focused on operational issues than the latter, whoenjoyed strategizing.)
However, JetBlue was likely to face many more challenges in the future than it had facedduring the first few years of operations. The FSAs, most of which recovered by 2007, wereready to defend their turf against LCCs. Delta had launched a big sale of discounted ticketsduring the Thanksgiving weekend in 2006, triggering a price war in the industry.
In addition to this, JetBlue was likely to face competition from other LCCs such as Air-Tran and Frontier, which had formed an alliance in late 2006, to combine their marketing andmileage programs.43 Competition was also expected from new airlines like Virgin America,which had been launched amidst a lot of buzz in August 2007, and was positioned as a “value”carrier. Like JetBlue, Virgin America also tried to attract passengers with amenities such assatellite TV, mood lighting, onboard self-service mini bar, and meals-on-demand. VirginAmerica had announced that it expected to expand to 10 cities within a year of operation andto up to 30 cities within five years.44
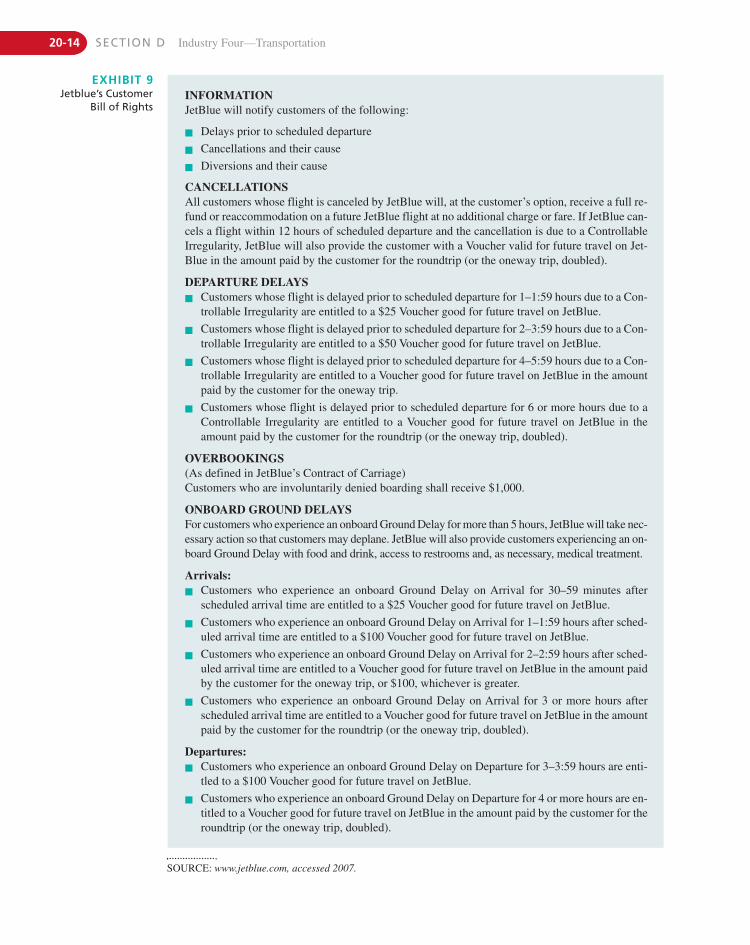
20-14 SECTION D Industry Four—Transportation
EXHIBIT 9Jetblue’s Customer
Bill of RightsINFORMATIONJetBlue will notify customers of the following:
� Delays prior to scheduled departure
� Cancellations and their cause
� Diversions and their cause
CANCELLATIONSAll customers whose flight is canceled by JetBlue will, at the customer’s option, receive a full re-fund or reaccommodation on a future JetBlue flight at no additional charge or fare. If JetBlue can-cels a flight within 12 hours of scheduled departure and the cancellation is due to a ControllableIrregularity, JetBlue will also provide the customer with a Voucher valid for future travel on Jet-Blue in the amount paid by the customer for the roundtrip (or the oneway trip, doubled).
DEPARTURE DELAYS� Customers whose flight is delayed prior to scheduled departure for 1–1:59 hours due to a Con-
trollable Irregularity are entitled to a $25 Voucher good for future travel on JetBlue.
� Customers whose flight is delayed prior to scheduled departure for 2–3:59 hours due to a Con-trollable Irregularity are entitled to a $50 Voucher good for future travel on JetBlue.
� Customers whose flight is delayed prior to scheduled departure for 4–5:59 hours due to a Con-trollable Irregularity are entitled to a Voucher good for future travel on JetBlue in the amountpaid by the customer for the oneway trip.
� Customers whose flight is delayed prior to scheduled departure for 6 or more hours due to aControllable Irregularity are entitled to a Voucher good for future travel on JetBlue in theamount paid by the customer for the roundtrip (or the oneway trip, doubled).
OVERBOOKINGS(As defined in JetBlue’s Contract of Carriage)Customers who are involuntarily denied boarding shall receive $1,000.
ONBOARD GROUND DELAYSFor customers who experience an onboard Ground Delay for more than 5 hours, JetBlue will take nec-essary action so that customers may deplane. JetBlue will also provide customers experiencing an on-board Ground Delay with food and drink, access to restrooms and, as necessary, medical treatment.
Arrivals:� Customers who experience an onboard Ground Delay on Arrival for 30–59 minutes after
scheduled arrival time are entitled to a $25 Voucher good for future travel on JetBlue.
� Customers who experience an onboard Ground Delay on Arrival for 1–1:59 hours after sched-uled arrival time are entitled to a $100 Voucher good for future travel on JetBlue.
� Customers who experience an onboard Ground Delay on Arrival for 2–2:59 hours after sched-uled arrival time are entitled to a Voucher good for future travel on JetBlue in the amount paidby the customer for the oneway trip, or $100, whichever is greater.
� Customers who experience an onboard Ground Delay on Arrival for 3 or more hours afterscheduled arrival time are entitled to a Voucher good for future travel on JetBlue in the amountpaid by the customer for the roundtrip (or the oneway trip, doubled).
Departures:� Customers who experience an onboard Ground Delay on Departure for 3–3:59 hours are enti-
tled to a $100 Voucher good for future travel on JetBlue.
� Customers who experience an onboard Ground Delay on Departure for 4 or more hours are en-titled to a Voucher good for future travel on JetBlue in the amount paid by the customer for theroundtrip (or the oneway trip, doubled).
SOURCE: www.jetblue.com, accessed 2007.
CASE 20 JetBlue Airways 20-15
N O T E S1. Eryn Brown, “A Smokeless Herb JetBlue Founder David
Neeleman . . .,” Fortune, May 28, 2001.2. Chris Zappone, “JetBlue Struggles with ‘Growing Pains,’”
money.cnn.com, April 20, 2007.3. The Federal Aviation Administration is an agency of the United
States Department of Transportation with the authority to regu-late and oversee all aspects of civil aviation in the United States.
4. Southwest Airlines, set up by Herb Kelleher in 1978, was the pi-oneer of low-cost airlines in the United States. The airline washeadquartered in Dallas, Texas, and was known for its prof-itability record (it had posted profits for the 34th consecutiveyear in January 2007).
5. Eryn Brown, “A Smokeless Herb JetBlue Founder David Neeleman . . .,” Fortune, May 28, 2001.
6. Airbus Industrie is a leading manufacturer of aircraft in theworld. It was established in 1970 and is headquartered inFrance.
7. Boeing is a U.S.-based manufacturer of aircraft. Boeing andAirbus are the two biggest aviation companies in the world.
8. Flights operating between 9:00 p.m. and 5:00 a.m. local timeare called red-eye flights. In North America, red-eye flights flyfrom the west to the east coast, capitalizing on the time-zonechanges.
9. Amy Tsao, “Thinking of Taking Off with JetBlue?” BusinessWeek, April 5, 2002.
10. The percentage of accomplished flights in relation to scheduledflight. In other words, it is the percentage of scheduled flightsthat were not canceled.
11. Paul C. Judge, “How Will Your Company Adapt?” Fast Com-pany, November 2001.
12. “Big Airlines Benefit from Bailout Bill,” www.taxpayer.net,June 7, 2002.
13. Paul C. Judge, “How Will Your Company Adapt?” Fast Com-pany, November 2001.
14. Amy Tsao, “Thinking of Taking Off with JetBlue?” BusinessWeek, April 5, 2002.
15. “JetBlue IPO Soars,” money.cnn.com, April 12, 2002.16. “JetBlue Closes Live TVAcquisition,” Communications Today,
September 30, 2002.17. An airline industry metric arrived at by dividing operating ex-
penses by available seat miles.18. JetBlue Airways Annual Report 2002.19. Embraer, a Brazil-based aircraft manufacturer, specialized in
manufacturing regional jets.20. Michael Bobelian, “JetBlue Lands Expansion Plans,” Forbes,
June 10, 2003.
21. JetBlue Airways Annual Report 2003.22. JetBlue Airways Annual Report 2003.23. JetBlue Airways Annual Report 2004.24. “JetBlue Stays in Black,” money.cnn.com, January 27, 2005.25. JetBlue Airways Annual Report 2004.26. JetBlue Airways Annual Report 2005.27. JetBlue Airways Annual Report, 2005.28. Chapter 11 is a chapter of the United States Bankruptcy Code,
which permits reorganization under the bankruptcy laws of theUnited States. Chapter 11 bankruptcy is available to any busi-ness, whether organized as a corporation or sole proprietorship,or individual with unsecured debts of at least $336,900.00 or se-cured debts of at least $1,010,650.00, although it is most promi-nently used by corporate entities. (www.wikipedia.org)
29. Chris Isidore, “Low Fare Blues,” money.cnn.com, Novem-ber 24, 2004.
30. Press release on www.jetblue.com, November 13, 2003.31. People Express had revolutionized air travel with its low fares,
customer focus, and energetic staff. Within five years, the air-line had reached one billion dollars in sales. However, PeopleExpress’ troubles started in 1985 after it acquired several air-lines in the United States, while facing aggressive competitionfrom the FSAs. It was eventually merged with Continental in1987. The case of People Express was often cited by airline in-dustry analysts as an example of an airline growing too fast andnot being able to sustain the growth.
32. The percentage of an aircraft seating capacity that is actuallyutilized.
33. The average amount one passenger pays to fly one mile.34. JetBlue Airways Annual Report 2006.35. JetBlue Airways Annual Report 2006.36. www.airlinepilotforums.com37. Grace Wong, “JetBlue Fiasco: $30M price tag,” money.cnn.com,
February 20 2007.38. In 2006, the complaint rate was only 0.4 complaints per 100,000
passengers, which was the third best in the industry, behindSouthwest, and a feeder airline for Continental Express called Ex-pressJet (Source: “JetBlue Fliers Stranded on Plane for 8 hours,”Fortune, February 15 2007.)
39. The airline featured consistently in the University of Nebraska’snational Airline Quality Rating (AQR) study every year since2003; it ranked first in 2004, 2005, and 2006. It won the Read-ers’ Choice Award from Condé Nast Traveler for five years un-til 2006, and ranked high in every measured category in theairline satisfaction ratings study conducted by J.D. Power &Associates.
Rising fuel costs were also a major concern for JetBlue in the future, as were potentiallyincreasing operational expenses as the airline’s fleet aged and operations expanded. Ana-lysts also thought that JetBlue’s growth would dilute the close-knit culture that the companyenjoyed in its initial years. However, many industry experts still believed that the airlinewould be able to overcome most of the hurdles it faced and enjoy significant growth in thefuture.

20-16 SECTION D Industry Four—Transportation
40. “An Extraordinary Stumble at JetBlue,” Business Week,March 5, 2007.
41. Crisis Management International was an Atlanta-based globalconsulting firm that specialized in helping organizations pre-pare for and manage the unexpected by offering strategic crisismanagement planning and related consulting services.
42. Chuck Salter, “Lessons from the Tarmac,” Fast Company,May 2007.
43. Under the alliance, passengers could use their frequent fliermiles on both the airlines.
44. Jessica Dickler, “Delays Thwart Virgin America’s First Flight,”money.cnn.com, August 8, 2007.
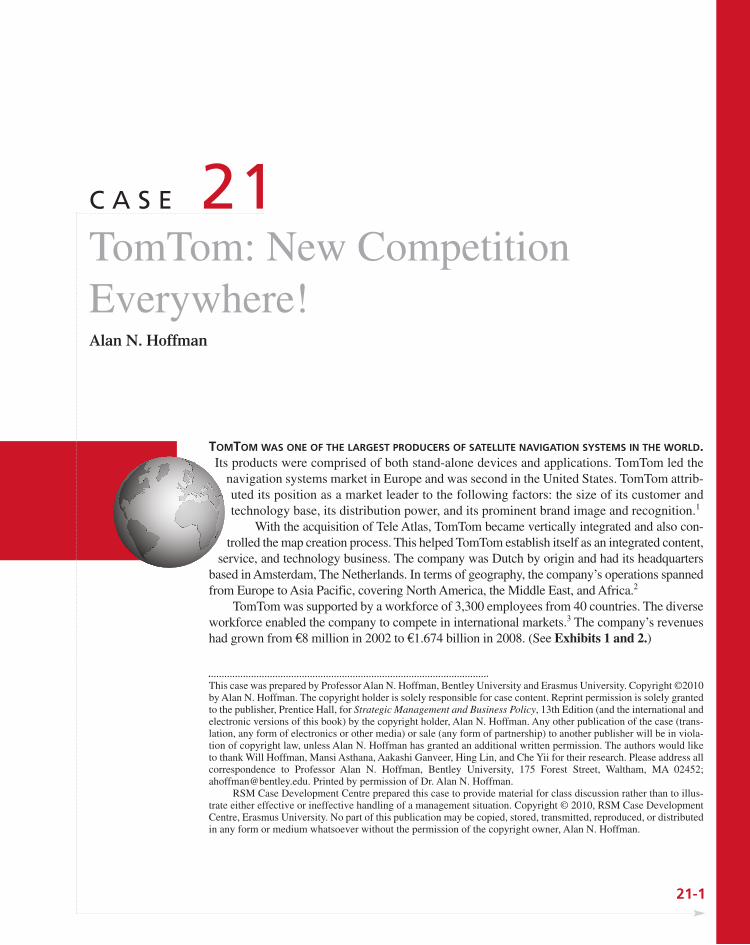
TOMTOM WAS ONE OF THE LARGEST PRODUCERS OF SATELLITE NAVIGATION SYSTEMS IN THE WORLD.Its products were comprised of both stand-alone devices and applications. TomTom led the
navigation systems market in Europe and was second in the United States. TomTom attrib-uted its position as a market leader to the following factors: the size of its customer andtechnology base, its distribution power, and its prominent brand image and recognition.1
With the acquisition of Tele Atlas, TomTom became vertically integrated and also con-trolled the map creation process. This helped TomTom establish itself as an integrated content,
service, and technology business. The company was Dutch by origin and had its headquartersbased in Amsterdam, The Netherlands. In terms of geography, the company’s operations spannedfrom Europe to Asia Pacific, covering North America, the Middle East, and Africa.2
TomTom was supported by a workforce of 3,300 employees from 40 countries. The diverseworkforce enabled the company to compete in international markets.3 The company’s revenueshad grown from €8 million in 2002 to €1.674 billion in 2008. (See Exhibits 1 and 2.)
21-1
C A S E 21TomTom: New CompetitionEverywhere!Alan N. Hoffman
This case was prepared by Professor Alan N. Hoffman, Bentley University and Erasmus University. Copyright ©2010by Alan N. Hoffman. The copyright holder is solely responsible for case content. Reprint permission is solely grantedto the publisher, Prentice Hall, for Strategic Management and Business Policy, 13th Edition (and the international andelectronic versions of this book) by the copyright holder, Alan N. Hoffman. Any other publication of the case (trans-lation, any form of electronics or other media) or sale (any form of partnership) to another publisher will be in viola-tion of copyright law, unless Alan N. Hoffman has granted an additional written permission. The authors would liketo thank Will Hoffman, Mansi Asthana, Aakashi Ganveer, Hing Lin, and Che Yii for their research. Please address allcorrespondence to Professor Alan N. Hoffman, Bentley University, 175 Forest Street, Waltham, MA 02452;[email protected]. Printed by permission of Dr. Alan N. Hoffman.
RSM Case Development Centre prepared this case to provide material for class discussion rather than to illus-trate either effective or ineffective handling of a management situation. Copyright © 2010, RSM Case DevelopmentCentre, Erasmus University. No part of this publication may be copied, stored, transmitted, reproduced, or distributedin any form or medium whatsoever without the permission of the copyright owner, Alan N. Hoffman.
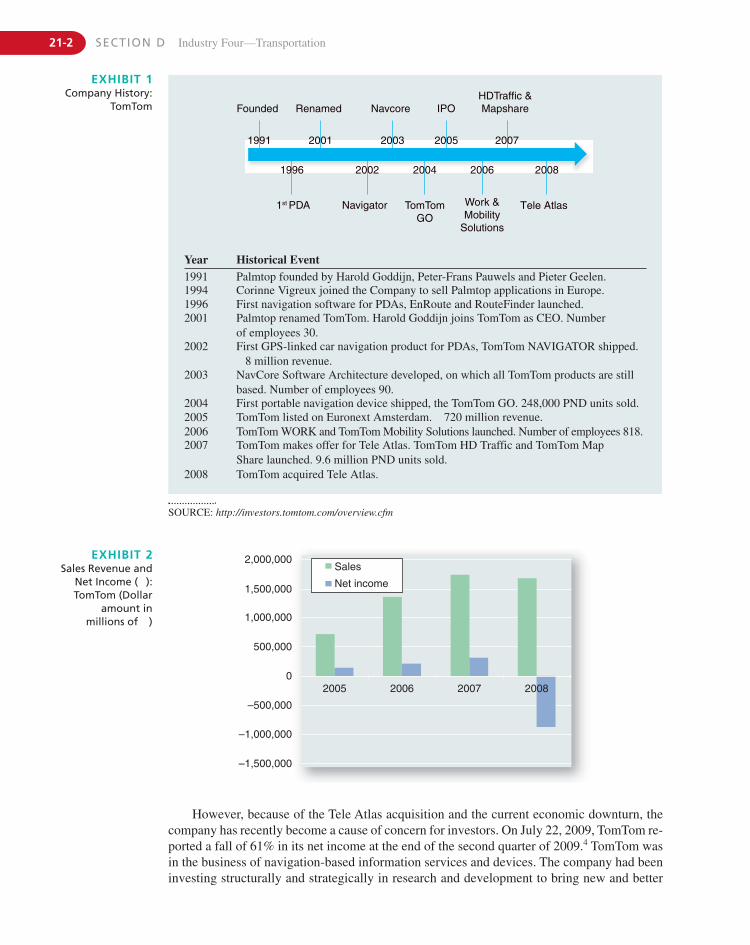
21-2 SECTION D Industry Four—Transportation
Year Historical Event1991 Palmtop founded by Harold Goddijn, Peter-Frans Pauwels and Pieter Geelen.1994 Corinne Vigreux joined the Company to sell Palmtop applications in Europe.1996 First navigation software for PDAs, EnRoute and RouteFinder launched.2001 Palmtop renamed TomTom. Harold Goddijn joins TomTom as CEO. Number
of employees 30.2002 First GPS-linked car navigation product for PDAs, TomTom NAVIGATOR shipped.
€8 million revenue.2003 NavCore Software Architecture developed, on which all TomTom products are still
based. Number of employees 90.2004 First portable navigation device shipped, the TomTom GO. 248,000 PND units sold.2005 TomTom listed on Euronext Amsterdam. €720 million revenue.2006 TomTom WORK and TomTom Mobility Solutions launched. Number of employees 818.2007 TomTom makes offer for Tele Atlas. TomTom HD Traffic and TomTom Map
Share launched. 9.6 million PND units sold.2008 TomTom acquired Tele Atlas.
1991
1996 2004 2006 2008
Tele AtlasTomTomGO
Work &Mobility
Solutions
2002
2001
Navigator1st PDA
Founded Renamed Navcore IPOHDTraffic &Mapshare
2003 2005 2007
EXHIBIT 1Company History:
TomTom
2,000,000
1,500,000
1,000,000
500,000
–500,000
–1,000,000
–1,500,000
02005 2006 2007 2008
Sales
Net income
EXHIBIT 2Sales Revenue and
Net Income (€):TomTom (Dollar
amount in millions of €)
SOURCE: http://investors.tomtom.com/overview.cfm
However, because of the Tele Atlas acquisition and the current economic downturn, thecompany has recently become a cause of concern for investors. On July 22, 2009, TomTom re-ported a fall of 61% in its net income at the end of the second quarter of 2009.4 TomTom wasin the business of navigation-based information services and devices. The company had beeninvesting structurally and strategically in research and development to bring new and better
products and services to its customers. The company’s belief in radical innovation helped it remain at the cutting edge of innovation within the navigation industry.
The vision of TomTom’s management was to improve people’s lives by transforming navi-gation from a “don’t-get-lost solution” into a true travel companion that gets people from one placeto another safer, faster, cheaper, and better informed. This vision helped the company become amarket leader in every marketplace in the satellite navigation information services market.5
The company’s goals focused around radical advances in three key areas:
� Better maps: This goal was achieved by maintaining TomTom’s high-quality map data-base, which was continuously kept up-to-date by a large community of active users whoprovided corrections, verifications, and updates to TomTom. This was supplemented byinputs from TomTom’s extensive fleet of surveying vehicles.6
� Better routing: TomTom had the world’s largest historical speed profile database IQRoutes™ facilitated by TomTom HOME, the company’s user portal.7
� Better traffic information: TomTom possessed a unique, real-time traffic informationservice called TomTom HD traffic™ which provided users with high-quality, real-timetraffic updates.8 These three goals formed the base of satellite navigation, working in con-junction to help TomTom achieve its mission.
CASE 21 TomTom: New Competition Everywhere! 21-3
TomTom’s ProductsTomTom offered a wide variety of products ranging from portable navigation devices to softwarenavigation applications and digital maps. The unique features in each of these products made themtruly “the smart choice in personal navigation.”9 Some of these products are described below.
TomTom Go and TomTom OneThese devices came with a LCD screen that made it easy to use with fingertips while driving.They provided 1,000 Points of Interest (POI) that helped in locating petrol stations, restau-rants, and places of importance. A number of other POIs could also be downloaded. Precise,up-to-the-minute traffic information, jam alerts, and road condition alerts were provided byboth these devices.10
TomTom RiderThese were portable models especially designed for bikers. The equipment consisted of anintegrated GPS receiver that can be mounted on any bike and a wireless headset inside thehelmet. Similar to the car Portable Navigation Devices (PNDs), the TomTom Rider modelshad a number of POI applications. The interfaces used in TomTom Rider were user-friendlyand came in a variety of languages.11
TomTom Navigator and TomTom MobileThese applications provided navigation software along with digital maps. Both of these ap-plications were compatible with most mobiles and PDAs provided by companies like Sony,Nokia, Acer, Dell, and HP. These applications came with TomTom HOME, which could beused to upgrade to the most recent digital maps and application versions.12
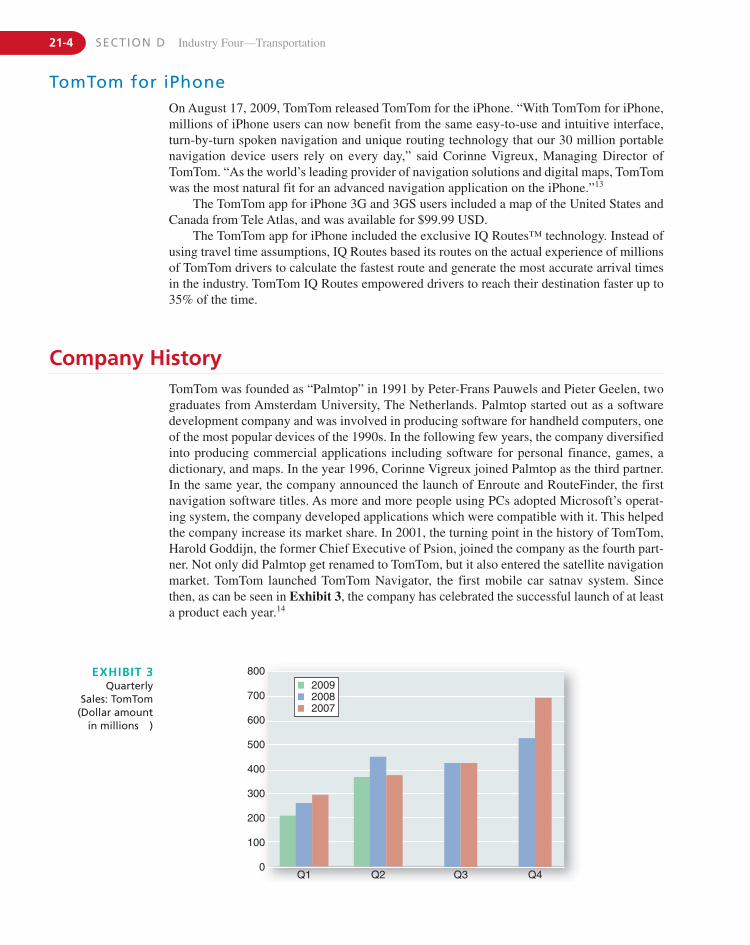
21-4 SECTION D Industry Four—Transportation
TomTom for iPhoneOn August 17, 2009, TomTom released TomTom for the iPhone. “With TomTom for iPhone,millions of iPhone users can now benefit from the same easy-to-use and intuitive interface,turn-by-turn spoken navigation and unique routing technology that our 30 million portablenavigation device users rely on every day,” said Corinne Vigreux, Managing Director of TomTom. “As the world’s leading provider of navigation solutions and digital maps, TomTom was the most natural fit for an advanced navigation application on the iPhone.”13
The TomTom app for iPhone 3G and 3GS users included a map of the United States andCanada from Tele Atlas, and was available for $99.99 USD.
The TomTom app for iPhone included the exclusive IQ Routes™ technology. Instead ofusing travel time assumptions, IQ Routes based its routes on the actual experience of millionsof TomTom drivers to calculate the fastest route and generate the most accurate arrival timesin the industry. TomTom IQ Routes empowered drivers to reach their destination faster up to35% of the time.
Company HistoryTomTom was founded as “Palmtop” in 1991 by Peter-Frans Pauwels and Pieter Geelen, twograduates from Amsterdam University, The Netherlands. Palmtop started out as a softwaredevelopment company and was involved in producing software for handheld computers, oneof the most popular devices of the 1990s. In the following few years, the company diversifiedinto producing commercial applications including software for personal finance, games, adictionary, and maps. In the year 1996, Corinne Vigreux joined Palmtop as the third partner.In the same year, the company announced the launch of Enroute and RouteFinder, the firstnavigation software titles. As more and more people using PCs adopted Microsoft’s operat-ing system, the company developed applications which were compatible with it. This helpedthe company increase its market share. In 2001, the turning point in the history of TomTom,Harold Goddijn, the former Chief Executive of Psion, joined the company as the fourth part-ner. Not only did Palmtop get renamed to TomTom, but it also entered the satellite navigationmarket. TomTom launched TomTom Navigator, the first mobile car satnav system. Sincethen, as can be seen in Exhibit 3, the company has celebrated the successful launch of at leasta product each year.14
800
700
600
500
400
300
200
100
0Q1 Q2 Q3 Q4
200920082007
EXHIBIT 3Quarterly
Sales: TomTom (Dollar amount
in millions €)
CASE 21 TomTom: New Competition Everywhere! 21-5
In 2002, the company generated revenue of €8 million by selling the first GPS-linked carnavigator, the TomTom Navigator, for PDAs. The upgraded version, Navigator 2, was releasedin early 2003. Meanwhile, the company made efforts to gain technical and marketing person-nel. TomTom took strategic steps to grow its sales. The former CTO of Psion, Mark Gretton,led the hardware team while Alexander Ribbink, a former top marketing official, looked aftersales of new products introduced by the company.
TomTom Go, an all-in-one car navigation system, was the company’s next major launch.With its useful and easy-to-use features, TomTom Go was included in the list of successfulproducts of 2004. In the same year, the company launched TomTom Mobile, a navigation sys-tem which sat on top of Smartphones.15
TomTom completed its IPO on the Amsterdam Stock Exchange in May 2005, raising €469 million ($587 million). The net worth of the company was nearly €2 billion after the IPO.A majority of the shares were held by the four partners.16 From the years 2006 to 2008, TomTomstrengthened itself by making three key strategic acquisitions. Datafactory AG was acquiredto power TomTom WORK through WEBfleet technology, while Applied Generics gave itstechnology for Mobility Solutions Services. However, the most prominent of these three wasthe acquisition of Tele Atlas.17
In July of 2007, TomTom bid for Tele Atlas, a company specializing in digital maps. Theoriginal bid price of €2 billion was countered by a €2.3 billion offer from Garmin, TomTom’sbiggest rival. When TomTom raised its bid price to €2.9 billion, the two companies initiated abidding war for Tele Atlas. Although there was speculation that Garmin would further increaseits bid price, in the end management decided not to pursue Tele Atlas any further. Rather,Garmin struck a content agreement with Navteq. TomTom’s shareholders approved thetakeover in December 2007.18
TomTom’s CustomersTomTom was a company that had a wide array of customers, each with their own individualneeds and desires. TomTom had a variety of products to meet the requirements of a large andvaried customer base. As an example, its navigational products ranged from $100–$500 inthe United States, ranging from lower-end products with fewer capabilities to high-end prod-ucts with advanced features.
The first group was the individual consumers who bought stand-alone portable navigationdevices and services. The second group was automobile manufacturers. TomTom teamed withcompanies such as Renault to develop built-in navigational units to install as an option in cars.A third group of customers was the aviation industry and pilots with personal planes. TomTomproduced navigational devices for air travel at affordable prices. A fourth group of customerswas business enterprises. Business enterprises referred to companies such as Wal-Mart, Tar-get, or Home Depot; huge companies with large mobile workforces. To focus on these cus-tomers, TomTom formed a strategic partnership with a technology company called AdvancedIntegrated Solutions to “optimize business fleet organization and itinerary planning on theTomTom pro series of navigation devices.” This new advanced feature on PNDs offered waysfor fleet managers and route dispatchers to organize, plan, and optimize routes and to providedetailed mapping information about the final destination. “Every day, companies with mobileworkforces are challenged to direct all their people to all the places they need to go. Our cus-tomers appreciate having a central web repository to hold and manage all their location andaddress information,19 said Scott Wyatt, CEO of Advanced Integrated Solutions. TomTom’sfifth group of customers, the Coast Guard, was able to use TomTom’s marine navigational de-vices for its everyday responsibilities.
21-6 SECTION D Industry Four—Transportation
Mergers and AcquisitionsTomTom made various mergers and acquisitions as well as partnerships which positioned thecompany well. In 2008, TomTom acquired a digital mapping company called Tele Atlas. Theacquisition significantly improved TomTom customers’ user experience and created otherbenefits for the customers and partners of both companies, including more accurate navigationinformation, improved coverage, and new enhanced features such as map updates and IQRoutes, which will be discussed in the Resources and Capabilities section of the case. Com-menting on the proposed offer, Alain De Taeye, Co-founder and CEO of Tele Atlas, said:
“. . . the TomTom-Tele Atlas partnership signals a new era in the digital mapping industry. Thecombination of TomTom’s customer feedback tools and Tele Atlas’ pioneering map productionprocesses allows Tele Atlas to dramatically change the way digital maps are continuously updatedand enhanced. The result will be a completely new level of quality, content and innovation thathelps our partners deliver the best navigation products. This transaction is not only very attractiveto our shareholders but demonstrates our longstanding commitment towards all of our partnersand customers to deliver the best digital map products available.”20
In addition to its partnership with Advanced Integrated Solutions, TomTom partnered withAvis in 2005, adding its user-friendly navigation system to all Avis rental cars. This partner-ship began in Europe, and recently the devices had made their way into Avis rental cars inNorth America as well as many other countries where Avis operated. Harold Goddijn, ChiefExecutive Officer of TomTom, commented:
“Any traveler can relate to the stress of arriving in a new and unfamiliar city and getting horri-bly lost. With the availability of the TomTom GO 700 we’re bringing unbeatable, full feature carnavigation straight into the hands of Avis customers.”21
TomTom acquired several patents for its many different technologies. By having thesepatents for each of its ideas, the company protected itself against its competition and othercompanies trying to enter into the market.
TomTom prided itself on being the industry innovator and always being a step ahead of thecompetition in terms of its technology. On the company’s website it said, “TomTom leadsthe navigation industry with the technological evolution of navigation products from static‘find-your-destination’ devices into products and services that provide connected, dynamic‘find-the-optimal-route-to-your-destination’, with time-accurate travel information. We arewell positioned to maintain that leading position over the long-term because of the size of ourcustomer and technology base, our distribution power, and our prominent brand image andrecognition. By being vertically integrated and also controlling the map creation process TomTomis in a unique position to evolve into an integrated content, service and technology business.”22
TomTom had a strong brand name/image. TomTom positioned itself well throughout theworld as a leader in portable navigation devices. The company marketed its products throughits very user-friendly online website and also through large companies such as Best Buy andWal-Mart. TomTom also teamed up with Locutio Voice Technologies and Twentieth CenturyFox Licensing & Merchandising to bring the original voice of Homer Simpson to all TomTomdevices via download. “Let Homer Simpson be your TomTom co-pilot” was one of the manyinteresting ways TomTom marketed its products and its name to its consumers.23
TomTom’s Resources and CapabilitiesThe company believed that there were three fundamental requirements to a navigation system—digital mapping, routing technology, and dynamic information. Based on these requirements,three key resources could be identified that really distinguished TomTom from its competition.
CASE 21 TomTom: New Competition Everywhere! 21-7
The first of these resources was the in-house routing algorithms. These algorithms en-abled TomTom to introduce technologies like IQ Routes that provided a “community based in-formation database.” IQ Routes calculated customer routes based on the real average speedsmeasured on roads at that particular time. TomTom’s website said, “The smartest route hour-by-hour, day-by-day, saving you time, money and fuel.”24
The second unique resource was Tele Atlas and the digital mapping technology that theTomTom group specialized in. Having the technology and knowledge in mapping that thecompany brought to TomTom allowed it to introduce many unique features to its customers.First, TomTom came out with a map update feature. The company recognized that roadsaround the world were constantly changing and, because of this, it used the technology to comeout with four new maps each year, one per business quarter. This allowed its customers to al-ways have the latest routes to incorporate into their everyday travel. A second feature it intro-duced is its Map Share program. The idea behind this is that customers of TomTom who noticemistakes in a certain map are able to go in and request a change to be made. The change wasthen verified and checked directly by TomTom and was shared with the rest of the global usercommunity. “One and a half million map corrections have been submitted since the launch ofTomTom Map Share™ in the summer of 2007.”25
The third unique resource was automotive partnerships with two companies in particu-lar: Renault and Avis. At the end of 2008, TomTom reached a deal with Renault to install itsnavigation devices in its cars as an option. An article in AutoWeek magazine said the followingabout the deal: “Renault developed its new low-cost system in partnership with Amsterdam-based technology company TomTom, the European leader in portable navigation systems. Thesystem will be an alternative to the existing satellite navigation devices in Renault’s upper-endcars.”26 The catch was the new price of the built-in navigation units. The cost of a navigationdevice installed in Renault’s cars before TomTom was €1,500. Now, with the TomTom system,it cost only €500. As mentioned earlier, TomTom also partnered with Avis in 2005 to offer itsnavigation devices, specifically the model GO 700, in all Avis rental cars, first starting inEurope and then expanding into other countries where Avis operated.
Traditional CompetitionTomTom faced competition from two main companies. The first of these was Garmin, whichheld 45% of the market share, by far the largest and double TomTom’s market share (24%).Garmin was founded in 1989 by Gary Burrell and Min H. Kao. The company was known forits on-the-go directions since its introduction into GPS navigation in 1989. At the end of2008, Garmin reported annual sales of $3.49 billion. Garmin had competed head-to-head in2009 with TomTom in trying to acquire Tele Atlas for its mapmaking. Garmin withdrew itsbid when it became evident that it was becoming too expensive to own Tele Atlas. Garminexecutives made a decision that it was cheaper to work out a long-term deal with its currentsupplier, Navteq, than to try to buy out a competitor.
The second direct competitor was Magellan, which held 15% of the market share. Magellan was part of a privately held company under the name of MiTac Digital Corporation.Similar to Garmin, Magellan products used Navteq-based maps. Magellan was the creator ofMagellan NAV 100, the world’s first commercial handheld GPS receiver, which was createdin 1989. The company was also well-known for its award-winning RoadMate and Maestro series portable car navigation systems.
Together these three dominant players accounted for about 85% of the total market. Othercompetitors in the personal navigation device market were Navigon, Nextar, and Nokia. Navigon and Nextar competed in the personal navigation devices with TomTom, Magellan, and
21-8 SECTION D Industry Four—Transportation
New Competition Everywhere!
Cell PhonesCell phones were widely used by people all around the world. With the 2005 FCC mandatethat required the location of any cell phone used to call 911 to be tracked, phone manufactur-ers included a GPS receiver in almost every cell phone. Due to this mandate, cell phone man-ufacturers and cellular services were able to offer GPS navigation services through the cellphone for a fee.
AT&T NavigatorGPS Navigation with AT&T Navigator and AT&T Navigator Global Edition feature real-timeGPS-enabled turn-by-turn navigation on AT&T mobile Smartphones (iPhone and Black-berry) or static navigation and Local Search on a non-GPS AT&T mobile Smartphone.
AT&T Navigator featured Global GPS turn-by-turn navigation—Mapping and Point ofAT&T Interest content for three continents, including North America (United States, Canada,and Mexico), Western Europe, and China, where wireless coverage was available from AT&Tor its roaming providers. The AT&T Navigator was sold as a subscription service and cost $9.99 per month.
Online Navigation ApplicationsOnline navigation websites that were still popular among many users for driving directionsand maps were MapQuest, Google Maps, and Yahoo Maps. Users were able to use these freesites to get detailed directions on how to get to their next destination. In the current economicdownturn, many people were looking for cheap, or if possible free, solutions to solve theirproblems. These online websites offered the use of free mapping and navigation informationthat will allow them to get what they needed at no additional cost. However, there were down-sides to these programs: they were not portable and may have poor visualization designs(such as vague image, or text-based).27
Built-In Car Navigation DevicesIn-car navigation devices first came about in luxury, high-end vehicles. Currently, it had be-come more mainstream and was now being offered in mid- to lower-tier vehicles. Thesebuilt-in car navigation devices offered similar features to the personal navigation device butdidn’t have the portability, so users wouldn’t have to carry multiple devices. However, it
Garmin, who were the top three in the industry. But Navigon competed in the high-end seg-ment which retailed for more than any of the competitors but offered a few extra features in itsPNDs. Nextar competed in the low-end market and its strategy was low cost. Finally, Nokiawas mentioned as a competitor in this industry because the company acquired Navteq, a ma-jor supplier of map services in this industry. Along with that, Nokia had a big market share inthe cell phone industry and planned on incorporating GPS technology in every phone, makingit a potential key player to look for in the GPS navigation industry.
CASE 21 TomTom: New Competition Everywhere! 21-9
came with a hefty price. Some examples of these are Kenwood, Pioneer, and Eclipse units,which are all installed in cars. These units tended to be expensive and overpriced becausethey were brand name products and required physical installation. For example, the top ofthe line Pioneer unit was $1,000 for the monitor and another $500 for the navigation deviceplus the physical labor. When buying such products, a customer spent a huge amount ofmoney on a product that was almost identical to a product TomTom offered at a significantlylower price.
Physical MapsPhysical maps were the primary option for navigating for decades until technology improvedthem. Physical maps provided detailed road information to help a person get from point A topoint B. Although more cumbersome to use than some of the modern technology alternatives,it was an alternative for people who were not technically savvy or for whom a navigation de-vice was an unnecessary luxury.
Potential Adverse Legislation and RestrictionsIn the legal and political realm, TomTom had faced two issues that were not critical now, butmay have significant ramifications to not only TomTom in the future, but also the entireportable navigation device industry. The reaction of TomTom’s management to each of theseissues will determine whether or not there was an opportunity for gain or a threat of a signifi-cant loss to the company.
The most important issue TomTom dealt with was the possible legislative banning of allnavigational devices from automobiles. In Australia, there was growing concern over the dis-traction caused by PNDs so the legislature took steps toward banning these devices entirelyfrom automobiles.28 There was a similar sentiment in Ontario, Canada, where a law that wascurrently under review would ban all PNDs that were not mounted either to the dashboard orto the windshield itself.29
With the increase in legislation adding to the restrictions placed on PND devices, thethreat that the PND market in the future will be severely limited could not be ignored. Allof the companies within the PND industry, not just TomTom, must create a coordinated andunited effort to stem this wave of restrictions as well as provide reassurance to the publicthat they were also concerned with the safe use of their products. This effort can be seen inthe heavily regulated toy industry. Many companies within the toy industry had combinedto form the International Council of Toy Industries30 to be proactive in regards to safety regulations, as well as lobby governments against laws that may unfairly threaten the toy industry.31
The other issue within the legal and political spectrum that TomTom must focus onwas the growing use of GPS devices as tracking devices. Currently, law enforcementagents were allowed to use their own GPS devices to track the movements and locationsof individuals they deemed suspicious. However, if budget cuts reduced the access to theseGPS devices, then the simple solution will be to use the PND devices already installed inmany automobiles.
This issue also required the industry as a whole to proactively work with the con-sumers and the government to come to an amicable resolution. The threat of having every
21-10 SECTION D Industry Four—Transportation
consumer’s GPS information at the fingertips of either the government or surveillancecompany will most certainly stunt or even completely halt any growth within the PND industry.
Another alarming trend was the rise in PND thefts around the country.32 With the pricesfor PNDs at a relatively high level, thieves were targeting vehicles that had visible docking sta-tions for PNDs either on the dashboard or the windshield. The onus will be on TomTom to cre-ate new designs that will not only hide PNDs from would-be thieves but also deter them fromtrying to steal one. Consumers who were scared to purchase PNDs because of this rise in crimewill become an issue if this problem is not resolved.
There was also a current trend, labeled the GREEN movement,33 that aimed to reduceany activities that will endanger the environment. This movement was a great opportunity forTomTom to tout its technology as the smarter and more environmentally safe tool if drivingis an absolute necessity. Not only can individuals tout this improved efficiency, but moreimportantly on a larger scale, businesses that require large amounts of materials to be trans-ported across long stretches can show activists that they too are working to becoming a greencompany.
It is ironic that the core technology used in TomTom’s navigation system, the GPS system, has proliferated into other electronic devices at such a rapid pace that it has causedserious competition to the PND industry. GPS functionality was a basic requirement for allnew Smartphones that entered the market and soon will become a basic functionality in reg-ular cellular phones. TomTom will be hard pressed to compete with these multifunctionaldevices unless it can improve upon its designs and transform itself into a single focused device.
Another concern for not only TomTom, but also every company that relies heavily onGPS technology, was the aging satellites that supported the GPS system. Analysts predictedthat these satellites will be either replaced or fixed before there are any issues, but this issuewas unsettling due to the fact that TomTom had no control over it.34 TomTom will have to devise contingency plans in case of catastrophic failure of the GPS system, much likewhat happened to Research in Motion when malfunctioning satellites caused disruption inits service.
TomTom was one of the leading companies in the PND markets in both Europe and theUnited States. Although they were the leader in Europe, that market was showing signs ofbecoming saturated. Even though the U.S. market was currently growing, TomTom couldnot wait for the inevitable signs of that market’s slowdown as well.
The two main opportunities for TomTom to expand—creating digital maps for develop-ing countries and creating navigational services—can either be piggybacked or can be takenin independent paths. The first-mover advantage for these opportunities will erect a high bar-rier of entry for any companies that do not have large amounts of resources to invest in the de-veloping country. TomTom was already playing catch-up to Garmin and its already establishedservice in India.
Globalization of any company’s products did not come without a certain set of issues. ForTomTom, the main threat brought on by foreign countries was twofold. The first threat, whichmay be an isolated instance, but could also be repeated in many other countries, was the re-striction of certain capabilities for all of TomTom’s products. Due to security and terrorismconcerns, GPS devices have not been allowed in Egypt since 2003.35 In times of global terror-ism, TomTom must be vigilant of the growing trend for countries to become overly protectiveof foreign companies and their technologies.
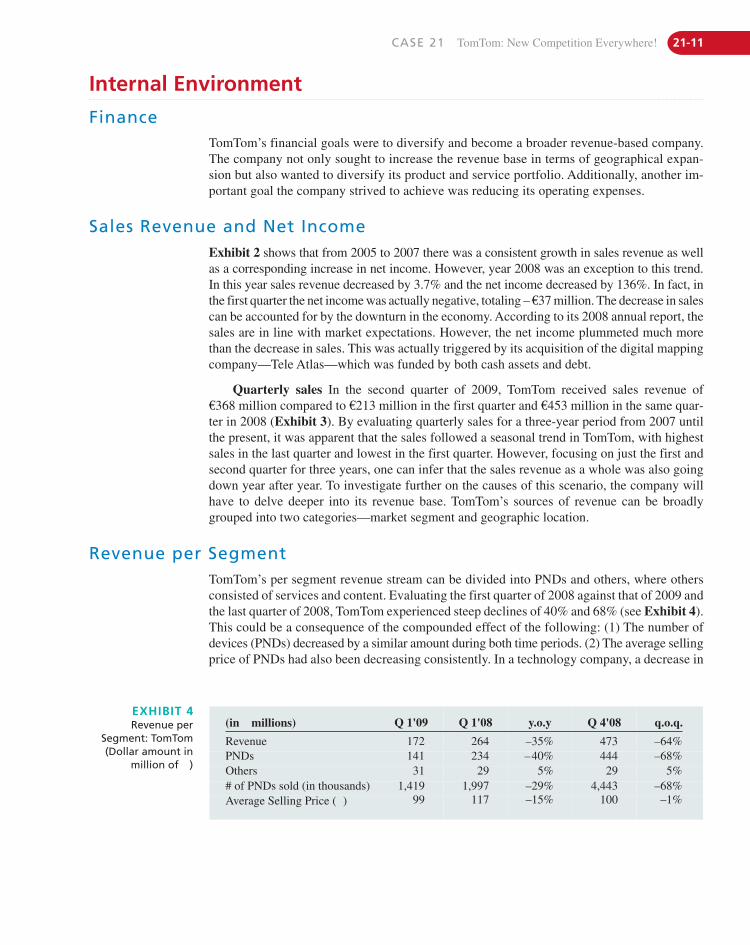
CASE 21 TomTom: New Competition Everywhere! 21-11
Internal Environment
FinanceTomTom’s financial goals were to diversify and become a broader revenue-based company.The company not only sought to increase the revenue base in terms of geographical expan-sion but also wanted to diversify its product and service portfolio. Additionally, another im-portant goal the company strived to achieve was reducing its operating expenses.
Exhibit 2 shows that from 2005 to 2007 there was a consistent growth in sales revenue as wellas a corresponding increase in net income. However, year 2008 was an exception to this trend.In this year sales revenue decreased by 3.7% and the net income decreased by 136%. In fact, inthe first quarter the net income was actually negative, totaling – €37 million. The decrease in salescan be accounted for by the downturn in the economy. According to its 2008 annual report, thesales are in line with market expectations. However, the net income plummeted much morethan the decrease in sales. This was actually triggered by its acquisition of the digital mappingcompany—Tele Atlas—which was funded by both cash assets and debt.
Quarterly sales In the second quarter of 2009, TomTom received sales revenue of €368 million compared to €213 million in the first quarter and €453 million in the same quar-ter in 2008 (Exhibit 3). By evaluating quarterly sales for a three-year period from 2007 untilthe present, it was apparent that the sales followed a seasonal trend in TomTom, with highestsales in the last quarter and lowest in the first quarter. However, focusing on just the first andsecond quarter for three years, one can infer that the sales revenue as a whole was also goingdown year after year. To investigate further on the causes of this scenario, the company willhave to delve deeper into its revenue base. TomTom’s sources of revenue can be broadlygrouped into two categories—market segment and geographic location.
Sales Revenue and Net Income
(in € millions) Q 1'09 Q 1'08 y.o.y Q 4'08 q.o.q.
Revenue 172 264 –35% 473 –64%PNDs 141 234 –40% 444 –68%Others 31 29 5% 29 5%# of PNDs sold (in thousands) 1,419 1,997 –29% 4,443 –68%Average Selling Price (€) 99 117 –15% 100 –1%
EXHIBIT 4Revenue per
Segment: TomTom(Dollar amount in
million of €)
Revenue per SegmentTomTom’s per segment revenue stream can be divided into PNDs and others, where othersconsisted of services and content. Evaluating the first quarter of 2008 against that of 2009 andthe last quarter of 2008, TomTom experienced steep declines of 40% and 68% (see Exhibit 4).This could be a consequence of the compounded effect of the following: (1) The number ofdevices (PNDs) decreased by a similar amount during both time periods. (2) The average sellingprice of PNDs had also been decreasing consistently. In a technology company, a decrease in
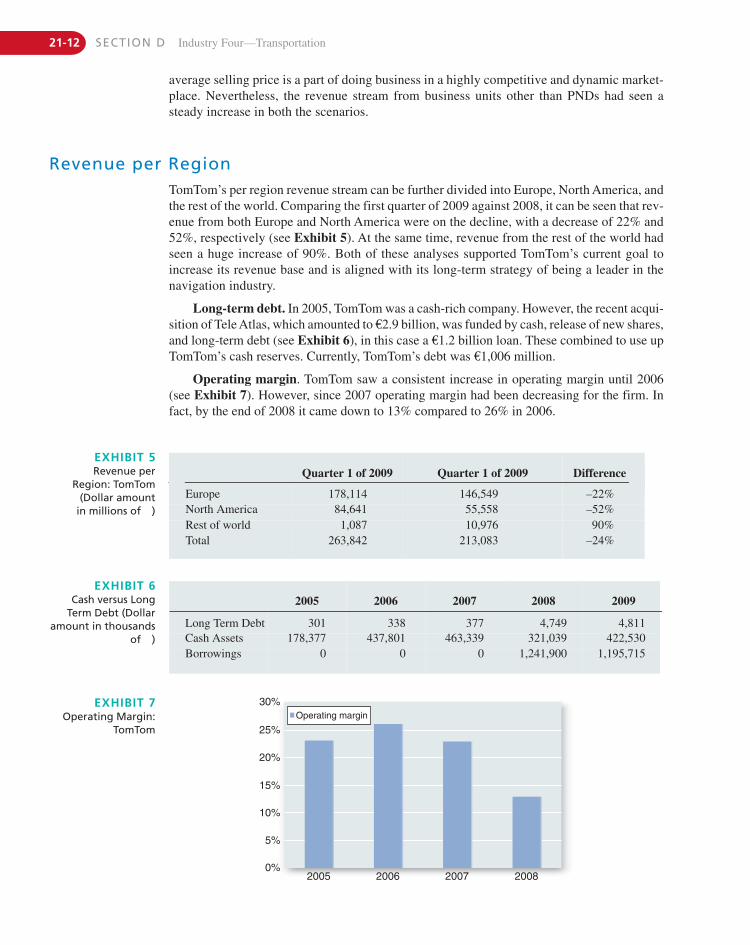
21-12 SECTION D Industry Four—Transportation
2005 2006 2007 2008 2009
Long Term Debt 301 338 377 4,749 4,811Cash Assets 178,377 437,801 463,339 321,039 422,530Borrowings 0 0 0 1,241,900 1,195,715
EXHIBIT 6Cash versus Long
Term Debt (Dollaramount in thousands
of €)
30%
25%
20%
15%
10%
5%
0%2005 2006 2007 2008
Operating marginEXHIBIT 7
Operating Margin:TomTom
Revenue per RegionTomTom’s per region revenue stream can be further divided into Europe, North America, andthe rest of the world. Comparing the first quarter of 2009 against 2008, it can be seen that rev-enue from both Europe and North America were on the decline, with a decrease of 22% and52%, respectively (see Exhibit 5). At the same time, revenue from the rest of the world hadseen a huge increase of 90%. Both of these analyses supported TomTom’s current goal to increase its revenue base and is aligned with its long-term strategy of being a leader in thenavigation industry.
Long-term debt. In 2005, TomTom was a cash-rich company. However, the recent acqui-sition of Tele Atlas, which amounted to €2.9 billion, was funded by cash, release of new shares,and long-term debt (see Exhibit 6), in this case a €1.2 billion loan. These combined to use upTomTom’s cash reserves. Currently, TomTom’s debt was €1,006 million.
Operating margin. TomTom saw a consistent increase in operating margin until 2006(see Exhibit 7). However, since 2007 operating margin had been decreasing for the firm. Infact, by the end of 2008 it came down to 13% compared to 26% in 2006.
Quarter 1 of 2009 Quarter 1 of 2009 Difference
Europe 178,114 146,549 –22%North America 84,641 55,558 –52%Rest of world 1,087 10,976 90%Total 263,842 213,083 –24%
EXHIBIT 5Revenue per
Region: TomTom (Dollar amount
in millions of €)
average selling price is a part of doing business in a highly competitive and dynamic market-place. Nevertheless, the revenue stream from business units other than PNDs had seen asteady increase in both the scenarios.
CASE 21 TomTom: New Competition Everywhere! 21-13
MarketingTraditionally, high quality and ease of use of solutions have been of utmost importance to TomTom. In a 2006 interview, TomTom’s Marketing Head, Anne Louise Hanstad, emphasizedthe importance of simplicity and ease of use with its devices. This underlined TomTom’s belief that people prefer fit for purpose devices that are developed and designed to do one spe-cific thing very well. At that time, both of these were core to TomTom’s strategy as its targetedcustomers were early adopters. Now, however, as the navigation industry moved from embry-onic to a growth industry, TomTom’s current customers were early majority. Hence, simplic-ity and ease alone could no longer provide it with a competitive advantage.
Recently, to be in line with its immediate goal of diversifying into different market segments, TomTom was more focused on strengthening its brand name. In December 2008,TomTom’s CEO stated “. . . we are constantly striving to increase awareness of our brand andstrengthen our reputation for providing smart, easy-to-use, high-quality portable navigationproducts and services.”36
Along with Tele Atlas, the TomTom group has gained depth and breadth of expertise overthe last 30 years, which made it a trusted brand. Three out of four people were aware of theTomTom brand across the markets. The TomTom group has always been committed to thethree fundamentals of navigation: mapping, routing algorithm, and dynamic information. TeleAtlas’ core competency was the digital mapping database and TomTom’s was routing algo-rithms and guidance services using dynamic information. Together, the group created syner-gies that enabled it to introduce products almost every year advancing on one or a combinationof these three elements. Acquiring its long time supplier of digital maps, Tele Atlas, in 2008gave TomTom an edge with in-house digital mapping technology.
TomTom provided a range of PND devices like TomTom One, TomTom XL, and the Tom-Tom Go Series. Periodically, it tried to enhance those devices with new features and servicesthat were built based on customer feedback. Examples of services were IQ Routes and LIVEservices. While IQ Routes provided drivers with the most efficient route planning, accountingfor situations as precise as speed bumps and traffic lights, LIVE services formed a range of in-formation services delivered directly to the LIVE devices. The LIVE services bundle includedMap Share and HD Traffic, bringing the content collected from vast driving communities di-rectly to the end user.
These products and services accentuated effective designs and unique features, and re-quired TomTom to work with its customers to share precise updates and also get feedback forfuture improvements. Hence, effective customer interaction became essential to its long-termgoal of innovation. In 2008, J. D. Power and Associates recognized TomTom for providing out-standing customer service experience.37 Although it awarded TomTom for customer servicesatisfaction, J. D. Power and Associates ranked Garmin highest in overall customer satisfac-tion. TomTom followed Garmin in the ranking, performing well in the routing, speed of sys-tem, and voice direction factors.38
As mentioned previously, when the navigation industry was still in its embryonic stages, fea-tures, ease of use, and high quality of its solutions gave TomTom products a competitive edge.Eventually, the competition increased in the navigation industry and even substitutes posed a sub-stantial threat to market share. TomTom offered PNDs in different price ranges, broadly classi-fied into high-range and mid-range PNDs, with an average selling price of €99. There wereentry-level options that allowed a savvy shopper to put navigation in his/her car for just over$100. Higher-end models added advanced features and services that were previously described.
TomTom sold its PNDs to consumers through retailers and distributors. After acquiringTele Atlas, it was strategically placed to gain the first mover advantage created by its rapid expansion of geographical coverage.39 This was of key importance when it came to increasingits global market share.
21-14 SECTION D Industry Four—Transportation
TomTom directed its marketing expenditure toward B2B advertising that was directedto retailers and distributors. TomTom also invested in an official blog website as well assearch optimization, which placed it in premium results in online searches. This enabledTomTom to do effective word-of-mouth promotion while keeping flexible marketing spend-ing, in accordance with changes in the macroeconomic environment or seasonal trends.40
Although this approach gave TomTom spending flexibility, it lacked a direct B2C approach.In 2009, only 21% of U.S. adults owned PNDs, whereas 65% of U.S. adults neither ownednor used navigation.41 By not spending on B2C marketing, TomTom discounted on the op-portunity both to attract first-tier noncustomers and glean an insight of needs of second-tiernoncustomers.42
OperationsThe focus of operations had always been on innovation. More recently, TomTom’s opera-tional objective had been to channel all its resources and core capabilities to createeconomies of scale so as to be aligned with its long-term strategy. TomTom aimed to focusand centralize R&D resources to create scale economies to continue to lead the industry interms of innovation.43
Implementation of this strategy was well underway and the changes were visible. By thesecond quarter of 2009, mid-range PNDs were introduced with the capabilities of high-rangedevices. In addition, 50% of PNDs were sold with IQ Routes technology. The first in-dashproduct was also launched in alliance with Renault, and the TomTom iPhone application wasalso announced.44
After acquiring Tele Atlas to better support the broader navigation solutions and contentand services, the group underwent restructuring. The new organizational structure consisted offour business units that had clear focus on a specific customer group and were supported bytwo shared development centers.
The four business units were CONSUMER (B2C), composed of retail sales of PND, on-board, and mobile; AUTOMOTIVE (B2B), composed of auto industry sales of integrated so-lutions and content & services; LICENSING (B2B), composed of PND, automotive, mobile,Internet, and GIS content and services; and WORK (B2B), composed of commercial fleetsales of Webfleet & Connected Solutions.
TomTom’s supply chain and distribution model was outsourced. This increased TomTom’s ability to scale up or down the supply chain, while limiting capital expenditure risks.At the same time, however, it depended on a limited number of third parties—and in certaininstances sole suppliers—for component supply and manufacturing, which increased its de-pendency on these suppliers.
TomTom’s dynamic content sharing model used high-quality digital maps along with theconnected services, like HD Traffic, Local Search with Google, and weather information. Thisprovided customers with relevant real-time information at the moment they needed it, whichhelped them deliver the benefits of innovative technology directly to the end user at affordableprices. Although the network externalities previously mentioned were among the advantagesof TomTom’s LIVE, it had also increased TomTom’s dependency on the network of the connected driving community. The bigger the network, the more effective the informationgathered from the guidance services.
CASE 21 TomTom: New Competition Everywhere! 21-15
Furthermore, in order to reduce operating expenses and strengthen the balance sheet,heavy emphasis had been placed on the cost-cutting program. In 2009, the cost reductions weremade up of reduction of staff, restructuring and integration of Tele Atlas, reduced discretionaryspending, and reduction in the number of contractors and marketing expenditures. However,if not executed wisely, it could hamper TomTom’s long-term objective of being a marketleader. For example, one of the core capabilities of any technology company was its staff; re-ducing it could hinder future innovative projects. This may also occur when reducing the mar-keting expenditures in a market which still held rich prospects of high growth. Among U.S.adults, 65% did not own any kind of navigation system.45
Human ResourcesLike in any other technology company the success of individual employees was very importantto TomTom. Additionally, TomTom had a vision that company success should also mean suc-cess for the individual employee. Therefore, at TomTom, employee competency was taken veryseriously and talent development programs were built around it. There was a personal naviga-tion plan that provided employees with a selection of courses based on competencies in theirprofile. In 2008, TomTom completed its Young Talent Development Program which was aimedat broadening the participants’ knowledge, while improving their technical and personal skills.
TomTom’s motto was to do business efficiently and profitably, as well as responsibly. Thisunderlined its corporate social responsibility. TomTom’s headquarters was one of the most en-ergy efficient buildings in Amsterdam. As previously mentioned, earlier navigation was ori-ented toward making the drivers arrive at their destination without getting lost. TomTom wasthe pioneer in introducing different technology that actually helped drivers to make their jour-neys safer and more economical. This showed TomTom’s commitment to its customer base aswell as to the community as a whole.
Issues of Concern for TomTomFirst, TomTom was facing increasing competition from other platforms using GPS technology,such as cell phones and Smartphones. In the cell phone industry, Nokia was leading thecharge in combining cell phone technology with GPS technology. Around the same timeTomTom acquired Tele Atlas, Nokia purchased Navteq, a competitor to Tele Atlas. With theacquisition of Navteq, Nokia hoped to shape the cell phone industry by merging cell phone,Internet, and GPS technology.
The Smartphone industry was emerging with the iPhone and the Palm Pre. There was alsoa shift in how people were able to utilize these technologies as a navigation tool. A big trendin Smartphones were applications. Because of the ease of developing software on platforms forSmartphones, more and more competitors were coming to the forefront and developing GPSnavigation applications. On October 28, 2009, Google announced the addition of Tom Tom andGarmin Ltd. as competitors. Google was adding driving directions to its Smartphones.
For TomTom, both of these sectors might signal that major change was on the horizon andthat there was no longer a need for hardware for GPS navigation devices. The world seemedto be heading toward a culture where consumers wanted an all-in-one device such as a cellphone or Smartphone that would do everything needed, including offering GPS navigationservices. A recent study done by Charles Golvin for Forrester suggested that by 2013 phone-based navigation will dominate the industry. The reason was due to Gen Y and Gen X cus-tomers who were increasingly reliant on their mobile phone and who will demand that socialnetworking and other connected services be integrated into their navigation experience.46
21-16 SECTION D Industry Four—Transportation
N O T E S1. TomTom AR-08, “TomTom Annual Report 2008,” TomTom An-
nual Report 2008, December 2008.2. Ibid.3. “TomTom Challenge,” http://www.tomtomchallenge.nl/resources/
AMGATE_400083_1_TICH_R76719135691/.4. Compare GPS Sat Nav Systems. http://www.satellitenavigation
.org.uk/gps-manufacturers/tomtom/. Robert Daniel, “TomTomNet Fell 61%, Revenue Off 19%,” http://www.foxbusiness.com/story/markets/industries/telecom/tomtom-net-fell—revenue/.
5. TomTom, “TomTom, Portable GPS Car Navigation Systems,”http://investors.tomtom.com/overview.cfm.
6. Ibid.7. Ibid.8. Ibid.9. TomTom AR-08, “TomTom Annual Report 2008,” TomTom
Annual Report 2008, December 2008.10. Compare GPS Sat Nav Systems. http://www.satellitenavigation
.org.uk/gps-manufacturers/tomtom/. Robert Daniel, “TomTomNet Fell 61%, Revenue Off 19%,” http://www.foxbusiness.com/story/markets/industries/telecom/tomtom-net-fell—revenue/.
11. Ibid.12. Ibid.13. TomTom, “TomTom, Portable GPS Car Navigation Systems,”
http://investors.tomtom.com/overview.cfm.14. Compare Sat Nav Systems. http://www.satellitenavigation.org
.uk/gps-manufacturers/tomtom/. Robert Daniel, “TomTom NetFell 61%, Revenue Off 19%,” http://www.foxbusiness.com/story/markets/industries/telecom/tomtom-net-fell—revenue/.
15. Ibid.16. “TomTom NV,” http://www.answers.com/topic/tomtom-n-v.17. Ibid.18. Thomson Reuters, “TomTom Launches 2.9 bln Euro Bid for Tele
Atlas,” http://www.reuters.com/article/technology-media-telco-SP/idUSL1839698320071119 (November 19, 2007).
19. Advanced Integrated Solutions, “TomTom and Advantage Integrated Solutions Partner to Deliver an Intelligent Fleet RoutingSolution for Businesses,” http://www.highbeam.com/doc/1G1-196311252.html (March 2009).
20. TeleAtlas Press Release, http://www.teleatlas.com/WhyTeleAtlas/Pressroom/PressReleases/TA_CT015133.
21. TomTom Press Release, “TomTom and Avis Announce the FirstPan-European Deal to Provide TomTom GO.”
22. TomTom, “TomTom, Portable GPS Car Navigation Systems,”http://investors.tomtom.com/overview.cfm.
23. Boston Business Article, http://www.boston.com/business/ticker/2009/06/let_homer_simps.html).
24. “TomTom NV,” http://www.answers.com/topic/tomtom-n-v.
25. Ibid.26. Auto-Week Article, “Renault, TomTom Promise Cheap Navi-
gation,” http://www.autoweek.com/article/20080929/free/809299989#ixzz0MQ8bKdYo.
27. Magellan website, http://www.magellangps.com/about/.28. David Richards, Smarthouse, June 17, 2009, http://www
.smarthouse.com.au/Automotive/Navigation/P4P3H9J8 (July 29,2009).
29. Tanya Talaga and Rob Ferguson, TheStar.com, October 28, 2008,http://www.thestar.com/News/Ontario/article/525697 (July 29,2009).
30. ICTI, 2009, http://www.toy-icti.org/ (July 29, 2009).31. Ibid.32. GPS Magazine, September 23, 2007, http://gpsmagazine.com/
2007/09/gps_thefts_rise.php (July 29, 2009).33. “Webist Media,” Web Ecoist, August 17, 2008, http://webecoist
.com/2008/08/17/a-brief-history-of-the-modern-green-movement/(July 29, 2009).
34. Nick Jones, Garnter, January 5, 2009, http://www.gartner.com/resources/168400/168438/findings_risks_of_gps_perfor_168438.pdf (July 29, 2009).
35. US News, October 14, 2008, http://usnews.rankingsandreviews.com/cars-trucks/daily-news/081014-GPS-Devices-Banned-in-Egypt/ (July 29, 2009).
36. TomTom AR-08, “TomTom Annual Report 2008,” TomTom Annual Report 2008, December 2008.
37. Reuters, “TomTom Inc. Recognized for Call Center CustomerSatisfaction Excellence by J.D. Power,” January 7, 2008,http://www.reuters.com/article/pressRelease/idUS141391�07-Jan-2008�PRN20080107.
38. J. D. Power and Associates, “Garmin Ranks Highest in Customer Sat-isfaction with Portable Navigation Devices,” October 23, 2008,http://www.jdpower.com/corporate/news/releases/pressrelease.aspx?ID�2008221.
39. TomTom AR-08, “TomTom Annual Report 2008,” TomTom Annual Report 2008, December 2008.
40. Ibid.41. Forrestor Research, “Phone-Based Navigation Will Dominate by
2013,” March 27, 2009.42. W. Chan Kim and Mauborgne, Blue Ocean Strategy (Boston:
Harvard Business School Press, 2005).43. TomTom AR-08, “TomTom Annual Report 2008,” TomTom
Annual Report 2008, December 2008.44. Ibid.45. Forrestor Research, “Phone-Based Navigation Will Dominate by
2013,” March 27, 2009.46. Ibid.
Secondly, TomTom faced a maturing U.S. and European personal navigation device market.After three years of steady growth in the PND market, TomTom had seen decreasing growth ratesfor PND sales. Initially entering the European market 12 months before entering the U.S. mar-ket, TomTom witnessed a 21% dip in sales for the European market. Although TomTom experi-enced some growth in the U.S. market for 2008, the growth rate was not as good as in prior years.
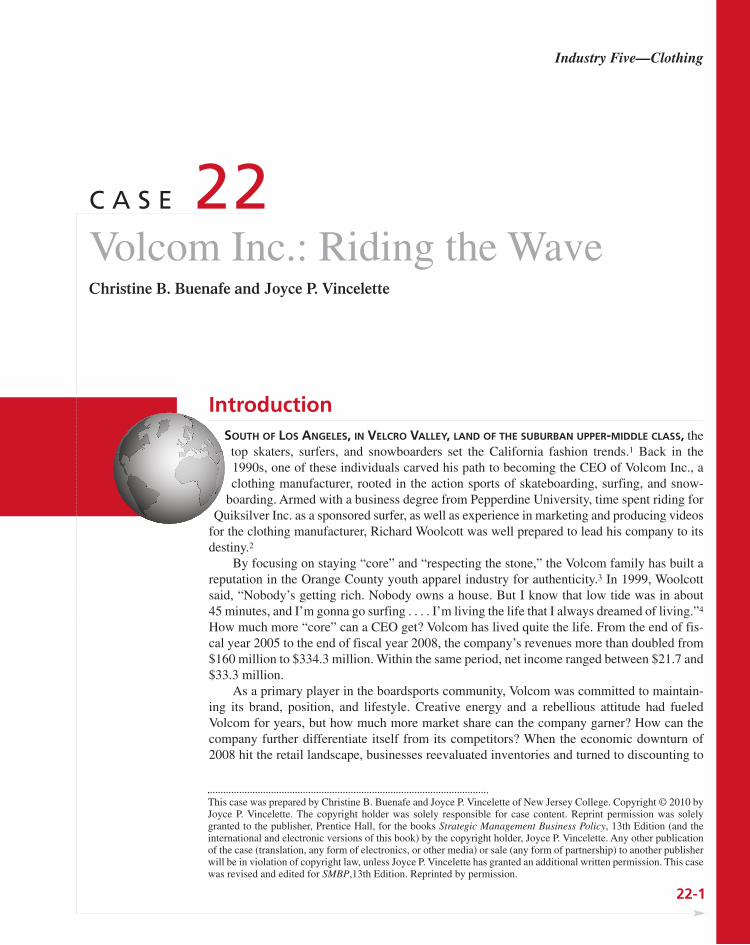
IntroductionSOUTH OF LOS ANGELES, IN VELCRO VALLEY, LAND OF THE SUBURBAN UPPER-MIDDLE CLASS, the
top skaters, surfers, and snowboarders set the California fashion trends.1 Back in the1990s, one of these individuals carved his path to becoming the CEO of Volcom Inc., aclothing manufacturer, rooted in the action sports of skateboarding, surfing, and snow-
boarding. Armed with a business degree from Pepperdine University, time spent riding forQuiksilver Inc. as a sponsored surfer, as well as experience in marketing and producing videos
for the clothing manufacturer, Richard Woolcott was well prepared to lead his company to itsdestiny.2
By focusing on staying “core” and “respecting the stone,” the Volcom family has built areputation in the Orange County youth apparel industry for authenticity.3 In 1999, Woolcottsaid, “Nobody’s getting rich. Nobody owns a house. But I know that low tide was in about 45 minutes, and I’m gonna go surfing . . . . I’m living the life that I always dreamed of living.”4
How much more “core” can a CEO get? Volcom has lived quite the life. From the end of fis-cal year 2005 to the end of fiscal year 2008, the company’s revenues more than doubled from$160 million to $334.3 million. Within the same period, net income ranged between $21.7 and$33.3 million.
As a primary player in the boardsports community, Volcom was committed to maintain-ing its brand, position, and lifestyle. Creative energy and a rebellious attitude had fueledVolcom for years, but how much more market share can the company garner? How can thecompany further differentiate itself from its competitors? When the economic downturn of2008 hit the retail landscape, businesses reevaluated inventories and turned to discounting to
22-1
C A S E 22Volcom Inc.: Riding the WaveChristine B. Buenafe and Joyce P. Vincelette
This case was prepared by Christine B. Buenafe and Joyce P. Vincelette of New Jersey College. Copyright © 2010 byJoyce P. Vincelette. The copyright holder was solely responsible for case content. Reprint permission was solelygranted to the publisher, Prentice Hall, for the books Strategic Management Business Policy, 13th Edition (and theinternational and electronic versions of this book) by the copyright holder, Joyce P. Vincelette. Any other publicationof the case (translation, any form of electronics, or other media) or sale (any form of partnership) to another publisherwill be in violation of copyright law, unless Joyce P. Vincelette has granted an additional written permission. This casewas revised and edited for SMBP,13th Edition. Reprinted by permission.
Industry Five—Clothing
HistoryVolcom broke onto the retail scene in 1991 in Orange County, California, the epicenter ofboardsports culture.5 Richard “Wooly” Woolcott and Tucker “T-Dawg” Hall came up with theidea to start a clothing company after one fateful snowboarding trip to Lake Tahoe. The twowere eager to build a business around their passion for skateboarding, snowboarding, andsurfing as well as their love for art, music, and film.
The founders borrowed $5,000 from Woolcott’s father to start their company while theysurfed and snowboarded on the side.6 Volcom was headquartered in Woolcott’s bedroom inNewport Beach, California, and sales were handled out of Tucker’s home in HuntingtonBeach.7 The two knew nothing about making clothes but left it all to spirit and creativity.
Volcom’s first year sales totaled $2,600. Richard Woolcott told Transworld Business mag-azine that his father called one morning and said, “Son, looking at your numbers, if you don’tget your act together, you’re going to be out of business in less than three months. I’m not go-ing to help you or bail you out. So you better figure it out.”8 Without any inventory and hardlyany money, Woolcott and Tucker decided to take the business more seriously as a step intoVolcom’s future.
Marketing became a focus for the company as it sought to strengthen the brand and dif-ferentiate Volcom within the action sports industry. In 1993, Veeco Production was formed tomarket Volcom’s first video release. In 1995, the company added the Volcom Entertainmentdivision to produce music CDs, and introduced the Volcom Featured Artist Series to showcasethe brand’s artistic depth. At this time, the company began sponsoring skateboard, snowboard,and surfing athletes and teams as team riders. Stars such as surfer Bruce Irons, skateboarderGeoff Rowley, and Olympic Gold-winning snowboarder Shaun White were contracted to en-dorse Volcom products.9 The company further expanded its marketing efforts via launchingboardsports competitions, global art tours such as its Hitten Switches book tours, and the Vol-comics comic book tour. In early 2001, Volcom contracted with MCA Records to create a newjoint venture record label.10 Other music-related pursuits included sponsoring a stage on theannual Vans Warped Tour, which was popular with the boarding crowd.11
Over the years, sales grew dramatically for Volcom, Woolcott’s father joined the com-pany’s board of directors, and eventually Tucker Hall retired. In 2004, the company recordeda net profit of $24.5 million on revenues of $110.6 million, up 42% from the year before.12
Menswear was outselling women’s by two to one and top customer Pacific Sunwear (PacSun)accounted for 27% of total sales.13 Volcom products were available in nearly 3,000 stores, rep-resenting 1,100 separate clients.14 Some 85% of sales took place in the United States, withCanada and Japan accounting for most of the rest.15 The company reincorporated in Delawarein April 2005 and went public in June of the same year. Until then, the company was officiallyknown as Stone Boardwear Inc. Volcom issued 4.19 million shares, which started at $19 andclosed at $26.77.16 In October 2005, the company acquired Welcom Distribution SARL, thedistributor of Volcom-branded products in Switzerland.17
Volcom Inc. made the No. 11 spot on BusinessWeek’s 2006 Hot Growth list of small com-panies. In that year, the company introduced three new product extensions: Creedler sandals andslip-ons, girl’s swimwear, and a boy’s clothing line for ages 4 to 7.18 In anticipating the
22-2 SECTION D Industry Five—Clothing
move products. What does this environment mean for a manufacturer like Volcom? Will thecompany’s strategies effectively influence revenue growth for the long term? Woolcott’s teamhas had plenty of experience in meeting waves, making jumps, and conquering slopes. Thecompany had established a loyal audience and supported talented individuals in living theirdreams. What other tricks can Volcom pull to maneuver through this point in the game?
CASE 22 Volcom Inc.: Riding the Wave 22-3
expiration of its licensing agreement with its European licensee at the end of fiscal year2006, the company took direct control of the brand in Europe.19 The company had beenoperating there under a licensee model for 10 years. Volcom began delivering product fromits newly formed, wholly owned subsidiary constructed in Anglet, France, in the secondhalf of 2007.
Volcom further expanded in 2008. The company entered into an agreement to take directcontrol of the Volcom brand in the U.K. and acquired the Japanese distributor of Volcom-branded products.20 Domestically, it acquired the assets of Laguna Surf & Sport, a California-based retail chain operating two retail stores.21 Furthermore, the company acquired all of theoutstanding membership interests of Electric Visual Evolution LLC, or Electric, for $26.3 mil-lion plus transaction costs of $1.2 million.22 Electric was a core action sports lifestyle brandwith a well-diversified product line encompassing surf, skate, snow, ski, motocross, andNASCAR.23
As of December 31, 2008, Volcom employed 490 full-time European and domestic em-ployees. The company had 13 full-price branded retail stores and licensed eight full-pricestores placed in strategic markets around the world. In addition, it owned two multi-brandLaguna Surf & Sport stores. Volcom-branded products were sold throughout the United Statesand in over 40 countries internationally by Volcom or international licenses supported by in-house sales personnel, independent sales representatives, and distributors.24 At the end of fis-cal year 2008, total revenues amounted to $334.3 million.
Corporate Governance
Board of DirectorsThe company’s seven directors as of December 31, 2008, were:25
Richard R. Woolcott, 43, founded Volcom in 1991 and has served as Chairman since June 2008 and Chief Executive Officer since Volcom’s inception. Mr. Woolcott also served as the Chairman from incep-tion until July 2000 and as President from inception until June 2008. From 1989 until 1991, he workedin the marketing and promotions department of Quiksilver Inc. From 1981 to 1989, he was a sponsoredathlete for Quiksilver. Mr. Woolcott was inducted into the National Scholastic Surfing Association Hallof Fame in 2004 and was named the Surf Industry Manufacturers Association Individual Achiever of theYear in 2003. Mr. Woolcott was a member of the National Scholastic Surfing Association National Teamfrom 1982 through 1985 and was selected as a member of the United States Surfing Team in 1984. Heearned a BS in Business Administration from Pepperdine University.
Douglas S. Ingram, 46, has served on Volcom’s board of directors since June 2005. Mr. Ingram has servedas the Lead Independent Director since June 2008. Mr. Ingram has been the Executive Vice President,Chief Administrative Officer, General Counsel, and Secretary of Allergan Inc., a NYSE-listed specialtypharmaceutical company, since October 2006. Mr. Ingram received a BS from Arizona State Universityand a law degree from the University of Arizona.
Anthony M. Palma, 47, has served on the board of directors since June 2005. Mr. Palma served asPresident and Chief Executive Officer of Easton-Bell Sports, a privately held manufacturer, marketer,and distributor of sports equipment, from April 2006 to March 2008. Mr. Palma earned a BS in BusinessAdministration and Accounting from California State University, Northridge.
Joseph B. Tyson, 47, has served on the board of directors since June 2005. From October 2006 until Au-gust 2007, Mr. Tyson was the Chief Operating Officer of The Picerne Group, a privately funded interna-tional investment firm.
Carl W. Womack, 57, has served on the board of directors since June 2005. Mr. Womack served as the Se-nior Vice President and Chief Financial Officer of Pacific Sunwear of California Inc., a NASDAQ-listed
22-4 SECTION D Industry Five—Clothing
apparel retailer, from 1994 until his retirement in October 2004. He earned a BS in Business Administra-tion and Accounting from California State University, Northridge.
René R. Woolcott, 77, has served on the board of directors since Volcom’s inception in 1991 andserved as the Chairman from July 2000 to June 2008. From 1985 to the present, Mr. Woolcott hasserved as Chairman and President of Clarendon House Advisors, Ltd., a privately owned investmentcompany. He holds a BS summa cum laude from New York University and an MBA from HarvardUniversity.
Kevin G. Wulff, 57, has served on the board of directors since June 2005. Mr. Wulff has been the President and Chief Executive Officer of Pony International, LLC since March 2007. Prior to that, hewas the President and Chief Executive Officer of American Sporting Goods from March 2005 throughFebruary 2007. He worked for Adidas of America and for Nike Inc. from 1993 to 2001 in various seniormanagement positions. Mr. Wulff was Chairman and CEO of the Women’s Tennis Association. He holdsa BS in Social Science, Business, and Physical Education from the University of Northern Iowa.
Corporate OfficersIn addition to Mr. Richard R. Woolcott, there were four other key corporate officers:26
Douglas P. Collier, 46, has served as the Chief Financial Officer and Secretary since 1994. He has alsoserved as the Treasurer since April 2005. He earned a BS in Business Administration and an MS inAccounting from San Diego State University.
Jason W. Steris, 38, has served as President since June 2008 and Chief Operating Officer since 1998.From 1995 to 1998, he served as the National Sales Manager and from 1993 to 1995 he served as thecompany’s Southern California Sales Representative.
Tom D. Ruiz, 48, has served as the Vice President of Sales since 1998.
Troy C. Eckert, 36, was the third person to join Volcom and has served as the Vice President of Market-ing since January 2001. Prior to January 2001, he held the position of Marketing Director since 1994.Mr. Eckert joined the company in 1991 as the main team rider and as a marketing assistant. In additionto his overall marketing duties, Mr. Eckert was charged with developing Volcom’s skateboarding, snow-boarding, and surfing teams, the company’s special events programs, and co-developing Veeco Produc-tions. He was a world-class surfer and a three-time champion of the H2O Winter Classic combinedsurf/snow competition.
The Volcom ConceptThe company stated the following as its mission on the Volcom website as well as on itsFacebook page:
Facets of an empire are vast. An empire was created somehow ingeniously, without paved roadsunique to their own trails. Pioneers to be forefathers. Clear thinking in a cloud of stagnant greyconfusion. Connections to vectors venting pressures of a pocket stuck in time. It was our oppor-tunity to share our quest with yours in honor of an era unestablished to the present society. Fu-turistic perhaps, but it does have people coming back for more. So let’s log now and reap later,for the furthest forest was glowing a printless picture. . . . The genetic makeup . . . . Volcom Stone.27
The distinctive diamond-shaped “Volcom Stone” logo was developed for use on productswith the help of McElroy Designs.28 According to Woolcott, the stone “represents the buzzfrom a good skate session or riding a 10-ft. wave at pipe. The stone represents the euphoricstate of riding.”29
The philosophy behind the brand, “youth against establishment,” captures an energybased on youth culture to support young creative thinking. The people behind the company“consider themselves to be a family of people not willing to accept the suppression of the
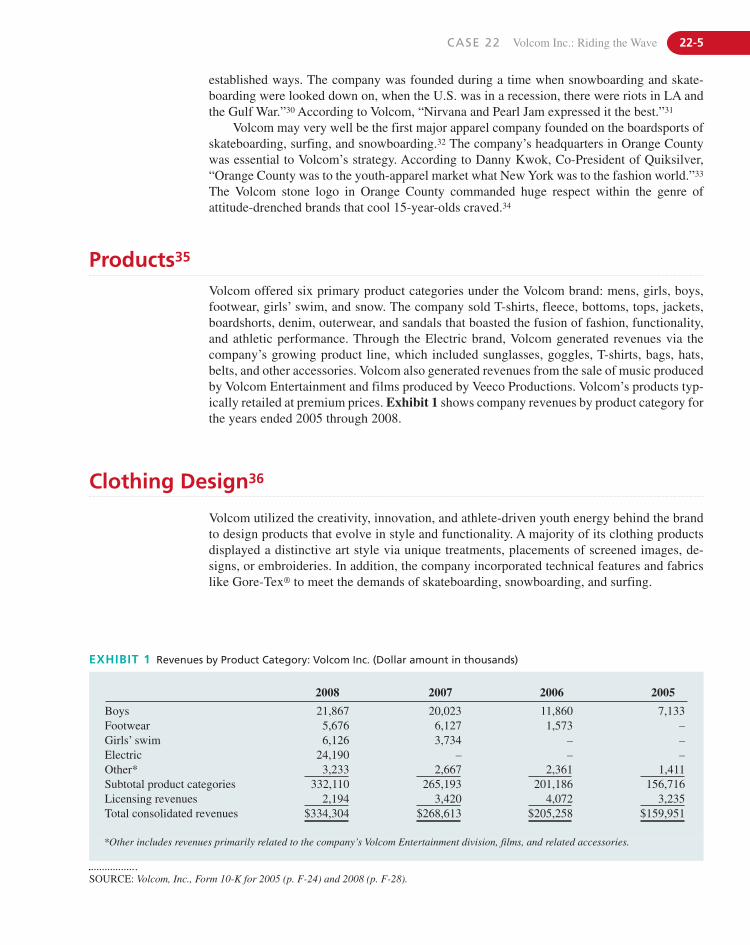
CASE 22 Volcom Inc.: Riding the Wave 22-5
established ways. The company was founded during a time when snowboarding and skate-boarding were looked down on, when the U.S. was in a recession, there were riots in LA andthe Gulf War.”30 According to Volcom, “Nirvana and Pearl Jam expressed it the best.”31
Volcom may very well be the first major apparel company founded on the boardsports ofskateboarding, surfing, and snowboarding.32 The company’s headquarters in Orange Countywas essential to Volcom’s strategy. According to Danny Kwok, Co-President of Quiksilver,“Orange County was to the youth-apparel market what New York was to the fashion world.”33
The Volcom stone logo in Orange County commanded huge respect within the genre ofattitude-drenched brands that cool 15-year-olds craved.34
Products35
Volcom offered six primary product categories under the Volcom brand: mens, girls, boys,footwear, girls’ swim, and snow. The company sold T-shirts, fleece, bottoms, tops, jackets,boardshorts, denim, outerwear, and sandals that boasted the fusion of fashion, functionality,and athletic performance. Through the Electric brand, Volcom generated revenues via thecompany’s growing product line, which included sunglasses, goggles, T-shirts, bags, hats,belts, and other accessories. Volcom also generated revenues from the sale of music producedby Volcom Entertainment and films produced by Veeco Productions. Volcom’s products typ-ically retailed at premium prices. Exhibit 1 shows company revenues by product category forthe years ended 2005 through 2008.
Clothing Design36
Volcom utilized the creativity, innovation, and athlete-driven youth energy behind the brandto design products that evolve in style and functionality. A majority of its clothing productsdisplayed a distinctive art style via unique treatments, placements of screened images, de-signs, or embroideries. In addition, the company incorporated technical features and fabricslike Gore-Tex® to meet the demands of skateboarding, snowboarding, and surfing.
EXHIBIT 1 Revenues by Product Category: Volcom Inc. (Dollar amount in thousands)
2008 2007 2006 2005
Boys 21,867 20,023 11,860 7,133Footwear 5,676 6,127 1,573 –Girls’ swim 6,126 3,734 – –Electric 24,190 – – –Other* 3,233 2,667 2,361 1,411Subtotal product categories 332,110 265,193 201,186 156,716Licensing revenues 2,194 3,420 4,072 3,235Total consolidated revenues $334,304 $268,613 $205,258 $159,951
SOURCE: Volcom, Inc., Form 10-K for 2005 (p. F-24) and 2008 (p. F-28).
*Other includes revenues primarily related to the company’s Volcom Entertainment division, films, and related accessories.
22-6 SECTION D Industry Five—Clothing
Music37
Volcom generated a mere 1% of revenue each year from 2005 until 2008 for the product cat-egory it referred to as “Other,” which included revenues generated from Volcom Entertain-ment, films, and related accessories. The company’s music label, Volcom Entertainment,signed musical artists and produced and distributed recordings in the form of CDs, digitaldownloads, vinyl LPs, and wireless media. Volcom did this worldwide through retail ac-counts, music retailers, and online distribution channels. The label reinforced the company’sbrand image and enhanced marketing efforts. The Volcom band played at tradeshows, ac-count demonstrations, and other company events. Music and bands were also integrated intothe Volcom brand seasonally via a line of music and musician-inspired clothing.
In 2007, the company launched “The Volcom Tour,” an international music tour featur-ing its artists. Volcom also operated and sponsored an annual music competition, “BandJoust,” for unsigned rock bands. In 2008, the company launched a subscription-based vinylrecord club, Volcom Ent Vinyl Club, which delivered to subscribers collectable vinyl sin-gles on a bi-monthly basis. The company entered into a distribution arrangement with WEARock LLC, pursuant to which ADA, a music distribution company owned by Warner MusicGroup, distributed its music. The arrangement provided Volcom bands with worldwide dis-tribution options.
Film38
The company produced skateboarding, snowboarding, and surfing films featuring sponsoredathletes through Veeco Productions, Volcom’s film production division. Volcom team riderswore branded products to emphasize the company’s boardsports heritage and close associa-tion with leading boardsports athletes. The division produced over 15 critically acclaimedfilms that received awards such as Best Core Film at the X-Dance Film Festival, Best Cine-matography for a Snow Movie at the Unvailed Band and Board Event, Surfer Magazine’sVideo of the Year, and Surfer Magazine’s Video Award for Best Performance by a Male Surfer (Bruce Irons—twice).
Films were distributed to retail customers, as well as to music and video stores. In 2008,Veeco Productions entered into distribution deals with iTunes and Fuel TV. As of 2008, thecompany sold four movies on iTunes under Volcom Films and produced and released twomovies specifically for Fuel TV.
Volcom’s design and product development teams were based at headquarters in OrangeCounty and in France. Each team was organized into groups that separately focused on eachproduct category. The company designed for five major seasons: spring, summer, fall, snow,and holiday. Volcom’s international licensees also hired designers and merchandisers to cre-ate products that integrated the brand with local trends. Several times each year, the in-housedesign team and the designers from the international licensees met to develop designs that re-flected fashion trends from around the world. These groups participated in approximately threetrips per year to locations known for their influence on fashion and style, such as New York,Paris, London, Sydney, and Tokyo.
Furthermore, the company utilized input from boardsports athletes and relevant artists inproduct development and design, reinforcing the credibility and authenticity of the brand.Through its V.Co-Operative product line, Volcom partnered with team riders, such as BruceIrons, Mark Appleyard, Ozzie Wright, Dean Morrwason, Bjorn Leines, Geoff Rowley, andDustin Dollin, to design signature product styles. Core retail accounts also offered input pro-viding the company with additional insight into consumer preferences.
CASE 22 Volcom Inc.: Riding the Wave 22-7
Manufacturing39
In 2006, Volcom was awarded the Surf Industry Manufacturers Association (SIMA) “Manu-facturer of the Year” title for the third time. Volcom did not own or operate any manufactur-ing facilities; rather, the company worked with local sourcing agents aligned withindependently owned foreign contract manufacturers. Volcom’s apparel and accessories weregenerally purchased or imported as finished goods; the company purchased only a limitedamount of raw materials. The manufacture of each product line was contracted separatelybased on fabric and design requirements. Instead of pursuing long-term contracts with man-ufacturers, Volcom chose to retain flexibility in re-evaluating sourcing and manufacturing de-cisions. Volcom had traditionally received a significant portion of its customer orders prior toplacement of its initial manufacturing orders. It used these early season orders, and its expe-rience, to project overall demand for its products to secure manufacturing capacity and to en-able its manufacturers to order sufficient raw materials.
The company chose vendors based on the quality of their work, ability to deliver on time,and cost. Commitment to quality control and monitoring procedures were an important and ef-fective means of maintaining the quality of Volcom’s products and its reputation among con-sumers. The company’s design and production staff, as well as third parties, formally assessedmanufacturers for quality and to ensure that they were in compliance with applicable laborpractices.
In 2008, Volcom contracted for manufacturing with approximately 49 foreign firms. Anestimated 66% and 14% of total product costs during 2008 and 72% and 13% of total productcosts during 2007 came from manufacturing operations in China and Mexico, respectively.Two of Volcom’s Chinese manufacturers, Dragon Crowd and Ningbo Jehson Textiles, ac-counted for 18% and 14% of product costs during 2008, respectively, and for 19% and 14% ofproduct costs during 2007, respectively. No other single manufacturer of finished goodsaccounted for more than 10% of production expenditures during 2008 or 2007.
Volcom contracted with several screen printers in the United States. Relationships withdomestic printers resulted in short lead times and enabled the company to react quickly toreorder demand from retailers and distributors.
Distribution and Sales40
The company sold merchandise in an environment that supported and reinforced its elite brandimage. Volcom’s retail customers were limited to independent surf and skateboard shops andhigh-end retail chains. Volcom products were offered over the Internet through selected au-thorized online retailers. In addition, the company sold to distributors in Latin America, AsiaPacific, and other developing markets. Volcom sought to enhance brand image by controllingthe distribution of its products around the world. The company website provided a link wherecustomers could report counterfeit and unauthorized Volcom products, or fakes.
Some of Volcom’s retailers included 17th Street Surf, Becker Surfboards, Froghouse,Hotline, Huntington Surf & Sport, IG Performance, K5 Board Shop, Macy’s, Nordstrom,Pacific Sunwear, Snowboard Connection, Sun Diego, Surfside Sports, Tilly’s, Val Surf, WestBeach, and Zumiez. In 2008, 2007, and 2006, 28%, 33%, and 44%, respectively, of productrevenues were derived from Volcom’s five largest customers. The largest of the five, PacificSunwear, accounted for 16%, 18%, and 26% of the company’s product revenues in 2008, 2007,and 2006, respectively.
Retailers represented the foundation of the boardsports market and were therefore a crit-ical element to Volcom’s success. Specialty retailers attracted skateboarders, snowboarders,and surfers who influenced fashion trends and demand for boardsports products. Volcom
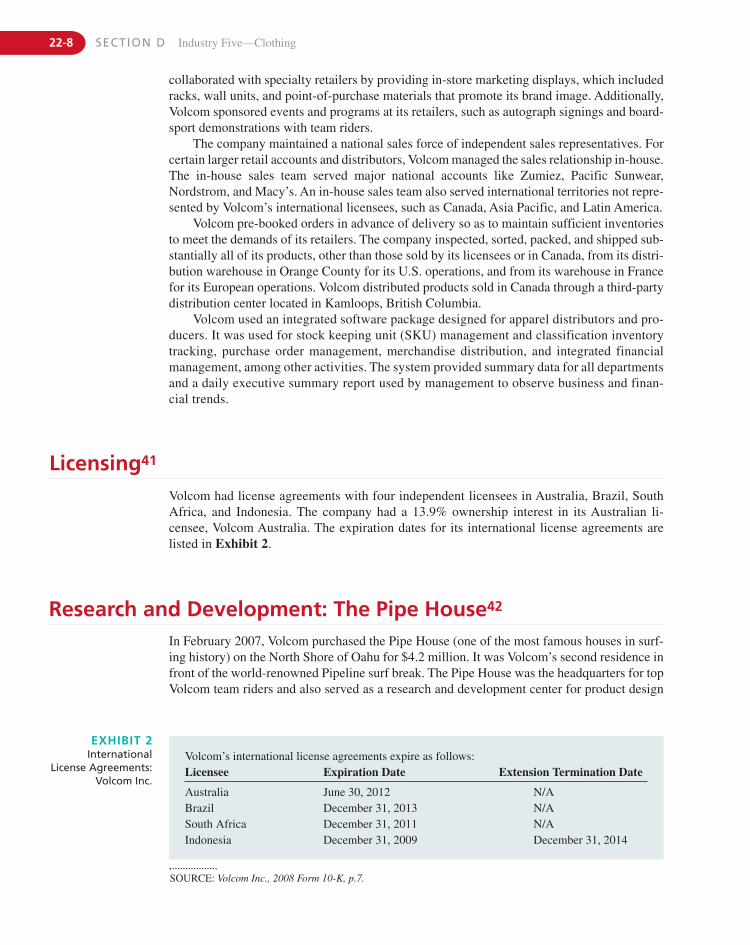
22-8 SECTION D Industry Five—Clothing
collaborated with specialty retailers by providing in-store marketing displays, which includedracks, wall units, and point-of-purchase materials that promote its brand image. Additionally,Volcom sponsored events and programs at its retailers, such as autograph signings and board-sport demonstrations with team riders.
The company maintained a national sales force of independent sales representatives. Forcertain larger retail accounts and distributors, Volcom managed the sales relationship in-house.The in-house sales team served major national accounts like Zumiez, Pacific Sunwear,Nordstrom, and Macy’s. An in-house sales team also served international territories not repre-sented by Volcom’s international licensees, such as Canada, Asia Pacific, and Latin America.
Volcom pre-booked orders in advance of delivery so as to maintain sufficient inventoriesto meet the demands of its retailers. The company inspected, sorted, packed, and shipped sub-stantially all of its products, other than those sold by its licensees or in Canada, from its distri-bution warehouse in Orange County for its U.S. operations, and from its warehouse in Francefor its European operations. Volcom distributed products sold in Canada through a third-partydistribution center located in Kamloops, British Columbia.
Volcom used an integrated software package designed for apparel distributors and pro-ducers. It was used for stock keeping unit (SKU) management and classification inventorytracking, purchase order management, merchandise distribution, and integrated financialmanagement, among other activities. The system provided summary data for all departmentsand a daily executive summary report used by management to observe business and finan-cial trends.
Licensing41
Volcom had license agreements with four independent licensees in Australia, Brazil, SouthAfrica, and Indonesia. The company had a 13.9% ownership interest in its Australian li-censee, Volcom Australia. The expiration dates for its international license agreements arelisted in Exhibit 2.
EXHIBIT 2International
License Agreements:Volcom Inc.
Volcom’s international license agreements expire as follows:Licensee Expiration Date Extension Termination Date
Australia June 30, 2012 N/ABrazil December 31, 2013 N/ASouth Africa December 31, 2011 N/AIndonesia December 31, 2009 December 31, 2014
SOURCE: Volcom Inc., 2008 Form 10-K, p.7.
Research and Development: The Pipe House42
In February 2007, Volcom purchased the Pipe House (one of the most famous houses in surf-ing history) on the North Shore of Oahu for $4.2 million. It was Volcom’s second residence infront of the world-renowned Pipeline surf break. The Pipe House was the headquarters for topVolcom team riders and also served as a research and development center for product design
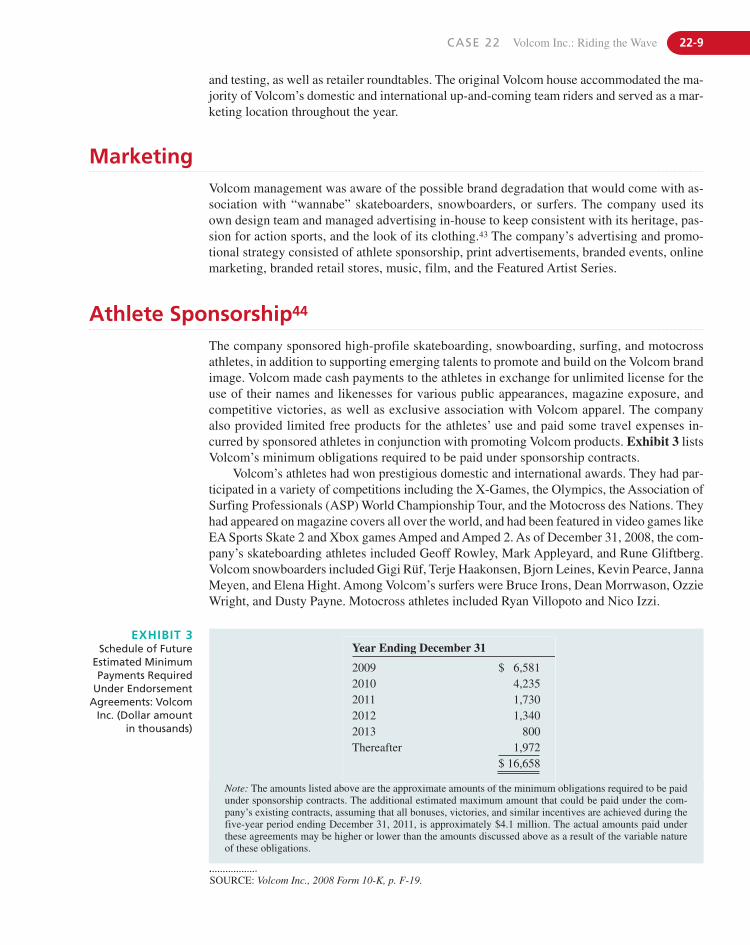
CASE 22 Volcom Inc.: Riding the Wave 22-9
MarketingVolcom management was aware of the possible brand degradation that would come with as-sociation with “wannabe” skateboarders, snowboarders, or surfers. The company used itsown design team and managed advertising in-house to keep consistent with its heritage, pas-sion for action sports, and the look of its clothing.43 The company’s advertising and promo-tional strategy consisted of athlete sponsorship, print advertisements, branded events, onlinemarketing, branded retail stores, music, film, and the Featured Artist Series.
Athlete Sponsorship44
The company sponsored high-profile skateboarding, snowboarding, surfing, and motocrossathletes, in addition to supporting emerging talents to promote and build on the Volcom brandimage. Volcom made cash payments to the athletes in exchange for unlimited license for theuse of their names and likenesses for various public appearances, magazine exposure, andcompetitive victories, as well as exclusive association with Volcom apparel. The companyalso provided limited free products for the athletes’ use and paid some travel expenses in-curred by sponsored athletes in conjunction with promoting Volcom products. Exhibit 3 listsVolcom’s minimum obligations required to be paid under sponsorship contracts.
Volcom’s athletes had won prestigious domestic and international awards. They had par-ticipated in a variety of competitions including the X-Games, the Olympics, the Association ofSurfing Professionals (ASP) World Championship Tour, and the Motocross des Nations. Theyhad appeared on magazine covers all over the world, and had been featured in video games likeEA Sports Skate 2 and Xbox games Amped and Amped 2. As of December 31, 2008, the com-pany’s skateboarding athletes included Geoff Rowley, Mark Appleyard, and Rune Gliftberg.Volcom snowboarders included Gigi Rüf, Terje Haakonsen, Bjorn Leines, Kevin Pearce, JannaMeyen, and Elena Hight. Among Volcom’s surfers were Bruce Irons, Dean Morrwason, OzzieWright, and Dusty Payne. Motocross athletes included Ryan Villopoto and Nico Izzi.
and testing, as well as retailer roundtables. The original Volcom house accommodated the ma-jority of Volcom’s domestic and international up-and-coming team riders and served as a mar-keting location throughout the year.
EXHIBIT 3Schedule of Future
Estimated MinimumPayments Required
Under EndorsementAgreements: Volcom
Inc. (Dollar amountin thousands)
SOURCE: Volcom Inc., 2008 Form 10-K, p. F-19.
Note: The amounts listed above are the approximate amounts of the minimum obligations required to be paidunder sponsorship contracts. The additional estimated maximum amount that could be paid under the com-pany’s existing contracts, assuming that all bonuses, victories, and similar incentives are achieved during thefive-year period ending December 31, 2011, is approximately $4.1 million. The actual amounts paid underthese agreements may be higher or lower than the amounts discussed above as a result of the variable natureof these obligations.
Year Ending December 31
2009 $ 6,5812010 4,2352011 1,7302012 1,3402013 800Thereafter 1,972
$ 16,658
22-10 SECTION D Industry Five—Clothing
Print Advertisements45
Volcom placed print advertisements in boardsports magazines like Thrasher, TransworldSkateboarding and Snowboarding, Snowboarder, Surfing, and Surfer. The company also ad-vertised in fashion lifestyle magazines like Vice, Frank 151, and Elle. The internal art depart-ment designed advertisements combining athletes, lifestyle, innovative visual designs, andVolcom’s unique style.
Volcom Branded Events46
Hundreds of competitors and spectators attended the separate contest series that Volcom ranfor skateboarding, snowboarding, and surfing. Volcom had created a global championshipevent for each series to which the company invited top qualifiers from each event to compete.Volcom’s driving philosophy behind its grassroots-branded events was “Let the Kids RideFree.” This philosophy sought to embody the company’s anti-establishment brand image. Thecontests were open on a first-come, first-served basis and entry was free, so amateurs andfirst-time competitors could compete alongside professionals. Volcom’s contests included theWild in the Parks Skate Series, the Peanut Butter and Rail Jam Snow Series, and the TotallyCrustaceous Surf Series.
Volcom relied on its internal marketing department to choose venues and arrange spon-sored athlete attendance, marketing, and staffing at each contest. Branded events provided an-other source of consumer interaction and feedback to help keep the company connected to itsaudience.
The Website47
The company also communicated with its target market via its website, www.volcom.com.Volcom made its collection of apparel and accessories available for viewing online as well asprovided links to online retailers and iTunes for access to films and podcasts. The companydid not sell apparel on the website but did offer select Volcom Entertainment products.
The website provided news releases, information on team riders, Volcom skate parks, andbranded events. In addition, Volcom kept up with the Internet generation through pages onFacebook, Myspace.com, Twitter, and YouTube. Facebook and Myspace friends could con-nect with other Volcom fans, and consumer affiliation with the company allowed for increasedbrand awareness. The company updated Twitter followers on events, contests, and its team rid-ers. Videos on YouTube showcased the talent of the Volcom team riders and highlight com-pany contest series.
The Operating EnvironmentFrom 2006 to 2007, the U.S. unemployment rate fluctuated between 4.5% and 4.9%.48 Whenhousing prices began declining in 2006, and defaults and foreclosures on sub-prime mort-gages made their impact on the value of mortgage-backed securities in 2007, the resultingcredit crunch scared the public into caution and worry.49 Consumer confidence was low,growth in consumer spending started to slow, and the unemployment rate went in the wrongdirection. In April 2008, the U.S. unemployment figure was 5.0%, but increased considerablyby 2009.50 News reports covered a frozen credit market, a global recession, and increasedgovernment intervention in the financial markets.
CASE 22 Volcom Inc.: Riding the Wave 22-11
CompetitorsVolcom competed with global companies of varying sizes and weights. The company’s directcompetitors include Quiksilver Inc., including the Roxy and DC brands; Billabong Interna-tional Limited, including the Billabong and Element brands; as well as Burton and Hurley.60
The company also competed with smaller companies that focused on one or more boardsportsegments.
In examining the broader U.S. Athletic Apparel and Footwear Industry, Volcom facedcompetitors like Nike Inc., the Adidas Group, Hanes/Champion, and Under Armour.61 In thisbroad category, Volcom held market shares of 0.7%, 0.6%, and 0.8% for the years 2008, 2007,and 2006, respectively.62 Nike Inc. held 8.3%, 8.0%, and 7.9% of the market, respectively.63
Quiksilver’s market share was 2.2%, 2.4%, and 2.6%.64 Billabong had 1.9%, 1.6%, and 1.7%.65
For retailers, this economic environment was like a tumultuous sea with threateningwaves. In 2007, companies like Circuit City, KB Toys, Mervyns, Boscov’s, Steve & Barry’s,and Sharper Image filed for bankruptcy.51 When the holiday season arrived in 2008, retailersheld their breath. Consumers had to shop and spend money for others, and profitability wassure to pick up. According to the International Council of Shopping Centers, however, indus-try sales fell 2.2% for the holiday shopping season, the biggest decline since at least 1970.52 InNovember 2008, chains posted a 2.7% decline in sales. In December, sales dropped 1.7%.53
Looking ahead, retail companies were keeping their eyes on pricing and costs in compet-ing within the industry. The business environment looked weak and uncertain considering riskslike disruptions to supply chains, currency volatility, natural and man-made disasters, legal lia-bility, and financial market disruption.54 High energy costs also influenced consumer behaviorand the supply chain. Companies had chosen to import products from emerging countries likeChina due to lower transportation costs and wages. Nevertheless, rising transportation costs andwages in those countries were making companies reconsider their sourcing and diversify theiroptions.55 In such an environment, retailers were willing to consolidate support functions, andcut underperforming activities, as well as trim payroll. On the other hand, in this buyer’s mar-ket, these companies had the advantage of negotiating better deals with their suppliers.
Besides maintaining extra cash on the company balance sheet, retailers were tailoring thecustomer experience to fit their overall image and strategy. Understanding and relating to thetarget market had to be second nature to the companies. In wooing an audience, retail compa-nies were building their relationships with consumers by catering to niche markets and mov-ing away from mass-marketing. Apparel retailers especially watched over consumers’ever-changing tastes, preferences, and shopping behaviors. The execution of their strategiesdetermined success. As one means of getting to their customers, companies used the Internetto build their brands and establish a following. Besides sharing information and offering en-tertainment and opportunities to purchase products online, retail companies were competingto flag consumer attention before they clicked someplace else.56
Teen shopping behavior and brand preferences were examined in a 2009 survey taken by1,200 students as well as their parents from 12 cities across the United States. Apparel spend-ing by parents for their teens in Spring 2009 was $915 compared to $1,085 in Fall 2008, butwas expected to increase in Fall 2009.57 West Coast Brands like Pacific Sunwear, Volcom,Quiksilver, and Zumiez took the top spot in clothing brand preferences among teens, followedby Forever 21, Hollwaster, Nike, and American Eagle.58 Jeff Klinefelter, a senior research an-alyst, believed the fashion industry in 2009 was in the early stages of a new cycle with trafficand conversion gradually improving as teenage consumers looked to replenish key items intheir wardrobes after underspending on the category.59
22-12 SECTION D Industry Five—Clothing
Burton SnowboardsBurton Snowboards, a private company, was founded in 1977 by Jake Burton Carpenter andwas headquartered in Vermont. Besides snowboards, the company’s product line encom-passed bindings, boots, outerwear, and accessories under the brands Anon Optics, RED, andGravwas. Carpenter’s snowboards were inspired by surfers, the first marketed snowboards.Carpenter campaigned resorts to open their slopes to snowboarders, creating a demand for hisproduct as well as a competitive sport.75 In 2006, the company extended its target market toinclude surfers when it bought Channel Islands Surfboards.76 Burton sponsored athleticevents as well as snowboarders like Shaun White and Frederik Kalbermatten.
Billabong70
Billabong was an Australian company that was founded in 1973. It sold apparel, accessories,eyewear, wetsuits, and hard goods in the boardsports sector under brands like Billabong, El-ement, and Palmers Surf. The company’s products were licensed and distributed in more than100 different countries. In 2008, the company had revenues of $1.35 billion.71 Billabong pro-motion and advertising strategies included athlete sponsorships as well as pro surfing tourna-ments in locations like Australia, South Africa, and Spain.
O’NeillO’Neill offered surf and snow-related technical products, clothing, footwear, and accessoriesin 84 countries.72 The company was founded in California in 1952 by Jack O’Neill, who wascredited with the design of neoprene wetsuits for surfers. Jack’s son, Pat, was credited withthe surfboard leash.73 In 2007, Logo International BV, a European fashion group, acquiredworldwide rights to the O’Neill brand and O’Neill Australia Pty Ltd. Under a separate agree-ment, the O’Neill family continued to own and operate the O’Neill wetsuit business world-wide, the U.S. outerwear business, and the O’Neill Surf Shops in Santa Cruz, California.74
O’Neill-sponsored events included the Swatch O’Neill Big Mountain Pro, and the O’NeillCold Water Classic held in locations like South Africa, Scotland, and Tasmania. The com-pany sponsored team riders in snowboarding, surfing, and wakeboarding.
In reference to Volcom’s potential growth, Richard Woolcott was quoted in an article forTime magazine saying that the core lifestyle was more important to him.66 He said, “Gettingbigger was totally secondary. I don’t want to put pressure on what we’re doing. I don’t eventhink about getting Quiksilver big.”67
Quiksilver68
In 2008, Quiksilver was the largest apparel company targeting surfers, skaters, and snow-boarders, with revenues of $2.26 billion. It sold apparel, footwear, accessories, and relatedproducts in over 90 countries with the brands Quiksilver, Roxy, and DC, among others. ThisCalifornia-based company was founded in 1970. Quiksilver’s roster of sponsored athletesincluded Kelly Slater and Tony Hawk. Its sponsored events included Quiksilver’s Big WaveInvitational and the Roxy Pro, a popular women’s surf event. In November 2008, the com-pany sold Rossignol, a wintersports and golf equipment manufacturer, for $50.8 million,eliminating Quiksilver’s risk in hard goods manufacturing and allowing the company to re-duce its debt.69
CASE 22 Volcom Inc.: Riding the Wave 22-13
Hurley77
Hurley sold apparel, athletic footwear, equipment, and accessories related to skateboardingand surfing. Besides sponsoring surfers and surf events, the company was also involved in themusic industry; it endorsed bands like Blink-182 and Avenged Sevenfold. In 1979, the com-pany began as Hurley Surfboards in California. In 1982, management pursued Billabong andestablished Billabong USA as a separate entity and licensee for its parent company. When thelicense agreement was up for renewal in 1995, management returned Billabong USA to itsparent company and continued with Hurley. Nike purchased Hurley in 2002 as a strategicmove into the action sports industry.
Pacific Sunwear of California Inc.78
Pacific Sunwear of California Inc., also known as “Pacific Sunwear” or “PacSun,” was a spe-cialty retailer inspired by the youth culture of Southern California. The company was incor-porated in 1982 and, as of January 31, 2009, operated 932 stores across the United States andPuerto Rico. PacSun’s objective was to be a “Branded House of Brands” that sold casual ap-parel targeting teens and young adults.79
As a percentage of PacSun’s total net sales during fiscal 2008, Billabong brands accountedfor 11% and Quick brands accounted for 10%. The next largest brand, Fox Racing, accountedfor 9% of total net sales that year. The company also offered its own proprietary brands instores, including Bullhead, Kirra, Kirra Girl, Burt, and Nollie. Sales of these brands accountedfor approximately 38% and 30% in fiscal 2008 and 2007, respectively. The company consid-ered its primary competitors to be Abercrombie and Fitch, Hollister, American Eagle Outfit-ters, Aeropostale, and Urban Outfitters.
Like many other retail stores, PacSun found 2008 to be a difficult year.80 Net sales de-creased 3.9% to $1.25 billion in fiscal 2008 from $1.31 billion in fiscal 2007. PacSun also sawa 6.2% net decrease in gross margin as a percentage of sales. Of that decline, 4.7% was due toincreased markdowns and promotional activity associated with the decline in consumer spend-ing and the economic environment, whereas 1.4% was attributed to an increase in occupancycharges as a percentage of net sales in fiscal 2008.
The company expected continued negative same-store results in the short term. To betterposition itself, PacSun reduced planned inventory levels by at least 20%; reduced planned cap-ital expenditures to not more than $30 million for 2009, a reduction of over $50 million fromthe fiscal 2008 level; and reduced planned selling, general, and administrative expenses by ap-proximately $35 million versus the fiscal 2008 level.81 The company also announced a reduc-tion of 11% of its headquarters and field management staff.
Financial Performance82
Volcom’s consolidated balance sheets and statements of operations for the fiscal years ended2005 through 2008 are shown in Exhibits 4 and 5, respectively.
Even with the economic slowdown of 2008, Volcom’s consolidated revenues increased24.5% to $334.4 million from $268.6 million in 2007. Revenues broken down by operatingsegment are identified in Exhibit 6. Revenues from the European operations increased $32.0million to $73.0 million primarily as a result of the transition from a licensee model to a directmodel during the third quarter of 2007. Consequently, licensing revenues in 2008 decreased35.8% to $2.2 million. Electric contributed $24.2 million in revenues in 2008; it had been in-cluded in Volcom’s operating results since January 17, 2008.
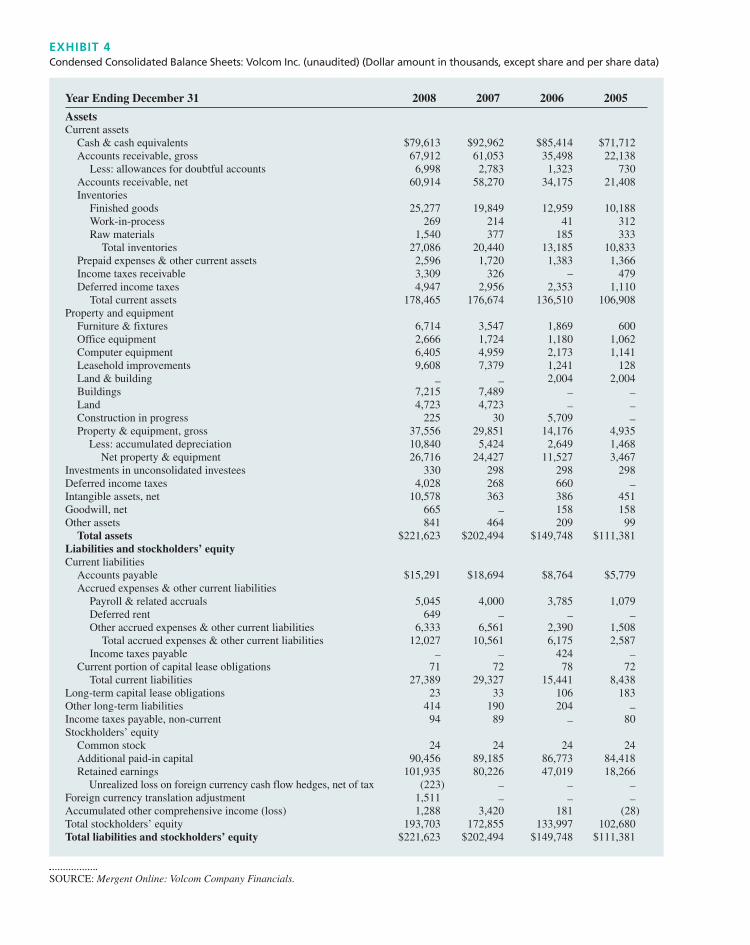
EXHIBIT 4Condensed Consolidated Balance Sheets: Volcom Inc. (unaudited) (Dollar amount in thousands, except share and per share data)
Year Ending December 31 2008 2007 2006 2005
AssetsCurrent assets
Cash & cash equivalents $79,613 $92,962 $85,414 $71,712Accounts receivable, gross 67,912 61,053 35,498 22,138
Less: allowances for doubtful accounts 6,998 2,783 1,323 730Accounts receivable, net 60,914 58,270 34,175 21,408Inventories
Finished goods 25,277 19,849 12,959 10,188Work-in-process 269 214 41 312Raw materials 1,540 377 185 333
Total inventories 27,086 20,440 13,185 10,833Prepaid expenses & other current assets 2,596 1,720 1,383 1,366Income taxes receivable 3,309 326 – 479Deferred income taxes 4,947 2,956 2,353 1,110
Total current assets 178,465 176,674 136,510 106,908Property and equipment
Furniture & fixtures 6,714 3,547 1,869 600Office equipment 2,666 1,724 1,180 1,062Computer equipment 6,405 4,959 2,173 1,141Leasehold improvements 9,608 7,379 1,241 128Land & building _ _ 2,004 2,004Buildings 7,215 7,489 _ _Land 4,723 4,723 _ _Construction in progress 225 30 5,709 _Property & equipment, gross 37,556 29,851 14,176 4,935
Less: accumulated depreciation 10,840 5,424 2,649 1,468Net property & equipment 26,716 24,427 11,527 3,467
Investments in unconsolidated investees 330 298 298 298Deferred income taxes 4,028 268 660 _Intangible assets, net 10,578 363 386 451Goodwill, net 665 _ 158 158Other assets 841 464 209 99
Total assets $221,623 $202,494 $149,748 $111,381Liabilities and stockholders’ equityCurrent liabilities
Accounts payable $15,291 $18,694 $8,764 $5,779Accrued expenses & other current liabilities
Payroll & related accruals 5,045 4,000 3,785 1,079Deferred rent 649 _ _ _Other accrued expenses & other current liabilities 6,333 6,561 2,390 1,508
Total accrued expenses & other current liabilities 12,027 10,561 6,175 2,587Income taxes payable _ _ 424 _
Current portion of capital lease obligations 71 72 78 72Total current liabilities 27,389 29,327 15,441 8,438
Long-term capital lease obligations 23 33 106 183Other long-term liabilities 414 190 204 _Income taxes payable, non-current 94 89 _ 80Stockholders’ equity
Common stock 24 24 24 24Additional paid-in capital 90,456 89,185 86,773 84,418Retained earnings 101,935 80,226 47,019 18,266
Unrealized loss on foreign currency cash flow hedges, net of tax (223) _ _ _Foreign currency translation adjustment 1,511 _ _ _Accumulated other comprehensive income (loss) 1,288 3,420 181 (28)Total stockholders’ equity 193,703 172,855 133,997 102,680Total liabilities and stockholders’ equity $221,623 $202,494 $149,748 $111,381
SOURCE: Mergent Online: Volcom Company Financials.
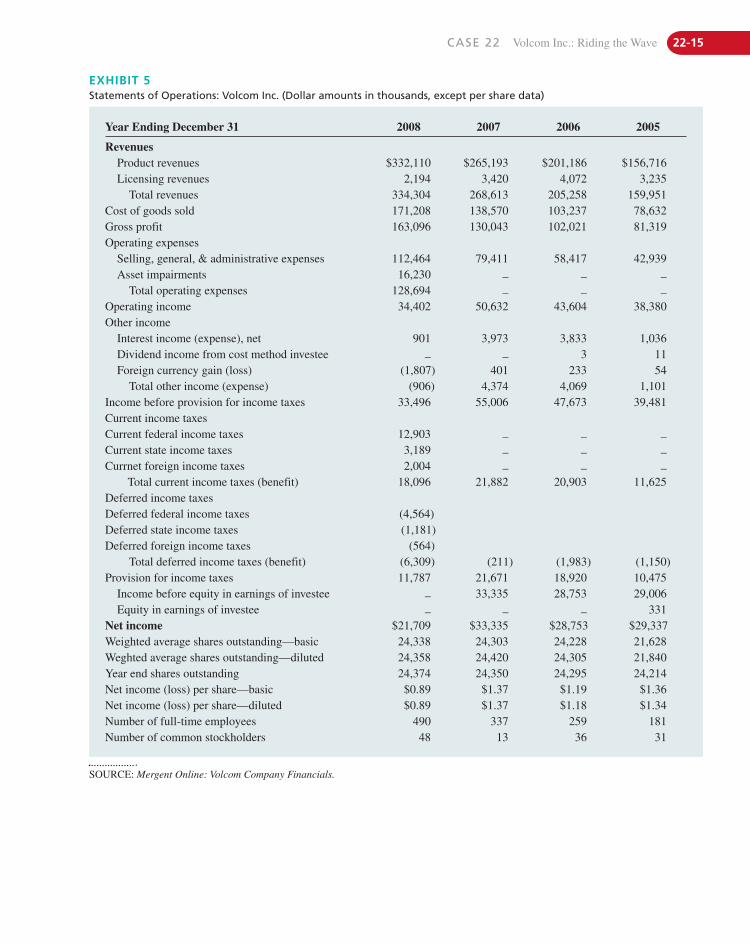
CASE 22 Volcom Inc.: Riding the Wave 22-15
EXHIBIT 5Statements of Operations: Volcom Inc. (Dollar amounts in thousands, except per share data)
Year Ending December 31 2008 2007 2006 2005
RevenuesProduct revenues $332,110 $265,193 $201,186 $156,716Licensing revenues 2,194 3,420 4,072 3,235
Total revenues 334,304 268,613 205,258 159,951Cost of goods sold 171,208 138,570 103,237 78,632Gross profit 163,096 130,043 102,021 81,319Operating expenses
Selling, general, & administrative expenses 112,464 79,411 58,417 42,939Asset impairments 16,230 _ _ _
Total operating expenses 128,694 _ _ _
Operating income 34,402 50,632 43,604 38,380Other income
Interest income (expense), net 901 3,973 3,833 1,036Dividend income from cost method investee _ _ 3 11Foreign currency gain (loss) (1,807) 401 233 54
Total other income (expense) (906) 4,374 4,069 1,101Income before provision for income taxes 33,496 55,006 47,673 39,481Current income taxesCurrent federal income taxes 12,903 _ _ _
Current state income taxes 3,189 _ _ _
Currnet foreign income taxes 2,004 _ _ _
Total current income taxes (benefit) 18,096 21,882 20,903 11,625Deferred income taxesDeferred federal income taxes (4,564)Deferred state income taxes (1,181)Deferred foreign income taxes (564)
Total deferred income taxes (benefit) (6,309) (211) (1,983) (1,150)Provision for income taxes 11,787 21,671 18,920 10,475
Income before equity in earnings of investee _ 33,335 28,753 29,006Equity in earnings of investee _ _ _ 331
Net income $21,709 $33,335 $28,753 $29,337Weighted average shares outstanding—basic 24,338 24,303 24,228 21,628Weghted average shares outstanding—diluted 24,358 24,420 24,305 21,840Year end shares outstanding 24,374 24,350 24,295 24,214Net income (loss) per share—basic $0.89 $1.37 $1.19 $1.36Net income (loss) per share—diluted $0.89 $1.37 $1.18 $1.34Number of full-time employees 490 337 259 181Number of common stockholders 48 13 36 31
SOURCE: Mergent Online: Volcom Company Financials.
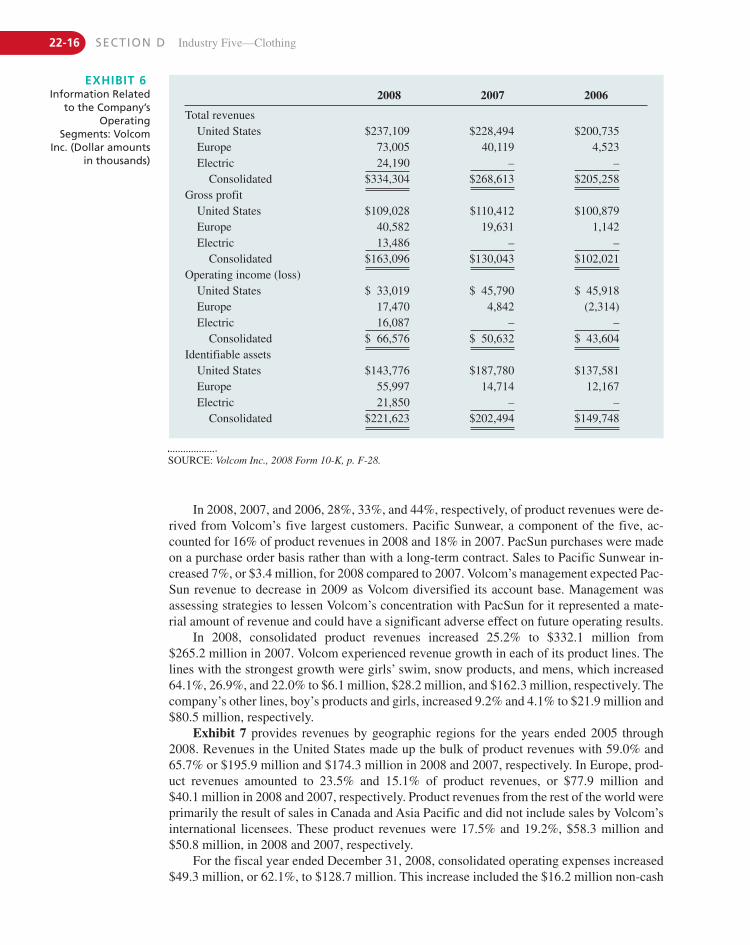
22-16 SECTION D Industry Five—Clothing
EXHIBIT 6Information Related
to the Company’sOperating
Segments: VolcomInc. (Dollar amounts
in thousands)
2008 2007 2006
Total revenuesUnited States $237,109 $228,494 $200,735Europe 73,005 40,119 4,523Electric 24,190 – –
Consolidated $334,304 $268,613 $205,258Gross profit
United States $109,028 $110,412 $100,879Europe 40,582 19,631 1,142Electric 13,486 – –
Consolidated $163,096 $130,043 $102,021Operating income (loss)
United States $ 33,019 $ 45,790 $ 45,918Europe 17,470 4,842 (2,314)Electric 16,087 – –
Consolidated $ 66,576 $ 50,632 $ 43,604Identifiable assets
United States $143,776 $187,780 $137,581Europe 55,997 14,714 12,167Electric 21,850 – –
Consolidated $221,623 $202,494 $149,748
SOURCE: Volcom Inc., 2008 Form 10-K, p. F-28.
In 2008, 2007, and 2006, 28%, 33%, and 44%, respectively, of product revenues were de-rived from Volcom’s five largest customers. Pacific Sunwear, a component of the five, ac-counted for 16% of product revenues in 2008 and 18% in 2007. PacSun purchases were madeon a purchase order basis rather than with a long-term contract. Sales to Pacific Sunwear in-creased 7%, or $3.4 million, for 2008 compared to 2007. Volcom’s management expected Pac-Sun revenue to decrease in 2009 as Volcom diversified its account base. Management wasassessing strategies to lessen Volcom’s concentration with PacSun for it represented a mate-rial amount of revenue and could have a significant adverse effect on future operating results.
In 2008, consolidated product revenues increased 25.2% to $332.1 million from $265.2 million in 2007. Volcom experienced revenue growth in each of its product lines. Thelines with the strongest growth were girls’ swim, snow products, and mens, which increased64.1%, 26.9%, and 22.0% to $6.1 million, $28.2 million, and $162.3 million, respectively. Thecompany’s other lines, boy’s products and girls, increased 9.2% and 4.1% to $21.9 million and$80.5 million, respectively.
Exhibit 7 provides revenues by geographic regions for the years ended 2005 through2008. Revenues in the United States made up the bulk of product revenues with 59.0% and65.7% or $195.9 million and $174.3 million in 2008 and 2007, respectively. In Europe, prod-uct revenues amounted to 23.5% and 15.1% of product revenues, or $77.9 million and $40.1 million in 2008 and 2007, respectively. Product revenues from the rest of the world wereprimarily the result of sales in Canada and Asia Pacific and did not include sales by Volcom’sinternational licensees. These product revenues were 17.5% and 19.2%, $58.3 million and$50.8 million, in 2008 and 2007, respectively.
For the fiscal year ended December 31, 2008, consolidated operating expenses increased$49.3 million, or 62.1%, to $128.7 million. This increase included the $16.2 million non-cash
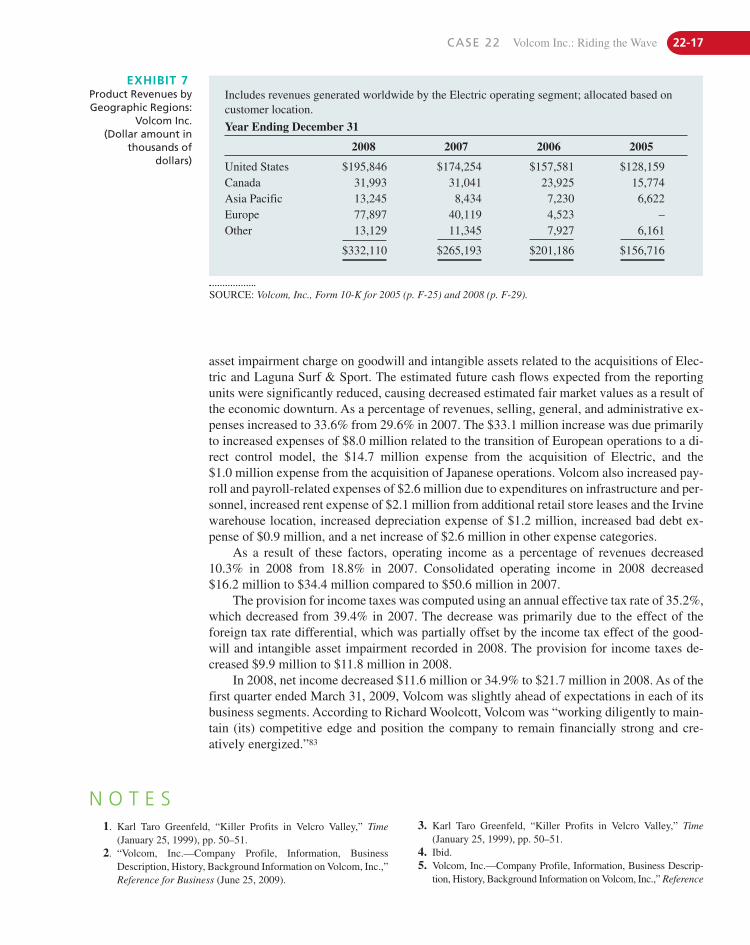
CASE 22 Volcom Inc.: Riding the Wave 22-17
EXHIBIT 7Product Revenues byGeographic Regions:
Volcom Inc. (Dollar amount in
thousands ofdollars)
Includes revenues generated worldwide by the Electric operating segment; allocated based oncustomer location.
Year Ending December 31
2008 2007 2006 2005
United States $195,846 $174,254 $157,581 $128,159Canada 31,993 31,041 23,925 15,774Asia Pacific 13,245 8,434 7,230 6,622Europe 77,897 40,119 4,523 –Other 13,129 11,345 7,927 6,161
$332,110 $265,193 $201,186 $156,716
SOURCE: Volcom, Inc., Form 10-K for 2005 (p. F-25) and 2008 (p. F-29).
asset impairment charge on goodwill and intangible assets related to the acquisitions of Elec-tric and Laguna Surf & Sport. The estimated future cash flows expected from the reportingunits were significantly reduced, causing decreased estimated fair market values as a result ofthe economic downturn. As a percentage of revenues, selling, general, and administrative ex-penses increased to 33.6% from 29.6% in 2007. The $33.1 million increase was due primarilyto increased expenses of $8.0 million related to the transition of European operations to a di-rect control model, the $14.7 million expense from the acquisition of Electric, and the $1.0 million expense from the acquisition of Japanese operations. Volcom also increased pay-roll and payroll-related expenses of $2.6 million due to expenditures on infrastructure and per-sonnel, increased rent expense of $2.1 million from additional retail store leases and the Irvinewarehouse location, increased depreciation expense of $1.2 million, increased bad debt ex-pense of $0.9 million, and a net increase of $2.6 million in other expense categories.
As a result of these factors, operating income as a percentage of revenues decreased10.3% in 2008 from 18.8% in 2007. Consolidated operating income in 2008 decreased $16.2 million to $34.4 million compared to $50.6 million in 2007.
The provision for income taxes was computed using an annual effective tax rate of 35.2%,which decreased from 39.4% in 2007. The decrease was primarily due to the effect of the foreign tax rate differential, which was partially offset by the income tax effect of the good-will and intangible asset impairment recorded in 2008. The provision for income taxes de-creased $9.9 million to $11.8 million in 2008.
In 2008, net income decreased $11.6 million or 34.9% to $21.7 million in 2008. As of thefirst quarter ended March 31, 2009, Volcom was slightly ahead of expectations in each of itsbusiness segments. According to Richard Woolcott, Volcom was “working diligently to main-tain (its) competitive edge and position the company to remain financially strong and cre-atively energized.”83
N O T E S1. Karl Taro Greenfeld, “Killer Profits in Velcro Valley,” Time
(January 25, 1999), pp. 50–51.2. “Volcom, Inc.—Company Profile, Information, Business
Description, History, Background Information on Volcom, Inc.,”Reference for Business (June 25, 2009).
3. Karl Taro Greenfeld, “Killer Profits in Velcro Valley,” Time(January 25, 1999), pp. 50–51.
4. Ibid.5. Volcom, Inc.—Company Profile, Information, Business Descrip-
tion, History, Background Information on Volcom, Inc.,” Reference
22-18 SECTION D Industry Five—Clothing
for Business (June 25, 2009), http://www.referenceforbusiness.com/hwastory2/3/Volcom-Inc.html.
6. “Investor Relations Overview—Profile,” Volcom (July 2, 2009),http://www.volcom.com/investorRelations/index.asp?catId�1.
7. “History,” Volcom (July 2, 2009), http://www.volcom.com/hwastory/index.asp.
8. “Volcom, Inc.—Company Profile, Information, Business Descrip-tion, History, Background Information on Volcom, Inc.,” Referencefor Business (June 25, 2009), http://www.referenceforbusiness.com/hwastory2/3/Volcom-Inc.html.
9. Volcom, Inc. 2005 Form 10-K.10. “Volcom, Inc.—Company Profile, Information, Business Descrip-
tion, History, Background Information on Volcom, Inc.,” Referencefor Business (June 25, 2009), http://www.referenceforbusiness.com/hwastory2/3/Volcom-Inc.html.
11. Ibid. This section was directly quoted, except for minor editing.12. Ibid. This section was directly quoted, except for minor editing.13. Ibid. This section was directly quoted, except for minor editing.14. Ibid. This section was directly quoted, except for minor editing.15. Ibid. This section was directly quoted, except for minor editing.16. “Volcom IPO Makes Big Debut,” Los Angeles Business. BizJour-
nals (June 30, 2005), http://www.bizjournals.com/losangeles/stories/2005/06/27/daily36.html. This section was directlyquoted, except for minor editing.
17. “Volcom, Inc.—Company Profile, Information, BusinessDescription, History, Background Information on Volcom,Inc.,” Reference for Business (June 25, 2009), http://www.referenceforbusiness.com/hwastory2/3/Volcom-Inc.html.
18. Volcom, Inc., 2008 Form 10-K, p. 12.19. Ibid., p. 30.20. Ibid., p. 2. This section was directly quoted, except for minor
editing.21. Ibid. This section was directly quoted, except for minor editing.22. Ibid. This section was directly quoted, except for minor editing.23. Ibid.24. Ibid., p. 30.25. Volcom, Inc., Proxy Statement (March 24, 2009), pp. 5–6. This
section was directly quoted, except for minor editing.26. “Management,” Volcom (June 26, 2009), http://volcom.com/
investorRelations/management.asp?catId�7. This section wasdirectly quoted, except for minor editing.
27. “Volcom,” Facebook http://www.facebook.com/Volcom?v�
info, “Mission Statement,” Volcom http://www.volcom.com/mwassionstatement1.asp (August 1, 2009).
28. “Volcom, Inc.—Company Profile, Information, BusinessDescription, History, Background Information on Volcom,Inc.,” Reference for Business (June 25, 2009), http://www.referenceforbusiness.com/hwastory2/3/Volcom-Inc.html.
29. Karl Taro Greenfeld, “Killer Profits in Velcro Valley,” Time(January 25, 1999), pp. 50–51.
30. “History,” Volcom (July 2, 2009), http://www.volcom.com/hwastory/index.asp.
31. Ibid. This section was directly quoted, except for minor editing.32. “Volcom, Inc.—Company Profile, Information, Business Descrip-
tion, History, Background Information on Volcom, Inc.,” Referencefor Business (June 25, 2009), http://www.referenceforbusiness.com/hwastory2/3/Volcom-Inc.html.
33. Karl Taro Greenfeld, “Killer Profits in Velcro Valley,” Time(January 25,1999), pp. 50–51.
34. Ibid.
35. Volcom, Inc., 2008 Form 10-K, pp. 2–4. This section wasdirectly quoted, except for minor editing.
36. Ibid., p. 4. This section was directly quoted, except for minorediting.
37. Ibid., p. 11. This section was directly quoted, except for minorediting.
38. Ibid., pp. 11–12.39. Ibid., pp. 4–5. This section was directly quoted, except for minor
editing.40. Ibid., pp. 6–7. This section was directly quoted, except for minor
editing.41. Ibid., p. 7. This section was directly quoted, except for minor
editing.42. Ibid., p. 12. This section was directly quoted, except for minor
editing.43. Ibid., p. 11. This section was directly quoted, except for minor
editing.44. Ibid., pp. 8–10. This section was directly quoted, except for mi-
nor editing.45. Ibid., p. 11. This section was directly quoted, except for minor
editing.46. Ibid., pp. 10–11. This section was directly quoted, except for mi-
nor editing.47. Ibid., p. 12. This section was directly quoted, except for minor
editing.48. “Bureau of Labor Statistics Data,” Databases, Tables & Calcula-
tors by Subject (October 18, 2009), http://data.bls.gov/PDQ/servlet/SurveyOutputServlet?data_tool�latest_numbers&series_id�LNS14000000.
49. Deloitte Touche Tohmatsu, Global Powers of Retailing 2009(May 16, 2009), http://public.deloitte.com/media/0460/2009GlobalPowersofRetail_FINAL2.pdf.
50. “Bureau of Labor Statistics Data,” Databases, Tables & Calcu-lators by Subject (October 18, 2009), http://data.bls.gov/PDQ/servlet/SurveyOutputServlet?data_tool�latest_numbers&series_id�LNS14000000.
51. Stephanie Rosenbloom, “After Weak Holiday Sales, RetailersPrepare for Even Worse,” The New York Times (January 8, 2009),http://www.nytimes.com/2009/01/09/business/economy/09shop.html (October 18, 2009).
52. Ibid.53. Ibid.54. Deloitte Touche Tohmatsu, Global Powers of Retailing 2009
(May 16, 2009), http://public.deloitte.com/media/0460/2009 GlobalPowersofRetail_FINAL2.pdf, p. G44.
55. Ibid., p. G46.56. Ibid., p. G44.57. “Teen Spending Survey Points to Early Stages of a Discretionary
Recovery and Fashion Replenishment Cycle,” Business Wire,Berkshire Hathaway (October 7, 2009), http://www.businesswire.com/portal/site/google/?ndmViewId�news_view&newsId�
20091007005743&newsLang�en (October 18, 2009).58. Ibid.59. Ibid.60. Volcom, Inc., 2008 Form 10-K, p. 13.61. Robert F. Ohmes and Helena Tse, “Industry Overview: Apparel &
Footwear,” Bank of America, Merrill Lynch Research (June 4,2009).
62. Ibid.63. Ibid.
CASE 22 Volcom Inc.: Riding the Wave 22-19
64. Ibid.65. Karl Taro Greenfeld, “Killer Profits in Velcro Valley,” Time
(January 25, 1999), pp. 50–51.66. Ibid.67. Ibid.68. Quiksilver, Inc., 2008 Form 10-K. This section was directly
quoted, except for minor editing.69. Ibid., p. 9.70. “Billabong,” http://www.billabongbiz.com/about-billabong.php.71. Billabong, Full Financial Report 07-08, p. 57.72. “The O’Neill Brand Was Acquired by Logo International BV,”
Surfesvillage (October 19, 2009), http://www.surfersvillage.com/surfing/27873/news.htm.
73. Ibid.74. Ibid.75. “Back in the Day: Burton History,” Burton, http://demandware
.edgesuite.net/aadf_prd/on/demandware.static/Sites-Burton_US-Site/Sites-Burton_US-Library/default/v1255721485198/pdfs/BackintheDay.pdf.
76. Nathan Myers, “Burton Snowboards Acquires Channel IslandsSurfboards,” Surfing Magazine, http://www.surfingmagazine.com/news/surfing-pulse/burton-merrick-interview/.
77. “Hurley,” K5 Board Shop (October 19, 2009), http://www.k5.com/getbrand.asp?b�66&partnerid�31&utm_source�
Hurley�Site&utm_medium�banner&utm_campaign�
vendor_links.78. Pacific Sunwear of California, Inc., 2008 Form 10-K. This sec-
tion was directly quoted, except for minor editing.79. Ibid., p. 2.80. Ibid., p. 20. This section was directly quoted, except for minor
editing.81. Ibid.82. Volcom, Inc., 2008 Form 10-K. This section was directly quoted,
except for minor editing, pp. 36–37.83. Volcom, Inc., 2009 First Quarter Financial Results, p. 1.

This page intentionally left blank
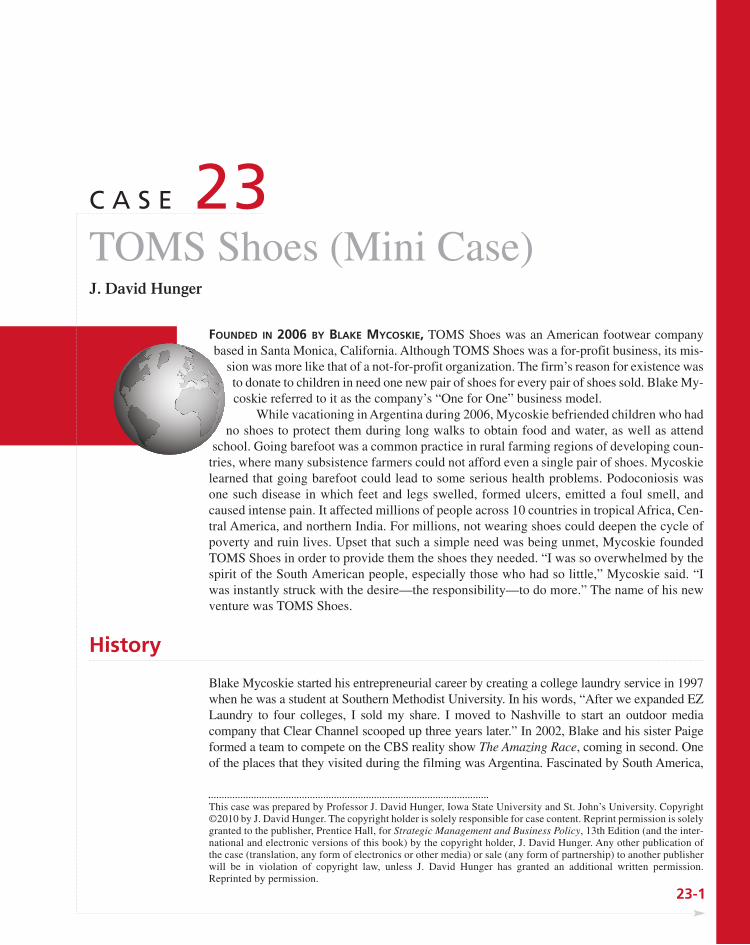
23-1
C A S E 23TOMS Shoes (Mini Case)J. David Hunger
History
Blake Mycoskie started his entrepreneurial career by creating a college laundry service in 1997when he was a student at Southern Methodist University. In his words, “After we expanded EZLaundry to four colleges, I sold my share. I moved to Nashville to start an outdoor mediacompany that Clear Channel scooped up three years later.” In 2002, Blake and his sister Paigeformed a team to compete on the CBS reality show The Amazing Race, coming in second. Oneof the places that they visited during the filming was Argentina. Fascinated by South America,
FOUNDED IN 2006 BY BLAKE MYCOSKIE, TOMS Shoes was an American footwear companybased in Santa Monica, California. Although TOMS Shoes was a for-profit business, its mis-
sion was more like that of a not-for-profit organization. The firm’s reason for existence wasto donate to children in need one new pair of shoes for every pair of shoes sold. Blake My-coskie referred to it as the company’s “One for One” business model.
While vacationing in Argentina during 2006, Mycoskie befriended children who hadno shoes to protect them during long walks to obtain food and water, as well as attend
school. Going barefoot was a common practice in rural farming regions of developing coun-tries, where many subsistence farmers could not afford even a single pair of shoes. Mycoskielearned that going barefoot could lead to some serious health problems. Podoconiosis wasone such disease in which feet and legs swelled, formed ulcers, emitted a foul smell, andcaused intense pain. It affected millions of people across 10 countries in tropical Africa, Cen-tral America, and northern India. For millions, not wearing shoes could deepen the cycle ofpoverty and ruin lives. Upset that such a simple need was being unmet, Mycoskie foundedTOMS Shoes in order to provide them the shoes they needed. “I was so overwhelmed by thespirit of the South American people, especially those who had so little,” Mycoskie said. “Iwas instantly struck with the desire—the responsibility—to do more.” The name of his newventure was TOMS Shoes.
This case was prepared by Professor J. David Hunger, Iowa State University and St. John’s University. Copyright©2010 by J. David Hunger. The copyright holder is solely responsible for case content. Reprint permission is solelygranted to the publisher, Prentice Hall, for Strategic Management and Business Policy, 13th Edition (and the inter-national and electronic versions of this book) by the copyright holder, J. David Hunger. Any other publication ofthe case (translation, any form of electronics or other media) or sale (any form of partnership) to another publisherwill be in violation of copyright law, unless J. David Hunger has granted an additional written permission.Reprinted by permission.
Business Model
Realizing that a not-for-profit organization would be heavily dependent upon sponsors andconstant fundraising, Mycoskie chose to create an innovative for-profit business model toachieve a charitable purpose. For every pair of shoes that the company sold, it would donate one pair to a child in need. Mycoskie felt that this model would be more economicallysustainable than a charity because sales would be used to achieve the company’s mission. Hesaw this to be a form of social entrepreneurship in which a new business venture acted to im-prove society through product donations at the same time it lived off society through its sales.
Mycoskie believed that the firm’s One-for-One model would be self-sustaining becausethe company could make and sell shoes at a price similar to other shoe companies, but withlower costs. “Selling online (www.toms.com) has allowed us to grow pretty rapidly, but we’renot going to make as much as another shoe company, and the margins are definitely lower,”he admits. “But what we do helps us to get publicity. Lots of companies give a percentage oftheir revenue to charity, but we can’t find anyone who matches one for one.”
23-2 SECTION D Industry Five—Clothing
Marketing and Distribution
TOMS Shoes kept expenses low by spending only minimally on marketing and promotion.The company’s marketing was primarily composed of presentations by Blake Mycoskie, fanword-of-mouth, and promotional events sponsored by the firm. The company won the 2007
Blake returned to Argentina in 2006 for a vacation. “On my visit I saw lots of kids with no shoeswho were suffering from injuries to their feet. I decided a business would be the most sustainableway to help, so I founded TOMS, which is short for a ‘better tomorrow,’” explained Mycoskie.
While in Argentina, Mycoskie had taken to wearing alpargatas—resilient, light-weight,slip-on shoes with a breathable canvas top and soft leather insole traditionally worn byArgentine workers, but worn casually by most people in that country. Mycoskie spent twomonths meeting with shoe and fabric makers in Argentina. Although he modeled his shoeafter the espadrille-like alpargata, he used brighter colors and different materials. “No onelooked twice at alpargatas, but I thought they had a really cool style,” said Mycoskie. “I’m afan of Vans, but they can be clunky and sweaty. These aren’t. They fit your foot like a glovebut are sturdy enough for a hike, the beach, or the city.”
Founding his new company that year in Santa Monica, California, the 30-year-old BlakeMycoskie began his third entrepreneurial venture. With a staff of seven full-time employees(including former Trovata clothing line designer John Whitledge), six sales representatives,and eight interns, TOMS Shoes introduced 15 styles of men’s and women’s shoes pluslimited-edition artist versions in June 2006. The shoes were quickly selected for distributionby stores like American Bag and Fred Segal in Los Angeles and Scoop in New York City. ByFall 2006, the company had sold 10,000 pairs of shoes, averaging $38 each, online andthrough 40 retail stores.
As promised, Mycoskie returned to Argentina in October 2006 with two dozen volunteersto give away 10,000 pairs of shoes along 2,200 miles of countryside. Mycoskie wrylyexplained what he learned from this experience. “I always thought that I’d spend the first halfof my life making money and the second half giving it away. I never thought I could do bothat the same time.” The next year, TOMS Shoes gave away 50,000 pairs of shoes in “shoedrops” to children in Argentina plus shoe drops to South Africa. More countries were addedto the list over the next three years.
CASE 23 TOMS Shoes (Mini Case) 23-3
Operations and Management
TOMS shoes were manufactured in Argentina, China, and Ethiopia. The company requiredthe factories to operate under sound labor conditions, pay fair wages, and follow local laborstandards. A code of conduct was signed by all factories. In addition to its production staffroutinely visiting the factories to ensure that they were maintaining good working standards,third parties annually audited the factories. The company’s original line of alpargata shoeswas expanded to include children’s shoes, leather shoes, cordones youth shoes, botas, andwedges. In January 2009, the company collaborated with Element Skateboards to create a lineof shoes, skate decks, and longboards. For each pair of TOMS Element shoes and/or skate-board bought, one of the same was given to children at the Indigo Skate Camp in the villageof Isithumba in Durban, South Africa.
People’s Design Award at Cooper-Hewitt’s National Design Awards. Two years later,Mycoskie and TOMS received the annual ACE award given by U.S. Secretary of StateHillary Clinton. This award recognized companies’ commitment to corporate social respon-sibility, innovation, exemplary practices, and democratic values worldwide. Mycoskie spokealong with President Bill Clinton at the Opening Plenary session of the Second AnnualClinton Global Initiative Conference in 2007. With other business leaders, he also met withPresident Obama’s senior administration in March 2009 to present solutions and ideas to sup-port small businesses. He was also featured in a CNBC segment titled “The Entrepreneurs,”in which he and TOMS Shoes was profiled.
Mycoskie explained why he spent so much time speaking to others about TOMS Shoes.“My goal is to inspire the next generation of entrepreneurs and company leaders to thinkdifferently about how they incorporate giving into their business models. Plus, many of thepeople who hear me speak eventually purchase a pair of Toms, share the story with others, orsupport our campaigns like One Day Without Shoes, which has people go barefoot for one daya year to raise awareness about the children we serve.”
Celebrities like Olivia Wilde, Karl Lagerfeld, and Scarlett Johansson loved the brand andwhat it stood for. Actress Demi Moore promoted the 2010 One Day Without Shoes campaignon The Tonight Show with Jay Leno. It didn’t hurt that Mycoskie’s fame was supported by hisBill Clinton-like charisma, Hollywood good looks, and his living on a boat in Marina del Reywith “TOMS” sails. Famed designer Ralph Lauren asked Mycoskie to work with him on afew styles for his Rugby collection, the first time Lauren had collaborated with another brand.
TOMS Shoes and Blake Mycoskie were profiled in the LA Times, as well as Inc., People,Forbes, Fortune, Fast Company, and Time magazines. Mycoskie pointed out that the 2009 LATimes article, “TOMS Shoes the Model: Sell 1, Give 1,” resulted in 2,200 orders for shoes injust 12 hours after the article appeared. In February 2010, FastCompany listed TOMS Shoesas #6 on its list of “Top Ten Most Innovative Retail Companies.”
By early 2007, TOMS Shoes had orders from 300 retail stores, including Nordstrom’s,Urban Outfitters, and Bloomingdale’s, for 41,000 pairs of shoes from its spring and summercollections. The company introduced a line of children’s shoes called Tiny Toms in May 2007and unveiled a pair of leather shoes in Fall of that year. By September 2010, the companyadded Whole Foods to its distribution network and had given over 1,000,000 pairs of newshoes to children in need living in more than 20 countries in the Americas (Argentina, ElSalvador, Guatemala, Haiti, Honduras, Nicaragua, and Peru), Africa (Burundi, Ethiopia,Lesotho, Malawi, Mali, Niger, Rwanda, South Africa, Swaziland, Uganda, and Zambia), Asia (Cambodia and Mongolia), and Eurasia (Armenia). The shoes were now selling for$45 to $85 a pair.
23-4 SECTION D Industry Five—Clothing
Mission Accomplished: Next Steps?When Blake Mycoskie originally proposed his One-for-One business model in 2006, few hadmuch confidence in his ability to succeed. He never generated a business plan or asked foroutside support. Mycoskie used the money he had earned from his earlier entrepreneurialventures to fund the new business. Looking back on those days, Mycoskie stated, “A lot of people thought we were crazy. They never thought we could make a profit.” Much to every-one’s surprise, TOMS Shoes had its first profitable year in 2008, only two years after beingfounded! The company’s sales kept increasing throughout the “great recession” of 2008–2009and continued being marginally profitable. Mycoskie admitted that the company would haveto sell about a million pairs of shoes annually to be really profitable. Nevertheless, TOMSShoes did not take on any outside investors and did not plan to do so.
In September 2010, Blake Mycoskie celebrated TOMS Shoes’ total sales of one millionpairs of shoes by returning to Argentina to give away the millionth pair. Looking forward toreturning to where it all began, Mycoskie mused: “To reach a milestone like this is really amaz-ing. We have been so busy giving shoes that we don’t even think about the scope of what we’vecreated and what we’ve done.”
What should be next for TOMS Shoes? Blake Mycoskie invested a huge amount of his owntime, energy, and enthusiasm in the growth and success of TOMS Shoes. Was the company toodependent upon its founder? How should it plan its future growth?
Blake Mycoskie was the company’s Chief Executive Officer and joked that he was also its“Chief Shoe Giver.” He spent much of his time traveling the country to speak at universities andcompanies about the TOMS Shoes’ business model. According to CEO Mycoskie in a June 2010article in Inc., “The reason I can travel so much is that I’ve put together a strong team of about tenpeople who pretty much lead the company while I am gone. Candice Wolfswinkel is my chief ofstaff and the keeper of the culture. . . . I have an amazing CFO, Jeff Tyler, and I’ll check in withhim twice a week. I talk to my sales managers on a weekly basis. I also call my younger brother,Tyler, a lot—he’s head of corporate sales.” The company had 85 employees plus interns andvolunteers. In 2009, more than 1,000 people applied for 15 summer internship positions.
The company depended upon many volunteers to promote the company and to distributeits shoes to needy children. For example, Friends of TOMS was a registered nonprofit affili-ate of TOMS Shoes that had been formed to coordinate volunteer activities and all shoe drops.The company sponsored an annual “Vagabond Tour” to reach college campuses. Volunteerswere divided into five regional teams to reach campuses throughout the United States to spreadinformation about the One-for-One movement. To capture volunteer enthusiasm, the companyformed a network of college representatives at 200 schools to host events, screen adocumentary about the brand, or throw shoe decorating parties.
Mycoskie believed that a key to success for his company was his generation’s desire tobecome involved in the world. “This generation is one that thrives off of action. We don’tdream about change, we make it happen. We don’t imagine a way to incorporate giving intoour daily lives—we do it. TOMS has so many young supporters who are passionate about theOne for One movement, and who share the story and inspire others every day they wear theirTOMS. Seeing them support this business model is proof that this generation is ready and ableto create a better tomorrow.”
BEST BUY CO. INC., HEADQUARTERED IN RICHFIELD, MINNESOTA, was a specialty retailer ofconsumer electronics. It operated over 1,100 stores in the United States, accounting for 19%
of the market. With approximately 155,000 employees, it also operated over 2,800 storesin Canada, Mexico, China, and Turkey. The company’s subsidiaries included Geek Squad,Magnolia Audio Video, and Pacific Sales. In Canada, Best Buy operated under both theBest Buy and Future Shop labels.
Best Buy’s mission was to make technology deliver on its promises to customers. To ac-complish this, Best Buy helped customers realize the benefits of technology and technological
changes so they could enrich their lives in a variety of ways through connectivity: “To make lifefun and easy,”1 as Best Buy put it. This was what drove the company to continually increase thetools to support customers in the hope of providing end-to-end technology solutions.
As a public company, Best Buy’s top objectives were sustained growth and earnings. This wasaccomplished in part by constantly reviewing its business model to ensure that it was satisfying cus-tomer needs and desires as effectively and completely as possible. The company strived to have notonly extensive product offerings but also highly trained employees with extensive product knowl-edge. The company encouraged its employees to go out of their way to help customers understandwhat these products could do and how customers could get the most out of the products they pur-chased. Employees recognized that each customer was unique and thus determined the best methodto help that customer achieve maximum enjoyment from the product(s) purchased.
24-1
C A S E 24Best Buy Co. Inc.: SustainableCustomer Centricity Model?Alan N. Hoffman
This case was prepared by Professor Alan N. Hoffman, Bentley University and Erasmus University. Copyright ©2010by Alan N. Hoffman. The copyright holder is solely responsible for case content. Reprint permission is solely grantedto the publisher, Prentice Hall, for Strategic Management and Business Policy, 13th Edition (and the international andelectronic versions of this book) by the copyright holder, Alan N. Hoffman. Any other publication of the case (transla-tion, any form of electronics or other media) or sale (any form of partnership) to another publisher will be in violationof copyright law, unless Alan N. Hoffman has granted an additional written permission. Reprinted by permission. The author would like to thank MBA students Kevin Clark, Leonard D’Andrea, Amanda Genesky, Geoff Merritt, ChrisMudarri, and Dan Fowler for their research. No part of this publication may be copied, stored, transmitted, reproduced,or distributed in any form or medium whatsoever without the permission of the copyright owner, Alan N. Hoffman.
Industry Six—Specialty Retailing
From a strategic standpoint, Best Buy moved from being a discount retailer (a low pricestrategy) to a service-oriented firm that relied on a differentiation strategy. In 1989, Best Buy changed the compensation structure for sales associates from commission-based to non-commissioned-based, which resulted in consumers having more control over the purchasingprocess and in cost savings for the company (the number of sales associates was reduced). In 2005,Best Buy took customer service a step further by moving from peddling gadgets to a customer-centric operating model. It was now gearing up for another change to focus on store design andproviding products and services in line with customers’ desire for constant connectivity.
24-2 SECTION D Industry Six—Specialty Retailing
Company History2
From Sound of Music to Best BuyBest Buy was originally known as Sound of Music. Incorporated in 1966, the companystarted as a retailer of audio components and expanded to retailing video products in the early1980s with the introduction of the videocassette recorder to its product line. In 1983, the com-pany changed its name to Best Buy Co. Inc. (Best Buy). Shortly thereafter, Best Buy beganoperating its existing stores under a “superstore” concept by expanding product offerings andusing mass marketing techniques to promote those products.
Best Buy dramatically altered the function of its sales staff in 1989. Previously, the salesstaff worked on a commission basis and was more proactive in assisting customers coming intothe stores as a result. Since 1989, however, the commission structure has been terminated andsales associates have developed into educators that assist customers in learning about the prod-ucts offered in the stores. The customer, to a large extent, took charge of the purchasingprocess. The sales staff’s mission was to answer customer questions so that the customerscould decide which product(s) fit their needs. This differed greatly from their former missionof simply generating sales.
In 2000, the company launched its online retail store: BestBuy.com. This allowed cus-tomers a choice between visiting a physical store and purchasing products online, thus expand-ing Best Buy’s reach among consumers.
Expansion Through AcquisitionsIn 2000, Best Buy began a series of acquisitions to expand its offerings and enter internationalmarkets:
2000: Best Buy acquired Magnolia Hi-Fi Inc., a high-end retailer of audio and video productsand services, which became Magnolia Audio Video in 2004. This acquisition allowedBest Buy access to a set of upscale customers.
2001: Best Buy entered the international market with the acquisition of Future Shop Ltd, aleading consumer electronics retailer in Canada. This helped Best Buy increase revenues,gain market share, and leverage operational expertise. The same year, Best Buy alsoopened its first Canadian store. In the same year, the company purchased Musicland, amall-centered music retailer throughout the United States (divested in 2003).
2002: Best Buy acquired Geek Squad, a computer repair service provider, to help develop atechnological support system for customers. The retailer began by incorporating in-storeGeek Squad centers in its 28 Minnesota stores and expanding nationally and then interna-tionally in subsequent years.
2005: Best Buy opened the first Magnolia Home Theater “store-within-a-store” (locatedwithin the Best Buy complex).
2006: Best Buy acquired Pacific Sales Kitchen and Bath Centers Inc. to develop a new cus-tomer base: builders and remodelers. The same year, Best Buy also acquired a 75% stakein Jiangsu Five Star Appliance Co., Ltd, a China-based appliance and consumer electron-ics retailer. This enabled the company to access the Chinese retail market and led to theopening of the first Best Buy China store on January 26, 2007.
2007: Best Buy acquired Speakeasy Inc., a provider of broadband, voice, data, and informa-tion technology services, to further its offering of technological solutions for customers.
2008: Through a strategic alliance with the Carphone Warehouse Group, a UK-based providerof mobile phones, accessories, and related services, Best Buy Mobile was developed. After acquiring a 50% share in Best Buy Europe (with 2,414 stores) from the CarphoneWarehouse, Best Buy intended to open small-store formats across Europe in 2011.3 BestBuy also acquired Napster, a digital download provider, through a merger to counter thefalling sales of compact discs. The first Best Buy Mexico store was opened.
2009: Best Buy acquired the remaining 25% of Jiangsu Five Star. Best Buy Mobile moved intoCanada.
CASE 24 Best Buy Co. Inc.: Sustainable Customer Centricity Model? 24-3
Industry Environment
Industry OverviewDespite the negative impact the financial crisis had on economies worldwide, in 2008 the con-sumer electronics industry managed to grow to a record high of US$694 billion in sales—anearly 14% increase over 2007. In years immediately prior, the growth rate was similar: 14%in 2007 and 17% in 2006. This momentum, however, did not last. Sales dropped 2% in 2009,the first decline in 20 years for the electronics giant.
A few product segments, including televisions, gaming, mobile phones, and Blu-ray play-ers, drove sales for the company. Television sales, specifically LCD units, which accounted for77% of total television sales, were the main driver for Best Buy, as this segment alone ac-counted for 15% of total industry revenues. The gaming segment continued to be a bright spotfor the industry as well, as sales were expected to have tremendous room for growth. Smart-phones were another electronics industry segment predicted to have a high growth impact onthe entire industry.
The consumer electronics industry had significant potential for expansion into the globalmarketplace. There were many untapped markets, especially newly developing countries.These markets were experiencing the fastest economic growth while having the lowest own-ership rate for gadgets.4 Despite the recent economic downturn, the future for this industry wasoptimistic. A consumer electronics analyst for the European Market Research Institute pre-dicted that the largest growth will be seen in China (22%), the Middle East (20%), Russia(20%), and South America (17%).5
Barriers to EntryAs globalization spread and use of the Internet grew, barriers to entering the consumer elec-tronics industry were diminished. When the industry was dominated by brick-and-mortar com-panies, obtaining the large capital resources needed for entry into the market was a barrier forthose looking to gain any significant market share. Expanding a business meant purchasing or
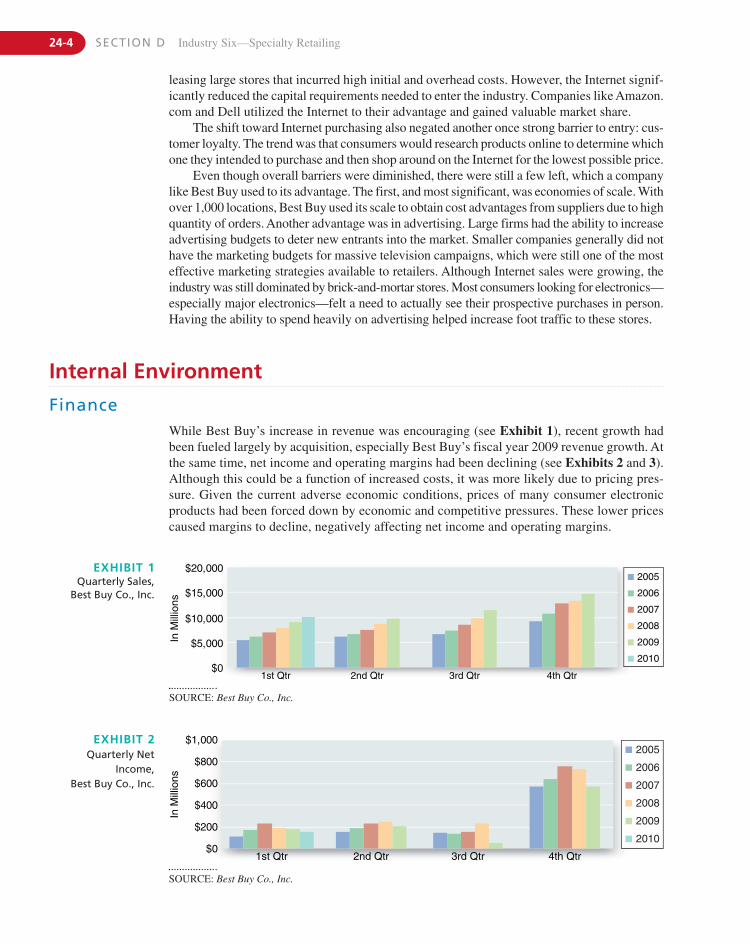
24-4 SECTION D Industry Six—Specialty Retailing
Internal Environment
FinanceWhile Best Buy’s increase in revenue was encouraging (see Exhibit 1), recent growth hadbeen fueled largely by acquisition, especially Best Buy’s fiscal year 2009 revenue growth. Atthe same time, net income and operating margins had been declining (see Exhibits 2 and 3).Although this could be a function of increased costs, it was more likely due to pricing pres-sure. Given the current adverse economic conditions, prices of many consumer electronicproducts had been forced down by economic and competitive pressures. These lower pricescaused margins to decline, negatively affecting net income and operating margins.
$0
$5,000In M
illio
ns
$10,000
$15,000
$20,000
1st Qtr 2nd Qtr 3rd Qtr 4th Qtr
2005
2006
2007
2008
2009
2010
EXHIBIT 1Quarterly Sales,
Best Buy Co., Inc.
$0
$200
$400
In M
illio
ns $600
$800
$1,000
1st Qtr 2nd Qtr 3rd Qtr 4th Qtr
2005
2006
2007
2008
2009
2010
EXHIBIT 2Quarterly Net
Income,Best Buy Co., Inc.
leasing large stores that incurred high initial and overhead costs. However, the Internet signif-icantly reduced the capital requirements needed to enter the industry. Companies like Amazon.com and Dell utilized the Internet to their advantage and gained valuable market share.
The shift toward Internet purchasing also negated another once strong barrier to entry: cus-tomer loyalty. The trend was that consumers would research products online to determine whichone they intended to purchase and then shop around on the Internet for the lowest possible price.
Even though overall barriers were diminished, there were still a few left, which a companylike Best Buy used to its advantage. The first, and most significant, was economies of scale. Withover 1,000 locations, Best Buy used its scale to obtain cost advantages from suppliers due to highquantity of orders. Another advantage was in advertising. Large firms had the ability to increaseadvertising budgets to deter new entrants into the market. Smaller companies generally did nothave the marketing budgets for massive television campaigns, which were still one of the mosteffective marketing strategies available to retailers. Although Internet sales were growing, theindustry was still dominated by brick-and-mortar stores. Most consumers looking for electronics—especially major electronics—felt a need to actually see their prospective purchases in person.Having the ability to spend heavily on advertising helped increase foot traffic to these stores.
SOURCE: Best Buy Co., Inc.
SOURCE: Best Buy Co., Inc.
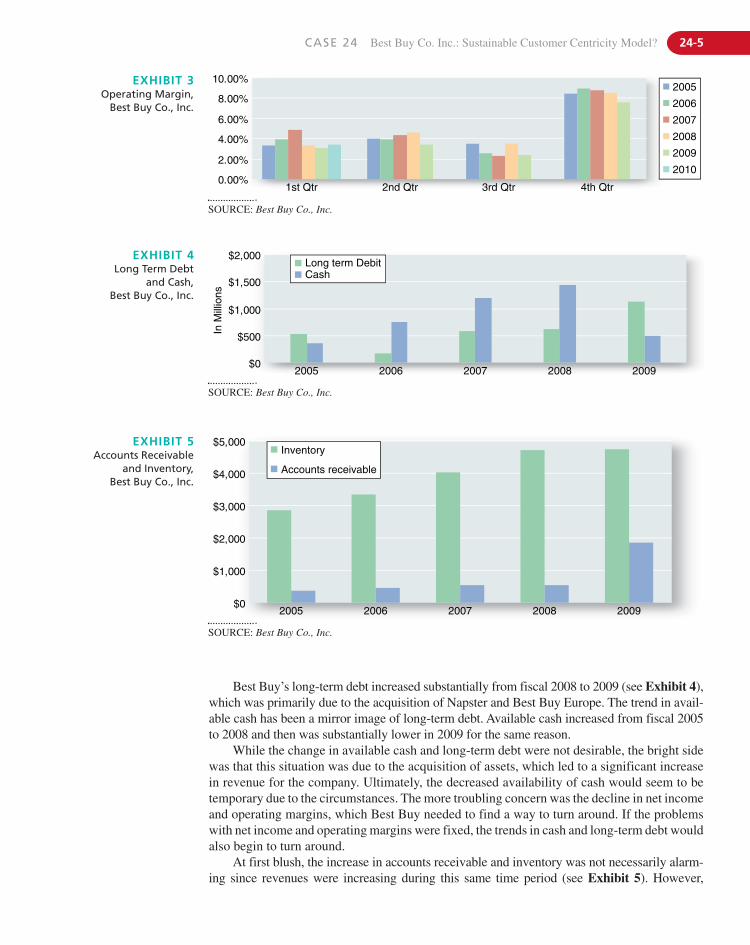
CASE 24 Best Buy Co. Inc.: Sustainable Customer Centricity Model? 24-5
0.00%
2.00%
4.00%
6.00%
8.00%
10.00%
1st Qtr 2nd Qtr 3rd Qtr 4th Qtr
2005
2006
2007
2008
2009
2010
EXHIBIT 3Operating Margin,
Best Buy Co., Inc.
$0
$500
$1,000
In M
illio
ns
$1,500
$2,000
2005 2006 2007 2008 2009
Long term DebitCash
EXHIBIT 4Long Term Debt
and Cash, Best Buy Co., Inc.
SOURCE: Best Buy Co., Inc.
SOURCE: Best Buy Co., Inc.
Best Buy’s long-term debt increased substantially from fiscal 2008 to 2009 (see Exhibit 4),which was primarily due to the acquisition of Napster and Best Buy Europe. The trend in avail-able cash has been a mirror image of long-term debt. Available cash increased from fiscal 2005to 2008 and then was substantially lower in 2009 for the same reason.
While the change in available cash and long-term debt were not desirable, the bright sidewas that this situation was due to the acquisition of assets, which led to a significant increasein revenue for the company. Ultimately, the decreased availability of cash would seem to betemporary due to the circumstances. The more troubling concern was the decline in net incomeand operating margins, which Best Buy needed to find a way to turn around. If the problemswith net income and operating margins were fixed, the trends in cash and long-term debt wouldalso begin to turn around.
At first blush, the increase in accounts receivable and inventory was not necessarily alarm-ing since revenues were increasing during this same time period (see Exhibit 5). However,
$0
$1,000
$2,000
$3,000
$4,000
$5,000
2005 2006 2007 2008 2009
Inventory
Accounts receivable
EXHIBIT 5Accounts Receivable
and Inventory, Best Buy Co., Inc.
SOURCE: Best Buy Co., Inc.
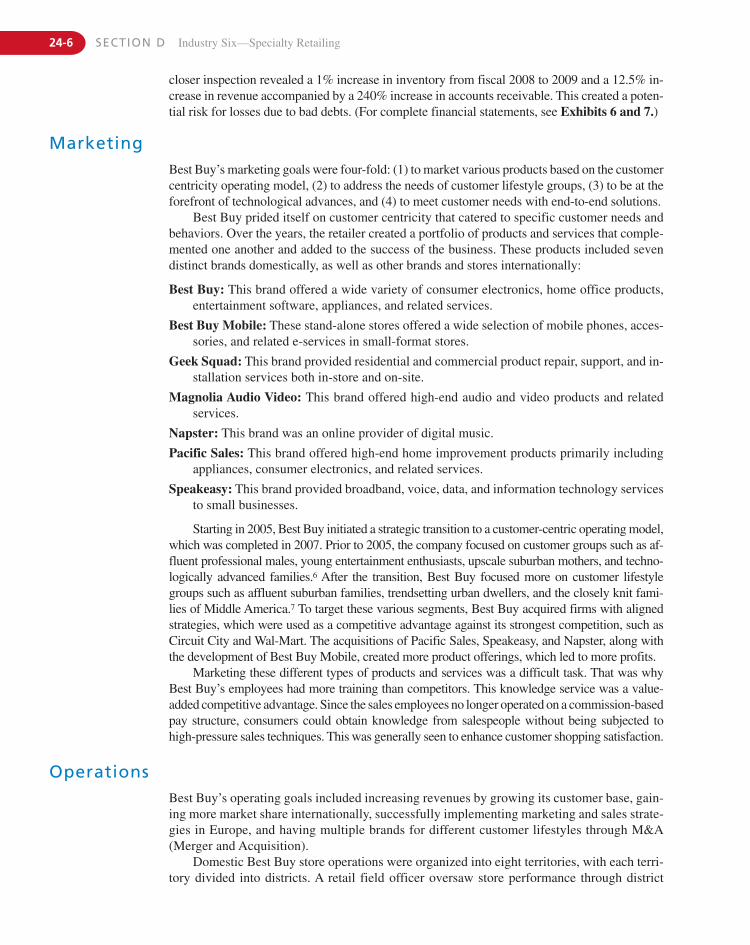
24-6 SECTION D Industry Six—Specialty Retailing
MarketingBest Buy’s marketing goals were four-fold: (1) to market various products based on the customercentricity operating model, (2) to address the needs of customer lifestyle groups, (3) to be at theforefront of technological advances, and (4) to meet customer needs with end-to-end solutions.
Best Buy prided itself on customer centricity that catered to specific customer needs andbehaviors. Over the years, the retailer created a portfolio of products and services that comple-mented one another and added to the success of the business. These products included sevendistinct brands domestically, as well as other brands and stores internationally:
Best Buy: This brand offered a wide variety of consumer electronics, home office products,entertainment software, appliances, and related services.
Best Buy Mobile: These stand-alone stores offered a wide selection of mobile phones, acces-sories, and related e-services in small-format stores.
Geek Squad: This brand provided residential and commercial product repair, support, and in-stallation services both in-store and on-site.
Magnolia Audio Video: This brand offered high-end audio and video products and relatedservices.
Napster: This brand was an online provider of digital music.
Pacific Sales: This brand offered high-end home improvement products primarily includingappliances, consumer electronics, and related services.
Speakeasy: This brand provided broadband, voice, data, and information technology servicesto small businesses.
Starting in 2005, Best Buy initiated a strategic transition to a customer-centric operating model,which was completed in 2007. Prior to 2005, the company focused on customer groups such as af-fluent professional males, young entertainment enthusiasts, upscale suburban mothers, and techno-logically advanced families.6 After the transition, Best Buy focused more on customer lifestylegroups such as affluent suburban families, trendsetting urban dwellers, and the closely knit fami-lies of Middle America.7 To target these various segments, Best Buy acquired firms with alignedstrategies, which were used as a competitive advantage against its strongest competition, such asCircuit City and Wal-Mart. The acquisitions of Pacific Sales, Speakeasy, and Napster, along withthe development of Best Buy Mobile, created more product offerings, which led to more profits.
Marketing these different types of products and services was a difficult task. That was why Best Buy’s employees had more training than competitors. This knowledge service was a value-added competitive advantage. Since the sales employees no longer operated on a commission-basedpay structure, consumers could obtain knowledge from salespeople without being subjected tohigh-pressure sales techniques. This was generally seen to enhance customer shopping satisfaction.
OperationsBest Buy’s operating goals included increasing revenues by growing its customer base, gain-ing more market share internationally, successfully implementing marketing and sales strate-gies in Europe, and having multiple brands for different customer lifestyles through M&A(Merger and Acquisition).
Domestic Best Buy store operations were organized into eight territories, with each terri-tory divided into districts. A retail field officer oversaw store performance through district
closer inspection revealed a 1% increase in inventory from fiscal 2008 to 2009 and a 12.5% in-crease in revenue accompanied by a 240% increase in accounts receivable. This created a poten-tial risk for losses due to bad debts. (For complete financial statements, see Exhibits 6 and 7.)
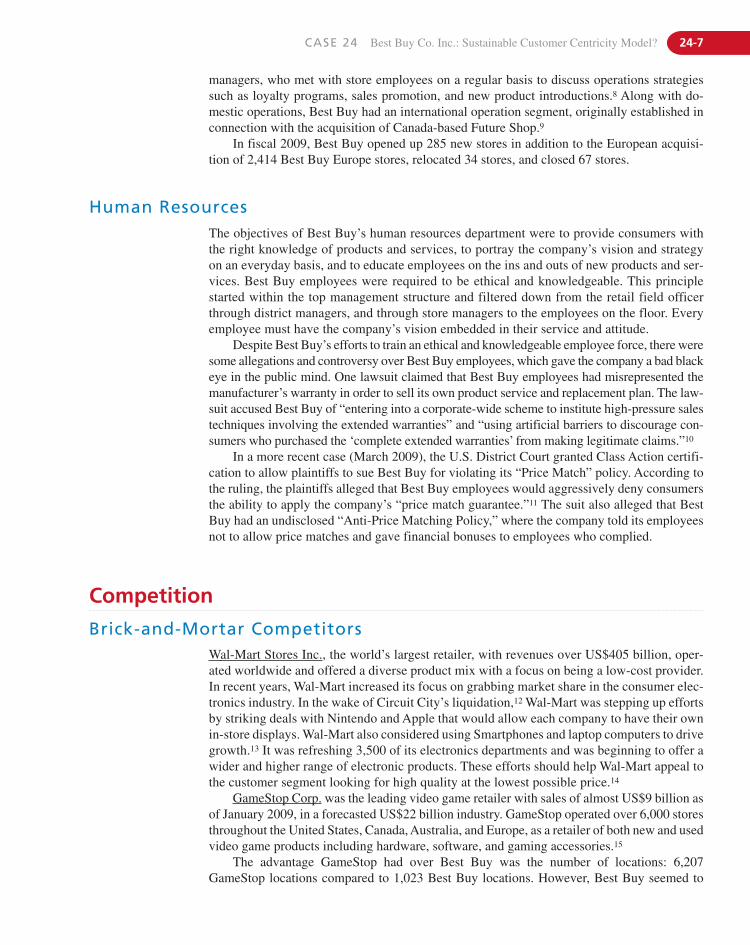
CASE 24 Best Buy Co. Inc.: Sustainable Customer Centricity Model? 24-7
Human ResourcesThe objectives of Best Buy’s human resources department were to provide consumers withthe right knowledge of products and services, to portray the company’s vision and strategyon an everyday basis, and to educate employees on the ins and outs of new products and ser-vices. Best Buy employees were required to be ethical and knowledgeable. This principlestarted within the top management structure and filtered down from the retail field officerthrough district managers, and through store managers to the employees on the floor. Everyemployee must have the company’s vision embedded in their service and attitude.
Despite Best Buy’s efforts to train an ethical and knowledgeable employee force, there weresome allegations and controversy over Best Buy employees, which gave the company a bad blackeye in the public mind. One lawsuit claimed that Best Buy employees had misrepresented themanufacturer’s warranty in order to sell its own product service and replacement plan. The law-suit accused Best Buy of “entering into a corporate-wide scheme to institute high-pressure salestechniques involving the extended warranties” and “using artificial barriers to discourage con-sumers who purchased the ‘complete extended warranties’ from making legitimate claims.”10
In a more recent case (March 2009), the U.S. District Court granted Class Action certifi-cation to allow plaintiffs to sue Best Buy for violating its “Price Match” policy. According tothe ruling, the plaintiffs alleged that Best Buy employees would aggressively deny consumersthe ability to apply the company’s “price match guarantee.”11 The suit also alleged that BestBuy had an undisclosed “Anti-Price Matching Policy,” where the company told its employeesnot to allow price matches and gave financial bonuses to employees who complied.
managers, who met with store employees on a regular basis to discuss operations strategiessuch as loyalty programs, sales promotion, and new product introductions.8 Along with do-mestic operations, Best Buy had an international operation segment, originally established inconnection with the acquisition of Canada-based Future Shop.9
In fiscal 2009, Best Buy opened up 285 new stores in addition to the European acquisi-tion of 2,414 Best Buy Europe stores, relocated 34 stores, and closed 67 stores.
Competition
Brick-and-Mortar CompetitorsWal-Mart Stores Inc., the world’s largest retailer, with revenues over US$405 billion, oper-ated worldwide and offered a diverse product mix with a focus on being a low-cost provider.In recent years, Wal-Mart increased its focus on grabbing market share in the consumer elec-tronics industry. In the wake of Circuit City’s liquidation,12 Wal-Mart was stepping up effortsby striking deals with Nintendo and Apple that would allow each company to have their ownin-store displays. Wal-Mart also considered using Smartphones and laptop computers to drivegrowth.13 It was refreshing 3,500 of its electronics departments and was beginning to offer awider and higher range of electronic products. These efforts should help Wal-Mart appeal tothe customer segment looking for high quality at the lowest possible price.14
GameStop Corp. was the leading video game retailer with sales of almost US$9 billion asof January 2009, in a forecasted US$22 billion industry. GameStop operated over 6,000 storesthroughout the United States, Canada, Australia, and Europe, as a retailer of both new and usedvideo game products including hardware, software, and gaming accessories.15
The advantage GameStop had over Best Buy was the number of locations: 6,207GameStop locations compared to 1,023 Best Buy locations. However, Best Buy seemed to
24-8 SECTION D Industry Six—Specialty Retailing
Online CompetitorsAmazon.com Inc., since 1994, had grown into the United States’ largest online retailer withrevenues of over US$19 billion in 2008 by providing just about any product imaginablethrough its popular website. Created as an online bookstore, Amazon soon ventured out intovarious consumer electronic product categories including computers, televisions, software,video games, and much more.18
Amazon.com gained an advantage over its supercenter competitors as Amazon was able tomaintain a lower cost structure compared to brick-and-mortar companies such as Best Buy. Ama-zon was able to push those savings through to its product pricing and selection/diversification.With an increasing trend in the consumer electronic industry to shop online, Amazon.com waspositioned perfectly to maintain strong market growth and potentially steal some market shareaway from Best Buy.
Netflix Inc. was an online video rental service, offering selections of DVDs and Blu-raydiscs. Since its establishment in 1997, Netflix had grown into a US$1.4 billion company. Withover 100,000 titles in its collection, the company shipped for free to approximately 10 millionsubscribers. Netflix began offering streaming downloads through its website, which elimi-nated the need to wait for a DVD to arrive.
Netflix was quickly changing the DVD market, which had dramatically impacted brick-and-mortar stores such as Blockbuster and Hollywood Video and retailers who offered DVDsfor sale. In a responsive move, Best Buy partnered with CinemaNow to enter the digital moviedistribution market and counter Netflix and other video rental providers.19
Core Competencies
Customer Centricity ModelMost players in the consumer electronics industry focused on delivering products at the low-est cost (Wal-Mart—brick-and-mortar, Amazon—web-based). Best Buy, however, took a dif-ferent approach by providing customers with highly trained sales associates who wereavailable to educate customers regarding product features. This allowed customers to makeinformed buying decisions on big-ticket items. In addition, with the Geek Squad, Best Buywas able to offer and provide installation services, product repair, and ongoing support. Inshort, Best Buy provided an end-to-end solution for its customers.
have what it took to overcome this advantage—deep pockets. With significantly higher net in-come, Best Buy could afford to take a hit to its margins and undercut GameStop prices.16
RadioShack Corp. was a retailer of consumer electronic goods and services including flatpanel televisions, telephones, computers, and consumer electronic accessories. Although thecompany grossed revenues of over US$4 billion from 4,453 locations, RadioShack consis-tently lost market share to Best Buy. Consumers had a preference for RadioShack for audioand video components, yet preferred Best Buy for their big box purchases.17
Second tier competitors were rapidly increasing. Wholesale shopping units were becom-ing more popular, and companies such as Costco and BJ’s had increased their piece of the con-sumer electronics pie over the past few years. After Circuit City’s bankruptcy, mid-levelelectronics retailers like HH Gregg and Ultimate Electronics were scrambling to grab CircuitCity’s lost market share. Ultimate Electronics, owned by Mark Wattles, who was a major in-vestor in Circuit City, had a leg up on his competitors. Wattles was on Circuit City’s board ofexecutives and had firsthand access to profitable Circuit City stores. Ultimate Electronicsplanned to expand its operations by at least 20 stores in the near future.
CASE 24 Best Buy Co. Inc.: Sustainable Customer Centricity Model? 24-9
Best Buy used its customer centricity model, which was built around a significant data-base of customer information, to construct a diversified portfolio of product offerings. This al-lowed the company to offer different products in different stores in a manner that matchedcustomer needs. This in turn helped keep costs lower by shipping the correct inventory to thecorrect locations. Since Best Buy’s costs were increased by the high level of training neededfor sales associates and service professionals, it had been important that the company remainvigilant in keeping costs down wherever it can without sacrificing customer experience.
The tremendous breadth of products and services Best Buy was able to provide allowedcustomers to purchase all components for a particular need within the Best Buy family. For ex-ample, if a customer wanted to set up a first-rate audio-visual room at home, he or she couldgo to the Magnolia Home Theater store-within-a-store at any Best Buy location and use theknowledge of the Magnolia or Best Buy associate in the television and audio areas to deter-mine which television and surround sound theater system best fit their needs. The customercould then employ a Geek Squad employee to install and set up the television and home the-ater system. None of Best Buy’s competitors offered this extensive level of service.
Successful AcquisitionsThrough its series of acquisitions, Best Buy had gained valuable experience in the process ofintegrating companies under the Best Buy family. The ability to effectively determine whereto expand was important to the company’s ability to differentiate itself in the marketplace.Additionally, Best Buy was also successfully integrating employees from acquired compa-nies. Best Buy had a significant global presence, which was important because of the matur-ing domestic market. This global presence provided the company with insights intoworldwide trends in the consumer electronics industry and afforded access to newly develop-ing markets. Best Buy used this insight to test products in different markets in its constant ef-fort to meet and anticipate customer needs.
Retaining TalentAnalyzing Circuit City’s demise, many experts concluded one of the major reasons for thecompany’s downfall was that Circuit City let go of their most senior and well-trained salesstaff in order to cut costs. Best Buy, on the other hand, had a reputation for retaining talentand was widely recognized for its superior service. Highly trained sales professionals had be-come a unique resource in the consumer electronics industry, where technology was chang-ing at an unprecedented rate, and was a significant source of competitive advantage.
Challenges Ahead
Economic DownturnElectronics retailers like Best Buy sold products that could be described as “discretionaryitems, rather than necessities.”20 During economic recessions, however, consumers had lessdisposable income to spend. While there was optimism about a possible economic turnaroundin 2010 or 2011, if the economy continued to stumble, this could present a real threat to sell-ers of discretionary products.
In order to increase sales revenues, many retailers, including Best Buy, offered customerslow interest financing through their private-label credit cards. These promotions were tremen-dously successful for Best Buy. From 2007 to 2009, these private-label credit card purchases
24-10 SECTION D Industry Six—Specialty Retailing
Pricing and Debt ManagementThe current depressed economic conditions, technological advances, and increased competitionput a tremendous amount of pricing pressure on many consumer electronics products. This was aconcern for all companies in this industry. The fact that Best Buy did not compete strictly on pricestructure alone made this an even bigger concern. Given the higher costs that Best Buy incurredtraining employees, any pricing pressure that decreased margins put stress on Best Buy’s finan-cial strength. In addition, the recent acquisition of Napster and the 50% stake in Best Buy Europesignificantly increased Best Buy’s debt and reduced available cash. Even in prosperous times, debtmanagement was a key factor in any company’s success, and it became even more important dur-ing the economic downturn. (See Exhibits 6 and 7 for Best Buy’s financial statements.)
accounted for 16%–18% of Best Buy’s domestic revenue. Due to the credit crisis, however, theFederal Reserve issued new regulations that could restrict companies from offering deferredinterest financing to customers. If Best Buy and other retailers were unable to extend thesecredit lines, it could have a tremendous negative impact on future revenues.21
Products and ServiceAs technology improved, product life cycles, as well as prices, decreased. As a result, mar-gins decreased. Under Best Buy’s service model, shorter product life cycles increased train-ing costs. Employees were forced to learn new products with higher frequency. This was notonly costly but also increased the likelihood that employees would make mistakes, therebytarnishing Best Buy’s service record and potentially damaging one of its most important, if not the most important, differentiators. In addition, more resources would be directed at research of new products to make sure Best Buy continued to offer the products consumersdesire.
One social threat to the retail industry was the growing popularity of the online market-place. Internet shoppers could browse sites searching for the best deals on specific products.This technology allowed consumers to become more educated about their purchases, whilecreating increased downward price pressure. Ambitious consumers could play the role of aBest Buy associate themselves by doing product comparisons and information gathering with-out a trip to the store. This emerging trend created a direct threat to companies like Best Buy,which had 1,023 stores in its domestic market alone. One way Best Buy tried to continue thedemand for brick-and-mortar locations and counter the threat of Internet-based competitionwas by providing value-added services in stores. Customer service, repairs, and interactiveproduct displays were just a few examples of these services.22
LeadershipThe two former CEOs of Best Buy, Richard Shultze and Brad Anderson, were extremely suc-cessful at making the correct strategic moves at the appropriate times. With Brad Andersonstepping aside in June 2009, Brian Dunn replaced him as the new CEO. Although Dunnworked for the company for 24 years and held the key positions of COO and President dur-ing his tenure, the position of CEO brought him to a whole new level and presented new chal-lenges, especially during the economic downturn. He was charged with leading Best Buy intothe world of increased connectivity. This required a revamping of products and store setupsto serve customers in realizing their connectivity needs. This was a daunting task for an ex-perienced CEO, let alone a new CEO who had never held the position.
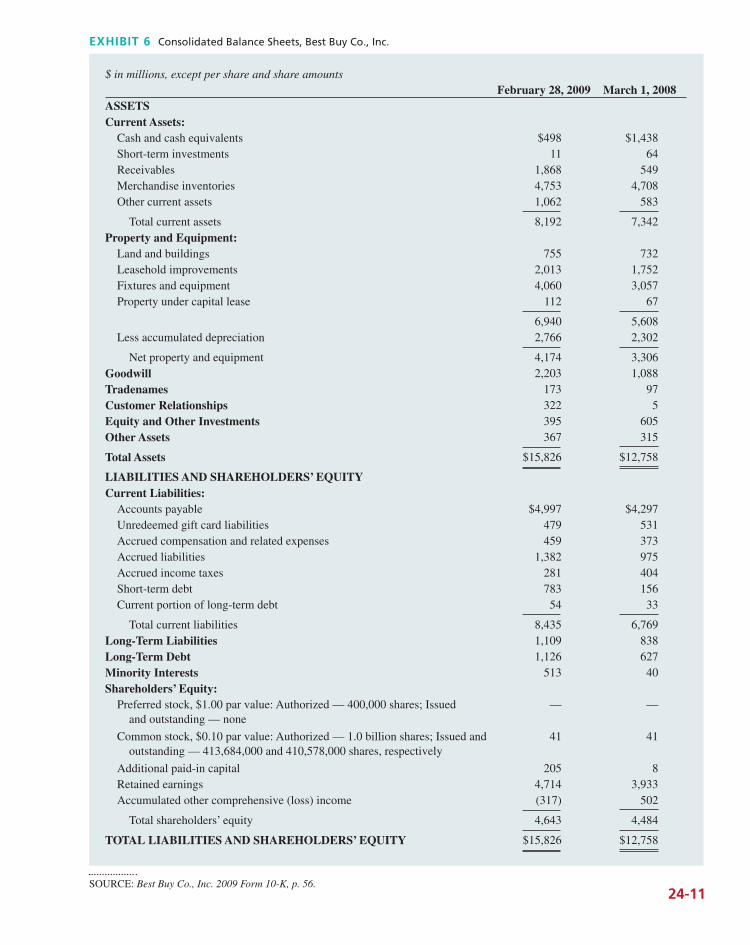
$ in millions, except per share and share amountsFebruary 28, 2009 March 1, 2008
ASSETSCurrent Assets:
Cash and cash equivalents $498 $1,438Short-term investments 11 64Receivables 1,868 549Merchandise inventories 4,753 4,708Other current assets 1,062 583
Total current assets 8,192 7,342Property and Equipment:
Land and buildings 755 732Leasehold improvements 2,013 1,752Fixtures and equipment 4,060 3,057Property under capital lease 112 67
6,940 5,608Less accumulated depreciation 2,766 2,302
Net property and equipment 4,174 3,306Goodwill 2,203 1,088Tradenames 173 97Customer Relationships 322 5Equity and Other Investments 395 605Other Assets 367 315
Total Assets $15,826 $12,758
LIABILITIES AND SHAREHOLDERS’ EQUITYCurrent Liabilities:
Accounts payable $4,997 $4,297Unredeemed gift card liabilities 479 531Accrued compensation and related expenses 459 373Accrued liabilities 1,382 975Accrued income taxes 281 404Short-term debt 783 156Current portion of long-term debt 54 33
Total current liabilities 8,435 6,769Long-Term Liabilities 1,109 838Long-Term Debt 1,126 627Minority Interests 513 40Shareholders’ Equity:
Preferred stock, $1.00 par value: Authorized — 400,000 shares; Issued and outstanding — none
— —
Common stock, $0.10 par value: Authorized — 1.0 billion shares; Issued and outstanding — 413,684,000 and 410,578,000 shares, respectively
41 41
Additional paid-in capital 205 8Retained earnings 4,714 3,933Accumulated other comprehensive (loss) income (317) 502
Total shareholders’ equity 4,643 4,484
TOTAL LIABILITIES AND SHAREHOLDERS’ EQUITY $15,826 $12,758
EXHIBIT 6 Consolidated Balance Sheets, Best Buy Co., Inc.
SOURCE: Best Buy Co., Inc. 2009 Form 10-K, p. 56.24-11
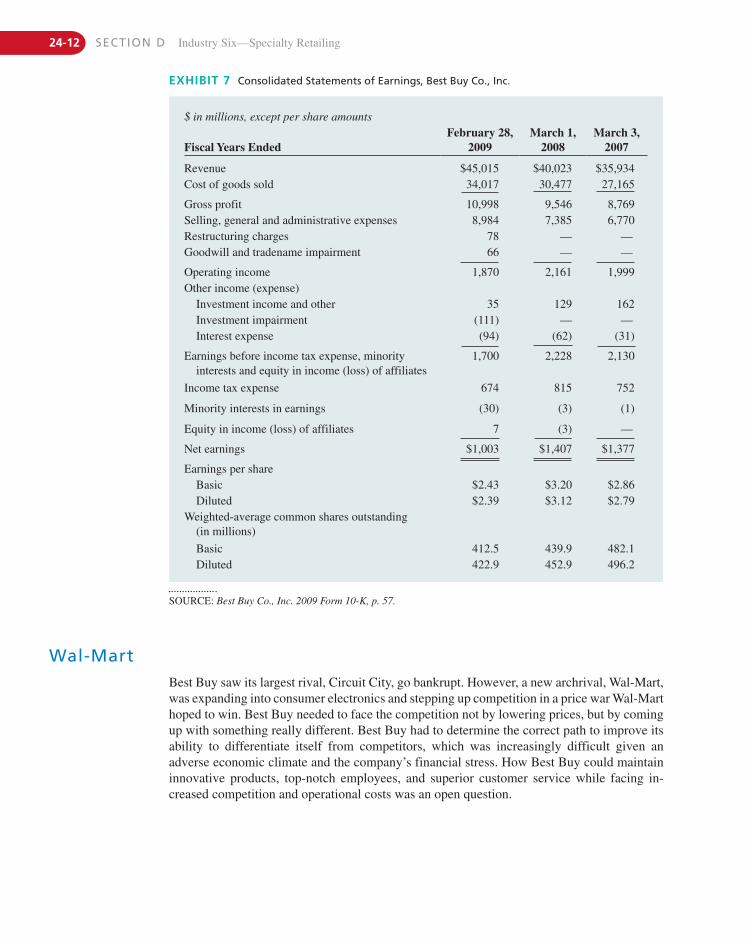
24-12 SECTION D Industry Six—Specialty Retailing
$ in millions, except per share amounts
Fiscal Years EndedFebruary 28,
2009March 1,
2008March 3,
2007
Revenue $45,015 $40,023 $35,934Cost of goods sold 34,017 30,477 27,165
Gross profit 10,998 9,546 8,769Selling, general and administrative expenses 8,984 7,385 6,770Restructuring charges 78 — —Goodwill and tradename impairment 66 — —
Operating income 1,870 2,161 1,999Other income (expense)
Investment income and other 35 129 162Investment impairment (111) — —Interest expense (94) (62) (31)
Earnings before income tax expense, minority interests and equity in income (loss) of affiliates
1,700 2,228 2,130
Income tax expense 674 815 752
Minority interests in earnings (30) (3) (1)
Equity in income (loss) of affiliates 7 (3) —
Net earnings $1,003 $1,407 $1,377
Earnings per shareBasic $2.43 $3.20 $2.86Diluted $2.39 $3.12 $2.79
Weighted-average common shares outstanding (in millions)
Basic 412.5 439.9 482.1Diluted 422.9 452.9 496.2
EXHIBIT 7 Consolidated Statements of Earnings, Best Buy Co., Inc.
SOURCE: Best Buy Co., Inc. 2009 Form 10-K, p. 57.
Wal-MartBest Buy saw its largest rival, Circuit City, go bankrupt. However, a new archrival, Wal-Mart,was expanding into consumer electronics and stepping up competition in a price war Wal-Marthoped to win. Best Buy needed to face the competition not by lowering prices, but by comingup with something really different. Best Buy had to determine the correct path to improve itsability to differentiate itself from competitors, which was increasingly difficult given anadverse economic climate and the company’s financial stress. How Best Buy could maintaininnovative products, top-notch employees, and superior customer service while facing in-creased competition and operational costs was an open question.
CASE 24 Best Buy Co. Inc.: Sustainable Customer Centricity Model? 24-13
1. Best Buy Co. Inc., Form 10-K. Securities and Exchange Com-mission, February 28, 2009.
2. Ibid.3. Ibid.4. Greg Keller, “Threat Grows by Ipod and Laptop,” The Colum-
bus Dispatch, May 18, 2009, http://www.dispatch.com/live/content/business/stories/2009/05/18/greener_gadgets.ART_ART_05-18-09_A9_TMDSJR8.html (July 10, 2009).
5. Larry Magid, “Consumer Electronics: The Future LooksBright,” CBSNews.com. May 2, 2008, http://www.cbsnews.com/stories/2008/05/02/scitech/pcanswer/main4067008.shtml(July 10, 2009).
6. Best Buy Co. Inc., Form 10-K, 2009.7. Ibid.8. Ibid.9. Ibid.
10. Manhattan Institute for Policy Research, “They’re Making a Fed-eral Case Out of It . . . in State Court,” Civil Justice Report 3. 2001,http://www.manhattan-institute.org/html/cjr_3_part2.htm.
11. “Best Buy Bombshell,” HD Guru, March 21, 2009, http://hdguru.com/best-buy-bombshell/400/.
12. Circuit City Stores Inc. was an American retailer in brand-nameconsumer electronics, personal computers, entertainment soft-ware, and (until 2000) large appliances. The company openedits first store in 1949 and liquidated its final American retailstores in 2009 following a bankruptcy filing and subsequentfailure to find a buyer. At the time of liquidation, Circuit Citywas the second largest U.S. electronics retailer, after Best Buy.
13. Z. Bissonnette, “Wal-Mart Looks to Expand ElectronicsBusiness,” Bloggingstocks.com, May 18, 2009, http://www.bloggingstocks.com/2009/05/18/wal-mart-looks-to-expand-electronics-business/.
14. N. Maestrie, “Wal-Mart Steps Up Consumer Electronics Push,”Reuters, May 19, 2009, http://www.reuters.com/article/technologyNews/idUSTRE54I4TR20090519.
15. Capital IQ, “GameStop Corp. Corporate Tearsheet,” CapitalIQ, 2009.
16. E. Sherman, “GameStop Faces Pain from Best Buy, download-ing,” BNET Technology, June 24, 2009, http://industry.bnet.com/technology/10002329/gamestop-faces-pain-from-best-buy-downloading/.
17. T. Van Riper, “RadioShack Gets Slammed,” Forbes.com,February 17, 2006, http://www.forbes.com/2006/02/17/radioshack-edmondson-retail_cx_tr_0217radioshack.html.
18. Capital IQ, “Amazon.com Corporate Tearsheet,” Capital IQ,2009.
19. T. Kee, “Netflix Beware: Best Buy Adds Digital Downloads with CinemaNow Deal,” paidContent.org. June 5, 2009, http://paidcontent.org/article/419-best-buy-adds-digital-movie-downloads-with-cinemanow-deal/.
20. Best Buy Co., Inc., Form 10-K, 2009.21. Ibid.22. Ibid.
N O T E S

This page intentionally left blank
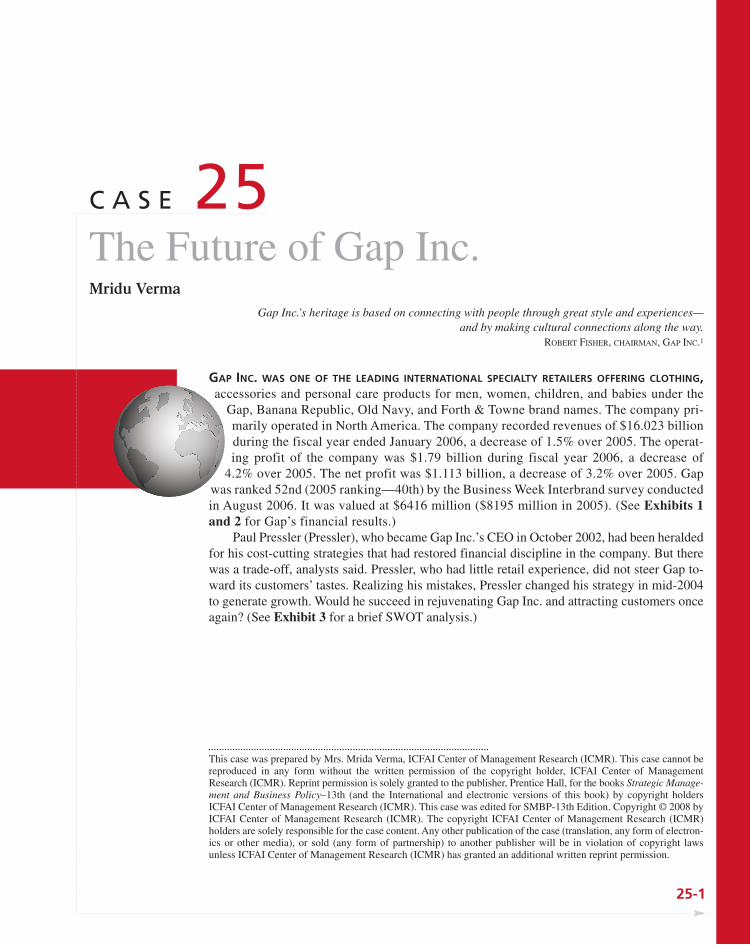
GAP INC. WAS ONE OF THE LEADING INTERNATIONAL SPECIALTY RETAILERS OFFERING CLOTHING,accessories and personal care products for men, women, children, and babies under the
Gap, Banana Republic, Old Navy, and Forth & Towne brand names. The company pri-marily operated in North America. The company recorded revenues of $16.023 billionduring the fiscal year ended January 2006, a decrease of 1.5% over 2005. The operat-ing profit of the company was $1.79 billion during fiscal year 2006, a decrease of
4.2% over 2005. The net profit was $1.113 billion, a decrease of 3.2% over 2005. Gapwas ranked 52nd (2005 ranking—40th) by the Business Week Interbrand survey conductedin August 2006. It was valued at $6416 million ($8195 million in 2005). (See Exhibits 1and 2 for Gap’s financial results.)
Paul Pressler (Pressler), who became Gap Inc.’s CEO in October 2002, had been heraldedfor his cost-cutting strategies that had restored financial discipline in the company. But therewas a trade-off, analysts said. Pressler, who had little retail experience, did not steer Gap to-ward its customers’ tastes. Realizing his mistakes, Pressler changed his strategy in mid-2004to generate growth. Would he succeed in rejuvenating Gap Inc. and attracting customers onceagain? (See Exhibit 3 for a brief SWOT analysis.)
This case was prepared by Mrs. Mrida Verma, ICFAI Center of Management Research (ICMR). This case cannot bereproduced in any form without the written permission of the copyright holder, ICFAI Center of Management Research (ICMR). Reprint permission is solely granted to the publisher, Prentice Hall, for the books Strategic Manage-ment and Business Policy–13th (and the International and electronic versions of this book) by copyright holders ICFAI Center of Management Research (ICMR). This case was edited for SMBP-13th Edition. Copyright © 2008 byICFAI Center of Management Research (ICMR). The copyright ICFAI Center of Management Research (ICMR)holders are solely responsible for the case content. Any other publication of the case (translation, any form of electron-ics or other media), or sold (any form of partnership) to another publisher will be in violation of copyright laws unless ICFAI Center of Management Research (ICMR) has granted an additional written reprint permission.
25-1
C A S E 25The Future of Gap Inc.Mridu Verma
Gap Inc.’s heritage is based on connecting with people through great style and experiences—and by making cultural connections along the way.
ROBERT FISHER, CHAIRMAN, GAP INC.1
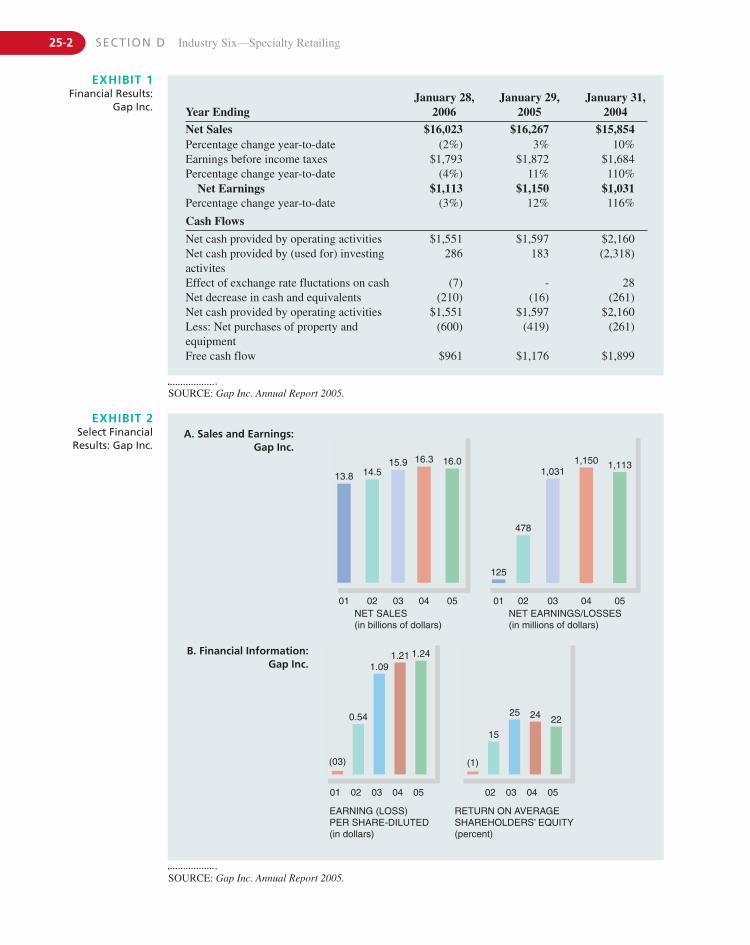
25-2 SECTION D Industry Six—Specialty Retailing
EXHIBIT 1Financial Results:
Gap Inc.
SOURCE: Gap Inc. Annual Report 2005.
Year EndingJanuary 28,
2006January 29,
2005January 31,
2004
Net Sales $16,023 $16,267 $15,854Percentage change year-to-date (2%) 3% 10%Earnings before income taxes $1,793 $1,872 $1,684Percentage change year-to-date (4%) 11% 110%
Net Earnings $1,113 $1,150 $1,031Percentage change year-to-date (3%) 12% 116%
Cash Flows
Net cash provided by operating activities $1,551 $1,597 $2,160Net cash provided by (used for) investingactivites
286 183 (2,318)
Effect of exchange rate fluctations on cash (7) - 28Net decrease in cash and equivalents (210) (16) (261)Net cash provided by operating activities $1,551 $1,597 $2,160Less: Net purchases of property and equipment
(600) (419) (261)
Free cash flow $961 $1,176 $1,899
EXHIBIT 2Select Financial
Results: Gap Inc.
SOURCE: Gap Inc. Annual Report 2005.
01
13.8
02
14.5
03
15.9
04
16.3
05
16.0
NET SALES(in billions of dollars)
01 02 03 04 05
1,0311,150
125
478
1,113
NET EARNINGS/LOSSES(in millions of dollars)
01 02 03 04 05
(03)
0.54
1.091.21 1.24
EARNING (LOSS)PER SHARE-DILUTED(in dollars)
25 24
(1)
02
15
03 04 05
22
RETURN ON AVERAGESHAREHOLDERS’ EQUITY(percent)
B. Financial Information: Gap Inc.
A. Sales and Earnings: Gap Inc.
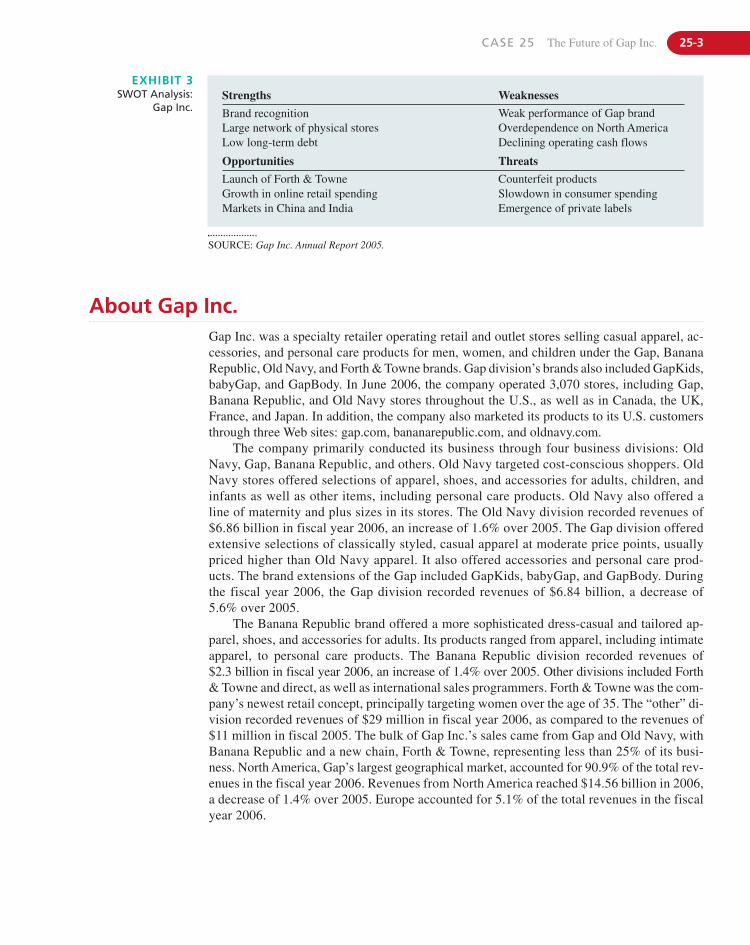
CASE 25 The Future of Gap Inc. 25-3
EXHIBIT 3SWOT Analysis:
Gap Inc.
SOURCE: Gap Inc. Annual Report 2005.
Strengths Weaknesses
Brand recognition Weak performance of Gap brandLarge network of physical stores Overdependence on North AmericaLow long-term debt Declining operating cash flows
Opportunities Threats
Launch of Forth & Towne Counterfeit productsGrowth in online retail spending Slowdown in consumer spendingMarkets in China and India Emergence of private labels
About Gap Inc.Gap Inc. was a specialty retailer operating retail and outlet stores selling casual apparel, ac-cessories, and personal care products for men, women, and children under the Gap, BananaRepublic, Old Navy, and Forth & Towne brands. Gap division’s brands also included GapKids,babyGap, and GapBody. In June 2006, the company operated 3,070 stores, including Gap,Banana Republic, and Old Navy stores throughout the U.S., as well as in Canada, the UK,France, and Japan. In addition, the company also marketed its products to its U.S. customersthrough three Web sites: gap.com, bananarepublic.com, and oldnavy.com.
The company primarily conducted its business through four business divisions: OldNavy, Gap, Banana Republic, and others. Old Navy targeted cost-conscious shoppers. OldNavy stores offered selections of apparel, shoes, and accessories for adults, children, andinfants as well as other items, including personal care products. Old Navy also offered aline of maternity and plus sizes in its stores. The Old Navy division recorded revenues of$6.86 billion in fiscal year 2006, an increase of 1.6% over 2005. The Gap division offeredextensive selections of classically styled, casual apparel at moderate price points, usuallypriced higher than Old Navy apparel. It also offered accessories and personal care prod-ucts. The brand extensions of the Gap included GapKids, babyGap, and GapBody. Duringthe fiscal year 2006, the Gap division recorded revenues of $6.84 billion, a decrease of5.6% over 2005.
The Banana Republic brand offered a more sophisticated dress-casual and tailored ap-parel, shoes, and accessories for adults. Its products ranged from apparel, including intimateapparel, to personal care products. The Banana Republic division recorded revenues of$2.3 billion in fiscal year 2006, an increase of 1.4% over 2005. Other divisions included Forth & Towne and direct, as well as international sales programmers. Forth & Towne was the com-pany’s newest retail concept, principally targeting women over the age of 35. The “other” di-vision recorded revenues of $29 million in fiscal year 2006, as compared to the revenues of$11 million in fiscal 2005. The bulk of Gap Inc.’s sales came from Gap and Old Navy, withBanana Republic and a new chain, Forth & Towne, representing less than 25% of its busi-ness. North America, Gap’s largest geographical market, accounted for 90.9% of the total rev-enues in the fiscal year 2006. Revenues from North America reached $14.56 billion in 2006,a decrease of 1.4% over 2005. Europe accounted for 5.1% of the total revenues in the fiscalyear 2006.
25-4 SECTION D Industry Six—Specialty Retailing
Background NoteGap
Gap was set up by Donald Fisher in 1969. After a pair of Levi’s jeans purchased by himfell short of his size requirements, Fisher sensed a gap in the market. He decided to startan only-jeans outlet that offered a wide range of sizes to the customers. With this inten-tion, the first store was started in San Francisco. To reinforce the choices available at thestores, Gap’s first advertisement carried the tag line “four tons of Levi’s.” The retail con-cept was an instant hit. Gap’s “basics look” comprising signature (Levi’s) blue jeans andwhite cotton shirts became a rage. Initially the goods were sold at Levi’s controlled prices,allowing Fisher to earn hefty margins (in the region of 50%). A 1976 Federal Trade Commis-sion (FTC) directive banned manufacturers from setting the retail price. With an increasingnumber of retailers discounting their retail offerings, competition in the market heated up andmargins dried up. Fisher parted ways with Levi’s and shifted to high-margin private labels. By1980, 200 Gap outlets in the U.S. offered 14 different private labels, such as Foxtails, Mon-terey Bay, and Durango. As other retailers started taking the same private label route to bol-ster their margins. Gap seemed to be getting lost in the crowd. It was at this juncture thatFisher hired Millard “Mickey” Drexler (Drexler) to give a new direction to Gap.
When Drexler joined Gap in 1983, the company’s turnover was just $500 million. Hedumped the private-label brands and introduced Gap as a clothing brand. Soon, Gap controlledeverything from manufacturing to marketing to the distribution of its offerings. Gap took ad-vantage of America’s casual-dress trend. Whenever growth appeared to slow, Drexler came upwith something new: GapKids, babyGap, and then discount stores. Gap led the corporatedress-down revolution, and earnings grew at an average of 30% for the five years through1999. In the mid-1990s, the Gap was so much a part of American pop culture that it warrantedits own skit on Saturday Night Live. Unfortunately, Gap’s khakis-and-blue-shirt formulaproved remarkably easy to replicate. The company soon found itself competing with discountretailers such as Target and Wal-Mart.
When laid-off dot-commers stopped loading up on casual clothes, Gap took desperatemeasures to lift sales, stocking trendy miniskirts and low-rise jeans to chase teenage shoppers.Its purple shirts in extra large sizes did not find any buyers. Gap’s core 30-and-over clientele,once Gap’s mainstay, fled to rivals such as value retailers Target and Kohl’s.
Banana RepublicStarted by Mel and Patricia Ziegler in 1978, Banana Republic was positioned as an adven-ture lifestyle store. It retailed bush jackets, travel trunks, travel books, fisherman hats, andexotic maps with most of its sales coming through catalogues. Its ascent coincided with the“safari fever”2 spreading across the U.S. in the early 1980s. When Banana Republic’s salestouched the $10 million mark in 1983, its stores were bought by Gap.
Gap transformed Banana Republic from a catalog-based retailer to a physical retailer withlarge stores across the country. The stores offered lifestyle apparels tailored to consumersneeds. By 1987, Banana Republic was a successful retail concept with sales revenue of$191 million. With safaris going out of fashion, Banana Republic’s fortunes plunged. It re-ported a loss of $10 million in 1988. Banana underwent a makeover and shed its safari-stylemerchandise in favor of clothes for the dressed-down workplace, a strategy that sustained itthrough the dot-com era. The emphasis was on a “modern casual lifestyle” look. Banana Repub-lic was struggling to come up with a fashion mix that its 30-and-older customers, especiallymen, felt more comfortable wearing.
CASE 25 The Future of Gap Inc. 25-5
Old NavyStarted in 1994, Old Navy targeted price-conscious customers. Old Navy apparels used dif-ferent fabrics as compared to Gap and the stores were given a “fun” look.3 Using differentblends of fabric that helped keep its manufacturing costs low, Old Navy retailed basics for the whole family at two-thirds Gap’s prices. It sold budget-priced jeans, T-shirts, and khakipants to kids, teens, and young adults. Thanks to a very successful season of fleece tops andvests, Old Navy became the biggest contributor to the parent company’s overall growth in2000, even when sales declined at the core Gap chain.
Encouraged by the sales, Drexler opened 282 Old Navy stores in the next three years. OldNavy became the first-ever retail chain to reach $1 billion sales within four years. In 2004, OldNavy accounted for 41% of Gap Inc.’s total sales. Though comparatively successful, Old Navyhad its own share of problems. Consumers complained that it was always bulging with mer-chandise, with the floor often being permanently devoted to discounted goods to boost sales.In 2000, Old Navy shifted its focus to teenagers. Initially, the brand was immensely popularamong teenagers, but soon the brand became a casualty of teenagers’ fickle preferences.
“Old Navy’s been a bit of a problem child for them recently. In some ways it became avictim of its own success. The younger crowd went crazy for them and they met that demand,but now they’re realizing that they need to appeal to a larger audience,” an analyst observed.4
Old Navy, whose merchandise mix was skewed too far toward teens in 2001, needed to winback grownups. Old Navy also needed to restore a distinct identity to avoid drawing bargain-hunting Gap shoppers.
Drexler acknowledged that each of the company’s three core brands—Gap, BananaRepublic, and Old Navy—had “come untethered from the tight rapport with consumers thataccounted for its earlier prosperity.” In the mid-1990s, Gap had embarked on an expansionspree, increasing its retail square footage by more than 20% annually. Square footage at Gap’sthree chains doubled between 1999 and 2002 even as sales per square foot plunged from$548 to $393 during the same period. In 2001, Gap posted a loss of $7.8 million on sales of $13.8 billion.5 By March 2002, rating agencies had downgraded Gap Inc.’s debt from in-vestment grade to junk. Heavy markdowns sliced Gap’s gross margins by 40%. In 2002, Gappaid interest worth $145 million on the $2 billion debt it had raised to fund its expansion plans.To make things worse, Gap’s per-store sales declined for 29 months straight as profits van-ished. Drexler stepped down in September 2002. He was replaced by Paul Pressler (Pressler),who had been running Disney’s consumer stores (which were later sold) and the Disneylandtheme park (where he expanded the souvenir shops and restaurants), and oversaw all Disneyparks and resorts, but had no previous fashion retail experience.
Pressler’s Turnaround StrategyInitially, Pressler focused on cost cutting, consumer research, and more targeted marketing ofthe three brands. Working with CFO Byron Pollitt (Pollitt), whom he had brought over fromDisney, Pressler shut down hundreds of stores, consolidated production among fewer suppli-ers, and revamped inventory management. He reduced the inventory per square foot by 16%.He attempted to increase margins by selling clothes closer to full price. To end panicky clear-ance sales, Pressler ordered managers to rely increasingly on software that would tell themwhen and by how much to mark down merchandise. Micro-management was replaced byhands-off leadership. Pressler was not as interested in product details. He left specific colorand design decisions to Gap, Old Navy, and Banana Republic division heads. Pressler devotedmore attention to areas visible to the customer, including marketing and store atmosphere.
He hired what he called a “chief algorithm officer” to analyze the sales from every cash reg-ister. It turned out that Gap had been sending the same size assortments to stores with different
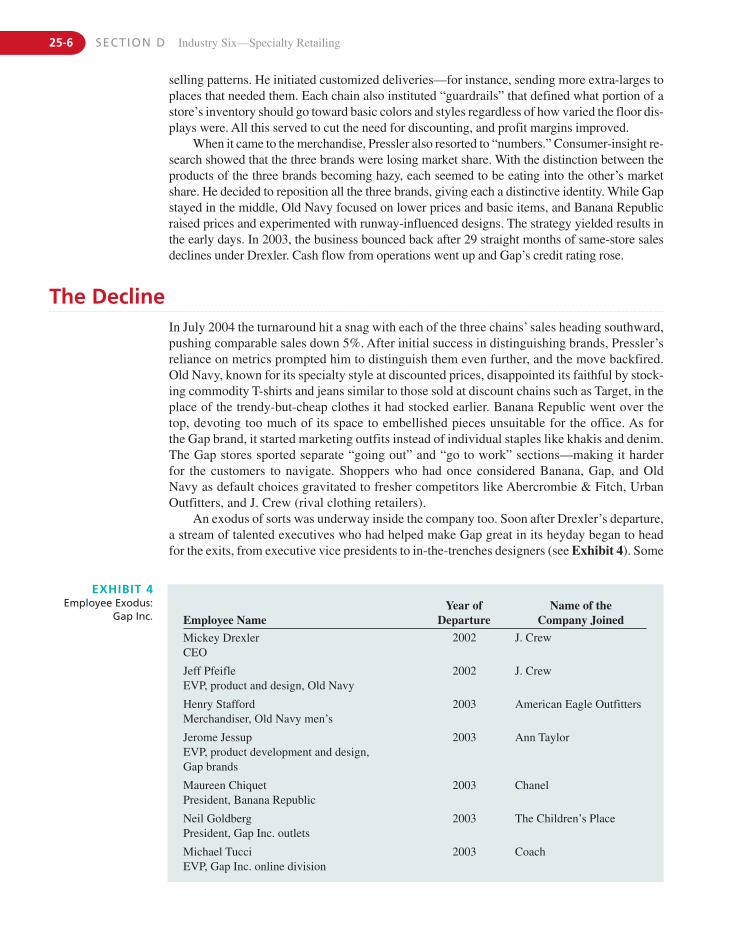
25-6 SECTION D Industry Six—Specialty Retailing
The DeclineIn July 2004 the turnaround hit a snag with each of the three chains’ sales heading southward,pushing comparable sales down 5%. After initial success in distinguishing brands, Pressler’sreliance on metrics prompted him to distinguish them even further, and the move backfired.Old Navy, known for its specialty style at discounted prices, disappointed its faithful by stock-ing commodity T-shirts and jeans similar to those sold at discount chains such as Target, in theplace of the trendy-but-cheap clothes it had stocked earlier. Banana Republic went over thetop, devoting too much of its space to embellished pieces unsuitable for the office. As for the Gap brand, it started marketing outfits instead of individual staples like khakis and denim.The Gap stores sported separate “going out” and “go to work” sections—making it harder for the customers to navigate. Shoppers who had once considered Banana, Gap, and Old Navy as default choices gravitated to fresher competitors like Abercrombie & Fitch, UrbanOutfitters, and J. Crew (rival clothing retailers).
An exodus of sorts was underway inside the company too. Soon after Drexler’s departure,a stream of talented executives who had helped make Gap great in its heyday began to headfor the exits, from executive vice presidents to in-the-trenches designers (see Exhibit 4). Some
EXHIBIT 4Employee Exodus:
Gap Inc. Employee NameYear of
DepartureName of the
Company Joined
Mickey DrexlerCEO
2002 J. Crew
Jeff PfeifleEVP, product and design, Old Navy
2002 J. Crew
Henry StaffordMerchandiser, Old Navy men’s
2003 American Eagle Outfitters
Jerome JessupEVP, product development and design, Gap brands
2003 Ann Taylor
Maureen ChiquetPresident, Banana Republic
2003 Chanel
Neil GoldbergPresident, Gap Inc. outlets
2003 The Children’s Place
Michael TucciEVP, Gap Inc. online division
2003 Coach
selling patterns. He initiated customized deliveries—for instance, sending more extra-larges toplaces that needed them. Each chain also instituted “guardrails” that defined what portion of astore’s inventory should go toward basic colors and styles regardless of how varied the floor dis-plays were. All this served to cut the need for discounting, and profit margins improved.
When it came to the merchandise, Pressler also resorted to “numbers.” Consumer-insight re-search showed that the three brands were losing market share. With the distinction between theproducts of the three brands becoming hazy, each seemed to be eating into the other’s marketshare. He decided to reposition all the three brands, giving each a distinctive identity. While Gapstayed in the middle, Old Navy focused on lower prices and basic items, and Banana Republicraised prices and experimented with runway-influenced designs. The strategy yielded results inthe early days. In 2003, the business bounced back after 29 straight months of same-store salesdeclines under Drexler. Cash flow from operations went up and Gap’s credit rating rose.
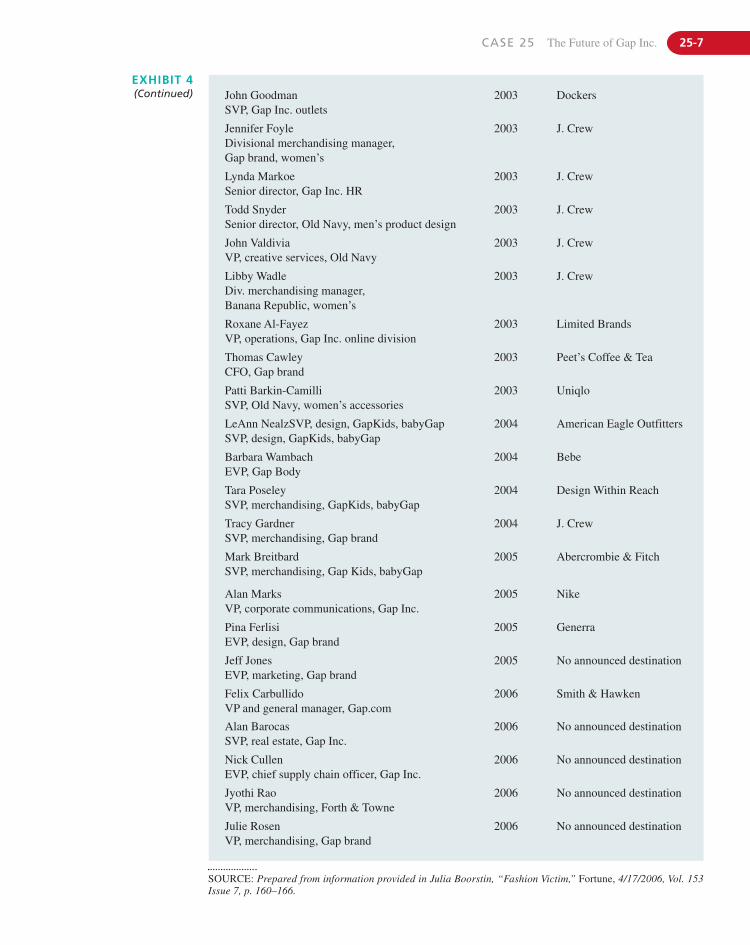
CASE 25 The Future of Gap Inc. 25-7
SOURCE: Prepared from information provided in Julia Boorstin, “Fashion Victim,” Fortune, 4/17/2006, Vol. 153Issue 7, p. 160–166.
John GoodmanSVP, Gap Inc. outlets
2003 Dockers
Jennifer FoyleDivisional merchandising manager, Gap brand, women’s
2003 J. Crew
Lynda MarkoeSenior director, Gap Inc. HR
2003 J. Crew
Todd SnyderSenior director, Old Navy, men’s product design
2003 J. Crew
John ValdiviaVP, creative services, Old Navy
2003 J. Crew
Libby WadleDiv. merchandising manager, Banana Republic, women’s
2003 J. Crew
Roxane Al-FayezVP, operations, Gap Inc. online division
2003 Limited Brands
Thomas CawleyCFO, Gap brand
2003 Peet’s Coffee & Tea
Patti Barkin-CamilliSVP, Old Navy, women’s accessories
2003 Uniqlo
LeAnn NealzSVP, design, GapKids, babyGapSVP, design, GapKids, babyGap
2004 American Eagle Outfitters
Barbara WambachEVP, Gap Body
2004 Bebe
Tara PoseleySVP, merchandising, GapKids, babyGap
2004 Design Within Reach
Tracy GardnerSVP, merchandising, Gap brand
2004 J. Crew
Mark BreitbardSVP, merchandising, Gap Kids, babyGap
2005 Abercrombie & Fitch
Alan MarksVP, corporate communications, Gap Inc.
2005 Nike
Pina FerlisiEVP, design, Gap brand
2005 Generra
Jeff JonesEVP, marketing, Gap brand
2005 No announced destination
Felix CarbullidoVP and general manager, Gap.com
2006 Smith & Hawken
Alan BarocasSVP, real estate, Gap Inc.
2006 No announced destination
Nick CullenEVP, chief supply chain officer, Gap Inc.
2006 No announced destination
Jyothi RaoVP, merchandising, Forth & Towne
2006 No announced destination
Julie RosenVP, merchandising, Gap brand
2006 No announced destination
EXHIBIT 4(Continued)
25-8 SECTION D Industry Six—Specialty Retailing
were fired, others left on their own. “From the day I got here, we’ve had to assess our tal-ent,” mentioned Pressler,6 who called the turnover healthy and normal. But analysts and in-dustry observers were not so sanguine, with some analysts downgrading the company.Morgan Stanley analyst Michelle Clark opined that with other ex-Disney players such asGap-brand head Cynthia Harriss in key roles, the company’s lack of fashion expertise at thetop was being exacerbated by a drain of youthful morale and energy. Even company insidersechoed her fears. “Ten of the best 15 executives in all retail were working for the company.Now they’ve lost the creative people, almost all the merchandising and design leadership,” ob-served a former head of one Gap division.7
By the time Pressler faced investors in Spring 2005, the momentum he had built up in his first18 months was gone. He tried to shift Wall Street’s focus to the future, announcing that the com-pany would introduce a new store chain, Forth & Towne, for women 35 and over. More privately,he went back to the core brands, working with their respective presidents to analyze customersurveys. The identity of each chain was recalibrated: Gap would offer high-quality basics withstyle; Banana Republic would emphasize fashionable classics but avoid the cutting edge; OldNavy would rededicate itself to low-priced trendy items. Pressler also cut the nine-month pro-duction cycle on some Old Navy clothes to three months—so it could adapt to emerging trendsmore readily—by moving designers from New York to its San Francisco headquarters, posi-tioning some merchants closer to factories in Southeast Asia, and sourcing more items in NorthAmerica. Gap’s 2005 fall line featured its classic navy, gray, crisp white, and denim, plus somericher materials—washed leather and cotton cashmere. Meanwhile, Banana Republic pulledback from fashion extremes and was focusing on the classics. At Old Navy—to which Presslerwas looking for a big chunk of the company’s growth—product quality was improved noticeably.
Gap continued to face a perception problem—a struggle to recapture customers who hadabandoned it. Fiscally and operationally, Gap was a tighter, stronger business than it was in2002. Pressler had hedged its fashion bets. Company-commissioned research was directingbrand presidents on how they could expand the chains into what Pressler called “lifestylebrands,” with line extensions such as accessories and baby-wear. While creating the Forth &Towne chain appeared a gamble, Pressler felt that the numbers pointed to an untapped market.Industry observers, however, opined that no matter how carefully calibrated Gap’s fashionchoices were, the nature of the business required a certain degree of risk taking. No one knewwhat consumers would actually buy until the goods were on the shelves.
Pressler also started investing more in the stores, where Gap’s minimalist look too oftenappeared dated and shabby, replacing it with darker-wood fixtures (like Abercrombie), paintedwalls (like J. Crew), and more dramatic window displays. A back wall dedicated to denim anda colorful “T-shirt bar” highlighted Gap’s traditional expertise. New spotlighting, hand-drawnchalk signs, and artful displays of intertwined jeans created a sense of theatricality. By year-end 2005, 60 Gap stores had been redesigned, with another 220 of the chain’s 1,335 storesscheduled to get the new look in 2006. The company expected to draw customers into thestores, so that they would notice the better-designed, higher-quality products. In 2005, thecompany opened 198 new stores and closed 139. In 2006, the company expected to open about175 store locations, weighted toward the Old Navy brand, and close about 135 store locations,weighted toward the Gap brand. Square footage was expected to increase between 1% and2% for fiscal year 2006. (See Exhibit 5.)
All this came at a financial cost, pushing Gap’s capital expenditures to among the high-est in specialty retail. It also meant operating margins would drop to between 10% and10.5% in 2006. For the year 2005, Gap group posted sales of $16 billion, a 2% drop com-pared with $16.3 billion for 2004. Comparative store sales for the year 2005 decreased by5%, as against flat sales in 2004. Sales at the flagship Gap stores in the U.S. were essentiallyflat at $1.2 billion year-over-year in 2005, but sales on the international front lost 5.6% to$339 million from $359 million a year ago. By February 2006, customer traffic across the
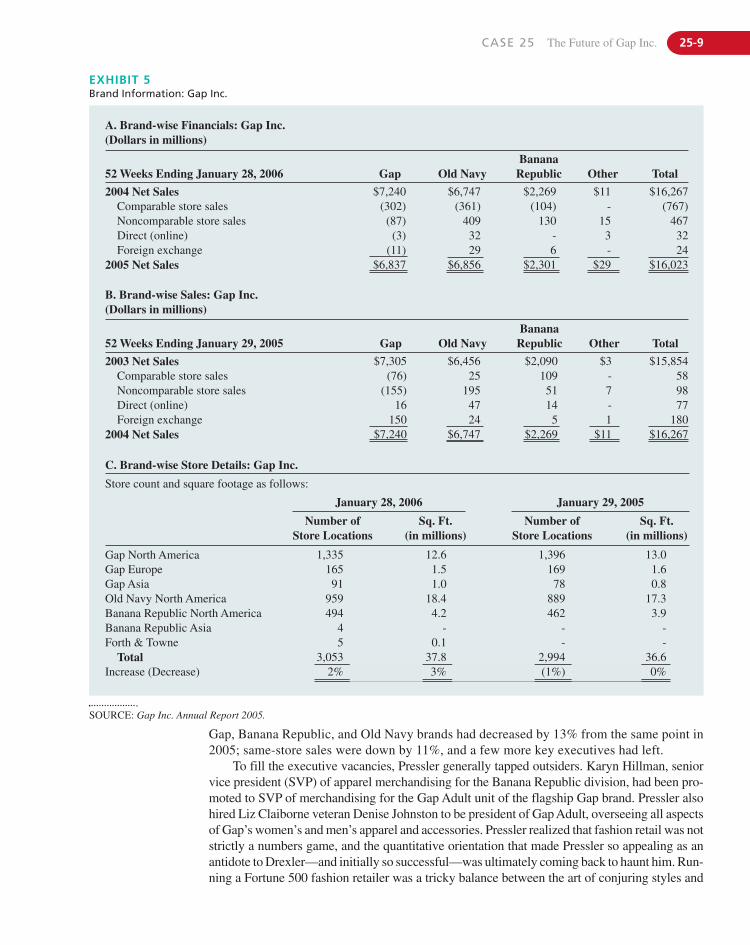
CASE 25 The Future of Gap Inc. 25-9
EXHIBIT 5Brand Information: Gap Inc.
SOURCE: Gap Inc. Annual Report 2005.
A. Brand-wise Financials: Gap Inc.(Dollars in millions)
52 Weeks Ending January 28, 2006 Gap Old NavyBanana
Republic Other Total
2004 Net Sales $7,240 $6,747 $2,269 $11 $16,267Comparable store sales (302) (361) (104) - (767)Noncomparable store sales (87) 409 130 15 467Direct (online) (3) 32 - 3 32Foreign exchange (11) 29 6 - 24
2005 Net Sales $6,837 $6,856 $2,301 $29 $16,023
B. Brand-wise Sales: Gap Inc. (Dollars in millions)
52 Weeks Ending January 29, 2005 Gap Old NavyBanana
Republic Other Total
2003 Net Sales $7,305 $6,456 $2,090 $3 $15,854Comparable store sales (76) 25 109 - 58Noncomparable store sales (155) 195 51 7 98Direct (online) 16 47 14 - 77Foreign exchange 150 24 5 1 180
2004 Net Sales $7,240 $6,747 $2,269 $11 $16,267
C. Brand-wise Store Details: Gap Inc.
Store count and square footage as follows:
January 28, 2006 January 29, 2005
Number of Store Locations
Sq. Ft. (in millions)
Number of Store Locations
Sq. Ft. (in millions)
Gap North America 1,335 12.6 1,396 13.0Gap Europe 165 1.5 169 1.6Gap Asia 91 1.0 78 0.8Old Navy North America 959 18.4 889 17.3Banana Republic North America 494 4.2 462 3.9Banana Republic Asia 4 - - -Forth & Towne 5 0.1 - -
Total 3,053 37.8 2,994 36.6Increase (Decrease) 2% 3% (1%) 0%
Gap, Banana Republic, and Old Navy brands had decreased by 13% from the same point in2005; same-store sales were down by 11%, and a few more key executives had left.
To fill the executive vacancies, Pressler generally tapped outsiders. Karyn Hillman, seniorvice president (SVP) of apparel merchandising for the Banana Republic division, had been pro-moted to SVP of merchandising for the Gap Adult unit of the flagship Gap brand. Pressler alsohired Liz Claiborne veteran Denise Johnston to be president of Gap Adult, overseeing all aspectsof Gap’s women’s and men’s apparel and accessories. Pressler realized that fashion retail was notstrictly a numbers game, and the quantitative orientation that made Pressler so appealing as anantidote to Drexler—and initially so successful—was ultimately coming back to haunt him. Run-ning a Fortune 500 fashion retailer was a tricky balance between the art of conjuring styles and
25-10 SECTION D Industry Six—Specialty Retailing
Recovery EffortsIn the summer of 2006, Gap launched a new marketing campaign called Rock Color to spot-light summer offerings. Inspired by the summer of 1969, the year the company was founded,the promotion featured a pop-up store, which was actually a converted school bus from theSixties that would drive to summer resort spots on a mission to sell T-shirts, hoodies, flip-flops, and beach hats. The campaign also involved in-store promotions, windows, print ads,direct-mail, and outdoor ads and an online microsite offering customers the chance to winconcert tickets. Color was a key component of the campaign. Gap also introduced a contestfor customers in New York, Los Angeles, San Francisco, and Chicago to win tickets to con-certs. Additionally, one grand-prize winner would receive a trip for two and backstage passesto Gap’s private concert featuring John Legend.
Inspired by the success of Hennes & Mauritz,9 Gap entered into a partnership with Britishdesigner Roland Mouret (Mouret) to launch a capsule collection of dresses in selected storesof Europe and a handful of units in New York. The company hoped to increase traffic to itsstores through these initiatives. The move was lauded by analysts. Christine Chen, senior re-search analyst at Pacific Growth Equities said, “Gap needs to rejuvenate their customer, whomthey have been disappointing for two years. Their problem has not been their merchandise,which I think has improved drastically, it’s the stigma associated with the brand.”10 Gap hadbeen attempting to recast its image throughout 2006 summer and back-to-school season withthe return of television ads, its Audrey Hepburn campaign for the return of basic pants and,most recently, product RED.
The Mouret collection was also a part of the Gap (RED) line and featured 10 dresses, rang-ing in price from 45 pounds to 78 pounds, or about $85 to $148.11 Styles included belted shirt-dresses; Courreges-inspired numbers and tunics with bib fronts or ruffled V-necks in charcoal,silver-gray, navy, black, and red. The collection was seen by analysts as the next step in bring-ing back old customers and getting new shoppers interested in the store. Mouret said he hadteamed up with Gap for a variety of reasons. “They came to me because they felt they weren’tstrong in the dress category. They wanted a new project that would take Gap dresses to a newlevel. I have always been a fan of Gap—I like their laid-back attitude, and it was the right mixof people to work with.”12
In April 2006, Pressler decided to concentrate on Southeast Asia to generate growth. Heentered into a franchise agreement with the leading retailers in Singapore, Kuala Lumpur,Malaysia, and the Middle East to open Gap and Banana Republic stores there. This was thefirst franchisee agreement entered into by the U.S.-based retailer that had always operatedcompany-owned stores. The main benefit of franchise partners was that they provided the lo-cal knowledge and experience to allow the company to quickly tap new markets. The merchan-dise in the new stores was a franchise-specific mix of products from the North American andEuropean collections as well as items not available in other markets. Prices were about 10 to15% more in the new stores, mainly because of import costs and high rent.
Looking AheadIn the third quarter of 2006, Gap Inc. reported a 10.8% decline in third-quarter earnings duein part to sagging sales at Old Navy. Foot traffic to the chains was also on the decline. At Gap,which was all but synonymous with the American mall, sales had fallen every month for the
the discipline of managing an enormous and far-flung operation. Pressler seemed much morecomfortable talking corporate strategy than clothing styles. He defined his task as “meetinginvestor expectations, building platforms, and building a vision of where we want to go.”8
CASE 25 The Future of Gap Inc. 25-11
N O T E S1. Chairman’s address Gap Inc’s Annual Report 2005.2. Films such as Raiders of Lost Ark and Romancing the Stone
were at their peak during this period.3. Old Navy had a practical décor, a lively ambiance, and concrete
floors unlike hardwood floors at Gap’s elite stores.4. Lee, Louise, “Gap: Missing that Ol’ Micky Magic,” Business
Week, October 29, 2001 Issue 3755, p. 86.5. Gap had posted a profit of $877 million in 2000.6. Julia. Boorstin, “Fashion Victim,” Fortune, April 17, 2006, Vol.
153, Issue 7, pp. 160–166.7. Ibid.8. Julia Boorstin, “Fashion Victim,” Fortune, April 17, 2006,
Vol. 153, Issue 7, pp. 160–166.
9. While Gap executives downplayed the comparison, the linkwith Mouret mirrored the strategy H&M had carried out overthe last few seasons by teaming up with designers, includingKarl Lagerfeld, Stella McCartney and, in 2006, with Viktor &Rolf.
10. Moin, David, “Gap Brand Taps Hillman For Merchandising,”Women’s Wear Daily, December 13, 2006, Vol. 192, Issue 124,p. 11.
11. At December 2006 exchange rate.12. Moin, David, “Gap Brand Taps Hillman for Merchandising
Post.” Women’s Wear Daily, December 13, 2006, Vol. 192,Issue 124, p. 11.
year 2006, as executives experimented with a dizzying number of fashions and store layouts.In the end, consumers appeared more confused than intrigued by the incessant changes. In thefourth quarter, overall sales fell by 8%, led by Old Navy and to some extent the flagship brandGap. Interestingly, Banana Republic sales had rebounded. The comeback at Gap Inc. re-mained a work in progress. A rotating cast of designers had tried to recreate the Gap brand—with expensive handbags, bell-bottom jeans, and evening gowns—but the result was the same:sales fell.
The overall decline in sales prompted the Gap Inc. board to hire Goldman Sachs (Goldman)to explore strategies ranging from the sale of its 3,000 stores to spinning off a single division,such as Banana Republic, which had become enticing to potential buyers. Goldman was expectedto conduct a full review of Gap’s business lines and then present a plan to directors.
Any decision about Gap’s future would be made by the company’s founding family, theFishers, who controlled more than 30% of its stock. A sale of Gap would be one of the largestbuyouts ever in the retail industry. The company’s prevailing market value in January 2007 was$16.4 billion, and analysts expected that a buyer would have to pay more than $18 billion.

This page intentionally left blank
Introduction
SITTING AT HIS DESK, ADMIRING THE COLORADO MOUNTAINS IN THE DISTANCE, Frank Crail wascounting his blessings at the success of Rocky Mountain Chocolate Factory Inc. (RMCF)over the past 27 years. The company had not only allowed him and his wife to raise their chil-
dren in Durango, Colorado, but had also provided them a more-than-comfortable livelihood.Crail knew that for his company to continue to grow and be successful, planning for the future wasnecessary. How long would growth continue in the gourmet segment of the chocolate industry? Con-sumer tastes were changing. Competition was heating up, with smaller companies being boughtby corporate giants who were eying the growth in the gourmet segment of the market. RMCF’sbusiness model had been effective, but should changes be considered? With one last glance atthe beginnings of springtime in the mountains, Crail left for RMCF’s annual planning meetingand his management team waiting in the board room across the hall.
26-1
C A S E 26Rocky Mountain Chocolate Factory Inc. (2008):RECIPE FOR SUCCESS?Annie Phan and Joyce Vincelette
This case was prepared by Annie Phan, a student, and Professor Joyce Vincelette of the College of New Jersey. Thiscase cannot be reproduced in any form without the written permission of the copyright holder, Annie Phan and Pro-fessor Joyce Vincelete. Reprint permission is solely granted to the publisher, Prentice Hall, for the book StrategicManagement and Business Policy-13th ed. (and the International and electronic versions of this book) by copyrightholders, Annie Phan and Professor Joyce Vincelete. This case was edited for SMBP-13th Edition. Copyright © 2008by Annie Phan and Professor Joyce Vincelete. The copyright holders are solely responsible for the case content. Anyother publication of the case (translation, any form of electronics or other media), or sold (any form of partnership) toanother publisher will be in violation of copyright laws unless Annie Phan and Professor Joyce Vincelete have grantedan additional written reprint permission.
History1
Rocky Mountain Chocolate Factory (RMCF) was built around a location and a lifestyle. RMCFbegan as Frank Crail’s dream to move his family from crowded and bustling Southern Califor-nia, where he owned CNI Data Processing Inc., a company that produced billing software for the
26-2 SECTION D Industry Six—Specialty Retailing
Corporate Governance11
The biographical sketches for the executive officers and directors as of April 30, 2008, wereas follows:
Executive OfficersFranklin E. Crail (age 66) co-founded the first RMCF store in May 1981. Since the incorpora-tion of the company in November 1982, he has served as its chief executive officer, president, anda director. He was elected chairman of the board in March 1986. Prior to founding the company,Mr. Crail was co-founder and president of CNI Data Processing Inc., a software firm that devel-oped automated billing systems for the cable television industry.
cable TV industry, to a slower-paced and family-friendly environment. He and his wife chose thesmall and quaint Victorian-era town of Durango, Colorado, and began surveying the town’s res-idents and merchants for business opportunities. “It came down to either a car wash or achocolate shop,” recalls the father of seven. “I think I made the right choice.”2
Founded in 1981 by Crail and two partners and incorporated in Colorado in 1982, RMCFwas successful from the start. In addition to the opening of the Durango store, Crail’s partnersopened stores in Breckenridge and Boulder, Colorado. The first franchised stores were openedin 1982 in Colorado Springs, and Park City, Utah. Crail later told ColoradoBiz that the “typi-cal franchisee was a professional who wanted to set out on a second career in a small, family-oriented town,”3 much as he himself had done. Crail’s two partners left the business in 1983.
Over the years, RMCF fine-tuned its chocolates and its strategy. In February 1986, Crailtook the company public, where it is now found on the NASDAQ under the symbol RMCF.Chain Store Age pronounced RMCF founder Frank Crail one of its Entrepreneurs of the Yearfor 1995. In the late 1990s most of the company-owned retail operations were closed or soldto franchisees, allowing RMCF to focus on franchising and manufacturing.
In 2008, RMCF was an international franchiser and confectionary manufacturer. The origi-nal shop “still stands on Main Street in Durango, with its sights and smells tempting tourists andlocals alike to experience a cornucopia of chocolaty treats before taking part in a scenic ride onthe Durango-Silverton Narrow Gauge Railroad or after a white water rafting trip through town.”4
As of March 31, 2008, there were five company-owned and 329 franchised RMCF storesoperating in 38 states (concentrated primarily on the west coast and in the Sun Belt), Canada,and the United Arab Emirates,5 with total revenues of $31,878,183.6
Frank Crail believed he had created the recipe that had driven the company to success.“The number one factor is the quality of the product,” said Crail. “Without that customersaren’t going to stay around long.”7 “As a testament, Crail proudly points to a page from Moneymagazine mounted on his office wall, which features Rocky Mountain Chocolate winning thecoveted 3-heart rating in a blind taste test. The candy maker’s chocolate beat out See’s Can-dies, Perugina, Teuscher, Godiva, and Fanny May for the richest chocolate, with intense nat-ural flavor.”8 In addition to product quality, taste, value, and variety having been key toRMCF’s business strategy, the company also believed that its store atmosphere and ambiance,its brand name recognition, its careful selection of sites for new stores and kiosks, its exper-tise in the manufacture, merchandising and marketing of chocolate and other candy products,and its commitment to customer service were keys to the accomplishment of its objective tobuild on its position as a leading international franchiser and manufacturer of high qualitychocolate and other confectionary products.9
“A great deal has happened over the years,” recounts Crail with a twinkle in his eye. “Inever imagined that in my search for a place to raise a family things would turn out so sweet!”10
CASE 26 Rocky Mountain Chocolate Factory Inc. (2008) 26-3
Bryan J. Merryman (age 47) joined the company in December 1997 as vice president, Finance,and chief financial officer. Since April 1999, Mr. Merryman has also served the company as chiefoperating officer and as a director, and since January 2000 as its treasurer. Prior to joining thecompany, Mr. Merryman was a principal in Knightsbridge Holdings Inc. (a leveraged buyoutfirm) from January 1997 to December 1997. Mr. Merryman also served as chief financial offi-cer of Super Shops Inc., a retailer and manufacturer of aftermarket auto parts from July 1996 toNovember 1997, and was employed for more than eleven years by Deloitte and Touche LLP, mostrecently as a senior manager.
Gregory L. Pope (age 41) became senior vice president of Franchise Development and Opera-tions in May 2004. Since joining the company in October 1990, he has served in various posi-tions, including store manager, new store opener, and franchise field consultant. In March 1996he became director of Franchise Development and Support. In June 2001 he became vice pres-ident of Franchise Development, a position he held until he was promoted to his present position.
Edward L. Dudley (age 44) joined the company in January 1997 to spearhead the company’snewly formed Product Sales Development function as vice president, sales and Marketing, withthe goal of increasing the company’s factory and retail sales. He was promoted to senior vicepresident in June 2001. During his 10-year career with Baxter Healthcare Corporation,Mr. Dudley served in a number of senior marketing and sales management capacities, includingmost recently that of director, Distribution Services from March 1996 to January 1997.
William K. Jobson (age 52) joined the company in July 1998 as director of information technol-ogy. In June 2001, he was promoted to chief information officer, a position created to enhancethe company’s strategic focus on information and information technology. From 1995 to 1998,Mr. Jobson worked for ADAC Laboratories in Durango, Colorado, a leading provider of diag-nostic imaging and information systems solutions in the healthcare industry, as manager of tech-nical services, and before that, regional manager.
Jay B. Haws (age 58) joined the company in August 1991 as vice president of Creative Services.Since 1981, Mr. Haws had been closely associated with the company, both as a franchisee andmarketing/graphic design consultant. From 1986 to 1991 he operated two RMCF franchises lo-cated in San Francisco. From 1983 to 1989 he served as vice president of Marketing for ImageGroup Inc., a marketing communications firm based in Northern California. Concurrently,Mr. Haws was co-owner of two other RMCF franchises located in Sacramento and WalnutCreek, California. From 1973 to 1983 he was principal of Jay Haws and Associates, an adver-tising and graphic design agency.
Virginia M. Perez (age 70) joined the company in June 1996 and has served as the company’scorporate secretary since February, 1997. From 1992 until joining the company, she was em-ployed by Huettig & Schromm Inc., a property management and development firm in Palo Alto,California, as executive assistant to the president and owner. Huettig & Schromm developed,owned, and managed over 1,000,000 square feet of office space in business parks and officebuildings on the San Francisco peninsula. Ms. Perez is a paralegal and has held various admin-istrative positions during her career, including executive assistant to the chairman and owner ofSunset Magazine & Books Inc.
DirectorsThe company bylaws provided for no fewer than three or more than nine directors. The boardhad previously fixed the number of directors at six. Directors were elected for one-year terms.Crail and Merryman were the only two internal board members. Directors of Rocky Moun-tain Chocolate Factory who did not also serve as an executive officer were as follows:
Gerald A. Kien (age 75) became a director in August 1995. He retired in 1995 from his positionsas president and chief executive officer of Remote Sensing Technologies Inc., a subsidiary of En-virotest Systems Inc., a company engaged in the development of instrumentation for vehicleemissions testing located in Tucson, Arizona. Mr. Kien has served as a director and as chairman
26-4 SECTION D Industry Six—Specialty Retailing
Store Concept15
RMCF shops were a blend of traditional and contemporary styles. The company sought to es-tablish a fun and inviting atmosphere in all of its locations. Unlike most other confectionarystores, each RMCF shop prepared certain products, including fudge and caramel apples, inthe store. Customers could observe store personnel making fudge from start to finish, includ-ing the mixing of ingredients in old-fashioned copper kettles and the cooling of the fudge onlarge granite or marble tables, and were often invited to sample the store’s products. RMCF
of the Executive Committee of Sun Electric Corporation since 1980 and as chairman, president,and chief executive officer of Sun Electric until retirement in 1993.
Lee N. Mortenson (age 71) has served on the board of directors of the company since 1987.Mr. Mortenson has been engaged in consulting and investments activities since July 2000, and wasa managing director of Kensington Partners LLC (a private investment firm) from June 2001 toApril 2006. Mr. Mortenson has been president and chief executive officer of Newell ResourcesLLC since 2002, providing management consulting and investment services. Mr. Mortensonserved as president, chief operating officer, and a director of Telco Capital Corporation ofChicago, Illinois, from January 1984 to February 2000. Telco Capital Corporation was princi-pally engaged in the manufacturing and real estate businesses. He was president, chief operat-ing officer, and a director of Sunstates Corporation from December 1990 to February 2000.Sunstates Corporation was a company primarily engaged in real estate development and man-ufacturing. Mr. Mortenson was a director of Alba-Waldensian Inc. from 1984 to July 1999, andserved as its president, chief executive officer, and director from February 1997 to July 1999.Alba was principally engaged in the manufacturing of apparel and medical products.
Fred M. Trainor (age 68) has served as a director of the company since August 1992. Mr. Trainor is the founder, and since 1984 has served as chief executive officer and president ofAVCOR Health Care Products Inc., Fort Worth, Texas (a manufacturer and marketer of spe-cialty dressings products). Prior to founding AVCOR Health Care Products Inc. in 1984,Mr. Trainor was a founder, chief executive officer, and president of Tecnol Inc. of Fort Worth,Texas (also a company involved with the health care industry). Before founding Tecnol Inc.,Mr. Trainor was with American Hospital Supply Corporation (AHSC) for 13 years in a numberof management capacities.
Clyde W. Engle (age 64) has served as a director of the company since January 2000.Mr. Engle is chairman of the board of directors and chief executive officer of sunstates cor-poration and chairman of the board of directors., president and chief executive officer of Lin-colnwood Bancorp, Inc. (formerly known as GSC Enterprises, Inc.), a one-bank holdingcompany, and chairman of the board and chief executive officer of its subsidiary, Bank ofLincolnwood.
The Board of Directors had determined that Klein, Mortensen, Trainor, and Engle were “inde-pendent directors” under Nasdaq Rule 4200. Mortenson, Trainor, and Kien served on the Au-diting Committee, Compensation Committee, and the Nominating Committee of thecompany’s board of directors.12
Directors of RMCF did not receive any compensation for serving on the board. Directorsreceived compensation for serving on board committees, chairing committees, and participat-ing in meetings. Directors who are not also officers or employees of the company were enti-tled to receive stock option awards.13
As of June 28, 2007, there were approximately 6,080,283 shares of common stockoutstanding and eligible to vote at the annual meeting. For each share of common stockheld, a shareholder was entitled to one vote on all matters voted on at the annual meetingexcept the election of directors. Shareholders had cumulative voting rights in the electionof directors.14
CASE 26 Rocky Mountain Chocolate Factory Inc. (2008) 26-5
Outlet CentersAs of February 29, 2008, there were approximately 110 factory outlet centers in the UnitedStates, and there were RMCF stores in approximately 67 (up from 65 in 2007) of these cen-ters in more than 25 states.
believed the in-store preparation and aroma of its products enhanced store ambiance, was funand entertaining for customers, conveyed an image of freshness and homemade quality, andencouraged additional impulse purchases by customers. According to Crail, “We have a greatmarketing advantage with our unique in-store candy demonstrations. Customers can watchthe cook spin a skewered apple in hot caramel or watch fudge being made before their eyes.Of course, everyone gets a sample!”16
RMCF stores opened prior to fiscal 2002 had a distinctive country Victorian décor. In fis-cal 2002, the company launched its revised store concept, intended specifically for high foottraffic regional shopping malls. This new store concept featured a sleeker and more contem-porary design that continued to prominently feature in-store cooking while providing a moreup-to-date backdrop for newly redesigned upscale packaging and displays. The company re-quired that all new stores incorporate the revised store design and also required that key ele-ments of the revised concept be incorporated into existing store designs upon renewal offranchise agreements or transfers in store ownership. Through March 31, 2008, 197 stores in-corporating the new design had been opened.
The average store size was approximately 1,000 square feet, approximately 650 squarefeet of which was selling space. Most stores were open seven days a week. Typical hours were10 a.m. to 9 p.m., Monday through Saturday, and 12 noon to 6 p.m. on Sundays. Store hoursin tourist areas may have varied depending upon the tourist season.
RMCF believed that careful selection of store sites was critical to its success, and itconsidered a number of factors in identifying suitable sites, including tenant mix, visibil-ity, attractiveness, accessibility, level of foot traffic, and occupancy costs. The company be-lieved that the experience of its management team in evaluating potential sites was one ofits competitive strengths, and all final site selection had to be approved by senior manage-ment. RMCF had established business relationships with most of the major regional andfactory outlet center developers in the United States and believed these relationships pro-vided it with the opportunity to take advantage of attractive sites in new and existing realestate environments.
The company established RMCF stores in five primary environments: 1) regional centers,2) tourist areas, 3) outlet centers, 4) street fronts, and 5) airports and other entertainment-oriented shopping centers. Each of these environments had a number of attractive features,including high levels of foot traffic. The company, over the last several years, has had a par-ticular focus on regional center locations.
Tourist Areas, Street Fronts, and Other Entertainment-OrientedShopping Centers
As of February 29, 2008, there were approximately 40 (down from 45 in 2007) RMCF storesin locations considered to be tourist areas, including Fisherman’s Wharf in San Francisco, andthe Riverwalk in San Antonio, Texas. RMCF believed that tourist areas offer high levels offoot traffic, favorable customer spending characteristics, and increase its visibility and namerecognition. The company believed that significant opportunities existed to expand into ad-ditional tourist areas.
26-6 SECTION D Industry Six—Specialty Retailing
Other1 7
RMCF believed there were a number of other environments that had the characteristics neces-sary for the successful operation of successful stores, such as airports and sports arenas. InFebruary 2008, twelve (up from nine in 2007) franchised RMCF stores existed at airport locations:two at both Denver and Atlanta international airports, one each at Charlotte, Minneapolis, SaltLake City, and Dallas/Fort Worth international airports, one at Phoenix Sky Harbor Airport, andthree in Canadian airports, including Edmonton, Toronto Pearson, and Vancouver internationalairports.
On July 20, 2007, RMCF entered into an exclusive Airport Franchise DevelopmentAgreement (which expires on July 20, 2009) with The Grove Inc. The company believed thisagreement would accelerate the opening of stores in high volume airport locations throughoutthe United States. The Grove Inc. was a privately owned retailer of natural snacks and otherbranded food products and, at the time of the agreement, owned and operated 65 food and bev-erage units, including retail stores in 13 airports throughout the United States. Under the termsof this agreement, The Grove Inc. had the exclusive right to open RMCF stores in all airportsin the United States where there were no stores currently operating or under development. TheGrove Inc., as of March 31, 2008, operated three stores under this agreement.
Kiosk ConceptIn fiscal 2002, RMCF opened its first full-service retail kiosk to display and sell the com-pany’s products. As of March 31, 2008, there were 18 (down from 24 in 2007) kiosks in op-eration. Kiosks ranged from 150 to 250 square feet and incorporated the company’strademark cooking area where popular confections are prepared in front of customers. Thekiosk also included the company’s core product and gifting lines in order to provide the cus-tomer with a full RMCF experience.
RMCF believed kiosks were a vehicle for retail environments where real estate is unavail-able or building costs and/or rent factors do not meet the company’s financial criteria. The com-pany also believed the kiosk concept enhanced its franchise opportunities by providing moreflexibility in support of existing franchisees’ expansion programs and allowed new franchiseesthat otherwise would not qualify for a store location, an opportunity to join the RMCF system.
Franchising ProgramThe RMCF franchising philosophy was one of service and commitment to its franchise sys-tem, and the company continuously sought to improve its franchise support services. Thecompany’s franchise concept had consistently been rated as an outstanding franchise oppor-tunity and in January 2008, RMCF was rated the number one franchise opportunity in thecandy category by Entrepreneur magazine. As of March 31, 2008, there were 329 franchisedstores in the RMCF system.
Regional CentersThere were approximately 1,400 regional centers in the United States, and as of February 29,2008, there were RMCF stores in approximately 95 (down from 100 in 2007) of these centers, in-cluding locations in the Mall of America in Bloomington, Minnesota; and Fort Collins, Colorado.Although often providing favorable levels of foot traffic, regional malls typically involved moreexpensive rent structures and competing food and beverage concepts. The company’s new storeconcept was designed to capitalize on the potential of the regional center environment.
CASE 26 Rocky Mountain Chocolate Factory Inc. (2008) 26-7
RMCF believed the visibility of its stores and the high foot traffic at many of its locationshad generated strong name recognition of and demand for its providers and franchises. RMCFstores had historically been concentrated in the western and Rocky Mountain regions of theUnited States, but new stores were gradually being opened in the eastern half of the country.
RMCF’s continued growth and success was dependent on both its ability to obtain suit-able sites at reasonable occupancy costs for both franchised stores and kiosks and its ability toattract, retain, and contract with qualified franchisees who were devoted to promoting and de-veloping the RMCF store concept, reputation, and product quality. RMCF had established cri-teria to evaluate prospective franchisees, which included the applicant’s net worth andliquidity, together with an assessment of work ethic and personality compatibility with thecompany’s operating philosophy. The majority of new franchises were awarded to persons re-ferred by existing franchisees, to interested consumers who had visited RMCF stores, and toexisting franchisees. The company also advertised for new franchisees in national and regionalnewspapers as suitable store locations were recognized.
Prior to store opening, each domestic franchise owner/operator and each store manager fora domestic franchisee was required to complete a seven-day comprehensive training program instore operations and management at its training center in Durango, Colorado, which included afull-sized replica of a properly configured and merchandised RMCF store. Topics covered in thetraining course included the company’s philosophy of store operation and management, cus-tomer service, merchandising, pricing, cooking, inventory and cost control, quality standards,record keeping, labor scheduling, and personnel management. Training was based on standardoperating policies and procedures contained in an operations manual provided to all franchisees,which the franchisee was required to follow by terms of the franchise agreement. Additionally,trainees were provided with a complete orientation to company operations by working in key fac-tory operational areas and by meeting with members of the senior management.
Ongoing support was provided to franchisees through communications and regular sitevisits by field consultants who audited performance, provided advice, and ensured that oper-ations were running smoothly, effectively, and according to the standards set by the company.
The franchisee agreement required compliance with RMCF’s procedures of operation andfood quality specifications, permitted audits and inspections by the company, and required fran-chisees to remodel stores to conform to established standards. RMCF had the right to terminate anyfranchise agreement for non-compliance with operating standards. Franchisees were generallygranted exclusive territory with respect to the operation of RMCF stores only in the immediatevicinity of their stores. Products sold at the stores and ingredients used in the preparation of prod-ucts approved for on-site preparation were required to be purchased from the company or from ap-proved suppliers. Franchise agreements could be terminated upon the failure of the franchisee tocomply with the conditions of the agreement or upon the occurrence of certain events, which in thejudgment of the company was likely to adversely affect the RMCF system. The agreements pro-hibited the transfer or assignment of any interest in the franchise without the prior written consentof the company and also gave RMCF the right of first refusal to purchase any interest in a franchise.
The term of each RMCF franchise agreement was 10 years, and franchisees had the rightto renew for one additional 10-year term. The company did not provide prospective fran-chisees with financing for their stores, but had developed relationships with sources of fran-chisee financing to which it would refer franchisees.
In fiscal 1992, the company entered into a franchise development agreement coveringCanada with Immaculate Confections Ltd. of Vancouver, BC. Under this agreement Immacu-late Confections had exclusive rights to franchise and operate RMCF stores in Canada. Immaculate Confections, as of March 31, 2008, operated 38 stores under this agreement.
In fiscal 2000, RMCF entered into a franchise development agreement covering the GulfCooperation Council States of United Arab Emirates, Qatar, Bahrain, Saudi Arabia, Kuwait,and Oman with Al Muhairy Group of United Arab Emirates. This agreement gave the
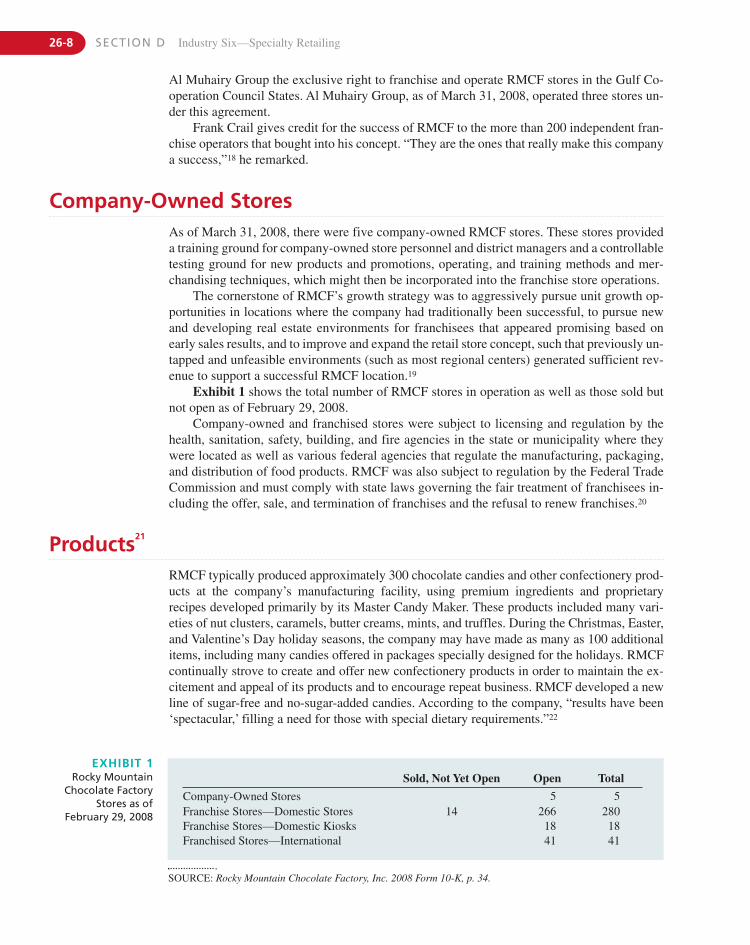
Al Muhairy Group the exclusive right to franchise and operate RMCF stores in the Gulf Co-operation Council States. Al Muhairy Group, as of March 31, 2008, operated three stores un-der this agreement.
Frank Crail gives credit for the success of RMCF to the more than 200 independent fran-chise operators that bought into his concept. “They are the ones that really make this companya success,”18 he remarked.
26-8 SECTION D Industry Six—Specialty Retailing
Company-Owned StoresAs of March 31, 2008, there were five company-owned RMCF stores. These stores provideda training ground for company-owned store personnel and district managers and a controllabletesting ground for new products and promotions, operating, and training methods and mer-chandising techniques, which might then be incorporated into the franchise store operations.
The cornerstone of RMCF’s growth strategy was to aggressively pursue unit growth op-portunities in locations where the company had traditionally been successful, to pursue newand developing real estate environments for franchisees that appeared promising based onearly sales results, and to improve and expand the retail store concept, such that previously un-tapped and unfeasible environments (such as most regional centers) generated sufficient rev-enue to support a successful RMCF location.19
Exhibit 1 shows the total number of RMCF stores in operation as well as those sold butnot open as of February 29, 2008.
Company-owned and franchised stores were subject to licensing and regulation by thehealth, sanitation, safety, building, and fire agencies in the state or municipality where theywere located as well as various federal agencies that regulate the manufacturing, packaging,and distribution of food products. RMCF was also subject to regulation by the Federal TradeCommission and must comply with state laws governing the fair treatment of franchisees in-cluding the offer, sale, and termination of franchises and the refusal to renew franchises.20
EXHIBIT 1Rocky Mountain
Chocolate FactoryStores as of
February 29, 2008
SOURCE: Rocky Mountain Chocolate Factory, Inc. 2008 Form 10-K, p. 34.
Sold, Not Yet Open Open Total
Company-Owned Stores 5 5Franchise Stores—Domestic Stores 14 266 280Franchise Stores—Domestic Kiosks 18 18Franchised Stores—International 41 41
Products21
RMCF typically produced approximately 300 chocolate candies and other confectionery prod-ucts at the company’s manufacturing facility, using premium ingredients and proprietaryrecipes developed primarily by its Master Candy Maker. These products included many vari-eties of nut clusters, caramels, butter creams, mints, and truffles. During the Christmas, Easter,and Valentine’s Day holiday seasons, the company may have made as many as 100 additionalitems, including many candies offered in packages specially designed for the holidays. RMCFcontinually strove to create and offer new confectionery products in order to maintain the ex-citement and appeal of its products and to encourage repeat business. RMCF developed a newline of sugar-free and no-sugar-added candies. According to the company, “results have been‘spectacular,’ filling a need for those with special dietary requirements.”22
In addition to RMCF’s traditional chocolates and candies, special treats were prepared ineach store. Besides the caramel-covered apples (some stores feature over 30 varieties), fudge(more than fifteen varieties) was made fresh every day in each store using a marble slab toliterally suck the heat out of the confection while the cook shaped it with paddles into a gi-ant 22-pound “loaf.” A variety of fruits, nuts, pretzels, and cookies were also dipped by handin pots of melted milk, dark, and even white chocolate.23
One of RMCF’s trademarks, big, chunky chocolate concoctions, were created somewhatby accident. According to Crail, “In the early days, my partners and I did not know how tomake chocolate and had to literally learn on a ping pong table.” Crail recalls that “from thestart we made the candy centers too big, not compensating for the added size and weight whencoating the pieces in chocolate. And if they didn’t look quite right we would dip them again.But the huge pieces instantly caught on and have remained the RMCF benchmark eversince.”24 One of these large-sized specialties was a king-sized peanut butter cup dubbed theBucket™. Another signature piece, the Bear™ (turtles), was a paw-sized concoction of chewycaramel, roasted nuts and a heavy coating of chocolate. The best-selling items were caramelapples, followed by Bears.25
All products were produced consistent with the company’s philosophy of using only thefinest, highest quality ingredients with no artificial preservatives to achieve its marketingmotto of “the Peak of Perfection in Handmade Chocolates®.”26
RMCF believed that, on average, approximately 40 percent of the revenues of RMCFstores were generated by products manufactured at the company’s factory, 50% by productsmade in each store using company recipes and ingredients purchased from the company or ap-proved suppliers, and the remaining 10% by products such as ice cream, coffee, and other sun-dries purchased from approved suppliers. Franchisees sales of products manufactured by thecompany’s factory generated higher revenue than sales of store-made or other products. A sig-nificant decrease in the volume of products franchisees purchase from the company would ad-versely affect total revenue and the results of operations. Such a decrease could result fromfranchisees decisions to sell more store-made products or products purchased from third-partysuppliers.27
Chocolate candies manufactured by the company were sold at prices ranging from$14.90 to $24.00 per pound, with an average price of $18.30 per pound. Franchisees were ableto set their own retail prices, though the company recommended prices for all of its products.28
CASE 26 Rocky Mountain Chocolate Factory Inc. (2008) 26-9
Packaging29
RMCF developed special packaging for the Christmas, Valentine’s Day, and Easter holidaysand customers could have their purchases packaged in decorative boxes and fancy tinsthroughout the year.
In 2002, RMCF completed a project to completely redesign the packaging featured in its re-tail stores. The new packaging was designed to be more contemporary and capture and conveythe freshness, fun, and excitement of the RMCF retail store experience. Sleek, new copper giftboxes were designed to reinforce the association with copper cooking kettles. And the new logowas meant to represent swirling chocolate.30 This new line of packaging won three National Pa-perbox Association Gold Awards in 2002, representing the association’s highest honors.31
Marketing32
RMCF sought low-cost, high-return publicity opportunities through participation in local andregional events, sponsorships, and charitable causes. The company had not historically anddid not intend to engage in national advertising. RMCF focused primarily on local in-storemarketing and promotional efforts by providing customizable marketing materials, including
26-10 SECTION D Industry Six—Specialty Retailing
Operations and Distribution36
Manufacturing
RMCF sought to ensure the freshness of products sold in its stores with frequent shipments todistribution outlets from its 53,000-square-foot manufacturing facility in Durango, Colorado.Franchisees were encouraged to order from the company only the quantities they could reason-ably expect to sell within two to four weeks because most stores did not have storage space forextra inventory.
RMCF believed that it should control the manufacturing of its own products in order tobetter maintain its high product quality standards, offer unique proprietary products, managecosts, control production and shipment schedules, and pursue new or underutilized distribu-tion channels. The company believed its manufacturing expertise and reputation for qualityhad facilitated the sale of selected products through new distribution channels, includingwholesaling, fundraising, corporate sales, mail order, and Internet sales.37
RMCF’s manufacturing process primarily involved cooking or preparing candy centers, in-cluding nuts, caramel, peanut butter, creams and jellies, and then coating them with chocolateor other toppings. All of these processes were conducted in carefully controlled temperatureranges, employing strict quality control procedures at every stage of the manufacturing process.RMCF used a combination of manual and automated processes at its factory. Although RMCFbelieved that it was preferable to perform certain manufacturing processes, such as dippingsome large pieces by hand, automation increased the speed and efficiency of the manufacturingprocess. The company had from time to time automated processes formerly performed by handwhere it had become cost-effective to do so without compromising product quality or appear-ance. Efforts in the last several years had included the purchase of additional automated factoryequipment, implementation of a comprehensive advanced planning and scheduling system, andinstallation of enhanced point-of-sales systems in all of its company-owned and 182 of its fran-chised stores through March 31, 2008. These measures had improved the company’s ability todeliver its products to the stores safely, quickly, and cost effectively.
Chocolate manufacturing had been a similar process for all companies within theconfectionary/chocolate industry up until 2005. In 2005, new chocolate manufacturingtechnology was introduced. This new manufacturing process, called NETZSCH’s ChocoEasy™,enabled chocolate makers of any size to cost-effectively manufacture all varieties of chocolatefrom scratch. For the first time, smaller chocolate companies were no longer dependant onlarge chocolate manufacturers and were now free to create their own chocolate recipes and todevelop their own proprietary chocolate brands.38
advertisements, coupons, flyers, and mail-order catalogs generated by its in-house CreativeServices Department, and point-of-purchase materials. The Creative Services Departmentworked directly with franchisees to implement local store marketing programs. To cover itscorporate marketing expenses, each franchised store paid a monthly marketing and promo-tions fee of 1 percent of its monthly gross sales.33
The trade name Rocky Mountain Chocolate Factory®, the phrases, The Peak of Perfectionin Handmade Chocolates, America’s Chocolatier®, The World’s Chocolatier®, as well as othertrademarks, service marks, symbols, slogans, emblems, logos, and designs used in the RockyMountain Chocolate factory system, were proprietary rights of the company. The registrationfor the trademark “Rocky Mountain Chocolate Factory” had been granted in the United Statesand Canada. Applications had been filed to register the Rocky Mountain Chocolate Factorytrademark in certain foreign countries.34 The company had not attempted to obtain patent pro-tection for the proprietary recipes developed by the company’s Master Candy Maker and wasrelying upon its ability to maintain confidentiality of those recipes.35
CASE 26 Rocky Mountain Chocolate Factory Inc. (2008) 26-11
During fiscal 2008, the RMCF’s manufacturing facility produced approximately 2.84 million pounds of chocolate candies, an increase of 4% from the approximately 2.73 mil-lion pounds produced in fiscal 2007. During fiscal 2008 the company conducted a study offactory capacity. As a result of this study, RMCF believed its factory had the capacity to pro-duce approximately 5.3 million pounds per year. In January 1998, the company acquired atwo-acre parcel adjacent to its factory to ensure the availability of adequate space to expandthe factory as volume demands.39
Ingredients40
RMCF maintained the taste and quality of its chocolate candies by using only the finest choco-late and other ingredients. The principal ingredients used by RMCF are chocolate, nuts, sugar,corn syrup, cream, and butter. Chocolate was purchased from the Guittard Chocolate company,known for 130 years as providing the finest, most intensely flavored chocolate.41 The factoryreceived shipments of ingredients daily. To ensure the consistency of its products, ingredientswere bought from a limited number of reliable suppliers. The company had one or more alter-native sources for all essential ingredients. RMCF also purchased small amounts of finishedcandy from third parties on a private-label basis for sale in its stores.
Several of the principal ingredients used in RMCF’s candies, including chocolate and nuts,were subject to significant price fluctuations. Although cocoa beans, the primary raw materialused in the production of chocolate, were grown commercially in Africa, Brazil, and several othercountries around the world, cocoa beans were traded in the commodities market, and their supplyand price were therefore subject to volatility. RMCF believed its principal chocolate supplier pur-chased most of its beans at negotiated prices from African growers, often at a premium to com-modity prices. RMCF purchased most of its nut meats from domestic suppliers who procured theirproducts from growers around the world. Although the price of chocolate and nut meats had beenrelatively stable in recent years, the supply and price of nut meats and cocoa beans, and, in turn,chocolate, were affected by many factors, including monetary fluctuations and economic, politi-cal, and weather conditions in countries in which both nut meats and cocoa beans were grown.
The Ivory Coast (Cote d’Ivoire) was responsible for producing 40 percent of the world’scocoa beans that are necessary for the manufacturing of chocolate.42 In late 2006, there was afive-day strike in which laborers refused to enter the factories because of unbearable workingconditions. These strikes led to an increase of 20 percent in the price of chocolate for mostcompanies within the industry.43 Forty-seven percent of the total U.S. imports of cocoa beanscame from the Ivory Coast.
RMCF did not engage in commodity futures trading or hedging activities. In order to as-sure a continuous supply of chocolate and certain nuts, the company entered into purchase con-tracts of between six to eighteen months for these products. These contracts permitted thecompany to purchase the specified commodity at a fixed price on an as-needed basis duringthe term of the contract.
Trucking OperationsUnable to find a suitable shipper, RMCF built its own fleet of brown and bronze semis.44 In2008 RMCF operated eight refrigerated trucks and shipped a substantial portion of its prod-ucts from its factory on its own fleet. The company’s trucking operations enabled it to deliverits products to the stores quickly and cost-effectively. In addition, the company back-hauledits own ingredients and supplies, as well as product from third parties to fill available space,on return trips as a basis for increasing trucking program economics.45 The company’s truck-ing operations are subject to various federal, state, and Canadian provincial regulations.46
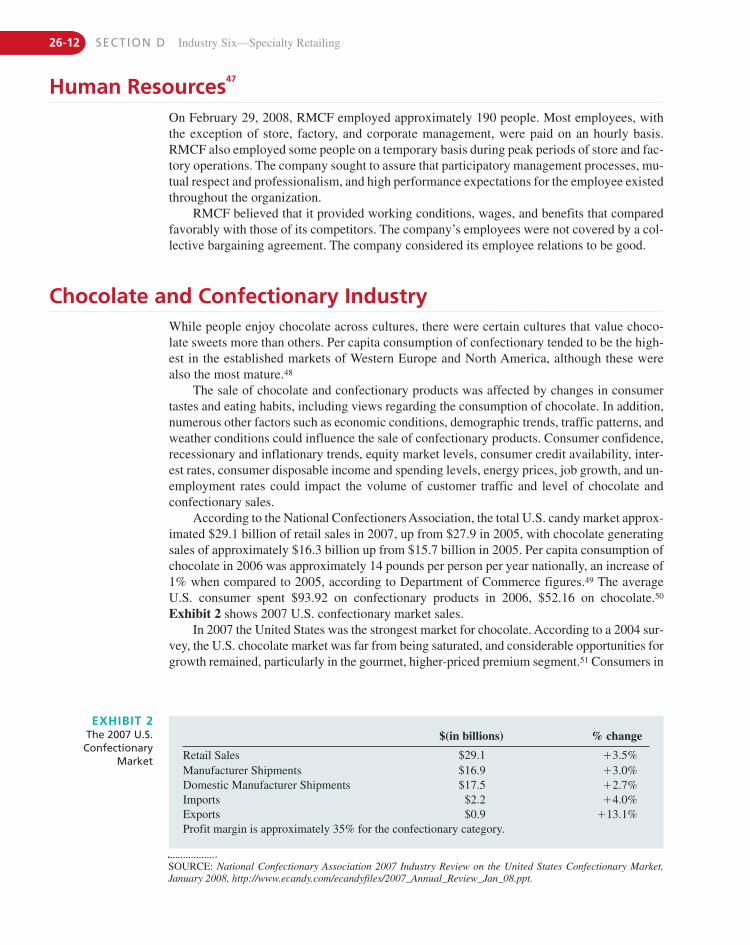
26-12 SECTION D Industry Six—Specialty Retailing
Human Resources47
On February 29, 2008, RMCF employed approximately 190 people. Most employees, withthe exception of store, factory, and corporate management, were paid on an hourly basis.RMCF also employed some people on a temporary basis during peak periods of store and fac-tory operations. The company sought to assure that participatory management processes, mu-tual respect and professionalism, and high performance expectations for the employee existedthroughout the organization.
RMCF believed that it provided working conditions, wages, and benefits that comparedfavorably with those of its competitors. The company’s employees were not covered by a col-lective bargaining agreement. The company considered its employee relations to be good.
Chocolate and Confectionary IndustryWhile people enjoy chocolate across cultures, there were certain cultures that value choco-late sweets more than others. Per capita consumption of confectionary tended to be the high-est in the established markets of Western Europe and North America, although these werealso the most mature.48
The sale of chocolate and confectionary products was affected by changes in consumertastes and eating habits, including views regarding the consumption of chocolate. In addition,numerous other factors such as economic conditions, demographic trends, traffic patterns, andweather conditions could influence the sale of confectionary products. Consumer confidence,recessionary and inflationary trends, equity market levels, consumer credit availability, inter-est rates, consumer disposable income and spending levels, energy prices, job growth, and un-employment rates could impact the volume of customer traffic and level of chocolate andconfectionary sales.
According to the National Confectioners Association, the total U.S. candy market approx-imated $29.1 billion of retail sales in 2007, up from $27.9 in 2005, with chocolate generatingsales of approximately $16.3 billion up from $15.7 billion in 2005. Per capita consumption ofchocolate in 2006 was approximately 14 pounds per person per year nationally, an increase of1% when compared to 2005, according to Department of Commerce figures.49 The averageU.S. consumer spent $93.92 on confectionary products in 2006, $52.16 on chocolate.50
Exhibit 2 shows 2007 U.S. confectionary market sales.In 2007 the United States was the strongest market for chocolate. According to a 2004 sur-
vey, the U.S. chocolate market was far from being saturated, and considerable opportunities forgrowth remained, particularly in the gourmet, higher-priced premium segment.51 Consumers in
EXHIBIT 2The 2007 U.S.Confectionary
Market
SOURCE: National Confectionary Association 2007 Industry Review on the United States Confectionary Market,January 2008, http://www.ecandy.com/ecandyfiles/2007_Annual_Review_Jan_08.ppt.
$(in billions) % change
Retail Sales $29.1 3.5%Manufacturer Shipments $16.9 3.0%Domestic Manufacturer Shipments $17.5 2.7%Imports $2.2 4.0%Exports $0.9 13.1%Profit margin is approximately 35% for the confectionary category.
�
���
�
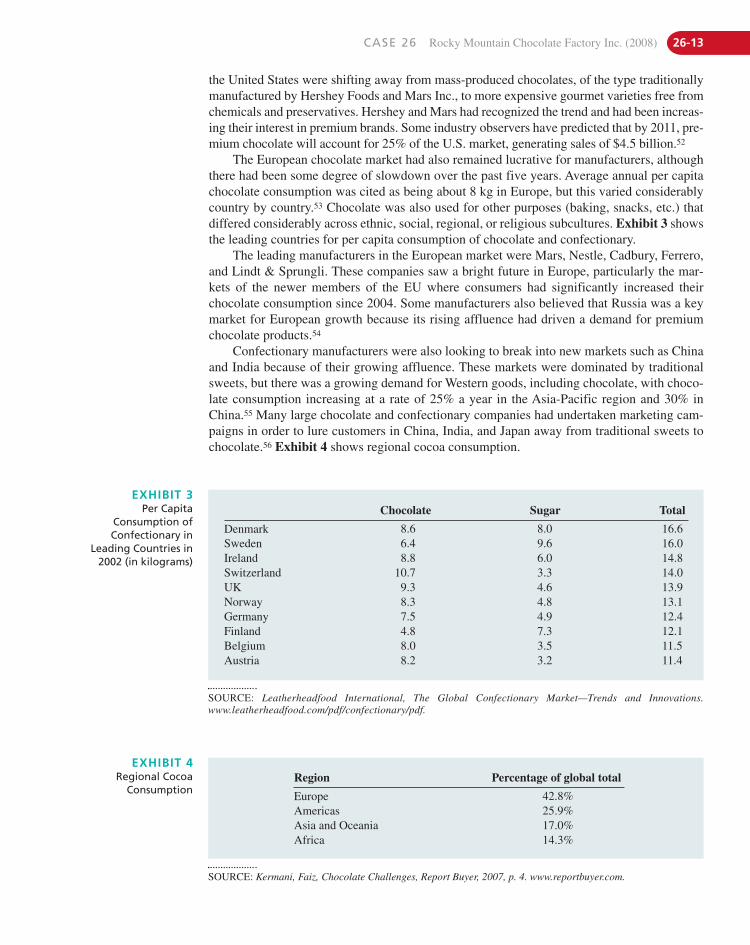
CASE 26 Rocky Mountain Chocolate Factory Inc. (2008) 26-13
the United States were shifting away from mass-produced chocolates, of the type traditionallymanufactured by Hershey Foods and Mars Inc., to more expensive gourmet varieties free fromchemicals and preservatives. Hershey and Mars had recognized the trend and had been increas-ing their interest in premium brands. Some industry observers have predicted that by 2011, pre-mium chocolate will account for 25% of the U.S. market, generating sales of $4.5 billion.52
The European chocolate market had also remained lucrative for manufacturers, althoughthere had been some degree of slowdown over the past five years. Average annual per capitachocolate consumption was cited as being about 8 kg in Europe, but this varied considerablycountry by country.53 Chocolate was also used for other purposes (baking, snacks, etc.) thatdiffered considerably across ethnic, social, regional, or religious subcultures. Exhibit 3 showsthe leading countries for per capita consumption of chocolate and confectionary.
The leading manufacturers in the European market were Mars, Nestle, Cadbury, Ferrero,and Lindt & Sprungli. These companies saw a bright future in Europe, particularly the mar-kets of the newer members of the EU where consumers had significantly increased their chocolate consumption since 2004. Some manufacturers also believed that Russia was a keymarket for European growth because its rising affluence had driven a demand for premiumchocolate products.54
Confectionary manufacturers were also looking to break into new markets such as Chinaand India because of their growing affluence. These markets were dominated by traditionalsweets, but there was a growing demand for Western goods, including chocolate, with choco-late consumption increasing at a rate of 25% a year in the Asia-Pacific region and 30% inChina.55 Many large chocolate and confectionary companies had undertaken marketing cam-paigns in order to lure customers in China, India, and Japan away from traditional sweets tochocolate.56 Exhibit 4 shows regional cocoa consumption.
EXHIBIT 3Per Capita
Consumption ofConfectionary in
Leading Countries in2002 (in kilograms)
SOURCE: Leatherheadfood International, The Global Confectionary Market—Trends and Innovations. www.leatherheadfood.com/pdf/confectionary/pdf.
Chocolate Sugar Total
Denmark 8.6 8.0 16.6Sweden 6.4 9.6 16.0Ireland 8.8 6.0 14.8Switzerland 10.7 3.3 14.0UK 9.3 4.6 13.9Norway 8.3 4.8 13.1Germany 7.5 4.9 12.4Finland 4.8 7.3 12.1Belgium 8.0 3.5 11.5Austria 8.2 3.2 11.4
EXHIBIT 4Regional Cocoa
Consumption
SOURCE: Kermani, Faiz, Chocolate Challenges, Report Buyer, 2007, p. 4. www.reportbuyer.com.
Region Percentage of global total
Europe 42.8%Americas 25.9%Asia and Oceania 17.0%Africa 14.3%
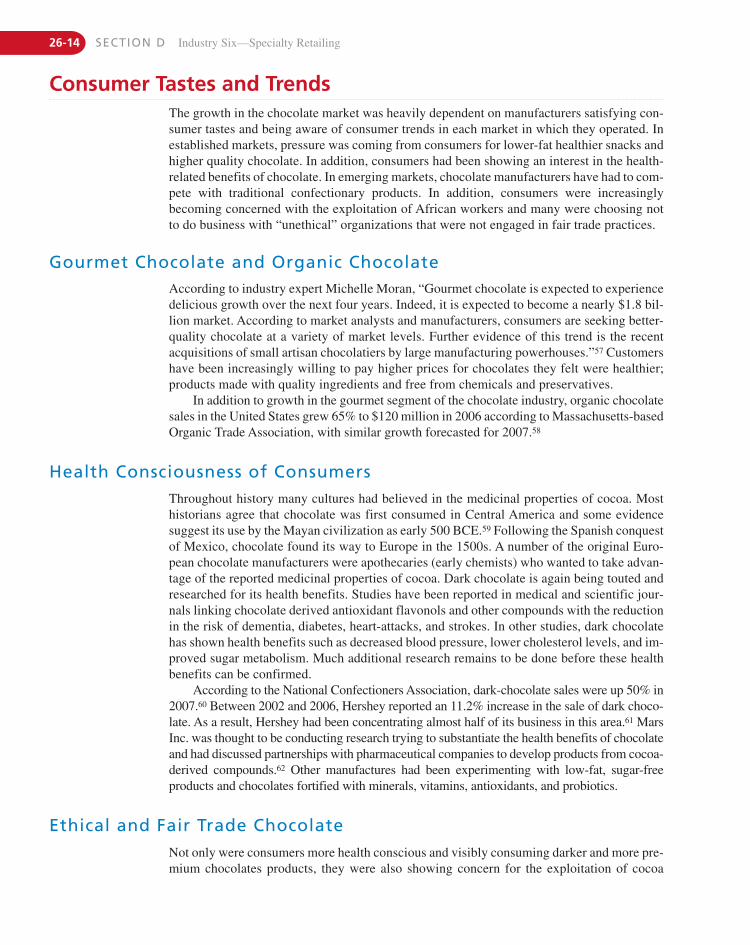
26-14 SECTION D Industry Six—Specialty Retailing
Consumer Tastes and TrendsThe growth in the chocolate market was heavily dependent on manufacturers satisfying con-sumer tastes and being aware of consumer trends in each market in which they operated. Inestablished markets, pressure was coming from consumers for lower-fat healthier snacks andhigher quality chocolate. In addition, consumers had been showing an interest in the health-related benefits of chocolate. In emerging markets, chocolate manufacturers have had to com-pete with traditional confectionary products. In addition, consumers were increasinglybecoming concerned with the exploitation of African workers and many were choosing notto do business with “unethical” organizations that were not engaged in fair trade practices.
Gourmet Chocolate and Organic ChocolateAccording to industry expert Michelle Moran, “Gourmet chocolate is expected to experiencedelicious growth over the next four years. Indeed, it is expected to become a nearly $1.8 bil-lion market. According to market analysts and manufacturers, consumers are seeking better-quality chocolate at a variety of market levels. Further evidence of this trend is the recentacquisitions of small artisan chocolatiers by large manufacturing powerhouses.”57 Customershave been increasingly willing to pay higher prices for chocolates they felt were healthier;products made with quality ingredients and free from chemicals and preservatives.
In addition to growth in the gourmet segment of the chocolate industry, organic chocolatesales in the United States grew 65% to $120 million in 2006 according to Massachusetts-basedOrganic Trade Association, with similar growth forecasted for 2007.58
Health Consciousness of ConsumersThroughout history many cultures had believed in the medicinal properties of cocoa. Mosthistorians agree that chocolate was first consumed in Central America and some evidencesuggest its use by the Mayan civilization as early 500 BCE.59 Following the Spanish conquestof Mexico, chocolate found its way to Europe in the 1500s. A number of the original Euro-pean chocolate manufacturers were apothecaries (early chemists) who wanted to take advan-tage of the reported medicinal properties of cocoa. Dark chocolate is again being touted andresearched for its health benefits. Studies have been reported in medical and scientific jour-nals linking chocolate derived antioxidant flavonols and other compounds with the reductionin the risk of dementia, diabetes, heart-attacks, and strokes. In other studies, dark chocolatehas shown health benefits such as decreased blood pressure, lower cholesterol levels, and im-proved sugar metabolism. Much additional research remains to be done before these healthbenefits can be confirmed.
According to the National Confectioners Association, dark-chocolate sales were up 50% in2007.60 Between 2002 and 2006, Hershey reported an 11.2% increase in the sale of dark choco-late. As a result, Hershey had been concentrating almost half of its business in this area.61 MarsInc. was thought to be conducting research trying to substantiate the health benefits of chocolateand had discussed partnerships with pharmaceutical companies to develop products from cocoa-derived compounds.62 Other manufactures had been experimenting with low-fat, sugar-free products and chocolates fortified with minerals, vitamins, antioxidants, and probiotics.
Ethical and Fair Trade ChocolateNot only were consumers more health conscious and visibly consuming darker and more pre-mium chocolates products, they were also showing concern for the exploitation of cocoa
CASE 26 Rocky Mountain Chocolate Factory Inc. (2008) 26-15
farmers in Western Africa, particularly the use of child labor and the prices that cocoa farm-ers were able to charge for their crop.
Many consumers were choosing to support organizations and purchase products from com-panies that supported both “ethical chocolates” as well as fair trade practices. These companieshad reported rising demand for their products as consumer interest in fair trade had grown.63
CompetitorsThe global market for chocolate was highly competitive. With consumer attitudes changingand new markets offering opportunities for growth, chocolate manufacturers faced a numberof challenges in keeping ahead of their rivals.
RMCF and its franchisees competed with numerous businesses that offered confec-tionery products, from large, publically held, global conglomerates to small, private, localbusinesses. Many of the large competitors had greater name recognition, both domesticallyand globally, and greater financial, marketing, and other resources than RMCF. In addition,there was intense competition among retailers for prime locations, store personnel, and qual-ified franchisees.
Large confectionary companies that had traditionally concentrated on mass-produced can-dies, sought to make inroads into the premium market. For example, in 2005 Hershey Foods ac-quired two medium-sized gourmet chocolate companies, Scharffen Berger and Joseph Schmidt,for between $46.6 million and $61.1 million.64 Mars Inc. established its catalog/retail sub-sidiary, Ethel M Chocolates, in 1981 when billionaire candy maker Forrest Mars developed achain of chocolate stores in the western U.S., specializing in liquor-filled candies. In 2005 EthelM’s launched an even more premium line of chocolates called ethel’s. Ethel’s chocolates wereavailable on-line and could be purchased at upscale department stores, including Nieman Mar-cus, Macy’s, and Marshall Fields.65 Also in 2005, Ethel’s Chocolate Lounge was created as aplace where sweets lovers could linger on sofas and order hot cocoa and chocolate fondue.
Principal competitors of RMCF included Alpine Confections Inc., Godiva ChocolatierInc., See’s Candies Inc., Chocoladefabriken Lindt & Sprungli AG, Fannie May (a whollyowned subsidiary of Alpine Confections), and Ethel M’s/ethel’s. These companies not onlymanufactured chocolate but also had their own retail outlets. Exhibit 5 shows the number ofstores in operation for each of these competitors in 2006.
Godiva Chocolatier, the Belgian chocolate maker, with annual sales of approximately$500 million, was one of the world’s leading premium chocolate businesses. Godiva sold itsproducts through company-owned and franchised retail stores, and wholesale distribution out-lets, including specialty retailers and finer department stores and on the Internet. In January2008, Campbell Soup company announced that it agreed to sell its Godiva Chocolatier unit toYildiz Holdings of Turkey for $850 million. Godiva was to become part of the Ulker Group,which is owned by Yildiz. Ulker is the largest consumer goods company in the Turkish foodindustry.66
Chocoladefabriken Lindt & Sprungli AG and its subsidiaries offered products under mul-tiple brands names, including Lindt, Ghirardelli, Caffarel, Hofbauer, and Kufferle. The com-pany was founded in 1845 and was based in Kilchberg, Switzerland, and had six productionsites in Europe, two in the United States, and distribution sites and sales companies on fourcontinents.67 Lindt & Sprungli was a recognized leader in the market for premium chocolate,and offered a large selection of products in more than 80 countries around the world.68
See’s Candies, Ethel M’s/ethel’s, and Alpine Confections Inc. were privately held compa-nies. Alpine Confections Inc. was based in Alpine, Utah, and had sales of approximately$125 million in 2005. Alpine owned a number of candy companies, including Maxfield Candycompany, Kencraft Inc., and Harry London Candies Inc. Alpine acquired the Fanny Farmer
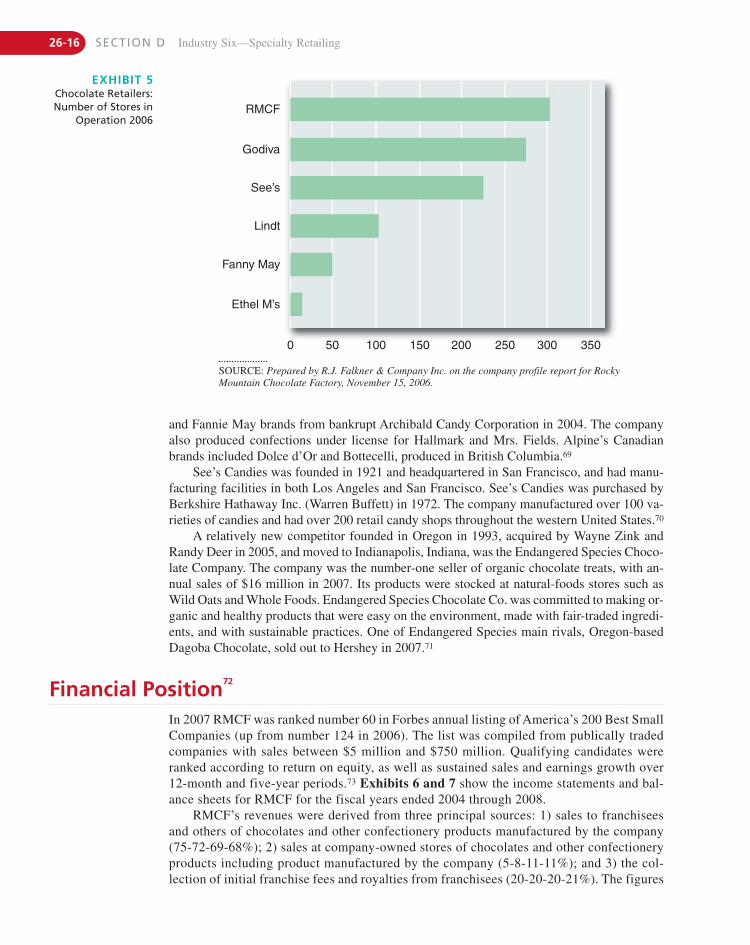
26-16 SECTION D Industry Six—Specialty Retailing
and Fannie May brands from bankrupt Archibald Candy Corporation in 2004. The companyalso produced confections under license for Hallmark and Mrs. Fields. Alpine’s Canadianbrands included Dolce d’Or and Bottecelli, produced in British Columbia.69
See’s Candies was founded in 1921 and headquartered in San Francisco, and had manu-facturing facilities in both Los Angeles and San Francisco. See’s Candies was purchased byBerkshire Hathaway Inc. (Warren Buffett) in 1972. The company manufactured over 100 va-rieties of candies and had over 200 retail candy shops throughout the western United States.70
A relatively new competitor founded in Oregon in 1993, acquired by Wayne Zink andRandy Deer in 2005, and moved to Indianapolis, Indiana, was the Endangered Species Choco-late Company. The company was the number-one seller of organic chocolate treats, with an-nual sales of $16 million in 2007. Its products were stocked at natural-foods stores such asWild Oats and Whole Foods. Endangered Species Chocolate Co. was committed to making or-ganic and healthy products that were easy on the environment, made with fair-traded ingredi-ents, and with sustainable practices. One of Endangered Species main rivals, Oregon-basedDagoba Chocolate, sold out to Hershey in 2007.71
EXHIBIT 5Chocolate Retailers:Number of Stores in
Operation 2006
SOURCE: Prepared by R.J. Falkner & Company Inc. on the company profile report for RockyMountain Chocolate Factory, November 15, 2006.
0 50 100 150 200 250 300 350
RMCF
Godiva
See’s
Lindt
Fanny May
Ethel M’s
Financial Position72
In 2007 RMCF was ranked number 60 in Forbes annual listing of America’s 200 Best SmallCompanies (up from number 124 in 2006). The list was compiled from publically tradedcompanies with sales between $5 million and $750 million. Qualifying candidates wereranked according to return on equity, as well as sustained sales and earnings growth over12-month and five-year periods.73 Exhibits 6 and 7 show the income statements and bal-ance sheets for RMCF for the fiscal years ended 2004 through 2008.
RMCF’s revenues were derived from three principal sources: 1) sales to franchiseesand others of chocolates and other confectionery products manufactured by the company(75-72-69-68%); 2) sales at company-owned stores of chocolates and other confectioneryproducts including product manufactured by the company (5-8-11-11%); and 3) the col-lection of initial franchise fees and royalties from franchisees (20-20-20-21%). The figures
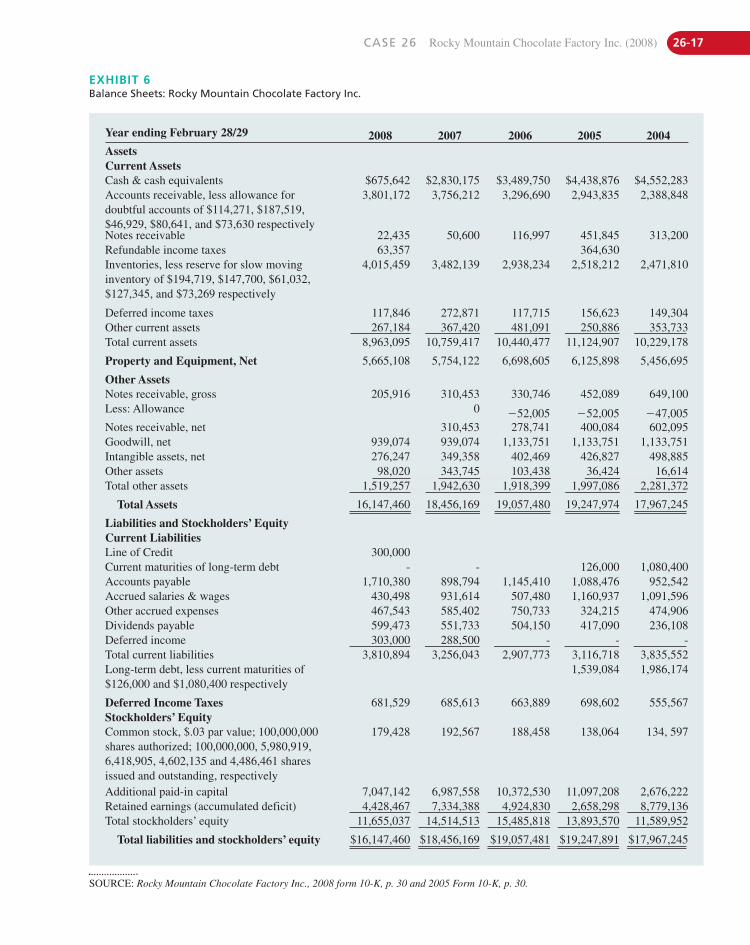
CASE 26 Rocky Mountain Chocolate Factory Inc. (2008) 26-17
EXHIBIT 6Balance Sheets: Rocky Mountain Chocolate Factory Inc.
SOURCE: Rocky Mountain Chocolate Factory Inc., 2008 form 10-K, p. 30 and 2005 Form 10-K, p. 30.
Year ending February 28/29 2008 2007 2006 2005 2004AssetsCurrent AssetsCash & cash equivalents $675,642 $2,830,175 $3,489,750 $4,438,876 $4,552,283Accounts receivable, less allowance fordoubtful accounts of $114,271, $187,519,$46,929, $80,641, and $73,630 respectively
3,801,172 3,756,212 3,296,690 2,943,835 2,388,848
Notes receivable 22,435 50,600 116,997 451,845 313,200Refundable income taxes 63,357 364,630Inventories, less reserve for slow movinginventory of $194,719, $147,700, $61,032,$127,345, and $73,269 respectively
4,015,459 3,482,139 2,938,234 2,518,212 2,471,810
Deferred income taxes 117,846 272,871 117,715 156,623 149,304Other current assets 267,184 367,420 481,091 250,886 353,733Total current assets 8,963,095 10,759,417 10,440,477 11,124,907 10,229,178
Property and Equipment, Net 5,665,108 5,754,122 6,698,605 6,125,898 5,456,695
Other AssetsNotes receivable, gross 205,916 310,453 330,746 452,089 649,100Less: Allowance 0 �52,005 �52,005 �47,005Notes receivable, net 310,453 278,741 400,084 602,095Goodwill, net 939,074 939,074 1,133,751 1,133,751 1,133,751Intangible assets, net 276,247 349,358 402,469 426,827 498,885Other assets 98,020 343,745 103,438 36,424 16,614Total other assets 1,519,257 1,942,630 1,918,399 1,997,086 2,281,372
Total Assets 16,147,460 18,456,169 19,057,480 19,247,974 17,967,245
Liabilities and Stockholders’ EquityCurrent LiabilitiesLine of Credit 300,000Current maturities of long-term debt - - 126,000 1,080,400Accounts payable 1,710,380 898,794 1,145,410 1,088,476 952,542Accrued salaries & wages 430,498 931,614 507,480 1,160,937 1,091,596Other accrued expenses 467,543 585,402 750,733 324,215 474,906Dividends payable 599,473 551,733 504,150 417,090 236,108Deferred income 303,000 288,500 - - -Total current liabilities 3,810,894 3,256,043 2,907,773 3,116,718 3,835,552Long-term debt, less current maturities of$126,000 and $1,080,400 respectively
1,539,084 1,986,174
Deferred Income Taxes 681,529 685,613 663,889 698,602 555,567Stockholders’ EquityCommon stock, $.03 par value; 100,000,000shares authorized; 100,000,000, 5,980,919,6,418,905, 4,602,135 and 4,486,461 sharesissued and outstanding, respectively
179,428 192,567 188,458 138,064 134, 597
Additional paid-in capital 7,047,142 6,987,558 10,372,530 11,097,208 2,676,222Retained earnings (accumulated deficit) 4,428,467 7,334,388 4,924,830 2,658,298 8,779,136Total stockholders’ equity 11,655,037 14,514,513 15,485,818 13,893,570 11,589,952
Total liabilities and stockholders’ equity $16,147,460 $18,456,169 $19,057,481 $19,247,891 $17,967,245
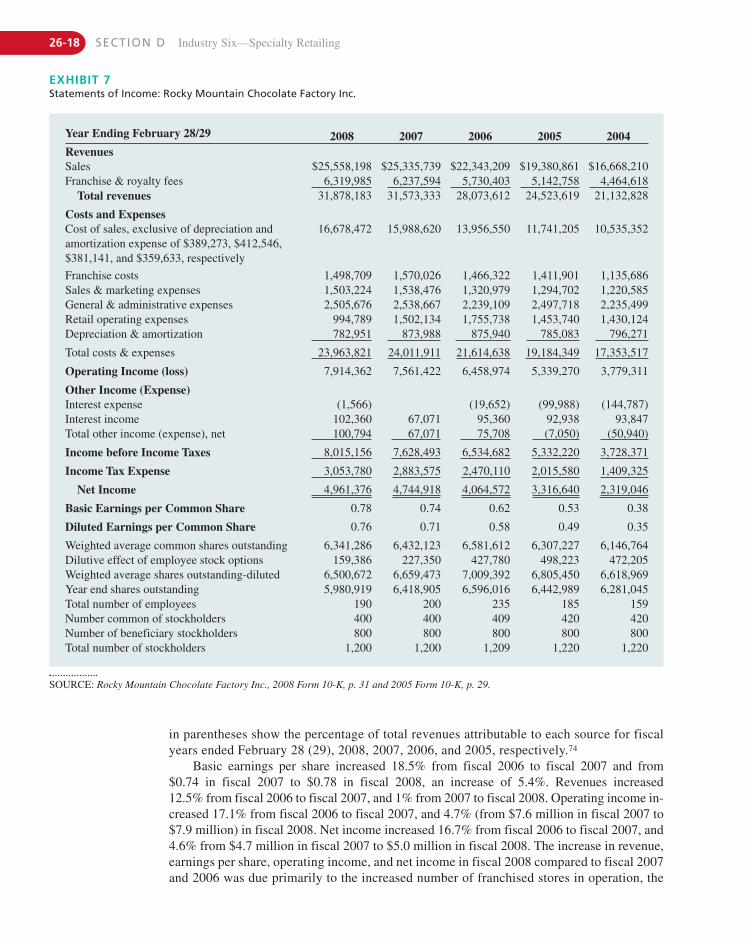
26-18 SECTION D Industry Six—Specialty Retailing
EXHIBIT 7Statements of Income: Rocky Mountain Chocolate Factory Inc.
SOURCE: Rocky Mountain Chocolate Factory Inc., 2008 Form 10-K, p. 31 and 2005 Form 10-K, p. 29.
Year Ending February 28/29 2008 2007 2006 2005 2004RevenuesSales $25,558,198 $25,335,739 $22,343,209 $19,380,861 $16,668,210Franchise & royalty fees 6,319,985 6,237,594 5,730,403 5,142,758 4,464,618
Total revenues 31,878,183 31,573,333 28,073,612 24,523,619 21,132,828
Costs and ExpensesCost of sales, exclusive of depreciation andamortization expense of $389,273, $412,546,$381,141, and $359,633, respectively
16,678,472 15,988,620 13,956,550 11,741,205 10,535,352
Franchise costs 1,498,709 1,570,026 1,466,322 1,411,901 1,135,686Sales & marketing expenses 1,503,224 1,538,476 1,320,979 1,294,702 1,220,585General & administrative expenses 2,505,676 2,538,667 2,239,109 2,497,718 2,235,499Retail operating expenses 994,789 1,502,134 1,755,738 1,453,740 1,430,124Depreciation & amortization 782,951 873,988 875,940 785,083 796,271
Total costs & expenses 23,963,821 24,011,911 21,614,638 19,184,349 17,353,517
Operating Income (loss) 7,914,362 7,561,422 6,458,974 5,339,270 3,779,311
Other Income (Expense)Interest expense (1,566) (19,652) (99,988) (144,787)Interest income 102,360 67,071 95,360 92,938 93,847Total other income (expense), net 100,794 67,071 75,708 (7,050) (50,940)
Income before Income Taxes 8,015,156 7,628,493 6,534,682 5,332,220 3,728,371
Income Tax Expense 3,053,780 2,883,575 2,470,110 2,015,580 1,409,325
Net Income 4,961,376 4,744,918 4,064,572 3,316,640 2,319,046
Basic Earnings per Common Share 0.78 0.74 0.62 0.53 0.38
Diluted Earnings per Common Share 0.76 0.71 0.58 0.49 0.35
Weighted average common shares outstanding 6,341,286 6,432,123 6,581,612 6,307,227 6,146,764Dilutive effect of employee stock options 159,386 227,350 427,780 498,223 472,205Weighted average shares outstanding-diluted 6,500,672 6,659,473 7,009,392 6,805,450 6,618,969Year end shares outstanding 5,980,919 6,418,905 6,596,016 6,442,989 6,281,045Total number of employees 190 200 235 185 159Number common of stockholders 400 400 409 420 420Number of beneficiary stockholders 800 800 800 800 800Total number of stockholders 1,200 1,200 1,209 1,220 1,220
in parentheses show the percentage of total revenues attributable to each source for fiscalyears ended February 28 (29), 2008, 2007, 2006, and 2005, respectively.74
Basic earnings per share increased 18.5% from fiscal 2006 to fiscal 2007 and from$0.74 in fiscal 2007 to $0.78 in fiscal 2008, an increase of 5.4%. Revenues increased12.5% from fiscal 2006 to fiscal 2007, and 1% from 2007 to fiscal 2008. Operating income in-creased 17.1% from fiscal 2006 to fiscal 2007, and 4.7% (from $7.6 million in fiscal 2007 to$7.9 million) in fiscal 2008. Net income increased 16.7% from fiscal 2006 to fiscal 2007, and4.6% from $4.7 million in fiscal 2007 to $5.0 million in fiscal 2008. The increase in revenue,earnings per share, operating income, and net income in fiscal 2008 compared to fiscal 2007and 2006 was due primarily to the increased number of franchised stores in operation, the
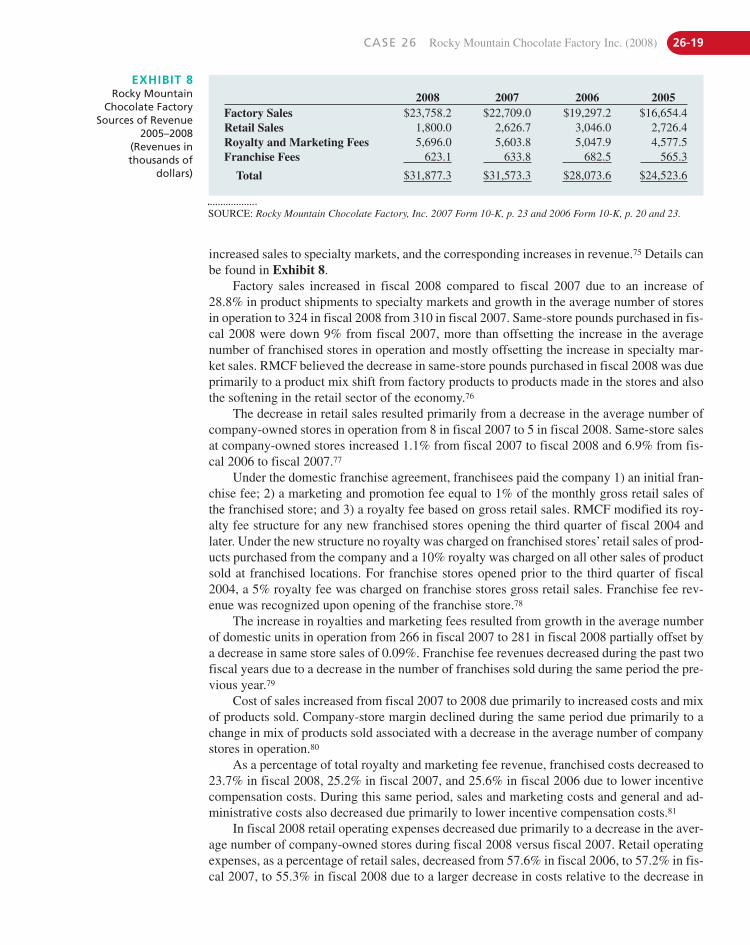
CASE 26 Rocky Mountain Chocolate Factory Inc. (2008) 26-19
EXHIBIT 8Rocky Mountain
Chocolate FactorySources of Revenue
2005–2008(Revenues inthousands of
dollars)
SOURCE: Rocky Mountain Chocolate Factory, Inc. 2007 Form 10-K, p. 23 and 2006 Form 10-K, p. 20 and 23.
2008 2007 2006 2005Factory Sales $23,758.2 $22,709.0 $19,297.2 $16,654.4Retail Sales 1,800.0 2,626.7 3,046.0 2,726.4Royalty and Marketing Fees 5,696.0 5,603.8 5,047.9 4,577.5Franchise Fees 623.1 633.8 682.5 565.3
Total $31,877.3 $31,573.3 $28,073.6 $24,523.6
increased sales to specialty markets, and the corresponding increases in revenue.75 Details canbe found in Exhibit 8.
Factory sales increased in fiscal 2008 compared to fiscal 2007 due to an increase of28.8% in product shipments to specialty markets and growth in the average number of storesin operation to 324 in fiscal 2008 from 310 in fiscal 2007. Same-store pounds purchased in fis-cal 2008 were down 9% from fiscal 2007, more than offsetting the increase in the average number of franchised stores in operation and mostly offsetting the increase in specialty mar-ket sales. RMCF believed the decrease in same-store pounds purchased in fiscal 2008 was dueprimarily to a product mix shift from factory products to products made in the stores and alsothe softening in the retail sector of the economy.76
The decrease in retail sales resulted primarily from a decrease in the average number ofcompany-owned stores in operation from 8 in fiscal 2007 to 5 in fiscal 2008. Same-store salesat company-owned stores increased 1.1% from fiscal 2007 to fiscal 2008 and 6.9% from fis-cal 2006 to fiscal 2007.77
Under the domestic franchise agreement, franchisees paid the company 1) an initial fran-chise fee; 2) a marketing and promotion fee equal to 1% of the monthly gross retail sales ofthe franchised store; and 3) a royalty fee based on gross retail sales. RMCF modified its roy-alty fee structure for any new franchised stores opening the third quarter of fiscal 2004 andlater. Under the new structure no royalty was charged on franchised stores’ retail sales of prod-ucts purchased from the company and a 10% royalty was charged on all other sales of productsold at franchised locations. For franchise stores opened prior to the third quarter of fiscal2004, a 5% royalty fee was charged on franchise stores gross retail sales. Franchise fee rev-enue was recognized upon opening of the franchise store.78
The increase in royalties and marketing fees resulted from growth in the average numberof domestic units in operation from 266 in fiscal 2007 to 281 in fiscal 2008 partially offset bya decrease in same store sales of 0.09%. Franchise fee revenues decreased during the past twofiscal years due to a decrease in the number of franchises sold during the same period the pre-vious year.79
Cost of sales increased from fiscal 2007 to 2008 due primarily to increased costs and mixof products sold. Company-store margin declined during the same period due primarily to achange in mix of products sold associated with a decrease in the average number of companystores in operation.80
As a percentage of total royalty and marketing fee revenue, franchised costs decreased to23.7% in fiscal 2008, 25.2% in fiscal 2007, and 25.6% in fiscal 2006 due to lower incentivecompensation costs. During this same period, sales and marketing costs and general and ad-ministrative costs also decreased due primarily to lower incentive compensation costs.81
In fiscal 2008 retail operating expenses decreased due primarily to a decrease in the aver-age number of company-owned stores during fiscal 2008 versus fiscal 2007. Retail operatingexpenses, as a percentage of retail sales, decreased from 57.6% in fiscal 2006, to 57.2% in fis-cal 2007, to 55.3% in fiscal 2008 due to a larger decrease in costs relative to the decrease in
26-20 SECTION D Industry Six—Specialty Retailing
revenues associated with a decrease in the average number of company stores in operation dur-ing each fiscal year.82
Depreciation and amortization of $783,000 in fiscal 2008 decreased 10.4% from the$874,000 incurred in fiscal 2007 due to the sale or closure of four company-owned stores andcertain assets becoming fully depreciated. Depreciation and amortization of $874,000 in fis-cal 2007 was essentially unchanged from the $876,000 incurred in fiscal 2006.83
Other, net of $101,000 realized in fiscal 2008 represented an increase of $34,000 from the$67,000 realized in fiscal 2007, due primarily to higher average outstanding balances of in-vested cash during fiscal 2008. Notes receivable balances and related interest income declinedin fiscal 2008 because of two notes maturing or being paid in full compared with fiscal 2007.RMCF also incurred interest expense in fiscal 2008 related to use of an operating line of credit.Other, net of $67,000 realized in fiscal 2007, represented a decrease of $9,000 from the$76,000 realized in fiscal 2006, due primarily to lower interest income on lower average out-standing balances of notes receivable and invested cash. RMCF paid its long-term debt in fullduring the first quarter of fiscal 2006.84
RMCF’s effective income tax rate in fiscal 2008 was 38.1%, which was an increase of0.3% compared to fiscal 2007. The increase in the effective tax rate was primarily due to in-creased income in states with higher income tax rates.85
In early 2008 RMCF repurchased 391,600 shares of its common stock at an average priceof $11.94 because the company believed the stock was undervalued.86 During the past eightyears, the company had repurchased approximately 3,909,000 shares of its common stock (ad-justed for stock splits and stock dividends), at an average price of $5.09 per share.87 As ofApril 30, 2008, there were 5,980,919 shares of common stock outstanding.88
As of February 29, 2008, working capital was $5.2 million compared with $7.5 million asof February 28, 2007. The change in working capital was due primarily to operating resultsless the payment of $2.4 million in cash dividends and the repurchase and retirement of$5.9 million of the company’s common stock.89
Cash and cash equivalent balances decreased from $2.8 million as of February 28, 2007,to $676,000 as of February 29, 2008, as a result of cash flows generated by operating and in-vesting activities being less than cash flows used in financing activities. RMCF had a $5.0 mil-lion line of credit, of which $4.7 million was available as of February 29, 2008, that bearsinterest at a variable rate. For fiscal 2009, the company anticipated making capital expendi-tures of approximately $500,000, which would be used to maintain and improve existing fac-tory and administrative infrastructure and update certain company-owned stores. Thecompany believed that cash flow from operations would be sufficient to fund capital expendi-tures and working capital requirements for fiscal 2009. If necessary, the company had avail-able bank lines of credit to help meet these requirements.90
RMCF revenues and profitability were subject to seasonal fluctuations in sales because ofthe location of its franchisees, which had traditionally been located in resort or tourist loca-tions. As the company had expanded its geographical diversity to include regional centers, ithad seen some moderation to its seasonal sales mix. Historically the strongest sales of the com-pany’s products had occurred during the Christmas holiday and summer vacation seasons. Ad-ditionally, quarterly results had been, and in the future are likely to be, affected by the timingof new store openings and sales of franchises.91
The most important factors in continued growth in the RMCF’s earnings were ongoingunit growth, increased same-store sales and increased same-store pounds purchased from thefactory. Historically, unit growth more than offset decreases in same-store sales and same-storepounds purchased.92 RMCF’s ability to successfully achieve expansion of its franchise systemdepended on many factors not within the company’s control, including the availability of suit-able sites for new store establishment and the availability of qualified franchises to supportsuch expansion.93
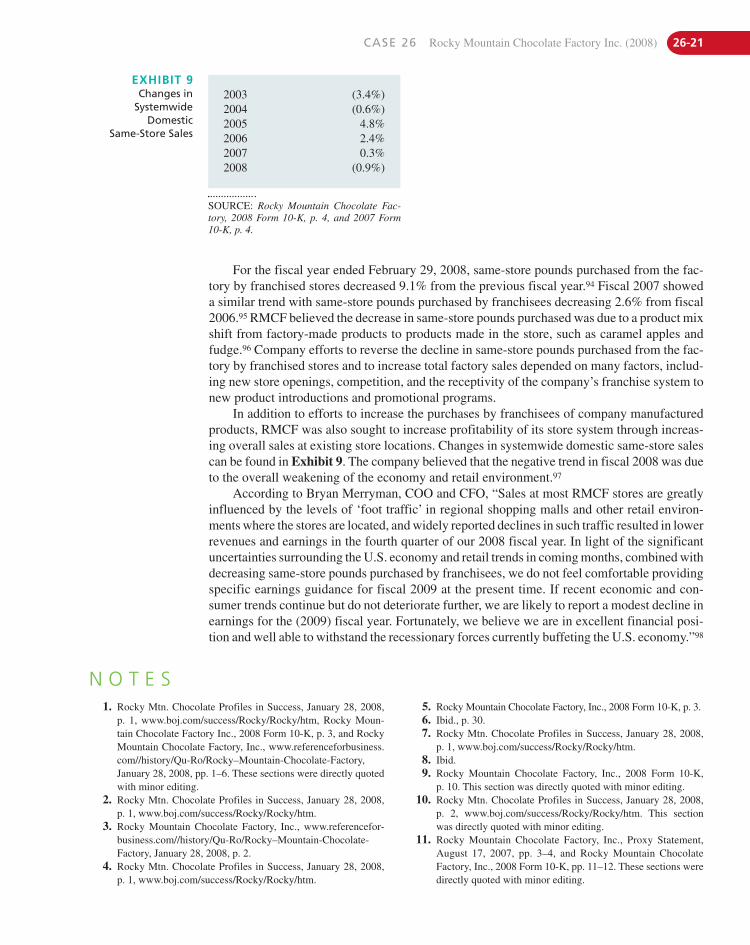
CASE 26 Rocky Mountain Chocolate Factory Inc. (2008) 26-21
For the fiscal year ended February 29, 2008, same-store pounds purchased from the fac-tory by franchised stores decreased 9.1% from the previous fiscal year.94 Fiscal 2007 showeda similar trend with same-store pounds purchased by franchisees decreasing 2.6% from fiscal2006.95 RMCF believed the decrease in same-store pounds purchased was due to a product mixshift from factory-made products to products made in the store, such as caramel apples andfudge.96 Company efforts to reverse the decline in same-store pounds purchased from the fac-tory by franchised stores and to increase total factory sales depended on many factors, includ-ing new store openings, competition, and the receptivity of the company’s franchise system tonew product introductions and promotional programs.
In addition to efforts to increase the purchases by franchisees of company manufacturedproducts, RMCF was also sought to increase profitability of its store system through increas-ing overall sales at existing store locations. Changes in systemwide domestic same-store salescan be found in Exhibit 9. The company believed that the negative trend in fiscal 2008 was dueto the overall weakening of the economy and retail environment.97
According to Bryan Merryman, COO and CFO, “Sales at most RMCF stores are greatlyinfluenced by the levels of ‘foot traffic’ in regional shopping malls and other retail environ-ments where the stores are located, and widely reported declines in such traffic resulted in lowerrevenues and earnings in the fourth quarter of our 2008 fiscal year. In light of the significantuncertainties surrounding the U.S. economy and retail trends in coming months, combined withdecreasing same-store pounds purchased by franchisees, we do not feel comfortable providingspecific earnings guidance for fiscal 2009 at the present time. If recent economic and con-sumer trends continue but do not deteriorate further, we are likely to report a modest decline inearnings for the (2009) fiscal year. Fortunately, we believe we are in excellent financial posi-tion and well able to withstand the recessionary forces currently buffeting the U.S. economy.”98
EXHIBIT 9Changes in
SystemwideDomestic
Same-Store Sales
SOURCE: Rocky Mountain Chocolate Fac-tory, 2008 Form 10-K, p. 4, and 2007 Form10-K, p. 4.
2003 (3.4%)2004 (0.6%)2005 4.8%2006 2.4%2007 0.3%2008 (0.9%)
N O T E S1. Rocky Mtn. Chocolate Profiles in Success, January 28, 2008,
p. 1, www.boj.com/success/Rocky/Rocky/htm, Rocky Moun-tain Chocolate Factory Inc., 2008 Form 10-K, p. 3, and RockyMountain Chocolate Factory, Inc., www.referenceforbusiness.com//history/Qu-Ro/Rocky–Mountain-Chocolate-Factory, January 28, 2008, pp. 1–6. These sections were directly quotedwith minor editing.
2. Rocky Mtn. Chocolate Profiles in Success, January 28, 2008,p. 1, www.boj.com/success/Rocky/Rocky/htm.
3. Rocky Mountain Chocolate Factory, Inc., www.referencefor-business.com//history/Qu-Ro/Rocky–Mountain-Chocolate-Factory, January 28, 2008, p. 2.
4. Rocky Mtn. Chocolate Profiles in Success, January 28, 2008,p. 1, www.boj.com/success/Rocky/Rocky/htm.
5. Rocky Mountain Chocolate Factory, Inc., 2008 Form 10-K, p. 3.6. Ibid., p. 30.7. Rocky Mtn. Chocolate Profiles in Success, January 28, 2008,
p. 1, www.boj.com/success/Rocky/Rocky/htm.8. Ibid.9. Rocky Mountain Chocolate Factory, Inc., 2008 Form 10-K,
p. 10. This section was directly quoted with minor editing.10. Rocky Mtn. Chocolate Profiles in Success, January 28, 2008,
p. 2, www.boj.com/success/Rocky/Rocky/htm. This sectionwas directly quoted with minor editing.
11. Rocky Mountain Chocolate Factory, Inc., Proxy Statement,August 17, 2007, pp. 3–4, and Rocky Mountain ChocolateFactory, Inc., 2008 Form 10-K, pp. 11–12. These sections weredirectly quoted with minor editing.
26-22 SECTION D Industry Six—Specialty Retailing
12. Rocky Mountain Chocolate Factory, Inc., Proxy Statement,August 17, 2007, p. 11. This section was directly quoted withminor editing.
13. Ibid., p. 20. This section was directly quoted with minor editing.14. Ibid., p. 1. This section was directly quoted with minor editing.15. Rocky Mountain Chocolate Factory, Inc., 2008 Form 10-K,
pp. 4–9 and 2007 Form 10-K, pp. 5–7. These sections were di-rectly quoted with minor editing.
16. Rocky Mtn. Chocolate Profiles in Success, January 28, 2008,www.boj.com/success/Rocky/Rocky/htm, p.1. This section wasdirectly quoted with minor editing.
17. Rocky Mountain Chocolate Factory, Inc., 2008 Form 10-K,pp. 7–8 and Rocky Mountain Chocolate Factory, Inc., Press Re-lease, August 1, 2007, p. 1. These sections were directly quotedwith minor editing.
18. Rocky Mtn. Chocolate Profiles in Success, January 28, 2008,www.boj.com/success/Rocky/Rocky/htm, p. 1.
19. Rocky Mountain Chocolate Factory, Inc., 2008 Form 10-K,p. 5. This section was directly quoted with minor editing.
20. Rocky Mountain Chocolate Factory, Inc., 2008 Form 10-K,p.13. This section was directly quoted with minor editing.
21. Rocky Mountain Chocolate Factory, Inc., 2008 Form 10-K,p. 6. This section was directly quoted with minor editing.
22. Rocky Mtn. Chocolate Profiles in Success, January 28, 2008,www.boj.com/success/Rocky/Rocky/htm, p. 2.
23. Rocky Mtn. Chocolate Profiles in Success, January 28, 2008,www.boj.com/success/Rocky/Rocky/htm, p. 2.
24. Ibid., p. 1. This section was directly quoted with minor editing.25. Rocky Mountain Chocolate Factory, Inc., www
.referenceforbusiness.com//history/Qu-Ro/Rocky–Mountain-Chocolate-Factory, January 28, 2008, p.3. This section wasdirectly quoted with minor editing.
26. Rocky Mountain Chocolate Factory, Inc., 2008 Form 10-K,p. 9. This section was directly quoted with minor editing.
27. Ibid., p. 14. This section was directly quoted with minorediting.
28. Ibid., p. 6. This section was directly quoted with minor editing.29. Ibid., pp. 4, 6. This section was directly quoted with minor editing.30. Rocky Mountain Chocolate Factory, Inc., www
.referenceforbusiness.com//history/Qu-Ro/Rocky–Mountain-Chocolate-Factory, January 28, 2008, p. 1. This section was directly quoted with minor editing.
31. Confectionary News.com, Rocky Mountain Chocolate WinsPackaging Award, May 31, 2002, http://www.confectionarynews.com/news/ng.asp?id�14118-rocky-mountain-chocolate.
32. Rocky Mountain Chocolate Factory, Inc., 2008 Form 10-K,p. 10. This section was directly quoted with minor editing.
33. RJFaulkner & Company, Inc.-Company Profile, Research Re-port, Rocky Mountain Chocolate Factory, Nov/Dec 2006, p. 5,www.rjfalkner.com/page.cfm?pageid�2140.
34. Rocky Mountain Chocolate Factory, Inc., 2008 Form 10-K,p. 10. This section was directly quoted with minor editing.
35. Ibid.36. Ibid., pp. 9–10. This section was directly quoted with minor
editing.37. Ibid., p. 3. This section was directly quoted with minor editing.38. NETZSCH’S ChocoEasy™, “New Chocolate Manufacturing
Technology Offers Chocolatiers Independence, More EfficientProduction,” Press release, November 17, 2005, http://www.foodprocessingtechnology.com/contractors/processing/netzsch/press2.html.
39. Rocky Mountain Chocolate Factory, Inc., 2008 Form 10-K,p. 15. This section was directly quoted with minor editing.
40. Ibid., pp. 9, 10, 13, 27, 38. These sections were directly quotedwith minor editing.
41. Rocky Mountain Chocolate Factory Corporate Site, Product Se-lection, p. 1, www.rmcf.com/CO/Denver50122/products.asp?.
42. Chanthavon, Samlanchith, “Chocolate and Slavery: Child La-bor in Cote d’Ivoire,” TED Case Studies, January 2001, http://www.american.edu/ted/chocolate-slave.htm.
43. Bax, Pauline. “Chocolate Industry Watching Cocoa Strike,” TheSeattle Times. October 7, 2006, http://seattletimes.nwsource.com/html/businesstechnology/2003308331_cocoa17.html.
44. Rocky Mountain Chocolate Factory, Inc., www.referenceforbusiness.com//history/Qu-Ro/Rocky–Mountain-Chocolate-Factory, January 28, 2008, p. 1. This sectionwas directly quoted with minor editing.
45. Rocky Mountain Chocolate Factory, Inc., 2008 Form 10-K,p. 10. This section was directly quoted with minor editing.
46. Ibid., p. 12. This section was directly quoted with minor editing.47. Ibid., p. 11. This section was directly quoted with minor editing.48. Leatherhead Food International, The Global Confectionary
Market-Trends and Innovations, www.leatherheadfood.com/pdf/confectionary/pdf.
49. Rocky Mountain Chocolate Factory, Inc., 2008 Form 10-K,p. 3. This section was directly quoted with minor editing.
50. National Confectioners Association, United States Confec-tionary Market, January 2008, Slide 5, http://www.ecandy.com/ecandyfiles/2007_Annual_Review_Jan_08.ppt.
51. Kermani, Faiz, “Chocolate Challenges,” Report Buyer, 2007,p. 3, www.reportbuyer.com. This section was directly quotedwith minor editing.
52. Ibid.53. Ibid.54. Ibid., pp. 3–4.55. Ibid., pp. 5–6.56. Ibid., p. 1.57. Moran, Michelle, “Category Analysis: Chocolate: Quality Sat-
isfies American Sweet Tooth,” Gourmet Retailer Magazine,June 1, 2006, http://www.gourmettretiiler.com/gourmetretailer/search/article_display.jsp?vnu_content_id�1002650555.
58. Schoettle, Anthony, “Local Chocolate Firm Leads OrganicPack,” Indianapolis Business Journal, December 17, 2007,Vol. 28, Issue 42, p. 19.
59. Kermani, Faiz, “Chocolate Challenges,” Report Buyer, 2007,p. 2, www.reportbuyer.com.
60. National Confectioners Association, United States Confec-tionary Market, January 2008., Slide 26, http://www.ecandy.com/ecandyfiles/2007_Annual_Review_Jan_08.ppt.
61. Kermani, Faiz, “Chocolate Challenges, Report Buyer,” 2007,p. 7, www.reportbuyer.com.
62. Ibid., p. 7.63. Ibid., p. 11.64. Ibid., p. 3.65. Young, Lauren, “Candy’s Getting Dandier,” Business Week,
February 13, 2006, Issue 3971, p. 88, and Fuller, Allisa C.,“Ethel M Ready to Rule Chocolate Kingdom,” Las Vegas Busi-ness Press, October 1986, Vol. 3, Issue 10, Section 1, p. 56.
66. Sorkin, Andrew Ross (ed.), “Campbell Soup Sells Godiva for$850 million,” DealBook, New York Times Business, January 14,2008, p. 1, http://dealbook.blogs.nytimes.com/2007/12/20/campbell-soup-sells-godiva-fpr-850-million/.
http://www.gourmettretiiler.com/gourmetretailer/search/article_display.jsp?vnu_content_id=1002650555
CASE 26 Rocky Mountain Chocolate Factory Inc. (2008) 26-23
67. Business Week, Chocoladefabriken Lindt & Sprengli Ag, 2007,http://investing.businessweek.com/research/stocks/snapshot.asp?capID�876088.
68. Lindt Company Website, About Lindt, July 3, 2008,http://investors.lindt.com/cgi-bin/show.ssp?id�5101&compa-nyName�lindt&language�Engl.
69. Alpine Confections, Inc. Company History, http://www.fundinguniverse.com/company-histories/AlpineConfections-Inc-Company-Hist
70. See’s Candies Website, July 3, 2008, http://www.sees.com/history.cfm and http://www.sees.com/about.cfm.
71. Schoettle, Anthony, “Local Chocolate Firm Leads OrganicPack,” Indianapolis Business Journal, December 17, 2007,Vol. 28, Issue 42, p. 19.
72. Rocky Mountain Chocolate Factory, Inc., 2008 Form 10-K.pp. 15–37 also 2007 and 2005 Form 10-K. This section was di-rectly quoted with minor editing.
73. Rocky Mountain Chocolate Factory Press Release, October 24,2007. This section was directly quoted with minor editing.
74. Rocky Mountain Chocolate Factory, Inc., 2008 Form 10-K, p. 3and 2007 form 10-K, p. 3. These sections were directly quotedwith minor editing.
75. Ibid., p. 20. These sections were directly quoted with minor editing.76. Rocky Mountain Chocolate Factory, Inc., 2008 Form 10-K,
p. 21. This section was directly quoted with minor editing.77. Ibid. This section was directly quoted with minor editing.78. Ibid., p. 35. This section was directly quoted with minor editing.79. Ibid., p. 21. This section was directly quoted with minor editing.
80. Ibid., p. 22.81. Ibid., p. 22.82. Ibid., p. 22.83. Ibid., p. 22.84. Ibid., p. 22.85. Ibid., p. 22.86. Ibid., p. 22. This section was directly quoted with minor editing.87. Rocky Mountain Chocolate Factory. Inc. Board Authorizes
New Stock Repurchase Program, PR Newswire, February 19,2008, p. 1, www.mergentonline.com/compdetail.asp?company.
88. Rocky Mountain Chocolate Factory, Inc., 2008 Form 10-K,p. 1. This section was directly quoted with minor editing.
89. Ibid., p. 24. This section was directly quoted with minor editing.90. Ibid., p. 24. This section was directly quoted with minor editing.91. Rocky Mountain Chocolate Factory, Inc., 2008 Form 10-K,
p. 25. This section was directly quoted with minor editing.92. Ibid., pp. 18–19. This section was directly quoted with minor
editing.93. Ibid., p. 19. This section was directly quoted with minor editing.94. Ibid., p. 19. This section was directly quoted with minor editing.95. Rocky Mountain Chocolate Factory, Inc., 2007 Form 10-K,
p. 19. This section was directly quoted with minor editing.96. Rocky Mountain Chocolate Factory, Inc., 2008 Form 10-K,
p. 4. This section was directly quoted with minor editing.97. Ibid.98. Rocky Mountain Chocolate Factory Reports Record FY2008
Revenues and Earnings, Press Release, May 8, 2008, pp. 1–2.This section was directly quoted with minor editing.

This page intentionally left blank
27-1
C A S E 27Dollar General Corporation: 2011 Growth Expansion Plans (Mini Case)Kathryn E. Wheelen
Expansion PlanOn January 6, 2011, the management of Dollar General announced its 2011 expansionplan for the company. Dollar General had plans to open 625 stores, add 6,000 employ-ees, and open stores in three additional states—Connecticut, Nevada, and New Hamp-shire. Recently, the company announced plans to open stores in Colorado. In addition,
the company intended to remodel or relocate 550 of its 9,200 stores in 35 states.Each store averaged 6 to 10 employees, a combination of full-time and part-time
employees. Employees had the option of flex-time. Wages were competitive to the localmarket wages. The company had 79,800 employees.1
IndustryThe dollar discount store industry’s primary competitors were Dollar General, the largestcompany, with revenues of $12.73 billion; Family Dollar Stores, with revenues of $8.04 billion;Dollar Tree in third place with revenues of $5.71 billion. The industry’s total revenue was$36.98 billion.2 See Exhibit 1 for information on each of the three major players in this indus-try segment.
This case was prepared by Kathryn E. Wheelen. Copyright ©2010 by Kathryn E. Wheelen. The copyright holder is solelyresponsible for the case content. This case was edited for Strategic Management and Business Policy, 13th edition.Reprinted by permission only for the 13th edition of Strategic Management and Business Policy (including internationaland electronic versions of the book). Any other publication of this case (translation, any form of electronic or media) orsale (any form of partnership) to another publisher will be in violation of copyright law unless Kathryn E.. Wheelen hasgranted additional written reprint permission.
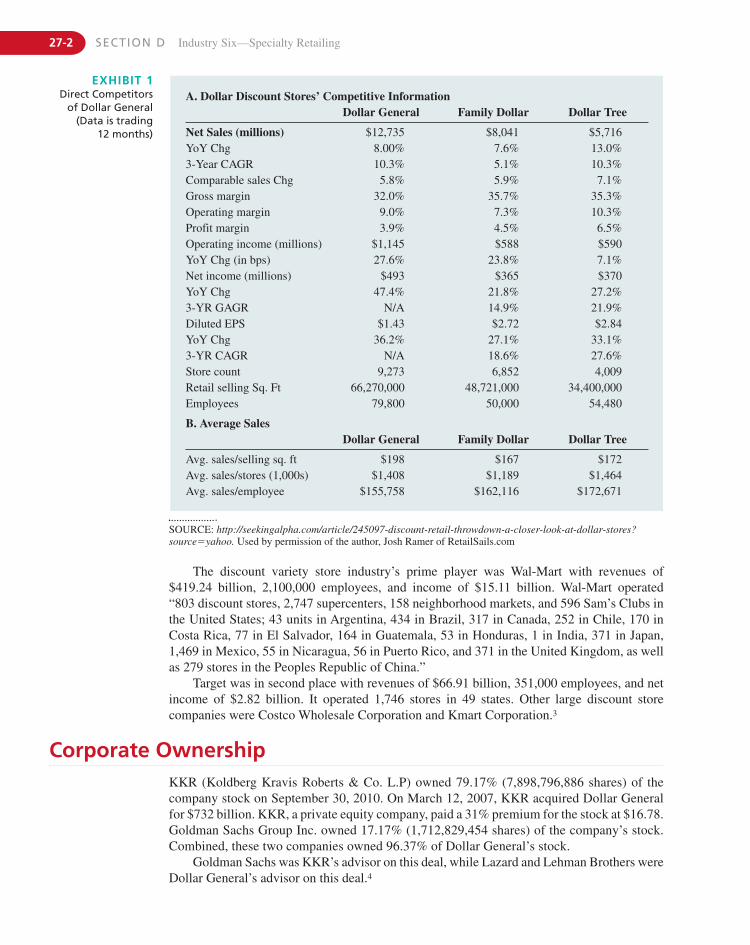
27-2 SECTION D Industry Six—Specialty Retailing
Corporate OwnershipKKR (Koldberg Kravis Roberts & Co. L.P) owned 79.17% (7,898,796,886 shares) of thecompany stock on September 30, 2010. On March 12, 2007, KKR acquired Dollar Generalfor $732 billion. KKR, a private equity company, paid a 31% premium for the stock at $16.78.Goldman Sachs Group Inc. owned 17.17% (1,712,829,454 shares) of the company’s stock.Combined, these two companies owned 96.37% of Dollar General’s stock.
Goldman Sachs was KKR’s advisor on this deal, while Lazard and Lehman Brothers wereDollar General’s advisor on this deal.4
A. Dollar Discount Stores’ Competitive InformationDollar General Family Dollar Dollar Tree
Net Sales (millions) $12,735 $8,041 $5,716YoY Chg 8.00% 7.6% 13.0%3-Year CAGR 10.3% 5.1% 10.3%Comparable sales Chg 5.8% 5.9% 7.1%Gross margin 32.0% 35.7% 35.3%Operating margin 9.0% 7.3% 10.3%Profit margin 3.9% 4.5% 6.5%Operating income (millions) $1,145 $588 $590YoY Chg (in bps) 27.6% 23.8% 7.1%Net income (millions) $493 $365 $370YoY Chg 47.4% 21.8% 27.2%3-YR GAGR N/A 14.9% 21.9%Diluted EPS $1.43 $2.72 $2.84YoY Chg 36.2% 27.1% 33.1%3-YR CAGR N/A 18.6% 27.6%Store count 9,273 6,852 4,009Retail selling Sq. Ft 66,270,000 48,721,000 34,400,000Employees 79,800 50,000 54,480
B. Average SalesDollar General Family Dollar Dollar Tree
Avg. sales/selling sq. ft $198 $167 $172Avg. sales/stores (1,000s) $1,408 $1,189 $1,464Avg. sales/employee $155,758 $162,116 $172,671
EXHIBIT 1Direct Competitors
of Dollar General(Data is trading
12 months)
The discount variety store industry’s prime player was Wal-Mart with revenues of$419.24 billion, 2,100,000 employees, and income of $15.11 billion. Wal-Mart operated“803 discount stores, 2,747 supercenters, 158 neighborhood markets, and 596 Sam’s Clubs inthe United States; 43 units in Argentina, 434 in Brazil, 317 in Canada, 252 in Chile, 170 inCosta Rica, 77 in El Salvador, 164 in Guatemala, 53 in Honduras, 1 in India, 371 in Japan,1,469 in Mexico, 55 in Nicaragua, 56 in Puerto Rico, and 371 in the United Kingdom, as wellas 279 stores in the Peoples Republic of China.”
Target was in second place with revenues of $66.91 billion, 351,000 employees, and netincome of $2.82 billion. It operated 1,746 stores in 49 states. Other large discount storecompanies were Costco Wholesale Corporation and Kmart Corporation.3
SOURCE: http://seekingalpha.com/article/245097-discount-retail-throwdown-a-closer-look-at-dollar-stores?source�yahoo. Used by permission of the author, Josh Ramer of RetailSails.com
CASE 27 Dollar General Corporation: 2011 Growth Expansion Plans (Mini Case) 27-3
Management Perspective on GrowthManagement’s stated position on growth as a strategy is cited as follows:
In 2008, management engaged Nielson to assist us in updating our proprietary customer re-search in an effort to better understand our customers, their purchasing habits and prefer-ences. The results of this study indicate that our highest frequency and highest spendingcustomers, comprising approximately 50% of our sales, are those for whom low prices andvalue are critical to their everyday shopping decisions. In August of 2009, we updated thisstudy with a customer survey designed to give us insight into recent changes in our customerbase. The results of this survey indicate that, while the description of our core customer re-mains the same, our stores are now attracting customers who had not shopped at our storespreviously because of their perception of image or quality. In addition, the percentage ofshoppers classified as one-stop shoppers has increased. We believe that recent additions toour merchandise offering, improvements to store operations and expansion of operatinghours, along with our consistent value proposition, are resonating well with our existing cus-tomers and have been critical to our success in attracting and retaining new customers.Based on additional proprietary survey results, management believes that in excess of 95%of our current customers expect to shop our stores with the same or greater frequency afterthe economy improves.
Based on Nielson Homescan Panel’s estimate of Dollar General shoppers, only 41% of thepopulation in our trade area, defined as the countries in which we have stores, has shopped atDollar General in the past year. We believe that the remaining 59% represents an opportunity togrow our customer base. We are striving to continue to improve on the quality, selection and pric-ing of our merchandise and upgrade our stores’ standards in order to attract and retain increas-ing numbers and demographics of customers.5
Analyst Views on Dollar General’s ExpansionAn analyst said, “(this announced 2011 expansion) . . . is in the face of the street’s perceptionlately that Dollar General and the other dollar stores have had their day. The Street’s view isthat Dollar General and the others will lose the middle income customers they’ve gained asthe economy continues to grow stronger.”6
The analyst further stated, “(third quarter) . . . declining growth rate is interpreted on theStreet as a trend that will continue. However, investors with a longer-term view might see thesame news with different eyes.”7
Another analyst said, “The dollar stores have included more national brands in theirmerchandise in a move to retain the new higher income customer and keep them coming backlong after the recession has passed.” He further stated, “Also, in a development the (Wall)Street dismissed, higher inflation on some of the dollar store merchandise is leading to . . .(lower store margins).”8
Anthony Chukunba, BB&T analyst, said, “Even though the economy is starting torecover, consumers will continue to look for ways to save money.” Management of DollarGeneral would agree with this analyst. The management also feels the company’s enhancedmerchandise with more national brands at a lower cost was a strong magnet to draw customersinto their store.9
An analyst said the crucial factor in the present depressed economy was the hiring ofemployees with wages to support a family, and not jobs at minimum wages and no health care.If the former occurs, this plays into the customers who will shop at Dollar General.
According to the Federal Reserve Chairman, Ben S. Bernanke, wages in 2010 increasedonly 1.7%. The country needed to add 230,000 jobs just to keep up with the growth in the
27-4 SECTION D Industry Six—Specialty Retailing
The Dollar General Store and MerchandiseThe average Dollar General store had approximately 7,100 square feet of selling space andwas typically operated by a manager, an assistant manager, and three or more sales clerks.Approximately 55% of the stores were in freestanding buildings, 43% in strip shoppingcenters, and 2% in downtown buildings. Most of its customers lived within three miles, or a10-minute drive, of the stores. The Dollar General store strategy featured low initial capitalexpenditures, limited maintenance capital, low occupancy and operating costs, and a focusedmerchandise offering within a broad range of categories, allowing the company to deliverlow retail prices while generating strong cash flows and investment returns. A typical newstore in 2009 required approximately $230,000 of equipment, fixtures, and initial inventory,net of payables.
Dollar General generally had not encountered difficulty locating suitable store sites in thepast. Given the size of the communities that it was targeting, Dollar General believed that therewas ample opportunity for new store growth in existing and new markets. In addition, thecurrent real estate market was providing an opportunity for Dollar General to access higherquality sites at lower rates than in recent years. Also, Dollar General believed it had signifi-cant opportunities available for its relocation and remodel programs. Remodeled storesrequired approximately $65,000 for equipment and fixtures while the cost of relocations wasapproximately $110,000 for equipment, fixtures, and additional inventory, net of payables.Dollar General has increased the combined number of remodeled and relocated stores to 450 in2009 as compared to 404 in 2008 and 300 in 2007.11
The following chart shows the Dollar General’s four major categories of merchandise:12
FinanceExhibit 2 shows the consolidated balance sheets and Exhibit 3 shows the consolidated state-ments of income for Dollar General. The key financial metrics shown below were developedby management for 2010.13
Management recognized that the company had substantial debt, which included a$1.964 billion senior secured term loan facility which matures on July 6, 2014; $979.3 millionaggregate principal amount of 10.623% senior notes due 2015; and $450.7 million aggre-gate principal amount of 11.875%/12.625% senior subordinated toggle notes due 2017. Thisdebt could have important negative consequences to the business, including:
� Same-store sales growth;
� Sales per square floor;
� Gross profit, as a percentage of sales;
2009 2008 2007Consumables 70.8% 69.3% 66.5%Seasonal 14.5% 14.6% 15.9%Home products 7.4% 8.2% 9.2%Apparel 7.3% 7.9% 8.4%
yearly population (college and high school graduates, etc.). If inflation returned to theeconomy, wages must exceed the annual wage increase so consumers would have moremoney to spend.
The U.S unemployment rate in January, 2011 was around 9.4%–9.6%. The actual totalunemployment rate was 16.6%.10
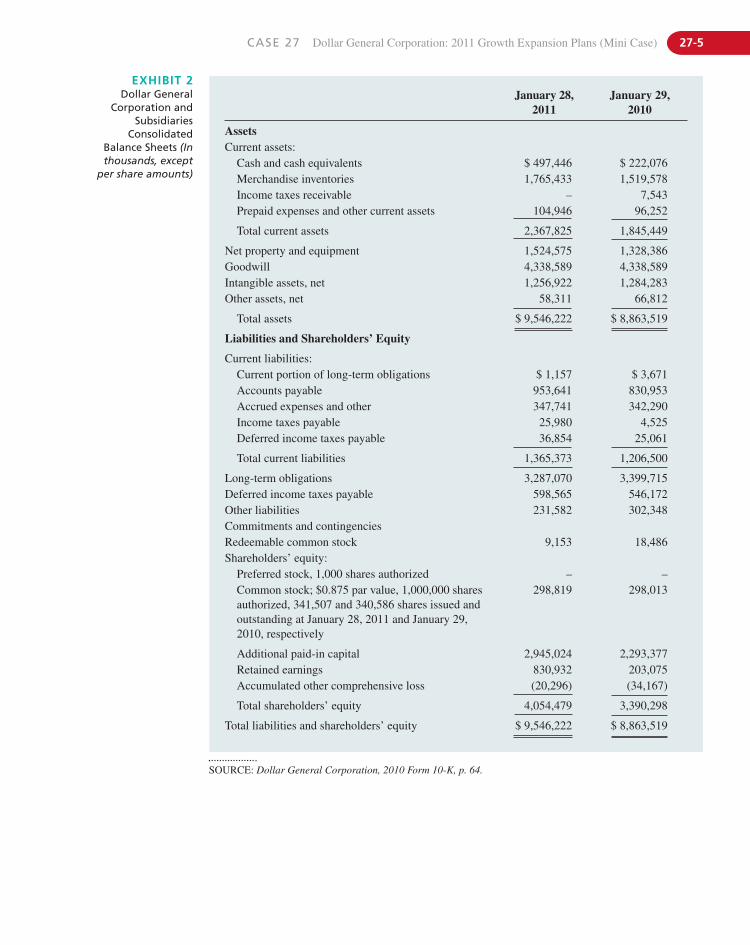
CASE 27 Dollar General Corporation: 2011 Growth Expansion Plans (Mini Case) 27-5
January 28, 2011
January 29, 2010
AssetsCurrent assets:
Cash and cash equivalents $ 497,446 $ 222,076Merchandise inventories 1,765,433 1,519,578Income taxes receivable – 7,543Prepaid expenses and other current assets 104,946 96,252
Total current assets 2,367,825 1,845,449
Net property and equipment 1,524,575 1,328,386Goodwill 4,338,589 4,338,589Intangible assets, net 1,256,922 1,284,283Other assets, net 58,311 66,812
Total assets $ 9,546,222 $ 8,863,519
Liabilities and Shareholders’ Equity
Current liabilities:Current portion of long-term obligations $ 1,157 $ 3,671Accounts payable 953,641 830,953Accrued expenses and other 347,741 342,290Income taxes payable 25,980 4,525Deferred income taxes payable 36,854 25,061
Total current liabilities 1,365,373 1,206,500
Long-term obligations 3,287,070 3,399,715Deferred income taxes payable 598,565 546,172Other liabilities 231,582 302,348Commitments and contingenciesRedeemable common stock 9,153 18,486Shareholders’ equity:
Preferred stock, 1,000 shares authorized – –Common stock; $0.875 par value, 1,000,000 sharesauthorized, 341,507 and 340,586 shares issued andoutstanding at January 28, 2011 and January 29,2010, respectively
298,819 298,013
Additional paid-in capital 2,945,024 2,293,377Retained earnings 830,932 203,075Accumulated other comprehensive loss (20,296) (34,167)
Total shareholders’ equity 4,054,479 3,390,298
Total liabilities and shareholders’ equity $ 9,546,222 $ 8,863,519
EXHIBIT 2Dollar General
Corporation andSubsidiaries
ConsolidatedBalance Sheets (Inthousands, except
per share amounts)
SOURCE: Dollar General Corporation, 2010 Form 10-K, p. 64.
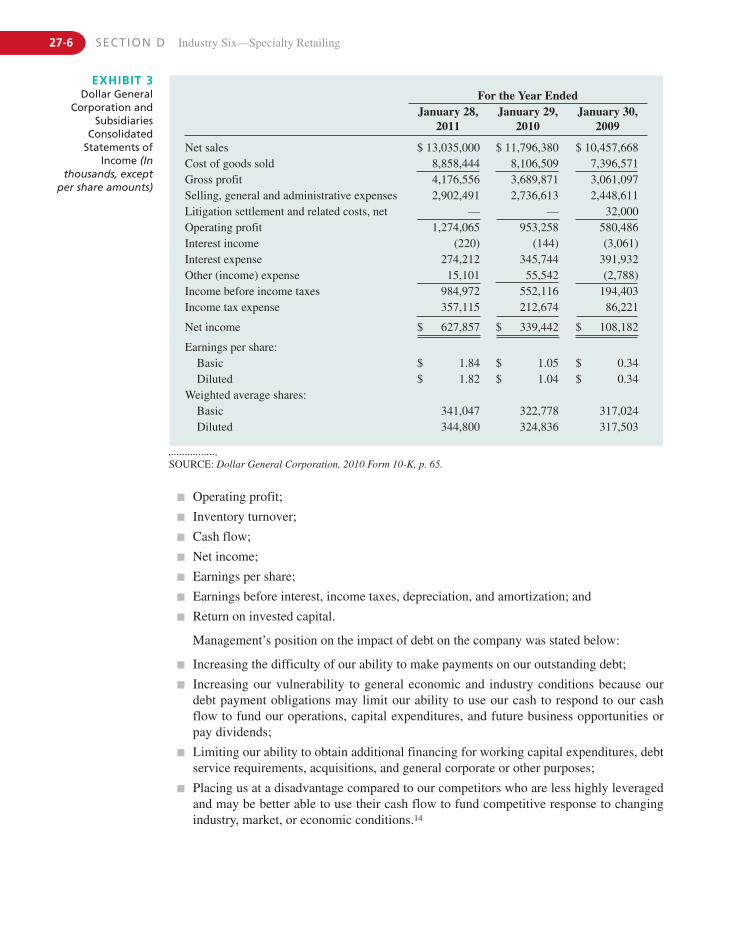
27-6 SECTION D Industry Six—Specialty Retailing
� Operating profit;
� Inventory turnover;
� Cash flow;
� Net income;
� Earnings per share;
� Earnings before interest, income taxes, depreciation, and amortization; and
� Return on invested capital.
Management’s position on the impact of debt on the company was stated below:
� Increasing the difficulty of our ability to make payments on our outstanding debt;
� Increasing our vulnerability to general economic and industry conditions because ourdebt payment obligations may limit our ability to use our cash to respond to our cashflow to fund our operations, capital expenditures, and future business opportunities orpay dividends;
� Limiting our ability to obtain additional financing for working capital expenditures, debtservice requirements, acquisitions, and general corporate or other purposes;
� Placing us at a disadvantage compared to our competitors who are less highly leveragedand may be better able to use their cash flow to fund competitive response to changingindustry, market, or economic conditions.14
For the Year EndedJanuary 28,
2011January 29,
2010January 30,
2009
Net sales $ 13,035,000 $ 11,796,380 $ 10,457,668Cost of goods sold 8,858,444 8,106,509 7,396,571Gross profit 4,176,556 3,689,871 3,061,097Selling, general and administrative expenses 2,902,491 2,736,613 2,448,611Litigation settlement and related costs, net — — 32,000Operating profit 1,274,065 953,258 580,486Interest income (220) (144) (3,061)Interest expense 274,212 345,744 391,932Other (income) expense 15,101 55,542 (2,788)Income before income taxes 984,972 552,116 194,403Income tax expense 357,115 212,674 86,221
Net income $ 627,857 $ 339,442 $ 108,182
Earnings per share:Basic $ 1.84 $ 1.05 $ 0.34Diluted $ 1.82 $ 1.04 $ 0.34
Weighted average shares:Basic 341,047 322,778 317,024Diluted 344,800 324,836 317,503
EXHIBIT 3Dollar General
Corporation andSubsidiaries
ConsolidatedStatements of
Income (Inthousands, except
per share amounts)
SOURCE: Dollar General Corporation, 2010 Form 10-K, p. 65.
CASE 27 Dollar General Corporation: 2011 Growth Expansion Plans (Mini Case) 27-7
1. Greg Stushinisu, “Dollar General Forges Ahead,” January 20,2011, and company announcement on January 6, 2011 andcompany documents.
2. Yahoo–Finance–competitors of Dollar General.3. Yahoo–Finance–for both Wal-Mart and Target.4. Parla B. Kavilana, “Dollar General to Be Acquired by KKR,”
CNNMoney.com, March 12, 2007.5. Dollar General Corporation, “SEC 10-K,” January 29, 2010,
p. 8. These two paragraphs are directly quoted.6. Greg Stushinisu, “Dollar General Forges Ahead,” January 20,
2011 (posted).
7. Ibid.8. Ibid.9. Ibid.
10. CNN Finance and MSNBC—both had Chairman Bernanke onthe news.
11. Dollar General Corporation, “SEC 10-K,” January 29, 2010,p.7. These two paragraphs are directly quoted.
12. Ibid.13. Ibid., p. 11.14. Ibid., p. 31.
N O T E S

This page intentionally left blank
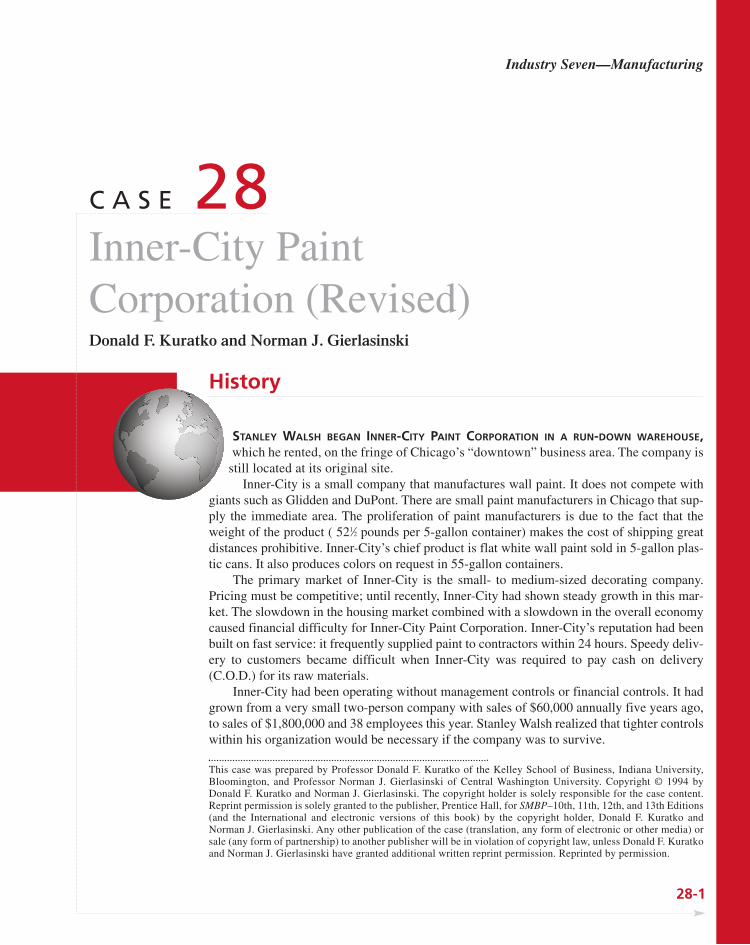
History
STANLEY WALSH BEGAN INNER-CITY PAINT CORPORATION IN A RUN-DOWN WAREHOUSE,which he rented, on the fringe of Chicago’s “downtown” business area. The company is
still located at its original site.Inner-City is a small company that manufactures wall paint. It does not compete with
giants such as Glidden and DuPont. There are small paint manufacturers in Chicago that sup-ply the immediate area. The proliferation of paint manufacturers is due to the fact that theweight of the product ( 521⁄2 pounds per 5-gallon container) makes the cost of shipping greatdistances prohibitive. Inner-City’s chief product is flat white wall paint sold in 5-gallon plas-tic cans. It also produces colors on request in 55-gallon containers.
The primary market of Inner-City is the small- to medium-sized decorating company.Pricing must be competitive; until recently, Inner-City had shown steady growth in this mar-ket. The slowdown in the housing market combined with a slowdown in the overall economycaused financial difficulty for Inner-City Paint Corporation. Inner-City’s reputation had beenbuilt on fast service: it frequently supplied paint to contractors within 24 hours. Speedy deliv-ery to customers became difficult when Inner-City was required to pay cash on delivery(C.O.D.) for its raw materials.
Inner-City had been operating without management controls or financial controls. It hadgrown from a very small two-person company with sales of $60,000 annually five years ago,to sales of $1,800,000 and 38 employees this year. Stanley Walsh realized that tighter controlswithin his organization would be necessary if the company was to survive.
This case was prepared by Professor Donald F. Kuratko of the Kelley School of Business, Indiana University,Bloomington, and Professor Norman J. Gierlasinski of Central Washington University. Copyright © 1994 by Donald F. Kuratko and Norman J. Gierlasinski. The copyright holder is solely responsible for the case content.Reprint permission is solely granted to the publisher, Prentice Hall, for SMBP–10th, 11th, 12th, and 13th Editions(and the International and electronic versions of this book) by the copyright holder, Donald F. Kuratko and Norman J. Gierlasinski. Any other publication of the case (translation, any form of electronic or other media) orsale (any form of partnership) to another publisher will be in violation of copyright law, unless Donald F. Kuratkoand Norman J. Gierlasinski have granted additional written reprint permission. Reprinted by permission.
28-1
C A S E 28Inner-City Paint Corporation (Revised)Donald F. Kuratko and Norman J. Gierlasinski
Industry Seven—Manufacturing
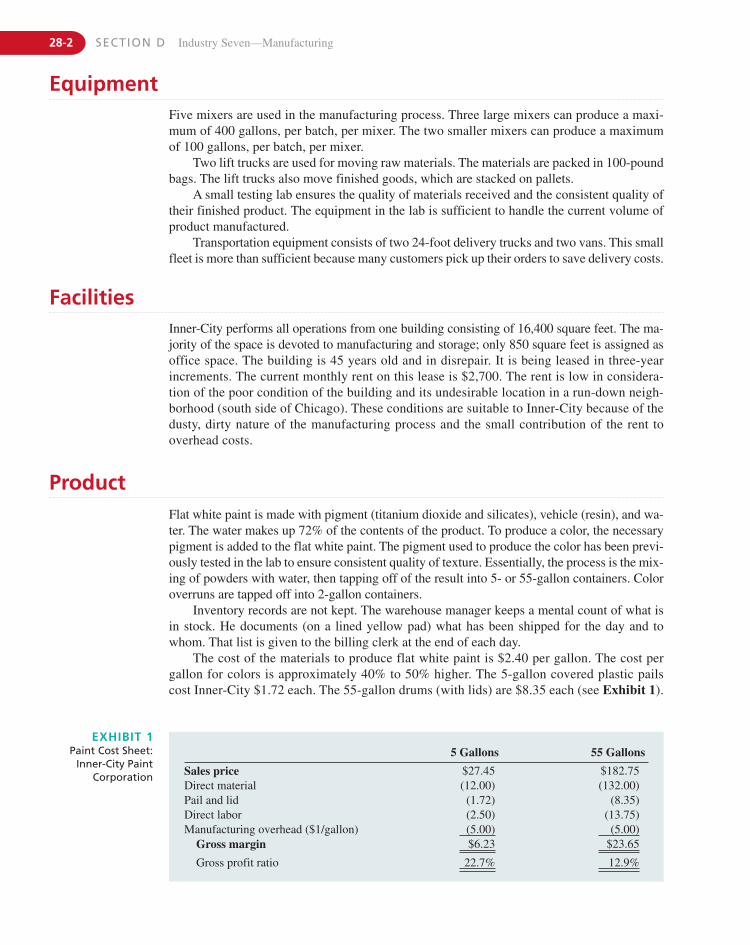
28-2 SECTION D Industry Seven—Manufacturing
EXHIBIT 1Paint Cost Sheet:
Inner-City PaintCorporation
EquipmentFive mixers are used in the manufacturing process. Three large mixers can produce a maxi-mum of 400 gallons, per batch, per mixer. The two smaller mixers can produce a maximumof 100 gallons, per batch, per mixer.
Two lift trucks are used for moving raw materials. The materials are packed in 100-poundbags. The lift trucks also move finished goods, which are stacked on pallets.
A small testing lab ensures the quality of materials received and the consistent quality oftheir finished product. The equipment in the lab is sufficient to handle the current volume ofproduct manufactured.
Transportation equipment consists of two 24-foot delivery trucks and two vans. This smallfleet is more than sufficient because many customers pick up their orders to save delivery costs.
FacilitiesInner-City performs all operations from one building consisting of 16,400 square feet. The ma-jority of the space is devoted to manufacturing and storage; only 850 square feet is assigned asoffice space. The building is 45 years old and in disrepair. It is being leased in three-year increments. The current monthly rent on this lease is $2,700. The rent is low in considera-tion of the poor condition of the building and its undesirable location in a run-down neigh-borhood (south side of Chicago). These conditions are suitable to Inner-City because of thedusty, dirty nature of the manufacturing process and the small contribution of the rent tooverhead costs.
ProductFlat white paint is made with pigment (titanium dioxide and silicates), vehicle (resin), and wa-ter. The water makes up 72% of the contents of the product. To produce a color, the necessarypigment is added to the flat white paint. The pigment used to produce the color has been previ-ously tested in the lab to ensure consistent quality of texture. Essentially, the process is the mix-ing of powders with water, then tapping off of the result into 5- or 55-gallon containers. Coloroverruns are tapped off into 2-gallon containers.
Inventory records are not kept. The warehouse manager keeps a mental count of what isin stock. He documents (on a lined yellow pad) what has been shipped for the day and towhom. That list is given to the billing clerk at the end of each day.
The cost of the materials to produce flat white paint is $2.40 per gallon. The cost pergallon for colors is approximately 40% to 50% higher. The 5-gallon covered plastic pailscost Inner-City $1.72 each. The 55-gallon drums (with lids) are $8.35 each (see Exhibit 1).
5 Gallons 55 Gallons
Sales price $27.45 $182.75Direct material (12.00) (132.00)Pail and lid (1.72) (8.35)Direct labor (2.50) (13.75)Manufacturing overhead ($1/gallon) (5.00) (5.00)
Gross margin $6.23 $23.65
Gross profit ratio 22.7% 12.9%
CASE 28 Inner-City Paint Corporation (Revised) 28-3
Selling price varies with the quantity purchased. To the average customer, flat white sellsat $27.45 for 5 gallons and $182.75 for 55 gallons. Colors vary in selling price because of thevariety in pigment cost and quantity ordered. Customers purchase on credit and usually paytheir invoices in 30 to 60 days. Inner-City telephones the customer after 60 days of nonpay-ment and inquires when payment will be made.
ManagementThe President and majority stockholder is Stanley Walsh. He began his career as a housepainter and advanced to become a painter for a large decorating company. Walsh paintedmostly walls in large commercial buildings and hospitals. Eventually, he came to believethat he could produce a paint that was less expensive and of higher quality than what wasbeing used. A keen desire to open his own business resulted in the creation of Inner-CityPaint Corporation.
Walsh manages the corporation today in much the same way that he did when the busi-ness began. He personally must open all the mail, approve all payments, and inspect all cus-tomer billings before they are mailed. He has been unable to detach himself from any detail ofthe operation and cannot properly delegate authority. As the company has grown, the time el-ement alone has aggravated the situation. Frequently, these tasks are performed days aftertransactions occur and mail is received.
The office is managed by Mary Walsh (Walsh’s mother). Two part-time clerks assist her,and all records are processed manually.
The plant is managed by a man in his twenties, whom Walsh hired from one of his cus-tomers. Walsh became acquainted with him when the man picked up paint from Inner-City forhis previous employer. Prior to the eight months he has been employed by Walsh as Plant Man-ager, his only other experience has been that of a painter.
EmployeesThirty-five employees (20 workers are part-time) work in various phases of the manufactur-ing process. The employees are nonunion, and most are unskilled laborers. They take turnsmaking paint and driving the delivery trucks.
Stanley Walsh does all of the sales work and public relations work. He spends approxi-mately one half of every day making sales calls and answering complaints about defectivepaint. He is the only salesman. Other salesmen had been employed in the past, but Walsh feltthat they “could not be trusted.”
Customer PerceptionCustomers view Inner-City as a company that provides fast service and negotiates on priceand payment out of desperation. Walsh is seen as a disorganized man who may not be ableto keep Inner-City afloat much longer. Paint contractors are reluctant to give Inner-Citylarge orders out of fear that the paint may not be ready on a continuous, reliable basis.Larger orders usually go to larger companies that have demonstrated their reliability andsolvency.
Rumors abound that Inner-City is in difficult financial straits, that it is unable to pay sup-pliers, and that it owes a considerable sum for payment on back taxes. All of the above con-tribute to the customers’ serious lack of confidence in the corporation.
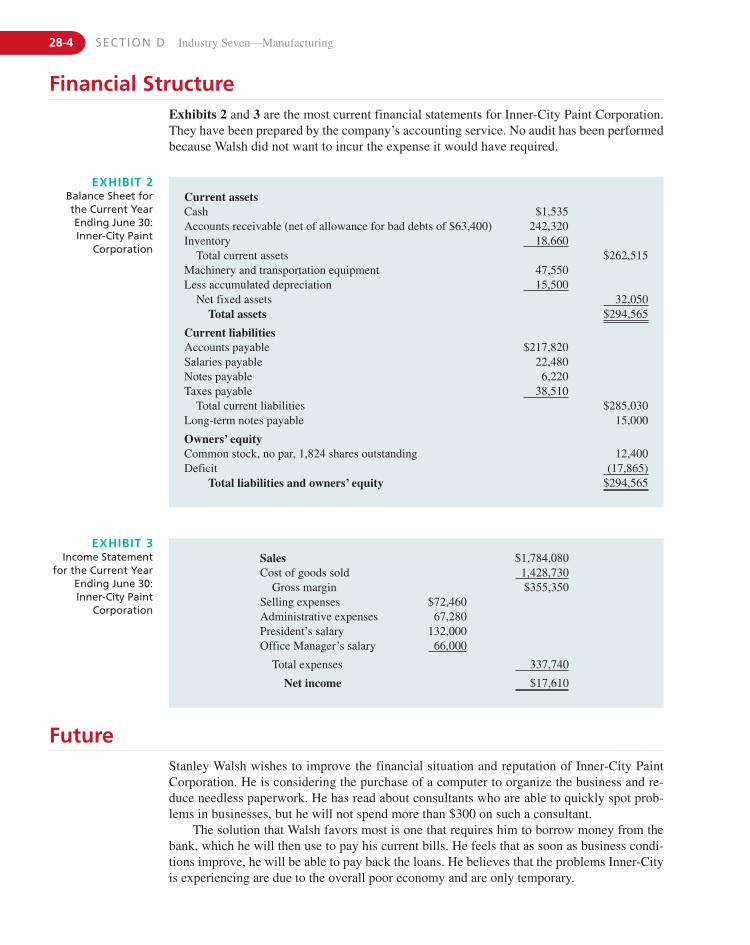
28-4 SECTION D Industry Seven—Manufacturing
Financial StructureExhibits 2 and 3 are the most current financial statements for Inner-City Paint Corporation.They have been prepared by the company’s accounting service. No audit has been performedbecause Walsh did not want to incur the expense it would have required.
EXHIBIT 2Balance Sheet forthe Current YearEnding June 30:Inner-City Paint
Corporation
EXHIBIT 3Income Statement
for the Current YearEnding June 30:Inner-City Paint
Corporation
Current assetsCash $1,535Accounts receivable (net of allowance for bad debts of $63,400) 242,320Inventory 18,660
Total current assets $262,515Machinery and transportation equipment 47,550Less accumulated depreciation 15,500
Net fixed assets 32,050Total assets $294,565
Current liabilitiesAccounts payable $217,820Salaries payable 22,480Notes payable 6,220Taxes payable 38,510
Total current liabilities $285,030Long-term notes payable 15,000
Owners’ equityCommon stock, no par, 1,824 shares outstanding 12,400Deficit (17,865)
Total liabilities and owners’ equity $294,565
Sales $1,784,080Cost of goods sold 1,428,730
Gross margin $355,350Selling expenses $72,460Administrative expenses 67,280President’s salary 132,000Office Manager’s salary 66,000
Total expenses 337,740
Net income $17,610
FutureStanley Walsh wishes to improve the financial situation and reputation of Inner-City PaintCorporation. He is considering the purchase of a computer to organize the business and re-duce needless paperwork. He has read about consultants who are able to quickly spot prob-lems in businesses, but he will not spend more than $300 on such a consultant.
The solution that Walsh favors most is one that requires him to borrow money from thebank, which he will then use to pay his current bills. He feels that as soon as business condi-tions improve, he will be able to pay back the loans. He believes that the problems Inner-Cityis experiencing are due to the overall poor economy and are only temporary.
THE GARDNER COMPANY WAS A RESPECTED NEW ENGLAND MANUFACTURER OF MACHINES andmachine tools purchased by furniture makers for use in their manufacturing process. As a
means of growing the firm, the Gardner Company acquired Carey Manufacturing threeyears ago from James Carey for $3,500,000. Carey Manufacturing was a high qualitymaker of specialized machine parts. Ralph Brown, Gardner’s Vice President of Finance,had been the driving force behind the acquisition. Except for Andy Doyle and Rod Davis,
all of Gardner’s Vice Presidents (Exhibit 1) had been opposed to expansion through acqui-sition. They preferred internal growth for Gardner because they felt that the company would
be more able to control both the rate and direction of its growth. Nevertheless, since both PeterFinch, President, and R. C. Smith, Executive Vice President, agreed with Brown’s strong rec-ommendation, Carey Manufacturing was acquired. Its primary asset was an aging manufactur-ing plant located 400 miles away from the Gardner Company’s current headquarters andmanufacturing facility. The Gardner Company was known for its manufacturing competency.Management hoped to add value to its new acquisition by transferring Gardner’s manufactur-ing skills to the Carey Plant through significant process improvements.
James Carey, previous owner of Carey Manufacturing, agreed to continue serving as PlantManager of what was now called the Carey Plant. He reported directly to the Gardner Com-pany Executive Vice President, R. C. Smith. All functional activities of Carey Manufacturinghad remained the same after the acquisition, except for sales activities being moved underAndy Doyle, Gardner’s Vice President of Marketing. The five Carey Manufacturing salesmenwere retained and allowed to keep their same sales territories. They exclusively sold only prod-ucts made in the Carey Plant. The other Carey Plant functional departments (Human Re-sources, Engineering, Finance, Materials, Quality Assurance, and Operations) weresupervised by Managers who directly reported to the Carey Plant Manager. The Managers ofthe Human Resources, Engineering, Materials, and Operations Departments also reported in-directly (shown by dotted lines in Exhibit 1) to the Vice Presidents in charge of their respec-tive function at Gardner Company headquarters.
This case was prepared by Professor Thomas L. Wheelen and J. David Hunger of Iowa State University. Names anddates in the case have been disguised. An earlier version of this case was presented to the 2000 annual meeting of theNorth American Case Research Association. This case may not be reproduced in any form without written permis-sion of the two copyright holders, Thomas L. Wheelen and J. David Hunger. This case was edited for SMBP–9th,10th, 11th, 12th, and 13th Editions. Copyright © 2001, 2005, and 2008 by Thomas L. Wheelen and J. David Hunger.The copyright holders are solely responsible for case content. Any other publication of the case (translation any formof electronic or other media) or sale (any form of partnership) to another publisher will be in violation of copyrightlaw, unless Thomas L. Wheelen and J. David Hunger have granted additional written reprint permission. Reprintedby permission.
29-1
C A S E 29The Carey PlantThomas L. Wheelen and J. David Hunger
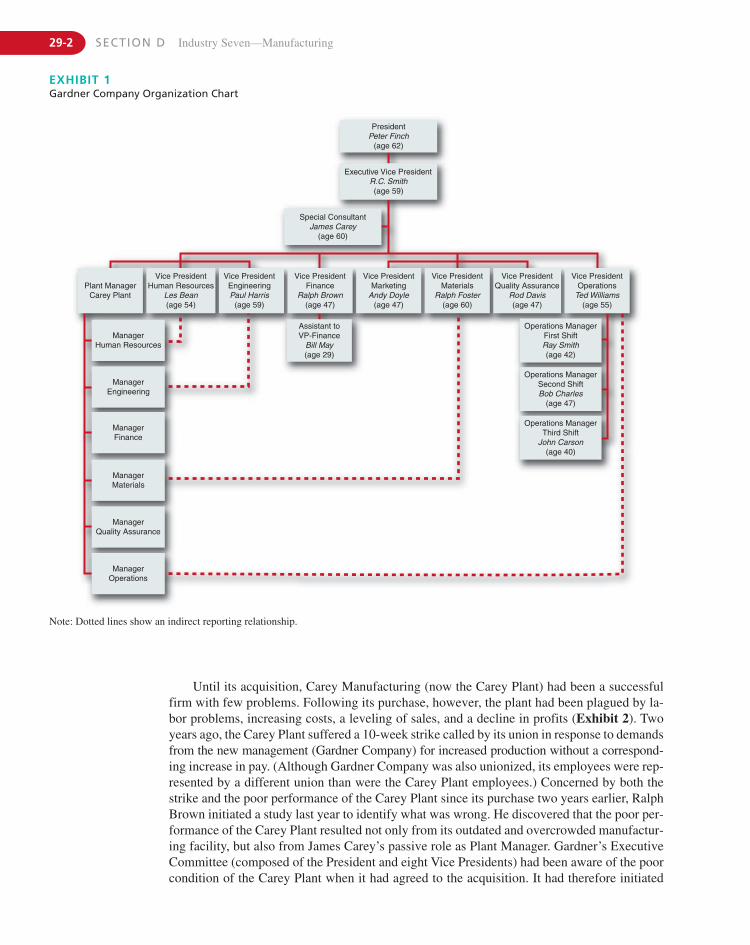
29-2 SECTION D Industry Seven—Manufacturing
PresidentPeter Finch
(age 62)
Executive Vice PresidentR.C. Smith(age 59)
Special ConsultantJames Carey
(age 60)
Plant ManagerCarey Plant
ManagerHuman Resources
ManagerEngineering
ManagerFinance
ManagerMaterials
ManagerQuality Assurance
ManagerOperations
Assistant toVP-Finance
Bill May(age 29)
Vice PresidentFinance
Ralph Brown(age 47)
Vice PresidentMaterials
Ralph Foster(age 60)
Vice PresidentMarketing
Andy Doyle(age 47)
Vice PresidentOperations
Ted Williams(age 55)
Operations ManagerFirst ShiftRay Smith(age 42)
Operations ManagerSecond ShiftBob Charles
(age 47)
Operations ManagerThird Shift
John Carson(age 40)
Vice PresidentQuality Assurance
Rod Davis(age 47)
Vice PresidentEngineeringPaul Harris
(age 59)
Vice PresidentHuman Resources
Les Bean(age 54)
EXHIBIT 1Gardner Company Organization Chart
Note: Dotted lines show an indirect reporting relationship.
Until its acquisition, Carey Manufacturing (now the Carey Plant) had been a successfulfirm with few problems. Following its purchase, however, the plant had been plagued by la-bor problems, increasing costs, a leveling of sales, and a decline in profits (Exhibit 2). Twoyears ago, the Carey Plant suffered a 10-week strike called by its union in response to demandsfrom the new management (Gardner Company) for increased production without a correspond-ing increase in pay. (Although Gardner Company was also unionized, its employees were rep-resented by a different union than were the Carey Plant employees.) Concerned by both thestrike and the poor performance of the Carey Plant since its purchase two years earlier, RalphBrown initiated a study last year to identify what was wrong. He discovered that the poor per-formance of the Carey Plant resulted not only from its outdated and overcrowded manufactur-ing facility, but also from James Carey’s passive role as Plant Manager. Gardner’s ExecutiveCommittee (composed of the President and eight Vice Presidents) had been aware of the poorcondition of the Carey Plant when it had agreed to the acquisition. It had therefore initiated
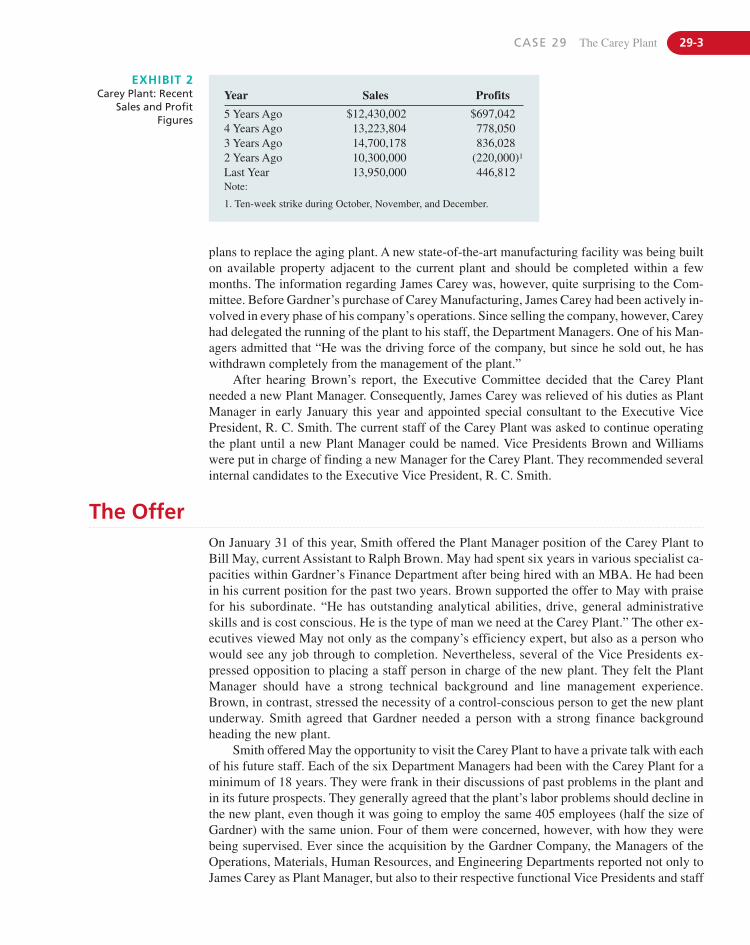
plans to replace the aging plant. A new state-of-the-art manufacturing facility was being builton available property adjacent to the current plant and should be completed within a fewmonths. The information regarding James Carey was, however, quite surprising to the Com-mittee. Before Gardner’s purchase of Carey Manufacturing, James Carey had been actively in-volved in every phase of his company’s operations. Since selling the company, however, Careyhad delegated the running of the plant to his staff, the Department Managers. One of his Man-agers admitted that “He was the driving force of the company, but since he sold out, he haswithdrawn completely from the management of the plant.”
After hearing Brown’s report, the Executive Committee decided that the Carey Plantneeded a new Plant Manager. Consequently, James Carey was relieved of his duties as PlantManager in early January this year and appointed special consultant to the Executive VicePresident, R. C. Smith. The current staff of the Carey Plant was asked to continue operatingthe plant until a new Plant Manager could be named. Vice Presidents Brown and Williamswere put in charge of finding a new Manager for the Carey Plant. They recommended severalinternal candidates to the Executive Vice President, R. C. Smith.
CASE 29 The Carey Plant 29-3
EXHIBIT 2Carey Plant: Recent
Sales and ProfitFigures
Year Sales Profits
5 Years Ago $12,430,002 $697,0424 Years Ago 13,223,804 778,0503 Years Ago 14,700,178 836,0282 Years Ago 10,300,000 (220,000)1
Last Year 13,950,000 446,812Note:
1. Ten-week strike during October, November, and December.
The OfferOn January 31 of this year, Smith offered the Plant Manager position of the Carey Plant toBill May, current Assistant to Ralph Brown. May had spent six years in various specialist ca-pacities within Gardner’s Finance Department after being hired with an MBA. He had beenin his current position for the past two years. Brown supported the offer to May with praisefor his subordinate. “He has outstanding analytical abilities, drive, general administrativeskills and is cost conscious. He is the type of man we need at the Carey Plant.” The other ex-ecutives viewed May not only as the company’s efficiency expert, but also as a person whowould see any job through to completion. Nevertheless, several of the Vice Presidents ex-pressed opposition to placing a staff person in charge of the new plant. They felt the PlantManager should have a strong technical background and line management experience.Brown, in contrast, stressed the necessity of a control-conscious person to get the new plantunderway. Smith agreed that Gardner needed a person with a strong finance backgroundheading the new plant.
Smith offered May the opportunity to visit the Carey Plant to have a private talk with eachof his future staff. Each of the six Department Managers had been with the Carey Plant for aminimum of 18 years. They were frank in their discussions of past problems in the plant andin its future prospects. They generally agreed that the plant’s labor problems should decline inthe new plant, even though it was going to employ the same 405 employees (half the size ofGardner) with the same union. Four of them were concerned, however, with how they were being supervised. Ever since the acquisition by the Gardner Company, the Managers of the Operations, Materials, Human Resources, and Engineering Departments reported not only toJames Carey as Plant Manager, but also to their respective functional Vice Presidents and staff
at Gardner headquarters. Suggestions from the various Vice Presidents and staff assistants of-ten conflicted with orders from the Plant Manager. When they confronted James Carey aboutthe situation, he had merely shrugged. Carey told them to expect this sort of thing after an ac-quisition. “It’s important that you get along with your new bosses, since they are the ones whowill decide your future in this firm,” advised Carey.
Bill May then met in mid-February with Ralph Brown, his current supervisor, to discussthe job offer over morning coffee. Turning to Brown, he said, “I’m worried about this PlantManager’s position. I will be in a whole new environment. I’m a complete stranger to thoseDepartment Managers, except for the Finance Manager. I will be the first member of the Gard-ner Company to be assigned to the Carey Plant. I will be functioning in a line position with-out any previous experience and no technical background in machine operations. I alsohonestly feel that several of the Vice Presidents would like to see me fail. I’m not sure if Ishould accept the job. I have a lot of questions, but I don’t know where to get the answers.”Looking over his coffee cup as he took a drink, Brown responded, “Bill, this is a great oppor-tunity for you. What’s the problem?” Adjusting himself in his chair, May looked directly at hismentor. “The specific details of the offer are very vague in terms of salary, responsibilities, andauthority. What is expected of me and when? Do I have to keep the current staff? Do I have tohire future staff members from internal sources or can I go outside the company? Finally, I’mconcerned about the lack of an actual job description.” Brown was surprised by his protégé’smany concerns. “Bill, I’m hoping that all of these questions, except for salary, will soon be an-swered at a meeting Smith is scheduling for you tomorrow with the Vice Presidents. He wantsit to be an open forum.”
The MeetingThe next morning, May took the elevator to the third floor. As he walked down the hall to theGardner Company Executive Committee conference room, he bumped into Ted Williams,Vice President of Manufacturing, who was just coming out of his office. Looking at Bill, Tedoffered, “I want to let you know that I’m behind you 100%. I wasn’t at first, but I do thinkyou may have what it takes to turn that place around. I don’t care what the others think.” Asthe two of them entered the conference room, May looked at the eight Gardner Vice Presi-dents. Some were sitting at the conference table and working on their laptops while otherswere getting some coffee from the decanter in the corner. R. C. Smith was already seated atthe head of the table. Ralph Brown, sitting on one side of the table, motioned to May to comesit in an empty chair beside him. “Want some coffee?” Brown asked. “Good idea,” respondedMay as he walked over to the decanter. Pouring cream into his coffee, May wondered, “Whatam I getting myself into?”
29-4 SECTION D Industry Seven—Manufacturing
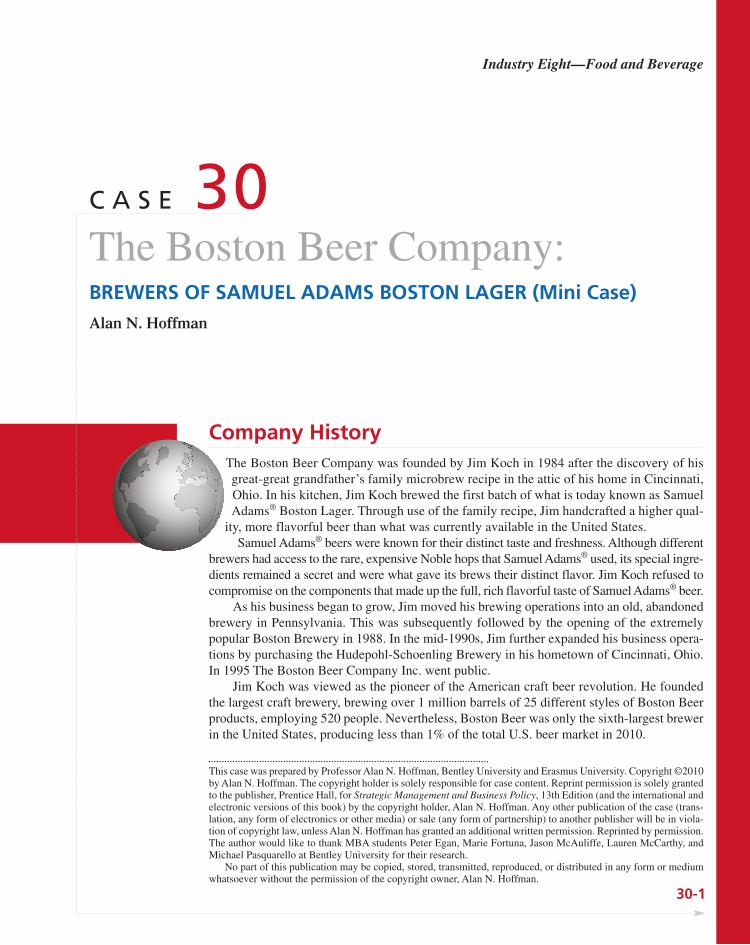
30-1
C A S E 30The Boston Beer Company:BREWERS OF SAMUEL ADAMS BOSTON LAGER (Mini Case)Alan N. Hoffman
Company HistoryThe Boston Beer Company was founded by Jim Koch in 1984 after the discovery of hisgreat-great grandfather’s family microbrew recipe in the attic of his home in Cincinnati,Ohio. In his kitchen, Jim Koch brewed the first batch of what is today known as SamuelAdams® Boston Lager. Through use of the family recipe, Jim handcrafted a higher qual-
ity, more flavorful beer than what was currently available in the United States.Samuel Adams® beers were known for their distinct taste and freshness. Although different
brewers had access to the rare, expensive Noble hops that Samuel Adams® used, its special ingre-dients remained a secret and were what gave its brews their distinct flavor. Jim Koch refused tocompromise on the components that made up the full, rich flavorful taste of Samuel Adams® beer.
As his business began to grow, Jim moved his brewing operations into an old, abandonedbrewery in Pennsylvania. This was subsequently followed by the opening of the extremelypopular Boston Brewery in 1988. In the mid-1990s, Jim further expanded his business opera-tions by purchasing the Hudepohl-Schoenling Brewery in his hometown of Cincinnati, Ohio.In 1995 The Boston Beer Company Inc. went public.
Jim Koch was viewed as the pioneer of the American craft beer revolution. He foundedthe largest craft brewery, brewing over 1 million barrels of 25 different styles of Boston Beerproducts, employing 520 people. Nevertheless, Boston Beer was only the sixth-largest brewerin the United States, producing less than 1% of the total U.S. beer market in 2010.
This case was prepared by Professor Alan N. Hoffman, Bentley University and Erasmus University. Copyright ©2010by Alan N. Hoffman. The copyright holder is solely responsible for case content. Reprint permission is solely grantedto the publisher, Prentice Hall, for Strategic Management and Business Policy, 13th Edition (and the international andelectronic versions of this book) by the copyright holder, Alan N. Hoffman. Any other publication of the case (trans-lation, any form of electronics or other media) or sale (any form of partnership) to another publisher will be in viola-tion of copyright law, unless Alan N. Hoffman has granted an additional written permission. Reprinted by permission.The author would like to thank MBA students Peter Egan, Marie Fortuna, Jason McAuliffe, Lauren McCarthy, andMichael Pasquarello at Bentley University for their research.
No part of this publication may be copied, stored, transmitted, reproduced, or distributed in any form or mediumwhatsoever without the permission of the copyright owner, Alan N. Hoffman.
Industry Eight—Food and Beverage
30-2 SECTION D Industry Eight—Food and Beverage
Corporate Mission and VisionThe mission of the Boston Beer Company was “to seek long term profitable growth by offer-ing the highest quality products to the U.S. beer drinker.”1 As the largest craft brewer, theBoston Beer Company had been successful for several reasons: (1) premium products pro-duced from the highest quality ingredients; (2) an unwavering commitment to the freshness ofits beer; (3) constant creativity and innovation that resulted in the introduction of a new flavorof beer every year; and (4) the passion and dedication of its employees.
The Boston Beer Company’s vision was “to become the leading brewer in the Better Beercategory by creating and offering high quality full-flavored beers.”2 The Better Beer categorywas comprised of craft brewers, specialty beers, and a large majority of the imports. As of2010, Samuel Adams® was the largest craft brewer and “the third largest brand in the BetterBeer category of the United States brewing industry, trailing only the imports Corona andHeineken.”3
In 2007, the Boston Beer Company had revenues of $341 million with COGS of $152 millionand $22.5 million of net income. From 2007 to 2009, revenues grew by 22% to $415 million withCOGS of $201 million and $31.1 million in net income. Management expected sales to be$430 million in 2010. The Boston Beer Company had no long-term debt and only 14 million sharesoutstanding. In August 2010, the stock price was $67.
The Beer IndustryThe domestic beer market in 2010 was facing many challenges. In 2010, domestic beer over-all sales declined 1.2%. Industry analysts predicted inflation-adjusted growth to be only 0.8%through 2012.4 Decreases in domestic beer sales as a whole were mainly due to decreasedalcohol consumption per person. U.S. consumers were drinking less beer because of healthconcerns, increased awareness of the legal consequences of alcohol abuse, and an increase inoptions for more flavorful wines and spirits.
To gain more market share in a highly competitive market, the industry was shifting to themass production of beers, leading to industry consolidation. There were two major players inthe brewing industry in the United States: AB InBev (Anheuser-Busch) and SABMiller PLC(SABMiller). SABMiller PLC was a 2007 joint venture of SABMiller and Molson Coors.Anheuser-Busch had been purchased in 2008 by Belgium producer InBev, the second largestbeer producer in the world.
The domestic beer industry also contained some opportunities. Although sales ofdomestic beer were flat, the past decade showed increases in the domestic consumption oflight beer and the craft beer categories. The Better Beer category (comprised of craft, spe-cialty, and import beers) was growing at an annual rate of 2.5% and comprised roughly 19%of all U.S. sales. Beers were classified as “better beers” mainly because of higher quality,taste, price, and image, compared to mass-produced domestic beers. The craft beer segmentgrew an estimated 9% in 2010. In an industry dominated by male customers, females wereviewed as an opportunity. Research showed that women were most concerned about thecalories in beer. However, 28% of these same women answered that they were presentlydrinking more wine.5
Since its inception, Jim Koch has had numerous offers from the large brewing companiesto buy him out, but he has consistently declined those offers. He wanted to remain independ-ent and never compromise on the full, rich flavorful and fresh taste of Samuel Adams® beer.Jim never altered his great-great grandfather’s original recipe created over a century ago.
CASE 30 The Boston Beer Company 30-3
Domestic BeersTwo major players in the U.S. domestic beer market—AB InBev and MillerCoors—accountedfor roughly 95% of all U.S. beer production and sales, minus imports.
MillerCoors LLC controlled roughly 30% of the U.S. beer market. MillerCoors recentlyentered the Better Beer category by acquiring, in whole or in part, existing craft brewers andby importing and distributing foreign brewers’ brands. In 2010, the company experienceddouble-digit growth with its Blue Moon, Leinenkugel’s, and Peroni Nastro Azzurro brands.
AB Inbev was the number one brewer in the U.S. market in terms of both volume and rev-enues. Its dominant position allowed it to exert significant influence over distributors, makingit difficult for smaller brewers to maintain their market presence or access new markets. Inbevwas created in the 2004 merger of the Belgian company Interbrew and the Brazilian brewerAmBev and subsequently purchased Anheuser-Busch in 2008.
The growth in craft beer sales was good news for the Boston Beer Company, which posi-tioned itself in this category and was the largest and most successful craft brewer in the UnitedStates. It ranked third overall in the U.S. Better Beer category, trailing only two imports:Corona from Mexico and Heineken from The Netherlands.
Craft Beer SegmentSierra Nevada Brewing Company was the second largest craft beer maker in the UnitedStates. Founded in Chico, California, in 1980, the company’s mission was to produce thefinest quality beers and ales, and believed that its mission could be accomplished “withoutcompromising its role as a good corporate citizen and environmental steward.” Its mostsuccessful brands included the hop-flavored Pale Ale, as well as Porter, Stout, and wheatvarieties. Sierra Nevada, like Samuel Adams®, produced seasonal brews including SummerFest, Celebration, and Big Foot. Although Sierra Nevada beer had been distributed nationallyfor some time, sales were still strongest on the West Coast.
New Belgium Brewing Company was founded in 1991 in Fort Collins, Colorado. ItsFat Tire brand made up two-thirds of the company’s total sales.6 New Belgium currently hadnine total craft beer brands, in addition to seasonal and limited brands. Its products wereoffered in 25 western and midwestern states. New Belgium, like Sierra Nevada, focused onbeing eco-friendly and stressed employee ownership in its mission.
ImportsGrupo Modelo was founded in 1925 and was the market leader in Mexico. Its most success-ful product, Corona Extra, was the United States’ number one beer import out of 450 importedbeers. AB Inbev held a 50% noncontrolling interest in Grupo Modelo.
Heineken, the third largest brewer by revenue, positioned itself as the world’s mostvaluable international premium beer. Heineken had over 170 international, regional, and localspecialty beers and 115 breweries in 65 countries. It had the widest presence of all internationalbrewers due to the sales of Heineken and Amstel products.
Flavored Malt Beverage CategorySamuel Adams® also competed in the “flavored malt beverage” (FMB) category with TwistedTea. The FMB category accounted for roughly 2% of U.S. alcohol consumption. Twisted Teacompeted mainly with beverages such as Smirnoff Ice, Bacardi Silver, and Mike’s HardLemonade. FMB products all targeted relatively the same consumers. Since pricing wassimilar, these products relied heavily upon advertising and promotions.
30-4 SECTION D Industry Eight—Food and Beverage
Current ChallengesThe Boston Beer Company had been growing revenues by 22% over the past two years, andthe craft beer industry as a whole continued to experience double-digit growth as well. How-ever, there were some challenges ahead if the company was to successfully achieve its missionand continue this level of growth.
1. Probably the most critical challenge was the increased level of competition in the craftbeer industry. “Volume sales within the craft beer industry increased 20% during2002–2010 to 220 million cases,”7 and this astonishing growth attracted many players intothis market, especially imported beers such as Corona and Heineken, and the top twobrewers AB Inbev and MillerCoors.
2. Through mergers and acquisitions, the major competitors achieved cost savings andgreater leverage with suppliers and distributors and preferential shelf space and placementwith retailers.
3. A continuous increase in production costs of all basic beer ingredients, such as barley maltand hops, as well as packaging materials like glass, cardboard, and aluminum continuedinto 2010 with further increases in fuel and transportation costs. The global inventory ofthe company’s “Noble” hops declined, and the harvest in recent years of its two key hopssuppliers in Germany did not meet the high standards of the Boston Beer Company. As aresult, Boston Beer received a lower quantity at a higher price than expected.
4. The company purchased a brewery in Breinigsville, Pennsylvania, in 2008 for $55 million.Although this brewery was expected to increase capacity by 1.6 million barrels of beerannually, it required significant renovations before it could produce quality beer.
United Airlines DilemmaUnited Airlines recently approached the Boston Beer Company with an interesting opportu-nity. United wanted to offer Samuel Adams® Boston Lager to fliers on all of its flights. Thiswould provide the Boston Beer Company increased national exposure and could result in asignificant increase in beer sales. However, United Airlines would only sell Samuel Adams®
Boston Lager in cans, not bottles.The Boston Beer Company had never sold any of its beers in cans because management
believed that metal detracts from the flavor of the beer. Management felt that the “full-flavor”of Samuel Adams® could only be realized using glass bottles. Should Boston Beer’s manage-ment rethink its decision not to distribute its beer in cans to take advantage of this opportu-nity? Many years ago, Jim Koch said that there would never be a “Sam Adams Light Beer,”but he eventually reversed that decision and Sam Light became a huge success.
N O T E S1. 2007 Annual Report, http://thomson.mobular.net/thomson/7/
2705/3248/.2. 2007 Annual Report, http://thomson.mobular.net/thomson/7/
2705/3248/.3. 2007 Annual Report, http://thomson.mobular.net/thomson/7/
2705/3248/.4. Mintel—US–Domestic Beer December 2007.
5. Ibid.6. http://www.rockymountainnews.com/news/2007/nov/24/
reuteman-colorado-rides-on-fat-tire-to-beer/.7. Mintel Report, “Domestic Beer – US – December 2007 –
Executive Summary,” http://academic.mintel.com.ezp.bentley.edu/sinatra/mintel/print/id�311747 (July 15, 2008).
PATRICK HUNN SAT AT HIS DESK WONDERING HOW COULD SUCH A GOOD DEAL BE VIEWED
NEGATIVELY? Patrick Hunn, team leader of Wal-Mart Sales, for Vlasic Foods International, hadmade a record-breaking deal with Wal-Mart that resulted in selling more pickles than Vlasichad ever sold to any one account. Wal-Mart was an important customer, accounting for 30%of Vlasic Foods’ sales. By negotiating a deal with Wal-Mart to offer a gallon jar of Vla-sic pickles for $2.97 at the front of the store, Hunn had given Wal-Mart its “customer stop-
per.” In addition, Hunn secured an agreement that Wal-Mart would continue to buygrocery size pickles, relishes, and peppers with each order of the gallon jar. The gallon
jar of Vlasic pickles was available in over 3,000 Wal-Mart stores in the United States. It hadbeen the deal of a lifetime, he had thought at the time. Why did Marketing conclude that thedeal was an enormous mistake even though Vlasic sold more product to Wal-Mart than hadever been sold into any account? Steve Young, vice president of Grocery Marketing for Vla-sic Foods International, had approved the deal. Why was Young so convinced now that Vlasicneeded to get out as soon as they could?
BackgroundThe Vlasic brand had a long heritage of being the number one pickle brand in America. Thefounders of the product line were Polish immigrants who sold their pickles through a dairy andfood distributor in Detroit. From a creamery business to a full-scale manufacturing operation,the Vlasic brand was built on product quality and strong advertising and promotion. An adver-tising campaign developed in 1974 featured a stork delivering the message, “Vlasic is the best-tasting pickle I ever heard!” This campaign helped give the brand a national identity.
31-1
C A S E 31Wal-Mart and Vlasic PicklesKaren A. Berger
This case was prepared by Professor Karen A. Berger of Lubin School of Business at Pace University. This casecannot be reproduced in any form without the written permission of the copyright holder, Professor Karen Berger.Reprint permission is solely granted to the publisher, Prentice Hall, for the book Strategic Management andBusiness Policy—13th (and the International and electronic versions of this book) by copyright holder, KarenBerger. This case was edited for SMBP—13th Edition. The copyright holders are solely responsible for the casecontent. Any other publication of the case (translation, any form of electronics or other media), or sold (any formof partnership) to another publisher will be in violation of copyright laws unless Professor Karen Berger has grantedan additional written reprint permission. This case was presented to and accepted by the Society for Case Research.This case appeared in a 2007 issue of the Business Case Journal. This case was edited for SMBP-13th Edition.Copyright © 2007 Professor Karen A. Berger. Reprinted by permission.
In 1978 the company was sold to the Campbell Soup Company. As part of Campbell, theVlasic brand prospered due to increased investment in both advertising expenditures andR&D. The 1994 roll-out of the Vlasic Stackers line of pickle slices intended for sandwichescontinued to help build the brand into a major line of pickle products accounting for over athird of the U.S. pickle market. By 2000 the brand boasted 95% consumer awareness and wasthe only national pickle brand in America. However, the overall pickle market had been flatfor a few years and Vlasic had only achieved small gains in the nineties. As Campbell’s recon-sidered its own agenda, its stock prices were sagging. Seeking to improve its profitability pic-ture, Campbell reviewed its business units with an eye to weed out those businesses that didnot meet Campbell’s corporate benchmarks and objectives. Ultimately, the decision was madeto spin off several non-core businesses, including Vlasic pickles as well as Open Pit BarbecueSauce, Swanson foods, Armour meats in Argentina, and a mushroom farm business.
In March 1998 Campbell spun off a newly public company called Vlasic Foods Interna-tional. This move was seen as essential to change Campbell’s strategic focus and improve itslong-term financial picture. The newly spun-off company, however, held debt of over $500million along with an annual sales volume of $1.1 billion. The Vlasic line was its strongestbusiness, accounting for sales of over $251 million in 2000.
Patrick Hunn had a long-established relationship with Wal-Mart. First, he was a major li-aison between Sam’s Club, a division of Wal-Mart, and Vlasic when it was part of Campbell’s.His decade-long relationship with Wal-Mart made him essential to the newly formed company.He was quickly promoted from team leader of Sam’s Clubs for Vlasic pickle brands to teamleader of Wal-Mart for all Vlasic brands and products.
Both Hunn and Young had access to the Retail Link database that Wal-Mart had madeavailable to its sixty-one thousand U.S. suppliers. From this database, first made accessible tovendors in 1991, Young and other selected executives from Vlasic could look at their sales datato help them understand the source and timing of their brands sold through Wal-Mart. This sys-tem helped Vlasic and other companies service Wal-Mart in the way that Wal-Mart wanted,with speed and care. In most stores, the system was connected at the individual store level al-lowing a given supplier to receive reports of shelf movement via real-time satellite links thatupdate the system report each time a scan occurred at the point-of-purchase. Thus, the supplierwas able to adjust its manufacturing qualities in real-time. The accuracy and timeliness of thistype of system eliminated warehouse stock pile-ups, saving time and processing costs for thesupplier. A supplier that did not have this type of electronic data interchange throughout thesupply chain usually had higher costs and, therefore, would be likely to have difficulty meet-ing Wal-Mart’s demands.
Like other Wal-Mart suppliers, Vlasic knew that Wal-Mart did not tolerate late orders orout-of-stocks. Wal-Mart provided the seamlessness for suppliers to maximize the efficiency ofthe supply chain and they expected their suppliers to respond. Vlasic had had no difficultiesmeeting Wal-Mart’s volume requirements.
Bob Bernstock, president of the newly formed Vlasic Foods, knew that Wal-Mart was es-sential to his company. By 1998 it was well-established—not just at Vlasic—that a contractwith Wal-Mart by definition was very important to a company’s growth and success. The scaleof business that Wal-Mart promised companies was unprecedented given the size of its ordersand distribution capabilities. Wal-Mart was able to go national with a new item in two weeksas compared to two months in many other chains.
Hunn knew that his “charge” was to build volume for Vlasic brands and products throughWal-Mart. He had successfully worked with Wal-Mart and saw this deal as just one more oppor-tunity to do business with this important and well-respected client. While he was not sure that theone gallon deal was a good idea at first, he had warmed up to the notion when he realized he couldtie the deal to the “grocery segment,” defined as pickles, relishes, and peppers 46 oz. and below.
31-2 SECTION D Industry Eight—Food and Beverage
Major deals and programs had to be approved by the president of Sales, Maurice Lane.Both Steven Young, vice president for grocery sales, and Pat Hunn, team leader for the Wal-Mart account, reported to the president of Sales.
By 1990 Wal-Mart was the number one retailer in the United States. By 1997 Wal-Mart hadalready had its first $100 billion sales year with combined national and international sales total-ing $105 billion. Wal-Mart had become an international company with stores in Canada, Ar-gentina, Korea, China, and Germany.As team leader of Sales for such a large, important account,Pat Hunn was an important player at Vlasic, controlling 30% of its largest line, Vlasic pickles.
The focus on the one-gallon jar of Vlasic pickles came into play when a Wal-Mart man-ager came up with the idea to offer the one-gallon jar usually sold in the Food Service sectionas a Memorial Day item at the promotion price of $2.97, instead of the everyday low price of$3.47. The Food Service section, also known as the Institutional section, was an eight-foot sec-tion near the rest of the grocery. The Food Service section contained items that small conces-sion businesses and “Mom ’n Pop” grocery stores regularly bought. This section tended to notbe as frequently shopped as the end aisles and other more prominent areas of the store. TheWal-Mart manager who wanted to do this promotion called the Bentonville headquarters, re-questing promotional dollars for the one-gallon jar. Like other consumer packaged goods com-panies, Vlasic regularly gave its customers allowance money, part of a Marketing InvestmentPlanning program (MIP fund for short). Once allowance money was paid, Vlasic customerscould utilize the funds as they wished. Wal-Mart was a centralized organization with promo-tional funds controlled at the Wal-Mart headquarters. Thus, the manager of an individual storehad to get promotional funding from headquarters.
According to Hunn, the allowance permitted this one Wal-Mart store to price the gallonjar at a price point of $2.97. The promotion ran over Memorial Day and “the gallon sold likecrazy. . . . surprising us all.”1 News of this success spread throughout the Wal-Mart district.Soon many managers in the region wanted to duplicate this success in their stores.
In late 1998, one of the Wal-Mart grocery buyers, remembering the success of the Vlasicgallon-jar promotion, brainstormed that the gallon jar could be a “customer stopper.” The over-whelming success of this limited market promotion triggered more discussions between Hunn,the Wal-Mart team leader at Vlasic, and the buying department at Wal-Mart. As team leaderof the Wal-Mart account, Hunn’s position required that he focus on building volume and mar-ket share. Approval of the deal needed to also come from Steve Young, vice president of gro-cery marketing. Both Hunn and Young were eager to build volume for their core brand.
CASE 31 Wal-Mart and Vlasic Pickles 31-3
The DealAccording to Hunn, this little promotion in a relatively low trafficked part of the store soonblossomed into a major deal, because of the newly expanded scope of the promotion. Wal-Mart executives were convinced that if consumers were enticed by a gallon of pickles at $2.97in the Food Service section, then they would be even more enticed if the promotion wasmoved to an end aisle. In fact, Wal-Mart buyers saw the one-gallon jar as the “customer stop-per” they wanted. The product was to be a special feature that was showcased in end stacksnear or at the front of the stores. At the agreed upon price of $2.97, the jar would yield onlyone or two cents per jar for Vlasic. At this lower cost, Wal-Mart could price the jar at $2.97,leaving no more than a few cents profit per gallon jar for Wal-Mart as well. However, Hunnsecured the deal with one proviso—all gallon-jar orders would have to be tied to a corre-sponding order of grocery sized items. As another control measure, the total number of casesthat Vlasic would sell to Wal-Mart was established at the start of the fiscal year as part of thenormal planning process.
31-4 SECTION D Industry Eight—Food and Beverage
The ResultsThe sales test proved right—the promotion was an enormous success for Wal-Mart. Vlasic’ssales numbers skyrocketed, showing double-digit growth in the first few weeks. The gallonjar was so successful that Wal-Mart was purportedly selling on average 80 jars per store perweek, or more than 240,000 gallons of pickles, just counting those sold in the gallon jars.However, the production quantities necessary to serve Wal-Mart put a strain on the procure-ment and production system. However, the product was selling and the Wal-Mart businessgrew to more than 30% of Vlasic Food International’s business.2
Wal-Mart was very pleased with the success of the item. Wal-Mart continued to re-ordergallon jars as stock became low. Since there was no cap on the order volume except for the re-quirement to also purchase the grocery size, the one-gallon jar was no longer a short-lived dealitem, but a regular deal. From the consumer’s point of view, the $2.97 deal was the Wal-MartEvery Day Low Price.
However, sources at Vlasic reported that profit was down 25%–50%. Some blamed theWal-Mart deal for this decline. Production was pressed to provide quantities in record num-bers and at times put a strain on the supply chain. Since the gallon jar used the same size andgenerally same product quality cucumbers as the dills and spears, this at times affected theavailability of pickles for the jars of dills and spears. Since the jars of dills and spears consistedof cut pickles, they carried higher margins than the whole pickles. In addition, the pickle costfor the gallon jar could be reduced if less perfectly shaped pickles were added to the one gal-lon jar. However, the expansion of the distribution of the gallon jar resulted in periodic substi-tutions of the more perfect (and higher cost) pickles intended for the smaller but moreprofitable jars of dills and spears. Thus, pickles that were needed for the jars of dills and spearswere sometimes in short supply and compromised the smooth flow of the supply chain. Mar-keting reported that over time, the few cents that Vlasic was making on the promotion waseroded, resulting in small losses per jar, given higher costs.
Supermarket sales, in non–Wal-Mart chains and independent stores, in 1999–2000 de-clined significantly with many customers placing smaller orders than the previous year. Mar-keting at Vlasic reported that predicted profits were eaten up by expenses associated with theloss of business in the non–Wal-Mart grocery sector.
On the other hand, Wal-Mart business showed real, incremental growth in its stores, basedon analysis of organic growth from store expansion versus same-store growth. Not only wasWal-Mart growing due to new stores, but its existing stores were growing and showing healthyrevenue and profit gains.
Through this promotion, volume of Vlasic pickles—all kinds—in Wal-Mart stores grew,so that Wal-Mart accounted for 33% of the Vlasic business. According to Hunn, sales revenueof Vlasic pickles was higher than before the gallon-jar “promotion.”
The Marketing PerspectiveSteve sat at his desk. His hands were full of problems due to cash flow shortages at his com-pany. Vlasic Foods International had been spun off from Campbell’s just months ago. The ef-fect of the $500 million of debt that the spun-off company took with it was just becomingknown. While this deal was only one issue in a sea of financial challenges, Steve felt that heshould weigh in on the Wal-Mart part of the business given its effects on non–Wal-Mart gro-cery accounts. He had pleaded with Hunn to dip into his equity with Wal-Mart and end thispromotion. Young was sure that this promotion had cannibalized the non–Wal-Mart business.According to Young, they “saw consumers who used to buy the spears and the chips in
CASE 31 Wal-Mart and Vlasic Pickles 31-5
The Sales PerspectivePat Hunn was surprised, if not disturbed, by the commentary from grocery marketing. Vlasichad financial troubles that went way beyond the sale of pickles. Wal-Mart was a greatcustomer—sales with Wal-Mart now reached 33% of the Vlasic Foods business. On the rev-enue side, Vlasic’s business was up with a dramatic shift upward in Wal-Mart sales. “Yes,there have been some troubles with production, but that was their job. Wal-Mart has helpedbuild Vlasic’s name as a leader in the pickle business. . . . I simply do not see why so manypeople are upset,” thought Hunn to himself. He sat at his desk, shrugged his shoulders, andwent back to work.
R E F E R E N C E SBerman, Barry (1996), Marketing Channels. New York: John
Wiley & Sons. Brynwood Partners (2005), “PinnacleFoods,” www.brynwoodpartners.com/investment/pinnacle. htm.
Dallas Business Journal (2003), “Hicks Muse Selling PinnacleFoods for $485 million,” www.bizjournals.ocm/dallas/stories/2003/08/11/daily1.html.
Fishman, Charles (2003), “The Wal-Mart You Don’t Know,”Fast Company, December 2003, p. 68, also available atpf.fastcompany.com/magazine/77/walmart.html.
Freeman, Richard (2003), “Wal-Mart ‘Eats’ More U.S. Manu-facturers,” Executive Intelligence Review, November 28.
Frontline (2004), “Interview with Cary Gereffi: Is Wal-MartGood for America?” posted Nov. 23, www.pbs.org/wgbh/pages/frontline/shows/walmart/interviews/gereffi.html.
Gerard, Kim (2003), “How Levi’s Got Its Jeans Into Wal-Mart,” CIO Magazine, July 15.
Hannaford, Steve (2004), “Wal-Mart’s oligonomy power,”www.oligopolywatch.com, 10/04.
Hornblower, Sam (2004), “Wal-Mart & China: A Joint Venture:Is Wal-Mart Good for America?,” Frontline, posted Nov.23, www.pbs.org/wgbh/pages/frontline/shows/walmart/secrets/wmchina.html.
Hunn, Patrick (2006), Phone interviews, conducted by K. A.Berger, July 26, 2006, and August 4, 2006.
Koch, Christopher (2005), “Supply Chain and Wal-Mart,” “TheABCs of Supply Chain Management,” CIO Magazine,
http://www.cio.com/research/scm/edit/012202_scm. html,10/4/05.
Lauster, Steffen M., and J. Neely (2004), “The Core’s Compe-tence: The Case for Recentralization in Consumer Prod-ucts Companies,” strategy�Business Magazine,Resilience Report, Booz Allen Hamilton.
Leis, Jorge (2005), transcript of radio interview, consulting ex-pert Bain & Co., March 29, www.bain.com/bainweb.
Lewis, M. Christine, and Dogulas M. Lambert, “A Model ofChannel Member Performance, Dependence, and Satis-faction,” Journal of Retailing, Vol. 67 (Summer 1991),pp. 206–207.
Maich, Steve (2004), “Why Wal-Mart is Good,” Rogers Me-dia Inc.
Porter (1991), “Know Your Place,” Inc. Boston, September,Vol. 13, Iss. 9, pp. 90–93.
Porter (1980), Competitive Strategy Techniques for AnalyzingIndustries and Competitors, New York: Free Press(pp. 3–5, 24–29, 180–181).
Porter (1979), “How Competitive Forces Shape Strategy,”Harvard Business Review.
Schooley, Tim (2001), “Heinz to Acquire Vlasic Pickles,”Pittsburgh Business Times, Jan. 29.
Wal-Mart Website (2005), visited September 28, 2005, www.walmartfacts.com/newsdesk/meet-our-partners.aspx.
Wal-Mart (2005), http://en.wikipedia.org/wiki/Wal-Mart.
supermarkets buying the Wal-Mart gallons. They’d eat a quarter of a jar and throw the thingaway when they got moldy. A family can’t eat them fast enough.”3
N O T E S1. Fishman, 2003, p. 3 of pdf file from pf.fastcompany.com/
magazine/77/walmart.html).2. Fishman, 2003, p. 4 of pdf file.3. Fishman, 2003, p. 4 of pdf file.

This page intentionally left blank
BREAD—ESSENTIAL AND BASIC, but nonetheless special—has transcended millennia. A masterbaker combined simple ingredients to create what has been an integral part of society and cul-
ture for over 6,000 years. Sourdough bread, a uniquely American creation, was made froma “culture” or “starter.” Sourdough starter contained natural yeasts, flour, and water andwas the medium that made bread rise. In order to survive, a starter had to be cultured, fed,and tended to by attentive hands in the right environment. Without proper care and main-
tenance, the yeast, or the growth factor, would slow down and die. Without a strong starter,bread would no longer rise.
Ronald Shaich, CEO and Chairman of Panera Bread Company, created the company’s“starter.” Shaich, the master baker, combined the ingredients and cultivated the leavening agentthat catalyzed the company’s phenomenal growth. Under Shaich’s guidance, Panera’s totalsystemwide (both company and franchisee) revenues rose from $350.8 million in 2000 to$1,353.5 million in 2009, consisting of $1,153.3 million from company-owned bakery-cafésales, $78.4 million from franchise royalties and fees, and $121.9 million from fresh doughsales to franchisees. Franchise-operated bakery-café sales, as reported by franchisees, were$1,640.3 million in fiscal 2009.1 Panera shares have outperformed every major restaurant stockover the last 10 years.2 Panera’s share price has risen over 1,600% from $3.88 a share onDecember 31, 1999, to $67.95 a share on December 28, 2009.3 Along the way, Panera largelyled the evolution of what became known as the “fast casual” restaurant category.
Ronald Shaich had clearly nurtured the company’s “starter” and had been the vision anddriving force behind Panera’s success from the company’s beginnings until his resignation asCEO and Chairman effective May 13, 2010. For Panera to continue to rise, the company’s newCEO, William Moreton, would need to continue to feed and maintain Panera’s “starter.” Inaddition to new unit growth, new strategies and initiatives must be folded into the mix.
This case was prepared by Ellie A. Fogarty, EdD, and Professor Joyce P. Vincelette of the College of New Jersey.Copyright © 2010 by Ellie A. Fogarty and Joyce P. Vincelette. This case cannot be reproduced in any form withoutthe written permission of the copyright holders, Ellie A. Fogarty and Joyce P. Vincelette. Reprint permission is solelygranted by the publisher, Prentice Hall, for the book Strategic Management and Business Policy, 13th Edition (andthe international and electronic versions of this book) by the copyright holders, Ellie A. Fogarty and Joyce P.Vincelette. This case was edited for SMBP 13th Edition. The copyright holders are solely responsible for case con-tent. Any other publication of the case (translation, any form of electronic or other media) or sale (any form of part-nership) to another publisher will be in violation of copyright law, unless Ellie A. Fogarty and Joyce P. Vincelettehave granted additional written reprint permission. Reprinted by permission.
32-1
C A S E 32Panera Bread Company (2010):Still Rising Fortunes?Joyce P. Vincelette and Ellie A. Fogarty
32-2 SECTION D Industry Eight—Food and Beverage
HistoryPanera Bread grew out of the company that could be considered the grandfather of the fastcasual concept: Au Bon Pain. In 1976, French oven manufacturer Pavailler opened the firstAu Bon Pain (a French colloquialism for “where good bread is”) in Boston’s Faneuil Hall asa demonstration bakery. Struck by its growth potential, Louis Kane, a veteran venture capi-talist, purchased the business in 1978.4 Between 1978 and 1981, Au Bon Pain opened 13, andsubsequently closed 10, stores in the Boston area and piled up $3 million in debt.5 Kane wasready to declare bankruptcy when he gained a new business partner in Ronald Shaich.6
Shortly after opening the Cookie Jar bakery in Cambridge, Massachusetts, in 1980,Shaich, a recent Harvard Business graduate, befriended Louis Kane. Shaich was interested inadding bread and croissants to his menu to stimulate morning sales. He recalled that “50,000people a day were going past my store, and I had nothing to sell them in the morning.”7 InFebruary 1981, the two merged the Au Bon Pain bakeries and the cookie store to form onebusiness, Au Bon Pain Co. Inc. The two served as co-CEOs until Kane’s retirement in 1994.They had a synergistic relationship that made Au Bon Pain successful: Shaich was the hard-driving, analytical strategist focused on operations, and Kane was the seasoned businesspersonwith a wealth of real estate and finance connections.8 Between 1981 and 1984, the teamexpanded the business, worked to decrease the company’s debt, and centralized facilities fordough production.9
In 1985, the partners added sandwiches to bolster daytime sales as they noticed a patternin customer behavior: “We had all of these customers coming and ordering a baguette cut inhalf. Then they’d take out these lunch bags full of cold cuts and start making sandwiches. Wedidn’t have to be marketing whizzes to know that there was an opportunity there,” recalledShaich.10 It was a “eureka” moment, and the birth of the fast casual restaurant category.11
According to Shaich, Au Bon Pain was the “first place that gave white collar folks a choicebetween fast food and fine dining.”12 Au Bon Pain became a lunchtime alternative for urbandwellers who were tired of burgers and fast food. Differentiated from other fast-food competi-tors by its commitment to fresh, quality sandwiches, bread, and coffee, Au Bon Pain attractedcustomers who were happy to pay more money ($5 per sandwich) than they would have paidfor fast food.13
In 1991, Kane and Shaich took the company public. By that time, the company had $68million in sales and was a leader in the quick service bakery segment. By 1994, the companyhad 200 stores and $183 million in sales, but that growth masked a problem. The company wasbuilt on a limited growth concept, what Shaich called, “high density urban feeding.”14 Themain customers of the company were office workers in locations like New York, Boston, andWashington DC. The real estate in such areas was expensive and hard to come by. This strate-gic factor limited expansion possibilities.15
Au Bon Pain acquired the Saint Louis Bread Company in 1993 for $24 million. Shaichsaw this as the company’s “gateway into the suburban marketplace.”16 The acquired company,founded in 1987 by Ken Rosenthal, consisted of a 19-store bakery-café chain located in theSaint Louis, Missouri, area. The concept of the café was based on San Francisco sourdoughbread bakeries. The acquired company would eventually become the platform for what is nowPanera.
Au Bon Pain management spent two years studying Saint Louis Bread Co., looking for theideal concept that would unite Au Bon Pain’s operational abilities and quality food with thebroader suburban growth appeal of Saint Louis Bread. The management team understood thata growing number of consumers wanted a unique expression of tastes and styles, and were tiredof the commoditization of fast-food service. Shaich and his team wrote a manifesto that spelledout what Saint Louis Bread would be, from the type of food it would serve, to the kind of peo-ple behind the counters, and to the look and feel of the physical space.17
Au Bon Pain began pouring capital into the chain when Shaich had another “eureka”moment in 1995. He entered a Saint Louis Bread store and noticed a group of business peoplemeeting in a corner. The customers explained that they had no other place to talk.18 This expe-rience helped Shaich realize that the potential of the neighborhood bakery-café concept wasgreater than that of Au Bon Pain’s urban store concept. The bakery-café concept capitalizedon a confluence of current trends: the welcoming atmosphere of coffee shops, the food of sand-wich shops, and the quick service of fast food.19
While Au Bon Pain was focusing on making Saint Louis Bread a viable national brand,the company’s namesake unit was faltering. Rapid expansion of its urban outlets had resultedin operational problems, bad real estate deals,20 debt over $65 million,21 and declining operat-ing margins.22 Stiff competition from bagel shops and coffee chains such as Starbucks com-pounded operational difficulties. Au Bon Pain’s fast-food ambiance was not appealing tocustomers who wanted to sit and enjoy a meal or a cup of coffee. At the same time, the caféstyle atmosphere of Saint Louis Bread, known as Panera (Latin for “time for bread”) outsidethe Saint Louis area, was proving to be successful. In 1996, comparable sales at Au Bon Painlocations declined 3% while same-store sales of the Panera unit were up 10%.23
Lacking the capital to overhaul the ambiance of the Au Bon Pain segment, the company de-cided to sell the unit. This allowed the company to strategically focus its time and resources onthe more successful Panera chain. Unlike Au Bon Pain, Panera was not confined to a small urban niche and had greater growth potential. On May 16, 1999, Shaich sold the Au Bon Painunit to investment firm Bruckman, Sherrill, and Co. for $73 million. At the time of the divestiture,the company changed its corporate name to Panera Bread Company. The sale left Panera BreadCompany debt-free, and the cash allowed for the immediate expansion of its bakery-café stores.24
Throughout the 2000s, Panera grew through franchise agreements, acquisitions (includ-ing the purchase of Paradise Bakery & Café, Inc.), and new company-owned bakery-cafés.By 2009, Panera had become a national bakery-café concept with 1,380 company-owned andfranchise-operated bakery-café locations in 40 states and in Ontario, Canada. Panera hadgrown from serving approximately 60 customers a day at its first bakery-café to servingnearly six million customers a week systemwide, becoming one of the largest food-servicecompanies in the United States. The company believed its success was rooted in its ability tocreate long-term dining concept differentiation.25 The company operated under the Panera®,Panera Bread®, Saint Louis Bread Co.®, Via Panera®, You Pick Two®, Mother Bread®, andParadise Bakery & Café® design trademark names registered in the United States. Otherswere pending. Panera also had some of its marks registered in foreign countries.26
May 13, 2010, marked a significant change in the history of Panera Bread Company. After28 years Ronald Shaich stepped down as CEO and Chairman effective immediately following theAnnual Stockholders Meeting, and William Moreton, previously the Executive Vice President andco-Chief Operating Officer, assumed the role of CEO. Shaich planned to remain as the company’sExecutive Chairman. He announced that he expected to focus his time and energy within Paneraon a range of strategic and innovation projects and mentoring the senior team. In typical Panerafashion, the transition had been planned for 1 1/2 years to ensure its success.
CASE 32 Panera Bread Company (2010): Still Rising Fortunes? 32-3
Concept and Strategy27
ConceptAt the time when Panera was created, the fast-food industry was described as featuring low-grade burgers, greasy fries, and sugared colas. Shaich decided to create a casual but comfort-able place where customers could eat fresh-baked artisan breads and fresh sandwiches, soups,and salads without worrying about whether it was nutritious.28
32-4 SECTION D Industry Eight—Food and Beverage
StrategyPanera operated in three business segments: company-owned bakery-café operations,franchise operations, and fresh dough operations. As of December 29, 2009, the company-owned bakery-café segment consisted of 585 bakery-cafes, all located in the United States,and the franchised operations segment consisted of 795 franchise-operated bakery-cafés,located throughout the United States and in Ontario, Canada. The company anticipated 80 to90 systemwide bakery-cafés opening in 2010 with average weekly sales for company-ownednew units of $36,000 to $38,000.36 Exhibit 1 shows the number and locations of all bakery-cafés in 2009. Exhibit 2 shows the total number of systemwide bakery-cafés for the last fiveyears. As of December 29, 2009, the company’s fresh dough operations segment, whichsupplied fresh dough items daily to most company-owned and franchise-operated bakery-cafés, consisted of 23 fresh dough facilities. The locations and sizes of the fresh doughfacilities can be found in Exhibit 3. Company-owned bakery-café operations accountedfor 85.2% of revenues in 2009, up from 78% in 2005. Royalties and fees from franchiseoperations made up 5.8% of revenues in 2009, down from 8.5% in 2005, and fresh dough op-erations accounted for 9% of total revenues in 2009, down from 13.5% in 2005.37
Panera’s restaurant concept focused on the specialty bread/bakery-café category. Breadwas Panera’s platform and entry point to the Panera experience at its bakery-cafés. It was thesymbol of Panera quality and a reminder of “Panera Warmth,” the totality of the experience thecustomer received and could take home to share with friends and family. The companyendeavored to offer a memorable experience with superior customer service. The company’sassociates were passionate about sharing their expertise and commitment with Panera cus-tomers. The company strove to achieve what Shaich termed “Concept Essence,” Panera’s blue-print for attracting targeted customers that the company believed differentiated it fromcompetitors. Concept Essence included a focus on artisan bread, quality products, and a warm,friendly, and comfortable environment. It called for each of the company’s bakery-cafés to bea place customers could trust to serve high-quality food. Panera’s mission statement was “aloaf of Bread in every arm®.”29 Bread was Panera’s passion, soul, expertise, and the platformthat made all other of the company’s food items special.
The company’s bakery-cafés were principally located in suburban, strip mall, and regionalmall locations and featured relaxing décor and free Internet access. Panera’s bakery-cafés weredesigned to visually reinforce the distinctive difference between its bakery-cafés and those ofits competititors.
Panera extended its strong values and concept of fresh food in an unpretentious, welcom-ing atmosphere to the nonprofit community. The company’s bakery-cafés routinely donatedbread and baked goods to community organizations in need. Panera’s boldest step was the May2010 opening of the Panera Cares bakery-café in Missouri, which had no set prices; instead,customers were asked to pay what they wanted.30
Panera’s success in achieving its concept was often acknowledged through customer sur-veys and awards from the press. From Advertising Age31 to Zagat,32 Panera was touted as oneof America’s hottest brands and most popular chain. Customers rated Panera fifth overall in therestaurant industry in 2008 and highest among fast casual eateries in an annual customer satis-faction and quality survey conducted by Dandelman & Associates, a restaurant market researchfirm.33 In 2009, Panera also was named number one on the “Healthiest for Eating on the Go”list by Health magazine for its variety of health menu options, whole grain breads, and half-sized items. Numerous other national and local awards had been received each year for the com-pany’s sandwiches, breads, lunches, soups, vegetarian offerings, cleanliness, Wi-Fi, communityresponsibility, best places to work, and kids’ menu.34 Panera’s own consumer panel testing of1,000 customers showed consistently high value perceptions of the company’s products.35
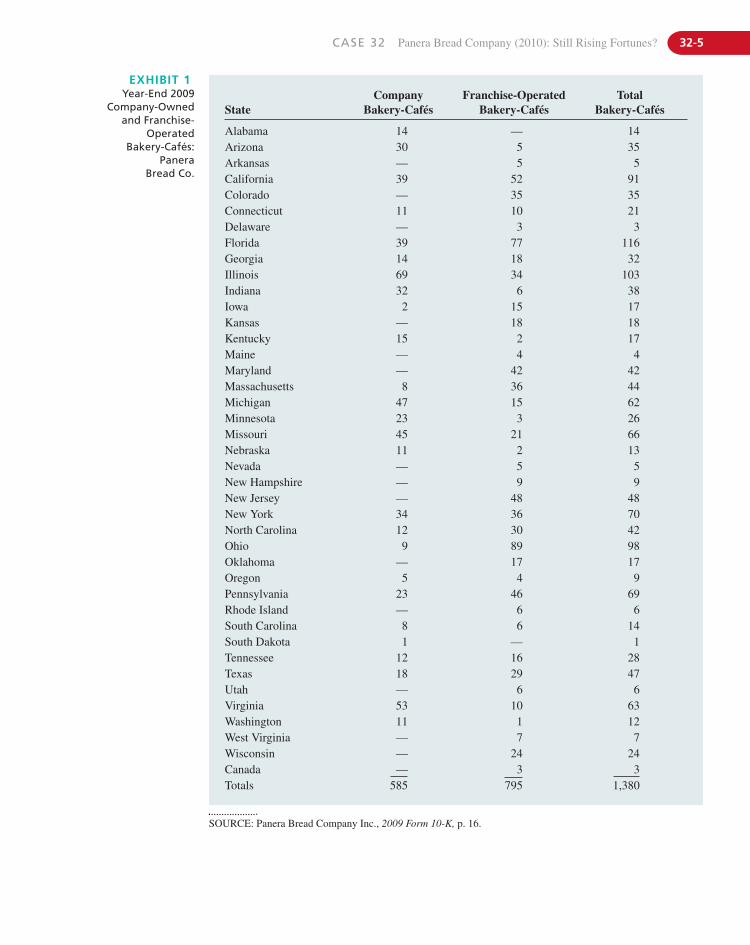
CASE 32 Panera Bread Company (2010): Still Rising Fortunes? 32-5
StateCompany
Bakery-CafésFranchise-Operated
Bakery-CafésTotal
Bakery-Cafés
Alabama 14 — 14Arizona 30 5 35Arkansas — 5 5California 39 52 91Colorado — 35 35Connecticut 11 10 21Delaware — 3 3Florida 39 77 116Georgia 14 18 32Illinois 69 34 103Indiana 32 6 38Iowa 2 15 17Kansas — 18 18Kentucky 15 2 17Maine — 4 4Maryland — 42 42Massachusetts 8 36 44Michigan 47 15 62Minnesota 23 3 26Missouri 45 21 66Nebraska 11 2 13Nevada — 5 5New Hampshire — 9 9New Jersey — 48 48New York 34 36 70North Carolina 12 30 42Ohio 9 89 98Oklahoma — 17 17Oregon 5 4 9Pennsylvania 23 46 69Rhode Island — 6 6South Carolina 8 6 14South Dakota 1 — 1Tennessee 12 16 28Texas 18 29 47Utah — 6 6Virginia 53 10 63Washington 11 1 12West Virginia — 7 7Wisconsin — 24 24Canada — 3 3Totals 585 795 1,380
EXHIBIT 1Year-End 2009
Company-Ownedand Franchise-
OperatedBakery-Cafés:
PaneraBread Co.
SOURCE: Panera Bread Company Inc., 2009 Form 10-K, p. 16.
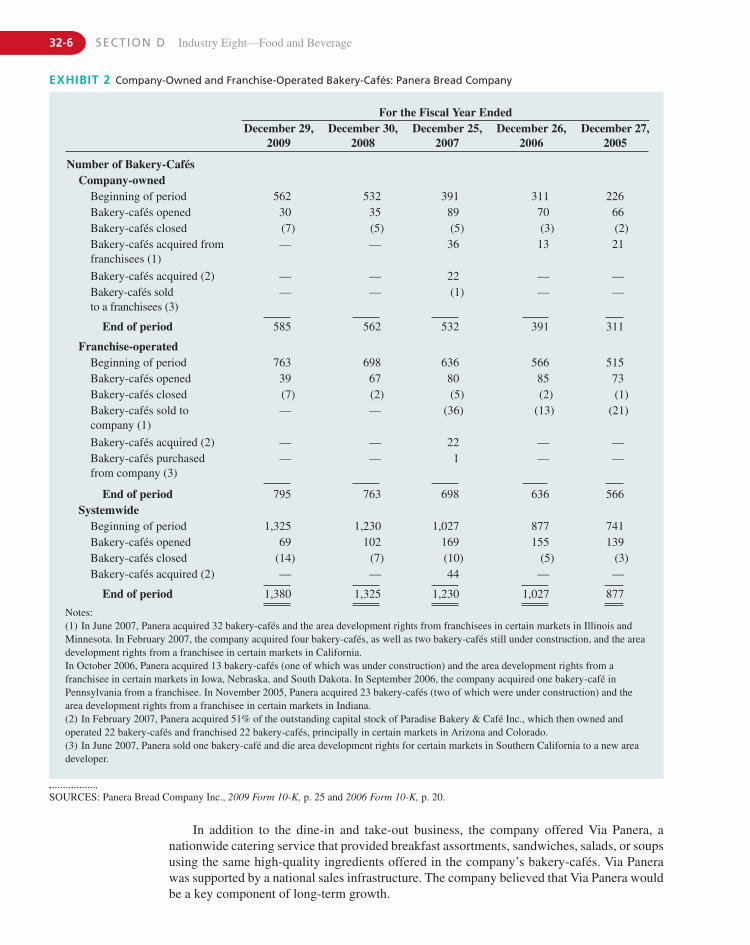
32-6 SECTION D Industry Eight—Food and Beverage
For the Fiscal Year EndedDecember 29,
2009December 30,
2008December 25,
2007December 26,
2006December 27,
2005
Number of Bakery-CafésCompany-owned
Beginning of period 562 532 391 311 226Bakery-cafés opened 30 35 89 70 66Bakery-cafés closed (7) (5) (5) (3) (2)Bakery-cafés acquired from franchisees (1)
— — 36 13 21
Bakery-cafés acquired (2) — — 22 — —Bakery-cafés sold to a franchisees (3)
— — (1) — —
End of period 585 562 532 391 311
Franchise-operatedBeginning of period 763 698 636 566 515Bakery-cafés opened 39 67 80 85 73Bakery-cafés closed (7) (2) (5) (2) (1)Bakery-cafés sold to company (1)
— — (36) (13) (21)
Bakery-cafés acquired (2) — — 22 — —Bakery-cafés purchased from company (3)
— — 1 — —
End of period 795 763 698 636 566Systemwide
Beginning of period 1,325 1,230 1,027 877 741Bakery-cafés opened 69 102 169 155 139Bakery-cafés closed (14) (7) (10) (5) (3)Bakery-cafés acquired (2) — — 44 — —
End of period 1,380 1,325 1,230 1,027 877
Notes:(1) In June 2007, Panera acquired 32 bakery-cafés and the area development rights from franchisees in certain markets in Illinois andMinnesota. In February 2007, the company acquired four bakery-cafés, as well as two bakery-cafés still under construction, and the areadevelopment rights from a franchisee in certain markets in California.In October 2006, Panera acquired 13 bakery-cafés (one of which was under construction) and the area development rights from afranchisee in certain markets in Iowa, Nebraska, and South Dakota. In September 2006, the company acquired one bakery-café inPennsylvania from a franchisee. In November 2005, Panera acquired 23 bakery-cafés (two of which were under construction) and thearea development rights from a franchisee in certain markets in Indiana.(2) In February 2007, Panera acquired 51% of the outstanding capital stock of Paradise Bakery & Café Inc., which then owned andoperated 22 bakery-cafés and franchised 22 bakery-cafés, principally in certain markets in Arizona and Colorado.(3) In June 2007, Panera sold one bakery-café and die area development rights for certain markets in Southern California to a new areadeveloper.
EXHIBIT 2 Company-Owned and Franchise-Operated Bakery-Cafés: Panera Bread Company
In addition to the dine-in and take-out business, the company offered Via Panera, anationwide catering service that provided breakfast assortments, sandwiches, salads, or soupsusing the same high-quality ingredients offered in the company’s bakery-cafés. Via Panerawas supported by a national sales infrastructure. The company believed that Via Panera wouldbe a key component of long-term growth.
SOURCES: Panera Bread Company Inc., 2009 Form 10-K, p. 25 and 2006 Form 10-K, p. 20.
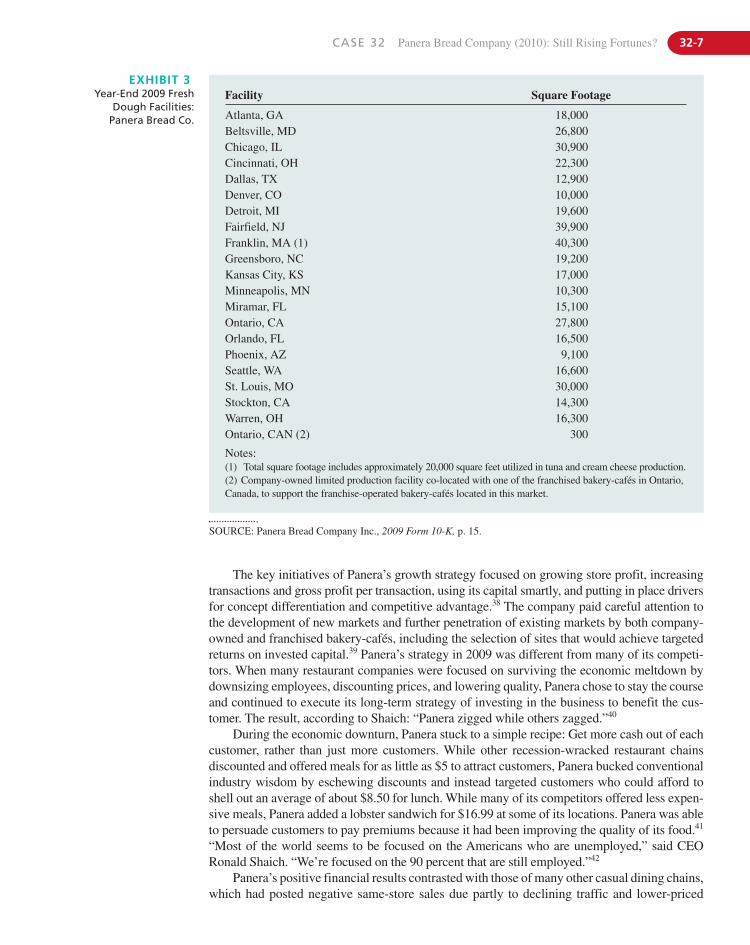
CASE 32 Panera Bread Company (2010): Still Rising Fortunes? 32-7
The key initiatives of Panera’s growth strategy focused on growing store profit, increasingtransactions and gross profit per transaction, using its capital smartly, and putting in place driversfor concept differentiation and competitive advantage.38 The company paid careful attention tothe development of new markets and further penetration of existing markets by both company-owned and franchised bakery-cafés, including the selection of sites that would achieve targetedreturns on invested capital.39 Panera’s strategy in 2009 was different from many of its competi-tors. When many restaurant companies were focused on surviving the economic meltdown bydownsizing employees, discounting prices, and lowering quality, Panera chose to stay the courseand continued to execute its long-term strategy of investing in the business to benefit the cus-tomer. The result, according to Shaich: “Panera zigged while others zagged.”40
During the economic downturn, Panera stuck to a simple recipe: Get more cash out of eachcustomer, rather than just more customers. While other recession-wracked restaurant chainsdiscounted and offered meals for as little as $5 to attract customers, Panera bucked conventionalindustry wisdom by eschewing discounts and instead targeted customers who could afford toshell out an average of about $8.50 for lunch. While many of its competitors offered less expen-sive meals, Panera added a lobster sandwich for $16.99 at some of its locations. Panera was ableto persuade customers to pay premiums because it had been improving the quality of its food.41
“Most of the world seems to be focused on the Americans who are unemployed,” said CEORonald Shaich. “We’re focused on the 90 percent that are still employed.”42
Panera’s positive financial results contrasted with those of many other casual dining chains,which had posted negative same-store sales due partly to declining traffic and lower-priced
Facility Square Footage
Atlanta, GA 18,000Beltsville, MD 26,800Chicago, IL 30,900Cincinnati, OH 22,300Dallas, TX 12,900Denver, CO 10,000Detroit, MI 19,600Fairfield, NJ 39,900Franklin, MA (1) 40,300Greensboro, NC 19,200Kansas City, KS 17,000Minneapolis, MN 10,300Miramar, FL 15,100Ontario, CA 27,800Orlando, FL 16,500Phoenix, AZ 9,100Seattle, WA 16,600St. Louis, MO 30,000Stockton, CA 14,300Warren, OH 16,300Ontario, CAN (2) 300
Notes:(1) Total square footage includes approximately 20,000 square feet utilized in tuna and cream cheese production.(2) Company-owned limited production facility co-located with one of the franchised bakery-cafés in Ontario,Canada, to support the franchise-operated bakery-cafés located in this market.
EXHIBIT 3Year-End 2009 Fresh
Dough Facilities:Panera Bread Co.
SOURCE: Panera Bread Company Inc., 2009 Form 10-K, p. 15.
32-8 SECTION D Industry Eight—Food and Beverage
food. Some chains found that discounting not only hurt margins but also failed to lure as manycustomers as hoped. Shaich seemed to thrive on doing the opposite of his competition. During2009, instead of slashing prices, he raised them twice, one on bagels and once on soup. “We’recontrarians to the core,” said Shaich. “We don’t offer a lower-end strategy. In a world whereeveryone is cutting back, we want to give more not less.”43 “This is the time to increase the foodexperience,” insisted Shaich, “that is, when consumers least expect it.”44
Also crucial to Panera’s success in 2009 was the company’s approach to operations dur-ing the recession. Over the years, many restaurant companies told investors they were able toimprove labor productivity while running negative comparable store sales. Panera believedthat reducing labor in a restaurant taxed the customer by creating longer waits, slower service,and more frazzled team members. Panera took the approach of keeping labor consistent withsales and continuing to invest in its employees as a way to better serve its customers.45
The results for 2009 showed that Panera’s strategy of zigging while others were zaggingpaid off. Panera met or exceeded its earnings targets in each quarter of 2009. Panera delivered25% earnings per share (EPS) growth in 2009 on top of 24% EPS growth in 2008. Panera’sstock price increased 115% from December 31, 2007, to March 30, 2010.
Panera’s objectives for 2010 included a target of 17%–20% EPS growth through theexecution of its key initiatives. To further build transactions, Panera planned to focus ondifferentiation through innovative salads utilizing new procedures to further improve quality.Panera also planned to test a new way to make paninis using newly designed grills. Thecompany expected to roll out improved versions of several Panera classics while continuing tofocus on improving operations, speed of service, and accuracy.46
In early 2010, to increase gross profit per transaction and further improve margins whilestill providing overall value to customers, Panera introduced an initiative called the MealUpgrade Program. With this program, a customer who ordered an entrée and a beverage wasoffered the opportunity to purchase a baked good to complete their meal at a “special” pricepoint. Panera intended to test other impulse add-on initiatives, bulk baked goods, and breadas a gift.47
“I worry about keeping the concept special,” said Shaich. “Is it worth walking across thestreet to? It doesn’t matter how cheap it is. If it isn’t special, there’s no reason the businessneeds to exist.”48
The Fast Casual SegmentPanera’s predecessor, Au Bon Pain, was a pioneer of the fast casual restaurant category.Dining trends caused fast casual to emerge as a legitimate trend in the restaurant industry asit bridged the gap between the burgers-and-fries fast-food industry and full service, sitdown,casual dining restaurants.
Technomic Information Services, a food-service industry consultant, coined the term todescribe restaurants that offered the speed, efficiency, and inexpensiveness of fast food with thehospitality, quality, and ambiance of a full-service restaurant. Technomic defined a fast casualrestaurant by whether or not the restaurant met the following four criteria: (1) The restaurant hadto offer a limited service or self-service format. (2) The average check had to be between $6 and$9, whereas fast-food checks averaged less than $5. This pricing scheme placed fast casualbetween fast food and casual dining. (3) The food had to be made-to-order, as consumersperceived newly prepared, made-to-order foods as fresh. Fast casual menus usually also had morerobust and complex flavor profiles than the standard fare at fast-food restaurants. (4) The décorhad to be upscale or highly developed. Décor inspired a more enjoyable experience for thecustomer as the environment of fast casual restaurants was more akin to a neighborhood bistro orcasual restaurant. The décor also created a generally higher perception of quality.49
CASE 32 Panera Bread Company (2010): Still Rising Fortunes? 32-9
The fast casual market was divided into three categories: bread-based chains, traditionalchains, and ethnic chains. According to a Mintel 2008 report, bread-based chains, such as Panera,and ethnic chains, such as Chipotle Mexican Grill, had sales momentum and were predicted togrow at the expense of traditional chains such as Steak n Shake, Boston Market, Fuddruckers, andFazoli’s, which were weighted down by older concepts. The report also suggested that bread-based and ethnic chains had an edge with respect to consumer perceptions about food healthful-ness.50 Most fast casual brands did not compete in all dayparts (breakfast, lunch, dinner,late-night); rather, they focused on one or two. While almost all competitors in this segment hada presence at lunch, many grappled with the question of whether and how to participate in otherdayparts.51 In addition, unlike fast-food restaurants that constructed stand-alone stores, fast casualchains were typically located in strip malls, small town main streets, and pre-existing properties.
According to Technomic, by offering high-quality food with fast service, fast casualchains had experienced increased traffic in 2009 as diners “traded-down” from casual diningchains and “traded-up” from fast-food restaurants to lower priced but still higher-quality freshfood.52 In other words, the desire to eat out did not diminish; only the destination changed.Sales in 2009 for the top 100 fast casual chains reached $17.5 billion, a 4.5% increase over2008; and units grew by 4.3% to 14,777 locations,53 compared to a 3.2% sales decline in theoverall restaurant industry.54 The growth in the fast casual segment was also due to the matu-ration of two large segments of the U.S. population; baby boomers and their children. Both agegroups had little time for cooking and were tired of fast food.
Bakery-café/bagel remained the largest of the fast casual restaurant clusters and the largestmenu category, generating $4.8 billion in U.S. sales in 2009 and jumping from 17% to 21% of thetop 100 fast casual restaurants. In 2009, Mexican, with total sales of $3.8 billion, was the secondlargest fast casual cluster of restaurants.55 Technomic’s 2009 Top 100 Fast-Casual Restaurant Re-port noted that besides burgers (up 16.7%), the fastest growing menu categories reflected the grow-ing interest of consumers in international flavors: Asian/noodle (up 6.4%) and Mexican (up 6.3%).56
According to Technomic, “Growth within the fast-casual segment reveals positive con-sumer preferences for the service format, concept, and menu positioning, and price points butcompetition is still fierce and dining-dollars are still minimal. Fast-casual operators will have tocontinue being creative with value-oriented menu offerings, uniqueness in terms of flavor, prepa-ration and quality, and new ways to bolster the bottom line.”57 This is in agreement with a state-ment made by Panera’s Chief Concept Officer, Scott Davis, “The key thing to remember aboutfast casual is this: customers don’t know what it is. To them, ‘fast casual’ just means ‘food.’Thatinsight can go a long way toward helping you refocus your energy where it counts most. Foodis what matters. It is the No. 1 way to differentiate your business from your competitors.”58
Exhibit 4 provides a list of the 20 largest fast casual franchises in 2010. Even thoughChipotle Mexican Grill was one of Panera’s key competitors, it was not included on this listbecause it did not franchise. Exhibit 5 lists the nine largest bread-based fast casual chains.
CompetitionPanera experienced competition from numerous sources in its trade areas. The company’sbakery-cafés competed with specialty food, casual dining and quick service cafés, bakeries, andrestaurant retailers, including national, regional, and locally owned cafés, bakeries, and restau-rants. The bakery-cafés competed in several segments of the restaurant business based on cus-tomers’needs for breakfast, AM “chill,” lunch, PM “chill,” dinner, and take-home through bothon-premise sales and Via Panera catering. The competitive factors included location, environ-ment, customer service, price, and quality of products. The company competed for leased spacein desirable locations and also for hourly employees. Certain competitors or potential competi-tors had capital resources that exceeded those available to Panera.59
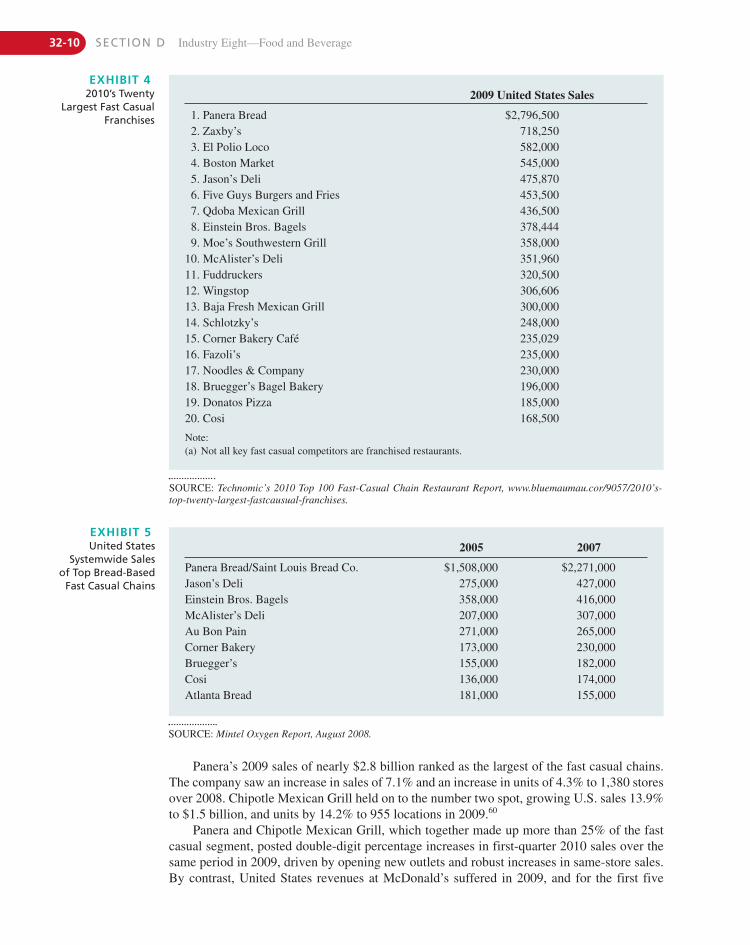
32-10 SECTION D Industry Eight—Food and Beverage
2009 United States Sales
1. Panera Bread $2,796,5002. Zaxby’s 718,2503. El Polio Loco 582,0004. Boston Market 545,0005. Jason’s Deli 475,8706. Five Guys Burgers and Fries 453,5007. Qdoba Mexican Grill 436,5008. Einstein Bros. Bagels 378,4449. Moe’s Southwestern Grill 358,000
10. McAlister’s Deli 351,96011. Fuddruckers 320,50012. Wingstop 306,60613. Baja Fresh Mexican Grill 300,00014. Schlotzky’s 248,00015. Corner Bakery Café 235,02916. Fazoli’s 235,00017. Noodles & Company 230,00018. Bruegger’s Bagel Bakery 196,00019. Donatos Pizza 185,00020. Cosi 168,500
Note:(a) Not all key fast casual competitors are franchised restaurants.
EXHIBIT 42010’s Twenty
Largest Fast CasualFranchises
Panera’s 2009 sales of nearly $2.8 billion ranked as the largest of the fast casual chains.The company saw an increase in sales of 7.1% and an increase in units of 4.3% to 1,380 storesover 2008. Chipotle Mexican Grill held on to the number two spot, growing U.S. sales 13.9%to $1.5 billion, and units by 14.2% to 955 locations in 2009.60
Panera and Chipotle Mexican Grill, which together made up more than 25% of the fastcasual segment, posted double-digit percentage increases in first-quarter 2010 sales over thesame period in 2009, driven by opening new outlets and robust increases in same-store sales.By contrast, United States revenues at McDonald’s suffered in 2009, and for the first five
2005 2007
Panera Bread/Saint Louis Bread Co. $1,508,000 $2,271,000Jason’s Deli 275,000 427,000Einstein Bros. Bagels 358,000 416,000McAlister’s Deli 207,000 307,000Au Bon Pain 271,000 265,000Corner Bakery 173,000 230,000Bruegger’s 155,000 182,000Cosi 136,000 174,000Atlanta Bread 181,000 155,000
EXHIBIT 5United States
Systemwide Sales of Top Bread-Based
Fast Casual Chains
SOURCE: Technomic’s 2010 Top 100 Fast-Casual Chain Restaurant Report, www.bluemaumau.cor/9057/2010’s-top-twenty-largest-fastcausual-franchises.
SOURCE: Mintel Oxygen Report, August 2008.
CASE 32 Panera Bread Company (2010): Still Rising Fortunes? 32-11
months of 2010, same-store sales were up 3% over the same period in 2009. Burger King strug-gled during the same period with revenues in the United States and Canada down 4% for thefirst three months of 2010.61 Established restaurant chains were beginning to take notice of theopportunities in the fast casual segment and considering options. For example, Subway startedtesting an upscale design in the Washington, DC, market in 2008. New competitors, such asOtarian, were also entering the fast casual segment testing new concepts, many having a healthand wellness or sustainability component to them.
Although Panera continued to learn from its competitors, none of its competitors had yet fig-ured out the formula to Panera’s success. While McDonald’s had rival Burger King, and Applebee’shad T.G.I. Friday’s, there was no direct national competitor that replicated Panera’s business model.Like Panera, Chipotle sold high-quality food made with fine ingredients—but it was Mexican. Cosisold quality sandwiches and salads, but lacked pastries and gourmet coffees. Starbucks had fine cof-fee and pastries but not Panera’s extensive food menu. According to Shaich, the reason is that “thisis hard to do, . . . what seems simple can be tough. It is not so easy to knock us off.”62
Corporate GovernancePanera was a Delaware corporation and its corporate headquarters were located in SaintLouis, Missouri.
Board of DirectorsPanera’s Board was divided into three classes of membership. The terms of service of the threeclasses of directors were staggered so that only one class expired at each annual meeting. At thetime of the May 2010 annual meeting the Board consisted of six members. Class I consisted ofRonald M. Shaich and Fred K. Foulkes, with terms expiring in 2011; Class II consisted ofDomenic Colasacco and Thomas E. Lynch, with terms expiring in 2012; and Class III consistedof Larry J. Franklin and Charles J. Chapmann III, with terms ending in 2010. Mr. Franklin andMr. Chapman were both nominated for re-election with terms ending in 2013, if elected.63
The biographical sketches for the board members are shown below.64
Ronald M. Shaich: (age 56), was a Director since 1981, co-founder, Chairman of the Boardsince May 1999, Co-Chairman of the Board from January 1988 to May 1999, Chief Ex-ecutive Officer since May 1994, and Co-Chief Executive Officer from January 1988 toMay 1994. Shaich served as a Director of Lown Cardiovascular Research Foundation, asa trustee of the nonprofit Rashi School, as Chairman of the Board of Trustees of ClarkUniversity, and as Treasurer of the Massachusetts Democratic Party. He had a Bachelorof Arts degree from Clark University and an MBA from Harvard Business School. Im-mediately following the 2010 Annual Meeting, Mr. Shaich planned to resign as Chief Ex-ecutive Officer and the Board intended to elect him as Executive Chairman of the Board.
Larry J. Franklin: (age 61), was a Director since June 2001. Franklin had been the Presidentand Chief Executive Officer of Franklin Sports Inc., a leading branded sporting goodsmanufacturer and marketer, since 1986. Franklin joined Franklin Sports Inc. in 1970 andserved as its Executive Vice President from 1981 to 1986. Franklin served on the Boardof Directors of Bradford Soap International Inc. and the Sporting Goods ManufacturersAssociation (Chairman of the Board and member of the Executive Committee).
Fred K. Foulkes: (age 68), was a Director since June 2003. Dr. Foulkes had been a Profes-sor of Organizational Behavior and had been the Director (and founder) of the Human Re-sources Policy Institute at Boston University School of Management since 1981. He had
32-12 SECTION D Industry Eight—Food and Beverage
Top ManagementThe biographical sketches for some of the key executive officers follow.67
Ronald Shaich: (age 56) planned to resign as Chief Executive Officer immediately followingthe May 2010 Annual Meeting. The Board of Directors announced its intentions to electhim as Executive Chairman of the Board at that time. The Board intended to appointWilliam W. Moreton to succeed Mr. Shaich as Chief Executive Officer and President andto elect him to the Board of Directors.68
William M. Moreton: (age 50) re-joined Panera in November 2008 as Executive Vice Pres-ident and Co-Chief Operating Officer. He previously served as Executive Vice Presidentand Chief Financial Officer from 1998 to 2003. From 2005 to 2007, Moreton served asPresident and Chief Financial Officer of Potbelly Sandwich Works, and from 2004–2005as Executive Vice President-Subsidiary Brands, and Chief Executive Officer of BajaFresh, a subsidiary of Wendy’s International Inc. Immediately following the conclusion
taught courses in human resource management and strategic management at BostonUniversity since 1980. From 1968 to 1980, Foulkes had been a member of the HarvardBusiness School faculty. Foulkes had written numerous books, articles, and case studies.He had served on the Board of Directors of Bright Horizons Family Solutions and the So-ciety for Human Resource Management Foundation.
Domenic Colasacco: (age 61), was a Director since March 2000, and Lead Independent Di-rector since 2008. Colasacco had been President and Chief Executive Officer of BostonTrust & Investment Management, a banking and trust company, since 1992. He alsoserved as Chairman of its Board of Directors. He joined Boston Trust in 1974 after begin-ning his career in the research division of Merrill Lynch & Co. in New York City.
Charles J. Chapman III: (age 47), was a Director since 2008. Chapman had been the ChiefOperating Officer and a Director of the American Dairy Queen Corporation sinceOctober 2005. From 2001 to October 2005, Chapman held a number of senior positionsat American Dairy Queen. Prior to joining American Dairy Queen, Chapman served asChief Operating Officer at Bruegger’s Bagel’s Inc. where he was also President and co-owner of a franchise. He also held marketing and operations positions with DardenRestaurants and served as a consultant with Bain & Company.
Thomas E. Lynch: (age 50), was a Director since March 2010 and previous Director from2003–2006. Lynch served as Senior Managing Director of Mill Road Capital, a private eq-uity firm, since 2005. From 2000 to 2004, Lynch served as Senior Managing Director ofMill Road Associates, a financial advisory firm that he founded in 2000. From 1997through 2000, Lynch was the founder and Managing Director of Lazard Capital PartnersFrom 1990 to 1997, Lynch was a Managing Director of the Blackstone Group, where hewas a senior investment professional for Blackstone Capital Partners. Prior to Blackstone,Lynch was a senior consultant at the Monitor Company. He also had previously served onthe Board of Directors of Galaxy Nutritional Foods Inc.
The Board had established three standing committees, each of which operated under acharter approved by the Board. The Compensation and Management Development Committeeincluded Foulkes (Chair), Franklin, and Colasacco. The Committee on Nominations and Cor-porate Governance included Franklin (Chair), Chapman, and Foulkes. The Audit Committeeincluded Colasacco (Chair), Foulkes, and Franklin.65
The compensation package of non-employee directors consisted of cash payments andstock and option awards. Total non-employee director compensation ranged from $29,724 to$124,851 in fiscal 2009 depending on services rendered.66
CASE 32 Panera Bread Company (2010): Still Rising Fortunes? 32-13
of the 2010 Annual Meeting, upon the resignation of Mr. Shaich, the Board planned forMr. Moreton to succeed Mr. Shaich as Chief Executive Officer, and the Board intended toappoint him as President and elect him to the Board.
John M. Maguire: (age 44) had been Chief Operating Officer and subsequently Co-Chief Op-erating Officer since March 2008 and Executive Vice President since April 2006. He pre-viously served as Senior Vice President, Chief Company, and Joint Venture OperationsOfficer from August 2001 to April 2006. From April 2000 to July 2001, Maguire servedas Vice President, Bakery Operations and from November 1998 to March 2000, as VicePresident, Commissary Operations. Maguire joined the company in April 1993; from1993 to October 1998, he was a Manager and Director of Au Bon Pain/Panera Bread/Saint. Louis Bread.
Cedric J. Vanzura: (age 46) had been Executive Vice President and Co-Chief Operating Of-ficer since November 2008 and Executive Vice President and Chief Administrative Offi-cer from March to November 2008. Prior to joining the company, Vanzura held a varietyof roles at Borders International from 2003 to 2007.
Mark A. Borland: (age 57) had been Senior Vice President and Chief Supply Chain Officersince August 2002. Borland joined the company in 1986 and held management positionswithin Au Bon Pain and Panera Bread divisions until 2000, including Executive Vice Pres-ident, Vice President of Retail Operations, Chief Operating Officer, and President of Man-ufacturing Services. From 2000 to 2001, Borland served as Senior Vice President ofOperations at RetailDNA, and then rejoined Panera as a consultant in the summer of 2001.
Jeffrey W. Kip: (42) had been Senior Vice President and Chief Financial Officer since May2006. He previously served as Vice President, Finance and Planning, and Vice Presi-dent, Corporate Development, from 2003 to 2006. Prior to joining Panera, Mr. Kip wasan Associate Director and then Director at UBS from 2002 to 2003 and an Associate atGoldman Sachs from 1999 to 2002.
Michael J. Nolan: (age 50) had been Senior Vice President and Chief Development Officersince he joined the company in August 2001. From December 1997 to March 2001,Nolan served as Executive Vice President and Director for John Harvard’s Brew House,L.L.C., and Senior Vice President, Development, for American Hospitality Concepts Inc.From March 1996 to December 1997, Nolan was Vice President of Real Estate and De-velopment for Apple South Incorporated, a chain restaurant operator, and from July 1989to March 1996, Nolan was Vice President of Real Estate and Development for MorrisonRestaurants Inc. Prior to 1989, Nolan served in various real estate and development ca-pacities for Cardinal Industries Inc. and Nolan Development and Investment.
Other key Senior Vice Presidents included Scott Davis, Chief Concept Officer; Scott Blair,Chief Legal Officer; Rebecca Fine, Chief People Officer; Thomas Kish, Chief Information Of-ficer; Michael Kupstas, Chief Franchise Officer; Michael Simon, Chief Marketing Officer; andWilliam Simpson, Chief Company and Joint Venture Operations Officer. In 2009, the totalcompensation for the top five highest paid executive officers ranged from $939,919 to$3,354,708.69
At year-end 2009 there were two classes of stock: (1) Class Acommon stock with 30,491,278shares outstanding and one vote per share, and (2) Class B common stock with 1,392,107 sharesoutstanding and three votes per share.70 Class A common stock was traded on NASDAQ underthe symbol PNRA. As of March 15, 2010, all directors, director nominees, and executive officersas a group (20 persons) held 1,994,642 shares or 6.22% of Class A common stock and 1,311,690shares or 94.22% of Class B common stock with a combined voting percentage of 13.23%. RonaldShaich owned 5.5% of Class A common stock and 94.22% of Class B common stock for a com-bined voting percentage of 12.42%.71 In November 2009, Panera’s Board of Directors approveda three-year share repurchase program of up to $600 million of Class A common stock.72
32-14 SECTION D Industry Eight—Food and Beverage
Menu73
Panera’s value-oriented menu was designed to provide the company’s target customers withaffordably priced products built on the strength of the company’s bakery expertise. “We hit acord with people who understand and respond to food, but we also opened a door for peoplewho are on the verge of that,” said Scott Davis. “We run an idea through a Panera filter andgive it a twist that takes a flavor profile closer to what you’d find in a bistro than a fast-foodjoint.”74 The Panera menu featured proprietary items prepared with high-quality fresh ingre-dients as well as unique recipes and toppings. The key menu groups were fresh-baked goods,including a variety of freshly baked bagels, breads, muffins, scones, rolls, and sweet goods;made-to-order sandwiches; hearty and unique soups; hand-tossed salads; and café beveragesincluding custom-roasted coffees, hot or cold espresso, cappuccino drinks, and smoothies.
The company regularly reviewed and updated its menu offerings to satisfy changing cus-tomer preferences, to improve its products, and to maintain customer interest. To give its cus-tomers a reason to return, Panera had been rolling out new products with fresher ingredientssuch as antibiotic-free chicken (Panera is the nation’s largest buyer75). The roots of most newPanera dishes could be traced to its R&D team’s twice-yearly retreats to the Adirondacks,where staffers took turns trying to out-do each other in the kitchen. “We start with: What dowe think tastes good,” said Scott Davis. “We’re food people, and if we’re not working on some-thing that gets us really excited, it’s kind of not worth working on.”76 Panera did not have testkitchens and instead tested all new menu items directly in its cafés. According to Davis, “Youcan experiment all you want in the kitchen with a new product but you won’t really see a mea-sure of its potential until you see it in a store.”77
Panera integrated new product rollouts into the company’s periodic or seasonal menu rota-tions, referred to as “Celebrations.” Examples of products introduced in fiscal 2009 included theChopped Cobb Salad and Barbeque Chicken Chopped Salad, introduced during the 2009 sum-mer salad celebration. Other menu changes in 2009 included a reformulated French baguette, anew line of smoothies, new coffee, a new Napa Almond Chicken Salad sandwich, a new Straw-berry Granola Parfait, the Breakfast Power Sandwich, and a new line of brownies and blondies.Three new salmon options, five years in the making, were introduced in early 2010 along witha new Low-Fat Garden Vegetable Soup and a new Asiago Bagel Breakfast Sandwich. New chiliofferings were in the planning stages. During this time Shaich had also been busy tweakingthings he wanted Panera to do better, such as improving the freshness of Panera’s lettuce bycutting the time from field to plate in half. He also improved the freshness of the company’sbreads by opting to bake all day long and not just in the early morning hours. Panera’s changesand improvements were all designed to build competitive advantage by strengthening value.Value, according to the company, meant offering guests an even better “total experience.”
In 2008, Panera introduced the antithesis to the microwaved, processed breakfast sandwich.“At Panera we believe customers deserve a breakfast that is made by bakers, not microwaves—so we have developed a hand-crafted, made to order grilled breakfast sandwich that literallybreaks the mold,” said Shaich. “Our survey shows that 82% of consumers would prefer freshlycooked eggs in their breakfast sandwiches and Panera is happy to oblige.”78 The new line ofbreakfast sandwiches were made fresh daily with quality ingredients—a combination of all-natural eggs, Vermont white cheddar cheese, Applewood-smoked bacon or all natural sausage,grilled between two slices of fresh baked ciabatta. Many of the company’s competitors had alsomoved to more protein-based breakfast sandwich offerings because of the growth opportunitiesin this segment of the market. “To compete in this business, we believe we need to have offer-ings that are worth getting out of your car for,”79 said Scott Davis.
Not all of Panera’s menu innovations had been successful with customers or had addedmuch to the bottom line. Panera redesigned its menu boards in 2009 to draw the customers’eyes toward meals with higher margins, like the soup and salad combo, rather than pricier
CASE 32 Panera Bread Company (2010): Still Rising Fortunes? 32-15
items, like a strawberry poppy-seed salad, that did not bring as much to the bottom line. TheCrispani pizza was discontinued in 2008, after it failed to drive business during evening hours.
To improve margins, Panera was able to anticipate and react to changes in food and sup-ply costs including, among other things, fuel, proteins, dairy, wheat, tuna, and cream cheesecosts through increased menu prices and to use its strength at purchasing to limit cost inflationin efforts to drive gross profit per transaction.
“Panera’s always been ahead of the curve in the transparency of their food,”80 said HowardGordon, a former Cheesecake Factory executive and now restaurant industry consultant.“Everyone said the antibiotic-free chicken was doomed to fail,” said Shaich. “They said it wastoo expensive and too difficult for consumers to understand the value of paying more.Wrong.”81 Panera chose to be ahead of the curve again when it announced in early 2010 thatit would post calorie information on all systemwide bakery-café menu boards by the end of2010. Panera had for a number of years provided a nutritional calculator on its website so thatcustomers were able to find nutritional information for individual products or build a meal ac-cording to their dietetic specifications. Recognizing the health risks associated with transfats,Panera had completely removed all transfat from its menu by 2006.82 Panera also offered awide range of organic food products including cookies, milk, and yogurt, which were incor-porated into the company’s childrens’ menu, Panera Kids, in 2006. Because of its healthychoices, Panera was named “One of the 10 Best Fast-Casual Family Restaurants” by ParentsMagazine in its July 2009 issue.83
Site Selection and Company-Owned Bakery-Cafés84
As of December 29, 2009, the company-owned bakery-café segment consisted of 585 company-owned bakery-cafés, all located in the United States. During 2009, Panera focused on using itscash to build new high ROI bakery-cafés and executed a disciplined development process that tookadvantage of the recession to drive down costs while selecting locations that delivered strong salesvolume. In 2009, Panera believed the best use of its capital was to invest in its core business, ei-ther through the development of new bakery-cafés or through the acquisition of existing bakery-cafés from franchisees or other similar restaurant or bakery-café concepts, such as the acquisitionof Paradise Bakery & Café Inc.
All company-owned bakery-cafés were in leased premises. Lease terms were typically10 years with one, two, or three five-year renewal option periods thereafter. Leases typicallyhad charges for a proportionate share of building and common area operating expenses andreal estate taxes, and contingent percentage rent based on sales above a stipulated sales level.Because Panera was considered desirable as a tenant due to its profitable balance sheet andnational reputation, the company enjoyed a favorable leasing environment in lease terms andthe availability of desirable locations.
The average size of a company-owned bakery-café was approximately 4,600 square feetas of December 29, 2009. The average construction, equipment, furniture and fixtures, andsignage costs for the 30 company-owned bakery-cafés opened in fiscal 2009 was approxi-mately $750,000 per bakery-café after landlord allowances and excluding capitalized develop-ment overhead. The company expected that future bakery-cafés would require, on average, aninvestment per bakery-café of approximately $850,000.
In evaluating potential new locations for both company-owned and franchised bakery-cafés, Panera studied the surrounding trade area, demographic information within the mostrecent year, and publicly available information on competitors. Based on this analysis andutilizing predictive modeling techniques, Panera estimated projected sales and a targeted returnon investment. Panera also employed a disciplined capital expenditure process focused onoccupancy and development costs in relation to the market, designed to ensure the right-sized
32-16 SECTION D Industry Eight—Food and Beverage
bakery-café and costs in the right market. Panera’s methods had proven successful in choosinga number of different types of locations, such as in-line or end-cap locations in strip or powercenters, regional malls, drive-through, and freestanding units.
Franchises85
Franchising was a key component of Panera’s growth strategy. Expansion through franchisepartners enabled the company to grow more rapidly as the franchisees contributed the re-sources and capabilities necessary to implement the concepts and strategies developed byPanera.
The company began a broad-based franchising program in 1996, when the company ac-tively began seeking to extend its franchise relationships. As of December 29, 2009, there were795 franchise-operated bakery-cafés open throughout the United States and in Ontario,Canada, and commitments to open 240 additional franchise-operated bakery-cafés. At thistime, 57.6% of the company’s bakery-cafés were owned by franchises comprised of 48 fran-chise groups. The company was selective in granting franchises, and applicants had to meetspecific criteria in order to gain consideration for a franchise. Generally, the franchisees hadto be well capitalized to open bakery-cafés, with a minimum net worth of $7.5 million andmeet liquidity requirements (liquid assets of $3 million),86 have the infrastructure and re-sources to meet a negotiated development schedule, have a proven track record as multi-unitrestaurant operators, and have a commitment to the development of the Panera brand. A num-ber of markets were still available for franchise development.
Panera did not sell single-unit franchises. Instead, they chose to develop by selling mar-ket areas using Area Development Agreements, referred to as ADAs, which required the fran-chise developer to open a number of units, typically 15 bakery-cafés, in a period of four to sixyears. If franchisees failed to develop bakery-cafés on schedule or defaulted in complying withthe company’s operating or brand standards, the company had the right to terminate the ADAand to develop company-owned locations or develop locations through new area developers inthat market.
The franchise agreement typically required the payment of an up-front franchise fee of$35,000 (broken down into $5,000 at the signing of the area development agreement and$30,000 at or before the bakery-café opens) and continued royalties of 4%–5% on sales fromeach bakery-café. The company’s franchise-operated bakery-cafés followed the same protocolfor in-store operating standards, product quality, menu, site selection, and bakery-café con-struction as did company-owned bakery-cafés. Generally, the franchisees were required to pur-chase all of their dough products from sources approved by the company.
The company did not generally finance franchise construction or area developmentagreement purchases. In addition, the company did not hold an equity interest in any of thefranchise-operated bakery-cafés. However, in fiscal 2008, to facilitate expansion intoOntario, Canada, the company entered into a credit facility with the Canadian franchisee. ByMarch 2010, Panera had repurchased the three franchises in Toronto in order to be moredirectly involved in the Canadian market. While the company thought the geographic marketrepresented a good growth opportunity, Panera decided to study and learn from otherU.S. firms that had expanded successfully in Canada.87
Bakery Supply Chain88
According to Ronald Shaich, “Panera has a commitment to doing the best bread in America.”89
Freshly baked bread made with fresh dough was integral to honoring this commitment.System-wide bakery-cafés used fresh dough for sourdough and artisan breads and bagels.
CASE 32 Panera Bread Company (2010): Still Rising Fortunes? 32-17
Panera believed its fresh dough facility system and supply chain function provided com-petitive advantage and helped to ensure consistent quality at its bakery-cafés. The companyhad a unique supply-chain operation in which dough was supplied daily from one of the com-pany’s regional fresh dough facilities to substantially all company-owned and franchise-operated bakery-cafés. Panera bakers then worked through the night shaping, scoring, andglazing the dough by hand to bring customers fresh-baked loaves every morning and through-out the day. In 2009, the company began baking loaves later in the morning to ensure fresh-ness throughout the day and altered the fermentation cycle of its baguettes to make themsweeter.
As of December 29, 2009, Panera had 23 fresh dough facilities, 21 of which werecompany-owned, including a limited production facility that was co-located with one of thecompany’s franchised bakery-cafés in Ontario, Canada, to support the franchise-operatedbakery-cafés located in that market, and two of which were franchise operated. All fresh doughfacilities were leased. In fiscal 2009, there was an average of 62.5 bakery-cafés per fresh doughfacility compared to an average of 62.0 in fiscal 2008.90
Distribution of the fresh dough to bakery-cafés took place daily through a leased fleet of184 temperature-controlled trucks driven by Panera employees. The optimal maximum distri-bution range for each truck was approximately 300 miles; however, when necessary, the dis-tribution ranges might be up to 500 miles. An average distribution route delivered dough toseven bakery-cafés.
The company focused its expansion in areas served by the fresh dough facilities in orderto continue to gain efficiencies through leveraging the fixed cost of its fresh dough facilitystructure. Panera expected to enter selectively new markets that required the construction ofadditional facilities until a sufficient number of bakery-cafés could be opened that permittedefficient distribution of the fresh dough.
In addition to its need for fresh dough, the company contracted externally for the manu-facture of the remaining baked goods in the bakery-cafés, referred to as sweet goods. Sweetgoods products were completed at each bakery-café by professionally trained bakers. Comple-tion included finishing with fresh toppings and other ingredients and baking to established ar-tisan standards utilizing unique recipes.
With the exception of products supplied directly by the fresh dough facilities, virtually allother food products and supplies for the bakery-cafés, including paper goods, coffee, andsmallwares, were contracted externally by the company and delivered by vendors to an inde-pendent distributor for delivery to the bakery-cafés. In order to assure high-quality food andsupplies from reliable sources, Panera and its franchisees were required to select from a list ofapproved suppliers and distributors. The company leveraged its size and scale to improve thequality of its ingredients, effect better purchasing efficiency, and negotiate purchase agree-ments with most approved suppliers to achieve cost reduction for both the company and itscustomers. One company delivered the majority of Panera’s ingredients and other products tothe bakery-cafés two or three times weekly. In addition, company-owned bakery-cafés andfranchisees relied on a network of local and national suppliers for the delivery of fresh produce(three to six times per week).
Marketing91
Panera focused on customer research to plan its marketing and brand-building initiatives.According to Panera executives, “everything we do at Panera goes through the customer filterfirst.”92 Panera’s target customers were between 25 and 50 years old, earned $40,000 to$100,000 a year, and were seeking fresh ingredients and high quality choices.93 The company’scustomers spent an average of $8.50 per visit.94
32-18 SECTION D Industry Eight—Food and Beverage
Management Information Systems100
Each company-operated bakery-café had programmed point-of-sale registers to collect trans-action data used to generate pertinent information, including transaction counts, product mix,and average check. All company-owned bakery-café product prices were programmed intothe system from the company’s corporate headquarters. The company allowed franchisees tohave access to certain proprietary bakery-café systems and systems support. The fresh doughfacilities had information systems that accepted electronic orders from the bakery-cafés andmonitored delivery of the ordered product. The company also used proprietary online toolssuch as eLearning to provide online training for retail associates and online baking instruc-tions for its bakers.
Panera’s intranet site, The Harvest, allowed the company to monitor important analyticsand provide support to its bakery-cafés. For example, Panera used a weather application on its
Panera was committed to improving the customer experience in ways the company be-lieved rare in the industry. The company leveraged its nationwide presence as part of a broadermarketing strategy of building name recognition and awareness. As much as possible, the com-pany used its store locations to market its brand image. When choosing a location to open anew store, Panera carefully selected the geographic area. Better locations needed less market-ing, and the bakery-café concept relied on a substantial volume of repeat business.
In 2009, Panera executed a more aggressive marketing strategy than most of its competi-tors. While many competitors discounted to lure customers back through 2009, Panera focusedon offering guests an even better “total experience.” Improvements to the “total experience”included new coffee and breakfast items, new salads, new China, smoothies, and Mac andCheese. The company focused on improving store profit by increasing transactions as well asincreasing gross profit per transaction through the innovation and sales of higher gross profititems. Panera also had a successful initiative to drive add-on sales through the Meal Upgradeprogram.95
In 2010, Panera began modest increases in advertising and additional investments in itsmarketing infrastructure because the company recognized the importance of marketing as adriver of earnings and sales increases.96 In spite of these increases, Panera remained very cau-tious about its marketing investments and focused on the appropriate mix for each market. Paneraprimarily used radio and billboard advertising, with some television, social networking, andin-store sampling days. Panera found that it benefited when other companies advertisedproducts that Panera also carried, such as McDonald’s early 2010 promotion of smoothies.Panera was testing additional television advertising in 20 markets but considered any significantgrowth in this medium to be a few years away.97
Panera’s franchise agreements required franchisees to pay the company advertising feesbased on a percentage of sales. In fiscal 2009, franchise-operated bakery-cafés contributed0.7% of their sales to a company-run national advertising fund, paid a marketing administra-tion fee of 0.4% of sales, and were required to spend 2.0% of their sales on advertising in theirrespective local markets. The company contributed the same sales percentages from company-owned bakery-cafés toward the national advertising fund and marketing administration fee.For fiscal 2010, the company increased the contribution rate to the national advertising fundto 1.1% of sales.98
Panera invested in cause-related marketing efforts and community activities through itsOperation Dough-Nation program. These programs included sponsoring runs and walks, help-ing nonprofits raise funds, and the Day-End Dough-Nation program through which unsoldbakery products were packaged at the end of each day and donated to local food banks andcharities.99
CASE 32 Panera Bread Company (2010): Still Rising Fortunes? 32-19
Human Resources104
From the beginning, Panera realized that the key ingredients to the successful developmentof the Panera brand ranged from the type of food it served to the kind of people behind thecounters. The company placed a priority on staffing its bakery-cafés, fresh dough facilities,and support center operations with skilled associates and invested in training programs toensure the quality of its operations. As of December 29, 2009, the company employedapproximately 12,000 full-time associates (defined as associates who average 25 hours ormore per week), of whom approximately 600 were employed in general or administrativefunctions, principally in the company’s support centers; approximately 1,200 were em-ployed in the company’s fresh dough facility operations; and approximately 10,300 wereemployed in the company’s bakery-café operations as bakers, managers, and associates. Thecompany also had approximately 13,200 part-time hourly associates at the bakery-cafés.There were no collective bargaining agreements. The company considered its employeerelations to be good.
Panera believed that providing bakery-café operators the opportunity to participate in thesuccess of the bakery-cafés enabled the company to attract and retain experienced and highlymotivated personnel, which resulted in a better customer experience. Through a Joint VentureProgram, the company provided selected general managers and multi-unit managers with amulti-year bonus program based upon a percentage of the cash flows of the bakery-café theyoperated. The intent of the program’s five-year period was to create team stability, generallyresulting in a higher level of stability for that bakery-café and to lead to stronger associateengagement and customer loyalty. In December 2009, approximately 50% of company-ownedbakery-café operators participated in the Joint Venture program.105
FinancePanera reported a 48% increase in net income of $25,845 million, or $0.82 per dilutedshare, during the first quarter of 2010, compared to $17,432 million, or $0.57 per dilutedshare, during the first quarter of 2009. For this same period, Panera reported revenues of$364,210 million, a 14% gain, over revenues of $320,709 for the same period in 2009.106
intranet that tied a bakery-café’s historic local weather to the store’s historic sales, allowingmanagers to forecast sales based on weather for any given day. “That helps in staffing and howyou’re going to allocate labor and what you need in terms of materials,” said Greg Rhoades,Panera’s senior manager in information services. He called The Harvest “our single source ofinformation.” Panera shared news with its employees about food safety and customer satis-faction websites and provided information on daily sales, hourly sales, staffing, product sales,labor costs, and ingredient costs.101
The company began offering Wi-Fi in its bakery-cafés in 2003. By 2010 most bakery-cafés provided customers free Internet access through a managed Wi-Fi network. As a result,Panera hosted one of the largest free public Wi-Fi networks in the country.102
In 2010, Panera began to pilot test a loyalty program, “My Panera,” in 23 stores. Ratherthan just a food-discounting program, “My Panera” was intended to provide a deeper relation-ship with the customer by including participants in events such as the food tasting of new prod-ucts. The company expected to complete the pilot by year-end 2010 and hoped to beginleveraging the data to better understand its high frequency customers and to “surprise anddelight” them in a way that was tailored to the customers’ buying habits.103
32-20 SECTION D Industry Eight—Food and Beverage
Company-owned comparable bakery-café sales in the first quarter of fiscal 2010 increased10.0%, due to transaction growth of 3.5% and average check growth of 6.5% over the com-parable period in 2009. Franchise-operated comparable bakery-café sales increased 9.2%in the first quarter of 2010 compared to the same period in 2009. As a result, total compa-rable bakery-café sales increased 9.5% in the first quarter of fiscal 2010 compared to thecomparable period in 2009.107 In addition, average weekly sales (AWS) for newly openedcompany-owned bakery-cafés during the first quarter of 2010 were $56,111 compared to$41,922 in the first quarter of 2009. During the first quarter of 2010, Panera and its fran-chises opened eight new bakery-cafés systemwide. No bakery-cafés were closed duringthis period.108
Exhibits 6 to 8 provide Panera’s consolidated statement of operations, common sizeincome statements, and consolidated balance sheets, respectively, for the company for thefiscal years ended 2005 through 2009.
In fiscal 2009, during an uncertain economic environment, Panera bucked industry-widetrends and increased performance on the following key metrics: (1) systemwide comparablebakery-café sales growth of 0.5% (0.7% for company-owned bakery-cafés and 0.5% forfranchise-operated bakery-cafés); (2) systemwide average weekly sales increased 1.8% to$39,926 ($39,050 for company-owned bakery-cafés and $40,566 for franchise-operatedbakery-cafés); and (3) 69 new bakery-cafés opened systemwide (7 company-owned bakery-cafés and 39 franchise-operated bakery-cafés). In fiscal 2009, Panera earned $2.78 per dilutedshare.109 In addition, average weekly sales (AWS) for newly opened company-owned bakery-cafés in 2009 reached a six-year high for new units.110 Exhibit 9 provides 2005–2009 selectedfinancial information about Panera.
Total company revenue in fiscal 2009 increased 4.2% to $1,353.5 million from $1,298.9million in fiscal 2008. This growth was primarily due to the opening of 69 new bakery-caféssystemwide in fiscal 2009 (and the closure of 14 bakery-cafés) and, to a lesser extent, the 0.5%increase in systemwide comparable bakery sales.
Company-owned bakery-café sales increased 4.2% in fiscal 2009 to $1,153.3 millioncompared to $1,106.3 million in fiscal 2008. This increase was due to the opening of 30 newcompany-owned bakery-cafés and to the 0.7% increase in comparable company-ownedbakery-café sales in 2009. Company-owned bakery-café sales as a percentage of revenue re-mained consistent at 85.2% in both fiscal 2009 and fiscal 2008. In addition, the increase in av-erage weekly sales for company-owned bakery-cafés in fiscal 2009 compared to the priorfiscal year was primarily due to the average check growth that resulted from the company’sinitiative to drive add-on sales. Franchise royalties and fees in fiscal 2009 were up 4.8% to$78.4 million, or 5.8% of total revenues, up from $74.8 million in 2008. Fresh dough salesto franchises increased 3.5% in fiscal 2009 to $121.9 million compared to $117.8 million infiscal 2008.111
Panera believed that its primary capital resource was cash generated by operations. Thecompany’s principal requirements for cash have resulted from the company’s capital expendi-tures for the development of new company-owned bakery-cafés; for maintaining or remodelingexisting company-owned bakery-cafés; for purchasing existing franchise-operated bakery-cafés or ownership interests in other restaurant or bakery-café concepts; for developing, main-taining, or remodeling fresh dough facilities; and for other capital needs such as enhancementsto information systems and infrastructure. The company had access to a $250 million credit fa-cility which, as of December 29, 2009, had no borrowings outstanding. Panera believed its cashflow from operations and available borrowings under its existing credit facility to be sufficientto fund its capital requirements for the foreseeable future.112
According to Nicole Miller Regan, an analyst at Piper Jaffray, “the key to Panera’s suc-cess during the recessionary period lies in what the company hasn’t done. . . . It hasn’t tried tochange.” 113 “For us, the recession has been the best of times,” said CEO Shaich.114
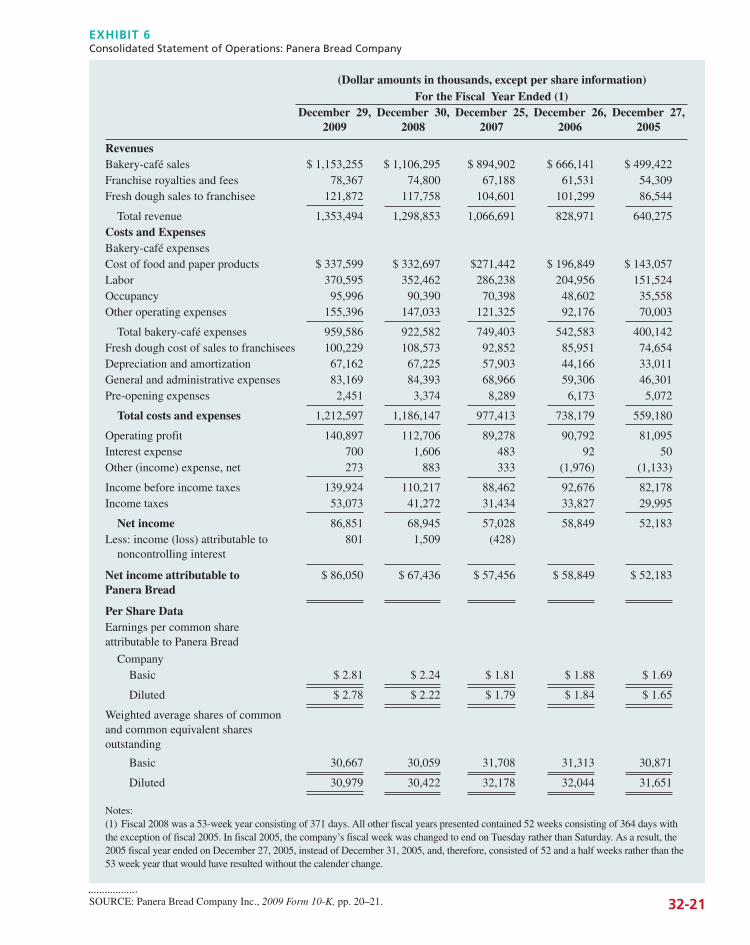
For the Fiscal Year Ended (1)December 29,
2009December 30,
2008December 25,
2007December 26,
2006December 27,
2005
RevenuesBakery-café sales $ 1,153,255 $ 1,106,295 $ 894,902 $ 666,141 $ 499,422Franchise royalties and fees 78,367 74,800 67,188 61,531 54,309Fresh dough sales to franchisee 121,872 117,758 104,601 101,299 86,544
Total revenue 1,353,494 1,298,853 1,066,691 828,971 640,275Costs and ExpensesBakery-café expensesCost of food and paper products $ 337,599 $ 332,697 $271,442 $ 196,849 $ 143,057Labor 370,595 352,462 286,238 204,956 151,524Occupancy 95,996 90,390 70,398 48,602 35,558Other operating expenses 155,396 147,033 121,325 92,176 70,003
Total bakery-café expenses 959,586 922,582 749,403 542,583 400,142Fresh dough cost of sales to franchisees 100,229 108,573 92,852 85,951 74,654Depreciation and amortization 67,162 67,225 57,903 44,166 33,011General and administrative expenses 83,169 84,393 68,966 59,306 46,301Pre-opening expenses 2,451 3,374 8,289 6,173 5,072
Total costs and expenses 1,212,597 1,186,147 977,413 738,179 559,180
Operating profit 140,897 112,706 89,278 90,792 81,095Interest expense 700 1,606 483 92 50Other (income) expense, net 273 883 333 (1,976) (1,133)
Income before income taxes 139,924 110,217 88,462 92,676 82,178Income taxes 53,073 41,272 31,434 33,827 29,995
Net income 86,851 68,945 57,028 58,849 52,183Less: income (loss) attributable to
noncontrolling interest801 1,509 (428)
Net income attributable to Panera Bread
$ 86,050 $ 67,436 $ 57,456 $ 58,849 $ 52,183
Per Share DataEarnings per common share attributable to Panera Bread
CompanyBasic $ 2.81 $ 2.24 $ 1.81 $ 1.88 $ 1.69
Diluted $ 2.78 $ 2.22 $ 1.79 $ 1.84 $ 1.65
Weighted average shares of common and common equivalent sharesoutstanding
Basic 30,667 30,059 31,708 31,313 30,871
Diluted 30,979 30,422 32,178 32,044 31,651
Notes:(1) Fiscal 2008 was a 53-week year consisting of 371 days. All other fiscal years presented contained 52 weeks consisting of 364 days withthe exception of fiscal 2005. In fiscal 2005, the company’s fiscal week was changed to end on Tuesday rather than Saturday. As a result, the2005 fiscal year ended on December 27, 2005, instead of December 31, 2005, and, therefore, consisted of 52 and a half weeks rather than the53 week year that would have resulted without the calender change.
(Dollar amounts in thousands, except per share information)
EXHIBIT 6Consolidated Statement of Operations: Panera Bread Company
SOURCE: Panera Bread Company Inc., 2009 Form 10-K, pp. 20–21. 32-21
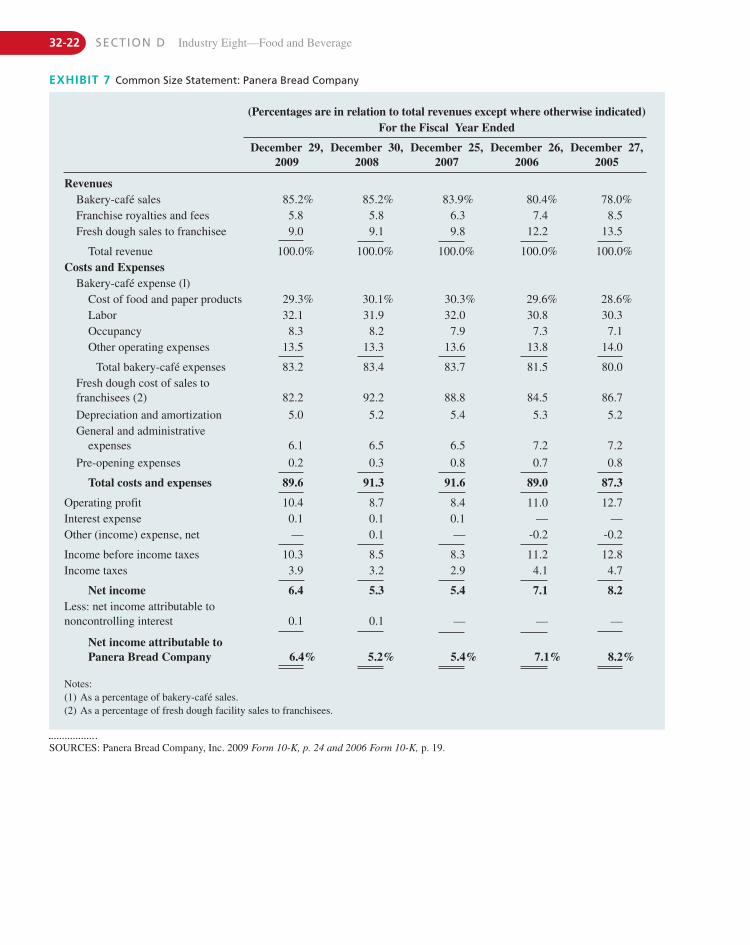
32-22 SECTION D Industry Eight—Food and Beverage
(Percentages are in relation to total revenues except where otherwise indicated)For the Fiscal Year Ended
December 29,2009
December 30,2008
December 25,2007
December 26,2006
December 27,2005
RevenuesBakery-café sales 85.2% 85.2% 83.9% 80.4% 78.0%Franchise royalties and fees 5.8 5.8 6.3 7.4 8.5Fresh dough sales to franchisee 9.0 9.1 9.8 12.2 13.5
Total revenue 100.0% 100.0% 100.0% 100.0% 100.0%Costs and Expenses
Bakery-café expense (l)Cost of food and paper products 29.3% 30.1% 30.3% 29.6% 28.6%Labor 32.1 31.9 32.0 30.8 30.3Occupancy 8.3 8.2 7.9 7.3 7.1Other operating expenses 13.5 13.3 13.6 13.8 14.0
Total bakery-café expenses 83.2 83.4 83.7 81.5 80.0Fresh dough cost of sales to franchisees (2) 82.2 92.2 88.8 84.5 86.7
Depreciation and amortization 5.0 5.2 5.4 5.3 5.2General and administrative
expenses 6.1 6.5 6.5 7.2 7.2
Pre-opening expenses 0.2 0.3 0.8 0.7 0.8
Total costs and expenses 89.6 91.3 91.6 89.0 87.3
Operating profit 10.4 8.7 8.4 11.0 12.7Interest expense 0.1 0.1 0.1 — —Other (income) expense, net — 0.1 — -0.2 -0.2
Income before income taxes 10.3 8.5 8.3 11.2 12.8Income taxes 3.9 3.2 2.9 4.1 4.7
Net income 6.4 5.3 5.4 7.1 8.2Less: net income attributable to noncontrolling interest 0.1 0.1 — — —
Net income attributable to Panera Bread Company 6.4% 5.2% 5.4% 7.1% 8.2%
Notes:(1) As a percentage of bakery-café sales.(2) As a percentage of fresh dough facility sales to franchisees.
EXHIBIT 7 Common Size Statement: Panera Bread Company
SOURCES: Panera Bread Company, Inc. 2009 Form 10-K, p. 24 and 2006 Form 10-K, p. 19.
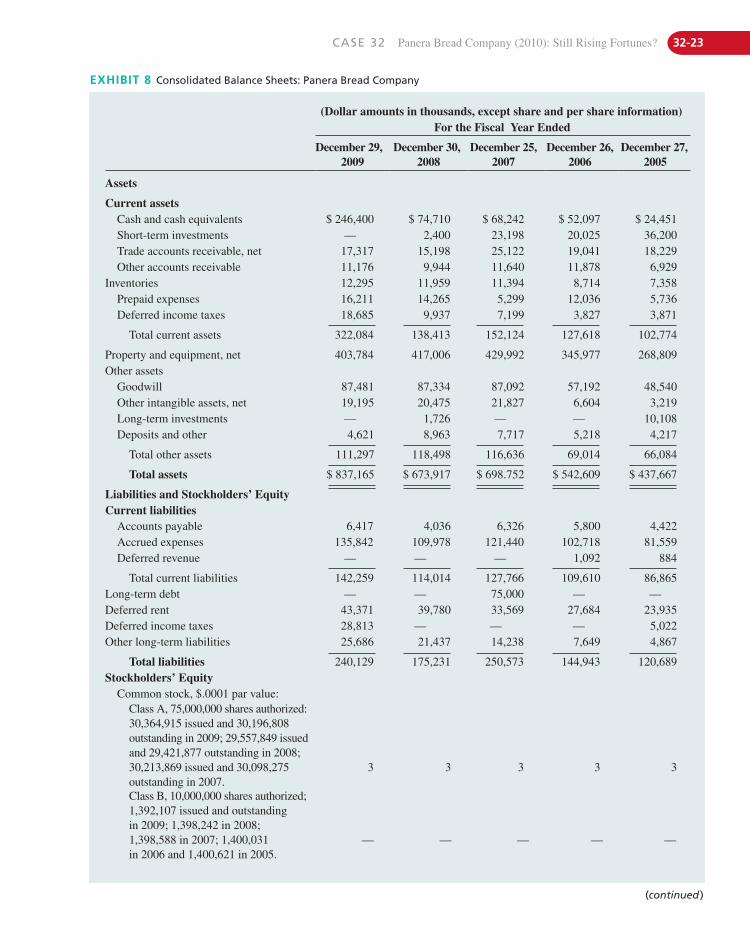
CASE 32 Panera Bread Company (2010): Still Rising Fortunes? 32-23
(Dollar amounts in thousands, except share and per share information)For the Fiscal Year Ended
December 29,2009
December 30,2008
December 25,2007
December 26,2006
December 27,2005
Assets
Current assetsCash and cash equivalents $ 246,400 $ 74,710 $ 68,242 $ 52,097 $ 24,451Short-term investments — 2,400 23,198 20,025 36,200Trade accounts receivable, net 17,317 15,198 25,122 19,041 18,229Other accounts receivable 11,176 9,944 11,640 11,878 6,929
Inventories 12,295 11,959 11,394 8,714 7,358Prepaid expenses 16,211 14,265 5,299 12,036 5,736Deferred income taxes 18,685 9,937 7,199 3,827 3,871
Total current assets 322,084 138,413 152,124 127,618 102,774
Property and equipment, net 403,784 417,006 429,992 345,977 268,809Other assets
Goodwill 87,481 87,334 87,092 57,192 48,540Other intangible assets, net 19,195 20,475 21,827 6,604 3,219Long-term investments — 1,726 — — 10,108Deposits and other 4,621 8,963 7,717 5,218 4,217
Total other assets 111,297 118,498 116,636 69,014 66,084
Total assets $ 837,165 $ 673,917 $ 698.752 $ 542,609 $ 437,667
Liabilities and Stockholders’ EquityCurrent liabilities
Accounts payable 6,417 4,036 6,326 5,800 4,422Accrued expenses 135,842 109,978 121,440 102,718 81,559Deferred revenue — — — 1,092 884
Total current liabilities 142,259 114,014 127,766 109,610 86,865Long-term debt — — 75,000 — —Deferred rent 43,371 39,780 33,569 27,684 23,935Deferred income taxes 28,813 — — — 5,022Other long-term liabilities 25,686 21,437 14,238 7,649 4,867
Total liabilities 240,129 175,231 250,573 144,943 120,689Stockholders’ Equity
Common stock, $.0001 par value:Class A, 75,000,000 shares authorized:30,364,915 issued and 30,196,808outstanding in 2009; 29,557,849 issued and 29,421,877 outstanding in 2008;30,213,869 issued and 30,098,275outstanding in 2007.
3 3 3 3 3
Class B, 10,000,000 shares authorized;1,392,107 issued and outstanding in 2009; 1,398,242 in 2008; 1,398,588 in 2007; 1,400,031 in 2006 and 1,400,621 in 2005.
— — — — —
EXHIBIT 8 Consolidated Balance Sheets: Panera Bread Company
(continued )
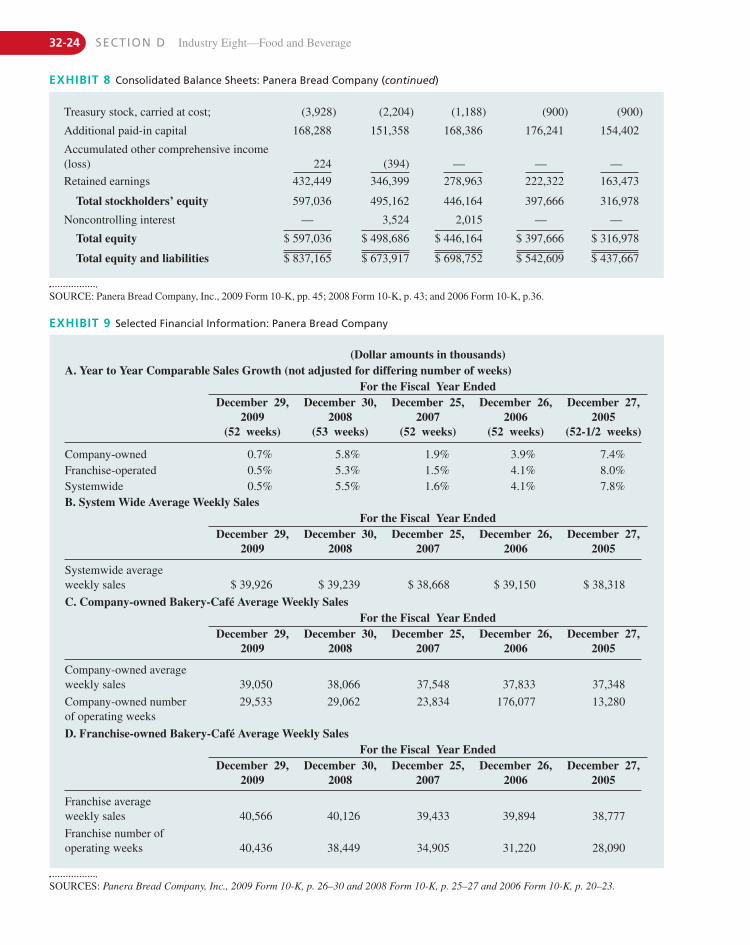
32-24 SECTION D Industry Eight—Food and Beverage
(Dollar amounts in thousands)A. Year to Year Comparable Sales Growth (not adjusted for differing number of weeks)
For the Fiscal Year EndedDecember 29,
2009(52 weeks)
December 30,2008
(53 weeks)
December 25,2007
(52 weeks)
December 26,2006
(52 weeks)
December 27,2005
(52-1/2 weeks)
Company-owned 0.7% 5.8% 1.9% 3.9% 7.4%Franchise-operated 0.5% 5.3% 1.5% 4.1% 8.0%Systemwide 0.5% 5.5% 1.6% 4.1% 7.8%B. System Wide Average Weekly Sales
For the Fiscal Year EndedDecember 29,
2009December 30,
2008December 25,
2007December 26,
2006December 27,
2005
Systemwide average weekly sales $ 39,926 $ 39,239 $ 38,668 $ 39,150 $ 38,318
C. Company-owned Bakery-Café Average Weekly SalesFor the Fiscal Year Ended
December 29,2009
December 30,2008
December 25,2007
December 26,2006
December 27,2005
Company-owned averageweekly sales 39,050 38,066 37,548 37,833 37,348
Company-owned number of operating weeks
29,533 29,062 23,834 176,077 13,280
D. Franchise-owned Bakery-Café Average Weekly SalesFor the Fiscal Year Ended
December 29,2009
December 30,2008
December 25,2007
December 26,2006
December 27,2005
Franchise average weekly sales 40,566 40,126 39,433 39,894 38,777
Franchise number ofoperating weeks 40,436 38,449 34,905 31,220 28,090
SOURCE: Panera Bread Company, Inc., 2009 Form 10-K, pp. 45; 2008 Form 10-K, p. 43; and 2006 Form 10-K, p.36.
Treasury stock, carried at cost; (3,928) (2,204) (1,188) (900) (900)
Additional paid-in capital 168,288 151,358 168,386 176,241 154,402
Accumulated other comprehensive income (loss) 224 (394) — — —
Retained earnings 432,449 346,399 278,963 222,322 163,473
Total stockholders’ equity 597,036 495,162 446,164 397,666 316,978
Noncontrolling interest — 3,524 2,015 — —
Total equity $ 597,036 $ 498,686 $ 446,164 $ 397,666 $ 316,978
Total equity and liabilities $ 837,165 $ 673,917 $ 698,752 $ 542,609 $ 437,667
EXHIBIT 9 Selected Financial Information: Panera Bread Company
SOURCES: Panera Bread Company, Inc., 2009 Form 10-K, p. 26–30 and 2008 Form 10-K, p. 25–27 and 2006 Form 10-K, p. 20–23.
EXHIBIT 8 Consolidated Balance Sheets: Panera Bread Company (continued)
CASE 32 Panera Bread Company (2010): Still Rising Fortunes? 32-25
1. Panera Bread Company Inc., 2009 Form 10-K, pp. 1–2.2. John Jannarone, “Panera Bread’s Strong Run,” Wall Street Jour-
nal (January 23, 2010).3. Christopher Tritto, “Panera’s Rosenthal Cashes In,” St. Louis
Business Journal (January 5, 2010), http://stlouis.bizjournals.com/stlouis/stories/2010/01/04/story2.html.
4. “Overview: Panera Bread Company,” Hoover’s Inc.5. Linda Tischler, “Vote of Confidence,” Fast Company 65
(December 2002), pp. 102–112.6. Peter O. Keegan, “Louis I. Kane & Ronald I. Shaich: Au Bon
Pain’s Own Dynamic Duo,” Nation’s Restaurant News 28(September 19, 1994), p. 172.
7. Tischler, pp. 102–112.8. Keegan, p. 172.9. Robin Lee Allen, “Au Bon Pain’s Kane Dead at 69; Founded
Bakery Chain,” Nation’s Restaurant News 34 (June 26, 2000),pp. 6–7.
10. Keegan, p. 172.11. Tischler, pp. 102–112.12. Ibid.13. Powers Kemp, “Second Rising,” Forbes 166 (November 13,
2000), p. 290.14. Tischler, pp. 102–112.15. Ibid.16. “Overview: Panera Bread Company,” Hoover’s Inc.17. Robin Lee Allen, “Au Bon Pain Co. Pins Hopes on New President,
Image,” Nation’s Restaurant News 30 (December 2, 1996), pp. 3–4.
18. Tischler, pp. 102–112.19. Chern Yeh Kwok, “Bakery-Café Idea Smacked of Success from
the Very Beginning; Concept Gives Rise to Rapid Growth inStores, Stock Price,” St. Louis Dispatch (May 20, 2001), p. E1.
20. Allen (December 2, 1996), pp. 3–4.21. Kemp, p. 290.22. Richard L. Papiernik, “Au Bon Pain Mulls Remedies, Pares
Back Expansion Plans,” Nation’s Restaurant News 29 (August 28,1995), pp. 3–4.
23. “Au Bon Pain Stock Drops 11% on News That Loss IsExpected,” Wall Street Journal (October 7, 1996), p. B2.
24. Andrew Caffrey, “Heard in New England: Au Bon Pain’s Planto Reinvent Itself Sits Well with Many Pros,” Wall StreetJournal (March 10, 1999), p. NE.2.
25. Panera Bread Company Inc., 2009 Form 10-K, p. 1.26. Ibid., pp. 6–7.27. Panera Bread Company Inc., 2009 Form 10-K, pp. 1–2.28. Bruce Horovitz, “Panera Bakes a Recipe for Success,” USA
Today (July 23, 2009), p. 1.29. Panera Press Kit, p.1.30. Christopher Leonard, “New Panera Location Says Pay What
You Want,” Associated Press (May 18, 2010).31. Emily Bryson York. “Panera: An America’s Hottest Brands
Case Study,” Advertising Age (November 16, 2009), http://adage.com/article?article_id=140482.
32. Zagat Survey, http://www.zagat.com/FASTFOOD.33. Tritto.34. Panera Company Overview, www.panerabread.com/about/
company/awards.php.35. Panera Bread Company Inc., Second Quarter Earnings Conference
Call, July 28, 2010.
36. Panera Press Release (314-633-4282), Panera Bread ReportsQ1 EPS of $.82, up 44% Over Q1 2009, on a 10% Company-owned Comparable Bakery-Café Sales Increase, pp. 1–10.
37. Ibid., p. 20.38. Panera Bread Company Inc., Second Quarter Earnings Confer-
ence Call, July 28, 2010.39. Ibid., p. 10.40. Panera, April 12, 2010 Letter to Stockholders, p. 1.41. Julie Jargon, “Slicing the Bread but Not the Prices,” Wall Street
Journal (August 18, 2009), B1.42. Ibid.43. Horovitz, p. 1.44. Ibid.45. Panera, April 12, 2010 Letter to Stockholders.46. Ibid.47. Ibid.48. Sean Gregory, “How Panera Bread Defies the Recession,” Time
(December 23, 2009), p. 2, www.time.com/time/printout/0,8816,1949371,00.html.
49. G. LaVecchia, “Fast Casual Enters the Fast Lane,” RestaurantHospitality 87 (February 2003), pp. 43–47.
50. MINTEL 2008.51. Ibid.52. Paul Ziobro, “Panera Looks to Bake Up Profit,” Wall Street
Journal (August 13, 2008), p. B3C.53. “Fast-Casual Chains Thriving During Tough Economy”
(June 24, 2010), www.foodproductdesign.com/news/2010/06/fast-casual-chains-thriving-during-tough-economy.aspx.
54. Lauren Shephard, “Convenience Key to Driving Fast-CasualSales,” Nations Restaurant News (June 16, 2010).
55. “Fast-Casual Chains Thriving. . . .”56. Bob Vosburgh, “The Future of Fast Casual Restaurants” (June
24, 2010), whrefresh.com/2010/06/24/the-future-of fast-casual-restaurants/.
57. “Fast-Casual Chains Thriving. . . .”58. Megan Conniff, “Food Should Be King at Fast-Casual Restau-
rants” (May 25, 2010), smartblogs.com.restaurants/2010/05/25/Food-should be-king at fast-casual-restaurants.
59. Panera Bread Company Inc., 2009 Form 10-K, p. 8.60. “Fast-Casual Chains Thriving. . . .”61. Greg Farrell, “Appetite Grows for US ‘Fast Casual Food,’”
Financial Times (June 18, 2010), www.ft.com/cms/s/0f452038-7b06-11df-8935-00144feabdc0.html.
62. Horovitz, p. 1.63. Panera Bread Company Inc. Notice of Annual Stockholders
Meeting, April 12, 2010, pp. 4–5.64. Ibid., pp. 5–8.65. Ibid., pp. 10–12.66. Ibid., p. 37.67. Ibid., pp. 14–16.68. Ibid., p. 5.69. Ibid., p. 29.70. Ibid., p. 3.71. Ibid., p. 40.72. Ibid., p. 1.73. Panera Bread Company Inc., 2009 Form 10-K, p. 4.74. Kate Rockwood, “Rising Dough: Why Panera Bread Is on a
Roll,” Fastcompany.Com (October 1, 2009), www.fastcompany.com//magazine/139/rising-dough.html.
N O T E S
75. Ibid.76. Ibid.77. Conniff.78. Panera Press Release, April 1, 2008, p. 1.79. Stephen Shuck, “Breakfast Proteins,” The Breakfast Journal,
A Special Edition from Nation’s Restaurant News (August 11,2008), p. 4.
80. Ibid.81. Ibid.82. www.Datamonitor.com (December 15, 2008), p. 8.83. www.panerabread.com/menu/cafe/kids.php.84. Panera Bread Company Inc., 2009 Form 10-K, pp. 5–6.85. Panera Bread Company Inc., 2009 Form 10-K, p. 7.86. Panera Bread Franchise Information, www.panerabread.com/
about/franchise/, pp. 1–8.87. Panera Bread Company Inc., Second Quarter Earnings Con-
ference Call, July 28, 2010.88. Panera Bread Company Inc., 2009 Form 10-K, p. 7.89. Tischler, p. 102–112.90. Panera Bread Company Inc., 2009 Form 10-K, p. 28.91. Panera Bread Company Inc., 2009 Form 10-K, pp. 3–4.92. Panera Bread Company Inc., Second Quarter Earnings Con-
ference Call, July 28, 2010.93. Jargon, p. B1.94. Ibid.95. Panera, April 12, 2010 Letter to Stockholders.96. Panera Bread Company Inc., Second Quarter Earnings Con-
ference Call, July 28, 2010.97. Ibid.
98. Panera Bread Company Inc., 2009 Form 10-K, p. 3.99. Panera Bread Company Inc. http://www.panerabread.com/
about/community/.100. Panera Bread Company Inc., 2009 Form 10-K, p. 6.101. Gregg Cebrzynski, “Panera Bread Managers ‘Harvest’Key Sales
Data via Intranet to Support Internal Marketing Goals,” Nation’sRestaurant News (November 3, 2008), www.nrn.com/article/panera-bread-managers-%E2%80%98harvest%E2%80%99-key-sales-data-intranet-support-internal-marketing-goals.
102. Panera, 2009 Form 10-K, p. 6.103. Panera Bread Company Inc., Second Quarter Earnings Con-
ference Call, July 28, 2010.104. Panera Bread Company Inc., 2009 Form 10-K, p. 8.105. Ibid. p. 5.106. Panera Press Release (314-633-4282), Panera Bread Reports
Q1 EPS of $.82, up 44% Over Q1 2009, on a 10.0% Company-owned Comparable Bakery-Café Sales Increase, pp. 1–10.
107. Ibid., pp. 1–2.108. Ibid., p. 2.109. Panera Bread Company Inc., 2009 Form 10-K, p. 23.110. Panera Bread Company Inc., 2009 Form 10-K, Annual Letter to
Stockholders, p. 2.111. Panera Bread Company Inc., 2009 Form 10-K, pp. 26–28.112. Panera Bread Company Inc., 2009 Form 10-K, pp. 4 and 32–33.113. Sean Gregory, “How Panera Bread Defies the Recession,” Time
(December 23, 2009), pp. 1–2, www.time.com/time/printout/0,8816,1949371,00.html.
114. Ibid., p. 1.
32-26 SECTION D Industry Eight—Food and Beverage
33-1
C A S E 33Whole Foods Market 2010: How to Grow in an IncreasinglyCompetitive Market? (Mini Case)Patricia Harasta and Alan N. Hoffman
REFLECTING BACK OVER HIS THREE DECADES OF EXPERIENCE IN THE GROCERY BUSINESS, John Mackeysmiled to himself over his previous successes. His entrepreneurial history began with a sin-
gle store which he has now grown into the nation’s leading natural food chain. WholeFoods is not just a food retailer but instead represents a healthy, socially responsiblelifestyle that customers can identify with. The company has differentiated itself fromcompetitors by focusing on quality as excellence and innovation that allows it to charge a
premium price for premium products. While proud of the past, John had concerns about thefuture direction Whole Foods should head.
Company BackgroundWhole Foods carries both natural and organic food, offering customers a wide variety ofproducts. “Natural” refers to food that is free of growth hormones or antibiotics, whereas“certificated organic” food conforms to the standards, as defined by the U.S. Departmentof Agriculture (USDA) in October 2002. Whole Foods Market® is the world’s leading
This case was prepared by Patricia Harasta and Professor Alan N. Hoffman, Bentley University and Erasmus University.Copyright ©2010 by Alan N. Hoffman. The copyright holder is solely responsible for case content. Reprint permission issolely granted to the publisher, Prentice Hall, for Strategic Management and Business Policy, 13th Edition (and the interna-tional and electronic versions of this book) by the copyright holder, Alan N. Hoffman. Any other publication of the case(translation, any form of electronics or other media) or sale (any form of partnership) to another publisher will be in viola-tion of copyright law, unless Alan N. Hoffman has granted an additional written permission. Reprinted by permission. Theauthors would like to thank Will Hoffman, Christopher Ferrari, Robert Marshall, Julie Giles, Jennifer Powers, and GretchenAlper for their research and contributions to this case. No part of this publication may be copied, stored, transmitted, repro-duced, or distributed in any form or medium whatsoever without the permission of the copyright owner, Alan N. Hoffman.
33-2 SECTION D Industry Eight—Food and Beverage
Whole Foods Market’s PhilosophyWhole Foods Market’s corporate website defines the company philosophy as follows:
Whole Foods Market’s vision of a sustainable future means our children and grandchildren will beliving in a world that values human creativity, diversity, and individual choice. Businesses will har-ness human and material resources without devaluing the integrity of the individual or the planet’secosystems. Companies, governments, and institutions will be held accountable for their actions.
While Whole Foods recognizes it is only a supermarket, management is working towardfulfilling their vision within the context of the industry. In addition to leading by example, theystrive to conduct business in a manner consistent with their mission and vision. By offeringminimally processed, high-quality food, engaging in ethical business practices, and providinga motivational, respectful work environment, the company believes it is on the path to asustainable future.
Whole Foods incorporates the best practices of each location back into the chain. This canbe seen in the company’s store product expansion from dry goods to perishable produce,including meats, fish, and prepared foods. The lessons learned at one location are absorbed byall, enabling the chain to maximize effectiveness and efficiency while offering a product linecustomers love. Whole Foods carries only natural and organic products. The best tasting andmost nutritious food available is found in its purest state—unadulterated by artificial additives,sweeteners, colorings, and preservatives.
Employee and Customer RelationsWhole Foods encourages a team-based environment allowing each store to make indepen-dent decisions regarding its operations. Teams consist of up to 11 employees and a team leader.The team leaders typically head up one department or another. Each store employs anywherefrom 72 to 391 team members. The manager is referred to as the “store team leader.”
retailer of natural and organic foods, with 193 stores in 31 states, Canada, and the UnitedKingdom.
According to the company, Whole Foods Market is highly selective about what it sells,dedicated to stringent quality standards, and committed to sustainable agriculture. It believesin a virtuous circle entwining the food chain, human beings and Mother Earth: each is reliantupon the others through a beautiful and delicate symbiosis. The message of preservation andsustainability are followed while providing high-quality goods to customers and high profitsto investors.
Whole Foods has grown over the years through mergers, acquisitions, and new store open-ings. The $565 million acquisition of its lead competitor, Wild Oats, in 2007 firmly set WholeFoods as the leader in the natural and organic food market and led to 70 new stores. The U.S.Federal Trade Commission (FTC) focused its attention on the merger on antitrust grounds. Thedispute was settled in 2009, with Whole Foods closing 32 Wild Oats stores and agreeing to sellthe Wild Oats Markets brand.
Although the majority of Whole Foods’ locations are in the United States, Europeanexpansion provides enormous potential growth due to the large population and it holds a moresophisticated organic-foods market than the U.S. in terms of suppliers and acceptance by thepublic. Whole Foods targets its locations specifically by an area’s demographics. The companytargets locations where 40% or more of the residents have a college degree as they are morelikely to be aware of nutritional issues.
CASE 33 Whole Foods Market 2010: How to Grow in an Increasingly Competitive Market? 33-3
The “store team leader” is compensated by an Economic Value Added (EVA) bonus and isalso eligible to receive stock options.
Whole Foods tries to instill a sense of purpose among its employees and has been namedfor 13 consecutive years as one of the “100 Best Companies to Work For” in America byFortune magazine. In employee surveys, 90% of its team members stated that they always orfrequently enjoy their job.
The company strives to take care of its customers, realizing they are the “lifeblood of ourbusiness,” and the two are “interdependent on each other.” Whole Foods’primary objective goesbeyond 100% customer satisfaction with the goal to “delight” customers in every interaction.
Competitive EnvironmentAt the time of Whole Foods’ inception, there was almost no competition with less than sixother natural food stores in the United States. Today, the organic foods industry is growingand Whole Foods finds itself competing hard to maintain its elite presence.
Whole Foods competes with all supermarkets. With more U.S. consumers focused onhealthful eating, environmental sustainability, and the green movement, the demand fororganic and natural foods has increased. More traditional supermarkets are now introducing“lifestyle” stores and departments to compete directly with Whole Foods. This can be seen inthe Wild Harvest section of Shaw’s, or the “Lifestyle” stores opened by conventional grocerychain Safeway.
Whole Foods’competitors now include big box and discount retailers who have made a forayinto the grocery business. Currently, the United States’ largest grocer is Wal-Mart. Not only doesWal-Mart compete in the standard supermarket industry, but it has even begun offering naturaland organic products in its supercenter stores. Other discount retailers now competing in the su-permarket industry include Target, Sam’s Club, and Costco. All of these retailers offer groceryproducts, generally at a lower price than what one would find at Whole Foods.
Another of Whole Foods’ key competitors is Los Angeles-based Trader Joe’s, a premiumnatural and organic food market. By expanding its presence and product offerings while main-taining high quality at low prices, Trader Joe’s has found its competitive niche. It has 215 stores,primarily on the west and east coasts of the United States, offering upscale grocery fare such ashealth foods, prepared meals, organic produce, and nutritional supplements. A low cost struc-ture allows Trader Joe’s to offer competitive prices while still maintaining its margins. TraderJoe’s stores have no service department and average just 10,000 square feet in store size.
A Different Shopping ExperienceThe setup of the organic grocery store is a key component to Whole Foods’ success. Thestore’s setup and its products are carefully researched to ensure that they are meeting thedemands of the local community. Locations are primarily in cities and are chosen for theirlarge space and heavy foot traffic. According to Whole Foods’ 10-K, “approximately 88% ofour existing stores are located in the top 50 statistical metropolitan areas.” The company usesa specific formula to choose store sites that is based upon several metrics, which include butare not limited to income levels, education, and population density.
Upon entering a Whole Foods supermarket, it becomes clear that the company attemptsto sell the consumer on the entire experience. Team members (employees) are well trained andthe stores themselves are immaculate. There are in-store chefs to help with recipes, winetasting, and food sampling. There are “Take Action food centers” where customers can access
33-4 SECTION D Industry Eight—Food and Beverage
The Green MovementWhole Foods exists in a time where customers equate going green and being environmentallyfriendly with enthusiasm and respect. In recent years, people began to learn about food and theprocesses completed by many to produce it. Most of what they have discovered is disturbing.Whole Foods launched a nationwide effort to trigger awareness and action to remedy the prob-lems facing the U.S. food system. It has decided to host 150 screenings of a 12 film series called“Let’s Retake Our Plates,” hoping to inspire change by encouraging and educating consumersto take charge of their food choices. Jumping on the bandwagon of the “go green” movement,Whole Foods is trying to show its customers that it is dedicated to not only all natural foods, butto a green world and healthy people. As more and more people become educated, the companyhopes to capitalize on them as new customers.1
Beyond the green movement, Whole Foods has been able to tap into a demographic thatappreciates the “trendy” theme of organic foods and all natural products. Since the store isassociated with a type of affluence, many customers shop there to show they fit into this categoryof upscale, educated, new age people.
The Economic Recession of 2008The uncertainty of today’s market is a threat to Whole Foods. The expenditure income is lowand “all natural foods” are automatically deemed as expensive. Because of people being laidoff, having their salaries cut, or simply not being able to find a job, they now have to be moreselective when purchasing things. While Whole Foods has been able to maintain profitability,it’s questionable how long this will last if the recession continues or worsens. The reputation oforganic products being costly may be enough to motivate people to not ever enter through thedoors of Whole Foods. In California, the chain is frequently dubbed “Whole Paycheck.”2
However, management understood that it must change a few things if the company was tosurvive the decrease in sales felt because customers were not willing to spend their money so easily. They have been working to correct this “pricey” image by expanding offerings ofprivate-label products through their “365 Everyday Value” and “365 Organic” product lines.Private-label sales accounted for 11% of Whole Foods’ total sales in 2009, up from 10% in 2008. They have also instituted a policy that their 365 product lines must match prices ofsimilar products at Trader Joe’s.3
information on the issues that affect their food such as legislation and environmental factors.Some stores offer extra services such as home delivery, cooking classes, massages, and valetparking. Whole Foods goes out of its way to appeal to the above-average income earner.
Whole Foods uses price as a marketing tool in a few select areas, as demonstrated by the365 Whole Foods brand name products priced less than similar organic products that arecarried within the store. However, the company does not use price to differentiate itself fromcompetitors. Rather, Whole Foods focuses on quality and service as a means of standing outfrom the competition.
Whole Foods spends much less than other supermarkets on advertising, approximately0.4% of total sales in the fiscal year 2009. It relies heavily on word-of-mouth advertising fromits customers to help market itself in the local community. The company advertises in severalhealth conscious magazines, and each store budgets for in-store advertising each fiscal year.
Whole Foods also gains recognition via its charitable contributions and the awareness thatthey bring to the treatment of animals. The company donates 5% of its after-tax profits to not-for-profit charities. It is also very active in establishing systems to make sure that the animalsused in their products are treated humanely.
CASE 33 Whole Foods Market 2010: How to Grow in an Increasingly Competitive Market? 33-5
Organic Foods as a CommodityWhen Whole Foods first started in the natural foods industry in 1980 it was a relatively newconcept. Over its first decade, Whole Foods enjoyed the benefits of offering a unique valueproposition to consumers wanting to purchase high-quality natural foods from a trustedretailer. Over the last few years, however, the natural and organic foods industry has attractedthe attention of general food retailers that have started to offer foods labeled as natural ororganic at reasonable prices.
By 2007, the global demand for organic and natural foods far exceeded the supply. Thisis becoming a huge issue for Whole Foods, as more traditional supermarkets with higherpurchasing power enter the premium natural and organic foods market. The supply of organicfood has been significantly impacted by the entrance of Wal-Mart into the competitive arena.Due to the limited resources within the United States, Wal-Mart began importing natural andorganic foods from China and Brazil, which led to it coming under scrutiny for passing offnon-natural or organic products as the “real thing.” Additionally, the quality of natural andorganic foods throughout the entire market has been decreased due to constant pressure fromWal-Mart.
The distinction between what is truly organic and natural is difficult for the consumer todecipher as general supermarkets have taken to using terms such as “all natural,” “free-range,”and “hormone free,” confusing customers. Truly organic food sold in the United States bearsthe “USDA Organic” label and needs to have at least 95% of the ingredients organic before itcan get this distinction.4
In May 2003 Whole Foods became America’s first Certified Organic grocer by a feder-ally recognized independent third-party certification organization. In July 2009, CaliforniaCertified Organic Growers (CCOF), one of the oldest and largest USDA-accredited third-partyorganic certifiers, individually certified each store in the United States, complying with stricterguidance on federal regulations. This voluntary certification tells customers that Whole Foodshas gone the extra mile by not only following the USDA’s Organic Rule, but opening its storesup to third-party inspectors and following a strict set of operating procedures designed toensure that the products sold and labeled as organic are indeed organic—procedures that arenot specifically required by the Organic Rule. This certification verifies the handling oforganic goods according to stringent national guidelines, from receipt through repacking tofinal sale to customers. To receive certification, retailers must agree to adhere to a strict set ofstandards set forth by the USDA, submit documentation, and open their facilities to on-siteinspections—all designed to assure customers that the chain of organic integrity is preserved.
Struggling to Grow in an Increasingly Competitive MarketWhole Foods has historically grown by opening new stores or acquiring stores in affluent neigh-borhoods targeting the wealthier and more educated consumers. This strategy has worked in thepast; however, the continued focus on growth has been impacting existing store sales. Averageweekly sales per store have decreased over the last number of years despite the fact that overallsales have been increasing. It is likely that this trend will continue unless Whole Foods starts tofocus on growing sales within the stores it has and not just looking to increase overall sales byopening new stores. It is also increasingly difficult to find appropriate locations for new stores that are first and foremost in an area where there is limited competition and also to havethe store in a location that is easily accessible by both consumers and the distribution network.Originally Whole Foods had forecast to open 29 new stores in 2010 but this has since beenrevised downward to 17.
33-6 SECTION D Industry Eight—Food and Beverage
N O T E S1. “Whole Foods Market; Whole Foods Market Challenge: Let’s
Retake Our Plates!” Food Business Week (April 15, 2010).2. “Eating Too Fast At Whole Foods,” Business Week (2005).3. Katy McLaughlin, “As Sales Slip, Whole Foods Tries Health
Push,” Wall Street Journal (August 15, 2009).
4. “Whole Foods Markets Organic China California Blend,”http://www.youtube.com/watch?v=JQ31Ljd9T_Y (April 10, 2010).
5. Organic Trade Association, http://www.organicnewsroom.com/2010/04/us_organic_product_sales_reach_1.html.
Opening up new stores or the acquisition of existing stores is also costly. The average costto open a new store ranges from $2 to $3 million, and it takes on average 8 to 12 months. A lotof this can be explained by the fact that Whole Foods custom builds the stores, which reducesthe efficiencies that can be gained from the experience of having opened up many new storespreviously. Opening new stores requires the company to adapt its distribution network, infor-mation management, supply, and inventory management, and adequately supply the newstores in a timely manner without impacting the supply to the existing stores. As the companyexpands, this task increases in complexity and magnitude.
The organic and natural foods industry overall has become a more concentrated marketwith few larger competitors having emerged from a more fragmented market composed of alarge number of smaller companies. Future acquisitions will be more difficult for Whole Foodsas the FTC will be monitoring the company closely to ensure that it does not violate any fed-eral antitrust laws through the elimination of any substantial competition within this market.
Over the last number of years there has been an increasing demand by consumers fornatural and organic foods. Sales of organic foods increased by 5.1% in 2009 despite the factthat U.S. food sales overall only grew by 1.6%.5 This increase in demand and high marginavailability on premium organic products led to an increasing number of competitors movinginto the organic foods industry. Conventional grocery chains such as Safeway have remodeledstores at a rapid pace and have attempted to narrow the gap with premium grocers like WholeFoods in terms of shopping experience, product quality, and selection of takeout foods. Thisincrease in competition can lead to the introduction of price wars where profits are eroded forboth existing competitors and new entrants alike.
Unlike low-price leaders such as Wal-Mart, Whole Foods dominates because of its brandimage, which is trickier to manage and less impervious to competitive threats. As competitorsstart to focus on emphasizing organic and natural foods within their own stores, the power ofthe Whole Foods brand will gradually decline over time as it becomes more difficult forconsumers to differentiate Whole Foods’ value proposition from that of its competitors.
ORIGINALLY CALLED INSTA-BURGER KING, the company was founded in Florida in 1953 byKeith Kramer and Matthew Burns. Their Insta-Broiler oven was so successful at cooking
hamburgers that they required all of their franchised restaurants to use the oven. After thechain ran into financial difficulties, it was purchased by its Miami-based franchisees,James McLamore and David Edgerton, in 1955. The new owners renamed the companyBurger King. The restaurant chain introduced the first Whopper sandwich in 1957.
Expanding to over 250 locations in the United States, the company was sold in 1967 toPillsbury Corporation.
The company successfully differentiated itself from McDonald’s, its primary rival, whenit launched the Have It Your Way advertising campaign in 1974. Unlike McDonald’s, whichhad made it difficult and time-consuming for customers to special-order standard items (suchas a plain hamburger), Burger King restaurants allowed people to change the way a food itemwas prepared without a long wait.
Pillsbury (including Burger King) was purchased in 1989 by Grand Metropolitan, whichin turn merged with Guinness to form Diageo, a British spirits company. Diageo’s manage-ment neglected the Burger King business, leading to poor operating performance. Burger Kingwas damaged to the point that major franchises went out of business and the total value of the
34-1
C A S E 34Burger King (Mini Case)J. David Hunger
This case was prepared by Professor J. David Hunger, Iowa State University and St. John’s University. Copyright ©2010by J. David Hunger. The copyright holder is solely responsible for case content. Reprint permission is solely granted tothe publisher, Prentice Hall, for Strategic Management and Business Policy, 13th Edition (and the international and electronic versions of this book) by the copyright holder, J. David Hunger. Any other publication of the case (transla-tion, any form of electronics or other media) or sale (any form of partnership) to another publisher will be in violationof copyright law, unless J. David Hunger has granted an additional written permission. Reprinted by permission.
34-2 SECTION D Industry Eight—Food and Beverage
firm declined. Diageo’s management decided to divest the money-losing chain by selling it toa partnership private equity firm led by TPG Capital in 2002.
The investment group hired a new advertising agency to create (1) a series of new adcampaigns, (2) a changed menu to focus on male consumers, (3) a series of programs designedto revamp individual stores, and (4) a new concept called the BK Whopper Bar. These changesled to profitable quarters and re-energized the chain. In May 2006, the investment group tookBurger King public by issuing an Initial Public Offering (IPO). The investment group continuedto own 31% of the outstanding common stock.
Business ModelBurger King was the second largest fast-food hamburger restaurant chain in the world asmeasured by the total number of restaurants and systemwide sales. As of June 30, 2010, thecompany owned or franchised 12,174 restaurants in 76 countries and U.S. territories, ofwhich 1,387 were company-owned and 10,787 were owned by franchisees. Of Burger King’srestaurant total, 7,258 or 60% were located in the United States. The restaurants featuredflame-broiled hamburgers, chicken and other specialty sandwiches, french fries, soft drinks,and other low-priced food items.
According to management, the company generated revenues from three sources: (1) retailsales at company-owned restaurants; (2) royalty payments on sales and franchise fees paid byfranchisees; and (3) property income from restaurants leased to franchisees. Approximately90% of Burger King restaurants were franchised, a higher percentage than other competitorsin the fast-food hamburger category. Although such a high percentage of franchisees meantlower capital requirements compared to competitors, it also meant that management had lim-ited control over franchisees. Franchisees in the United States and Canada paid an average of3.9% of sales to the company in 2010. In addition, these franchisees contributed 4% of grosssales per month to the advertising fund. Franchisees were required to purchase food, packag-ing, and equipment from company-approved suppliers.
Restaurant Services Inc. (RSI) was a purchasing cooperative formed in 1992 to act aspurchasing agent for the Burger King system in the United States. As of June 30, 2010, RSIwas the distribution manager for 94% of the company’s U.S. restaurants, with four distrib-utors servicing approximately 85% of the U.S. system. Burger King had long-term exclu-sive contracts with Coca Cola and with Dr. Pepper/Seven-Up to purchase soft drinks for itsrestaurants.
Management touted its business strategy as growing the brand, running great restaurants,investing wisely, and focusing on its people. Specifically, management planned to accelerategrowth between 2010 and 2015 so that international restaurants would comprise 50% of thetotal number. The focus in international expansion was to be in (1) countries with growthpotential where Burger King was already established, such as Spain, Brazil, and Turkey;(2) countries with potential where the firm had a small presence, such as Argentina,Colombia, China, Japan, Indonesia, and Italy; and (3) attractive new markets in the MiddleEast, Eastern Europe, and Asia.
Management was also working to update the restaurants by implementing its new20/20 design and complementary Whopper Bar design introduced in 2008. By 2010, more than200 Burger King restaurants had adopted the new 20/20 design that evoked the industrial lookof corrugated metal, brick, wood, and concrete. The new design was to be introduced in95 company-owned restaurants during fiscal 2011.
Management was using a “barbell” menu strategy to introduce new products at both thepremium and low-priced ends of the product continuum. As part of this strategy, the companyintroduced in 2010 the premium Steakhouse XT burger line and BK Fire-Grilled Ribs, the first
bone-in pork ribs sold at a national fast-food hamburger restaurant chain. At the other end ofthe menu, the company introduced in 2010 the 1⁄4 pound Double Cheeseburger, the Buck Dou-ble, and the $1 BK Breakfast Muffin Sandwich.
Management continued to look for ways to reduce costs and boost efficiency. ByJune 30, 2010, point-of-sale cash register systems had been installed in all company-owned,and 57% of franchise-owned, restaurants. It had also installed a flexible batch broiler to max-imize cooking flexibility and facilitate a broader menu selection while reducing energycosts. By June 30, 2010, the flexible broiler was in 89% of company-owned restaurants and68% of franchise restaurants.
IndustryThe fast-food hamburger category operated within the quick service restaurant (QSR) seg-ment of the restaurant industry. QSR sales had grown at an annual rate of 3% over the past10 years and were projected to continue increasing at 3% from 2010 to 2015. The fast-foodhamburger restaurant (FFHR) category represented 27% of total QSR sales. FFHR sales wereprojected to grow 5% annually during this same time period. Burger King accounted foraround 14% of total FFHR sales in the United States.
The company competed against market-leading McDonald’s, Wendy’s, and Hardee’srestaurants in this category and against regional competitors, such as Carl’s Jr., Jack in the Box,and Sonic. It also competed indirectly against a multitude of competitors in the QSR restau-rant segment, including Taco Bell, Arby’s, and KFC, among others. As the North Americanmarket became saturated, mergers occurred. For example, Taco Bell, KFC, and Pizza Hut werenow part of Yum! Brands. Wendy’s and Arby’s merged in 2008. Although the restaurant in-dustry as a whole had few barriers to entry, marketing and operating economies of scale madeit difficult for a new entrant to challenge established U.S. chains in the FFHR category.
The quick service restaurant market segment appeared to be less vulnerable to a recessionthan other businesses. For example, during the quarter ended May 2010, both QSR and FFHRsales decreased 0.5%, compared to a 3% decline at both casual dining chains and family diningchains. The U.S. restaurant category as a whole declined 1% during the same time period.
America’s increasing concern with health and fitness was putting pressure on restau-rants to offer healthier menu items. Given its emphasis on fried food and saturated fat, thequick service restaurant market segment was an obvious target for likely legislation. Forexample, Burger King’s recently introduced Pizza Burger was a 2,530-calorie item thatincluded four hamburger patties, pepperoni, mozzarella, and Tuscan sauce on a sesame seedbun. Although the Pizza Burger may be the largest hamburger produced by a fast-food chain,the foot-long cheeseburgers of Hardee’s and Carl’s Jr. were similar entries. A health reformbill passed by the U.S. Congress in 2010 required restaurant chains with 20 or more outletsto list the calorie content of menu items. A study by the National Bureau of EconomicResearch found that a similar posting law in New York City caused the average calorie countper transaction to fall 6%, and revenue increased 3% at Starbucks stores where a DunkinDonuts outlet was nearby. One county in California attempted to ban McDonald’s fromincluding toys in its high-calorie “Happy Meal” because legislators believed that toysattracted children to unhealthy food.
IssuesEven though Burger King was the second largest hamburger chain in the world, it lagged farbehind McDonald’s, which had a total of 32,466 restaurants worldwide. McDonald’s averagedabout twice the sales volume per U.S. restaurant and was more profitable than Burger King.
CASE 34 Burger King (Mini Case) 34-3
34-4 SECTION D Industry Eight—Food and Beverage
New Owners: Time for a Strategic Change?On September 2, 2010, 3G Capital, an investment group dominated by three Brazilianmillionaires, offered $4 billion to purchase Burger King Holdings Inc. At $24 a share, theoffer represented a 46% premium over Burger King’s August 31 closing price. According toJohn Chidsey, Burger King’s Charman and CEO, “It was a call out of the blue.” Both theboard of directors and the investment firms owning 31% of the shares supported acceptanceof the offer. New ownership should bring a new board of directors and a change in topmanagement. What should new management propose to ensure the survival and long-termsuccess of Burger King?
McDonald’s was respected as a well-managed company. During fiscal year 2009 (endingDecember 31), McDonald’s earned $4.6 billion on revenues of $22.7 billion. Although its total revenues had dropped from $23.5 billion in 2008, net income had actually increased from$4.3 billion in 2008. In contrast to most corporations, McDonald’s common stock price hadrisen during the 2008–2010 recession, reaching an all-time high in August 2010.
In contrast, Burger King was perceived by industry analysts as having significant prob-lems. As a result, Burger King’s share price had fallen by half from 2008 to 2010. Duringfiscal year 2010 (ending June 30), Burger King earned $186.8 million on revenues of$2.50 billion. Although its total revenues had dropped only slightly from $2.54 billion infiscal 2009 and increased from $2.45 billion in 2008, net income fell from $200.1 millionin 2009 and $189.6 million in 2008. Even though same-store sales stayed positive forMcDonald’s during the recession, they dropped 2.3% for Burger King from fiscal 2009 to2010. In addition, some analysts were concerned that expenses were high at Burger King’scompany-owned restaurants. Expenses as a percentage of total company-owned restaurantrevenues were 87.8% in fiscal 2010 for Burger King compared to only 81.8% forMcDonald’s in fiscal 2009.
McDonald’s had always emphasized marketing to families. The company significantlyoutperformed Burger King in both “warmth” and “competence” in consumers’ minds. WhenMcDonald’s recently put more emphasis on women and older people by offering relativelyhealthy salads and upgraded its already good coffee, Burger King continued to market toyoung men by (according to one analyst) offering high-calorie burgers and ads featuring danc-ing chickens and a “creepy-looking” king. These young men were the very group who hadbeen hit especially hard by the recession. According to Steve Lewis, who operated 36 BurgerKing franchises in the Philadelphia area, “overall menu development has been horrible. . . . Wedisregarded kids, we disregarded families, we disregarded moms.” For example, sales of new,premium-priced menu items like the Steakhouse XT burger declined once they were no longerbeing advertised. One analyst stated that the company had “put a lot of energy into gimmickyadvertising” at the expense of products and service. In addition, analysts commented that fran-chisees had also disregarded their aging restaurants.
Some analysts felt that Burger King may have cannibalized its existing sales by puttingtoo much emphasis on value meals. For example, Burger King franchisees sued the companyin 2009 over the firm’s double-cheeseburger promotion, claiming that it was unfair for themto be required to sell these cheeseburgers for only $1 when they cost $1.10. Even though theprice was subsequently raised to $1.29, the items on Burger King’s “value menu” accountedfor 20% of all sales in 2010, up from 12% in 2009.
“A DECADE AGO, CHURCH & DWIGHT WAS A LARGELY HOUSEHOLD DOMESTIC PRODUCTS COMPANY
with one iconic brand, delivering less than $1 billion in annual sales. Today, the company has been transformed into a diversified packaged goods company with a well-balancedportfolio of leading household and personal care brands delivering over $2.5 in annualsales worldwide.”1 Now, after a decade of rapid growth fueled by a string of acquisitions,the top management team is faced with a new challenge. It must now rationalize the firm’s
expanded consumer products portfolio of 80 brands into the existing corporate structurewhile continuing to scout for new avenues of growth. This is no easy task as it competes for
market share with such formidable consumer products powerhouses as Colgate-Palmolive,Clorox, and Procter & Gamble, commanding combined sales of over $100 billion. Futuredecisions will determine if the company can compete successfully with these other well-known giants in the consumer products arena or remain in their shadows.
35-1
C A S E 35Church & Dwight: Time to Rethink the Portfolio?Roy A. Cook
This case was prepared by RoyA. Cook of Fort Lewis College. Copyright © 2010 by RoyA. Cook. The copyright holderis solely responsible for case content. Reprint permission is solely granted to the publisher, Prentice Hall, for the bookStrategic Management Business Policy, 13th Edition (and the international and electronic versions of this book) by thecopyright holder, Roy A. Cook. Any other publication of the case (translation, any form of electronics or other media) orsale (any form of partnership) to another publisher will be in violation of copyright law, unless Roy A. Cook has grantedan additional written permission. This case was revised and edited for SMBP, 13th Edition. Reprinted by permission.
BackgroundFor over 160 years, Church & Dwight Co. Inc. has been working to build market share on abrand name that is rarely associated with the company. When consumers are asked, “Are youfamiliar with Church & Dwight products?” the answer is typically “No.” Yet, Church &
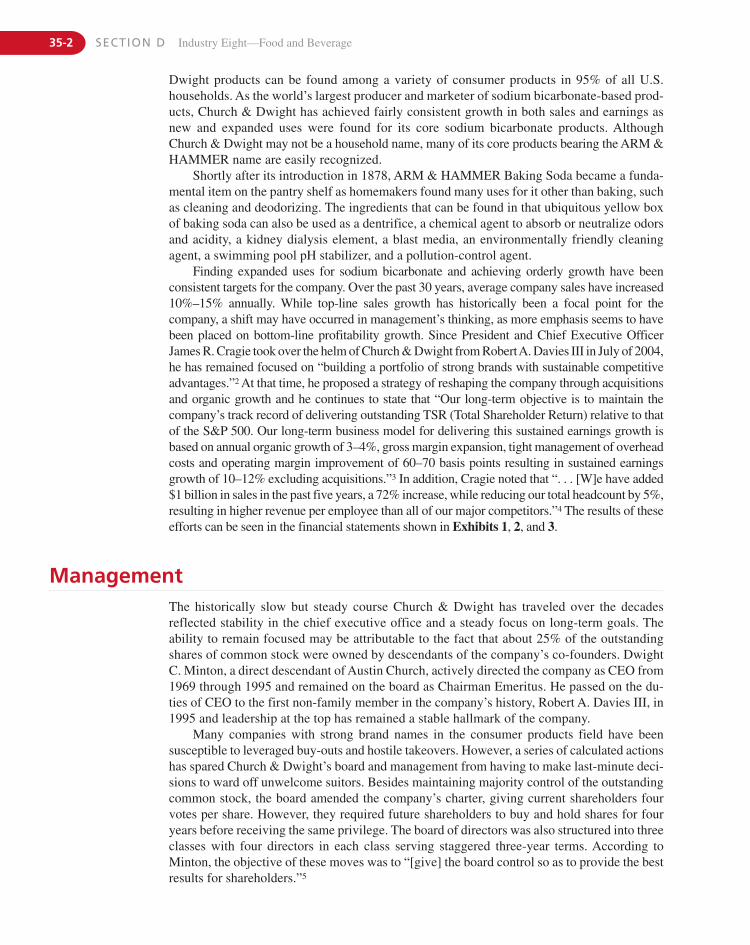
35-2 SECTION D Industry Eight—Food and Beverage
ManagementThe historically slow but steady course Church & Dwight has traveled over the decadesreflected stability in the chief executive office and a steady focus on long-term goals. Theability to remain focused may be attributable to the fact that about 25% of the outstandingshares of common stock were owned by descendants of the company’s co-founders. DwightC. Minton, a direct descendant of Austin Church, actively directed the company as CEO from1969 through 1995 and remained on the board as Chairman Emeritus. He passed on the du-ties of CEO to the first non-family member in the company’s history, Robert A. Davies III, in1995 and leadership at the top has remained a stable hallmark of the company.
Many companies with strong brand names in the consumer products field have beensusceptible to leveraged buy-outs and hostile takeovers. However, a series of calculated actionshas spared Church & Dwight’s board and management from having to make last-minute deci-sions to ward off unwelcome suitors. Besides maintaining majority control of the outstandingcommon stock, the board amended the company’s charter, giving current shareholders fourvotes per share. However, they required future shareholders to buy and hold shares for fouryears before receiving the same privilege. The board of directors was also structured into threeclasses with four directors in each class serving staggered three-year terms. According toMinton, the objective of these moves was to “[give] the board control so as to provide the bestresults for shareholders.”5
Dwight products can be found among a variety of consumer products in 95% of all U.S.households. As the world’s largest producer and marketer of sodium bicarbonate-based prod-ucts, Church & Dwight has achieved fairly consistent growth in both sales and earnings asnew and expanded uses were found for its core sodium bicarbonate products. AlthoughChurch & Dwight may not be a household name, many of its core products bearing the ARM &HAMMER name are easily recognized.
Shortly after its introduction in 1878, ARM & HAMMER Baking Soda became a funda-mental item on the pantry shelf as homemakers found many uses for it other than baking, suchas cleaning and deodorizing. The ingredients that can be found in that ubiquitous yellow boxof baking soda can also be used as a dentrifice, a chemical agent to absorb or neutralize odorsand acidity, a kidney dialysis element, a blast media, an environmentally friendly cleaningagent, a swimming pool pH stabilizer, and a pollution-control agent.
Finding expanded uses for sodium bicarbonate and achieving orderly growth have beenconsistent targets for the company. Over the past 30 years, average company sales have increased10%–15% annually. While top-line sales growth has historically been a focal point for thecompany, a shift may have occurred in management’s thinking, as more emphasis seems to havebeen placed on bottom-line profitability growth. Since President and Chief Executive OfficerJames R. Cragie took over the helm of Church & Dwight from RobertA. Davies III in July of 2004,he has remained focused on “building a portfolio of strong brands with sustainable competitiveadvantages.”2 At that time, he proposed a strategy of reshaping the company through acquisitionsand organic growth and he continues to state that “Our long-term objective is to maintain thecompany’s track record of delivering outstanding TSR (Total Shareholder Return) relative to thatof the S&P 500. Our long-term business model for delivering this sustained earnings growth isbased on annual organic growth of 3–4%, gross margin expansion, tight management of overheadcosts and operating margin improvement of 60–70 basis points resulting in sustained earningsgrowth of 10–12% excluding acquisitions.”3 In addition, Cragie noted that “. . . [W]e have added$1 billion in sales in the past five years, a 72% increase, while reducing our total headcount by 5%,resulting in higher revenue per employee than all of our major competitors.”4 The results of theseefforts can be seen in the financial statements shown in Exhibits 1, 2, and 3.
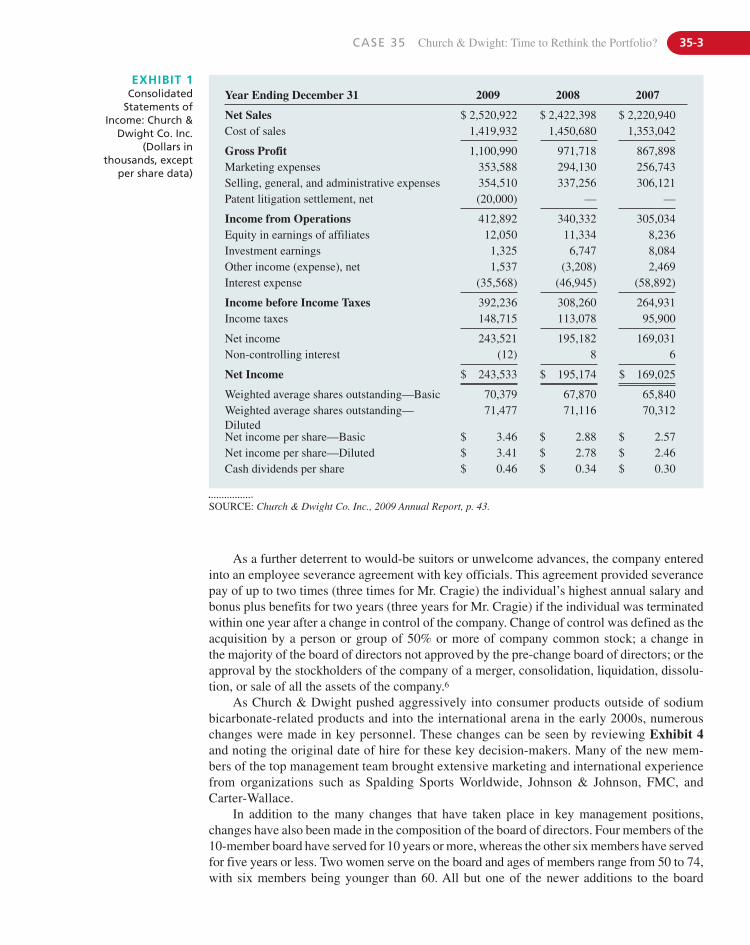
CASE 35 Church & Dwight: Time to Rethink the Portfolio? 35-3
Year Ending December 31 2009 2008 2007
Net Sales $ 2,520,922 $ 2,422,398 $ 2,220,940Cost of sales 1,419,932 1,450,680 1,353,042
Gross Profit 1,100,990 971,718 867,898Marketing expenses 353,588 294,130 256,743Selling, general, and administrative expenses 354,510 337,256 306,121Patent litigation settlement, net (20,000) — —
Income from Operations 412,892 340,332 305,034Equity in earnings of affiliates 12,050 11,334 8,236Investment earnings 1,325 6,747 8,084Other income (expense), net 1,537 (3,208) 2,469Interest expense (35,568) (46,945) (58,892)
Income before Income Taxes 392,236 308,260 264,931Income taxes 148,715 113,078 95,900
Net income 243,521 195,182 169,031Non-controlling interest (12) 8 6
Net Income $ 243,533 $ 195,174 $ 169,025
Weighted average shares outstanding—Basic 70,379 67,870 65,840Weighted average shares outstanding—Diluted
71,477 71,116 70,312
Net income per share—Basic $ 3.46 $ 2.88 $ 2.57Net income per share—Diluted $ 3.41 $ 2.78 $ 2.46Cash dividends per share $ 0.46 $ 0.34 $ 0.30
EXHIBIT 1Consolidated
Statements ofIncome: Church &
Dwight Co. Inc.(Dollars in
thousands, exceptper share data)
SOURCE: Church & Dwight Co. Inc., 2009 Annual Report, p. 43.
As a further deterrent to would-be suitors or unwelcome advances, the company enteredinto an employee severance agreement with key officials. This agreement provided severancepay of up to two times (three times for Mr. Cragie) the individual’s highest annual salary andbonus plus benefits for two years (three years for Mr. Cragie) if the individual was terminatedwithin one year after a change in control of the company. Change of control was defined as theacquisition by a person or group of 50% or more of company common stock; a change inthe majority of the board of directors not approved by the pre-change board of directors; or theapproval by the stockholders of the company of a merger, consolidation, liquidation, dissolu-tion, or sale of all the assets of the company.6
As Church & Dwight pushed aggressively into consumer products outside of sodiumbicarbonate-related products and into the international arena in the early 2000s, numerouschanges were made in key personnel. These changes can be seen by reviewing Exhibit 4and noting the original date of hire for these key decision-makers. Many of the new mem-bers of the top management team brought extensive marketing and international experiencefrom organizations such as Spalding Sports Worldwide, Johnson & Johnson, FMC, andCarter-Wallace.
In addition to the many changes that have taken place in key management positions,changes have also been made in the composition of the board of directors. Four members of the10-member board have served for 10 years or more, whereas the other six members have servedfor five years or less. Two women serve on the board and ages of members range from 50 to 74,with six members being younger than 60. All but one of the newer additions to the board
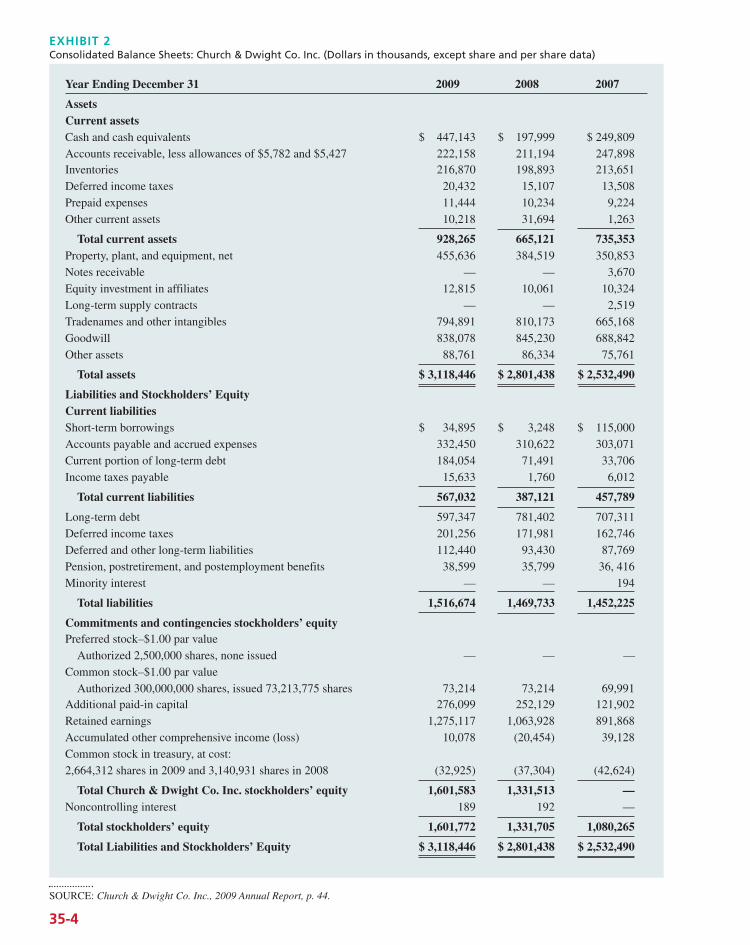
Year Ending December 31 2009 2008 2007
AssetsCurrent assetsCash and cash equivalents $ 447,143 $ 197,999 $ 249,809Accounts receivable, less allowances of $5,782 and $5,427 222,158 211,194 247,898Inventories 216,870 198,893 213,651Deferred income taxes 20,432 15,107 13,508Prepaid expenses 11,444 10,234 9,224Other current assets 10,218 31,694 1,263
Total current assets 928,265 665,121 735,353Property, plant, and equipment, net 455,636 384,519 350,853Notes receivable — — 3,670Equity investment in affiliates 12,815 10,061 10,324Long-term supply contracts — — 2,519Tradenames and other intangibles 794,891 810,173 665,168Goodwill 838,078 845,230 688,842Other assets 88,761 86,334 75,761
Total assets $ 3,118,446 $ 2,801,438 $ 2,532,490
Liabilities and Stockholders’ EquityCurrent liabilitiesShort-term borrowings $ 34,895 $ 3,248 $ 115,000Accounts payable and accrued expenses 332,450 310,622 303,071Current portion of long-term debt 184,054 71,491 33,706Income taxes payable 15,633 1,760 6,012
Total current liabilities 567,032 387,121 457,789
Long-term debt 597,347 781,402 707,311Deferred income taxes 201,256 171,981 162,746Deferred and other long-term liabilities 112,440 93,430 87,769Pension, postretirement, and postemployment benefits 38,599 35,799 36, 416Minority interest — — 194
Total liabilities 1,516,674 1,469,733 1,452,225
Commitments and contingencies stockholders’ equityPreferred stock–$1.00 par value
Authorized 2,500,000 shares, none issued — — —Common stock–$1.00 par value
Authorized 300,000,000 shares, issued 73,213,775 shares 73,214 73,214 69,991Additional paid-in capital 276,099 252,129 121,902Retained earnings 1,275,117 1,063,928 891,868Accumulated other comprehensive income (loss) 10,078 (20,454) 39,128Common stock in treasury, at cost:2,664,312 shares in 2009 and 3,140,931 shares in 2008 (32,925) (37,304) (42,624)
Total Church & Dwight Co. Inc. stockholders’ equity 1,601,583 1,331,513 —Noncontrolling interest 189 192 —
Total stockholders’ equity 1,601,772 1,331,705 1,080,265
Total Liabilities and Stockholders’ Equity $ 3,118,446 $ 2,801,438 $ 2,532,490
EXHIBIT 2Consolidated Balance Sheets: Church & Dwight Co. Inc. (Dollars in thousands, except share and per share data)
SOURCE: Church & Dwight Co. Inc., 2009 Annual Report, p. 44.
35-4
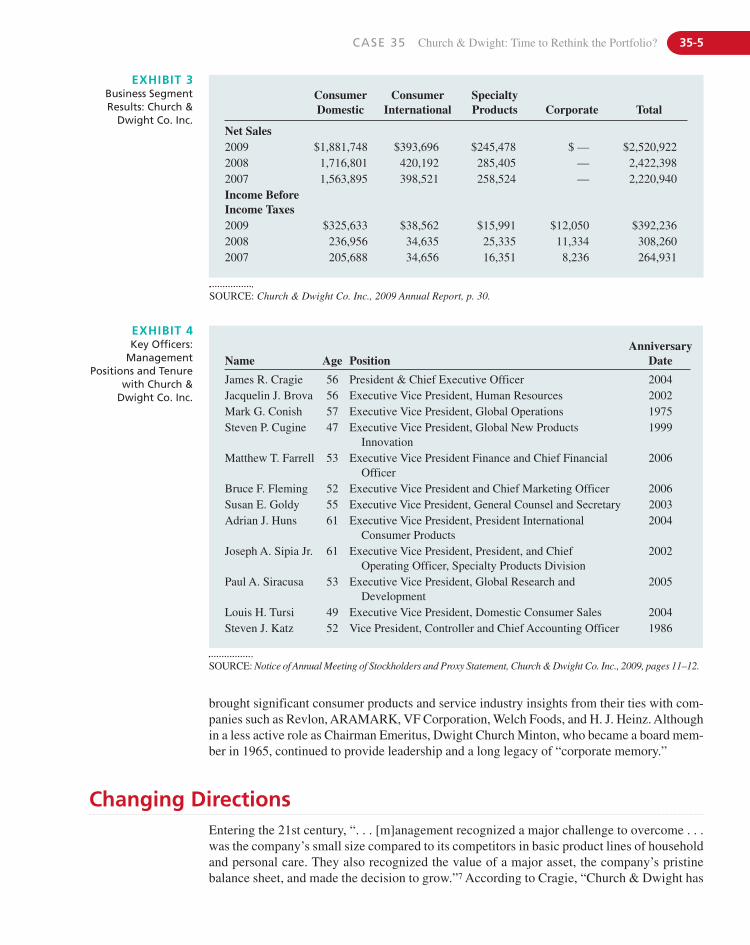
CASE 35 Church & Dwight: Time to Rethink the Portfolio? 35-5
ConsumerDomestic
ConsumerInternational
SpecialtyProducts Corporate Total
Net Sales2009 $1,881,748 $393,696 $245,478 $ — $2,520,9222008 1,716,801 420,192 285,405 — 2,422,3982007 1,563,895 398,521 258,524 — 2,220,940Income Before Income Taxes2009 $325,633 $38,562 $15,991 $12,050 $392,2362008 236,956 34,635 25,335 11,334 308,2602007 205,688 34,656 16,351 8,236 264,931
EXHIBIT 3Business SegmentResults: Church &
Dwight Co. Inc.
Name Age PositionAnniversary
Date
James R. Cragie 56 President & Chief Executive Officer 2004Jacquelin J. Brova 56 Executive Vice President, Human Resources 2002Mark G. Conish 57 Executive Vice President, Global Operations 1975Steven P. Cugine 47 Executive Vice President, Global New Products
Innovation1999
Matthew T. Farrell 53 Executive Vice President Finance and Chief FinancialOfficer
2006
Bruce F. Fleming 52 Executive Vice President and Chief Marketing Officer 2006Susan E. Goldy 55 Executive Vice President, General Counsel and Secretary 2003Adrian J. Huns 61 Executive Vice President, President International
Consumer Products2004
Joseph A. Sipia Jr. 61 Executive Vice President, President, and Chief Operating Officer, Specialty Products Division
2002
Paul A. Siracusa 53 Executive Vice President, Global Research andDevelopment
2005
Louis H. Tursi 49 Executive Vice President, Domestic Consumer Sales 2004Steven J. Katz 52 Vice President, Controller and Chief Accounting Officer 1986
EXHIBIT 4Key Officers:
ManagementPositions and Tenure
with Church &Dwight Co. Inc.
SOURCE: Church & Dwight Co. Inc., 2009 Annual Report, p. 30.
SOURCE: Notice of Annual Meeting of Stockholders and Proxy Statement, Church & Dwight Co. Inc., 2009, pages 11–12.
brought significant consumer products and service industry insights from their ties with com-panies such as Revlon, ARAMARK, VF Corporation, Welch Foods, and H. J. Heinz. Althoughin a less active role as Chairman Emeritus, Dwight Church Minton, who became a board mem-ber in 1965, continued to provide leadership and a long legacy of “corporate memory.”
Changing DirectionsEntering the 21st century, “. . . [m]anagement recognized a major challenge to overcome . . .was the company’s small size compared to its competitors in basic product lines of householdand personal care. They also recognized the value of a major asset, the company’s pristinebalance sheet, and made the decision to grow.”7 According to Cragie, “Church & Dwight has
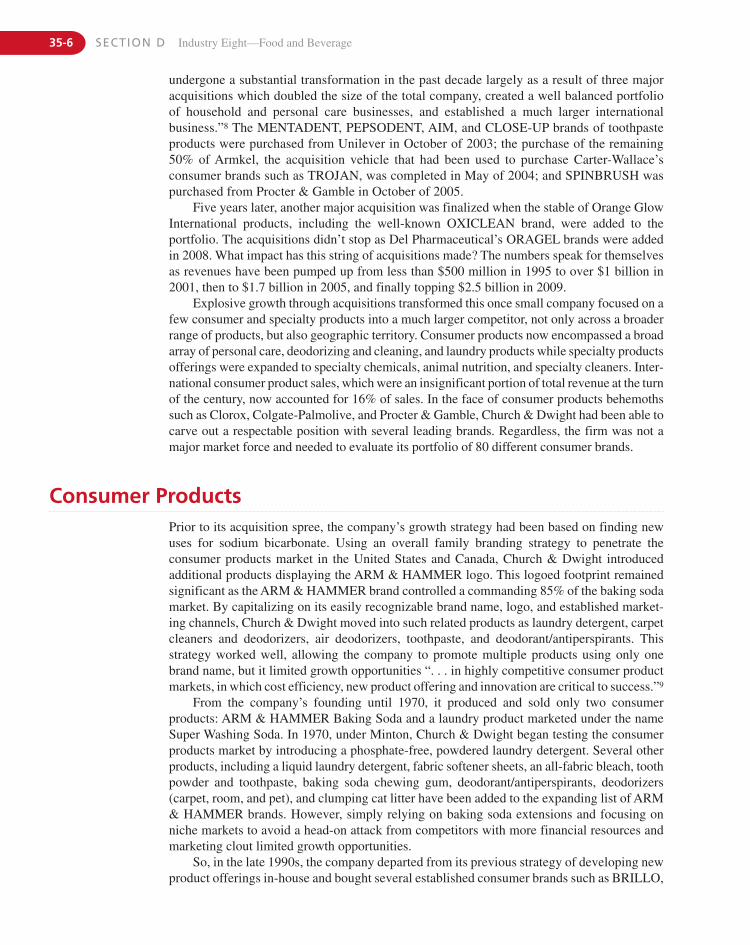
35-6 SECTION D Industry Eight—Food and Beverage
Consumer ProductsPrior to its acquisition spree, the company’s growth strategy had been based on finding newuses for sodium bicarbonate. Using an overall family branding strategy to penetrate theconsumer products market in the United States and Canada, Church & Dwight introducedadditional products displaying the ARM & HAMMER logo. This logoed footprint remainedsignificant as the ARM & HAMMER brand controlled a commanding 85% of the baking sodamarket. By capitalizing on its easily recognizable brand name, logo, and established market-ing channels, Church & Dwight moved into such related products as laundry detergent, carpetcleaners and deodorizers, air deodorizers, toothpaste, and deodorant/antiperspirants. Thisstrategy worked well, allowing the company to promote multiple products using only onebrand name, but it limited growth opportunities “. . . in highly competitive consumer productmarkets, in which cost efficiency, new product offering and innovation are critical to success.”9
From the company’s founding until 1970, it produced and sold only two consumerproducts: ARM & HAMMER Baking Soda and a laundry product marketed under the nameSuper Washing Soda. In 1970, under Minton, Church & Dwight began testing the consumerproducts market by introducing a phosphate-free, powdered laundry detergent. Several otherproducts, including a liquid laundry detergent, fabric softener sheets, an all-fabric bleach, toothpowder and toothpaste, baking soda chewing gum, deodorant/antiperspirants, deodorizers(carpet, room, and pet), and clumping cat litter have been added to the expanding list of ARM& HAMMER brands. However, simply relying on baking soda extensions and focusing onniche markets to avoid a head-on attack from competitors with more financial resources andmarketing clout limited growth opportunities.
So, in the late 1990s, the company departed from its previous strategy of developing newproduct offerings in-house and bought several established consumer brands such as BRILLO,
undergone a substantial transformation in the past decade largely as a result of three majoracquisitions which doubled the size of the total company, created a well balanced portfolioof household and personal care businesses, and established a much larger internationalbusiness.”8 The MENTADENT, PEPSODENT, AIM, and CLOSE-UP brands of toothpasteproducts were purchased from Unilever in October of 2003; the purchase of the remaining50% of Armkel, the acquisition vehicle that had been used to purchase Carter-Wallace’sconsumer brands such as TROJAN, was completed in May of 2004; and SPINBRUSH waspurchased from Procter & Gamble in October of 2005.
Five years later, another major acquisition was finalized when the stable of Orange GlowInternational products, including the well-known OXICLEAN brand, were added to theportfolio. The acquisitions didn’t stop as Del Pharmaceutical’s ORAGEL brands were addedin 2008. What impact has this string of acquisitions made? The numbers speak for themselvesas revenues have been pumped up from less than $500 million in 1995 to over $1 billion in2001, then to $1.7 billion in 2005, and finally topping $2.5 billion in 2009.
Explosive growth through acquisitions transformed this once small company focused on afew consumer and specialty products into a much larger competitor, not only across a broaderrange of products, but also geographic territory. Consumer products now encompassed a broadarray of personal care, deodorizing and cleaning, and laundry products while specialty productsofferings were expanded to specialty chemicals, animal nutrition, and specialty cleaners. Inter-national consumer product sales, which were an insignificant portion of total revenue at the turnof the century, now accounted for 16% of sales. In the face of consumer products behemothssuch as Clorox, Colgate-Palmolive, and Procter & Gamble, Church & Dwight had been able tocarve out a respectable position with several leading brands. Regardless, the firm was not amajor market force and needed to evaluate its portfolio of 80 different consumer brands.
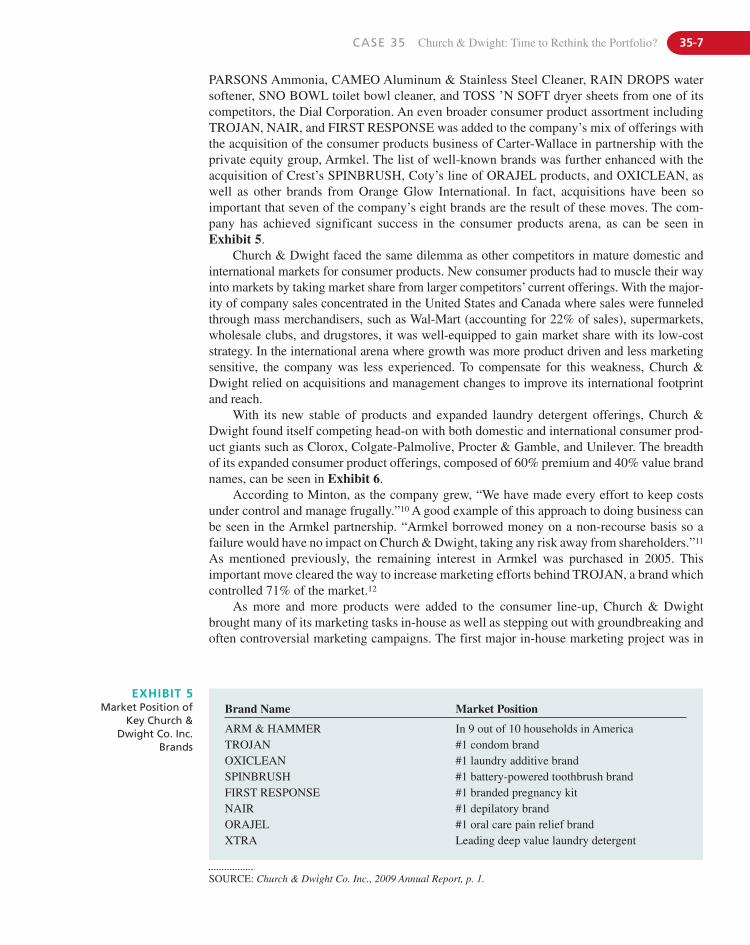
CASE 35 Church & Dwight: Time to Rethink the Portfolio? 35-7
Brand Name Market Position
ARM & HAMMER In 9 out of 10 households in AmericaTROJAN #1 condom brandOXICLEAN #1 laundry additive brandSPINBRUSH #1 battery-powered toothbrush brandFIRST RESPONSE #1 branded pregnancy kitNAIR #1 depilatory brandORAJEL #1 oral care pain relief brandXTRA Leading deep value laundry detergent
EXHIBIT 5Market Position of
Key Church &Dwight Co. Inc.
Brands
PARSONS Ammonia, CAMEO Aluminum & Stainless Steel Cleaner, RAIN DROPS watersoftener, SNO BOWL toilet bowl cleaner, and TOSS ’N SOFT dryer sheets from one of itscompetitors, the Dial Corporation. An even broader consumer product assortment includingTROJAN, NAIR, and FIRST RESPONSE was added to the company’s mix of offerings withthe acquisition of the consumer products business of Carter-Wallace in partnership with theprivate equity group, Armkel. The list of well-known brands was further enhanced with theacquisition of Crest’s SPINBRUSH, Coty’s line of ORAJEL products, and OXICLEAN, aswell as other brands from Orange Glow International. In fact, acquisitions have been soimportant that seven of the company’s eight brands are the result of these moves. The com-pany has achieved significant success in the consumer products arena, as can be seen inExhibit 5.
Church & Dwight faced the same dilemma as other competitors in mature domestic andinternational markets for consumer products. New consumer products had to muscle their wayinto markets by taking market share from larger competitors’ current offerings. With the major-ity of company sales concentrated in the United States and Canada where sales were funneledthrough mass merchandisers, such as Wal-Mart (accounting for 22% of sales), supermarkets,wholesale clubs, and drugstores, it was well-equipped to gain market share with its low-coststrategy. In the international arena where growth was more product driven and less marketingsensitive, the company was less experienced. To compensate for this weakness, Church &Dwight relied on acquisitions and management changes to improve its international footprintand reach.
With its new stable of products and expanded laundry detergent offerings, Church &Dwight found itself competing head-on with both domestic and international consumer prod-uct giants such as Clorox, Colgate-Palmolive, Procter & Gamble, and Unilever. The breadthof its expanded consumer product offerings, composed of 60% premium and 40% value brandnames, can be seen in Exhibit 6.
According to Minton, as the company grew, “We have made every effort to keep costsunder control and manage frugally.”10 A good example of this approach to doing business canbe seen in the Armkel partnership. “Armkel borrowed money on a non-recourse basis so afailure would have no impact on Church & Dwight, taking any risk away from shareholders.”11
As mentioned previously, the remaining interest in Armkel was purchased in 2005. Thisimportant move cleared the way to increase marketing efforts behind TROJAN, a brand whichcontrolled 71% of the market.12
As more and more products were added to the consumer line-up, Church & Dwightbrought many of its marketing tasks in-house as well as stepping out with groundbreaking andoften controversial marketing campaigns. The first major in-house marketing project was in
SOURCE: Church & Dwight Co. Inc., 2009 Annual Report, p. 1.
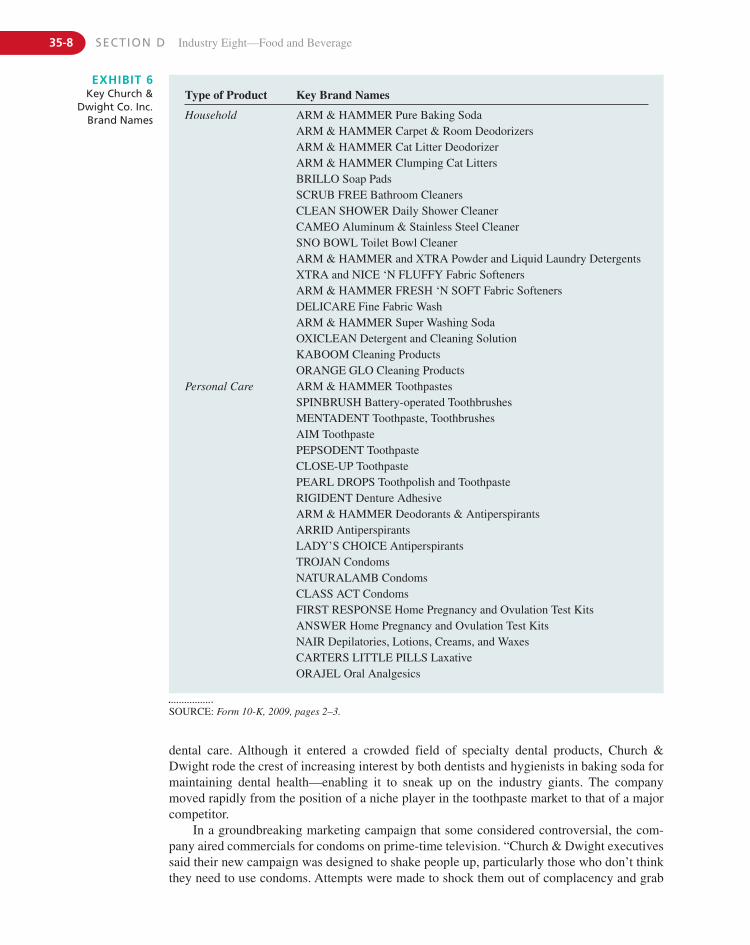
35-8 SECTION D Industry Eight—Food and Beverage
Type of Product Key Brand Names
Household ARM & HAMMER Pure Baking SodaARM & HAMMER Carpet & Room DeodorizersARM & HAMMER Cat Litter DeodorizerARM & HAMMER Clumping Cat LittersBRILLO Soap PadsSCRUB FREE Bathroom CleanersCLEAN SHOWER Daily Shower CleanerCAMEO Aluminum & Stainless Steel CleanerSNO BOWL Toilet Bowl CleanerARM & HAMMER and XTRA Powder and Liquid Laundry DetergentsXTRA and NICE ‘N FLUFFY Fabric SoftenersARM & HAMMER FRESH ‘N SOFT Fabric SoftenersDELICARE Fine Fabric WashARM & HAMMER Super Washing SodaOXICLEAN Detergent and Cleaning SolutionKABOOM Cleaning ProductsORANGE GLO Cleaning Products
Personal Care ARM & HAMMER ToothpastesSPINBRUSH Battery-operated ToothbrushesMENTADENT Toothpaste, ToothbrushesAIM ToothpastePEPSODENT ToothpasteCLOSE-UP ToothpastePEARL DROPS Toothpolish and ToothpasteRIGIDENT Denture AdhesiveARM & HAMMER Deodorants & AntiperspirantsARRID AntiperspirantsLADY’S CHOICE AntiperspirantsTROJAN CondomsNATURALAMB CondomsCLASS ACT CondomsFIRST RESPONSE Home Pregnancy and Ovulation Test KitsANSWER Home Pregnancy and Ovulation Test KitsNAIR Depilatories, Lotions, Creams, and WaxesCARTERS LITTLE PILLS LaxativeORAJEL Oral Analgesics
EXHIBIT 6Key Church &
Dwight Co. Inc.Brand Names
dental care. Although it entered a crowded field of specialty dental products, Church &Dwight rode the crest of increasing interest by both dentists and hygienists in baking soda formaintaining dental health—enabling it to sneak up on the industry giants. The companymoved rapidly from the position of a niche player in the toothpaste market to that of a majorcompetitor.
In a groundbreaking marketing campaign that some considered controversial, the com-pany aired commercials for condoms on prime-time television. “Church & Dwight executivessaid their new campaign was designed to shake people up, particularly those who don’t thinkthey need to use condoms. Attempts were made to shock them out of complacency and grab
SOURCE: Form 10-K, 2009, pages 2–3.
CASE 35 Church & Dwight: Time to Rethink the Portfolio? 35-9
their attention.”13 Other campaigns, such as when the Trojan brand advertised its own stimuluspackage at the same time as the federal stimulus package was enacted, stated, “because we be-lieve we should ride out these hard times together.”14 A Valentine’s Day ad featuring condomsin place of candy in a heart-shaped box of chocolates continued to highlight the shock theme.15
The company’s increasing marketing strength caught the attention of potential partners asis evidenced by its partnership with Quidel Corporation, a provider of point-of-care diagnostictests, to meet women’s health and wellness needs. “The partnership combined Church &Dwight’s strength in the marketing, distribution and sales of consumer products with Quidel’sstrength in the development and manufacture of rapid diagnostic tests.”16 Other product tie-ins,especially with ARM & HAMMER Baking Soda, have been created with air filter, paint, andvacuum cleaner bag brands.
For the most part, Church & Dwight’s acquired products and entries into the consumerproducts market have met with success. However, potential marketing problems may be loom-ing on the horizon for its ARM & HAMMER line of consumer products. The company couldbe falling into the precarious line-extension snare. Placing a well-known brand name on a widevariety of products could cloud the brand’s image, leading to consumer confusion and loss ofmarketing pull. In addition, competition in the company’s core laundry detergent market con-tinues to heat up as the market matures and sales fall with major retailers such as Wal-Mart andTarget wringing price concessions from all producers.17 Will the addition of such well-knownbrand names as ORAJEL, OXICLEAN, and SPINBRUSH continue the momentum gainedfrom the XTRA, NAIR, TROJAN, and FIRST RESPONSE additions? Where would newavenues for consumer products’ growth come from?
Specialty ProductsIn addition to a large and growing stable of consumer products, Church & Dwight also has avery solid core of specialty products. The Specialty Products Division basically consists ofthe manufacture and sale of sodium bicarbonate for three distinct market segments: specialtychemicals, animal nutrition products, and specialty cleaners. Manufacturers utilize sodiumbicarbonate performance products as a leavening agent for commercial baked goods; anantacid in pharmaceuticals; a chemical in kidney dialysis; a carbon dioxide release agent infire extinguishers; and an alkaline in swimming pool chemicals, detergents, and varioustextile and tanning applications. Animal feed producers use sodium bicarbonate nutritionalproducts predominantly as a buffer, or antacid, for dairy cattle feeds and make a nutritionalsupplement that enhances milk production of dairy cattle. Sodium bicarbonate has also beenused as an additive to poultry feeds to enhance feed efficiency.
“Church & Dwight has long maintained its leadership position in the industry through astrategy of sodium bicarbonate product differentiation, which hinges on the development ofspecial grades for specific end users.”18 Management’s apparent increased focus on consumerproducts has only recently impacted the significance of specialty products in the overallcorporate mix of revenues, as is shown in Exhibit 7.
Church & Dwight was in an enviable position to profit from its dominant niche in the sodiumbicarbonate products market since it controlled the primary raw material used in its production.The primary ingredient in sodium bicarbonate is produced from the mineral trona, which isextracted from the company’s mines in southwestern Wyoming. The other ingredient, carbondioxide, is a readily available chemical which can be obtained from a variety of sources. Produc-tion of the final product, sodium bicarbonate, for both consumer and specialty products is com-pleted at one of the two company plants located in Green River, Wyoming, and Old Fort, Ohio.
The company maintained a dominant position in the production of the required rawmaterials for both its consumer and industrial products. It manufactures almost two-thirds
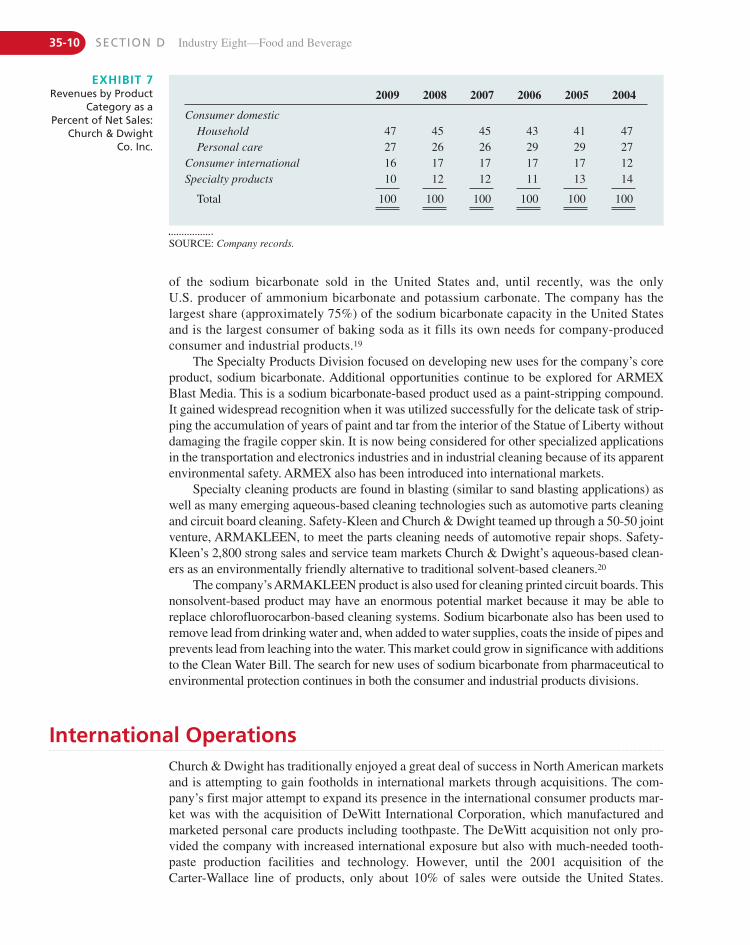
35-10 SECTION D Industry Eight—Food and Beverage
2009 2008 2007 2006 2005 2004
Consumer domesticHousehold 47 45 45 43 41 47Personal care 27 26 26 29 29 27
Consumer international 16 17 17 17 17 12Specialty products 10 12 12 11 13 14
Total 100 100 100 100 100 100
EXHIBIT 7Revenues by Product
Category as aPercent of Net Sales:
Church & DwightCo. Inc.
of the sodium bicarbonate sold in the United States and, until recently, was the onlyU.S. producer of ammonium bicarbonate and potassium carbonate. The company has thelargest share (approximately 75%) of the sodium bicarbonate capacity in the United Statesand is the largest consumer of baking soda as it fills its own needs for company-producedconsumer and industrial products.19
The Specialty Products Division focused on developing new uses for the company’s coreproduct, sodium bicarbonate. Additional opportunities continue to be explored for ARMEXBlast Media. This is a sodium bicarbonate-based product used as a paint-stripping compound.It gained widespread recognition when it was utilized successfully for the delicate task of strip-ping the accumulation of years of paint and tar from the interior of the Statue of Liberty withoutdamaging the fragile copper skin. It is now being considered for other specialized applicationsin the transportation and electronics industries and in industrial cleaning because of its apparentenvironmental safety. ARMEX also has been introduced into international markets.
Specialty cleaning products are found in blasting (similar to sand blasting applications) aswell as many emerging aqueous-based cleaning technologies such as automotive parts cleaningand circuit board cleaning. Safety-Kleen and Church & Dwight teamed up through a 50-50 jointventure, ARMAKLEEN, to meet the parts cleaning needs of automotive repair shops. Safety-Kleen’s 2,800 strong sales and service team markets Church & Dwight’s aqueous-based clean-ers as an environmentally friendly alternative to traditional solvent-based cleaners.20
The company’sARMAKLEEN product is also used for cleaning printed circuit boards. Thisnonsolvent-based product may have an enormous potential market because it may be able toreplace chlorofluorocarbon-based cleaning systems. Sodium bicarbonate also has been used toremove lead from drinking water and, when added to water supplies, coats the inside of pipes andprevents lead from leaching into the water. This market could grow in significance with additionsto the Clean Water Bill. The search for new uses of sodium bicarbonate from pharmaceutical toenvironmental protection continues in both the consumer and industrial products divisions.
International OperationsChurch & Dwight has traditionally enjoyed a great deal of success in North American marketsand is attempting to gain footholds in international markets through acquisitions. The com-pany’s first major attempt to expand its presence in the international consumer products mar-ket was with the acquisition of DeWitt International Corporation, which manufactured andmarketed personal care products including toothpaste. The DeWitt acquisition not only pro-vided the company with increased international exposure but also with much-needed tooth-paste production facilities and technology. However, until the 2001 acquisition of theCarter-Wallace line of products, only about 10% of sales were outside the United States.
SOURCE: Company records.
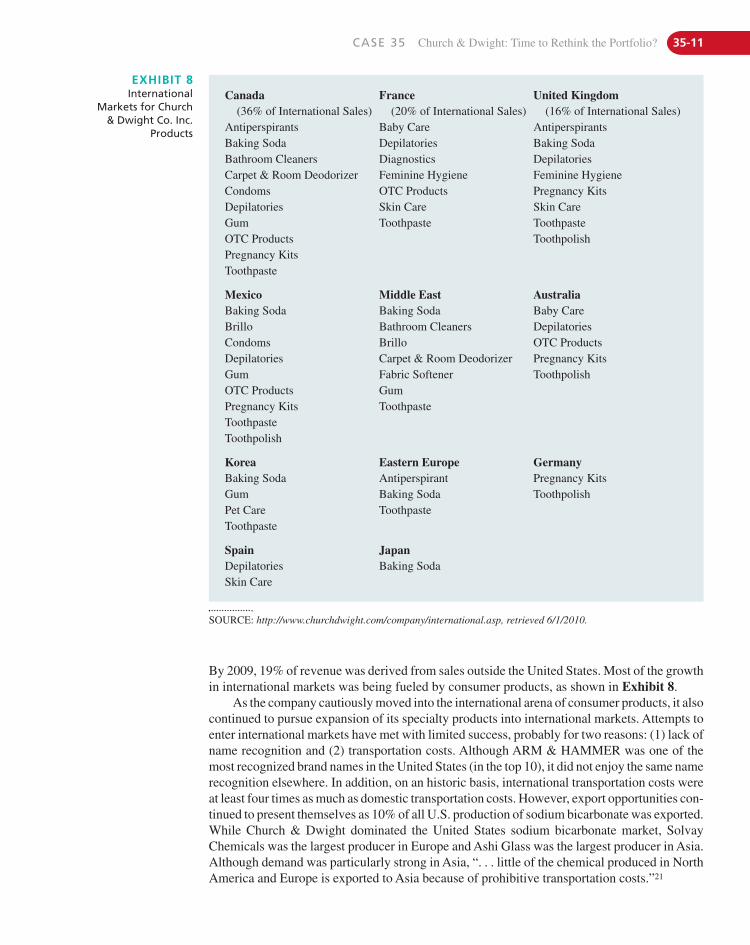
CASE 35 Church & Dwight: Time to Rethink the Portfolio? 35-11
EXHIBIT 8International
Markets for Church& Dwight Co. Inc.
Products
Canada France United Kingdom(36% of International Sales) (20% of International Sales) (16% of International Sales)
Antiperspirants Baby Care AntiperspirantsBaking Soda Depilatories Baking SodaBathroom Cleaners Diagnostics DepilatoriesCarpet & Room Deodorizer Feminine Hygiene Feminine HygieneCondoms OTC Products Pregnancy KitsDepilatories Skin Care Skin CareGum Toothpaste ToothpasteOTC Products ToothpolishPregnancy KitsToothpaste
Mexico Middle East AustraliaBaking Soda Baking Soda Baby CareBrillo Bathroom Cleaners DepilatoriesCondoms Brillo OTC ProductsDepilatories Carpet & Room Deodorizer Pregnancy KitsGum Fabric Softener ToothpolishOTC Products GumPregnancy Kits ToothpasteToothpasteToothpolish
Korea Eastern Europe GermanyBaking Soda Antiperspirant Pregnancy KitsGum Baking Soda ToothpolishPet Care ToothpasteToothpaste
Spain JapanDepilatories Baking SodaSkin Care
By 2009, 19% of revenue was derived from sales outside the United States. Most of the growthin international markets was being fueled by consumer products, as shown in Exhibit 8.
As the company cautiously moved into the international arena of consumer products, it alsocontinued to pursue expansion of its specialty products into international markets. Attempts toenter international markets have met with limited success, probably for two reasons: (1) lack ofname recognition and (2) transportation costs. Although ARM & HAMMER was one of themost recognized brand names in the United States (in the top 10), it did not enjoy the same namerecognition elsewhere. In addition, on an historic basis, international transportation costs wereat least four times as much as domestic transportation costs. However, export opportunities con-tinued to present themselves as 10% of all U.S. production of sodium bicarbonate was exported.While Church & Dwight dominated the United States sodium bicarbonate market, SolvayChemicals was the largest producer in Europe and Ashi Glass was the largest producer in Asia.Although demand was particularly strong in Asia, “. . . little of the chemical produced in NorthAmerica and Europe is exported to Asia because of prohibitive transportation costs.”21
SOURCE: http://www.churchdwight.com/company/international.asp, retrieved 6/1/2010.
35-12 SECTION D Industry Eight—Food and Beverage
N O T E S1. Church & Dwight Co. Inc. Annual Report, 2009, p. 2.2. Church & Dwight Co. Inc. Annual Report, 2005, p. 3.3. Church & Dwight Co. Inc. Annual Report, 2009, p. 5.4. Ibid.5. Minton, Dwight Church, personal interview, October 2, 2002.6. 8-K, 2006.7. Church & Dwight Co. Inc. Proxy Statement, 2004.8. Church & Dwight Co. Inc. Annual Report, 2006, p. 3.9. 10-k, 2006, p. 20.
10. Minton, Dwight Church, personal interview, October 2, 2002.11. Ibid.12. Jack Neff, “Trojan,” Advertising Age 76 (November 7, 2005).13. Mary Ann Liebert, “Condom Maker Wants to Go Prime Time,”
in Drug Development and STD News. AIDS Patient Care andSTDs 19 (2005), p. 470.
14. “BEST of BRANDFREAK 2010,” Brandweek 50 (December 14,2009), p. 58.
15. Stuart Elliot, “This Campaign Is Wet (and Wild),” The New YorkTimes on the Web (February 9, 2010), Business/Financial Desk;CAMPAIGN SPOTLIGHT.
16. Press Release, 2006, p.1.17. Doris de Guzman, “Household Products Struggle,” Chemical
Market Reporter 269 (2006).18. Church & Dwight Co. Inc. Annual Report, 2000, p. 17.19. Lisa Jarvis, “Church & Dwight Builds Sales Through Strength
in Bicarbonate,” Chemical Market Report 257 (April 10, 2002).20. Helena Harvilicz, “C&D’s Industrial Cleaning Business Contin-
ues to Grow,” Chemical Market Reporter 257 (May 15, 2000).21. Gordon Graff, “Sodium Bicarb Supply Strong, Tags Level with
Producer Costs,” Purchasing (April 6, 2006), p. 28C1.22. Kerri Walsh, “Stocking Up on Innovation,” Chemical Week
(January 18–25, 2010), p. 19.
StreamliningTwo significant projects were completed in 2009. One was the completion and start-up of amajor new manufacturing facility and the other was the disposition of some non-core assets.
With the completion of a 1.1 million square foot manufacturing plant for laundry deter-gent, the company consolidated into one facility the functions that had previously been com-pleted in five separate facilities with room to grow. This move took place in an industry facingslowing growth. Global laundry detergent sales had grown by 8% between 2003 and 2008, butwere only forecast to grow by 3% between 2008 and 2013.22
Although the company had made some minor asset sales in the past, the disposition in2009 of five domestic and international consumer product brands acquired during the 2008 DelLaboratories transaction marked the first major jettisoning of non-core assets for the company.This was followed by the disposition of the Lambert Kay pet supplies line; then the BRILLObrand in March of 2010. These changes were just the beginning. To remain competitive in avolatile retail market with major competitors jockeying for shelf space and retailers seeking torationalize their breadth of product offerings, more changes may be considered.
The core business and foundation on which the company was built remained the sameafter more than 160 years. However, as management looks to the future, can it successfullyachieve a balancing act based on finding growth through expanded uses of sodium bicarbon-ate while assimilating a divergent group of consumer products into an expanding internationalfootprint? Will the current portfolio of products continue to deliver the same results in the faceof competitors who, unlike consumers, know the company and must react to its strategic andtactical moves?
Andean Community A South Americanfree-trade alliance composed of Columbia,Ecuador, Peru, Bolivia, and Chili.
Annual report A document published eachyear by a company to show its financial con-dition and products.
Assessment center An approach to evaluat-ing the suitability of a person for a position bysimulating key parts of the job.
Assimilation A strategy that involves the dom-ination of one corporate culture over another.
Association of South East Asian Nations(ASEAN) A regional trade association com-posed of Asian countries of Brunei Darus-salam, Cambodia, Indonesia, Laos, Malaysia,Myanmar, Philippines, Singapore, Thailand,and Vietnam. ASEA+3 includes China,Japan, and South Korea.
Autonomous (self-managing) work teamsA group of people who work together withouta supervisor to plan, coordinate, and evaluatetheir own work.
Backward integration Assuming a functionpreviously provided by a supplier.
Balanced scorecard Combines financialmeasures with operational measures on cus-tomer satisfaction, internal processes, andthe corporation’s innovation and improve-ment activities.
Bankruptcy A retrenchment strategy thatforfeits management of the firm to the courtsin return for some settlement of the corpora-tion’s obligations.
Basic R&D Research and development thatis conducted by scientists in well-equippedlaboratories where the focus is on theoreticalproblem areas.
BCG (Boston Consulting Group) Growth-Share Matrix A simple way to portray a cor-poration’s portfolio of products or divisionsin terms of growth and cash flow.
Behavior control A control that specifieshow something is to be done through policies,rules, standard operating procedures, and or-ders from a superior.
Behavior substitution A phenomenon thatoccurs when people substitute activities that do not lead to goal accomplishment for ac-tivities that do lead to goal accomplishmentbecause the wrong activities are beingrewarded.
Benchmarking The process of measuringproducts, services, and practices againstthose of competitors or companies recog-nized as industry leaders.
Best practice A procedure that is followed bysuccessful companies.
Blind spot analysis An approach to analyz-ing a competitor by identifying its perceptualbiases.
Board of director responsibilitiesCommonly agreed obligations of directors,which include: setting corporate strategy,overall direction, mission or vision; hiringand firing the CEO and top management;controlling, monitoring, or supervising topmanagement; reviewing and approving theuse of resources; and caring for shareholderinterest.
Board of directors’ continuum A range ofthe possible degree of involvement by theboard of directors (from low to high) in thestrategic management process.
BOT (build-operate-transfer) concept Atype of international entry option for a com-pany. After building a facility, the companyoperates the facility for a fixed period of timeduring which it earns back its investment,plus a profit.
Brainstorming The process of proposingideas in a group without first mentally screen-ing them.
Brand A name that identifies a particularcompany’s product in the mind of theconsumer.
Budget A statement of a corporation’s pro-grams in terms of money required.
Business model The mix of activities a com-pany performs to earn a profit.
Business plan A written strategic plan for anew entrepreneurial venture.
Business policy A previous name for strate-gic management. It has a general manage-ment orientation and tends to look inwardwith primary concern for integrating the cor-poration’s many functional activities.
Business strategy Competitive and coopera-tive strategies that emphasize improvement ofthe competitive position of a corporation’sproducts or services in a specific industry ormarket segment.
Cannibalize To replace popular products be-fore they reach the end of their life cycle.
Cap-and-trade A government-imposed ceil-ing (cap) on the amount of allowed green-house gas emissions combined with a systemallowing a firm to sell (trade) its emissionreductions to another firm whose emissionsexceed the allowed cap.
Capability A corporation’s ability to exploitits resources.
Capital budgeting The process of analyzingand ranking possible investments in terms ofthe additional outlays and additional receiptsthat will result from each investment.
10-K form An SEC form containing incomestatements, balance sheets, cash flow state-ments, and information not usually available inan annual report.
10-Q form An SEC form containing quar-terly financial reports.
14-A form An SEC form containing proxystatements and information on a company’sboard of directors.
360-degree performance appraisal Anevaluation technique in which input is gath-ered from multiple sources.
80/20 rule A rule of thumb stating that oneshould monitor those 20% of the factors thatdetermine 80% of the results.
Absorptive capacity A firm’s ability tovalue, assimilate, and utilize new externalknowledge.
Acquisition The purchase of a company thatis completely absorbed by the acquiringcorporation.
Action plan A plan that states what actionsare going to be taken, by whom, duringwhat time frame, and with what expectedresults.
Activity ratios Financial ratios that indi-cate how well a corporation is managing itsoperations.
Activity-based costing (ABC) An account-ing method for allocating indirect and fixedcosts to individual products or product linesbased on the value-added activities goinginto that product.
Adaptive mode A decision-making modecharacterized by reactive solutions to existingproblems, rather than a proactive search fornew opportunities.
Advisory board A group of external businesspeople who voluntarily meet periodicallywith the owners/managers of the firm to dis-cuss strategic and other issues.
Affiliated directors Directors who, thoughnot really employed by the corporation, han-dle the legal or insurance work for the com-pany or are important suppliers.
Agency theory A theory stating that prob-lems arise in corporations because the agents(top management) are not willing to bear re-sponsibility for their decisions unless theyown a substantial amount of stock in thecorporation.
Altman’s Bankruptcy Formula A formulaused to estimate how close a company is todeclaring bankruptcy.
Analytical portfolio manager A type of gen-eral manager needed to execute a diversifica-tion strategy.
GLOSSARY
G-1
G-2 GLOSSARY
Captive company strategy Dedicating afirm’s productive capacity as primary supplierto another company in exchange for a long-term contract.
Carbon footprint The amount of greenhousegases being created by an entity and releasedinto the air.
Cash cow A product that brings in far moremoney than is needed to maintain its marketshare.
Categorical imperatives Kant’s two princi-ples to guide actions: A person’s action is ethi-cal only if that person is willing for that sameaction to be taken by everyone who is in a sim-ilar situation, and a person should never treatanother human being simply as a means but al-ways as an end.
Cautious profit planner The type of leaderneeded for a corporation choosing to follow astability strategy.
Cellular/modular organization structure Astructure composed of cells (self-managingteams, autonomous business units, etc.) thatcan operate alone but can interact with othercells to produce a more potent and competentbusiness mechanism.
Center of excellence A designated area inwhich a company has a core or distinctivecompetence.
Center of gravity The part of the industryvalue chain that is most important to the com-pany and the point where the company’sgreatest expertise and capabilities lay.
Central American Free Trade Agreement(CAFTA) A regional trade association com-posed of El Salvador, Guatemala, Nicaragua,Honduras, Costa Rica, the United States,and the Dominican Republic.
Clusters Geographic concentrations of inter-connected companies and industries.
Code of ethics A code that specifies how anorganization expects its employees to behavewhile on the job.
Codetermination The inclusion of a corpo-ration’s workers on its board of directors.
Collusion The active cooperation of firmswithin an industry to reduce output and raiseprices in order to get around the normal eco-nomic law of supply and demand. This practiceis usually illegal.
Commodity A product whose characteristicsare the same regardless of who sells it.
Common-size statements Income state-ments and balance sheets in which the dol-lar figures have been converted intopercentages.
Competency A cross-functional integrationand coordination of capabilities.
Competitive intelligence A formal programof gathering information about a company’scompetitors.
Cooperative strategies Strategies that in-volve working with other firms to gain com-petitive advantage within an industry.
Co-opetition A term used to describe si-multaneous competition and cooperationamong firms.
Core competency A collection of corporatecapabilities that cross divisional borders andare widespread within a corporation, and issomething that a corporation can do exceed-ingly well.
Core rigidity/deficiency A core competencyof a firm that over time matures and becomesa weakness.
Corporate brand A type of brand in whichthe company’s name serves as the brandname.
Corporate capabilities See capability.
Corporate culture A collection of beliefs,expectations, and values learned and sharedby a corporation’s members and transmittedfrom one generation of employees toanother.
Corporate culture pressure A force fromexisting corporate culture against the imple-mentation of a new strategy.
Corporate entrepreneurship Also calledintrapreneurship, the creation of a new busi-ness within an existing organization.
Corporate governance The relationshipamong the board of directors, top manage-ment, and shareholders in determining the di-rection and performance of a corporation.
Corporate parenting A corporate strategythat evaluates the corporation’s businessunits in terms of resources and capabilitiesthat can be used to build business unit valueas well as generate synergies across businessunits.
Corporate reputation A widely held percep-tion of a company by the general public.
Corporate scenario Pro forma balancesheets and income statements that forecastthe effect that each alternative strategy willlikely have on return on investment.
Corporate stakeholders Groups that affector are affected by the achievement of a firm’sobjectives.
Corporate strategy A strategy that states acompany’s overall direction in terms of itsgeneral attitude toward growth and the man-agement of its various business and productlines.
Corporation A mechanism legally estab-lished to allow different parties to contributecapital, expertise, and labor for their mutualbenefit.
Cost focus A low-cost competitive strategythat concentrates on a particular buyer groupor geographic market and attempts to serveonly that niche.
Competitive scope The breadth of a com-pany’s or a business unit’s target market.
Competitive strategy A strategy that stateshow a company or a business unit will com-pete in an industry.
Competitors The companies that offer thesame products or services as the subjectcompany.
Complementor A company or an industrywhose product(s) works well with anotherindustry’s or firm’s product and withoutwhich that product would lose much of itsvalue.
Concentration A corporate growth strategythat concentrates a corporation’s resources oncompeting in one industry.
Concentric diversification A diversificationgrowth strategy in which a firm uses its cur-rent strengths to diversify into related prod-ucts in another industry.
Concurrent engineering A process in whichspecialists from various functional areaswork side by side rather than sequentially inan effort to design new products.
Conglomerate diversification A diversifica-tion growth strategy that involves a move intoanother industry to provide products unre-lated to its current products.
Conglomerate structure An assemblage oflegally independent firms (subsidiaries) op-erating under one corporate umbrella butcontrolled through the subsidiaries’ boardsof directors.
Connected line batch flow A part of a cor-poration’s manufacturing strategy in whichcomponents are standardized and each ma-chine functions like a job shop but is posi-tioned in the same order as the parts areprocessed.
Consensus A situation in which all partiesagree to one alternative.
Consolidated industry An industry in whicha few large companies dominate.
Consolidation The second phase of a turn-around strategy that implements a program tostabilize the corporation.
Constant dollars Dollars adjusted for inflation.
Continuous improvement A system devel-oped by Japanese firms in which teamsstrive constantly to improve manufacturingprocesses.
Continuous systems Production organizedin lines on which products can be continu-ously assembled or processed.
Continuum of sustainability A representa-tion that indicates how durable and imitablean organization’s resources and capabilitiesare.
Contraction The first phase of a turnaroundstrategy that includes a general across-the-board cutback in size and costs.

GLOSSARY G-3
particular buyer group, product line segment,or geographic market.
Differentiation strategy See differentiation.
Dimensions of national culture A set of fivedimensions by which each nation’s uniqueculture can be identified.
Directional strategy A plan that is composedof three general orientations: growth, stabil-ity, and retrenchment.
Distinctive competencies A firm’s compe-tencies that are superior to those of competi-tors.
Diversification A corporate growth strategythat expands product lines by moving into an-other industry.
Divestment A retrenchment strategy inwhich a division of a corporation with lowgrowth potential is sold.
Divisional structure An organizationalstructure in which employees tend to befunctional specialists organized according toproduct/market distinctions.
Downsizing Planned elimination of positionsor jobs.
Due care The obligation of board mem-bers to closely monitor and evaluate topmanagement.
Durability The rate at which a firm’s under-lying resources and capabilities depreciate orbecome obsolete.
Dynamic industry expert A leader with agreat deal of experience in a particular indus-try appropriate for executing a concentrationstrategy.
Dynamic capabilities Capabilities that arecontinually being changed and reconfiguredto make them more adaptive to an uncertainenvironment.
Dynamic pricing A marketing practice inwhich different customers pay differentprices for the same product or service.
Earnings per share (EPS) A calculation thatis determined by dividing net earnings by thenumber of shares of common stock issued.
Economic value added (EVA) A shareholdervalue method of measuring corporate and di-visional performance. Measures after-tax op-erating income minus the total annual cost ofcapital.
Economies of scale A process in which unitcosts are reduced by making large numbers ofthe same product.
Economies of scope A process in which unitcosts are reduced when the value chains oftwo separate products or services share activ-ities, such as the same marketing channels ormanufacturing facilities.
EFAS (External Factor Analysis Sum-mary) table A table that organizes externalfactors into opportunities and threats and how
well management is responding to these spe-cific factors.
Electronic commerce The use of the Internetto conduct business transactions.
Engineering (or process) R&D R&D con-centrating on quality control and the develop-ment of design specifications and improvedproduction equipment.
Enterprise resource planning (ERP) soft-ware Software that unites all of a company’smajor business activities, from order pro-cessing to production, within a single familyof software modules.
Enterprise risk management (ERM) Acorporatewide, integrated process to managethe uncertainties that could negatively orpositively influence the achievement of thecorporation’s objectives.
Enterprise strategy A strategy that explic-itly articulates a firm’s ethical relationshipwith its stakeholders.
Entrepreneur A person who initiates andmanages a business undertaking and whoassumes risk for the sake of a profit.
Entrepreneurial characteristics Traits of an entrepreneur that lead to a new venture’ssuccess.
Entrepreneurial mode A strategy made byone powerful individual in which the focusis on opportunities, and problems aresecondary.
Entrepreneurial venture Any new businesswhose primary goals are profitability andgrowth and that can be characterized by inno-vative strategic practices.
Entry barrier An obstruction that makes itdifficult for a company to enter an industry.
Environmental scanning The monitoring,evaluation, and dissemination of informationfrom the external and internal environmentsto key people within the corporation.
Environmental sustainability The use ofbusiness practices to reduce a company’simpact upon the natural, physical environ-ment.
Environmental uncertainty The degree ofcomplexity plus the degree of change existingin an organization’s external environment.
Ethics The consensually accepted stan-dards of behavior for an occupation, trade,or profession.
European Union (EU) A regional tradeassociation composed of 27 Europeancountries.
Evaluation and control A process in whichcorporate activities and performance resultsare monitored so that actual performance canbe compared with desired performance.
Executive leadership The directing of activ-ities toward the accomplishment of corporateobjectives.
Cost leadership A low-cost competitivestrategy that aims at the broad mass market.
Cost proximity A process that involves keep-ing the higher price a company charges forhigher quality close enough to that of thecompetition so that customers will see the ex-tra quality as being worth the extra cost.
Crisis of autonomy A time when peoplemanaging diversified product lines need moredecision-making freedom than top manage-ment is willing to delegate to them.
Crisis of control A time when business unitsact to optimize their own sales and profitswithout regard to the overall corporation. Seealso suboptimization.
Crisis of leadership A time when an entre-preneur is personally unable to manage agrowing company.
Cross-functional work teams A work teamcomposed of people from multiple functions.
Cultural integration The extent to whichunits throughout an organization share a com-mon culture.
Cultural intensity The degree to whichmembers of an organizational unit accept thenorms, values, or other culture content asso-ciated with the unit.
Deculturation The disintegration of onecompany’s culture resulting from unwantedand extreme pressure from another to imposeits culture and practices.
Dedicated transfer line A highly automatedassembly line making one mass-producedproduct using little human labor.
Defensive centralization A process in whichtop management of a not-for-profit retains alldecision-making authority so that lower-levelmanagers cannot take any actions to whichthe sponsors may object.
Defensive tactic A tactic in which a companydefends its current market.
Delphi technique A forecasting technique inwhich experts independently assess the prob-abilities of specified events. These assess-ments are combined and sent back to eachexpert for fine-tuning until agreement isreached.
Devil’s advocate An individual or a groupassigned to identify the potential pitfalls andproblems of a proposal.
Dialectical inquiry A decision-makingtechnique that requires that two proposals using different assumptions be generated forconsideration.
Differentiation A competitive strategy that isaimed at the broad mass market and that in-volves the creation of a product or service thatis perceived throughout its industry asunique.
Differentiation focus A differentiationcompetitive strategy that concentrates on a
G-4 GLOSSARY
Executive succession The process of groom-ing and replacing a key top manager.
Executive type An individual with a particu-lar mix of skills and experiences.
Exit barrier An obstruction that keeps acompany from leaving an industry.
Expense center A business unit that usesmoney but contributes to revenues onlyindirectly.
Experience curve A conceptual frameworkthat states that unit production costs declineby some fixed percentage each time the to-tal accumulated volume of production inunits doubles.
Expert opinion A nonquantitative forecast-ing technique in which authorities in aparticular area attempt to forecast likelydevelopments.
Explicit knowledge Knowledge that can beeasily articulated and communicated.
Exporting Shipping goods produced in acompany’s home country to other coun-tries for marketing.
External environment Forces outside an or-ganization that are not typically within theshort-run control of top management.
External strategic factor Environmentaltrend with both high probability ofoccurrence and high probability of impact onthe corporation.
Externality Costs of doing business that arenot included in a firm’s accounting system,but felt by others.
Extranet An information network within anorganization that is available to key suppliersand customers.
Extrapolation A form of forecasting that ex-tends present trends into the future.
Family business A company that is eitherowned or dominated by relatives.
Family directors Board members who aredescendants of the founder and own signifi-cant blocks of stock.
Financial leverage The ratio of total debt tototal assets.
Financial strategy A functional strategy tomake the best use of corporate monetaryassets.
First mover The first company to manufac-ture and sell a new product or service.
Flexible manufacturing A type of manu-facturing that permits the low-volume out-put of custom-tailored products at relativelylow unit costs through economies of scope.
Follow-the-sun-management A manage-ment technique in which modern communi-cation enables project team members livingin one country to pass their work to teammembers in another time zone so that theproject is continually being advanced.
of another company that is listed on the ac-quiring company’s balance sheet.
Grand strategy Another name for direc-tional strategy.
Green-field development An internationalentry option to build a company’s manufac-turing plant and distribution system in an-other country.
Greenwash A derogatory term referring to acompany’s promoting its environmental sus-tainability efforts with very little action to-ward improving its measurable environmentalperformance.
Gross domestic product (GDP) A measureof the total output of goods and serviceswithin a country’s borders.
Growth strategies A directional strategy thatexpands a company’s current activities.
Hierarchy of strategy A nesting of strategiesby level from corporate to business to func-tional, so that they complement and supportone another.
Horizontal growth A corporate growthconcentration strategy that involves expand-ing the firm’s products into other geographiclocations and/or increasing the range ofproducts and services offered to currentmarkets.
Horizontal integration The degree to whicha firm operates in multiple geographic loca-tions at the same point in an industry’s valuechain.
Horizontal strategy A corporate parentingstrategy that cuts across business unit bound-aries to build synergy across business unitsand to improve the competitive position ofone or more business units.
House of quality A method of managing newproduct development to help project teamsmake important design decisions by gettingthem to think about what users want and howto get it to them most effectively.
Human resource management (HRM)strategy A functional strategy that makes thebest use of corporate human assets.
Human diversity A mix of people from dif-ferent races, cultures, and backgrounds in theworkplace.
Hypercompetition An industry situationin which the frequency, boldness, and ag-gressiveness of dynamic movement by theplayers accelerates to create a condition ofconstant disequilibrium and change.
Idea A concept that could be the foundation of an entrepreneurial venture if the conceptis feasible.
IFAS (Internal Factor Analysis Summary)table A table that organizes internal factorsinto strengths and weaknesses and how wellmanagement is responding to these specificfactors.
Forward integration Assuming a functionpreviously provided by a distributor.
Four-corner exercise An approach to ana-lyzing a competitor in terms of its futuregoals, current strategy, assumptions, andcapabilities, in order to develop a competi-tor’s response profile.
Fragmented industry An industry inwhich no firm has large market share andeach firm serves only a small piece of the to-tal market.
Franchising An international entry strategyin which a firm grants rights to anothercompany/individual to open a retail storeusing the franchiser’s name and operatingsystem.
Free cash flow The amount of money a newowner can take out of a firm without harmingthe business.
Full vertical integration A growth strategyunder which a firm makes 100% of its keysupplies internally and completely controlsits distributors.
Functional strategy An approach taken by afunctional area to achieve corporate and busi-ness unit objectives and strategies by maxi-mizing resource productivity.
Functional structure An organizationalstructure in which employees tend to be spe-cialists in the business functions important tothat industry, such as manufacturing, sales, orfinance.
GE Business Screen A portfolio analysismatrix developed by General Electric, withthe assistance of the McKinsey & Companyconsulting firm.
Geographic-area structure A structure thatallows a multinational corporation to tailorproducts to regional differences and toachieve regional coordination.
Global industry An industry in which a com-pany manufactures and sells the same prod-ucts, with only minor adjustments forindividual countries around the world.
Globalization The internationalization ofmarkets and corporations.
Global warming A gradual increase in theEarth’s temperature leading to changes in theplanet’s climate.
Goal displacement Confusion of means withends, which occurs when activities originallyintended to help managers attain corporateobjectives become ends in themselves or areadapted to meet ends other than those forwhich they were intended.
Goal An open-ended statement of what onewants to accomplish, with no quantificationof what is to be achieved and no time criteriafor completion.
Good will An accounting term describing thepremium paid by one company in its purchase

GLOSSARY G-5
protected by a patent, copyright, trademark,or trade secret.
Interlocking directorate A condition thatoccurs when two firms share a director orwhen an executive of one firm sits on theboard of a second firm.
Intermittent system A method of manufac-turing in which an item is normally processedsequentially, but the work and the sequence ofthe processes vary.
Internal environment Variables within theorganization not usually within the short-runcontrol of top management.
Internal strategic factors Strengths (corecompetencies) and weaknesses that are likelyto determine whether a firm will be able takeadvantage of opportunities while avoidingthreats.
International transfer pricing A method ofminimizing taxes by declaring high profits ina subsidiary located in a country with a lowtax rate and small profits in a subsidiary lo-cated in a country with a high tax rate.
Intranet An information network within an or-ganization that also has access to the Internet.
Investment center A unit in which perfor-mance is measured in terms of the differencebetween the unit’s resources and its servicesor products.
ISO 9000 Standards Series An internationallyaccepted way of objectively documenting acompany’s high level of quality operations.
ISO 14000 Standards Series An internation-ally accepted way to document a company’simpact on the environment.
Issues priority matrix A chart that ranks theprobability of occurrence versus the probableimpact on the corporation of developments inthe external environment.
Job characteristics model An approach tojob design that is based on the belief that taskscan be described in terms of certain objectivecharacteristics and that those characteristicsaffect employee motivation.
Job design The design of individual tasks inan attempt to make them more relevant to thecompany and more motivating to theemployee.
Job enlargement Combining tasks to give aworker more of the same type of duties toperform.
Job enrichment Altering jobs by giving theworker more autonomy and control overactivities.
Job rotation Moving workers through sev-eral jobs to increase variety.
Job shop One-of-a-kind production usingskilled labor.
Joint venture An independent business en-tity created by two or more companies in astrategic alliance.
Justice approach An ethical approach thatproposes that decision makers be equitable,fair, and impartial in the distribution of costsand benefits.
Just-In-Time A purchasing concept in whichparts arrive at the plant just when they areneeded rather than being kept in inventories.
Key performance measures Essentialmeasures for achieving a desired strategicoption—used in the balanced scorecard.
Key success factors Variables that signifi-cantly affect the overall competitive positionof a company within a particular industry.
Late movers Companies that enter a new mar-ket only after other companies have done so.
Law A formal code that permits or forbidscertain behaviors.
Lead director An outside director who callsmeetings of the outside board members andcoordinates the annual evaluation of the CEO.
Lead user A customer who is ahead of mar-ket trends and has needs that go beyond thoseof the average user.
Leading Providing direction to employeesto use their abilities and skills most effec-tively and efficiently to achieve organiza-tional objectives.
Lean Six Sigma A program incorporating thestatistical approach of Six Sigma with the leanmanufacturing program developed by Toyota.
Learning organization An organization thatis skilled at creating, acquiring, and transfer-ring knowledge and at modifying its behaviorto reflect new knowledge and insights.
Levels of moral development Kohlberg pro-posed three levels of moral development: pre-conventional, conventional, and principled.
Leverage ratio An evaluation of how effec-tively a company utilizes its resources to gen-erate revenues.
Leveraged buy-out An acquisition in whicha company is acquired in a transaction fi-nanced largely by debt—usually obtainedfrom a third party, such as an insurance com-pany or an investment banker.
Licensing arrangement An agreement inwhich the licensing firm grants rights to an-other firm in another country or market toproduce and/or sell a branded product.
Lifestyle company A small business inwhich the firm is purely an extension of theowner’s lifestyle.
Line extension Using a successful brandname on additional products, such as Arm& Hammer brand first on baking soda, thenon laundry detergents, toothpaste, and de-odorants.
Linkage The connection between the wayone value activity (for example, marketing) isperformed and the cost of performance of an-other activity (for example, quality control).
Imitability The rate at which a firm’s under-lying resources and capabilities can be dupli-cated by others.
Index of R&D effectiveness An index that iscalculated by dividing the percentage of totalrevenue spent on research and developmentinto new product profitability.
Index of sustainable growth A calculationthat shows how much of the growth rate ofsales can be sustained by internally generatedfunds.
Individual rights approach An ethics be-havior guideline that proposes that humanbeings have certain fundamental rights thatshould be respected in all decisions.
Individualism-collectivism (IC) The extentto which a society values individual freedomand independence of action compared with atight social framework and loyalty to thegroup.
Industry A group of firms producing a simi-lar product or service.
Industry analysis An in-depth examinationof key factors within a corporation’s taskenvironment.
Industry matrix A chart that summarizes the key success factors within a particular industry.
Industry scenario A forecasted descriptionof an industry’s likely future.
Information technology strategy A func-tional strategy that uses information systemstechnology to provide competitive advantage.
Input control A control that specifies re-sources, such as knowledge, skills, abilities,values, and motives of employees.
Inside director An officer or executive em-ployed by a corporation who serves on thatcompany’s board of directors; also calledmanagement director.
Institution theory A concept of organiza-tional adaptation that proposes that organ-izations can and do adapt to changingconditions by imitating other successfulorganizations.
Institutional advantage A competitive bene-fit for a not-for-profit organization when itperforms its tasks more effectively than othercomparable organizations.
Integration A process that involves a rela-tively balanced give-and-take of cultural andmanagerial practices between merger part-ners, with no strong imposition of culturalchange on either company.
Integration manager A person in charge oftaking an acquired company throughthe process of integrating its people andprocesses with those of the acquiring company.
Intellectual property Special knowledgeused in a new product or process developedby a company for its own use and is usually
G-6 GLOSSARY
Liquidation The termination of a firm inwhich all its assets are sold.
Liquidity ratio The percentage showing towhat degree a company can cover its currentliabilities with its current assets.
Logical incrementalism A decision-makingmode that is a synthesis of the planning, adap-tive, and entrepreneurial modes.
Logistics strategy A functional strategy thatdeals with the flow of products into and outof the manufacturing process.
Long-term contract Agreements betweentwo separate firms to provide agreed-upongoods and services to each other for a speci-fied period of time.
Long-term evaluation method A method inwhich managers are compensated for achiev-ing objectives set over a multiyear period.
Long-term orientation (LT) The extent towhich society is oriented toward the longterm versus the short term.
Lower cost strategy A strategy in which acompany or business unit designs, produces,and markets a comparable product more effi-ciently than its competitors.
Management audit A technique used toevaluate corporate activities.
Management By Objectives (MBO) Anorganization-wide approach ensuring pur-poseful action toward mutually agreed-upon objectives.
Management contract Agreements throughwhich a corporation uses some of its person-nel to assist a firm in another country for aspecified fee and period of time.
Market development A marketing functionalstrategy in which a company or business unitcaptures a larger share of an existing market forcurrent products through market penetration or develops new markets for current products.
Market location tactics Tactics that deter-mine where a company or business unit willcompete.
Market position Refers to the selection ofspecific areas for marketing concentrationand can be expressed in terms of market,product, and geographical locations.
Market research A means of obtaining newproduct ideas by surveying current or potentialusers regarding what they would like in a newproduct.
Market segmentation The division of a mar-ket into segments to identify available niches.
Market value added (MVA) The differencebetween the market value of a corporation andthe capital contributed by shareholders andlenders.
Marketing mix The particular combinationof key variables (product, place, promotion,and price) that can be used to affect demandand to gain competitive advantage.
Multinational corporation (MNC) A com-pany that has significant assets and activitiesin multiple countries.
Multiple sourcing A purchasing strategy inwhich a company orders a particular partfrom several vendors.
Multipoint competition A rivalry in which alarge multibusiness corporation competesagainst other large multibusiness firms in anumber of markets.
Mutual service consortium A partnership ofsimilar companies in similar industries thatpool their resources to gain a benefit that istoo expensive to develop alone.
Natural environment That part of the ex-ternal environment that includes physicalresources, wildlife, and climate that are aninherent part of existence on Earth.
Net present value (NPV) A calculation ofthe value of a project that is made by pre-dicting the project’s payouts, adjusting themfor risk, and subtracting the amountinvested.
Network structure An organization (vir-tual organization) that outsources most ofits business functions.
New entrants Businesses entering an indus-try that typically bring new capacity to an in-dustry, a desire to gain market share, andsubstantial resources.
New product experimentation A method oftest marketing the potential of innovativeideas by developing products, probing poten-tial markets with early versions of the prod-ucts, learning from the probes, and probingagain.
No-change strategy A decision to do noth-ing new; to continue current operations andpolicies for the foreseeable future.
North American Free Trade Agreement(NAFTA) Regional free trade agreementbetween Canada, the United States, andMexico.
Not-for-profit organization Private non-profit corporations and public governmentalunits or agencies.
Objectives The end result of planned activitystating what is to be accomplished by when,and quantified if possible.
Offensive tactic A tactic that calls for com-peting in an established competitor’s currentmarket location.
Offshoring The outsourcing of an activity orfunction to a provider in another country.
Open innovation A new approach to R&D inwhich a firm uses alliances and connectionswith corporate, government, and academiclabs to learn about new developments.
Operating budget A budget for a businessunit that is approved by top management dur-ing strategy formulation and implementation.
Marketing strategy A functional strategythat deals with pricing, selling, and distribut-ing a product.
Masculinity-femininity (MF) The extent towhich society is oriented toward money andthings.
Mass customization The low-cost produc-tion of individually customized goods andservices.
Mass production A system in which em-ployees work on narrowly defined, repetitivetasks under close supervision in a bureau-cratic and hierarchical structure to produce alarge amount of low-cost, standard goods andservices.
Matrix of change A chart that compares tar-get practices (new programs) with existingpractices (current activities).
Matrix structure A structure in which func-tional and product forms are combinedsimultaneously at the same level of the orga-nization.
Mercosur/Mercosul South American free-trade area including Argentina, Brazil,Uruguay, and Paraguay.
Merger A transaction in which two or morecorporations exchange stock, but from whichonly one corporation survives.
Mission The purpose or reason for an organi-zation’s existence.
Mission statement The definition of thefundamental, unique purpose that sets anorganization apart from other firms of its typeand identifies the scope or domain of theorganization’s operations in terms of products(including services) offered and marketsserved.
Modular manufacturing A system in whichpreassembled subassemblies are delivered asthey are needed to a company’s assembly-lineworkers who quickly piece the modules to-gether into finished products.
Moore’s law An observation of GordonMoore, co-founder of Intel, that microproces-sors double in complexity every 18 months.
Moral relativism A theory that proposes thatmorality is relative to some personal, social,or cultural standard, and that there is nomethod for deciding whether one decision isbetter than another.
Morality Precepts of personal behavior thatare based on religious or philosophicalgrounds.
Most favored nation A policy of the WorldTrade Organization stating that a membercountry cannot grant one trading partnerlower customs duties without granting them toall WTO member nations.
Multidomestic industry An industry inwhich companies tailor their products to thespecific needs of consumers in a particularcountry.

GLOSSARY G-7
Penetration pricing A marketing pricingstrategy to obtain dominant market share byusing low price.
Performance The end result of activities, ac-tual outcomes of a strategic managementprocess.
Performance appraisal system A system tosystematically evaluate employee perfor-mance and promotion potential.
Performance gap A performance gap existswhen performance does not meet expecta-tions.
Periodic statistical report Reports summa-rizing data on key factors such as the numberof new customer contracts, volume of re-ceived orders, and productivity figures.
Phases of strategic management A set of four levels of development through whicha firm generally evolves into strategicmanagement.
Piracy The making and selling counterfeitcopies of well-known name-brand products,especially software.
Planning mode A decision-making modethat involves the systematic gathering of ap-propriate information for situation analysis,the generation of feasible alternative strate-gies, and the rational selection of the mostappropriate strategy.
Policy A broad guideline for decision makingthat links the formulation of strategy with itsimplementation.
Political strategy A strategy to influence acorporation’s stakeholders.
Population ecology A theory that proposesthat once an organization is successfully es-tablished in a particular environmentalniche, it is unable to adapt to changingconditions.
Portfolio analysis An approach to corporatestrategy in which top management views itsproduct lines and business units as a series ofinvestments from which it expects a prof-itable return.
Power distance (PD) The extent to which a society accepts an unequal distribution ofinfluence in organizations.
Prediction markets A forecasting techniquein which people make bets on the likelihoodof a particular event taking place.
Pressure-cooker crisis A situation that existswhen employees in collaborative organiza-tions eventually grow emotionally and physi-cally exhausted from the intensity ofteamwork and the heavy pressure for innova-tive solutions.
Primary activity A manufacturing firm’scorporate value chain, including inboundlogistics, operations process, outbound lo-gistics, marketing and sales, and service.
Primary stakeholders A high prioritygroup that affects or is affected by theachievement of a firm’s objectives.
Prime interest rate The rate of interest bankscharge on their lowest-risk loans.
Private nonprofit corporation A non-governmental not-for-profit organization.
Privatization The selling of state-ownedenterprises to private individuals. Also thehiring of a private business to provide serv-ices previously offered by a state agency.
Procedures A list of sequential steps thatdescribe in detail how a particular task or jobis to be done.
Process innovation Improvement to themaking and selling of current products.
Product champion A person who generatesa new idea and supports it through many or-ganizational obstacles.
Product development A marketing strategyin which a company or unit develops newproducts for existing markets or develops newproducts for new markets.
Product innovation The development of anew product or the improvement of an exist-ing product’s performance.
Product life cycle A graph showing timeplotted against sales of a product as it movesfrom introduction through growth and matu-rity to decline.
Product R&D Research and developmentconcerned with product or product-packagingimprovements.
Product/market evolution matrix A chartdepicting products in terms of their competi-tive positions and their stages of product/market evolution.
Product-group structure A structure of amultinational corporation that enables thecompany to introduce and manage a similarline of products around the world.
Production sharing The process of combin-ing the higher labor skills and technologyavailable in developed countries with thelower-cost labor available in developingcountries.
Professional liquidator An individual calledon by a bankruptcy court to close a firm andsell its assets.
Profit center A unit’s performance, mea-sured in terms of the difference between rev-enues and expenditures.
Profit strategy A strategy that artificiallysupports profits by reducing investment andshort-term discretionary expenditures.
Profitability ratios Ratios evaluating a com-pany’s ability to make money over a period of time.
Profit-making firm A firm depending onrevenues obtained from the sale of its goods
Operating cash flow The amount of moneygenerated by a company before the costs offinancing and taxes are figured.
Operating leverage The impact of a specificchange in sales volume on net operatingincome.
Operations strategy A functional strategythat determines how and where a productor service is to be manufactured, the levelof vertical integration in the productionprocess, and the deployment of physicalresources.
Opportunity A strategic factor consideredwhen using the SWOT analysis.
Orchestrator A top manager who articulatesthe need for innovation, provides funding forinnovating activities, creates incentives formiddle managers to sponsor new ideas, andprotects idea/product champions from suspi-cious or jealous executives.
Organization slack Unused resources withinan organization.
Organizational analysis Internal scanningconcerned with identifying an organization’sstrengths and weaknesses.
Organizational learning theory A theoryproposing that an organization adjusts tochanges in the environment through the learn-ing of its employees.
Organizational life cycle How organizationsgrow, develop, and eventually decline.
Organizational structure The formal setupof a business corporation’s value chain com-ponents in terms of work flow, communica-tion channels, and hierarchy.
Output control A control that specifies whatis to be accomplished by focusing on the endresult of the behaviors through the use of ob-jectives and performance targets.
Outside directors Members of a board of directors who are not employees of the board’s corporation; also callednon–management directors.
Outsourcing A process in which resourcesare purchased from others through long-termcontracts instead of being made within thecompany.
Parallel sourcing A process in which twosuppliers are the sole suppliers of two differ-ent parts, but they are also backup suppliersfor each other’s parts.
Pattern of influence A concept stating thatinfluence in strategic management derivesfrom a not-for-profit organization’s sourcesof revenue.
Pause/proceed with caution strategy Acorporate strategy in which nothing newis attempted; an opportunity to rest beforecontinuing a growth or retrenchmentstrategy.

G-8 GLOSSARY
and services to customers, who typically payfor the costs and expenses of providing theproduct or service plus a profit.
Program A statement of the activities orsteps needed to accomplish a single-use planin strategy implementation.
Propitious niche A portion of a market thatis so well suited to a firm’s internal and exter-nal environment that other corporations arenot likely to challenge or dislodge it.
Public governmental unit or agency A kindof not-for-profit organization that is estab-lished by government or governmental agen-cies (such as welfare departments, prisons,and state universities).
Public or collective good Goods that arefreely available to all in a society.
Pull strategy A marketing strategy in whichadvertising pulls the products through thedistribution channels.
Punctuated equilibrium A point at which acorporation makes a major change in its strat-egy after evolving slowly through a longperiod of stability.
Purchasing power parity (PPP) A measureof the cost, in dollars, of the U.S.-producedequivalent volume of goods that another na-tion’s economy produces.
Purchasing strategy A functional strategythat deals with obtaining the raw materials,parts, and supplies needed to perform theoperations functions.
Push strategy A marketing strategy in whicha large amount of money is spent on tradepromotion in order to gain or hold shelf spacein retail outlets.
Quality of work life A concept that empha-sizes improving the human dimension ofwork to improve employee satisfaction andunion relations.
Quasi-integration A type of vertical growth/integration in which a company does notmake any of its key supplies but purchasesmost of its requirements from outside suppli-ers that are under its partial control.
Question marks New products that havepotential for success and need a lot of cash for development.
RFID A technology in which radio frequencyidentification tags containing product infor-mation is used to track goods through inven-tory and distribution channels.
R&D intensity A company’s spending onresearch and development as a percentage ofsales revenue.
R&D mix The balance of basic, product, andprocess research and development.
R&D strategy A functional strategy thatdeals with product and process innovation.
Ratio analysis The calculation of ratios fromdata in financial statements to identify possi-ble strengths or weaknesses.
Sarbanes-Oxley Act Legislation passed bythe U.S. Congress in 2002 to promote andformalize greater board independence andoversight.
Scenario box A tool for developing corpo-rate scenarios in which historical data areused to make projections for generating proforma financial statements.
Scenario writing A forecasting technique inwhich focused descriptions of different likelyfutures are presented in a narrative fashion.
Secondary stakeholders Lower-prioritygroups that affect or are affected by theachievement of a firm’s objectives.
Sell-out strategy A retrenchment optionused when a company has a weak competitiveposition resulting in poor performance.
Separation A method of managing the cul-ture of an acquired firm in which the twocompanies are structurally divided, withoutcultural exchange.
SFAS (Strategic Factors Analysis Sum-mary) matrix A chart that summarizes an or-ganization’s strategic factors by combiningthe external factors from an EFAS table withthe internal factors from an IFAS table.
Shareholder value The present value of theanticipated future stream of cash flows froma business plus the value of the company if itwere liquidated.
Short-term orientation The tendency ofmanagers to consider only current tactical oroperational issues and ignore strategic ones.
Simple structure A structure for new entre-preneurial firms in which the employees tendto be generalists and jacks-of-all-trades.
Six Sigma A statistically-based programdeveloped to identify and improve a poorlyperforming process.
Skim pricing A marketing strategy in whicha company charges a high price while a prod-uct is novel and competitors are few.
Small-business firm An independentlyowned and operated business that is not dom-inant in its field and that does not engage ininnovative practices.
SO, ST, WO, WT strategies A series of pos-sible business approaches based on combi-nations of opportunities, threats, strengths,and weaknesses.
Social capital The goodwill of key stake-holders, which can be used for competitiveadvantage.
Social entrepreneurship A business inwhich a not-for-profit organization starts anew venture to achieve social goals.
Social responsibility The ethical and discre-tionary responsibilities a corporation owes itsstakeholders.
Societal environment Economic, technolog-ical, political-legal, and sociocultural envi-ronmental forces that do not directly touch on
Real options approach An approach to newproject investment when the future is highly uncertain.
Red flag An indication of a serious underly-ing problem.
Red tape crisis A crisis that occurs when acorporation has grown too large and complexto be managed through formal programs.
Reengineering The radical redesign of busi-ness processes to achieve major gains in cost,service, or time.
Regional industry An industry in whichmultinational corporations primarily coordi-nate their activities within specific geo-graphic areas of the world.
Relationship-based governance A govern-ment system perceived to be less transparentand have a higher degree of corruption.
Repatriation of profits The transfer of prof-its from a foreign subsidiary to a corpora-tion’s headquarters.
Replicability The ability of competitors to du-plicate resources and imitate another firm’ssuccess.
Resources A company’s physical, human,and organizational assets that serve as thebuilding blocks of a corporation.
Responsibility center A unit that is isolatedso that it can be evaluated separately from therest of the corporation.
Retired executive directors Past leaders of acompany kept on the board of directors afterleaving the company.
Retrenchment strategy Corporate strategiesto reduce a company’s level of activities andto return it to profitability.
Return on equity (ROE) A measure of per-formance that is calculated by dividing net in-come by total equity.
Return on investment (ROI) A measure ofperformance that is calculated by dividing netincome before taxes by total assets.
Revenue center A responsibility center inwhich production, usually in terms of unit ordollar sales, is measured without considera-tion of resource costs.
Reverse engineering Taking apart a competi-tor’s product in order to find out how it works.
Reverse stock split A stock split in which aninvestor’s shares are reduced for the same to-tal amount of money.
Risk A measure of the probability that onestrategy will be effective, the amount of assetsthe corporation must allocate to that strategy,and the length of time the assets will beunavailable.
Rule-based governance A governancesystem based on clearly stated rules andprocedures.
Rules of thumb Approximations basednot on research, but on years of practicalexperience.

the short-run activities of an organization butinfluence its long-run decisions.
Sole sourcing Relying on only one supplierfor a particular part.
Sources of innovation Drucker’s proposedseven sources of new ideas that should bemonitored by those interested in starting en-trepreneurial ventures.
Sponsor A department manager who recog-nizes the value of a new idea, helps obtainfunding to develop the innovation, and facili-tates the implementation of the innovation.
Stability strategy Corporate strategies tomake no change to the company’s currentdirection or activities.
Staffing Human resource management pri-orities and use of personnel.
Stages of corporate development A patternof structural development that corporationsfollow as they grow and expand.
Stages of international development Thestages through which international corpora-tions evolve in their relationships with widelydispersed geographic markets and the mannerin which they structure their operations and programs.
Stages of new product development Thestages of getting a new innovation into themarketplace.
Stage-gate process A method of managingnew product development to increase thelikelihood of launching new products quicklyand successfully. The process is a series ofsteps to move products through the six stagesof new product development.
Staggered board A board on which directorsserve terms of more than one year so that onlya portion of the board of directors stands forelection each year.
Stakeholder analysis The identification andevaluation of corporate stakeholders.
Stakeholder measure A method of keepingtrack of stakeholder concerns.
Stakeholder priority matrix A chart thatcategorizes stakeholders in terms of theirinterest in a corporation’s activities andtheir relative power to influence the corpo-ration’s activities.
Stall point A point at which a company’sgrowth in sales and profits suddenly stops andbecomes negative.
Standard cost center A responsibility centerthat is primarily used to evaluate the perfor-mance of manufacturing facilities.
Standard operating procedures Plans thatdetail the various activities that must be carriedout to complete a corporation’s programs.
Star Market leader that is able to generateenough cash to maintain its high market share.
Statistical modeling A quantitative tech-nique that attempts to discover causal or
Strategic piggybacking The development ofa new activity for a not-for-profit organiza-tion that would generate the funds needed tomake up the difference between revenues andexpenses.
Strategic planning staff A group of peoplecharged with supporting both top manage-ment and business units in the strategicplanning process.
Strategic R&D alliance A coalitionthrough which a firm coordinates its re-search and development with another firm(s)to offset the huge costs of developing newtechnology.
Strategic rollup A means of consolidating afragmented industry in which an entrepreneuracquires hundreds of owner-operated smallbusinesses resulting in a large firm with eco-nomies of scale.
Strategic sweet spot A market niche inwhich a company is able to satisfy customers’needs in a way that competitors cannot.
Strategic type A category of firms based ona common strategic orientation and a combi-nation of structure, culture, and processes thatare consistent with that strategy.
Strategic vision A description of what thecompany is capable of becoming.
Strategic window A unique market opportu-nity that is available only for a particulartime.
Strategic-funds method An evaluationmethod that encourages executives to look atdevelopment expenses as being different fromexpenses required for current operations.
Strategies to avoid Strategies sometimes fol-lowed by managers who have made a pooranalysis or lack creativity.
Strategy A comprehensive plan that states how a corporation will achieve its missionand objectives.
Strategy formulation Development of long-range plans for the effective management ofenvironmental opportunities and threats inlight of corporate strengths and weaknesses.
Strategy implementation A process bywhich strategies and policies are put into ac-tion through the development of programs,budgets, and procedures.
Strategy-culture compatibility The matchbetween existing corporate culture and a newstrategy to be implemented.
Structure follows strategy The process throughwhich changes in corporate strategy normallylead to changes in organizational structure.
Stuck in the middle A situation in which acompany or business unit has not achieved ageneric competitive strategy and has no com-petitive advantage.
Suboptimization A phenomenon in which aunit optimizes its goal accomplishment to thedetriment of the organization as a whole.
explanatory factors that link two or more timeseries together.
STEEP analysis An approach to scanning thesocietal environment that examines socio-cultural, technological, economic, ecological,and political-legal forces. Also called PESTELanalysis.
Steering control Measures of variables thatinfluence future profitability.
Stewardship theory A theory proposing thatexecutives tend to be more motivated to act inthe best interests of the corporation than intheir own self-interests.
Strategic alliance A partnership of two ormore corporations or business units toachieve strategically significant objectivesthat are mutually beneficial.
Strategic audit A checklist of questions byarea or issue that enables a systematic analy-sis of various corporate functions and activi-ties. It’s a type a management audit.
Strategic audit worksheet A tool used to an-alyze a case.
Strategic business unit (SBU) A division orgroup of divisions composed of independentproduct-market segments that are given pri-mary authority for the management of theirown functions.
Strategic choice The evaluation of strategiesand selection of the best alternative.
Strategic choice perspective A theory thatproposes that organizations adapt to a changingenvironment and have the opportunity andpower to reshape their environment.
Strategic decision-making process Aneight-step process that improves strategic de-cision making.
Strategic decisions Decisions that deal withthe long-run future of an entire organizationand are rare, consequential, and directive.
Strategic factors External and internal factorsthat determine the future of a corporation.
Strategic flexibility The ability to shift fromone dominant strategy to another.
Strategic group A set of business units orfirms that pursue similar strategies and havesimilar resources.
Strategic inflection point The period in anorganization’s life in which a major changetakes place in its environment and creates anew basis for competitive advantage.
Strategic management A set of managerialdecisions and actions that determine the long-run performance of a corporation.
Strategic management model A rational,prescriptive planning model of the strategicmanagement process including environmen-tal scanning, strategy formulation, strategyimplementation, and evaluation and control.
Strategic myopia The willingness to rejectunfamiliar as well as negative information.
GLOSSARY G-9
Tipping point The point at which a slowlychanging situation goes through a massive,rapid change.
Top management responsibilities Leadershiptasks that involve getting things accomplishedthrough and with others in order to meet thecorporate objectives.
Total Quality Management (TQM) Anoperational philosophy that is committed to customer satisfaction and continuous improvement.
TOWS matrix A matrix that illustrates howexternal opportunities and threats facing a particular company can be matched withthat company’s internal strengths andweaknesses to result in four sets of strategicalternatives.
Transaction cost economics A theory that proposes that vertical integration is moreefficient than contracting for goods and serv-ices in the marketplace when the transactioncosts of buying goods on the open market be-come too great.
Transfer price A practice in which oneunit can charge a transfer price for eachproduct it sells to a different unit within acompany.
Transferability The ability of competitors togather the resources and capabilities neces-sary to support a competitive challenge.
Transformational leader A leader whocauses change and movement in an organiza-tion by providing a strategic vision.
Transparent The speed with which otherfirms can understand the relationship of re-sources and capabilities supporting a success-ful firm’s strategy.
Trends in governance Current developmentsin corporate governance.
Trigger point The point at which a countryhas developed economically so that demandfor a particular product or service is increas-ing rapidly.
Triggering event Something that acts as astimulus for a change in strategy.
Turnaround specialist A manager who isbrought into a weak company to salvage thatcompany in a relatively attractive industry.
Turnaround strategy A plan that empha-sizes the improvement of operational effi-ciency when a corporation’s problems arepervasive but not yet critical.
Turnkey operation Contracts for the con-struction of operating facilities in exchangefor a fee.
Turnover A term used by European firms torefer to sales revenue. It also refers to theamount of time needed to sell inventory.
Uncertainty avoidance (UA) The extent towhich a society feels threatened by uncertainand ambiguous situations.
Union of South American Nations An orga-nization formed in 2008 to unite Mercosurand the Andean Community.
Utilitarian approach A theory that proposesthat actions and plans should be judged bytheir consequences.
Value chain A linked set of value-creatingactivities that begins with basic raw materialscoming from suppliers and ends with distrib-utors getting the final goods into the hands ofthe ultimate consumer.
Value-chain partnership A strategic al-liance in which one company or unit forms along-term arrangement with a key supplier ordistributor for mutual advantage.
Value disciplines An approach to evaluating acompetitor in terms of product leadership, op-erational excellence, and customer intimacy.
Vertical growth A corporate growth strategyin which a firm takes over a function previ-ously provided by a supplier or distributor.
Vertical integration The degree to which afirm operates in multiple locations on an in-dustry’s value chain from extracting raw ma-terials to retailing.
Virtual organization An organizational struc-ture that is composed of a series of projectgroups or collaborations linked by changingnonhierarchical, cobweb-like networks.
Virtual team A group of geographicallyand/or organizationally dispersed coworkersthat are assembled using a combination oftelecommunications and information tech-nologies to accomplish an organizational task.
Vision A view of what management thinks anorganization should become.
VRIO framework Barney’s proposed analysisto evaluate a firm’s key resources in terms ofvalue, rareness, imitability, and organization.
Web 2.0 A term used to describe the evolu-tion of the Internet into wikis, blogs, RSS,social networks, podcasts, and mash-ups.
Weighted-factor method A method that is appropriate for measuring and rewardingthe performance of top SBU managers andgroup-level executives when performancefactors and their importance vary from oneSBU to another.
Whistle-blower An individual who reports toauthorities incidents of questionable organi-zational practices.
World Trade Organization A forum forgovernments to negotiate trade agreementsand settle trade disputes.
Z-value A formula that combines five ratiosby weighting them according to their impor-tance to a corporation’s financial strength topredict the likelihood of bankruptcy.
NOTE: This glossary contains terms used inthe twelve chapters of this textbook plus thethree additional chapters provided on thepublisher’s Web site to buyers of this book.
Substages of small business development Aset of five levels through which new venturesoften develop.
Substitute products Products that appear tobe different but can satisfy the same need asother products.
Supply-chain management The formation ofnetworks for sourcing raw materials, manufac-turing products or creating services, storingand distributing goods, and delivering goods orservices to customers and consumers.
Support activity An activity that ensures thatprimary value-chain activities operate effec-tively and efficiently.
SWOT analysis Identification of strengths,weaknesses, opportunities, and threats thatmay be strategic factors for a specificcompany.
Synergy A concept that states that the whole isgreater than the sum of its parts; that two unitswill achieve more together than they couldseparately.
Tacit knowledge Knowledge that is not eas-ily communicated because it is deeply rootedin employee experience or in a corporation’sculture.
Tactic A short-term operating plan detailinghow a strategy is to be implemented.
Takeover A hostile acquisition in which onefirm purchases a majority interest in anotherfirm’s stock.
Taper integration A type of vertical integra-tion in which a firm internally produces lessthan half of its own requirements and buys therest from outside suppliers.
Task environment The part of the businessenvironment that includes the elements orgroups that directly affect the corporationand, in turn, are affected by it.
Technological competence A corporation’sproficiency in managing research personneland integrating their innovations into its day-to-day operations.
Technological discontinuity The displace-ment of one technology by another.
Technological follower A company that imi-tates the products of competitors.
Technological leader A company that pioneersan innovation.
Technology sourcing A make-or-buy deci-sion that can be important in a firm’s R&Dstrategy.
Technology transfer The process of taking anew technology from the laboratory to the marketplace.
Time to market The time from inception toprofitability of a new product.
Timing tactics Tactics that determines whena business will enter a market with a newproduct.
G-10 GLOSSARY
I-1
Applebee’s, 304Apria Healthcare, 47Arcelor, 278Archer Daniels Midland (ADM), 195Arctic Cat, 279, 280Arctic Council, 96Aristotle, 257Arm & Hammer, 180, 238Arthur D. Little Inc., 115Asea Brown Boveri (ABB), 290, 294Ashridge Strategic Management Centre, 18Association of Southeast Asian Nations
(ASEAN), 8, 9, 113Astra Zenica, 188AT&T, 240, 307, 316Automotive Resources, 346Avis, 300Avnet, Inc., 123Avon Co., 27, 121, 138, 247
Baan, 162, 347Baby Fresh Organic Baby Foods, 287Badaracco, J., 86Bain & Co., 7, 217, 248, 306, 340, 344Bajal Auto, 142Baldor Electric Company, 242Baldwin Locomotive, 98Baldwin-United, 284Ballmer, S., 60Banadex, 90Banbury, C., 296Banerjee, P., 361Bank of America, 11Bank of Montreal, 47Bank One, 270Bankers Trust of New York, 306, 309Banking Act of 1933, 52Barclays, 370Barnevik, P., 150Barney, J. B., 195Baxter Healthcare, 134Bechtel Group Inc., 27Beijing Olympics, 22Bell South, 240, 341Ben & Jerry’s Ice Cream, 75Benetton, 287Bennigan’s Grill & Tavern, 220Berkshire Hathaway, 215, 355Berle, A. A., 50Bert, A., 272Best Buy, 119, 144, 209, 270Best Western, 47Bezos, J., 26, 61Bharti Enterprises, 213Bharti-Mart, 213Bice, A., 79Big Idea Group, 242
Bill of Rights, 85Birkinshaw, J. M., 228Bisquick, 225Black & Decker, 198Black, J. S., 310Blank, A., 42Bloom, R., 160BMW, 21, 149, 152, 158, 187, 213, 355Body Shop, 59, 60Boeing Company, 21, 111, 159, 170, 214,
248, 316Bombardier, 214, 215, 288Borders, 230Bosch Appliances, 229Bosch-Siemens, 191Bose Corporation, 244Boston Consulting Group, 5, 221Boston University, 360Boveri AG, 150BP Amoco, 145Brabeck-Letmathe, P., 295Brady Bunch, 105Branson, R., 60Brastemp, 243Brigham, L., 94Bristol-Myers Squibb, 210, 306British Aerospace, 197British Airways, 8, 19, 125British Petroleum (BP), 13, 145, 209, 371Brynjolfsson, E., 274Budweiser, 196, 212, 346Buffet, W., 215Burger King, 116Burns, L., 222Busch Gardens, 104Business Environment Risk Index, 115Business Roundtable Institute for Corporate
Ethics, 83Business Software Alliance, 246Business Week, 11, 42, 63, 302Byron, W., 72
Cadbury Cocoa Partnership, 276Cadbury Report, 56Cadbury Schweppes, 18, 19, 276Cadillac, 22CAFTA, 8Calhoun, D., 4Callaway, 346Campbell, A., 18, 226, 227, 278Canadair, 214Canary Wharf, 370CANENA, 345Canon, 84, 211Carbon Trust, 11, 340Carbonrally.com, 100Carrefour, 211, 213
3Com, 2403M, 21, 47, 125, 270, 290, 294, 333, 35560 Minutes, 346A&W, 198A. C. Nielsen Co., 121Abbott Laboratories, 312Accenture, 360Ace Hardware, 246Addidas, 111Adelphia Communications, 55Admiral, 315Adobe, 354Aerospatiale, 197AES, 370AFL-CIO, 58AIM Global, 348Airbus Industrie, 111, 170, 197, 214, 254Ajax Continental, 316Alamo, 186Albertson’s, 188Alcatel-Alsthorn NV, 150Alcoa, 322Aldi, 186Alexander, M., 226, 227All-China Federation of Trade Unions, 105Allen, J., 204Allied Corp. 207Allied Signal, 208, 290, 306Allport-Vernon-Lindzey Study of Values, 80Altman, E.I., 371Amazon.com, 26, 61, 143, 230America West, 211America’s Most Admired Companies, 355American Airlines, 8, 19, 332American Customer Satisfaction Index
(ACSI), 44, 332American Cyanamid, 294, 295American Express, 240, 355American Family Association (AFA), 78American Hospital Supply (AHS), 162American Management Assoc., 248, 333American Productivity & Quality Center
(APQC), 344American Society for Industrial
Security, 121American Society of Training and
Development, 303Americans for Balanced Energy Choices, 322Amgen, 25Amnesty International, 59Amoco, 145Andean Community, 8, 9Anheuser-Busch, 53, 143, 153, 194, 196,
212, 213, 245, 343Aossey, B., 174Apple, 60, 109, 112, 139, 187, 194, 230,
239, 270, 283, 343, 347, 355
NAME INDEX

I-2 NAME INDEX
Carroll, A., 72, 73Carroll’s Foods, 208, 209Case, 102Casey’s General Store, 258Castaño, C., 90Caterpillar, 152, 165, 229, 270, 289, 322Cavanagh, G. F., 85Celta, 243Census of Manufacturing, 318Center for Energy & Economic Develop-
ment (CEED), 322Center for Financial Research & Analysis
(DFRA), 364Central American Free Trade Agreement
(CAFTA), 9Certified Emissions Reducer (CER), 370Chandler, A., 14, 279, 283Chang, S., 294Charan, R., 341Charmin, 188Checkers Restaurants, 364Cheerios, 70, 111Chevrolet Volt, 222Chevron, 254Chiquita Brands International Inc., 90Chiscos, 346Chouinard, Y., 187Chow, D., 346Christensen, C. M., 156Chrysler Corp., 52, 159, 196, 241, 244, 259,
322, 334Chung, W., 8Church & Dwight Co., 180, 236, 238Circuit City, 144, 220Cisco Systems, 21, 55, 73, 122, 208, 331,
346, 355Citibank, 370Citicorp, 306Citigroup, 11Claussen, E., 9Clayton Act, 52Clinton, H., 125Clorox Company, 195, 198Coca-Cola, 11, 18, 152, 161, 194, 245, 338,
339, 347Colgate-Palmolive, 236, 238Colt’s Manufacturing, 284Combined Code of Conduct, 56Comcast, 57Compaq, 112, 216, 360, 361ConAgra, 257Cone, Inc., 74Conference Board, 74ConocoPhillips, 10Construcciones Aeronáuticas, 197Converse, 111Cooper & Lybrand, 196Cooper, C. 80Corning, Inc., 291, 303Corporate Library, 53, 56Cosby Show, 105
Eastman Kodak, 98, 284, 308Eaton Corporation, 352eBay, 143, 260, 348Echeverria, J. 11Eckberg, J., 321Eco-Management and Audit Regulations, 59Economic Espionage Act in 1996, 122Economist, 122Economist Intelligence Unit, 74, 115, 197Ecopods, 86Eisner, M., 62Electrolux, 51, 125, 191, 310, 371Electronic Data Systems (EDS), 360Eli Lilly, 125Elion Chemical, 245Elliot, J. R., 104Ellison, L., 207, 280, 281Emerson Electric, 53Encyclopaedia Britannica Inc., 26Energy Star, 229Enhanced Tracker, 342Enron, 44, 45, 55, 79, 80, 82Ensign, P.C., 228Enterprise Rent-A-Car, 300Environics, 10Environmental Protection Agency, 100Equitable Life, 46Erhardt, W., 302Ericsson, 211Eskew, M., 125Estée Lauder, 104Ethics Resource Center, 79European Aeronautic & Space Co.
(EADS), 170European Union (EU), 8, 9, 10, 104, 113,
119, 370Excel, 111, 251Exxon, 21
Facebook, 162Fairfax, 121Fazio, L., 79Federated Department Stores, 278FedEx, 4, 22, 138, 162, 208, 247, 342,
348, 355Ferari, M., 144Fiat, 213, 214Fiat Group, 296Findex, 121Finsbury Data Services, 121Fiorina, C., 62, 360First Boston, 240Folgers, 198Footprint Chronicles, 187Forbes 100, 6Ford Motor Co., 78, 136, 144, 145, 160,
244, 248, 274, 283, 290,308, 333
Ford, H, 144, 208, 283Fortune, 70, 355Foster, R., 155
Costco Wholesale, 270, 355Craigslist, 260Cramer, J., 23Crane, A., 75Credit Suisse, 370Crest, 211Crest Whitestrips, 227Cromme Commission, 56CSX Corp., 216Cummins, Inc., 229CVS, 270
D’Aveni, R., 13, 118, 191, 192Daft, D., 161Daimler-Benz Aerospace, 197, 270DaimlerChrysler, 314Daksh eServices Ltd., 248Dale, K., 244Danone, 245Dashboard software, 332Davis, S. M., 286Dean Foods Co., 241Dean, H., 241Deere and Co., 188, 274, 338Defining Moments, 86Degeorge, 82Delawder, T., 333Delay, T., 340Dell Computer, 23, 105, 110, 112, 133, 141,
143, 163, 186, 191, 217, 244,248, 355, 360
Dell, M., 23, 141, 217Deloitte & Touche Consulting Group, 107Delphi Corp., 220, 243Delta Airlines, 211, 219, 278Delta Small Car Program, 150Deming, W. E., 244DHL, 200Diligence Inc., 121Disney, W., 143Dixon, L., 244Dodge Viper, 259Doha Round, 103Dole Food, 348Donahoe, J., 260Dow Chemical, 290Dow Corning, 134Dow Jones & Company, 75, 76Dow Jones Sustainability Index (DJSI),
11, 76Dr. Pepper/Snapple, 19Draghi Law of l998, 56Drauch, D., 222Dreamliner, 248Duke Energy, 322DuPont, 63, 143, 223, 279, 280,
282, 333Durant, W., 283
Eastern Airlines, 250, 284Eastman Chemical Co., 341

NAME INDEX I-3
Greiner, L. E., 280, 283Gretzky, W., 127Grey-Wheelright, 323Group Danone, 295Grove, A., 24, 77, 113, 254
Hambrick, D., 29, 30Hamilton Beach, 198Hamilton, R. D., 333Hammer, M., 289Hardee’s, 116Harley-Davidson, 290, 309Harper Collins, 230Harrigan, K. R., 209Harris Interactive, 70Harris Poll, 75Hay Group, 355Hayes Microcomputer Products, 285Hayes, D., 285HCL Technologies, 246Head & Shoulders, 211, 346Healthy Choice, 257Heartland Institute, 322Hegel, 257Heilmeier, G., 156Heineken, 163, 181Herd, T., 272Hershey Foods, 19, 308, 347Hertz, 300Hesse, D., 109Hewitt Associates, 314Hewlett, W., 360Hewlett-Packard, 13, 62, 84, 134, 143, 149,
158, 191, 206, 211, 216, 246,284, 333, 260, 361
Hofstede, G., 319, 320Home Café, 198Home Depot, 22, 42, 200, 239, 277, 285,
312, 314, 347Homecoming Financial, 79Honda, 139, 189, 213Honeywell, 244Hoover, 219Hoover, R., 291, 303Hoover’s Online, 12, 121Hovis, J., 123HSBC, 370Huggies, 193Hurricane Katrina, 11Hurt, M., 360Hypercompetition, 13, 191
IBM, 8, 26, 27, 107, 112, 115, 117, 133,142, 58, 197, 213, 223, 242,244, 247, 250, 280, 307, 310,354, 255, 360
ImClone, 210Immelt, J., 2, 308Impacts of a Warming Arctic, 94In Search of Excellence, 352In the Garden, 391
InBev, 213Indian Auto Show, 136Infrasource Services, 57Ingersoll-Rand, 244Innovator’s Dilemma, 156Institutional Shareholder Services (ISS), 56Intel, 21, 77, 113, 140, 152, 224, 241,
254, 339Intercontinental Hotels, 251Intergovernmental Panel on Climate Change
(IPCC), 12International Accounting Standards
Board, 345International Electrotechnical Commission
(IEC), 345International Energy Agency, 10International Harvester, 284, 347International House of Pancakes (IHOP), 304International Monetary Fund, 101International Organization for Standardiza-
tion (ISO), 345International Panel on Climate Change, 128International Paper, 212International Standards Assoc., 333Internet Explorer, 143, 193Interstate Bakeries, 104Intrade.com, 125Investor Responsibility Research
Center, 57Iowa State University, 274ISDC, 346Iverson, K., 328Ivory, 152
J. D. Edwards, 162, 347J. P. Morgan Chase & Co., 249Jaguar, 136, 219JetBlue, 170Jewel, 188Jobs, S., 60, 230, 283John Deere, 102, 239Johns-Manville, 284Johnson & Johnson (J&J), 78, 84, 133, 228,
259, 355Johnson, L., 274Jones Surplus, 316Jones, M., 277Joyce, W., 7JPMorgan Chase, 11Jung, C., 323
Kant, I. 85Kaplan, R. S., 339KappaWest, 134Kearney, A. T., 272Kellogg Co., 239Kenworth, 187KeraVision, Inc., 341KFC, 174, 198Kimberly Clark, 134, 193, 228, 240King, S., 230
Frank J. Zamboni & Co., 179Fredrickson, J., 29, 30Freeman, K., 322Freightliner, 187Friedman, M., 72, 73, 74Friedman, T., 8Friends of the Earth, 59Frost, T. S., 115, 228Fujitsu Ltd., 250Fuld-Gilad-Herring Academy of Competi-
tive Intelligence, 108
Galbraith, 145Gap International, 84Gartner Group, 159Gaskell, J., 144Gates, W., 60, 118Gateway, 105, 112GE Capital International Services, 248GE Energy Financial Services, 370Genentech, 25, 55, 354General Agreement on Tariffs and Trade
(GATT), 103General Electric (GE), 2, 5, 6, 8, 21, 22, 27,
47, 98, 125, 138, 152, 159,196, 211, 215, 219, 223, 227,245, 247, 248, 258, 282, 290,304, 306, 307, 308, 322, 339,343, 354, 355, 370
General Foods, 148General Mills, 70, 72, 111, 121, 225General Motors (GM), 22, 60, 98, 142, 150,
196, 219, 222, 243, 248, 257,260, 279, 280, 282, 283, 285,308, 310, 311, 313, 322, 333,339, 349, 360
George Washington University, 102Georgetown University’s Environmental
Law & Policy Institute, 11Georgia-Pacific, 246Gerstner, L., 26, 60Ghosn, C., 315Gilad, 123, 133Gillette, 26, 133, 140, 141, 142, 151, 193,
208, 278, 341Glass, Lewis & Co., 55Global Crossing, 45, 55Goizueta, R., 338Goldman Sachs Group, 11, 355Goodyear Tire & Rubber, 160, 243Google, 17, 57, 125, 143, 149, 355Goold, M., 226, 227, 278Graduate Management Admission
Council, 79Graduate Management Admission Test
(GMAT), 79Grant, R. M., 27Grantham, C., 159Green Book, 59Greenpeace, 59, 77Gregersen, H. B., 310

I-4 NAME INDEX
Kinko’s 208Kirin, 196KLD Broad Market Social Index, 11Kleenex, 152Kleiner Perkins, 52K-Mart, 189, 284Knight, P., 60Kohlberg, L., 83Korn/Ferry International, 51, 341Koutsky, J., 274Kraft Foods,18, 19, 295, 364Kramer, M. R., 74Kroger, 270Kroll, Inc., 121Krups, 198Kugler, R., 24Kurtzman Group, 81Kvinnsland, S., 321Kyoto Protocol, 10, 370
L. L. Bean, 344L’Oreal, 59Labatt, 196Lada, 214Lafley, A., 242Land, E., 283Land Rover, 136, 219Langone, K., 42Larsen, R., 259Lawrence, P. R., 286Lay, K., 80Leadership Development Center, 307Lear, 243Learjet, 214Leder, M., 365LEGO, 163Lehman Brothers, 370Lemon Fresh Comet, 195Lenovo Group, 223Levi Strauss & Co., 75, 84, 125, 270Levinson, A., 25Lewis, J., 316LexisNexis, 121Lincoln Electric, 117Linebarger, T., 229Linux, 242,Livingston, R., 247Loarie, T., 341Lockheed Martin, 134, 247Loewen Group, 190Logitech, 294Long John Silver’s, 198Long Range Planning, 18Lorange, P., 198Lorsch, J., 57Lovins, A., 161Lutz, B., 60, 222, 259
MacDonald, T., 272Macy’s Department Stores, 278, 284Mad Money, 23
Morgan Stanley, 370Morningstar, 56Mossville Engine Center, 289Motorola, 84, 141, 159, 211, 303Movie Gallery, 102MphasiS, 360Mr. Coffee, 198Mr. Donut, 238MS-DOS, 111Mullen, D., 348Mulva, J., 10Muralidharan, R., 333Myers-Briggs, 323MySpace, 162
NAFTA, 8, 113Nardelli, R., 42, 277, 314NASDAQ, 49, 55, 57National Association of Corporate
Directors, 45National Car Rental, 300National Nanotechnology Infrastructure
Network, 242National Research Center, 332Nature Conservancy, 100NCR Corp., 159, 316, 360Nestlé, 18, 151, 245, 294, 295Netscape, 143, 193Netsuite, 332New Balance, 111New York Stock Exchange, 49, 55, 57Newman’s Own, 84Newport News Shipbuilding, 17News Corp, 370Nickelodeon, 188Nike, 8, 86, 111, 187, 204, 241, 287, 306Nissan Motor Company, 142, 213,
278, 315Nohria, N., 7Nokia, 152Noorda, R., 200Nordstrom, 149, 258, 355North America Index, 76Northern Telecom, 159Northwest Airlines, 52, 211, 219, 278Norton, D. P., 339Novartis, 25Novell, 200Nucor Corporation, 149, 328NutraSweet, 112Nutt, P., 257
O’Reilly, T., 230Obama, B., 125Ocean Spray, 238Ocean Tomo, 241Office Depot, 332Ohio State University, 346Olay, 211Olive Garden, 116Olivetti, 223
Magic Chef, 20Malik, O., 230Malmendier, U., 61Management Tools and Trends, 7Manco, Inc., 344Marchionne, S., 296Marcus, B., 42Margolis, J. D., 74Market Research.com, 121Marlboro, 346Marriott, 246Marsh Center for Risk Insights, 245Mary Kay Corp., 121Mary Poppins, 143Maslow, A., 83Matsushita Electric Industrial Corporation
(MEI), 150Matsushita, K., 150Mattel, 242, 247Matten, D., 75MaxiShips, 247May Company, 278Maybelline, 104Maytag Corp., 76, 127, 139, 165, 177, 183,
191, 197, 213, 219, 241, 315,373, 376, 383
McCain, J., 125McDonald’s, 74, 104, 116, 152, 174, 186,
190, 246, 247, 277, 306McDonnell Douglas, 170, 316McKesson, 322McKinsey & Co., 6, 8, 46, 47, 57, 74, 120,
155, 162, 176, 216, 220, 223,256, 306, 314, 340, 375
McLeodUSA, 195McNealy, S., 283Mead Corporation, 47Means, G. C., 50Medtronic, 47, 84Mercedes Benz, 152Mercer Delta Consulting, 56Merck, 188Mercosur (Mercosul), 8, 9, 112Merrill Lynch, 348Mesa Airlines, 211Microsoft, 8, 20, 60, 111, 118, 121, 125,
143, 152, 180, 193, 194, 207,242, 306, 335, 339, 347, 355
Midamar Corp., 174, 188Miles, R. E., 117, 288Miller Brewing Co., 8, 181Millstone, 198Mintzberg, H., 23, 26, 259Mission Point Capital Partners, 370MIT, 248Mitsubishi Motors, 314Mittal Steel, 278Modelo, 196Montgomery Ward, Inc., 284, 304Moody’s, 56Morgan Motor Car Co., 188

NAME INDEX I-5
242, 278, 280, 287, 305, 306,347, 355
Project Fusion, 278Project GLOBE, 320
Quaker Oats, 370Quinn, J. B., 26Qwest, 45, 55, 195
Radio Shack, 341RAND Corp., 124Random House, 230Raytheon, 341RCA Labs, 156RE/MAX A-1 Best Realtors, 79Reebok, 8, 111, 204, 287Reinemund, S., 60Reinhardt, F. L., 10Renault, 142, 214, 278, 315Renshaw, A. A., 274Rensi, E., 247Rent.com, 260RHR International, 307Richardson, B., 158Riding the Bullet, 230Rituxan, 25River Rouge plant, 208Rivers, R., 24RJR Nabisco, 339Roadway Logistics, 246Roberson, B., 7Roberts, B., 57Rockwell Aerospace, 170Rockwell Collins, 154Rocky Mountain Institute, 161Roddick, A., 59, 60Roj, Y, 56Rolm and Haas, 47Roman Catholic Church, 257Romanos, J., 230Rosenkrans, W., 133Ross, D., 302Royal Dutch Shell, 125, 209RSD, 197Rubbermaid, 117, 344Rumelt, R., 214Ryall, M. D., 120
S. C. Johnson, 84Safeguard, 346Safeway, 188, 270SAM (Sustainable Asset Management AG)
Research, 76SAM (Sustainable Asset Management
Group, 11SAP AG, 162, 207, 347Sarason, Y., 296Sarbanes-Oxley Act, 55, 56, 84Saturn, 313Savage, R., 352SBC Communications, 53
Schilit, H., 364Schlitz Brewing Co., 51Schroeder, K., 100Scientific-Atlanta Inc., 208ScoreTop.com, 79Scott Paper, 228Sears Manufacturing Co., 274Sears Roebuck and Co., 105, 119, 279, 295,
307, 350Securities and Exchange Commission
(lSEC), 49, 55, 57, 58Security Outsources Solutions, 121Seidenberg, I., 61Service Corporation International, 47, 190ShareNet, 13Shea, C., 70Sherwin-Williams Co., 209Shopping.com, 260Shorebank, 84Siemens, 13, 150, 211Signal Companies, 207Simon & Schuster, 210Simpson Industries, 219Singer-Loomis, 323Skoll, J., 260Skype, 260Sloan, A. P., 257, 279SmartyPig, 143, 144Smith & Wesson, 238Smithfield Foods, 208, 209Smucker, 84Snow, C. C. 117, 288Society of Competitive Intelligence Profes-
sionals (SCIP), 122, 133Sony Corp., 84, 143, 194, 197, 218South African Breweries (SAB), 8, 181Southwest Airlines, 21, 143, 170, 186, 195,
332, 355Sparks, 81Sprint Nextel, 109SSA, 347Stanberry, T., 144Standard & Poor’s (S&P), 56Standard Oil, 279, 307Stanley Works, 347Staples, 19, 190Starbucks, 75, 212, 308, 355Steak & Ale, 220Steinway, 194Stern Stewart & Co., 338Stewart Enterprises, 190Stewart, J., 304Stringer, H., 218Structured Query Language (SQL), 280Stuart, L. S., 306Stuart, S., 51StubHub, 260Stumbleupon, 260Sullivan, J., 115, 160Sun Microsystems, 283Sunbeam, 364
Olson, M., 270, 272Omidyar, P., 260Open Compliance and Ethics Group, 84Open Standards Benchmarking
Collaborative, 344Oppenheimer, P., 239Oracle Corp., 121, 162, 207, 278, 280,
282, 347Orbitz, 57Orion Pictures, 284Orphagenix, 188Owens-Corning, 347
P. F. Chang’s, 190Pacar Inc., 187Pacific Gas and Electricity, 125Packard, D., 360Palm, 194Pampers, 193, 211Pan Am Building, 251Pan American Airlines, 250, 251, 284Panasonic, 150, 223Panda Restaurant Group, 190Pascal, 11Patagonia, 84, 187Patel, 82PayPal, 260Pelino, D., 307People’s Car, 136, 142PeopleShareNet, 13PeopleSoft, 162, 207, 347PepsiCo., 18, 60, 152, 306, 344, 370Perez, A., 284Perot, R., 360, 361Peterbilt, 187Peters, T. J., 352Pew Center on Global Climate Change, 9Pfizer, 47, 282, 306Pharmacia AB, 281, 321Pharmacia Upjohn, 154Philips, 139, 294Pitney Bowes, 55Pizza Hut, 174, 190, 198, 314Plato, 257PlayStation 3, 197Pohang Iron & Steel Co. Ltd. (POSCO), 56Polaroid Corporation, 250, 283Porter, M.E., 10, 74, 99, 110, 112, 113, 114,
123, 133, 134, 140, 146, 189,192, 194
Potlach Corporation, 187PowerShip, 247Prahalad, C. K., 294Preda Code of Conduct, 56PriceWaterhouseCoopers, 121, 341, 360PRISM software, 348Prius, 222Procter & Gamble (P&G), 20, 24, 75, 107,
111, 117, 121, 141, 145, 161,163, 168, 163, 193, 195, 198,208, 211, 227, 228, 236, 238,

I-6 NAME INDEX
Super Size Me, 74Surowiecki, J., 124Sustainability Yearbook, 11SWD. Inc., 333Swiss Re, 10
Taco Bell, 314Taisei Corp., 27Target, 27, 47, 189, 270, 341, 355Tata Consultancy Services, 360Tata Group, 255Tata Motors, 136, 142, 219Tate, G., 61Taxin, G., 55Taylor, A., 399Technic, 150Tennessee Valley Authority, 254Tesco, 211, 213, 348Tesla Motors, 10Texas Gas Resources, 216Texas Instruments, 47Textron, 354TIAA-CREF, 51Tide, 111, 211, 346Tilt, 81Timberland, 200Time, 127Timex, 186Toman Corp., 225Toro, 215Toshiba, 197, 211Tower Records, 102Toyota Motor, 152, 163, 189, 213,
222, 290, 355Toys “R” Us, 270Trading Process Network, 247Trans World Airlines (TWA), 250Treacy, M. 123, 133, 135Trend Micro, 294Tricon Global Restaurants, 314Trident Group, 121Tyco, 45, 55, 79, 80
U.S. Airways, 211U.S. Airways Express, 211U.S. Arctic Research Commission, 94U.S. Climate Action Partnership
(USCAP), 322U.S. Constitution, 85U.S. Department of Defense, 348
Walt Disney Co., 62, 152, 187, 251, 283Warner-Lambert, 27, 282Waterman, R. H., 352Watkins, S., 80, 82Web 2.0, 230WebFountain, 107Welch, J., 227, 258, 290, 308West Bank, 144Westinghouse, 196Weyerhauser, 145Wheaties, 70Wheeling-Pittsburgh Steel, 52, 284Whirlpool Corp., 47, 127, 139, 177, 191,
219, 240, 243, 247, 315, 347Whisper, 211Whitman, M., 260, 348Who Wants to Be a Millionaire?, 251Wiersema, F., 123, 33, 135Wiersema, M., 62Wilburn, N., 287Wilburn, R., 287Williamson, O. E., 210Windows, 111, 118, 193Wisdom of Crowds, 124Woods, T., 204Word, 111Work Design Collaborative, 159World Bank, 101World Custom Organization, 346World Index, 76World is Flat, 8World Knowledge, 230World Political Risk Forecasts, 115World Trade Organization (WTO),
103, 112WorldCom, 44, 45, 55, 79, 80Wrigley, 18
Xerox, 139, 274, 290, 307, 308, 309, 344
Yahoo!, 370Yamaha, 194Yankelovich Partners, 366Young, S., 310Yum! Brands, 198, 212, 314
Zabriskie, 321Zamboni, F., 179Zimmer Holdings, 104Zook, C. 204
U.S. Department of Energy (DOE), 245U.S. Environmental Protection Agency, 260U.S. False Claims Act, 84U.S. Internal Revenue Service, 345U.S. Securities and Exchange Commission
(SEC), 48, 122U.S. Steel, 56U.S. West, 195Unilever, 24, 236, 238, 245, 295, 310Union Carbide, 246Union of South American Nations, 9United Airlines (UAL), 52, 211, 250United Auto Workers, 160United Distillers, 125United Express, 211United Parcel Service (UPS), 19, 22, 125,
160, 200, 247, 355United Self Defense Forces of Columbia
(AUC), 90United States Chamber of Commerce, 121United States Index, 76United Steel Workers, 160University of Michigan, 294University of Southern California, 56University of the Arctic, 97Upjohn Pharmaceuticals, 321Urschel Laboratories, 239
Van Alstyne, M. 274Van Bever, D., 270, 272Van Der Linde, B., 334VCA Antech, 190Venktraman, N. V., 360Verizon Communications, 61Verry, S., 270, 272Vidal Sassoon, 346Virgin, 60Volkswagen, 347Volvo, 270
W&T Offshore, 57Wagoner, R., 222Wake Forest University, 322Walgreen Co., 104, 270Wall Street Journal, 70Wal-Mart, 11, 143, 1613, 186, 189, 211,
212, 213, 218, 242, 258, 270,344, 347, 348, 355
Walsh, J. P., 74Walsh K., 370
I-7
Brainstorming, 124Brand management, 287Brand, 152Brand, corporate, 152BRIC countries, 101Budget, 22, 276Budget analysis, 344Business ethics, 79Business intelligence, 120Business model, 142Business policy, 5Business strategy, 19, 183Buyers, bargaining power, 112Bypass attack, 194
CAD/CAM, 158, 242Capabilities, 138Capabilities, dynamic, 138, 191Cap-and-trade, 370Capital budgeting, 153Capital, social, 74Captive company, 211Captive company strategy, 219Carbon footprint, 99, 100Carbon trading, 370Case analysis methodology, 380Case method, 365Cash cows, 23Categorical imperatives, 85Cautious profit planner, 304Cellular organization, 288Cellular structure, 288Center of excellence, 228Center of gravity, 145Centralization, 294Chairman of the Board, 54Chief Risk Officer, 335Chief Strategy Officer, 62Choice, criteria, 258Choice, strategic, 267Cloud computing, 102Co-creation, 163Code of ethics, 83Codetermination, 52Collusion, 195Commodity, 112Common-size statements, 371Common thread, 182Communication, 314Competency, core, 138Competency, distinctive, 138Competition, multipoint, 228Competitive advantage, 139Competitive analysis techniques, 133Competitive intelligence, 120Competitive intelligence, sources, 121Competitive scope, 185
Competitive strategy, 183Competitive tactics, 192Complementor, 113Concentration strategy, 208Concentric diversification, 214, 215Concurrent engineering, 159Conglomerate diversification, 215Conglomerate structure, 148Connected line batch flow, 242Consensus, 257Consolidated industry, 114Consolidation, 218Constant dollars, 372Consumer Price Index (CPI), 372Continuous improvement, 243, 318Continuous systems, 157Continuum of sustainability, 141Continuum, board of directors, 46Continuum, vertical integration, 209Contraction, 218Control, guidelines, 351Controls, behavior, 332Controls, input, 333Controls, output, 332Cooperative strategies, 195Co-opetition, 200Core competency, 138Core rigidity/deficiency, 138, 284Corporate brand, 152Corporate culture, 149, 255Corporate culture, managing, 311Corporate culture, pressures
from, 255Corporate governance, 45, 56Corporate governance, trends, 57Corporate parenting, 226, 227Corporate reputation, 152Corporate scenarios, 251Corporate stakeholders, 75Corporate strategy, 19, 206Corporate valuation, 340Corporate value-chain analysis, 146Corporation, 45Cost focus, 187Cost leadership, 186Cost proximity, 188Costing, activity-based, 334Counterfeit goods, 346Crisis of autonomy, 282Crisis of control, 282Crisis of leadership, 280Critical mass, 207Cross-functional work teams, 159Cultural integration, 149Cultural intensity, 149Culture of fear, 42Culture, corporate, 149, 255, 311
10-K form, 36610-Q form, 36614-A form, 366360-degree appraisal, 24680/20 rule, 351Accounting, forensic, 364Acquisition, 208, 213Action plan, 316, 317Activity-based costing (ABC), 334Activity ratios, 366Adaptive mode, 26Advanced Manufacturing Technology
(AMT), 242Affiliated directors, 49Agency theory, 48, 50AIDS, 104Analysis, financial, 366Analysis, industry, 110Analysis, organizational, 138Analysis, portfolio, 220Analytical portfolio manager, 304Analyzers, 117Annual report, 366Appraisal system, 307Arms race, 250Assessment centers, 307Assets, 138Assimilation, 315Assumptions, 123Autonomous (self-managing) work
teams, 159
Backward integration, 208Bad service excuses, 277Balanced scorecard, 339Bankruptcy formula, 371Bankruptcy, 219Bargaining power of buyers, 112Bargaining power of suppliers, 113Barrier, entry, 111Basic R&D, 154Behavior controls, 332Behavior substitution, 350Benchmarking, 344Blind spot analysis, 133Board of directors, 45Board of directors, committees, 54Board of directors, continuum, 46, 47Board of directors, election, 53Board of directors, evaluation of, 341Board of directors, members, 48Board of directors, nomination, 53Board of directors, organization, 54Board of directors, responsibilities, 45Board of directors, staggered, 53Books, electronic, 230BOT concept (Build Operate Transfer), 214
SUBJECT INDEX

I-8 SUBJECT INDEX
Customer satisfaction, 318Cycle of decline, 220
Decentralization, 294Decision making, ethical, 79Decision making modes, 25Decision making, strategic, 25Deculturation, 316Dedicated transfer lines, 242Defenders, 117Defensive tactics, 194Delphi technique, 124Devil’s advocate, 257Dialectical inquiry, 257Differentiation, 186Differentiation focus, 188Differentiation strategy, 185Dimensions of quality, 189Directional strategy, 206, 207Director of Corporate Development, 62Director, lead, 54Directors, affiliated, 49Directors, family, 51Directors, inside, 48Directors, outside, 48Directors, retired executive, 49Discretionary responsibilities 73Disk operating system (DOS), 180Distinctive competencies, 138Diverse workforce, 246Diversification, concentric, 214Diversification, conglomerate, 215Diversification, related, 214Diversification strategy, 208, 214Diversification, unrelated, 215Diversity, human, 161Divestment, 219Divisional structure, 147, 279, 282Do everything strategy, 250Dogs, 223Downsizing, 308Due care, 46Durability, 140Dynamic capabilities, 138, 191Dynamic industry expert, 304Dynamic pricing, 239
Earnings guidance, 349Earnings per share (EPS), 332, 335e-books, 230Ecomagination, 2Economic forces, 101Economic responsibilities, 73Economic Value Added (EVA), 338Economics, transaction cost, 109Economies of scale, 158Economies of scope, 147, 158EFAS (External Factors Analysis Summary)
Table, 126Election of board members, 53
Flexible manufacturing, 158Flexible manufacturing systems, 242Follow the leader, 250Follow-the-sun management, 247Forecasting, 123Forecasting techniques, 124Forensic accounting, 364Form 10-K, 366Form 10-Q, 366Form 14-A, 366Formulation of strategy, 17Forward integration, 208Four-corner exercise, 133, 134Fragmented industry, 114Franchising, 212Frankenfood, 104Free cash flow, 336Free-market capitalism, 80Frogs in boiling water, 82Frontal assault, 193Full integration, 209Functional strategy, 20, 236Functional structure, 147, 281
GE business screen, 223Generally Accepted Accounting Principles
(GAAP), 345, 371Geographic-area structure, 295Global industries, 115Global MNC, 346Global warming, 12, 340Globalization, 8Goal, 18Goal displacement, 350Golden rule, 85Good will, 370Governance system, 80, 81Governance, corporate, 45, 56Green-field development, 213Greenwash, 4Gross domestic product (GDP), 373Group, strategic, 115Growth, external, 216Growth, horizontal, 211Growth, internal, 216Growth strategies, 207Growth strategies, controversies, 216Growth, vertical, 208Guerrilla warfare, 194Guideline for decision making, 21Guidelines for control, 351
Halal foods, 174Hierarchy of strategy, 20Historical comparisons, 344Hit another home run, 250Horizontal growth, 211Horizontal integration, 211Horizontal strategy, 228Hubris, 61
Electric car, 222Electronic books, 230Employee stock ownership plans
(ESOP), 52Encirclement, 194Engineering (or process) R&D, 154Enterprise Resource Planning (ERP), 347Enterprise Risk Management (ERM), 335Enterprise strategy, 76Entrepreneurial mode, 26Entry barrier, 111Environment, natural, 99Environment, societal, 100Environment, task, 107Environmental scanning, 16, 98Environmental sustainability, 8, 75Environmental uncertainty, 98Environmental variables, 16EPS (earnings per share), 349Equilibrium, punctuated, 23Ethical decision making, 79Ethical responsibilities, 73Ethics, 84Ethics code, 83Evaluating board of directors, 341Evaluating top management, 341Evaluation and control, 22Evaluation and control process, 320Evolution, industry, 114Exclusive contract, 210Excuses for bad service, 277Executive leadership, 60Executive succession, 305Executive type, 304Exit barriers, 112Expatriate, 310Expatriates, stealth, 311Expense centers, 343Experience curve, 157Expert opinion, 124Explicit knowledge, 141Exporting, 211External environment, 16External growth, 216External strategic factors, 109Externalities, 99Extranet, 162Extrapolation, 124Eyeballs, 336
Family directors, 51Financial analysis, 366, 369Financial expert, 55Financial issues, 153Financial leverage, 153Financial measures, 335Financial statements, 369Financial strategy, 239First mover, 193Flanking maneuver, 194

SUBJECT INDEX I-9
Islamic law (sharia), 105ISO 9000 Standards Series, 333ISO 14000 Standards Series, 333Issues priority matrix, 109
Job characteristics model, 291Job design, 290Job enlargement, 290Job enrichment, 290Job rotation, 290, 307Job shop, 156, 242Joint venture, 197, 212Justice approach, 85Just-In-Time (JIT), 243, 244
Keiretsu, 52Keirsey Temperament Sorter, 323Key performance measures, 339Key success factors, 118KFC, 31Knowledge, explicit, 141Knowledge, tacit, 141
Laissez-faire, 72Late movers, 193Law, 84Lead director, 54Leaders, transformational, 60Leadership, executive, 60Leading, 311Leading, international, 319Lean Six Sigma, 274, 290Learning organization, 13Legal responsibilities, 73Levels of moral development, 83Leverage ratios, 366Leverage, financial, 153Leverage, operating, 157Leveraged buyout, 240Licensing, 212Licensing arrangement, 198Line extensions, 236Liquidation, 220Liquidity ratios, 366Logical incrementalism, 26Logistics strategy, 246Long-range plans, 17Long-term contracts, 210Long-term evaluation method, 352Long-term orientation (LT), 320Losing hand, 251Lower cost strategy, 185
Management audits, 341Management Buy Outs, 240Management By Objectives (MBO),
318, 320Management contracts, 214Management directors, 48Management tool, 7
Manual typewriters, 223Manufacturing, flexible, 158Market development, 236Market development strategy, 236Market location tactic, 193Market position, 151Market segmentation, 151Market Value Added (MVA), 338Marketing issues, 151Marketing mix, 151Marketing strategy, 236Masculinity-femininity (M-F), 320Mass customization, 158, 244Mass production, 242Matrix, BCG growth share, 221Matrix, industry, 119Matrix of change, 274, 275, 276Matrix, SFAS, 176Matrix structure, 285, 286Matrix, TOWS, 182Measurement problems, 348Measures of corporate performance, 335Measures of divisional and functional
performance, 342Measures, financial, 335Measures, international, 344Measures, key performance, 339Measures, stakeholder, 337Measuring performance, 332Merger, 207Mindshare, 336Mission, 17, 181Mission statement, 17, 18MNC, global, 346MNC, multidomestic, 346Model, business, 142Modes of strategic decision making, 25Modular manufacturing, 243Modular structure, 288Moore’s Law, 155Moral development levels, 83Moral relativism, 82Morality, 84Most favored nation, 103Muddling through, 26Multidomestic industries, 114Multidomestic MNC, 345, 346Multinational Corporation (MNC), 105, 291Multinational corporation, global, 292Multinational corporation,
multidomestic, 292Multiple sourcing, 244Multipoint competition, 228Mutual service consortium, 197MUUs (monthly unique users), 336
Natural environment, 99Net present value (NPV), 254Network structure, 287New entrants, 111
Human assets, 138Human diversity, 161Human resource issues, 158Human Resource Management (HRM)
strategy, 246Hurdle rate, 22, 153Hypercompetition, 117, 191
IFAS (Internal Factor Analysis Summary)Table, 164
Imitability, 140Implementation of strategy, 21Incentives, strategic, 352Index of sustainable growth, 372Individual rights approach, 85Individualism-collectivism (I-C), 319Industries, globalIndustries, multidomesticIndustries, regional, 115Industry, 109Industry analysis, 99, 110Industry evolution, 114Industry matrix, 119Industry scenario, 125, 252Industry value-chain analysis, 145Information systems, strategic, 347Information technology issues, 162Information technology strategy, 247Input controls, 333Inside directors, 48Institution theory, 13Institutional investors, 57Intangible assets, 138Integration, 315Integration, backward, 208Integration, forward, 208Integration, full, 209Integration, horizontal, 211Integration manager, 303Integration, quasi, 209Integration, taper, 209Integration, vertical, 208Intelligence, competitive, 120Interlocking directorate, 52Interlocking directorate, direct, 52Interlocking directorate, indirect, 52Intermittent systems, 156Internal environment, 16Internal growth, 216International entry options, 211International Financial Reporting
Standards(IFRS), 345International measurement, 344International societal considerations, 105International strategic alliances, 292International transfer pricing, 345Intranet, 162Inventory turnover ratio, 332Investment centers, 343Investors, institutional, 57

I-10 SUBJECT INDEX
Niche, propitious, 177No-change strategy, 217Nomination of board members, 53Non-management directors, 48Northern Sea Route, 96Northwest Passage, 94
Objectives, 18, 181Offensive tactics, 193Offshoring, 248Open innovation, 241Operating budgets, 342Operating cash flow, 336Operating leverage, 157Operational planning, 21Operations issues, 156Operations strategy, 242Organization slack, 208Organizational learning theory, 13Organizational life cycle, 283Organizational structures, 147, 285Other stakeholders, 113Output controls, 332Outside directors, 48Outsourcing, 211, 213, 247Outsourcing matrix, 250
Parallel sourcing, 245Parenting, corporate, 226Parenting strategy, 206Pascal’s wager, 11Pause/proceed-with-caution strategy, 217Penetration pricing, 239PepsiCo, 314Performance, 22, 332Performance appraisal system, 307Performance, corporate, 335Performance, divisional, 342Performance evaluations, 341Performance, functional, 342Performance gap, 24Performance, key measures, 339Periodic statistical reports, 342PESTEL analysis, 101Phases of strategic management, 5Pioneer, 193Pirated software, 346Planning mode, 26Planning, operational, 21Plans, long-range, 17Policies, 21, 258Policy, 21Political-legal forces, 102Political strategy, 255Pooling method, 370Population ecology, 12, 13Portfolio analysis, 206, 220Portfolio analysis, advantages/
disadvantages, 225Portfolio analysis, strategic alliances, 225
Retaliation, 195Retired executive directors, 49Retrenchment, 308Retrenchment strategies, 207, 218Return On Equity (ROE), 336Return On Investment (ROI), 332, 335, 336,
343, 344, 345, 349Revenue centers, 343Reverse engineering, 140Reverse logistics, 166Reverse stock splits, 240Revival phase, 284Rightsizing, 308Risk, 253Risks in competitive strategies, 188Rivalry, 111Rivalry among existing firms, 111ROE (Return on Equity), 336ROI (Return on Investment), 335Role of the board of directors, 46Rules of thumb, 351
Sarbanes-Oxley Act, 55SBUs, 282, 352Scenario analysis, 335Scenario box, 252Scenario, industry, 125Scenario writing, 125Scorecard, balanced, 339SEC 10-K form, 366SEC 10-Q forms, 366SEC 14-A forms, 366Self-managing work teams, 246Sell-out strategy, 219Separation, 316SFAS (Strategic Factors Analysis Summary)
Matrix, 176Shareholder, 45Shareholder value, 337Short-term orientation, 349Simple structure, 147, 280Situational analysis, 176Six Sigma, 4, 274, 289Skim pricing, 239Social capital, 74Social responsibility, 72Societal environment, 99, 100, 101Societal environment, international, 105Sociocultural forces, 103Sole sourcing, 244Sourcing, 247Stability strategies, 207, 217Staff, strategic planning, 62Staffing, 302Staffing follows strategy, 303Staffing, international, 309Stages of corporate development, 280Stages of international development, 293Staggered board, 53Stakeholder analysis 75
Power distance (PD), 319Prediction markets, 124Pressure-cooker crisis, 283Pricing, dynamic, 239Pricing, penetration, 239Pricing, skim, 239Prime interest rate, 372Problem children, 222Procedures, 22, 276Product development, 236Product development strategy, 236Product life cycle, 152Product R&D, 154Product-group structure, 295Production sharing, 213Professional liquidator, 304Profit centers, 343Profit strategy, 218Profitability ratios, 366Profits, repatriation of, 345Program, 21, 274Propitious niche, 177, 181Prospectors, 117Pull strategy, 239Punctuated equilibrium, 23Purchasing power parity (PPP), 107Push strategy, 239
Quality circles, 320Quality dimensions, 189Quality of Work, 160Quasi-integration, 209Question marks, 222
R&D intensity, 154R&D issues, 154R&D mix, 154R&D strategy, 241Radio frequency identification (RFID),
163, 348Ratio analysis, 366Reactors, 117Real-options approach, 254Red flag, 364Red tape crisis, 282Reengineering, 288Regional industries, 115Related diversification, 214Relativism, moral, 82Repatriation of profits, 100, 345Replicability, 141Report, annual, 366Reputation, corporate, 152Resizing, 308Resource-based approach, 138Resources, 138Resources for Case Research, 377Responsibilities, boards of directors, 45Responsibilities of a business, 72, 73Responsibilities, top management, 58

SUBJECT INDEX I-11
Strategy-culture compatibility, 312Strategy, diversification, 214Strategy, enterprise, 76Strategy formulation, 17, 176Strategy, functional, 20Strategy, hierarchy, 20Strategy, horizontal, 228Strategy implementation, 221, 72, 274Strategy, political, 255Structural barriers, 194Structure, cellular, 288Structure, divisional, 282Structure follows strategy, 279Structure, functional, 281Structure, geographic-area, 295Structure, matrix, 285Structure, modular, 288Structure, network, 287Structure, product-group, 295Structure, simple, 280Structures, organizational, 147, 285Stuck in the middle, 189, 266Suboptimization, 350Substitute product, 112Suppliers, bargaining power, 113Supply chain management, 163Sustainability continuum, 141Sustainability, 75, 140Sustainability, environmental, 8, 75Sustainability index, 76Sustainable growth, index of, 371Sweet spot, strategic, 177Switching costs, 111SWOT analysis, 16, 176Synergy, 214, 278Synergy Game, 296
Tacit knowledge, 141Tactic, 192Tactics, timing, 193Tactics, competitive, 192Tactics, defensive, 194Tactics, market location, 193Tactics, offensive, 193Take rate, 348Takeovers, 208Tangible assets, 138Taper integration, 209Task environment, 99, 107Teams, 158, 159Technological competence, 154Technological discontinuity, 155Technological follower, 241Technological forces, 102Technological leader, 241Technology scouts, 242Technology transfer, 154Temporary/part-time workers, 159Theories of organizational adaptation, 12Threat of new entrants, 111
Threat of substitutes 112Timing tactic, 193Top management, 45Top management responsibilities, 58Top management, evaluation of, 341Total Quality Management (TQM), 318, 320TOWS Matrix, 182Trade associations, 9Transaction cost economics, 209, 210Transfer pricing, 343Transfer pricing, international, 345Transferability, 140Transformational leaders, 60Transparency, 140Trends in corporate governance, 57Trigger point, 106, 107Triggering event, 24Turnaround specialist, 304Turnaround strategy, 218Turnkey operations, 213Turnover, 371Types, strategic, 117Typewriters, manual, 223
Uncertainty avoidance (UA), 319Union relations, 159Unrelated diversification, 215Utilitarian approach, 85
Valuation, corporate, 340Value Added, economic, 338Value added, market, 338Value chain, 143Value discipline triad, 135Value disciplines, 133Value, shareholder, 337Value-chain analysis, 143Value-chain, corporate, 146Value-chain, industry, 145Value-chain partnership, 198Values statement, 17Vertical growth 210Vertical growth strategy, 208Vertical integration, 145, 208, 210Virtual organization, 287Virtual teams, 159Vision, 17Vision, strategic, 60VRIO framework, 138
War game, 134Web 2.0, 162, 230Weighted-factor method, 352Whistleblowers, 55, 84Wildcats, 222
Z-Value Bankruptcy Formula, 371
Stakeholder measures, 337Stakeholder priority matrix, 255Stakeholder, primary, 77Stakeholder, secondary, 77Stakeholders, 75Stall point, 270Standard cost centers, 342Standard Operating Procedure (SOP),
22, 276Star employee, 322Stars, 222Statistical modeling, 124Stealth expatriates, 311STEEP analysis, 100, 101Steering controls, 332Stewardship theory, 49, 50Stickiness, 336Strategic alliance portfolio, 225Strategic alliance, 196Strategic alliances, international, 292Strategic audit, 28, 34, 125, 163, 342, 373Strategic audit, student-written, 383Strategic audit worksheet, 373, 374Strategic business units (SBUs), 148Strategic choice, 257Strategic choice perspective, 13Strategic decision making, 25Strategic decision-making process, 27, 28Strategic decisions, 25Strategic factors, 16, 109, 177Strategic flexibility, 13Strategic-funds method, 353Strategic group, 115Strategic incentive management, 352Strategic inflection point, 24Strategic information systems, 347Strategic management benefits, 6Strategic management model, 15Strategic management phases, 5Strategic management process, 15Strategic management, 5Strategic myopia, 108Strategic planning process, 61Strategic planning staff, 62Strategic posture, 34Strategic rollup, 190Strategic sweet spot, 177, 180Strategic type, 117Strategic vision, 60Strategic window, 179Strategies to avoid, 250Strategies, growth, 207Strategies, retrenchment, 218Strategies, stability, 217Strategy, 19Strategy, business, 19, 183Strategy, competitive, 183Strategy, concentration, 208Strategy, cooperative, 195Strategy, corporate, 19
Related Documents