Strategic Environmental Impact Study of the Transport Development Strategy of the Republic of Croatia 2017-2030 Strategic Environmental Impact Study of the Transport Development Strategy of the Republic of Croatia 2017-2030 Zagreb, August 2017.

Welcome message from author
This document is posted to help you gain knowledge. Please leave a comment to let me know what you think about it! Share it to your friends and learn new things together.
Transcript
Strategic Environmental Impact Study of the Transport Development Strategy of the Republic of Croatia 2017-2030
Strategic Environmental Impact Study
of the Transport Development Strategy
of the Republic of Croatia 2017-2030
Zagreb, August 2017.
Strategic Environmental Impact Study of the Transport Development Strategy of the Republic of Croatia 2017-2030
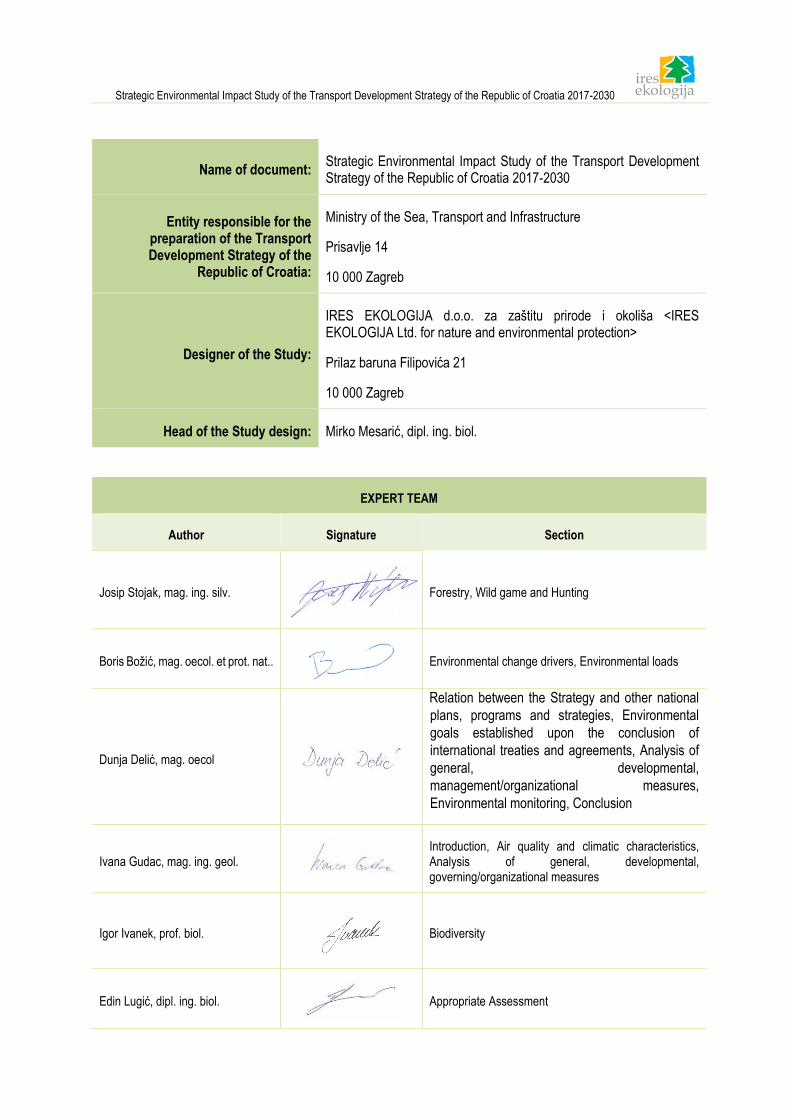
Name of document: Strategic Environmental Impact Study of the Transport Development Strategy of the Republic of Croatia 2017-2030
Entity responsible for the preparation of the Transport Development Strategy of the
Republic of Croatia:
Ministry of the Sea, Transport and Infrastructure
Prisavlje 14
10 000 Zagreb
Designer of the Study:
IRES EKOLOGIJA d.o.o. za zaštitu prirode i okoliša <IRES EKOLOGIJA Ltd. for nature and environmental protection>
Prilaz baruna Filipovića 21
10 000 Zagreb
Head of the Study design: Mirko Mesarić, dipl. ing. biol.
EXPERT TEAM
Author Signature Section
Josip Stojak, mag. ing. silv.
Forestry, Wild game and Hunting
Boris Božić, mag. oecol. et prot. nat..
Environmental change drivers, Environmental loads
Dunja Delić, mag. oecol
Relation between the Strategy and other national
plans, programs and strategies, Environmental
goals established upon the conclusion of
international treaties and agreements, Analysis of
general, developmental,
management/organizational measures,
Environmental monitoring, Conclusion
Ivana Gudac, mag. ing. geol.
Introduction, Air quality and climatic characteristics, Analysis of general, developmental, governing/organizational measures
Igor Ivanek, prof. biol.
Biodiversity
Edin Lugić, dipl. ing. biol.
Appropriate Assessment
Strategic Environmental Impact Study of the Transport Development Strategy of the Republic of Croatia 2017-2030
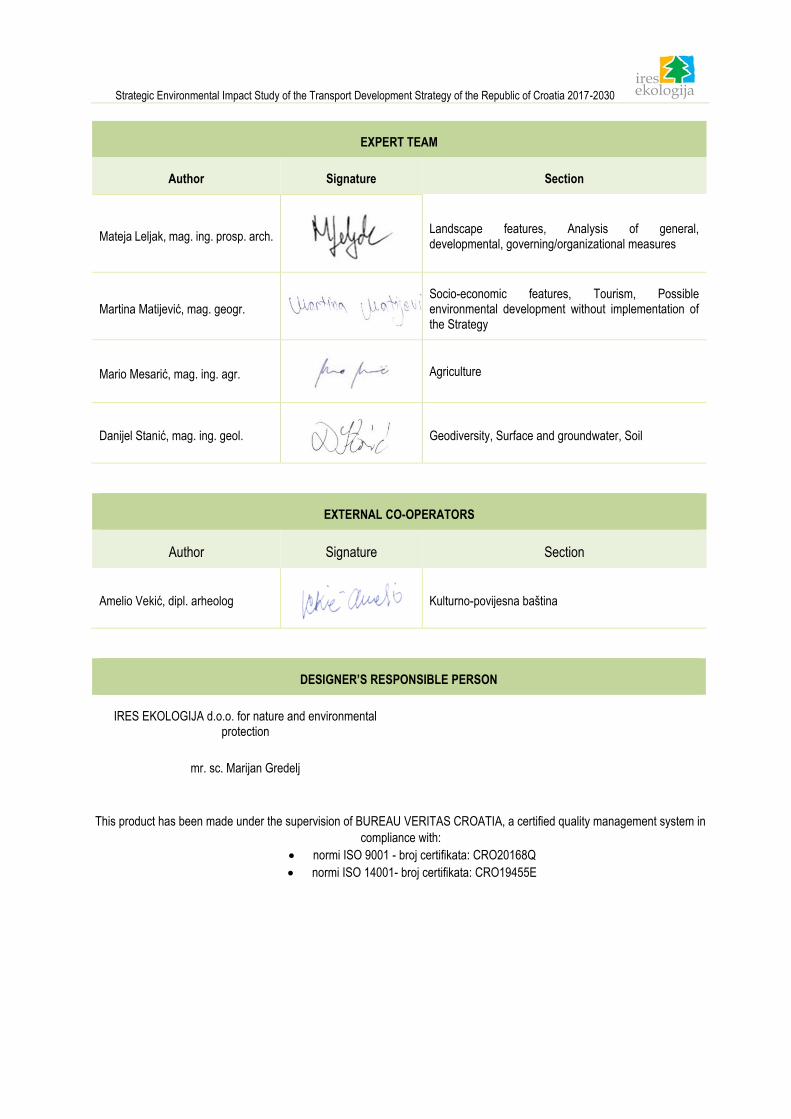
EXPERT TEAM
Author Signature Section
Mateja Leljak, mag. ing. prosp. arch.
Landscape features, Analysis of general, developmental, governing/organizational measures
Martina Matijević, mag. geogr.
Socio-economic features, Tourism, Possible environmental development without implementation of the Strategy
Mario Mesarić, mag. ing. agr.
Agriculture
Danijel Stanić, mag. ing. geol.
Geodiversity, Surface and groundwater, Soil
EXTERNAL CO-OPERATORS
Author Signature Section
Amelio Vekić, dipl. arheolog
Kulturno-povijesna baština
DESIGNER’S RESPONSIBLE PERSON
IRES EKOLOGIJA d.o.o. for nature and environmental protection
mr. sc. Marijan Gredelj
This product has been made under the supervision of BUREAU VERITAS CROATIA, a certified quality management system in
compliance with:
• normi ISO 9001 - broj certifikata: CRO20168Q
• normi ISO 14001- broj certifikata: CRO19455E
Strategic Environmental Impact Study of the Transport Development Strategy of the Republic of Croatia 2017-2030
Table of Contents
1 Introduction .......................................................................................................................................................... 1
1.1 Purpose and objectives of the Strategy ...................................................................................................... 2
2 Relationship between the Strategy and other appropriate strategies, plans and programes .............................. 6
3 Existing environmental status and possible environmental development without the Strategy implementation 16
3.1 Environmental change drivers .................................................................................................................. 16
3.1.1 Traffic as a whole ................................................................................................................................. 16
3.1.2 Road traffic ........................................................................................................................................... 20
3.1.3 Railway transport .................................................................................................................................. 22
3.1.4 Air transport .......................................................................................................................................... 24
3.1.5 River traffic ........................................................................................................................................... 25
3.1.6 Maritime traffic ...................................................................................................................................... 27
3.1.7 Public urban transport .......................................................................................................................... 30
3.2 Environmental loads ................................................................................................................................. 33
3.2.1 Air pollutants due to traffic .................................................................................................................... 33
3.2.2 Greenhouse gas emissions .................................................................................................................. 35
3.2.3 Noise .................................................................................................................................................... 36
3.2.4 Emissions of waste and ballast waters ................................................................................................. 37
3.2.5 Extraordinary events (accidents) .......................................................................................................... 39
3.3 Description of a state of environmental components ................................................................................ 40
3.3.1 Air quality and climatic features ............................................................................................................ 40
3.3.2 Geodiversity ......................................................................................................................................... 47
3.3.3 Biodiversity ........................................................................................................................................... 48
3.3.4 Landscape features .............................................................................................................................. 68
3.3.5 Soil ....................................................................................................................................................... 75
3.3.6 Waters .................................................................................................................................................. 80
3.3.7 Cultural and historical heritage ........................................................................................................... 101
3.3.8 Agriculture .......................................................................................................................................... 103
3.3.9 Forestry .............................................................................................................................................. 105
3.3.10 Wild game and hunting .................................................................................................................. 111
3.3.11 Tourism .......................................................................................................................................... 113
3.3.12 Social and Economic characteristics .............................................................................................. 120
3.4 Potential environment development without the implementation of the Strategy .................................... 135
4 Environmental Characteristics of the Areas that can be significantly affected by the Strategy ....................... 137
5 Existing Environmental Issues of Importance for the Strategy ........................................................................ 139
5.1 Air Quality and Climate Characteristics .................................................................................................. 139
Strategic Environmental Impact Study of the Transport Development Strategy of the Republic of Croatia 2017-2030
5.2 Geodiversity ............................................................................................................................................ 140
5.3 Biodiversity ............................................................................................................................................. 140
5.4 Landscape Features ............................................................................................................................... 141
5.5 Soil .......................................................................................................................................................... 141
5.6 Water ...................................................................................................................................................... 142
5.7 Cultural and historical heritage ............................................................................................................... 142
5.8 Agriculture .............................................................................................................................................. 143
5.9 Forestry .................................................................................................................................................. 144
5.10 Wild game and hunting ........................................................................................................................... 148
5.11 Tourism ................................................................................................................................................... 150
5.12 Social and Economic Characteristics ..................................................................................................... 151
6 Environmental objectives established upon the conclusion of international treaties and agreements relating to
the Strategy .............................................................................................................................................................. 152
7 Environmental impacts of the Strategy ............................................................................................................ 166
7.1 Impact assessment methodology ........................................................................................................... 166
7.2 Environmental impact assessment of the strategy ................................................................................. 167
7.2.1 Analysis of general measures ............................................................................................................ 168
7.2.2 Analysis of development measures .................................................................................................... 177
7.2.3 Analysis of management/organisational measures ............................................................................ 187
7.2.4 Environmental impacts of spatial measures ....................................................................................... 201
7.3 Transboundary impacts .......................................................................................................................... 281
7.3.1 Italy ..................................................................................................................................................... 282
7.3.2 Hungary .............................................................................................................................................. 284
7.3.3 Bosnia and Herzegovina .................................................................................................................... 285
7.3.4 Republic of Montenegro ..................................................................................................................... 288
7.3.5 Republic of Slovenia ........................................................................................................................... 289
7.3.6 Republic of Serbia .............................................................................................................................. 290
7.3.7 Conclusion.......................................................................................................................................... 291
8 Environmental protection measures ................................................................................................................ 293
8.1 Soil .......................................................................................................................................................... 293
8.2 Waters .................................................................................................................................................... 293
8.3 Biodiversity ............................................................................................................................................. 293
8.4 Cultural and historical heritage ............................................................................................................... 294
8.5 Agriculture .............................................................................................................................................. 294
8.6 Landscape characteristics ...................................................................................................................... 294
8.7 Social and economic characteristics ....................................................................................................... 295
8.8 Climate changes ..................................................................................................................................... 295
9 Alternative solutions ........................................................................................................................................ 296
Strategic Environmental Impact Study of the Transport Development Strategy of the Republic of Croatia 2017-2030
10 Environment monitoring................................................................................................................................... 297
11 Appropriate assessment .................................................................................................................................. 298
11.1 Introduction ............................................................................................................................................. 298
11.1.1 Data on the authorized entity and reasons for Study preparation .................................................. 298
11.1.2 Description of the impact prediction method .................................................................................. 298
11.2 Ecological network data .......................................................................................................................... 300
11.2.1 Description of ecological network area which the Strategy may have an impact on ...................... 300
11.3 Description of the impacts of the Strategy on ecological network ........................................................... 313
11.3.1 Possible individual impacts of the spatially located measures of the strategy ............................... 317
11.3.2 Possible cumulative impact of the intervention .............................................................................. 361
11.4 Measures to mitigate the negative impacts of the intervention on conservation goals and the integrity of
the ecological network area ................................................................................................................................. 365
11.5 Conclusion .............................................................................................................................................. 366
12 Conclusion ....................................................................................................................................................... 367
13 Summary ......................................................................................................................................................... 369
13.1 Introduction ............................................................................................................................................. 369
13.2 Preliminary environmental impact analysis of the Strategy .................................................................... 369
13.3 Impact assessment methodology ........................................................................................................... 371
13.3.1 Environmental impact assessment of the Strategy ........................................................................ 372
13.4 Environmental protection measures ....................................................................................................... 373
13.4.1 Soil ................................................................................................................................................. 373
13.4.2 Waters............................................................................................................................................ 373
13.4.3 Biodiversity ..................................................................................................................................... 373
13.4.4 Cultural and historical heritage....................................................................................................... 374
13.4.5 Agriculture ...................................................................................................................................... 374
13.4.6 Landscape characteristics ............................................................................................................. 374
13.4.7 Social and economic characteristics .............................................................................................. 375
13.4.8 Climate changes ............................................................................................................................ 375
13.5 Appropriate assessment ......................................................................................................................... 375
13.5.1 Impacts of the Strategy on the Ecological Network ........................................................................ 375
13.5.2 Measures to mitigate the negative impacts of the intervention on conservation goals and the integrity
of the ecological network area ......................................................................................................................... 377
13.5.3 Conclusion ..................................................................................................................................... 379
14 Sources of Data ............................................................................................................................................... 380
14.1 Scientific papers ..................................................................................................................................... 380
14.2 Internet databases .................................................................................................................................. 383
14.3 Laws, Ordinances, Decisions, Regulations............................................................................................. 384
14.4 Directives, Conventions, Charters, Agreements and Protocols .............................................................. 385
Strategic Environmental Impact Study of the Transport Development Strategy of the Republic of Croatia 2017-2030
14.5 Publications ............................................................................................................................................ 386
14.6 Plans, programs, strategies .................................................................................................................... 387
14.7 Reports ................................................................................................................................................... 389
15 Appendices ...................................................................................................................................................... 390
15.1 Approval for the performance of expert environmental protection activities ........................................... 390
15.2 Approval for the performance of expert environmental protection activities ........................................... 396
15.3 Decision of the Ministry of Environment and Energy on the obligation to implement the Main Assessment
of Acceptability for the Ecological Network .......................................................................................................... 399
15.4 Decision on the content of the Study ...................................................................................................... 402
15.5 Deviation of mean air temperature in the period from 2012 to 2016 ....................................................... 407
15.6 Deviation of rainfall in the period from 2012 to 2016 .............................................................................. 408
15.7 Types of general population movements ................................................................................................ 409
15.8 Age indicators, structure and population density by counties in Croatia in 2011 .................................... 410
15.9 The rate of total population changes between the 1991, 2001 and 2011 censuses and the interventions for
2020 and 2030, by counties ................................................................................................................................. 411
15.10 Natural change, migration balance and types of general population movements from 2001 to 2011 412
15.11 Share of reported vacancies in the total number of registered unemployed persons, in % ................ 413
Strategic Environmental Impact Study of the Transport Development Strategy of the Republic of Croatia 2017-2030
Zagreb, kolovoz 2017. 8
List of figures
Figure 3.1 Average road traffic over the year (left) and in the season (right) - the thickness of the green line represents
the density of traffic (Source: Transport Development Strategy of the Republic of Croatia 2017-2030) ....................17
Figure 3.2 Energy consumption in Croatia by type of traffic from 1988 to 2014 (Source: Energy in Croatia in 2014) 18
Figure 3.3 Energy consumption in transport by energy sources from 1988 to 2014 (Source: Energy in Croatia in 2014)
...................................................................................................................................................................................19
Figure 3.4 Number of registered passenger cars per year (Source: Transport Development Strategy of the Republic
of Croatia 2017-2030) .................................................................................................................................................21
Figure 3.5 Share of transported passengers by passenger number (Left) compared to transported passengers´ share
per passenger-km (Right) by category of transportation in 2015 (Adapted to: Transport and Telecommunications in
2015) ..........................................................................................................................................................................24
Figure 3.6 The annual number of passengers in Croatian airports in 2013 (Source: Transport Development Strategy
of the Republic of Croatia 2017-2030) ........................................................................................................................25
Figure 3.7 Connections between the Zagreb airport and other world destination (Source: Transport Development
Strategy of the Republic of Croatia 2017-2030) .........................................................................................................25
Figure 3.8 The network of inland waterways of the Republic of Croatia (Source: The Ministry of the Sea, Transport
and Infrastructure) ......................................................................................................................................................26
Figure 3.9 Trend of the goods transport on inland waterways from 2011 to 2015 (Source: Transport and
Communications in 2015) ...........................................................................................................................................27
Figure 3.10 The vessel, passenger and goods transport in seaports from 2011 to 2015 (Source: Transport and
Communications in 2015) ...........................................................................................................................................28
Figure 3.11 Position and connection of the Ports of Rijeka and Ploče (Source: Transport Development Strategy of the
Republic of Croatia 2017-2030). .................................................................................................................................29
Figure 3.12 The most frequent cruiser routes in the Mediterranean Sea in 2010 (Source: Carić and Mackelworth,
2014) ..........................................................................................................................................................................30
Figure 3.13 The percentage of daily passengers in Zagreb, Split, Rijeka and Osijek in relation to the total number of
employed persons that gravitate towards the centres of those agglomerations (Source: Transport Development
Strategy of the Republic of Croatia 2017-2030) .........................................................................................................31
Figure 3.14 Share of the contribution of transport sector per individual pollutants (Adjusted according to: Croatian
Agency for the Environment and Nature, 2016) .........................................................................................................34
Figure 3.15 Pollutants in the air released from transport sector (Source: Croatian Environment Agency, 2015) .......35
Figure 3.16 CO2 emissions from transport sector for the period from 2009 to 2014 (Adjusted according to: Energy in
Croatia in 2014) ..........................................................................................................................................................36
Figure 3.17 Quantities of ballast waters (Environmental Protection Agency, 2015) ...................................................38
Figure 3.18 Number of extraordinary events in traffic according to a transport mode (Source: Environmental Protection
Agency 2015) Note: Data for 2009 by type of transport are not available, but only the total number of extraordinary
events in traffic for this year is 33 ...............................................................................................................................39
Figure 3.19 Sudden pollutions of maritime good according to the pollution source (Source: Ministry of the Sea,
Transport and Infrastructure, taken from the State of the Environment Report, EPA 2015) .......................................40
Figure 3.20 Zones and agglomerations for the purposes of air quality monitoring with the representation of measuring
stations (Source: Annual Report on the Air Quality Monitoring in the Area of the Republic of Croatia for 2015)........41
Figure 3.21 Number of zones / agglomerations polluted with an individual pollutant (left) and the relation of the
overstepping reasons categories (right) for 2013 (Prepared by: IRES EKOLOGIJA d.o.o.) .......................................43
Strategic Environmental Impact Study of the Transport Development Strategy of the Republic of Croatia 2017-2030
Zagreb, August 2017. 9
Figure 3.22 Number of zones / agglomerations polluted with an individual pollutant (left) and the relation of the
overstepping reasons categories (right) for 2014 (Prepared by: IRES EKOLOGIJA d.o.o.) .......................................43
Figure 3.23 Number of zones / agglomerations polluted with an individual pollutant (left) and the relation of the
overstepping reasons categories (right) for 2015 (Prepared by: IRES EKOLOGIJA d.o.o.) .......................................44
Figure 3.24 Trend of the polluted zones / agglomerations number for the period from 2013 to 2015 (Prepared by: IRES
EKOLOGIJA d.o.o.) ....................................................................................................................................................44
Figure 3.25 The share of emissions from transport in the Energetics sector (Prepared by: IRES EKOLOGIJA d.o.o.)
...................................................................................................................................................................................45
Figure 3.26 The CO2eq emission from the Transport sub-sector (Source: Report on the inventory of greenhouse gases
in the area of the Republic of Croatia for the period 1990-2014, Modified: IRES EKOLOGIJA d.o.o.) .......................46
Figure 3.27 Protected locations of geodiversity on the area of the Republic of Croatia (Source: Bioportal.hr) ..........48
Figure 3.28 Areas larger than km2 which are not fragmented with transport infrastructure (Source: Analysis of the state
of nature in the Republic of Croatia for the period of 2008-2012, 2014) .....................................................................49
Figure 3.29 Fragmentation of habitats with transport infrastructure in 1980 (Source: Nature Protection Indicators,
2014) ..........................................................................................................................................................................50
Figure 3.30 Fragmentation of habitats due to transport infrastructure in 2012 (Source: Nature Protection Indicators,
2014) ..........................................................................................................................................................................51
Figure 3.31 Arrangement of the (significance) classes of lynx habitats in land area and its distribution (Prepared by:
IRES EKOLOGIJA d.o.o., Source: CAEN) .................................................................................................................53
Figure 3.32 Arrangement of the (significance) classes of wolf habitats in land area and its distribution (Prepared by:
IRES EKOLOGIJA d.o.o., Source: CAEN) .................................................................................................................53
Figure 3.33 Arrangement of the (significance) classes of bear habitats in land area and its distribution (Prepared by:
IRES EKOLOGIJA d.o.o., Source: CAEN) .................................................................................................................54
Figure 3.34 Arrangement of the cumulative (significance) classes of large carnivore habitats in the land area of the
Republic of Croatia (Prepared by: IRES EKOLOGIJA d.o.o., Source: CAEN) ...........................................................54
Figure 3.35 A share of evaluated species per groups on which roads and tracks have an influence (Source: Analysis
of the state of nature in the Republic of Croatia for the period of 2008-2012) ............................................................55
Figure 3.36 The number of killed animals on motorways per years in the period of 2008-2012 (Source: Analysis of the
state of nature in the Republic of Croatia for the period of 2008-2012) ......................................................................56
Figure 3.37 Locations of the wolf individuals fatalities induced by road transport in the period 2008-2012 (Source:
Analysis of the state of nature in the Republic of Croatia for the period of 2008-2012) ..............................................57
Figure 3.38 Locations of the bear individuals fatalities induced by road and rail transport in the period 2008-2012
(Source: Analysis of the state of nature in the Republic of Croatia for the period of 2008-2012) ...............................58
Figure 3.39 Geographical representation of endangered families and important areas for amphibians and reptiles in
Croatia, with a presented sum of species and subspecies on a certain area (Source: Red book of amphibians and
reptiles of Croatia, 2012) ............................................................................................................................................59
Figure 3.40 The number of collisions of airplanes with animals per airports in the period 2008-2012. It includes also
avoided collisions with no direct contact of an aeroplane with an animal (Source: Analysis of the state of nature in the
Republic of Croatia for the period of 2008-2012) ........................................................................................................60
Figure 3.41 The number of collisions per families / groups per years (more than 2 individuals in total in the period
2008-2012)(Source: Analysis of the state of nature in the Republic of Croatia for the period of 2008-2012) .............61
Figure 3.42 The share of the estimated species per groups which are endangered with the presence of invasive
species (Source: Analysis of the state of nature in the Republic of Croatia for the period from 2008 to 2012) ..........63
Figure 3.43 Protected areas in the Republic of Croatia (Prepared by: IRES EKOLOGIJA d.o.o.) ..............................65
Strategic Environmental Impact Study of the Transport Development Strategy of the Republic of Croatia 2017-2030
Zagreb, August 2017. 10
Figure 3.44 Habitats in the Republic of Croatia (dotted habitat types are not shown, and mosaic habitats are grouped
according to the first mentioned habitat type)(Prepared by: IRES EKOLOGIJA d.o.o.) .............................................67
Figure 3.45 Landscape regionalization of the Republic of Croatia according to Bralić (1995) from the Strategy of the
spatial arrangement of the Republic of Croatia (Modified: IRES EKOLOGIJA d.o.o.) ................................................69
Figure 3.46 Black spots in the area of the Republic of Croatia (Source: State of the Environment Report 2009-2012,
Modified: IRES EKOLOGIJA d.o.o.) ...........................................................................................................................77
Figure 3.47 The real risk of a soil erosion by water (Source: State of the Environment Report in the Republic of Croatia,
2014) ..........................................................................................................................................................................80
Figure 3.48 Ecological status of water bodies of rivers and lakes (Source: River Basin Management Plan 2016-2021)
...................................................................................................................................................................................82
Figure 3.49 Distribution of bodies of rivers according to their ecological status (Source: River Basin Management Plan
2016-2021) .................................................................................................................................................................83
Figure 3.50 Distribution of bodies of lakes according to their ecological status (Source: River Basin Management Plan
2016-2021) .................................................................................................................................................................83
Figure 3.51 Chemical status of bodies of rivers and lakes (Source: River Basin Management Plan 2016-2021). .....84
Figure 3.52 Distribution of river bodiesaccording to their chemical status (Source: River Basin Management Plan 2016-
2021) ..........................................................................................................................................................................85
Figure 3.53 Spatial distribution of chemical status by groups of bodies of coastal waters (Source: River Basin
Management Plan 2016-2021) ...................................................................................................................................86
Figure 3.54 Spatial distribution of chemical status by groups of bodies of transitional waters (Source: River Basin
Management Plan 20162021). ...................................................................................................................................87
Figure 3.55 Chemical status of transitional and coastal water (Source: River Basin Management Plan 2016-2021) 88
Figure 3.56 Spatial distribution of ecological status of groups of bodies of coastal water (Source: River Basin
Management Plan 2016-2021) ...................................................................................................................................89
Figure 3.57 Spatial distribution of ecological status by groups of bodies of transitional water (Source: River Basin
Management Plan 2016-2021) ...................................................................................................................................90
Figure 3.58 Ecological and overall status of transitional and coastal waters (Source: River Basin Management Plan
2016-2021) .................................................................................................................................................................91
Figure 3.59 Spatial distribution of chemical status of groundwater bodies in Pannonian Croatia (Source: River Basin
Management Plan 2016-2021). ..................................................................................................................................93
Figure 3.60 Spatial distribution of groundwater chemical status in the karst area of the Republic of Croatia (Source:
River Basin Management Plan 2016-2021). ...............................................................................................................95
Figure 3.61 Zones of sanitary protection of water sources intended for human consumption (Source: River Basin
Management Plan 20162021) ....................................................................................................................................98
Figure 3.62 Flood Hazard Map with low, medium and high probability of occurrence of flooding event (Source: River
Basin Management Plan 2016-2021) .........................................................................................................................99
Figure 3.63 Land of P1 and P2 value in the Republic of Croatia (Source: Digital Soil Map of the Republic of Croatia)
................................................................................................................................................................................. 104
Figure 3.64 Agricultural area in Croatia (Source: CLC database) ............................................................................. 105
Figure 3.65 Habitat Map of the forest vegetation in Croatia (Author: IRES EKOLOGIJA d.o.o.) .............................. 109
Figure 3.66 Silviculture forms by the area in Croatia, data from 2012 (Source: Draft report on environment condition
in the Republic of Croatia, 2014) .............................................................................................................................. 110
Strategic Environmental Impact Study of the Transport Development Strategy of the Republic of Croatia 2017-2030
Zagreb, August 2017. 11
Figure 3.67 Main tree species share in total wood stock of the forest management area (Source: Basic areas, 2016-
2025) ........................................................................................................................................................................ 110
Figure 3.68 The number of overnight stays in continental and Adriatic Croatia, 2011-2015 (Source: Croatian Bureau
of Statistics) .............................................................................................................................................................. 117
Figure 3.69 The number of overnight stays per county in Croatia, 2011-2015 (Source: Croatian Bureau of Statistics)
................................................................................................................................................................................. 118
Figure 3.70 The number of overnight stays in continental and Adriatic Croatia, 2011-2015 (Source: Croatian Bureau
of Statistics) .............................................................................................................................................................. 119
Figure 3.71 Share of domestic and foreign guests in the total number of nights per county in Croatia in 2015 (Source:
Croatian Bureau of Statistics) ................................................................................................................................... 120
Figure 3.72 Share of the counties in the total population of the Republic of Croatia in 2011 (Source: Transport
development strategy of the Republic of Croatia for the period 2017-2030 - draft) .................................................. 121
Figure 3.73 Croatian population movement in the period 2001-2011 and projections until 2030 per county (Source:
Croatian Bureau of Statistics, Demographic scenarios and migrations, 2014, Prepared by: IRES EKOLOGIJA d.o.o.)
................................................................................................................................................................................. 122
Figure 3.74 Indicators of population age per county in the Republic of Croatia in 2011 (Source: Croatian Bureau of
Statistics; Made by: IRES EKOLOGIJA d.o.o.) ......................................................................................................... 124
Figure 3.75 Counties according to classification of general movement of population in 2011 (Source: Croatian Bureau
of Statistics; Made by: IRES EKOLOGIJA d.o.o.) ..................................................................................................... 126
Figure 3.76 The number of vacant job posts registered at Croatian Employment Service in the period 2011-2015
(Source: Croatian Employment Service) .................................................................................................................. 128
Figure 3.77 The number of registered unemployed persons per county in Croatia, 2011-2016 (Source: Croatian
Employment Service) ............................................................................................................................................... 129
Figure 3.78 Share of registered job vacancies in total number of the registered unemployed persons (%) in the period
2012 -2016 base=share in 2011 (Source: On-line Statistics, Croatian Employment Service) .................................. 130
Figure 3.79 Development Index per county in 2013 in the Republic of Croatia (Source: Ministry of regional
development and European Funds) ......................................................................................................................... 131
Figure 3.80 Gross domestic product per capita in 2012 (up left) 2013 (up right) until 2014 (down left), per County
(Source: Croatian Bureau of Statistics) .................................................................................................................... 132
Figure 3.81 Total number of deaths and the number of killed in traffic accidents in Croatia in 2011-2015 (Source:
Croatian Bureau of Statistics) ................................................................................................................................... 133
Figure 3.82 Persons killed by type of the traffic accident in Croatia in 2015. (Source: Croatian Bureau of Statistics)
................................................................................................................................................................................. 134
Figure 5.1 Agricultural land converted into the “Road and railway network and associated land” category (Source:
CLC database) ......................................................................................................................................................... 144
Figure 5.2 Ratio of forests and artificial surfaces (Source: CLC database, Habitat map) ......................................... 145
Figure 5.3 Damage to wood stock on the territory of Croatia (Source: RFA) ............................................................ 147
Figure 5.4 Fatalities per single animal species on railway tracks in the period 2008-2012 (Source: Analysis of the state
of nature in the Republic of Croatia for the period 2008-2012) ................................................................................. 150
Figure 7.1 Relationship between the existing and planned railway infrastructure with non-fragmented areas greater
than 100 km2 (A: part of the Karlovac - Rijeka corridor Measures R.3; B: Zagreb junction corridor Measures R.11)
(Source: State of the Environment in the Republic of Croatia for 2008 -2012; Modified by: IRES EKOLOGIJA d.o.o.)
................................................................................................................................................................................. 215
Figure 7.2 Barrier effect of the railway track for turtles (Source: Dorsey et al., 2015) .............................................. 216
Strategic Environmental Impact Study of the Transport Development Strategy of the Republic of Croatia 2017-2030
Zagreb, August 2017. 12
Figure 7.3 Relationship between the existing and planned roads and the habitats of high suitability for bear denning
(Prepared by: IRES EKOLOGIJA d.o.o., Source: Croatian Agency for the Environment and Nature) ..................... 217
Figure 7.4 The relationship between the existing and planned roads with habitats of high suitability for bears (Prepared
by: IRES EKOLOGIJA d.o.o., Source: Croatian Agency for the Environment and Nature) ..................................... 217
Figure 7.5 The relationship between the existing and planned roads with habitats of high suitability for wolves
(Prepared by: IRES EKOLOGIJA d.o.o., Source: Croatian Agency for the Environment and Nature) ..................... 218
Figure 7.6 The relationship between the existing and planned roads with habitats of high suitability for bobcats
(Prepared by: IRES EKOLOGIJA d.o.o., Source: Croatian Agency for the Environment and Nature) ..................... 218
Figure 7.7 Planned corridor of the railway infrastructure from Zagreb to Rijeka (Figure A represents the area of most
frequent collision of bears and trains) (Prepared by: IRES EKOLOGIJA d.o.o.; Source; HAOP) ............................. 220
Figure 7.8 Planned corridor of the railway infrastructure from Zagreb to Rijeka passing through habitats of high
suitability for bear denning (Prepared by: IRES EKOLOGIJA d.o.o.; Source; HAOP) .............................................. 221
Figure 7.9 Planned corridor of the railway infrastructure from Zagreb to Rijeka passing through habitats of high
suitability for bear denning (Prepared by: IRES EKOLOGIJA d.o.o.; Source; HAOP) .............................................. 221
Figure 7.10 Relationship of road routes planned by the Strategy and areas of distribution of the species Lutra lutra
(Eurasian otter) (Source: National Monitoring Programs for Species in Croatia – otter; Modified by: IRES EKOLOGIJA
d.o.o.) ....................................................................................................................................................................... 223
Figure 7.11 The relationship between the road routes planned by the Strategy and areas of distribution of Castor fiber
(Eurasian beaver) (Source: Red Book of Mammals of Croatia; Modified by: IRES EKOLOGIJA d.o.o.) .................. 224
Figure 7.12 Relationship between road routes planned by the Strategy and Protected Areas of the Republic of Croatia
(Prepared by: IRES EKOLOGIJA d.o.o.) .................................................................................................................. 227
Figure 7.13 Railway transport routes in relation to the landscape regions (Prepared by: IRES EKOLOGIJA d.o.o.)
................................................................................................................................................................................. 231
Figure 7.14 Road traffic routes in relation to landscape regions (Prepared by: IRES EKOLOGIJA d.o.o.) .............. 233
Figure 7.15 Air traffic in relation to landscape regions (Prepared by: IRES EKOLOGIJA d.o.o.) ............................. 235
Figure 7.16 Maritime traffic in relation to landscape regions (Prepared by: IRES EKOLOGIJA d.o.o.) .................... 236
Figure 7.17 Inland waterway transport in relation to landscape regions (Prepared by: IRES EKOLOGIJA d.o.o.)... 238
Figure 7.18 Overlapping of planned railways with sanitary protection areas (Source: Water Management Plan 2016-
2021) ........................................................................................................................................................................ 242
Figure 7.19 Overlapping of roads with sanitary protection areas (Source: Water Resources Management Plan 2016-
2021) ........................................................................................................................................................................ 244
Figure 7.20 Railway infrastructure on P1 and P2 land capability class (Prepared by: IRES EKOLOGIJA d.o.o.) .... 251
Figure 7.21 Agricultural land according to CLC and planned railway infrastructure (Prepared by: IRES EKOLOGIJA
d.o.o.) ....................................................................................................................................................................... 252
Figure 7.22 Road infrastructure on P1 and P2 land capability class (Prepared by: IRES EKOLOGIJA d.o.o.) ........ 253
Figure 7.23 Agricultural land according to the CLC database and planned road infrastructure (Prepared by: IRES
EKOLOGIJA d.o.o.) .................................................................................................................................................. 255
Figure 7.24 Agricultural land according to CLC at the location of Split Airport (Prepared by: IRES EKOLOGIJA d.o.o.)
................................................................................................................................................................................. 257
Figure 7.25 P1 and P2 land capability class and planned interventions from the sector Inland Waterway Transport
(Prepared by: IRES EKOLOGIJA d.o.o.) .................................................................................................................. 258
Figure 7.26 Agricultural land according to CLC at the location of port of Sisak (Prepared by: IRES EKOLOGIJA d.o.o.)
................................................................................................................................................................................. 260
Strategic Environmental Impact Study of the Transport Development Strategy of the Republic of Croatia 2017-2030
Zagreb, August 2017. 13
Figure 7.27 Representation of R11, Ro.8. and I.7 measures and their spatial distribution in relation to the lowland
forest ecosystems they may impact (Prepared by: IRES EKOLOGIJA d.o.o.) ......................................................... 263
Figure 7.28 Pedunculate oak (a and b) trees and large degrees of crown defoliation (c and d) (Source: Tikvić et al.,
2009) ........................................................................................................................................................................ 263
Figure 7.29 Percentage share of pedunculate oak tree trees according to the degrees of crown defoliation (Source:
Tikvić et al., 2009) .................................................................................................................................................... 264
Figure 7.30 Percentage share of veneer and sawn timber for greater or less defoliation in the total technical roundwood
(Source: Tikvić et al., 2009) ...................................................................................................................................... 266
Figure 7.31 Annual survey of fire-damaged area (ha) for different types of forests in the karst area of the Republic of
Croatia in the period 2008 - 2012 (Source: State of the Environment in the Republic of Croatia for the period 2008-
2012) ........................................................................................................................................................................ 267
Figure 7.32 Areas under the greatest risk of fragmentation (Prepared by: IRES EKOLOGIJA d.o.o.) ..................... 269
Figure 7.33 Roe deer fatality in the Republic of Croatia (Source: Šprem et al., 2013) ............................................. 270
Figure 7.34 Wild boar fatality in the Republic of Croatia (Source: Šprem et al., 2013) ............................................. 270
Figure 7.35 Wild boar fatality in the Republic of Croatia (Source: Šprem et al., 2013) ............................................. 271
Figure 7.36 DC 12 junction Vrbovec 2 – Ivanja Reka – Vrbovec – Bjelovar – Virovitica – State border with Hungary
towards Barcs in relation to Natura 2000 areas in Hungary ..................................................................................... 285
Figure 7.37 A5 from A3 to the state border with Bosnia and Herzegovina (TEN-T comprehensive network/Pan-
European corridor Vc) (Svilaj bridge)........................................................................................................................ 287
Figure 11.2 Conservation areas significant for species and habitat types (Source: Appendix IV of the Regulation on
Ecological Network, OG 124/13, 105/15) ................................................................................................................. 302
Figure 11.3 Ecological network share in RoC by particular biogeographical regions (Source: HAOP) .................... 303
Figure 11.4 Areas of ecological network located in the area of the intervention planned by the Ro1 measure (prepared
by: IRES EKOLOGIJA d.o.o.) ................................................................................................................................... 319
Figure 11.5 Areas of the ecological network located in the area of the intervention planned by the Ro4 measure
(prepared by: IRES EKOLOGIJA d.o.o.) .................................................................................................................. 322
Figure 11.6 Overview of the intervention planned by the Ro4 measure in relation to the area of the ecological network
HR2000131 Škabac špilja (prepared by: IRES EKOLOGIJA d.o.o., Source: Bioportal) ........................................... 323
Figure 11.7 Speleological object Zagorska peć in relation to the planned section (prepared by: IRES
EKOLOGIJAd.o.o., Source: Croatian Agency for the Environment and Nature, 2017) ............................................ 324
Figure 11.8 Area of the ecological network HR2000190 Vlaška peć (prepared by: IRES EKOLOGIJA d.o.o., Source:
Bioportal) .................................................................................................................................................................. 324
Figure 11.9 Area of the ecological network HR2001154 Orlovac špilja (prepared by: IRES EKOLOGIJA d.o.o., Source:
Bioportal) .................................................................................................................................................................. 325
Figure 11.10 Areas of the ecological network located in the area of the intervention planned by the Ro5 measure
(prepared by: IRES EKOLOGIJA d.o.o.) .................................................................................................................. 327
Figure 11.11 Areas of the ecological network located in the area of the intervention planned by the Ro6 measure 330
Figure 11.12 Područja ekološke mreže na području zahvata planiranog mjerom Ro.8 (Izrađivač: IRES EKOLOGIJA
d.o.o.) ....................................................................................................................................................................... 331
Figure 11.13 Part of the route planned by the measure Ro9 passing through the area of the ecologic network
HR2001416 Brezovica-Jelik (Izrađivač: IRES EKOLOGIJA d.o.o.) .......................................................................... 334
Figure 11.14 Part of the route planned by the measure Ro.9 passing through the area of the ecologic network
HR2001088 Mala Dubrava - Vučedol (Izrađivač: IRES EKOLOGIJA d.o.o.) ............................................................ 335
Strategic Environmental Impact Study of the Transport Development Strategy of the Republic of Croatia 2017-2030
Zagreb, August 2017. 14
Figure 11.15 Part of the route planned by the Ro9 measure passing through the area of the ecologic network
HR2001500 Stepska staništa kod Bapske (prepared by: IRES EKOLOGIJA d.o.o.) ............................................... 336
Figure 11.16 Ecological network on the area Područja ekološke mreže na području zahvata planiranog mjerom Ro.9
(Izrađivač: IRES EKOLOGIJA d.o.o.) ....................................................................................................................... 337
Figure 11.17 Scope of the Ro10 measure (prepared by: IRES EKOLOGIJA d.o.o.) ............................................... 339
Figure 11.18 Scope of the Ro.11 measure (prepared by: IRES EKOLOGIJA d.o.o.) .............................................. 340
Figure 11.19 Speleological objects of the area of the ecological network HR2001010 Paleoombla - Ombla classified
as a habitat type 8310 Caves and pits closed to the public in relation to the planned section covered by the Ro11
measure (prepared by: IRES EKOLOGIJA d.o.o., Source: Croatian Agency for the Environment and Nature, 2017)
................................................................................................................................................................................. 341
Figure 11.20 Scope of the Ro.15 measure (prepared by: IRES EKOLOGIJA d.o.o.) ............................................... 344
Figure 11.21 Područje obuhvata mjere I.7. (Izrađivač: IRES EKOLOGIJA) ............................................................. 360
List of tables
Table 1.1 Steps in SEIA implementation ......................................................................................................................1
Table 3.1 Energy consumption of certain types of transport in Croatia from 2009 to 2014 (Source: Energy in Croatia
in 2014) ......................................................................................................................................................................17
Table 3.2 Direct energy consumption in Croatia by energy source from 2009 to 2014 (Source: Energy in Croatia in
2014) ..........................................................................................................................................................................18
Table 3.3 Average age of cars per year (Source: Croatian Vehicle Center) ...............................................................21
Table 3.4 Network length of the road infrastructure by categories and years (Source: Transport and Communications
in 2015) ......................................................................................................................................................................22
Table 3.5 Length of railway tracks and number of railway stations by years (Source: Transport and Communications
in 2015) ......................................................................................................................................................................22
Table 3.6 Railway hazardous goods transport by years and categories in thousands of tons and total tons mileage
(Source: Transport and Communications in 2015) .....................................................................................................23
Table 3.7 Hazardous goods transport in seaports from 2011 to 2015 in thousands of tons (Source: Transport and
Communications in 2015) ...........................................................................................................................................29
Table 3.8 Passengers from cruiser in Croatia (Source: Carić and Mackelworth, 2014)..............................................30
Table 3.9 Transported passengers (in thousands) and travelled kilometres (in thousands) in urban and suburban
transport (Source: Transport and Communications in 2015) ......................................................................................32
Table 3.10 Average age of the public transporters' rolling stock per cities (Source: Transport Development Strategy
of the Republic of Croatia 2017-2030) ........................................................................................................................32
Table 3.11 Persons killed and injured in road traffic accidents (Source: Transport and Communications in 2015) ...33
Table 3.12 Air quality categories for all zones and agglomerations from 2013 to 2015 (Prepared by: IRES EKOLOGIJA
d.o.o.) .........................................................................................................................................................................42
Table 3.13 The number of protected localities of geodiversity according to categories and subcategories of protection
(www.bioportal.hr) ......................................................................................................................................................47
Table 3.14 Relation between traffic density and permeability for mammals (Source: Iuell et al., 2003) .....................51
Table 3.15 Distances from roads on which an influence of noise on birds populations has been recorded (Source:
Forman and Alexander, 1998) ....................................................................................................................................63
Table 3.16 Categories of protected areas (Source: http://www.dzzp.hr/) ...................................................................64
Strategic Environmental Impact Study of the Transport Development Strategy of the Republic of Croatia 2017-2030
Zagreb, August 2017. 15
Table 3.17 Representation of motorways, fast and state roads inside protected areas (Source: Pressures on protected
areas, 2007) ...............................................................................................................................................................66
Table 3.18 The status of the black spots recovery in the area of the Republic of Croatia (Source: State of the
Environment Report 2009-2012, Modified: IRES EKOLOGIJA d.o.o.) .......................................................................75
Table 3.19 Comparative table of major statistical parameters for individual regions, Croatia and Europe (Source: State
of the Environment Report 2009-2012) ......................................................................................................................78
Table 3.20 Chemical status of groundwater body in the Pannonian part of Croatia (Source: River Basin Management
Plan 2016-2021) .........................................................................................................................................................92
Table 3.21 Chemical status of groundwater bodies in the karst region (Source: River Basin Management Plan 2016-
2021) ..........................................................................................................................................................................94
Table 3.22 Renewable resources and abstracted quantity of groundwater in the Pannonian region (Source: River
Basin Management Plan 2016-2021) .........................................................................................................................96
Table 3.23 Quantity of GWB in the karst area of Croatia (Source: River Basin Management Plan 2016-2021) ........96
Table 3.24 Surface of flooded areas for three scenarios according to elaborated Flood Hazard Maps (Source: River
Basin Management Plan 2016-2021). ........................................................................................................................99
Table 3.25 Intangible cultural goods listed in the Register of cultural goods of the Republic of Croatia by county
(permanently and preventively protected, status in 04/2017) ................................................................................... 102
Table 3.26 Land of P1 and P2 value in the Republic of Croatia (Source: Digital Soil Map of the Republic of Croatia)
................................................................................................................................................................................. 103
Table 3.27 Agricultural area in Croatia (Source: CLC database) .............................................................................. 105
Table 3.28 Number of beds per 1000 population, per county in Croatia in the period 2011-2015 (Source: Croatian
Bureau of Statistics) ................................................................................................................................................. 115
Table 3.29 Number of beds per km2 per county in Croatia in the period 2011-2015 (Source: Croatian Bureau of
Statistics) .................................................................................................................................................................. 116
Table 3.30 Working-age population in 2011, employed and unemployed persons shares, active population shares,
activity and employment rate in 2015 per county (Source: Croatian Bureau of Statistics, Croatian Employment Service)
................................................................................................................................................................................. 127
Table 5.1 Surface area of converted agricultural areas in the period 2006-2012 (Source: CLC database) .............. 143
Table 5.2 Forest surface in Croatia (Source: CLC database) ................................................................................... 144
Table 5.3 Crown defoliation on the territory of Croatia (Source: Reporting and forecasting activities in forestry for
2015/2016) ............................................................................................................................................................... 146
Table 5.4 Fire-damaged forest areas in Croatia (Source: Statistical Yearbook of the Republic of Croatia, 2016).... 147
Table 5.5 Wild game fatalities in road traffic in Croatia (2007-2009) (Source: Šprem et al., 2013) .......................... 148
Table 5.6 Wild game fatalities in road traffic in Croatia by type of game .................................................................. 149
Table 7.1 Railway transport Measures within Croatian Landscape Regions (Producer: IRES EKOLOGIJA d.o.o.). 230
Table 7.2 Road Traffic Measures within Croatian Landscape Regions (Producer: IRES EKOLOGIJA d.o.o.) ......... 232
Table 7.3 Air traffic measures within Croatian landscape regions (Prepared by: IRES EKOLOGIJA d.o.o.) ............ 234
Table 7.4 Maritime traffic measures within Croatian landscape regions (Developer: IRES EKOLOGIJA d.o.o.)...... 236
Table 7.5 Measures of inland waterways transport within the Croatian landscape regions (Producer: IRES
EKOLOGIJA d.o.o.) .................................................................................................................................................. 237
Table 7.6 Overlap of the sanitary protection zone of sources with planned railway tracks (Prepared by: IRES
EKOLOGIJA d.o.o.) .................................................................................................................................................. 241
Strategic Environmental Impact Study of the Transport Development Strategy of the Republic of Croatia 2017-2030
Zagreb, August 2017. 16
Table 7.7 Overlap of sanitary protection area with planned roads (Prepared by: IRES EKOLOGIJA d.o.o.) ........... 243
Table 7.8 Conflict between the road sector and P1 and P2 land capability class (Prepared by: IRES EKOLOGIJA
d.o.o.) ....................................................................................................................................................................... 252
Table 7.9 List of measures which are in conflict with the forest area (Prepared by: IRES EKOLOGIJA d.o.o.) ....... 261
Table 11.1 Applied scale for the intensity assessment of the impact of the planned intervention (Source: Manual for
Acceptability Assessment of the Intervention for Ecological Network) ..................................................................... 299
Table 11.2 Data on the number and area of ecological network areas in the Republic of Croatia (Source: HAOP,
http://www.dzzp.hr/ekoloska-mreza/natura-2000) .................................................................................................... 300
Table 11.3 Number of habitat types for 126 species of birds according to which the ecological network areas have
been indicated (Source: Topić and Vukelić 2009; Gottstein 2010; Bakran-Petricioli 2011; Regulation on the Ecological
Network, OG 124/13, 105/15) ................................................................................................................................... 303
Table 11.4 Number of species by groups according to which the ecological network areas have been indicated
(Source: Regulation on Ecological Network, OG 124/13, 105/15) ............................................................................ 304
Table 11.5 List of threats in category D of Traffic and Infrastructure (Source: Reference material for the reporting
period 2007-2012 under the Article 17 of the Habitats Directive) ............................................................................. 304
Strategic Environmental Impact Study of the Transport Development Strategy of the Republic of Croatia 2017-2030
Zagreb, kolovoz 2017. 1
1 Introduction
Strategic Environmental Impact Assessment (hereinafter: SEIA) is a procedure for assessing the likely significant
environmental impacts that may arise from the implementation of a strategy, plan or programme. The implementation
of the SEIA is the basis for promoting sustainable development by integrating the conditions for environmental
protection into the strategies, plans and programmes of a particular area. This enables the adoption of relevant
decisions on the approval of strategies, plans and programmes taking into account possible significant impacts that
the strategy, plan and programme could have on the environment and provides the persons responsible for the
implementation with the framework of action and the possibility to include essential environmental protection elements
in decision-making (Environmental Protection Act (Official Gazette of the Republic of Croatia 80/13, 153/13, 78/15)).
The designer of the Transport Development Strategy of the Republic of Croatia for the period 2017-2030 (hereinafter:
the Strategy) is the Ministry of Maritime Affairs, Transport and Infrastructure1 (hereinafter: the Ministry of Sea,
Transport and Infrastructure). The SEIA procedure started on 21 July 2015 with the adoption of the Decision on the
implementation of the procedure for Strategic Environmental Impact Assessment for the “Transport Development
Strategy of the Republic of Croatia for the period 2017-2030” (Class: 340-03/15-10/03, Reg. No.: 530-08-2-3-2-15-4).
The SEIA procedure for the Strategy is implemented on the basis of the provisions of the Environmental Protection
Act, the Regulation on the Strategic Environmental Impact Assessment of the Strategy, Plan and Programme (Official
Gazette of the Republic of Croatia 64/08)2 and the Regulation on Information and Participation of the Public and
Interested Public in Environmental Issues (Official Gazette of the Republic of Croatia 64/08). This procedure assesses
the likely significant impacts on the environment and human health that may arise from the implementation of the
Strategy.
The Strategic Environmental Impact Study (hereinafter: the Study) is developed in the SEIA procedure, a professional
background attached to the Strategy and includes all the necessary data, explanations and descriptions in textual and
graphic form. The study identifies, describes and assesses the likely significant impacts on the environment and
human health that may arise from the implementation of the Strategy. It is intended to ensure that the consequences
on the environment and human health are assessed during the preparation of the Strategy, prior to the final proposal
and referral to the procedure for its adoption.
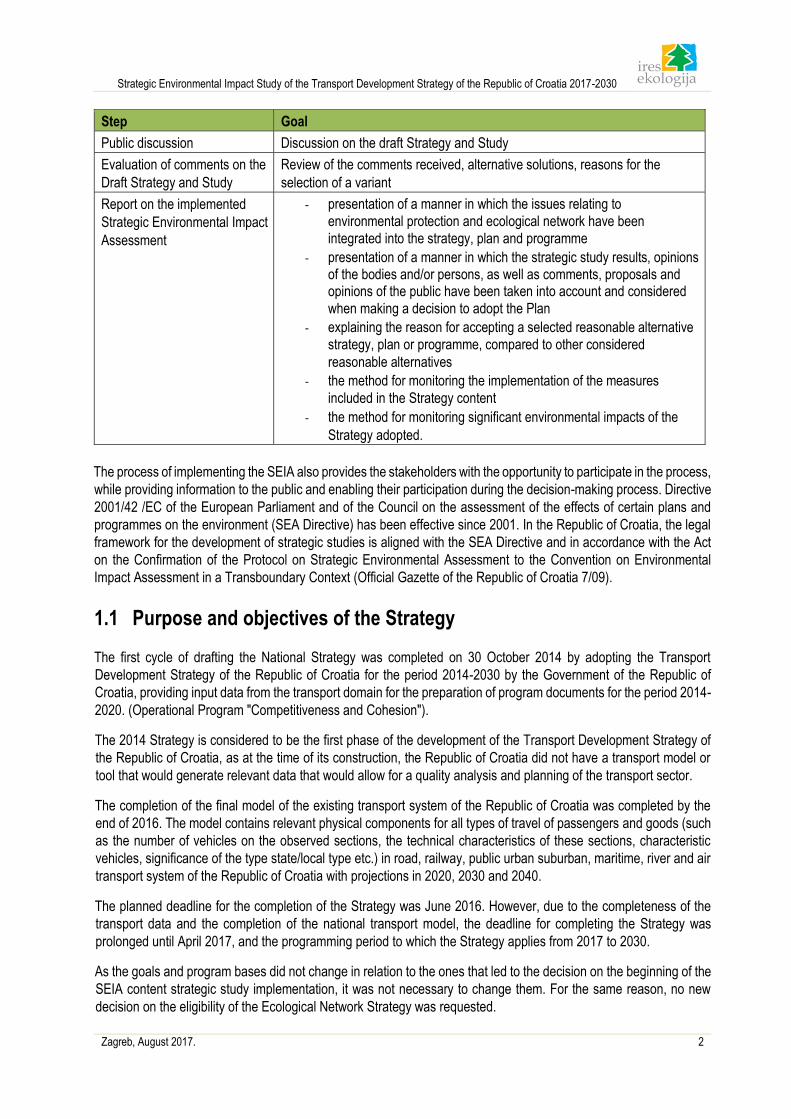
SEIA procedure consists of steps provided in the table (Table 1.1).
Table 1.1 Steps in SEIA implementation
Step Goal
Analytical review Determine whether the strategic assessment is mandatory under the
provisions of the Environmental Protection Act
Opinion of the body competent
for nature protection
Implementing the preliminary acceptability assessment of the Strategy for the
Ecological Network
Opinion of the body Obtaining an opinion on the strategic assessment from the body competent for
environmental protection
Defining the content of the
Strategic Study
Defining the scope and level of details that shall be addressed in the
assessment
Preparation of the Strategic
Study and
evaluation of its integrity and
professional grounds
Assessment of likely significant environmental impacts as a result of
implementing the Strategy
1 The Ministry of Maritime Affairs, Transport and Infrastructure changed its name to Ministry of Sea, Transport and Infrastructure,
October 2016. 2 From January 2017, a new Regulation on the Strategic Environmental Impact Assessment of the Strategy, Plan and Programme
(Official Gazette of the Republic of Croatia 3/17) is effective.
Strategic Environmental Impact Study of the Transport Development Strategy of the Republic of Croatia 2017-2030
Zagreb, August 2017. 2
Step Goal
Public discussion Discussion on the draft Strategy and Study
Evaluation of comments on the
Draft Strategy and Study
Review of the comments received, alternative solutions, reasons for the
selection of a variant
Report on the implemented
Strategic Environmental Impact
Assessment
- presentation of a manner in which the issues relating to
environmental protection and ecological network have been
integrated into the strategy, plan and programme
- presentation of a manner in which the strategic study results, opinions of the bodies and/or persons, as well as comments, proposals and opinions of the public have been taken into account and considered
when making a decision to adopt the Plan
- explaining the reason for accepting a selected reasonable alternative
strategy, plan or programme, compared to other considered
reasonable alternatives
- the method for monitoring the implementation of the measures
included in the Strategy content
- the method for monitoring significant environmental impacts of the
Strategy adopted.
The process of implementing the SEIA also provides the stakeholders with the opportunity to participate in the process,
while providing information to the public and enabling their participation during the decision-making process. Directive
2001/42 /EC of the European Parliament and of the Council on the assessment of the effects of certain plans and
programmes on the environment (SEA Directive) has been effective since 2001. In the Republic of Croatia, the legal
framework for the development of strategic studies is aligned with the SEA Directive and in accordance with the Act
on the Confirmation of the Protocol on Strategic Environmental Assessment to the Convention on Environmental
Impact Assessment in a Transboundary Context (Official Gazette of the Republic of Croatia 7/09).
1.1 Purpose and objectives of the Strategy
The first cycle of drafting the National Strategy was completed on 30 October 2014 by adopting the Transport
Development Strategy of the Republic of Croatia for the period 2014-2030 by the Government of the Republic of
Croatia, providing input data from the transport domain for the preparation of program documents for the period 2014-
2020. (Operational Program "Competitiveness and Cohesion").
The 2014 Strategy is considered to be the first phase of the development of the Transport Development Strategy of
the Republic of Croatia, as at the time of its construction, the Republic of Croatia did not have a transport model or
tool that would generate relevant data that would allow for a quality analysis and planning of the transport sector.
The completion of the final model of the existing transport system of the Republic of Croatia was completed by the
end of 2016. The model contains relevant physical components for all types of travel of passengers and goods (such
as the number of vehicles on the observed sections, the technical characteristics of these sections, characteristic
vehicles, significance of the type state/local type etc.) in road, railway, public urban suburban, maritime, river and air
transport system of the Republic of Croatia with projections in 2020, 2030 and 2040.
The planned deadline for the completion of the Strategy was June 2016. However, due to the completeness of the
transport data and the completion of the national transport model, the deadline for completing the Strategy was
prolonged until April 2017, and the programming period to which the Strategy applies from 2017 to 2030.
As the goals and program bases did not change in relation to the ones that led to the decision on the beginning of the
SEIA content strategic study implementation, it was not necessary to change them. For the same reason, no new
decision on the eligibility of the Ecological Network Strategy was requested.
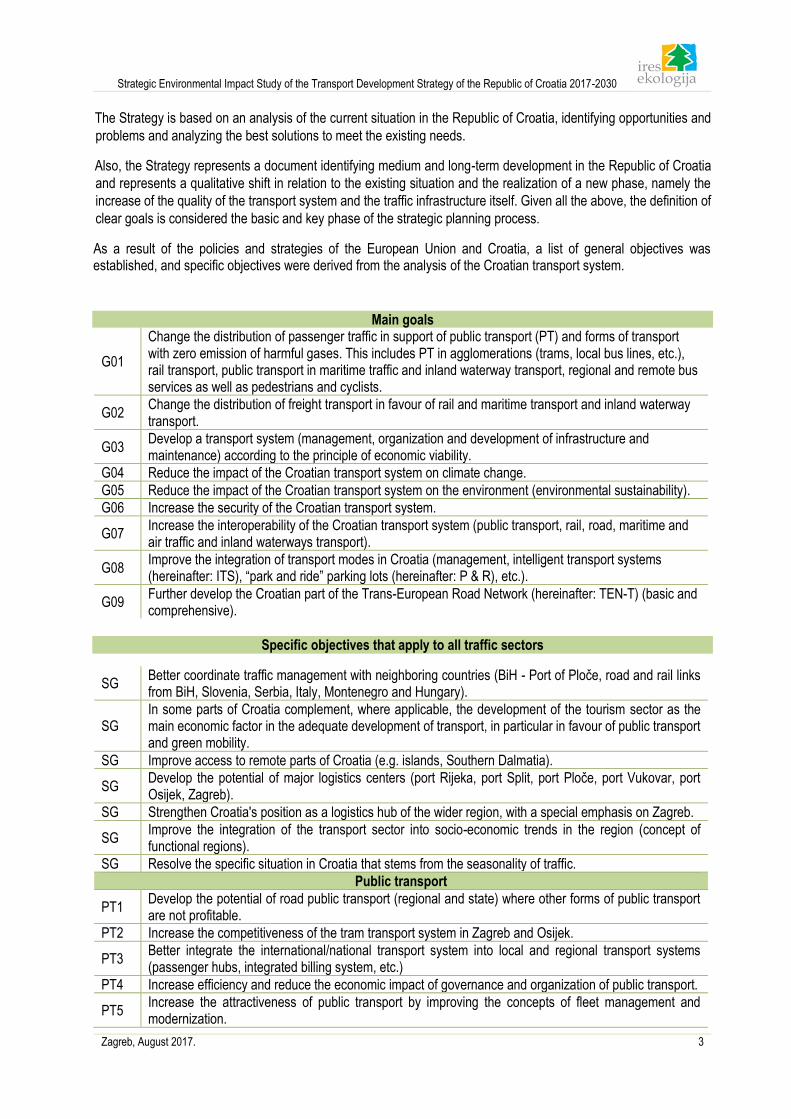
Strategic Environmental Impact Study of the Transport Development Strategy of the Republic of Croatia 2017-2030
Zagreb, August 2017. 3
The Strategy is based on an analysis of the current situation in the Republic of Croatia, identifying opportunities and
problems and analyzing the best solutions to meet the existing needs.
Also, the Strategy represents a document identifying medium and long-term development in the Republic of Croatia
and represents a qualitative shift in relation to the existing situation and the realization of a new phase, namely the
increase of the quality of the transport system and the traffic infrastructure itself. Given all the above, the definition of
clear goals is considered the basic and key phase of the strategic planning process.
As a result of the policies and strategies of the European Union and Croatia, a list of general objectives was established, and specific objectives were derived from the analysis of the Croatian transport system.
Main goals
G01
Change the distribution of passenger traffic in support of public transport (PT) and forms of transport with zero emission of harmful gases. This includes PT in agglomerations (trams, local bus lines, etc.), rail transport, public transport in maritime traffic and inland waterway transport, regional and remote bus services as well as pedestrians and cyclists.
G02 Change the distribution of freight transport in favour of rail and maritime transport and inland waterway transport.
G03 Develop a transport system (management, organization and development of infrastructure and maintenance) according to the principle of economic viability.
G04 Reduce the impact of the Croatian transport system on climate change.
G05 Reduce the impact of the Croatian transport system on the environment (environmental sustainability).
G06 Increase the security of the Croatian transport system.
G07 Increase the interoperability of the Croatian transport system (public transport, rail, road, maritime and air traffic and inland waterways transport).
G08 Improve the integration of transport modes in Croatia (management, intelligent transport systems (hereinafter: ITS), “park and ride” parking lots (hereinafter: P & R), etc.).
G09 Further develop the Croatian part of the Trans-European Road Network (hereinafter: TEN-T) (basic and comprehensive).
Specific objectives that apply to all traffic sectors
SG Better coordinate traffic management with neighboring countries (BiH - Port of Ploče, road and rail links from BiH, Slovenia, Serbia, Italy, Montenegro and Hungary).
SG In some parts of Croatia complement, where applicable, the development of the tourism sector as the main economic factor in the adequate development of transport, in particular in favour of public transport and green mobility.
SG Improve access to remote parts of Croatia (e.g. islands, Southern Dalmatia).
SG Develop the potential of major logistics centers (port Rijeka, port Split, port Ploče, port Vukovar, port Osijek, Zagreb).
SG Strengthen Croatia's position as a logistics hub of the wider region, with a special emphasis on Zagreb.
SG Improve the integration of the transport sector into socio-economic trends in the region (concept of functional regions).
SG Resolve the specific situation in Croatia that stems from the seasonality of traffic.
Public transport
PT1 Develop the potential of road public transport (regional and state) where other forms of public transport are not profitable.
PT2 Increase the competitiveness of the tram transport system in Zagreb and Osijek.
PT3 Better integrate the international/national transport system into local and regional transport systems (passenger hubs, integrated billing system, etc.)
PT4 Increase efficiency and reduce the economic impact of governance and organization of public transport.
PT5 Increase the attractiveness of public transport by improving the concepts of fleet management and modernization.
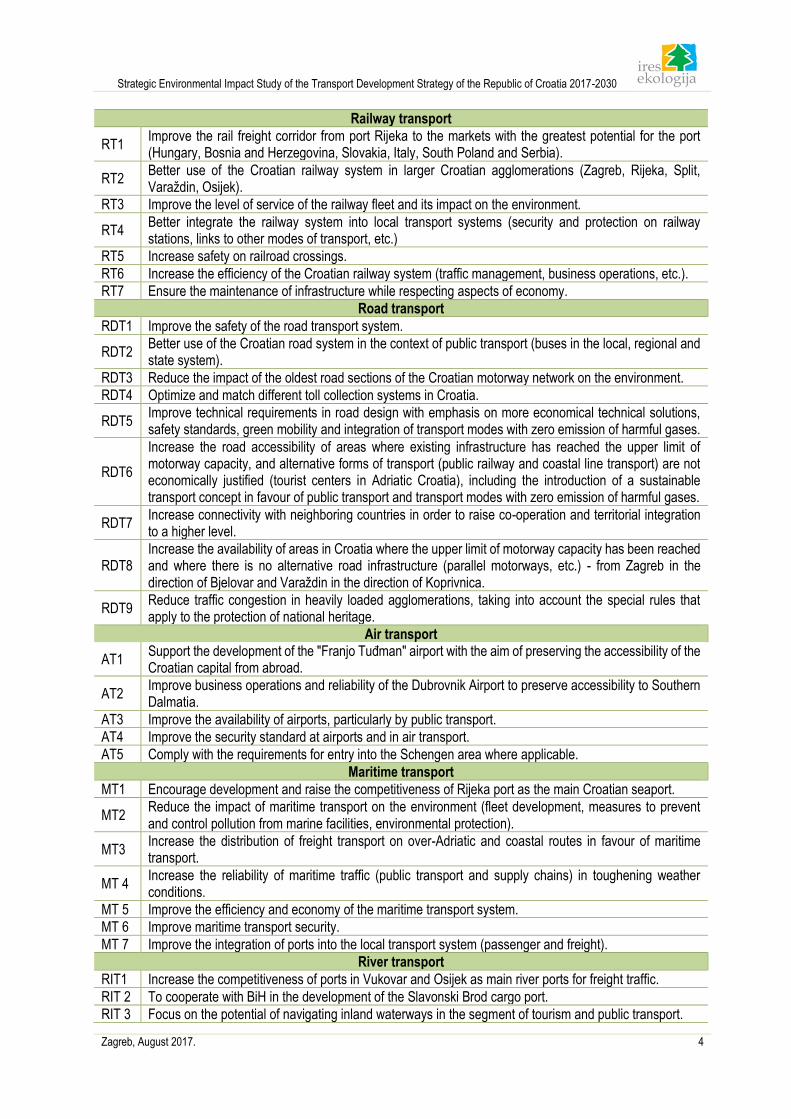
Strategic Environmental Impact Study of the Transport Development Strategy of the Republic of Croatia 2017-2030
Zagreb, August 2017. 4
Railway transport
RT1 Improve the rail freight corridor from port Rijeka to the markets with the greatest potential for the port (Hungary, Bosnia and Herzegovina, Slovakia, Italy, South Poland and Serbia).
RT2 Better use of the Croatian railway system in larger Croatian agglomerations (Zagreb, Rijeka, Split, Varaždin, Osijek).
RT3 Improve the level of service of the railway fleet and its impact on the environment.
RT4 Better integrate the railway system into local transport systems (security and protection on railway stations, links to other modes of transport, etc.)
RT5 Increase safety on railroad crossings.
RT6 Increase the efficiency of the Croatian railway system (traffic management, business operations, etc.).
RT7 Ensure the maintenance of infrastructure while respecting aspects of economy.
Road transport
RDT1 Improve the safety of the road transport system.
RDT2 Better use of the Croatian road system in the context of public transport (buses in the local, regional and state system).
RDT3 Reduce the impact of the oldest road sections of the Croatian motorway network on the environment.
RDT4 Optimize and match different toll collection systems in Croatia.
RDT5 Improve technical requirements in road design with emphasis on more economical technical solutions, safety standards, green mobility and integration of transport modes with zero emission of harmful gases.
RDT6
Increase the road accessibility of areas where existing infrastructure has reached the upper limit of motorway capacity, and alternative forms of transport (public railway and coastal line transport) are not economically justified (tourist centers in Adriatic Croatia), including the introduction of a sustainable transport concept in favour of public transport and transport modes with zero emission of harmful gases.
RDT7 Increase connectivity with neighboring countries in order to raise co-operation and territorial integration to a higher level.
RDT8 Increase the availability of areas in Croatia where the upper limit of motorway capacity has been reached and where there is no alternative road infrastructure (parallel motorways, etc.) - from Zagreb in the direction of Bjelovar and Varaždin in the direction of Koprivnica.
RDT9 Reduce traffic congestion in heavily loaded agglomerations, taking into account the special rules that apply to the protection of national heritage.
Air transport
AT1 Support the development of the "Franjo Tuđman" airport with the aim of preserving the accessibility of the Croatian capital from abroad.
AT2 Improve business operations and reliability of the Dubrovnik Airport to preserve accessibility to Southern Dalmatia.
AT3 Improve the availability of airports, particularly by public transport.
AT4 Improve the security standard at airports and in air transport.
AT5 Comply with the requirements for entry into the Schengen area where applicable.
Maritime transport
MT1 Encourage development and raise the competitiveness of Rijeka port as the main Croatian seaport.
MT2 Reduce the impact of maritime transport on the environment (fleet development, measures to prevent and control pollution from marine facilities, environmental protection).
MT3 Increase the distribution of freight transport on over-Adriatic and coastal routes in favour of maritime transport.
MT 4 Increase the reliability of maritime traffic (public transport and supply chains) in toughening weather conditions.
MT 5 Improve the efficiency and economy of the maritime transport system.
MT 6 Improve maritime transport security.
MT 7 Improve the integration of ports into the local transport system (passenger and freight).
River transport
RIT1 Increase the competitiveness of ports in Vukovar and Osijek as main river ports for freight traffic.
RIT 2 To cooperate with BiH in the development of the Slavonski Brod cargo port.
RIT 3 Focus on the potential of navigating inland waterways in the segment of tourism and public transport.
Strategic Environmental Impact Study of the Transport Development Strategy of the Republic of Croatia 2017-2030
Zagreb, August 2017. 5
RIT 4 Adapt the buoyance conditions to transport needs and maintain the required level of navigation.
RIT 5 Improve operational and organizational conditions in river transport (economic viability).
Based on analysis of present conditions and with the aim of achieving defined general and specific objectives, a
set of measures has been established in each sector of transport. Measures suggest interventions that are related
to improving the infrastructure of different transport systems, but also with operational and organizational aspects.
Also, the Strategy sets out measures for all transport sectors that are to a large extent related to improving safety
and environmental protection.
All measures defined by the Strategy are listed and described in Chapter 7. Impact of the Strategy on the
environment. Measures are within the Study, aiming at a better approach to assess the impact of the Strategy on
the environment, divided into four categories: general measures (15), development measures (38),
management/organization (58) and spatially located measures (48).
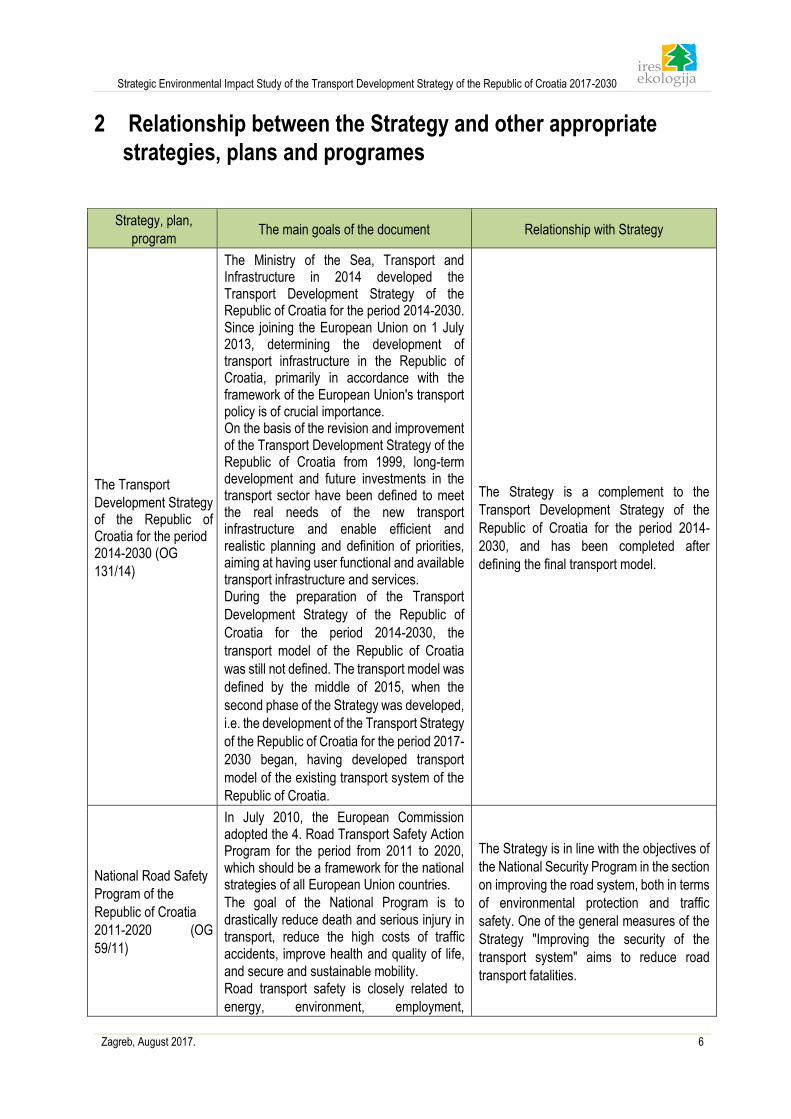
Strategic Environmental Impact Study of the Transport Development Strategy of the Republic of Croatia 2017-2030
Zagreb, August 2017. 6
2 Relationship between the Strategy and other appropriate
strategies, plans and programes
Strategy, plan,
program The main goals of the document Relationship with Strategy
The Transport
Development Strategy of the Republic of Croatia for the period 2014-2030 (OG
131/14)
The Ministry of the Sea, Transport and Infrastructure in 2014 developed the Transport Development Strategy of the Republic of Croatia for the period 2014-2030. Since joining the European Union on 1 July 2013, determining the development of transport infrastructure in the Republic of Croatia, primarily in accordance with the framework of the European Union's transport policy is of crucial importance. On the basis of the revision and improvement of the Transport Development Strategy of the Republic of Croatia from 1999, long-term development and future investments in the transport sector have been defined to meet the real needs of the new transport infrastructure and enable efficient and realistic planning and definition of priorities, aiming at having user functional and available transport infrastructure and services. During the preparation of the Transport
Development Strategy of the Republic of
Croatia for the period 2014-2030, the
transport model of the Republic of Croatia
was still not defined. The transport model was
defined by the middle of 2015, when the
second phase of the Strategy was developed,
i.e. the development of the Transport Strategy
of the Republic of Croatia for the period 2017-
2030 began, having developed transport
model of the existing transport system of the
Republic of Croatia.
The Strategy is a complement to the
Transport Development Strategy of the
Republic of Croatia for the period 2014-
2030, and has been completed after
defining the final transport model.
National Road Safety
Program of the
Republic of Croatia
2011-2020 (OG
59/11)
In July 2010, the European Commission adopted the 4. Road Transport Safety Action Program for the period from 2011 to 2020, which should be a framework for the national strategies of all European Union countries.
The goal of the National Program is to
drastically reduce death and serious injury in transport, reduce the high costs of traffic accidents, improve health and quality of life,
and secure and sustainable mobility.
Road transport safety is closely related to
energy, environment, employment,
The Strategy is in line with the objectives of
the National Security Program in the section
on improving the road system, both in terms
of environmental protection and traffic
safety. One of the general measures of the
Strategy "Improving the security of the
transport system" aims to reduce road
transport fatalities.
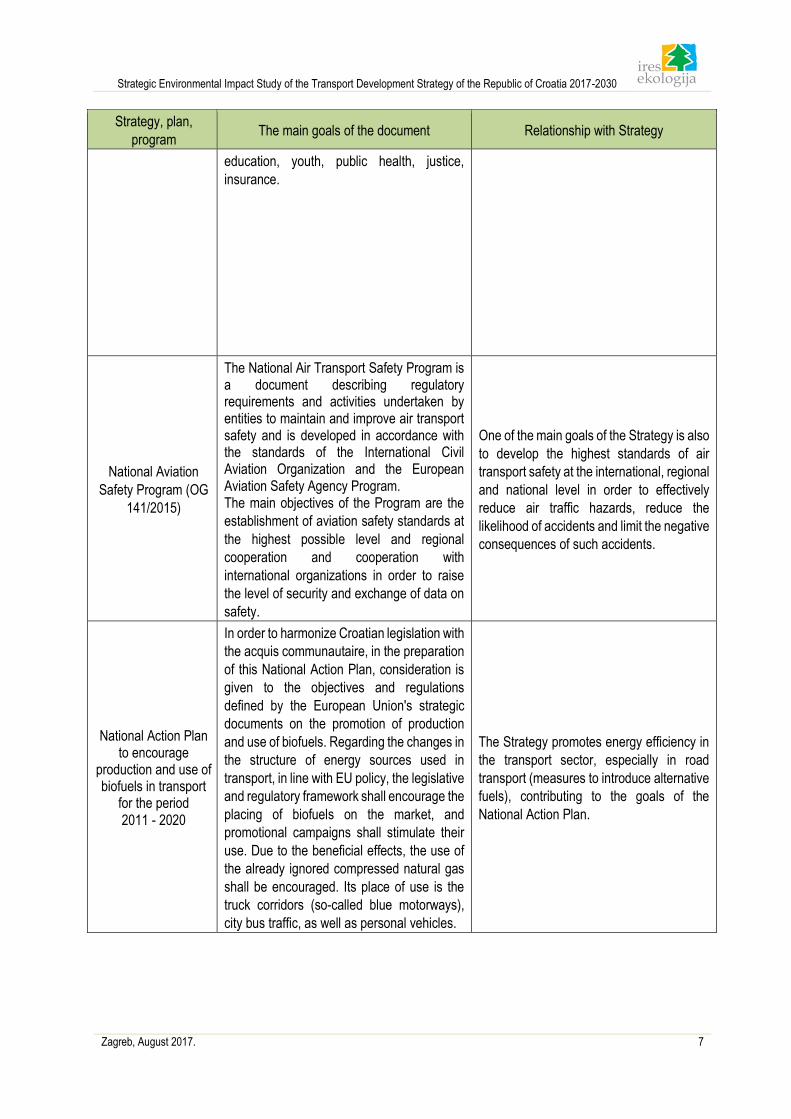
Strategic Environmental Impact Study of the Transport Development Strategy of the Republic of Croatia 2017-2030
Zagreb, August 2017. 7
Strategy, plan,
program The main goals of the document Relationship with Strategy
education, youth, public health, justice,
insurance.
National Aviation
Safety Program (OG
141/2015)
The National Air Transport Safety Program is a document describing regulatory requirements and activities undertaken by entities to maintain and improve air transport safety and is developed in accordance with the standards of the International Civil Aviation Organization and the European Aviation Safety Agency Program. The main objectives of the Program are the
establishment of aviation safety standards at
the highest possible level and regional
cooperation and cooperation with
international organizations in order to raise
the level of security and exchange of data on
safety.
One of the main goals of the Strategy is also
to develop the highest standards of air
transport safety at the international, regional
and national level in order to effectively
reduce air traffic hazards, reduce the
likelihood of accidents and limit the negative
consequences of such accidents.
National Action Plan to encourage
production and use of biofuels in transport
for the period 2011 - 2020
In order to harmonize Croatian legislation with
the acquis communautaire, in the preparation
of this National Action Plan, consideration is
given to the objectives and regulations
defined by the European Union's strategic
documents on the promotion of production
and use of biofuels. Regarding the changes in
the structure of energy sources used in
transport, in line with EU policy, the legislative
and regulatory framework shall encourage the
placing of biofuels on the market, and
promotional campaigns shall stimulate their
use. Due to the beneficial effects, the use of
the already ignored compressed natural gas
shall be encouraged. Its place of use is the
truck corridors (so-called blue motorways),
city bus traffic, as well as personal vehicles.
The Strategy promotes energy efficiency in
the transport sector, especially in road
transport (measures to introduce alternative
fuels), contributing to the goals of the
National Action Plan.
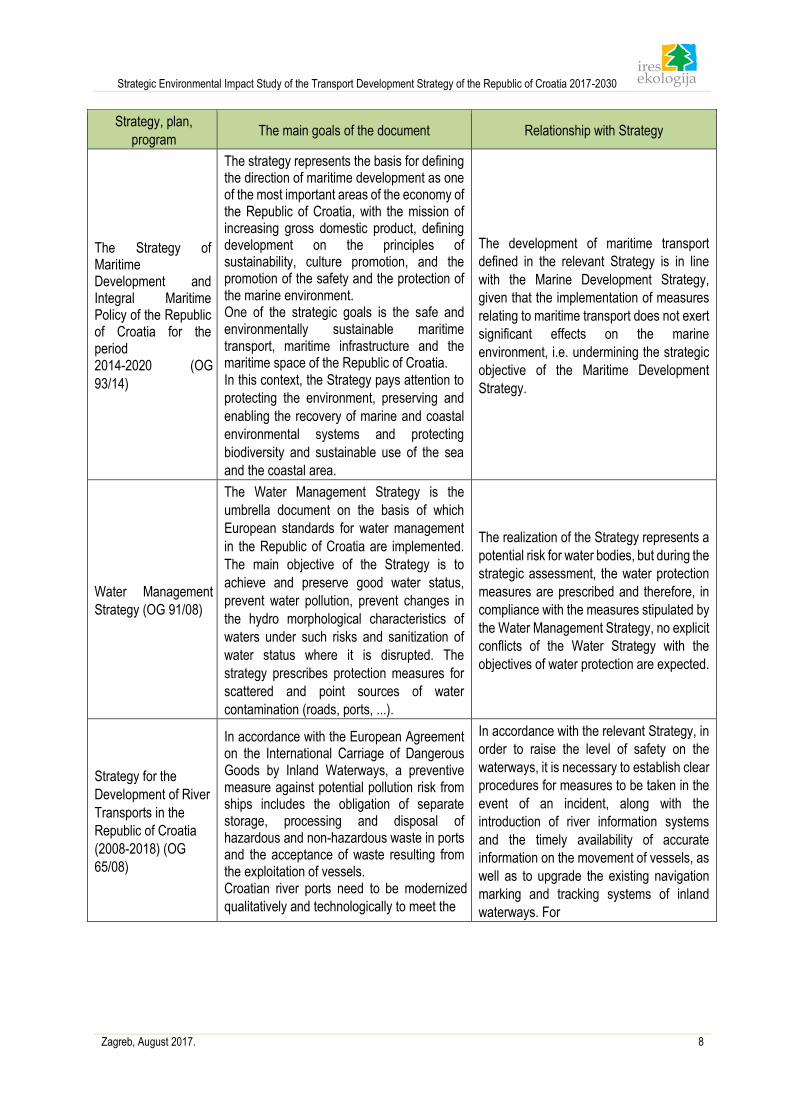
Strategic Environmental Impact Study of the Transport Development Strategy of the Republic of Croatia 2017-2030
Zagreb, August 2017. 8
Strategy, plan,
program The main goals of the document Relationship with Strategy
The Strategy of Maritime Development and Integral Maritime Policy of the Republic of Croatia for the period 2014-2020 (OG
93/14)
The strategy represents the basis for defining the direction of maritime development as one of the most important areas of the economy of the Republic of Croatia, with the mission of increasing gross domestic product, defining development on the principles of sustainability, culture promotion, and the promotion of the safety and the protection of the marine environment. One of the strategic goals is the safe and environmentally sustainable maritime transport, maritime infrastructure and the maritime space of the Republic of Croatia. In this context, the Strategy pays attention to
protecting the environment, preserving and
enabling the recovery of marine and coastal
environmental systems and protecting
biodiversity and sustainable use of the sea
and the coastal area.
The development of maritime transport
defined in the relevant Strategy is in line
with the Marine Development Strategy,
given that the implementation of measures
relating to maritime transport does not exert
significant effects on the marine
environment, i.e. undermining the strategic
objective of the Maritime Development
Strategy.
Water Management
Strategy (OG 91/08)
The Water Management Strategy is the
umbrella document on the basis of which
European standards for water management
in the Republic of Croatia are implemented.
The main objective of the Strategy is to
achieve and preserve good water status,
prevent water pollution, prevent changes in
the hydro morphological characteristics of
waters under such risks and sanitization of
water status where it is disrupted. The
strategy prescribes protection measures for
scattered and point sources of water
contamination (roads, ports, ...).
The realization of the Strategy represents a
potential risk for water bodies, but during the
strategic assessment, the water protection
measures are prescribed and therefore, in
compliance with the measures stipulated by
the Water Management Strategy, no explicit
conflicts of the Water Strategy with the
objectives of water protection are expected.
Strategy for the
Development of River
Transports in the
Republic of Croatia
(2008-2018) (OG
65/08)
In accordance with the European Agreement on the International Carriage of Dangerous Goods by Inland Waterways, a preventive measure against potential pollution risk from ships includes the obligation of separate storage, processing and disposal of hazardous and non-hazardous waste in ports and the acceptance of waste resulting from the exploitation of vessels. Croatian river ports need to be modernized
qualitatively and technologically to meet the
In accordance with the relevant Strategy, in
order to raise the level of safety on the
waterways, it is necessary to establish clear
procedures for measures to be taken in the
event of an incident, along with the
introduction of river information systems
and the timely availability of accurate
information on the movement of vessels, as
well as to upgrade the existing navigation
marking and tracking systems of inland
waterways. For
Strategic Environmental Impact Study of the Transport Development Strategy of the Republic of Croatia 2017-2030
Zagreb, August 2017. 9
existing and expected transport demand. In
addition to the modernization of the basic port
infrastructure, security and surveillance
systems in the port area should be improved.
Ports must be connected to main road and
railway corridors in order to achieve better
integration with economic hinterland and to
create preconditions for the development of
intermodal traffic.
security reasons, it is necessary to
modernize ports and equip them with
modern security systems. With regard to
the action of the Strategy in the direction
of improving the conditions of the port
area, conflicts with the objectives of the
Development Strategy of River Transport
in the Republic of Croatia are not
expected.
Croatia's Tourism
Development
Strategy by 2020 (OG
55/13)
The Tourism Development Strategy of the
Republic of Croatia by 2020 has set the main
objective of tourism development in
increasing tourism attractiveness and
competitiveness, which should result in
country entering the list of the leading 20
tourist destinations in the world according to
the competitiveness criteria. Strategic goals
of tourism development are oriented towards
achieving the main goal and they include
improving the structure and quality of
accommodation, new employment,
investments and increasing tourism supply.
The Strategy contributes to
improvements in the tourism sector in a
way that ensures better tourist
connectivity, mobility and accessibility of
tourist products to all aspects of transport.
Nautical Tourism Development Strategy of the Republic of Croatia for the Period
2009 - 2019
The greatest threat to the long-term development of nautical tourism is the uncontrolled use of naturally shaped area and natural goods. Therefore, the responsible management of natural resources and goodwill, i.e. protection of nature and environment for the purpose of their conservation, contained in the principle of sustainable development, represents an imperative for the creators of economic development and the planning of the use of space at all levels. With all the positive economic effects, tourism also has negative ones. The negative impact of tourism is reflected, above all, in the use of natural space for capacity building and the short seasonal concentration of a large number of tourists in a given area. The negative impacts of tourism on space and the environment can be reduced to the smallest possible extent by managing its development, which implies planning a rational and controlled, limited and targeted use of space for capacity building and the application of all environmental protection measures. By implementing regulations, the nautical tourism ports undertake the obligation to implement the receiving systems for the collection of waste materials from the vessels (faeces, oils, communal waste), thereby
The objectives of the Strategy are in line
with the Strategy for the Development of
Nautical Tourism in the area of improving
safety and environmental protection in
ports.
Strategic Environmental Impact Study of the Transport Development Strategy of the Republic of Croatia 2017-2030
Zagreb, August 2017. 10
contributing to the preservation of the environment. When designing the construction of nautical ports, it is necessary to valorize and apply more criteria, and certainly one of the most important criteria is selecting a location.
The European Union Strategy for the Danube Region
The Danube region covers the fifth of the
territory of the European Union and its well-
being is inseparably linked to the Union as a
whole. Many problems in the region have no
borders (flood, transport and energy
connectivity, environmental protection and
security challenges) and require a unique
approach. Due to the geographical and
political characteristics of the region,
migration, climate change and security have
a particularly strong impact on this area.
Projects proposed in the priority area to which
the Republic of Croatia belongs include:
removal of ship wrecks and other remnants
from river basin, faster interurban railway
links, multimodal investment to foster green
mobility solutions.
The Strategy is not in conflict with the
objectives of the Danube Strategy. In the
priority area for the Republic of Croatia,
the environmental development
objectives are in line with the Croatian
Road Transport Strategy.
Energy development
Strategy of the
Republic of Croatia
(OG 130/09)
Dev
The fast-growing sectors in the Republic of Croatia include energy-intensive activities such as power engineering, oil refining and mineral products (cement, lime, glass). These Sectors shall be included in the emission trading system and burdened with the price of carbon dioxide. In addition, due to increased mobility and high price non-elasticity, there is also a significant increase in road traffic emissions. Emissions from this sector shall be limited by the development of sustainable transportation, technological development and the use of neutral fuels for carbon dioxide emissions. The transport sector participates in total direct
energy consumption with about 30%. The
growth rate is exceptionally high (over 5% per
year over the past five years). The largest
share of energy consumption in the sector
has road traffic with almost 90%. Such a
share is also expected in the future, due to the
increase in the number of cars, the increased
prevalence of the car's distance and the
reduced number of passengers per car.
Therefore, the focus of the energy efficiency
policy in the transport sector is precisely on
road transport.
The objective of the Strategy is to
increase the energy efficiency of the
transport sector, with particular emphasis
on road traffic, i.e. the use of alternative
fuels and encouraging the use of electric
vehicles. In this context, these two
strategies have harmonized goals.
Strategic Environmental Impact Study of the Transport Development Strategy of the Republic of Croatia 2017-2030
Zagreb, August 2017. 11
Strategy and Action Plan for the Protection of Biological and Landscape Diversity of the Republic of Croatia (OG 143/08)
According to the Strategy, the greatest threat to wild species in Croatia is the destruction and loss of habitats, partly as a result of transforming natural habitats into construction or agricultural land or the construction of roads and other transport routes, which often leads to fragmentation of habitats. Also, great danger represents the ballast water as the main cause of invasive foreign (allochthones) species water entry point, especially in marine ecosystems. Strategic goals for transport have been:
• reduce the impact of transport infrastructure on wild species and natural habitats
• prevent the introduction of foreign invasive species into the nature of the Republic of Croatia and continue to address the problems of existing invasive species.
A new Strategy and Action Plan for the
Protection of Nature of the Republic of Croatia
is under preparation (draft).
The Strategy could potentially undermine
biodiversity conservation goals, as it
contributes to building new transport
areas. On the other hand, during the
strategic assessment, potential conflicts
of the Strategy for the conservation of wild
species and habitats are recorded, but
adequate mitigation measures are
prescribed for the development of
transport.
The Rural
Development Program
of the Republic of
Croatia for the period
2014-2020
Program goals:
1. encourage the competitiveness of
agriculture
2. ensure sustainable management of natural
resources and climate change
3. to achieve balanced territorial development of rural areas, including the creation and preservation of jobs. According to the Program, poorly populated
rural areas have remained at a lower level of
communal and transport infrastructure
development compared to urban areas. The
poor linkage of underdeveloped rural areas with
local and regional centers, inadequate quality
and the build-up of existing communal and
transport infrastructure still does not provide the
necessary conditions for sustainable
development of rural areas and quality of life in
this area.
The Transport Development Strategy
contributes to better conditions for rural
development, primarily by encouraging
better
transport links of rural areas with local and
regional centers.
Strategic Environmental Impact Study of the Transport Development Strategy of the Republic of Croatia 2017-2030
Zagreb, August 2017. 12
Sava River Basin
Management Plan
The Sava River Basin Management Plan was developed in line with the requirements of the EU Water Framework Directive, which establishes a legal framework for the protection and improvement of the status of all waters and protected areas, including water-dependent ecosystems, prevention of deterioration of their condition while ensuring long-term, sustainable use of water resources. The Sava River Basin Management Plan
establishes several principles of integral
water management, including the integration
of water protection into river basin
development activities.
The upgrading of the Sava River Basin is
one of the measures of the Strategy,
which is in line with the objectives defined
in the Sava River Basin Management
Plan.
Emergency Sea
Pollution Plan (OG
92/08)
The Emergency Sea Pollution Intervention
Plan is a document of sustainable
development and environmental protection
that sets out the procedures and measures for
predicting, preventing, limiting, responding to
the sudden sea pollution and the
extraordinary natural events at sea in order to
protect the marine environment. The
intervention plan is in line with the
international agreements on the protection of
the marine environment, the Republic of
Croatia being a party in these international
agreements. The intervention plan is applied
to the marine areas, the sea bottom and the
submarine waters of the Republic of Croatia,
which include maritime welfare, internal sea
water, territorial sea and protected ecological
fishing zone. All coastal counties have
adopted intervention plans for sudden
pollution of the sea.
Intervention plans ensure the protection
of the marine environment in ports, which
is also one of the goals of the Strategy in
the area related to maritime transport.
During the strategic assessment,
additional measures are stipulated for the
provision of port equipment devices for
the pollution prevention.
Waste Management
Plan of the Republic of Croatia for the
Period 2017-2022 (OG 3/17)
The Waste Disposal Act (OG 94/13) lays
down the following specific categories of
waste: biowaste, waste textile and footwear,
waste packaging, waste tires, waste oils,
waste batteries and accumulators, waste
vehicles, asbestos waste, electrical and
electronic waste (hereinafter referred to as:
EE) devices and equipment, waste ships,
marine waste, building waste, waste sludge
from wastewater treatment plants, waste from
titanium dioxide production, waste
polychlorinated biphenyls and polychlorinated
terphenyls.
The realization of the Strategy can lead to
the generation of a larger amount of
waste, which is particularly significant in
terms of marine waste that is difficult to
control. The security measures defined in
the Strategy also work in the direction of
better waste management from specific
transport sectors (e.g. ports).
Strategic Environmental Impact Study of the Transport Development Strategy of the Republic of Croatia 2017-2030
Zagreb, August 2017. 13
Water Management Plan 2016-2021 OG
(66/16)
The Water Management Plan analyzed,
among other things, dotted and scattered
sources of water pollution, whose coverage
was extended in relation to the first water
management plan. Evidence of sources and
estimates of pollutant emissions has been
made for all known types of pointy and
scattered sources.
The Strategy defines the objectives of
environmental protection, i.e. it goes in
the direction of improving the traffic
system in a way that, among other things,
it mostly reduces pollution of the
environment (including waters) caused by
roads and ports. Along with the goals of
the Strategy, during strategic assessment
additional measures to protect water from
pollution have been defined, and it is
concluded that the Strategy shall not be in
conflict with the measures defined by the
Water Management Plan.
Air Protection Plan for the Protection of Air, Ozone Layer and Climate Change Mitigation in the Republic of Croatia for the Period 2013 to 2017 (OG 139/13)
The purpose of the Plan is to define and develop objectives and measures by priority sectors, deadlines and implementing measures, with the main objective of protecting and improving the air quality in the Republic of Croatia, particularly in areas where air quality is not of the first category, ozone layer protection and mitigation of climate change. This Plan, among other things, provides for
measures to reduce total emissions from
transport.
The relevant Strategy defines measures
related to the application of more
environmentally friendly fuels and
investment in the renewal of the railway
fleet, as well as maritime transport.
Improved transport systems planned by
the Strategy lead to the reduction of
harmful emissions to the air and to the
reduction of fuel consumption. The
relevant Strategy is consistent with the
objectives of the Air Protection Plan, i.e.
measures related to the reduction of
emissions from transport.
Strategy for Spatial Planning for the Republic of Croatia (1997) and amendments of the Strategy (OG 76/13)
Within general objectives of achieving a higher level of security and development of the country, increasing the quality of life of the population and increasing the value of the Croatian area and its inclusion in the European development systems, the main spatial development objectives are highlighted, with an emphasis on strengthening the spatial-development structures of the state through a balanced and realistic polycentric development, the establishment of strong bases and the focus of development based on defined and potential traffic routes, city networks and improvement of infrastructure equipment as a condition for quality development. When it comes to the transport network, the priority of the Strategy is its modernization, reconstruction and improvement of existing capacities and traffic systems. Particularly emphasized is:
• good internal connectivity and connectivity within the European transport system
The general and specific objectives of the
Development Strategy take into account
the starting points for defining the goals
and objectives for spatial development in
Croatia, in which it is estimated that the
degree of development of Croatia does
not correspond to objective
developmental opportunities and that the
economic and traffic dynamics are
insufficient, thereby disrupting the proper
flow of traffic within the country and its
connection with other countries.
Furthermore, the current development
processes show great regional
differences which can be further
enhanced by the strengthening of the
main traffic-development corridors as well
as the intensified interest in building on
attractive areas.
Also, the general objectives of the
Strategy, as well as its specific sectoral
objectives take into the special interests
of Croatia: to take advantage of a
favorable geographical and strategic
Strategic Environmental Impact Study of the Transport Development Strategy of the Republic of Croatia 2017-2030
Zagreb, August 2017. 14
• construction of highways of high rank, new railway tracks on the main directions
• activation and modernization of the sea and river ports
position, to encourage development
programs with technologies that improve
area and do not pollute the environment,
and develop large infrastructural projects
to enable functional integration of
Croatian territory, independence and
security, as well as the possibility of
joining the European network.
Spatial Planning Program for the Republic of Croatia (1999.) and amendments of the Programe (OG 84/13)
The Program is the Implementation Document of the Spatial Planning Strategy which determines the activities and measures for implementing the Strategy. Objectives of the Spatial Planning Program of the Republic of Croatia (1999 and 2013):
• strengthen the spatial developmental structure of the country
• increase the value and quality of area and the environment
• rational use and protection of national goods
• recognize the common features and
particularities of the area
• develop infrastructure systems
• ensure the effectiveness of spatial planning systems
• direct spatial-development priorities.
When it comes to development programs for transport sectors, the Program covers the aspects of the Integrated Traffic System, all components of the action and the planning of new routes based on economic parameters and other relevant indicators of justification and realities of performance, rational use and protection of area as well as:
• accelerated road traffic development
• internal consolidation of railway transport
• connection to the European transport system
• organization of ports and existing docks for fast shipping lines
• regulation of maritime transport space
• river port network projection
• alignment of interest in the airspace
The objectives of the development of
transport systems in the present Strategy
are in accordance with the sustainable
and economically justified development of
the Croatian transport system as
stipulated by this Program, especially
when it comes to the application of new
technologies, the introduction of
integrated transport and environmental
sustainability.
Strategic Environmental Impact Study of the Transport Development Strategy of the Republic of Croatia 2017-2030
Zagreb, August 2017. 15
• modernization of existing capacity and airport security equipment
• etc.
Strategic Environmental Impact Study of the Transport Development Strategy of the Republic of Croatia 2017-2030
Zagreb, August 2017. 16
3 Existing environmental status and possible environmental
development without the Strategy implementation
3.1 Environmental change drivers
In the context of this document, the main driver of all changes in the environment is transport. Transport plays an
important role in all segments of society's development. Transport connectivity is an important precondition for
raising standards of living and for a regionally balanced development of the Republic of Croatia. Nowadays,
transport provides a faster and easier link between people and education, the access to business opportunities,
the exchange of goods and services, and is an important segment of the development of all business sectors.
At the same time, the faster and more efficient movement of people and goods requires the technological
development of transport facilities and the increase in their number and the construction of additional transport
infrastructure. In this way, the transport has a negative impact on nature and the environment. Due to the
intensification of traffic, there is a growing release of pollutants into the environment (airborne, soil and water),
which is most significant in the case of road traffic, which is recognized as one of the main sources of greenhouse
gas emissions in Croatia. Also, transport is responsible for a large part of the noise pollution, as well as for the
discharge of exhaust gases and dust particles, and is the main source of pollution in the cities. The construction of
transport infrastructure irreversibly changes the landscape and natural value of space, while having a negative
impact on habitats, flora and fauna, and thus landscape diversity. In addition, the transport represents a potential
hazard for all environmental elements in the case of uncontrolled release of hazardous substances into the
environment.
Since the transport system in Croatia is divided into six mutually different sectors, this section shall cover each
sector, addressing the most significant impacts on the environment and human health. In addition, transport shall
be discussed as a whole as well, potentially identifying negative cumulative impacts.
3.1.1 Traffic as a whole According to the Environmental Report in the Republic of Croatia (Environmental Protection Agency, 2015), the
key issue to be considered when considering the impact of the transport on the environment is:
Is Croatia's quality transport connection possible, while at the same time implementing environmental protection
and conservation measures?
The answer can be reduced to 3 key points in the Report:
• the greatest development of the transport infrastructure is recorded in the road transport sector, thus
achieving a better linkage of parts of Croatia, while in other transport sectors there is no significant
progress.
• environmental protection and conservation measures are carried out while planning and constructing the
transport infrastructure, in accordance with regulations in the field of environmental protection, spatial
planning and construction works.
• the level of transport activities that are the source of environmental and nature pollution have been
increased and the measures taken to reduce negative impacts do not fully deliver the desired results.
Comparing the last two reporting periods, from 2005 to 2008 (Environmental Protection Agency, 2012) with the
period 2008 - 2012 (Environment Protection Agency, 2015), the road transport sector remained the most important
source of pressures on environment. However, by adopting the Regulation on Strategic Environmental Impact
Assessment and amendments to the relevant legislative and by-laws concerning the protection of nature and the
environment, the level of environmental impact assessment in the context of traffic development increased in the
last reporting period.
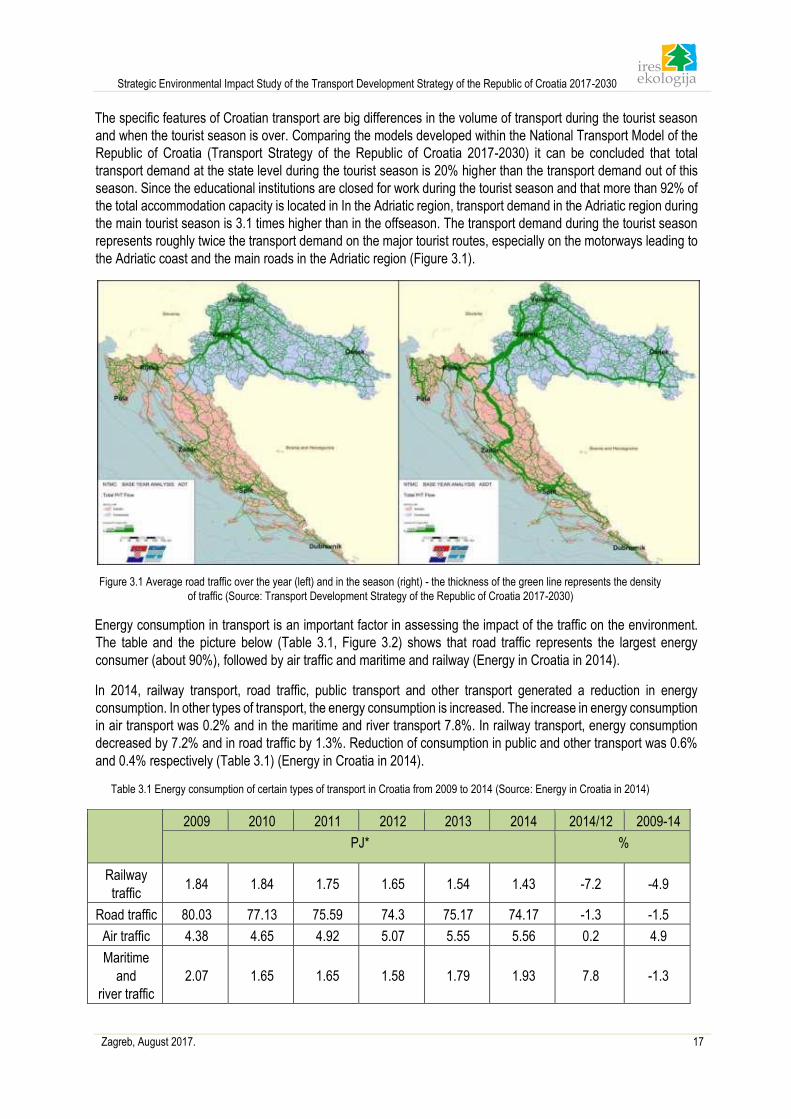
Strategic Environmental Impact Study of the Transport Development Strategy of the Republic of Croatia 2017-2030
Zagreb, August 2017. 17
The specific features of Croatian transport are big differences in the volume of transport during the tourist season
and when the tourist season is over. Comparing the models developed within the National Transport Model of the
Republic of Croatia (Transport Strategy of the Republic of Croatia 2017-2030) it can be concluded that total
transport demand at the state level during the tourist season is 20% higher than the transport demand out of this
season. Since the educational institutions are closed for work during the tourist season and that more than 92% of
the total accommodation capacity is located in In the Adriatic region, transport demand in the Adriatic region during
the main tourist season is 3.1 times higher than in the offseason. The transport demand during the tourist season
represents roughly twice the transport demand on the major tourist routes, especially on the motorways leading to
the Adriatic coast and the main roads in the Adriatic region (Figure 3.1).
Figure 3.1 Average road traffic over the year (left) and in the season (right) - the thickness of the green line represents the density
of traffic (Source: Transport Development Strategy of the Republic of Croatia 2017-2030)
Energy consumption in transport is an important factor in assessing the impact of the traffic on the environment.
The table and the picture below (Table 3.1, Figure 3.2) shows that road traffic represents the largest energy
consumer (about 90%), followed by air traffic and maritime and railway (Energy in Croatia in 2014).
In 2014, railway transport, road traffic, public transport and other transport generated a reduction in energy
consumption. In other types of transport, the energy consumption is increased. The increase in energy consumption
in air transport was 0.2% and in the maritime and river transport 7.8%. In railway transport, energy consumption
decreased by 7.2% and in road traffic by 1.3%. Reduction of consumption in public and other transport was 0.6%
and 0.4% respectively (Table 3.1) (Energy in Croatia in 2014).
Table 3.1 Energy consumption of certain types of transport in Croatia from 2009 to 2014 (Source: Energy in Croatia in 2014)
2009 2010 2011 2012 2013 2014 2014/12 2009-14
PJ* %
Railway
traffic 1.84 1.84 1.75 1.65 1.54 1.43 -7.2 -4.9
Road traffic 80.03 77.13 75.59 74.3 75.17 74.17 -1.3 -1.5
Air traffic 4.38 4.65 4.92 5.07 5.55 5.56 0.2 4.9
Maritime
and
river traffic
2.07 1.65 1.65 1.58 1.79 1.93 7.8 -1.3
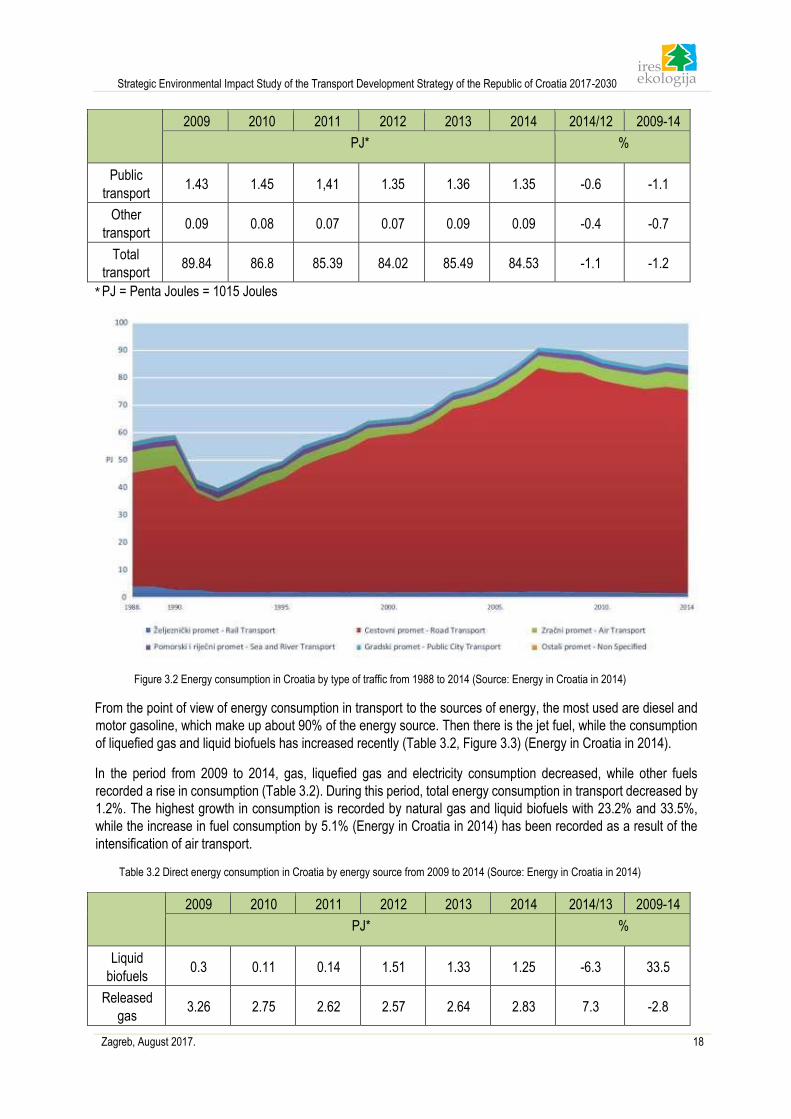
Strategic Environmental Impact Study of the Transport Development Strategy of the Republic of Croatia 2017-2030
Zagreb, August 2017. 18
2009 2010 2011 2012 2013 2014 2014/12 2009-14
PJ* %
Public
transport 1.43 1.45 1,41 1.35 1.36 1.35 -0.6 -1.1
Other
transport 0.09 0.08 0.07 0.07 0.09 0.09 -0.4 -0.7
Total
transport 89.84 86.8 85.39 84.02 85.49 84.53 -1.1 -1.2
* PJ = Penta Joules = 1015 Joules
Figure 3.2 Energy consumption in Croatia by type of traffic from 1988 to 2014 (Source: Energy in Croatia in 2014)
From the point of view of energy consumption in transport to the sources of energy, the most used are diesel and
motor gasoline, which make up about 90% of the energy source. Then there is the jet fuel, while the consumption
of liquefied gas and liquid biofuels has increased recently (Table 3.2, Figure 3.3) (Energy in Croatia in 2014).
In the period from 2009 to 2014, gas, liquefied gas and electricity consumption decreased, while other fuels
recorded a rise in consumption (Table 3.2). During this period, total energy consumption in transport decreased by
1.2%. The highest growth in consumption is recorded by natural gas and liquid biofuels with 23.2% and 33.5%,
while the increase in fuel consumption by 5.1% (Energy in Croatia in 2014) has been recorded as a result of the
intensification of air transport.
Table 3.2 Direct energy consumption in Croatia by energy source from 2009 to 2014 (Source: Energy in Croatia in 2014)
2009 2010 2011 2012 2013 2014 2014/13 2009-14
PJ* %
Liquid
biofuels 0.3 0.11 0.14 1.51 1.33 1.25 -6.3 33.5
Released
gas 3.26 2.75 2.62 2.57 2.64 2.83 7.3 -2.8
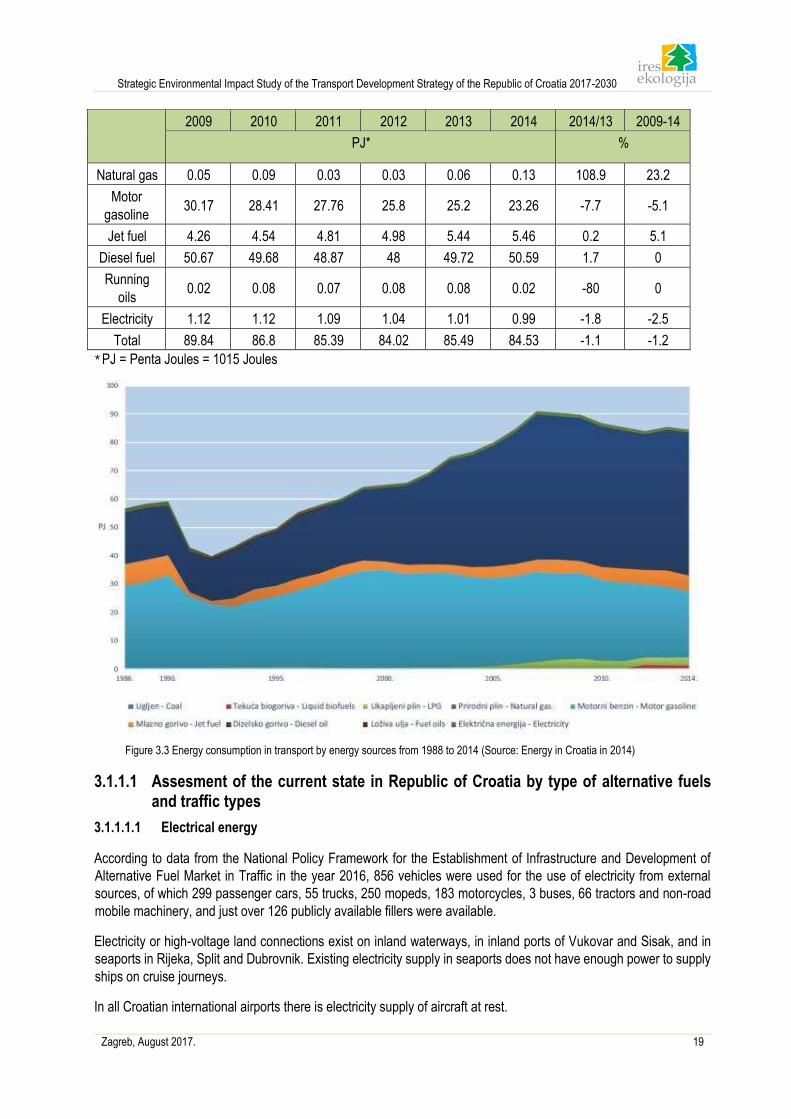
Strategic Environmental Impact Study of the Transport Development Strategy of the Republic of Croatia 2017-2030
Zagreb, August 2017. 19
2009 2010 2011 2012 2013 2014 2014/13 2009-14
PJ* %
Natural gas 0.05 0.09 0.03 0.03 0.06 0.13 108.9 23.2
Motor
gasoline 30.17 28.41 27.76 25.8 25.2 23.26 -7.7 -5.1
Jet fuel 4.26 4.54 4.81 4.98 5.44 5.46 0.2 5.1
Diesel fuel 50.67 49.68 48.87 48 49.72 50.59 1.7 0
Running
oils 0.02 0.08 0.07 0.08 0.08 0.02 -80 0
Electricity 1.12 1.12 1.09 1.04 1.01 0.99 -1.8 -2.5
Total 89.84 86.8 85.39 84.02 85.49 84.53 -1.1 -1.2
* PJ = Penta Joules = 1015 Joules
Figure 3.3 Energy consumption in transport by energy sources from 1988 to 2014 (Source: Energy in Croatia in 2014)
3.1.1.1 Assesment of the current state in Republic of Croatia by type of alternative fuels and traffic types
3.1.1.1.1 Electrical energy
According to data from the National Policy Framework for the Establishment of Infrastructure and Development of
Alternative Fuel Market in Traffic in the year 2016, 856 vehicles were used for the use of electricity from external
sources, of which 299 passenger cars, 55 trucks, 250 mopeds, 183 motorcycles, 3 buses, 66 tractors and non-road
mobile machinery, and just over 126 publicly available fillers were available.
Electricity or high-voltage land connections exist on inland waterways, in inland ports of Vukovar and Sisak, and in
seaports in Rijeka, Split and Dubrovnik. Existing electricity supply in seaports does not have enough power to supply
ships on cruise journeys.
In all Croatian international airports there is electricity supply of aircraft at rest.
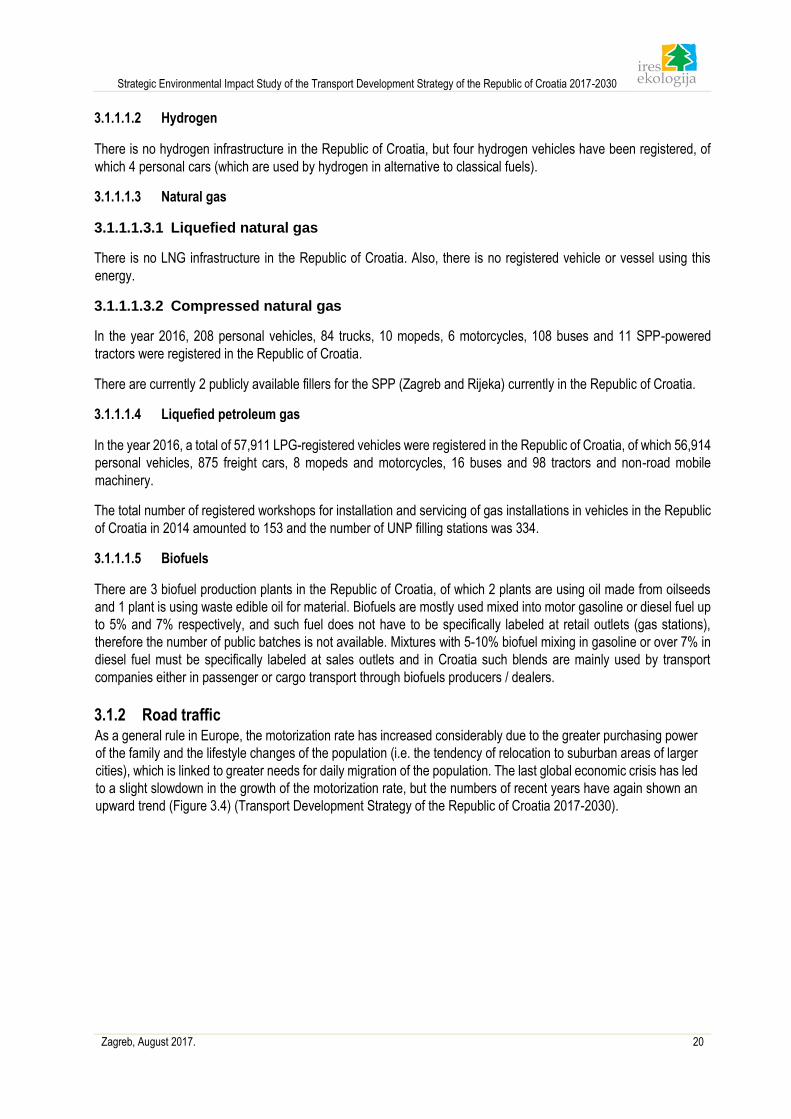
Strategic Environmental Impact Study of the Transport Development Strategy of the Republic of Croatia 2017-2030
Zagreb, August 2017. 20
3.1.1.1.2 Hydrogen
There is no hydrogen infrastructure in the Republic of Croatia, but four hydrogen vehicles have been registered, of
which 4 personal cars (which are used by hydrogen in alternative to classical fuels).
3.1.1.1.3 Natural gas
3.1.1.1.3.1 Liquefied natural gas
There is no LNG infrastructure in the Republic of Croatia. Also, there is no registered vehicle or vessel using this
energy.
3.1.1.1.3.2 Compressed natural gas
In the year 2016, 208 personal vehicles, 84 trucks, 10 mopeds, 6 motorcycles, 108 buses and 11 SPP-powered
tractors were registered in the Republic of Croatia.
There are currently 2 publicly available fillers for the SPP (Zagreb and Rijeka) currently in the Republic of Croatia.
3.1.1.1.4 Liquefied petroleum gas
In the year 2016, a total of 57,911 LPG-registered vehicles were registered in the Republic of Croatia, of which 56,914
personal vehicles, 875 freight cars, 8 mopeds and motorcycles, 16 buses and 98 tractors and non-road mobile
machinery.
The total number of registered workshops for installation and servicing of gas installations in vehicles in the Republic
of Croatia in 2014 amounted to 153 and the number of UNP filling stations was 334.
3.1.1.1.5 Biofuels
There are 3 biofuel production plants in the Republic of Croatia, of which 2 plants are using oil made from oilseeds
and 1 plant is using waste edible oil for material. Biofuels are mostly used mixed into motor gasoline or diesel fuel up
to 5% and 7% respectively, and such fuel does not have to be specifically labeled at retail outlets (gas stations),
therefore the number of public batches is not available. Mixtures with 5-10% biofuel mixing in gasoline or over 7% in
diesel fuel must be specifically labeled at sales outlets and in Croatia such blends are mainly used by transport
companies either in passenger or cargo transport through biofuels producers / dealers.
3.1.2 Road traffic As a general rule in Europe, the motorization rate has increased considerably due to the greater purchasing power
of the family and the lifestyle changes of the population (i.e. the tendency of relocation to suburban areas of larger
cities), which is linked to greater needs for daily migration of the population. The last global economic crisis has led
to a slight slowdown in the growth of the motorization rate, but the numbers of recent years have again shown an
upward trend (Figure 3.4) (Transport Development Strategy of the Republic of Croatia 2017-2030).
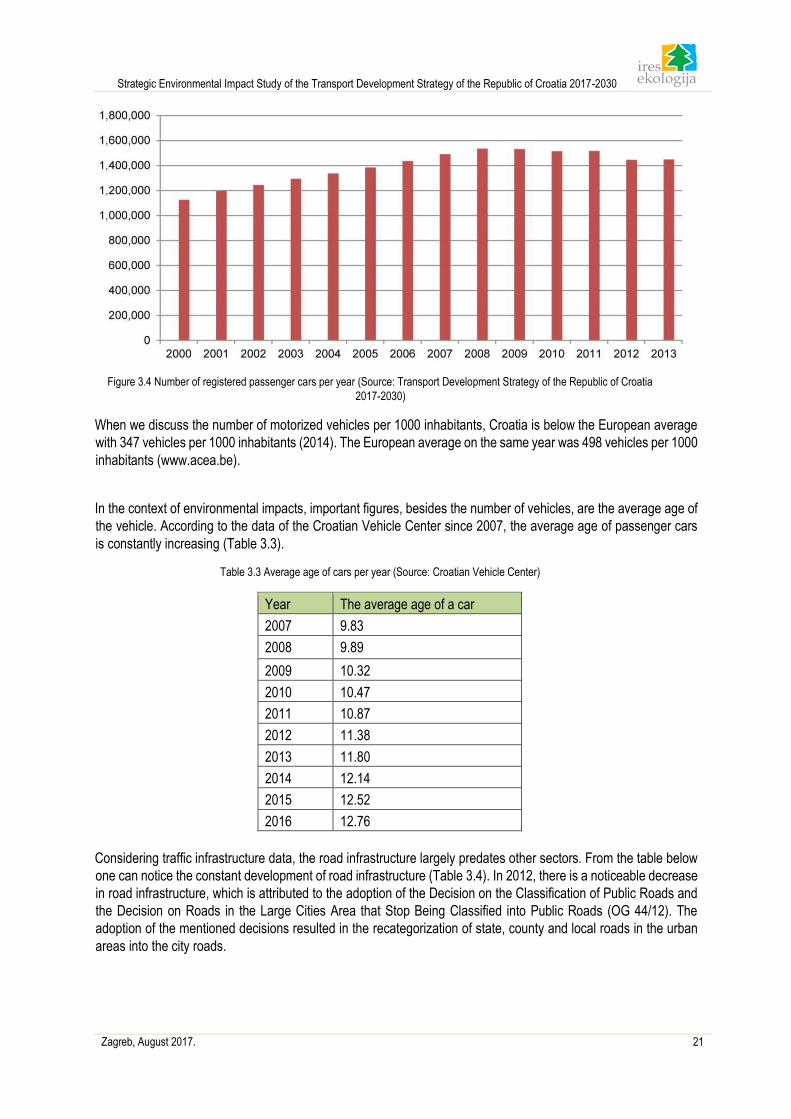
Strategic Environmental Impact Study of the Transport Development Strategy of the Republic of Croatia 2017-2030
Zagreb, August 2017. 21
Figure 3.4 Number of registered passenger cars per year (Source: Transport Development Strategy of the Republic of Croatia
2017-2030)
When we discuss the number of motorized vehicles per 1000 inhabitants, Croatia is below the European average
with 347 vehicles per 1000 inhabitants (2014). The European average on the same year was 498 vehicles per 1000
inhabitants (www.acea.be).
In the context of environmental impacts, important figures, besides the number of vehicles, are the average age of
the vehicle. According to the data of the Croatian Vehicle Center since 2007, the average age of passenger cars
is constantly increasing (Table 3.3).
Table 3.3 Average age of cars per year (Source: Croatian Vehicle Center)
Year The average age of a car
2007 9.83
2008 9.89
2009 10.32
2010 10.47
2011 10.87
2012 11.38
2013 11.80
2014 12.14
2015 12.52
2016 12.76
Considering traffic infrastructure data, the road infrastructure largely predates other sectors. From the table below
one can notice the constant development of road infrastructure (Table 3.4). In 2012, there is a noticeable decrease
in road infrastructure, which is attributed to the adoption of the Decision on the Classification of Public Roads and
the Decision on Roads in the Large Cities Area that Stop Being Classified into Public Roads (OG 44/12). The
adoption of the mentioned decisions resulted in the recategorization of state, county and local roads in the urban
areas into the city roads.
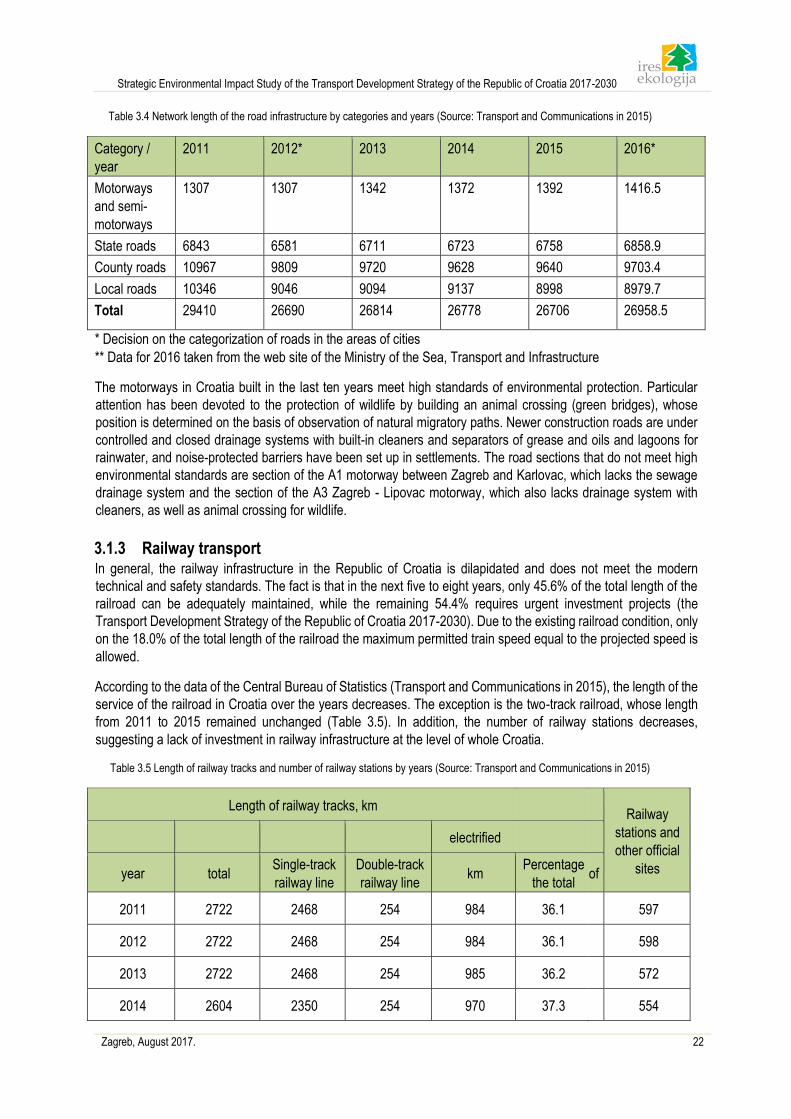
Strategic Environmental Impact Study of the Transport Development Strategy of the Republic of Croatia 2017-2030
Zagreb, August 2017. 22
Table 3.4 Network length of the road infrastructure by categories and years (Source: Transport and Communications in 2015)
Category /
year
2011 2012* 2013 2014 2015 2016*
Motorways
and semi-
motorways
1307 1307 1342 1372 1392 1416.5
State roads 6843 6581 6711 6723 6758 6858.9
County roads 10967 9809 9720 9628 9640 9703.4
Local roads 10346 9046 9094 9137 8998 8979.7
Total 29410 26690 26814 26778 26706 26958.5
* Decision on the categorization of roads in the areas of cities
** Data for 2016 taken from the web site of the Ministry of the Sea, Transport and Infrastructure
The motorways in Croatia built in the last ten years meet high standards of environmental protection. Particular
attention has been devoted to the protection of wildlife by building an animal crossing (green bridges), whose
position is determined on the basis of observation of natural migratory paths. Newer construction roads are under
controlled and closed drainage systems with built-in cleaners and separators of grease and oils and lagoons for
rainwater, and noise-protected barriers have been set up in settlements. The road sections that do not meet high
environmental standards are section of the A1 motorway between Zagreb and Karlovac, which lacks the sewage
drainage system and the section of the A3 Zagreb - Lipovac motorway, which also lacks drainage system with
cleaners, as well as animal crossing for wildlife.
3.1.3 Railway transport In general, the railway infrastructure in the Republic of Croatia is dilapidated and does not meet the modern
technical and safety standards. The fact is that in the next five to eight years, only 45.6% of the total length of the
railroad can be adequately maintained, while the remaining 54.4% requires urgent investment projects (the
Transport Development Strategy of the Republic of Croatia 2017-2030). Due to the existing railroad condition, only
on the 18.0% of the total length of the railroad the maximum permitted train speed equal to the projected speed is
allowed.
According to the data of the Central Bureau of Statistics (Transport and Communications in 2015), the length of the
service of the railroad in Croatia over the years decreases. The exception is the two-track railroad, whose length
from 2011 to 2015 remained unchanged (Table 3.5). In addition, the number of railway stations decreases,
suggesting a lack of investment in railway infrastructure at the level of whole Croatia.
Table 3.5 Length of railway tracks and number of railway stations by years (Source: Transport and Communications in 2015)
Length of railway tracks, km Railway
stations and
other official
sites
electrified
year total Single-track
railway line
Double-track
railway line km
Percentage
the total of
2011 2722 2468 254 984 36.1 597
2012 2722 2468 254 984 36.1 598
2013 2722 2468 254 985 36.2 572
2014 2604 2350 254 970 37.3 554
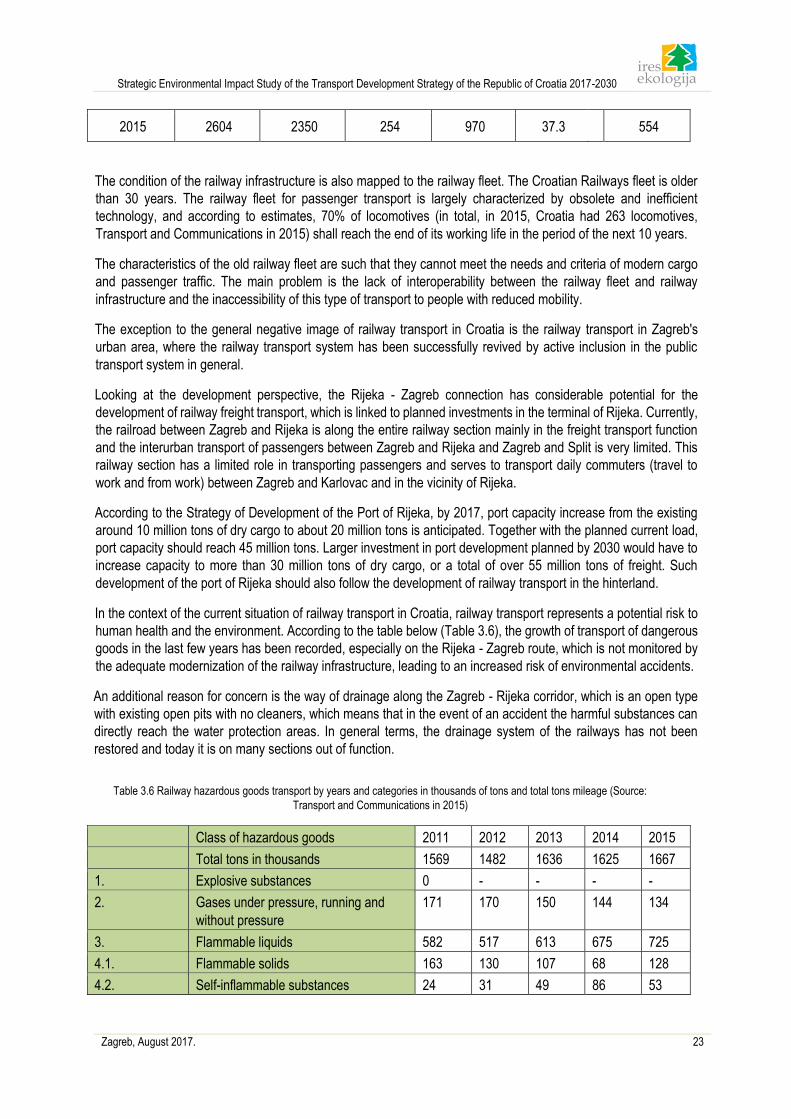
Strategic Environmental Impact Study of the Transport Development Strategy of the Republic of Croatia 2017-2030
Zagreb, August 2017. 23
2015 2604 2350 254 970 37.3 554
The condition of the railway infrastructure is also mapped to the railway fleet. The Croatian Railways fleet is older
than 30 years. The railway fleet for passenger transport is largely characterized by obsolete and inefficient
technology, and according to estimates, 70% of locomotives (in total, in 2015, Croatia had 263 locomotives,
Transport and Communications in 2015) shall reach the end of its working life in the period of the next 10 years.
The characteristics of the old railway fleet are such that they cannot meet the needs and criteria of modern cargo
and passenger traffic. The main problem is the lack of interoperability between the railway fleet and railway
infrastructure and the inaccessibility of this type of transport to people with reduced mobility.
The exception to the general negative image of railway transport in Croatia is the railway transport in Zagreb's
urban area, where the railway transport system has been successfully revived by active inclusion in the public
transport system in general.
Looking at the development perspective, the Rijeka - Zagreb connection has considerable potential for the
development of railway freight transport, which is linked to planned investments in the terminal of Rijeka. Currently,
the railroad between Zagreb and Rijeka is along the entire railway section mainly in the freight transport function
and the interurban transport of passengers between Zagreb and Rijeka and Zagreb and Split is very limited. This
railway section has a limited role in transporting passengers and serves to transport daily commuters (travel to
work and from work) between Zagreb and Karlovac and in the vicinity of Rijeka.
According to the Strategy of Development of the Port of Rijeka, by 2017, port capacity increase from the existing
around 10 million tons of dry cargo to about 20 million tons is anticipated. Together with the planned current load,
port capacity should reach 45 million tons. Larger investment in port development planned by 2030 would have to
increase capacity to more than 30 million tons of dry cargo, or a total of over 55 million tons of freight. Such
development of the port of Rijeka should also follow the development of railway transport in the hinterland.
In the context of the current situation of railway transport in Croatia, railway transport represents a potential risk to
human health and the environment. According to the table below (Table 3.6), the growth of transport of dangerous
goods in the last few years has been recorded, especially on the Rijeka - Zagreb route, which is not monitored by
the adequate modernization of the railway infrastructure, leading to an increased risk of environmental accidents.
An additional reason for concern is the way of drainage along the Zagreb - Rijeka corridor, which is an open type
with existing open pits with no cleaners, which means that in the event of an accident the harmful substances can
directly reach the water protection areas. In general terms, the drainage system of the railways has not been
restored and today it is on many sections out of function.
Table 3.6 Railway hazardous goods transport by years and categories in thousands of tons and total tons mileage (Source:
Transport and Communications in 2015)
Class of hazardous goods 2011 2012 2013 2014 2015
Total tons in thousands 1569 1482 1636 1625 1667
1. Explosive substances 0 - - - -
2. Gases under pressure, running and
without pressure
171 170 150 144 134
3. Flammable liquids 582 517 613 675 725
4.1. Flammable solids 163 130 107 68 128
4.2. Self-inflammable substances 24 31 49 86 53
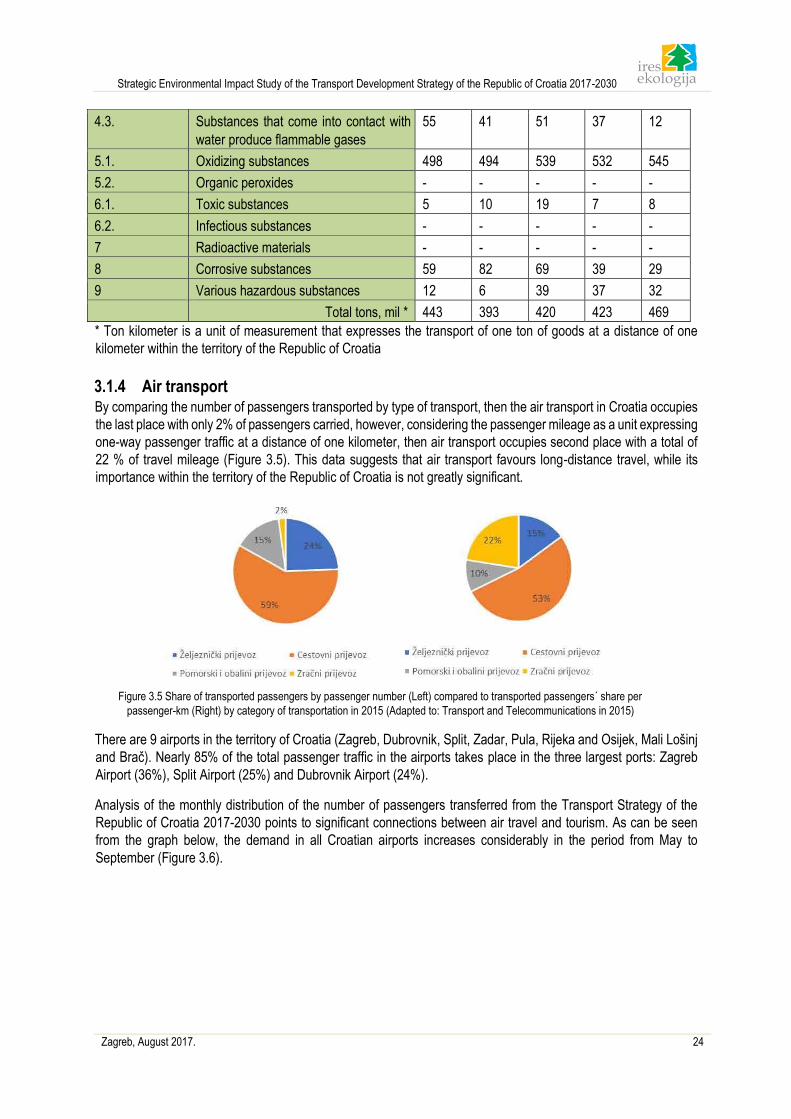
Strategic Environmental Impact Study of the Transport Development Strategy of the Republic of Croatia 2017-2030
Zagreb, August 2017. 24
4.3. Substances that come into contact with
water produce flammable gases
55 41 51 37 12
5.1. Oxidizing substances 498 494 539 532 545
5.2. Organic peroxides - - - - -
6.1. Toxic substances 5 10 19 7 8
6.2. Infectious substances - - - - -
7 Radioactive materials - - - - -
8 Corrosive substances 59 82 69 39 29
9 Various hazardous substances 12 6 39 37 32
Total tons, mil * 443 393 420 423 469
* Ton kilometer is a unit of measurement that expresses the transport of one ton of goods at a distance of one
kilometer within the territory of the Republic of Croatia
3.1.4 Air transport By comparing the number of passengers transported by type of transport, then the air transport in Croatia occupies
the last place with only 2% of passengers carried, however, considering the passenger mileage as a unit expressing
one-way passenger traffic at a distance of one kilometer, then air transport occupies second place with a total of
22 % of travel mileage (Figure 3.5). This data suggests that air transport favours long-distance travel, while its
importance within the territory of the Republic of Croatia is not greatly significant.
Figure 3.5 Share of transported passengers by passenger number (Left) compared to transported passengers´ share per
passenger-km (Right) by category of transportation in 2015 (Adapted to: Transport and Telecommunications in 2015)
There are 9 airports in the territory of Croatia (Zagreb, Dubrovnik, Split, Zadar, Pula, Rijeka and Osijek, Mali Lošinj
and Brač). Nearly 85% of the total passenger traffic in the airports takes place in the three largest ports: Zagreb
Airport (36%), Split Airport (25%) and Dubrovnik Airport (24%).
Analysis of the monthly distribution of the number of passengers transferred from the Transport Strategy of the
Republic of Croatia 2017-2030 points to significant connections between air travel and tourism. As can be seen
from the graph below, the demand in all Croatian airports increases considerably in the period from May to
September (Figure 3.6).
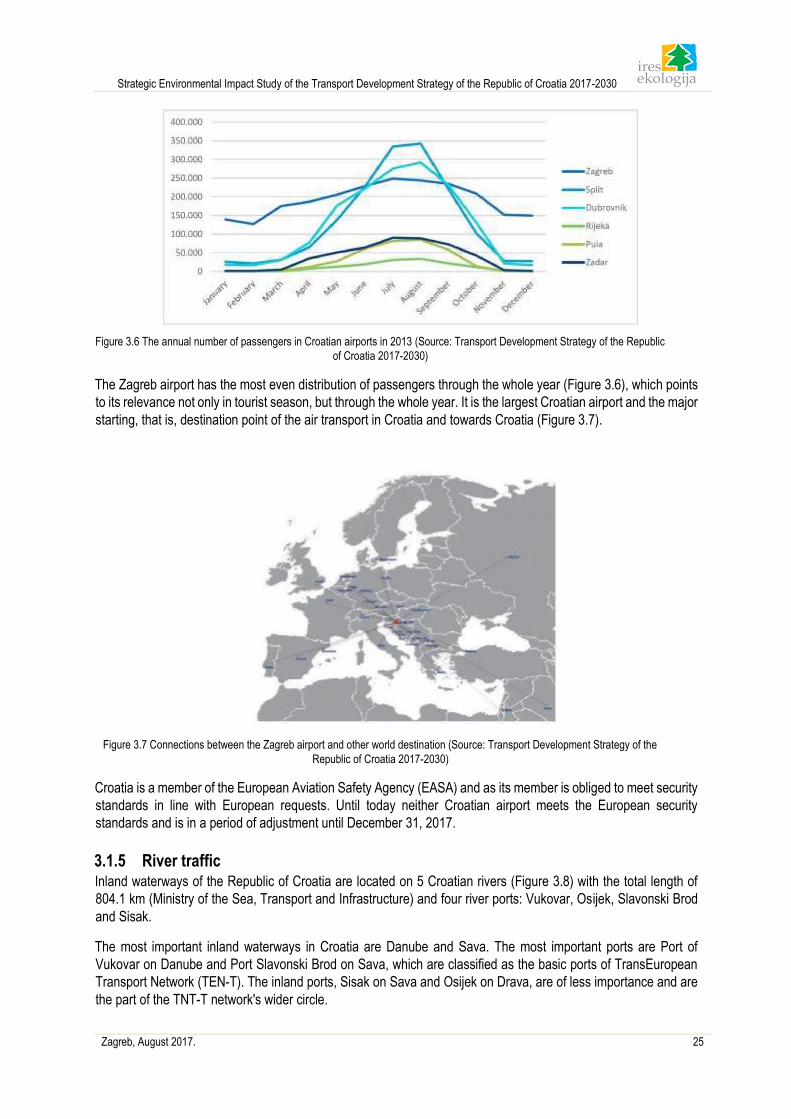
Strategic Environmental Impact Study of the Transport Development Strategy of the Republic of Croatia 2017-2030
Zagreb, August 2017. 25
Figure 3.6 The annual number of passengers in Croatian airports in 2013 (Source: Transport Development Strategy of the Republic
of Croatia 2017-2030)
The Zagreb airport has the most even distribution of passengers through the whole year (Figure 3.6), which points
to its relevance not only in tourist season, but through the whole year. It is the largest Croatian airport and the major
starting, that is, destination point of the air transport in Croatia and towards Croatia (Figure 3.7).
Figure 3.7 Connections between the Zagreb airport and other world destination (Source: Transport Development Strategy of the
Republic of Croatia 2017-2030)
Croatia is a member of the European Aviation Safety Agency (EASA) and as its member is obliged to meet security
standards in line with European requests. Until today neither Croatian airport meets the European security
standards and is in a period of adjustment until December 31, 2017.
3.1.5 River traffic Inland waterways of the Republic of Croatia are located on 5 Croatian rivers (Figure 3.8) with the total length of
804.1 km (Ministry of the Sea, Transport and Infrastructure) and four river ports: Vukovar, Osijek, Slavonski Brod
and Sisak.
The most important inland waterways in Croatia are Danube and Sava. The most important ports are Port of
Vukovar on Danube and Port Slavonski Brod on Sava, which are classified as the basic ports of TransEuropean
Transport Network (TEN-T). The inland ports, Sisak on Sava and Osijek on Drava, are of less importance and are
the part of the TNT-T network's wider circle.
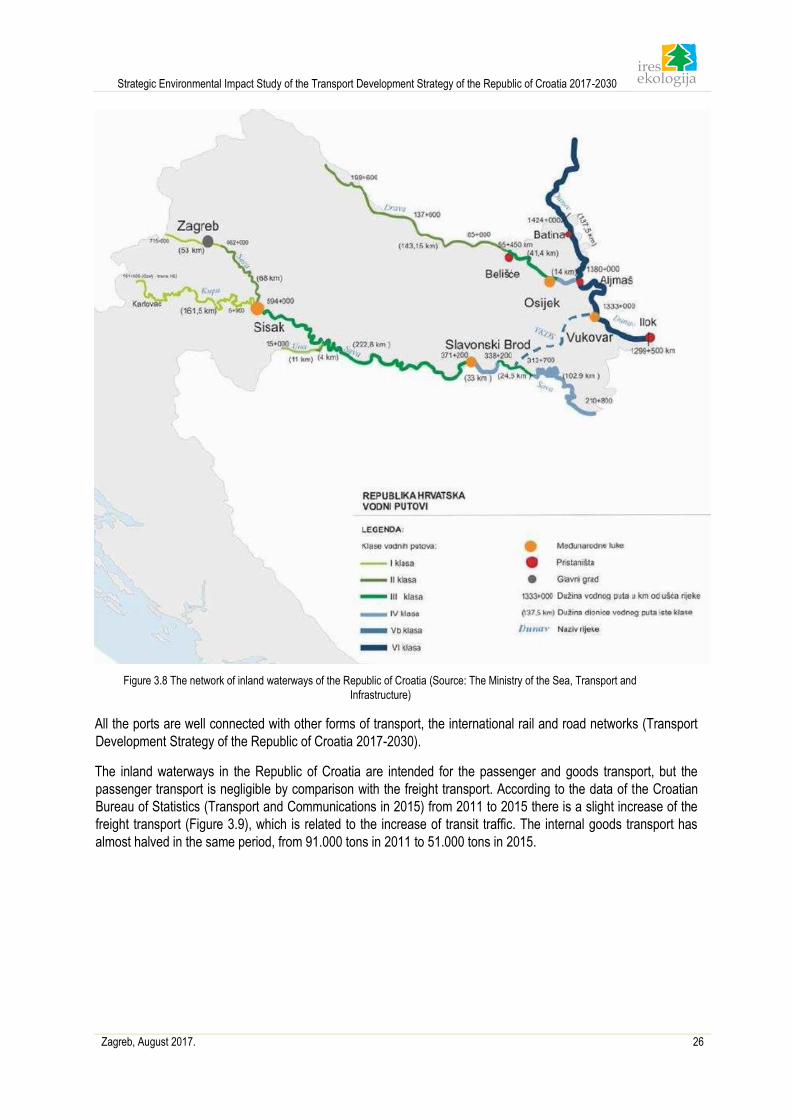
Strategic Environmental Impact Study of the Transport Development Strategy of the Republic of Croatia 2017-2030
Zagreb, August 2017. 26
Figure 3.8 The network of inland waterways of the Republic of Croatia (Source: The Ministry of the Sea, Transport and
Infrastructure)
All the ports are well connected with other forms of transport, the international rail and road networks (Transport
Development Strategy of the Republic of Croatia 2017-2030).
The inland waterways in the Republic of Croatia are intended for the passenger and goods transport, but the
passenger transport is negligible by comparison with the freight transport. According to the data of the Croatian
Bureau of Statistics (Transport and Communications in 2015) from 2011 to 2015 there is a slight increase of the
freight transport (Figure 3.9), which is related to the increase of transit traffic. The internal goods transport has
almost halved in the same period, from 91.000 tons in 2011 to 51.000 tons in 2015.
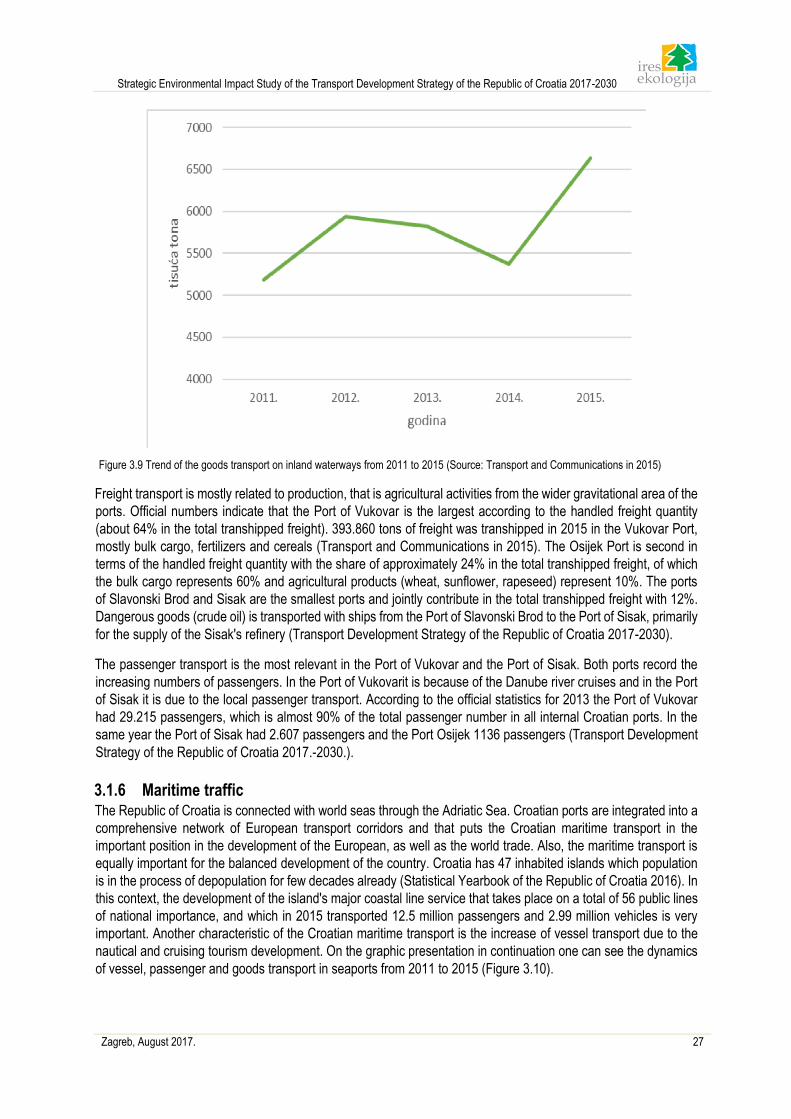
Strategic Environmental Impact Study of the Transport Development Strategy of the Republic of Croatia 2017-2030
Zagreb, August 2017. 27
Figure 3.9 Trend of the goods transport on inland waterways from 2011 to 2015 (Source: Transport and Communications in 2015)
Freight transport is mostly related to production, that is agricultural activities from the wider gravitational area of the
ports. Official numbers indicate that the Port of Vukovar is the largest according to the handled freight quantity
(about 64% in the total transhipped freight). 393.860 tons of freight was transhipped in 2015 in the Vukovar Port,
mostly bulk cargo, fertilizers and cereals (Transport and Communications in 2015). The Osijek Port is second in
terms of the handled freight quantity with the share of approximately 24% in the total transhipped freight, of which
the bulk cargo represents 60% and agricultural products (wheat, sunflower, rapeseed) represent 10%. The ports
of Slavonski Brod and Sisak are the smallest ports and jointly contribute in the total transhipped freight with 12%.
Dangerous goods (crude oil) is transported with ships from the Port of Slavonski Brod to the Port of Sisak, primarily
for the supply of the Sisak's refinery (Transport Development Strategy of the Republic of Croatia 2017-2030).
The passenger transport is the most relevant in the Port of Vukovar and the Port of Sisak. Both ports record the
increasing numbers of passengers. In the Port of Vukovarit is because of the Danube river cruises and in the Port
of Sisak it is due to the local passenger transport. According to the official statistics for 2013 the Port of Vukovar
had 29.215 passengers, which is almost 90% of the total passenger number in all internal Croatian ports. In the
same year the Port of Sisak had 2.607 passengers and the Port Osijek 1136 passengers (Transport Development
Strategy of the Republic of Croatia 2017.-2030.).
3.1.6 Maritime traffic The Republic of Croatia is connected with world seas through the Adriatic Sea. Croatian ports are integrated into a
comprehensive network of European transport corridors and that puts the Croatian maritime transport in the
important position in the development of the European, as well as the world trade. Also, the maritime transport is
equally important for the balanced development of the country. Croatia has 47 inhabited islands which population
is in the process of depopulation for few decades already (Statistical Yearbook of the Republic of Croatia 2016). In
this context, the development of the island's major coastal line service that takes place on a total of 56 public lines
of national importance, and which in 2015 transported 12.5 million passengers and 2.99 million vehicles is very
important. Another characteristic of the Croatian maritime transport is the increase of vessel transport due to the
nautical and cruising tourism development. On the graphic presentation in continuation one can see the dynamics
of vessel, passenger and goods transport in seaports from 2011 to 2015 (Figure 3.10).
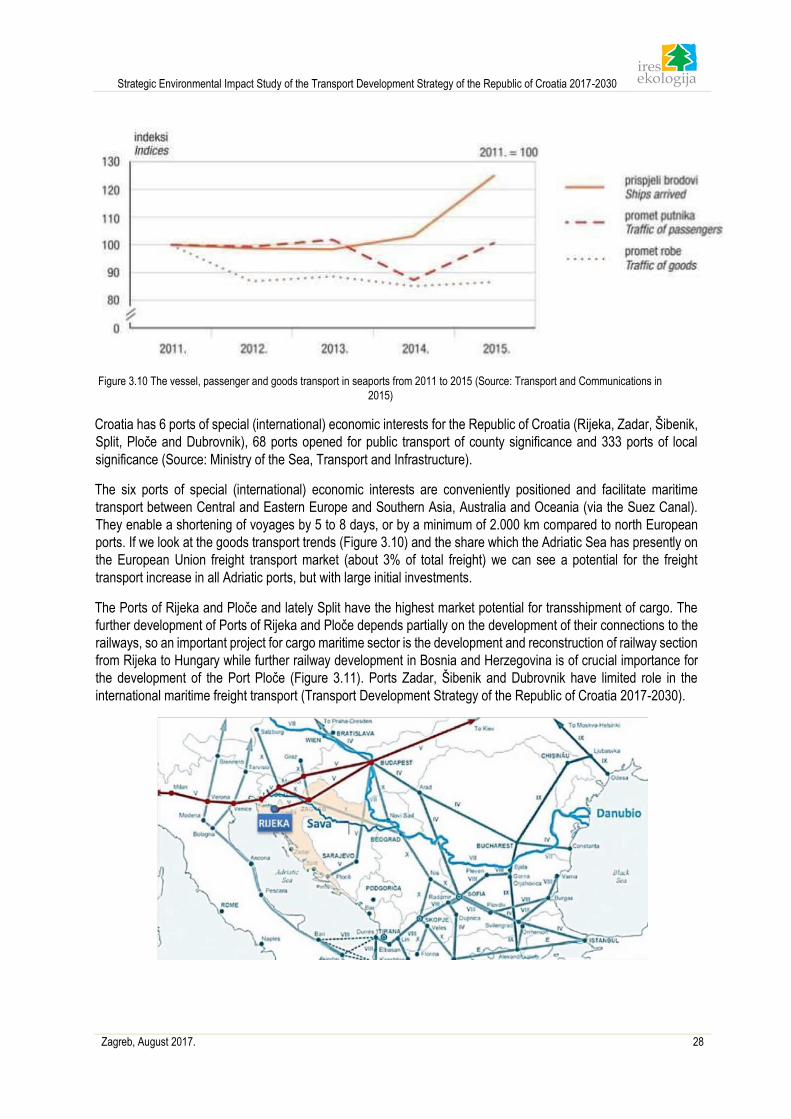
Strategic Environmental Impact Study of the Transport Development Strategy of the Republic of Croatia 2017-2030
Zagreb, August 2017. 28
Figure 3.10 The vessel, passenger and goods transport in seaports from 2011 to 2015 (Source: Transport and Communications in
2015)
Croatia has 6 ports of special (international) economic interests for the Republic of Croatia (Rijeka, Zadar, Šibenik,
Split, Ploče and Dubrovnik), 68 ports opened for public transport of county significance and 333 ports of local
significance (Source: Ministry of the Sea, Transport and Infrastructure).
The six ports of special (international) economic interests are conveniently positioned and facilitate maritime
transport between Central and Eastern Europe and Southern Asia, Australia and Oceania (via the Suez Canal).
They enable a shortening of voyages by 5 to 8 days, or by a minimum of 2.000 km compared to north European
ports. If we look at the goods transport trends (Figure 3.10) and the share which the Adriatic Sea has presently on
the European Union freight transport market (about 3% of total freight) we can see a potential for the freight
transport increase in all Adriatic ports, but with large initial investments.
The Ports of Rijeka and Ploče and lately Split have the highest market potential for transshipment of cargo. The
further development of Ports of Rijeka and Ploče depends partially on the development of their connections to the
railways, so an important project for cargo maritime sector is the development and reconstruction of railway section
from Rijeka to Hungary while further railway development in Bosnia and Herzegovina is of crucial importance for
the development of the Port Ploče (Figure 3.11). Ports Zadar, Šibenik and Dubrovnik have limited role in the
international maritime freight transport (Transport Development Strategy of the Republic of Croatia 2017-2030).
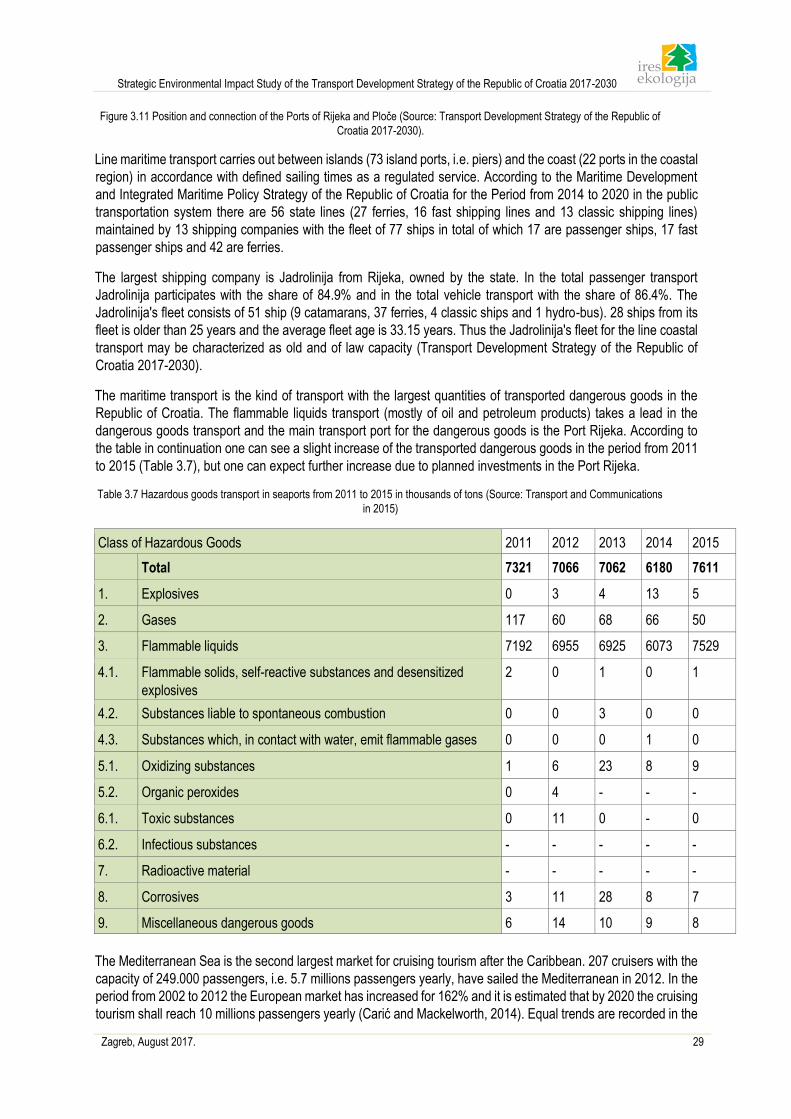
Strategic Environmental Impact Study of the Transport Development Strategy of the Republic of Croatia 2017-2030
Zagreb, August 2017. 29
Figure 3.11 Position and connection of the Ports of Rijeka and Ploče (Source: Transport Development Strategy of the Republic of
Croatia 2017-2030).
Line maritime transport carries out between islands (73 island ports, i.e. piers) and the coast (22 ports in the coastal
region) in accordance with defined sailing times as a regulated service. According to the Maritime Development
and Integrated Maritime Policy Strategy of the Republic of Croatia for the Period from 2014 to 2020 in the public
transportation system there are 56 state lines (27 ferries, 16 fast shipping lines and 13 classic shipping lines)
maintained by 13 shipping companies with the fleet of 77 ships in total of which 17 are passenger ships, 17 fast
passenger ships and 42 are ferries.
The largest shipping company is Jadrolinija from Rijeka, owned by the state. In the total passenger transport
Jadrolinija participates with the share of 84.9% and in the total vehicle transport with the share of 86.4%. The
Jadrolinija's fleet consists of 51 ship (9 catamarans, 37 ferries, 4 classic ships and 1 hydro-bus). 28 ships from its
fleet is older than 25 years and the average fleet age is 33.15 years. Thus the Jadrolinija's fleet for the line coastal
transport may be characterized as old and of law capacity (Transport Development Strategy of the Republic of
Croatia 2017-2030).
The maritime transport is the kind of transport with the largest quantities of transported dangerous goods in the
Republic of Croatia. The flammable liquids transport (mostly of oil and petroleum products) takes a lead in the
dangerous goods transport and the main transport port for the dangerous goods is the Port Rijeka. According to
the table in continuation one can see a slight increase of the transported dangerous goods in the period from 2011
to 2015 (Table 3.7), but one can expect further increase due to planned investments in the Port Rijeka.
Table 3.7 Hazardous goods transport in seaports from 2011 to 2015 in thousands of tons (Source: Transport and Communications
in 2015)
Class of Hazardous Goods 2011 2012 2013 2014 2015
Total 7321 7066 7062 6180 7611
1. Explosives 0 3 4 13 5
2. Gases 117 60 68 66 50
3. Flammable liquids 7192 6955 6925 6073 7529
4.1. Flammable solids, self-reactive substances and desensitized
explosives
2 0 1 0 1
4.2. Substances liable to spontaneous combustion 0 0 3 0 0
4.3. Substances which, in contact with water, emit flammable gases 0 0 0 1 0
5.1. Oxidizing substances 1 6 23 8 9
5.2. Organic peroxides 0 4 - - -
6.1. Toxic substances 0 11 0 - 0
6.2. Infectious substances - - - - -
7. Radioactive material - - - - -
8. Corrosives 3 11 28 8 7
9. Miscellaneous dangerous goods 6 14 10 9 8
The Mediterranean Sea is the second largest market for cruising tourism after the Caribbean. 207 cruisers with the
capacity of 249.000 passengers, i.e. 5.7 millions passengers yearly, have sailed the Mediterranean in 2012. In the
period from 2002 to 2012 the European market has increased for 162% and it is estimated that by 2020 the cruising
tourism shall reach 10 millions passengers yearly (Carić and Mackelworth, 2014). Equal trends are recorded in the
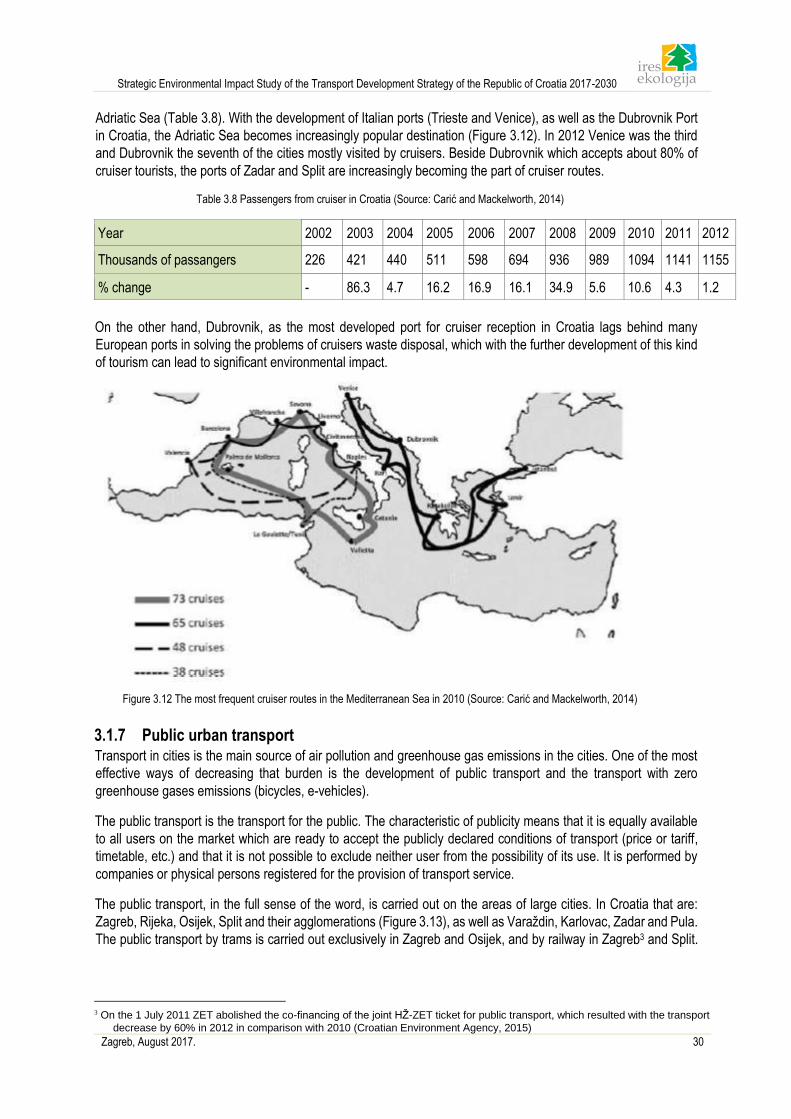
Strategic Environmental Impact Study of the Transport Development Strategy of the Republic of Croatia 2017-2030
Zagreb, August 2017. 30
Adriatic Sea (Table 3.8). With the development of Italian ports (Trieste and Venice), as well as the Dubrovnik Port
in Croatia, the Adriatic Sea becomes increasingly popular destination (Figure 3.12). In 2012 Venice was the third
and Dubrovnik the seventh of the cities mostly visited by cruisers. Beside Dubrovnik which accepts about 80% of
cruiser tourists, the ports of Zadar and Split are increasingly becoming the part of cruiser routes.
Table 3.8 Passengers from cruiser in Croatia (Source: Carić and Mackelworth, 2014)
Year 2002 2003 2004 2005 2006 2007 2008 2009 2010 2011 2012
Thousands of passangers 226 421 440 511 598 694 936 989 1094 1141 1155
% change - 86.3 4.7 16.2 16.9 16.1 34.9 5.6 10.6 4.3 1.2
On the other hand, Dubrovnik, as the most developed port for cruiser reception in Croatia lags behind many
European ports in solving the problems of cruisers waste disposal, which with the further development of this kind
of tourism can lead to significant environmental impact.
Figure 3.12 The most frequent cruiser routes in the Mediterranean Sea in 2010 (Source: Carić and Mackelworth, 2014)
3.1.7 Public urban transport Transport in cities is the main source of air pollution and greenhouse gas emissions in the cities. One of the most
effective ways of decreasing that burden is the development of public transport and the transport with zero
greenhouse gases emissions (bicycles, e-vehicles).
The public transport is the transport for the public. The characteristic of publicity means that it is equally available
to all users on the market which are ready to accept the publicly declared conditions of transport (price or tariff,
timetable, etc.) and that it is not possible to exclude neither user from the possibility of its use. It is performed by
companies or physical persons registered for the provision of transport service.
The public transport, in the full sense of the word, is carried out on the areas of large cities. In Croatia that are:
Zagreb, Rijeka, Osijek, Split and their agglomerations (Figure 3.13), as well as Varaždin, Karlovac, Zadar and Pula.
The public transport by trams is carried out exclusively in Zagreb and Osijek, and by railway in Zagreb3 and Split.
3 On the 1 July 2011 ZET abolished the co-financing of the joint HŽ-ZET ticket for public transport, which resulted with the transport
decrease by 60% in 2012 in comparison with 2010 (Croatian Environment Agency, 2015)
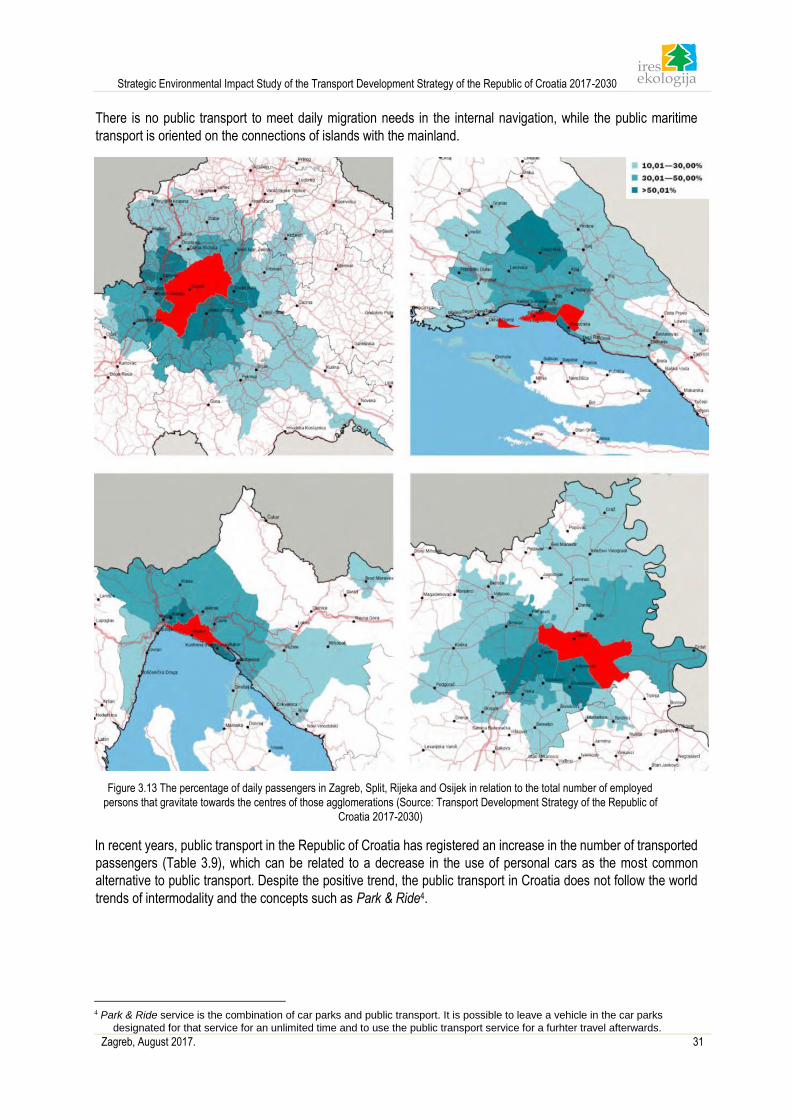
Strategic Environmental Impact Study of the Transport Development Strategy of the Republic of Croatia 2017-2030
Zagreb, August 2017. 31
There is no public transport to meet daily migration needs in the internal navigation, while the public maritime
transport is oriented on the connections of islands with the mainland.
Figure 3.13 The percentage of daily passengers in Zagreb, Split, Rijeka and Osijek in relation to the total number of employed
persons that gravitate towards the centres of those agglomerations (Source: Transport Development Strategy of the Republic of
Croatia 2017-2030)
In recent years, public transport in the Republic of Croatia has registered an increase in the number of transported
passengers (Table 3.9), which can be related to a decrease in the use of personal cars as the most common
alternative to public transport. Despite the positive trend, the public transport in Croatia does not follow the world
trends of intermodality and the concepts such as Park & Ride4.
4 Park & Ride service is the combination of car parks and public transport. It is possible to leave a vehicle in the car parks
designated for that service for an unlimited time and to use the public transport service for a furhter travel afterwards.
Strategic Environmental Impact Study of the Transport Development Strategy of the Republic of Croatia 2017-2030
Zagreb, August 2017. 32
Table 3.9 Transported passengers (in thousands) and travelled kilometres (in thousands) in urban and suburban transport (Source:
Transport and Communications in 2015)
Total Trams Buses
transported
passengers
travelled km transported
passengers
travelled km transported
passengers
travelled km
2011. 364.382 86.805 173.177 16.150 191.205 70.655
2012. 363.198 84.807 174.139 14.903 189.059 69.904
2013. 371.840 83.139 177.596 14.586 194.244 68.553
2014. 388.295 83.860 191.899 15.593 196.396 68.267
2015. 398.160 83.367 199.322 14.830 198.838 68.537
At present, public transport in the Republic of Croatia is not integrated. Intermodal terminals, which enable transit
from one mode of transport to another, do not exist, and there are no coordinated timetables or single tickets for
different modes of transport. At the same time bus and rail carries have "parallel routes". Also, average age of the
rolling stock (including the railway rolling stock) is close to the end of its service life. The situation is somewhat
satisfying in the cities of Zagreb and Rijeka, while the rolling stocks of Osijek and Split are in much worse shape
(Table 3.10). In addition, Osijek needs significant investments for a modernization of its tram traffic infrastructure.
Table 3.10 Average age of the public transporters' rolling stock per cities (Source: Transport Development Strategy of the Republic
of Croatia 2017-2030)
City Year
Counting
of Buses Average Age Trams Average Age
Split 2015 154 12.2 - -
Rijeka 2015 172 11 - -
Osijek 2014 38 10 26 47
Zagreb 2015 426 8 277 12
Bicycle is a very useful mode of transport on shorter distances and inside urban areas and there is a great potential
for the development of that mode of transport, thereby significantly decreasing greenhouse gases emissions and
enabling the use of multimodal transport systems. According to the Transport Development Strategy of the Republic
of Croatia 2017-2030 the share of bicycle as a mode of transport in daily migrations on the level of whole country
is 7.1% (data from 2014), while in the city of Zagreb in 2012 it amounts to 10.1% in relation to other modes of
transport. Regarding the share of bicycle use in daily migrations Zagreb is in the 6th place comparing to other
European cities.
Relatively large number of bicyclists in traffic calls into question the traffic safety, which is visible from the number
of injured and killed bicyclists on Croatian roads from 2013 to 2015 (Table 3.11).
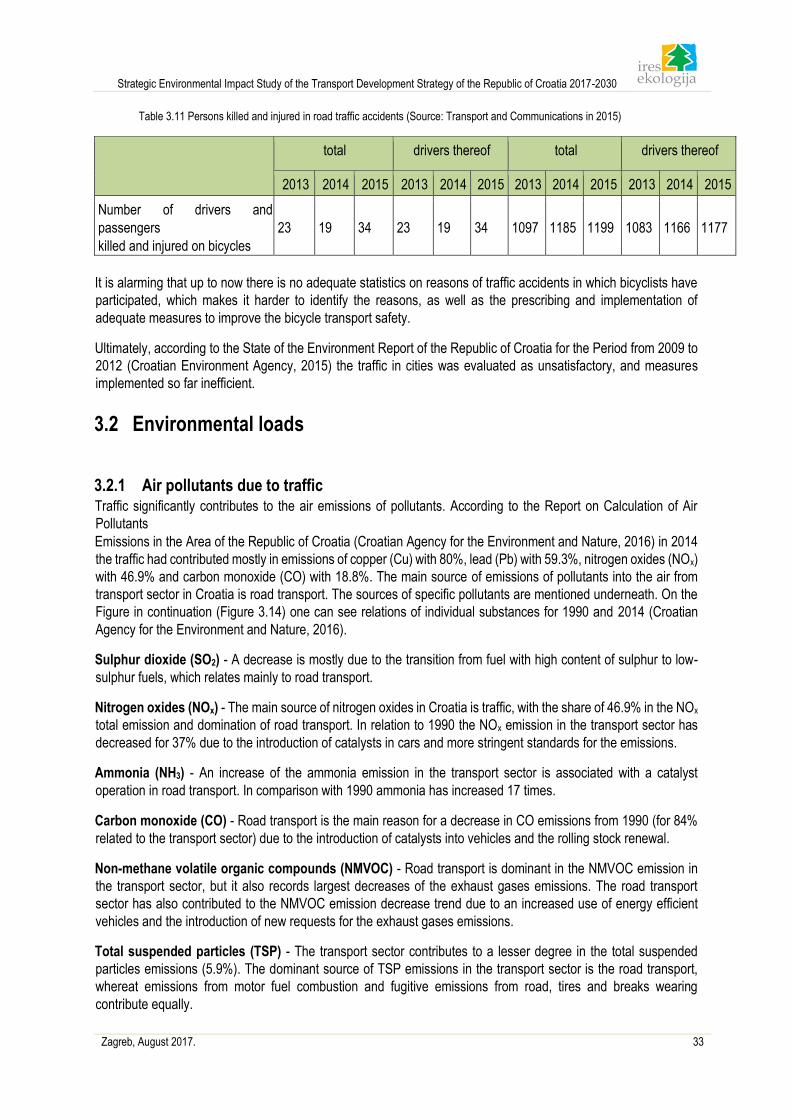
Strategic Environmental Impact Study of the Transport Development Strategy of the Republic of Croatia 2017-2030
Zagreb, August 2017. 33
Table 3.11 Persons killed and injured in road traffic accidents (Source: Transport and Communications in 2015)
total drivers thereof total drivers thereof
2013 2014 2015 2013 2014 2015 2013 2014 2015 2013 2014 2015
Number of drivers and
passengers
killed and injured on bicycles
23 19 34 23 19 34 1097 1185 1199 1083 1166 1177
It is alarming that up to now there is no adequate statistics on reasons of traffic accidents in which bicyclists have
participated, which makes it harder to identify the reasons, as well as the prescribing and implementation of
adequate measures to improve the bicycle transport safety.
Ultimately, according to the State of the Environment Report of the Republic of Croatia for the Period from 2009 to
2012 (Croatian Environment Agency, 2015) the traffic in cities was evaluated as unsatisfactory, and measures
implemented so far inefficient.
3.2 Environmental loads
3.2.1 Air pollutants due to traffic Traffic significantly contributes to the air emissions of pollutants. According to the Report on Calculation of Air
Pollutants
Emissions in the Area of the Republic of Croatia (Croatian Agency for the Environment and Nature, 2016) in 2014
the traffic had contributed mostly in emissions of copper (Cu) with 80%, lead (Pb) with 59.3%, nitrogen oxides (NOx)
with 46.9% and carbon monoxide (CO) with 18.8%. The main source of emissions of pollutants into the air from
transport sector in Croatia is road transport. The sources of specific pollutants are mentioned underneath. On the
Figure in continuation (Figure 3.14) one can see relations of individual substances for 1990 and 2014 (Croatian
Agency for the Environment and Nature, 2016).
Sulphur dioxide (SO2) - A decrease is mostly due to the transition from fuel with high content of sulphur to low-
sulphur fuels, which relates mainly to road transport.
Nitrogen oxides (NOx) - The main source of nitrogen oxides in Croatia is traffic, with the share of 46.9% in the NOx
total emission and domination of road transport. In relation to 1990 the NOx emission in the transport sector has
decreased for 37% due to the introduction of catalysts in cars and more stringent standards for the emissions.
Ammonia (NH3) - An increase of the ammonia emission in the transport sector is associated with a catalyst
operation in road transport. In comparison with 1990 ammonia has increased 17 times.
Carbon monoxide (CO) - Road transport is the main reason for a decrease in CO emissions from 1990 (for 84%
related to the transport sector) due to the introduction of catalysts into vehicles and the rolling stock renewal.
Non-methane volatile organic compounds (NMVOC) - Road transport is dominant in the NMVOC emission in
the transport sector, but it also records largest decreases of the exhaust gases emissions. The road transport
sector has also contributed to the NMVOC emission decrease trend due to an increased use of energy efficient
vehicles and the introduction of new requests for the exhaust gases emissions.
Total suspended particles (TSP) - The transport sector contributes to a lesser degree in the total suspended
particles emissions (5.9%). The dominant source of TSP emissions in the transport sector is the road transport,
whereat emissions from motor fuel combustion and fugitive emissions from road, tires and breaks wearing
contribute equally.
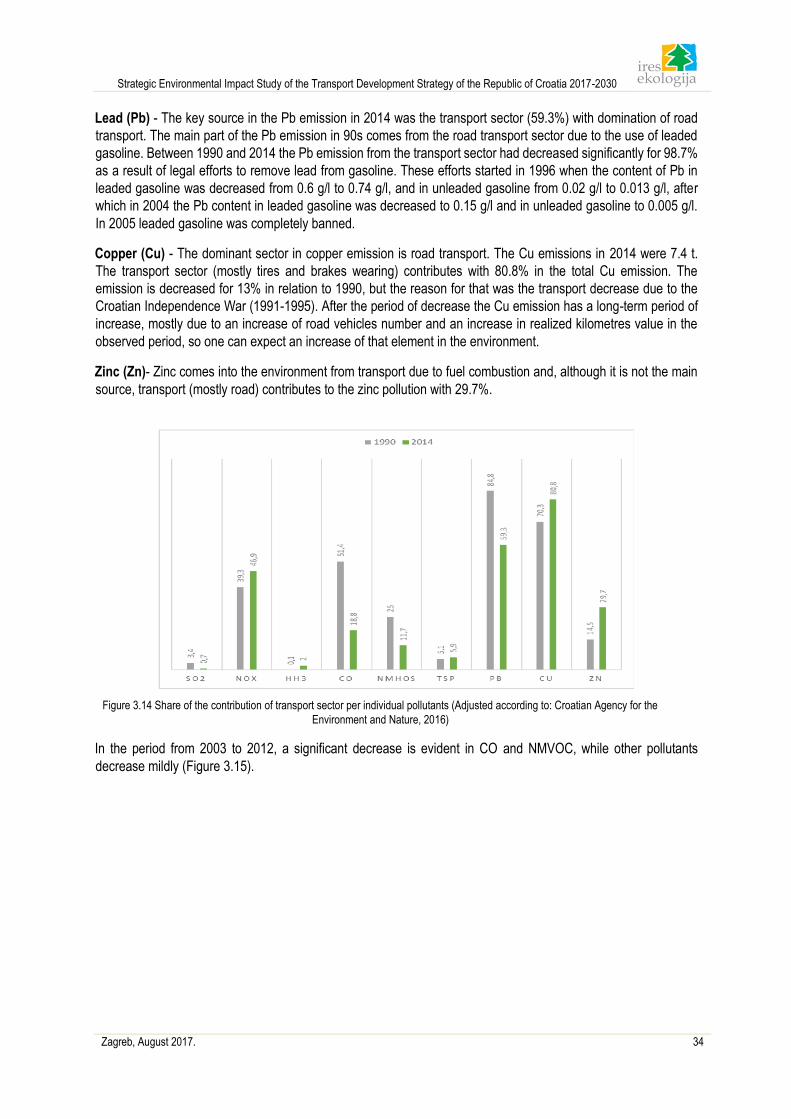
Strategic Environmental Impact Study of the Transport Development Strategy of the Republic of Croatia 2017-2030
Zagreb, August 2017. 34
Lead (Pb) - The key source in the Pb emission in 2014 was the transport sector (59.3%) with domination of road
transport. The main part of the Pb emission in 90s comes from the road transport sector due to the use of leaded
gasoline. Between 1990 and 2014 the Pb emission from the transport sector had decreased significantly for 98.7%
as a result of legal efforts to remove lead from gasoline. These efforts started in 1996 when the content of Pb in
leaded gasoline was decreased from 0.6 g/l to 0.74 g/l, and in unleaded gasoline from 0.02 g/l to 0.013 g/l, after
which in 2004 the Pb content in leaded gasoline was decreased to 0.15 g/l and in unleaded gasoline to 0.005 g/l.
In 2005 leaded gasoline was completely banned.
Copper (Cu) - The dominant sector in copper emission is road transport. The Cu emissions in 2014 were 7.4 t.
The transport sector (mostly tires and brakes wearing) contributes with 80.8% in the total Cu emission. The
emission is decreased for 13% in relation to 1990, but the reason for that was the transport decrease due to the
Croatian Independence War (1991-1995). After the period of decrease the Cu emission has a long-term period of
increase, mostly due to an increase of road vehicles number and an increase in realized kilometres value in the
observed period, so one can expect an increase of that element in the environment.
Zinc (Zn)- Zinc comes into the environment from transport due to fuel combustion and, although it is not the main
source, transport (mostly road) contributes to the zinc pollution with 29.7%.
Figure 3.14 Share of the contribution of transport sector per individual pollutants (Adjusted according to: Croatian Agency for the
Environment and Nature, 2016)
In the period from 2003 to 2012, a significant decrease is evident in CO and NMVOC, while other pollutants
decrease mildly (Figure 3.15).
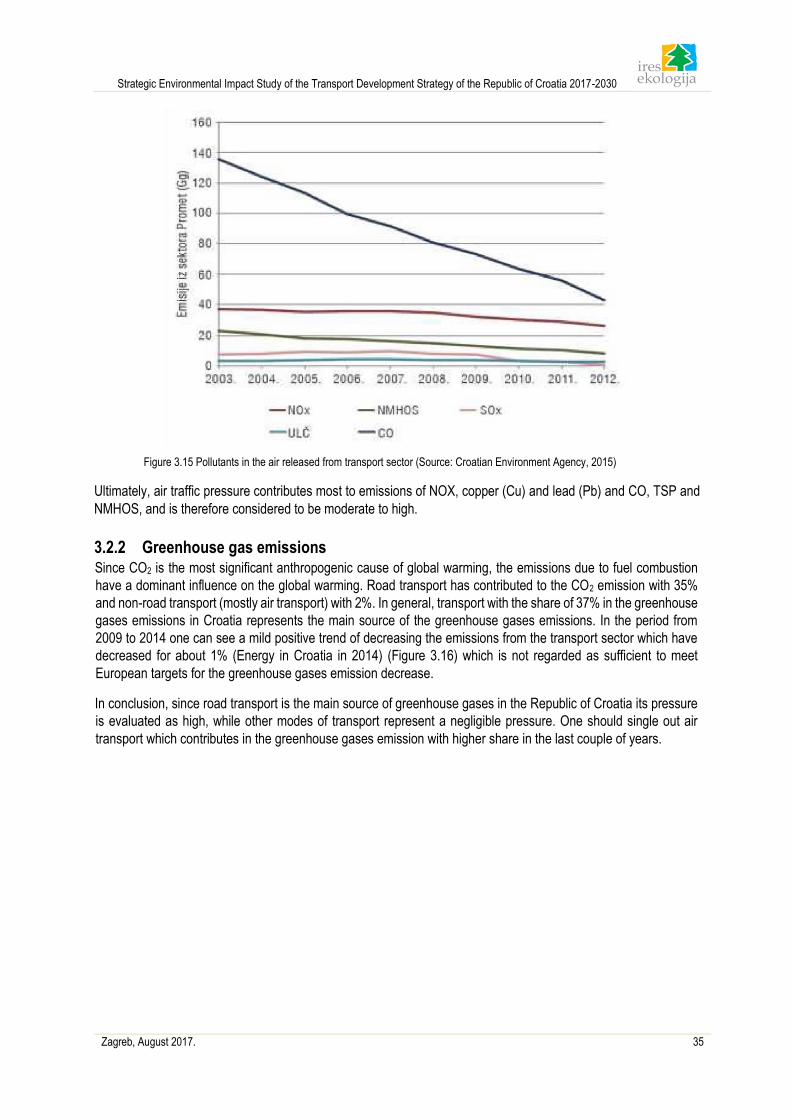
Strategic Environmental Impact Study of the Transport Development Strategy of the Republic of Croatia 2017-2030
Zagreb, August 2017. 35
Figure 3.15 Pollutants in the air released from transport sector (Source: Croatian Environment Agency, 2015)
Ultimately, air traffic pressure contributes most to emissions of NOX, copper (Cu) and lead (Pb) and CO, TSP and
NMHOS, and is therefore considered to be moderate to high.
3.2.2 Greenhouse gas emissions Since CO2 is the most significant anthropogenic cause of global warming, the emissions due to fuel combustion
have a dominant influence on the global warming. Road transport has contributed to the CO2 emission with 35%
and non-road transport (mostly air transport) with 2%. In general, transport with the share of 37% in the greenhouse
gases emissions in Croatia represents the main source of the greenhouse gases emissions. In the period from
2009 to 2014 one can see a mild positive trend of decreasing the emissions from the transport sector which have
decreased for about 1% (Energy in Croatia in 2014) (Figure 3.16) which is not regarded as sufficient to meet
European targets for the greenhouse gases emission decrease.
In conclusion, since road transport is the main source of greenhouse gases in the Republic of Croatia its pressure
is evaluated as high, while other modes of transport represent a negligible pressure. One should single out air
transport which contributes in the greenhouse gases emission with higher share in the last couple of years.
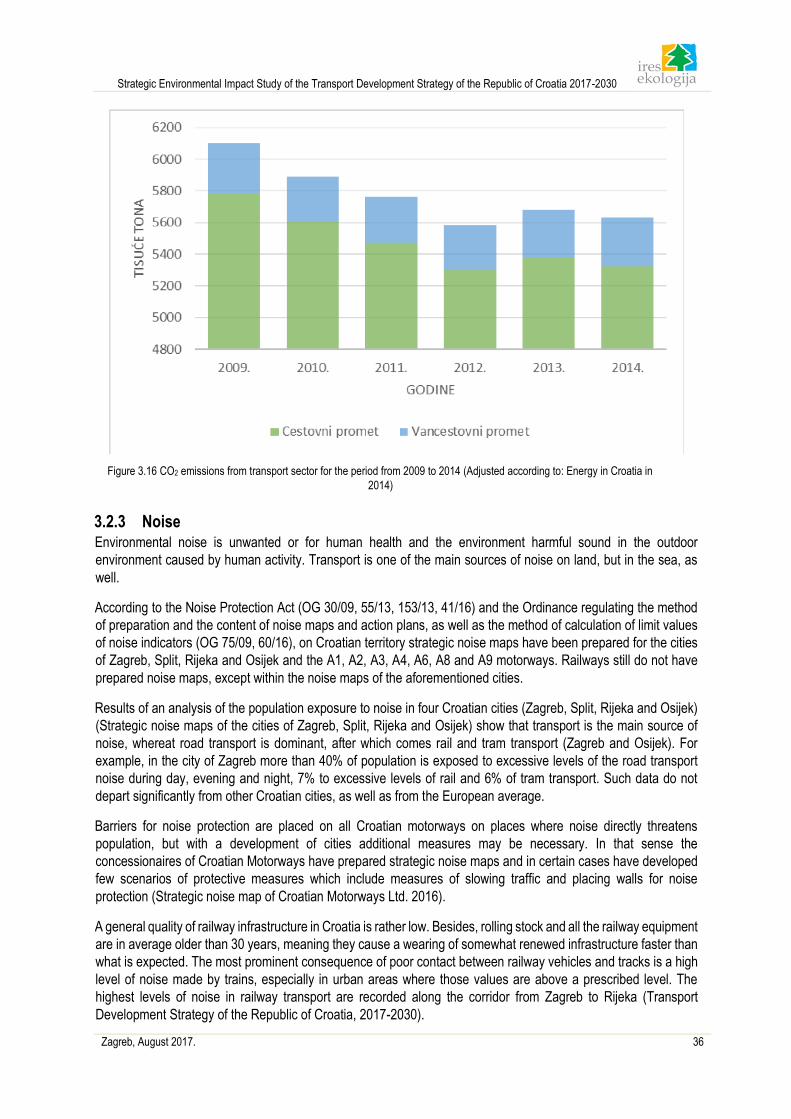
Strategic Environmental Impact Study of the Transport Development Strategy of the Republic of Croatia 2017-2030
Zagreb, August 2017. 36
Figure 3.16 CO2 emissions from transport sector for the period from 2009 to 2014 (Adjusted according to: Energy in Croatia in
2014)
3.2.3 Noise Environmental noise is unwanted or for human health and the environment harmful sound in the outdoor
environment caused by human activity. Transport is one of the main sources of noise on land, but in the sea, as
well.
According to the Noise Protection Act (OG 30/09, 55/13, 153/13, 41/16) and the Ordinance regulating the method
of preparation and the content of noise maps and action plans, as well as the method of calculation of limit values
of noise indicators (OG 75/09, 60/16), on Croatian territory strategic noise maps have been prepared for the cities
of Zagreb, Split, Rijeka and Osijek and the A1, A2, A3, A4, A6, A8 and A9 motorways. Railways still do not have
prepared noise maps, except within the noise maps of the aforementioned cities.
Results of an analysis of the population exposure to noise in four Croatian cities (Zagreb, Split, Rijeka and Osijek)
(Strategic noise maps of the cities of Zagreb, Split, Rijeka and Osijek) show that transport is the main source of
noise, whereat road transport is dominant, after which comes rail and tram transport (Zagreb and Osijek). For
example, in the city of Zagreb more than 40% of population is exposed to excessive levels of the road transport
noise during day, evening and night, 7% to excessive levels of rail and 6% of tram transport. Such data do not
depart significantly from other Croatian cities, as well as from the European average.
Barriers for noise protection are placed on all Croatian motorways on places where noise directly threatens
population, but with a development of cities additional measures may be necessary. In that sense the
concessionaires of Croatian Motorways have prepared strategic noise maps and in certain cases have developed
few scenarios of protective measures which include measures of slowing traffic and placing walls for noise
protection (Strategic noise map of Croatian Motorways Ltd. 2016).
A general quality of railway infrastructure in Croatia is rather low. Besides, rolling stock and all the railway equipment
are in average older than 30 years, meaning they cause a wearing of somewhat renewed infrastructure faster than
what is expected. The most prominent consequence of poor contact between railway vehicles and tracks is a high
level of noise made by trains, especially in urban areas where those values are above a prescribed level. The
highest levels of noise in railway transport are recorded along the corridor from Zagreb to Rijeka (Transport
Development Strategy of the Republic of Croatia, 2017-2030).
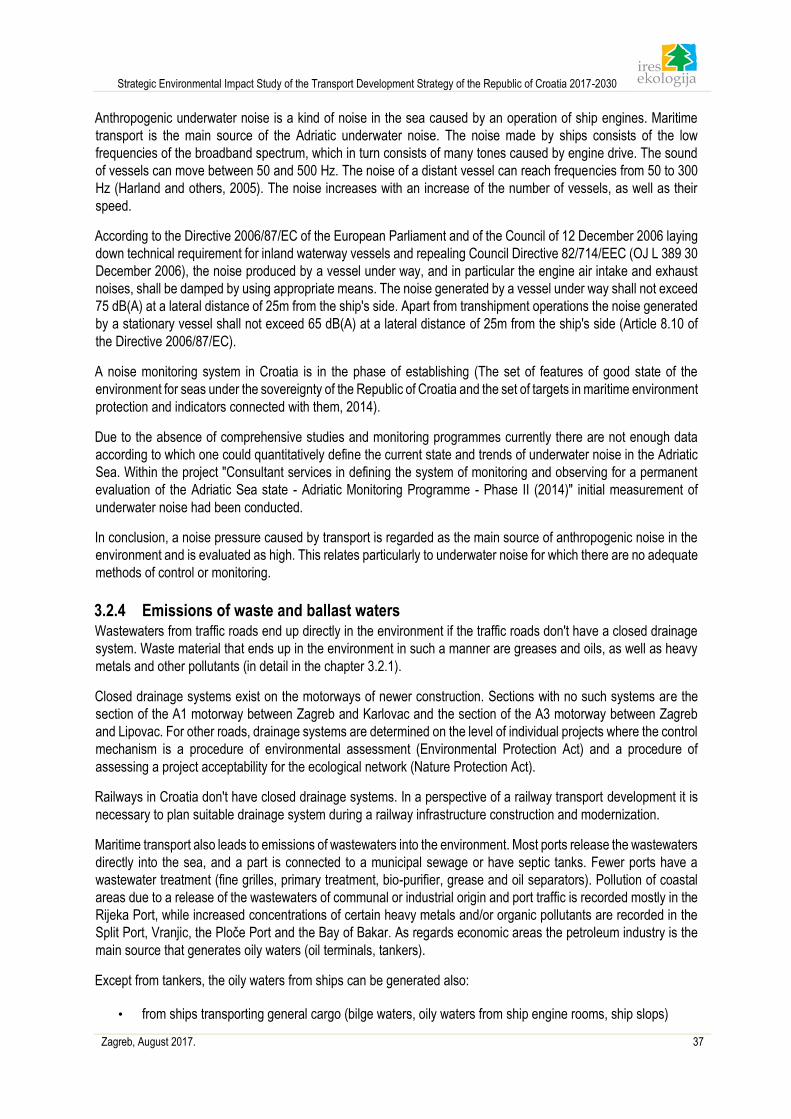
Strategic Environmental Impact Study of the Transport Development Strategy of the Republic of Croatia 2017-2030
Zagreb, August 2017. 37
Anthropogenic underwater noise is a kind of noise in the sea caused by an operation of ship engines. Maritime
transport is the main source of the Adriatic underwater noise. The noise made by ships consists of the low
frequencies of the broadband spectrum, which in turn consists of many tones caused by engine drive. The sound
of vessels can move between 50 and 500 Hz. The noise of a distant vessel can reach frequencies from 50 to 300
Hz (Harland and others, 2005). The noise increases with an increase of the number of vessels, as well as their
speed.
According to the Directive 2006/87/EC of the European Parliament and of the Council of 12 December 2006 laying
down technical requirement for inland waterway vessels and repealing Council Directive 82/714/EEC (OJ L 389 30
December 2006), the noise produced by a vessel under way, and in particular the engine air intake and exhaust
noises, shall be damped by using appropriate means. The noise generated by a vessel under way shall not exceed
75 dB(A) at a lateral distance of 25m from the ship's side. Apart from transhipment operations the noise generated
by a stationary vessel shall not exceed 65 dB(A) at a lateral distance of 25m from the ship's side (Article 8.10 of
the Directive 2006/87/EC).
A noise monitoring system in Croatia is in the phase of establishing (The set of features of good state of the
environment for seas under the sovereignty of the Republic of Croatia and the set of targets in maritime environment
protection and indicators connected with them, 2014).
Due to the absence of comprehensive studies and monitoring programmes currently there are not enough data
according to which one could quantitatively define the current state and trends of underwater noise in the Adriatic
Sea. Within the project "Consultant services in defining the system of monitoring and observing for a permanent
evaluation of the Adriatic Sea state - Adriatic Monitoring Programme - Phase II (2014)" initial measurement of
underwater noise had been conducted.
In conclusion, a noise pressure caused by transport is regarded as the main source of anthropogenic noise in the
environment and is evaluated as high. This relates particularly to underwater noise for which there are no adequate
methods of control or monitoring.
3.2.4 Emissions of waste and ballast waters Wastewaters from traffic roads end up directly in the environment if the traffic roads don't have a closed drainage
system. Waste material that ends up in the environment in such a manner are greases and oils, as well as heavy
metals and other pollutants (in detail in the chapter 3.2.1).
Closed drainage systems exist on the motorways of newer construction. Sections with no such systems are the
section of the A1 motorway between Zagreb and Karlovac and the section of the A3 motorway between Zagreb
and Lipovac. For other roads, drainage systems are determined on the level of individual projects where the control
mechanism is a procedure of environmental assessment (Environmental Protection Act) and a procedure of
assessing a project acceptability for the ecological network (Nature Protection Act).
Railways in Croatia don't have closed drainage systems. In a perspective of a railway transport development it is
necessary to plan suitable drainage system during a railway infrastructure construction and modernization.
Maritime transport also leads to emissions of wastewaters into the environment. Most ports release the wastewaters
directly into the sea, and a part is connected to a municipal sewage or have septic tanks. Fewer ports have a
wastewater treatment (fine grilles, primary treatment, bio-purifier, grease and oil separators). Pollution of coastal
areas due to a release of the wastewaters of communal or industrial origin and port traffic is recorded mostly in the
Rijeka Port, while increased concentrations of certain heavy metals and/or organic pollutants are recorded in the
Split Port, Vranjic, the Ploče Port and the Bay of Bakar. As regards economic areas the petroleum industry is the
main source that generates oily waters (oil terminals, tankers).
Except from tankers, the oily waters from ships can be generated also:
• from ships transporting general cargo (bilge waters, oily waters from ship engine rooms, ship slops)
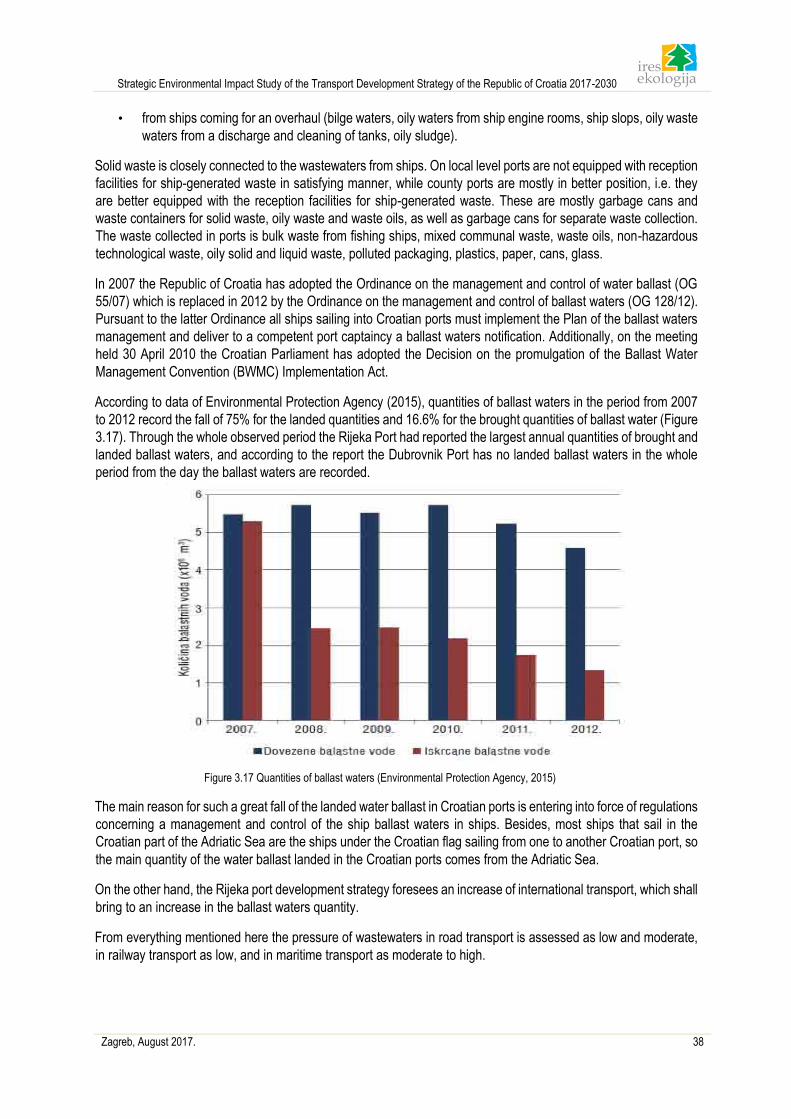
Strategic Environmental Impact Study of the Transport Development Strategy of the Republic of Croatia 2017-2030
Zagreb, August 2017. 38
• from ships coming for an overhaul (bilge waters, oily waters from ship engine rooms, ship slops, oily waste
waters from a discharge and cleaning of tanks, oily sludge).
Solid waste is closely connected to the wastewaters from ships. On local level ports are not equipped with reception
facilities for ship-generated waste in satisfying manner, while county ports are mostly in better position, i.e. they
are better equipped with the reception facilities for ship-generated waste. These are mostly garbage cans and
waste containers for solid waste, oily waste and waste oils, as well as garbage cans for separate waste collection.
The waste collected in ports is bulk waste from fishing ships, mixed communal waste, waste oils, non-hazardous
technological waste, oily solid and liquid waste, polluted packaging, plastics, paper, cans, glass.
In 2007 the Republic of Croatia has adopted the Ordinance on the management and control of water ballast (OG
55/07) which is replaced in 2012 by the Ordinance on the management and control of ballast waters (OG 128/12).
Pursuant to the latter Ordinance all ships sailing into Croatian ports must implement the Plan of the ballast waters
management and deliver to a competent port captaincy a ballast waters notification. Additionally, on the meeting
held 30 April 2010 the Croatian Parliament has adopted the Decision on the promulgation of the Ballast Water
Management Convention (BWMC) Implementation Act.
According to data of Environmental Protection Agency (2015), quantities of ballast waters in the period from 2007
to 2012 record the fall of 75% for the landed quantities and 16.6% for the brought quantities of ballast water (Figure
3.17). Through the whole observed period the Rijeka Port had reported the largest annual quantities of brought and
landed ballast waters, and according to the report the Dubrovnik Port has no landed ballast waters in the whole
period from the day the ballast waters are recorded.
Figure 3.17 Quantities of ballast waters (Environmental Protection Agency, 2015)
The main reason for such a great fall of the landed water ballast in Croatian ports is entering into force of regulations
concerning a management and control of the ship ballast waters in ships. Besides, most ships that sail in the
Croatian part of the Adriatic Sea are the ships under the Croatian flag sailing from one to another Croatian port, so
the main quantity of the water ballast landed in the Croatian ports comes from the Adriatic Sea.
On the other hand, the Rijeka port development strategy foresees an increase of international transport, which shall
bring to an increase in the ballast waters quantity.
From everything mentioned here the pressure of wastewaters in road transport is assessed as low and moderate,
in railway transport as low, and in maritime transport as moderate to high.
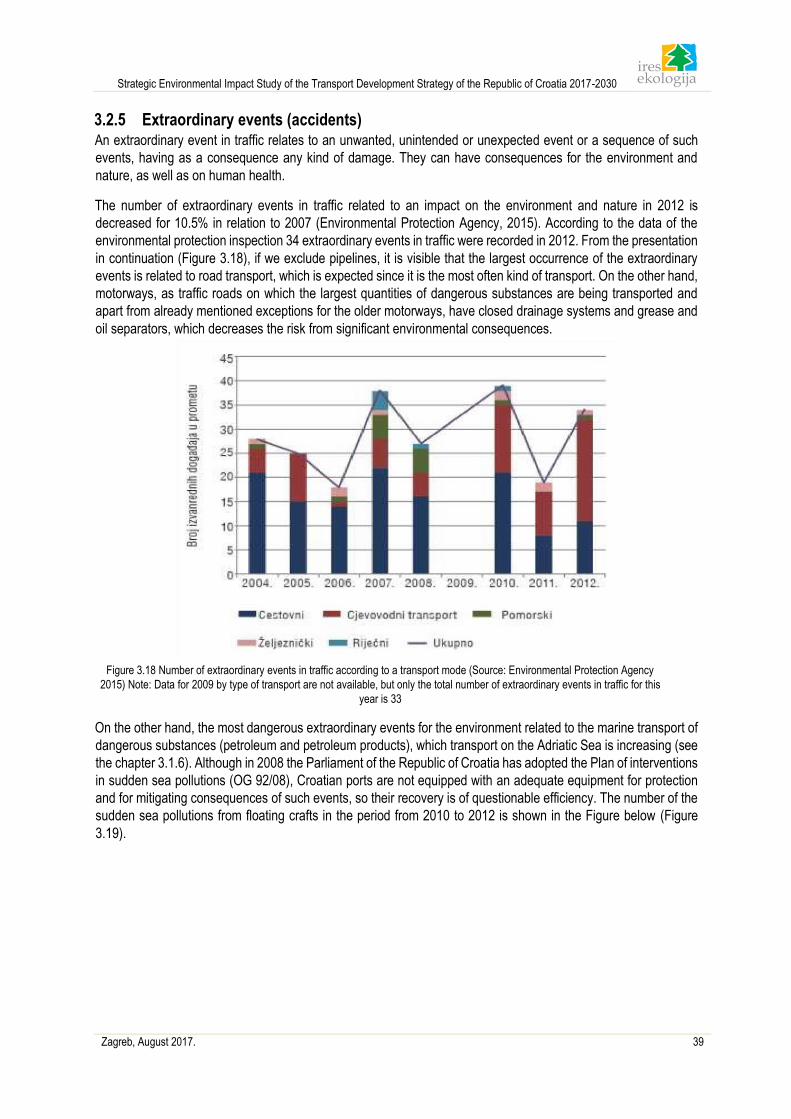
Strategic Environmental Impact Study of the Transport Development Strategy of the Republic of Croatia 2017-2030
Zagreb, August 2017. 39
3.2.5 Extraordinary events (accidents) An extraordinary event in traffic relates to an unwanted, unintended or unexpected event or a sequence of such
events, having as a consequence any kind of damage. They can have consequences for the environment and
nature, as well as on human health.
The number of extraordinary events in traffic related to an impact on the environment and nature in 2012 is
decreased for 10.5% in relation to 2007 (Environmental Protection Agency, 2015). According to the data of the
environmental protection inspection 34 extraordinary events in traffic were recorded in 2012. From the presentation
in continuation (Figure 3.18), if we exclude pipelines, it is visible that the largest occurrence of the extraordinary
events is related to road transport, which is expected since it is the most often kind of transport. On the other hand,
motorways, as traffic roads on which the largest quantities of dangerous substances are being transported and
apart from already mentioned exceptions for the older motorways, have closed drainage systems and grease and
oil separators, which decreases the risk from significant environmental consequences.
Figure 3.18 Number of extraordinary events in traffic according to a transport mode (Source: Environmental Protection Agency
2015) Note: Data for 2009 by type of transport are not available, but only the total number of extraordinary events in traffic for this
year is 33
On the other hand, the most dangerous extraordinary events for the environment related to the marine transport of
dangerous substances (petroleum and petroleum products), which transport on the Adriatic Sea is increasing (see
the chapter 3.1.6). Although in 2008 the Parliament of the Republic of Croatia has adopted the Plan of interventions
in sudden sea pollutions (OG 92/08), Croatian ports are not equipped with an adequate equipment for protection
and for mitigating consequences of such events, so their recovery is of questionable efficiency. The number of the
sudden sea pollutions from floating crafts in the period from 2010 to 2012 is shown in the Figure below (Figure
3.19).
Strategic Environmental Impact Study of the Transport Development Strategy of the Republic of Croatia 2017-2030
Zagreb, August 2017. 40
Figure 3.19 Sudden pollutions of maritime good according to the pollution source (Source: Ministry of the Sea, Transport and
Infrastructure, taken from the State of the Environment Report, EPA 2015)
Immediately after the risk from extraordinary events in maritime transport comes railway transport whose
infrastructure does not meet modern security standards. If to this one adds that the main railway route for
transporting dangerous substances, Rijeka - Zagreb (for more details see chapter 3.1.3), passes almost totally
through a karst area, and has not a closed drainage system the extraordinary events in that area can have major
ecological consequences.
3.3 Description of a state of environmental components The state of the environment in the area of the Republic of Croatia is described using indicators that were selected
in accordance with the preliminary analysis of the Strategy. Pursuant to identified potential impacts of the Strategy
on the environmental components the clear indicators, that is, identifiers of the state of the environment were
defined that allow a focused presentation of a certain trend in the environment. Beside the most significant
influences of the Strategy, data availability, that is, a possibility of quantitative and qualitative presentation of
environmental elements that shall be the object of the assessment of the Strategy's environmental impact was also
a criterion for a selection of the indicators.
3.3.1 Air quality and climatic features
3.3.1.1 Concentration of pollutants in air
The air quality in Croatia is being monitored on the basis of the data measured on the measuring stations of the
national and local networks for the permanent monitoring of air quality.
In the Annual report on the air quality monitoring in the area of the Republic of Croatia for 2013, 2014 and 2015
one can see the air quality assessment in five zones (HR1 Continental Croatia, HR2 Industrial Zone, HR3 Lika,
Gorski Kotar and Primorje, HR4 Istria and HR5 Dalmatia) and four agglomerations (Zagreb, Split, Rijeka and Osijek)
from the measuring places defined with the Regulation on the definition of the list of measuring places for monitoring
concentrations of certain pollutants in the air and the locations of the measuring stations in the national network for
permanent monitoring of air quality (OG 22/14).
On the Figure below one can see the spatial distribution of zones and agglomerations with the measuring stations
for pollution assessment, that is the measuring stations for monitoring the pollutants mentioned below (Figure 3.20).
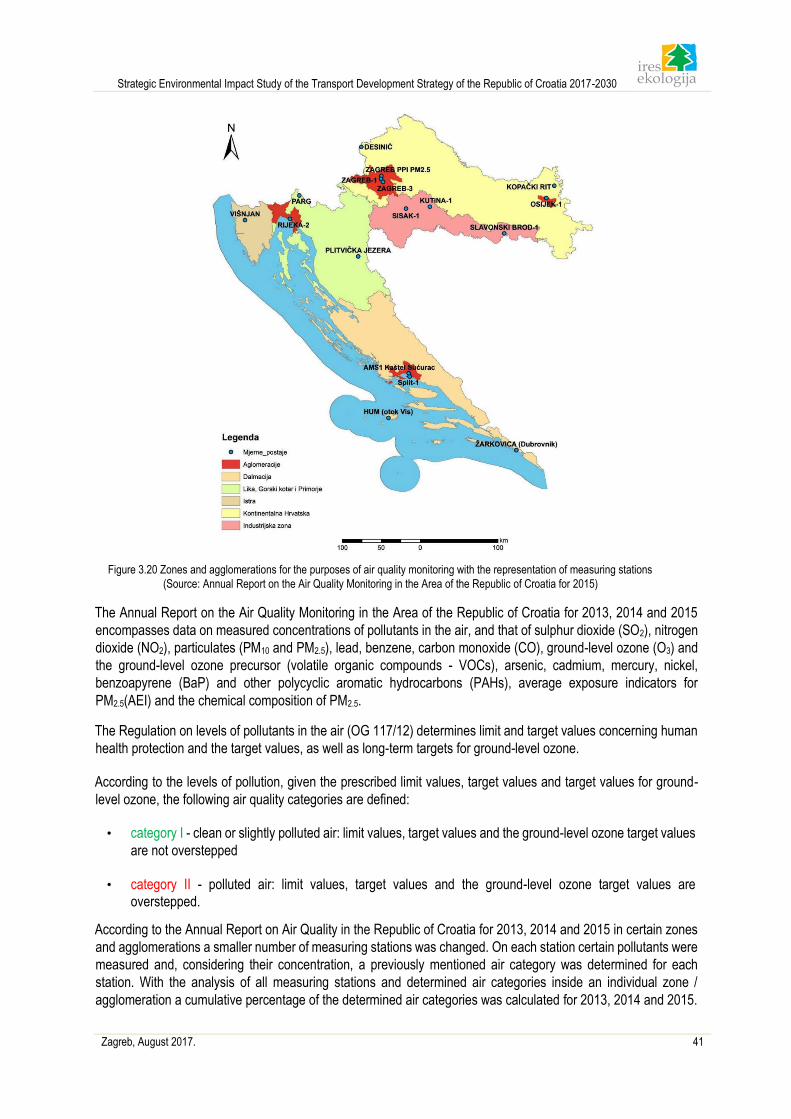
Strategic Environmental Impact Study of the Transport Development Strategy of the Republic of Croatia 2017-2030
Zagreb, August 2017. 41
Figure 3.20 Zones and agglomerations for the purposes of air quality monitoring with the representation of measuring stations
(Source: Annual Report on the Air Quality Monitoring in the Area of the Republic of Croatia for 2015)
The Annual Report on the Air Quality Monitoring in the Area of the Republic of Croatia for 2013, 2014 and 2015
encompasses data on measured concentrations of pollutants in the air, and that of sulphur dioxide (SO2), nitrogen
dioxide (NO2), particulates (PM10 and PM2.5), lead, benzene, carbon monoxide (CO), ground-level ozone (O3) and
the ground-level ozone precursor (volatile organic compounds - VOCs), arsenic, cadmium, mercury, nickel,
benzoapyrene (BaP) and other polycyclic aromatic hydrocarbons (PAHs), average exposure indicators for
PM2.5(AEI) and the chemical composition of PM2.5.
The Regulation on levels of pollutants in the air (OG 117/12) determines limit and target values concerning human
health protection and the target values, as well as long-term targets for ground-level ozone.
According to the levels of pollution, given the prescribed limit values, target values and target values for ground-
level ozone, the following air quality categories are defined:
• category I - clean or slightly polluted air: limit values, target values and the ground-level ozone target values
are not overstepped
• category II - polluted air: limit values, target values and the ground-level ozone target values are
overstepped.
According to the Annual Report on Air Quality in the Republic of Croatia for 2013, 2014 and 2015 in certain zones
and agglomerations a smaller number of measuring stations was changed. On each station certain pollutants were
measured and, considering their concentration, a previously mentioned air category was determined for each
station. With the analysis of all measuring stations and determined air categories inside an individual zone /
agglomeration a cumulative percentage of the determined air categories was calculated for 2013, 2014 and 2015.
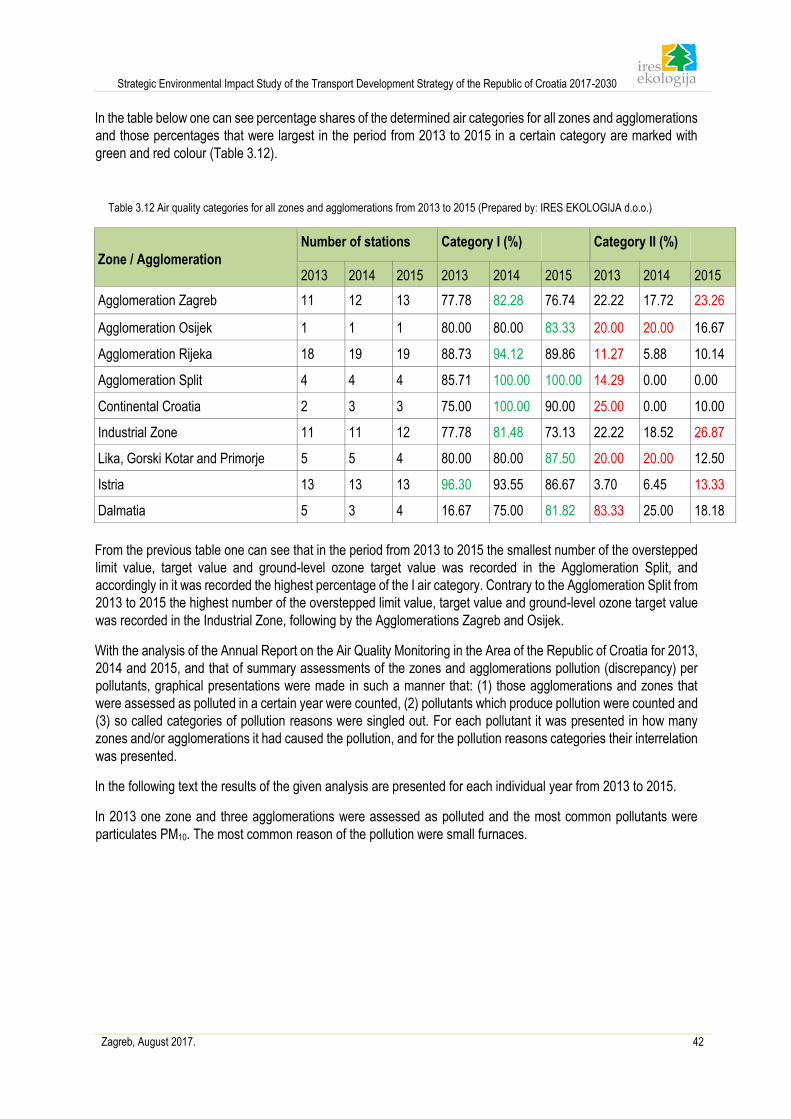
Strategic Environmental Impact Study of the Transport Development Strategy of the Republic of Croatia 2017-2030
Zagreb, August 2017. 42
In the table below one can see percentage shares of the determined air categories for all zones and agglomerations
and those percentages that were largest in the period from 2013 to 2015 in a certain category are marked with
green and red colour (Table 3.12).
Table 3.12 Air quality categories for all zones and agglomerations from 2013 to 2015 (Prepared by: IRES EKOLOGIJA d.o.o.)
Zone / Agglomeration
Number of stations Category I (%) Category II (%)
2013 2014 2015 2013 2014 2015 2013 2014 2015
Agglomeration Zagreb 11 12 13 77.78 82.28 76.74 22.22 17.72 23.26
Agglomeration Osijek 1 1 1 80.00 80.00 83.33 20.00 20.00 16.67
Agglomeration Rijeka 18 19 19 88.73 94.12 89.86 11.27 5.88 10.14
Agglomeration Split 4 4 4 85.71 100.00 100.00 14.29 0.00 0.00
Continental Croatia 2 3 3 75.00 100.00 90.00 25.00 0.00 10.00
Industrial Zone 11 11 12 77.78 81.48 73.13 22.22 18.52 26.87
Lika, Gorski Kotar and Primorje 5 5 4 80.00 80.00 87.50 20.00 20.00 12.50
Istria 13 13 13 96.30 93.55 86.67 3.70 6.45 13.33
Dalmatia 5 3 4 16.67 75.00 81.82 83.33 25.00 18.18
From the previous table one can see that in the period from 2013 to 2015 the smallest number of the overstepped
limit value, target value and ground-level ozone target value was recorded in the Agglomeration Split, and
accordingly in it was recorded the highest percentage of the I air category. Contrary to the Agglomeration Split from
2013 to 2015 the highest number of the overstepped limit value, target value and ground-level ozone target value
was recorded in the Industrial Zone, following by the Agglomerations Zagreb and Osijek.
With the analysis of the Annual Report on the Air Quality Monitoring in the Area of the Republic of Croatia for 2013,
2014 and 2015, and that of summary assessments of the zones and agglomerations pollution (discrepancy) per
pollutants, graphical presentations were made in such a manner that: (1) those agglomerations and zones that
were assessed as polluted in a certain year were counted, (2) pollutants which produce pollution were counted and
(3) so called categories of pollution reasons were singled out. For each pollutant it was presented in how many
zones and/or agglomerations it had caused the pollution, and for the pollution reasons categories their interrelation
was presented.
In the following text the results of the given analysis are presented for each individual year from 2013 to 2015.
In 2013 one zone and three agglomerations were assessed as polluted and the most common pollutants were
particulates PM10. The most common reason of the pollution were small furnaces.
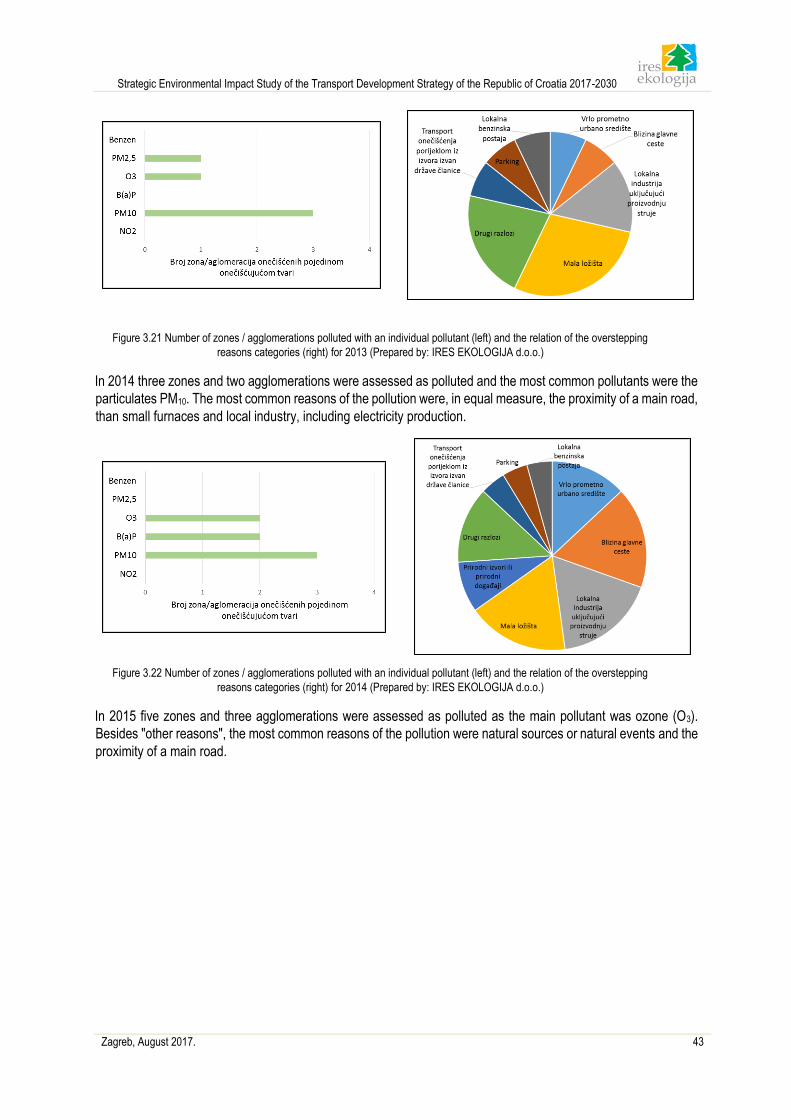
Strategic Environmental Impact Study of the Transport Development Strategy of the Republic of Croatia 2017-2030
Zagreb, August 2017. 43
Figure 3.21 Number of zones / agglomerations polluted with an individual pollutant (left) and the relation of the overstepping
reasons categories (right) for 2013 (Prepared by: IRES EKOLOGIJA d.o.o.)
In 2014 three zones and two agglomerations were assessed as polluted and the most common pollutants were the
particulates PM10. The most common reasons of the pollution were, in equal measure, the proximity of a main road,
than small furnaces and local industry, including electricity production.
Figure 3.22 Number of zones / agglomerations polluted with an individual pollutant (left) and the relation of the overstepping
reasons categories (right) for 2014 (Prepared by: IRES EKOLOGIJA d.o.o.)
In 2015 five zones and three agglomerations were assessed as polluted as the main pollutant was ozone (O3).
Besides "other reasons", the most common reasons of the pollution were natural sources or natural events and the
proximity of a main road.
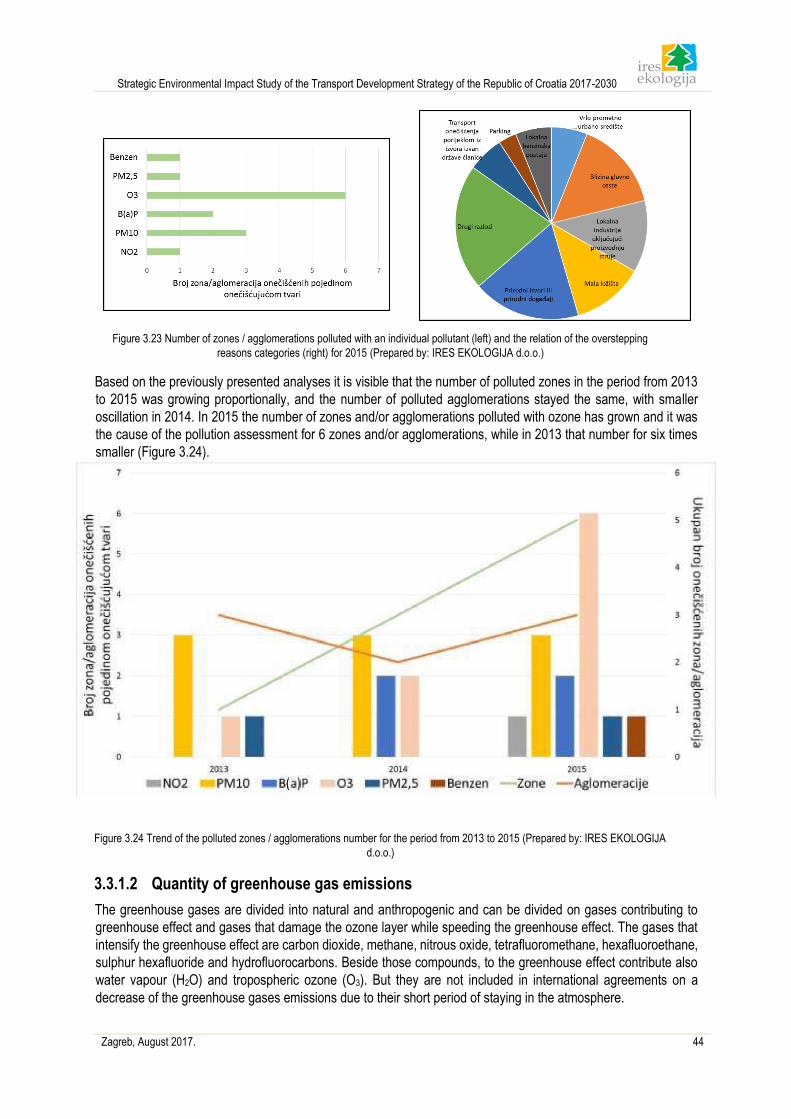
Strategic Environmental Impact Study of the Transport Development Strategy of the Republic of Croatia 2017-2030
Zagreb, August 2017. 44
Figure 3.23 Number of zones / agglomerations polluted with an individual pollutant (left) and the relation of the overstepping
reasons categories (right) for 2015 (Prepared by: IRES EKOLOGIJA d.o.o.)
Based on the previously presented analyses it is visible that the number of polluted zones in the period from 2013
to 2015 was growing proportionally, and the number of polluted agglomerations stayed the same, with smaller
oscillation in 2014. In 2015 the number of zones and/or agglomerations polluted with ozone has grown and it was
the cause of the pollution assessment for 6 zones and/or agglomerations, while in 2013 that number for six times
smaller (Figure 3.24).
Figure 3.24 Trend of the polluted zones / agglomerations number for the period from 2013 to 2015 (Prepared by: IRES EKOLOGIJA
d.o.o.)
3.3.1.2 Quantity of greenhouse gas emissions
The greenhouse gases are divided into natural and anthropogenic and can be divided on gases contributing to
greenhouse effect and gases that damage the ozone layer while speeding the greenhouse effect. The gases that
intensify the greenhouse effect are carbon dioxide, methane, nitrous oxide, tetrafluoromethane, hexafluoroethane,
sulphur hexafluoride and hydrofluorocarbons. Beside those compounds, to the greenhouse effect contribute also
water vapour (H2O) and tropospheric ozone (O3). But they are not included in international agreements on a
decrease of the greenhouse gases emissions due to their short period of staying in the atmosphere.
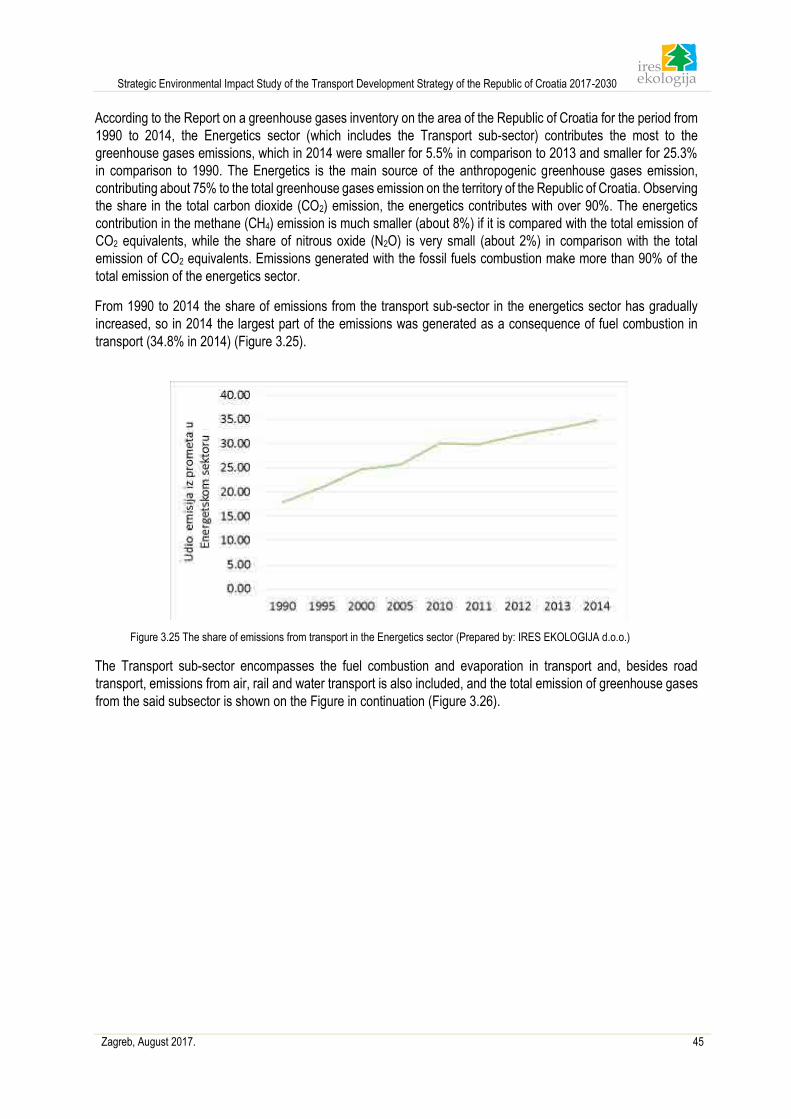
Strategic Environmental Impact Study of the Transport Development Strategy of the Republic of Croatia 2017-2030
Zagreb, August 2017. 45
According to the Report on a greenhouse gases inventory on the area of the Republic of Croatia for the period from
1990 to 2014, the Energetics sector (which includes the Transport sub-sector) contributes the most to the
greenhouse gases emissions, which in 2014 were smaller for 5.5% in comparison to 2013 and smaller for 25.3%
in comparison to 1990. The Energetics is the main source of the anthropogenic greenhouse gases emission,
contributing about 75% to the total greenhouse gases emission on the territory of the Republic of Croatia. Observing
the share in the total carbon dioxide (CO2) emission, the energetics contributes with over 90%. The energetics
contribution in the methane (CH4) emission is much smaller (about 8%) if it is compared with the total emission of
CO2 equivalents, while the share of nitrous oxide (N2O) is very small (about 2%) in comparison with the total
emission of CO2 equivalents. Emissions generated with the fossil fuels combustion make more than 90% of the
total emission of the energetics sector.
From 1990 to 2014 the share of emissions from the transport sub-sector in the energetics sector has gradually
increased, so in 2014 the largest part of the emissions was generated as a consequence of fuel combustion in
transport (34.8% in 2014) (Figure 3.25).
Figure 3.25 The share of emissions from transport in the Energetics sector (Prepared by: IRES EKOLOGIJA d.o.o.)
The Transport sub-sector encompasses the fuel combustion and evaporation in transport and, besides road
transport, emissions from air, rail and water transport is also included, and the total emission of greenhouse gases
from the said subsector is shown on the Figure in continuation (Figure 3.26).
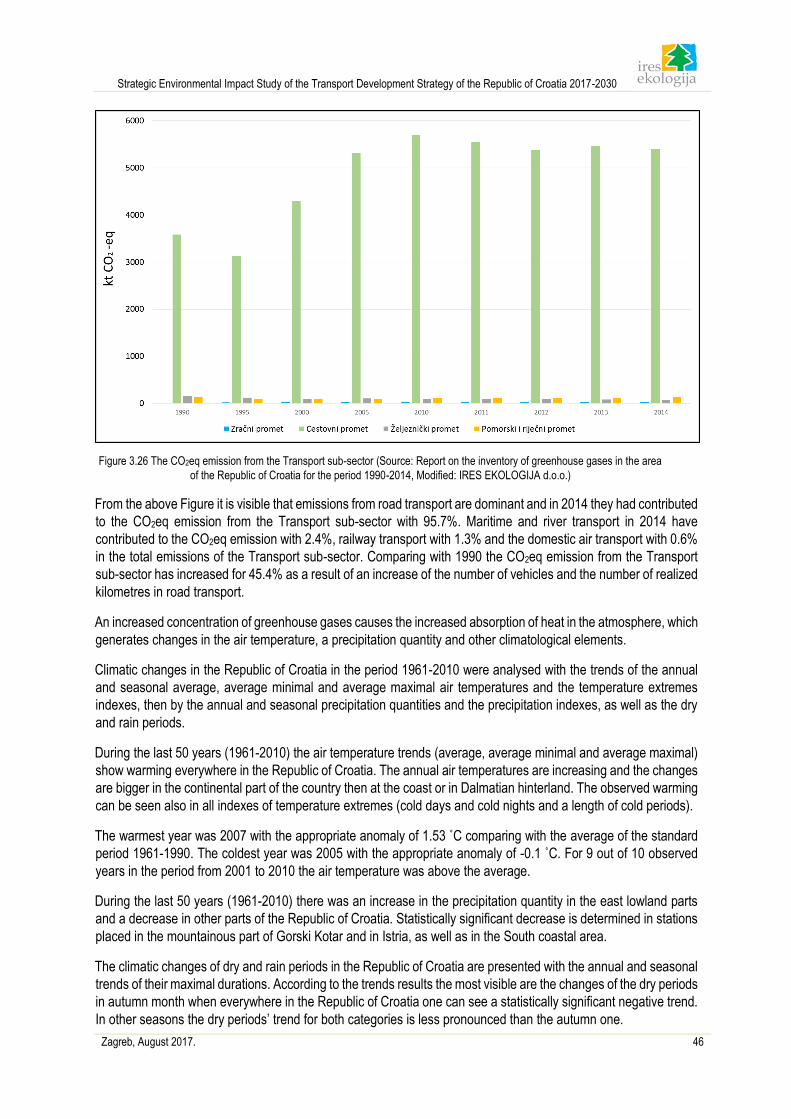
Strategic Environmental Impact Study of the Transport Development Strategy of the Republic of Croatia 2017-2030
Zagreb, August 2017. 46
Figure 3.26 The CO2eq emission from the Transport sub-sector (Source: Report on the inventory of greenhouse gases in the area
of the Republic of Croatia for the period 1990-2014, Modified: IRES EKOLOGIJA d.o.o.)
From the above Figure it is visible that emissions from road transport are dominant and in 2014 they had contributed
to the CO2eq emission from the Transport sub-sector with 95.7%. Maritime and river transport in 2014 have
contributed to the CO2eq emission with 2.4%, railway transport with 1.3% and the domestic air transport with 0.6%
in the total emissions of the Transport sub-sector. Comparing with 1990 the CO2eq emission from the Transport
sub-sector has increased for 45.4% as a result of an increase of the number of vehicles and the number of realized
kilometres in road transport.
An increased concentration of greenhouse gases causes the increased absorption of heat in the atmosphere, which
generates changes in the air temperature, a precipitation quantity and other climatological elements.
Climatic changes in the Republic of Croatia in the period 1961-2010 were analysed with the trends of the annual
and seasonal average, average minimal and average maximal air temperatures and the temperature extremes
indexes, then by the annual and seasonal precipitation quantities and the precipitation indexes, as well as the dry
and rain periods.
During the last 50 years (1961-2010) the air temperature trends (average, average minimal and average maximal)
show warming everywhere in the Republic of Croatia. The annual air temperatures are increasing and the changes
are bigger in the continental part of the country then at the coast or in Dalmatian hinterland. The observed warming
can be seen also in all indexes of temperature extremes (cold days and cold nights and a length of cold periods).
The warmest year was 2007 with the appropriate anomaly of 1.53 ˚C comparing with the average of the standard
period 1961-1990. The coldest year was 2005 with the appropriate anomaly of -0.1 ˚C. For 9 out of 10 observed
years in the period from 2001 to 2010 the air temperature was above the average.
During the last 50 years (1961-2010) there was an increase in the precipitation quantity in the east lowland parts
and a decrease in other parts of the Republic of Croatia. Statistically significant decrease is determined in stations
placed in the mountainous part of Gorski Kotar and in Istria, as well as in the South coastal area.
The climatic changes of dry and rain periods in the Republic of Croatia are presented with the annual and seasonal
trends of their maximal durations. According to the trends results the most visible are the changes of the dry periods
in autumn month when everywhere in the Republic of Croatia one can see a statistically significant negative trend.
In other seasons the dry periods’ trend for both categories is less pronounced than the autumn one.
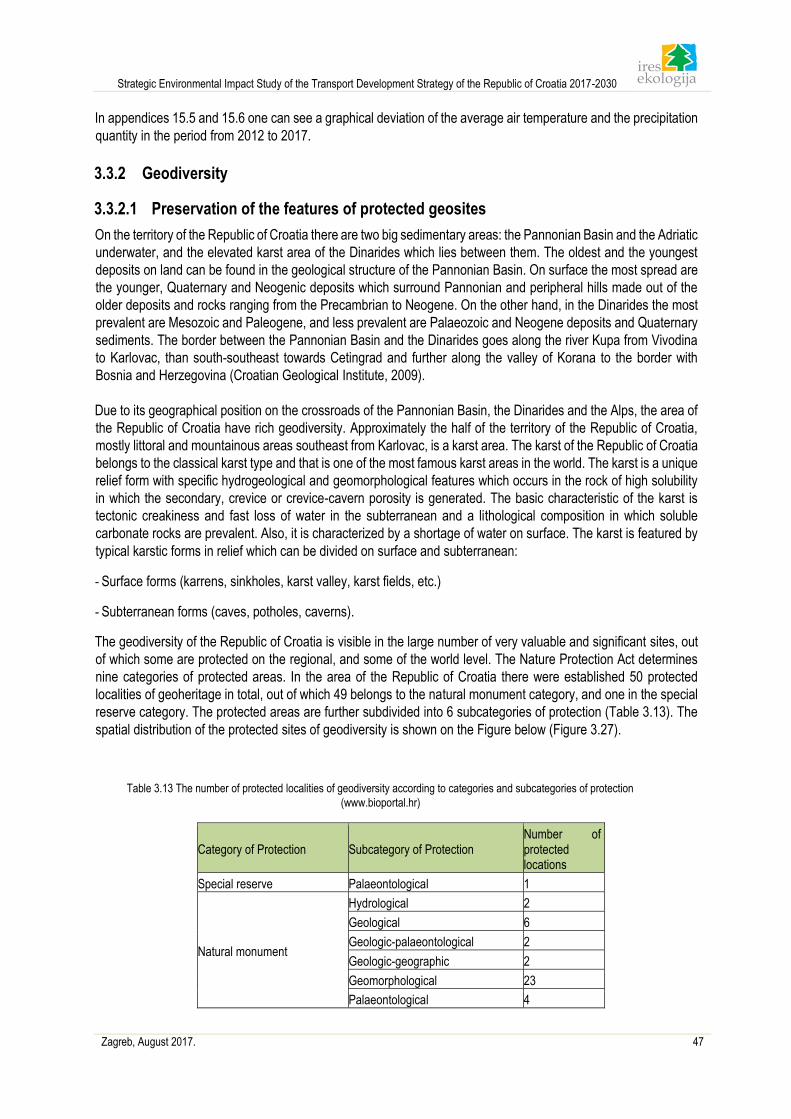
Strategic Environmental Impact Study of the Transport Development Strategy of the Republic of Croatia 2017-2030
Zagreb, August 2017. 47
In appendices 15.5 and 15.6 one can see a graphical deviation of the average air temperature and the precipitation
quantity in the period from 2012 to 2017.
3.3.2 Geodiversity
3.3.2.1 Preservation of the features of protected geosites
On the territory of the Republic of Croatia there are two big sedimentary areas: the Pannonian Basin and the Adriatic
underwater, and the elevated karst area of the Dinarides which lies between them. The oldest and the youngest
deposits on land can be found in the geological structure of the Pannonian Basin. On surface the most spread are
the younger, Quaternary and Neogenic deposits which surround Pannonian and peripheral hills made out of the
older deposits and rocks ranging from the Precambrian to Neogene. On the other hand, in the Dinarides the most
prevalent are Mesozoic and Paleogene, and less prevalent are Palaeozoic and Neogene deposits and Quaternary
sediments. The border between the Pannonian Basin and the Dinarides goes along the river Kupa from Vivodina
to Karlovac, than south-southeast towards Cetingrad and further along the valley of Korana to the border with
Bosnia and Herzegovina (Croatian Geological Institute, 2009).
Due to its geographical position on the crossroads of the Pannonian Basin, the Dinarides and the Alps, the area of
the Republic of Croatia have rich geodiversity. Approximately the half of the territory of the Republic of Croatia,
mostly littoral and mountainous areas southeast from Karlovac, is a karst area. The karst of the Republic of Croatia
belongs to the classical karst type and that is one of the most famous karst areas in the world. The karst is a unique
relief form with specific hydrogeological and geomorphological features which occurs in the rock of high solubility
in which the secondary, crevice or crevice-cavern porosity is generated. The basic characteristic of the karst is
tectonic creakiness and fast loss of water in the subterranean and a lithological composition in which soluble
carbonate rocks are prevalent. Also, it is characterized by a shortage of water on surface. The karst is featured by
typical karstic forms in relief which can be divided on surface and subterranean:
- Surface forms (karrens, sinkholes, karst valley, karst fields, etc.)
- Subterranean forms (caves, potholes, caverns).
The geodiversity of the Republic of Croatia is visible in the large number of very valuable and significant sites, out
of which some are protected on the regional, and some of the world level. The Nature Protection Act determines
nine categories of protected areas. In the area of the Republic of Croatia there were established 50 protected
localities of geoheritage in total, out of which 49 belongs to the natural monument category, and one in the special
reserve category. The protected areas are further subdivided into 6 subcategories of protection (Table 3.13). The
spatial distribution of the protected sites of geodiversity is shown on the Figure below (Figure 3.27).
Table 3.13 The number of protected localities of geodiversity according to categories and subcategories of protection
(www.bioportal.hr)
Category of Protection Subcategory of Protection Number of protected locations
Special reserve Palaeontological 1
Natural monument
Hydrological 2
Geological 6
Geologic-palaeontological 2
Geologic-geographic 2
Geomorphological 23
Palaeontological 4
Strategic Environmental Impact Study of the Transport Development Strategy of the Republic of Croatia 2017-2030
Zagreb, August 2017. 48
Figure 3.27 Protected locations of geodiversity on the area of the Republic of Croatia (Source: Bioportal.hr)
The largest number of the protected localities of geodiversity belongs to the subcategory of geomorphological
natural monuments. All are formed in carbonate rocks, and mostly they are subterranean karstic forms, caves and
potholes. Croatia is rich with caves and potholes, out of which the big part is still unexplored, and prevalent are the
caves and potholes in the karstic relief in the limestone and dolomite deposits.
On the area of Croatian karst there are three potholes deeper than 1000m, as well. The deepest is the pothole
system Lukina jama – Trojama with the depth of 1.431m, which is located on the 14th place of the deepest potholes
in the world. Also, on the area of Croatia there are three caves, that is, pothole systems of the length above
10.000m. The longest is the pothole system Kita Gaćešina – Draženova puhaljka with 32.337m, which is at the
same time the longest system on the Dinarides area. The cave in the Tounj quarry with the length of 8.639m is the
5th longest in Croatia. In it the very rare sediment, corrosive and erosive forms were found which belong into world
phenomena (special kind of phreatic speleothems, facets, so called “leopard skins” and “hieroglyphs”) and the very
rarely ascertained simultaneous active nontectonic elevation and sinking of very close blocks inside a cave.
3.3.3 Biodiversity
3.3.3.1 Fragmentation of habitats
The most significant influence of transport infrastructure on biodiversity is visible through the fragmentation of
habitats and a creation of obstacles for animals movement. The fragmentation of habitats with the transport
infrastructure is seen as one of the most significant factors which influences a biodiversity decrease in Europe.
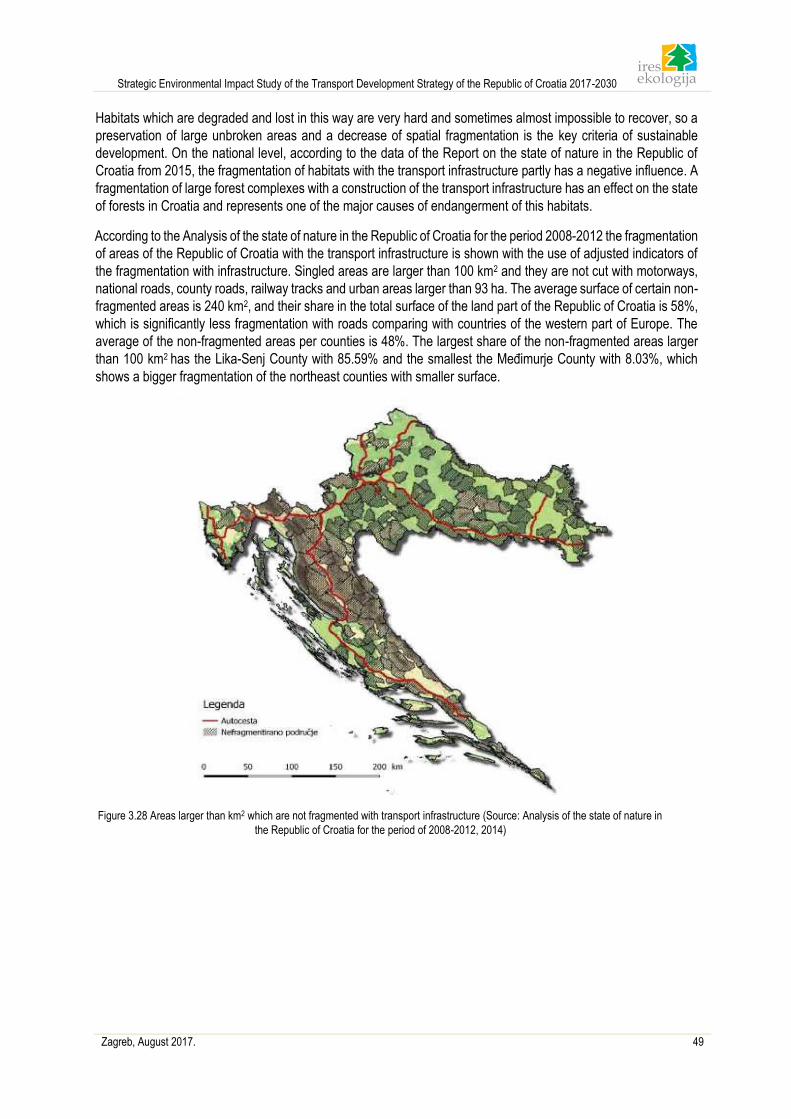
Strategic Environmental Impact Study of the Transport Development Strategy of the Republic of Croatia 2017-2030
Zagreb, August 2017. 49
Habitats which are degraded and lost in this way are very hard and sometimes almost impossible to recover, so a
preservation of large unbroken areas and a decrease of spatial fragmentation is the key criteria of sustainable
development. On the national level, according to the data of the Report on the state of nature in the Republic of
Croatia from 2015, the fragmentation of habitats with the transport infrastructure partly has a negative influence. A
fragmentation of large forest complexes with a construction of the transport infrastructure has an effect on the state
of forests in Croatia and represents one of the major causes of endangerment of this habitats.
According to the Analysis of the state of nature in the Republic of Croatia for the period 2008-2012 the fragmentation
of areas of the Republic of Croatia with the transport infrastructure is shown with the use of adjusted indicators of
the fragmentation with infrastructure. Singled areas are larger than 100 km2 and they are not cut with motorways,
national roads, county roads, railway tracks and urban areas larger than 93 ha. The average surface of certain non-
fragmented areas is 240 km2, and their share in the total surface of the land part of the Republic of Croatia is 58%,
which is significantly less fragmentation with roads comparing with countries of the western part of Europe. The
average of the non-fragmented areas per counties is 48%. The largest share of the non-fragmented areas larger
than 100 km2 has the Lika-Senj County with 85.59% and the smallest the Međimurje County with 8.03%, which
shows a bigger fragmentation of the northeast counties with smaller surface.
Figure 3.28 Areas larger than km2 which are not fragmented with transport infrastructure (Source: Analysis of the state of nature in
the Republic of Croatia for the period of 2008-2012, 2014)
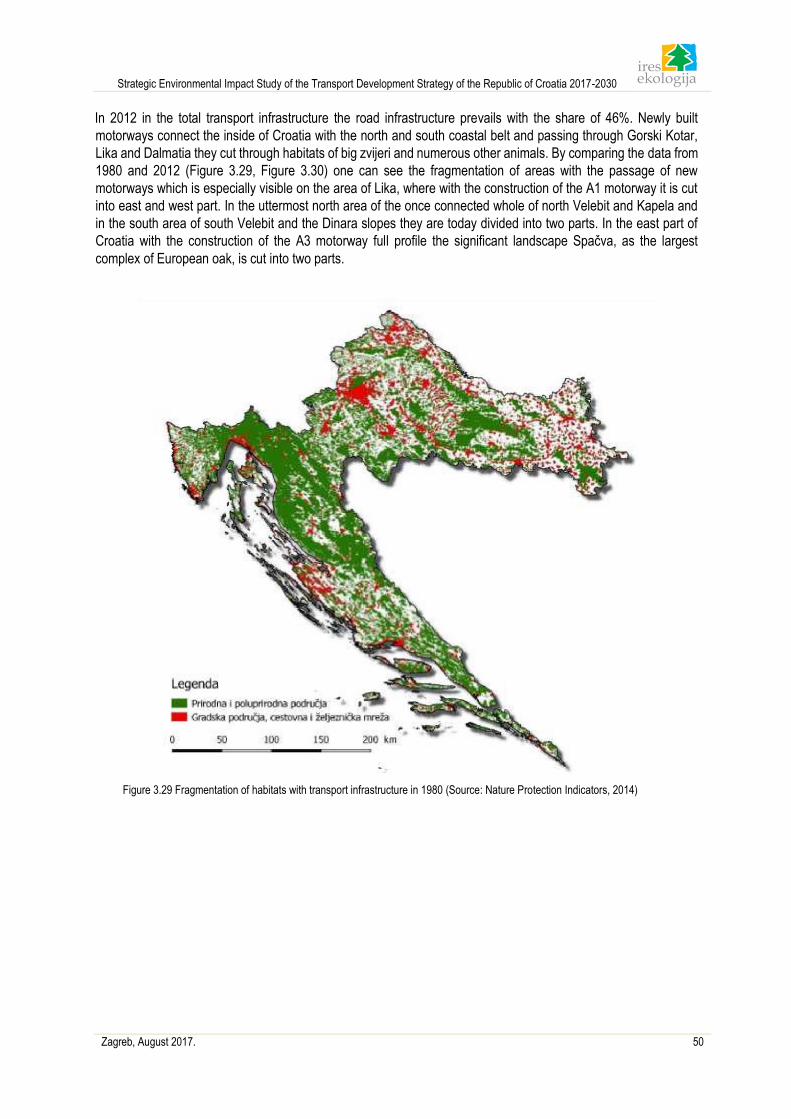
Strategic Environmental Impact Study of the Transport Development Strategy of the Republic of Croatia 2017-2030
Zagreb, August 2017. 50
In 2012 in the total transport infrastructure the road infrastructure prevails with the share of 46%. Newly built
motorways connect the inside of Croatia with the north and south coastal belt and passing through Gorski Kotar,
Lika and Dalmatia they cut through habitats of big zvijeri and numerous other animals. By comparing the data from
1980 and 2012 (Figure 3.29, Figure 3.30) one can see the fragmentation of areas with the passage of new
motorways which is especially visible on the area of Lika, where with the construction of the A1 motorway it is cut
into east and west part. In the uttermost north area of the once connected whole of north Velebit and Kapela and
in the south area of south Velebit and the Dinara slopes they are today divided into two parts. In the east part of
Croatia with the construction of the A3 motorway full profile the significant landscape Spačva, as the largest
complex of European oak, is cut into two parts.
Figure 3.29 Fragmentation of habitats with transport infrastructure in 1980 (Source: Nature Protection Indicators, 2014)
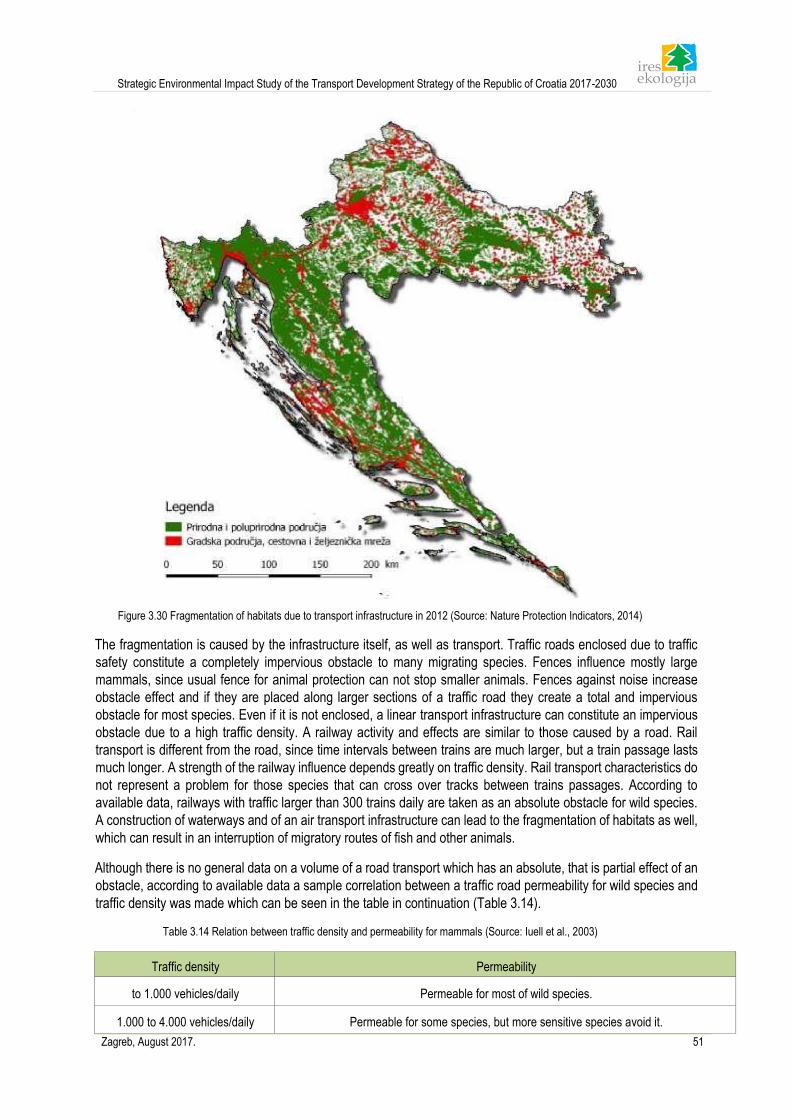
Strategic Environmental Impact Study of the Transport Development Strategy of the Republic of Croatia 2017-2030
Zagreb, August 2017. 51
Figure 3.30 Fragmentation of habitats due to transport infrastructure in 2012 (Source: Nature Protection Indicators, 2014)
The fragmentation is caused by the infrastructure itself, as well as transport. Traffic roads enclosed due to traffic
safety constitute a completely impervious obstacle to many migrating species. Fences influence mostly large
mammals, since usual fence for animal protection can not stop smaller animals. Fences against noise increase
obstacle effect and if they are placed along larger sections of a traffic road they create a total and impervious
obstacle for most species. Even if it is not enclosed, a linear transport infrastructure can constitute an impervious
obstacle due to a high traffic density. A railway activity and effects are similar to those caused by a road. Rail
transport is different from the road, since time intervals between trains are much larger, but a train passage lasts
much longer. A strength of the railway influence depends greatly on traffic density. Rail transport characteristics do
not represent a problem for those species that can cross over tracks between trains passages. According to
available data, railways with traffic larger than 300 trains daily are taken as an absolute obstacle for wild species.
A construction of waterways and of an air transport infrastructure can lead to the fragmentation of habitats as well,
which can result in an interruption of migratory routes of fish and other animals.
Although there is no general data on a volume of a road transport which has an absolute, that is partial effect of an
obstacle, according to available data a sample correlation between a traffic road permeability for wild species and
traffic density was made which can be seen in the table in continuation (Table 3.14).
Table 3.14 Relation between traffic density and permeability for mammals (Source: Iuell et al., 2003)
Traffic density Permeability
to 1.000 vehicles/daily Permeable for most of wild species.
1.000 to 4.000 vehicles/daily Permeable for some species, but more sensitive species avoid it.
Strategic Environmental Impact Study of the Transport Development Strategy of the Republic of Croatia 2017-2030
Zagreb, August 2017. 52
Traffic density Permeability
4.000 to 10.000 vehicles/daily Strong obstacle, noise and movement shall repel many individuals. A large number of those
individuals that shall try to cross a road shall be killed.
> 10.000 vehicles/daily Unpermeable for most of the species.
Fragmentation and obstacle effects can influence on a separation of different habitats necessary for species, but
also of the habitats of the same quality and intent, and prevent in such a manner local migrations or migrations on
larger distances and disrupt the flow of genes which in the long term can result with a decrease of a number of
individuals and a disruption of a favourable state of populations (Iuell et al., 2003).
A fragmentation influence and an obstacle effect depend greatly on species present in habitats. The species in
Croatia which are especially sensitive to the fragmentation are rare species with small local populations and large
territories (large carnivores) and species with daily and seasonal local migrations (amphibians).
Regarding the populations of large carnivores, a transport and other infrastructure can act as an element of the
fragmentation of habitats, as the source of a direct mortality (as it is described in the 3.3.3.2 chapter), but also as
a kind of limitation for pray populations.
With the network of the Karlovac - Rijeka and Bosiljevo - Ravče (Ploče) motorways the habitat of large carnivores
is conditionally divided into four parts. Although those traffic roads have an influence on a habitat quality and
possibilities of animal movement, due to the large number and length of the objects on the motorway is is deemed
that an enough permeability has been ensured. Therefore the motorway Bosiljevo - Rijeka has almost 25% of its
total length with possible crossing, including one green bridge (Dedin). The motorway Bosiljevo - Šestanovac has
half as many objects (12.5%) suitable for the wild species crossing, but on key places five green bridges were
constructed which ensure the motorway permeability along with all other objects.
Other public traffic roads of national, county or local importance have also a significant influence on the
fragmentation of large carnivore habitats.
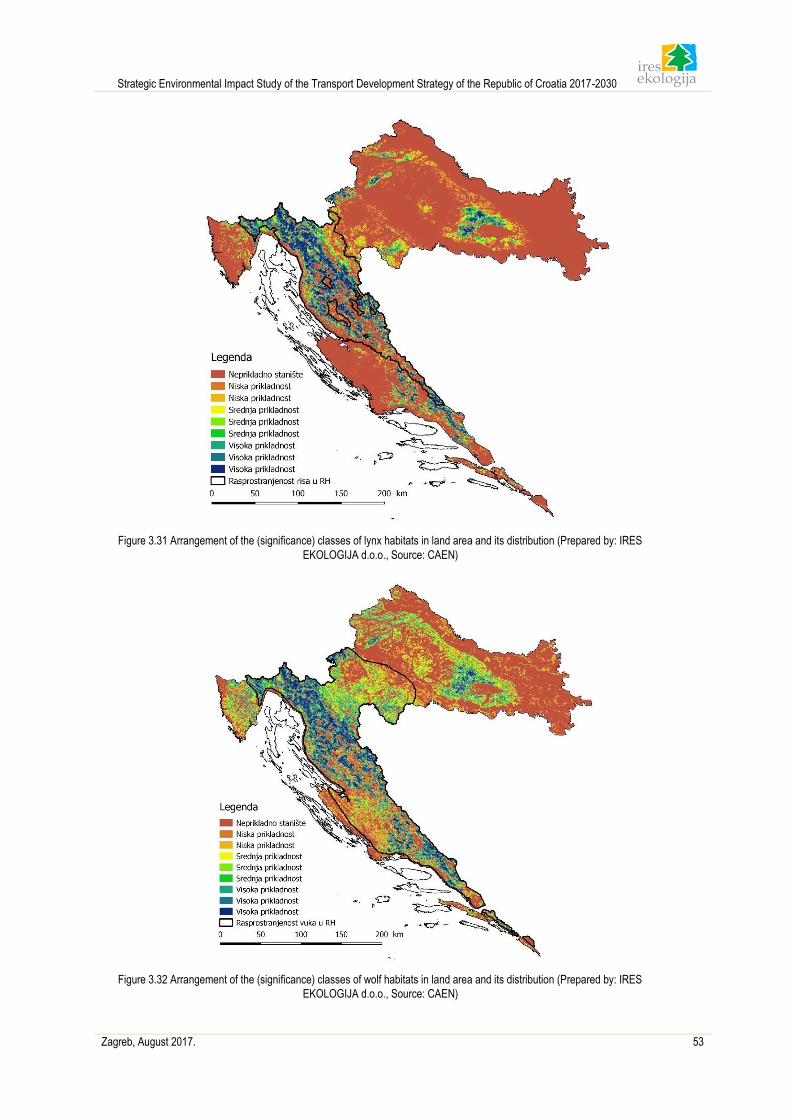
Strategic Environmental Impact Study of the Transport Development Strategy of the Republic of Croatia 2017-2030
Zagreb, August 2017. 53
Figure 3.31 Arrangement of the (significance) classes of lynx habitats in land area and its distribution (Prepared by: IRES
EKOLOGIJA d.o.o., Source: CAEN)
Figure 3.32 Arrangement of the (significance) classes of wolf habitats in land area and its distribution (Prepared by: IRES
EKOLOGIJA d.o.o., Source: CAEN)
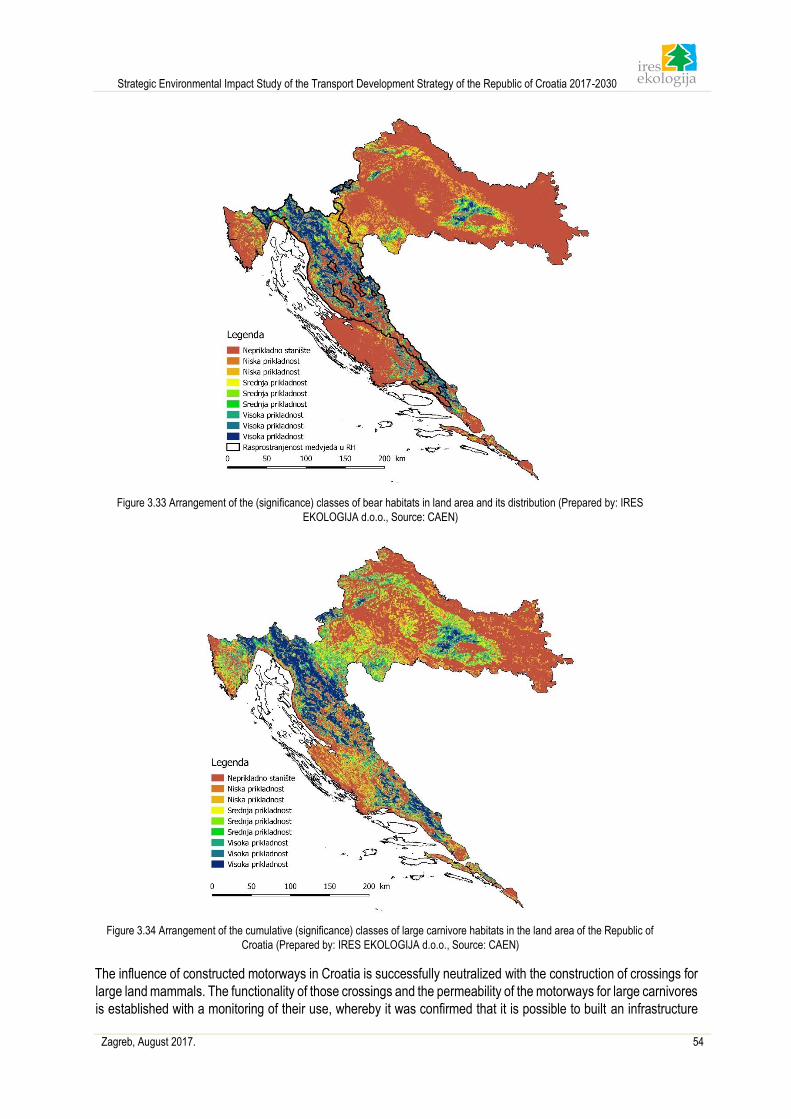
Strategic Environmental Impact Study of the Transport Development Strategy of the Republic of Croatia 2017-2030
Zagreb, August 2017. 54
Figure 3.33 Arrangement of the (significance) classes of bear habitats in land area and its distribution (Prepared by: IRES
EKOLOGIJA d.o.o., Source: CAEN)
Figure 3.34 Arrangement of the cumulative (significance) classes of large carnivore habitats in the land area of the Republic of
Croatia (Prepared by: IRES EKOLOGIJA d.o.o., Source: CAEN)
The influence of constructed motorways in Croatia is successfully neutralized with the construction of crossings for
large land mammals. The functionality of those crossings and the permeability of the motorways for large carnivores
is established with a monitoring of their use, whereby it was confirmed that it is possible to built an infrastructure
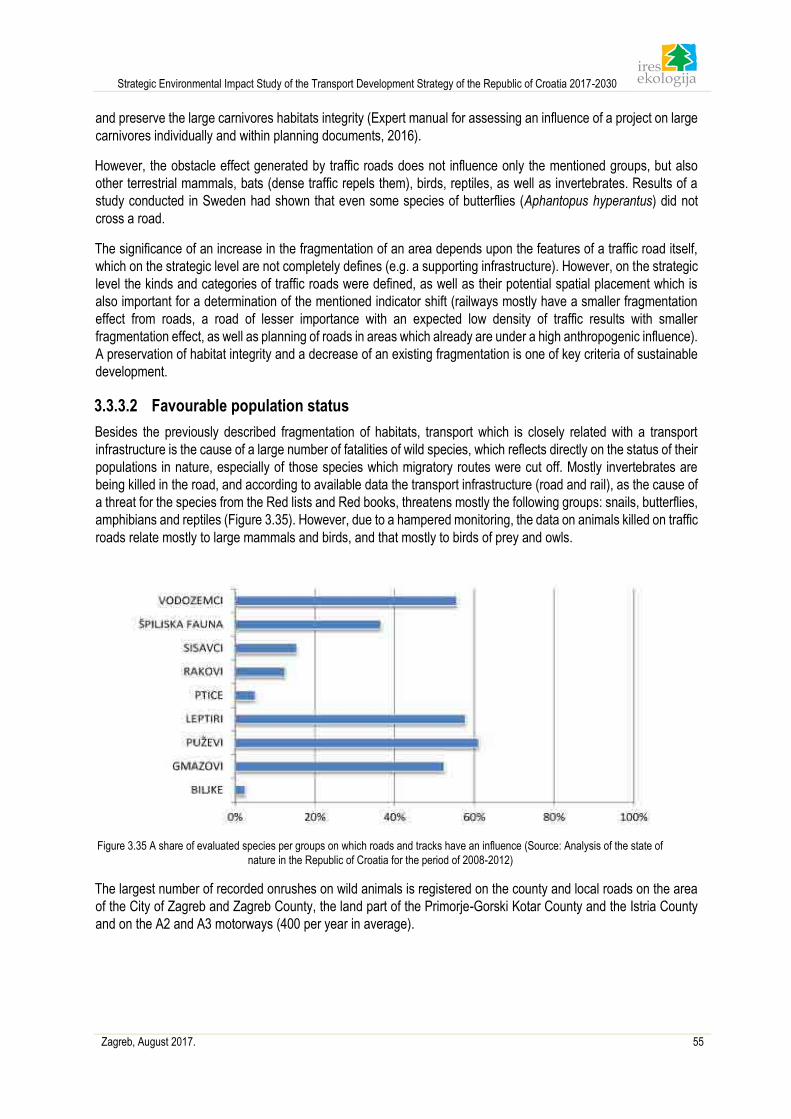
Strategic Environmental Impact Study of the Transport Development Strategy of the Republic of Croatia 2017-2030
Zagreb, August 2017. 55
and preserve the large carnivores habitats integrity (Expert manual for assessing an influence of a project on large
carnivores individually and within planning documents, 2016).
However, the obstacle effect generated by traffic roads does not influence only the mentioned groups, but also
other terrestrial mammals, bats (dense traffic repels them), birds, reptiles, as well as invertebrates. Results of a
study conducted in Sweden had shown that even some species of butterflies (Aphantopus hyperantus) did not
cross a road.
The significance of an increase in the fragmentation of an area depends upon the features of a traffic road itself,
which on the strategic level are not completely defines (e.g. a supporting infrastructure). However, on the strategic
level the kinds and categories of traffic roads were defined, as well as their potential spatial placement which is
also important for a determination of the mentioned indicator shift (railways mostly have a smaller fragmentation
effect from roads, a road of lesser importance with an expected low density of traffic results with smaller
fragmentation effect, as well as planning of roads in areas which already are under a high anthropogenic influence).
A preservation of habitat integrity and a decrease of an existing fragmentation is one of key criteria of sustainable
development.
3.3.3.2 Favourable population status
Besides the previously described fragmentation of habitats, transport which is closely related with a transport
infrastructure is the cause of a large number of fatalities of wild species, which reflects directly on the status of their
populations in nature, especially of those species which migratory routes were cut off. Mostly invertebrates are
being killed in the road, and according to available data the transport infrastructure (road and rail), as the cause of
a threat for the species from the Red lists and Red books, threatens mostly the following groups: snails, butterflies,
amphibians and reptiles (Figure 3.35). However, due to a hampered monitoring, the data on animals killed on traffic
roads relate mostly to large mammals and birds, and that mostly to birds of prey and owls.
Figure 3.35 A share of evaluated species per groups on which roads and tracks have an influence (Source: Analysis of the state of
nature in the Republic of Croatia for the period of 2008-2012)
The largest number of recorded onrushes on wild animals is registered on the county and local roads on the area
of the City of Zagreb and Zagreb County, the land part of the Primorje-Gorski Kotar County and the Istria County
and on the A2 and A3 motorways (400 per year in average).
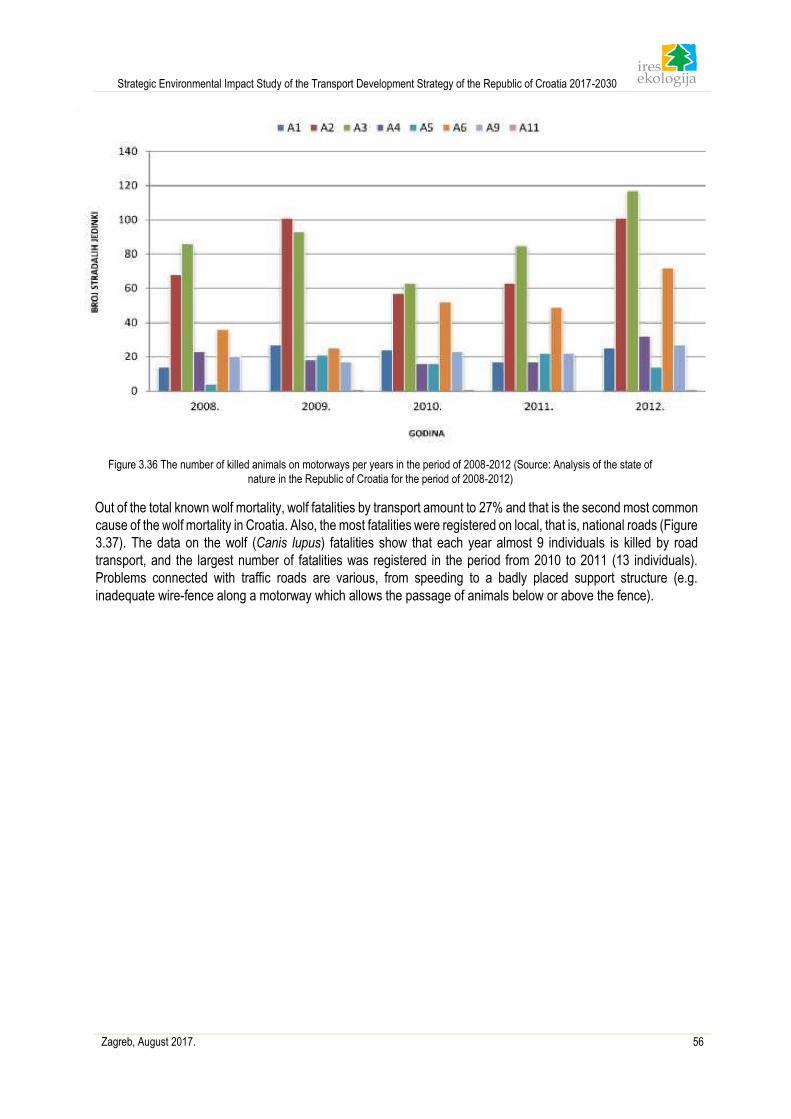
Strategic Environmental Impact Study of the Transport Development Strategy of the Republic of Croatia 2017-2030
Zagreb, August 2017. 56
Figure 3.36 The number of killed animals on motorways per years in the period of 2008-2012 (Source: Analysis of the state of
nature in the Republic of Croatia for the period of 2008-2012)
Out of the total known wolf mortality, wolf fatalities by transport amount to 27% and that is the second most common
cause of the wolf mortality in Croatia. Also, the most fatalities were registered on local, that is, national roads (Figure
3.37). The data on the wolf (Canis lupus) fatalities show that each year almost 9 individuals is killed by road
transport, and the largest number of fatalities was registered in the period from 2010 to 2011 (13 individuals).
Problems connected with traffic roads are various, from speeding to a badly placed support structure (e.g.
inadequate wire-fence along a motorway which allows the passage of animals below or above the fence).
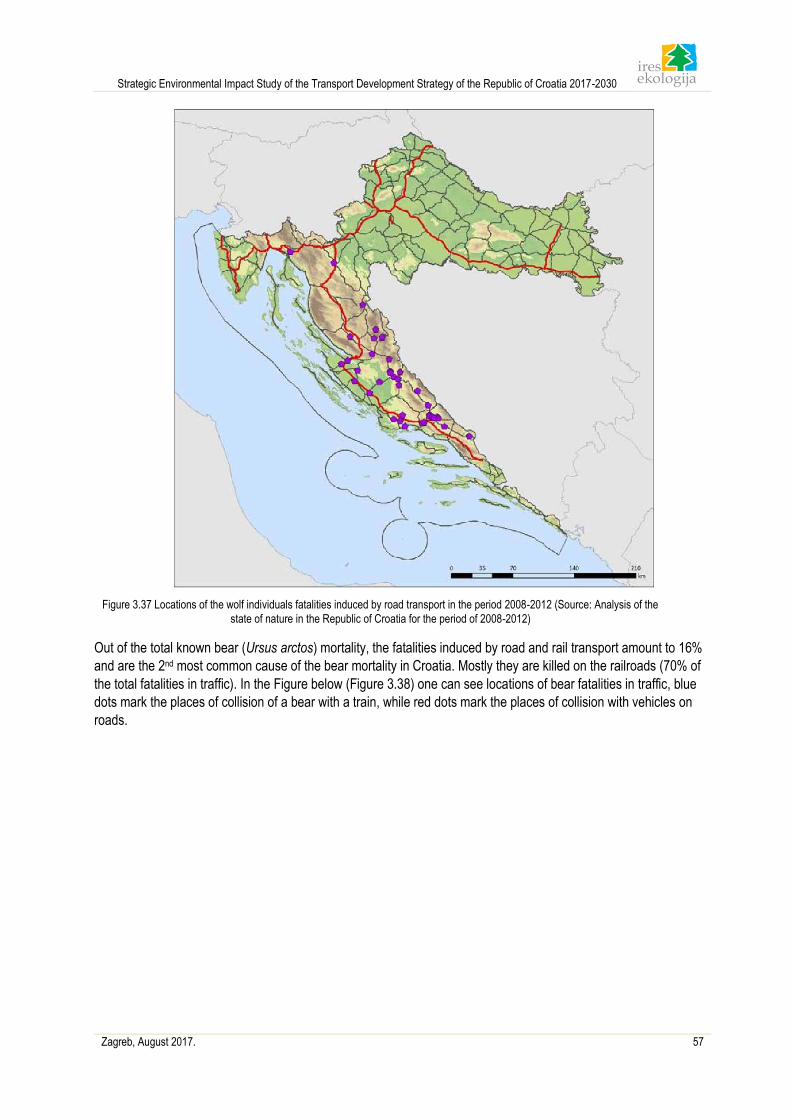
Strategic Environmental Impact Study of the Transport Development Strategy of the Republic of Croatia 2017-2030
Zagreb, August 2017. 57
Figure 3.37 Locations of the wolf individuals fatalities induced by road transport in the period 2008-2012 (Source: Analysis of the
state of nature in the Republic of Croatia for the period of 2008-2012)
Out of the total known bear (Ursus arctos) mortality, the fatalities induced by road and rail transport amount to 16%
and are the 2nd most common cause of the bear mortality in Croatia. Mostly they are killed on the railroads (70% of
the total fatalities in traffic). In the Figure below (Figure 3.38) one can see locations of bear fatalities in traffic, blue
dots mark the places of collision of a bear with a train, while red dots mark the places of collision with vehicles on
roads.
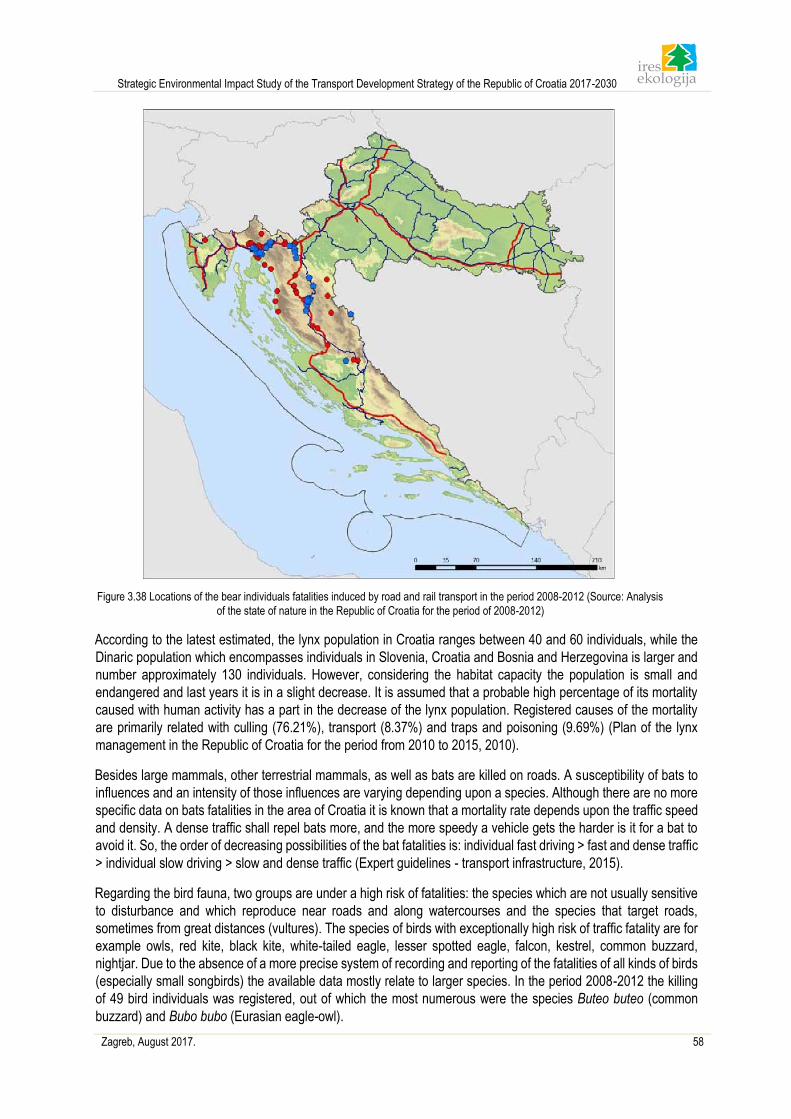
Strategic Environmental Impact Study of the Transport Development Strategy of the Republic of Croatia 2017-2030
Zagreb, August 2017. 58
Figure 3.38 Locations of the bear individuals fatalities induced by road and rail transport in the period 2008-2012 (Source: Analysis
of the state of nature in the Republic of Croatia for the period of 2008-2012)
According to the latest estimated, the lynx population in Croatia ranges between 40 and 60 individuals, while the
Dinaric population which encompasses individuals in Slovenia, Croatia and Bosnia and Herzegovina is larger and
number approximately 130 individuals. However, considering the habitat capacity the population is small and
endangered and last years it is in a slight decrease. It is assumed that a probable high percentage of its mortality
caused with human activity has a part in the decrease of the lynx population. Registered causes of the mortality
are primarily related with culling (76.21%), transport (8.37%) and traps and poisoning (9.69%) (Plan of the lynx
management in the Republic of Croatia for the period from 2010 to 2015, 2010).
Besides large mammals, other terrestrial mammals, as well as bats are killed on roads. A susceptibility of bats to
influences and an intensity of those influences are varying depending upon a species. Although there are no more
specific data on bats fatalities in the area of Croatia it is known that a mortality rate depends upon the traffic speed
and density. A dense traffic shall repel bats more, and the more speedy a vehicle gets the harder is it for a bat to
avoid it. So, the order of decreasing possibilities of the bat fatalities is: individual fast driving > fast and dense traffic
> individual slow driving > slow and dense traffic (Expert guidelines - transport infrastructure, 2015).
Regarding the bird fauna, two groups are under a high risk of fatalities: the species which are not usually sensitive
to disturbance and which reproduce near roads and along watercourses and the species that target roads,
sometimes from great distances (vultures). The species of birds with exceptionally high risk of traffic fatality are for
example owls, red kite, black kite, white-tailed eagle, lesser spotted eagle, falcon, kestrel, common buzzard,
nightjar. Due to the absence of a more precise system of recording and reporting of the fatalities of all kinds of birds
(especially small songbirds) the available data mostly relate to larger species. In the period 2008-2012 the killing
of 49 bird individuals was registered, out of which the most numerous were the species Buteo buteo (common
buzzard) and Bubo bubo (Eurasian eagle-owl).
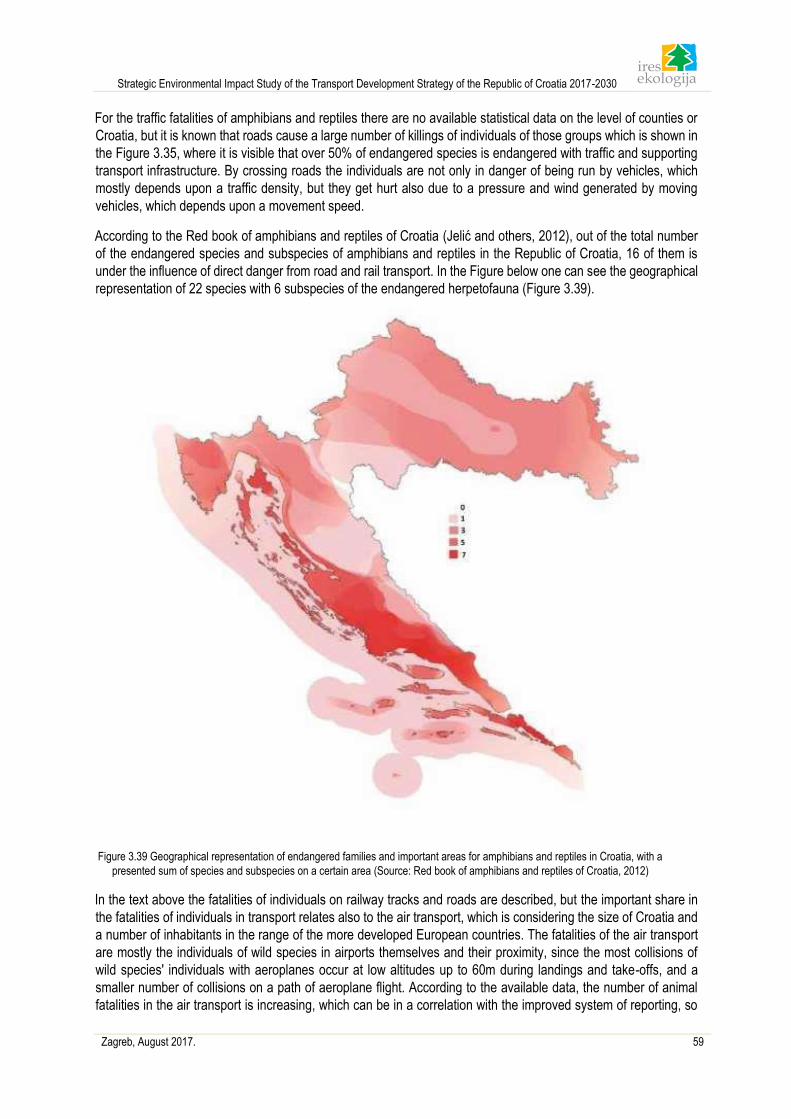
Strategic Environmental Impact Study of the Transport Development Strategy of the Republic of Croatia 2017-2030
Zagreb, August 2017. 59
For the traffic fatalities of amphibians and reptiles there are no available statistical data on the level of counties or
Croatia, but it is known that roads cause a large number of killings of individuals of those groups which is shown in
the Figure 3.35, where it is visible that over 50% of endangered species is endangered with traffic and supporting
transport infrastructure. By crossing roads the individuals are not only in danger of being run by vehicles, which
mostly depends upon a traffic density, but they get hurt also due to a pressure and wind generated by moving
vehicles, which depends upon a movement speed.
According to the Red book of amphibians and reptiles of Croatia (Jelić and others, 2012), out of the total number
of the endangered species and subspecies of amphibians and reptiles in the Republic of Croatia, 16 of them is
under the influence of direct danger from road and rail transport. In the Figure below one can see the geographical
representation of 22 species with 6 subspecies of the endangered herpetofauna (Figure 3.39).
Figure 3.39 Geographical representation of endangered families and important areas for amphibians and reptiles in Croatia, with a
presented sum of species and subspecies on a certain area (Source: Red book of amphibians and reptiles of Croatia, 2012)
In the text above the fatalities of individuals on railway tracks and roads are described, but the important share in
the fatalities of individuals in transport relates also to the air transport, which is considering the size of Croatia and
a number of inhabitants in the range of the more developed European countries. The fatalities of the air transport
are mostly the individuals of wild species in airports themselves and their proximity, since the most collisions of
wild species' individuals with aeroplanes occur at low altitudes up to 60m during landings and take-offs, and a
smaller number of collisions on a path of aeroplane flight. According to the available data, the number of animal
fatalities in the air transport is increasing, which can be in a correlation with the improved system of reporting, so
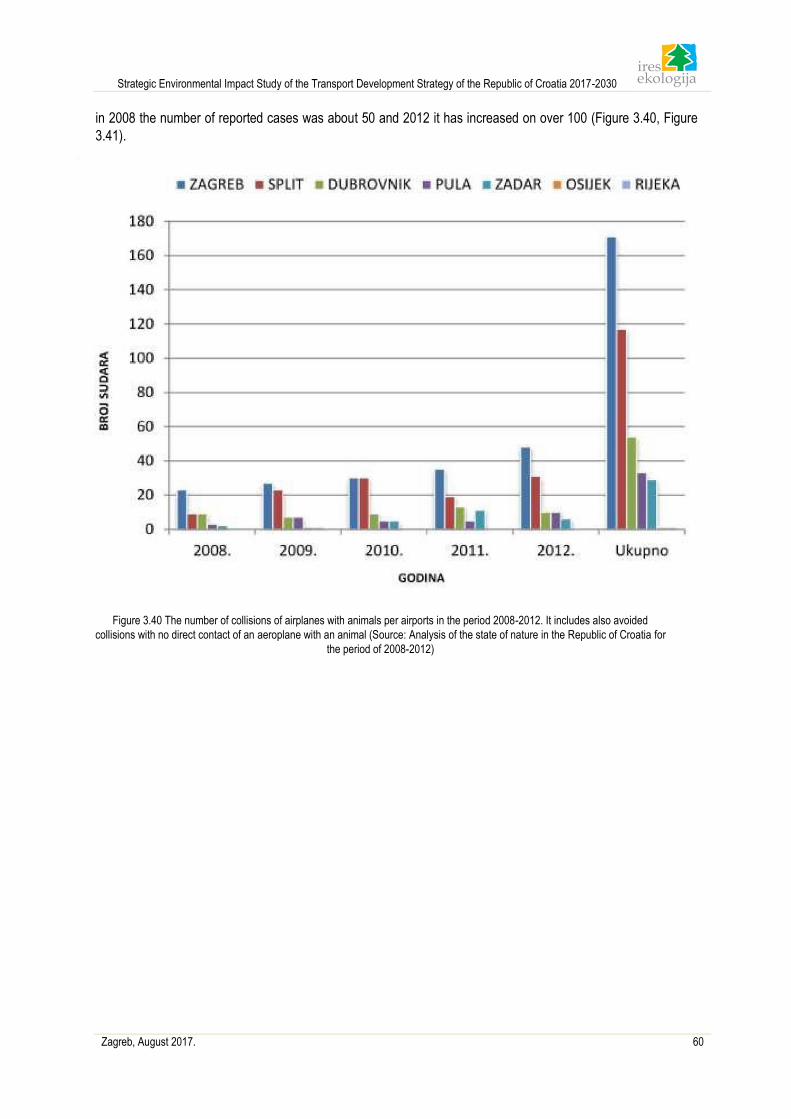
Strategic Environmental Impact Study of the Transport Development Strategy of the Republic of Croatia 2017-2030
Zagreb, August 2017. 60
in 2008 the number of reported cases was about 50 and 2012 it has increased on over 100 (Figure 3.40, Figure
3.41).
Figure 3.40 The number of collisions of airplanes with animals per airports in the period 2008-2012. It includes also avoided
collisions with no direct contact of an aeroplane with an animal (Source: Analysis of the state of nature in the Republic of Croatia for
the period of 2008-2012)
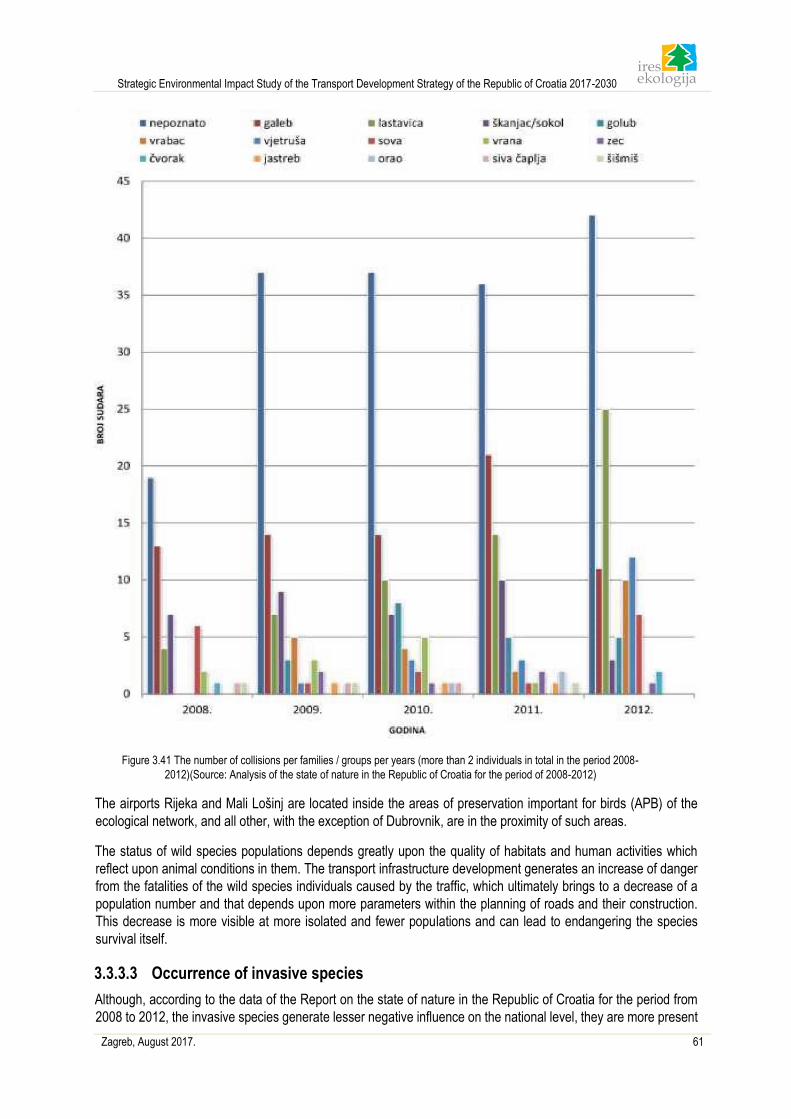
Strategic Environmental Impact Study of the Transport Development Strategy of the Republic of Croatia 2017-2030
Zagreb, August 2017. 61
Figure 3.41 The number of collisions per families / groups per years (more than 2 individuals in total in the period 2008-
2012)(Source: Analysis of the state of nature in the Republic of Croatia for the period of 2008-2012)
The airports Rijeka and Mali Lošinj are located inside the areas of preservation important for birds (APB) of the
ecological network, and all other, with the exception of Dubrovnik, are in the proximity of such areas.
The status of wild species populations depends greatly upon the quality of habitats and human activities which
reflect upon animal conditions in them. The transport infrastructure development generates an increase of danger
from the fatalities of the wild species individuals caused by the traffic, which ultimately brings to a decrease of a
population number and that depends upon more parameters within the planning of roads and their construction.
This decrease is more visible at more isolated and fewer populations and can lead to endangering the species
survival itself.
3.3.3.3 Occurrence of invasive species
Although, according to the data of the Report on the state of nature in the Republic of Croatia for the period from
2008 to 2012, the invasive species generate lesser negative influence on the national level, they are more present
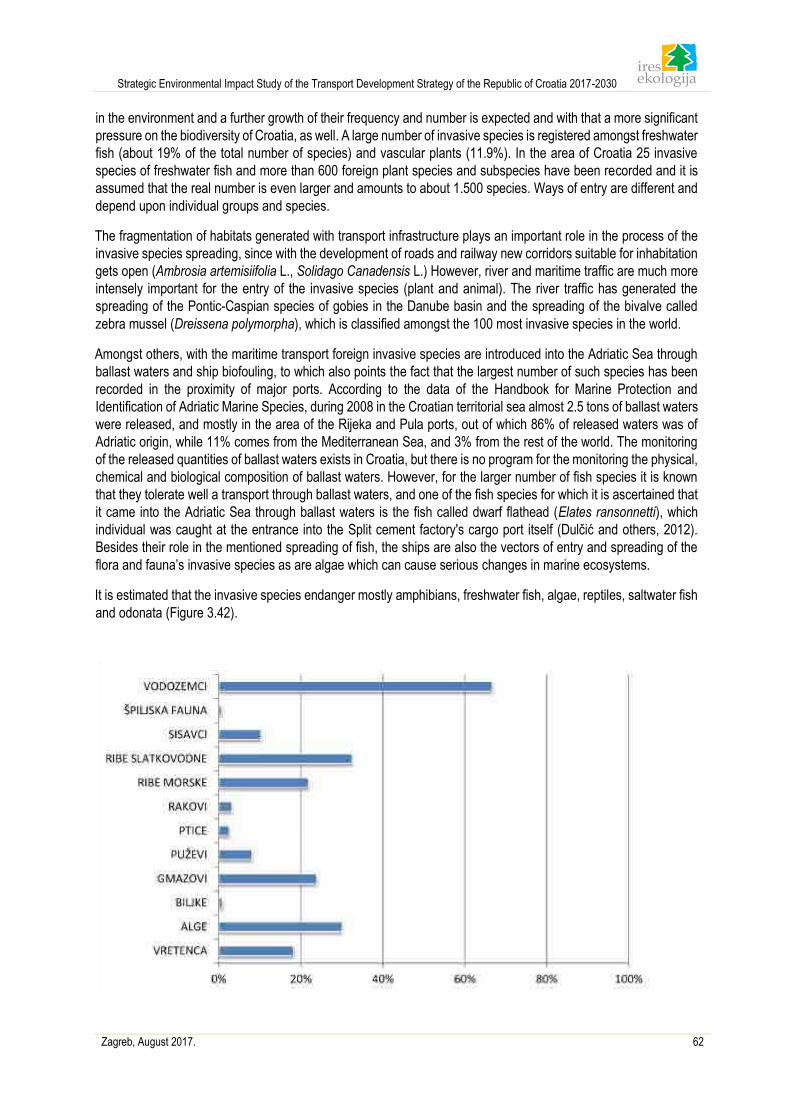
Strategic Environmental Impact Study of the Transport Development Strategy of the Republic of Croatia 2017-2030
Zagreb, August 2017. 62
in the environment and a further growth of their frequency and number is expected and with that a more significant
pressure on the biodiversity of Croatia, as well. A large number of invasive species is registered amongst freshwater
fish (about 19% of the total number of species) and vascular plants (11.9%). In the area of Croatia 25 invasive
species of freshwater fish and more than 600 foreign plant species and subspecies have been recorded and it is
assumed that the real number is even larger and amounts to about 1.500 species. Ways of entry are different and
depend upon individual groups and species.
The fragmentation of habitats generated with transport infrastructure plays an important role in the process of the
invasive species spreading, since with the development of roads and railway new corridors suitable for inhabitation
gets open (Ambrosia artemisiifolia L., Solidago Canadensis L.) However, river and maritime traffic are much more
intensely important for the entry of the invasive species (plant and animal). The river traffic has generated the
spreading of the Pontic-Caspian species of gobies in the Danube basin and the spreading of the bivalve called
zebra mussel (Dreissena polymorpha), which is classified amongst the 100 most invasive species in the world.
Amongst others, with the maritime transport foreign invasive species are introduced into the Adriatic Sea through
ballast waters and ship biofouling, to which also points the fact that the largest number of such species has been
recorded in the proximity of major ports. According to the data of the Handbook for Marine Protection and
Identification of Adriatic Marine Species, during 2008 in the Croatian territorial sea almost 2.5 tons of ballast waters
were released, and mostly in the area of the Rijeka and Pula ports, out of which 86% of released waters was of
Adriatic origin, while 11% comes from the Mediterranean Sea, and 3% from the rest of the world. The monitoring
of the released quantities of ballast waters exists in Croatia, but there is no program for the monitoring the physical,
chemical and biological composition of ballast waters. However, for the larger number of fish species it is known
that they tolerate well a transport through ballast waters, and one of the fish species for which it is ascertained that
it came into the Adriatic Sea through ballast waters is the fish called dwarf flathead (Elates ransonnetti), which
individual was caught at the entrance into the Split cement factory's cargo port itself (Dulčić and others, 2012).
Besides their role in the mentioned spreading of fish, the ships are also the vectors of entry and spreading of the
flora and fauna’s invasive species as are algae which can cause serious changes in marine ecosystems.
It is estimated that the invasive species endanger mostly amphibians, freshwater fish, algae, reptiles, saltwater fish
and odonata (Figure 3.42).
Strategic Environmental Impact Study of the Transport Development Strategy of the Republic of Croatia 2017-2030
Zagreb, August 2017. 63
Figure 3.42 The share of the estimated species per groups which are endangered with the presence of invasive species (Source:
Analysis of the state of nature in the Republic of Croatia for the period from 2008 to 2012)
Invasive species are present in Croatia already for many years, but only lately the negative influences which they
have on biodiversity have been pointed out. The invasive species have a direct negative effect on the fauna and
flora of Croatia, but also an indirect effect through the change of habitats’ conditions. A transport improvement with
the development of transport infrastructure generates increased risks of the entry and spreading of new invasive
species of plants and animals on the area of Croatia, as well as of the further spreading of the already present
species. The fragmentation of natural habitats with transport corridors generates suitable habitats for the invasive
species’ settlement, but much bigger problem is the development of river and marine traffic since additional ways
are opened through which, besides the spreading, the entry of the invasive species from more distant parts of the
world is enabled.
3.3.3.4 Stress
With the development of transport infrastructure, besides material changes, also new immaterial factors are being
introduced into the environment, which have a negative effect on the environment and that on a bigger area than
it was the case with the material factors, which is especially pronounced in undisturbed natural habitats. The
immaterial factors that follow the development of transport infrastructure include an increase of noise and vibration
and the light flash phenomena, and all mentioned increase the stress of the present fauna.
According to the available data related to roads for which the greatest number of studies was conducted, to the
stress generated by the transport activity the most sensitive are birds, so in the table below (Table 3.15) one can
see the indicative review of the distancing of the birds from different habitats from the roads. In the study conducted
in the Netherlands a decrease of birds populations in a proximity of motorways for 60% has been noticed. The
recorded distancing from the roads was greatest amongst the birds of open habitats and somewhat lesser amongst
the species that inhabit forest habitats (Forman and Alexander, 1998).
Table 3.15 Distances from roads on which an influence of noise on birds populations has been recorded (Source: Forman and
Alexander, 1998)
Road* Open habitats species Forest habitats species
10.000 vehicles / day 365m 305m
50.000 vehicles / day 930m 810m
*vehicles movement speed 120 km/h
A decrease of the population of the open habitats birds has been noticed already at the transport density of 5.000
vehicles daily when the vehicles movement was slower than 120 km/h and at higher speeds the population
decreases even at the transport density of 3.000 vehicles daily. Although it depends upon a species, in average
the forest species of birds are more sensitive that the birds of open spaces, however, due to the character of noise
spreading through the environment, an influence on forest habitats is limited on somewhat smaller areas. The forest
species shall distance themselves from locations on which noise level is 42dB, while the birds of open habitats
shall react to the noise intensity of 48 dB (Forman and Alexander, 1998).
Considering populations of large mammals, a decreased movement on the distance of 100 to 200m from a road
has been recorded (with the exception of forest paths which large mammals use as movement corridors, especially
in the period of no human activity, i.e. at night).
The previously described stress is caused by land roads, but an increase of stress for wild species, which is mostly
related with noise, is generated by other transport forms, as well. An air transport noise has a smaller area of
influence, since it is closely related to the area of an airport and its surrounding.
In the marine environment, except for noise generated by natural phenomena, the largest source of noise is marine
transport (Rako and others, 2012). According to the data from the Handbook for Marine Protection and Identification
Strategic Environmental Impact Study of the Transport Development Strategy of the Republic of Croatia 2017-2030
Zagreb, August 2017. 64
of Adriatic Marine Species, in the territorial sea in 2015, 220 459 recreation vessels and 327 782 transport ships
were recorded so, although there are no relevant data on the noise pollution of the Adriatic Sea, one can conclude
that this kind of pollution is present in the Adriatic Sea and that it surly reflects on an increase of stress in marine
organisms. Although there are no comprehensive studies, according to a study conducted in the North Adriatic it
was determined that noise influences on the populations of common bottlenose dolphins (Tursiops truncatus), and
the intensity of that influence is in the correlation with a tourist season and an increased transport quantity (Rako
and others, 2013). The dolphin populations which are endangered with this type of stress spend less time in feeding
activities and resting, which has a direct influence on their health. Studies conducted in the Miramare Reserve in
the Gulf of Trieste point to an influence of noise on fish populations. The Miramare Reserve in Italy is characterized
with a high quantity of human activities, and is at the same time an important nursery of the Mediterranean fish
species (Codarin and others, 2009).
Despite the fact that in Croatia a small number of studies have been conducted which relate to the increase of
stress and the changes of behaviour at individuals of wild species generated with transport, considering world
studies one can conclude that the stress is present in the area of Croatia as well and that by further development
of transport infrastructure in undisturbed parts of nature this kind of stress shall increase, too.
3.3.3.5 Preservation of features of protected areas
A protected area is a geographically clearly defined area intended for nature protection and governed for the
purposes of a long-term protection of nature and the supporting services of an ecological system. According to the
Protected Areas Register of the Ministry of Environment and Energy in the Republic of Croatia there are 409
protected areas in different categories (Table 3.16). The protected areas today encompass 8.56% of the total
surface area of Croatia, that is, 12.24% of its land territory and 1.94% of its territorial sea. The largest part of the
protected area is covered by nature parks (4.56% of the total state territory).
Table 3.16 Categories of protected areas (Source: http://www.dzzp.hr/)
Category Purpose Number of protected
areas Surface (km2)
% of the surface area of Croatia
Strict reserve Protection of original nature, monitoring of
the nature state and education 2 24.25 0.03
National park Protection of original natural values, scientific, cultural, educational and
recreational 8 966.65 1.10
Special reserve Protection for its uniqueness, rarity or representativeness, and is of a special
scientific importance 77 398.30 0.45
Nature park
Protection of biologic and landscape diversity, educational, cultural-historical, touristrecreational
purpose
11 4020.90 4.56
Regional park Protection of landscape diversity, sustainable
development and tourism 2 1020.12 1.16
Natural monument Ecological, scientific, aesthetic or educational 81 1.18 0.001
Significant landscape
Protection of a landscape value and biological diversity or a cultural-historical
value or a landscape with conserved unique features, rest and recreation
83 1077.77 1.22
Forest park Protection of a natural or planted forest of a larger landscape value, rest and recreation
26 30.23 0.03
Monument of park architecture
Protection of a natural or planted forest of a larger landscape value, rest and recreation
119 7.78 0.01
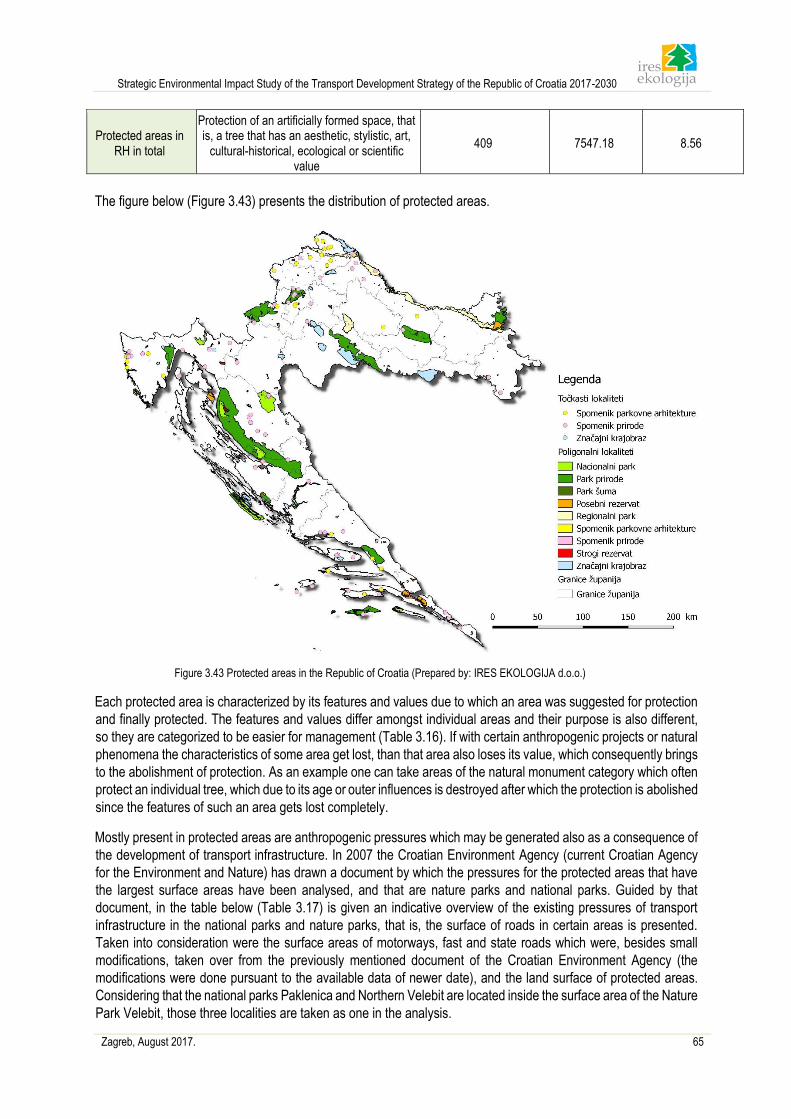
Strategic Environmental Impact Study of the Transport Development Strategy of the Republic of Croatia 2017-2030
Zagreb, August 2017. 65
Protected areas in RH in total
Protection of an artificially formed space, that is, a tree that has an aesthetic, stylistic, art,
cultural-historical, ecological or scientific value
409 7547.18 8.56
The figure below (Figure 3.43) presents the distribution of protected areas.
Figure 3.43 Protected areas in the Republic of Croatia (Prepared by: IRES EKOLOGIJA d.o.o.)
Each protected area is characterized by its features and values due to which an area was suggested for protection
and finally protected. The features and values differ amongst individual areas and their purpose is also different,
so they are categorized to be easier for management (Table 3.16). If with certain anthropogenic projects or natural
phenomena the characteristics of some area get lost, than that area also loses its value, which consequently brings
to the abolishment of protection. As an example one can take areas of the natural monument category which often
protect an individual tree, which due to its age or outer influences is destroyed after which the protection is abolished
since the features of such an area gets lost completely.
Mostly present in protected areas are anthropogenic pressures which may be generated also as a consequence of
the development of transport infrastructure. In 2007 the Croatian Environment Agency (current Croatian Agency
for the Environment and Nature) has drawn a document by which the pressures for the protected areas that have
the largest surface areas have been analysed, and that are nature parks and national parks. Guided by that
document, in the table below (Table 3.17) is given an indicative overview of the existing pressures of transport
infrastructure in the national parks and nature parks, that is, the surface of roads in certain areas is presented.
Taken into consideration were the surface areas of motorways, fast and state roads which were, besides small
modifications, taken over from the previously mentioned document of the Croatian Environment Agency (the
modifications were done pursuant to the available data of newer date), and the land surface of protected areas.
Considering that the national parks Paklenica and Northern Velebit are located inside the surface area of the Nature
Park Velebit, those three localities are taken as one in the analysis.
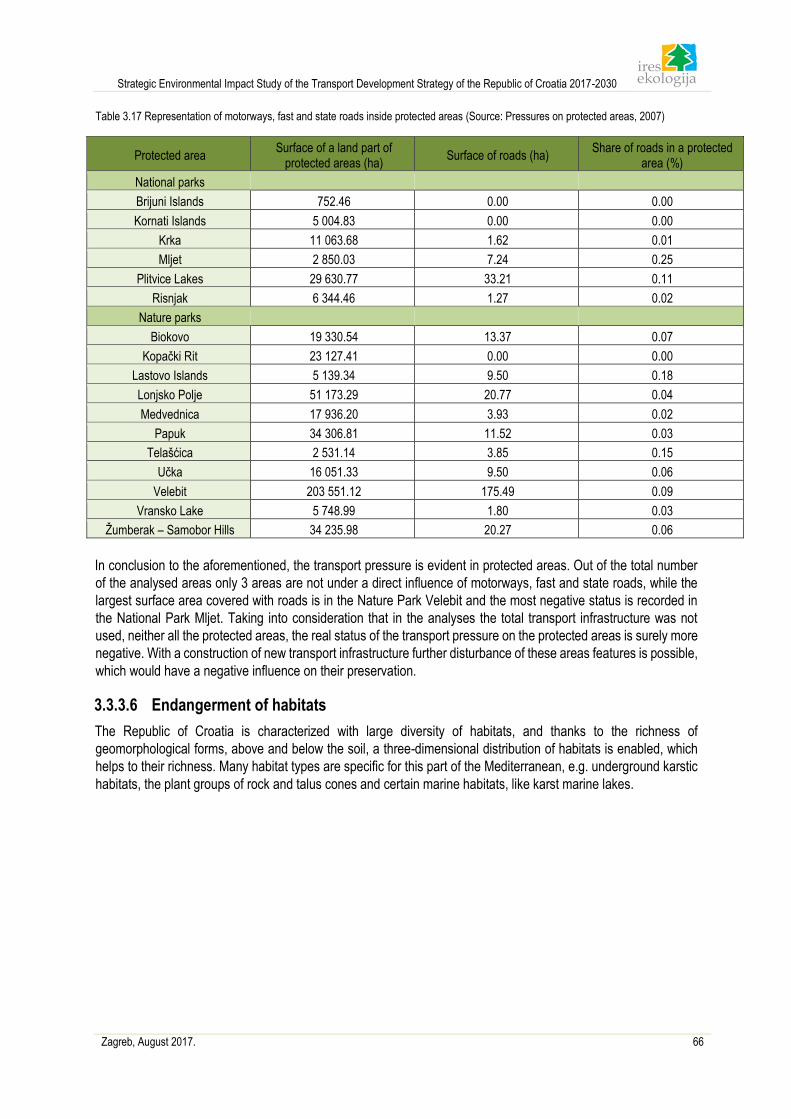
Strategic Environmental Impact Study of the Transport Development Strategy of the Republic of Croatia 2017-2030
Zagreb, August 2017. 66
Table 3.17 Representation of motorways, fast and state roads inside protected areas (Source: Pressures on protected areas, 2007)
Protected area Surface of a land part of
protected areas (ha) Surface of roads (ha)
Share of roads in a protected area (%)
National parks
Brijuni Islands 752.46 0.00 0.00
Kornati Islands 5 004.83 0.00 0.00
Krka 11 063.68 1.62 0.01
Mljet 2 850.03 7.24 0.25
Plitvice Lakes 29 630.77 33.21 0.11
Risnjak 6 344.46 1.27 0.02
Nature parks
Biokovo 19 330.54 13.37 0.07
Kopački Rit 23 127.41 0.00 0.00
Lastovo Islands 5 139.34 9.50 0.18
Lonjsko Polje 51 173.29 20.77 0.04
Medvednica 17 936.20 3.93 0.02
Papuk 34 306.81 11.52 0.03
Telašćica 2 531.14 3.85 0.15
Učka 16 051.33 9.50 0.06
Velebit 203 551.12 175.49 0.09
Vransko Lake 5 748.99 1.80 0.03
Žumberak – Samobor Hills 34 235.98 20.27 0.06
In conclusion to the aforementioned, the transport pressure is evident in protected areas. Out of the total number
of the analysed areas only 3 areas are not under a direct influence of motorways, fast and state roads, while the
largest surface area covered with roads is in the Nature Park Velebit and the most negative status is recorded in
the National Park Mljet. Taking into consideration that in the analyses the total transport infrastructure was not
used, neither all the protected areas, the real status of the transport pressure on the protected areas is surely more
negative. With a construction of new transport infrastructure further disturbance of these areas features is possible,
which would have a negative influence on their preservation.
3.3.3.6 Endangerment of habitats
The Republic of Croatia is characterized with large diversity of habitats, and thanks to the richness of
geomorphological forms, above and below the soil, a three-dimensional distribution of habitats is enabled, which
helps to their richness. Many habitat types are specific for this part of the Mediterranean, e.g. underground karstic
habitats, the plant groups of rock and talus cones and certain marine habitats, like karst marine lakes.
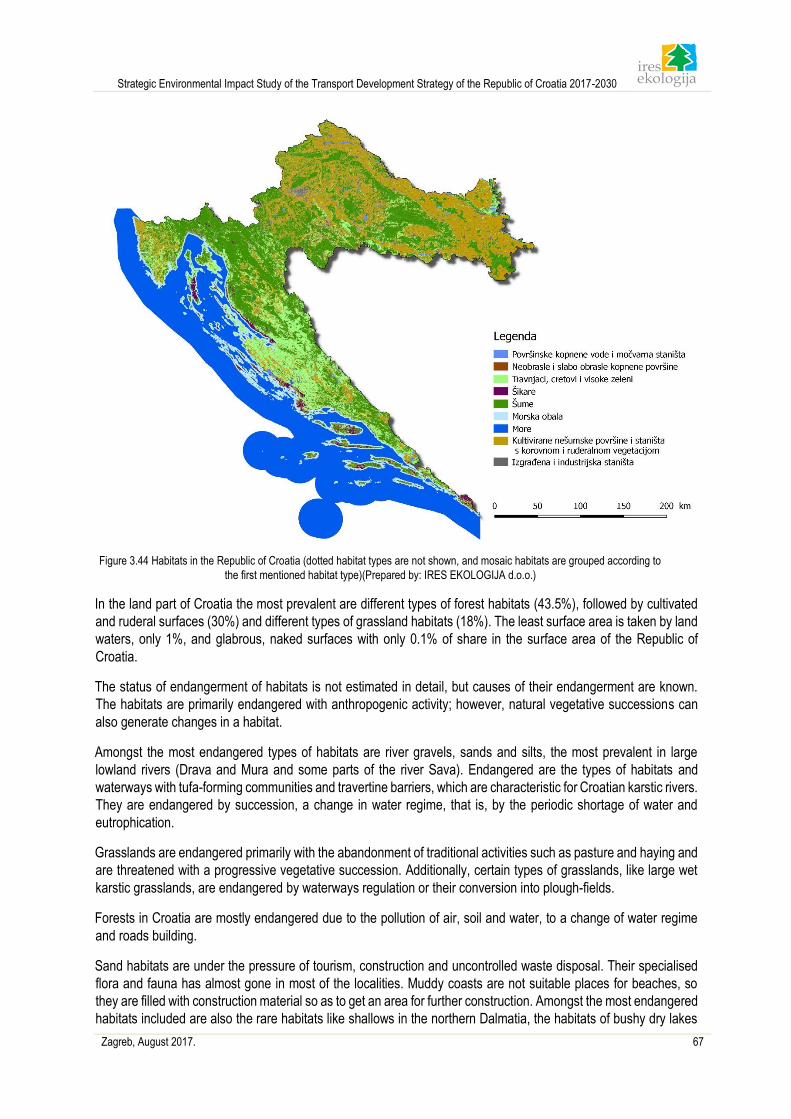
Strategic Environmental Impact Study of the Transport Development Strategy of the Republic of Croatia 2017-2030
Zagreb, August 2017. 67
Figure 3.44 Habitats in the Republic of Croatia (dotted habitat types are not shown, and mosaic habitats are grouped according to
the first mentioned habitat type)(Prepared by: IRES EKOLOGIJA d.o.o.)
In the land part of Croatia the most prevalent are different types of forest habitats (43.5%), followed by cultivated
and ruderal surfaces (30%) and different types of grassland habitats (18%). The least surface area is taken by land
waters, only 1%, and glabrous, naked surfaces with only 0.1% of share in the surface area of the Republic of
Croatia.
The status of endangerment of habitats is not estimated in detail, but causes of their endangerment are known.
The habitats are primarily endangered with anthropogenic activity; however, natural vegetative successions can
also generate changes in a habitat.
Amongst the most endangered types of habitats are river gravels, sands and silts, the most prevalent in large
lowland rivers (Drava and Mura and some parts of the river Sava). Endangered are the types of habitats and
waterways with tufa-forming communities and travertine barriers, which are characteristic for Croatian karstic rivers.
They are endangered by succession, a change in water regime, that is, by the periodic shortage of water and
eutrophication.
Grasslands are endangered primarily with the abandonment of traditional activities such as pasture and haying and
are threatened with a progressive vegetative succession. Additionally, certain types of grasslands, like large wet
karstic grasslands, are endangered by waterways regulation or their conversion into plough-fields.
Forests in Croatia are mostly endangered due to the pollution of air, soil and water, to a change of water regime
and roads building.
Sand habitats are under the pressure of tourism, construction and uncontrolled waste disposal. Their specialised
flora and fauna has almost gone in most of the localities. Muddy coasts are not suitable places for beaches, so
they are filled with construction material so as to get an area for further construction. Amongst the most endangered
habitats included are also the rare habitats like shallows in the northern Dalmatia, the habitats of bushy dry lakes
Strategic Environmental Impact Study of the Transport Development Strategy of the Republic of Croatia 2017-2030
Zagreb, August 2017. 68
and dry lakes with the tall types of Juncaceae recorded on a few smaller localities, the mixed habitats of the Neretva
Delta, as well as sand and gravel coasts. Shallows are rare on the Croatian coast, and are best preserved in the
area of the Neretva Delta and in the northern Dalmatia, where there sea bays with shallows bordering with the dry
lakes of glassworts and the wet grassland vegetation.
Sea caves are endangered with pollution and waste deposits, with the filling of coast, and anchialine caves are
especially endangered by the pollution through water filtered through the karst, by the filling of coast and waste
disposal. Similar to the anchialine caves, the submarine karst springs known as vruljas are endangered with
pollution that comes into them in fresh water filtered through the karst and by filling and construction along the
coast. Meadows of Neptune grass are present and grow in areas where the pressure of human activities is large.
A natural recovery of the damaged Neptune grass settlements lasts a few decades, which makes that species
especially sensitive and endangered. The Neptune grass is endangered by anchoring, fishing with towed gear,
pollution and shading, the spreading of invasive species, as are green algae Caulerpa taxifolia and Caulerpa
racemose. The survival of coralligenous communities is endangered by pollution, than by overfishing that changes
the populations’ structure. The anchoring can also damage coralligenous organisms, as well as the use of various
towing and net fishing gears. The invasive green algae Caulerpa racemosa is recorded in the Adriatic Coralligena.
The underground habitats are especially sensitive and endangered by outer influences. From the major reasons of
endangerment one can single out road construction, invasive urbanization, the pollution of water with large waste
and the waste waters from industry and households, intensive agricultural production with a use of chemical
fertilizers and pesticides, changes in the regime of underground waters or of their quality and large hydrotechnical
projects (Analysis of the state of nature in the Republic of Croatia for the period from 2008 to 2012).
Regarding the described reasons of the habitats endangerment in Croatia one can conclude that the most of the
endangered and rare habitats are sensitive to the development of transport and transport infrastructure through
direct or indirect influences. In conclusion, with the further development of traffic one can expect an increase of
their endangerment, which depends mostly upon transport types, the spatial distribution of roads and waterways
and the manner of their construction.
3.3.3.7 Presence of pollutants in habitats
With the development of new transport infrastructure comes an increase of transport in areas where there was
none before or not in such a measure, and the transport, that is, vehicles generate different byproducts that pollute
water, soil and air and finally the habitats present, as well.
Considering that an increase of pollutants in a habitat is a consequence of the pollution of other environmental
components (water, sea, soil and air) the current state of indicators which describe pollution is explained within the
components on which the pollution has a direct influence.
3.3.4 Landscape features For the purposes of the Strategy of spatial arrangement of the Republic of Croatia (Bralić, 1995) the landscape
regionalization of Croatia was defined considering natural features and the presence of man in a certain area.
Based on the aforementioned, 16 basic landscape units were separated:
1. Lowland areas of Northern Croatia
2. Pannonian highlands
3. Bilogora and Moslavina area
4. Northwest Croatia
5. Žumberak and Samobor Hills
6. Kordun plateau
7. Gorski Kotar
8. Lika
9. Peak Velebit strip
10. Kvarner-Velebit area
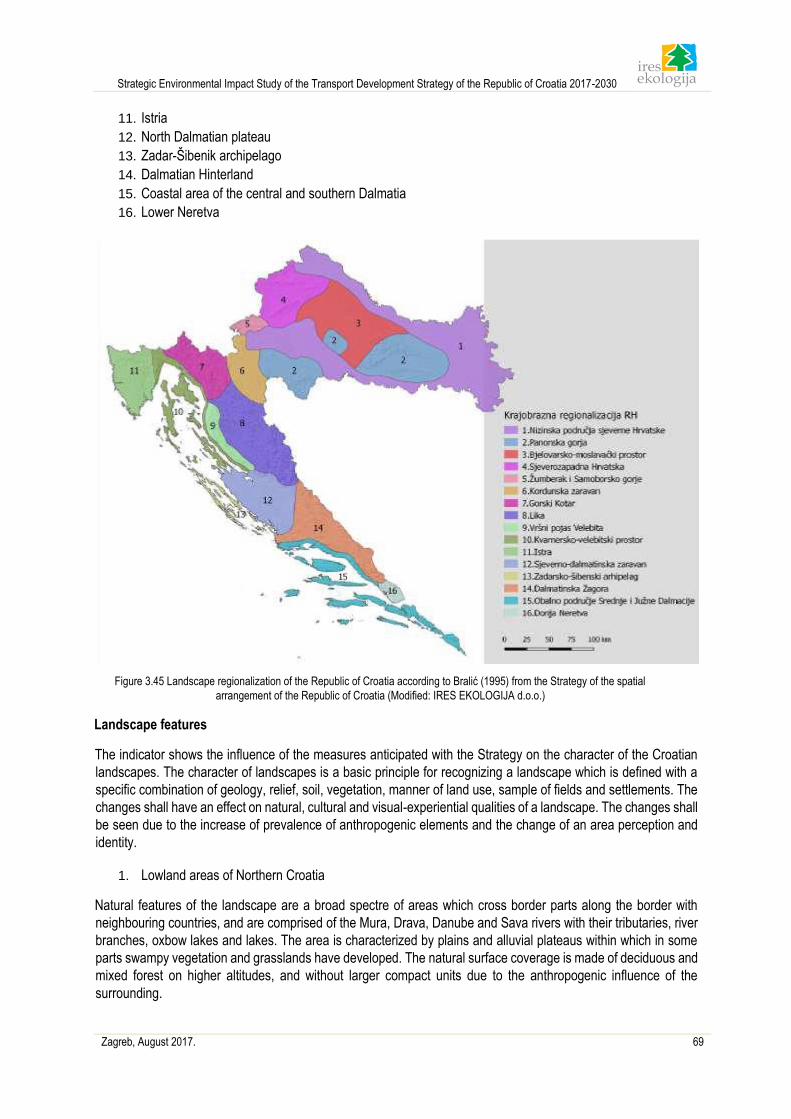
Strategic Environmental Impact Study of the Transport Development Strategy of the Republic of Croatia 2017-2030
Zagreb, August 2017. 69
11. Istria
12. North Dalmatian plateau
13. Zadar-Šibenik archipelago
14. Dalmatian Hinterland
15. Coastal area of the central and southern Dalmatia
16. Lower Neretva
Figure 3.45 Landscape regionalization of the Republic of Croatia according to Bralić (1995) from the Strategy of the spatial
arrangement of the Republic of Croatia (Modified: IRES EKOLOGIJA d.o.o.)
Landscape features
The indicator shows the influence of the measures anticipated with the Strategy on the character of the Croatian
landscapes. The character of landscapes is a basic principle for recognizing a landscape which is defined with a
specific combination of geology, relief, soil, vegetation, manner of land use, sample of fields and settlements. The
changes shall have an effect on natural, cultural and visual-experiential qualities of a landscape. The changes shall
be seen due to the increase of prevalence of anthropogenic elements and the change of an area perception and
identity.
1. Lowland areas of Northern Croatia
Natural features of the landscape are a broad spectre of areas which cross border parts along the border with
neighbouring countries, and are comprised of the Mura, Drava, Danube and Sava rivers with their tributaries, river
branches, oxbow lakes and lakes. The area is characterized by plains and alluvial plateaus within which in some
parts swampy vegetation and grasslands have developed. The natural surface coverage is made of deciduous and
mixed forest on higher altitudes, and without larger compact units due to the anthropogenic influence of the
surrounding.
Strategic Environmental Impact Study of the Transport Development Strategy of the Republic of Croatia 2017-2030
Zagreb, August 2017. 70
Anthropogenic (and cultural) features of the landscape are characterized by an agrarian use of land through the
melioration of agricultural areas which make a dominant geometric sample of parcelling. The parcelling size and
sample differ from the north part of the Republic of Croatia towards the east. Water surfaces (lakes, ponds, rivers)
make a significant landscape pattern that, along with roads, settlements and other infrastructural elements dictate
the direction and pattern of cultural landscapes. Urban landscape is visible through the division of open green areas
inside cities as are Varaždin, Čakovec, Osijek, Vukovar, Slavonski Brod and Sisak, out of which certain parts are
of special historical importance.
Visual-experiential features of the landscape are seen in a relatively flat terrain which is not dictated by relief
segmentation, but by its vertical surface which enables a spatial organization. An important element in space are
river courses which link the area naturalness to themselves. Considering that there aren't many forest areas, as an
important element of the landscape one can single out mixed forests which are visually valuable and interesting
due to colour and texture variations through the year.
2. Pannonian highlands
Natural features of the landscape are seen in an indented terrain of the highlands which stand out inside the flat
surface of the Pannonian Basin. This landscape area is placed in three separated zones inside the lowland Croatia,
and is comprised of the Banovina highlands (Petrova Gora and Zrinska Gora), Moslavačka Gora and Slavonian
highlands (Papuk, Psunj, Krndija and Dilj). From the west of the region towards the east the mountain peaks get
gradually elevated and in the area of Banovina the average altitude is about 350m a.s.l., while Slavonian highlands
mutually vary from 600 to over 900m a.s.l. The karstic relief of Slavonian highlands gives a special value and
geomorphological diversity which is atypical for this region.
Anthropogenic (and cultural) features of the landscape make a combination of fragmented and consolidated parcels
which distribution depends on natural features. So in the area of Banovina and Moslavačka Gora prevalent are
small fragmented parcels with small areas of arable land, while the urban centres of Glina and Kutina were
developed along the alluvial plains of the homonymic rivers, with agricultural areas that are related to suburban
settlements. On the area of the Slavonian highlands' plateau, in the so called Požega Valley, there is a cultural
landscape comprised of large areas of arable land of regular shape that follow water canals and are related to the
settlements in near proximity. The water canals are followed by groups of trees that create a visual and physical
barrier inside the plain. From larger settlements one can single out Požega, to which smaller settlements are linked
that are linearly developed along transport infrastructure.
The visual-experiential features of the landscape are emphasized in a vertical segmentation of the highlands inside
the surface of the plain which creates an accent in the space with its volume and naturalness. The cultural
landscape of the Požega Valley is specific for its position and recognisability, where against the dark volume of the
highlands dominate the light surfaces of arable land of different cultures, between which linear elements of water
intertwine.
3. Bilogora and Moslavina area
The natural features of the landscape are determined by a rich Lonja-Ilova Basin (120 to 160m a.s.l.) surrounded
with the slopes of the neighbouring highlands (Bilogora, Moslavačka Gora). The relief characteristics have
influenced the creation of swamps and ponds, out of which some are converted for economic purposes (fish farms).
The area is characterized by the river Česma, which basin is fan-shaped and is comprised of numerous courses
which spring out in the area of Bilogora and Moslavačka Gora. Natural vegetation is characterized in individual
forest stands of deciduous forest.
Anthropogenic (and cultural) features of the landscape are comprised of cities (Bjelovar, Križevci, Koprivnica) with
their infrastructure elements and open spaces. Villages are connected with central settlements by road
infrastructure along which they develop linearly, so there are no large interruptions (distances) between the
neighbouring settlements. Mosaics of cultural surfaces occupy the larger part of the area between which irregular
Strategic Environmental Impact Study of the Transport Development Strategy of the Republic of Croatia 2017-2030
Zagreb, August 2017. 71
forms of lakes, ponds and other water surfaces are intertwined. Agricultural areas of mixed purpose follow the basic
physiognomy of the area and make the largest share of the anthropogenic landscape.
Visual-experiential features of the landscape are comprised by organic forms of water surface against the relatively
flat, narrow and elongated agricultural areas which makes a specific spatial pattern. A cultural value is made by
visible anthropogenic structures (sacral and secular architecture) inside urban areas, while in rural areas objects
of oil fields, wood industry and agriculture single out.
4. Northwesten Croatia
Natural features of the landscape are made by a relief indented area in which high areas of highlands, lower areas
of hills and lowland areas of river alluvial plains alternate. The high areas of highlands are covered with forest,
mostly with beech and fir where the highest peaks reah over 1000m a.s.l. The mixed forest in the lower areas of
hills covers small fragmented areas under anthropogenic influence.
Anthropogenic (and cultural) features of the landscape are defined in cities which are linearly developed along
alluvial plains of rivers (Krapina, Sava, Lonja) and their tributaries. The phases of city development are clearly
visible in architecture, and mostly in forming of open spaces, so the most important city of this area is Zagreb.
Besides Zagreb, smaller cities are also important (Krapina, Lepoglava, Ivanec) which make urban centres on the
hilly-mountainous area of Zagorje. Foots of the highlands are relatively densely populated since the terrain allows
a possibility for economic activity. The cultural landscape is comprised of agricultural areas in the form of
fragmented and segmented mosaic surfaces of plough-fields, vineyards and orchards, as well as pastures,
meadows and gardens on the hills.
Visual-experiential features of the landscape can be seen in the domination of higher vegetation. Characteristic are
the width open views from mountain peaks on river valleys and other water surfaces and on lower surrounding hilly
areas. A vertical segmentation of the hilly area have influenced its ambient value, along with narrow and closed
views. In the space one can see visually exposed routes of rail, road, river and power line infrastructure.
5. Žumberak and Samobor Hills
Natural features of the landscape are seen in the rich segmented relief with expressed peaks and dominant brook
hollows, which descent from higher areas into the hill’s foots. The natural vegetation coverage is comprised from
deciduous forest and the area covered with meadows with overrun land. The area is also characterized by a
representation of karstic forms as are caves and potholes.
Anthropogenic (and cultural) features of the landscape can be seen in small dispersed rural settlements with no
larger areas of arable land. Smaller areas of arable land (meadows, plough-fields and pastures) alternate inside
forest areas and the areas of settlements which are located even up to 800m a.s.l. Those areas, along with
vineyards on foothills of Plješivica and Japetić, make an important areal pattern of the cultural landscape. The
wooden traditional architecture of settlements with a church/chapel and ruins of old towns make a recognizable
Figure of this area, while from the cities of urban character here lies Samobor.
Visual-experiential features of the landscape can be seen in the woodiness of the area and the recognizable relief
forms on which higher altitudes hamlets with small mosaic fields are dispersed. The area of highlands present a
visual background from larger distances.
6. Kordun plateau
Natural features of the landscape are created by a wide limestone plateau which in the north is closed by the river
Kupa, in the east by the line Petrova Gora – Žumberak and in the west by Gorski Kotar-Lika mountains. Although
the area is rich with numerous geomorphological forms they are not visible enough in space due to dense natural
vegetation composed mostly of mixed forest and surfaces under succession.
Strategic Environmental Impact Study of the Transport Development Strategy of the Republic of Croatia 2017-2030
Zagreb, August 2017. 72
Anthropogenic (and cultural) features of the landscape are created by the cities of Karlovac and Ozalj which are
located near the border of the landscape region itself. Smaller cities as Slunj and Duga Resa to which surrounding
settlements and hamlets are connected are also important. The cultural landscape is composed of small agricultural
parcels along rivers (Mrežnica, Kupa, Korana and Dobra) which creates a striking element in the space.
Visual-experiential features of the landscape are composed of the rivers Kupa, Dobra, Korana and Mrežnica, as
well as of canyons which represent a specific natural-anthropogenic system.
7. Gorski Kotar
Natural features of the landscape are composed of the forest-hilly area of a plateau which elevates abruptly and
steeply above the Kvarner with mountain peaks that reaches up to 1500m a.s.l. A high degree of naturalness is
visible in protected areas and through natural phenomena. In the area a vegetation of mixed forest is prevalent,
amongst which an accent in the space is created by coniferous forests in combination with grey rocky karstic peaks.
Anthropogenic (and cultural) features of the landscape are composed of cities (Ogulin, Delnice) alongside which
important infrastructural elements pass. Also, smaller urban units and their gravitating settlements (Ravna Gora,
Skrad, Mrkopalj) are important since the cultural landscape of agricultural areas is connected to them. There are
no many areas of arable land, so meadows and pastures make an impressive element in the landscape. Pastures
on the rocky ground dominate at high altitudes and they are mostly neglected.
Visual-experiential features of the landscape are composed of lakes as surface elements within the dark volumes
of forests. The area’s naturalness is seen through a dark, closed and forested ambient against small and dispersed
cultural units (pastures and areas of arable land). Closed views are prevalent, while panoramic views characteristic
for higher altitudes open in places.
8. Lika
Natural features of the landscape are seen in mountain ranges which clearly define this area inside which a
mountain plateau has settled. In the south the border is determined by the Velebit mountain, in the west by Velika
Kapela, in the north by Mala Kapela and in the east by Lička Plješivica. The plateau is segmented with smaller
mountain ranges inside which karst fields have settled: Gacko Polje, Ličko Polje and Krbava. Natural vegetation
coverage is created from deciduous, coniferous and mixed forest in combination with natural grasslands and
overrun land. Considering that it is a karstic area one can recognize numerous forms of karst sinkholes, sinkholes,
sinter pools and potholes up to hydrogeological features in forms of springs, water swallows and pools.
Anthropogenic (and cultural) features of the landscape are created by larger settlements (Otočac, Gospić, Gračac)
on the border parts of fertile fields along rivers (Lika, Gacka, Krbava) and other water surfaces. Regarding that the
area is of rural character the only larger urban centre is Gospić while other settlements are of compacted type with
an open central square connected to a cultural landscape in near surrounding. In lowland parts present are
agricultural areas of different purposes while higher altitudes are related to pastures and livestock activity.
Visual-experiential features of the landscape are created by the dominant geometrical patterns of the meliorated
fields of different purpose closed with mountainous slopes where regularity and flatness is expressed in relation to
a dynamic forest surrounding. A contrast in space is created by carriers of lighter tones out of which roads, rocky
grounds and agricultural areas are stand out against the dark tones of high vegetation which is prevalent in this
area.
9. Peak Velebit strip
Spatially defined measures of the Strategy are not within the mentioned landscape region, so it shall not be
described in the Study.
10. Kvarner-Velebit area
Strategic Environmental Impact Study of the Transport Development Strategy of the Republic of Croatia 2017-2030
Zagreb, August 2017. 73
Natural features of the landscape are created by the expressed peaks of the mountains of Učka and Velebit from
the landside and large Kvarner islands of Cres, Krk, Rab and Pag.
Anthropogenic (and cultural) features of the landscape are created by the coastal cities like Rijeka, Opatija, Senj
and Karlobag, as well as larger island centres lake Cres, Rab, Pag and Krk with their zones for different use and
purpose. The largest anthropogenic influence due to its function and spatial location has the city of Rijeka as the
largest urban centre, while the island cities have preserved their rural character and a central settlement structure.
Cultural landscapes are created by agricultural and livestock surfaces with drywall structures which differ
considering their type, size, location and natural conditions of an area. On the area of Littoral Croatia Andlar (2012)
records and describes exceptional cultural landscapes amongst which 24 of them (Cres olive groves, Učka
pastures etc.) are within the Kvarner-Velebit landscape region.
Visual-experiential features of the landscape are created by dominant lines of the mountain ranges of Učka and
Velebit. Vertical segmentation of the space is visible through an agitated terrain and peaks from which panoramic
views on open sea and neighbouring countries are visible. A micro-ambient value of the space is created by the
cultural landscape with specific patterns, construction technique and a manner of land use.
11. Istria
Natural features of the landscape are visible in the coastal line which in the west becomes more shallow and
indented, and in the east steeper. Considering vegetation coverage and the type of soil, three units which mutually
differ in colour and texture are clearly divided in the landscape. The west coast manifests in the red soil and from
that it got its name Red Istria. Grey clay soil is characteristic for the middle part, that is the Grey Istria, while the
White Istria has got its name due to its rocky foundation which encompasses the eastern part.
Anthropogenic (and cultural) features of the landscape are created by cities and settlements with the related rural
and urban landscape. From the cities on the coast the more important are Pula, Rovinj, Poreč and Umag which
have the characteristics of urban centres, while the cities in the inside like Pazin, Buzet and Žminj are of rural
character. Andlar (2012) says that the Grey Istria is made by the grouped smaller settlements and the cultural
flysch terraces of mixed purposes (olive growing, viticulture), while the Red Istria is characterized by the radial
open/closed system of irregular fields, forests and meadows on the karstic plateau which surrounds the centrally
grouped settlements on natural hills/mounds.
Visual-experiential features of the Istria landscape stand out through the closed and protected units with specific
geographical and geomorphological characteristics. This area is not perceived as a whole in that sense, which is
expressed in different landscape elements of the land and the coastal parts of Istria.
12. North Dalmatian plateau
Natural features of the landscape of this region are composed of smaller relief forms (closed sinkholes of different
sizes), than dry valleys and ravines, tectonic depressions and large canyon forms (Krka, Čikola, Zrmanja). Natural
vegetation coverage is composed of small scattered areas of deciduous forest with surfaces under succession.
Natural grasslands take the largest part of the surfaces of this region in combination with bushy vegetation. An
important natural element is composed the water surfaces of the Lake Vrana, Lake Prokljan and Visovačko Lake
and the Karin Sea.
Anthropogenic (and cultural) features of the landscape are created by specific rural units with dispersed hamlets
located along edges of sinkholes. The rural unit includes also the spaces outside the hamlets in open pastures of
extensive character. Drywall construction is closely related to areas of arable land in the function of fences or in
the function of stables for livestock farming. Larger settlements of urban character are located along the sea coast
out of which stands out Zadar and Šibenik as cultural and historical centres with numerous open green surfaces
within the city. In their background the mosaics of arable land are located which continually follow larger settlements
and transport infrastructure out of which the area of Ravni Kotari is the most significant.
Strategic Environmental Impact Study of the Transport Development Strategy of the Republic of Croatia 2017-2030
Zagreb, August 2017. 74
Visual-experiential features of the landscape of this region are created by the unique and recognizable plateau with
traditional features of an enclosure system. Important elements of the area identity are views on river canyons, the
sea and lthe akes.
13. Zadar-Šibenik archipelago
Spatially defined measures of the Strategy are not within the mentioned landscape region, so it shall not be
described in the Study.
14. Dalmatian Hinterland
Natural features of the landscape distinguish via three relief elements amongst which stand out the mountain ranges
of Dinara, Svilaja, Mosor and Biokovo, then karstic depressions inside which are located Petrovo, Sinjsko and
Imotsko fields and the limestone plateaus around the fields. Of other elements stand out the river Cetina with fields
and the canyon, the Peruća Lake and the hydrological-morphological phenomena of Imotski lakes. Mountain areas
are characterized by naked rocks with smaller share of natural vegetation.
Anthropogenic (and cultural) features of the landscape are manifested through the rural type of settlements which
differ in their function, structure and shape, as well as in their spatial placement. The cultural landscape of the
hinterland fields is adjusted to the direction and shape of relief and to canals and roads. Former livestock presence
is visible in drywall construction and the manner of land use.
Visual-experiential features of the landscape are defined by wide panoramic views from the mountain peaks of
Svilaja, Mosor and Dinara and contrasts of light and dark elements of infrastructural objects, scattered settlements
and the arable land mosaics. The karstic fields areas are visually more visible in tone and structure in relation to
mountain massifs which lack vegetation.
15. Coastal area of central and southern Dalmatia
Natural features of the landscape are composed of the land coastal belt which which the vertical segmentation of
the mountain peaks of Mosor, Biokovo, Snježnica alternates with areas of larger islands as are Hvar, Korčula, Brač
and the Pelješac peninsula. The area is also characteristic for its numerous smaller islands which, parallel to each
other, stretch along the Dinaric direction Northwest-Southeast.
Anthropogenic (and cultural) features of the landscape are composed of the urban areas of cities on coast of which
the most prominent are Split and Dubrovnik. The architectural value of this landscape is one of the most significant
for Croatia and Dalmatia due to is long history and preservation. Andlar (2012) mentions that exceptional cultural
landscapes (pastures, olive groves, sinkholes, fields) of this region which are represented on the islands of Brač,
Hvar, Korčula and Mljet are composed of the system of intensive drywall and terraced olive groves and vineyards
distant from the settlements.
Visual-experiential features of the landscape of this region are composed of the views on open sea and
neighbouring islands which get on the experiential value with the elevation to higher altitudes. Prevalent are the
narrow views inside the streets of old city centres and settlements. An interesting micro-ambient value of a historical
character is composed of the cities of Dubrovnik, Stari Grad, Ston, Konavle and others within cultural landscapes
which makes a visual-experiential attraction from the sea side.
16. Lower Neretva
Natural features of the landscape are comprised of the Neretva Delta. The north and northeast part of the Delta is
enclosed with the slopes of Dinaric mountains, the south part is enclosed with the so called Podgradina-Slivanja
hills, while in the west the Delta is under the constant influence of the sea.
Anthropogenic (and cultural) features of the landscape are composed of the numerous melioration areas within 12
river branches. Besides the cultural landscape of a large karst field and a river valley of mixed purpose are located
cities, that is, larger settlement and important transport routes. Of the more important cities in this area stand out
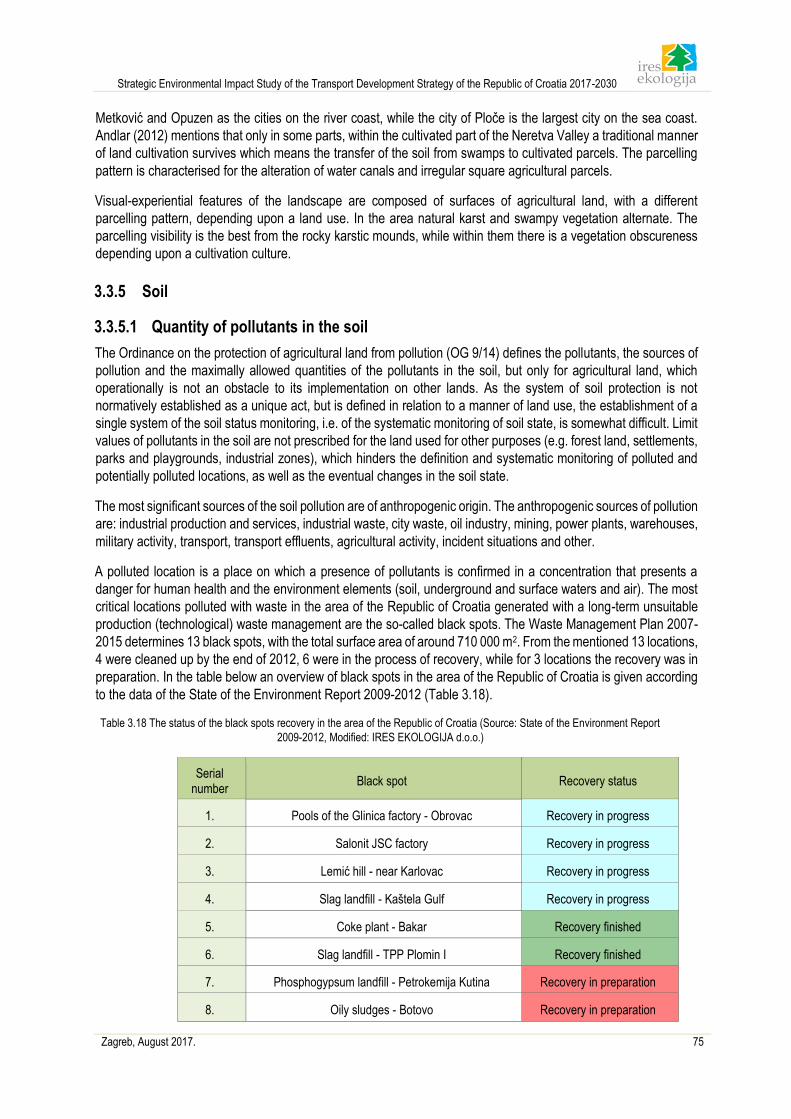
Strategic Environmental Impact Study of the Transport Development Strategy of the Republic of Croatia 2017-2030
Zagreb, August 2017. 75
Metković and Opuzen as the cities on the river coast, while the city of Ploče is the largest city on the sea coast.
Andlar (2012) mentions that only in some parts, within the cultivated part of the Neretva Valley a traditional manner
of land cultivation survives which means the transfer of the soil from swamps to cultivated parcels. The parcelling
pattern is characterised for the alteration of water canals and irregular square agricultural parcels.
Visual-experiential features of the landscape are composed of surfaces of agricultural land, with a different
parcelling pattern, depending upon a land use. In the area natural karst and swampy vegetation alternate. The
parcelling visibility is the best from the rocky karstic mounds, while within them there is a vegetation obscureness
depending upon a cultivation culture.
3.3.5 Soil
3.3.5.1 Quantity of pollutants in the soil
The Ordinance on the protection of agricultural land from pollution (OG 9/14) defines the pollutants, the sources of
pollution and the maximally allowed quantities of the pollutants in the soil, but only for agricultural land, which
operationally is not an obstacle to its implementation on other lands. As the system of soil protection is not
normatively established as a unique act, but is defined in relation to a manner of land use, the establishment of a
single system of the soil status monitoring, i.e. of the systematic monitoring of soil state, is somewhat difficult. Limit
values of pollutants in the soil are not prescribed for the land used for other purposes (e.g. forest land, settlements,
parks and playgrounds, industrial zones), which hinders the definition and systematic monitoring of polluted and
potentially polluted locations, as well as the eventual changes in the soil state.
The most significant sources of the soil pollution are of anthropogenic origin. The anthropogenic sources of pollution
are: industrial production and services, industrial waste, city waste, oil industry, mining, power plants, warehouses,
military activity, transport, transport effluents, agricultural activity, incident situations and other.
A polluted location is a place on which a presence of pollutants is confirmed in a concentration that presents a
danger for human health and the environment elements (soil, underground and surface waters and air). The most
critical locations polluted with waste in the area of the Republic of Croatia generated with a long-term unsuitable
production (technological) waste management are the so-called black spots. The Waste Management Plan 2007-
2015 determines 13 black spots, with the total surface area of around 710 000 m2. From the mentioned 13 locations,
4 were cleaned up by the end of 2012, 6 were in the process of recovery, while for 3 locations the recovery was in
preparation. In the table below an overview of black spots in the area of the Republic of Croatia is given according
to the data of the State of the Environment Report 2009-2012 (Table 3.18).
Table 3.18 The status of the black spots recovery in the area of the Republic of Croatia (Source: State of the Environment Report
2009-2012, Modified: IRES EKOLOGIJA d.o.o.)
Serial number
Black spot Recovery status
1. Pools of the Glinica factory - Obrovac Recovery in progress
2. Salonit JSC factory Recovery in progress
3. Lemić hill - near Karlovac Recovery in progress
4. Slag landfill - Kaštela Gulf Recovery in progress
5. Coke plant - Bakar Recovery finished
6. Slag landfill - TPP Plomin I Recovery finished
7. Phosphogypsum landfill - Petrokemija Kutina Recovery in preparation
8. Oily sludges - Botovo Recovery in preparation
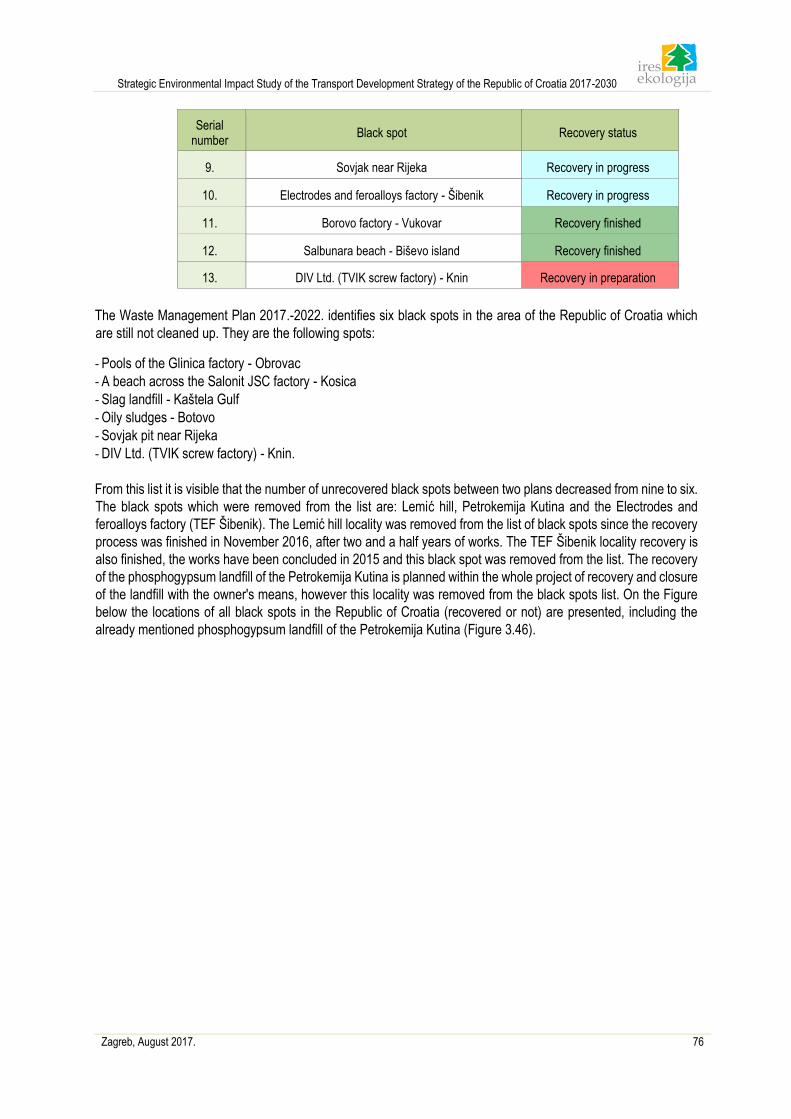
Strategic Environmental Impact Study of the Transport Development Strategy of the Republic of Croatia 2017-2030
Zagreb, August 2017. 76
Serial number
Black spot Recovery status
9. Sovjak near Rijeka Recovery in progress
10. Electrodes and feroalloys factory - Šibenik Recovery in progress
11. Borovo factory - Vukovar Recovery finished
12. Salbunara beach - Biševo island Recovery finished
13. DIV Ltd. (TVIK screw factory) - Knin Recovery in preparation
The Waste Management Plan 2017.-2022. identifies six black spots in the area of the Republic of Croatia which
are still not cleaned up. They are the following spots:
- Pools of the Glinica factory - Obrovac
- A beach across the Salonit JSC factory - Kosica
- Slag landfill - Kaštela Gulf
- Oily sludges - Botovo
- Sovjak pit near Rijeka
- DIV Ltd. (TVIK screw factory) - Knin.
From this list it is visible that the number of unrecovered black spots between two plans decreased from nine to six.
The black spots which were removed from the list are: Lemić hill, Petrokemija Kutina and the Electrodes and
feroalloys factory (TEF Šibenik). The Lemić hill locality was removed from the list of black spots since the recovery
process was finished in November 2016, after two and a half years of works. The TEF Šibenik locality recovery is
also finished, the works have been concluded in 2015 and this black spot was removed from the list. The recovery
of the phosphogypsum landfill of the Petrokemija Kutina is planned within the whole project of recovery and closure
of the landfill with the owner's means, however this locality was removed from the black spots list. On the Figure
below the locations of all black spots in the Republic of Croatia (recovered or not) are presented, including the
already mentioned phosphogypsum landfill of the Petrokemija Kutina (Figure 3.46).
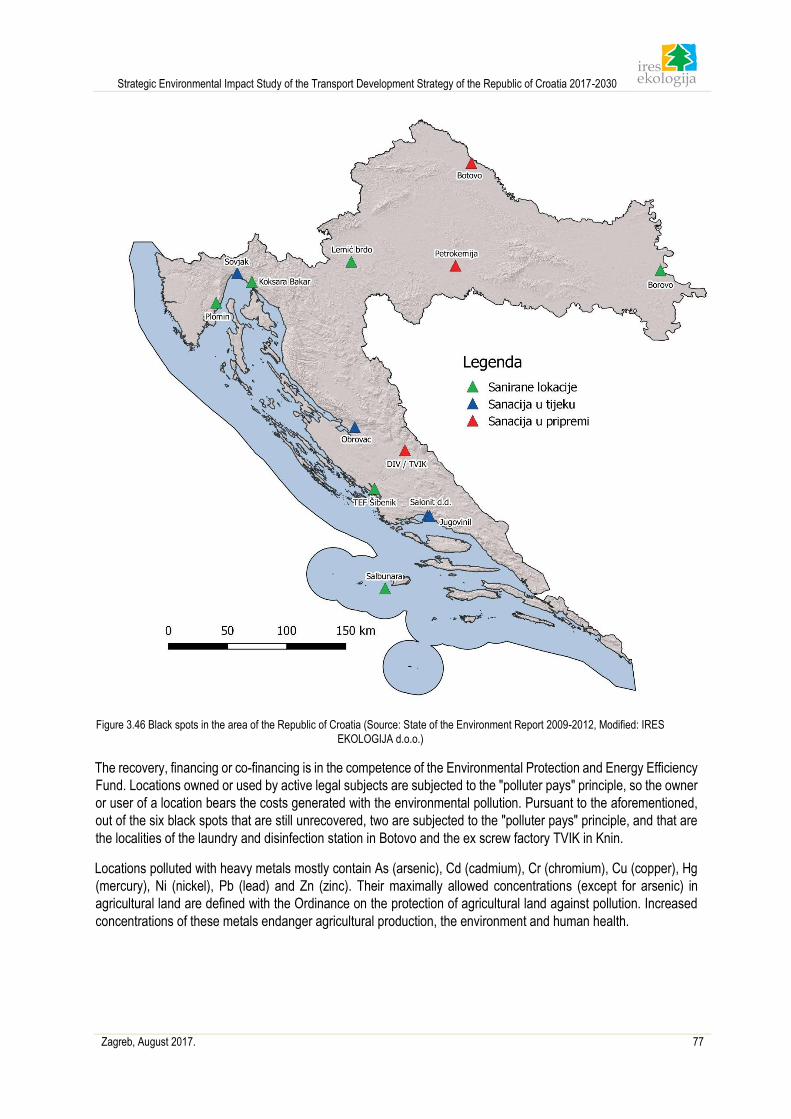
Strategic Environmental Impact Study of the Transport Development Strategy of the Republic of Croatia 2017-2030
Zagreb, August 2017. 77
Figure 3.46 Black spots in the area of the Republic of Croatia (Source: State of the Environment Report 2009-2012, Modified: IRES
EKOLOGIJA d.o.o.)
The recovery, financing or co-financing is in the competence of the Environmental Protection and Energy Efficiency
Fund. Locations owned or used by active legal subjects are subjected to the "polluter pays" principle, so the owner
or user of a location bears the costs generated with the environmental pollution. Pursuant to the aforementioned,
out of the six black spots that are still unrecovered, two are subjected to the "polluter pays" principle, and that are
the localities of the laundry and disinfection station in Botovo and the ex screw factory TVIK in Knin.
Locations polluted with heavy metals mostly contain As (arsenic), Cd (cadmium), Cr (chromium), Cu (copper), Hg
(mercury), Ni (nickel), Pb (lead) and Zn (zinc). Their maximally allowed concentrations (except for arsenic) in
agricultural land are defined with the Ordinance on the protection of agricultural land against pollution. Increased
concentrations of these metals endanger agricultural production, the environment and human health.
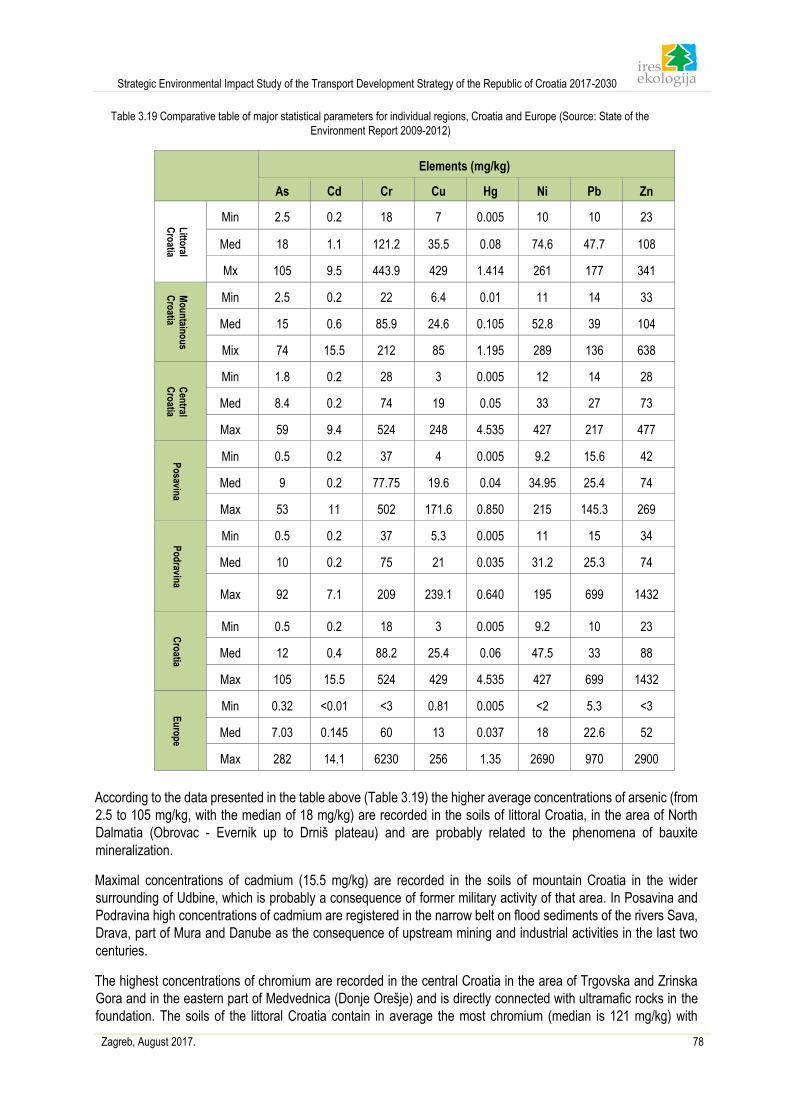
Strategic Environmental Impact Study of the Transport Development Strategy of the Republic of Croatia 2017-2030
Zagreb, August 2017. 78
Table 3.19 Comparative table of major statistical parameters for individual regions, Croatia and Europe (Source: State of the
Environment Report 2009-2012)
Elements (mg/kg)
As Cd Cr Cu Hg Ni Pb Zn
Min 2.5 0.2 18 7 0.005 10 10 23
Med 18 1.1 121.2 35.5 0.08 74.6 47.7 108
Mx 105 9.5 443.9 429 1.414 261 177 341
Min 2.5 0.2 22 6.4 0.01 11 14 33
Med 15 0.6 85.9 24.6 0.105 52.8 39 104
Mix 74 15.5 212 85 1.195 289 136 638
Min 1.8 0.2 28 3 0.005 12 14 28
Med 8.4 0.2 74 19 0.05 33 27 73
Max 59 9.4 524 248 4.535 427 217 477
Min 0.5 0.2 37 4 0.005 9.2 15.6 42
Med 9 0.2 77.75 19.6 0.04 34.95 25.4 74
Max 53 11 502 171.6 0.850 215 145.3 269
Min 0.5 0.2 37 5.3 0.005 11 15 34
Med 10 0.2 75 21 0.035 31.2 25.3 74
Max 92 7.1 209 239.1 0.640 195 699 1432
Min 0.5 0.2 18 3 0.005 9.2 10 23
Med 12 0.4 88.2 25.4 0.06 47.5 33 88
Max 105 15.5 524 429 4.535 427 699 1432
Min 0.32 <0.01 <3 0.81 0.005 <2 5.3 <3
Med 7.03 0.145 60 13 0.037 18 22.6 52
Max 282 14.1 6230 256 1.35 2690 970 2900
According to the data presented in the table above (Table 3.19) the higher average concentrations of arsenic (from
2.5 to 105 mg/kg, with the median of 18 mg/kg) are recorded in the soils of littoral Croatia, in the area of North
Dalmatia (Obrovac - Evernik up to Drniš plateau) and are probably related to the phenomena of bauxite
mineralization.
Maximal concentrations of cadmium (15.5 mg/kg) are recorded in the soils of mountain Croatia in the wider
surrounding of Udbine, which is probably a consequence of former military activity of that area. In Posavina and
Podravina high concentrations of cadmium are registered in the narrow belt on flood sediments of the rivers Sava,
Drava, part of Mura and Danube as the consequence of upstream mining and industrial activities in the last two
centuries.
The highest concentrations of chromium are recorded in the central Croatia in the area of Trgovska and Zrinska
Gora and in the eastern part of Medvednica (Donje Orešje) and is directly connected with ultramafic rocks in the
foundation. The soils of the littoral Croatia contain in average the most chromium (median is 121 mg/kg) with
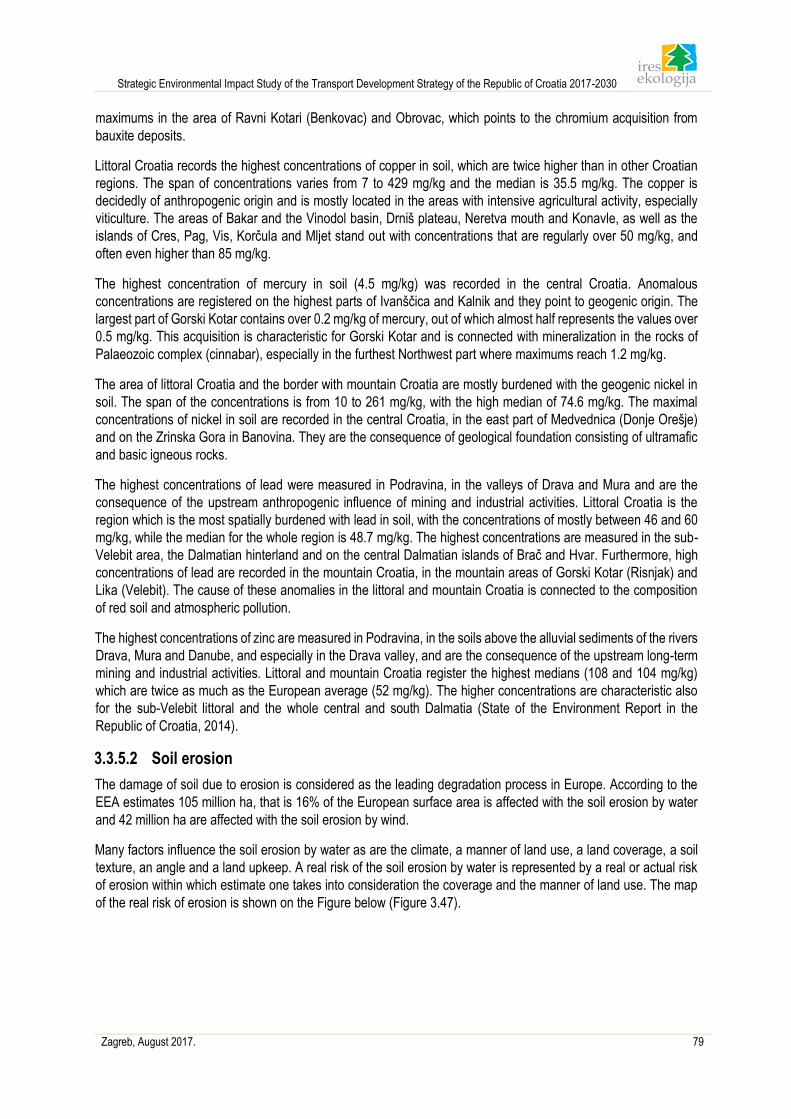
Strategic Environmental Impact Study of the Transport Development Strategy of the Republic of Croatia 2017-2030
Zagreb, August 2017. 79
maximums in the area of Ravni Kotari (Benkovac) and Obrovac, which points to the chromium acquisition from
bauxite deposits.
Littoral Croatia records the highest concentrations of copper in soil, which are twice higher than in other Croatian
regions. The span of concentrations varies from 7 to 429 mg/kg and the median is 35.5 mg/kg. The copper is
decidedly of anthropogenic origin and is mostly located in the areas with intensive agricultural activity, especially
viticulture. The areas of Bakar and the Vinodol basin, Drniš plateau, Neretva mouth and Konavle, as well as the
islands of Cres, Pag, Vis, Korčula and Mljet stand out with concentrations that are regularly over 50 mg/kg, and
often even higher than 85 mg/kg.
The highest concentration of mercury in soil (4.5 mg/kg) was recorded in the central Croatia. Anomalous
concentrations are registered on the highest parts of Ivanščica and Kalnik and they point to geogenic origin. The
largest part of Gorski Kotar contains over 0.2 mg/kg of mercury, out of which almost half represents the values over
0.5 mg/kg. This acquisition is characteristic for Gorski Kotar and is connected with mineralization in the rocks of
Palaeozoic complex (cinnabar), especially in the furthest Northwest part where maximums reach 1.2 mg/kg.
The area of littoral Croatia and the border with mountain Croatia are mostly burdened with the geogenic nickel in
soil. The span of the concentrations is from 10 to 261 mg/kg, with the high median of 74.6 mg/kg. The maximal
concentrations of nickel in soil are recorded in the central Croatia, in the east part of Medvednica (Donje Orešje)
and on the Zrinska Gora in Banovina. They are the consequence of geological foundation consisting of ultramafic
and basic igneous rocks.
The highest concentrations of lead were measured in Podravina, in the valleys of Drava and Mura and are the
consequence of the upstream anthropogenic influence of mining and industrial activities. Littoral Croatia is the
region which is the most spatially burdened with lead in soil, with the concentrations of mostly between 46 and 60
mg/kg, while the median for the whole region is 48.7 mg/kg. The highest concentrations are measured in the sub-
Velebit area, the Dalmatian hinterland and on the central Dalmatian islands of Brač and Hvar. Furthermore, high
concentrations of lead are recorded in the mountain Croatia, in the mountain areas of Gorski Kotar (Risnjak) and
Lika (Velebit). The cause of these anomalies in the littoral and mountain Croatia is connected to the composition
of red soil and atmospheric pollution.
The highest concentrations of zinc are measured in Podravina, in the soils above the alluvial sediments of the rivers
Drava, Mura and Danube, and especially in the Drava valley, and are the consequence of the upstream long-term
mining and industrial activities. Littoral and mountain Croatia register the highest medians (108 and 104 mg/kg)
which are twice as much as the European average (52 mg/kg). The higher concentrations are characteristic also
for the sub-Velebit littoral and the whole central and south Dalmatia (State of the Environment Report in the
Republic of Croatia, 2014).
3.3.5.2 Soil erosion
The damage of soil due to erosion is considered as the leading degradation process in Europe. According to the
EEA estimates 105 million ha, that is 16% of the European surface area is affected with the soil erosion by water
and 42 million ha are affected with the soil erosion by wind.
Many factors influence the soil erosion by water as are the climate, a manner of land use, a land coverage, a soil
texture, an angle and a land upkeep. A real risk of the soil erosion by water is represented by a real or actual risk
of erosion within which estimate one takes into consideration the coverage and the manner of land use. The map
of the real risk of erosion is shown on the Figure below (Figure 3.47).
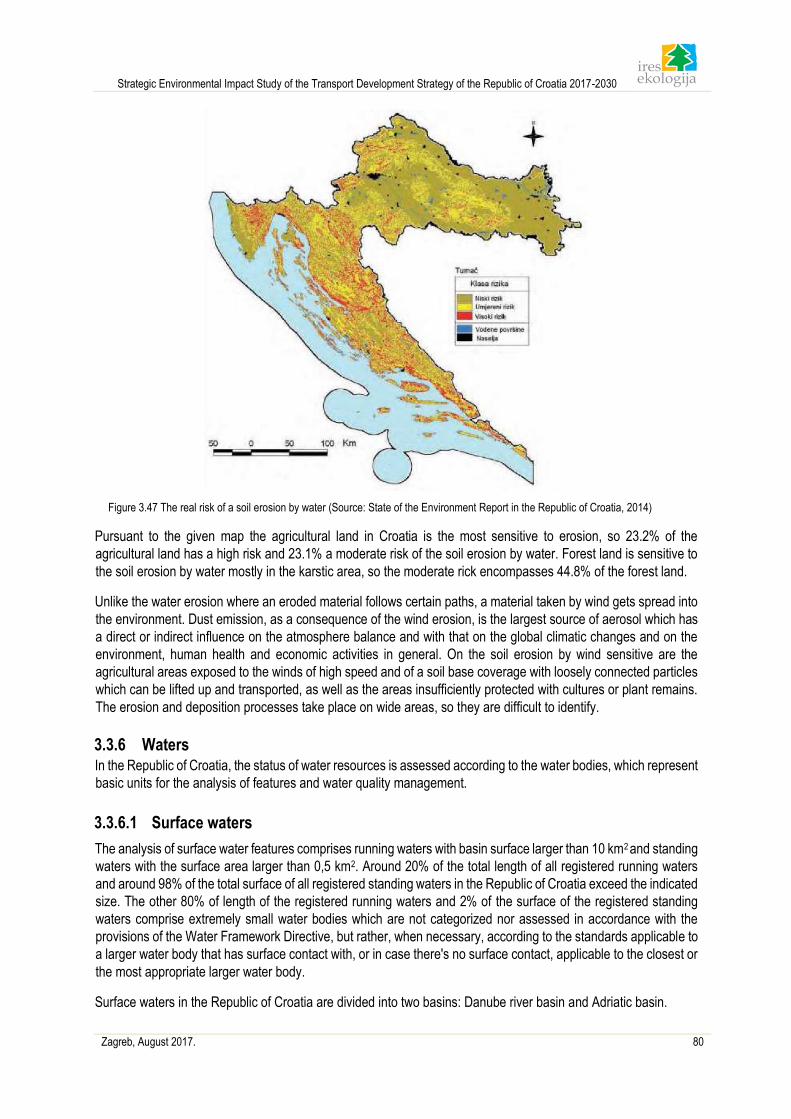
Strategic Environmental Impact Study of the Transport Development Strategy of the Republic of Croatia 2017-2030
Zagreb, August 2017. 80
Figure 3.47 The real risk of a soil erosion by water (Source: State of the Environment Report in the Republic of Croatia, 2014)
Pursuant to the given map the agricultural land in Croatia is the most sensitive to erosion, so 23.2% of the
agricultural land has a high risk and 23.1% a moderate risk of the soil erosion by water. Forest land is sensitive to
the soil erosion by water mostly in the karstic area, so the moderate rick encompasses 44.8% of the forest land.
Unlike the water erosion where an eroded material follows certain paths, a material taken by wind gets spread into
the environment. Dust emission, as a consequence of the wind erosion, is the largest source of aerosol which has
a direct or indirect influence on the atmosphere balance and with that on the global climatic changes and on the
environment, human health and economic activities in general. On the soil erosion by wind sensitive are the
agricultural areas exposed to the winds of high speed and of a soil base coverage with loosely connected particles
which can be lifted up and transported, as well as the areas insufficiently protected with cultures or plant remains.
The erosion and deposition processes take place on wide areas, so they are difficult to identify.
3.3.6 Waters In the Republic of Croatia, the status of water resources is assessed according to the water bodies, which represent
basic units for the analysis of features and water quality management.
3.3.6.1 Surface waters
The analysis of surface water features comprises running waters with basin surface larger than 10 km2 and standing
waters with the surface area larger than 0,5 km2. Around 20% of the total length of all registered running waters
and around 98% of the total surface of all registered standing waters in the Republic of Croatia exceed the indicated
size. The other 80% of length of the registered running waters and 2% of the surface of the registered standing
waters comprise extremely small water bodies which are not categorized nor assessed in accordance with the
provisions of the Water Framework Directive, but rather, when necessary, according to the standards applicable to
a larger water body that has surface contact with, or in case there's no surface contact, applicable to the closest or
the most appropriate larger water body.
Surface waters in the Republic of Croatia are divided into two basins: Danube river basin and Adriatic basin.
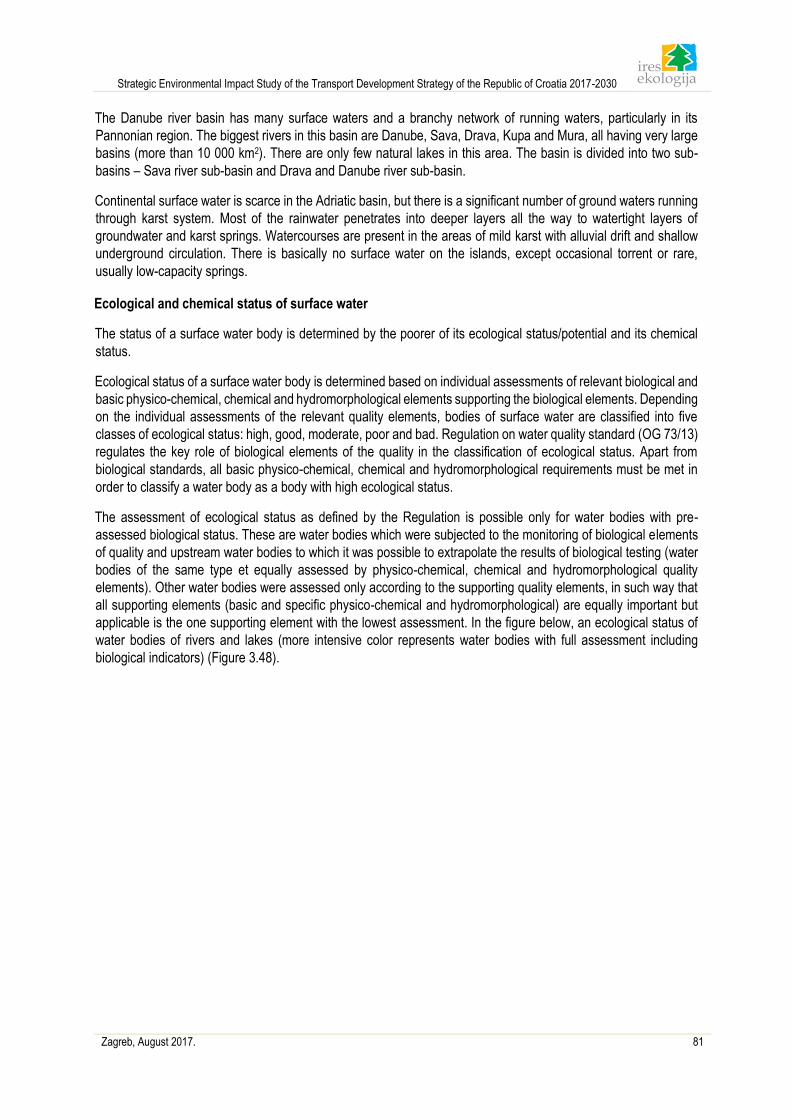
Strategic Environmental Impact Study of the Transport Development Strategy of the Republic of Croatia 2017-2030
Zagreb, August 2017. 81
The Danube river basin has many surface waters and a branchy network of running waters, particularly in its
Pannonian region. The biggest rivers in this basin are Danube, Sava, Drava, Kupa and Mura, all having very large
basins (more than 10 000 km2). There are only few natural lakes in this area. The basin is divided into two sub-
basins – Sava river sub-basin and Drava and Danube river sub-basin.
Continental surface water is scarce in the Adriatic basin, but there is a significant number of ground waters running
through karst system. Most of the rainwater penetrates into deeper layers all the way to watertight layers of
groundwater and karst springs. Watercourses are present in the areas of mild karst with alluvial drift and shallow
underground circulation. There is basically no surface water on the islands, except occasional torrent or rare,
usually low-capacity springs.
Ecological and chemical status of surface water
The status of a surface water body is determined by the poorer of its ecological status/potential and its chemical
status.
Ecological status of a surface water body is determined based on individual assessments of relevant biological and
basic physico-chemical, chemical and hydromorphological elements supporting the biological elements. Depending
on the individual assessments of the relevant quality elements, bodies of surface water are classified into five
classes of ecological status: high, good, moderate, poor and bad. Regulation on water quality standard (OG 73/13)
regulates the key role of biological elements of the quality in the classification of ecological status. Apart from
biological standards, all basic physico-chemical, chemical and hydromorphological requirements must be met in
order to classify a water body as a body with high ecological status.
The assessment of ecological status as defined by the Regulation is possible only for water bodies with pre-
assessed biological status. These are water bodies which were subjected to the monitoring of biological elements
of quality and upstream water bodies to which it was possible to extrapolate the results of biological testing (water
bodies of the same type et equally assessed by physico-chemical, chemical and hydromorphological quality
elements). Other water bodies were assessed only according to the supporting quality elements, in such way that
all supporting elements (basic and specific physico-chemical and hydromorphological) are equally important but
applicable is the one supporting element with the lowest assessment. In the figure below, an ecological status of
water bodies of rivers and lakes (more intensive color represents water bodies with full assessment including
biological indicators) (Figure 3.48).
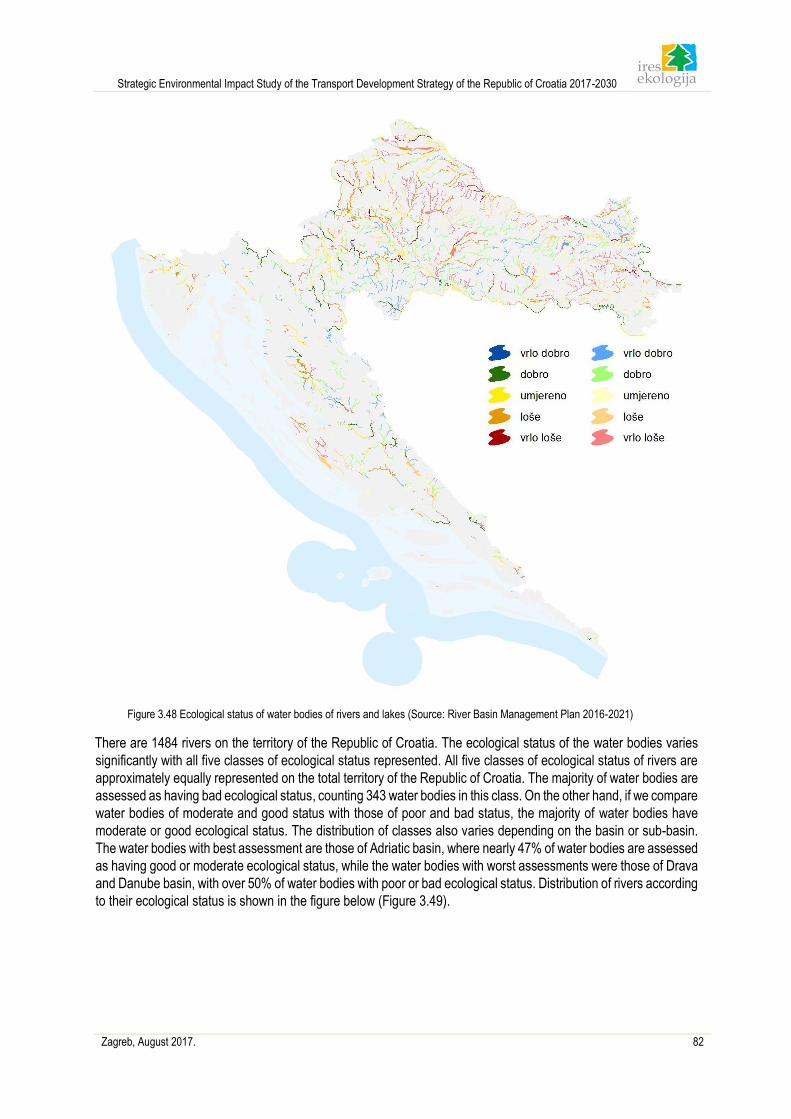
Strategic Environmental Impact Study of the Transport Development Strategy of the Republic of Croatia 2017-2030
Zagreb, August 2017. 82
Figure 3.48 Ecological status of water bodies of rivers and lakes (Source: River Basin Management Plan 2016-2021)
There are 1484 rivers on the territory of the Republic of Croatia. The ecological status of the water bodies varies
significantly with all five classes of ecological status represented. All five classes of ecological status of rivers are
approximately equally represented on the total territory of the Republic of Croatia. The majority of water bodies are
assessed as having bad ecological status, counting 343 water bodies in this class. On the other hand, if we compare
water bodies of moderate and good status with those of poor and bad status, the majority of water bodies have
moderate or good ecological status. The distribution of classes also varies depending on the basin or sub-basin.
The water bodies with best assessment are those of Adriatic basin, where nearly 47% of water bodies are assessed
as having good or moderate ecological status, while the water bodies with worst assessments were those of Drava
and Danube basin, with over 50% of water bodies with poor or bad ecological status. Distribution of rivers according
to their ecological status is shown in the figure below (Figure 3.49).
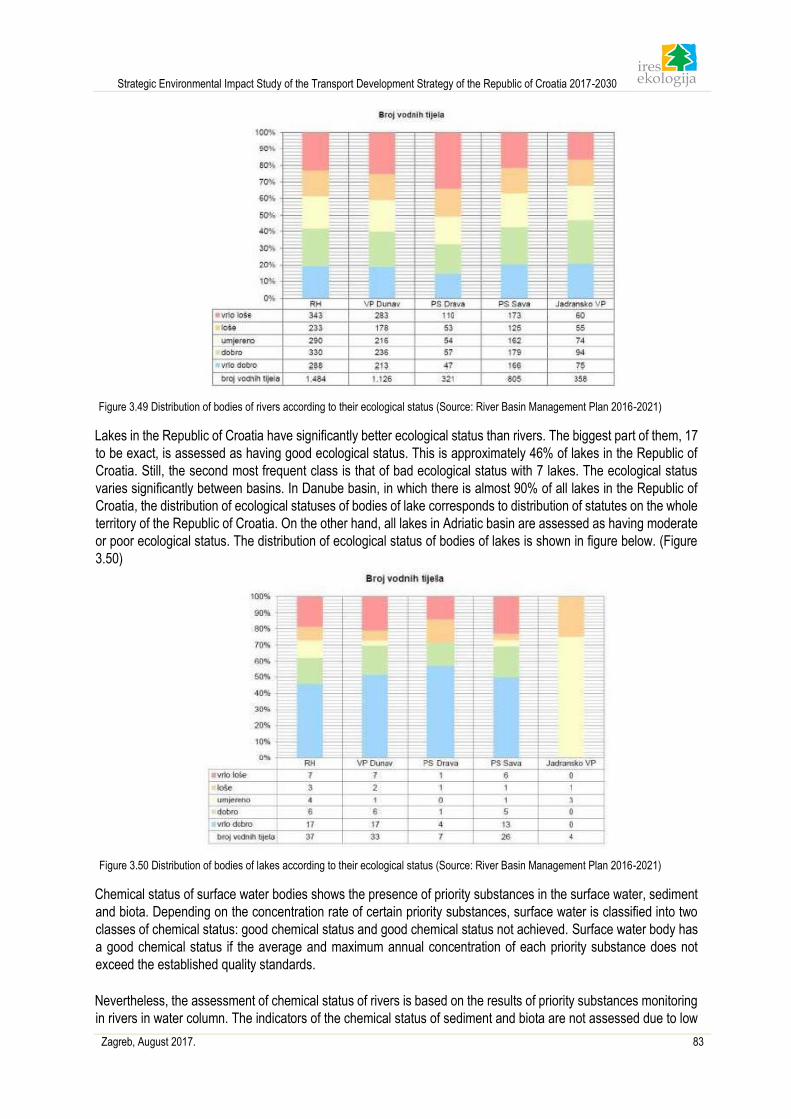
Strategic Environmental Impact Study of the Transport Development Strategy of the Republic of Croatia 2017-2030
Zagreb, August 2017. 83
Figure 3.49 Distribution of bodies of rivers according to their ecological status (Source: River Basin Management Plan 2016-2021)
Lakes in the Republic of Croatia have significantly better ecological status than rivers. The biggest part of them, 17
to be exact, is assessed as having good ecological status. This is approximately 46% of lakes in the Republic of
Croatia. Still, the second most frequent class is that of bad ecological status with 7 lakes. The ecological status
varies significantly between basins. In Danube basin, in which there is almost 90% of all lakes in the Republic of
Croatia, the distribution of ecological statuses of bodies of lake corresponds to distribution of statutes on the whole
territory of the Republic of Croatia. On the other hand, all lakes in Adriatic basin are assessed as having moderate
or poor ecological status. The distribution of ecological status of bodies of lakes is shown in figure below. (Figure
3.50)
Figure 3.50 Distribution of bodies of lakes according to their ecological status (Source: River Basin Management Plan 2016-2021)
Chemical status of surface water bodies shows the presence of priority substances in the surface water, sediment
and biota. Depending on the concentration rate of certain priority substances, surface water is classified into two
classes of chemical status: good chemical status and good chemical status not achieved. Surface water body has
a good chemical status if the average and maximum annual concentration of each priority substance does not
exceed the established quality standards.
Nevertheless, the assessment of chemical status of rivers is based on the results of priority substances monitoring
in rivers in water column. The indicators of the chemical status of sediment and biota are not assessed due to low
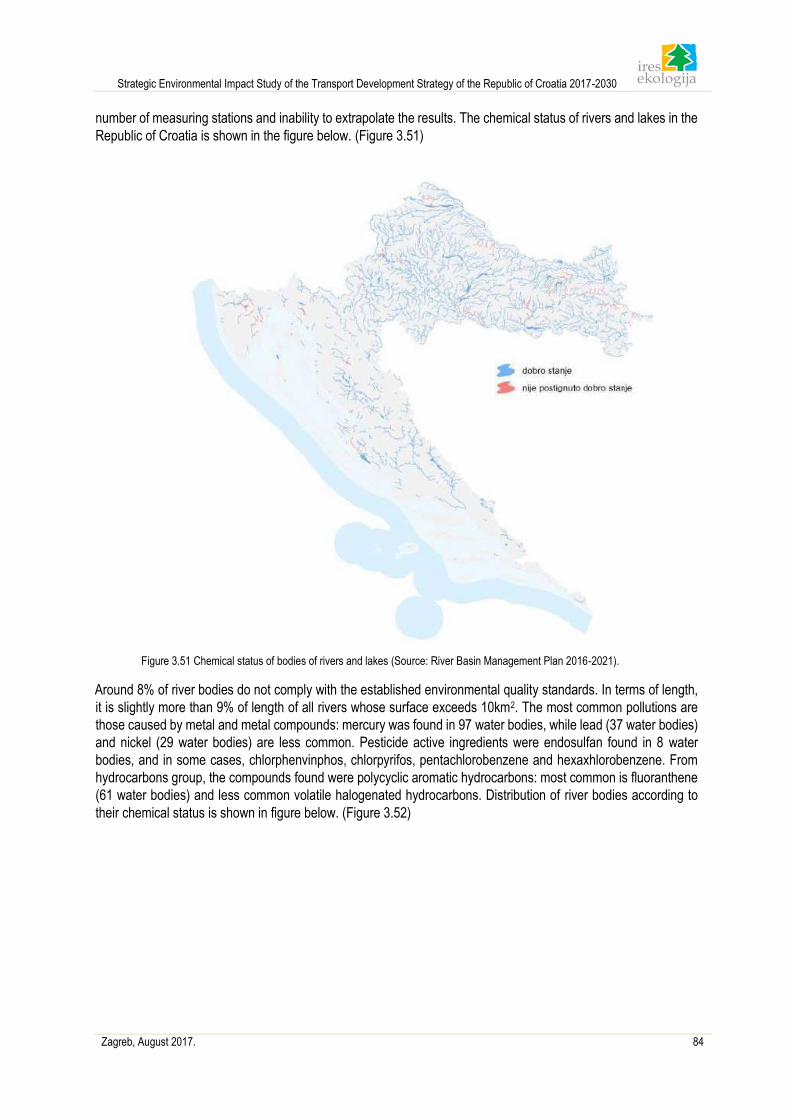
Strategic Environmental Impact Study of the Transport Development Strategy of the Republic of Croatia 2017-2030
Zagreb, August 2017. 84
number of measuring stations and inability to extrapolate the results. The chemical status of rivers and lakes in the
Republic of Croatia is shown in the figure below. (Figure 3.51)
Figure 3.51 Chemical status of bodies of rivers and lakes (Source: River Basin Management Plan 2016-2021).
Around 8% of river bodies do not comply with the established environmental quality standards. In terms of length,
it is slightly more than 9% of length of all rivers whose surface exceeds 10km2. The most common pollutions are
those caused by metal and metal compounds: mercury was found in 97 water bodies, while lead (37 water bodies)
and nickel (29 water bodies) are less common. Pesticide active ingredients were endosulfan found in 8 water
bodies, and in some cases, chlorphenvinphos, chlorpyrifos, pentachlorobenzene and hexaxhlorobenzene. From
hydrocarbons group, the compounds found were polycyclic aromatic hydrocarbons: most common is fluoranthene
(61 water bodies) and less common volatile halogenated hydrocarbons. Distribution of river bodies according to
their chemical status is shown in figure below. (Figure 3.52)
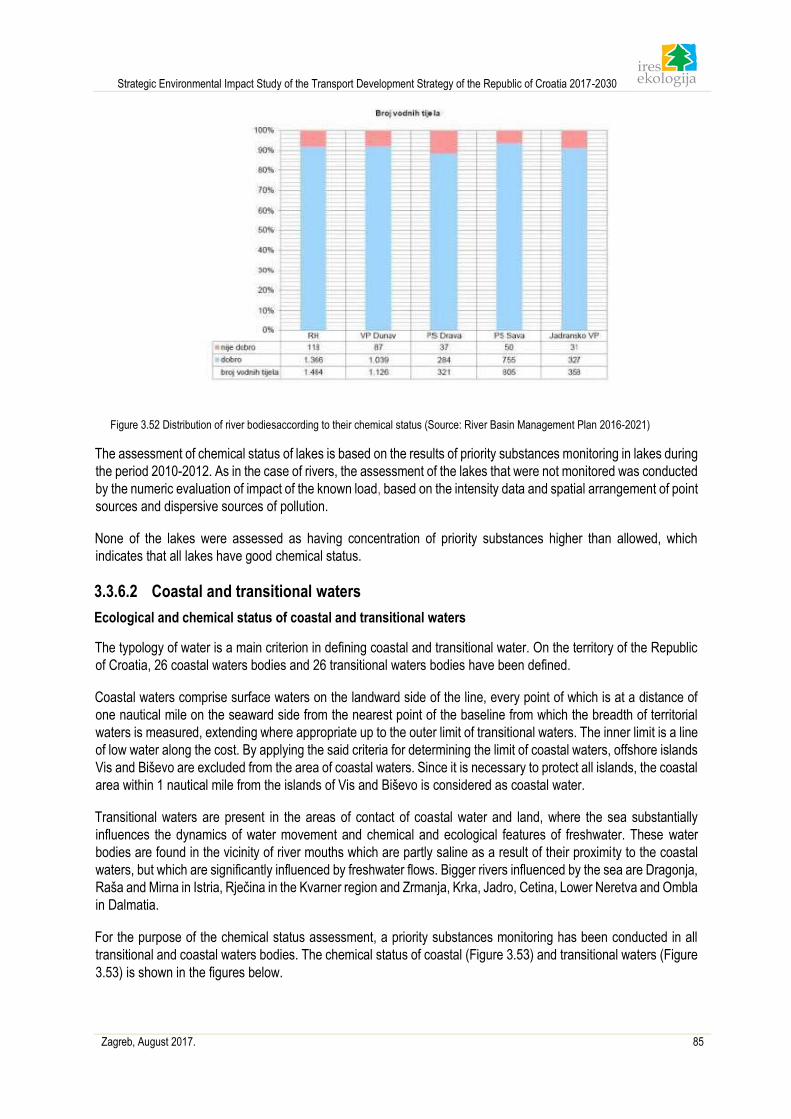
Strategic Environmental Impact Study of the Transport Development Strategy of the Republic of Croatia 2017-2030
Zagreb, August 2017. 85
Figure 3.52 Distribution of river bodiesaccording to their chemical status (Source: River Basin Management Plan 2016-2021)
The assessment of chemical status of lakes is based on the results of priority substances monitoring in lakes during
the period 2010-2012. As in the case of rivers, the assessment of the lakes that were not monitored was conducted
by the numeric evaluation of impact of the known load, based on the intensity data and spatial arrangement of point
sources and dispersive sources of pollution.
None of the lakes were assessed as having concentration of priority substances higher than allowed, which
indicates that all lakes have good chemical status.
3.3.6.2 Coastal and transitional waters
Ecological and chemical status of coastal and transitional waters
The typology of water is a main criterion in defining coastal and transitional water. On the territory of the Republic
of Croatia, 26 coastal waters bodies and 26 transitional waters bodies have been defined.
Coastal waters comprise surface waters on the landward side of the line, every point of which is at a distance of
one nautical mile on the seaward side from the nearest point of the baseline from which the breadth of territorial
waters is measured, extending where appropriate up to the outer limit of transitional waters. The inner limit is a line
of low water along the cost. By applying the said criteria for determining the limit of coastal waters, offshore islands
Vis and Biševo are excluded from the area of coastal waters. Since it is necessary to protect all islands, the coastal
area within 1 nautical mile from the islands of Vis and Biševo is considered as coastal water.
Transitional waters are present in the areas of contact of coastal water and land, where the sea substantially
influences the dynamics of water movement and chemical and ecological features of freshwater. These water
bodies are found in the vicinity of river mouths which are partly saline as a result of their proximity to the coastal
waters, but which are significantly influenced by freshwater flows. Bigger rivers influenced by the sea are Dragonja,
Raša and Mirna in Istria, Rječina in the Kvarner region and Zrmanja, Krka, Jadro, Cetina, Lower Neretva and Ombla
in Dalmatia.
For the purpose of the chemical status assessment, a priority substances monitoring has been conducted in all
transitional and coastal waters bodies. The chemical status of coastal (Figure 3.53) and transitional waters (Figure
3.53) is shown in the figures below.
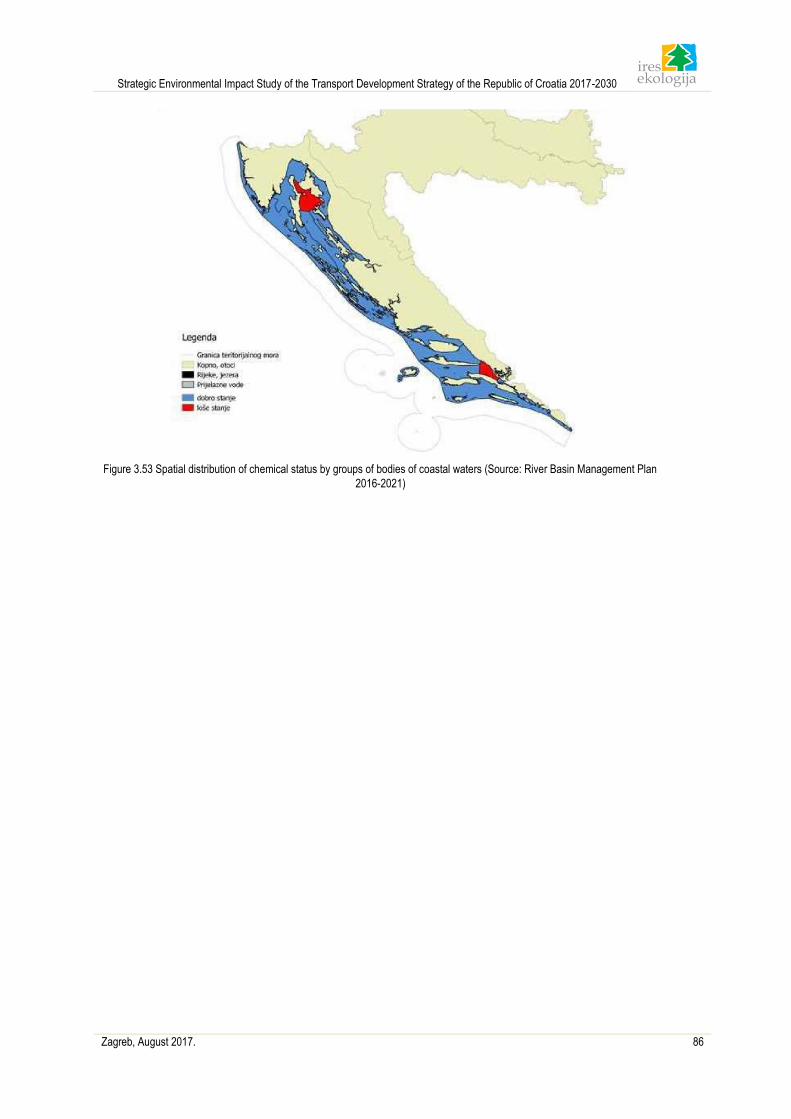
Strategic Environmental Impact Study of the Transport Development Strategy of the Republic of Croatia 2017-2030
Zagreb, August 2017. 86
Figure 3.53 Spatial distribution of chemical status by groups of bodies of coastal waters (Source: River Basin Management Plan
2016-2021)
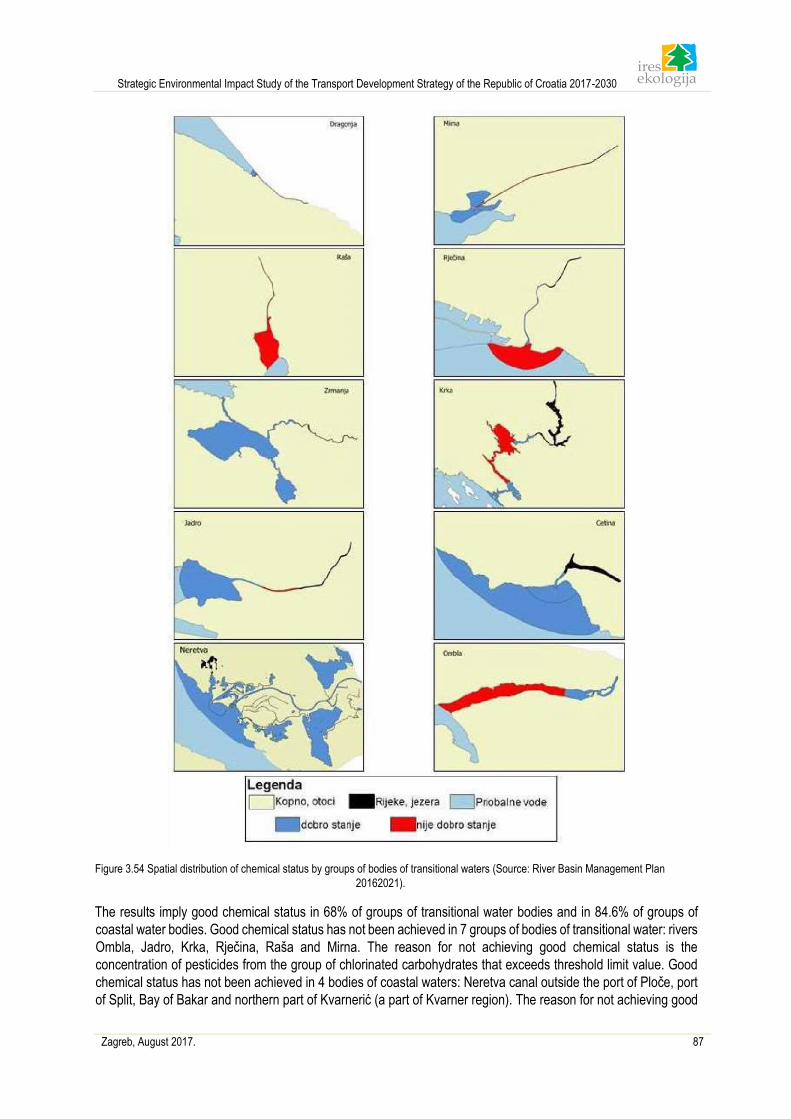
Strategic Environmental Impact Study of the Transport Development Strategy of the Republic of Croatia 2017-2030
Zagreb, August 2017. 87
Figure 3.54 Spatial distribution of chemical status by groups of bodies of transitional waters (Source: River Basin Management Plan
20162021).
The results imply good chemical status in 68% of groups of transitional water bodies and in 84.6% of groups of
coastal water bodies. Good chemical status has not been achieved in 7 groups of bodies of transitional water: rivers
Ombla, Jadro, Krka, Rječina, Raša and Mirna. The reason for not achieving good chemical status is the
concentration of pesticides from the group of chlorinated carbohydrates that exceeds threshold limit value. Good
chemical status has not been achieved in 4 bodies of coastal waters: Neretva canal outside the port of Ploče, port
of Split, Bay of Bakar and northern part of Kvarnerić (a part of Kvarner region). The reason for not achieving good
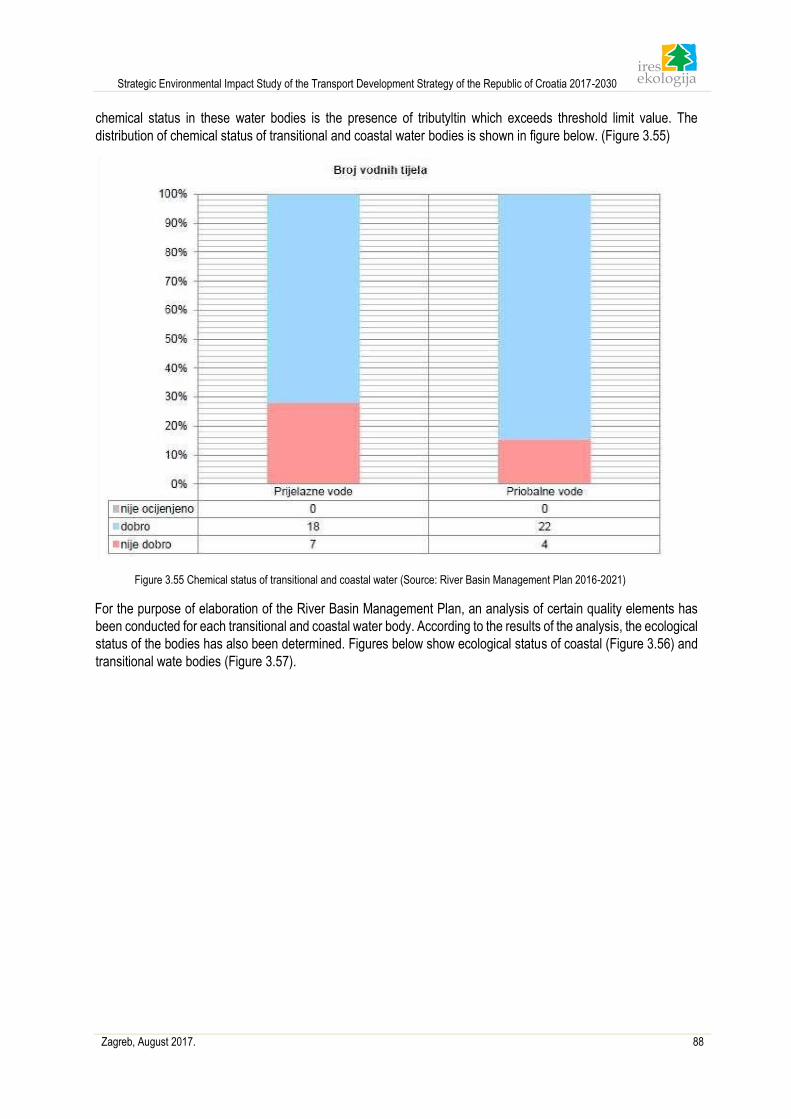
Strategic Environmental Impact Study of the Transport Development Strategy of the Republic of Croatia 2017-2030
Zagreb, August 2017. 88
chemical status in these water bodies is the presence of tributyltin which exceeds threshold limit value. The
distribution of chemical status of transitional and coastal water bodies is shown in figure below. (Figure 3.55)
Figure 3.55 Chemical status of transitional and coastal water (Source: River Basin Management Plan 2016-2021)
For the purpose of elaboration of the River Basin Management Plan, an analysis of certain quality elements has
been conducted for each transitional and coastal water body. According to the results of the analysis, the ecological
status of the bodies has also been determined. Figures below show ecological status of coastal (Figure 3.56) and
transitional wate bodies (Figure 3.57).
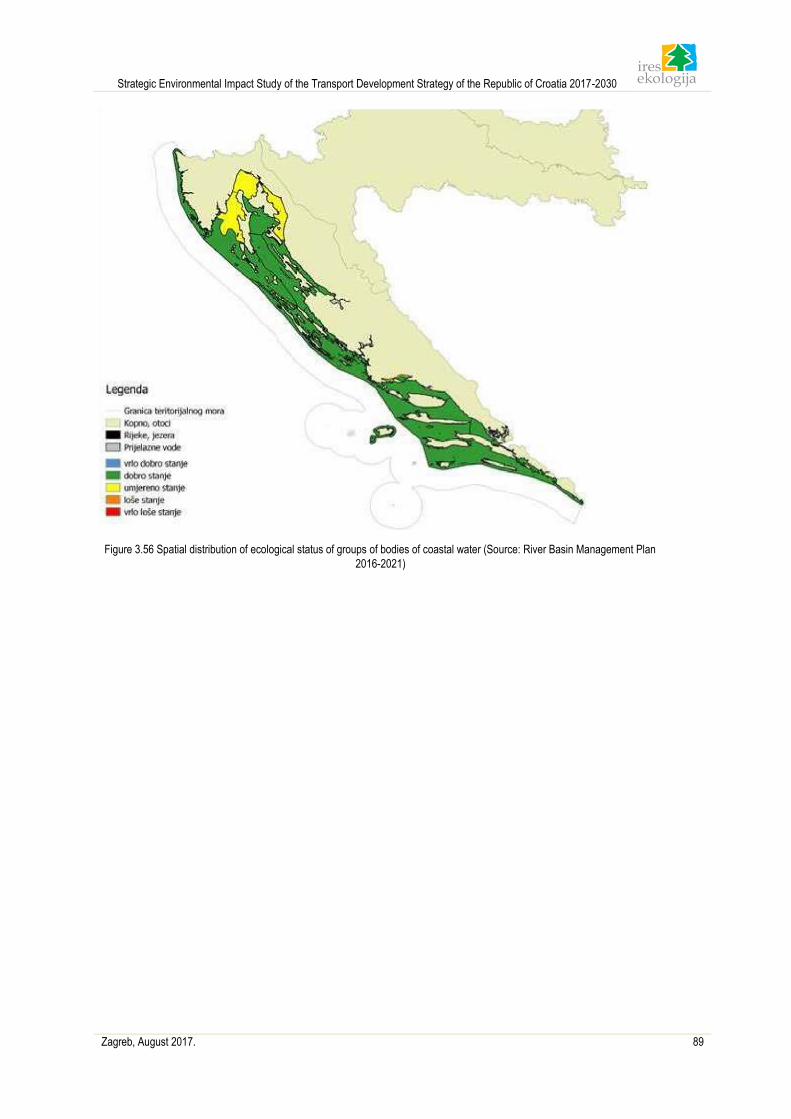
Strategic Environmental Impact Study of the Transport Development Strategy of the Republic of Croatia 2017-2030
Zagreb, August 2017. 89
Figure 3.56 Spatial distribution of ecological status of groups of bodies of coastal water (Source: River Basin Management Plan
2016-2021)
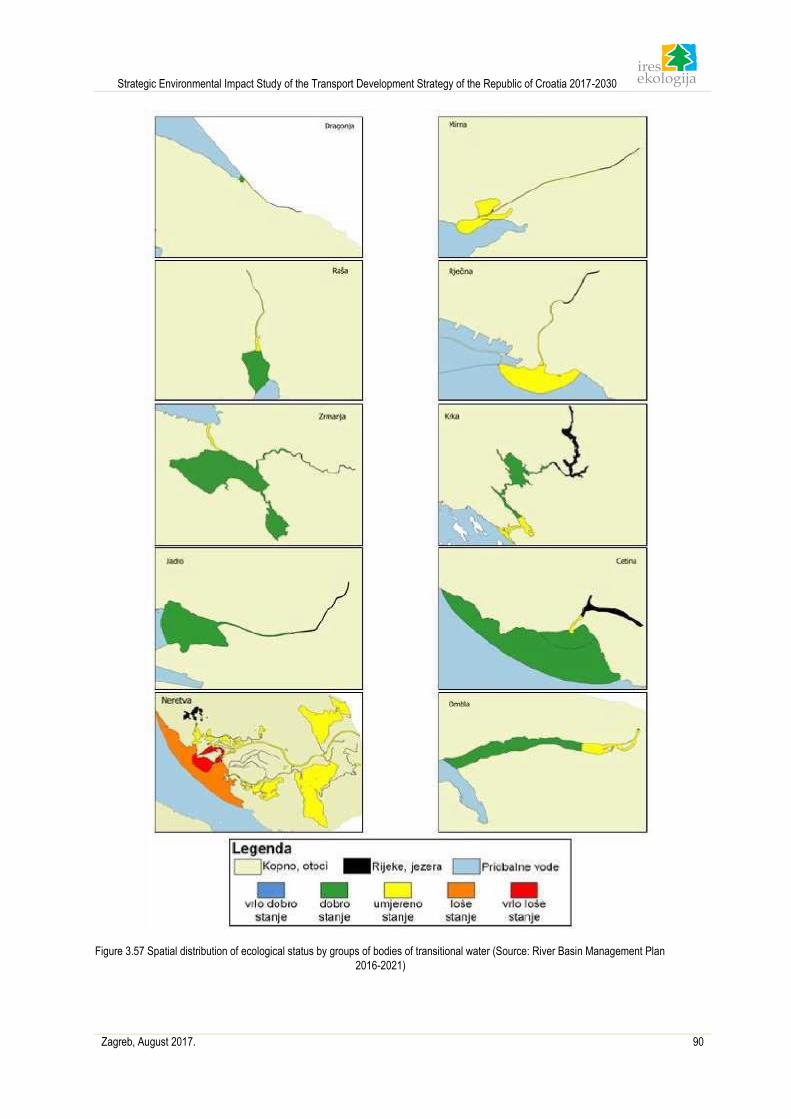
Strategic Environmental Impact Study of the Transport Development Strategy of the Republic of Croatia 2017-2030
Zagreb, August 2017. 90
Figure 3.57 Spatial distribution of ecological status by groups of bodies of transitional water (Source: River Basin Management Plan
2016-2021)
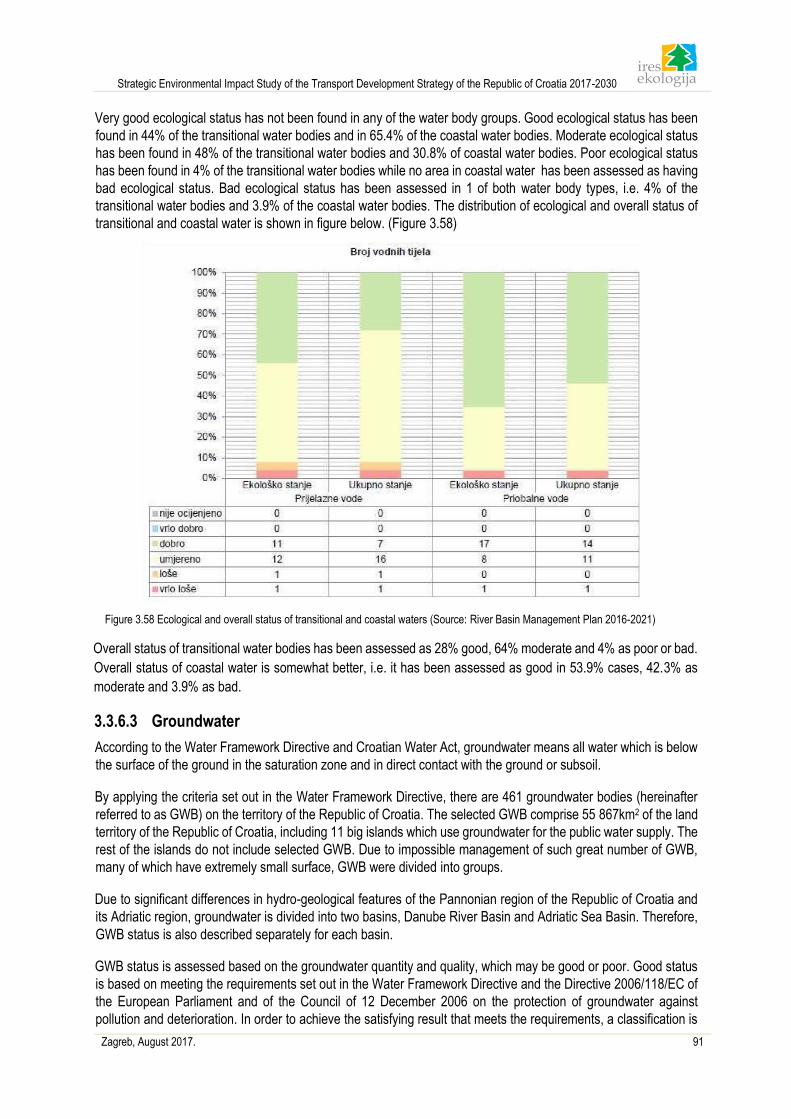
Strategic Environmental Impact Study of the Transport Development Strategy of the Republic of Croatia 2017-2030
Zagreb, August 2017. 91
Very good ecological status has not been found in any of the water body groups. Good ecological status has been
found in 44% of the transitional water bodies and in 65.4% of the coastal water bodies. Moderate ecological status
has been found in 48% of the transitional water bodies and 30.8% of coastal water bodies. Poor ecological status
has been found in 4% of the transitional water bodies while no area in coastal water has been assessed as having
bad ecological status. Bad ecological status has been assessed in 1 of both water body types, i.e. 4% of the
transitional water bodies and 3.9% of the coastal water bodies. The distribution of ecological and overall status of
transitional and coastal water is shown in figure below. (Figure 3.58)
Figure 3.58 Ecological and overall status of transitional and coastal waters (Source: River Basin Management Plan 2016-2021)
Overall status of transitional water bodies has been assessed as 28% good, 64% moderate and 4% as poor or bad.
Overall status of coastal water is somewhat better, i.e. it has been assessed as good in 53.9% cases, 42.3% as
moderate and 3.9% as bad.
3.3.6.3 Groundwater
According to the Water Framework Directive and Croatian Water Act, groundwater means all water which is below
the surface of the ground in the saturation zone and in direct contact with the ground or subsoil.
By applying the criteria set out in the Water Framework Directive, there are 461 groundwater bodies (hereinafter
referred to as GWB) on the territory of the Republic of Croatia. The selected GWB comprise 55 867km2 of the land
territory of the Republic of Croatia, including 11 big islands which use groundwater for the public water supply. The
rest of the islands do not include selected GWB. Due to impossible management of such great number of GWB,
many of which have extremely small surface, GWB were divided into groups.
Due to significant differences in hydro-geological features of the Pannonian region of the Republic of Croatia and
its Adriatic region, groundwater is divided into two basins, Danube River Basin and Adriatic Sea Basin. Therefore,
GWB status is also described separately for each basin.
GWB status is assessed based on the groundwater quantity and quality, which may be good or poor. Good status
is based on meeting the requirements set out in the Water Framework Directive and the Directive 2006/118/EC of
the European Parliament and of the Council of 12 December 2006 on the protection of groundwater against
pollution and deterioration. In order to achieve the satisfying result that meets the requirements, a classification is
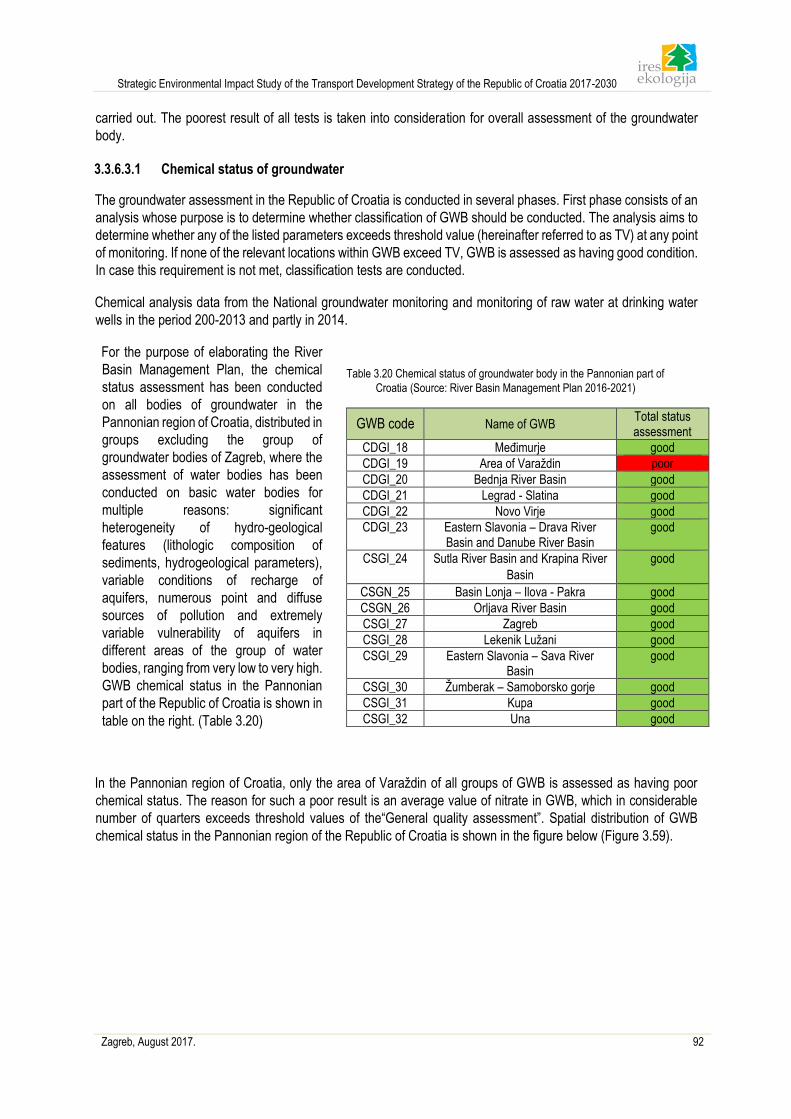
Strategic Environmental Impact Study of the Transport Development Strategy of the Republic of Croatia 2017-2030
Zagreb, August 2017. 92
carried out. The poorest result of all tests is taken into consideration for overall assessment of the groundwater
body.
3.3.6.3.1 Chemical status of groundwater
The groundwater assessment in the Republic of Croatia is conducted in several phases. First phase consists of an
analysis whose purpose is to determine whether classification of GWB should be conducted. The analysis aims to
determine whether any of the listed parameters exceeds threshold value (hereinafter referred to as TV) at any point
of monitoring. If none of the relevant locations within GWB exceed TV, GWB is assessed as having good condition.
In case this requirement is not met, classification tests are conducted.
Chemical analysis data from the National groundwater monitoring and monitoring of raw water at drinking water
wells in the period 200-2013 and partly in 2014.
For the purpose of elaborating the River
Basin Management Plan, the chemical
status assessment has been conducted
on all bodies of groundwater in the
Pannonian region of Croatia, distributed in
groups excluding the group of
groundwater bodies of Zagreb, where the
assessment of water bodies has been
conducted on basic water bodies for
multiple reasons: significant
heterogeneity of hydro-geological
features (lithologic composition of
sediments, hydrogeological parameters),
variable conditions of recharge of
aquifers, numerous point and diffuse
sources of pollution and extremely
variable vulnerability of aquifers in
different areas of the group of water
bodies, ranging from very low to very high.
GWB chemical status in the Pannonian
part of the Republic of Croatia is shown in
table on the right. (Table 3.20)
Table 3.20 Chemical status of groundwater body in the Pannonian part of
Croatia (Source: River Basin Management Plan 2016-2021)
GWB code Name of GWB Total status assessment
CDGI_18 Međimurje good
CDGI_19 Area of Varaždin poor
CDGI_20 Bednja River Basin good
CDGI_21 Legrad - Slatina good
CDGI_22 Novo Virje good
CDGI_23 Eastern Slavonia – Drava River Basin and Danube River Basin
good
CSGI_24 Sutla River Basin and Krapina River
Basin
good
CSGN_25 Basin Lonja – Ilova - Pakra good
CSGN_26 Orljava River Basin good
CSGI_27 Zagreb good
CSGI_28 Lekenik Lužani good
CSGI_29 Eastern Slavonia – Sava River Basin
good
CSGI_30 Žumberak – Samoborsko gorje good
CSGI_31 Kupa good
CSGI_32 Una good
In the Pannonian region of Croatia, only the area of Varaždin of all groups of GWB is assessed as having poor
chemical status. The reason for such a poor result is an average value of nitrate in GWB, which in considerable
number of quarters exceeds threshold values of the“General quality assessment”. Spatial distribution of GWB
chemical status in the Pannonian region of the Republic of Croatia is shown in the figure below (Figure 3.59).
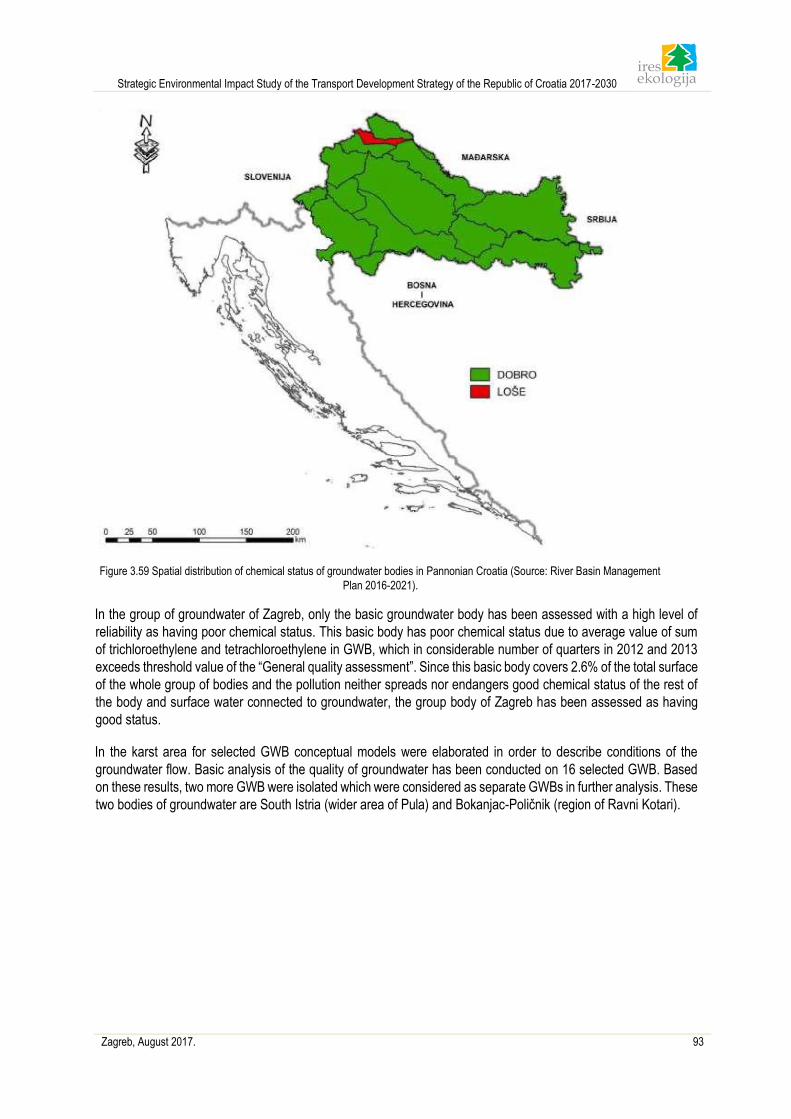
Strategic Environmental Impact Study of the Transport Development Strategy of the Republic of Croatia 2017-2030
Zagreb, August 2017. 93
Figure 3.59 Spatial distribution of chemical status of groundwater bodies in Pannonian Croatia (Source: River Basin Management
Plan 2016-2021).
In the group of groundwater of Zagreb, only the basic groundwater body has been assessed with a high level of
reliability as having poor chemical status. This basic body has poor chemical status due to average value of sum
of trichloroethylene and tetrachloroethylene in GWB, which in considerable number of quarters in 2012 and 2013
exceeds threshold value of the “General quality assessment”. Since this basic body covers 2.6% of the total surface
of the whole group of bodies and the pollution neither spreads nor endangers good chemical status of the rest of
the body and surface water connected to groundwater, the group body of Zagreb has been assessed as having
good status.
In the karst area for selected GWB conceptual models were elaborated in order to describe conditions of the
groundwater flow. Basic analysis of the quality of groundwater has been conducted on 16 selected GWB. Based
on these results, two more GWB were isolated which were considered as separate GWBs in further analysis. These
two bodies of groundwater are South Istria (wider area of Pula) and Bokanjac-Poličnik (region of Ravni Kotari).
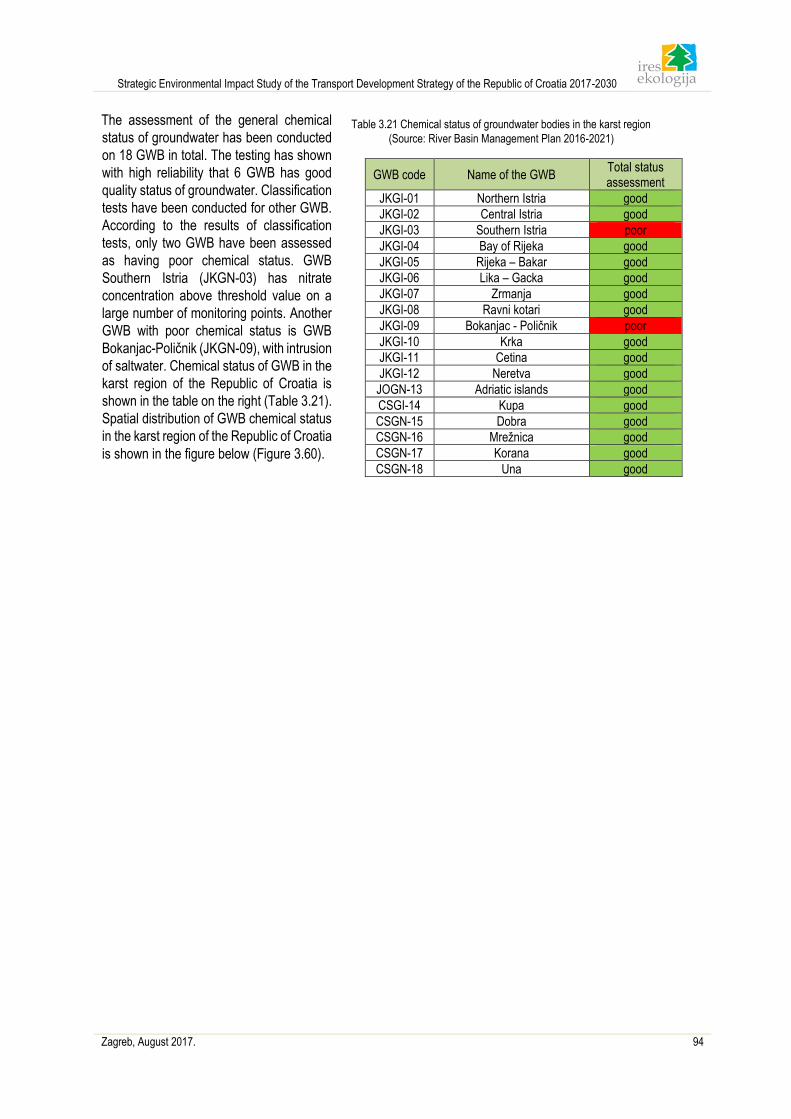
Strategic Environmental Impact Study of the Transport Development Strategy of the Republic of Croatia 2017-2030
Zagreb, August 2017. 94
The assessment of the general chemical
status of groundwater has been conducted
on 18 GWB in total. The testing has shown
with high reliability that 6 GWB has good
quality status of groundwater. Classification
tests have been conducted for other GWB.
According to the results of classification
tests, only two GWB have been assessed
as having poor chemical status. GWB
Southern Istria (JKGN-03) has nitrate
concentration above threshold value on a
large number of monitoring points. Another
GWB with poor chemical status is GWB
Bokanjac-Poličnik (JKGN-09), with intrusion
of saltwater. Chemical status of GWB in the
karst region of the Republic of Croatia is
shown in the table on the right (Table 3.21).
Spatial distribution of GWB chemical status
in the karst region of the Republic of Croatia
is shown in the figure below (Figure 3.60).
Table 3.21 Chemical status of groundwater bodies in the karst region
(Source: River Basin Management Plan 2016-2021)
GWB code Name of the GWB Total status assessment
JKGI-01 Northern Istria good
JKGI-02 Central Istria good
JKGI-03 Southern Istria poor
JKGI-04 Bay of Rijeka good
JKGI-05 Rijeka – Bakar good
JKGI-06 Lika – Gacka good
JKGI-07 Zrmanja good
JKGI-08 Ravni kotari good
JKGI-09 Bokanjac - Poličnik poor
JKGI-10 Krka good
JKGI-11 Cetina good
JKGI-12 Neretva good
JOGN-13 Adriatic islands good
CSGI-14 Kupa good
CSGN-15 Dobra good
CSGN-16 Mrežnica good
CSGN-17 Korana good
CSGN-18 Una good
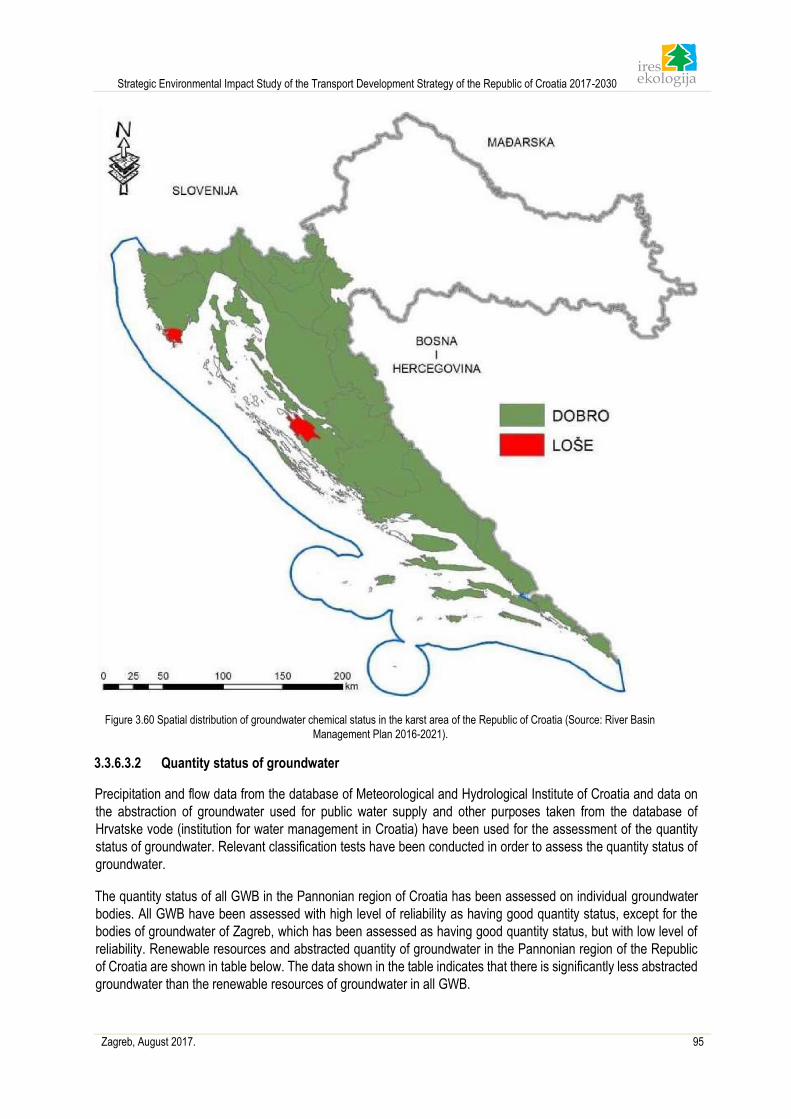
Strategic Environmental Impact Study of the Transport Development Strategy of the Republic of Croatia 2017-2030
Zagreb, August 2017. 95
Figure 3.60 Spatial distribution of groundwater chemical status in the karst area of the Republic of Croatia (Source: River Basin
Management Plan 2016-2021).
3.3.6.3.2 Quantity status of groundwater
Precipitation and flow data from the database of Meteorological and Hydrological Institute of Croatia and data on
the abstraction of groundwater used for public water supply and other purposes taken from the database of
Hrvatske vode (institution for water management in Croatia) have been used for the assessment of the quantity
status of groundwater. Relevant classification tests have been conducted in order to assess the quantity status of
groundwater.
The quantity status of all GWB in the Pannonian region of Croatia has been assessed on individual groundwater
bodies. All GWB have been assessed with high level of reliability as having good quantity status, except for the
bodies of groundwater of Zagreb, which has been assessed as having good quantity status, but with low level of
reliability. Renewable resources and abstracted quantity of groundwater in the Pannonian region of the Republic
of Croatia are shown in table below. The data shown in the table indicates that there is significantly less abstracted
groundwater than the renewable resources of groundwater in all GWB.
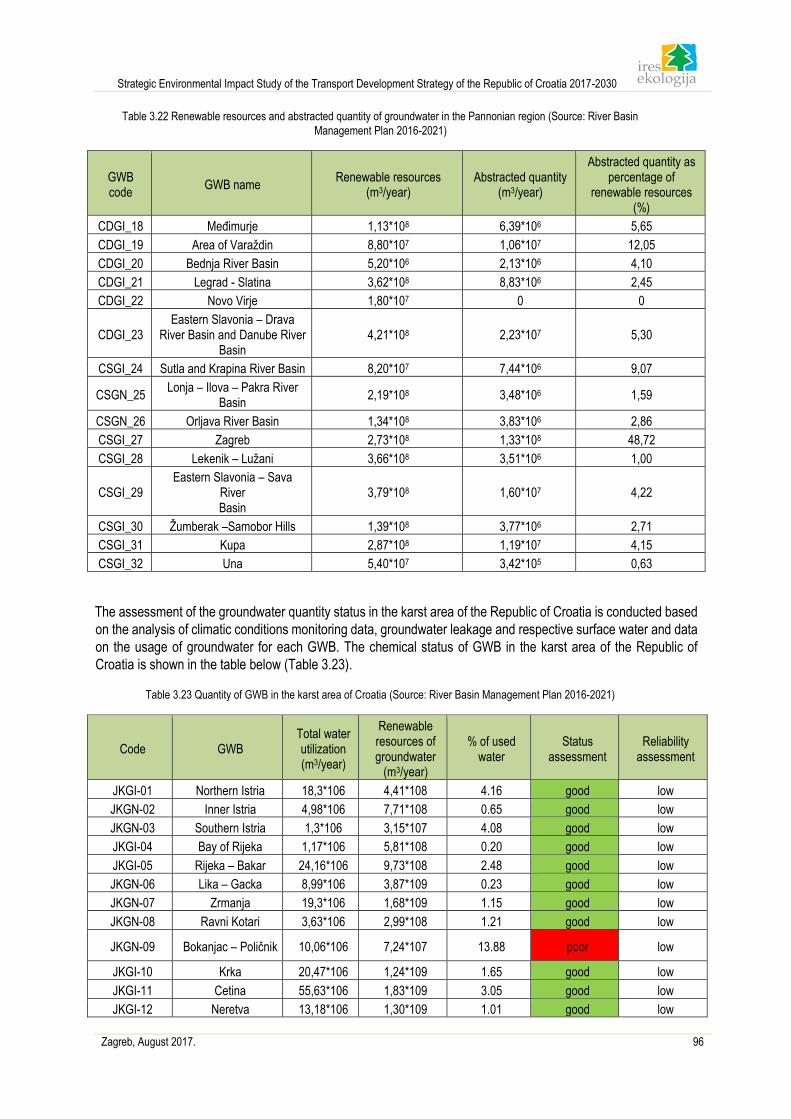
Strategic Environmental Impact Study of the Transport Development Strategy of the Republic of Croatia 2017-2030
Zagreb, August 2017. 96
Table 3.22 Renewable resources and abstracted quantity of groundwater in the Pannonian region (Source: River Basin
Management Plan 2016-2021)
GWB code
GWB name Renewable resources
(m3/year) Abstracted quantity
(m3/year)
Abstracted quantity as percentage of
renewable resources (%)
CDGI_18 Međimurje 1,13*108 6,39*106 5,65
CDGI_19 Area of Varaždin 8,80*107 1,06*107 12,05
CDGI_20 Bednja River Basin 5,20*106 2,13*106 4,10
CDGI_21 Legrad - Slatina 3,62*108 8,83*106 2,45
CDGI_22 Novo Virje 1,80*107 0 0
CDGI_23 Eastern Slavonia – Drava
River Basin and Danube River Basin
4,21*108 2,23*107 5,30
CSGI_24 Sutla and Krapina River Basin 8,20*107 7,44*106 9,07
CSGN_25 Lonja – Ilova – Pakra River
Basin 2,19*108 3,48*106 1,59
CSGN_26 Orljava River Basin 1,34*108 3,83*106 2,86
CSGI_27 Zagreb 2,73*108 1,33*108 48,72
CSGI_28 Lekenik – Lužani 3,66*108 3,51*106 1,00
CSGI_29 Eastern Slavonia – Sava
River Basin
3,79*108 1,60*107 4,22
CSGI_30 Žumberak –Samobor Hills 1,39*108 3,77*106 2,71
CSGI_31 Kupa 2,87*108 1,19*107 4,15
CSGI_32 Una 5,40*107 3,42*105 0,63
The assessment of the groundwater quantity status in the karst area of the Republic of Croatia is conducted based
on the analysis of climatic conditions monitoring data, groundwater leakage and respective surface water and data
on the usage of groundwater for each GWB. The chemical status of GWB in the karst area of the Republic of
Croatia is shown in the table below (Table 3.23).
Table 3.23 Quantity of GWB in the karst area of Croatia (Source: River Basin Management Plan 2016-2021)
Code GWB Total water utilization (m3/year)
Renewable resources of groundwater
(m3/year)
% of used water
Status assessment
Reliability assessment
JKGI-01 Northern Istria 18,3*106 4,41*108 4.16 good low
JKGN-02 Inner Istria 4,98*106 7,71*108 0.65 good low
JKGN-03 Southern Istria 1,3*106 3,15*107 4.08 good low
JKGI-04 Bay of Rijeka 1,17*106 5,81*108 0.20 good low
JKGI-05 Rijeka – Bakar 24,16*106 9,73*108 2.48 good low
JKGN-06 Lika – Gacka 8,99*106 3,87*109 0.23 good low
JKGN-07 Zrmanja 19,3*106 1,68*109 1.15 good low
JKGN-08 Ravni Kotari 3,63*106 2,99*108 1.21 good low
JKGN-09 Bokanjac – Poličnik 10,06*106 7,24*107 13.88 poor low
JKGI-10 Krka 20,47*106 1,24*109 1.65 good low
JKGI-11 Cetina 55,63*106 1,83*109 3.05 good low
JKGI-12 Neretva 13,18*106 1,30*109 1.01 good low
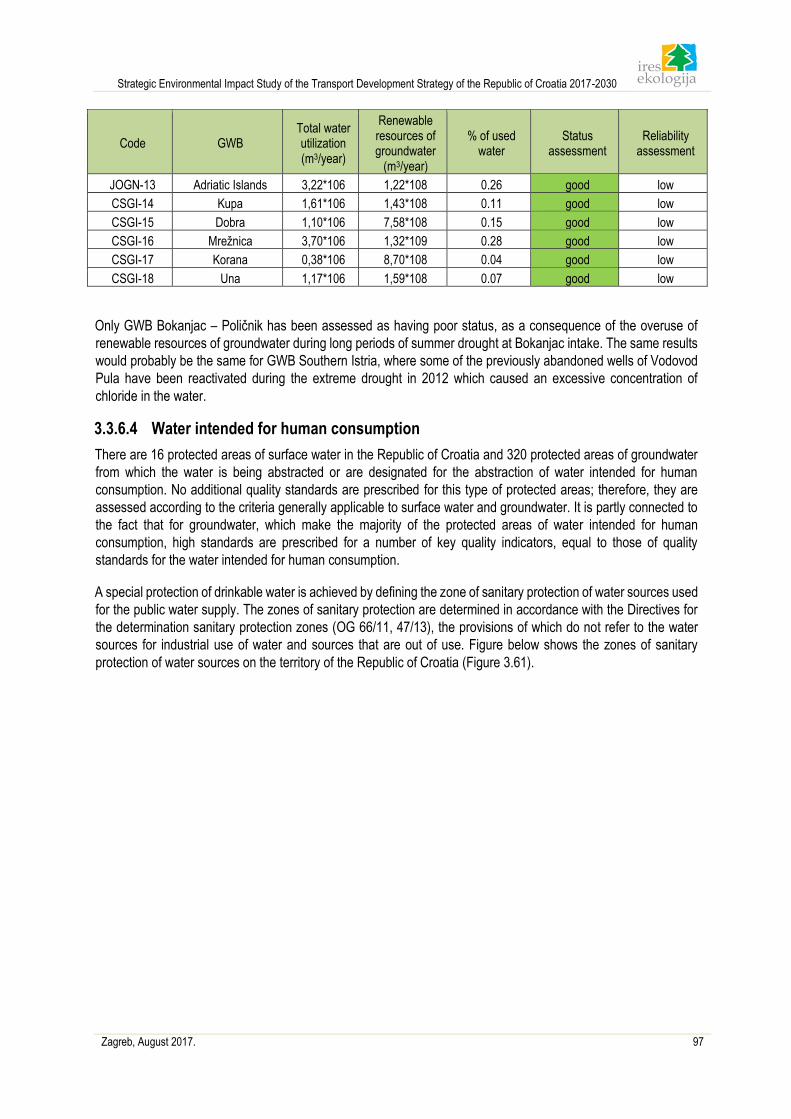
Strategic Environmental Impact Study of the Transport Development Strategy of the Republic of Croatia 2017-2030
Zagreb, August 2017. 97
Code GWB Total water utilization (m3/year)
Renewable resources of groundwater
(m3/year)
% of used water
Status assessment
Reliability assessment
JOGN-13 Adriatic Islands 3,22*106 1,22*108 0.26 good low
CSGI-14 Kupa 1,61*106 1,43*108 0.11 good low
CSGI-15 Dobra 1,10*106 7,58*108 0.15 good low
CSGI-16 Mrežnica 3,70*106 1,32*109 0.28 good low
CSGI-17 Korana 0,38*106 8,70*108 0.04 good low
CSGI-18 Una 1,17*106 1,59*108 0.07 good low
Only GWB Bokanjac – Poličnik has been assessed as having poor status, as a consequence of the overuse of
renewable resources of groundwater during long periods of summer drought at Bokanjac intake. The same results
would probably be the same for GWB Southern Istria, where some of the previously abandoned wells of Vodovod
Pula have been reactivated during the extreme drought in 2012 which caused an excessive concentration of
chloride in the water.
3.3.6.4 Water intended for human consumption
There are 16 protected areas of surface water in the Republic of Croatia and 320 protected areas of groundwater
from which the water is being abstracted or are designated for the abstraction of water intended for human
consumption. No additional quality standards are prescribed for this type of protected areas; therefore, they are
assessed according to the criteria generally applicable to surface water and groundwater. It is partly connected to
the fact that for groundwater, which make the majority of the protected areas of water intended for human
consumption, high standards are prescribed for a number of key quality indicators, equal to those of quality
standards for the water intended for human consumption.
A special protection of drinkable water is achieved by defining the zone of sanitary protection of water sources used
for the public water supply. The zones of sanitary protection are determined in accordance with the Directives for
the determination sanitary protection zones (OG 66/11, 47/13), the provisions of which do not refer to the water
sources for industrial use of water and sources that are out of use. Figure below shows the zones of sanitary
protection of water sources on the territory of the Republic of Croatia (Figure 3.61).
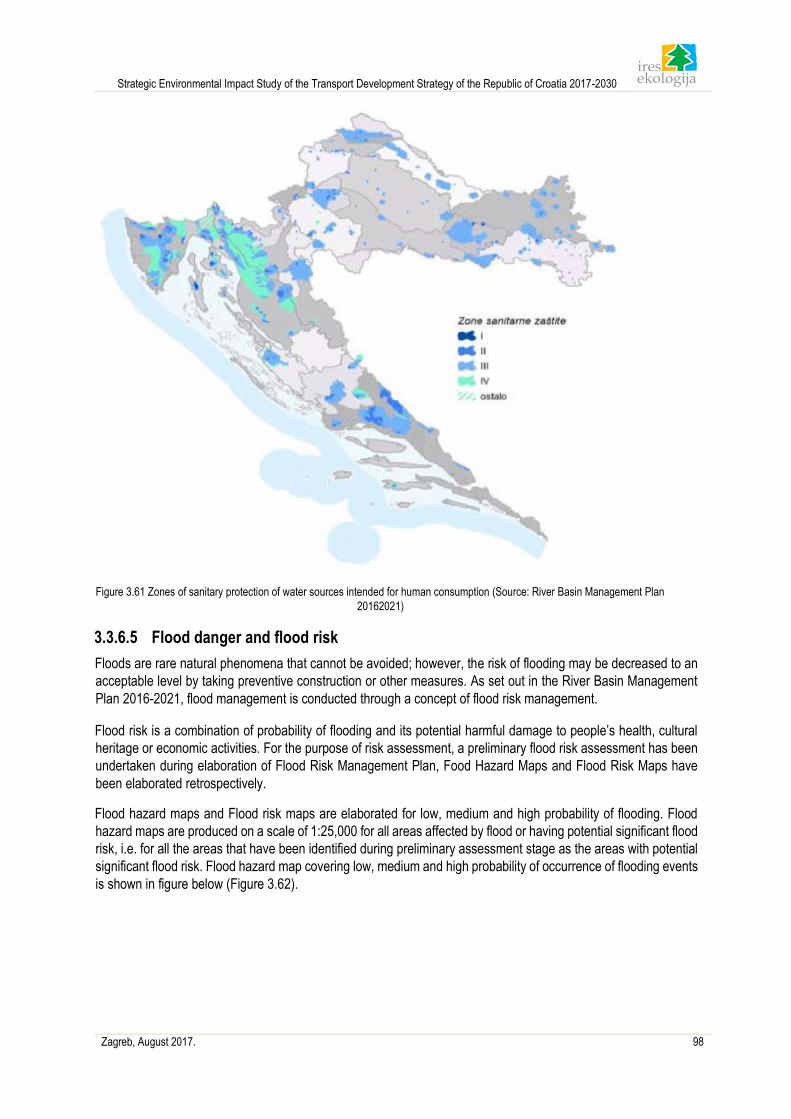
Strategic Environmental Impact Study of the Transport Development Strategy of the Republic of Croatia 2017-2030
Zagreb, August 2017. 98
Figure 3.61 Zones of sanitary protection of water sources intended for human consumption (Source: River Basin Management Plan
20162021)
3.3.6.5 Flood danger and flood risk
Floods are rare natural phenomena that cannot be avoided; however, the risk of flooding may be decreased to an
acceptable level by taking preventive construction or other measures. As set out in the River Basin Management
Plan 2016-2021, flood management is conducted through a concept of flood risk management.
Flood risk is a combination of probability of flooding and its potential harmful damage to people’s health, cultural
heritage or economic activities. For the purpose of risk assessment, a preliminary flood risk assessment has been
undertaken during elaboration of Flood Risk Management Plan, Food Hazard Maps and Flood Risk Maps have
been elaborated retrospectively.
Flood hazard maps and Flood risk maps are elaborated for low, medium and high probability of flooding. Flood
hazard maps are produced on a scale of 1:25,000 for all areas affected by flood or having potential significant flood
risk, i.e. for all the areas that have been identified during preliminary assessment stage as the areas with potential
significant flood risk. Flood hazard map covering low, medium and high probability of occurrence of flooding events
is shown in figure below (Figure 3.62).
Strategic Environmental Impact Study of the Transport Development Strategy of the Republic of Croatia 2017-2030
Zagreb, August 2017. 99
Figure 3.62 Flood Hazard Map with low, medium and high probability of occurrence of flooding event (Source: River Basin
Management Plan 2016-2021)
Flood lines defined on the Flood Hazard and Flood Risk Maps show that potential significant flood risk is present
on 6.2 % of the land territory of the Republic of Croatia in case of high probability of occurrence of flooding events,
on around 8.1% of the territory for medium probability of flooding and on 17.1 % of the territory for low probability
of flooding events. As for the river basins, Danube River Basin is at considerably larger danger of flooding than the
Adriatic basin. Taking into account floods with low probability of occurrence, one fourth of the Danube River Basin
is at flood hazard, while only 3.9 % of the Adriatic Basin faces the same hazard. The surfaces of flooded areas for
three scenarios of probability of occurrence of flooding event are shown in table below (Table 3.24).
Table 3.24 Surface of flooded areas for three scenarios according to elaborated Flood Hazard Maps (Source: River Basin
Management Plan 2016-2021).
Low probability Medium
probability High probability
Land and islands
total
Adriaic Basin km2 829 534 286 21.445
% 3.9% 2.5% 1.3% 100.0%
Danube River Basin km2 8.818 4.049 3.218 35.117
% 25.1% 11.5% 9.2% 100.0%
Strategic Environmental Impact Study of the Transport Development Strategy of the Republic of Croatia 2017-2030
Zagreb, August 2017. 100
Sava River Sub-basin km2 5.341 2.209 1.820 26.764
% 20.0% 8.3% 6.8% 100.0%
Drava and Danube River Sub-basin km2 3.477 1.840 1.398 9.363
% 37.2% 19.7% 14.9% 100.0%
Republic of Croatia km2 9.646 4.583 3.503 56.562
% 17.1% 8.1% 6.2% 100.0%
Flood Risk Maps show potential harmful damage in the areas for which flood hazard maps have been preliminarily
elaborated for the analyzed scenarios (low, medium and high probability of flooding event) taking the following into
account:
• indicative number of inhabitants potentially affected by flooding
• type of potentially affected economic activities in the area
• industrial facilities and equipment that may cause accidental pollution in case of flood and potentially
affect protected areas and
• other information
Flood Risk Maps are produced at 1:25.000 scale and are publicly available on a website. According to the available
data, Flood Risk Maps contain the following data:
• Number of potentially affected inhabitants by village, displayed in three categories (0-100, 101-1000
and 1001-100000)
• Facilities with considerable number of vulnerable people, such as hospitals, schools, pre-school
facilities, retirement homes
• Economic activities and land cover within the area affected by flood grouped by categories (populated
areas, entrepreneurial zones, sports and recreational facilities, intensive agriculture, other agricultural
activities, forests and low vegetation, marsh zones and poor vegetation, water surfaces)
• Different infrastructures such as water intakes, airports, railway and bus stations, substation,
railroads, dams, motorways, other roads (data taken from authorities and/or collected from public data
sources)
• Protected areas such as national parks, protected natural valuables (areas for preservation of species
and habitat types, drinking water protected areas and bathing areas) and possible significant
pollutants such as industrial facilities, landfill sites and water treatment plants
• Cultural heritage and sights (areas under the protection of UNESCO).
Strategic Environmental Impact Study of the Transport Development Strategy of the Republic of Croatia 2017-2030
Zagreb, August 2017. 101
3.3.7 Cultural and historical heritage Representation and proximity of architectural heritage (individual structures and cultural and historical
complexes, cultural landscapes), archaeological zones and sites listed in the Register of cultural goods of
the Republic of Croatia and recorded physical planning documents within the scope of the Strategy
Croatia is a Mediterranean and Central European country by its geographical and cultural definition. On its territory
there could be found traces and remains of urban and architectural culture dating from prehistoric era, Illyrian hill
forts (6th/5th century B.C.) and first Greek cities in the Adriatic (4th century B.C.), Roman camps and cities, medieval
and renaissance cities, cities dating from the Baroque period or 19th century, and even modern cities of 20th century.
The architectural heritage of Croatia is more than just cultural goods of high value and of national importance and
those inscribed on the UNESCO’s list of cultural heritage, it also consist of modest examples of historical buildings,
urban and rural settlements, archaeological localities and landscapes formed by man. This is a materialized history
that determines the identity of the territory and in this way the cultural heritage of Croatia contributes to European
cultural diversity. Over 2500 years of urban culture and architectural tradition of Croatia mark the autochthony born
from this climate, topographic features of the territory, skills and creation of constructors and social and economic
circumstances.
Rich and various cultural heritage of Croatia is categorized according to the basic division of heritage into tangible
(movable and immovable) and intangible heritage. The most numerous type of immovable cultural heritage, which
is in great measure exposed to the influence of changing purpose and way of use, is an architectural heritage
(individual structures and complexes, cultural and historical settlements, historic parts of settlements, historic
remains of civil engineering, industrial facilities with equipment and similar facilities), cultural landscapes (designed:
gardens and parks; organically developed landscapes and associative cultural landscapes: memorials, historic
events localities) and archaeological zones and sites, including submarine zones and sites.
Archaeological sites are often being discovered during construction work or during recreational diving in case of
submarine sites, while the level of perseverance varies from intact remains to the heavily damaged ones.
Nevertheless, the importance of archaeological sites is of greatest importance to Croatian and world culture and
science. Many of them are inscribed on the World Heritage list or have been recognized by European projects as
localities that have strongly affected the history of civilization during Prehistory and Antiquity, while lately even the
Medieval and New Age localities are being found.
A cultural landscape is a type of immovable cultural heritage having historically characteristic features that witness
human presence in the area, and they represent a piece made both by a man and nature that illustrates the
development of the community and its territory through the course of history. In the Republic of Croatia many
characteristic types of cultural landscapes can be found which make an integral element of its spatial identity. On
this rather small territory of various geomorphologic and microclimate features, diverse cultural landscapes have
been created through the history that can be comparable to the Mediterranean and Central European regions of
Europe. Being a life environment they are subject to changes, frequently deteriorated by the social and
technological development, urbanization and other forms of construction, but also due to abandonment or
inappropriate use. In many areas of Croatia there are historical cultural landscapes that have preserved traditional
spatial relations, historical patterns and way of use (rural landscapes of Lonja field, Žumberak, central Istria, karst
fields of Dinaric Alps, Gorski kotar, Neretva valley, some parts of coastal Croatia, off-shore islands etc.) Only one
area of the cultural landscape has so far been preventively protected in Croatia: Žumberak – Samoborsko gorje –
Plješivičko prigorje.
Other types of heritage, such as movable heritage (museum collections, gallery collections, library collections and
other collections in public or private institutions, church inventory, archives, pieces of art, applied arts, design arts,
ethnographic objects, old and rare books, money, objects in use) and intangible cultural heritage (various forms of
spiritual creation, languages, dialects, oral literature, folklore creations and other traditional folk valuables,
traditional arts and crafts) are less exposed to physical influence of development and application of modern
technology.
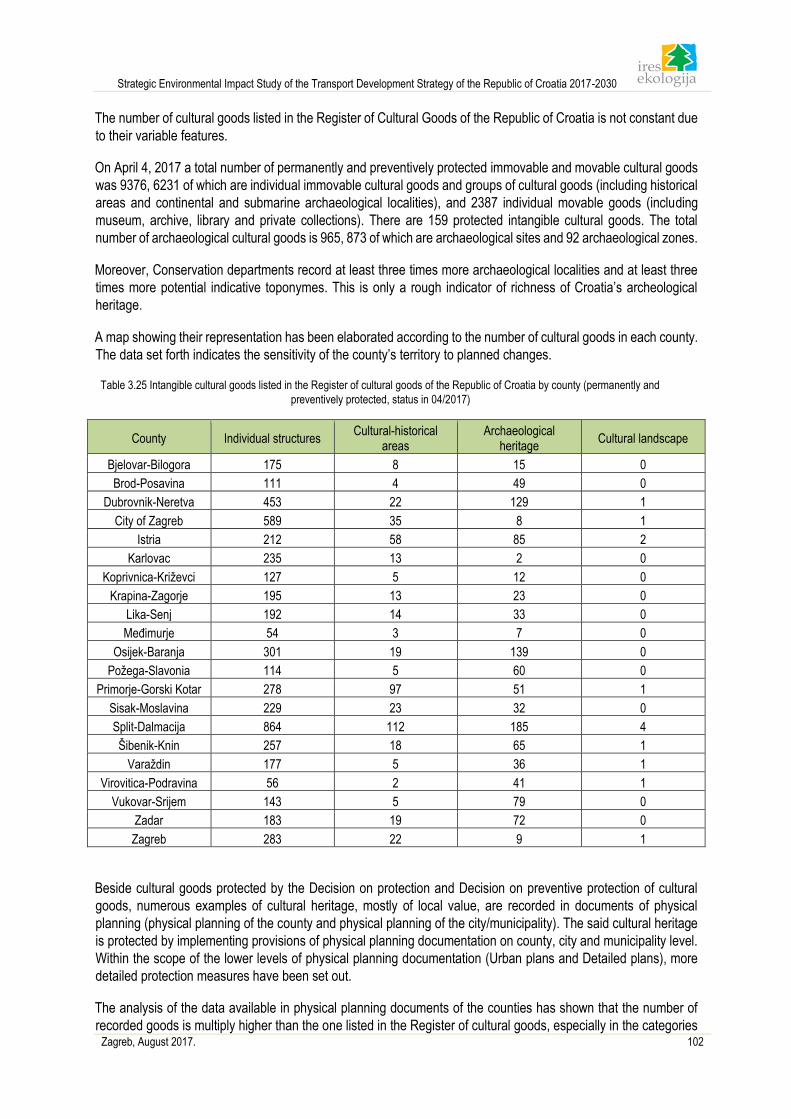
Strategic Environmental Impact Study of the Transport Development Strategy of the Republic of Croatia 2017-2030
Zagreb, August 2017. 102
The number of cultural goods listed in the Register of Cultural Goods of the Republic of Croatia is not constant due
to their variable features.
On April 4, 2017 a total number of permanently and preventively protected immovable and movable cultural goods
was 9376, 6231 of which are individual immovable cultural goods and groups of cultural goods (including historical
areas and continental and submarine archaeological localities), and 2387 individual movable goods (including
museum, archive, library and private collections). There are 159 protected intangible cultural goods. The total
number of archaeological cultural goods is 965, 873 of which are archaeological sites and 92 archaeological zones.
Moreover, Conservation departments record at least three times more archaeological localities and at least three
times more potential indicative toponymes. This is only a rough indicator of richness of Croatia’s archeological
heritage.
A map showing their representation has been elaborated according to the number of cultural goods in each county.
The data set forth indicates the sensitivity of the county’s territory to planned changes.
Table 3.25 Intangible cultural goods listed in the Register of cultural goods of the Republic of Croatia by county (permanently and
preventively protected, status in 04/2017)
County Individual structures Cultural-historical
areas Archaeological
heritage Cultural landscape
Bjelovar-Bilogora 175 8 15 0
Brod-Posavina 111 4 49 0
Dubrovnik-Neretva 453 22 129 1
City of Zagreb 589 35 8 1
Istria 212 58 85 2
Karlovac 235 13 2 0
Koprivnica-Križevci 127 5 12 0
Krapina-Zagorje 195 13 23 0
Lika-Senj 192 14 33 0
Međimurje 54 3 7 0
Osijek-Baranja 301 19 139 0
Požega-Slavonia 114 5 60 0
Primorje-Gorski Kotar 278 97 51 1
Sisak-Moslavina 229 23 32 0
Split-Dalmacija 864 112 185 4
Šibenik-Knin 257 18 65 1
Varaždin 177 5 36 1
Virovitica-Podravina 56 2 41 1
Vukovar-Srijem 143 5 79 0
Zadar 183 19 72 0
Zagreb 283 22 9 1
Beside cultural goods protected by the Decision on protection and Decision on preventive protection of cultural
goods, numerous examples of cultural heritage, mostly of local value, are recorded in documents of physical
planning (physical planning of the county and physical planning of the city/municipality). The said cultural heritage
is protected by implementing provisions of physical planning documentation on county, city and municipality level.
Within the scope of the lower levels of physical planning documentation (Urban plans and Detailed plans), more
detailed protection measures have been set out.
The analysis of the data available in physical planning documents of the counties has shown that the number of
recorded goods is multiply higher than the one listed in the Register of cultural goods, especially in the categories
Strategic Environmental Impact Study of the Transport Development Strategy of the Republic of Croatia 2017-2030
Zagreb, August 2017. 103
of cultural-historical areas – rural settlements and archaeological localities. It should be mentioned that, apart in
Spatial planning documentation, a great number of archaeological sites is recorded and recognized during the
elaboration of the study on environmental impact and through archaeological research conducted prior to large
infrastructure projects: construction of traffic, energetic and communal infrastructure and other construction
projects. Archaeological site recording is being conducted regularly by museums, archaeological institutions and
Conservatory Departments.
3.3.8 Agriculture
3.3.8.1 Land of level P1 and level P2 value
Pursuant to Article 20 of the Agricultural Land Act (OG 39/15, 48/15), a study has shown that the land of P1 and
P2 value which represents a valuable land resources should be protected from conversion and should be solely
and exclusively used for agricultural production which is not always possible to achieve. Other types of land,
categorized as P3 (other arable land), N1 (temporary inappropriate land) and N2 (permanently inappropriate land)
are not included in this study since P1 (particularly valuable arable land) and P2 (valuable arable land) are
considered having the greatest value from the economic aspect of agriculture.
Considering the fact that distribution and surface area data of certain land categories are not available in Croatia,
that is, considering the fact that different methods of land evaluation have been used in elaboration of each county’s
physical plans and that these data are not comparable, for the purpose of this Study a data from digital soil map of
the Republic of Croatia have been used.
Land of P1 and P2 value on the territory of the Republic of Croatia are shown in table (Table 3.26) and figure
(Figure 3.63) below.
Table 3.26 Land of P1 and P2 value in the Republic of Croatia (Source: Digital Soil Map of the Republic of Croatia)
Land value Surface (ha) Share in total surface of Croatia (%)
Particularly valuable arable land (P1) 266 715 4.71
Valuable arable land (P2) 805 513 14.23
Particularly valuable arable land (P1) and valuable arable land (P2) are dominant in the Pannonian region of Croatia
and Istria, while there are only few in the region of Dinaric Alps. The fact that in the region of the Dinaric Alps the
number of particularly valuable arable land is extremely low and the number of valuable arable land is low indicates
the need for maximum protection of these lands in accordance with the regulatory requirements from all kinds of
deterioration, especially during conversion of the land.
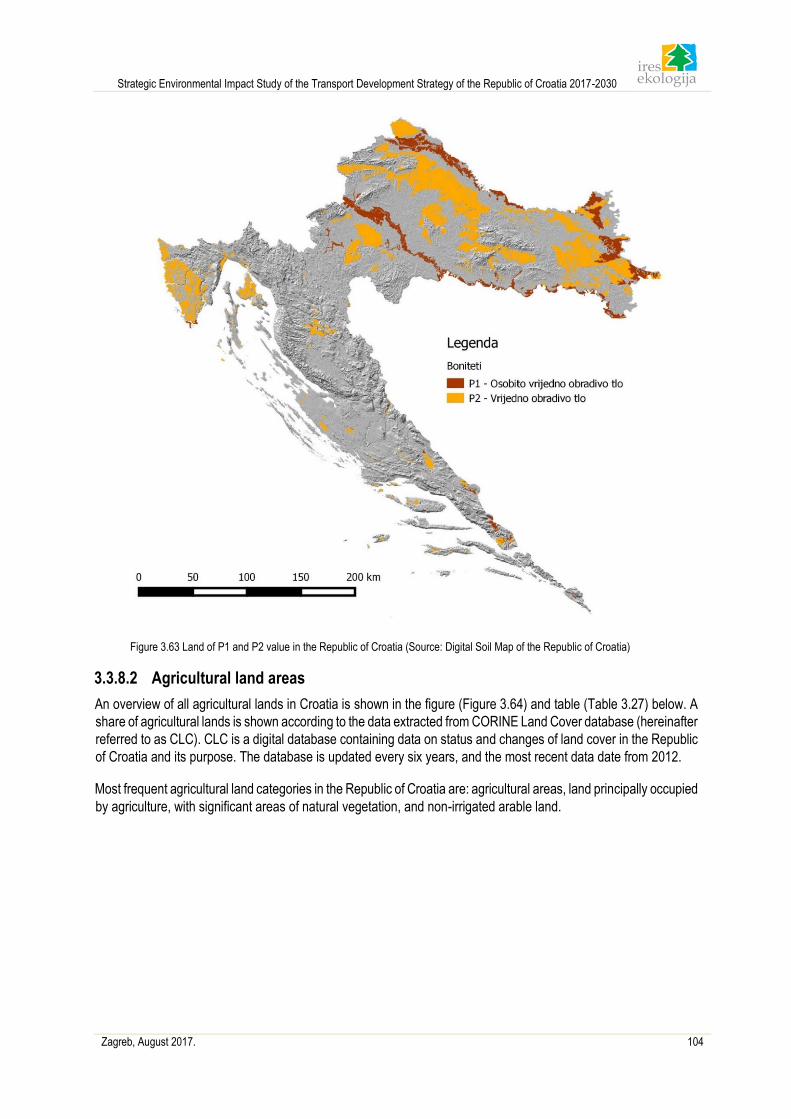
Strategic Environmental Impact Study of the Transport Development Strategy of the Republic of Croatia 2017-2030
Zagreb, August 2017. 104
Figure 3.63 Land of P1 and P2 value in the Republic of Croatia (Source: Digital Soil Map of the Republic of Croatia)
3.3.8.2 Agricultural land areas
An overview of all agricultural lands in Croatia is shown in the figure (Figure 3.64) and table (Table 3.27) below. A
share of agricultural lands is shown according to the data extracted from CORINE Land Cover database (hereinafter
referred to as CLC). CLC is a digital database containing data on status and changes of land cover in the Republic
of Croatia and its purpose. The database is updated every six years, and the most recent data date from 2012.
Most frequent agricultural land categories in the Republic of Croatia are: agricultural areas, land principally occupied
by agriculture, with significant areas of natural vegetation, and non-irrigated arable land.
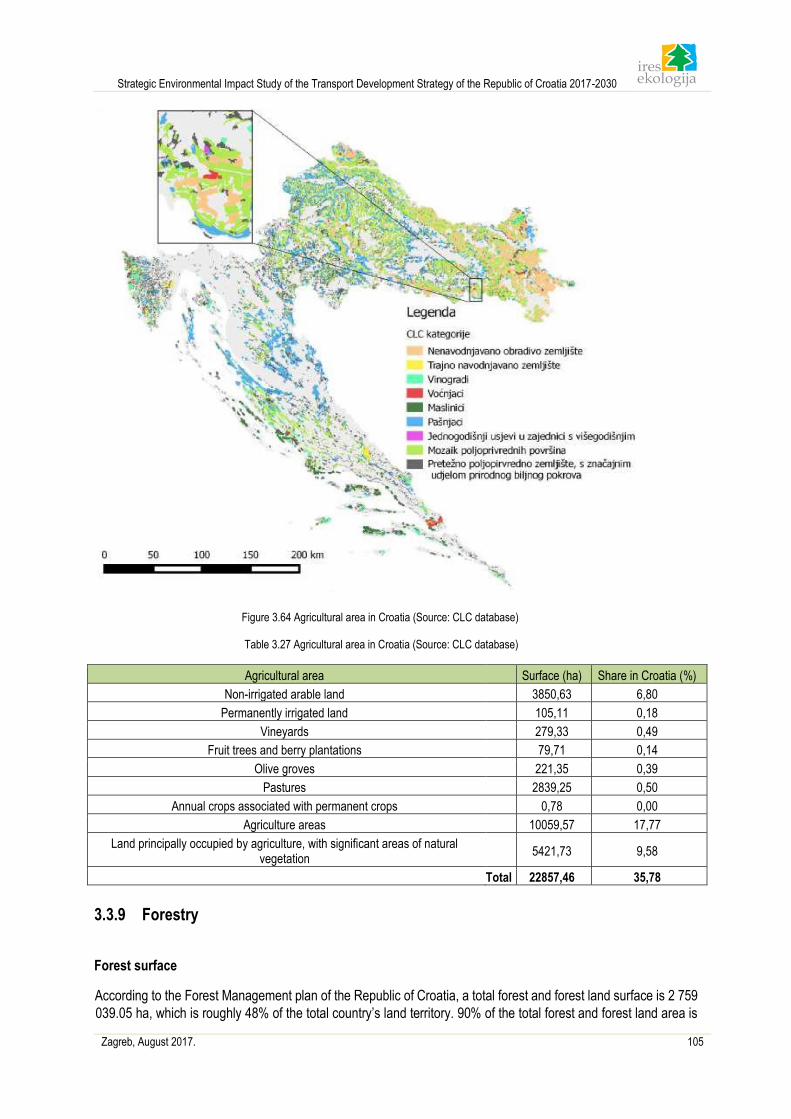
Strategic Environmental Impact Study of the Transport Development Strategy of the Republic of Croatia 2017-2030
Zagreb, August 2017. 105
Figure 3.64 Agricultural area in Croatia (Source: CLC database)
Table 3.27 Agricultural area in Croatia (Source: CLC database)
Agricultural area Surface (ha) Share in Croatia (%)
Non-irrigated arable land 3850,63 6,80
Permanently irrigated land 105,11 0,18
Vineyards 279,33 0,49
Fruit trees and berry plantations 79,71 0,14
Olive groves 221,35 0,39
Pastures 2839,25 0,50
Annual crops associated with permanent crops 0,78 0,00
Agriculture areas 10059,57 17,77
Land principally occupied by agriculture, with significant areas of natural vegetation
5421,73 9,58
Total 22857,46 35,78
3.3.9 Forestry
Forest surface
According to the Forest Management plan of the Republic of Croatia, a total forest and forest land surface is 2 759
039.05 ha, which is roughly 48% of the total country’s land territory. 90% of the total forest and forest land area is
Strategic Environmental Impact Study of the Transport Development Strategy of the Republic of Croatia 2017-2030
Zagreb, August 2017. 106
covered by forest vegetation, bare productive land covers 7% of the total forest land, bare non-productive land
covers 1% of the area, while infertile forest land covers 1% of the forest area. 76% of the forest area is state-owned,
while the other 24% is the property of the private forest owners. 97% of State forests are managed by the state
forest company Hrvatske šume d.o.o, while the remainder is used by the state administration bodies and legal
persons. Private forests are managed by their owners with the help of the Advisory Service.
Deciduous forests cover 84% and evergreen forest cover 16% of the forest area. The forest vegetation of the
Croatia is divided into continental and Mediterranean part. The continental part is subdivided into 5 zones: lowland,
hilly forests, mountainous forest, high-mountainous and subalpine forests.
The lowland zone comprises the area north of the city of Karlovac, particularly the area between Sava and Drava
rivers. The altitude of this zone ranges 80-150 m, but characteristics of this vegetation zone can be found on higher
altitudes (300-600 m) on the plateau of Lika. The most important tree species are pedunculate oak (Quercus robur),
narrow-leaved ash (Fraxinus angustifolia), black alder (Alnus glutinosa), common hornbeam (Carpinus betulus),
silverleaf poplar and black poplar (Populus alba and Populus nigra) and various species of willow (Salix spp.). The
key environmental factor is water, especially flood water in willow and poplar forests, groundwater (in pedunculate
oak forests) and combination of flood water and groundwater (in narrow-leaved ash and black alder forests). The
most frequent forest types of this area are pedunculate oak flooded forest and broom (Genisto elatae-Quercetum
roboris), black alder forests (Carici elongatae-Alnetum glutinosae in the region of Podravina and Frangulo-Alnetum
glutinosae in the region of Posavina) and narrow-leaved ash forests (Leucoio Fraxinetum and Pruno-Fraxinetum).
In higher and drained areas out of reach of flood water, bur still rather influenced by high groundwater, pedunculate
oak forests and common hornbeam forests have developed (Carpino betuli-Quercetum roboris). The white willow
forests with bedstraw (Galio-Salicetum albae) are common in the region around Danube and the lower stream of
the river Drava. The zone of hilly forests is found at the altitude of 150-500 m. This zone comprises hills and lower
parts of the Pannonian highlands (Medvednica, Ivanščica, Kalnik and highlands of Slavonia), areas south of
Karlovac towards Severin na Kupi and towards Josipdol, border of plateau of Lika and a part of Istria. The most
common tree species are sessile oak (Quercus petraea). Other common tree species are common hornbeam
(Carpinus belutus), sweet chestnut (Castanea sativa), silver birch (Betula pendula), Turkey oak (Quercus cerris),
downy oak (Quercus pubescens), field maple (Acer campestre), wild cherry (Prunus avium), common beech (Fagus
sylvatica). The forest communities belonging to this zone are sessile oak forests and common hornbeam
(Epimedio-Carpinetum betuli), sessile oak forest and sweet chestnut forests (Querco-Castanetum sativae) and
thermophile forests of hop hornbeam and downy oak forests (Ostryo-Quercetum pubescentis). Mountainous forest
can be found in the areas of 350 m of altitude and higher in the Pannonian region or above 600m in Dinaric Alps,
while the upper altitude limit is between 700-900 m. Apart from beech tree, the most common tree species are
sessile oak (Quercus petraea), common hornbeam (Carpinus betulus), wych elm (Ulmus glabra), maple trees (Acer
platanoides and A. pseudoplatanus) and common ash (Fraxinus excelsior). The forest communities also common
in this zone are beech forests with deadnettle (Lamio-orvalae Fagetum), beech forests of the coastal region
(Seslerio-Fagetum), yew and linden forests (Tilio-Taxetum) and black pine forests (Pinus nigra ssp. illirica).
Mountainous forest zones in Dinaric Alps and Pannonian mountains is present at the altitudes 600 (800)-1100
m, while the can also be found in the lower parts of the northern slopes of Papuk and Medvednica. Virgin forests
i.e. the forests that haven’t been affected by human activities may also be found in this zone such as Čorkova uvala
near Plitvice Lakes, Devčića tavani and Nadžak Bilo in northern Velebit. There are beech trees (Fagus sylvatica)
and silver fir (Albies alba) but also maple trees (Acer platanoides and A. pseudoplatanus), common ash (Fraxinus
excelsior), wych elm (Ulmu glabra). The most common forest communities found here are fir-beech forests (Abieti-
Fagetum) and fir-spruce-beech forests (BlechnoAbietetum). High-mountainous zone covers the area at the altitude
1100-1700 m and includes forest communities in the Dinaric Alps. The most common forest communities here are
pre-alpine beech forests (Homogyno sylvestris-Fagetum), mountain pine forests (Lonicero borbasiane-Pinetum
mugi) and common spruce forests.
Unlike the Mediterranean region, the continental part is characterized by lower temperatures and a sufficient level
of rainfalls during summer months so there are no periods of summer drought. The Mediterranean region consists
Strategic Environmental Impact Study of the Transport Development Strategy of the Republic of Croatia 2017-2030
Zagreb, August 2017. 107
of thermophilic evergreen and deciduous forests of the Adriatic region and can be divided into two zones:
Mediterranean-littoral and Mediterranean-mountainous.
The Mediterranean-littoral zone includes most of the islands, narrow littoral zone and Central and South Dalmatia.
The area is characterized by the evergreen forests of evergreen oak (Quercus ilex) and the forests of Aleppo pine
and black pine (Pinus halepensis and Pinus nigra dalmatica) frequent in steno-Mediterranean and European-
Mediterranean zone. In the littoral zone there are forests of downy oak (Quercus pubescens) that are a part of sub-
Mediterranean zone. Due to longterm human activities in the area, the forest vegetation covers only small areas
and does not have any significant share in the total forest vegetation. The most common vegetation species are
maquis (short and dense shrublands), garrigue (widely spaced bush), karst terrain and karst pastures and small
fragmented arable land. Mediterranean-mountain zone includes vegetation growing in the higher areas of the
Mediterranean region and is directly connected to the sub-Mediterranean vegetation zone. This vegetation is found
on the islands mostly above 400 m (hemimediterranean vegetation zone), while in the continental part the
vegetation is present above 300 m (epimediterranean zone) in northern Adriatic part, or above 600 m in south
Adriatic part. The most common species here is the hop hornbeam (Ostrya carpinifolia). The evergreen oak
(Quercus ilex) is also present. The most common species of the continental part are oriental hornbeam (Carpuni
orientalis), downy oak (Quercus pubescens), Dalmatian black pine (Pinus nigra dalmatica), and silver fir on Biokovo
(Abies alba). Hemimediterranean vegetation zone of evergreen/deciduous forests is common in the highest parts
of Adriatic islands Hvar, Brač, Korčula, Mljet and peninsula Pelješac. This type of forest community has a rather
small area, but a great value due to their biodiversity. Epimediterranean zone of thermophilic deciduous or
evergreen forests are present in the highest zones of the Mediterranean vegetation in Croatia, most common in
northern Istria and southern slopes of Dinaric Alps.
Spatial distribution of the forest vegetation of Croatia is shown in the figure bellow (Figure 3.65). It is observed that
the biggest forest complex are present in western Dinaric Alps (Gorski kotar, Velebit), dominated by beech and fir
forests (around 200 000 ha) in Sava valley with floodplains Spačva and Lonjsko polje with forests of pedunculate
oak, common hornbeam and narrow-leaved ash (around 200 000 ha). The Mediterranean is dominated by forest
communities of maquis (Eumediterranean) or shrubland (submediterranean), while only the smaller area is covered
by well-preserved forests of evergreen oak and black pine.
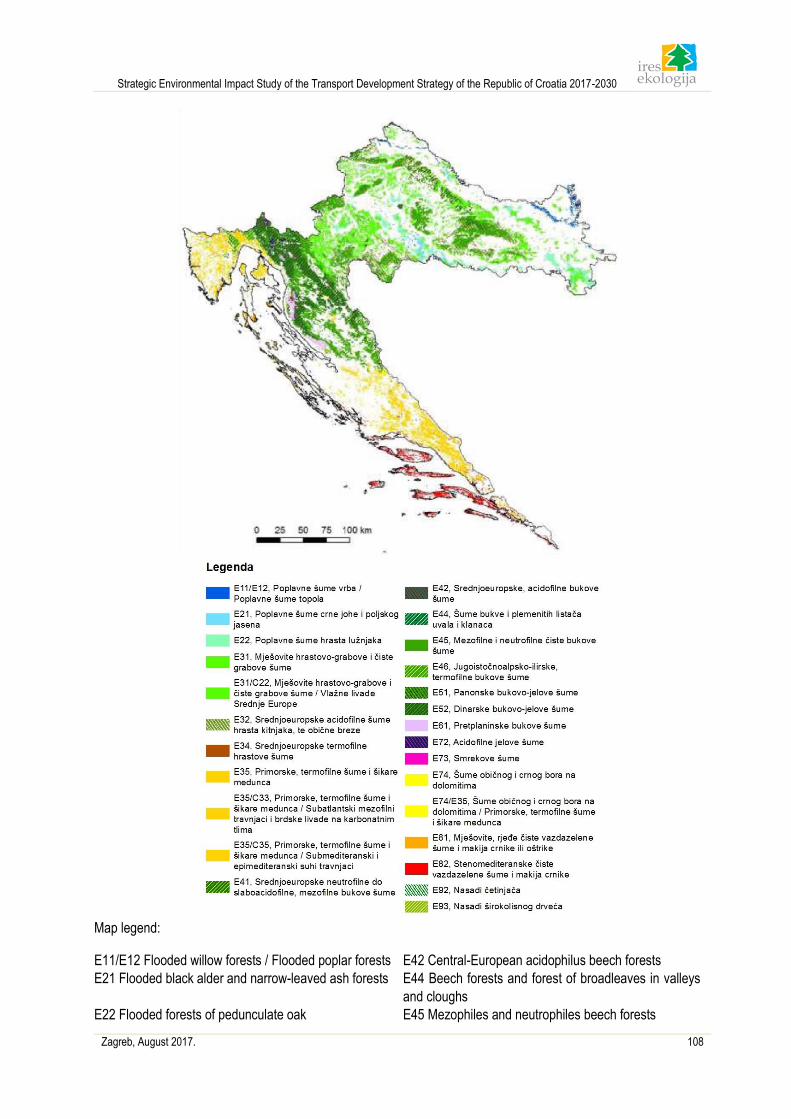
Strategic Environmental Impact Study of the Transport Development Strategy of the Republic of Croatia 2017-2030
Zagreb, August 2017. 108
Map legend:
E11/E12 Flooded willow forests / Flooded poplar forests E42 Central-European acidophilus beech forests
E21 Flooded black alder and narrow-leaved ash forests E44 Beech forests and forest of broadleaves in valleys
and cloughs
E22 Flooded forests of pedunculate oak E45 Mezophiles and neutrophiles beech forests
Strategic Environmental Impact Study of the Transport Development Strategy of the Republic of Croatia 2017-2030
Zagreb, August 2017. 109
E31 Mixed oak-hornbeam forests and hornbeam forests E46 Southeast-Alpine-Illyric thermophilic beech forests
E31/C22 Mixed oak-hornbeam forests and hornbeam
forests / wet meadows of Central Europe
E51 Pannonian beech-fir forests
E32 Central-European acidophilus forests of sessile oak
and silver birch
E52 Dinaric Alps beech-fir forests
E34 Central-European acidophilus oak forests E61 Pre-mountainous beech forests
E35 Littoral, thermophilic forests and downy oak in
shrublands
E72 Acidophilus fir forests
E35/C33 Littoral, thermophilic forest and shrublands of
downy oak / Sub-Atlantic mezophiles meadows and
mountain meadows on carbonate soil
E73 Spruce forests
E35/C35 Littoral, thermophilic forests and shrublands of
downy oak / Sub-Mediterranean and epimediterranean
dry meadows
E74 Forests of common and black pine on dolomite soil
E41 Central-European neutrophile to fairy acidophilus,
mezophiles beech forests
E74/E35 Forests of common and black pine on dolomite
soils / Littoral, thermophile forests and shrublands of
downy oak
E81 Mixed, evergreen forests and maquis of evergreen
oak or kermes oak
E82 Stenomediterranean evergreen forests, maquis and
evergreen oak
E92 Conifers
E93 Broad-leaved trees
Figure 3.65 Habitat Map of the forest vegetation in Croatia (Author: IRES EKOLOGIJA d.o.o.)
Stability of the forest ecosystem
The forests in Croatia are managed by the principles of the sustainable management with the aim to establish a
permanent balance between total biomass production and general benefit from forests by sustaining permanent
productivity of all forest benefits. Sustainable management means that forest and forest lands are being used but
at the same time their biodiversity, productivity, ability to regenerate, vitality and potential are preserved and they
fulfill present and future economic, environmental and social function on a local and global level without doing any
harm to other ecosystems. This means that deforestation never exceeds forestation. A part of increment is
accumulated in wood stocks so the forest cover is always present, while silviculture helps to preserve the natural
structure of forests. Surface share of natural forests in total forest surface is very high, to be exact 95% of our
forests is regenerated in a natural way and deforestation is forbidden by Croatian forest Act (OG 140/05, 82/06,
129/08, 80/10, 124/10, 25/12, 68/12 and 148/13). Moreover, the whole forest area managed by Hrvatske šume
d.o.o. is managed as prescribed by Forest Stewardship Council certificate, which confirms that the forest are
managed in accordance with strict environmental, social and economic standards. The monitoring of forests
through ICP Forest (the International Co-operative program on Assessment and Monitoring of Air Pollution Effects
on Forests) and forecasts on the impact of abiotic and biotic factors are effective and timely way to preserve forests
health. In Croatia, there is a general decrease of concentration of acidic substances which has a positive impact
on forest condition.
From biological and environmental prospective, the condition of Croatian forests is one of the best in Europe. Apart
from the previously mentioned naturality of our forests, they also have a favorable age structure and diversity (ratio
of main and incident tree species). A continuous transition from shrublands (degraded stands) and coppice to seed
plants, which is a result of biological regeneration of forests, conducted in accordance with forest management
plans. Naturality and forests ratio of Croatian forests are shown in the figure below (Figure 3.66).
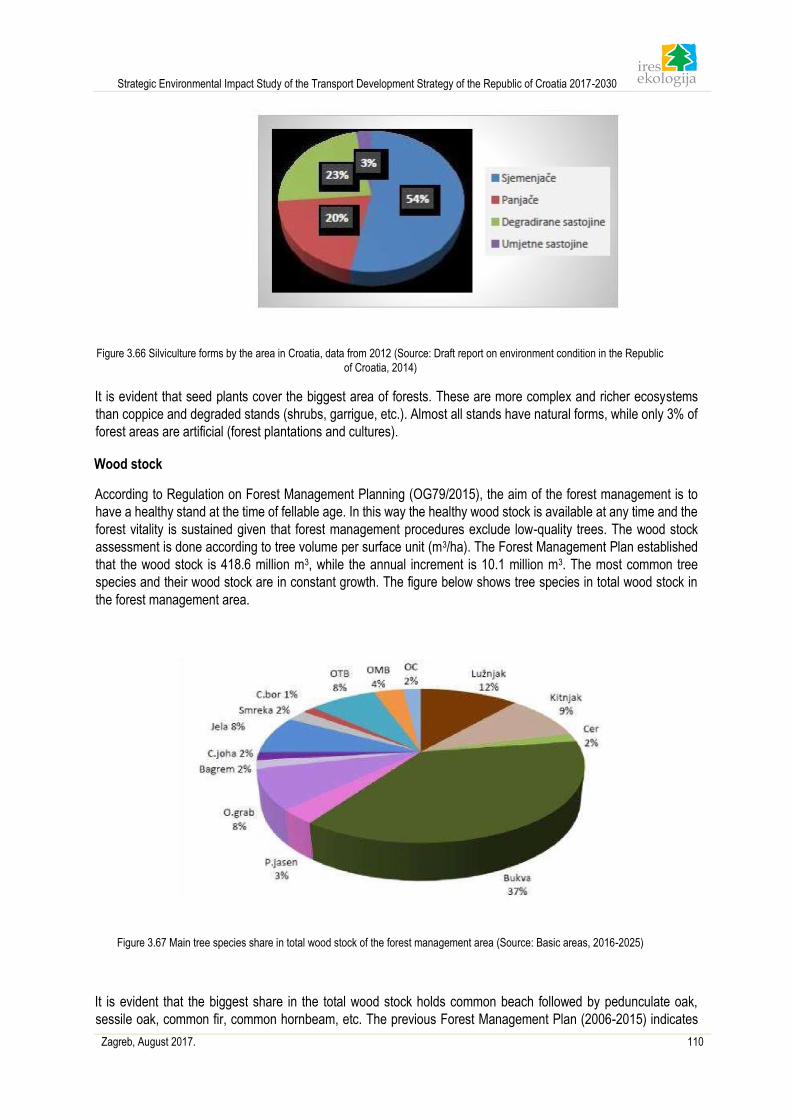
Strategic Environmental Impact Study of the Transport Development Strategy of the Republic of Croatia 2017-2030
Zagreb, August 2017. 110
Figure 3.66 Silviculture forms by the area in Croatia, data from 2012 (Source: Draft report on environment condition in the Republic
of Croatia, 2014)
It is evident that seed plants cover the biggest area of forests. These are more complex and richer ecosystems
than coppice and degraded stands (shrubs, garrigue, etc.). Almost all stands have natural forms, while only 3% of
forest areas are artificial (forest plantations and cultures).
Wood stock
According to Regulation on Forest Management Planning (OG79/2015), the aim of the forest management is to
have a healthy stand at the time of fellable age. In this way the healthy wood stock is available at any time and the
forest vitality is sustained given that forest management procedures exclude low-quality trees. The wood stock
assessment is done according to tree volume per surface unit (m3/ha). The Forest Management Plan established
that the wood stock is 418.6 million m3, while the annual increment is 10.1 million m3. The most common tree
species and their wood stock are in constant growth. The figure below shows tree species in total wood stock in
the forest management area.
Figure 3.67 Main tree species share in total wood stock of the forest management area (Source: Basic areas, 2016-2025)
It is evident that the biggest share in the total wood stock holds common beach followed by pedunculate oak,
sessile oak, common fir, common hornbeam, etc. The previous Forest Management Plan (2006-2015) indicates
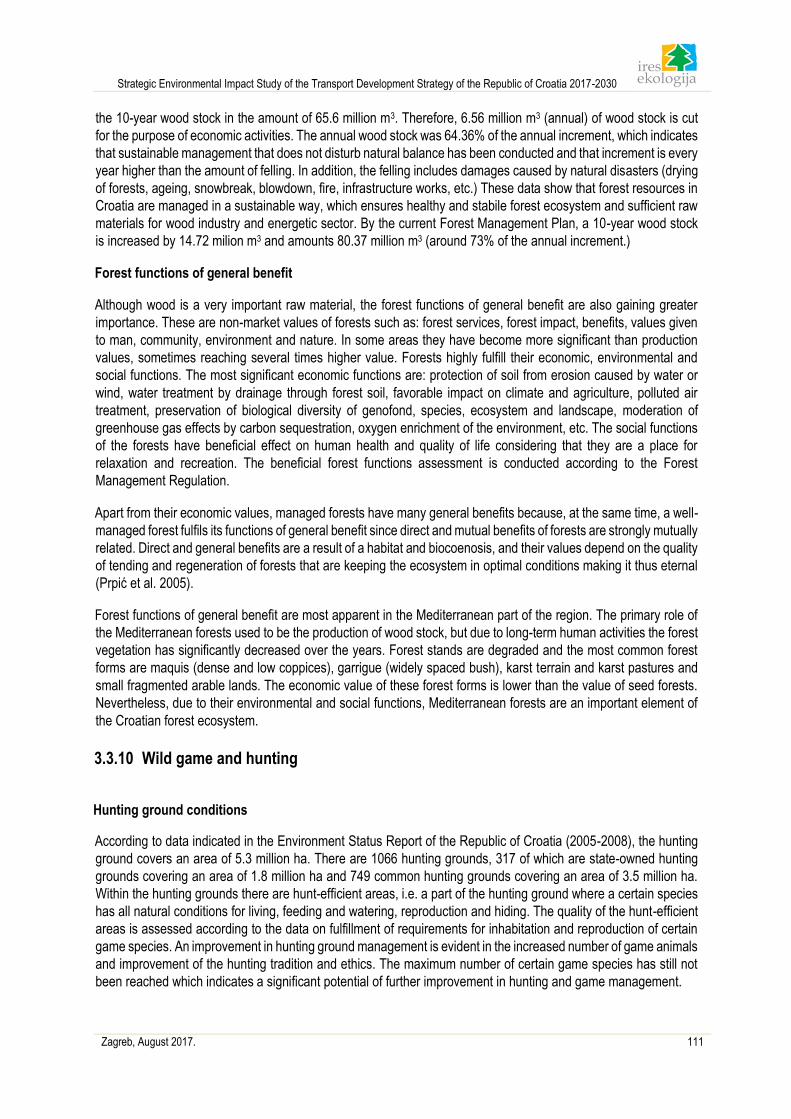
Strategic Environmental Impact Study of the Transport Development Strategy of the Republic of Croatia 2017-2030
Zagreb, August 2017. 111
the 10-year wood stock in the amount of 65.6 million m3. Therefore, 6.56 million m3 (annual) of wood stock is cut
for the purpose of economic activities. The annual wood stock was 64.36% of the annual increment, which indicates
that sustainable management that does not disturb natural balance has been conducted and that increment is every
year higher than the amount of felling. In addition, the felling includes damages caused by natural disasters (drying
of forests, ageing, snowbreak, blowdown, fire, infrastructure works, etc.) These data show that forest resources in
Croatia are managed in a sustainable way, which ensures healthy and stabile forest ecosystem and sufficient raw
materials for wood industry and energetic sector. By the current Forest Management Plan, a 10-year wood stock
is increased by 14.72 milion m3 and amounts 80.37 million m3 (around 73% of the annual increment.)
Forest functions of general benefit
Although wood is a very important raw material, the forest functions of general benefit are also gaining greater
importance. These are non-market values of forests such as: forest services, forest impact, benefits, values given
to man, community, environment and nature. In some areas they have become more significant than production
values, sometimes reaching several times higher value. Forests highly fulfill their economic, environmental and
social functions. The most significant economic functions are: protection of soil from erosion caused by water or
wind, water treatment by drainage through forest soil, favorable impact on climate and agriculture, polluted air
treatment, preservation of biological diversity of genofond, species, ecosystem and landscape, moderation of
greenhouse gas effects by carbon sequestration, oxygen enrichment of the environment, etc. The social functions
of the forests have beneficial effect on human health and quality of life considering that they are a place for
relaxation and recreation. The beneficial forest functions assessment is conducted according to the Forest
Management Regulation.
Apart from their economic values, managed forests have many general benefits because, at the same time, a well-
managed forest fulfils its functions of general benefit since direct and mutual benefits of forests are strongly mutually
related. Direct and general benefits are a result of a habitat and biocoenosis, and their values depend on the quality
of tending and regeneration of forests that are keeping the ecosystem in optimal conditions making it thus eternal
(Prpić et al. 2005).
Forest functions of general benefit are most apparent in the Mediterranean part of the region. The primary role of
the Mediterranean forests used to be the production of wood stock, but due to long-term human activities the forest
vegetation has significantly decreased over the years. Forest stands are degraded and the most common forest
forms are maquis (dense and low coppices), garrigue (widely spaced bush), karst terrain and karst pastures and
small fragmented arable lands. The economic value of these forest forms is lower than the value of seed forests.
Nevertheless, due to their environmental and social functions, Mediterranean forests are an important element of
the Croatian forest ecosystem.
3.3.10 Wild game and hunting
Hunting ground conditions
According to data indicated in the Environment Status Report of the Republic of Croatia (2005-2008), the hunting
ground covers an area of 5.3 million ha. There are 1066 hunting grounds, 317 of which are state-owned hunting
grounds covering an area of 1.8 million ha and 749 common hunting grounds covering an area of 3.5 million ha.
Within the hunting grounds there are hunt-efficient areas, i.e. a part of the hunting ground where a certain species
has all natural conditions for living, feeding and watering, reproduction and hiding. The quality of the hunt-efficient
areas is assessed according to the data on fulfillment of requirements for inhabitation and reproduction of certain
game species. An improvement in hunting ground management is evident in the increased number of game animals
and improvement of the hunting tradition and ethics. The maximum number of certain game species has still not
been reached which indicates a significant potential of further improvement in hunting and game management.
Strategic Environmental Impact Study of the Transport Development Strategy of the Republic of Croatia 2017-2030
Zagreb, August 2017. 112
According to the Croatian Hunting Act (OG 140/05, 75/09, 153/09, 14/14, 21/16, 41/16, 67/16), the following species
are considered wild game:
1. big game: red deer (Cervus elaphus L.), fallow deer (Dama dama L.), axis deer (Axis axis L), roe deer
(Capreolus capreolus L.), chamois (Rupicapra rupicapra L.), mouflon (Ovis aries musimon Pall.), wild boar
(Sus scrofa L.), brown bear (Ursus arctos L.)
2. small game:
a) small hairy game: badger (Meles meles L.), wild cat (Felis silvestris Schr.), marten (Martes foina Ehr.), fine
marten (Martes martes L.), small weasel (Mustela nivalis L.), beaver (Castor fiber L.), rabbit (Lepus
europaeus Pall.), wild rabbit (Oryctolangus cuniculus L.), big dormouse (Myoxus glis L.), fox (Vulpes vulpes
L.), jackdal (Canis aureus L.), skunk (Putorius putorius L.), mungos (Herpestes ishneumon L.)
b) wild fowl: pheasant (Phasianus sp. L.), rocky partridge (Alectoris graeca Meissn), chukar partridge
(Alectoris chucar), field partridge (Perdix perdix; L.), quail (Coturnix coturnix L.), virginian partridge
(Coturnis virginiana L.), wood cock (Scolopax rusticola L.), snipe (Gallinago gallinago L.), ringdove
(Columba palumbus L.), rock doves (Columba livia Gmelin.), Taiga bean goose (Anser fabalis Latham.),
Greater White-fronted Goose (Anser albifrons Scopoli.), wild duck (Anas platyrhynchos L.), big-headed
duck (grey duck) (Aythya ferina L.), tufted duck (Aythya fuligula L.), garganey (Anas querquedula L.),
common teal (Anas crecca L.), black moorhen (Fulica atra L.), grey crow (Corvus corone cornix L.), rook
(Corvus frugilegus L.), western jackdaw (Coloeus monedula L.), magpie (Pica pica L.), jay (Garrulus
glandarius L.).
According to Regulation on the proclamation of protected and strictly protected wild taxa (OG 099/09) and its Annex
III, the list of the protected species also contains those species considered as hunting species, including brown
bear. Brown bear management in the Republic of Croatia is conducted in accordance with the Brown Bear
Management Plan, established in 2005, revised in 2008. The current management plan is the Brown Bear
Management Action Plan for the Republic of Croatia for the year 2017.
Considering the conditions of game habitats in Croatia, the hunting ground are divided into lowland, hilly,
mountainous and Mediterranean hunting grounds.
Lowland hunting grounds are entirely or mainly established in the Pannonian region covering the area of eastern,
central and northern Republic of Croatia extending from the border of the Republic of Slovenia west of Samobor,
to Jastrebarsko, Karlovac, along the Kupa river to Sisak and along railway road to Sunja and Dubica all the way to
the border of the Republic of Bosnia and Herzegovina. The area comprises all hunting grounds lower than 200 m
of altitude with extremely continental climate. Game species found in this area are: deer, fallow deer, roe deer, wild
boar, rabbit, fox, badger, beaver, skunk, sunbleak marten, fine marten, small weasel, quail, rocky partridge,
pheasant, wild duck, wild goose, woodcock, and coot.
Hilly hunting grounds are entirely established in the area above 200 m of altitude or partially in the region of Dinaric
Alps. The eastern border of the area matches the west border of the Pannonian region. The western border of the
area is established along the border of the Republic of Slovenia near Klana heading south at the altitude of 800 m
towards coastal slopes of the Velebit, passes Maslenica canal, towards east and Knin. The area also comprises
the slopes of Dinara all the way to the border of the Republic of Bosnia and Herzegovina. Game species found in
this area are: brown bear, deer, roe deer, wild boar, mouflon, badger, dormouse, skunk, and rabbit.
Mountainous hunting grounds are established in the region of Gorski kotar and the region of Dinaric Alps at the
altitude above 800 m with severe continental climate and constant presence of big predators. Game species found
in these areas are: brown bear, chamois, jackal, wild boar, rabbit, marten and fine marten. Mediterranean hunting
grounds are established in the whole Adriatic region comprising Istria, Croatian Littoral with islands and Dalmatia
with islands. The eastern border of the area matches western border of the region of Dinaric Alps. The
Mediterranean hunting grounds are characterized by Mediterranean climate and relief. Game species found in this
Strategic Environmental Impact Study of the Transport Development Strategy of the Republic of Croatia 2017-2030
Zagreb, August 2017. 113
area are: roe deer, wild boar, fallow deer, deer, mouflon, jackal, rabbit, wild rabbit, pheasant, rocky partridge,
partridge, Virginian quail, and wild pigeon.
3.3.11 Tourism
3.3.11.1 Tourism offer in Croatia
Croatia is characterized by two main features of its geographical location which are crucial for the development of
tourism: the country is not only oriented towards the important communication and tourism flows but also towards
the attractive neighboring area and leading emitive markets in Europe (Bešker, 2005). Croatia is located in a
geographical, cultural, historical and political crossroad of Eastern and Western Europe, thus its historical, ethnic,
cultural, economic, urban, administrative and other particularities attract many visitors. Moreover, Croatia abounds
with natural attractions. The most important tourism development factors are the sea, indented coastline, multitude
of islands, well-preserved natural beaches, protected natural areas, biodiversity, rivers, lakes and other continental
waters. Along with the attractive natural resources, the richness of the Croatian cultural-historical heritage is also
an important factor of tourism development in this country. Many cultural goods are protected by UNESCO, such
as historical center of Dubrovnik, Diocletian Palace in Split, Cathedral of Šibenik, historical center of Trogir, the
Euphrasian Basilica in Poreč, Stari Grad Plain on the island of Hvar, but also many other valuable cultural goods
such as Arena in Pula, historical center of Hvar, city walls of Ston and a large number of individual buildings in well-
preserved historical part of Zagreb and other cities and villages (Tourism Development Strategy of the Republic of
Croatia until 2020, 2013) In addition, Croatia is the leading country in Europe by the number of intangible goods
protected by UNESCO, while on global level Croatia is placed right after China and Japan.
According to the Tourism Development Strategy the key tourism products of Croatia are:
• The sun and the sea
Thanks to rich natural resources for tourism development, this tourism product dominates the tourist offer and
tourism-related activities in Croatia. Its share in the total tourism product of Croatia is around 85%, with a lower
share in total revenue (75-80%), due to low prices caused by huge capacities of private accommodations.
• Nautical tourism (yachting/cruising)
Thanks to its geo-traffic location and one of the most indented coastlines in the world, moderate climate and winds,
Croatia is one of the most popular nautical destinations in the world. This fact is evident in the constant growth of
nautical tourism (especially in the prolongation of the nautical season), but also in the continuous creation of the
corresponding value chain. Cruising tourism records an increased number of mega cruiser arrivals in the last
decade, as well as the growing demand for cruises on national cruisers.
• Business tourism
There’s a relatively constant demand in Croatia by individual and group business guests, changing only its
qualitative features depending on current trends. The research among hoteliers has shown that business guests
make 10-15% of the total of hotel guests.
• Cultural tourism
A great number of cultural-historical sites and events in Croatia make it a destination for “cultural travels”. Cultural
tourism includes: urban tourism, heritage tourism, event tourism, creative tourism and religious tourism.
In the last few years, tourism products described in the text below are more and more developed and they contribute
to differentiation of the tourism offer of Croatia
• Health tourism
Strategic Environmental Impact Study of the Transport Development Strategy of the Republic of Croatia 2017-2030
Zagreb, August 2017. 114
Thermal springs, proximity of the emitive markets, price competitiveness and good reputation of health services in
general are the reason why Croatia is suitable for development of health tourism. The health tourism products
especially relevant for Croatia are namely: wellness tourism, health tourism and medical tourism.
• Bicycle tourism
Croatia has a rather well-developed network of local and regional cycling paths, some of which are a part of
international cycling routes. This product is presented in the tourism offer of Croatia as an additional vacation
activity.
• Gastronomy and oenology
Gastro-oenological tourism offer has been for many years an integral part of the tourist promotion of Croatia. This
complex product consumed by almost all tourists even though only a small number of international tourists travel
exclusively for gastro-oenological reasons, so demand growth is mostly generated by the local population.
Gastronomy and oenology as tourism products are best developed in Istria, Dalmatia and Slavonia.
• Rural and mountain tourism
Rural tourism in Croatia is characterized by a very slow development. The only exception is Istria and Osijek-
Baranja County. This product is especially attractive to the emitive market of big cities, as well as to transit tourists,
so it is primarily developed near bigger cities, established tourist destinations and in the vicinity of major traffic
routes. Regarding mountain tourism, there are potential mountain centers like Bjelolasica, Begovo Razdolje and
Platak, and many mountain paths in Croatian mountains and hills.
• Golf tourism
Currently, there are only 4 golf courses with 18 holes, two 9-hole courses and a few training course. For this reason,
Croatia is not present on the golf tourism map even though golf tourism is today, and will be in the future, one of
the most important market segments of the Mediterranean tourism demand, especially in the off-season period.
• Adventure and sports tourism
This fast-growing product group is gaining more and more significance and includes: scuba diving, kayaking,
canoeing, rafting, extreme sports, hunting, fishing, winter sports and trainings. The hilly and coastal part of Croatia
rapidly develops a wide and diversified offer, including niche offers (speleological tourism, paragliding) and
adventure sports programs. Croatia is still not using sufficiently its comparative advantages to develop of this
product group.
• Eco tourism
Supported by the growing environmental awareness of clients, this tourism product demonstrates intensive
development around the world. Despite the availability, attractiveness and perseverance of natural resources, eco-
tourism in Croatia is still poorly developed. The ecotourism can be developed in national parks and other protected
locations, as well as on family farms running business in accordance with the principles of organic agricultural
production. In order to provide tourism activities in rural area, a family-run farm has to offer organic groceries and
additional tourist and hospitality services.
3.3.11.2 Tourism intensity
In 2015, Croatia had 942.830 permanent beds in registered commercial accommodations mostly of which were in
hotels, camps and households. A majority of permanent registered beds is in Adriatic Croatia (95.66%), while only
4.34% of the registered beds are in continental Croatia. The leading county in total number of permanent beds in
Adriatic Croatia is Istria County (26.15%), followed by Split-Dalmatia County (20.67%) and Primorje-Gorski kotar
County (17.89%).
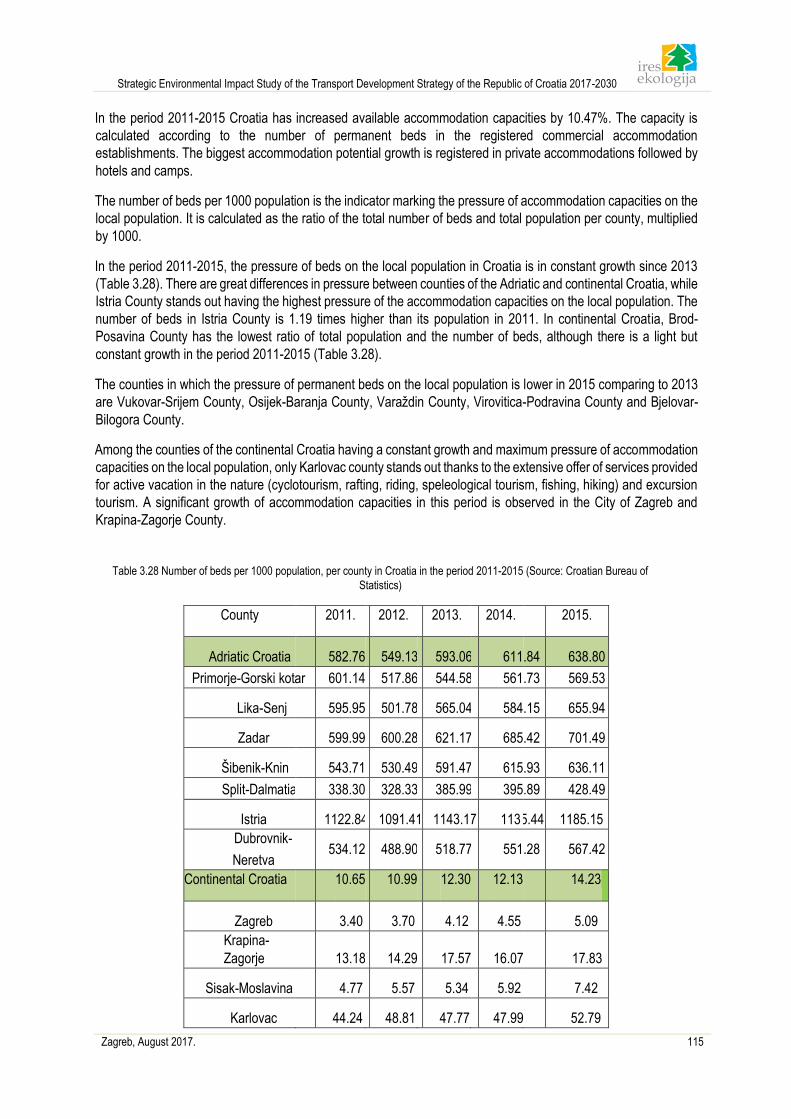
Strategic Environmental Impact Study of the Transport Development Strategy of the Republic of Croatia 2017-2030
Zagreb, August 2017. 115
In the period 2011-2015 Croatia has increased available accommodation capacities by 10.47%. The capacity is
calculated according to the number of permanent beds in the registered commercial accommodation
establishments. The biggest accommodation potential growth is registered in private accommodations followed by
hotels and camps.
The number of beds per 1000 population is the indicator marking the pressure of accommodation capacities on the
local population. It is calculated as the ratio of the total number of beds and total population per county, multiplied
by 1000.
In the period 2011-2015, the pressure of beds on the local population in Croatia is in constant growth since 2013
(Table 3.28). There are great differences in pressure between counties of the Adriatic and continental Croatia, while
Istria County stands out having the highest pressure of the accommodation capacities on the local population. The
number of beds in Istria County is 1.19 times higher than its population in 2011. In continental Croatia, Brod-
Posavina County has the lowest ratio of total population and the number of beds, although there is a light but
constant growth in the period 2011-2015 (Table 3.28).
The counties in which the pressure of permanent beds on the local population is lower in 2015 comparing to 2013
are Vukovar-Srijem County, Osijek-Baranja County, Varaždin County, Virovitica-Podravina County and Bjelovar-
Bilogora County.
Among the counties of the continental Croatia having a constant growth and maximum pressure of accommodation
capacities on the local population, only Karlovac county stands out thanks to the extensive offer of services provided
for active vacation in the nature (cyclotourism, rafting, riding, speleological tourism, fishing, hiking) and excursion
tourism. A significant growth of accommodation capacities in this period is observed in the City of Zagreb and
Krapina-Zagorje County.
Table 3.28 Number of beds per 1000 population, per county in Croatia in the period 2011-2015 (Source: Croatian Bureau of
Statistics)
County 2011. 2012. 2013. 2014. 2015.
Adriatic Croatia
582.76 549.13 593.06 611 .84 638.80
Primorje-Gorski kot ar 601.14 517.86 544.58 561 .73 569.53
Lika-Senj
595.95 501.78 565.04 584 .15 655.94
Zadar
599.99 600.28 621.17 685 .42 701.49
Šibenik-Knin
543.71 530.49 591.47 615 .93 636.11
Split-Dalmatia 338.30 328.33 385.99 395 .89 428.49
Istria
1122.84 1091.4 1 1143.1 7 113 5.44 1185.15
Dubrovnik-
Neretva
534.12 488.90 518.77 551 .28 567.42
Continental Croatia 10.65 10.99 12.30 12.13 14.23
Zagreb
3.40
3.70
4.12
4.55
5.09
Krapina-
Zagorje
13.18 14.29 17.57 16.07 17.83
Sisak-Moslavina
4.77
5.57
5.34
5.92
7.42
Karlovac
44.24
48.81
47.77
47.99 52.79
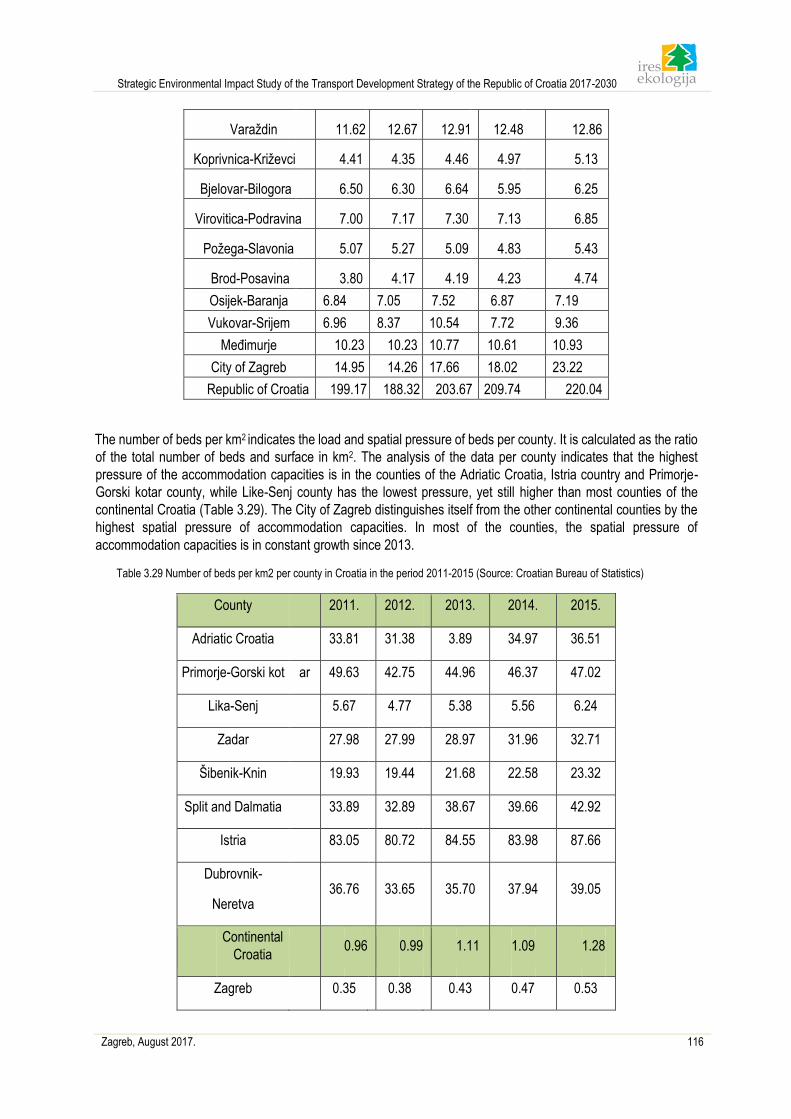
Strategic Environmental Impact Study of the Transport Development Strategy of the Republic of Croatia 2017-2030
Zagreb, August 2017. 116
Varaždin
11.62 12.67 12.91 12.48 12.86
Koprivnica-Križevci 4.41
4.35
4.46
4.97
5.13
Bjelovar-Bilogora
6.50
6.30
6.64
5.95
6.25
Virovitica-Podravin a 7.00
7.17
7.30
7.13
6.85
Požega-Slavonia
5.07
5.27
5.09
4.83
5.43
Brod-Posavina
3.80
4.17
4.19
4.23
4.74
Osijek-Baranja 6.84 7.05 7.52 6.87 7.19
Vukovar-Srijem 6.96 8.37 10.54 7.72 9.36
Međimurje 10.23 10.23 10.77 10.61 10.93
City of Zagreb 14.95 14.26 17.66 18.02 23.22
Republic of Croatia 199.17 188.32 203.67 209.74 220.04
The number of beds per km2 indicates the load and spatial pressure of beds per county. It is calculated as the ratio
of the total number of beds and surface in km2. The analysis of the data per county indicates that the highest
pressure of the accommodation capacities is in the counties of the Adriatic Croatia, Istria country and Primorje-
Gorski kotar county, while Like-Senj county has the lowest pressure, yet still higher than most counties of the
continental Croatia (Table 3.29). The City of Zagreb distinguishes itself from the other continental counties by the
highest spatial pressure of accommodation capacities. In most of the counties, the spatial pressure of
accommodation capacities is in constant growth since 2013.
Table 3.29 Number of beds per km2 per county in Croatia in the period 2011-2015 (Source: Croatian Bureau of Statistics)
County 2011. 2012. 2013. 2014. 2015.
Adriatic Croatia 33.81 31.38 3.89 34.97 36.51
Primorje-Gorski kot ar 49.63 42.75 44.96 46.37 47.02
Lika-Senj 5.67 4.77 5.38 5.56 6.24
Zadar 27.98 27.99 28.97 31.96 32.71
Šibenik-Knin 19.93 19.44 21.68 22.58 23.32
Split and Dalmatia 33.89 32.89 38.67 39.66 42.92
Istria 83.05 80.72 84.55 83.98 87.66
Dubrovnik-
Neretva 36.76 33.65 35.70 37.94 39.05
Continental
Croatia 0.96 0.99 1.11 1.09 1.28
Zagreb 0.35 0.38 0.43 0.47 0.53
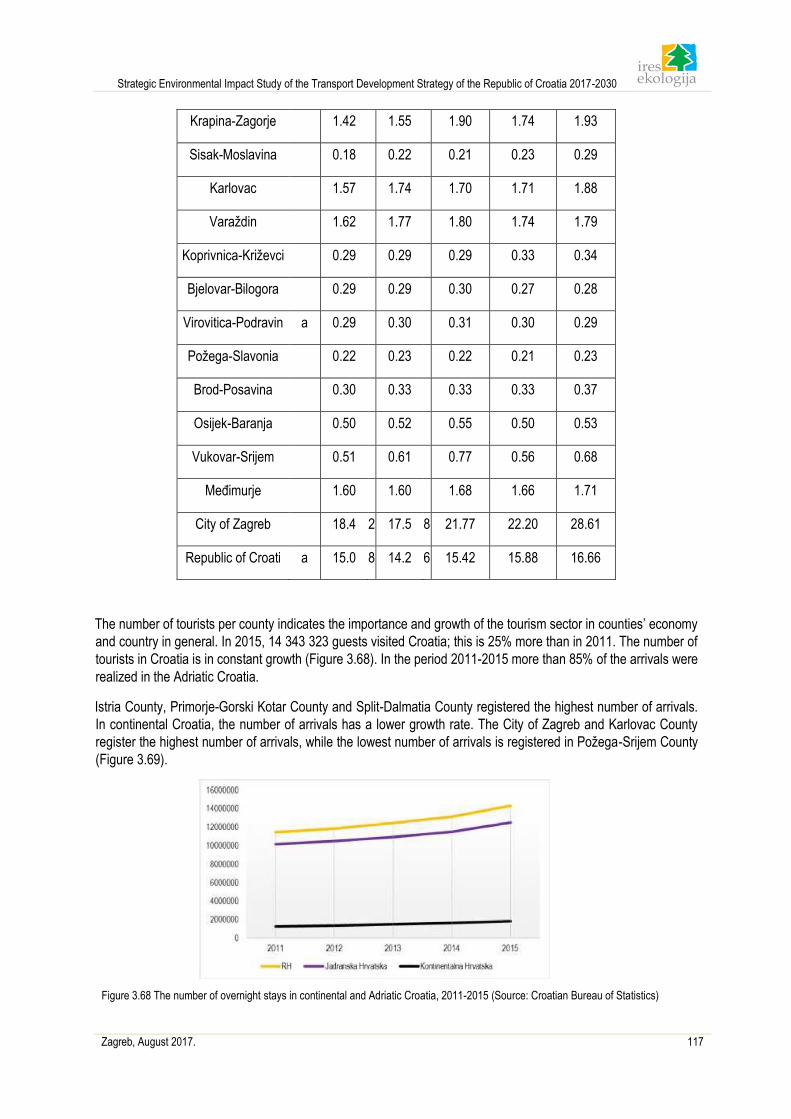
Strategic Environmental Impact Study of the Transport Development Strategy of the Republic of Croatia 2017-2030
Zagreb, August 2017. 117
Krapina-Zagorje 1.42 1.55 1.90 1.74 1.93
Sisak-Moslavina 0.18 0.22 0.21 0.23 0.29
Karlovac 1.57 1.74 1.70 1.71 1.88
Varaždin 1.62 1.77 1.80 1.74 1.79
Koprivnica-Križevci 0.29 0.29 0.29 0.33 0.34
Bjelovar-Bilogora 0.29 0.29 0.30 0.27 0.28
Virovitica-Podravin a 0.29 0.30 0.31 0.30 0.29
Požega-Slavonia 0.22 0.23 0.22 0.21 0.23
Brod-Posavina 0.30 0.33 0.33 0.33 0.37
Osijek-Baranja 0.50 0.52 0.55 0.50 0.53
Vukovar-Srijem 0.51 0.61 0.77 0.56 0.68
Međimurje 1.60 1.60 1.68 1.66 1.71
City of Zagreb 18.4 2 17.5 8 21.77 22.20 28.61
Republic of Croati a 15.0 8 14.2 6 15.42 15.88 16.66
The number of tourists per county indicates the importance and growth of the tourism sector in counties’ economy
and country in general. In 2015, 14 343 323 guests visited Croatia; this is 25% more than in 2011. The number of
tourists in Croatia is in constant growth (Figure 3.68). In the period 2011-2015 more than 85% of the arrivals were
realized in the Adriatic Croatia.
Istria County, Primorje-Gorski Kotar County and Split-Dalmatia County registered the highest number of arrivals.
In continental Croatia, the number of arrivals has a lower growth rate. The City of Zagreb and Karlovac County
register the highest number of arrivals, while the lowest number of arrivals is registered in Požega-Srijem County
(Figure 3.69).
Figure 3.68 The number of overnight stays in continental and Adriatic Croatia, 2011-2015 (Source: Croatian Bureau of Statistics)
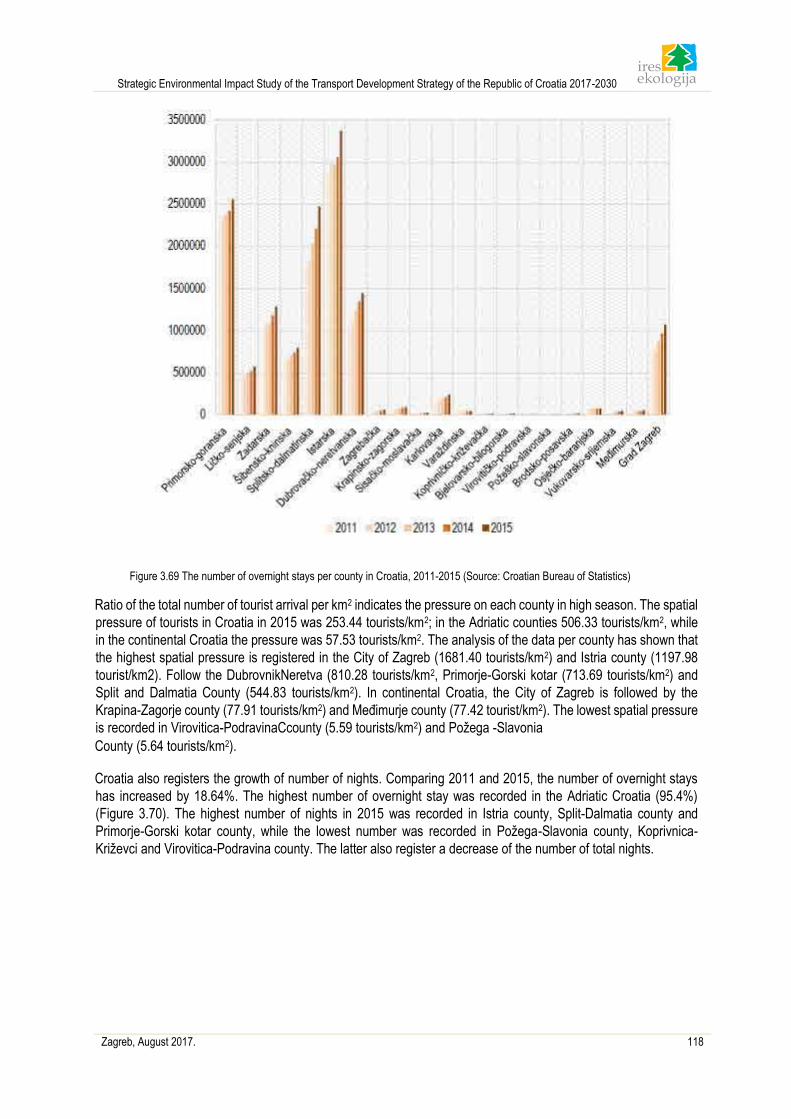
Strategic Environmental Impact Study of the Transport Development Strategy of the Republic of Croatia 2017-2030
Zagreb, August 2017. 118
Figure 3.69 The number of overnight stays per county in Croatia, 2011-2015 (Source: Croatian Bureau of Statistics)
Ratio of the total number of tourist arrival per km2 indicates the pressure on each county in high season. The spatial
pressure of tourists in Croatia in 2015 was 253.44 tourists/km2; in the Adriatic counties 506.33 tourists/km2, while
in the continental Croatia the pressure was 57.53 tourists/km2. The analysis of the data per county has shown that
the highest spatial pressure is registered in the City of Zagreb (1681.40 tourists/km2) and Istria county (1197.98
tourist/km2). Follow the DubrovnikNeretva (810.28 tourists/km2, Primorje-Gorski kotar (713.69 tourists/km2) and
Split and Dalmatia County (544.83 tourists/km2). In continental Croatia, the City of Zagreb is followed by the
Krapina-Zagorje county (77.91 tourists/km2) and Međimurje county (77.42 tourist/km2). The lowest spatial pressure
is recorded in Virovitica-PodravinaCcounty (5.59 tourists/km2) and Požega -Slavonia
County (5.64 tourists/km2).
Croatia also registers the growth of number of nights. Comparing 2011 and 2015, the number of overnight stays
has increased by 18.64%. The highest number of overnight stay was recorded in the Adriatic Croatia (95.4%)
(Figure 3.70). The highest number of nights in 2015 was recorded in Istria county, Split-Dalmatia county and
Primorje-Gorski kotar county, while the lowest number was recorded in Požega-Slavonia county, Koprivnica-
Križevci and Virovitica-Podravina county. The latter also register a decrease of the number of total nights.
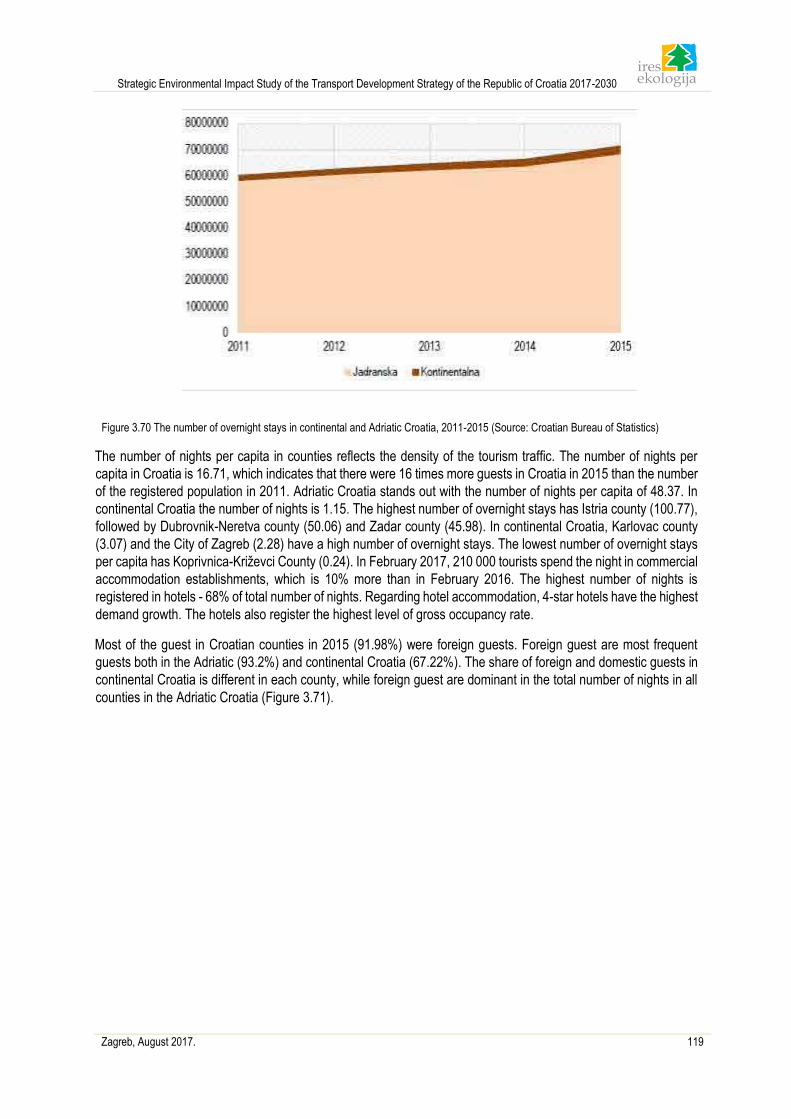
Strategic Environmental Impact Study of the Transport Development Strategy of the Republic of Croatia 2017-2030
Zagreb, August 2017. 119
Figure 3.70 The number of overnight stays in continental and Adriatic Croatia, 2011-2015 (Source: Croatian Bureau of Statistics)
The number of nights per capita in counties reflects the density of the tourism traffic. The number of nights per
capita in Croatia is 16.71, which indicates that there were 16 times more guests in Croatia in 2015 than the number
of the registered population in 2011. Adriatic Croatia stands out with the number of nights per capita of 48.37. In
continental Croatia the number of nights is 1.15. The highest number of overnight stays has Istria county (100.77),
followed by Dubrovnik-Neretva county (50.06) and Zadar county (45.98). In continental Croatia, Karlovac county
(3.07) and the City of Zagreb (2.28) have a high number of overnight stays. The lowest number of overnight stays
per capita has Koprivnica-Križevci County (0.24). In February 2017, 210 000 tourists spend the night in commercial
accommodation establishments, which is 10% more than in February 2016. The highest number of nights is
registered in hotels - 68% of total number of nights. Regarding hotel accommodation, 4-star hotels have the highest
demand growth. The hotels also register the highest level of gross occupancy rate.
Most of the guest in Croatian counties in 2015 (91.98%) were foreign guests. Foreign guest are most frequent
guests both in the Adriatic (93.2%) and continental Croatia (67.22%). The share of foreign and domestic guests in
continental Croatia is different in each county, while foreign guest are dominant in the total number of nights in all
counties in the Adriatic Croatia (Figure 3.71).
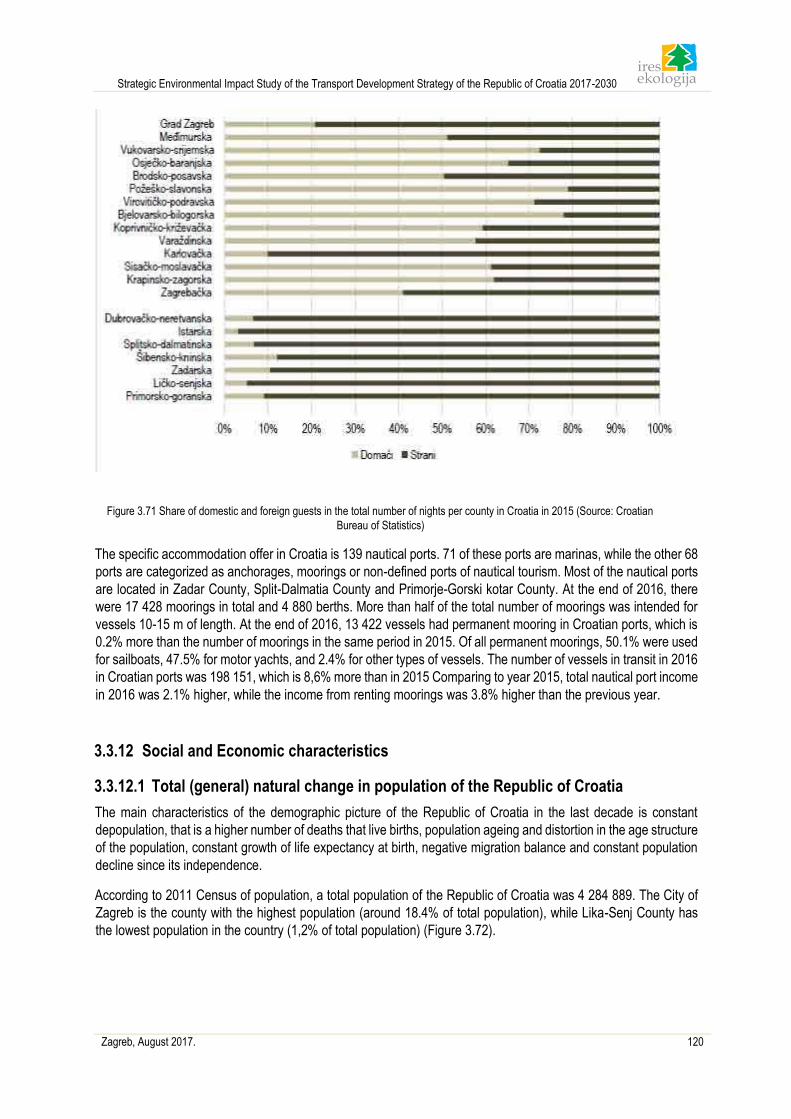
Strategic Environmental Impact Study of the Transport Development Strategy of the Republic of Croatia 2017-2030
Zagreb, August 2017. 120
Figure 3.71 Share of domestic and foreign guests in the total number of nights per county in Croatia in 2015 (Source: Croatian
Bureau of Statistics)
The specific accommodation offer in Croatia is 139 nautical ports. 71 of these ports are marinas, while the other 68
ports are categorized as anchorages, moorings or non-defined ports of nautical tourism. Most of the nautical ports
are located in Zadar County, Split-Dalmatia County and Primorje-Gorski kotar County. At the end of 2016, there
were 17 428 moorings in total and 4 880 berths. More than half of the total number of moorings was intended for
vessels 10-15 m of length. At the end of 2016, 13 422 vessels had permanent mooring in Croatian ports, which is
0.2% more than the number of moorings in the same period in 2015. Of all permanent moorings, 50.1% were used
for sailboats, 47.5% for motor yachts, and 2.4% for other types of vessels. The number of vessels in transit in 2016
in Croatian ports was 198 151, which is 8,6% more than in 2015 Comparing to year 2015, total nautical port income
in 2016 was 2.1% higher, while the income from renting moorings was 3.8% higher than the previous year.
3.3.12 Social and Economic characteristics
3.3.12.1 Total (general) natural change in population of the Republic of Croatia
The main characteristics of the demographic picture of the Republic of Croatia in the last decade is constant
depopulation, that is a higher number of deaths that live births, population ageing and distortion in the age structure
of the population, constant growth of life expectancy at birth, negative migration balance and constant population
decline since its independence.
According to 2011 Census of population, a total population of the Republic of Croatia was 4 284 889. The City of
Zagreb is the county with the highest population (around 18.4% of total population), while Lika-Senj County has
the lowest population in the country (1,2% of total population) (Figure 3.72).
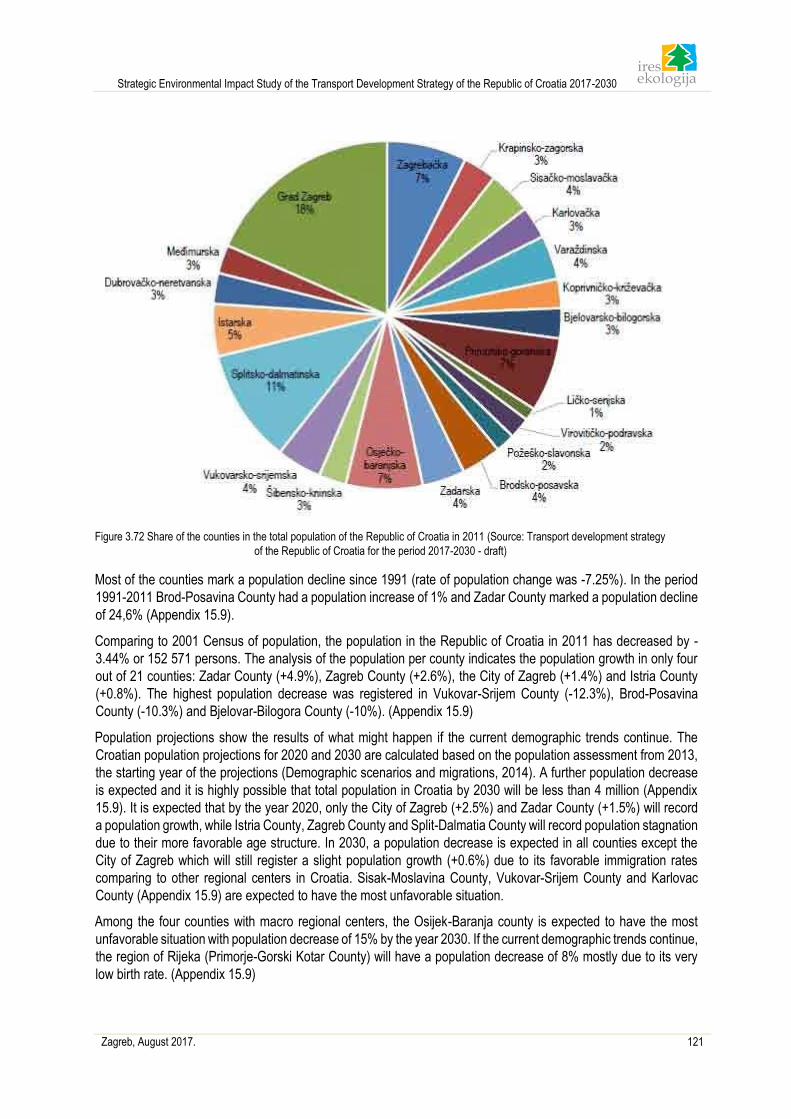
Strategic Environmental Impact Study of the Transport Development Strategy of the Republic of Croatia 2017-2030
Zagreb, August 2017. 121
Figure 3.72 Share of the counties in the total population of the Republic of Croatia in 2011 (Source: Transport development strategy
of the Republic of Croatia for the period 2017-2030 - draft)
Most of the counties mark a population decline since 1991 (rate of population change was -7.25%). In the period
1991-2011 Brod-Posavina County had a population increase of 1% and Zadar County marked a population decline
of 24,6% (Appendix 15.9).
Comparing to 2001 Census of population, the population in the Republic of Croatia in 2011 has decreased by -
3.44% or 152 571 persons. The analysis of the population per county indicates the population growth in only four
out of 21 counties: Zadar County (+4.9%), Zagreb County (+2.6%), the City of Zagreb (+1.4%) and Istria County
(+0.8%). The highest population decrease was registered in Vukovar-Srijem County (-12.3%), Brod-Posavina
County (-10.3%) and Bjelovar-Bilogora County (-10%). (Appendix 15.9)
Population projections show the results of what might happen if the current demographic trends continue. The
Croatian population projections for 2020 and 2030 are calculated based on the population assessment from 2013,
the starting year of the projections (Demographic scenarios and migrations, 2014). A further population decrease
is expected and it is highly possible that total population in Croatia by 2030 will be less than 4 million (Appendix
15.9). It is expected that by the year 2020, only the City of Zagreb (+2.5%) and Zadar County (+1.5%) will record
a population growth, while Istria County, Zagreb County and Split-Dalmatia County will record population stagnation
due to their more favorable age structure. In 2030, a population decrease is expected in all counties except the
City of Zagreb which will still register a slight population growth (+0.6%) due to its favorable immigration rates
comparing to other regional centers in Croatia. Sisak-Moslavina County, Vukovar-Srijem County and Karlovac
County (Appendix 15.9) are expected to have the most unfavorable situation.
Among the four counties with macro regional centers, the Osijek-Baranja county is expected to have the most
unfavorable situation with population decrease of 15% by the year 2030. If the current demographic trends continue,
the region of Rijeka (Primorje-Gorski Kotar County) will have a population decrease of 8% mostly due to its very
low birth rate. (Appendix 15.9)
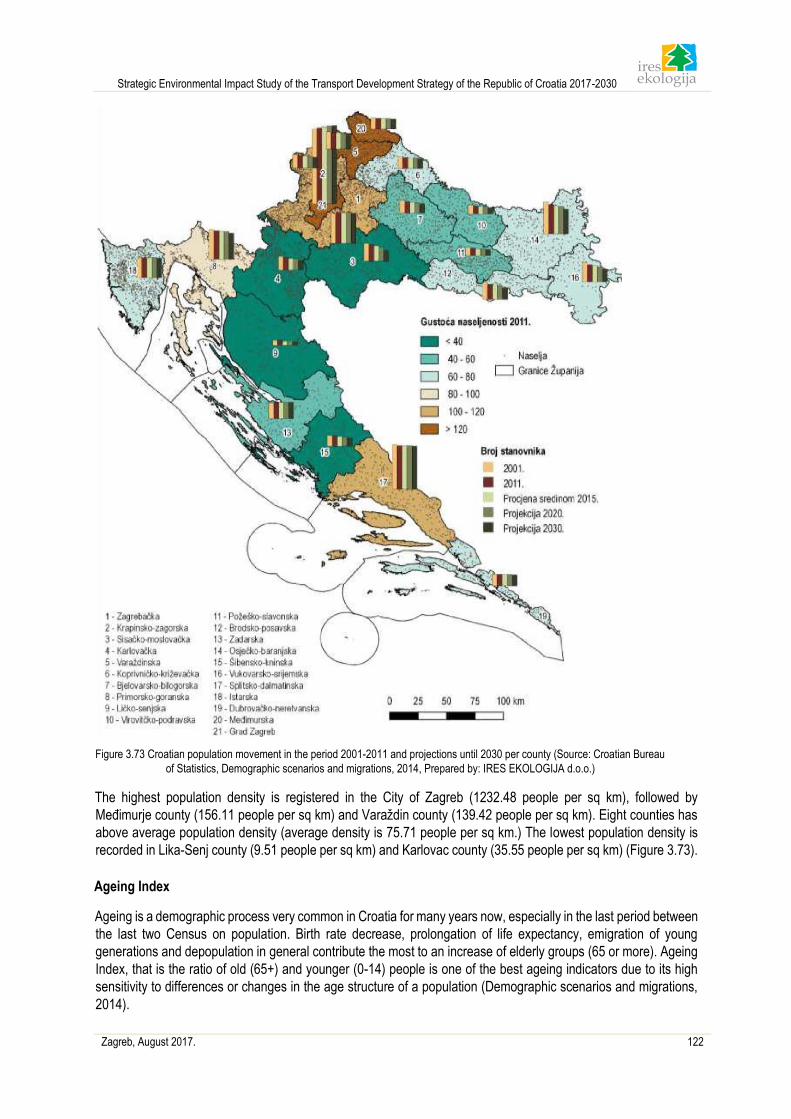
Strategic Environmental Impact Study of the Transport Development Strategy of the Republic of Croatia 2017-2030
Zagreb, August 2017. 122
Figure 3.73 Croatian population movement in the period 2001-2011 and projections until 2030 per county (Source: Croatian Bureau
of Statistics, Demographic scenarios and migrations, 2014, Prepared by: IRES EKOLOGIJA d.o.o.)
The highest population density is registered in the City of Zagreb (1232.48 people per sq km), followed by
Međimurje county (156.11 people per sq km) and Varaždin county (139.42 people per sq km). Eight counties has
above average population density (average density is 75.71 people per sq km.) The lowest population density is
recorded in Lika-Senj county (9.51 people per sq km) and Karlovac county (35.55 people per sq km) (Figure 3.73).
Ageing Index
Ageing is a demographic process very common in Croatia for many years now, especially in the last period between
the last two Census on population. Birth rate decrease, prolongation of life expectancy, emigration of young
generations and depopulation in general contribute the most to an increase of elderly groups (65 or more). Ageing
Index, that is the ratio of old (65+) and younger (0-14) people is one of the best ageing indicators due to its high
sensitivity to differences or changes in the age structure of a population (Demographic scenarios and migrations,
2014).
Strategic Environmental Impact Study of the Transport Development Strategy of the Republic of Croatia 2017-2030
Zagreb, August 2017. 123
According to the 2011 Census of population, the population of Croatia is extremely old with ageing index 115.
Comparing to the 2001 Census of population, the share of people over the age of 65 in total population has
increased by 9.4% (Ageing index in 2001 was 90.7) (Appendix 15.8).
A longer life expectancy in Croatia stems from the fact that in the period 2001-2011 the number of the oldest age
groups (80+) has increased by almost 70%, from 99.507 to 168.704 people.
The ageing speed is depicted by the fact that most of the counties according to the 2001 Census of population had
more young age groups than elderly age groups in the total population. Only one decade later, in 2011, only Zagreb
county and Međimurje County had less old people that the young ones in the total population (Appendix 15.8). On
the other hand, Primorje-Gorski Kotar County, Šibenik-Knin County, Karlovac county have 50% more elderly people
than the young ones, especially Lika-Senj county with the difference of more than 80% (Demographic scenarios
and migrations, 2014).
Lika-Senj County has the oldest population in the country, with more than a half of population over the age of 45
(ageing index 166). Lika-Senj is followed by the Primorje-Gorski kotar county (ageing index 155.3), Karlovac county
(ageing index 149) and Šibenik-Knin County (ageing index 146.1). According to the 2011 Census of population
Međimurje County, Zagreb county and Vukovar-Srijem County had the youngest population (Appendix 15.8)
The share of old population (65+) in the total population of Lika-Senj county, Karlovac county and Šibenik-Knin
county is higher than 20%, and since the age structure in the said counties is not favorable it is expected that
demographic ageing will continue to grow even faster. The lowest share of old age groups (65+) in total population
have Međimurje County (15.6%), Zagreb County (15.9%) and Split-Dalmatia County (16.6%).
According to the 2001 Census of population, Croatia had 17% of children under the age of 15 in total population,
while according to the 2011 Census, that share has decreased by 15.2% which is about one tenth. According to
the 2011 Census of population, the lowest share of children under the age of 15 in total population was registered
in Primorje-Gorski kotar county (12.5%), Istria county (13.4%) and Karlovac county (13.4%). It is the result of low
birth rates and above-average high life expectancy in those counties. The highest share of children in total
population is registered in Brod-Posavina (17.1%) et Vukovar-Srijem county (17%), which is the result of the lower
life expectancy in those counties. The highest decrease of share of children in the age 0-14 is recorded in Šibenik-
Knin county and Požega-Slavonia county, and the lowest one in the City of Zagreb and Zagreb county.
The ageing speed in certain counties is evident through the change of average age between the two recent
Censuses of population. In fact, in all counties an average age growth has been registered in the period 2001-
2011. In that period, the fastest ageing was registered in Zadar county and Šibenik-Knin county, while the City of
Zagreb and Koprivnica-Križevci county have the slowest ageing speed (Demographic scenarios and migrations,
2014).
It is expected that by the year 2020 every fifth citizen (every fourth by 2030) will be 65 or older. What is certainly
expected is not just the ageing of the entire population, but also ageing of the older population. By the year 2020,
more than 5% of the total Croatian population will be aged 80 or more, and their share in total population by the
year 2050 shall double, so every tenth citizen of Croatia could be over 80 (Demographic scenarios and migrations,
2015).
Along with the current birth and death trends that shall continue even in the future, Primorje-Gorski Kotar County,
SisakMoslavina County and Karlovac County will also have the least favorable situation regarding the age structure
of the population. In those three counties, along with the continuation of the current trends, there will also be a
decrease in the share of children (0-14) in total population to 10%, and at the same time the share of elderly
population (65+) to almost 30%. It is estimated that in 2030 there will be two and a half times more elderly population
(65+) than young population in those counties. Within the indicated age group, the highest and fastest growth is
expected in the population above the age of 80.
Međimurje county, Požega-Slavonia county and Brod-Posavina county are expected to have the most favorable
age structure with 50-60% more elderly that young population (Demographic scenarios and migrations, 2014).
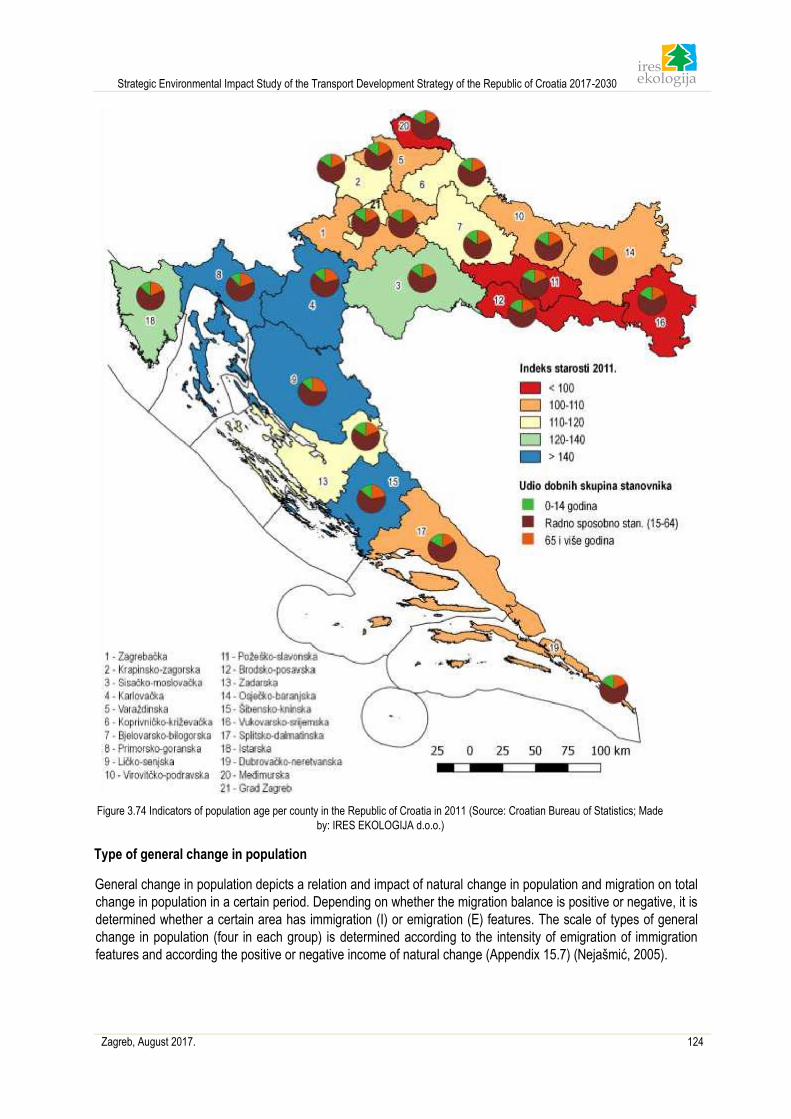
Strategic Environmental Impact Study of the Transport Development Strategy of the Republic of Croatia 2017-2030
Zagreb, August 2017. 124
Figure 3.74 Indicators of population age per county in the Republic of Croatia in 2011 (Source: Croatian Bureau of Statistics; Made
by: IRES EKOLOGIJA d.o.o.)
Type of general change in population
General change in population depicts a relation and impact of natural change in population and migration on total
change in population in a certain period. Depending on whether the migration balance is positive or negative, it is
determined whether a certain area has immigration (I) or emigration (E) features. The scale of types of general
change in population (four in each group) is determined according to the intensity of emigration of immigration
features and according the positive or negative income of natural change (Appendix 15.7) (Nejašmić, 2005).
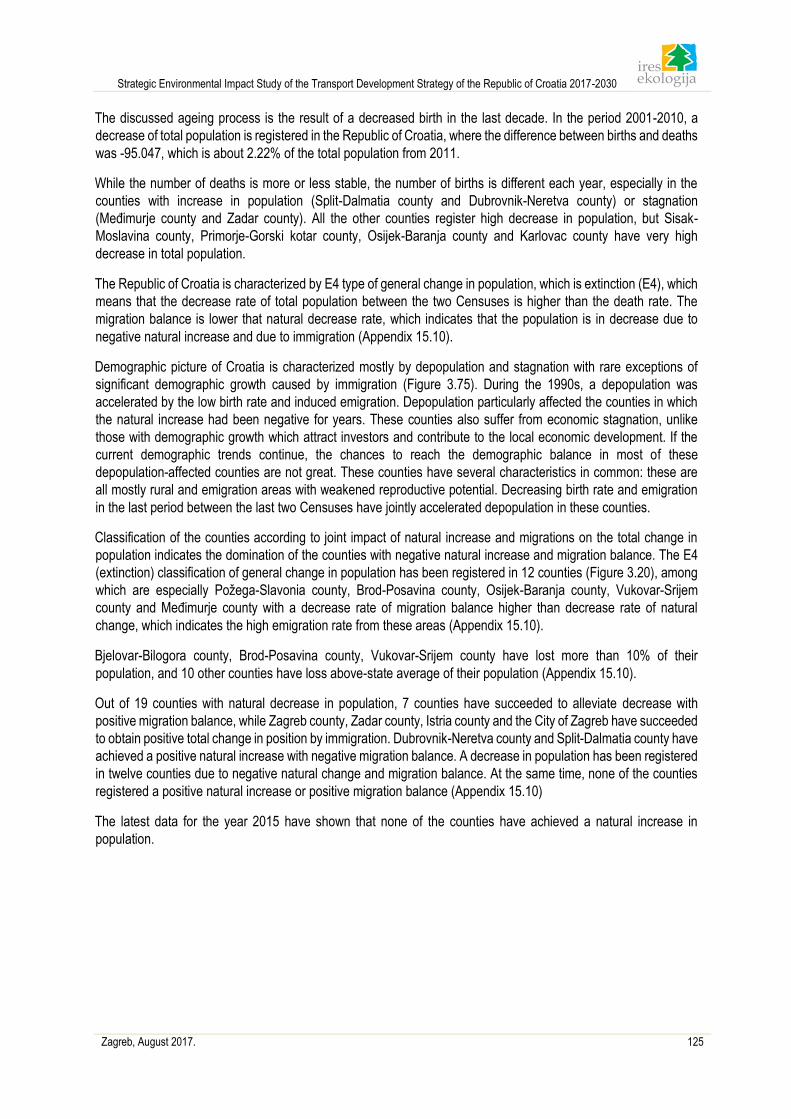
Strategic Environmental Impact Study of the Transport Development Strategy of the Republic of Croatia 2017-2030
Zagreb, August 2017. 125
The discussed ageing process is the result of a decreased birth in the last decade. In the period 2001-2010, a
decrease of total population is registered in the Republic of Croatia, where the difference between births and deaths
was -95.047, which is about 2.22% of the total population from 2011.
While the number of deaths is more or less stable, the number of births is different each year, especially in the
counties with increase in population (Split-Dalmatia county and Dubrovnik-Neretva county) or stagnation
(Međimurje county and Zadar county). All the other counties register high decrease in population, but Sisak-
Moslavina county, Primorje-Gorski kotar county, Osijek-Baranja county and Karlovac county have very high
decrease in total population.
The Republic of Croatia is characterized by E4 type of general change in population, which is extinction (E4), which
means that the decrease rate of total population between the two Censuses is higher than the death rate. The
migration balance is lower that natural decrease rate, which indicates that the population is in decrease due to
negative natural increase and due to immigration (Appendix 15.10).
Demographic picture of Croatia is characterized mostly by depopulation and stagnation with rare exceptions of
significant demographic growth caused by immigration (Figure 3.75). During the 1990s, a depopulation was
accelerated by the low birth rate and induced emigration. Depopulation particularly affected the counties in which
the natural increase had been negative for years. These counties also suffer from economic stagnation, unlike
those with demographic growth which attract investors and contribute to the local economic development. If the
current demographic trends continue, the chances to reach the demographic balance in most of these
depopulation-affected counties are not great. These counties have several characteristics in common: these are
all mostly rural and emigration areas with weakened reproductive potential. Decreasing birth rate and emigration
in the last period between the last two Censuses have jointly accelerated depopulation in these counties.
Classification of the counties according to joint impact of natural increase and migrations on the total change in
population indicates the domination of the counties with negative natural increase and migration balance. The E4
(extinction) classification of general change in population has been registered in 12 counties (Figure 3.20), among
which are especially Požega-Slavonia county, Brod-Posavina county, Osijek-Baranja county, Vukovar-Srijem
county and Međimurje county with a decrease rate of migration balance higher than decrease rate of natural
change, which indicates the high emigration rate from these areas (Appendix 15.10).
Bjelovar-Bilogora county, Brod-Posavina county, Vukovar-Srijem county have lost more than 10% of their
population, and 10 other counties have loss above-state average of their population (Appendix 15.10).
Out of 19 counties with natural decrease in population, 7 counties have succeeded to alleviate decrease with
positive migration balance, while Zagreb county, Zadar county, Istria county and the City of Zagreb have succeeded
to obtain positive total change in position by immigration. Dubrovnik-Neretva county and Split-Dalmatia county have
achieved a positive natural increase with negative migration balance. A decrease in population has been registered
in twelve counties due to negative natural change and migration balance. At the same time, none of the counties
registered a positive natural increase or positive migration balance (Appendix 15.10)
The latest data for the year 2015 have shown that none of the counties have achieved a natural increase in
population.
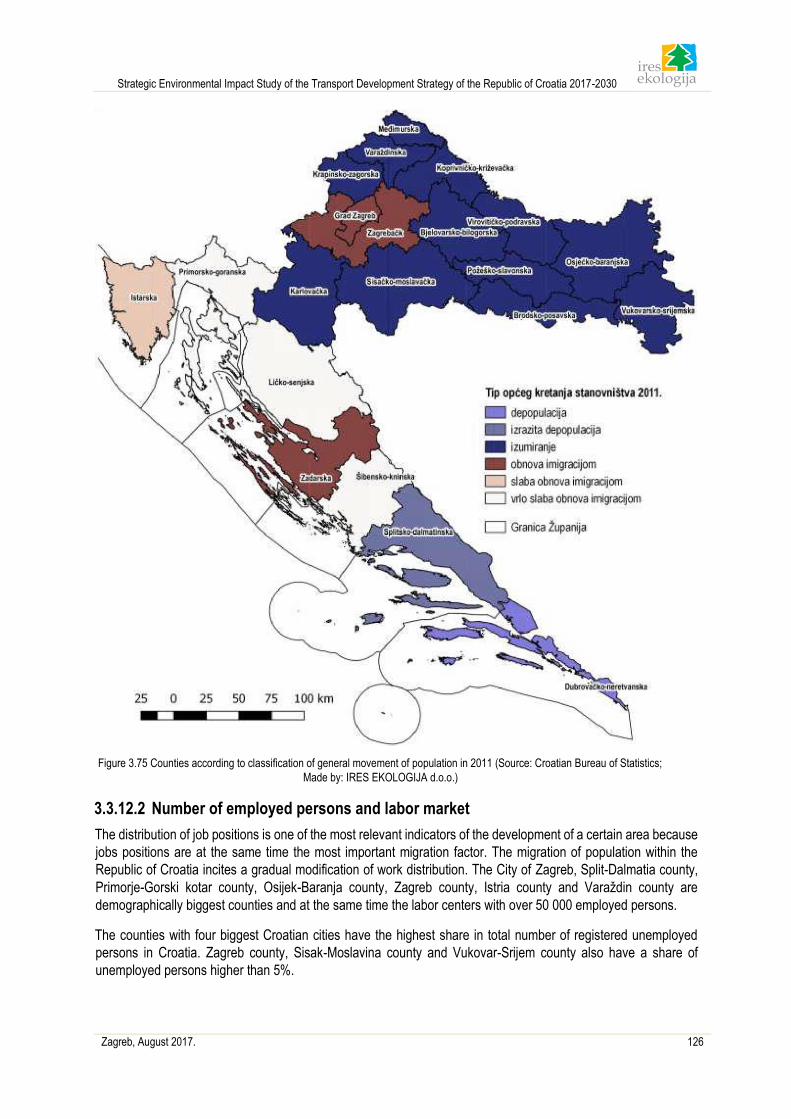
Strategic Environmental Impact Study of the Transport Development Strategy of the Republic of Croatia 2017-2030
Zagreb, August 2017. 126
Figure 3.75 Counties according to classification of general movement of population in 2011 (Source: Croatian Bureau of Statistics;
Made by: IRES EKOLOGIJA d.o.o.)
3.3.12.2 Number of employed persons and labor market
The distribution of job positions is one of the most relevant indicators of the development of a certain area because
jobs positions are at the same time the most important migration factor. The migration of population within the
Republic of Croatia incites a gradual modification of work distribution. The City of Zagreb, Split-Dalmatia county,
Primorje-Gorski kotar county, Osijek-Baranja county, Zagreb county, Istria county and Varaždin county are
demographically biggest counties and at the same time the labor centers with over 50 000 employed persons.
The counties with four biggest Croatian cities have the highest share in total number of registered unemployed
persons in Croatia. Zagreb county, Sisak-Moslavina county and Vukovar-Srijem county also have a share of
unemployed persons higher than 5%.
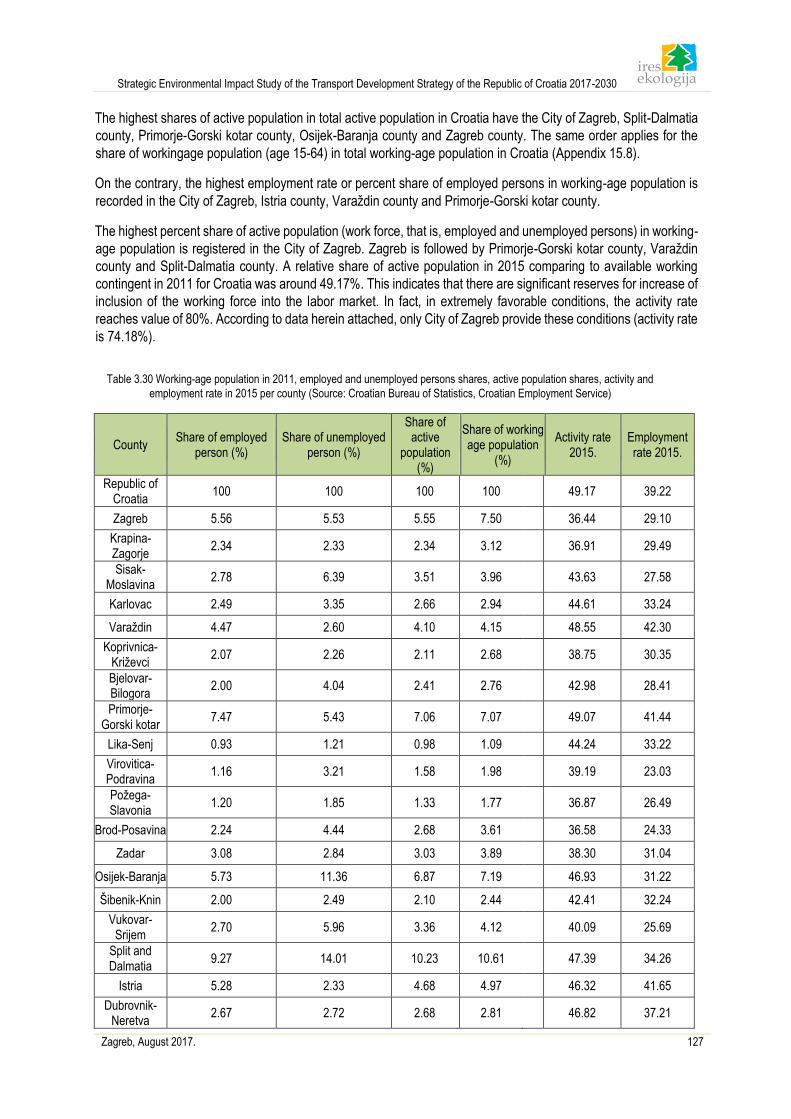
Strategic Environmental Impact Study of the Transport Development Strategy of the Republic of Croatia 2017-2030
Zagreb, August 2017. 127
The highest shares of active population in total active population in Croatia have the City of Zagreb, Split-Dalmatia
county, Primorje-Gorski kotar county, Osijek-Baranja county and Zagreb county. The same order applies for the
share of workingage population (age 15-64) in total working-age population in Croatia (Appendix 15.8).
On the contrary, the highest employment rate or percent share of employed persons in working-age population is
recorded in the City of Zagreb, Istria county, Varaždin county and Primorje-Gorski kotar county.
The highest percent share of active population (work force, that is, employed and unemployed persons) in working-
age population is registered in the City of Zagreb. Zagreb is followed by Primorje-Gorski kotar county, Varaždin
county and Split-Dalmatia county. A relative share of active population in 2015 comparing to available working
contingent in 2011 for Croatia was around 49.17%. This indicates that there are significant reserves for increase of
inclusion of the working force into the labor market. In fact, in extremely favorable conditions, the activity rate
reaches value of 80%. According to data herein attached, only City of Zagreb provide these conditions (activity rate
is 74.18%).
Table 3.30 Working-age population in 2011, employed and unemployed persons shares, active population shares, activity and
employment rate in 2015 per county (Source: Croatian Bureau of Statistics, Croatian Employment Service)
County Share of employed
person (%) Share of unemployed
person (%)
Share of active
population (%)
Share of working age population
(%)
Activity rate 2015.
Employment rate 2015.
Republic of Croatia
100 100 100 100 49.17 39.22
Zagreb 5.56 5.53 5.55 7.50 36.44 29.10
Krapina-Zagorje
2.34 2.33 2.34 3.12 36.91 29.49
Sisak-Moslavina
2.78 6.39 3.51 3.96 43.63 27.58
Karlovac 2.49 3.35 2.66 2.94 44.61 33.24
Varaždin 4.47 2.60 4.10 4.15 48.55 42.30
Koprivnica-Križevci
2.07 2.26 2.11 2.68 38.75 30.35
Bjelovar-Bilogora
2.00 4.04 2.41 2.76 42.98 28.41
Primorje-Gorski kotar
7.47 5.43 7.06 7.07 49.07 41.44
Lika-Senj 0.93 1.21 0.98 1.09 44.24 33.22
Virovitica-Podravina
1.16 3.21 1.58 1.98 39.19 23.03
Požega-Slavonia
1.20 1.85 1.33 1.77 36.87 26.49
Brod-Posavina 2.24 4.44 2.68 3.61 36.58 24.33
Zadar 3.08 2.84 3.03 3.89 38.30 31.04
Osijek-Baranja 5.73 11.36 6.87 7.19 46.93 31.22
Šibenik-Knin 2.00 2.49 2.10 2.44 42.41 32.24
Vukovar-Srijem
2.70 5.96 3.36 4.12 40.09 25.69
Split and Dalmatia
9.27 14.01 10.23 10.61 47.39 34.26
Istria 5.28 2.33 4.68 4.97 46.32 41.65
Dubrovnik-Neretva
2.67 2.72 2.68 2.81 46.82 37.21
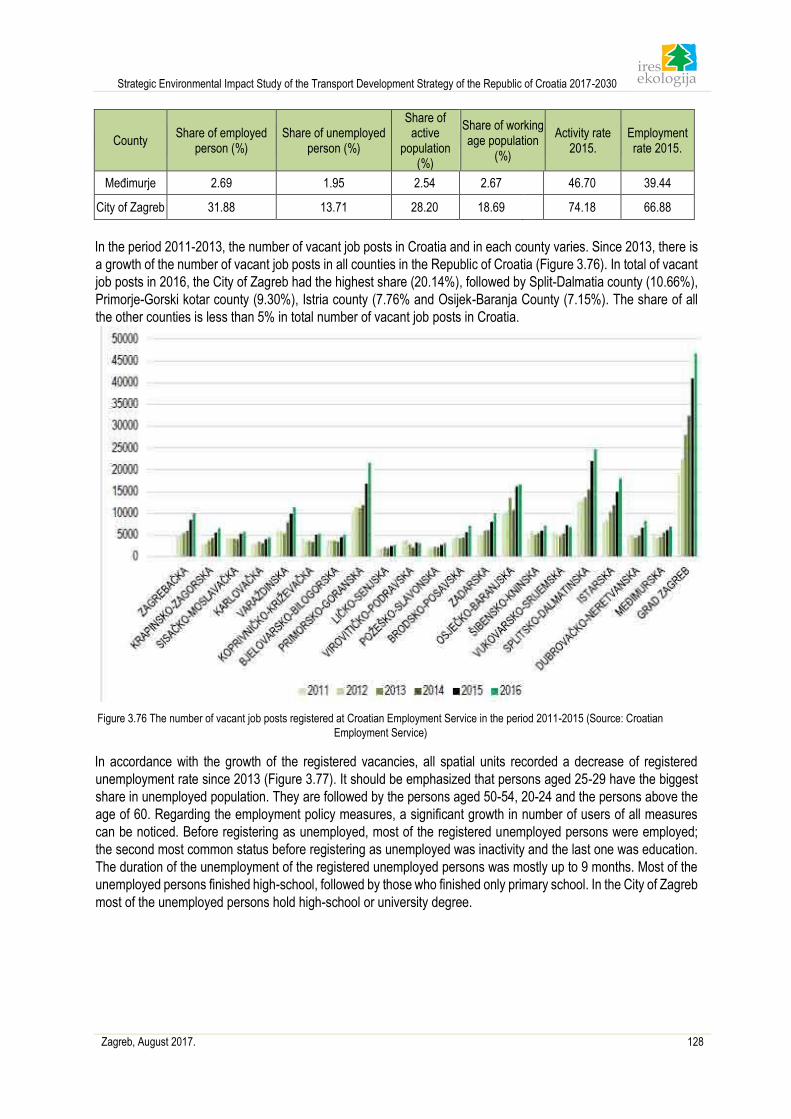
Strategic Environmental Impact Study of the Transport Development Strategy of the Republic of Croatia 2017-2030
Zagreb, August 2017. 128
County Share of employed
person (%) Share of unemployed
person (%)
Share of active
population (%)
Share of working age population
(%)
Activity rate 2015.
Employment rate 2015.
Međimurje 2.69 1.95 2.54 2.67 46.70 39.44
City of Zagreb 31.88 13.71 28.20 18.69 74.18 66.88
In the period 2011-2013, the number of vacant job posts in Croatia and in each county varies. Since 2013, there is
a growth of the number of vacant job posts in all counties in the Republic of Croatia (Figure 3.76). In total of vacant
job posts in 2016, the City of Zagreb had the highest share (20.14%), followed by Split-Dalmatia county (10.66%),
Primorje-Gorski kotar county (9.30%), Istria county (7.76% and Osijek-Baranja County (7.15%). The share of all
the other counties is less than 5% in total number of vacant job posts in Croatia.
Figure 3.76 The number of vacant job posts registered at Croatian Employment Service in the period 2011-2015 (Source: Croatian
Employment Service)
In accordance with the growth of the registered vacancies, all spatial units recorded a decrease of registered
unemployment rate since 2013 (Figure 3.77). It should be emphasized that persons aged 25-29 have the biggest
share in unemployed population. They are followed by the persons aged 50-54, 20-24 and the persons above the
age of 60. Regarding the employment policy measures, a significant growth in number of users of all measures
can be noticed. Before registering as unemployed, most of the registered unemployed persons were employed;
the second most common status before registering as unemployed was inactivity and the last one was education.
The duration of the unemployment of the registered unemployed persons was mostly up to 9 months. Most of the
unemployed persons finished high-school, followed by those who finished only primary school. In the City of Zagreb
most of the unemployed persons hold high-school or university degree.
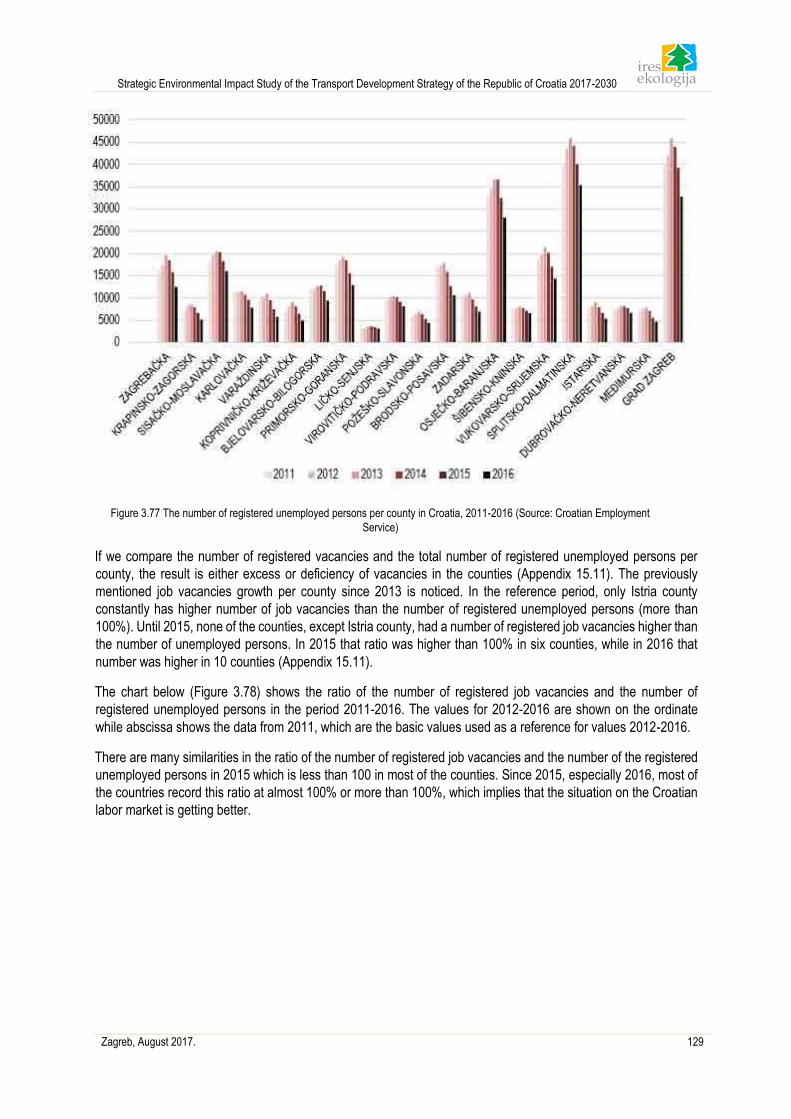
Strategic Environmental Impact Study of the Transport Development Strategy of the Republic of Croatia 2017-2030
Zagreb, August 2017. 129
Figure 3.77 The number of registered unemployed persons per county in Croatia, 2011-2016 (Source: Croatian Employment
Service)
If we compare the number of registered vacancies and the total number of registered unemployed persons per
county, the result is either excess or deficiency of vacancies in the counties (Appendix 15.11). The previously
mentioned job vacancies growth per county since 2013 is noticed. In the reference period, only Istria county
constantly has higher number of job vacancies than the number of registered unemployed persons (more than
100%). Until 2015, none of the counties, except Istria county, had a number of registered job vacancies higher than
the number of unemployed persons. In 2015 that ratio was higher than 100% in six counties, while in 2016 that
number was higher in 10 counties (Appendix 15.11).
The chart below (Figure 3.78) shows the ratio of the number of registered job vacancies and the number of
registered unemployed persons in the period 2011-2016. The values for 2012-2016 are shown on the ordinate
while abscissa shows the data from 2011, which are the basic values used as a reference for values 2012-2016.
There are many similarities in the ratio of the number of registered job vacancies and the number of the registered
unemployed persons in 2015 which is less than 100 in most of the counties. Since 2015, especially 2016, most of
the countries record this ratio at almost 100% or more than 100%, which implies that the situation on the Croatian
labor market is getting better.

Strategic Environmental Impact Study of the Transport Development Strategy of the Republic of Croatia 2017-2030
Zagreb, August 2017. 130
Figure 3.78 Share of registered job vacancies in total number of the registered unemployed persons (%) in the period 2012 -2016
base=share in 2011 (Source: On-line Statistics, Croatian Employment Service)
3.3.12.3 Development Index
Development Index (hereinafter referred to as: DI) is a composite indicator calculated as ponderated average of
multiple social and economic indicators (unemployment rate, per capita income, budget income of local or regional
self-government per capita, general population movement rate and education rate) for measurement of the level of
development of local and regional self-government bodies and is based on deviation of indicator value from the
state average of local and regional self-government bodies categorized in development groups.
DI was introduced for the purpose of objective measurements of development of all local and regional self-
government units in the Republic of Croatia. By directly connecting the levels of the economic development
incentives with the levels of development, a quality frame of development drive is obtained for all local and regional
units in accordance with the development level of each unit. Croatia’s Regional Development Act (OG 147/14)
states that assessment procedure is to be conducted every five years, while the last procedure of assessment and
distribution of all units of local and regional self-government according to development index has been conducted
at the end of 2013.
The development index of twelve counties distributed in the Development group I is by 75% lower than Croatian
average. This lowest development group is also qualified as assisted area. The Development group II comprises
Šibenik-Knin County, Varaždin County and Split-Dalmatia County, while the Group III comprises Zadar County,
Dubrovnik-Neretva county and Zagreb county. The most developed counties are Istria County, Primorje-Gorski
Kotar County and the City of Zagreb.
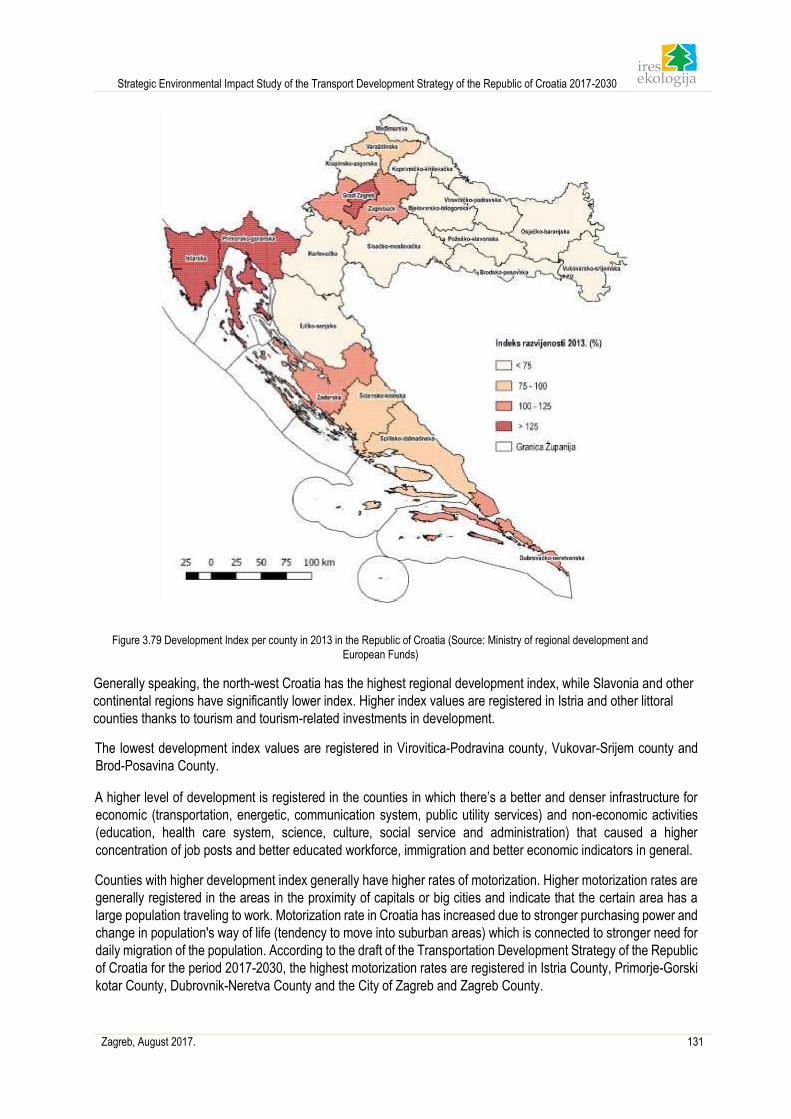
Strategic Environmental Impact Study of the Transport Development Strategy of the Republic of Croatia 2017-2030
Zagreb, August 2017. 131
Figure 3.79 Development Index per county in 2013 in the Republic of Croatia (Source: Ministry of regional development and
European Funds)
Generally speaking, the north-west Croatia has the highest regional development index, while Slavonia and other
continental regions have significantly lower index. Higher index values are registered in Istria and other littoral
counties thanks to tourism and tourism-related investments in development.
The lowest development index values are registered in Virovitica-Podravina county, Vukovar-Srijem county and
Brod-Posavina County.
A higher level of development is registered in the counties in which there’s a better and denser infrastructure for
economic (transportation, energetic, communication system, public utility services) and non-economic activities
(education, health care system, science, culture, social service and administration) that caused a higher
concentration of job posts and better educated workforce, immigration and better economic indicators in general.
Counties with higher development index generally have higher rates of motorization. Higher motorization rates are
generally registered in the areas in the proximity of capitals or big cities and indicate that the certain area has a
large population traveling to work. Motorization rate in Croatia has increased due to stronger purchasing power and
change in population's way of life (tendency to move into suburban areas) which is connected to stronger need for
daily migration of the population. According to the draft of the Transportation Development Strategy of the Republic
of Croatia for the period 2017-2030, the highest motorization rates are registered in Istria County, Primorje-Gorski
kotar County, Dubrovnik-Neretva County and the City of Zagreb and Zagreb County.
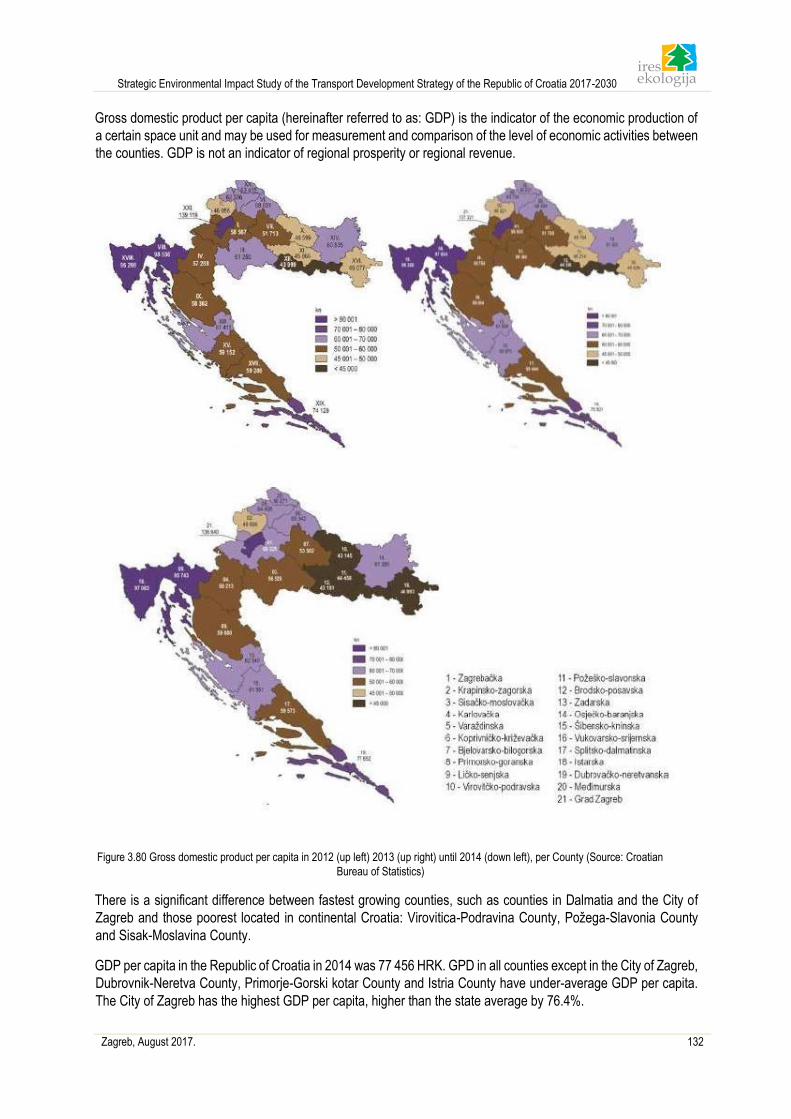
Strategic Environmental Impact Study of the Transport Development Strategy of the Republic of Croatia 2017-2030
Zagreb, August 2017. 132
Gross domestic product per capita (hereinafter referred to as: GDP) is the indicator of the economic production of
a certain space unit and may be used for measurement and comparison of the level of economic activities between
the counties. GDP is not an indicator of regional prosperity or regional revenue.
Figure 3.80 Gross domestic product per capita in 2012 (up left) 2013 (up right) until 2014 (down left), per County (Source: Croatian
Bureau of Statistics)
There is a significant difference between fastest growing counties, such as counties in Dalmatia and the City of
Zagreb and those poorest located in continental Croatia: Virovitica-Podravina County, Požega-Slavonia County
and Sisak-Moslavina County.
GDP per capita in the Republic of Croatia in 2014 was 77 456 HRK. GPD in all counties except in the City of Zagreb,
Dubrovnik-Neretva County, Primorje-Gorski kotar County and Istria County have under-average GDP per capita.
The City of Zagreb has the highest GDP per capita, higher than the state average by 76.4%.
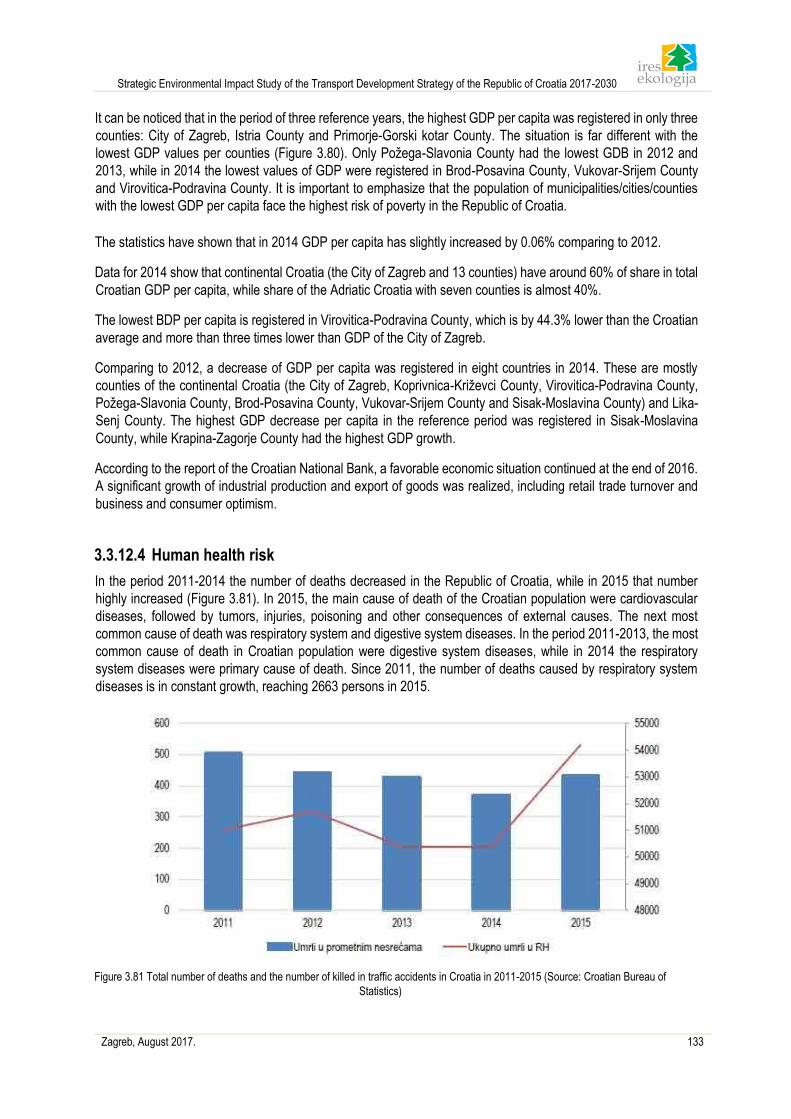
Strategic Environmental Impact Study of the Transport Development Strategy of the Republic of Croatia 2017-2030
Zagreb, August 2017. 133
It can be noticed that in the period of three reference years, the highest GDP per capita was registered in only three
counties: City of Zagreb, Istria County and Primorje-Gorski kotar County. The situation is far different with the
lowest GDP values per counties (Figure 3.80). Only Požega-Slavonia County had the lowest GDB in 2012 and
2013, while in 2014 the lowest values of GDP were registered in Brod-Posavina County, Vukovar-Srijem County
and Virovitica-Podravina County. It is important to emphasize that the population of municipalities/cities/counties
with the lowest GDP per capita face the highest risk of poverty in the Republic of Croatia.
The statistics have shown that in 2014 GDP per capita has slightly increased by 0.06% comparing to 2012.
Data for 2014 show that continental Croatia (the City of Zagreb and 13 counties) have around 60% of share in total
Croatian GDP per capita, while share of the Adriatic Croatia with seven counties is almost 40%.
The lowest BDP per capita is registered in Virovitica-Podravina County, which is by 44.3% lower than the Croatian
average and more than three times lower than GDP of the City of Zagreb.
Comparing to 2012, a decrease of GDP per capita was registered in eight countries in 2014. These are mostly
counties of the continental Croatia (the City of Zagreb, Koprivnica-Križevci County, Virovitica-Podravina County,
Požega-Slavonia County, Brod-Posavina County, Vukovar-Srijem County and Sisak-Moslavina County) and Lika-
Senj County. The highest GDP decrease per capita in the reference period was registered in Sisak-Moslavina
County, while Krapina-Zagorje County had the highest GDP growth.
According to the report of the Croatian National Bank, a favorable economic situation continued at the end of 2016.
A significant growth of industrial production and export of goods was realized, including retail trade turnover and
business and consumer optimism.
3.3.12.4 Human health risk
In the period 2011-2014 the number of deaths decreased in the Republic of Croatia, while in 2015 that number
highly increased (Figure 3.81). In 2015, the main cause of death of the Croatian population were cardiovascular
diseases, followed by tumors, injuries, poisoning and other consequences of external causes. The next most
common cause of death was respiratory system and digestive system diseases. In the period 2011-2013, the most
common cause of death in Croatian population were digestive system diseases, while in 2014 the respiratory
system diseases were primary cause of death. Since 2011, the number of deaths caused by respiratory system
diseases is in constant growth, reaching 2663 persons in 2015.
Figure 3.81 Total number of deaths and the number of killed in traffic accidents in Croatia in 2011-2015 (Source: Croatian Bureau of
Statistics)
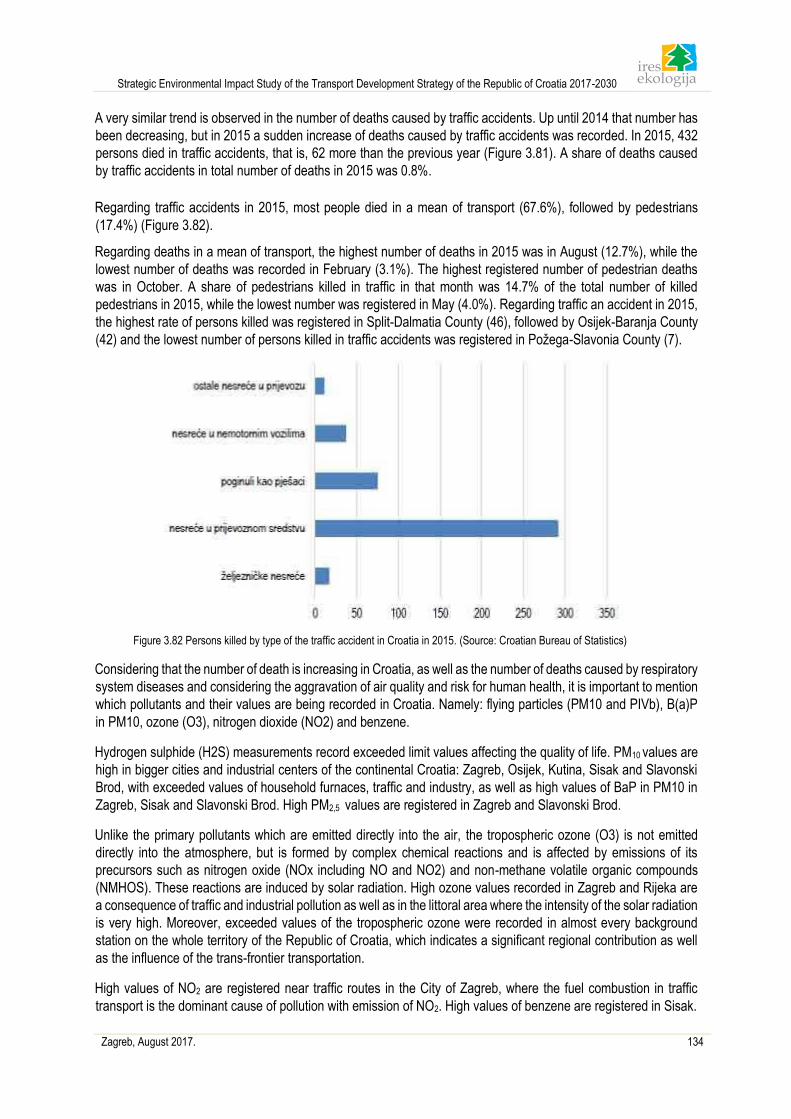
Strategic Environmental Impact Study of the Transport Development Strategy of the Republic of Croatia 2017-2030
Zagreb, August 2017. 134
A very similar trend is observed in the number of deaths caused by traffic accidents. Up until 2014 that number has
been decreasing, but in 2015 a sudden increase of deaths caused by traffic accidents was recorded. In 2015, 432
persons died in traffic accidents, that is, 62 more than the previous year (Figure 3.81). A share of deaths caused
by traffic accidents in total number of deaths in 2015 was 0.8%.
Regarding traffic accidents in 2015, most people died in a mean of transport (67.6%), followed by pedestrians
(17.4%) (Figure 3.82).
Regarding deaths in a mean of transport, the highest number of deaths in 2015 was in August (12.7%), while the
lowest number of deaths was recorded in February (3.1%). The highest registered number of pedestrian deaths
was in October. A share of pedestrians killed in traffic in that month was 14.7% of the total number of killed
pedestrians in 2015, while the lowest number was registered in May (4.0%). Regarding traffic an accident in 2015,
the highest rate of persons killed was registered in Split-Dalmatia County (46), followed by Osijek-Baranja County
(42) and the lowest number of persons killed in traffic accidents was registered in Požega-Slavonia County (7).
Figure 3.82 Persons killed by type of the traffic accident in Croatia in 2015. (Source: Croatian Bureau of Statistics)
Considering that the number of death is increasing in Croatia, as well as the number of deaths caused by respiratory
system diseases and considering the aggravation of air quality and risk for human health, it is important to mention
which pollutants and their values are being recorded in Croatia. Namely: flying particles (PM10 and PIVb), B(a)P
in PM10, ozone (O3), nitrogen dioxide (NO2) and benzene.
Hydrogen sulphide (H2S) measurements record exceeded limit values affecting the quality of life. PM10 values are
high in bigger cities and industrial centers of the continental Croatia: Zagreb, Osijek, Kutina, Sisak and Slavonski
Brod, with exceeded values of household furnaces, traffic and industry, as well as high values of BaP in PM10 in
Zagreb, Sisak and Slavonski Brod. High PM2,5 values are registered in Zagreb and Slavonski Brod.
Unlike the primary pollutants which are emitted directly into the air, the tropospheric ozone (O3) is not emitted
directly into the atmosphere, but is formed by complex chemical reactions and is affected by emissions of its
precursors such as nitrogen oxide (NOx including NO and NO2) and non-methane volatile organic compounds
(NMHOS). These reactions are induced by solar radiation. High ozone values recorded in Zagreb and Rijeka are
a consequence of traffic and industrial pollution as well as in the littoral area where the intensity of the solar radiation
is very high. Moreover, exceeded values of the tropospheric ozone were recorded in almost every background
station on the whole territory of the Republic of Croatia, which indicates a significant regional contribution as well
as the influence of the trans-frontier transportation.
High values of NO2 are registered near traffic routes in the City of Zagreb, where the fuel combustion in traffic
transport is the dominant cause of pollution with emission of NO2. High values of benzene are registered in Sisak.
Strategic Environmental Impact Study of the Transport Development Strategy of the Republic of Croatia 2017-2030
Zagreb, August 2017. 135
Exceeded values of H2S are registered in the industrial centers Sisak, Urinja and Slavonski Brod, which is also
located near an industrial center.
The pollutants that may cause damages to human health are also found in the soil. Pollutant in the soil are heavy
metals (Cd, Cr, Cu, Hg, Ni, Pb i Zn) and potentially toxic essential elements (Zn and Cu), organic pollutants
(pesticides, industrial chemicals, combustion by-products and industrial processes by-products), radionuclide and
pathogenic organisms. The most significant soil pollution causes are those of anthropogenic origin (waste,
emissions from traffic, accidents, etc.). The Regulation on the protection of the cultivated land from contamination
defines pollutants, causes of pollution and maximum allowed quantities of pollutants in soil, but these only apply to
cultivated land. Threshold limit values of pollutants are not defined for land used for other purposes (forest land,
settlements, parks and playgrounds, industrial zones), which prevents defining and monitoring of polluted and
potentially polluted locations and potential changes in soil.
3.4 Potential environment development without the implementation of
the Strategy By joining the European Union, Croatia has assumed the responsibility to reduce the greenhouse gas emission as
well as to improve environment and nature status, especially regarding water, biodiversity and air quality. National
strategies, programs and plans define measures for the improvement of status of a certain activity which should
ultimately result in a reduced impact on the environment.
In the context of this document, the main driver of changes in the environment is the construction and organization
of traffic system. The traffic connection is an important precondition for raising life standard of the population and
for regionally balanced development of the Republic of Croatia. The transportation ensures faster and easier
availability, better mobility of people, access to a work place, effective trade of services and goods, which is why it
represents an essential segment of the development of all economic sectors.
Should the Strategy not be implemented, the negative demographic trends would continue, that is the low birth rate
would affect the total population movement, younger and working-age population would emigrate and the
population would continue to age which all initiated the extinction process in many areas in Croatia. The growing
trend of population ageing affects both socioeconomic needs of total population and the mobility of the population.
The increasing share of elderly population in the total population shall have greater needs for public transportation,
the availability of which is not adequately solved in all parts of Croatia. Should the objectives of this Strategy
regarding the improvement of the public transportation system in general (GO 1 and PT1-PT5) and by transport
sector (RDT2, AT3, MT6) not be implemented, meeting the social needs demanded by the elderly Croatian
population may be postponed or even ignored.
Moreover, in case the Strategy’s objectives GO3, GO7, GO8, GO9, GO3 and SG6 are not implemented, high
differences in values of development index and GDP may continue in the counties. A diversified spatial
development creates uneven conditions for the development of entrepreneurship. This leads to deepening of
socioeconomic differences between the counties and population migration to the counties with better availability of
job vacancies and social infrastructure which ultimately leads to higher pressure on the environment. Non-
implementation of the objectives RDT6 and RDT8 shall lead to further deepening of the socioeconomic differences
in Croatia in the areas that are less available because the upper limit of the maximum road capacity has been
reached in the existing transportation infrastructure and in which there are no alternative means of transportation
or they are not economically justified. In case the objectives regarding development of the logistic potential of main
traffic crossroads (SG4, SG5), increasing competitiveness of ports (AT1, AT2, MT1, RIT1, RIT2) and increasing
the efficacy of traffic systems (GO2, RT1, RT2, RT6, RT7, RDT4, RDT7, MT3, MT5, RIT4, RIT5) are not
implemented, the differences in values of development index per County and uneven spatial development in
Croatia will be even stronger.
Intensification of social and economic activities in most developed and most populated counties induces an
increasing level of pollution emissions into air/soil and water (most significant pollutions in road traffic), noise
Strategic Environmental Impact Study of the Transport Development Strategy of the Republic of Croatia 2017-2030
Zagreb, August 2017. 136
pollution, exhaust gas pollution and dust pollution. Non-implementation of Strategy’s general objectives GO4 an
GO5 irreversibly changes natural values of space and has negative impact on the habitat fragmentation and
flora/fauna diminution. In addition, lack of control of pollutant emissions represents a risk for human health.
Moreover, excess traffic infrastructure (especially road traffic infrastructure in the littoral area) contributes to the
modification of landscape visual features which has a negative impact on tourist perception and experience of the
location. On the other hand, traffic is an important factor of the tourism development, so non-implementation of
Strategy’s objectives GO9, SG1, SG2, SG7, RDT9 and RIT3 would lead to further deepening of transportation
issues in the tourism sector.
The non-implementation of Strategy’s general objectives GO1, GO4, GO5 and GO6 would postpone some positive
changes regarding reduction of environmental pollution, especially by using environmentally-friendly fuel,
improvement of transportation system security, raising transportation system effectiveness using energy sources
with low or zero carbohydrate emission, reduction of noise pollution and waste. The same applies to non-
implementation of the specific objectives in the respective transportation sectors: RT3, RT4, RT5, RDT1, RDT3,
RDT5, AT4, MT2 and MT4.
Should the measures defined in this Strategy not be implemented, Croatia would not fulfill internationally assumed
responsibility of reduction of greenhouse gas emission so the environmental development would still be affected
by the greenhouse gas emissions and pollutant caused by the transportation sector. Even though the Croatia’s
share in total global emissions is low, it is necessary that Croatia joins the world countries in their efforts to reduce
greenhouse gas emissions and to contribute to limit global temperature growth to maximum of 2°C.
Finally, it is estimated that without the implementation of this Strategy, the environment would continue to develop
in accordance with the currents trends with potential improvements in transportation sector that might help fulfill
development strategies and Spatial planning documents in counties, cities or municipalities.
Strategic Environmental Impact Study of the Transport Development Strategy of the Republic of Croatia 2017-2030
Zagreb, August 2017. 137
4 Environmental Characteristics of the Areas that can be
significantly affected by the Strategy
Environmental characteristics of the area that can be significantly influenced by the implementation of the Strategy
are described in Chapter 3.3 Description of Environmental Components. This chapter describes identified expected
impacts on the area environmental characteristics that can be significantly influenced by the implementation of the
Strategy.
Air quality and climate features
At a strategic assessment level, when we exclude specific impacts that are either limited by legal regulations or are
considered at the level of environmental impact, the Strategy has potentially positive and negative impact on air
quality and climate features. Using the newly constructed transport infrastructure and increasing the number of
vehicles shall increase the amount of harmful exhaust and greenhouse gases, which negatively affects the air
quality. The implementation of the measures that contribute to the reduction of greenhouse gas emissions and the
introduction of an intermodal system based on ecological and innovative solutions shall have a positive impact on
the air quality and climate features.
Geodiversity
By analysing the locations of protected geoheritage sites and interventions planned in the Strategy, it has been
established that there are no conflicts in the area, i.e. that the intervention shall not devastate the protected
geoheritage sites.
Biodiversity
In the implementation of the Strategy, there are possible impacts on biodiversity, which are primarily reflected in
additional fragmentation of rare and endangered habitats, disturbing species and reducing the stability of important
ecosystems. Significant impacts are possible due to changes in hydromorphological conditions of water bodies,
which may lead to changes in habitat conditions. In addition, new roads significantly reduce habitats by causing
edge effects and barrier effects.
Landscape characteristics
Large transport infrastructure projects and associated infrastructure generate negative impact on the landscape.
The impact intensity depends on the area through which it passes or its characteristics. The characteristics of each
area are manifested through natural, anthropogenic (cultural) and visual experiential qualities. Given the number
and types of projects, that is, the type of transport, the most significant impact of the Strategy is expected in the
landscape region of the Lowland areas of northern Croatia.
Soil
The construction of railway tracks and roads shall lead to a negative impact on the soil in the form of soil
contamination with pollutants which occur due to transport by trains and road vehicles and potential soil degradation
due to erosion or soil displacement. Since the impacts on the soil are largely related to the narrow area around the
roads themselves, significant impacts on the soil during the implementation of the Strategy are not expected.
Water
Due to the implementation of the Strategy, negative impacts are expected due to potential pollution of water bodies
and water for human consumption, as well as impacts on the hydromorphological condition of water bodies.
However, it is estimated that these impacts shall not be significant if the existing legal regulations and water
protection measures prescribed by the subject Study shall be applied.
Strategic Environmental Impact Study of the Transport Development Strategy of the Republic of Croatia 2017-2030
Zagreb, August 2017. 138
Cultural and historical heritage
Due to the implementation of the Strategy, negative impacts are possible on the architectural heritage (individual
buildings, cultural and historical units) and the cultural landscape, as well as the archeological zones and sites.
Nevertheless, the preliminary analysis of the Strategy implementation does not show significant impacts, given that
due to the character of the impact it is possible to implement protection measures for the conflict areas.
Agriculture
Realising the measures in the road and rail transport sector and inland waterway transport may result in the
conversion and fragmentation of agricultural land P1 and P2. Given the presence of P1 and P2 land, the influence
of the conversion of P1 and P2 land can be significant in the Dinarides.
Forestry
Significant impacts may be expected in the implementation of planned measures in the area of endangered lowland
forests, in particular common oak forests that are regularly flooded. The construction of roads and railway tracks
shall lead to fragmentation of forest areas, and the construction of the Danube - Sava canal to significant changes
in the water regime, which shall have a significant impact on the stability of the lowland forest ecosystem.
Wild game and hunting
The main impacts that may arise from the implementation of the Strategy are the fragmentation of hunting areas,
disturbance and fatalities of wild game on the roads.
Tourism
Transport capability to meet tourism needs is determined by the size and condition of the transport infrastructure
and transport capacities as well as their ability to meet demand requirements with their services. The importance
of tourism for Croatian economy is great and therefore the transport system appears as a factor for improving or
limiting the development of tourism. The development and equipping of passenger terminals and accompanying
facilities, a systematic improvement of infrastructure and transport service and the uniform development of all
transport modes within the traffic system shall positively influence the accessibility of tourist destinations, the
comfort, speed and safety of travel and the mobility of tourists within destinations, which shall synergistically affect
the increase in the indicators of the tourism intensity and the possibilities of improving or creating new tourist
products.
Social and economic characteristics
Today, a harmonised economic development and valorisation of economic and natural resources is inconceivable
without the adequate development of the entire transport infrastructure complex. It is even more important
considering the attractiveness of the coastline and islands in our country and the primacy of the most developed
tourist area where most of the country's GDP is generated. The wide offer of different means of transport,
infrastructure and various transport systems has a major role to play in raising the quality of life of citizens by
improving accessibility and increasing travel speeds. This strengthens the mobility of the population, ensures
sufficient and rapid supply of remote parts of Croatia, which leads to the intensification of the business of economic
entities, strengthening of tourism activities, increase in the number of employees and the growth of the general and
economic well-being of the society. The synergistic impact of these effects is reflected in the slow economic
emigration of the population from the emigration areas in Croatia, which directly affects the stable overall (general)
movement of the population.
Strategic Environmental Impact Study of the Transport Development Strategy of the Republic of Croatia 2017-2030
Zagreb, August 2017. 139
5 Existing Environmental Issues of Importance for the Strategy
5.1 Air Quality and Climate Characteristics
Concentration of Air Pollutants
The most common pollutants in the air, which caused the pollution of the largest number of zones and
agglomerations in the period from 2013 to 2015, are PM10 and O3. Floating particles with a diameter of less than
10 μm polluted each year three zones/agglomerations, which accounts for 33% of zones and agglomerations.
Excessive air pollution by PM10 floating particles occurs mainly as a direct consequence of traffic, fireplaces and
industry: The number of polluted zones and agglomerations by ground-level ozone (O3) in the period 2013 to 2015
is increasing. In 2013, one agglomeration was contaminated by ground-level ozone, in 2014 two, and in 2015 as
many as six zones/agglomerations were ozonecontaminated (66% in total).
According to the 2009-2012 Environmental Report, the ground-level ozone concentrations in Croatia are mostly
influenced by natural conditions, strong summer insolation, vegetation that is a natural source of ground-level ozone
precursor emissions and the geographic position, which is why our area is exposed to the remote transport of
ground-level ozone and its precursors from the West Europe area. This is the reason for occasional episodic
elevated ground-level ozone concentrations in almost the entire country.
In the period from 2013 to 2015, total concentrations of pollutants in the air increased and accordingly the number
of zones and agglomerations evaluated as contaminated, at least with regard to one pollutant. The Zagreb and
Osijek agglomerations and the Industrial Zone have been rated as contaminated for all three years.
The reasons for increasing concentrations of pollutants in the air in the period from 2013 to 2015 can be attributed
to the following categories:
• small fireboxes
• local industry including electricity generation
• vicinity of main roads
• natural sources or natural events other reasons, etc.
Small fireboxes and the local industry, including electricity production, are one of the most common causes of
pollution in certain zones. Their share in overall pollution for each particular year varies, but they are always at the
top of the causes of pollution.
From 2013 to 2015, the highest number of exceeded limit values, target values and target values for ground-level
ozone was recorded in the Industrial zone, followed by the Zagreb and Osijek agglomerations. According to the
above mentioned, the lowest percentage of the category 1 air was recorded in the Industrial zone and Split and
Osijek agglomerations.
Amount of greenhouse gases
The amount of greenhouse gas emissions, from 1990 to 2014, has been steadily increasing in the energy sector,
and in 2014 the majority of the emissions occurred as a result of the combustion of fuel in traffic (34.8% in 2014).
Road transport is the dominant source of CO2 - eq and it accounts for 95.7% of total CO2 - eq emissions in the
transport sector. The remaining 4.3% of the emissions from the transport sector are produced by the maritime and
river transport (2.4%), railway transport (1.3%) and the least part of air transport (0.6%). Compared to 1990, CO2-
eq emissions from the transport sector increased by 45.4%, as a result of an increase in the number of vehicles
and the number of kilometers travelled in road transport.
Strategic Environmental Impact Study of the Transport Development Strategy of the Republic of Croatia 2017-2030
Zagreb, August 2017. 140
5.2 Geodiversity
Vulnerability of geodiversity sites
The geological and geomorphological phenomena that make up geodiversity are the result of various processes
that can take place during millions of years. Due of the aforementioned, environmental issues related to geological
diversity are particularly emphasized, since any damage and destruction leads to their permanent disappearance.
The greatest pressures on geodiversity, which are the consequence of human activity, result from the exploitation
of mineral resources, since exploitation causes permanent loss of valuable geodiversity areas. Additional problems
are the consequence of the development of new construction sites, as well as the construction of infrastructure
facilities such as roads and railway tracks. The primary impacts of the construction of these facilities are the direct
destruction of geodiversity during construction, but their construction can also activate natural processes such as
landslides that may also affect geodiversity. The collection and intentional destruction of fossils and minerals
(especially in speleological facilities) is problematic and irresponsible.
5.3 Biodiversity The biodiversity of areas in Croatia has been influenced by various anthropogenic pressures for years, due to the
centuriesold population density, however, the development of the society in the past and this century has increased
these pressures, leaving an evident trace on the nature. Urbanization and all its inheritance with the changes in the
habits of the population have led to the subject intensification. One of the main drivers of the pressures is the
increase in traffic with the development of transport infrastructure, resulting in an increasing fragmentation of areas,
a reduction in wild species populations, introduction of invasive foreign species, changes in water conditions in
habitats and others.
The most vulnerable habitats, with regard to the pressures of transport infrastructure, are forest and aquatic habitats
and wetlands, which traffic routes affect by fragmentation, pollution, changes in water conditions and the
introduction and spread of invasive species. However, unfavourable impacts have also been noted in marine
habitats, which are, with the development of maritime traffic, under the great influence of invasive foreign species,
which came to the Adriatic via ballast water and hulls of ships. The spread of invasive species is also contributed
by the changes in climatic characteristics that enable the settlement of species from warmer seas. These impacts
could be mitigated by improved ballast water control; however, a Ballast Water Monitoring Program for the Republic
of Croatia has not yet been developed. A similar situation regarding the transfer of invasive species by ships is also
present in river transport, through which the zebra mussel, one of the most invasive species in the world, has
reached the Croatian rivers of the Danube River Basin.
Although the fragmentation of the Croatian territory is still at a lower level than most states in Europe and still has
not significantly disturbed the balance of the ecosystem, the increase in habitat fragmentation and its consequent
factors is expected with the development of transport. The construction of the transport infrastructure, apart from
habitat fragmentation and preventing the undisturbed movement of animals, also results in the loss of individual
animals on the roads as evidenced by the data specified in Chapter 3.3.3.2. The fatalities of individual animals
depend on several parameters such as the category of roads, the accompanying infrastructure, and the species
composition in the habitat. For example, the largest number of bear and vehicle collisions in Croatia has been
recorded on railway tracks, while wolves are mostly killed on smaller roads passing through their territory. Air
transport is a problem in Croatia, since it is also the cause of many fatalities, contributed to by the fact that Rijeka,
Zadar and Split airports are located within the conservation areas important for the birds of the ecological network
(POP), and all the others, with the exception of Dubrovnik, are located in their vicinity.
In addition, the development of transport in Croatia has resulted in increased stress in wild species resulting from
the amount of noise and vibration in natural and semi-natural habitats. Despite a small quantity of data for Croatia,
the noise and vibrations, together with the flash of vehicle lights, have adversely affected wild species and have
Strategic Environmental Impact Study of the Transport Development Strategy of the Republic of Croatia 2017-2030
Zagreb, August 2017. 141
further diminished their habitat. According to available data, the groups most vulnerable to these impacts on land
are birds and mammals, and marine mammals and fish in the marine environment.
The impact of traffic has not bypassed the protected areas in Croatia, which is evident from the analysis of the
presence of motorways, fast and state roads in national parks and nature parks. In the area of the Velebit Nature
Park (covering Paklenica National Park and Northern Velebit), the largest area is covered by roads, and due to the
share of road surface in the total land area of the protected area, the most unfavourable condition was recorded in
the National Park Mljet.
5.4 Landscape Features Negative changes in the Croatian landscape have so far resulted from different types of activities, starting from the
unharmonized urbanization, which implies the growth of cities, i.e. the abandonment of villages, to major
infrastructural interventions of roads, pipelines and power stations. Landscape issues are created by unplanned
construction associated with urbanization and mass tourism that places the greatest pressure on the coastal area.
Agricultural activity also plays a major role in the formation of landscape areas through systems of melioration,
coagulation, monoculture, felling of forests and hedges.
An additional issue is the fact that the Strategic Plans and Landscape Conventions (European Landscape
Convention) are not linked to any binding legal document that would condition the preparation of a document of
identification, protection, planning and management.
Landscape issues have been addressed in the spatial planning documents, namely the 1997 Spatial planning
Strategy and the 1999 Spatial planning Program. They are also mentioned in the environmental protection system
through the 2002 National Environmental Action Plan and through the nature protection system in the documents:
Strategy and Action Plan for the Protection of Biological and Landscape Diversity of the Republic of Croatia, based
on the Convention on Biological Diversity and the European Biological Protection Strategy And Landscape
Diversity. These documents failed to produce a shift in the landscape problem resolution, so negative impacts are
visible in the areas.
5.5 Soil
Lack of legal framework for soil protection
Since the soil protection system is not normatively constituted as a single law but rather a standardized method of
land use, it is also difficult to establish a unique soil monitoring system, i.e. systematic monitoring of the soil
condition. The incomplete legal regulations of the Republic of Croatia related to the soil and its protection resulted
in the lack of data on the state of the soil, as well as the lack of data on land use. Limit values of pollutants in the
soil are prescribed exclusively for agricultural land, while they are not prescribed for land used for other purposes
(for example forest land, settlements, parks and playgrounds, industrial zones). A consequence of such a situation
is a further disruption in the determination of changes in soil condition, i.e. monitoring soil contamination caused by
natural or anthropogenic sources. Due to the aforementioned, there are no specific preventive measures for soil
protection and sustainable land management.
Soil contamination
With the 2006 Thematic Strategy on Soil Protection, the European Commission identified the most significant
threats to soil in Europe, stating that, as in the case of the Republic of Croatia, soil contamination is caused by
anthropogenic activities. Anthropogenic sources of soil pollution are mostly industrial production (nuclear, chemical,
mining, metallurgical, electronic and other), disposal of industrial (hazardous) waste, disposal of municipal waste,
agriculture, accidents, military activities and similar.
Strategic Environmental Impact Study of the Transport Development Strategy of the Republic of Croatia 2017-2030
Zagreb, August 2017. 142
The most critical soil contamination locations in the Republic of Croatia are unofficially termed "black spots". These
are locations where long-term and inadequate disposal of technological waste resulted in soil contamination. There
are currently six other black spots in the Republic of Croatia presenting significant environmental hazards. Of these
six spots, four are currently in the process of restoration, while the restoration for the remaining two is under
preparation.
5.6 Water Environmental problems related to road, rail, air, river and sea transport are the consequence of insufficient
monitoring of the surrounding water body, i.e. the inability to directly link the pollution of water bodies caused by
traffic. An additional issue is the lack of a legal framework that would prescribe measures to protect water bodies
from contamination. Water protection measures are set out in the Ordinance on the Conditions for Determination
of Sanitary Protection Area Areas and refer only to water for human consumption.
One of the environmental issues is the poor chemical status of certain water bodies of coastal waters. A good
chemical status on the territory of the Republic of Croatia in a total of four water bodies has not been achieved.
Two water bodies of the above four are particularly important for the Strategy. These are the Neretva canal in front
of the Port of Ploče and Port of Split. The reason for the lack of a good chemical status in these water bodies is the
presence of tributyltin above the permissible limit values. It is a chemical compound that has been used in the last
40 years as a biocide coating on ships for the purpose of preventing ship fouling. The issue with this compound is
that it is gradually released into the marine environment where it is extremely toxic to marine organisms. For this
reason, the application of this coating on ships is completely prohibited in the European Union, including the
Republic of Croatia. However, irrespective of these prohibitions, ships with such coatings are not forbidden to enter
ports of the European Union and their negative impact has not been eliminated. According to some estimates, 85%
of the world fleet has biocide coatings based on tin.
The environmental issues associated primarily with river and sea transport are the consequence of the deterioration
of the hydromorphological condition of water bodies of surface waters and water bodies of coastal and transitional
waters and pollution from ships and floating facilities. The hydromorphological condition is disturbed during the
construction of naval and river ports, and the arrangement of riverbeds that are navigable waterways, thus
disrupting the natural condition of the sea shore, i.e. riverbeds. This causes deterioration of the morphological
conditions of water bodies, and consequently their hydromorphological and ecological condition.
In river transport, this issue is evident in the hydromorphological condition of water water bodiescourses that
represent larger waterways within the Republic of Croatia (Danube, Sava and Drava rivers). The
hydromorphological condition of these water bodies is largely disrupted, and is generally considered as being in a
moderate, bad or very bad condition. In maritime traffic, the hydromorphological condition of coastal and transitional
waters is mostly assessed as very good or good. With regard to the transitional waters, a very good or good
condition was found on 62% of the surface, and a moderate condition on 38%. In coastal waters, very good or good
condition was found on as much as 99.6% of the surface and moderate only on 0.4%. A bad or very bad condition
has not been established on no water body of transitional or coastal waters.
It should be noted, however, that an unfavourable assessment of the hydromorphological condition can not be
directly related solely to the impact of the construction of the transport infrastructure, that is, an unfavourable
assessment of the consequences and interventions on water bodies constructed for other purposes, such as water
flood control or coastal settlement for the purpose of coastal tourism.
5.7 Cultural and historical heritage The architectural heritage, which, apart from individual buildings and assemblies, includes urban and rural areas,
is mostly in poor and unmaintained condition. In addition, it is exposed to lasting influences and pressures of
modern development, and due to its material substance it is particularly sensitive and prone to decay. Due to the
poor condition, the endangerment of numerous cultural and historical units and individual structures has been
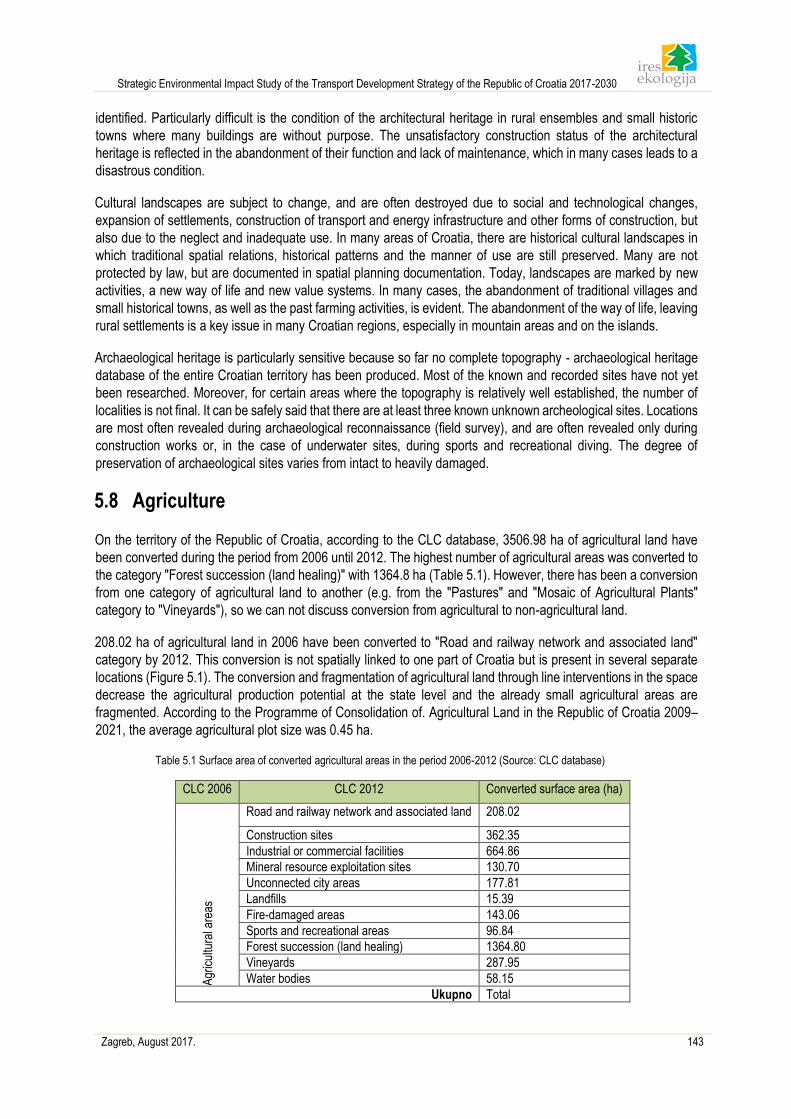
Strategic Environmental Impact Study of the Transport Development Strategy of the Republic of Croatia 2017-2030
Zagreb, August 2017. 143
identified. Particularly difficult is the condition of the architectural heritage in rural ensembles and small historic
towns where many buildings are without purpose. The unsatisfactory construction status of the architectural
heritage is reflected in the abandonment of their function and lack of maintenance, which in many cases leads to a
disastrous condition.
Cultural landscapes are subject to change, and are often destroyed due to social and technological changes,
expansion of settlements, construction of transport and energy infrastructure and other forms of construction, but
also due to the neglect and inadequate use. In many areas of Croatia, there are historical cultural landscapes in
which traditional spatial relations, historical patterns and the manner of use are still preserved. Many are not
protected by law, but are documented in spatial planning documentation. Today, landscapes are marked by new
activities, a new way of life and new value systems. In many cases, the abandonment of traditional villages and
small historical towns, as well as the past farming activities, is evident. The abandonment of the way of life, leaving
rural settlements is a key issue in many Croatian regions, especially in mountain areas and on the islands.
Archaeological heritage is particularly sensitive because so far no complete topography - archaeological heritage
database of the entire Croatian territory has been produced. Most of the known and recorded sites have not yet
been researched. Moreover, for certain areas where the topography is relatively well established, the number of
localities is not final. It can be safely said that there are at least three known unknown archeological sites. Locations
are most often revealed during archaeological reconnaissance (field survey), and are often revealed only during
construction works or, in the case of underwater sites, during sports and recreational diving. The degree of
preservation of archaeological sites varies from intact to heavily damaged.
5.8 Agriculture
On the territory of the Republic of Croatia, according to the CLC database, 3506.98 ha of agricultural land have
been converted during the period from 2006 until 2012. The highest number of agricultural areas was converted to
the category "Forest succession (land healing)" with 1364.8 ha (Table 5.1). However, there has been a conversion
from one category of agricultural land to another (e.g. from the "Pastures" and "Mosaic of Agricultural Plants"
category to "Vineyards"), so we can not discuss conversion from agricultural to non-agricultural land.
208.02 ha of agricultural land in 2006 have been converted to "Road and railway network and associated land"
category by 2012. This conversion is not spatially linked to one part of Croatia but is present in several separate
locations (Figure 5.1). The conversion and fragmentation of agricultural land through line interventions in the space
decrease the agricultural production potential at the state level and the already small agricultural areas are
fragmented. According to the Programme of Consolidation of. Agricultural Land in the Republic of Croatia 2009–
2021, the average agricultural plot size was 0.45 ha.
Table 5.1 Surface area of converted agricultural areas in the period 2006-2012 (Source: CLC database)
CLC 2006 CLC 2012 Converted surface area (ha)
Agr
icul
tura
l are
as
Road and railway network and associated land 208.02
Construction sites 362.35
Industrial or commercial facilities 664.86
Mineral resource exploitation sites 130.70
Unconnected city areas 177.81
Landfills 15.39
Fire-damaged areas 143.06
Sports and recreational areas 96.84
Forest succession (land healing) 1364.80
Vineyards 287.95
Water bodies 58.15
Ukupno Total
Strategic Environmental Impact Study of the Transport Development Strategy of the Republic of Croatia 2017-2030
Zagreb, August 2017. 144
Figure 5.1 Agricultural land converted into the “Road and railway network and associated land” category (Source: CLC database)
5.9 Forestry Forest area
In the period from 2004 to 2011, 23 298 ha of forests and forest land have been converted (extracted), and this
figure has surely increased to date. The aforementioned is also contributed to by the Forest Act itself, which
stipulates: "easement may be established over forest or forest land owned by the Republic of Croatia for the
purpose of raising multi-annual crops on unproductive forest land and land covered by initial or degrading
development stages of forest stands". The forest conversion trend has also been affected forest owner forests,
who for this purpose decide on deforestation. However, the exact area of forest land lost in this manner is not
known. The Road Act (OG 84/11, 22/13, 54/13, 148/13, 92/14) and the Act on the Regulation of Property and Legal
Relations for the Construction of Infrastructure Buildings (OG 80/2011) also affect the reduction of forest areas.
The Road Act states: "in the case of extracting forests and forest land owned by the Republic of Croatia from the
forest and economic area for the purposes of construction, reconstruction and maintenance of public roads, no fee
for the transferred rights prescribed by the act governing the management of forests shall be paid". For example,
for the needs of the Sv. Rok – Dugo polje motorway section, 567 ha of forests and forest land were extracted from
the forest and economic area, and without the fee for transferred rights the lost forest area could not have been
compensate (Gallo, 2011).
Although the forests and their total surface area are of great importance, the trend of forest surface reduction in
Croatia has been noted. This is also supported by the data from the table below (Table 5.2), which shows the forest
area in Croatia from 1980 to 2012.
Table 5.2 Forest surface in Croatia (Source: CLC database)
Forest type
Years/ha
1980 1990 2000 2006 2012 Difference
Deciduous forests
1,706,106 1,694,509 1,695,173 1,667,894 1,653,401 -52 705
Coniferous forests
105,460 102,465 105,598 103,473 102,127 -3333
Strategic Environmental Impact Study of the Transport Development Strategy of the Republic of Croatia 2017-2030
Zagreb, August 2017. 145
Forest type
Years/ha
1980 1990 2000 2006 2012 Difference
Mixed forests 273,643 275,068 272,636 274,578 273,965 22
It can be noticed that the total forest area decreased by 56 038 hectares in the period of 22 years. The largest
share refers to deciduous forests, a smaller part to coniferous forests, while no significant changes have occurred
in the mixed forests. The forests have changed into a transitional area of forests (healing), referring to the young
forests after restoration. The cause of the loss of older stands that are most important for forest biodiversity is still
unknown. Furthermore, in the same period, an increase in the surface area of artificial surfaces predominantly of
unconnected city areas, industrial zones and the road and railway networks were recorded. The figure below
(Figure 5.2) shows the relationship between the surface of forests and the aforementioned artificial surfaces in
Croatia.
Figure 5.2 Ratio of forests and artificial surfaces (Source: CLC database, Habitat map)
Although the figure indicates forest areas in relation to infrastructure buildings, it does not necessarily mean that
their construction has led to a conversion (fragmentation) forest land, as no other areas such as agricultural land,
water areas, etc. are indicated. However, it can be noticed how the construction of a certain part of the artificial
surfaces was performed through forest complexes, which caused their fragmentation, i.e. division into smaller
segments.
Forest ecosystem stability
Although the condition of the Croatian Forests is one of the best in Europe, a large number of harmful factors
(droughts, forest fires, diseases and pests) and the impact of human activities (air pollution, soil acidification,
changes in the water regime of flood and groundwater) weaken the functions and quality of the forest ecosystem.
The main causes of forest endangerment in Croatia are the pollution of air, soil and water (pine trees the most
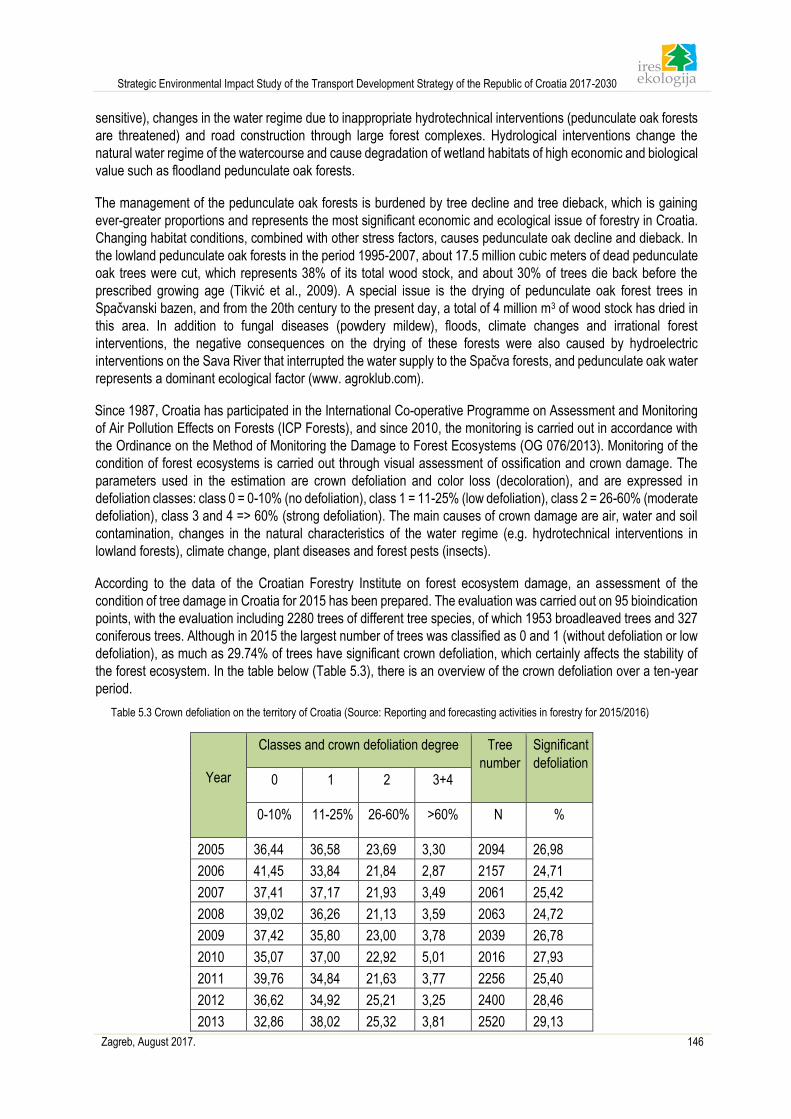
Strategic Environmental Impact Study of the Transport Development Strategy of the Republic of Croatia 2017-2030
Zagreb, August 2017. 146
sensitive), changes in the water regime due to inappropriate hydrotechnical interventions (pedunculate oak forests
are threatened) and road construction through large forest complexes. Hydrological interventions change the
natural water regime of the watercourse and cause degradation of wetland habitats of high economic and biological
value such as floodland pedunculate oak forests.
The management of the pedunculate oak forests is burdened by tree decline and tree dieback, which is gaining
ever-greater proportions and represents the most significant economic and ecological issue of forestry in Croatia.
Changing habitat conditions, combined with other stress factors, causes pedunculate oak decline and dieback. In
the lowland pedunculate oak forests in the period 1995-2007, about 17.5 million cubic meters of dead pedunculate
oak trees were cut, which represents 38% of its total wood stock, and about 30% of trees die back before the
prescribed growing age (Tikvić et al., 2009). A special issue is the drying of pedunculate oak forest trees in
Spačvanski bazen, and from the 20th century to the present day, a total of 4 million m3 of wood stock has dried in
this area. In addition to fungal diseases (powdery mildew), floods, climate changes and irrational forest
interventions, the negative consequences on the drying of these forests were also caused by hydroelectric
interventions on the Sava River that interrupted the water supply to the Spačva forests, and pedunculate oak water
represents a dominant ecological factor (www. agroklub.com).
Since 1987, Croatia has participated in the International Co-operative Programme on Assessment and Monitoring
of Air Pollution Effects on Forests (ICP Forests), and since 2010, the monitoring is carried out in accordance with
the Ordinance on the Method of Monitoring the Damage to Forest Ecosystems (OG 076/2013). Monitoring of the
condition of forest ecosystems is carried out through visual assessment of ossification and crown damage. The
parameters used in the estimation are crown defoliation and color loss (decoloration), and are expressed in
defoliation classes: class 0 = 0-10% (no defoliation), class 1 = 11-25% (low defoliation), class 2 = 26-60% (moderate
defoliation), class 3 and 4 => 60% (strong defoliation). The main causes of crown damage are air, water and soil
contamination, changes in the natural characteristics of the water regime (e.g. hydrotechnical interventions in
lowland forests), climate change, plant diseases and forest pests (insects).
According to the data of the Croatian Forestry Institute on forest ecosystem damage, an assessment of the
condition of tree damage in Croatia for 2015 has been prepared. The evaluation was carried out on 95 bioindication
points, with the evaluation including 2280 trees of different tree species, of which 1953 broadleaved trees and 327
coniferous trees. Although in 2015 the largest number of trees was classified as 0 and 1 (without defoliation or low
defoliation), as much as 29.74% of trees have significant crown defoliation, which certainly affects the stability of
the forest ecosystem. In the table below (Table 5.3), there is an overview of the crown defoliation over a ten-year
period.
Table 5.3 Crown defoliation on the territory of Croatia (Source: Reporting and forecasting activities in forestry for 2015/2016)
Year
Classes and crown defoliation degree Tree
number
Significant
defoliation 0 1 2 3+4
0-10% 11-25% 26-60% >60% N %
2005 36,44 36,58 23,69 3,30 2094 26,98
2006 41,45 33,84 21,84 2,87 2157 24,71
2007 37,41 37,17 21,93 3,49 2061 25,42
2008 39,02 36,26 21,13 3,59 2063 24,72
2009 37,42 35,80 23,00 3,78 2039 26,78
2010 35,07 37,00 22,92 5,01 2016 27,93
2011 39,76 34,84 21,63 3,77 2256 25,40
2012 36,62 34,92 25,21 3,25 2400 28,46
2013 32,86 38,02 25,32 3,81 2520 29,13
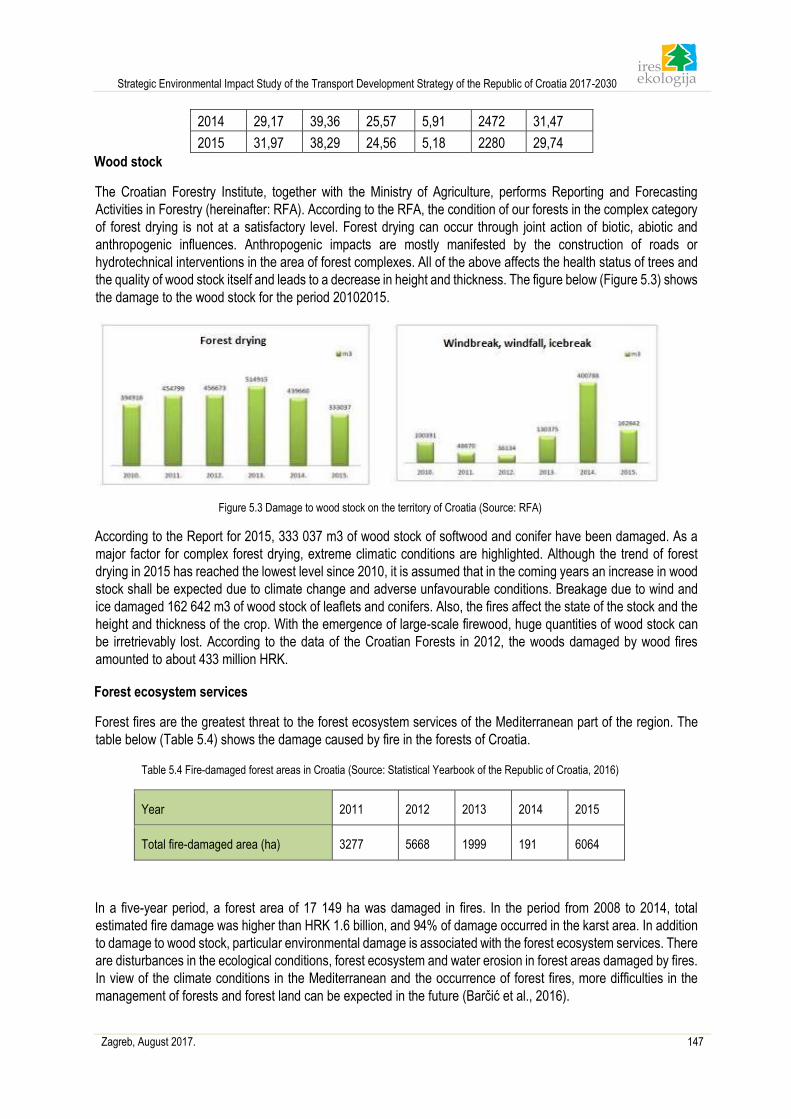
Strategic Environmental Impact Study of the Transport Development Strategy of the Republic of Croatia 2017-2030
Zagreb, August 2017. 147
2014 29,17 39,36 25,57 5,91 2472 31,47
2015 31,97 38,29 24,56 5,18 2280 29,74
Wood stock
The Croatian Forestry Institute, together with the Ministry of Agriculture, performs Reporting and Forecasting
Activities in Forestry (hereinafter: RFA). According to the RFA, the condition of our forests in the complex category
of forest drying is not at a satisfactory level. Forest drying can occur through joint action of biotic, abiotic and
anthropogenic influences. Anthropogenic impacts are mostly manifested by the construction of roads or
hydrotechnical interventions in the area of forest complexes. All of the above affects the health status of trees and
the quality of wood stock itself and leads to a decrease in height and thickness. The figure below (Figure 5.3) shows
the damage to the wood stock for the period 20102015.
Figure 5.3 Damage to wood stock on the territory of Croatia (Source: RFA)
According to the Report for 2015, 333 037 m3 of wood stock of softwood and conifer have been damaged. As a
major factor for complex forest drying, extreme climatic conditions are highlighted. Although the trend of forest
drying in 2015 has reached the lowest level since 2010, it is assumed that in the coming years an increase in wood
stock shall be expected due to climate change and adverse unfavourable conditions. Breakage due to wind and
ice damaged 162 642 m3 of wood stock of leaflets and conifers. Also, the fires affect the state of the stock and the
height and thickness of the crop. With the emergence of large-scale firewood, huge quantities of wood stock can
be irretrievably lost. According to the data of the Croatian Forests in 2012, the woods damaged by wood fires
amounted to about 433 million HRK.
Forest ecosystem services
Forest fires are the greatest threat to the forest ecosystem services of the Mediterranean part of the region. The
table below (Table 5.4) shows the damage caused by fire in the forests of Croatia.
Table 5.4 Fire-damaged forest areas in Croatia (Source: Statistical Yearbook of the Republic of Croatia, 2016)
Year 2011 2012 2013 2014 2015
Total fire-damaged area (ha) 3277 5668 1999 191 6064
In a five-year period, a forest area of 17 149 ha was damaged in fires. In the period from 2008 to 2014, total
estimated fire damage was higher than HRK 1.6 billion, and 94% of damage occurred in the karst area. In addition
to damage to wood stock, particular environmental damage is associated with the forest ecosystem services. There
are disturbances in the ecological conditions, forest ecosystem and water erosion in forest areas damaged by fires.
In view of the climate conditions in the Mediterranean and the occurrence of forest fires, more difficulties in the
management of forests and forest land can be expected in the future (Barčić et al., 2016).
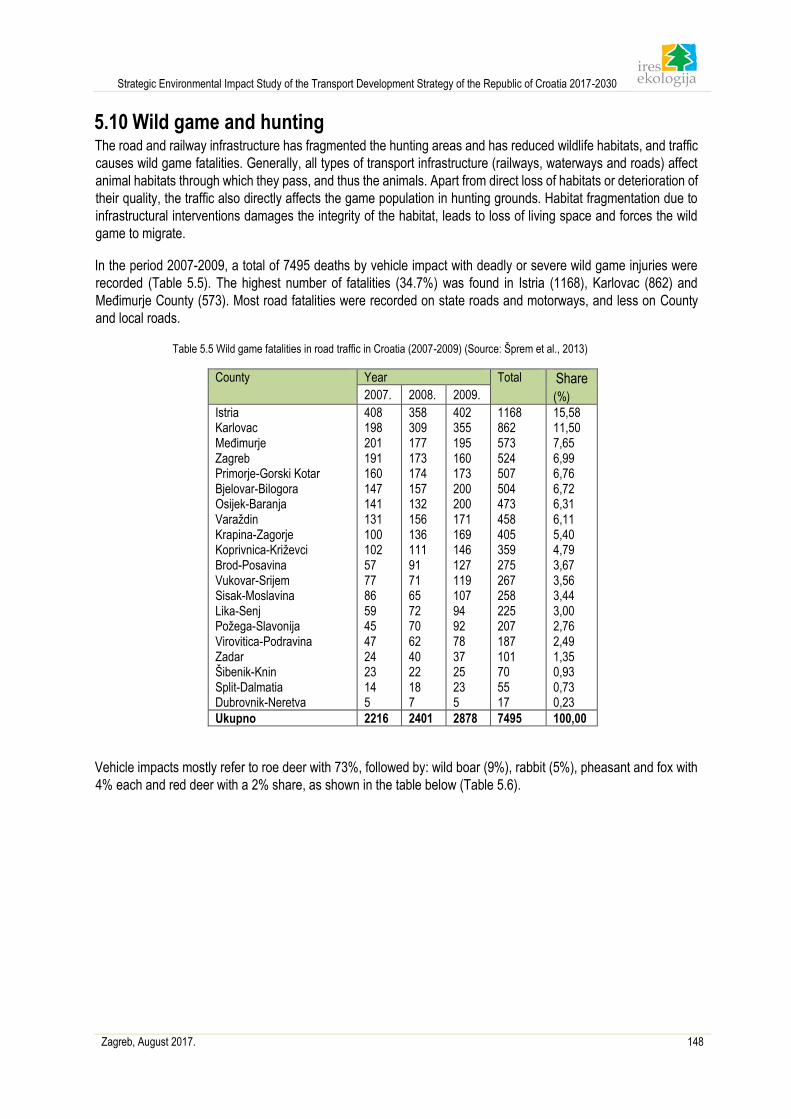
Strategic Environmental Impact Study of the Transport Development Strategy of the Republic of Croatia 2017-2030
Zagreb, August 2017. 148
5.10 Wild game and hunting The road and railway infrastructure has fragmented the hunting areas and has reduced wildlife habitats, and traffic
causes wild game fatalities. Generally, all types of transport infrastructure (railways, waterways and roads) affect
animal habitats through which they pass, and thus the animals. Apart from direct loss of habitats or deterioration of
their quality, the traffic also directly affects the game population in hunting grounds. Habitat fragmentation due to
infrastructural interventions damages the integrity of the habitat, leads to loss of living space and forces the wild
game to migrate.
In the period 2007-2009, a total of 7495 deaths by vehicle impact with deadly or severe wild game injuries were
recorded (Table 5.5). The highest number of fatalities (34.7%) was found in Istria (1168), Karlovac (862) and
Međimurje County (573). Most road fatalities were recorded on state roads and motorways, and less on County
and local roads.
Table 5.5 Wild game fatalities in road traffic in Croatia (2007-2009) (Source: Šprem et al., 2013)
County Year Total Share
(%) 2007. 2008. 2009.
Istria Karlovac Međimurje Zagreb Primorje-Gorski Kotar Bjelovar-Bilogora Osijek-Baranja Varaždin Krapina-Zagorje Koprivnica-Križevci Brod-Posavina Vukovar-Srijem Sisak-Moslavina Lika-Senj Požega-Slavonija Virovitica-Podravina Zadar Šibenik-Knin Split-Dalmatia Dubrovnik-Neretva
408 198 201 191 160 147 141 131 100 102 57 77 86 59 45 47 24 23 14 5
358 309 177 173 174 157 132 156 136 111 91 71 65 72 70 62 40 22 18 7
402 355 195 160 173 200 200 171 169 146 127 119 107 94 92 78 37 25 23 5
1168 862 573 524 507 504 473 458 405 359 275 267 258 225 207 187 101 70 55 17
15,58 11,50 7,65 6,99 6,76 6,72 6,31 6,11 5,40 4,79 3,67 3,56 3,44 3,00 2,76 2,49 1,35 0,93 0,73 0,23
Ukupno 2216 2401 2878 7495 100,00
Vehicle impacts mostly refer to roe deer with 73%, followed by: wild boar (9%), rabbit (5%), pheasant and fox with
4% each and red deer with a 2% share, as shown in the table below (Table 5.6).
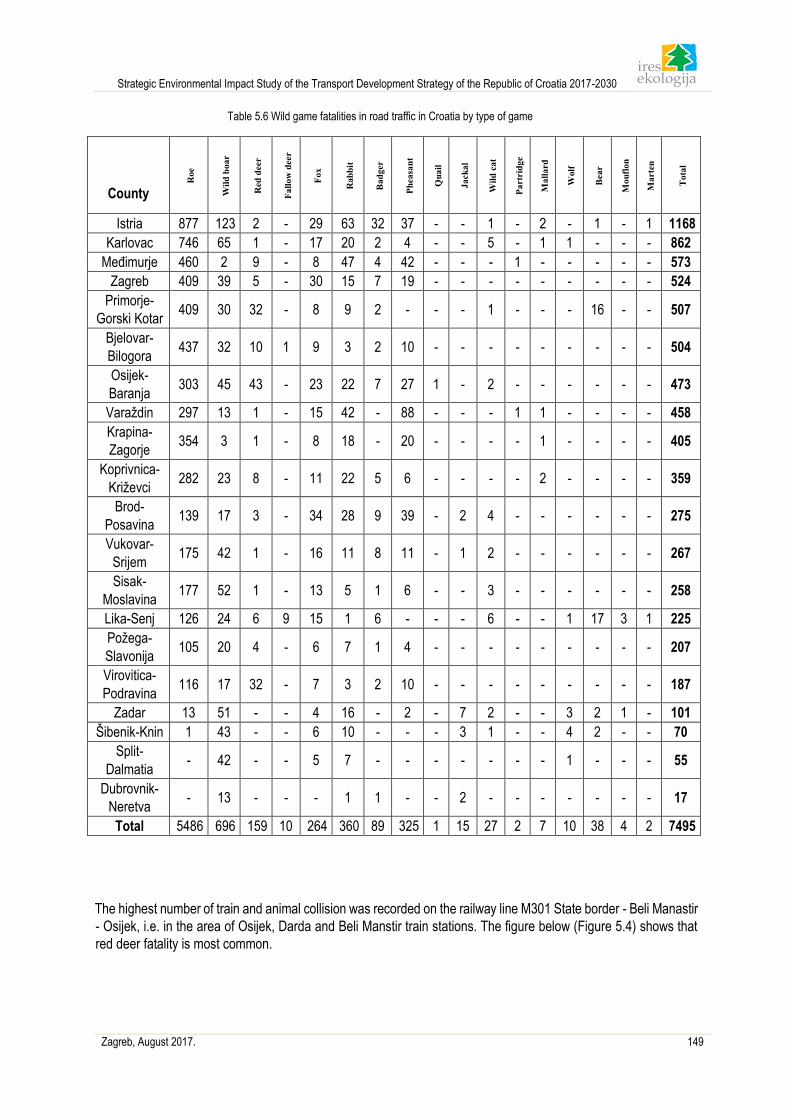
Strategic Environmental Impact Study of the Transport Development Strategy of the Republic of Croatia 2017-2030
Zagreb, August 2017. 149
Table 5.6 Wild game fatalities in road traffic in Croatia by type of game
County
Istria 877 123 2 - 29 63 32 37 - - 1 - 2 - 1 - 1 1168
Karlovac 746 65 1 - 17 20 2 4 - - 5 - 1 1 - - - 862
Međimurje 460 2 9 - 8 47 4 42 - - - 1 - - - - - 573
Zagreb 409 39 5 - 30 15 7 19 - - - - - - - - - 524
Primorje-
Gorski Kotar 409 30 32 - 8 9 2 - - - 1 - - - 16 - - 507
Bjelovar-
Bilogora 437 32 10 1 9 3 2 10 - - - - - - - - - 504
Osijek-
Baranja 303 45 43 - 23 22 7 27 1 - 2 - - - - - - 473
Varaždin 297 13 1 - 15 42 - 88 - - - 1 1 - - - - 458
Krapina-
Zagorje 354 3 1 - 8 18 - 20 - - - - 1 - - - - 405
Koprivnica-
Križevci 282 23 8 - 11 22 5 6 - - - - 2 - - - - 359
Brod-
Posavina 139 17 3 - 34 28 9 39 - 2 4 - - - - - - 275
Vukovar-
Srijem 175 42 1 - 16 11 8 11 - 1 2 - - - - - - 267
Sisak-
Moslavina 177 52 1 - 13 5 1 6 - - 3 - - - - - - 258
Lika-Senj 126 24 6 9 15 1 6 - - - 6 - - 1 17 3 1 225
Požega-
Slavonija 105 20 4 - 6 7 1 4 - - - - - - - - - 207
Virovitica-
Podravina 116 17 32 - 7 3 2 10 - - - - - - - - - 187
Zadar 13 51 - - 4 16 - 2 - 7 2 - - 3 2 1 - 101
Šibenik-Knin 1 43 - - 6 10 - - - 3 1 - - 4 2 - - 70
Split-
Dalmatia - 42 - - 5 7 - - - - - - - 1 - - - 55
Dubrovnik-
Neretva - 13 - - - 1 1 - - 2 - - - - - - - 17
Total 5486 696 159 10 264 360 89 325 1 15 27 2 7 10 38 4 2 7495
The highest number of train and animal collision was recorded on the railway line M301 State border - Beli Manastir
- Osijek, i.e. in the area of Osijek, Darda and Beli Manstir train stations. The figure below (Figure 5.4) shows that
red deer fatality is most common.
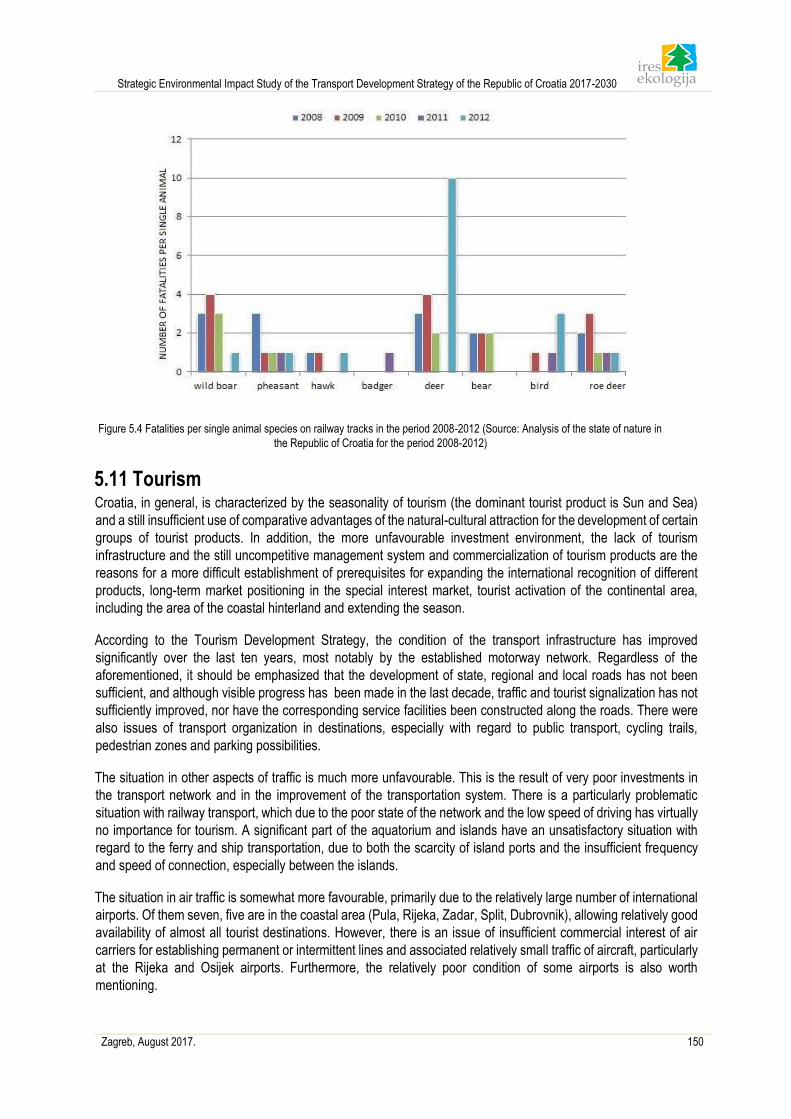
Strategic Environmental Impact Study of the Transport Development Strategy of the Republic of Croatia 2017-2030
Zagreb, August 2017. 150
Figure 5.4 Fatalities per single animal species on railway tracks in the period 2008-2012 (Source: Analysis of the state of nature in
the Republic of Croatia for the period 2008-2012)
5.11 Tourism Croatia, in general, is characterized by the seasonality of tourism (the dominant tourist product is Sun and Sea)
and a still insufficient use of comparative advantages of the natural-cultural attraction for the development of certain
groups of tourist products. In addition, the more unfavourable investment environment, the lack of tourism
infrastructure and the still uncompetitive management system and commercialization of tourism products are the
reasons for a more difficult establishment of prerequisites for expanding the international recognition of different
products, long-term market positioning in the special interest market, tourist activation of the continental area,
including the area of the coastal hinterland and extending the season.
According to the Tourism Development Strategy, the condition of the transport infrastructure has improved
significantly over the last ten years, most notably by the established motorway network. Regardless of the
aforementioned, it should be emphasized that the development of state, regional and local roads has not been
sufficient, and although visible progress has been made in the last decade, traffic and tourist signalization has not
sufficiently improved, nor have the corresponding service facilities been constructed along the roads. There were
also issues of transport organization in destinations, especially with regard to public transport, cycling trails,
pedestrian zones and parking possibilities.
The situation in other aspects of traffic is much more unfavourable. This is the result of very poor investments in
the transport network and in the improvement of the transportation system. There is a particularly problematic
situation with railway transport, which due to the poor state of the network and the low speed of driving has virtually
no importance for tourism. A significant part of the aquatorium and islands have an unsatisfactory situation with
regard to the ferry and ship transportation, due to both the scarcity of island ports and the insufficient frequency
and speed of connection, especially between the islands.
The situation in air traffic is somewhat more favourable, primarily due to the relatively large number of international
airports. Of them seven, five are in the coastal area (Pula, Rijeka, Zadar, Split, Dubrovnik), allowing relatively good
availability of almost all tourist destinations. However, there is an issue of insufficient commercial interest of air
carriers for establishing permanent or intermittent lines and associated relatively small traffic of aircraft, particularly
at the Rijeka and Osijek airports. Furthermore, the relatively poor condition of some airports is also worth
mentioning.
Strategic Environmental Impact Study of the Transport Development Strategy of the Republic of Croatia 2017-2030
Zagreb, August 2017. 151
5.12 Social and Economic Characteristics Economic and social activities are mutually dependent. The city industry promotes the development of the service
sector, and the stronger service sector promotes the development of new industries and services in the area. Every
job in production creates 0.5-2 jobs in other sectors. This includes jobs in the quaternary sector, and it can also
promote positive demographic trends, since a significant part of migration is economically driven (Development of
Economic Activities in Space, 2014). The reasons for residing/migration of the population are therefore linked to
the availability of health care, educational institutions, administration and transport connections, which are key
elements of the development of a given area.
The spatial development and economic progress of the counties in the Republic of Croatia is uneven due to
negative demographic trends, consequences of war (e.g. mining of the area), non-optimal use of comparative
advantages of particular areas (e.g. agriculture in continental Croatia), lack of economic specialization of certain
areas, inadequate transport connections, unfinished transition and privatization processes, industry shutdown,
deagrarization, deruralization, neglect of certain areas, and litoralisation and tertiarization, which provided better
social and economic features for larger regional and macroregional centers and coastal counties. Uneven spatial
development creates uneven conditions for the development of entrepreneurship. This leads to an increase in
social and economic differences between counties and population migration to the counties with greater availability
of jobs and social infrastructure.
The population of Croatia is decreasing and the depopulation process has affected most of the counties. The
combined effect of low birth rates, unfavourable age structure and emigration of young people in the reproductive
age has led to the beginning of the extinction process of many areas of Croatia.
Demographic aging, i.e. changes in the age structure of the population, which are manifested through the reduction
of the number of young people and the growth of the number of elderly in the population, represent a social and
economic problem, primarily due to the rise in economic and social costs (lack of workforce, issues of the pension,
health and welfare systems, political influence of the elderly, reduced economic growth and long-term innovation,
etc.), which shall promote demographic aging, but also the viable functioning of many smaller environments that
shall be most affected by aging. The growing aging trend of the population is visibly reflected in the mobility and
social and economic needs of the total population.
Projections of future total mobility depend on the rate of increase in expected life expectancy, especially in older
age groups, as well as trends in birth rates and migration trends. Demographic processes are relatively slow and
quite predictable, and unlike many other factors affecting the social and economic development of a certain area,
their effect is usually manifested in the long term. It is important to emphasize that demographic trends are a
precondition, but also the limitation of spatial development, functioning of the labor market and polycentric
economic and social development.
The continental and coastal part of Croatia in relation to the City of Zagreb has varying levels of development and
quality of life. The counties of continental Croatia are significantly affected by depopulation, poor job vacancies,
unemployment and large emigration, especially of young, productive and working age groups who ultimately
migrate to better living standards under conditions of insufficient economic development. The lowest population
density is particularly visible in rural areas and in the part of Croatia with poor traffic connections, namely Lika-Senj,
Primorje-Gorski Kotar, Bjelovar-Bilogora, ViroviticaPodravina and Požega-Slavonia counties, followed by the
islands and areas along the state border. This has great implications for the country's economy, and in the long
term, it has the potential to determine future changes in the natural and overall movement of the nation's population.
The coastal part of the country and central Croatia, particularly the areas around the capital city, have better social
and economic indicators and living standards, primarily due to the greater utilization of comparative advantages
provided by the natural resources and geographic position of that area, which have conditioned the development
of tertiary and quaternary activities.
Strategic Environmental Impact Study of the Transport Development Strategy of the Republic of Croatia 2017-2030
Zagreb, August 2017. 152
6 Environmental objectives established upon the conclusion of
international treaties and agreements relating to the Strategy
The conventions and protocols are international treaties whose provisions of the signatories of documents shall be
respected. Their ratification is formally binding for the countries with regard to the implementation of the provisions,
both in legislation and practice.
International treaties and
agreements Goals and purpose of the document
European Agreeement on
International Carriage of
Dangerous Goods (ADR)
Dangerous goods are considered to be substances that can endanger human
health, cause environmental pollution, or cause material damage, which have
dangerous properties for human health and the environment, as defined by
legislation, other regulations and international treaties which, by virtue of their
nature or properties and conditions, in connection with transport, may be
dangerous to public safety or order or have proven toxic, corrosive, irritant,
flammable, explosive or radioactive effects, i.e. as dangerous goods are also
considered raw materials from which dangerous goods and wastes are
produced if they have properties of dangerous substances. Hazardous
substances are classified as:
• explosive substances and articles with explosive substances
• gases
• flammable liquids
• flammable solids, self-reactive substances and solid desensitizing
explosives
• substances subject to spontaneous self-ignition
• substances that create flammable gases in contact with water
• oxidizing substances
• organic peroxides
• toxic substances
• infectious substance
• radioactive material
• corrosive substances
• other dangerous substances and articles.
The regulations of the Republic of Croatia relating to the transport of
dangerous goods in road transport are being gradually aligned with
Strategic Environmental Impact Study of the Transport Development Strategy of the Republic of Croatia 2017-2030
Zagreb, August 2017. 153
International treaties and
agreements Goals and purpose of the document
international regulations and the acquis communautaire of the European
Community.
The aim of alignment is to reduce the risk of pollution to the smallest extent
possible, as well as to reduce the number of accidents with hazardous
substances and to ensure uniformity of regulation in all signatories of the
European Agreement on International Carriage of Dangerous Goods by Road
(ADR).
The European Agreement on International Carriage of Dangerous Goods by
Road (ADR) entered into force on 29 January 1968. Attachments A and B as
an integral part of the Agreement were subsequently adopted and annexed to
the Agreement in 1969. In accordance with Article 2 of the Agreement,
dangerous substances whose transport excludes Annex A may not be
transported in international traffic while the transport of other dangerous
substances shall be permitted in accordance with:
• the conditions set out in Annex A for the packaging and
labeling of dangerous substances and
• the conditions set out in Annex B for the construction,
manufacture, equipping and operation of vehicles
carrying certain dangerous substances.
Attachments A and B are integral parts of the Agreement that are amended
by every other (odd) year, and these amendments directly affect national
regulations and handling of dangerous goods and shall be continuously
monitored and adopted.
This document is harmonised with the following goals of the Strategy: GO4,
GO5, GO6, RDT1, RDT3 and RDT5.
International Convention for
the Prevention of Pollution
from Ships (MARPOL 73/78)
The MARPOL Convention regulates the prevention of pollution by all harmful
substances discharged from or discharged by vessels, either intentionally or
by accident, which also regulates their obligations in ports.
The Convention contains six chapters, or annexes, which prescribe measures
to prevent pollution of the sea from shipwrecks.
• Annex I - Rules on the prevention of pollution by oil & oily water
• Annex II - Rules on the control of pollution by noxious liquid
substances in bulk
• Annex III - Rules on the prevention of pollution by harmful substances
carried by sea in packaged form
• Annex IV - Rules on the prevention of pollution by sewage from ships
Strategic Environmental Impact Study of the Transport Development Strategy of the Republic of Croatia 2017-2030
Zagreb, August 2017. 154
International treaties and
agreements Goals and purpose of the document
• Annex V - Rules on the prevention pollution by garbage from ships
• Annex VI - Rules on the prevention of air pollution from ships.
MARPOL 73/78 provides general provisions to be met by the ports, and IMO
(International Maritime Organization) has prepared general guides (MARPOL
How to do it – Manual of Practical Implications of Ratifying and Implementing
MARPOL 73/78) that should assist ports in designing or installing appropriate
waste disposal facilities, in order to facilitate the implementation of measures
in accordance with the Convention. IMO recognized that the provision of
marine waste management services is a key issue for MARPOL
implementation. However, there is no general solution for all ports with regard
to accepting waste. The final choice of equipment and waste treatment
methods is still left to the ports. Each port in accordance with its needs shall:
• install waste collection facilities
• determine the manner of his or her care
• adopt measures to ensure compliance with the regulations.
However, in planning there are still elements that each port shall take into
account and which shall facilitate the choice of capacity to meet the needs of
ships, within the scope of ports. It is possible to define the key elements that
each port should take into account when designing a system for receiving
waste from ships:
• international standards regulating and providing instructions on ports
for the acceptance and disposal of waste from ships,
• types of existing waste collection and disposal facilities.
This document is harmonised with the following goals of the Strategy: GO4,
GO5, GO6 and PP2.
Annex I to the MARPOL
Convention: Reception of oil &
oily water
The Convention states that ports and terminals shall have sufficient reception
facilities to receive oil and oily mixtures in the case of ports and terminals:
• in which crude oil is loaded into tankers
• in which oils are distributed
• which handle ships equipped with sludge tanks
• for bulk loading with regard to oil residues
• which provide ship repair or tank cleaning services, i.e. ship repair
yards. The capacity of the reception facility shall be such as to
Strategic Environmental Impact Study of the Transport Development Strategy of the Republic of Croatia 2017-2030
Zagreb, August 2017. 155
International treaties and
agreements Goals and purpose of the document
dispose of all ships without consequences to their failure. If any party
finds that the facilities are installed inadequate, the competent
international authorities shall be notified to inform all interested
parties.
This document is harmonised with the following goals of the Strategy: GO4,
GO5, GO6 and PP2
Annex II to the MARPOL
Convention: Reception of
noxious liquid substances
MARPOL 73/78 states that ports shall provide adequate capacity for the
reception of noxious liquid substances. All ports and terminals shall have
reception facilities for noxious liquid substances in accordance with the
quantity and type of waste that can be expected from the ships concerned,
without consequences to their failure. The same applies to repair ports, i.e.
ship repair yards. The type of reception facilities, with regard to the type of
cargo, shall be defined by the government of the country in whose territory the
subject facilities are located and all interested parties shall be accordingly
notified. If any party finds that the facilities are installed inadequate, the
competent international authorities shall be notified to inform all interested
parties.
This document is harmonised with the following goals of the Strategy: GO4,
GO5, GO6 and PP2.
Annex IV to the MARPOL
Convention: Reception of
sewage
MARPOL 73/78 requires that ships (new ships larger than 400 GT or more
than 15 passengers and existing ships with the same characteristics 10 years
after the entry into force of the subject rule) have holding tanks for sewage.
Under certain conditions, ships may discharge sewage into the sea, but in all
other cases they shall land it. To accept sewage from ports, ports shall have
adequate facilities and equipment in such a manner as to handle all ships,
which they receive without delays. Furthermore, in the event that these
facilities are inadequate, all interested parties shall be informed.
This document is harmonised with the following goals of the Strategy: GO4,
GO5, GO6 and PP2.
Annex V to the MARPOL
COnvention: Reception of
garbage from ships
As with the acceptance of the aforementioned waste types, ports shall provide
adequate capacities in accordance with the needs of ships. The same applies
to information in case the capacities are inadequate. Although each of the
aforementioned waste is specific and requires special treatment, the system
for receiving and disposing of waste in ports shall generally cover the
following:
• installation of appropriate capacities, fixed or movable containers, for
disposal of waste from ships,
Strategic Environmental Impact Study of the Transport Development Strategy of the Republic of Croatia 2017-2030
Zagreb, August 2017. 156
International treaties and
agreements Goals and purpose of the document
• establishment of an appropriate transport system for the transport of
collected garbage to remote landfills or to final disposal sites,
• final neutralization of waste, i.e. processing after which residues may
be released into the environment or disposed of at dedicated
locations.
This document is harmonised with the following goals of the Strategy: GO4,
GO5, GO6 and PP2.
Convention for Protection of
the Mediterranean Sea against
Pollution (Barcelona
Convention 1976.)
The most important international instruments for the protection and
conservation of the Mediterranean Sea are the Convention on the Protection
of the Mediterranean Sea against Pollution (hereinafter referred to as the
Barcelona Convention) signed in Barcelona on 16 February 1976 and the
Protocols adopted in the 20-year period from 1976 to 1996.
The seven Barcelona Convention convention protocols are:
Dumping Protocol - Protocol on the Prevention and Removal of Pollution from
the Mediterranean Sea by Incineration of Waste and Other Substances by
Ship and Aircraft or Incineration at Sea (1976, amended and amended in
1995)
Emergency Protocol - Protocol on Co-operation in the Prevention of Pollution
from Ships and, In Dangerous Matters, in the Suppression of Pollution of the
Mediterranean Sea (1976, replaced by the new 2002)
LBS Protocol - Protocol for the Protection of the Mediterranean Sea against
Pollution from Land Resources and Activities (1980, supplemented in 1996)
SPA and Biodiversity Protocol - Protocol on Specially Protected Areas and
Biodiversity in the Mediterranean (1982, Replaced in 1995)
Offshore Protocol - Protocol for the Protection of the Mediterranean Sea from
Pollution
Due to Investigation and Utilization of the Epicontinental Belt, Sea Bottom and
Sea Underground (1994)
Hazardous Wastes Protocol - Protocol for the Prevention of Pollution of the
Mediterranean Sea by Transboundary Transport of Hazardous Waste and its
Disposal (1996)
IUOP (ICMZ) Protocol - Protocol on Integrated Coastal Zone Management of
the Mediterranean (2008).
This document is harmonised with the following goals of the Strategy: GO4,
GO5, GO6 and PP2
Strategic Environmental Impact Study of the Transport Development Strategy of the Republic of Croatia 2017-2030
Zagreb, August 2017. 157
International treaties and
agreements Goals and purpose of the document
Protocol concerning
cooperation in preventing
pollution from ships and, in
cases of emergency,
combating pollution of the
Mediterranean Sea
The Parties shall, in accordance with generally accepted international rules
and norms and the global mandate of the International Maritime Organization,
individually, bilaterally or multilaterally, take the necessary steps to assess the
environmental hazards of recognized routes used in maritime traffic and take
appropriate measures with a view to reduce the risk of accidents or the
consequence thereof for the environment.
Each Party shall require that the authorities or operators responsible for the
seaports and handling facilities under its jurisdiction, as deemed appropriate,
should have pollution plans or similar arrangements that are in line with the
national system of the competent state authority.
The Parties shall take all necessary steps, whether individually, bilaterally or
multilaterally, to ensure that their receiving facilities at their ports and terminals
are adequate to meet the needs of the ships using them.
The Parties shall designate national, subregional or regional strategies for
accepting their shelter, including ports, for threatened marine lifeboats.
Pursuant to the provisions of the present Protocol, the Contracting States shall
define the level of port equipment in relation to the needs of the protection of
the marine shall and the coastal area. Furthermore, infrastructure planning
and port facilities should comply with the provisions of this Protocol.
This document is harmonised with the following goals of the Strategy: GO4,
GO5, GO6 and PP2.
Protocol concerning specially
protected areas and biological
diversity in the Mediterranean
(SPA Protocol)
The Protocol Concerning Specially Protected Areas and Biological Diversity in
the
Mediterranean within the framework of the Convention on the Protection of the
Marine Environment and the Coastal Area of the Mediterranean is a document
establishing a framework for the protection and conservation of biodiversity of
valuable areas in the Mediterranean Sea.
The SPA/BD Protocol is the basic tool for implementing the Convention on
Biological Diversity in the Mediterranean related to the sustainable
management of biodiversity in coastal and marine areas. The SPA / BD
Protocol was adopted in 1982, and was replaced by a new one within the 1995
Mediterranean System Update. In the Republic of Croatia, the Protocol
entered into force on 12 May 2002 (OG-MU 11/01).
The Protocol provides for three main elements to ensure the conservation of
biodiversity in the Mediterranean:
• Creation, Protection and Management of Specially Protected Areas
(SPAs)
Strategic Environmental Impact Study of the Transport Development Strategy of the Republic of Croatia 2017-2030
Zagreb, August 2017. 158
International treaties and
agreements Goals and purpose of the document
• establishment of a list of specially protected areas of Mediterranean
importance (SPAMI)
• protection and conservation of species.
This Protocol defines measures for the protection of specially protected areas
involving the ban on the discharge of waste and sewage into the sea (as far
as ports are concerned) and imposes regulation of maritime traffic and
stopping of ships within protected areas.
This document is harmonised with the following goals of the Strategy: GO4,
GO5, GO6 and PP2 and SO2.
Protocol on Integrated Coastal
Zone Management of the
Mediterranean (Barcelona
2008)
The Protocol requires the implementation of a previous risk assessment
related to various human activities and infrastructure to prevent and mitigate
their negative impact on coastal areas.
Infrastructure, power plants, ports and maritime structures and constructions
shall be planned in such a manner as to minimize the negative impact on
coastal ecosystems, landscapes and geomorphology.
This document is harmonised with the following goals of the Strategy: GO4,
GO5, GO6 and PP2 and SO2.
United Nations Convention on
the Law of the Sea (1982)
Pursuant to the provisions of the Convention, coastal States may, by
exercising sovereignty over their territorial sea, adopt laws and other
regulations to prevent, reduce and control seawater pollution from foreign
vessels, including vessels that exercise the right to a safe passage.
The National Legislative Acts of the Republic of Croatia have adopted
provisions regulating port management.
This document is harmonised with the following goals of the Strategy: GO4,
GO5, GO6 and PP2 and SO2.
Convention concerning
International Carriage by Rail
(COTIF)
Member States agree to take all necessary measures to facilitate and
accelerate international rail traffic. In that sense, each Member State
undertakes its obligation, as far as its power is concerned:
• remove any unnecessary procedures
• simplify and standardize already existing formalities
• simplify border controls.
With the aim of facilitating and improving international rail traffic, Member
States agree to give their support to achieve the greatest possible uniformity
of the regulations, standards, procedures and methods of organization relating
to railway vehicles, railway staff, railway infrastructure and auxiliary services.
Strategic Environmental Impact Study of the Transport Development Strategy of the Republic of Croatia 2017-2030
Zagreb, August 2017. 159
International treaties and
agreements Goals and purpose of the document
Due to the growing pressure from competitive road transport and the opening
of the liberalization of the rail services market in the European Union in the
1990s, COTIF was amended by two protocols 1990 and 1999. The COTIF
Amendment Protocol, drawn up on 3 June 1999 in Vilnius, the Convention
structure was amended, and consists of the main provisions of the Convention
itself and 7 annexes:
• Uniform Rules concerning the Agreement on International Carriage
by Rail (CIV), Appendix A to the Convention
• Uniform Rules relating to the Agreement on International Rail Freight
Transport (CIM), Appendix B to the Convention
• Regulation on International Carriage of Dangerous Goods by Rail
(RID), Appendix C to the Convention
• Uniform Rules on the Use of Vehicles in International Railway
transport (CUV), Appendix D to the Convention
• Uniform Rules on Infrastructure Use Contracts in International
Railway transport (CUI), Appendix E to the Convention
• Uniform Rules on Validation of Technical Standards and Acceptance
of Unique Technical Regulations Applicable to Rail Transfers for
International Use (APTU), Appendix F to the Convention
• Uniform Rules on Technical Approval for the Acceptance of Railway
Devices Intended for Use in International Traffic (ATMF), Appendix
G to the Convention.
This document is harmonised with the following goals of the Strategy: GO1,
GO2, GO4, GO5, SO1, RT1, RT2, RT3, RT4, RT5, RT6, and RT7
Convention on International
Civil Aviation (OG MU 1/96)
Each State signing the Convention agrees that all aircraft of other non-
scheduled air carriers are entitled, under the terms of this Convention, to fly in
or out of its territory without landing and to perform non-commercial landing
without the need to obtain prior approval, subject to compliance with the law
of the state which requires them to land. Due to flight safety, however, each
country reserves the right to request aircraft flying over inaccessible areas or
areas without appropriate navigational means to comply with prescribed
routes or to obtain a special permit for such flights.
If in such international aircraft, such airplanes carry passengers, cargo or mail
for remuneration or on the basis of a lease agreement, they shall be entitled
to board or land the passengers, cargo or mail, subject to compliance with the
law of the State where such boarding or landing is carried out to determine
Regulations, conditions or limitations it considers desirable.
Strategic Environmental Impact Study of the Transport Development Strategy of the Republic of Croatia 2017-2030
Zagreb, August 2017. 160
International treaties and
agreements Goals and purpose of the document
This document is harmonised with the following objectives of the Strategy:
ZP5.
UN Framework Convention on
Climate Change (UNFCCC)
(1992)
The aim of the UN Framework Convention on Climate Change is to achieve
the stabilization of greenhouse gas concentrations in the atmosphere in such
a manner as not to jeopardize the production of food and to enable the
continuation of economic development in a sustainable manner. Related to
this, traffic is recognized as one of the main sources of greenhouse gases,
which, to a lesser extent, includes ports as an element of the transport system
of the Republic of Croatia.
The Republic of Croatia became a party to the UN Framework Convention on
Climate Change in 1996. By adopting the Convention, the Republic of Croatia
has undertaken to undertake protection measures to anticipate and prevent or
reduce the climate change and adverse impacts that climate change causes.
This document is harmonised with the following goals of the Strategy: GO1,
GO4, GO5, RDT3, PP2, RDT3 and RDT5.
Convention on Biological
Diversity (1992)
The Convention on Biological Diversity is a fundamental document for the
protection of biodiversity, which establishes the conservation of biodiversity as
a fundamental principle in the protection of nature. It was adopted in Rio de
Janeiro in 1992 at the United Nations Conference on Environment and
Development. The Republic of Croatia entered into force on 7 October 1996
(NN-MU 6/96).
The main objective of the Convention is to preserve overall biodiversity, and
its achievement can be achieved primarily through the incorporation of
biodiversity conservation measures into all sectors, especially those that
directly use natural resources, then by developing national strategies,
programs and plans, or by incorporating biodiversity conservation measures
into Existing strategies, programs and plans.
Also, each Contracting Party should take care of the protection and
sustainable use of biological resources when deciding on a national level.
The national plan for port development of County and local importance should
define port management models in a manner that does not undermine the
biodiversity of the marine environment and the coastal area.
This document is harmonised with the following goals of the Strategy: GO1,
GO4, GO5, RDT3, RDT3 and PP2.
Charter for the Protection and
Management of the
Archaeological Heritage,
Lausanne (1990)
Archaeological resources research is the main tool for the protection of
archaeological heritage and shall be a general obligation under the protection
and planning.
Strategic Environmental Impact Study of the Transport Development Strategy of the Republic of Croatia 2017-2030
Zagreb, August 2017. 161
International treaties and
agreements Goals and purpose of the document
Development projects are one of the biggest threats to archeological heritage.
The duty of the developer of development projects is to provide archaeological
heritage research in impact studies prior to the implementation of the project.
This document is harmonised with the following goals of the Strategy: GO5.
Convention concerning the
Protection of the World Cultural
and Natural Heritage, UNESCO
(1972)
The purpose of establishing this Convention is to effectively protect and
preserve cultural and natural heritage on the territory of the signatory states,
as well as to popularize the the subject heritage.
This document is harmonised with the following goals of the Strategy: GO5.
Convention on the Protection
of the Underwater Cultural
Heritage, Paris (2001
The Convention confirms the importance of underwater cultural heritage as an
integral part of the cultural heritage of humankind and a particularly significant
factor in the history of people, peoples and their mutual relations with regard
to their common heritage. The importance of the protection and preservation
of underwater cultural heritage is emphasized and the responsibility lies with
it in all countries, observing the increasing public interest and the public's
concern for underwater cultural heritage.
This document is harmonised with the following goals of the Strategy: GO5.
Stockholm Convention on
Persistent Organic Pollutants
(2001) (NN-MU 11/06)
It is necessary to ensure the reduction or elimination of the production, use,
discharge, import and export of highly toxic substances for the purpose of
protection of humans and the environment and to select alternatives for
persistent organic pollutants.
This document is harmonised with the following goals of the Strategy: GO1,
GO4, GO5, SO2, RDT3, RDT3, RDT5, RDT6 and PP2.
Vienna Convention for the
Protection of the Ozone Layer
(1985) (NN-MU 12/93)
The protection of human health and the environment from the adverse effects,
which come or may come from human activity that modify or modify the ozone
layer.
States shall take appropriate measures in accordance with the provisions of
this Convention for the protection of human health and the environment
against the adverse effects which come from or may come from human activity
that modifies or may modify the ozone layer.
This document is harmonised with the following goals of the Strategy: GO1,
GO4, GO5, SO2, RDT3, RDT3, RDT5, RDT6 and PP2.
Montreal Protocol on Ozone
Depleting Substances
(Montreal, 1987)
The signatories undertake to reduce the use of freons by 50%.
The Montreal Protocol was reinforced by two revisions in 1990 in London and
1992 in Copenhagen, which required general discontinuation of the use of
freons, halons and other halogenated hydrocarbons until 2000.
Strategic Environmental Impact Study of the Transport Development Strategy of the Republic of Croatia 2017-2030
Zagreb, August 2017. 162
International treaties and
agreements Goals and purpose of the document
This document is harmonised with the following goals of the Strategy: GO1,
GO4, GO5, SO2, RDT3, RDT3, RDT5, RDT6 and PP2
Convention on the
Conservation of Migratory
Species of Wild Animals (CMS)
(1979) (NN-MU 6/00)
The objectives of the Convention are:
• protection and conservation of migratory species and their habitats
on a global scale. - promoting national policies for the conservation
of wildlife and plants and their natural habitats.
• ensuring the protection of wildlife and plants in planning and
development policies and anti-pollution measures.
• promoting education and information exchange on the need to
preserve wildlife and plants and their natural habitats.
The Convention on the Protection of Migratory Species of Wild Animals calls
for the inclusion of wild animals and plants in national plans, strategies, and
programs.
This document is harmonised with the following goals of the Strategy: GO5.
Convention on Environmental
Impact Assessment in a
Transboundary Context
(Espoo, 1991) (NN-MU 6/96)
The Parties to the Convention shall individually or jointly take all appropriate
and effective measures to prevent, reduce and control significant negative
impacts of planned activities on the environment across the state border.
Furthermore, the country of origin shall ensure that environmental impact
assessment is carried out in accordance with the provisions of this Convention
before deciding to approve or carry out the planned activity.
The signatories should pay particular attention to the development or
intensification of specific research programs aimed at:
• improve existing qualitative and quantitative methods for assessing
the impact of planned activities
• to achieve a better understanding of cause-and-effect relationships
and their role in comprehensive environmental management
• analyze and monitor the effective implementation of decisions on
planned activities with a view to minimizing or minimizing
consequences
• develop methods to stimulate creative approaches in search of
environmentally-friendly alternatives for planned activities, ways of
production and consumption, to develop a methodology for applying
the macroeconomic impact assessment principle to the environment.
This document is harmonised with the following goals of the Strategy: GO4,
GO5.
Strategic Environmental Impact Study of the Transport Development Strategy of the Republic of Croatia 2017-2030
Zagreb, August 2017. 163
International treaties and
agreements Goals and purpose of the document
Protocol on Strategic
Environmental Assessment to
the Convention on
Environmental Impact
Assessment in a
Transboundary Context (OG
7/09)
The purpose of this Protocol is to ensure a high level of environmental
protection, including health, through:
(A) ensuring that environmental issues, including health, are fully taken
into account in the design of plans and programs
(B) contributing to the consideration of environmental requirements,
including health, in drafting policies and legislation
(C) establishing clear, transparent and effective procedures for strategic
environmental assessment
(D) ensuring public participation in strategic environmental assessment
and
(E) inclusion in such manner of environmental requirements, including
health, in measures and instruments intended to encourage sustainable
development.
Pursuant to the Protocol, each Party shall ensure that strategic environmental
assessment is carried out for plans and programs that may have significant
environmental impacts, including health.
If a Party of Origin considers that the implementation of a plan or program may
have a significant transboundary impact on the environment, including health,
or if a party that could be significantly affected so requests, the Originating
Party informs the affected Party as soon as possible prior to the adoption of
the plan or program.
This document is harmonised with the following goals of the Strategy: GO1,
GO4, GO5, SO2, RDT3, RDT3, RDT5, RDT6 and PP2.
Convention on the
Conservation of European
Wildlife and Natural Habitats
(Bern Convention) (NN-MU
6/00)
The Convention requires the protection of European wildlife flora and fauna
and their natural habitats as well as endangered migratory species.
Conservation measures require all forms of intentional capture, retention and
killing, deliberate damage or destruction of sites that are important for mating
or resting, as well as any form of disturbance or trade in these species.
This document is harmonised with the following goals of the Strategy: GO5.
Convention on International
Trade in Endangered Species
of Wild Fauna and Flora
(CITES)
The Convention on International Trade in Endangered Species of Wild Fauna
and Flora (CITES) is an international agreement aimed at preventing
uncontrolled international trade and commercial exploitation of endangered
species, maintaining ecological balance within species populations that are
the subject of international trade and assisting States Parties to the
Convention in achieving sustainable trade. CITES is an abbreviation of the
English name, but is also known as the "Washington Convention". It entered
into force on 1 July 1975 and since then it has been approached by a total of
180 countries, which is the most widely accepted international convention in
the field of nature protection. CITES has been established as a system of
Strategic Environmental Impact Study of the Transport Development Strategy of the Republic of Croatia 2017-2030
Zagreb, August 2017. 164
International treaties and
agreements Goals and purpose of the document
international trade surveillance based on the procedure of issuing import and
export permits that is uniquely applied in all signatory states.
The European Union is fully implementing the CITES Convention since 1
January 1984. Due to a single European market, the provisions of the CITES
Convention must be uniformly applied in all EU Member States under the
provisions of the so-called " "EU Wildlife Trade Regulations", of which 7 are
currently in force:
• Council Regulation (EC) No. 338/97
• Commission Regulation (EC) 865/2006
• Commission Regulation (EU) No. 100/2008
• Commission Implementing Regulation (EU) no. 791/2012
• Commission Implementing Regulation (EU) no. 792/2012
• Commission Regulation (EU) No. 578/2013
• Commission Regulation (EU) No. 750/2013.
This document is harmonised with the following goals of the Strategy: GO5.
Convention on European
Landscapes (Florence, 2000)
The Convention aims at promoting the protection of landscapes, management
and planning and organizing European co-operation on landscape issues.
This document is harmonised with the following goals of the Strategy: GO5,
RDT9.
European Convention on the
Protection of the
Archaeological Heritage of
Europe (London 1969)
Objective of the Convention:
• to protect the archaeological heritage of Europe as a source of
collective memory and as a basis for historical and scientific
research.
This document is harmonised with the following goals of the Strategy: GO5,
RDT9.
Declaration on the
Conservation of the Setting of
Heritage Structures, Sites and
Areas, Xi’an (2005)
The recommendations refer to:
Protection, preservation and improvement of the historical structures of the
architectural and spatial heritage, and of the settlements and landscapes,
preservation and improvement of the environment, location of historic
buildings, settlements and landscapes, as a buffer zone in order to prevent the
degradation of their values.
This document is harmonised with the following goals of the Strategy: GO5,
RDT9.
Strategic Environmental Impact Study of the Transport Development Strategy of the Republic of Croatia 2017-2030
Zagreb, August 2017. 165
International treaties and
agreements Goals and purpose of the document
Convention concerning the
Protection of the World Cultural
and Natural Heritage, UNESCO,
(1972)
The purpose of the establishment of this Convention is the effective protection
and preservation of cultural and natural heritage on the territory of the
signatory states as well as the popularization of the said heritage.
This document is harmonised with the following goals of the Strategy: GO5,
RDT9.
European Convention on the
Protection of Archaeological
Heritage, Valetta (1992)
Archaeological finds are all remains and objects, traces of human existence,
which testify of epics and civilizations and are the main or one of the main
sources of scientific data.
This document is harmonised with the following goals of the Strategy: GO5,
RDT9.
Charter for the Protection and
Management of the
Archaeological Heritage,
Lausanne (1990)
Archaeological resources research is the main tool for the protection of
archaeological heritage and shall be a general obligation under the protection
and planning.
Development projects are one of the biggest threats to archeological heritage.
The duty of the developer of development projects is to provide archaeological
heritage research in impact studies prior to the implementation of the project.
This document is harmonised with the following goals of the Strategy: GO5,
RDT9.
Venice Charter ICOMOS (1964) Preservation and restoration of monuments as art and historical evidence. The
aim of conservation is not just individual architectural works, but urban or rural
settlements where we find evidence of the existence of a civilization or a
historical event.
This document is harmonised with the following goals of the Strategy: GO5,
RDT9
Convention for the Protection
of the Architectural Heritage of
Europe, Granada (1985)
Each Party agrees to:
• protect the architectural heritage which includes buildings,
groups of buildings and places (a common work of man and
nature)
• prevent the destruction, destruction or destruction of the
architectural heritage.
This document is harmonised with the following goals of the Strategy: GO5,
RDT9.
Strategic Environmental Impact Study of the Transport Development Strategy of the Republic of Croatia 2017-2030
Zagreb, August 2017. 166
7 Environmental impacts of the Strategy
7.1 Impact assessment methodology
The impact assessment is based on a strategic level that excludes individual projects and a specific project-related
environmental impact assessment. In line with the methodological recommendations for the development of
strategic studies that analyse the strategies, plans and programmes proposed under the IPA 2010 project
"Strengthening Capacities for Strategic Environmental Impact Assessment (SEIA) at Regional and Local Level"
from 2014, the impact assessment was conducted through the selection of the strategic goal of the Study. The
strategic goal of assessing the impact is "Compliance of the Strategy measures with the environmental and
nature requirements". It is evident from the selection of the goal that the main methodological guideline for
assessing the impact is an analysis of the acceptability of the measures proposed by the Strategy in relation to the
relevant environmental topics with their components.
When assessing the impacts, four impact categories are used:
- Positive impact - describes the assessment that, due to the implementation of the measure, the state of
the environmental elements in relation to the present situation shall be improved. This can be the result of
solving some of the existing environmental problems, or due to the change in the existing negative trend.
- Neutral impact – the assessment has shown that there are no impacts on the environmental component.
- Moderate negative impact - describes the assessment that, due to the implementation of the measure,
the state of the environmental elements in relation to the present situation shall slightly deteriorate, but not
to the extent that it could lead to significant and persistent disturbance of the environment or nature. In this
category, there are impacts involving the release of pollutants within the limits prescribed by legal
regulations, taking of smaller parts of numerous or less valuable habitats, the risk of fatalities of a smaller
number of individuals belonging to the species that are not in the protection regime etc.
- Significantly negative impact – describes the assessment that there is a risk that, due to the
implementation of the measure, the state of the environmental elements shall deteriorate to the extent that
it could lead to a significant disturbance of the environment or nature. A measure that would bring a
significant impact to the level of moderate or eliminate it shall be prescribed for this impact.
In addition to the analysis of the Strategy measures, their justification in relation to the environmental and
nature requirements is assessed, as well as possible direct, indirect, short-term, medium-term, permanent,
cumulative and transboundary environmental impacts.
When describing the impacts of the proposed measures on the environment and nature, the following terms
are used to provide a more detailed definition of the type and scope of individual impacts:
- Direct impact – if the measure is a direct source of the impact described
- Indirect impact – of the measure generates a change that is the source of the impact described (future)
- Short-term impact – if the impact on the environment/nature ceases within 5 years
- Medium-term impact – if the impact on the environment/nature ceases between 5th and 10th year from the
beginning of the impact development
- Permanent impact – of the impact has permanent consequences on the environment/nature and does not
cease even after 10 years
- Cumulative impact – if several measures from the Strategy generate equal impacts on the environmental
component, their joint impact on this component is cumulative
- Synergetic impact - if several measures from the Strategy generate different impacts that jointly affect the
environmental component in a manner that joint impact is stronger than the sum of individual impacts on
the subject component, this impact is called synergetic
- Transboundary impact – if the measure can affect the environment/nature of other countries.
Strategic Environmental Impact Study of the Transport Development Strategy of the Republic of Croatia 2017-2030
Zagreb, August 2017. 167
7.2 Environmental impact assessment of the strategy
For the purposes of the environmental impact assessment, the measures defined by the Strategy are divided
into four categories:
1. General measures
2. Development measures
3. Management and organisational measures
4. Spatially located measures
The first three categories contain all the measures pertaining to the organization and management of the transport
system or to the development and improvement of the transport infrastructure without mentioning specific projects.
For these measures, the environmental impact assessment is shown in the tables below (subsections 7.2.1-7.2.3).
The last category of measures contains specific projects in the area and the impact assessment of the measures
belonging to the category of Spatially located measures is shown in subsection 7.2.4. Cartographic representations
in the Study are of an informative nature and serve solely for the purposes of this document.
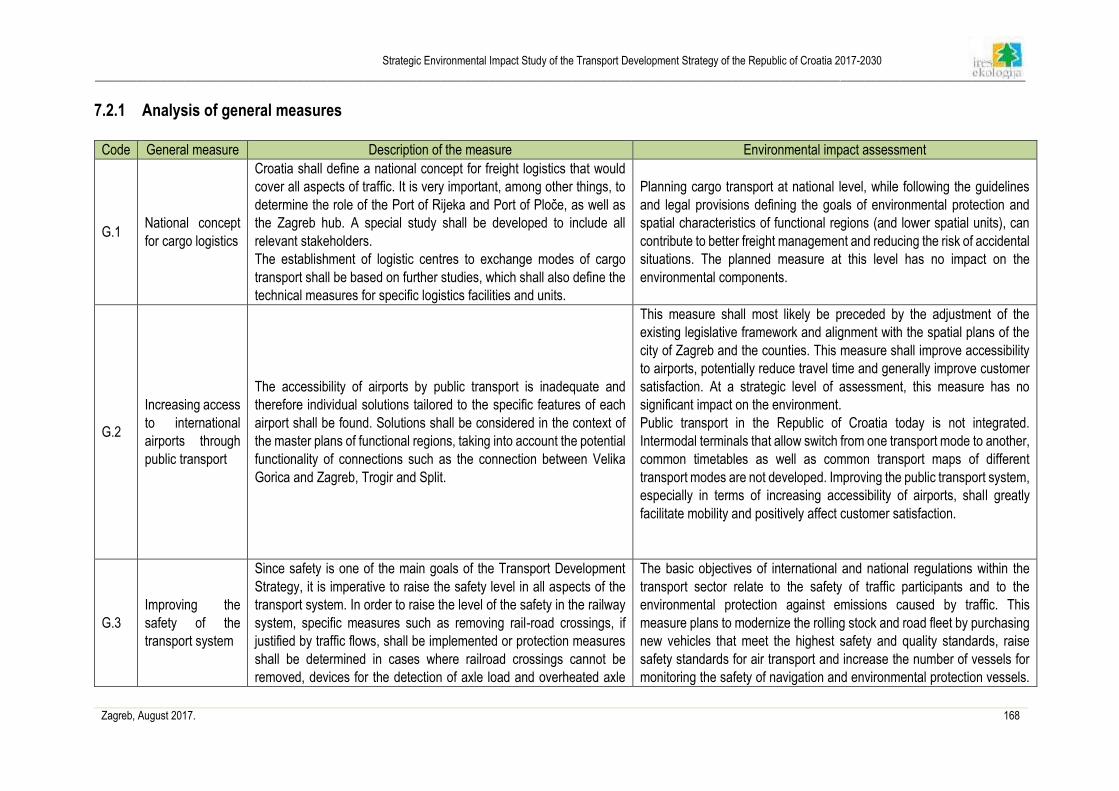
Strategic Environmental Impact Study of the Transport Development Strategy of the Republic of Croatia 2017-2030
____________________________________________________________________________________________________________________________________________________________
Zagreb, August 2017. 168
7.2.1 Analysis of general measures
Code General measure Description of the measure Environmental impact assessment
G.1 National concept
for cargo logistics
Croatia shall define a national concept for freight logistics that would
cover all aspects of traffic. It is very important, among other things, to
determine the role of the Port of Rijeka and Port of Ploče, as well as
the Zagreb hub. A special study shall be developed to include all
relevant stakeholders.
The establishment of logistic centres to exchange modes of cargo
transport shall be based on further studies, which shall also define the
technical measures for specific logistics facilities and units.
Planning cargo transport at national level, while following the guidelines
and legal provisions defining the goals of environmental protection and
spatial characteristics of functional regions (and lower spatial units), can
contribute to better freight management and reducing the risk of accidental
situations. The planned measure at this level has no impact on the
environmental components.
G.2
Increasing access
to international
airports through
public transport
The accessibility of airports by public transport is inadequate and
therefore individual solutions tailored to the specific features of each
airport shall be found. Solutions shall be considered in the context of
the master plans of functional regions, taking into account the potential
functionality of connections such as the connection between Velika
Gorica and Zagreb, Trogir and Split.
This measure shall most likely be preceded by the adjustment of the
existing legislative framework and alignment with the spatial plans of the
city of Zagreb and the counties. This measure shall improve accessibility
to airports, potentially reduce travel time and generally improve customer
satisfaction. At a strategic level of assessment, this measure has no
significant impact on the environment.
Public transport in the Republic of Croatia today is not integrated.
Intermodal terminals that allow switch from one transport mode to another,
common timetables as well as common transport maps of different
transport modes are not developed. Improving the public transport system,
especially in terms of increasing accessibility of airports, shall greatly
facilitate mobility and positively affect customer satisfaction.
G.3
Improving the
safety of the
transport system
Since safety is one of the main goals of the Transport Development
Strategy, it is imperative to raise the safety level in all aspects of the
transport system. In order to raise the level of the safety in the railway
system, specific measures such as removing rail-road crossings, if
justified by traffic flows, shall be implemented or protection measures
shall be determined in cases where railroad crossings cannot be
removed, devices for the detection of axle load and overheated axle
The basic objectives of international and national regulations within the
transport sector relate to the safety of traffic participants and to the
environmental protection against emissions caused by traffic. This
measure plans to modernize the rolling stock and road fleet by purchasing
new vehicles that meet the highest safety and quality standards, raise
safety standards for air transport and increase the number of vessels for
monitoring the safety of navigation and environmental protection vessels.
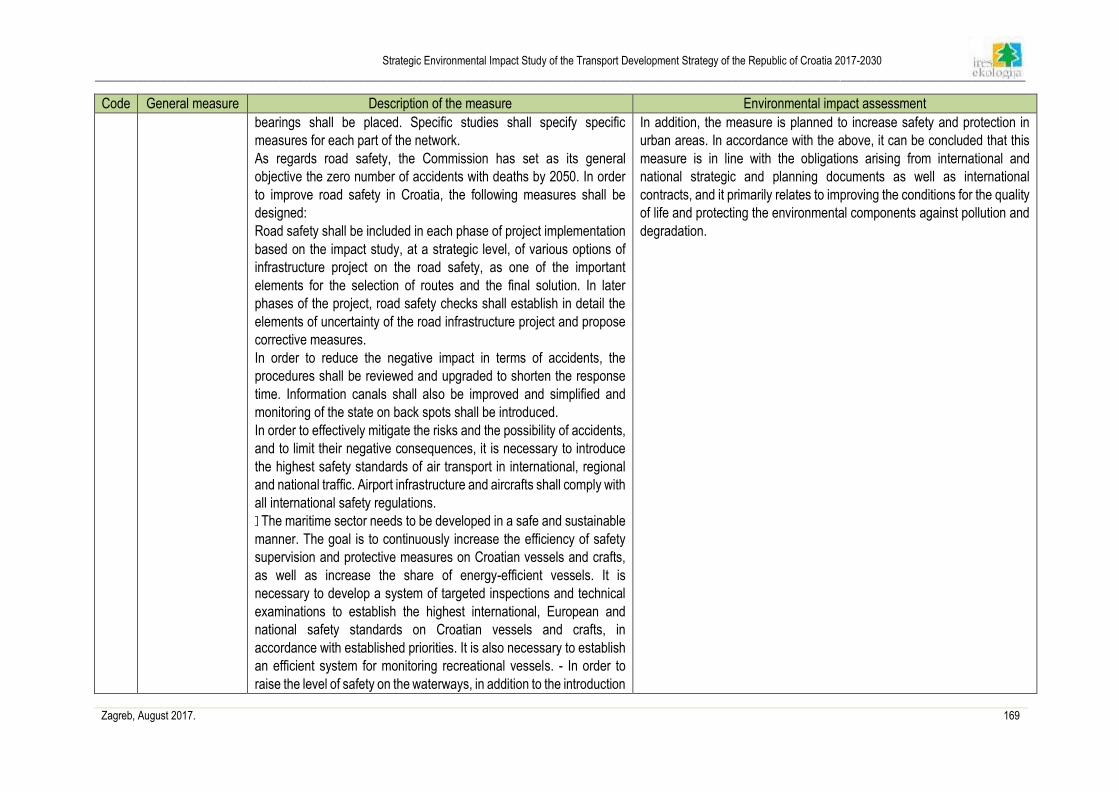
Strategic Environmental Impact Study of the Transport Development Strategy of the Republic of Croatia 2017-2030
____________________________________________________________________________________________________________________________________________________________
Zagreb, August 2017. 169
Code General measure Description of the measure Environmental impact assessment
bearings shall be placed. Specific studies shall specify specific
measures for each part of the network.
As regards road safety, the Commission has set as its general
objective the zero number of accidents with deaths by 2050. In order
to improve road safety in Croatia, the following measures shall be
designed:
Road safety shall be included in each phase of project implementation
based on the impact study, at a strategic level, of various options of
infrastructure project on the road safety, as one of the important
elements for the selection of routes and the final solution. In later
phases of the project, road safety checks shall establish in detail the
elements of uncertainty of the road infrastructure project and propose
corrective measures.
In order to reduce the negative impact in terms of accidents, the
procedures shall be reviewed and upgraded to shorten the response
time. Information canals shall also be improved and simplified and
monitoring of the state on back spots shall be introduced.
In order to effectively mitigate the risks and the possibility of accidents,
and to limit their negative consequences, it is necessary to introduce
the highest safety standards of air transport in international, regional
and national traffic. Airport infrastructure and aircrafts shall comply with
all international safety regulations.
The maritime sector needs to be developed in a safe and sustainable
manner. The goal is to continuously increase the efficiency of safety
supervision and protective measures on Croatian vessels and crafts,
as well as increase the share of energy-efficient vessels. It is
necessary to develop a system of targeted inspections and technical
examinations to establish the highest international, European and
national safety standards on Croatian vessels and crafts, in
accordance with established priorities. It is also necessary to establish
an efficient system for monitoring recreational vessels. - In order to
raise the level of safety on the waterways, in addition to the introduction
In addition, the measure is planned to increase safety and protection in
urban areas. In accordance with the above, it can be concluded that this
measure is in line with the obligations arising from international and
national strategic and planning documents as well as international
contracts, and it primarily relates to improving the conditions for the quality
of life and protecting the environmental components against pollution and
degradation.
Strategic Environmental Impact Study of the Transport Development Strategy of the Republic of Croatia 2017-2030
____________________________________________________________________________________________________________________________________________________________
Zagreb, August 2017. 170
Code General measure Description of the measure Environmental impact assessment
of river information systems and timely availability of accurate
information on the vessel movement, it is necessary to establish clear
procedures for measures to be taken in the event of an incident, and
to upgrade the existing navigation and tracking systems for inland
waterways. For safety reasons, it is necessary to modernize ports and
equip them with modern security systems. In order to achieve more
efficient systems for monitoring the safety of navigation and inspection
and install and maintain signalling systems on waterways, it is
necessary to increase the number of vessels for monitoring the safety
of navigation and vessels for environmental protection.
Safety and protection in urban areas shall be improved at least on two
different levels:
identifying and removing black spots such as rail-road crossings, traffic
signs and lights on pedestrian crossings, with additional protection of
pedestrians and cyclists by building new sidewalks or bike paths at
places where it is needed,
constructing pedestrian islands that would reduce the length of path
and extending curbs where necessary and constructing new footpaths
or sidewalks, which would provide easier access to stops and terminals
for public transport vehicles
rolling stock and road fleet intended for public transport shall be
modernized. One of the priorities is the purchase of new public
transport vehicles that are in line with the highest safety and quality
standards, which shall be equipped with state-of-the-art safety-
management-control systems (e.g. video cameras). Infrastructure and
stops shall also be modernized with adaptations necessary to safety
and accessibility to public transport, and the installation of monitoring
and control devices shall increase safety as well.
G.4
Increasing
intermodality in
the passenger
traffic and
In order to achieve the sustainability of the transport sector as a whole,
it is important to increase the interoperability that shall enable the use
of potentials of every transport mode. A network of intermodal
terminals shall be set up, enabling passengers to easily switch from
In the Republic of Croatia, some projects are being prepared or
implemented in order to promote the development of intelligent and
integrated transport systems: Integrated Public Transport of the City of
Zagreb, Zagreb and Krapina-Zagorje County, Integrated Development
Strategic Environmental Impact Study of the Transport Development Strategy of the Republic of Croatia 2017-2030
____________________________________________________________________________________________________________________________________________________________
Zagreb, August 2017. 171
Code General measure Description of the measure Environmental impact assessment
development of
passenger hubs
one transport mode to another. A well-designed, balanced intermodal
network is key to achieving the maximum efficiency of the entire
system and reducing customer inconveniences to the level as low as
possible. The location and form of each terminal shall be determined
according to the studies for the specific area (e.g. master plan).
In the road transport sector, it is important to provide an appropriate
level of accessibility in accordance with the needs, i.e. hubs in
gravitation areas (such as sea, river and air ports, railway stations,
workplaces, business zones, etc.). Larger number of parking spaces
linked to public transport systems, sea, river and air ports shall
stimulate the transition from one transport mode to another in favour of
public transport, and thus reduce the number of bottlenecks on the
roads.
Project of Passenger Transport and Intermodal Cargo Transport in the
Region of Northern Croatia (Varaždin, Međimurje, Koprivnica-Križevci
Counties), Transport System of the City of Zadar: Intelligent Transport
System and Reconstruction of Roads in the City of Zadar, Development of
the Rijeka and Dubrovnik Region.
As a priority of the public urban, suburban and regional mobility sector in
the European Union (Roadmap to a single European transport area —
Towards a competitive and resource-efficient transport system, European
Commission, 2011), the introduction of integrated transport systems in
major cities and their suburbs and/or regional areas has been defined.
Spatial and organizational rationalization of ports and bus stations,
establishment of signalling and information system of various forms of
public urban and suburban transport, equipping of public transport stops,
ports and piers with accompanying facilities and services, greater number
of parking spaces, as well as monitoring the number of public transport
users in order to adapt routes and frequencies according to the needs, has
a direct positive impact on increasing the number of public transport users,
the economic productivity of public transport companies and the comfort
and safety of passenger travel.
G.5
Maintenance
concept for
various transport
systems
In general, transport infrastructure in Croatia is not well maintained.
The owner of the national infrastructure should have a maintenance
concept that shall guarantee the long-term sustainability of different
transport modes.
An appropriate structure and organization of maintenance needs to be
established to enable railway service to be efficient and effective, that
is, sustainable. The concept shall be derived from the purposeful and
concrete analysis of the situation in Croatia and the company "HŽ
Infrastruktura d.o.o.", taking into account the technical and financial
conditions as well as the needs of users, as set out in Directive
2008/57/EC on the interoperability of the relating to Railway
applications - The specification and demonstration of Reliability,
Availability, Maintainability and Safety (RAMS) (HRN EN 50126).
When reliability and safety of signal-security devices are considered in the
function of the availability of the railway system, then we talk about the
reliability, availability, maintenance and safety, i.e. the process of
managing these components.
The first European standard mentioned in this context is HRN EN 50126,
according to which the availability is the product's ability to perform the
required function under the given conditions at a certain time or interval
with external resources provided. In line with this, the availability of the
railway system is the ability to provide a safe traffic flow in the function of
passenger and cargo transport in line with the timetable.
In recent years, many studies have been carried out and research on
Intelligent Transport Systems has been conducted. In addition to a shift in
terms of road safety and traffic jams, another benefit of these systems is
Strategic Environmental Impact Study of the Transport Development Strategy of the Republic of Croatia 2017-2030
____________________________________________________________________________________________________________________________________________________________
Zagreb, August 2017. 172
Code General measure Description of the measure Environmental impact assessment
Road maintenance is essential for preserving the roads in their original
state, protecting nearby resources and user safety as well as traveling
comfort along the route. It is necessary to introduce a maintenance
system that is efficient and effective, that is, sustainable and
characterized by an appropriate structure and organization. The
concept of the maintenance system shall be derived from the
purposeful and concrete analysis of the situation in Croatia and
relevant stakeholders, taking into account technical and financial
conditions and the needs of users. The concept of maintenance for the
maritime sector can be divided into maintenance of ports and port
infrastructure, on the one hand, and maintenance of the fleet, on the
other. An appropriate structure and organization of maintenance needs
to be established to provide a maritime transport service that shall be
efficient and effective, i.e. sustainable. The concept of maintenance
system shall be derived from the purposeful and concrete analysis of
the situation in Croatia and vessel operators, taking into account
technical and financial conditions and the needs of users.
reflected in reduced harmful emissions and fuel consumption. Significant
progress in road traffic safety is expected from the development and
implementation of the so-called cooperative systems, where data is
exchanged between vehicles and between vehicles and infrastructure,
enabling drivers to be informed at any time about the situation on the road.
The development of the Republic of Croatia into a modern maritime
country means that selective and thoughtful use of available potentials is
necessary in order to improve and modernize all the activities of the
maritime economy. The maintenance concept for the maritime sector shall
be implemented in accordance with the provisions of nature protection
documents, in particular taking into account the Program of measures for
the protection of the marine environment and coastal area, whose
measures relate to sustainable management while preserving marine and
coastal biodiversity. The subject measure does not generate
environmental impacts at a strategic level, but it may positively affect the
environmental components in the long-term.
G.6
Increasing energy
efficiency of the
transport system
According to the guidelines for the development of the trans-European
transport network, promoting efficient and sustainable use of
infrastructure is one of the priorities in infrastructure development. In
this sense, it is necessary to raise the level of energy efficiency and to
identify low-carbon energy sources and power systems as a priority.
Further studies shall aim at analysing specific requirements.
With the purchase of more environmentally friendly vehicles (gas and
biofuel drive) and investing in the renovation of the fleet, a positive impact
on the environment is expected at a strategic level of impact assessment.
Transport system improvement leads to reductions in harmful emissions
into the air and reduced fuel consumption.
Additional infrastructure shall be required for electric vehicles in traffic, in
terms of electric vehicle charging stations. Additional infrastructure
changes shall also be needed for future electrification of the railways.
Hydrogen as a fuel can be in the form of gas or liquid, and the infrastructure
it requires can be developed gradually with market demands by
introducing hydrogen-fuelling systems at existing gas stations.
Biofuels can be distributed through existing oil and gas pipelines, when
and where possible. The transport of liquefied petroleum gas from the
place of exploitation to gas stations includes the combination of pipes,
tankers, etc. (European Expert Group on Future Transport Fuels, 2011).
Strategic Environmental Impact Study of the Transport Development Strategy of the Republic of Croatia 2017-2030
____________________________________________________________________________________________________________________________________________________________
Zagreb, August 2017. 173
Code General measure Description of the measure Environmental impact assessment
Infrastructure development, in terms of performing specific environmental
interventions, can have adverse effects on the environmental components,
which shall be recorded in the process of environmental impact
assessment. If we exclude infrastructure needs, this measure has a
positive impact on the quality of air and the quality of life of people due to
reduced emissions of harmful gases.
When it comes to biofuels, we need to consider the process of obtaining
this energy product, that is, the impact of this process on the environment.
Due to the unspecified biofuel resource, the impact assessment remains
at this level.
Replacing outdated vessels and purchasing new ecologically and energy
efficient vessels shall have a positive impact on the environment, as it shall
reduce emissions of pollutants into the environment and greenhouse
gases into the atmosphere.
G.7
Reorganisation of
the transport
system for
greater
sustainability
Public service contracts concluded in accordance with Regulation
1370/2007 on public passenger transport services by rail and road and
repealing Council Regulations (EEC) No. 1191/69 and (EEC) No.
1107/70 are one of the basic mechanisms to guarantee the
transparency and efficiency of the public transport service. Therefore,
their wider application is necessary not only to comply with the
Regulation but also as a first step towards increasing the sustainability
of the Croatian transport system. The type and duration of a public
service contract shall be determined on the basis of an analysis of each
individual case in combination with an analysis of existing internal
models, either for conformity check, or after a thorough examination of
technical and financial conditions.
Increasing financial sustainability is one of the goals of the trans-
European transport network. To achieve this goal, the organization of
transport systems shall be optimised and the efficiency of operations
and maintenance shall be raised. The financial sustainability of the
transport system aims to reduce the system dependence on the
subsidies from public revenue.
Traditionally, the traffic infrastructure is built from funds raised by public
funding, at the level of regions, countries or the European Union. This
method is used to finance most road or rail projects.
By introducing new procedures in the sphere of public contracts, the
Commission is trying to encourage greater private equity participation in
financing infrastructure projects.
The EU White Paper on Transport presents a number of recommendations
aimed at achieving the integration of all types of transport for the benefit of
a more efficient, sustainable, competitive, accessible transport system that
is user-friendly. Some of the main points are change in the modes of
transport and comfort, modern
infrastructure and smart financing, urban mobility, users in the center of
traffic policy and the global dimension of traffic. At a strategic level, this
measure contributes to improving the quality of life of people, while not
generating negative impacts on the environment.
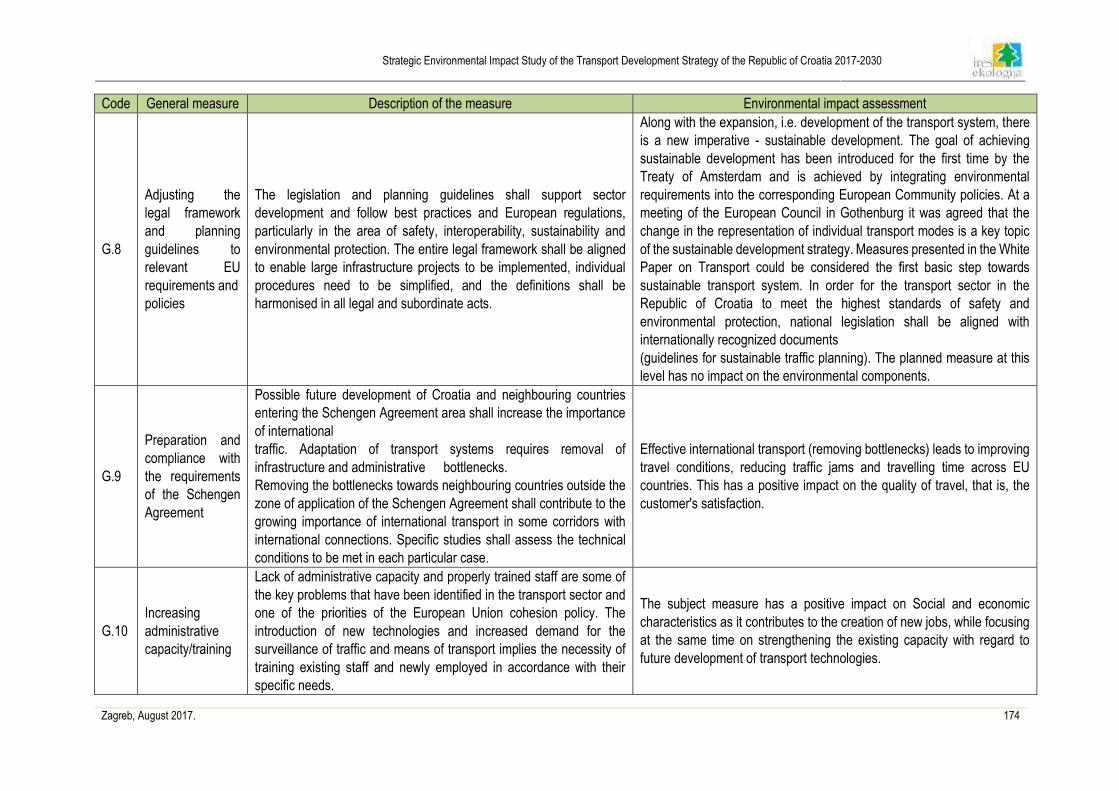
Strategic Environmental Impact Study of the Transport Development Strategy of the Republic of Croatia 2017-2030
____________________________________________________________________________________________________________________________________________________________
Zagreb, August 2017. 174
Code General measure Description of the measure Environmental impact assessment
G.8
Adjusting the
legal framework
and planning
guidelines to
relevant EU
requirements and
policies
The legislation and planning guidelines shall support sector
development and follow best practices and European regulations,
particularly in the area of safety, interoperability, sustainability and
environmental protection. The entire legal framework shall be aligned
to enable large infrastructure projects to be implemented, individual
procedures need to be simplified, and the definitions shall be
harmonised in all legal and subordinate acts.
Along with the expansion, i.e. development of the transport system, there
is a new imperative - sustainable development. The goal of achieving
sustainable development has been introduced for the first time by the
Treaty of Amsterdam and is achieved by integrating environmental
requirements into the corresponding European Community policies. At a
meeting of the European Council in Gothenburg it was agreed that the
change in the representation of individual transport modes is a key topic
of the sustainable development strategy. Measures presented in the White
Paper on Transport could be considered the first basic step towards
sustainable transport system. In order for the transport sector in the
Republic of Croatia to meet the highest standards of safety and
environmental protection, national legislation shall be aligned with
internationally recognized documents
(guidelines for sustainable traffic planning). The planned measure at this
level has no impact on the environmental components.
G.9
Preparation and
compliance with
the requirements
of the Schengen
Agreement
Possible future development of Croatia and neighbouring countries
entering the Schengen Agreement area shall increase the importance
of international
traffic. Adaptation of transport systems requires removal of
infrastructure and administrative bottlenecks.
Removing the bottlenecks towards neighbouring countries outside the
zone of application of the Schengen Agreement shall contribute to the
growing importance of international transport in some corridors with
international connections. Specific studies shall assess the technical
conditions to be met in each particular case.
Effective international transport (removing bottlenecks) leads to improving
travel conditions, reducing traffic jams and travelling time across EU
countries. This has a positive impact on the quality of travel, that is, the
customer's satisfaction.
G.10
Increasing
administrative
capacity/training
Lack of administrative capacity and properly trained staff are some of
the key problems that have been identified in the transport sector and
one of the priorities of the European Union cohesion policy. The
introduction of new technologies and increased demand for the
surveillance of traffic and means of transport implies the necessity of
training existing staff and newly employed in accordance with their
specific needs.
The subject measure has a positive impact on Social and economic
characteristics as it contributes to the creation of new jobs, while focusing
at the same time on strengthening the existing capacity with regard to
future development of transport technologies.
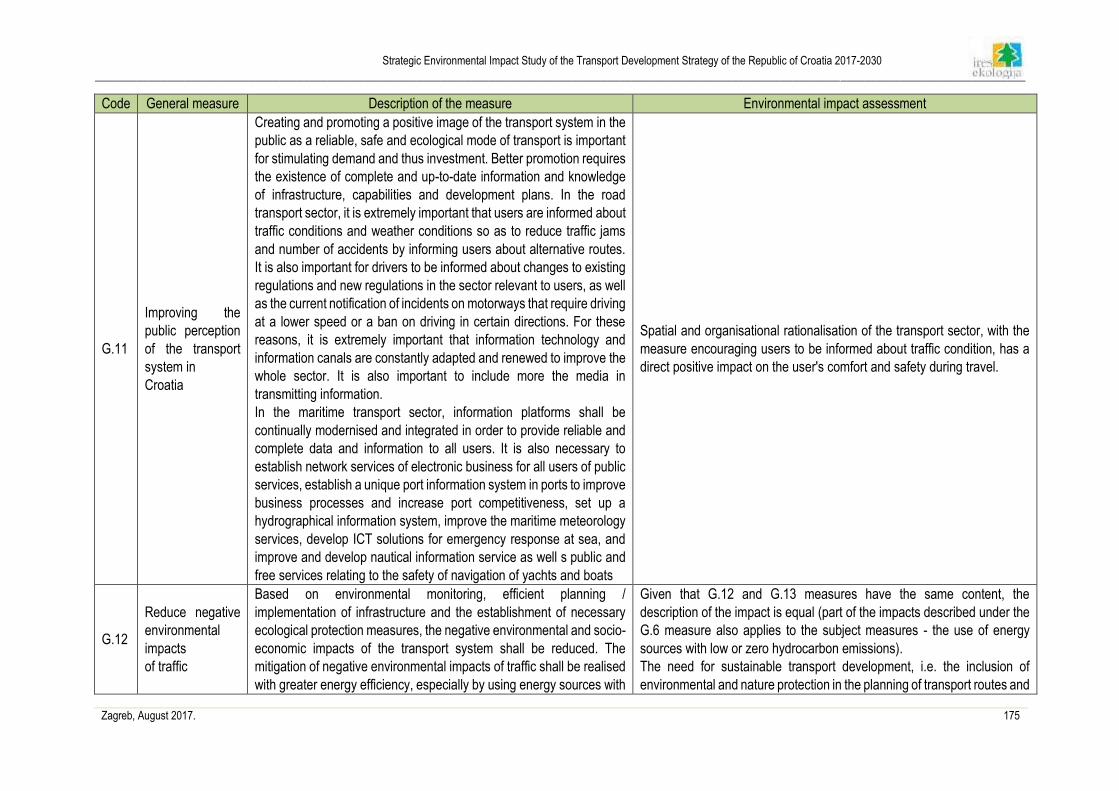
Strategic Environmental Impact Study of the Transport Development Strategy of the Republic of Croatia 2017-2030
____________________________________________________________________________________________________________________________________________________________
Zagreb, August 2017. 175
Code General measure Description of the measure Environmental impact assessment
G.11
Improving the
public perception
of the transport
system in
Croatia
Creating and promoting a positive image of the transport system in the
public as a reliable, safe and ecological mode of transport is important
for stimulating demand and thus investment. Better promotion requires
the existence of complete and up-to-date information and knowledge
of infrastructure, capabilities and development plans. In the road
transport sector, it is extremely important that users are informed about
traffic conditions and weather conditions so as to reduce traffic jams
and number of accidents by informing users about alternative routes.
It is also important for drivers to be informed about changes to existing
regulations and new regulations in the sector relevant to users, as well
as the current notification of incidents on motorways that require driving
at a lower speed or a ban on driving in certain directions. For these
reasons, it is extremely important that information technology and
information canals are constantly adapted and renewed to improve the
whole sector. It is also important to include more the media in
transmitting information.
In the maritime transport sector, information platforms shall be
continually modernised and integrated in order to provide reliable and
complete data and information to all users. It is also necessary to
establish network services of electronic business for all users of public
services, establish a unique port information system in ports to improve
business processes and increase port competitiveness, set up a
hydrographical information system, improve the maritime meteorology
services, develop ICT solutions for emergency response at sea, and
improve and develop nautical information service as well s public and
free services relating to the safety of navigation of yachts and boats
Spatial and organisational rationalisation of the transport sector, with the
measure encouraging users to be informed about traffic condition, has a
direct positive impact on the user's comfort and safety during travel.
G.12
Reduce negative
environmental
impacts
of traffic
Based on environmental monitoring, efficient planning /
implementation of infrastructure and the establishment of necessary
ecological protection measures, the negative environmental and socio-
economic impacts of the transport system shall be reduced. The
mitigation of negative environmental impacts of traffic shall be realised
with greater energy efficiency, especially by using energy sources with
Given that G.12 and G.13 measures have the same content, the
description of the impact is equal (part of the impacts described under the
G.6 measure also applies to the subject measures - the use of energy
sources with low or zero hydrocarbon emissions).
The need for sustainable transport development, i.e. the inclusion of
environmental and nature protection in the planning of transport routes and
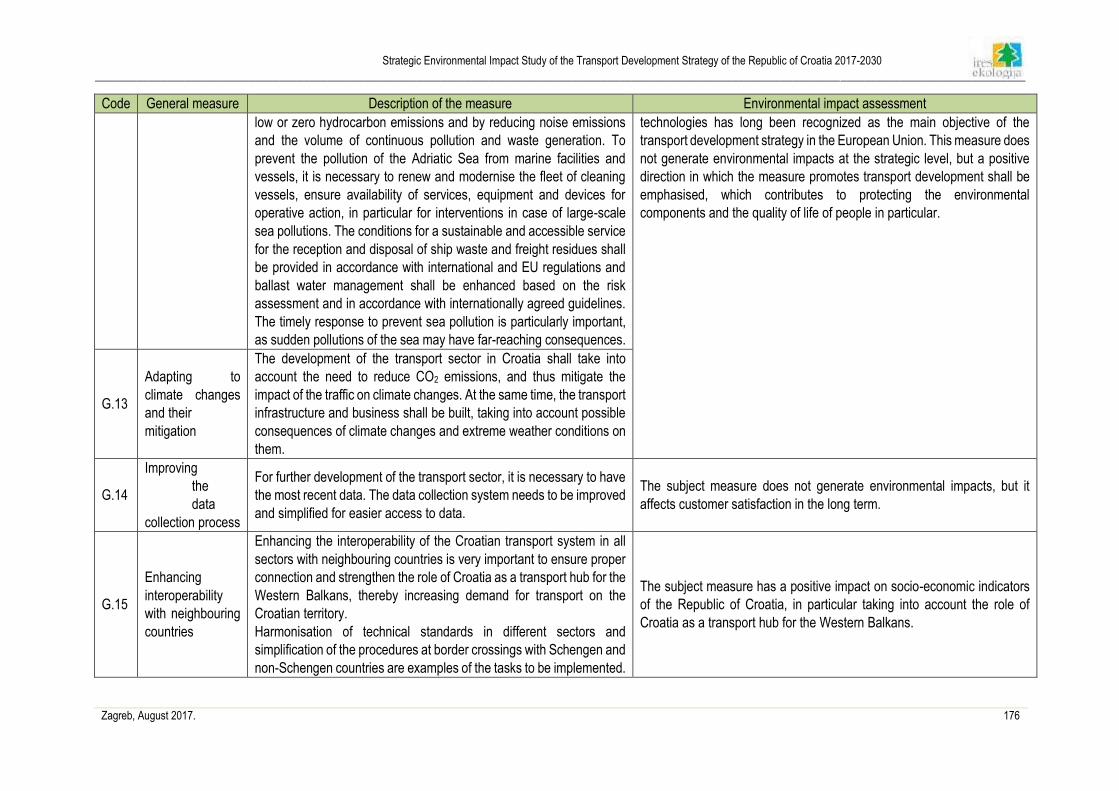
Strategic Environmental Impact Study of the Transport Development Strategy of the Republic of Croatia 2017-2030
____________________________________________________________________________________________________________________________________________________________
Zagreb, August 2017. 176
Code General measure Description of the measure Environmental impact assessment
low or zero hydrocarbon emissions and by reducing noise emissions
and the volume of continuous pollution and waste generation. To
prevent the pollution of the Adriatic Sea from marine facilities and
vessels, it is necessary to renew and modernise the fleet of cleaning
vessels, ensure availability of services, equipment and devices for
operative action, in particular for interventions in case of large-scale
sea pollutions. The conditions for a sustainable and accessible service
for the reception and disposal of ship waste and freight residues shall
be provided in accordance with international and EU regulations and
ballast water management shall be enhanced based on the risk
assessment and in accordance with internationally agreed guidelines.
The timely response to prevent sea pollution is particularly important,
as sudden pollutions of the sea may have far-reaching consequences.
technologies has long been recognized as the main objective of the
transport development strategy in the European Union. This measure does
not generate environmental impacts at the strategic level, but a positive
direction in which the measure promotes transport development shall be
emphasised, which contributes to protecting the environmental
components and the quality of life of people in particular.
G.13
Adapting to
climate changes
and their
mitigation
The development of the transport sector in Croatia shall take into
account the need to reduce CO2 emissions, and thus mitigate the
impact of the traffic on climate changes. At the same time, the transport
infrastructure and business shall be built, taking into account possible
consequences of climate changes and extreme weather conditions on
them.
G.14
Improving
the
data
collection process
For further development of the transport sector, it is necessary to have
the most recent data. The data collection system needs to be improved
and simplified for easier access to data.
The subject measure does not generate environmental impacts, but it
affects customer satisfaction in the long term.
G.15
Enhancing
interoperability
with neighbouring
countries
Enhancing the interoperability of the Croatian transport system in all
sectors with neighbouring countries is very important to ensure proper
connection and strengthen the role of Croatia as a transport hub for the
Western Balkans, thereby increasing demand for transport on the
Croatian territory.
Harmonisation of technical standards in different sectors and
simplification of the procedures at border crossings with Schengen and
non-Schengen countries are examples of the tasks to be implemented.
The subject measure has a positive impact on socio-economic indicators
of the Republic of Croatia, in particular taking into account the role of
Croatia as a transport hub for the Western Balkans.
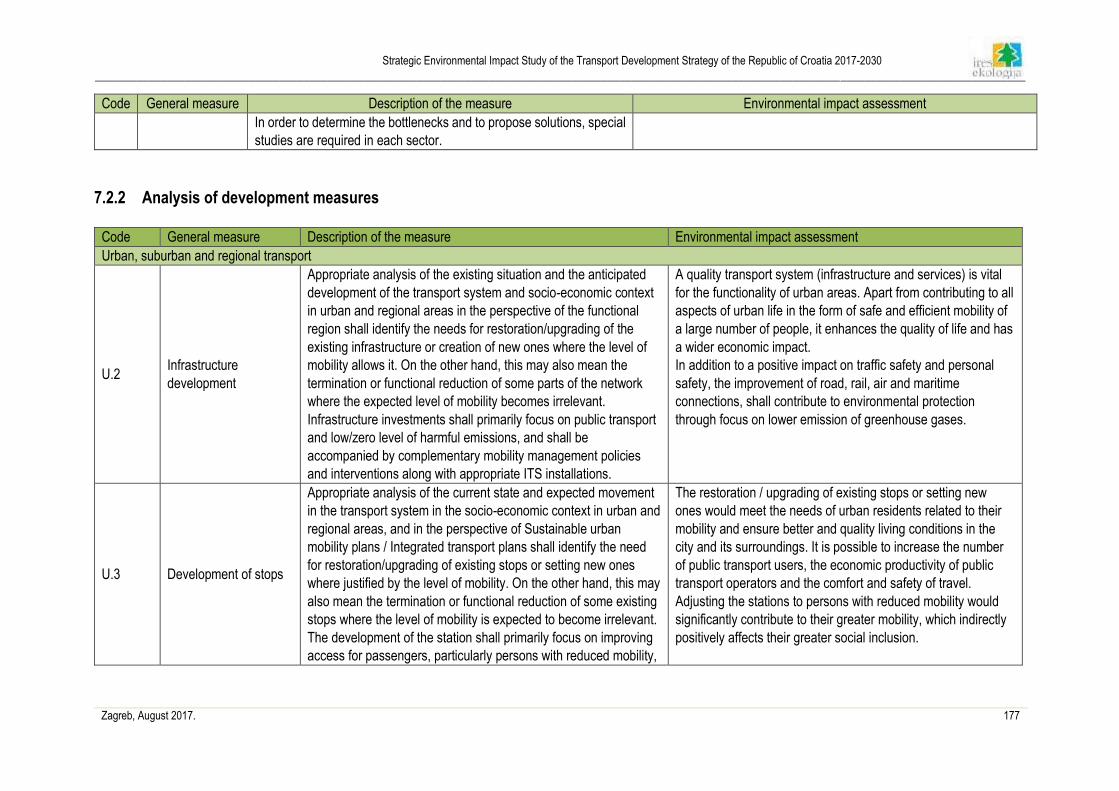
Strategic Environmental Impact Study of the Transport Development Strategy of the Republic of Croatia 2017-2030
____________________________________________________________________________________________________________________________________________________________
Zagreb, August 2017. 177
Code General measure Description of the measure Environmental impact assessment
In order to determine the bottlenecks and to propose solutions, special
studies are required in each sector.
7.2.2 Analysis of development measures
Code General measure Description of the measure Environmental impact assessment
Urban, suburban and regional transport
U.2 Infrastructure
development
Appropriate analysis of the existing situation and the anticipated
development of the transport system and socio-economic context
in urban and regional areas in the perspective of the functional
region shall identify the needs for restoration/upgrading of the
existing infrastructure or creation of new ones where the level of
mobility allows it. On the other hand, this may also mean the
termination or functional reduction of some parts of the network
where the expected level of mobility becomes irrelevant.
Infrastructure investments shall primarily focus on public transport
and low/zero level of harmful emissions, and shall be
accompanied by complementary mobility management policies
and interventions along with appropriate ITS installations.
A quality transport system (infrastructure and services) is vital
for the functionality of urban areas. Apart from contributing to all
aspects of urban life in the form of safe and efficient mobility of
a large number of people, it enhances the quality of life and has
a wider economic impact.
In addition to a positive impact on traffic safety and personal
safety, the improvement of road, rail, air and maritime
connections, shall contribute to environmental protection
through focus on lower emission of greenhouse gases.
U.3 Development of stops
Appropriate analysis of the current state and expected movement
in the transport system in the socio-economic context in urban and
regional areas, and in the perspective of Sustainable urban
mobility plans / Integrated transport plans shall identify the need
for restoration/upgrading of existing stops or setting new ones
where justified by the level of mobility. On the other hand, this may
also mean the termination or functional reduction of some existing
stops where the level of mobility is expected to become irrelevant.
The development of the station shall primarily focus on improving
access for passengers, particularly persons with reduced mobility,
The restoration / upgrading of existing stops or setting new
ones would meet the needs of urban residents related to their
mobility and ensure better and quality living conditions in the
city and its surroundings. It is possible to increase the number
of public transport users, the economic productivity of public
transport operators and the comfort and safety of travel.
Adjusting the stations to persons with reduced mobility would
significantly contribute to their greater mobility, which indirectly
positively affects their greater social inclusion.
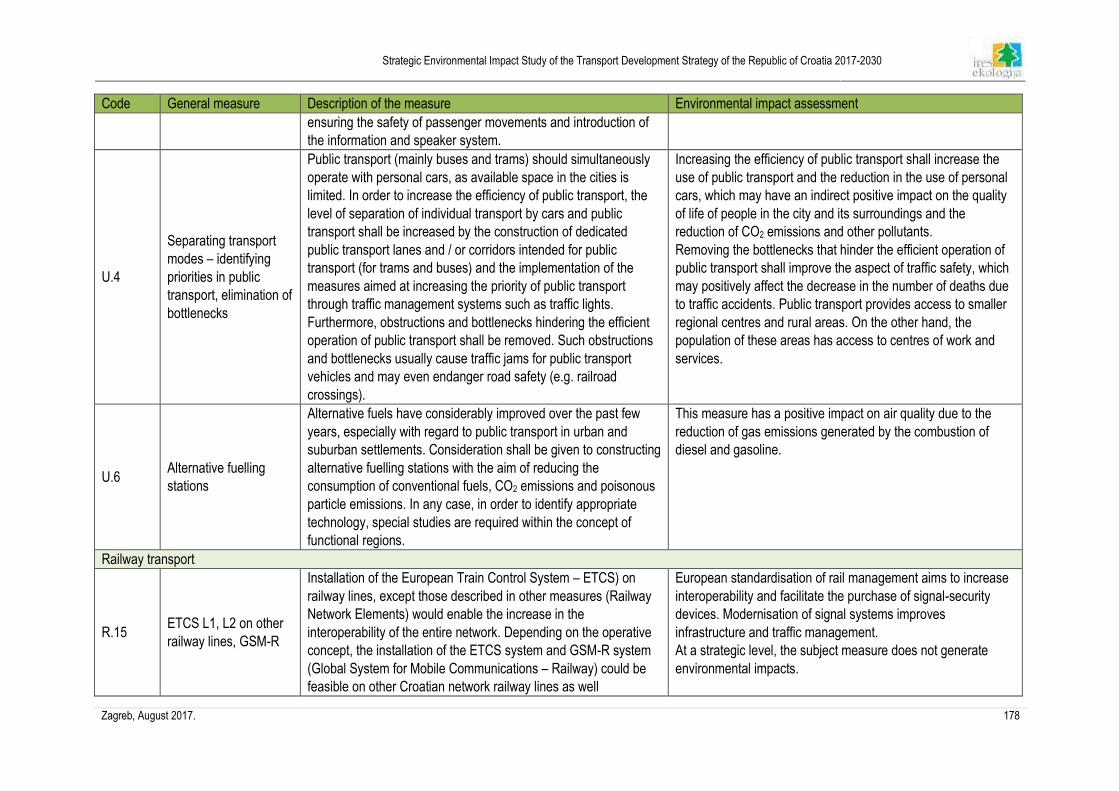
Strategic Environmental Impact Study of the Transport Development Strategy of the Republic of Croatia 2017-2030
____________________________________________________________________________________________________________________________________________________________
Zagreb, August 2017. 178
Code General measure Description of the measure Environmental impact assessment
ensuring the safety of passenger movements and introduction of
the information and speaker system.
U.4
Separating transport
modes – identifying
priorities in public
transport, elimination of
bottlenecks
Public transport (mainly buses and trams) should simultaneously
operate with personal cars, as available space in the cities is
limited. In order to increase the efficiency of public transport, the
level of separation of individual transport by cars and public
transport shall be increased by the construction of dedicated
public transport lanes and / or corridors intended for public
transport (for trams and buses) and the implementation of the
measures aimed at increasing the priority of public transport
through traffic management systems such as traffic lights.
Furthermore, obstructions and bottlenecks hindering the efficient
operation of public transport shall be removed. Such obstructions
and bottlenecks usually cause traffic jams for public transport
vehicles and may even endanger road safety (e.g. railroad
crossings).
Increasing the efficiency of public transport shall increase the
use of public transport and the reduction in the use of personal
cars, which may have an indirect positive impact on the quality
of life of people in the city and its surroundings and the
reduction of CO2 emissions and other pollutants.
Removing the bottlenecks that hinder the efficient operation of
public transport shall improve the aspect of traffic safety, which
may positively affect the decrease in the number of deaths due
to traffic accidents. Public transport provides access to smaller
regional centres and rural areas. On the other hand, the
population of these areas has access to centres of work and
services.
U.6 Alternative fuelling
stations
Alternative fuels have considerably improved over the past few
years, especially with regard to public transport in urban and
suburban settlements. Consideration shall be given to constructing
alternative fuelling stations with the aim of reducing the
consumption of conventional fuels, CO2 emissions and poisonous
particle emissions. In any case, in order to identify appropriate
technology, special studies are required within the concept of
functional regions.
This measure has a positive impact on air quality due to the
reduction of gas emissions generated by the combustion of
diesel and gasoline.
Railway transport
R.15 ETCS L1, L2 on other
railway lines, GSM-R
Installation of the European Train Control System – ETCS) on
railway lines, except those described in other measures (Railway
Network Elements) would enable the increase in the
interoperability of the entire network. Depending on the operative
concept, the installation of the ETCS system and GSM-R system
(Global System for Mobile Communications – Railway) could be
feasible on other Croatian network railway lines as well
European standardisation of rail management aims to increase
interoperability and facilitate the purchase of signal-security
devices. Modernisation of signal systems improves
infrastructure and traffic management.
At a strategic level, the subject measure does not generate
environmental impacts.
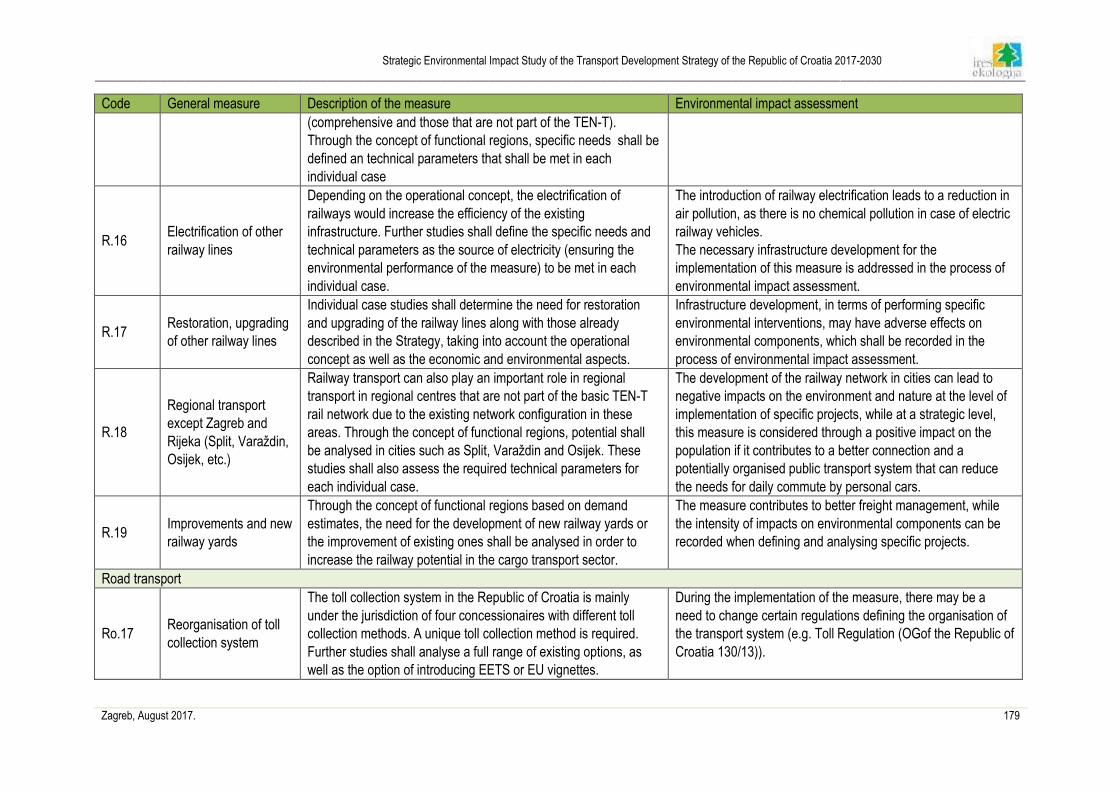
Strategic Environmental Impact Study of the Transport Development Strategy of the Republic of Croatia 2017-2030
____________________________________________________________________________________________________________________________________________________________
Zagreb, August 2017. 179
Code General measure Description of the measure Environmental impact assessment
(comprehensive and those that are not part of the TEN-T).
Through the concept of functional regions, specific needs shall be
defined an technical parameters that shall be met in each
individual case
R.16 Electrification of other
railway lines
Depending on the operational concept, the electrification of
railways would increase the efficiency of the existing
infrastructure. Further studies shall define the specific needs and
technical parameters as the source of electricity (ensuring the
environmental performance of the measure) to be met in each
individual case.
The introduction of railway electrification leads to a reduction in
air pollution, as there is no chemical pollution in case of electric
railway vehicles.
The necessary infrastructure development for the
implementation of this measure is addressed in the process of
environmental impact assessment.
R.17 Restoration, upgrading
of other railway lines
Individual case studies shall determine the need for restoration
and upgrading of the railway lines along with those already
described in the Strategy, taking into account the operational
concept as well as the economic and environmental aspects.
Infrastructure development, in terms of performing specific
environmental interventions, may have adverse effects on
environmental components, which shall be recorded in the
process of environmental impact assessment.
R.18
Regional transport
except Zagreb and
Rijeka (Split, Varaždin,
Osijek, etc.)
Railway transport can also play an important role in regional
transport in regional centres that are not part of the basic TEN-T
rail network due to the existing network configuration in these
areas. Through the concept of functional regions, potential shall
be analysed in cities such as Split, Varaždin and Osijek. These
studies shall also assess the required technical parameters for
each individual case.
The development of the railway network in cities can lead to
negative impacts on the environment and nature at the level of
implementation of specific projects, while at a strategic level,
this measure is considered through a positive impact on the
population if it contributes to a better connection and a
potentially organised public transport system that can reduce
the needs for daily commute by personal cars.
R.19 Improvements and new
railway yards
Through the concept of functional regions based on demand
estimates, the need for the development of new railway yards or
the improvement of existing ones shall be analysed in order to
increase the railway potential in the cargo transport sector.
The measure contributes to better freight management, while
the intensity of impacts on environmental components can be
recorded when defining and analysing specific projects.
Road transport
Ro.17 Reorganisation of toll
collection system
The toll collection system in the Republic of Croatia is mainly
under the jurisdiction of four concessionaires with different toll
collection methods. A unique toll collection method is required.
Further studies shall analyse a full range of existing options, as
well as the option of introducing EETS or EU vignettes.
During the implementation of the measure, there may be a
need to change certain regulations defining the organisation of
the transport system (e.g. Toll Regulation (OGof the Republic of
Croatia 130/13)).
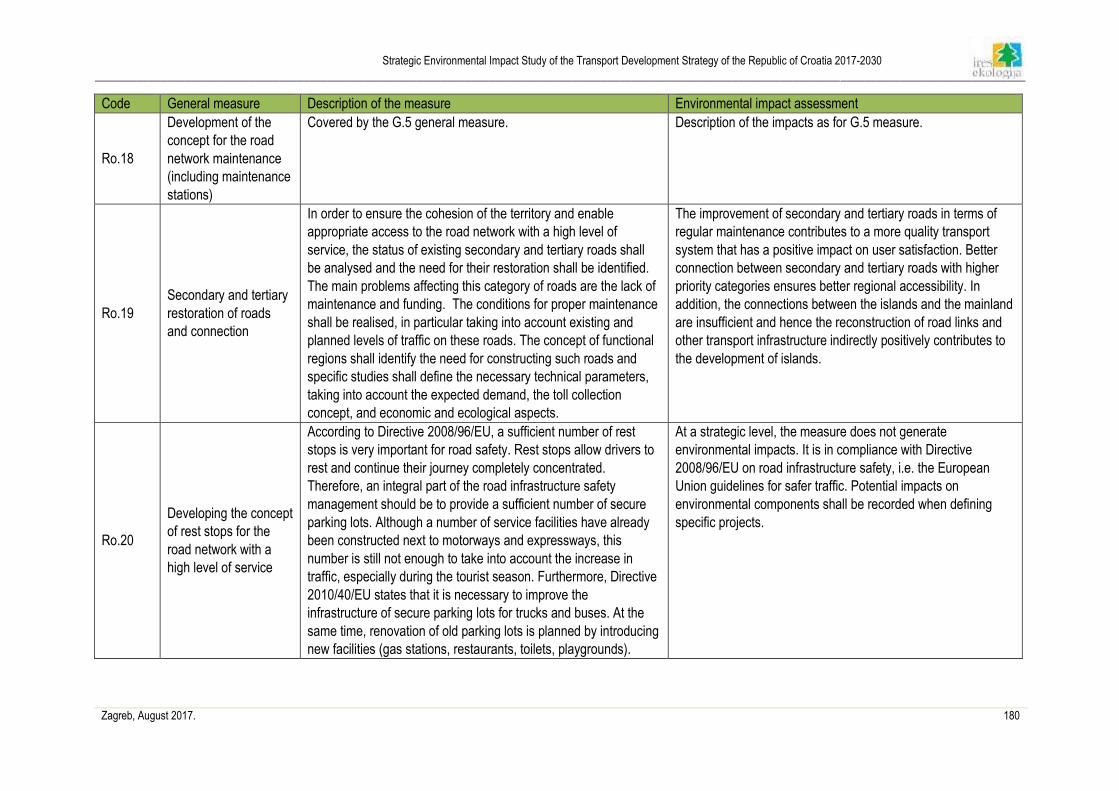
Strategic Environmental Impact Study of the Transport Development Strategy of the Republic of Croatia 2017-2030
____________________________________________________________________________________________________________________________________________________________
Zagreb, August 2017. 180
Code General measure Description of the measure Environmental impact assessment
Ro.18
Development of the
concept for the road
network maintenance
(including maintenance
stations)
Covered by the G.5 general measure. Description of the impacts as for G.5 measure.
Ro.19
Secondary and tertiary
restoration of roads
and connection
In order to ensure the cohesion of the territory and enable
appropriate access to the road network with a high level of
service, the status of existing secondary and tertiary roads shall
be analysed and the need for their restoration shall be identified.
The main problems affecting this category of roads are the lack of
maintenance and funding. The conditions for proper maintenance
shall be realised, in particular taking into account existing and
planned levels of traffic on these roads. The concept of functional
regions shall identify the need for constructing such roads and
specific studies shall define the necessary technical parameters,
taking into account the expected demand, the toll collection
concept, and economic and ecological aspects.
The improvement of secondary and tertiary roads in terms of
regular maintenance contributes to a more quality transport
system that has a positive impact on user satisfaction. Better
connection between secondary and tertiary roads with higher
priority categories ensures better regional accessibility. In
addition, the connections between the islands and the mainland
are insufficient and hence the reconstruction of road links and
other transport infrastructure indirectly positively contributes to
the development of islands.
Ro.20
Developing the concept
of rest stops for the
road network with a
high level of service
According to Directive 2008/96/EU, a sufficient number of rest
stops is very important for road safety. Rest stops allow drivers to
rest and continue their journey completely concentrated.
Therefore, an integral part of the road infrastructure safety
management should be to provide a sufficient number of secure
parking lots. Although a number of service facilities have already
been constructed next to motorways and expressways, this
number is still not enough to take into account the increase in
traffic, especially during the tourist season. Furthermore, Directive
2010/40/EU states that it is necessary to improve the
infrastructure of secure parking lots for trucks and buses. At the
same time, renovation of old parking lots is planned by introducing
new facilities (gas stations, restaurants, toilets, playgrounds).
At a strategic level, the measure does not generate
environmental impacts. It is in compliance with Directive
2008/96/EU on road infrastructure safety, i.e. the European
Union guidelines for safer traffic. Potential impacts on
environmental components shall be recorded when defining
specific projects.

Strategic Environmental Impact Study of the Transport Development Strategy of the Republic of Croatia 2017-2030
____________________________________________________________________________________________________________________________________________________________
Zagreb, August 2017. 181
Code General measure Description of the measure Environmental impact assessment
Ro.21
Traffic management
and control, traffic
counting and
information system
New technologies shall be introduced to improve the methods and
manners of collecting information to ensure that the collected
information on traffic management meet the international level in
terms of the content and quality. New technologies enable, inter
alia, the collection of real-time data and control of traffic
conditions.
In order to use the benefits of new technologies, the need for new
centralised traffic management centres shall be analysed, which
would be equipped with the latest ITS (Intelligent Transportation
Systems) solutions. Traffic management and control is of
particular importance in managing incidents and traffic jams at the
peak of the tourist season. This shall enable qualitative
improvement of planning and monitoring alternative routes,
information for passengers, traffic control and the collection of
real-time data on traffic jams.
The introduction of intelligent transport systems, which improve
traffic management and control, especially in increased traffic
periods, contributes to the safety of passenger travel.
Ro.22 Junction development
plan
In order to improve the connection with road networks with a high
level of service, a junction development plan is needed. The plan
shall take into account the functionality of each road, and hence
the number and locations of junctions shall be determined in order
to avoid, for example, a large volume of local traffic on interurban
corridors, which could worsen the level of service.
Specific seasonal requirements of the tourist season shall also be
considered.
A new toll collection system shall be proposed and evaluated.
The junction development plan shall contribute to a better traffic
organisation, reduction in traffic jams and cars stopping when
passing through bottlenecks, which shall contribute to user
satisfaction and better environmental conditions.
Ro.23 Road transport safety Covered by the general measure G.3. Impact assessment of general measures is given in chapter
7.2.1.
Ro. 24
Development of
networks to intermodal
hubs, agglomerations
in accordance with the
demand
Covered by the general measure G.4
Ro. 25 Interoperability
improvement Covered by the general measures G.4 and G.15.
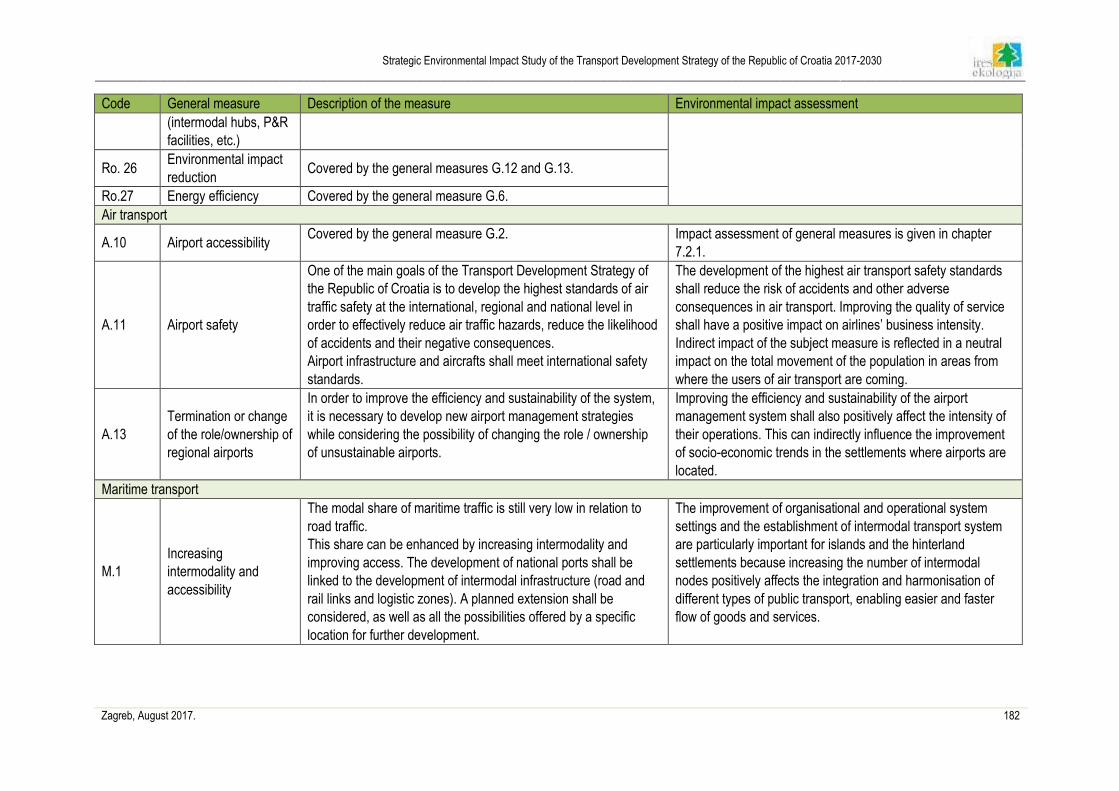
Strategic Environmental Impact Study of the Transport Development Strategy of the Republic of Croatia 2017-2030
____________________________________________________________________________________________________________________________________________________________
Zagreb, August 2017. 182
Code General measure Description of the measure Environmental impact assessment
(intermodal hubs, P&R
facilities, etc.)
Ro. 26 Environmental impact
reduction Covered by the general measures G.12 and G.13.
Ro.27 Energy efficiency Covered by the general measure G.6.
Air transport
A.10 Airport accessibility Covered by the general measure G.2. Impact assessment of general measures is given in chapter
7.2.1.
A.11 Airport safety
One of the main goals of the Transport Development Strategy of
the Republic of Croatia is to develop the highest standards of air
traffic safety at the international, regional and national level in
order to effectively reduce air traffic hazards, reduce the likelihood
of accidents and their negative consequences.
Airport infrastructure and aircrafts shall meet international safety
standards.
The development of the highest air transport safety standards
shall reduce the risk of accidents and other adverse
consequences in air transport. Improving the quality of service
shall have a positive impact on airlines’ business intensity.
Indirect impact of the subject measure is reflected in a neutral
impact on the total movement of the population in areas from
where the users of air transport are coming.
A.13
Termination or change
of the role/ownership of
regional airports
In order to improve the efficiency and sustainability of the system,
it is necessary to develop new airport management strategies
while considering the possibility of changing the role / ownership
of unsustainable airports.
Improving the efficiency and sustainability of the airport
management system shall also positively affect the intensity of
their operations. This can indirectly influence the improvement
of socio-economic trends in the settlements where airports are
located.
Maritime transport
M.1
Increasing
intermodality and
accessibility
The modal share of maritime traffic is still very low in relation to
road traffic.
This share can be enhanced by increasing intermodality and
improving access. The development of national ports shall be
linked to the development of intermodal infrastructure (road and
rail links and logistic zones). A planned extension shall be
considered, as well as all the possibilities offered by a specific
location for further development.
The improvement of organisational and operational system
settings and the establishment of intermodal transport system
are particularly important for islands and the hinterland
settlements because increasing the number of intermodal
nodes positively affects the integration and harmonisation of
different types of public transport, enabling easier and faster
flow of goods and services.
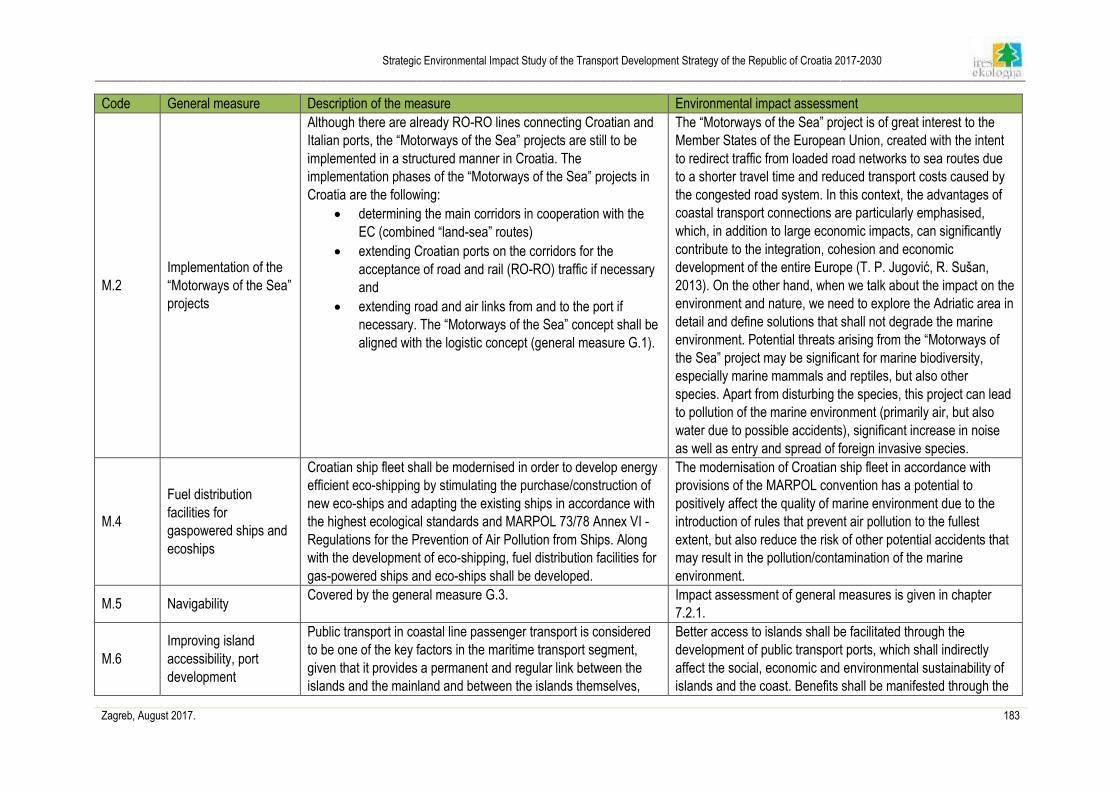
Strategic Environmental Impact Study of the Transport Development Strategy of the Republic of Croatia 2017-2030
____________________________________________________________________________________________________________________________________________________________
Zagreb, August 2017. 183
Code General measure Description of the measure Environmental impact assessment
M.2
Implementation of the
“Motorways of the Sea”
projects
Although there are already RO-RO lines connecting Croatian and
Italian ports, the “Motorways of the Sea” projects are still to be
implemented in a structured manner in Croatia. The
implementation phases of the “Motorways of the Sea” projects in
Croatia are the following:
• determining the main corridors in cooperation with the
EC (combined “land-sea” routes)
• extending Croatian ports on the corridors for the
acceptance of road and rail (RO-RO) traffic if necessary
and
• extending road and air links from and to the port if
necessary. The “Motorways of the Sea” concept shall be
aligned with the logistic concept (general measure G.1).
The “Motorways of the Sea” project is of great interest to the
Member States of the European Union, created with the intent
to redirect traffic from loaded road networks to sea routes due
to a shorter travel time and reduced transport costs caused by
the congested road system. In this context, the advantages of
coastal transport connections are particularly emphasised,
which, in addition to large economic impacts, can significantly
contribute to the integration, cohesion and economic
development of the entire Europe (T. P. Jugović, R. Sušan,
2013). On the other hand, when we talk about the impact on the
environment and nature, we need to explore the Adriatic area in
detail and define solutions that shall not degrade the marine
environment. Potential threats arising from the “Motorways of
the Sea” project may be significant for marine biodiversity,
especially marine mammals and reptiles, but also other
species. Apart from disturbing the species, this project can lead
to pollution of the marine environment (primarily air, but also
water due to possible accidents), significant increase in noise
as well as entry and spread of foreign invasive species.
M.4
Fuel distribution
facilities for
gaspowered ships and
ecoships
Croatian ship fleet shall be modernised in order to develop energy
efficient eco-shipping by stimulating the purchase/construction of
new eco-ships and adapting the existing ships in accordance with
the highest ecological standards and MARPOL 73/78 Annex VI -
Regulations for the Prevention of Air Pollution from Ships. Along
with the development of eco-shipping, fuel distribution facilities for
gas-powered ships and eco-ships shall be developed.
The modernisation of Croatian ship fleet in accordance with
provisions of the MARPOL convention has a potential to
positively affect the quality of marine environment due to the
introduction of rules that prevent air pollution to the fullest
extent, but also reduce the risk of other potential accidents that
may result in the pollution/contamination of the marine
environment.
M.5 Navigability Covered by the general measure G.3. Impact assessment of general measures is given in chapter
7.2.1.
M.6
Improving island
accessibility, port
development
Public transport in coastal line passenger transport is considered
to be one of the key factors in the maritime transport segment,
given that it provides a permanent and regular link between the
islands and the mainland and between the islands themselves,
Better access to islands shall be facilitated through the
development of public transport ports, which shall indirectly
affect the social, economic and environmental sustainability of
islands and the coast. Benefits shall be manifested through the
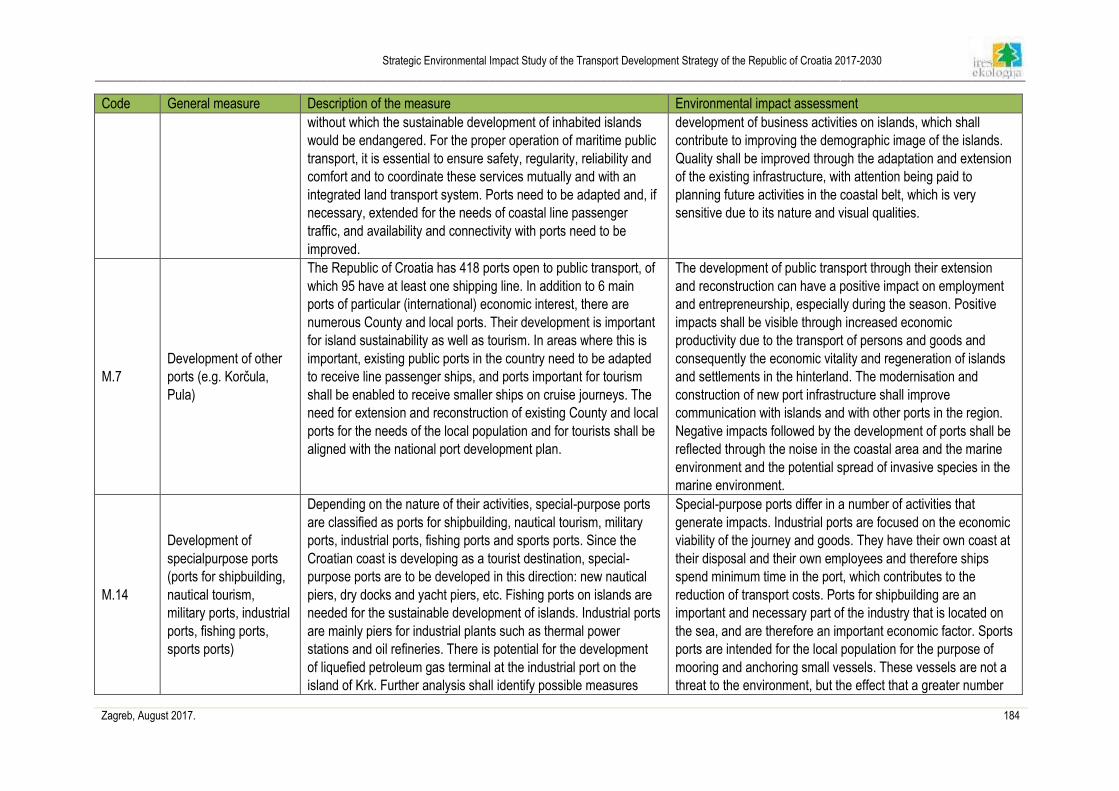
Strategic Environmental Impact Study of the Transport Development Strategy of the Republic of Croatia 2017-2030
____________________________________________________________________________________________________________________________________________________________
Zagreb, August 2017. 184
Code General measure Description of the measure Environmental impact assessment
without which the sustainable development of inhabited islands
would be endangered. For the proper operation of maritime public
transport, it is essential to ensure safety, regularity, reliability and
comfort and to coordinate these services mutually and with an
integrated land transport system. Ports need to be adapted and, if
necessary, extended for the needs of coastal line passenger
traffic, and availability and connectivity with ports need to be
improved.
development of business activities on islands, which shall
contribute to improving the demographic image of the islands.
Quality shall be improved through the adaptation and extension
of the existing infrastructure, with attention being paid to
planning future activities in the coastal belt, which is very
sensitive due to its nature and visual qualities.
M.7
Development of other
ports (e.g. Korčula,
Pula)
The Republic of Croatia has 418 ports open to public transport, of
which 95 have at least one shipping line. In addition to 6 main
ports of particular (international) economic interest, there are
numerous County and local ports. Their development is important
for island sustainability as well as tourism. In areas where this is
important, existing public ports in the country need to be adapted
to receive line passenger ships, and ports important for tourism
shall be enabled to receive smaller ships on cruise journeys. The
need for extension and reconstruction of existing County and local
ports for the needs of the local population and for tourists shall be
aligned with the national port development plan.
The development of public transport through their extension
and reconstruction can have a positive impact on employment
and entrepreneurship, especially during the season. Positive
impacts shall be visible through increased economic
productivity due to the transport of persons and goods and
consequently the economic vitality and regeneration of islands
and settlements in the hinterland. The modernisation and
construction of new port infrastructure shall improve
communication with islands and with other ports in the region.
Negative impacts followed by the development of ports shall be
reflected through the noise in the coastal area and the marine
environment and the potential spread of invasive species in the
marine environment.
M.14
Development of
specialpurpose ports
(ports for shipbuilding,
nautical tourism,
military ports, industrial
ports, fishing ports,
sports ports)
Depending on the nature of their activities, special-purpose ports
are classified as ports for shipbuilding, nautical tourism, military
ports, industrial ports, fishing ports and sports ports. Since the
Croatian coast is developing as a tourist destination, special-
purpose ports are to be developed in this direction: new nautical
piers, dry docks and yacht piers, etc. Fishing ports on islands are
needed for the sustainable development of islands. Industrial ports
are mainly piers for industrial plants such as thermal power
stations and oil refineries. There is potential for the development
of liquefied petroleum gas terminal at the industrial port on the
island of Krk. Further analysis shall identify possible measures
Special-purpose ports differ in a number of activities that
generate impacts. Industrial ports are focused on the economic
viability of the journey and goods. They have their own coast at
their disposal and their own employees and therefore ships
spend minimum time in the port, which contributes to the
reduction of transport costs. Ports for shipbuilding are an
important and necessary part of the industry that is located on
the sea, and are therefore an important economic factor. Sports
ports are intended for the local population for the purpose of
mooring and anchoring small vessels. These vessels are not a
threat to the environment, but the effect that a greater number
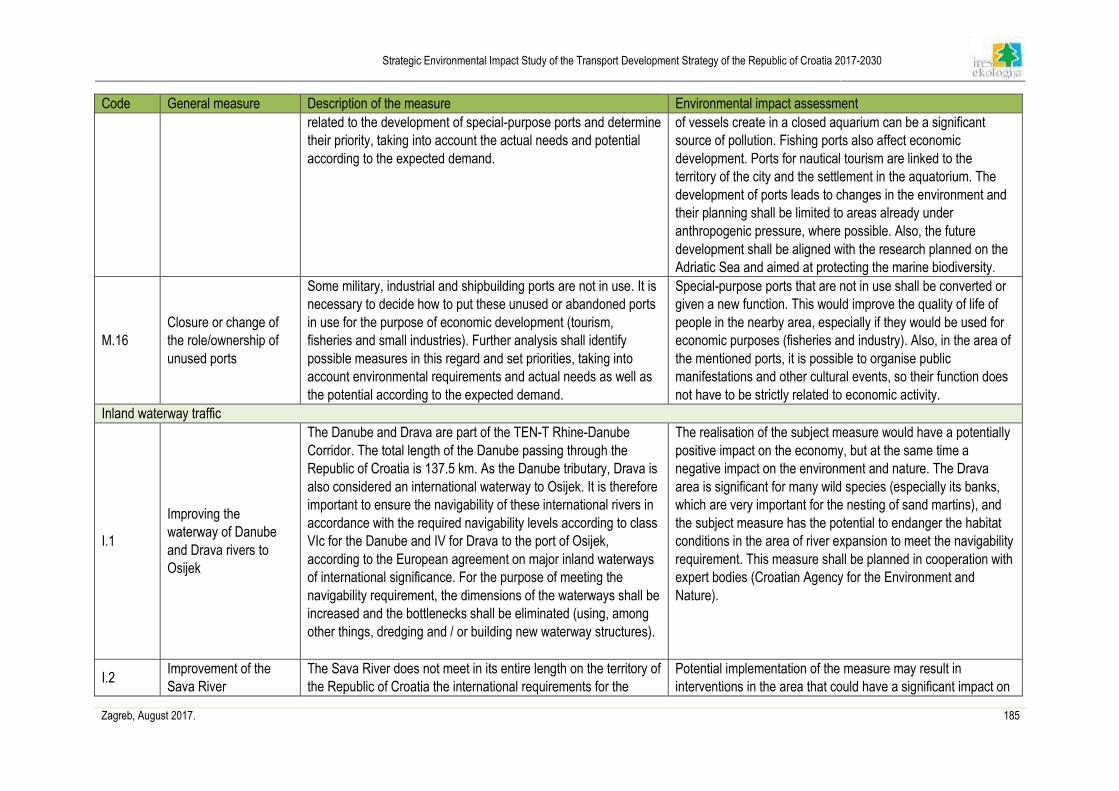
Strategic Environmental Impact Study of the Transport Development Strategy of the Republic of Croatia 2017-2030
____________________________________________________________________________________________________________________________________________________________
Zagreb, August 2017. 185
Code General measure Description of the measure Environmental impact assessment
related to the development of special-purpose ports and determine
their priority, taking into account the actual needs and potential
according to the expected demand.
of vessels create in a closed aquarium can be a significant
source of pollution. Fishing ports also affect economic
development. Ports for nautical tourism are linked to the
territory of the city and the settlement in the aquatorium. The
development of ports leads to changes in the environment and
their planning shall be limited to areas already under
anthropogenic pressure, where possible. Also, the future
development shall be aligned with the research planned on the
Adriatic Sea and aimed at protecting the marine biodiversity.
M.16
Closure or change of
the role/ownership of
unused ports
Some military, industrial and shipbuilding ports are not in use. It is
necessary to decide how to put these unused or abandoned ports
in use for the purpose of economic development (tourism,
fisheries and small industries). Further analysis shall identify
possible measures in this regard and set priorities, taking into
account environmental requirements and actual needs as well as
the potential according to the expected demand.
Special-purpose ports that are not in use shall be converted or
given a new function. This would improve the quality of life of
people in the nearby area, especially if they would be used for
economic purposes (fisheries and industry). Also, in the area of
the mentioned ports, it is possible to organise public
manifestations and other cultural events, so their function does
not have to be strictly related to economic activity.
Inland waterway traffic
I.1
Improving the
waterway of Danube
and Drava rivers to
Osijek
The Danube and Drava are part of the TEN-T Rhine-Danube
Corridor. The total length of the Danube passing through the
Republic of Croatia is 137.5 km. As the Danube tributary, Drava is
also considered an international waterway to Osijek. It is therefore
important to ensure the navigability of these international rivers in
accordance with the required navigability levels according to class
VIc for the Danube and IV for Drava to the port of Osijek,
according to the European agreement on major inland waterways
of international significance. For the purpose of meeting the
navigability requirement, the dimensions of the waterways shall be
increased and the bottlenecks shall be eliminated (using, among
other things, dredging and / or building new waterway structures).
The realisation of the subject measure would have a potentially
positive impact on the economy, but at the same time a
negative impact on the environment and nature. The Drava
area is significant for many wild species (especially its banks,
which are very important for the nesting of sand martins), and
the subject measure has the potential to endanger the habitat
conditions in the area of river expansion to meet the navigability
requirement. This measure shall be planned in cooperation with
expert bodies (Croatian Agency for the Environment and
Nature).
I.2 Improvement of the
Sava River
The Sava River does not meet in its entire length on the territory of
the Republic of Croatia the international requirements for the
Potential implementation of the measure may result in
interventions in the area that could have a significant impact on
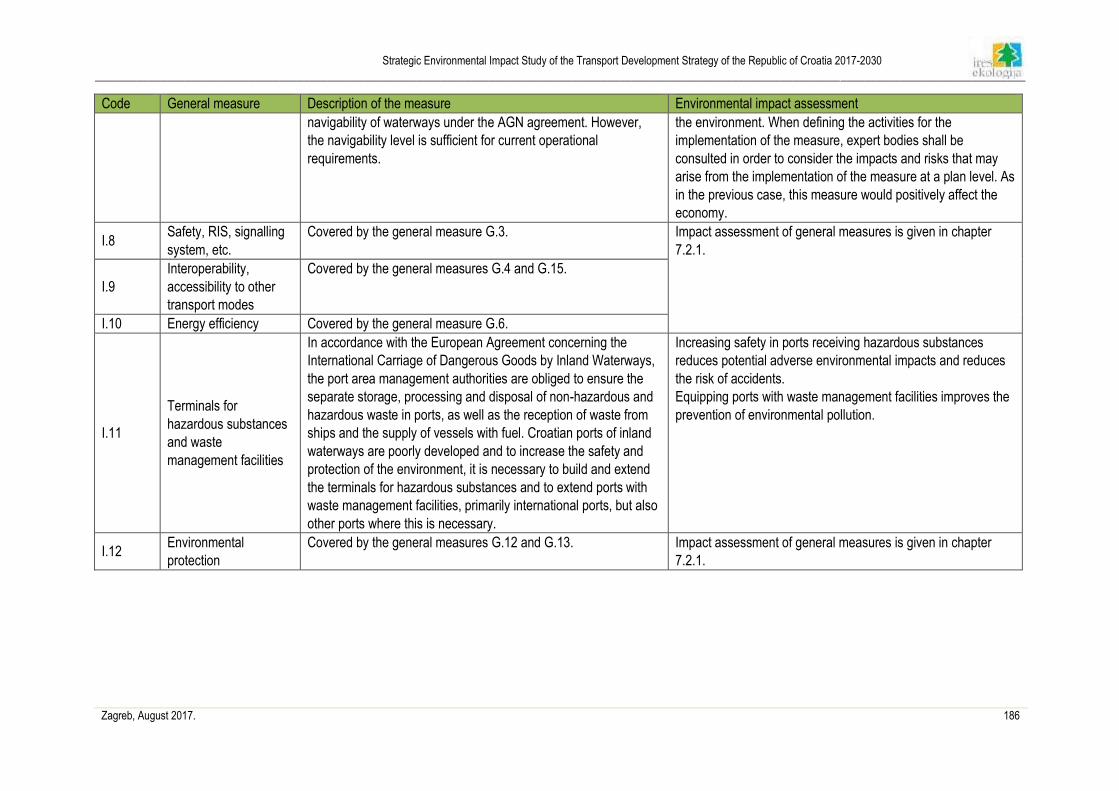
Strategic Environmental Impact Study of the Transport Development Strategy of the Republic of Croatia 2017-2030
____________________________________________________________________________________________________________________________________________________________
Zagreb, August 2017. 186
Code General measure Description of the measure Environmental impact assessment
navigability of waterways under the AGN agreement. However,
the navigability level is sufficient for current operational
requirements.
the environment. When defining the activities for the
implementation of the measure, expert bodies shall be
consulted in order to consider the impacts and risks that may
arise from the implementation of the measure at a plan level. As
in the previous case, this measure would positively affect the
economy.
I.8 Safety, RIS, signalling
system, etc.
Covered by the general measure G.3. Impact assessment of general measures is given in chapter
7.2.1.
I.9
Interoperability,
accessibility to other
transport modes
Covered by the general measures G.4 and G.15.
I.10 Energy efficiency Covered by the general measure G.6.
I.11
Terminals for
hazardous substances
and waste
management facilities
In accordance with the European Agreement concerning the
International Carriage of Dangerous Goods by Inland Waterways,
the port area management authorities are obliged to ensure the
separate storage, processing and disposal of non-hazardous and
hazardous waste in ports, as well as the reception of waste from
ships and the supply of vessels with fuel. Croatian ports of inland
waterways are poorly developed and to increase the safety and
protection of the environment, it is necessary to build and extend
the terminals for hazardous substances and to extend ports with
waste management facilities, primarily international ports, but also
other ports where this is necessary.
Increasing safety in ports receiving hazardous substances
reduces potential adverse environmental impacts and reduces
the risk of accidents.
Equipping ports with waste management facilities improves the
prevention of environmental pollution.
I.12 Environmental
protection
Covered by the general measures G.12 and G.13. Impact assessment of general measures is given in chapter
7.2.1.
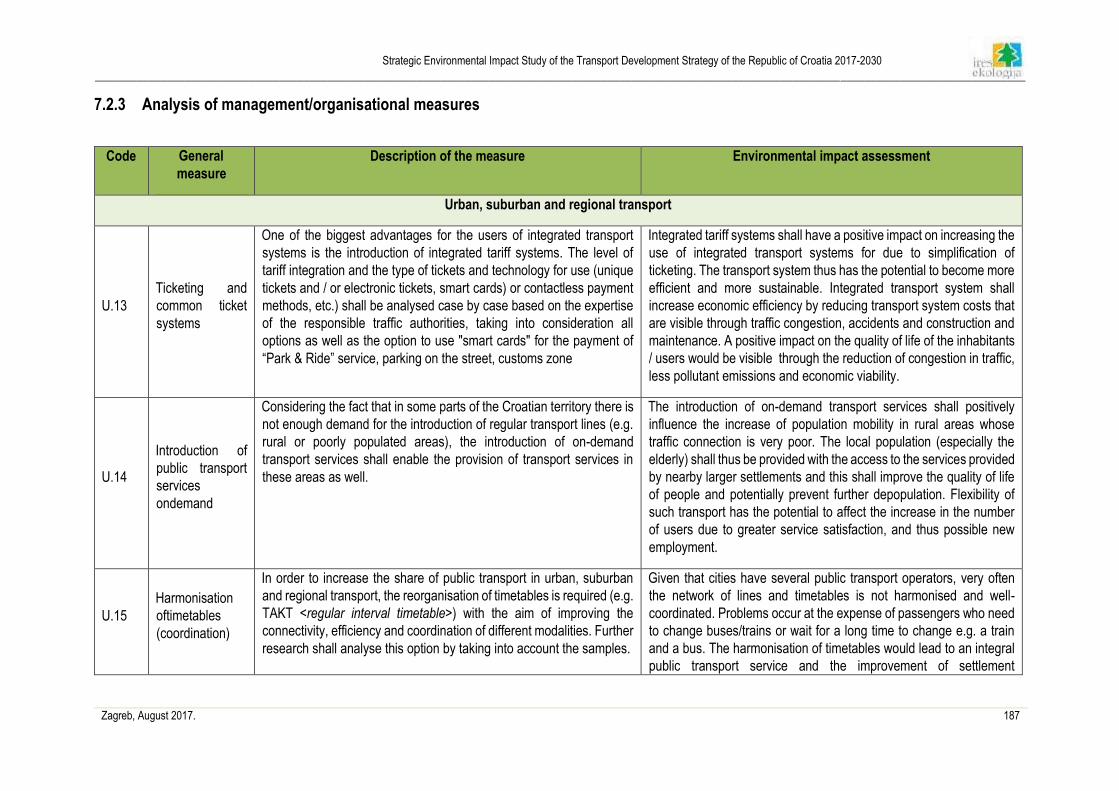
Strategic Environmental Impact Study of the Transport Development Strategy of the Republic of Croatia 2017-2030
____________________________________________________________________________________________________________________________________________________________
Zagreb, August 2017. 187
7.2.3 Analysis of management/organisational measures
Code General
measure
Description of the measure Environmental impact assessment
Urban, suburban and regional transport
U.13
Ticketing and
common ticket
systems
One of the biggest advantages for the users of integrated transport
systems is the introduction of integrated tariff systems. The level of
tariff integration and the type of tickets and technology for use (unique
tickets and / or electronic tickets, smart cards) or contactless payment
methods, etc.) shall be analysed case by case based on the expertise
of the responsible traffic authorities, taking into consideration all
options as well as the option to use "smart cards" for the payment of
“Park & Ride” service, parking on the street, customs zone
Integrated tariff systems shall have a positive impact on increasing the
use of integrated transport systems for due to simplification of
ticketing. The transport system thus has the potential to become more
efficient and more sustainable. Integrated transport system shall
increase economic efficiency by reducing transport system costs that
are visible through traffic congestion, accidents and construction and
maintenance. A positive impact on the quality of life of the inhabitants
/ users would be visible through the reduction of congestion in traffic,
less pollutant emissions and economic viability.
U.14
Introduction of
public transport
services
ondemand
Considering the fact that in some parts of the Croatian territory there is
not enough demand for the introduction of regular transport lines (e.g.
rural or poorly populated areas), the introduction of on-demand
transport services shall enable the provision of transport services in
these areas as well.
The introduction of on-demand transport services shall positively
influence the increase of population mobility in rural areas whose
traffic connection is very poor. The local population (especially the
elderly) shall thus be provided with the access to the services provided
by nearby larger settlements and this shall improve the quality of life
of people and potentially prevent further depopulation. Flexibility of
such transport has the potential to affect the increase in the number
of users due to greater service satisfaction, and thus possible new
employment.
U.15
Harmonisation
oftimetables
(coordination)
In order to increase the share of public transport in urban, suburban
and regional transport, the reorganisation of timetables is required (e.g.
TAKT <regular interval timetable>) with the aim of improving the
connectivity, efficiency and coordination of different modalities. Further
research shall analyse this option by taking into account the samples.
Given that cities have several public transport operators, very often
the network of lines and timetables is not harmonised and well-
coordinated. Problems occur at the expense of passengers who need
to change buses/trains or wait for a long time to change e.g. a train
and a bus. The harmonisation of timetables would lead to an integral
public transport service and the improvement of settlement
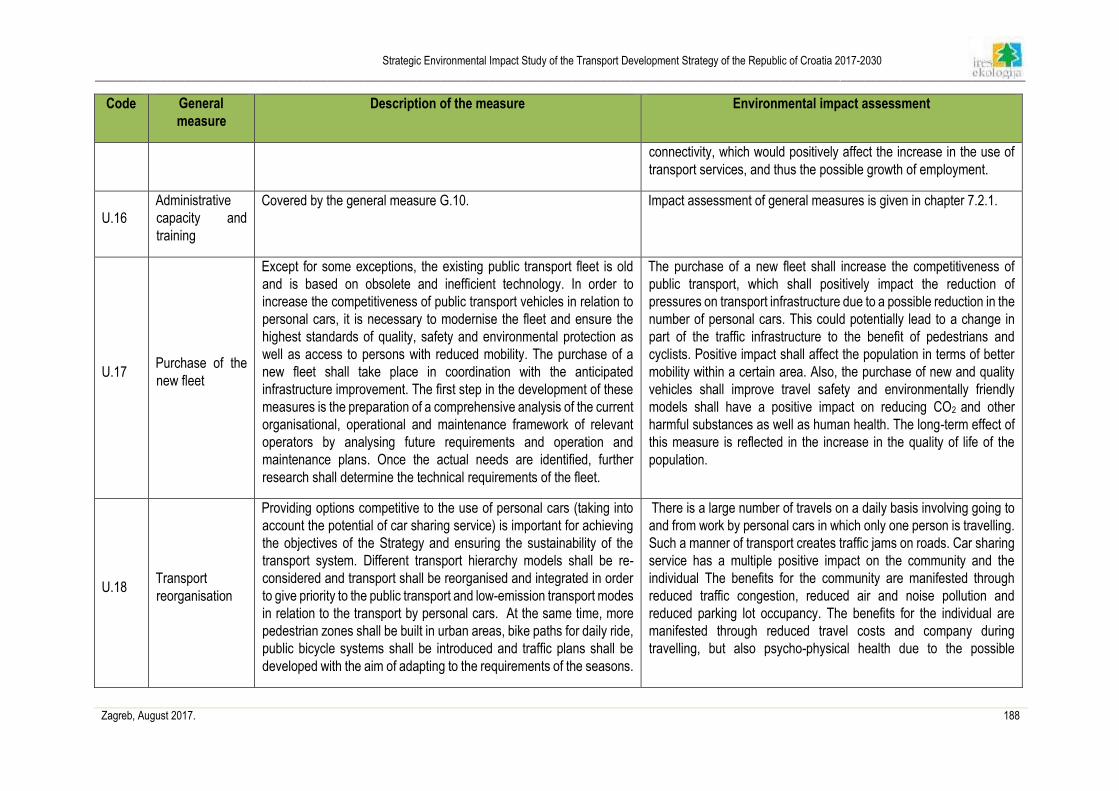
Strategic Environmental Impact Study of the Transport Development Strategy of the Republic of Croatia 2017-2030
____________________________________________________________________________________________________________________________________________________________
Zagreb, August 2017. 188
Code General
measure
Description of the measure Environmental impact assessment
connectivity, which would positively affect the increase in the use of
transport services, and thus the possible growth of employment.
U.16
Administrative
capacity and
training
Covered by the general measure G.10. Impact assessment of general measures is given in chapter 7.2.1.
U.17 Purchase of the
new fleet
Except for some exceptions, the existing public transport fleet is old
and is based on obsolete and inefficient technology. In order to
increase the competitiveness of public transport vehicles in relation to
personal cars, it is necessary to modernise the fleet and ensure the
highest standards of quality, safety and environmental protection as
well as access to persons with reduced mobility. The purchase of a
new fleet shall take place in coordination with the anticipated
infrastructure improvement. The first step in the development of these
measures is the preparation of a comprehensive analysis of the current
organisational, operational and maintenance framework of relevant
operators by analysing future requirements and operation and
maintenance plans. Once the actual needs are identified, further
research shall determine the technical requirements of the fleet.
The purchase of a new fleet shall increase the competitiveness of
public transport, which shall positively impact the reduction of
pressures on transport infrastructure due to a possible reduction in the
number of personal cars. This could potentially lead to a change in
part of the traffic infrastructure to the benefit of pedestrians and
cyclists. Positive impact shall affect the population in terms of better
mobility within a certain area. Also, the purchase of new and quality
vehicles shall improve travel safety and environmentally friendly
models shall have a positive impact on reducing CO2 and other
harmful substances as well as human health. The long-term effect of
this measure is reflected in the increase in the quality of life of the
population.
U.18 Transport
reorganisation
Providing options competitive to the use of personal cars (taking into
account the potential of car sharing service) is important for achieving
the objectives of the Strategy and ensuring the sustainability of the
transport system. Different transport hierarchy models shall be re-
considered and transport shall be reorganised and integrated in order
to give priority to the public transport and low-emission transport modes
in relation to the transport by personal cars. At the same time, more
pedestrian zones shall be built in urban areas, bike paths for daily ride,
public bicycle systems shall be introduced and traffic plans shall be
developed with the aim of adapting to the requirements of the seasons.
There is a large number of travels on a daily basis involving going to
and from work by personal cars in which only one person is travelling.
Such a manner of transport creates traffic jams on roads. Car sharing
service has a multiple positive impact on the community and the
individual The benefits for the community are manifested through
reduced traffic congestion, reduced air and noise pollution and
reduced parking lot occupancy. The benefits for the individual are
manifested through reduced travel costs and company during
travelling, but also psycho-physical health due to the possible
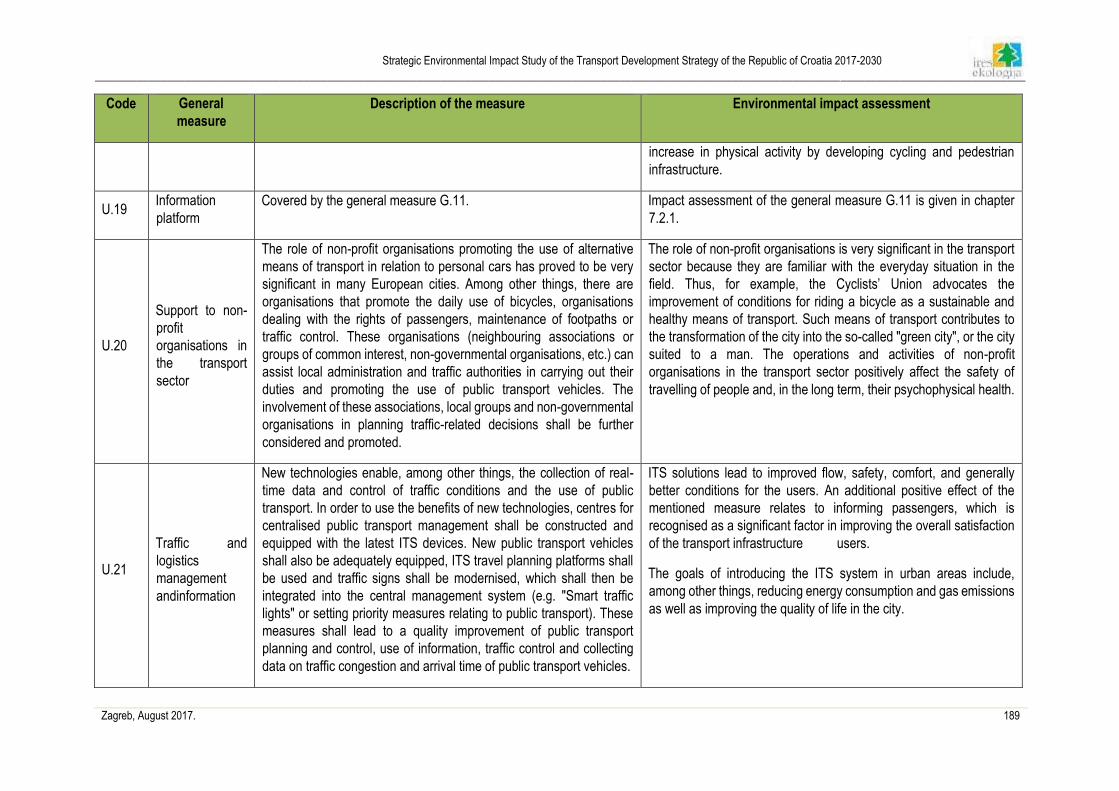
Strategic Environmental Impact Study of the Transport Development Strategy of the Republic of Croatia 2017-2030
____________________________________________________________________________________________________________________________________________________________
Zagreb, August 2017. 189
Code General
measure
Description of the measure Environmental impact assessment
increase in physical activity by developing cycling and pedestrian
infrastructure.
U.19 Information
platform
Covered by the general measure G.11. Impact assessment of the general measure G.11 is given in chapter
7.2.1.
U.20
Support to non-
profit
organisations in
the transport
sector
The role of non-profit organisations promoting the use of alternative
means of transport in relation to personal cars has proved to be very
significant in many European cities. Among other things, there are
organisations that promote the daily use of bicycles, organisations
dealing with the rights of passengers, maintenance of footpaths or
traffic control. These organisations (neighbouring associations or
groups of common interest, non-governmental organisations, etc.) can
assist local administration and traffic authorities in carrying out their
duties and promoting the use of public transport vehicles. The
involvement of these associations, local groups and non-governmental
organisations in planning traffic-related decisions shall be further
considered and promoted.
The role of non-profit organisations is very significant in the transport
sector because they are familiar with the everyday situation in the
field. Thus, for example, the Cyclists’ Union advocates the
improvement of conditions for riding a bicycle as a sustainable and
healthy means of transport. Such means of transport contributes to
the transformation of the city into the so-called "green city", or the city
suited to a man. The operations and activities of non-profit
organisations in the transport sector positively affect the safety of
travelling of people and, in the long term, their psychophysical health.
U.21
Traffic and
logistics
management
andinformation
New technologies enable, among other things, the collection of real-
time data and control of traffic conditions and the use of public
transport. In order to use the benefits of new technologies, centres for
centralised public transport management shall be constructed and
equipped with the latest ITS devices. New public transport vehicles
shall also be adequately equipped, ITS travel planning platforms shall
be used and traffic signs shall be modernised, which shall then be
integrated into the central management system (e.g. "Smart traffic
lights" or setting priority measures relating to public transport). These
measures shall lead to a quality improvement of public transport
planning and control, use of information, traffic control and collecting
data on traffic congestion and arrival time of public transport vehicles.
ITS solutions lead to improved flow, safety, comfort, and generally
better conditions for the users. An additional positive effect of the
mentioned measure relates to informing passengers, which is
recognised as a significant factor in improving the overall satisfaction
of the transport infrastructure users.
The goals of introducing the ITS system in urban areas include,
among other things, reducing energy consumption and gas emissions
as well as improving the quality of life in the city.
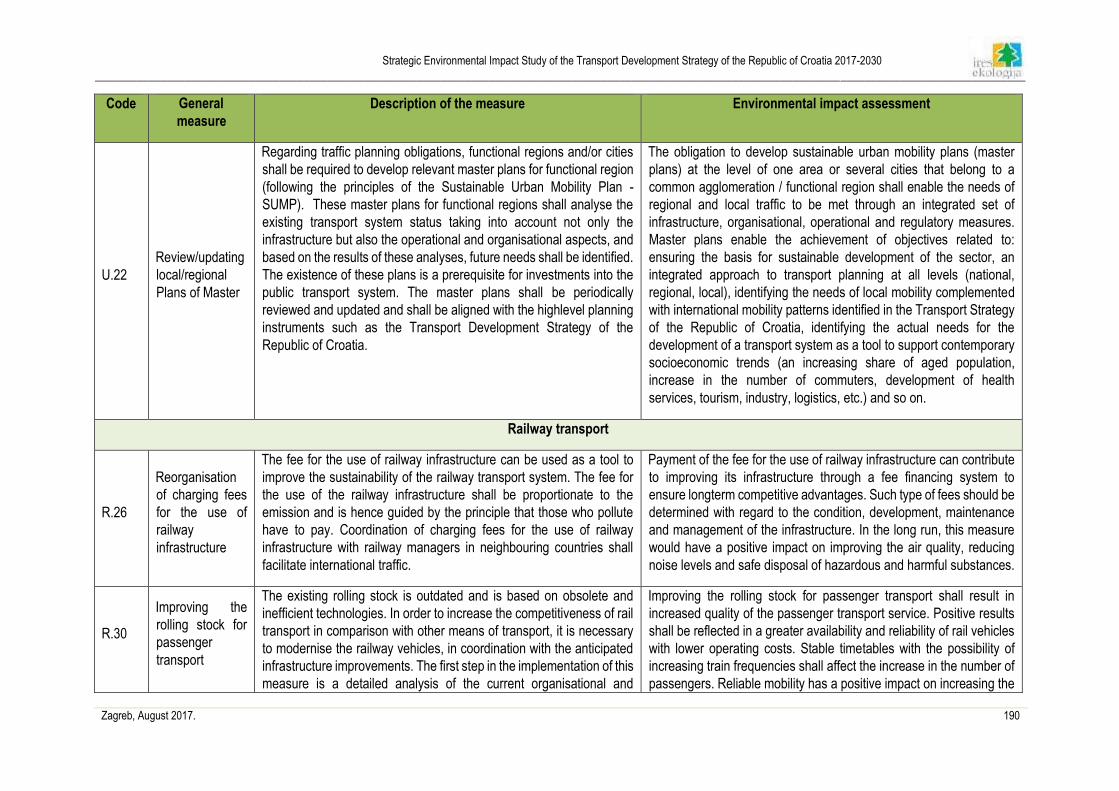
Strategic Environmental Impact Study of the Transport Development Strategy of the Republic of Croatia 2017-2030
____________________________________________________________________________________________________________________________________________________________
Zagreb, August 2017. 190
Code General
measure
Description of the measure Environmental impact assessment
U.22
Review/updating
local/regional
Plans of Master
Regarding traffic planning obligations, functional regions and/or cities
shall be required to develop relevant master plans for functional region
(following the principles of the Sustainable Urban Mobility Plan -
SUMP). These master plans for functional regions shall analyse the
existing transport system status taking into account not only the
infrastructure but also the operational and organisational aspects, and
based on the results of these analyses, future needs shall be identified.
The existence of these plans is a prerequisite for investments into the
public transport system. The master plans shall be periodically
reviewed and updated and shall be aligned with the highlevel planning
instruments such as the Transport Development Strategy of the
Republic of Croatia.
The obligation to develop sustainable urban mobility plans (master
plans) at the level of one area or several cities that belong to a
common agglomeration / functional region shall enable the needs of
regional and local traffic to be met through an integrated set of
infrastructure, organisational, operational and regulatory measures.
Master plans enable the achievement of objectives related to:
ensuring the basis for sustainable development of the sector, an
integrated approach to transport planning at all levels (national,
regional, local), identifying the needs of local mobility complemented
with international mobility patterns identified in the Transport Strategy
of the Republic of Croatia, identifying the actual needs for the
development of a transport system as a tool to support contemporary
socioeconomic trends (an increasing share of aged population,
increase in the number of commuters, development of health
services, tourism, industry, logistics, etc.) and so on.
Railway transport
R.26
Reorganisation
of charging fees
for the use of
railway
infrastructure
The fee for the use of railway infrastructure can be used as a tool to
improve the sustainability of the railway transport system. The fee for
the use of the railway infrastructure shall be proportionate to the
emission and is hence guided by the principle that those who pollute
have to pay. Coordination of charging fees for the use of railway
infrastructure with railway managers in neighbouring countries shall
facilitate international traffic.
Payment of the fee for the use of railway infrastructure can contribute
to improving its infrastructure through a fee financing system to
ensure longterm competitive advantages. Such type of fees should be
determined with regard to the condition, development, maintenance
and management of the infrastructure. In the long run, this measure
would have a positive impact on improving the air quality, reducing
noise levels and safe disposal of hazardous and harmful substances.
R.30
Improving the
rolling stock for
passenger
transport
The existing rolling stock is outdated and is based on obsolete and
inefficient technologies. In order to increase the competitiveness of rail
transport in comparison with other means of transport, it is necessary
to modernise the railway vehicles, in coordination with the anticipated
infrastructure improvements. The first step in the implementation of this
measure is a detailed analysis of the current organisational and
Improving the rolling stock for passenger transport shall result in
increased quality of the passenger transport service. Positive results
shall be reflected in a greater availability and reliability of rail vehicles
with lower operating costs. Stable timetables with the possibility of
increasing train frequencies shall affect the increase in the number of
passengers. Reliable mobility has a positive impact on increasing the
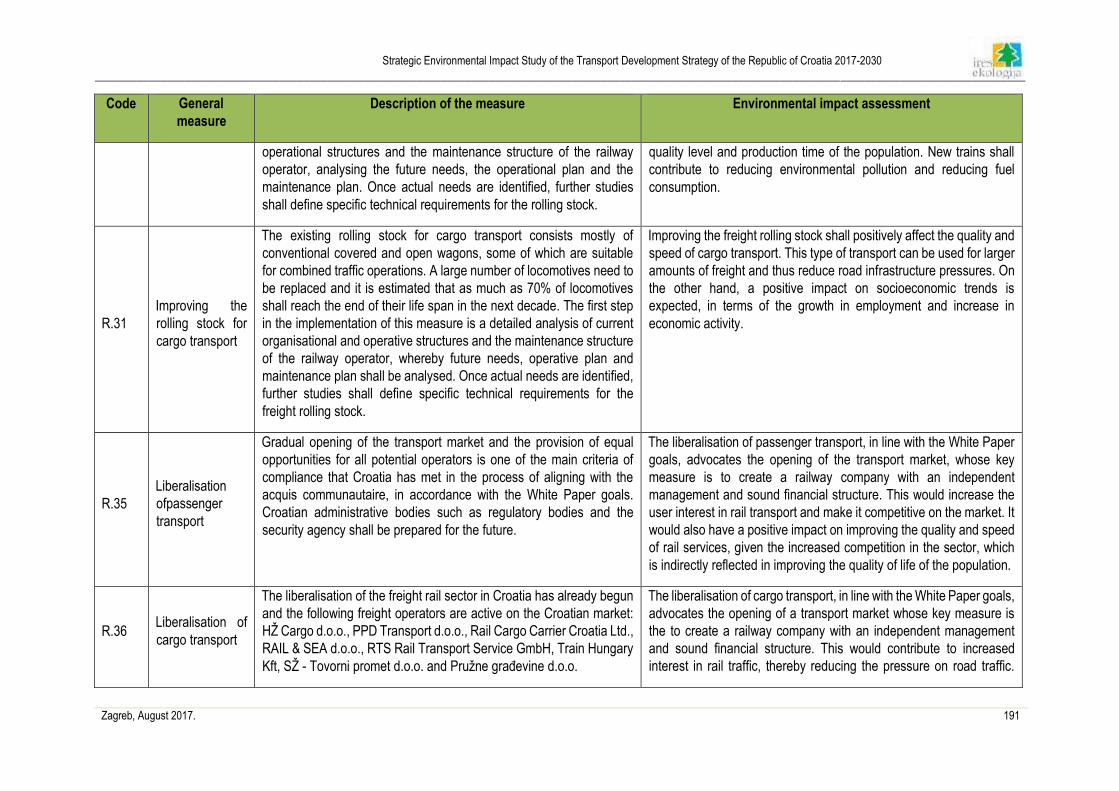
Strategic Environmental Impact Study of the Transport Development Strategy of the Republic of Croatia 2017-2030
____________________________________________________________________________________________________________________________________________________________
Zagreb, August 2017. 191
Code General
measure
Description of the measure Environmental impact assessment
operational structures and the maintenance structure of the railway
operator, analysing the future needs, the operational plan and the
maintenance plan. Once actual needs are identified, further studies
shall define specific technical requirements for the rolling stock.
quality level and production time of the population. New trains shall
contribute to reducing environmental pollution and reducing fuel
consumption.
R.31
Improving the
rolling stock for
cargo transport
The existing rolling stock for cargo transport consists mostly of
conventional covered and open wagons, some of which are suitable
for combined traffic operations. A large number of locomotives need to
be replaced and it is estimated that as much as 70% of locomotives
shall reach the end of their life span in the next decade. The first step
in the implementation of this measure is a detailed analysis of current
organisational and operative structures and the maintenance structure
of the railway operator, whereby future needs, operative plan and
maintenance plan shall be analysed. Once actual needs are identified,
further studies shall define specific technical requirements for the
freight rolling stock.
Improving the freight rolling stock shall positively affect the quality and
speed of cargo transport. This type of transport can be used for larger
amounts of freight and thus reduce road infrastructure pressures. On
the other hand, a positive impact on socioeconomic trends is
expected, in terms of the growth in employment and increase in
economic activity.
R.35
Liberalisation
ofpassenger
transport
Gradual opening of the transport market and the provision of equal
opportunities for all potential operators is one of the main criteria of
compliance that Croatia has met in the process of aligning with the
acquis communautaire, in accordance with the White Paper goals.
Croatian administrative bodies such as regulatory bodies and the
security agency shall be prepared for the future.
The liberalisation of passenger transport, in line with the White Paper
goals, advocates the opening of the transport market, whose key
measure is to create a railway company with an independent
management and sound financial structure. This would increase the
user interest in rail transport and make it competitive on the market. It
would also have a positive impact on improving the quality and speed
of rail services, given the increased competition in the sector, which
is indirectly reflected in improving the quality of life of the population.
R.36 Liberalisation of
cargo transport
The liberalisation of the freight rail sector in Croatia has already begun
and the following freight operators are active on the Croatian market:
HŽ Cargo d.o.o., PPD Transport d.o.o., Rail Cargo Carrier Croatia Ltd.,
RAIL & SEA d.o.o., RTS Rail Transport Service GmbH, Train Hungary
Kft, SŽ - Tovorni promet d.o.o. and Pružne građevine d.o.o.
The liberalisation of cargo transport, in line with the White Paper goals,
advocates the opening of a transport market whose key measure is
the to create a railway company with an independent management
and sound financial structure. This would contribute to increased
interest in rail traffic, thereby reducing the pressure on road traffic.
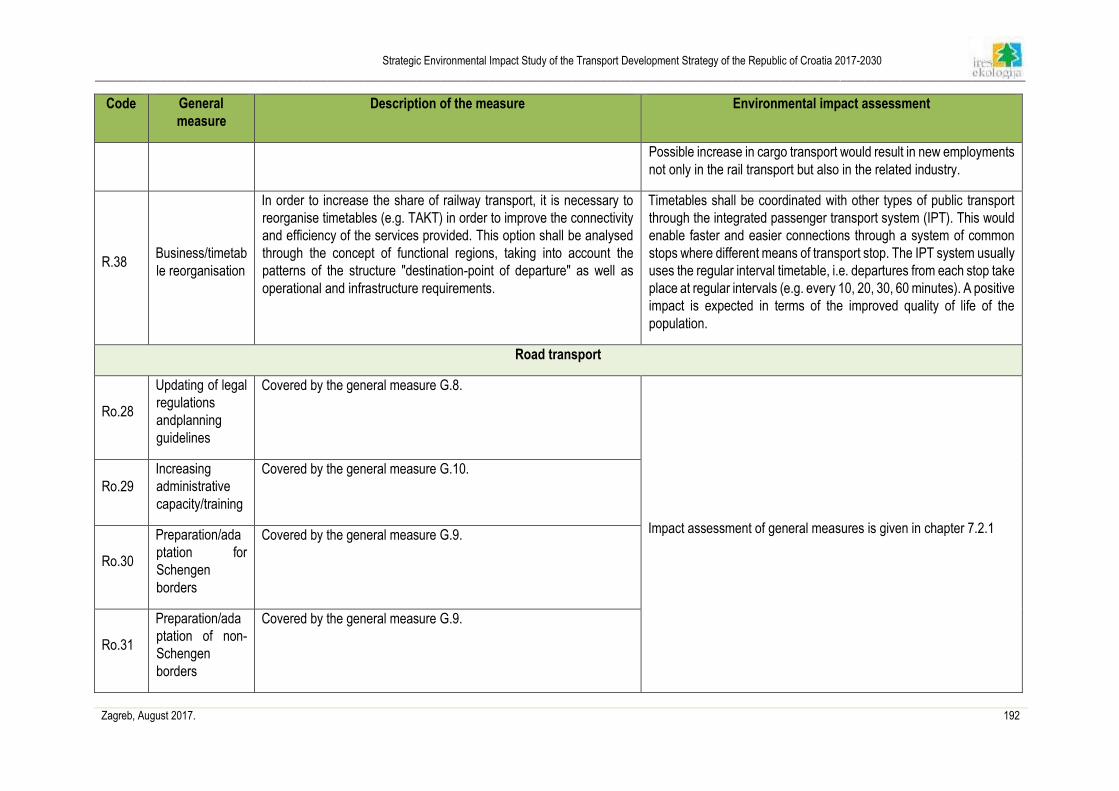
Strategic Environmental Impact Study of the Transport Development Strategy of the Republic of Croatia 2017-2030
____________________________________________________________________________________________________________________________________________________________
Zagreb, August 2017. 192
Code General
measure
Description of the measure Environmental impact assessment
Possible increase in cargo transport would result in new employments
not only in the rail transport but also in the related industry.
R.38 Business/timetab
le reorganisation
In order to increase the share of railway transport, it is necessary to
reorganise timetables (e.g. TAKT) in order to improve the connectivity
and efficiency of the services provided. This option shall be analysed
through the concept of functional regions, taking into account the
patterns of the structure "destination-point of departure" as well as
operational and infrastructure requirements.
Timetables shall be coordinated with other types of public transport
through the integrated passenger transport system (IPT). This would
enable faster and easier connections through a system of common
stops where different means of transport stop. The IPT system usually
uses the regular interval timetable, i.e. departures from each stop take
place at regular intervals (e.g. every 10, 20, 30, 60 minutes). A positive
impact is expected in terms of the improved quality of life of the
population.
Road transport
Ro.28
Updating of legal
regulations
andplanning
guidelines
Covered by the general measure G.8.
Impact assessment of general measures is given in chapter 7.2.1
Ro.29
Increasing
administrative
capacity/training
Covered by the general measure G.10.
Ro.30
Preparation/ada
ptation for
Schengen
borders
Covered by the general measure G.9.
Ro.31
Preparation/ada
ptation of non-
Schengen
borders
Covered by the general measure G.9.
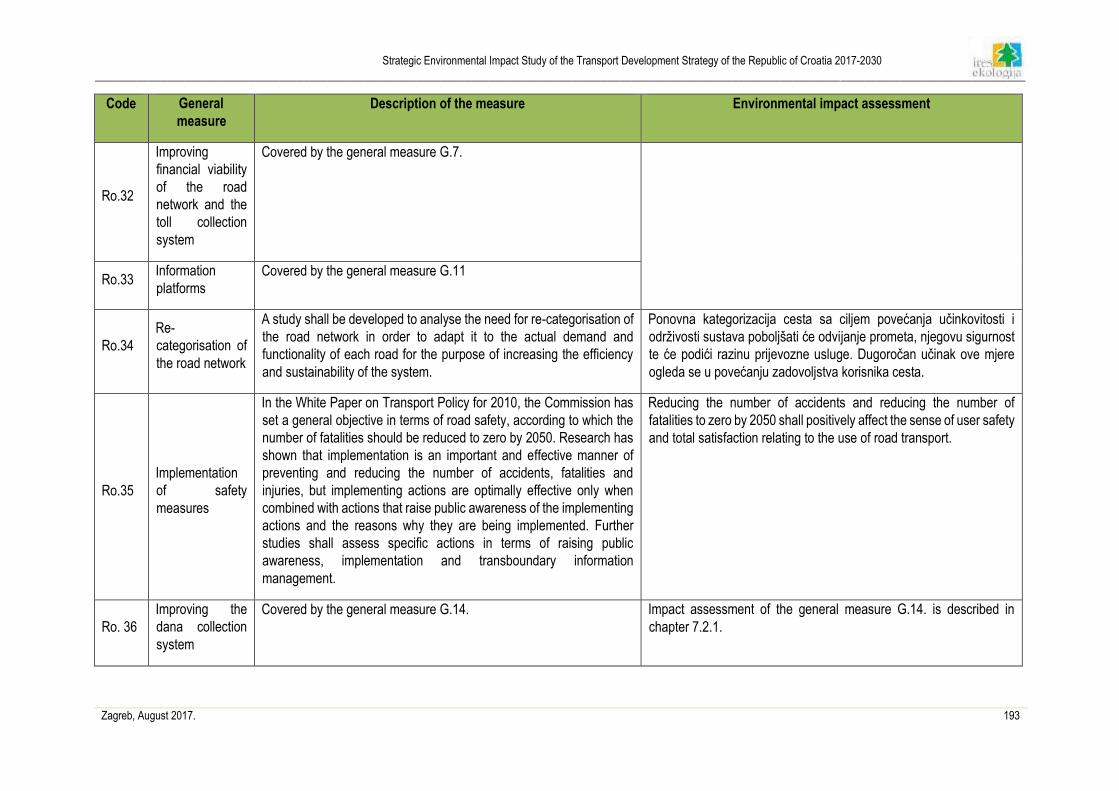
Strategic Environmental Impact Study of the Transport Development Strategy of the Republic of Croatia 2017-2030
____________________________________________________________________________________________________________________________________________________________
Zagreb, August 2017. 193
Code General
measure
Description of the measure Environmental impact assessment
Ro.32
Improving
financial viability
of the road
network and the
toll collection
system
Covered by the general measure G.7.
Ro.33 Information
platforms
Covered by the general measure G.11
Ro.34
Re-
categorisation of
the road network
A study shall be developed to analyse the need for re-categorisation of
the road network in order to adapt it to the actual demand and
functionality of each road for the purpose of increasing the efficiency
and sustainability of the system.
Ponovna kategorizacija cesta sa ciljem povećanja učinkovitosti i
održivosti sustava poboljšati će odvijanje prometa, njegovu sigurnost
te će podići razinu prijevozne usluge. Dugoročan učinak ove mjere
ogleda se u povećanju zadovoljstva korisnika cesta.
Ro.35
Implementation
of safety
measures
In the White Paper on Transport Policy for 2010, the Commission has
set a general objective in terms of road safety, according to which the
number of fatalities should be reduced to zero by 2050. Research has
shown that implementation is an important and effective manner of
preventing and reducing the number of accidents, fatalities and
injuries, but implementing actions are optimally effective only when
combined with actions that raise public awareness of the implementing
actions and the reasons why they are being implemented. Further
studies shall assess specific actions in terms of raising public
awareness, implementation and transboundary information
management.
Reducing the number of accidents and reducing the number of
fatalities to zero by 2050 shall positively affect the sense of user safety
and total satisfaction relating to the use of road transport.
Ro. 36
Improving the
dana collection
system
Covered by the general measure G.14. Impact assessment of the general measure G.14. is described in
chapter 7.2.1.
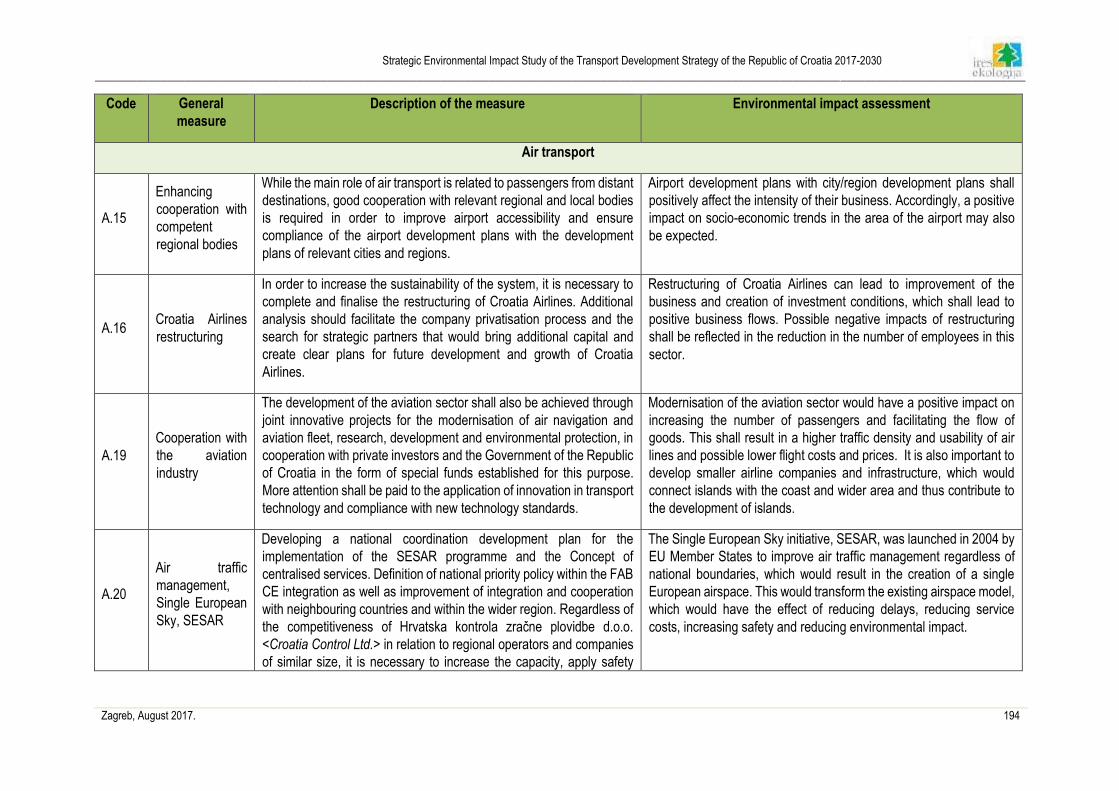
Strategic Environmental Impact Study of the Transport Development Strategy of the Republic of Croatia 2017-2030
____________________________________________________________________________________________________________________________________________________________
Zagreb, August 2017. 194
Code General
measure
Description of the measure Environmental impact assessment
Air transport
A.15
Enhancing
cooperation with
competent
regional bodies
While the main role of air transport is related to passengers from distant
destinations, good cooperation with relevant regional and local bodies
is required in order to improve airport accessibility and ensure
compliance of the airport development plans with the development
plans of relevant cities and regions.
Airport development plans with city/region development plans shall
positively affect the intensity of their business. Accordingly, a positive
impact on socio-economic trends in the area of the airport may also
be expected.
A.16 Croatia Airlines
restructuring
In order to increase the sustainability of the system, it is necessary to
complete and finalise the restructuring of Croatia Airlines. Additional
analysis should facilitate the company privatisation process and the
search for strategic partners that would bring additional capital and
create clear plans for future development and growth of Croatia
Airlines.
Restructuring of Croatia Airlines can lead to improvement of the
business and creation of investment conditions, which shall lead to
positive business flows. Possible negative impacts of restructuring
shall be reflected in the reduction in the number of employees in this
sector.
A.19
Cooperation with
the aviation
industry
The development of the aviation sector shall also be achieved through
joint innovative projects for the modernisation of air navigation and
aviation fleet, research, development and environmental protection, in
cooperation with private investors and the Government of the Republic
of Croatia in the form of special funds established for this purpose.
More attention shall be paid to the application of innovation in transport
technology and compliance with new technology standards.
Modernisation of the aviation sector would have a positive impact on
increasing the number of passengers and facilitating the flow of
goods. This shall result in a higher traffic density and usability of air
lines and possible lower flight costs and prices. It is also important to
develop smaller airline companies and infrastructure, which would
connect islands with the coast and wider area and thus contribute to
the development of islands.
A.20
Air traffic
management,
Single European
Sky, SESAR
Developing a national coordination development plan for the
implementation of the SESAR programme and the Concept of
centralised services. Definition of national priority policy within the FAB
CE integration as well as improvement of integration and cooperation
with neighbouring countries and within the wider region. Regardless of
the competitiveness of Hrvatska kontrola zračne plovidbe d.o.o.
<Croatia Control Ltd.> in relation to regional operators and companies
of similar size, it is necessary to increase the capacity, apply safety
The Single European Sky initiative, SESAR, was launched in 2004 by
EU Member States to improve air traffic management regardless of
national boundaries, which would result in the creation of a single
European airspace. This would transform the existing airspace model,
which would have the effect of reducing delays, reducing service
costs, increasing safety and reducing environmental impact.
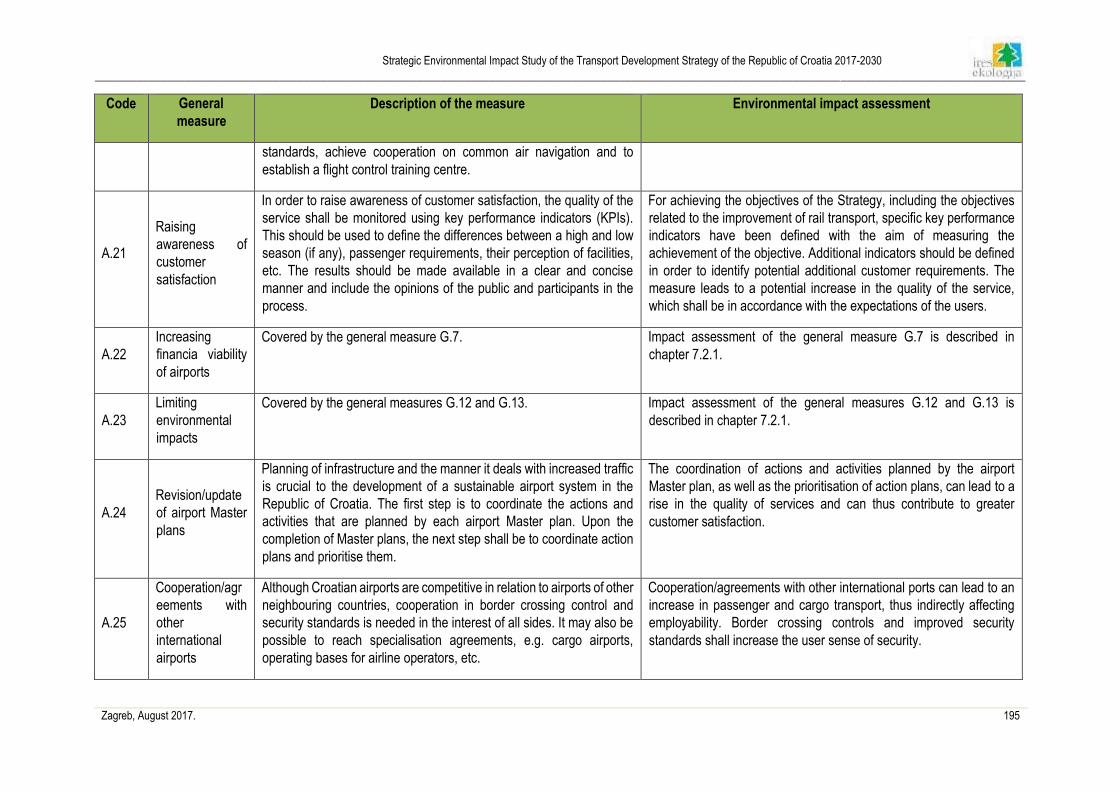
Strategic Environmental Impact Study of the Transport Development Strategy of the Republic of Croatia 2017-2030
____________________________________________________________________________________________________________________________________________________________
Zagreb, August 2017. 195
Code General
measure
Description of the measure Environmental impact assessment
standards, achieve cooperation on common air navigation and to
establish a flight control training centre.
A.21
Raising
awareness of
customer
satisfaction
In order to raise awareness of customer satisfaction, the quality of the
service shall be monitored using key performance indicators (KPIs).
This should be used to define the differences between a high and low
season (if any), passenger requirements, their perception of facilities,
etc. The results should be made available in a clear and concise
manner and include the opinions of the public and participants in the
process.
For achieving the objectives of the Strategy, including the objectives
related to the improvement of rail transport, specific key performance
indicators have been defined with the aim of measuring the
achievement of the objective. Additional indicators should be defined
in order to identify potential additional customer requirements. The
measure leads to a potential increase in the quality of the service,
which shall be in accordance with the expectations of the users.
A.22
Increasing
financia viability
of airports
Covered by the general measure G.7. Impact assessment of the general measure G.7 is described in
chapter 7.2.1.
A.23
Limiting
environmental
impacts
Covered by the general measures G.12 and G.13. Impact assessment of the general measures G.12 and G.13 is
described in chapter 7.2.1.
A.24
Revision/update
of airport Master
plans
Planning of infrastructure and the manner it deals with increased traffic
is crucial to the development of a sustainable airport system in the
Republic of Croatia. The first step is to coordinate the actions and
activities that are planned by each airport Master plan. Upon the
completion of Master plans, the next step shall be to coordinate action
plans and prioritise them.
The coordination of actions and activities planned by the airport
Master plan, as well as the prioritisation of action plans, can lead to a
rise in the quality of services and can thus contribute to greater
customer satisfaction.
A.25
Cooperation/agr
eements with
other
international
airports
Although Croatian airports are competitive in relation to airports of other
neighbouring countries, cooperation in border crossing control and
security standards is needed in the interest of all sides. It may also be
possible to reach specialisation agreements, e.g. cargo airports,
operating bases for airline operators, etc.
Cooperation/agreements with other international ports can lead to an
increase in passenger and cargo transport, thus indirectly affecting
employability. Border crossing controls and improved security
standards shall increase the user sense of security.
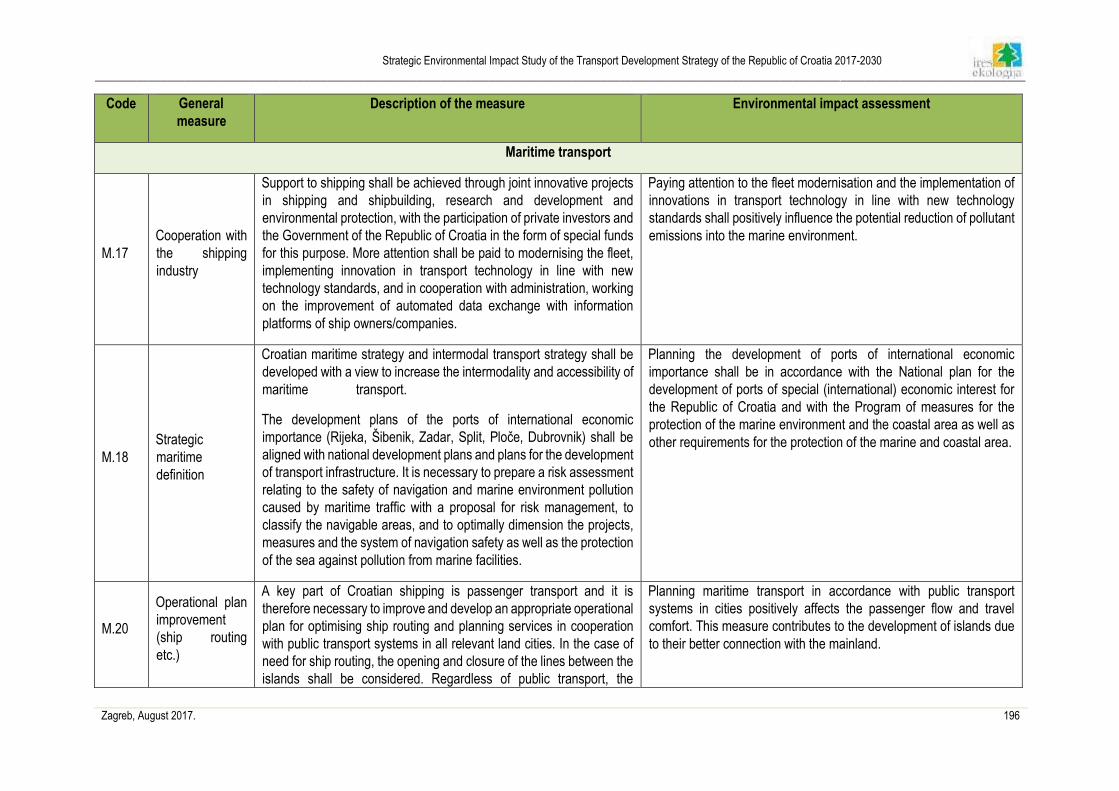
Strategic Environmental Impact Study of the Transport Development Strategy of the Republic of Croatia 2017-2030
____________________________________________________________________________________________________________________________________________________________
Zagreb, August 2017. 196
Code General
measure
Description of the measure Environmental impact assessment
Maritime transport
M.17
Cooperation with
the shipping
industry
Support to shipping shall be achieved through joint innovative projects
in shipping and shipbuilding, research and development and
environmental protection, with the participation of private investors and
the Government of the Republic of Croatia in the form of special funds
for this purpose. More attention shall be paid to modernising the fleet,
implementing innovation in transport technology in line with new
technology standards, and in cooperation with administration, working
on the improvement of automated data exchange with information
platforms of ship owners/companies.
Paying attention to the fleet modernisation and the implementation of
innovations in transport technology in line with new technology
standards shall positively influence the potential reduction of pollutant
emissions into the marine environment.
M.18
Strategic
maritime
definition
Croatian maritime strategy and intermodal transport strategy shall be
developed with a view to increase the intermodality and accessibility of
maritime transport.
The development plans of the ports of international economic
importance (Rijeka, Šibenik, Zadar, Split, Ploče, Dubrovnik) shall be
aligned with national development plans and plans for the development
of transport infrastructure. It is necessary to prepare a risk assessment
relating to the safety of navigation and marine environment pollution
caused by maritime traffic with a proposal for risk management, to
classify the navigable areas, and to optimally dimension the projects,
measures and the system of navigation safety as well as the protection
of the sea against pollution from marine facilities.
Planning the development of ports of international economic
importance shall be in accordance with the National plan for the
development of ports of special (international) economic interest for
the Republic of Croatia and with the Program of measures for the
protection of the marine environment and the coastal area as well as
other requirements for the protection of the marine and coastal area.
M.20
Operational plan
improvement
(ship routing
etc.)
A key part of Croatian shipping is passenger transport and it is
therefore necessary to improve and develop an appropriate operational
plan for optimising ship routing and planning services in cooperation
with public transport systems in all relevant land cities. In the case of
need for ship routing, the opening and closure of the lines between the
islands shall be considered. Regardless of public transport, the
Planning maritime transport in accordance with public transport
systems in cities positively affects the passenger flow and travel
comfort. This measure contributes to the development of islands due
to their better connection with the mainland.
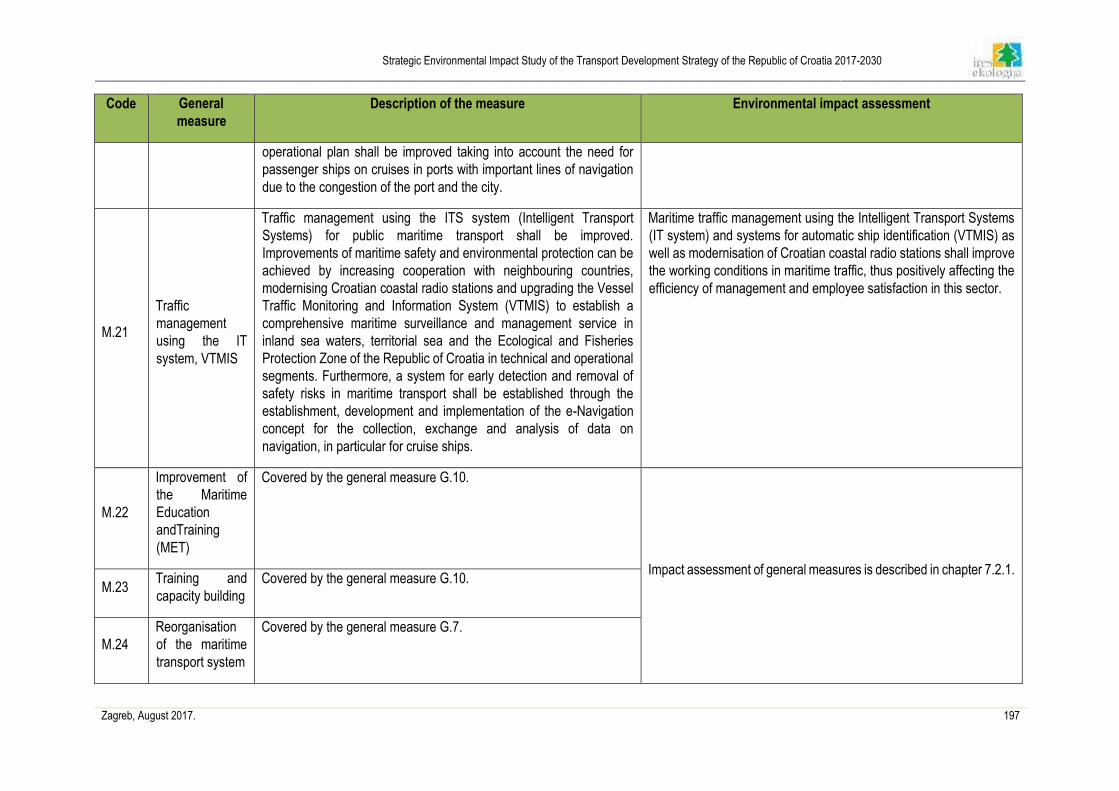
Strategic Environmental Impact Study of the Transport Development Strategy of the Republic of Croatia 2017-2030
____________________________________________________________________________________________________________________________________________________________
Zagreb, August 2017. 197
Code General
measure
Description of the measure Environmental impact assessment
operational plan shall be improved taking into account the need for
passenger ships on cruises in ports with important lines of navigation
due to the congestion of the port and the city.
M.21
Traffic
management
using the IT
system, VTMIS
Traffic management using the ITS system (Intelligent Transport
Systems) for public maritime transport shall be improved.
Improvements of maritime safety and environmental protection can be
achieved by increasing cooperation with neighbouring countries,
modernising Croatian coastal radio stations and upgrading the Vessel
Traffic Monitoring and Information System (VTMIS) to establish a
comprehensive maritime surveillance and management service in
inland sea waters, territorial sea and the Ecological and Fisheries
Protection Zone of the Republic of Croatia in technical and operational
segments. Furthermore, a system for early detection and removal of
safety risks in maritime transport shall be established through the
establishment, development and implementation of the e-Navigation
concept for the collection, exchange and analysis of data on
navigation, in particular for cruise ships.
Maritime traffic management using the Intelligent Transport Systems
(IT system) and systems for automatic ship identification (VTMIS) as
well as modernisation of Croatian coastal radio stations shall improve
the working conditions in maritime traffic, thus positively affecting the
efficiency of management and employee satisfaction in this sector.
M.22
Improvement of
the Maritime
Education
andTraining
(MET)
Covered by the general measure G.10.
Impact assessment of general measures is described in chapter 7.2.1.
M.23 Training and
capacity building
Covered by the general measure G.10.
M.24
Reorganisation
of the maritime
transport system
Covered by the general measure G.7.
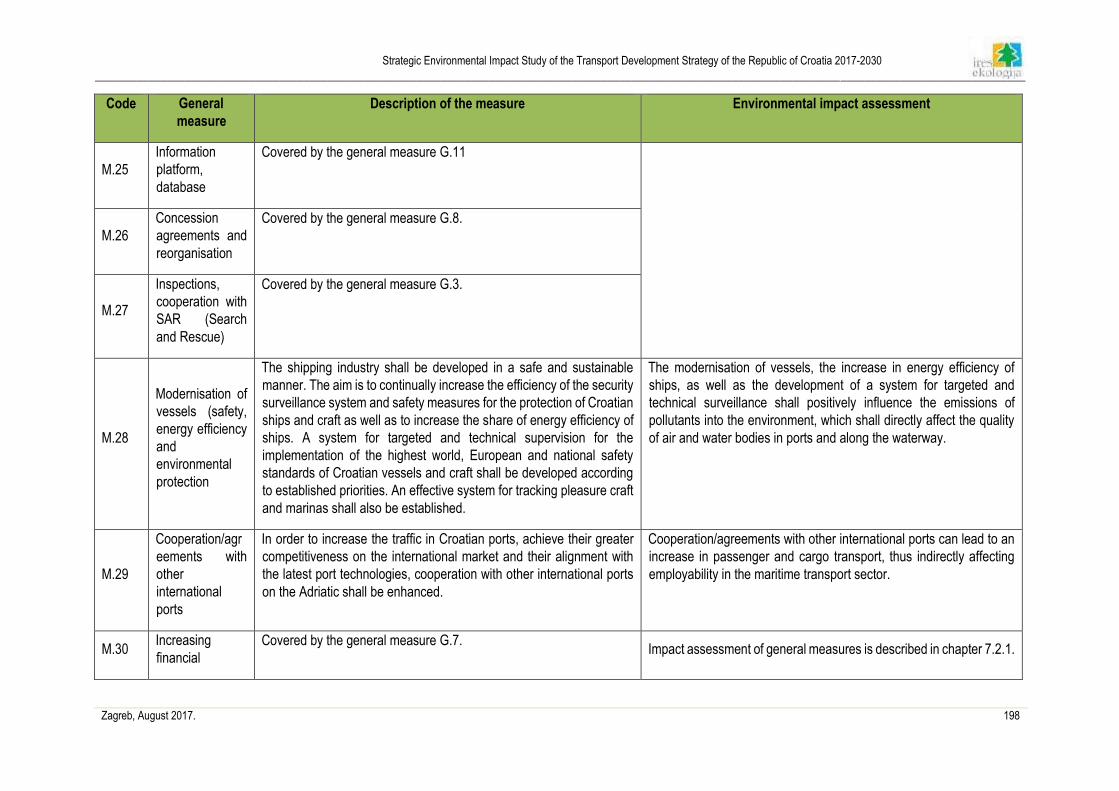
Strategic Environmental Impact Study of the Transport Development Strategy of the Republic of Croatia 2017-2030
____________________________________________________________________________________________________________________________________________________________
Zagreb, August 2017. 198
Code General
measure
Description of the measure Environmental impact assessment
M.25
Information
platform,
database
Covered by the general measure G.11
M.26
Concession
agreements and
reorganisation
Covered by the general measure G.8.
M.27
Inspections,
cooperation with
SAR (Search
and Rescue)
Covered by the general measure G.3.
M.28
Modernisation of
vessels (safety,
energy efficiency
and
environmental
protection
The shipping industry shall be developed in a safe and sustainable
manner. The aim is to continually increase the efficiency of the security
surveillance system and safety measures for the protection of Croatian
ships and craft as well as to increase the share of energy efficiency of
ships. A system for targeted and technical supervision for the
implementation of the highest world, European and national safety
standards of Croatian vessels and craft shall be developed according
to established priorities. An effective system for tracking pleasure craft
and marinas shall also be established.
The modernisation of vessels, the increase in energy efficiency of
ships, as well as the development of a system for targeted and
technical surveillance shall positively influence the emissions of
pollutants into the environment, which shall directly affect the quality
of air and water bodies in ports and along the waterway.
M.29
Cooperation/agr
eements with
other
international
ports
In order to increase the traffic in Croatian ports, achieve their greater
competitiveness on the international market and their alignment with
the latest port technologies, cooperation with other international ports
on the Adriatic shall be enhanced.
Cooperation/agreements with other international ports can lead to an
increase in passenger and cargo transport, thus indirectly affecting
employability in the maritime transport sector.
M.30 Increasing
financial
Covered by the general measure G.7. Impact assessment of general measures is described in chapter 7.2.1.
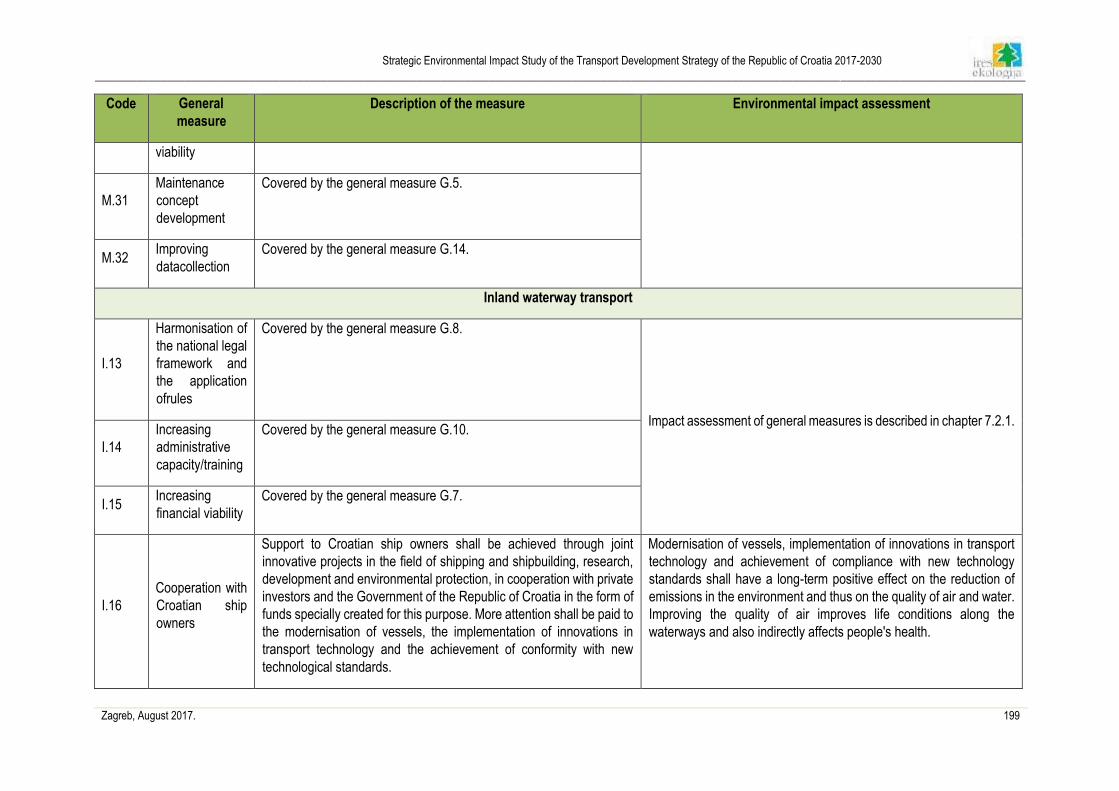
Strategic Environmental Impact Study of the Transport Development Strategy of the Republic of Croatia 2017-2030
____________________________________________________________________________________________________________________________________________________________
Zagreb, August 2017. 199
Code General
measure
Description of the measure Environmental impact assessment
viability
M.31
Maintenance
concept
development
Covered by the general measure G.5.
M.32 Improving
datacollection
Covered by the general measure G.14.
Inland waterway transport
I.13
Harmonisation of
the national legal
framework and
the application
ofrules
Covered by the general measure G.8.
Impact assessment of general measures is described in chapter 7.2.1.
I.14
Increasing
administrative
capacity/training
Covered by the general measure G.10.
I.15 Increasing
financial viability
Covered by the general measure G.7.
I.16
Cooperation with
Croatian ship
owners
Support to Croatian ship owners shall be achieved through joint
innovative projects in the field of shipping and shipbuilding, research,
development and environmental protection, in cooperation with private
investors and the Government of the Republic of Croatia in the form of
funds specially created for this purpose. More attention shall be paid to
the modernisation of vessels, the implementation of innovations in
transport technology and the achievement of conformity with new
technological standards.
Modernisation of vessels, implementation of innovations in transport
technology and achievement of compliance with new technology
standards shall have a long-term positive effect on the reduction of
emissions in the environment and thus on the quality of air and water.
Improving the quality of air improves life conditions along the
waterways and also indirectly affects people's health.
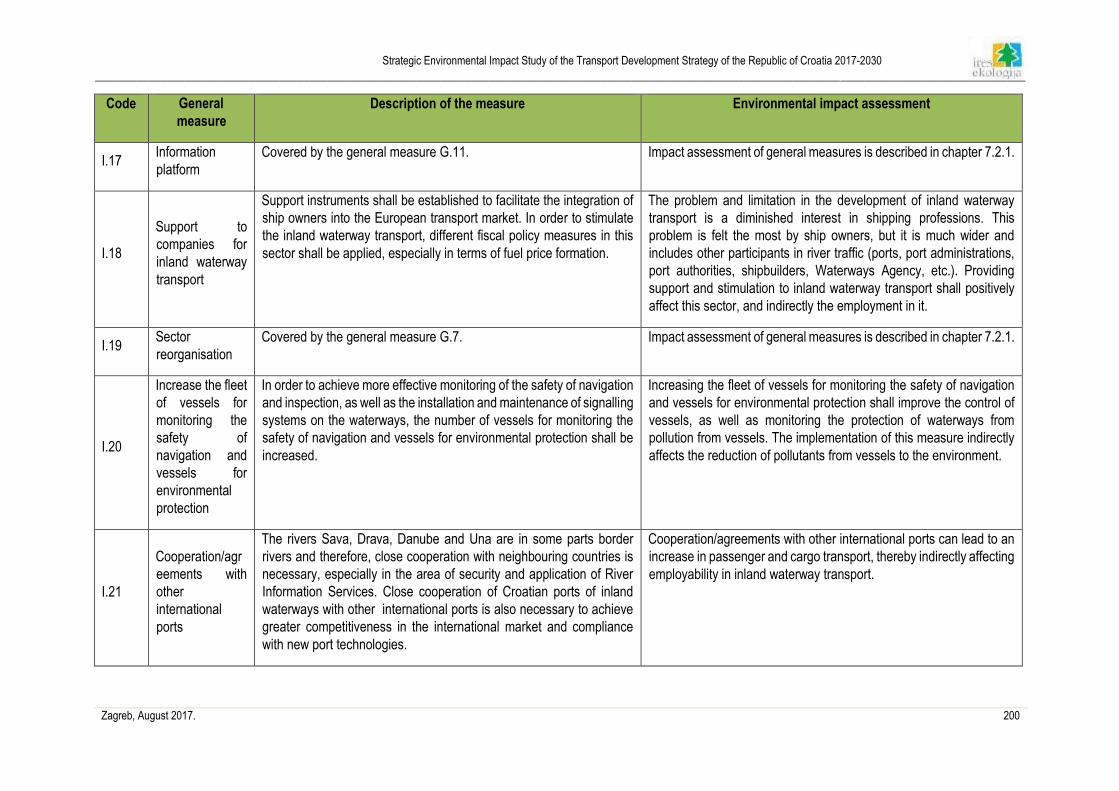
Strategic Environmental Impact Study of the Transport Development Strategy of the Republic of Croatia 2017-2030
____________________________________________________________________________________________________________________________________________________________
Zagreb, August 2017. 200
Code General
measure
Description of the measure Environmental impact assessment
I.17 Information
platform
Covered by the general measure G.11. Impact assessment of general measures is described in chapter 7.2.1.
I.18
Support to
companies for
inland waterway
transport
Support instruments shall be established to facilitate the integration of
ship owners into the European transport market. In order to stimulate
the inland waterway transport, different fiscal policy measures in this
sector shall be applied, especially in terms of fuel price formation.
The problem and limitation in the development of inland waterway
transport is a diminished interest in shipping professions. This
problem is felt the most by ship owners, but it is much wider and
includes other participants in river traffic (ports, port administrations,
port authorities, shipbuilders, Waterways Agency, etc.). Providing
support and stimulation to inland waterway transport shall positively
affect this sector, and indirectly the employment in it.
I.19 Sector
reorganisation
Covered by the general measure G.7. Impact assessment of general measures is described in chapter 7.2.1.
I.20
Increase the fleet
of vessels for
monitoring the
safety of
navigation and
vessels for
environmental
protection
In order to achieve more effective monitoring of the safety of navigation
and inspection, as well as the installation and maintenance of signalling
systems on the waterways, the number of vessels for monitoring the
safety of navigation and vessels for environmental protection shall be
increased.
Increasing the fleet of vessels for monitoring the safety of navigation
and vessels for environmental protection shall improve the control of
vessels, as well as monitoring the protection of waterways from
pollution from vessels. The implementation of this measure indirectly
affects the reduction of pollutants from vessels to the environment.
I.21
Cooperation/agr
eements with
other
international
ports
The rivers Sava, Drava, Danube and Una are in some parts border
rivers and therefore, close cooperation with neighbouring countries is
necessary, especially in the area of security and application of River
Information Services. Close cooperation of Croatian ports of inland
waterways with other international ports is also necessary to achieve
greater competitiveness in the international market and compliance
with new port technologies.
Cooperation/agreements with other international ports can lead to an
increase in passenger and cargo transport, thereby indirectly affecting
employability in inland waterway transport.
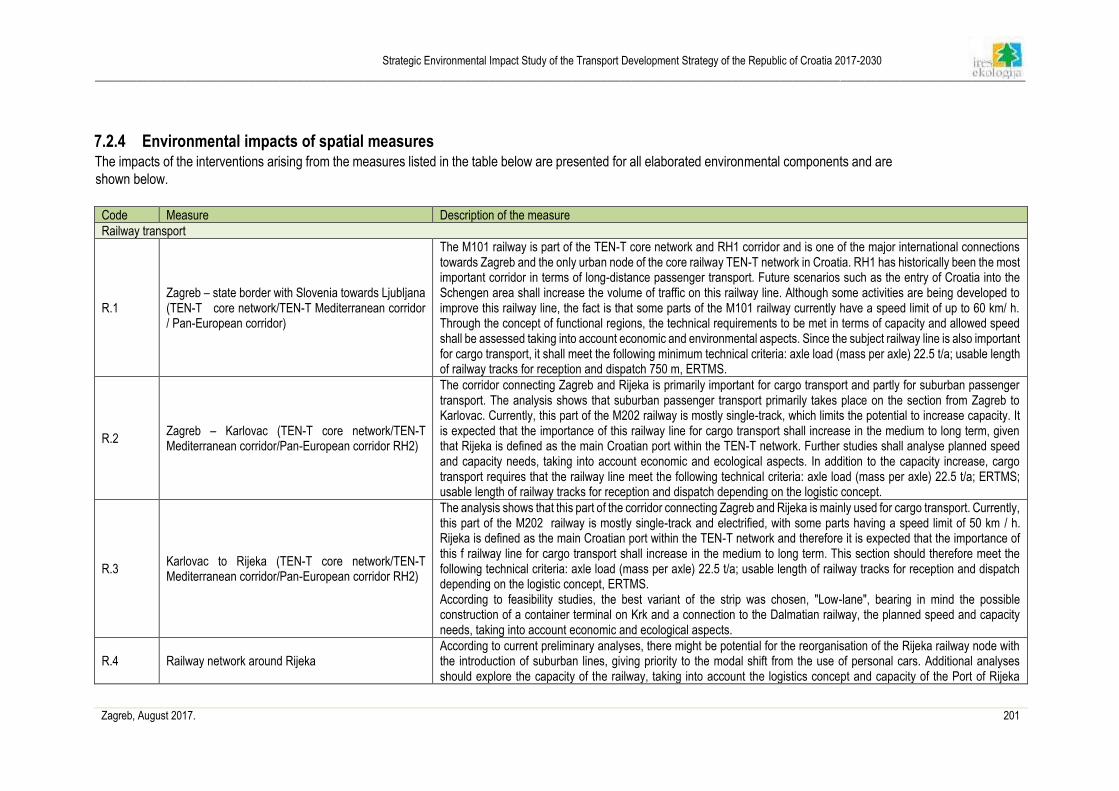
Strategic Environmental Impact Study of the Transport Development Strategy of the Republic of Croatia 2017-2030
____________________________________________________________________________________________________________________________________________________________
Zagreb, August 2017. 201
7.2.4 Environmental impacts of spatial measures The impacts of the interventions arising from the measures listed in the table below are presented for all elaborated environmental components and are
shown below.
Code Measure Description of the measure
Railway transport
R.1 Zagreb – state border with Slovenia towards Ljubljana (TEN-T core network/TEN-T Mediterranean corridor / Pan-European corridor)
The M101 railway is part of the TEN-T core network and RH1 corridor and is one of the major international connections towards Zagreb and the only urban node of the core railway TEN-T network in Croatia. RH1 has historically been the most important corridor in terms of long-distance passenger transport. Future scenarios such as the entry of Croatia into the Schengen area shall increase the volume of traffic on this railway line. Although some activities are being developed to improve this railway line, the fact is that some parts of the M101 railway currently have a speed limit of up to 60 km/ h. Through the concept of functional regions, the technical requirements to be met in terms of capacity and allowed speed shall be assessed taking into account economic and environmental aspects. Since the subject railway line is also important for cargo transport, it shall meet the following minimum technical criteria: axle load (mass per axle) 22.5 t/a; usable length of railway tracks for reception and dispatch 750 m, ERTMS.
R.2 Zagreb – Karlovac (TEN-T core network/TEN-T Mediterranean corridor/Pan-European corridor RH2)
The corridor connecting Zagreb and Rijeka is primarily important for cargo transport and partly for suburban passenger transport. The analysis shows that suburban passenger transport primarily takes place on the section from Zagreb to Karlovac. Currently, this part of the M202 railway is mostly single-track, which limits the potential to increase capacity. It is expected that the importance of this railway line for cargo transport shall increase in the medium to long term, given that Rijeka is defined as the main Croatian port within the TEN-T network. Further studies shall analyse planned speed and capacity needs, taking into account economic and ecological aspects. In addition to the capacity increase, cargo transport requires that the railway line meet the following technical criteria: axle load (mass per axle) 22.5 t/a; ERTMS; usable length of railway tracks for reception and dispatch depending on the logistic concept.
R.3 Karlovac to Rijeka (TEN-T core network/TEN-T Mediterranean corridor/Pan-European corridor RH2)
The analysis shows that this part of the corridor connecting Zagreb and Rijeka is mainly used for cargo transport. Currently, this part of the M202 railway is mostly single-track and electrified, with some parts having a speed limit of 50 km / h. Rijeka is defined as the main Croatian port within the TEN-T network and therefore it is expected that the importance of this f railway line for cargo transport shall increase in the medium to long term. This section should therefore meet the following technical criteria: axle load (mass per axle) 22.5 t/a; usable length of railway tracks for reception and dispatch depending on the logistic concept, ERTMS. According to feasibility studies, the best variant of the strip was chosen, "Low-lane", bearing in mind the possible construction of a container terminal on Krk and a connection to the Dalmatian railway, the planned speed and capacity needs, taking into account economic and ecological aspects.
R.4 Railway network around Rijeka According to current preliminary analyses, there might be potential for the reorganisation of the Rijeka railway node with the introduction of suburban lines, giving priority to the modal shift from the use of personal cars. Additional analyses should explore the capacity of the railway, taking into account the logistics concept and capacity of the Port of Rijeka
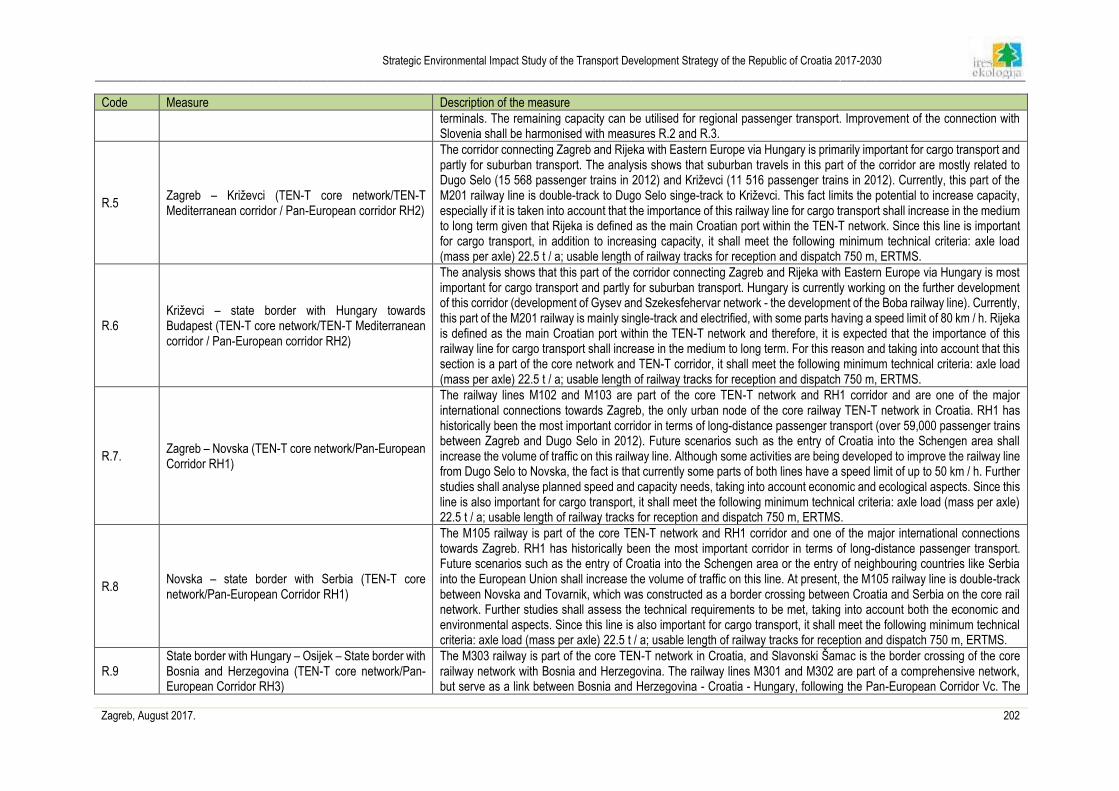
Strategic Environmental Impact Study of the Transport Development Strategy of the Republic of Croatia 2017-2030
____________________________________________________________________________________________________________________________________________________________
Zagreb, August 2017. 202
Code Measure Description of the measure
terminals. The remaining capacity can be utilised for regional passenger transport. Improvement of the connection with Slovenia shall be harmonised with measures R.2 and R.3.
R.5 Zagreb – Križevci (TEN-T core network/TEN-T Mediterranean corridor / Pan-European corridor RH2)
The corridor connecting Zagreb and Rijeka with Eastern Europe via Hungary is primarily important for cargo transport and partly for suburban transport. The analysis shows that suburban travels in this part of the corridor are mostly related to Dugo Selo (15 568 passenger trains in 2012) and Križevci (11 516 passenger trains in 2012). Currently, this part of the M201 railway line is double-track to Dugo Selo singe-track to Križevci. This fact limits the potential to increase capacity, especially if it is taken into account that the importance of this railway line for cargo transport shall increase in the medium to long term given that Rijeka is defined as the main Croatian port within the TEN-T network. Since this line is important for cargo transport, in addition to increasing capacity, it shall meet the following minimum technical criteria: axle load (mass per axle) 22.5 t / a; usable length of railway tracks for reception and dispatch 750 m, ERTMS.
R.6 Križevci – state border with Hungary towards Budapest (TEN-T core network/TEN-T Mediterranean corridor / Pan-European corridor RH2)
The analysis shows that this part of the corridor connecting Zagreb and Rijeka with Eastern Europe via Hungary is most important for cargo transport and partly for suburban transport. Hungary is currently working on the further development of this corridor (development of Gysev and Szekesfehervar network - the development of the Boba railway line). Currently, this part of the M201 railway is mainly single-track and electrified, with some parts having a speed limit of 80 km / h. Rijeka is defined as the main Croatian port within the TEN-T network and therefore, it is expected that the importance of this railway line for cargo transport shall increase in the medium to long term. For this reason and taking into account that this section is a part of the core network and TEN-T corridor, it shall meet the following minimum technical criteria: axle load (mass per axle) 22.5 t / a; usable length of railway tracks for reception and dispatch 750 m, ERTMS.
R.7. Zagreb – Novska (TEN-T core network/Pan-European Corridor RH1)
The railway lines M102 and M103 are part of the core TEN-T network and RH1 corridor and are one of the major international connections towards Zagreb, the only urban node of the core railway TEN-T network in Croatia. RH1 has historically been the most important corridor in terms of long-distance passenger transport (over 59,000 passenger trains between Zagreb and Dugo Selo in 2012). Future scenarios such as the entry of Croatia into the Schengen area shall increase the volume of traffic on this railway line. Although some activities are being developed to improve the railway line from Dugo Selo to Novska, the fact is that currently some parts of both lines have a speed limit of up to 50 km / h. Further studies shall analyse planned speed and capacity needs, taking into account economic and ecological aspects. Since this line is also important for cargo transport, it shall meet the following minimum technical criteria: axle load (mass per axle) 22.5 t / a; usable length of railway tracks for reception and dispatch 750 m, ERTMS.
R.8 Novska – state border with Serbia (TEN-T core network/Pan-European Corridor RH1)
The M105 railway is part of the core TEN-T network and RH1 corridor and one of the major international connections towards Zagreb. RH1 has historically been the most important corridor in terms of long-distance passenger transport. Future scenarios such as the entry of Croatia into the Schengen area or the entry of neighbouring countries like Serbia into the European Union shall increase the volume of traffic on this line. At present, the M105 railway line is double-track between Novska and Tovarnik, which was constructed as a border crossing between Croatia and Serbia on the core rail network. Further studies shall assess the technical requirements to be met, taking into account both the economic and environmental aspects. Since this line is also important for cargo transport, it shall meet the following minimum technical criteria: axle load (mass per axle) 22.5 t / a; usable length of railway tracks for reception and dispatch 750 m, ERTMS.
R.9 State border with Hungary – Osijek – State border with Bosnia and Herzegovina (TEN-T core network/Pan-European Corridor RH3)
The M303 railway is part of the core TEN-T network in Croatia, and Slavonski Šamac is the border crossing of the core railway network with Bosnia and Herzegovina. The railway lines M301 and M302 are part of a comprehensive network, but serve as a link between Bosnia and Herzegovina - Croatia - Hungary, following the Pan-European Corridor Vc. The
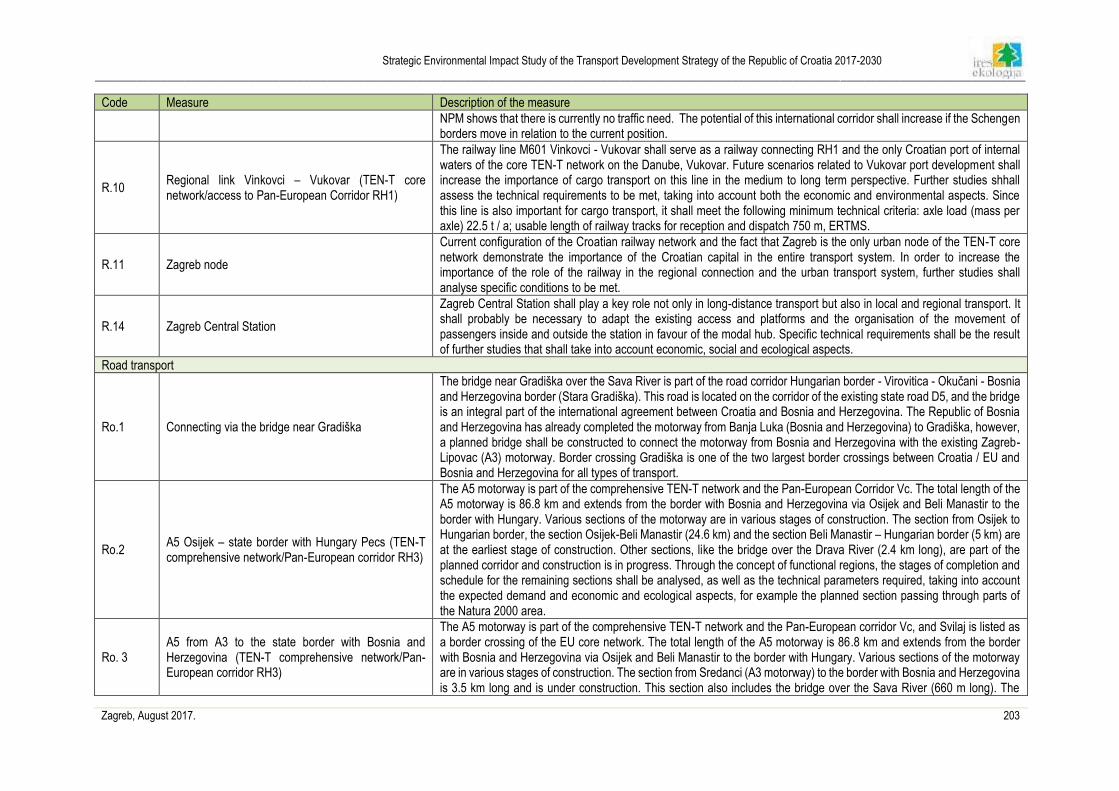
Strategic Environmental Impact Study of the Transport Development Strategy of the Republic of Croatia 2017-2030
____________________________________________________________________________________________________________________________________________________________
Zagreb, August 2017. 203
Code Measure Description of the measure
NPM shows that there is currently no traffic need. The potential of this international corridor shall increase if the Schengen borders move in relation to the current position.
R.10 Regional link Vinkovci – Vukovar (TEN-T core network/access to Pan-European Corridor RH1)
The railway line M601 Vinkovci - Vukovar shall serve as a railway connecting RH1 and the only Croatian port of internal waters of the core TEN-T network on the Danube, Vukovar. Future scenarios related to Vukovar port development shall increase the importance of cargo transport on this line in the medium to long term perspective. Further studies shhall assess the technical requirements to be met, taking into account both the economic and environmental aspects. Since this line is also important for cargo transport, it shall meet the following minimum technical criteria: axle load (mass per axle) 22.5 t / a; usable length of railway tracks for reception and dispatch 750 m, ERTMS.
R.11 Zagreb node
Current configuration of the Croatian railway network and the fact that Zagreb is the only urban node of the TEN-T core network demonstrate the importance of the Croatian capital in the entire transport system. In order to increase the importance of the role of the railway in the regional connection and the urban transport system, further studies shall analyse specific conditions to be met.
R.14 Zagreb Central Station
Zagreb Central Station shall play a key role not only in long-distance transport but also in local and regional transport. It shall probably be necessary to adapt the existing access and platforms and the organisation of the movement of passengers inside and outside the station in favour of the modal hub. Specific technical requirements shall be the result of further studies that shall take into account economic, social and ecological aspects.
Road transport
Ro.1 Connecting via the bridge near Gradiška
The bridge near Gradiška over the Sava River is part of the road corridor Hungarian border - Virovitica - Okučani - Bosnia and Herzegovina border (Stara Gradiška). This road is located on the corridor of the existing state road D5, and the bridge is an integral part of the international agreement between Croatia and Bosnia and Herzegovina. The Republic of Bosnia and Herzegovina has already completed the motorway from Banja Luka (Bosnia and Herzegovina) to Gradiška, however, a planned bridge shall be constructed to connect the motorway from Bosnia and Herzegovina with the existing Zagreb-Lipovac (A3) motorway. Border crossing Gradiška is one of the two largest border crossings between Croatia / EU and Bosnia and Herzegovina for all types of transport.
Ro.2 A5 Osijek – state border with Hungary Pecs (TEN-T comprehensive network/Pan-European corridor RH3)
The A5 motorway is part of the comprehensive TEN-T network and the Pan-European Corridor Vc. The total length of the A5 motorway is 86.8 km and extends from the border with Bosnia and Herzegovina via Osijek and Beli Manastir to the border with Hungary. Various sections of the motorway are in various stages of construction. The section from Osijek to Hungarian border, the section Osijek-Beli Manastir (24.6 km) and the section Beli Manastir – Hungarian border (5 km) are at the earliest stage of construction. Other sections, like the bridge over the Drava River (2.4 km long), are part of the planned corridor and construction is in progress. Through the concept of functional regions, the stages of completion and schedule for the remaining sections shall be analysed, as well as the technical parameters required, taking into account the expected demand and economic and ecological aspects, for example the planned section passing through parts of the Natura 2000 area.
Ro. 3 A5 from A3 to the state border with Bosnia and Herzegovina (TEN-T comprehensive network/Pan-European corridor RH3)
The A5 motorway is part of the comprehensive TEN-T network and the Pan-European corridor Vc, and Svilaj is listed as a border crossing of the EU core network. The total length of the A5 motorway is 86.8 km and extends from the border with Bosnia and Herzegovina via Osijek and Beli Manastir to the border with Hungary. Various sections of the motorway are in various stages of construction. The section from Sredanci (A3 motorway) to the border with Bosnia and Herzegovina is 3.5 km long and is under construction. This section also includes the bridge over the Sava River (660 m long). The
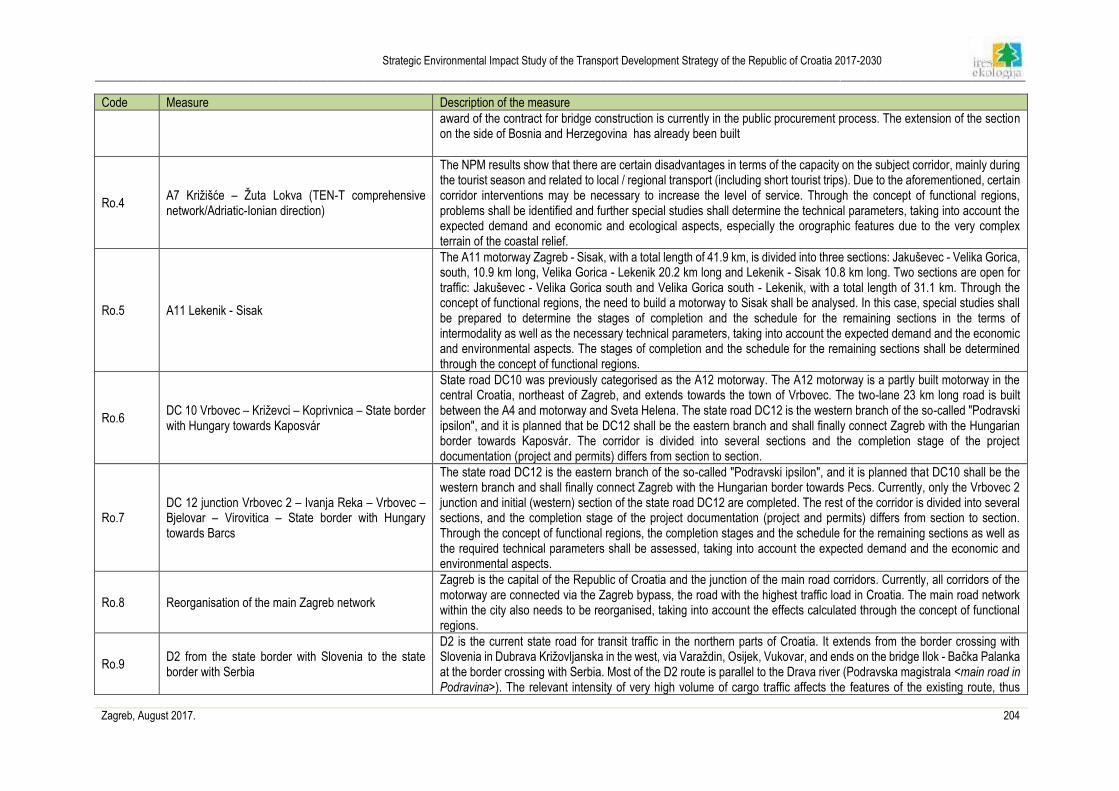
Strategic Environmental Impact Study of the Transport Development Strategy of the Republic of Croatia 2017-2030
____________________________________________________________________________________________________________________________________________________________
Zagreb, August 2017. 204
Code Measure Description of the measure
award of the contract for bridge construction is currently in the public procurement process. The extension of the section on the side of Bosnia and Herzegovina has already been built
Ro.4 A7 Križišće – Žuta Lokva (TEN-T comprehensive network/Adriatic-Ionian direction)
The NPM results show that there are certain disadvantages in terms of the capacity on the subject corridor, mainly during the tourist season and related to local / regional transport (including short tourist trips). Due to the aforementioned, certain corridor interventions may be necessary to increase the level of service. Through the concept of functional regions, problems shall be identified and further special studies shall determine the technical parameters, taking into account the expected demand and economic and ecological aspects, especially the orographic features due to the very complex terrain of the coastal relief.
Ro.5 A11 Lekenik - Sisak
The A11 motorway Zagreb - Sisak, with a total length of 41.9 km, is divided into three sections: Jakuševec - Velika Gorica, south, 10.9 km long, Velika Gorica - Lekenik 20.2 km long and Lekenik - Sisak 10.8 km long. Two sections are open for traffic: Jakuševec - Velika Gorica south and Velika Gorica south - Lekenik, with a total length of 31.1 km. Through the concept of functional regions, the need to build a motorway to Sisak shall be analysed. In this case, special studies shall be prepared to determine the stages of completion and the schedule for the remaining sections in the terms of intermodality as well as the necessary technical parameters, taking into account the expected demand and the economic and environmental aspects. The stages of completion and the schedule for the remaining sections shall be determined through the concept of functional regions.
Ro.6 DC 10 Vrbovec – Križevci – Koprivnica – State border with Hungary towards Kaposvár
State road DC10 was previously categorised as the A12 motorway. The A12 motorway is a partly built motorway in the central Croatia, northeast of Zagreb, and extends towards the town of Vrbovec. The two-lane 23 km long road is built between the A4 and motorway and Sveta Helena. The state road DC12 is the western branch of the so-called "Podravski ipsilon", and it is planned that be DC12 shall be the eastern branch and shall finally connect Zagreb with the Hungarian border towards Kaposvár. The corridor is divided into several sections and the completion stage of the project documentation (project and permits) differs from section to section.
Ro.7 DC 12 junction Vrbovec 2 – Ivanja Reka – Vrbovec – Bjelovar – Virovitica – State border with Hungary towards Barcs
The state road DC12 is the eastern branch of the so-called "Podravski ipsilon", and it is planned that DC10 shall be the western branch and shall finally connect Zagreb with the Hungarian border towards Pecs. Currently, only the Vrbovec 2 junction and initial (western) section of the state road DC12 are completed. The rest of the corridor is divided into several sections, and the completion stage of the project documentation (project and permits) differs from section to section. Through the concept of functional regions, the completion stages and the schedule for the remaining sections as well as the required technical parameters shall be assessed, taking into account the expected demand and the economic and environmental aspects.
Ro.8 Reorganisation of the main Zagreb network
Zagreb is the capital of the Republic of Croatia and the junction of the main road corridors. Currently, all corridors of the motorway are connected via the Zagreb bypass, the road with the highest traffic load in Croatia. The main road network within the city also needs to be reorganised, taking into account the effects calculated through the concept of functional regions.
Ro.9 D2 from the state border with Slovenia to the state border with Serbia
D2 is the current state road for transit traffic in the northern parts of Croatia. It extends from the border crossing with Slovenia in Dubrava Križovljanska in the west, via Varaždin, Osijek, Vukovar, and ends on the bridge Ilok - Bačka Palanka at the border crossing with Serbia. Most of the D2 route is parallel to the Drava river (Podravska magistrala <main road in Podravina>). The relevant intensity of very high volume of cargo traffic affects the features of the existing route, thus
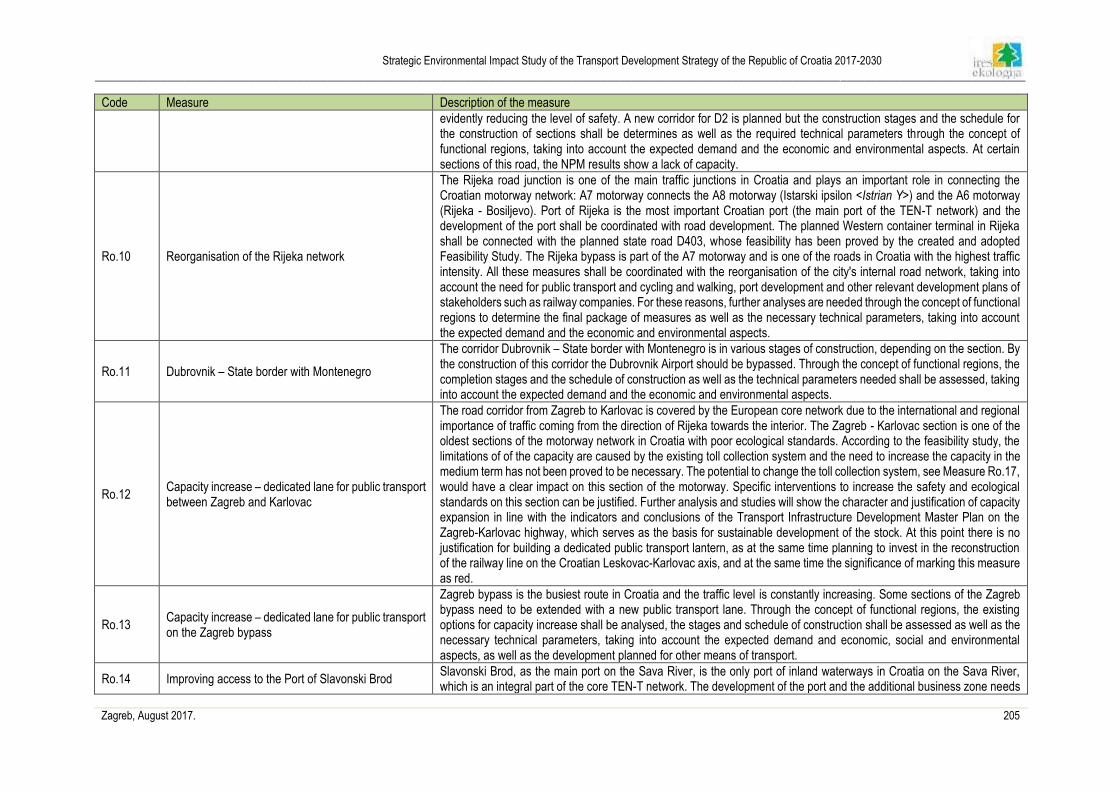
Strategic Environmental Impact Study of the Transport Development Strategy of the Republic of Croatia 2017-2030
____________________________________________________________________________________________________________________________________________________________
Zagreb, August 2017. 205
Code Measure Description of the measure
evidently reducing the level of safety. A new corridor for D2 is planned but the construction stages and the schedule for the construction of sections shall be determines as well as the required technical parameters through the concept of functional regions, taking into account the expected demand and the economic and environmental aspects. At certain sections of this road, the NPM results show a lack of capacity.
Ro.10 Reorganisation of the Rijeka network
The Rijeka road junction is one of the main traffic junctions in Croatia and plays an important role in connecting the Croatian motorway network: A7 motorway connects the A8 motorway (Istarski ipsilon <Istrian Y>) and the A6 motorway (Rijeka - Bosiljevo). Port of Rijeka is the most important Croatian port (the main port of the TEN-T network) and the development of the port shall be coordinated with road development. The planned Western container terminal in Rijeka shall be connected with the planned state road D403, whose feasibility has been proved by the created and adopted Feasibility Study. The Rijeka bypass is part of the A7 motorway and is one of the roads in Croatia with the highest traffic intensity. All these measures shall be coordinated with the reorganisation of the city's internal road network, taking into account the need for public transport and cycling and walking, port development and other relevant development plans of stakeholders such as railway companies. For these reasons, further analyses are needed through the concept of functional regions to determine the final package of measures as well as the necessary technical parameters, taking into account the expected demand and the economic and environmental aspects.
Ro.11 Dubrovnik – State border with Montenegro
The corridor Dubrovnik – State border with Montenegro is in various stages of construction, depending on the section. By the construction of this corridor the Dubrovnik Airport should be bypassed. Through the concept of functional regions, the completion stages and the schedule of construction as well as the technical parameters needed shall be assessed, taking into account the expected demand and the economic and environmental aspects.
Ro.12 Capacity increase – dedicated lane for public transport between Zagreb and Karlovac
The road corridor from Zagreb to Karlovac is covered by the European core network due to the international and regional importance of traffic coming from the direction of Rijeka towards the interior. The Zagreb - Karlovac section is one of the oldest sections of the motorway network in Croatia with poor ecological standards. According to the feasibility study, the limitations of of the capacity are caused by the existing toll collection system and the need to increase the capacity in the medium term has not been proved to be necessary. The potential to change the toll collection system, see Measure Ro.17, would have a clear impact on this section of the motorway. Specific interventions to increase the safety and ecological standards on this section can be justified. Further analysis and studies will show the character and justification of capacity expansion in line with the indicators and conclusions of the Transport Infrastructure Development Master Plan on the Zagreb-Karlovac highway, which serves as the basis for sustainable development of the stock. At this point there is no justification for building a dedicated public transport lantern, as at the same time planning to invest in the reconstruction of the railway line on the Croatian Leskovac-Karlovac axis, and at the same time the significance of marking this measure as red.
Ro.13 Capacity increase – dedicated lane for public transport on the Zagreb bypass
Zagreb bypass is the busiest route in Croatia and the traffic level is constantly increasing. Some sections of the Zagreb bypass need to be extended with a new public transport lane. Through the concept of functional regions, the existing options for capacity increase shall be analysed, the stages and schedule of construction shall be assessed as well as the necessary technical parameters, taking into account the expected demand and economic, social and environmental aspects, as well as the development planned for other means of transport.
Ro.14 Improving access to the Port of Slavonski Brod Slavonski Brod, as the main port on the Sava River, is the only port of inland waterways in Croatia on the Sava River, which is an integral part of the core TEN-T network. The development of the port and the additional business zone needs
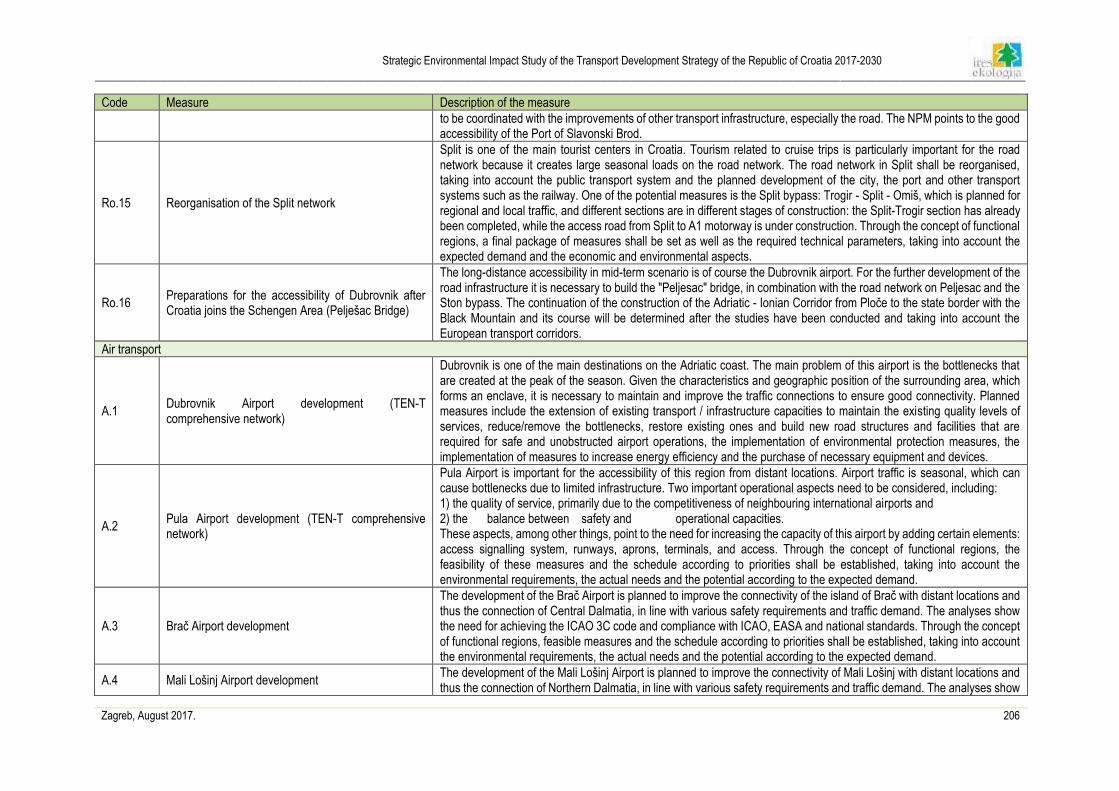
Strategic Environmental Impact Study of the Transport Development Strategy of the Republic of Croatia 2017-2030
____________________________________________________________________________________________________________________________________________________________
Zagreb, August 2017. 206
Code Measure Description of the measure
to be coordinated with the improvements of other transport infrastructure, especially the road. The NPM points to the good accessibility of the Port of Slavonski Brod.
Ro.15 Reorganisation of the Split network
Split is one of the main tourist centers in Croatia. Tourism related to cruise trips is particularly important for the road network because it creates large seasonal loads on the road network. The road network in Split shall be reorganised, taking into account the public transport system and the planned development of the city, the port and other transport systems such as the railway. One of the potential measures is the Split bypass: Trogir - Split - Omiš, which is planned for regional and local traffic, and different sections are in different stages of construction: the Split-Trogir section has already been completed, while the access road from Split to A1 motorway is under construction. Through the concept of functional regions, a final package of measures shall be set as well as the required technical parameters, taking into account the expected demand and the economic and environmental aspects.
Ro.16 Preparations for the accessibility of Dubrovnik after Croatia joins the Schengen Area (Pelješac Bridge)
The long-distance accessibility in mid-term scenario is of course the Dubrovnik airport. For the further development of the road infrastructure it is necessary to build the "Peljesac" bridge, in combination with the road network on Peljesac and the Ston bypass. The continuation of the construction of the Adriatic - Ionian Corridor from Ploče to the state border with the Black Mountain and its course will be determined after the studies have been conducted and taking into account the European transport corridors.
Air transport
A.1 Dubrovnik Airport development (TEN-T comprehensive network)
Dubrovnik is one of the main destinations on the Adriatic coast. The main problem of this airport is the bottlenecks that are created at the peak of the season. Given the characteristics and geographic position of the surrounding area, which forms an enclave, it is necessary to maintain and improve the traffic connections to ensure good connectivity. Planned measures include the extension of existing transport / infrastructure capacities to maintain the existing quality levels of services, reduce/remove the bottlenecks, restore existing ones and build new road structures and facilities that are required for safe and unobstructed airport operations, the implementation of environmental protection measures, the implementation of measures to increase energy efficiency and the purchase of necessary equipment and devices.
A.2 Pula Airport development (TEN-T comprehensive network)
Pula Airport is important for the accessibility of this region from distant locations. Airport traffic is seasonal, which can cause bottlenecks due to limited infrastructure. Two important operational aspects need to be considered, including: 1) the quality of service, primarily due to the competitiveness of neighbouring international airports and 2) the balance between safety and operational capacities. These aspects, among other things, point to the need for increasing the capacity of this airport by adding certain elements: access signalling system, runways, aprons, terminals, and access. Through the concept of functional regions, the feasibility of these measures and the schedule according to priorities shall be established, taking into account the environmental requirements, the actual needs and the potential according to the expected demand.
A.3 Brač Airport development
The development of the Brač Airport is planned to improve the connectivity of the island of Brač with distant locations and thus the connection of Central Dalmatia, in line with various safety requirements and traffic demand. The analyses show the need for achieving the ICAO 3C code and compliance with ICAO, EASA and national standards. Through the concept of functional regions, feasible measures and the schedule according to priorities shall be established, taking into account the environmental requirements, the actual needs and the potential according to the expected demand.
A.4 Mali Lošinj Airport development The development of the Mali Lošinj Airport is planned to improve the connectivity of Mali Lošinj with distant locations and thus the connection of Northern Dalmatia, in line with various safety requirements and traffic demand. The analyses show
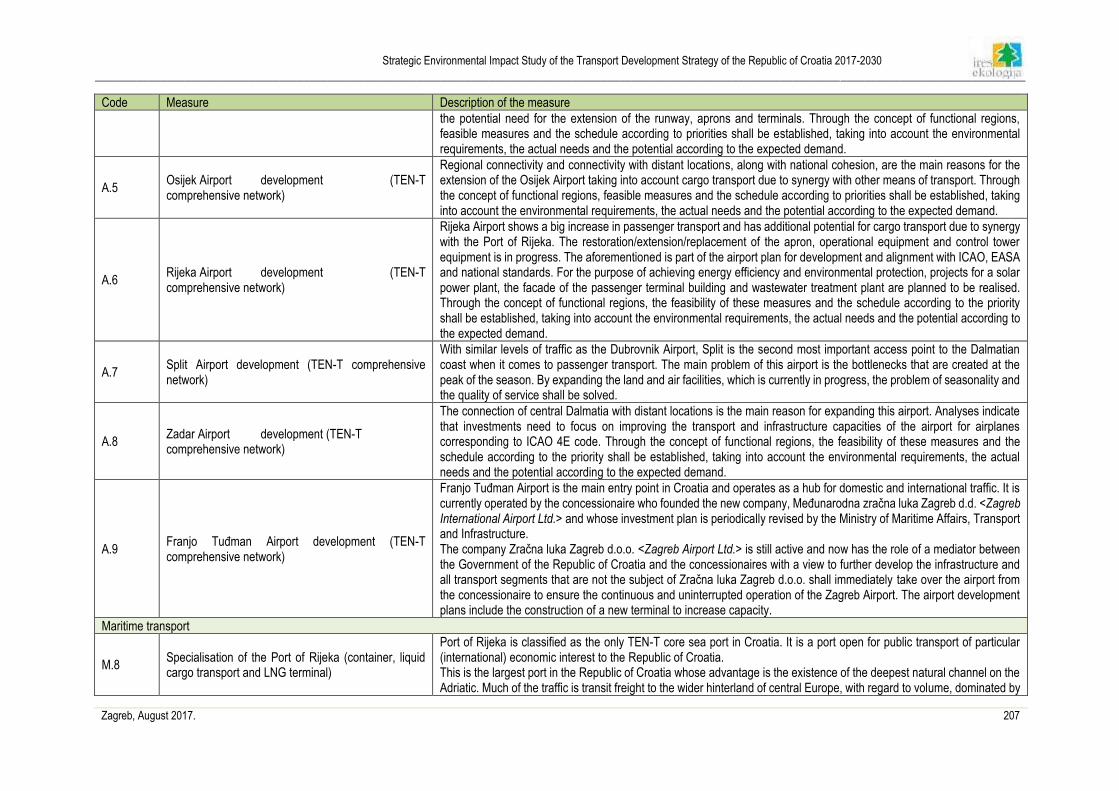
Strategic Environmental Impact Study of the Transport Development Strategy of the Republic of Croatia 2017-2030
____________________________________________________________________________________________________________________________________________________________
Zagreb, August 2017. 207
Code Measure Description of the measure
the potential need for the extension of the runway, aprons and terminals. Through the concept of functional regions, feasible measures and the schedule according to priorities shall be established, taking into account the environmental requirements, the actual needs and the potential according to the expected demand.
A.5 Osijek Airport development (TEN-T comprehensive network)
Regional connectivity and connectivity with distant locations, along with national cohesion, are the main reasons for the extension of the Osijek Airport taking into account cargo transport due to synergy with other means of transport. Through the concept of functional regions, feasible measures and the schedule according to priorities shall be established, taking into account the environmental requirements, the actual needs and the potential according to the expected demand.
A.6 Rijeka Airport development (TEN-T comprehensive network)
Rijeka Airport shows a big increase in passenger transport and has additional potential for cargo transport due to synergy with the Port of Rijeka. The restoration/extension/replacement of the apron, operational equipment and control tower equipment is in progress. The aforementioned is part of the airport plan for development and alignment with ICAO, EASA and national standards. For the purpose of achieving energy efficiency and environmental protection, projects for a solar power plant, the facade of the passenger terminal building and wastewater treatment plant are planned to be realised. Through the concept of functional regions, the feasibility of these measures and the schedule according to the priority shall be established, taking into account the environmental requirements, the actual needs and the potential according to the expected demand.
A.7 Split Airport development (TEN-T comprehensive network)
With similar levels of traffic as the Dubrovnik Airport, Split is the second most important access point to the Dalmatian coast when it comes to passenger transport. The main problem of this airport is the bottlenecks that are created at the peak of the season. By expanding the land and air facilities, which is currently in progress, the problem of seasonality and the quality of service shall be solved.
A.8 Zadar Airport development (TEN-T comprehensive network)
The connection of central Dalmatia with distant locations is the main reason for expanding this airport. Analyses indicate that investments need to focus on improving the transport and infrastructure capacities of the airport for airplanes corresponding to ICAO 4E code. Through the concept of functional regions, the feasibility of these measures and the schedule according to the priority shall be established, taking into account the environmental requirements, the actual needs and the potential according to the expected demand.
A.9 Franjo Tuđman Airport development (TEN-T comprehensive network)
Franjo Tuđman Airport is the main entry point in Croatia and operates as a hub for domestic and international traffic. It is currently operated by the concessionaire who founded the new company, Međunarodna zračna luka Zagreb d.d. <Zagreb International Airport Ltd.> and whose investment plan is periodically revised by the Ministry of Maritime Affairs, Transport and Infrastructure. The company Zračna luka Zagreb d.o.o. <Zagreb Airport Ltd.> is still active and now has the role of a mediator between the Government of the Republic of Croatia and the concessionaires with a view to further develop the infrastructure and all transport segments that are not the subject of Zračna luka Zagreb d.o.o. shall immediately take over the airport from the concessionaire to ensure the continuous and uninterrupted operation of the Zagreb Airport. The airport development plans include the construction of a new terminal to increase capacity.
Maritime transport
M.8 Specialisation of the Port of Rijeka (container, liquid cargo transport and LNG terminal)
Port of Rijeka is classified as the only TEN-T core sea port in Croatia. It is a port open for public transport of particular (international) economic interest to the Republic of Croatia. This is the largest port in the Republic of Croatia whose advantage is the existence of the deepest natural channel on the Adriatic. Much of the traffic is transit freight to the wider hinterland of central Europe, with regard to volume, dominated by
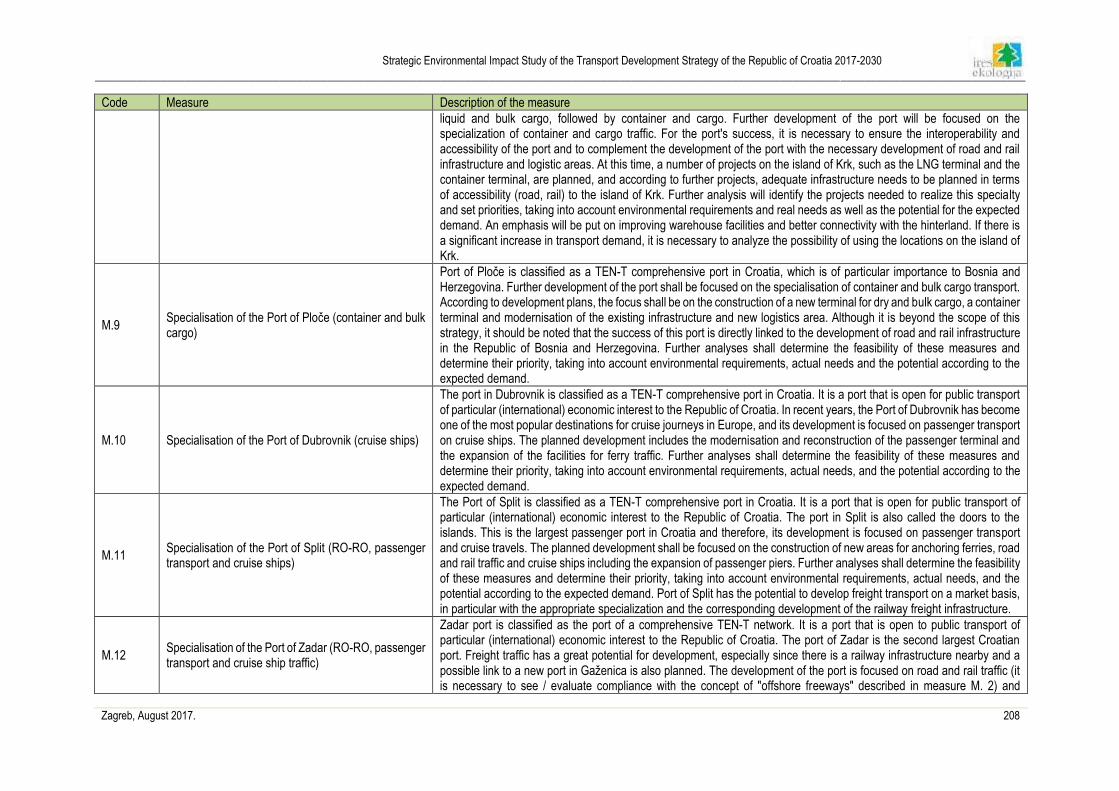
Strategic Environmental Impact Study of the Transport Development Strategy of the Republic of Croatia 2017-2030
____________________________________________________________________________________________________________________________________________________________
Zagreb, August 2017. 208
Code Measure Description of the measure
liquid and bulk cargo, followed by container and cargo. Further development of the port will be focused on the specialization of container and cargo traffic. For the port's success, it is necessary to ensure the interoperability and accessibility of the port and to complement the development of the port with the necessary development of road and rail infrastructure and logistic areas. At this time, a number of projects on the island of Krk, such as the LNG terminal and the container terminal, are planned, and according to further projects, adequate infrastructure needs to be planned in terms of accessibility (road, rail) to the island of Krk. Further analysis will identify the projects needed to realize this specialty and set priorities, taking into account environmental requirements and real needs as well as the potential for the expected demand. An emphasis will be put on improving warehouse facilities and better connectivity with the hinterland. If there is a significant increase in transport demand, it is necessary to analyze the possibility of using the locations on the island of Krk.
M.9 Specialisation of the Port of Ploče (container and bulk cargo)
Port of Ploče is classified as a TEN-T comprehensive port in Croatia, which is of particular importance to Bosnia and Herzegovina. Further development of the port shall be focused on the specialisation of container and bulk cargo transport. According to development plans, the focus shall be on the construction of a new terminal for dry and bulk cargo, a container terminal and modernisation of the existing infrastructure and new logistics area. Although it is beyond the scope of this strategy, it should be noted that the success of this port is directly linked to the development of road and rail infrastructure in the Republic of Bosnia and Herzegovina. Further analyses shall determine the feasibility of these measures and determine their priority, taking into account environmental requirements, actual needs and the potential according to the expected demand.
M.10 Specialisation of the Port of Dubrovnik (cruise ships)
The port in Dubrovnik is classified as a TEN-T comprehensive port in Croatia. It is a port that is open for public transport of particular (international) economic interest to the Republic of Croatia. In recent years, the Port of Dubrovnik has become one of the most popular destinations for cruise journeys in Europe, and its development is focused on passenger transport on cruise ships. The planned development includes the modernisation and reconstruction of the passenger terminal and the expansion of the facilities for ferry traffic. Further analyses shall determine the feasibility of these measures and determine their priority, taking into account environmental requirements, actual needs, and the potential according to the expected demand.
M.11 Specialisation of the Port of Split (RO-RO, passenger transport and cruise ships)
The Port of Split is classified as a TEN-T comprehensive port in Croatia. It is a port that is open for public transport of particular (international) economic interest to the Republic of Croatia. The port in Split is also called the doors to the islands. This is the largest passenger port in Croatia and therefore, its development is focused on passenger transport and cruise travels. The planned development shall be focused on the construction of new areas for anchoring ferries, road and rail traffic and cruise ships including the expansion of passenger piers. Further analyses shall determine the feasibility of these measures and determine their priority, taking into account environmental requirements, actual needs, and the potential according to the expected demand. Port of Split has the potential to develop freight transport on a market basis, in particular with the appropriate specialization and the corresponding development of the railway freight infrastructure.
M.12 Specialisation of the Port of Zadar (RO-RO, passenger transport and cruise ship traffic)
Zadar port is classified as the port of a comprehensive TEN-T network. It is a port that is open to public transport of particular (international) economic interest to the Republic of Croatia. The port of Zadar is the second largest Croatian port. Freight traffic has a great potential for development, especially since there is a railway infrastructure nearby and a possible link to a new port in Gaženica is also planned. The development of the port is focused on road and rail traffic (it is necessary to see / evaluate compliance with the concept of "offshore freeways" described in measure M. 2) and
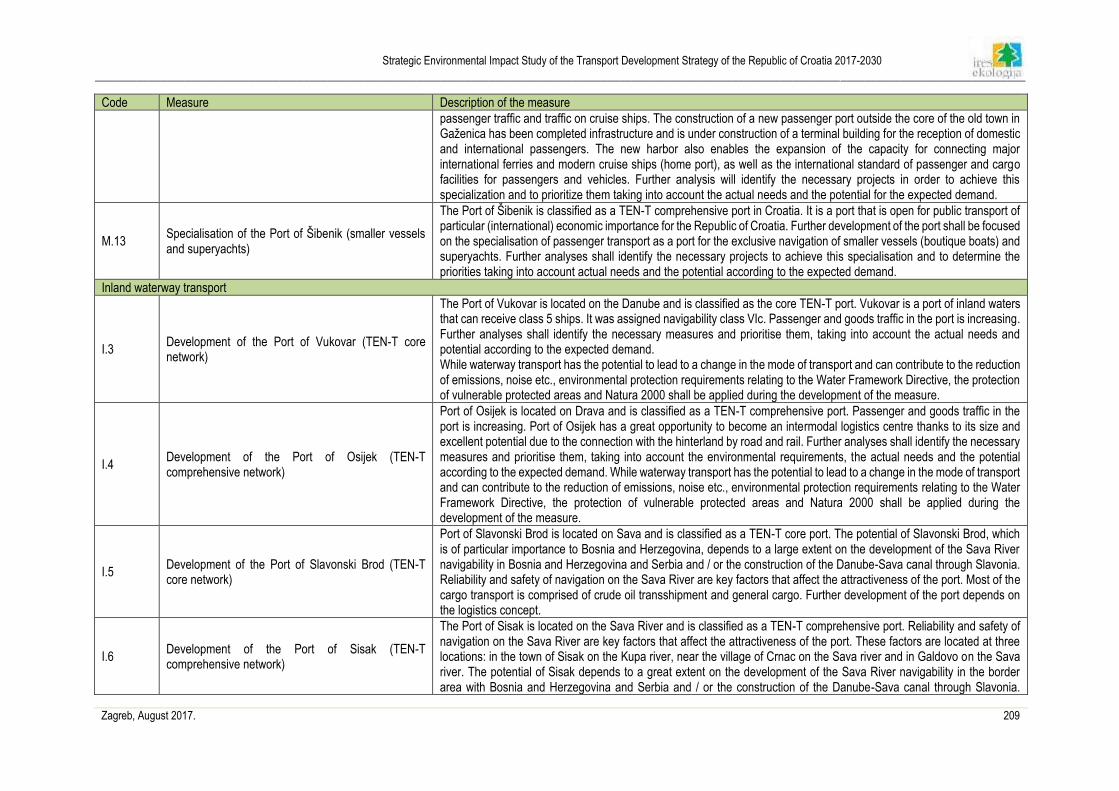
Strategic Environmental Impact Study of the Transport Development Strategy of the Republic of Croatia 2017-2030
____________________________________________________________________________________________________________________________________________________________
Zagreb, August 2017. 209
Code Measure Description of the measure
passenger traffic and traffic on cruise ships. The construction of a new passenger port outside the core of the old town in Gaženica has been completed infrastructure and is under construction of a terminal building for the reception of domestic and international passengers. The new harbor also enables the expansion of the capacity for connecting major international ferries and modern cruise ships (home port), as well as the international standard of passenger and cargo facilities for passengers and vehicles. Further analysis will identify the necessary projects in order to achieve this specialization and to prioritize them taking into account the actual needs and the potential for the expected demand.
M.13 Specialisation of the Port of Šibenik (smaller vessels and superyachts)
The Port of Šibenik is classified as a TEN-T comprehensive port in Croatia. It is a port that is open for public transport of particular (international) economic importance for the Republic of Croatia. Further development of the port shall be focused on the specialisation of passenger transport as a port for the exclusive navigation of smaller vessels (boutique boats) and superyachts. Further analyses shall identify the necessary projects to achieve this specialisation and to determine the priorities taking into account actual needs and the potential according to the expected demand.
Inland waterway transport
I.3 Development of the Port of Vukovar (TEN-T core network)
The Port of Vukovar is located on the Danube and is classified as the core TEN-T port. Vukovar is a port of inland waters that can receive class 5 ships. It was assigned navigability class VIc. Passenger and goods traffic in the port is increasing. Further analyses shall identify the necessary measures and prioritise them, taking into account the actual needs and potential according to the expected demand. While waterway transport has the potential to lead to a change in the mode of transport and can contribute to the reduction of emissions, noise etc., environmental protection requirements relating to the Water Framework Directive, the protection of vulnerable protected areas and Natura 2000 shall be applied during the development of the measure.
I.4 Development of the Port of Osijek (TEN-T comprehensive network)
Port of Osijek is located on Drava and is classified as a TEN-T comprehensive port. Passenger and goods traffic in the port is increasing. Port of Osijek has a great opportunity to become an intermodal logistics centre thanks to its size and excellent potential due to the connection with the hinterland by road and rail. Further analyses shall identify the necessary measures and prioritise them, taking into account the environmental requirements, the actual needs and the potential according to the expected demand. While waterway transport has the potential to lead to a change in the mode of transport and can contribute to the reduction of emissions, noise etc., environmental protection requirements relating to the Water Framework Directive, the protection of vulnerable protected areas and Natura 2000 shall be applied during the development of the measure.
I.5 Development of the Port of Slavonski Brod (TEN-T core network)
Port of Slavonski Brod is located on Sava and is classified as a TEN-T core port. The potential of Slavonski Brod, which is of particular importance to Bosnia and Herzegovina, depends to a large extent on the development of the Sava River navigability in Bosnia and Herzegovina and Serbia and / or the construction of the Danube-Sava canal through Slavonia. Reliability and safety of navigation on the Sava River are key factors that affect the attractiveness of the port. Most of the cargo transport is comprised of crude oil transshipment and general cargo. Further development of the port depends on the logistics concept.
I.6 Development of the Port of Sisak (TEN-T comprehensive network)
The Port of Sisak is located on the Sava River and is classified as a TEN-T comprehensive port. Reliability and safety of navigation on the Sava River are key factors that affect the attractiveness of the port. These factors are located at three locations: in the town of Sisak on the Kupa river, near the village of Crnac on the Sava river and in Galdovo on the Sava river. The potential of Sisak depends to a great extent on the development of the Sava River navigability in the border area with Bosnia and Herzegovina and Serbia and / or the construction of the Danube-Sava canal through Slavonia.
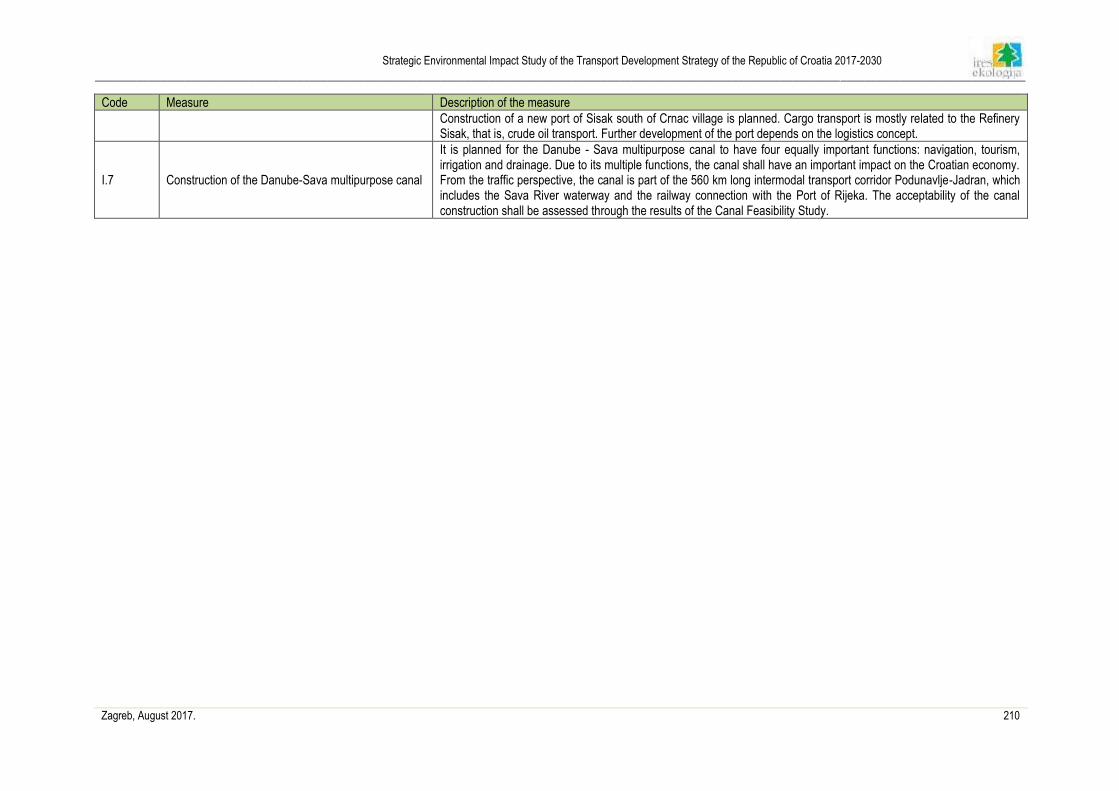
Strategic Environmental Impact Study of the Transport Development Strategy of the Republic of Croatia 2017-2030
____________________________________________________________________________________________________________________________________________________________
Zagreb, August 2017. 210
Code Measure Description of the measure
Construction of a new port of Sisak south of Crnac village is planned. Cargo transport is mostly related to the Refinery Sisak, that is, crude oil transport. Further development of the port depends on the logistics concept.
I.7 Construction of the Danube-Sava multipurpose canal
It is planned for the Danube - Sava multipurpose canal to have four equally important functions: navigation, tourism, irrigation and drainage. Due to its multiple functions, the canal shall have an important impact on the Croatian economy. From the traffic perspective, the canal is part of the 560 km long intermodal transport corridor Podunavlje-Jadran, which includes the Sava River waterway and the railway connection with the Port of Rijeka. The acceptability of the canal construction shall be assessed through the results of the Canal Feasibility Study.
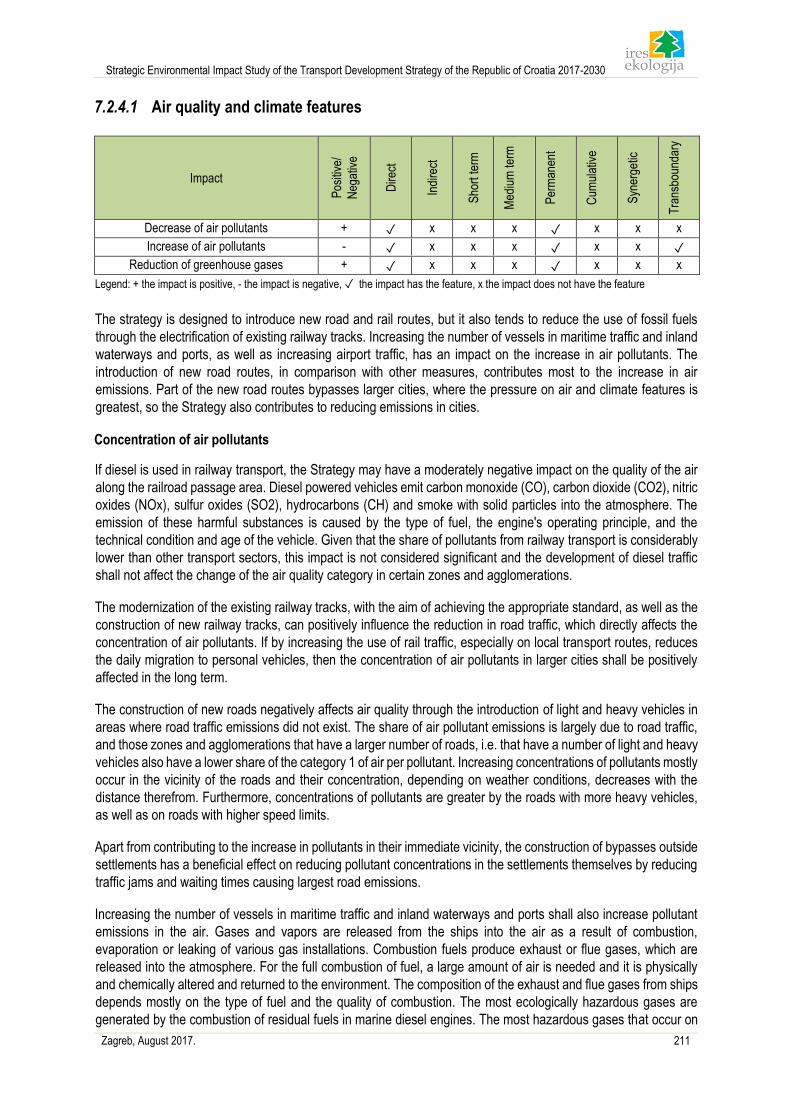
Strategic Environmental Impact Study of the Transport Development Strategy of the Republic of Croatia 2017-2030
Zagreb, August 2017. 211
7.2.4.1 Air quality and climate features
Legend: + the impact is positive, - the impact is negative, ✓ the impact has the feature, x the impact does not have the feature
The strategy is designed to introduce new road and rail routes, but it also tends to reduce the use of fossil fuels
through the electrification of existing railway tracks. Increasing the number of vessels in maritime traffic and inland
waterways and ports, as well as increasing airport traffic, has an impact on the increase in air pollutants. The
introduction of new road routes, in comparison with other measures, contributes most to the increase in air
emissions. Part of the new road routes bypasses larger cities, where the pressure on air and climate features is
greatest, so the Strategy also contributes to reducing emissions in cities.
Concentration of air pollutants
If diesel is used in railway transport, the Strategy may have a moderately negative impact on the quality of the air
along the railroad passage area. Diesel powered vehicles emit carbon monoxide (CO), carbon dioxide (CO2), nitric
oxides (NOx), sulfur oxides (SO2), hydrocarbons (CH) and smoke with solid particles into the atmosphere. The
emission of these harmful substances is caused by the type of fuel, the engine's operating principle, and the
technical condition and age of the vehicle. Given that the share of pollutants from railway transport is considerably
lower than other transport sectors, this impact is not considered significant and the development of diesel traffic
shall not affect the change of the air quality category in certain zones and agglomerations.
The modernization of the existing railway tracks, with the aim of achieving the appropriate standard, as well as the
construction of new railway tracks, can positively influence the reduction in road traffic, which directly affects the
concentration of air pollutants. If by increasing the use of rail traffic, especially on local transport routes, reduces
the daily migration to personal vehicles, then the concentration of air pollutants in larger cities shall be positively
affected in the long term.
The construction of new roads negatively affects air quality through the introduction of light and heavy vehicles in
areas where road traffic emissions did not exist. The share of air pollutant emissions is largely due to road traffic,
and those zones and agglomerations that have a larger number of roads, i.e. that have a number of light and heavy
vehicles also have a lower share of the category 1 of air per pollutant. Increasing concentrations of pollutants mostly
occur in the vicinity of the roads and their concentration, depending on weather conditions, decreases with the
distance therefrom. Furthermore, concentrations of pollutants are greater by the roads with more heavy vehicles,
as well as on roads with higher speed limits.
Apart from contributing to the increase in pollutants in their immediate vicinity, the construction of bypasses outside
settlements has a beneficial effect on reducing pollutant concentrations in the settlements themselves by reducing
traffic jams and waiting times causing largest road emissions.
Increasing the number of vessels in maritime traffic and inland waterways and ports shall also increase pollutant
emissions in the air. Gases and vapors are released from the ships into the air as a result of combustion,
evaporation or leaking of various gas installations. Combustion fuels produce exhaust or flue gases, which are
released into the atmosphere. For the full combustion of fuel, a large amount of air is needed and it is physically
and chemically altered and returned to the environment. The composition of the exhaust and flue gases from ships
depends mostly on the type of fuel and the quality of combustion. The most ecologically hazardous gases are
generated by the combustion of residual fuels in marine diesel engines. The most hazardous gases that occur on
Impact
Pos
itive
/
Neg
ativ
e
Dire
ct
Indi
rect
Sho
rt te
rm
Med
ium
term
Per
man
ent
Cum
ulat
ive
Syn
erge
tic
Tra
nsbo
unda
ry
Decrease of air pollutants + ✓ x x x ✓ x x x
Increase of air pollutants - ✓ x x x ✓ x x ✓
Reduction of greenhouse gases + ✓ x x x ✓ x x x
Strategic Environmental Impact Study of the Transport Development Strategy of the Republic of Croatia 2017-2030
Zagreb, August 2017. 212
ships today are certain groups of freons and halons. Freons are used in refrigeration plants while halons are used
as fire extinguishers. From other gases, inert gases in tankers, CO2, acetylene, propane-butane, etc. pose a risk
to human and the environment. All technical gases are contained in tanks or associated installations and in the
environment usually come due to improper handling (Analysis of the Harmful Effects of Ships on the Marine
Environment, Jelavić and Kurtela, 2007). Consequently, it is possible to have a negative impact on air quality due
to the increase in pollutants in the air as a result of the increase in the vessel number.
Increasing traffic at airports may have an impact on the concentration of pollutants in the air, especially those arising
from combustion of fossil fuels in aircraft engines. However, in addition to airplanes, pollutant emissions in airports
are also caused by fuel combustion needed to operate ground equipment for aircraft maintenance and servicing.
Air traffic emissions present the smallest part of the total amount of pollutants in the air.
Based on the above, it is evident that the indicator value, depending on the transport sector, increases or decreases.
Any reduction in the indicator positively affects the air quality and contributes to the increase of the category 1 air
in certain zones and agglomerations. The increase in the indicators leads to the reduction of air quality and to the
increase in the number of contaminated zones and agglomerations at least with one pollutant. Given that the
number of contaminated zones and agglomerations increased in the period from 2013 to 2015 and since only Split
Agglomeration was rated as clean in 2015, the overall situation shall slightly worsen with the implementation of the
Strategy compared to the current situation, hence the influence of increased pollutants in the air is estimated to be
moderately negative.
Amount of greenhouse gas emissions
Rail traffic has a small share in greenhouse gas emissions if diesel vehicles are used, and if the track is fully
electrified, then there is no greenhouse gas emissions from the railways.
The construction of new road routes, and thus the use of new vehicles on new routes directly leads to increased
greenhouse gas emissions. Road transport, in relation to other transport sectors, is by far the largest source of
greenhouse gas emissions and the additional development of this sector contributes to the creation of new or
redistribution of existing sources of greenhouse gas emissions.
The share of air traffic in total greenhouse gas emissions is subordinated, but the development of airports, as well
as the increase in air traffic, can lead to greenhouse gas emissions, which in part increases their share in total
greenhouse gas emissions.
The specialization of seaports, as well as the development of inland waterway ports through increased passenger
and freight traffic and the use of vessels with greenhouse gas emissions directly affect the increase in greenhouse
gases along their waterways as well as in port locations.
The transport sector is the largest source of greenhouse gas emissions, and its contribution over the years is
increasing, and road transport emissions are far greater than other forms of transport within the transport sector.
Therefore, road traffic largely leads to an increase in the indicators, while other transport sectors have less influence
on the increase in the indicators. Any modernization or construction of railway and maritime traffic and inland
waterway transport, which directly leads to a reduction in the use of road traffic, whether in a passenger or freight
traffic, leads to a reduction in greenhouse gas emissions.
Since CO2 – eq emissions from road traffic in 2014 were dominant, and their total share in total emissions in
transport amounted to 95.7%, new road routes shall slightly alter the existing amounts of greenhouse gas
emissions, so the impact of the increase in volume of greenhouse gas emissions is assessed as moderately
negative.
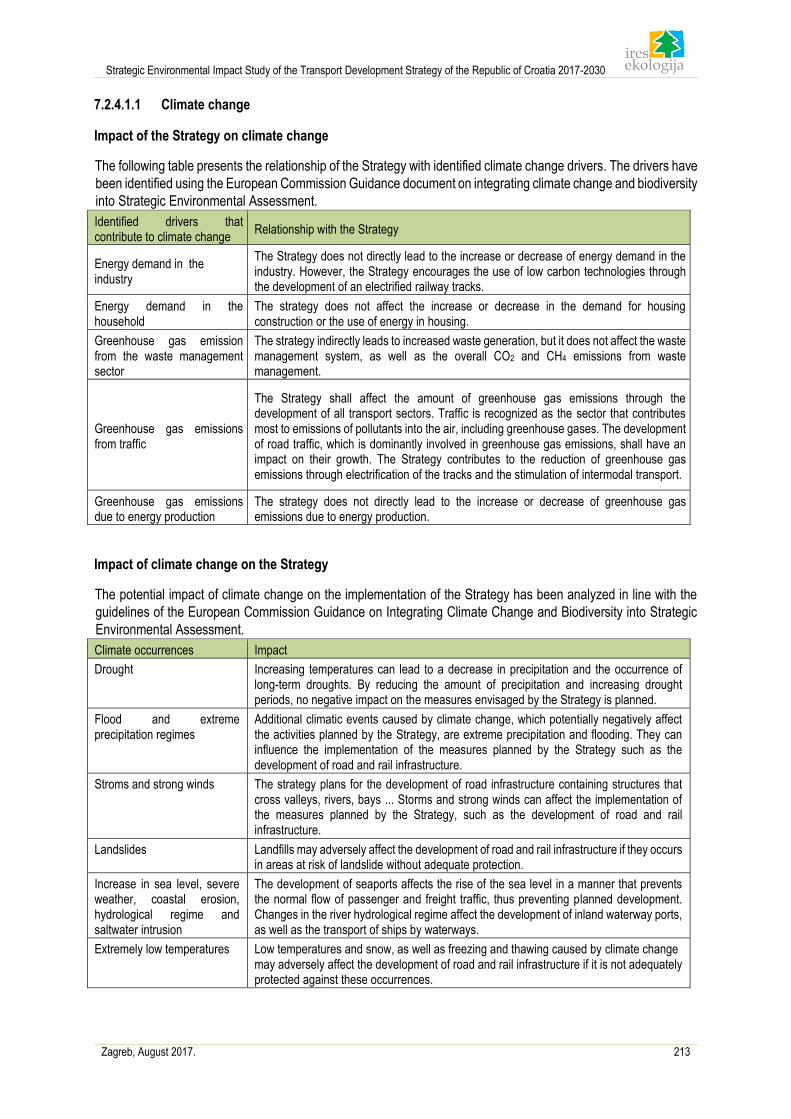
Strategic Environmental Impact Study of the Transport Development Strategy of the Republic of Croatia 2017-2030
Zagreb, August 2017. 213
7.2.4.1.1 Climate change
Impact of the Strategy on climate change
The following table presents the relationship of the Strategy with identified climate change drivers. The drivers have
been identified using the European Commission Guidance document on integrating climate change and biodiversity
into Strategic Environmental Assessment.
Identified drivers that contribute to climate change
Relationship with the Strategy
Energy demand in the industry
The Strategy does not directly lead to the increase or decrease of energy demand in the industry. However, the Strategy encourages the use of low carbon technologies through the development of an electrified railway tracks.
Energy demand in the household
The strategy does not affect the increase or decrease in the demand for housing construction or the use of energy in housing.
Greenhouse gas emission from the waste management sector
The strategy indirectly leads to increased waste generation, but it does not affect the waste management system, as well as the overall CO2 and CH4 emissions from waste management.
Greenhouse gas emissions from traffic
The Strategy shall affect the amount of greenhouse gas emissions through the development of all transport sectors. Traffic is recognized as the sector that contributes most to emissions of pollutants into the air, including greenhouse gases. The development of road traffic, which is dominantly involved in greenhouse gas emissions, shall have an impact on their growth. The Strategy contributes to the reduction of greenhouse gas emissions through electrification of the tracks and the stimulation of intermodal transport.
Greenhouse gas emissions due to energy production
The strategy does not directly lead to the increase or decrease of greenhouse gas emissions due to energy production.
Impact of climate change on the Strategy
The potential impact of climate change on the implementation of the Strategy has been analyzed in line with the
guidelines of the European Commission Guidance on Integrating Climate Change and Biodiversity into Strategic
Environmental Assessment.
Climate occurrences Impact
Drought Increasing temperatures can lead to a decrease in precipitation and the occurrence of long-term droughts. By reducing the amount of precipitation and increasing drought periods, no negative impact on the measures envisaged by the Strategy is planned.
Flood and extreme precipitation regimes
Additional climatic events caused by climate change, which potentially negatively affect the activities planned by the Strategy, are extreme precipitation and flooding. They can influence the implementation of the measures planned by the Strategy such as the development of road and rail infrastructure.
Stroms and strong winds The strategy plans for the development of road infrastructure containing structures that cross valleys, rivers, bays ... Storms and strong winds can affect the implementation of the measures planned by the Strategy, such as the development of road and rail infrastructure.
Landslides Landfills may adversely affect the development of road and rail infrastructure if they occurs in areas at risk of landslide without adequate protection.
Increase in sea level, severe weather, coastal erosion, hydrological regime and saltwater intrusion
The development of seaports affects the rise of the sea level in a manner that prevents the normal flow of passenger and freight traffic, thus preventing planned development. Changes in the river hydrological regime affect the development of inland waterway ports, as well as the transport of ships by waterways.
Extremely low temperatures Low temperatures and snow, as well as freezing and thawing caused by climate change may adversely affect the development of road and rail infrastructure if it is not adequately protected against these occurrences.
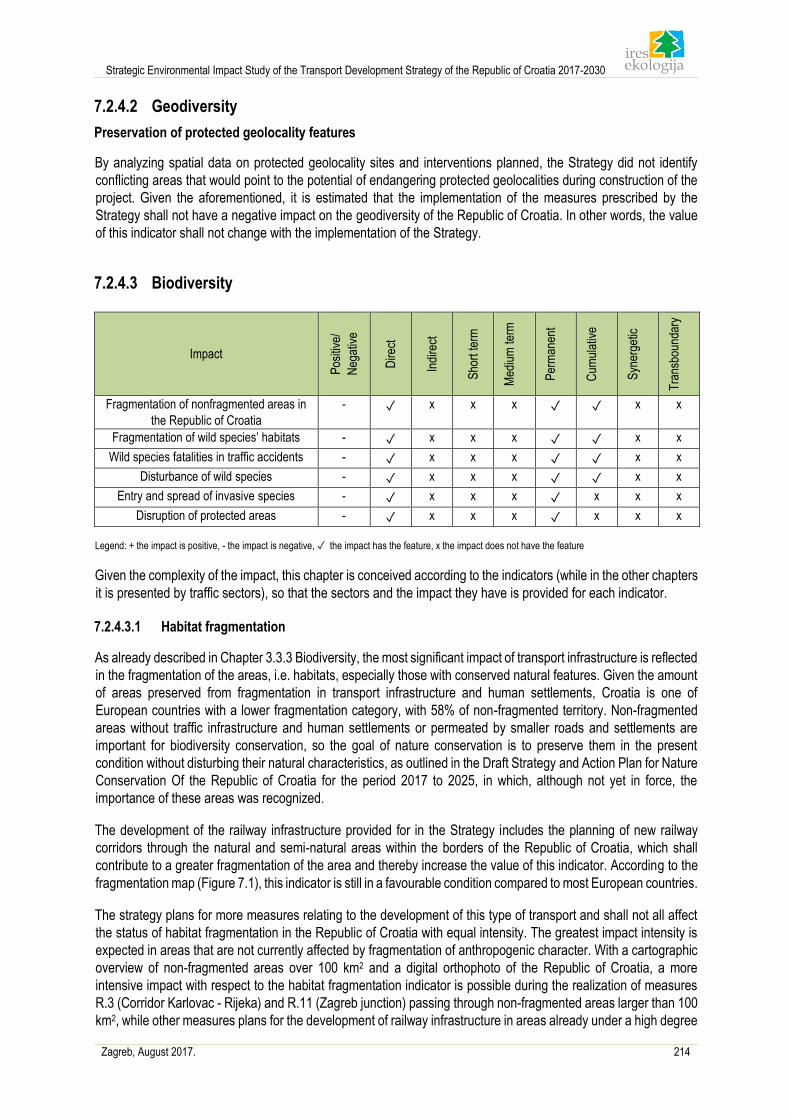
Strategic Environmental Impact Study of the Transport Development Strategy of the Republic of Croatia 2017-2030
Zagreb, August 2017. 214
7.2.4.2 Geodiversity
Preservation of protected geolocality features
By analyzing spatial data on protected geolocality sites and interventions planned, the Strategy did not identify
conflicting areas that would point to the potential of endangering protected geolocalities during construction of the
project. Given the aforementioned, it is estimated that the implementation of the measures prescribed by the
Strategy shall not have a negative impact on the geodiversity of the Republic of Croatia. In other words, the value
of this indicator shall not change with the implementation of the Strategy.
7.2.4.3 Biodiversity
Legend: + the impact is positive, - the impact is negative, ✓ the impact has the feature, x the impact does not have the feature
Given the complexity of the impact, this chapter is conceived according to the indicators (while in the other chapters
it is presented by traffic sectors), so that the sectors and the impact they have is provided for each indicator.
7.2.4.3.1 Habitat fragmentation
As already described in Chapter 3.3.3 Biodiversity, the most significant impact of transport infrastructure is reflected
in the fragmentation of the areas, i.e. habitats, especially those with conserved natural features. Given the amount
of areas preserved from fragmentation in transport infrastructure and human settlements, Croatia is one of
European countries with a lower fragmentation category, with 58% of non-fragmented territory. Non-fragmented
areas without traffic infrastructure and human settlements or permeated by smaller roads and settlements are
important for biodiversity conservation, so the goal of nature conservation is to preserve them in the present
condition without disturbing their natural characteristics, as outlined in the Draft Strategy and Action Plan for Nature
Conservation Of the Republic of Croatia for the period 2017 to 2025, in which, although not yet in force, the
importance of these areas was recognized.
The development of the railway infrastructure provided for in the Strategy includes the planning of new railway
corridors through the natural and semi-natural areas within the borders of the Republic of Croatia, which shall
contribute to a greater fragmentation of the area and thereby increase the value of this indicator. According to the
fragmentation map (Figure 7.1), this indicator is still in a favourable condition compared to most European countries.
The strategy plans for more measures relating to the development of this type of transport and shall not all affect
the status of habitat fragmentation in the Republic of Croatia with equal intensity. The greatest impact intensity is
expected in areas that are not currently affected by fragmentation of anthropogenic character. With a cartographic
overview of non-fragmented areas over 100 km2 and a digital orthophoto of the Republic of Croatia, a more
intensive impact with respect to the habitat fragmentation indicator is possible during the realization of measures
R.3 (Corridor Karlovac - Rijeka) and R.11 (Zagreb junction) passing through non-fragmented areas larger than 100
km2, while other measures plans for the development of railway infrastructure in areas already under a high degree
Impact
Pos
itive
/
Neg
ativ
e
Dire
ct
Indi
rect
Sho
rt te
rm
Med
ium
term
Per
man
ent
Cum
ulat
ive
Syn
erge
tic
Tra
nsbo
unda
ry
Fragmentation of nonfragmented areas in
the Republic of Croatia
- ✓ x x x ✓ ✓ x x
Fragmentation of wild species’ habitats - ✓ x x x ✓ ✓ x x
Wild species fatalities in traffic accidents - ✓ x x x ✓ ✓ x x
Disturbance of wild species - ✓ x x x ✓ ✓ x x
Entry and spread of invasive species - ✓ x x x ✓ x x x
Disruption of protected areas - ✓ x x x ✓ x x x
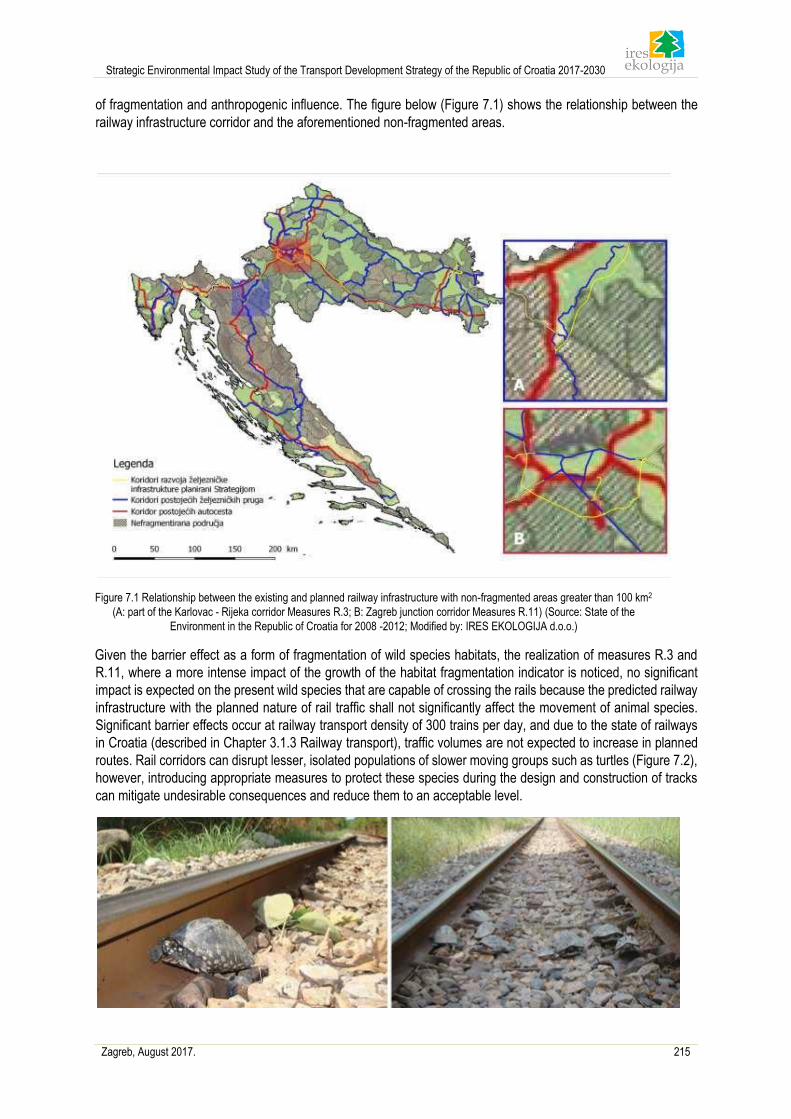
Strategic Environmental Impact Study of the Transport Development Strategy of the Republic of Croatia 2017-2030
Zagreb, August 2017. 215
of fragmentation and anthropogenic influence. The figure below (Figure 7.1) shows the relationship between the
railway infrastructure corridor and the aforementioned non-fragmented areas.
Figure 7.1 Relationship between the existing and planned railway infrastructure with non-fragmented areas greater than 100 km2
(A: part of the Karlovac - Rijeka corridor Measures R.3; B: Zagreb junction corridor Measures R.11) (Source: State of the
Environment in the Republic of Croatia for 2008 -2012; Modified by: IRES EKOLOGIJA d.o.o.)
Given the barrier effect as a form of fragmentation of wild species habitats, the realization of measures R.3 and
R.11, where a more intense impact of the growth of the habitat fragmentation indicator is noticed, no significant
impact is expected on the present wild species that are capable of crossing the rails because the predicted railway
infrastructure with the planned nature of rail traffic shall not significantly affect the movement of animal species.
Significant barrier effects occur at railway transport density of 300 trains per day, and due to the state of railways
in Croatia (described in Chapter 3.1.3 Railway transport), traffic volumes are not expected to increase in planned
routes. Rail corridors can disrupt lesser, isolated populations of slower moving groups such as turtles (Figure 7.2),
however, introducing appropriate measures to protect these species during the design and construction of tracks
can mitigate undesirable consequences and reduce them to an acceptable level.
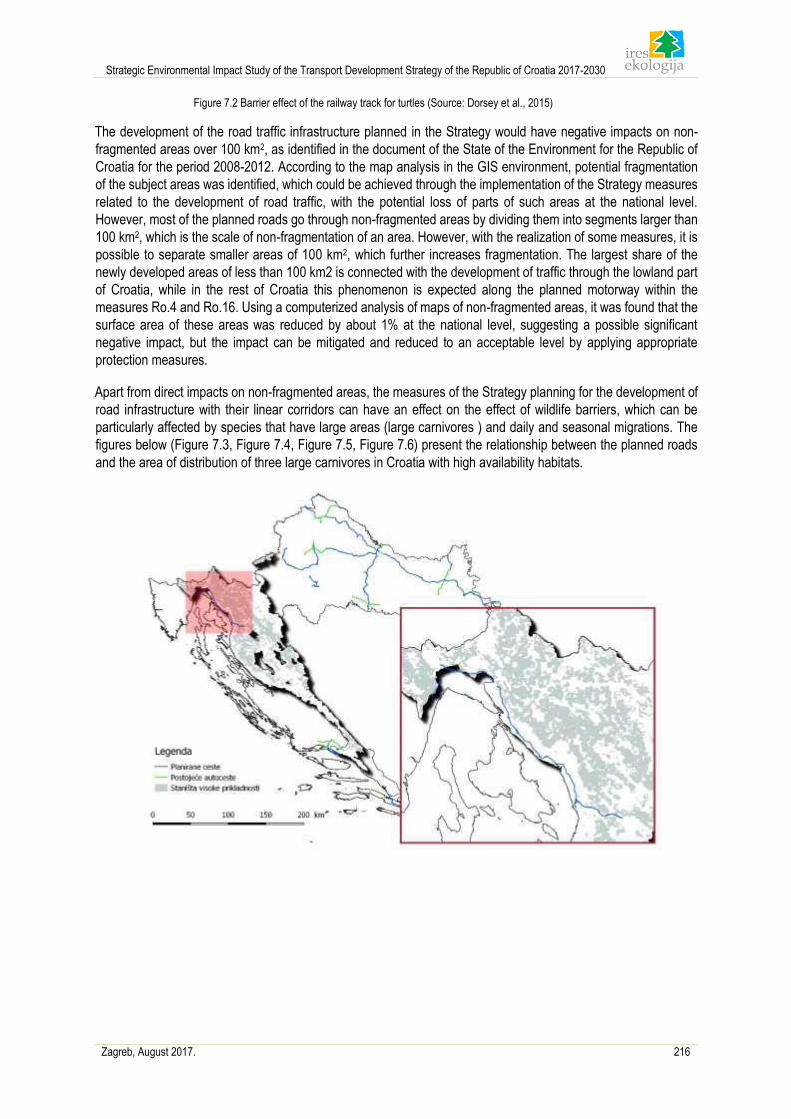
Strategic Environmental Impact Study of the Transport Development Strategy of the Republic of Croatia 2017-2030
Zagreb, August 2017. 216
Figure 7.2 Barrier effect of the railway track for turtles (Source: Dorsey et al., 2015)
The development of the road traffic infrastructure planned in the Strategy would have negative impacts on non-
fragmented areas over 100 km2, as identified in the document of the State of the Environment for the Republic of
Croatia for the period 2008-2012. According to the map analysis in the GIS environment, potential fragmentation
of the subject areas was identified, which could be achieved through the implementation of the Strategy measures
related to the development of road traffic, with the potential loss of parts of such areas at the national level.
However, most of the planned roads go through non-fragmented areas by dividing them into segments larger than
100 km2, which is the scale of non-fragmentation of an area. However, with the realization of some measures, it is
possible to separate smaller areas of 100 km2, which further increases fragmentation. The largest share of the
newly developed areas of less than 100 km2 is connected with the development of traffic through the lowland part
of Croatia, while in the rest of Croatia this phenomenon is expected along the planned motorway within the
measures Ro.4 and Ro.16. Using a computerized analysis of maps of non-fragmented areas, it was found that the
surface area of these areas was reduced by about 1% at the national level, suggesting a possible significant
negative impact, but the impact can be mitigated and reduced to an acceptable level by applying appropriate
protection measures.
Apart from direct impacts on non-fragmented areas, the measures of the Strategy planning for the development of
road infrastructure with their linear corridors can have an effect on the effect of wildlife barriers, which can be
particularly affected by species that have large areas (large carnivores ) and daily and seasonal migrations. The
figures below (Figure 7.3, Figure 7.4, Figure 7.5, Figure 7.6) present the relationship between the planned roads
and the area of distribution of three large carnivores in Croatia with high availability habitats.
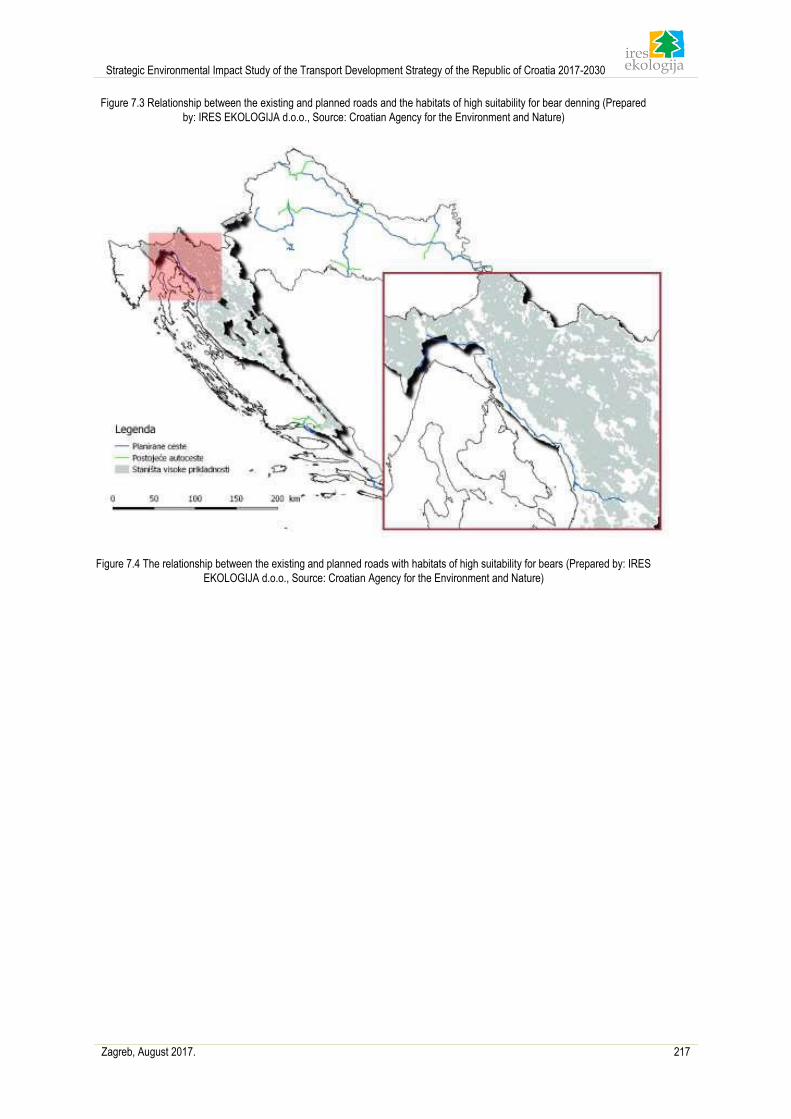
Strategic Environmental Impact Study of the Transport Development Strategy of the Republic of Croatia 2017-2030
Zagreb, August 2017. 217
Figure 7.3 Relationship between the existing and planned roads and the habitats of high suitability for bear denning (Prepared
by: IRES EKOLOGIJA d.o.o., Source: Croatian Agency for the Environment and Nature)
Figure 7.4 The relationship between the existing and planned roads with habitats of high suitability for bears (Prepared by: IRES
EKOLOGIJA d.o.o., Source: Croatian Agency for the Environment and Nature)
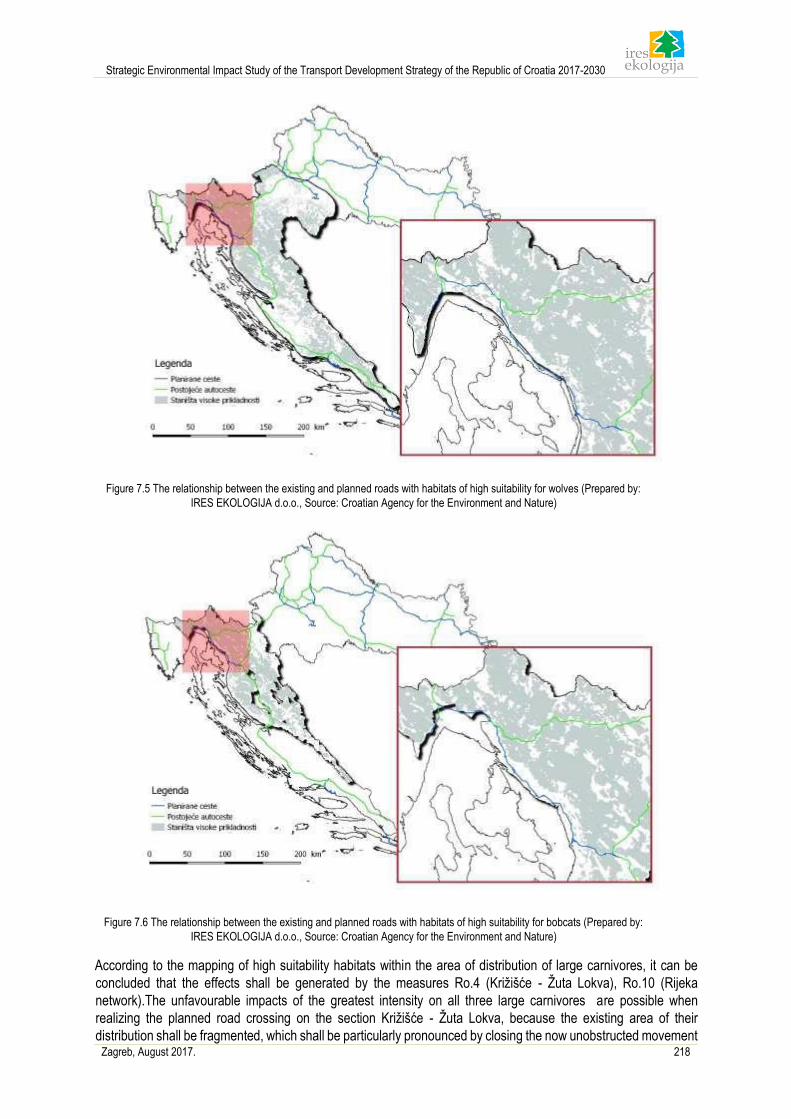
Strategic Environmental Impact Study of the Transport Development Strategy of the Republic of Croatia 2017-2030
Zagreb, August 2017. 218
Figure 7.5 The relationship between the existing and planned roads with habitats of high suitability for wolves (Prepared by:
IRES EKOLOGIJA d.o.o., Source: Croatian Agency for the Environment and Nature)
Figure 7.6 The relationship between the existing and planned roads with habitats of high suitability for bobcats (Prepared by:
IRES EKOLOGIJA d.o.o., Source: Croatian Agency for the Environment and Nature)
According to the mapping of high suitability habitats within the area of distribution of large carnivores, it can be
concluded that the effects shall be generated by the measures Ro.4 (Križišće - Žuta Lokva), Ro.10 (Rijeka
network).The unfavourable impacts of the greatest intensity on all three large carnivores are possible when
realizing the planned road crossing on the section Križišće - Žuta Lokva, because the existing area of their
distribution shall be fragmented, which shall be particularly pronounced by closing the now unobstructed movement
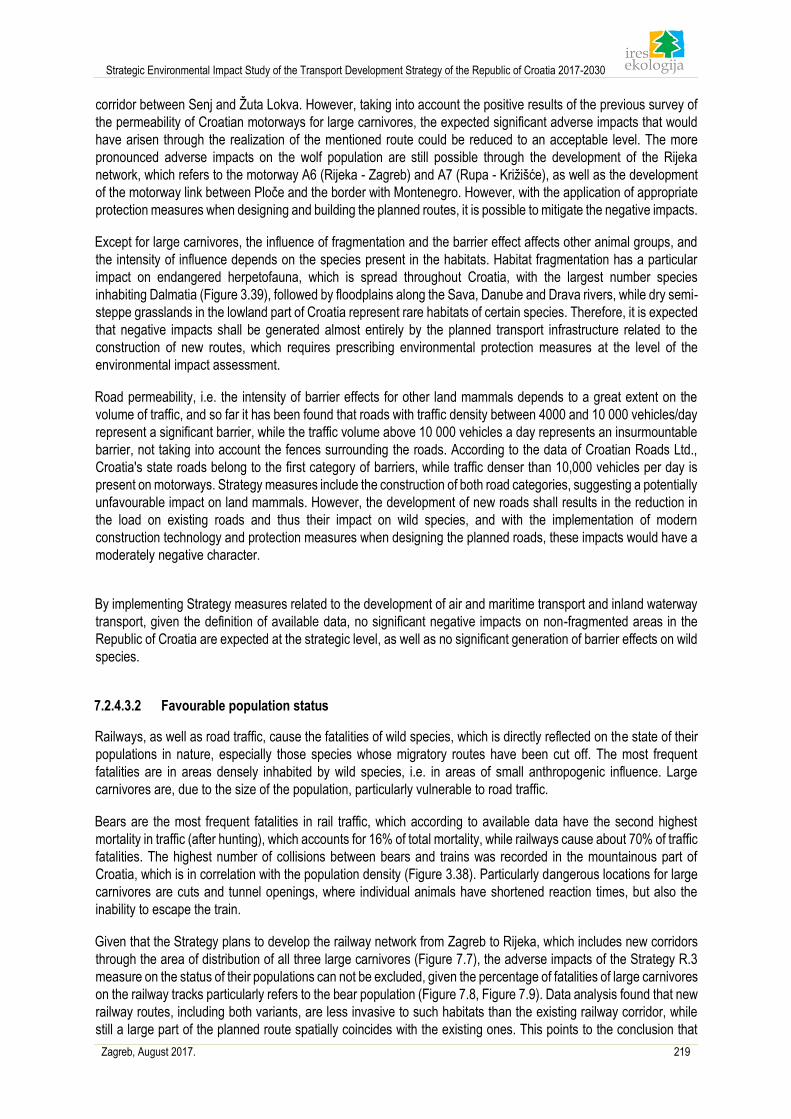
Strategic Environmental Impact Study of the Transport Development Strategy of the Republic of Croatia 2017-2030
Zagreb, August 2017. 219
corridor between Senj and Žuta Lokva. However, taking into account the positive results of the previous survey of
the permeability of Croatian motorways for large carnivores, the expected significant adverse impacts that would
have arisen through the realization of the mentioned route could be reduced to an acceptable level. The more
pronounced adverse impacts on the wolf population are still possible through the development of the Rijeka
network, which refers to the motorway A6 (Rijeka - Zagreb) and A7 (Rupa - Križišće), as well as the development
of the motorway link between Ploče and the border with Montenegro. However, with the application of appropriate
protection measures when designing and building the planned routes, it is possible to mitigate the negative impacts.
Except for large carnivores, the influence of fragmentation and the barrier effect affects other animal groups, and
the intensity of influence depends on the species present in the habitats. Habitat fragmentation has a particular
impact on endangered herpetofauna, which is spread throughout Croatia, with the largest number species
inhabiting Dalmatia (Figure 3.39), followed by floodplains along the Sava, Danube and Drava rivers, while dry semi-
steppe grasslands in the lowland part of Croatia represent rare habitats of certain species. Therefore, it is expected
that negative impacts shall be generated almost entirely by the planned transport infrastructure related to the
construction of new routes, which requires prescribing environmental protection measures at the level of the
environmental impact assessment.
Road permeability, i.e. the intensity of barrier effects for other land mammals depends to a great extent on the
volume of traffic, and so far it has been found that roads with traffic density between 4000 and 10 000 vehicles/day
represent a significant barrier, while the traffic volume above 10 000 vehicles a day represents an insurmountable
barrier, not taking into account the fences surrounding the roads. According to the data of Croatian Roads Ltd.,
Croatia's state roads belong to the first category of barriers, while traffic denser than 10,000 vehicles per day is
present on motorways. Strategy measures include the construction of both road categories, suggesting a potentially
unfavourable impact on land mammals. However, the development of new roads shall results in the reduction in
the load on existing roads and thus their impact on wild species, and with the implementation of modern
construction technology and protection measures when designing the planned roads, these impacts would have a
moderately negative character.
By implementing Strategy measures related to the development of air and maritime transport and inland waterway
transport, given the definition of available data, no significant negative impacts on non-fragmented areas in the
Republic of Croatia are expected at the strategic level, as well as no significant generation of barrier effects on wild
species.
7.2.4.3.2 Favourable population status
Railways, as well as road traffic, cause the fatalities of wild species, which is directly reflected on the state of their
populations in nature, especially those species whose migratory routes have been cut off. The most frequent
fatalities are in areas densely inhabited by wild species, i.e. in areas of small anthropogenic influence. Large
carnivores are, due to the size of the population, particularly vulnerable to road traffic.
Bears are the most frequent fatalities in rail traffic, which according to available data have the second highest
mortality in traffic (after hunting), which accounts for 16% of total mortality, while railways cause about 70% of traffic
fatalities. The highest number of collisions between bears and trains was recorded in the mountainous part of
Croatia, which is in correlation with the population density (Figure 3.38). Particularly dangerous locations for large
carnivores are cuts and tunnel openings, where individual animals have shortened reaction times, but also the
inability to escape the train.
Given that the Strategy plans to develop the railway network from Zagreb to Rijeka, which includes new corridors
through the area of distribution of all three large carnivores (Figure 7.7), the adverse impacts of the Strategy R.3
measure on the status of their populations can not be excluded, given the percentage of fatalities of large carnivores
on the railway tracks particularly refers to the bear population (Figure 7.8, Figure 7.9). Data analysis found that new
railway routes, including both variants, are less invasive to such habitats than the existing railway corridor, while
still a large part of the planned route spatially coincides with the existing ones. This points to the conclusion that
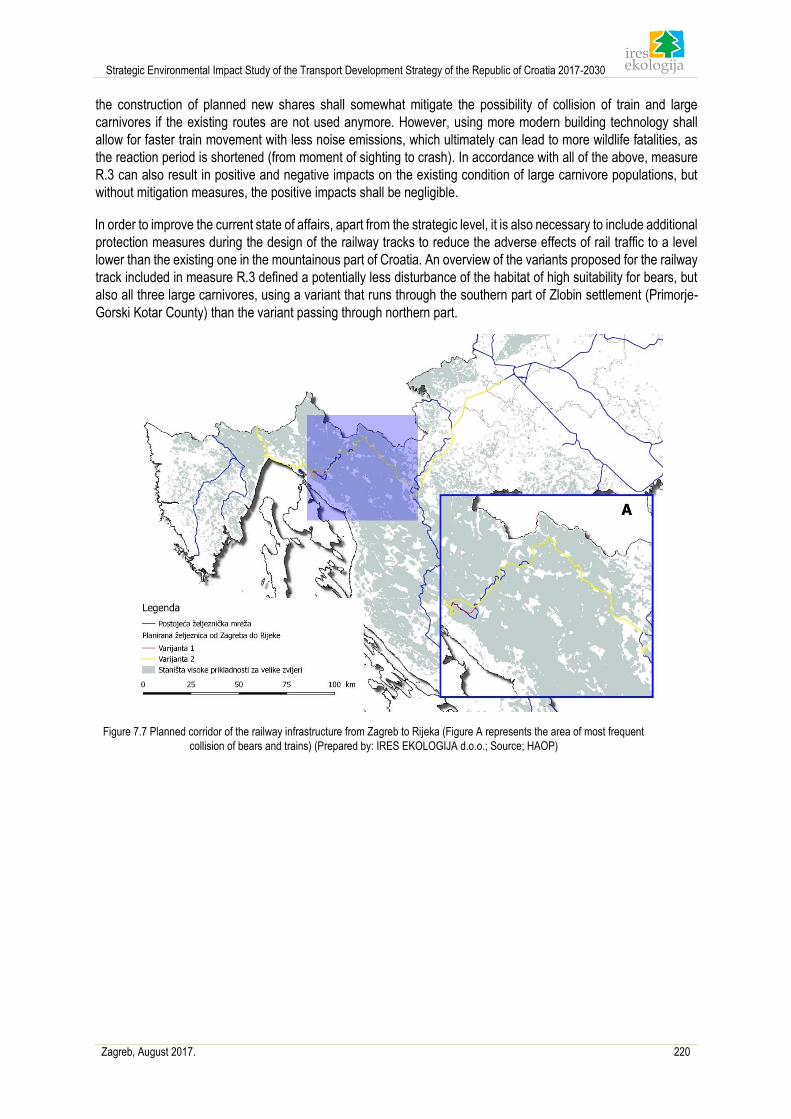
Strategic Environmental Impact Study of the Transport Development Strategy of the Republic of Croatia 2017-2030
Zagreb, August 2017. 220
the construction of planned new shares shall somewhat mitigate the possibility of collision of train and large
carnivores if the existing routes are not used anymore. However, using more modern building technology shall
allow for faster train movement with less noise emissions, which ultimately can lead to more wildlife fatalities, as
the reaction period is shortened (from moment of sighting to crash). In accordance with all of the above, measure
R.3 can also result in positive and negative impacts on the existing condition of large carnivore populations, but
without mitigation measures, the positive impacts shall be negligible.
In order to improve the current state of affairs, apart from the strategic level, it is also necessary to include additional
protection measures during the design of the railway tracks to reduce the adverse effects of rail traffic to a level
lower than the existing one in the mountainous part of Croatia. An overview of the variants proposed for the railway
track included in measure R.3 defined a potentially less disturbance of the habitat of high suitability for bears, but
also all three large carnivores, using a variant that runs through the southern part of Zlobin settlement (Primorje-
Gorski Kotar County) than the variant passing through northern part.
Figure 7.7 Planned corridor of the railway infrastructure from Zagreb to Rijeka (Figure A represents the area of most frequent
collision of bears and trains) (Prepared by: IRES EKOLOGIJA d.o.o.; Source; HAOP)
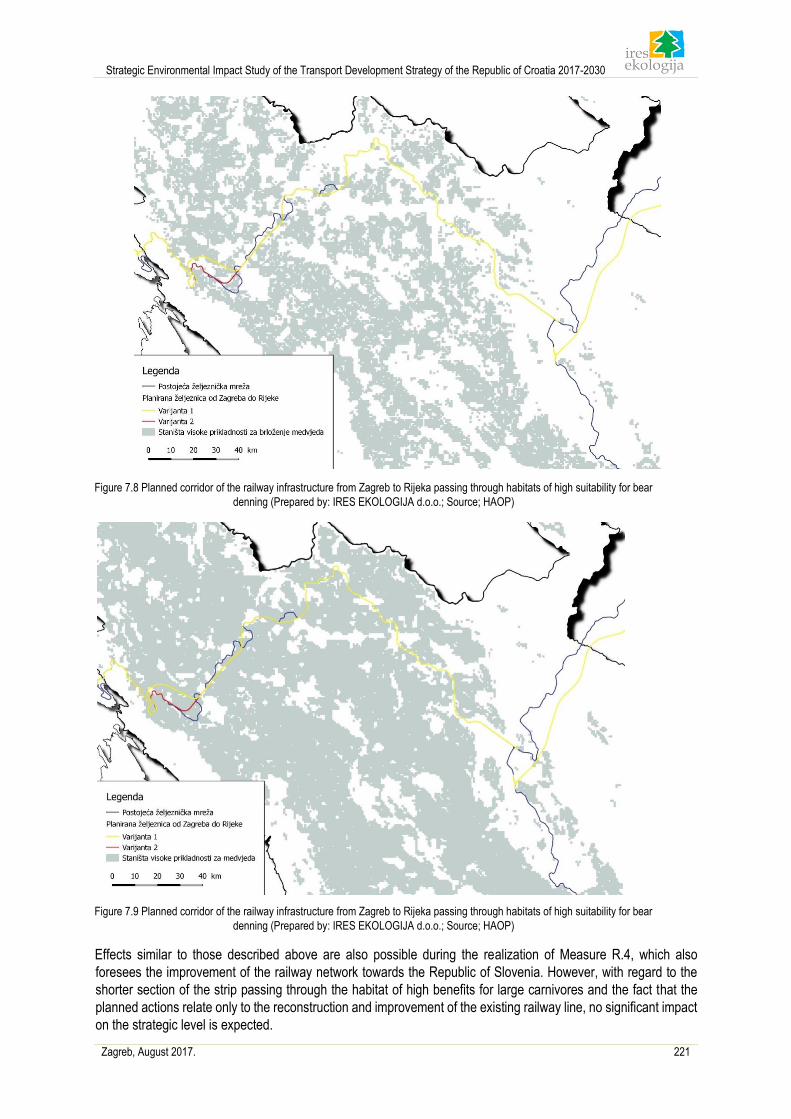
Strategic Environmental Impact Study of the Transport Development Strategy of the Republic of Croatia 2017-2030
Zagreb, August 2017. 221
Figure 7.8 Planned corridor of the railway infrastructure from Zagreb to Rijeka passing through habitats of high suitability for bear
denning (Prepared by: IRES EKOLOGIJA d.o.o.; Source; HAOP)
Figure 7.9 Planned corridor of the railway infrastructure from Zagreb to Rijeka passing through habitats of high suitability for bear
denning (Prepared by: IRES EKOLOGIJA d.o.o.; Source; HAOP)
Effects similar to those described above are also possible during the realization of Measure R.4, which also
foresees the improvement of the railway network towards the Republic of Slovenia. However, with regard to the
shorter section of the strip passing through the habitat of high benefits for large carnivores and the fact that the
planned actions relate only to the reconstruction and improvement of the existing railway line, no significant impact
on the strategic level is expected.
Strategic Environmental Impact Study of the Transport Development Strategy of the Republic of Croatia 2017-2030
Zagreb, August 2017. 222
During the implementation of the other measures envisaged in this Strategy related to the development of the
railway infrastructure, the expected negative impact on the wild species resulting from fatalities due to collisions
between individual animals and trains is of a moderate nature, according to the available data analysis.
Road transport closely related to the development of transport infrastructure is the cause of a large number of wild
species fatalities that is directly reflected on the state of their populations in nature. The development of road routes
covered by the Strategy can not exclude the negative impact of fatalities of large carnivorous animals in collisions
with vehicles, which applies to the same roads that shall affect the fragmentation of their habitats (Figure 7.3, Figure
7.4, Figure 7.5, Figure 7.6). The current tracking data of bear and wolf fatalities on roads described in Chapter
3.3.3.2 indicate the least frequent collisions on motorways, whereas, due to the size of the population of the three
large carnivores, the most endangered by this type of road are the bobcats because they can skip the protective
fence the easiest. Considering that within the area of distribution of the motorway planned by the Strategy (with the
exception of shorter routes of the road covered by the reorganization of the Split network), with a favourable
permeability in habitats suitable for large carnivores and their inability to access the surface, the expected impact
would not significantly affect the population of bear, wolf and bobcat In Croatia.
In addition to the aforementioned species, a large part of the land fauna of Croatia is endangered by road traffic,
which shall be further affected by the development of new traffic routes. For amphibians and reptiles there is no
statistically detailed data on the impact of single species on different categories of roads per area, but given the
spread of endangered species and their population density, at a strategic level it can be concluded that the roads
that pass through the areas of greater diversity and density also have a more intense impact on the national level.
The most varied areas are, as already mentioned in the Chapter on traffic impacts on non-fragmented areas,
Dalmatia, floodplain areas along the Sava, Danube and Drava rivers, while the types of dry semi-steppe grassland
in the lowland part of Croatia are particularly sensitive because they are located on very limited habitats.
Adverse impacts on birds and mammals (otter and beaver) are also possible. According to available data from the
Red Books, bird fatalities on the roads is not one of the main causes of endangerment of species characterized as
regionally extinct (RE), critically endangered (CR), endangered (EN) and vulnerable (VU), while endangered
mammals (except large carnivores) include especially the Eurasian beaver (Castor fiber) and the Eurasian otter
(Lutra lutra).
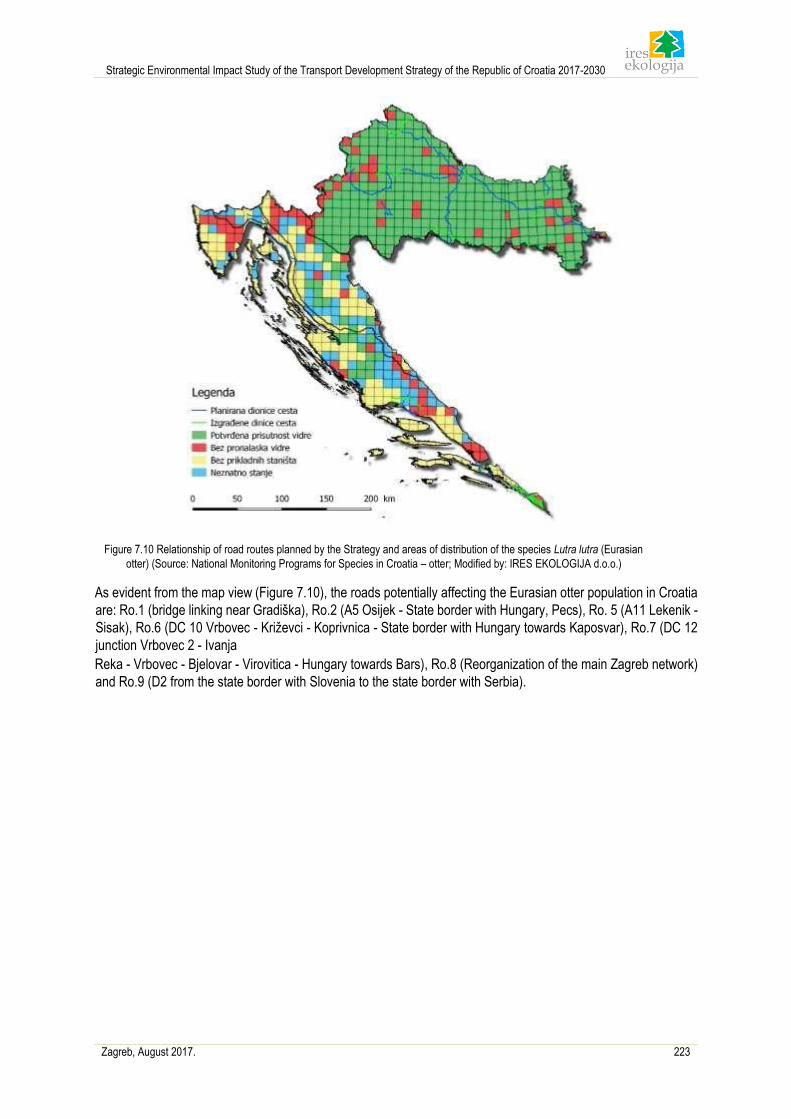
Strategic Environmental Impact Study of the Transport Development Strategy of the Republic of Croatia 2017-2030
Zagreb, August 2017. 223
Figure 7.10 Relationship of road routes planned by the Strategy and areas of distribution of the species Lutra lutra (Eurasian
otter) (Source: National Monitoring Programs for Species in Croatia – otter; Modified by: IRES EKOLOGIJA d.o.o.)
As evident from the map view (Figure 7.10), the roads potentially affecting the Eurasian otter population in Croatia
are: Ro.1 (bridge linking near Gradiška), Ro.2 (A5 Osijek - State border with Hungary, Pecs), Ro. 5 (A11 Lekenik -
Sisak), Ro.6 (DC 10 Vrbovec - Križevci - Koprivnica - State border with Hungary towards Kaposvar), Ro.7 (DC 12
junction Vrbovec 2 - Ivanja
Reka - Vrbovec - Bjelovar - Virovitica - Hungary towards Bars), Ro.8 (Reorganization of the main Zagreb network)
and Ro.9 (D2 from the state border with Slovenia to the state border with Serbia).
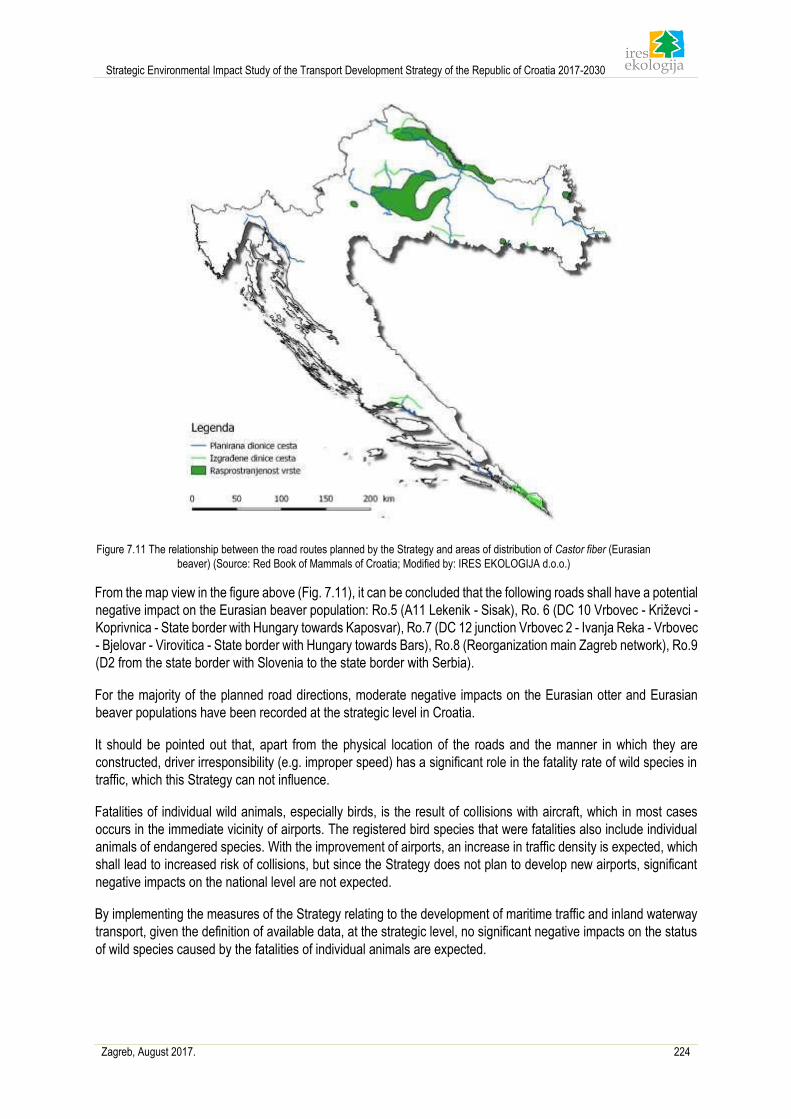
Strategic Environmental Impact Study of the Transport Development Strategy of the Republic of Croatia 2017-2030
Zagreb, August 2017. 224
Figure 7.11 The relationship between the road routes planned by the Strategy and areas of distribution of Castor fiber (Eurasian
beaver) (Source: Red Book of Mammals of Croatia; Modified by: IRES EKOLOGIJA d.o.o.)
From the map view in the figure above (Fig. 7.11), it can be concluded that the following roads shall have a potential
negative impact on the Eurasian beaver population: Ro.5 (A11 Lekenik - Sisak), Ro. 6 (DC 10 Vrbovec - Križevci -
Koprivnica - State border with Hungary towards Kaposvar), Ro.7 (DC 12 junction Vrbovec 2 - Ivanja Reka - Vrbovec
- Bjelovar - Virovitica - State border with Hungary towards Bars), Ro.8 (Reorganization main Zagreb network), Ro.9
(D2 from the state border with Slovenia to the state border with Serbia).
For the majority of the planned road directions, moderate negative impacts on the Eurasian otter and Eurasian
beaver populations have been recorded at the strategic level in Croatia.
It should be pointed out that, apart from the physical location of the roads and the manner in which they are
constructed, driver irresponsibility (e.g. improper speed) has a significant role in the fatality rate of wild species in
traffic, which this Strategy can not influence.
Fatalities of individual wild animals, especially birds, is the result of collisions with aircraft, which in most cases
occurs in the immediate vicinity of airports. The registered bird species that were fatalities also include individual
animals of endangered species. With the improvement of airports, an increase in traffic density is expected, which
shall lead to increased risk of collisions, but since the Strategy does not plan to develop new airports, significant
negative impacts on the national level are not expected.
By implementing the measures of the Strategy relating to the development of maritime traffic and inland waterway
transport, given the definition of available data, at the strategic level, no significant negative impacts on the status
of wild species caused by the fatalities of individual animals are expected.
Strategic Environmental Impact Study of the Transport Development Strategy of the Republic of Croatia 2017-2030
Zagreb, August 2017. 225
7.2.4.3.3 Occurrence of invasive species
According to the Strategic assessment, significant negative impacts are not expected with regard to the introduction
and expansion of invasive foreign species when implementing the Strategy measures related to the development
of railway and road infrastructure in the Republic of Croatia, as well as the development of airports.
Strategic measures that encompass the development of maritime traffic and inland waterway transport shall have a
potential impact on the status of invasive foreign species in the Republic of Croatia through the introduction of new
foreign species and the expansion of existing ones. The cause of this phenomenon is the increase in the volume of
national and international traffic, as well as the creation of new suitable habitats by the degradation of existing ones.
The most intensive quantitative and qualitative change in the status of invasive foreign species is expected in the
ports, since their reconstruction and construction shall open new suitable habitats. Given that the Strategy plans to
specialize existing ports, which are already under high anthropogenic influence, the realization of the measures
planned does not provide for a significant change in the current status of invasive species. There are similar
expectations for measures related to the construction of the existing river ports, but the Strategy also plans for the
construction of a new industrial jetty on the Danube in Ilok, the construction of a new eastern port in Vukovar and
the construction of a new infrastructure for the inland waterway traffic in Sisak, which shall result in favourable
conditions for the spreading of invasive species. Although the impacts shall be more intense, no significant change
in the status of invasive species is expected, as the subject areas have already been invaded.
Inland waterway transport in the Republic of Croatia has been present for many years, and the development of
existing ports and the planned construction of infrastructure elements on the Sava and Danube rivers refers to
existing waterways, and the impact of introducing new foreign species by vessels is of moderate character. The
impact of introducing new foreign species by increasing maritime traffic, given the definition of existing data, can
not be quantified.
The planned construction of the Danube - Sava canal shall also contribute to the introduction and spread of invasive
foreign species, thus creating numerous new habitats suitable for their settlement, as well as creating the
accelerated possibility of spreading to new surrounding areas, so the significant impact of this project can not be
excluded.
In 2013, the BALMAS project was launched, which is designed as a project to link the scientific research of the
Adriatic, experts and responsible national institutions to eliminate the undesirable risk to the environment and
humans by the transmission of harmful aquatic organisms and pathogens through the control and management of
marine ballast waters.
The project encompassed several sub-topics:
• preparing the zero state of sea in 12 Adriatic ports covered by the project (Bari, Ancona, Venice and Trieste
- Italy, Kopar - Slovenia, Pula, Rijeka, Šibenik, Split and Ploče - Croatia, Bar - Montenegro, Drač – Albania)
• creating a monitoring plan in ports,
• establishing an early warning system in ports,
• developing a system to support competent institutions for faster and more effective decision-making on
ballast water management.
7.2.4.3.4 Stress
Stress in individual animals of wild species that is caused by rail and road traffic is the result of noise and vibration
caused by the wheel and track (railway) interactions, engine noise and vehicle and road surface interactions, while
road traffic causes stress and light flash.
Improving the railway infrastructure shall result in the reduction in the noise levels in the environment caused by the
installation of new tracks, which would be neutralized with the increase in the train speed (higher train speed emits
noise of higher intensity), and the anticipated increase in rail traffic volume would lead to more frequent
environmental noise. However, at a strategic level, it is not possible to define the impact of noise on wild species in
Strategic Environmental Impact Study of the Transport Development Strategy of the Republic of Croatia 2017-2030
Zagreb, August 2017. 226
more detail due to the lack of more detailed data. On the other hand, with the fact that the railway noise has a lesser
effect on the wild species than noise caused by road traffic and that the noise generated by the train often prevents
animal and train collisions and taking into account that most of the measures in the Strategy relate to the
reconstruction and improvement of already existing railway lines, no significant negative impacts of traffic noise on
the biodiversity of Croatia are expected at a strategic level.
Stress caused by road traffic has the greatest impact on the bird and mammal group. As already mentioned above,
the decline in populations of open habitat birds has been noted already at traffic density of 5000 vehicles/day when
the vehicle movement is slower than 120 km/h, and at higher speeds, the population also decreases at a density of
3000 vehicles per day. Although it depends on the species, on average, forest bird species are more susceptible
than open-air birds, however, due to the nature of environmental noise distribution, the impact on forest habitats is
limited to somewhat smaller areas.
In accordance with the abovementioned, as well as the described effects of road traffic on the above indicators and
taking into account the data on the existing density of traffic on state roads and motorways in the Republic of Croatia
and the speed limitation, a more intense impact on bird species populations shall be generated by the development
of new motorways, which shall be most prominent in areas significant for them. However, by performing an
assessment at a strategic level, while respecting legal regulations and traffic constraints, the stress caused by the
implementation of the Strategy measures related to the development of road traffic shall not significantly affect
Croatia's ornithology.
Road traffic also has an impact on mammalian stress, which is mainly related to large mammals. The available
data indicates a reduced movement at a distance of 100 - 200 m from the road. The potential impact of stress on
mammals of road traffic at a strategic level was assessed as moderately negative.
With the development of new road routes, it is expected that the traffic on existing roads shall be relieved, thus
potentially reducing the stress in wild species in the areas of their impact, however, this positive impact is at a
strategic level is of very low intensity.
Stress in wild species caused by noise in the environment is a consequence of air traffic, but the impact of air traffic
noise has a lesser scope because it is closely related to the area of the airport and its surroundings. Given that the
Strategy plans to improve the existing ports, despite the increase in traffic volume, the expected impact on the
increased noise-induced stress is moderate.
Marine and river vessels by their action have an impact on increasing environmental noise, which generates impacts
on increased stress of wild species, particularly in aquatic habitats. Physical properties of water contribute to the
intensity of the influence. Data on the effects of noise on inland waterways on biodiversity are very scarce, while
the effects of noise on maritime transport are better explored, although still insufficient for the Adriatic. Despite the
lack of relevant data on the pollution of the Adriatic by noise, it can be concluded that this aspect of pollution is
present in the Adriatic and it is certainly reflected in the increase of the stress of marine organisms. According to
research carried out in the Northern Adriatic, it was established that noise affects the marine mammal (bottlenose
dolphin) and fish. The impact intensity is correlated with the tourist season and increased traffic volume (Rako et
al., 2013). At the strategic level, due to lack of data, it is not possible to estimate the extent to which the intensity of
noise in the Adriatic, the Sava and Danube rivers shall increase, as well as the negative impact on biodiversity, but
with the expected increase in maritime and river traffic noise. However, environmental protection measures can
mitigate the occurrence of significantly negative impacts on the marine environment.
7.2.4.3.5 Preservation of protected area features
The railway network of the Republic of Croatia has been conceived in a manner that avoids protected areas, which
has somewhat continued with the Strategy measures related to the further development of the railway infrastructure.
However, the railways planned by Strategy measures R.3 and R.9 enter the protected area with one part of the new
section of the route. Namely, the planned railway line from Karlovac to Rijeka passes through the edge of the
Japlenški vrh Forest Park, while the smaller part of the route crossing the border with Hungary - Osijek - the state
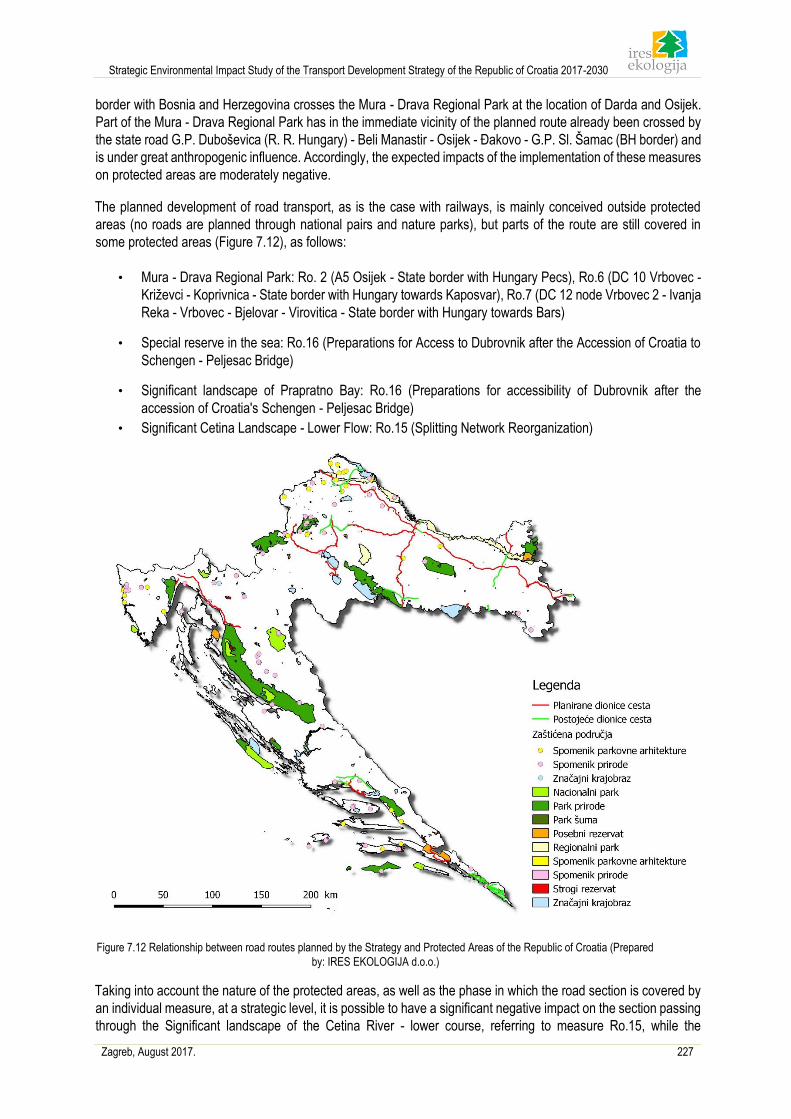
Strategic Environmental Impact Study of the Transport Development Strategy of the Republic of Croatia 2017-2030
Zagreb, August 2017. 227
border with Bosnia and Herzegovina crosses the Mura - Drava Regional Park at the location of Darda and Osijek.
Part of the Mura - Drava Regional Park has in the immediate vicinity of the planned route already been crossed by
the state road G.P. Duboševica (R. R. Hungary) - Beli Manastir - Osijek - Đakovo - G.P. Sl. Šamac (BH border) and
is under great anthropogenic influence. Accordingly, the expected impacts of the implementation of these measures
on protected areas are moderately negative.
The planned development of road transport, as is the case with railways, is mainly conceived outside protected
areas (no roads are planned through national pairs and nature parks), but parts of the route are still covered in
some protected areas (Figure 7.12), as follows:
• Mura - Drava Regional Park: Ro. 2 (A5 Osijek - State border with Hungary Pecs), Ro.6 (DC 10 Vrbovec -
Križevci - Koprivnica - State border with Hungary towards Kaposvar), Ro.7 (DC 12 node Vrbovec 2 - Ivanja
Reka - Vrbovec - Bjelovar - Virovitica - State border with Hungary towards Bars)
• Special reserve in the sea: Ro.16 (Preparations for Access to Dubrovnik after the Accession of Croatia to
Schengen - Peljesac Bridge)
• Significant landscape of Prapratno Bay: Ro.16 (Preparations for accessibility of Dubrovnik after the
accession of Croatia's Schengen - Peljesac Bridge)
• Significant Cetina Landscape - Lower Flow: Ro.15 (Splitting Network Reorganization)
Figure 7.12 Relationship between road routes planned by the Strategy and Protected Areas of the Republic of Croatia (Prepared
by: IRES EKOLOGIJA d.o.o.)
Taking into account the nature of the protected areas, as well as the phase in which the road section is covered by
an individual measure, at a strategic level, it is possible to have a significant negative impact on the section passing
through the Significant landscape of the Cetina River - lower course, referring to measure Ro.15, while the
Strategic Environmental Impact Study of the Transport Development Strategy of the Republic of Croatia 2017-2030
Zagreb, August 2017. 228
implementation of other measures would generate moderately negative impacts. Namely, the construction of the
traffic network along the lower course of the Cetina River can significantly distort the features of this protected area.
Existing airports covered by this Strategy are not located in protected areas and therefore shall not affect the
condition of their preservation.
Planned infrastructure related to the development of maritime and river transport is mainly located outside the
protected areas, while some measures envisage interventions on the outskirts of protected areas of nature, namely:
• M. 10 Specialization of the Port of Dubrovnik - Significant Landscape Rijeka Dubrovačka
• I. 3 Development of the Port of Vukovar - Special reserve of forest vegetation of Vukovar Danube Ait
• I. 4 Development of the Port of Osijek - Kopački rit Nature Park and Mura - Drava Regional Park
A potentially negative impact could arise as a result of the construction of a new eastern port in Vukovar that
would significantly deteriorate a part of the Vukovar Danube Ait Special Reserve for forest vegetation if the
planned port is planned to be located within the boundaries of the reserve. A significant negative impact can be
avoided by planning a port outside its boundaries.
7.2.4.3.6 Habitat endangerment
The realization of the Strategy's measures related to the development of railway and road infrastructure can lead
to a disruption of natural habitats, which only applies to measures providing for the construction of new routes,
while no additional negative impact on the level of strategic assessment is expected for reconstruction and
improvement measures. The construction of land transport infrastructure is mentioned as one of the main causes
of endangered forest habitats in Croatia.
A spatial data analysis, with a review of the already constructed sections of the transport infrastructure, has found
that a more noticeable disturbance in the forest habitats shall be caused by the realization of the measures of the
Strategy, which plan for the construction of new railway routes on the Karlovac - Rijeka, Zagreb junction and the
construction of new road routes Vrbovec 2 - Hungarian border Towards Barč, Križišće - Žuta Lokva, Permani -
Grobnicko polje, Zagreb Ring (reorganization of the Zagreb network) and new road roads in the Dubrovnik-Neretva
County. Namely, the realization of these measures would lead to the loss and fragmentation of forest habitats.
By inspecting the variants proposed for the section of the Karovac - Rijeka railway line, a smaller loss of forest
habitat was found for the variant that passes through the southern part of Zlobin settlement (Primorje-Gorski Kotar
County) than the variant passing through its northern part.
The most prominent impact of the loss and degradation of forest habitats would be evident in the continental region
of Croatia, where mostly the construction of new railway lines, according to the map of habitats, would cause
disturbances of mixed oak-hornbeam and exclusively hornbeam forests, while road traffic would deteriorate the
above mentioned habitats, as well as the habitats of Central European neutrophilic to low-dideophilous, mesophilic
beech forests. However, given the character of the project and the share of loss of certain forest habitats in their
total surface in some biogeographic regions of Croatia, at strategic level the impacts are moderately negative.
It should be noted that certain measures provide for the development of railway and road corridors through larger
rivers, i.e. through inland water habitats, which shall lead to the construction of bridge crossings. The planned
section of the Karlovac - Rijeka railway crosses the Mrežnica River into two places, the Zagreb junction route
crosses the Sava river at three locations, while the route Hungarian border - Osijek crosses the Drava river at the
Retfala settlement in Osijek.
Road traffic development measures that affect inland waters by building bridges are:
• Ro. 1 bridge connection over the Sava river between Croatia and BH near Gradiška on the corridor
Hungarian border - Virovitica - Okučani – BH border
• Ro. 3 bridge connection over the Sava river between Croatia and BH near Svilaj on the A5 from A3
motorway corridor to the BH border
Strategic Environmental Impact Study of the Transport Development Strategy of the Republic of Croatia 2017-2030
Zagreb, August 2017. 229
• Ro. 5 which with its last route passes at two locations across the Kupa river
• Ro. 9 bridge connection over the Drava river between Croatia and Slovenia on the road corridor DC 2
The construction of bridges could deteriorate the characteristics of aquatic habitats, but at a strategic level, given
the character and range of potential impacts, they are characterized as moderate.
By analyzing the data from the cadastre of speleological objects, the planned routes of the railway and road
infrastructure and the areas of the sea ports, it has been established that a large number of planned projects enter
the areas of recorded speleological objects. Speleological objects are habitats rich in endemic endangered species
and are extremely sensitive to external influences that may be caused by the construction of a transport
infrastructure. Given that squares in the cadastre of speleological objects occupy 1 km2, the precise intensity of
influence can not be identified at a strategic level. Possible significant negative impacts shall be identified at the
project level, when their intensity can be accurately defined, and, depending on the field situation, impact mitigation
measures can be proposed.
The planned improvement of airports may lead to the occupation of habitats whose status is characterized as
endangered, however, given the definition of available data, the potential share of the affected shall not be of
significant character.
The Strategy measures that encompass the development of maritime traffic and inland waterway transport shall
potentially affect the degree of vulnerability of habitats in the Republic of Croatia through their loss and disturbance
during the implementation of the measures planned. The most intense impact is expected in the ports, as their
reconstruction and construction shall permanently affect the quality of the habitat, or increase the anthropogenic
character. However, the Strategy plans for the specialization of existing seaports, which are already under high
anthropogenic influence and the implementation of the measures planned does not provide for a significant change
in the degree of habitat endangerment, which does not refer to habitats in speleological objects. There are similar
expectations for measures related to the expansion of the existing river ports (other than the impact on the
speleological objects not located near the planned ports of inland navigation), but the Strategy also foresees the
construction of a new industrial jetty on the Danube in Ilok, the construction of a new eastern port of Vukovar and
the construction of a new infrastructure for Sisak inland waterways, which shall result in more intense impacts.
Although the impacts shall be more intense, no significant change in the degree of vulnerability is expected, as a
large share of the area is already under certain anthropogenic impact, while habitats unpopulated by human activity
are negligible at the national level.
The aforementioned does not apply to the planned construction of the Danube - Sava canal, which shall also affect
the natural and semi-natural habitats, but in a much larger and more significant volume. The most intense impacts
would be evident on the surrounding stands of oak trees, which would be particularly affected by changes in the
groundwater dynamics resulting from the construction of the canal. If the groundwater permanently drops more
than 0.5 m, the oak tree physiologically weakens and is dried. The same happens if the groundwater level is
permanently raised and produces a swamp effect on the ground where the roots of oak trees are located. The
above impacts are described in more detail in the Chapter on impact on forestry. Significant damage to oak forests
would greatly reduce the habitat for numerous and varied fauna of the area. Accordingly, significant impacts
resulting from the realization of measure I 7 can not be excluded.
An additional significant impact on the development of inland waterways on inland waters and surrounding habitats
would be caused by a need for an increase in the water flow, which would require additional works on deepening,
extending and streamlining.
Cumulative impacts
Measures of the Strategy that can have a cumulative impact through common interaction are related to the
development of railway and road infrastructure, while for other types of traffic at a strategic level, this type of impact
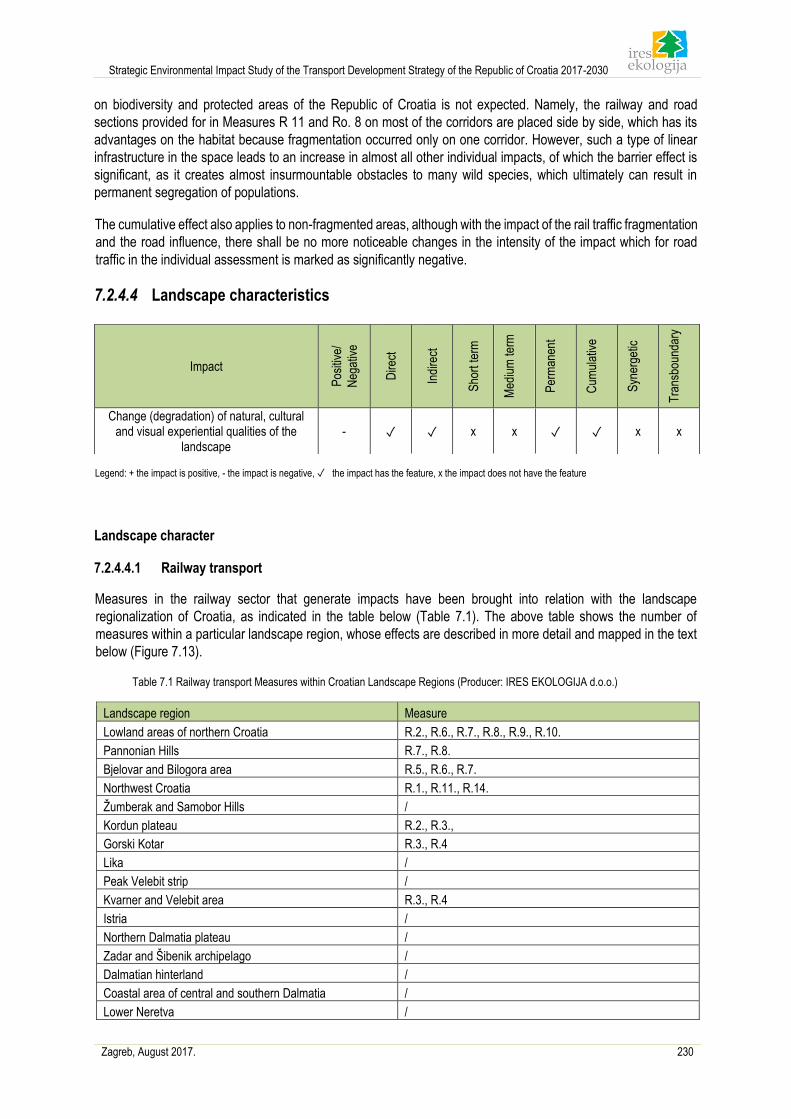
Strategic Environmental Impact Study of the Transport Development Strategy of the Republic of Croatia 2017-2030
Zagreb, August 2017. 230
on biodiversity and protected areas of the Republic of Croatia is not expected. Namely, the railway and road
sections provided for in Measures R 11 and Ro. 8 on most of the corridors are placed side by side, which has its
advantages on the habitat because fragmentation occurred only on one corridor. However, such a type of linear
infrastructure in the space leads to an increase in almost all other individual impacts, of which the barrier effect is
significant, as it creates almost insurmountable obstacles to many wild species, which ultimately can result in
permanent segregation of populations.
The cumulative effect also applies to non-fragmented areas, although with the impact of the rail traffic fragmentation
and the road influence, there shall be no more noticeable changes in the intensity of the impact which for road
traffic in the individual assessment is marked as significantly negative.
7.2.4.4 Landscape characteristics
Legend: + the impact is positive, - the impact is negative, ✓ the impact has the feature, x the impact does not have the feature
Landscape character
7.2.4.4.1 Railway transport
Measures in the railway sector that generate impacts have been brought into relation with the landscape
regionalization of Croatia, as indicated in the table below (Table 7.1). The above table shows the number of
measures within a particular landscape region, whose effects are described in more detail and mapped in the text
below (Figure 7.13).
Table 7.1 Railway transport Measures within Croatian Landscape Regions (Producer: IRES EKOLOGIJA d.o.o.)
Landscape region Measure
Lowland areas of northern Croatia R.2., R.6., R.7., R.8., R.9., R.10.
Pannonian Hills R.7., R.8.
Bjelovar and Bilogora area R.5., R.6., R.7.
Northwest Croatia R.1., R.11., R.14.
Žumberak and Samobor Hills /
Kordun plateau R.2., R.3.,
Gorski Kotar R.3., R.4
Lika /
Peak Velebit strip /
Kvarner and Velebit area R.3., R.4
Istria /
Northern Dalmatia plateau /
Zadar and Šibenik archipelago /
Dalmatian hinterland /
Coastal area of central and southern Dalmatia /
Lower Neretva /
Impact
Pos
itive
/
Neg
ativ
e
Dire
ct
Indi
rect
Sho
rt te
rm
Med
ium
term
Per
man
ent
Cum
ulat
ive
Syn
erge
tic
Tra
nsbo
unda
ry
Change (degradation) of natural, cultural and visual experiential qualities of the
landscape - ✓ ✓ x x ✓ ✓ x x
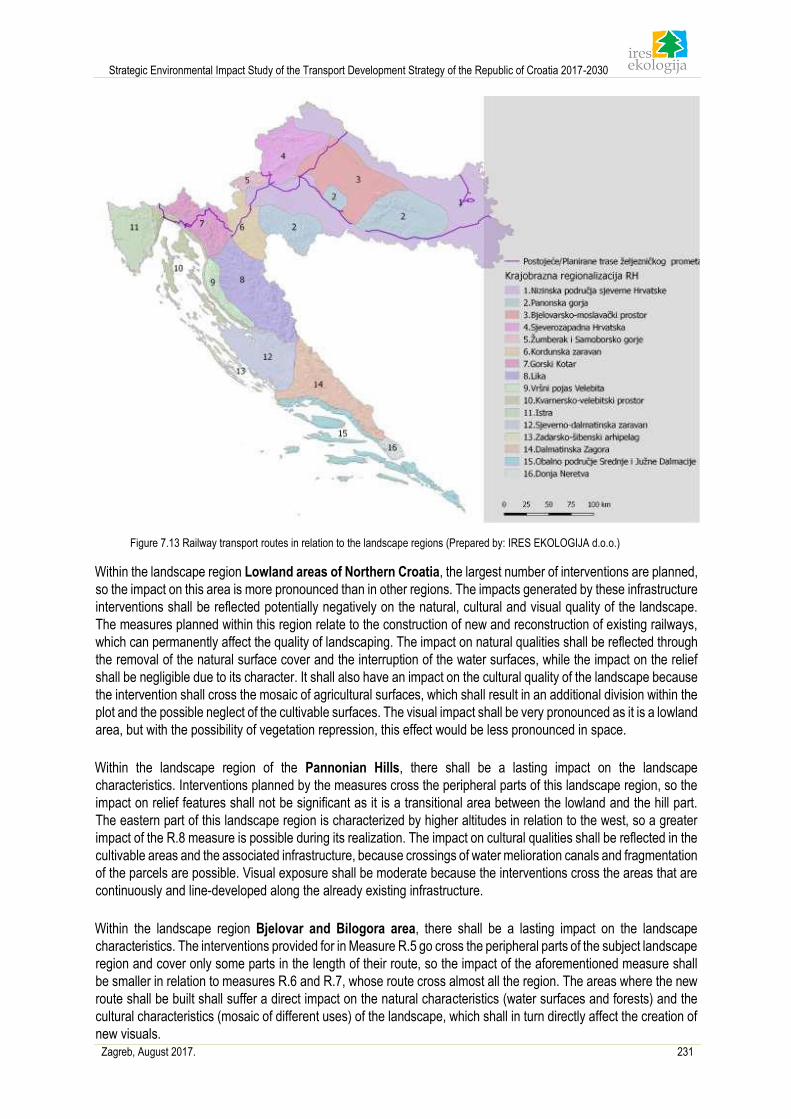
Strategic Environmental Impact Study of the Transport Development Strategy of the Republic of Croatia 2017-2030
Zagreb, August 2017. 231
Figure 7.13 Railway transport routes in relation to the landscape regions (Prepared by: IRES EKOLOGIJA d.o.o.)
Within the landscape region Lowland areas of Northern Croatia, the largest number of interventions are planned,
so the impact on this area is more pronounced than in other regions. The impacts generated by these infrastructure
interventions shall be reflected potentially negatively on the natural, cultural and visual quality of the landscape.
The measures planned within this region relate to the construction of new and reconstruction of existing railways,
which can permanently affect the quality of landscaping. The impact on natural qualities shall be reflected through
the removal of the natural surface cover and the interruption of the water surfaces, while the impact on the relief
shall be negligible due to its character. It shall also have an impact on the cultural quality of the landscape because
the intervention shall cross the mosaic of agricultural surfaces, which shall result in an additional division within the
plot and the possible neglect of the cultivable surfaces. The visual impact shall be very pronounced as it is a lowland
area, but with the possibility of vegetation repression, this effect would be less pronounced in space.
Within the landscape region of the Pannonian Hills, there shall be a lasting impact on the landscape
characteristics. Interventions planned by the measures cross the peripheral parts of this landscape region, so the
impact on relief features shall not be significant as it is a transitional area between the lowland and the hill part.
The eastern part of this landscape region is characterized by higher altitudes in relation to the west, so a greater
impact of the R.8 measure is possible during its realization. The impact on cultural qualities shall be reflected in the
cultivable areas and the associated infrastructure, because crossings of water melioration canals and fragmentation
of the parcels are possible. Visual exposure shall be moderate because the interventions cross the areas that are
continuously and line-developed along the already existing infrastructure.
Within the landscape region Bjelovar and Bilogora area, there shall be a lasting impact on the landscape
characteristics. The interventions provided for in Measure R.5 go cross the peripheral parts of the subject landscape
region and cover only some parts in the length of their route, so the impact of the aforementioned measure shall
be smaller in relation to measures R.6 and R.7, whose route cross almost all the region. The areas where the new
route shall be built shall suffer a direct impact on the natural characteristics (water surfaces and forests) and the
cultural characteristics (mosaic of different uses) of the landscape, which shall in turn directly affect the creation of
new visuals.
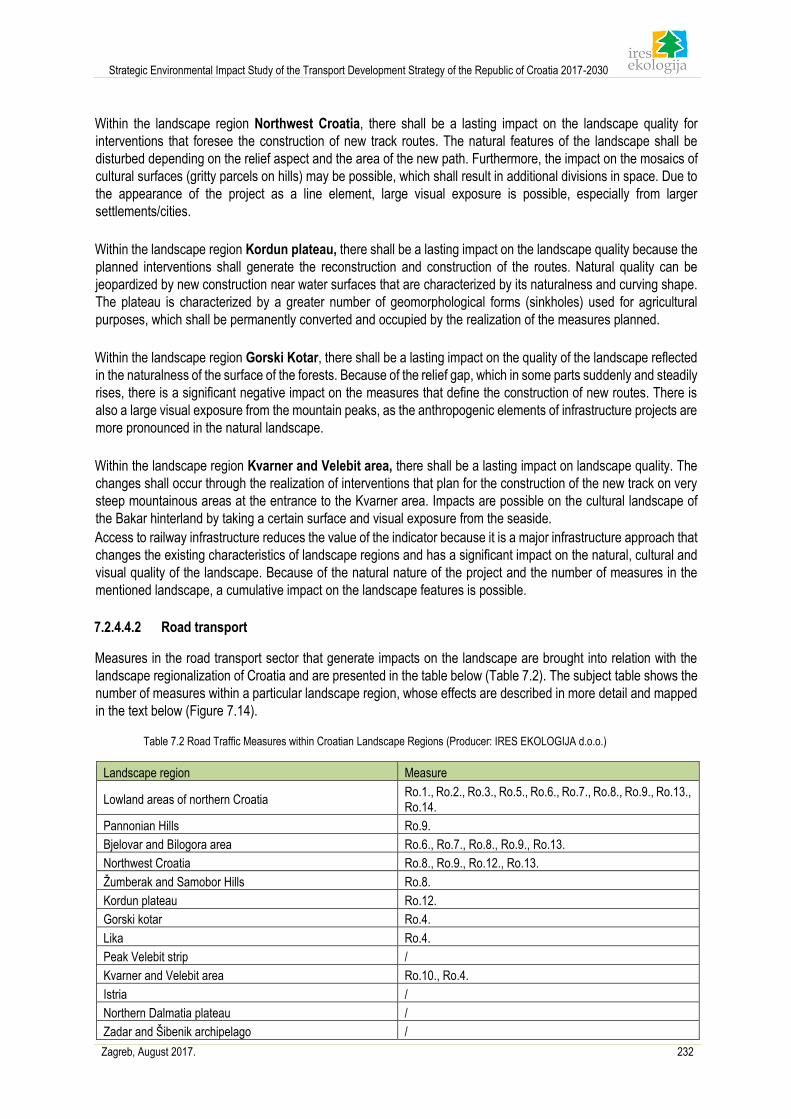
Strategic Environmental Impact Study of the Transport Development Strategy of the Republic of Croatia 2017-2030
Zagreb, August 2017. 232
Within the landscape region Northwest Croatia, there shall be a lasting impact on the landscape quality for
interventions that foresee the construction of new track routes. The natural features of the landscape shall be
disturbed depending on the relief aspect and the area of the new path. Furthermore, the impact on the mosaics of
cultural surfaces (gritty parcels on hills) may be possible, which shall result in additional divisions in space. Due to
the appearance of the project as a line element, large visual exposure is possible, especially from larger
settlements/cities.
Within the landscape region Kordun plateau, there shall be a lasting impact on the landscape quality because the
planned interventions shall generate the reconstruction and construction of the routes. Natural quality can be
jeopardized by new construction near water surfaces that are characterized by its naturalness and curving shape.
The plateau is characterized by a greater number of geomorphological forms (sinkholes) used for agricultural
purposes, which shall be permanently converted and occupied by the realization of the measures planned.
Within the landscape region Gorski Kotar, there shall be a lasting impact on the quality of the landscape reflected
in the naturalness of the surface of the forests. Because of the relief gap, which in some parts suddenly and steadily
rises, there is a significant negative impact on the measures that define the construction of new routes. There is
also a large visual exposure from the mountain peaks, as the anthropogenic elements of infrastructure projects are
more pronounced in the natural landscape.
Within the landscape region Kvarner and Velebit area, there shall be a lasting impact on landscape quality. The
changes shall occur through the realization of interventions that plan for the construction of the new track on very
steep mountainous areas at the entrance to the Kvarner area. Impacts are possible on the cultural landscape of
the Bakar hinterland by taking a certain surface and visual exposure from the seaside.
Access to railway infrastructure reduces the value of the indicator because it is a major infrastructure approach that
changes the existing characteristics of landscape regions and has a significant impact on the natural, cultural and
visual quality of the landscape. Because of the natural nature of the project and the number of measures in the
mentioned landscape, a cumulative impact on the landscape features is possible.
7.2.4.4.2 Road transport
Measures in the road transport sector that generate impacts on the landscape are brought into relation with the
landscape regionalization of Croatia and are presented in the table below (Table 7.2). The subject table shows the
number of measures within a particular landscape region, whose effects are described in more detail and mapped
in the text below (Figure 7.14).
Table 7.2 Road Traffic Measures within Croatian Landscape Regions (Producer: IRES EKOLOGIJA d.o.o.)
Landscape region Measure
Lowland areas of northern Croatia Ro.1., Ro.2., Ro.3., Ro.5., Ro.6., Ro.7., Ro.8., Ro.9., Ro.13., Ro.14.
Pannonian Hills Ro.9.
Bjelovar and Bilogora area Ro.6., Ro.7., Ro.8., Ro.9., Ro.13.
Northwest Croatia Ro.8., Ro.9., Ro.12., Ro.13.
Žumberak and Samobor Hills Ro.8.
Kordun plateau Ro.12.
Gorski kotar Ro.4.
Lika Ro.4.
Peak Velebit strip /
Kvarner and Velebit area Ro.10., Ro.4.
Istria /
Northern Dalmatia plateau /
Zadar and Šibenik archipelago /
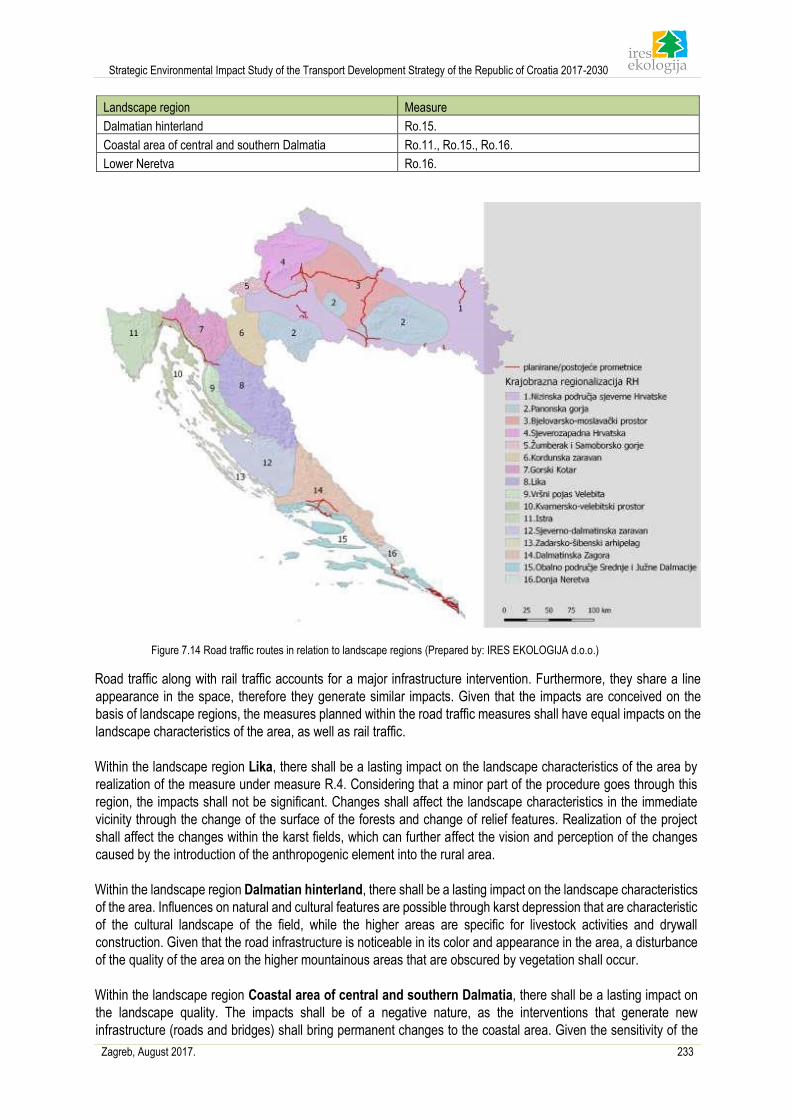
Strategic Environmental Impact Study of the Transport Development Strategy of the Republic of Croatia 2017-2030
Zagreb, August 2017. 233
Landscape region Measure
Dalmatian hinterland Ro.15.
Coastal area of central and southern Dalmatia Ro.11., Ro.15., Ro.16.
Lower Neretva Ro.16.
Figure 7.14 Road traffic routes in relation to landscape regions (Prepared by: IRES EKOLOGIJA d.o.o.)
Road traffic along with rail traffic accounts for a major infrastructure intervention. Furthermore, they share a line
appearance in the space, therefore they generate similar impacts. Given that the impacts are conceived on the
basis of landscape regions, the measures planned within the road traffic measures shall have equal impacts on the
landscape characteristics of the area, as well as rail traffic.
Within the landscape region Lika, there shall be a lasting impact on the landscape characteristics of the area by
realization of the measure under measure R.4. Considering that a minor part of the procedure goes through this
region, the impacts shall not be significant. Changes shall affect the landscape characteristics in the immediate
vicinity through the change of the surface of the forests and change of relief features. Realization of the project
shall affect the changes within the karst fields, which can further affect the vision and perception of the changes
caused by the introduction of the anthropogenic element into the rural area.
Within the landscape region Dalmatian hinterland, there shall be a lasting impact on the landscape characteristics
of the area. Influences on natural and cultural features are possible through karst depression that are characteristic
of the cultural landscape of the field, while the higher areas are specific for livestock activities and drywall
construction. Given that the road infrastructure is noticeable in its color and appearance in the area, a disturbance
of the quality of the area on the higher mountainous areas that are obscured by vegetation shall occur.
Within the landscape region Coastal area of central and southern Dalmatia, there shall be a lasting impact on
the landscape quality. The impacts shall be of a negative nature, as the interventions that generate new
infrastructure (roads and bridges) shall bring permanent changes to the coastal area. Given the sensitivity of the
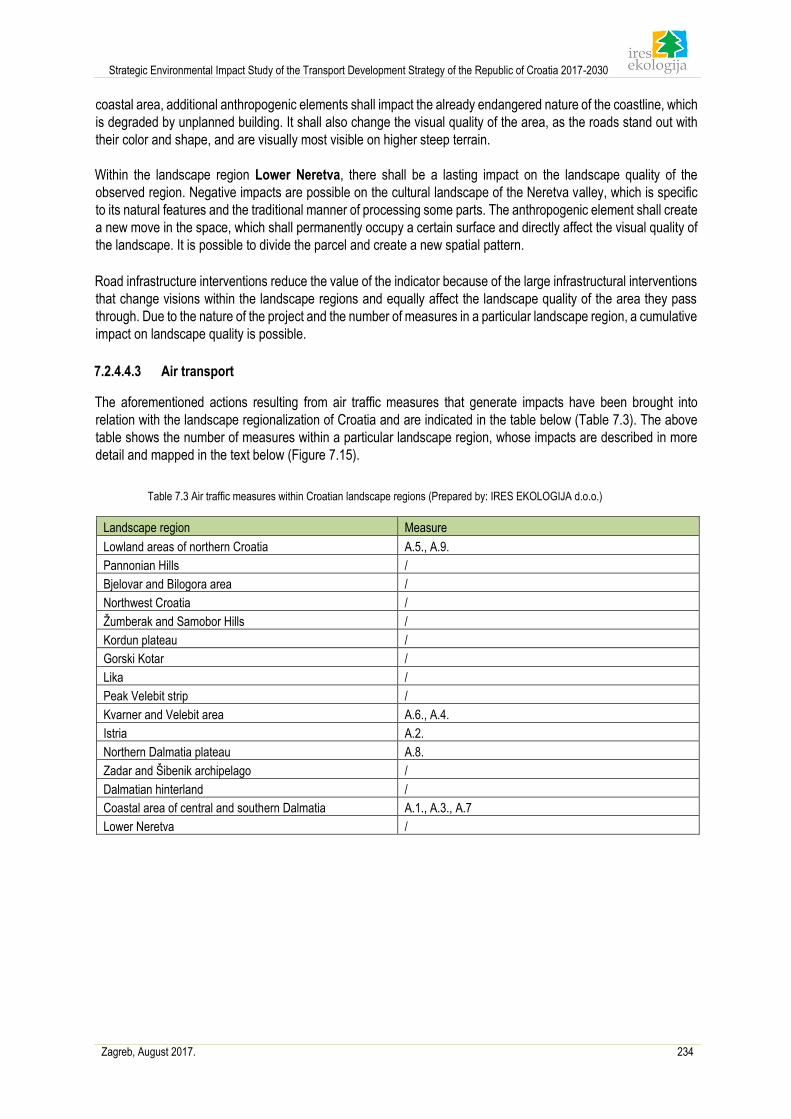
Strategic Environmental Impact Study of the Transport Development Strategy of the Republic of Croatia 2017-2030
Zagreb, August 2017. 234
coastal area, additional anthropogenic elements shall impact the already endangered nature of the coastline, which
is degraded by unplanned building. It shall also change the visual quality of the area, as the roads stand out with
their color and shape, and are visually most visible on higher steep terrain.
Within the landscape region Lower Neretva, there shall be a lasting impact on the landscape quality of the
observed region. Negative impacts are possible on the cultural landscape of the Neretva valley, which is specific
to its natural features and the traditional manner of processing some parts. The anthropogenic element shall create
a new move in the space, which shall permanently occupy a certain surface and directly affect the visual quality of
the landscape. It is possible to divide the parcel and create a new spatial pattern.
Road infrastructure interventions reduce the value of the indicator because of the large infrastructural interventions
that change visions within the landscape regions and equally affect the landscape quality of the area they pass
through. Due to the nature of the project and the number of measures in a particular landscape region, a cumulative
impact on landscape quality is possible.
7.2.4.4.3 Air transport
The aforementioned actions resulting from air traffic measures that generate impacts have been brought into
relation with the landscape regionalization of Croatia and are indicated in the table below (Table 7.3). The above
table shows the number of measures within a particular landscape region, whose impacts are described in more
detail and mapped in the text below (Figure 7.15).
Table 7.3 Air traffic measures within Croatian landscape regions (Prepared by: IRES EKOLOGIJA d.o.o.)
Landscape region Measure
Lowland areas of northern Croatia A.5., A.9.
Pannonian Hills /
Bjelovar and Bilogora area /
Northwest Croatia /
Žumberak and Samobor Hills /
Kordun plateau /
Gorski Kotar /
Lika /
Peak Velebit strip /
Kvarner and Velebit area A.6., A.4.
Istria A.2.
Northern Dalmatia plateau A.8.
Zadar and Šibenik archipelago /
Dalmatian hinterland /
Coastal area of central and southern Dalmatia A.1., A.3., A.7
Lower Neretva /
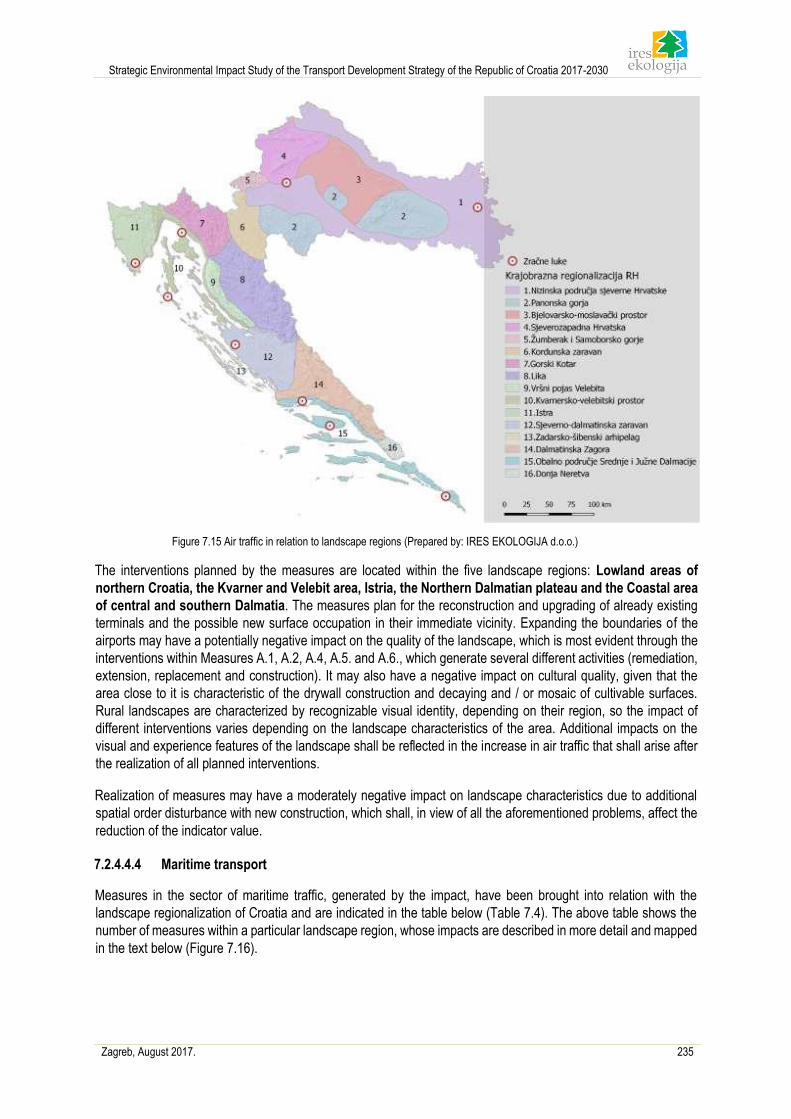
Strategic Environmental Impact Study of the Transport Development Strategy of the Republic of Croatia 2017-2030
Zagreb, August 2017. 235
Figure 7.15 Air traffic in relation to landscape regions (Prepared by: IRES EKOLOGIJA d.o.o.)
The interventions planned by the measures are located within the five landscape regions: Lowland areas of
northern Croatia, the Kvarner and Velebit area, Istria, the Northern Dalmatian plateau and the Coastal area
of central and southern Dalmatia. The measures plan for the reconstruction and upgrading of already existing
terminals and the possible new surface occupation in their immediate vicinity. Expanding the boundaries of the
airports may have a potentially negative impact on the quality of the landscape, which is most evident through the
interventions within Measures A.1, A.2, A.4, A.5. and A.6., which generate several different activities (remediation,
extension, replacement and construction). It may also have a negative impact on cultural quality, given that the
area close to it is characteristic of the drywall construction and decaying and / or mosaic of cultivable surfaces.
Rural landscapes are characterized by recognizable visual identity, depending on their region, so the impact of
different interventions varies depending on the landscape characteristics of the area. Additional impacts on the
visual and experience features of the landscape shall be reflected in the increase in air traffic that shall arise after
the realization of all planned interventions.
Realization of measures may have a moderately negative impact on landscape characteristics due to additional
spatial order disturbance with new construction, which shall, in view of all the aforementioned problems, affect the
reduction of the indicator value.
7.2.4.4.4 Maritime transport
Measures in the sector of maritime traffic, generated by the impact, have been brought into relation with the
landscape regionalization of Croatia and are indicated in the table below (Table 7.4). The above table shows the
number of measures within a particular landscape region, whose impacts are described in more detail and mapped
in the text below (Figure 7.16).
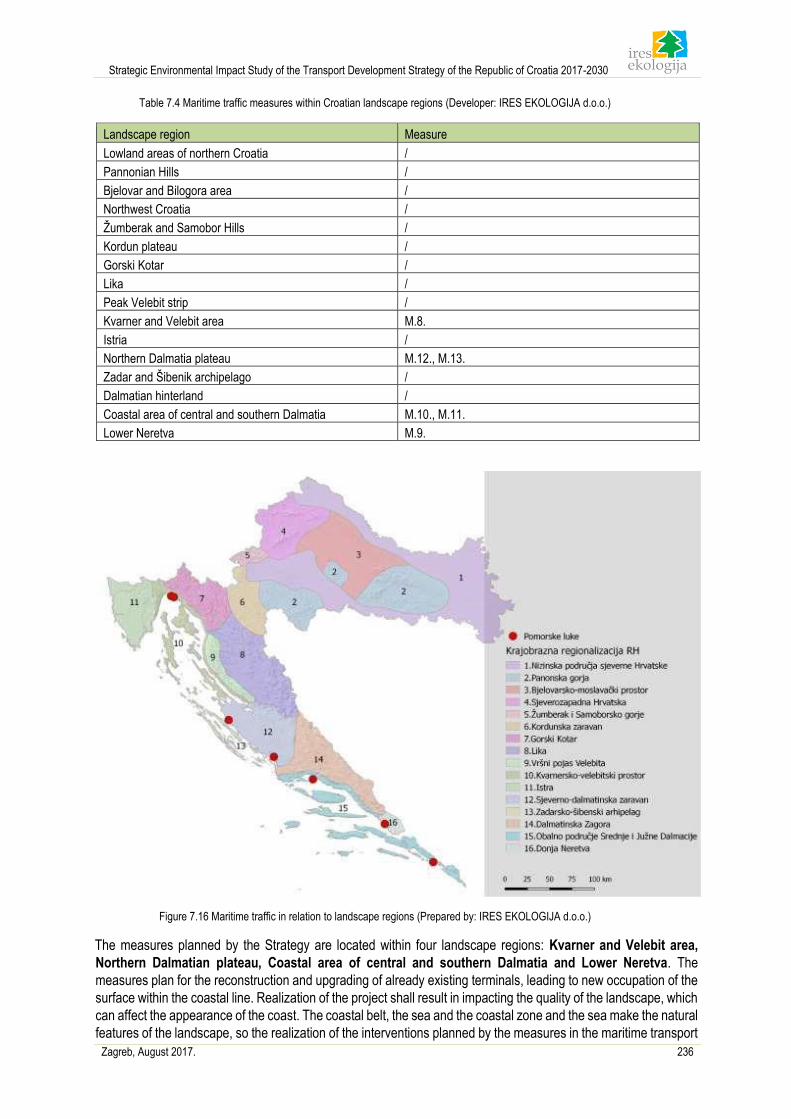
Strategic Environmental Impact Study of the Transport Development Strategy of the Republic of Croatia 2017-2030
Zagreb, August 2017. 236
Table 7.4 Maritime traffic measures within Croatian landscape regions (Developer: IRES EKOLOGIJA d.o.o.)
Landscape region Measure
Lowland areas of northern Croatia /
Pannonian Hills /
Bjelovar and Bilogora area /
Northwest Croatia /
Žumberak and Samobor Hills /
Kordun plateau /
Gorski Kotar /
Lika /
Peak Velebit strip /
Kvarner and Velebit area M.8.
Istria /
Northern Dalmatia plateau M.12., M.13.
Zadar and Šibenik archipelago /
Dalmatian hinterland /
Coastal area of central and southern Dalmatia M.10., M.11.
Lower Neretva M.9.
Figure 7.16 Maritime traffic in relation to landscape regions (Prepared by: IRES EKOLOGIJA d.o.o.)
The measures planned by the Strategy are located within four landscape regions: Kvarner and Velebit area,
Northern Dalmatian plateau, Coastal area of central and southern Dalmatia and Lower Neretva. The
measures plan for the reconstruction and upgrading of already existing terminals, leading to new occupation of the
surface within the coastal line. Realization of the project shall result in impacting the quality of the landscape, which
can affect the appearance of the coast. The coastal belt, the sea and the coastal zone and the sea make the natural
features of the landscape, so the realization of the interventions planned by the measures in the maritime transport
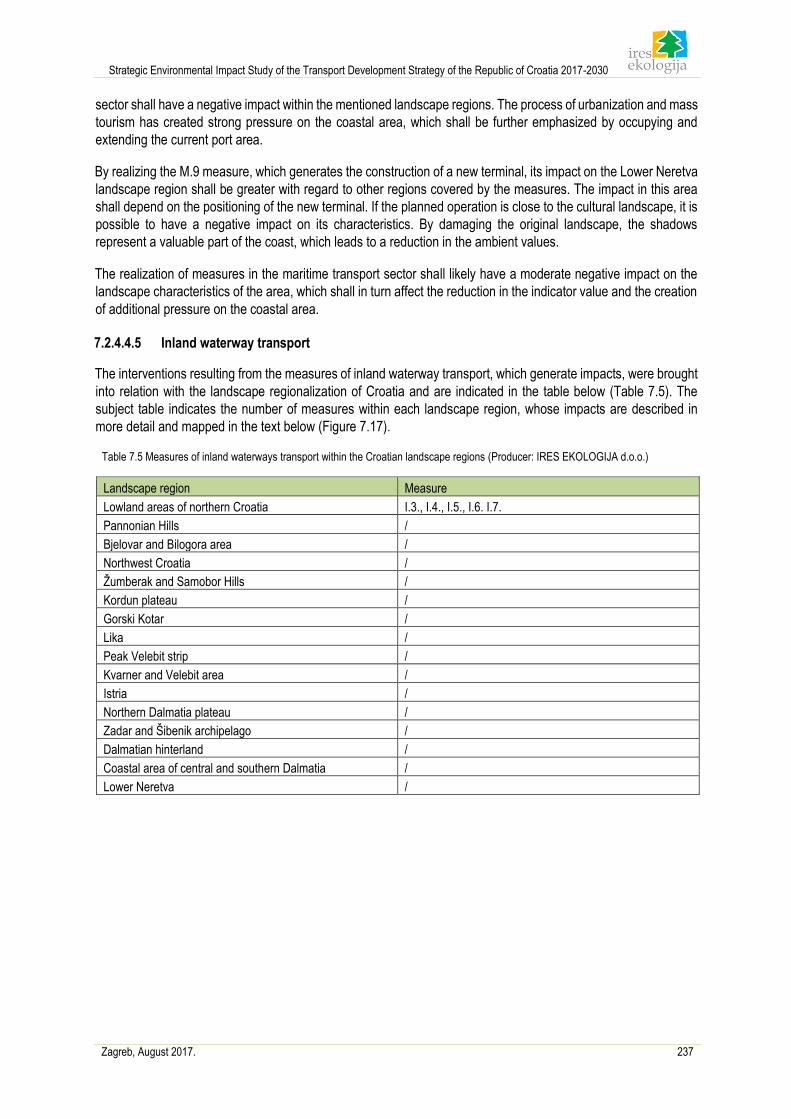
Strategic Environmental Impact Study of the Transport Development Strategy of the Republic of Croatia 2017-2030
Zagreb, August 2017. 237
sector shall have a negative impact within the mentioned landscape regions. The process of urbanization and mass
tourism has created strong pressure on the coastal area, which shall be further emphasized by occupying and
extending the current port area.
By realizing the M.9 measure, which generates the construction of a new terminal, its impact on the Lower Neretva
landscape region shall be greater with regard to other regions covered by the measures. The impact in this area
shall depend on the positioning of the new terminal. If the planned operation is close to the cultural landscape, it is
possible to have a negative impact on its characteristics. By damaging the original landscape, the shadows
represent a valuable part of the coast, which leads to a reduction in the ambient values.
The realization of measures in the maritime transport sector shall likely have a moderate negative impact on the
landscape characteristics of the area, which shall in turn affect the reduction in the indicator value and the creation
of additional pressure on the coastal area.
7.2.4.4.5 Inland waterway transport
The interventions resulting from the measures of inland waterway transport, which generate impacts, were brought
into relation with the landscape regionalization of Croatia and are indicated in the table below (Table 7.5). The
subject table indicates the number of measures within each landscape region, whose impacts are described in
more detail and mapped in the text below (Figure 7.17).
Table 7.5 Measures of inland waterways transport within the Croatian landscape regions (Producer: IRES EKOLOGIJA d.o.o.)
Landscape region Measure
Lowland areas of northern Croatia I.3., I.4., I.5., I.6. I.7.
Pannonian Hills /
Bjelovar and Bilogora area /
Northwest Croatia /
Žumberak and Samobor Hills /
Kordun plateau /
Gorski Kotar /
Lika /
Peak Velebit strip /
Kvarner and Velebit area /
Istria /
Northern Dalmatia plateau /
Zadar and Šibenik archipelago /
Dalmatian hinterland /
Coastal area of central and southern Dalmatia /
Lower Neretva /
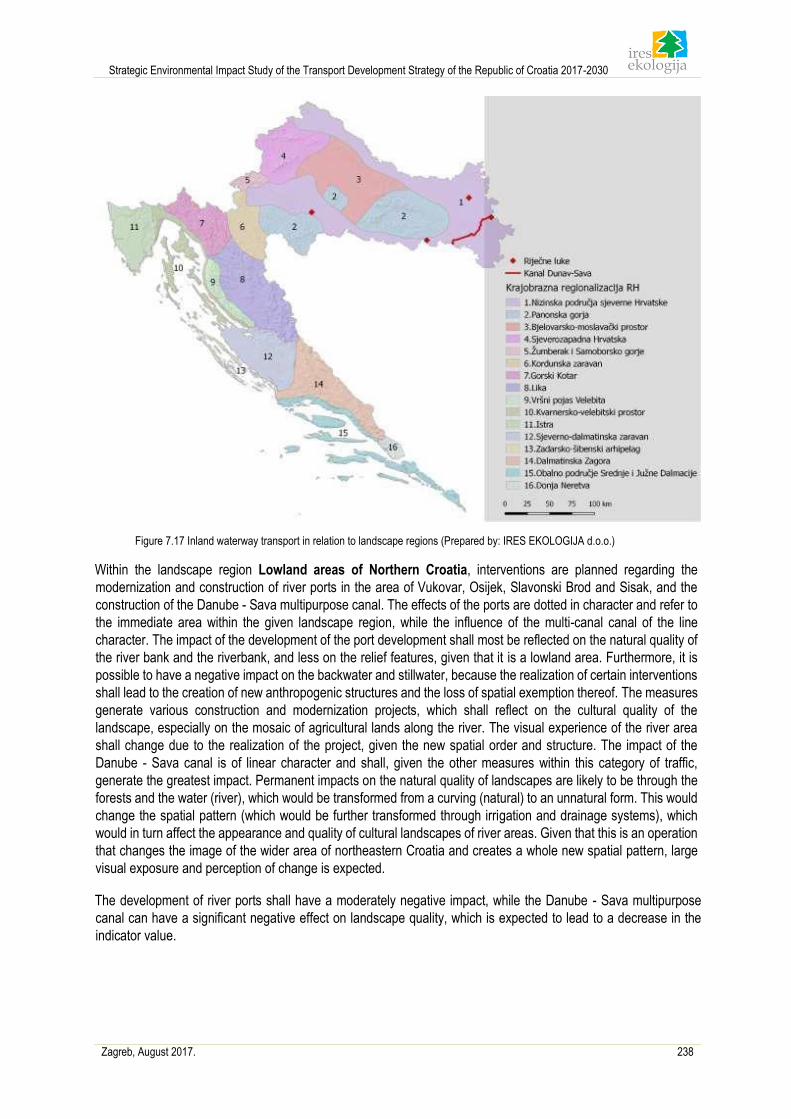
Strategic Environmental Impact Study of the Transport Development Strategy of the Republic of Croatia 2017-2030
Zagreb, August 2017. 238
Figure 7.17 Inland waterway transport in relation to landscape regions (Prepared by: IRES EKOLOGIJA d.o.o.)
Within the landscape region Lowland areas of Northern Croatia, interventions are planned regarding the
modernization and construction of river ports in the area of Vukovar, Osijek, Slavonski Brod and Sisak, and the
construction of the Danube - Sava multipurpose canal. The effects of the ports are dotted in character and refer to
the immediate area within the given landscape region, while the influence of the multi-canal canal of the line
character. The impact of the development of the port development shall most be reflected on the natural quality of
the river bank and the riverbank, and less on the relief features, given that it is a lowland area. Furthermore, it is
possible to have a negative impact on the backwater and stillwater, because the realization of certain interventions
shall lead to the creation of new anthropogenic structures and the loss of spatial exemption thereof. The measures
generate various construction and modernization projects, which shall reflect on the cultural quality of the
landscape, especially on the mosaic of agricultural lands along the river. The visual experience of the river area
shall change due to the realization of the project, given the new spatial order and structure. The impact of the
Danube - Sava canal is of linear character and shall, given the other measures within this category of traffic,
generate the greatest impact. Permanent impacts on the natural quality of landscapes are likely to be through the
forests and the water (river), which would be transformed from a curving (natural) to an unnatural form. This would
change the spatial pattern (which would be further transformed through irrigation and drainage systems), which
would in turn affect the appearance and quality of cultural landscapes of river areas. Given that this is an operation
that changes the image of the wider area of northeastern Croatia and creates a whole new spatial pattern, large
visual exposure and perception of change is expected.
The development of river ports shall have a moderately negative impact, while the Danube - Sava multipurpose
canal can have a significant negative effect on landscape quality, which is expected to lead to a decrease in the
indicator value.
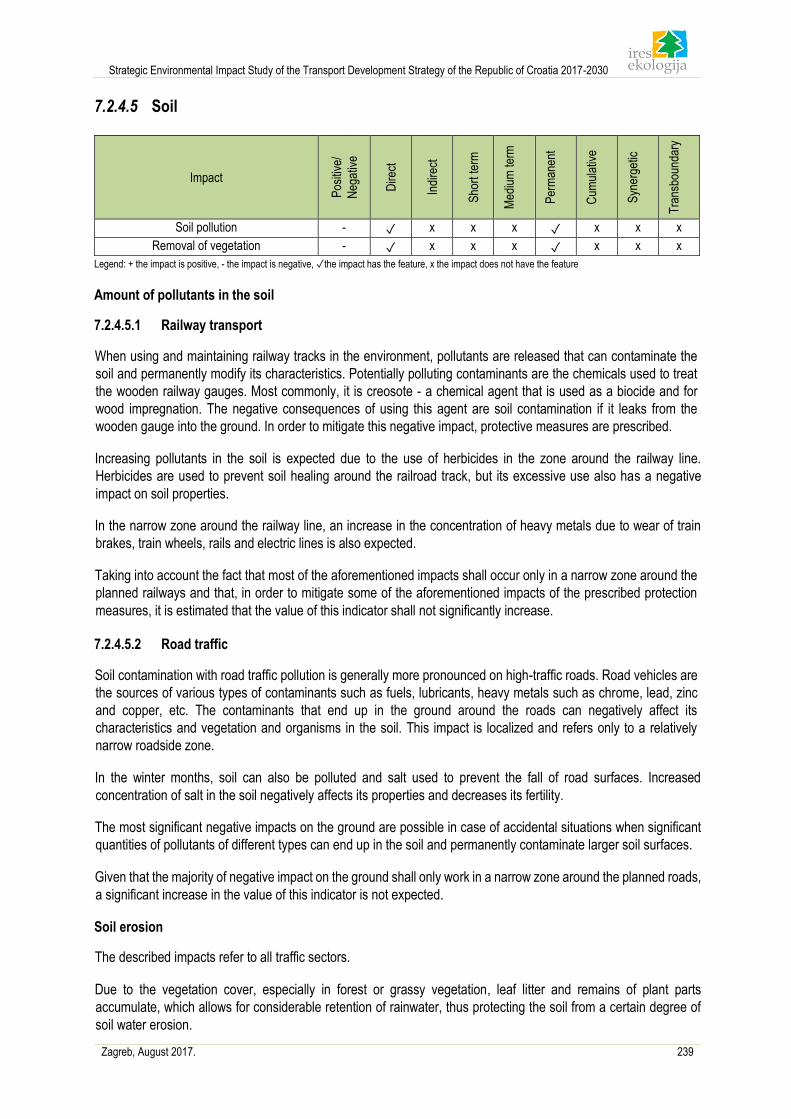
Strategic Environmental Impact Study of the Transport Development Strategy of the Republic of Croatia 2017-2030
Zagreb, August 2017. 239
7.2.4.5 Soil
Legend: + the impact is positive, - the impact is negative, ✓the impact has the feature, x the impact does not have the feature
Amount of pollutants in the soil
7.2.4.5.1 Railway transport
When using and maintaining railway tracks in the environment, pollutants are released that can contaminate the
soil and permanently modify its characteristics. Potentially polluting contaminants are the chemicals used to treat
the wooden railway gauges. Most commonly, it is creosote - a chemical agent that is used as a biocide and for
wood impregnation. The negative consequences of using this agent are soil contamination if it leaks from the
wooden gauge into the ground. In order to mitigate this negative impact, protective measures are prescribed.
Increasing pollutants in the soil is expected due to the use of herbicides in the zone around the railway line.
Herbicides are used to prevent soil healing around the railroad track, but its excessive use also has a negative
impact on soil properties.
In the narrow zone around the railway line, an increase in the concentration of heavy metals due to wear of train
brakes, train wheels, rails and electric lines is also expected.
Taking into account the fact that most of the aforementioned impacts shall occur only in a narrow zone around the
planned railways and that, in order to mitigate some of the aforementioned impacts of the prescribed protection
measures, it is estimated that the value of this indicator shall not significantly increase.
7.2.4.5.2 Road traffic
Soil contamination with road traffic pollution is generally more pronounced on high-traffic roads. Road vehicles are
the sources of various types of contaminants such as fuels, lubricants, heavy metals such as chrome, lead, zinc
and copper, etc. The contaminants that end up in the ground around the roads can negatively affect its
characteristics and vegetation and organisms in the soil. This impact is localized and refers only to a relatively
narrow roadside zone.
In the winter months, soil can also be polluted and salt used to prevent the fall of road surfaces. Increased
concentration of salt in the soil negatively affects its properties and decreases its fertility.
The most significant negative impacts on the ground are possible in case of accidental situations when significant
quantities of pollutants of different types can end up in the soil and permanently contaminate larger soil surfaces.
Given that the majority of negative impact on the ground shall only work in a narrow zone around the planned roads,
a significant increase in the value of this indicator is not expected.
Soil erosion
The described impacts refer to all traffic sectors.
Due to the vegetation cover, especially in forest or grassy vegetation, leaf litter and remains of plant parts
accumulate, which allows for considerable retention of rainwater, thus protecting the soil from a certain degree of
soil water erosion.
Impact
Pos
itive
/
Neg
ativ
e
Dire
ct
Indi
rect
Sho
rt te
rm
Med
ium
term
Per
man
ent
Cum
ulat
ive
Syn
erge
tic
Tra
nsbo
unda
ry
Soil pollution - ✓ x x x ✓ x x x
Removal of vegetation - ✓ x x x ✓ x x x
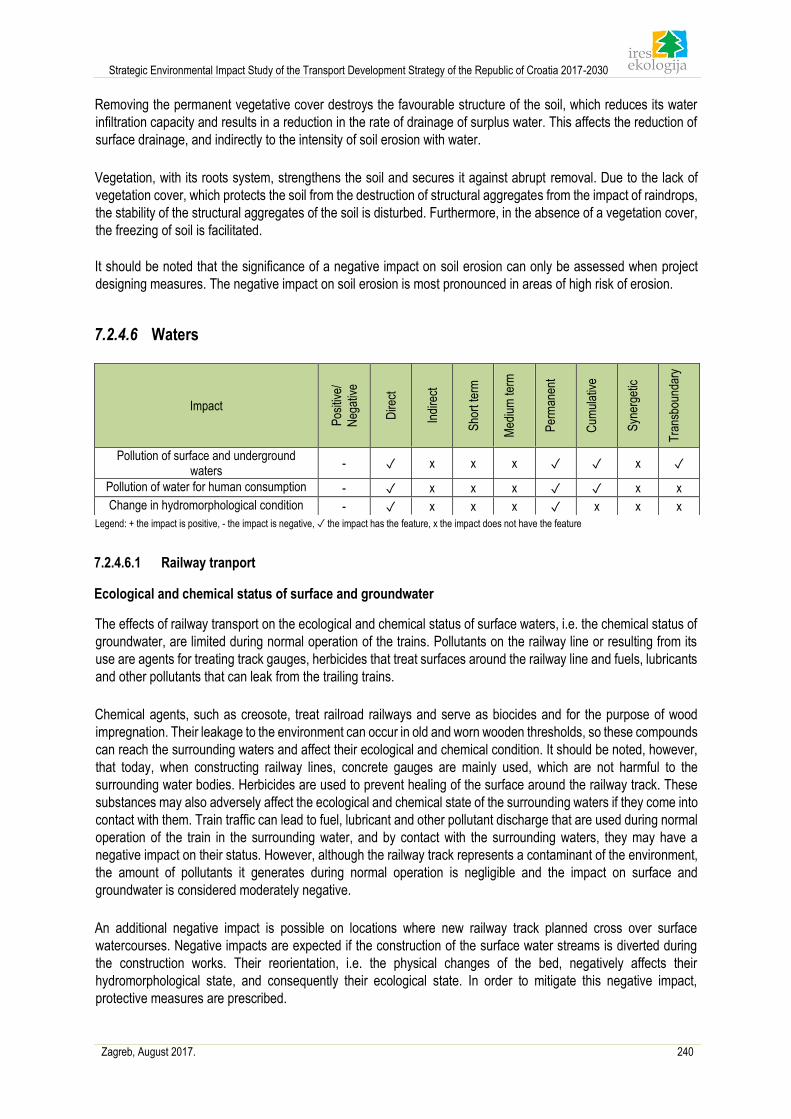
Strategic Environmental Impact Study of the Transport Development Strategy of the Republic of Croatia 2017-2030
Zagreb, August 2017. 240
Removing the permanent vegetative cover destroys the favourable structure of the soil, which reduces its water
infiltration capacity and results in a reduction in the rate of drainage of surplus water. This affects the reduction of
surface drainage, and indirectly to the intensity of soil erosion with water.
Vegetation, with its roots system, strengthens the soil and secures it against abrupt removal. Due to the lack of
vegetation cover, which protects the soil from the destruction of structural aggregates from the impact of raindrops,
the stability of the structural aggregates of the soil is disturbed. Furthermore, in the absence of a vegetation cover,
the freezing of soil is facilitated.
It should be noted that the significance of a negative impact on soil erosion can only be assessed when project
designing measures. The negative impact on soil erosion is most pronounced in areas of high risk of erosion.
7.2.4.6 Waters
Legend: + the impact is positive, - the impact is negative, ✓ the impact has the feature, x the impact does not have the feature
7.2.4.6.1 Railway tranport
Ecological and chemical status of surface and groundwater
The effects of railway transport on the ecological and chemical status of surface waters, i.e. the chemical status of
groundwater, are limited during normal operation of the trains. Pollutants on the railway line or resulting from its
use are agents for treating track gauges, herbicides that treat surfaces around the railway line and fuels, lubricants
and other pollutants that can leak from the trailing trains.
Chemical agents, such as creosote, treat railroad railways and serve as biocides and for the purpose of wood
impregnation. Their leakage to the environment can occur in old and worn wooden thresholds, so these compounds
can reach the surrounding waters and affect their ecological and chemical condition. It should be noted, however,
that today, when constructing railway lines, concrete gauges are mainly used, which are not harmful to the
surrounding water bodies. Herbicides are used to prevent healing of the surface around the railway track. These
substances may also adversely affect the ecological and chemical state of the surrounding waters if they come into
contact with them. Train traffic can lead to fuel, lubricant and other pollutant discharge that are used during normal
operation of the train in the surrounding water, and by contact with the surrounding waters, they may have a
negative impact on their status. However, although the railway track represents a contaminant of the environment,
the amount of pollutants it generates during normal operation is negligible and the impact on surface and
groundwater is considered moderately negative.
An additional negative impact is possible on locations where new railway track planned cross over surface
watercourses. Negative impacts are expected if the construction of the surface water streams is diverted during
the construction works. Their reorientation, i.e. the physical changes of the bed, negatively affects their
hydromorphological state, and consequently their ecological state. In order to mitigate this negative impact,
protective measures are prescribed.
Impact
Pos
itive
/
Neg
ativ
e
Dire
ct
Indi
rect
Sho
rt te
rm
Med
ium
term
Per
man
ent
Cum
ulat
ive
Syn
erge
tic
Tra
nsbo
unda
ry
Pollution of surface and underground waters
- ✓ x x x ✓ ✓ x ✓
Pollution of water for human consumption - ✓ x x x ✓ ✓ x x
Change in hydromorphological condition - ✓ x x x ✓ x x x
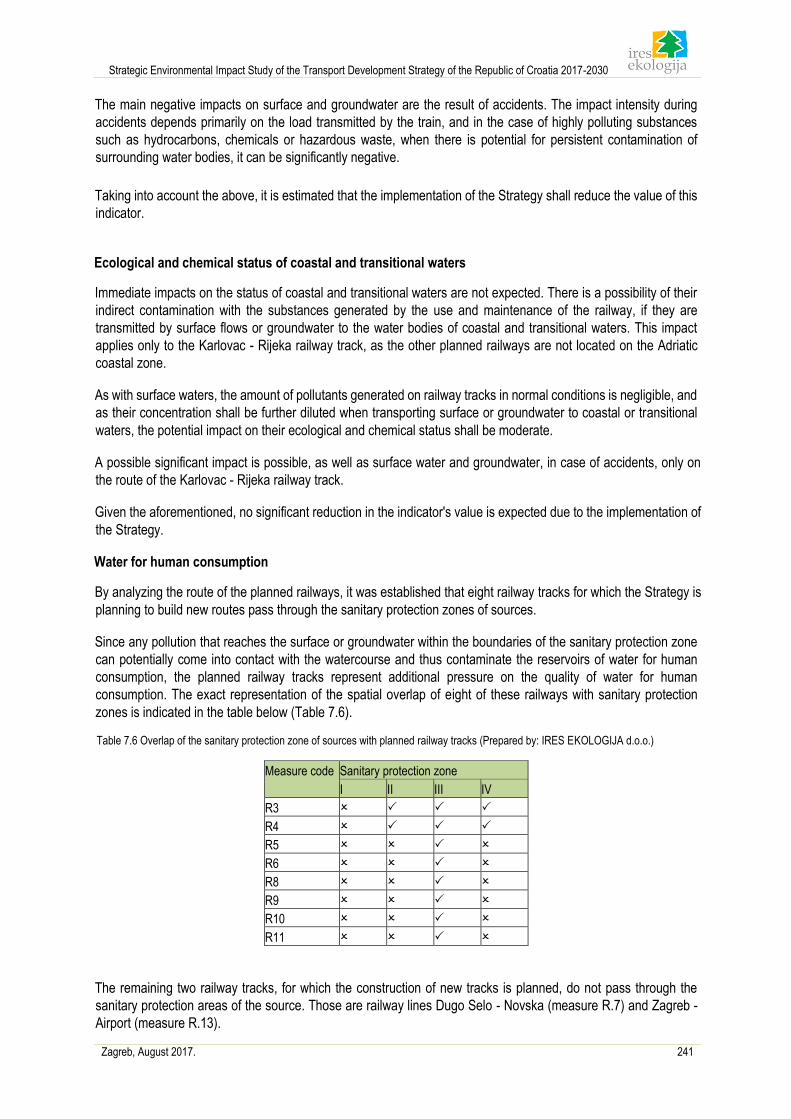
Strategic Environmental Impact Study of the Transport Development Strategy of the Republic of Croatia 2017-2030
Zagreb, August 2017. 241
The main negative impacts on surface and groundwater are the result of accidents. The impact intensity during
accidents depends primarily on the load transmitted by the train, and in the case of highly polluting substances
such as hydrocarbons, chemicals or hazardous waste, when there is potential for persistent contamination of
surrounding water bodies, it can be significantly negative.
Taking into account the above, it is estimated that the implementation of the Strategy shall reduce the value of this
indicator.
Ecological and chemical status of coastal and transitional waters
Immediate impacts on the status of coastal and transitional waters are not expected. There is a possibility of their
indirect contamination with the substances generated by the use and maintenance of the railway, if they are
transmitted by surface flows or groundwater to the water bodies of coastal and transitional waters. This impact
applies only to the Karlovac - Rijeka railway track, as the other planned railways are not located on the Adriatic
coastal zone.
As with surface waters, the amount of pollutants generated on railway tracks in normal conditions is negligible, and
as their concentration shall be further diluted when transporting surface or groundwater to coastal or transitional
waters, the potential impact on their ecological and chemical status shall be moderate.
A possible significant impact is possible, as well as surface water and groundwater, in case of accidents, only on
the route of the Karlovac - Rijeka railway track.
Given the aforementioned, no significant reduction in the indicator's value is expected due to the implementation of
the Strategy.
Water for human consumption
By analyzing the route of the planned railways, it was established that eight railway tracks for which the Strategy is
planning to build new routes pass through the sanitary protection zones of sources.
Since any pollution that reaches the surface or groundwater within the boundaries of the sanitary protection zone
can potentially come into contact with the watercourse and thus contaminate the reservoirs of water for human
consumption, the planned railway tracks represent additional pressure on the quality of water for human
consumption. The exact representation of the spatial overlap of eight of these railways with sanitary protection
zones is indicated in the table below (Table 7.6).
Table 7.6 Overlap of the sanitary protection zone of sources with planned railway tracks (Prepared by: IRES EKOLOGIJA d.o.o.)
Measure code Sanitary protection zone
I II III IV
R3
R4
R5
R6
R8
R9
R10
R11
The remaining two railway tracks, for which the construction of new tracks is planned, do not pass through the
sanitary protection areas of the source. Those are railway lines Dugo Selo - Novska (measure R.7) and Zagreb -
Airport (measure R.13).
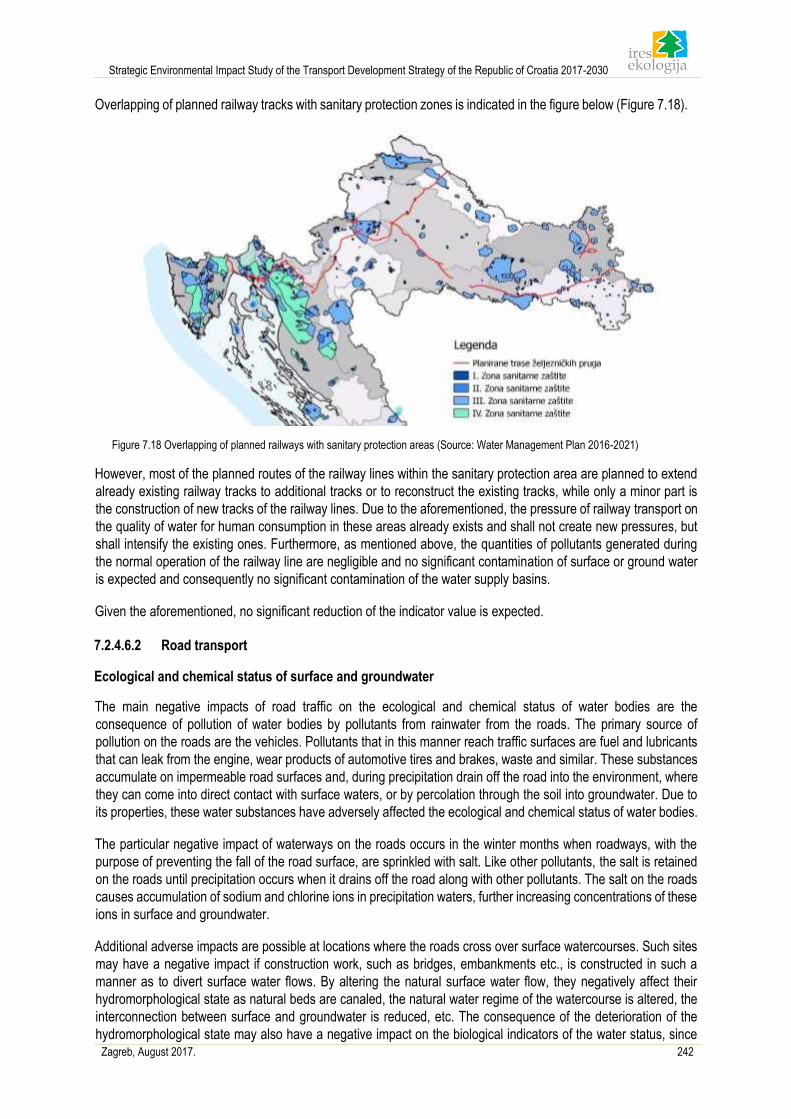
Strategic Environmental Impact Study of the Transport Development Strategy of the Republic of Croatia 2017-2030
Zagreb, August 2017. 242
Overlapping of planned railway tracks with sanitary protection zones is indicated in the figure below (Figure 7.18).
Figure 7.18 Overlapping of planned railways with sanitary protection areas (Source: Water Management Plan 2016-2021)
However, most of the planned routes of the railway lines within the sanitary protection area are planned to extend
already existing railway tracks to additional tracks or to reconstruct the existing tracks, while only a minor part is
the construction of new tracks of the railway lines. Due to the aforementioned, the pressure of railway transport on
the quality of water for human consumption in these areas already exists and shall not create new pressures, but
shall intensify the existing ones. Furthermore, as mentioned above, the quantities of pollutants generated during
the normal operation of the railway line are negligible and no significant contamination of surface or ground water
is expected and consequently no significant contamination of the water supply basins.
Given the aforementioned, no significant reduction of the indicator value is expected.
7.2.4.6.2 Road transport
Ecological and chemical status of surface and groundwater
The main negative impacts of road traffic on the ecological and chemical status of water bodies are the
consequence of pollution of water bodies by pollutants from rainwater from the roads. The primary source of
pollution on the roads are the vehicles. Pollutants that in this manner reach traffic surfaces are fuel and lubricants
that can leak from the engine, wear products of automotive tires and brakes, waste and similar. These substances
accumulate on impermeable road surfaces and, during precipitation drain off the road into the environment, where
they can come into direct contact with surface waters, or by percolation through the soil into groundwater. Due to
its properties, these water substances have adversely affected the ecological and chemical status of water bodies.
The particular negative impact of waterways on the roads occurs in the winter months when roadways, with the
purpose of preventing the fall of the road surface, are sprinkled with salt. Like other pollutants, the salt is retained
on the roads until precipitation occurs when it drains off the road along with other pollutants. The salt on the roads
causes accumulation of sodium and chlorine ions in precipitation waters, further increasing concentrations of these
ions in surface and groundwater.
Additional adverse impacts are possible at locations where the roads cross over surface watercourses. Such sites
may have a negative impact if construction work, such as bridges, embankments etc., is constructed in such a
manner as to divert surface water flows. By altering the natural surface water flow, they negatively affect their
hydromorphological state as natural beds are canaled, the natural water regime of the watercourse is altered, the
interconnection between surface and groundwater is reduced, etc. The consequence of the deterioration of the
hydromorphological state may also have a negative impact on the biological indicators of the water status, since
Strategic Environmental Impact Study of the Transport Development Strategy of the Republic of Croatia 2017-2030
Zagreb, August 2017. 243
any change in the existing surface water conditions can have a negative impact on the biodiversity of water bodies.
Given that the hydromorphological and biological conditions are constituents of the ecological condition, their
disruption shall also negatively affect the ecological state of the water bodies. In order to mitigate this negative
impact, protective measures are prescribed.
Given the aforementioned, it is possible to conclude that the construction of new roads shall result in a decrease in
the indicator values.
Ecological and chemical status of coastal and transitional waters
The direct impact of road traffic on coastal and transitional water is generally not expected. Exceptions are possible
for planned roads whose route runs along the coast where there is a possibility that contaminated rainwater from
the traffic surfaces shall flow directly into coastal or transitional waters. The main negative impacts on the state of
coastal and transitional waters, as well as surface waters, are the consequence of the drainage of various pollutants
accumulating on the surface of the road, and the precipitation in the surrounding water bodies. In most cases, they
are surface flows, or groundwater, which due to precipitation come into contact with the soil. In this case, it is
possible that contaminated water is transported to the coastal or transitional water bodies and has a negative
impact. Given the hydrographic division of the Republic of Croatia into the Adriatic water area and the river Danube
river area, this negative impact is expected only due to the construction of road roads in the coastal part of the
Republic of Croatia.
Given the aforementioned, the possibility of reducing the indicator value can not be ruled out.
Water for human consumption
By analyzing the routes of the planned roads, it was established that eight planned road routes pass through the
sanitary protection areas, while six of them do not. Since surface and groundwater within these zones can naturally
come into contact with watercourses within any of these zones, any pollution of them can potentially contaminate
water resources for human consumption. The construction of new road roads within the sanitary protection area
shall increase the existing pressures on the water bodies within the zone, thereby further jeopardizing the quality
of water on the bound waterworks. Overlapping of planned road roads with sanitary protection areas is shown in
the table below (Table 7.7).
Table 7.7 Overlap of sanitary protection area with planned roads (Prepared by: IRES EKOLOGIJA d.o.o.)
Measure code Sanitary protection zone
I I
Ro. 1
Ro. 2
Ro. 4
Ro. 7
Ro. 8
Ro. 9
Ro. 10
Ro. 15
The road traffic routes planned under the remaining measures of the Strategy (measures 3, 5, 5, 10, 16, 16, 16)
do not pass through the sanitary protection zones.
Overlapping of planned roads with sanitary protection areas of the source is indicated in the figure below (Figure
7.19).
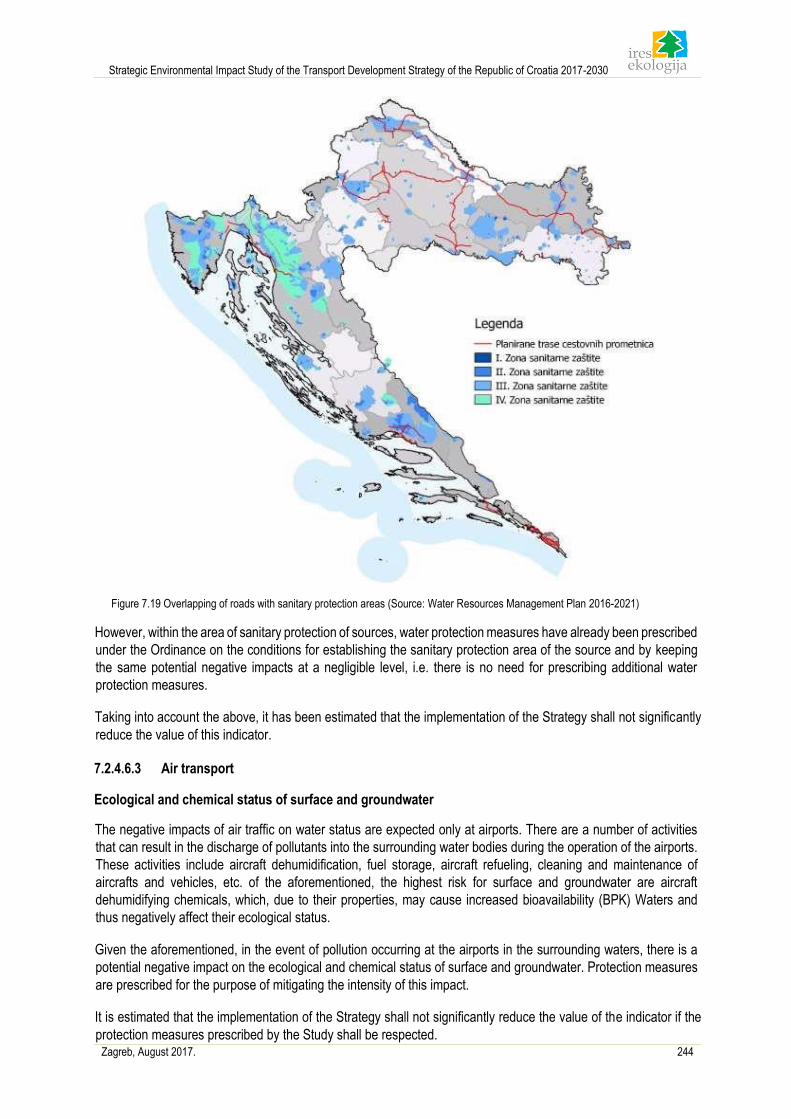
Strategic Environmental Impact Study of the Transport Development Strategy of the Republic of Croatia 2017-2030
Zagreb, August 2017. 244
Figure 7.19 Overlapping of roads with sanitary protection areas (Source: Water Resources Management Plan 2016-2021)
However, within the area of sanitary protection of sources, water protection measures have already been prescribed
under the Ordinance on the conditions for establishing the sanitary protection area of the source and by keeping
the same potential negative impacts at a negligible level, i.e. there is no need for prescribing additional water
protection measures.
Taking into account the above, it has been estimated that the implementation of the Strategy shall not significantly
reduce the value of this indicator.
7.2.4.6.3 Air transport
Ecological and chemical status of surface and groundwater
The negative impacts of air traffic on water status are expected only at airports. There are a number of activities
that can result in the discharge of pollutants into the surrounding water bodies during the operation of the airports.
These activities include aircraft dehumidification, fuel storage, aircraft refueling, cleaning and maintenance of
aircrafts and vehicles, etc. of the aforementioned, the highest risk for surface and groundwater are aircraft
dehumidifying chemicals, which, due to their properties, may cause increased bioavailability (BPK) Waters and
thus negatively affect their ecological status.
Given the aforementioned, in the event of pollution occurring at the airports in the surrounding waters, there is a
potential negative impact on the ecological and chemical status of surface and groundwater. Protection measures
are prescribed for the purpose of mitigating the intensity of this impact.
It is estimated that the implementation of the Strategy shall not significantly reduce the value of the indicator if the
protection measures prescribed by the Study shall be respected.
Strategic Environmental Impact Study of the Transport Development Strategy of the Republic of Croatia 2017-2030
Zagreb, August 2017. 245
Ecological and chemical status of coastal and transitional waters
Contamination of coastal and transitional water bodies is possible through the implementation of seven out of nine
Strategy measures regarding air traffic. The remaining two measures refer to the airports in Zagreb and Osijek that
are not located in the Adriatic water area and there is no possibility of their impact on the ecological and chemical
status of coastal and transitional waters.
At the seven airports in the Adriatic basin, there is a potential for direct or indirect pollution of water bodies of coastal
and transitional waters. Since airports are sources of different types of pollutants that can adversely affect the
ecological and chemical status of water bodies, direct impacts are possible at airports located near water bodies
of coastal and transitional waters. Possible impacts are possible if the pollutants are transported by surface or
underground waters and thus reach coastal and transitional waters. These negative impacts can be alleviated by
adhering to the protection measures prescribed for the previous indicator for the purpose of protecting surface and
groundwater from pollution from airports.
Given the aforementioned, it has been estimated that the implementation of the Strategy shall not significantly
reduce the value of the indicator if it complies with the measures prescribed by the Study.
Water for human consumption
Negative impacts on the quality of water for human consumption are possible at the airports of Zadar and Pula.
Zadar Airport is located within the scope of Zone IV of sanitary protection of sources, the limit zone, while the Pula
Airport is within the scope of Zone III of sanitary protection of sources, limit and surveillance zone. The strategy
plans for the expansion of these two airports, which shall also intensify pressures on the ecological and chemical
status of water.
Since any pollution of water within these zones could potentially endanger the quality of water for human
consumption, the expansion of airports shall have a negative impact on the reservoirs of water for human
consumption. It is estimated that the intensity of this impact shall not be significant if the general measures
prescribed for the purpose of protecting the ecological and chemical status of groundwater, which are within these
sanitary protection areas, and the Ordinance on Conditions for Determination of Sanitary Protection Areas, are
respected.
Since the measures for the protection of water for human consumption are stipulated, apart from the Study and the
Ordinance on the Conditions for Determination of the Sanitary Protection Area of the Source, it is estimated that
there shall be no significant decrease in the value of the indicator if these protection measures are respected.
7.2.4.6.4 Maritime transport
Ecological and chemical status of surface and groundwater
A negative impact on the ecological and chemical status of surface or chemical groundwater status is not expected.
All potential negative impacts shall be related to coastal and transitional waters and are described in a separate
indicator below.
Ecological and chemical status of coastal and transitional waters
The implementation of the maritime sector strategy measures shall result in adverse impacts due to an increase in
the amount of maritime traffic and the work on expanding the ports.
During the works on the port expansion, interventions shall be carried out in the area where the seacoast and the
seabed shall be physically modified, which represent elements of the hydromorphological state of the coastal and
transitional waters. Due to the above, the implementation of these measures may have a negative impact on the
hydromorphological state of water, and consequently on their ecological status. The mitigating factor is the fact that
with all measures of this type aimed at planning to expand the existing ports, i.e. that there are already pressures
of this type in these locations, which shall be intensified in this case.
Strategic Environmental Impact Study of the Transport Development Strategy of the Republic of Croatia 2017-2030
Zagreb, August 2017. 246
The primary impact on coastal and transitional waters shall result as a consequence of increased maritime traffic
due to the implementation of the Strategy measures. The implementation of the measures is expected to increase
the number of freight forwarders, including liquid, bulk and container freight, and passenger vessels, cruise ships,
and smaller yachts and vessels.
The marine environment is exposed to intense ecological damaging effects from ships of various shapes, the most
significant of which are the harmful substances that are discharged from ships. The manner and intensity of the
damaging effect depend mainly on the type of vessel. In cargo ships, the risk of pollution depends primarily on the
type of freight transported and its aggregate state. Liquid cargo is highly damaging for waters, which, depending
on the properties of the liquid and the external conditions (sea temperature, sea condition, sea currents), can
endanger a wide area. Passenger ships cause most of the negative impacts by the discharge of wastewater
produced by travelers during travel. These are gray and black wastewater that present an ecological and toxic
hazard to the surrounding sea.
Apart from the release of harmful substances, the negative impact on water is possible due to the use of biocidal
coatings for the purpose of protection against overflow of the hull. The coatings are generally applied while the ship
is in the dock, and after drying, they do not represent a more serious environmental problem. However, it is
important to note that two of the planned ports (port of Ploče and port of Split) are located within the water bodies
of the coastal waters that did not meet the conditions for achieving a good chemical status. The reason for the lack
of good condition is the presence of tributyl tin above the permissible limit values. This compound is contained in
biocide coatings on ships and the further increase in maritime traffic within this area shall further increase pressures
that have caused unsatisfactory chemical status evaluation.
Taking into account the above, the value of this indicator is expected to decrease.
Water for human consumption
Given that the interventions planned by Strategy measures from the maritime transport sector are not within the
boundaries of the sanitary protection zone, the impact of these measures on the quality of water for human
consumption is not expected, i.e. no change in the value of this indicator is expected.
7.2.4.6.5 Inland waterway transport
Ecological and chemical status of surface and groundwater
The impacts to be generated by the implementation of measures in this sector derive from the project of upgrading
and extension of river ports, increasing the concentration of river traffic and the construction of the Danube - Sava
multipurpose canal.
The effects of the extension of the river ports are primarily related to the hydromorphological state of the surface
waters, since the works shall change the natural appearance of the watercourse basin. The negative influence on
the hydromorphological condition shall also affect the ecological state of the surface waters, as it is an integral part
of the ecological condition.
Generally, the impact with the highest risk of ships on the surrounding water is caused by harmful substances
discharged from ships. The manner of the harmful impact and the intensity of the environmentally harmful effects
depend primarily on the type of vessel. Although all ships in a smaller quantity pollute water due to leakage of
lubricants and similar substances, dissolving biocide coatings or rejecting waste, the main impacts depend on the
type of cargo being transported by ship. Depending on whether the liquid cargo, dry bulk cargo or other types of
cargo (including passengers) are transported, the type and intensity of the negative impact depend on the condition
of the water bodies. However, given that each ship poses additional pressure on the status of water bodies, it is to
be expected that the existing pressures shall intensify by the implementation of measures related to the
development of inland waterway transport.
The construction of the Danube - Sava multipurpose canal shall divert a part of the Danube and Sava water, which
shall affect the natural water regime of these watercourses, i.e. their water flow dynamics shall be changed. Water
Strategic Environmental Impact Study of the Transport Development Strategy of the Republic of Croatia 2017-2030
Zagreb, August 2017. 247
flow dynamics form an integral part of the hydromorphological state of surface water and, due to its modification,
can lead to significant changes in the habitat conditions, thus making a negative impact on the biological state of
surface water. Since the hydromorphological and biological state of the water is an integral part of the ecological
water status, the construction of the project shall have a direct negative impact on their ecological status.
Taking into account all the above, it has been estimated that the implementation of the Strategy shall reduce the
value of this indicator.
Ecological and chemical status of coastal and transitional waters
All planned Strategy measures aimed at the development of inland waterway transport are located within the
Danube river basin, i.e. within the catchment area of the Black Sea. Since the surface and groundwater of this area
are not hydrologically related to the coastal and transitional waters of the Republic of Croatia, the impact of these
measures on the ecological and chemical status of coastal and transitional waters is not expected or is not expected
to change the value of this indicator.
Water for human consumption
Negative impacts on water quality for human consumption, due to the implementation of measures from the inland
waterway transport sector, are potentially possible in the case of surface or groundwater contamination.
The direct impact on the water reservoirs for human consumption due to water pollution in the ports is possible in
Osijek, near which there are sanitary protection zones of sources. Since at this level of impact assessment there
is no precise information on the extent of the interventions for that port, it is not possible to estimate whether the
extension of the port shall include the area of the sanitary protection zone and therefore, in the event of any
pollution, whether reservoirs of water for human consumption shall be endangered.
Indirect impacts are possible in case of contamination of surface water bodies with pollutants from ships. Pollution
of watercourses can potentially contaminate the groundwater that is in contact with them, and in the case of
groundwater within the sanitary protection area of the source, it is possible to contaminate water for human
consumption.
However, pollutants that are released from surface water in normal working conditions are small quantities, i.e. not
concentrations of pollutants that could seriously jeopardize the waterworks, and thus the quality of water for
human consumption.
Taking into account the above, the reduction in the value of this indicator is not expected.
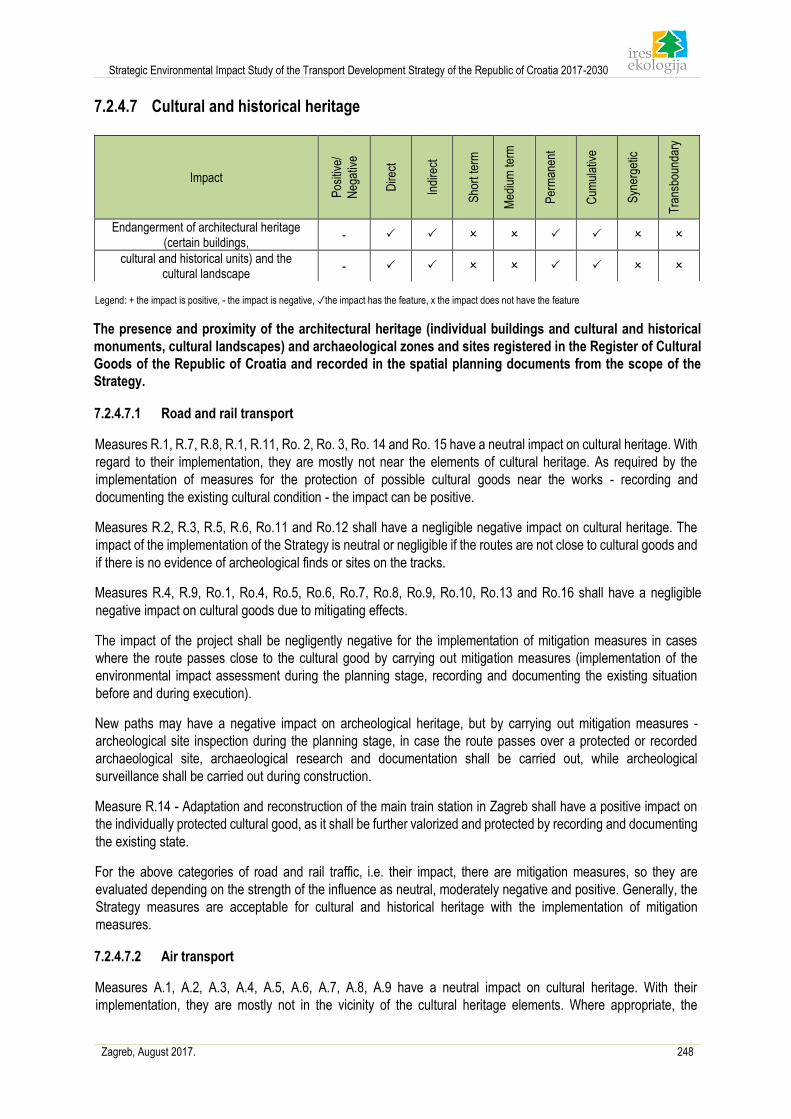
Strategic Environmental Impact Study of the Transport Development Strategy of the Republic of Croatia 2017-2030
Zagreb, August 2017. 248
7.2.4.7 Cultural and historical heritage
Legend: + the impact is positive, - the impact is negative, ✓the impact has the feature, x the impact does not have the feature
The presence and proximity of the architectural heritage (individual buildings and cultural and historical
monuments, cultural landscapes) and archaeological zones and sites registered in the Register of Cultural
Goods of the Republic of Croatia and recorded in the spatial planning documents from the scope of the
Strategy.
7.2.4.7.1 Road and rail transport
Measures R.1, R.7, R.8, R.1, R.11, Ro. 2, Ro. 3, Ro. 14 and Ro. 15 have a neutral impact on cultural heritage. With
regard to their implementation, they are mostly not near the elements of cultural heritage. As required by the
implementation of measures for the protection of possible cultural goods near the works - recording and
documenting the existing cultural condition - the impact can be positive.
Measures R.2, R.3, R.5, R.6, Ro.11 and Ro.12 shall have a negligible negative impact on cultural heritage. The
impact of the implementation of the Strategy is neutral or negligible if the routes are not close to cultural goods and
if there is no evidence of archeological finds or sites on the tracks.
Measures R.4, R.9, Ro.1, Ro.4, Ro.5, Ro.6, Ro.7, Ro.8, Ro.9, Ro.10, Ro.13 and Ro.16 shall have a negligible
negative impact on cultural goods due to mitigating effects.
The impact of the project shall be negligently negative for the implementation of mitigation measures in cases
where the route passes close to the cultural good by carrying out mitigation measures (implementation of the
environmental impact assessment during the planning stage, recording and documenting the existing situation
before and during execution).
New paths may have a negative impact on archeological heritage, but by carrying out mitigation measures -
archeological site inspection during the planning stage, in case the route passes over a protected or recorded
archaeological site, archaeological research and documentation shall be carried out, while archeological
surveillance shall be carried out during construction.
Measure R.14 - Adaptation and reconstruction of the main train station in Zagreb shall have a positive impact on
the individually protected cultural good, as it shall be further valorized and protected by recording and documenting
the existing state.
For the above categories of road and rail traffic, i.e. their impact, there are mitigation measures, so they are
evaluated depending on the strength of the influence as neutral, moderately negative and positive. Generally, the
Strategy measures are acceptable for cultural and historical heritage with the implementation of mitigation
measures.
7.2.4.7.2 Air transport
Measures A.1, A.2, A.3, A.4, A.5, A.6, A.7, A.8, A.9 have a neutral impact on cultural heritage. With their
implementation, they are mostly not in the vicinity of the cultural heritage elements. Where appropriate, the
Impact
Pos
itive
/
Neg
ativ
e
Dire
ct
Indi
rect
Sho
rt te
rm
Med
ium
term
Per
man
ent
Cum
ulat
ive
Syn
erge
tic
Tra
nsbo
unda
ry
Endangerment of architectural heritage (certain buildings,
-
cultural and historical units) and the cultural landscape
-
Strategic Environmental Impact Study of the Transport Development Strategy of the Republic of Croatia 2017-2030
Zagreb, August 2017. 249
implementation of measures for the protection of any cultural goods in the vicinity may cause the impact to be
positive.
Although it is planning at the strategic level, detailed locations of works are mostly known. In accordance with
current legislation, planning and practice system, a more detailed selection of final locations and placement of
certain interventions is planned in the future stages of Strategy implementation and development. By lowering to
the lower levels, more attention shall be paid to impacts on cultural goods and to prescribe the necessary mitigation
measures. Therefore, only those mitigation measures and/or recommendations that could be defined at a strategic
level are listed here.
There is a possibility of degradation of the spatial and visual integrity of historic buildings, cultural and historical
units, and cultural landscapes near the planned interventions. If adequate measures are set at project levels, it is
possible to mitigate the negative impact.
There is a risk of damage or destruction of potential archaeological sites. However, if prior archeological
reconnaissance and research is carried out, considering the evaluation/valuation of the findings, it is possible to
find the find or to adapt to the microposition.
From the aspect of cultural and historical heritage, the greatest impact of the Strategy has been identified in relation
to archaeological heritage. Negligible negative impact is expected on historic rural and urban integrity, individual
architectural heritage. For all the assessed impacts, mitigation measures are included, which include, analyzing
and evaluating the spatial and visual integrity of historic buildings and archaeological reconnaissance of the route
and areas of the planned operations.
7.2.4.7.3 Maritime transport
Measures M.8, M.12, M.13 have a neutral impact on cultural heritage. With their implementation, they are mostly
not in the vicinity of the cultural heritage elements. Where appropriate, the implementation of measures for the
protection of any cultural goods in the vicinity(recording and documenting the existing cultural condition) may cause
the impact to be positive.
Measures M.9, M.11 (Split and Šibenik) can potentially have negative impacts on individual buildings and cultural
and historical units if they are realized in close proximity. The impacts of the project shall be negligibly negative for
the implementation of mitigation measures in cases of possible impact in the vicinity of the cultural good (recording
and documenting the existing state before and during the execution).
Measures M.9, M.11 (Split and Šibenik) can have potentially negative impacts as they can lead to potential
degradation of submarine archeological heritage. However, by implementing mitigation measures - archeological
examination of the terrain at the planning stage, possibly with prior archaeological research and documentation,
the impacts may be negligibly negative.
Measure M.10 can have a potentially negative impact on the wider visual environment of the historic whole of
Dubrovnik - the monuments of the world heritage, and in particular the physical, spatial and visual integrity of the
summer houses (Bunić Kaboga and Stay) and the urban area of the suburbs of Dubrovnik.
There are mitigation measures for the mentioned categories of maritime traffic, i.e. their impacts, and are therefore
assessed depending on the strength of the impact as neutral or moderately negative. Generally, the Strategy
measures are acceptable for cultural and historical heritage with the implementation of mitigation measures.
7.2.4.7.4 Inland waterway traffic
Measure I.5 has a neutral impact on cultural heritage. With its implementation, it is mostly not in the vicinity of the
cultural heritage elements.
Measures I.3, I.4, I.6 and I.7 may have potentially negative impacts on individual buildings and cultural and historical
units if they are realized in the immediate vicinity. The effects of the procedure shall be negligibly negative for the
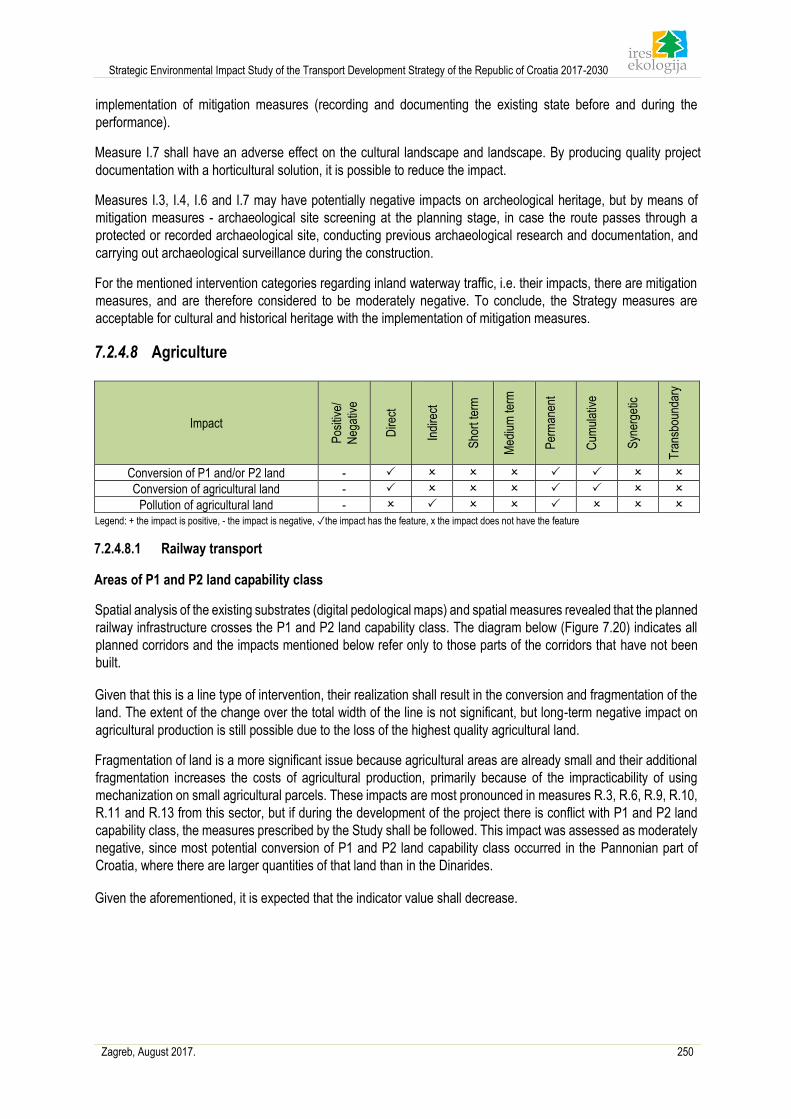
Strategic Environmental Impact Study of the Transport Development Strategy of the Republic of Croatia 2017-2030
Zagreb, August 2017. 250
implementation of mitigation measures (recording and documenting the existing state before and during the
performance).
Measure I.7 shall have an adverse effect on the cultural landscape and landscape. By producing quality project
documentation with a horticultural solution, it is possible to reduce the impact.
Measures I.3, I.4, I.6 and I.7 may have potentially negative impacts on archeological heritage, but by means of
mitigation measures - archaeological site screening at the planning stage, in case the route passes through a
protected or recorded archaeological site, conducting previous archaeological research and documentation, and
carrying out archaeological surveillance during the construction.
For the mentioned intervention categories regarding inland waterway traffic, i.e. their impacts, there are mitigation
measures, and are therefore considered to be moderately negative. To conclude, the Strategy measures are
acceptable for cultural and historical heritage with the implementation of mitigation measures.
7.2.4.8 Agriculture
Legend: + the impact is positive, - the impact is negative, ✓the impact has the feature, x the impact does not have the feature
7.2.4.8.1 Railway transport
Areas of P1 and P2 land capability class
Spatial analysis of the existing substrates (digital pedological maps) and spatial measures revealed that the planned
railway infrastructure crosses the P1 and P2 land capability class. The diagram below (Figure 7.20) indicates all
planned corridors and the impacts mentioned below refer only to those parts of the corridors that have not been
built.
Given that this is a line type of intervention, their realization shall result in the conversion and fragmentation of the
land. The extent of the change over the total width of the line is not significant, but long-term negative impact on
agricultural production is still possible due to the loss of the highest quality agricultural land.
Fragmentation of land is a more significant issue because agricultural areas are already small and their additional
fragmentation increases the costs of agricultural production, primarily because of the impracticability of using
mechanization on small agricultural parcels. These impacts are most pronounced in measures R.3, R.6, R.9, R.10,
R.11 and R.13 from this sector, but if during the development of the project there is conflict with P1 and P2 land
capability class, the measures prescribed by the Study shall be followed. This impact was assessed as moderately
negative, since most potential conversion of P1 and P2 land capability class occurred in the Pannonian part of
Croatia, where there are larger quantities of that land than in the Dinarides.
Given the aforementioned, it is expected that the indicator value shall decrease.
Impact
Pos
itive
/
Neg
ativ
e
Dire
ct
Indi
rect
Sho
rt te
rm
Med
ium
term
Per
man
ent
Cum
ulat
ive
Syn
erge
tic
Tra
nsbo
unda
ry
Conversion of P1 and/or P2 land -
Conversion of agricultural land -
Pollution of agricultural land -
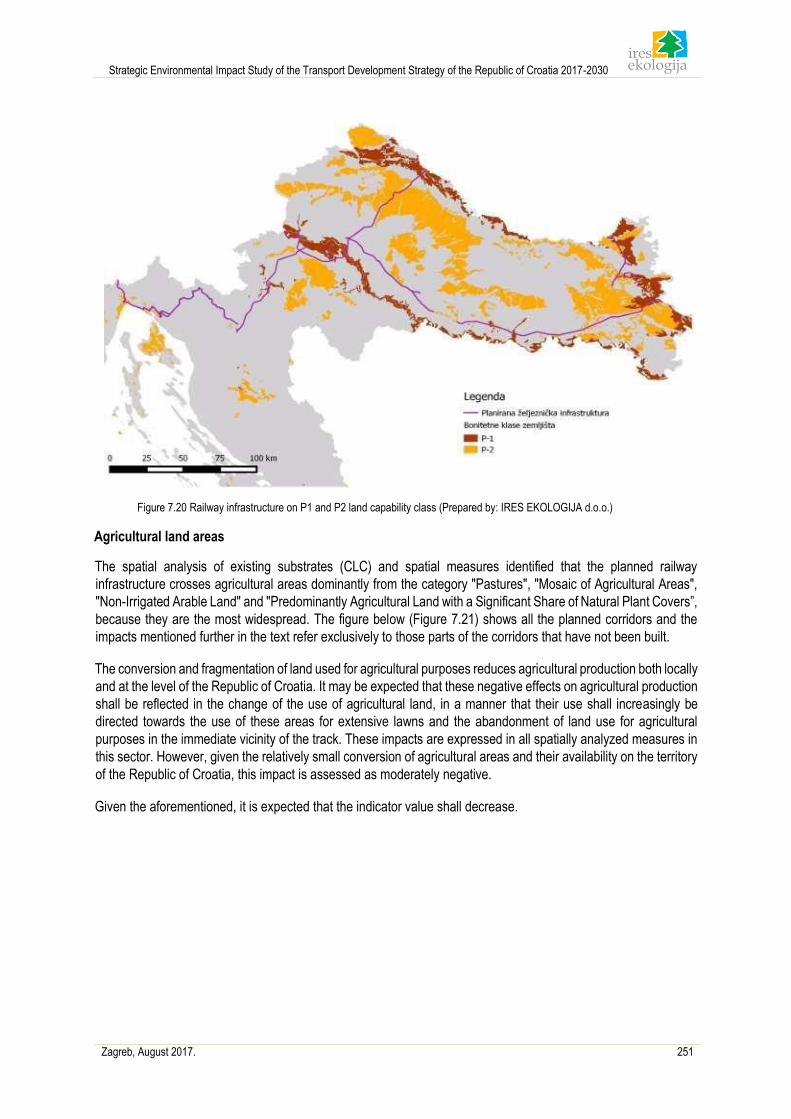
Strategic Environmental Impact Study of the Transport Development Strategy of the Republic of Croatia 2017-2030
Zagreb, August 2017. 251
Figure 7.20 Railway infrastructure on P1 and P2 land capability class (Prepared by: IRES EKOLOGIJA d.o.o.)
Agricultural land areas
The spatial analysis of existing substrates (CLC) and spatial measures identified that the planned railway
infrastructure crosses agricultural areas dominantly from the category "Pastures", "Mosaic of Agricultural Areas",
"Non-Irrigated Arable Land" and "Predominantly Agricultural Land with a Significant Share of Natural Plant Covers”,
because they are the most widespread. The figure below (Figure 7.21) shows all the planned corridors and the
impacts mentioned further in the text refer exclusively to those parts of the corridors that have not been built.
The conversion and fragmentation of land used for agricultural purposes reduces agricultural production both locally
and at the level of the Republic of Croatia. It may be expected that these negative effects on agricultural production
shall be reflected in the change of the use of agricultural land, in a manner that their use shall increasingly be
directed towards the use of these areas for extensive lawns and the abandonment of land use for agricultural
purposes in the immediate vicinity of the track. These impacts are expressed in all spatially analyzed measures in
this sector. However, given the relatively small conversion of agricultural areas and their availability on the territory
of the Republic of Croatia, this impact is assessed as moderately negative.
Given the aforementioned, it is expected that the indicator value shall decrease.
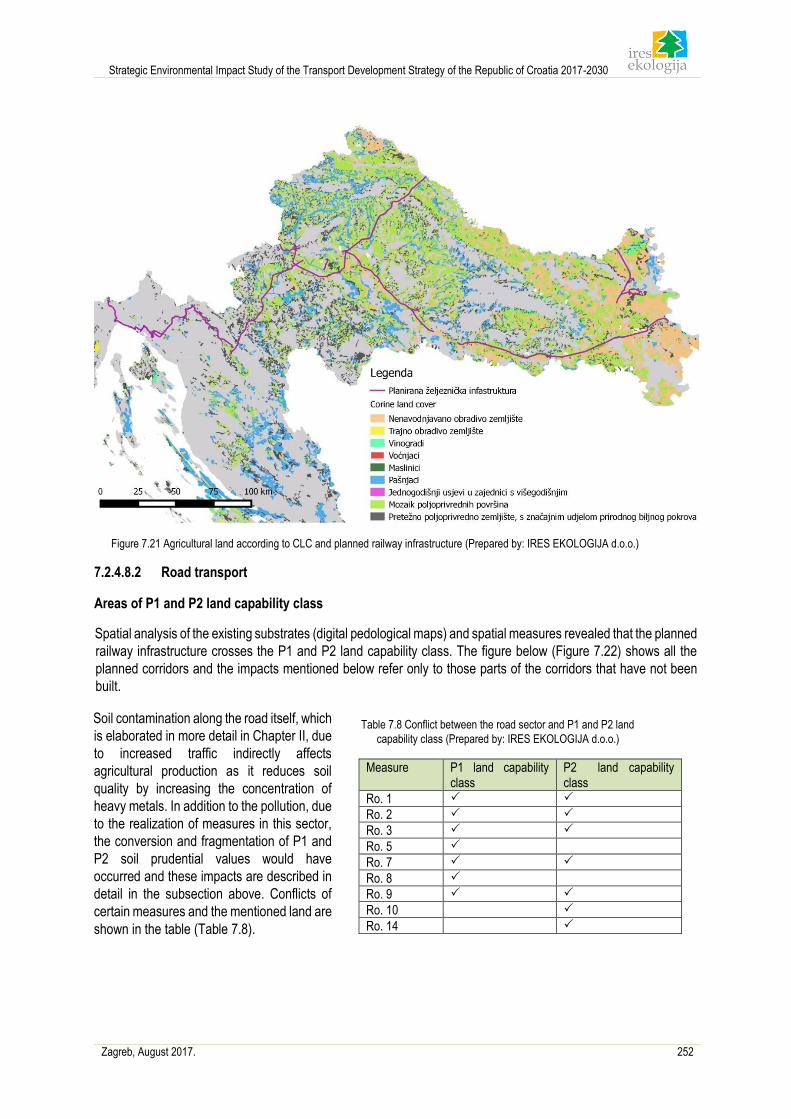
Strategic Environmental Impact Study of the Transport Development Strategy of the Republic of Croatia 2017-2030
Zagreb, August 2017. 252
Figure 7.21 Agricultural land according to CLC and planned railway infrastructure (Prepared by: IRES EKOLOGIJA d.o.o.)
7.2.4.8.2 Road transport
Areas of P1 and P2 land capability class
Spatial analysis of the existing substrates (digital pedological maps) and spatial measures revealed that the planned
railway infrastructure crosses the P1 and P2 land capability class. The figure below (Figure 7.22) shows all the
planned corridors and the impacts mentioned below refer only to those parts of the corridors that have not been
built.
Soil contamination along the road itself, which
is elaborated in more detail in Chapter II, due
to increased traffic indirectly affects
agricultural production as it reduces soil
quality by increasing the concentration of
heavy metals. In addition to the pollution, due
to the realization of measures in this sector,
the conversion and fragmentation of P1 and
P2 soil prudential values would have
occurred and these impacts are described in
detail in the subsection above. Conflicts of
certain measures and the mentioned land are
shown in the table (Table 7.8).
Table 7.8 Conflict between the road sector and P1 and P2 land
capability class (Prepared by: IRES EKOLOGIJA d.o.o.)
Measure P1 land capability class
P2 land capability class
Ro. 1
Ro. 2
Ro. 3
Ro. 5
Ro. 7
Ro. 8
Ro. 9
Ro. 10
Ro. 14
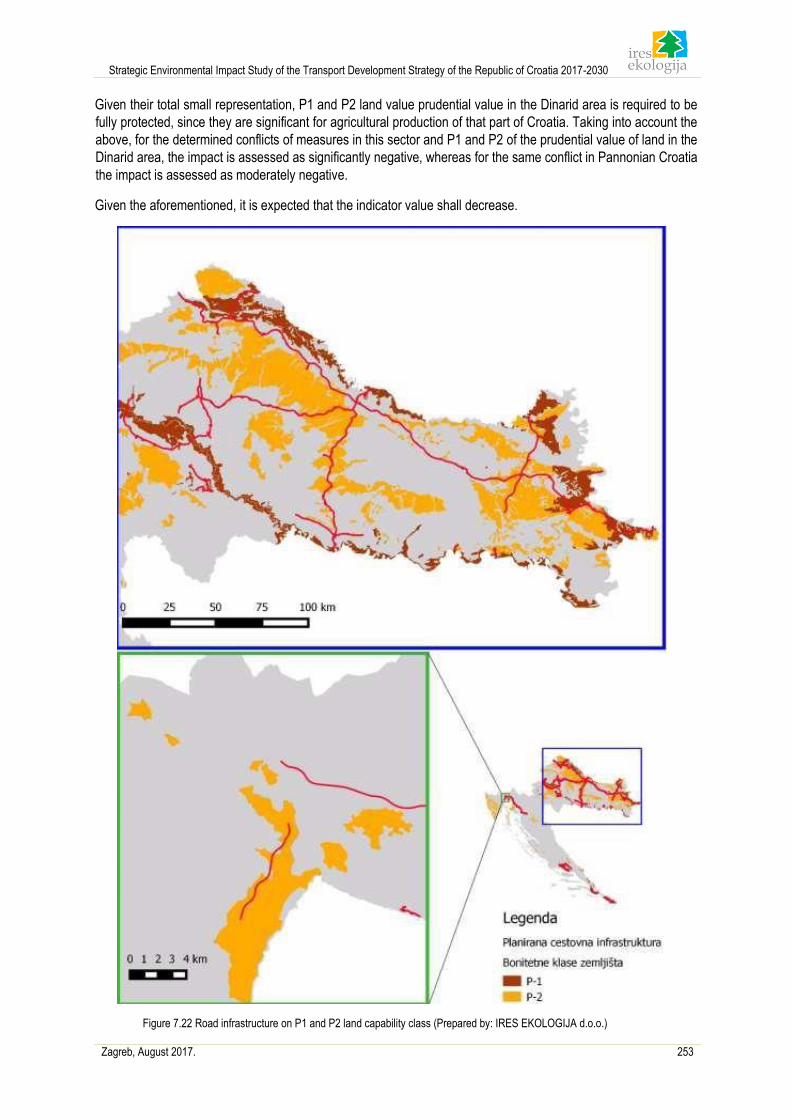
Strategic Environmental Impact Study of the Transport Development Strategy of the Republic of Croatia 2017-2030
Zagreb, August 2017. 253
Given their total small representation, P1 and P2 land value prudential value in the Dinarid area is required to be
fully protected, since they are significant for agricultural production of that part of Croatia. Taking into account the
above, for the determined conflicts of measures in this sector and P1 and P2 of the prudential value of land in the
Dinarid area, the impact is assessed as significantly negative, whereas for the same conflict in Pannonian Croatia
the impact is assessed as moderately negative.
Given the aforementioned, it is expected that the indicator value shall decrease.
Figure 7.22 Road infrastructure on P1 and P2 land capability class (Prepared by: IRES EKOLOGIJA d.o.o.)
Strategic Environmental Impact Study of the Transport Development Strategy of the Republic of Croatia 2017-2030
Zagreb, August 2017. 254
Agricultural land areas
Spatial analysis of the existing substrates (CLC) and spatial measures revealed that the planned road infrastructure
crosses the same categories of agricultural areas as the railway infrastructure. The diagram below (7.23) indicates
all the planned corridors and the impacts mentioned below refer only to those parts of the corridors that have not
been built.
The effects of transformation and fragmentation are described in more detail in the subsection Rail Traffic. With the
conversion and fragmentation of agricultural areas through the use of roads, soil contamination increases, which
negatively affects agricultural production near the roads. The described impacts relate to all spatially analyzed
measures from this sector.
Given the relatively small conversion of agricultural areas and its availability on the territory of the Republic of
Croatia, this impact is assessed as moderately negative.
Given the aforementioned, it is expected that the indicator value shall decrease.
Agricultural land areas
Spatial analysis of the existing substrates (digital pedological maps) and spatial measures revealed that by
implementing Measure A.7, it is possible to convert land from the category "Agricultural Area Mosaic" (Figure 7.24).
By inspecting the ortophoto footage, it has confirmed that agricultural land has been found on these areas. The
abandonment of agricultural land reduces the agricultural production potential at the local level, but at the level of
the Republic of Croatia it can not be said to have a negative impact with regard to the potentially minor conversion
of the areas. Consequently, this impact is assessed as neutral.
For other planned ports, for which at the time of the Study we did not have the limits of potential expansion, the
constraints in the estimation are the same as in the previous indicator and the measures prescribed by the Study
shall be respected when implementing the measures.
Given the aforementioned, the indicator value is not expected to change.
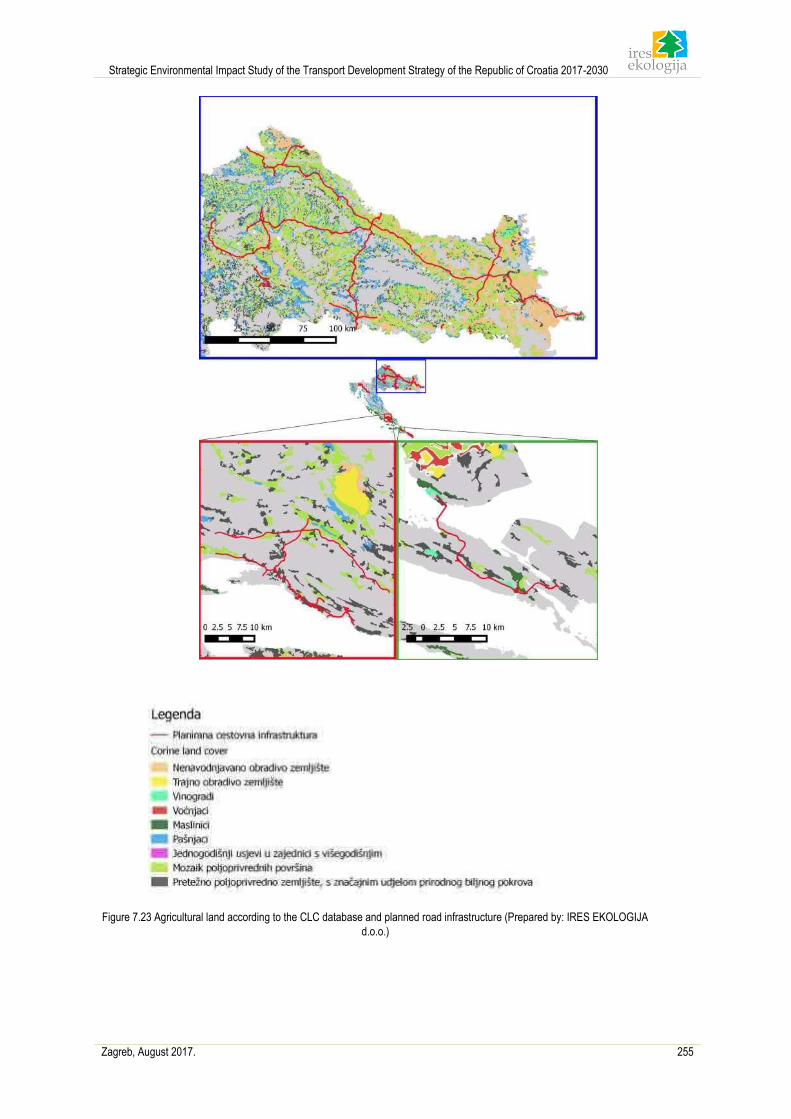
Strategic Environmental Impact Study of the Transport Development Strategy of the Republic of Croatia 2017-2030
Zagreb, August 2017. 255
Figure 7.23 Agricultural land according to the CLC database and planned road infrastructure (Prepared by: IRES EKOLOGIJA
d.o.o.)
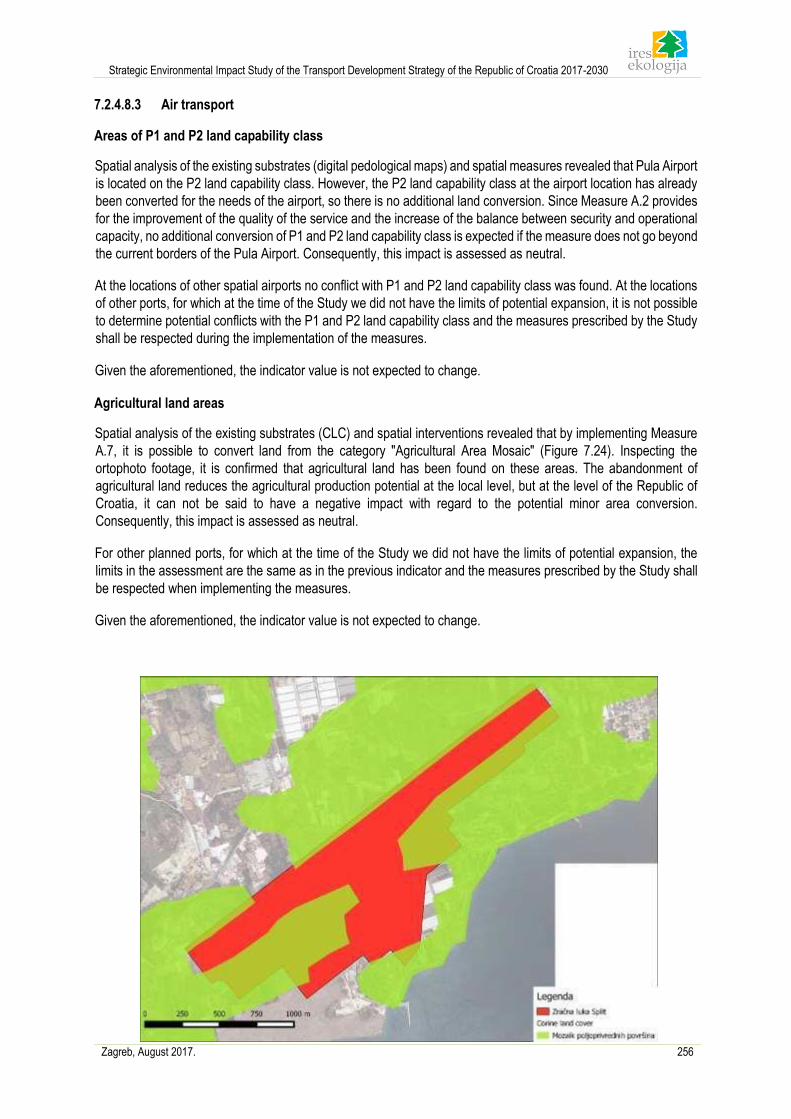
Strategic Environmental Impact Study of the Transport Development Strategy of the Republic of Croatia 2017-2030
Zagreb, August 2017. 256
7.2.4.8.3 Air transport
Areas of P1 and P2 land capability class
Spatial analysis of the existing substrates (digital pedological maps) and spatial measures revealed that Pula Airport
is located on the P2 land capability class. However, the P2 land capability class at the airport location has already
been converted for the needs of the airport, so there is no additional land conversion. Since Measure A.2 provides
for the improvement of the quality of the service and the increase of the balance between security and operational
capacity, no additional conversion of P1 and P2 land capability class is expected if the measure does not go beyond
the current borders of the Pula Airport. Consequently, this impact is assessed as neutral.
At the locations of other spatial airports no conflict with P1 and P2 land capability class was found. At the locations
of other ports, for which at the time of the Study we did not have the limits of potential expansion, it is not possible
to determine potential conflicts with the P1 and P2 land capability class and the measures prescribed by the Study
shall be respected during the implementation of the measures.
Given the aforementioned, the indicator value is not expected to change.
Agricultural land areas
Spatial analysis of the existing substrates (CLC) and spatial interventions revealed that by implementing Measure
A.7, it is possible to convert land from the category "Agricultural Area Mosaic" (Figure 7.24). Inspecting the
ortophoto footage, it is confirmed that agricultural land has been found on these areas. The abandonment of
agricultural land reduces the agricultural production potential at the local level, but at the level of the Republic of
Croatia, it can not be said to have a negative impact with regard to the potential minor area conversion.
Consequently, this impact is assessed as neutral.
For other planned ports, for which at the time of the Study we did not have the limits of potential expansion, the
limits in the assessment are the same as in the previous indicator and the measures prescribed by the Study shall
be respected when implementing the measures.
Given the aforementioned, the indicator value is not expected to change.
Strategic Environmental Impact Study of the Transport Development Strategy of the Republic of Croatia 2017-2030
Zagreb, August 2017. 257
Figure 7.24 Agricultural land according to CLC at the location of Split Airport (Prepared by: IRES EKOLOGIJA d.o.o.)
7.2.4.8.4 Maritime transport
Areas of P1 and P2 land capability class
Agricultural land areas
Since measures in the maritime transport sector provide for the specialization of individual ports for the acceptance
of different types of cargo, the modernization and reconstruction of terminals and docks, as well as directing the
ports for the reception of ships on round trips, and since the port boundaries are not expected to be expanded,
conversion of agricultural land is not expected. Consequently, the impact of measures in the maritime transport
sector is assessed as neutral and no change in the indicator values is expected.
7.2.4.8.5 Inland waterway transport
Areas of P1 and P2 land capability class
Spatial analysis of the existing substrates (digital pedological maps) and spatial measures revealed that the location
of the planned port of Sisak (I.6) and the port of Slavonski Brod (I.5) is P1 land capability class, i.e. P1 and P2
agricultural land capability class (Figure 7.25). With its conversion, we can expect the need for greater investments
in agricultural production in order to maintain the same profits, that is, a smaller profit with equal investments.
However, given the small area that would be converted and considering the amount of P1 and P2 land capability
class in the vicinity of the planned project, this impact is estimated to be moderately negative.
The realization of measure I.7 would result in the conversion of P1 and P2 land capability class. Given that this is
a line object, there shall be fragmentation of agricultural land. The effects of fragmentation and conversion of P1
and P2 land capability class are described in more detail in the subsection Rail Traffic. Given the relatively small
potential conversion of agricultural areas and their availability on the territory of the Republic of Croatia, this impact
is assessed as moderately negative. However, the implementation of this measure plans for the irrigation of
agricultural land, which has a positive impact on agricultural production at the local level and, if it includes larger
areas, at the regional and national level, so that the implementation of this measure can have a positive impact.
Given the aforementioned, it is expected that the indicator value shall decrease.
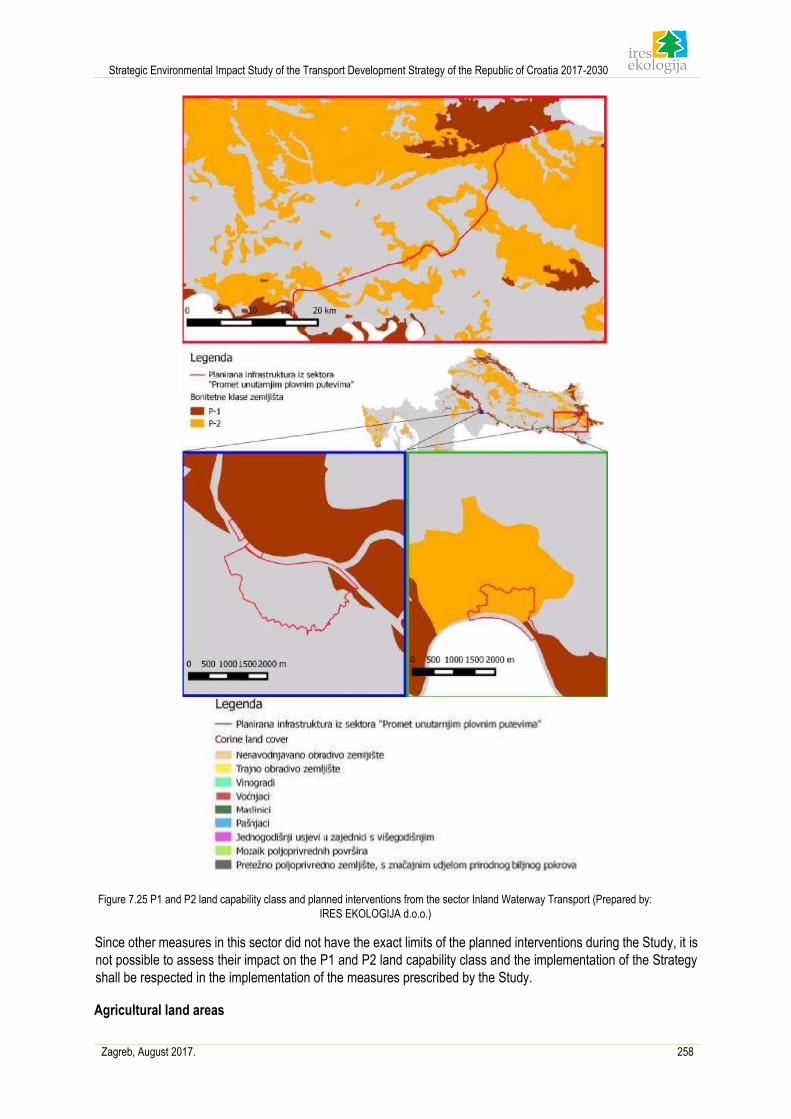
Strategic Environmental Impact Study of the Transport Development Strategy of the Republic of Croatia 2017-2030
Zagreb, August 2017. 258
Figure 7.25 P1 and P2 land capability class and planned interventions from the sector Inland Waterway Transport (Prepared by:
IRES EKOLOGIJA d.o.o.)
Since other measures in this sector did not have the exact limits of the planned interventions during the Study, it is
not possible to assess their impact on the P1 and P2 land capability class and the implementation of the Strategy
shall be respected in the implementation of the measures prescribed by the Study.
Agricultural land areas
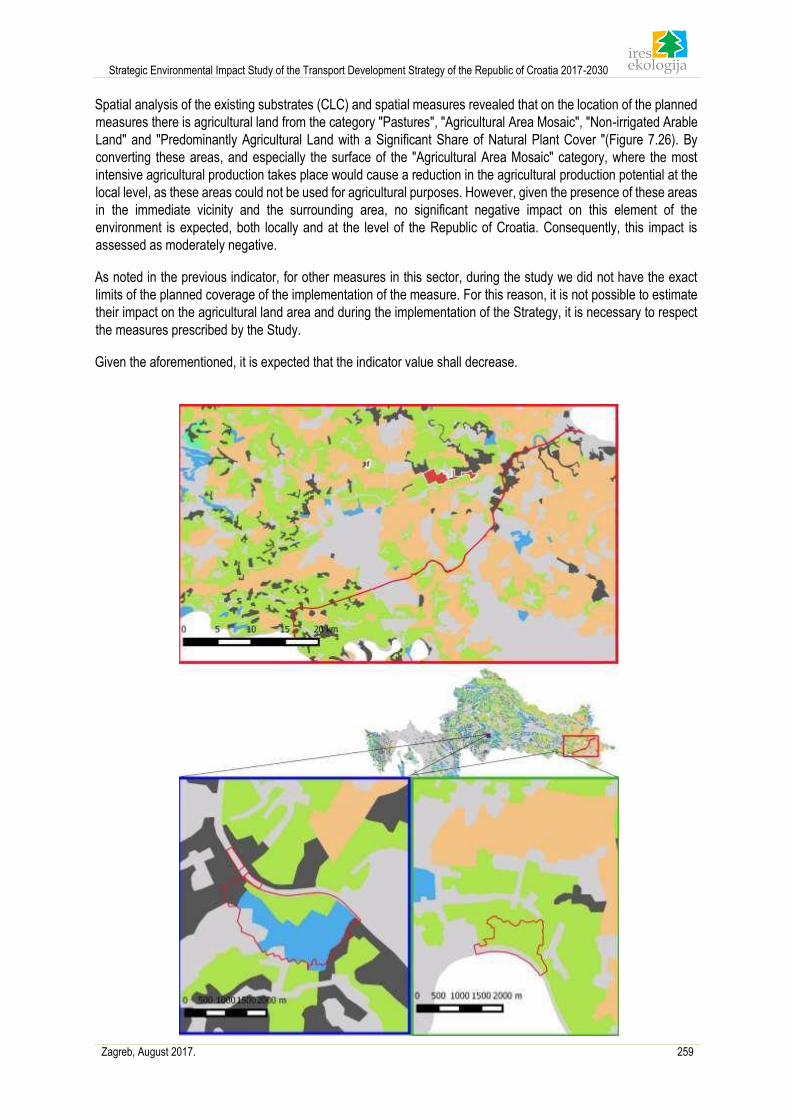
Strategic Environmental Impact Study of the Transport Development Strategy of the Republic of Croatia 2017-2030
Zagreb, August 2017. 259
Spatial analysis of the existing substrates (CLC) and spatial measures revealed that on the location of the planned
measures there is agricultural land from the category "Pastures", "Agricultural Area Mosaic", "Non-irrigated Arable
Land" and "Predominantly Agricultural Land with a Significant Share of Natural Plant Cover "(Figure 7.26). By
converting these areas, and especially the surface of the "Agricultural Area Mosaic" category, where the most
intensive agricultural production takes place would cause a reduction in the agricultural production potential at the
local level, as these areas could not be used for agricultural purposes. However, given the presence of these areas
in the immediate vicinity and the surrounding area, no significant negative impact on this element of the
environment is expected, both locally and at the level of the Republic of Croatia. Consequently, this impact is
assessed as moderately negative.
As noted in the previous indicator, for other measures in this sector, during the study we did not have the exact
limits of the planned coverage of the implementation of the measure. For this reason, it is not possible to estimate
their impact on the agricultural land area and during the implementation of the Strategy, it is necessary to respect
the measures prescribed by the Study.
Given the aforementioned, it is expected that the indicator value shall decrease.
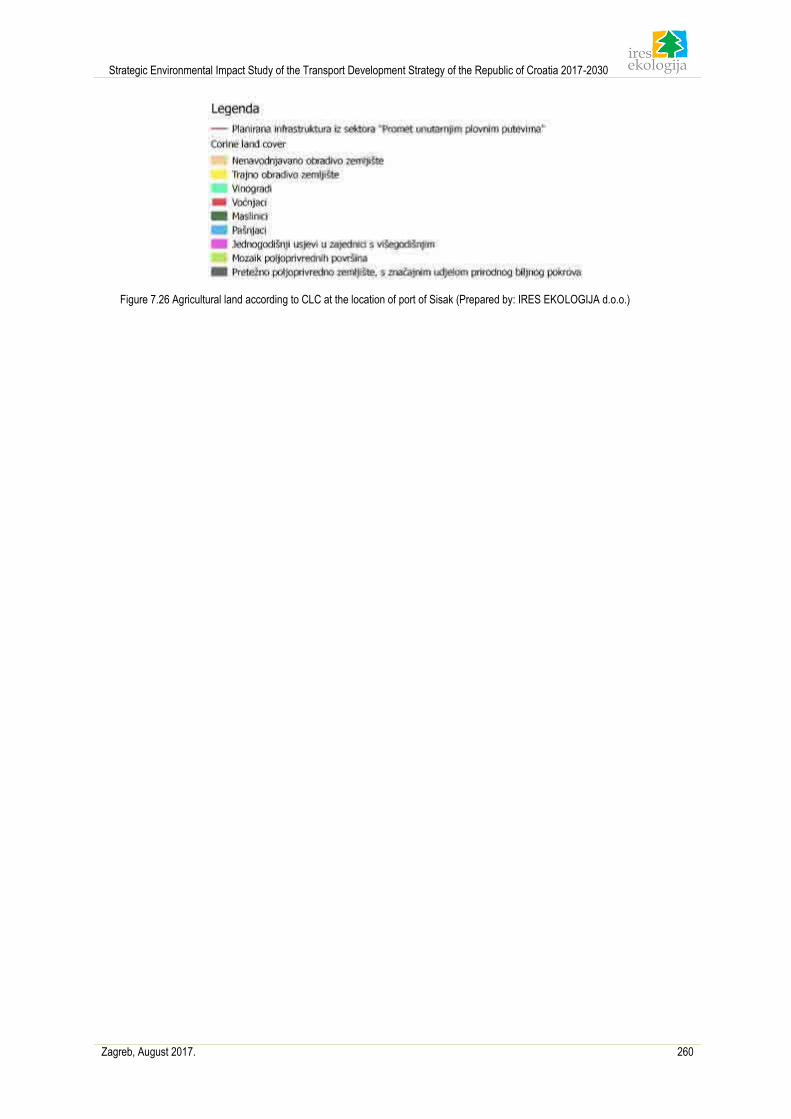
Strategic Environmental Impact Study of the Transport Development Strategy of the Republic of Croatia 2017-2030
Zagreb, August 2017. 260
Figure 7.26 Agricultural land according to CLC at the location of port of Sisak (Prepared by: IRES EKOLOGIJA d.o.o.)
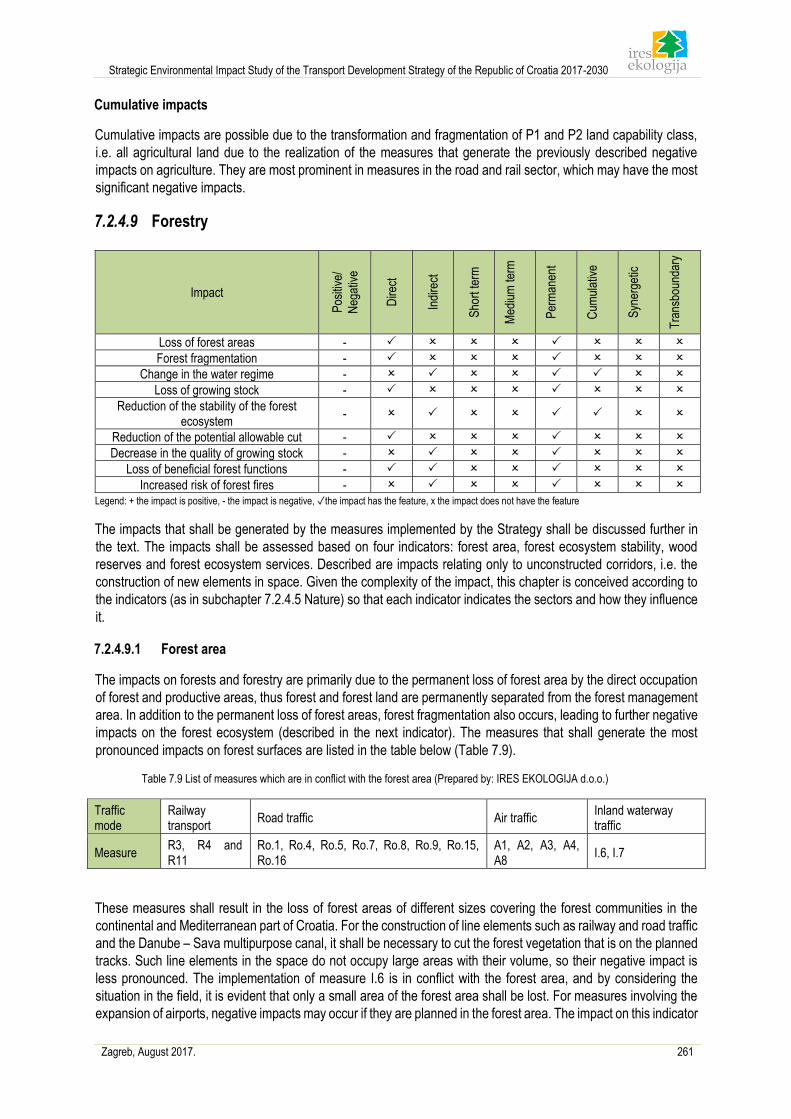
Strategic Environmental Impact Study of the Transport Development Strategy of the Republic of Croatia 2017-2030
Zagreb, August 2017. 261
Cumulative impacts
Cumulative impacts are possible due to the transformation and fragmentation of P1 and P2 land capability class,
i.e. all agricultural land due to the realization of the measures that generate the previously described negative
impacts on agriculture. They are most prominent in measures in the road and rail sector, which may have the most
significant negative impacts.
7.2.4.9 Forestry
Legend: + the impact is positive, - the impact is negative, ✓the impact has the feature, x the impact does not have the feature
The impacts that shall be generated by the measures implemented by the Strategy shall be discussed further in
the text. The impacts shall be assessed based on four indicators: forest area, forest ecosystem stability, wood
reserves and forest ecosystem services. Described are impacts relating only to unconstructed corridors, i.e. the
construction of new elements in space. Given the complexity of the impact, this chapter is conceived according to
the indicators (as in subchapter 7.2.4.5 Nature) so that each indicator indicates the sectors and how they influence
it.
7.2.4.9.1 Forest area
The impacts on forests and forestry are primarily due to the permanent loss of forest area by the direct occupation
of forest and productive areas, thus forest and forest land are permanently separated from the forest management
area. In addition to the permanent loss of forest areas, forest fragmentation also occurs, leading to further negative
impacts on the forest ecosystem (described in the next indicator). The measures that shall generate the most
pronounced impacts on forest surfaces are listed in the table below (Table 7.9).
Table 7.9 List of measures which are in conflict with the forest area (Prepared by: IRES EKOLOGIJA d.o.o.)
Traffic mode
Railway transport
Road traffic Air traffic Inland waterway traffic
Measure R3, R4 and R11
Ro.1, Ro.4, Ro.5, Ro.7, Ro.8, Ro.9, Ro.15, Ro.16
A1, A2, A3, A4, A8
I.6, I.7
These measures shall result in the loss of forest areas of different sizes covering the forest communities in the
continental and Mediterranean part of Croatia. For the construction of line elements such as railway and road traffic
and the Danube – Sava multipurpose canal, it shall be necessary to cut the forest vegetation that is on the planned
tracks. Such line elements in the space do not occupy large areas with their volume, so their negative impact is
less pronounced. The implementation of measure I.6 is in conflict with the forest area, and by considering the
situation in the field, it is evident that only a small area of the forest area shall be lost. For measures involving the
expansion of airports, negative impacts may occur if they are planned in the forest area. The impact on this indicator
Impact
Pos
itive
/
Neg
ativ
e
Dire
ct
Indi
rect
Sho
rt te
rm
Med
ium
term
Per
man
ent
Cum
ulat
ive
Syn
erge
tic
Tra
nsbo
unda
ry
Loss of forest areas -
Forest fragmentation -
Change in the water regime -
Loss of growing stock -
Reduction of the stability of the forest ecosystem
-
Reduction of the potential allowable cut -
Decrease in the quality of growing stock -
Loss of beneficial forest functions -
Increased risk of forest fires -
Strategic Environmental Impact Study of the Transport Development Strategy of the Republic of Croatia 2017-2030
Zagreb, August 2017. 262
is estimated to be moderately negative as no direct crossing of larger forest areas would occur. In the area of other
measures there are no larger forest areas that shall be lost and their impact shall not be felt.
As one of the environmental problems of forestry, the forest area at the level of Croatia has decreased over the
years, i.e. the presence of the trend of converting forestland for other purposes, and with the Strategy
implementation, this trend shall continue, which shall reduce the indicator value.
7.2.4.9.2 Forest ecosystem stability
The implementation of the line deforestation for the construction of roads and railways shall lead to the direct
interruption of forest areas, which shall fragment larger segments of the forest into smaller segments.
Fragmentation of forest areas leads to the opening of new forest edges, changing the microclimate habitat
conditions (higher insolation, reduced humidity) in that part of the forest stands, which results in a slower life cycle
and drying of the trees over a certain period. Depending on the conservation and species of forest communities
through which routes pass, different degrees of influence shall be generated.
The route of the railway track covering the area south of Karlovac towards Josipdol (R3) crosses the area of sessile
oak and common hornbeam. On the majority of the route, there are large areas of sessile oak and common
hornbeam forests, which have been reclaimed and turned into different types of anthropogenic vegetation, and only
in the smaller part there are complete forest complexes. Furthermore, sessile oak and common hornbeam forests
are not sensitive and are relatively stable in Croatia, therefore the negative impacts shall be of lower intensity. The
R4 track route runs through the beech and silver fir forests and silver fir forests. Silver fir according to the degree
of crowning defoliation represents the most endangered species of forests in Croatia. Although the creation of a
new forest edge in that part of the stands shall cause a certain degree of damage to the stability of the forests, the
overall stability of the forests shall not be significantly affected, given that these forests are much more endangered
by air, water, and soil pollution. The Ro.9 road route passes through a very small part of the forest areas, whereas
the Ro.15, Ro.16 road routes mostly cut off the degraded forest forms of evergreen oak and downy oak forests
(macquis and coppice). Ro.4 road route passes mostly through degraded forms of downy oak forests, and to a
lesser extent through unendangered forest areas of common beech. Although part of the Ro.1 and Ro.7 measures
are planned through the lowland forests, their routes only partially pass through endangered forest areas and
largely go through unendangered forest areas, such as beech and sessile oak and hornbeam forests. Given all the
mentioned, the implementation of these measures shall have a moderately negative impact on the forests in the
Republic of Croatia.
Measures R11, Ro.8 and I.7 (Figure 7.27) shall have the most pronounced impact on the forests of the lowland
part of Croatia, given that in the lowland ecosystems the greatest changes have been determined in natural
biological and ecological balance compared to other forest ecosystems. Especially endangered are pedunculate
oak forests that are under heavy strain of debris and dehydration, contributing to changes in the habitat conditions
combined with certain other stress factors. This issue represents the most significant problem of forestry in Croatia,
so it is very important to protect these economically and ecologically valuable forest complexes.
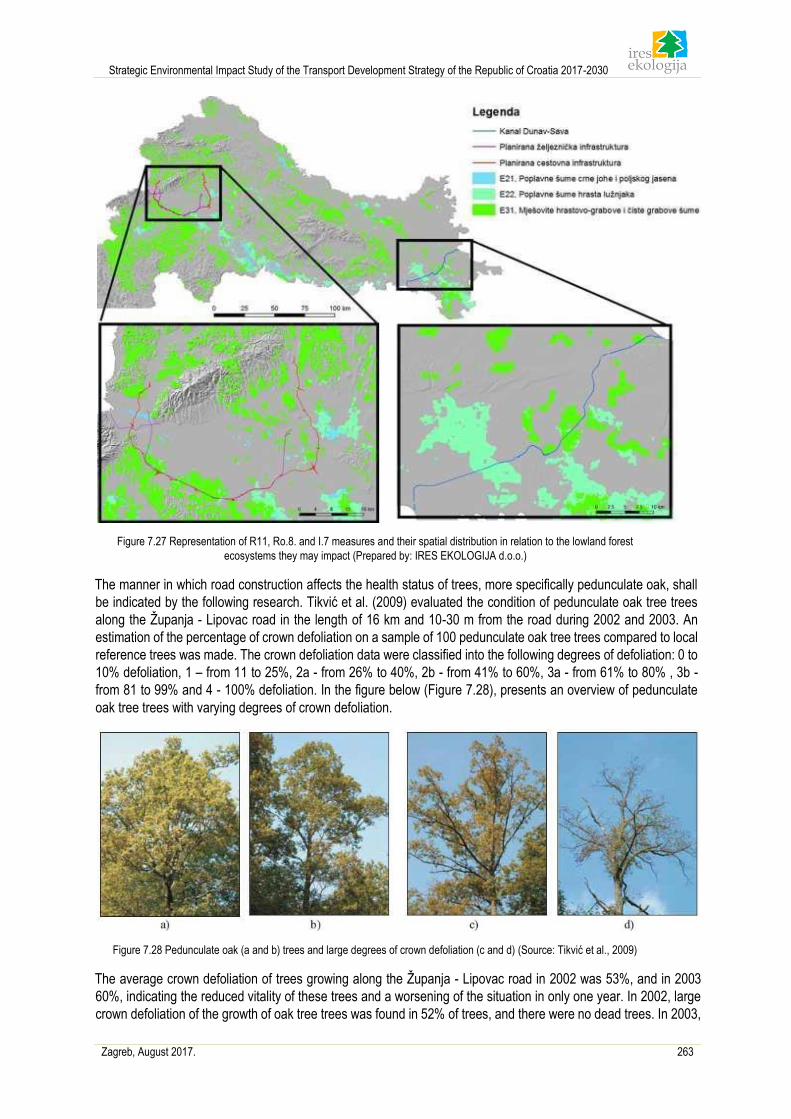
Strategic Environmental Impact Study of the Transport Development Strategy of the Republic of Croatia 2017-2030
Zagreb, August 2017. 263
Figure 7.27 Representation of R11, Ro.8. and I.7 measures and their spatial distribution in relation to the lowland forest
ecosystems they may impact (Prepared by: IRES EKOLOGIJA d.o.o.)
The manner in which road construction affects the health status of trees, more specifically pedunculate oak, shall
be indicated by the following research. Tikvić et al. (2009) evaluated the condition of pedunculate oak tree trees
along the Županja - Lipovac road in the length of 16 km and 10-30 m from the road during 2002 and 2003. An
estimation of the percentage of crown defoliation on a sample of 100 pedunculate oak tree trees compared to local
reference trees was made. The crown defoliation data were classified into the following degrees of defoliation: 0 to
10% defoliation, 1 – from 11 to 25%, 2a - from 26% to 40%, 2b - from 41% to 60%, 3a - from 61% to 80% , 3b -
from 81 to 99% and 4 - 100% defoliation. In the figure below (Figure 7.28), presents an overview of pedunculate
oak tree trees with varying degrees of crown defoliation.
Figure 7.28 Pedunculate oak (a and b) trees and large degrees of crown defoliation (c and d) (Source: Tikvić et al., 2009)
The average crown defoliation of trees growing along the Županja - Lipovac road in 2002 was 53%, and in 2003
60%, indicating the reduced vitality of these trees and a worsening of the situation in only one year. In 2002, large
crown defoliation of the growth of oak tree trees was found in 52% of trees, and there were no dead trees. In 2003,
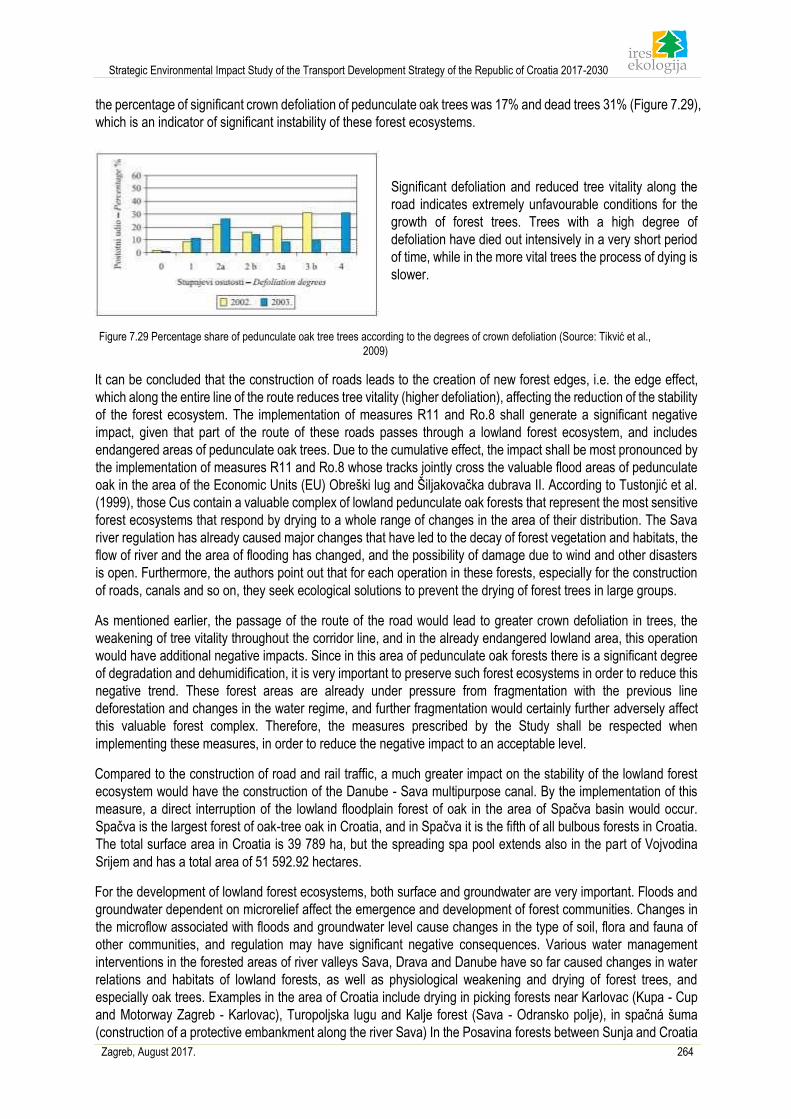
Strategic Environmental Impact Study of the Transport Development Strategy of the Republic of Croatia 2017-2030
Zagreb, August 2017. 264
the percentage of significant crown defoliation of pedunculate oak trees was 17% and dead trees 31% (Figure 7.29),
which is an indicator of significant instability of these forest ecosystems.
Significant defoliation and reduced tree vitality along the
road indicates extremely unfavourable conditions for the
growth of forest trees. Trees with a high degree of
defoliation have died out intensively in a very short period
of time, while in the more vital trees the process of dying is
slower.
Figure 7.29 Percentage share of pedunculate oak tree trees according to the degrees of crown defoliation (Source: Tikvić et al.,
2009)
It can be concluded that the construction of roads leads to the creation of new forest edges, i.e. the edge effect,
which along the entire line of the route reduces tree vitality (higher defoliation), affecting the reduction of the stability
of the forest ecosystem. The implementation of measures R11 and Ro.8 shall generate a significant negative
impact, given that part of the route of these roads passes through a lowland forest ecosystem, and includes
endangered areas of pedunculate oak trees. Due to the cumulative effect, the impact shall be most pronounced by
the implementation of measures R11 and Ro.8 whose tracks jointly cross the valuable flood areas of pedunculate
oak in the area of the Economic Units (EU) Obreški lug and Šiljakovačka dubrava II. According to Tustonjić et al.
(1999), those Cus contain a valuable complex of lowland pedunculate oak forests that represent the most sensitive
forest ecosystems that respond by drying to a whole range of changes in the area of their distribution. The Sava
river regulation has already caused major changes that have led to the decay of forest vegetation and habitats, the
flow of river and the area of flooding has changed, and the possibility of damage due to wind and other disasters
is open. Furthermore, the authors point out that for each operation in these forests, especially for the construction
of roads, canals and so on, they seek ecological solutions to prevent the drying of forest trees in large groups.
As mentioned earlier, the passage of the route of the road would lead to greater crown defoliation in trees, the
weakening of tree vitality throughout the corridor line, and in the already endangered lowland area, this operation
would have additional negative impacts. Since in this area of pedunculate oak forests there is a significant degree
of degradation and dehumidification, it is very important to preserve such forest ecosystems in order to reduce this
negative trend. These forest areas are already under pressure from fragmentation with the previous line
deforestation and changes in the water regime, and further fragmentation would certainly further adversely affect
this valuable forest complex. Therefore, the measures prescribed by the Study shall be respected when
implementing these measures, in order to reduce the negative impact to an acceptable level.
Compared to the construction of road and rail traffic, a much greater impact on the stability of the lowland forest
ecosystem would have the construction of the Danube - Sava multipurpose canal. By the implementation of this
measure, a direct interruption of the lowland floodplain forest of oak in the area of Spačva basin would occur.
Spačva is the largest forest of oak-tree oak in Croatia, and in Spačva it is the fifth of all bulbous forests in Croatia.
The total surface area in Croatia is 39 789 ha, but the spreading spa pool extends also in the part of Vojvodina
Srijem and has a total area of 51 592.92 hectares.
For the development of lowland forest ecosystems, both surface and groundwater are very important. Floods and
groundwater dependent on microrelief affect the emergence and development of forest communities. Changes in
the microflow associated with floods and groundwater level cause changes in the type of soil, flora and fauna of
other communities, and regulation may have significant negative consequences. Various water management
interventions in the forested areas of river valleys Sava, Drava and Danube have so far caused changes in water
relations and habitats of lowland forests, as well as physiological weakening and drying of forest trees, and
especially oak trees. Examples in the area of Croatia include drying in picking forests near Karlovac (Kupa - Cup
and Motorway Zagreb - Karlovac), Turopoljska lugu and Kalje forest (Sava - Odransko polje), in spačná šuma
(construction of a protective embankment along the river Sava) In the Posavina forests between Sunja and Croatia
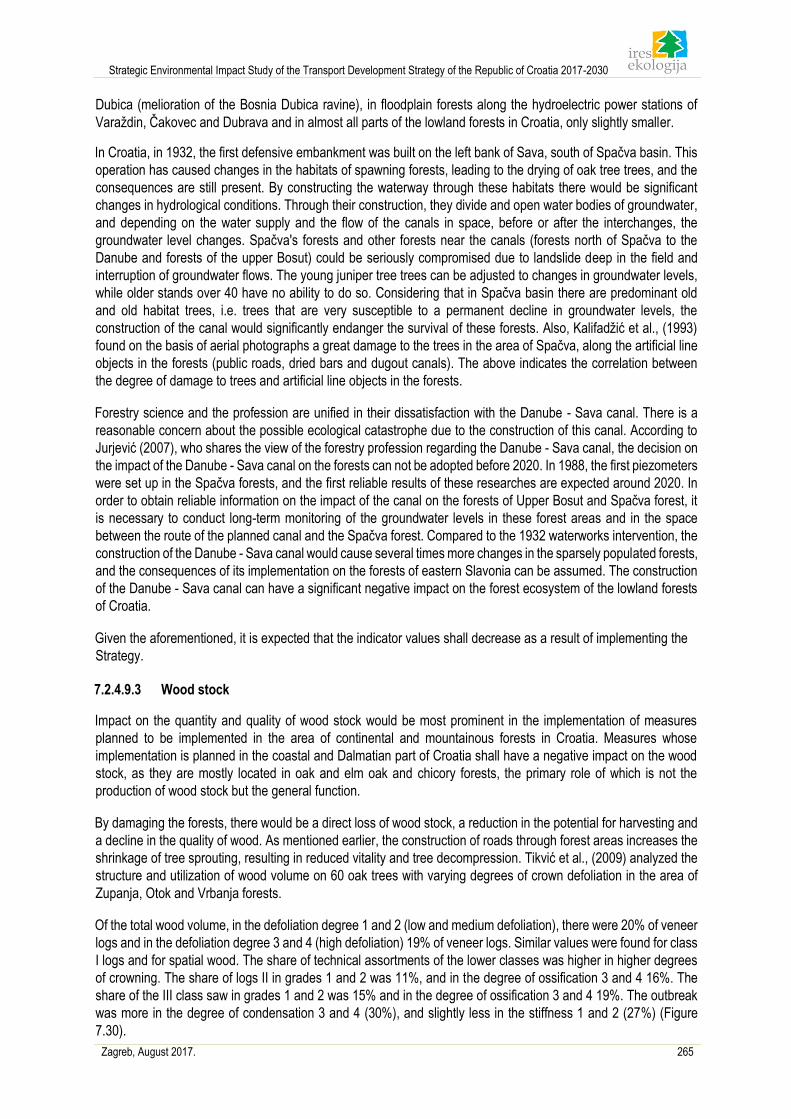
Strategic Environmental Impact Study of the Transport Development Strategy of the Republic of Croatia 2017-2030
Zagreb, August 2017. 265
Dubica (melioration of the Bosnia Dubica ravine), in floodplain forests along the hydroelectric power stations of
Varaždin, Čakovec and Dubrava and in almost all parts of the lowland forests in Croatia, only slightly smaller.
In Croatia, in 1932, the first defensive embankment was built on the left bank of Sava, south of Spačva basin. This
operation has caused changes in the habitats of spawning forests, leading to the drying of oak tree trees, and the
consequences are still present. By constructing the waterway through these habitats there would be significant
changes in hydrological conditions. Through their construction, they divide and open water bodies of groundwater,
and depending on the water supply and the flow of the canals in space, before or after the interchanges, the
groundwater level changes. Spačva's forests and other forests near the canals (forests north of Spačva to the
Danube and forests of the upper Bosut) could be seriously compromised due to landslide deep in the field and
interruption of groundwater flows. The young juniper tree trees can be adjusted to changes in groundwater levels,
while older stands over 40 have no ability to do so. Considering that in Spačva basin there are predominant old
and old habitat trees, i.e. trees that are very susceptible to a permanent decline in groundwater levels, the
construction of the canal would significantly endanger the survival of these forests. Also, Kalifadžić et al., (1993)
found on the basis of aerial photographs a great damage to the trees in the area of Spačva, along the artificial line
objects in the forests (public roads, dried bars and dugout canals). The above indicates the correlation between
the degree of damage to trees and artificial line objects in the forests.
Forestry science and the profession are unified in their dissatisfaction with the Danube - Sava canal. There is a
reasonable concern about the possible ecological catastrophe due to the construction of this canal. According to
Jurjević (2007), who shares the view of the forestry profession regarding the Danube - Sava canal, the decision on
the impact of the Danube - Sava canal on the forests can not be adopted before 2020. In 1988, the first piezometers
were set up in the Spačva forests, and the first reliable results of these researches are expected around 2020. In
order to obtain reliable information on the impact of the canal on the forests of Upper Bosut and Spačva forest, it
is necessary to conduct long-term monitoring of the groundwater levels in these forest areas and in the space
between the route of the planned canal and the Spačva forest. Compared to the 1932 waterworks intervention, the
construction of the Danube - Sava canal would cause several times more changes in the sparsely populated forests,
and the consequences of its implementation on the forests of eastern Slavonia can be assumed. The construction
of the Danube - Sava canal can have a significant negative impact on the forest ecosystem of the lowland forests
of Croatia.
Given the aforementioned, it is expected that the indicator values shall decrease as a result of implementing the
Strategy.
7.2.4.9.3 Wood stock
Impact on the quantity and quality of wood stock would be most prominent in the implementation of measures
planned to be implemented in the area of continental and mountainous forests in Croatia. Measures whose
implementation is planned in the coastal and Dalmatian part of Croatia shall have a negative impact on the wood
stock, as they are mostly located in oak and elm oak and chicory forests, the primary role of which is not the
production of wood stock but the general function.
By damaging the forests, there would be a direct loss of wood stock, a reduction in the potential for harvesting and
a decline in the quality of wood. As mentioned earlier, the construction of roads through forest areas increases the
shrinkage of tree sprouting, resulting in reduced vitality and tree decompression. Tikvić et al., (2009) analyzed the
structure and utilization of wood volume on 60 oak trees with varying degrees of crown defoliation in the area of
Zupanja, Otok and Vrbanja forests.
Of the total wood volume, in the defoliation degree 1 and 2 (low and medium defoliation), there were 20% of veneer
logs and in the defoliation degree 3 and 4 (high defoliation) 19% of veneer logs. Similar values were found for class
I logs and for spatial wood. The share of technical assortments of the lower classes was higher in higher degrees
of crowning. The share of logs II in grades 1 and 2 was 11%, and in the degree of ossification 3 and 4 16%. The
share of the III class saw in grades 1 and 2 was 15% and in the degree of ossification 3 and 4 19%. The outbreak
was more in the degree of condensation 3 and 4 (30%), and slightly less in the stiffness 1 and 2 (27%) (Figure
7.30).
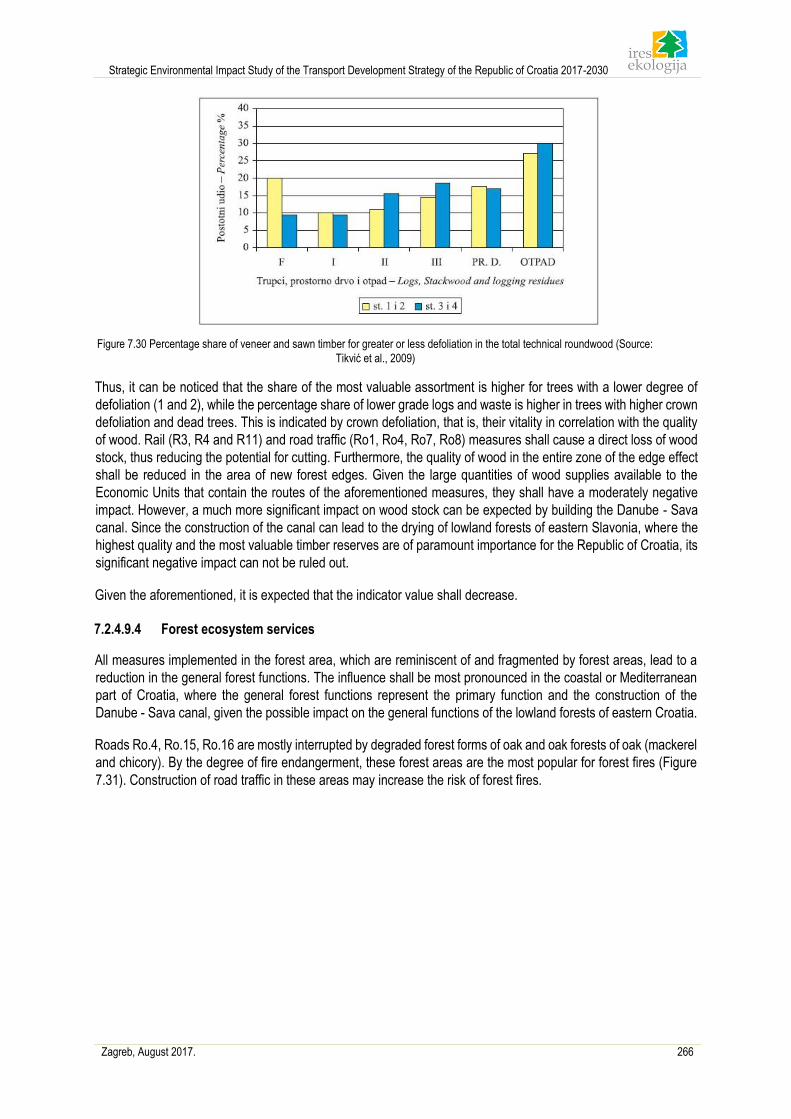
Strategic Environmental Impact Study of the Transport Development Strategy of the Republic of Croatia 2017-2030
Zagreb, August 2017. 266
Figure 7.30 Percentage share of veneer and sawn timber for greater or less defoliation in the total technical roundwood (Source:
Tikvić et al., 2009)
Thus, it can be noticed that the share of the most valuable assortment is higher for trees with a lower degree of
defoliation (1 and 2), while the percentage share of lower grade logs and waste is higher in trees with higher crown
defoliation and dead trees. This is indicated by crown defoliation, that is, their vitality in correlation with the quality
of wood. Rail (R3, R4 and R11) and road traffic (Ro1, Ro4, Ro7, Ro8) measures shall cause a direct loss of wood
stock, thus reducing the potential for cutting. Furthermore, the quality of wood in the entire zone of the edge effect
shall be reduced in the area of new forest edges. Given the large quantities of wood supplies available to the
Economic Units that contain the routes of the aforementioned measures, they shall have a moderately negative
impact. However, a much more significant impact on wood stock can be expected by building the Danube - Sava
canal. Since the construction of the canal can lead to the drying of lowland forests of eastern Slavonia, where the
highest quality and the most valuable timber reserves are of paramount importance for the Republic of Croatia, its
significant negative impact can not be ruled out.
Given the aforementioned, it is expected that the indicator value shall decrease.
7.2.4.9.4 Forest ecosystem services
All measures implemented in the forest area, which are reminiscent of and fragmented by forest areas, lead to a
reduction in the general forest functions. The influence shall be most pronounced in the coastal or Mediterranean
part of Croatia, where the general forest functions represent the primary function and the construction of the
Danube - Sava canal, given the possible impact on the general functions of the lowland forests of eastern Croatia.
Roads Ro.4, Ro.15, Ro.16 are mostly interrupted by degraded forest forms of oak and oak forests of oak (mackerel
and chicory). By the degree of fire endangerment, these forest areas are the most popular for forest fires (Figure
7.31). Construction of road traffic in these areas may increase the risk of forest fires.
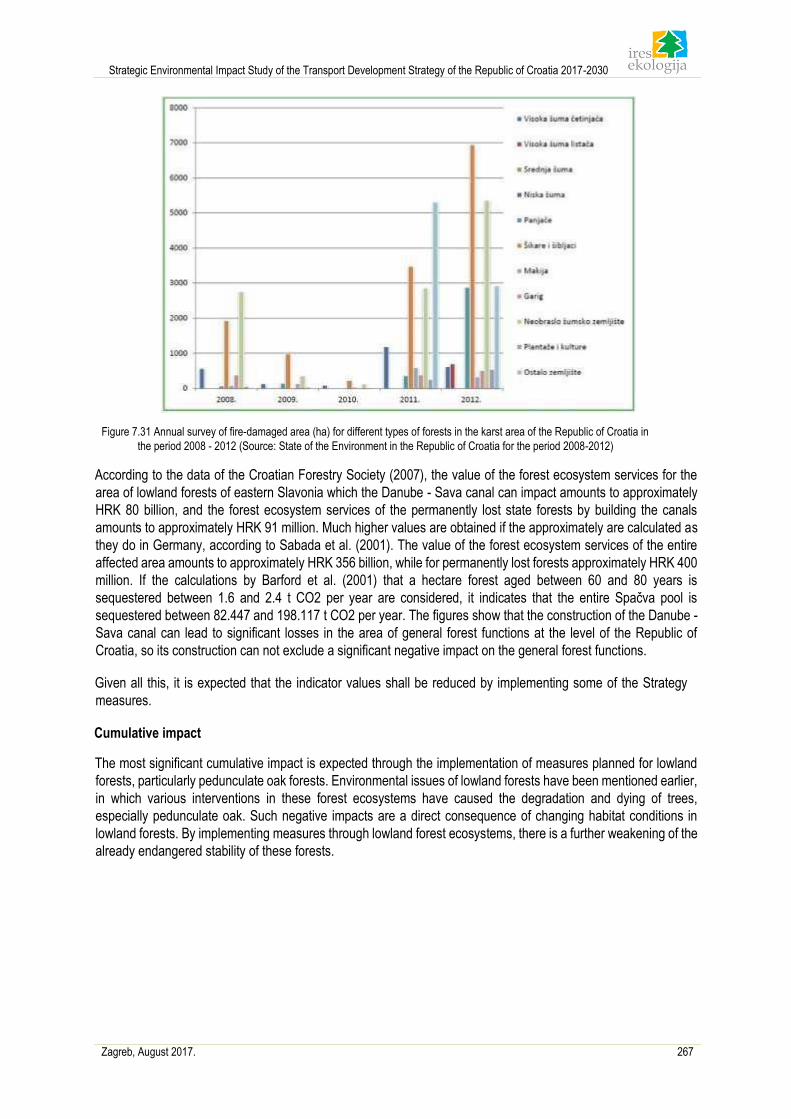
Strategic Environmental Impact Study of the Transport Development Strategy of the Republic of Croatia 2017-2030
Zagreb, August 2017. 267
Figure 7.31 Annual survey of fire-damaged area (ha) for different types of forests in the karst area of the Republic of Croatia in
the period 2008 - 2012 (Source: State of the Environment in the Republic of Croatia for the period 2008-2012)
According to the data of the Croatian Forestry Society (2007), the value of the forest ecosystem services for the
area of lowland forests of eastern Slavonia which the Danube - Sava canal can impact amounts to approximately
HRK 80 billion, and the forest ecosystem services of the permanently lost state forests by building the canals
amounts to approximately HRK 91 million. Much higher values are obtained if the approximately are calculated as
they do in Germany, according to Sabada et al. (2001). The value of the forest ecosystem services of the entire
affected area amounts to approximately HRK 356 billion, while for permanently lost forests approximately HRK 400
million. If the calculations by Barford et al. (2001) that a hectare forest aged between 60 and 80 years is
sequestered between 1.6 and 2.4 t CO2 per year are considered, it indicates that the entire Spačva pool is
sequestered between 82.447 and 198.117 t CO2 per year. The figures show that the construction of the Danube -
Sava canal can lead to significant losses in the area of general forest functions at the level of the Republic of
Croatia, so its construction can not exclude a significant negative impact on the general forest functions.
Given all this, it is expected that the indicator values shall be reduced by implementing some of the Strategy
measures.
Cumulative impact
The most significant cumulative impact is expected through the implementation of measures planned for lowland
forests, particularly pedunculate oak forests. Environmental issues of lowland forests have been mentioned earlier,
in which various interventions in these forest ecosystems have caused the degradation and dying of trees,
especially pedunculate oak. Such negative impacts are a direct consequence of changing habitat conditions in
lowland forests. By implementing measures through lowland forest ecosystems, there is a further weakening of the
already endangered stability of these forests.
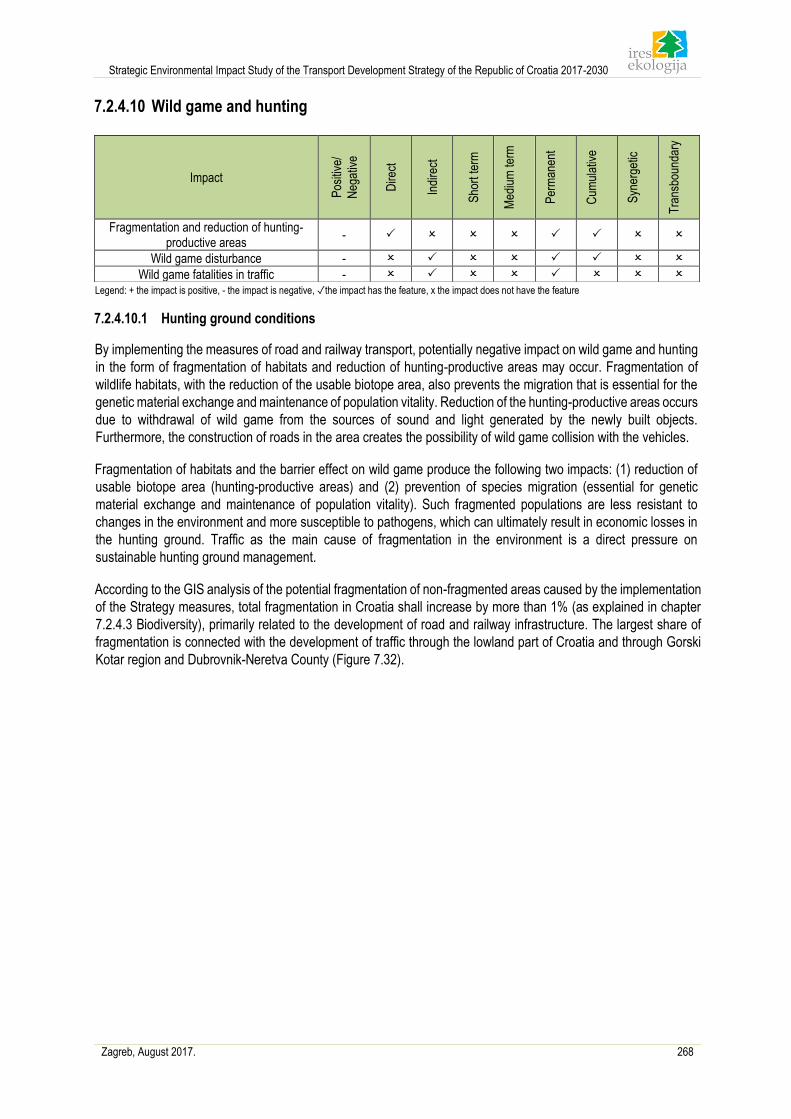
Strategic Environmental Impact Study of the Transport Development Strategy of the Republic of Croatia 2017-2030
Zagreb, August 2017. 268
7.2.4.10 Wild game and hunting
Legend: + the impact is positive, - the impact is negative, ✓the impact has the feature, x the impact does not have the feature
7.2.4.10.1 Hunting ground conditions
By implementing the measures of road and railway transport, potentially negative impact on wild game and hunting
in the form of fragmentation of habitats and reduction of hunting-productive areas may occur. Fragmentation of
wildlife habitats, with the reduction of the usable biotope area, also prevents the migration that is essential for the
genetic material exchange and maintenance of population vitality. Reduction of the hunting-productive areas occurs
due to withdrawal of wild game from the sources of sound and light generated by the newly built objects.
Furthermore, the construction of roads in the area creates the possibility of wild game collision with the vehicles.
Fragmentation of habitats and the barrier effect on wild game produce the following two impacts: (1) reduction of
usable biotope area (hunting-productive areas) and (2) prevention of species migration (essential for genetic
material exchange and maintenance of population vitality). Such fragmented populations are less resistant to
changes in the environment and more susceptible to pathogens, which can ultimately result in economic losses in
the hunting ground. Traffic as the main cause of fragmentation in the environment is a direct pressure on
sustainable hunting ground management.
According to the GIS analysis of the potential fragmentation of non-fragmented areas caused by the implementation
of the Strategy measures, total fragmentation in Croatia shall increase by more than 1% (as explained in chapter
7.2.4.3 Biodiversity), primarily related to the development of road and railway infrastructure. The largest share of
fragmentation is connected with the development of traffic through the lowland part of Croatia and through Gorski
Kotar region and Dubrovnik-Neretva County (Figure 7.32).
Impact
Pos
itive
/
Neg
ativ
e
Dire
ct
Indi
rect
Sho
rt te
rm
Med
ium
term
Per
man
ent
Cum
ulat
ive
Syn
erge
tic
Tra
nsbo
unda
ry
Fragmentation and reduction of hunting-productive areas
-
Wild game disturbance -
Wild game fatalities in traffic -
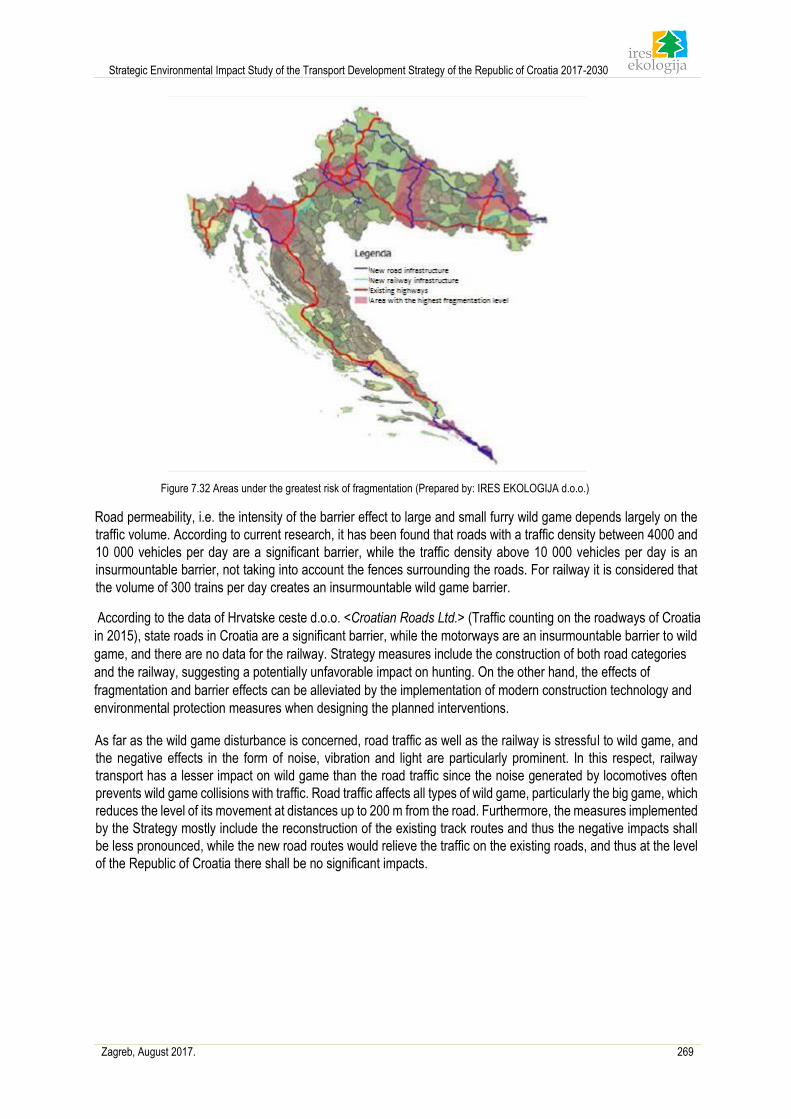
Strategic Environmental Impact Study of the Transport Development Strategy of the Republic of Croatia 2017-2030
Zagreb, August 2017. 269
Figure 7.32 Areas under the greatest risk of fragmentation (Prepared by: IRES EKOLOGIJA d.o.o.)
Road permeability, i.e. the intensity of the barrier effect to large and small furry wild game depends largely on the
traffic volume. According to current research, it has been found that roads with a traffic density between 4000 and
10 000 vehicles per day are a significant barrier, while the traffic density above 10 000 vehicles per day is an
insurmountable barrier, not taking into account the fences surrounding the roads. For railway it is considered that
the volume of 300 trains per day creates an insurmountable wild game barrier.
According to the data of Hrvatske ceste d.o.o. <Croatian Roads Ltd.> (Traffic counting on the roadways of Croatia
in 2015), state roads in Croatia are a significant barrier, while the motorways are an insurmountable barrier to wild
game, and there are no data for the railway. Strategy measures include the construction of both road categories
and the railway, suggesting a potentially unfavorable impact on hunting. On the other hand, the effects of
fragmentation and barrier effects can be alleviated by the implementation of modern construction technology and
environmental protection measures when designing the planned interventions.
As far as the wild game disturbance is concerned, road traffic as well as the railway is stressful to wild game, and
the negative effects in the form of noise, vibration and light are particularly prominent. In this respect, railway
transport has a lesser impact on wild game than the road traffic since the noise generated by locomotives often
prevents wild game collisions with traffic. Road traffic affects all types of wild game, particularly the big game, which
reduces the level of its movement at distances up to 200 m from the road. Furthermore, the measures implemented
by the Strategy mostly include the reconstruction of the existing track routes and thus the negative impacts shall
be less pronounced, while the new road routes would relieve the traffic on the existing roads, and thus at the level
of the Republic of Croatia there shall be no significant impacts.
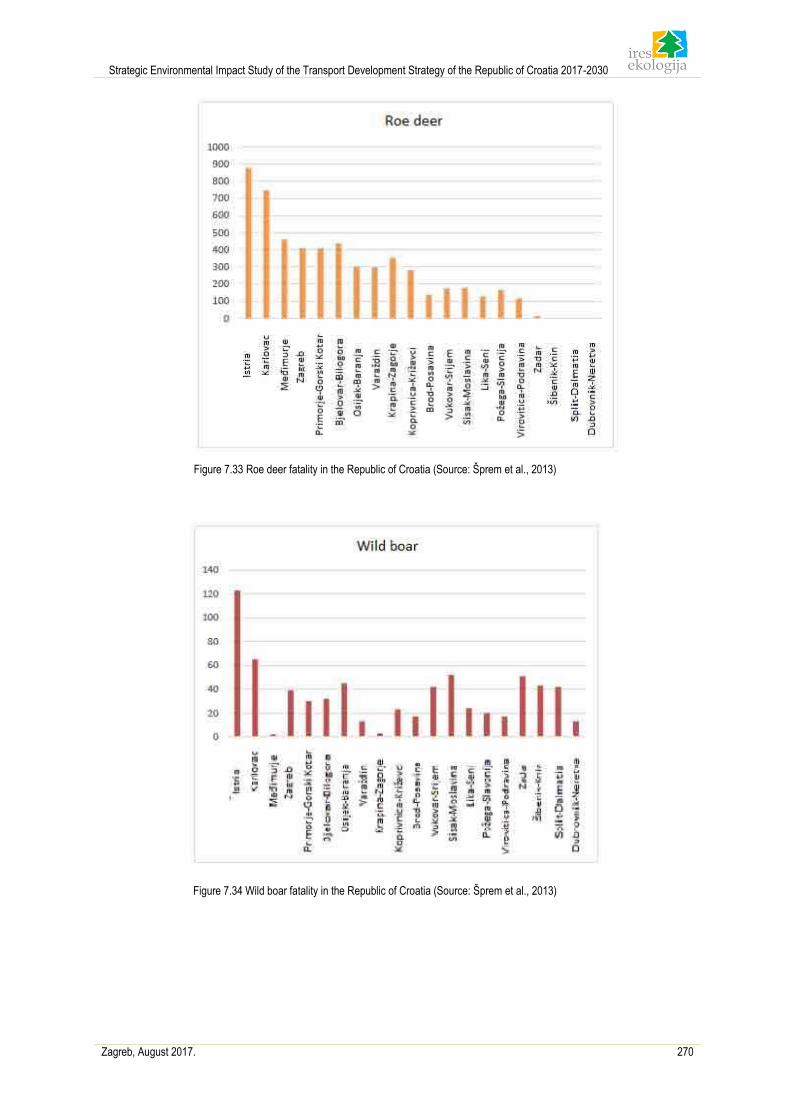
Strategic Environmental Impact Study of the Transport Development Strategy of the Republic of Croatia 2017-2030
Zagreb, August 2017. 270
Figure 7.33 Roe deer fatality in the Republic of Croatia (Source: Šprem et al., 2013)
Figure 7.34 Wild boar fatality in the Republic of Croatia (Source: Šprem et al., 2013)
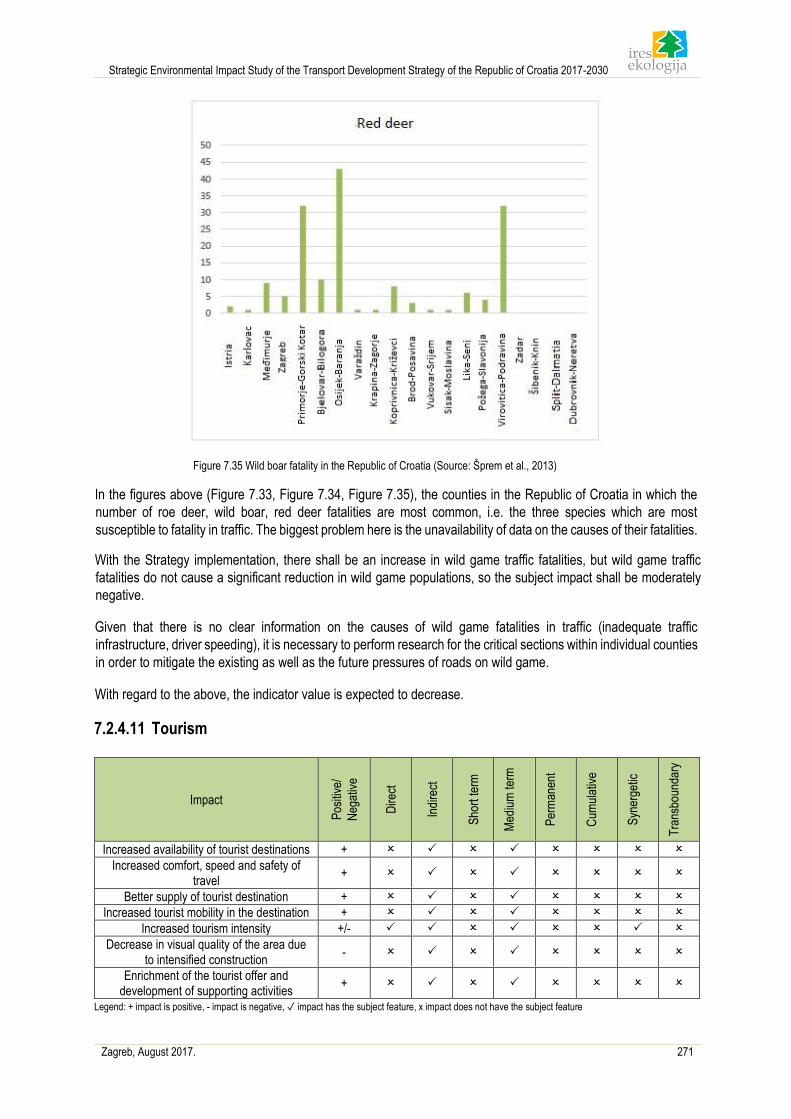
Strategic Environmental Impact Study of the Transport Development Strategy of the Republic of Croatia 2017-2030
Zagreb, August 2017. 271
Figure 7.35 Wild boar fatality in the Republic of Croatia (Source: Šprem et al., 2013)
In the figures above (Figure 7.33, Figure 7.34, Figure 7.35), the counties in the Republic of Croatia in which the
number of roe deer, wild boar, red deer fatalities are most common, i.e. the three species which are most
susceptible to fatality in traffic. The biggest problem here is the unavailability of data on the causes of their fatalities.
With the Strategy implementation, there shall be an increase in wild game traffic fatalities, but wild game traffic
fatalities do not cause a significant reduction in wild game populations, so the subject impact shall be moderately
negative.
Given that there is no clear information on the causes of wild game fatalities in traffic (inadequate traffic
infrastructure, driver speeding), it is necessary to perform research for the critical sections within individual counties
in order to mitigate the existing as well as the future pressures of roads on wild game.
With regard to the above, the indicator value is expected to decrease.
7.2.4.11 Tourism
Legend: + impact is positive, - impact is negative, ✓ impact has the subject feature, x impact does not have the subject feature
Impact
Pos
itive
/
Neg
ativ
e
Dire
ct
Indi
rect
Sho
rt te
rm
Med
ium
term
Per
man
ent
Cum
ulat
ive
Syn
erge
tic
Tra
nsbo
unda
ry
Increased availability of tourist destinations +
Increased comfort, speed and safety of travel
+
Better supply of tourist destination +
Increased tourist mobility in the destination +
Increased tourism intensity +/-
Decrease in visual quality of the area due to intensified construction
-
Enrichment of the tourist offer and development of supporting activities
+
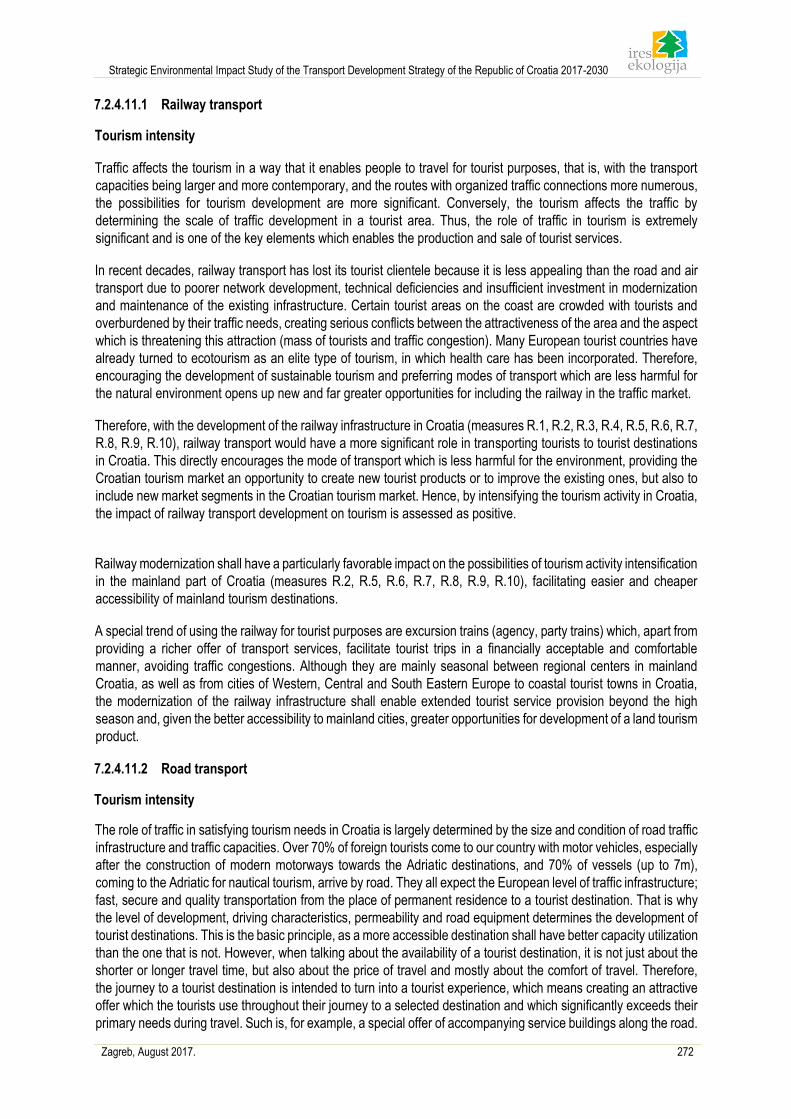
Strategic Environmental Impact Study of the Transport Development Strategy of the Republic of Croatia 2017-2030
Zagreb, August 2017. 272
7.2.4.11.1 Railway transport
Tourism intensity
Traffic affects the tourism in a way that it enables people to travel for tourist purposes, that is, with the transport
capacities being larger and more contemporary, and the routes with organized traffic connections more numerous,
the possibilities for tourism development are more significant. Conversely, the tourism affects the traffic by
determining the scale of traffic development in a tourist area. Thus, the role of traffic in tourism is extremely
significant and is one of the key elements which enables the production and sale of tourist services.
In recent decades, railway transport has lost its tourist clientele because it is less appealing than the road and air
transport due to poorer network development, technical deficiencies and insufficient investment in modernization
and maintenance of the existing infrastructure. Certain tourist areas on the coast are crowded with tourists and
overburdened by their traffic needs, creating serious conflicts between the attractiveness of the area and the aspect
which is threatening this attraction (mass of tourists and traffic congestion). Many European tourist countries have
already turned to ecotourism as an elite type of tourism, in which health care has been incorporated. Therefore,
encouraging the development of sustainable tourism and preferring modes of transport which are less harmful for
the natural environment opens up new and far greater opportunities for including the railway in the traffic market.
Therefore, with the development of the railway infrastructure in Croatia (measures R.1, R.2, R.3, R.4, R.5, R.6, R.7,
R.8, R.9, R.10), railway transport would have a more significant role in transporting tourists to tourist destinations
in Croatia. This directly encourages the mode of transport which is less harmful for the environment, providing the
Croatian tourism market an opportunity to create new tourist products or to improve the existing ones, but also to
include new market segments in the Croatian tourism market. Hence, by intensifying the tourism activity in Croatia,
the impact of railway transport development on tourism is assessed as positive.
Railway modernization shall have a particularly favorable impact on the possibilities of tourism activity intensification
in the mainland part of Croatia (measures R.2, R.5, R.6, R.7, R.8, R.9, R.10), facilitating easier and cheaper
accessibility of mainland tourism destinations.
A special trend of using the railway for tourist purposes are excursion trains (agency, party trains) which, apart from
providing a richer offer of transport services, facilitate tourist trips in a financially acceptable and comfortable
manner, avoiding traffic congestions. Although they are mainly seasonal between regional centers in mainland
Croatia, as well as from cities of Western, Central and South Eastern Europe to coastal tourist towns in Croatia,
the modernization of the railway infrastructure shall enable extended tourist service provision beyond the high
season and, given the better accessibility to mainland cities, greater opportunities for development of a land tourism
product.
7.2.4.11.2 Road transport
Tourism intensity
The role of traffic in satisfying tourism needs in Croatia is largely determined by the size and condition of road traffic
infrastructure and traffic capacities. Over 70% of foreign tourists come to our country with motor vehicles, especially
after the construction of modern motorways towards the Adriatic destinations, and 70% of vessels (up to 7m),
coming to the Adriatic for nautical tourism, arrive by road. They all expect the European level of traffic infrastructure;
fast, secure and quality transportation from the place of permanent residence to a tourist destination. That is why
the level of development, driving characteristics, permeability and road equipment determines the development of
tourist destinations. This is the basic principle, as a more accessible destination shall have better capacity utilization
than the one that is not. However, when talking about the availability of a tourist destination, it is not just about the
shorter or longer travel time, but also about the price of travel and mostly about the comfort of travel. Therefore,
the journey to a tourist destination is intended to turn into a tourist experience, which means creating an attractive
offer which the tourists use throughout their journey to a selected destination and which significantly exceeds their
primary needs during travel. Such is, for example, a special offer of accompanying service buildings along the road.
Strategic Environmental Impact Study of the Transport Development Strategy of the Republic of Croatia 2017-2030
Zagreb, August 2017. 273
Since tourism in Dalmatian destinations is characterized by mass tourism rates in the summer part of the year, a
positive impact of reducing the limited possibilities of transit traffic infrastructure is expected in order to
accommodate more vehicles. Modernization of the road network by building and reconstruction of road
infrastructure (measures Ro.2, Ro.3, Ro.4, Ro.5, Ro.6, Ro.7, Ro.9, Ro.11 and Ro.16) shall positively affect the
accessibility of tourist destinations throughout Croatia, the comfort and speed of travel, the tourist flows between
tourist destinations and indirectly, in the long term, greater tourism intensity and the development of accompanying
contents in the function of tourism.
Due to the dominance of road traffic in tourist arrivals to the northern Adriatic, the northernmost tourist destinations
are in a better market position than the southern ones, because they are more accessible and offer more frequent
arrivals. In the south, however, the destinations are naturally more attractive, but tend to experience difficulties in
valorizing this advantage due to a poorer traffic accessibility. Areas recognizable by their poorer road traffic
connection, particularly the southern part of Croatia and the eastern part of Croatia, have the potential to use the
development of traffic infrastructure for better tourism product development due to increased availability of tourist
destinations.
Although all the larger tourist towns have bypasses, which relieve traffic congestion during the tourist season, there
are occasional problems in traffic flow (congestion, deadlocks) in city centers which disturb the tourist vacation and
disrupt the tourist experience of the area. The reorganization of internal traffic network in Zagreb (Ro.8), Rijeka
(Ro.10) and Split (Ro.15) shall thus help alleviate the subject problems.
Growth, development and dimensioning of road traffic capacities has a negative impact on tourism, which is
reflected in the need for ever larger space, the reduction of visual landscape quality and the impact on the pollution
of natural resources (by noise, vibration, pollution of soil, water and air). Negative impact primarily refers to the
most valuable coastal area. Namely, road routes often contribute to additional construction (e.g. housing and
tourism capacities) and thus prevent the proper valorization of certain coastal parts, disrupting the organization of
space and mutual communication, and due to the constant presence of noise and intensive traffic, the intense
traffic area becomes less attractive for a tourist stay.
7.2.4.11.3 Air transport
Tourism intensity
Due to geographic indentedness and poor road infrastructure, tourists did not come to certain parts of Croatia by
cars in equal percentage. In parts of the country whose destinations are closer to emissive countries, such as Istria
and Kvarner, tourists mainly arrive by roads, while in more distant destinations (southern Dalmatia), they arrive
mainly by plane or boat.
Today, air traffic in Croatia with regard to the speed, frequency, comfort and favorable prices of low-fare flights
accounts for the major part of the realized tourism traffic in the high season, thereby better connecting the northern
and southern domestic tourist destinations with the European emissive markets. An important aspect in the arrival
of tourists by air is the good road connection between the centers of Dalmatian destinations and other tourist resorts
and airports, i.e. the proper connection of Croatian airports to the traffic system, and especially an inadequate role
of maritime transport in connecting airports with tourist destinations. Quality of airport connections to the traffic
systems in their environments, measures A.1, A.2, A.3, A.4, A.6, A.7, A.8 and A.9, shall positively affect, by
facilitating the accessibility of tourist destinations, the establishment and realization of a number of air traffic
connections with foreign destinations and consequently the increase of emissive tourist markets and tourist traffic.
Unlike at the summer vacation coastal destinations, tourists in the mainland Croatia tend to stay for a shorter period.
Therefore, the impact of measure A.5 on a larger number of tourist arrivals in Slavonia is assessed as positive
because it has the potential to remedy limiting factors in the development of tourism in this area, which are the
significant distance and tourist attraction when compared to the position, i.e. attractiveness of the Adriatic
destinations.
Strategic Environmental Impact Study of the Transport Development Strategy of the Republic of Croatia 2017-2030
Zagreb, August 2017. 274
7.2.4.11.4 Maritime transport
Tourism intensity
Tourism growth requires a quality additional offer and accompanying services of all kinds of traffic to increase the
attractiveness of the travel destination and ease the way to the desired location. Increased arrival of tourists to the
Adriatic by personal cars creates additional difficulties for maritime carriers, who in a relatively short time have to
provide large ship capacities which are not properly utilized for the rest of the year. The pronounced seasonality of
the traffic capacity utilization creates difficulties for traffic planners, transport companies, but also for the state as a
whole, which must ensure the traffic flow under all conditions and thus the cohesion of the state territory. Therefore,
organization plays an important role in destination attractiveness, which greatly influences good positioning on the
tourist market. This primarily relates to the introduction of intermodal traffic and the introduction of new and
reorganization of the existing public maritime transport lines, the harmonization of time and the increase of
departure and arrival frequency of various means of public transport, improvement of signaling and information
systems in public transport, establishment of international waterways and provision of traffic routes (and port
terminals) with accompanying amenities. This consequently affects the frequency of tourist flows and the traffic
flow in all conditions, the cohesion of the state territory, year-round sustainability, and in the long term the
continuous growth of tourist activity and a greater degree of tourist offer utilization.
Modernization and reconstruction of passenger terminals shall reorganize maritime passenger transport services
in Croatia, resulting in a positive shift in the accessibility of islands and other destinations, speed of travel and
positive changes in market segments (especially thanks to cruising and yachting tourism), which shall indirectly
and in the long term influence the tourism sustainability of the cities of Dubrovnik, Split, Zadar and Šibenik
(measures M.10, M.11, M.12 and M.13) and Dalmatian islands.
7.2.4.11.5 Inland waterway transport
Tourism intensity
In order to provide quality service to river tourism clients, it is necessary to ensure a continuous and safe ship
navigation under a certain draught. In Croatia, the Danube, the Sava and the Drava rivers have the comparative
advantages.
Realization of measures I.3, I.4, I.5 and I.6 can positively impact the gradual increase of one-day cruises and
yachting in nautical tourism on the rivers and intensify the tourist activity of the river tourism products in all cities
which are suitable for the docking of river cruise ships (Vukovar, Ilok, Osijek, Aljmaš; Batina, Sisak, Slavonski
Brod).
River cruisers most frequently dock in Vukovar, and additional activities regarding the modernization of ports,
construction of new facilities and improvement of road and railway infrastructure connectivity shall positively
influence the number of dockings, i.e. increase Croatia's competitiveness in the river cruise market.
It is an incentive for the economic development of river port cities because with every river cruise ship, the cities
and their sights and tourist attractions are included in the tourist offer of tourists who arrive on cruisers. This is also
an opportunity for creating and implementing new land itineraries for river cruise visitors, improving the existing
and creating new tourist attractions in the continental Croatia, and enhancing the management and interpretation
of continental protected nature and cultural heritage.
Development of supporting activities and the enrichment of tourist offer in river ports and tourist destinations in the
hinterland of river ports can represent a benefit for the local population due to increased consumption of river cruise
visitors and other revenues.
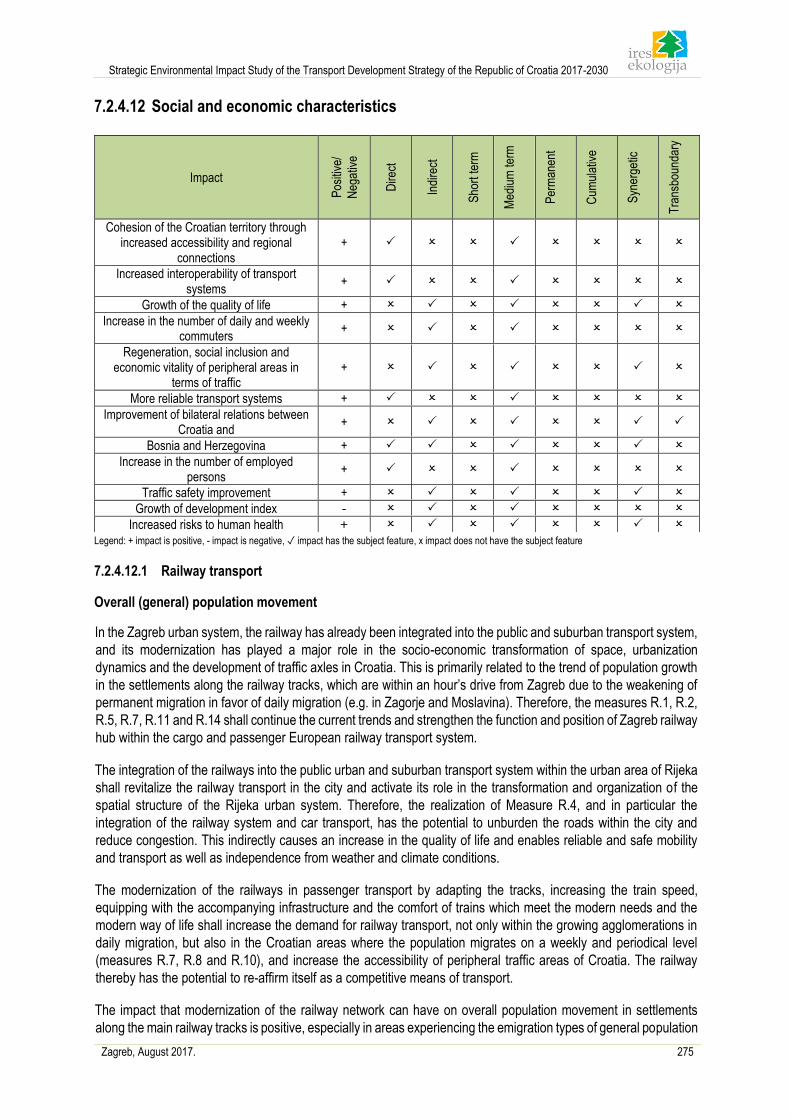
Strategic Environmental Impact Study of the Transport Development Strategy of the Republic of Croatia 2017-2030
Zagreb, August 2017. 275
7.2.4.12 Social and economic characteristics
Legend: + impact is positive, - impact is negative, ✓ impact has the subject feature, x impact does not have the subject feature
7.2.4.12.1 Railway transport
Overall (general) population movement
In the Zagreb urban system, the railway has already been integrated into the public and suburban transport system,
and its modernization has played a major role in the socio-economic transformation of space, urbanization
dynamics and the development of traffic axles in Croatia. This is primarily related to the trend of population growth
in the settlements along the railway tracks, which are within an hour’s drive from Zagreb due to the weakening of
permanent migration in favor of daily migration (e.g. in Zagorje and Moslavina). Therefore, the measures R.1, R.2,
R.5, R.7, R.11 and R.14 shall continue the current trends and strengthen the function and position of Zagreb railway
hub within the cargo and passenger European railway transport system.
The integration of the railways into the public urban and suburban transport system within the urban area of Rijeka
shall revitalize the railway transport in the city and activate its role in the transformation and organization of the
spatial structure of the Rijeka urban system. Therefore, the realization of Measure R.4, and in particular the
integration of the railway system and car transport, has the potential to unburden the roads within the city and
reduce congestion. This indirectly causes an increase in the quality of life and enables reliable and safe mobility
and transport as well as independence from weather and climate conditions.
The modernization of the railways in passenger transport by adapting the tracks, increasing the train speed,
equipping with the accompanying infrastructure and the comfort of trains which meet the modern needs and the
modern way of life shall increase the demand for railway transport, not only within the growing agglomerations in
daily migration, but also in the Croatian areas where the population migrates on a weekly and periodical level
(measures R.7, R.8 and R.10), and increase the accessibility of peripheral traffic areas of Croatia. The railway
thereby has the potential to re-affirm itself as a competitive means of transport.
The impact that modernization of the railway network can have on overall population movement in settlements
along the main railway tracks is positive, especially in areas experiencing the emigration types of general population
Impact
Pos
itive
/
Neg
ativ
e
Dire
ct
Indi
rect
Sho
rt te
rm
Med
ium
term
Per
man
ent
Cum
ulat
ive
Syn
erge
tic
Tra
nsbo
unda
ry
Cohesion of the Croatian territory through increased accessibility and regional
connections +
Increased interoperability of transport systems
+
Growth of the quality of life +
Increase in the number of daily and weekly commuters
+
Regeneration, social inclusion and economic vitality of peripheral areas in
terms of traffic +
More reliable transport systems +
Improvement of bilateral relations between Croatia and
+
Bosnia and Herzegovina +
Increase in the number of employed persons
+
Traffic safety improvement +
Growth of development index -
Increased risks to human health +
Strategic Environmental Impact Study of the Transport Development Strategy of the Republic of Croatia 2017-2030
Zagreb, August 2017. 276
movement and a large share of older population in the total population (Mountainous Croatia, Slavonia and
Podravina) due to faster and quality mobility that enables the population to remain in the place of residence and
increase daily and weekly migration (measures R.3, R.6 and R.9).
Development index, employment
Traffic system is the fundamental infrastructural segment of the economy with exceptional significance for the
functioning of virtually all economic and social activities of each country, for the life of the population and for
inclusion in international flows of goods and passengers. That is why the economic power of a country is directly
related to the state of development of its traffic flows and roads. The use of railways in passenger transport is not
only economical for the population, but it also, along with the potential financial savings, has a positive impact on
increasing their living standard, intensity increase of railway utilization in cargo transport (measures R.3, R.6 and
R.10) directly affects the market widening (geographically and economically), reduces transport costs, increases
production marketability, enables market integration and competition, increase the economy of exchange, etc.
Indirect lowering of commodity prices affects the production growth, which also influences the employment increase
in production locations and cargo exchange places (logistics centers such as the Rijeka port and Vukovar port).
Potential growth of employment in the railway passenger sector is expected due to increase of line frequency and
intensification of operations. This directly influences the integration of railway transport into socio-economic trends
and positively influences the development index growth and economic well-being of the society.
Human health risk
Since the railway is considered the (most) ecologically acceptable form of land transport, the impact on population
health is assessed as neutral. On the other hand, train tracks construction forms the line noise sources due to train
traffic. The intensity of noise impact on the population depends primarily on the distance of the railway track from
the settlement and it is not possible to exclude the possibility of a significant negative impact of noise generated by
trains on the population.
7.2.4.12.2 Road transport
Overall (general) population movement
The construction and completion of state road and motorway sections listed in Ro.2, Ro.3, Ro.4, Ro.5, Ro.6, Ro.7,
Ro.9, Ro.11 and Ro.16 measures shall have a positive impact on integration of Croatian territories and better
connectivity and easier and faster access areas in Croatia where the existing infrastructure has reached the upper
limit of permeability, and alternative modes of transport (public railway, coastal line) are not economically valid or
where there is no alternative road infrastructure. The development of road infrastructure shall positively influence
the provision of optimal planning and more efficient use of the wider space for life and work. The traffic thus
increases the satisfaction and the quality of life for people.
Polycentric and balanced spatial development, which would make more counties more competitive, would reduce
the difference in living standard and income level, stimulate symmetric migration movements and alleviate
depopulation and aging processes.
Reorganization measures of the Zagreb, Rijeka and Split road networks (Ro. 8, 10 and 15) shall positively affect
the reduction of congestion, which interferes with the interurban and urban mobility, which shall in the long term
affect the perception of urban systems in Zagreb, Rijeka and Split as urban areas of high life quality. It is assumed
that the realization of these measures shall have a positive impact on increasing the daily circulation of population
and the mobility of the workforce between their hometown and its surroundings and faster and easier access to
work and housing, city facilities and institutions (e.g. health and education and other services). The realization of
measures Ro.12 and Ro.13 also contributes to the aforementioned. Construction of the bypass shall divert the
transit traffic outside the city, which contributes to strengthening of the vitality and functionality of urban areas and
to the safer and more efficient mobility of the inhabitants within urban agglomerations.
Development index, employment
Strategic Environmental Impact Study of the Transport Development Strategy of the Republic of Croatia 2017-2030
Zagreb, August 2017. 277
High quality transport system (infrastructure and services), besides being of vital importance to the functionality of
urban areas, also facilitates the easier and faster input and flow of goods and services and has a wider economic
impact. This applies in particular to emigration areas with lower development index, where the development of the
transport system has the potential to indirectly affect the regeneration of negative socio-economic trends.
Generally, the development of road traffic meets the socio-economic needs due to its great flexibility and
adaptability to different requirements of transport users, the independence of movement from other similar vehicles
(it can fully adapt the time of departure to passengers or the needs of cargo transport) and the independence of
the transport units from each other, enabling a flexible organization of work with regard to transport needs in
different directions and relations.
Measures Ro.1 and Ro.3, i.e. the construction of bridges across Sava shall, besides directly connecting the border
areas of the Republic of Croatia and Bosnia and Herzegovina, enable the territorial integration of Bosnia and
Herzegovina with Western Europe (A3 motorway), i.e. Eastern and Northeast Europe (A5 motorway). Therefore,
these measures have a transboundary impact. In addition to a better regional connection, a significant increase in
the transboundary fluctuation of the local population can be expected, which shall also have a positive impact on
local economic co-operation and trade.
On the other hand, construction of a bridge near Gradiška can help solve daily traffic congestions, as this is one of
the most frequent border crossings and has the status of BIP, i.e. a crossing with all necessary inspection controls
for the traffic of all types of goods.
Due to the realization of the bridge construction, creation of new jobs at the border crossings can be expected and,
given the fact that Croatia is in the process of signing the Schengen Agreement, the translocation of existing police
personnel to this border crossing. With the creation of new jobs at the border crossings, there is the possibility of
developing service activities in the immediate vicinity of the bridge. Therefore, the construction of the Sava bridges
shall have a positive impact on socioeconomic trends in the Brod-Posavina County in terms of reducing
unemployment and possible GDP growth.
Human health risk
Planned roads represent line sources of noise and can adversely affect the quality of life of the population, and the
intensity of this impact primarily depends on the distance of the roads from the settlement and the type of planned
traffic. The noise generated on the roads depends on the volume and structure of traffic and on the technical
characteristics of the road. Noise is a daily environmental factor which is stressful, and people are not capable of
adapting to it. Noise produced by means of transport can cause fatigue, reduced working ability, and disruption in
communication, concentration, rest and sleep. It causes various negative mental conditions, from feeling of
discomfort to stress and certain health disorders (as well as exacerbation of the existing ones), such as the impact
on the cardiovascular system. Reactions to noise are individual and, depending on the noise level and frequency,
as well as the exposure time, may range from mild and transient to permanent damages.
Elevated emissions of air pollution from road traffic directly adversely affect human health. Pollution is the largest
beside the roads, and twenty meters away the amount of nitrogen dioxide and floating particles drops drastically.
Floating particles are the most dangerous for health because they can cause serious health problems, especially
in children and the elderly. Although air in Croatian cities rarely reaches or exceeds the alert threshold, long-term
exposure can have a serious impact on human health. Headaches, blood vessel system disorders, eye irritation,
asthma, function impairment, and even lung cancer are the consequences that can be caused by air pollution. A
large share of nitrogen dioxide air pollution in our cities is caused by road traffic, and the greatest concentration is
beside the road and at the height of the human respiratory system. The highest extreme levels of air pollution occur
in peak hours when the traffic density is the highest. With regard to the above, it is not possible to exclude the
possibility of negative impact on the health of the population.
On the other hand, the predicted bypass construction (measures Ro. 8, 10 and 15) shall reduce the traffic frequency
through the city center, which shall result in the reduction of noise levels and harmful emissions in the city. By
Strategic Environmental Impact Study of the Transport Development Strategy of the Republic of Croatia 2017-2030
Zagreb, August 2017. 278
reducing the noise levels in the city center, its negative impact on the population shall also be reduced, which is
why the implementation of measures Ro. 8, 10 and 15 is rated as positive.
7.2.4.12.3 Air transport
Development index, employment
Of the nine airports in Croatia, whose development is planned through measures A.1, A.2, A.3, A.4, A.5, A.6, A.7,
A.8 and A.9, three are larger: Zagreb, Dubrovnik and Split, while the other six are smaller and can be characterized
as secondary. These are Pula, Rijeka, Zadar, Osijek, Mali Lošinj and Brač. There are many factors that affect the
volume of traffic, and one of the most important demand generators is certainly tourism. Due to the commercial
attractiveness of the airport on the coast to low-cost carriers, the largest increase in traffic over the past few years
has been noted there. New business models have led to better offer and lower transport prices and more accessible
air transport services to a wider range of people. This large increase in traffic burdened the existing infrastructure
and conditioned further investment in the development of passenger buildings, aprons and access roads and
parking areas.
Further increase in spatial capacity and improved access infrastructure shall have an impact on the elimination of
bottlenecks, especially during summer season at coastal airports, and shall increase the availability of airports, the
flow of passengers and luggage and improve the quality of service. In addition, the speed and comfort of traveling
by air using the shortest and most convenient directions and the well-arranged landings shall positively impact the
increase in passenger traffic at airports.
Air transport industry is the only one, from the aspect of the entire transport industry, which can ensure an efficient
global connectivity and national cohesion (the development of Osijek airport is of special importance), which is a
major prerequisite for further development of all aspects of business in the country. Therefore, the aviation industry
has a direct positive impact on the environment, regional development and economic development. The positive
influence of the development of airports in Brač and Mali Lošinj is reflected in the growth of the island economic
vitality.
Measures A.5 and A.6 influence the development of cargo air traffic, whereby synergistic effects can be expected
with other modes of transport (e.g. road and maritime).
Analyses show that GDP growth directly affects the double growth of air traffic. Since the GDP growth in Croatia
can mainly be linked to an increase in the number of tourists, tourism can be regarded as the generator of modern
air traffic development. Therefore, the indirect influence of air traffic intensification on the development of other
activities of the tertiary sector is assessed as positive.
Human health risk
In accordance with increase of airports capacity and increase in air passenger and cargo transport, significant noise
levels can be expected. Aircrafts produce the greatest noise at take-off and landing. Airports are not only burdened
by aircraft noise, but also the noise created by various vehicles, such as admission and transportation vehicles for
passengers, cargo and aircrafts, and motor vehicles of passengers, employees and airport visitors. Since most of
the major airports are located in industrial and urban areas, the population in these areas are affected by aircraft
noise. Although air traffic contributes with only around 1% of noise higher than 65 dB, its impact is the most harmful
to employees at the airport and the airport vicinity (Steiner, Božičević, Kaštela, 2003).
Aircraft emissions cause air pollution at the airport itself, but also in its surroundings. They refer to exhaust emissions
from aircraft engines, aviation fuel systems, aircraft servicing motor vehicles and ground airport equipment.
Due to the aforementioned, it is not possible to exclude the possibility of a negative impact of air traffic on the health
of residents in the vicinity of the airports.
Strategic Environmental Impact Study of the Transport Development Strategy of the Republic of Croatia 2017-2030
Zagreb, August 2017. 279
7.2.4.12.4 Maritime transport
Development index, employment
Development of access traffic infrastructure (railway, road) in ports shall increase their interoperability and
accessibility to European traffic routes. This shall lead to the integration of ports into the local transport system
(passenger and cargo), increased competitiveness of Croatian ports due to faster and easier intake and flow of
goods and services in port areas, as well as increased distribution of cargo transport on the Adriatic and coastal
routes in favour of maritime transport.
Realization of measures M.8, M.9, M.10, M.11, M.12 and M.13 shall increase the efficiency of port operations,
which shall potentially positively affect the economic activity in port cities, whereby Croatia shall achieve a more
competitive position as the port, industrial, transport and distribution center of Southern Europe.
Extensions and construction of passenger terminals and ferry docks shall help reduce travel time, crowds and traffic
congestion that hinders the intra-city mobility, especially during the tourist season. This shall make the maritime
passenger transport system more reliable in the long-term, which contributes to the productivity of public transport
and the economy in general. Activities planned under these measures have the potential to positively influence the
direct and indirect employability (equipping public transport stations, ports and jetties with accompanying amenities
and services generates indirect employment).
The transboundary impact of measure M.9 is reflected in the importance of the Port of Ploče for the economy of
Bosnia and Herzegovina, whose transport infrastructure directly dictates the success of the Port of Ploče business.
Overall (general) population movement
The development of transit cargo seaports has the potential to, as a result of growth of their business, positively
influence the new employment opportunities of residents or possible new immigration of people for work. The
synergistic impact of these effects is, due to the development of port activities, reflected in the long-term
sustainability of the maritime transport system in the port cities, which has the potential to indirectly influence the
possible changes in demographic structures and the overall movement of the population of the port areas leading
to population progression.
Human health risk
The impact of port complexes on human health is manifested mainly through the effects of noise, air emissions of
harmful gases from traffic and emissions into the sea.
The most significant impact on the noise level at the port location shall have an increasing number of ships, which
shall generate noise during their operation and docking in ports and an increased concentration of people in the
port area. Traffic congestion in new passenger ports can be triggered by an increased number of cars and other
vehicles waiting for boarding on ferries, especially during the tourist season.
The synergistic effect of local air pollution due to the emission of harmful gases and dust into the air from traffic is
reflected in the increase of overall pollution, thereby reducing the quality of the air, i.e. increasing the risk of harmful
effects on people and the environment.
In addition, potential seawater pollution in the port area can lead to local changes in sea quality, thus adversely
affecting human health. In order to mitigate this potentially negative impact, protective measures have been
prescribed in the environmental component Surface and Groundwater.
7.2.4.12.5 Inland waterway transport
Development index, employment
The revitalization of inland waterway traffic shall improve rational resource management, which means that the
comparative advantages of inland waterways shall be more utilized. There is a great justification for the
Strategic Environmental Impact Study of the Transport Development Strategy of the Republic of Croatia 2017-2030
Zagreb, August 2017. 280
development of this mode of transport since it is more profitable and economically exploited, particularly in areas
where there are more favourable conditions for sailing on rivers with more peaceful flows or canals. By modernizing
waterways and river ports of the Republic of Croatia, it would be possible to divert large volumes of goods to river
traffic. On the other hand, the development of inland navigation also facilitates the development of combined
transport (Dundović, Vilke, 2009).
The development of ports on inland waterways shall have a positive effect on improving the efficiency of transport
of goods and people on inland waterways and increasing the interoperability of the transport system in Croatia. By
establishing an intermodal transport chain in cargo transport (measure I.4), the efficiency and reliability of inland
navigation shall be achieved. Modernization of road and railway infrastructure links has the potential to influence
the promotion of jobs, skills and knowledge related to waterway activities (e.g. tourism, public transport, production
and economic activities in the hinterland).
The long-term impact of river transport development is reflected in increasing the competitiveness of river ports in
Vukovar and Osijek as the main ports for cargo and passenger transport. This may indirectly affect the improvement
of the development index through strengthening economic activity, GDP growth and employability of the local
population, and reducing emigration in Osijek-Baranja and Vukovar-Srijem County, which may favourably affect
the socio-economic trends.
The construction of the Danube - Sava multipurpose canal (measure I.7) shall create conditions for the relocation
of certain traffic flows (e.g. road and railway cargo transport) to river traffic, which could further lead to overall
economic development in Croatia. This would directly connect Croatian waterways to the European network of
inland waterways and the multifunctional Rhine - Main – Danube canal, i.e. communication with important European
economic and traffic centers would be realized. The construction of the canal and the construction of a new high -
performance railway line Zagreb - Rijeka, along with the arrangement of the Sava River waterway, would result in
an intermodal transport route between Vukovar and Rijeka, which would connect the Danube and Mediterranean
countries via the Rijeka port. The transport integration of the Danube and the Adriatic, which would be the most
favourable combined route from the Adriatic to Central Europe, along with the link between the Danube River and
the Black Sea ports, would significantly strengthen the strategic position of the port of Vukovar. In addition to the
main effect of the potential canal for the economic development of the Republic of Croatia, which consists of savings
in cargo transport via the Podunavlje - Jadran corridor, the increase of agricultural production is highlighted as well,
which would be achieved through irrigation of agricultural areas using drainage and irrigation systems, along with
benefits for the food industry, flood protection and fish farming (Dundović, Vilke, 2009).
Furthermore, a positive transboundary impact of measures I.5 and I.6 is expected, through the realization of
favourable bilateral and economic relations between Croatia and Bosnia and Herzegovina. Port of Slavonski Brod
is located near the junction of the Vc and X corridors, which is why it has the potential for development into an
important intermodal hub. With the development of the Sisak port, the industrial and commercial area of Zagreb
with the Sava River and inland waterways would be well connected, with the broader port area being the distributive
and logistics center.
Human health risk
Inland waterways traffic is characterized as being extremely safe in terms of navigation and its impact on the
increase of pollutant emissions in the environment is considered the least harmful in relation to railway and road
traffic. Due to the relatively low traffic density and low number of accidents, the safety of navigation in inland
waterways is very high. Inland waterway navigation is the most acceptable mode of transport from the point of view
of emissions into the environment, because water and air pollution and noise pollution produced by inland
navigation vessels is insignificant compared to road and railway transport. Accordingly, the impact of the subject
measures on the health of population is neutral.
Strategic Environmental Impact Study of the Transport Development Strategy of the Republic of Croatia 2017-2030
Maps in the Study are informative and solely for the purpose of the subject document.
Zagreb, August 2017. 281
7.3 Transboundary impacts
Transboundary impacts are the result of certain activities that may cause change in environmental components in
countries bordering with the territory of the country where a particular activity takes place.
The Act on the Confirmation of the Protocol on Strategic Environmental Assessment to the Convention on
Environmental Impact Assessment in a Transboundary Context (OG 7/09) represents an international agreement
which defines the cooperation with regard to the transboundary environmental impact. Parties shall assess the
environmental impact of certain activities at an early stage of planning and communicate and consult each other in
all major potential interventions which may have an impact on the environment across national borders.
The methods of testing and the criteria for determining the likely impact of the strategy, plan or programme on the
environment include the identification of the characteristics/intensity of the impacts of the strategy, plan or
programme, taking into account the transboundary nature of the impact.
The Republic of Croatia borders with the following countries for which the transboundary environmental impact5
has been estimated: the Republic of Slovenia, the Republic of Hungary, Bosnia and Herzegovina, the Republic of
Serbia, Montenegro and the Italian Republic.
The strategy defines the goals, whose realisation shall probably have transboundary impacts:
• SO1 Better coordinate traffic management with neighboring countries (BiH - Port of Ploče, road and rail
links from BiH, Slovenia, Serbia, Italy, Montenegro and Hungary)
• SO4 Develop the potential of major logistics centers (port Rijeka, port Split, port Ploče, port Vukovar,
port Osijek, Zagreb node)
• RT1 Improve the rail freight corridor from port Rijeka to the markets with the greatest potential for the
port (Hungary, Bosnia and Herzegovina, Slovakia, Italy, South Poland and Serbia).
• RDT7 Increase connectivity with neighboring countries in order to raise co-operation and territorial
integration to a higher level.
• RDT8 Increase the availability of areas in Croatia where the upper limit of motorway capacity has been
reached and where there is no alternative road infrastructure (parallel motorways, etc.) - from Zagreb in
the direction of Bjelovar and Varaždin in the direction of Koprivnica.
• RIT1 Increase the competitiveness of ports in Vukovar and Osijek as main river ports for freight traffic.
• RIT2 To cooperate with BiH in the development of the Slavonski Brod cargo port.
Measures which are connected with the subject goal, and may generate negative and positive impact on the
neighboring countries are as follows:
Railway transport:
• R.1 Zagreb – state border with Slovenia towards Ljubljana (TEN-T core network/TEN-T Mediterranean
corridor / Pan-European corridor)
• R.6 Križevci – state border with Hungary towards Budapest (TEN-T core network/TEN-T Mediterranean
corridor / Pan-European corridor RH2)
• R.8 Novska – state border with Serbia (TEN-T core network/Pan-European Corridor RH1)
5 Maps in the Study are informative and solely for the purpose of the subject document.
Strategic Environmental Impact Study of the Transport Development Strategy of the Republic of Croatia 2017-2030
Maps in the Study are informative and solely for the purpose of the subject document.
Zagreb, August 2017. 282
• R.9 State border with Hungary – Osijek – State border with Bosnia and Herzegovina (TEN-T core
network/PanEuropean Corridor RH3).
Road transport:
• Ro.11 Dubrovnik – State border with Montenegro
• Ro.9 D2 from the state border with Slovenia to the state border with Serbia
• Ro.1 Connecting via the bridge near Gradiška
• Ro.2 A5 Osijek – state border with Hungary Pecs (TEN-T comprehensive network/Pan-European
corridor RH3)
• Ro.3 A5 from A3 to the state border with Bosnia and Herzegovina (TEN-T comprehensive network/Pan-
European corridor RH3)
• Ro.6 DC 10 Vrbovec – Križevci – Koprivnica – State border with Hungary towards Kaposvár
• Ro.7 DC 12 junction Vrbovec 2 – Ivanja Reka – Vrbovec – Bjelovar – Virovitica – State border with
Hungary towards Barcs
• Ro.16 Preparations for accessibility of Dubrovnik after the accession of Croatia to Schengen (Peljesac
Bridge), continuation of the Adriatic-Ionian Corridor
Maritime transport:
• M.2 Implementation of the “Motorways of the Sea” projects
• M.9 Specialisation of the Port of Ploče (container and bulk cargo).
Inland waterway transport:
• I.1 Improvement of waterway of Danube and Drava rivers to Osijek
• I.2 Improvement of the Sava River
• I.3 Development of the Port of Vukovar (TEN-T core network)
• I.4 Development of the Port of Osijek (TEN-T comprenhensive network)
• I.5 Development of the Port of Slavonski Brod (TEN-T core network)
• I.6 Development of the Port of Sisak (TEN-T comprehensive network)
• I.7 Construction of the Danube-Sava multipurpose canal.
7.3.1 Italy The implementation of the Strategy could lead to negative impacts on the marine environment of the Republic of
Italy, in the form of cumulative impacts due to increased maritime traffic and cargo transport lines.
The greatest pressure on the marine environment comes from economic maritime traffic, cruise ships and nautical
tourism, including the construction of nautical ports and the discharge of untreated wastewater into the sea.
Measures that can adversely affect the marine environment (sea quality, biodiversity) of Italy are the implementation
of the "Motorways of the Sea" projects and the development of seaports in the context of traffic intensification.
Impacts are related to sea pollution and increased noise levels in the sea. In addition, the most significant negative
impacts on the marine environment can occur due to accidents, especially ships carrying dangerous cargo.
7.3.1.1 Impact of maritime transport
Measure:
• M.2 Implementation of project „Sea motorways“
Strategic Environmental Impact Study of the Transport Development Strategy of the Republic of Croatia 2017-2030
Maps in the Study are informative and solely for the purpose of the subject document.
Zagreb, August 2017. 283
Potential pollution of the marine environment in the territory of the Italian Republic is possible due to the
implementation of "Motorways of the Sea" projects and partly due to the development of ports. These projects,
which at this stage of the Strategy are not yet clearly defined, lead to an increase in maritime traffic, i.e. maritime
routes, which increases the risk of accidental situations that may lead to pollution of the marine environment.
However, given that the Strategy plans to introduce systems to improve the safety in maritime navigation, the
potential risks of accidents can be better controlled.
7.3.1.1.1 Accidental situations
Increased maritime traffic can also increase the risk of accidental situation, especially when it comes to ships
carrying dangerous cargo. These are unpredictable situations that are difficult to prevent, but it is precisely for that
reason that adequate intervention plans need to be in place to address potential accidental situations without
significant consequences for the marine environment.
Pursuant to the provisions of the Intervention plan for sudden sea pollution (OG 92/08), reports on accidents are
prepared and the public is informed through public media and other media about the actions taken. Also, the
Subregional intervention plan for the prevention, readiness for and response to the large-scale sudden pollution of
the Adriatic Sea (OG-IC 7/08) prescribes the obligation to notify the bodies of other states about the sea pollution.
If pollution by hazardous and harmful substances or exceptional natural event in the sea may endanger the marine
environment, human health and economic use of the sea and may have consequences on two or more counties
or when the amount of pollution by oil and/or oil mixture exceeds 2000 m³, command action is implemented by the
Staff for the implementation of the Intervention Plan, in cooperation with the County Operational Centers.
7.3.1.1.2 Noise
By increasing maritime traffic, as a result of the implementation of the "Sea Highway" measure, there will be
increased noise emissions. Sound power levels and associated effects on marine ecosystems have increased over
the past period, although there are few studies that can quantify these changes. Under water there is sound and
no human influence. The main natural sources of sound are seismic (shaking, moving, etc.), meteorological (wind,
rain, waves, etc.) and biological (many organisms in the sea produce sound). Many organisms use sound in
communication, detecting prey, and invasion of the predator threat. Part of their natural environment is in a sound
environment, and by entering anthropogenic noise this environment changes, becomes unnatural so that marine
organisms can endure adverse effects. The input of sound energy occurs in a wide range both in space and time.
Anthropogenic sounds can be short (impulsive) or long (continuous) duration. Impulse sounds can be repeated at
longer or shorter intervals, but such repetition can be "deformed" with the distance from the source and the
reverberation and become unrecognizable by continuous noise. More sound frequencies are worse in the marine
environment while low frequencies can travel longer. The main source of continuous noise is ship traffic, and
impulse underwater noise is the work of ultrasonic devices (sonar, geological and seismic research), explosion and
underwater works. The problem of noise exposure is complex because it involves a wide range of anthropogenic
sources in the marine environment, numerous species inhabiting this environment and overlapping in space and
time with noise sources. Potential adverse effects of noise exposure range from negligible to significant.
ACCOBAMS (2013) has also defined categories into which negative impacts of noise on the marine mammals can
be classified. The first group is physical trauma, i.e. temporary or permanent hearing loss, tissue injuries that do
not lead to death and injuries that can potentially lead to the death of the organism in case of immediate exposure.
There is also a group of impacts that lead to behavioural changes. Behavioural changes can be small, where the
Strategic Environmental Impact Study of the Transport Development Strategy of the Republic of Croatia 2017-2030
Maps in the Study are informative and solely for the purpose of the subject document.
Zagreb, August 2017. 284
normal activity of the individual does not change, but can be more pronounced when the individuals stop performing
their normal activities. The last category refers to noise below the level of the environment and does not affect the
organisms.
7.3.2 Hungary Potential transboundary impacts of the Strategy on the environment of the Republic of Hungary are possible due
to the implementation of measures relating to the construction or reconstruction of roads.
7.3.2.1 Impact of railway and road transport
Railway transport:
• R.6 Križevci – State border with Hungary towards Budapest (TEN-T core network/TEN-T Mediterranean
corridor/PanEuropean corridor Vb)
• R.9 State border with Hungary – Osijek – State border with Bosnia and Herzegovina (TEN-T
comprehensive network/core network/Pan-European corridor Vc)
Road transport:
• Ro.2 A5 Osijek – State border with Hungary Pecs (TEN-T comprehensive network/Pan-European corridor
RH3)
• Ro.6 DC 10 Vrbovec – Križevci – Koprivnica – State border with Hungary towards Kaposvár
• Ro.7 DC 12 junction Vrbovec 2 – Ivanja Reka – Vrbovec – Bjelovar – Virovitica – State border with Hungary
towards Barcs
The impacts are manifested primarily in the form of air pollution due to increased traffic on the roads and potentially
due to railway transport, if it shall be powered by diesel. The study assessed the impact of the Strategy on air
quality as moderately negative. For the territory of the Republic of Hungary, a moderate impact of the
implementation of these measures relating to road and railway transport on air quality was also assessed.
7.3.2.2 Impact of inland waterways transport
Measures:
• I.1 Improvement of inland waterway of Danube and Drava rivers to Osijek
• I.4 Development of the Port of Osijek (TEN-T comprenhensive network)
With the development of the measure I.1 Improvement of the waterway of the Danube River and Drava River to
Osijek on the level of strategic assessment is not expected to have a significant negative impact on water bodies
and protected areas as well as on the goals of conservation and integrity of the ecological network of the Republic
of Hungary, the measure concerns the arrangement of the Drava River waterway from Danube to Osijek (distance
more than 50 rkm from the border with the Republic of Hungary). On the intensity and duration of the possible
negative impact, a project-level assessment will be carried out, including cross-border impacts in accordance with
the Convention on Environmental Impact Assessment across State Boundaries (ESPO).
During the implementation of the measure I.4 Development of the Port of Osijek (TEN-T comprehensive network),
since it is a spot site about 50 rkm from the border with the Republic of Hungary, no impact on the water bodies in
the Republic of Hungary is expected at the level of strategic assessment. During the development of this measure,
the environmental protection requirements applicable to the Water Framework Directive, the Protection of Sensitive
Areas and Natura 2000 Areas will be applied, and in the phase of its implementation, a process of estimating the
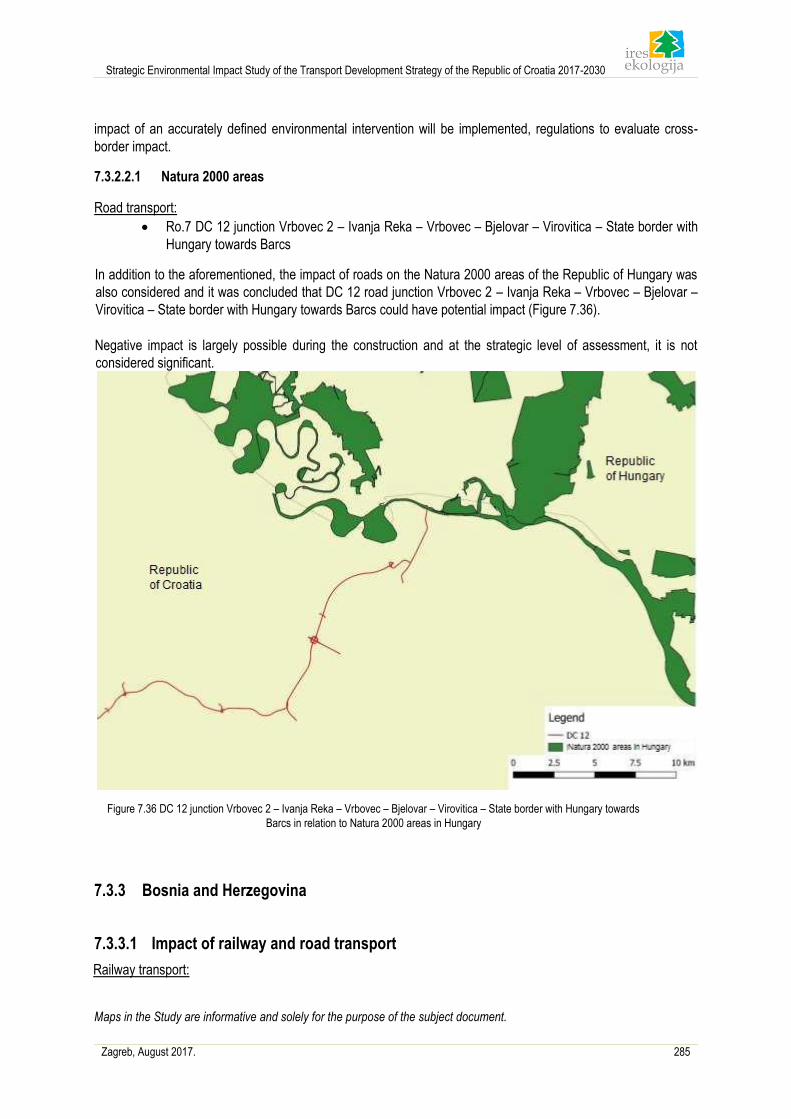
Strategic Environmental Impact Study of the Transport Development Strategy of the Republic of Croatia 2017-2030
Maps in the Study are informative and solely for the purpose of the subject document.
Zagreb, August 2017. 285
impact of an accurately defined environmental intervention will be implemented, regulations to evaluate cross-
border impact.
7.3.2.2.1 Natura 2000 areas
Road transport:
• Ro.7 DC 12 junction Vrbovec 2 – Ivanja Reka – Vrbovec – Bjelovar – Virovitica – State border with
Hungary towards Barcs
In addition to the aforementioned, the impact of roads on the Natura 2000 areas of the Republic of Hungary was
also considered and it was concluded that DC 12 road junction Vrbovec 2 – Ivanja Reka – Vrbovec – Bjelovar –
Virovitica – State border with Hungary towards Barcs could have potential impact (Figure 7.36).
Negative impact is largely possible during the construction and at the strategic level of assessment, it is not
considered significant.
Figure 7.36 DC 12 junction Vrbovec 2 – Ivanja Reka – Vrbovec – Bjelovar – Virovitica – State border with Hungary towards
Barcs in relation to Natura 2000 areas in Hungary
7.3.3 Bosnia and Herzegovina
7.3.3.1 Impact of railway and road transport
Railway transport:
Strategic Environmental Impact Study of the Transport Development Strategy of the Republic of Croatia 2017-2030
Maps in the Study are informative and solely for the purpose of the subject document.
Zagreb, August 2017. 286
• R.9 State border with Hungary – Osijek – State border with Bosnia and Herzegovina (TEN-T
comprehensive network/core network/Pan-European corridor (RH3)
Road transport:
• Ro.1 Connecting by the bridge near Gacka
• Ro.3 A5 from A3 to the state border with Bosnia and Herzegovina (TEN-T comprehensive network//Pan-
European corridor RH3)
• Ro.16 Preparations for accessibility of Dubrovnik after the accession of Croatia to Schengen (Peljesac
Bridge), continuation of the Adriatic-Ionian Corridor
Interventions that could potentially lead to air pollution in Bosnia and Herzegovina are related to road and railway
infrastructure. Potential impacts are possible due to the use of roads (including bridges on the Sava river), that is,
emissions of pollutants from vehicles. Since these are not entirely isolated areas, no significant impacts from road
activities are expected at the strategic level, i.e. no exceedance of air pollutant concentrations is expected that
could lead to a change in the category of air quality in the territory of neighbouring countries.
The impacts of the railway transport development relate to an increase in the volume of traffic on the existing
sections. As already mentioned, negative impacts could be expected on wild species and habitats, primarily in the
form of fragmentation of habitats and increased noise and vibration along the railway line. The impacts, on the
other hand, are considered moderate because they can be mitigated by environmental protection measures during
design.
As regards the road traffic, it is important to emphasise that the A5 motorway sections from A3 to the state border
with Bosnia and Herzegovina are in different stages of construction (Figure 3.2). The section from Sredanci (A3
motorway) to the border with Bosnia and Herzegovina is currently under construction. This section also includes
the bridge across the Sava River. The award of a contract on bridge construction is currently in the public
procurement process. The extension of the section on the Bosnian-Herzegovinian side has already been
constructed.
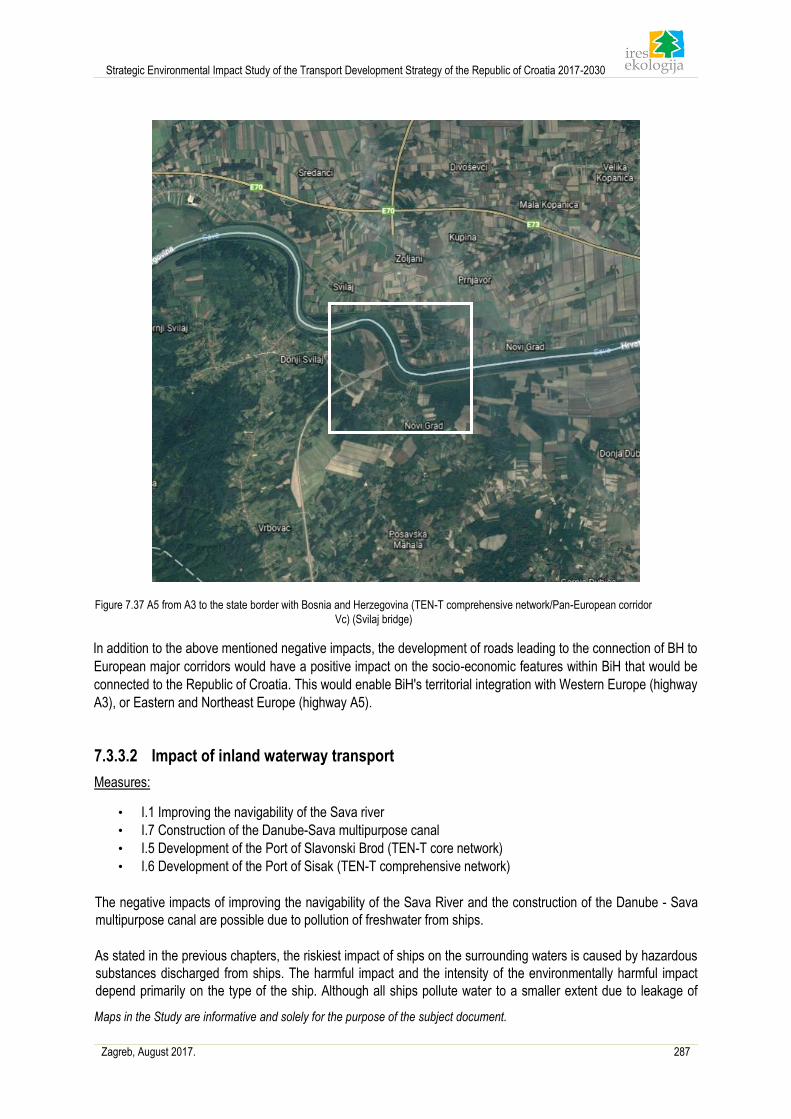
Strategic Environmental Impact Study of the Transport Development Strategy of the Republic of Croatia 2017-2030
Maps in the Study are informative and solely for the purpose of the subject document.
Zagreb, August 2017. 287
Figure 7.37 A5 from A3 to the state border with Bosnia and Herzegovina (TEN-T comprehensive network/Pan-European corridor
Vc) (Svilaj bridge)
In addition to the above mentioned negative impacts, the development of roads leading to the connection of BH to
European major corridors would have a positive impact on the socio-economic features within BiH that would be
connected to the Republic of Croatia. This would enable BiH's territorial integration with Western Europe (highway
A3), or Eastern and Northeast Europe (highway A5).
7.3.3.2 Impact of inland waterway transport
Measures:
• I.1 Improving the navigability of the Sava river
• I.7 Construction of the Danube-Sava multipurpose canal
• I.5 Development of the Port of Slavonski Brod (TEN-T core network)
• I.6 Development of the Port of Sisak (TEN-T comprehensive network)
The negative impacts of improving the navigability of the Sava River and the construction of the Danube - Sava
multipurpose canal are possible due to pollution of freshwater from ships.
As stated in the previous chapters, the riskiest impact of ships on the surrounding waters is caused by hazardous
substances discharged from ships. The harmful impact and the intensity of the environmentally harmful impact
depend primarily on the type of the ship. Although all ships pollute water to a smaller extent due to leakage of
Strategic Environmental Impact Study of the Transport Development Strategy of the Republic of Croatia 2017-2030
Maps in the Study are informative and solely for the purpose of the subject document.
Zagreb, August 2017. 288
lubricants and similar substances, dissolving of biocide coatings or disposing waste, the main impacts depend on
the type of cargo being transported by the ship. The type and intensity of the negative impact on the condition of
water bodies depend on whether the liquid cargo, dry bulk cargo or other types of load (including passengers) is
transported.
Stimulating the use of inland waterways by the EU directly affects the growth of transport demand on the Danube,
thus potentially increasing the risks of surface and groundwater pollution due to the transport of hazardous
substances by inland waterways.
In addition, negative transboundary impacts are possible due to the improvement of the navigability of the Sava
river, which can lead to hydromorphological changes that may indirectly affect water habitats and wild species
within the borders of Bosnia and Herzegovina.
7.3.3.3 Impact of maritime transport
Measure:
• M.9 Specialization of the Port of Ploče (kontejnerski i rasuti teret)
Transboundary impact of the Ploče port specialization is reflected in the importance of the Ploče port for the
economy of Bosnia and Herzegovina, whose transport infrastructure directly depends on the success of the port of
Ploče.
7.3.4 Republic of Montenegro
7.3.4.1 Impacts of maritime transport
Measure:
• M.2 Implementation of the “Motorways of the Sea” projects
Potential pollution of the marine environment in the territory of the Montenegro is possible due to the implementation
of "Motorways of the Sea" projects and partly due to the planned development of the sea ports. The subject projects,
which at this stage of the Strategy are not yet clearly defined, can lead to an increase in maritime traffic, thus
increasing the risk of accidental situations that can significantly pollute the marine environment.
7.3.4.1.1 Accidental situations
Increased maritime traffic can also increase the risk of accidental situation, especially when it comes to ships
carrying dangerous cargo. These are unpredictable situations that are difficult to prevent, but it is precisely for that
reason that adequate intervention plans need to be in place to address potential accidental situations without
significant consequences for the marine environment.
Pursuant to the provisions of the Intervention plan for sudden sea pollution (OG 92/08), reports on accidents are
prepared and the public is informed through public media and other media about the actions taken. Also, the
Subregional intervention plan for the prevention, readiness for and response to the large-scale sudden pollution of
the Adriatic Sea (OG-IC 7/08) prescribes the obligation to notify the bodies of other states about the sea pollution.
If pollution by hazardous and harmful substances or exceptional natural event in the sea may endanger the marine
environment, human health and economic use of the sea and may have consequences on two or more counties
Strategic Environmental Impact Study of the Transport Development Strategy of the Republic of Croatia 2017-2030
Maps in the Study are informative and solely for the purpose of the subject document.
Zagreb, August 2017. 289
or when the amount of pollution by oil and/or oil mixture exceeds 2000 m³, command action is implemented by the
Staff for the implementation of the Intervention Plan, in cooperation with the County Operational Centers.
7.3.4.1.2 Noise
By increasing maritime traffic, as a result of the implementation of the measure "Motorways of the Sea", there shall
be increased noise emissions. Sound levels and associated effects on marine ecosystems have increased over
the past periods, though there are few studies that can quantify these changes. Under water there is sound even
without human influence. The main natural sources of sound are seismic (earthquakes, shifts, etc.), meteorological
(wind, rain, waves, etc.) and biological (many organisms in the sea produce sound). Many organisms use sound in
communication, detecting prey, and threats from predators. Part of their natural environment is in a sound
environment, and by placing anthropogenic noise this environment changes, becomes unnatural so that marine
organisms can suffer adverse effects. The input of sound energy occurs in a wide range, both in space and time.
Anthropogenic sounds can be of short (impulse) or long (continuous) duration. Impulse sounds can be repeated at
longer or shorter intervals, but such repetition can be "decomposed" with the distance from the source and the
reverberation and become unrecognizable from the continuous noise. Higher frequencies of sound poorly spread
in the marine environment, while low frequencies can travel longer. The main source of continuous noise is ship
traffic, and impulse underwater noise is caused by the operation of ultrasonic devices (sonars, geological and
seismic research), explosions and underwater works. The problem of noise exposure is complex because it
includes a wide range of anthropogenic sources in the marine environment, numerous species inhabiting the
environment and overlapping in space and time with noise sources. Potential adverse effects of noise exposure
range from negligible to significant.
ACCOBAMS (2013) has also defined categories into which negative impacts of noise on the marine mammals can
be classified. The first group is physical trauma, i.e. temporary or permanent hearing loss, tissue injuries that do
not lead to death and injuries that can potentially lead to the death of the organism in case of immediate exposure.
There is also a group of impacts that lead to behavioural changes. Behavioural changes can be small, where the
normal activity of the individual does not change, but can be more pronounced when the individuals stop performing
their normal activities. The last category refers to noise below the level of the environment and does not affect the
organisms.
7.3.4.2 Impacts of road traffic
Measure:
• Ro.11 Dubrovnik – State border with Montenegro
The impact is manifested in the form of air pollution due to increased traffic. Since these are not fully isolated areas
of traffic activities, at the strategic level no significant impacts are expected, i.e. no exceedance of concentrations
of pollutants in the air is expected, which may lead to changes in the air quality category on the territory of the
Republic of Montenegro. At a strategic level, the impact of pollution caused by the new road traffic is assessed as
moderately negative and no mitigation measures are prescribed, as the technical measures for mitigating local
impact are defined when defining the project, i.e. using the environmental impact assessment.
7.3.5 Republic of Slovenia
7.3.5.1 Impacts of railway and road transport
Interventions which may potentially lead to air pollution in the Republic of Slovenia are related to road and railway
infrastructure. Potential impacts are possible due to increased use of routes, i.e. emission of pollutants from the
vehicles.
Railway transport:
Strategic Environmental Impact Study of the Transport Development Strategy of the Republic of Croatia 2017-2030
Maps in the Study are informative and solely for the purpose of the subject document.
Zagreb, August 2017. 290
• R.1 Zagreb – state border with Slovenia towards Ljubljana (TEN-T core network/TEN-T Mediterranean
corridor / Pan-European corridor)
Road traffic:
• Ro.9 D2 from the state border with Slovenia to the state border with Serbia
The impact of measure R.1 has been rated as moderately negative, as these are not areas where there is no traffic
infrastructure, i.e. new polluters. This measure implies improving the M101 track.
Road D2 is an existing corridor, but if new directions are defined, this shall be realized in the next steps of the
Strategy implementation. Realization of the measure Ro. 9 is therefore also estimated as having a moderately
negative impact on the strategic level.
7.3.5.2 Impacts of maritime transport
Measure:
• M.2 Implementation of the “Motorways of the Sea” projects
Potential pollution of the marine environment in the territory of the Republic of Slovenia is possible due to the
implementation of "Motorways of the Sea" projects and partly due to the planned development of the sea ports.
The subject projects, which at this stage of the Strategy are not yet clearly defined, can lead to an increase in
maritime traffic, thus increasing the risk of accidental situations that can significantly pollute the marine
environment. However, given that the Strategy plans to introduce systems to improve maritime safety, the potential
risks of accidents can be controlled more successfully.
7.3.5.2.1 Accidental situations
Increased maritime traffic can also increase the risk of accidental situation, especially when it comes to ships
carrying dangerous cargo. These are unpredictable situations that are difficult to prevent, but it is precisely for that
reason that adequate intervention plans need to be in place to address potential accidental situations without
significant consequences for the marine environment.
Pursuant to the provisions of the Intervention plan for sudden sea pollution (OG 92/08), reports on accidents are
prepared and the public is informed through public media and other media about the actions taken. Also, the
Subregional intervention plan for the prevention, readiness for and response to the large-scale sudden pollution of
the Adriatic Sea (OG-IC 7/08) prescribes the obligation to notify the bodies of other states about the sea pollution.
If pollution by hazardous and harmful substances or exceptional natural event in the sea may endanger the marine
environment, human health and economic use of the sea and may have consequences on two or more counties
or when the amount of pollution by oil and/or oil mixture exceeds 2000 m³, command action is implemented by the
Staff for the implementation of the Intervention Plan, in cooperation with the County Operational Centers.
7.3.6 Republic of Serbia
7.3.6.1 Impact of railway and road transport
Measures that could potentially lead to transboundary pollution, i.e. local exhaust emission increases and pollution
of surface and underground flows are as follows:
Strategic Environmental Impact Study of the Transport Development Strategy of the Republic of Croatia 2017-2030
Maps in the Study are informative and solely for the purpose of the subject document.
Zagreb, August 2017. 291
Railway transport:
• R.8 Novska – state border with Serbia (TEN-T core network/Pan-European Corridor X)
Road traffic:
• Ro.9 D2 from the state border with Slovenia to the state border with Serbia
Increased concentrations of pollutants mostly occur the vicinity of the roads and their concentration, depending on
weather conditions, decreases with distance. Also, concentrations of pollutants are greater by the roads with more
heavy duty vehicles, as well as roads with higher speed limits.
7.3.6.2 Impacts of inland waterway transport
Measures:
• I.3 Development of the Port of Vukovar (TEN-T core network)
• I.7 Construction of the Danube-Sava multipurpose canal
The effects of the extension of the river ports are primarily related to the hydromorphological state of the surface
waters, since the works shall change the natural appearance of the watercourse basin. The negative influence on
the hydromorphological condition shall also affect the ecological state of the surface waters, as it is an integral part
of the ecological condition.
Generally, the impact with the highest risk of ships on the surrounding water is caused by harmful substances
discharged from ships. The manner of the harmful impact and the intensity of the environmentally harmful effects
depend primarily on the type of vessel. Although all ships in a smaller quantity pollute water due to leakage of
lubricants and similar substances, dissolving biocide coatings or rejecting waste, the main impacts depend on the
type of cargo being transported by ship.
The construction of the Danube - Sava multipurpose canal shall divert a part of the Danube and Sava water, which
shall affect the natural water regime of these watercourses, i.e. their water flow dynamics shall be changed. Water
flow dynamics form an integral part of the hydromorphological state of surface water and, due to its modification,
can lead to significant changes in the habitat conditions, thus making a negative impact on the biological state of
surface water.
7.3.7 Conclusion Estimated impacts of traffic pollution at strategic level have been assessed as moderately negative and local, and
no mitigation measures have not been prescribed at strategic level. Measures to mitigate the local impacts of roads
that are of technical character are prescribed at the level of environmental impact assessment.
The negative impacts of inland waterway traffic at a strategic level (including accidental situations) may cause
significant consequences on the environment and nature. No mitigation measures have been prescribed at the
strategic level since the intensity of impact can not be accurately defined without detailed information on the
interventions.
In order for the planning of inland navigation not to have significant consequences for surface and ground water
and biodiversity of the Danube region, transboundary cooperation has been established within the European
Strategy for the Danube Region. The objective of joint management is to define guidance and instructions for
decision-makers dealing with water management with the aim of environmentally acceptable planning of inland
waterway navigation.
Strategic Environmental Impact Study of the Transport Development Strategy of the Republic of Croatia 2017-2030
Maps in the Study are informative and solely for the purpose of the subject document.
Zagreb, August 2017. 292
The implementation of the measures proposed by the Strategy shall have a positive impact on traffic connection
between the Republic of Croatia and the neighboring countries. Graphic presentations in the study are for the
purpose of analyzing the potential impacts and the subject document does not prejudice the boundaries.
Strategic Environmental Impact Study of the Transport Development Strategy of the Republic of Croatia 2017-2030
Zagreb, August 2017. 293
8 Environmental protection measures
8.1 Soil 1. If the intervention is planned in the area of moderate and high risk of erosion, agrotechnical mitigation
measures shall be used in accordance with the Ordinance on Agrotechnical Measures.
8.2 Waters 2. When constructing railway lines, concrete sleepers shall be used as much as possible, i.e. wooden
sleepers that need to be treated with chemicals before use shall be avoided.
3. During the design and construction of railway lines and roads, the road routes shall be defined in a manner
that minimises the impact of changes in the existing river and lake basins to reduce the impact on their
hydromorphological condition. When constructing roadways in vulnerable, sensitive or protected areas, at
the level of the project, an analysis of potential pollution of the surrounding water bodies shall be conducted
and appropriate protection measures shall be prescribed.
4. During the works on the expansion of airports, wastewater drainage system shall be constructed as well
as wastewater treatment facilities of the appropriate category.
5. All line and point interventions shall be designed in such a manner as to avoid areas of special water
protection - sanitary protection zones.
6. Each newly constructed port, before the preparation of the main design or before the start of use of the
port, if the main design is not required, shall have a maritime study accepted and certified by the Port
authority in accordance with Article 5 of the Regulation on Conditions to be met by the Ports (OG 110/04).
7. In planned ports, solid waste collection shall be organised and adequate infrastructure shall be provided
for wastewater collection from ships.
8. New sea and river ports are planned at locations where the morphological condition of water bodies is
rated as very good, i.e. at locations where there are no existing hydromorphological pressures.
8.3 Biodiversity 9. The development of the railway transport on the Karlovac-Rijeka section shell based on a variant solution
that passes through the south of the Zlobin village in Primorje-Gorski Kotar County with the sanation of
the existing railway line.
10. Motorways and other roads with a planned traffic density of more than 5000 vehicles per day are planned
in a manner that shall enable the establishment of adequate capacity for wild species in the next stages
of their realisation, taking into account existing transport infrastructure.
11. The transport infrastructure in areas that are evaluated as non-fragmented shall be planned primarily in
habitats that are under higher anthropogenic influence with the use of the shortest possible sections
through non-fragmented areas. The transport infrastructure shall be planned in a manner that enables the
implementation of green infrastructure.
12. The improvement of the maritime transport shall be planned in such a manner as to avoid the areas
inhabited by the species Tursiops truncatus (bottlenose dolphin) and fish hatches in the Adriatic.
13. The new eastern port on the Danube in Vukovar shall be planned completely outside the borders of the
Special reserve of forest vegetation Vukovarske dunavske ade.
14. The section of the road that is planned within the boundaries of the Significant landscape Cetina – Donji
tok, and is covered by the measure of Ro. 15 Reorganisation of the Split network, shall be constructed in
such a way to avoid disturbing the features of this protected area.
15. The traffic corridor envisaged by measures R.11 Zagreb Node and Ro.8 Reorganization of the main
Zagreb network, in which several types of parallel line transport infrastructure are planned to be
implemented with a view to mitigate cumulative impacts, shall be constructed in cooperation of all the
transport sectors involved, as well as the bodies competent for expert nature protection activities and
Strategic Environmental Impact Study of the Transport Development Strategy of the Republic of Croatia 2017-2030
Zagreb, August 2017. 294
bodies competent for forest management in the given area, in order to enable adequate capacity for wild
species through parallel roads with minimum disturbance of forest habitats.
8.4 Cultural and historical heritage
Protection of archaeological heritage
16. Prior to undertaking the interventions in the area that arise from spatially located measures, the
archaeological field examination shall be conducted and, if necessary, test archaeological research on the
positions of known and recorded archaeological sites, which shall determine the scope of protective
archaeological research, documentation and conservation of the findings and sites. Archaeological field
examination shall be conducted at the locations of potential archaeological sites with indicative names,
toponyms and places where changes in relief caused by human action in history are evident.
17. If protective archaeological research results in significant findings that need to be preserved and
presented, there is a possibility of relocating the infrastructure route and other planned structures on the
locations of such sites.
Protection of cultural and historical units, historical structures and buildings
18. The protection measure system includes the exploration and documentation of the endangered cultural
heritage with maximum preservation to mitigate the negative impact on the spatial and visual integrity of
the architectural heritage.
Protection of historical cultural landscape
19. Measures for the protection of the historical cultural landscape shall be implemented during the project
design stage by designing a landscaping design of the intervention zone area.
20. A landscape sensitivity study shall be prepared prior to the landscaping design.
8.5 Agriculture
21. In the area of Pannonian Croatia, the implementation of the measures that can generate conversion and
fragmentation of P1 and P2 land capability class shall be planned to avoid by all means, except in
exceptional circumstances, taking P1 and P2 land capability classes.
22. In the area of Dinarides, the measures that can generate conversion and fragmentation of P1 and P2 land
capability class shall be implemented outside P1 and P2 land capability class.
23. Measures that can generate conversion and fragmentation of agricultural land shall be planned to
maximise the use of existing infrastructure and avoid unnecessary conversion and fragmentation of
agricultural land.
8.6 Landscape characteristics
24. The measures envisaged by the Strategy shall be incorporated into the landscape through green
infrastructure projects, or projects of Landscaping by an expert (landscape architect).

Strategic Environmental Impact Study of the Transport Development Strategy of the Republic of Croatia 2017-2030
Zagreb, August 2017. 295
8.7 Social and economic characteristics
25. When designing roads, the significance of impacts shall be assessed taking into account the estimated
traffic increase and, if necessary, appropriate noise protection measures shall be implemented.
8.8 Climate changes
26. All infrastructure projects arising from the measures of the Strategy shall be planned taking into account
the potential climate phenomena in the area of measure implementation. The project design shall be
realised in accordance with non-formal guidelines: „Non-paper Guidelines for Project Managers: making
vulnerable investments climate resilient“ (European Commission, Directorate-General for Climate Action).
27. The measures envisaged by the Strategy are to be implemented in accordance with the National Policy
Framework for the Establishment of Infrastructure and Development of Alternative Fuel Market (NFP) (OG
34/17) and strategic documents and incentives by local and regional self-government units related to the
establishment of alternative fuels infrastructure are contained in the aforementioned National Framework
Strategic Environmental Impact Study of the Transport Development Strategy of the Republic of Croatia 2017-2030
Zagreb, August 2017. 296
9 Alternative solutions
General, developmental and management and organizational measures of the Strategy do not offer alternative
solutions to its activities, while for the spatially located measures are alternative solutions only to the extent of R.3
construction of the railway line from Karlovac to Rijeka (TEN-T basic network / TEN-T Mediterranean corridor /
Pan-European Corridor Vb). It offers two variants of the railroad track in Zlobin - northern and southern. As the
impact of spatially-located Strategy measures on the environment is thoroughly assessed in chapter 7.2.4 by
environmental components, so is the impact of both alternative solutions of measure R.3 on the environment.
The impact of alternative solutions of measure R.3 on the environment has been identified and evaluated on the
Biodiversity component of the environment. Given that the Strategy plans to develop the railway network from
Zagreb to Rijeka, which includes new corridors through the area of distribution of all three large carnivores (Figure
7.7), the adverse impacts of measure R.3 on the status of their populations can not be ruled out, given the
percentage of fatalities on the railway tracks, which especially applies to the bear population. Data analysis found
that the new railway sections, covering both alternatives, are interfering the habitats of the three large carnivores
less than the existing railway corridor, while a large part of the planned route spatially matches the existing ones.
An overview of the alternative solutions suggested for railway construction under measure R.3 found potentially
less disturbance of the habitat highly suitable for bears, but also for all three large carnivores, by using the
alternatives that pass through the southern part of Zlobin (Primorje-Gorski Kotar County), than the alternative which
passes through its northern part. When it comes to habitats, there is a smaller loss of forest habitat with the
alternative that passes through the southern part of Zlobin (Primorje-Gorski Kotar County), than with the
alternatives which passes through its northern part.
An analysis of the impact of the Zagreb - Rijeka railway network development on the environment identified a
railway route which has a moderate impact on the area biodiversity and it was determined and recommended to
develop the railway transport on the Karlovac - Rijeka section based on an alternative solution which passes south
of the Zlobin settlement in Primorje – Gorski Kotar County, along with the renovation of the existing railway line.
In order to improve the current state, along with the strategic level, it is also necessary to include additional
protection measures during the design of the railway to reduce the adverse impacts of railway transport to a lower
level than the current one in the mountainous part of Croatia.
Strategic Environmental Impact Study of the Transport Development Strategy of the Republic of Croatia 2017-2030
Zagreb, August 2017. 297
10 Environment monitoring
Implementation of the Strategy measures is planned through implementing activities that shall be further elaborated
in terms of defining specific projects and the bodies which shall implement a particular project, so that the
environmental monitoring obligations shall be defined more precisely.
For this level of defining the Strategy measures, no programme of environmental monitoring and the implementation
of measures has been prescribed.
Strategic Environmental Impact Study of the Transport Development Strategy of the Republic of Croatia 2017-2030
Zagreb, August 2017. 298
11 Appropriate assessment
11.1 Introduction
11.1.1 Data on the authorized entity and reasons for Study preparation
The developer of the Study of the Main Acceptability Assessment of the Strategy for the Ecological Network is the
company IRES EKOLOGIJA d.o.o. with registered office in Zagreb, Prilaz baruna Filipovića 21. The copy of the
authorization for performance of professional activities in the field of nature protection issued by the Ministry of
Environment and Energy is in Chapter 14 of the Appendices.
On 13 July 2015, the Ministry of Environment and Energy issued a Decision (Class: UP/I 612-07/15-71/136, Reg.
No.: 51707-2-1-15-4) that for the Transport Development Strategy of the Republic of Croatia for the period 2017-
2030, the possibility of significant negative impacts on the conservation objectives and the integrity of the ecological
network area shall not be ruled out and the implementation of the main acceptability assessment for the ecological
network shall be mandatory for the subject Strategy. The Decision is attached as Appendix 14.3 pursuant to Article
26 of the Nature Protection Act (OGof the Republic of Croatia 80/13) for the strategies, plans and programmes
subject to the strategic assessment, the Main assessment shall be conducted within the procedure for strategic
environmental impact assessment of the strategy, plan and programme (SEA).
11.1.2 Description of the impact prediction method Given that the scope of the Strategy covers the entire territory of the Republic of Croatia and therefore overlaps
with the scope of the ecological network proclaimed by the Regulation on the Proclamation of Ecological Network
(OGof the Republic of Croatia 124/2013, 105/15), the scope of the possible influence of the Strategy refers to the
territory of the Republic of Croatia covered by ecological network.
For indicating the significance of the influence, the scale with five values is used, ranging from -2 (significant
negative impact) to +2 (significant positive impact). Each target species and habitat type on which the intervention
could have an impact is evaluated with one the values according to the following table (Table 11.1). Additionally,
for strategic planning documents, the value "?" is added, where the impacts depend on the manner of implementing
specific interventions.
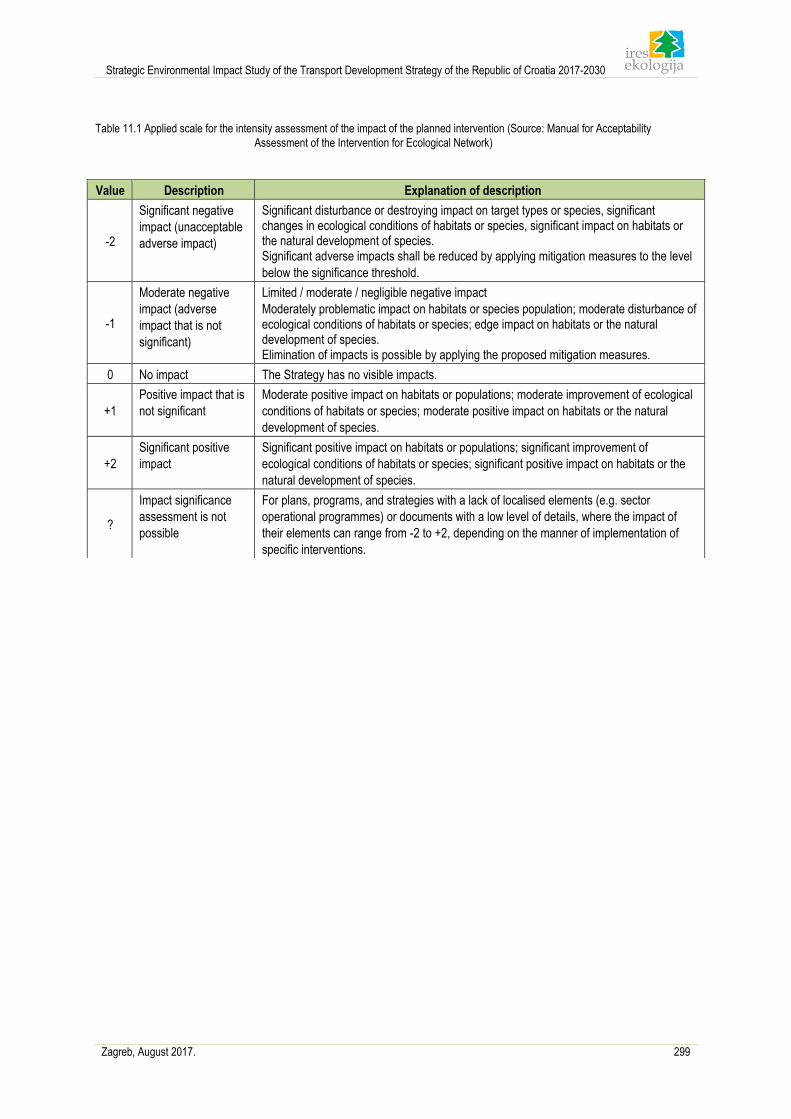
Strategic Environmental Impact Study of the Transport Development Strategy of the Republic of Croatia 2017-2030
Zagreb, August 2017. 299
Table 11.1 Applied scale for the intensity assessment of the impact of the planned intervention (Source: Manual for Acceptability
Assessment of the Intervention for Ecological Network)
Value Description Explanation of description
-2
Significant negative
impact (unacceptable
adverse impact)
Significant disturbance or destroying impact on target types or species, significant changes in ecological conditions of habitats or species, significant impact on habitats or the natural development of species. Significant adverse impacts shall be reduced by applying mitigation measures to the level
below the significance threshold.
-1
Moderate negative
impact (adverse
impact that is not
significant)
Limited / moderate / negligible negative impact
Moderately problematic impact on habitats or species population; moderate disturbance of ecological conditions of habitats or species; edge impact on habitats or the natural development of species. Elimination of impacts is possible by applying the proposed mitigation measures.
0 No impact The Strategy has no visible impacts.
+1
Positive impact that is
not significant
Moderate positive impact on habitats or populations; moderate improvement of ecological
conditions of habitats or species; moderate positive impact on habitats or the natural
development of species.
+2
Significant positive
impact
Significant positive impact on habitats or populations; significant improvement of
ecological conditions of habitats or species; significant positive impact on habitats or the
natural development of species.
?
Impact significance
assessment is not
possible
For plans, programs, and strategies with a lack of localised elements (e.g. sector
operational programmes) or documents with a low level of details, where the impact of
their elements can range from -2 to +2, depending on the manner of implementation of
specific interventions.
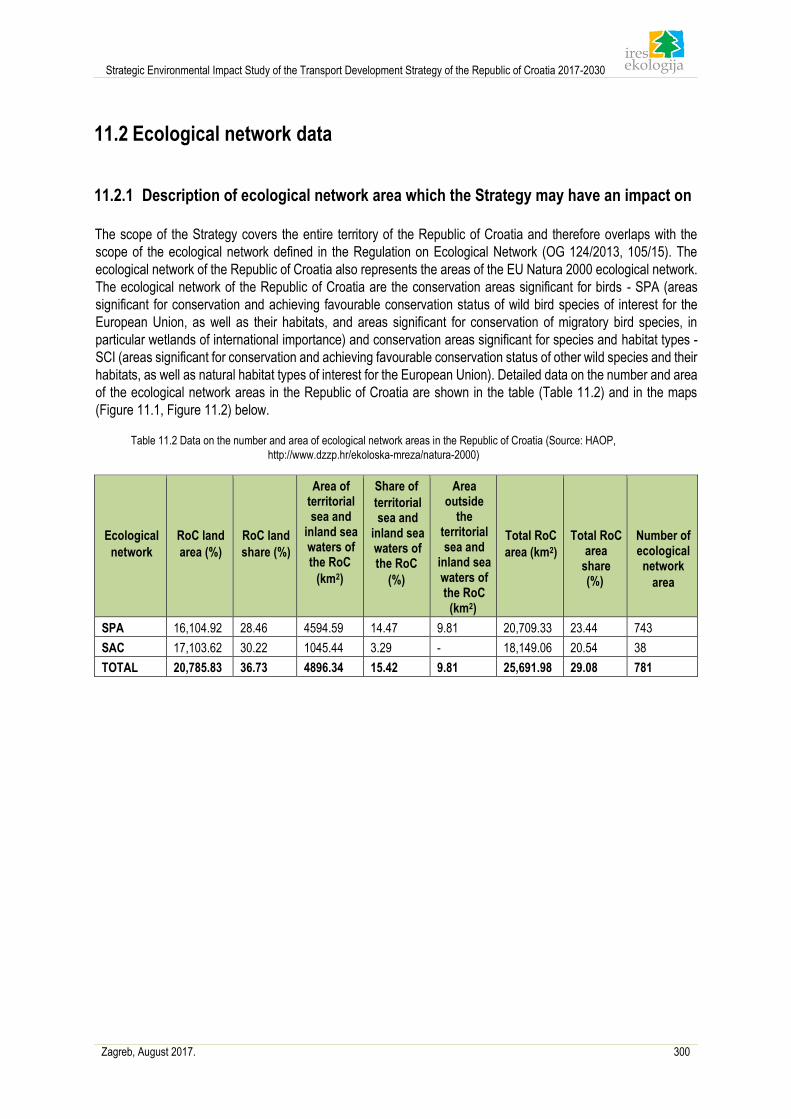
Strategic Environmental Impact Study of the Transport Development Strategy of the Republic of Croatia 2017-2030
Zagreb, August 2017. 300
11.2 Ecological network data
11.2.1 Description of ecological network area which the Strategy may have an impact on
The scope of the Strategy covers the entire territory of the Republic of Croatia and therefore overlaps with the
scope of the ecological network defined in the Regulation on Ecological Network (OG 124/2013, 105/15). The
ecological network of the Republic of Croatia also represents the areas of the EU Natura 2000 ecological network.
The ecological network of the Republic of Croatia are the conservation areas significant for birds - SPA (areas
significant for conservation and achieving favourable conservation status of wild bird species of interest for the
European Union, as well as their habitats, and areas significant for conservation of migratory bird species, in
particular wetlands of international importance) and conservation areas significant for species and habitat types -
SCI (areas significant for conservation and achieving favourable conservation status of other wild species and their
habitats, as well as natural habitat types of interest for the European Union). Detailed data on the number and area
of the ecological network areas in the Republic of Croatia are shown in the table (Table 11.2) and in the maps
(Figure 11.1, Figure 11.2) below.
Table 11.2 Data on the number and area of ecological network areas in the Republic of Croatia (Source: HAOP,
http://www.dzzp.hr/ekoloska-mreza/natura-2000)
Ecological
network
RoC land
area (%)
RoC land
share (%)
Area of territorial sea and
inland sea waters of the RoC
(km2)
Share of
territorial sea and
inland sea waters of the RoC
(%)
Area outside
the territorial sea and
inland sea waters of the RoC
(km2)
Total RoC
area (km2)
Total RoC area
share (%)
Number of ecological network
area
SPA 16,104.92 28.46 4594.59 14.47 9.81 20,709.33 23.44 743
SAC 17,103.62 30.22 1045.44 3.29 - 18,149.06 20.54 38
TOTAL 20,785.83 36.73 4896.34 15.42 9.81 25,691.98 29.08 781
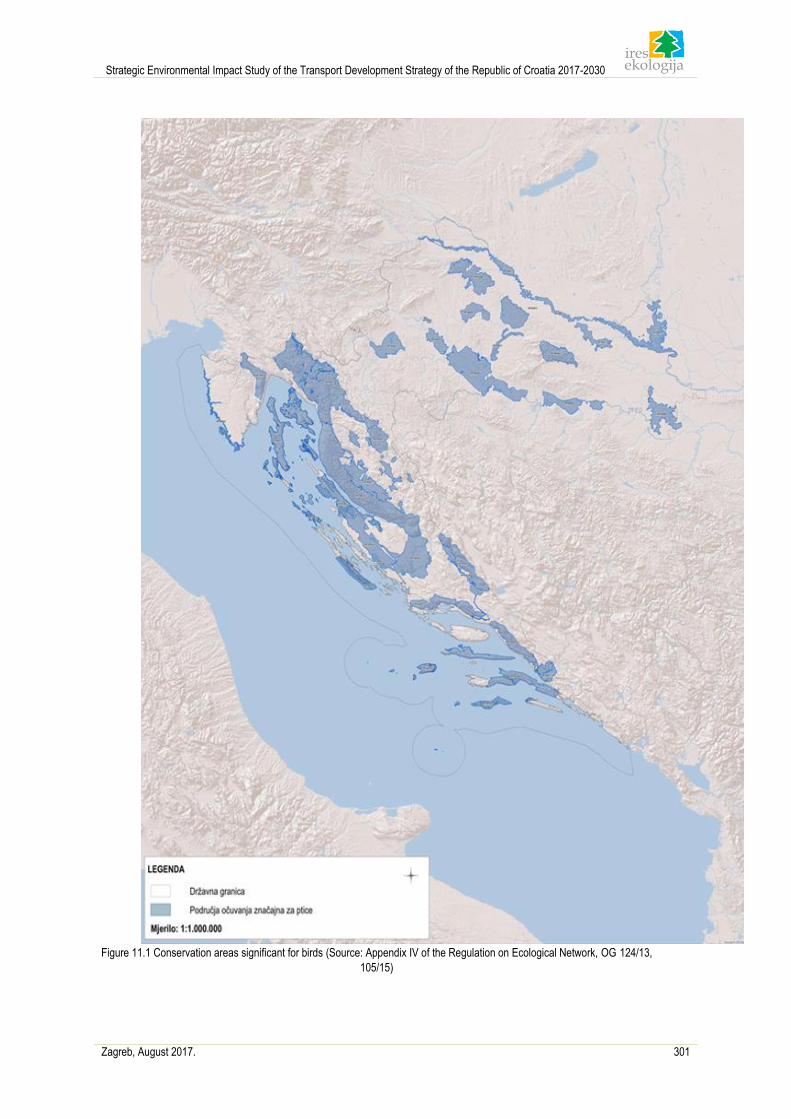
Strategic Environmental Impact Study of the Transport Development Strategy of the Republic of Croatia 2017-2030
Zagreb, August 2017. 301
Figure 11.1 Conservation areas significant for birds (Source: Appendix IV of the Regulation on Ecological Network, OG 124/13,
105/15)
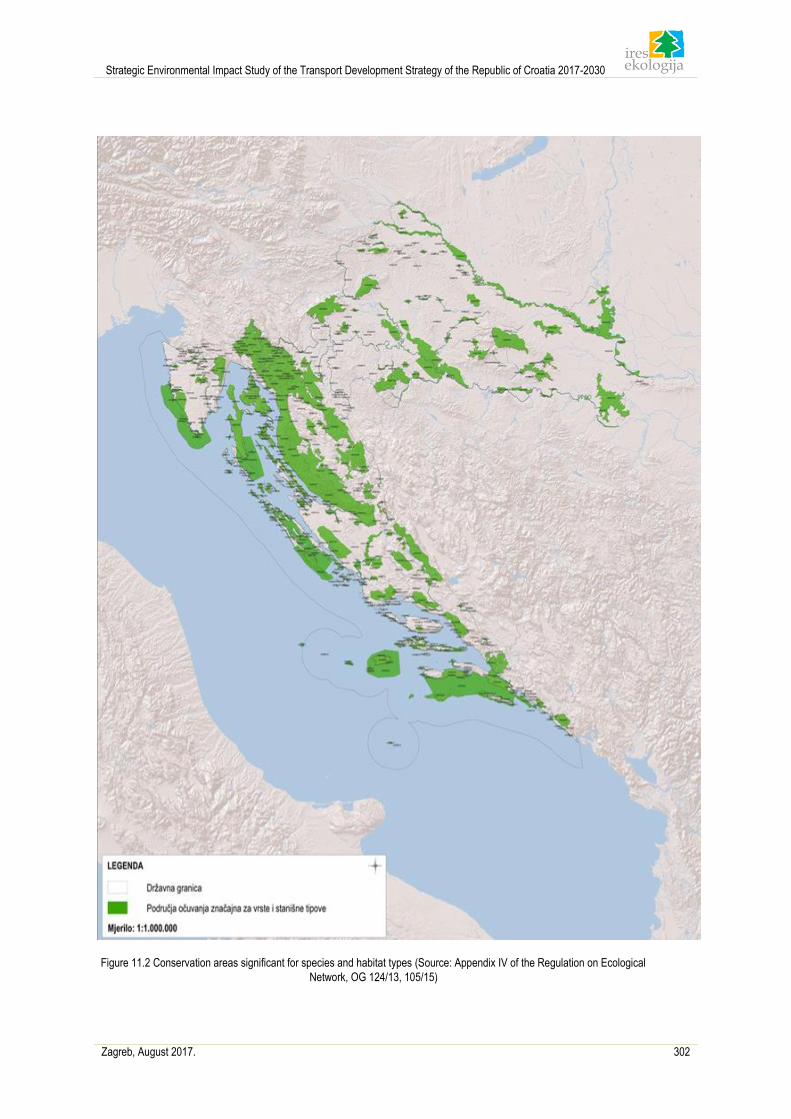
Strategic Environmental Impact Study of the Transport Development Strategy of the Republic of Croatia 2017-2030
Zagreb, August 2017. 302
Figure 11.2 Conservation areas significant for species and habitat types (Source: Appendix IV of the Regulation on Ecological
Network, OG 124/13, 105/15)
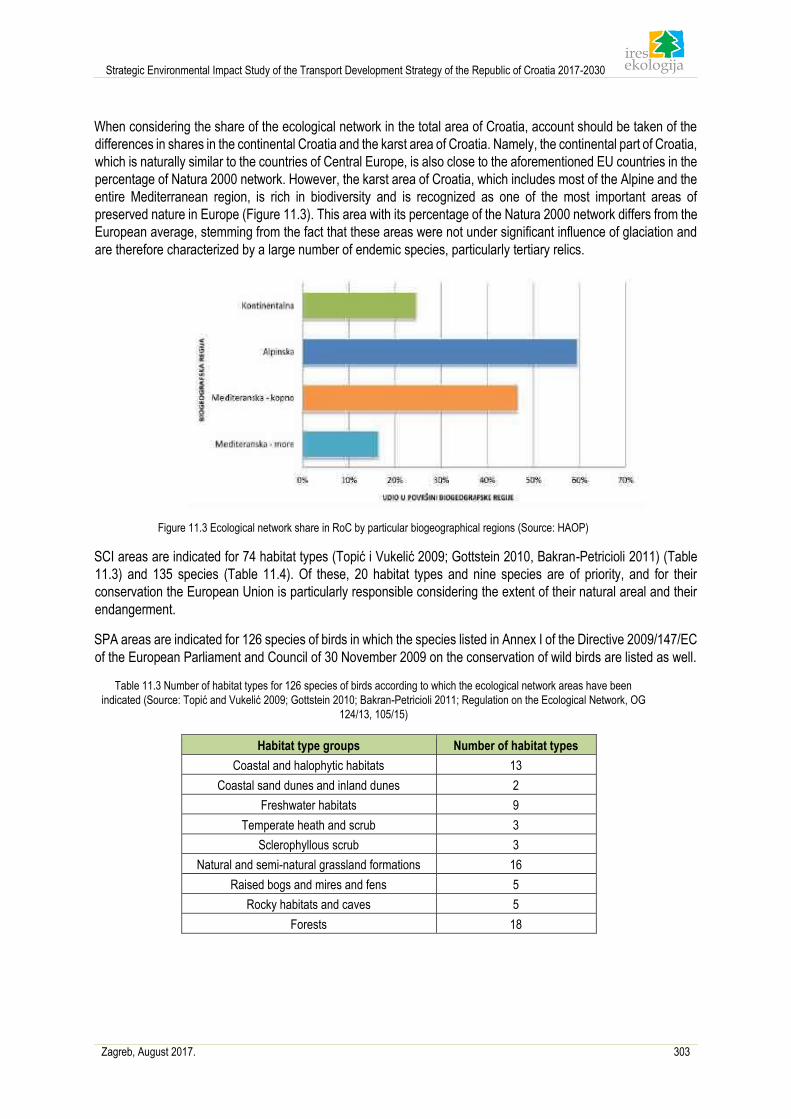
Strategic Environmental Impact Study of the Transport Development Strategy of the Republic of Croatia 2017-2030
Zagreb, August 2017. 303
When considering the share of the ecological network in the total area of Croatia, account should be taken of the
differences in shares in the continental Croatia and the karst area of Croatia. Namely, the continental part of Croatia,
which is naturally similar to the countries of Central Europe, is also close to the aforementioned EU countries in the
percentage of Natura 2000 network. However, the karst area of Croatia, which includes most of the Alpine and the
entire Mediterranean region, is rich in biodiversity and is recognized as one of the most important areas of
preserved nature in Europe (Figure 11.3). This area with its percentage of the Natura 2000 network differs from the
European average, stemming from the fact that these areas were not under significant influence of glaciation and
are therefore characterized by a large number of endemic species, particularly tertiary relics.
Figure 11.3 Ecological network share in RoC by particular biogeographical regions (Source: HAOP)
SCI areas are indicated for 74 habitat types (Topić i Vukelić 2009; Gottstein 2010, Bakran-Petricioli 2011) (Table
11.3) and 135 species (Table 11.4). Of these, 20 habitat types and nine species are of priority, and for their
conservation the European Union is particularly responsible considering the extent of their natural areal and their
endangerment.
SPA areas are indicated for 126 species of birds in which the species listed in Annex I of the Directive 2009/147/EC
of the European Parliament and Council of 30 November 2009 on the conservation of wild birds are listed as well.
Table 11.3 Number of habitat types for 126 species of birds according to which the ecological network areas have been
indicated (Source: Topić and Vukelić 2009; Gottstein 2010; Bakran-Petricioli 2011; Regulation on the Ecological Network, OG
124/13, 105/15)
Habitat type groups Number of habitat types
Coastal and halophytic habitats 13
Coastal sand dunes and inland dunes 2
Freshwater habitats 9
Temperate heath and scrub 3
Sclerophyllous scrub 3
Natural and semi-natural grassland formations 16
Raised bogs and mires and fens 5
Rocky habitats and caves 5
Forests 18
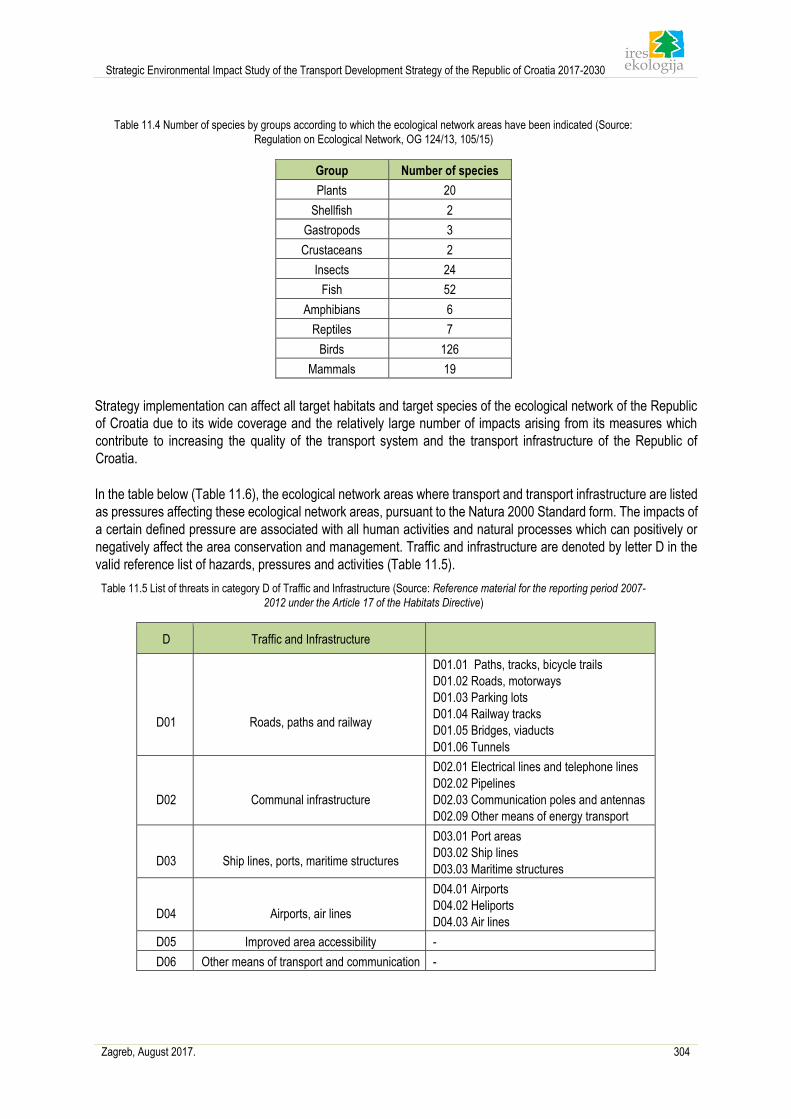
Strategic Environmental Impact Study of the Transport Development Strategy of the Republic of Croatia 2017-2030
Zagreb, August 2017. 304
Table 11.4 Number of species by groups according to which the ecological network areas have been indicated (Source:
Regulation on Ecological Network, OG 124/13, 105/15)
Group Number of species
Plants 20
Shellfish 2
Gastropods 3
Crustaceans 2
Insects 24
Fish 52
Amphibians 6
Reptiles 7
Birds 126
Mammals 19
Strategy implementation can affect all target habitats and target species of the ecological network of the Republic
of Croatia due to its wide coverage and the relatively large number of impacts arising from its measures which
contribute to increasing the quality of the transport system and the transport infrastructure of the Republic of
Croatia.
In the table below (Table 11.6), the ecological network areas where transport and transport infrastructure are listed
as pressures affecting these ecological network areas, pursuant to the Natura 2000 Standard form. The impacts of
a certain defined pressure are associated with all human activities and natural processes which can positively or
negatively affect the area conservation and management. Traffic and infrastructure are denoted by letter D in the
valid reference list of hazards, pressures and activities (Table 11.5).
Table 11.5 List of threats in category D of Traffic and Infrastructure (Source: Reference material for the reporting period 2007-
2012 under the Article 17 of the Habitats Directive)
D Traffic and Infrastructure
D01
Roads, paths and railway
D01.01 Paths, tracks, bicycle trails
D01.02 Roads, motorways
D01.03 Parking lots
D01.04 Railway tracks
D01.05 Bridges, viaducts
D01.06 Tunnels
D02
Communal infrastructure
D02.01 Electrical lines and telephone lines
D02.02 Pipelines
D02.03 Communication poles and antennas
D02.09 Other means of energy transport
D03
Ship lines, ports, maritime structures
D03.01 Port areas
D03.02 Ship lines
D03.03 Maritime structures
D04
Airports, air lines
D04.01 Airports
D04.02 Heliports
D04.03 Air lines
D05 Improved area accessibility -
D06 Other means of transport and communication -
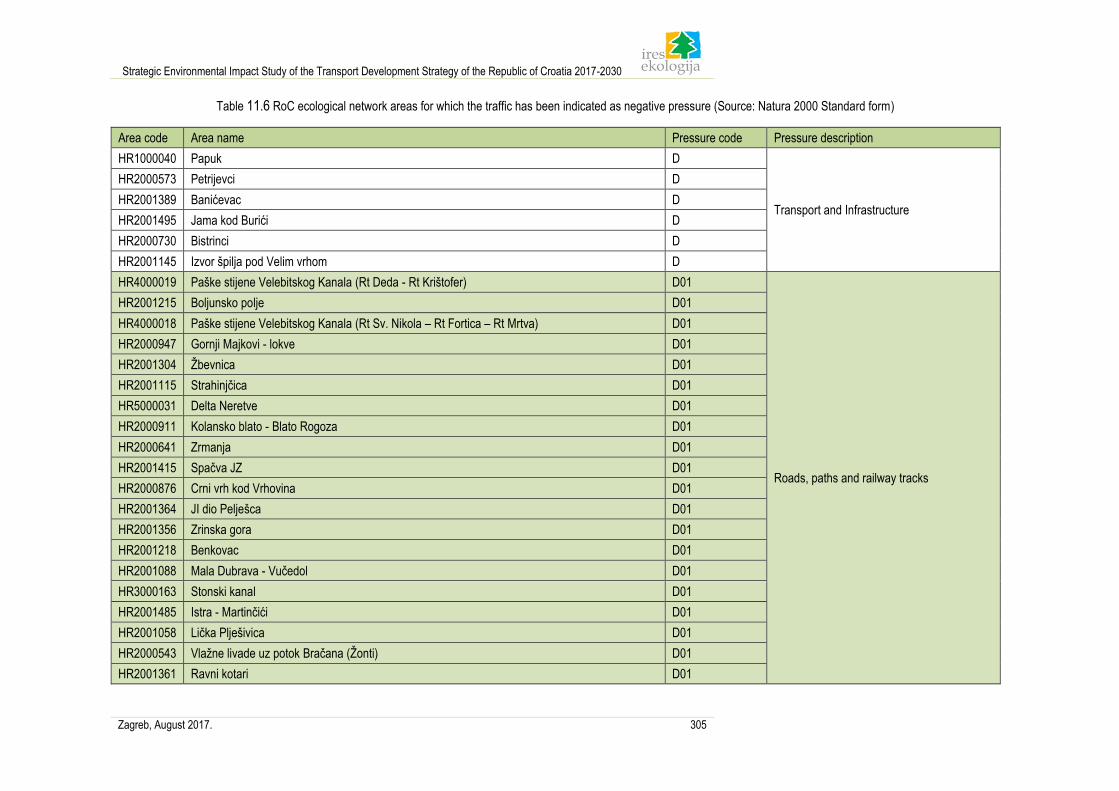
Strategic Environmental Impact Study of the Transport Development Strategy of the Republic of Croatia 2017-2030
Zagreb, August 2017. 305
Table 11.6 RoC ecological network areas for which the traffic has been indicated as negative pressure (Source: Natura 2000 Standard form)
Area code Area name Pressure code Pressure description
HR1000040 Papuk D
Transport and Infrastructure
HR2000573 Petrijevci D
HR2001389 Banićevac D
HR2001495 Jama kod Burići D
HR2000730 Bistrinci D
HR2001145 Izvor špilja pod Velim vrhom D
HR4000019 Paške stijene Velebitskog Kanala (Rt Deda - Rt Krištofer) D01
Roads, paths and railway tracks
HR2001215 Boljunsko polje D01
HR4000018 Paške stijene Velebitskog Kanala (Rt Sv. Nikola – Rt Fortica – Rt Mrtva) D01
HR2000947 Gornji Majkovi - lokve D01
HR2001304 Žbevnica D01
HR2001115 Strahinjčica D01
HR5000031 Delta Neretve D01
HR2000911 Kolansko blato - Blato Rogoza D01
HR2000641 Zrmanja D01
HR2001415 Spačva JZ D01
HR2000876 Crni vrh kod Vrhovina D01
HR2001364 JI dio Pelješca D01
HR2001356 Zrinska gora D01
HR2001218 Benkovac D01
HR2001088 Mala Dubrava - Vučedol D01
HR3000163 Stonski kanal D01
HR2001485 Istra - Martinčići D01
HR2001058 Lička Plješivica D01
HR2000543 Vlažne livade uz potok Bračana (Žonti) D01
HR2001361 Ravni kotari D01
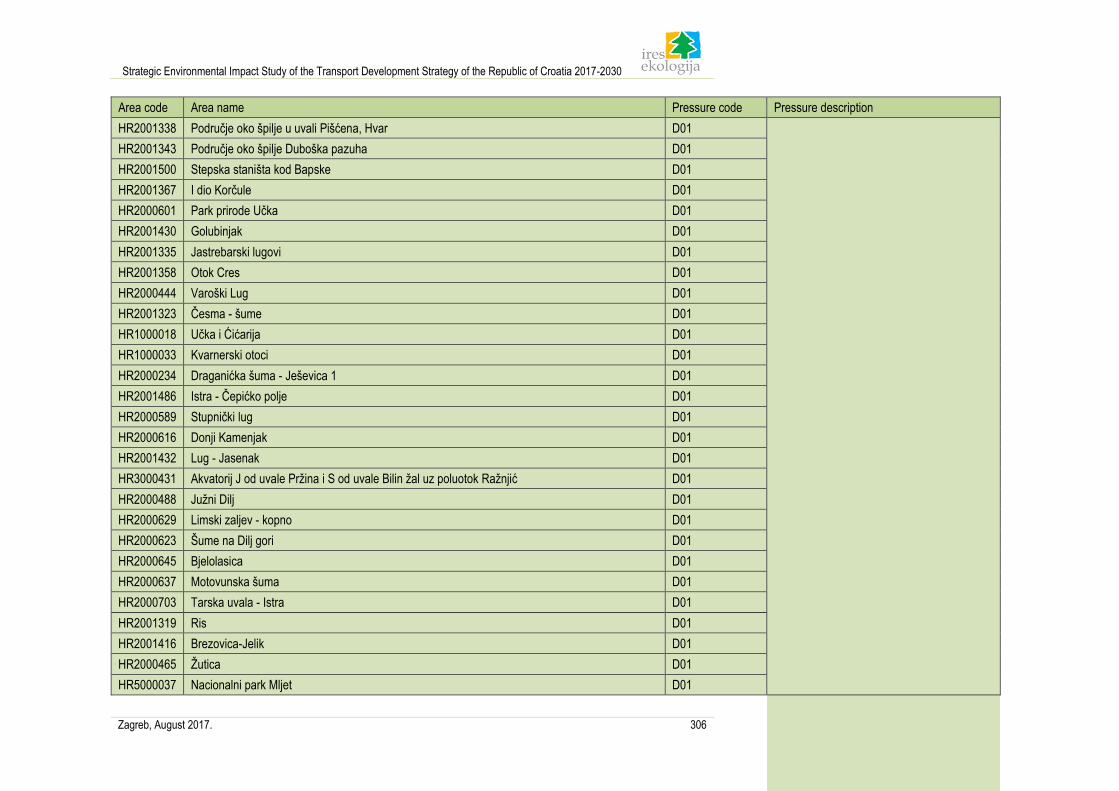
Strategic Environmental Impact Study of the Transport Development Strategy of the Republic of Croatia 2017-2030
Zagreb, August 2017. 306
Area code Area name Pressure code Pressure description
HR2001338 Područje oko špilje u uvali Pišćena, Hvar D01
HR2001343 Područje oko špilje Duboška pazuha D01
HR2001500 Stepska staništa kod Bapske D01
HR2001367 I dio Korčule D01
HR2000601 Park prirode Učka D01
HR2001430 Golubinjak D01
HR2001335 Jastrebarski lugovi D01
HR2001358 Otok Cres D01
HR2000444 Varoški Lug D01
HR2001323 Česma - šume D01
HR1000018 Učka i Ćićarija D01
HR1000033 Kvarnerski otoci D01
HR2000234 Draganićka šuma - Ješevica 1 D01
HR2001486 Istra - Čepićko polje D01
HR2000589 Stupnički lug D01
HR2000616 Donji Kamenjak D01
HR2001432 Lug - Jasenak D01
HR3000431 Akvatorij J od uvale Pržina i S od uvale Bilin žal uz poluotok Ražnjić D01
HR2000488 Južni Dilj D01
HR2000629 Limski zaljev - kopno D01
HR2000623 Šume na Dilj gori D01
HR2000645 Bjelolasica D01
HR2000637 Motovunska šuma D01
HR2000703 Tarska uvala - Istra D01
HR2001319 Ris D01
HR2001416 Brezovica-Jelik D01
HR2000465 Žutica D01
HR5000037 Nacionalni park Mljet D01
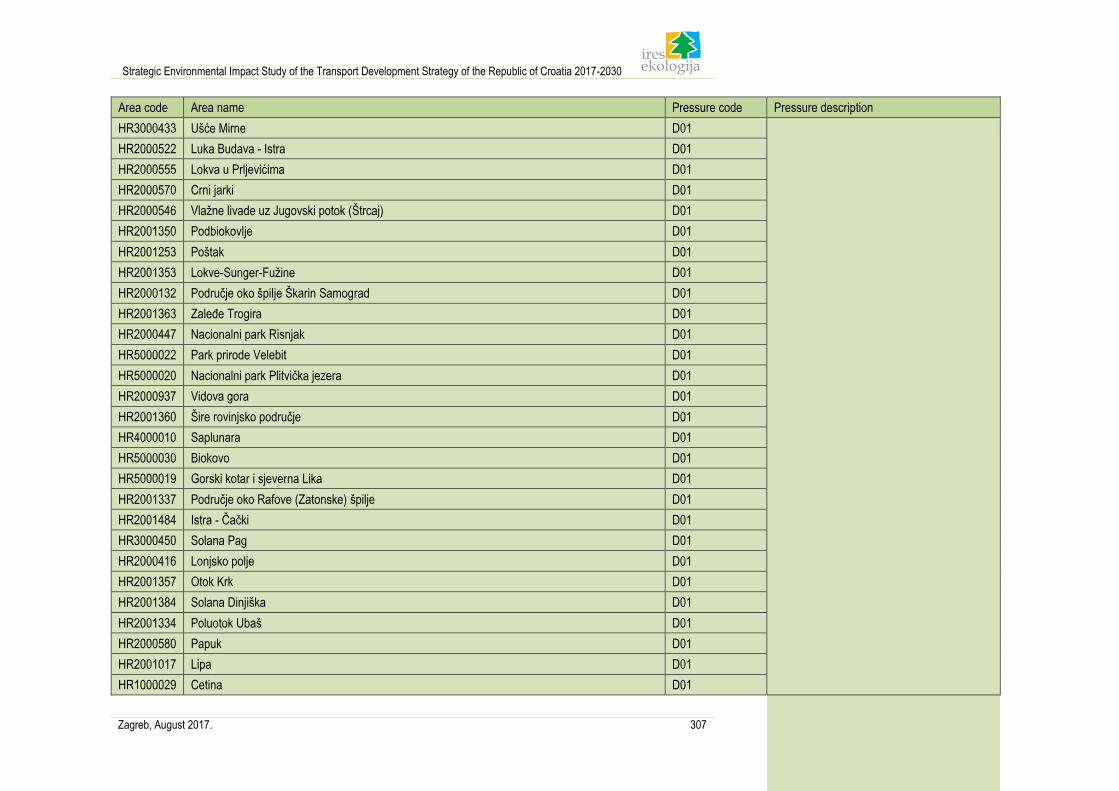
Strategic Environmental Impact Study of the Transport Development Strategy of the Republic of Croatia 2017-2030
Zagreb, August 2017. 307
Area code Area name Pressure code Pressure description
HR3000433 Ušće Mirne D01
HR2000522 Luka Budava - Istra D01
HR2000555 Lokva u Prljevićima D01
HR2000570 Crni jarki D01
HR2000546 Vlažne livade uz Jugovski potok (Štrcaj) D01
HR2001350 Podbiokovlje D01
HR2001253 Poštak D01
HR2001353 Lokve-Sunger-Fužine D01
HR2000132 Područje oko špilje Škarin Samograd D01
HR2001363 Zaleđe Trogira D01
HR2000447 Nacionalni park Risnjak D01
HR5000022 Park prirode Velebit D01
HR5000020 Nacionalni park Plitvička jezera D01
HR2000937 Vidova gora D01
HR2001360 Šire rovinjsko područje D01
HR4000010 Saplunara D01
HR5000030 Biokovo D01
HR5000019 Gorski kotar i sjeverna Lika D01
HR2001337 Područje oko Rafove (Zatonske) špilje D01
HR2001484 Istra - Čački D01
HR3000450 Solana Pag D01
HR2000416 Lonjsko polje D01
HR2001357 Otok Krk D01
HR2001384 Solana Dinjiška D01
HR2001334 Poluotok Ubaš D01
HR2000580 Papuk D01
HR2001017 Lipa D01
HR1000029 Cetina D01
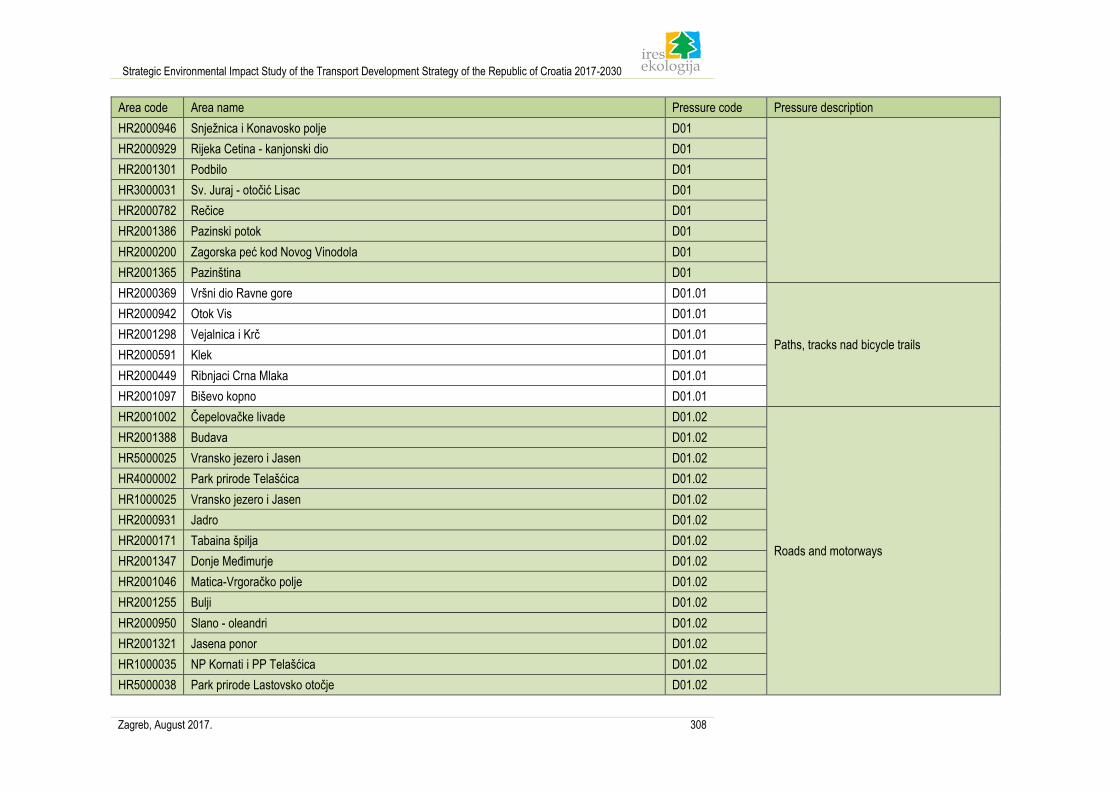
Strategic Environmental Impact Study of the Transport Development Strategy of the Republic of Croatia 2017-2030
Zagreb, August 2017. 308
Area code Area name Pressure code Pressure description
HR2000946 Snježnica i Konavosko polje D01
HR2000929 Rijeka Cetina - kanjonski dio D01
HR2001301 Podbilo D01
HR3000031 Sv. Juraj - otočić Lisac D01
HR2000782 Rečice D01
HR2001386 Pazinski potok D01
HR2000200 Zagorska peć kod Novog Vinodola D01
HR2001365 Pazinština D01
HR2000369 Vršni dio Ravne gore D01.01
Paths, tracks nad bicycle trails
HR2000942 Otok Vis D01.01
HR2001298 Vejalnica i Krč D01.01
HR2000591 Klek D01.01
HR2000449 Ribnjaci Crna Mlaka D01.01
HR2001097 Biševo kopno D01.01
HR2001002 Čepelovačke livade D01.02
Roads and motorways
HR2001388 Budava D01.02
HR5000025 Vransko jezero i Jasen D01.02
HR4000002 Park prirode Telašćica D01.02
HR1000025 Vransko jezero i Jasen D01.02
HR2000931 Jadro D01.02
HR2000171 Tabaina špilja D01.02
HR2001347 Donje Međimurje D01.02
HR2001046 Matica-Vrgoračko polje D01.02
HR2001255 Bulji D01.02
HR2000950 Slano - oleandri D01.02
HR2001321 Jasena ponor D01.02
HR1000035 NP Kornati i PP Telašćica D01.02
HR5000038 Park prirode Lastovsko otočje D01.02
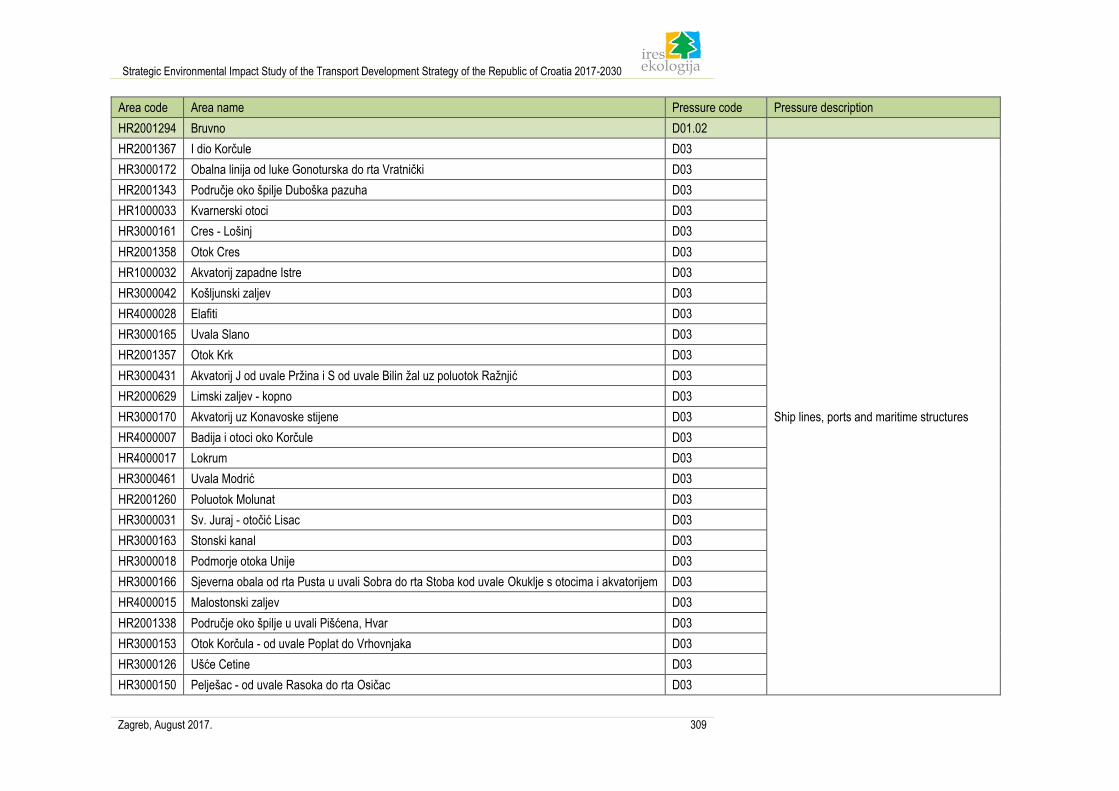
Strategic Environmental Impact Study of the Transport Development Strategy of the Republic of Croatia 2017-2030
Zagreb, August 2017. 309
Area code Area name Pressure code Pressure description
HR2001294 Bruvno D01.02
HR2001367 I dio Korčule D03
Ship lines, ports and maritime structures
HR3000172 Obalna linija od luke Gonoturska do rta Vratnički D03
HR2001343 Područje oko špilje Duboška pazuha D03
HR1000033 Kvarnerski otoci D03
HR3000161 Cres - Lošinj D03
HR2001358 Otok Cres D03
HR1000032 Akvatorij zapadne Istre D03
HR3000042 Košljunski zaljev D03
HR4000028 Elafiti D03
HR3000165 Uvala Slano D03
HR2001357 Otok Krk D03
HR3000431 Akvatorij J od uvale Pržina i S od uvale Bilin žal uz poluotok Ražnjić D03
HR2000629 Limski zaljev - kopno D03
HR3000170 Akvatorij uz Konavoske stijene D03
HR4000007 Badija i otoci oko Korčule D03
HR4000017 Lokrum D03
HR3000461 Uvala Modrić D03
HR2001260 Poluotok Molunat D03
HR3000031 Sv. Juraj - otočić Lisac D03
HR3000163 Stonski kanal D03
HR3000018 Podmorje otoka Unije D03
HR3000166 Sjeverna obala od rta Pusta u uvali Sobra do rta Stoba kod uvale Okuklje s otocima i akvatorijem D03
HR4000015 Malostonski zaljev D03
HR2001338 Područje oko špilje u uvali Pišćena, Hvar D03
HR3000153 Otok Korčula - od uvale Poplat do Vrhovnjaka D03
HR3000126 Ušće Cetine D03
HR3000150 Pelješac - od uvale Rasoka do rta Osičac D03
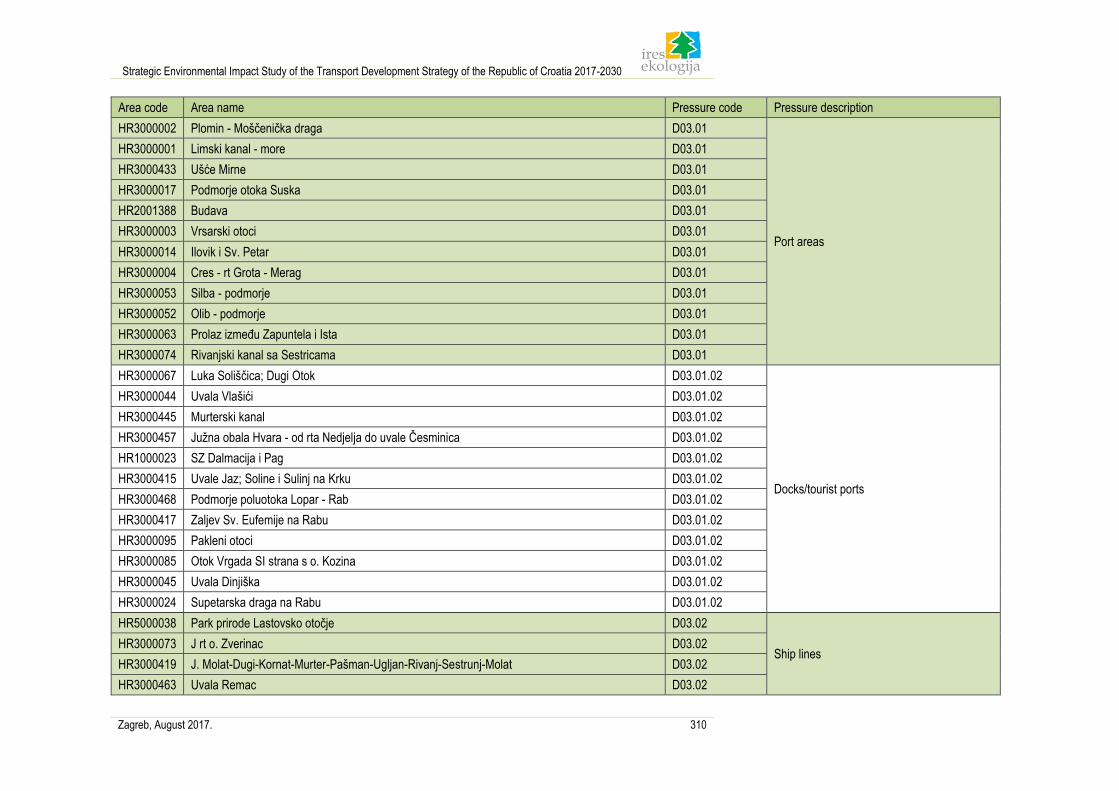
Strategic Environmental Impact Study of the Transport Development Strategy of the Republic of Croatia 2017-2030
Zagreb, August 2017. 310
Area code Area name Pressure code Pressure description
HR3000002 Plomin - Moščenička draga D03.01
Port areas
HR3000001 Limski kanal - more D03.01
HR3000433 Ušće Mirne D03.01
HR3000017 Podmorje otoka Suska D03.01
HR2001388 Budava D03.01
HR3000003 Vrsarski otoci D03.01
HR3000014 Ilovik i Sv. Petar D03.01
HR3000004 Cres - rt Grota - Merag D03.01
HR3000053 Silba - podmorje D03.01
HR3000052 Olib - podmorje D03.01
HR3000063 Prolaz između Zapuntela i Ista D03.01
HR3000074 Rivanjski kanal sa Sestricama D03.01
HR3000067 Luka Soliščica; Dugi Otok D03.01.02
Docks/tourist ports
HR3000044 Uvala Vlašići D03.01.02
HR3000445 Murterski kanal D03.01.02
HR3000457 Južna obala Hvara - od rta Nedjelja do uvale Česminica D03.01.02
HR1000023 SZ Dalmacija i Pag D03.01.02
HR3000415 Uvale Jaz; Soline i Sulinj na Krku D03.01.02
HR3000468 Podmorje poluotoka Lopar - Rab D03.01.02
HR3000417 Zaljev Sv. Eufemije na Rabu D03.01.02
HR3000095 Pakleni otoci D03.01.02
HR3000085 Otok Vrgada SI strana s o. Kozina D03.01.02
HR3000045 Uvala Dinjiška D03.01.02
HR3000024 Supetarska draga na Rabu D03.01.02
HR5000038 Park prirode Lastovsko otočje D03.02
Ship lines HR3000073 J rt o. Zverinac D03.02
HR3000419 J. Molat-Dugi-Kornat-Murter-Pašman-Ugljan-Rivanj-Sestrunj-Molat D03.02
HR3000463 Uvala Remac D03.02
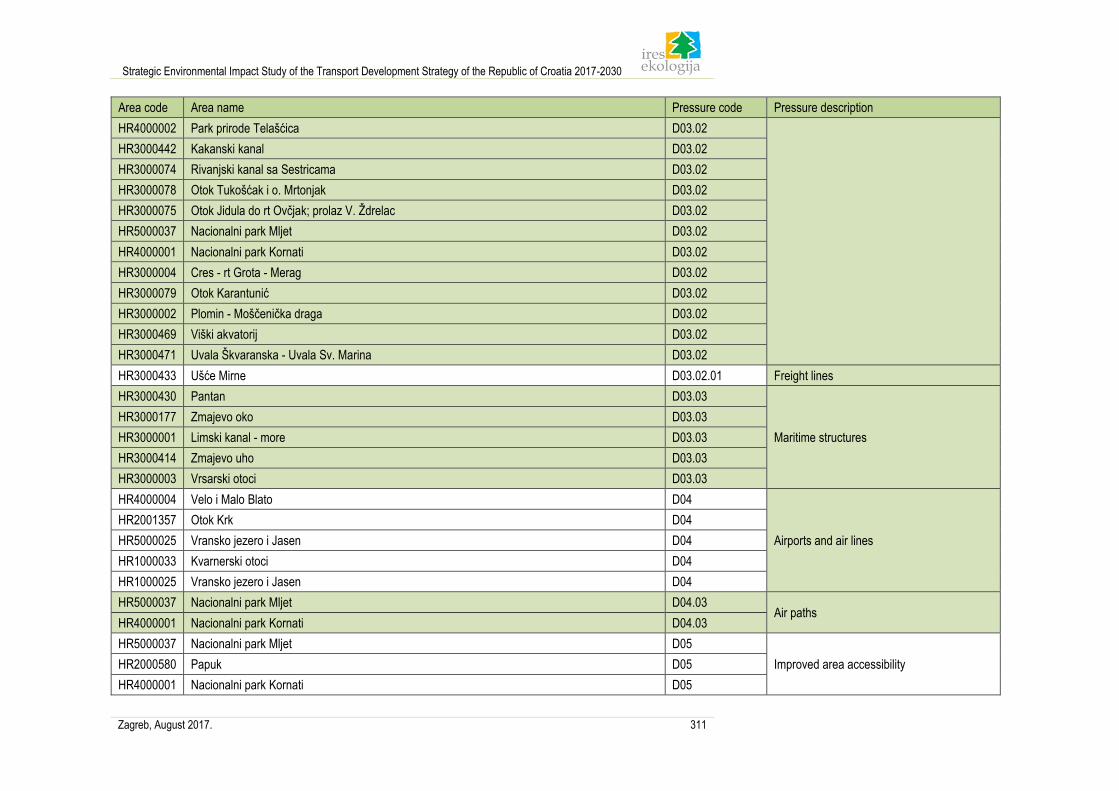
Strategic Environmental Impact Study of the Transport Development Strategy of the Republic of Croatia 2017-2030
Zagreb, August 2017. 311
Area code Area name Pressure code Pressure description
HR4000002 Park prirode Telašćica D03.02
HR3000442 Kakanski kanal D03.02
HR3000074 Rivanjski kanal sa Sestricama D03.02
HR3000078 Otok Tukošćak i o. Mrtonjak D03.02
HR3000075 Otok Jidula do rt Ovčjak; prolaz V. Ždrelac D03.02
HR5000037 Nacionalni park Mljet D03.02
HR4000001 Nacionalni park Kornati D03.02
HR3000004 Cres - rt Grota - Merag D03.02
HR3000079 Otok Karantunić D03.02
HR3000002 Plomin - Moščenička draga D03.02
HR3000469 Viški akvatorij D03.02
HR3000471 Uvala Škvaranska - Uvala Sv. Marina D03.02
HR3000433 Ušće Mirne D03.02.01 Freight lines
HR3000430 Pantan D03.03
Maritime structures
HR3000177 Zmajevo oko D03.03
HR3000001 Limski kanal - more D03.03
HR3000414 Zmajevo uho D03.03
HR3000003 Vrsarski otoci D03.03
HR4000004 Velo i Malo Blato D04
Airports and air lines
HR2001357 Otok Krk D04
HR5000025 Vransko jezero i Jasen D04
HR1000033 Kvarnerski otoci D04
HR1000025 Vransko jezero i Jasen D04
HR5000037 Nacionalni park Mljet D04.03 Air paths
HR4000001 Nacionalni park Kornati D04.03
HR5000037 Nacionalni park Mljet D05
Improved area accessibility HR2000580 Papuk D05
HR4000001 Nacionalni park Kornati D05
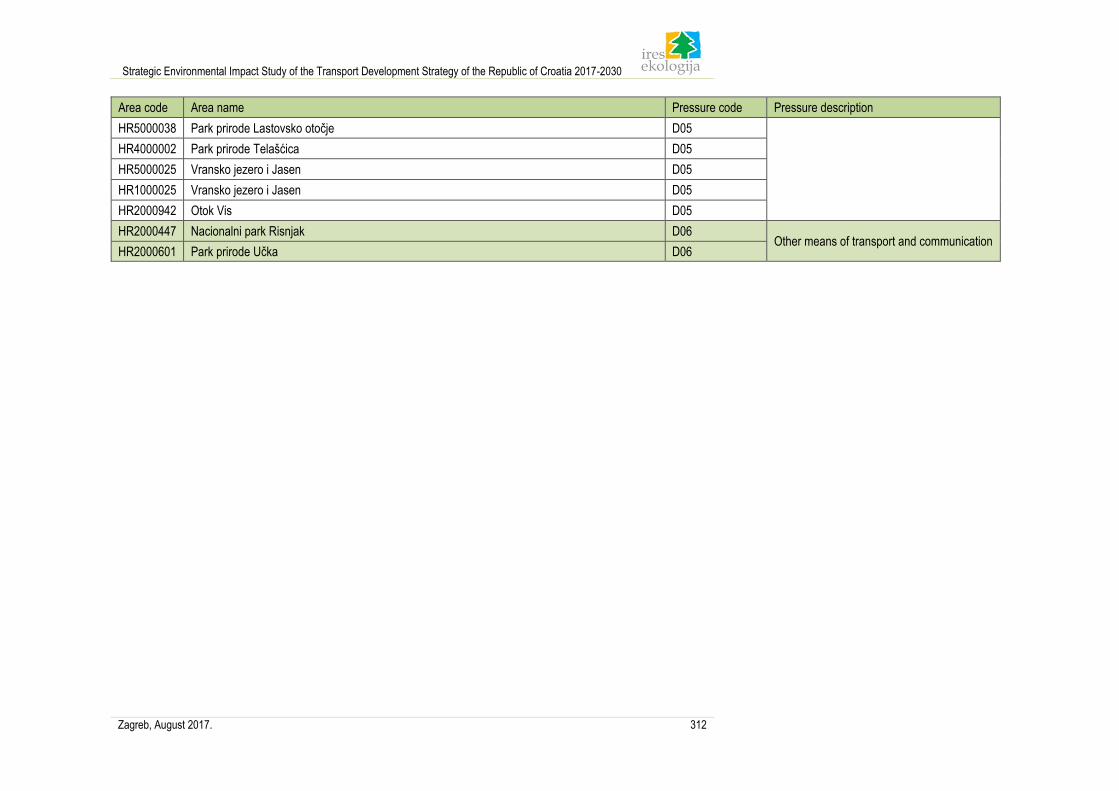
Strategic Environmental Impact Study of the Transport Development Strategy of the Republic of Croatia 2017-2030
Zagreb, August 2017. 312
Area code Area name Pressure code Pressure description
HR5000038 Park prirode Lastovsko otočje D05
HR4000002 Park prirode Telašćica D05
HR5000025 Vransko jezero i Jasen D05
HR1000025 Vransko jezero i Jasen D05
HR2000942 Otok Vis D05
HR2000447 Nacionalni park Risnjak D06 Other means of transport and communication
HR2000601 Park prirode Učka D06
Strategic Environmental Impact Study of the Transport Development Strategy of the Republic of Croatia 2017-2030
Zagreb, August 2017. 313
11.3 Description of the impacts of the Strategy on ecological network
The impacts of transport development on biodiversity, that is, the target species and target habitat types of the
ecological network are manifested in several ways, depending on the type of transport that is divided into the
following sectors in the subject Study: public transport, road transport, railway transport, air transport, maritime
transport and inland waterways transport.
Primary impacts are related with the fragmentation of habitats, the interruption of migratory paths (especially for
large carnivores, amphibians and reptiles), fatalities of species due to collisions with means of transport,
environmental pollution (air, soil, underground, land and sea water), noise disturbance, vibration, light, spread of
invasive species, etc.
In the case of waterways, the impacts relate to degradation of aquatic and wetland habitats, hydromorphological
changes in river flow, water quality changes, continuous disturbance of species. In the case of air traffic, adverse
effects may arise from bird disturbance, land use for the expansion of airports, collision of birds with airplanes and
the like.
The major impacts expected in the sea transport are strongly linked to the impacts on sea quality, eutrophication
in ports and the spread of invasive species. All these impacts are intensified with the already existing infrastructure
and the existing impacts of various forms of traffic (cumulative impact).
By analysing the Main Objectives and Specific Objectives applicable to all traffic sectors, it is concluded that their
impact is neutral for the ecological network and that only the specific measures that are spatially located have been
separated and their impact on the ecological network is analysed below.
For the purposes of the environmental impact assessment, the measures defined by the Strategy are divided into
four categories:
1. General measures
2. Development measures
3. Management and organisational measures
4. Spatially located measures
The first three categories contain all the measures pertaining to the organization and management of the traffic
system or to the development and improvement of the traffic infrastructure without mentioning specific projects.
For these measures, it has been assessed that they have neutral impact (0) or impact which can not be assessed
(?), and they are listed below according to sectors. For the two measures which may potentially have an impact on
the ecological network: I.1 Improving the waterway of Danube and Drava rivers to Osijek and I.2 Improvement of
the Sava River, impact assessment has been performed.
Last category of measures includes specific spatial interventions, and the impact assessment of measures which
belong to the category Spatially located measures is shown in subsection 11.3.1.
General measures
G.1 National concept for cargo logistics
G.2 Increasing access to international airports through public transport
G.3 Improving the safety of the transport system
G.4 Increasing intermodality in the passenger transport and development of passenger hubs
G.5 Maintenance concept for various traffic systems
G.6 Increasing energy efficiency of the traffic system
G.7 Reorganisation of the transport system for greater sustainability
G.8 Adjusting the legal framework and planning guidelines to relevant EU requirements and policies
Strategic Environmental Impact Study of the Transport Development Strategy of the Republic of Croatia 2017-2030
Zagreb, August 2017. 314
G.9 Preparation and compliance with the requirements of the Schengen Agreement
G.10 Increasing administrative capacity/training
G.11 Improving the public perception of the traffic system in Croatia
G.12 Reduce negative environmental impacts of traffic
G.13 Adapting to climate changes and their mitigation
G.14 Improving the data collection process
G.15 Enhancing interoperability with neighbouring countries
Development measures
Urban, suburban and regional transport
U.2 Infrastructure development
U.3 Development of stops
U.4 Separating transport modes – identifying priorities in public transport, elimination of bottlenecks
U.6 Alternative fuelling stations
Railway transport
R.15 ETCS L1, L2 on other railway lines, GSM-R
R.16 Electrification of other railway lines
R.17 Restoration, upgrading of other railway lines
R.18 Regional transport except Zagreb and Rijeka (Split, Varaždin, Osijek, etc.)
R.19 Improvements and new railway yards
Road transport
Ro.18 Reorganisation of toll collection system
Ro.20 Secondary and tertiary restoration of roads and connection
Ro.21 Developing the concept of rest stops for the road network with a high level of service
Ro.22 Traffic management and control, traffic counting and information system
Ro.23 Junction development plan
Air transport
A.10 Airport accessibility
A.11 Airport safety
A.13 Termination or change of the role/ownership of regional airports
Maritime transport
M.1 Increasing intermodality and accessibility
M.2 Implementation of the “Motorways of the Sea” projects
M.4 Fuel distribution facilities for gas-powered ships and eco-ships
M.5 Sea safety
M.6 Improving island accessibility, port development M.7 Development of other ports (e.g. Korčula, Pula)
M.14 Development of special-purpose ports (ports for shipbuilding, nautical tourism, military ports, industrial ports,
fishing ports, sports ports)
M.16 Closure or change of the role/ownership of unused ports
Inland waterway transport
Strategic Environmental Impact Study of the Transport Development Strategy of the Republic of Croatia 2017-2030
Zagreb, August 2017. 315
I.1 Improving the waterway of Danube and Drava rivers to Osijek
I.2 Improvement of the Sava River
I.11 Terminals for hazardous substances and waste management facilities
Management and organisational measures
Urban, suburban and regional transport
U.13 Ticketing and common ticket systems
U.14 Introduction of public transport services on-demand
U.15 Harmonisation of timetables (coordination)
U.16 Administrative capacity and training
U.17 Purchase of the new fleet
U.18 Transport reorganisation
U.19 Information platform
U.20 Support to non-profit organisations in the transport sector
U.21 Traffic and logistics management and information
U.22 Review/updating of local/regional Master Plans
Railway transport
R.26 Reorganisation of charging fees for the use of railway infrastructure
R.30 Improving the rolling stock for passenger transport
R.31 Improving the rolling stock for cargo transport
R.35 Liberalisation of passenger transport
R.36 Liberalisation of cargo transport
R.38 Business/timetable reorganisation
Road transport
Ro.34 Updating of legal regulations and planning guidelines
Ro.35 Implementation
Ro.36 Improving the data collection system
Air transport
A.15 Enhancing cooperation with competent regional bodies
A.16 Croatia Airlines restructuring
A.19 Cooperation with the aviation industry
A.20 Air traffic management, Single European Sky, SESAR
A.21 Raising awareness of customer satisfaction
A.22 Increasing financial viability of airports
A.23 Limiting environmental impacts
A.24 Revision/update of airport Master plans
A.25 Cooperation/agreements with other international airports
Maritime transport
M.17 Cooperation with the shipping industry
M.18 Strategic maritime definition
Strategic Environmental Impact Study of the Transport Development Strategy of the Republic of Croatia 2017-2030
Zagreb, August 2017. 316
M.20 Operational plan improvement (ship routing etc.)
M.21 Traffic management using the IT system, VTMIS
M.28 Modernisation of vessels (safety, energy efficiency and environmental
protection) M.29 Cooperation/agreements with other international ports
Inland waterway transport
I.16 Cooperation with Croatian ship owners
I.18 Support to companies for inland waterway transport
I.20 Increase the fleet of vessels for monitoring the safety of navigation and vessels for environmental
protection
I.21 Cooperation/agreements with other international ports
Spatially located measures
Road traffic
Ro.1 Connecting via the bridge near Gradiška
Ro.2 A5 Osijek – state border with Hungary Pecs (TEN-T comprehensive network/Pan-European corridor RH3)
Ro.3 A5 from A3 to the state border with Bosnia and Herzegovina (TEN-T comprehensive network/Pan-European
corridor RH3)
Ro.4 A7 Križišće – Žuta Lokva (TEN-T comprehensive network/Adriatic-Ionian
direction)
Ro.5 A11 Lekenik – Sisak
Ro.6 DC 10 Vrbovec – Križevci – Koprivnica – State border with Hungary towards Kaposvár
Ro.7 DC 12 junction Vrbovec 2 – Ivanja Reka – Vrbovec – Bjelovar – Virovitica – State border with Hungary towards
Barcs
Ro.8 Reorganisation of the main Zagreb network
Ro.9 D2 from the state border with Slovenia to the state border with Serbia
Ro.10 Reorganisation of the Rijeka network
Ro.11 Dubrovnik – State border with Montenegro
Ro.12 Capacity increase – dedicated lane for public transport between Zagreb and Karlovac
Ro.13 Capacity increase – dedicated lane for public transport on the Zagreb bypass
Ro.14 Improving access to the Port of Slavonski Brod
Ro.15 Reorganisation of the Split network
Ro.16 Preparations for the accessibility of Dubrovnik after Croatia joins the Schengen Area (Pelješac
Bridge)
Railway transport
R.1 Zagreb – state border with Slovenia towards Ljubljana (TEN-T core network/TEN-T Mediterranean corridor /
PanEuropean corridor)
R.2 Zagreb – Karlovac (TEN-T core network/TEN-T Mediterranean corridor/Pan-European corridor RH2)
R.3 Karlovac to Rijeka (TEN-T core network/TEN-T Mediterranean corridor/Pan-European corridor RH2)
R.4 Railway network around Rijeka
R.5 Zagreb – Križevci (TEN-T core network/TEN-T Mediterranean corridor / Pan-European corridor RH2)
R.6 Križevci – state border with Hungary towards Budapest (TEN-T core network/TEN-T Mediterranean corridor /
PanEuropean corridor RH2)
R.7 Zagreb – Novska (TEN-T core network/Pan-European Corridor RH1)
R.8 Novska – state border with Serbia (TEN-T core network/Pan-European Corridor RH1)
Strategic Environmental Impact Study of the Transport Development Strategy of the Republic of Croatia 2017-2030
Zagreb, August 2017. 317
R.9 State border with Hungary – Osijek – State border with Bosnia and Herzegovina (TEN-T core network/Pan-
European Corridor RH3)
R.10 Regional link Vinkovci – Vukovar (TEN-T core network/access to Pan-European Corridor RH1)
R.11 Zagreb node
R.14 Zagreb Central Station
Air transport
A.1 Dubrovnik Airport development (TEN-T comprehensive network)
A.2 Pula Airport development (TEN-T comprehensive network)
A.3 Brač Airport development
A.4 Mali Lošinj Airport development
A.5 Osijek Airport development (TEN-T comprehensive network)
A.6 Rijeka Airport development (TEN-T comprehensive network)
A.7 Split Airport development (TEN-T comprehensive network)
A.8 Zadar Airport development (TEN-T comprehensive network)
A.9 Franjo Tuđman Airport development (TEN-T comprehensive network)
Maritime transport
M.8 Specialization of the Port of Rijeka (container, liquid cargo transport and LNG terminal)
M.9 Specialization of the Port of Ploče (container and bulk cargo)
M.10 Specialization of the Port of Dubrovnik (cruise ships)
M.11 Specialization of the Port of Split (RO-RO, passenger and cruise traffic)
M.12 Specialization of the Port of Zadar (RO-RO, passenger and cruise traffic)
M.13 Specialization of the Port of Šibenik (smaller vessels and super yachts)
Inland waterway transport
I.3 Development of the Port of Vukovar (TEN-T core network)
I.4 Development of the Port of Osijek (TEN-T comprehensive network)
I.5 Development of the Port of Slavonski Brod (TEN-T core network)
I.6 Development of the Port of Sisak (TEN-T comprehensive network)
I.7 Construction of the Danube-Sava multipurpose canal
11.3.1 Possible individual impacts of the spatially located measures of the strategy When it comes to the transport infrastructure, the interventions differ largely only in size and accordingly in the
intensity of the impact. The size of the intervention ranges from constructing a new road to extending or
reconstructing an already existing road by adding traffic lanes, intersections, crossings, etc. The impacts that traffic
interventions can have on the target species and habitats of the ecological network are mostly of a similar nature.
The impact assessment depends on the size and intervention design of a particular intervention.
According to the HAOP <Croatian Agency for the Environment and Nature> Expert Guidelines, the three major
sources of intervention impact should be distinguished for the purpose of assessing the impact of traffic
interventions on the ecological network. The first source of impact is the performance of construction works, the
second is the facility itself, and the third is the traffic activity. Depending on the original source of impact, they differ
in terms of intensity, coverage, duration, and characteristics. The impact is usually most pronounced during
construction works. However, it is also of a limited duration depending on the size of the intervention. During the
construction of large motorways, the works of different intensity may last several years. Once the works are
completed, the construction stage impact is reduced, but it still remains present for a longer period of time. On the
Strategic Environmental Impact Study of the Transport Development Strategy of the Republic of Croatia 2017-2030
Zagreb, August 2017. 318
other hand, the impact of the traffic itself is usually increased over time and depends largely on the density and
amount of vehicles.
The following impacts are possible during construction:
▪ Loss of land/area use: Temporary used areas (outside the location of the road, work belt), e.g. for storage
purposes, work machines, etc.
▪ Change in the landscape layout (geomorphology): Visual changes are greatest during construction works,
since construction often requires the transfer of large quantities of land. The underground parts of the
structure itself need to be dug in, construction works require a larger space for e.g. storing and moving,
than the road itself.
▪ Change in functional connection: the construction site hinders connectivity, especially in areas of intensive
works.
▪ Noise: Construction sites are usually a source of great noise, which is continuous during the performance
of works (e.g. machine operation, etc.), and the most noise is produced by works such as mining or drilling.
▪ Air pollution: Machines emit substances that pollute the air, dust is spread, mining causes great amount of
dust
▪ Water pollution: Normal operation of work machines causes the release of substances that pollute the water,
but also possible release of fuel, oil, etc.
▪ Vibrations: Construction works, trucks and large machines cause vibrations, which are most intense during
mining or drilling.
▪ Changes in the hydrological regime (quality and quantity): Construction works can temporarily disrupt the
hydrological regime, and it may be necessary to move underground and surface water flows.
Line facility with secondary structures may have the following impacts:
▪ Loss of land/area use: Permanent use of areas where the road is located, but also secondary structures
such as auxiliary roads, structure for water source protection, etc.
▪ Asphalting: Mainly roads, but also secondary structures such as auxiliary roads
▪ Change in the landscape layout: Dams, bridges and crossings change the layout, but after the completion
of the works, efforts are made to integrate the road into the surrounding landscape where possible (growing
vegetation).
▪ Change in functional connection: Roads can interrupt connectivity (depending on the structure); if there are
no mitigation measures, the connection is terminated permanently.
▪ Changes in the hydrological regime: The facility may permanently disturb the hydrological regime due to
e.g. laying the foundations, which affects groundwater.
During the use, the transport infrastructure interventions may have the following impacts:
▪ Noise: Traffic emits the noise of different volume, intensity, characteristics, and frequencies depending on
the traffic density, which may vary depending on the time of the day, but also the type of traffic, e.g. only
cargo vehicles or only personal cars (the noise emitted by the railway has completely different
characteristics than the noise emitted by car traffic).
▪ Air pollution: substances that pollute the air largely depend on the type of traffic, vehicles (e.g. trucks, cars),
traffic density, speed limits, etc.
▪ Light: Roads of great importance usually do not have lighting, but vehicles in motion emit light.
▪ Water pollution: depends on the traffic density, accidents during the transport of dangerous cargo, etc.
▪ Vibrations after the start of using the infrastructure: Vibrations are mostly caused by the railway, while cars
usually do not cause vibrations, but goods vehicles and trucks do cause vibrations, mostly in a relatively
small range.
▪ Change in functional connection: Traffic density is often a key factor that conditions whether or not the
connection shall be interrupted.
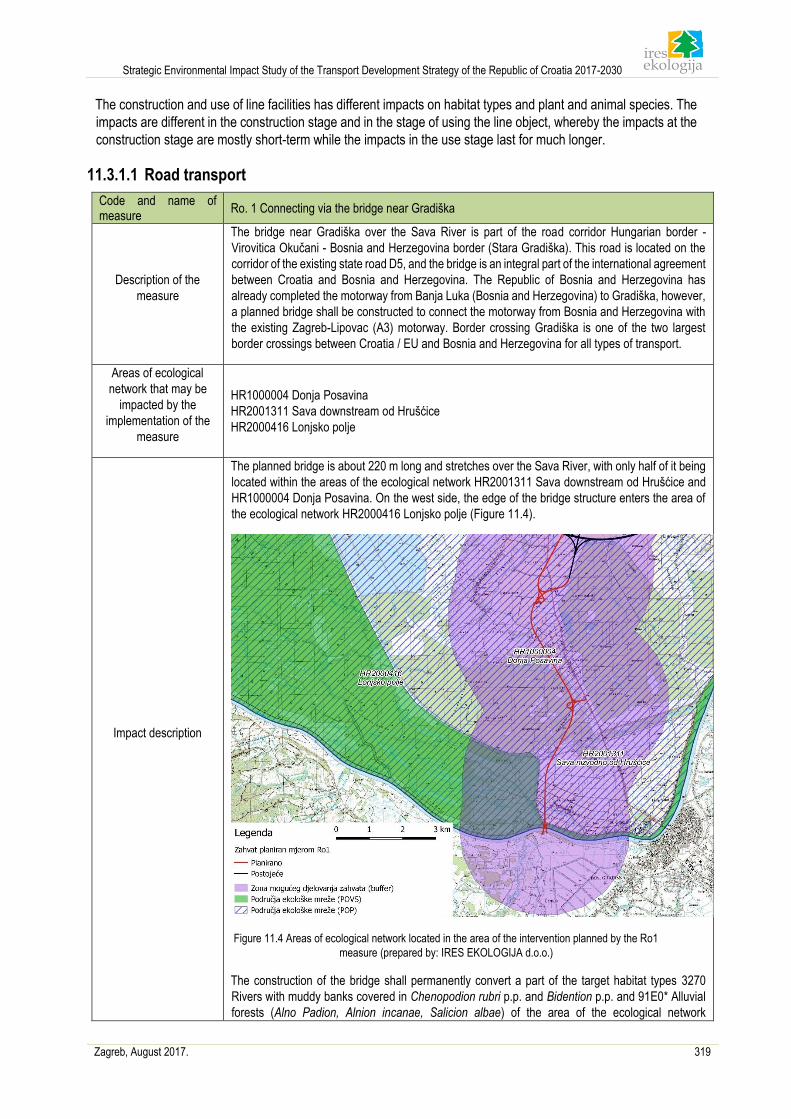
Strategic Environmental Impact Study of the Transport Development Strategy of the Republic of Croatia 2017-2030
Zagreb, August 2017. 319
The construction and use of line facilities has different impacts on habitat types and plant and animal species. The
impacts are different in the construction stage and in the stage of using the line object, whereby the impacts at the
construction stage are mostly short-term while the impacts in the use stage last for much longer.
11.3.1.1 Road transport
Code and name of measure
Ro. 1 Connecting via the bridge near Gradiška
Description of the
measure
The bridge near Gradiška over the Sava River is part of the road corridor Hungarian border -
Virovitica Okučani - Bosnia and Herzegovina border (Stara Gradiška). This road is located on the
corridor of the existing state road D5, and the bridge is an integral part of the international agreement
between Croatia and Bosnia and Herzegovina. The Republic of Bosnia and Herzegovina has
already completed the motorway from Banja Luka (Bosnia and Herzegovina) to Gradiška, however,
a planned bridge shall be constructed to connect the motorway from Bosnia and Herzegovina with
the existing Zagreb-Lipovac (A3) motorway. Border crossing Gradiška is one of the two largest
border crossings between Croatia / EU and Bosnia and Herzegovina for all types of transport.
Areas of ecological
network that may be
impacted by the
implementation of the
measure
HR1000004 Donja Posavina
HR2001311 Sava downstream od Hrušćice
HR2000416 Lonjsko polje
Impact description
The planned bridge is about 220 m long and stretches over the Sava River, with only half of it being
located within the areas of the ecological network HR2001311 Sava downstream od Hrušćice and
HR1000004 Donja Posavina. On the west side, the edge of the bridge structure enters the area of
the ecological network HR2000416 Lonjsko polje (Figure 11.4).
Figure 11.4 Areas of ecological network located in the area of the intervention planned by the Ro1
measure (prepared by: IRES EKOLOGIJA d.o.o.)
The construction of the bridge shall permanently convert a part of the target habitat types 3270
Rivers with muddy banks covered in Chenopodion rubri p.p. and Bidention p.p. and 91E0* Alluvial
forests (Alno Padion, Alnion incanae, Salicion albae) of the area of the ecological network
Strategic Environmental Impact Study of the Transport Development Strategy of the Republic of Croatia 2017-2030
Zagreb, August 2017. 320
HR2001311 Sava downstream od Hrušćice in the approximate surface of 0.22 ha. During
construction, target species of fish (asp - Aspius aspius, schraetzer - Gymnocephalus schraetser,
common zingel - Zingel zingel, streber - Zingel streber, Vladykov’s Lamprey - Eudontomyzon
vladykovi, Balkan loach - Cobitis elongata, spined loach - Cobitis elongatoides, Danube whitefin
gudgeon - Romanogobio vladykovi, cactus roach - Rutilus virgo) and bivalves (thick shelled river
mussel - Unio crassus) may be disturbed.
During the construction of the bridge and the section of the joint to the A3 motorway, a temporary
negative impact of the construction (noise and conversion of a part of the habitat) on the target
species of birds in the area of the ecological network HR1000004 Donja Posavina is expected.
During the use of the same section, an additional negative impact can be expected in the form of
bird fatalities and departure from the newly constructed section
Impact
significance assessment
HR1000004 Donja Posavina -1
HR2001311 Sava downstream od Hrušćice
-1
HR2000416 Lonjsko polje 0
Code and name of measure Ro. 2 A5 Osijek - State border with Hungary Pécs (TEN-T comprehensive
network/Pan-European corridor RH3)
Description of the measure
The A5 motorway is part of the comprehensive TEN-T network and the Pan-European
Corridor Vc. The total length of the A5 motorway is 86.8 km and extends from the border
with Bosnia and Herzegovina via Osijek and Beli Manastir to the border with Hungary.
Various sections of the motorway are in various stages of construction. The section from
Osijek to Hungarian border, the section Osijek-Beli Manastir (24.6 km) and the section
Beli Manastir – Hungarian border (5 km) are at the earliest stage of construction. Other
sections, like the bridge over the Drava River (2.4 km long), are part of the planned
corridor and construction is in progress. Through the concept of functional regions, the
stages of completion and schedule for the remaining sections shall be analysed, as well
as the technical parameters required, taking into account the expected demand and
economic and ecological aspects, for example the planned section passing through
parts of the Natura 2000 area.
The competent Ministry has adopted the Decision on acceptability for the ecological network for the Ro2 measure, with the implementation of the legally prescribed and established measures to mitigate the negative impacts on the goals of the conservation and integrity of the ecological network area (CLASS: UP/I 612-07/13-60/63, FILE NO.: 517-07-1-1-2-14-12, 3 June 2014).
Code and
name of
measure
Ro. 3 A5 from A3 to the state border with Bosnia and Herzegovina (TEN-T comprehensive network/Pan-
European corridor RH3)
Description
of the
measure
The A5 motorway is part of the comprehensive TEN-T network and the Pan-European corridor Vc, and Svilaj is listed as a border crossing of the EU core network. The total length of the A5 motorway is 86.8 km and extends from the border with Bosnia and Herzegovina via Osijek and Beli Manastir to the border with Hungary. Various sections of the motorway are in various stages of construction. The section from Sredanci (A3
motorway) to the border with Bosnia and Herzegovina is 3.5 km long and is under construction. This section
also includes the bridge over the Sava River (660 m long). The award of the contract for bridge construction is
currently in the public procurement process. The extension of the section on the side of Bosnia and Herzegovina
has already been built.
The competent Ministry has adopted the Decision on acceptability for the environment and ecological network
for the Ro3 measure, with the implementation of the legally prescribed and established measures to mitigate the
negative impacts on the goals of the conservation and integrity of the ecological network area (CLASS: UP/I
351-03/15-02/16, FILE NO.: 517-06-2-1-2-15-16, 2 November 2015).
Strategic Environmental Impact Study of the Transport Development Strategy of the Republic of Croatia 2017-2030
Zagreb, August 2017. 321
Code and name
of measure Ro.4 A7 Križišće - Žuta Lokva (TEN-T comprehensive network/Adriatic–Ionian route)
Description of the
measure
The results of the NPM show that there are certain perturbation shortcomings in the corridor, mainly during
the tourist season and related to local / regional traffic (including short tourist trips). Due to this, certain
interventions in the corridor may be necessary to increase the level of service. Through the concept of
functional regions, problems will be identified and further special studies will determine the technical
parameters, taking into account the expected demand and economic and ecological aspects, especially
geographic features due to the very complex terrain of the coastal relief.
Areas of
ecological
network that may
be impacted by
the
implementation
of the measure
HR1000019 Gorski kotar i sjeverna Lika
HR1000022 Velebit
HR1000033 Kvarnerski otoci
HR2000131 Škabac špilja
HR2000190 Vlaška peć
HR2000200 Zagorska peć kod Novog Vinodolskog
HR2001154 Orlovac špilja
HR2001357 Otok Krk
HR5000019 Gorski kotar i sjeverna Lika
HR5000022 Park prirode Velebit
From the start of the section from Križišće, the planned section passes at a distance of about 200 m from the area of the ecological network HR2000131 Škabac špilja, then passes through the area HR2000200 Zagorska peć kod Novog Vinodolskog in the length of about 4.5 km. In nearly its entire second part, the section passes through the area of the ecological network HR1000019 Gorski kotar i sjeverna Lika and HR5000019 Gorski kotar i sjeverna Lika in the length of about 22 km, and partly above Senj, along the areas of the ecological network HR1000022 Velebit and HR5000022 Park prirode Velebit (Figure 11.5)
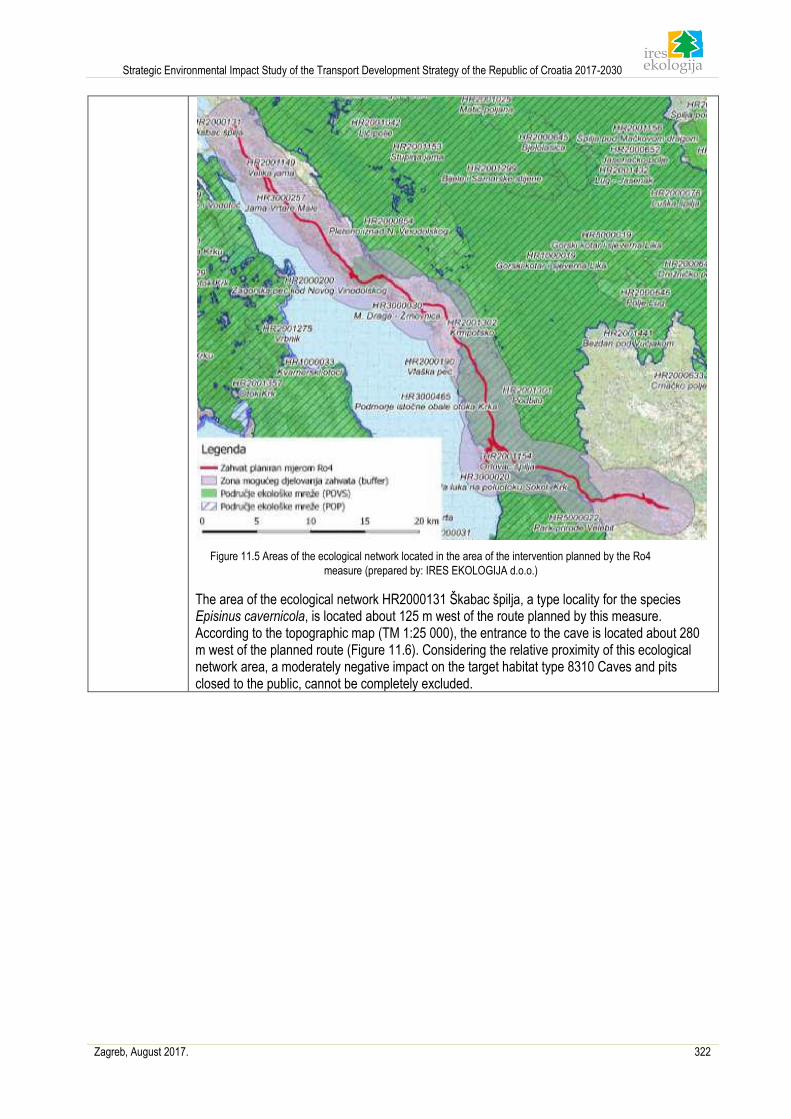
Strategic Environmental Impact Study of the Transport Development Strategy of the Republic of Croatia 2017-2030
Zagreb, August 2017. 322
Figure 11.5 Areas of the ecological network located in the area of the intervention planned by the Ro4
measure (prepared by: IRES EKOLOGIJA d.o.o.)
The area of the ecological network HR2000131 Škabac špilja, a type locality for the species Episinus cavernicola, is located about 125 m west of the route planned by this measure. According to the topographic map (TM 1:25 000), the entrance to the cave is located about 280 m west of the planned route (Figure 11.6). Considering the relative proximity of this ecological network area, a moderately negative impact on the target habitat type 8310 Caves and pits closed to the public, cannot be completely excluded.
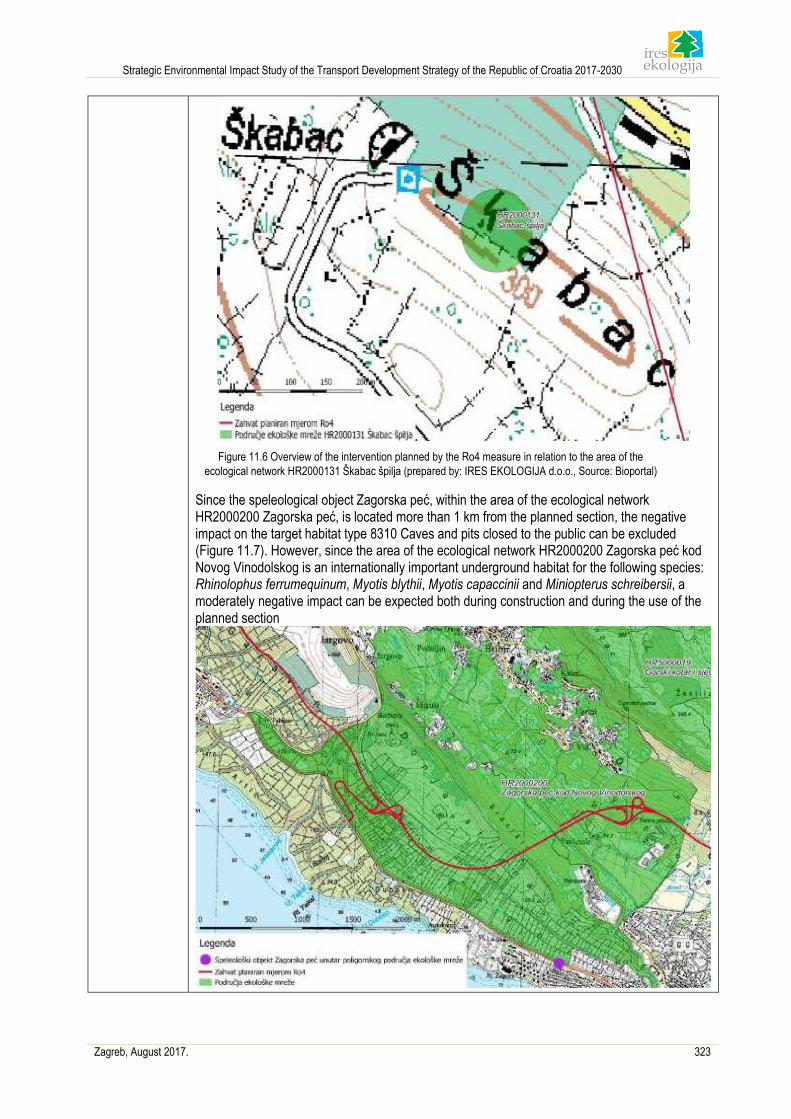
Strategic Environmental Impact Study of the Transport Development Strategy of the Republic of Croatia 2017-2030
Zagreb, August 2017. 323
Figure 11.6 Overview of the intervention planned by the Ro4 measure in relation to the area of the
ecological network HR2000131 Škabac špilja (prepared by: IRES EKOLOGIJA d.o.o., Source: Bioportal)
Since the speleological object Zagorska peć, within the area of the ecological network HR2000200 Zagorska peć, is located more than 1 km from the planned section, the negative impact on the target habitat type 8310 Caves and pits closed to the public can be excluded (Figure 11.7). However, since the area of the ecological network HR2000200 Zagorska peć kod Novog Vinodolskog is an internationally important underground habitat for the following species: Rhinolophus ferrumequinum, Myotis blythii, Myotis capaccinii and Miniopterus schreibersii, a moderately negative impact can be expected both during construction and during the use of the planned section
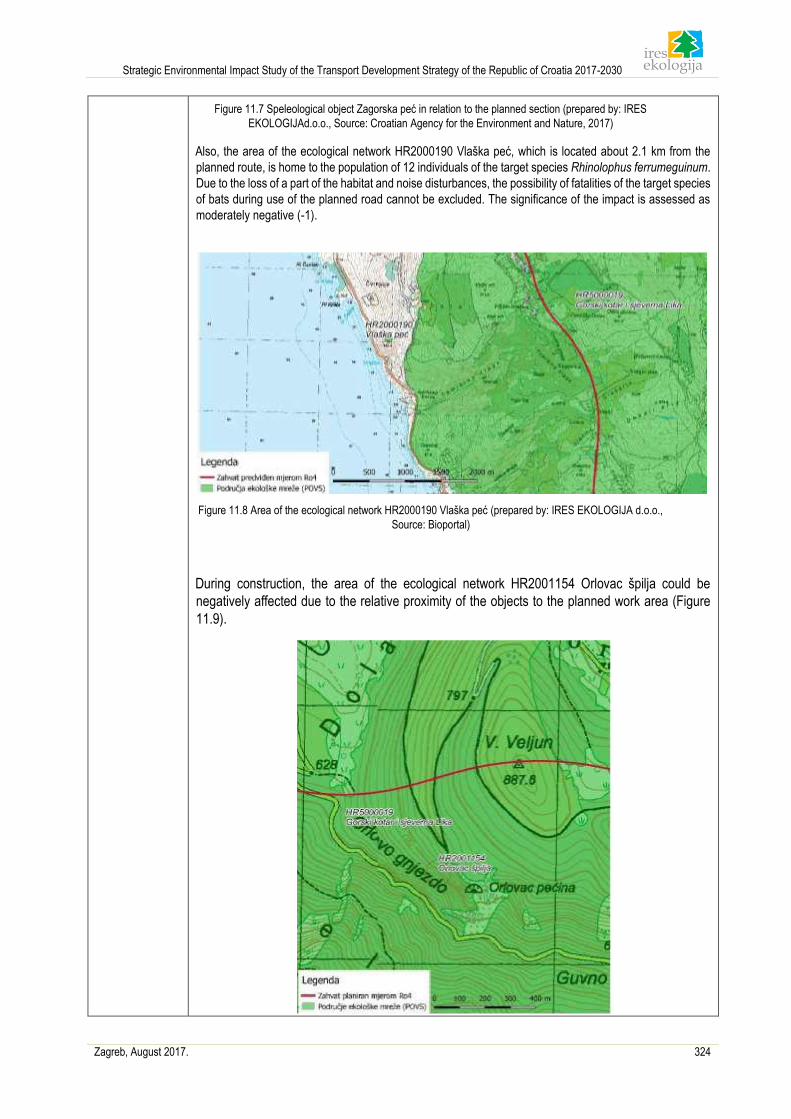
Strategic Environmental Impact Study of the Transport Development Strategy of the Republic of Croatia 2017-2030
Zagreb, August 2017. 324
Figure 11.7 Speleological object Zagorska peć in relation to the planned section (prepared by: IRES
EKOLOGIJAd.o.o., Source: Croatian Agency for the Environment and Nature, 2017)
Also, the area of the ecological network HR2000190 Vlaška peć, which is located about 2.1 km from the
planned route, is home to the population of 12 individuals of the target species Rhinolophus ferrumeguinum.
Due to the loss of a part of the habitat and noise disturbances, the possibility of fatalities of the target species
of bats during use of the planned road cannot be excluded. The significance of the impact is assessed as
moderately negative (-1).
Figure 11.8 Area of the ecological network HR2000190 Vlaška peć (prepared by: IRES EKOLOGIJA d.o.o.,
Source: Bioportal)
During construction, the area of the ecological network HR2001154 Orlovac špilja could be
negatively affected due to the relative proximity of the objects to the planned work area (Figure
11.9).
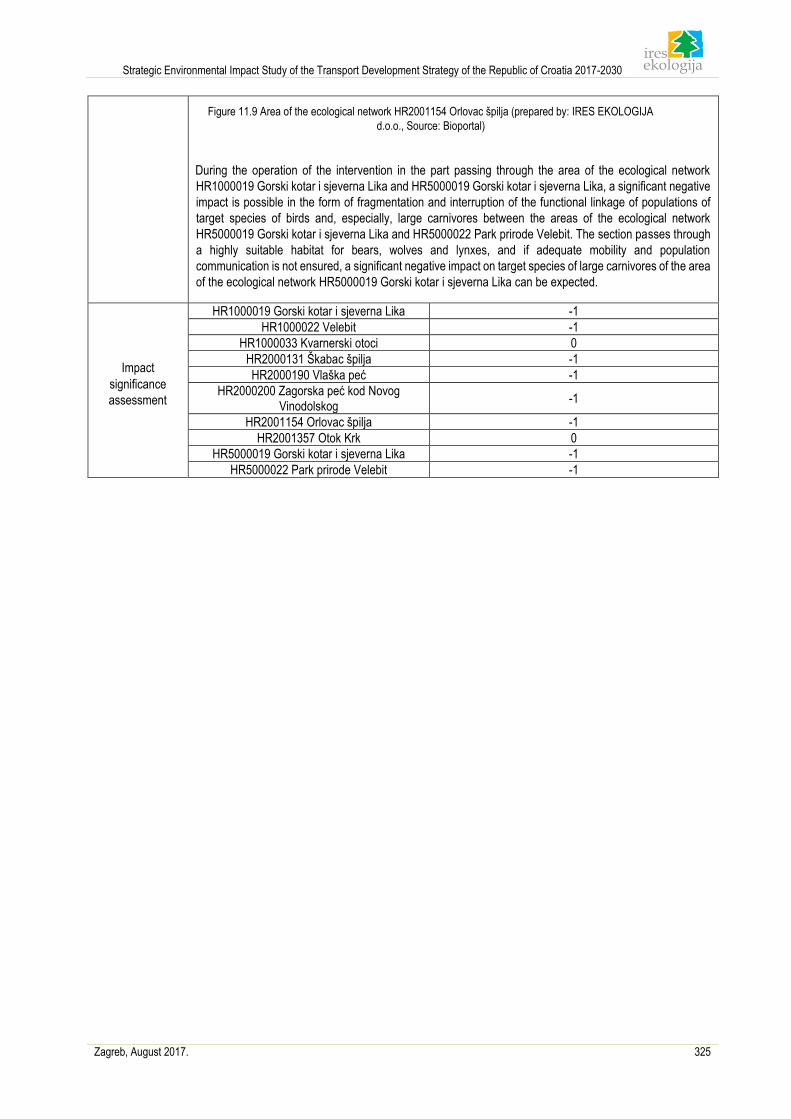
Strategic Environmental Impact Study of the Transport Development Strategy of the Republic of Croatia 2017-2030
Zagreb, August 2017. 325
Figure 11.9 Area of the ecological network HR2001154 Orlovac špilja (prepared by: IRES EKOLOGIJA
d.o.o., Source: Bioportal)
During the operation of the intervention in the part passing through the area of the ecological network
HR1000019 Gorski kotar i sjeverna Lika and HR5000019 Gorski kotar i sjeverna Lika, a significant negative
impact is possible in the form of fragmentation and interruption of the functional linkage of populations of
target species of birds and, especially, large carnivores between the areas of the ecological network
HR5000019 Gorski kotar i sjeverna Lika and HR5000022 Park prirode Velebit. The section passes through
a highly suitable habitat for bears, wolves and lynxes, and if adequate mobility and population
communication is not ensured, a significant negative impact on target species of large carnivores of the area
of the ecological network HR5000019 Gorski kotar i sjeverna Lika can be expected.
Impact
significance
assessment
HR1000019 Gorski kotar i sjeverna Lika -1
HR1000022 Velebit -1
HR1000033 Kvarnerski otoci 0
HR2000131 Škabac špilja -1
HR2000190 Vlaška peć -1
HR2000200 Zagorska peć kod Novog Vinodolskog
-1
HR2001154 Orlovac špilja -1
HR2001357 Otok Krk 0
HR5000019 Gorski kotar i sjeverna Lika -1
HR5000022 Park prirode Velebit -1
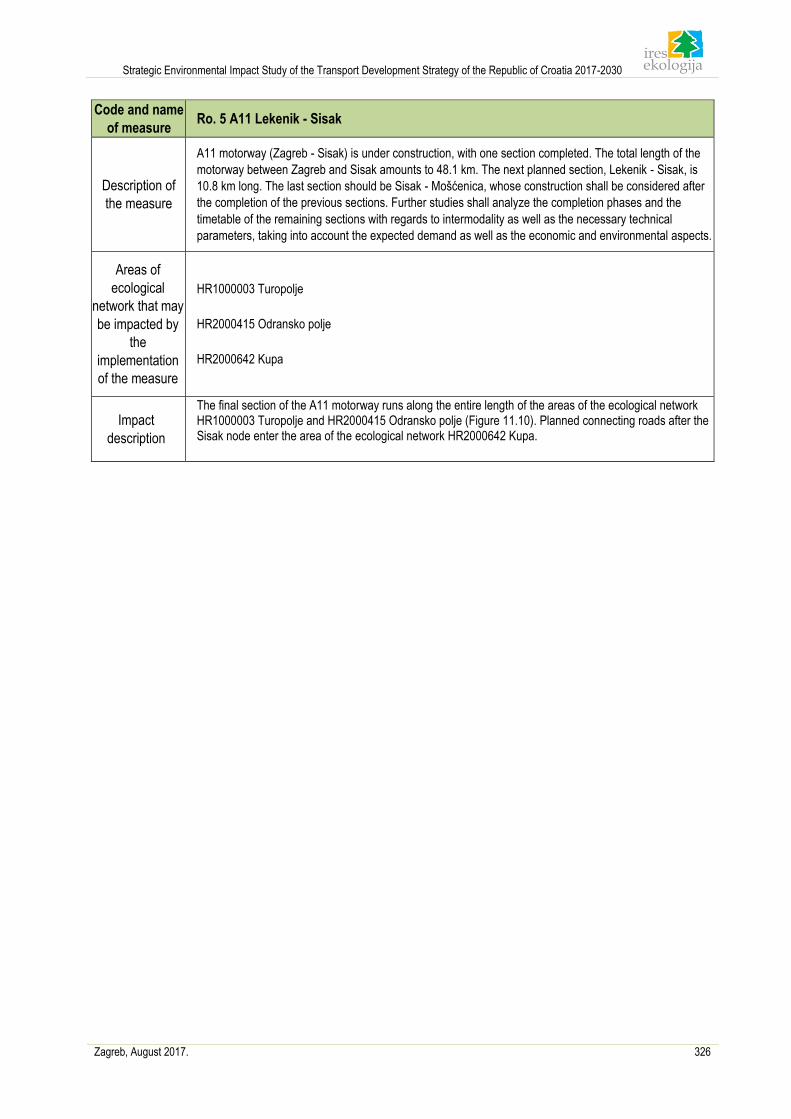
Strategic Environmental Impact Study of the Transport Development Strategy of the Republic of Croatia 2017-2030
Zagreb, August 2017. 326
Code and name
of measure Ro. 5 A11 Lekenik - Sisak
Description of
the measure
A11 motorway (Zagreb - Sisak) is under construction, with one section completed. The total length of the
motorway between Zagreb and Sisak amounts to 48.1 km. The next planned section, Lekenik - Sisak, is
10.8 km long. The last section should be Sisak - Mošćenica, whose construction shall be considered after
the completion of the previous sections. Further studies shall analyze the completion phases and the
timetable of the remaining sections with regards to intermodality as well as the necessary technical
parameters, taking into account the expected demand as well as the economic and environmental aspects.
Areas of
ecological
network that may
be impacted by
the
implementation
of the measure
HR1000003 Turopolje
HR2000415 Odransko polje
HR2000642 Kupa
Impact
description
The final section of the A11 motorway runs along the entire length of the areas of the ecological network HR1000003 Turopolje and HR2000415 Odransko polje (Figure 11.10). Planned connecting roads after the Sisak node enter the area of the ecological network HR2000642 Kupa.
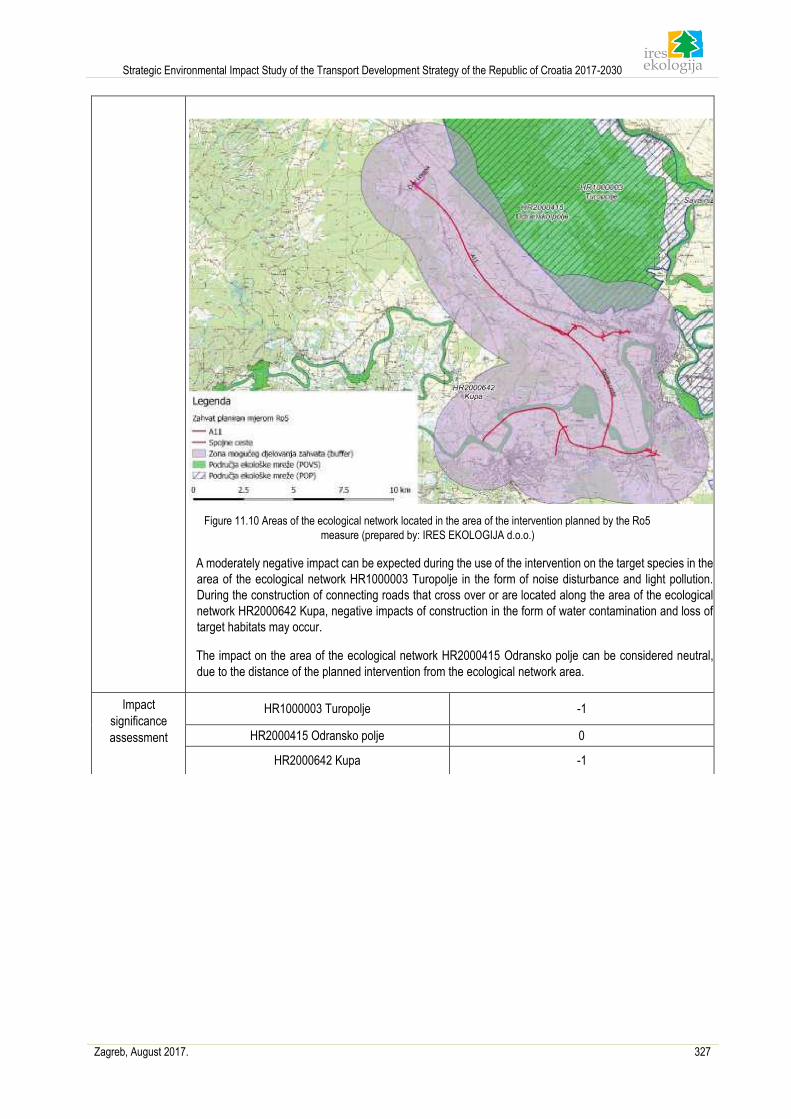
Strategic Environmental Impact Study of the Transport Development Strategy of the Republic of Croatia 2017-2030
Zagreb, August 2017. 327
Figure 11.10 Areas of the ecological network located in the area of the intervention planned by the Ro5
measure (prepared by: IRES EKOLOGIJA d.o.o.)
A moderately negative impact can be expected during the use of the intervention on the target species in the
area of the ecological network HR1000003 Turopolje in the form of noise disturbance and light pollution.
During the construction of connecting roads that cross over or are located along the area of the ecological
network HR2000642 Kupa, negative impacts of construction in the form of water contamination and loss of
target habitats may occur.
The impact on the area of the ecological network HR2000415 Odransko polje can be considered neutral,
due to the distance of the planned intervention from the ecological network area.
Impact
significance
assessment
HR1000003 Turopolje -1
HR2000415 Odransko polje 0
HR2000642 Kupa -1
Strategic Environmental Impact Study of the Transport Development Strategy of the Republic of Croatia 2017-2030
Zagreb, August 2017. 328
Code and name
of measure Ro. 6 DC 10 Vrbovec - Križevci - Koprivnica - State border with Hungary towards Kaposvár
Description of the
measure
State road DC10 was previously categorised as the A12 motorway. The A12 motorway is a partly built
motorway in the central Croatia, northeast of Zagreb, and extends towards the town of Vrbovec. The
twolane 23 km long road is built between the A4 motorway and Sveta Helena. The state road DC12 is
the western branch of the so-called "Podravski ipsilon", and it is planned that be DC12 shall be the
eastern branch and shall finally connect Zagreb with the Hungarian border towards Kaposvár. The
corridor is divided into several sections and the completion stage of the intervention documentation
(intervention and permits) differs from section to section.
Areas of
ecological
network that HR1000008 Bilogora i Kalničko gorje
HR1000014 Gornji tok Drave (od Donje Dubrave do Terezinog polja)
HR2001404 Glogovnica
HR5000014 Gornji tok Drave (od Donje Dubrave do Terezinog polja)
may be impacted
by the
implementation
of the measure
Impact description
The planned section passes through the area of the ecological network HR1000008 Bilogora i Kalničko gorje in the length of 8 km, whereby it significantly fragments the area of the ecological network, the habitats used by birds are permanently being converted, and during the construction and use a negative impact on target species of birds is expected, in the form of noise disturbance and light pollution. Considering that the section between Križevci and Koprivnica, in the part that crosses the area of the ecological network HR1000008 Bilogora i Kalničko gorje up to Velika Mučna, is already in preparation, and considering that this track follows the existing traffic infrastructure (road and railroad), the impact of construction and use of the planned section is considered moderately negative. The terrain configuration enables for an extended route that is laid in lowland terrain with adequate crossings over existing watercourses, roads and railways. A negative impact on the areas of the ecological network HR1000014 Gornji tok Drave (od Donje Dubrave do Terezinog polja), HR2001404 Glogovnica and HR5000014 Gornji tok Drave (od Donje Dubrave do Terezinog polja), is possible during construction in the form of watercourse contamination. However, at the intervention level, for the purpose of preventing possible contamination of existing watercourses; throughout the section, protection measures with a closed drainage system and purification devices - separators and lagoons, have been envisaged.
HR1000008 Bilogora i Kalničko gorje -1
Impact
significance
assessment
HR1000014 Gornji tok Drave (od Donje Dubrave do
Terezinog polja) -1
HR2001404 Glogovnica 0
HR5000014 Gornji tok Drave (od Donje Dubrave do
Terezinog polja) -1
Strategic Environmental Impact Study of the Transport Development Strategy of the Republic of Croatia 2017-2030
Zagreb, August 2017. 329
Code and name
of measure
Ro. 7 DC 12 Vrbovec 2 hub - Ivanja Reka - Vrbovec - Bjelovar - Virovitica - State border with Hungary
towards Barcs
Description of the
measure
The state road DC12 is the eastern branch of the so-called "Podravski ipsilon", and it is planned that DC10
shall be the western branch and shall finally connect Zagreb with the Hungarian border towards Pecs.
Currently, only the Vrbovec 2 junction and initial (western) section of the state road DC12 are completed. The
rest of the corridor is divided into several sections, and the completion stage of the intervention documentation
(intervention and permits) differs from section to section. Through the concept of functional regions, the
completion stages and the schedule for the remaining sections as well as the required technical parameters
shall be assessed, taking into account the expected demand and the economic and environmental aspects.
Areas of ecological
network that may be
impacted by the implementation of
the measure
HR1000008 Bilogora i Kalničko gorje
HR1000012 Taložnice Virovitičke šećerane
HR1000014 Gornji tok Drave (od Donje Dubrave do Terezinog polja)
HR1000009 Ribnjaci uz Česmu
HR5000015 Srednji tok Drave (od Terezinog polja do Donjeg Miholjca)
HR2001281 Bilogora
HR2000441 Ribnjaci Narta
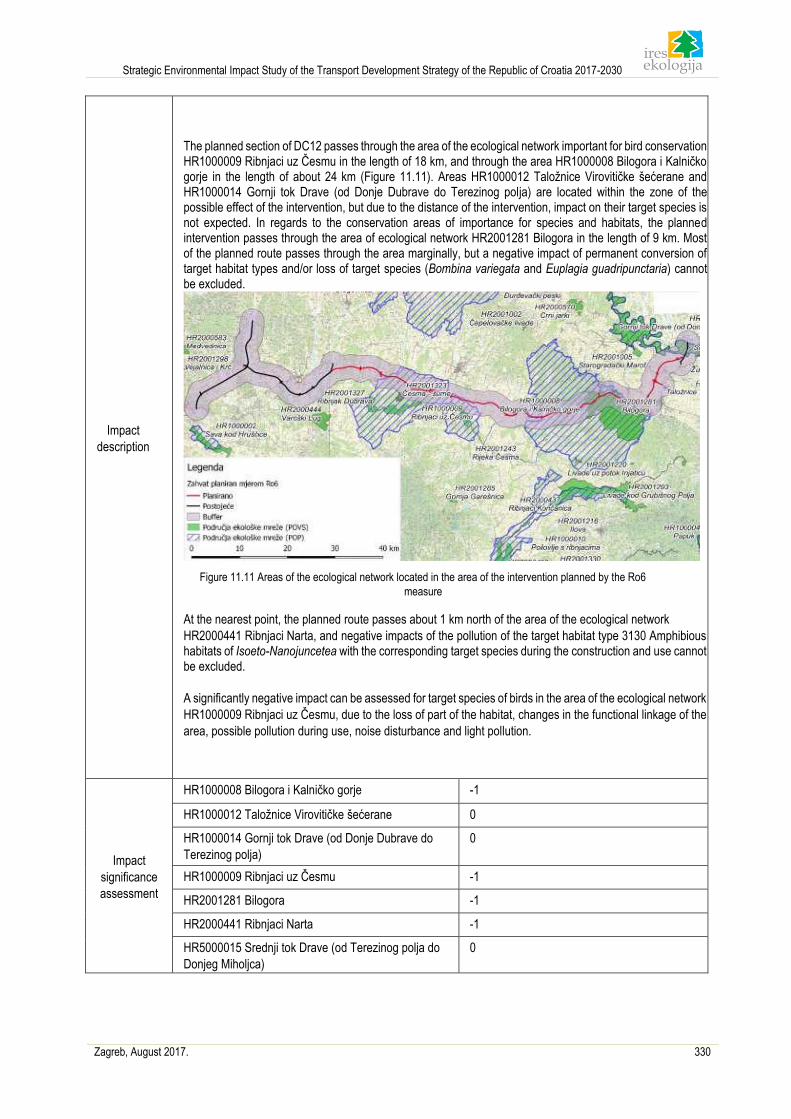
Strategic Environmental Impact Study of the Transport Development Strategy of the Republic of Croatia 2017-2030
Zagreb, August 2017. 330
Impact
description
The planned section of DC12 passes through the area of the ecological network important for bird conservation HR1000009 Ribnjaci uz Česmu in the length of 18 km, and through the area HR1000008 Bilogora i Kalničko gorje in the length of about 24 km (Figure 11.11). Areas HR1000012 Taložnice Virovitičke šećerane and HR1000014 Gornji tok Drave (od Donje Dubrave do Terezinog polja) are located within the zone of the possible effect of the intervention, but due to the distance of the intervention, impact on their target species is not expected. In regards to the conservation areas of importance for species and habitats, the planned intervention passes through the area of ecological network HR2001281 Bilogora in the length of 9 km. Most of the planned route passes through the area marginally, but a negative impact of permanent conversion of target habitat types and/or loss of target species (Bombina variegata and Euplagia guadripunctaria) cannot be excluded.
Figure 11.11 Areas of the ecological network located in the area of the intervention planned by the Ro6
measure
At the nearest point, the planned route passes about 1 km north of the area of the ecological network
HR2000441 Ribnjaci Narta, and negative impacts of the pollution of the target habitat type 3130 Amphibious habitats of Isoeto-Nanojuncetea with the corresponding target species during the construction and use cannot be excluded.
A significantly negative impact can be assessed for target species of birds in the area of the ecological network
HR1000009 Ribnjaci uz Česmu, due to the loss of part of the habitat, changes in the functional linkage of the
area, possible pollution during use, noise disturbance and light pollution.
Impact
significance
assessment
HR1000008 Bilogora i Kalničko gorje -1
HR1000012 Taložnice Virovitičke šećerane 0
HR1000014 Gornji tok Drave (od Donje Dubrave do
Terezinog polja)
0
HR1000009 Ribnjaci uz Česmu -1
HR2001281 Bilogora -1
HR2000441 Ribnjaci Narta -1
HR5000015 Srednji tok Drave (od Terezinog polja do
Donjeg Miholjca)
0
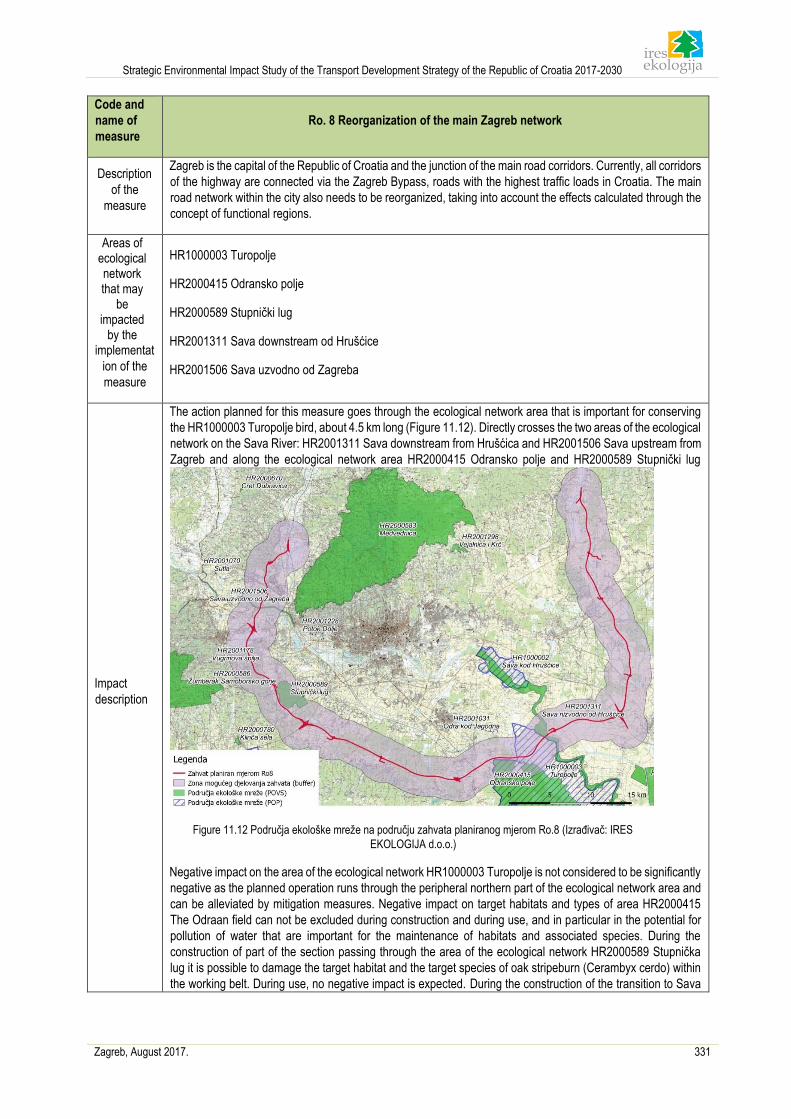
Strategic Environmental Impact Study of the Transport Development Strategy of the Republic of Croatia 2017-2030
Zagreb, August 2017. 331
Code and
name of
measure
Ro. 8 Reorganization of the main Zagreb network
Description
of the
measure
Zagreb is the capital of the Republic of Croatia and the junction of the main road corridors. Currently, all corridors
of the highway are connected via the Zagreb Bypass, roads with the highest traffic loads in Croatia. The main
road network within the city also needs to be reorganized, taking into account the effects calculated through the
concept of functional regions.
Areas of ecological network that may
be impacted
by the implementat
ion of the
measure
HR1000003 Turopolje
HR2000415 Odransko polje
HR2000589 Stupnički lug
HR2001311 Sava downstream od Hrušćice
HR2001506 Sava uzvodno od Zagreba
Impact
description
The action planned for this measure goes through the ecological network area that is important for conserving
the HR1000003 Turopolje bird, about 4.5 km long (Figure 11.12). Directly crosses the two areas of the ecological
network on the Sava River: HR2001311 Sava downstream from Hrušćica and HR2001506 Sava upstream from
Zagreb and along the ecological network area HR2000415 Odransko polje and HR2000589 Stupnički lug
Figure 11.12 Područja ekološke mreže na području zahvata planiranog mjerom Ro.8 (Izrađivač: IRES
EKOLOGIJA d.o.o.)
Negative impact on the area of the ecological network HR1000003 Turopolje is not considered to be significantly
negative as the planned operation runs through the peripheral northern part of the ecological network area and
can be alleviated by mitigation measures. Negative impact on target habitats and types of area HR2000415
The Odraan field can not be excluded during construction and during use, and in particular in the potential for
pollution of water that are important for the maintenance of habitats and associated species. During the
construction of part of the section passing through the area of the ecological network HR2000589 Stupnička
lug it is possible to damage the target habitat and the target species of oak stripeburn (Cerambyx cerdo) within
the working belt. During use, no negative impact is expected. During the construction of the transition to Sava
Strategic Environmental Impact Study of the Transport Development Strategy of the Republic of Croatia 2017-2030
Zagreb, August 2017. 332
can not exclude the negative impact of construction works for the HR2001311 Sava downstream of Hrušćica
and HR2001506 Sava upstream of Zagreb.
Impact
significance
assessment
HR1000003 Turopolje -1
HR2000415 Odransko polje -1
HR2000589 Stupnički lug -1
HR2001311 Sava downstream od Hrušćice -1
HR2001506 Sava uzvodno od Zagreba -1
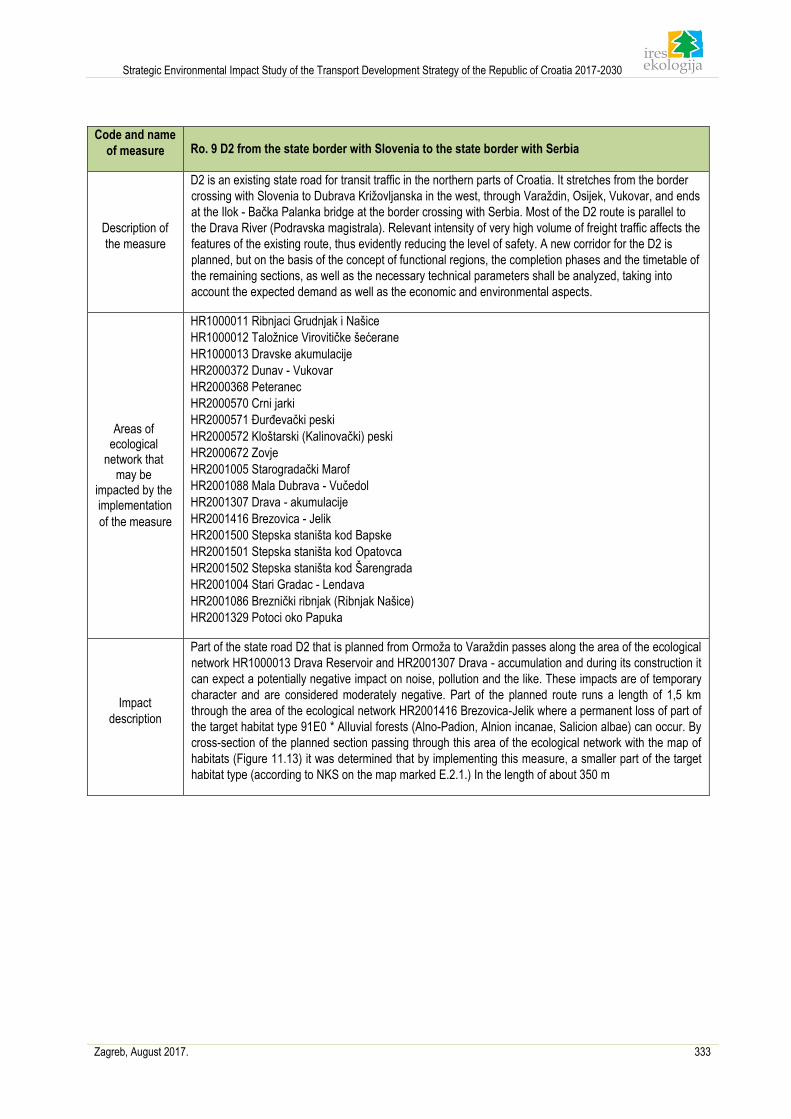
Strategic Environmental Impact Study of the Transport Development Strategy of the Republic of Croatia 2017-2030
Zagreb, August 2017. 333
Code and name
of measure Ro. 9 D2 from the state border with Slovenia to the state border with Serbia
Description of
the measure
D2 is an existing state road for transit traffic in the northern parts of Croatia. It stretches from the border
crossing with Slovenia to Dubrava Križovljanska in the west, through Varaždin, Osijek, Vukovar, and ends
at the Ilok - Bačka Palanka bridge at the border crossing with Serbia. Most of the D2 route is parallel to
the Drava River (Podravska magistrala). Relevant intensity of very high volume of freight traffic affects the
features of the existing route, thus evidently reducing the level of safety. A new corridor for the D2 is
planned, but on the basis of the concept of functional regions, the completion phases and the timetable of
the remaining sections, as well as the necessary technical parameters shall be analyzed, taking into
account the expected demand as well as the economic and environmental aspects.
Areas of ecological
network that may be
impacted by the implementation
of the measure
HR1000011 Ribnjaci Grudnjak i Našice
HR1000012 Taložnice Virovitičke šećerane
HR1000013 Dravske akumulacije
HR2000372 Dunav - Vukovar
HR2000368 Peteranec
HR2000570 Crni jarki
HR2000571 Đurđevački peski
HR2000572 Kloštarski (Kalinovački) peski
HR2000672 Zovje
HR2001005 Starogradački Marof
HR2001088 Mala Dubrava - Vučedol
HR2001307 Drava - akumulacije
HR2001416 Brezovica - Jelik
HR2001500 Stepska staništa kod Bapske
HR2001501 Stepska staništa kod Opatovca
HR2001502 Stepska staništa kod Šarengrada
HR2001004 Stari Gradac - Lendava
HR2001086 Breznički ribnjak (Ribnjak Našice)
HR2001329 Potoci oko Papuka
Impact
description
Part of the state road D2 that is planned from Ormoža to Varaždin passes along the area of the ecological
network HR1000013 Drava Reservoir and HR2001307 Drava - accumulation and during its construction it
can expect a potentially negative impact on noise, pollution and the like. These impacts are of temporary
character and are considered moderately negative. Part of the planned route runs a length of 1,5 km
through the area of the ecological network HR2001416 Brezovica-Jelik where a permanent loss of part of
the target habitat type 91E0 * Alluvial forests (Alno-Padion, Alnion incanae, Salicion albae) can occur. By
cross-section of the planned section passing through this area of the ecological network with the map of
habitats (Figure 11.13) it was determined that by implementing this measure, a smaller part of the target
habitat type (according to NKS on the map marked E.2.1.) In the length of about 350 m
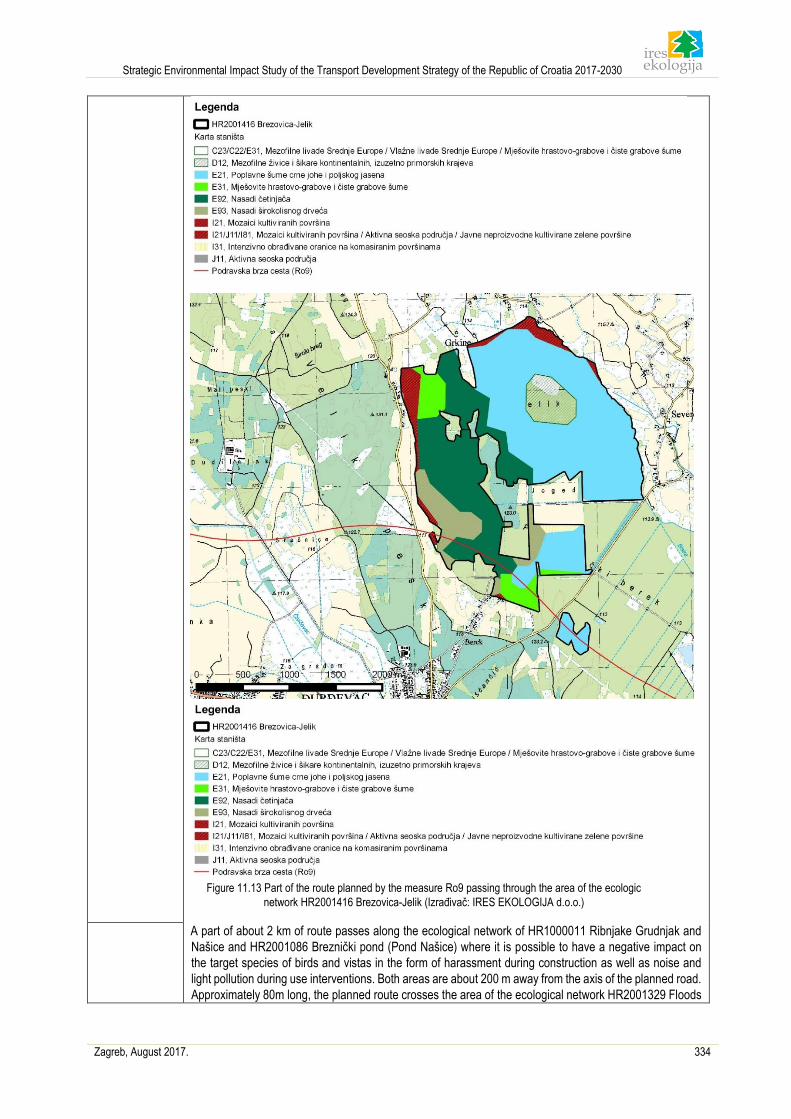
Strategic Environmental Impact Study of the Transport Development Strategy of the Republic of Croatia 2017-2030
Zagreb, August 2017. 334
Figure 11.13 Part of the route planned by the measure Ro9 passing through the area of the ecologic
network HR2001416 Brezovica-Jelik (Izrađivač: IRES EKOLOGIJA d.o.o.)
A part of about 2 km of route passes along the ecological network of HR1000011 Ribnjake Grudnjak and
Našice and HR2001086 Breznički pond (Pond Našice) where it is possible to have a negative impact on
the target species of birds and vistas in the form of harassment during construction as well as noise and
light pollution during use interventions. Both areas are about 200 m away from the axis of the planned road.
Approximately 80m long, the planned route crosses the area of the ecological network HR2001329 Floods
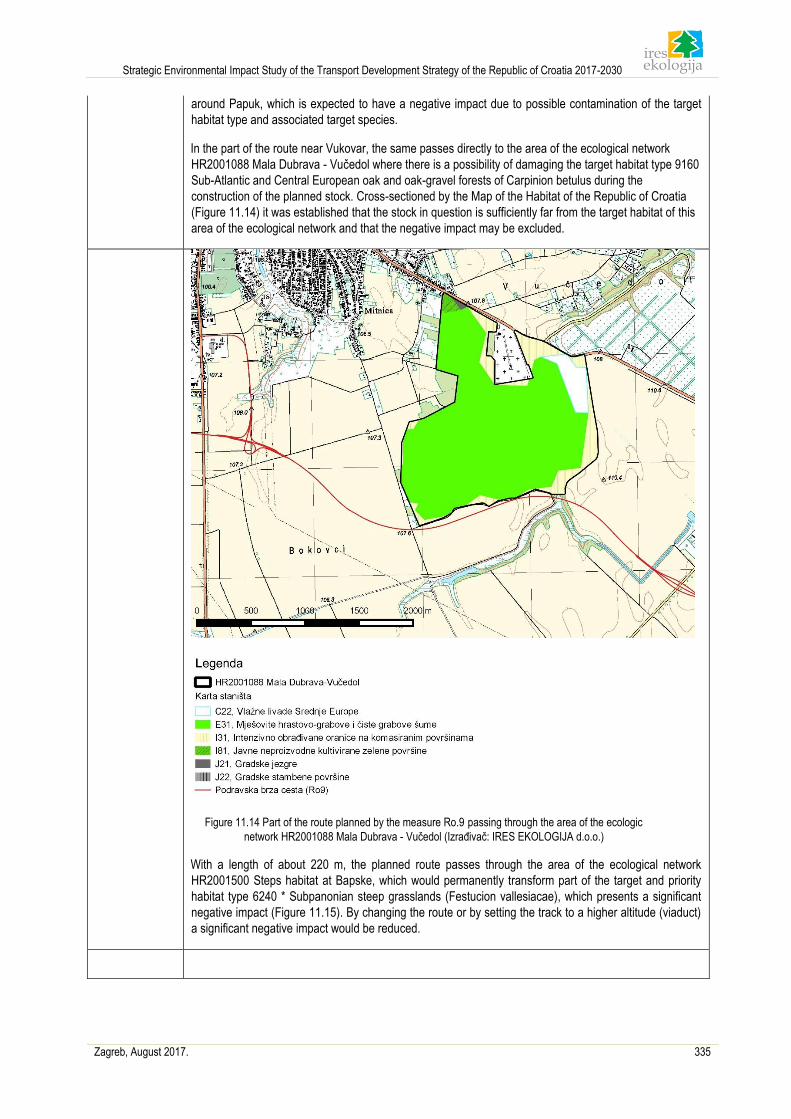
Strategic Environmental Impact Study of the Transport Development Strategy of the Republic of Croatia 2017-2030
Zagreb, August 2017. 335
around Papuk, which is expected to have a negative impact due to possible contamination of the target
habitat type and associated target species.
In the part of the route near Vukovar, the same passes directly to the area of the ecological network
HR2001088 Mala Dubrava - Vučedol where there is a possibility of damaging the target habitat type 9160
Sub-Atlantic and Central European oak and oak-gravel forests of Carpinion betulus during the
construction of the planned stock. Cross-sectioned by the Map of the Habitat of the Republic of Croatia
(Figure 11.14) it was established that the stock in question is sufficiently far from the target habitat of this
area of the ecological network and that the negative impact may be excluded.
Figure 11.14 Part of the route planned by the measure Ro.9 passing through the area of the ecologic
network HR2001088 Mala Dubrava - Vučedol (Izrađivač: IRES EKOLOGIJA d.o.o.)
With a length of about 220 m, the planned route passes through the area of the ecological network
HR2001500 Steps habitat at Bapske, which would permanently transform part of the target and priority
habitat type 6240 * Subpanonian steep grasslands (Festucion vallesiacae), which presents a significant
negative impact (Figure 11.15). By changing the route or by setting the track to a higher altitude (viaduct)
a significant negative impact would be reduced.
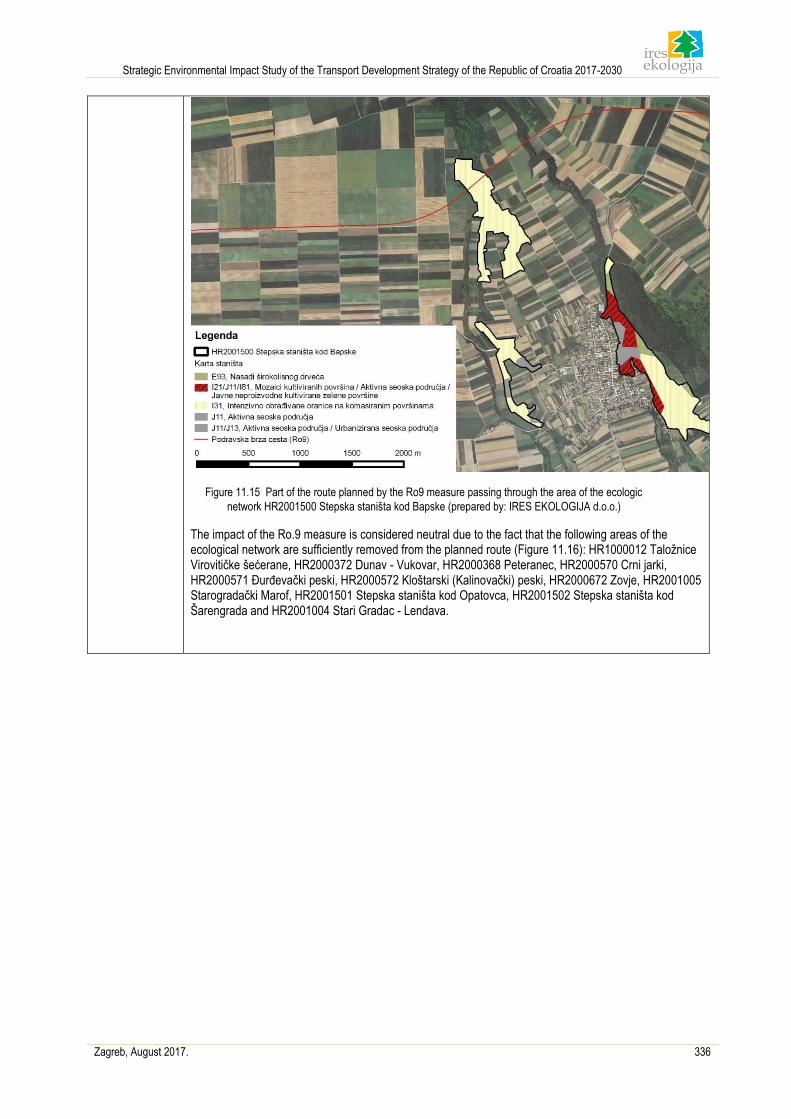
Strategic Environmental Impact Study of the Transport Development Strategy of the Republic of Croatia 2017-2030
Zagreb, August 2017. 336
Figure 11.15 Part of the route planned by the Ro9 measure passing through the area of the ecologic
network HR2001500 Stepska staništa kod Bapske (prepared by: IRES EKOLOGIJA d.o.o.)
The impact of the Ro.9 measure is considered neutral due to the fact that the following areas of the ecological network are sufficiently removed from the planned route (Figure 11.16): HR1000012 Taložnice Virovitičke šećerane, HR2000372 Dunav - Vukovar, HR2000368 Peteranec, HR2000570 Crni jarki, HR2000571 Đurđevački peski, HR2000572 Kloštarski (Kalinovački) peski, HR2000672 Zovje, HR2001005 Starogradački Marof, HR2001501 Stepska staništa kod Opatovca, HR2001502 Stepska staništa kod Šarengrada and HR2001004 Stari Gradac - Lendava.
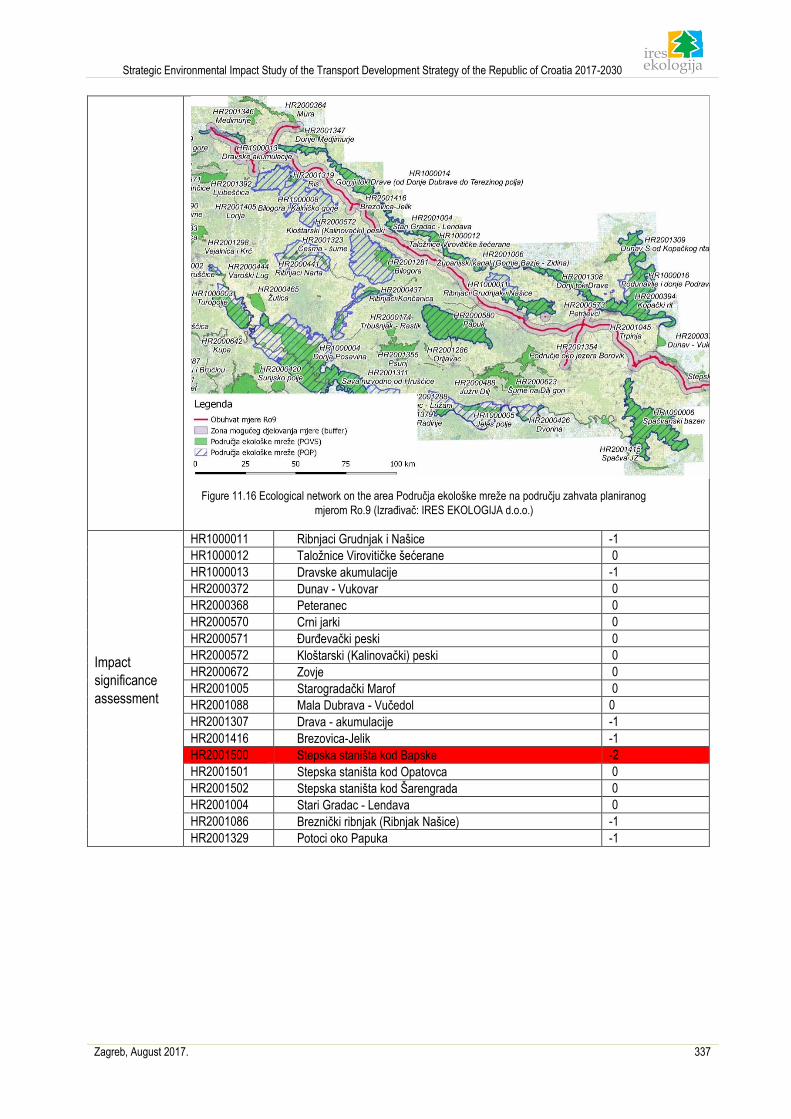
Strategic Environmental Impact Study of the Transport Development Strategy of the Republic of Croatia 2017-2030
Zagreb, August 2017. 337
Figure 11.16 Ecological network on the area Područja ekološke mreže na području zahvata planiranog
mjerom Ro.9 (Izrađivač: IRES EKOLOGIJA d.o.o.)
Impact
significance
assessment
HR1000011 Ribnjaci Grudnjak i Našice -1
HR1000012 Taložnice Virovitičke šećerane 0
HR1000013 Dravske akumulacije -1
HR2000372 Dunav - Vukovar 0
HR2000368 Peteranec 0
HR2000570 Crni jarki 0
HR2000571 Đurđevački peski 0
HR2000572 Kloštarski (Kalinovački) peski 0
HR2000672 Zovje 0
HR2001005 Starogradački Marof 0
HR2001088 Mala Dubrava - Vučedol 0
HR2001307 Drava - akumulacije -1
HR2001416 Brezovica-Jelik -1
HR2001500 Stepska staništa kod Bapske -2
HR2001501 Stepska staništa kod Opatovca 0
HR2001502 Stepska staništa kod Šarengrada 0
HR2001004 Stari Gradac - Lendava 0
HR2001086 Breznički ribnjak (Ribnjak Našice) -1
HR2001329 Potoci oko Papuka -1
Strategic Environmental Impact Study of the Transport Development Strategy of the Republic of Croatia 2017-2030
Zagreb, August 2017. 338
Code and name
of measure Ro10 Reorganization of the Rijeka network
Description of the
measure
The Rijeka road junction is one of the main traffic hubs in Croatia and has an important role in connecting
the Croatian motorway network: A7 motorway connects the A8 motorway (Istrian Y) and the A6 (Rijeka -
Bosiljevo) motorway. Port of Rijeka is the most important Croatian port (the main port of the TEN-T
network) and the development of the port must be harmonized with the road development. The planned
western container terminal in Rijeka is connected to the planned D403 state road. The Rijeka Bypass is
part of the A7 motorway and is one of the roads in Croatia with the highest traffic intensity. For the
purpose of further improvement of the road network, a new corridor outside of the city is planned for the
A7, on the Permani - Grobničko polje (A6) – Križišće section. The northern part of the island of Krk is
planned as part of the potential further development of the Port of Rijeka. The construction of a new
corridor of the D102 state road is also planned for the island of Krk, which includes a new bridge. All
these measures need to be coordinated with the reorganization of Rijeka’s internal road network, taking
into account the need for public transport as well as cycling and walking, port development and other
development plans of relevant stakeholders, such as railway companies. For these reasons, further
analysis is needed on the basis of the concept of functional regions, in order to establish the final
package of measures, as well as the necessary technical parameters, taking into account the expected
demand as well as the economic and environmental aspects.
Areas of ecological
network that may
be impacted by the
implementation of
the measure
HR1000018 Učka i Ćićarija
HR1000019 Gorski kotar i sjeverna Lika
HR2000131 Škabac špilja
HR2000146 Velika špilja u Permanima
HR2000601 Park prirode Učka
HR2000643 Obruč
HR2000658 Rječina
HR2001487 Bakar - Meja
HR5000019 Gorski kotar i sjeverna Lika
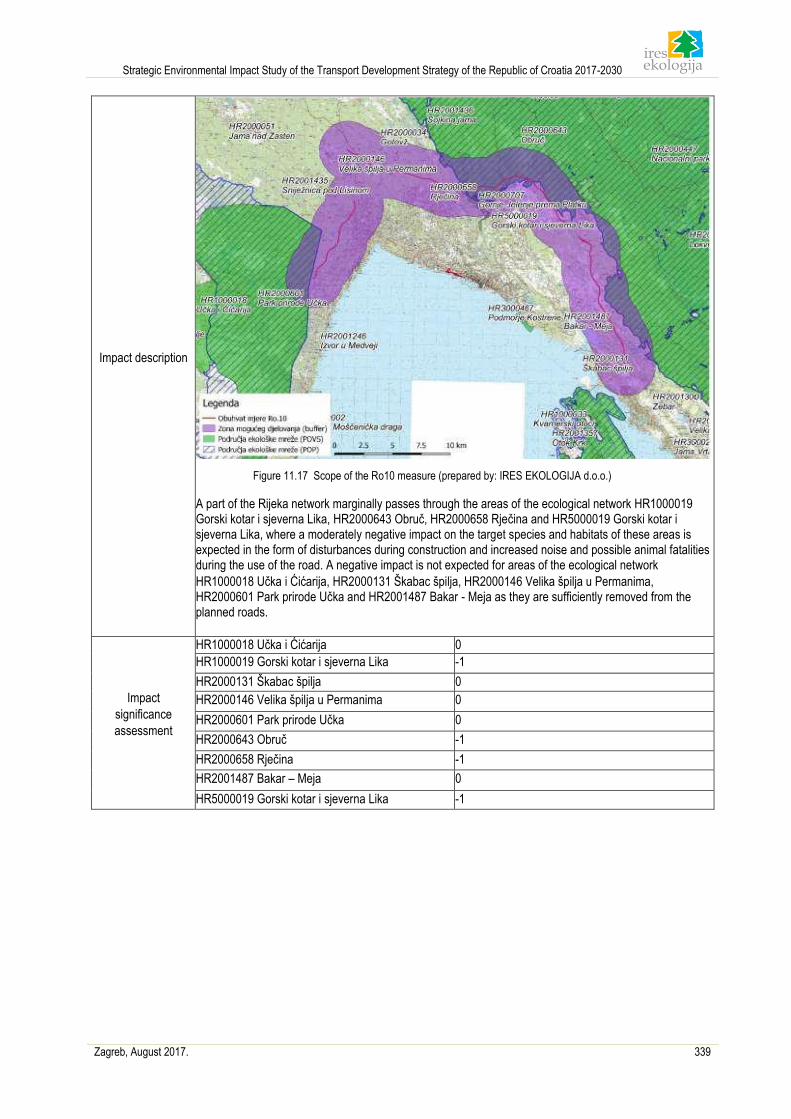
Strategic Environmental Impact Study of the Transport Development Strategy of the Republic of Croatia 2017-2030
Zagreb, August 2017. 339
Impact description
Figure 11.17 Scope of the Ro10 measure (prepared by: IRES EKOLOGIJA d.o.o.)
A part of the Rijeka network marginally passes through the areas of the ecological network HR1000019 Gorski kotar i sjeverna Lika, HR2000643 Obruč, HR2000658 Rječina and HR5000019 Gorski kotar i sjeverna Lika, where a moderately negative impact on the target species and habitats of these areas is expected in the form of disturbances during construction and increased noise and possible animal fatalities during the use of the road. A negative impact is not expected for areas of the ecological network
HR1000018 Učka i Ćićarija, HR2000131 Škabac špilja, HR2000146 Velika špilja u Permanima, HR2000601 Park prirode Učka and HR2001487 Bakar - Meja as they are sufficiently removed from the planned roads.
Impact
significance
assessment
HR1000018 Učka i Ćićarija 0
HR1000019 Gorski kotar i sjeverna Lika -1
HR2000131 Škabac špilja 0
HR2000146 Velika špilja u Permanima 0
HR2000601 Park prirode Učka 0
HR2000643 Obruč -1
HR2000658 Rječina -1
HR2001487 Bakar – Meja 0
HR5000019 Gorski kotar i sjeverna Lika -1
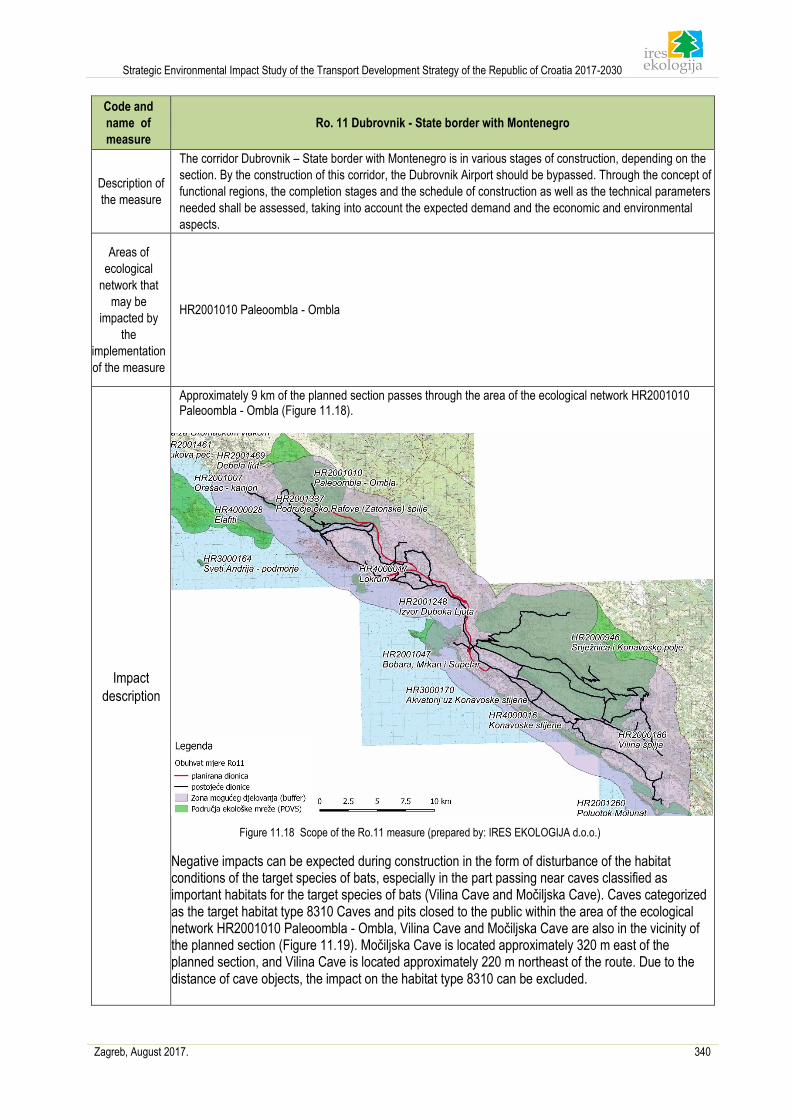
Strategic Environmental Impact Study of the Transport Development Strategy of the Republic of Croatia 2017-2030
Zagreb, August 2017. 340
Code and
name of
measure
Ro. 11 Dubrovnik - State border with Montenegro
Description of
the measure
The corridor Dubrovnik – State border with Montenegro is in various stages of construction, depending on the
section. By the construction of this corridor, the Dubrovnik Airport should be bypassed. Through the concept of
functional regions, the completion stages and the schedule of construction as well as the technical parameters
needed shall be assessed, taking into account the expected demand and the economic and environmental
aspects.
Areas of
ecological
network that
may be
impacted by
the
implementation
of the measure
HR2001010 Paleoombla - Ombla
Impact
description
Approximately 9 km of the planned section passes through the area of the ecological network HR2001010 Paleoombla - Ombla (Figure 11.18).
Figure 11.18 Scope of the Ro.11 measure (prepared by: IRES EKOLOGIJA d.o.o.)
Negative impacts can be expected during construction in the form of disturbance of the habitat conditions of the target species of bats, especially in the part passing near caves classified as important habitats for the target species of bats (Vilina Cave and Močiljska Cave). Caves categorized as the target habitat type 8310 Caves and pits closed to the public within the area of the ecological network HR2001010 Paleoombla - Ombla, Vilina Cave and Močiljska Cave are also in the vicinity of the planned section (Figure 11.19). Močiljska Cave is located approximately 320 m east of the planned section, and Vilina Cave is located approximately 220 m northeast of the route. Due to the distance of cave objects, the impact on the habitat type 8310 can be excluded.
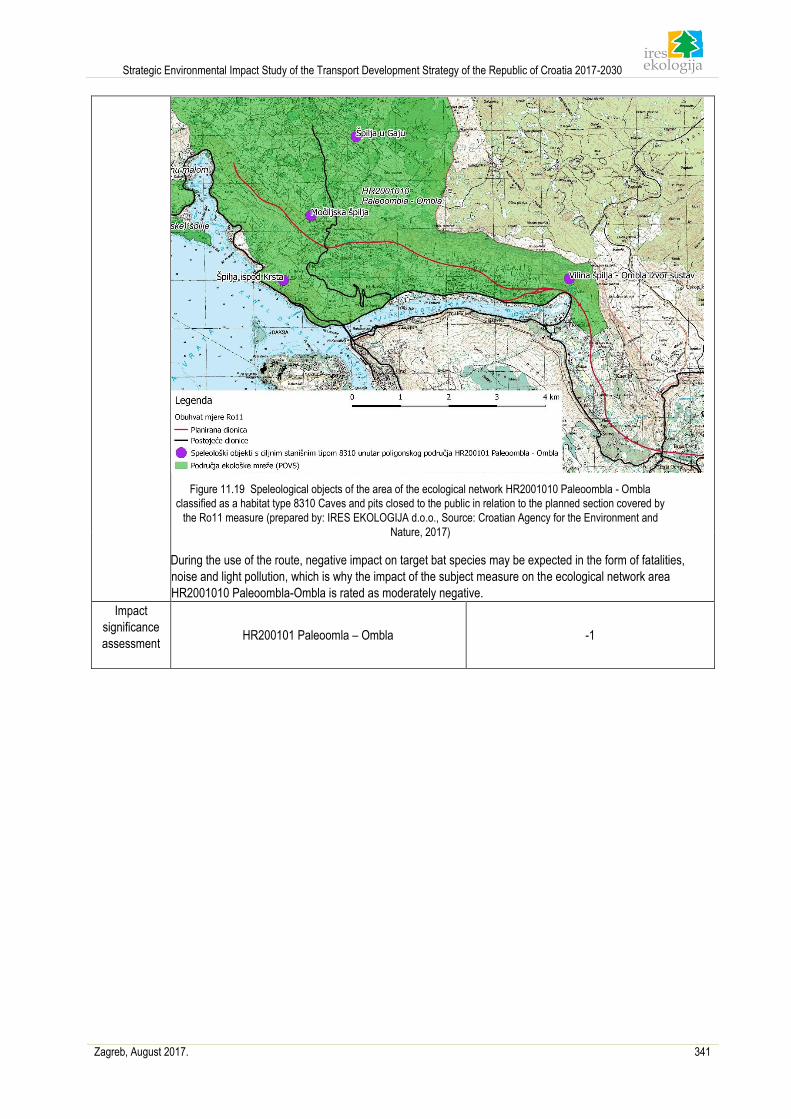
Strategic Environmental Impact Study of the Transport Development Strategy of the Republic of Croatia 2017-2030
Zagreb, August 2017. 341
Figure 11.19 Speleological objects of the area of the ecological network HR2001010 Paleoombla - Ombla
classified as a habitat type 8310 Caves and pits closed to the public in relation to the planned section covered by
the Ro11 measure (prepared by: IRES EKOLOGIJA d.o.o., Source: Croatian Agency for the Environment and
Nature, 2017)
During the use of the route, negative impact on target bat species may be expected in the form of fatalities,
noise and light pollution, which is why the impact of the subject measure on the ecological network area
HR2001010 Paleoombla-Ombla is rated as moderately negative.
Impact
significance
assessment
HR200101 Paleoomla – Ombla -1
Strategic Environmental Impact Study of the Transport Development Strategy of the Republic of Croatia 2017-2030
Zagreb, August 2017. 342
Code and
name Ro. 12 Capacity increase - A dedicated lane for public transport between Zagreb and Karlovac
Description
of the
measure
The road corridor from Zagreb to Karlovac is covered by the European core network due to the international
and regional importance of traffic coming from the direction of Rijeka towards the interior. The Zagreb - Karlovac
section is one of the oldest sections of the motorway network in Croatia with poor ecological standards.
According to the feasibility study, the limitations of of the capacity are caused by the existing toll collection
system.
The potential to change the toll collection system (see Measure Ro.17) would have a clear impact on this section
of the highway. If the significant increase in the number of vehicles on this section continues, consideration
should be given to the option of building a third track. Specific interventions to increase safety and environmental
standards on this section are also justified.
Further analysis and studies will show the character and justification of capacity expansion in line with the
indicators and conclusions of the Transport Infrastructure Development Master Plan on the Zagreb-Karlovac
highway, which serves as the basis for sustainable development of the stock. At this point, there is no
justification for building a dedicated public transport lantern, as at the same time it is planning to invest in the
reconstruction of the strip on the Croatian Leskovac-Karlovac part, and it is also the meaning of marking this
measure as red.
Areas of the
ecological
network that
may be
impacted by
the
implementat
ion of the
measure
HR1000001 Pokupski bazen
HR2001335 Jastrebarski lugovi
HR2000450 Ribnjaci Draganići
Impact
description
During the construction of the dedicated public transport lane, a moderately negative impact on target. Impact
species found on the areas of the ecological network HR1000001 Pokupski bazen, HR2001335 description
Jastrebarski lugovi and HR2000450 Ribnjaci Draganići can be expected.
Impact
significance
assessment
HR1000001 Pokupski bazen -1
HR2001335 Jastrebarski lugovi -1
HR2000450 Ribnjaci Draganići -1
Code and name of
measure Ro. 13 Capacity increase - A dedicated lane for public transport on the Zagreb bypass
Description of the
measure
Zagreb bypass is the busiest route in Croatia and the traffic level is constantly increasing. Some sections
of the Zagreb bypass need to be extended with a new public transport lane. Through the concept of
functional regions, the existing options for capacity increase shall be analysed, the stages and schedule
of construction shall be assessed as well as the necessary technical parameters, taking into account the
expected demand and economic, social and environmental aspects, as well as the development planned
for other means of transport.
Strategic Environmental Impact Study of the Transport Development Strategy of the Republic of Croatia 2017-2030
Zagreb, August 2017. 343
Areas of ecological
network that may
be impacted by the
implementation of
the measure
HR2001311 Sava downstream od Hrušćice
Impact
description
Given that this is an upgrade of an existing road, no significant impacts are expected on the area of the
ecological network HR2001311 Sava downstream od Hrušćice at the strategic assessment level.
Impact
significance
assessment HR2001311 Sava downstream od Hrušćice 0
Code and name
of measure Ro. 14 Improving access to the Port of Slavonski Brod
Description of the
measure
Slavonski Brod, as the main port on the Sava River, is the only port of inland waterways in Croatia on the
Sava River, which is an integral part of the core TEN-T network. The development of the port and the
additional business zone needs to be coordinated with the improvements of other transport
infrastructure, especially the road. The NPM points to the good accessibility of the Port of Slavonski
Brod.
Areas of ecological
network that may
be impacted by the
implementation of
the measure
HR2001311 Sava downstream od Hrušćice
Impact
description
The planned road is located approximately 700 m north of the area of the ecological network HR2001311
Sava downstream od Hrušćice, which means that no negative impacts on the ecological network are
expected due to the implementation of the Ro.14 measure.
Impact
significance
assessment
HR2001311 Sava downstream od Hrušćice 0
Code and
name of
measure
Ro. 15 Reorganisation of the Split network
Description of
the measure
Split is one of the main tourist centers in Croatia. Tourism related to cruise trips is particularly important for the
road network because it creates large seasonal loads on the road network. The road network in Split shall be
reorganised, taking into account the public transport system and the planned development of the city, the port
and other transport systems such as the railway. One of the potential measures is the Split bypass: Trogir - Split
- Omiš, which is planned for regional and local traffic, and different sections are in different stages of
construction: the Split-Trogir section has already been completed, while the access road from Split to A1
motorway is under construction. Through the concept of functional regions, a final package of measures shall be
set as well as the required technical parameters, taking into account the expected demand and the economic
and environmental aspects.
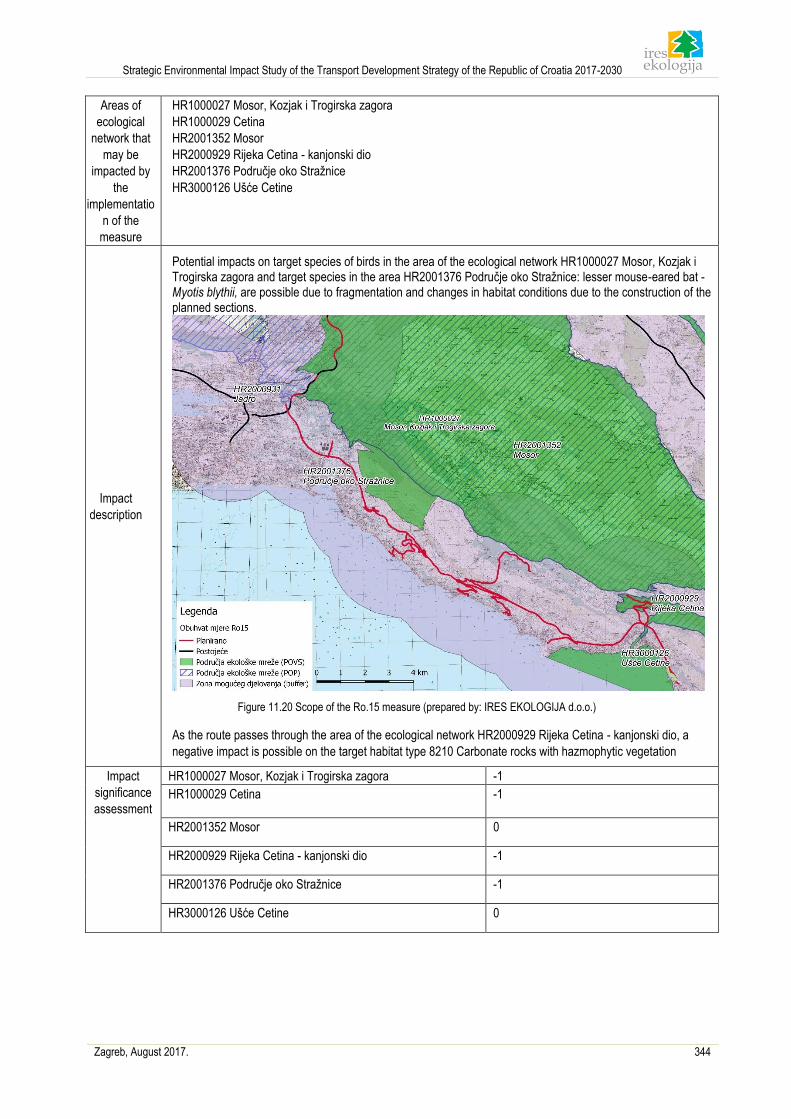
Strategic Environmental Impact Study of the Transport Development Strategy of the Republic of Croatia 2017-2030
Zagreb, August 2017. 344
Areas of
ecological
network that
may be
impacted by
the
implementatio
n of the
measure
HR1000027 Mosor, Kozjak i Trogirska zagora
HR1000029 Cetina
HR2001352 Mosor
HR2000929 Rijeka Cetina - kanjonski dio
HR2001376 Područje oko Stražnice
HR3000126 Ušće Cetine
Impact
description
Potential impacts on target species of birds in the area of the ecological network HR1000027 Mosor, Kozjak i Trogirska zagora and target species in the area HR2001376 Područje oko Stražnice: lesser mouse-eared bat - Myotis blythii, are possible due to fragmentation and changes in habitat conditions due to the construction of the planned sections.
Figure 11.20 Scope of the Ro.15 measure (prepared by: IRES EKOLOGIJA d.o.o.)
As the route passes through the area of the ecological network HR2000929 Rijeka Cetina - kanjonski dio, a
negative impact is possible on the target habitat type 8210 Carbonate rocks with hazmophytic vegetation
Impact
significance
assessment
HR1000027 Mosor, Kozjak i Trogirska zagora -1
HR1000029 Cetina -1
HR2001352 Mosor 0
HR2000929 Rijeka Cetina - kanjonski dio -1
HR2001376 Područje oko Stražnice -1
HR3000126 Ušće Cetine 0
Strategic Environmental Impact Study of the Transport Development Strategy of the Republic of Croatia 2017-2030
Zagreb, August 2017. 345
Code and name
Ro. 16 Preparations for Dubrovnik’s accessibility after Croatia’s accession to Schengen (Pelješac Bridge – Adriatic Ionian corridor)
Description of the
measure
The long-distance accessibility in mid-term scenario is of course the Dubrovnik airport. For the further development of the road infrastructure it is necessary to build the "Peljesac" bridge, in combination with the road network on Peljesac and the Ston bypass. The continuation of the construction of the Adriatic - Ionian Corridor from Ploče to the state border with the Black Mountain and its course will be determined after the studies have been conducted and taking into account the European transport corridors.
Areas of ecological
network that may be
impacted by the
implementation of the measure
HR1000036 Srednjedalmatinski otoci i Pelješac HR1000031 Delta Neretve HR2001364 JI dio Pelješca HR3000163 Stonski kanal HR3000167 Solana Ston HR4000015 Malostonski zaljev HR5000031 Delta Neretve
Impact description
Potential impacts resulting from the implementation of the intervention planned by this measure can be
expected during construction, and later in the usage phase, in the form of potential contamination of the
marine areas of the ecological network HR4000015 Malostonski zaljev, HR3000163 Stonski kanal,
HR3000167 Solana Ston. The use of intervention may have a negative impact on target species of birds in
the areas of the ecological network HR100003 Srednjedalmatinski otoci i Pelješac and HR1000031 Delta
Neretve. By selecting adequate techniques for the implementation of the intervention and later solving the
problems of rainwater, the impact would be moderate for the areas HR4000015 Malostonski zaljev,
HR3000163 Stonski kanal, HR3000167 Solana Ston. The full coverage of the Ro.16 measure shall Impact
contribute to the negative impact of fragmentation of the habitat and increased traffic pressure, in the form
description of noise disturbance, light pollution and animal fatalities in the areas of the ecological network
HR1000036 Srednjedalmatinski otoci i Pelješac and HR2001364 JI dio Pelješca. For the planned intervention
provided for in this Land - Pelješac Bridge with access road measure, the competent Ministry has adopted the
Decision on acceptability for the environment and ecological network, with the implementation of the legally
prescribed and established mitigation measures for the goals of the conservation and integrity of the
ecological network area (CLASS: UP/I 351-03/15-02/59, FILE NO.: 51706-2-1-2-15-15, 30 October 2015).
The Decision on acceptability for the environment and ecological network (CLASS: UP/I 351-03/15-02/76,
FILE NO.: 517-06-2-1-2-16-13, 26 April 2016) was also adopted for the Sparagovići - Doli section of the state
road.
Impact
significance assessment
HR1000036 Srednjedalmatinski otoci i Pelješac -1
HR1000031 Delta Neretve -1
HR2001364 JI dio Pelješca -1
HR3000163 Stonski kanal -1
HR3000167 Solana Ston -1
HR4000015 Malostonski zaljev -1
HR5000031 Delta Neretve 0
Strategic Environmental Impact Study of the Transport Development Strategy of the Republic of Croatia 2017-2030
Zagreb, August 2017. 346
11.3.1.2 Railway transport
In railway transport, the defined measures mainly relate to the improvement of the existing railway corridors, so impacts
during the usage of the interventions, i.e. railways, were analyzed, in line with the expected increase in traffic. Negative
impacts recognized as possible effects are mainly noise, vibration, pollution caused by accidents, target species fatalities
and light pollution.
Code and name of measure R1. Zagreb - State border with Slovenia towards Ljubljana (TEN-T basic network/TEN-T
Mediterranean corridor/ Pan-European corridor)
Description of the measure
The M101 railway is part of the TEN-T core network and RH1 corridor and is one of the major
international connections towards Zagreb and the only urban node of the core railway TEN-T
network in Croatia. RH1 has historically been the most important corridor in terms of long-distance
passenger transport. Future scenarios such as the entry of Croatia into the Schengen area shall
increase the volume of traffic on this Description of the railway line. Although some activities
are being developed to improve this railway line, the fact is that some measure parts of the M101
railway currently have a speed limit of up to 60 km/ h. Through the concept of functional regions,
the technical requirements to be met in terms of capacity and allowed speed shall be assessed
taking into account economic and environmental aspects. Since the subject railway line is also
important for cargo transport, it shall meet the following minimum technical criteria: axle load
(mass per axle) 22.5 t/a; usable length of railway tracks for reception and dispatch 750 m, ERTMS
Code and name of measure R.2 Zagreb - Karlovac (TEN-T basic network/TEN-T Mediterranean corridor/ Pan-European
corridor RH2)
Description of the measure
The corridor connecting Zagreb and Rijeka is primarily important for cargo transport and partly for
suburban passenger transport. The analysis shows that suburban passenger transport primarily
takes place on the section from Zagreb to Karlovac. Currently, this part of the M202 railway is
mostly single-track, which limits the potential to increase capacity. It is expected that the
importance of this railway line for cargo transport shall increase in the medium to long term, given
that Rijeka is defined as the main Croatian port within the TEN-T network. Further studies shall
analyse planned speed and capacity needs, taking into account economic and ecological aspects.
In addition to the capacity increase, cargo transport requires that the railway line meet the following
technical criteria: axle load (mass per axle) 22.5 t/a; ERTMS; usable length of railway tracks for
reception and dispatch depending on the logistic concept.
Code and name of measure R.3 Karlovac + to Rijeka (TEN-T basic network/TEN-T Mediterranean corridor/ Pan-
European corridor RH2)
Description of the measure
The analysis shows that this part of the corridor connecting Zagreb and Rijeka is mainly
used for cargo transport. Currently, this part of the M202 railway is mostly single-track
and electrified, with some parts having a speed limit of 50 km / h. Rijeka is defined as the
main Croatian port within the TEN-T network and Description of the therefore it is
expected that the importance of this f railway line for cargo transport shall increase in the
medium to long term. This section should therefore meet the following technical criteria:
axle load (mass per axle) 22.5 t/a; usable length of railway tracks for reception and
dispatch depending on the logistic concept, ERTMS. According to feasibility studies, the
best variant of the strip was chosen, "Low-lane", bearing in mind the possible construction
of a container terminal on Krk and a connection to the Dalmatian railway, the planned
speed and capacity needs, taking into account economic and ecological aspects.
Code and name of measure R.4 Railway network around Rijeka
Description of the measure
According to current preliminary analyses, there might be potential for the reorganisation of the
Rijeka railway node with the introduction of suburban lines, giving priority to the modal shift from
the use of Description of the personal cars. Additional analyses should explore the capacity of the
railway, taking into account the measure logistics concept and capacity of the Port of
Strategic Environmental Impact Study of the Transport Development Strategy of the Republic of Croatia 2017-2030
Zagreb, August 2017. 347
Rijeka terminals. The remaining capacity can be utilised for transport. Improvement of the
connection with Slovenia shall be harmonised with measures R.2 and R.3
Code and name of measure R.5 Zagreb - Križevci (TEN-T basic network/TEN-T Mediterranean corridor/ Pan-European
corridor RH2)
Description of the measure
The corridor connecting Zagreb and Rijeka with Eastern Europe via Hungary is primarily important
for cargo transport and partly for suburban transport. The analysis shows that suburban travels in
this part of the corridor are mostly related to Dugo Selo (15 568 passenger trains in 2012) and
Križevci (11 516 passenger trains in 2012). Currently, this part of the M201 railway line is double-
track to Dugo Selo singe-track to Križevci. This fact limits the potential to increase capacity,
especially if it is taken into account that the importance of this railway line for cargo transport shall
increase in the medium to long term given that Rijeka is defined as the main Croatian port within
the TEN-T network. Since this line is important for cargo transport, in addition to increasing
capacity, it shall meet the following minimum technical criteria: axle load (mass per axle) 22.5 t /
a; usable length of railway tracks for reception and dispatch 750 m, ERTMS.
Code and name of measure R.6. Križevci - State border with Hungary towards Budapest (TEN-T basic network/TEN-T
measure Mediterranean corridor/ Pan-European corridor RH2)
Description of the measure
The analysis shows that this part of the corridor connecting Zagreb and Rijeka with Eastern
Europe via Hungary is most important for cargo transport and partly for suburban transport.
Hungary is currently working on the further development of this corridor (development of Gysev
and Szekesfehervar network - the development of the Boba railway line). Currently, this part of
the M201 railway is mainly single-track Description of the and electrified, with some parts having
a speed limit of 80 km / h. Rijeka is defined as the main Croatian measure port within the
TEN-T network and therefore, it is expected that the importance of this railway line for cargo
transport shall increase in the medium to long term. For this reason and taking into account that
this section is a part of the core network and TEN-T corridor, it shall meet the following minimum
technical criteria: axle load (mass per axle) 22.5 t / a; usable length of railway tracks for reception
and dispatch 750 m, ERTMS.
Code and name of measure R.7 Zagreb - Novska (TEN-T basic network/Pan-European corridor RH1)
Description of the measure
The railway lines M102 and M103 are part of the core TEN-T network and RH1 corridor and are
one of the major international connections towards Zagreb, the only urban node of the core railway
TEN-T network in Croatia. RH1 has historically been the most important corridor in terms of long-
distance passenger transport (over 59,000 passenger trains between Zagreb and Dugo Selo in
2012). Future scenarios such Description of the as the entry of Croatia into the Schengen area
shall increase the volume of traffic on this railway line. Although some activities are being
developed to improve the railway line from Dugo Selo to Novska, the fact is that currently some
parts of both lines have a speed limit of up to 50 km / h. Further studies shall analyse planned
speed and capacity needs, taking into account economic and ecological aspects. Since this line
is also important for cargo transport, it shall meet the following minimum technical criteria: axle
load (mass per axle) 22.5 t / a; usable length of railway tracks for reception and dispatch 750 m,
ERTMS.
Code and name of measure R.8 Novska - State border with Serbia (TEN-T basic network/Pan-European corridor RH1)
Description of the measure
The M105 railway is part of the core TEN-T network and RH1 corridor and one of the major
international connections towards Zagreb. RH1 has historically been the most important corridor
in terms of longdistance passenger transport. Future scenarios such as the entry of Croatia into
the Schengen area or the entry of neighbouring countries like Serbia into the European Union
shall increase the volume of traffic on Description of the this line. At present, the M105 railway
line is double-track between Novska and Tovarnik, which was measure constructed as a border
crossing between Croatia and Serbia on the core rail network. Further studies shall assess the
technical requirements to be met, taking into account both the economic and environmental
aspects. Since this line is also important for cargo transport, it shall meet the following minimum
Strategic Environmental Impact Study of the Transport Development Strategy of the Republic of Croatia 2017-2030
Zagreb, August 2017. 348
technical criteria: axle load (mass per axle) 22.5 t / a; usable length of railway tracks for reception
and dispatch 750 m, ERTMS.
Code and name of measure R.9 State border with Hungary – Osijek - State border with Bosnia and Herzegovina (TEN-
T comprehensive network/basic network/Pan-European corridor RH3)
Description of the measure
The M303 railway is part of the core TEN-T network in Croatia, and Slavonski Šamac is the border
crossing of the core railway network with Bosnia and Herzegovina. The railway lines M301 and
M302 are Description of the part of a comprehensive network, but serve as a link between Bosnia
and Herzegovina - Croatia - Hungary, measure following the Pan-European Corridor Vc. The NPM
shows that there is currently no traffic need. The potential of this international corridor shall
increase if the Schengen borders move in relation to their current position.
Code and name of measure R.10 Regional link Vinkovci - Vukovar (TEN-T basic network/Pan-European corridor RH1)
Description of the measure
The railway line M601 Vinkovci - Vukovar shall serve as a railway connecting RH1 and the only
Croatian port of internal waters of the core TEN-T network on the Danube, Vukovar. Future
scenarios related to Vukovar port development shall increase the importance of cargo transport
on this line in the medium to of the long-term perspective. Further studies shall assess the
technical requirements to be met, taking into account both the economic and environmental
aspects. Since this line is also important for cargo transport, it shall meet the following minimum
technical criteria: axle load (mass per axle) 22.5 t / a; usable length of railway tracks for reception
and dispatch 750 m, ERTMS.
Code and name of measure R.11 Zagreb Node
Description of the measure
Current configuration of the Croatian railway network and the fact that Zagreb is the only urban
node of the TEN-T core network demonstrate the importance of the Croatian capital in the entire
transport system. In order to increase the importance of the role of the railway in the regional
connection and the urban transport system, further studies shall analyse specific conditions to be
met.
Code and name of measure R.14 Zagreb Central Station
Description of the measure
Zagreb Central Station shall play a key role not only in long-distance transport but also in local
and regional transport. It shall probably be necessary to adapt the existing access and platforms
and the organisation of the movement of passengers inside and outside the station in favour of
the modal hub. Specific technical requirements shall be the result of further studies that shall take
into account economic, social and ecological aspects.
Measures R1, R2, R3, R4, R5, R8, R9, R10 and R11 relate to the increase in the volume of traffic on the already existing
sections. As already mentioned above, negative impacts can affect target species of the ecological network, primarily in
the form of additional animal fatalities caused by collision with locomotives, increased noise and vibration along the
railway and potential environmental pollution due to accidents. These impacts can be mitigated by mitigation measures
for the ecological network and are considered moderately negative (-1).
For the R11 measure - Zagreb Node, a possible negative impact on the area of the ecological network HR2000589
Stupnički lug has been identified, if the measure involves the construction of new railway sections.
The procedure of Assessment of acceptability for the ecological network was implemented for measures R6 and R7 and
the competent Ministry has issued the Decision that the intended intervention was acceptable to the environment and
the ecological network with the application of mitigation measures for the goals of ecological network conservation
(CLASS: UP/I 351-03/14-02/59, FILE NO.: 517-06-2-1-1-15-09, 16 March 2015 and CLASS: UP/I 351-03/18-02/27, FILE
NO.: 51706-2-1-217-23, 23 February 2017).
As part of the R.14 measure - Zagreb Central Station, interventions are planned which, due to their distance, shall not
have an impact on the ecological network (0).
Strategic Environmental Impact Study of the Transport Development Strategy of the Republic of Croatia 2017-2030
Zagreb, August 2017. 349
11.3.1.3 Air transport
Measures of the Strategy do not provide for the construction of new airports which would have a negative impact
on the goals of the conservation and integrity of the ecological network. However, most of the measures plan to
extend the existing traffic capacity and/or upgrade certain elements (access light signaling system and the like).
Code and name of
measure A.1 Development of the Dubrovnik Airport (TEN-T comprehensive network)
Description of the
measure
Dubrovnik is one of the main destinations on the Adriatic coast. The main problem of this airport are
bottlenecks that occur at the peak of the tourist season. Given the characteristics and geographic
position of the surrounding area that forms the enclave, it is necessary to maintain and improve the
traffic connections to ensure good connectivity. Planned measures include the expansion of the existing
transport/infrastructure capacities to maintain existing quality levels of service, the reduction/removal of
bottlenecks, the rehabilitation of the existing and construction of new road structures and facilities that
are required for safe and unobstructed airport operations, the implementation of environmental
protection measures, the implementation of measures to increase energy efficiency and the supply of
necessary equipment and devices.
Areas of ecological
network that may be
impacted by the
implementation of
the measure
HR2000946 Snježnica i Konavosko polje
Impact description
The implementation of this measure could have a negative impact on the target species of bats (greater horseshoe bat - Rhinolophus ferrumequinum, Mediterranean horseshoe bat - Rhinolophus euryale,
lesser mouse-eared bat - Myotis blythii, common bent-wing bat Miniopterus schreibersii, Geoffroy’s bat - Myotis emarginatus) in the area of the ecological network due to the fact that the Dubrovnik Airport
borders with the area of the ecological network HR2000946 Snježnica i Konavosko polje. Additional
negative impact of extending existing traffic capacities can be expected in the form of light pollution to which bats are
sensitive, increased noise sources and direct collision with aircrafts.
Impact
significance
assessment
HR2000946 Snježnica i Konavosko polje -1
Strategic Environmental Impact Study of the Transport Development Strategy of the Republic of Croatia 2017-2030
Zagreb, August 2017. 350
Code and name of measure A.2 Development of the Pula Airport (TEN-T comprehensive network)
Description of the measure
The Pula Airport is important for the accessibility of this region from remote locations. Airport traffic is seasonal, which can cause bottlenecks due to limited infrastructure. Two important operational aspects need to be considered, including: 1) Quality of service, primarily due to the competitiveness of neighboring international airports, and 2) Balance between security and operational capacity. These aspects, among other things, stress the need to increase the capacity of this airport by
upgrading certain elements: the access light signaling system, runway, apron, terminal, and
access points. On the basis of the concept of functional regions, the feasibility of these measures
and the order of priority shall be established, taking into account the environmental requirements
and the real needs, as well as the potential in regards to the expected demand.
Areas of ecological network that
may be impacted by the
implementation of the measure
HR1000032 Akvatorij zapadne Istre
HR2000522 Luka Budava - Istra
Impact description
Increasing the capacity of the Pula Airport can potentially have a negative impact on the target
species of birds in the area of the ecological network HR1000032 Akvatorij zapadne Istre, but
this impact can be considered acceptable due to the distance of the area (about 4 km). The
negative impact on target habitat 9340 Evergreen oak forests (Quercus ilex) in the area of the
ecological network HR2000522 Luka Budava Istra, can also be considered acceptable due to
the fact that no activities in that area of the ecological network were planned.
Impact significance
assessment
HR1000032 Akvatorij zapadne Istre 0
HR2000522 Luka Budava - Istra 0
Code and name of
measure A.3 Development of the Brač Airport
Description of the
measure
The development of the Brač Airport is planned to improve the connectivity of the island of Brač with remote
locations and thus the connectivity of Central Dalmatia, in line with various security requirements and traffic
demand. The analyzes show the need for the ICAO 3C code and compliance with ICAO, EASA and
national standards. On the basis of the concept of functional regions, feasible measures and order
according to priorities shall be established, taking into account the environmental requirements and the
real needs, as well as the potential in regards to the expected demand. The Evaluation procedure for the
assessment of the impact of the extension of the runway was performed and the decision was made that
the intervention was acceptable to the ecological network.
The measure provides for no interventions that could impact the ecological network.
Strategic Environmental Impact Study of the Transport Development Strategy of the Republic of Croatia 2017-2030
Zagreb, August 2017. 351
Code and name of
measure A.4 Development of the Mali Lošinj Airport
Description of the
measure
The development of the Mali Lošinj Airport is planned to improve the connectivity of Mali Lošinj with
remote locations and thus the connectivity of Northern Dalmatia, in line with various security
requirements and traffic demand. The analyzes show a potential need for expansion of the runway,
apron and terminals. On the basis of the concept of functional regions, the feasibility of these measures
and the order of priority shall be established, taking into account the environmental requirements and
the real needs, as well as the potential in regards to the expected demand.
Areas of ecological
network that may be
impacted by the
implementation of
the measure
HR1000033 Kvarnerski otoci
Impact description
With the expansion of the runway, apron and terminals of the Mali Lošinj Airport, a moderately negative
impact on the target species of birds in the area of the ecological network HR1000033 Kvarnerski otoci
is expected, primarily in the form of bird fatalities resulting from direct collisions with aircrafts, light
pollution and an additional source of noise. Given that the intervention planned by this measure requires
a location permit with included environmental and nature protection conditions, the impact of this
measure can be considered moderately negative for the ecological network.
The increase in air traffic in the Mali Lošinj area can have a negative effect on the target types of birds of
prey that use higher airspace: Aquila chrysaetos - golden eagle, Bubo bubo - eurasian eagle-owl,
Circaetus gallicus - short-toed snake eagle, Circus cyaneus - hen harrier, Falco columbarius - merlin,
Falco naumanni - lesser kestrel, Falco peregrinus - peregrine falcon, Falco vespertinus - red-footed
falcon and Pernis apivorus - European honey buzzard. Air traffic may also have an adverse impact on
the prey population of the common crane (Grus grus).
Impact
significance
assessment HR1000033 Kvarnerski otoci -1
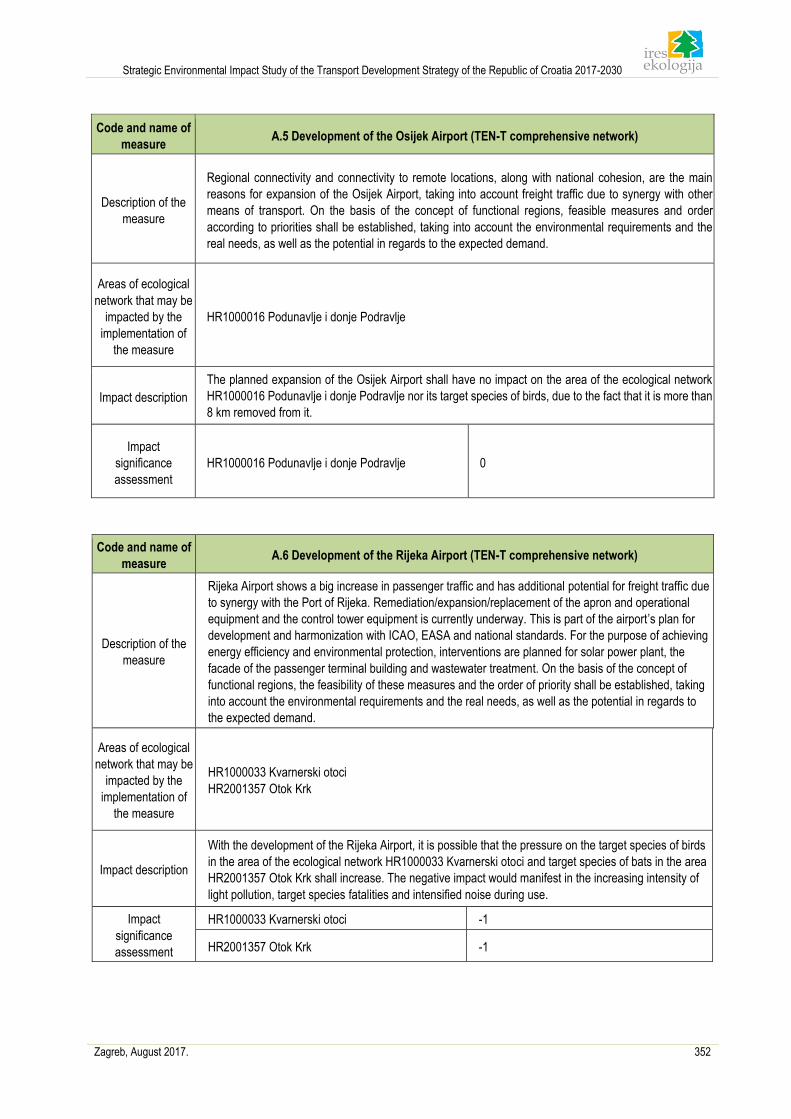
Strategic Environmental Impact Study of the Transport Development Strategy of the Republic of Croatia 2017-2030
Zagreb, August 2017. 352
Code and name of
measure A.5 Development of the Osijek Airport (TEN-T comprehensive network)
Description of the
measure
Regional connectivity and connectivity to remote locations, along with national cohesion, are the main
reasons for expansion of the Osijek Airport, taking into account freight traffic due to synergy with other
means of transport. On the basis of the concept of functional regions, feasible measures and order
according to priorities shall be established, taking into account the environmental requirements and the
real needs, as well as the potential in regards to the expected demand.
Areas of ecological
network that may be
impacted by the
implementation of
the measure
HR1000016 Podunavlje i donje Podravlje
Impact description
The planned expansion of the Osijek Airport shall have no impact on the area of the ecological network
HR1000016 Podunavlje i donje Podravlje nor its target species of birds, due to the fact that it is more than
8 km removed from it.
Impact
significance
assessment
HR1000016 Podunavlje i donje Podravlje 0
Code and name of
measure A.6 Development of the Rijeka Airport (TEN-T comprehensive network)
Description of the
measure
Rijeka Airport shows a big increase in passenger traffic and has additional potential for freight traffic due
to synergy with the Port of Rijeka. Remediation/expansion/replacement of the apron and operational
equipment and the control tower equipment is currently underway. This is part of the airport’s plan for
development and harmonization with ICAO, EASA and national standards. For the purpose of achieving
energy efficiency and environmental protection, interventions are planned for solar power plant, the
facade of the passenger terminal building and wastewater treatment. On the basis of the concept of
functional regions, the feasibility of these measures and the order of priority shall be established, taking
into account the environmental requirements and the real needs, as well as the potential in regards to
the expected demand.
Areas of ecological
network that may be
impacted by the
implementation of
the measure
HR1000033 Kvarnerski otoci
HR2001357 Otok Krk
Impact description
With the development of the Rijeka Airport, it is possible that the pressure on the target species of birds
in the area of the ecological network HR1000033 Kvarnerski otoci and target species of bats in the area
HR2001357 Otok Krk shall increase. The negative impact would manifest in the increasing intensity of
light pollution, target species fatalities and intensified noise during use.
Impact
significance
assessment
HR1000033 Kvarnerski otoci -1
HR2001357 Otok Krk -1
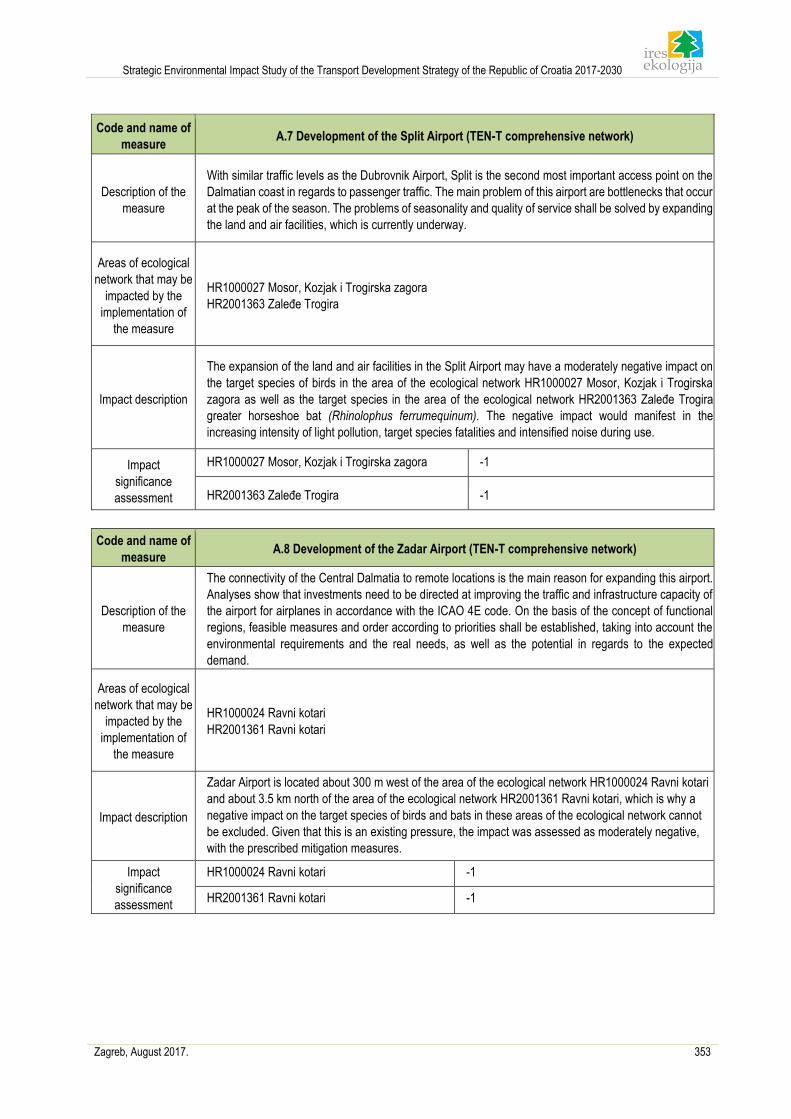
Strategic Environmental Impact Study of the Transport Development Strategy of the Republic of Croatia 2017-2030
Zagreb, August 2017. 353
Code and name of
measure A.7 Development of the Split Airport (TEN-T comprehensive network)
Description of the
measure
With similar traffic levels as the Dubrovnik Airport, Split is the second most important access point on the
Dalmatian coast in regards to passenger traffic. The main problem of this airport are bottlenecks that occur
at the peak of the season. The problems of seasonality and quality of service shall be solved by expanding
the land and air facilities, which is currently underway.
Areas of ecological
network that may be
impacted by the
implementation of
the measure
HR1000027 Mosor, Kozjak i Trogirska zagora
HR2001363 Zaleđe Trogira
Impact description
The expansion of the land and air facilities in the Split Airport may have a moderately negative impact on
the target species of birds in the area of the ecological network HR1000027 Mosor, Kozjak i Trogirska
zagora as well as the target species in the area of the ecological network HR2001363 Zaleđe Trogira
greater horseshoe bat (Rhinolophus ferrumequinum). The negative impact would manifest in the
increasing intensity of light pollution, target species fatalities and intensified noise during use.
Impact
significance
assessment
HR1000027 Mosor, Kozjak i Trogirska zagora -1
HR2001363 Zaleđe Trogira -1
Code and name of
measure A.8 Development of the Zadar Airport (TEN-T comprehensive network)
Description of the
measure
The connectivity of the Central Dalmatia to remote locations is the main reason for expanding this airport.
Analyses show that investments need to be directed at improving the traffic and infrastructure capacity of
the airport for airplanes in accordance with the ICAO 4E code. On the basis of the concept of functional
regions, feasible measures and order according to priorities shall be established, taking into account the
environmental requirements and the real needs, as well as the potential in regards to the expected
demand.
Areas of ecological
network that may be
impacted by the
implementation of
the measure
HR1000024 Ravni kotari
HR2001361 Ravni kotari
Impact description
Zadar Airport is located about 300 m west of the area of the ecological network HR1000024 Ravni kotari
and about 3.5 km north of the area of the ecological network HR2001361 Ravni kotari, which is why a
negative impact on the target species of birds and bats in these areas of the ecological network cannot
be excluded. Given that this is an existing pressure, the impact was assessed as moderately negative,
with the prescribed mitigation measures.
Impact
significance
assessment
HR1000024 Ravni kotari -1
HR2001361 Ravni kotari -1
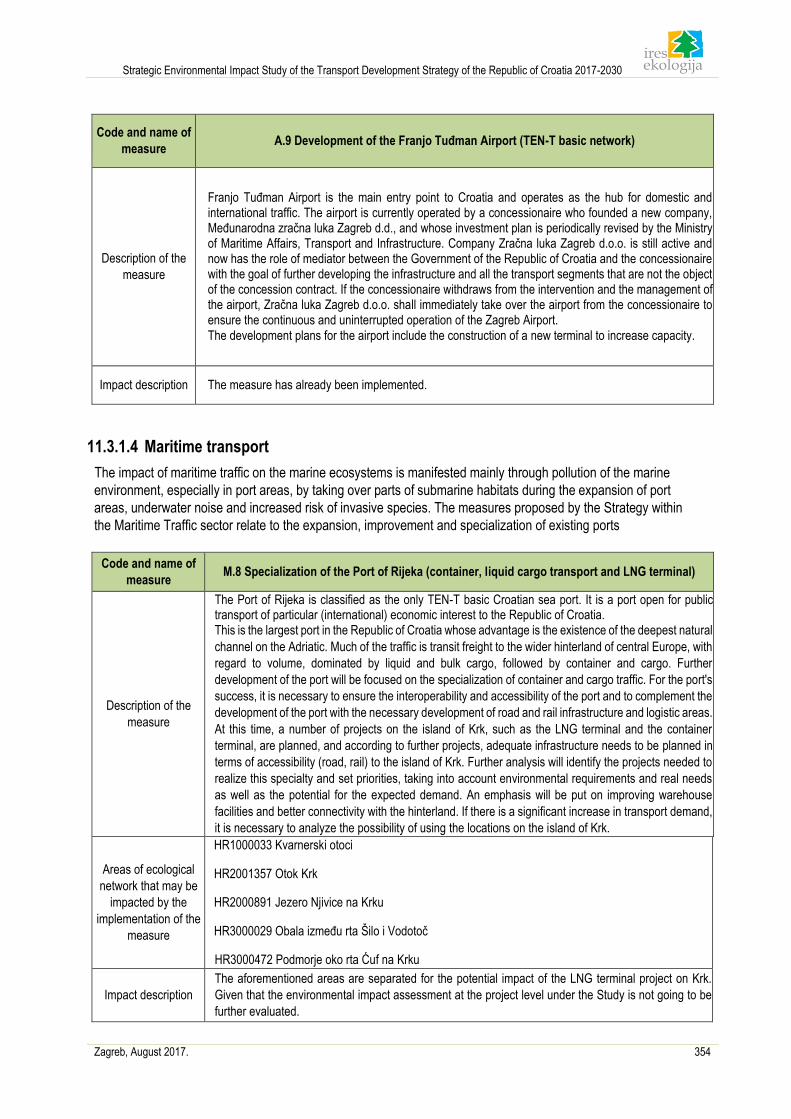
Strategic Environmental Impact Study of the Transport Development Strategy of the Republic of Croatia 2017-2030
Zagreb, August 2017. 354
Code and name of
measure A.9 Development of the Franjo Tuđman Airport (TEN-T basic network)
Description of the
measure
Franjo Tuđman Airport is the main entry point to Croatia and operates as the hub for domestic and international traffic. The airport is currently operated by a concessionaire who founded a new company, Međunarodna zračna luka Zagreb d.d., and whose investment plan is periodically revised by the Ministry of Maritime Affairs, Transport and Infrastructure. Company Zračna luka Zagreb d.o.o. is still active and now has the role of mediator between the Government of the Republic of Croatia and the concessionaire with the goal of further developing the infrastructure and all the transport segments that are not the object of the concession contract. If the concessionaire withdraws from the intervention and the management of the airport, Zračna luka Zagreb d.o.o. shall immediately take over the airport from the concessionaire to ensure the continuous and uninterrupted operation of the Zagreb Airport. The development plans for the airport include the construction of a new terminal to increase capacity.
Impact description The measure has already been implemented.
11.3.1.4 Maritime transport
The impact of maritime traffic on the marine ecosystems is manifested mainly through pollution of the marine
environment, especially in port areas, by taking over parts of submarine habitats during the expansion of port
areas, underwater noise and increased risk of invasive species. The measures proposed by the Strategy within
the Maritime Traffic sector relate to the expansion, improvement and specialization of existing ports
Code and name of
measure M.8 Specialization of the Port of Rijeka (container, liquid cargo transport and LNG terminal)
Description of the
measure
The Port of Rijeka is classified as the only TEN-T basic Croatian sea port. It is a port open for public transport of particular (international) economic interest to the Republic of Croatia. This is the largest port in the Republic of Croatia whose advantage is the existence of the deepest natural
channel on the Adriatic. Much of the traffic is transit freight to the wider hinterland of central Europe, with
regard to volume, dominated by liquid and bulk cargo, followed by container and cargo. Further
development of the port will be focused on the specialization of container and cargo traffic. For the port's
success, it is necessary to ensure the interoperability and accessibility of the port and to complement the
development of the port with the necessary development of road and rail infrastructure and logistic areas.
At this time, a number of projects on the island of Krk, such as the LNG terminal and the container
terminal, are planned, and according to further projects, adequate infrastructure needs to be planned in
terms of accessibility (road, rail) to the island of Krk. Further analysis will identify the projects needed to
realize this specialty and set priorities, taking into account environmental requirements and real needs
as well as the potential for the expected demand. An emphasis will be put on improving warehouse
facilities and better connectivity with the hinterland. If there is a significant increase in transport demand,
it is necessary to analyze the possibility of using the locations on the island of Krk.
Areas of ecological
network that may be
impacted by the
implementation of the
measure
HR1000033 Kvarnerski otoci
HR2001357 Otok Krk
HR2000891 Jezero Njivice na Krku
HR3000029 Obala između rta Šilo i Vodotoč
HR3000472 Podmorje oko rta Ćuf na Krku
Impact description
The aforementioned areas are separated for the potential impact of the LNG terminal project on Krk.
Given that the environmental impact assessment at the project level under the Study is not going to be
further evaluated.
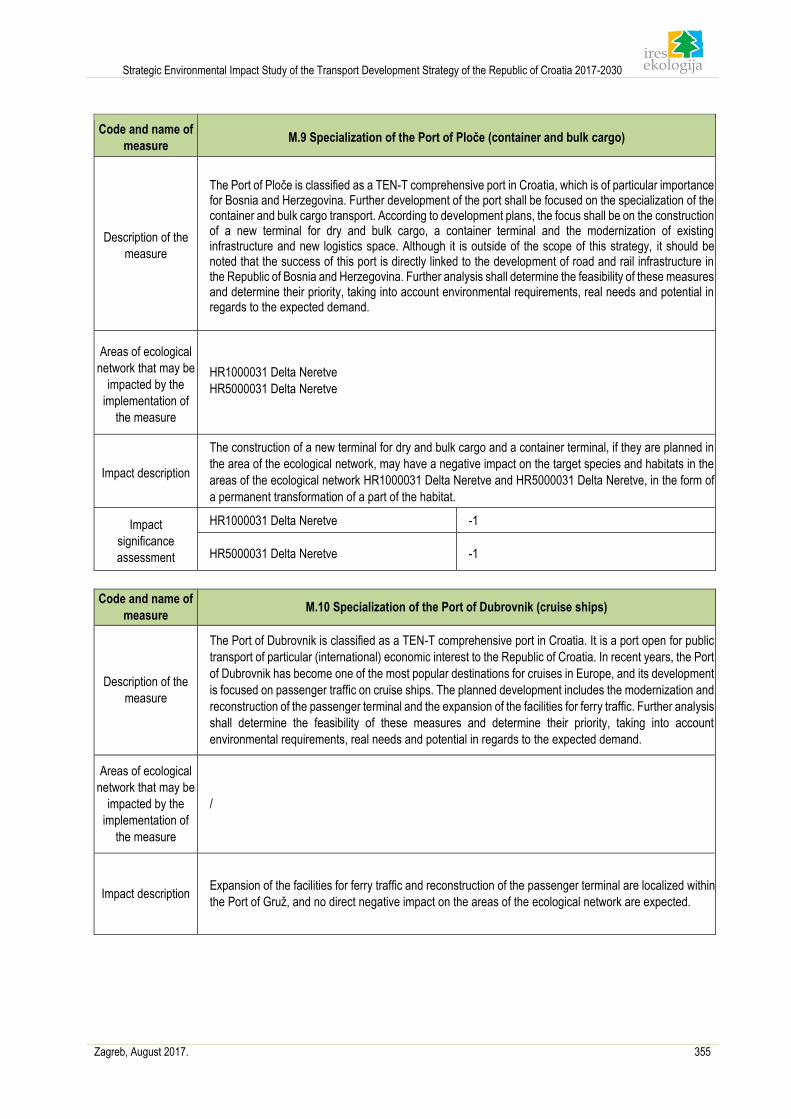
Strategic Environmental Impact Study of the Transport Development Strategy of the Republic of Croatia 2017-2030
Zagreb, August 2017. 355
Code and name of
measure M.9 Specialization of the Port of Ploče (container and bulk cargo)
Description of the
measure
The Port of Ploče is classified as a TEN-T comprehensive port in Croatia, which is of particular importance for Bosnia and Herzegovina. Further development of the port shall be focused on the specialization of the container and bulk cargo transport. According to development plans, the focus shall be on the construction of a new terminal for dry and bulk cargo, a container terminal and the modernization of existing infrastructure and new logistics space. Although it is outside of the scope of this strategy, it should be noted that the success of this port is directly linked to the development of road and rail infrastructure in the Republic of Bosnia and Herzegovina. Further analysis shall determine the feasibility of these measures and determine their priority, taking into account environmental requirements, real needs and potential in regards to the expected demand.
Areas of ecological
network that may be
impacted by the
implementation of
the measure
HR1000031 Delta Neretve
HR5000031 Delta Neretve
Impact description
The construction of a new terminal for dry and bulk cargo and a container terminal, if they are planned in
the area of the ecological network, may have a negative impact on the target species and habitats in the
areas of the ecological network HR1000031 Delta Neretve and HR5000031 Delta Neretve, in the form of
a permanent transformation of a part of the habitat.
Impact
significance
assessment
HR1000031 Delta Neretve -1
HR5000031 Delta Neretve -1
Code and name of
measure M.10 Specialization of the Port of Dubrovnik (cruise ships)
Description of the
measure
The Port of Dubrovnik is classified as a TEN-T comprehensive port in Croatia. It is a port open for public
transport of particular (international) economic interest to the Republic of Croatia. In recent years, the Port
of Dubrovnik has become one of the most popular destinations for cruises in Europe, and its development
is focused on passenger traffic on cruise ships. The planned development includes the modernization and
reconstruction of the passenger terminal and the expansion of the facilities for ferry traffic. Further analysis
shall determine the feasibility of these measures and determine their priority, taking into account
environmental requirements, real needs and potential in regards to the expected demand.
Areas of ecological
network that may be
impacted by the
implementation of
the measure
/
Impact description Expansion of the facilities for ferry traffic and reconstruction of the passenger terminal are localized within
the Port of Gruž, and no direct negative impact on the areas of the ecological network are expected.
Strategic Environmental Impact Study of the Transport Development Strategy of the Republic of Croatia 2017-2030
Zagreb, August 2017. 356
Code and name of
measure M.11 Specialization of the Port of Split (RO-RO, passenger and cruise traffic)
Description of the
measure
The Port of Split is classified as a TEN-T comprehensive port in Croatia. It is a port open for public transport
of particular (international) economic interest to the Republic of Croatia. The Port of Split is also called the
gate to the islands. This is the largest passenger port in Croatia and therefore its development is focused
on passenger traffic and cruise travel. The planned development shall be aimed at building new space for
ferry anchorage, road and rail traffic, and cruise ships on cruise travels, including the expansion of
passenger piers. Further analysis shall determine the feasibility of these measures and determine their
priority, taking into account environmental requirements, real needs and the potential in regards to the
expected demand.
Areas of ecological
network that may be
impacted by the
implementation of
the measure
/
Impact description The construction of new space for ferry anchorage and the expansion of passenger piers are planned
within the existing Port of Split and no additional negative impacts on the ecological network are expected.
Code and name of
measure M.12 Specialization of the Port of Zadar (RO-RO, passenger and cruise traffic)
Description of the
measure
Construction of a new passenger port outside the center of the old town in Gaženica is in progress. The
new port shall enable the expansion of capacity for berthing major international ferries and modern cruise
ships (“home port”), and the international standard for passenger and vehicle docking facilities. Further
analysis shall identify the necessary interventions in order to achieve this specialization and establish
priorities, taking into account environmental real needs and the potential in regards to the expected
demand.
Areas of ecological
network that may be
impacted by the
implementation of
the measure
/
Impact description Activities planned for in this measure are located in the scope of Luke Gaženica, which is not located
outside of the area of the ecological network.
Strategic Environmental Impact Study of the Transport Development Strategy of the Republic of Croatia 2017-2030
Zagreb, August 2017. 357
Code and name of
measure M.13 Specialization of the Port of Šibenik (smaller vessels and super yachts)
Description of the
measure
The Port of Šibenik is classified as a TEN-T comprehensive port in Croatia. It is a port open for public
transport of particular (international) economic interest to the Republic of Croatia. Further development of
the port shall focus on the specialization of passenger traffic as a port for the exclusive navigation of
smaller capacity vessels (boutique boats) and super yachts. Further analysis shall establish the necessary
interventions for the achievement of the specialization and determining priority, taking into account
environmental requirements, real needs and the potential in regards to the expected demand.
Areas of ecological
network that may be
impacted by the
implementation of
the measure
HR3000171 Ušće Krke
Impact description
This measure envisages the specialization of passenger traffic to the exclusive navigation of smaller
capacity vessels and super yachts, which shall not negatively impact the area of the ecological network
HR3000171 Ušće Krke and its associated target species and habitats.
11.3.1.5 Inland waterway transport
Code and name of
measure I.3 Development of the Port of Vukovar (TEN-T basic network)
Description of the
measure
The Port of Vukovar is located on the Danube River and is classified as a basic TEN-T port. Vukovar is an
inland port that can accommodate class 5 vessels. It has been assigned the VIc class of navigability.
Passenger and goods traffic of the port is increasing. It was established that the following measures should
be implemented for the purpose of development and upgrading the Port of Vukovar: the modernization and
construction of new facilities to increase the capacity of the existing port, the development and construction
of the new eastern port, the modernization of connections with road and rail infrastructure, the construction
of an industrial pier in Ilok, the development of facilities in the ports for passengers. Further analysis shall
determine the feasibility of these measures and their order of priority, taking into account the environmental
requirements and real needs, as well as the potential in regards to the expected demand.
Areas of ecological network that may
be impacted by the implementation of
the measure
HR2000372 Dunav - Vukovar
Impact
description
Activities provided for in this measure may have a negative impact on the target species and habitats in
the area of the ecological network, primarily due to the permanent conversion of target habitat types 3270
Rivers with muddy banks covered in Chenopodion rubri p.p. and Bidention p.p., and 91E0* Alluvial forests
(Alno-Padion, Alnion incanae, Salicion albae), as well as due to the disturbance of the target species of
fish (asp Aspius aspius, schraetzer Gymnocephalus schraetser, common zingel Zingel zingel, sichel
Pelecus cultratus and Balon’s ruffe Gymnocephalus baloni).
Strategic Environmental Impact Study of the Transport Development Strategy of the Republic of Croatia 2017-2030
Zagreb, August 2017. 358
Impact
significance
assessment
HR2000372 Dunav - Vukovar -1
Code and
name of
measure
I.4 Development of the Port of Osijek (TEN-T comprehensive network)
Description
of the
measure
The Port of Osijek is located on the Drava River and is classified as a TEN-T comprehensive port. Passenger
and goods traffic of the port is increasing. The Port of Osijek has a great opportunity to become an intermodal
logistics center thanks to its size and excellent potential due to the road and rail connection to the hinterland. It
was established that the following measures should be implemented for the purpose of development and
upgrading the Port of Osijek: the construction of a port basin and business zone development, the construction
of bulk cargo reloading terminals, the construction and remediation of the existing coastline, the modernization
of basic river infrastructure and security systems. Further analysis shall determine the feasibility of these
measures and their order of priority, taking into account the environmental requirements and real needs, as well
as the potential in regards to the expected demand.
Areas of
ecological
network that
may be
impacted by
the
implementat
ion of the
measure
HR1000016 Podunavlje i donje Podravlje
HR2001308 Donji tok Drave
Impact
description
The construction of the port basin in the Port of Osijek can temporarily negatively affect the target species of
fish in the area of the ecological network HR2001308 Donji tok Drave and on the target species in the area
HR1000016 Podunavlje i donje Podravlje. Other activities are limited to the land part of the existing Port and no
additional negative impact on the ecological network is expected from the implementation of these activities.
Impact
significance
assessment
HR1000016 Podunavlje i donje Podravlje -1
HR2001308 Donji tok Drave -1
Code and
name
of measure
I.5 Development of the Port of Slavonski Brod (TEN-T basic network)
Description
of the
measure
The Port of Slavonski Brod is located on the Drava River and is classified as a TEN-T basic port. The potential
of Slavonski Brod, which is of particular importance to Bosnia and Herzegovina, largely depends on the
development of the navigability of the Sava River in Bosnia and Herzegovina and Serbia and on the construction
of the Danube-Sava canal through Slavonia. Reliability and safety of navigation on the Sava River are key
factors affecting the attractiveness of the port. Most of the freight traffic consists of crude oil and item cargo
transshipment. Further development of the port depends on the logistics concept.
Impact
significance
assessment
The competent Ministry issued the confirmation that the planned intervention shall not have a significant impact
on the area of the ecological network (CLASS: 612-07/09-01/554, FILE NO.: 532-0802-1/2-09-4, 9 February
2009).
Strategic Environmental Impact Study of the Transport Development Strategy of the Republic of Croatia 2017-2030
Zagreb, August 2017. 359
Code and
name of
measure
I.6 Development of the Port of Sisak (TEN-T comprehensive network)
Description
of the
measure
The Port of Sisak is located on the Sava River and is classified as a TEN-T comprehensive port. Reliability and
safety of navigation on the Sava River are key factors affecting the attractiveness of the port. These factors are
located in three locations: in the town of Sisak on the Kupa River, near the town of Crnac on the Sava River
and in Galdovo on the Sava River. The potential of Sisak greatly depends on the development of the Sava River
navigability in the border area with Bosnia and Herzegovina and Serbia and/or the construction of the Danube-
Sava canal through Slavonia. The construction of the new Port of Sisak to the south of the town of Crnac is
planned. Freight traffic is mostly related to the Sisak oil refinery, i.e. the transportation of crude oil. Further
development of the port depends on the logistics concept.
Areas of
ecological
network that
may be
impacted by
the
implementat
ion of the
measure
HR1000004 Donja Posavina
HR2001311 Sava nizvodno od Hrušćice
Impact
description
The planned construction of the new Port of Sisak south of the town of Crnac may have a negative impact on
target species of birds in the area of the ecological network HR1000004 Donja Posavina during the construction,
in the form of disturbance and noise emission. Negative impact on target species of fish and habitats in the area
of ecological network HR2001311 Sava nizvodno od Hrušćice is expected in the case of conversion of target
habitats and temporary disturbance of target species and fish.
Impact
significance
assessment
HR1000004 Donja Posavina -1
HR2001311 Sava nizvodno od Hrušćice -1
Code and
name of
measure
I.7 Construction pf the Danube-Sava multipurpose canal
Description
of the
measure
It is planned that the Danube-Sava multipurpose canal shall have four equally important functions navigation,
tourism, irrigation and drainage. Due to its multiple functions, the canal shall have an important impact on the
Croatian economy. From a traffic perspective, the canal is part of the 560 kilometer long intermodal traffic
corridor of the Danube River basin – Adriatic, which includes the Sava River's waterway and a railway link with
the Port of Rijeka. The acceptability of the canal construction shall be assessed through the results of the Canal
feasinility study.
Areas of
ecological
network that
may be
impacted by
the
implementat
ion of the
measure
HR1000006 Spačvanski bazen
HR2000372 Dunav - Vukovar
HR2001311 Sava nizvodno od Hrušćice
HR2001414 Spačvanski bazen
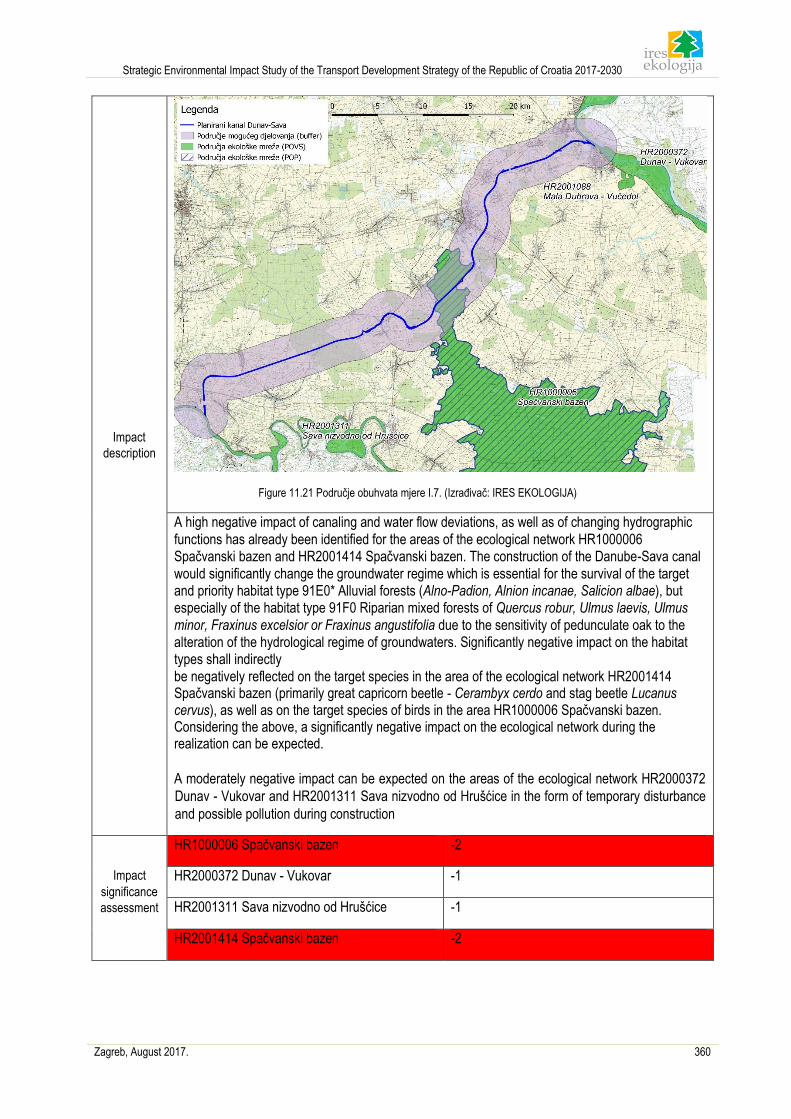
Strategic Environmental Impact Study of the Transport Development Strategy of the Republic of Croatia 2017-2030
Zagreb, August 2017. 360
Impact
description
Figure 11.21 Područje obuhvata mjere I.7. (Izrađivač: IRES EKOLOGIJA)
A high negative impact of canaling and water flow deviations, as well as of changing hydrographic
functions has already been identified for the areas of the ecological network HR1000006 Spačvanski bazen and HR2001414 Spačvanski bazen. The construction of the Danube-Sava canal
would significantly change the groundwater regime which is essential for the survival of the target and priority habitat type 91E0* Alluvial forests (Alno-Padion, Alnion incanae, Salicion albae), but especially of the habitat type 91F0 Riparian mixed forests of Quercus robur, Ulmus laevis, Ulmus
minor, Fraxinus excelsior or Fraxinus angustifolia due to the sensitivity of pedunculate oak to the alteration of the hydrological regime of groundwaters. Significantly negative impact on the habitat types shall indirectly
be negatively reflected on the target species in the area of the ecological network HR2001414 Spačvanski bazen (primarily great capricorn beetle - Cerambyx cerdo and stag beetle Lucanus cervus), as well as on the target species of birds in the area HR1000006 Spačvanski bazen. Considering the above, a significantly negative impact on the ecological network during the realization can be expected.
A moderately negative impact can be expected on the areas of the ecological network HR2000372
Dunav - Vukovar and HR2001311 Sava nizvodno od Hrušćice in the form of temporary disturbance
and possible pollution during construction
Impact
significance
assessment
HR1000006 Spačvanski bazen -2
HR2000372 Dunav - Vukovar -1
HR2001311 Sava nizvodno od Hrušćice -1
HR2001414 Spačvanski bazen -2
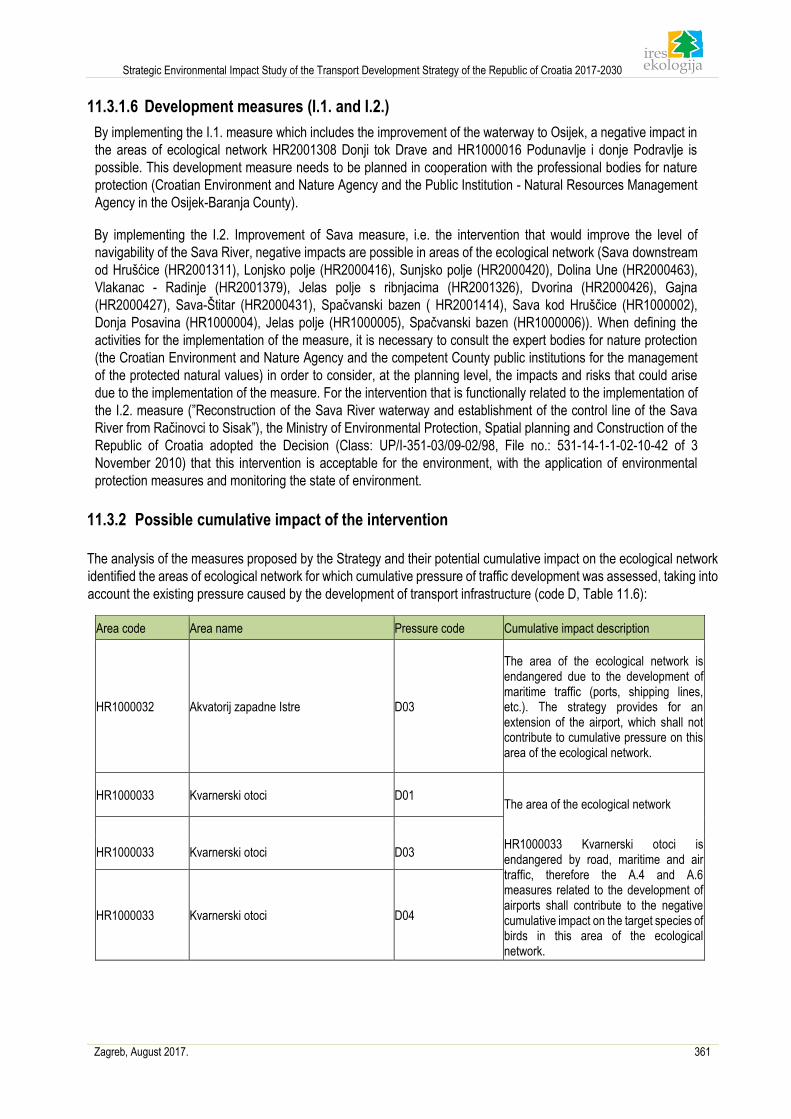
Strategic Environmental Impact Study of the Transport Development Strategy of the Republic of Croatia 2017-2030
Zagreb, August 2017. 361
11.3.1.6 Development measures (I.1. and I.2.)
By implementing the I.1. measure which includes the improvement of the waterway to Osijek, a negative impact in
the areas of ecological network HR2001308 Donji tok Drave and HR1000016 Podunavlje i donje Podravlje is
possible. This development measure needs to be planned in cooperation with the professional bodies for nature
protection (Croatian Environment and Nature Agency and the Public Institution - Natural Resources Management
Agency in the Osijek-Baranja County).
By implementing the I.2. Improvement of Sava measure, i.e. the intervention that would improve the level of
navigability of the Sava River, negative impacts are possible in areas of the ecological network (Sava downstream
od Hrušćice (HR2001311), Lonjsko polje (HR2000416), Sunjsko polje (HR2000420), Dolina Une (HR2000463),
Vlakanac - Radinje (HR2001379), Jelas polje s ribnjacima (HR2001326), Dvorina (HR2000426), Gajna
(HR2000427), Sava-Štitar (HR2000431), Spačvanski bazen ( HR2001414), Sava kod Hruščice (HR1000002),
Donja Posavina (HR1000004), Jelas polje (HR1000005), Spačvanski bazen (HR1000006)). When defining the
activities for the implementation of the measure, it is necessary to consult the expert bodies for nature protection
(the Croatian Environment and Nature Agency and the competent County public institutions for the management
of the protected natural values) in order to consider, at the planning level, the impacts and risks that could arise
due to the implementation of the measure. For the intervention that is functionally related to the implementation of
the I.2. measure (”Reconstruction of the Sava River waterway and establishment of the control line of the Sava
River from Račinovci to Sisak”), the Ministry of Environmental Protection, Spatial planning and Construction of the
Republic of Croatia adopted the Decision (Class: UP/I-351-03/09-02/98, File no.: 531-14-1-1-02-10-42 of 3
November 2010) that this intervention is acceptable for the environment, with the application of environmental
protection measures and monitoring the state of environment.
11.3.2 Possible cumulative impact of the intervention
The analysis of the measures proposed by the Strategy and their potential cumulative impact on the ecological network
identified the areas of ecological network for which cumulative pressure of traffic development was assessed, taking into
account the existing pressure caused by the development of transport infrastructure (code D, Table 11.6):
Area code Area name Pressure code Cumulative impact description
HR1000032 Akvatorij zapadne Istre D03
The area of the ecological network is endangered due to the development of maritime traffic (ports, shipping lines, etc.). The strategy provides for an extension of the airport, which shall not contribute to cumulative pressure on this area of the ecological network.
HR1000033 Kvarnerski otoci D01 The area of the ecological network
HR1000033 Kvarnerski otoci D03 HR1000033 Kvarnerski otoci is endangered by road, maritime and air traffic, therefore the A.4 and A.6 measures related to the development of airports shall contribute to the negative cumulative impact on the target species of birds in this area of the ecological network.
HR1000033 Kvarnerski otoci D04
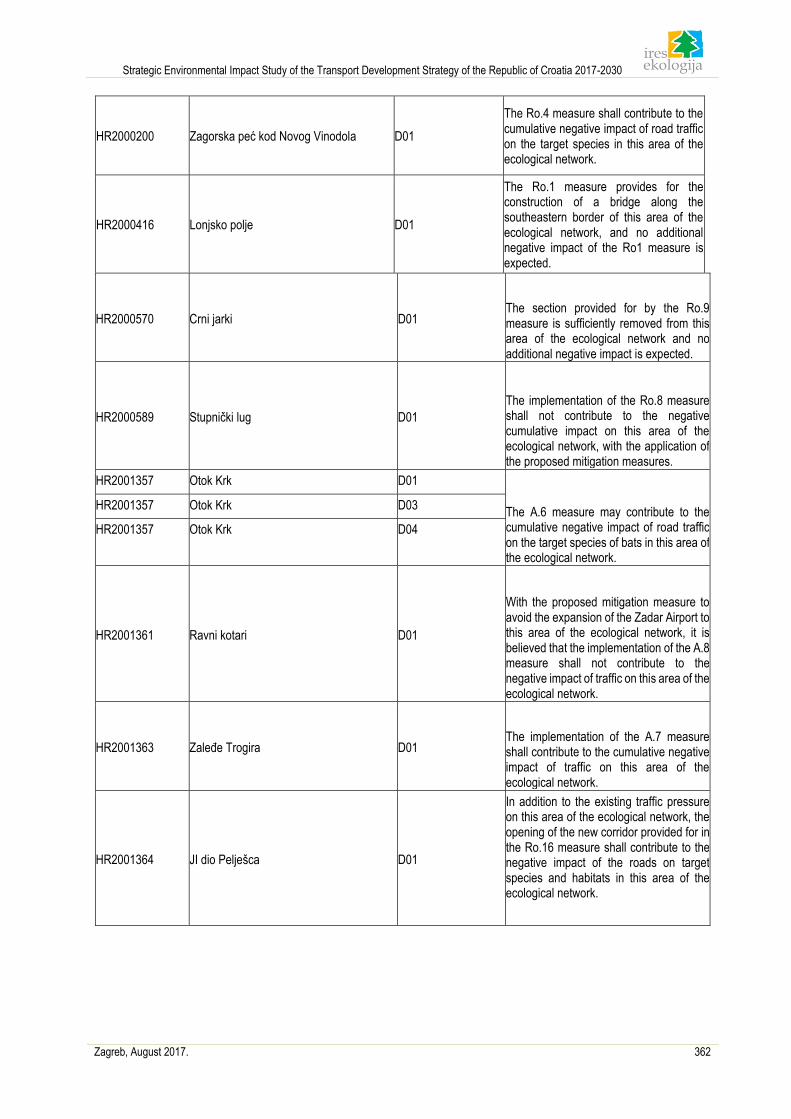
Strategic Environmental Impact Study of the Transport Development Strategy of the Republic of Croatia 2017-2030
Zagreb, August 2017. 362
HR2000200 Zagorska peć kod Novog Vinodola D01
The Ro.4 measure shall contribute to the cumulative negative impact of road traffic on the target species in this area of the ecological network.
HR2000416 Lonjsko polje D01
The Ro.1 measure provides for the construction of a bridge along the southeastern border of this area of the ecological network, and no additional negative impact of the Ro1 measure is expected.
HR2000570 Crni jarki D01 The section provided for by the Ro.9 measure is sufficiently removed from this area of the ecological network and no additional negative impact is expected.
HR2000589 Stupnički lug D01
The implementation of the Ro.8 measure shall not contribute to the negative cumulative impact on this area of the ecological network, with the application of the proposed mitigation measures.
HR2001357 Otok Krk D01
The A.6 measure may contribute to the cumulative negative impact of road traffic on the target species of bats in this area of the ecological network.
HR2001357 Otok Krk D03
HR2001357 Otok Krk D04
HR2001361 Ravni kotari D01
With the proposed mitigation measure to avoid the expansion of the Zadar Airport to this area of the ecological network, it is believed that the implementation of the A.8 measure shall not contribute to the negative impact of traffic on this area of the ecological network.
HR2001363 Zaleđe Trogira D01 The implementation of the A.7 measure shall contribute to the cumulative negative impact of traffic on this area of the ecological network.
HR2001364 JI dio Pelješca D01
In addition to the existing traffic pressure on this area of the ecological network, the opening of the new corridor provided for in the Ro.16 measure shall contribute to the negative impact of the roads on target species and habitats in this area of the ecological network.
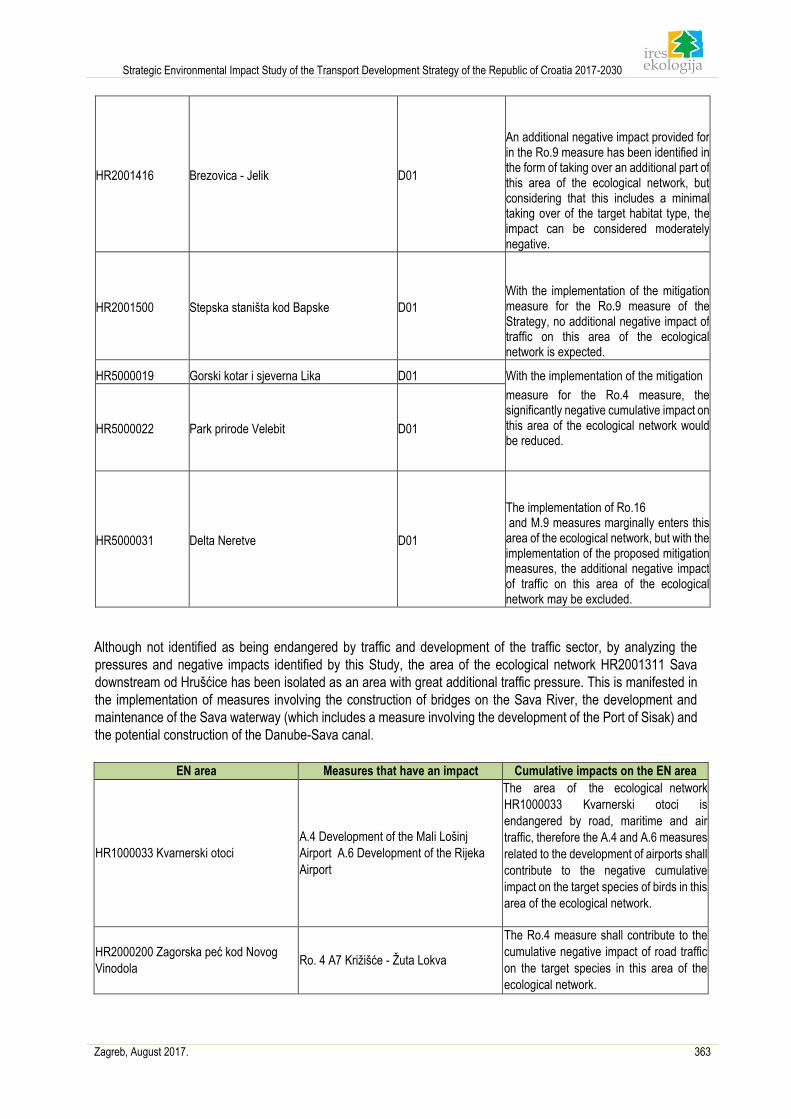
Strategic Environmental Impact Study of the Transport Development Strategy of the Republic of Croatia 2017-2030
Zagreb, August 2017. 363
HR2001416 Brezovica - Jelik D01
An additional negative impact provided for in the Ro.9 measure has been identified in the form of taking over an additional part of this area of the ecological network, but considering that this includes a minimal taking over of the target habitat type, the impact can be considered moderately negative.
HR2001500 Stepska staništa kod Bapske D01
With the implementation of the mitigation measure for the Ro.9 measure of the Strategy, no additional negative impact of traffic on this area of the ecological network is expected.
HR5000019 Gorski kotar i sjeverna Lika D01 With the implementation of the mitigation
HR5000022 Park prirode Velebit D01
measure for the Ro.4 measure, the significantly negative cumulative impact on this area of the ecological network would be reduced.
HR5000031 Delta Neretve D01
The implementation of Ro.16 and M.9 measures marginally enters this area of the ecological network, but with the implementation of the proposed mitigation measures, the additional negative impact of traffic on this area of the ecological network may be excluded.
Although not identified as being endangered by traffic and development of the traffic sector, by analyzing the
pressures and negative impacts identified by this Study, the area of the ecological network HR2001311 Sava
downstream od Hrušćice has been isolated as an area with great additional traffic pressure. This is manifested in
the implementation of measures involving the construction of bridges on the Sava River, the development and
maintenance of the Sava waterway (which includes a measure involving the development of the Port of Sisak) and
the potential construction of the Danube-Sava canal.
EN area Measures that have an impact Cumulative impacts on the EN area
HR1000033 Kvarnerski otoci
A.4 Development of the Mali Lošinj
Airport A.6 Development of the Rijeka
Airport
The area of the ecological network
HR1000033 Kvarnerski otoci is
endangered by road, maritime and air
traffic, therefore the A.4 and A.6 measures
related to the development of airports shall
contribute to the negative cumulative
impact on the target species of birds in this
area of the ecological network.
HR2000200 Zagorska peć kod Novog
Vinodola Ro. 4 A7 Križišće - Žuta Lokva
The Ro.4 measure shall contribute to the
cumulative negative impact of road traffic
on the target species in this area of the
ecological network.
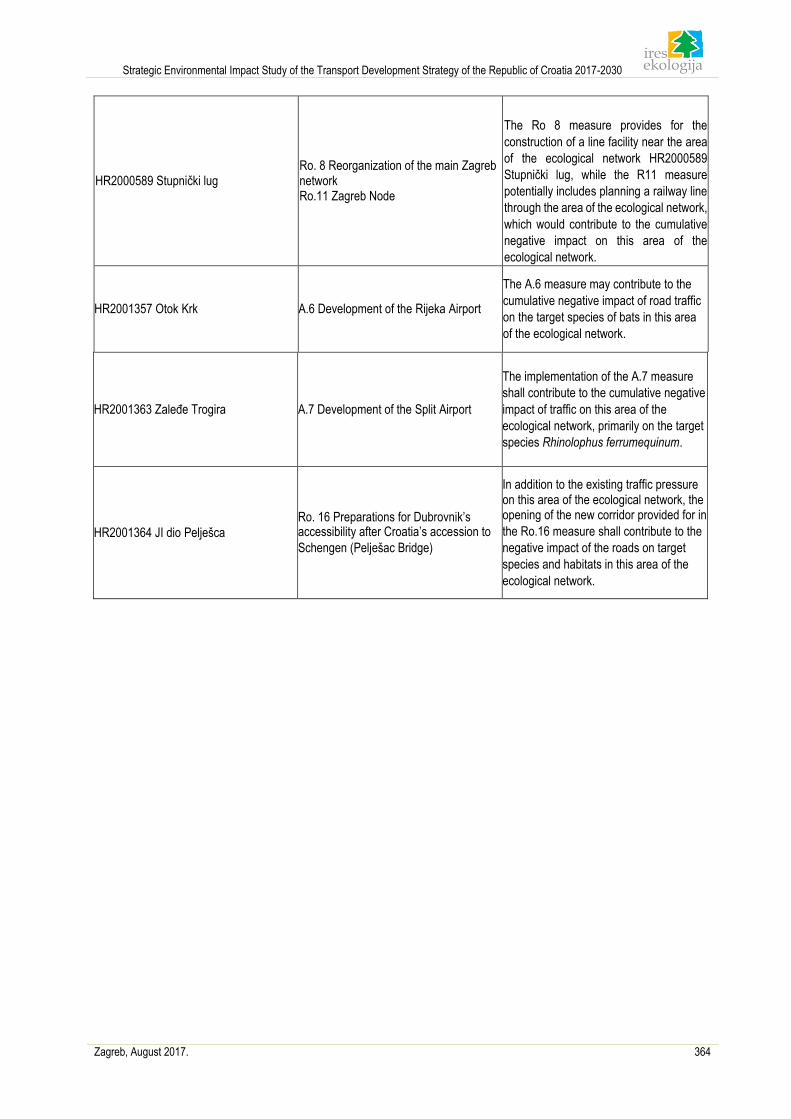
Strategic Environmental Impact Study of the Transport Development Strategy of the Republic of Croatia 2017-2030
Zagreb, August 2017. 364
HR2000589 Stupnički lug Ro. 8 Reorganization of the main Zagreb network Ro.11 Zagreb Node
The Ro 8 measure provides for the
construction of a line facility near the area
of the ecological network HR2000589
Stupnički lug, while the R11 measure
potentially includes planning a railway line
through the area of the ecological network,
which would contribute to the cumulative
negative impact on this area of the
ecological network.
HR2001357 Otok Krk A.6 Development of the Rijeka Airport
The A.6 measure may contribute to the
cumulative negative impact of road traffic
on the target species of bats in this area
of the ecological network.
HR2001363 Zaleđe Trogira A.7 Development of the Split Airport
The implementation of the A.7 measure
shall contribute to the cumulative negative
impact of traffic on this area of the
ecological network, primarily on the target
species Rhinolophus ferrumequinum.
HR2001364 JI dio Pelješca
Ro. 16 Preparations for Dubrovnik’s accessibility after Croatia’s accession to
Schengen (Pelješac Bridge)
In addition to the existing traffic pressure on this area of the ecological network, the opening of the new corridor provided for in
the Ro.16 measure shall contribute to the
negative impact of the roads on target
species and habitats in this area of the
ecological network.
Strategic Environmental Impact Study of the Transport Development Strategy of the Republic of Croatia 2017-2030
Zagreb, August 2017. 365
11.4 Measures to mitigate the negative impacts of the intervention on
conservation goals and the integrity of the ecological network area
Spatially located measures
Road traffic
1. During the intervention preparation for the Ro.1 Connection with the bridge near Gradišta measure, the
construction time and planning of usage have to be adapted, with the objectives of conservation of the
area of the ecological network HR1000004 Donja Posavina and avoidance of the construction of the bridge
during the period of the highest activity of the target species of fish in the area of the ecological network
HR2001311 Sava nizvodno od Hrušćice.
2. For the Ro.4 A7 Križišće - Žuta Lokva measure, the possibility of mitigating significantly negative impacts
on the target species of the area of the ecological network HR2000200 Zagorska peć kod Novog
Vinodolskog has to be considered, by implementing adequate mitigation measures for target species of
bats (e.g. routing the species that follow vegetation during flight to a higher level by using structures that
allow bats to fly over (hop-over) the road by using structures that overhang the road (closed screen).
3. When determining the work area, it is necessary to exclude any activity near the area of the ecological
network HR2000131 Škabac špilja and HR2001154 Orlovac špilja.
4. When planning the part of the route passing through the area of the ecological network HR5000019 Gorski
kotar i sjeverna Lika, which passes through a highly suitable habitat for target species of large carnivores
(bear, wolf and lynx), adequate mobility across the road has to be ensured by building green infrastructure
elements.
5. During the implementation of the Ro.5 A11 Lekenik - Sisak measure, noise protection towards the area of
the ecological network HR1000003 Turopolje has to be planned on the intervention level in cooperation
with an expert – ornithologist, and during the construction of the connecting roads over the river Kupa,
entering priority target habitat types 91E0* Alluvial forests (Alno-Padion, Alnion incanae, Salicion albae)
and 7220* Springs next to which tuff deposits (Cratoneurion) - dotted or ribbed formations dominated by
moss of the species Cratoneurion commutati has to be avoided.
6. When implementing the Ro.6 DC 10 Vrbovec - Križevci - Koprivnica - State border with Hungary towards
Kaposvár measure, additional mitigation measures such as building opaque noise reducing fences
alongside the road have to be considered.
7. The route provided for in the Ro.7 DC 12 Vrbovec 2 hub - Ivanja Reka - Vrbovec - Bjelovar - Virovitica -
State border with Hungary towards Barcs measure needs to be moved so it does not cross the area of the
ecological network HR1000009 Ribnjaci uz Česmu.
8. Alongside the section provided for in the Ro.8. Reorganization of the main Zagreb network measure, which
passes through the area of the ecological network HR1000003 Turopolje, opaque noise reducing fences
have to be integrated. In the part of the section passing next to the area of the ecological network
HR2000589 Stupnički lug, damage to the surrounding trees of the target habitat type 9160 Sub-Atlantic
and Central European oak and oakhornbeam forests Carpinion betuli has to be avoided.
9. The section provided for in the Ro.9. D2 from the state border with Slovenia to the state border with Serbia
measure, which passes through the area of the ecological network HR2001500 Stepska staništa kod
Bapske, has to be moved or arched over by a viaduct in order to prevent the conversion of the target
habitat type 6240* SubPannonian steppe grasslands (Festucion vallesiacae).
10. During the construction of the part of the section under the Ro.15 Reorganization of the Split network: Split
- Omiš measure, attention has to be paid to the part that passes next to the area of the ecological network
Strategic Environmental Impact Study of the Transport Development Strategy of the Republic of Croatia 2017-2030
Zagreb, August 2017. 366
HR2001376 Područje oko Stražnice and the construction time has to be adapted to the ecology of the
target species lesser mouse-eared bat - Myotis blythii. During the usage of the section, mitigation
measures for bats (enabling bats to fly-over the road (hop-over) have to be planned and light pollution has
to be reduced.
Railway transport
11. When improving the railway lines provided for by measures R1, R2, R3, R4, R5, R8, R9, R10 and R11,
mitigate measures to alleviate target species fatalities (especially large carnivores) over and under the
planned roads have to be planned.
Air traffic
12. When implementing the A.8. Development of the Zadar Airport measure, the expansion of the airport into
the areas of the ecological network HR1000024 Ravni kotari and HR2001361 Ravni kotari has to be
avoided.
Maritime traffic
13. During the construction of the new terminal provided for in the M9 Specialization of the Port of Ploče
(container and bulk cargo) measure, taking over the habitats in the area of the ecological network
HR1000031 Delta Neretve i HR5000031 Delta Neretve has to be avoided.
Cumulative impacts
14. Due to the identified negative cumulative impact on the area of the ecological network HR2001311 Sava
nizvodno od Hrušćice, it is necessary to temporally separate the construction of bridges and reconstruction
works of the river ports on Sava.
15. If the R11 measure plans to build new railway lines, it is necessary to harmonize them with the Ro8
Reorganization of the main Zagreb network measure, so that it follows the road infrastructure and does
not occupy parts of areas of the ecological network (especially the area of the ecological network
HR2000589 Stupnički lug).
Monitoring of mitigation measures is essential for determining their effectiveness. Sometimes only minor changes are
enough to significantly increase their functionality. Also, based on the data collected through monitoring, future
interventions and mitigation measures can be better planned. Monitoring should be anticipated during the mitigation
measures planning in the intervention approval procedure.
11.5 Conclusion
The following was established by analyzing the potential impacts of the Ecological Network Strategy:
- The strategy contains general, development and management-organizational measures that have a neutral
impact or impact that cannot be estimated.
- The analysis of spatially located measures showed that one measure has a significant negative impact on
the ecological network.
- It was identified that the implementation of the Strategy measures shall have negative impacts during the
construction of certain interventions provided for by the measures as well as during usage.
- Given that some parts of the measures (i.e. some sections within the scope of a measure) have already
been built or are currently in construction (according to the most recent digital orthophoto data), the
environmental impact assessment focuses on the period of usage of the scope of measures. Measures
that have not yet been implemented, but may have an impact on the ecological network, can be made
acceptable for the ecological network by implementing ecological network acceptability assessments within
lower-level implementation programs.
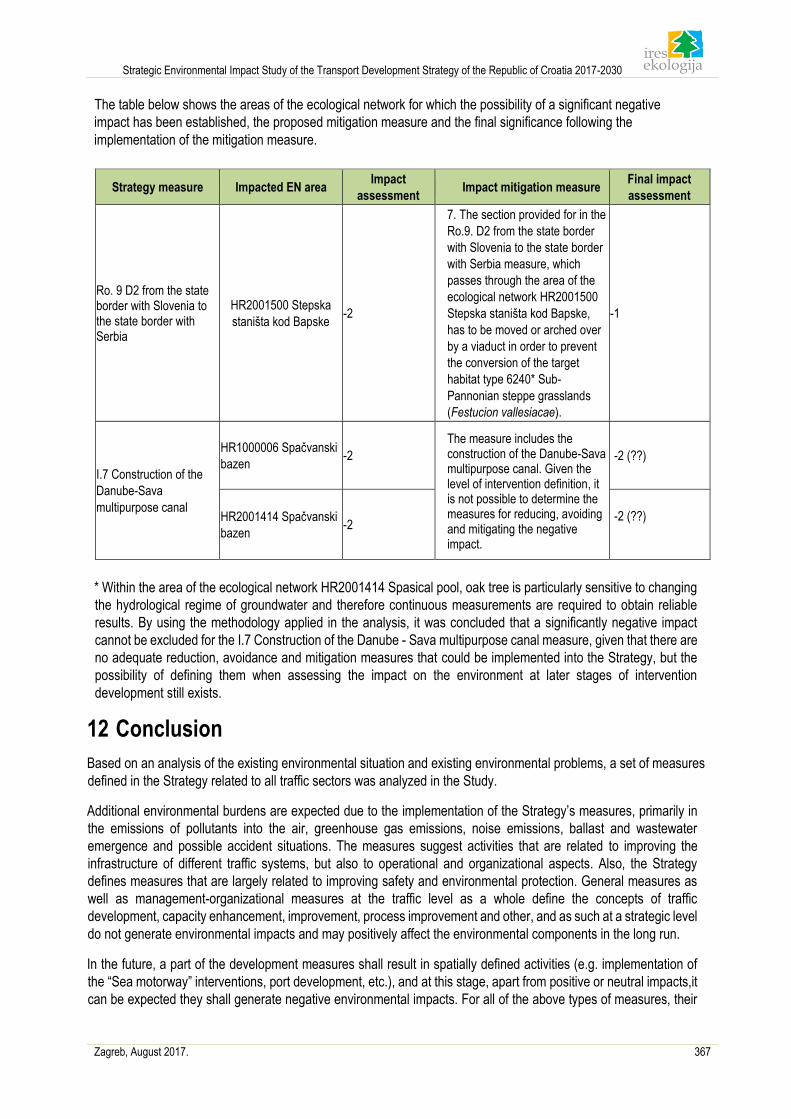
Strategic Environmental Impact Study of the Transport Development Strategy of the Republic of Croatia 2017-2030
Zagreb, August 2017. 367
The table below shows the areas of the ecological network for which the possibility of a significant negative
impact has been established, the proposed mitigation measure and the final significance following the
implementation of the mitigation measure.
Strategy measure Impacted EN area Impact
assessment Impact mitigation measure
Final impact
assessment
Ro. 9 D2 from the state border with Slovenia to the state border with Serbia
HR2001500 Stepska
staništa kod Bapske -2
7. The section provided for in the
Ro.9. D2 from the state border
with Slovenia to the state border
with Serbia measure, which
passes through the area of the
ecological network HR2001500
Stepska staništa kod Bapske,
has to be moved or arched over
by a viaduct in order to prevent
the conversion of the target
habitat type 6240* Sub-
Pannonian steppe grasslands
(Festucion vallesiacae).
-1
I.7 Construction of the
Danube-Sava
multipurpose canal
HR1000006 Spačvanski
bazen -2
The measure includes the construction of the Danube-Sava multipurpose canal. Given the level of intervention definition, it is not possible to determine the measures for reducing, avoiding and mitigating the negative impact.
-2 (??)
HR2001414 Spačvanski
bazen -2
-2 (??)
* Within the area of the ecological network HR2001414 Spasical pool, oak tree is particularly sensitive to changing
the hydrological regime of groundwater and therefore continuous measurements are required to obtain reliable
results. By using the methodology applied in the analysis, it was concluded that a significantly negative impact
cannot be excluded for the I.7 Construction of the Danube - Sava multipurpose canal measure, given that there are
no adequate reduction, avoidance and mitigation measures that could be implemented into the Strategy, but the
possibility of defining them when assessing the impact on the environment at later stages of intervention
development still exists.
12 Conclusion
Based on an analysis of the existing environmental situation and existing environmental problems, a set of measures
defined in the Strategy related to all traffic sectors was analyzed in the Study.
Additional environmental burdens are expected due to the implementation of the Strategy’s measures, primarily in
the emissions of pollutants into the air, greenhouse gas emissions, noise emissions, ballast and wastewater
emergence and possible accident situations. The measures suggest activities that are related to improving the
infrastructure of different traffic systems, but also to operational and organizational aspects. Also, the Strategy
defines measures that are largely related to improving safety and environmental protection. General measures as
well as management-organizational measures at the traffic level as a whole define the concepts of traffic
development, capacity enhancement, improvement, process improvement and other, and as such at a strategic level
do not generate environmental impacts and may positively affect the environmental components in the long run.
In the future, a part of the development measures shall result in spatially defined activities (e.g. implementation of
the “Sea motorway” interventions, port development, etc.), and at this stage, apart from positive or neutral impacts,it
can be expected they shall generate negative environmental impacts. For all of the above types of measures, their
Strategic Environmental Impact Study of the Transport Development Strategy of the Republic of Croatia 2017-2030
Zagreb, August 2017. 368
impact on the environment and health was assessed on the basis of their description. Spatially defined measures
formulate the planned activities and their impact assessment was performed at the environmental components level,
which has resulted in proposing measures to mitigate adverse environmental impacts.
Due to the lack of systematic research and data and the lack of specific data for measure I.7 The construction of the
Danube - Sava multipurpose canal can not be confirmed with certainty the significant negative impact of this
environmental measure. The intensity and significance of possible impacts will be assessed at the level of the project
when project data is available and a feasibility study is carried out and an environmental impact assessment procedure
is carried out.
At the strategic level of assessment, when we exclude specific impacts that are either constrained by legal regulation
or are considered at the level of environmental impact assessment, the Strategy has potentially positive and negative
impacts on environmental components. To mitigate the identified negative impacts, the Study prescribes measures
for environmental protection, i.e. the mitigation of the potential impacts of the Strategy.
During the environmental impact assessment of the Strategy, potential transboundary impacts mainly related to air
and water pollution and noise pollution were identified, but positive impacts have also been identified in terms of
improving economic and socio-economic image of neighboring countries (traffic connections with European
corridors).
Within the process of strategic assessment of the environmental impact of the Strategy, a process of assessing the
acceptability of the Strategy for the ecological network was performed. Potential negative impacts of the Strategy
on the ecological network were identified and mitigation measures were defined.
For the impacts of the Strategy that were assessed as significantly negative, adequate protection measures have been prescribed, i.e. measures to mitigate negative impacts. By implementing defined environmental protection measures stipulated in the Study, the Strategy is acceptable for the environment and the ecological network of the Republic of Croatia.
Strategic Environmental Impact Study of the Transport Development Strategy of the Republic of Croatia 2017-2030
Zagreb, August 2017. 369
13 Summary
13.1 Introduction The designer of the Transport Development Strategy of the Republic of Croatia for the period 2017-2030
(hereinafter: the Strategy) is the Ministry of Maritime Affairs, Transport and Infrastructure6 (hereinafter: the Ministry
of Sea, Transport and Infrastructure). The SEIA procedure started on 21 July 2015 with the adoption of the Decision
on the implementation of the procedure for Strategic Environmental Impact Assessment for the “Transport
Development Strategy of the Republic of Croatia for the period 2017-2030” (Class: 340-03/15-10/03, Reg. No.:
530-08-2-3-2-15-4).
The SEIA procedure for the Strategy is implemented on the basis of the provisions of the Environmental Protection
Act, the Regulation on the Strategic Environmental Impact Assessment of the Strategy, Plan and Programme (OGof
the Republic of Croatia 64/08)7 and the Regulation on Information and Participation of the Public and Interested
Public in Environmental Issues (OGof the Republic of Croatia 64/08). This procedure assesses the likely significant
impacts on the environment and human health that may arise from the implementation of the Strategy.
The Strategic Environmental Impact Study (hereinafter: the Study) is developed in the SEIA procedure, a
professional background attached to the Strategy and includes all the necessary data, explanations and
descriptions in textual and graphic form. The study identifies, describes and assesses the likely significant impacts
on the environment and human health that may arise from the implementation of the Strategy. It is intended to
ensure that the consequences on the environment and human health are assessed during the preparation of the
Strategy, prior to the final proposal and referral to the procedure for its adoption.
13.2 Preliminary environmental impact analysis of the Strategy
Air quality and climate features
At a strategic assessment level, when we exclude specific impacts that are either limited by legal regulations or are
considered at the level of environmental impact, the Strategy has potentially positive and negative impact on air quality
and climate features. Using the newly constructed transport infrastructure and increasing the number of vehicles shall
increase the amount of harmful exhaust and greenhouse gases, which negatively affects the air quality. The
implementation of the measures that contribute to the reduction of greenhouse gas emissions and the introduction of an
intermodal system based on ecological and innovative solutions shall have a positive impact on the air quality and climate
features.
Geodiversity
By analysing the locations of protected geoheritage sites and interventions planned in the Strategy, it has been
established that there are no conflicts in the area, i.e. that the intervention shall not devastate the protected
geoheritage sites.
Biodiversity
In the implementation of the Strategy, there are possible impacts on biodiversity, which are primarily reflected in
additional fragmentation of rare and endangered habitats, disturbing species and reducing the stability of important
ecosystems. Significant impacts are possible due to changes in hydromorphological conditions of water bodies, which
6 The Ministry of Maritime Affairs, Transport and Infrastructure changed its name to Ministry of Sea, Transport and Infrastructure,
October 2016. 7 From January 2017, a new Regulation on the Strategic Environmental Impact Assessment of the Strategy, Plan and Programme
(Official Gazette of the Republic of Croatia 3/17) is effective.
Strategic Environmental Impact Study of the Transport Development Strategy of the Republic of Croatia 2017-2030
Zagreb, August 2017. 370
may lead to changes in habitat conditions. In addition, new roads significantly reduce habitats by causing edge effects
and barrier effects.
Landscape characteristics
Large transport infrastructure projects and associated infrastructure generate negative impact on the landscape. The
impact intensity depends on the area through which it passes or its characteristics. The characteristics of each area
are manifested through natural, anthropogenic (cultural) and visual experiential qualities. Given the number and types
of projects, that is, the type of transport, the most significant impact of the Strategy is expected in the landscape region
of the Lowland areas of northern Croatia.
Soil
The construction of railway tracks and roads shall lead to a negative impact on the soil in the form of soil contamination
with pollutants which occur due to transport by trains and road vehicles and potential soil degradation due to erosion
or soil displacement. Since the impacts on the soil are largely related to the narrow area around the roads themselves,
significant impacts on the soil during the implementation of the Strategy are not expected.
Water
Due to the implementation of the Strategy, negative impacts are expected due to potential pollution of water bodies
and water for human consumption, as well as impacts on the hydromorphological condition of water bodies. However,
it is estimated that these impacts shall not be significant if the existing legal regulations and water protection measures
prescribed by the subject Study shall be applied.
Cultural and historical heritage
Due to the implementation of the Strategy, negative impacts are possible on the architectural heritage (individual
buildings, cultural and historical units) and the cultural landscape, as well as the archeological zones and sites.
Nevertheless, the preliminary analysis of the Strategy implementation does not show significant impacts, given that
due to the character of the impact it is possible to implement protection measures for the conflict areas.
Agriculture
Realising the measures in the road and rail transport sector and inland waterway transport may result in the conversion
and fragmentation of agricultural land P1 and P2. Given the presence of P1 and P2 land, the influence of the
conversion of P1 and P2 land can be significant in the Dinarides.
Forestry
Significant impacts may be expected in the implementation of planned measures in the area of endangered lowland
forests, in particular common oak forests that are regularly flooded. The construction of roads and railway tracks shall
lead to fragmentation of forest areas, and the construction of the Danube - Sava canal to significant changes in the
water regime, which shall have a significant impact on the stability of the lowland forest ecosystem.
Wild game and hunting
The main impacts that may arise from the implementation of the Strategy are the fragmentation of hunting areas,
disturbance and fatalities of wild game on the roads.
Tourism
Transport capability to meet tourism needs is determined by the size and condition of the transport infrastructure and
transport capacities as well as their ability to meet demand requirements with their services. The importance of tourism
for Croatian economy is great and therefore the transport system appears as a factor for improving or limiting the
development of tourism. The development and equipping of passenger terminals and accompanying facilities, a
systematic improvement of infrastructure and transport service and the uniform development of all transport modes
Strategic Environmental Impact Study of the Transport Development Strategy of the Republic of Croatia 2017-2030
Zagreb, August 2017. 371
within the traffic system shall positively influence the accessibility of tourist destinations, the comfort, speed and safety
of travel and the mobility of tourists within destinations, which shall synergistically affect the increase in the indicators
of the tourism intensity and the possibilities of improving or creating new tourist products.
Social and economic characteristics
Today, a harmonised economic development and valorisation of economic and natural resources is inconceivable
without the adequate development of the entire transport infrastructure complex. It is even more important considering
the attractiveness of the coastline and islands in our country and the primacy of the most developed tourist area where
most of the country's GDP is generated. The wide offer of different means of transport, infrastructure and various
transport systems has a major role to play in raising the quality of life of citizens by improving accessibility and
increasing travel speeds. This strengthens the mobility of the population, ensures sufficient and rapid supply of remote
parts of Croatia, which leads to the intensification of the business of economic entities, strengthening of tourism
activities, increase in the number of employees and the growth of the general and economic well-being of the society.
The synergistic impact of these effects is reflected in the slow economic emigration of the population from the
emigration areas in Croatia, which directly affects the stable overall (general) movement of the population.
13.3 Impact assessment methodology The impact assessment is based on a strategic level that excludes individual interventions and a specific
intervention-related environmental impact assessment. In line with the methodological recommendations for the
development of strategic studies that analyse the strategies, plans and programmes proposed under the IPA 2010
intervention "Strengthening Capacities for Strategic Environmental Impact Assessment (SEIA) at Regional and
Local Level" from 2014, the impact assessment was conducted through the selection of the strategic goal of the
Study. The strategic goal of assessing the impact is "Compliance of the Strategy measures with the
environmental and nature requirements". It is evident from the selection of the goal that the main methodological
guideline for assessing the impact is an analysis of the acceptability of the measures proposed by the Strategy in
relation to the relevant environmental topics with their components.
When assessing the impacts, four impact categories are used:
- Positive impact - describes the assessment that, due to the implementation of the measure, the state of
the environmental elements in relation to the present situation shall be improved. This can be the result of
solving some of the existing environmental problems, or due to the change in the existing negative trend.
- Neutral impact – the assessment has shown that there are no impacts on the environmental component.
- Moderate negative impact - describes the assessment that, due to the implementation of the measure,
the state of the environmental elements in relation to the present situation shall slightly deteriorate, but not
to the extent that it could lead to significant and persistent disturbance of the environment or nature. In this
category, there are impacts involving the release of pollutants within the limits prescribed by legal
regulations, taking of smaller parts of numerous or less valuable habitats, the risk of fatalities of a smaller
number of individuals belonging to the species that are not in the protection regime etc.
- Significantly negative impact – describes the assessment that there is a risk that, due to the
implementation of the measure, the state of the environmental elements shall deteriorate to the extent that
it could lead to a significant disturbance of the environment or nature. A measure that would bring a
significant impact to the level of moderate or eliminate it shall be prescribed for this impact.
In addition to the analysis of the Strategy measures, their justification in relation to the environmental and nature
requirements is assessed, as well as possible direct, indirect, short-term, medium-term, permanent, cumulative and
transboundary environmental impacts.
When describing the impacts of the proposed measures on the environment and nature, the following terms are used
to provide a more detailed definition of the type and scope of individual impacts:
- Direct impact – if the measure is a direct source of the impact described
Strategic Environmental Impact Study of the Transport Development Strategy of the Republic of Croatia 2017-2030
Zagreb, August 2017. 372
- Indirect impact – of the measure generates a change that is the source of the impact described (future)
- Short-term impact – if the impact on the environment/nature ceases within 5 years
- Medium-term impact – if the impact on the environment/nature ceases between 5th and 10th year from the
beginning of the impact development
- Permanent impact – of the impact has permanent consequences on the environment/nature and does not
cease even after 10 years
- Cumulative impact – if several measures from the Strategy generate equal impacts on the environmental
component, their joint impact on this component is cumulative
- Synergetic impact - if several measures from the Strategy generate different impacts that jointly affect the
environmental component in a manner that joint impact is stronger than the sum of individual impacts on
the subject component, this impact is called synergetic
- Transboundary impact – if the measure can affect the environment/nature of other countries.
13.3.1 Environmental impact assessment of the Strategy For the purposes of the environmental impact assessment, the measures defined by the Strategy are divided
into four categories:
1. General measures
2. Development measures
3. Management and organisational measures
4. Spatially located measures
At the strategic level of assessment, when we exclude specific impacts that are either constrained by legal regulation
or are considered at the level of environmental impact assessment, the Strategy has potentially positive and negative
impacts on environmental components. Usage of the newly constructed traffic infrastructure and the increase in the
number of vehicles shall increase the amount of harmful exhaust and greenhouse gases, but the implementation of
measures that contribute to the reduction of greenhouse gas emissions and the introduction of an intermodal system
based on ecological and innovative solutions shall reduce the negative impact on the environment.
Impacts on biodiversity are primarily reflected in the additional fragmentation of rare and endangered habitats,
disturbance of species and reduction of the stability of important ecosystems. Significant impacts are possible due
to changes in hydromorphological conditions of water-bodies, which may lead to changes in habitat conditions. In
addition, new roads significantly reduce habitats by causing edge and barrier effects. Through the analysis of the
development of the railway network Zagreb - Rijeka, a variant solution was considered, i.e. a track line that has a
moderate impact on biodiversity has been identified.
Given the landscape features, the most significant impact of the Strategy is expected in the landscape region Lowland
areas of northern Croatia. As a result of the implementation of the Strategy, an increase in water and soil pollution
sources is also expected, however, it was estimated that these impacts shall not be significant if the existing legal
regulations and water protection measures prescribed by this Study are implemented.
Significant impacts on forestry can be expected during the implementation of planned measures in the area of
endangered lowland forests, in particular riparian pedunculate oak forests (construction of the Danube - Sava canal).
It was assessed that the construction of the Danube - Sava canal shall have a significant impact without any
mitigation measures or alternative solutions.
On the other hand, the Strategy is positively reflected on the overall socio-economic picture of the Republic of Croatia.
A wide offer of different means of transport, infrastructure and various traffic systems has a major role in raising the
quality of citizens’ life by improving accessibility and increasing travel speeds. This increases the mobility of the
population, ensures sufficient and rapid supply of remote parts of Croatia, which in turn leads to intensification of the
business operations of business entities, the strengthening of tourism activities, the increase of the number of
employees and the growth of the general and economic well-being of the society.
Strategic Environmental Impact Study of the Transport Development Strategy of the Republic of Croatia 2017-2030
Zagreb, August 2017. 373
The strategy sets out objectives whose realization is expected to have transboundary impacts. This primarily refers
to the specific objective that includes all traffic sectors in terms of better alignment of traffic management with
neighboring countries (Bosnia and Herzegovina - Port of Ploče, road and rail connections with Bosnia and
Herzegovina, Slovenia, Serbia, Italy, Montenegro and Hungary), but also on other goals, such as the realization of
cooperation with Bosnia and Herzegovina in the development of the cargo port Slavonski Brod and the development
of the potential for navigation on inland waterways in the segment of tourism and public transport, since a part of
these routes often constitutes the borders with the neighboring countries. As the Strategy shall be the starting point
for spatial planning of smaller spatial units, i.e. the development of master plans for functional regions, possible
transboundary impacts for each activity shall be possible to be closely identified during further phases.
13.4 Environmental protection measures
13.4.1 Soil 1. If the intervention is planned in the area of moderate and high risk of erosion, agrotechnical mitigation measures
shall be used in accordance with the Ordinance on Agrotechnical Measures.
13.4.2 Waters 2. When constructing railway lines, concrete sleepers shall be used as much as possible, i.e. wooden sleepers that
need to be treated with chemicals before use shall be avoided.
3. During the design and construction of railway lines and roads, the road routes shall be defined in a manner that
minimises the impact of changes in the existing river and lake basins to reduce the impact on their
hydromorphological condition. When constructing roadways in vulnerable, sensitive or protected areas, at the
level of the project, an analysis of potential pollution of the surrounding water bodies shall be conducted and
appropriate protection measures shall be prescribed.
4. During the works on the expansion of airports, wastewater drainage system shall be constructed as well as
wastewater treatment facilities of the appropriate category.
5. All line and point interventions shall be designed in such a manner as to avoid areas of special water protection
- sanitary protection zones.
6. Each newly constructed port, before the preparation of the main design or before the start of use of the port, if
the main design is not required, shall have a maritime study accepted and certified by the Port authority in
accordance with Article 5 of the Regulation on Conditions to be met by the Ports (OG 110/04).
7. In planned ports, solid waste collection shall be organised and adequate infrastructure shall be provided for
wastewater collection from ships.
8. New sea and river ports are planned at locations where the morphological condition of water bodies is rated as
very good, i.e. at locations where there are no existing hydromorphological pressures.
13.4.3 Biodiversity 9. The development of the railway transport on the Karlovac-Rijeka section shell based on a variant solution that
passes through the south of the Zlobin village in Primorje-Gorski Kotar County with the sanation of the existing
railway line.
10. Motorways and other roads with a planned traffic density of more than 5000 vehicles per day are planned in a
manner that shall enable the establishment of adequate capacity for wild species in the next stages of their
realisation, taking into account existing transport infrastructure.
11. The transport infrastructure in areas that are evaluated as non-fragmented shall be planned primarily in habitats
that are under higher anthropogenic influence with the use of the shortest possible sections through non-
fragmented areas. The transport infrastructure shall be planned in a manner that enables the implementation of
green infrastructure.
12. The improvement of the maritime transport shall be planned in such a manner as to avoid the areas inhabited
by the species Tursiops truncatus (bottlenose dolphin) and fish hatches in the Adriatic.
Strategic Environmental Impact Study of the Transport Development Strategy of the Republic of Croatia 2017-2030
Zagreb, August 2017. 374
13. The new eastern port on the Danube in Vukovar shall be planned completely outside the borders of the Special
reserve of forest vegetation Vukovarske dunavkse ade.
14. The section of the road that is planned within the boundaries of the Significant landscape Cetina – Donji tok, and
is covered by the measure of Ro. 15 Reorganisation of the Split network, shall be constructed in such a way to
avoid disturbing the features of this protected area.
15. The traffic corridor envisaged by measures R.11 Zagreb Node and Ro.8 Reorganization of the main Zagreb
network, in which several types of parallel line transport infrastructure are planned to be implemented with a
view to mitigate cumulative impacts, shall be constructed in cooperation of all the transport sectors involved, as
well as the bodies competent for expert nature protection activities and bodies competent for forest management
in the given area, in order to enable adequate capacity for wild species through parallel roads with minimum
disturbance of forest habitats.
13.4.4 Cultural and historical heritage Protection of archaeological heritage
16. Prior to undertaking the interventions in the area that arise from spatially located measures, the archaeological
field examination shall be conducted and, if necessary, test archaeological research on the positions of known
and recorded archaeological sites, which shall determine the scope of protective archaeological research,
documentation and conservation of the findings and sites. Archaeological field examination shall be conducted
at the locations of potential archaeological sites with indicative names, toponyms and places where changes in
relief caused by human action in history are evident.
17. If protective archaeological research results in significant findings that need to be preserved and presented,
there is a possibility of relocating the infrastructure route and other planned structures on the locations of such
sites.
Protection of cultural and historical units, historical structures and buildings
18. The protection measure system includes the exploration and documentation of the endangered cultural heritage
with maximum preservation to mitigate the negative impact on the spatial and visual integrity of the architectural
heritage.
Protection of historical cultural landscape
19. Measures for the protection of the historical cultural landscape shall be implemented during the project design
stage by designing a landscaping design of the intervention zone area.
20. A landscape sensitivity study shall be prepared prior to the landscaping design.
13.4.5 Agriculture 21. In the area of Pannonian Croatia, the implementation of the measures that can generate conversion and
fragmentation of P1 and P2 land capability class shall be planned to avoid by all means, except in exceptional
circumstances, taking P1 and P2 land capability classes.
22. In the area of Dinarides, the measures that can generate conversion and fragmentation of P1 and P2 land
capability class shall be implemented outside P1 and P2 land capability class.
23. Measures that can generate conversion and fragmentation of agricultural land shall be planned to maximise the
use of existing infrastructure and avoid unnecessary conversion and fragmentation of agricultural land.
13.4.6 Landscape characteristics 24. The measures envisaged by the Strategy shall be incorporated into the landscape through green infrastructure
interventions, or interventions of Landscaping by an expert (landscape architect).
Strategic Environmental Impact Study of the Transport Development Strategy of the Republic of Croatia 2017-2030
Zagreb, August 2017. 375
13.4.7 Social and economic characteristics 25. When designing roads, the significance of impacts shall be assessed taking into account the estimated traffic
increase and, if necessary, appropriate noise protection measures shall be implemented.
13.4.8 Climate changes 26. All infrastructure interventions arising from the measures of the Strategy shall be planned taking into account the
potential climate phenomena in the area of measure implementation. The intervention design shall be realised
in accordance with non-formal guidelines: „Non-paper Guidelines for Intervention Managers: making vulnerable
investments climate resilient“ (European Commission, Directorate-General for Climate Action).
27. The measures envisaged by the Strategy are to be implemented in accordance with the National Policy
Framework for the Establishment of Infrastructure and Development of Alternative Fuel Market (NFP) (OG 34/17)
and strategic documents and incentives by local and regional self-government units related to the establishment
of alternative fuels infrastructure are contained in the aforementioned National Framework
Due to the lack of systematic research and data and the lack of specific data for measure I.7 The construction of the
Danube - Sava multipurpose canal can not be confirmed with certainty the significant negative impact of this
environmental measure. The intensity and significance of possible impacts will be assessed at the level of the project
when project data is available and a feasibility study is carried out and an environmental impact assessment procedure
is carried out.
13.5 Appropriate assessment
The scope of the Strategy covers the entire territory of the Republic of Croatia and therefore overlaps with the scope
of the ecological network defined in the Regulation on Ecological Network (OG 124/2013, 105/15). The ecological
network of the Republic of Croatia also represents the areas of the EU Natura 2000 ecological network. The
ecological network of the Republic of Croatia are the conservation areas significant for birds - SPA (areas significant
for conservation and achieving favourable conservation status of wild bird species of interest for the European
Union, as well as their habitats, and areas significant for conservation of migratory bird species, in particular
wetlands of international importance) and conservation areas significant for species and habitat types - SAC (areas
significant for conservation and achieving favourable conservation status of other wild species and their habitats,
as well as natural habitat types of interest for the European Union).
13.5.1 Impacts of the Strategy on the Ecological Network
When it comes to the transport infrastructure, the interventions differ largely only in size and accordingly in the
intensity of the impact. The size of the intervention ranges from constructing a new road to extending or
reconstructing an already existing road by adding traffic lanes, intersections, crossings, etc. The impacts that traffic
interventions can have on the target species and habitats of the ecological network are mostly of a similar nature.
The impact assessment depends on the size and intervention design of a particular intervention.
According to the HAOP <Croatian Agency for the Environment and Nature> Expert Guidelines, the three major
sources of intervention impact should be distinguished for the purpose of assessing the impact of traffic
interventions on the ecological network. The first source of impact is the performance of construction works, the
second is the facility itself, and the third is the traffic activity. Depending on the original source of impact, they differ
in terms of intensity, coverage, duration, and characteristics. The impact is usually most pronounced during
construction works. However, it is also of a limited duration depending on the size of the intervention. During the
construction of large motorways, the works of different intensity may last several years. Once the works are
completed, the construction stage impact is reduced, but it still remains present for a longer period of time. On the

Strategic Environmental Impact Study of the Transport Development Strategy of the Republic of Croatia 2017-2030
Zagreb, August 2017. 376
other hand, the impact of the traffic itself is usually increased over time and depends largely on the density and
amount of vehicles.
The following impacts are possible during construction:
▪ Loss of land/area use: Temporary used areas (outside the location of the road, work belt), e.g. for storage
purposes, work machines, etc.
▪ Change in the landscape layout (geomorphology): Visual changes are greatest during construction works,
since construction often requires the transfer of large quantities of land. The underground parts of the
structure itself need to be dug in, construction works require a larger space for e.g. storing and moving, than
the road itself.
▪ Change in functional connection: the construction site hinders connectivity, especially in areas of intensive
works.
▪ Noise: Construction sites are usually a source of great noise, which is continuous during the performance
of works (e.g. machine operation, etc.), and the most noise is produced by works such as mining or drilling.
▪ Air pollution: Machines emit substances that pollute the air, dust is spread, mining causes great amount of
dust
▪ Water pollution: Normal operation of work machines causes the release of substances that pollute the water,
but also possible release of fuel, oil, etc.
▪ Vibrations: Construction works, trucks and large machines cause vibrations, which are most intense during
mining or drilling.
▪ Changes in the hydrological regime (quality and quantity): Construction works can temporarily disrupt the
hydrological regime, and it may be necessary to move underground and surface water flows.
Line facility with secondary structures may have the following impacts:
▪ Loss of land/area use: Permanent use of areas where the road is located, but also secondary structures
such as auxiliary roads, structure for water source protection, etc.
▪ Asphalting: Mainly roads, but also secondary structures such as auxiliary roads
▪ Change in the landscape layout: Dams, bridges and crossings change the layout, but after the completion
of the works, efforts are made to integrate the road into the surrounding landscape where possible (growing
vegetation).
▪ Change in functional connection: Roads can interrupt connectivity (depending on the structure); if there are
no mitigation measures, the connection is terminated permanently.
▪ Changes in the hydrological regime: The facility may permanently disturb the hydrological regime due to
e.g. laying the foundations, which affects groundwater.
During the use, the transport infrastructure interventions may have the following impacts:
▪ Noise: Traffic emits the noise of different volume, intensity, characteristics, and frequencies depending on
the traffic density, which may vary depending on the time of the day, but also the type of traffic, e.g. only
cargo vehicles or only personal cars (the noise emitted by the railway has completely different
characteristics than the noise emitted by car traffic).
▪ Air pollution: substances that pollute the air largely depend on the type of traffic, vehicles (e.g. trucks, cars),
traffic density, speed limits, etc.
▪ Light: Roads of great importance usually do not have lighting, but vehicles in motion emit light.
▪ Water pollution: depends on the traffic density, accidents during the transport of dangerous cargo, etc.
▪ Vibrations after the start of using the infrastructure: Vibrations are mostly caused by the railway, while cars
usually do not cause vibrations, but goods vehicles and trucks do cause vibrations, mostly in a relatively
small range.
▪ Change in functional connection: Traffic density is often a key factor that conditions whether or not the
connection shall be interrupted.
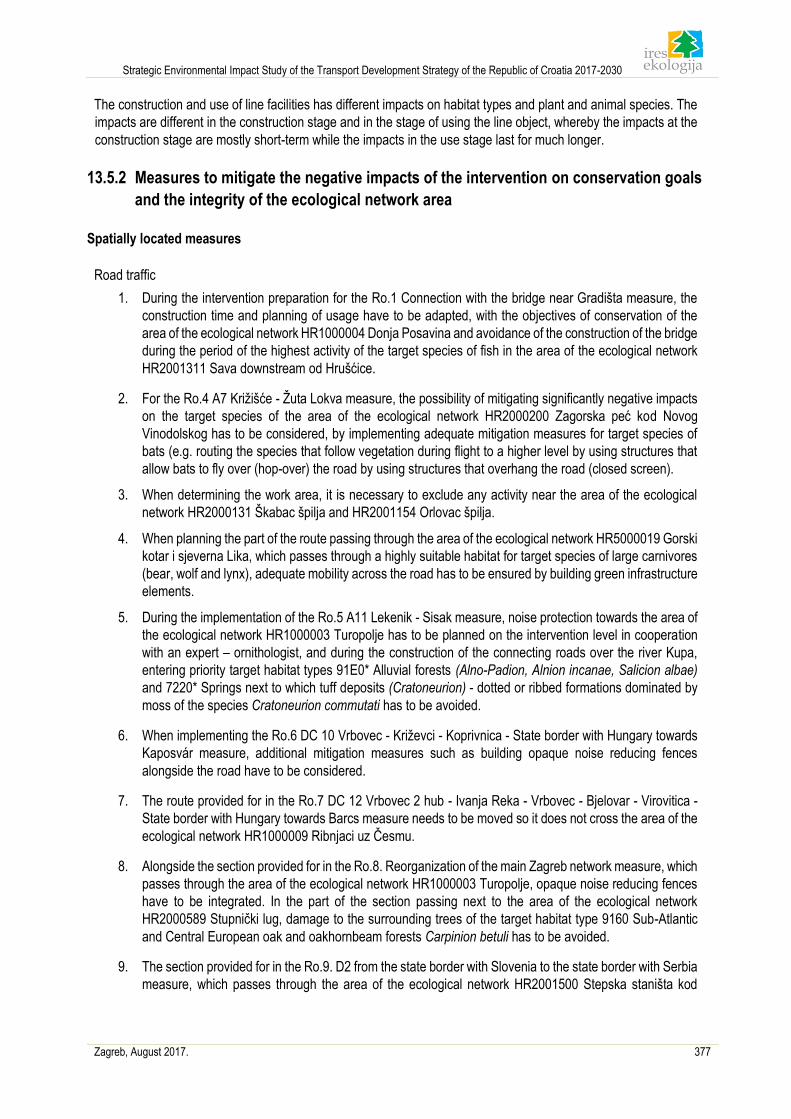
Strategic Environmental Impact Study of the Transport Development Strategy of the Republic of Croatia 2017-2030
Zagreb, August 2017. 377
The construction and use of line facilities has different impacts on habitat types and plant and animal species. The
impacts are different in the construction stage and in the stage of using the line object, whereby the impacts at the
construction stage are mostly short-term while the impacts in the use stage last for much longer.
13.5.2 Measures to mitigate the negative impacts of the intervention on conservation goals
and the integrity of the ecological network area
Spatially located measures
Road traffic
1. During the intervention preparation for the Ro.1 Connection with the bridge near Gradišta measure, the
construction time and planning of usage have to be adapted, with the objectives of conservation of the
area of the ecological network HR1000004 Donja Posavina and avoidance of the construction of the bridge
during the period of the highest activity of the target species of fish in the area of the ecological network
HR2001311 Sava downstream od Hrušćice.
2. For the Ro.4 A7 Križišće - Žuta Lokva measure, the possibility of mitigating significantly negative impacts
on the target species of the area of the ecological network HR2000200 Zagorska peć kod Novog
Vinodolskog has to be considered, by implementing adequate mitigation measures for target species of
bats (e.g. routing the species that follow vegetation during flight to a higher level by using structures that
allow bats to fly over (hop-over) the road by using structures that overhang the road (closed screen).
3. When determining the work area, it is necessary to exclude any activity near the area of the ecological
network HR2000131 Škabac špilja and HR2001154 Orlovac špilja.
4. When planning the part of the route passing through the area of the ecological network HR5000019 Gorski
kotar i sjeverna Lika, which passes through a highly suitable habitat for target species of large carnivores
(bear, wolf and lynx), adequate mobility across the road has to be ensured by building green infrastructure
elements.
5. During the implementation of the Ro.5 A11 Lekenik - Sisak measure, noise protection towards the area of
the ecological network HR1000003 Turopolje has to be planned on the intervention level in cooperation
with an expert – ornithologist, and during the construction of the connecting roads over the river Kupa,
entering priority target habitat types 91E0* Alluvial forests (Alno-Padion, Alnion incanae, Salicion albae)
and 7220* Springs next to which tuff deposits (Cratoneurion) - dotted or ribbed formations dominated by
moss of the species Cratoneurion commutati has to be avoided.
6. When implementing the Ro.6 DC 10 Vrbovec - Križevci - Koprivnica - State border with Hungary towards
Kaposvár measure, additional mitigation measures such as building opaque noise reducing fences
alongside the road have to be considered.
7. The route provided for in the Ro.7 DC 12 Vrbovec 2 hub - Ivanja Reka - Vrbovec - Bjelovar - Virovitica -
State border with Hungary towards Barcs measure needs to be moved so it does not cross the area of the
ecological network HR1000009 Ribnjaci uz Česmu.
8. Alongside the section provided for in the Ro.8. Reorganization of the main Zagreb network measure, which
passes through the area of the ecological network HR1000003 Turopolje, opaque noise reducing fences
have to be integrated. In the part of the section passing next to the area of the ecological network
HR2000589 Stupnički lug, damage to the surrounding trees of the target habitat type 9160 Sub-Atlantic
and Central European oak and oakhornbeam forests Carpinion betuli has to be avoided.
9. The section provided for in the Ro.9. D2 from the state border with Slovenia to the state border with Serbia
measure, which passes through the area of the ecological network HR2001500 Stepska staništa kod
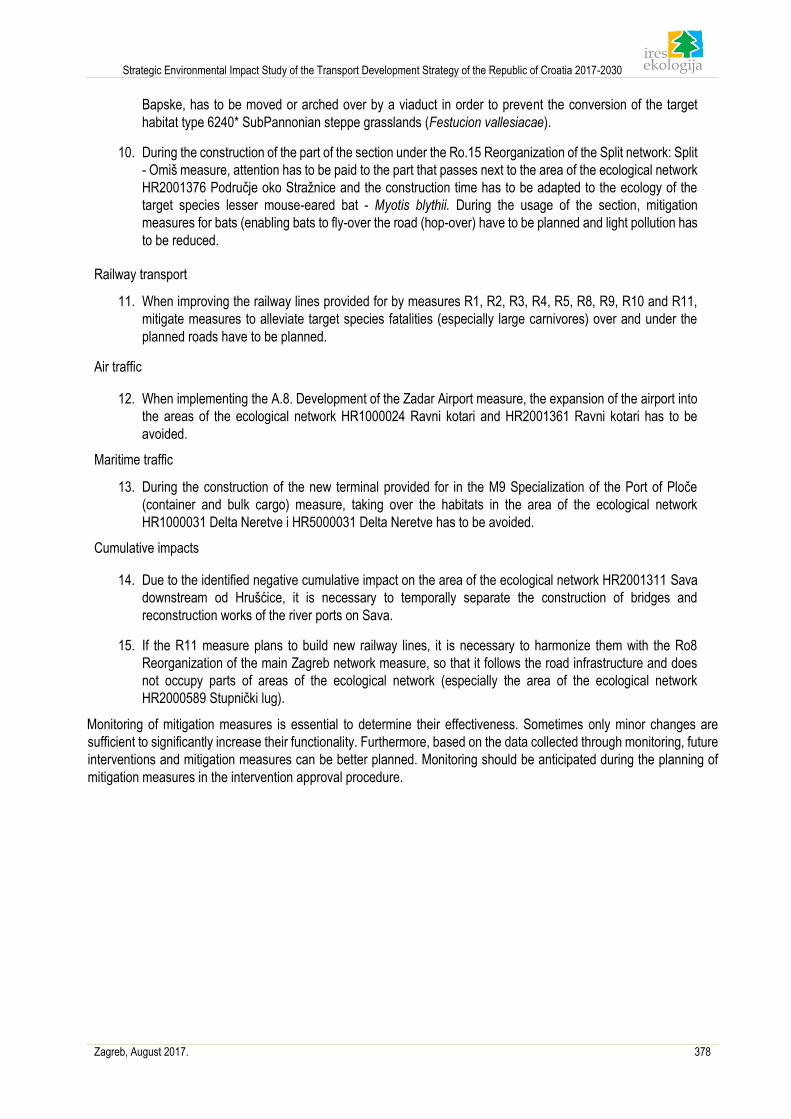
Strategic Environmental Impact Study of the Transport Development Strategy of the Republic of Croatia 2017-2030
Zagreb, August 2017. 378
Bapske, has to be moved or arched over by a viaduct in order to prevent the conversion of the target
habitat type 6240* SubPannonian steppe grasslands (Festucion vallesiacae).
10. During the construction of the part of the section under the Ro.15 Reorganization of the Split network: Split
- Omiš measure, attention has to be paid to the part that passes next to the area of the ecological network
HR2001376 Područje oko Stražnice and the construction time has to be adapted to the ecology of the
target species lesser mouse-eared bat - Myotis blythii. During the usage of the section, mitigation
measures for bats (enabling bats to fly-over the road (hop-over) have to be planned and light pollution has
to be reduced.
Railway transport
11. When improving the railway lines provided for by measures R1, R2, R3, R4, R5, R8, R9, R10 and R11,
mitigate measures to alleviate target species fatalities (especially large carnivores) over and under the
planned roads have to be planned.
Air traffic
12. When implementing the A.8. Development of the Zadar Airport measure, the expansion of the airport into
the areas of the ecological network HR1000024 Ravni kotari and HR2001361 Ravni kotari has to be
avoided.
Maritime traffic
13. During the construction of the new terminal provided for in the M9 Specialization of the Port of Ploče
(container and bulk cargo) measure, taking over the habitats in the area of the ecological network
HR1000031 Delta Neretve i HR5000031 Delta Neretve has to be avoided.
Cumulative impacts
14. Due to the identified negative cumulative impact on the area of the ecological network HR2001311 Sava
downstream od Hrušćice, it is necessary to temporally separate the construction of bridges and
reconstruction works of the river ports on Sava.
15. If the R11 measure plans to build new railway lines, it is necessary to harmonize them with the Ro8
Reorganization of the main Zagreb network measure, so that it follows the road infrastructure and does
not occupy parts of areas of the ecological network (especially the area of the ecological network
HR2000589 Stupnički lug).
Monitoring of mitigation measures is essential to determine their effectiveness. Sometimes only minor changes are
sufficient to significantly increase their functionality. Furthermore, based on the data collected through monitoring, future
interventions and mitigation measures can be better planned. Monitoring should be anticipated during the planning of
mitigation measures in the intervention approval procedure.
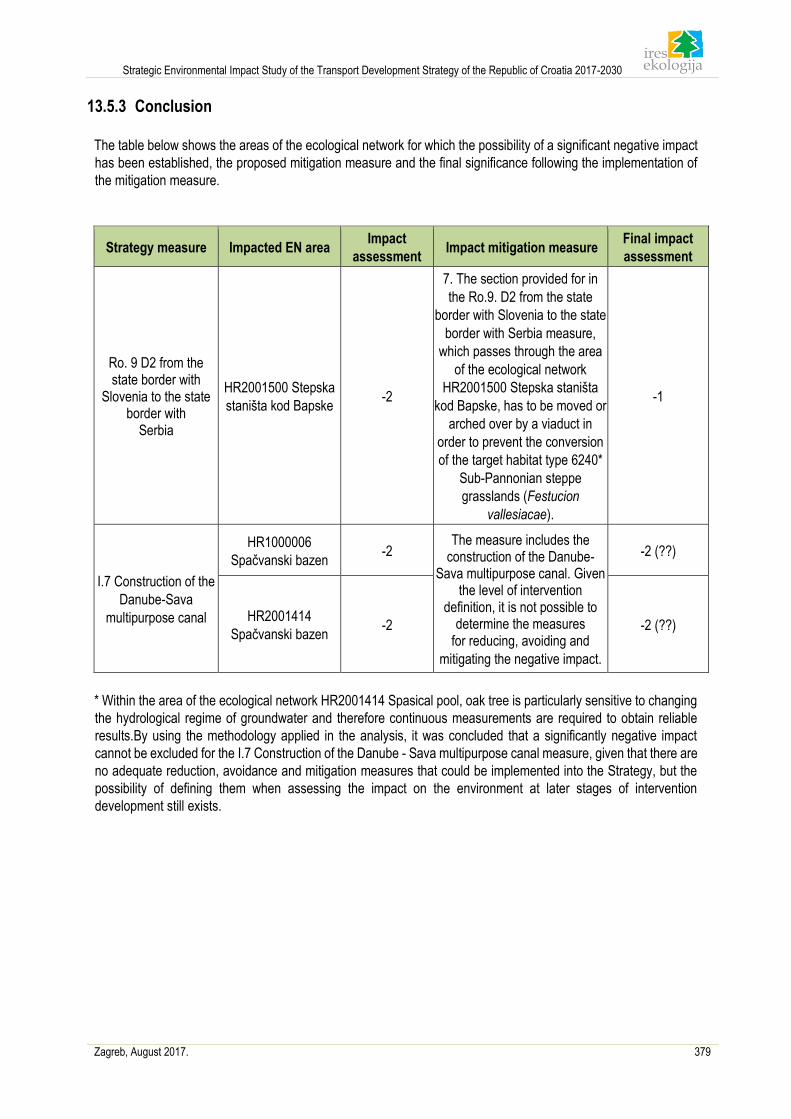
Strategic Environmental Impact Study of the Transport Development Strategy of the Republic of Croatia 2017-2030
Zagreb, August 2017. 379
13.5.3 Conclusion
The table below shows the areas of the ecological network for which the possibility of a significant negative impact
has been established, the proposed mitigation measure and the final significance following the implementation of
the mitigation measure.
Strategy measure Impacted EN area Impact
assessment Impact mitigation measure
Final impact
assessment
Ro. 9 D2 from the state border with
Slovenia to the state border with
Serbia
HR2001500 Stepska
staništa kod Bapske -2
7. The section provided for in
the Ro.9. D2 from the state
border with Slovenia to the state
border with Serbia measure,
which passes through the area
of the ecological network
HR2001500 Stepska staništa
kod Bapske, has to be moved or
arched over by a viaduct in
order to prevent the conversion
of the target habitat type 6240*
Sub-Pannonian steppe
grasslands (Festucion
vallesiacae).
-1
I.7 Construction of the
Danube-Sava
multipurpose canal
HR1000006
Spačvanski bazen -2
The measure includes the construction of the Danube-
Sava multipurpose canal. Given the level of intervention
definition, it is not possible to determine the measures
for reducing, avoiding and
mitigating the negative impact.
-2 (??)
HR2001414
Spačvanski bazen -2 -2 (??)
* Within the area of the ecological network HR2001414 Spasical pool, oak tree is particularly sensitive to changing
the hydrological regime of groundwater and therefore continuous measurements are required to obtain reliable
results.By using the methodology applied in the analysis, it was concluded that a significantly negative impact
cannot be excluded for the I.7 Construction of the Danube - Sava multipurpose canal measure, given that there are
no adequate reduction, avoidance and mitigation measures that could be implemented into the Strategy, but the
possibility of defining them when assessing the impact on the environment at later stages of intervention
development still exists.
Strategic Environmental Impact Study of the Transport Development Strategy of the Republic of Croatia 2017-2030
Zagreb, August 2017. 380
14 Sources of Data
14.1 Scientific papers
Andlar, G. (2012). Iznimni kulturni krajobrazi primorske Hrvatske. Disertacija, Agronomski fakultet Sveučilišta u Zagrebu
Andlar, G., Aničić, B., Pereković, P., Rechner Dika I., Hrdalo I. (2010): Kulturni krajobraz i legislativa – stanje u Hrvatskoj,
Društvena istraživanja, 20 (3), str. 813 – 835
Barčić, D., Dubravac, T., Rosavec, R. (2016): Utjecaj požara otvorenog prostora na šumarstvo sredozemnog područja
krša. Vatrogastvo i upravljanje požarima, br. 2/2016., vol. VI, Zagreb
Barford, C.C. et al., 2001. Factors Controlling Long- and Short-Term Sequestration of Atmospheric CO2 in a Mid-latitude
Forest. Science, 294(5547).
Bešker, I. (2005): Turizam Zagreba, diplomski rad, Geografski odsjek, Prirodoslovno-matematički fakultet, Zagreb.
Bezić, A. (2016): Razvoj prometa i turizma, Završni rad, Ekonomski fakultet Zagreb.
Borošak I. Benchmarking pristojbi za željezničku infrastrukturu u srednjoj Europi. Sveučilište u Zagrebu Fakultet
prometnih znanosti, Diplomski rad
Bosna, J., Krajinović, A., Nekić, N. (2016): Utjecaj niskotarifnih zrakoplovnih kompanija na gospodarstvo s posebnim
osvrtom na turizam, Oeconomicus Vol.1 No.1
Butula, S., Andlar G., Hrdalo I., Hudaklin J., Kušan T., Kušan V., Marković B., Šteko V. (2009): Inventarizacija,
vrednovanje i planiranje obalnih krajobraza Dalmacije, Project COAST
Carić, H., i Mackelworth, P. (2014). Cruise tourism environmental impacts – The perspective from the Adriatic Sea.
Ocean & coastal management, 102, 350-363.
Codarin A., Wysocki L.E., Ladich F., Picciulin M. (2009): Effects of ambient and boat noise on hearing and
communication in three fish species living in a marine protected area (Miramare, Italy). Mar Pollut Bull. 58: 1880. – 1887.
Čipin, I., Akrap, A., Knego, J., Međimurec, P., Đurđević, K. (2014): Stručna podloga za izradu Strategije prostornog
razvoja Republike Hrvatske: Demografski scenariji i migracije, Katedra za demografiju, Ekonomski fakultet, Sveučilište
u Zagrebu.
Dorsey, B., Olsson, M. & Rew, L.J. (2015): Ecological effects of railways on wildlife. Handbook of Road Ecology (van
der Ree, R., Smith, D.J., Grilo, C.), pp. 219–227. John Wiley & Sons, UK.
Dramstad, W.E., Olson, J.D., Forman, R.T. T., 1996. Landscape ecology principles in landscape architecture and
landuse planning, Harvard University Graduate School of Design, Island Press and the American Society of Landscape
Architects
Dulčić, J., Đođo, Ž., Dragičević, B., Ćukteraš, M., Glamuzina, B. (2012). Nove vrste u jadranskoj ihtiofauni i socio-
ekonomske posljedice na hrvatsko morsko ribarstvo. Croatian Journal of Fisheries : Ribarstvo, 70 (Supplement 1), S111-
S123. Preuzeto s http://hrcak.srce.hr/97754
Dundović, Č., Šantić, L., Kolanović, I. (2009): Ocjena postojećeg stanja i smjernice razvitka sustava unutarnjeg vodnog
prometa u Republici Hrvatskoj, Pomorstvo, god. 23, br. 2, str. 609-633.
Dundović, Č., Vilke, S. (2009): Izgradnja višenamjenskog kanala Dunav – Sava u funkciji prometne integracije
Podunavlja i Jadrana, Pomorstvo, god. 23, br. 2, str. 589-608.
Strategic Environmental Impact Study of the Transport Development Strategy of the Republic of Croatia 2017-2030
Zagreb, August 2017. 381
Forman, R. T. T., and Alexander, L. E. (1998). Roads and their major ecological effects. Annual Review of Ecology and
Systematics 29, 207-231.
Gallo C. (2011): Maslinari šumom, šumari drumom. Šumarski list, 11-12, str. 605, Zagreb.
Gašparović, S. (2011): Zračni promet i turizam Primorske Hrvatske, Geoadria 16/2, str. 155-187.
Harland, E. J., Jones S. A. S., Clarke T. (2005): SEA 6 Technical report: Underwater ambient noise
QINETIC/S&E/MAC/CR050575, Farnborough, Qinetiq
Horak, S. (2007): Turizam i promet, ZSM knjiga, Zagreb
Hrvatsko šumarsko društvo (2007): Mišljenje šumarske struke o studiji o utjecaju na okoliš višenamjenskog kanala Dunav
– Sava, Šumarski list, 7-8, str. 371, Zagreb
Huber, Đ., Tvrtković, N., Dušek, A., Štahan, Ž., Pavlinić, I., Krivak Obadić, V., Budak Rajčić, D. (2002b): Propusnost
cesta za životinje (Prijedlog smjernica za projektiranje). Institut građevinarstva Hrvatske, Zagreb, 195 p.
Iuell, B., Bekker, H., Cuperu, R., Dufek, J., Fry, G., Hick, C., Hlavác, H., Keller, V., Rosell, C., Sangwine, T., Torslov N.
& Wandall, B. (2003): Wildlife and Traffic. A European Handbook for Identifying Conflicts and Designing Solutions. KNNV
Publishers.
Jelić, D., Kuljerić, M., Koren, T., Treer, D., Šalamon, D., Lončar, M., Podnar-Lešić, M., Janev Hutinec, B., Bogdanović,
T., Mekinić, S. i Jelić, K. (2015): Crvena knjiga vodozemaca i gmazova Hrvatske. Državni zavod za zaštitu prirode,
Hrvatsko herpetološko društvo HYLA, Zagreb.
Jurjević, P. (2007): O kanalu Dunav – Sava sa šumarskoga stajališta. Šumarski.list, 5-6, str. 269, Zagreb
Kalafadžić, Z., Kušan, V., Horvatić, Z. i Pernar, R. (1993): Oštećenost šuma i neki čimbenici okoliša u šumskom bazenu
„Spačva“. Šumarski list. 6-8, str. 281, Zagreb
Koščak, V., Aničić, B., Bužan, M. (1999): Opći okviri zaštite krajobraza za krajobraznu osnovu Hrvatske – Poljodjelski
krajobrazi, Krajolik: Sadržajna i metodska podloga Krajobrazne osnove Hrvatske, Agronomski fakultet Sveučilišta u
Zagrebu – Zavod za ukrasno bilje i krajobraznu arhitekturu, Ministarstvo prostornog uređenja, graditeljstva i stanovanja
– Zavod za prostorno planiranje, Zagreb, str. 34-73.
Kovačić M., (2002) Specifičnosti razvoja luka posebne namjene u Primorsko-goranskoj županiji. Pomorski zbornik 40
(2002) 177-204
Krajnović A., Bolfek B., Nekić N. (2014) Low-cost strategija u zračnom prijevozu putnika. Sveučilište u Zadru, Odjel za
ekonomiju, Znanstveni članak
Krilanović, B. (2015): Utjecaj izgradnje zračne luke Dubrovnik na okoliš, Završni rad, Fakultet prometnih znanosti,
Zagreb.
Lončar, J. (2007): Međuovisnost prometa i turizma u Hrvatskoj, www.geografija.hr
Mikuska T., Grlica I.D., Grgić M. & Tomik A. (2015) Fauna ptica hrvatskog dijela Rezervata biosfere „Mura-Drava-Dunav“.
Hrvatsko društvo za zaštitu ptica i prirode, Osijek.
Ministarstvo regionalnog razvoja i fondova Europske Unije, www.razvoj.gov.hr
Nejašmić I., 2005.: Demogeografija: stanovništvo u prostornim odnosima i procesima, Školska knjiga, Zagreb.
Nikolić, T. i Topić, J. (ur.) (2005): Crvena knjiga vaskularne flore Hrvatske. Ministarstvo kulture, Državni zavod za zaštitu
prirode, Zagreb
Nikolić, T., Milašinović, B. (2014). Prostorni profil svojti i analiza raznolikosti u sklopu Flora Croatica baze podataka.
Glasnik Hrvatskog botaničkog društva, 2(1), 16-22. Preuzeto s http://hrcak.srce.hr/127475
Strategic Environmental Impact Study of the Transport Development Strategy of the Republic of Croatia 2017-2030
Zagreb, August 2017. 382
Nikolić, T., Topić, J. (urednici) (2005): Crvena knjiga vaskularne flore Hrvatske. Ministarstvo kulture, Državni zavod za
zaštitu prirode, Zagreb
Pašalić, Ž. (2001): Razvojna međuovisnost i konfliktnost prometa i turizma, Suvremeni promet, 21, br. 3-4, p.155-160,
Zagreb.
Prelec, N. (2013): Utjecaj željezničkog prometa u razvoju Grada Rijeke, Diplomski rad, Pomorski Fakultet Rijeka.
Prirodoslovno društvo „Drava“ (2017): Izvješće o provedenom ekološkom monitoringu starog toka rijeke Drave za
potrebe projekta OldDrava.
Prpić, B. (2005): Protuerozijska i vodozaštitna uloga šume i postupci njezina očuvanja i unaprjeđenja. Šumarski list 13,
Zagreb
Purger J. J. 1998. Small mammal fauna of the region of Drava river in county Somogy (Hungary), obtained by barn owl,
Tyto alba (Scopoli, 1769) pellet analysis. Dunántúli Dolg. Term. tud. Sorozat 9: 489-500.
Rako, N., Picciulin, M., Vilibić, I., & Fortuna, C. M. (2013): Spatial and temporal variability of sea ambient noise as an
anthropogenic pressure index: the case of the Cres-Lošinj archipelago, Croatia. Journal of the Marine Biological
Association of the United Kingdom, 93(01), 27-36
Rako, N., Picculin, M., Mackelworth, P., Holcer, D., Fortuna, C.M., 2012. Long-Term Monitoring of Anthropogenic Noise
and Its Relationship to Bottlenose Dolphin (Tursiops truncatus) Distribution in the CreseLo sinj Archipelago, Northern
Adriatic, Croatia. In: Popper, A., Hawkins, A. (Eds.), The Effects of Noise on Aquatic Life, Adv. Exp. Med. Biol., vol. 730,
pp. 323e325.
Steiner, S., Božičević, J., Kaštela, S.: Ekološki aspekti zračnog prometa // Naučni skup" Ekološki problemi suvremenog
prometa"- Zbornik radova / Čekić, Šefkija(ur.). Sarajevo: Saobraćaj i komunikacije, Društvo za izdavačku djelatnost,
2003. 33-40(pozvano predavanje, međunarodna recenzija, objavljeni rad, znanstveni).
Šolman, S. (2010): Uloga cestovnog prometa u turizmu Hrvatske, Acta Turistica Nova, Vol. 4, No.2, pp.121-250, str.
231-245.
Šprem, N., Duduković, D., Keros, T., Konjević, D. (2013.): Wildlife-Vehicle Collision in Croatia–A Hazard for Humans
and Animals. Collegium Antropologicum 37(2): 531–535
Tikvić, I., Ž. Zečić, D. Ugarković, D. Posarić, 2009: Oštećenost stabala i kakvoća drvnih sortimenata hrasta lužnjaka na
spačvanskom području. Šumarski. list, 5-6, str. 237, Zagreb
Topić, J., Ilijanić, Lj., Tvrtković N., Nikolić, T. (2006): Priručniku za inventarizaciju, kartiranje i praćenje stanja staništa
Topić, J., Vukelić, J. (2009): Priručnik za određivanje kopnenih staništa u Hrvatskoj prema Direktivi o staništima EU,
Državni zavod za zaštitu prirode, 376. str, Zagreb.
Topić, J., Vukelić, J. (2009): Priručnik za određivanje kopnenih staništa u Hrvatskoj prema Direktivi o staništima EU
Trocmé, M., Cahill, S., De Vries, J. G., Farall, H., Folkeson, L., Fry, G. L., Hicks, C. and Peymen, J. (2003): COST 341
- Habitat Fragmentation due to transportation infrastructure, The European Review, Office for Official Publications of the
European Communities.
Tustonjić, A., Pavelić, J., Farkaš-Topolnik, N., Đuričić-Kuric, T. (1999): Šume unutar prostornog plana Zagrebačke
županije. Šumarski list. 9-10, str. 469, Zagreb
Tutiš, V., Kralj, J., Radović, D., Ćiković, D., Barišić S. (2013): Crvena knjiga ptica Hrvatske. Zagreb
Žgaljić, D., Perkušić, Z., Schiozzi, D., (2014): Značenje multimodalnog, intermodalnog i kombiniranog prijevoza u razvoju
pomorskih prometnica, Pomorski zbornik 49-50, str. 265-279.
Strategic Environmental Impact Study of the Transport Development Strategy of the Republic of Croatia 2017-2030
Zagreb, August 2017. 383
14.2 Internet databases
Coastal Liner Services Agency - list of state shipping lines -
http://www.agencijazolpp.hr/Brodskelinije/tabid/3928/Default.aspx, Accessed: 4 April 2017
Agroklub, www.agroklub.com, Accessed: April 2017
Croatian Vehicle Center - average age of vehicles - https://www.cvh.hr/tehnicki-pregled/statistika/, Accessed: 4 April
2017
Croatia Airlines, www.croatiaairlines.com, Accessed: April 2017
Flora Croatica Database, http://hirc.botanic.hr/fcd/
Croatian Civil Aviation Agency, www.ccaa.hr, Accessed: April 2017
Croatian Agency for the Environment and Nature (2017): Web portal of the Nature Protection Information System
“BIOPORTAL”. Available at: www.iszp.hr/gis/. Accessed: March 2017
Croatian Employment Service, On-line statistics,
https://statistika.hzz.hr/
http://www.dzzp.hr/dokumenti_upload/20150821/dzzp201508211258
200.pdf http://www.iucnredlist.org/ http://www.ptice.net/
http://www.ribe-hrvatske.com/new
http://zastita-prirode-smz.hr/ficedula-albicollis-bjelovrata-muharica/
HŽ Putnički prijevoz, www.hzpp.hr, Accessed: April 2017
Settlements and Population of the Republic of Croatia 1857 - 2001, Databases, Croatian Bureau of Statistics, Zagreb.
Basic Transport Infrastructure Network - Ministry of the Sea, Transport and Infrastructure -
http://www.mppi.hr/default.aspx?id=3113, Accessed: 4 April 2017
Census of Population, Households and Dwelling of 2001 - Population contingents by towns and municipalities,
Croatian Bureau of Statistics, Zagreb.
Census of Population, Households and Dwelling of 2001 - Population by age and gender by towns, Croatian Bureau
of Statistics, Zagreb.
Census of Population, Households and Dwelling of 2011 - Population contingents by towns and municipalities,
Croatian Bureau of Statistics, Zagreb.
Census of Population, Households and Dwelling of 2011 - Population by age and gender by towns, Croatian Bureau
of Statistics, Zagreb.
The Cultural Heritage Register of the Republic of Croatia, Ministry of Culture, Directorate for the Protection of Cultural
Heritage
Motorization rates in the EU - European Automobile Manufacturers Association
http://www.acea.be/statistics/tag/category/passenger-car-fleet-per-capita, Accessed: 4 April 2017
Web portal of the Nature Protection Information System, http://bioportal.hr/
Strategic Environmental Impact Study of the Transport Development Strategy of the Republic of Croatia 2017-2030
Zagreb, August 2017. 384
14.3 Laws, Ordinances, Decisions, Regulations
Decision on the roads in large city areas that cease to be classified as public roads (OG 44/12)
Decision on the Classification of Public Roads (OG 44/12)
Maritime code (OG 181/04, 76/07, 146/08, 61/11 and 56/13, 26/15)
Ordinance on conservation objectives and basic measures to conserve birds in areas of the ecological network (OG
15/2014)
Ordinance on emission limit values for wastewater discharges (OG. 80/13, 43/14)
Ordinance on the method of preparation and content of noise maps and action plans
Ordinance on the method of preparation and content of noise maps and action plans and the method of calculating
the permitted noise indicator (OG 75/09, 60/16)
Ordinance on the method of monitoring the damage to forest ecosystems (OG 076/13)
Ordinance on assessing the acceptability for the ecological network (OG 146/2014)
Ordinance on habitat types, habitat map and endangered and rare habitat types (OG 88/14)
Ordinance on proclaiming wild taxa protected or strictly protected (OG 99/09)
Ordinance on strictly protected species (OG 144/2013, 73/2016)
Ordinance on ballast water management and control (OG 128/12)
Ordinance on ballast water management and control (OG 128/12)
Ordinance on water ballast management and control (OG 55/07)
Ordinance on forest management (OG 79/15)
Ordinance on the conditions and method of maintaining order in ports and on other parts of internal waters and
territorial sea of the Republic of Croatia (OG 90/05, 10/08, 155/08, 127/10 and 80/12)
Ordinance on Conditions for Determination of Sanitary Protection Areas of Water Sources (OG 66/11, 47/13)
Ordinance on the Protection of Agricultural Land from Pollution (OG 9/14)
Ordinance on the Method of Monitoring the Damage to Forest Ecosystems (OG 076/13)
Commission Implementing Decision of 11 July 2011 concerning a site information format for Natura 2000 sites
(notified under document C(2011) 4892) (2011/484/EU)
Regulation on the Ecological Network (OG 124/13, 105/15)
Regulation on Informing and Participation of the Public and Interested Public in Environmental Issues (OG
64/08)
Regulation on the Development and Implementation of the Strategy for the Management of the Marine Environment
and the Coastal Region of the Republic of Croatia (OG 112/14)
Regulation on the Publication of the Agreement between the Government of the Republic of Croatia and the
Government of the United States of America on the Protection and Conservation of Certain Cultural Property (OG-
MU 9/06,2/07)
Regulation on the Water Quality Standard (OG 73/13)
Regulation on Strategic Environmental Impact Assessment for Strategies, Plans and Programs (OG 3/17)
Regulation on the establishment of a list of measurement points for the concentration of certain pollutants in the air
and the location of measurement stations in the national network for continuous air quality monitoring (OG 22/14)
Strategic Environmental Impact Study of the Transport Development Strategy of the Republic of Croatia 2017-2030
Zagreb, August 2017. 385
Regulation on the establishment of a list of measurement points for the concentration of certain pollutants in the air
and the location of measurement stations in the national network for continuous air quality monitoring (OG 22/14)
Regulation on requirements that must be met by ports (OG 110/04).
Roads Act (OG 84/11, 22/13, 54/13, 148/13, 92/14)
Hunting Act (OG 140/05, 75/09, 153/09, 14/14, 21/16, 41/16, 67/16)
Act on Sustainable Waste Management (OG 94/13)
Agricultural Land Act (OG 39/14, 48/15)
Act on Ratification of the Second Protocol to the Convention for the Protection of Cultural Property in the Event of
Armed Conflict (OG- MU no. 11/05)
Act on Ratification of the Convention on the Protection of Intangible Cultural Heritage (OG- MU nos. 5/05, 5/07)
Act on Ratification of the Council of Europe Framework Convention on the Value of Cultural Heritage for Society
(OG- MU no. 5/07)
Act on Ratification of the Strategic Environmental Assessment Protocol with the Convention on Environmental Impact
Assessment in a Transboundary Context (OG 7/09)
Act on Ratification of the UNIDROT Convention on Stolen or Illegally Exported Cultural Objects, Rome 1995 (OG-
MU nos. 5/00, 6/02)
Act on Ratification of the 1992 European Convention on the Protection of Archaeological Heritage (Revised), drawn
up in Valetta (OG- Mu nos. 4/04 and 9/04)
Act on Regional Development of the Republic of Croatia (OG 147/14)
Forest Act (OGnos. 140/05, 82/06, 129/08, 80/10, 124/10, 25/12, 68/12, and 148/13)
Act on the Regulation of Property relations for the Purpose of the Construction of Infrastructure Buildings (OG
80/2011)
Water Act (OG. 153/09, 63/11, 130/11, 56/13, 14/14)
Act on the Protection and Preservation of Cultural Property (OG 69/99, 151/03, 157/03 Correction, 87/09, 88/10,
61/11, 25/12, 136/12, 157/13,152/14 and 44/17)
Noise Protection Act (OG. 30/09, 55/13, 153/13, 41/16)
Environmental Protection Act (OG. 80/13, 153/13, 78/15)
Nature Protection Act (OG 80/13),
14.4 Directives, Conventions, Charters, Agreements and Protocols
Vienna Convention on the Protection of the Ozone Layer (1985) (OG- MU no. 12/93)
European Agreement on the International Carriage of Dangerous Goods by Road (ADR)
Biological Diversity Convention (1992)
European Landscape Convention (Florence, 2000)
Convention on International Trade in Endangered Species of Wild Fauna and Flora (CITES)
Convention on International Carriage by Rail (COTIF)
Convention on International Civil Aviation (OG- MU no. 1/96)
Convention on Environmental Impact Assessment in a Transboundary Context (Espoo, 1991) (OG- MU no.
6/96)
Strategic Environmental Impact Study of the Transport Development Strategy of the Republic of Croatia 2017-2030
Zagreb, August 2017. 386
Convention on the Conservation of European Wildlife and Natural Habitats (Bern Convention) (OG- MU no.
6/00)
Convention on the Protection of Cultural Property in the Event of Armed Conflict and Protocol on the Prohibition of
the Export of Cultural Property from Occupied Territories (OG- MU nos. 12/93 and 6/02)
Convention on the Conservation of Migratory Species of Wild Animals (CMS) (1979) (OG- MU no. 6/00)
Convention for the Protection of the Mediterranean Sea against Pollution (Barcelona Convention of 1976)
Convention on the Protection of the World Cultural and Natural Heritage, UNESCO (1972)
United Nations Convention on the Law of the Sea (1982)
Convention on the Protection of the Underwater Cultural Heritage, Paris (2001)
Council of Europe Convention for the Protection of the Architectural Heritage of Europe (OG- MU no. 6/94)
International Convention for the Prevention of Pollution from Ships (MARPOL 73/78)
Montreal Protocol on Substances that Deplete the Ozone Layer (Montreal, 1987)
United Nations Framework Convention on Climate Change (UNFCCC) (1992)
Charter on the Protection and Management of Archaeological Heritage, Lausanne (1990)
MARPOL Convention Annex I Reception of oil and oily liquids
MARPOL Convention Annex II: Reception of toxic substances in the liquid state
MARPOL Convention Annex IV: Reception of feces
MARPOL Convention Annex V: Reception of garbage from ships
Protocol on Integrated Coastal Zone Management of the Mediterranean (Barcelona 2008)
Protocol on Specially Protected Areas and Biodiversity in the Mediterranean (SPA Protocol)
Protocol on Cooperation in Preventing Pollution from Ships and, in Cases of Emergency, Combating Pollution of the
Mediterranean Sea
Stockholm Convention on Persistent Organic Pollutants (2001) (OG- MU no. 11/06)
UNESCO Convention on the Means of Prohibiting and Preventing the Illicit Import, Export and Transfer of Ownership
of Cultural Property (OG- MU no. 12/93)
14.5 Publications
Analiza stanja prirode u Republici Hrvatskoj za razdoblje 2008. -2012., Državni zavod za zaštitu prirode, 2014
Brčić D., Šimunović Lj., Slavulj M. (2016.) Upravljanje prijevoznom potražnjom u gradovima. Sveučilište u Zagrebu,
Fakultet prometnih znanosti, Priručnik
Bruto domaći proizvod za Republiku Hrvatsku, prostorne jedinice za statistiku 2. razine i županije za razdoblje 2000. -
2012., u 2013. i 2014. godini, Publikacije prema statističkim područjima, Nacionalni računi, Državni zavod za statistiku.
Dr. sc. Biserka Bilušić Dumbović, Krajolik kao kulturno nasljeđe – metode prepoznavanja, vrjednovanja i zaštite kulturnih
krajolika Hrvatske, Zagreb 2015.
Guidance on Integrating Climate Change and Biodiversity into Strategic Environmental Assessment
Hrvatska agencija za okoliš i prirodu (2016): Priručnik za ocjenu prihvatljivosti zahvata za ekološku mrežu (OPEM)
Hrvatska narodna banka, Bilten 230, Zagreb, siječanj 2017.
Strategic Environmental Impact Study of the Transport Development Strategy of the Republic of Croatia 2017-2030
Zagreb, August 2017. 387
Landscape character assessment, Guidance for England and Scotland, 2002.: The countryside Agency and Scottish
Natural Heritage, Sheffild
Non-paper Guidelines for Project Managers: making vulnerable investments climate resilient (Europska komisija, Glavna
uprava za klimatsku politiku)
Pokazatelji zaštite prirode, Agencija za zaštitu okoliša, 2014.
Prirodno kretanje stanovništva Republike Hrvatske od 2001. do 2015. godine, Publikacije prema statističkim područjima,
Stanovništvo, Državni zavod za statistiku.
Pritisci na zaštićena područja, Agencija za zaštitu okoliša, 2007
Razvoj gospodarskih djelatnosti u prostoru, Institut za razvoj i međunarodne odnose, Zagreb, listopad 2014.
Reference material for the reporting period 2007-2012 under the Article 17 of the Habitats Directive
(http://bd.eionet.europa.eu/activities/Reporting/Article_17/reference_portal)
Stručne smjernice – prometna infrastruktura, Hrvatska agencija za okoliš i prirodu, 2015
Stručni priručnik za procjenu utjecaja zahvata na velike zvijeri pojedinačno te u sklopu planskih dokumenta, Verzija 1.0
– primjer vjetroelektrane, Hrvatska agencija za okoliš i prirodu, Veterinarki fakultet Sveučilišta u Zagrebu, 2016
T. P. Jugović, R. Sušan, 2013., „Morske autoceste“ u funkciji optimizacije strukture robnih tokova
The Landscape Institute and Institute of EMA 2002, Guidelines for Landscape and Visual Impact Assessment, London
and New York, str. 145)
Udruga za prirodu, okoliš i održivi razvoj Sunce (2016): Priručnik za zaštitu mora i prepoznavanja živog svijeta Jadrana.
Umrli prema prometnim nesrećama Republike Hrvatske 2001.-2015. godine, Publikacije prema statističkim područjima,
Stanovništvo, Državni zavod za statistiku.
Vrijednosti indeksa razvijenosti i pokazatelja za izračun indeksa razvijenosti 2013., https://razvoj.gov.hr/o-
ministarstvu/regionalni-razvoj/indeks-razvijenosti/112
Zaposleni prema područjima djelatnosti i po županijama, stanje 31. ožujka 2015. godine, Publikacije prema statističkim
područjima, Zaposlenost i plaće, Zaposlenost, Državni zavod za statistiku.
14.6 Plans, programs, strategies
Landscape, Content and methodical background of the landscape basis of Croatia, MEPPP Department of Spatial
Planning, Faculty of Agriculture, Department of Ornamental Plants and Landscape Architecture Zagreb, 1999
Ministry of Environmental Protection and Nature (2014): A set of features of good environmental status for marine
waters under the sovereignty of the Republic of Croatia and a set of goals in the protection of the marine
environment and related indicators
National action plan to promote production and use of biofuels in transport for the period 2011 – 2020
National Road Safety Program of the Republic of Croatia 2011-2020 (OG 59/11)
National Air Traffic Safety Program (OG 141/2015)
National Programs for Monitoring of the State of Species in Croatia - otter (Lutra lutra), State Institute for Nature
Protection, 2013
The draft proposal of the Strategy and Action Plan for Nature Protection of the Republic of Croatia for the period
from 2017 to 2025, 2017
Strategic Environmental Impact Study of the Transport Development Strategy of the Republic of Croatia 2017-2030
Zagreb, August 2017. 388
Waste Management Plan of the Republic of Croatia for the period 2017-2022 (OG 3/17)
Ship waste management plan
Waste Management Plan of the Republic of Croatia for the period 2007-2015 (OG 85/07)
Brown Bear Management Plan for the Republic of Croatia, Ministry of Regional Development, Forestry and Water
Management, Hunting Directorate; Ministry of Culture, Directorate for Nature Protection, 2008
Accidental Marine Pollution Action Plan (OG 92/08)
Lynx Management Plan in the Republic of Croatia for the period 2010-2015, Ministry of Culture, State Institute for
Nature
Protection, 2010
Sava River Basin Management Plan
Water Areas Management Plan 2016 - 2021, Hrvatske vode, 2016
Wolf Management Plan in the Republic of Croatia for the period 2010-2015, Ministry of Culture, State Institute for
Nature Protection, 2010
Plan for Air Protection, Protection of the Ozone Layer and Climate Change Mitigation in the Republic of Croatia for
the Period 2013-2017 (OG 139/13)
Program of Protection and Management Measures for the Marine Environment and the Coastal Region
Spatial planning Program of the Republic of Croatia, MEPPP Department of Spatial Planning, Zagreb, 1999
Rural Development Program of the Republic of Croatia for the period 2014-2020
A set of features of good environmental status for marine waters under the sovereignty of the Republic of Croatia
and a set of goals in the protection of the marine environment and related indicators
Energy Development Strategy of the Republic of Croatia (OG 130/09)
The European Union Strategy for the Danube Region
The European Union Strategy for the Adriatic-Ionian Region
Strategy and Action Plan for the Protection of Biological and Landscape Diversity of the Republic of Croatia (OG
143/08)
Low-Carbon Development Strategy of the Republic of Croatia by 2030, with a view to 2050 - draft
Strategy of Maritime Development and Integral Maritime Policy of the Republic of Croatia for the period 2014-2020
(OG 93/14)
Traffic Development Strategy of the Republic of Croatia for the period 2014-2030
Spatial planning Strategy of the Republic of Croatia (1997, 2015)
River Traffic Development Strategy in the Republic of Croatia (2008-2018) (OG 65/08)
Nautical Tourism Development Strategy of the Republic of Croatia for the period 2009 – 2019
Tourism Development Strategy of the Republic of Croatia by 2020 (OG 55/13)
Strategy for the Management of the Marine Environment and the Coastal Region
Water Management Strategy (OG 91/08)
Strategy for the Protection, Conservation and Sustainable Economic Use of Cultural Heritage of the Republic of
Croatia for the period 2011-2015, Ministry of Culture, July 2011
Strategic noise map of the city of Osijek, 2014
Strategic noise map of the city of Rijeka, 2009
Strategic noise map of the city of Split, 2009
Strategic Environmental Impact Study of the Transport Development Strategy of the Republic of Croatia 2017-2030
Zagreb, August 2017. 389
Strategic noise map of the city of Zagreb, 2014
Strategic noise map of Hrvatske autoceste d.o.o. 2016
Forest management area base of the territory of the Republic of Croatia (2016-2025)
14.7 Reports
Counting of traffic on the roads in the Republic of Croatia in 2015, Hrvatske ceste, Zagreb, 2016
Croatian Bureau of Statistics - Statistical Yearbook of the Republic of Croatia 2016, Zagreb, 2016
Croatian Bureau of Statistics - Transport and communications in 2015, Zagreb, 2016
Annual Report on Air Quality Monitoring in the Republic of Croatia for 2013, Environmental Protection Agency, 2014
Annual Report on Air Quality Monitoring in the Republic of Croatia for 2014, Croatian Agency for the Environment
and Nature, 2015
Annual Report on Air Quality Monitoring in the Republic of Croatia for 2015, Croatian Agency for the Environment
and Nature, 2016
Greenhouse Gas Inventory Report for the Territory of the Republic of Croatia for the period 1990 - 2014, Croatian
Agency for the Environment and Nature, June 2016
Report on the Calculation of Air Pollutant Emissions in the territory of the Republic of Croatia of 2016 (1990 - 2014)
Croatian Environment and Nature Protection Agency, 2016
State of the Environment Report of the Republic of Croatia of 2014 (period from 2009 to 2012), Environmental
Protection Agency, 2015
Report on the status of lynx population in Croatia for the year 2011 and 2012, State Institute for Nature Protection,
2013
Report on the status of wolf population in Croatia for the year 2014, State Institute for Nature Protection, 2014
Report on the status of nature in the Republic of Croatia for the period from 2008 to 2012, State Institute for Nature
Protection, 2015
State of the Environment Report of the Republic of Croatia for the period 2005 - 2008, Environmental Protection
Agency, 2012
Reporting and forecasting activities in forestry for the year 2015/2016
Ministry of Economy, Entrepreneurship and Crafts: Energy in Croatia in 2014 - Annual energy review
Statistical reports, Tourism in 2011 (1463), 2012 (1491), 2013 (1515), 2014 (1539), 2015 (1564), Publications by
statistical areas, Trade and other services, foreign trade and tourism, Tourism, Croatian Bureau of Statistics.
Statistical report no. 4.3.4., Nautical tourism - the capacity and operation of nautical ports in 2016, Publications by
statistical areas, Trade and other services, foreign trade and tourism, Tourism, Croatian Bureau of Statistics
Strategic Environmental Impact Study of the Transport Development Strategy of the Republic of Croatia 2017-2030
Zagreb, August 2017. 390
15 Appendices
15.1 Approval for the performance of expert environmental protection
activities
Strategic Environmental Impact Study of the Transport Development Strategy of the Republic of Croatia 2017-2030
Zagreb, August 2017. 391
Strategic Environmental Impact Study of the Transport Development Strategy of the Republic of Croatia 2017-2030
Zagreb, August 2017. 392
Strategic Environmental Impact Study of the Transport Development Strategy of the Republic of Croatia 2017-2030
Zagreb, August 2017. 393
Strategic Environmental Impact Study of the Transport Development Strategy of the Republic of Croatia 2017-2030
Zagreb, August 2017. 394
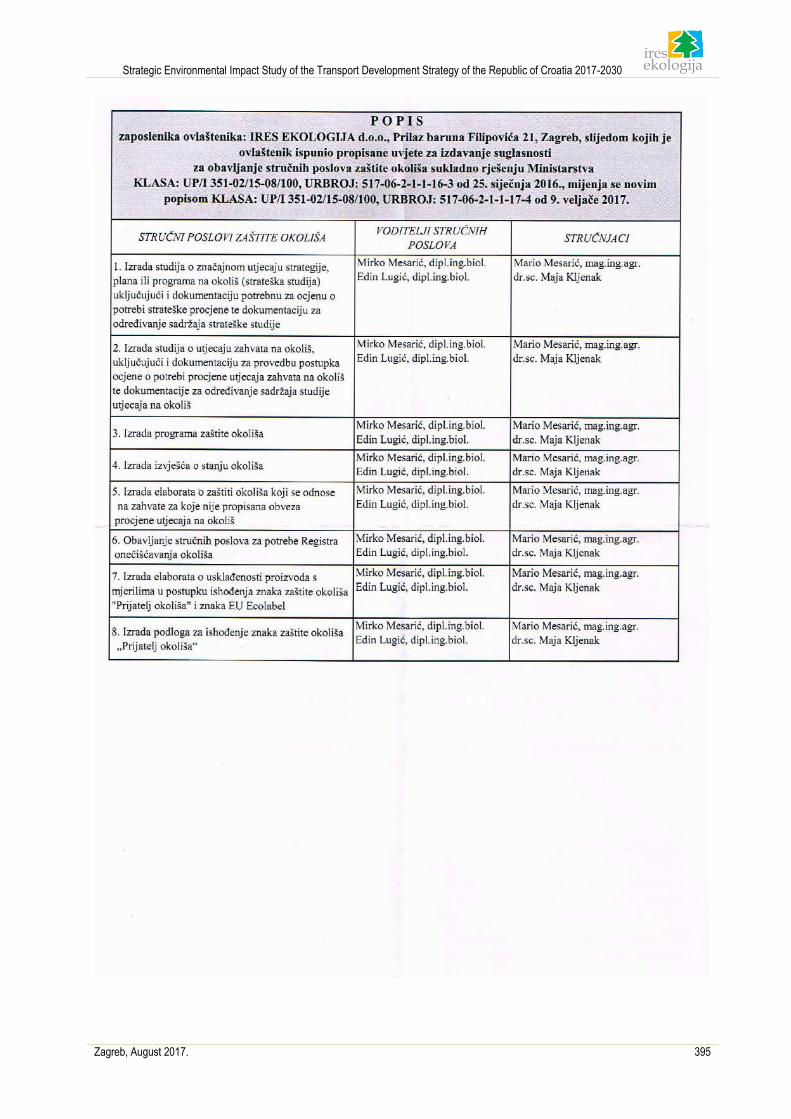
Strategic Environmental Impact Study of the Transport Development Strategy of the Republic of Croatia 2017-2030
Zagreb, August 2017. 395
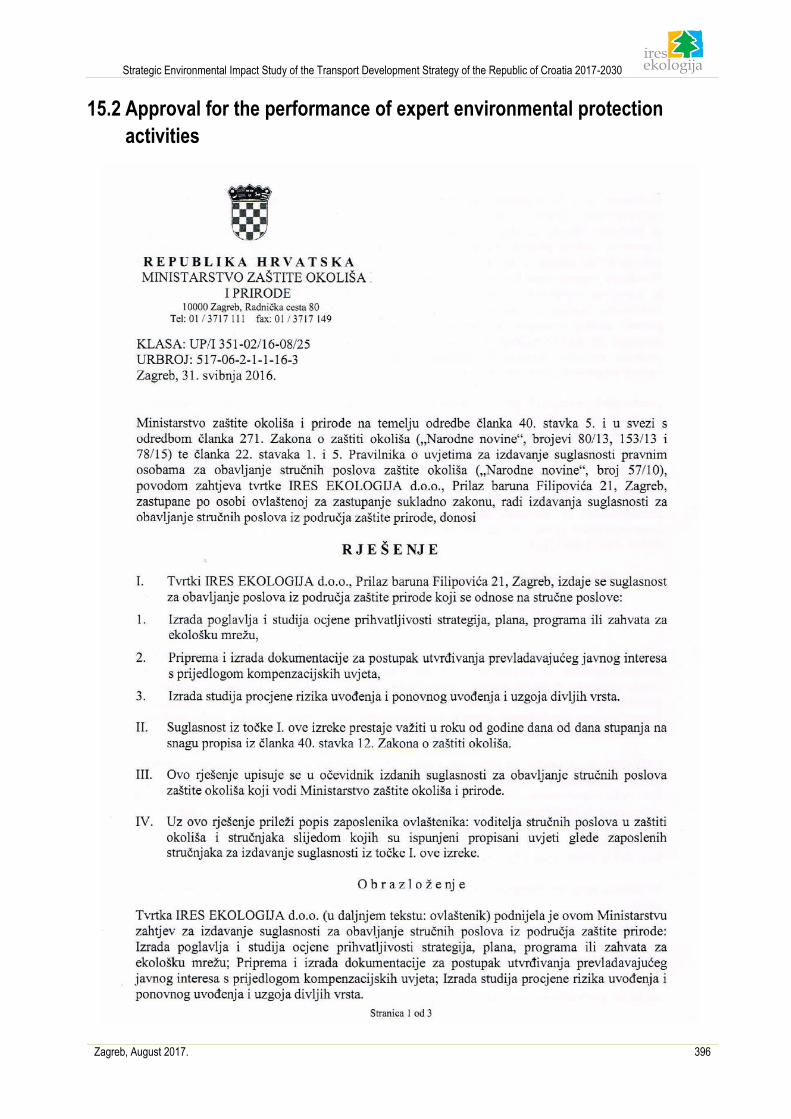
Strategic Environmental Impact Study of the Transport Development Strategy of the Republic of Croatia 2017-2030
Zagreb, August 2017. 396
15.2 Approval for the performance of expert environmental protection
activities
Strategic Environmental Impact Study of the Transport Development Strategy of the Republic of Croatia 2017-2030
Zagreb, August 2017. 397
Strategic Environmental Impact Study of the Transport Development Strategy of the Republic of Croatia 2017-2030
Zagreb, August 2017. 398
Strategic Environmental Impact Study of the Transport Development Strategy of the Republic of Croatia 2017-2030
Zagreb, August 2017. 399
15.3 Decision of the Ministry of Environment and Energy on the obligation
to implement the Main Assessment of Acceptability for the Ecological
Network
Strategic Environmental Impact Study of the Transport Development Strategy of the Republic of Croatia 2017-2030
Zagreb, August 2017. 400
Strategic Environmental Impact Study of the Transport Development Strategy of the Republic of Croatia 2017-2030
Zagreb, August 2017. 401
Strategic Environmental Impact Study of the Transport Development Strategy of the Republic of Croatia 2017-2030
Zagreb, August 2017. 402
15.4 Decision on the content of the Study
Strategic Environmental Impact Study of the Transport Development Strategy of the Republic of Croatia 2017-2030
Zagreb, August 2017. 403
Strategic Environmental Impact Study of the Transport Development Strategy of the Republic of Croatia 2017-2030
Zagreb, August 2017. 404
Strategic Environmental Impact Study of the Transport Development Strategy of the Republic of Croatia 2017-2030
Zagreb, August 2017. 405
Strategic Environmental Impact Study of the Transport Development Strategy of the Republic of Croatia 2017-2030
Zagreb, August 2017. 406
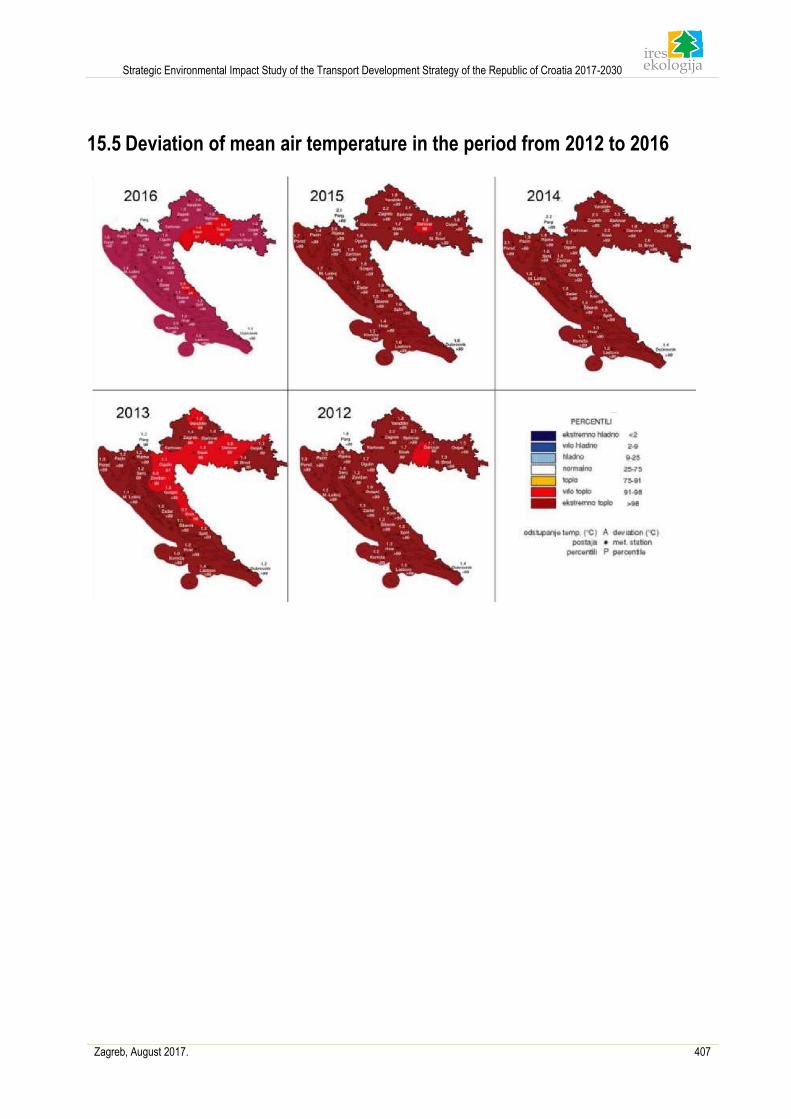
Strategic Environmental Impact Study of the Transport Development Strategy of the Republic of Croatia 2017-2030
Zagreb, August 2017. 407
15.5 Deviation of mean air temperature in the period from 2012 to 2016
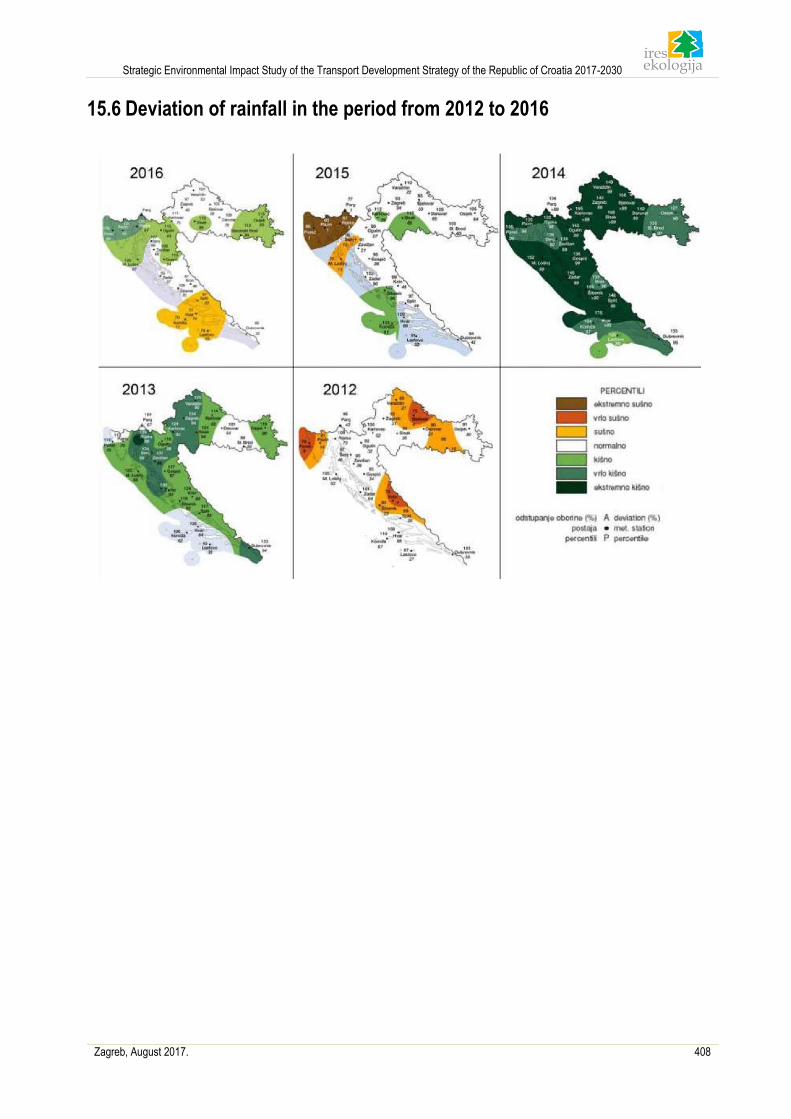
Strategic Environmental Impact Study of the Transport Development Strategy of the Republic of Croatia 2017-2030
Zagreb, August 2017. 408
15.6 Deviation of rainfall in the period from 2012 to 2016
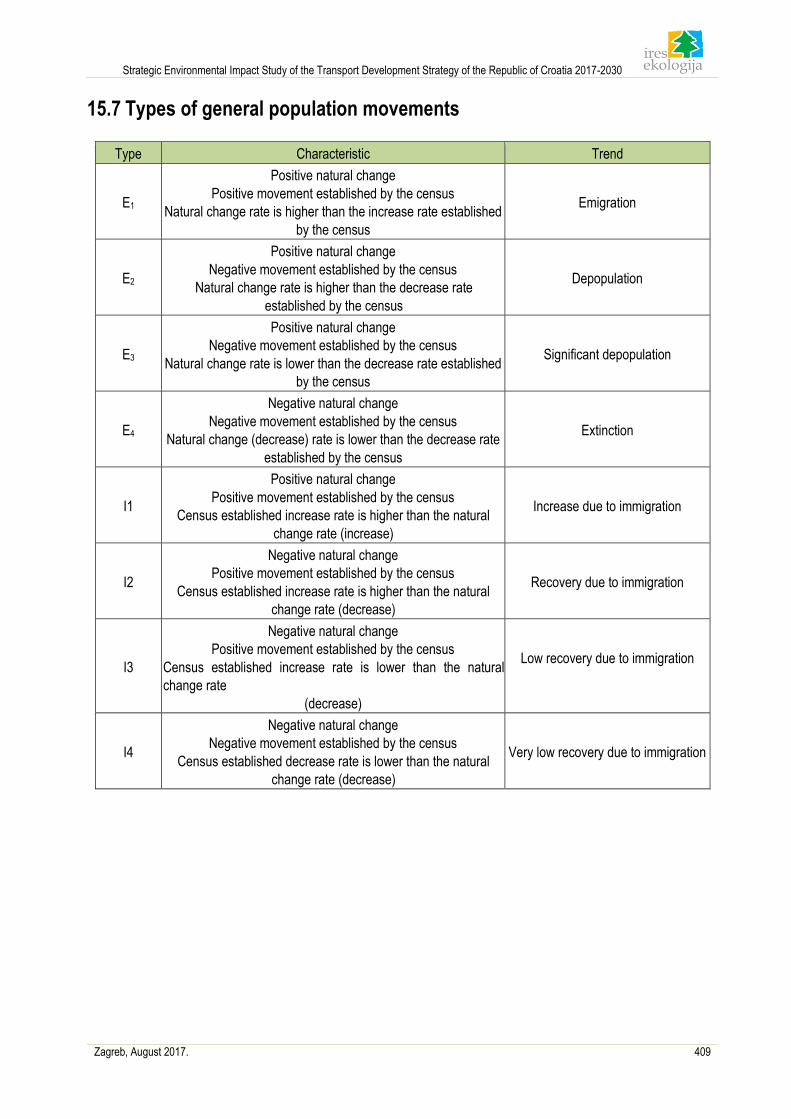
Strategic Environmental Impact Study of the Transport Development Strategy of the Republic of Croatia 2017-2030
Zagreb, August 2017. 409
15.7 Types of general population movements
Type Characteristic Trend
E1
Positive natural change
Positive movement established by the census
Natural change rate is higher than the increase rate established
by the census
Emigration
E2
Positive natural change
Negative movement established by the census
Natural change rate is higher than the decrease rate
established by the census
Depopulation
E3
Positive natural change
Negative movement established by the census
Natural change rate is lower than the decrease rate established
by the census
Significant depopulation
E4
Negative natural change
Negative movement established by the census
Natural change (decrease) rate is lower than the decrease rate
established by the census
Extinction
I1
Positive natural change
Positive movement established by the census
Census established increase rate is higher than the natural
change rate (increase)
Increase due to immigration
I2
Negative natural change
Positive movement established by the census
Census established increase rate is higher than the natural
change rate (decrease)
Recovery due to immigration
I3
Negative natural change
Positive movement established by the census
Census established increase rate is lower than the natural
change rate
(decrease)
Low recovery due to immigration
I4
Negative natural change
Negative movement established by the census
Census established decrease rate is lower than the natural
change rate (decrease)
Very low recovery due to immigration
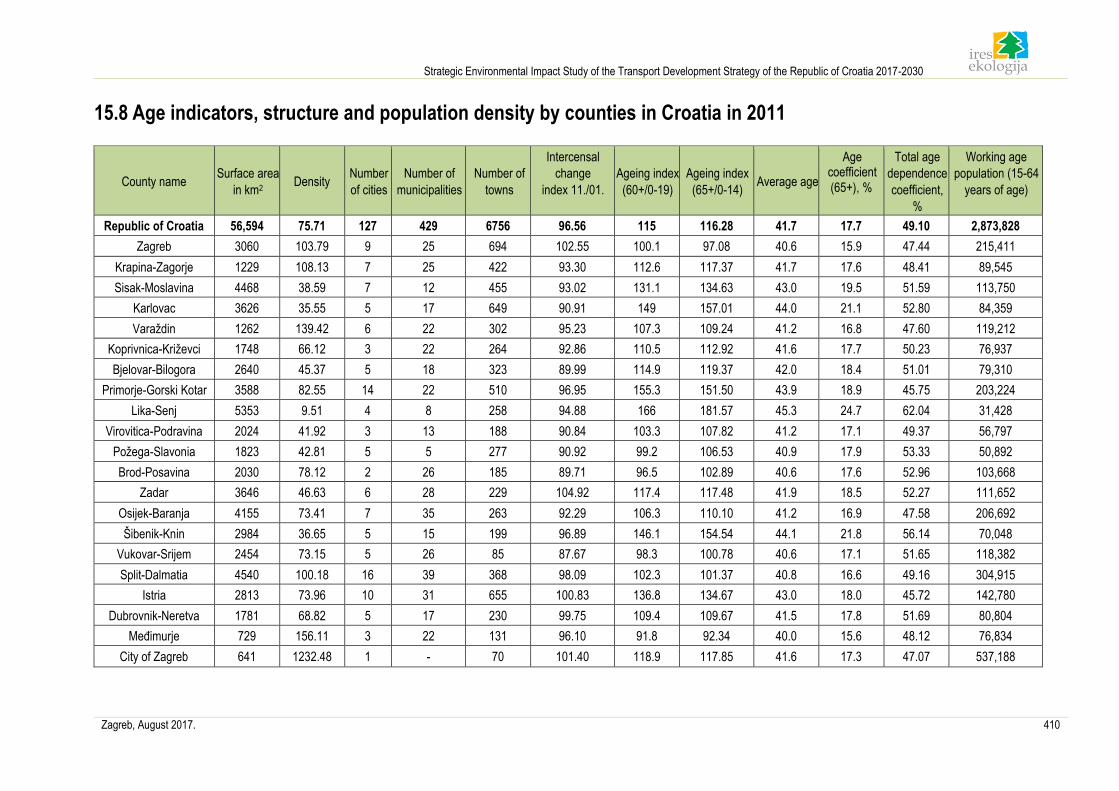
Strategic Environmental Impact Study of the Transport Development Strategy of the Republic of Croatia 2017-2030
Zagreb, August 2017. 410
15.8 Age indicators, structure and population density by counties in Croatia in 2011
County name Surface area
in km2 Density
Number
of cities
Number of
municipalities
Number of
towns
Intercensal
change
index 11./01.
Ageing index
(60+/0-19)
Ageing index
(65+/0-14) Average age
Age coefficient (65+), %
Total age
dependence
coefficient,
%
Working age
population (15-64
years of age)
Republic of Croatia 56,594 75.71 127 429 6756 96.56 115 116.28 41.7 17.7 49.10 2,873,828
Zagreb 3060 103.79 9 25 694 102.55 100.1 97.08 40.6 15.9 47.44 215,411
Krapina-Zagorje 1229 108.13 7 25 422 93.30 112.6 117.37 41.7 17.6 48.41 89,545
Sisak-Moslavina 4468 38.59 7 12 455 93.02 131.1 134.63 43.0 19.5 51.59 113,750
Karlovac 3626 35.55 5 17 649 90.91 149 157.01 44.0 21.1 52.80 84,359
Varaždin 1262 139.42 6 22 302 95.23 107.3 109.24 41.2 16.8 47.60 119,212
Koprivnica-Križevci 1748 66.12 3 22 264 92.86 110.5 112.92 41.6 17.7 50.23 76,937
Bjelovar-Bilogora 2640 45.37 5 18 323 89.99 114.9 119.37 42.0 18.4 51.01 79,310
Primorje-Gorski Kotar 3588 82.55 14 22 510 96.95 155.3 151.50 43.9 18.9 45.75 203,224
Lika-Senj 5353 9.51 4 8 258 94.88 166 181.57 45.3 24.7 62.04 31,428
Virovitica-Podravina 2024 41.92 3 13 188 90.84 103.3 107.82 41.2 17.1 49.37 56,797
Požega-Slavonia 1823 42.81 5 5 277 90.92 99.2 106.53 40.9 17.9 53.33 50,892
Brod-Posavina 2030 78.12 2 26 185 89.71 96.5 102.89 40.6 17.6 52.96 103,668
Zadar 3646 46.63 6 28 229 104.92 117.4 117.48 41.9 18.5 52.27 111,652
Osijek-Baranja 4155 73.41 7 35 263 92.29 106.3 110.10 41.2 16.9 47.58 206,692
Šibenik-Knin 2984 36.65 5 15 199 96.89 146.1 154.54 44.1 21.8 56.14 70,048
Vukovar-Srijem 2454 73.15 5 26 85 87.67 98.3 100.78 40.6 17.1 51.65 118,382
Split-Dalmatia 4540 100.18 16 39 368 98.09 102.3 101.37 40.8 16.6 49.16 304,915
Istria 2813 73.96 10 31 655 100.83 136.8 134.67 43.0 18.0 45.72 142,780
Dubrovnik-Neretva 1781 68.82 5 17 230 99.75 109.4 109.67 41.5 17.8 51.69 80,804
Međimurje 729 156.11 3 22 131 96.10 91.8 92.34 40.0 15.6 48.12 76,834
City of Zagreb 641 1232.48 1 - 70 101.40 118.9 117.85 41.6 17.3 47.07 537,188
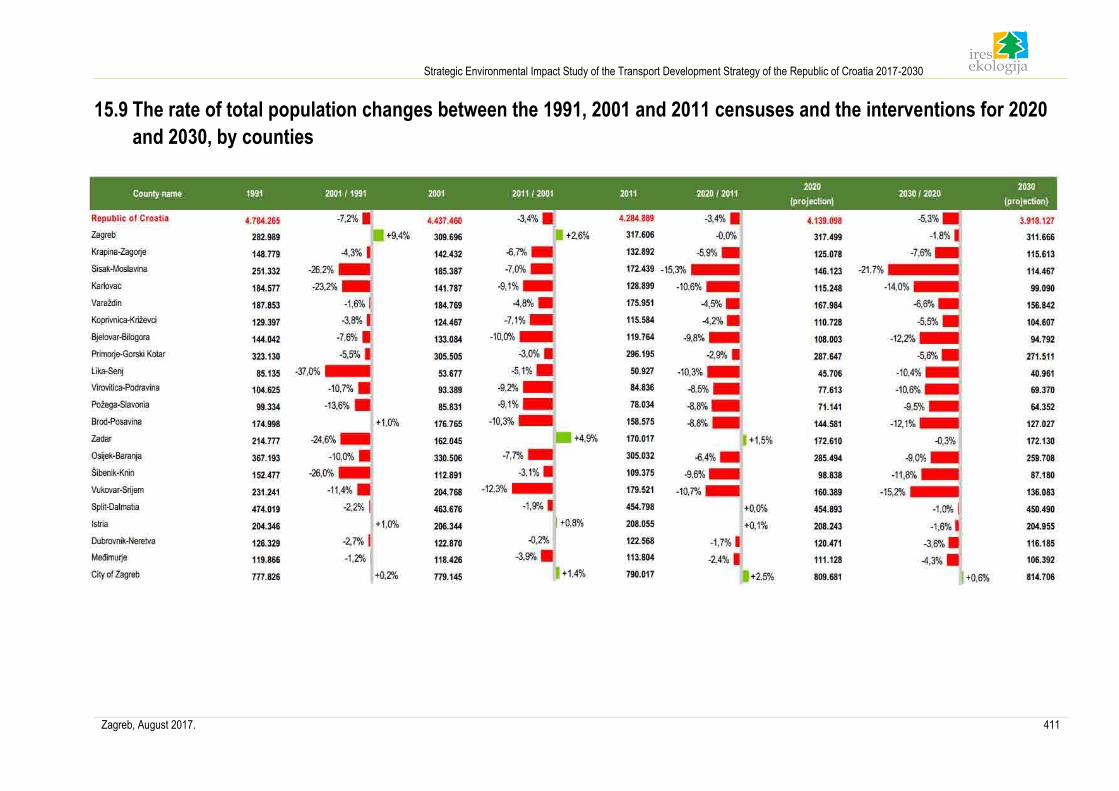
Strategic Environmental Impact Study of the Transport Development Strategy of the Republic of Croatia 2017-2030
Zagreb, August 2017. 411
15.9 The rate of total population changes between the 1991, 2001 and 2011 censuses and the interventions for 2020
and 2030, by counties
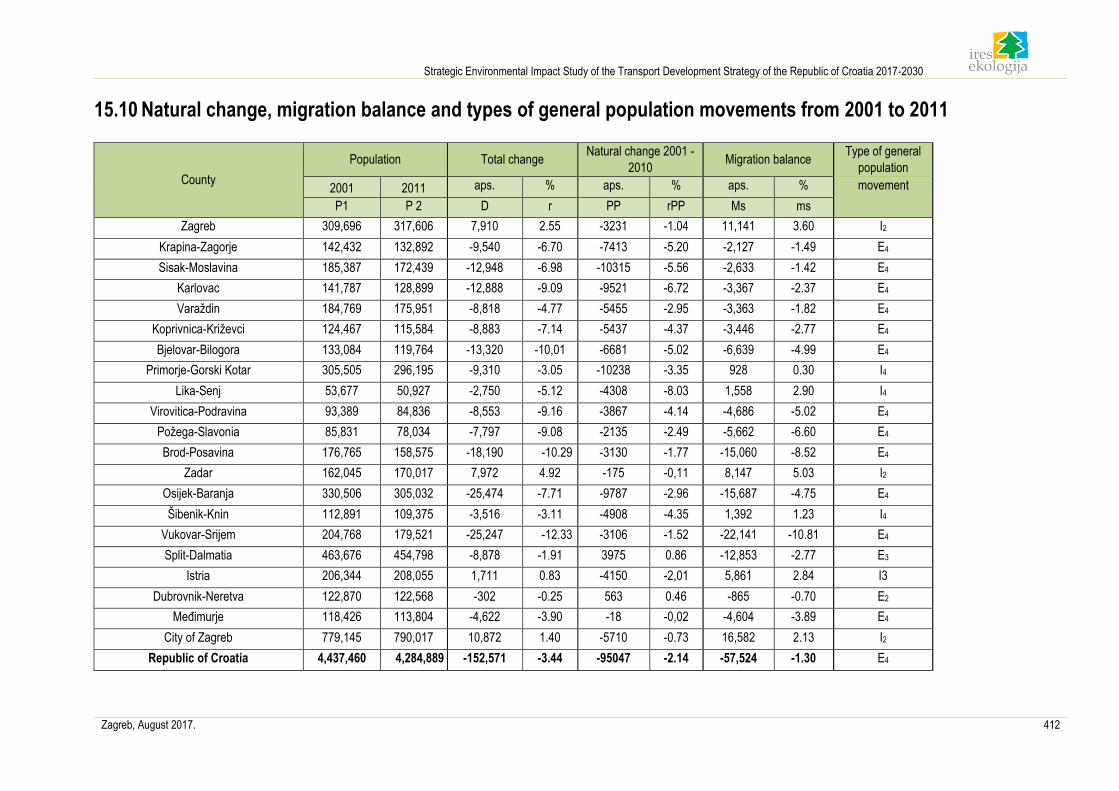
Strategic Environmental Impact Study of the Transport Development Strategy of the Republic of Croatia 2017-2030
Zagreb, August 2017. 412
15.10 Natural change, migration balance and types of general population movements from 2001 to 2011
County
Population Total change Natural change 2001 -
2010 Migration balance
Type of general
population
2001 2011 aps. % aps. % aps. % movement
P1 P 2 D r PP rPP Ms ms
Zagreb 309,696 317,606 7,910 2.55 -3231 -1.04 11,141 3.60 I2
Krapina-Zagorje 142,432 132,892 -9,540 -6.70 -7413 -5.20 -2,127 -1.49 E4
Sisak-Moslavina 185,387 172,439 -12,948 -6.98 -10315 -5.56 -2,633 -1.42 E4
Karlovac 141,787 128,899 -12,888 -9.09 -9521 -6.72 -3,367 -2.37 E4
Varaždin 184,769 175,951 -8,818 -4.77 -5455 -2.95 -3,363 -1.82 E4
Koprivnica-Križevci 124,467 115,584 -8,883 -7.14 -5437 -4.37 -3,446 -2.77 E4
Bjelovar-Bilogora 133,084 119,764 -13,320 -10,01 -6681 -5.02 -6,639 -4.99 E4
Primorje-Gorski Kotar 305,505 296,195 -9,310 -3.05 -10238 -3.35 928 0.30 I4
Lika-Senj 53,677 50,927 -2,750 -5.12 -4308 -8.03 1,558 2.90 I4
Virovitica-Podravina 93,389 84,836 -8,553 -9.16 -3867 -4.14 -4,686 -5.02 E4
Požega-Slavonia 85,831 78,034 -7,797 -9.08 -2135 -2.49 -5,662 -6.60 E4
Brod-Posavina 176,765 158,575 -18,190 -10.29 -3130 -1.77 -15,060 -8.52 E4
Zadar 162,045 170,017 7,972 4.92 -175 -0,11 8,147 5.03 I2
Osijek-Baranja 330,506 305,032 -25,474 -7.71 -9787 -2.96 -15,687 -4.75 E4
Šibenik-Knin 112,891 109,375 -3,516 -3.11 -4908 -4.35 1,392 1.23 I4
Vukovar-Srijem 204,768 179,521 -25,247 -12.33 -3106 -1.52 -22,141 -10.81 E4
Split-Dalmatia 463,676 454,798 -8,878 -1.91 3975 0.86 -12,853 -2.77 E3
Istria 206,344 208,055 1,711 0.83 -4150 -2,01 5,861 2.84 I3
Dubrovnik-Neretva 122,870 122,568 -302 -0.25 563 0.46 -865 -0.70 E2
Međimurje 118,426 113,804 -4,622 -3.90 -18 -0,02 -4,604 -3.89 E4
City of Zagreb 779,145 790,017 10,872 1.40 -5710 -0.73 16,582 2.13 I2
Republic of Croatia 4,437,460 4,284,889 -152,571 -3.44 -95047 -2.14 -57,524 -1.30 E4
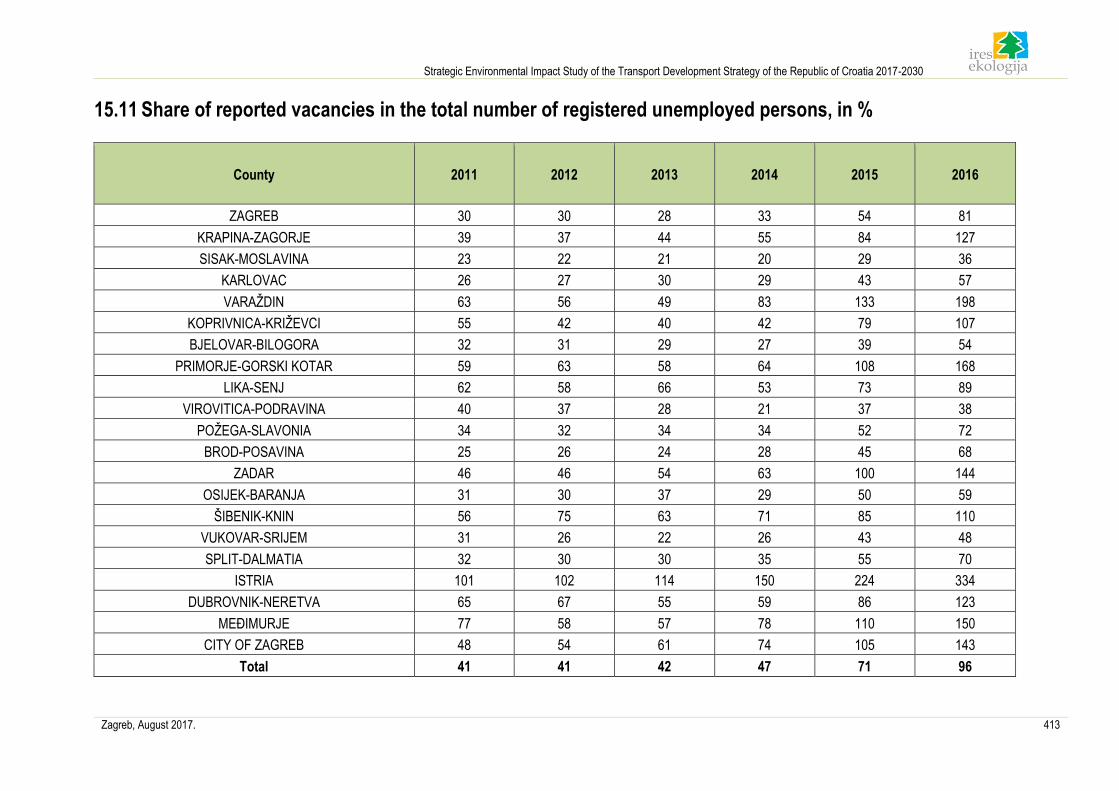
Strategic Environmental Impact Study of the Transport Development Strategy of the Republic of Croatia 2017-2030
Zagreb, August 2017. 413
15.11 Share of reported vacancies in the total number of registered unemployed persons, in %
County 2011 2012 2013 2014 2015 2016
ZAGREB 30 30 28 33 54 81
KRAPINA-ZAGORJE 39 37 44 55 84 127
SISAK-MOSLAVINA 23 22 21 20 29 36
KARLOVAC 26 27 30 29 43 57
VARAŽDIN 63 56 49 83 133 198
KOPRIVNICA-KRIŽEVCI 55 42 40 42 79 107
BJELOVAR-BILOGORA 32 31 29 27 39 54
PRIMORJE-GORSKI KOTAR 59 63 58 64 108 168
LIKA-SENJ 62 58 66 53 73 89
VIROVITICA-PODRAVINA 40 37 28 21 37 38
POŽEGA-SLAVONIA 34 32 34 34 52 72
BROD-POSAVINA 25 26 24 28 45 68
ZADAR 46 46 54 63 100 144
OSIJEK-BARANJA 31 30 37 29 50 59
ŠIBENIK-KNIN 56 75 63 71 85 110
VUKOVAR-SRIJEM 31 26 22 26 43 48
SPLIT-DALMATIA 32 30 30 35 55 70
ISTRIA 101 102 114 150 224 334
DUBROVNIK-NERETVA 65 67 55 59 86 123
MEĐIMURJE 77 58 57 78 110 150
CITY OF ZAGREB 48 54 61 74 105 143
Total 41 41 42 47 71 96
Strategic Environmental Impact Study of the Transport Development Strategy of the Republic of Croatia 2017-2030
Zagreb, August 2017. 414
Related Documents