MINISTRY OF INDUSTRY AND TRADE Strategic Environmental Assessment of The National Plan For Power Development for the Period 2011-2020 with Perspective to 2030 (PDP VII) (with comments from the appraisal committee in the meeting on 16 April 2011) Hanoi, May 2011

Welcome message from author
This document is posted to help you gain knowledge. Please leave a comment to let me know what you think about it! Share it to your friends and learn new things together.
Transcript

MINISTRY OF INDUSTRY AND TRADE
Strategic Environmental Assessment
of
The National Plan For Power Development for the Period 2011-2020 with Perspective to 2030 (PDP VII)
(with comments from the appraisal committee in the meeting on 16 April 2011)
Hanoi, May 2011

ii
MINISTRY OF INDUSTRY AND TRADE
Strategic Environmental Assessment
of
The National Plan For Power Development for the Period 2011-2020 with Perspective to 2030 (PDP VII)
(with comments from the appraisal committee in the meeting on 16 April 2011)
Project Implementing Agency
Hanoi, May 2011
TABLE OF CONTENT Acronyms 1 Executive Summary 2 1. Background and Context of the National Power Development Plan 9 2. Legal and Institutional Framework for the SEA 11 2.1. Legal Framework 11 2.1.1. Laws and Policies Related to Environmental Protection 11 2.1.2. Laws and Legislation on Water Resources 13 2.1.3. Laws and Regulations on Environmental Preservation and Protection 13 2.1.4. Legislation Related to Resettlement 16 2.1.5. Law and Legislation on Energy and Electricity 17 2.1.6. Other Legislation 18 2.2. Overall Strategies and Policies 19 2.2.1. Environmental and Socio- economic Strategies and Policies 19 2.2.2. Energy Strategies and Policies 20 2.3. Technical Framework 21 3. Objectives, Approach, Methodology, Organization and Implementation of the SEA
21
3.1. Objectives of the SEA 21 3.2. Approach and Methodology 21 3.2.1. Methodology 21 3.2.2. The SEA Phases 23 3.3. Organization and Implementation of the SEA 33 3.4. Members of the SEA Working Group 36 Chapter 1: Project Summary and the Key Environmental Issues of PDP VII
39
1.1. Project Implementing Agency 39 1.2. Project Summary 39 1.2.1. Summary of the PDP VII 39 1.2.1.1. Objectives of the PDP VII 39 1.2.1.2. Main content of the PDP VII 40 1.2.1.3. Development Viewpoints and Direction of the PDP VII 43 1.2.2. The PDP VII in Relation with Other National Development Plans 45 1.2.3. Core and Prioritized Projects and Programs in the PDP VII 59 1.2.4. General Approach of the PDP VII 61 1.3. Scope of Research of the SEA 63 1.3.1. Scope of Research of the SEA 63 1.3.1.1. Geographical Coverage 63 1.3.1.2. Timeline 67 1.3.2. The Key Environmental Issues of PDP VII 67 Chapter 2: Environmental Issues Related to the PDP VII 72 2.1. Brief Description of Environmental Conditions 72 2.1.1. Topographic, Geographic and Geological Conditions 72 2.1.2. Climatic and Hydrological Conditions 77 2.1.3. Oceanographic Conditions 86 2.2. The Past Environmental and Socio-economic Development Trends and the
iv
PDP VII Baseline Situation 88 2.2.1. Current Situation and Development Trends of Natural Conditions 88 2.2.2. Environmental impacts 89 2.2.2.1. Loss of Forest and Biodiversity 89 2.2.2.2. Changes to Hydrological Regimes, Water Resource Management and Downstream Salt Intrusion
96
2.2.2.3. Changes to Environmental Quality 98 2.2.2.4. Solid Waste and Toxic Waste 111 2.2.2.5. Natural Resources Efficiency and Conservation 112 2.2.2.6. Climate Change 115 2.2.2.7. Energy Security 119 2.2.2.8. Environmental Conflicts, Risks and Accidents 119 2.2.2.9. The Current State and Future Trends of Socio-economic Development 121 2.2.2.10. Livelihood 127 2.2.2.11. Community Health 132 2.2.2.12. Agriculture and Food security 133 Chapter 3: Environmental Impact Forecast for the PDP VII 134 3.1. The Relevancy of PDP VII to Environmental Protection Targets 134 3.2. Assessment and Comparison of the Proposed Development Scenarios 137 3.3. Environmental Impact Forecast for the Proposed Development Plan 139 3.3.1. Loss of Forest and Biodiversity 147 3.3.1.1. Hydropower Impacts on Forest and Biodiversity Resources 147 3.3.1.2. Thermal Power and Nuclear Power Impacts on Forest and Biodiversity Resources
154
3.3.1.3. Transmission Line Impacts on Forest and Biodiversity Resources 155 3.3.2. Changes to Hydrological Regimes, Integrated Water Resource Management, and Salt Water Intrusion
162
3.3.2.1. Changes to Downstream Hydrological Regimes 162 3.3.2.2. Assessment of Impacts on Water Resource and Integrated Water Resource Management
165
3.3.3. Changes to Environmental Elements 171 3.3.3.1. Deterioration of Water Quality 171 3.3.3.2. Air Pollution 172 3.3.4. Solid Waste and Toxic Waste 178 3.3.4.1. Solid Waste 178 3.3.4.1. Toxic Waste 179 3.3.5. Efficient Use of Natural Mineral Resources 179 3.3.6. Climate Change 186 3.3.6.1. Greenhouse Gases 186 3.3.6.2. Impacts of Climate Change 187 3.3.7. Energy Security 189 3.3.8. Environmental Conflicts, Risks and Accidents 189 3.3.8.1. Environmental Conflicts over Shared Resources 189 3.3.8.2. Unpredictable Environmental Risks and Accidents 189 3.3.9. Social Impacts and Resettlement 192 3.3.9.1. Hydropower Impacts on the Economy, Society, and Local Communities 192 3.3.9.2. Thermal Power Impacts on the Economy, Society and Local Communities 194 3.3.9.3. Nuclear Power Impacts on the Economy, Society and Local Community 196

v
3.3.9.4. Transmission Line Impacts on the Economy, Society and Local Communities
197
3.3.9.5. Other Issues 197 3.3.10. Local Livelihood 199 3.3.11. Community Health 201 3.3.11.1. Water-related Diseases as the Result of Hydropower Development 201 3.3.11.2. Air-related Diseases as the Result of Thermal Power Development 202 3.3.11.3. Illnesses Caused by Electromagnetic Fields from High Voltage Transmission Lines
207
3.3.12. Food Security 208 3.3.13. Impacts of Complementary Civil Work 211 3.3.14. Cumulative Impacts and Development Trends of Environmental Issues 212 Chapter 4: Stakeholder Consultation 220 4.1. The Organization of Stakeholder Consultation 220 4.1.1. Objectives of Stakeholder Consultation 220 4.1.2. Consultation Methods and Participants 220 4.2. Consultation Results 221 4.2.1. Consultation Results 221 4.2.2. Opinions of the SEA Working Group Regarding Recommendations of the Stakeholders during the Consultation Process
225
Chapter 5: Recommendations on Preventative and Mitigation Measures and Environmental Management and Monitoring Programs
226
5.1. Options to Prevent and Mitigate Negative Risks and Enhance Positive Potentials for the PDP VII
226
5.1.1. Prevent and Mitigate Negative Risks by Changing the Project’s Plan, Location and Scale
226
5.1.2. Mitigation Measures Involving the Organization of Implementation of the PDP VII and Financial Mechanism
230
5.1.3. Mitigation Measures for Inevitable Adverse Impacts and Directions for SEAs of PDP VII Sub-component Projects
234
5.1.3.1. Thermal Power Mitigation Measures 234 5.1.3.2. Hydropower Mitigation Measures 237 5.1.3.3. Nuclear Power Mitigation Measures 240 5.1.3.4. Transmission Line Mitigation Measures 240 5.1.3.5. Orientation for the SEAs of PDP VII Sub-component Power Projects 241 5.1.4. Mitigation Measures Using Scientific and Technological Advances 243 5.1.5. Regional Power Integration with Other ASEAN and GMS Countries 243 5.1.6. Other Mitigation Measures 245 5.2. Environmental Management and Monitoring Programs 246 5.2.1. Objectives of Environmental Management and Monitoring Programs 246 5.2.2. Environmental Management Program 246 5.2.3. Environmental Monitoring Program 246 5.2.4. Reporting Mechanism during Implementation 247 Chapter 6: Data Sources and Assessment Methodologies 250 6.1. Data Sources 250 6.1.1. Data and Reference Sources 250 6.1.2. Data Created by the Institute of Energy 251 6.1.3. Assessment of the Level of Detail, Reliability and Currency of the Data

vi
Sources 251 6.2. Methodologies 252 6.2.1. List of methodologies 252 6.3. Level of Detail and Reliability of the Assessment in SEA 255 6.3.1. Level of Detail and Reliability of the Assessment in SEA 255 6.3.2. Implications of Data Unreliability (Due to Objective and Subjective Reasons)
256
CONCLUSIONS AND RECOMMENDATIONS 257 I. Conclusions 257 1. Contribution of the SEA to the PDP VII 257 2. Adverse Environmental Impacts of the PDP VII 259 II. Recommendations 260 1. Recommendations on Project Approval 260 2. Other Recommendations 261

1
ACRONYMS
ADB Asian Development Bank ASEAN Association of South East Asian Nations MARD Ministry of Agriculture and Rural Development MoNRE Ministry of Natural Resources and Environment EP Environmental Protection DSM Demand-Side Management SEA Strategic Environmental Protection EMF Electromagnetic Fields EPA Environmental Protection Agency EVN Electricity of Vietnam FDI Foreign Direct Investment GDP Gross Domestic Production IZ Industrial Zone MPI Ministry of Planning and Investment ODA Official Development Aid PDP Power Development Plan PC People’s Committee WHO World Health Organization

2
EXECUTIVE SUMMARY
The results presented in this Strategic Environmental Assessment (SEA) demonstrate the importance of SEA in the PDP VII planning process. The SEA has provided a mechanism to assess and understand the full range of potential risks associated with different types of power development and transmission for people and the environment, both within the immediate vicinity of power project site and beyond. It also provides a mechanism for identifying and assessing the most effective mitigation and compensation actions, including actions to mitigate health, economic, and social impacts, to reduce risks and to fully compensate for negative impacts when they do occur. The SEA also has started to identify costs associated with human health, environmental and social impacts, and mitigation measures, and internalize these costs into the assessment of the economic feasibility of power development schemes. This is an approach that balances economic development, environmental sustainability, and social equity that has never been done before in the implementation of a master development plan for the electricity sector.
Thermal power constitutes by far the largest component of the power generation sector in Vietnam, so it is no surprise that it is also the source of by far largest social and environmental impacts. The most significant by far are the impacts of the atmospheric pollution resultant from the combustion of the fossil fuels used, and especially of coal. The consequences of the four main pollutants (CO2, SO2, NOx and PM) are three main impacts: acidification, human health, and climate change. Under the plans in PDP VII, CO2 and PM releases will increase more than ten-fold during the PDP VII period up to 2030 and those for SO2 and NOx will increase several fold. The impacts of these atmospheric pollutants will be severe and widespread. Vietnam is also in the list of the most vulnerable countries to global climate change with more than 10 million people living in the mountainous, coastline and delta areas, which are vulnerable to negative impacts of climate change. Acidification, affecting both soil and water quality, is spreading and increasingly affecting the Mekong river basin. Million people will be affected at different and increasing levels by abnormal weather phenomena and the risks of climate change. The number of people exposing to air pollutants at different levels is increasing and contributing to the rises in the incidence of health problems such as respiratory diseases and other diseases. The impacts on human health from atmospheric pollutants associated with thermal power plants are particularly severe in large cities where there are many economic activities and where the existing ambient air quality is poor. These impacts have been assessed and valued at about US$9.7 billion per annum by 2030 unless actions are taken to reduce the levels of of atmospheric pollutant releases from, in particular, coal-fired power generation.

3
Hydropower is the second largest source of power generation in Viet Nam. It has the potential to produce a number of adverse social and environmental impacts, including the loss of land and disruption of sensitive ecosystems, the displacement of people and effects on the culture and livelihoods of communities not physically displaced, disruption to hydrological systems and ecosystems that depend on them and other effects. With hydropower, most of the social and environmental impacts associated with the schemes in the power plan are: impacts on displaced people, inundation, forest clearing, and changes to river ecosystems. The total area that will be submerged in hydropower schemes in PDP VII is 25,133 ha. A total of 61,571 people will be displaced for the construction of reservoirs. Over 90% of the displaced people are ethnic minorities. There will be bigger loss of forest, ecosystem fragmentation, and especially impacts on protected areas and areas of biodiversity significance. There are 10 sites of biodiversity value where the risk of fragmentation is assessed as significant. The Dak Mi 1 and Dong Nai 5 schemes will have severe impacts on areas of biological sensitivity, which have international biodiversity significance.
One recognized positive impact of hydropower is improvement to dry season water flows, leading to benefits in agricultural production over whole river basins but several river ecosystems are vulnerable to degradation in the immediate vicinity of hydropower schemes. The impacts of hydropower development are complex and widespread, but many can be minimized depending on how the schemes are planned and developed and more effective and sustainable approaches to hydropower have the potential to produce the benefits such schemes generate without many negative impacts.
Nuclear power will be a new development for Viet Nam. It is a source of power generation that is characterized by risks that are low probability but extremely high in impact if they do occur: reflecting the extreme hazards associated with the use and management of radiological materials. It is essential that Viet Nam develops the capabilities and management systems to handle radiological materials before nuclear power development starts. There are additional predicable impacts that are a cause for concern. These impacts are associated with the use and release of cooling waters, especially when the nuclear power stations locate in areas of biological sensitivity. The site selection of the power station is the key issue here: any locations in the proximity of sensitive or high value ecological areas must be avoided and the possible impacts of cooling water on riverine and marine ecosystems must be carefully assessed.
Renewable energy impacts will be extremely small and confined to some potential disruption and aesthetic effects in the immediate vicinity of wind, solar or mini-hydro schemes. These low impacts reflect the low level of renewable energy development in the PDP VII base case and the inherent nature of these technologies that are more socially and environmentally benign than other forms of power generation.
Transmission line investments in PDP VII will represent a major but necessary expansion of the transmission system. There will be adverse impacts, especially associated with the clearance of land along the routes of the transmission lines. The transmission line expansion plan in PDP VII will result in the clearing of 14,000 ha of forest, including 7,739 ha of rich and medium forest. The total resource value of the forests cleared would be around US$218 million. The transmission lines will pass through a total of 59 protected areas (Pas) and 39 key biodiversity areas (KBAs), with 3,387 ha cleared in Pas and 2,297 ha in KBAs. This has potentially negative ecological impacts because of the fragmentation of habitats, with several areas likely to be

4
divided into several fragments that could potentially compromise the integrity of high value biodiversity areas.
1. Strategic Environmental Issues
The contribution of the electricity sector to economic development demonstrates that the level of power development planned in PDP VII is essentially a desirable one in terms of the least cost means to ensure that Vietnam’s future power needs are met. This is true even where the full range of social and environmental costs is internalized into the economic analysis of power generation and power grid, as the full costs of alternative generation sources are even higher. As such, the significance of hydropower in contributing to overall national development has been demonstrated.
The SEA also suggests that power development can contribute to development in another way if appropriate measures are taken: it can be a catalyst to the development of the economies of remote locations inhabited by poor and marginalized people. Therefore, the planning of power development needs to include measures to take advantage of local development opportunities. Where this is the case, power development can provide significant benefits to local communities through improved access to external markets, new livelihood opportunities and better access to a range of services.
There are many environmental issues related to the power plan but within the scope of the SEA analyses focus on several main strategic issues as follows:
Loss of forest and biodiversity as the result of unsustainable development of hydropower schemes and transmission lines: The most dangerous threat is fragmentation and breakdown of the ecosystem. There are potential impacts on ecosystems, biodiversity, forest resources, and natural flows. The risks of such impacts can, however, be significantly reduced through the adoption of effective anticipatory mitigation measures, with the cost of these measures internalized into the costs of power development. Such measures require much closer links to other agencies responsible for agriculture, fisheries, protected areas, etc.
Changes to hydrological regimes, integrated water resources management and lower river basin salt intrusion: The present management regimes are in general single purpose: to maximise power generation, which can cause big losses. In every case, it is necessary to take into account common interests such as flood control, water supply for agricultural activities, and the need to ensure minimum environmental flows if serious downstream impacts on ecosystems integrity are to be avoided. The analysis also demonstrated the potential benefits in terms of flood protection and improvements to dry season water availability that could be accrued if more effective multipurpose management regimes are adopted.
Changes to quality of environmental elements: the consequences of atmospheric pollution are three main impacts: (i) greenhouse emissions and climate change; (ii) water pollution and acidification of soil (due to acid rain); (iii) human health impacts.
Radioactive accident in nuclear power development can happen in any stage of the full production process from uranium prospecting, mining, and enrichment to combustion by nuclear reactions to generate electricity. The post-power production stages including interim storage, reprocessing to waste treatment and waste disposal can also potentially cause radioactive

5
accident.
Nuclear power production in Vietnam only involves power generation from nuclear reactors and storage and treatment of radioactive waste from electricity generation. Main environmental impacts from nuclear power production include: (i) nuclear safety issues during the power production process, which is extremely important because nuclear accidents are usually very serious; (ii) radioactive waste management; (iii) impacts on ecosystems and biodiversity, especially from the nuclear power project located near Nui Chua national nature reserve and other projects that are located in areas with high coral reef density; and (iv) social impacts (number of families/local residents evacuated, resettlement issues, impacts on community health, consensus of local people). Power production from renewable energy is a form of “clean” power production. However, it also has some environmental impacts that need to be considered and assessed such as: (i) changes to landscape and architecture; (ii) downstream sedimentation and erosion; (iii) changes to land use plan.
Solid waste and toxic waste: is a cause of soil, water and air pollution, and a threat to the ecosystems, especially toxic waste and nuclear waste. Treatment for these kinds of waste often costs a lot of money and takes a lot of efforts. Large quantities of these kinds of waste also require large land areas for storage, which is challenging in the context of limited land resources.
Efficient use of natural mineral resources: Natural mineral resources are limited and cannot be renewed. These include water, coal, gas, limestone, forest resources and biological resources. There is an urgent need for an appropriate plan for natural mineral resources management for the benefits of the Vietnamese people, and to reduce the chance of Vietnam being reliant on the international fuel market. This plan also aims at preventing crisis in case of the exhaustion of water resources, and forest resources and services, and avoiding damages to natural scenery.
Climate change and acidification impacts are the consequences of air pollutants from thermal power plants, especially coal-fired thermal power plants. Parts of the costs of these impacts will are health care for affected people, and improvements of infrastructure. Mitigation measures for these impacts include reforestation, establishment of green parks where possible, and maintenance and preservation of ecosystems, as discussed in Chapter 3.
Coal ash reuse can help to mitigate negative impacts on the environment, to save land and other resources, and to generate additional incomes and reduce the pressure on investors of thermal power projects to find solutions for coal ash. However, it is important to pay attention to the proportion of heavy metal in coal ash when reuse.
Energy security is the main factor that controls the economy. The risk of primary energy exhaustion was forecasted in the development plans of various sectors. According to these plans, Vietnam is likely to be heavily dependent on the availability and price of primary energy in the international market by 2017.
Environmental conflicts, risks and accidents are becoming more and more urgent and severe due to over exploitation of natural resources, especially water, forest and mineral resources, and conflicts of interests over natural resources. The scale and level of conflicts vary. These conflicts

6
can be between people, communities, localities, and nations.
The displacement of local communities is a key and controversial issue for power development, especially hydropower development. It is an inevitable consequence of economic development in many localities. The mitigation package entails additional costs and requires political will and more effective coordination amongst relevant stakeholders. However, it is achievable if and when the sector recognizes its obligations to demonstrate social responsibility and the need to establish better relations with local government institutions and the communities in the areas where dams are built.
Livelihood is an issue for displaced people who lose their homes and land to power development projects. This is one of the impacts on local communities.
Community Health: Atmospheric pollution and human health are the main impacts of thermal power development, which are mainly caused by the combustion of fossil fuels. These impacts are intensified when thermal power plants are located in areas where the ambient air quality is already poor, such as in Ho Chi Minh City and the surrounding areas and the Red River Delta. New power projects planned for these areas will have to bear higher payments for environmental services to meet environmental requirements and to reduce impacts on human health.
Food security: Land area for agricultural production is decreasing due to land acquisition for other purposes and in this case, for power development. As more than 70% of the population of Vietnam work in agriculture, the impacts this has on agriculture and food supply are obvious.
2. Recommendations
Grid interconnection: Vietnam is a densely populated country. Conflicts over land and the associated impacts have always been problematic. In general, the potential generation capacity in neighboring countries brings with it less environmental and social impact per kWh because fewer people are affected. Therefore, it makes regional, economic and environmental sense for Vietnam to pursue with vigor grid interconnections with Laos, Cambodia and China at locations that offer favorable conditions for doing so. Vietnam is currently doing this but it needs to be encouraged and developed further.
Institutional harmonization to prepare for regional power trade and further integration between countries in the GMS, will eventually enable capacity planning and balancing of a much larger system, which, as the GMS energy strategy “Building a Sustainable Energy Future” states, brings with it significant efficiency gains. This gives the opportunity for lower prices and lower environmental impacts since expensive and dirty marginal thermal power can be reduced.
Natural resources efficiency and conservation: Readjustments are proposed to the plans for exporting coal, oil and gas to make sure that there will be enough supply for domestic use in the near future.
Clean Development Mechanism to replace coal with renewable energy
Internalization of external costs of power technologies in PDP VII optimization modeling: the differences in externalities between different technologies suggest that the optimization represents an optimum only for the electricity-producing sector. If this can be done it will produce results that are closer to a social optimum.
7
Recommendations on Policy and Regulatory Changes
Air pollution and climate change related: best solution is to minimize the number of coal-fired thermal plants in the future through supporting measures to improve the effectiveness of the energy saving and efficiency program and to increase the use of renewable energy as an energy source to meet the national targets.
This solution will ensure a reduction in air pollutants and CO2, which will consequently reduce acid rain and its effects on crop yield, the risk of abnormal weather phenomena and finally the environmental cost that will lead to a reduction in project investment.
Water resource management: It is recommended that the 11 procedures for multi-reservoir management for 11 river basins to be completed, as directed by the Prime Minister, and based on lesson learned from the existing management procedure. It is also necessary to study the multi-purpose reservoir management approach (including of the existing schemes) to assess the potential of participatory management of the electricity sector in the new river basin management systems in Vietnam.
It is recommended that a more detailed and thorough assessment of the costs and benefits of multipurpose management should be undertaken (including distributive effects) and that new reservoir management regulations should be issued for both existing and future reservoirs to reflect the benefits of multi-purpose management within an integrated water resources management context and based on cumulative river basin effects where multiple reservoirs exist.
Implementation capacity: It is recommended that further capacity development takes place in IE, as well as MoIT and other agencies associated with them in planning, to strengthen their capacity to execute an SEA independently and with no external support.
Data and statistic system: Steps need to be taken to systematically assess and address data gaps so that future SEAs can provide more rigorous analyses.
Recommendation about financing SEA: The budget for the SEA from the government was limited and inadequate to do the job.

8
ACKNOWLEDGEMENT
The Strategic Environmental Assessment of the national Power Development Plan for the period 2011-2020 with vision to 2030 (PDP VII) contains the essential analyses and assessment about environmental and social impacts of PDP VII. The SEA provides a basis for the approval of the strategic power development plan for the next ten years with a vision to the ten years after that. The analyses in the SEA reflect a good understanding of environmental and social issues in planning important economic sectors of Vietnam in the near future to achieve sustainable development. Many complex issues were selected for analysis, which required a high level of capacity and a new way of working which changed the habit of disregarding environmental issues in planning in Vietnam. The results reflect great efforts of the SEA working group and long lasting support of experts and relevant agencies. The SEA and PDP VII were both prepared by the Institute of Energy as assigned by the Ministry of Industry and Trade. The Institute of Energy established a working group consisting of experts in different specializations to take care of these tasks. Members of the working group are Associate Prof. Nguyen Thi Ha, Dr. Le Thu Hoa, Mr. Bach Tan Sinh, Mr. Pham Quang Tu, Mr. Tran Quang Lam and Mr. Nguyen Trung Kien. The group was headed by Ms. Nguyen Thi Thu Hien and worked under the supervision of Mr. Pham Khanh Toan, Director of the Institute of Energy and person in charge of PDP VII, and Mr. Nguyen Anh Tuan, Vice Director of the Institute of Energy, second in charge of PDP VII and also a member of the working group. Input data for the SEA came from the Institute of Energy, electricity consulting companies, Electricity of Vietnam, National Petroleum Corporation, Vietnam Coal & Mineral Resources Corporation, Forestry Bureau, Institute of Strategic Development (under Ministry of Planning and Investment), Institute of Ecology and Biological Resources, Ministry of Natural Resources and Environment, and many others. A group of international experts participated in the preparation of the SEA. They are Mr. Sumit Pokharel from the ADB’s Environmental Operation Centre (EOC), Prof. John Soussan (group leader) from the Stockholm Environment Institute, Dr. Romeo Pacuadan and Mr. Lothar Linde. The international experts provided great support during the preparation of SEA. Together with the Institute of Energy, they are responsible for the results presented in this SEA.
The SEA provides a basis for implementing the national power development plan in a sustainable manner whilst meeting the energy demands for economic development in the near future. It also confirms the close relation between electricity sector development and environmental and social issues, which were only regarded as “secondary issues” in the previous plans. In the SEA, environmental and social costs are included as part of the investment for power development. This has been clearly reflected in the recommendation part of the SEA to inform decision makers about the additional costs that should be taken into account while planning investment for power development.
During the SEA development process, 2 national conferences were organized with the participation of about 70 experts from various ministries, relevant government management agencies, and businesses in the electricity sector, consulting companies, and provincial Departments of Natural Resources and Environment and Departments of Industry and Trade. The provincial departments played an important role in making the SEA consultation a success. They provided technical information and data, as well as their expertise opinions to complete the SEA.
9
INTRODUCTION
1. Background and Context of the National Power Development Plan
Electricity is the most important energy source for socio-economic development and national energy security in the present and future. The electricity sector has achieved rapid growth and relatively incredible success in realizing its responsibility of supplying electricity for the socio-economic development activities of the country. The total capacity of all power stations is over 20,600 MW in 2010, a 3.2 time increase in ten years and a 1.78 time increase compared with in 2005. The total amount of electricity produced in 2010 was over 100 billion kWh, a 3.7 time increase compared with in 2000 and a 1.88 time increase compared with in 2005. With this high growth rate, the electricity sector provides a significant contribution to socio-economic development and life improvement of Vietnamese people.
However, the global financial crisis has affected many aspects of the industry, export, and commerce. Domestic and foreign investment to the production and service sectors has slowed down. The consequence is an undesirably slow economic growth rate and the demand for electricity increases at a lower rate than expected. The average electricity demand increase has been at 13.6% per annum for the last 4 years, which is lower than the low case in PDP VI (15% per annum). Demand for electricity is now back on the track of fast increase. It is expected that electricity demand in 2010 will be over 15 %. In 2011, it will be equivalent to the rate predicted for 2010 in the base scenario of PDP VI.
There are also short-comings in development activities in the electricity sector: a review of the 2006-2009 period revealed that the total capacity of all projects in this period was about over 9,500 MW, which is only 65.3% of the target of 14,581 MW in PDP VI. Transmission line development also only achieved 60% of the target. Although the demand for electricity was lower than expected during this period, the poor performance of the electricity sector in power generation and transmission line development has resulted in a shortage in power supply during the hot months when the water level in reservoirs was lower than usual. This has affected production and people’s life in the last June and July. If remedy actions are not in place, this situation is likely to persist in the coming time.
Lessons learnt from the neighboring countries (Thailand and Indonesia) show that it is necessary to evaluate power demand increases regularly to adjust plans and mobilize power to ensure a safe, adequate and reliable supply for the economy. The Vietnamese economy is in the stage of relatively fast development, and facing quite many challenges in joining the regional and the world economy. Demand for electricity will continue to increase. However, there is a level of instability that cannot be reflected in power demand forecast. That is the reason for the Government and the Ministry of Industry and Trade to conduct evaluations on power demand as well as to restructure electricity consumption to have a better control over the power supply and the progress of power generation and transmission line development.
As directed by the Vice-Prime Minister and head of the Government Steering Committee for PDP VI, the Ministry of Industry and Trade has assigned the Institute of Energy with the task of
10
preparing the next national power development plan for the period of 2011-2020 with a view to 2030 (PDP VII). This task is officially stated in Document No. 11693/BCT-NL dated 9th December 2008, regarding the preparation of PDP VII. According to this Document, the preparation of PDP VII needs to conform to Decision No. 42/2005/QD-BCN dated 30th December 2005, on contents and order of, and procedures for the formulation and evaluation of electricity development planning. It is stated in this Decision that “National Power Development Plan provides the objectives, direction, and policy mechanism for the electricity sector to improve power generation and power grid to ensure a safe, adequate, and reliable power supply for economic sectors, social welfare, people’s life and national security, on the basis of energy saving and efficiency”.
Using on the same methodology and learning from the experiences and lessons of PDP VI, PDP VII was developed to assess the power demand increases in the last few years, and to forecast socio-economic development for the period 2011-2015 with a view to 2020 and 2030. PDP VII also took account of the draft resolution of the Party meeting XI to forecast future power demand for inclusion in power development scenarios.
Power generation in Vietnam relies on three main primary energy sources, which are hydropower, coal, and oil and gas. Electricity is distributed through the high voltage transmission line system running from the North to the South of Vietnam. According to forecast to 2025, the power generation source mix will be balanced with a higher proportion of thermal power and a reduced number of hydropower plants.
The SEA of PDP VII is a mandatory requirement to meet national regulations on planning for all sectors. It is also an important mechanism to improve the overall scope and effectiveness of the PDP VII planning process. In particular, it is the means through which issues, such as environmental and social issues, that have not been given sufficient attention can be fully integrated into the preparation of the PDP VII, which aims at achieving sustainable power production for national economic development. In other words, major costs and benefits relating to environmental and social impacts that have traditionally been treated as “externalities” that are not taken into account in the economic analysis of different power sector options are now considered as part of power project investment. The SEA is the means through which these costs and benefits can be assessed and, where technically possible, internalized into the PDP VII economic analysis of different power supply costs and benefits.
This SEA is the first of a PDP to consider the full range of environmental and social issues and also the first that was prepared accordingly with the current SEA guidelines as reflected in Circular No. 05/2008/TT-BTNMT dated 8th December 2008 by the Ministry of Natural Resources and Environment. The SEA not only provides assessment of environmental impacts but also expresses a commitment to environmental protection, through the main contents and follows:
Chapter 1: Project Summary and the Key Environmental Issues of PDP VII Chapter 2: Environmental Issues Related to the PDP VII Chapter 3: Environmental Impact Forecast for the PDP VII
Chapter 4: Stakeholder Consultation Chapter 5: Recommendations on Preventative and Mitigation Measures and Environment Management and Monitoring Programs.

11
Chapter 6: Data Sources and Assessment Methodologies Conclusions and Recommendations
The study of and assessment in this SEA were conducted in accordance with the Strategic Environmental Assessment Guidelines, which was completed by the Department of Appraisal and Strategic Environmental Assessment, under the Ministry of Natural Resources and Environment, in January 2008, within the scope of the SIDA SEMLA program. This Guidelines was issued in October 2008.
The assessment and consultation in SEA focused on 12 main socio-economic and environmental issues of concern for the sustainable implementation of PDP. The conclusion of this SEA is that the original plan for power development, which proposes an increase in thermal power production from the existing 10.5% to 56% in the power generation source mix in 2030, is a unsafe and unsustainable plan considering that fossil fuel is the biggest source of air pollutants and fossil fuel resources are running out. Taking into account the importance of this issue, the SEA also recommends solutions to reduce dependency on coal-fired thermal power production. This has been recognized as the biggest success of this SEA.
2. Legal and Institutional Framework for the SEA
The development of a strategic plan for the development of the power sector, which takes social and environmental issues in as integral parts of the planning process, needs to be based on the wider policy and institutional environment of the contemporary Viet Nam. There are a number of key pieces of policy and legislation that directly affect an SEA of the power sector in Viet Nam. This section reviews this policy, legal and institutional framework within which an SEA of PDP VII must take place. It identifies a number of key characteristics that the SEA will possess to ensure it conforms to legislative requirements and will be policy relevant.
2.1. Legal Framework There are many existing laws, regulations and legal documents that are related to environmental protection and management. The SEA of PDP VII was based on the following main legal framework:
2.1.1. Laws and Policies Related to Environmental Protection
The Law on Environmental Protection (LEP) 2005: This law was amended and replaced the 1993 Environment Protection Law. There are several articles of LEP 2005 that address SEA issues:
- Article 14 identifies 6 areas where SEA should be applied. It is required that SEA shall be applied in preparing “National development strategy/plan of sector at national level”. Therefore, it is required that SEA shall be applied for PDP VII for the period 2011-2015 with vision to 2030.
- Article 15 specifies the responsibility and timeframe for SEA. Any agency expected to prepare a strategy/plan according to Article 14 of LEP are also responsible for preparing an SEA. An SEA is an important part of the strategy/plan and needs to be prepared at the same time as the strategy/plan.
- Article 16 states that an SEA report shall cover five specific issues:

12
(1) Briefing plan/project objective/scope that relating to environment. (2) Outline natural, economic, social and environment conditions related to project. (3) Forecast possible negative impacts to environment (4) Identify data sources and assessment approach. (5) Proposing environmental protection measures in project implementation.
This can be taken as a mandatory minimum in the development of any SEA but should not be regarded as defining the limits of an SEA assessment.
- Article 17 provides a procedure for appraisal and approval of SEAs. It states that MoNRE shall organize an SEA appraisal committee for stategies/plans that are to be approved by the National Assembly, Government and Prime Minister; that ministries establish SEA appraisal committees for projects approved by them; and Provincial People’s Committees set up SEA appraisal committees for proejcts approved by Provincial People’s Councils.
- LEP 2005 has provisions that state that renewable energy including hydropower is encouraged and government will have privilege treatments (tax, credit, land rent) to support renewable energy projects (article 33). Objectives on renewable energy development are clear as they focus on:
• Increasing ratio of renewable energy in total energy sources. • Contributing to energy security. • Reducing climate change. • Integrating with poverty alleviation.
The Law emphasizes the important role of an SEA, confirming that the SEA appraisal report is a precondition for strategy/plan approval.
LEP 2005 legislation
1) Decree No. 80/2006/ND-CP dated 9 August 2006 by the Government on LEP 2005 implementation guidelines.
2) Decree No. 21/2008/ND-CP dated 28 February 2008 by the Prime Minister, amending and supplementing a number of articles of the Government’s Decree No. 80/2006/ND-CP, detailing and guiding the implementation of a number of articles of the LEP 2005.
3) Decree No. 140/2006/ND-CP dated 22 November 2006, promulgating on environmental protection in preparation, review, approval and organization for conducting to strategies, schemes, plans and development projects.
4) Circular No. 05/2008/TT-BTNMT dated 8 December 2008 by MoNRE, guiding strategic environmental assessment and environmental protection commitment. This is the main guiding legal document for the SEA of PDP VII.
5) Circular No. 06/2007/TT-BKH dated 27 August 2007, guiding the implementation of the Government Decree No. 140/2006/ND-CP dated 22 November 2006, providing for environmental protection in the formulation, evaluation, approval and organization of implementation of development strategies, plannings, plans, programs and projects.
13
2.1.2. Laws and Legislation on Water Resources
The 1998 Law on Water Resource has focused on water resource management and exploitation for consuming purposes by river basin.
Hydro power projects do not consume water like agricultural and industrial activities but only use water to generate power then return water to rivers. However, the impacts of hydropower are assessed as significant. Article 29 hydropower construction projects shall follow river basin (water resource management) plan and environmental protection regulations. It is interesting to note that the law requests that water management in hydropower shall follow water operational procedure approved by an authorized institution (Article 29). This means that in special cases, the priority is given to water for other purposes (flood control, water supply to agriculture for example) but not for power generation.
In addition to the Law on Water Resources, directly relevant legislation includes:
1) Government Resolution No. 179/1999/ND-CP dated 30 December 1999, on the implementation of the LWR;
2) Decision No. 26/2000/PL-UBTVQH10 dated 24 August 2000, on storm and flood control;
3) Decisions No 37, 38 and 39/2001/QD/BNN-TCCB dated 9 April 2001, by the Minister of Agriculture and Rural Development on the establishment of River Basin Planning Management Organisations (RBO) in the Lower Mekong, Dong Nai and Red River basins;
4) Decree No. 32/2001/PL-UBTVQH10 dated 4 April 2002, on exploitation and protection of hydraulic works, effective 1st July 2001.
5) Decree No. 149/2004/ND-CP dated 25 June 2004 by the Government, on regulation on licensing of water resources exploitation, extraction and use and wastewater discharge in water sources.
6) Decree No. 134/2005/ND-CP on regulation on sanction of violation in the field of water resources.
2.1.3. Laws and Regulations on Environmental Preservation and Protection
The 2009 Biodiversity Law intends to legalize the payment for environmental services (PES) provided by forests, including water supply for hydropower stations.
Law on Natural Resource Tax, 2009.
Fisheries Law, 2003.
Law on Forest Protection and Development, 2004.
Land Law, 2003
Law on Natural Resources, 1996 and Law on Cultural Heritage, 2001.
Legislation: 1) Decree No. 23/2006/ND-CP dated 3 March 2006 by the Government, on implementation
of Law on Forest Protection and Development, defining types of forest for protection.

14
Special-use forests (SUFs): In total, Vietnam has established 128 SUFs covering an area of 2.5 million ha (7% of the national land area). SUFs are classified into four management categories: (1) national parks, (2) “nature conservation zones” including nature reserves and species-habitat conservation zones, (3) landscape protection zones (formerly cultural and historical sites) and (4) forests for scientific research or experimentation.
2) Decree No. 32/2006/ND-CP, on management of rare and valuable fauna and flora.
3) Decree No. 27/2005/ND-CP dated 8 March 2005 by the Government, on implementation of several articles of Law on Fisheries, providing regulations on some protected areas as follows:
Marine Protected Areas (MPA): including (i) marine parks, (ii) marine species and habitat conservation areas and (iii) aquatic resource reserves. In addition to the Nha Trang Bay and Cu Lao Cham MPAs which were established in 2001 and 2005, further 13 MPAs are proposed for formal establishment and recognition by 2015.
Wetland Conservation Areas (WLAs): 86 wetlands are recognized to be of national importance and potential PAs. Yet, none have been formally designated as “wetland conservation areas” and more than half have already been listed as either SUFs or MPAs - 23 are SUFs (or within them), 14 are proposed SUFs and a further seven are proposed as MPAs.
One covering the Can Gio mangrove forests is a Biosphere Reserve established by the Ho Chi Minh City People’s Committee. Two others - Xuan Thuy National Park on the Red River Delta, and the Nam Cat Tien swamp complex are recognized as Ramsar Sites.
Table 1 summarizes the current institutional arrangements for planning and management of the national PA system. Apart from seven national parks and one MPA (Truong Sa), all PAs are managed or proposed for management at local government level. MARD is responsible for the development of the national system of SUFs and the development of a national system of Marine Protected Areas (MPAs) and inland wetland protected areas. MoNRE has responsibility for defining the detailed institutional arrangements for wetland conservation areas under a National Wetlands Programme.
The management boards of the PAs are considered the “owners” of these areas. There are still 40% of the PAs without management boards due to budget limitation and mostly because these areas have not been officially recognized as PAs.

15
Table 1: Management Responsibilities for PAs PA types Central level Provincial level Site level
SUFs MARD is responsible for strategic planning, policy formulation & supervision & technical assistance
MARD oversees the management of seven national parks
PPCs oversee the management of other SUFs, either directly or via line departments
Management boards are responsible for day-to-day management of most SUFs
Various arrangements for other SUFs
MPAs and aquatic resources reserves
MOFI is responsible for strategic planning, policy formulation & technical assistance
Institutional arrangements are not yet finalised
MOFI will have direct responsibility for Truong Sa MPA
PPCs will oversee the management of most MPAs
Management boards will be responsible for day-to-day management
Wetland Conservation Areas
MONRE is responsible for strategic planning
Institutional arrangements for WCA management are not defined
Detailed institutional arrangements are not yet defined
Detailed institutional arrangements are not yet defined
4) Decree No. 119/2006/ND-CP dated 16 October 2006, on organization and operation of
forest protection services.
5) Decree No. 109/2003/ND-CP dated 23 September 2003 by the Government, on the conservation and development of wetlands. This is the first time wetland is officially recognized as a natural resource. It was the first time that “wetlands” as a category of natural systems was recognized in a legal instrument. It assigns responsibilities for wetland management to various Ministries and other government agencies. MoNRE is responsible for wetland establishment and defining the policy framework for their management.

16
6) Decision No. 186/2006/QD-TTg dated 18 August 2006 by the Prime Minister, on forest protection mechanism. This Decision allows management board to “permit the rational use of natural resources in SUFs....“subject to prior approval of the PPC. It specifies that PA management boards are allowed to lease forest environment to institutions for developing ecotourism. Management boards are also given discretion to use funding available for staff salaries to contract local households to undertake forest protection work.
7) Decision No. 192/2003/QD-TTg dated 17 September 2003 by the Prime Minister, on approval of the management of the PA system in Vietnam until 2010. It highlights the buffer zone issue as one requiring urgent and systematic attention. It directs the appropriate authorities to “clarify the relationship between buffer zones and PAs by developing regulations governing operations based on the principles of collaboration; regulate the benefits and obligations of each party involved in managing buffer zones, especially ethnic communities located close to or in PAs; and develop long term investment plans for buffer zones”. The Decision also calls to “define the specific role of PA management boards in socio-economic development in buffer zones” and to “supplement and complete procedures and policies for development in buffer zones.”
8) Decision No. 08/2001/ND-TTg dated 11 January 2001 by the Prime Minister, on the management mechanism of SUFs, protection forest, and natural forest used as production forest. This Decision defines “buffer zones as forest, land or wetland areas bodering national parks or nature reserves, helping to prevent or alleviate encroachment to special use forests. All activities in the buffer zones shall aim at supporting the conservation, protection and management of special use forests, and limiting people going into the buffer zones...”
9) The National Conservation Strategy 1986 and the Biodiversity Action Plan 1995 proposed conservation policy initiatives and identified key actions towards the establishment and management of the PA system.
10) The Conservation and Sustainable Development of Wetlands Action Plan for the period 2004-2010, approved by MoNRE in April 2005.
11) Decree No. 120/2008/ND-CP dated 1 December 2008 by the Government, on river basin management.
12) Decree No. 99/2010/ND-CP dated 24 September 2010 by the Government, on payment for environmental services.
2.1.4. Legislation Related to Resettlement
Land Law 2003.
1) Decree 181/2004/ND-CP, on provisions for implementing Land Law. Article 36 regulated that Government taking back land from other stakeholders to serve for national security purpose, national and communal benefit.
2) Decree 197/2004/ND-CP from December 2004 on "compensation, assistance and resettlement when Government taking back the land" regulates compensation for local
17
people when Government taking back their land. According to this Decree, when Government used the land from people for national security and national benefit purposes, the compensation for those who effected including: land (resident, agriculture and non-agriculture...), properties over land (houses, graves, cultural constructions, animals, trees and others), resettlement and other assistance like job recreation and education. The Decree also regulates that the conditions of the resettlement area needs to have enough necessary infrastructures and have to be better than the former area.
In cases where projects affect a whole community and multiple aspects of people life such as economic, social, traditional culture, compensation arrangements need to be decided by Central Government or Assembly case by case. Article 47 of the Decree states that in case the Government has implementing the right compensation and resettlement policy but the individual or households still do not follow, these families will have to be subject to compulsory resettlement according to the Law.
3) Decree No. 69/2009/ND-CP dated 13 August 2009 by the Government, on land use planning, land prices, land acquisition, compensation, support and resettlement. This Decree marks a step forward in compensation and resettlement through a negotiation mechanism between investors and affected people.
2.1.5. Laws and Legislation on Energy and Electricity
The 2004 Electricity Law provided clear provisions for power development planning and investment, and energy saving, as well as the rights and responsibilities of individuals and organizations to “follow the laws and regulations on environmental protection in power generation”. It also included provisions for electricity users, protection of electricity equipment, and power safety. This Law is applied for all organizations and individuals involved in power generation, trade, consumption, and other related activities. The 2004 Electricity Law1 has focused more on electricity market, and not addressed in detail environment protection or hydropower development. But it has confirmed the policy on accelerating renewable energy development and considering environment protection in electricity development (article 4), and on the special privilege policy on investment, tax, electricity price to renewable energy projects (article 13).
Law on Energy Efficiency and Conservation (EEC) on 7/6/2010 provided legal guidelines for the sector development in the future. This law aims to facilitate long-term development in the context of Vietnam where power demand increases more than double the economic growth rate, which is very unsustainable for the natural resources and the economy. The Law recognizes that the electricity sector is usually less efficient than international standards due to old-fashioned equipment and ineffective operation systems, which contribute to environmental pollution and climate change. Article 6 of the Law focuses on SEA with the following details:
Energy strategies/plans need to meet the following requirements:
a) A safe and stable supply of energy; rational and efficient use of energy/power sources.
1 Electricity Law. National Assembly, decision 28/2004/QH11, December 2004

18
b) Energy demand-supply forecast needs to fit in with socio-economic development strategies, plans and programs; there should be a balance between the coal, oil and gas, and electricity development plans and development plans of other forms of energy.
c) Accelerate efficient and rational use of renewable energy, prioritize clean energy development and increase renewable energy in power generation.
d) Develop and implement a roadmap for the manufacture of energy saving equipment, machinery and construction material.
The Prime Minister himself directs the implementation of the energy efficiency and conservation strategy/plan/program.
The 2008 Law on Nuclear Power and Decree No. 50/1998/ND-CP dated 16 July 1998 by the Government, on radio safety and control.
2.1.6. Other Legislation
- Resolution No. 41-NQ/TW dated 15 November 2004 by the Polit-Bureau, on environmental protection during the period of industrialization and modernization of the country.
- Decree No. 59/2007/ND-CP dated 09 April 2007 by the Government, on solid waste management.
- Directive of the Secretariat, which reinforced the implementation of Resolution No. 41-NQ/TW dated 15 November 2004 by the Polit-Bureau on environmental protection during the period of industrialization and modernization of the country.
- Decision 192/2003/QD-TTg dated 17 September 2003 by the Prime Minister, on approving the Management Stategy for a Protected Area system in Vietnam to 2010.
- Decision No. 22/2006/QD-BTNMT dated 18 December 2006 by MoNRE, on the compulsory application of Vietnam environmental standards.
- Decision No. 1855/QD-TTg dated 27 December 2007 by the Prime Minister, on approving Vietnam’s National Energy Development Strategy up to 2020 with 2050 vision. A clear direction for the development of the power sector was presented in this strategy.
- Decision No. 16/2008/QD-BTNMT dated 31 December 2008 by MoNRE, on promulgation of National Technical Standards for the environment.
- Circular No. 25/2009/TT-BTNMT dated 16 November 2009 by MoNRE, on issuing technical standards for the environment.
- Document No. 10982/BCT-ATMT dated 17 November 2008 by MoI, on preparation of SEAs for plans. This document stated that all agencies in charge of preparing strategies/plans are also responsible for preparing SEAs for these strategies/plans in accordance with Article 14 of Law on Environmental Protection and submit SEAs to authorized agencies for appraisal according to the law. Relevant departments only submit strategies/plans to the Ministers for approval only when appraisal reports of their SEAs are available by environmental protection agencies.
- Decision No. 6385/QD-BCT dated 21 December 2009, on approving the plan and estimated budget for the “Strategic Environmental Assessment for national Power Development Plan for the

19
period 2011-2020 with vision to 2030”.
2.2. Overall Strategies and Policies 2.2.1.Environmental and Socio-Economic Strategies and Policies
National Strategy for Environmental Protection up to 2010 and vision toward 2020, which was approved in Decision No. 256/2003/QD-TTg dated 2 December 2003, on approving the National Strategy for Environmental Protection. Main objectives and responsibilities set out in this strategy are: (1) Protection and sustainable extraction of natural resources (rational extraction, and suitable, effective and economical use of land and mineral resources; rational water extraction, protection and development; (2) Environmental protection and improvement of focal areas such as urban and industrial areas, marine, coastal and island areas, river basins and wetlands, and natural and cultural heritage sites; (3) Nature and biodiversity conservation, including conservation and development of nature conservation areas and national parks, forest development and increase in vegetation cover, and biodiversity conservation.
National Program to respond to Climate Change, which was approved in Decision No.158/QD-TTg dated 2 December 2008, with clear guiding principles of sustainable development, response to climate change as the responsibility of the whole political system, society, sectors, regions, and gender equity and poverty reduction.
Socio-Economic Development Plan for the period 2011-2015, published by the Government of Vietnam in 2010, and the draft socio-economic development plan and government budget for the 5 year period 2011-2015. The Central Executive Committee has discussed and commented on the content of this draft, focusing on the details of: development viewpoints, objectives and points of breakthrough, overall development responsibilities and restructuring the economy, and organization and implementation of the 5 year plan.
Overall goals of the five year plan are: (i) Consolidating macro-economic stability; (ii) striving for higher economic growth; (iii) elevating the quality, efficiency, and competitiveness of the national economy; (iii) To achieve political and social stability, consensus, democracy, and discipline; (iii) ensuring social security and welfare, bettering people’s life, especially poor people and ethnic minority people living in mountainous and remote areas; (iv) reinforcing work in protection of the environment and natural resources and in response to climate change; (v) raising the efficiency of diplomatic work and international integration; (vi) consolidating national defense; guaranteeing security, social order and safety; and (vii) creating a foundation for making Vietnam a modern industrialized country by 2020.
Key targets of the five year plan are: the gross domestic product (GDP) increase to 7-7.5% per annum; GDP per person in 2015 at around US$2,000, increase by 1.7 times compared with 2010; Productivity in 2015 increase two times compared with 2010; consumer price index growth rate at the average 7% per annum; total export increase by 12% per annum; trade deficit under 15% of total export turnover by 2015; average total social investment capital at 40% of GDP; state budget deficit reduce to under 5% of GDP in five years to 4.5% by 2015; safe level of public debt and debt to foreign countries; proportion of trained workers accounting for 55% of the labor force by 2015; proportion of poor households reduce by 2% per annum; forest coverage increase to 45% by 2015; and 20% of the communes classified as “new rural communes” by 2015, etc.

20
The national Socio-Economic Development Plan (SEDP) for the period 2010-2020 was approved in the Party meeting in January 2011. The SEDP anticipates Viet Nam’s transition to being a developed country by the year 2020, with a knowledge-based economy and stable and secure livelihoods for all sections of society. The SEDP emphasizes the diversification of the rural economy, the need to target appropriate development solutions for the needs of communities in remote and impoverished parts of the country, the strengthening of private sector engagement in rural development and the continuation of decentralization and local democratization processes. The priorities and development principles set out in the SEDP provide a context within which sectoral and provincial level plans should be established.
Balanced and sustainable development principles are built into and reinforced in the new SEDP for the period 2010-2020. This includes the incorporation of new regulations and decrees on different aspects of sustainable development and environmental protection that have been issued since the last SEDP was prepared. As such, the policy and legislative context for balanced and sustainable development continues to be strengthened in Viet Nam and is an integral and central part of the overall development objectives of the country now and in the future. These principles should be reflected in the preparation of sectoral plans such as the PDP VII that is the subject of this SEA.
The overall approach to the power sector is to expand capacity to meet demands, but also to improve efficiency, balance fuel sources, expand the network to poor and remote areas (using new and renewable energy technologies where needed) and reduce the environmental impacts associated with electricity generation. The SEDP includes measures to ensure reasonable, effective and sustainable use of natural and environmental resources in watershed areas, and mainstream environmental protection into socio-economic development plans; renew the planning work in regard to environmental protection. There are provisions to expand forest coverage and to integrate climate change into strategic planning and natural resource management. These goals and targets will be taken into account in power planning and development decisions.
National Water Resources Strategy up to 2020, which was approved in Decision No. 81/2006/QD-TTg dated 14 April 2006
Forest Development Strategy for the period 2001-2010 by MoNRE;
Hydropower Development Strategy up to 2010 by MARD;
National Target Program for Rural Water Supply and Sanitation by the Government, which was approved in Decision No 237/1998/QD-TTg dated 03 December 1998;
National Strategy for Natural Disaster Prevention and Mitigation up to 2020 by the Government, which as approved in Decition No. 172/2007/QD-TTg dated 16 November 2007.
2.2.2. Energy Strategies and Policies
Decision No. 1855/QD-TTg, dated 27 December 2007, on approval of Vietnam’s National Energy Strategy up to 2020 with vision to 2050 has a clear statement on the overall approach to the development of energy resources and production capacities:
“Exploiting and using reasonably and effectively the domestic energy resources; Supplying

21
sufficiently the energy requirements with the highly increasing quality and the reasonable price for the socio-economic development course; Ensuring the national energy security; Diversifying the investment and commerce ways in the energy field, gradually establishing and developing the competitive energy market; Strengthening the development of the new and renewable energy sources in order to meet the need of power requirement, especially in the remote areas, border and islands; Developing rapidly, effectively and sustainably the energy sector, developing must be attached to the environment protection”.
The National Energy Efficiency and Conservation Program has some initial success: the Law on Energy Efficiency and Conservation was completed and a guideline for energy efficiency and conservation for government agencies, businesses, local government, and households was drafted. The target was to reduce national power consumption from 3-5% for the period of 2006-2010. This target now is to reduce from 5-8% of national power consumption for the period of 2011-2015, according to the normal development scenario.
2.3. Technical Framework The SEA of PDP VII was prepared based on the main following technical documents:
- PDP VI, prepared by the Institute of Energy, EVN, in 2005.
- PDP VII, prepared by Institute of Energy, MoIT, in January 2011.
- General Technical Guidance for SEAs, completed by the Department of Appraisal and Strategic Environmental Assessment under the Ministry of Natural Resources and Environment in January 2008, under the scope of the SIDA SEMLA program, and issued in October 2008.
3. Objectives, Approach, Methodology, Organization and Implementation of the SEA
3.1. Objectives of the SEA Main objectives of the SEA of PDP VII are:
1) To ensure that the power development plan satisfies the power demand for national socio-economic development in an efficient and sustainable manner.
2) To identify social and environmental issues of power development plans and to analyze and calculate social and environmental costs of development scenarios in PDP VII.
3) To assess key GoV policies (renewable energy, climate change, environmental flows, energy efficiency and conservation, and benefit sharing, etc.) to reflect the benefits and influence of these policies in PDP VII.
4) To propose mitigation measures to reduce negative impacts or compensate people negatively affected by the implementation of PDP VII.
3.2. Approach and Methodology 3.2.1. Methodology In order to achieve its objectives, the SEA adopted a methodology that combines the two

22
interrelated processes of assessing environmental impacts and identifying options for power development plans.
The SEA was prepared in the context that there were scarce financial and human resources, as well as limited time. Information on key issues was either not in place or only partial available. This necessitated a method and process which relied heavily on the judgments and opinions of the government officers and other national experts involved
The SEA focuses on the role and contribution of the national power development plan to national development. Through this approach, the SEA helps to create a balance between economic development, social equity and environmental sustainability.
Trend analysis: The methodology adopted in the pilot SEA used trend analysis as the primary analytical tool. This method was adopted following the recommendations of the MoNRE Technical Guidelines, which follow a process similar to approaches adopted in the European Union. Trend analysis is the most important component of every strategic assessment. Considering the requirements for SEAs in Vietnam2, this analysis can be seen as an analysis that reflects changes over time in key socio-economic and environmental issues.
Trend analysis in this SEA focused on key issues that were identified and selected by experts based on results of the stakeholder workshop and the national consultation (by distributing and collecting assessment forms to relevant provincial authorities).
The environmental impacts assessment (which also includes reviews of socio-economic impacts, development plans of other sectors, and technical indicators) was based on power demand and supply forecast scenarios (for both power source development and power grid expansion) presented in PDP VII, taking account of each component project, to propose adjustments to the power development plan. This assessment process is illustrated in Figure 1.
Quantitative method allows impact assessment of verifiable indicators such as loss of forest, land area, level of gaseous emissions, number of people affected by gaseous emissions from thermal power plants, and number of displaced people, etc. The costs of these impacts are then calculated and internalized into the overall cost calculations for all environmental and social costs and benefits from different proposed sources of power generation and power grid development options. This overall cost will be included in the calculations of the minimal and optimized investment costs of proposed power development projects.
The use of GIS analysis and the method of overlapping maps were adopted for this assessment of socio-economic and environmental issues.
Qualitative assessment was adopted for indicators that cannot be quantified, such as the main trends and their motivations, territorial size, and key issues of concern in power development in Vietnam.
This methodology allows identification of main trends and models within the scope of this research in the last 10 years, and a view of the situation in the next 20 years. The expected result
2 Law on Environmental Protection (2005), Chapter 1, Article 3, Item 19 emphasizes the important role of an SEA, confirming that the SEA appraisal report is a preconditions for strategy/plan approval to ensure sustainable development.

23
will reflect: (a) key national policy and development objectives and (b) the opinions and knowledge of key stakeholders.
3.2.2. SEA Phases
The key steps in the SEA are as follows:
Stage 1: Define the analytical framework
1) Define the key national socio-economic and environmental issues of concern and priorities that should be considered in PDP. These issues and priorities are related to all five categories of power development: hydropower, thermal power, nuclear power, renewable energy, and transmission line expansion (500 and 220kV lines).
The SEA started with a stakeholder consultation workshop, which was organized in Qui Nhon city in July 2010. The purpose of this workshop was to define key socio-economic and environmental issues that are related to the sustainable and strategic environmental aspects of PDP. 20 socio-economic and environmental issues of PDP (see Table 2) were discussed in the workshop. The result of this workshop was a set of the most important strategic issues that was used as the analytical framework in this SEA.
Table 2: Key issues related to the development of PDP
Area of concern
Issue identified by provincial and district authority
Environment 1 Hydrology Lack of water during dry season, low water level
Big flood disrupting river flows Increased level of salt intrusion in dry season Reduced downstream water flows 2 Quality of water,
air and soil Increased pollution due to gaseous emissions, wastewater and solid waste
3 Aquatic biodiversity
Increased demand for use and export of natural products
Environmental pollution affecting fish and aquatic vegetation
Use of destructive fishing equipment Reduction in traditional fishing activities and sustainable use 4 Terrestrial
biodiversity Degradation of the diverse fauna and flora system
Biodiversity values mainly remain in upstream areas Reinforcing regional biodiversity conservation 5 Loss of forest Loss of biodiversity and rare genetic sources of international value significance
Increased risks of downstream sedimentation, erosion and flood Reduced water bearing capacity in soil and the effects of this on river basins Loss of forest biological services Livelihoods of people who are dependent on forests 6 Land/soil High and increasing land erosion 7 Degradation of
natural resources Fuel consumption during the construction and operation of power projects resulting in degradation of natural resources

24
8 Climate change Increased risk and incidence of natural disasters Reduced agricultural and industrial productivity as a result of changes in weather
patterns. Economy 9 Fishing and
aquaculture Increased level of fishing resulting in reduced quantities of each catch
Reduced food supply for aquaculture leading to higher cost Loss or reduction in quantity of economically valuable species in rivers due to
construction of dams and reservoirs. Pollution affecting aquatic habitats
10 Agriculture Reduction in agricultural production land Reduced productivity due to air pollution and climate change Land erosion, acidification of soil in agricultural areas, degradation of
agricultural production land in lower river basins Use of fertilizer and pesticide resulting in soil and water pollution
Reduction in brackish water aquaculture and increase in fresh water aquaculture having high environmental impacts
Food security 11 Forestry Environmental and biological services
Livelihoods of many households dependent on forest resources and forestry production
12 Hydropower Only 55% of hydropower demand is met Conflict of interest in water demand for irrigation and hydropower – need for
multipurpose water resources management 13 Water supply Lack of water supply for residential areas
Rapid increase in water demand for industrial activities and domestic supply Increase in water demand for biological recovery, reduction of salt intrusion,
surface pollutant wash-off, mitigation of river-edge erosion by reducing severe flooding
Lack of attention to systematic river basin management and use of hydropower stations, lack of coordination across sectors
Lack of regular information updates on quality and capacity of water supply
Development of industrial zones and increased water demand resulting in an
imbalance between biology and population density 14 Urban
development Construction of infrastructure in lowlands which are prone to floods
Scattered housing development along side big roads outside of the city with inadequate supporting infrastructure
Lack of clean water supply for residential areas 15 Energy security Reduced reliance on fossil fuel
Dependence on fuel price and primary fuel market
Limited financial capacity for new and renewable energy development and fuel conservation
16 Natural resource exploitation
Degradation of natural resources
Exploitation of limestone and production land resulting in changes to the natural scenery.

25
Illegal logging along side rivers and in special use forests
17 Industry Focus on development within river basin areas – remote areas for material exploitation and processing factories
Conflict between primary industrial development (in resources exploitation, including water resources) and development of other sectors – use of land and other natural resources
Pollution of surface water and ground water
18 Use of water resources
Water discharge management
Lack of water during dry season due to water storing in reservoirs for power generation
Sedimentation in rivers and reservoirs – reservoir longevity?
Competition for water use/demand amongst sectors
Society 19 Demographic
and ethnic minority
Increased migration from rural areas to urban areas
Increased level of resettlement and re-impoverishment Poor quality in job training Slow improvement of employment structure: high employment rate in public
sector Dependence on shifting agriculture, forestry and river fishery High poverty rate Low education level Preservation of outstanding cultural values Risks of loss of traditional cultural values and increased social evils Need for education and health care services development 20 Health Increased incidence of diseases related to environmental pollution,
especially air pollution
Increased incidence of water born diseases during flood season Better access to health care services Transmissible diseases

26
Based on the results of this first round of consultation and the consultation (using the scoring method) with specialized agencies and local management authorities (see Appendix 1), the working group had discussed and selected 12 strategic environmental issues (see Table 3), and developed assessment indicators for each of these issues.
Key environmental issues presented in the SEA
This list of strategic environmental issues and their assessment indicators constitute the framework of the SEA of PDP VII.
Table 3: Key environmental issues of the SEA
Key issues for assessment within the scope of the SEA (See Chapter 3,4 and 6)
1. “Loss of forest and biodiversity“ 2. “Hydrological regime, water resources management and saltwater intrusion
management
3. “Changes to environmental quality“ 4. “Solid waste and toxic waste“ 5. “Natural resources conservation and efficiency“
6. “Climate change “
7. “Energy security”
8. “Environmental conflicts, risks and accidents”
9. “Resettlement and impoverishment”
10. “Community health” 11. “Agriculture and food security”
12. “Livelihood”
These issues are presented by order of priority in Table 4, based on the level of concern of the local authorities, and the concern of the central government, which was expressed through the strategies and national target programs discussed in the previous section. The next chapter provides qualitative and quantitative analyses of the assessment indicators of each of these issues (see table below). The analyses take into account past, present and future trends to assess the impacts of PDP VII.
Table 4: Key socio-economic and environmental issues and assessment indicators
No. Key issues Assessment indicator
1 Loss of forest and biodiversity
Loss of forest, degradation of biodiversity, including many rare genetic sources of international value significance
Loss of forest biological services Environmental pollution affecting different species Increased demand for use and export of natural products Traditional fishing activities and unsustainable use of natural resources
Degradation of biodiversity; biodiversity values mainly remain in upstream areas

27
Reinforced regional biodiversity conservation Livelihood of households dependent on forests Increased risks of downstream sedimentation, erosion and flood 2 Hydrological regime,
water resources management, and saltwater intrusion management
Reduced downstream water flows resulting in lack of water and saltwater intrusion during dry season, especially when reservoirs start storing water for power generation
Increased water demand for biological recovery, reduction of saltwater intrusion, surface pollutants wash-off, mitigation of river-edge erosion by reducing severe flooding
Competition for water use/demand across sectors Rapid increase in water demand for industrial activities and domestic
supply Development of industrial zones and increased water demand resulting in
an imbalance between biology and population density Lack of attention to systematic river basin management and use of
hydropower stations, lack of coordination across sectors Lack of regular information updates on quality and capacity of water supply Management of water discharge and flood issues
Sedimentation in rivers and reservoirs
Conflict of interest in water demand for irrigation and hydropower – need for multipurpose water resources management
Lack of water supply for residential areas
3 Changes to environmental quality
Gaseous emissions
Wastewater
Acidification of soil 4 Solid waste and toxic
waste Quantity and type of waste
Environmental issues of waste storage
5 Natural resources conservation and efficiency
Over-exploitation
Fossil fuel consumption Increased efficiency in fuel consumption, reduction of loss and increased
efficiency in fuel exploitation
Natural resources exploitation for power development 6 Climate change Increased risk and incidence of natural disasters
Reduction in industrial and agricultural productivity due to changes of weather patterns.
7 Energy security Reduced reliance on primary fuel, especially fossil fuel Dependence on fuel price and primary fuel market Limited financial capacity for new and renewable energy development and
fuel conservation 8 Environmental conflicts,
risks and accidents Water conflict, flood, erosion and environmental flows
Competition for natural resources Conflict of benefits from biological services Subjective risks
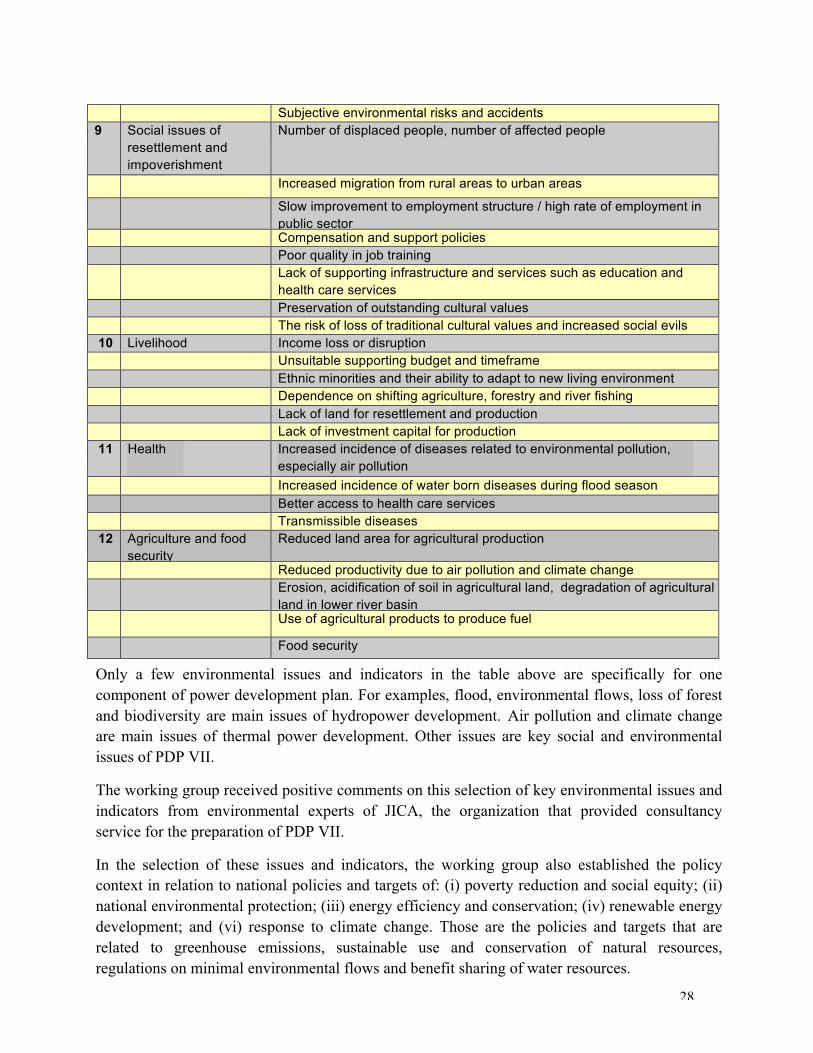
28
Subjective environmental risks and accidents 9 Social issues of
resettlement and impoverishment
Number of displaced people, number of affected people
Increased migration from rural areas to urban areas
Slow improvement to employment structure / high rate of employment in public sector
Compensation and support policies Poor quality in job training Lack of supporting infrastructure and services such as education and
health care services Preservation of outstanding cultural values The risk of loss of traditional cultural values and increased social evils
10 Livelihood Income loss or disruption Unsuitable supporting budget and timeframe Ethnic minorities and their ability to adapt to new living environment Dependence on shifting agriculture, forestry and river fishing Lack of land for resettlement and production Lack of investment capital for production
11 Health Increased incidence of diseases related to environmental pollution, especially air pollution
Increased incidence of water born diseases during flood season Better access to health care services Transmissible diseases
12 Agriculture and food security
Reduced land area for agricultural production
Reduced productivity due to air pollution and climate change Erosion, acidification of soil in agricultural land, degradation of agricultural
land in lower river basin Use of agricultural products to produce fuel
Food security
Only a few environmental issues and indicators in the table above are specifically for one component of power development plan. For examples, flood, environmental flows, loss of forest and biodiversity are main issues of hydropower development. Air pollution and climate change are main issues of thermal power development. Other issues are key social and environmental issues of PDP VII.
The working group received positive comments on this selection of key environmental issues and indicators from environmental experts of JICA, the organization that provided consultancy service for the preparation of PDP VII.
In the selection of these issues and indicators, the working group also established the policy context in relation to national policies and targets of: (i) poverty reduction and social equity; (ii) national environmental protection; (iii) energy efficiency and conservation; (iv) renewable energy development; and (vi) response to climate change. Those are the policies and targets that are related to greenhouse emissions, sustainable use and conservation of natural resources, regulations on minimal environmental flows and benefit sharing of water resources.

29
The basis for assessing the adherence of PDP VII to national policies and targets are:
- Article 4 of the Electricity Law stressed on the need for sustainable power development based on optimal use of resources to supply electricity for domestic use and socio-economic development and contribute to national defense and security, and energy security. This article also stated the need for accelerating exploration and use of renewable energy for power generation. Article 60 of this Law stated that individuals and businesses shall be encouraged to invest in the development of power grid and power generators using locally available energy and renewable energy to provide electricity for rural, mountainous and island areas.
- The target set out in the b section of Article 2 of Decision No. 1855/QD-TTg, on approving Vietnam’s National Energy Development Strategy up to 2020 with 2050 vision, was to “increase the use of new and renewable energy to around 3% of the total primary commercial energy use in 2010, around 5% in 2020 and around 11% in 2050”.
- Section 2 of Article 1 of Decision No. 79/2006/QD-TTg dated 14/04/2006, on approving the National Target Program for Energy Efficiency and Conservation stated that the target was to “reduce national power consumption from 3-5% for the period of 2006-2010. This target now is to reduce from 5-8% of national power consumption for the period of 2011-2015, according to the normal development scenario…”
- The overall objectives of the National Target Program for Climate Change were to “assess climate change impacts on sectors, areas and regions in specific periods and develop feasible action plan to effectively respond to climate change in each short-term/long-term period to ensure sustainable development of Viet Nam, to take full use of opportunities to develop towards a low-carbon economy, and to join international community effort to mitigate climate change impacts and protect global climatic system. Every ministry, sector, and local government shall be expected to have a specific action plan to respond to climate change”.
2) Assess the power development scenarios in PDP VII, and establish the supply – demand options and alternatives to be included in the analysis.
Based on the national targets discussed above, the SEA working group has requested the PDP VII working group to include the two following comparative scenarios:
- Alternative 1: to increase the rate of energy saving and efficiency from 1-3% (base case scenario) to 5-8% in 2030 (demand scenario).
- Alternative 2: to assume the use of renewable energy from 4% (base case scenario) to 10% in 2030 (supply scenario).
3) Define the role of GIS analysis in the overall SEA approach.
Stage 2: Data collection and definition of the baseline analysis.
1) For each of the quantifiable indicators, identify and collect (a) data already available to IE; (b) data available to the ADB advisors; (c) data from other sources; and (d) data available to
30
national experts. Additional data collection was supported buy MoIT.
2) Establish the structure and parameters for GIS analysis and identify indicators suitable for GIS analysis based on the locations of future power plants, transmission lines, and the zones of influence of thermal power plants (areas affected by gaseous emissions) and hydropower plants (areas affected by construction of dams and surrounding areas). The immediate affected areas are within 10 km from plant and the larger affected areas are within 30 km from plant.
- For hydropower, identify where the analysis undertaken in the 2009 PDP VI Pilot SEA needs extension and/or amendment.
- For nuclear power, analysis was taken from the strategic environmental impact assessment of the location plan for nuclear power development in Vietnam, which was undertaken in 2009.
3) Study the PDP VII demand scenarios and baseline supply options, including information about locations of potential power plants, new transmission lines and zones of influence of hydropower power plants and power plants of other generation types.
Stage 3: Stakeholder consultations, which were undertaken in several phases of the project.
The first stakeholder workshop “The SEA Scope and Methodology” was organized to gather stakeholders’ opinions on the selection of key environmental issues for developing the analytical framework.
The Impact Matrices were distributed to relevant provincial authorities (Provincial Departments of Natural Resources and Environment and Provincial Departments of Industry and Trade) in provinces where PDP VII power development projects are located to gather their key concerns regarding potential environment impacts. Based on the results collected from the provincial authorities, the SEA working group gained knowledge about their concerns about the potential impacts, both positive and negative, of different types of power generation and transmission line expansion planned for their provinces.
In the final phase of the project, another workshop was organized to present the results and receive feedback on the assessment and recommendations in the SEA. The workshop included a discussion about government agencies responsible for relevant policy areas in revision of possible recommendations for the SEA.
Stage 4: Impact analysis and weighting.
1) Analysis of different impacts using economic valuation and scoring.
2) Quantitative analysis of the physical quantities of different impacts, both positive and negative, for the different power supply options included in the SEA.
3) Economic valuation, where possible, of the costs and benefits of impacts of the power supply options in PDP VII for comparison and ranking, and development of indicators to demonstrate the scale of impacts where valuation is not possible.
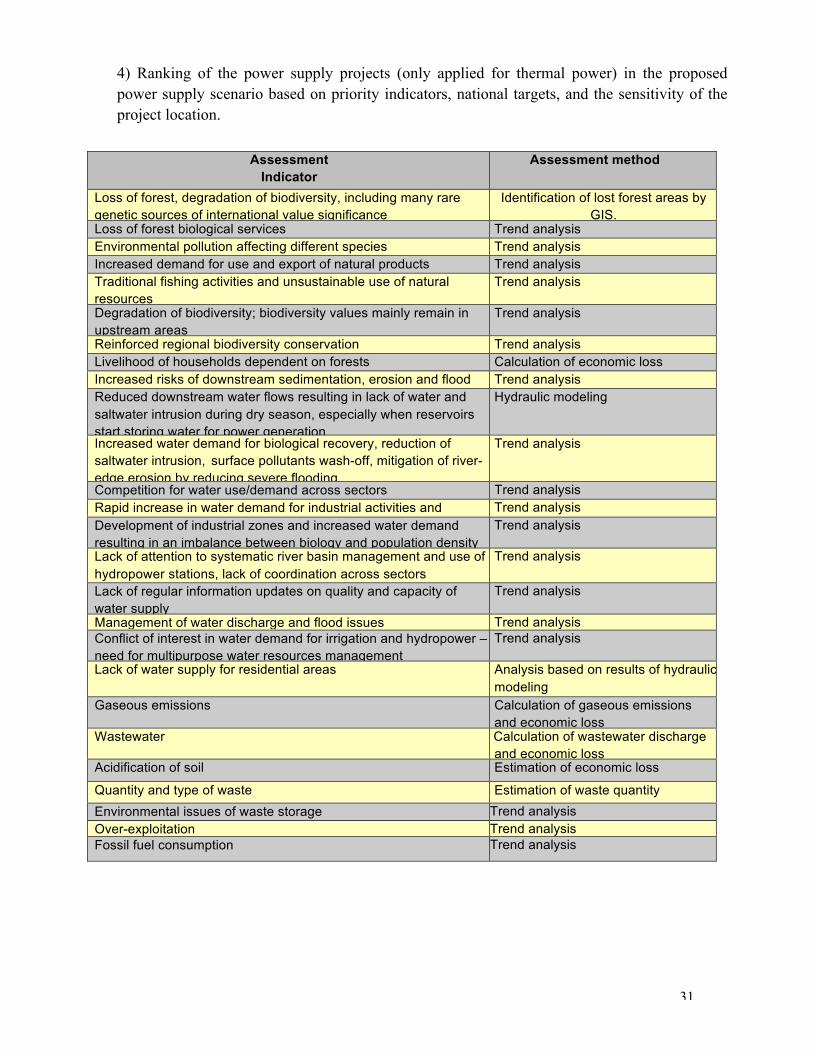
31
4) Ranking of the power supply projects (only applied for thermal power) in the proposed power supply scenario based on priority indicators, national targets, and the sensitivity of the project location.
Assessment Indicator
Assessment method
Loss of forest, degradation of biodiversity, including many rare genetic sources of international value significance
Identification of lost forest areas by GIS.
Loss of forest biological services Trend analysis Environmental pollution affecting different species Trend analysis Increased demand for use and export of natural products Trend analysis Traditional fishing activities and unsustainable use of natural resources
Trend analysis
Degradation of biodiversity; biodiversity values mainly remain in upstream areas
Trend analysis
Reinforced regional biodiversity conservation Trend analysis Livelihood of households dependent on forests Calculation of economic loss Increased risks of downstream sedimentation, erosion and flood Trend analysis Reduced downstream water flows resulting in lack of water and saltwater intrusion during dry season, especially when reservoirs start storing water for power generation
Hydraulic modeling
Increased water demand for biological recovery, reduction of saltwater intrusion, surface pollutants wash-off, mitigation of river-edge erosion by reducing severe flooding
Trend analysis
Competition for water use/demand across sectors Trend analysis Rapid increase in water demand for industrial activities and domestic supply
Trend analysis Development of industrial zones and increased water demand resulting in an imbalance between biology and population density
Trend analysis
Lack of attention to systematic river basin management and use of hydropower stations, lack of coordination across sectors
Trend analysis
Lack of regular information updates on quality and capacity of water supply
Trend analysis
Management of water discharge and flood issues Trend analysis Conflict of interest in water demand for irrigation and hydropower – need for multipurpose water resources management
Trend analysis
Lack of water supply for residential areas Analysis based on results of hydraulic modeling Gaseous emissions Calculation of gaseous emissions and economic loss
Wastewater Calculation of wastewater discharge and economic loss
Acidification of soil Estimation of economic loss
Quantity and type of waste Estimation of waste quantity Environmental issues of waste storage Trend analysis Over-exploitation Trend analysis Fossil fuel consumption Trend analysis

32
Increased efficiency in fuel consumption, reduction of loss and increased efficiency in fuel exploitation
Trend analysis
Natural resources exploitation for power development Trend analysis
Increased risk and incidence of natural disasters Trend analysis Reduction in industrial and agricultural productivity due to changes of weather patterns.
Trend analysis
Reduced reliance on primary fuel, especially fossil fuel Trend analysis
Dependence on fuel price and primary fuel market Trend analysis Limited financial capacity for new and renewable energy development and fuel conservation
Trend analysis
Water conflict, flood, erosion and environmental flows Trend analysis
Competition for natural resources Trend analysis Conflict of benefits from biological services Trend analysis Subjective risks Trend analysis Subjective environmental risks and accidents Trend analysis
Number of displaced people, number of affected people Trend analysis Increased migration from rural areas to urban areas Trend analysis Slow improvement to employment structure / high rate of employment in public sector
Trend analysis
Compensation and support policies Trend analysis Poor quality in job training Trend analysis Lack of supporting infrastructure and services such as education and health care services
Trend analysis
Preservation of outstanding cultural values Trend analysis The risk of loss of traditional cultural values and increased social evils
Trend analysis Income loss or disruption Trend analysis
Unsuitable supporting budget and timeframe Trend analysis Ethnic minorities and their ability to adapt to new living environment
Trend analysis Dependence on shifting agriculture, forestry and river fishing Trend analysis
Lack of land for resettlement and production Trend analysis Lack of investment capital for production Trend analysis
Increased incidence of diseases related to environmental pollution, especially air pollution
Cost calculation of health impacts
Increased incidence of water born diseases during flood season Trend analysis Better access to health care services Trend analysis Transmissible diseases Trend analysis Reduced land area for agricultural production Identification of agricultural land
affected by power projects
Reduced productivity due to air pollution and climate change Trend analysis
Erosion, acidification of soil in agricultural land, degradation of agricultural land in lower river basin
Trend analysis
Use of agricultural products to produce fuel Trend analysis Food security Trend analysis

33
Stage 5: Identification of areas and options for mitigation and compensation. For areas and people affected negatively by power plant and transmission line development, identify appropriate compensation and mitigation approaches, based on national regulations and good experiences in Viet Nam and other countries.
Assess the financial implications and financing options for mitigation and compensation measures, including the potential of benefit sharing mechanisms based on Decree No. 99/2010/ND-CP dated 24 September 2010 on Payment for Environmental Services.
Propose monitoring and management programs to achieve environmental protection targets.
Stages 6: Conclusions and Recommendations
At this stage, the SEA report is completed and submitted to the government for appraisal.
The figure below illustrates the process of undertaking the SEA and the relation between the SEA working group and the PDP VII working group.
132
Figure 7-3: Suggested Integration of SEA into PDP VII!
!!
"#$%!&'()&*!
+,- .&&(&&$%/!(%0$12%3(%'#4!5#3#/(!62&'&!721!#$1!)2448'#%'&!#%5!/1((%928&(!/#&(&!+:- ;%'(1%#4$<$%/!'9(&(!(='(1%#4!62&'&!$%'2!/(%(1#'$2%!)4#%%$%/!325(4!+>- ?(0(42)$%/! 5$77(1(%'! #4'(1%#'$0(! &6(%#1$2&! 2%! )2@(1! &8))4A! &2816(! +%2'! 2%4A!9A512)2@(1!B8'!#4&2!2'9(1!&2816(&!&869!#&!62#4C!/#&C!%864(#1C!1(%(@#B4(C!('6-!
+D- EB'#$%$%/!4(#&'F62&'!)4#%&!+'2'#4!62&'!#%5!/(%(1#'$2%!3$=-!721!(#69!&6(%#1$2!'#G$%/!$%'2!#6628%'!B2'9!&8))4A!#%5!(%0$12%3(%'#4!62&'&!
+H- I#48$%/!2'9(1!(%0$12%3(%'#4C!&26$#4!#%5!2'9(1!$&&8(&!+J- K(6233(%5$%/!3(#&81(&!721!3$'$/#'$%/!$3)#6'&!+L- M0#48#'$2%!27!&6(%#1$2&!+N- K(6233(%5$%/!#!)2@(1!5(0(42)3(%'!)4#%!
Alternative Scenarios
Technical-Economic
Supply Cost (Power Supply
Source and Transmission)
Internalizing of Externalities (Air Pollutants and Greenhouse Gases)
Other Environmental Issues
Social Issues
Other Issues
Measures for Abatement
Evaluation of Scenarios
Recommended Power
Development Plan
Generation Planning Model Demand Forecast Model
GIS Database
Social Data
Water Resource Data
Bio-Ecological Data
Capacity Building Needed Fields
Socio-economic Data
EE&C Activities Power Demand Forecast
Potential for Primary Energy Supply and Power Interconnection
Situation of Load System
Economic-Technical-Environmental Data on Existing and Candidate Projects
Development Policies, Strategies and Plans
Fuel Price Forecast
Legend:
Figure 1. Integration of SEA into PDP VII (This figure has been modified)
3.3. Organization and Implementation of the SEA
The Institute of Energy (IE) was in charge of the plan and has made the following arrangements:

34
The IE set up the SEA working group, consisting of 12 members who are experts from different fields including environment, economics, electricity, etc. 5 members of the SEA group were also members of the PDP VII working group. The SEA working group is headed by IE Director, who is also the chairman of PDP VII, and IE Vice-Director and vice-chairman of PDP VII.
Other members of the SEA working group are strategic environmental experts in the fields of environment, environmental economics, biology, etc. International expertise was provided by an expert from the Stockholm Environment Institute, a GIS specialist from the Environment Operations Center of the GMS Core Environment Program of the ADB, and an energy specialist from the ADB. The cost of the international experts was covered by the ADB.
The SEA working group established the scope and methodology and identified strategic environmental factors, impacts and indicators for assessment.
The power development scenario was developed based on the power demand scenario. The PDP VII consists of two main components, which are power sources development (or power production development) and transmission line development. Power production development is divided into 4 categories: (1) Thermal power development from coal, oil and gas; (2) Hydropower development; (3) Nuclear power development; and (4) New and renewable power development. The national transmission line development is the expansion of the 220 kV and the 500 kV transmission lines.
In May 2010, the power development scenario was completed and sent to the SEA working group for assessment and analysis. Important details of this scenario are:
(1) Hydropower: compared with PDP VI, the total capacity of all hydropower plants in PDP VII is lower but the number of hydropower plants is higher. The two new hydropower plants in the North are the Ba Tuoc 1 and Ba Tuoc 2 with combined capacity of 120 MW. Ba Tuoc 2 is currently in operation phase and Ba Tuoc 1 is still under construction. In the Centre, the new Serepok 4A with total capacity of 70 MW is currently under construction and expected to be in operation in 2013. The new project in the South is the Dong Nai 6, which is expected to be in operation in 2016.
(2) Thermal power: compared with the forecast in PDP VI, the number of thermal power plants is lower in PDP VII. However, this number and the planned capacity still seem to be too ambitious: the plan is to produce 4,185 MW in 2011 (PDP VI planned for 9,655 MW in 2011), 86,625 MW in 2020 and 94,625 MW in 2030. In the PDP VII power development scenario, all gas-fired thermal plants will be converted to coal-fired thermal plants after 2017 when gas runs out and all new thermal power plants are designed to be coal-fired.
(3) Power generation from renewable energy only accounts for 3.1% of the total power production, which is in line with the renewable energy availability.
(4) Nuclear power: the plan is to build 8 nuclear power generators in the South.
After reviewing this power development scenario, the SEA working group concluded that it was unsustainable for the following reasons:
(1) According to this power development scenario, Vietnam will have to import coal for power

35
generation after 2015. Vietnam will need to import 79% of the coal for power generation by 2020 and 71% by 2030.
(2) This scenario shows a weakness in the power supply structure that might seriously threaten national energy security because it leads to a heavy reliance on the world fuel market when fuel price is climbing, and fuel supply is limited and unstable.
(3) Most thermal power plants are planned to be near rivers and in coastal areas to take advantage of the good water supply and transportation conditions. However, these areas are often densely populated and the environment is usually already compromised by pollution from local industrial activities. Therefore, the pressure of environmental impacts of these projects will be very high.
This power development scenario of PDP VII did not meet the national targets for the environment and socio-economic development. The SEA working group discussed this issue with the PDP VII working group and proposed a reduction in the reliance on thermal power in power production by cutting down the number of proposed coal-fired thermal power plants in order to reduce coal consumption and its consequences.
In July 2010 the adjusted power development scenario was completed and sent to the SEA working group. In this version, thermal power generation is much reduced but still at a desirable level. The plan in this power development scenario is:
(1) Hydropower: unchanged
(2) Thermal power: the number of gas-fired thermal power plants remains unchanged. A few more gas-fired thermal plants using imported LNG are proposed for the Central Region. This means there is the need to look for LNG sources for import.
(3) Power generation using renewable energy increases to 4%, mainly by small hydropower development.
(4) Nuclear power: three more nuclear power generators are proposed for the Central Region.
After a discussion with the PDP VII working group, the SEA working group concluded that this adjusted power development scenario was the optimal scenario for analysis in the SEA. This adjusted power development scenario is now considered the base case scenario (see Appendix 1). Important details of this base case scenario are:
a. Power supply sources:
< Hydropower development in the PDP VII base case is similar to PDP VI, as discussed above. It is planned to take full advantage of the forecasted hydropower potential. In the PDP VII base case there are two projects that have significant biological impacts, namely the Dak Mi 1 and the Dong Nai 5.
< Coal-fired thermal power generation is planned to increase strongly to around 15,365 MW in 2015, 32,385 MW in 2020, and 77,160 MW in 2030. Power generation from renewable energy is planned to accounts for 4% of the total power supply, which is around 4,900 MW. This is higher than the target of 3.1% - 3.8% for the period 2015-2020 in the National Target Program
36
for Energy Efficiency and Conservation and the Master Plan for Renewable Energy Development in Vietnam).
< Nuclear power development will only happen after 2020. Therefore, only basic information on nuclear power development is included in the PDP VII base case.
b. Transmission line development: In the base case, the transmission line expansion connects 220 kV substations in the whole country with total capacity of 53,700 MVA, 90,000 MVA, 128,600 MVA, and 176,000 MVA in 2015, 2020, 2025, and 2030, respectively. The contingency set of this power system is N-1.
Although this PDP VII base case scenario was assessed as the optimal scenario, the SEA working group and the PDP VII working group have considered more possibilities based on demand and supply forecasts and various options to increase energy efficiency in power production and reduce energy loss in the transmission grid in order to reduce the number of coal-fired thermal power plants and to ensure adequate power supply at the same time.
The SEA provides assessment and calculations of the costs and benefits of the main impacts of the proposed power development projects. The SEA working group also produced a thermal power plant impact ranking based on national policies and targets.
From the impact assessment and analysis of the PDP VII base case, a set of mitigation, monitoring and management measures was produced and proposed to the PDP VII working group. The PDP VII working group then included additional power development options, which take account of changes in power supply – demand, in the PDP VII. The SEA working group also took these options to form the basis for the development of desirable mitigation measures. The proposed mitigation measures were approved at the final consultation workshop of the project.
The working process described above reflects a close collaboration between the SEA working group and the PDP VII working group.
3.4. Members of the SEA Working Group
No. Full name Specialization/area of contribution to the SEA
Organization
I. National experts 1 Dr. Pham Khanh Toan Energy Economics Director of IE and Chairman of PDP
VII. 2 Associate Prof. Dr. Nguyen
Thi Ha Environmental Technology Head of Environmental Technology
Subject, Faculty of Environment, Hanoi University of Natural Sciences, National University.
3 Associate Prof., Dr. Le Thu Hoa
Environmental Economics. Head of Faculty of Environment and Urban Area, Hanoi University of Economics

37
4 Mr. Phan Mach Ecology and Environmental Protection. Ecological impact assessment.
Institute of Ecology & Biological Resources
5 Dr. Nguyen Van Du Ecology and Environmental
Protection. Ecological impact assessment.
Institute of Ecology & Biological Resources
6 Dr. Bach Tan Sinh Social Environment and Climate Change
Institute of Strategy – Ministry of Science and Technology
7 Dr. Pham Quang Tu Social Impact Assessment Vietnam Institute of Social Affairs
8 Pham Quang Lam, Msc. Health Impact Assessment Institute of Community Health
9 Nguyen Anh Tuan Electricity System Vice-Director of IE, Vice Chairman of PDP VII
10 Dr. Hoang Tien Dung Thermal Power Vice-Director of IE 11 Đoan Ngoc Duong, Msc. Thermal Power Director of Centre for Thermal
Power, Nuclear Power and Environment Consulting Services, IE
12 Nguyen Thi Thu Huyen (Head of the SEA working group)
Environmental Engineering Vice-Director of Environmental Technology Office, Centre for Thermal Power, Nuclear Power and Environment Consulting Services, IE
13 To Thi Ngoc, Msc. Environmental Engineering Environmental Technology Office, Centre for Thermal Power, Nuclear Power and Environment Consulting Services, IE
14 Le Hoang Anh, Bsc. Hydrology
Environmental Technology Office, Centre for Thermal Power, Nuclear Power and Environment Consulting Services, IE
15 Nguyen The Bac, Msc. Electricity System Electricity System Office, IE 16 Nguyen The Thang, Bsc. Electricity System Head of Electricity System Office,
IE 17 Nguyen Khoa Dieu
Ha, Bsc. Energy Economics Energy demand management and
Economic forecast Office, IE

38
18 Phan Thi Thanh Thuy Energy Economics Centre for Renewable Energy and Clean Development, IE
19 Đang Huong Giang Environmental Chemistry Centre for Renewable Energy and Clean Development, IE
20 Ngo Thi Truc Ha, Bsc. Hydrology Hydropower Office, IE 21 Nguyen Tuan Nghia, Bsc. Thermal Power, GIS
Environmental Technology Office, Centre for Thermal Power, Nuclear Power and Environment Consulting Services, IE
22 Vu The Uy, Bsc. Thermal Power, GIS Environmental Technology Office, Centre for Thermal Power, Nuclear Power and Environment Consulting Services, IE
23 Nguyen Trong Luong, Bsc. Power Grid Planning Office, IE
II. International Experts 1 Prof. John Soussan
(Group Leader) Strategic Environmental Assessment
Stockholm Environment Institute
2 Dr. Romeo Pacudan Energy Economics ADB (Responsible for internalizing costs and benefits traditionally treated as “externalities” in to cost calculation of power development projects)
3 Mr. Lothar Linde GIS ADB, GMS, Environment Operations Center

39
Chapter 1: Project Summary and the Key Environmental Issues of PDP VII
1.1. Project Implementing Agency - Project Implementing Agency of PDP VII: Ministry of Industry and Trade
- Address: 54 – Hai Ba Trung, Hanoi
- Telephone: 04-22202222
- Fax: 04-22202525
- Person in charge: Hoang Quoc Vuong
- Position: Vice-Minister, Ministry of Industry and Trade, in charge of Energy Sector
1.2. Project Summary 1.2.1. Summary of the PDP VII
Power Developments Plans (PDPs) are the main strategic planning tool for the power sector. A PDP includes the following: (i) an Electricity Demand Forecast to predict the capacity (MW) and energy (GWh) demand in the future; (ii) a Least Cost Expansion Plan giving the infrastructure needed to meet that demand at all times for the forecast period and at the lowest possible cost, while maintaining system reliability and quality of supply; (iii) a Transmission Expansion Plan to transmit the generated electricity to the customers; (iv) a Fuel Supply Assessment to determine the energy resources (coal, gas, oil) available for energy generation; (v) a Rural Electrification Program for electricity supply to remote areas that cannot be covered by the national grid; and (vi) an Investment Program on how to finance investments in the power sector.
1.2.1.1. Objectives of the PDP VII
The objectives of PDP VII are:
< To secure a safe, adequate and reliable electricity supply for all parts of the country to meet socio-economic development needs, with power production for the whole country in 2015, 2020, 2025, 2030 at the base case of 184.2 billion kWh, 318.5 billion kWh, 494.1 billion kWh and 737.9 billion kWh, respectively.
< To produce an analysis and assessment of the current power situation and the implementation of the previous master plan to propose solutions for reinforcing the strength and addressing the weaknesses.
< To assess the primary energy potential and supply sources for power production to propose a suitable plan for importing primary energy for power production.
< To develop the most appropriate plan for meeting needs with total installed capacity

40
for the whole country in 2015, 2020, 2025, 2030 at the base case of 43000MW, 65,400MW, 95,000MW, 135,700MW, respectively. This total installed capacity ensures a safe supply of electricity for the whole country, which only allows less than 24 hours of under-supply per year.
< To develop a transmission line system that connects 220 kV substations in the whole country with total capacity of 53,700 MVA, 90,000 MVA, 128,600 MVA, and 176,000 MVA in 2015, 2020, 2025, and 2030, respectively. The contingency set of this power system is N-1.
< To identify grid connection possibility with neighboring countries and to provide direction for power grid connection with ASEAN countries and China to achieve regional primary energy efficiency.
< To develop investment plans for the development of the power sector by stages and to propose an investment structure and investment mobilization options for the development of the power sector.
< To evaluate the social and environmental impacts and solutions for minimizing these impacts from the power development plan.
1.2.1.2. Main Content of the PDP VII
The PDP VII consists of 15 chapters and 1 appendix as follows:
Chapter 1: The Current Situation of the National Power System. This section provides a description and analysis of the current situation of the national power system in many aspects:
< Evaluation of the power demand for the period 2001 – 2009, which includes information about power supply at national and regional level and across sectors.
< Evaluation of the power production, power generation equipment and technologies of the existing power plants.
< Evaluation of the current power grid, information and regulatory system of the national power system.
This Chapter also presents an assessment and analysis of what have been done well in the past and weaknesses of the power system that need to be addressed in the future.
Chapter 2: Overview of the Implementation of PDP VI in the Period 2006-2015. The overview covers the following aspects of PDP VI:
< Comparison and analysis of the actual power demand and the PDP VI’s power demand forecast for the period 2006-2009.
< Evaluation of the PDP VI’s power source development plan and transmission grid expansion plan.
< Evaluation and analysis of EVN’s financial situation in the period 2006-2008.

41
This Chapter includes comments and recommendations based on the evaluation of PDP VI for the subsequent chapters.
Chapter 3: Overview of the Socio-economic Situation and the Energy System in Vietnam. This Chapter presents an overview of the current socio-economic situation and development trends in Vietnam. It also includes an energy demand-supply forecast for the whole country.
Chapter 4: Power Demand Forecast. Based on information provided in Chapter 1-3, Chapter 4 presents a power demand forecast in both national and regional scale in three development scenarios: high scenario, base scenario and low scenario. This Chapter also provides some analysis about the effects of the Demand Side Management (DSM) program on national power demand.
Chapter 5 presents an analysis of technical and investment criteria for power source development and power grid expansion.
Chapter 6 provides an evaluation on primary energy sources, with information about exploration potential, and exports and import potential, and a fuel price forecast.
This Chapter includes an assessment of the exploration potential of primary energy sources, such as coal, oil, gas, hydropower, uranium, and new energy sources, such as wind, tide, solar, biomass etc. The methodology for this assessment is also clearly explained in the Chapter. A fuel price forecast for both Vietnam and the international fuel market is also included in this Chapter.
Chapter 7: Power Source Development. Selected contents of this Chapter are:
< Plan for power source development that includes hydropower, thermal power, and nuclear power development. Power generation from renewable energy should be encouraged. Power import and cooperation with neighboring countries are also favorable options. The plan thrives for optimized results in power development.
< Evaluation of input data and power development options.
< Analysis of power development options: cost calculations for power development following the high and base scenarios.
Chapter 8: Power Grid Expansion. Selected contents of this Chapter are:
< Objectives, requirements, methodology and criteria for power grid expansion. The objective of power grid expansion is to ensure safe and reliable power supply with a contingency set of N-1.
< Power grid development plan should follow the power development base scenario.
< Analysis of the operation of the power system with the existing power grid.
Chapter 9: Regional Power Grid Connection. This Chapter presents information about the possibility to connect with the power grids of ASEAN countries and China to achieve regional energy efficiency.
Chapter 10: Power Development Program for Rural, Mountainous, and Island Areas. This

42
Chapter presents information about power demand and power supply targets of the rural power development plan to 2020, including details about connecting rural areas with the national power grid and new energy development for remote and island areas.
Chapter 11: Information and Regulatory System. This Chapter presents information about the function, responsibility and direction for further development of the information and regulatory system in the power system.
Chapter 12: The Environment and Environmental Protection in the National Power Development Plan. This Chapter provides an assessment of environmental impacts of the power development plan and proposes mitigation measures that can be applied in power generation and power grid expansion.
Chapter 13 and 14 are about an investment plan for the development of the power sector and financial analysis for the expansion of the power grid.
Chapter 15 consists of information about the national power management structure.
1.2.1.3. Development Viewpoints and Direction of the PDP VII
In PDP VII, a power sources and power grid development plan was prepared based on the following key viewpoints:
a. Power sources development:
In the present, power supply sources are located as follows:
• Most coal-fired thermal power plants are located in the North where big coal reserves are. From 2015, thermal power plants will have to rely on imported coal. Therefore, new thermal power plants can be located in other regions like the Centre or the South.
• Gas-fired thermal power plants are located in the South where the natural gas reserves are. However, it is necessary to look for an alternative fuel source to replace gas in power production to meet the increasing demand of this region because the gas reserves are limited.
• Hydropower potential, mostly in the North and the Centre, is being fully explored.
• Nuclear power plants in Vietnam are now relying on imported Uranium because of limited domestic supply.
• Imported energy and electricity in the North mostly come from China, Central Laos, Cambodia and Thailand.
Regional power development will need to find a balance with regional primary energy availability in order to ensure reliable power supply. Good inter-regional power connections are also required to reduce power loss in transmission and to share power reserves (power generated during rainy season) during dry season. In Vietnam, 50% of the power is consumed in the North, 40% in the South and only 10% in the Centre. However, it is important to avoid excessive investment in power development in the North and the South where most power is consumed

43
without taking advantage of the favorable conditions for power development in terms of primary energy availability and locations in the Centre. Having to transfer significant loads of power from one region to another will put pressure on the transmission lines and compromise the reliability of power supply.
It is recommended to increase the use of domestic coal for thermal power plants, including thermal power plants in the Centre and the South.
It is further recommended to maintain coal-fired thermal power production at below 60% of the total power production. This is a target that the PDP VII working group has agreed with the SEA working group. It is a rational target considering that the domestic coal reserves and land area for thermal power development are both running out. It is necessary to build more gas turbine combined cycle power plants in the South and to develop new gas turbine combined power projects for the Centre in the period 2019-2020.
The development of small hydropower plants and power plants using renewable energy should be encouraged. Power generated from these plants should be mostly for local supply to avoid power loss in the transmission.
Power generation using renewable energy (wind, solar, biomass etc.) is recommended for areas where these energy sources are available.
It is advised to develop pumped storage hydropower plants where possible, especially in the South, in the near future to reduce reliance on thermal power production.
More nuclear power plants should be built to reduce the use of fossil fuel, and greenhouse emissions. The two nuclear power plants planned in Phuoc Dinh and Vinh Hai have the capacity of 4x1000MW each. First generators of these two plants are planned to be in operation in 2020-2021. The construction of both plants should be completed between 2025 and 2027. After 2025, there will be more nuclear power development projects in the Centre with bigger capacity (1,300-1,400MW/generator)
Vietnam should continue to import electricity from Laos, Cambodia and China. Investment should be prioritized for the development of hydropower plants in areas bordering Vietnam in southern Laos and eastern Cambodia.
b. Power grid expansion: The goal is to ensure safe power supply to every consumer when the power grid operates with a contingency set of N-1 (if accident happens to any element of the transmission system, power supply to all consumers is maintained and all of the other elements of the transmission system should still work as normal).
Development of power sources should be consistent with power grid expansion to avoid power loss transmission.
Power grid expansion maps need to be simple, flexible, and taking into account power reserves as well as ensuring power supply quality (voltage, frequency) for the benefits of the customers.
In designing power grid expansion, it is necessary to consider factors such as the transmission

44
distance and load-carrying capacity to choose between super-voltage line and high voltage line, with the tendency to limit the use of super-voltage line if possible.
In the context where land area available for transmission line expansion is limited and environmental protection requirements are increasingly high, the approaches recommended are: (i) use of large distribution lines; (ii) use of tower/pole that can take multiple circuits of multiple voltage levels, or compact poles; (iii) improvement to existing towers/poles to take more circuits – this allows the use of existing transmission lines therefore reduces the land area lost to development of new lines.
For big cities like Hanoi, Hai Phong, Ho Chi Minh City, Dong Nai, Can Tho, etc., it is recommended to use double circuit or ring circuit, multi-phase transmission line, 500 kV cable with cross section between 1,300mm2 and 2,400mm2, 220 kV cable with cross section between 660mm2 and 1400mm2; and tower/pole that can take multiple circuits of multiple voltage levels.
In designing substations of high capacity (500/220kV or 220/110kV) in big cities, it is recommended to use GIS to minimize land loss. Substation step-down transformers need to be designed with 3 or 4 transformers (900MVA – 2,000MVA transformer for 500kV substations and 250MVA or bigger transformer for 220/110kV substations). When possible, multilevel transformers should be installed inside the substation to save space.
1.2.2. The PDP VII in Relation with Other National Development Plans
(1) Socio-Economic Development Plan for the period 2011-2020 with 2030 vision
Electricity supply is closely linked with GDP progress. Therefore, one important task of the PDP VII is to propose a power development plan that ensures adequate power supply for socio-economic development needs for the period 2011-2020 with 2030 vision. On the other hand, the Plan for Socio-economic Development for the Period 2011-2020 with 2030 Vision provides data for developing power demand forecast and calculating power supply capacity. These data include:
- Population growth: at the end of 2008, Vietnam population was 86,161 people. The table below presents population growth forecast until 2020 by the Population Committee:
Table 1.1. Population Growth Forecast
Year 2008 2010 2015 2020 2030
Population (Thousand People) 86,160 88,038 92,499 97,187 102,421
- Economic growth: At the moment, there is no official forecast of economic growth in Vietnam from the government. However, a group of experts from the Ministry of Planning and Investment has developed 3 economic growth scenarios based on the current situation of the national economy and a view of the world economy to the year 2020 and beyond.
Vietnam’s ability to accelerate economic growth is evaluated based on the challenges and
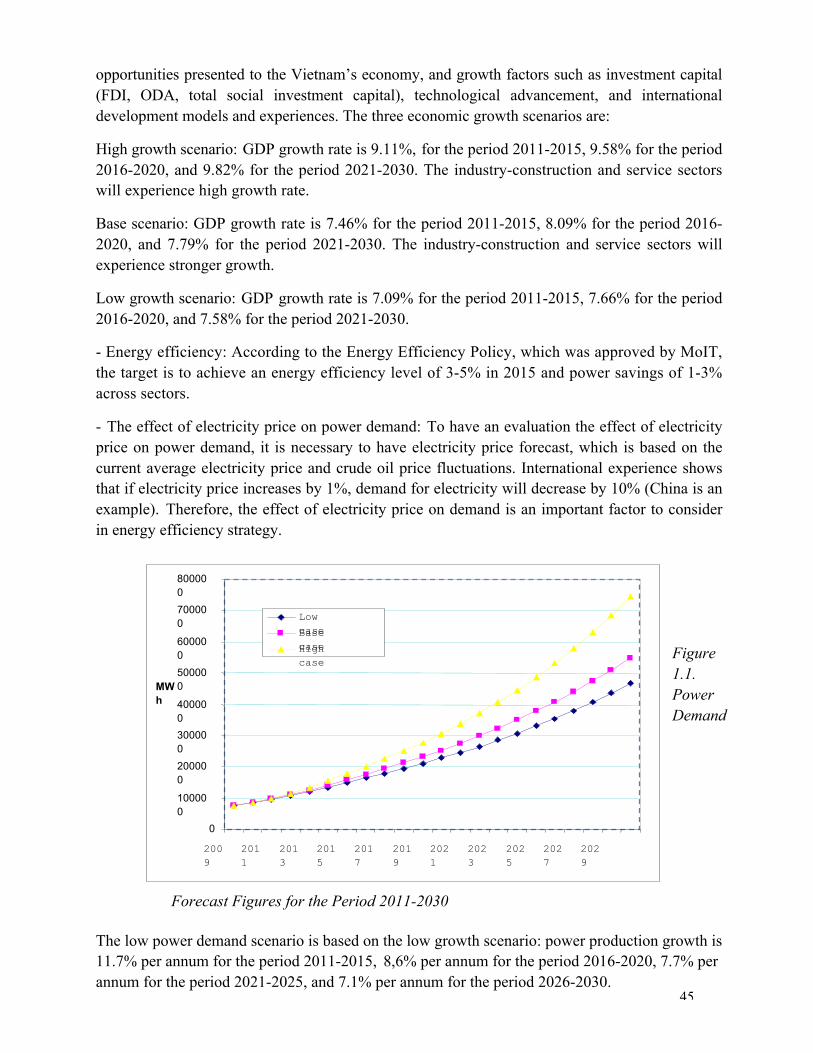
45
opportunities presented to the Vietnam’s economy, and growth factors such as investment capital (FDI, ODA, total social investment capital), technological advancement, and international development models and experiences. The three economic growth scenarios are:
High growth scenario: GDP growth rate is 9.11%, for the period 2011-2015, 9.58% for the period 2016-2020, and 9.82% for the period 2021-2030. The industry-construction and service sectors will experience high growth rate.
Base scenario: GDP growth rate is 7.46% for the period 2011-2015, 8.09% for the period 2016-2020, and 7.79% for the period 2021-2030. The industry-construction and service sectors will experience stronger growth.
Low growth scenario: GDP growth rate is 7.09% for the period 2011-2015, 7.66% for the period 2016-2020, and 7.58% for the period 2021-2030.
- Energy efficiency: According to the Energy Efficiency Policy, which was approved by MoIT, the target is to achieve an energy efficiency level of 3-5% in 2015 and power savings of 1-3% across sectors.
- The effect of electricity price on power demand: To have an evaluation the effect of electricity price on power demand, it is necessary to have electricity price forecast, which is based on the current average electricity price and crude oil price fluctuations. International experience shows that if electricity price increases by 1%, demand for electricity will decrease by 10% (China is an example). Therefore, the effect of electricity price on demand is an important factor to consider in energy efficiency strategy.
Figure 1.1. Power Demand
Forecast Figures for the Period 2011-2030
The low power demand scenario is based on the low growth scenario: power production growth is 11.7% per annum for the period 2011-2015, 8,6% per annum for the period 2016-2020, 7.7% per annum for the period 2021-2025, and 7.1% per annum for the period 2026-2030.
0
100000
200000
300000
400000
500000
600000
700000
800000
2009
2011
2013
2015
2017
2019
2021
2023
2025
2027
2029
MWh
Low case Base case High case

46
The base power demand scenario is based on the base scenario: power production growth is 13% per annum for the period 2011-2015, 9.4% per annum for the period 2016-2020, 8.5% per annum for the period 2021-2025, and 7.6% per annum for the period 2026-2030.
The high power demand scenario is based on the high growth scenario: power production growth is 15.6% per annum for the period 2011-2015, 11.3% per annum for the period 2016-2020, 9.7% per annum for the period 2021-2025, and 8.8% per annum for the period 2026-2030.
Table 1.2. Power Demand Growth Rate for the Period 2010 - 2030
Sales Electricity Power Production
Period Low Base High Period Low Base Hight
2006-2010
13.5%
2006-2010
13.0%
2011-2015
11.8%
13.1%
15.8%
2011-2015
11.7%
13.0%
15.6%
2016-2020
8.7%
9.6%
11.4%
2016-2020
8.6%
9.4%
11.3%
2021-2025
7.7%
8.5%
9.7%
2021-2025
7.7%
8.5%
9.7%
2026-2030
7.2%
7.7%
8.9%
2026-2030
7.1%
7.6%
8.8%
The power generation and transmission line development plan will be developed accordingly to satisfy the power demand of the base case. A plan will also be developed according to the high growth scenario as an alternative.
Table 1.3. Power Demand Forecast Figures until 2030 – Base Case Scenario
Unit 2010 2015 2020 2025 2030
Sales Electricity
Power Production Pmax
GWh
GWh
MW
85,932
98,886
15,731
159,202
182,154
28,876
251,763
286,094
45,197
378,379
429,977
67,693
548,800
620,113
98,318
Forecast figures show that the power demand will be higher in the industry and service sectors and lower in domestic use. The distribution of sales electricity is illustrated in figure below.

47
!"#$%"#$ "&'$()"$*+)$,- &($.') &$/ %$ $$
0) &$1 &($/ &($ $ 23$
45$ 6' $ , )$ % $ 7 $ % &($ %$ 8 $ 9"#$ ,':#$ , %$ $ , &($ ,- &($;<4$ $ 6' &($ "&$ % $ 7 =$ > &($,- &($ ) &$7 &$?@ ,$9A&'$B@C&$DEFG& H$()I)$ # &$JKDDLJKDMN$() H$?@ &($3N2FG& H$()I)$ # &$JKDOLJKJKN$()I)$ # &$JKJDLJKJM$, &($9A&'$B@C&$PNMFG& H$QR$JKJOLJKEK$, &($SNOFG& HT$$
45$6' $, )$%I#$ %$8 $9"#$,':#$, %$ $, &($;<4$%I#$, &($ &($ ) &$7 &$?@ ,$, &($,- &($,':#$%"%$()I)$ # &$/R=$DMNOFLDDNEFL3NSFLPNPFG& HT$$
! "#$%&'&$( )$ $* "#$*+ "#$),)$-. "#$,"$"./$) /$ 0 "$#010$ 2 "$'3%3$4$$'353$
! "#$%& "#$ ' "$%( "#$)( *$ ! "#$%& "#$ ' "$+ "$,- %$;)I)$ # &$ 45$>' 6$ 45$. $7 $ 45$%I#$ ;)I)$ # &$ 45$,' 6$ 45$. $7 $ 45$%I#
JKKOLJKDK$ $$ DETMF$ $$ JKKOLJKDK$ $$ DETKF$ $$
JKDDLJKDM$ DDTPF$ DETDF$ DMTPF$ JKDDLJKDM$ DDTSF$ DETKF$ DMTOF$
JKDOLJKJK$ PTSF$ 3TOF$ DDT2F$ JKDOLJKJK$ PTOF$ 3T2F$ DDTEF$
JKJDLJKJM$ STSF$ PTMF$ 3TSF$ JKJDLJKJM$ STSF$ PTMF$ 3TSF$
JKJOLJKEK$ STJF$ STSF$ PT3F$ JKJOLJKEK$ STDF$ STOF$ PTPF$
.' &($,-A&'$6'",$,-) &$&(@ &$QR$/ )$7 $ %$,') ,$U $,-V&$% $7 $ "6$ &($6' &($"&$6' $, )$% $7 $QR$% $8 $6'W&($%'#$6' &($"&$6' $, )$%I#$
! "#$%&5&$6 *$7/ $8 $9,2$"./$) /$ 0 "$*2:"$7/ )$ "$" ;$'353$4$<=$) $> $?<=$). "@$
$ &$Q $ JKDK$ $JKDM$ JKJK$ $JKJM$ $JKEK$
) &$,' &($6' H$ ;X'$ PM3EJ$ DM3JKJ$ JMDSOE$ ESPES3$ M2PPKK$
) &$7 &$?@ ,$ ;X'$ 3PPPO$ DPJDM2$ JPOK32$ 2J33SS$ OJKDDE$
<;1A$ BC$ %DE5%$ 'FFEG$ HD%IE$ GEGI5$ IF5%F$
Y ,$B@ $8 $9"#$%'#$ ,' Z$% $% @$ ,)V@$ ,' $ ) &$%[$?@$' &($, &($8 &$ , $ ,- &($ ) &$ ,)V@$ ,' $%'#$%+&($&(') 6N$8 %'$Q $,' &($H )T$> $,- &($ ) &$,)V@$,' $%'#$8C&$8 &($7 $() H$8 &T$. $% @$,)V@$,' $ ) &$,' &($6' H$ $, &($()I)$ # &$8 $9"#$ %$H)&'$' I$ $'A&'$DTJ$7I@=$
$
!
"#!!!
$#!!!
%#!!!
&#!!!
'#!!!
(#!!!
)#!!!
" $ % & ' ( ) * + "! "" "$ "% "& "' "( ") "* "+ $! $" $$ $% $&
!"
,-./0./12 3
,12 4056./0 -071
89.0: ./
;1 ./0< 2
,-./0= ./0>7?=12 4056./@
A-./0./12 3
JK".$%&'&$L $9,2$),"$)M"$*0N/$*. $ 0 "$
Figure 1.2: Sales Electricity Distribution Forecast
The figure below shows that there are similarities between power demand forecasts for the period until 2025 of PDP VII and PDP VI.
!"#$%"#$ "&'$()"$*+)$,- &($.') &$/ %$ $$
0) &$1 &($/ &($ $ 23$
!"#$%&'#(!)#*++#,#(!)#*+
!
"!!!!!
#!!!!!
$!!!!!
%!!!!!
&!!!!!
'!!!!!
(!!!!!
)!!!!!
#!!*
#!"!
#!""
#!"#
#!"$
#!"%
#!"&
#!"'
#!"(
#!")
#!"*
#!#!
#!#"
#!##
#!#$
#!#%
#!#&
#!#'
#!#(
#!#)
#!#*
#!$!
)-.&#(/012'3
!"#$%&#'()#*+
,-#./#01
,-#.2&
,-#3456
4 ,$56 $7 $8"#$%'#$,' 9:$&'6$% 6$ ) &$();)$ # &$ &$<3<2$=> $0??$@A$=> $0?$ $'B&'$7 )$( &$() &($&';6C$
$
$
$
$
$
$
$
$
$
$
!"#$%&'('%)*%+,#$%- .%/0 %1 %2,*%#$0%3 0% 4 #%.5*#6%%7879%:! ;<<%=>%:! ;<%D<E$=69$'# %'$F'",$ ,-) &$&(A&'$ ,';&$0) ,$1;G$ &$& G$<3H2$@A$ ,-) &$@ &($ &$& G$<3<2$@A$=69$'# %'$, &($,' $F'",$,-) &$&(A&'$%+&($&(') F$7 6$@A$I'J$0) ,$1;G$();)$ # &$ &$& G$<3H2:$&'$' &($ &$& G$<3<2C$
=> $0??$ K$LMG$LN,$I' $& &($%6&($% F$,';&$@A$7 6$I'J$,-#&($& %$,-#&($,' )$();&$, )$ $,J&'$,#"&$I' $& &($F'",$,-) &$&(6 &$ ) &$, $%"%$/# )$'B&'$& &($/ &($O $% F$&A9C$$
? #6%&'%@'%A #6%$ B%+ #%C #6%-$D4%.$,3%.$D#%+ 3$% #%# E%(878%4 5# !"## !"#$ !"!" !"!$# !"%"
P &$/ &($,-) 6$, &$ QQRQS# 22R2T# S3:2RSU:2 SQ:2RSS:2# V2#
? #6%&'%9%F4 #%24 #%-$D4%.$,3%1 0%.$G%=>%-$H% .%64D4% * #%&II8%J%788I%& '( 6787 6789 6767 6769( 67:7
W 6$,'+$ # # # # #XY$% $O $DH3S$, &E$ 7898 :;9; :;9< :79<$ ::Z-#&($ [$& )$ ;$DH3S$, &E$ 7=9; 7<9; 7:9> 89?$ @9?4'J$ ,$ # # # # #XY$% $O \XY$%;#$D, $GUE$ <98A 7:9>B7:9@ 7>9:B789@ 7797B7A9:$ 89@B7?9>
Z $ [$,J&'$,#"&$%]&$8 &($I' $& &($%6&($% F$,';&$@A$I'J$,-#&($& %$ $%]&$ )$@ )$&'6$% 6$F' )$&' F$I' 6C$1(#A)$-;:$ &'$' &($% ;$()"$,';&:$O $F' $,'6 %$@A#$,' $,- &($,';&$,' $() )$@A$%"%$9 6$, $% &($ K$ %$LMG$LN,$ &C$
DUE$.' &($,-B&'$G %$,)^6$56 %$();$@ $,) ,$I) G$@A$O $7 &($& &($/ &($') 6$56 $
=> $0??$% &($ K$LMG$LN,$G %$ $ "F$ &($@ )$%' &($,-B&'$G %$,)^6$56 %$();$@ $,) ,$I) G$@A$O $7 &($& &($/ &($') 6$56 $G %$7_$ $G %$,' F$O#$@ )$G %$,)^6$ ;$-;$/A$, $UR2`:$ ) &$HRU`$
Figure 1.3. Comparison of PDP VII’s and PDP VI’s Power Demand Forecasts
(2) Master Plan for Development of the Coal Sector in Vietnam until 2015 and vision to 2025 and Master Plan for Development of the Oil and Gas Industry in Vietnam until 2015 and direction to 2025.
In PDP VII, domestic supply of coal, oil and gas in the near future has been reviewed so that calculations of power production from each of these primary sources can be established.

48
Table 1. 4. Domestic Coal Supply Forecast for the Period 2011-2030
Year 2011 2015 2020 2025 2030 Coal (million tonnes) 44-46 55-58 60.5-63.5 64.5-66.5 75
Table 1. 5 Domestic Oil and Gas Supply Forecast for the Period 2010-2030
Year 2010 2015 2020 2025 2030 Crude oil Base case (106 tonnes) 19.9 20.0 20.7 21.7 22 Domestic (106 tonnes) 15.0 17.0 12.4 9.3 6.3 Gas Base/High scenario (million m3)
7.98 12.4-12.6 14.2-19.6 11.1-18.2 9.6-13.4
From analyzing the domestic supply forecast of coal, oil and gas it was possible to calculate the import amount. Other factors such as coal prices and reliance on the international coal market were also considered.
(3) National Program for Energy Efficiency and Conservation
PDP VII also supports the national energy efficiency and conservation targets of 3-5% for energy savings and 1-3% for electricity savings. These targets were developed based on actual results of projects implemented in Vietnam.
(4) National Energy Development Strategy until 2020 with 2050 vision.
PDP VII was developed on the basis of the targets set out in the National Energy Development Strategy until 2020 with 2050 vision, which was approved in the Prime Minister’s Decision No.1855/QD-TTg dated 27 December 2007. This strategy set out the orientation for power development in Vietnam in four sectors: electricity, coal, oil and gas, new and renewable energy. The objectives of this strategy are:
“To ensure an adequate power supply for socio-economic development; To develop oil refineries, to increase the total capacity of oil refineries to 25-30 million tonnes of crude oil by 2020; to raise the level of national strategic petrol and oil reserves to the equivalent of 45 days of average consumption by 2010, 60 days by 2020, and 90 days by 2025; To complete the program on rural and mountainous energy; To strongly switch the operation of the electricity, coal and petroleum industries to competitive market mechanism regulated by the State, to form a competitive electricity retail market in the post-2022 period, to form coal and petroleum trading markets in the period from now to 2015; To actively prepare for the launch of the first nuclear power generator in 2020. By 2050, nuclear power will account for about 15-20% of the total national commercial energy consumption; To strive to connect the regional electricity grids (of a voltage up to 500 kV) in 2010-2015, and to connect to the regional gas system in 2015-2020”.
The strategy also set out development orientations for the 4 energy sectors (electricity, coal, oil and gas, and new and renewable energy), 3 development policies regarding national energy security, energy price, and environmental protection, and 3 implementation solutions concerning

49
development investment, financial mechanism, and human resource development and organizational mechanism. MoIT is responsible for managing and directing the implementation of this strategy. Other ministries (MoNRE, MoF, MPI, MoST, and MoET), departments, local governments, and relevant businesses, organizations and individuals are obliged to implement this strategy accordingly to their responsibilities and functions.
(5) Other national infrastructure development plans.
The PDP VII in Relation to Regional Multipurpose Water Resources Management Plans
Water resources are needed not only for hydropower development but also for irrigation, water supply for domestic use, and production activities. According to the overall natural resources management plan, the plans for water resources development in different regions are as follows (these plans do not include hydropower):
The Northern Economic Focal Region: Water from Da River, Red River, and Duong River supplies to the urban areas of Mieu Mon, Xuan Mai, Hoa Lac, Son Tay, Ha Dong, Hanoi, urban projects in Red River Basin as part of the larger Hanoi area and Hoa Binh, and the industrial zones north of Red River (in Hanoi, Bac Ninh, Hai Duong, Hung Yen, and Vinh Phuc).
The Southern Economic Focal Region: Water from Tri An reservoir and Dong Nai River supplies to urban areas and industrial zones located in the western part Dong Nai, southern part of Binh Duong, and Ho Chi Minh City. Water from Dau Tieng reservoir and Sai Gon River supplies to the southern part of Binh Duong and Tay Ninh, Ho Chi Minh City, and the eastern part of Long An (where the Long An thermal power project is planned to be). Water from Tien River supplies to the southern part of Tien Giang, and Long An.
Northern Middle Land and Mountainous Region: Big irrigation projects will be built in the Da River, Lo River, Cau River and Luc Nam River to: (i) irrigate over 372,027 ha of agricultural land; (ii) supply domestic water for residents in border areas in Ha Giang, Cao Bang, Lao Cai, Lai Chau, etc.; and (iii) to protect Phu Tho and some communes in Bac Giang and some other areas from flood.
Red River Delta: A multi-reservoir management system needs to be completed for the Red River and Thai Binh River basin areas. Main objective is to improve the existing irrigation systems and build more water supply facilities in Bac Hung Hai, Nhue River, Bac Nam Ha, Tich River, Day River, An Kim Hai and Bac Duong, etc., to supply enough water for 860,000 ha of production land for at least 85% of the time. Improvement plans for this area aim at increasing soil quality by taking advantage of sediments from floodwater, expanding winter crop areas, cultivating 4,000 ha of the Red River flood plain, and increasing water supply for the industrial triangle of Hanoi, Quang Ninh and Hai Phong and other industrial and urban areas.
North Central Region: There is a plan for management and protection of water resources in this region, which involves an irrigation project for Ma River, Ca River, Huong River, and Chu River. A multi-reservoir management plan will be developed for the river basin areas of Ma River, Ca River and Huong River to improve water supply for domestic use, industrial activities, and to irrigate 515,790 ha of production land. This will contribute to reduce desertification in dry sandy land. Projects under development in Cua Dat, Ta Trach, Binh Dien, etc. should be completed.
50
Small and medium sized reservoirs should be built in Ban Mong, Ngan Truoi, Thac Muoi, Chuc A, and other areas for hydropower development and better flood control for downstream areas.
South Central Region: A water resource management plan will be developed for the Tranh 2 River, A Vuong 1 River, Dac Drinh River, Dong Mit River, Dinh Binh River, Tro 1 River, Ba Ha River, Ea Krong Ru River, Tra Khuc River, Thu Bon River, Ba River, Lai Giang River, Tra Cau River, Ban Thach River, and Cai Nha Trang River, etc., for hydropower development, irrigation, flood control and water supply for domestic, industrial and tourism activities. This plan will contribute to improve flood control for lowlands such as Thoa and Tam Ky River Basins and urban areas near the coast. Water discharge from the Hinh River hydropower plant will be used to irrigate 91,968 ha of agricultural land.
Central Highland Region: An integrated water resource plan will be developed for big projects on the mainstreams of Se San River, Srepok River, Ba River and Dong Nai River for water supply, flood control, and hydropower development. This plan will ensure adequate irrigation water for 486,921 ha of agricultural land to sustain crop yields in rainy season and enable the expansion of cultivated land in dry season. It also should provide water for domestic and business activities in resettlement areas, and remote residential areas along side the Ho Chi Minh highway.
South-East Region: An integrated water resource plan will be developed for Dong Nai 3 River, Dong Nai 4 River, La Nga 3 River, Tan My River, Ta Pao River, Ly River, Phuoc Hoa River, Ray River, and Vo Dat River, etc. This plan is to facilitate: (i) water supply for agricultural, domestic and industrial activities (especially for the industrial triangle of Ho Chi Minh City – Ba Ria Vung Tau – Dong Nai); (ii) hydropower development, aquaculture, flood control, and environmental improvement. This plan should enable a water supply volume at 919,600 m3/day for 342,082 ha of land, and a power generation capacity of 451 MW.
Other smaller plans will be developed to use water from Dinh River, Tam Bo River, Ca Stream, Phuoc Thai River, Thien Tan pump station, Dong Phu group of lakes, Tan Hung water supply facility, Tay Ninh pum station, and Ben Than pump station, etc. to supply for domestic and income generating activities such as tourism and aquaculture at household level, and production in industrial zones on the coast, and to contribute to fight desertification.
There is also the need to develop a mechanism for multi-reservoir management for this area and to ensure the aquatic benefits of these rivers. This mechanism will provide a basis for management activities of all relevant stakeholders.
Mekong River Delta: The water management plan for this area involves taking fresh water from Tien River and Hau River and other big river systems such as the Tu Giac Long Xuyen, Quan Lo – Phung Hiep, Nam Mang Thit, Dong Thap Muoi, O Mon – Xa No, Ba Lai, and Tra Su – Tha La to supply for coastal districts in Bai Lieu, Soc Trang, Tra Vinh, Ben Tra and Ca Mau where people have no access to fresh water. The plan will provide water for domestic and agricultural activities and improve sanitation situation in residential areas during flood season. It will also provide the means to shift the production structure in many areas from rice cultivation only to rice cultivation combined with shrimp farming.
The water management plan for this region requires some adjustment in response to climate

51
change and changes in water use patterns in upstream countries.
It is obvious in these regional water management plans that water resources are used for many other purposes rather than hydropower development. To achieve these purposes, the top issues of concern are protection of water resources and development of multi-reservoir management mechanisms for hydropower projects in PDP VII to ensure adequate domestic water supply.
The PDP VII in Relation to the Transport Development Strategy
The Vietnam’s Transport Development Strategy until 2020 with 2030 vision involves improvement to the North-South road systems including expansion and improvement of the National Highway No.1 section from Huu Nghi Quan to Nam Cam, improvement and connection of sections of Ho Chi Minh Highway from Cao Bang to Dat Mui, construction of the North-South Express Way and coastal road systems, and up-gradation of the Thong Nhat train line to national and regional standards. The plan also initiates research for the development of a national North-South express train line and a North-South passenger sea transport route.
The North: The plan is to build two new corridor expressways and a ring road for the Vietnam-China economic region, sections of the North-South highway, several roads to city centers, and ring roads around Hanoi to improve traffic conditions. Part of the plan is also to connect and upgrade all national highways in the northern corridor and along the coast, to complete the construction of the ring roads on the border and to upgrade all other national roads to meet with technical standards.
A new section of the North-South express train line will be built to connect Hanoi and Vinh. New high-speed train lines will also be built for the two corridors and the ring area of the Vietnam-China economic region, for connections with seaports and big economic areas. The existing train lines will be upgraded.
Within this plan, the seaports in Hai Phong and Quang Ninh will be expanded, and the Lach Huyen international port will be built to handle ships of up to 80,000 DWT. Priorities will go to developing container and specialized ports, and constructing passenger ports in Hai Phong and Quang Ninh. Main ports in Ninh Binh - Ninh Phuc, Da Phuc, Viet Tri, and Hoa Binh will be upgraded and expanded. The Phu Dong container port will be rebuilt. New passenger ports will be built in Hanoi, Hai Phong and Quang Ninh. Research will be done on converting the Hanoi port to passenger-only for tourism purposes.
The Noi Bai and Cat Bi international airports will need continual development work. The Dien Bien and Na San airports will be upgraded. New airports will be built in Quang Ninh and Lao Cai.
The Centre and Central Highlands
The transport development plan for this region includes construction of the central section of the North-South highway, up-gradation and new construction of roads in the East-West economic corridor and across-country-roads that connect the central coast and the highland provinces, and connect seaports in Vietnam with neighboring countries such as Laos, Thailand and Cambodia. Part of the plan is to connect and upgrade the roads along the coast, and also to improve all the

52
other national roads to meet technical standards. The plan also involves construction of corridor roads near the border, the road system for the western part of central provinces from Thanh Hoa to Quang Nam, and the East Truong Son road from Da Nang to Lam Dong.
For train line system improvement, the plan involves construction of central section of the North-South express train line, a train line that connects Vung Ang and Cha Lo (Mu Gia), and train lines connecting the highland provinces. The construction of a train line to support the exploration and production of aluminum in the highland provinces and to connect the Central Highland with seaports is also part of the plan.
Construction of the two piers of Van Phong international port will be completed. The operation of these two piers is the first step to make Van Phong port a regional and international transshipment port. The construction, up-gradation and expansion of Nghi Son, Cua Lo, Vung Ang, Da Nang, Dung Quat and Quy Nhon ports will continue. More specialized ports will be constructed for thermal power development and for aluminum export. Some locations will be selected to build more international passenger terminals in Hue, Da Nang, and Nha Trang.
International air terminals in Da Nang, Phu Bai, and Cam Ranh will continue to develop. Chu Lai airport will be upgraded to be a regional air cargo transport hub. Airports in Vinh, Dong Hoi, Phu Cat, Tuy Hoa, Lien Khuong, Pleiku and Buon Ma Thuat will be upgraded to meet international standards for domestic airports when possible.
The South
The plan for this region includes construction of the southern section of the North-South highway, expressways connecting Ho Chi Minh City with other provinces and ring roads around Ho Chi Minh City. It also includes up-gradation of existing roads and construction of new roads for the main North-South route, connections of roads along the coastline, and improvement of other national roads to meet technical standards.
Part of the plan is also to complete water routes connecting Ho Chi Minh City with the south west provinces, to upgrade sea routes along the coast from Ho Chi Minh City, Ben Tre, Tra Vinh, Soc Trang and Ca Mau. Existing domestic passenger and cargo ports will also be upgraded and new ports will be built.
The express train line between Ho Chi Minh City and Nha Trang (part of the North-South express line), between Bien Hoa and Vung Tau will be built. The train line between Di An and Loc Ninh will also be built and connected to the trans-Asia railway. Construction of the train line connecting Ho Chi Minh City with My Tho and Dong Thap is also part of the plan.
Improvement, up-gradation and new construction are required for the four groups of seaports in the South-East, including:
- Cai Mep, Ben Dinh Sao Mai, and Vung Tau Group: international ports for the Southern Economic Focal Region;
- Ho Chi Minh City Group: Hiep Phuoc port can handle ships of up to 50,000 DWT, Cai Lai port can handle ships of up to 30,000 DWT, and Sai Gon, Nha Be port can handle ships of up to 50,000 DWT. The plan is to move all inner city ports to Cai Lai-Hiep Phuoc and Cai Mep-Thi

53
Vai areas. The Sai Gon port will be restructured to fit in with the city planning.
- Dong Nai Group: including ports in Dong Nai, Phu Huu, Nhon Trach, Phuoc An and Go Dau.
- Ba Ria – Vung Tai Group: including ports in My Xuan, Phu My, Dinh, and Vung Tau.
A new water way will be developed to in Hau River to handle ships of between 10,000 DWT and 20,000 DWT. The Can Tho-Cai Cui port group will be developed to be the main port for the South West region.
Investment will go to construction of Long Thanh international airport to make it a competitive passenger and cargo airport in the region. The Tan Son Nhat airport will also develop to play a supporting role for Long Thanh airport in the future. Can Tho international airport and Phu Quoc airport will continue to receive investment to upgrade. An airport will be built in Vung Tau for special service flights and other airline services. Airports in Ca Mau, Rach Gia and Con Dao will continue to expand and upgrade.
The Multipurpose Water Resource Management Plan as well as the Transport Development Strategy and land use plans were considered in PDP VII in order to avoid any nonconformity to these plans and strategies. Assessment shows that there are advantages and challenges in these plans and strategies that concern PDP VII. For example, the development of roads will reduce some infrastructure costs and some other unpredictable losses of power development projects.
The Plan for Land Use and Industrial Parks
Total land area of Vietnam is 33,168,855 ha, including around 9.3 million ha for agriculture. On average, it is 0.4 ha per capita. Around 7 million ha is flat land, and 25 million ha is sloping land. Over 50% of the land in the delta and nearly 70% of the land in the mountainous area has poor quality and low fertility level (including nearly 3 million ha of infertile soil, 5.76 million ha of stony soil, 0.91 million ha of saline soil, and 12.4 million ha of sloping land at more than 25o).
By December 2010, 255 industrial parks were approved for development in a total area of 69,253 ha in a Prime Minister’s Decision. 171 industrial parks (43,580 ha) were in operation and 84 industrial parks (43,580 ha) were still in site clearance and construction phase. Only in 2010, 21 new industrial parks were developed in the country, taking up an additional area of 3,958 ha. Total investment for infrastructure development of these industrial zones was at nearly 7,000 billion VND. According to the Prime Minister’s Decision No. 1107/QD-TTg, dated 21 August 2006, there will be total of 115 new industrial parks by 2015, which will take up around 26,400 ha, and 27 other industrial parks will be expanded, increasing the land area taken for industrial activities to 30,000 ha for this period. Within three years from 2006 to 2008, 20,500 ha were converted to land for industrial park development. Between now and 2020, 209 new industrial parks will be developed in a total area of 64,210 ha.
According to the approved industrial development plan, more industrial parks will be located in the poorer northern middle-land and mountainous areas (Yen Bai, Tuyen Quang, Hoa Binh, Bac Can, etc.), the Central Highland (Đak Lak, Đak Nong, Gia Lai, Kon Tum, Lâm Đong, etc.), and the South West region (Hau Giang, An Giang, Soc Trang) to promote development in these areas.

54
The figure below demonstrates the industrial growth rate in these areas:
Figure 1.4. The Number and Land Area of Industrial Parks by Economic Region, 2008. Source: MPI; Survey data by the Environment Bureau, October 2009
Economic growth presents some advantages and challenges to power development. For example, power development projects in areas with developed industrial activities or in underdeveloped areas that are receiving investment for industrial projects will have more advantages than power projects in areas without some level of development.
The biggest barrier for power projects in areas with developmental advantages is that the compensation cost and payments for environmental services will be higher.

58
!"#$%"#$ "&'$()"$*+)$,- &($.') &$/ %$ $$
0) &$1 &($/ &($ $ 23$
$
45&'$6727$! &$ $89:$'# %'$%"%$;.1$ $0) ,$1<=$
Figure 1.5. Development and Planning of Industrial Parks in Vietnam

59
Plans for National Parks, Nature Reserves, Special-use Forests, Biosphere Reserves, Areas for Tourism, and Wetlands
There are a total of 50 national nature reserves and 16 marine nature reserves (in the islands of Tran, Co To, Bach Long Vi, Cat Ba, Hon Me, Con Co, Hai Van – Son Tra, Cu Lao Cham, Ly Son, Nam Yet, and in Nha Trang Bay, Nui Chua, Phu Quy, Hon Cau, Con Dao, and Phu Quoc). Around 0.24% of the sea area in Vietnam is in marine protected area (according to the Prime Minister’s Decision 742/QD-TTg, dated 26 May 2010, on approval of the marine nature reserves in Vietnam until 2020).
The locations of these nature reserves and marine nature reserves are taken into account in PDP VII to minimize the impacts of the proposed power development projects. A list of these nature reserves is included in the appendices of this report.
1.2.3. Core and Prioritized Projects and Programs in the PDP VII
The core and prioritized projects and programs in PDP VII were selected based on evaluation of the implementation of PDP VI. In PDP VI, power demand forecast was based on the three growth scenarios of 15%, 16% and 17% per annum for the period 2006-2010, with the GDP growth rates at 7.5% and 8.5%. With an ambition to improve power supply capacity and to ensure energy security, the Government approved the high scenario of 17% per annum in Decision No. 110/QD-TTG in July 2007. However, power demand growth was at only 13.6% per annum in the period 2006-2009, due to the financial crisis. In 2009, power generation was at 87 TWh, with a total production of 13,867 MW, including sales electricity at 76 TWh, as illustrated in the figure below.
Figure 1.6 Power consumption in the period 2001-2009
!"#$%"#$ "&'$()"$*+)$,- &($.') &$/ %$ $$
0) &$1 &($/ &($ $ 23$
!"#$%& '%$'('$) *$+" '$,-./$0%"$1 &$2 *$ 2%-3*$*%-3*/$4 *,$ '$5 *,/$0%"$5 $ 24 $6-*%$+"# */$0%"$5"$7 '%/$)8*,$ 2$*, 9$* '$$
4'5#$678$'# %'$9'",$ ,-) &$%"%$:'7$; #$ , &$67 %$()<=$') &$&<8$%>$:'# &($ ,-?&$2@$:'7$; #$ , &$67 %$()<$,-?&$% &$AB$CD$:'7$; #$, &$;) &$( E$ #$4- &=$.+$4+=$! %'$F#&($0 =$.",$!B=$GH&$*?=$. &$. =$G )$0I&$J$K &$4-B=$.L$F<#$.'BE=$FM$K &=$1<E$N ,=$0 &'$1'<$4-<&(=$1O)$.'O<=$P'O$Q7M=$GH&$.<7=$.+&$ #=$P'O$Q7 %$A )$:'# &($@=RST$U) &$,V%'$AL&($;) &$0) ,$1<E$& E$,-#&($%"%$:'7$; #$, &$;) &$WQ78 ,$ &'$X $YSRZQ J44($A $A) %$9'?$U78 ,$678$'# %'$' $,' &($:'7$; #$, &$;) &$0) ,$1<E$ &$& E$R@R@=$&(B8$RDZ2ZR@C@$% <$4' $, &($.'V&'$9' [\$
0 $,-V$%"%$:'7$; #$, &$,')?&$&')?&$AB$; #$, &$;) &$ %$]"%$ &'$ $' &$%' $]IE$9' E$U#$%"%$U $"&$9'",$,-) &$ ) &$ $]7 ,\$^<&'$X"%'$%"%$:'7$; #$, &$,')?&$&')?&$ %$ <$%')$,) ,$,-#&($9' $/ %$;"#$%"#\$$
:;<;=;$>('$'% *,$24?*%/$5 $(*$24 *,$ - @$)A$ "$2-3*$24&*,$!B $C$$
."%$%' &($,-_&'$AB$U $"&$,- &($ ) E$ 7$,)?&$X $U <$,-?&$&' &($9'I&$,V%'$AB$ "&'$()"$,_&'$'_&'$,' %$') &$QG $0`\$4-#&($QG $0`=$&'7$% 7$ ) &$ %$&(')?&$% 7$U $;"#$,'5#$a$: %'$; &$, &($,- &($C2T=$CDT=$AB$CYT$%'#$()<)$ # &$R@@DJR@C@$, &($ &($A )$R$: %'$; &$, &($,- &($b^P$Y=2T$AB$ c=2T\$0 )$ ,)?7$ %'V$ &I&($ %<#$ :' $ & &($ %7&($ % 9$ ) &=$ E$ ; #$ <&$ &)&'$ & &($ / &(=$.'V&'$9' $ d$9'?$U78 ,$QG $0`$ ,'5#$9' &($"&$, &($,- &($CYTZ& E$WQ78 ,$ &'$CC@ZQ J44($,'"&($YZR@@Y[\$478$&')?&=$ ,)?7$,' $ ) &$,' %$, $()<)$ # &$R@@DJR@@3$%' $, &($,- &($;_&'$67I&$ Ca=DTZ& E$U#$ ; $ &'$ ' &($ ; )$ :' &($'# &($:)&'$ , \$1 E$R@@3=$ ) &$ X &$ ]7 ,$ ,$ cY$4e'=$%+&($X7 ,$,#B&$' $,' &($:'# &($Ca\cDY*e=$,-#&($ >$ ) &$,' &($9' E$/B$YD$4e'$&' $X $$U )$ I8\$
$!"#$%&'(%%)*+,%-$ % * #%.*/*% 0 #%122&31224%
!"#$% #$ & '$())*+()),
!"#$%!&#&%
!'#"% !(#)%!*#*% !'#)%
!(#+% !(#+%
$!$$$$
($$$$'$$$$*$$$$
&$$$$,$$$$
"$$$$+$$$$
($$! ($$( ($$' ($$* ($$& ($$, ($$" ($$+ ($$)
!"#$%#$
&'-./"0
$#$%(#$%*#$%,#$%+#$%!$#$%!(#$%!*#$%!,#$%!+#$%
1%$
$2'3-40
-./01 /0 2 34 10 05 36

60
The average economic growth rate in the period 2006-2009 was also lower than predicted, at only 7.35% per annum. Economic growth rate for 2010 was estimated at below 6.7%. The tables below present data of sales electricity growth rate by region, power production, and the progress of the power grid and substation development projects.
Table 1.6 Sales Electricity Growth Rate by Region
Region
Indicator
2009
Average Growth Rate
2001-2009
Average Growth Rate 2006-2009
Average Growth Rate 2008-2009
Sales Electricity (GWh)
76,046 14,3% 13,6% 12,8%
Power Production (GWh)
87,109 13,7% 12,9% 14,7%
National
Pmax (MW) 13,867 11,9% 10,6% 9,7%
Sales Electricity (GWh)
29,445
13,8%
13,4%
14,5%
North
Pmax (MW) 6,207 12,3% 12,4% 22,5% Centre
Sales Electricity (GWh)
Pmax (MW)
7,426
1,482
14,1%
11,7%
12,4%
10,9%
13,7%
17,7%
Sales Electricity (GWh)
39175
14,7%
13,8%
11,6%
South
Pmax (MW) 7001 12,9% 11,4% 11,9%
Table 1.7 Power Production in PDP VI
2006 2007 2008 2009 đến 2010 2006-2010
Approved target -MW 861 2096 3271 3393 4960 14.581
Actual - MW 756 1297 2251 2286 3151 9.741
% 87.8% 61.9% 68.8% 67.4% 63.5% 66.8%
Table 1.8. Power Grid and Substation Development in PDP VI
Plan Actual (%)
Newly constructed and expansion (2006-2010) Qty. MVA-km Qty. MVA-km Qty. Capacity
500kV Substation 16 8,400 12 5,850 75% 69,6%
DZ 500kV 12 1,339 6 593 50% 44,3%
220kV Substation 89 19,326 63 13,001 70,8% 66,8%
DZ 220kV 121 4,666 66 3,238 54,5% 68,5%
61
PDP VI only achieved 66.8% of power production and 65% of power grid development against the planned targets. Main reasons for this are:
(1) The global financial crisis: PDP VI was prepared in the context when Vietnam was experiencing strong growth. Vietnam was expecting stronger growth in industries, services, FDI, and an increasing power demand for industrial parks and other business activities. In the years of 2008 and 2009, Vietnam’s economic growth was slowed down by the global financial crisis, which consequently affected power demand. In 2009, growth in sales electricity was at 12.8% per annum, which was lower than in 2006 and 2007 (14.4% and 13.9%, respectively). In 2009, growth in sales electricity was at 13.6% per annum.
(2) Many power projects were implemented at the same time, which put pressure on investment. Many investors did not have enough financial and human resources, which undermined their ability to obtain loans.
(3) There was a lack of capacity and experience in tendering, selecting contractors and consultants, and establishing management boards;
(4) Prices for equipment and material increased, which discouraged investors;
(5) Thermal power projects in the South struggled to import coal.
(6) There was a slow progress in site clearance. Collaboration with local authorities was also lacking.
Learning from the lessons of the previous power development plan, prioritized projects in PDP VII should aim to ensure the following conditions:
- If a project is included in the power development plan, the land acquisition plan should be approved ahead of time.
- Investor for a project should have proven capacity to mobilize adequate investment capital and access to fuel sources.
- A project can only be approved if it is proven to be efficient, produce little gaseous emissions, and have little impacts on areas of ecological sensitivity such as national parks, nature reserves, scenic areas, and cultural structures.
- Power grid development projects that have little impacts on nature reserves, natural forests, areas of biological significance, and residential areas, should be prioritized. Priority should also go to transmission line expansion projects connecting power stations with big cities that have adequate financial resources.
1.2.4. General Approach of the PDP VII
After PDP VII is approved, it is recommended that the government maintain a Central Government Steering Committee for the implementation of PDP VII as for PDP VI. It is also recommended that representatives from IE, who were in charge of the development of PDP VII, participate in meetings of the Central Government Steering Committee to consult the committee

62
and propose solutions for the implementation of PDP VII if needed.
Relevant ministries, departments, local governments and relevant agencies need to collaborate closely during the implementation of PDP VII. Responsibilities of all involved are specified below:
MoIT is responsible for:
- Regularly assessing the power demand-supply situation and supervising the implementation of power source and power grid development projects. When necessary, MoIT should propose adjustment to the plan (such as for the projects, selection of investors, implementation progress, etc.) to reflect changes in the electricity sector in the implementation of the power development plan.
- Approving site selections and detailed development plans for thermal power and hydropower development projects, and calling for investment from national and foreign investors for these plans. MoIT also provides direction for the exploration and extraction of natural gas for power generation and other industrial and domestic use.
- Taking the lead, in collaboration with relevant ministries and departments, in developing a financial mechanism for attracting investment to new and renewable energy development projects.
- Taking the lead, in collaboration with relevant ministries and departments, in negotiating and signing cooperation agreements and power import/export contracts with neighboring countries, and agreements about the participation of Vietnam in the GMS power grid system.
- Providing direction and ensuring that investors and local governments make the right progress in rural energy development.
- Directing research activities, pilot manufacture and use of new equipment in thermal power and hydropower development.
MPI is responsible for developing policies and mechanisms to attract ODA and to use ODA in a rational manner to enable sustainable and consistent development in the electricity sector.
MoF is responsible for taking the lead, in collaboration with relevant ministries and departments, in developing mechanisms for mobilizing investment capital for the implementation of the PDP VII.
The State Bank of Vietnam is responsible for taking the lead, in collaboration with relevant ministries and departments, in developing suitable policies and mechanisms to motivate investment for the sustainable development of the electricity sector.
Electricity of Vietnam is responsible for ensuring safe and stable power supply for socio-economic development needs. EVN is also responsible for implementing power source and power grid development projects in a consistent and efficient manner.
Part of EVN’s responsibility is to develop infrastructure for thermal power development projects that are either fully or partially funded by EVN. EVN is also expected to apply measures to

63
reduce power loss in transmission and implement power saving programs in power production and consumption to achieve sustainable development.
Local governments, organizations and individuals:
- Local governments are expected to collaborate with project investors on issues such as site clearance, compensation, and resettlement for power development projects.
- Agencies, organizations and individuals working in the electricity sector are responsible for implementing Decision No.79/2006/QD-TTg, dated 14 April 2006 by the Prime Minister on approving the National Program for Energy Efficiency and Conservation, and Circular No. 19/2005/CT-TTg, dated 2 June 2005 by the Prime Minister on power savings in power consumption.
It is further recommended to develop a reward – penalty scheme for investors who have permission from the Government to develop power projects to increase their accountability.
A big issue for the implementation of PDP VII is investment capital, especially the mobilization of investment capital. It is recommended that the government develop a mechanism through which EVN and power production investors can approach ODA, OCR, and low-interest loans, etc. Power projects developed under the Build-Own-Operate (BOO) and the Build-Own-Transfer (BOT) arrangements play an important role in promoting competitiveness in the electricity market and reducing pressure on government budget. It is also recommended that the government create a legal framework to facilitate the implementation of power source development projects.
1.3. Scope of Research of the SEA 1.3.1. Scope of Research of the SEA
1.3.1.1. Geographical Coverage
The national power development plan provides options for power development (i.e. thermal power, hydropower, nuclear power, and renewable energy), and power grid expansion to ensure safe, adequate, and reliable electricity supply for economic development, social welfare, and national security and defense in Vietnam.
The geographical coverage of the SEA is in line with the power development projects included in the PDP VII:
(1) All power development projects are designed to work well with regional features, based on a development principle of: “Finding a balance in power development in each region, considering the efficiency and limitation of the transmission system to ensure safe and reliable electricity supply in every region and nation-wide”. A list of power projects with operation timeframe can be found in Appendix 1.
- The North West: focus is on hydropower and pumped storage hydropower projects.
- The North East and the Red River Delta: focus is on coal-fired thermal power projects using domestic coal.

64
- The North Centre and South Central Coast: focus is on developing big coal-fired thermal plants and nuclear power plants in the eastern part of the region, and hydropower projects in the western part and in Laos.
- The Central Highland: focus is on hydropower projects and collaborative power projects with Laos and Cambodia.
- The South East and Mekong Delta: focus is on developing big coal-fired thermal power plants using imported coal, and gas-fired thermal plants.
(2) The power grid expansion plan has a regional focus:
- The national power grid is divided into three systems:
The northern power grid system: including all northern provinces up to Ha Tinh (the Ha Tinh 500 kV substation).
The central power grid system: including provinces from Quang Binh to Dak Nong (Di Linh substation)
The southern power grid system: including all provinces south of Dak Nong.
The SEA only covers large and medium sized hydropower projects with capacity of over 30 MW which are included in PDP VI and PDP VII. Small hydropower projects approved by provincial governments are not included for assessment in the SEA.
Most of the 70 power development projects in PDP VII were also in PDP VI. Therefore, assessment in this SEA only focuses on around 17 new hydropower projects that either are under construction or will soon be under construction.
The SEA includes assessment only for the 220 kV and 500 kV transmission lines in the national power grid.
The SEA does not take into account independent power projects in island areas.
The GMS is working to develop several cross-border power transmission projects. One of the projects is the ADB funded “Facilitating Regional Power Trading and Environmentally Sustainable Development of Electricity Infrastructure in the Greater Mekong Sub-region”. This project will be implemented in several phases. A strategic environmental impact assessment will be conducted for these projects. At the time this SEA was being conducted for PDP VII, this strategic environmental impact assessment had not started. Therefore, information on this subject is still limited. In this SEA, it was only possible to have some indicative information about where the cross-border power transmission lines might be in the future if the power trade negotiations are successful.
Geographical coverage of the SEA is illustrated in the map below:

66
Figure 1.7: Locations of power development projects proposed in PDP VII
!"#$%"#$ "&'$()"$*+)$,- &($.') &$/ %$ $$
0) &$1 &($/ &($ $ 23$
$
$
$
$
$
$
$
$
$
$
$
$
$
$
$
$
$
$
$
$
$
$
$
$
$
$
!!"#$%!&'('!) ! !* !+,-! .!/0!121!3 !2$! 4 $! !56 +!+,7$8!9" !:;;!

67
1.3.1.2. Timeline
Research in this SEA focus on two periods: between 2006 and 2010 (the PDP VI period) and between 2011 and 2030 (the PDP VII period). The overlapping period of the two plans is 2011-2020.
For the period 2006-2010, there is enough information for assessment of environmental trends in the past.
For the period 2011-2015, there is adequate information from the SEAs and there are also records of site planning for power development projects.
For the period 2016-2020, detailed information is only available for a few projects, which by that time will be at a more advanced stage.
There is almost no information available from the projects planned for the period 2020-2030. Therefore, assessment for this period is only indicative.
In short, in-depth assessment is provided for projects within the period 2011-2020. For the period 2020-2030, assessment is only indicative.
Under the scope of research of this SEA, key environmental impacts of PDP VII are assessed based on the characteristics of each region.
1.3.2. The Key Environmental Issues of PDP VII
The scale of PDP VII raises a wide range of environmental and social issues that need to be taken into account in the SEA. The plan covers the whole country, affects all sectors of the economy and every section of the society, and has impacts on all aspects of the environment. In some cases, such as greenhouse gaseous emission, acidification, or electricity import from hydropower plants in neighboring countries, the environmental impacts of the PDP VII go beyond the borders of Viet Nam. The scale of these diverse impacts is hard to assess in the SEA due to the fact that there was not enough time for consultation and detailed assessment of all the aspects of the potential impacts. Only main and recognized impacts are included in this SEA.
With properly implemented mitigation measures, many of the negative environmental and related social impacts of power development projects can be reduced to acceptable levels. As will be discussed later in this report, mitigation measures can effectively prevent, minimize, or compensate for most adverse impacts, but only if they are properly implemented. These include anticipatory measures that need to be put in place before the planning and implementation of individual projects starts: for example the adjustment to original plan, the creation of an adequate system for handling radiological materials or the extension of the protected area system.
There are, however, environmental impacts which occur at some power development projects that cannot be avoided, but can only be mitigated at an acceptable level to ensure a balance between economic growth and environmental sustainability. These include:

68
(i) Loss of forest and biodiversity Some unique natural habitats are affected by power sources development or power grid development projects; Ecosystems and biodiversity impacts are an important issue in relation to power development, with potentially serious and widespread impacts from hydropower, transmission lines and thermal power stations. Some reservoirs permanently flood extensive natural habitats, with local and even global extinctions of animal and plant species. Particularly hard-hit are riverine forests and other riparian ecosystems, which naturally occur only along rivers and streams. From a biodiversity conservation standpoint, the terrestrial natural habitats lost to flooding are usually much more valuable than the aquatic habitats created by the reservoir. One occasional exception to this rule is that shallow reservoirs in dry zones can provide a permanent oasis, sometimes important for migratory waterfowl and other terrestrial and aquatic fauna.
Hydropower projects often have effects on fish and other aquatic life. Reservoirs positively affect certain fish species (and fisheries) by increasing the area of available aquatic habitat. However, the net impacts are often negative because (a) the dam blocks upriver fish migrations and affects downstream passage. Fish passage facilities frequently cannot restore the pre-dam ecological balance of a river, in terms of species composition or fish migrations; (b) many river-adapted fish and other aquatic species cannot survive in artificial lake; (c) changes in downstream flow patterns adversely affect many species; (d) water quality deterioration in or downstream of reservoirs kills fish and damages aquatic habitats. Freshwater molluscs, crustaceans, and other benthic organisms are even more sensitive to these changes than most fish species, due to their limited mobility. The impacts of cooling water on the surrounding ecosystems vary depending on the location and capacity of the nuclear power plants. Cooling water can have serious impacts on ecosystems that are sensitive to temperature changes, Special attention should be paid to marine ecosystems in areas such as coral reefs and riverine ecosystems where the cooling water discharge is more than the river water flows. Transmission lines also have big impacts on ecosystems and biodiversity. Construction of new lines, based on a 45 meter clearance tract for 500kv lines and a 23 meter clearance tract for 220kv lines, results in thousands of hectares of forest cleared and fragmentation of areas of sensitive ecosystems.
(ii) Downstream hydrological changes, issues related to sustainable water resource management and concern about potential downstream salt intrusion:

69
Major downstream hydrological changes can affect riparian ecosystems dependent on periodic natural flooding, exacerbate water pollution during low flow periods and increase saltwater intrusion near river mouths. Sedimentation can reduce longevity and water level in reservoirs. Construction of dams results in reduced sediment and nutrient loads downstream of dams can increase coastal erosion and damage the biological and economic productivity of rivers and estuaries. The construction of a dam inevitably alters the water flow within a river, and in basins where several dams are located the cumulative impact can be profound. If managed appropriately, this can be beneficial through reducing flood risks and improving dry season water flows, but this requires multi-purpose objectives in the management system.
(iii) Impacts on environmental quality Impacts on water quality: The biggest effect of thermal power is the use of large quantities of cooling water, which can cause significant impacts on water resources and aquatic ecosystems. The use and release of cooling water can affect riverine and marine ecosystems and water quality due to changes in oxygenation and dilution of pollutants. The damming of rivers can cause serious water quality deterioration, due to the reduced oxygenation and dilution of pollutants by relatively stagnant reservoirs (compared to fast- flowing rivers), flooding of biomass (especially forests) and resulting underwater decay, and/or reservoir stratification. If effectively implemented, watershed management can minimize sedimentation and extend a reservoir’s useful physical life, through the control of forestry, road construction, mining, agriculture, and other land use in the upper catchment and lower river basin area. Aside from watershed management, other sediment management techniques for hydroelectric reservoirs may at times be physically and economically feasible; they include, among others, upstream check structures, protecting dam outlets, reservoir flushing, mechanical removal, and increasing the dam’s height. Impacts on air quality: Human health impacts from both gaseous pollutants and particulate matter releases. Acid rain is caused by gaseous emissions such as SO2. Acidification of soils and water caused by SO2 and gaseous pollutants. Acidification caused by sulfur and nitrous oxides in rainwater is an increasing issue at regional scale for the Mekong region. Many parts of Vietnam suffer from the impacts of acidification, affecting water catchment and wetlands. The electricity sector is one of the main sources of these gaseous pollutants, accounting for 25% of the total gaseous emissions of Vietnam. Although the existing measuring system is not accurate enough to produce an overall picture, forecast measurement and modeling of future trends show that both the scale and level of impacts by acidification will increase significantly in the future.
(iv) Solid waste and toxic waste: This is not an issue for hydropower plants but for thermal power projects, especially coal-fired thermal plants. The transmission grid also emits a large quantity of oil from the transformers.
(v) Natural resources efficiency and conservation: This is an issue related to power development plan, which use fossil fuels such as coal, oil and gas for power generation. These natural resources are limited and at risk of exhaustion. Other
70
natural resources such as soil, water, and limestone are also often used in power development projects, especially in the construction phase. The exploitation and use of these natural resources need proper planning and direction.
(vi) Environmental risks and accidents: there are impacts on the environment that are not human-induced. These impacts often result in big and serious losses. It is not easy to predict and avoid these impacts. Environmental risks and accidents can be human-induced or natural. Some of these risks and impacts are fire, explosion, radioactive leak and toxic waste, flood, drought, etc. Some of these impacts are resulted from climate change.
(vii) Climate change: Climate change is caused by emissions of CO2 and other greenhouse gases. Power generation using fossil fuels (especially coal) is one of the biggest sources of greenhouse gases. Another source of greenhouse gases is hydropower reservoir. The greenhouse gaseous emission per capita in Vietnam is still lower than in developed countries. However, it is increasing fast. Vietnam already has national policies and international commitments in reducing greenhouse gaseous emissions. There needs to be specific action plans to reduce greenhouse gaseous emissions, especially in the development of the electricity sector.
(viii) Energy security in the context when traditional primary fuels are running out. There is increasing reliance on the international fuel market when fuel prices are climbing. Environmental conflicts, risks and accidents happen in many areas such as conflicts over water resources, natural resources, land resources for project development, forest resources, etc. The scale and severity of these problems vary depending on their characteristics. However, they tend to persist and result in heavy consequences.
(ix) Social issues, resettlement and impoverishment: The biggest impact is displacement of people due to the construction of power plants, dams or reservoirs. Hydropower development results in the largest number of displaced people. According to regulations, resettlement should at least not worsen the situation of the displaced people and should aim to improve the living standards of the displaced people through the compensation package. Vietnam currently has developed policies and regulations on resettlement and compensation based the 2004 Law on Land. However, these policies and regulations, as reviewed in the previous section, only focus on compensation and support for short-term verifiable losses such as loss of land, plants and houses. Long-term impacts such as loss of livelihood, and other psychological aspects, such as tradition and cultural conditions, sense of belonging, etc., are not determined for compensation. Resettlement and compensation are currently handled at project level. Investors are expected to follow provincial regulations about resettlement. Strategic environmental assessment is mandatory for all power development projects. However, because social impact assessment is currently not mandatory, it is still a challenging job to undertake. Pressing issues are the preservation and promotion of cultural assets (including in sacred areas) due to reservoir filling and construction of power plants and changes to the labor force and population structure in affected areas.
71
(x) Livelihood: Up to now, resettlement in Viet Nam has been aiming at stabilizing people’s livelihoods in the short term, with the hope that this would lead to subsequent development. However, experiences show (Hoa Binh, Yali, Song Hinh) that in the long term, displaced people’s living standard has not been improved. Rather, in many cases, the living standard has deteriorated. Generally, displaced people, of which a great majority are ethnic groups other than Kinh, has had difficulties in adapting to the new situation in the resettlement areas. This is not only due to the fact that the resettled areas are alien to the newcomers, but also that the host people often is of another ethnic group, that in-migration is attractive due to the ‘new frontier’ atmosphere, that new agricultural plants and techniques are introduced, that the existing forest is not open for exploitation, that the housing style and location is not according to the preferences of the displaced people etc.
(xi) Community Health: Community health is directly related to elements of the environment such as water, soil and air. If these elements of the environment are affected, community health is also affected directly through exposure to polluted air and food, or indirectly by pollutants that are stored in plants or animals in the food chain. The severity of health impacts depends on the level pollution of the environmental elements.
(xii) Agriculture and food security: With the level of industrial development as planned, it is expected that agricultural land would rapidly reduce to 3.8 million ha. Vietnam’s population is increasing and land quality is deteriorating. Food security is an issue of national interest. Climate change might also affect national food security.
With properly implemented mitigation measures, many of the above impacts can be reduced to acceptable levels. The single most important environmental mitigation measure for a new power project is good site selection, to ensure that the proposed dam, plant or transmission line will be largely benign in the first place. Adverse environmental impacts can be properly mitigated by corresponding mitigation options and risks associated with all of these types of impacts can be reduced through good project site selection.

72
Chapter 2: The Environmental Issues Related to PDP VII
2.1. Brief Description of Environmental Conditions 2.1.1. Topographic, Geographic and Geological Conditions
a. The North West: This area locates on the left of Red River and upstream of Da River. Elevation ranges from 100 - 800 m above sea level. Sharing its borders with China and Laos, this area has national defense and security importance. High mountains in this area include Pu Si Lung (3,076 m), Pu Dinh (1,886 m), and Pu Huoi Long (2,178 m). This area is the most mountainous area in Vietnam with hundreds of mountain ranges running North West to South East from Lai Chau to Son La, including many peaks of between 2,090 – 3,080 m above the sea level. The topography of this area consists of high mountains, steep slopes, and sharp fragmentations with rivers, streams, and narrow valleys in between. It is rare to see large, level, and continuous strips of land in this area. This topography is favorable for hydropower development. Many big hydropower plants and projects are located in this area.
The North West has unfavorable climate conditions for living and agricultural development. However, this is the area with lots of mineral resources such as coal, iron, manganese, nickel, copper, lead, zinc, mercury, rare earth, gold, mineral water, limestone, clay, etc. Rare earth reserves in this area account for almost 100% of the national rare earth reserves. This North West area also has high hydropower development potential, accounting for 56% of the national hydropower development potential.
Regarding land use, about 240,000 ha in this area can be used for agriculture and 1,783,000 ha for forestry and other economic activities. Quality of land in this area is relatively good, although facing deterioration. Soil quality is suitable for many types of high market value plant to grow and yield well.
Annual rainfall varies between 1,500-1,800 mm, providing adequate water for domestic and economic activities. However, due to the topography of the area, access to water during dry season is limited in many mountainous parts, affecting living and production activities.
b. The North East
This area covers mountainous and middle land of the North with many limestone and soil mountains. The eastern part of this area is lower with four curvy mountain ranges starting from Tam Dao, and running East-West to the sea, namely Song Gam, Ngan Son, Bac Son and Dong Trieu. The height ranges between 50-500 m. These mountain ranges extend to the South China Sea, creating the renowned Ha Long Bay.
The North East consists of the mountainous and hilly land left of Red River and the thin delta strip along the coast in Quang Ninh province. This area has 250 km of coastline on the East side, facing around 3,000 islands. It is possible to build deep-water ports in several locations in this area, which can be of importance not only to the northern Vietnam, but also to the southwestern China. This area shares 1,180 km long land border with China in the North (out of the total of nearly 1,150 km long land border between Vietnam and China).

73
Although located within the tropical rainfall climate zone, this area is directly affected by the North-East seasonal winds. This area therefore is divided into many sub-climate areas, enabling a diverse range of crop and husbandry varieties, including many of high economic value such as tea (Tuyen Quang, Thai Nguyen, snow tea, yellow tea), anise, cinnamon, lacquer tree, plum, apricot, peach, many precious herbs, etc.
The North East is rich in minerals, including those with large reserves such as coal (90% of national reserves), apatite (100% of national reserves), and copper (70% of national reserves). There are also limestone (for cement production), iron, lead, zinc, tin, etc. The availability of mineral reserves is the strength of this area. It forms the basis for the mineral exploration and processing industry, which contributes to the regional and national modernization and industrialization. This is also the area with high concentration of thermal power plants using locally available coal.
Land resources in this area are suitable for the development of agriculture and forestry. Total land area is about 5 million ha, including 1 million ha for agriculture and 4 million ha for forestry. Parts of the land resources are used for industrial parks and urban development. This area has much potential for developing agriculture (industrial plants, specialty plants, and big cattle), industry (energy resources, metal and non-metal resources), tourism, marine economy, and forestry (only to some extend – as the forestry resources in this area are much deteriorated).
c. The Red River Delta
This area covers a large part of the east, centre and northwest of northern Vietnam. The eastern part of this area consists of a coastline, lowland areas of 0-2 m above sea level, and coastal strips of sand dunes. The central part of the area is 2-4m above sea level with large fields suitable for growing crops.
The Red River Delta is an economic hub for the North East, North West, the northern mountainous areas, and the Central Region. Thanks to its location, the Red River Delta has many favorable conditions to accommodate economic, trade, and international transport activities. It is also a large electricity consumption centre of the country. Therefore, there is a need for developing thermal power plants in this area in PDP VII to accommodate local power demand and reduce transmission loss.
All big rivers running through the Red River Detla start from the mountainous areas in the North and end in the South China Sea. All impacts on the environment upstream of these rivers such as loggings and soil erosion directly affect the Red River Delta.
d. The North Centre and South Central Coast
The North Centre is adjacent to the Northern Economic Focal Region and is where the Central Focal Economic Region is located. All the North-South train lines and roads, and some East-West roads (number 7, 8, 9, 29) pass through this area. There are also many seaports in this area, which make inter-provincial, regional and international transport convenient. This area is typically long and narrow. The Truong Son Mountains occupy the western part of this area and the South China Sea is on the east side. This area also has narrow deltas, mountainous, hilly and coastal lands, and islands, which are good conditions for a diverse economy. Regional topography

74
is complex. Regional weather conditions are hash and unpredictable. There are many deep-water areas and river mouths in this area, suitable for the development of small to large seaports to accommodate inter-provincial, regional and international transport.
Weather conditions in the North Centre are not favorable for living and production activities. 80% of the land in this area is either mountainous or hilly, and the remaining 20% of the land is coastal delta with many sand dunes and flood plains. Land area available for agriculture is limited. There are land sites suitable for industrial and urban development. This area ranks second to the Central Highland in terms of forest resources. However, most forests in this area are of poor quality.
Marine resources are abundant with 670 km of coastline, 23 river mouths, many beautiful beaches and swamps, and a wide continental shelf offering many resources. This area has potential for developing tourism and economic activities using marine resources.
Mineral resources: 60% of national iron reserves 80% of national tin reserves, and 40% of national limestone reserves are located in this area. Large reserves of stones (marble, limestone) and clay can also be found here. There is also potential for oil and gas exploration in this area. These are good conditions for developing industrial activities such as mineral exploitation, metal and construction materials production, making the North Centre an outstanding area for industrial development.
Hydropower potential in this area is estimated at around 7 billion kWh in 30 locations that do not require large areas for reservoir filling. The economic structure of this area can be developed to take full advantage of its potential for irrigation, hydropower, transportation, agriculture, forestry and aquaculture.
The South Central Coast covers the coastal provinces from Da Nang to Binh Thuan. The western part of this area consists of many mountains and hills, with some peaks of the South Truong Son reaching over 1,500 m above the sea level. Elevation decreases gradually from the west to the east of the area. The eastern part of the area covers the coastal delta from Hai Van Pass to end of Binh Thuan province. The northern part of the area consists of three relatively large delta areas in Quang Nam, Quang Ngai and Binh Duong. The southern part of the area covers narrow delta strips in Khanh Hoa and Ninh Thuan, which are separated by Cu Mong and Ca mountain passes.
The South Central Coast has great geographic advantages. It is located in most land, sea, and air travel routes. It is also close to Ho Chi Minh City and the South East economic triangle. It is the gateway to the Central Highland and it is where the trans-Asia route can connect with international seaways are. The long coastline offers many beautiful beaches, scenic spots and renowned cultural and heritage sites. This area can potentially become one of the biggest tourist destinations in Vietnam and South East Asia.
Marine resources are the biggest natural advantage of this area, both in terms of fishing and aquaculture. There are also a series of deep-water ports that can handle big ships. Developed infrastructure and land availability around ports provide good conditions for the development of industrial parks. With great geographic advantages, the South Central Coast can be chosen to be the sea gateway for the “trans-Asia” route.

75
Mineral resources in this area are quite diverse. However, mineral reserves are not big. Some minerals are of high economic value such as glass sand, bentonite, graphite, titanium, granite, gold, and mineral water. There is also a potential for oil and gas exploration in the sea.
e. The Central Highlands
Elevation ranges from 100-800 m above sea level. This area shares borders with both Laos and Cambodia in Kon Tum province. This area covers a large plateau surrounded by high mountains and the South Truong Son range in the East.
The Central Highlands is divided into three sub-climate areas: the North Central Highlands (Kon Tum and Gia Lai), the Mid-Lowlands (Dak Lak and Dak Nong), and the South Central Highlands (Lam Đong). With the advantage of having bazan red soil at the elevation of from 500 – 600 m above sea level, the Central Highlands offers great conditions for industrial plantation such as coffee, cocoa, pepper, mulberry, cashew, and rubber. This area also has great mineral resources, which are currently unexplored, except for bauxite.
The Central Highlands is divided into many sub-areas with different ecological conditions, which can support the development of a wide range of plants and animals.
The Central Highlands also has large forest areas with diverse vegetation and high potential for tourism. The Central Highlands can be considered the roof of the Central Region, providing great protection for the entire region. However, illegal loggings and exploitation of forest products in this area can potentially lead to damages to natural resources, exhaustion of forest resources, and changes to the ecology and environment at a high level in North Central Highlands and South Central Highlands.
Surface water resources: there are four main river systems in the area: (i) the upper Se San River with total river basin area of 11,450 km2; (ii) the upper Srepok River with total river basin area of 11,721 km2; (3) the upper Ba River with total river basin area of 11,410 km2; and (iv) the Dong Nai River with total river basin area of 22,600 km2. Average water flow in the Central Highlands is at 50 billion m3 per annum. Water is unevenly distributed throughout the year in this area. This is the main reason for flooding in rainy season and prolonged drought and severe water shortage in dry season. Irrigation and multipurpose water resources management of reservoirs is a decisive factor for the socio-economic development of this area. Large quantities of the annual rainfall are stored in rock aquifers. Therefore, groundwater is an important resource in the Central Highlands.
Forest resources: The Central Highlands has the most intensive forest systems in the country, accounting for 31.9% of national forest area and 36.3% of national forest reserves (41.2% of rich forest and 51.2% of medium range forest). This is the only area in Vietnam where forests resembling tropical rainforest can be seen.
Mineral resources: bauxite, gold, construction materials, precious stones, peat and brown coal are available in this area. Apart from that, nonferrous metals such as Sn, W, Pb, Zn, Sb, and Pirit can also be found in the Central Highlands.
The Central Highlands is a strategic area in terms of economic development, political stability

76
and national defense for Vietnam and Indochina. With elevation ranges from 250-2,500 m above sea level, the Central Highlands is the source of four big river systems. The road system in the Central Highlands consists of national roads number 14, 19, 20, 24, 25, and 27. There are close socio-economic and environmental ties between the Central Highlands and the South Central Coast. The Central Highlands is also directly next to Laos and North East Cambodia.
f. The South East
This area has an elevation of less than 50 m above sea level. It borders with Cambodia in the West, with the Mekong Delta in the South and South West, and with the South Central Coast and South China Sea in the East and South East, respectively. Geographic advantages help this area to be one of the best economic areas in Vietnam and South East Asia.
The South East is one of the key economic areas in Vietnam with Ho Chi Minh City as a centre for economic and commercial activities. The biggest industrial area of the South East is in Dong Nai province, with high concentration of large industrial parks in Bien Hoa City.
The South East is a developed industrial area with established infrastructure and experiences in socio-economic development. The transportation network in this area is especially more developed than in other areas, both in land and river transport. Sea and air transport in this area is also quite developed. Land resources are also available for industrial, infrastructure and urban development without affecting agriculture, especially wetland rice cultivation.
Land resources: Around 1.3 – 1.4 million ha are suitable for industrial and fruit tree plantation and forestation.
Water resources are not abundant in this area. Water supply mainly comes from Dong Nai River and Sai Gon River.
There are oil reserves in the continental shelf in this area, with an estimated amount of around 3-4 billion tonnes of oil and 500 billion m3 of gas. These are important sources of energy for power generation, industrial development, domestic use and export.
g. The Mekong Delta
The Mekong Delta is located around the last section of the Mekong River. It has a total area of 3.96 million ha, which is 5% of the total area of the Mekong River Basin. The Mekong Delta covers 12 provinces, accounting for 12% of the total land area of Vietnam. The Mekong Delta borders with Cambodia, is near Laos, and next to the Central Highlands and the South East. The topography is level with an intensive network of rivers and canals, making water transport in this area the most convenient in the country.
The Mekong River Delta is one of the most fertile deltas in South East Asia and in the world. This is an important area for food production, aquaculture and fruit tree plantation in the country. This area is also recognized as having great potential for power generation using husks in the future.
The Mekong Delta also has some favorable and unique weather conditions. This area is more protected from natural disasters like typhoon.
77
Water resources: Water supply for the Mekong Delta comes from the Mekong River and rainwater, both of which are highly seasonal. The intensive canal network in the Mekong Delta plays a big role in supplying water all year round for this area.
The Mekong River has created many types of natural habitats, ranging from tidal plain, sand dune, wetland, floodplain, lowland, peat swamp, to fertile alluvial soil adjacent to Mekong River and alluvial soil layers further away from the river.
There is a potential for oil exploration on the continental shelf in the South China Sea near the Gulf of Thailand. Minerals available in this area are limestone, granite, clay, stone and peat, etc.
The Mekong Delta has a long coastline of over and around 360,000km2 of exclusive economic zone adjacent to the South China Sea and the Gulf of Thailand, which is very convenient for developing marine economic activities. The Mekong Delta is located near the Southern Economic Focal Region, which is the most developed economic area in Vietnam, and other South East Asian countries (Thailand, Singapore, Malaysia, the Philippines and Indonesia, etc.), which present opportunities for important market and partnership development.
Many important sea and air routes are connected to this area, especially the South Asian and South East Asian routes. The Mekong Delta is also next to Cambodia, Laos, the Central Highland and the South East, which have rich mineral and forest resources for the development of power generation using oil, gas and coal.
2.1.2. Climatic and Hydrological Conditions
(Source: Regions, Provinces, and Cities under State Management: Potentials and Prospect until 2020, Institute of Strategy and Development, Ministry of Science and Technology, National Political Publishing House, 2009)
a. The Red River Delta
This region has tropical monsoon climate, with seasonal cold winds from the North. It has a cold winter with little sun and drizzling rain, which makes it possible to diversify crops. Summer is hot with lots of rain. The rainy season almost overlaps with the hot season.
Average hours of sunshine range from 1,400-1,700 hours per year.
Average annual temperature is from 23-24oC. Average temperature of the hot months is from 28 – 29oC. Highest temperature ranges from 38-41oC.
Mean annual rainfall is from 1,400-1,800 mm. Rainy season is from April to October. Rainfall mostly occurs in July, August and September. The dry months are often the winter months.
Average humidity throughout the year ranges from 82-85%.
Average wind speed is from 1.5-2 m/s, with highest wind speed reaching from 30-40 m/s. Common winds in winter are from the East and North East. Common winds in summer are from the East and South East.
78
The Red River Delta is under strong influence of the South China Sea, especially in terms of storm and flood during rainy season. In dry season, salt intrusion often affects river water and production activities along the coast. Reverse flow in high tide carries salt water in land through river mouths to up to 20 km in Red River and 40 km in Thai Binh River. Wash-off from river basins is also quite strong. Red River carries the largest amount of sand and silt of all rivers in Vietnam. This amount of wash-off from river basins creates hundreds of hectares of new land towards the sea. Sand and mud often block many estuaries and navigation canals and dredging is often required.
b. The North West
Typical weather feature of this area is a cold winter with a considerable amount of sun and frost in some years and not so much drizzling rain. Summer in this area is hot with dry hot winds from the West. This area is not directly affected by tropical storm and typhoon. It has considerable rainfall in rainy season, which almost overlaps with winter.
Average hours of sunshine range from 1,800-2,000 hours per year. Most months have more than 100 hours of sunshine. Average annual temperature is from 18-22oC. Average temperature of the hot months is from 26-27oC. Highest temperature ranges from 38-40oC. Average temperature of the cold months is from 13-16oC. Lowest temperature ranges from -2-2oC.
Mean annual rainfall is from 1,200-1,600 mm in Son La and from 1,600-2,000 mm in Lai Chau and Dien Bien. Rainy season is from April to September. Rainfall mostly occurs in June, July and August. The least rainfall is in November, December and January. Droughts often occur in winter and spring.
Average humidity throughout the year ranges from 82-85%.
Average wind speed is from 0.8-1.5 m/s. Winds come from the East for most of the year. Highest wind speed is no more than 35 m/s.
Water resources are abundant and of good quality, distributed evenly in rivers, streams, lakes, and rice fields in the area.
c. The North East
Typical weather feature of this area is a cold winter with little sun, and a lot of frost and drizzling rain. Summer is hot with a lot of rain. Rainy season almost overlaps with hot season.
Average hours of sunshine range from 1,400-1,800 hours per year.
Average annual temperature is from 18-23oC (from 14-18oC for the Hoang Lien Son area). Average temperature of the hot months is from 26-28oC. Highest temperature ranges from 38-41oC. Average temperature of the cold months is from 12-16oC. Lowest temperature ranges from -2-2oC. There is snow and snow rain sometimes in this area.
Mean annual rainfall is from 1,400-2,000 mm. Rainy season is from May to September. Rainfall mostly occurs in June, July and August. Dry season is in winter although there is a lot of

79
drizzling rain at the end of winter.
Average humidity through out the year ranges from 82-85%.
Average wind speed is from 1-2.5 m/s. Highest wind speed rages from 30-40 m/s. Winds in winter are from the East and North East. Winds in summer are from the East and South East.
Water resources are abundant and of good quality. There are many big river systems in this area, including Red River, Thai Binh River, Ki Cung River, Bac Giang River, Cau River, etc. There are also many small rivers along the coast in Quang Ninh province. This presents good conditions for water supply for domestic use and production activities. There are considerable ground water resources in some areas. However, water shortage is an issue in mountainous and coastal areas.
d. The North Centre and South Central Coast
The North Centre has elevations of generally less than 100 m above sea level and the following weather features:
Winter is rather cold with little sunshine, and occasional drizzling rain and frost in some places. Dry and hot winds from the West are experienced in summer with high temperature and a lot of rain in the second half of the year. Rainy season does not overlap with hot season.
Average hours of sunshine range from 1,500-2,000 per year.
Average annual temperature is from 23-25oC. Average temperature of the hot months is from 285-30oC. Highest temperature ranges from 40-42oC, reaching 42,7oC in some places. Average temperature of cold months is from 16.5-19.5oC. Lowest temperature ranges from 3-8oC, down to -0.2oC in some places.
Mean annual rainfall is from 1,400-2,000 mm. Rainy season is from August to December. Rainfall mostly occurs in August, September and October. Droughts mostly occur in the middle of summer when dry and hot winds come from the West.
Average humidity through out the year ranges from 84-86%.
In winter, winds come from the North (North West, North, and North East) and in summer, winds come from the South (South East, South, and South West). Average wind speed is from 1.5-3 m/s. The highest wind speed ranges from 30-40 m/s.
Water resources: Total volume of surface water is around 154,300,000 m3 per year (18.39 m3/year/person). However, rainfall is unevenly distributed through out the year, causing flash flood and draughts.
The South Central Coast has elevations of generally less than 100 m above the sea and the following weather features:
Winter is not cold with a lot of sunshine and dry and hot winds from the West. Rainy season starts in the end of summer and ends in the beginning of winter. The most southern part of the
80
area has very little rain and a lot of sunshine.
Average annual temperature is from 25-27oC. Average temperature of the hot months is from 28.5-30oC. Highest temperature ranges from 4042oC (from 6-9 months of the year average temperature is above 25oC). Average temperature of the cold months is from 20-24oC. Lowest temperature ranges from 8-13oC.
Mean annual rainfall is from 1,200-2,000 mm in the Northern part and from 1200-1600 mm in the Southern part. Droughts occur from the end of winter to the middle of summer.
Average humidity through out the year ranges from 80-84%.
In winter, winds come from the North (North West, North and North East) and in summer, winds come from the South (South West, South and South East). Wind speed averages from 1.5-3.5 m/s. The highest wind speed ranges from 30-40 m/s.
The coastal area from Hai Van Pass to Khanh Hoa province is quite narrow with the land sloping West-East. Rivers and streams in this area are often short and steep. Forests in the area are heavily damaged. This area suffers from hash weather conditions and disasters at increasing level.
e. The Central Highlands
There are two distinctive seasons in this area: rainy season from May until the end of October and dry season from November to April. March and April are the two hottest and driest months in the year.
In most plains of 400-500 m above sea level, the weather is often cool with a lot of rain. In higher plains (more than 1,000 m above sea level) such as Da Lat, the weather is cool all year round – similar to temperate weather.
Average temperature is rather low. Temperature comes down below 20oC in the middle of winter (December and January) then increases rapidly and peaks during transitional time between winter and summer (April and May). There is a lot of rain in summer and very little rain in winter. Serious droughts can be experienced in the hot months the end of winter and beginning of summer. There is a distinctive difference between the rainy and dry seasons in the Central Highland and in the South.
Average hours of sunshine range from 2,000-2,500 hours per year.
Average annual temperature is from 24-28oC. Highest temperature ranges from 37-40oC.
Mean annual rainfall is from 1,400-2,000 mm. Rainy season is from May to October. Rainfall mostly occurs in July, August and September. Droughts often occur in the second half of winter until the beginning of summer.
Average humidity throughout the year ranges from 78-84%.
In winter, winds come from the North and North East, and in summer, winds come from the West and South West. Average wind speed is from 1.5-3.5 m/s. The highest wind speed ranges from

81
20-35 m/s.
There are four main river systems in the area. Surface water resources are abundant. However, rainfall is unevenly distributed in time, causing flood, serious droughts and water shortage.
f. The South East
This area has a lot of sun, and high temperature throughout the year. Rainy season is in summer. Dry season is from the middle of winter to the beginning of summer. There is a distinctive difference between the two seasons.
Average hours of sunshine range from 2,400-3,000 hours per year.
Average annual temperature is from 26.5-27.5oC. Average temperature of the hot months is from 28-29oC. Highest temperature ranges from 38-40oC. Average temperature of the cold months is from 24-26oC. Lowest temperature ranges from 14-18oC.
Mean annual rainfall is from 1,600-2,000 mm. Rainy season is from May to October. Rainfall mostly occurs in August, September and October. Average rainfall is more than 200 mm/month during the rainy season. Average rainfall is less than 50 mm/month in the dry season. Droughts often occur in the end of winter and spring.
Average humidity throughout the year ranges from 78-84%.
In winter, winds come from the North and North East, and in summer, winds come from the South and South East. Average wind speed is from 1.5-3.5 m/s. The highest wind speed ranges from 20-35 m/s.
The two big rivers in the area are the Dong Nai River and the Sai Gon River. These two rivers bring 37-40 billion m3 of water to the sea every year. The lowest water flow of these two rivers is at about 55-56 m3/s. After the Tri An hydropower plant was built, river flows were improved to 180 m3/s. After the construction of a series of hydropower plants in Dong Nai River, river flows were improved to 250-260 m3/s, equaling 22 million m3/day.
Groundwater resources in the South East are quite diverse but unevenly distributed. Groundwater extraction in the Southern Economic Focal Region are only gives around 500,000 m3/day, which is barely enough for water supply in some places, especially in dry season. This is the biggest economic area in the country. Therefore, power demand in this area is very big. Power development in this area focuses on gas-fired and oil-fired thermal power.
g. The Mekong Delta
This area has high and stable temperature. Average temperature is at 28oC.
Average hours of sunshine range from 2,226-2,709 hours per year.
Rainfall mostly occurs in summer. Dry season is mostly in the middle and last months of winter. Mean annual rainfall is from 1,600-2,000 mm. Largest volume of rainfall in a day is around 150-350 mm. Rain season is from May to October. Rainfall mostly occurs in August, September and

82
October. During the four to six months of rainy season, average rainfall is more than 200 mm per month. During dry season, average rainfall is less than 50 mm per month.
Average wind speed is from 1.5-3.5 m/s. The highest wind speed ranges from 20-35 m/s. In winter, winds come from North East, North and South East. In summer, winds come from South West and South. In general, the Southern region has the same level of wind power as the Central Highlands, which is higher than the Northern region.
Average humidity throughout the year ranges from 78-84%.
Water resources are abundant, thanks to the Mekong River. There is an intensive network of canals in this area.
h. Abnormal weather phenomena
Abnormal weather phenomena include El Nino, La Nina, snow, hail, frost, tornado, flood, etc. These are common phenomena that are hard to predict and prevent. These phenomena are often changing in terms of intensity and frequency. They often cause heavy consequences. They can be referred to as disasters.
In the recent years, Vietnam has suffered from serious impacts of disasters and negative weather conditions. Vietnam lies in the tropical monsoon region, which means it is directly affected by Asia Pacific monsoon regime - one of the five biggest monsoon regimes in the world. As one of the ten countries in the world that are subject to the highest frequency of disaster, Vietnam often suffer many types of disaster ranging from storm, typhoon, flash flood, landslide, and drought, etc. The most frequent and serious disasters are typhoon, tropical depression, flood and inundation.
According to statistics, in the last 50 years (1956 - 2008), Vietnam suffered from 390 typhoons and tropical depressions. From 80-90% of the Vietnam’s population is affected by typhoon. On top of that, flood and inundation in cities often cause serious traffic jams, affecting people’s life and economic activities. Landslides also frequently happen in rivers, streams, mountains, etc., causing death and severe loss of assets and houses, as well destroying the environment. Droughts have also occurred in the recent years in many parts of the country, resulting in heavy consequences. Severe droughts in some years reduced crop yields by 20-30 %. Between 1996 and 2008, disasters of different types resulted in a total number of 9,600 deaths and missing persons. Total loss of assets was estimated at 1.5% GDP per annum. Disasters in Vietnam are increasing in quantity, scale and frequency and becoming more and more unpredictable. (Asia Pacific Forum on Disaster Mitigation and Climate Change Adaptation, Hanoi, 2009)
Natural disaster is a threat to the sustainable socio-economic development as it increases poverty. In addition to climate change, the situation of disasters is expected to worsen with increased frequency and intensity of typhoon, rain, landslide, inundation and spreading diseases.
At the moment, there has not been a thorough study to confirm that these negative weather conditions are the results of human doings. However, by looking at the nature of these conditions it is easy to see that flood often occurs in areas with mountains, valleys and intertwined rivers and streams. When the heavy rains come in wet season, water accumulates quickly on the ground and

83
flows to rivers and streams, causing flood in the area. Floodwater comes from the rain (or snow), which means that floods often occur in rainy season. Flash flood is most dangerous. The level of impacts of flood often depends on the level of vegetation in the area. In the last 10 years, forest area in Vietnam has decreased dramatically, which contributes to the increased frequency and intensity of flood and inundation, especially flash flood in the northern provinces, the Central Region and the Central Highlands. These are areas where many hydropower projects have been built, which resulted in a strong decrease in forest coverage.
Droughts occur when there is a lack of rain for a prolonged period. In the incidence of a drought, the humidity in the air and the level of water stored in soil both decrease, water flows in rivers and streams are reduced, and the level of water in ponds, lakes, and in underground aquifers go down low. This results in negative impacts on crop growth and on the environment. It also contributes to the spreading of poverty and illnesses.
There are two main causes of droughts:
Natural cause: Unusual weather conditions resulting in reduced rainfall. This might be temporary or prolonged lack of rain. This situation often occurs in arid or semi-arid areas. It can be either an unusually prolonged period when the rainfall is much lower compared with the average rainfall in similar period of many years, or a period of slightly lower rainfall following a period of not enough rain for production and for the surrounding environment.
Human-induced cause: Deforestation results in reduced groundwater level that leads to depletion of water resources. Inappropriate agricultural practices, such as growing water intensive crops in areas experiencing water shortages, also leads to depletion of water resources. Wrongdoings in water supply planning, such as building a small water supply facility in an area with high water demand or a big facility in an area short of natural water sources, also have negative impacts. Unfortunately it is not uncommon that development plans for socio-economic development are not taking into account the availability of water resources. The risk of drought is increasing as the result of water resource mismanagement.
In Vietnam, droughts occur in many areas at various levels of intensity and in different times, causing serious impacts on the socio-economic development and affecting both the water resources and agricultural production. Within the last 40 years, there have been many serious droughts. In the North, big droughts occurred during the winter - spring crop in 1959,1961, 1970, 1984, 1986, 1989, 1993, and 1998 and during the summer crop in 1960, 1961, 1963, and 1964. In the Central Region and the South, droughts occurred in 1983, 1987,1988, 1990, 1992, 1993, 2003, and 2004, and most seriously in 1993 and 1998.
The 1993 drought severely affected agricultural production in provinces from Thanh Hoa to Binh Thuan when nearly half of the summer – autumn crop area was affected, of which 24,093 ha died out.
Annual rainfall in 1998 was at only 30-70% of average rainfall of many years. The Central Highlands, Central Region, South East, and Mekong Delta barely had any rain. The temperature through out 1998 was from 1-3oC higher than average temperature of many years. Water level in all big rivers was from 0.5-1.5 m lower than average river water level of many years. Small

84
streams in the Central Region, Central Highlands, and South East had very little flow or no flow. Some of the medium lakes and all small lakes dried out (579 lakes in Nghe An, 110 lakes in Quang Binh, 85 lakes in Quang Tri, etc.). Water level in some big and medium lakes almost touched dead level. In the Central Region and the Southern Region, salt intrusion affected as far as 15-20 km inland. Many fresh water sources were also contaminated with salt water, which affected water supply for irrigation and domestic use. This drought had serious impacts on agricultural production in the whole country: 750,000 ha of crops were affected, of which 120,000 ha were completely lost; 236,000 ha of industrial and fruit tree plantation were affected, of which nearly 51,000 ha were completely lost. About 3.1 million people had limited access to water. Total loss of this drought was estimated at around 5,000 billion VND. There were other losses that could not be calculated such as long-term impacts on the economy and the environment (erosion, desertification), lack of food, malnutrition, impacts on physical and psychological health of millions of affected people.
In 2001, the provinces of Phu Yen, Quang Nam, Quang Binh, and Quang Tri were severely affected by droughts. Droughts in Phu Yen province affected 7,200 ha of sugar cane plantation, 500 ha of cassava plantation, 225 ha of wet-rice field, and 300 ha of dry rice field.
Only in the first 6 months of 2002, droughts in the South Central Coast, Central Highlands and South East caused damages to crops, and forest fires in large scale, including fires in the upper and lower U Minh natural forest.
In 2003, droughts in the Central Highlands affected 300 ha of rice field in Kon Tum, 3,000 ha of rice field in Gia Lai, and 50,000 ha of cultivated land in Dak Lak. 100,000 families had limited access to water. The estimated cost of the drought impacts in Dak Lak only was around 250 billion VND.
During the period of 2004-2005, in the Northern Region, water level of the Red River in Hanoi went down to 1.72 m, which is the lowest level between 1963 and 2005. In the Central Region and Central Highlands, the weather was hot and sunny for a long period, resulting in low flows in rivers and streams in the area. Some streams completely dried out. Many reservoirs and dams were operating at maximum capacity for water supply. Ninh Thuan was most affected in 20 years. Most rivers, streams, ponds and lakes in the province dried out. Water level in Tan Giang lake went down below dead level with only 500,000 m3 of water. Da Nhim reservoir, the main source of water supply for Ninh Thuan province, had one third of the water volume of same time the year before. There were 47,220 people without access to adequate water supply. In Binh Thuan province, most rivers dried out or had very little flow. Water level in most lakes in the province was lower than dead level, ranging from 1.7 to 2.2 m. The remaining amount of water in reservoirs was not enough to supply water for domestic use and cattle raising. Droughts and water shortage resulted in inadequate domestic water supply for 50,000 people, impoverishment of 16,790 households, food shortage for about 123,800 cows and drinking water shortage for more than 89,000 cows, goats and lambs.
In 2008, impact value of droughts and salt intrusion in the Mekong Delta was estimated at 720 billion VND. Salt intrusion in Tien River, Hang Luong River, Co Chien River and Hau River was from 60-80 km inland. Salt intrusion hit the record of 120-140 km in Van Co River. Surface water from rivers, canals, ponds and lakes, etc. and groundwater are the main sources of water supply

85
for domestic use and production activities. When a drought occurs, both surface water and groundwater are reduced, affecting water supply for domestic use and agricultural production. In the 2008 drought in Binh Dinh province, 18,840 ha of rice field were affected or at risk of being affected, of which 2,500 ha were severely affected. The drought also affected water supply for 11,850 households, mostly in Phu Cat and Phu My district. These two districts received support from the neighboring districts to get daily access to water. The local governments had to use trucks to transport water from the town centre to the villages.
Most recently, in 2010, a long period of hot and sunny weather boosted power demand to a high level. Power production was extended to an average of 260-265 million kWh per day, with top power generation days reaching 277 million kWh per day, or even higher. The lack of rain during this period also forced reservoirs in the Northern Region to discharge 3 billion m3 to supply for the winter-spring crop. This resulted in the lowest water level in reservoirs in the Northern Region in the last 100 years. There was not enough water for hydropower plants to operate at their capacity. Prolonged droughts were affecting many parts of the country.
The upstream area of Red River in Lao Cai province was also experiencing droughts.
The lower river basin of Thu Bon River in Quang Nam province suffered from salt intrusion, which posed threat of water shortage for irrigation for more than 600 ha of winter – spring crop in Duy Xuyen district. Serious water shortage also affected water supply for domestic use and production in Da Nang City.
The Central Highlands and Southern Region suffered from the most severe drought in many years. Forest fire was detected at level V (extremely dangerous) in many forest areas including national parks such as Tri Ton, Tinh Bien (An Giang province), all of Ca Mau province, Chu Pah, Duc Co, Chu Prong, Chu Se and Mang Yang (Gia Lai province), Phu Quoc (Kien Giang province), etc. The Central Highlands experienced extreme drought in large scale. Water level in rivers, streams, ponds and lakes went down to the lowest level, resulting in water shortage for thousands of households in the affected area. In big rivers in the Central Highlands, such as Ba River and Se San River, water level was from 0.5-1.5 m lower than water level in the same time the previous year. This is the result of reduced forest area and reservoir filling for hydropower generation.
The Dong Nai River in the South, which is the main water supply source for nearly 17 million people and 12 provinces and cities in the Southern key economic area, also experienced low water level. River water level was reduced by 20 cm and salt intrusion occurred 2 months earlier than in the previous years. This was a big concern of managers of domestic water supply facilities.
Prolonged heat also put mangrove forests in An Giang, Kien Giang and Ca Mau at high risk of fire. Most notably, in the lower U Minh forest area (Ca Mau), around 36,000 ha of mangrove forest and 700 ha of forest in Khoai and Chuoi islands were at risk level 4 and 5 (extremely dangerous levels). On top of that, under the pressure of droughts, 6,000 local households around mangrove forests have to access the forest for food and income, which increases the chance of forest fire.

86
According to the Bureau of Statistics, in the first 2 months of 2010, the area of forest destroyed as the result of fire and illegal loggings was 1,210.8 ha, which was 2.6 times higher than the same time in the previous year. The forest area destroyed by fire was 1,029.4 ha, which was 7.2 times higher than the same time in the previous year. The forest area destroyed by illegal loggings was 181.4 ha, which was 42% less than the same time in the previous year.
There have been some opinions about the fact that hydropower development at upstream river affects the ecosystem of river basin area. For example, the Central Highlands used to have 4 layers of vegetation. Now there is only 1 layer. Forest area is being reduced dramatically. An obvious consequence is reduced water storing capacity in soil, and stronger water flows that damage river edges. Water from upstream flows to downstream and through canal systems to the sea faster, causing flood, including flash flood, and deep inundation in lower river basin. Flood season is often followed by severe droughts in dry season when water level goes down low. There is no doubt that hydropower development has significant impacts on rivers. However, water resource mismanagement of local governments is also a contributing factor and is an issue that requires more attention.
In conclusion, negative weather conditions have significant impacts on the natural environment, social, economic and political environment, and human health. Negative weather conditions also contribute to the spreading of poverty, illnesses and conflicts over shared water sources. Serious impacts include damages to the fauna and flora, threats to desolate animals, decrease in air and water quality, forest fire, and land erosion. These impacts might be prolonged and irreversible. Changes in the weather can have direct impacts on human such as loss of life and asset in flood, and impacts on the economy such as loss of crop or reduced productivity in food production as the result of water shortage, unusual cold weather and frost. This in turn increases production cost in agriculture and reduces profit for farmers. It also increases food price. The total value of husbandry is reduced. Hydropower plants encounter many challenges during operation phase.
2.1.3. Oceanographic Conditions
Vietnam has a large territory in the South China Sea (referred to as the East Sea in Vietnam), including the continental shelf, territorial waters and exclusive economic zones with many small and large islands. The total area of the South China Sea that belongs to Vietnam is nearly 1 million km2.
The South China Sea is the second largest sea in the Pacific Ocean and the third largest sea in the world, with total area of 3,447 million km2 and total volume of 3,928 million m3, and two large bays, which is the Gulf of Tonkin (150,000 km2) and the Gulf of Thailand (462,000 km2). The oceanological conditions of the South China Sea influence the oceanological system of Vietnam. The East Sea of Vietnam has two important features: it is a protected sea and it is governed by the winter and summer monsoons.
Sea water temperature: average annual temperature of the surface layer is more than 23oC and varies according to season, region and depth. In the shallow bays and the Gulf of Tonkin, temperature of the bottom layer is only 1-2oC lower than the surface layer. Further out in the deep ocean, the temperature gaps between layers are bigger, especially at the depth of from 100-400 m.

87
Salinity: average salinity is from 32-33‰, and varies according to season, region and depth. Further from shore, salinity is high and stable. Near the coast, salinity is influenced by the presence of fresh water inputs from rivers. There is a clear difference in salinity in different seasons and in three parts of the country from North to South.
Salinity is higher in dry season and lower in rainy season. When there is a large volume of fresh water inputs from rivers, salinity level at the river mouth can reduce to less than 24‰ and the water becomes brackish water.
Wave: Waves in the East Sea are generally not big, and are influenced by seasonal winds and other coastal features. There are more waves and stronger waves when the winds come from the North East. There are less waves and smaller waves when the winds come from the South West. Whenever there is a storm, the waves become much bigger, especially in the Central Region. In a storm, if the winds get to a speed of 200 km/h there might be waves of up to 12 m. At the same time, on the coasts of the Philippines or in protected bays, waves are much less and smaller.
The Central Coast has much more and stronger waves, especially in Con Co and Phu Quy where the average height of waves is at level IV. The Gulf of Thailand experiences much less and much smaller waves, usually at level I or II. The Gulf of Tonkin is protected buy the Hainan Island. Therefore, there are less waves and smaller waves compared with the Central Coast. Average height of waves in the Gulf of Tonkin is level II or III. In winter when the winds come from the North or in case of storms there can be big waves. For examples waves can get up to 6.1 m in Co to, up to 7 m in Bach Long Vi and up to 11 m in Hoang Sa and Truong Sa (Spatlys Islands).
Tide: The tidal regime on the coast of Vietnam is very special. There are distinctive regional differences in tidal regimes from Mong Cai to Ha Tien. In general, regular and irregular diurnal tidal regimes dominate the coast of Vietnam. Some areas have typical diurnal tidal regime, with a tidal range of over 20 m (i.e. Hon Dau).
Hoang Sa diurnal waves are the strongest on the coasts in the Northern Region. From there they start becoming weaker until Hue, where they start picking up again on the coasts on the Southern Region. Semi-diurnal waves are the strongest on the coasts in the Southern Region, then becoming weaker northwards and towards the Gulf of Thailand. There are six different tidal regimes in six sections of the coast of Vietnam as follows:
- A tidal regime from Mong Cai to Thanh Hoa
- Tidal regime from Nghe An to Quang Binh
- Tidal regime from Quang Tri to Da Nang
- Tidal regime from Da Nang to Ba Khiem
- Tidal regime from Ba Kiem to Ca Mau
- Tidal regime from Ca Mau to Ha Tien
Hydrology: The East Sea is a protected sea like the Mediterranean Sea. There are local currents, which are influenced by the monsoons and the coastal landscape. Currents coming down from the North or in from the Pacific Ocean only make these local currents stronger. Currents in the East

88
Sea change according to seasonal and regional changes and are much dependent on the time and zone of influence of seasonal winds.
In winter, the North East winds create a current running North East – South West along the coast of Vietnam. This is a cold current, partly because of the impact of the extreme tropical air mass and partly because of the influence of the cold current coming from the North through the Taiwan Strait. The average current speeds in winter are from 60-70 cm/s (more than 1 nautical mile/hour). In the middle of winter (December to February), the North East winds are strong and constant, resulting in faster speeds of the North East – South West currents of up to 2-3 nautical miles/hour.
In summer, the South West winds create a current running in the reversed direction from South West to North East. This current runs along the Central Coast, veering East as it goes Northwards.
Tsunami:
According to research results and simulation studies of the national Institute of Hydrometeorology, there is a chance of Tsunami in the East Sea, on the coast of Vietnam and in the Vietnamese islands in case of an Mw= 9,0 earthquake in the submerged suction Manila.
If an earthquake occurs in the submerged suction Manila, except for the western part of the Vietnamese coast in the Gulf of Thailand, the rest of the coast from Mong Cai to Ca Mau will experience Tsunami of more than 1 m high. The coast from Nam Dinh to Vung Tau is subject to Tsunami of more than 2 m high. The coast in Quang Ngai province is subject to Tsunami of more than 10 m high.
It takes about 2 hours for a Tsunami to travel from the submerged suction Manila to the central coast of Vietnam. It takes much less time for a Tsunami to reach the islands: about 40 minutes to get to the Paracels Islands and about 1 hour to get to the Spratlys Islands. It’s likely to take about 1 hour 40 minutes for a Tsunami from the submerged suction Manila to have the first hit on the Central coast in Phu Yen.
There is a chance that Vietnam might be subject to Tsunami. More studies are needed to fully evaluate the possibility and effects of Tsunami on specific areas.
2.2. The Past Environmental and Socio-economic Development Trends and the PDP VII Baseline Situation Information in this section is based on the National Environmental Impact Assessment reports from 2006 to 2009 and the Environmental Impact Assessment reports of the power sector reports in 2007 and 2008. The analyses of past environmental and socio-economic development trends and pre-PDP VII baseline situation take into account all economic sectors, including the power sector with information from the PDP VI. Assessment of environmental elements and development trends of key environmental issues is presented below.
2.2.1. Current Situation and Development Trends of Natural Conditions Development trends of natural conditions are much dependent on socio-economic development activities and people’s awareness. Inappropriate water exploitation and uncontrolled wastewater

89
discharge will have impacts on water resources, living conditions, health and business activities of local residents and people living in lower river basin area. Irrational exploitation will exhaust natural resources and lead to other environmental, social and economic impacts. Loss of forest will result in undesirable impacts such as soil quality deterioration, desertification, reduction and loss of biodiversity value, etc. Limestone exploitation for cement production in limestone mountain areas and minerals extraction, especially bauxite exploitation in the Central Highlands where there is high forest coverage, are examples of irrational natural resources exploitation.
Changes to the environment are inevitable results of economic development in all countries in the world. Pressure of population growth only worsens the situation. However, if mitigation measures are properly implemented, there might be less negative impacts and some changes to the environment can even be positive as experiences show in some developed countries.
The natural environment of Viet Nam has experienced a number of human-induced changes in recent decades that have, in many cases, led to a deterioration of environmental quality. This has affected all aspects of the environment: the atmosphere, land resources, water resources and biotic resources including biodiversity. Whilst Viet Nam is in many ways still rich in environmental resources, the trends are such that there must be serious concerns about the future integrity of the environment in many parts of the country unless sustained efforts are made to reverse current trends and protect the natural resource base. The deterioration of the environment in much of the country is in many ways a reflection of the rapid and sustained economic growth and development that Viet Nam has experienced in the last two decades. Economic growth has been between 5% and 10% per annum throughout this period, with much of the growth coming from sustained industrial development so that more than 40% of GDP now comes from industrial output. Personal incomes have also steadily increased, meaning a rapid growth in consumer demand for timber products and reliable services such as tourism, housing, resort, etc. These trends underlie the sustained increase in demand for electricity of around 15% per annum, which means increased pressure on power generation and power grid development. This in turn increases fuel consumption, gaseous emissions, land acquisition, loss of forest, and impacts on the ecosystems.
2.2.2. Environmental Impacts
2.2.2.1. Loss of Forest and Biodiversity
Current forest cover: According to statistics collected from local authorities, as of 2008, there are more than 12.9 million ha of forest in Vietnam, including 10.3 million ha of natural forest and 2.6 million ha of planted forest. Forest cover in Vietnam is currently at 38.7%. From 1991 to the present time (after the Law on Forest Protection and Development was issued), forest protection activities have resulted in some improvement as the Law being implemented. Some forest areas have been recovered. Vietnam became the only country in the region with increasing forest cover.
Forest area has been increasing in the last few years thanks to regeneration and forestation efforts. Statistics show that in the 5 years between 2002 and 2007, forest cover increases by 0.5 % per annum on the average. This is a positive result of Vietnam’s efforts in forest management, protection and development.

90
Although national forest cover has been increasing in the last few years, deforestation is still an issue. According to statistics from 1991 to October 2008, a total area of 399,118 ha was lost, on the average of 57,019 ha/year. In 2009, a total area of 3,221 ha was lost to fire and loggings, which is 18.8% less than in 2008, of which 1,658 ha were lost to fire (1.2% less than in 2008), and 1,563 ha were lost to loggings (30.3% less than I 2008). Loggings mostly happened in Binh Phuoc (489 ha), Lam Dong (488 ha), Dak Nong (284 ha), and Son La (227 ha).
!"#$%"#$ "&'$()"$*+)$,- &($.') &$/ %$ $$
0) &$1 &($/ &($ $ 22$
&$, &($&'3$% 3$4 $ ) &$4 )$5 %$, &($6'# &($789$5 )$& 5$(:;$"<$/ %$%'#$4) %$, &($,- &($&(3 &$4=$' $,' &($,-3; &$, )$ "<$ &($&'3$% 3$, &($5 &'$&=;$/=$"<$/ %$4 $> $? &($&')@&$/) 3A$<'",$,' )A$%') 5$? &($?) &$,B%'$ ,$4=$() 5$?) &$,B%'$- &(A$ &'$' &($ &$>)&'$,'")C$
!"!"!"#$%#& '(#)* '# *#+,+#-&.'&#/& '#01*#-2 '(#- #'&*3'#
!"!"!"4"#5 -#2 '(#6.# 7#8 '(#9*'&#& +#!" #$%& #'$& #'($D'E#$,' &($6@$% F$%"%$ F$<' &($,-#&($% $& %A$ &$& 5$GHH2A$,#=&$I3 %$%J$,-@&$7GAK$,-) 3$'F$L'M%,FN$- &(A$OF#$( 5P$7HAQ$,-) 3$L'FN$- &($, $&')@&$4=$,-@&$GAR$,-) 3$L'FN$- &($,- &(S$ $%'E$<' $ ,$Q2AT9C$D $& 5$7KK7$ &$&F;$L>F3$6')$U3 ,$! #$4 $4=$<'",$,-) &$- &($ %$OF&$'=&'NA$'# ,$ &($O #$4 $- &($4=$,' %$,')$<'"<$/3 ,$/:5$&(') <$%J$%'3; &$O) &$,B%'$% %A$?) &$,B%'$- &($&(=;$%=&($ %$<' %$' )A$0) ,$1F5$,- $,'=&'$I3 %$()F$?3;$&' ,$,-#&($6'3$4 %$%J$?) &$,B%'$- &($&(=;$%=&($, &(C$$
V) &$,B%'$- &($, &($/@&$?#$6'#F&'$&3+)A$WX%$,) &$,")$>)&'$, $&')@&$4=$,- &($5 )$&' &($& 5$I3F$/3+&$%F#$' &$?) &$,B%'$- &($O $() 5$ )C$D' &($6@$4 $?) &$,B%'$- &($,-@&$ :;$%'#$,' ;A$ $%'E$<' $- &($,#=&$I3 %$8$& 5$I3F$LGHHG$Y$GHHTN$, &($OZ&'$I3:&$( &$HA89$5 )$& 5A$6 ,$I3 $&=;$/=$% $( &($- ,$/ &$,-#&($%+&($,"%$I3 &$/[$O #$4 A$<'",$,-) &$- &($% F$0) ,$1F5C$
* %$?\$, &($?) &$,B%'$- &($,#=&$I3 %$, &($,-#&($&' &($& 5$I3FA$&' &($?) &$,B%'$- &($O $5 ,$%]&$ $ 5 %$ %F#C$ D' &($ 6@$ , $ & 5$ 7KK7$ &$ ,'"&($ 7H^GHH2A$ , &($ ?) &$ ,B%'$ - &($ O $ 5 ,$ /=$QKKC772'FA$OZ&'$I3:&$8TCH7K'F^& 5C$1 5$GHHKA$ , &($?) &$ ,B%'$- &($O $%'";$4=$O $%' ,$<'"$ /=$QGG7$'FA$() 5$72A29$>#$4 )$& 5$GHH2A$,-#&($ J$?) &$,B%'$- &($O $%'";$7R82$'FA$() 5$7AG9S$?) &$,B%'$ - &($O $ %' ,$ <'"$78RQ$'FA$ () 5$QHAQ9C$1' &($ F$ <' &($ %J$?) &$ ,B%'$ - &($O $ %' ,$ <'"$&') 3$/=P$!Z&'$_' %$`2K$'FS$U:5$ &($`22$'FS$ 6$1+&($G2`$'FS$a &$UF$GGT$'FC$
!!"###"###$
!!"%##"###$
!&"###"###$
!&"%##"###$
!'"###"###$
!'"%##"###$
&##& &##' &##( &##% &##) &##* &##+
!"
$
!)#*$+,-,$." #$/" #$0" #$%12*$& #'$3" %$456$% $# 6$+77+8+779$:4'; #($<=#'$/ $*" #$%& #'$& #'$%>?#$@; 2$2A2$# 6$% $+77+$B$+779C$D $44EF4FC$+77GH$
a $5 ,$ )$%"%$' $>)&'$,'")$4=$,B&'$ F$? &($>)&'$' %$%' $; 3$/=$?#$> $5 ,$- &($4=$>3;$,'#")$- &($(:;$&@&A$ %$O) ,$/=$?#P$$
Figure 2.1. Forest Area in Vietnam in the Period 2002-2008
(Source: National forest situation in the period 2002 – 2008, MARD, 2009)
Impacts on ecosystems and key biodiversity areas are mainly due to loss of forest and forest deterioration, especially as the result of:
- Unsustainable exploitation of timber and non-timber products: legal and illegal logging is one of the main causes of the reduction in forest cover. The government allows logging of around 150,000 m3 of natural forest every year. However, according to the website of the Forestry Department, this figure is a lot higher at around 2 million m3 every year. The consequence is the loss of big area of forest. In the recent historical flood, big wood logs and tree roots were seen floating down a river covering a big section of this river as an obvious evidence of this situation.
- Conversion of forest to industrial tree plantation and agricultural land: recently, thousands of hectares of “poor” forest land were converted to coffee and rubber plantation for profit. On top of that, many families, especially ethnic minority families, also started to grow coffee and rubber plants instead of tending forests and continued with their shifting cultivation practice, which caused loss of forest land and forest deterioration.
- Conversion of peat swamp forest to aqua-farming land: increasing area of mangrove forest in Vietnam has been replaced with shrimp farms. To date, there are only 200,000 ha of mangrove forest in the whole country. Economic gain is the main motivation: a family can earn hundreds of million VND per year from one hectare of shrimp farming while they only get paid 100,000 VND by the government for one hectare of forest they protect in one year.
- Conflict of interests is one of the main reasons. According to the current Vietnamese

91
constitution, the State government owns all natural resources, including land resources. Forests are managed by Forest Management Boards and State Forest Enterprises. The people and communities only have access to poor forests or barren lands.
- Other reasons: forest areas are reduced for many other purposes such as hydropower development, industrial park development, mineral extraction, civil projects, or due to inappropriate planning and management, etc.
- Illegal wildlife hunting and trade. According to statistics, in 2002, the revenue of national and international wildlife trade via Vietnam was up to 3,050 tonnes, equivalent to USD 66 millions3. Illegal exploitation of non-timber products.
- Invasive alien species.
- Increasing impacts of climate change on ecosystems and biodiversity.
Biodiversity value, reserves and quality are well maintained and preserved in special-use forests with designated management units. However, the more common situation is that natural forests are loosing their values. Primary forests and rich forests can only be seen within special-use or protected forest areas. Of the 3,105,647 ha of natural forest only 652,645 ha (21%) are rich and medium stocked forest, and 2,453,002 ha (79%) are poor and regenerated forest.
Table 2.1. Forest Land Area and Forest Cover
Land Area (ha)
Year Total Natural Plantation
Forest Cover (%)
1998 9,432,900 8,099,858 1,333,042 28.80 1999 10,915,592 9,444,198 1,471,394 33.20 2000 11,314,626 9,675,700 1,638,926 34.40 2001 11,685,835 9,942,920 1,742,915 35.50 2002 11,784,589 9,865,020 1,919,569 35.80 2003 12,094,517 10,004,709 2,089,808 36.10 2004 12,306,805 10,088,288 2,218,517 36.70 2005 12,616,700 10,283,173 2,333,527 37.00 2006 12,873,850 10,410,141 2,463,709 38.00 2007 12,895,396 10,340,284 2,555,112 38.20 2008 13,118,773 10,348,591 2,770,182 38.70 2009 13,258,842 10,339,305 2,919,538 39.10
Source: SEA for Vietnam Forestry Master Plan 2010 - 2020
3 Nguyen Van Song, 2008, Wildlife trade and solutions for wildlife conservation in Vietnam. Environment and Construction Magazine. Issue 17, volume 2, 2008. P 145-165.

92
Figure 2.2. Forest Cover Change in Vietnam in the Period 1983-2004 Source: SEA for Vietnam Forestry Master Plan 2010 - 2020
Vietnam is one of the world’s 10 most biologically diverse countries - containing about 10 % of the world’s species, even while covering less than 1 % of the earth’s surface (World Bank, 20024). Vietnam’s valuable biodiversity include tigers, elephants, and 5 of the most valuable and rare primates in the world. Flora diversity can be seen in over 13,000 reported species. The unique climate and geography of Vietnam have resulted in many ecological areas, ecosystems, habitats, and high endemism. The forest ecosystem has the highest biological value in Vietnam in comparison with other ecosystems such as those of grassland and limestone mountains (MoNRE, 20085).
Biodiversity in Vietnam is rather high. However, it is being threatened by industrial and domestic pollution, construction activities, overfishing, and destructive fishing methods.
Aqua-habitat
The freshwaters of Vietnam are tropically rich in flora and fauna biodiversity including species of fish, shrimp, crab, snail, mussels, amphibians, insects and plants. In different fresh water systems, there are about totally 20 species of freshwater weeds; 1402 species of algae; 782 of invertebrates; 544 of fish species and 52 species of crabs6.
4 Vietnam Environment Monitor 2002, World Bank, Ha Noi
5 MoNRE, Vietnam Environment Bureau, 4th Country Report: Vietnam Implementing the Biodiversity Convention, Hanoi, 2008
6 Source: Vietnam Environment Monitor 2003, WB

93
!"!"
Vietnam’s freshwater and marine biodiversity is relativelyhigh but threatened by domestic and industrial waterpollution, dam and road construction, dredging, destructivefisheries techniques, aquaculture and over-fishing.
#$%&$' ()*+,+-./The freshwaters of Vietnam are tropically rich in flora andfauna biodiversity including species of fish, shrimp, crab,snail, mussels, amphibians, insects and plants. In differentfresh water systems, there are about totally 20 species offreshwater weeds; 1402 species of algae; 782 of invertebrates;544 of fish species and 52 species of crabs. Distribution offish species among the regions is presented in Fig 7.
Only scarce quantitative data are available for inlandaquatic ecosystems, and the extent of the deterioration offreshwater biodiversity is still poorly known. However, thereare indicators showing that many species are in danger ofextinction or becoming rare (Box 1). Listed in the Red Book2002 (forthcoming) are 6 wetland waterfowl birds, 24reptiles, 14 amphibian, 37 fish, 19 mollusk and 1 insectfreshwater species.
In a recent study by the World Bank 268 native freshwaterfish species have been recorded only from the Ca Riverbasin northwards, showing that a significant part of thenorthern Vietnamese fish fauna is shared with southernChina!. This study is particular concerned freshwaterbiodiversity in the context of the Vietnam NationalHydropower Study. The study shows that changes in thehydrological regime of river systems due to construction ofdams for irrigation and hydropower causes loss ofmigrating routes for many species like the !"#$%&'('& )*+,--%in the Red River and eels .&/#,""% spp. in various rivers inVietnam.
0*&+-&% &$' /&12$. 32*'24.1+2-,More than 2000 fish species are found in the sea waters ofVietnam. Of these, approximately 130 species are economicallyimportant. Additionally, there are more than 1,600 speciesof crustaceans and 2,500 species of mollusks with anannual allowable catch of 50,000-60,000 and 60,000-70,000tons respectively. Aside from marine fauna, each year
5*6 !7 8.)%2$. 2$ 91.+:;&-.1 92+:.12.+&$' 32*'24.1+2-,
Decline is seen in various reservoirs and lakes in Vietnam. In the BaBe lake fish species have been disappearing at a rapid rate from 1998to 2001. Over this short period 20 species have disappeared, out ofwhich 15 are Cypranidae.
This is a continuation of a steady decline over decades. The fishcatches have gone down since the 1960s:
<*=1).> 0,-* 0%#&% ,& 1% 12 3%425 6/#72& 8+'&/
?.12*' <*=1). ?1*'=)-2*$ @2.%'A-B ACDE: &E,1B
1961-62 Nguyen Van Hao (1964) 38 85.01962-67 Mai Dinh Yen, Bui Lai (1969) 20 45.01975 Nguyen Van Hao (1975) 15 33.41993-97 Nguyen Van Hao 11 24.52000 Nguyen Trong Hiep (2001) 7 15.0
FGHFI#0 5#J8#K(L<#I@ >M1.+:;&-.1 &$' N&12$.
"#$% !& 91 : ;'))2"%) <5= >??@= 0+2-*A%)2+ 0,-*2- 'B 6'+)*2+& C,2)&%D5
"#$% '& E%' <%&* F'&= >??@5 GBBH-*'+2 D%+,&2 B,-*2+7 +2-'#+I2- 'BC,2)&%D5 J& A'+4-*'$ $+'I22(,&/- KL%),'&%" %&( F#-)%,&%M"2 N),",-%),'& 'B<%+,&2 L2-'#+I2- ,& C,2)&%DO= 6'P2DM2+ >??@5
M2D O7 M2+: <P.)2.+ 82+-123=-2*$ 2$ K2.-$&/
<*=1).> E%)% M%-2( '& (,BB2+2&) -'#+I2- I'D$,""2( M7 0,-*2+7 L2-2+%I*J&-),)#)2 J= >??Q5
approximately 45,000-50,000 tons of seaweed such asGracilaria verrucosa and Sargassum can be exploited'.Among marine mammals the most abundant are dolphin(14 species), then whale (8 species). The dugong (E#/'&/(#/'&) in Vietnam is under threat from hunting despite theGoV’s prohibition: more than ten dugongs were killed lastyear. Vietnam now reports only 10 dugongs left in Con Daosea-waters and another group of 100 dugongs around PhuQuoc island.(
"#$% (& R!< !,)7 S'#)* T#" U= >??Q
Figure 2.3. Fish Species Distribution in Vietnam
Saltwater and brackish water ecosystems are quite diverse, with distinctive features of the uplands. To date, around 11,000 phytoplankton and marine species have been identified, including 537 species of phytoplankton, 667 species of seaweeds, 657 species of zooplankton, 600 species of benthic species, 225 species of shrimps, 2,038 fish species, and nearly 300 species of corals. Apart from that, there are also 50 species of sea snakes and other toxic algae.
Coastal and marine ecosystems
The very diverse ecosystems distribute along the coastline. More than 2,000 fish species are found in the sea waters of Vietnam, approximately 130 species of which are economically important. Additionally, there are more than 1,600 species of crustaceans and 2,500 species of mollusks with an annual allowable catch of 50,000-60,000 and 60,000-70,000 tonnes respectively. Approximately 45,000-50,000 tonnes of seaweed can be exploited. Many of these species are endangered.
Among these ecosystems, the most important are wetlands, coral reefs, and sea grass. These ecosystems provide habitats, sprawning fields, and food for many species. These ecosystems not only serve as the lungs for many areas and act as protective shields in case of typhoons and floods. However, these ecosystems are declining rapidly both in size and quality.

94
!"
Rare and endangered species listed in the Red Book (2002)of Vietnam include: 5 mammals, 6 waterfowls living inwetlands, 5 marine turtle species, 1 crocodile, 53 marine fish,15 corals, 5 echinoderms, 1 horseshoe crab, 2 marine crabs,6 shrimp, 6 species of !"#$%&'$(") family, and 26 molluskspecies.
#$%&'%( %)* +%,-). ./$&0&'.+&The very diverse ecosystems distribute along the coastline(Table 5). Among these the most important are wetlands,coral reefs, and sea grass
*)+#"%(,Vietnam is rich in freshwater and marine wetlands. Theseare mainly distributed in the Red River and the Mekong RiverDeltas and along the 3,260 km coastline. TheDirectory of Asian Wetlands lists over 25 wetland sites inVietnam that meet the criteria of ‘Wetlands of InternationalImportance.’ Despite this the only designated such siteunder the Ramsar Convention is the Xuan Thuy NationalPark, a 12,000 ha mangrove on the mouth of the Red Riverin Nam Dinh Province. However, there are plans foradditional Ramsar sites, including the Tram Chim NationalPark in Dong Thap Province in the Mekong River Delta. CanGio mangrove forest as Vietnam's first protected area wasdesignated as Man and Biosphere Reserve by UNESCO(2000).
-"%.'/0),Over the last 50 years of development, Vietnam has lostmore than 80% of mangrove forest. The surge in shrimpfarming emerges as one of the leading causes of mangroveforest destruction. The loss of mangrove forest area is largestin the Mekong (Cuu Long) Delta, Quang Ninh and Hai Phongprovinces. Other causes for mangrove losses includeconversion to agricultural and construction lands, wardestruction, fuel wood collection.
Over the last three decades from 1960 to 1995, Quang Ninhand Hai Phong has seen the disappearance of close to fortythousands hectares of mangrove forest. Only 15,700hectares remain in the two provinces. It was estimated thatthe annual loss in terms of forgone benefits of mangrove func-tions (e.g., fishery, forestry, and erosion) could be in the rageof 10-32 mill. USD per year!.
Estimated data compiled from various sources for 1999 and2001 indicates some increase in mangrove areas (Fig 8).
1-2 34 5%)2,$6. ($&& -) 7-.')%+
8$9,/.: 12345122678$)+%"9 :/'),+ ;),/&'<), =%0)%+/'> "%( -/%$+/'$%. !'/5.'"9? :=!=@ ABB1?1222 "%( ABB17 C,+$9"+)( ("+" D'/9 0"'$/&, ,/&'<),@
;%<(. =4 5%>$, /$%&'%( %)* +%,-). ./$&0&'.+&
8$9,/.&: E'$.$%"+)( D'/9 F.&>)% GH& I/$? 122J@ 8$)+%"9 F"+$/%"# *)+5#"%( G/%,)'0"+$/% "%( -"%".)9)%+ K+'"+).>? */'L,H/M !'/<))($%., "%( NOP64A15;CQ !'/R)<+? ABBB@ N')" D$.&') D/' 9"%.'/0), $, M'/0$()( S> :=!=? ;)5M/'+ +/ +H) Q/8? ABB1@
?/$&0&'.+& @-&',-<9'-$) ?&'-+%'.*.A-&'-)2%,.% BC%D
Agro-systems Concentrated in the Red and 5,500,000Mekong River Delta
Aquaculture Entire coastline 10,000Tidal wetlands Mainly concentrated in areas 1,000,000
of river mouths and aroundsome islands
Lagoons 12 lagoons at the coast from 100,000Thua Thien Hue to BinhThuan province
Sand beaches Broad extent along coast 600,000Mangroves Estuaries, sheltered bays, 156,608
primarily North andSouth coast
Sea grass North to south, inshore and 6,800offshore
Coral reefs (in near shore and some offshore 7,5326m depth)Islands about 2,779 inshore islands 1,630
recorded
"#$% !& */'#( P"%L? T1222U? V WH) X&"%. F$%H "%( I"$ !H/%. G/",+"# ;)5.$/%7 EM+$/%, D/' G/9M')H)%,$0) O)0)#/M9)%+?Y K)9$%"' /% EM+$/%, D/' G/95M')H)%,$0) O)0)#/M9)%+ $% +H) X&"%. F$%H "%( I"$ !H/%. G/",+"# ;).$/%@
EFGE;H# IHJ@H7?K8H;L :1,.&CM%'., %)* 5%,-).
Table 2.2. Main coastal and marine ecosystems
Wetlands
Vietnam is rich in freshwater and marine wetlands. These are mainly distributed in the Red River and the Mekong River Deltas and along the 3,260 km coastline. The Directory of Asian Wetlands lists over 25 wetland sites in Vietnam that meet the criteria of ‘Wetlands of International Importance’. Despite this the only designated such site under the Ramsar Convention is the Xuan Thuy National Park - a 12,000 ha mangrove park.
Mangroves
Over the last 50 years of development, Vietnam has lost more than 80% of mangrove forest. The surge in shrimp farming emerges as one of the leading causes of mangrove forest destruction. The loss of mangrove forest area is largest in the Mekong (Cuu Long) Delta, Quang Ninh and Hai Phong provinces. Other causes for mangrove losses include conversion to agricultural and construction lands, war destruction, fuel wood collection.

95
!"
Rare and endangered species listed in the Red Book (2002)of Vietnam include: 5 mammals, 6 waterfowls living inwetlands, 5 marine turtle species, 1 crocodile, 53 marine fish,15 corals, 5 echinoderms, 1 horseshoe crab, 2 marine crabs,6 shrimp, 6 species of !"#$%&'$(") family, and 26 molluskspecies.
#$%&'%( %)* +%,-). ./$&0&'.+&The very diverse ecosystems distribute along the coastline(Table 5). Among these the most important are wetlands,coral reefs, and sea grass
*)+#"%(,Vietnam is rich in freshwater and marine wetlands. Theseare mainly distributed in the Red River and the Mekong RiverDeltas and along the 3,260 km coastline. TheDirectory of Asian Wetlands lists over 25 wetland sites inVietnam that meet the criteria of ‘Wetlands of InternationalImportance.’ Despite this the only designated such siteunder the Ramsar Convention is the Xuan Thuy NationalPark, a 12,000 ha mangrove on the mouth of the Red Riverin Nam Dinh Province. However, there are plans foradditional Ramsar sites, including the Tram Chim NationalPark in Dong Thap Province in the Mekong River Delta. CanGio mangrove forest as Vietnam's first protected area wasdesignated as Man and Biosphere Reserve by UNESCO(2000).
-"%.'/0),Over the last 50 years of development, Vietnam has lostmore than 80% of mangrove forest. The surge in shrimpfarming emerges as one of the leading causes of mangroveforest destruction. The loss of mangrove forest area is largestin the Mekong (Cuu Long) Delta, Quang Ninh and Hai Phongprovinces. Other causes for mangrove losses includeconversion to agricultural and construction lands, wardestruction, fuel wood collection.
Over the last three decades from 1960 to 1995, Quang Ninhand Hai Phong has seen the disappearance of close to fortythousands hectares of mangrove forest. Only 15,700hectares remain in the two provinces. It was estimated thatthe annual loss in terms of forgone benefits of mangrove func-tions (e.g., fishery, forestry, and erosion) could be in the rageof 10-32 mill. USD per year!.
Estimated data compiled from various sources for 1999 and2001 indicates some increase in mangrove areas (Fig 8).
1-2 34 5%)2,$6. ($&& -) 7-.')%+
8$9,/.: 12345122678$)+%"9 :/'),+ ;),/&'<), =%0)%+/'> "%( -/%$+/'$%. !'/5.'"9? :=!=@ ABB1?1222 "%( ABB17 C,+$9"+)( ("+" D'/9 0"'$/&, ,/&'<),@
;%<(. =4 5%>$, /$%&'%( %)* +%,-). ./$&0&'.+&
8$9,/.&: E'$.$%"+)( D'/9 F.&>)% GH& I/$? 122J@ 8$)+%"9 F"+$/%"# *)+5#"%( G/%,)'0"+$/% "%( -"%".)9)%+ K+'"+).>? */'L,H/M !'/<))($%., "%( NOP64A15;CQ !'/R)<+? ABBB@ N')" D$.&') D/' 9"%.'/0), $, M'/0$()( S> :=!=? ;)5M/'+ +/ +H) Q/8? ABB1@
?/$&0&'.+& @-&',-<9'-$) ?&'-+%'.*.A-&'-)2%,.% BC%D
Agro-systems Concentrated in the Red and 5,500,000Mekong River Delta
Aquaculture Entire coastline 10,000Tidal wetlands Mainly concentrated in areas 1,000,000
of river mouths and aroundsome islands
Lagoons 12 lagoons at the coast from 100,000Thua Thien Hue to BinhThuan province
Sand beaches Broad extent along coast 600,000Mangroves Estuaries, sheltered bays, 156,608
primarily North andSouth coast
Sea grass North to south, inshore and 6,800offshore
Coral reefs (in near shore and some offshore 7,5326m depth)Islands about 2,779 inshore islands 1,630
recorded
"#$% !& */'#( P"%L? T1222U? V WH) X&"%. F$%H "%( I"$ !H/%. G/",+"# ;)5.$/%7 EM+$/%, D/' G/9M')H)%,$0) O)0)#/M9)%+?Y K)9$%"' /% EM+$/%, D/' G/95M')H)%,$0) O)0)#/M9)%+ $% +H) X&"%. F$%H "%( I"$ !H/%. G/",+"# ;).$/%@
EFGE;H# IHJ@H7?K8H;L :1,.&CM%'., %)* 5%,-).
Figure 2.4. Mangrove Loss in Vietnam17
Coral Reefs
The coverage of coral reef in northern Vietnam generally falls between 25 and 50%. Based on the IUCN criteria for assessing coral reefs, only 1.4 % of the reefs studied in southern Vietnam are in excellent condition. The number of poor reefs occupied 37.3% and the reefs considered to be in fair and good condition occupied 48.6% and 31% respectively (Table 6). The total area of coastal coral reefs is about 40,000 ha2
8. In general, coral reefs are found in three areas: in the west of Tonkin Gulf, in Central Vietnam and in the eastern Siam Gulf. The marine areas with the largest coral reefs are in the Spratly and Paracel Archipelagos. The main threats to the reefs are destructive fishing methods, over-fishing, sedimentation, and pollution from territorial sources.
Table 2.3. Live Coral Coverage in Some Sites
7 Viet Nam Forest Resources Inventory and Monitoring Program, Institute of Forest Resources Inventory and Planning, 2001 8 Reefs at risk in South East Asia, World Resources Institute and Ministry of Fisheries
!"!"
!"#$% &''()The coverage of coral reef in northern Vietnam generally fallsbetween 25 and 50%. Based on the IUCN criteria for assess-ing coral reefs, only 1.4 % of the reefs studied in southern Viet-nam are in excellent condition. The number of poor reefsoccupied 37.3% and the reefs considered to be in fair andgood condition occupied 48.6% and 31% respectively (Table6). The total area of coastal coral reefs is about 40,000 ha. Ingeneral, coral reefs are found in three areas: in the west ofTonkin Gulf, in Central Vietnam and in the eastern SiamGulf. The marine areas with the largest coral reefs are in theSpratly and Paracel Archipelagos. The main threats to thereefs are destructive fishing methods, over-fishing,sedimentation, and pollution from territorial sources.Destructive fishing practices, such as the use of poison anddynamite, threaten as much as 85% of the country’s reefs.Over-fishing is a pervasive threat to more than 60%, whilesediment from upland sources is estimated to threaten 50%of Vietnam’s reefs.
*'$ +#$))covers an area of 6,800 ha in Vietnam (Table 7). 15 species ofsea grass have been identified. The sea grass beds providehabitats of rare and endangered marine species such as dug-ong and sea turtles and support food for many species likefishes, shrimps, crabs and sea mammals. Phu Quoc and ConDao have the most diverse seagrass composition inVietnam. Seagrass beds have also been severely degradedfrom inappropriate fishing, aquaculture production, andpollution from waste discharges.
#$%&'()* +&,-.-%-(. / 0)&$Excellent >75% live coral 1.4Good 50-75% live coral 31.0Fair 25-50% live coral 48.6Poor <25% live coral 37.3
1$23& 4$5 67$3-%* (, #()$3 8&&,9 -. :-&%.$;
<(7)=&> ,"#%- &')".#/') 01)232.2'4 56654 7&''() $2 #3)8 31 *".29'$)2 :)3$;<
Location Live coral cover (%)
Co To Archipelago 51.2Ha Long Bay 34.2Cat Ba Islands 47.7Long Chau Archipelago 42.1Bach Long Vi Island 31.0Son Duong-Mui Ron Islands 50.0Con Co Island 23.8Son Tra-Hai Van 50.5
1$23& 425 ?-@& =()$3 =(@&)$'& -. 9(;& 9-%&9
<(7)=&> =313)2#> "( ?3)9'#>@0A!B4 566C;
Name of location Area (ha) Number of species
Tam Giang – Cau Hai lagoon 1000 2Thuy Trieu lagoon-Cam Ranh Bay 800 7(Khanh Hoa province)Phu Quoc island 500 9Nha Mac marsh (Quang Ninh province) 500 1Cua Gianh estuary (Quang Binh) 500 1Thu Bon river mouth (Quang Nam) 500 1Phu Quy island (Binh Thuan province) 300 6Han river mouth (Da Nang) 300 1Cu Mong marsh (Phu Yen province) 250 5Con Dao archipelago 200 8
1$23& A5 1(B "C 3$)'&9% 9&$')$99 2&D9 -. :-&%.$;
<(7)=&9> D$3 E9"1+ 01)232.2' "( F/'$1"+#$G9>4 5665;
06E01F# GFH+F:I8<F1J >K)&9LM$%&) $.D N$)-.&

96
Sea grass: covers an area of 6,800 ha in Vietnam. 15 species9 of sea grass have been identified. The sea grass beds provide habitats of rare and endangered marine species such as dugong and sea turtles and support food for many species like fishes, shrimps, crabs and sea mammals. Phu Quoc and Con Dao have the most diverse seagrass composition in Vietnam. Seagrass beds have also been severely degraded from inappropriate fishing, aquaculture production, and pollution from waste discharges.
Table 2.4. Top 10 Largest Sea Grass Beds in Vietnam
!"!"
!"#$% &''()The coverage of coral reef in northern Vietnam generally fallsbetween 25 and 50%. Based on the IUCN criteria for assess-ing coral reefs, only 1.4 % of the reefs studied in southern Viet-nam are in excellent condition. The number of poor reefsoccupied 37.3% and the reefs considered to be in fair andgood condition occupied 48.6% and 31% respectively (Table6). The total area of coastal coral reefs is about 40,000 ha. Ingeneral, coral reefs are found in three areas: in the west ofTonkin Gulf, in Central Vietnam and in the eastern SiamGulf. The marine areas with the largest coral reefs are in theSpratly and Paracel Archipelagos. The main threats to thereefs are destructive fishing methods, over-fishing,sedimentation, and pollution from territorial sources.Destructive fishing practices, such as the use of poison anddynamite, threaten as much as 85% of the country’s reefs.Over-fishing is a pervasive threat to more than 60%, whilesediment from upland sources is estimated to threaten 50%of Vietnam’s reefs.
*'$ +#$))covers an area of 6,800 ha in Vietnam (Table 7). 15 species ofsea grass have been identified. The sea grass beds providehabitats of rare and endangered marine species such as dug-ong and sea turtles and support food for many species likefishes, shrimps, crabs and sea mammals. Phu Quoc and ConDao have the most diverse seagrass composition inVietnam. Seagrass beds have also been severely degradedfrom inappropriate fishing, aquaculture production, andpollution from waste discharges.
#$%&'()* +&,-.-%-(. / 0)&$Excellent >75% live coral 1.4Good 50-75% live coral 31.0Fair 25-50% live coral 48.6Poor <25% live coral 37.3
1$23& 4$5 67$3-%* (, #()$3 8&&,9 -. :-&%.$;
<(7)=&>,"#%- &')".#/') 01)232.2'4 56654 7&''() $2 #3)8 31 *".29'$)2 :)3$;<
Location Live coral cover (%)
Co To Archipelago 51.2Ha Long Bay 34.2Cat Ba Islands 47.7Long Chau Archipelago 42.1Bach Long Vi Island 31.0Son Duong-Mui Ron Islands 50.0Con Co Island 23.8Son Tra-Hai Van 50.5
1$23& 425 ?-@& =()$3 =(@&)$'& -. 9(;& 9-%&9
<(7)=&> =313)2#> "( ?3)9'#>@0A!B4 566C;
Name of location Area (ha) Number of species
Tam Giang – Cau Hai lagoon 1000 2Thuy Trieu lagoon-Cam Ranh Bay 800 7(Khanh Hoa province)Phu Quoc island 500 9Nha Mac marsh (Quang Ninh province) 500 1Cua Gianh estuary (Quang Binh) 500 1Thu Bon river mouth (Quang Nam) 500 1Phu Quy island (Binh Thuan province) 300 6Han river mouth (Da Nang) 300 1Cu Mong marsh (Phu Yen province) 250 5Con Dao archipelago 200 8
1$23& A5 1(B "C 3$)'&9% 9&$')$99 2&D9 -. :-&%.$;
<(7)=&9> D$3 E9"1+ 01)232.2' "( F/'$1"+#$G9>4 5665;
06E01F# GFH+F:I8<F1J >K)&9LM$%&) $.D N$)-.&
The biggest consequence of loss of forest and biodiversity is the loss of forest biological services such as medicinal herbs, livelihoods (especially of ethnic minority people), water source protection, soil protection (sedimentation, erosion, soil deterioration), environment for scientific research, and tourism potential, etc. The consequences of loss of forest are the most heavy considering that Vietnam is one of the most vulnerable countries to climate change.
The area of forest lost to hydropower reservoirs only accounts for a small proportion of the total area of forest loss in Vietnam every year, which was recorded at 161.1 km2 according to survey statistics collected in 2006 during the implementation of the PVP VI. However, hydropower development provides entries for motorized vehicles, which will open forest areas up to further encroachment and degradation.
2.2.2.2. Changes to Hydrological Regimes, Water Resource Management and Downstream Salt Intrusion
All natural water resources are distributed unevenly in time and space. Human’s demand for water also varies in time and space. However, human’s demand for water and water availability are often out of sync. Appropriate water regulation according to human’s demand through the use of reservoirs is one of the most effective solutions for this issue.
Reservoirs stabilize flows by regulating water supply capacity from the natural flow. A reservoir can change the flowing regimes of a river dramatically in time and space. Apart from that, the
9 Hai Phong Institute of Oceanography, 2002.

97
presence of a reservoir can change the potential and kinetic energy in portions of the river. This feature is applied in hydropower development. The establishment of dams is considered an effective method in water management, especially in flow, flood and drought control for downstream area. Other benefits of reservoirs include irrigation for agricultural production, domestic water supply, water transport, fish farming, climate regulation, tourism, water sport, and recreation, etc.
There are many benefits of hydropower reservoirs that cannot be quantified in figures. Experiences from the Lower Mekong Basin flood control projects by the Mekong River Commission (1960 – 1981) and the Netherlands Delta Team (1974) show that if a dam is built in Tongle Sap to check the volume of water going to the lake, the dam gate can be closed when flood water starts to flow downstream to reduce flow load in the Mekong Delta. Water in the Great Lake can be discharged gradually during the dry season for irrigation, water transport and salt intrusion reduction. Modeling studies show that this dam can reduce flood water level in Phnom Penh by 0.41 m, in Chau Doc by 0.2 m, and in Tan Chau by 0.19 m. However, if the dam is built there will be considerable impacts on the environment and ecosystems. For example, the studies have not fully assessed the risk of reduced fish stock in the Great Lake, potential impacts on water transport between Phnom Penh and Tongle Sap and possible changes to the natural habitats for fauna and flora in the region.
Vietnamese farmers have a saying: “Thượng điền tích nước, hạ điền khan”, which can literally be translated as “if the fields upstream are storing water, the fields downstream will have no water”. This saying is not true for any big river basin because in reality water in the river comes mostly from the rain. Rainfall in upstream area contributes about 25% of the total water volume in a river. Water volume in the river is dependent on: (1) river basin area; (2) landscape of the river basin; (3) vegetation; (4) river basin slope; (5) geological and soil conditions; and (6) most importantly, volume and duration of rain. Therefore, it is not true to say that cascade hydropower always has negative impacts on lower river basin.
However, if the water resources are not well managed and large quantities of water are stored upstream, it will have big impacts on the lower river basin. Big river dams can result in many changes to the geology, topography, and soil. Water in the reservoir can absorb through layers of soil, causing water loggings and increasing the level of water saturation in soil, which can affect the earth’s crust in the region. There has been incidence of earthquake and landslide in some areas after the construction of reservoirs. If geological surveys are not done properly, water in reservoir can seep through and dissolve underground salt deposits, causing negative impacts on crops.
Changes to hydrological regimes can result in a new situation of downstream erosion and sedimentation. These changes partly affect the stability of river edges and riverine ecosystems. There were opinions about how water discharges from hydropower reservoirs contributed to the recent historical floods in the Central Region.
According to statistics, the water level in most reservoirs in Vietnam has declined from 20-40% compared with annual average water level in many years. In the reservoirs of Hoa Binh hydropower station – the biggest hydropower station in South East Asia – water level has reached the lowest point in 40 years. Dryness can also be witnessed along the Mekong River. In the dry season of 2004, most rivers and streams in the areas from Vientian and Savanakhet to Champasak

98
dried out. It was even possible to walk on the dry river floors. The rice paddies in Thailand on the right side of the Mekong River were all dry and almost all lost. All the remaining forests in Central Highlands of Vietnam on the left side of the Mekong River were at high risk of fire. Coastal provinces in the Mekong Delta such as Ben Tre, Tra Vinh, Soc Trang suffer from deep salt water intrusion. This situation has led many countries, organizations and scientists to study the effects of the dams on upstream Mekong River and the reservoirs in Van Nam, China.
Deterioration of water quality and river ecosystems is also an alarming issue. There is a need for strict mechanisms for water resources management.
All the above are environmental impacts before the PDP VII.
2.2.2.3. Changes to Environmental Quality
a. Air Quality
Air quality in all of Vietnam is deteriorating, most obviously in big cities, some industrial parks, and craft villages. More details are provided below:
Air quality in urban areas and industrial parks
Particulate Matter (PM): Most urban areas in Vietnam are polluted with PM. In some areas, the situation is very serious, even at alarming levels. The concentration of PM in the air in big cities such as Hanoi, Ho Chi Minh City, Hai Phong, and Da Nang is from 2-3 times higher than the standard. PM concentration in the air at intersections can be 2-5 times higher than the permitted level, and at construction sites can be 10-20 times higher10.
Developed mineral extraction and industrial activities in Thai Nguyen and Quang Ninh cause atmospheric pollution in nearby urban areas. Trucks coming in and out of the sites often do not follow environmental sanitation requirements such as cleaning their tires or covering up the material content in the back of the truck, and often transport more than their load limit, causing serious PM pollution on their tracks.
In areas with developed industrial activities and heavy load of traffic (such as Bien Hoa and Viet Tri), PM concentration in the air around roads, industrial parks, and nearby residential areas is beyond the permitted level. 100 % of the one hour averaging time PM samples in all monitoring points are above the permitted level. In some intersections, the PM concentration in the air is sometimes 5 times higher than the permitted level. The pollution situation in these areas is not likely to improve, except for in some roads that have recently been upgraded.
10 Source: Vietnam Environment Report 2009: Industrial Park Environment, MoNRE 2009

99
Figure 2.5. PM Concentration in the Air around Some Industrial Parks in the North and Central Vietnam 2006-2008. (Source: Vietnam Environment Report 2009: Industrial Park Environment)
SO2 releases: The average SO2 concentration in most urban areas and industrial parks is lower than the permitted level. Industrial and craft activities contribute to 95% of the total SO2 releases, traffic contributes to 1.2% and urban living activities contribute to less than 1%. SO2
concentration around some industrial parks in Viet Tri city and Bien Hoa city is higher than in other areas but still under the permitted level specified in the Vietnamese Standards QCVN 05:2009/BTNMT.
Figure 2.6. SO2 Concentration in Gaseous Releases from Some Factories in the North Thang Long Industrial Park and Tien Son Industrial Park (Bac Ninh) 2006-2008.
(Source: Vietnam Environment Report 2009: Industrial Park Environment)
Note: VAP Co.: gaseous releases from casting, foaming, painting, wielding
Toto Co.: gaseous releases from drying and calcining
Acecook Co.: gaseous releases from oil-fired boiler
Granit Viglacera Co.: gaseous releases from drying/heating (Coal gasification technology)

100
Figure 2.7. SO2 Concentration in the Air around Some Industrial Parks in Northern Vietnam in 2006-2008
(Source: Vietnam Environment Report 2009: Industrial Park Environment)
NO2 releases
NO2 concentration in the air is higher around roads in urban areas, especially in highly populated cities such as Hanoi and Ho Chi Minh. From13-85% of the monitoring samples collected from 2002 to June 2007 in these two cities showed higher NO2 concentration than the permitted level. In other urban areas, NO2 concentration at the times of observation is within the limit of the Vietnamese Standards QCVN 05:2009/BTNMT.
Figure 2.8. NO2 Concentration in the Air around Some Industrial Parks in the Central Vietnam 2997 (Source: Vietnam Environment Report 2009: Industrial Park Environment).
CO releases
CO concentration in the air in most cities is within limit of the Vietnamese Standards QCVN 05:2009/BTNMT. However, in areas with heavy traffic, CO concentration is obviously higher. In

101
Bien Hoa, 20% of the samples collected from traffic routes in 2006 showed CO concentration higher than the permitted level11.
Noise pollution
Along with urbanization, noise pollution from traffic also increases. Noise level measured on traffic routes in big cities such as Hanoi, Hai Phong, Da Nang and Ho Chi Minh City is higher than the permitted level in the Vietnamese Standards TCVN 5949:1998. In most second grade urban areas, noise level on traffic routes is around the permitted level in the Vietnamese Standards TCVN 5949:1998, except for in Bien Hoa city.
The level of noise pollution in industrial parks, product processing zones, and craft production areas is quite high, especially between 22:00 and 06:00.
The situation of atmospheric pollution in urban areas and big industrial parks is measured from atmospheric pollutant emissions. The table below presents data about atmospheric pollutant emissions from the Environment in Industrial Parks, Vietnam Environment Performance Report 2009 by MoNRE.
11 Source: Vietnam Environment Report 2009: Industrial Park Environment, MoNRE

102
Table 2.5. Concentrations of Atmospheric Pollutants in Industrial Parks in Four Economic Focal Regions. (Source: Vietnam Environment Report 2009: Industrial Park Environment)
A study of the areas with high load of pollutants shows that the Southern Economic Focal Region is quite polluted with pollutant concentrations above the limited level in some places (highlighted in figure 2.9).
Other studies and survey results show that areas of high concentration of thermal power plants also have high concentration of pollutants, such as Quang Ninh, Hai Phong, Ba Ria Vung Tau, Dong Nai, and Bien Hoa.
The Central Region, the Northern Mountainous Region, and the Central Highlands have the lowest pollutant concentration. These regions are in the process of industrial development and have no big industrial project in the present. According to the industrial development plan
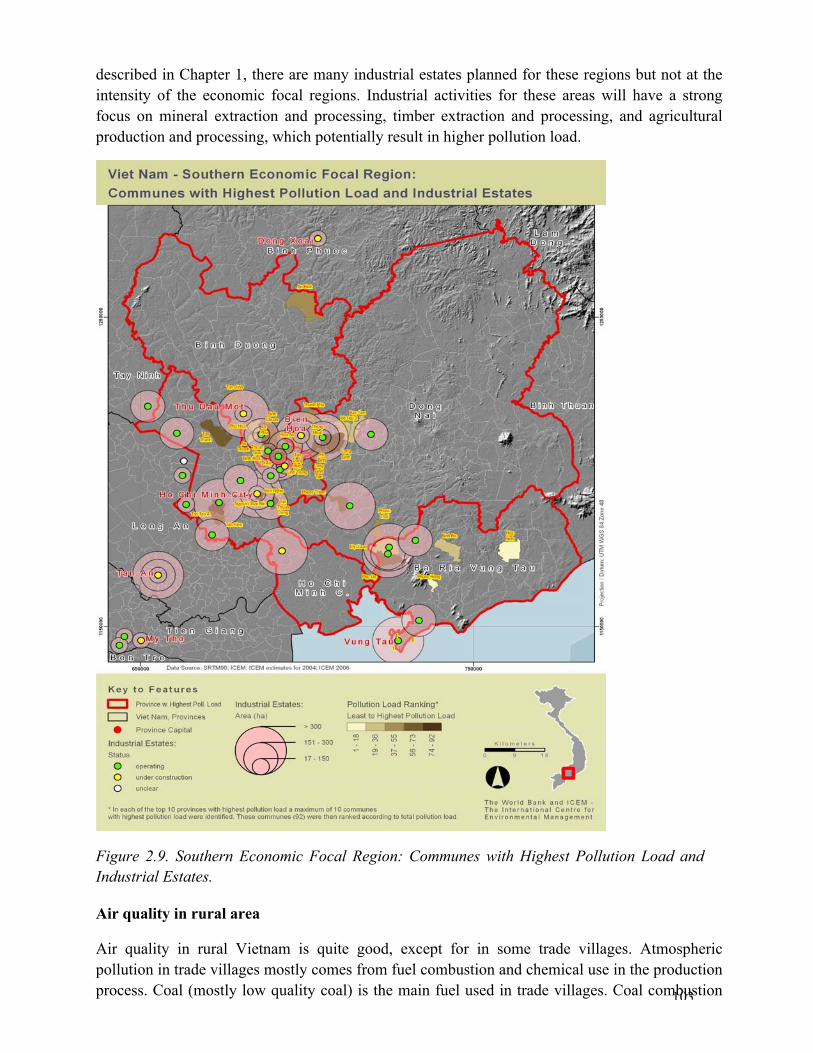
103
described in Chapter 1, there are many industrial estates planned for these regions but not at the intensity of the economic focal regions. Industrial activities for these areas will have a strong focus on mineral extraction and processing, timber extraction and processing, and agricultural production and processing, which potentially result in higher pollution load.
Figure 2.9. Southern Economic Focal Region: Communes with Highest Pollution Load and Industrial Estates.
Air quality in rural area
Air quality in rural Vietnam is quite good, except for in some trade villages. Atmospheric pollution in trade villages mostly comes from fuel combustion and chemical use in the production process. Coal (mostly low quality coal) is the main fuel used in trade villages. Coal combustion
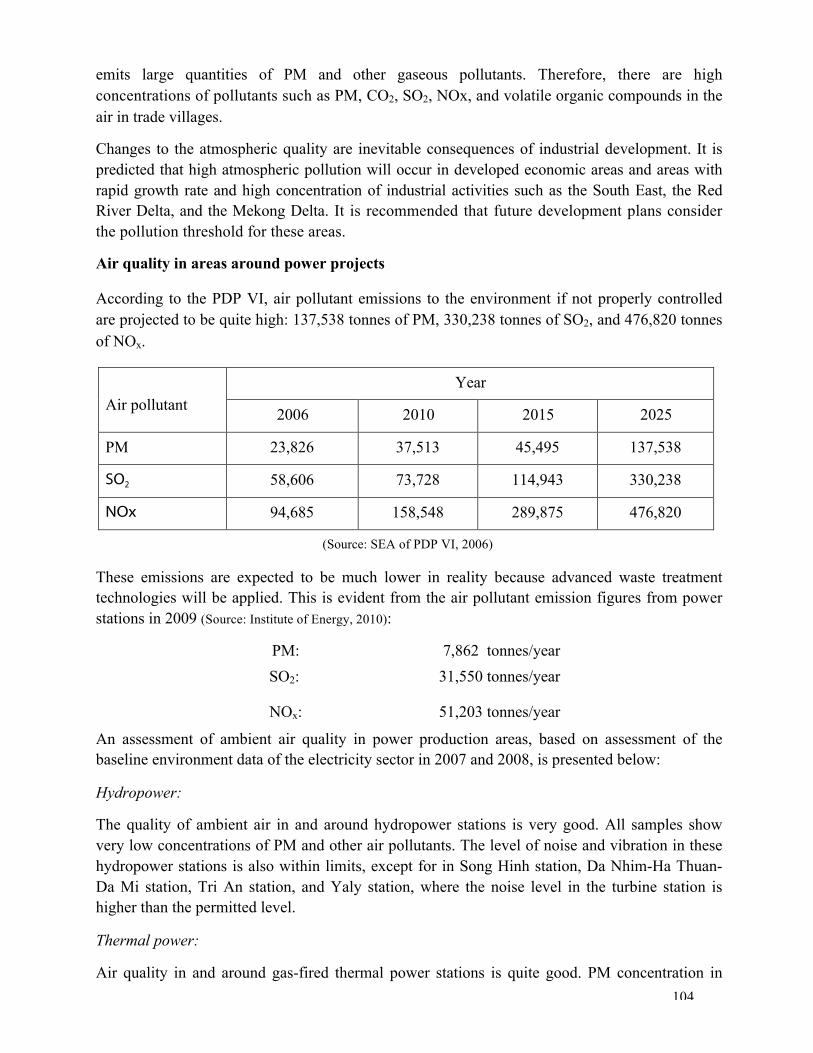
104
emits large quantities of PM and other gaseous pollutants. Therefore, there are high concentrations of pollutants such as PM, CO2, SO2, NOx, and volatile organic compounds in the air in trade villages.
Changes to the atmospheric quality are inevitable consequences of industrial development. It is predicted that high atmospheric pollution will occur in developed economic areas and areas with rapid growth rate and high concentration of industrial activities such as the South East, the Red River Delta, and the Mekong Delta. It is recommended that future development plans consider the pollution threshold for these areas.
Air quality in areas around power projects
According to the PDP VI, air pollutant emissions to the environment if not properly controlled are projected to be quite high: 137,538 tonnes of PM, 330,238 tonnes of SO2, and 476,820 tonnes of NOx.
Year
Air pollutant 2006 2010 2015 2025
PM 23,826 37,513 45,495 137,538
SO2 58,606 73,728 114,943 330,238
NOx 94,685 158,548 289,875 476,820
(Source: SEA of PDP VI, 2006)
These emissions are expected to be much lower in reality because advanced waste treatment technologies will be applied. This is evident from the air pollutant emission figures from power stations in 2009 (Source: Institute of Energy, 2010):
PM: 7,862 tonnes/year SO2: 31,550 tonnes/year
NOx: 51,203 tonnes/year
An assessment of ambient air quality in power production areas, based on assessment of the baseline environment data of the electricity sector in 2007 and 2008, is presented below:
Hydropower:
The quality of ambient air in and around hydropower stations is very good. All samples show very low concentrations of PM and other air pollutants. The level of noise and vibration in these hydropower stations is also within limits, except for in Song Hinh station, Da Nhim-Ha Thuan-Da Mi station, Tri An station, and Yaly station, where the noise level in the turbine station is higher than the permitted level.
Thermal power:
Air quality in and around gas-fired thermal power stations is quite good. PM concentration in

105
several stations was recorded at above the permitted level due to the road condition (earth road) and high level of traffic at intersections. These are thermal stations ran by the Phu My Thermal Power Single Member Limited Liability Company, the Thu Duc Thermal Power Single Member Limited Liability Company, the Can Tho Thermal Power Single Member Limited Liability Company, and the Ba Ria Thermal Power Joint Stock Company. The noise level recorded in some areas inside some thermal power stations was higher than the permitted level.
Air quality in and around coal-fired thermal power stations mostly satisfies basic standards in current regulations. Localized pollution occurs in some stations, for example the Ninh Binh thermal power station.
General assessment shows that atmospheric pollution is only an issue of concern in the area around thermal power stations, especially old thermal stations such as the Pha Lai 1 and the Ninh Binh stations. According to the assessment, atmospheric pollution situation has improved in the recent years after a PM treatment facility for gaseous emissions was installed in these stations. This proves that attention to environmental issues can reduce potential negative impacts12.
In conclusion, with or without PDP VII, the air quality is still affected by gaseous emissions from other economic sectors and especially from thermal power plants of PDP VI.
b. Water quality
Surface water:
Water management in river basins is a complex issue. Water quality in many rivers is decreasing, especially in river sections in urban areas, industrial parks, and trade villages. Water pollution in the three basins of Cau - Nhue – Day and the Dong Nai river system is currently a pressing issue. Water in these rivers is severely polluted due to untreated wastewater discharges from industrial and domestic activities. In some places, water quality is decreasing rapidly. Some indicators such as BOD5, COD, NH4, total N, and total P in water are many times higher than the permitted level.
Water quality in the upstream of rivers is considerably good. Water pollution often occurs in the middle and lower sections of rivers. Pollution situation in rivers becomes worse during dry season when flows reduce. Surface water pollution in rivers, lakes, canals, etc., is increasing in urban areas. The level of water pollution is often dependent on the level of wastewater discharge. The figure below shows the total amount of wastewater discharge in national scale.
12 Environmental protection baseline data compilation for industries in Vietnam, EVN, 2007.
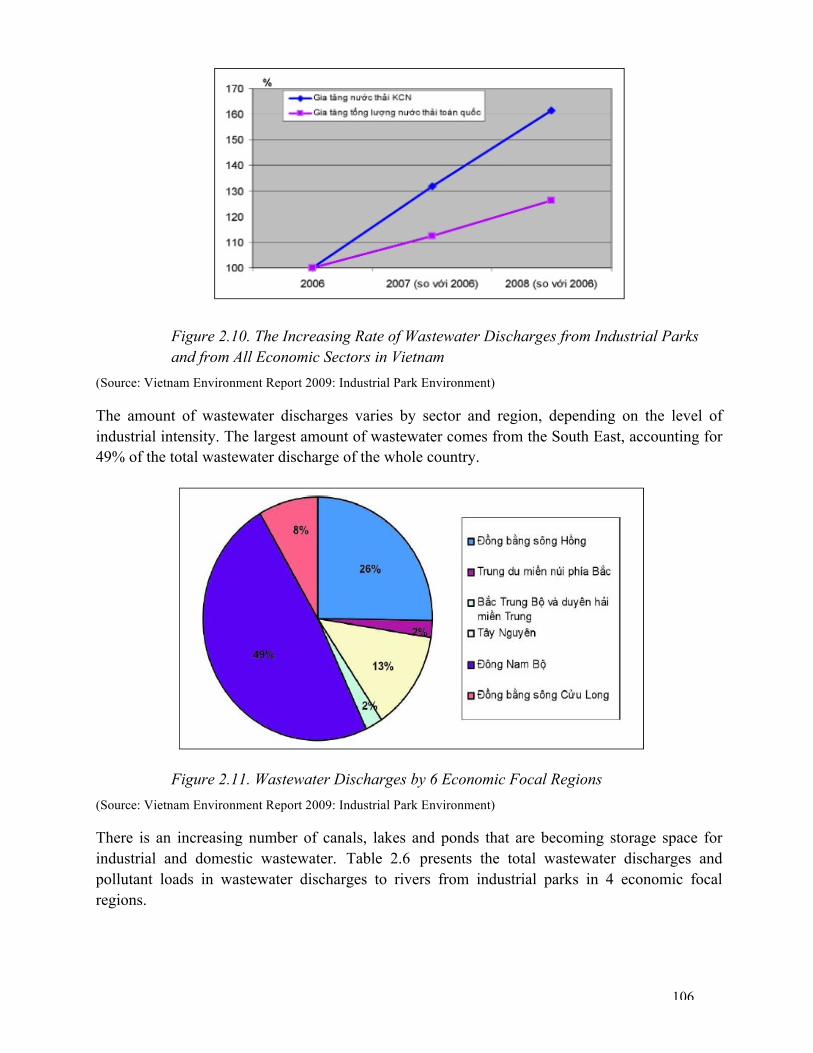
106
Figure 2.10. The Increasing Rate of Wastewater Discharges from Industrial Parks and from All Economic Sectors in Vietnam
(Source: Vietnam Environment Report 2009: Industrial Park Environment)
The amount of wastewater discharges varies by sector and region, depending on the level of industrial intensity. The largest amount of wastewater comes from the South East, accounting for 49% of the total wastewater discharge of the whole country.
Figure 2.11. Wastewater Discharges by 6 Economic Focal Regions (Source: Vietnam Environment Report 2009: Industrial Park Environment)
There is an increasing number of canals, lakes and ponds that are becoming storage space for industrial and domestic wastewater. Table 2.6 presents the total wastewater discharges and pollutant loads in wastewater discharges to rivers from industrial parks in 4 economic focal regions.

107
Table 2.6. Total Wastewater Discharges and Pollutant Loads in Wastewater Discharges from Industrial Parks in 4 Economic Focal Regions in 2009.
(Source: Vietnam Environment Report 2009: Industrial Park Environment)
The changes in the level of some pollutants in wastewater discharges are observed every year to monitor the development trend and speed of water quality in rivers. It is possible to see the development trend of surface water quality from some detailed research and survey results.
Changes to the level of COD in rivers (especially the level of COD and DO in Thi Vai River) where Ba Ria and Phu My thermal power plants are located, are very important. Water is taken from rivers for cooling and other purposes in power plants. After that, the water is discharged back to rivers. During the period of 2005-2008, pollution in these rivers increased rapidly due to increased industrial activities.
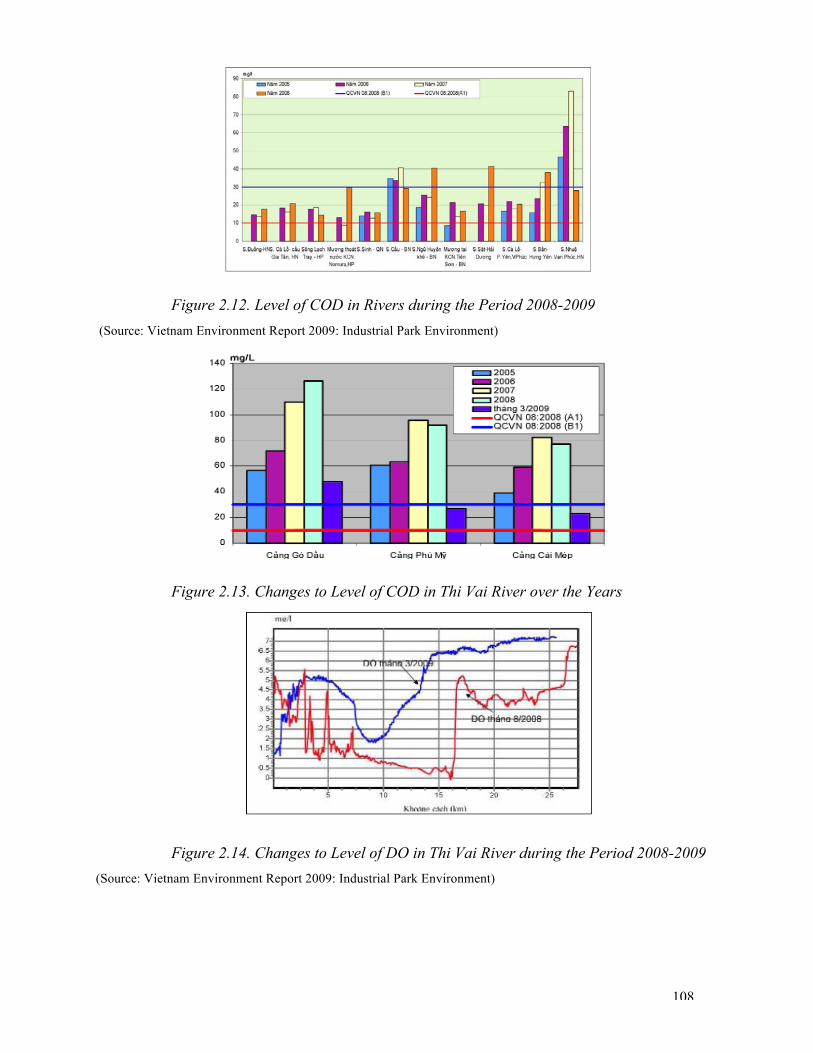
108
Figure 2.12. Level of COD in Rivers during the Period 2008-2009 (Source: Vietnam Environment Report 2009: Industrial Park Environment)
Figure 2.13. Changes to Level of COD in Thi Vai River over the Years
Figure 2.14. Changes to Level of DO in Thi Vai River during the Period 2008-2009 (Source: Vietnam Environment Report 2009: Industrial Park Environment)
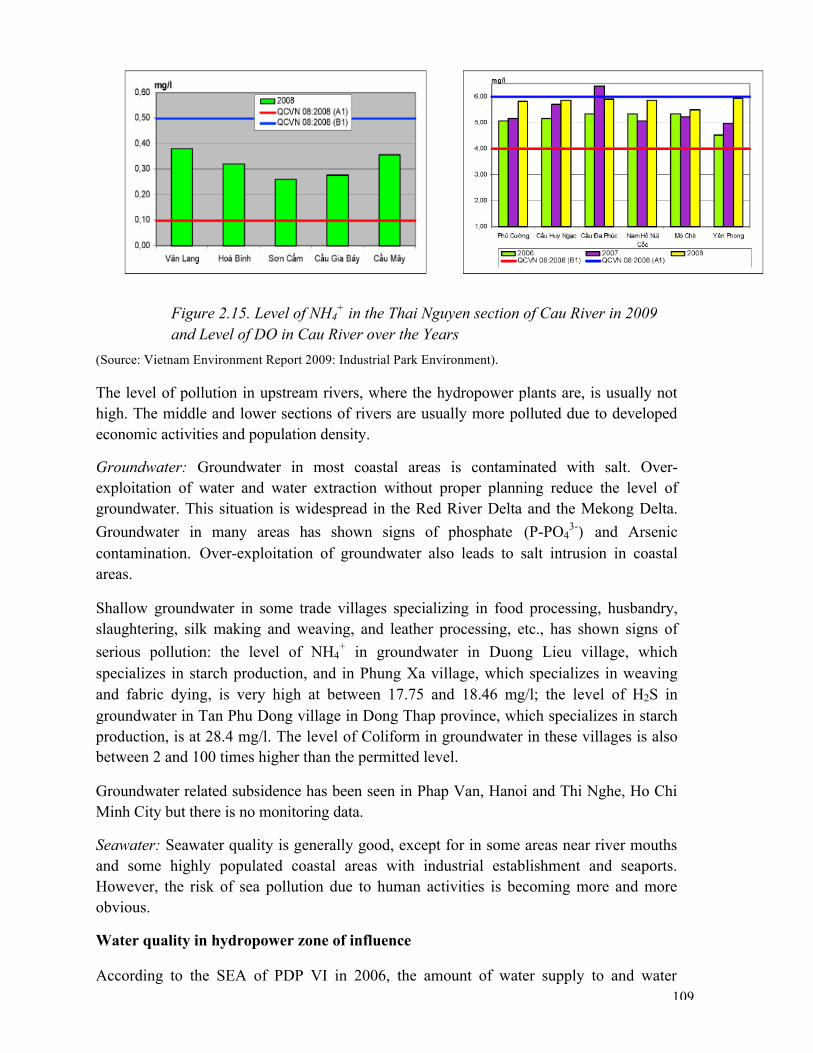
109
Figure 2.15. Level of NH4+ in the Thai Nguyen section of Cau River in 2009
and Level of DO in Cau River over the Years (Source: Vietnam Environment Report 2009: Industrial Park Environment).
The level of pollution in upstream rivers, where the hydropower plants are, is usually not high. The middle and lower sections of rivers are usually more polluted due to developed economic activities and population density.
Groundwater: Groundwater in most coastal areas is contaminated with salt. Over-exploitation of water and water extraction without proper planning reduce the level of groundwater. This situation is widespread in the Red River Delta and the Mekong Delta. Groundwater in many areas has shown signs of phosphate (P-PO4
3-) and Arsenic contamination. Over-exploitation of groundwater also leads to salt intrusion in coastal areas.
Shallow groundwater in some trade villages specializing in food processing, husbandry, slaughtering, silk making and weaving, and leather processing, etc., has shown signs of serious pollution: the level of NH4
+ in groundwater in Duong Lieu village, which specializes in starch production, and in Phung Xa village, which specializes in weaving and fabric dying, is very high at between 17.75 and 18.46 mg/l; the level of H2S in groundwater in Tan Phu Dong village in Dong Thap province, which specializes in starch production, is at 28.4 mg/l. The level of Coliform in groundwater in these villages is also between 2 and 100 times higher than the permitted level.
Groundwater related subsidence has been seen in Phap Van, Hanoi and Thi Nghe, Ho Chi Minh City but there is no monitoring data.
Seawater: Seawater quality is generally good, except for in some areas near river mouths and some highly populated coastal areas with industrial establishment and seaports. However, the risk of sea pollution due to human activities is becoming more and more obvious.
Water quality in hydropower zone of influence
According to the SEA of PDP VI in 2006, the amount of water supply to and water
110
discharge from power development projects in the period 2011-2015, when the power production is expected to increase to 20,200 MW, and until 2025 when the power production is expected to increase to 65,400 MW, are as followed: - Water supply to power development projects:
0.83 m3/h x 20,200 MW = 16,833 m3/h
0.83 m3/h x 65,400 MW = 54,500 m3/h.
- Water discharge from power development projects:
0.2 m3/h x 20,200 MW = 4,040 m3/h
0.2 m3/h x 65,400 MW = 13,080 m3/h.
According to these figures, the level of water supply to and water discharge from power development projects are already quite high, even without PDP VII.
The base environmental data report for the manufacturing sector in Vietnam in 2007 and 2008 included annual monitoring data from power production companies. Analysis of water quality survey data in this report shows that:
Water quality in reservoirs: Water quality in most reservoirs is quite good, with standard physical, metal, and bacteria levels. The level of coliform in Tri An reservoir and the level of Nitrogen in wastewater outlets of La Nga Surgar Factory are both higher than the permitted levels. At the Song Hinh hydropower station, samples collected from the upper section of reservoir B at 2,500 m and 700 m before flood gate, from the upper section of reservoir A at 2,800 m and 500 m before flood gate, from the water intake, from the upper section at 300 m before the Song Hinh flood gate, and from the middle of Song Hinh reservoir, all show high level of bacteria, as the result of increasing migration, cultivation and husbandry activities along the Kon River section from the hydropower plant to the management and operation office.
Surface water of rivers receiving wastewater discharges from thermal power plants, as data from provincial departments show, is mostly contaminated due to human activities from residential areas around the project sites. For example: surface water quality of Hau River and Tra Noc River (at the section near Can Tho thermal power station) is only at B level. Some water quality indicators are even above the limit of B level. On top of that, these rivers are still receiving on a daily basis large quantities of cooling water and water discharges from other activities from thermal power plants, which contain various pollutants. Wastewater discharges from power plants are contributing to the pollution of river water.
Managers of hydropower plants claim that the pollution of surface water in rivers and reservoirs is not from the operation of the hydropower plants but from agricultural and aqua-cultural activities, and eco-tourism projects by local authorities in the reservoir area, which do not only affect the water quality in the reservoir but also disturb the operation of the hydropower plants.
Wastewater quality: Wastewater from hydropower plants mostly comes from domestic activities. Test results of wastewater from hydropower plants after treatment show that wastewater is at level A before discharge.

111
Wastewater from thermal power plants comes from living, production, and other industrial activities. According to survey results, wastewater from thermal power plants is often treated to acceptable quality before discharge. However, test results of wastewater discharges from several thermal power plants prove otherwise:
- Ninh Binh thermal power plant: the level of mineral oil is above limit.
- Line 1 of the Pha Lai thermal power plant: test results of many years show that the wastewater discharges do not meet the standards for industrial wastewater. Some monitoring parameters are many times higher than the permitted levels, such as Coliform (1-3 times higher), COD, BOD and TSS (4-5 times higher), and mineral oil. The level of TSS at Line 2 is also higher than the permitted level, which contributes to affect the water quality of Kinh Thay River.
- Uong Bi thermal power plant: level of TSS and Coliform in wastewater is also higher than the permitted level.
Groundwater quality: Analyses of annual data show that most monitoring parameters are lower than limits, except for iron and Coliform.
c. Changes to Soil Quality
Vietnam’s economy relies on agriculture, mostly wet rice production. Other agricultural activities, forestry and aquaculture (including crop growing, husbandry, agricultural and forestry product processing) contribute to around 20.91% of the GDP and 22.12% of the NDP in 2009.
However, soil quality in Vietnam is deteriorating dramatically. According to data from the coordination office for the United Nations Convention to Combat Desertification (MARD), around 7,055,000 ha of land in Vietnam are affected by desertification, including 7,000,000 ha of heavily degraded and lateritized land, 400,000 ha of sand dune and moving sand bank in the central provinces, 120,000 ha of eroded land in the North West, Central Highlands and other places, 30,000 ha of saline and sulfated land in the Mekong Delta (Long Xuyen Quadrangle), and 300,000 ha of seasonal or permanent drought land in the South Central provinces of Binh Thuan, Ninh Thuan and south of Khanh Hoa13. This situation poses a threat to food security and livelihood of Vietnamese people.
2.2.2.4. Solid Waste and Toxic Waste
Vietnam generates 15 tonnes of solid waste on the average every year. The amount of solid waste in Hanoi is 730,000 tonnes per year, accounting for 5% of the total amount of solid waste of the country, which is a very big for a small area. It is predicted that the amount of solid waste generated in Hanoi will only increase. If appropriate and timely actions are not taken, this situation will have serious impacts on human health and the environment.
Solid waste is categorized into two types: normal solid waste and toxic solid waste.
Normal solid waste include: grass, trash and garbage, mops and gloves which do not contain toxic material, electricity cables, insulated ceramic conductors, glass insulators, metal, wood,
13 World Development Report 2010, Development and Climate Change, World Bank

112
stationery, papers, concrete, sand, soil etc.
Toxic waste include: filters, mops and gloves with oil stain, used batteries and lead accumulators, insulating oil, lubricating oil, heat transferring oil, hydraulic oil, neon light bulbs, fluorescent light bulbs and other materials that contain mercury, electronic and electrical devices, waste products from paint scraping, peeling or varnish, aluminum lead, used cartridges, used oil from machinery, metal cables that contain oil, break pads and other used parts from cars that contain oil, chemicals, carbonate, silica gel with oil content, etc.
Apart from that, solid waste from coal-fired thermal plants, such as coal ash and clay, is also increasing. This kind of solid waste raises concerns about the environment, especially because it requires large areas of land for storage. According to statistics from the recent years, the whole electricity sector has signed up for producing around 34,129 tonnes of normal waste per month, including coal ash and clay. The amount of this kind of waste according to the PDP VI forecast is presented below:
Year 2009 2011 2015 2020 2025 Coal ash and bi-products from SO2
treatment process (million tonnes) 2.61 3.57 7.19 11.74 14.13
The amount of solid waste is predicted to increase over the years, depending on the population growth, production types and consumption patterns, and industrial development, of which the later two are much influenced by the implementation of the PDP VI.
2.2.2.5. Natural Resources Efficiency and Conservation
Natural resources include fauna and flora resources, water and land resources, and mineral resources. Fauna and flora resources and water resources have been reviewed in the previous sections. This section particularly focuses on land resources and mineral resources, especially fossil fuels, as the main primary energy.
In the last decade, the energy supply system in Vietnam, including extraction, production and supply of primary energy such as coal, crude oil, gas and especially hydropower, has achieve some strong progress and contributed to the economic development and life improvement in the country.
The use of natural resources (coal, oil and gas, diesel, and hydropower) for electricity generation affects the extraction and availability of these resources. Below is a review of energy extraction and use: Coal production: Growth at 9.6% per annum on average during the period 1991-2000, and 16.7% per annum on average during the period 2001-2008. Total production in 1990 was 4.6 million tonnes, in 2000 was 11.6 tonnes, in 2005 was 34.1 tonnes and in 2008 was 39.8 tonnes (Source: Statistical Year Book of Vietnam National Coal and Mineral Industries Cooperation).
The table below presents information about coal consumption for electricity generation according to forecast in the PDP VI.
Coal Consumption 2009 2011 2015 2020 2025

113
North - Domestic – million tonnes 8.309 11.56 19.99 27.68 39.58 North - Imported - million tonnes 7.05 Central - Imported - million tonnes 5.17 South - Imported - million tonnes 0.382 0.35 3.98 11.46 24.54 Total 8.69 11.91 23.97 39.14 76.34
According to the development forecast in PDP VI, total coal demand for electricity generation is 11.9 million tonnes in 2010, 24 million tonnes in 2015, 39.1 million tonnes in 2020, and 76.4 tonnes in 2025. Imported coal is around 4 million tonnes in 2015, around 11.5 tonnes in 2020, and around 36.7 million tonnes in 2030. Primary energy shortage will be the case even without PDP VII. However, with the implementation of PDP VII, the issue of primary energy shortage will be much pressing.
Oil and gas extraction: Crude oil extraction was at 40,000 tonnes in 1986, 2.7 million tonnes in 1990, and 7.6 million tonnes in 1995. The rate of increase in crude oil extraction was at 23% for the period 1986-1995. In 2000, crude oil extraction topped at 16.3 tonnes. From then it started to decrease. In 2008, it was at 14.85 million tonnes. The rate of increase in crude oil extraction was 19.7% for the period 1990-2000 and -1.2 % for the period 2000-2008. All of the crude oil was for export. In 2008, 800,000 tonnes of crude oil were used for a pilot oil refinery project at the Dung Quat oil refinery14.
Natural gas has been used for electricity generation since the end of 1995, when the pipe system connecting Bach Ho oil field to Ba Ria power station was completed. Since 1999, gas has been supplied to Phu My power station and LPG factory in Dinh Co. Natural gas extraction was at 1.6 billion m3 in 2000. In 2008, it increased by 5 folds to 7.9 billion m3. Average rate of increase of natural gas extraction was at 22.4% per year for the period 2001-2008. The table below summaries natural gas extraction progress in the period 1995-2008:
Table 2.7. Natural gas extraction in the period 1995-2008
Unit: million m3
Year 1995 2000 2005 2006 2007 2008
Extracted 183 1580 6890 7520 6860 7944
Gas for electricity generation
182 1224 4460 4950 5050 5410
Source: Statistical Year Book 2009, Petro Vietnam
Hydropower: Hydropower plays an important role as one of the power sources in Vietnam. In the period 1990-2002, the proportion of electricity produced from hydropower in total electricity production changed every year, at the highest of 75% in 1994 and the lowest of 51% in 1998. In the recent years, there have not been so many new hydropower plants but many new thermal power plants with high capacity. Therefore, hydropower is decreasing in the power
14 Source: Statistical Year Book, Petro Vietnam.

114
sources balance, from 51.9% in 2000 to 32.8% in 2008 (Source: Institute of Energy).
Energy import/export: There is a strong increase in crude oil and coal export. Vietnam has grown from an energy importer to an energy exporting country in the region. In spite of that, Vietnam still has to import most oil products, which have mostly satisfied the country demand for economic development in the past. The table below shows the energy import/export in the period 1990-2008.
Table 2.8. Energy import/export in the period 1990-2008
Unit: 1,000 tonnes
Year 1990 1995 2000 2005 2006 2007 2008
Oil product import 2,888 5,004 8,748 9,636 11,894 13,651 13,665
Crude oil export 2,617 7,652 15,423 17,967 16,442 15,062 13,908
Coal export 789 2,821 3,251 17,987 29,308 31,948 19,699
Electricity import (GWh) 383 966 2,630 3,220
Source: Statistical Yeark Book 2009, Custom Bureau, EVN.
Primary energy consumption: Demand for primary energy is increasing, from 5.6% in the period 1990-2005 to 6.4% in the period 2006-2008. Demand for gas was the strongest increase at 20.5% per annum in the period 2000-2008. The table below shows the levels of consumption of various types of primary energy:
Table 2.9. Primary Energy Import/Export Unit: KTOE
The consumption of primary energy for electricity production and percentage against total primary energy consumption is shown in the table below.
Year 1990 1995 2000 2005 2006 2007 2008
Coal 2,212 3,314 4,372 8,341 9,030 9,681 12,017
Petrol and oil 2,860 4,617 7,917 12,336 12,022 14,149 14,058
Gas 7.7 186 1,441 4,908 5,360 5,653 6,408
Hydropower 2,063 3,237 4,314 3,835 4,619 5,213 5,881
Non-commercial 12,421 12,872 14,191 14,794 14,767 14,748 14,724
Electricity import 33 83 226 277
Total 19,564 24,225 32,236 44,247 45,881 49,670 53,364

115
Table 2.10. Consumption of Primary Energy for Electricity Production and Percentage Against Total Primary Energy Consumption
Unit: KTOE
Year 1990 1995 2000 2005 2006 2007 2008
Total
2,212.2
3,313.5
4,372.5
8,341.5
9,030.4
9,681.2
12,016.7
For E.P.
888
710
1150
2,990.7
3,468.0
3,591.7
3,727.9
C
oal
%
40.1
21.4
26.3
35.9
38.4
37.1
31.0
Total
2,859.6
4,616.6
7,916.9
12,336.3
12,022.2
14,148.9
14,057.8
For E.P.
381
369
1310
699.7
483.1
821.0
590.0
Pe
trol
&oi
l
%
13.3
8.0
16.5
5.7
4.0
5.8
4.2
Total
7.74
185.85
1,441.35
4,907.7
5,360.4
5,652.9
6,408.0
For E.P.
2.7
165
1,102
4,154.3
4,636.4
4,916.3
5,693.0
G
as
%
34.9
88.6
76.4
84.6
86.5
87.0
88.8
Source: EVN; Petro Vietnam. (E.P.: Electricity Production)
Analysis of national total primary energy consumption and primary energy consumption in the electricity sector according to the PDP VI shows a strong decrease in the availability of natural resources in Vietnam after the year 2015.
2.2.2.6. Climate Change
Climate change is caused by the increased level of CO2 and other greenhouse gases, mostly from gaseous emissions. Analyses of climate data of Vietnam show the following details of concern about climate change and rising sea level:
Temperature: In the past 50 years (1958-2007), average temperature in Vietnam increased from 0.5oC – 0.7oC. Temperature in winter increases faster than in summer and in the North than in the South. Annual average temperature of the four decades from 1961-2000 is higher than of the three decades before that (1931-1960).
Rainfall: Annual average rainfall in nine years from 1991-2000 varied in time and space. Annual rainfall decreases in the North and increases in the South. On the average, annual rainfall in 50 years (1958-2007) decreased by about 2%.
Cold air mass: The number of cold air mass affecting Vietnam is clearly decreasing in the last two decades (from the end of 20th century to the beginning of 21st century). In 1994 and in 2007 there were 15-16 cold air masses in the year, which is 56% of the annual average of many years. The most recent abnormal weather condition was the severely cold air mass for 38 days in January and February of 2008, which resulted in big loss in agricultural production.
Typhoon: Recently, there have been more intense typhoons, with the typhoon’s trajectory gradually moving southwards. The typhoon season finishes later and there are more typhoons

116
with abnormal trajectory.
The number of days with drizzling rain gradually reduced during 1981-1990 and halved in the last ten years (15 days per year).
Sea level: Monitoring data from oceanographic stations along the coast of Vietnam show that sea level was rising at 3 mm/year on the average in Vietnam from 1993-2008, which is equivalent to the world’s average. In the past 50 years, sea level has risen 20 cm as recorded at the Hon Dau oceanographic station.
Assessment and evaluation of the future trends of climate change
Changes in temperature
Winter temperature might rise faster than summer temperature in all climatic regions of Vietnam. Temperature in the Northern climatic regions might rise faster than temperature in the Southern climatic regions. Forecast of changes in temperature is based on the three emission scenarios as followed:
Low emission scenario: By the end of the 21st century, the annual average temperature in the Northern climatic regions might be from 1.6 to 1.9 oC higher than the annual average temperature in the period 1980-1999, whilst in the Southern climatic regions the increase might be less, from 1.1 to 1.4oC.
Table 2.11. Annual Average Temperature Increase (oC) Compared with the Period 1980-199915 - Low Emission Scenario
Timeline in the 21st century
Region 2020 2030 2040 2050 2060 2070 2080 2090 2100
North West 0.5 0.7 1.0 1.2 1.4 1.6 1.6 1.7 1.7 North East 0.5 0.7 1.0 1.2 1.4 1.5 1.6 1.7 1.7 Red River Delta 0.5 0.7 0.9 1.2 1.4 1.5 1.5 1.6 1.6 North Centre 0.6 0.8 1.1 1.4 1.6 1.7 1.8 1.9 1.9 South Centre 0.4 0.6 0.7 0.9 1.0 1.2 1.2 1.2 1.2 Central Highlands 0.3 0.5 0.6 0.8 0.9 1.0 1.0 1.1 1.1 South 0.4 0.6 0.8 1.0 1.1 1.3 1.3 1.4 1.4
Medium emission scenario: By the end of the 21st century, the annual average temperature might increase by 2.6oC in the North West, 2.5oC in the North East, 2.4oC in the Red River Delta, 2.8oC in the North Centre, 1.9oC in the South Centre, 1.6oC in the Central Highlands, and 2oC in the South compared with the annual average temperature in the period 1980 – 1999.
15 Climate change scenation report, MoNRE.

117
Table 2.12. Annual Average Temperature Increase (oC) Compared with the Period 1980-1999 – Medium Emission Scenario
Timeline in the 21st century
Region 2020 2030 2040 2050 2060 2070 2080 2090 2100
North West 0.5 0.7 1.0 1.3 1.6 1.9 2.1 2.4 2.6 North East 0.5 0.7 1.0 1.2 1.6 1.8 2.1 2.3 2.5 Red River Delta 0.5 0.7 0.9 1.2 1.5 1.8 2.0 2.2 2.4 North Centre 0.5 0.8 1.1 1.5 1.8 2.1 2.4 2.6 2.8 South Centre 0.4 0.5 0.7 0.9 1.2 1.4 1.6 1.8 1.9 Central Highlands 0.3 0.5 0.6 0.8 1.0 1.2 1.4 1.5 1.6 South 0.4 0.6 0.8 1.0 1.3 1.8 1.8 1.9 2.0
High emission scenario: By the end of the 21st century, annual average temperature in the Northern climatic regions might increase from 3.1 to 3.6oC compared with the period 1980 – 1999, with the regional increase of 3.3oC in the North West, 3.2oC in the North East, 3.1oC in the Red River Delta, and 3.6oC in the North Centre. Annual average temperature increase in the Southern climatic regions might be 2.4oC in the South Centre, 2.1oC in the Central Highlands, and 2.6oC in the South.
Table 2.13. Annual Average Temperature Increase (oC) Compared with the Period 1980-1999 – High Emission Scenario
Timeline in the 21st century
Region 2020 2030 2040 2050 2060 2070 2080 2090 2100
North West 0.5 0.8 1.0 1.3 1.7 2.0 2.4 2.8 3.3 North East 0.5 0.7 1.0 1.3 1.6 1.9 2.3 2.7 3.2 Red River Delta 0.5 0.7 1.0 1.3 1.6 1.9 2.3 2.6 3.1 North Centre 0.5 0.9 1.2 1.5 1.8 2.2 2.6 3.1 3.6 South Centre 0.4 0.5 0.8 1.0 1.2 1.5 1.8 2.1 2.4 Central Highlands 0.3 0.5 0.7 0.8 1.0 1.3 1.5 1.8 2.1 South 0.4 0.6 0.8 1.0 1.3 1.6 1.9 2.3 2.6
Changes in rainfall
Rainfall in dry season might decrease in most climatic regions in the country, especially in the Southern climatic regions. Rainfall in wet season and mean annual rainfall might in crease in all climatic regions.
Low emission scenario: By the end of the 21st century, mean annual rainfall might increase by 5% in the North West, North East, Red River Delta and North Centre, and from 1-2% in the South Centre, Central Highlands, and South compared with the annual average in the period 1980 – 1999. Rainfall in the period from March to May might decrease from 3-6% in the Northern climatic regions and rainfall in the middle of dry season in the Southern climatic regions might decrease by from 7-10% compared with the period 1980-1999. Rainfall during the peak months of the wet season might increase from 6-10% in all four climatic regions in the North and at

118
around 1% in the Central Highlands and the South compared with the period 1980-1999.
Table 2.14. Changes in Annual Rainfall (%) Compared with the Period 1980-1999 – Low Emission Scenario
Timeline in the 21st century
Region 2020 2030 2040 2050 2060 2070 2080 2090 2100
North West 1.4 2.1 3.0 3.6 4.1 4.4 4.6 4.8 4.8 North East 1.4 2.1 3.0 3.6 4.1 4.5 4.7 4.8 4.8 Red River Delta 1.6 2.3 3.2 3.9 4.5 4.8 5.1 5.2 5.2 North Centre 1.5 2.2 3.1 3.8 4.3 4.7 4.9 5.0 5.0 South Centre 0.7 1.0 1.3 1.6 1.8 2.0 2.1 2.2 2.2 Central Highlands 0.3 0.4 0.5 0.7 0.7 0.9 0.9 1.0 1.0 South 0.3 0.4 0.6 0.7 0.8 0.9 1.0 1.0 1.0
Medium emission scenario: By the end of the 21st century, mean annual rainfall might increase from 7-8% in the North West, North East, and Red River Delta, and from 2-3% in the South Centre, Central Highlands, and South compared with the period 1980-1999. Rainfall in the period from March to May might decrease from 4-7% in North West, North East, and Red River Delta, and around 10% in the North Centre. Rainfall in the middle of the dry season in the Southern climatic regions might decrease from 10-15% compared with the period 1980-1999. Rainfall in the peak months of the wet season might increase from 10-15% in all four climatic regions in the North and in the South Centre, and only increase by less than 1% in the Central Highlands and the South.
Table 2.15. Changes in Annual Rainfall (%) Compared with the Period 1980-1999 – Medium Emission Scenario
Timeline in the 21st century
Region 2020 2030 2040 2050 2060 2070 2080 2090 2100
North West 1.4 2.1 3.0 3.8 4.6 5.4 6.1 6.7 7.4 North East 1.4 2.1 3.0 3.8 4.7 5.4 6.1 6.8 7.3 Red River Delta 1.6 2.3 3.2 4.1 5.0 5.9 6.6 7.3 7.9 North Centre 1.5 2.2 3.1 4.0 4.9 5.7 6.4 7.1 7.7 South Centre 0.7 1.0 1.3 1.7 2.1 2.4 2.7 3.0 3.2 Central Highlands 0.3 0.4 0.5 0.7 0.9 1.0 1.2 1.3 1.4 South 0.3 0.4 0.6 0.8 1.0 1.1 1.2 1.4 1.5
Sea level rise
Calculations based on the low, medium, and high emission scenarios show that in the middle of the 21st century sea level might rise from 28 to 33 cm and by the end of the 21st century sea level might rise from 65 to 100 cm compared with the period 1980-1999 (Table 2.16).

119
Table 2.16. Sea Level Rise (cm) Compared with the Period 1980-1999
Timeline in the 21st century
Region 2020 2030 2040 2050 2060 2070 2080 2090 2100
Low 11 17 23 28 35 42 50 57 65 Medium 12 17 23 30 37 46 54 64 75 High 12 17 24 33 44 57 71 86 100
Figure 2.16. Forecast of Sea Level Rise (cm) According to the 3 Climate Change Scenarios
The future trends of climate change as described above show that there will be challenges to socio-economic development in the near future, especially in areas that are prone to drought in dry season. Priorities will need to go to multi-purpose reservoir management as a solution.
2.2.2.7. Energy Security
In the past 10 years, energy security and environmental conflicts have become issues of concern of many countries, including Vietnam. These issues are viewed as an inevitable trend as the result of the scarcity of the traditional primary energy whilst new energy is still expensive. Energy price is increasing along with the rise of human’s demand for energy. Science and technology is developing day by day however it is still not catching up with human’s demand.
As analyses in the section 2.2.2.5 show, by the year 2015 energy security still might not be a pressing issue in Vietnam. Vietnam will only be starting to join the international energy market by that time so its reliance on this market is still not significant. However, this reliance will increase accordingly with the energy demand increase as in the forecast.
2.2.2.8. Environmental Conflicts, Risks and Accidents
Environmental conflict is increasing in the same track as energy security. Environmental conflict could be over resources amongst different communities in one society, or amongst countries. It could also be between preservation and development, which are represented by different groups in a society. The roots of environmental conflict are the unequal distribution of natural resources, regional economic development gaps, the link between economic development and environmental pollution, and between population growth and natural resources encroachment.

120
Environmental conflict can be of different levels. The breeding phase starts with differences in purposes and incompatibilities in actions. If this situation persists, there might be conflicts or disagreements over the management of resources and benefit sharing. If these conflicts are not resolved, they will develop to a higher and more aggressive level, which might lead to actions such as meetings, demonstrations, petitions, or more seriously armed conflicts, which pose threats to social and political stability. Examples are the conflict over water resources in the Mekong River Basin, or the case of wastewater discharges of Vedan factory. Another example is the conflict over water resources in Vu Gia River, which is still an on-going issue. According the SEA of Vu Gia-Thu Bon hydropower development project, if the Dak Mi 4 hydropower project takes water from Thu Bon River without discharging water to Vu Gia River, as proposed by the Da Nang authority, more than 1.7 million people in the lower Vu Gia River Bain will suffer from water shortage for around 9 months in a year and more than 20,000 ha of production land will be at risk of desertification.
Environmental risk and accident can either be as the result of natural disaster, climate change, broken dam, or aftershock in reservoir, etc., or it can be human-induced.
The followings are some examples of human-induced environmental risks and accidents:
Erosion and sedimentation: During the typhoon number 9 in Quang Nam Province, a flash flood swept through Dai My commune, where 240 households resided on the side of Con River. The flood water brought with it wood logs and mud from upstream, destroyed houses, and covered gardens and crops in 2 meters of mud. A series of hydropower projects were under development upstream of Con River at the time, including the An Diem 1, An Diem 2, and Song Con 2, etc.
According to the International Centre for Environment Management (ICEM), sedimentation of rivers in Quang Nam is currently at an alarming state. As recorded at the Thanh My monitoring station in Nam Giang, Vu Gia River receives 460,000 tonnes of sand and soil run-off every year. ICEM has warned that at this speed of sedimentation in the area, the old town of Hoi An will become the target of many big floods.
Downstream desiccation: Also according to ICEM, reservoir filling of the Song Bung 4 hydropower project (490 million m3) will lead to downstream desiccation and water shortage for production. On top of that, the construction of too many dams in upstream river will result in the risk of salt intrusion in estuaries and loss of nutrition for the East Sea.
Downstream flooding: The design of some hydropower dams incorporates flood control feature. However, during operation, although water discharges are done accordingly with regulations by MoIT, untimely releases of floodwater are unavoidable and causing severe loss of life and assets in lower river basins. It is not a problem if water is released when downstream water level is low. However, releasing water when downstream water level is at about flood level 3 will result in serious consequences.
On the other hand, many hydropower dams in Vietnam still do not always follow government regulations when it comes to releasing water from dams. Water is often released without notification and coordination with relevant parties, which results in many risks, especially in the case of cascade hydropower projects development, as regarded in the “Recommendations of the

121
World Commission on Dams for Hydropower Development in Dong Nai River Basin”.
Lessons about flood control were evident in the typhoon 9 and 10 in 2009 when floodwater releases from Ba Ha, Binh Dien and A Vuong hydropower plants resulted in a historical flash flood that caused severe damages to life and assets. More details are presented below:
Floodwater releases of A Vuong hydropower plant on the two days of September 29 and 30 contributed to the flooding of a large area in the lower river basin, which resulted in serious damages. Losses caused by typhoon number 9 in Quang Nam province was estimated at 3,500 billion VND, of which the cost of damages to Dai Loc district, which was directly affected by the floodwater releases from A Vuong, was estimated at over 600 billion VND.
The Binh Dien hydropower plant (by Binh Dien Joint Stock Company in Thua Thien - Hue) opened all its five flood gates all year round to the Huong River (Perfume River), causing serious impacts in the lower river basin.
The Ba Ha reservoir, located in Ba River Basin, was designed to control flood and protect the Tuy Hoa township and important residential and economic areas in the lower river basin. However, the flood control capacity, which was at 256.5 million m3 in the planning phase, was reduced to 167.3 million m3 in the feasibility study phase and was reduced even more in the technical design, which included a method that was supposed to reduce floodwater level to 2.5 m lower than the normal rising water level. This project therefore is not performing its flood control function as planned.
Decisions to release flood water at the wrong times and technical solutions that disregard environmental impacts and risks are the main contributing factors to flooding in lower river basins. The main problems are the focus on power generation capacity and safety of the structures and lack of attention to the flooding issue in lower river basins.
2.2.2.9. Current State and Future Trends of Socio-economic Development
The development of power in any place, any country, has implications for a wide range of social and environmental issues. Of course, not all of these are relevant in all places and some will be far more important than others. This section discusses the range of issues that need to be considered in the assessment of social and environmental risks and impacts as part of a strategic planning process for the power sector in the later chapter.
Vietnam is located in South East Asia, and running north-to-south with a coastline of 3,260 km. The widest point from East to West of the country is 600 km in the North, and the narrowest point is about 50 km in the Centre.
Based on natural and social conditions, and traditional economic relations, Vietnam can be divided into 6 ecological regions, with the land area of each ecological regions detailed in the table below.

122
Table 2.17. Land Area in the Six Ecological Regions of Vietnam
Land area distribution across sectors (%)
No.
Region
Natural
land area (km2)
Agri-culture
Fores-try
Special Use
Residen-tial
Total
1 Red River Delta
21,063
37.7
21.9
13.8
6.3
100
2 Northern middle and mountainous region
95,337
15.0
54.8
2.9
1.1
100
3 North Centre and South Central Coast
95,886
18.4
53.8
4.8
1.8
100
4 Central Highlands 54,641 30.5 56.4 2.9 0.6 100
5 South East 23,605 59.0 21.6 8.6 2.7 100
6 Mekong Delta
40,519
63.0
8.2
6.0
2.8
100 Nation-wide 33,1051 29.0 44.6 4.9 1.9 100
Source: Statistical Year Book 2009
Land area for different purposes varies from one ecological region to another. The Red River Delta region has a natural land area of 21,063 km2, of which 38% is used for agricultural production. This region has a higher population density than all the other regions with around 932 people/km2
whilst the national density is 260 people/km2.
In the South, 63% of the land area in the Mekong River Delta is used for agricultural production, and 56.4% of the Central Highlands is forest area. In general, about 73.6% of the total land area of the country is used in agriculture and forestry.
a. Population and Employment
According to the preliminary results of the population and housing survey in 2009, the total population of Vietnam is 85.789 million people. Population growth during the period 1999-2009 was at 1.2%. More than 70% of the Vietnamese population live in the delta and middle land, mostly the Mekong Delta, Red River Delta and along the coast. Although the population growth rate slowed down, Viet Nam’s population is still growing with about 1 million more persons per year. Population growth rates vary considerably between regions. High growth rates are found in the Central Highlands and the South East. The lowest population growth rates occur in the North and South Centre, and the Mekong Delta.
Vietnam has 54 different ethnic groups, of which the majority are Kinh people, accounting for 86.2% of the total population. There are 12 million people of different minority groups, accounting for nearly 14% of the total population. Ethnic groups such as the Tay, Thai, Muong, Khmer, Hoa,
123
Nung, H’mong, Dao, Ede, Gia rai, Cham, and Sai Gui live in mountainous and remote areas in the North (Hoa Binh, Thanh Hoa, Lang Son, Cao Bang, Son La and Lai Chau), the Central Highlands (along the Truong Son mountain and the central coast), and the Mekong Delta. The smallest ethnic groups are the Brau, O Du and Ro Mam, with a total population of around 650 people. There are about 322 Brau and O Du people living in Bo Y commune, Ngoc Hoi district in Kon Tum province. About 350 Ro Mam people live in Sa Thay, Kon Tum province in the Central Highlands. Ethnic minority people live in mountainous areas, which accounts for ¾ of the natural land area of the country. They experience less development and their life are much dependent on the nature.
By April 1, 2009, total urban population was 25.4 million, accounting for 29.6% of the total population, and rural population was 60.4 million, accounting for 70.4% of the total population. In the period 1999-2009, annual population growth in urban area was at 3.4% whilst growth was at only 0.4% in rural area. Most of the urban population concentrates in the South East and the Red River Delta.
In 2009, there were 42.5 million males, accounting for 49.5% of the population, and 43.3 million females, accounting for 50.5% of the population. The male to female ratio was 98.1 males for every 100 females.
Also according to the 2009 population and housing survey, 55 million Vietnamese people are in working age, of which 45.2 million people are in the labor force, accounting for 82.2% of the total population in the labor age. 43.9 million people in working age are employed, accounting for 51.1% of the total population, of which 12 million people are working in urban areas, accounting for 27% of the total people in working age who are employed, and 31.9 million people are working in rural areas, accounting for 73%. 56.7% of the people in labor age finish at least secondary school, 27.8% of which hold a high school diploma or higher. 5.3% of the people in labor age are university graduates, of which 14.4% are in urban areas and 1.8% are in rural areas, and 5.6% are male and 5% are female. At the time of the survey, 1.3 million people in working age were unemployed. Unemployment rate at the time was 2.9% (higher than the 2.38% in 2008). Unemployment rate in urban areas was 4.64%, which is similar to the 2008 rate. Unemployment rate in rural areas was 2.25%, which was higher than the 1.53% in 2008). Education level amongst ethnic minority people is very low, despite the government’s supporting policies to improve the situation.
In the period 2004-2009, domestic migration involved 2.2 million people more than the period 1994-1999, with a significant increase in long distance migration. While the number of people migrate within a district was 275,000, the number of people migrate within a province is 571,000, and the number of people migrate from one province to another is 1.4 million. Regional migration also increased by 1 million. In 2009, out of the 6 geographic-economic regions, only the Central Highlands and the South East received more migrants coming from the other 4 regions. In the South East, Ho Chi Minh City and Binh Duong continued to be leading economic areas, and attracting a large number of migrants. In the North, Hanoi is also a destination for migrants.
b. State of Economy of Vietnam Economic growth in the period 2006-2009

124
Economic growth in the period 2006-2009 was considerably high with an average annual GDP of 7.07%, which is much higher than the GDP growth of 4.45% in the period 1986-1990, when Vietnam started the renovation process, and also higher than the 6.95% GDP growth in the period 1996-2000, but lower than the 7.51% annual GDP growth in the period 2001-2005. Development in the industry and construction sector achieved the highest growth of 8% per annum, followed by 7.78% in the service sector and 3.48% in agriculture and fishery.
Growth has been experienced in all economic sectors, usually associated with economic restructuring and product quality improvement.
!"#$%"#$ "&'$()"$*+)$,- &($.') &$/ %$ $$
0) &$1 &($/ &($ $ 233$
$
$
$
$
$
$
$
$
$
!"# $%&!'($&"')*&+, $"&-(&.//0&12&3 &4 &,5 6,&7 #&+ &
89$,&.:;<:&= 6& &+ $"&+> $"&?@A&1'4&$/ )$, &($,- &($% 5$& &$6)&'$, $,-#&($&' &($& 7$895$: &$%;&$7 ,$< $: &$ $% &$ %$=>7$=?,@$
A &($,- &($&'4&$%'9&($%' 5$,' %$< $: &($%' %$%'#$,' B$%"%$%'C&'$<"%'$%' 5$,' %$< $D'",$'9B$%$< %$7 &'$, &($' D$% 5$,#E&$& &$6)&'$, $ $, &($,- &($&'5&'$' &F$%' ,$/ &($, &($,- &(F$
') 9$89 $:E$< %$% &'$,-5&'$% 5$& &$6)&'$, $%;&$,' DF$%' 7$ %$% )$,') &G$ H&($(HD$:E#$, &($,- &($%' $B 9$: &$/E$B 9$, $: &$: ,$%' ,F$()5)$ # &$3II2J3IIKF$7 %$ H&($(HD$% 5$,E)$< &$: ,$%' ,$:E#$, &($,- &($6)&'$, $/E$LMFKNG$.' ,$/ &($, &($,- &($,' D$,' $') &$ $O$7 ,$6)&'$, F$=P$' )$:E$7+)$ ,- &(@$ < %$% &'$ ,-5&'$% 5$< &$D' 7$:E$% 5$& &$6)&'$ , $%;&$' &$%' $:E$B 9$6?7F$& &($<9 ,$/5#$ &($,' DQ$,) &$R $: $=P$' )$%' 5$, &($= &($: )$, &($,- &($6)&'$, Q$,4&'$,- &($+$&') 7$& &($& $:E$,E)$&(9BS&$,')S&$&')S&$R $,E&$D'"F$%' 5$%H$%"%$() )$D'"D$6' %$D' %$' 9$') 9G$
T9B$7+$& &$6)&'$, $&' $:E$&(9B$% $, ,$' 9$/ &G$1 7$3IIUF$VWX$ ,$6'# &($YUFM$, $Z[W$:E$R4&'$89\&$ 9$&( )$ ,$6'# &($2GIL3$Z[WF$- ,$,' D$<#$: )$%"%$& %$D'",$,-) &$,-#&($6'9$: %G$]'# &($%"%'$() 5$0) ,$157$: )$%"%$& %$,9B$%H$-^,$&( &F$&' &($&(9B$% $, ,$' 9$: $6)&'$, $: &$%;&$/ &G$$
A &($,- &($%H$ %$,-#&($&' &($& 7$895$D' $,'9 %$- ,$/ &$:E#$&(9 &$: &$ 9$, $& %$&(#E)$,-#&($ ) 9$6) &$& %$ ,5$ 5&($ ,') 9$: &G$_ 9$ , $: $6'#5$' %$:E$%+&($&(' $ H&($(HD$:E#$ , &($,- &($,9B$%H$, &($/S&F$&' &($: &$%') 7$, $,- &($&' G$A-#&($6')$ HF$/5#$ &($') &$: &$, 7$,' )$
%$%#)$/E$/ )$,' $,'4$:) %$6'5)$,'"%$/ )$,' $ H$%' 5$ %$%#)$,- &($ ^&($7 %F$6 $% $%+&($,"%$ E#$, #$:E$< $` &(F$&' ,$/E$/5#$ &($6'9$: %$&+&($,'+&G$
?@A&B9$,&C#D$& #&$" '&
0 )$, %$ $, &($,- &($6)&'$, $6'"$%5#$:E$%'C&'$<"%'$D'\&$D' )$,'9$&' D$' D$/aF$ )$< &($ )$R $D' &$`\&$% $,-#&($&' &($& 7$895$ P$%H$&' &($R %$% )$,') &$ "&($6 G$A'9$&' D$R4&'$89\&$ 9$&( )$% 5$`\&$% $ P$, &($&'5&'$, $KOI$Z[W$& 7$3IIM$/S&$YbO$Z[W$& 7$3IIKF$2Ib3$Z[W$& 7$3IIY$:E$2IL3$Z[W$& 7$3IIUG$
! "# #$ %&#'()
Figure 2.17. GDP Growth
A review of economic growth in the last few years reveals many issues, as discussed below:
Economic growth has not been stable, which indicates that the existing governing policies have not successfully enabled the integrated strength of the economy to boost its growth, efficiency and competitiveness. Main contribution to growth is still physical capital, as in the period 2001-2007, physical capital contributes 56.7% to economic growth. The low growth quality is shown in the economy, society and environment: the competitiveness of Vietnamese products and the economy is limited; social progress is not at the same pace as economic growth; heavy pollution and over-exploitation of natural resources are still on-going issues without effective remedies.
Vietnam’s economy is rather small. It is also facing the risk of falling backwards. In 2009, national GDP was at around 89.6 billion USD and the average income per capita was at 1,052 USD, which is much lower compared with other developed countries in the region. Although it is catching up with other countries, Vietnam is still facing the risk of having its economy falling backwards.
The growth that Vietnam achieved in the last few years is largely dependent on foreign investment when investment from domestic sources is still lacking. Advancement in science and technology only contributed a small part to the growth. Vietnam has the advantage of having a large labor force. However, this advantage is not adequately taken advantage of, as the labor force in Vietnam is neither trained nor used appropriately, especially in the rural area.

125
GDP per capita
Thanks to a considerably high economic growth and rational income distribution policies, the life of the majority of the Vietnamese population has been improved. Average income per capita has increased rapidly from 730 USD in 2006 to 843 USD in 2007, 1,042 USD in 2008 and 1,052 USD in 2009. In terms of poverty and hunger eradication, according to the new standard of the Vietnamese government (a household is classified as poor household if the average monthly income per person is less than 260,000 VND in urban area, and less than 200,000 VND in rural area), the number of poor household has decreased rapidly from 15.5% of the total households in 2006 to 14.8% in 2007 and 13.4% in 2008. The number of poor household, according to the standard jointly developed by GOS and the World Bank (a household is classified as poor household if the average monthly income per person of less than 213,000 VND in 2006, and less than 280,000 VND in 2008), has decreased from 19.5% in 2004, to 16% in 2006, and 14.5% in 2008. This means from 2006 to 2008, the number of poor household has decreased by 2.5%. This figure means a lot more considering that the standard for poor household has been modified according to international standard.
Vietnam has 54 ethnic groups, of which the Kinh majority constitutes more than 86% of the total population. The population of the other 53 ethnic minority groups scatters in ¾ of the land area of the country, mostly in mountainous and remote areas. These are also areas with high potential for hydropower development and the development of other industrial projects. Therefore, there is a large number of ethnic minority people who are effected by development projects. From the 1960s, the Government of Vietnam as initiated the “fixed cultivation and habitation” program to help ethnic minority people to move away from shifting cultivation, which is considered the cause of poverty and deforestation. Of course many people are still against this policy because according to them, shifting cultivation is the traditional lifestyle of many ethnic groups and is sustainable and suitable to their situation.
Economic restructuring
In 2009, the contribution of agriculture, forestry and fishery to GDP decreased to 20,91%, whilst the industry and construction contributed 40.24% of the GDP, and service sector accounted for 38.85%.
Table 2.18. Restructuring of the Economic Sectors and the Labor Force (%)
No. Sector 2001 2005 2006 2007 2008 Est. 2009 All economic sectors 100.00 100.00 100.00 100.00 100.00 100.00
1 Agriculture, forestry and fishery
23.04 20.97 20.40 20.30 22.21 20.91
2 Industry and construction 38.23 41.02 41.54 41.58 39.84 40.24
3 Service 38.73 38.01 38.06 38.12 37.95 38.85
Source: Socio-economic Statistics 2001-2009, GOS The industry sector has made significant progress towards industrialization and modernization. Manufacturing has shifted towards a focus on the processing industry, which brings more

126
economic value. The processing industry itself has taken advantage of locally available raw materials to improve the value of export products.
Positive development has been seen in the service sector. Traditional services such as trade, transport, postal and telecommunication, and hospitality have been well developed. Some services that require low intermediary cost such as banking and insurance has developed rapidly, which brought more value to the service sector.
Overall, economic restructuring has been slow in the last 10 years in terms of meeting the requirements for sustainable development. Economic restructuring mainly focused on increasing the contribution of the industry and the service sector to GDP, whilst not much attention was paid to economic restructuring towards modernization, which involves strong development in technology in all sectors. Many industrial establishments still use out-of-date technologies, which are often associated with high cost, high safety requirements and low economic value.
There has not been any obvious improvement in the restructuring of agriculture and rural economy. The economic focal regions have not developed to their full potential, with little investment in high technology and moving towards modernization.
The restructuring of the labor force is neither spontaneous nor responsive, and not meeting the requirements of industrialization and modernization. There is still a high proportion of the labor force working in agriculture. There number of unskilled workers is abundant whilst what the economy needs more is trained workers who can handle high technologies. This is an urgent matter that needs to be addressed through proper planning.
c. Future Trends of Socio-economic Development in Vietnam
In the forecast scenario of socio-economic development, growth in the industry, construction and service sector is not much higher than the high growth scenario but still rather high. This growth rate reflects Vietnam’s ambition to join the list of developing countries with medium high income per person level, which is around 3,000 USD per person per year. The world’s economy and the Vietnam’s economy are on the road of early recovery after the financial crisis.
In agriculture, a stable growth is maintained with an appropriate, medium level of restructuring. The contribution of agriculture in the economy is expected to decrease to 17.2% in 2020, while the industry and service sectors each would contribute from 41-42%. By 2030, agriculture is expected to account for around 5.7-5.8%, industry and construction sector for around 41.64%, and service sector for 52.6%, of the economy.
In this scenario, the labor force is planned and used appropriately. Higher productivity of the labor force would be achieved through engaging more labor from rural area in the industry and service sectors, especially the service sector.
In general, the economy from 2009 to 2020 will experience rapid growth in the industry sector (unless Vietnam’s integration into the world’s economy is unsuccessful and results in significant economic turbulences, or economic recovery is slow after the financial crisis). Emerging from a period of low growth (2008, 2009 and the first half of 2010), Vietnam’s economy could achieve rapid growth during the period 2020-2025 before starting to stabilize.

127
The above indicators about socio-economic development are used as basis for comparison, analysis, and assessment of socio-economic development when PDP VII is implemented.
2.2.2.10. Livelihood
Livelihood is assessed through changes in the economic sectors in Vietnam, as discussed below:
Agriculture, forestry, and fishery
Total production value of agriculture, forestry and fishery was 219.9 thousand billion VND in 2009, a 3% increase compared with 2008, of which agricultural production value was 160.1 thousand billion VND (2.2% increase), forestry production value was 7 thousand billion VND (3.8% increase), and fishery production value was 52.8 thousand million VND (5.4% increase).
- Agriculture: The 2008 rice production was 38.7 million tonnes, which is 2.8 million tonnes more than the 2007 production, which was the highest production in 12 years. In 2009, although Vietnam was heavily affected by typhoons and floods, especially in the Central Highlands and the South Central Coast, rice production was still at 38.9 million tonnes, which is 165.7 thousand tonnes more than in 2008. This high production was the result of a 47.6 thousand ha increase in rice cultivation area, and a 30kg/ha increase in productivity. If taking account of the 4.4 million tonnes of corn produced in the same year, the total amount of food production in 2009 was 43.3 million tonnes, which is 24.4 thousand tonnes more than in 2008 (the corn production was 141.3 thousand tonnes less than in 2008).
Perennial crops were doing well thanks to a price increase and the fact that some localities had planted high yielding and high value varieties a few years before. Income from perennial crops was higher than from other crops, which motivated local businesses and people to further expand perennial crop area. According to a survey on animal husbandry that was done before July 1, 2009, the number of husbandry farms increased by 18.5% compared with the same time in 2008.
- Forestry: Total area of forest plantation in 2009 was estimated at 212,000 ha, which is a 5.9% increase from 2008. Some provinces had large area of new forest such as Ha Giang (17,000 ha), Tuyen Quang (14,900 ha), Yen Bai (13,900 ha), Thanh Hoa (12,000 ha), Nghe An (9,500 ha), and Quang Ngai (8,700 ha). Total area of forest regeneration in 2009 was estimated at 1,032,000 ha, which is a 5.2% increase from the previous year. Timber extraction was at 3,766,700 m3, which is a 5.7% increase from the year before. Provinces with high timber extraction volume are Tuyen Quang (218,000 m3), Yen Bai (200,000 m3), Quang Nghai (180,000 m3), Quang Nam (169,000 m3), Binh Dinh (167,000 m3), and Hoa Binh (135,000 m3).
Positive progress in forestation, forest protection and timber extraction is the result of better investment. Apart from investment from projects and programs (only the “5 million ha of forest” project in 2009 provided 1,180 billion VND, a 43.9% increase from 2008), many localities also motivated investment from households by handling forest management responsibility to them, which means more profit for people who engage in forest regeneration.
- Fishery: Total catch volume in 2009 was estimated at 4,847,600 tonnes, a 5.3% increase compared with 2008, of which catch of fish was 3,654,100 tonnes (5.3% increase), catch of shrimp was 537,700 tonnes (7.2% increase).

128
Total production in shrimp farming in 2009 was estimated at 2,569,900 tonnes, which is a 4.2% increase compared with the previous year. This high production was the result of continuous efforts in expanding shrimp farming area. Fishermen also receive government support to build or buy new high capacity boats, which help them to improve offshore fishery productivity. Apart from that, fishery services are also improved, enabling increases in number of fishing boats and length of fishing trips.
Manufacturing
The manufacturing sector was heavily affected when the export market was reduced. Manufacturing value in January 2009 was 0.2% lower than the same time in 2008 (assessment using the 1994 comparative prices). In the consequent months, growth rate was positive but increasing slowly (only at 4.8% for the first half of the year). After efforts were made to overcome challenges, growth rate was recovered at around 10% in the last few months of the year. Total value of the manufacturing sector in 2009 was estimated at 696,600 billion VND, a 7.6% increase compared with 2008. The public sector achieved 3.7% growth rate, the private sector 9.9%; foreign invested business sector 8,1%, oil and gas 9.2%, and all the others 8%.
High growth rate was seen in cities with large scale manufacturing sector such as Quang Ninh (15.8%), Thanh Hoa (13.9%), Dong Nai (10.6%), Binh Duong (10.3%), Khanh Hoa (10%), Hanoi (9.4%), Can Tho (9.1%), Da Nang (9.1%), Ho Chi Minh City (7.9%), and Hai Phong (7.7%). Some provinces experienced low growth rate such as Hai Duong (6.2%), Phu Tho (5.3%), Vinh Phuc (5%), and Ba Ria-Vung Tau (3.1%).
Service and tourism
When domestic production recovered and product prices and services stabilized, many enterprises actively explored the domestic market. As the result, sales of retail goods and services were boosted to a total value of 1,197,500 billion VND in 2009, an increase of 18.6% compared with 2008, or 11% if not considering the price factor.
In the total value of retail goods and services in 2009, one-person businesses accounted for 663,200 billion VND (20.3% increase), private sector accounted for 374,900 billion VND (22.9% increase), public sector accounted for 116,300 billion VND (1.4% increase), foreign invested businesses accounted for 31,300 billion VND (9.5% increase), and collective businesses accounted for 11,800 billion VND (18.8% increase). Divided by business type, trading contributed 939,600 billion VND (18.6% increase), hospitality contributed 135,000 billion VND (20.3% increase), and tourism contributed 11,300 billion VND (1.9% increase).
Due to the economic downturn, only 3.8 million foreign tourists came to Vietnam in 2009, which is 10.9% less than the previous year.
Transportation
Passenger transport in 2009 increased by 8.2%, which is an increase of 6.2% compared with 2008. Land transport engaged 1,798.8 million passengers (8.6% increase), or 62.6 billion passengers-kilometers (9.3% increase). Water transport engaged 162.5 million passengers (4.5% increase), or 3.3 billion passengers-kilometers (4.6% increase). Railway transport engaged 11 million

129
passengers (2.6% decrease), or 4.1 billion passengers-kilometers (7.9% decrease). Airway transport engaged 11 million passengers (4.2% increase), or 16.5 passengers-kilometers (1.6% decrease).
Good transportation in 2009 was estimated at 640.3 million tonnes (4.1% increase), or 184.5 billion tonnes-kilometers (8.6% increase), of which inbound good transportation accounted for 612.8 million tonnes (5.6% increase), and 63.9 billion tonnes-kilometers (5.3% increase), and outbound good transportation accounted for 27.5 million tonnes (2.5% decrease), or 120.5 billion tonnes-kilometers (9.6% increase). Good transportation by road was estimated at 470 million tonnes (5.2% increase), or 23.3 billion tonnes-kilometers (8.2% increase compared with 2008). Good transportation by river was estimated at 117.1 million tonnes (2.3% increase), or 18.7 billion tonnes-kilometers (2% increase). Good transportation by sea was estimated at 45 million tonnes (1% decrease), or 138.3 billion tonnes-kilometers (10% increase). Good transportation by railway was estimated at 8.1 million tonnes (4.9% decrease), or 3.8 billion tonnes-kilometers (8.8% decrease).
Income and living standards
To achieve the goal of social security and welfare, the Government has focused on directing agencies across various sectors at different levels to implement hunger and poverty eradication programs such as the 134 Program, 135 Program, 30a Program, and many other national programs targeting ethnic minority people and communes with “special difficulty”. Other on-going efforts include issuance of free health care cards, reduction of medical care fee, and other activities to support policy families and poor people. These programs and efforts have achieved good results in improving people’s lives, especially for poor people and people living in remote areas.
Although the floods in 2009 caused serious damages in the Central Highlands and the South Central Coast, the pre-harvest hunger situation was significantly reduced. According to reports from localities, there were 676,500 households (2,973,300 people) in hunger in 2009, which is a decrease of 29.4% of households and 26.2% of people compared with the previous year. A large proportion of households (people) in hunger mostly concentrated in the Northern mountainous region and the middle land, Central Highlands, North Centre, and Central Coast.
The life of salaried employees was much improved by an increase of 20% of base salary. Retirement pension also increased by 5%. Average monthly income of a civil servant in 2009 was at 3,084,800 VND, which is a 14.2% increase compared with 2008. Average monthly income of a civil servant working at central government level is 3,979,100 VND (16.1% increase), whilst a civil servant working at local government level gets an average monthly income of 2,532,999 VND (13% increase).
Thanks to the right policies, as discussed above, agricultural productivity has improved. Food prices have increased, which means more profit for farmers. Local enterprises were able to sustain and develop their business. Life quality has improved, especially for people with low income or rely on a salary. National poverty rate in 2009 was estimated at 12.3%, which is lower than the 2007 poverty rate of 14.8%, and the 2008 rate of 13.4%.

130
There are still unsolved issues related to resettlement. It is generally considered that resettlement should at least not worsen the situation of the displaced people. In fact, the intention of resettlement and compensation plans is to improve the living standard of the displaced people. Up to now, resettlement in Viet Nam has been aiming at stabilizing people’s livelihoods in the short term, with the hope that this would lead to subsequent development. The Ethnic Minority Development Plan has been implemented to preserve cultural identity of ethnic groups, with activities such as taking care of people’s wishes regarding handling graves and reconstructing community traditional house. In terms of livelihood development, displaced people also receive financial support to improve traditional crafts such as weaving and embroidering. Some hydropower development projects have been successful in resettlement. One example is the Ban Ve hydropower project, which displaced 2,103 households. These households have by now stabilized and some good development has been seen in the community. However, experiences show (Hoa Binh, Yali, Song Hinh) that in the long term, displaced people’s living standard has not been improved. Rather, in many cases, the living standard has deteriorated, in particular when it comes to access to land of good quality and to the cultural and psychological dimensions of daily life such as opportunities to preserve and develop local traditions and habits and to take part in decision- making related to the displaced people’s situation.
Resettlement issues of some hydropower development projects have become quite pressing as they have significant impacts on people’s livelihoods.
Resettlement and unsettled issues
According to preliminary statistical collection, there are about 800 small and medium hydropower development projects in Vietnam, of which 335 projects are located in the central provinces. Hydropower plants contribute a large quantity of electricity for socio-economic development needs. However, the resettlement component of these hydropower development projects is not always done correctly, resulting negative environmental impacts.
For example, displaced people from reservoir area of the Ba Ha hydropower project in Phu Yen did not have enough land in the new location. They had no choice but to rely on forest products from the Krong Trai protected forest (Son Hoa, Phu Yen) and that is why this forest is severely damaged. Only in 2008, there were 33 incidents of violation in Krong Trai forest in Suoi Trai commune, resulting in 136 ha of forest loss.
Another example is the resettlement story of the A Vuong hydropower project in Dong Giang and Nam Giang district of Quang Nam province. As the project investor did not fulfill their commitments regarding compensation and resettlement, 357 displaced households (around 2,000 people) living in resettlement areas in Màcooih commune in Dong Giang and in Dang commune in Tay Giang have been living in poverty for the last 5 years. A displaced person living in Màcooih commune said: “We were given mainly rocky land for compensation, which is not possible to grow crop. We have to deal with hunger but our biggest concern is landslide whenever it rains heavily”.
To move people out of the site of A Vuong hydropower project, the Project Management Unit 3 built three resettlement areas in Pache-Palanh and Kurt-Chrun in MàCooih commune, Dong Giang district, and in Alua in Tay Giang district. This was the starting point of a series of troubles and
131
challenges for displaced people.
Houses in these resettlement areas were designed to look like stilt house but built with bricks. The main living quarter is around 42 m2, and supporting structures include a kitchen and a bathroom. When a few people were brought to see their future homes, most of them were not happy. The reason being all of the houses look the same and were built close to one another like in urban area. This is something completely different to the way Cotu people live and work. Land for cultivation is also too far away from where they live. Another problem was that the construction works in the resettlement areas, such as sewages and reinforcing walls, were done shortly after the site preparation, without taking in consideration the fact that the site foundation had not yet stabilized. The consequences were serious erosion and landslide. Many houses were damaged or completely destroyed. Many families became homeless – they either left and moved to the forest, or constructed temporary cottages for themselves somewhere else.
People often think about their old villages with fertile rice paddies, which are now submerged in the reservoir, with sadness and regrets over their decision to give up their land to the A Vuong hydropower project. Their biggest challenge now is having no land for cultivation. Second to that, their life has been turned up side down by the new housing arrangement in the resettlement areas, which placed their houses one next to another like in urban area.
Quang Nam is one of the central provinces that plan and build many small and medium hydropower projects. Some 50 hydropower projects that have started in Quang Nam displaced 1,739 households. The total area of land that has been taken for hydropower projects since 2000 in Quang Nam province is 11,589 ha. The issue of land for housing and cultivation for displaced people as in the An Vuong hydropower project is currently a big challenge.
In the Central Highlands, according to specialists, 4,000 ha will be submerged by the time the Plei Krong hydropower project is finished. A total of around 1,300 households or more than 6,000 people will be displaced. People from 9 communes in Sa Thay district, Dak Ha district, Dak To district, and Kon Tum city were already heavily affected. Many households had to give up their 3-4 ha of coffee plantation, which brought them an annual income of hundreds of million VND. These losses were not adequately compensated by the project.
The A Luoi hydropower project started 3 years ago. To date, 913 affected households have not received their compensation, and 179 other households have not been relocated. These households are now in an extremely challenging situation where they have not received any compensation and they had no land for cultivation for three years. They are not only worried about having no food to eat, but also deeply concerned about their future. At the same time, people who have been relocated by the project have their own issues such as the infrastructure and housing quality within the resettlement area is inadequate or unsafe. The biggest concern is that part of the resettlement area is planned on the bank of A Sap River, which is prone to landslide due to the fact that this has been a popular gold mining area.
Hydropower development in the Central Region has put thousands of affected people in challenging living situation. Local authorities have been planning on some post-resettlement arrangement for these people but it is not easy to do. At the moment, Song Tranh 2 project investor is asking to use 600 ha of protected forest to use as land compensation for displaced people.

132
According to Hydropower Project Management Unit 3, 320 households out of 1,046 households affected by the Song Tranh 2 hydropower project from the two districts of Bac Tra My and Nam Tra My are living inside the protected forest. Having their land taken away by the project, these households had no choice but to turn forest into cultivation land in the last 3 years. Nearly 5 years after relocating to the resettlement area of Song Tranh 2 hydropower project, many households are still without land for cultivation or even for burying dead people. They also seriously lack of domestic water supply. To date, 259 households still refuse to use land in resettlement area for cultivation because they think that the land quality is bad. These households also refuse to take money for compensation because they believe that the land price per unit that was used to calculate the compensation value was too low.
The development of power projects is taking away production land from people. The current compensation package is very close to the actual loss of affected people. However, giving money compensation without a plan to support displaced people to re-establish their livelihood is not the best solution as it might lead to other social issues.
Generally, displaced people, of which a great majority are ethnic groups other than Kinh, has had difficulties in adapting to the new situation in the resettlement areas. This is not only due to the fact that the resettled areas are alien to the newcomers, but also that the host people often is of another ethnic group, that in-migration is attractive due to the ‘new frontier’ atmosphere, that new agricultural plants and techniques are introduced, that the existing forest is not open for exploitation, that the housing style and location is not according to the preferences of the displaced people etc.
2.2.2.11. Community Health
Environmental pollution and employment pressure increase the risks of air related diseases such as respiratory disease, pulmonary disease, and cardiovascular disease, etc. There are water related diseases such as malaria and snail fever, which are caused by organisms living in the water (mosquitoes and snails), and dysentery, cholera and hepatitis A, which are spread through contaminated water. Occupational illnesses include deafness, loss of vision, blood pressure, etc. Some diseases are more dangerous such as cancer, cardiovascular disease, and liver and kidney failure, etc.
Illnesses reduce productivity and income. If someone in the family is ill, it not only costs money but also has effects on the time and psychology of the sick person and other family members. However, this issue has not yet received adequate attention and there is yet a mechanism that requires people who are responsible for releasing pollutants to the environment to compensate for health problems that these pollutants cause in the local community, or for affected people to receive health care services or other support.
As health care services at local level are inadequate and health care workers are less qualified, patients are often transferred to health care services at a higher level for diagnoses and treatments, which often cost them more time and money.
2.2.2.12. Agriculture and Food Security
The agriculture sector uses 52% of the labor force, accounts for 6.3% of the government

133
investment, and contributes 22.6% of the total export value of Vietnam in 2008. According to current statistics, out of more than 33,105,000 ha of land, around 25,127 ha are for agriculture, 38.2% of which (or 9,599,00 ha) are cultivated land, and 58.7% are forest land. Land for agriculture is not distributed evenly across regions. The Mekong Delta has 26.6% of cultivated land and contributes 33% to the national total agricultural production. The Red River Delta has 8.3% of the cultivated land and contributes 17.6% to the national total agricultural production. At the moment, Vietnam can provide enough food for domestic demand and export from 3-4 tonnes of rice every year, making it currently the second biggest rice exporter in the world.
In the last two decades, urbanization happened very quickly, which reduced agricultural land significantly. Statistics show that total land area for rice cultivation was only 4.1 million ha in 2007, which is 362,000 ha less than in 2005. It is predicted that by 2025, 10-15% of agricultural land and land from other sources will be taken for industrial development. It means that total land area for rice cultivation will be reduced to around 4 million ha in 2010, around 3.8 million ha in 2015, and around 3.6 million ha in 2020. After 2020, total rice cultivation area will be maintained at around 3.5 million ha, of which 3.1 million ha will be for wet rice cultivation.
70% of Vietnam’s large population lives in rural area. The amount of agricultural land per capita of Vietnam is amongst the lowest in the world. According to the Ministry of Agriculture and Rural Development, to be able to supply for a population of 130 million people in the country in 2035, Vietnam needs to produce 36 million tonnes of rice, which means there will need to be at least 3 million ha of land for rice cultivation which can handle two crops a year (or an equivalent of total of 6 million ha of land for rice cultivation).
There is a difference between regional levels of food production. There are also factors such as natural disaster, disease, and global climate change impacts such as rising sea level and loss of production land etc. Vietnam is one of the countries that will be most affected by global climate change. If sea level rises by 1 meter, the Red River Delta will loose 5,000 km2 of land, and between 15.000 and 20.000 km2 of the Mekong River Delta will be under water. This this happens, total agriculture of Vietnam will but cut down by 5 million tonnes. Agriculture activity can be unpredictable due to bad crop yield, natural disaster such as flooding and pets, etc. Therefore, food security is always an urgent matter that needs special attention.
134
Chapter 3: Environmental Impact Forecast for PDP VII
3.1. The Relevancy of PDP VII to Environmental Protection Targets The relevancy of PDP VII to environmental protection targets is evident in the proposed scenarios as explained below:
Environmental Protection Policies and Regulations
Relevancy of PDP VII to Environmental Protection Targets
Vietnam’s Agenda 21 is a document that provides direction for a long-term development strategy. The viewpoints and objectives expressed in this document constitute a legal framework that guide activities by Ministries, departments, local governments, organizations and individuals to shift Vietnam’s development towards the path of sustainable development in the 21st century.
Within the current planning system, the Strategic Orientation for Sustainable Development in Vietnam focuses on priority activities for the next 10 year development, as follows:
Sustainable Economic Development Objectives
- To maintain a rapid and sustainable economic growth rate on the basis of increased productivity, application of advanced science and technology, and effective and efficient use of natural resources.
- To transform production and consumption patterns towards environment-friendly direction.
- To implement the ‘clean industrialization’ mechanism.
- To achieve sustainable agricultural and rural development.
- To achieve sustainable regional and local development.
Sustainable Social Development Objectives
- To focus great efforts on hunger eradication, poverty reduction, and job creation.
- To continue to reduce the population growth rate
Basing on these viewpoints and directions for environmental protection, PDP VII harmonizes economic development targets with environmental protection targets:
- The development of PDP supports the national electricity system, which means support to the socio-economic development, and the balance between economic growth and sustainable environmental development.
- The electricity for rural areas program ensures that by 2020 a hundred percent of rural households, including the ones in isolated and remote areas as well as in the islands, have access to electricity. The PDP VII is supported by local infrastructure development and development of resettlement areas. It aims at providing a better living standards and bringing civilization to the people.
- The PDP VII contributes to the development of the power sector and creates more jobs.
- The PDP VII supports appropriate use of natural resources in power production and resource conservation for the long-term development of all economic sectors. The plan is to diversify power sources, including nuclear power. It also envisages the import of primary energy and electricity.
- The PDP VII incorporates energy saving in the production and use of electricity.
- The PDP VII applies advanced technologies (i.e. Circulating Fluidized Bed CFB, supercritical and extreme supercritical
135
and the pressure of high population growth rate such as unemployment.
- To manage the process of urbanization and migration to ensure reasonable regional distribution of the population and the labor force, and sustainable environmental protection in local communities, starting from urban areas.
- To improve education quality in order to raise the average intellectual level, and professional skills and qualification in the population to meet the national development needs.
- To increase the quantity and quality of health care services and to improve working conditions as well as environmental sanitation conditions.
Sustainable environmental and natural resource development objectives
- To use land resources in a sustainable manner to stop land deterioration.
- To use mineral resources in an effective, efficient and sustainable manner.
- To protect and use water resources in a sustainable manner.
- To protect the marine and marine resources.
- To protect and develop forest areas.
- To reduce air pollution in urban areas and industrial zones.
- To manage solid waste and toxic waste.
- To promote bio-diversity conservation.
- To implement measures in response to climate change and mitigate its negative impacts for better natural disaster prevention and control.
Law on Environmental Protection, the Politburo’s Circular No. 36 - CT/TW and Resolution No. 45 - NQ/TW (dated 15 November 2004) regarding environmental protection in the period of industrialization and
technologies, coal gasification, etc., in energy production; use of super high voltage cable in power transmission) in power production, transmission and distribution.
- Environmental protection measures such as air pollution management systems (i.e. air filter, elimination of NOx and SO2 and carbon dioxide mitigation via capture), waste water treatment systems, reuse of coal waste, power plant pollution control and monitoring, etc., will be applied.
- Hydropower development requires appropriate selection of location and power plant capacity, minimal inundation and loss of forest, and appropriate water regulation infrastructure for integrated water management.
- Development of nuclear power and renewable energy is encouraged for ‘cleaner’ energy production practices.
- Transmission line development requires appropriate planning to minimize impacts on biodiversity and forest area.
- PDP VII also commits to meet conservation and energy saving objectives by reducing greenhouse gas emission, adjusting to climate change and developing new and renewable energies.

136
modernization:
(1) To prevent and reduce environmental issues, such as pollution, environmental degradation and accidents, as the result of human behaviors and natural impacts; to use natural resources in a sustainable manner; and to promote biodiversity conservation; (2) To control the impacts of environmental pollution, especially in areas of large population; and to promote the recovery of bio-systems from degradation in order to gradually achieve quality improvement for the environment; and (3) To build a healthy environment and to achieve a balance between economic growth, social improvement, welfare and environmental protection for Vietnam where every citizen is aware of the responsibility of protecting the environment and living in harmonization with nature.
Vietnam’s National Strategy for Environmental Protection until 2010 and vision toward 2020 was approved in 2003. The viewpoints and objectives expressed in this strategy are as follows:
- The National Strategy for Environmental Protection is an intergral part of the National Socio-economic Development Strategy, and serves as grounds for sustainable development of the country. Environmental protection investment means investment for sustainable development.
- Environmental protection must be the task of the whole society, all levels of the authority, sectors, organizations, communities and all citizens; as environmental protection is national, regional and global in its nature, it requires to bring into full play the country’s internal strength combined with the extension of international cooperation.
- Environmental protection is a constant and long lasting work. Pollution prevention must be viewed as the key solution in combination with pollution control and treatment, remedy of degradation and improvement of the environmental quality. The

137
implementation of these activities must aim at the focal points and locations; and science and technology must be viewed as effective tools for environmental protection.
Vision toward 2020: To basically halt pollution acceleration, remedy degraded areas and improve the environment quality and ensure sustainable development of the country be achieved; guarantee that all the people are entitled to live in the environment, landscapes and other environmental components with the good quality of air, land, and water measuring up to standards stipulated by the State.
3.2. Assessment and Comparison of the Proposed Development Scenarios
Development scenarios proposed in PDP VII are based on energy demand forecast and aim at providing sufficient supply and reserve. In order to achieve this, the two main areas of work of power production, the purpose of which is to produce sufficient electricity for socio-economic development and domestic needs, and power transmission need to be developed simultaneously.
Energy production relies on four sources, which are: (i) thermal energy from coal, oil and gas; (ii) hydropower; (iii) nuclear power; and (iv) renewable energy. The national transmission grid use 220kv and 500kv cables.
On the basis of the environmental protection targets mentioned above and after considering the un-sustainable development scenario in May 2010, the working group noted the following:
- Vietnam is expected to import fuels for electricity production after 2015. This scenario also predicts that by Vietnam would need to import 79 % of coal for electricity production by 2020 and 71 % by 2030 provided that coal extraction from the Red River reserve is possible by then.
Table 3.1. Primary Energy Demand Increase in the period 2011-2030 according to Base Scenario
Year 2011 2015 2020 2030 Coal (106 ton) 11.2 32 221.2 230.7 Domestic production 10.82 30 46.6 66.2 Import 0.38 2 174.6 164.5 Oil (103 ton) 776 468 79 93
Due to technical requirements, most thermal power plants are located near rivers or in coastal areas where it is easy to get access to water and transportation. These are also highly populated areas that offer favorable conditions for the development of other industries.

138
Therefore, the development of thermal power plants put serious pressure on the environment, as explained bellow:
- Coal-fired thermal power plants have negative impacts on air, water and soil quality in a large scale such as acid rain or CO2 emission, which has a global impact.
- Thermal power impacts are contributing factors to climate change.
- Air pollution and wastewater (especially cooling water) from coal-fired thermal power plants have serious health impacts.
- Coal-fired thermal power plants also use a large amount of limestone and chemicals such as Urea and NH3.
- Large quantities of coal ash and other waste products from coal-fired thermal power plants requires a large waste storage area of more than 8,000 ha while land resource is limited.
It is evident from the above facts that the shortage of primary energy is a threat to national energy security. Vietnam relies heavily on the international energy market while price for fossil fuel is climbing and the fossil fuel supply in the world’s market is limited and changing at the same time. Recently, many thermal power projects have been delayed due to the lack of fossil fuel supply. Most recently, in March 2010, when Vietnam was urgently in need of power supply, the Yunnan Power Grid Company, who was a power supplier for Vietnam, has stopped the operation of both the 220kV Tan Kieu – Lao Cai and the 110kV Lao Cai – Ha Khau lines for maintenance. This incident has put Vietnam in a very vulnerable situation when providing adequate energy supply in the country was a struggle.
The SEA working group has discussed this situation with the PDP working group and proposed to reduce the number of thermal power plants, which means reduced demand for coal, in the power development plan. The PDP working group has considered this proposal and included necessary changes in the PDP VII accordingly. In July 2010, the SEA working group received the newly revised power plan development scenario. In this scenario, the expected amount of power produced by thermal power plants although has been reduced in comparison with the first version but is still at a desirable rate.
According to the newly revised scenario, no change was made to hydropower plant projects. Most hydropower projects are in the implementation phase accordingly with the PDP VI. Some projects are currently in the investment preparation period, such as the Dakmi 1, Dong Nai 5 and Dong Nai 6.
The total number of thermal power projects remains as planned. There is an increase in the number of gas-fired thermal power plants in the central and southern regions. According to the plan, these gas-fired thermal power plants will use Liquefied Natural Gas (LNG) to be imported to Vietnam as part of the regional power grid cooperation and other programs that will seek to import LNG.
Also according to this scenario, power production using renewable energy will increase by 4% and there will be three more nuclear power plants in the Centre.

139
The newly revised power development scenario was found to meet certain environmental targets in key policy documents. This scenario was used for further analysis and assessment to form the base scenario. A list of power plants, which are included in the power development base scenario, is presented in Appendix 1 of this report. The main environmental impacts are analyzed and evaluated in detail in the next section.
3.3. Environmental Impacts Forecast for the Proposed Development Plan
Vietnam is a country endowed with relatively abundant natural energy such as hydropower, coal, oil and gas. This is an important basis for planning power development as well as meeting the power demand, which is projected to increase rapidly in the future.
According to the forecast in the base scenario, energy demand in the period between 2011 and 2030 will increase to 110.215 MW. Energy supply is epected to come from the following energy sources:
Table 3.2. The Power Supply Sources in the Period 2011-2030
Power resources Power capacity to 2010
Power capacity to 2030 (MW)
Output to 2030 (TWh)
Plant average factor
Hydropower + Pump storage hydroeletrictcity
8,535 21,125 58.25 0.48
Small hydropower + NLTT
511 4,829 13.34 0.40
Coal fired power 3,041 77,160 428.56 0.65 Gas power + oil 7,768 17,465 90.98 0.45 Nuclear power 10,700 56.53 0.76 Import 670 6,109 28,77 0.61 Total 20,525 110,215 695.15
Percentage allocation of energy sources in Table 3.2 is based on the development and expansion plan which requires minimum cost in the PDP VII. The plan is to achieve optimal results by combining power development projects using different energy sources with the lowest Net Present Value (NPV) to meet the future power demand for the period up to 2030.
As presented in Appendix 1, the power development plan of Viet Nam to 2030 includes:
62 coal-fired thermal power plants with total capacity of 77,160 MW, including 31 projects in the North, 12 projects in the Center, and 19 projects in the South. There will be 9 generators with total capacity of 1,000 MW. The locations for these generators are still to be determined.
12 gas-fired thermal power plants with total capacity of 17,465 MW, including 3 new projects in the Center and 7 new projects in the South of Vietnam.
7 oil-fired thermal power plants and oil-fired gas turbines. 79 hydropower projects with totall capacity of 21,125 MW, including 32 projects in the
North, 30 projects in the Center, and 17 projects in the South. All of these projects were
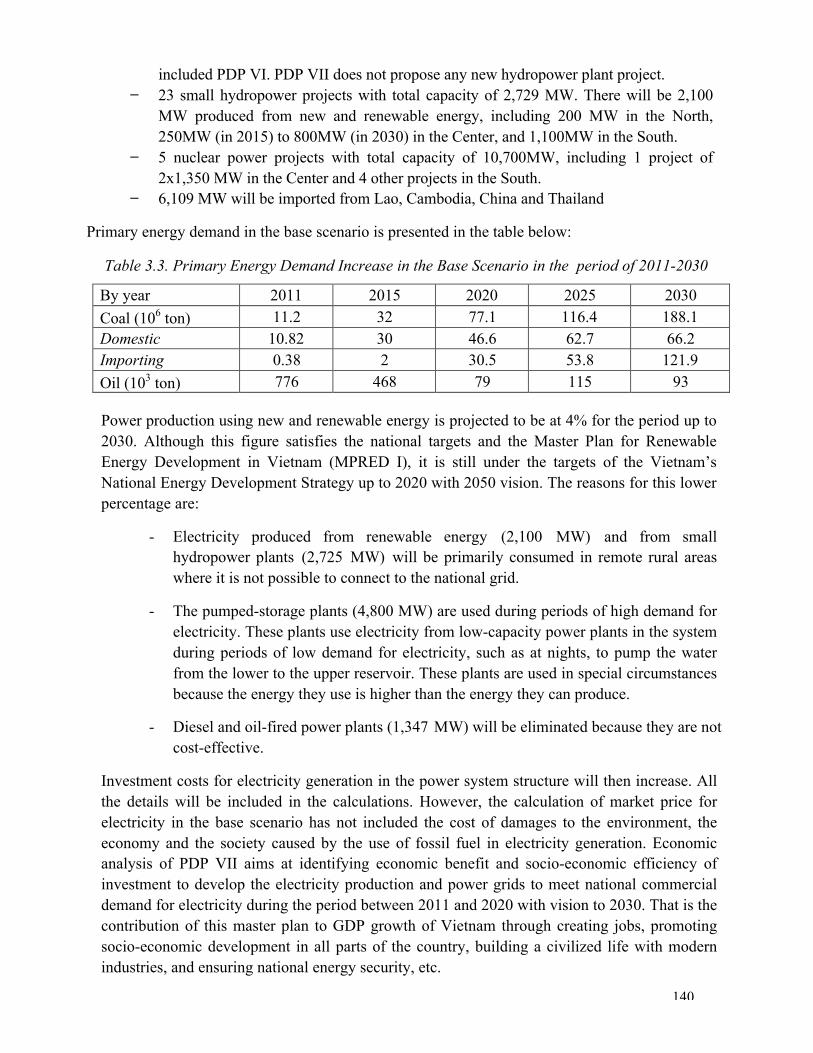
140
included PDP VI. PDP VII does not propose any new hydropower plant project. 23 small hydropower projects with total capacity of 2,729 MW. There will be 2,100
MW produced from new and renewable energy, including 200 MW in the North, 250MW (in 2015) to 800MW (in 2030) in the Center, and 1,100MW in the South.
5 nuclear power projects with total capacity of 10,700MW, including 1 project of 2x1,350 MW in the Center and 4 other projects in the South.
6,109 MW will be imported from Lao, Cambodia, China and Thailand
Primary energy demand in the base scenario is presented in the table below:
Table 3.3. Primary Energy Demand Increase in the Base Scenario in the period of 2011-2030
By year 2011 2015 2020 2025 2030 Coal (106 ton) 11.2 32 77.1 116.4 188.1 Domestic 10.82 30 46.6 62.7 66.2 Importing 0.38 2 30.5 53.8 121.9 Oil (103 ton) 776 468 79 115 93
Power production using new and renewable energy is projected to be at 4% for the period up to 2030. Although this figure satisfies the national targets and the Master Plan for Renewable Energy Development in Vietnam (MPRED I), it is still under the targets of the Vietnam’s National Energy Development Strategy up to 2020 with 2050 vision. The reasons for this lower percentage are:
- Electricity produced from renewable energy (2,100 MW) and from small hydropower plants (2,725 MW) will be primarily consumed in remote rural areas where it is not possible to connect to the national grid.
- The pumped-storage plants (4,800 MW) are used during periods of high demand for electricity. These plants use electricity from low-capacity power plants in the system during periods of low demand for electricity, such as at nights, to pump the water from the lower to the upper reservoir. These plants are used in special circumstances because the energy they use is higher than the energy they can produce.
- Diesel and oil-fired power plants (1,347 MW) will be eliminated because they are not cost-effective.
Investment costs for electricity generation in the power system structure will then increase. All the details will be included in the calculations. However, the calculation of market price for electricity in the base scenario has not included the cost of damages to the environment, the economy and the society caused by the use of fossil fuel in electricity generation. Economic analysis of PDP VII aims at identifying economic benefit and socio-economic efficiency of investment to develop the electricity production and power grids to meet national commercial demand for electricity during the period between 2011 and 2020 with vision to 2030. That is the contribution of this master plan to GDP growth of Vietnam through creating jobs, promoting socio-economic development in all parts of the country, building a civilized life with modern industries, and ensuring national energy security, etc.

141
According to the base scenario, the investment for infrastructure development to meet the demand for electricity between now and 2030 is estimated to be 2,977,572 billion VND (not including the cost of damages to the environment), which is about US$156.3 billion. Every year from now until 2030, the electricity sector requires an investment of US$7.8 billion, of which a relatively big amount of US$5.5 billion is for electricity generation.
Environmental impacts of power development projects are assessed and forecasted accordingly with the base scenario provided in PDP VII. Different types of power generation have different impacts on the environment depending on the project location, scale, source energy and technology. The following section presents information about impacts of power production and transmission lines:
Hydropower Impacts
Most environmental and social impacts of hydropower plant development have been taken into account in the development plan through cost calculations for resettlement, inundation, loss of forest, changes in river ecology, etc. Continuous impacts of most projects show to be very small after the plant is built. Therefore, the assessment of environmental and social impacts of hydropower development in PDP VII will focus on the impacts in the planning and construction phase of hydropower plants. The environmental impact assessment in this part includes details from the pilot Strategic Environmental Assessment of the Hydropower Master Plan in the Context of the Power Development Plan VI by the ADB.
The range of adverse environmental and related social impacts that can result from hydropower projects is remarkably diverse. While some impacts occur only during construction, the most important impacts usually are due to the long-term existence and operation of the reservoirs. Other significant impacts can result from complementary civil works such as access roads, power transmission lines, and quarries and borrow pits.
With properly implemented mitigation measures, many of the negative environmental and related social impacts of hydroelectric projects can be reduced to very acceptable levels. As will be discussed later in this report, mitigation measures can effectively prevent, minimize, or compensate for most adverse impacts, but only if they are properly implemented.
There are however, environmental impacts which occur at some hydropower projects that cannot be fully mitigated. These include (i) irreversible biodiversity loss, if critical natural habitats not occurring elsewhere are submerged (or left dry) by the dam; (ii) fish passage facilities frequently cannot restore the pre-dam ecological balance of a river, in terms of species composition or fish migrations; and (iii) some cultural property (including sacred sites) cannot be adequately salvaged prior to reservoir inundation. Thus, because mitigation measures are often not fully implemented, and are sometimes inherently inadequate, the single most important environmental mitigation measure for a new hydropower project is good site selection, to ensure that the proposed dam will be largely benign in the first place. In the following summary of potential adverse environmental impacts and corresponding mitigation options, it is important to keep in mind that the risks associated with all of these types of impacts can be reduced through good project site selection.

142
Thermal Power Impacts
The generation of electricity through the combustion of fossil fuels (mainly coal but also gas and oil) constitutes the largest element of the planned expansion in generating capacity in PDP VII and will consequently represent the largest source of environmental impacts. Apart from impacts of resettlement and impacts on the water resources, the main form of impacts from thermal power is from the three categories of atmospheric pollution impacts: (i) climate change impacts resulting from greenhouse gas emissions; (ii) acidification of soils and water caused by gaseous pollutants; and (iii) human health impacts from both gaseous pollutants and particulate matter releases.
Nuclear Power Impacts
Plans to increase the power of the base scenario proposed in PDP VII is mainly development of new projects in Vietnam, which includes plans to build three nuclear power plants in next decades. This is a new set of issues that should be assessed in the SEA because nuclear power plants typically generate many different types of risk: if nuclear power plants are deployed in accordance with international regulations (thus can be applied to forecast for Vietnam), although the risk level is very low, but its happens will cause unpredictable effects. Experience shows that, the impacts from this type of power production occurs mostly due to risks than predicted impact could be as prevalent in other forms of electricity production, for example, CO2 emissions from coal-fired power plants or loss of land to build hydroelectric dams.
Results of the SEA study for the location planning project of nuclear power plants in Vietnam that was done in 2009 reveal a fairly complete list of potential problems related to the nuclear power projects. This is a comprehensive exercise that has been made about the limits of the uncertainty inherent in developing nuclear power plants. In this SEA report, two types of potential impacts are identified accurately: (i) radiation and other effects related to the food chain (in Vietnam, there are only 2 steps involved in this effect, those are processes of production and disposal of radioactive waste), (ii) the effects of radiation and other possible nuclear accident (as already noted, the probability of risks are generally low but the impact is often specially serious as happened at Three Mile Island and Chernobyl cases).
There are some specific effects that can be expected from the development of nuclear power, the group of these effects are similar to the one of other power projects. These effects are divided into categories in the SEA and they should be taken into consideration in calculating the period of deployment of nuclear power projects.
Renewable Energy Impacts
The advantage of renewable energy projects is that they are environment-friendly as: (1) Renewable energy projects help to reduce the consumption of fossil fuels in electricity generation, which means reduced gaseous emissions, including greenhouse gases (CO2), and other acid rain causing emissions such as SOx and NOx. The use of renewable energy represents opportunities for pursuing Clean Development Mechanism (CDM) and participating in the active international market for greenhouse gas; and (2) Renewable energy projects help to reduce air pollution caused by odors, CH4, disease vectors and from landfills, land area required for landfills, and cost of waste treatment (in case of power generation using biomass).
143
The base case of PDP VII contains only a small expansion in renewable energy generation sources and in general renewable sources of power generation produce very few negative social and environmental impacts and the low level of expansion of these power sources in PDP VII means that the total impact of renewable energy power generation will be minimal. The main concerns, where they exist, are usually closely associated with the characteristics of individual sites and renewable energy has few, if any, wider negative impacts on the natural environment or people outside of the immediate location where the facilities are constructed. There are issues that have to be taken into consideration during the planning and construction of renewable energy facilities: especially larger ones where several individual turbines or other pieces of power generation infrastructure are sited together. The plans for increased generation capacity contained in PDP VII do not as yet specify the precise location of these facilities: this will be decided at a late stage. It is consequently not possible to assess with any accuracy the potential site-specific impacts of renewable energy development as contained in the PDP VII base case.
The use of renewable energy sources such as solar and wind energy does not require fuel, therefore, it does not produce waste. However, there are a few issues of concern as follows:
Wind power can cause some noise pollution for people living in the immediate vicinity of the turbines and, if sited insensitively, the tall turbines are considered by some to have negative aesthetic impacts (especially where they are located in areas of outstanding natural beauty). Others consider them to be aesthetically pleasing, however, and certainly wind farms have become a tourist attraction in many countries. The consultation and consent of local residents is essential (and is in any case a normal part of infrastructure planning) and some appropriate compensation should be agreed for any noise impacts or loss of amenity. The effect of large turbines on migratory birds can also be a concern where they are directly in their flight path and site selection should avoid the roosting locations or main flight paths of important bird species.
Solar power generation through photovoltaic cells is only a potential concern where the generation is concentrated on large ‘farms’, and in these cases it related directly to the characteristics of the site and the vegetation cleared for the solar farms. This should not be an issue in Viet Nam so long as the site selection avoids sites of any ecological significance: an issue to be determined in the detailed planning of such facilities. There are few, if any, other social and environmental issues to be concerned with for solar power generation.
Comparison of the environmental impacts of fossil fuel, hydropower and renewable energy is shown in table below:

144
Table 3.4. Comparison of Environmental Impacts of Fossil Fuel, Hydropower and Renewable Energy
Main environmental impact
Type of energy CO2cq
(Greenhouse gas emission)
SOx (Acid rain)
NOx (Acid rain)
Dust Impact on forest and
climate change
Coal X x x x Oil X x x Marginal
Fossil fuel
Big impact
- - - - Loss of forest
Solar - - - - - Wind - - - - - Biomass Neutral Marginal Not considerable - Promoting forest
plantation
Small impact
Marginal
Renew-able energy
Geothermal heat
Marginal
Despite having more positive impacts, renewable energy projects, such as small hyrdropower, biomass, solar, wind and geothermal energy projects, also have some negative impacts on the environment. The strategic environmental assessment of the Master Plan for Renewable Energy Development in Vietnam to 2010 with 2025 Vision by the Energy Institute in 2010 provides forecast and assessment of negative environmental impacts of various types of renewable energy.
Renewable energy projects, including solar, wind and biomass projects, create waste during energy production and storage, which has several impacts on the environment:
- Similar to fossil fuel-fired thermal power production, combustion and gasification of biomass in power production emits CO2, which is one of the greenhouse gases, and NOx and SOx, which cause acid rain, only at a lower level for the following reasons: (i) the amount CO2 that biomass captures when growing balances out the amount of CO2 emitted during the production process; (ii) the proportion of sulfur (S) in biomass is very low and zero in many cases, such as in bagasse and rice husk; (iii) some solid and liquid waste from biomass-fired thermal power plants, such as husk ash or waste from underground composting tanks, is not harmful and can bring high economic value if reused as fertilizer.
- Wind power projects do not produce waste or gas emissions but have other effects such as noise, visibility and other aesthetic effects to nearby residents and landscape. - Batteries used for storing energy from solar or wind power projects need to be handled and burried like toxic waste. - Large scale solar or wind power projects usually take up large areas of land.
The table below presents a summary of the types of waste produced during the construction and operation of renewable energy projects in the PDP VII and the associated environmental impacts.

145
Table 3.5. Environmental Impacts of Waste from Renewable Energy Projects
Renewable Energy Process Type of Waste
Impact (Positive/Negative) 1. Biomass
CO2 Neutral CO2 balance
SOx Nearly zero because of the small sulfur proportion (0,1-0,05%)
NOx Acid rain of not significant amount because the combustion temperature is low nhiệt độ thấp
+ Direct combustion for power generation
Power production
Ash Solid waste (husk ash – which can bring high economic value if reused)
2. Biogas
Liquid waste Replacing chemical fertilizer as high quality, eco-friendly fertilizer
Power production
Solid waste Used in production of eco-friendly micro-nuitrition fertilizer
3. Solar Power storage Waste battery - Increased demand for land but not
significant. - Changes to landscape and architectural setting but not significant. - Impacts on soil and water resources if waste management not done properly
4. Wind Power storage Waste battery - Impacts on soil and water resources.
- Changes to landscape and architectural setting but not significant. - Noise, visibility.
5. Small hydropower, geothermal
Power production
None - Sendimentation and erosion at lower river basin. - Dry lakes. - Disruption to fish migration, affecting biodiversity. - Impacts on water use for other purposes
Overall, renewable energy has more positive impacts on the environment. However, it is not easy to quantify these impact values into the cost structure. The issue is, despite all the positive impacts, renewable energy is not well developed both in Vietnam and internationally. Studies show that the initial investment for renewable energy is too high. Analysis in the chosen scenario for renewable energy provides investment figures for each type of renewable energy as follows:
Development of a grid connected renewable energy system needs a total investment of 74,019 billion VND for the whole period (2009-2025), which means an average of 4,354 billion VND per year.
Development of independent (not connected to the grid) renewable energy systems needs a total investment of 20,391 billion VND. This investment should come from the state budget because

146
the government is expected to invest in power development for remote areas to meet the target of 100% of the households have access to electricity by 2020.
Development of renewable energy for heating needs a total development of 42,140 billion VND for the whole period (2009-2025). This investment is for households to buy and install equipment. The investment provided to each household should be just enough to levarage their own investment, to create a movement in using renewable energy in the communities, and to develop a market for renewable energy.
The total investment for the development of reneawable energy between 2009 and 2015 is 53,439 billion VND, which equals an average of 3,143 billion VND per year. Fifty percent of the total investment, which equals 31,191 billion VND for the whole period or 1,834 VND per year, is for the development of grid connected renewable energy systems. Thirty eight percent of the total investment, which equals 20,391 billion VND for the whole period or 1,199 billion VND per year, is for the development of independent renewable energy system. Four percent of the total investment, which equals 1,857 billion VND for the whole period or 109.2 billion VND per year, is for the development of renewable energy for heating.
The total investment for the development of renewable energy is not high. It only accounts for a small percentage of the total investment for national power development for the whole period of 2009-2025.
Transmission Lines: Social and Environmental Impacts
PDP VII contains plans for the significant improvement and extension of the transmission grid across the country. These investments are essential for the continued development and improvement of Viet Nam’s power supply system, but their construction, and the associated land clearance, will have some significant social, environmental and economic impacts. These have been calculated based on the following information, processed through the use of GIS analysis with support from the ADB:
• The tracts of the planned new transmission lines, both 220kv and 500kv, derived from maps provided by the SEA working group and digitized for analysis in the GIS.
• The calculation of the area of forest cleared and the level of fragmentation of both protected areas and key biodiversity areas during the construction of the new lines. This calculation is based on the Transmission Line Regulations issued with Decree 106/2005/NĐ-CP dated 17 August 2005 and instructions in the Law on Power Grid Safety Corridors, which specify a 45 meter clearance track for 500kV lines and 25 meter clearance track for 220kV lines.
• The assessment of the economic value of the forest cover lost to the transmission line tracts, based on valuation data from the Forest Science Institute of Viet Nam.
• The identification of areas of critical biodiversity sensitivity that will be affected by the transmission lines where special remedial measures need to be taken.
The followings are detailed assessment of main environmental impacts of different types of power development in the base scenario:
3.3.1. Loss of Forest and Biodiversity

147
Loss of forest and biodiversity in power development is mainly caused by hydropower and transmission line development. The heaviest consequences are loss of forest and habitat fragmentation that lead to serious impacts on the ecology and biodiversity. These impacts are mostly impossible to fully avoided or mitigated. The sections below provide a detailed analysis of these impacts.
3.3.1.1. Hydropower Impacts on Forest and Biodiversity Resources
The assessment of impacts from hydropower is based on the SEA of hydropower in PDP VI executed in 2008-2009. Where necessary, the information from this SEA has been updated and extended to reflect changes in PDP VII and new national regulations on issues such as payments for environmental services.
Main assessment indicators are: (i) irreversible biodiversity loss, if critical natural habitats not occurring elsewhere are submerged (or left dry) by the dam; (ii) fish passage facilities frequently cannot restore the pre-dam ecological balance of a river, in terms of species composition or fish migrations. Because mitigation measures are often not fully implemented, and are sometimes inherently inadequate, the single most important environmental mitigation measure for a new hydropower project is good site selection.
Flooding of Natural Habitats
Some reservoirs permanently flood extensive natural habitats, with local and even global extinctions of animal and plant species. Very large hydropower reservoirs in the tropics are especially likely to cause species extinctions (although such losses are only infrequently documented due to the lack of scientific data).
Particularly hard-hit are riverine forests and other riparian ecosystems, which naturally occur only along rivers and streams. From a biodiversity conservation standpoint, the terrestrial natural habitats lost to flooding are usually much more valuable than the aquatic habitats created by the reservoir. One occasional exception to this rule is that shallow reservoirs in dry zones can provide a permanent oasis, sometimes important for migratory waterfowl and other terrestrial and aquatic fauna.
This issue has not been well researched in Vietnam but studies of the dams in coastal areas of North America along the Atlantic and Pacific ocean show that they block the upriver migration passage of wild salmon although most of these dams provide fish ladders. This results in a decreasing number of wild salmon. The young salmon also find it hard to migrate to sea because they have to swim through the turbines. In some areas, people have to transport young salmon to sea in certain periods of the year.
There are other issues concerning water quality after running through the turbines such as changes in oxygen sublubility and water temperature. These changes affect aquatic fauna, especially indigenous species. The Lost Life Environment of Desolate Animal
The loss of terrestrial wildlife to drowning during reservoir filling is an inherent consequence of

148
the flooding of terrestrial natural habitats, although often treated as a separate impact. Instead of drowning, the captured and relocated animals typically starve, are killed by competitors or predators, or fail to reproduce successfully, due to the limited carrying capacity of their new habitats. Wildlife rescue is most likely to be justified on conservation grounds if (a) the species rescued are globally threatened with extinction and (b) the relocation habitat is ecologically suitable and effectively protected.
Although they may be useful for public relations purposes, wildlife rescue efforts rarely succeed in restoring wild populations. However, the money spent on rescue would usually do much more for wildlife conservation if it were invested in compensatory protected areas. The most effective way to minimize wildlife mortality in hydropower projects is to choose dam sites which minimize the wildlife habitat flooded.
Environmental Impacts are assessed through the analysis of two issues: (i) the resource value of natural resources, valuing where possible both the inherent value of the resource and the cost of mitigation measures to ameliorate any negative impacts; and (ii) the inherent biodiversity value of the ecosystems that are at risk of being affected by hydropower development. The biodiversity assets are not given either quantitative (e.g. number of species affected) or economic values: the data does not exist to make this possible within the scope of the present study. Instead, an assessment is made of the level of potential risk of loss of biodiversity values.
This in turn is related to the proportion of particular ecosystems that fall within the zones of influence and the presence in these ecosystems of animals, plants or habitats of particular biodiversity significance. A detailed map of special ecosystems and conservation areas is provided in Appendix 1.
The proportion of ecosystems in the zones is assessed through the GIS analysis in relation to two (related) areas: Protected Areas (Pas): that is, areas designated under Vietnamese regulations as being subject to particular types of protection such as Special Use Forests and Key Biodiversity Areas (KBAs).
Fish and Other Aquatic Life
Hydropower projects often have major effects on fish and other aquatic life. Reservoirs positively affect certain fish species (and fisheries) by increasing the area of available aquatic habitat. However, the net impacts are often negative because (a) the dam blocks upriver fish migrations and affects downstream passage; (b) many river-adapted fish and other aquatic species cannot survive in artificial lakes; (c) changes in downstream flow patterns adversely affect many species, and (d) water quality deterioration in or downstream of reservoirs kills fish and damages aquatic habitats. Freshwater molluscs, crustaceans, and other benthic organisms are even more sensitive to these changes than most fish species, due to their limited mobility. Management of water releases may be needed for the survival of certain fish species, in and downstream of the reservoir.
Fish passage facilities (fish ladders, elevators, or trap-and-truck operations) are intended to help migratory fish move upstream past a dam but are usually of limited effectiveness. Fish hatcheries can be useful for maintaining populations of native species which can survive but not

149
successfully reproduce within the reservoir. They are also often used for stocking the reservoir with economically desired species, although introducing non-native fish is often devastating to native species and not ecologically desirable. Fishing regulation is often essential to maintain viable populations of commercially valuable species, especially in the waters immediately downstream of a dam where migratory fish species concentrate in high numbers and are unnaturally easy to catch.
Floating Aquatic Vegetation
Floating aquatic vegetation can rapidly proliferate in eutrophic reservoirs, causing problems such as (a) degraded habitat for most species of fish and other aquatic life, (b) improved breeding grounds for mosquitoes and other nuisance species and disease vectors, (c) impeded navigation and swimming, (d) clogging of electro-mechanical equipment at dams, and (e) increased water loss from some reservoirs.
Pollution control and pre-impoundment selective forest clearing will make reservoirs less conducive to aquatic weed growth. Physical removal or containment of floating aquatic weeds is effective but imposes a high and recurrent expense for large reservoirs. Where compatible with other objectives (power generation, fish survival, etc.), occasional drawdown of reservoir water levels may be used to kill aquatic weeds. Chemical poisoning of weeds or related insect pests requires much environmental caution and is usually best avoided.
Impacts on forest resources: The assessment of risk and impacts took place at three scales: for the reservoir area, for a “Zone of Influence” (ZoI) surrounding each dam site and for the wider area beyond this zone (within 20km radius). GIS analysis was used to calculate land area and forest affected by large and medium sized hydropower projects in PDP VII. These projects are either in construction or investment preparation phse. The table below provides more details about these projects.

148
Dam and lake (ha)
Forest area in Zone of Influence
A L
uoi-N
ot
Bac
Me
Ban
Cha
t D
ak M
i 1
Dak
Mi 4
D
ong
Nai
2
Don
g N
ai 5
H
oi X
uan
Hua
Na
Huo
i Qua
ng
Khe
Bo
Lai
Cha
u N
am
Na
Nho
Q
ue 3
So
ng B
ung
2 So
ng B
ung
4
Song
Bun
g 5
Srep
ok 4
Tr
ung
Son
Upp
er K
on T
um
Vin
h So
n II
T
otal
land
are
a
Natural forest managed for timber
Immature/regenerating forest Natural forest Vegetation Grassland/shrubland/rocky mountain
Perennial cropland
Annual cropland
Other land
Wetland and water surface
15, 24,7 2,95 38, 18, 5,7 17, 4,0 14, 9,1 1,0 37,0 6,82 3,1 26, 17, 4,5 4,4 18, 49,3 14,
862 09 4 988 191 04 713 08 387 33 66 46 9 93 302 088 40 93 890 65 497
1,2 28,0 16,9 7,0 4,5 11, 1,6 8,6 10, 2,7 67,7 18,8 5,7 2,8 40 2,6 4,1 30,4 4,3 14 71 32 78 919 75 917 00 48 521 45 98 99 55 92 774 7 18 46 26 05
1,64 2,4 18, 14, 1,4 9,6 4,2 3,99 1,0 39, 7,5 4,01
0 5 106 03 0 300 910 26 17 348 08 3 0 37 62 120 0 734 05 7 0
1,2 1,80 6,2 1,1 7,9 1,5 4,33 2,86 32 8,5 2,73 85 321 0 26 55 453 132 32 620 476 47 5 9 221 0 0 9 12 42 7 865
13, 70,4 62,0 20, 17, 5,2 1,4 13, 8,2 49, 13, 167, 73,6 62, 24, 5,8 1,1 8,3 25, 18,9 13,
619 65 24 463 843 80 11 857 03 829 177 092 42 055 562 61 06 09 908 14 257
5,6 3,2 0 244 35 392 0 0 17 0 0 11 320 0 0 0 0 0 0 39 0 711 218
7,54 2,60 5,4 4,4 33, 5,9 1,9 10, 2,9 19,8 9,04 10, 4,0 1,5 2,0 15, 8,4 3,42
0 5 2 63 27 323 33 24 899 417 89 83 4 054 25 98 94 280 02 2 834
4,63 21,8 1,1 1,1 5,0 1,00 1,6 2,2 0 7 38 317 0 69 489 63 71 43 103 8 667 862 168 0 0 88 72 364 312
1,01 1,03 1,2 2,40 1,3 43 1,0
0 0 1 148 0 0 172 958 339 01 636 9 924 42 0 9 3 40 859 269 929
0 837 15 7 0 0 2 0 2 19 0 0 0 0 0 39 0 0 192 14 10
Total land area in 31, 139, 109, 81, 42, 67, 58, 32, 43, 86, 26, 303, 112, 83, 59, 25, 8,9 76, 76, 110, 35, zone of influence 981 484 336 486 536 704 295 868 886 997 790 565 874 520 012 489 09 413 716 240 226
321,1
08
213,8 87
109,1
97
37,38 4
609,0
82
10,78 6
143,6
59
36,77 9
12,43
3
1,130
1,494,
315

151
Reservoir area: assessment includes recently completed projects and projects that are either under construction or will soon be under construction. The total area that will be submerged in the 21 schemes is 25,133 ha, including 4,227 ha of natural forests, 1,367 ha of plantations, 5,961 ha of agricultural land, 737 ha of residential land and 12,810 ha of grasslands, bare land and other non-productive land.
Total forest value lost, including timber value lost and payment for environmental services, is estimated at about 72.4 million US dollars. The basis for this estimation is the value of each type of forest specified in an assessment of forest classification by the Vietnam Forest Science Institute. Detailed calculations of the value loss of each hydropower project are included in Appendix 2.
The main risks have been assessed as being where increased population and reduced forest resources would result in unsustainable pressure on remaining forests. The main risks have been assessed as being where increased population, urbanization, road development and reduced forest resources would result in increased pressure on remaining forests. The risk of unsustainable pressure is assessed using existing data through a combination of per capita forest area and the significance of forest products in local livelihoods. The analysis suggests that 11 schemes have a risk of unsustainable pressure on forests, with the risk being severe in 4 schemes (see Appendix 2). It is also obvious that impacts and risks of a single project are a lot lower than a series of projects in the same area.
Environmental risks in the ZoI are assessed in relation to three factors: changes to forest area and quality, impacts on river ecosystems and biodiversity impacts. The first two factors are estimated in relation to resource values, using valuation studies and estimates of the roles of forests and rivers in local livelihoods.
The biodiversity impacts are assessed in relation to two main variables: the existence of endangered and/or indigenous species in the ZoI and the proportion of Key Biodiversity Areas or Protected Areas that fall within the different ZoI. The analysis suggests that there are 10 sites where the risk of damage to biodiversity resources is significant, with a recommendation for the establishment of protected areas where they do not exist and the preparation of a biodiversity action plan as part of the planning of these schemes.
In certain cases, these potential impacts on areas of great biodiversity significance are such that serious consideration should be given on whether to continue to develop the scheme. For examples: (1) the construction of A Vuong hydropower project resulted in 943 ha of old forest lost to the reservoir area; (2) the proposed development of Dak Mi 1 hydropower scheme would impact upon over 23,000 ha (48% of the total area) of Ngoc Linh, a key biodiversity area of international significance. This area contains large areas of intact evergreen forests of great value and is the habitat of tigers, deer, muntjacs and rare endemic birds; (3) the Dong Nai hydropower scheme will impact over 19,000 ha of Cat Tien protected area, an area also subject to potential fragmentation from transmission lines. Cat Tien again has unique and international biodiversity significance, being the home of the lesser one-horned rhinoceros, the Asian elephant, Siamese crocodile and many rare bird species; (4) the Upper Kon Tum and Sre pok 4 hydropwer project will also have high level of impact on biodiversity. Upper Kon Tum will affect 62,446 ha of Kon Plong national park and Sre pok 4 will affect 20,472 ha of Chu M’lanh – Yok Don national park

152
and 7,446 ha of Cu Jut forest. The cancellation of these schemes with great biodiversity impacts should be given serious consideration where their development has not already commenced.
Further studies show that small hydropower projects have big impacts on forest ecology systems. There have not been detailed research and statistics about the area of forest lost to one specific type of power development, such as hydropower development, in Vietnam. However, opinions voiced by a number of experts and local administrators that “investors only set up hydropower projects so that they have access to logging” ring an alarming bell. These small hydropower projects are usually in sensitive areas of high biodiversity significance.
According to statictics from the Quang Nam provincial Department of Environment and Natural Resources, four new hydropower projects have just been implemented that resulted in the loss of 4,000 ha of forest and another 6,000 ha was logged for infrastructure and transmission line development. If all the hydropower projects that have been approved in Quang Nam are implemented the impacts will be immesurable. Below are some examples of forest areas lost to small hydropower projects:
Ha Nang hydropower project of 11 MW station capacity is located in Tra Bong district. The construction of the reservoir of this project will result in the loss of 36.15 ha of natural forest.
Dak Ru hydropower project of only 7.5 MW station capacity resulted in the loss of hundreds of hectares of forest on the sides of the Dak Ru Stream, which were logged during the construction of a dam and a canal system of more than 5 km long. The investor of this project used the fact that Dak Ru is a small stream with small water flow to justify this construction.
Dak Po Ko hydropower project (in Tan Canh and Po Ko commune, Dak To district, Kontum province) has a capacity of 15 MW. The reservoir filling will destroy 117.2 ha of natural forest, agricultural and industrial crops.
Forest clearing for hydropower projects is still happening although it is stated in the regulation that the area of forest lost to a hydropower project needs to be re-planted in another area of comparable size.
Cost of Damages to Forest and Biodiversity
Cost of damages to forest and biodiversity is calculated for all projects that remain in the plan. This cost is actually the cost of operating community-based forest management schemes as a mitigation measure. The cost to implement this mitigation measure for 11 projects in the plan (see list of projects in Appendix 3) is calculated based on a new government decree (Decree 99/2010/ND-CP dated 24 September 2010 regarding payment for environmental services). This new national decree decree will apply a charge of 20 VND/kWh to act as a payment for environmental services in the watershed of hydropower schemes in relation to soil conservation and water regulation.
These charges reflect environmental services that have to date been treated as externalities. This will not be the case in future and such charges, which will provide incentives for upstream resource owners to manage their lands sustainably, need to be reflected in the assessment of the costs and benefits of hydropower development. The charge levels have been applied to the

153
planned generation levels from hydropower for each year of the PDP VII period (2011 to 2030). The levels of PES income generated are significant: starting at US$ 41,182,000 in 2011 and rising rapidly over the next decade (during which there will be significant expansion of hydropower generating capacity) to reach US$ 71,152,000 by 2021 and more-or-less stabilizing thereafter to be US$71,535,000 in 2030 (see detailed calculation in Appendix 2). This represents a cost to the power sector, which will presumably be passed on to consumers in the tariff structure, but a major development benefit to the upstream forest resource owners, who are often poor, often ethnic minorities and almost invariably living in remote locations where opportunities for cash income are restricted. That an additional $40-70 million dollars a year will be passed on to these communities from the PES charges to the hydropower sector is a significant cost to hydropower (as a former externality that is now internalized by national decree) but a positive development benefit to the population of the areas in which the dams are constructed and operated.
Figure 3.1. Inundation & Zone of Influence Figure 3.2. Inundation & Zone of Influence Dong Nai 2 Hydropower Projects in Central Vietnam

154
!"#$%"#$ "&'$()"$*+)$,- &($.') &$/ %$ $$
0) &$1 &($/ &($ $ 234$
$$ $ $ $
!"#$%&'&'%()#*%#* +%,-%,)#*% #$%$ #*%. /%0 %1#%2 .%34%,-%5$6%78 %&%$
Figure 3.3. Inundation & Zone of Influence – Bac Me and Nho Que 3

153
Figure 3.4. HPP with High Risk of Significant Biodiversity Impacts

154
3.3.1.2. Thermal Power and Nuclear Power Impacts on Forest and Biodiversity Resources
Thermal power plants usually do not have many direct impacts on forest and biodiversity resources. However, most big thermal power plants are located near rivers and in coastal areas. Thermal power stations require very large quantities of cooling water for their thermal powers, with temperature increases of 7-8oC when the water are released. The main impacts are the effects of temperature change to river ecology or seawater along the coast through the decrease of oxygen, changes in the habitat of aquatic species that leads to ecological imbalance in the basin, or most seriously loss of rare and valueable aquatic species due to sudden changes in the habitat.
The operation of thermal power plants can have significant impacts on the surrounding environment. These impacts are variable and site-specific in most cases. For example, the Van Phong 1 coal-fired plant is planned for construction near the Van Phong gulf, an area of high biodiversity value that includes the habitat of two critically endangered species listed in the Red Book and seven reptile species that are potentially endangered. Similarly, the Mong Duong 2 coal-fired power station will affect 3.3 ha of mangroves and is likely to affect valuable marine habitats, including habitats of seahorses and other rare species. Similar site-specific impacts were recorded in several cases. In many other cases, no such local environmental impacts were detected.
These local environmental impacts are often associated with the effects of cooling water. Thermal power stations require very large quantities of waters for their cooling towers, with temperature increases of several degrees when the waters are released. According to the forecast figures for the period between 2011 and 2015, power productivity will increase to 15, 365MW in 2015, to 32,385 MW in 2020 and to 77,160 MW in 2030. As the required amount of cooling water for 1MW is at about 100-120m3/h, the total demand for cooling water is estimated as follows:
Between 2011 and 2015: 100 – 120 m3/h x 15,365 MW = 1,536,500 – 1,843,800 m3/h Between 2016 and 2020: 100 – 120 m3/h x 32,385 MW = 3,238,500 – 3,886,200 m3/h. By 2030: 100 – 120 m3/h x 77,160MW = 7,716,000 – 9,259,200m3/h
Particular care needs to be taken when planning and selecting the site of thermal power plants to (a) ensure that the quantities of water used will not disrupt local hydrological conditions and (b) avoid locations where cooling waters will be released close to or affecting areas of high ecological and biodiversity value or sensitivity: especially areas such as mangroves and coral reefs that are extremely sensitive to water temperature changes. The coastal location of many thermal power plants means that this is a particularly sensitive issue: something reflected in a number of the EIA reports that were examined.
It is necessary to assess the cumulative effects of cooling water of several power stations located near each other or in one river basin in the process of detailed planning and designing each power station. This should be done within the framework of river basin planning which is proposed to most river basins in Vietnam.
According to statistics, cooling water from big power stations (capacity of about 2,400 MW), increases temperature of sea water within 10 km2 from the coast by 1oC, and within 5 km2 from

155
the coast by 2oC. The size of affected area varies depending on the station capacity, the weather, and seasonal and tidal conditions. The scale and level of environmental impacts of each thermal power project will be assessed during the project implementation phase in the environmental impact assessment to be executed by the thermal power plants.
Nuclear power uses extremely high levels of cooling water. The physical separation of these cooling waters from any radioactive materials means that there is unlikely to be any radioactive contamination unless an accident occurs, but the high volume of water used (70m3/second/generation unit) and the high temperature increase (typically around 7oC) means that potential local environmental impacts on wetlands, coral reefs, sea grass beds, mangroves, spawning grounds, etc., can be significant.
3.3.1.3. Transmission Line Impacts on Forest and Biodiversity Resources
The calculation of forest area and area of high biodiversity significance affected by the development of new transmission lines was done using GIS. This calculation was based on the Transmission Line Regulation issued with Decree 106/2005/ND-CP dated 17 August 2005 and instructions of the Law on Power Grid Safety Corridors, which specify a 45 meter clearance track for 500kV lines and a 25 meter clearance track for 220kV lines.
The results show that 14,103 ha of forest will be cleared for the construction of the new transmission lines, with over 9,149 ha cleared for the 500kv lines and 4,954 ha cleared for the 220kv lines. The quality and value of these forests varies greatly, both in their inherent value and in the level of human interference. The areas to be cleared have been grouped into four categories as defined by Forest Science Institute: rich, average, poor and regenerating forests. The area to be cleared includes 7,739 ha of rich forest, 2,542 ha of medium forest, 1,445 ha of poor forest and 2,378 ha of regenerating forest.
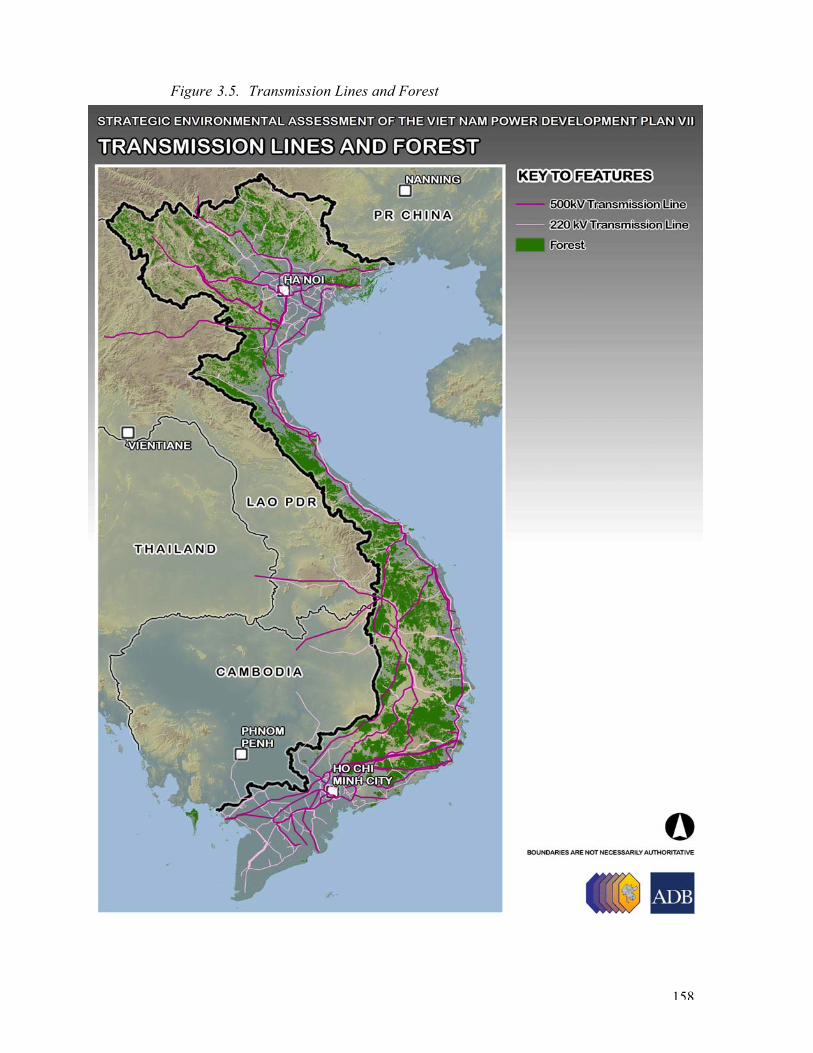
158
Figure 3.5. Transmission Lines and Forest
!"#$%"#$ "&'$()"$*+)$,- &($.') &$/ %$ $$
0) &$1 &($/ &($ $ 234$
!"#$%&'('%%) #% %$*#$%+,#-%./0 #%123%4$ 3%5*6%787%78#$%9 #-%%
$

158
!"#$%"#$ "&'$()"$*+)$,- &($.') &$/ %$ $$
0) &$1 &($/ &($ $ 234$
$
!"#$%&'('%) #% %$*#$%+,#-%./0 #% "%1/,%2$/%3 4%45% ,%6 #-%7"#$%$ 4%4,8%%5)"$,- $% 6$%"%$/# )$- &($ %$,7&'$,#"&$8 6$,-9&$()"$,- $%"%$,)9:$%': &$ "&'$()"$% 6$0) &$1(')9&$% :$;<=$&(') >$% $,' $&' $?6:@$()"$,- $A $( $B,7&'$()"$,- $A $, &($,- $/ &(C$AD$&(: &$,D)$&(:E9&$
Figure 3.6. Transmission Lines and Biodiversity Values
The assessment of the economic value of the forest cover lost to the transmission line tracks was based on valuation data from the Forest Science Institute of Viet Nam, which include data about timber product, non-timber forest product and other ecological effects such as soil protection, water regulation and carbon absorption.

158
The value of the forest to be cleared in the whole country during the construction of the transmission lines in PDP VII are set out in the table below. The total resource value of the forests cleared would be around 4,350 billion VND, the equivalent of approximately US$218 million. Of course, some of these values can be recouped if the timber cleared during construction is sold but this nonetheless represents a major loss of resource values associated with the construction of the transmission lines.

159
Table 3.6. Values of Forests Cleared in Transmission Line Construction
Forest Type Timber Values Ecosystems Services Values (million VND) Category Hectares Million
VND/ha Total Value
(million VND) NTFP* Soil
Protection Water
Regulation Carbon
Sequestration Total ES
Value
Total Values (million VND)
Rich 7,739 270 2,089395 18,573 45,657 136,792 916,239 1,121,940 3,211,335 Medium 2,542 150 381,225 6,099 13,979 35,327 220,094 275,499 656,724 Poor 1,445 65 93,925 3,468 7,515 16,762 101,584 129,328 223,253 Regenerating 2,378 40 95,100 5,706 11,650 18,307 127,197 162,860 257,960 Total 14,103 2,659,645** 33,848 78,800 207,368 1,365,113 1,689,626*** 4,349,271****
* Non-Timber Forest Products **equates to US$133 million *** equates to US$85 million **** equates to US$218 million

160
The construction of transmission lines also results in loss of ecosystem service value in areas of high tourism potential such as national parks and conservation areas. If the transmission lines pass through these areas there will be amendity value impacts, which leads to loss of local livelihood and income. Furthermore, the transmission line route will open forest areas up to further encroachment and degradation of the forests. Although impossible to quantify, these are significant threats to forest resource values attributable to the construction of the transmission lines through forest areas.
The transmission lines in PDP VII sometimes will pass through protected areas (Pas) and key biodiversity areas (KBAs). It is necessary to identify which transmission lines will pass through conservation areas and areas of high biodiversity interest and determine the area of forest lost to these transmission lines.
The results (see Appendix 4) show that the transmission lines in PDP VII will pass through a total of 59 Pas and 39 KBAs, with 3,387 ha cleared in Pas and 2,297 ha in KBAs. This represents only a small fraction of the total area of these two categories of land of particular biodiversity and ecological significance (less than 0.5% of the total of each category), but it is significant in another way. The ecological value and viability of these sensitive areas can be seriously compromised when they are fragmented: divided into a number of different areas where the habitats of sensitive species are divided up with a risk of their becoming non-viable.
The extent of fragmentation varies greatly, with many areas having one division within them but others being divided into several fragments. For example, Na Hang protected area will be divided into 5 fragments, as will Yen Tu, Vinh Cuu and others. The integrity of these most severely affected areas could be seriously compromised. In some cases, the impact of the transmission lines in terms of area cleared and, in particular, fragmentation is further compounded by the fact that these areas will also be affected by the development of hydropower schemes in their vicinity. For example, the 500 kV transmission line through Cat Tien national part will result in the loss of 200 ha and the park will be divided into at least 4 fragments as shown in the figure below.
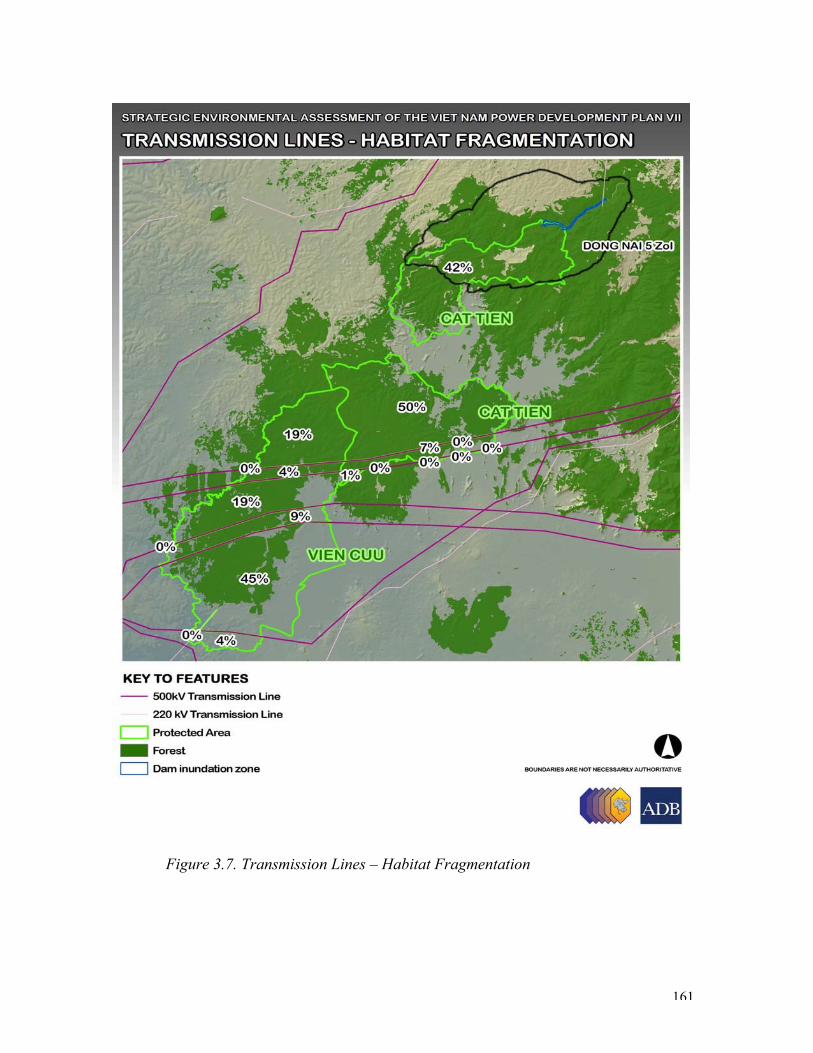
161
Figure 3.7. Transmission Lines – Habitat Fragmentation

162
The figure above shows how the transmission lines 550 kV and 220 kV divide Cat Tien national park. It also shows that this area will also be impacted by hydropower development from Dong Nai 4 and Dong Nai 5 dams. The forest area will be affected by the construction of dams in Dong nai 4 and Dong Nai 5 (the zone of influence of which will affect 19,092 ha, 24% of the Park’s total area). Cat Tien is an example of an area of extremely high ecological significance of international importance, as it is the habitat of the Lesser One-Horned Rhinoceros, the Asian Elephant, the Gaur, Orange-Necked Partridge, the Siamese Crocodile and other species of great biodiversity significance. Similarly, Ngoc Linh Nature Reserve will lose around 80 ha and will be divided into at least two fragments. It will also be seriously compromised by the development of Dak Mi 1 hydropower scheme, with 23,061 ha, 48% of the Reserve’s total area falling in to Dak Mi’s zone of influence. Ngoc Linh is the habitat for a variety sensitive and rare species of birds, mammals and reptiles, including several in the Red Book of endangered species.
The construction of transmission lines as presented in PDP VII will consequently have significant ecological and resource value impacts. These in turn will have economic consequences in terms of the loss of ecosystems services values and negative local livelihood and amenity value impacts. There are also negative aesthetic impacts wherever the lines are constructed, including through rural areas where the land cover loss is small but the visual impact can be great. These impacts are again impossible to quantify but are nonetheless significant and need to be assessed.
The extension of the transmission grid is vital to the future development of the power supply system in Viet Nam and there are both technical and economic restrictions that limit the extent to which the negative impacts itemized above can be mitigated.
3.3.2. Changes to Hydrological Regimes, Integrated Water Resource Management, and Salt Water Intrusion.
Altering the natural flows of rivers and streams and storing water in reservoirs to regulate the flows to serve different human interests including hydropower development have many potential impacts on flow mechanism, water quality and flow load.
Part of this problem is inappropriate use of water resources. Big thermal power and nucluear power plants use an enormous amount of water. The fact that these plants are located in areas of limited surface water resources, such as Binh Dinh and Ninh Thuan, only makes the problem worse.
Below are results of detailed research on this type of impacts.
3.3.2.1. Changes to Downstream Hydrological Regimes
Major downstream hydrological changes can affect riparian ecosystems dependent on periodic natural flooding, exacerbate water pollution during low flow periods and increase saltwater intrusion near river mouths. Reduced sediment and nutrient loads downstream of dams can increase river-edge and coastal erosion and damage the biological and economic productivity of rivers and estuaries. Induced desiccation of rivers below dams (when the water is diverted to another portion of the river or to a different river) kills fish and other fauna and flora dependent on the river; it can also damage agriculture and human water supplies.

163
According to International Center for Environmental Management (ICEM), reservoir filling of Song Bung 4 (490 million m3) will result in downstream desiccation and a lack of water for production. The construction of too many dams upstream will also lead to salt water intrusion at the river mouth and loss of nutrition load in the South China Sea.
There are two types of project that uses water: (1) project that uses most of the input water; and (2) project that releases the water after use.
Type 1 includes irrigation, domestic water supply and hydropower development projects. In these projects, the water volume downstream of dams is much less because water stored in the dams is used up and not released back to rivers.
An Khe – Kat Nat hydropower plant by Electricity Vietnam (EVN) is an example of how this type of project can affect the environment. The plant has a capacity of 160 MW and has been affecting the downstream of Ba river basin. The construction was finished in September 2010 in Gia Lai province with the minimum environmental flow of 4m3/s. In the plant design, instead of being released back to the river after running the turbines, the water is channeled through a several kilometer long pipeline system through the mountains to Ko River in Binh Dinh province where the generators are located. This means death to a segment of Ba River of about 50km from An Khe district capital to Kong Choro district. Thousands of local residents who used to rely on water from this river for their domestic and productive water supply have lost their water source and now are faced with serious pollution.
Ba River is about 374 km long, flowing North-South from Kon Plong district in Kon Tum province through KBang, An Khe, Dak Po, Kong Chro, Ia Pa, and Ayun Pa in Gia Lai province to the South China Sea in Da Dien, Phu Yen province. When the An Khe – Na Kat hydropower plant was completed in September 2010 and started storing water for power production in June 2011, it disrupted the flow of Ba River and caused a lot of trouble for local people. There is no longer water flow in downstream Ba River but only wastewater discharges from the An Khe sugar factory, Ve Yu cassava factory, and a MDF factory.
The An Khe water supply facility now has gone out of operation because the water ran out. As a consequence, thousands of households in An Khe town have no access to domestic water supply. Most local people had to dig wells for drinking water. The dried out river is now a waste dump full of dead cattle and fish. The pollution in this section of the river is becoming more and more serious.
Local residents of An Khe, Dak Po and Hinh River Basin area have made many complaints to local governments and to the An Khe – Ka Nat Hydropower Company. The company only releases water from the reservoir occationally to “help out”. Their response to local pressure was that local people need to make “a proposal specifying how much water is needed for local domestic water supply, agricultural and industrial activities for them to make a plan for water release to avoid wasteful release of the water”.
The Dak Mi 4 hydropower project also caused conflicts over the use of water. According to the plan designed by IDICO, the water is taken from upsteam Vu Gia River and released to Thu Bon River. This resulted in the dry-out of downstream Vu Gia River where it passes through Da Nang

164
province, affecting thousands of hectares of cropland and 1.7 million river basin residents living in the north of Quang Nam and Da Nang province. The Ministry of Commerce has recommended the government to instruct IDICO to build a pipeline system to run water back to Vu Gia River at the rate of 8 m3/second. The government of Da Nang City was not happy with this low rate. The Ministry of Environment and Natural Resources then advised the Government that water should be returned at the rate of 25 m3/second. However, to date, the government of Da Nang City is still not happy with this recommendation and asking for all the water to be released to Vu Gia River after being used in Dak Mi 4 hydropower project.
Type 2 are hydropower plants located downstream of dams or next to dams. These hydropower plants do not affect the overall or seasonal downstream water flows. There might be some difference at different times of the day or of the month (or between day and night, within a year, within a few years) depending on the water regulation schedule. One example of a hydropower project of this type is the Xayaburi dam in the meanstream Mekong River. This is a project that involves many countries. Vietnam might be the country that is affected the most.
The Xayaburi hydropower station is built, it will only operate during high demand hours (for 7-8 hours). For the rest of the time, water will refill the dam’s resevoir and only a small amount of water will flow downstream. This can potentially cause many disavantages for downstream countries including Vietnam for the following reasons:
+ Low water flow at river mouth will increase salt intrusion in the Mekong River Delta. This will pose a serious threat especially in the context of climate change and rising sea level.
+ Downstream riparian ecosystem can be severely destroyed by the big differences in river flows in one day when the flow is manually regulated on daily basis.
+ A dam can potentially have serious impacts on the ecological health of a river and domestic as well as economic activities of local residents who rely on products and services made available by the river.
The presence of a new dam can cause significant changes to river ecology hundreds of kilometers downstream due to changes in water flow (in both volume flow rate and time), water chemical properties, physical structure of the river bed and river basin, and the hydrological connectivity between upstream and downstream water and between the river and its basin. Chemical and physical changes to the river often lead to ecological changes, notably the loss of high economic value fauna and flora that local residents use as food, construction materials, and effects on other entertainment, tourism and cultural purposes.
While only 40 to 80 million people were relocated globally as the result of dam construction, millions have suffered from the degradation of downstream river ecology.
These adverse impacts can be minimized through careful management of water releases. Objectives to consider in optimizing water releases from the turbines include adequate downstream water supply for riparian ecosystems, reservoir and downstream fish survival, reservoir and downstream water quality, aquatic weed and disease vector control, irrigation and other human uses of water, downstream flood protection, recreation (such as whitewater boating), and, of course, power generation.

165
From an ecological standpoint, the ideal water release pattern would closely mimic the natural flooding regime. Dams that generate baseload electricity are typically more capable of replicating near-natural downstream flows than those that produce peaking power (where daily water releases may fluctuate sharply, often to the detriment of aquatic organisms that are adapted to less frequent flow changes). Environmental management plans for hydropower projects should specify environmental water releases, including for dams owned or operated by the private sector.
Figure 3.8. Water Release Regime Ensuring Environmental Flow
3.3.2.2. Assessment of Impacts on Water Resource and Integrated Water Resource Management
Environmental impacts on water resource are likely to happen when a series of hydropower plants is planned in a river basin. The SEA of impacts on water resources of hydropower projects in PDP VII mainly focuses on the likelihood of changes to hydrological regimes in river basins in which hydropower plants are planned to be built. The basis of the assessment presented here is the hydrological modelling undertaken by the Institute for Water Resources Planning using the MIKE Basin model (with support from the ADB). Supply-demand balances for the years 2015 and 2025 were calculated for the ten river basins in which hydropower schemes are planned in the scenarios analysed in the SEA of PDP VI. The results are as follows:
Of these ten river basins, five have only one scheme planned: the Ca RB (Khe Bo scheme), Huong RB (A Luoi scheme), San Se RB (Upper Kon Tum scheme), Srepok RB (Srepok 4 scheme) and Kone RB (Vinh Son II scheme). These are mostly smaller schemes and their overall impacts on the basins in which they are planned for would be small in terms of changes to hydrological flows. Together, these five schemes represent only 5% of the total additions to storage capacity of the 21 schemes that are planned for development after 2010 and considered in the scenarios. The hydrological modelling showed that the hydropower schemes will make only marginal differences to river flows and storage capacities in these basins, including where (such as in the Srepok river basin) there are predicted future problems in meeting dry season water demands. Other solutions

166
to these likely deficits will need to be found, including the construction of additional storage capacities where appropriate.
The remaining five basins have at least two planned schemes: the Da river basin with four schemes, the Lo Gam river basin with two schemes, the Ma-Chu river basin with three schemes, the Vu Gia-Thu Bon river basin with five schemes and the Dong Nai river basin with two schemes. The impacts of the planned hydropower schemes on hydrological flows are more significant in these basins as briefly discussed below.
The four schemes in the Da RB (which feeds into the Red River in northern Viet Nam, see Map 4-1) include Lai Chau (1,215 million m3) and Ban Chat (2,138 million m3) which, between them, represent over 43% of the total changes to storage capacity of the 21 planned schemes. The impact of the schemes on the Da RB will be significant, both reducing wet season flood peaks (for example, the flood peak at Pa Vinh will be reduced by 10%) and adding some 145 m3/second to dry season flows. Although there are not at present any concerns over drought conditions in this river basin, further ensuring the security of dry season flows is potentially valuable.
Figure 3.9: Planned Hydropower Schemes in the Da River Basin

167
89
Figure 4-9: !
!
"!
#!
$!
%!
&!
'!
(!
)!*+,-./01234
$5,6
7/8 92: ;/0 <=0 ;/> 7?8 7?@ <?1 A2= B-C DEF *2-
;E8C.
G/C20 H/@/8-2 /C *EI8AC02/4 EJ K.? L+F20 H/,+8 M2/0 #!#&
G/C20 *24/8N,
O8J@EI
!"#$!%&'!()*++$,!-.#$/$-!0+!%#$!1'23*/!45-6!5*.!7$!*+,!8#'!9:$!;6!0+!%#$!<$=>!+'=%#!'?!@0$%!8*/6!*=$!0+!*+!*=$*!&#$=$!%#$!(='-($.%-!'?!-%=:.%:=*)!,=>!-$*-'+!&*%$=!,$?0.0%-!*=$!<$=>!-$=0':-! 0?! %#$=$! *=$! +'%! 0+%$=<$+%0'+-! %'! 0+.=$*-$! -%'=*A$! .*(*.0%>! *+,! =$A:)*%$! ?)'&-B! ! "#$!#>,=')'A0.*)! /',$))0+A! -:AA$-%! %#*%! %#$-$! ,$?0.0%-! &0))! C$.'/$! *.:%$! C>! DEDF! &0%#':%!0+%$=<$+%0'+-6! *??$.%0+A! ,'&+-%=$*/! &*%$=! :-$=-! *+,! G$'(*=,0-0+A! $+<0='+/$+%*)! ?)'&-! %'!,'&+-%=$*/! $.'->-%$/-B! ! 5*.! 7$! H>,='('&$=! I='G$.%! &0))! .'+%=0C:%$! %'6! C:%! +'%! C$!-:??0.0$+%6!*,,=$--0+A!%#0-!(='C)$/B!
"#$!%#=$$!-.#$/$-!()*++$,!?'=!%#$!7*!J!K:!C*-0+-!L"=:+A!M'+6!H'0!N:*+!*+,!H:*!8*O6!'+!%#$!C'=,$=!C$%&$$+!+'=%#$=+!*+,!.$+%=*)!@0$%!8*/6!&0))!#*<$!*!%'%*)!-%'=*A$!.*(*.0%>!'?!'<$=!PEE!/0))0'+!/;6! �.#! 0-! *! -0A+0?0.*+%! */':+%! '+! *! =0<$=! ->-%$/! '?! %#0-! -0Q$B! ! "#$=$! 0-! *%!(=$-$+%!+'!&*%$=!-#'=%*A$!0+!%#0-!*=$*!C:%!%#$!/',$))0+A!(=$,0.%$,!*!,$?0.0%!0+!%#$!,=>!-$*-'+!C>!DEDF!0?!%#$!*,,0%0'+*)!-%'=*A$!.*(*.0%>!0+!%#$!#>,='('&$=!-.#$/$-!0-!+'%!.'+-%=:.%$,B!!R-!%#$! ?0A:=$! *C'<$! -#'&-6! %#$-$! ('%$+%0*)! -#'=%*A$-! &':),! G:-%! *C':%! C$! *,,=$--$,! C>! %#$!.'+-%=:.%0'+!'?!%#$!#>,='('&$=!-.#$/$-B!
"#$!?0<$!-.#$/$-!LM'+A!5:+A!D6!M'+A!5:+A!S6!-'+A!5:+A!F6!T*U!70!V!*+,!T*U!70SO!()*++$,!?'=!%#$!@:!30*!J!"#:!5'+!C*-0+!&':),6!0?!.'+-%=:.%$,6!(='<0,$!*+!*,,0%0'+*)!V6S;S!/0))0'+!/;!-%'=*A$!.*(*.0%>!0+!*+!*=$*!%#*%!0-!)0U$)>!%'!$W($=0$+.$!-$<$=$!,=>!-$*-'+!&*%$=!-#'=%*A$-!0+!%#$!+$*=!?:%:=$B! !"#$!/',$)0+A!(=$,0.%$,!*!PEX!(='C*C0)0%>!'?!-0A+0?0.*+%!&*%$=!-#'=%*A$-!0+!%#$!)'&$=!=$*.#$-!'?!%#$!C*-0+!0+!%#$!?0<$!/'+%#-!R(=0)!J!R:A:-%6!*%!*+!*<$=*A$!%'%*)!)$<$)!'?!DYY!/0))0'+!/;!?'=!%#0-!($=0',!0?!%#$=$!0-!+'!*,,0%0'+*)!-%'=*A$!.*(*.0%>!C:0)%!0+!%#$!C*-0+B!!"#$!?0<$!-.#$/$-!&':),!#*<$! %#$!('%$+%0*)! %'! (='<0,$! *+! *,,0%0'+*)! DVZ!/;! ?'=! %#0-! ($=0',6!/$$%0+A!/'-%!C:%!+'%!*))!'?!%#$!(=$,0.%$,!,$?0.0%6!if!%#$!=$-$=<'0=-!*=$!/*+*A$,!%'!/*W0/0Q$!,=>!-$*-'+!?)'&-B! !"#$! =$/*0+0+A!,$?0.0%! .':),!C$!/$%! 0?! $W0-%0+A!#>,='('&$=! -.#$/$-! LR!@:'+A! *+,!M'+A! "=*+#! DO! *=$!/*+*A$,! %'! =$A:)*%$! %#$0=! =$)$*-$! ,0-.#*=A$-! 0+! *+! *((='(=0*%$!/*++$=B!!"#$=$! 0-! .'+-$[:$+%)>! )0%%)$! ,':C%! %#*%! %#$! #>,='('&$=! -.#$/$-! 0+! %#$!@:!30*! J! "#:!5'+!C*-0+!&0))!#*<$!*!-0A+0?0.*+%!0/(*.%!'+!%#$!#>,=')'A>!'?!%#$!*=$*B!!"#$!(=$.0-$!+*%:=$!'?!%#0-!0/(*.%!0-!.'+%0+A$+%!:('+!%#$!/*+*A$/$+%!=$A0/$!0/()$/$+%$,!0+!%#$!=$-$=<'0=-!'?!%#$-$!?0<$!#>,='('&$=!-.#$/$-B!
"#$!%&'!-.#$/$-!()*++$,!?'=!%#$!T'+A!8*0!C*-0+6!T'+A!8*0!D!*+,!T'+A!8*0!F6!*=$!%'!C$!C:0)%!0+!'+$!'?!%#$!/'-%!0+%$+-0<$)>!,$<$)'($,!(*=%-!'?!@0$%!8*/6!&0%#!%#$!T'+A!8*0!40<$=!?$$,0+A!
Figure 3.10: Water Balance at Downstream of Chu River Basin
The two planned schemes in the Lo-Gam RBs, Bac Me and Nho Que 3, in the very north of Viet Nam, are in an area where the prospects of structural dry season water deficits are very serious if there are not interventions to increase storage capacity and regulate flows. The hydrological modelling suggests that these deficits will become acute by 2025 without interventions, affecting downstream water users and jeopardising environmental flows to downstream ecosystems. Bac Me Hydropower Project will contribute to, but not be sufficient, addressing this problem.
The three schemes planned for the Ma – Cu basins (Trung Son, Hoi Xuan and Hua Na), on the border between northern and central Viet Nam, will have a total storage capacity of over 900 million m3, which is a significant amount on a river system of this size. There is at present no water shortage in this area but the modelling predicted a deficit in the dry season by 2025 if the additional storage capacity in the hydropower schemes is not constructed. As the figure above shows, these potential shortages would just about be addressed by the construction of the hydropower schemes.
The five schemes (Song Bung 2, Song Bung 4, song Bung 5, Dak Mi 1 and Dak Mi 4) planned for the Vu Gia – Thu Bon basin would, if constructed, provide an additional 1,434 million m3
storage capacity in an area that is likely to experience severe dry season water shortages in the near future. The modelling predicted a 90% probability of significant water shortages in the lower reaches of the basin in the five months April – August, at an average total level of 277 million m3
for this period if there is no additional storage capacity built in the basin. The five schemes would have the potential to provide an additional 218 m3
for this period, meeting most but not all of the predicted deficit, if the reservoirs are managed to maximize dry season flows. The remaining deficit could be met if existing hydropower schemes (A Vuong and Song Tranh 2) are managed to regulate their release discharges in an appropriate manner. There is consequently little doubt that the hydropower schemes in the Vu Gia – Thu Bon basin will have a significant impact on the hydrology of the area. The precise nature of this impact is contingent upon the management regime implemented in the reservoirs of these five hydropower schemes.
168
The three schemes planned for the Dong Nai basin, Dong Nai 2, Dong Nai 5, and Dong Nai 6 are to be built in one of the most intensively developed parts of Viet Nam, with the Dong Nai River feeding into the Ho Chi Minh City region with its dense collection of industry, intensive agriculture and human settlements. This area is not likely to suffer from water shortages in the future. The model predicts that inflows in this area will exceed demand by several times in 2025 even during the dry season but will start to decrease by 2030. The impact of the two hydropower schemes on the hydrology of this river basin will be marginal.
The above paragraphs provide an overview of the likely impacts of the 21 hydropower schemes on the hydrology of the nine river basins in which they are planned to be built. The impact will be significant, in terms of overall and seasonal water flows, in a few basins and marginal in the rest. To what extent will these changes in hydrology be reflected in significant impacts on the economies and human development of the different basins? These effects are assessed here, firstly through the consideration of changes in dry season water availability and then through a discussion of potential impacts on the incidence of floods in the different basins.
The data on storage capacities, dry season supply changes and flood control capacities were derived from the modeling exercise. The data on irrigated area, crop yields and economic values for crops were derived using average national figures in 2008. This is based on the assumption that all of the additional dry season water flows are used for irrigated paddy rice production, and that average yields are achieved in the areas irrigated. The figured consequently represent a theoretical maximum, not a likely outcome. But balanced against this is the consideration that using the water for irrigated agriculture represents a low economic value use of water and it is possible that some of the water would be used for higher value forms of production (including activities such as vegetable production and aquaculture in the agricultural sector as well as non-agricultural activities).
As such, the figures do provide a robust indication of the potential economic impact of changes to dry season water flows if and when the reservoir discharge regimes are managed to take these potential non-power benefits into account (though of course the total value cannot be attributed to changed water management alone, as there are other costs of production such construction and operation & maintenance that need to be taken into account). This, of course, represents a further qualification to the analysis presented here, as at present most hydropower reservoirs are managed for power generation purposes only and the potential non-power benefits are not sufficiently recognized. As analysis presented in 3.3.2.1 shows shows, such benefits are far from insignificant. It should however be noted that any changes in the reservoir operation to carter for other water users could imply decreased energy production and thus less power benefits.
At the moment when all 21 schemes are being built, is of course when the highest impacts would be found. The improvements to dry season water flows in this scenario would allow over 25,000 extra hectares to be irrigated, producing a yield of over 150,000 tonnes of rice and generating an income of over $90 million (using March 2008 prices16) per year. This additional income would benefit many thousands of farming families throughout the country. Given that, at the time of writing, the world is experiencing a rice shortage and rapidly rising prices, and that such problems are predicted to intensify in the future, the economic and food security benefits of improved dry
16 Rice price updates by Food and Agriculture Organization (FAO): www.fao.org/es/esc/en/15/70

169
season water availability are likely to be even more significant than the figures presented above.
The data presented here translates these figures into an economic value that can be taken as a minimum. If dry season water deficits impacts beyond irrigated agriculture, into human consumption, industrial production or the maintenance of ecosystems integrity, then the social, economic and environmental impacts would be even higher.
The planned hydropower schemes also have potential flood control benefits in a number of river basins. The data available does not permit a calculation of the economic significance of these potential flood control benefits (data on the economic losses from flooding is almost non-existent in Viet Nam and by their very nature floods are unpredictable so calculating the reduction of risk is itself an inherently risky business). It is possible to provide some indicative analysis on the potential scale of such benefits.
Floods in the wet season are a concern in the Red River system, with at present Hanoi vulnerable to 500 and 1000 year return flood events and many rural areas experiencing inundations on a regular basis. There is an extensive and long-standing system of flood control measures in the lower Red River, but these are not effective against all floods and future uncertainties over the impact of climate change mean that there is a risk that such system failures will increase in the future. Upstream reservoirs, if managed effectively, can significantly improve the prospects of water levels remaining below the water levels of the existing dyke systems. The modeling of water flows in Da and Lo-Gam river basins suggests that the risks of downstream floods would be significantly reduced, with Hanoi no longer at risk from 500 and 1000 year return events and water levels staying below dyke design levels in most years for most of the lower Red River area. Such potential benefits cannot be quantified but are of major significance.
There are also potentially significant flood control benefits in the lower Vu Gia-Thu Bon basin. The total flood storage capacity of the reservoirs would be over 1 billion m3, about 20% of the total designed flood volumes at a frequency of 10% at Ai Nghia and Giao Thuy if all the schemes were built in this basin. This translates to a reduction of between 0.7 and 1 metre in maximum inundation depths in the lower basin, which is in itself significant but does not provide anything close to full flood protection as there are still maximum potential inundation depths of between 2 and 3 metres in some places. As such, flood risks will be reduced but will still be significant in this river basin.
Taken together, the impacts of the altered hydrology of the ten river basins in which it is planned to build hydropower schemes are extremely significant if, and this must be stressed, the resultant reservoirs are managed so as to maximize multi-purpose benefits. Potential increases in dry season water flows could generate additional income for thousands of families and improve national food security. Apart from calculating the costs of air pollution, the assessment also makes suggestions to improvement of water supply in river basins in dry season (not by individual project but by each base scenario alternative). The value is estimated based on the assumption that all of the additional dry season water flows are used for irrigated agricultural production (according to forecasts, there will not be any problem in minimum environmental flows in all river basins). Increases in irrigated agricultural production area will be calculated based on the round up of annual average figures. Increases in additional crop yield and economic value of crop yield will be calculated based on average annual crop yield figures. The result shows an increase in annual economic value

170
of crop yield at about $92 million.
If taking into account the potential flood control benefits it is certain that the overall benefits of hydropower development projects of PDP VII in terms of water resources are very high. It is not possible to calculate the economic significance of the potential flood control benefits using the existing data. However, there is a methodology to do this calculation if data to be gathered in the future permit.
This reflects, firstly, widespread concerns over the future availability and quality of water when PDP VII is implemented. Secondly, it reflects the awareness that existing hydropower schemes have had a substantial effect on the hydrological regime. These concerns were compounded by the existing management regime of hydro reservoirs, which are not generally managed with multi-purpose objectives as a specific intent but only with the power production objective. The extent to which this has an impact on other sectors at the present time is hard to calculate, but as the analysis below shows the potential benefits of multi-purpose management are significant.
Thermal power development also has impacts on water resources. However there has been no detailed calculation or specific study on the subject in all research reports and designs of thermal power development projects that provides a view on impacts on water resources of thermal power plants located in river basins. In reality, thermal power plants have certain impacts on water resources and these impacts can be quite significant. Thermal power generation is different from hydropower generation. Thermal plants use circulating water from a cooling tower or once-through water from a river for cooling purposes and also use water for other productive activities in the station. According to the forecast scenario, water demand in thermal power development projects is quite significant, as showed below:
Between 2011 and 2015: 0.5 m3/h x 15,365 MW = 7,682.5 m3/h Between 2016 and 2020: 0.5 m3/h x 32,385 MW =16,192.5 m3/h. By 2030: 0.5 m3/h x 77,160MW = 38,580 m3/h
The pressure on water resources will be significant considering how water resources are becoming more and more rare. The fact that big power plants using large amount of water will affect the use of water by families residing in the lower river basin areas and increase salt water intrusion, which have big impacts on human living and production activities as well as the ecosystems of rivers. Some projects take large amounts of water for cooling purpose from one river and release the water into another river, which affects the hydrology of both river basins.
As studies show and evident by the recent floods, Vietnam is facing a wide range of challenges related to water supply and water resource management in meeting future water demand in an efficient and sustainable manner. These challenges include increasing water shortages in many river basins during dry season, widespread vulnerability to floods (especially in the central and southern parts of the country), degrading water quality as the result of increasing pollutant loads from a variety of sources (i.e. industry, agriculture and human settlements), concerns over the widespread degradation of aquatic ecosystem quality, and major uncertainties over the future impacts of climate change on the water resources of Viet Nam. The Water Sector Review and the Rural Water Supply and Sanitation Review identified the link between access to water resources and poverty reduction. These reviews pointed out a number of specific issues in relation to the

171
impacts of hydropower on water resources. These issues are: (a) poor integration of hydropower development into the overall water resource management system; (b) low level of attention of other sectors and other nations to the design and management of dams and reservoirs, especially dams and reservoirs in rivers that flow through several countries like the Mekong River; (c) low level of participation and lack of attention to social and environmental impacts (something this SEA intended to fix); and (d) limited knowledge about the impacts of changes to hydrological regimes (including inter-basin impacts) on the overall water resource.
It is worth noting that these concerns relate as much or more to the process of planning, implementation and management of hydropower schemes than any inherent effects of hydropower. In other words, most of these concerns could be addressed if and when hydropower is more effectively integrated into the overall water resources management system and, in particular, when the needs and concerns of other sectors (including the environment) are taken into account in the planning and design of schemes and the management of reservoirs. A specific intention of the National Water Resources Strategy is to ensure the integrated planning of water resources within river basins, but this has been hampered in Viet Nam by a lack of specific legislation.
3.3.3. Changes to Environmental Elements
3.3.3.1. Deterioration of Water Quality
a. Hydropower Impacts:
The damming of rivers can cause serious water quality deterioration, due to the reduced oxygenation and dilution of pollutants by relatively stagnant reservoirs (compared to fast- flowing rivers), flooding of biomass (especially forests) and resulting underwater decay, and/or reservoir stratification (where deeper lake waters lack oxygen). Where poor water quality would result from the decay of flooded biomass, selective forest clearing within the impoundment area should be completed before reservoir filling.
Downstream flow is often reduced as the result of reservoir management. When the flow is reduced, the ability of a river to dissolve wastewater discharges from nearby factories is also reduced. This results in deterioration of water quality. Good examples of this phenomenon are the An Khe – Kanak project in Gia Lai and the Dak Mi 4.
b. Thermal Power Impacts Wastewater discharges from thermal power plants carry variable amounts of pollutants depending on the types of thermal plant. Wastewater discharges from thermal power plants if not properly treated tend to cause serious pollution to surface water. Even when treated, wastewater discharges to a river can still cause pollution if the discharges exceed the permitted level.
Standard use of water in thermal power plant is 0.5m3/h, which means the future demand for water for thermal power development will be:
Between 2011 and 2015: 0.5 m3/h x 15,365 MW = 7682.5 m3/h Between 2016 and 2020: 0.5 m3/h x 32,385 MW =16,192.5 m3/h. By 2030: 0.5 m3/h x 77,160MW = 38,580 m3/h
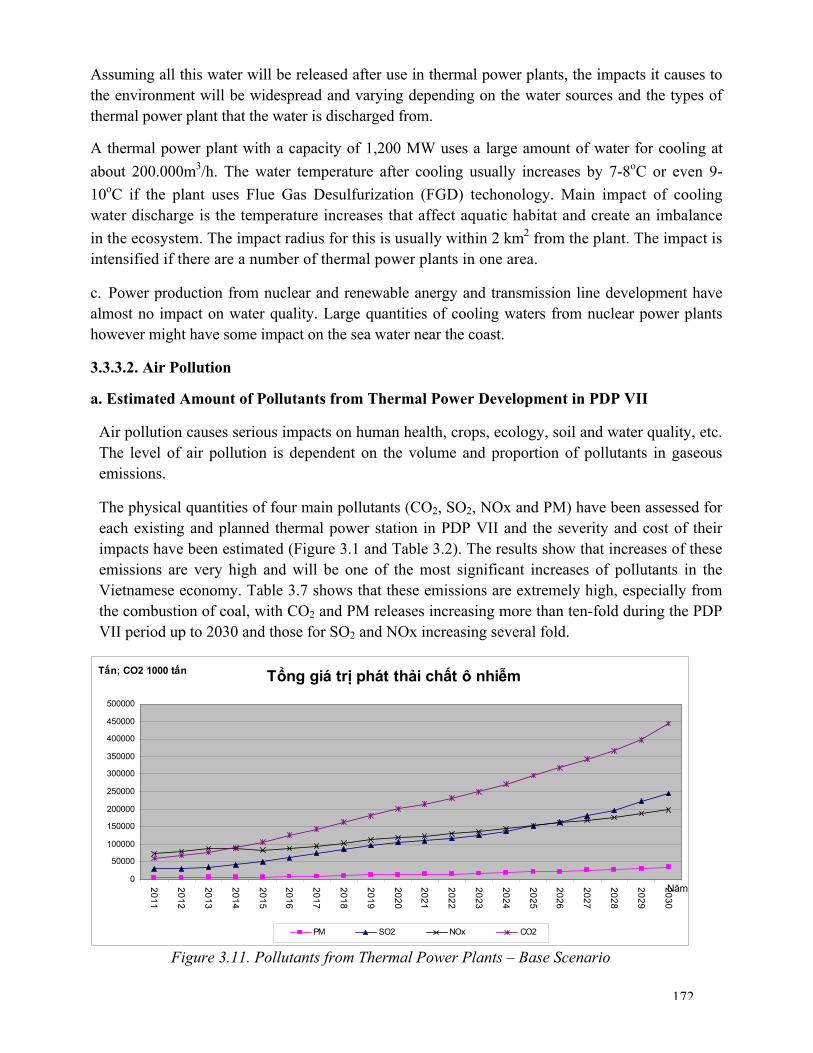
172
Assuming all this water will be released after use in thermal power plants, the impacts it causes to the environment will be widespread and varying depending on the water sources and the types of thermal power plant that the water is discharged from.
A thermal power plant with a capacity of 1,200 MW uses a large amount of water for cooling at about 200.000m3/h. The water temperature after cooling usually increases by 7-8oC or even 9-10oC if the plant uses Flue Gas Desulfurization (FGD) techonology. Main impact of cooling water discharge is the temperature increases that affect aquatic habitat and create an imbalance in the ecosystem. The impact radius for this is usually within 2 km2 from the plant. The impact is intensified if there are a number of thermal power plants in one area.
c. Power production from nuclear and renewable anergy and transmission line development have almost no impact on water quality. Large quantities of cooling waters from nuclear power plants however might have some impact on the sea water near the coast.
3.3.3.2. Air Pollution
a. Estimated Amount of Pollutants from Thermal Power Development in PDP VII
Air pollution causes serious impacts on human health, crops, ecology, soil and water quality, etc. The level of air pollution is dependent on the volume and proportion of pollutants in gaseous emissions.
The physical quantities of four main pollutants (CO2, SO2, NOx and PM) have been assessed for each existing and planned thermal power station in PDP VII and the severity and cost of their impacts have been estimated (Figure 3.1 and Table 3.2). The results show that increases of these emissions are very high and will be one of the most significant increases of pollutants in the Vietnamese economy. Table 3.7 shows that these emissions are extremely high, especially from the combustion of coal, with CO2 and PM releases increasing more than ten-fold during the PDP VII period up to 2030 and those for SO2 and NOx increasing several fold.
!"#$%"#$ "&'$()"$*+)$,- &($.') &$/ %$ $$
0) &$1 &($/ &($ $ 234$
5'6#$78 $099:$,' )$/ &($% ;$< &$%' ,$+$&') =$%'>&'$?.@A:$B@A:$1@C$DE$< )F$,-#&($G'H)$,' )$% ;$%"%$&'E$="I$&') ,$ ) &$ J$ %$,>&'$,#"&$DE$ "&'$()"$% $D )$%"%$&'E$="I$') &$%H$DE$%"%$&'E$="I$= )$& =$,-#&($KLI$'# %'M$* %$ $();$ , &($ , )$ / &($,' )$% &($&' $%')$N'>$ ,') ,$' )$=+)$,- &($% ;$%"%$,"%$ &($ H$ J$ %$O $<"#$?'P&'$4M2$DE$< &($4MAFM$$Q ,$KL $,>&'$,#"&$%'#$,' I$, %$ $();$, &($N'",$,' )$DE$,' )$/ &($%"%$/# )$G'>$+$&') =$/E$- ,$/ &$DE$R $/E$= ,$,-#&($&' &($&(L &$N'",$,' )$%' ,$+$&') =$, &($ "&($G $&' ,$,-#&($,#E&$& &$G)&'$, $0) ,$1;=M$! &($4M3$ J$%' $-S:$N'",$,' )$, $&'E$="I$&') ,$ ) &$,';&:$D )$/ &($.@A$DE$< )$();$, &($, )$,-T&$2U$/ &$, )$AU4U$,-#&($();)$ # &$78 $3$DE$();$, &($DE)$/ &$ )$D )$B@A$DE$1@CM$$$
! "#$#%&$'( $)*&'$'* %$+* '$,$"*% -
!
"!!!!
#!!!!!
#"!!!!
$!!!!!
$"!!!!
%!!!!!
%"!!!!
&!!!!!
&"!!!!
"!!!!!
$!##
$!#$
$!#%
$!#&
$!#"
$!#'
$!#(
$!#)
$!#*
$!$!
$!$#
$!$$
$!$%
$!$&
$!$"
$!$'
$!$(
$!$)
$!$*
$!%!
+ ,
! ".$/01$2333$' "
-. /0$ +01 20$
$!"#$%&'(('%)$*+%+$ ,%-$ +%.%#$, /%+ %-*-%#$0%/*1%#$, +% , #%2%3 -$%4 #%- %5 %%%6 #7%&'8'% -%+9#$%:$*+%+$ ,%+ %-*-%#$0%/*1%#$, +% , #%+$;<%= #7%#$,>#%?, @%%
1 =$ AU22$ AU2V AUAU AUAV$ AU4U5';&$ &$D W$, &$?.@AW$2UUU$, &F$
! )$ AUAXM2$ V3XAM2 2XUXYMX A242YMX$ 4XXZ2
B@A$ 42ZAVMX$ VUUVXMA 2UVXVYM2 2V2VZ2MZ$ AXZXXAMZ
1@C$ 4VAXUMZ$ XYZXAMY [U2A[MA 2UVAX[MY$ 2V2XA[
.@A$ A3Y3VMY$ 3AZ32MA 2V324YM[ A44XZ3MV$ 43YY4[M4
\ L$ $$ $$ $$ $$ $$
! )$ A33AMZ$ [UVMY UMYY UMYY$ UMYY
B@A$ [XMY$ AZMZ XMZA 3M2$ VM3
1@C$ X[X[$ 2AZ3 ZX A24$ 2A3
.@A$ A3XUM2$ 2A[[MA 2Z[MV AV[MZ$ AUZM4
Figure 3.11. Pollutants from Thermal Power Plants – Base Scenario
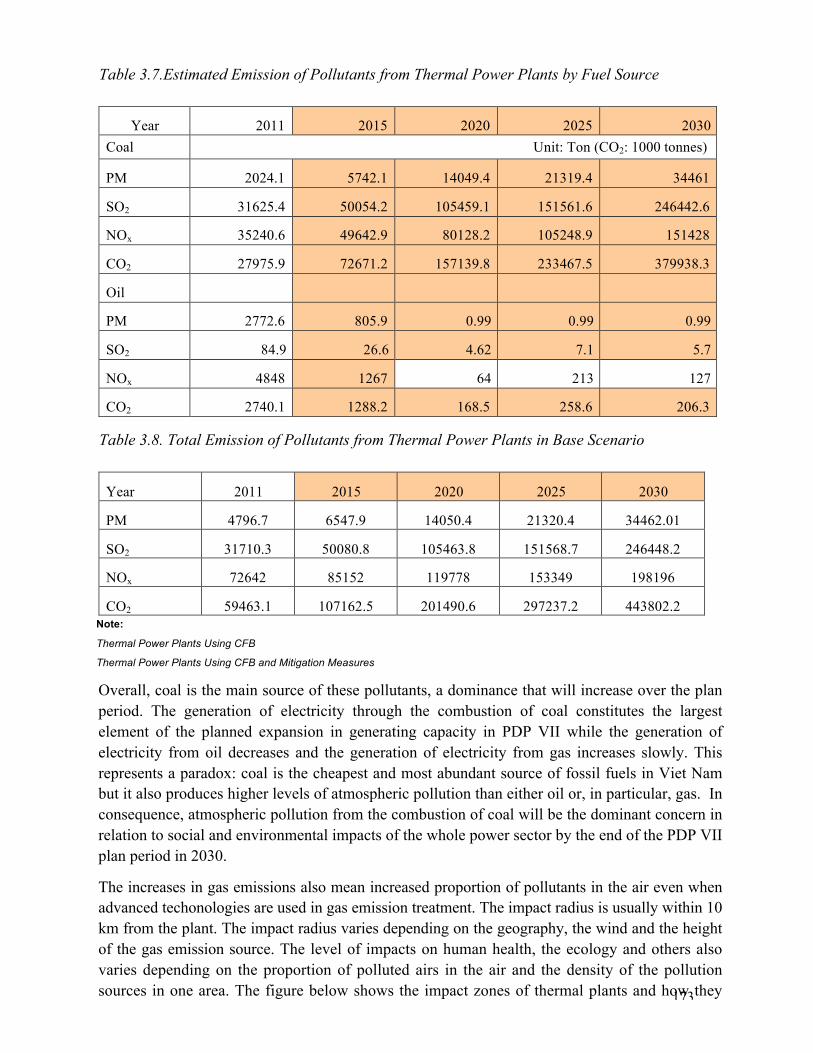
173
Table 3.7.Estimated Emission of Pollutants from Thermal Power Plants by Fuel Source
Year
2011
2015
2020
2025
2030 Coal Unit: Ton (CO2: 1000 tonnes)
PM
2024.1
5742.1
14049.4
21319.4
34461
SO2
31625.4
50054.2
105459.1
151561.6
246442.6
NOx
35240.6
49642.9
80128.2
105248.9
151428
CO2
27975.9
72671.2
157139.8
233467.5
379938.3
Oil
PM
2772.6
805.9
0.99
0.99
0.99
SO2
84.9
26.6
4.62
7.1
5.7
NOx
4848
1267
64
213
127
CO2
2740.1
1288.2
168.5
258.6
206.3
Table 3.8. Total Emission of Pollutants from Thermal Power Plants in Base Scenario
Year
2011
2015
2020
2025
2030
PM
4796.7
6547.9
14050.4
21320.4
34462.01
SO2
31710.3
50080.8
105463.8
151568.7
246448.2
NOx
72642
85152
119778
153349
198196
CO2
59463.1
107162.5
201490.6
297237.2
443802.2 Note:
Thermal Power Plants Using CFB
Thermal Power Plants Using CFB and Mitigation Measures
Overall, coal is the main source of these pollutants, a dominance that will increase over the plan period. The generation of electricity through the combustion of coal constitutes the largest element of the planned expansion in generating capacity in PDP VII while the generation of electricity from oil decreases and the generation of electricity from gas increases slowly. This represents a paradox: coal is the cheapest and most abundant source of fossil fuels in Viet Nam but it also produces higher levels of atmospheric pollution than either oil or, in particular, gas. In consequence, atmospheric pollution from the combustion of coal will be the dominant concern in relation to social and environmental impacts of the whole power sector by the end of the PDP VII plan period in 2030.
The increases in gas emissions also mean increased proportion of pollutants in the air even when advanced techonologies are used in gas emission treatment. The impact radius is usually within 10 km from the plant. The impact radius varies depending on the geography, the wind and the height of the gas emission source. The level of impacts on human health, the ecology and others also varies depending on the proportion of polluted airs in the air and the density of the pollution sources in one area. The figure below shows the impact zones of thermal plants and how they
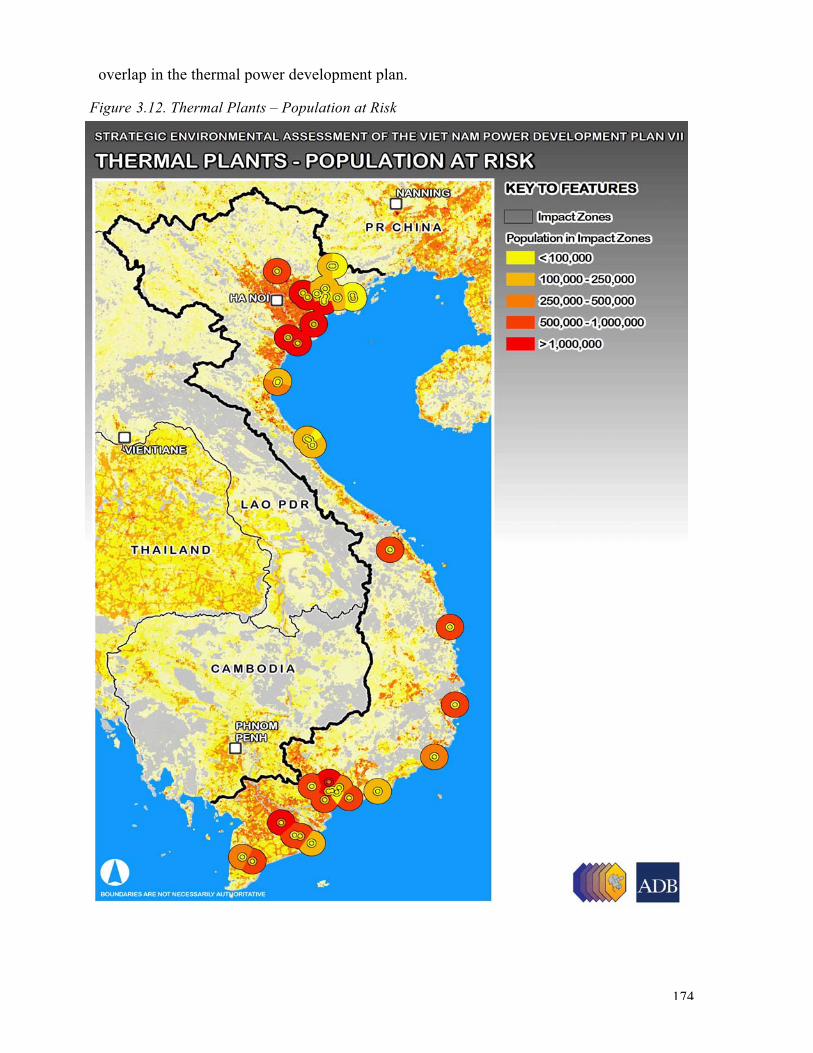
174
overlap in the thermal power development plan.
Figure 3.12. Thermal Plants – Population at Risk
!"#$%"#$ "&'$()"$*+)$,- &($.') &$/ %$ $$
0) &$1 &($/ &($ $ 234$
!"#$%&'()'%* +% %,-+% #.%/0%1 %+$ #.%.$23%/4#.%,-+% #.% %#$ #.%/4#.% +%567%$8 +$%#$9 6%: %-#%#$9 ,% 9 #%
$

175
Acidification: is the consequence of SO2 emissions. This is currently an important issue because it has been seen more and more in the South East Asian region, causing regional impacts on ecosystems a long way away from the emission sources. Many parts of Viet Nam suffer from the impacts of acidification, affecting both soil and water quality and impacting on freshwater aquatic ecosystems. According to acidification monitoring data of 20 monitoring stations (Institute of Science, Meteology, Hydrology and Environment), acid rain was most seen in the south eastern region, followed by Can Tho, Tay Ninh, Viet Tri, Vinh, Hue, Da Nang and Ca Mau. This has impacts on freshwater aquatic ecosystems. Under the base case scenario, SO2 releases increase from over 31 thousand tonnes in 2011 to over 246 thousand tonnes in 2030. Coal fired stations are the main source of these pollutants.
These ‘acid rain’ impacts are particularly felt by ecosystems that are highly dependent upon water and that are vulnerable to changes in the acidity of water inputs or sediments. These impacts can seriously affect crop yields, destroy microorganism, disrupt the food chain, and damage the integrity of the ecosystems. The most serious consequences might be loss of biodiversity due to the distinction of many species, and even worse, destruction of the entire ecosystem. The acidification of soils can also have an adverse impact on agricultural productivity and will require substantial chemical inputs to restore a suitable soil ph level, with high costs to farmers and the danger of further pollution associated with agro-chemical use.
Apart from that, acid rain also has impacts on the longevity and quality of instructures such as roads, train rails, bridges and drainage systems.
Estimated Cost of Air Pollution from Thermal Power Plants
All three impacts of air pollution from thermal power plants (climate change, acidification and human health) are significant. The calculation of cost associated with these impacts was based on international norms with appropriate adjustments to the Vietnamese context. The cost of impacts of electricity generation from coal is the highest and increasing. This cost is estimated at nearly US$9.7 billion, higher than the annual investment required for the electricity sector (US$7.8 billion). These figures are only indicative and therefore cannot be used in calculating project investment value as expected because there is no statistics available in Vietnam for this cost calculation.
This cost figure shows the reliance on coal in electricity production and that the social cost of impacts on the environment and human health contributes to the high cost of electricity in Vietnam. Similar cost of electricity production from oil and especially gas is considerably lower. Therefore it is not necessary to consider this cost for electricity production from oil and gas.

176
Table 3.8. Environmental Costs of Impacts on Human Health and Other Impacts
Year
2011
2015
2020
2025
2030 Coal Million USD
PM
41.71
118.34
289.55
439.38
710.22
SO2
93.52
148.01
311.84
448.16
728.72
NOx
113.59
160.02
258.28
339.25
488.10
CO2
57.19
1,485.5
3,212.1
4,772.4
7,766.5 Oil
PM
57.14
16.61
0.02
0.02
0.02
SO2
0.25
0.078
0.01
0.02
0.02
NOx
15.63
4.0841
0.21
0.69
0.41
CO2
56.0
26.33
3.4
5.3
4.2
Gas
NOx
104.93
110.37
127.60
154.36
150.34
CO2
587.6
678.7
903.2
1,298.2
1,301.2
Table 3.9. Total Environmental Costs for Each Pollutant
Unit: million USD
Year
2011
2015
2020
2025
2030
PM
98.86
134.95
289.57
439.40
710.24
SO2
93.77
148.09
311.85
448.18
728.74
NOx
234.15
274.48
386.09
494.30
638.86
CO2
1,215.5
2,190.5
4,118.7
6,075.9
9,071.9

177
!"#$%"#$ "&'$()"$*+)$,- &($.') &$/ %$ $$
0) &$1 &($/ &($ $ 234$
$
!"#$%&'(&'%)$*%+$,%+$-.%/*#$%01%2$,%.$ *%.')$5'6$,') ,$' )$7#$8 9$9:),$(;<$-9$/=$8 ,$5' &$&' $% 9$()"$,- $,') ,$' )$ >$ %$,6&'$,#"&?$% &$% $@=#$()"$,- $,') ,$' )$8+)$,- &($7#$%"%$%' ,$+$&') 8$%'6&'$(;<$-9$% 9$*9&A$1)/A#&$,'B %$0) &$*+)$ ,- &($C' <$ ) &$ ,-#&($D"#$%"#$EF)"$ ,- $ ,') ,$' )$@ $8+)$ ,- &($ ,-#&($%') &$ / %$&(=&'$& &($/ &($ $%"%$& %$,) B$@G&($A+&($*H$I+&(E$,6&'$%'#$J)K$ &'$' &($ &$A %$L' M$(;<$() 8$,B )$,' $@=$ &'$' &($ &$A %$L' M$7#$%"%$D &'$'+$' 5?$5' )NNN$/=8$()"&$ # &$,'B$&' 5O$J))K$%')$5'6$L'"8$%' 9$D &'$J)))K$,') ,$' )$8G9$8=&(O$J)@K$ &'$' &($ &$%"%$%+&($,-P&'$:;<$7 &($@=$9:),$'Q9$ ,$,-G&($/ 5N$.')$5'6$,') ,$' )$L)&'$, $7#$5'",$,' )$RST$JD9#$( 8$,"%$ &($, )$A %$L' M$ %$,-P&'$D=<$DH&$7 )K$ %$7 $ #"&$/=$, &($, $( &$UV$,-) B$WRX$@=#$& 8$TY22$, )$( &$3TU$,-) B$WRX$@=#$& 8$TYZY?$@=$A $9$:6,$'Q9$% &$5' )$ %$[B9&$,;8$&' $8 ,$ ,-#&($&' &($,'"%'$,' %$8+)$,- &($%'6&'$(;<$D )$+$&') 8$L'+&($L'6$7#$5'",$,-) &$&(=&'$ ) &$, )$0) ,$198N$
!"#$%&# '(# '#)*+#,- '(#./*'(#./0#12#3 '#45 ,# + '#/ ,#'/6'#
C"%$ &($ 7#$ 5'Q&($ : $ , $ [B"$ ,-P&'$ A &$ :B ,$ ) &$ ' ,$ &';&$ D ,$ &(B &$ , $ ()9)$ # &$ L'9)$ ,'"%$[B &(?$,B< &$[B &($@=$/=8$()=B$[B &($, )$%' $, #$&')H&$/) B$@=$ ,$&')H&$/) B$D &($5' &$ &($' ,$&';&$ $ ,'B$&') ,$5'",$ ) &N$."%$%+&($ # &$A9B$( 8$/ B$%' 9?$ ,")$%' $&')H&$ /) B$@=$: $ /\$%"%$%' ,$,' )$5'Q&($: $,- %$L')$ 9$%']&($@=#$8+)$,- &($8 ,$%"%'$9&$,#=&$% &($%Q$L' $& &($(;<$&'$' &($5'Q&($: N$$
$0) ,$198$8 )$%' $,' %$') &$%+&($ # &$A $7 &($&')H&$/) B$,-#&($/^$5' &$ &($' ,$&';&$ $5'",$) &$@=$/ B$() $: $/\$%' ,$,' )$5'Q&($: $, $A &$:B ,$ ) &N$0 &$ $8+)$,- &($%'6&'$/)H&$[B9&$ &$'# ,$ &($A &$:B ,$ ) &$, $/# )$'P&'$&=<$D9#$( 8$J)K$_&$,#=&$' ,$&';&$,-#&($[B"$,-P&'$A &$:B ,$) &$/=$8 ,$@ &$ $[B9&$,- &($'=&($ B$7#$&' &($,"%$ &($,-#&($,- &($' 5$A $% $% 9$&'=$8"<$) &$' ,$&';&$,' &($/ &$@=$&(')H8$,- &(O$J))K$`B &$/\$%' ,$,' )$5'Q&($: O$J)))K$C"%$ &($ &$' $A)&'$,'")$@=$ 9$7 &($A)&'$' %$ %$D) ,$@ $,-6$7 $"&$& 8$,-#&($@G&($ 8$% 9$L'B$D #$, &$[B %$()9$&])$%']9?$L'B$@ %$%Q$- &$A9&$'+$%Q$8 ,$ $%9#O$@=$J)@K$%"%$,"%$ &($ &$8+)$,- &($:>$' )$JA $' a&( )$7;&$5' )$7)$7 )$7;&$@=$,")$ &'$% ?$ &'$' &($ &$A %$L'# $% &($ &(?$A $ &($,'B &$% 9$&( )$7;&KN$$
!"#$%"&$'"# '$" #$()#$'* +,$-.$/ 0$1" 2
!"!!
#!!"!!
$!!"!!
%!!"!!
&!!"!!
'!!"!!
(!!"!!
)!!"!!
*!!"!!
+!!"!!
#!!!"!!$
$!## $!#$ $!#%$ $!#& $!#'$ $!#($ $!#) $!#* $!#+ $!$! $!$# $!$$ $!$% $!$& $!$' $!$( $!$) $!$* $!$+ $!%!,-.
3*# 4$5678$!9:$;<3*# 4$567
/0$ 12$ ,23 42$
Figure 3.13. Additional Costs of Gaseous Emissions: Costs of Environmental and Health Impacts
The economic cost of acid rain accounts for a very small proportion of environmental costs by main pollutants, as calculated in the “Valuation of Some Environmental Costs within the GMS Energy Sector Strategy” by Mans Nilson, the Stockholm Environment Institute. In this report, environmental costs account for: (i) impacts on health that lead to life expectancy loss and other health issues such as respiratory and lung problems, etc., that cause income loss; (ii) hospital costs; (iii) loss of crop yields; and (iv) impacts on the infrastructure and acidification of soil. The costs of SO2 emissions (including health impacts discussed below) are estimated to rise from nearly US$94 million in 2011 to nearly US$729 million in 2030. Acidification must be regarded as one of the main environmental challenges resultant from power generation in Viet Nam.
b. Air Pollution Caused by Nuclear Power Development
Radioactive accident of nuclear power development can occur in any stage of the full production chain from uranium exploration, mining, and enrichment to fuel production and fuel combustion by nuclear reactions to generate power. The post-power production stages including interim storage, reprocessing to waste treatment and safe waste disposal can also potentially cause radioactive accident.
Nuclear power production in Vietnam only involves power generation from nuclear reactors and storage and treatment of radioactive waste from electricity generation. Main environmental impacts from nuclear power production include: (i) nuclear safety during the power production process, which is extremely important because nuclear accidents are usually very serious; (ii) radioactive waste management; (iii) impacts on the ecology and biodiversity, especially from the nuclear power project located near Nui Chua national nature reserve and other projects that are located in areas with high coral reef density; and (iv) social impacts (number of families/local residents evacuated, resettlement, impacts on community health, consensus of local people)

178
Although adequate safeguards can be assumed for nuclear power projects, there is almost always some level of release of radioactive pollutants in atmospheric emissions. These can result in measurable increases in associated health problems such as thyroid cancer and cardiovascular diseases. The prefeasibility study for Ninh Thuan 1 and 2 Nuclear Power projects estimated that the impact radius for such risks is 2 km from the plant stack. But balanced against these must be the very high positive impact of nuclear power where it replaces thermal power as a generating source. The SEA estimates that the development of nuclear power in Viet Nam to a generation capacity of 4,000 MW will reduce CO2 emissions and other atmospheric pollutants by removing 12 million tons of CO2 a year from coal combustion. This reduction of CO2 emissions is comparable with the benefits from reduction of environmental impacts of thermo-power development such as acid rain and impacts on human health, which is estimated at US$ 245.3 million (it is not possible to estimate the benefits of climate change impact mitigation). This means that recognizing the potential risks of accidental releases of radioactive materials in nuclear power production has no bigger impacts than air pollution impacts of thermal power production. From 2016 Vietnam will have to import more than 50 million tonnes of coal every year to 120 million tonnes in 2030. This means Vietnam will be very dependent on prices and supply of fuel from other countries. Nuclear power development will help to reduce this risk.
c. Power Production from Renewable Energy
Power production from renewable energy is a form of “clean” power production. However it also has some environmental impacts that need to be considered and assessed such as (1) changes to landscape and architecture; (ii) downstream sedimentation and erosion; (iii) changes to land use structure.
3.3.4. Solid Waste and Toxic Waste
3.3.4.1. Solid Saste
The number of power development projects in the proposed scenario will produce the amount of solid waste as mentioned in section 2.2.2.4 of this report. Forecast shows that the total amount of waste of the electricity sector will increase by 1.5 million tonnes/month in 2030 (the electricity production will increase by 50 times).
Coal ash produced from the coal combustion process in thermal power plants accounts for the largest proportion of solid waste. Management of coal ash poses an increasingly serious problem in Vietnam. Coal ash contains a few lethal substances such as heavy metals, which can cause serious impacts on water resources and air pollution in waste dump areas if not managed properly. Effective planning and management of solid waste is getting more attention from the central and local goverments in Vietnam.
Considering the proportions of ash in domestic and imported coal are 23-25% and 16-17% respectively, the estimated of solid waste (coal ash) from thermal power production will be about 2.8 tonnes in 2011 and increase to between 15.6 and 16.8 tonnes in 2020 (higher than the estimated figure of 11.74 million tonnes in PDP VI) and to between 34.7 and 37.3 million tonnes in 2030. The amount of solid waste in 2020 will increase six folds compared with that in 2011. The land area required for managing solid waste will increase accordingly. Assuming that a thermal power plant with a capacity of 1,200 MW needs 55 ha of land for storing coal ash,
179
thermal power production will need 704 ha in 2011, 1,349 ha in 2020 and 3,215 ha in 2030 for coal ash storage. Most of this area will be taken from agricultural production land. Therefore, land area for agricultural production will decrease and the payments for environmental services (for water, soil and air pollution management) will increase.
There is currently no available data about the economic cost of solid waste. This is an issue that needs more attention, especially to studying international experiences in managing coal ash.
3.3.4.2. Toxic Waste
Toxic waste is currently not a big issue because the amount of toxic waste is not large but it will increase when the number of power plants increases. This is the kind of waste that is hard to manage as it has big impacts on the environment, ecology and human health.
Nuclear waste: one of the great unanswered questions associated with nuclear power development globally is what to do with the waste products. The risks associated with highly toxic materials with a half life measured in generations have not yet found a permanent solution. The most common international practice of nuclear waste disposal is interim storage. There are strict regulations regarding interim storage of nuclear waste are very strict from site selection to construction specification and management technologies. At the moment, Vietnam does not have any regulation or technical standard for interim storage of nuclear waste. Therefore, first step in nuclear power development in Vietnam should be preparation of an adequate legal framework for nuclear waste disposal.
The transportation of raw materials and waste products is also a significant issue, as the risks of accidental contamination are much higher during this process. The eventual decommissioning of nuclear power plants is also a critical step with high risks and high costs where large quantities of contaminated wastes are produced (contamination is found not only in the materials but also the physical structure of a nuclear power plant). The planned development of nuclear power in Viet Nam is some time into the future, but it is essential that a strategy for the disposal of radioactive waste products is developed, in particular looking for the radioactive waste disposal site.
3.3.5. Efficient Use of Natural Mineral Resources
The social economic development of Vietnam will no doubt exhaust the country’s natural resources. To achieve sustainable development, Vietnam needs to pay attention to maintaining and preserving natural resources through appropriate and efficient use of these resources.
In the past, Vietnam has been pursuing short-term benefits insteading of developing a long term vision regarding the use of natural resources. There is a lack of sectoral cooperation in the planning and management of natural resources that results in wasteful use of natural resources including coal, oil, gas, rock, limestone, water and forest resources.
To meet the goal of efficient use of natural resources, a scenario was proposed in PDP VII to achieve optimal and balanced use of natural resources. The scenario shows that from now until 2030, the electricity sector will consume a large quantity of fossil fuels of 188 x 106 tonnes of coal and 776-93 x 103 tonnes of oil.
All impacts of fossil fuels from exploration, supply to comsumption were taken into account in
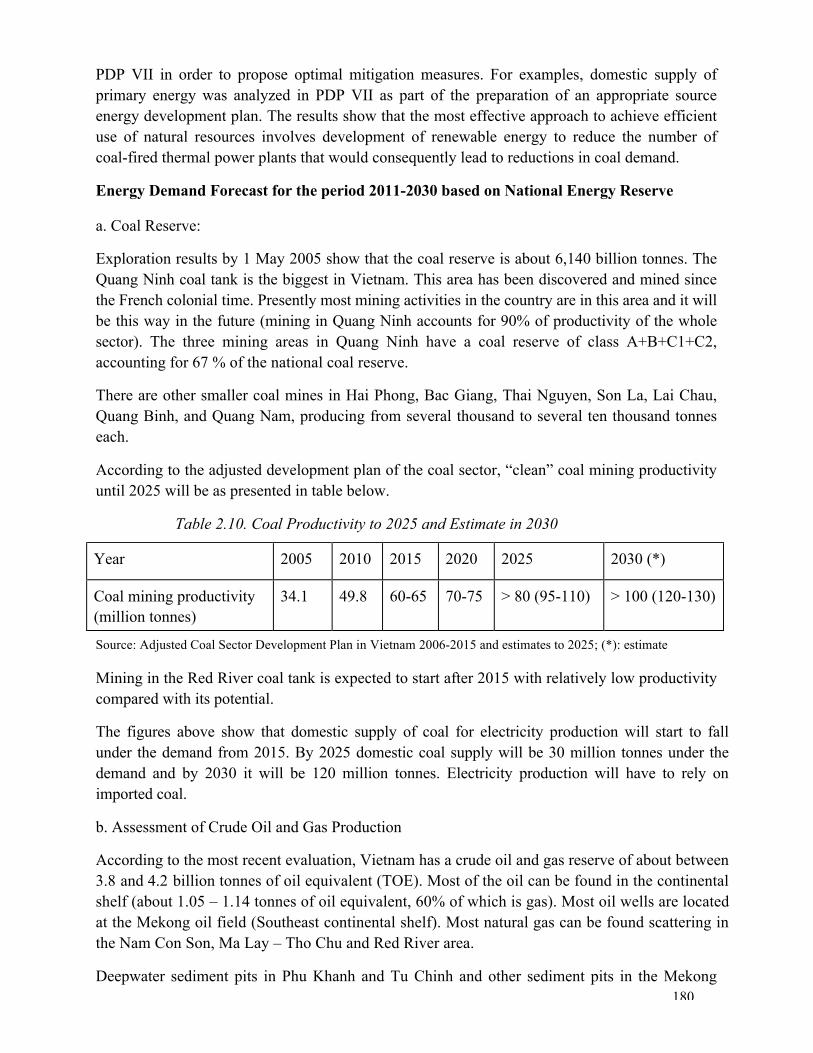
180
PDP VII in order to propose optimal mitigation measures. For examples, domestic supply of primary energy was analyzed in PDP VII as part of the preparation of an appropriate source energy development plan. The results show that the most effective approach to achieve efficient use of natural resources involves development of renewable energy to reduce the number of coal-fired thermal power plants that would consequently lead to reductions in coal demand.
Energy Demand Forecast for the period 2011-2030 based on National Energy Reserve
a. Coal Reserve:
Exploration results by 1 May 2005 show that the coal reserve is about 6,140 billion tonnes. The Quang Ninh coal tank is the biggest in Vietnam. This area has been discovered and mined since the French colonial time. Presently most mining activities in the country are in this area and it will be this way in the future (mining in Quang Ninh accounts for 90% of productivity of the whole sector). The three mining areas in Quang Ninh have a coal reserve of class A+B+C1+C2, accounting for 67 % of the national coal reserve.
There are other smaller coal mines in Hai Phong, Bac Giang, Thai Nguyen, Son La, Lai Chau, Quang Binh, and Quang Nam, producing from several thousand to several ten thousand tonnes each.
According to the adjusted development plan of the coal sector, “clean” coal mining productivity until 2025 will be as presented in table below.
Table 2.10. Coal Productivity to 2025 and Estimate in 2030
Year 2005 2010 2015 2020 2025 2030 (*)
Coal mining productivity (million tonnes)
34.1 49.8 60-65 70-75 > 80 (95-110) > 100 (120-130)
Source: Adjusted Coal Sector Development Plan in Vietnam 2006-2015 and estimates to 2025; (*): estimate
Mining in the Red River coal tank is expected to start after 2015 with relatively low productivity compared with its potential.
The figures above show that domestic supply of coal for electricity production will start to fall under the demand from 2015. By 2025 domestic coal supply will be 30 million tonnes under the demand and by 2030 it will be 120 million tonnes. Electricity production will have to rely on imported coal.
b. Assessment of Crude Oil and Gas Production
According to the most recent evaluation, Vietnam has a crude oil and gas reserve of about between 3.8 and 4.2 billion tonnes of oil equivalent (TOE). Most of the oil can be found in the continental shelf (about 1.05 – 1.14 tonnes of oil equivalent, 60% of which is gas). Most oil wells are located at the Mekong oil field (Southeast continental shelf). Most natural gas can be found scattering in the Nam Con Son, Ma Lay – Tho Chu and Red River area.
Deepwater sediment pits in Phu Khanh and Tu Chinh and other sediment pits in the Mekong

181
Delta and in the lowland area in Hanoi were assessed as having oil and gas potential but this has not been confirmed. Oil and gas potential of Vietnam is assessed as at medium level in South East Asia, which is lower than Indonesia and Malaysia but higher than the rest of the other countries.
According to the oil and gas sector development strategy, average raw oil production in Vietnam is at 19 million tonnes per year. Vietnam at the moment still imports 2-4 million tonnes of crude oil per year. In the base scenario and the high scenario, between 2010 and 2020, crude oil production in Vietnam will decrease to between 16 and 17 tonnes per annum and imported oil will be around 6 to 8 million tonnes per annum.
The table below presents forecast figures of crude oil production from now to 2025.
Table 2.11. Crude Oil Production Plan until 202517
Year 2005 2010 2015 2020 2025
Base PA (106 tonnes) 18.5 19.86 20.0 20.7 21.7
Domestic supply (106 tonnes) 18.5 19.16 17.0 16.3 16.2
Gas exploration is accelerating. According to the oil and gas sector development strategy, 10.7-18 billion m3 of oil can be harvested between 2021 and 2025. A plan for gas production is presented in the table below.
Table 2.12. Gas Production Plan until 202518
Year 2008 2010 2015 2020 2025
Base PA / High PA (billion m3) 7.12 7.98 13.16-13.36 14.8-20.3 10.7-18
Estimates for oil and gas production after 2025 will be at about 20 million tonnes of oil and 11 billion m3 of gas.
c. Assessment of Hydropower Potential
According to the assessment in the national research KHCN 09 “Development of Sustainable Energy Strategy and Policy”, Vietnam has a hydropower potential of 123 billion kWh, equivalent to a 31,000 MW station capacity. Taking into consideration the economic, social and environmental impacts, this figure should be at between 75 and 80 billion kWh, equivalent to 18.000-20.000 MW.
17 According to “Vietnam oil and gas sector development strategy until 2015 with direction to 2025”, 2008 18 According to “Vietnam oil and gas sector development strategy until 2015 with direction to 2025”, 2008

182
Table 2.13. Hydropower Potential in Vietnam
River Basin
Capacity (MW)
Productivity (TWh)
Density (MWh/km2)
( % )
1 Lo - Gam – Chay River 1,120 4.10 212 4.9 2 Da River 6,960 26.96 1,400 32.3
3 Ma River 890 3.37 74 4.0 4 Ca River 520 2.09 147 2.5 5 Vu Gia-Thu Bon River 1,360 5.10 475 6.1 6 Tra Khuc-Huong River 480 2.13 531 2.6 7 Ba River 670 2.7 150 3.2 8 Se San River 1,980 9.36 700 11.2
9 Srepok River 700 3.32 143 4.0 10 Dong Nai River 2,870 11.64 436 14.0
Total 10 River Basins chính
17,550 70.77 423 84.8 Nation-wide 20,560 83.42 250 10
0
The potential value of hydropower development in the 10 main river basins accounts for 85.9% of the nation-wide value. Potential hydropower production capcity of these river basins is 17,550 MW, equivalent to about 71 billion kWh, of which 9,056 MW will be produced in the North (51.6%), 5,598 MW will be produced in the Centre (31.9%), and 2,896 MW will be produced in the South (16.5%). By 2020, Vietnam is expected to produce up to 84% of its potential hydropower production, which is over 72 billion kWh.
A considerable part of hydropower production of Vietnam comes from small hydropower plants with capacity of less than 10 MW per plant. According to the most recent plans and assessments, potential capcity and productivity are estimated at over 4,000 MW and 16.4 billion kWh, respectively. However, some of the small hydropower plants are planned to be in locations far away from residential centres where the most electricity is consumed. These plants will not be in operation immediately but are included as part of the economic social development plan for the areas.
In 2007, the Japan International Cooperation Agency (JICA) in collaboration with Vietnamese experts completed a plan for pumped-storage hydropower development in Vietnam. This plan identified 10 locations suitable for pumped-storage hydropower development with station capacity of between 400 and 1000 MW each in all three regions in the country but mostly in the North. Estimated total capcity of pumped-storage hydropower is about over 10,000 MW.
d. Assessment of Renewable Energy Potential:
- Wind and solar energy
Vietnam has on the average between 200 and 2,500 hours of sun in a year with a high level of solar raditation of about between 100 and 175 Kcal/cm2 per annum. The cost of solar power development is very high at about 7,500-8,500 USD/kWp. In 2005, solar power production in Vietnam is at about 1,150 kWp. According to statistics from the Department of

183
Hydrometeorology, the annual average solar radiation is higher and more stable through out the year in the Central Highland, the Central Coast and the South than in the North of Vietnam. This means the cost of solar power development in the North will be higher than that in the South of Vietnam. Solar power systems in the North also need to have higher capacity to make up for the cloudy winter months.
As a tropical country with seasonal winds with more than 3,000 km of coastline, Vietnam is considered a country with wind energy potential. To date, there have been several studies about wind energy potential of Vietnam. The most recent study is the “Wind Energy for Electricity Production Plan” by EVN (2005-2006). According to this study, wind energy in Vietnam can potentially produce 1,785 MW of electricity, of which 880 MW can be produced in Quang Binh and Binh Dinh, and 855 MW can be produced in the southern part of the country, mostly from Ninh Thuan and Binh Thuan.
Although Vietnam has potential in terms of wind and solar energy, the practicality of power development using wind and solar energy is assessed as not high because areas with wind energy tend to have complicated landscape and the wind pattern can change dramatically even between day and night. This means the productivity of wind and solar energy equipment can be low. Study results show that electricity production from wind energy could only be at between 400 and 600 MW in 2025 if investment was made to develop power production from wind energy. Lessons from countries with experiences in power production using wind energy show that if the wind energy is unstable and seasonal the unit cost of electricity produced from wind energy will be much higher than from other forms of power production.
It is also very costly to produce solar power and to maintain solar energy equipment. Even in Japan, a country that imports more than 95% of the energy it consumes and a leading country in solar energy technology, only 465 MW of the electricity produced comes from solar energy. Therefore, it is very challenging for Vietnam to develop power production from renewable energy in large scale to balance out its reliance on other source energies in the future. Vietnam could capture a wind and solar energy level equivalent to about 494,000 tonnes of oil in 2030, 59% of which would be use for electricity generation and 41% will be used for consumption in commercial activities and residential areas.
- Biomass
There are many kinds of biomass in Vietnam that can be effectively used as fuels for power production. The two main types of biomass are fuel wood and waste product from agricultural crops. Vietnam has very big biomass resources: biomass of agricultural bi-product only is over 70 million tonnes, which is about nearly 20 million tonnes of oil equivalent. Assessment and analysis show that in short term large quantities of biomass should be used for power generation. The four main sources of biomass in Vietnam are rice husk from husking factories, bagasse from sugar factories, coffee bean husk from coffee factories (mainly from four provinces in the Central Highlands), and wood pellet from sawmilling factories. Total biomass resource in Vietnam can be up to 9.4 million tonnes of oil equivalent in 2030, of which 0.7 percent would be used for electricity generation.
Evaluation of Uranium Reserve and Uranium Mining Potential of Vietnam

184
The Vietnam Geology Federation 10 has been conducting studies about the uranium reserve in Vietnam. Their study results in December 2004 showed that the total uranium reserve in Vietnam was about 254,000 tonnes of triuranium oxtoxide (U3O8 ) of which the U3O8 content is higher than 0.015. Most uranium mines in Vietnam are quite small with low to very low uranium concentration. To date there has not been detailed and adequate evaluation of uranium availability in Vietnam.
From now until 2020, there needs to be proper uranium exploration and research to gather reliable data for the development of a plan for nuclear power development in Vietnam.
Fuel production for nuclear power development is a very complicated process which requires high technologies. Vietnam is unlikely to be in the position of producing fuel for nuclear power plants by 2020. However, it is necessary to have a plan so that in a few decades Vietnam can be a few steps closer to producing fuel for nuclear power plants.
Forecast of energy demand increase: According to the high economic growth scenario, energy demand in Vietnam will be 93/98 million TOE in 2020 and 165/188 million TOE in 2030.
According to the base scenario, energy consumption in 2020 will be 19.4% of coal, 37% of oil products, 26.9% of electricity, 1.5% of gas and 15.1% of renewable energy. Also in this scenario, in 2020, 38.1% of the energy will be consumed in the industry sector, 32.5% in home use and service sector, 27.1% in transportation, 0.9% in agriculture, and 0.8% in the energy-free sectors.
The table below gives details about energy demand forecast for each energy type in the three proposed scenarios.
Table 2.14. Energy Demand Forecast for the Period up to 2030 by Energy Type
Unit: million TOE
2015 2020 2025 2030 Year 2010
Base High Base High Base High Base High
Coal 9,547 13,607 13,897 17,997 18,873 23,608 25,812 29,974 34,197
Electricity 7,539 14,605 15,848 24,930 27,392 37,055 42,495 52,908 63,462
Oil product 15,770 23,472 23,904 34,434 35,855 48,231 51,939 66,959 74,753
Gas 654 1,006 1,030 1,419 1,495 1,968 2,173 2,593 3,007
Non-commercial energy
14,695 14,474 14,719 14,044 14,328 13,272 13,600 12,443 12,804
Total 48,205 67,163 69,398 92,824 97,943 124,134 136,018 164,877 188,223

185
The table below shows figures of commercial energy consumption per person in the period 2005-2030.
Table 2.15. Average commercial energy consumption per person
Year 2005 2008 2010 2020 2030
Average per person commercial energy consumption (kgoe/person/year) – (Base - High)
265
331
386
821-871
1488-1713
In 2010, the average commercial energy consumption per person in Vietnam is still lower than that in China in 1990, which is 408 kgoe/person/year. In 2020, the average commercial energy consumption per person in Vietnam will be 786 kgoe/person/year, same as that in China in 2010. In 2030, this figure in Vietnam will be 1,490 kgoe/person/year, same as that in Malaysia in 2005.
Energy demand forecast for Vietnam was done for the period between 2008 and 2030. The calculation is based on the type of energy and by economic sector.
The calculation of power demand as aboved has taken into account factors that might affect the energy demand in medium and long term such as changes to the economic structure, urbanization that shifts energy demand amongst people from one form to another, fast development in science and technology, and the shift in economic structure from traditional production such as steel, cement and fertilizer, etc., to “smokeless” industries such as information technology, microprocessing, biological industries and agriculture, etc., that contribute to reductions in energy demand.
Vietnam is currently at the early stage of industrialization and modernization in economic development. There are many economic sectors that are still under-developed. Energy consumption in Vietnam is also lower than in many other countries in the region. Therefore, energy demand forecast shows that during the period from now until 2015 energy demand will still increase and it will start decreasing after 2015.
Balancing national energy demand - supply
Based on the final energy demand forecast in the base scenario and evaluations of natural resources potential it is possible to see how much primary energy that comes from domestic supply and how much of the natural resource will be used in each period.

186
Table 2.16. Total Energy Demand and Primary Energy Supply in Base Scenario
Energy type 2010 2015 2020 2030 Unit
KTOE Unit
KTOE Unit
KTOE Unit
KTOE Primary energy demand
61123 91675 148786 256691
Domestic supply 76889
89402
96172
113387
Including:
Coal 49.8 mil. tonnes
27888 60 mil. tonnes
31680 70 mil. tonnes
34562 120 mil. tonnes
55932
Oil products 19.86 mil. tonnes
20217 20 mil. tonnes
20360 20.7 mil. tonnes
21073 20 mil. tonnes
20360
Gas 7.98 bil. m3
7183
11.43 bil. m3
10288
12.68 bil. m3
11413
10 bil. m3
9000
Hydropower 30.13 TWh 6478 54.4 TWh 11695 60,4TWh 12994 58,2TWh 12523 Small hydropower 1.99 TWh 428 4.2 TWh 905 6,46TWh 1391 9,12TWh 1961 Renewable energy
44.5 mil. tonnes
14695
43.8 mil. tonnes
14474
44.6 mil. tonnes
14740
41.2 mil.
tonnes
13610
Surplus (+) Deficit (-)
+15766
-2273
-52614
-143304
Figures in Table 2.23 show that domestic supply of primary energy is always higher than demand in the period from now until 2015. Vietnam can export its surplus primary energy during this period. According to the base scenario, primary energy deficit in 2020 is 53 million TOE and in 2030 is 143 million TOE. If there is no new primary energy source to make up for this deficit, Vietnam will have to import 36% of primary energy for consumption in 2020 and 57% in 2030 and increasing in the subsequent years. There is an urgent need for solutions to preserve primary energy in the country, which requires collaboration efforts from all sectors and overall direction from the government. It is most important that these start immediately.
Apart from that, the construction of power plants uses large quantities of soil and rock and thermal power plants use a lot of fresh water and limestone every year. This means a challenge in preserving these natural resources.
It is necessary to assess forest resources and propose forest conservation and development measures in areas surrounding hydropower projects and in upstream forests to increase protection of water sources for reservoirs.
To protect water resources, PDP VII also considered and proposed several power plants of medium rather than big capacity in areas that are prone to drought. For example, the capacity of the Binh Dinh thermal power plant needs to adjust its capacity from 4,400 MW to under 2,400 MW due to the serious lack of surface water in this area.
3.3.6. Climate Change
3.3.6.1. Greenhouse Gases

187
a. From Rreservoirs
Greenhouse gases (carbon dioxide and methane) are released into the atmosphere from reservoirs that flood forests and other biomass, either slowly (as flooded organic matter decomposes) or rapidly (if the forest is cut and burned before reservoir filling). Many hydropower reservoirs actually flood relatively little forest or biomass. Most hydropower plants generate sufficient electricity to offset the greenhouse gases, which would otherwise have been produced by burning fossil fuels (natural gas, fuel oil, or coal) in thermal power plants.
However, some projects which flood extensive forest areas, such as the Balbina Dam in Amazonian Brazil, appear to emit greenhouse gases in greater amounts than would be produced by burning natural gas for many years of comparable electricity generation. Greenhouse gas releases from reservoirs can be reduced by a thorough salvage of commercial timber and fuelwood, although frequently this does not happen because of (a) high extraction and transportation costs, (b) marketing constraints, or (c) political and economic pressures not to delay reservoir filling. The surest way to minimize greenhouse gas releases from reservoirs is to choose dam sites that minimize the flooding of land in general, and forests in particular.
According to the calculation in PDP VII, average releases of CO2 from reservoirs are 6.65kg/ha/day, whilst those of CH4 are 0.1kg/ha/day. With a total reservoir area of 25,133 ha for the 21 reservoirs, this would mean a total of 61,000 tonnes of CO2/year and 917 tonnes of CH4/year.
b. From Fuel Combustion Process in Thermal Power Plants Through out the whole period that PDP VII is implemented, the release of CO2 increases from just below 60 million tonnes in 2011 to nearly 444 million tonnes in 2030: nearly an eight-fold increase.
In terms of economic value, the costs of climate change impact are estimated at US$1.2 billion in 2011 and rising to over US$9 billion by 2030. The calculation is based on the environmental costs of main pollutants specified in the report “Valuation of Some Environmental Costs within the GMS Energy Sector Strategy” by Mans Nilson, the Stockholm Environment Institute. The impacts considered for this calculation are: (i) impacts on health that lead to life expectancy loss and other health issues such as respiratory and lung problems, etc., that cause income loss; (ii) hospital costs; (iii) loss of crop yields; and (iv) impacts on the infrastructure and acidification of soil.
3.3.6.2. Impacts of Climate Change
Greenhouse gases cause global climate change. Forecast shows that Vietnam will release a considerable amount of greenhouse gases (444 million tonnes) in 2030, which will contribute to increase the risk of global climate change. Viet Nam is classified by the IPCC as one of the most vulnerable countries in the world to climate change impacts. The long, densely-populated coastline and delta areas (Red River Delta and Mekong Delta) are where half of the country’s population live and where and the most important agricultural production areas are. These areas are particularly vulnerable to the impacts
188
of climate change, especially to the impacts of rising sea water level, and other impacts such as chages to the weather, rainfall and river flows.
Similarly, the mountainous upstream areas where some of the poorest communities live are also vulnerable to the impacts of climate change. These communities mainly rely on agricultural production and changes to the rainfall patterns as the result of climate change will affect these communities. These and other widespread effects mean that climate change could jeopardize the development gains that Viet Nam has experienced in recent decades.
The impacts of global climate change show in abnormal natural phenomena that can be felt by any one. According to the World Development Report 2010 by the World Bank, climate change is making the world warmer, changing rainfall patterns and making negative events such as drought, flood and forest fire more frequent. These impacts pose threats to many countries, in which developing countries are most vulnerable. It is estimated that developing coun- tries will bear most of the costs of the damages—some 75–80 percent. Warming of 2°C could result in a 4 to 5 percent permanent reduction in annual income per capita in Africa and South Asia, as opposed to minimal losses in high-income countries and a global average GDP loss of about 1 percent. Most developing countries, including Vietnam, lack of financial and technical capacity to manage the risks of increased climate change. These countries are reliant on natural resources to generate income and assets and most of these countries are starting to suffer from dramatic climate changes.
Human-induced climate change gives ecosystems and societies little time to adapt. Such a drastic change would cause large dislocations in ecosystems fundamental to human societies and economies – such as the possible dieback of the Amazon rain forest, complete loss of glaciers in the Andes and the Himalayas, and rapid ocean acidification leading to disruption of marine ecosystems and death of coral reefs. The speed and magnitude of change could condemn more than 50% of species to extinction. Sea level could rise by one meter this century, threatening more than 60 million people and $200 billion in assets in developing countries alone. Agricultural productivity would likely decline through-out the world, particularly in the tropics, and over 3 million additional people could die from malnutrition each year.
There are about 40 million people living along the coast and low-lying islands in Vietnam, who are reliant on agriculture for income. As pressures on land, water, and forest resources increase -as a result of population growth, urbanization, and environmental degradation caused by rapid industrialization - greater variability and extremes will complicate their management. In the Mekong River basin, the rainy season will see more intense precipitation, while the dry season lengthens by two months. The South East Asia region’s economies, including the economy of Vietnam, are highly dependent on marine resources – the value of well-managed coral reefs is US$13 billion – which are already stressed by industrial pollution, coastal development, overfishing, and runoff of agricultural pesticides and nutrients.
The calculated costs associated with climate change impacts, based on international norms per tonne of CO2 released, is estimated at US$1.2 billion in 2011 and rising to over US$9 billion by 2030. The impacts of greenhouse gas emissions represent a significant part of the full economic costs of the power generation proposals set out on PDP VII.
Economic growth alone is unlikely to be fast or equitable enough to cope with the risks of climate

189
change, especially when the economic growth is carbon intensive. This is the key environmental issue that was assessed in SEA and considered in all scenarios proposed in PDP VII.
3.3.7. Energy Security
Energy security is currently an extremely important issue in both developing and developed countries. Energy security is often associated with sustainability and economic development. Energy security is much reliant on oil, which is currently a limited resource.
According to the energy sector’s development plans, Vietnam is currently exporting crude oil and coal but importing large quanities oil and petrol of up to tens of million tonnes. Vietnam will start to import coal after 2015 and gas after 2017. Vietnam is currently importing electricity. This means energy security in Vietnam needs special attention from all government sectors and departments at all levels. The base scenario shows that in a near future the electricity sector will rely heavily on imported fuels such as coal and gas in terms of both availability and price. The world’s energy price has been in crisis recently. Vietnam is also dependent on imported electricity from neighboring countries. This means unstability for the young economy of Vietnam and for domestic electricity supply.
The issue of energy security is in discussion not only to raise awareness amongst policy makers but also to establish a basis for recommendations concerning the government’s regulating role in energy security. It is recommended that the government review and issue policies to encourage appropriate exploration and use of domestic energy for both immediate economic growth and national long term benefit.
It is also recommended that every sector should develop an energy security plan. In the energy security plan of the electricity sector, the use of renewable energy is recommended along side with energy saving and efficiency in production, and further research on nuclear power development.
3.3.8. Environmental Conflicts, Risks and Accidents
3.3.8.1. Environmental Conflicts over Shared Resources
The proposed power development plan shows that there will be increasing environmental conflicts in terms of water resources, fuels, natural resources, land resources and land use. It is necessary to develop preventative measures and solutions in case these conflicts happen during the implementation of PDP VII.
Environmental conflicts might happen due to unpredictable reasons and usually result in serious loss both of life and assests, and long term impacts on the environment. There are risk of abnormal weather phenomena and accidents during the construction and operation phases of power projects.
3.3.8.2. Unpredictable Environmental Risks and Accidents
a. Climate Change
Fossil fuel-combustion power production releases greenhouse gases that contribute to climate change and its impacts such as drought, flood, rising sea level and temperature. Climate change is

190
a global issue. Developed countries are major contributors to climate change due to their large energy consumption, however, developing countries, such as Vietnam, are the most vulnerable to climate change. Apart from direct impacts on human and assets, climate change also threatens food security as it results in lower productivity and loss of crop yields.
Climate change causes global warming and increased sea water level, which result in the following impacts on thermal power plants:
- Lower cooling effect that leads to lower productivity of the turbines and higher fuel consumption
- Lower efficiency of the air turbines - Power stations near the coast and river mouth need to elevate in response to increased
water level. This feature is incoperated in all designs of new power plants.
b. Hurricanes, Cyclones, Tsunami, Earthquarkes, Subsidence, Tectonic Breaks, and Increased Temperature
These are unpredictable natural events that usually result in heavy consequences for the economy and people’s life. Power project designs need to take into account the risks of these events to ensure safety and contingency plans for such natural events are in place. For hydropower projects it is important to ensure dam safety and appropriate water release management. For thermal power projects, attention should be paid to coal ash storage management in case these events happen. For nuclear power projects it is extremely important to consider these risks in the design of the power station to guarantee safety.
Lessons learnt from events of natural disaster can be drawn from the historical floods in Vietnam in 2009 and 2010 as described in Chapter 2. Nuclear disaster event following the tsunami in Fukushima is a lesson for nuclear power development.
c. Human-induced Environmental Risks and Accidents
+ Erosion, landslides, and changes to hydrological regimes
The construction of power plants and associated infrastructure often cause:
(1) Erosion and landslides due to impacts on the land surface structure and vegetation clearing;
(2) River-edge and coastal erosion due to construction on riversides and coastal areas that result in changes to hydrological regime.
(3) The construction of dams and water regultion regimes of reservoirs alter river flows and result in changes to hydrological regimes. The impacts are aquatic ecosystem imbalance, desiccation and salt intrusion in lower river basins.
Power projects also affect the water level in reservoirs, river flows and river transportation, etc., causing serious impacts on river ecosystems and production activities in lower river basins.
Over time, live storage and power generation are reduced by reservoir sedimentation, such that much of some projects’ hydroelectric energy might not be renewable over the long term. If

191
effectively implemented, watershed management can minimize sedimentation and extend a reservoir’s useful physical life, through the control of forestry, road construction, mining, agriculture, and other land use in the upper catchment area. Protected areas are sometimes established in upper catchments to reduce sediment flows into reservoirs, as in the proposed Nam Theun II (Laos) project. Aside from watershed management, other sediment management techniques for hydroelectric reservoirs may at times be physically and economically feasible; they include, among others, upstream check structures, protecting dam outlets, reservoir flushing, mechanical removal, and increasing the dam’s height. The problem is that waters after running through turbines often carry sediments and might increase river floor wash-off and river-edge erosion. Waters are often released from turbines very quickly and therefore tend to cause erosion of the river floor and river-edge.
+ Workplace and fire safety
Many workplace accidents can happen during the construction and operation of a power project such as fall, electric shock, chemical explosion, transfomer/boiler/oil pipeline explosion, oil/coal storage fire, etc. The impacts and losses of these accidents are usually big and unforeseeable. However, these impacts can be mitigated by having strict technical requirements, procedures and regulations, which are the prerequisite for an industrial facility.
+ Radioactive contamination
Radioactive contamination happens when nuclear accidents occur as the result of leaks in nuclear protection layers, geological instabilities or human-induced impacts. Whatever the cause is, radioactive contamination is an environmental disaster should it happen.
+ Traffic accident
When a project is being implemented the level of traffic in the project site will increase as fuel and other products need to be transported to the station for power production and workers and clients travel to the project site for work and business transactions. It is possible that both road traffic and river traffic will increase, causing air/noise pollution and traffic jams that affect local residents and possibly more traffic accidents. Should these accidents occur, the environmental impacts would be significant, especially if the accidents involve oil or waste transporting vehicles.
+ Disaster vulnerability
The hazardous nature of nuclear power facilities means that they must be sited and constructed to reduce or remove any possible risks associated with natural disasters. The coastal areas of Central Viet Nam, in which the planned nuclear power plants will be built, are particularly vulnerable to cyclones as an expected consequence of climate change and sea level rise. This region is also tectonically active. It is essential that the design and construction of the nuclear facilities take into account the need to plan for the increase of frequency and severity of cyclones, rising sea levels and of the possibility of earthquakes and tsunami in the future.
There are many other environmental risks and accidents that are not foreseeable.

192
3.3.9. Social Impacts and Resettlement
3.3.9.1. Hydropower Impacts on the Economy, Society and Local Communities
a. Reservoir area
A total of 61,571 people would be displaced if all 21 schemes are constructed (of which 259,142 people have been displaced for the on-going projects). The numer of displaced people varies from scheme to scheme (see Appendix 2). Seven of the 21 schemes would require little or no resettlement and a further three have 650 or less people, whilst Ba Me would result in the displacement of 10,700 people and Ban Chat of 14,800 people. The Huoi Quang and Lai Chau schemes would result in 7,000 displaced people each.
The four schemes with more than 7,000 displaced people (Ban Chat, Bac Me, Huoi Quang and Lai Chau) would result in over 41,000 displaced people, or two-thirds of the total. These schemes require special attention with regard to the resettlement issue. Over 90% of the displaced people are ethnic minorities with a poverty rate well above double the national average. These people are highly dependent on access to natural resources (including forests) for their livelihoods and a close connection to where they live is an integral part of their cultural identity.
These communities are highly vulnerable to disruption to the lives and livelihoods from resettlement. Chapter 2 of this report analyses in details resettlement issues of power development projects in PDP VI. Power development projects in PDP VII are likely to result in poverty in displaced communities unless proactive actions are taken. International practice19
shows that the proposed mitigation package is intended to provide the means for displaced people to establish in a new location, to gain access to adequate services and reconstruct their livelihoods. In other words, the proposed mitigation package, which incorporates international practice, includes and reflects the necessary conditions of the new location.
Assessment of the social impacts and impacts on livelihoods is based on the Impoverishment Risk and Reconstruction (IRR) model developed by Micheal Cernea for the World Bank. This model demonstrates international best practice in resettlement as it reflects risk factors, which have not been adequately accounted for in existing social impact assessment approaches, to propose appropriate mitigation measures. This model is especially suitable for long-term development plan such as SEA. The compensation package includes an additional amount to support the development of displaced communities within ten years (from the time of displacement until communities gain access to adequate services and reconstruct livelihoods at the same level as before their displacement). It is estimated that the additional items would add an additional 23% to the cost of the existing compensation package. The full compensation package does not compromise the economic viability of any of the schemes.
The main risks of resettlement and mitigation measures for each of these risks are presented in Table 3.17.
19 Cernea, M. (2000) Impoverishment, Risk and Reconstruction: A Model for Population Displacement and Resettlement in Cernea, M. & McDowell, C. (eds 2000) Risk and Reconstruction: Experiences of Resettlers and Refugees World Bank, Washington D.C.
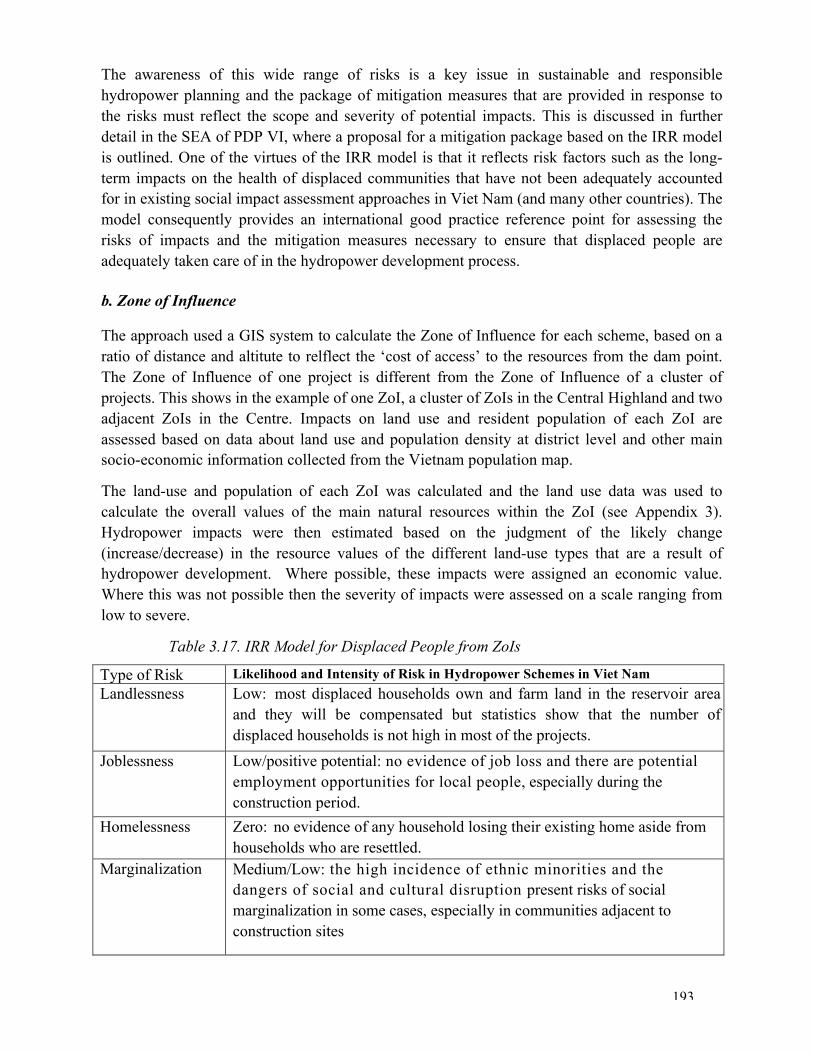
193
The awareness of this wide range of risks is a key issue in sustainable and responsible hydropower planning and the package of mitigation measures that are provided in response to the risks must reflect the scope and severity of potential impacts. This is discussed in further detail in the SEA of PDP VI, where a proposal for a mitigation package based on the IRR model is outlined. One of the virtues of the IRR model is that it reflects risk factors such as the long- term impacts on the health of displaced communities that have not been adequately accounted for in existing social impact assessment approaches in Viet Nam (and many other countries). The model consequently provides an international good practice reference point for assessing the risks of impacts and the mitigation measures necessary to ensure that displaced people are adequately taken care of in the hydropower development process.
b. Zone of Influence
The approach used a GIS system to calculate the Zone of Influence for each scheme, based on a ratio of distance and altitute to relflect the ‘cost of access’ to the resources from the dam point. The Zone of Influence of one project is different from the Zone of Influence of a cluster of projects. This shows in the example of one ZoI, a cluster of ZoIs in the Central Highland and two adjacent ZoIs in the Centre. Impacts on land use and resident population of each ZoI are assessed based on data about land use and population density at district level and other main socio-economic information collected from the Vietnam population map.
The land-use and population of each ZoI was calculated and the land use data was used to calculate the overall values of the main natural resources within the ZoI (see Appendix 3). Hydropower impacts were then estimated based on the judgment of the likely change (increase/decrease) in the resource values of the different land-use types that are a result of hydropower development. Where possible, these impacts were assigned an economic value. Where this was not possible then the severity of impacts were assessed on a scale ranging from low to severe.
Table 3.17. IRR Model for Displaced People from ZoIs
Type of Risk Likelihood and Intensity of Risk in Hydropower Schemes in Viet Nam Landlessness Low: most displaced households own and farm land in the reservoir area
and they will be compensated but statistics show that the number of displaced households is not high in most of the projects.
Joblessness Low/positive potential: no evidence of job loss and there are potential employment opportunities for local people, especially during the construction period.
Homelessness Zero: no evidence of any household losing their existing home aside from households who are resettled.
Marginalization Medium/Low: the high incidence of ethnic minorities and the dangers of social and cultural disruption present risks of social marginalization in some cases, especially in communities adjacent to construction sites

194
Increased morbidity
Medium/Low: existing morbidity levels are relatively high and the disruption in access to services and health facilities will increase these risks unless appropriate remedial actions are taken.
Food Insecurity Low/Medium/likely to change in positive direction: some communities in
the ZoIs will experience food insecurity for other reasons than reduced access to forest foods. This issue should be balanced with increased agricultural production thanks to impoved access to the market
Loss of access to Common Property Resources
Medium/High: the construction of dams and other facilities, such as roads, might reduce forest area and quality of the forests in ZoIs and also might have serious impacts on aquaculture resources.
Social Disarticulation
Medium/High: this varies according to the social characteristics of both the host community in the resettlement area and the relocated communities.
The social impacts in the ZoI are assessed in relation to the impacts of changes in access to natural resources and to external markets on the livelihoods of resident populations. The main risks have been assessed as being where increased population and reduced forest resources would result in unsustainable pressure on remaining forests.
Balanced against this risk is the likely increase in agricultural incomes, with studies in Viet Nam showing that income per hectare of agricultural land increases by an average of 10% where upland areas are connected to markets through improved transport facilities.
Below is further analysis of potential social and cultural impacts on local communities:
Calculated economic benefit from appropriate use of water resources: As analyses in this section show there are potential non-power benefits such as irrigated agriculture and flood control. It should however be noted that any changes in the reservoir operation to carter for other water users could imply decreased energy production and thus less power benefits.
If all 21 projects are built, the highest impacts would be found. The improvements to dry season water flows would allow over 25,000 extra hectares to be irrigated, producing a yield of over 150,000 tonnes of rice and generating an income of over $90 million.
3.3.9.2. Thermal Power Impacts on the Economy, Society and Local Communities
Socio-economic impacts of thermal power development include the displacement of people living on the site of the planned power station. The costs of this impact by thermal power plants have been included in the project costs for compensation. Study results of the socio-economic impacts of several big thermal power projects have confirmed this assessment.
There are social and environmental costs in addition to atmospheric pollution from thermal power generation. These include the displacement of people living on the site of the planned power station. Existing data from 14 thermal power plants in PDP VII have been collected for assessment. The exact numbers of displaced people are unknown because some projects are still in the planning phase but some cost estimates have been included, based on existing regulations.
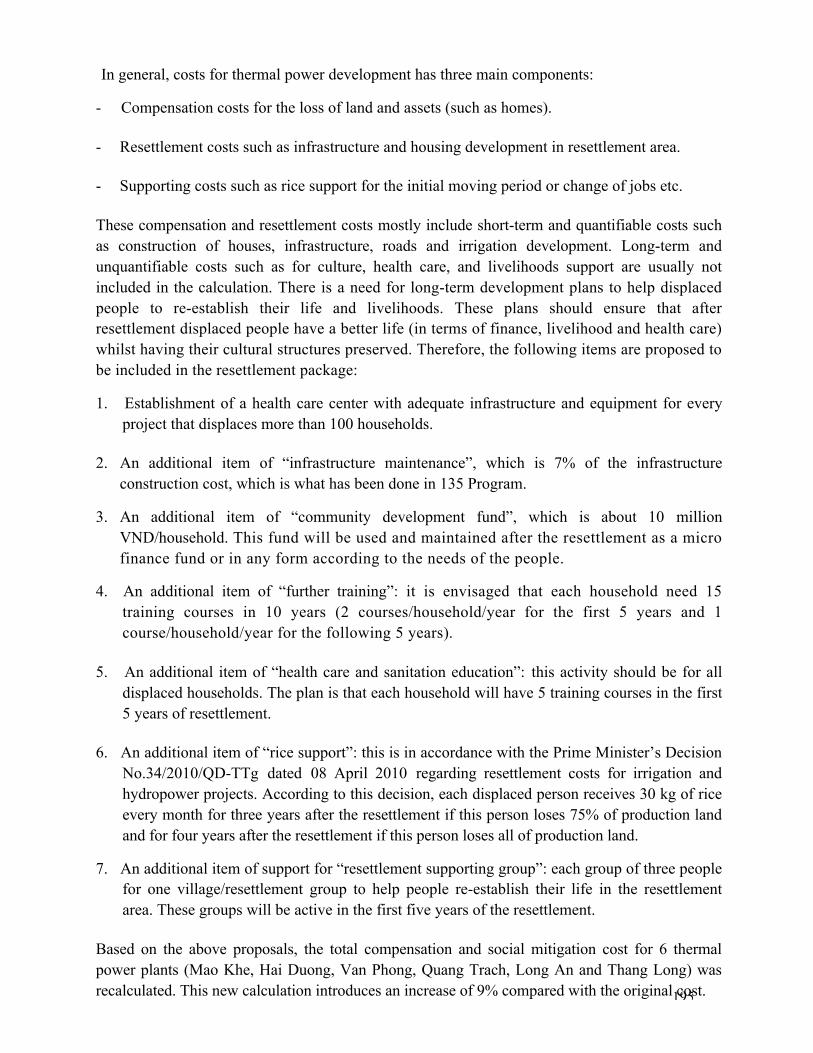
195
In general, costs for thermal power development has three main components:
- Compensation costs for the loss of land and assets (such as homes).
- Resettlement costs such as infrastructure and housing development in resettlement area.
- Supporting costs such as rice support for the initial moving period or change of jobs etc.
These compensation and resettlement costs mostly include short-term and quantifiable costs such as construction of houses, infrastructure, roads and irrigation development. Long-term and unquantifiable costs such as for culture, health care, and livelihoods support are usually not included in the calculation. There is a need for long-term development plans to help displaced people to re-establish their life and livelihoods. These plans should ensure that after resettlement displaced people have a better life (in terms of finance, livelihood and health care) whilst having their cultural structures preserved. Therefore, the following items are proposed to be included in the resettlement package:
1. Establishment of a health care center with adequate infrastructure and equipment for every project that displaces more than 100 households.
2. An additional item of “infrastructure maintenance”, which is 7% of the infrastructure construction cost, which is what has been done in 135 Program.
3. An additional item of “community development fund”, which is about 10 million VND/household. This fund will be used and maintained after the resettlement as a micro finance fund or in any form according to the needs of the people.
4. An additional item of “further training”: it is envisaged that each household need 15 training courses in 10 years (2 courses/household/year for the first 5 years and 1 course/household/year for the following 5 years).
5. An additional item of “health care and sanitation education”: this activity should be for all displaced households. The plan is that each household will have 5 training courses in the first 5 years of resettlement.
6. An additional item of “rice support”: this is in accordance with the Prime Minister’s Decision No.34/2010/QD-TTg dated 08 April 2010 regarding resettlement costs for irrigation and hydropower projects. According to this decision, each displaced person receives 30 kg of rice every month for three years after the resettlement if this person loses 75% of production land and for four years after the resettlement if this person loses all of production land.
7. An additional item of support for “resettlement supporting group”: each group of three people for one village/resettlement group to help people re-establish their life in the resettlement area. These groups will be active in the first five years of the resettlement.
Based on the above proposals, the total compensation and social mitigation cost for 6 thermal power plants (Mao Khe, Hai Duong, Van Phong, Quang Trach, Long An and Thang Long) was recalculated. This new calculation introduces an increase of 9% compared with the original cost.

196
The table below presents changes to the resettlement package for the 14 thermal power plants:
Table 3.18 Changes to Rsettlement Costs of 14 Thermal Power Plants Unit: VND
No.
Power Plant
Original Resettlement Cost
Adjusted Resettlement Cost
1
Mao Khe 60,304,000,000
65,731,360,000
2 Thang Long
14,370,650,000
15,664,008,500
3
Long An
39,673,000,000
43,243,570,000
4
Thai Binh
130,721,606,000
142,486,550,540
5
Hai Dương
255,615,000,000
278,620,350,000
6
Nam Đinh
595,642,297,757
649,250,104,555
7
Quang Trach
509,504,436,672
555,359,835,972
8
Van Phong
115,868,780,160
126,296,970,374
9
Vinh Tan
52,972,492,888
57,740,017,248
10
Duyên Hai
65,476,945,656
71,369,870,765
11
Song Hau
570,522,000,000
621,868,980,000
12
Binh Đinh
305,320,980,000
332,799,868,200
13
Vung Ang 3
457,263,810
498,417,553
14
Mong Dương
1,660,000,000
1,809,400,000
Total (VND)
2,718,109,452,943
2,962,739,303,708
Total (USD)
139,390,228
151,935,349
3.3.9.3. Nuclear Power Impacts on the Economy, Society and Local Communities
The SEA of nuclear power plant siting recognizes a few big socio-economic impacts on communities living nearby the project sites. These are impacts on displaced communities, which is only 704 households in two nuclear power projects that are being implemented, and on the livelihoods of local residents. Economic impacts are mainly found in aquaculture due to cooling water releases rather than other pollutants. These impacts can be mitigated through calculation of economic value loss from aquaculture production and spawning ground. Compensation for these impacts was calculated and included in the feasibility studies of both projects. The total amount
197
of compensation for both projects is about 700 billion VND.
There are other concerns about impacts on other economic activities such as tourism, which is an important activity for coastal areas, and agriculture. The first and foremost concerns of local people about nuclear power development are impacts on the environment and human health and other risks of nuclear accidents. Lessons learnt from the Fukushima nuclear power plant in Japan show that nuclear power disaster is big and often have long-term impacts, which are hard to evaluate.
The SEA of nuclear power plant siting also shows that all provinces (accept for Ninh Thuan) support the idea of nuclear power development but disapprove nuclear power plants to be located in their provinces: this reaction is no different from any where else in the world. Although these concerns cannot be qualified in costs, they show uncertainties and fear of nuclear risks.
3.3.9.4. Transmission Line Impacts on the Economy, Society and Local Communities
Power transmission lines will for sure go through agriculture land, grassland, rocky mountains, residential areas and industrial zones. Although these transmission lines will not have much effect on land use, forest clearing will be required within the power transmission line rights-of-way in areas where there are high trees that might threaten the safety of the transmission lines. The area of rice paddy lost to transmission line development is very small, which means the compensation value for lost crop yields is not big. The most considerable impacts are visibility and other health impacts for people living nearby the transmisson lines who might be affected by electromagnetic waves generated by these lines. Detailed assessment of these impacts will follow.
3.3.9.5. Other Issues
Opportunities for support to poverty reduction, social equity and income gap amongst economic regions
Even if there is limited evidence so far in Viet Nam, in theory, hydropower development could contribute to poverty reduction in the areas where hydropower schemes are built. Whatever form it takes, there is little doubt that major infrastructure investments such as hydropower have a great impact upon the locality where it is constructed: the issue is whether this is beneficial in poverty reduction terms.
Experiences from Hoa Binh, Yali and Song Hinh show that one key issue concerns the affected people’s participation in the planning and implementation of the hydropower construction. If information, options, alternatives and local participation in decision-making are at hand, affected people will take their responsibility and the basis for sustainable livelihoods could be established. Another key issue is that if all short and long term costs are taken into account, then hydropower development could also support poverty reduction in affected areas through enhancing positive development opportunities whilst effectively mitigating potentially negative impacts.
Changes in culture and the issue of cultural preservation and intangible cultural assets
As shown from numerous experiences in Viet Nam and elsewhere, power development has many potential economic, social and cultural impacts on local communities in both short and long term.

198
Hydropower development will, intentionally or not, change the current livelihood and cultural patterns of the different ethnic groups and in different ways. Therefore, such development needs to be closely interlinked with the general social, cultural and economic development plans in each area. Generally, the ethnic groups in Viet Nam (including Kinh) represent a great variety in cultural traditions and languages. Historically, the worldview and following rituals to uphold it is inherently linked to the different production systems in the lowlands as well as in the highlands. This relationship is particularly strong in the highland areas where alternative production systems have yet not penetrated in full. Being removed from their home land and influenced by other cultures will make it challenging for displaced communities to preserve their cultural structures, let alone the cultural assets that are part of their home land and daily life.
Every ethnicity in every region has its own cultural and living characteristics and products: Dao people have their bath medicine, Seng Cu people have their rice, Ta Phin people in Sa Pa have their weaved fabric, Muong Khuong people have their chilli sauce, etc. It is recommended that the economic development incorporate these specialties of each ethnicity to encourage product branding and tourism in the region.
Economic development and hydropower development will result in the loss of many cultural aspects, traditions and habbits of different ethnic minority groups as well as their specialty products. Resettlement of residents in reservoir area cannot compensate for the psychological effects such as feelings of belongingness to the homeland of their ancestors and culture as they have spiritual value to them. The new location is often much different in terms of geography, history and important landsmarks.
Indigenous knowledge is also a valuable asset. This knowledge is demonstrated through local interactions with the environment and in the society, such as the experiences of Ha Nhi people who worship the “forest sprit” and have strict but simple village rules for protection of forest and water sources. There are traditions and habbits that were passed on through generations that support the protection of upstream forest and river ecosystems. When hydropower plants are built and people are resettled in a new location they might struggle to reestablish their life and change their way of thinking and lose their indigenous knowledge and traditions.
An example of this is what happened in Lao Cai. There are 13 different ethnic minorities and 25 local sub-groups in Lao Cai. Local festivals are often organized when all the farming is done that feature music, dance, and theatre, which demonstrate cultural values of people living in mountainous regions. Each district has its own special festival features, such as the ‘going to the rice paddy’ ritual of the Day people in Sa Pa, or the horse race in Bac Ha. Tay and Dao people also still maintain their habbit of living in houses on stilts. The Department of Culture and Information of Lao Cai province has been making great efforts and investing in preserving these cultural heritages.
The plan to build 17 small hydropower plants in Sa Pa (approved by the Ministry of Industry and Trade) will destroy the environment in Sa Pa in the future. After the Ban Den hydropower plant was built in Ban Den village, the number of tourists to this village decreased by two third because the contruction had destroyed the local scenery.
Similar situation is happening in the Central Highland where intangible culture heritage is being altered or disappearing. These are examples of unsustainable development. This issue will need a

199
lot of attention during the implementation of PDP VII.
Changes in consumption patterns
According to the forecast results in Chapter 2, among five groups of electricity consumer, management and domestic consumption stay in the second place after the industry and construction sector. Though the share of electricity consumption for management and domestic will reduce to only 30% in 2030, it still accounts for a considerable share of total demand. The average electricity consumption per capita for household use in 2010 was about 996 kWh/year, which is double the consumption per capita in 2005, but still a remarkably low level given Viet Nam’s rapid development of recent years. Population growth, urbanization and increased per capita electricity consumption will have a direct and considerable impact on future demand for electricity. Urban residents typically consumes more electricity than people living in rural areas. According to the Institute of Energy (2007), electricity consumption per capita in rural areas was only 122 kWh/person/year in 2004: the figure was 12 times higher for the urban population (1488 kWh). It is forecasted that urban population will increase from 27% in 2006 to 40% in 2025.
Opportunities for local people to participate in development project planning
Generally, the current ‘socialization’ policies intend to bring responsibilities down to the lowest levels. In practice this often means that lower levels should take greater charge of development costs.
Until now, the role of the mass organizations20, led by the Fatherland Front, has been crucial and effective to bring in local people’s interests into the focus of the development. Not the least, have the mass organizations assumed the tasks of managing credit schemes bringing them to the most remote areas and to people (often ethnic minorities) who then have been able to raise their living standard; where often women have been playing a key role.
Current trends of devolved decision-making and community participation in Viet Nam open up increased opportunities to involve local stakeholders (authorities, mass organizations and people) in hydropower planning. Until now, local stakeholders have typically not participated in feasibility studies and early stages of hydropower planning. In all cases so far, except the NHP Study, the participation, if any, starts only after the decision on a hydropower complex has already been made. Examples where local participation in resettlement planning and implementation have taken/are taking place are Song Hinh and Son La.
3.3.10. Local Livelihood
There are benefits from power development projects that support the development of local businesses and contribute to national economic development. A stable supply of energy lies the path that leads to job creation, and more stable and better income generation. Each power development project often creates thousands of jobs during the construction and operation phase. Other busineses also benefit from the project such as in the hospitality sector, material supply, and entertainment, etc.
However, in many cases, ethnic minority people who are highly dependent on natural resources 20 Farmers Association, Women’s Union, Youth Union, Veterans Association

200
and agriculture production will be directly affected in long term due to loss of access to vital livelihood assets and common property resources. This happens when power development projects take away the homes and large areas of production land of farmers who have limited capacity and are less adaptitive to new working environment and practices. In some other cases, the ecosystem is lost, exhausted or fragmented and can no longer supply for local residents or people who have been relying on natural resources are relocated to a new place with limited access to these resources which leads to loss of income and livelihoods. The level of impacts on local livelihood varies depending on the nature of each project.
The affected populations are different in different types of power development project. Thermal power development projects affect the population in the delta areas where there are favorable transportation, water supply and infrastructure whilst ethnic minority people living in mountainous areas are often affected by hydropower development projects.
Job Opportunities and Changes to Population Structure
It is generally considered that resettlement should at least not worsen the situation of the displaced people. In some cases, investors and local authorities create opportunities for affected people to have new jobs, which give more stable and higher income. In some other cases, large areas of land are taken away from people who are older, unskilled and less adaptable to new changes and the number of people who lost their livelihoods is higher than the number of new jobs available. This puts affected people in a challenging situation and they are likely to become impoverished.
Local participation in the early stage of planning of a power development project effectively contributes to the process of employment and livelihood orientation for affected people, especially when the project plans to take away their access to good quality land and their cultural and psychological dimensions of daily life such as opportunities to preserve and develop local traditions and habbits. It presents the local community an opportunity to take part in decision-making related to the displaced people’s situation.
Experiences show that when a power project starts a number of workers and engineers will come to live and work in the project area. These people are often more educated and have better income than local people. The presence of these workers and engineers will encourage the development of local infrastructure and services to meet with their demands.
Until now, there is no overall policy for resettlement and compensation in Viet Nam. Compensation is regulated by the Land Law (2003). In the present, resettlement of power development is decided at project level, but project investors must follow the state and provincial guidelines for resettlement. Unlike in environment where EIAs have become compulsory, there are still no obligations for social impact assessment in resettlement. Resettlement and compensation in power projects tend to only cover the short term impacts like loss of land, plants and houses. The long term impacts such as loss of livelihoods, having to adapt to a new culture, feelings of belongingness, and not having the opportunity to influence the new situation, have in the past not been satisfactorily addressed or compensated for. If a resettlement plan is well considered and implemented, it will allow the resettlers and the host population to re-establish their livelihoods.

201
3.3.11. Community Health
Air, water and soil pollution (as discussed in previous sections) means changes in air composition and poor water quality. Pollutants cause negative changes to physical, chemical and biological quality of water that are harmful to humans and animals. According to an assessment by the World Health Organization (WHO) in 2006, about 24% of diseases and mortalities in the world are related to the environment. Also according to this World Health Report, 85 of 102 common diseases are related to the environment, including many waterborne diseases such as diarrhea, dysentery, scabies, and conjunctivitis. Both human health and the ecology can be affected by pollution. Air pollution threatens the life of many living organisms including human who can die from repiratory diseases, cardiovascular, throat inflammation, chest pain, and breathlessness. Water pollution causes 14,000 deaths everyday through food poisoning. The presence of heavy metal in food and drinking water can cause cancer. Noise pollution can cause ear-related diseases, high blood pressure, depression, and isomia. Oil spills can cause rashes and blisters, etc., amongst many other serious impacts. Economic losses as the result of environment-related diseases are reviewed for each type of production and pollution in Chapter 3. The calculation was based on total hospital cost and economic losses due to diseases.
3.3.11.1. Water-related Diseases as the Result of Hydropower Development
Some infectious diseases can spread around hydropower reservoirs, particularly in warm climates and densely populated areas. Some diseases (such as malaria and schistosomiasis) are the results of water-dependent disease vectors (mosquitoes and aquatic snails); others (such as dysentery, cholera, and hepatitis A) are spread by contaminated water, which is worse in stagnant reservoirs than in fast-flowing rivers. The public health sector should introduce preventive measures (such as awareness and information campaigns), monitor disease vectors and outbreaks, and provide clinical treatment as needed. Control of floating aquatic weeds (see below) near populated areas can reduce mosquito-borne disease risks.
Currently, water supply for most rural people comes from rain water and surface water taken directly from rivers and near by surface water sources for domestic use. Wastewater is often released directly to the environment without any treatment. Polluted surface water results in an increasing number of diseases in local communities in river basins, especially in the lower river basins. Some diseases show immediate effects on human such as scabbies, skin infections, diarrhea, etc. Some more dangerous diseases only show effects when toxins have been accumulated in the body for a long time. When the proportion of heavy metal or chemical (from pesticide runoff) in water exceeds the safety level, the water becomes contaminated. These contaminants are stored in aquatic organisms and plants. When these organisms and plants become food the contaminants are transferred to human body. If exceeding a certain level, these contaminants will cause functional disorder of the organs that can result in some dangerous diseases such as genetic mutations, cancer, anemia and heart diseases (i.e. blood pressure, blood circulatory disorder, pulmonary embolism, coronary artery disease, ischemia, diabete, liver failure etc.). As discussed in Chapter 2, PDP VII is not the only cause of pollution but a contributing factor aside from other agricultural, industrial and living activities that result in an increased level of pollution of surface water.
Clean water supply in Vietnam is still inadequate. Wastewater treatment is only available in a few

202
big urban areas. If wastewater treatment is not done properly there will be serious impacts of pollution of surface water.
3.3.11.2. Air-related Diseases as the Result of Thermal Power Development
Air pollution from both gaseous emissions (SO2, O3 and NOx) and Particulate Matter (PM) not only has negative impacts on human health but also causes economic loss and climate change.
Air pollution happens when there is the presence of a strange substance in the air or a change in the air composition that makes the air unclean, causes unpleasant odor, reduces visibility, or produces acid rain. Air pollution also affects soild and water quality. Of the 25 government insured occupational diseases, 18 are related to air pollution.
As discussed in Chapter 2, air pollution in Vietnam is getting worse and the amount of air pollutants is increasing, especially in industrial zones. Forecast results in PDP VII show that the electricity sector contributes significantly to air pollution. The analysis shows that the quantities of particulate matter releases in particular (not SO2 and NOx) will rise from nearly 4,800 tonnes in 2011 to over 34,460 tonnes in 2030: a seven-fold increase. Examples of human health impacts of air pollution can be found in the results of the 10 year statistic collection by the Children Hosptial 1 in Ho Chi Minh City, which show that air pollution related diseases are increasing rapidly. The number of children who were diagnosed with asthma was 3,074 in 1996 and 11,491 in 2005. There were only 441 children with middle ear infection in 1996. In 2005, this figure increased to 1,999. The number of children who suffered from juvenile cerebral palsy was 553 in 1996 and 895 in 2005. In 1996 there were 968 children born with birth defect. This number was 2,335 in 2005.
Human health impacts of air pollution are determined both in terms of increased morbidity (frequency and severity of illnesses) and reduced life expectancy amongst vulnerable populations. The most common illnesses are asthma and bronchitis. Other health problems as a result of air pollution include cardiovascular and cerebrovascular diseases. The severity of these impacts depends on distance from the power station and the existing levels of pollution from other sources. The additional pollutant load from from the thermal power station in urban areas and industrial zones, where the existing ambient air quality is poor, will have a greater impact. In rural area where the air quality is good, the impact of air pollutants from thermal power plants will not be big although areas of close vinicity to the plant will experience significant air pollution.
Detailed assessment of these human health impacts shows that they vary in different parts of the country and different power stations. The differences are determined by (i) pollutant distribution patterns (clustered pollution); (ii) population density (reflective of the number of people at risk); and (iii) existing ambient air quality.
Research results from pollutant distribution model in EIAs of several thermal power projects in the plan and reference information from epidemiological studies about the spatial effects of air polutants from thermal power plants were used to assess the impacts that might increase the risks of respiratory diseases and other illnesses related to gaseous pollutants from thermal power plants in the zones of influence of power projects. A three-fold zonation of future epidemiological risks has been produced (see maps below):

203
1. Zone 1: up to 5 km from the power stations, where the risks of increased disease incidence are high, especially where existing ambient air quality is poor. This is the zone where the level of gaseous emissions and PM concentration is high. It is estimated that there are about 1.78 million people living in zone 1 of up to 5 km from the existing power stations and the ones included in the plan that are going to be built. Below are maps that illustrate this zone. Detailed calculation can be found in Appendix 1 of this report.
2. Zone 2: between 5 and 10 km of the plants, where there is a medium risk of increased disease incidence. The remaining PM pollutants will be deposited in this zone along with further levels of gaseous pollutants. The concentration of pollutants in this zone might be lower than in zone 1 but can be significant if the existing ambient air quality is poor or there are a few power stations in the area. It is estimated that there are about 5 million people living in zone 2.
3. Zone 3: between 10 and 30 km of the plants. This is a low risk zone, with little or no PM deposition but some residual risk of impacts from gaseous pollutants. There are more than 25.4 million people living in zone but only a small part of this population is at risk. The risks here are higher where clusters of power stations are found and several zones overlap in areas where ambient air quality is already an issue.

205
!"#$%"#$ "&'$()"$*+)$,- &($.') &$/ %$ $$
0) &$1 &($/ &($ $ 234$
$$
! "#$%&'(&$)*+$",-$.*/$ 0 "$1-$2, .$10$ ",$, "#$ "$34"$+ $$$
Figure 3.14. Thermal P lants – Popula t ion a t R isk

!"#$%"#$ "&'$()"$*+)$,- &($.') &$/ %$ $$
0) &$1 &($/ &($ $ 234$
! "#$%&'(&$)*+$,-"#$. $ "/$/ "#$0 "$12$3/*4$4/ 5$4 $+*+$"/6$7*8$"/5 4$ 5 "$$
Table 3.15. T h e r m a l P l a n t s – P o p u l a t i o n a t R i s k

207
The maps above shows affected zones in the country, with more details for the zones in the northern and southern regions. It is easy to see from these maps that there is an obvious link between human health risks and thermal power production. Thermal power plants in the central and the far southern region of Vietnam have the lowest risks because they are often located far away from one another and in areas with reasonably good ambient air quality. Assessment results show that the populations of the two main economic focal regions (Northern Delta Region and South East Region) will be most affected by power development in the future. The two main clusters of existing and planned power stations are near the coalfields and industrial zones along the coast in the North and around Ho Chi Minh City in the South. Both areas have high level of zones overlap, poor exisiting ambient air quality, and high population density. The air in the area around HCMC already has a high level of PM. If all the planned power plants are built, human health impacts in this area will be significant because the existing ambient air quality is already poor and continues to deteriorate due to urbanization, industrialization and increasing private car ownership.
The economic cost of PM releases will increase from $99 million in 2011 to $710 million in 2030, whilst those for NOx will rise from $234 million in 2011 to $639 million in 2030. In health terms, these costs reflect both the increased cost of health care and the value of lost productive time due to increased sickness and earlier deaths. These represent significant economic costs that need to be ‘internalized’ into the cost calculations of thermal power production.
3.3.11.3. Illnesses Caused by Electromagnetic Fields from High Voltage Transmission Lines
The final possible impact to be considered in this section is the issue of possible adverse effects on human health from the electro-magnetic fields (EMF) generated by the transmission system: the lines, transformers and sub-stations. This is an extremely controversial issue, with a number of scientists pointing to the potential impacts of EMF on the incidence of health problems such as cancer and cardio-vascular diseases. The evidence to support such claims is limited and the current consensus is that such a link is as yet not established.
The World Health Organization announced that: “At low frequencies, external electric and magnetic fields induce small circulating currents within the body. In virtually all ordinary environments, the levels of induced currents inside the body are too small to produce obvious effects”.
Similarly, an important report by the European Commission21 concluded: “In summary, the available evidence from epidemiological studies is not sufficient to draw any conclusions about potential health effects of static magnetic field exposure”.
21 European Commission Scientific Committee on Emerging and Newly-Identified Health Risks (2006). Preliminary Opinion on the Possible Effecfs of Electro-Magnetic Fields on Human Health page 38

208
This does not mean risks do not exist, but rather that they have not been scientifically proven and it is agreed that a precautionary approach should be applied to this issue. For example, the US Environment Protection Agency advice people living near or under power lines to take precautionary measures. In Vietnam, the “Standards for Industrial Electromagnetic Frequency and Workplace Safety Inspections” provides information about the industrial electromagnetic frequency, the allowed length of time of exposure to EMF accordingly with the frequency and how inspection of electromagnetic frequency should be done. More details are provided in the table below.
Table 3.19 : Electromagnetic Frequency and Allowed Length of Time of Exposure
Electromagnetic frequency (kV/m)
< 5 5 8 10 12 15 18 20 20<E≤ 25
> 25
Allowed length of time of exposure (h)
Unlimited
8 4.2 5
3 2.2 1.3 3
0.8 0.5 1/6 (10 mins)
0
The affected area of EMF is where the electromagnetic frequency is above 5kV/m. When the frequency is below or as high as 5kV/m, workers operating the power lines and substations and people living near or under power lines are not affected.
It was not possible to evaluate the number of people who will be affected by EMF in this SEA. However, it is necessary to identify the number of affected people when implementing power development projects in the plan.
3.3.12. Food Security
Vietnam currently is not only self-efficient in terms of food supply but also able to export about 5 million tonnes of rice every year. However, national food security is still an important issue that needs attention from now on as discussed in the previous section. Current concerns are natural disaster, epidemics and impacts of climate change such as salt intrusion and loss of agricultural production land.
Vietnam is one of the countries that will be most affected by global climate change. If
sea level rises by 1 metter, the Red River Delta will lose 5,000 km2 of land (1/3 of the
total area), and between 15,000 and 20,000 km2 of the Mekong River Delta (half of the current total area) will be under water. If this happens, total agricultural production of Vietnam will be cut down by 5 million tonnes. Agricultural productivity can be unpredictable due to bad crop yield, natural disaster such as flooding, and pets, etc. Therefore, food security is always an urgent matter that needs special attention (“Food Security and Climate Change” conference, organized in Hanoi on 31 May 2010).
In 2020, the population of Vietnam will increase to more than 100 million. The demand for food will increase by half of the current amount. There have been evidence of how food security affects national security: high price increases have caused violence in many countries from Africa (Egypt, Burkina Faso, Marocco, Côte d’Ivoire, Mauritania,

209
Somali, Senegal, Cameroon, Mozambque, South Africa, Yemen, etc.) to South America (Bolivia and Mexico), to the Middle East (Afghanistan and Uzbekistan), and Asia (India, Bangladesh, Indonesia, and Srilanka). The picture of hungry people eating dirt in Haiti has touched the world.
Climate change, global financial crisis, food crisis are among many other direct reasons that have made the situation worse. There are natural disaster events such as too much rain in Europe and drought in Ukraine or the long drought from 2006 to 2007 in Australia. There are human-induced disasters such as the construction of dams for hydropower development in upstream Mekong river that violates the rights of people who live downstream whose livelihoods depend on the river and increases drought and flood, and deforestration that causes inundation, flash flood and landslide which result in low productivity.
According to the low case of climate change, Vietnam will lose 40% of rice cultivating land in the Mekong Delta in the coming few decades. Without having good agricultural development strategies in place, Vietnam might have to import food like in the period before Doi Moi.
There have been many studies that identify challenges and propose solutions for the world and regional food security. In Vietnam, challenges and solutions to food security are closely related to the following factors:
(i) Rapid population growth: On average, the population of Vietnam grows by the population of a province, and the population of a province in Vietnam grows by the population of a district in a year;
(ii) Reduced land area for food production: A few decades ago, land area for rice production in Vietnam was 4.2 million hectares, producing the equivalent amount of rice as 7 million hectares because 25% of the rice production land area in Mekong Delta (0.5 million hectares) was used to grow three crops a year. To date the land area for rice production has not changed much and productivity is increasing thanks to high-yielding varieties. The Mekong Delta can potentially produce more rice by increasing both the number of crops in a year and the crop yield to make up for the rice production land area lost to industrial and urban development;
(iii) Bio-energy: is an increasing trend. The source of food for more than 1 billion people in the world who are livingin hunger is becoming a fuel source. It takes 204 kg of corn, which is enough to feed a person in one year, to fill a 94.5 litter tank of ethanol.
(iv) Land speculation and acquisition: food-importing countries are rushing to acquire land in other countries to secure their food supply. This is potentially becoming a new form of “colonization”. According to many researchers, Vietnam is a place for other countries to come and rent land from;
(v) Natural disaster due to climate change: Vietnam is one of the five most vulnerable countries to the impacts of climate change, especially in the rice production area s of the Mekong Delta, the Red River Delta, and the central coastline. Poor countries and poor

210
people, most of whom are farmers, suffer the most from global climate change, financial crisis, and food crisis. Agricultural production is facing more and more challenges. Extreme weather conditions such as typhoon, flood, drought, and salt intrusion are becoming more and more severe. The main reason for this development is the CO2 emissions (and also H2S, SO2 emissions) from industrial production activities, causing global temperature rise, ice melting and other heavy consequences.
The global financial crisis originated from American financial corporations in Wall Street has spread all over the world. Rich countries use the excuse of the financial crisis to neglect their aid promises to help poor countries buy food. At the same time, food production is facing more challenges due to hash climate;
(vi) Lack of comprehensive planning in hydropower development: the short term thinking in hydropower development planning has caused severe natural disaster such as typhoon, flooding, salt intrusion, and landslide. Vietnam and many other countries have long disapproved the construction of dams that alter the flow of the Mekong River by upstream countries. China is an example of a country disregarding international regulations by not recognizing the Mekong River as a common property.
In the last two years, investment in hydropower projects has become very attractive because it brings good economic result and quick return on investment: with an average investment of 25 billion VND/MW it only takes from 8 to 10 years to recover the investment capital. The investment per MW can be even less if the hydropower plant has bigger capacity and good location. There has been a lot of investment from businesses within and outside the electricity sector to hydropower development. The result is an intensive network of hydropower plants has been developed in the Central Region, especially the Central Highlands, causing many environmental and socio-economic losses. Quang Nam province has approved 62 hydropower projects, including 10 in the Vu Gia – Thu Bon River. The provincial government has also allowed research and investment studies of 47 other projects. Quang Nam is one of the provinces in the Central Region that have planned and built many small and medium sized hydropower projects. The 50 projects that either have been built or are being built in the province result in 1,739 displaced families. Since 2000, hydropower development has taken 11,589 hectares of land in the province. The issue of lack of land for production and housing for displaced people is currently affecting food security in Quang Nam province.
The national power development plan will affect a large area of agricultural production land, as discussed in the previous sections. Some of the land taken for power development was already included in the plan for industrial and infrastructure development. However, more than 3.7 million ha of agricultural land that was not included in the industrial and infrastructure development plan will be affected by the power development plan.
Additionally, hydropower production also directly affects water supply sources for

211
agriculture due to the operation regimes of reservoirs. Gas emissions from thermal power plants contribute to climate change therefore have direct impacts on food security in Vietnam.
3.3.13. Impacts of Complementary Civil Work
Apart from impacts that are easy to see and can be mitigated such as noise, air/water/soil pollution as the result of activities of transporting vehicles and waste disposal of workers in the construction site, there are many other big impacts that need to be adequately assessed, as discussed below:
Access road
New access roads to hydropower dams can induce major land use changes, particularly deforestation, with resulting loss of biodiversity, accelerated erosion, and other environmental problems. In some projects, environmental impacts of access roads can greatly exceed those of the reservoir. On the 10 km long access road of A Luoi hydropower plant lay many big wood logs that were cut down. Some of the wood logs have been sawed and are waiting to be taken away. The contractor had to log tens of hectares of old forest to build this road. There is no record of how many hectares of forest that was cleared for the construction of other complementary civil works in this project. The construction of Dak Ru hydropower plant has cleared hundreds of hectares of forest along side the Dak Ru stream to build a dam an a cannal system of more than 5 km long.
The worker living quarter that houses many people coming from different areas is often the source of many social and security issues, including the issue of transmissible diseases.
The siting of any new access roads should be in the environmentally and socially least damaging corridors. Forests and other environmentally sensitive areas along the chosen road corridor should receive legal and on-the-ground protection. Road engineering should ensure proper drainage, to protect waterways and minimize erosion.
Environmental rules for contractors (including penalties for noncompliance) should cover construction camp siting, gravel extraction, waste disposal, avoiding water pollution, worker behavior (such as no hunting), and other construction practices.
Power transmission lines
Impacts of power transmission lines can be small in thermal power projects but these impacts are significant in hydropower projects. Power transmission line rights-of-way often reduce and fragment forests; indirectly, they occasionally facilitate further deforestation by improving physical access. Large birds are sometimes killed in collisions with power lines, or by electrocution. Power lines can also be aesthetically objectionable. Power lines should be sited to minimize these concerns and built using good environmental practices (as with roads). In areas with concentrations of vulnerable bird species, the top (grounding) wire should be made more visible with plastic devices.

212
Electrocution (mainly of large birds of prey) should be avoided through bird-friendly tower design and proper spacing of conducting wires.
Quarries and borrow pits
Quarries and borrow pits are used to provide material for construction of the dam and complementary works. They can considerably increase the area of natural habitats or agricultural lands that are lost to a hydropower project.
Associated Development Projects
Power development projects often make possible new development projects with major environmental impacts, including irrigation, urban expansion, and industrial facilities (due to new water supplies). New development projects should be planned to minimize adverse environmental and social impacts. Environmental impact assessment studies should be carried out in the early stages of project planning.
Change of natural scenery
Industrial projects are often located in areas with favorable natural conditions for water supply and transportation, and low population density. The first requirement for a hydropower or a renewable energy project is that the location needs to be near a primary energy source such as a river where it is possible to build dams, wind and solar energy that is available all year round, or good supply of rice husk or bagasse, etc. Because of these requirements, most projects are located in areas with beautiful natural scenery and they often alter the natural conditions of both aquatic and terrestrial habitats by power plant construction work and complementary civil works such as establishment of fuel and product port, dam and reservoir building, and installation of giant wind mills in coastal sand dunes, etc. These changes have direct impacts on local people’s psychology and natural ecosystems. In long term, these projects might cause changes to the landscape and hydrological regimes in the project site and surrounding areas, and microclimate change.
3.3.7. Cumulative Impacts and Development Trends of Environmental Issues
Detailed assessment results for each type of power project are included in Table 3.12. These results show that power development projects have big impacts on the environment from every aspect. The cost for environmental impacts mitigation also varies from project to project.
a. Thermal Power Development:
Thermal power development projects often affect large areas. The cumulative impact and impact coefficient of thermal power development are assessed below:
Areas with developed economic activities and high population density are usually where the environment is already quite stressed (such as the Red River Delta Economic Focal Region). Additional pollutant load in these areas will have big impacts on the ecosystems, human health and economic activities. The effects of the pollutant load

213
are not only obvious at the source but also can be seen within 5 or 10 km from the source, depending on various factors. The impacts of thermal power projects are assessed as widespread but these impacts can be fully mitigated if a large amount of investment is spent on taking care of the environment in these sensitive areas. Typical examples of cumulative environmental impacts can be seen in coal-fired thermal power projects in the North (Mong Duong, Hai Duong, thang Long, Thai Binh, Nam Dinh, and Hai Phong 3), and in the South (Duyen Hai, Hiep Phuoc 2, cai Mau, Soc Trang, Tra Vinh, Son My, and Song Hau), especially in clusters around Ho Chi Minh City and Bien Hoa – Dong Nai such as the Hiep Phuoc 2 and Formosa. More details are included in Figure 3.13. According to research results in Chapter 2, these two areas are sensitive to environmental pollution even without the power projects in PDP VII. Therefore, the power development projects proposed for these two areas in PDP VII will be under the pressure of high environmental costs to meet the investment requirements.
Power development projects proposed for the Central Region where the water resources are limited will have to consider adjusting their proposed capacity to minimize impacts on water supply for local residents and power production activities of the projects.
b. Hydropower Development
Table 3.20. Hydropower Projects with Big Impacts and High Biological Risks
Project Area of high biodiversity
Affected area of high biodiverisy (ha)
Conservation area
Affected conservation
area (ha)
A Luoi A Luoi-Nam Đong 9,032
Du Gia 1,179 Bac Me 24,238 Bac Me Sinh Long 459 Du Gia 1,14
4 Ban Chat Nam Đon 3,592 Lo Xo Pass 18,245 Ngoc Linh
(Kon Tum) 23,061 Dak Mi 1
Song Thanh 9,607 Song Thanh 9,541 Loc Bac – Bao Loc
1,208 South West Lam Đong
1,168 Đong Nai 2
Ta Dung 6,870 Song Thanh 6,601 Loc Bac – Bao Loc
9,504 Cat Tien 19,092 Đong Nai 5 Cat Loc 19,684 South West Lam
Đong 9,798
Xuan Lien 11,247 Mu Cang Chai 298 Hua Na Nam Đon 12,144
Lai Chau Muong Nhe 77,968 SrePok 4 Chu M’Lanh-Yok
Đon 20,472 Yok Đon 20,229

214
Cu Jut 7,446 Pu Hu 12,533 Pu Luong 1,025
Trung Son
Xuan Nha 11,298 Mac Cooih 17,693 Song Bung 4 Song Thanh 2,133
Upper Kon Tum
Kon Plong 62,446
The table above shows that hydropower projects in Bac Me, Ban Chat, Trung Son and Lao Chau have big impacts on areas with biodiversity sensitivity. All of these schemes are located in the north of Viet Nam, in areas where poverty is particularly entrenched and where there is a very high proportion of ethnic minorities in the affected populations.
The presence of several schemes on one river basin presents the possibility of cumulative impacts that will compound the effects of individual schemes. This is particularly an issue in the Vu Gai-Thu Bon basin, the river basins in the Central Highland, and Dong Nai 2 and 5 in the South.
It is highly important to recoganize the common interests (multinational and regional) and practice multi-purpose water resource management in big rivers when developing hydropower projects in the upstream of these rivers. When China started their hydropower projects in upstream Mekong River it affected large delta areas in the Mekong sub-region nations, amongst which Vietnam was most affected, because the release regimes of the dams completely change downstream hydrological regimes. The Mekong River plays an important role in the socio-economic development of these sub-region countries.
Environmental issues associated with small hydropower projects seems to have gone beyond the control of the authorities and are causing significant impacts. Initial data collection shows that there are about 800 small and medium hydropower projects in the whole country, including 335 projects in the Central Region. These hydropower plants contribute greatly to socio-economic targets. However, they have some negative impacts on the environment due to inappropriate planning and practices.
Hydropower development in the Central Region is now in a situation that “no expert or authority can possibly draw a location map of all hydropower projects. Simply because there are too many! So many that experts would say to each other that by randomly pinning a point on the map one can find that there is actually a hydropower plant there”. In the three provinces of Gia Lai, Dak Nong and Kon Tum only there are 257 small and medium hydropower projects. There are 113 hydropower projects in Gia Lai with total capacity of 549,781 MW, which is about 1/10 of the total capacity of 11 hydropower plants by EVN). 21 of these projects are now in operation.
In Dak Nong province there are 70 hydropower projects with total capacity of 241,07MW, of which 26 projects are now in operation. In the Dong Nai River Basin,

215
the three big hydropower projects namely Dong Nai 3 and Dong Nai 4 (total capacity of 520 MW, by EVN) and Dac R’Tih (144 MW capacity, by Construction Company 1) are under construction. These projects will be completed and connected to the national grid in 2012. There are medium and large hydropower projects which are either already completed or still under construction in Krong No – Serepok river. They are: Buon Tua Srah (86 MW, by EVN), Buon Kuop (280 MW, by EVN), Đray H’Linh II (16 MW, by Electricity Joint Stock Company 3), Serepok III (220 MW, by EVN), Serepok IV (70 MW, by Dai Hai Ltd. Co.).
Kon Tum is a province with diverse hydropower resources for hydropower development. The hydropower development potential of Kon Tum is still high considering there have been many national hydropower projects in the Se San, Poko and Dak Nghe rivers. Kon Tum also has a development plan for 74 small and medium hydropower projects with the total capacity of about 300 MW.
c. Transmission Line Development Project
Conservation areas and areas of high biodiversity are severely affected by transmission line development projects as summed up in Appendix 4. It is most important to note that large areas of conservation in Cat Tien, Cuc Phuong, Hon Son Tra – Hai Van, Mom Ray, Muong Sai, Nui Chua, Vinh Cuu, and Yok Don are significantly affected and fragmented.
The National Power Development Plan also shows that there are some cumulative impacts when the zones of influence overlap, which creates more serious impacts. An example is that there are too many hydropower development projects in the Vu Gia – Thu Bon river system. Transmission line development projects near or within the hydropower zones of influence will exelerate the existing impacts in affected areas or increase the risks of impacts in the remaining areas of biodiversity sensitivity. For example, the Dong Nai 5 ZoI and the 500 kV transmission lines will divide Cat Tien national reserve into 8 fragments and threaten biodiversity of the remaining forests. Similar impact is likely to happen to Nui Chua and Yok Don national park.
Thermal power: Generally, thermal power development is necessary because it contributes to economic development and domestic power supply. Planning for thermal power development needs to be based on efficient economic and sustainable environmental development targets. In order to achieve this, the costs of environmental, social and economic impacts need to be quantified as much as possible to be included in cost calculations for comparison and assessment. Additional cost for social and environmental impacts is US$27 billion per annum during the PDP VII period up to 2030, accounting for 17% of the total investment for this period (US$156.3). This calculation has not included all the costs of impacts on the environment, economy, society, and human health. However, it shows that environment impacts of PDP VII are relatively high. These impacts can be mitigated considerably if the Government and management authorities take positive actions and make more efforts.
Transmission line: The construction of transmission lines as presented in PDP VII will consequently have significant ecological and resource value impacts. These in turn will

216
have economic consequences in terms of the loss of ecosystems services values and negative local livelihood and amenity value impacts. The extension of the transmission grid is vital to the future development of the power supply system in Viet Nam and there are both technical and economic restrictions that limit the extent to which the negative impacts itemized above can be mitigated.
The overall impacts of PDP VII were assessed using Multi-Criteria Analysis (MCA) method. This is an assessment tool for complex problems in a situation where multiple criteria are involved. The table below presents a summary of power development assessment results from 47 Provincial Departments of Natural Resources and Environment and 47 Provincial Departments of Industry and Trade.
As seen in the table below, the assessment results show that overall PDP VII has big environmental and social impacts in all three areas of thermal power, hydropower and nuclear power, although each type of power development has its own impacts. The results also show that there is a concern amongst local people and governments about current environmental issues.

216
TABLE 3.21: IMPACT ASSESSMENT SUMMARY
Assessment Criteria
SCORE BY POWER DEVELOPMENT
TYPE (0-100)
POWER DEVELOPMENT TYPE
OBJECTIVE
CAUSE, AFFECTED
PEOPLE AND SCOPE OF INFLUENCE
Score 1 - 10 Hydro-
power Thermal power
Nuclear power
Power grid
Renewable
Ethnic Minority 3 80 20 20 40 10 People
Gender/Vulnerable Group
3 90 70 70 30 0
Large scale (> 1.000 household)
5 70 20 70 20 0 Number of affected people
Scale (> 100 household)
To ensure good living conditions and benefits for affected people.
2 90 80 100 40 0
Change in land use and land reserve for resettlement
4 70 90 70 40 10
Cultural heritage /asset/natural resources including fuel
4 80 100 20 0 0
Natural scenery
To preserve natural resources that local people are dependent on
and cultural heritage that that
they own
3 90 50 40 70
Agriculture 4 60 90 90 10 10
Fishery 4 90 60 70 10 10
Social Impact
People’s life
Water use
To ensure local income and livelihood
Land acquisition for power plant project Areas affected by development activities. Ethnic minority group, low income group, vulnerable group (women, children, elderly, veterans,), indigenous people. Effects on religion and belief. - Conflict of interests and benefits in the use of water, soil and other resources. - Changes to or loss of cultural aspects, habbits or lifestyle of local people, especially ethnic minority people.
5 80 50 60 0 0

217
Job/Employment 4 80
Income level and income gap
3 60 70 80 20 30
Unfairness in development activities and benefit sharing and lack of information exchange
3 80 60 30 50 20
Social equity
Lack of local consensus
To get local consensus through information distribution.
- Withholding information from relevant parties: local government, people’s committees at different levels. Limitation of decision makers.
3 50 40 60 20 20
Ecosystem (Deterrioration & loss of forest; loss of habitats of endangered species, impacts on national parks, preservation areas and biosphere reserves)
To protect original forests, tropical forests, and habitats of high biological values such as coral reefs, mangroves, and tidal areas.
Construction of roads, ports, new navigation routes. The scope of work and scope of influences of these activities.
5 90 30 70 70 10
Coastal areas Changes to coastline in large scale đường bờ.
3 20 60 80 0 0
Wetlands
3
70 40
Landscape or impacts on landscape. To prevent landslide, erosion, sedimentation and surface runoff.
Ground leveling, embankment reenforcement Building activities, including building of waste storage areas.
3 80 20 30 30 10
Environmental Impact
Changes to hydrological regimes 5 90
40
10
0
0

218
Climate Change
CO2 and other greenhouse gas emissions To limit the impacts of GHG
Fossil fuel and biomass combustion, geothermal, methan hydrate reaction, treatment of coal and fuel coke.
4
10
80
0
0
20
Air quality (SO2, NOx, ordor, PM, other gases and radioactive agent)
To meet the standards for gaseous emissions and ambient air. Effects of the compound and cumulative effects.
Fuel treatment. Fuel combustion. Operation of fuel port. Operation of vehicle and mechinary. Coal ash storage area. Scope of influence of power plant. Wind blowing to residential area.
4 20 80 70 20 30
Water quality (pH, SS, BOD, COD, organic compound, oil, Phenol, sulfur and sulfide). Heavy metals (Cu, Cd, Zn, Pb, Cr, Ni, Hg, and other metals). Over-fertilization, thermal pollution and rainwater runoff.
To meet the standards for gaseous emissions. Protection of river basin, river ecosystems and domestic water supply sources.
From various sources: untreated wastewater, rainwater runoff, waste storage area, cooling water, fuel port, wastewater from coal storage, runoff from coal ash storage area.
3 80 60 60 10 10
Envi
ronm
ent
Soil quality: pH, heavy metal, oil, radioactive material
Around the waste area of the plant. Earth work for the plant.
4 10 50 60 0 0
Noise 3 20 70 10 10 70
Impacts Electromagnetic fields 1 20 20 20 70 10
Pollution
Solid waste 3 20 80 40 10 60
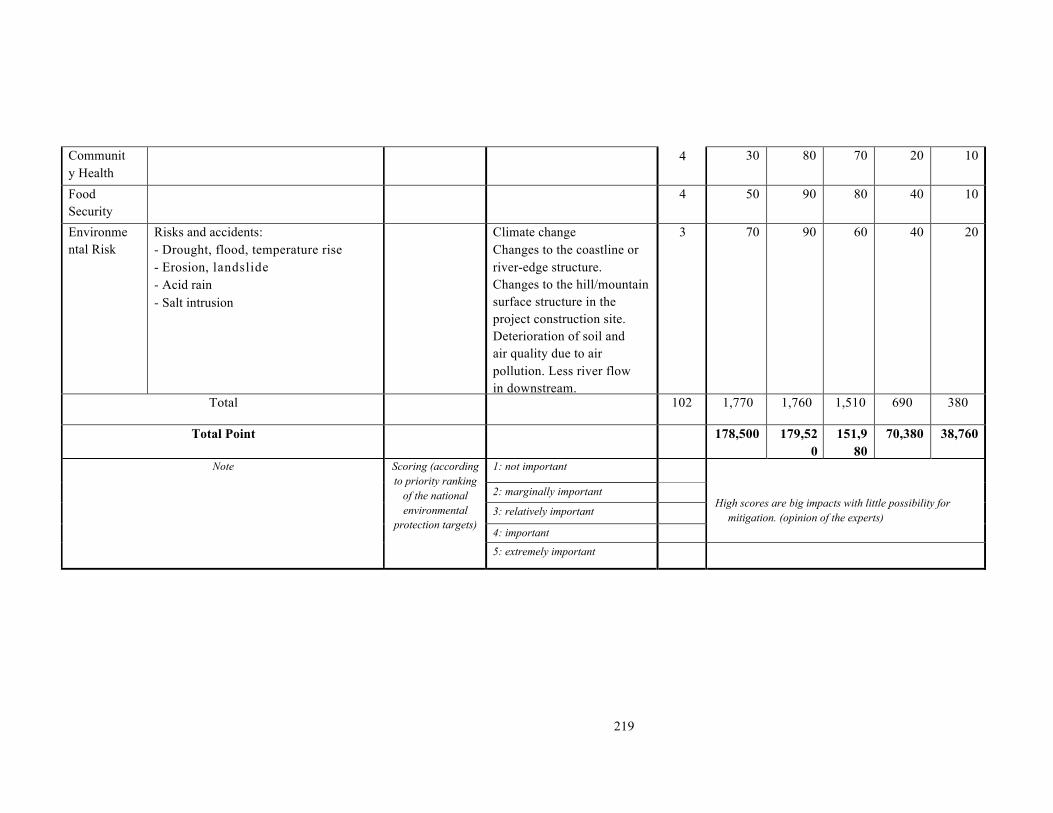
219
Community Health
4 30 80 70 20 10
Food Security
4 50 90 80 40 10
Environmental Risk
Risks and accidents: - Drought, flood, temperature rise - Erosion, landslide - Acid rain - Salt intrusion
Climate change Changes to the coastline or river-edge structure. Changes to the hill/mountain surface structure in the project construction site. Deterioration of soil and air quality due to air pollution. Less river flow in downstream.
3 70 90 60 40 20
Total 102 1,770 1,760 1,510 690 380
Total Point 178,500 179,52 0
151,9 80
70,380 38,760
1: not important 2: marginally important 3: relatively important 4: important
High scores are big impacts with little possibility for mitigation. (opinion of the experts)
Note Scoring (according to priority ranking
of the national environmental
protection targets)
5: extremely important

220
Chapter 4: Stakeholder Consultation
4.1. Organization of Stakeholder Consultation 4.1.1. Objectives of Stakeholder Consultation
Following the sequencing of SEA phases, stakeholder consultations were organized in the 3rd and the 6th stage of the SEA.
The objectives of the stakeholder consultations cover the following issues of the SEA of PDP VII:
(1) The main environmental issues and environmental indicators to be assessed in the SEA (2) The SEA approach and evaluation methods (3) The analysis of the results of the social and environmental impact assessments of the different power development scenario (4) The feasibility of the draft mitigation measures to address main social and environmental impacts.
4.1.2. Consultation Methods and Participants
There were two methods selected for consultation: workshop and distribution and collection of questionnaires.
(1) Consultation workshops with support from the Environmental Operation Centre of the Asian Development Bank:
1st workshop: The objective of this workshop was to gather stakeholder’s comments on the SEA approach and evaluation methods, and strategic environmental issues to be assessed in the SEA of PDP VII.
Participants to this workshop included representatives of related ministries and departments, government management agencies, enterprises in the electricity sector, provinces with big power development projects, and some NGOs working in Vietnam.
2nd workshop: This final workshop expected to gather stakeholder’s comments on the assessment and comparison of the proposed scenarios, the proposed mitigation measures for environmental impacts, and the feasibility of the recommendations and proposals.
Participants to this workshop were the same as the first workshop. Additional activities on the side of the workshop included interviews with managers in the environment and energy sector.
(2) Questionnaires:
The Impact Matrices were sent to provincial authorities responsible for environment and power management. The Impact Matrices provide a list of impacts of power development and grid expansion, and criteria to rank impacts. Impact Matrices for

221
certain power development projects were sent to provincial Department of Industry and Trade and Department of Natural Resources and Environment for provinces in which significant investments were proposed in PDP VII. The results collected from the provincial key informants provided additional information for the SEA.
A list of key informants for the Impact Matrices is included in Appendix 6. This list consists of around 50 key informants whom the Impact Matrices were sent to.
4.2. Consultation Results 4.2.1. Consultation Results
a. Exchanges between the SEA Working Group and the PDP VII Working Group
In May 2010, the power development scenario was completed and sent to the SEA working group for assessment and analysis. Important details of this scenario are:
(1) Thermal power: According to this scenario, all gas-fired thermal power plants will be converted to coal-fired thermal power plants after 2017 when gas runs out, and all new thermal power plants are designed to be coal-fired.
(2) Power generation from renewable energy accounts for 3.1% of the total power production, which is in line with the availablibility of renewable energy.
This power development scenario of PDP VII did not meet national targets for environment and socio-economic development. The SEA working group has discussed this issue with the PDP VII working group and proposed a reduction in power production from thermal power and in the number of proposed coal-fired thermal power plants in order to reduce coal consumption and its consequences.
In July 2010 the adjusted power development scenario was completed and sent to the SEA working group again. The plan in this scenario is:
(1) Thermal power: the number of gas-fired thermal power plants remains unchanged. A few more gas-fired thermal plants are proposed in the Centre, which will be using imported Liquified National Gas. This means there is the need to look for LNG sources for import.
(2) Power generation using renewable energy increases to 4%, mainly by small hydropower development.
(3) Nuclear power: three more nuclear power generators in the Centre.
The PDP VII working group also considered two other alternatives that the SEA working group proposed, which were:
+ To increase the electricity efficiency and conservation rate from 3% in the base case to 5-8% as set out in the National Strategy for Electricity Efficiency and Conservation. The calculation shows that there will be around 14,600 MW reduction compared with

222
the base case scenario.
+ To increase the rate of electricity generation from renewable energy and nuclear power from 4.1% in the base case to 8-10% as set out in the National Energy Development Strategy. This means a reduction of 6,200 MW from coal-fired thermal power production.
These two alternatives propose reduction in power generation, which means less reliance on coal, less impacts from coal-fired thermal power production, and less cost for the electricity sector.
However, the analysis of all scenarios shows that the base scenario is the optimal scenario because it is not only feasible but also incorporating all social and environmental issues. During the implementation of PDP VII, these two alternatives should be considered for implementation to whatever extent possible. According to analysis of the PDP VII working group, these two scenarios require big investment but have low potential and high technical standards that are not easy to achieve.
b. Workshop
The 1st workshop focused on discussions and comments from the stakeholders about the key environmental issues and the prospect of the SEA identifying all main environmental issues related to PDP VII. Main discussions and comments are:
< Review of some indicators that might be beyond the scope of the SEA such as social equity, food security, income gap and some other over ambitious indicators. Environmental cost should be eternalized into the cost structure of electricity. It is necessary to evaluate the environmental load of each power development center.
< Power generation using fossil fuels contributes to climate change, rising sea level and the overall sustainable development. It is necessary to develop renewable energy. To achieve effectiveness in renewable energy development, the government needs to develop and issue policies to support the use of renewable energy.
< Power development needs to consider environmental impacts beyond the national scale.
< Impact assessment should cover the issue of electricity import from neighboring countries.
< The PDP VI did not meet the targets, which had negative impacts on socio-economic development. Lessons learned from the implementation of PDP VI should be considered and carefully assessed in PDP VII.
< Environmental assessment indicators need to be clear for each type of power production. There needs to be an additional set of assessment indicator for soil quality (especially for thermal power and nuclear power plants).

223
Indicators for noise and heat pollution need to be considered for some types of power plants.
< Environmental assessment for hydropower plants should include integrated river basin management.
The 2nd workshop was organized on the 17 December 2010. The objective of this workshop was to present findings of the SEA and to collect feedback from stakeholders on these findings so that the SEA working group could incorporate the feedback into the final report.
Over 70 invitees to the workshop were representatives of relevant ministries and departments, research institutes, universities, management authorities at provincial level, and Non-governmental organizations. Most of these participants also took part in the first workshop.
c. Questionnaires
The Impact Matrices were sent to the provincial Department of Industry and Trade and Department of Natural Resources and Environment in more than 50 provinces in which significant investments were proposed in PDP VII. 48 provinces sent back the results, which included their assessment on the impacts of power projects in their provinces.
Feedback Summary
The Impact Matrices were sent to the provincial Department of Industry and Trade and Department of Natural Resources and Environment for provinces in which significant investments were proposed in PDP VII. The Impact Matrices provide a list of potential impacts by power generation and power grid development, together with a set of criteria for ranking and an impact scoring system. The provincial departments were asked to provide their answers about power development projects in their provinces based on their knowledge of the issues. A list of recipients of the Impact Matrices is included in Appendix 6.
The provincial consultations provide the knowledge and perceptions of managers at provincial level, who will have big responsibilities in dealing with the potential impacts, both positive and negative, from power plants in their local areas. In general, the consultation results show that there was an acknowledgement of both positive and negative impacts of power development. There were also concerns about certain impacts and the characteristics of these impacts. The impacts were scored from 3 to -1, with 3 for a big and unchangeable impact, 2 for a medium impact that can be mitigated, 0 for no impact, and -1 for a positive impact.
Thermal power development: Health impacts from atmospheric pollution and acid rain were identified as the biggest concern by provincial authorities. Some concerns were expressed about displacement of people and loss of agricultural land and houses. These issues were thought as could be handled well in some provinces but were identified as challenging or impossible by some other provinces due to the specific locations of the

224
projects. The issue of solid waste raised a considerable level of concern, as identified in about 50% of the responses. Some were concerned about greenhouse gases but scored them quite low at 1 (as in small and indirect impacts). Loss of biodiversity was not an issue of concern for most provincial authorities, except for several provinces that have experienced this from past projects. This shows that the SEA was successful in bringing this issue to the attention of local authorities and raising their awareness about this issue for the implementation of power development projects in the future. The overall results show that there is a good understanding about thermal power development and local authorities have good understanding of their local situations and are concerned about the potential impacts of thermal power development. However, local understanding about long-term impacts of thermal development is still limited. Direct and immediate impacts seemed to draw more concerns. Big impacts, such as climate change, were often assessed as small and indirect. Therefore, climate change can be considered as a national level issue.
Hydropower development: Social and environmental issues did not seem to draw much attention. Most social impacts, such as impacts on livelihood, were scored very low. Only a few provinces had different opinions on the matter. This raised the question whether all issues related to compensation and resettlement are currently handled to the satisfaction of the people and there does not need to be any additional support in this area? The issues of biodiversity, loss of land and natural resources received more attention. Many provinces gave high or medium scores for these issues. This is helpful in terms of pointing out the local situation of understanding the issue and giving an idea of what provinces might need attention when it comes to biodiversity issues in the future implementation of hydropower development projects. The level of concerns about impacts by hydrological changes also varied. Local authorities in some provinces believed that hydrological changes could result in negative impacts but in some other provinces pointed out that hydrological changes could be positive. The reasons for the difference in opinions are unclear. Further research is required for a better understanding of this difference. The issue of reservoir greenhouse gases did not raise much attention.
Transmission line development: This area received the most attention. Most impacts were scored medium or low. Very few provinces recognized the impacts of transmission line development as big and serious. This reflects the fact that most provinces are affected by transmission line development plan. In most cases, local authorities did not recognize the impacts of transmission line development as the result of development but only regarded them as losses for their provinces.
Overall, the provincial consultations provided the SEA working group a different view about the environmental issues related to PDP VII. Most local concerns are about the issues listed in the Impact Matrices. It was not a surprise to see that environmental issues that are most concerned about are the ones that have significant and direct impacts on people’s lives. Other issues that are less concerned about are issues that have long-term impacts and are regarded as less serious. The provincial consultation results reflect the fact that local authorities are more focused on their local issues in their
225
decision-making, rather than national or global issues.
4.2.2. Opinions of the SEA Working Group Regarding Recommendations of the Stakeholders during the Consultation Process
The 1st workshop gathered results beyond the expectations of the SEA working group. Apart from comments on the methodology, approach, scope of research, and key environmental issues for assessment of the SEA, further information collected included: (i) the new government decree on payments for environmental services; and (ii) the SEAs of hydropower projects in the Mekong River Basin.
To conduct a thorough research and to gather adequate information on the impacts of power development projects in PDP VII, it will require an enormous amount of data and will be costly as well as time-consuming. During the provincial consultation there was a lot of missing information. However, local assessment of the impacts helped to increase the reliability and reduce the uncertainty of this research.
The last workshop was an important activity because it gained consensus on the research findings and the feasibility of the recommendations.
The very short (half day) workshop gathered many relevant and useful ideas regarding the role of hydropower, how to balance water resources with integrated water resources management, solutions for traditional cultural heritage preservation for ethnic minority groups, resettlement, and livelihood. One of the issues that were most concerned about in the workshop was the reliance on coal-fired power production. The SEA working group has taken into account all the comments and feedback in the workshop and adjusted the report accordingly.
226
Chapter 5: Recommendations on Preventative and Mitigation Measures and Enviornmental Management and Monitoring Programs
5.1. Options to Prevent and Mitigate Negative Risks and Enhance Positive Potentials for the PDP VII 5.1.1. Prevent and Mitigate Negative Risks by Changing Project’s Plan, Location and Scale
The world’s economy is in the process of post-crisis recovery and development, which provides Vietnam with good opportunities to promote trade and attract foreign investment. Economic development creates greater demand for electricity and presents a larger market for the electricity industry, both in terms of production and geographical coverage. The renovation roadmap of the electricity sector includes diversification of investment in power production and development of various internationally available power production models as part of the efforts to improve electricity productivity and sales.
As discussed in the previous section, the SEA working group has considered the pressure to find affordable fuel sources and to reduce the reliance on the international fuel market to ensure energy security. The SEA working group then concluded that coal-fired thermal power production would be the main type of power production in the coming time although it is classified as the “dirty” type of power production. The proposed base scenario for power development aims at ensuring minimum cost in the context where oil price is climbing, natural gas reserve is limited, and it is not yet possible to develop nuclear power.
The SEA working also tried to examine other options for energy efficiency on the basis of government policies and national targets. The SEA working group has reached an agreement with the PDP VII working group in developing two more alternative scenarios based on certain assumptions. The two working groups also recommended changes to the development scenario to reduce the number of thermal power plants to reduce potential social and environmental impacts.
The alternative scenarios recommended for the preparation of the energy development strategy might be not economically feasible, but are likely to have more positive social and environmental impacts. The base case scenario for power development still has a few shortcomings, as discussed below:
< The assessment of the primary energy potential and supply sources for power production in PDP VII shows that thermal power will be the main power source in the future, accept for nuclear power, and that thermal power will rely mainly on coal. However, Vietnam will have to import coal from 2015, which will affect energy security and primary energy supply of coal exporting countries in the primary energy market.
< Diesel-fired and oil-fired thermal plants are considered as not economically feasible compared with other thermal energy sources.

227
< Nuclear power is not considered as an option in this research.
< Electricity import from neighboring countries is not regarded as an option due to legal barrier and all of the above reasons.
< Increasing power production from renewable energy, including small hydropower, is not considered as a feasible option because power production from this source only accounts for a small proportion of the total power production, and is mainly an option for areas that are not connected to the main grid. On top of that, power production using renewable energy usually requires high investment.
< Increasing productivity of pumped-storage hydropower is not considered as an option because it is simply just a way of using electricity. This should be combined with nuclear power development in Vietnam.
The assumptions in the alternative power development scenarios are based on the criteria of: (1) reducing the number of thermal power plants as in the base case scenario; (2) meeting all the environmental targets as discussed in the last chapter.
Alternative Scenarios for the National Power Development Plan
The SEA working group (with approval from the PDP VII working group) proposed two more power supply scenarios for the national power development plan, which have the following advantages and disadvantages:
Alternative Scenario 1:
- The energy efficiency and conservation target was set at 1-3% in the base case scenario, which was believed to be feasible and achievable. In this scenario, the energy efficiency and conservation target was set at 5-8% to be consistent with the National Strategy for Energy Efficiency and Conservation. This higher target of energy efficiency and conservation is for the best interest of the energy sector, especially in terms of the use of primary energy.
In assessing the feasibility of this target, it is recognized that in the electricity sector some energy savings can be done with the old fashioned coal-fired and oil-fired boilers. However, this old technology only accounts for a small proportion of power production in the electricity sector. Most energy savings should be expected from electrical devices and electricity transmission. Most projects with high energy saving potential in the National Targeted Program on Energy Efficiency and Conservation have been implemented. The remaining projects have lower energy saving potential. These projects are also more challenging to implement, as the costs for implementing them are higher because they require more advanced technologies and equipment. Power loss in transmission line is currently under 10%. The goal is to reduce it to 7%. To achieve this goal, it is required that the power transmission and supply system is upgraded to ensure maximum transmission capacity and contingency. However, there has been not
228
much positive result and almost no significant improvement in the past few years because the investment required for this work is too high. Investment requirement to upgrade the power transmission and supply system can be seen as a burden but also as an opportunity to invest into the electricity sector.
- The rate of energy efficiency and conservation that is feasible and investment efficient for the electricity sector, according to expert opinion, cannot exceed 3%.
Alternative Scenario 2:
- The target of this scenario is to increase renewable energy use from 3.8-4%, as determined in the research phase, to 8-10%. This new target is in line with the National Energy Development Strategy. According to the calculations and forecast of renewable energy in development scenarios in the Master Plan for Renewable Energy Development I, the highest level of renewable energy use is 4.1%, as determined in the research phase. This target is achievable in theory, considering the potential of all renewable energy sources. However, the potential of using renewable energy for power generation is very low because of the low technical and economic efficiency.
- On the other hand, investment for power development using renewable energy is often much higher than other traditional forms of power development. On top of that, power development using renewable energy has a very low resource mobilization rate of only 1/3 compare with power development using other energy sources, which is not very attractive to investors. Renewable energy development clearly has many benefits in terms of the environment. However, these benefits are not verifiable.
The conclusion drawn from the above discussion is that the optimal scenario for power development for PDP VII, which should be both feasible and economically efficient, is the base scenario. This power development scenario was chosen for the planning phase of the PDP VII. In the preparation of the PDP VII, the power demand forecast had taken into account the power demand for the period 2011-2030, the rate of power saving and efficiency by using advanced technologies, and the results of the DSM programs. A more sensible rate of energy efficiency and conservation was identified at 3%, This is a new development from the PDP VI as the result of the contribution of the SEA working group.
However, there are obvious benefits for the environment in the alternative scenarios in terms of reducing the number of coal-fired thermal power plants: (i) the alternative scenario 1 proposes a cut back of 16 coal thermal power plants (around 14,600 MW) – most of which are not included in the plan and located in the South and the South Central Coast where the ambient air is already compromised. This cut back on the number of coal thermal power plants is expected to reduce the annual amount of greenhouse emissions and the social cost of environmental pollution by around US$3,893 million by 2030. It is also expected to result in a reduction of around 56.3

229
million tonnes of import coal, which would help to reduce the reliance on the international energy supply market and prices (ii) the alternative scenario 2 proposes a cut back of 9 coal thermal power plants (around 6,200 MW), which would result in a reduction of 10.6 tonnes of coal and US$1,868 million of social cost. Although these alternative scenarios are not optimal, it is recommended that more supporting measures are applied to achieve best level of energy efficiency and conservation through increasing the use of renewable energy in power production during the implementation of the PDP VII. It is also possible to combine these two alternative scenarios during the implementation of the PDP VII to achieve the desirable targets.
The power development scenario for the period 2011-2013 was based on the power demand forecast and the socio-economic growth scenarios for the same period. The accuracy of the power demand forecast is much dependent on the socio-economic growth scenarios. Thermal power, especially coal thermal power, contributes the biggest part of the power development plan. Power contribution from this source will increase strongly in the future to 56%. The social and environmental impacts of thermal power development will also increase, as well as issues related to energy security such as the heavy reliance on fossil fuel sources and market prices, and global climate change. The goal is to reduce the number of coal thermal plants to reduce the pressure of these issues. Considering the existing conditions and capacity, the SEA working group and other experts participating in the planning have assessed other options such as energy efficiency and conservation, and development of renewable energy at the highest level in order to achieve the pre-determined targets. However, it is very difficult to achieve these targets because there are many challenges in terms of technical requirements, management, and costs.
To increase the rate of energy efficiency and conservation to 5-8%, as specified in alternative scenario 1, it is very important to use various methods to reduce the level of power loss to under 7%. It is only possible if the power supply and transmission system is upgraded to accommodate a better transmission capacity and contingengy. Research and development of an ultrahigh voltage transmission system (100-1100kV) is recommended for reducing the number of transmission lines and minimizing power loss during transmission. Estimated investment packages for the expansion of the 500kV and 1,100kV transmission lines in the South East are US$1,164.4 million and US$1,717.4 million, respectively, which means investment needed for the ultrahigh voltage lines is much higher than for the 500kV lines.
Changes to the Scale and Location of Projects in PDP VII
The assessment in Chapter 3 shows that the zones of influence of several hydropower and transmission development projects that are either very close or overlapping, which intensifies the impacts. This is particularly true in cases of infringement to national parks, nature reserves, special-use forests, biosphere reserves, and areas of significant biodiversity, tourism potential and ecosystem services. Attention should focus on minimizing potential impacts when mapping transmission line routes and planning investment for hydropower projects. A list of 500kV and 220kV transmission line

230
development projects that are planned to pass through national parks, nature reserves and areas of high biodiversity density, which need consideration for impact mitigation, is included in Appendix 4.
It is recommended that the two planned schemes, Dak Mi 1 and Dong Nai 5, are actively examined for cancellation because of their likely severe biodiversity impacts. The SEA working group also recommended that the Serepok 4a and the Dong Nai 6, which are still in the site-planning phase, are excluded from the power development plan.
It is further recommended that the thermal plants with big capacity, which are planned for the drought-prone areas in the Central Region, are examined for possible reduction in capacity to reduce their impacts. The Binh Dinh thermal power plant with a proposed capacity of 4,400 MW is an example. A series of power stations with capacity of over 2,400 MW in Ha Tinh and Quang Binh and some coal thermal plants in the South are also recommended for capacity reduction.
5.1.2. Mitigation Measures Involving the Organization of Implementation of the PDP VII and Financial Mechanism
There are issues that need to be emphasized and turned in to actions during the implementation of the PDP VII. These issues are:
Management Policies and Financial Mechanism
Requirements for Issues Related to Multi-purpose Water Resources Management and Environmental Risk Mitigation:
- Develop and implement plans for water extraction and reservoir regulation in accordance with the National Target Program for Integrated Water Resources Management and the Irrigation Development Planning Program as discussed in Section 1.2.3.
- Finalize multi reservoir operation procedures for river basins. To date, there are 3 complete procedures for reservoir operation and management. However, all of them have proven to be problematic during application. In response to this situation, the Prime Minister has instructed the development of multi reservoir operation procedures for 11 river basins, based on the lessons learned from the implementation of the three existing procedures.
- To study reservoir management (including of the current schemes) to assess the potential of multi-purpose management method. This method must be applied from the design stage, where hydropower schemes should consider their impacts on the whole river basins to assess the costs and benefits of design modification to include purposes beyond power generation.
The criteria for this should reflect national water management policies and priorities and should specifically include the assessment of water release regimes necessary to guarantee minimum environmental flows in order to ensure the maintenance of the

231
integrity of downstream ecosystems in dry season and flood control in rainy season.
There also needs to be regulations on the accountability of relevant parties responsible for reservoir management in case of loss of ecosystem, life, and asset due to mismanagement of water discharges.
Although general regulations on the need for this exist, they are not specific enough to provide clear guidance for reservoir managers on the most appropriate regimes. The basis for achieving this is the full participation of the power sector and the power project investors in the emerging river basin management systems of Viet Nam. It is recommended that a more detailed and thorough assessment of the costs and benefits of multipurpose management should be undertaken (including distributive effects) and that new reservoir management regulations should be issued for both existing and future reservoirs to reflect the benefits of multi-purpose management within an integrated water resources management context and based on cumulative river basin effects where multiple reservoirs exist.
Benefit sharing mechanisms: the contribution of hydropower development to the long-term development of communities in the vicinity of dam development is a key means for ensuring that hydropower has positive impacts for local communities. The financing of such development actions (such as infrastructure development, community forestry, improved agriculture and enterprise development activities) should come from a benefit sharing mechanism whereby a percentage of revenues from electricity generation is provided for local development activities. A successful piloting of such a mechanism under an ADB-funded project22 in relation to the A’Vuong hydropower scheme in Central Viet Nam demonstrates the viability of such an approach and it is recommended that this mechanism be adopted for all future hydropower development.
The overall power development plan requires coordination among relevant departments to combine improved energy efficiency and accelerated renewable energy development, while prioritizing fuel supply for domestic production activities and water resources sharing. This would include further assessments of the potential scale and best sites for renewable energy development as well as the means through which greater energy efficiency and a reduction of future dependency on coal can be achieved for the sustainable power development of Vietnam.
The assessment of approaches to improve management and operational efficiency in the power sector through economic incentives needs to be explored. This includes options to charge a fee for the use of cooling waters, polluter pays fees that reflect levels of atmospheric emissions of particular pollutants, the establishment of a management mechanism for the collected fees and the implementation of the recent national decree on the payment or forest ecosystems services in relation to upper watershed management for hydropower development. The MoIT should also define and enforce clear regulations on the technologies to be used for thermal power generation so as to ensure that the highest
22 Haas, L., Dang Vu Tung and the Institute for Energy Studies (2007) Benefit Sharing Mechanisms for People Adversely Affected by Power Generation Projects in Viet Nam Electricity Regulatory Authority of Viet Nam.

232
standards of generation efficiency and pollution mitigation possible are found.
Water quality management: Provincial Departments of Natural Resources and Environment need to work with local people to manage and control wastewater discharges from power stations and aquaculture, agriculture and tourism activities in river basin areas.
Promoting renewable energy development: The Government and relevant ministries and departments need to develop financial mechanisms to encourage investment in new and renewable energy development. In particular, favorable policies, such as equipment price and import tax support, prioritized access to loans and sites, are needed to encourage investment from private and foreign sectors to renewable energy development. With the right support, power production from renewable energy can develop fast in the future to meet the desirable targets of the power development scenario and to reduce investment from the government and government enterprises to the power sector. Examples of this include the solar power project funded by the Vietnam National Petroleum Corporation in the Spratly Islands, which brought invaluable benefits to local people, and the big wind power project in Binh Dinh, which is being implemented by the Song Da Joint Stock Co.
Energy saving and efficiency: The next phase of the Energy Efficiency and Conservation Program will be implemented and strengthened in all sectors and all parts of the country. Specific measures are:
(1) More research on technology improvement to promote electricity saving. (2) Changes to the pricing mechanism of electricity to eliminate cross-subsidies to reduce power consumption. (3) Monitor and supervise localities and individuals in implementing the Prime Minister’s Decision No.79/2006/QD-TTg, dated 14 April 2006, on approving the National Target Program on Energy Efficiency and Conservation, and Decree No.19/2005/CT-TTg, dated 02 June 2005, on electricity saving.
Rational extraction and use of fossil fuels such as oil, coal, and natural gas. The Government, MOIT, and energy corporations should pay more attention to issues related to the extraction and use of fossil fuels. The level of fossil fuel export should be managed to prioritize energy for domestic production activities. Attention should also be paid to the market fossil fuel prices to make sure that energy corporations can still sustain their income.
If this is done well, Vietnam will have a better chance of delaying coal import and reducing reliance on the availability and prices of primary energy in the world’s market to strengthen national energy security.
Resettlement and livelihood for local people: Although the recent Decree 69 has shown many positive changes in terms of meeting the needs of displaced people and motivating investors to fulfill their responsibilities, it is still inadequate, as discussed in Chapter 2 and 3. There is a need for an accountability mechanism that legally binds project

233
investors with their responsibilities for displaced people. This mechanism should include:
- Requirements for selecting resettlement location and production land to avoid situations where people are relocated to areas where they cannot grow crops such as in special-use forest or low quality land or areas that are prone to landslide, etc.
- Requirements for construction quality of infrastructure, houses, and supporting facilities within resettlement area.
- Requirements for a timeframe within which a resettlement package should be implemented, and transparency requirements to ensure that the compensation package enables local people to sustain their lives after being displaced.
To fulfill these requirements, there needs to be collaboration amongst relevant agencies such as MoNRE, MARD, MOC and other specialized agencies at different levels.
The “responsible persons pay” solution: There are laws and national decrees, standards, and regulations concerning gaseous emission. Thermal power plants are often equipped with treatment facilities, which are continuously improving. Although there have been efforts focusing on limiting the amount of gaseous emissions, there needs to be mitigation measures for the impacts. It is recommended that part of the costs associated with environmental and health impacts as the result of gaseous emissions from power generation is covered by owners of the emission sources, as a contribution to the community and society. There needs to be a legal document that specifies how this contribution should be collected from the owners of the emission sources, following the example of similar process in wastewater management.
This financial contribution should be managed in an efficient manner. Experiences show that the National Environmental Protection Fund has not been successful in achieving the goal of providing financial support for environmental protection and environmental accident recovery. It is proposed that financial contribution from thermal power plants that release gaseous emissions is used to invest in infrastructure development for local communities and to support the public health system through health insurance and development and maintenance of health care facilities. Part of the investment should go to nature reserves to increase carbon absorption capacity, and to the development of renewable energy and other activities that promote energy efficiency and conservation.
The Regulatory Framework for Nuclear Development
A critical constraint to the safe development of nuclear power in Viet Nam is the lack of radioactive management regulations and norms, along with experience in the construction and operation a nuclear power plant.
Nuclear power development requires agencies to work together closely to develop a legal basis and conditions for radioactive safety to:
< pass appropriate laws and regulations based on international experiences in

234
planning, designing, construction and operation of nuclear facilities. < establish clear and detailed operational guidelines for all stages of the
planning, construction and operation of nuclear facilities. < define and implement a sustained program of training and capacity
development, including building institutional capacities, for the planning, construction, operation and independent monitoring and supervision of nuclear facilities to ensure absolute conformity to all regulations.
These steps represent a significant investment that must be seen as an integral and indivisible part of the costs of establishing nuclear power in Viet Nam. The absence of such a system of regulations, guidelines, institutional and human capacities and effective monitoring and supervision will significantly increase the likelihood of a catastrophic accident, potentially with devastating releases of radiological material. This is one of the most important mitigation measures for nuclear power development in this SEA.
5.1.3. Mitigation Measures for Inevitable Adverse Impacts and Directions for SEAs of PDP VII Sub-component Projects
5.1.3.1. Thermal Power Mitigation Measures
Assessment of the scenarios included in PDP VII (see Chapter 3) shows that potential impacts from the atmospheric emissions from thermal power, especially coal-fired thermal generation, is the most serious issue in the SEA of PDP VII. These impacts have very high social, environmental and economic costs. It is concluded that the identification of possible options to reduce the future dependency on coal-fired power generation is consequently the key to the mitigation of adverse social and environmental impacts from PDP VII.
There are many management and financial solutions to support the two alternative scenarios proposed by the SEA working group, such as:
Various solutions could be applied to achieve the energy savings potential of around 36% in the residential sector, and more than 20% and 12% in the industrial and commercial sectors. The World Bank’s Commercial Energy Efficiency Program (CEEP), which involves pilot projects in commercial and industrial sectors, shows project savings between 15-30%.
EVN’s DSM Assessment Study considered achieving the 5-8% electricity savings target set under the Vietnam Energy Efficiency Program (VEEP) for the period 2010-2015 and gradually increasing this savings target to 20% of the total electricity demand during the period 2015-2030. These targets bring down the country’s electricity elasticity (ratio of growth rate of electricity demand and growth rate of GDP demand) from a high of 1.90 in 2010 to 0.85 in 2030, which is consistent with those of many efficient developing and developed countries.
Achieving these high levels of energy efficiency improvements requires successful implementation, enforcement and large-scale replication of the measures identified in the

235
VEEP. This includes: i) legislative frameworks on energy efficiency and conservation in all the sectors of the economy were formulated and effectively enforced; ii) education and information dissemination systems established and projects in the residential sector implemented; iii) energy efficiency standards and labeling systems introduced and assistance extended to domestic appliance manufacturers; iv) energy efficiency and conservation management models developed and support provided to industrial enterprises; and v) capacities strengthened related to energy efficiency and conservation in building design and management as well as successful demonstration of projects related to building energy efficiency improvement.
The DSM program will expand to include measures and actions to reduce the gap between planning and implementation, and to tackle the lack of human and financial resources to implement the measures, and the lack of a monitoring and evaluation system and coordination amongst relevant parties to achieve energy efficiency targets.
One of the critical factors, in addition to the regulatory and management measures, is financing of energy efficiency activities and projects. An energy efficiency fund could be established to support activities and leverage private sector investments. Similarly, the market for energy efficiency services and the establishment of energy efficiency service companies should be stimulated and supported by the government.
Solutions for Increasing the Use of Renewable Energy in Power Generation
The second major element of any strategy to reduce the levels of coal-fired power generation needed in the future is to generate the electricity from other sources. Under the existing base case of PDP VII, large-scale hydropower will be close to maximized in terms of feasible hydropower construction sites, nuclear power will be developed at as fast a rate as is feasible for Viet Nam and both oil and gas will be at levels that are as high as is likely to be economically and technically feasible. This leaves the further rapid expansion of power generation from renewable energy sources as the outstanding option for reducing coal consumption and impacts through substituting alternative power generation sources.
At present, grid connected renewable energies are mainly from small hydropower systems, which are projected to increase from 461 MW in 2011 to 3,129 MW in 2030. Wind power generation will increase from a minimal level at present to 2900 MW by 2030. For this renewable energy scenario, an additional 4800 MW of small hydropower systems and 3000 MW of wind power plants are to be installed.
To achieve the goal of renewable energy development, the government should encourage investment into this area through the introduction of favorable laws, policies and a special legal framework to support the participation of private national and international investors.
However, according to the most recent statistics in the strategic report of the Vietnam Renewable Energy Master Plan I, renewable energy supply potential of Vietnam is rather limited (see table below). Total renewable energy potential is estimated at 11.17

236
million Wh/year in 2025, and the total power generation from renewable energy in 2008 was only at 159.39 MW, of which 132.23 MW was not connected to the grid. The base scenario of PDP VII expects 13.021 million Wh or 4,829 MW from renewable energy in 2030, which means more than 81% of total renewable energy potential would be used for power generation in 2030.
The cost of renewable energy is higher than any other traditional forms of energy for three reasons: (i) Low capacity level and power generation is dependent on weather conditions (wind generators, solar energy, tidal harnesses, small hydroelectric), and seasonal (biomass, biogas, etc.); (ii) the government still supports the use of conventional forms of energy; and (iii) inadequate investment into research to reduce price and increase productivity of renewable energy equipment and technology. Renewable energy development currently still needs government support with the level of support depending on many factors such as type of technology, target users, time and length of support.
According to calculations in the Renewable Energy Master Plan I, the cost of coal-fried thermal is the lowest in thermal power production. The cost of electricity generation using wind power is much higher (even when the investment package was at US$1,000/kW) than thermal power using coal or gas (although the investment package was assumed to be at US$1,750/kW, which is much lower than in reality), but lower than thermal power using oil.
Table 5.1. Renewable Energy Potential for Power Generation in Vietnam – Alternative Scenario 2
Source
Potential location
Capacity
MW
Potential Annual
Production GWh/year
Cost
USD/KW Small hydropower
Technically exploitable 1,050 4,015 16.4
Economically exploitable
408
152
13.35
1,200 (50% performanc
e load)
Geothermal 1,700 Technically exploitable 269 400
Economically exploitable 6 112.7
Wind
Technically exploitable
39% of Vietnam’s territory
22,400
1,000 (25% performance
load)
Economically exploitable 12 1,785

237
Biomass Bagasse 1,200
Technically exploitable 276 1,103
Economically exploitable 221 882
Rice husk 1,600 Technically exploitable 225 Economically exploitable 197 299 Solid waste/ landfill gass
Technically exploitable >15 298 214 NA Economically exploitable PV solar Technically exploitable 11 provinces 0.00124 Economically exploitable Tidal harness 14 1,60
0
An Integrated Solution
The issue of whether it is feasible to combine the two proposed alternative scenarios to reduce environmental and social impacts of coal-fired thermal power needs further and more in-depth consideration. To do this, it is advised to consider all technical and economic aspects of renewable energy potential. This strategy should also be used as the basic framework for actions in PDP VII to achieve sustainable development goals.
5.1.3.2. Hydropower Mitigation Measures
Mitigating social impacts: SEA proves that power development can cause many impacts to local communities, displaced residents and residents living in affected area. Here are some detail suggestions for social impacts:
< A package of mitigation measures for displaced people. < Support for local communities in resettlement areas. < Support for agricultural development. < Mitigate the risks caused by reduced access/exploitation of forestrial
resources. < Introduce PES based on national regulations to encourage river basin
management. < Mitigate the risks caused by reduced access to aquatic ecosystem resources.
In general, mitigation measures for social impacts defined in SEA are over the limit of cover method that are only defined and compensated for direct measurable impacts. Components on this mitigation package supply a comprehensive method to ensure that power sector is dynamic sector for development, poverty reduction in project areas.
SEA report defines a mitigation package for social impacts that affect to comunities displaced for power development based on Model of “Impoverishment, Risk and

238
Reconstruction„23 that includes advanced approachs of resettlement. This package consists of mitigation measures for long-term livelihold development, poverty alleviation for affected comunities. Cost for this package increase but it does not affect to the economic feasibilty of each project. This cost is only 23% higher than cost of mitigation measures mentioned in PDP VI study. This cost should be considered as a part of cost for hydropower sustainable development and more social responsibility. Compulsory regulation should be established soon for all power projects including projects owned by individual invester at provincial level.
Resettlement “host” populations: the risk of negative impacts on the host populations where resettlement takes place are significant but are impossible to predict until the specific resettlement sites are identified. Nonetheless, mitigation measures can be identified. The approach recommended is to ensure that the host populations are provided with the same development possibilities as the resettled households, with in particular investments provided to ensure that they have equal access to basic services and livelihood development opportunities. The planning of resettlement and development activities should be jointly undertaken by the resettled and host communities, providing a means to build mutual understanding and shared development objectives and ensuring that the potential resentment of host populations to the resettled communities is reduced.
Reduce impacts to forest resources: the SEA has identified the risk of negative impacts on forest resources in the areas affected by the planned schemes. The valuation of these resources estimated their total value as being over US$7 billion, so even a relatively minor negative impact can have a high value. These risks reflect increased pressures on forest resources due to a combination of increased population and the possible reduction of forest area and quality. These impacts can be mitigated through the introduction of a community forestry programme in areas where there is a risk of increased stress on forest resources; that is, in zones of influence where there is a high dependency on forests as part of local livelihood patterns and where the density of population is such that potential declines in forest area and/or quality could result in unsustainable pressures. The costs of the community forestry should be internalised in the calculations of the hydropower development costs. Community forestry is organised at a village level, with standardised unit costs per village of approximately US$45,000 per village group. It is estimated that the likely total cost of the introduction of community forestry would be minor compared to the resource value of forest areas under risk from hydropower development and that economic rates of return in the order of 10:1 or more could be expected.
Development of the Payment for Environmental Services: The Government Decree No. 99/2010/ND-CP, dated 24 September 2010, on Payment for Environmental Services (PES) for water management and erosion control are being introduced at a uniform level of 20 VND 20 VND/kWh. This will provide an important revenue stream for upstream
23Cernea, M. (2000), Impoverishment, Risk and Reconstruction: Model of population movement and Resettlement in Cernea, M. & McDowell, C. (2000) Impoverishment and Reconstruction: Experience of resettles and refugees, World Bank, Washington DC. Experience of resettles and refugees, World Bank

239
resource owners that will have major local development benefits. For example, the pilot study in Lam Dong Province has resulted in many poor upland families gaining PES income that has nearly doubled their existing cash income streams. The PES system can be perceived as an additional charge to the hydropower sector, but if it results in the successful preservation of upstream forests, with better water management and reduced siltation, it is likely to be beneficial in economic terms to the hydropower sector by significantly extending the life of many hydropower schemes. This system is consequently an important and positive mitigation measure that benefits both local people and the hydropower sector.
Mitigating negative impacts on quatic resources: the National Hydropower Plan (NHP) identifies the lengths of upstream and downstream rivers that are likely to be severely affected by the individual hydropower schemes. The impact on the availability of aquatic resources is likely to be severe in most cases. It is estimated that over 100,000 people live within one kilometre of these lengths of affected rivers and rely on these resources to a greater or lesser extent. These can be mitigated by the introduction of measures such as aquaculture development, the introduction of hatcheries to reintroduce productive fish species and the development of alternative livelihood options. The provision of these investments should be an integral part of the planning of each scheme and the costs of such measures (which in most cases will not be particularly expensive) internalised in the cost calculations of the different schemes.
Identifying and mitigating biodiversity impacts: the assessment of potential biodiversity impacts of the hydropower schemes assessed in detail in the SEA found that there are a number of schemes where potential risks to biodiversity are of particular concern. This is a combination of fragmentation risks, where a high proportion of key biodiversity areas lie within a zone of influence, and inherent biodiversity value as represented by the presence of endangered or indigenous species. These concerns are compounded where there are several schemes within a river basin. They will also be compounded, as we have seen, by fragmentation due to the expansion of the transmission grid. Where risks to biodiversity are high it is recommended that the planning process for the hydropower scheme and/or the construction of transmission lines include the detailed assessment of likely impacts and a biodiversity action plan, including necessary funding, to ensure that adequate protection measures are introduced and implemented.
A key part of this will be the establishment of protected areas in localities where threatened key habitats do not have a protected status. The mitigation measures should also include exploring the costs and technical feasibility of transferring key endangered species to new habitats.
It is also recommended that an education and awareness programme on the importance and value of biodiversity resources is developed for implementation both in the sites where schemes are constructed and for wider stakeholders involved in the sector. As with other areas of mitigation, the costs of biodiversity protection measures should be internalised to the calculation of the economic costs of individual hydropower schemes.
240
5.1.3.3. Nuclear Power Mitigation Measures
The first priority in the planning phase of a nuclear power plant should be to comply with regulations on radiation safety, including first of all the safe radioactive isolation distances. These are the absolute isolation zone, the protective isolation zone, and the peripheral isolation zone and emergency evacuation zone. In this, it is essential that Viet Nam follows international standards and good practice.
The planning of the location and layout of the plant must pay attention to issues of the environment, natural resources, economy and society in the region besides requirements in terms of economic, technical, and transport aspects.
The construction phase should consider design options to ensure absolute conformity to all regulations regarding health safety for workers, including evacuation procedure and radioactive management.
It is necessary to define and implement a sustained program of training and capacity development, including building institutional capacities, for the planning, construction, operation and independent monitoring and supervision of nuclear facilities to ensure absolute conformity to all regulations.
5.1.3.4. Transmission Line Mitigation Measures
The inherent nature of the most important impacts of the transmission lines mean that they are difficult to mitigate in any way other than changing the route of the line so that it passes through less sensitive localities. This is of particular importance in relation to the issue of ecosystems fragmentation. It is recommended that assessments are conducted for projects included in the plan that have transmission lines passing through national parks (see list in Appendix 4) to evaluate the scale and level of fragmentation for adjustments in later phases.
The use of ultra-high voltage cable (1,100KV) is recommended to reduce the number of lines (for example in the South East route, the number of line was reduced from ten 500kV lines to four 1,100kV lines. It is also recommended to use transmission lines that require less space for the safety corridor to save land and reduce risk of impacts.
Physical barriers to at least prevent and control the entry of motorized vehicles (both for the project activities or others) into forest areas opened up by transmission line routes should also be a mandatory requirement. It will not prevent all access, and will need to be maintained, but it can at least limit illegal logging and encroachment for commercial purposes.
The local communities and the Forestry Department (under the provincial Department of Agriculture and Rural Development) should be notified about line routing, any possible environmental impacts, and planned protective measures to have the opportunity to provide feedback and to collaborate in the planning and implementation of the forest protection programs to ensure that the line construction does as little damage to the integrity of the forest area as possible.

241
The final area where mitigation measures should be introduced is with regard to the possible health risks associated with EMFs from the transmission system. Line routing should avoid residential areas. Regulations about safety corridor for transmission lines should be strictly followed.
5.1.3.5. Orientation for the SEAs of PDP VII Sub-component Power Projects
Thermal power projects
Thermal power projects are often located in river basin and delta areas where the population is high and the existing ambient air quality is either already compromised or already beyond the limit in some areas. New projects planned for these areas must strictly follow the requirements for environmental protection and therefore the cost for environmental protection of these projects would be much higher. The assessment in Chapter 3 leads to a proposal to reduce the number of thermal power plants based on some specific criteria, such as time of operation, in order to systematically optimize the power plan. Some thermal power plants recommended for cancellation are the ones that have not had fixed locations and that are likely to affect agricultural land in the future. These plants were expected to be in operation in 2009-2030.
Thermal power plants in economic focal regions and big cities with high concentration of population and industrial parks, such as the Red River Delta and the South East Economic Regions, need to be monitored closely to ensure that environmental protection requirements are strictly followed. This is necessary because the environment quality in some of these areas is already beyond the limit, in regards to both air and water quality. It is further recommended to pay more attention to the issues of erosion and impacts on aqua-habitat ecosystem in estuaries and coastal areas where clusters of big thermal power plants are planned. These issues can be addressed by adjusting the station capacity and planning fewer big power plants in one area. Attention is needed when preparing strategic environmental assessments for and during the implementation of thermal power projects in Quang Ninh, Hai Phong, Ha Tinh provinces (such as the Quynh Luu, Vung Ang 1, 2 and 3), and other thermal power projects such as the Long An, Song Hau, Long Phu, Duyen Hai 1, 2 and 3.
Regarding social issues, it is important to implement compensation and support policies in accordance with the Government Decree No. 69/2009/ND-CP, dated 13 August 2009, on additional provisions for land use planning, land prices, land acquisition, compensation, support and resettlement. However, SEAs should do better in assessing social impacts and long-term costs to support displaced people, as proposed in Chapter 3, to ensure that these costs are internalized in the calculations of project investment.
Hydropower projects: Most of hydropower projects included in PDP VII are either in construction phase or investment preparation phase. Therefore, recommendations for the SEAs of these projects are no longer needed. Issues that need attention in the future is revision of the implementation of hydropower projects, particularly the resettlement and compensation aspects, and evaluation of the quality of life of the displaced people,
242
especially after 3 years or more. The situations of forest ecosystem fragmentation, loss of upstream forest, water management and hydrological regimes in river basins where many hydropower projects have been implemented also need to be evaluated. Further recommendations can then be made to relevant ministries and departments on protection of the remaining forests, reforestation and support to displaced people who are still struggling.
Transmission line development projects: it is necessary to identify the level of damage to sensitive ecosystems and fragmentation of biodiversity areas to consider if re-routing is necessary. The construction of transmission lines should be planned to best minimize or avoid ecosystems fragmentation. In case fragmentation is inevitable, it is necessary to propose solutions for protecting the remaining of the ecosystems to limit the risk of total damage.
Nuclear power projects:
The most important measures involve site selection and absolute conformity to nuclear safety regulations from planning, designing, construction and operation of nuclear power facilities. The SEAs for nuclear power projects will base on these established criteria and the following design features:
There needs to be two separate sewage networks – one for the inside of the factory boundaries and one for the outside of the factory boundaries, both need to comply to the following rules:
- Sewage networks need to ensure that rain water drains quickly without causing any overflowing.
- Wastewater contaminated with radioactive or chemical materials needs to be collected and treated within the factory in accordance with Vietnamese environmental standards before discharge.
- Cooling water intake and outlet structures need to be designed and placed in locations that have the least impact on the sea ecosystem. Temperature of cooling water when discharged needs to be lower than water temperature in the cooling tower to ensure no impact on the ecosystem.
Resettlement and compensation for displacement of people as the result of nuclear power development need to follow the national standards for resettlement package as for other forms of power development.
Rational site selection and technical solutions embedded in design of nuclear power plants can minimize impacts on aqua habitats and coral reefs. It is recommended that different options are considered for site selection and construction of nuclear power plants to maintain local scenery and to reduce impacts on local tourism. During project implementation, it is proposed that the project works with science institutes to develop optimal conservation plan for the project. Detailed research and mapping of coral reef areas are needed to protect the aqua-systems and aquatic resources.
243
During operation, each of the 1,000 MW generators of the two planned nuclear power plants uses around 252,000m3/h of cooling water. It is absolutely necessary to have solutions for surface water protection, which should be based on integrated water resources and ecosystem management principles. A system should be established for controlling water pollution. All calculations, monitoring and supervision of wastewater discharges need to strictly comply with environmental protection standards for all kinds of wastewater, including domestic wastewater and cooling water.
Cooling water discharge needs to be less than 40oC, as specified in Vietnamese Standard QCVN 24:2009/BTNMT. If the temperature of cooling water discharge is at 40oC or higher, the system design needs to be examined and adjusted to reduce the temperature of cooling water before discharge. Cooling water should also be treated to ensure that the level of radioactive contamination (if any) is lower than the permitted level before discharge.
Treatment facilities need to be installed for smoke and radioactive contaminated gaseous emissions in accordance with radioactive safety regulations. Air circulation system also needs to be installed using appropriate technology to be complied with safety regulations.
5.1.4. Mitigation Measures Using Scientific and Technological Advances
Scientific and technological advances play an important role in power development, as they provide solutions for fuel efficiency and reduction of power loss and gaseous emissions. Scientific and technological advances that should be considered for the implementation of the PDP VII include:
+ New technologies in thermal power development such as critical or super-critical thermal power technologies, which improve fuel efficiency.
+ Advanced treatment technologies for gaseous emissions and wastewater, which result in high treatment performance, such as carbon capture and storage technology.
+ Installation of high capacity generators in one location when possible to reduce cost and investment capital.
+ Smart grid technology for grid development and use of ultra-high voltage transmission lines to reduce the total number of lines and consequently the land area needed for safety corridor.
+ Technologies for treatment and reuse of waste materials, especially coal ash.
5.1.5. Regional Power Integration with Other ASEAN and GMS Countries Grid connection with Laos and Cambodia creates an opportunity for Vietnam to explore further grid connection and power trade with other ASEAN countries such as Thailand and Malaysia. Regional grid connection brings significant benefits, such as lower level of power reserve for the inter-connected power system, higher operation efficiency, and

244
possibility of installing generators of bigger capacity to take full advantage of domestic hydraulic power. An inter-connected power system also allows a more flexible operation mechanism and reduces gaseous emissions to 15-20% compared with separate national power systems. Overall, it contributes to sustainable energy development and promotes international integration and regional cooperation.
Grid connection plan with Laos: In 1998, Vietnam and Laos signed an agreement, according to which Vietnam would buy 2,000 MW from Laos by 2010. On January 10, 2008, the Governments of the two countries signed an agreement on economic, cultural, scientific and technological cooperation, which specified that Vietnam would import over 5,000 MW from Laos by 2020 through two 500 kV transmission lines. In the present, there are 35 kV lines transmitting electricity from Vietnam to several areas near the border in Laos. It is expected that in the period 2010-2011 Vietnam will import electricity from various hydropower plants in Laos, such as the Sekaman 3 (250 MW), Sekaman 1 (320 MW), and Nam Mo (105 MW), etc. In the period 2016-2017, Vietnam will import 1,410 MW from the Luong Pra Bang hydropower plant, which is located on the Mekong mainstream.
The power connection plan with Laos is as follows:
- From Southern Laos (Ban Sok) to Pleiku is a 500 kV line from the 500 kV Ban Sok station to the 500 kV Pleiku station, covering a distance of 180 km. This line will transmit electricity from hydropower plants on Sekong River such as the Se Kaman 1, Se Kong 4, Se Kong 5, and Nam Kong 1 & 2, etc., with total capacity of nearly 1,600 MW. In the future, this line can be connected to the power system in Thailand through Udon area.
- From Northern Laos (Luong Pra Bang) to the North of Vietnam is a 500 kV line from Luong Pra Bang hydropower plant to the 500 kV Nho Quan station, with total capacity of 1,410 MW. The total length of this line is around 400 km.
Grid connection plan with Cambodia: There is an agreement between the Vietnamese and the Cambodian Governments about Vietnam selling electricity to Cambodia to supply for the Phnom Penh area via a 220 kV line from Chau Doc through Tinh Bien and Ta Keo to Phnom Penh with a total capacity of around 200 MW.
The two hydropower schemes Ha Se San 1 and Ha Se San 2 are both funded by EVN International Company. After 2010, Vietnam will import electricity from several hydropower plants in Cambodia, such as the Se San 5 (90 MW) and Ha Se San 2 (420 MW). It is expected that Vietnam will import over 1,000 MW from Cambodia by 2020, and 2,000 MW by 2030, when Cambodia has developed more hydropower plants on the Mekong mainstream.
Grid connection plan with Yunnan (China): Yunnan province in China, north of Vietnam, has a high hydropower potential of over 400 billion kWh. By 2008, Vietnam had imported over 550 MW of electricity from Yunnan through 110 kV and 220 kV lines. A grid connection plan using 500 kV line is currently under preparation. If this

245
plan is implemented, Vietnam will import between 2,000 MW and 3,000 MW from China between now and 2020.
From the analysis above, the total amount of electricity import from neighboring countries can be between 5,000 MW and 6,000 MW by 2025 and between 8,000 MW and 9,000 MW by 2030. However, these calculations are solely based on assumptions from the Vietnam side. Whether it is possible to import electricity to Vietnam and what would be the possible amount depends the opinions of the other countries, and on whether a consensus is reached. This means there is uncertainty over the possibility to import electricity from neighboring countries.
The Trans-ASEAN Gas Pipeline Project is also being promoted. This project explores the possibility to connect big oil fields in Indonesia and Malaysia with Singapore, Thailand, and Vietnam through a pipeline network on the continental shelf. If all goes well, Vietnam is expected to be connected to this network in the late 2020s. Within the ASEAN grid connection plan, Vietnam might be able to connect with Thailand through other countries and through the 500 kV lines between Vietnam and Laos.
Whether these plans and projects are feasible or not depends on the economic development of each country in the region, influences of the global market, and national and regional policies for bi-lateral and multi-lateral cooperation.
5.1.6. Other Mitigation Measures
This section discusses mainly mitigation measures for the construction phase, which should form the basis for implementation of the next phases of the projects included in the power development plants.
Transportation, supporting facilities and infrastructure: Impacts of complementary civil works often contribute to environmental deterioration, including forest ecosystem deterioration, and reduction of agricultural land area. The impacts are usually not obvious at this stage – it is either not easy or impossible to identify them. Therefore, it is recommended that studies are conducted during implementation to evaluate environmental factors related to these works, particularly in relation to the location, construction plans for complementary civil works, total affected land area, and other effects. Special attention should be paid to the effects that power development projects might have on local traffic. As the pre-project road conditions are to accommodate local traffic only, appropriate solution might be needed after the project commences to make sure that the extra load of traffic from the project will not affect local people, damage roads and cause traffic accidents.
Quarries and borrow pits are used to provide material for construction of power plant and other complementary works. They can considerably increase the area of natural habitats or agricultural lands that are lost to a power development project. To the greatest extent feasible, quarries and borrow pits should be sited within the future inundation zone. Where this is not possible, the pits should be rehabilitated after use, ideally for conservation purposes such as wetland habitats.

246
The Ministry of Commerce and Trade and the Ministry of Natural Resources and Environment need to have supporting policies and measures to promote the development of technologies for reusing coal ash from coal-fired thermal plants. If coal ash is reused, thermal power plants will not need to look further for storage area and the costs of management and environmental treatment for coal ash storage areas will be reduced. Storage area of coal ash is currently a pressing issue for coal-fired thermal projects in Vietnam and it will persist in the future without a practical solution.
5.2. Environmental Management and Monitoring Programs
5.2.1. Objectives of Environmental Management and Monitoring Programs
Objectives of Environmental Management and Monitoring Programs of the PDP VII are:
- To ensure that all environmental targets for the PDP VII are met, and electricity development is done in a sustainable manner, both in terms of the economics and the environment.
- To make sure that all power projects recommended for cancellation in the previous sections of this report will not be implemented without commitments and detailed solutions to avoid or mitigate all the potential impacts.
- To ensure that the proposed mitigation measures will be implemented well and to collect information about changes to the environmental quality on a regular basis to promptly detect any negative impacts on the environment caused by sub-component projects.
5.2.2. Environmental Management Program
In order to manage and supervise the environmental protection targets of the PDP VII effectively, it is recommended that a working group is set up to supervise the activities and to collaborate with relevant ministries and departments in support of the full implementation of the proposed mitigation measures and recommendations for the PDP VII and the sub-component projects.
This program will supervise and provide guidance for project investors to ensure energy efficiency and full conformity to environmental laws and regulations.
5.2.3. Environmental Monitoring program
The main principle is to ensure full conformity to national guidance and guidance of the Ministry of Commerce and Trade on environmental management. Detailed tasks are as follows:
Monitoring is required for the implementation of environmental protection measures in power development projects included in the power plan. Special attention is needed for projects that are recommended for cancellation in the SEA. It is necessary to monitor
247
the conformity to environmental protection requirements of power projects during operation phase.
Required monitoring activities are as follows:
1. Monitoring of waste discharges and gaseous emissions, including wastewater, CTR, CTNH, etc., and of the atmospheric pollutants in the surrounding environment (PM, SO2, NOx);
2. Monitoring of wastewater quality from power production facilities and domestic use to ensure conformity to Vietnamese Standards QCVN 24:2009/BTNMT and QCVN 14:2008/BTNMT, and changes to surface water quality;
3. Monitoring of soil quality;
4. Monitoring of the impacts on ecosystems, national parks, and nature reserves. There needs to be research and statistic collection to assess these impacts as well as to find out the causes for timely interventions.
5. Monitoring of the progress of displaced people in resettlement areas. All indicators should be monitored, such as level of people’s satisfaction with their home, their livelihood and income, their living arrangement, etc.
6. Revision and improvement of detecting systems for environmental risks and accidents during the implementation of PDP VII for timely interventions and remedies.
Monitoring is required for all locations of sub-component power projects.
The project owners can either take charge of the monitoring, or hire independent environmental companies for this job.
5.2.4. Reporting Mechanism during Implementation
The reporting needs to be in accordance with regulations by the Ministry of Commerce and Trade and the Ministry of Natural Resources and Environment:
The environmental working group of PDP VII should report to the Minister of Commerce and Trade every 6 months on the progress of power projects in the plan. The report should specify what mitigation measures have been implemented and the results. Information on challenges during the implementation and plans for the coming projects should also be included.
An annual report on environmental protection progress of the power plan is required. This report should include environment related information from all power projects, including information about the good progress as well as mitigation measures that are challenging or impossible to implement, and the support needed.
Environment reports of PDP VII can be sent to leaders of the Ministry of Commerce and Trade if necessary.

250
Chapter 6: Data Sources and Assessment Methodologies
6.1. Data Sources 6.1.1. Data and reference sources
- The Strategic Environmental Report of Location Plan for Nuclear Power Development in Vietnam.
- The Pilot Strategic Environmental Assessment of the Hydropower sector in the Context of the Power Development Plan VI, implemented by the Stockholm Environment Institute, with support from the GMS Core Environment Program, funded by the Asian Development Bank (ADB).
- The Strategic Environmental Assessment of the Quang Nam Province Hydropower Plan for the Vu Gia-Thu Bon River Basin, prepared by the International Centre for Environmental Management (ICEM) for the ADB, MoNRE and EVN.
- The Mekong River Commission Strategic Environmental Assessment of Hydropower on the Mekong Mainstream, by the Mekong River Commission Office, prepared by ICEM in 2010.
- The Strategic Environmental Assessment for Vietnam Forestry Master Plan 2010-2020, a project by the Forestry Bureau, MARD, funded by the World Bank, prepared by IECM Vietnam in collaboration with Integra Consulting Services (Czech).
- The Strategic Environmental Assessment of Power Development Plan VI, by JICA in 2007.
- The Strategic Environmental Assessment of Vietnam Energy Development Plan, by JICA in 2008.
- The Vietnam National Target Program to Respond to Climate Change, in accordance with Decision No. 158/2008/QD-TTg dated 02/12/2008, and the National Action Plan of Vietnam for Climate Change.
- Specialized report on “Socio-economic Situation in the Present and Future with Long-term Prospects to 2020 and Further to 2030 and 2050”, prepared by experts from the Institute of Strategy and Policy, Ministry of Planning and Investment, 2009-2010.
- Specialized report on “Industrial Park Development in Vietnam to 2020” (reference document, unofficial).
- Specialized report on “The State of Nature Reserves, National Parks, and Wetlands and Recommendations for the Future”.
- The National Action Plan for Environmental Protection for the period 2010-2020.
- The National Environmental Protection Strategy to 2020.

251
- The State of the Environment Report in 2005, 2006, 2007 and 2008.
- The Report on Environmental Baseline Data by MoIT and EVN in 2007 and 2008.
- The National Strategy for Energy Development to 2020 with 2050 vision, as approved by the Prime Minister’s Decision No. 1855/QD-TTg dated 27/12/2007.
- The Strategy and Plan for the Development of New and Renewable Energies for the period 2011-2020.
- Water management plan for river basins
- Statistics on forest land area in Vietnam in 2007, 2008 and 2009 provided by the Forestry Bureau, MARD.
- Development Plan for the Coal Sector in Vietnam to 2015 with Perspective to 2025.
- Master Plan for the Development of the Oil & Gas Sector in Vietnam to 2015, with Perspective to 202.
And many other foreign data sources.
6.1.2. Data Created by the Institute of Energy
The National Plan for Power Development in the period 2011-2020 with Perspective to 2030, prepared by the Institute of Energy in 12/2010.
The Strategy and Master Plan for Renewable Energy Development in Vietnam (Master Plan for Renewable Energy Development I), prepared by the Institute of Energy in 2010.
The National Power Development Plan for the period 2005-2015 with vision to 2025, prepared by the Institute of Energy in 2006.
6.1.3. Assessment of the Level of Detail, Reliability and Currency of the Data Sources.
All the materials and data on socio-economic situation, the environment, hydrology, oceanology, and biological resources are reliable as they were provided by recognized agencies and organizations. Some of the data came from the ADB data bank.
However, gaps are seen in data from the project level on displaced people, affected land area, compensation cost in resettlement, health care cost, cost of work loss due to illness, and cost of environmental impact caused by power generation and transmission. Information about these costs was taken from previous projects, which was based on lower cost calculations, or from research results provided by international experts, which might have come from different cost calculations. The calculations of these costs in this SEA are for references rather than application in the future projects.

252
Some power projects planned for the period after 2020 have not yet had identified locations. Therefore, it is not possible to have detailed calculations or forecast of the potential impacts.
The results of assessment on the affected people based on population map using GIS are only indicative.
Because information about power transmission routing is only on proposal, the cost calculations and assessment of impacts of power transmission development presented in this SEA are subject to changes.
Any missing information in this SEA will be added in the implementation phase.
6.2. Methodologies
6.2.1. List of Methodologies
The methodology adopted for this SEA aims at linking the SEA process with development plans of the electricity sector as well as of other economic sectors, and the development process of the whole country. The SEA was prepared in the context that there were scarce financial and human resources, as well as limited time. Information on key issues was either not in place or only partial available. This necessitated a method and process which relied heavily on the judgments and opinions of the government officers and other national experts involved.
- Statistic collection and comparison method: this method was used in collecting and processing statistics on hydrology, oceanology, socio-economic development, the state of the environment, and calculations of environmental costs and benefits for the various scenarios.
- Trend analysis method: this method was used as the primary analytical tool. Trend analysis is the most important component of every strategic assessment. Considering the requirements for SEAs in Vietnam, this analysis can be seen as an analysis that reflects changes over time in key socio-economic and environmental issues.
Trend analysis in this SEA focused on key issues that were identified and selected by stakeholders from the government and the private sector. It allows the identification of the main trends and models within the scope of the research in the last 10 years and a view of the future in 20 years. These trends are mainly described through details of the main qualitative trends, their motivations as well as geographical coverage, and the main concerns in the development of electricity sector.
- Expert consultation method: Experts were consulted in the areas of hydropower, thermal power, nuclear power, new and renewable energy, power grid expansion, environmental planning, environmental management and the management of other fields. International experts were consulted for strategic environmental analyses, assessment and comments.
- The followings are cost calculation methods used in the SEA of PDP VII, including

253
cost calculation of losses and social impacts.
Cost calculation of losses and social impacts:
Indicator Method Investment cost for power production and supply
According to the current rate of investment for power plant
Loss of biodiversity value: river ecology, forest ecology.
Use of GIS to define the scope and use coefficients in “Changes in Nature’s Balance sheet: Model-based Estimates of Future World Wide Ecosystem Services” and “The Economic of Ecosystem and Biodiversity”, provided by Prof. John Soussan. Calculation of loss of environmental services.
Atmospheric pollution, greenhouse gases
Use of GIS to define the scope and use coefficients in “Changes in Nature’s Balance sheet: Model-based Estimates of Future World Wide Ecosystem Services”. Information on the costs of health care services, reduced longevity, time and income loss due to illnesses, loss of crops.
Cost of climate change Reference information from Development and Climate Change Report of the World Bank.
Cost calculation and identification of scope of influence for social and environmental indicators
Indicator Method
Cost of social impacts Use of current rates for compensation and resettlement.
Number of displaced households
Use of GIS and survey for power projects that have completed project investment report. For hydropower and nuclear power - use existing data combined with the number of household displaced by PDP VII.

254
Cost of affected land - Loss of income due to agricultural land is affected. - Forest.
Use of GIS to define the scope and use coefficients in “Changes in Nature’s Balance sheet: Model-based Estimates of Future World wide Ecosystem Services”, provided by Prof. John Soussan. Use of standard rates for cost and land compensation for projects based on reports of compensation for displaced people. For hydropower projects, use existing calculations in the Pilot SEA for the Hydropower Sector in the Context of PDP VI. Reference information from Benefit Sharing Mechanisms for People Adversely Affected by Power Generation Projects in Viet Nam, ADB. - Further reference information from the Sustainable Development Report by the WB and Planning for Existing and Proposed Nature Reserves in Vietnam Project.
Cost of loss or additional cost due to changes of water use purposes.
Use the same analytical method in the Pilot SEA for Hydropower Sector in the Context of PDP VI and reference information from “Changes in Nature’s Balance Sheet: Model-based Estimates of Future World Wide Ecosystem Services” for other areas. Calculate the cost of impacts on the ecosystem. Calculate the costs of health care services, reduced longevity, time and income loss due to illnesses, and loss of crops.
Food insecurity. Reference information from “Changes in Nature’s Balance Sheet: Model-based Estimates of Future World Wide Ecosystem Services” for other areas. Reference information from other relevant materials.
Loss of income due to loss of access to resources.
Reference information from the World Development Report: Development and Climate Change, 2010, World Bank, and other relevant materials.
Increased poverty rate. Use analytical method in the Pilot SEA for Hydropower Sector in the Context of PDP VI and reference information from “Changes in Nature’s Balance Sheet: Model-based Estimates of Future World Wide Ecosystem Services” for other areas. Reference information from the World Development Report: Development and Climate Change, 2010, World Bank, and other relevant materials.
Increased/decreased income from agriculture and/or manufacturing.
Use analytical method in the Pilot SEA for Hydropower Sector in the Context of PDP VI and reference information from the World Development Report: Development and Climate Change, 2010,

255
Value of aqua resources (upstream and downstream).
Use analytical method in the Pilot SEA for Hydropower Sector in the Context of PDP VI and reference information from “Changes in Nature’s Balance Sheet: Model-based Estimates of Future World Wide Ecosystem Services” for other areas. Look for new relevant materials. Community health issues due to
increased atmospheric pollution. Calculate the costs of health care services, reduced longevity, and time and income loss due to illnesses.
- The use of GIS as an analytical tool: by overlapping maps that show geographical scale of main socio-economic and environmental issues;
- Risk assessment: by analyzing changes in the development trends of environmental elements and characteristics of projects.
- Maps and graphs in this SEA were built using available data to illustrate the development of the main issues over time when possible.
- The SEA is based on assessment and analyses of socio-economic and environmental impacts of power projects in the areas where the sub-component projects are implemented or planned for.
6.3. Level of Detail and Reliability of the Assessment in SEA
6.3.1. Level of Detail and Reliability of the Assessment in SEA
The assessment methods adopted in this SEA are popular methods in the world and in Vietnam. Different methods were used for different assessments and sometimes several methods that complement each other were used for one assessment. The method of statistic collection and comparison gives quantitative results that are highly accurate and reliable. The use of matrices is helpful for listing all the impacts of projects included in the power development plan and for determining the level of impact for project priority ranking, etc.
All the methods listed above have helped the experts to produce reliable assessments, which determine the high quality of the report.
The execution of the SEA in this study demonstrates the potential of the SEA as a key part of the strategic planning framework for the power sector. The SEA has provided a mechanism to assess and understand the full range of potential risks associated with power development for people and the environment, both within the immediate vicinity of project construction and beyond. It also provides a mechanism for identifying and assessing the most effective mitigation and compensation actions, including actions to reduce risks and to fully compensate for negative impacts where they do occur.
The SEA identifies costs related to human health and other social and environmental costs and introduces mitigation measures and a mechanism to internalize these costs into the cost calculations of power projects. This approach balances economic
256
development, social equity and environmental sustainability for the development of the power sector, which has never been done before.
The SEA proposes a few alternative scenarios to reduce the number of thermal power plants in the future. It also recommends cancellation of several hydropower projects that potentially have big impacts, and re-routing of some 500 kV and 200 kV lines, which might have big impacts.
The SEA provides a framework for establishing a consensus among stakeholders on the most appropriate forms of social and environmental mitigation measures and the level of development of the overall power sector that is most efficient and sustainable. It provides a means for ensuring objectivity and balance in the decision-making system.
When approached in this way, the full potential of SEA as part of strategic planning can be realised. This differentiates SEA from more traditional EIA and safeguard approaches to social and environmental issues, approaches that have often proved to be ineffective in catalyzing more sustainable patterns of development. The introduction to SEA, as previously presented, emphasised that an SEA should be decision-oriented, balanced and evidence-based. The SEA presented in this report demonstrated that these three principles can be followed in relation to the development of the national plan for power development.
The effectiveness of the SEA as a mechanism for strategic planning in the power sector, which is inherently complex and controversial, is demonstrated in this report.
6.3.2. Implications of Data Unreliability (Due to Objective and Subjective Reasons).
The SEA requires a significant amount of original data. However, the time and resources available means that it was only possible to use data from existing sources in most cases. There is a need for a more adequate data collection, considering the current state of institutional capacity. Conclusions in some areas could have been more reliable if there were adequate data, such as data on compensation for displaced people, land area lost to power projects, number of affected and displaced households/persons, level of concentrations of air pollutants from thermal power projects and the zone of influence of these pollutants, and health care statistics of affected people, etc.
In the future, the quality of analyses and assessments in SEAs can be improved by having a better system for statistic collection and filing. This task can only be done gradually and one part at a time. The analyses in this report guarantee reliable conclusions, considering the available data. However, there is a need to institutionalize all aspects of SEAs in the strategic planning systems.

257
Conclusions and Recommendations
The analysis presented in this SEA shows the importance of an integrated and effective plan for the managed expansion of the power generation sector in Viet Nam over the coming decades. Demand will continue to grow as the economy develops and living standards rise and not meeting this demand would have serious social and economic consequences. The central goal of PDP VII is to meet future demand through the most effective strategy for economic development, social progress, and sustainable protection and preservation of the environment. Meeting this goal will require a balance between the development of different types of power generation and the expansion of the power transmission system with the main environmental issues and factors.
The requirement for PDP VII is to provide adequate power supply for economic development for the period 2011-2030 in a way that is both cost-effective and environmentally sustainable.
The conclusions presented in this part mainly focus on results of the assessment in the previous chapters and the contribution of the SEA to the development of the power plan. The recommendations aim at realizing the proposed mitigation measures.
I. Conclusions
1. Contribution of the SEA to the PDP VII
The execution of the SEA in this study demonstrates the potential of SEA as a key part of the strategic planning framework for the hydropower sector. The SEA has provided a mechanism to assess and understand the full range of potential risks associated with hydropower for people and the environment, both within the immediate vicinity of project construction and beyond. It also provides a mechanism for identifying and assessing the most effective mitigation and compensation actions, including actions to reduce risks and to fully compensate for negative impacts where they do occur.
The SEA has changed opinions about power development and the power development plan towards a more optimal and sustainable manner. Changes that were made under the influence of the SEA include:
+ Cancellation of unsustainable development plans at early stage (plans with more than 60% of coal-based power generation).
+ The optimal power development scenario that was chosen for PDP VII features energy efficiency and conservation on the demand side and an increase in renewable energy in power source development.
+ Attention was drawn to a few alternative scenarios, which are more favorable of the environment but not feasible nor cost effective.
+ Attention to re-routing some transmission lines.

258
+ The SEA recognized a few projects that have significant impacts and recommended cancellation of these projects, including the Dak Mi 1, Dong Nai 5, and Srepok 4 for their significant impacts on the ecosystem and biodiversity. The SEA also proposed re-routing a few 500 kV and 200kV lines.
The effectiveness of the SEA as a mechanism for strategic planning in the power sector, which is inherently complex and controversial, is demonstrated in this report.
The SEA also has identified costs associated with human health, environmental and social impacts, and mitigation measures, and internalized these costs into the assessment of the economic feasibility of power development schemes. This is an approach that balances economic development, environmental sustainability, and social equity that has never been done before in the implementation of an overall development plan for the electricity sector.
The SEA acknowledges the progress that Vietnam has made in collecting payments for environmental services from hydropower projects and internalizing a series of costs that have been traditionally treated as externalities into the calculations of costs and benefits for power projects, which are the costs of impacts such as environmental pollution, gaseous emissions, damage to the integrity of the ecosystem in the expansion of the transmission system. These costs need to be included in assessment of economic feasibility and calculation of investment for power development projects.
The SEA has provided a mechanism to assess and understand the full range of potential risks associated with power generation and transmission for people and environment, both within the vicinity of project construction and beyond. It also provides a mechanism for identifying and assessing the most effective mitigation and compensation actions, including actions to reduce risks and to fully compensate for negative impacts where they do occur.
Where an economic analysis is undertaken, the SEA also provides a basis for the internalization of costs and benefits that have traditionally been treated as externalities. This in turn provides a means for comparing the full range of risks and impacts that are very different in character. For example, through the economic analysis one can compare potential impacts on human health due to pollution, and on the culture and livelihoods of local communities with risks to biodiversity resources and with impacts on global atmospheric processes including greenhouse gas emissions. This in turn provides a basis for objective decision-making on the most desirable, sustainable and competitive levels of the types of power source development and the expansion of the transmission system. When approach this way, the full potential of SEA as part of strategic planning can be realized. This differentiates SEA from more traditional EIA and safeguard approaches to social and environmental issues, approaches that have often proved to be ineffective in catalyzing more sustainable patterns of development.
The SEA provides a framework for establishing a consensus amongst stakeholders on the most appropriate forms of social and environmental mitigation measures and the
259
level of overall development of the power sector that is most efficient and sustainable. It provides a means for ensuring objectivity and balance in the decision-making system.
The SEA analyzes potential social and environmental impacts of the power sources included in the base scenario of the PDP VII. The impacts of the expansion of the transmission line system in the PDP VII are also analyzed and assessed. Conclusions about the adverse impacts on the environment of the power development plan are presented below.
2. Adverse Environmental Impacts of the PDP VII
The impacts of atmospheric pollution are resulted from the combustion of fossil fuels, and especially of coal. The consequences of the four main pollutants (CO2, SO2, NOx and PM) are the three main impacts: acidification, human health and climate change.
Under the plan in PDP VII, CO2 and PM releases will increase more than ten-fold during the PDP VII period up to 2030. The impacts of these atmospheric pollutants will be severe and widespread. Acidification, affecting both soil and water quality, is spreading and increasingly affecting the Mekong River Basin. The number of people exposing to air pollutants at different levels is increasing and contributing to the rises in the incidence of health problems such as respiratory disease and other diseases. The impacts on human health from atmospheric pollutants associated with thermal power plants are particularly severe in large cities where there are many economic activities and where the existing ambient air quality is poor. These impacts have been assessed and valued at about US$9.7 billion per annum by 2030 unless actions are taken to reduce the levels of atmospheric pollutant releases from, in particular, coal-fired power generation.
There are 10 million people in Vietnam living in the mountainous, coastline and delta areas, who are vulnerable to negative impacts of climate change. Millions of people will be affected at different and increasing levels by abnormal weather phenomena and the risks of climate change.
Damage to the integrity of ecosystems: Fragmentation of ecosystems and forest land area, especially in protected areas and areas of high biodiversity significance, has been recorded in 10 key biodiversity areas of international significance.
Resettlement and impacts on the culture and livelihood of affected communities, including communities that are not displaced: All total of 61,571 people would be displaced (more than 90% of whom are ethnic minority people) if the 21 hydropower schemes under consideration are constructed.
The total area that will be submerged in the 21 schemes is 25,133 ha.
Changes to hydrological regimes, multi-purpose water resources management and the issue of downstream salt intrusion: Water resources will for sure be affected by hydropower development. Many stakeholders were concerned that the impacts of

260
hydropower development on water resources were not full taken into account in the planning and management of reservoirs. The present management regimes are in general single purpose: to maximize power generation, which can cause big losses, as discussed in the previous chapters. In every case, it is necessary to take into account common interests such as flood control, water supply for agricultural activities, and the need to ensure minimum environmental flows if serious downstream impacts on ecosystems are to be avoided. The analysis also demonstrated the potential benefits in terms of flood protection and improvements to dry season water availability that could be accrued if more effective multipurpose management regimes are adopted.
Natural resources efficiency and conservation: from the energy import forecasts and issues in power source development, there is an urgent need for a plan of actions for energy use, conservation and efficiency to ensure national energy security in the coming time.
Nuclear power development in Vietnam: Nuclear power is a source of power generation that is characterized by risks that are low probability but extremely high in impact if they do occur: reflecting the extreme hazards associated with the use and management of radiological materials. It is essential that Viet Nam develops the capabilities and management systems to handle radiological materials before nuclear power development starts. There are additional predicable impacts that are a cause for concern, especially associated with the use and release of the very high levels of cooling waters that nuclear power stations require. The site selection of the power station is the key issue here: any locations in the proximity of sensitive or high value ecological areas must be avoided and the possible impacts of cooling water on riverine and marine ecosystems must be carefully assessed.
Renewable energy is the source of clean power production that contributes to the reduction of environmental impacts caused by power generation from coal. Power generation from renewable energy has low impacts and is more socially and environmentally benign than other forms of power generation.
Impacts of the transmission line development are mostly associated with the clearance of land along the routes of transmission lines. The transmission line expansion plan in PDP VII will clear more than 14,000 ha of forest, including 7,739 ha of rich and medium forest. The resource value of the forests cleared would be around US$218 million. The line routes will pass through a total of 59 protected areas and 39 key biodiversity areas, with 3,387 ha cleared in protected areas and 2,297 ha in key biodiversity areas. This has potentially negative impacts because of the fragmentation of habitats, with several areas likely to be divided into several fragments that could potentially compromise the integrity of high value biodiversity areas.
II. Recommendations
1. Recommendations on Project Approval

261
The study in the SEA shows that the PDP VII is necessary to meet economic development needs. During the implementation of the PDP VII, impacts on people and the environment and other social impacts are inevitable. However, the PDP VII is an effective national power plan for power generation development and transmission grid expansion, which meets all environmental protection targets by ensuring a balance between economic development and environmental sustainability. Thanks to the SEA, all national environmental targets and main related environmental issues are recognized in the PDP VII. Assessment and selection of development options are based on the recognition of these targets and issues to reach community consensus, to ensure protection and preservation of the environment, forest and riverine ecosystems, and local livelihood, and to attend to social and cultural and health related issues. These are the basic conditions that the Government and related agencies need to pay attention to when appraising the PDP VII, with regards to environmental issues and mitigation measures presented in Chapter 3 and 5 of this report.
2. Other Recommendations
Capacity development for undertaking SEAs: The use of SEA as an integral part of the preparation of PDP VII has helped to improve the quality of strategic planning in the power sector significantly. However, to improve the quality of SEAs in the future, it is recommended that further capacity development takes place in planning agencies and other relevant agencies. Specialized areas that need improvement include the capacity to analyze environmental and social issues, as well as the economic and technical aspects of power projects, and the skills to collect and process a significant amount of data, especially data management skills (such as GIS).
As regards to internalization of external costs of power technologies in PDP planning and modeling, the differences in externalities between different technologies suggest that the optimization means a lot for the electricity-producing sector. Power generation using renewable energy can compete with other forms of power generation. Integrating external costs into the optimization runs will lead closer to a socially optimal power generation mix.
It is recommended that the multi-reservoir operation procedures are finalized soon for the 11 river basins.
It is further recommended that additional efforts are made to ensure the necessary data are available for undertaking SEAs. In this SEA, there were a number of data limitations, most notably on aspects of the calculation and valuation of the impacts of the different supply option proposals, data availability on health impacts and costs, compensation and resettlement costs of each power project, the implications of climate change for the sector’s development and the verifiable potential of renewable energy development options. Steps need to be taken to systematically assess and address these data gaps so that future SEAs can provide more rigorous analyses.
262
A financial mechanism for undertaking SEAs needs to be issued soon. The undertaking of a SEA is a long process that requires significant human resources from many areas, a large amount of data, and an information exchange mechanism for relevant parties to share their concerns in regards to the plans/strategies under development. Therefore, it requires a relatively big budget. The execution of this SEA was faced with many challenges, as there has not been a basis for budget planning and appraisal.
The current SEA Guidelines, as reflected in Circular No. 05/2008/TT-BTNMT dated 08 December 2008, provide a strong national framework for the execution of SEAs, but it has been found that the structure of the SEA report is not the most convenient or effective one for producing an efficient SEA report. It is recommended that this required report structure should be reviewed, drawing on international experience and good practices in the SEA preparation.
Hanoi, May 2011

263
APPENDICES

264
APPENDIX 1
LEGAL DOCUMENTS AND INFORMATION RELATED TO THE PDP VII
Document No. 11693/BCT-NL dated 09/12/2008 regarding budget planning for PDP VII
App. 1.1: Summary of investment capital for national power development by 2030
App. 1. 2: A list of thermal power plants in PDP VI
App. 1.3: A list of hydropower plants in PDP VI
App. 1.4: A list of thermal plants in PDP VII
App. 1.5: A list of hydropower plants in PDP VII
App. 1.6: A list of 20 nature reserves in 2008
App. 1.7: Nature reserve areas in Vietnam (National parks)
App. 1.8: A map of nature reserves in Vietnam
265
APPENDIX 2
GIS RESULTS OF IMPACTS OF HYDROPOWER PLANTS IN PDP VII
App. 2.1: Total land area that will be submerged in reservoirs
App. 2.2: Timber value in Vietnam
App. 2.3: Estimated value of forest services in Vietnam
App. 2.4: Value of forest that will be lost to hydropower reservoirs in PDP VII
App. 2.5: Number of displaced people in each project according to each scenario
App. 2.6: Increased agricultural value thanks to water regulation by hydropower development projects
App. 2.7: Forest land area in the ZoIs
App. 2.8: Economic value of forest in the ZoIs
App. 2.9: Number of people within 1 km – Upstream and downstream
App. 2.10: Hydropower projects with potential biodiversity impacts
App. 2.11: Assessment of biodiversity value in nature reserves at high risk
App. 2.12: Inundation areas
App. 2.13: Affected area by hydropower projects by district and province
App. 2.14: Areas of high biodiversity significance
App. 2.15: Land area of affected nature reserves (ha)
App. 2.16: Inundation area of the Bac Me project
App. 2.17: Areas identified as at high risk of disruption to ecosystems

266
APPENDIX 3
GIS CALCULATION RESULTS OF IMPACTS OF THERMAL POWER PLANTS IN PDP VII
App. 3.1: Number of people affected by thermal power plants
App. 3.2: Population (2009) in affected areas
App. 2.3: Gaseous emissions of the scenarios
App. 2.4: Costs of environmental impacts of the scenarios

260
APPENDIX 4
GIS CALCULATION RESULTS OF IMPACTS OF THE EXPANSION OF THE TRANSMISSION SYSTEM OF PDP VII
App. 4.1: Area of nature reserves affected by transmission lines
App. 4.2: Fragmentation of nature reserves
App. 4.3: Area of high biodiversity significance affected by transmission lines
App. 4.4: The scale and percentage of fragmented areas of high biodiversity significance
App. 4.5: Area of different types of forest affected by transmission lines
App. 4.6: Transmission routes passing through forest
App. 4.7: Transmission lines and areas of high biodiversity significance
App. 4.8: Transmission lines and fragmentation of natural habitats
Related Documents