Strategic Economic Plan Draft Version 19 December 2013

Welcome message from author
This document is posted to help you gain knowledge. Please leave a comment to let me know what you think about it! Share it to your friends and learn new things together.
Transcript

Strategic Economic Plan Draft Version
19 December 2013

Contents
Executive Summary
1. Introduction Page 1
2. Investment priorities and activities Page 4
3. Economic geography and evidence Page 28
4. Collaboration and partnership Page 65
5. Cross cutting issues Page 71
6. Resources and funding allocations Page 76
7. Delivery and governance Page 80
Annex Page 89

i
Executive Summary
Our vision is to make York, North Yorkshire & East Riding the place in England to grow a small business, combining a vibrant business location with an enviable quality of life. Our quality of life is unquestionable. Harrogate is the happiest place in England, York has been voted the best place to live in Britain and Yorkshire the best tourist destination in Europe. We have an excellent cultural offer and the world’s greatest cycle race is coming in 2014! We have unique industry assets and our unparalleled, multi-billion private sector investments are revolutionising the Agri-Tech and Bio-renewable industries. Coupled with the roll-out of superfast broadband, easy access to Leeds and fast mainline rail links to London, this gives us the opportunity to work with our resilient and innovative small business base to deliver growth, quality jobs and to address long standing issues of coastal deprivation and a low wage culture in rural areas. Most businesses stay where they start. Growing our existing businesses, whilst inspiring enterprise, is part of a long term strategy for growth. We shall, within five years, combine an enterprising, innovative, outward looking culture with unique economic assets and strengths. We will provide a supportive environment that backs businesses 100 per cent, with excellent ICT and accommodation, networking and contract opportunities and access to high quality advice that supports new and existing SMEs alike. Leading edge assets in the food manufacturing, agri-tech and bio-renewables sectors (the ‘bio-economy’) will establish a worldwide reputation and create thousands of new jobs. Offshore opportunities and a new potash mine in Whitby have the potential to tackle head-on the declining role of the seaside town and make the Yorkshire Coast - The Opportunity Coast. Our strengths will form the basis of a programme of growth, revolutionising towns such as Northallerton and Ripon, which are suffering from public sector cuts. Yorkshire is home to some of the most successful town centres in the country in places such as Beverley and Skipton. We must build upon our successes to allow towns across the region to think as a business, to understand their place in the market and to invest to be successful and sustainable in the long term. There are few landscapes as famous as Yorkshire. We have inspired and shaped the literature, art and music of this country for hundreds of years. Our area has an outstanding offer that few can match; two stunning national parks, one of the finest coastlines in England and the historic city of York. The tourism industry employs thousands of people and we must ensure our plans for growth reflect changing customer demand and increasing customer expectations. If we want to tackle issues such as seasonality and to increase visitor spend and length of stay, we must be world class, not just in our assets, but by investing in skills and the use of technology to deliver a world class visitor experience.
World leader in Agri-tech
Food and Environment Research Agency
(FERA) employs 600 scientists and is a globally
significant research agency at the forefront of
government responses to Agri-tech and food
issues. The site will become an internationally
important asset, leading the response to
global challenges such as food security and
supply-chain integrity.
We aim to double employment on the site
from 800 to 1,600 high quality jobs and to
boost the economy by £100m.
ii
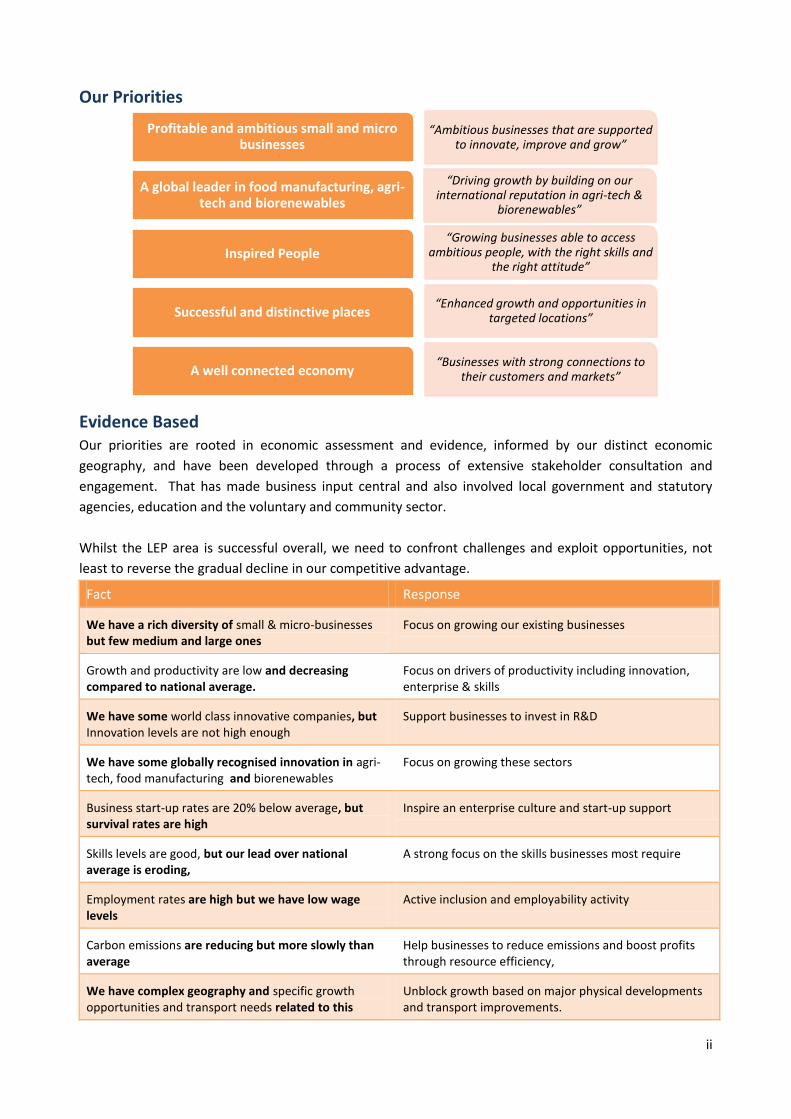
Our Priorities
Evidence Based Our priorities are rooted in economic assessment and evidence, informed by our distinct economic
geography, and have been developed through a process of extensive stakeholder consultation and
engagement. That has made business input central and also involved local government and statutory
agencies, education and the voluntary and community sector.
Whilst the LEP area is successful overall, we need to confront challenges and exploit opportunities, not
least to reverse the gradual decline in our competitive advantage.
Fact Response
We have a rich diversity of small & micro-businesses but few medium and large ones
Focus on growing our existing businesses
Growth and productivity are low and decreasing compared to national average.
Focus on drivers of productivity including innovation, enterprise & skills
We have some world class innovative companies, but Innovation levels are not high enough
Support businesses to invest in R&D
We have some globally recognised innovation in agri-tech, food manufacturing and biorenewables
Focus on growing these sectors
Business start-up rates are 20% below average, but survival rates are high
Inspire an enterprise culture and start-up support
Skills levels are good, but our lead over national average is eroding,
A strong focus on the skills businesses most require
Employment rates are high but we have low wage levels
Active inclusion and employability activity
Carbon emissions are reducing but more slowly than average
Help businesses to reduce emissions and boost profits through resource efficiency,
We have complex geography and specific growth opportunities and transport needs related to this
Unblock growth based on major physical developments and transport improvements.
Profitable and ambitious small and micro businesses
“Ambitious businesses that are supported to innovate, improve and grow”
A global leader in food manufacturing, agri-tech and biorenewables
“Driving growth by building on our international reputation in agri-tech &
biorenewables”
Inspired People “Growing businesses able to access
ambitious people, with the right skills and the right attitude”
Successful and distinctive places “Enhanced growth and opportunities in
targeted locations”
A well connected economy “Businesses with strong connections to
their customers and markets”

iii
Making a difference To ensure we are adding value, we will only fund activity where there
is market failure or where we can stimulate bigger, better or faster
delivery. All investments will pass a selection test which considers;
Strategic fit, value for money, market failure and additionality.
Delivery and Resources We will use a range of funding and influencing
mechanisms to deliver the strategy, including existing
local funding streams, private sector investment, central
government funding and EU support.
A local growth team will be created, bringing together
partners from different organisations to deliver the LEP
strategy. The core secretariat will be funded via local
authority contributions, central government funding and
EU Technical Capacity
We have been allocated £83.4m of EU Structural and
Investment Funds for our LEP area. This document sets
out how these funds will be used to deliver our priorities.
Measuring Success For businesses, success will mean increased business
profitability, productivity and resilience. For people, it
will also mean rising incomes, and we will strive to ensure
that economic growth goes hand in hand with an
excellent quality of life and a high quality environment.
Businesses and their growth are at the heart of our approach.
Change must be demand led and business driven. And it must
deliver hard outcomes. We will have a wide range of outputs,
which individual investments are targeted to achieve, however
overall success will be measured against these 10 tests.
Global event,
North Yorkshire engineering
The 2012 Olympics was a global success. The
opening ceremony celebrated the UK’s
industrial heritage and culminated in the lighting
of the Olympic flame
North Yorkshire based Stage One’s world class,
precision engineering produced the acclaimed
Olympic Cauldron.
Key Outputs:
3000 Businesses Supported
1650 Jobs created
7450 People trained
“Impact and value for
money will drive our
delivery model”
2020 Outcome Tests
1. Is GVA and productivity increasing ? 6. Are our higher level skills above the national average?
2. Are more business starting and surviving? 7. Are employers able to recruit better quality local people?
3. Have exports and investment in R&D increased?
8. Have the major developments been delivered?
4. Are we a global leader in agri-tech and biorenewables?
9. Is ICT access and uptake keeping pace?
5. Are employment rates back to pre-recessionary levels?
10. Are carbon emissions falling at least as fast as nationally?

iv
Delivery Activities We have established ambitious goals under each of our five, connected priorities and identified core
activities for each.
Overview of Priorities, Objectives and Core Activities
Priority and Goal Objectives Core Activities
1) Profitable and ambitious small and micro businesses
“Ambitious businesses
that are supported to
innovate, improve and
grow”
Innovative, growing small businesses
More entrepreneurs who start and grow a business
Ambitious business leaders
[a] Increase innovation in small businesses
[b] Inspire and supporting new business starts
[c] Improve business competitiveness through co-ordinated business support
[d] New market development
[e] Deliver business friendly planning, regulation and procurement
[f] Enhance leadership and management skills
2) A global leader in food manufacturing, agri-tech and biorenewables
“Driving growth by
building on our
international reputation
in agri-tech &
biorenewables”
World class innovation in agri-tech and biorenewables
Agriculture and food business connected to new opportunities
Low Carbon businesses
[a] Grow our International competitiveness in Agri-tech
[b] Capitalise on our biorenewables & low carbon assets
[c] Connect our agricultural sector to agri-tech and biorenewables based expertise and opportunities
[d] Support investment in energy & resource efficiency
3) Inspired People
“Growing businesses
able to access ambitious
people, with the right
skills and the right
attitude”
A Productive workforce for growing businesses
Inspired people making the right job choices
Empowered communities delivering support and inclusion
[a] Increase productivity by investing in workforce skills
[b] Build competitive advantage through higher level skills
[c] Increase employability by connecting business to education
[d] Support high quality apprenticeships and internships
[e] Build skills, attitude and ambition to help people access jobs
[f] Develop strong communities and active inclusion
[g] Deliver a skills capital programme
4) Successful and distinctive places
“Enhanced growth and
opportunities in targeted
locations”
Unlock major growth opportunities
New development in response to economic shocks and closures
Environmental quality and community needs
[a] Strategic investments in the A1/A19 corridor
[b] A strong and growing coastal economy
[c] Strengthen economic links with neighbouring cities
[d] Sustainable growth in the Dales, Moors and Wolds
[e] Business led investments in market towns
5) A well connected economy
“Businesses with strong
connections to their
customers and markets”
Fast, reliable journeys between key centres
Transport that underpins growth
Access to UK and international markets
[a] Improved east-west connections
[b] Investment to ensure the existing transport network supports growth
[c] World class ICT & broadband

1
1. Introduction
York, North Yorkshire and East Riding Local Enterprise Partnership will work with partners to transform
the economic ambitions of our area, turning major opportunities into tangible achievements and
delivering business led growth.
This Strategic Economic Plan is a single strategy for our area that serves three purposes:
1. It sets out the key economic issues, opportunities and priorities for our area in their own right
2. It is the EU Strategic and Investment Funds Strategy required for EU funding purposes (supported
by a separate detailed spreadsheet on activities, outputs and funding)
3. It is the Strategic Economic Plan that Central Government require for Growth Deal funding
purposes (supported by a more detailed Local Growth Deal Implementation Plan)
The strategy is owned by stakeholders across our area and will focus activity and resources on priorities,
align the work of partners, and ensure we deliver clear outcomes that add value.
Our area is genuinely distinctive.
Small and micro enterprises predominate;
We enjoy a wonderful geography of market towns, coastline and countryside, complemented by
the famous centres of Harrogate and York; and
Our agri-tech, agriculture, food manufacturing and energy sectors are pronounced, full of
potential and entwined with our rural character.
These assets drive our economy and will be central to future prosperity.
This will make us a thriving, prosperous place where businesses are growing in size, number and long term
profitability.
Our vision is to make York, North Yorkshire & East Riding the place in England to grow a small business, combining a quality business location with a great quality of life.
Strategic
Economic
Plan
York, North
Yorkshire &
East Riding
Plan for Growth
EU Structural &
Investment Funds
Plan
Growth Deal
Implementation Plan

2
We will focus on delivering five, outcome focused priorities to enable business led growth:
1 Profitable and ambitious small and micro businesses
2 A global leader in food manufacturing, agri-tech and biorenewables (the ‘bio-
economy’)
3 Inspired people
4 Successful and distinctive places
5 A well connected economy
As the diagram shows these priorities connect to one another and will together drive business growth.
For instance, small businesses in the food manufacturing, agri-tech and biorenewables sector (priority 2)
can benefit from business support (priority 1) and enhanced skills levels (priority 3). The attributes of the
places they are based in – rural and urban – affect their success (priority 4), as do good connections to
markets (priority 5).
Five priorities working as one for business growth
Business Led Growth
GVA-Jobs-Low Carbon
Profitable and ambitious small and
micro businesses
A global leader in food
manufacturing, agri-tech and
biorenewables
Successful and distinctive
places
Inspired people
A well connected economy

3
As the vision makes clear, businesses and their growth are at the heart of our approach. Change must be
demand led and business driven. And it must deliver hard outcomes. We will measure success by
progress made towards the following outcomes:1
Higher total GVA (economic output)
More jobs
Reduced carbon emissions
For businesses, success will mean increased business profitability, productivity and resilience. For people,
it will also mean rising incomes, and we will strive to ensure that economic growth goes hand in hand with
an excellent quality of life and a high quality environment. We will take account of this range of factors in
how we monitor success and focus on ‘ten tests for 2020’ (see section 6) that we will use to assess
whether the LEP area has met the ambitious goals that have been set.
Delivery and monitoring will take into local areas, including those of the East Riding of Yorkshire as a
‘transitional area’ (for EU funding purposes) and the imperative of delivering change right across the LEP
area, in remote rural areas as well as in our towns and cities.
1 Targets will be agreed before final submission and once resources are clear. Profitability is not shown in the outcomes as it cannot be easily
measured - we will use productivity and incomes as proxy measures for it.

4
2. Investment Priorities and Activities
The following Table sets out the Priorities, Objectives and deliverable Core Activities in overview. These
are covered in detail, priority by priority in this section before resourcing is set out in section 6.
Overview of Priorities, Objectives and Core Activities
Priority Objectives Core Activities
1 Profitable and ambitious small and micro businesses
Innovative, growing small businesses
More entrepreneurs who start and grow a business
Ambitious business leaders
[a] Increase innovation in small businesses
[b] Inspire and supporting new business starts
[c] Improve business competitiveness through co-ordinated business support
[d] New market development
[e] Deliver business friendly planning, regulation and procurement
[f] Enhance leadership and management skills
2 A global leader in food manufacturing, agri-tech and biorenewables (the ‘bio-economy’)
World class innovation in agri-tech and biorenewables
Agriculture and food business connected to new opportunities
Low carbon businesses
[a] Grow our International competitiveness in agri-tech
[b] Capitalise on our biorenewables & low carbon assets
[c] Connect our agricultural sector agri-tech and biorenewables based expertise and opportunities
[d] Support investment in energy & resource efficiency
3 Inspired People
A Productive workforce for growing businesses
Inspired people making the right job choices
Empowered communities delivering support and inclusion
[a] Increase productivity by investing in workforce skills
[b] Build competitive advantage through higher level skills
[c] Increase employability by connecting business to education
[d] Support high quality apprenticeships and internships
[e] Build skills, attitude and ambition to help people access jobs
[f] Develop strong communities and active inclusion
[g] Deliver a skills capital programme
4 Successful and distinctive places
Unlock major growth opportunities
New development in response to economic shocks and closures
Environmental quality and community needs
[a] Strategic investments in the A1/A19 corridor
[b] A strong and growing coastal economy
[c] Strengthen economic links with neighbouring cities
[d] Sustainable growth in the Dales, Moors and Wolds
[e] Business led investments in market towns
5 A well connected economy
Fast, reliable journeys between key centres
Transport that underpins growth
Access to UK and international markets
[a] Improve east-west connections
[b] Invest to ensure the existing transport network supports growth
2
[c] Ensure world class ICT and broadband
2 This includes North Yorkshire Local Transport Body proposals on managing urban traffic, congestion and pinch points; the
reliability of current transport networks; and addressing specific local transport issues

5
Priority 1: Profitable and ambitious small and micro businesses
Goal
Ambitious businesses that are supported to innovate improve and grow
We will create conditions which enable all businesses with an ambition to grow to do so, and boost
innovation levels by connecting businesses to the best expertise. This will help growing businesses to
achieve greater overall size and profitability than they would otherwise. As a result, local growth will
outstrip benchmark growth rates, in a sustainable manner.
Objectives:
Innovative, growing small businesses
More entrepreneurs who start and grow a business
Ambitious business leaders
Action Table
Core Activities Core Theme (EU)*
Actions Delivery Route
Lead Partner(s)
Resource Streams
Increase innovation in small businesses
Innovation Create a single access point to improve links between business and universities
University of York
ERDF
Financial support for R&D and new product development
SCY ERDF
Inspire and support new business starts
SMEs Skills
Business start-up support Various ERDF/ESF, Growth Deal
Enterprise education and culture Education providers
ERDF/ESF
Improve business competitiveness through co-ordinated business support
SMEs Simplify and incentivise access to business advice including business networks
Business Networks
LEP Funding, ERDF, Growth Deal
Tailored business support to meet specific needs
To be commissioned
ERDF, ESF, EAFRD, MAS, Growth Deal
Access to Finance (including Business Growth Grants for capital investment)
TBC ERDF, RGF, Growth Deal
Business Improvement Programme Chartered institutes
ERDF, Growth Deal
New market development
SMEs Export market development UKTI ERDF
Supply chain development MAS ERDF
Deliver business friendly planning, regulation and procurement
SMEs Better, business friendly advice on legislation, planning & regulation
Various ERDF, Growth Deal
Better procurement that widens SME opportunities
TBC ERDF
Enhance leadership and management skills
SMEs Leadership development programme Universities ESF

6
Why this is a priority
We have a micro and small business based economy.
Future growth therefore depends on a highly
competitive and growing small and micro business
sector.
We have 20% fewer medium and 50% fewer large
companies than the UK average. Growth and job
creation is therefore going to come from our small
businesses base.
Productivity is below national average and falling,
SMEs will be central to a turnaround.
Pre-recession, our economic growth rate (total Gross
Value Added) was below national average, however
since 2009 our growth has matched or slightly beaten
national rates. We need to help businesses to
capitalise on this success.
2006
2007
2008
2009
2010
2011
England GVA growth % 5.3 6.0 2.2 -1.5 3.4 2.3
LEP area GVA growth % 5.0 4.7 1.6 -2.3 3.4 2.5
In summary, we have a very resilient small business base, which has fared better in the economic
downturn than in many areas. However, historically we have grown slower than the national average and
we need to increase the productivity and growth rate of our businesses.
We need to build on our current position to outstrip the UK growth rate
In driving our growth we know that:
Businesses taking external advice are twice as likely to grow as those that do not.
Productivity increases are best driven by investing in innovation and skills.
We have genuine world leading innovation in some of our small businesses; however many small
businesses have unrealised growth potential because of a lack of capacity and internal expertise.
Our inward investment opportunities are likely to be limited and linked to a small number of supply
chain opportunities linked to specific growth opportunities.
Many of our biggest companies started out as micro businesses here. The quality of life, coupled with
a quality business environment, means businesses are likely to stay and grow in the area.
Business start-up rates are 20% below national average; we need more new firms to start up.
We are therefore likely to deliver best results by helping our existing base of small and micro
businesses to grow, whilst helping new firms to start up and survive.
Collaborating to support small
business
We have brought together business networks
and their members with chartered professionals
– connecting businesses to trusted sources of
advice.
The LEP has also brought together the ‘big five’
business membership organisations to cross
promote each other’s work and that of smaller
networks, the first time this collaboration has
happened.

7
Whilst there is latent capacity in some
aspects of the market to support growth and
improvement, the support landscape is
fragmented and demand is inhibited.
We estimate that around 25% of our business
community, that equates to 14,000 VAT
registered businesses and up to 7,000
businesses below the VAT threshold, have
growth aspirations that are not currently
being effectively supported and realised.
Making the most of this potential is key to
our future growth and stability. Evidence also
shows innovation has the potential to drive
business growth. We will work with HE and
FE to drive this, linked to our ‘Smart
Specialisation’ approach. We will also help
businesses to embed a culture of new ideas
and continual improvement around their
goods, processes and services, linked to
business support.
How we will make a difference
Our approach will be business led and focus
on stimulating demand for external advice
and addressing market failures - for instance
relating to imperfect information, merit
goods and barriers to market entry.
We need to build on the many innovative businesses already operating in our region, but also to stimulate
ambition in others and support those businesses that are willing to invest to improve their
competitiveness and grow.
The rural geography and dispersed nature of our business base mean that much support which is readily
available in more urban areas is not promoted to our rural businesses. We will ensure that businesses,
wherever they are located, have access to the same level of support and same opportunities.
We will improve the productivity of our businesses by capitalising on the investment in superfast
broadband, helping businesses to take advantage of the productivity and new market opportunities this
presents. We will work across sectors and geographies to learn and share best practice and support our
small business base to improve margins and win new business.
And we will remove barriers to innovation, including de-risking investment in research and development.
We will ensure businesses are supported to access and work with the very best innovation expertise in
UK, and will provide financial support to those that are willing to invest in research and development.
Cutting red tape to help business
Yorkshire, Europes best tourism destination has secured the start of the 2014 Tour De France
Almost 500,000 visitors are expected to flood into the area for next year’s Grand Départ so it’s really important for businesses to take advantage of this huge opportunity
It’s always great news for businesses when public bodies cut the red tape and let them get on with boosting the economy.
That’s why we were so excited to see Harrogate Borough Council agree a planning amnesty for businesses who wish to set up temporary campsites, caravan parks, or car parks during the Tour de France. The same amnesty also applies to any businesses displaying advertising material linked to the Tour.

8
Finally, we will back our business leaders. Sustainable business growth needs strong leadership and good
management. We already work closely with the many business networks in our region. We will continue
to partner with these networks to ensure business leaders have access to the support, peers and mentors
they need to grow their business. We also benefit from great universities, ambitious colleges and a
wealth of knowledge assets. Our role is to ensure businesses can access these assets, to provide them
with the confidence, learning and ambition to drive business growth.
We will also look to remove barriers to
growth, intervening only when we can make a
real difference so that businesses that are
wanting to expand and grow are able to do so.
Planning, regulation and public procurement is
a good example where businesses often cite
complexity and bureaucracy as a real barrier
to their growth. We are already running a
better regulation programme and will expand
this to ensure business and the regulators
work together to support local ambition and
growth.
A further example of removing barriers is the
Business Growth Grants Programme. This will
provide capital finance to unlock development
and where proven market failure based gaps exist, using modest resources to lever in investment, growth
and jobs.
Growth is a spectrum: much of our unrealised growth potential will come from incremental changes in
smaller companies. Local opportunities for significant one off economic boosts, particularly in terms of
new jobs, are limited. Therefore, we understand the path to growth to be a progression, which may begin
with fresh ambition or a new start up, move through improvement and modest growth before possibly
reaching high growth. We will ensure that support is available through partner organisations at each
stage, as appropriate to the business needs and demands.
Yorkshire is home to some of the most resilient,
experienced businesses in the UK. It's no secret that part of
the reason why our businesses have one of the best
survival rates in the country, is that they're run by sensible,
innovative, forward-thinkers.
Our mentors are passionate about business and want
others to share in their success
Support:
Time for a
Business Mentor

9
Core Activities
We will focus on six Core Activities:
[a] Increase innovation in small businesses – We will de-risk investment in R&D and make it easier for
small businesses to innovate. We have world class innovation assets in the region that we will utilise.
However we will also seek to use the University of York as a conduit to connect businesses to the best
expertise across the UK. We will create a single entry point, whereby a business wishing to innovate is
helped to find and access the very best expertise and support and supported in invest in developing new
products and processes. We also recognise that broadband is an enabling technology that can support
long term competitiveness (see also Priority 5). Where broadband has been rolled out we will help
businesses make the most of it. Unleashing the innovation and expertise in the region’s businesses and
universities will play a key role in driving high value growth.
[b] Inspire and support new business starts - A fundamental foundation of our economy is the high
quality of life, which attracts and retains entrepreneurs and business leaders. Recognising that self-
employment is an increasing trend, particularly amongst 25+ returnees to the area, we will ensure that we
effectively support those with a desire to establish their own business and instil an enterprising mindset in
our young people.
[c] Improve business competitiveness through co-ordinated business support - We will encourage
realistic growth ambitions within our business community by demonstrating how others have created a
path to success. The LEP will play a central role in coordinating and aligning the fragmented support
network, particularly via its online insight and introductions service www.businessinspiredgrowth.com
We will link interventions, so that for example mentoring and peer support are wrapped around the
provision of finance for growth. In particular we focus on the creation of value relationships, such as
incentivising the take up of support, whilst recognising that there’s little value in ‘free’. Typically we will
encourage the provision of specialist advice for established businesses, to further build value relationships
and make the most of the expertise within the business community to support growth. Tailored support
will also extend to sectors with specific needs such as the visitor economy and engineering. We will
support people working as catalysts and network enablers along with the provision of infrastructure that
meets the needs of businesses, such as physical Business Hubs. Support will be linked to resource
efficiency and low carbon goals (see 2d) and cover areas including marketing, finance, ICT, staffing and
investment readiness. It will also include access to capital finance through Business Growth Grants.
[d] New market development - Businesses looking to grow know they need a market for the goods and
services they provide. Where there is a need or opportunity to develop, test, establish or access these
markets, which require additional intervention, we will assist. Whilst many of these markets will be
international, there remain domestic opportunities to maximise, such as making the most of
infrastructure such as roads and tourism and recreational markets linked to long distance cycle paths and
footpaths through our region and promotional opportunities linked to events such as the Tour de France
in Yorkshire.
[e] Deliver customer friendly planning, regulation and procurement – The potential for the public sector
to play a stronger role in supporting the economic growth of the local business community is recognised
by both public and private sectors. The LEP will use our role as a bridge between these sectors to

10
facilitate progress. Once again, we will look to the business community to help the public sector
understand where there are barriers to growth or opportunities to support additional local growth, whilst
making it easier for business to deal with regulation. We will seek to encourage a positive, business
friendly culture, including in planning, and explore potential for free pre-application planning advice to
businesses, customer care training, and simplified planning regimes.
[f] Enhance leadership and management skills - As part of the overall principle of supporting linked
interventions, it is important that business people receiving support have the skills required to make the
most of this. Accordingly, both basic and specific business skills and higher level leadership and
management skills will be key elements on the path to growth.
Outcome Indicators and Benefits to Business
We will create a minimum of 300 additional jobs per year, equating to £15,000,000 of additional GVA, or
around 0.1% of extra GVA growth. Additional results and output measures include:
Jobs created
Increased business start-ups
Enterprises co-operating with research institutions
Enterprises actively innovating and introducing new to market and new to firm products
More productive and profitable businesses, with enhanced economic resilience
Enterprises accessing ICT products and developing ICT based products or services
Greenhouse gas reduction and businesses supported with energy and resource efficiency
Economic viability through infrastructure (including natural environment/green infrastructure)
More ambitious businesses people
A better connected, better supported, business community
Associated benefits for businesses and the economy include access to good quality help and advice,
improved access to finance, ease of accessing university, college and R&D expertise, better skills, raised
productivity, lower resource costs, and enhanced access to new markets and supply chain opportunities.
11
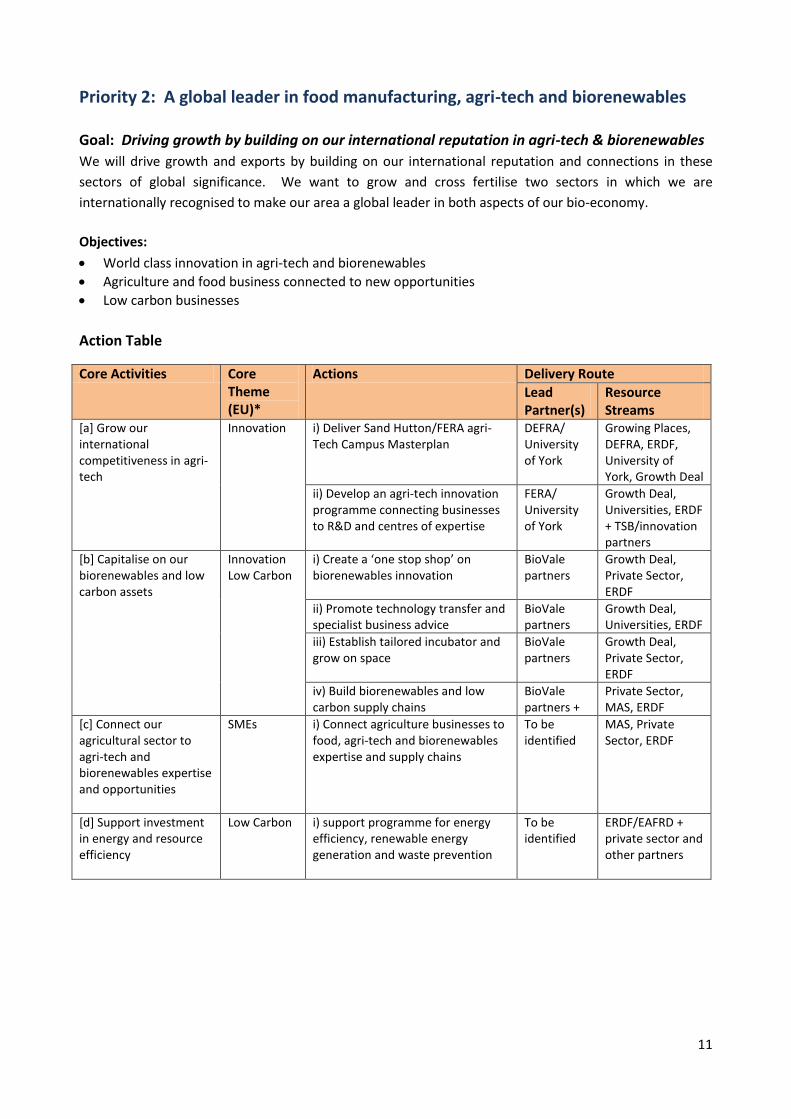
Priority 2: A global leader in food manufacturing, agri-tech and biorenewables
Goal: Driving growth by building on our international reputation in agri-tech & biorenewables
We will drive growth and exports by building on our international reputation and connections in these
sectors of global significance. We want to grow and cross fertilise two sectors in which we are
internationally recognised to make our area a global leader in both aspects of our bio-economy.
Objectives:
World class innovation in agri-tech and biorenewables
Agriculture and food business connected to new opportunities
Low carbon businesses
Action Table
Core Activities Core Theme (EU)*
Actions Delivery Route
Lead Partner(s)
Resource Streams
[a] Grow our international competitiveness in agri-tech
Innovation i) Deliver Sand Hutton/FERA agri-Tech Campus Masterplan
DEFRA/ University of York
Growing Places, DEFRA, ERDF, University of York, Growth Deal
ii) Develop an agri-tech innovation programme connecting businesses to R&D and centres of expertise
FERA/ University of York
Growth Deal, Universities, ERDF + TSB/innovation partners
[b] Capitalise on our biorenewables and low carbon assets
Innovation Low Carbon
i) Create a ‘one stop shop’ on biorenewables innovation
BioVale partners
Growth Deal, Private Sector, ERDF
ii) Promote technology transfer and specialist business advice
BioVale partners
Growth Deal, Universities, ERDF
iii) Establish tailored incubator and grow on space
BioVale partners
Growth Deal, Private Sector, ERDF
iv) Build biorenewables and low carbon supply chains
BioVale partners +
Private Sector, MAS, ERDF
[c] Connect our agricultural sector to agri-tech and biorenewables expertise and opportunities
SMEs i) Connect agriculture businesses to food, agri-tech and biorenewables expertise and supply chains
To be identified
MAS, Private Sector, ERDF
[d] Support investment in energy and resource efficiency
Low Carbon i) support programme for energy efficiency, renewable energy generation and waste prevention
To be identified
ERDF/EAFRD + private sector and other partners

12
Why this is a priority
The region is internationally competitive in agri-
tech & biorenewables
Across Europe the bio-economy sectors have a
reported turnover of some 2 trillion Euros3 and
the global market for biochemicals has been
predicted to increase tenfold between 2005 and
2015.
The R&D base in York competes on the
international stage in agri-tech and
biorenewables. It is home to the Biorenewables
Development Centre and two internationally
recognised research groupings at the University of
York, the Centre for Novel Agricultural Products
and the Green Chemistry Centre of Excellence.
The Food and Environment Research Agency
(Fera) complements these resources. Located at
Sand Hutton outside York, it connects our
agricultural sector to agri-tech and biorenewables based expertise and opportunities. Fera employs some
550 scientists to support and develop a sustainable food chain, a healthy natural environment, and to
protect the global community from biological and chemical risks. This site is at the heart of the UK
strategy for agricultural technologies and is identified as a candidate for ‘Catapult centre’ status in the
future, reflecting its role as a centre of expertise and innovation.
Land based industries training is offered by Askham Bryan, the fastest growing college in the UK
specialising in land based disciplines, and by Bishop Burton agricultural college.
Importantly, these different elements in the knowledge base work closely with each other. For instance
Fera works closely with the University of York, including the recent development of an Agri-food
Resilience Initiative in collaboration with York Environmental Sustainability Institute.
We have innovative businesses in Food, Agri-tech & Biorenewables
Our LEP area benefits from high quality and often small food manufacturers, such as Wensleydale Cheese,
whilst major international brands such as McCain and Nestle are also based in the region. Nestle has
located its product innovation centre in York.
We are home to Drax, the largest coal-fired power station in the UK, and Eggborough power station, both
near Selby. Drax has made a £700 million pound investment to transform itself into a largely biomass
fuelled facility. Alongside its investment in converting to biomass, it is shortlisted for a £1bn carbon
capture and storage investment.
3 Statistic taken from BioVale proposal consultation document, July 2013
Yorkshire Innovation
Global Ambition
Yorkshire and the Humber has a unique combination of industry, agriculture and a world class knowledge base to capitalise on agri-tech and biorenewables opportunities. This combination includes internationally recognised biorenewables research at the University of York and Fera, innovative chemicals-using industries, biofuel and bioenergy suppliers, forward-looking agricultural enterprises and the largest concentration of food and drink businesses in the UK
13
Development of the sector, and other planned
investments such as the proposed £2billion potash
mine near Whitby which could generate £1 billion of
annual exports, will generate employment and
present supply chain opportunities for local
companies. More widely there is great potential for
sustainable energy and resource efficiency in farms
and food businesses. That includes producing
energy from waste with leading businesses such as
Peel Environmental investing in excess of £200m in
the technology.
Lastly, we have a diverse agricultural base.
Businesses in the agricultural sector are around 3.5
times more concentrated in the LEP area than
national average, and more concentrated than any
other sector locally, whilst food manufacturing
accounts for around 35% of all manufacturing jobs.
Focus on food manufacturing, agri-tech and
biorenewables is in keeping with a ‘smart
specialisation’ approach given the strength of the
sectors here and the pronounced R&D activity and
expertise in them.
How we will make a difference
This mix of internationally leading innovation, global
brands and ambitious small businesses present three
major growth opportunities
1. New product and process and development
2. New and increased exports, supply chain and inward investment opportunities
3. Competitiveness and growth in a low carbon economy
In terms of R&D and innovation, although there are initiatives to bridge the gap between the region’s
agriculture, industry and its outstanding R&D knowledge base, in practice there are substantial gaps and
interactions are often ad hoc. There is a need to draw new industries into the agri-tech and bio-based
innovation environment and promote movement of staff between the academic and private sector
science base. FERA expansion and the BioVale vision both respond to these issues and ideas.
Our vision aligns exactly with the preliminary recommendations of the Witty review and the principles of
Smart Specialisation. We are making sector/cluster strengths a foundation of our growth strategy. And
we will ensure that universities play a stronger role in economic development, working together with LEPs
and with central bodies such as UKTI, the TSB and BIS to support business growth, innovation and to
attract inward investment to the UK.
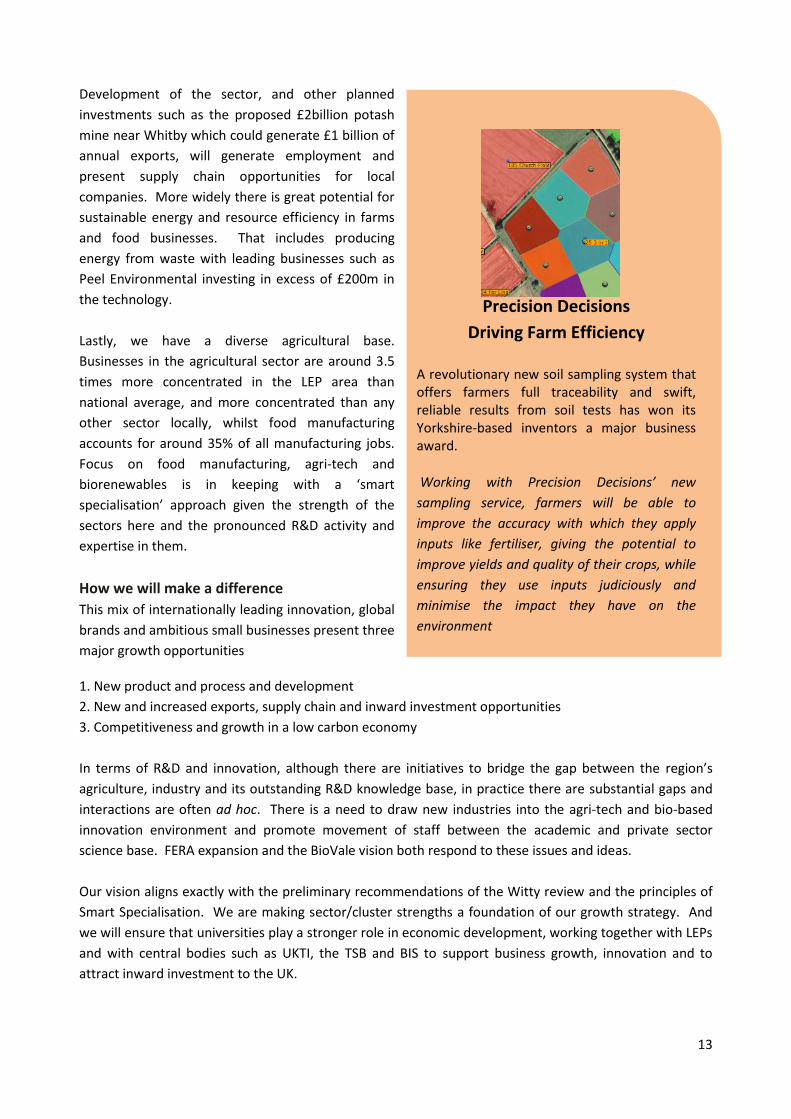
Precision Decisions
Driving Farm Efficiency
A revolutionary new soil sampling system that offers farmers full traceability and swift, reliable results from soil tests has won its Yorkshire-based inventors a major business award.
Working with Precision Decisions’ new
sampling service, farmers will be able to
improve the accuracy with which they apply
inputs like fertiliser, giving the potential to
improve yields and quality of their crops, while
ensuring they use inputs judiciously and
minimise the impact they have on the
environment

14
This proposal links strongly to our neighbour, the Humber LEP. We have a large overlapping area and will
collaborate to link key investments in bioenergy to the Humber’s growing low carbon and renewables
sector and its diverse chemicals industry. These links will create new market and supply chain
opportunities and enhance our international reputation in the sectors. More widely we will look to
connect businesses here to low carbon opportunities and supply chain needs in the Humber. We will also
work with Leeds City Region (LCR) on this agenda and develop an integrated bio-economy delivery plan
with LCR and the Humber to drive the growth of the sector.
Food and energy security are issues of global significance. We already have a major international
presence through the University of York and Fera, which works across over 100 countries. Strengthening
the links between industry and research will create major export opportunities in what are rapidly
growing international markets.
We will address a number of market failures to catalyse growth. These include public goods and positive
externalities market failures that mitigate against business R&D and technology transfer, as well as issues
around imperfect information.
Core Activities
We will focus on four Core Activities:
a) Grow our international competitiveness in Agri-Tech - FERA at Sand Hutton is a key asset for
agriculture and related food and energy businesses. This world class facility sits at the heart of the UK
agri-tech strategy and has potential to double in size, creating 800 jobs and boosting the economy by
£100m. It has an excellent case to be at the core of the new national agri-tech ‘catalyst’ programme
and to become an exemplar ‘catapult’ centre. Investment will build an innovation cluster around the
FERA business, supporting investment in R&D, technology transfer and creating major new business
and export opportunities.
b) Capitalise on our biorenewables and low carbon assets – The BioVale Vision is for a Yorkshire and
Humber wide biorenewables based4 innovation cluster focused on centres of expertise in the
University of York. This would connect to low carbon and biomass developments at Drax, low carbon
energy and chemicals in the Humber, and expertise in other R&D institutions and universities. The
proposal will make it easier for business to access the world class innovation assets in the region and
will promote technology transfer, build supply chains and bridge gaps between sectors. We will
develop an integrated bio-economy delivery plan in collaboration with neighbouring LEP areas to
drive the sector’s growth, incorporating all relevant parts of this Priority.
c) Connect our agricultural sector to agri-tech and biorenewables expertise and opportunities –
Growth of the food manufacturing, agri-tech and the biorenewables sectors will create major supply
chain and innovation opportunities. These include those from investment in agri-innovation, potash
mining, low carbon transformation at Drax and offshore wind energy development. We will seek to
ensure local SMEs, including farms, are aware of supply chain opportunities and enhance their
capacity to secure them. We will also exploit opportunities for inward investment and reinvestment
based on the supply chains of major investors. 4 Biorenewables specialisms include high value chemicals, natural products, next generation biofuels and biowastes

15
d) Support investment in energy and resource efficiency – There is great potential to turn waste into a
source of renewable energy and an income stream, as well as to implement other energy saving,
waste reduction and energy microgeneration activities in farms and SMEs. However, market failures
including access to finance (barriers to market entry) and lack of awareness (imperfect information)
are preventing take up. This programme will open up grants, advice and other support that
encourage small scale take up of low carbon and sustainable technologies across the LEP area.
Outcome Indicators and Benefits to Business
The overall outcomes that will result from this activity are private sector investment, employment, sector
growth and reduced waste and carbon emissions. Specific results and outputs from activities that
contribute to these overall outcomes include:
Number of enterprises engaging with universities and other research bodies
Number of enterprises introducing new to market or new to firm products
Number of businesses that are actively innovating
Private investment
Jobs created
Greenhouse gas reductions
‘Smart specialisation’ – embedding innovation and value chain connections
Companies delivering low carbon practices, processes, services or products
Associated benefits for businesses and the economy include world class agri-tech and food expertise and
innovation accessible locally; improved access to new supply chain opportunities; and lower energy and
waste costs, plus new income streams for farm and food businesses.

16
Priority 3: Inspired People
Goal:
Growing businesses able to access ambitious people, with the right skills and the right attitude
We want to have one of the best workforces in the country, with ambitious and enterprising young
people, excellent employability skills and qualifications that meet business needs now and in the future.
Achieving that will drive business growth and competitiveness and support employment and incomes.
Objectives:
A productive workforce for growing businesses
Inspired people making the right job choices
Empowered communities delivering support and inclusion
Action Table
Core Activities Core Theme (EU)*
Actions Delivery Route
Lead Partner(s)
Resource Streams
[a] Increase productivity by investing in workforce skills
Skills i) Research and communicate sector needs SFA opt in, FE
ESF + SFA, Growth Deal ii) Develop specific training packages that
meet local priority sector and investor needs
[b] Build competitive advantage through higher level skills
Skills i) Promote the benefits of higher level skill to business and encourage their uptake
SFA opt in ESF + SFA. Growth Deal
ii) Graduate and postgraduate retention
[c] Increase employability by connecting business to education
Employment Skills
i) Mainstream employability into education and roll out employability charter activity
SFA opt in ESF + SFA, Growth Deal
ii) Devise and deliver targeted initiatives to enhance employability
SFA/Big Lottery opt in
ESF + SFA /Big Lottery
iii) Develop links between business and education providers
SFA opt in ESF + SFA
iv) Promote ‘careers inspiration’ through better advice and guidance linked to local business needs and opportunities
[d] Support high quality apprenticeships and internships
Skills i) Promote higher level apprenticeships SFA opt in ESF + SFA
ii) Create hubs to promote apprenticeships and simplify take up for business
iii) Promote widened use of placements, internships and work experience
[e] Build skills, attitude and ambition to help people access jobs
Employment i) Build self-employment and enterprise skills SFA opt in ESF + SFA,
ii) Intensive support to help people upgrade skills, move towards and enter work, including workless people and those facing redundancy
Big Lottery opt in
ESF + Big Lottery
iii) Overcome rural employment challenges, including travel difficulties
iv) Connect young people not in employment/ training to local employers and opportunities
[f] Develop strong communities and active inclusion
Inclusion i) Develop the capacity of the community and social enterprise sectors to meet local needs
Big Lottery opt in
ESF + Big Lottery
ii) Community led local development activity to build inclusion and employability
iii) Activities that promote social inclusion through delivering environmental benefits

17
g) Deliver a skills capital programme
Skills i) Bring all FE college infrastructure up to an suitable standard to enable sound business engagement, training and career choices
FE colleges Growth Deal
ii) Targeted investment in facilities that meet sector specific needs (as per this strategy)
Why this is a priority
Businesses need people with the right skills and qualities to flourish and grow. The same skills help people
to get jobs and progress in their careers. There is a strong link between skills (especially higher level ones)
and business productivity. On average, businesses that invest in training perform far better than those
that do not. Likewise, people with better skills are far more likely to be employed and to earn more. Skills
are as vital to jobs and inclusion as to business success.
Qualifications levels across most of the LEP area are above national average. They are rising over time,
but not as fast as nationally, so we need to improve further and faster to stay ahead. Additionally, there
are localised areas where skills levels are lower, most notably on the Yorkshire Coast, where
unemployment is highest too.
Higher skills have a pivotal impact on growth and productivity, but our lead over national average at this
level is slipping away. Higher level skills – at graduate and postgraduate level, as well as higher level
apprenticeships – is a key focus and also links to key business leadership and management skills. Those
are also critical to business growth and success and covered in Priority 1 (ambitious businesses) because
they relate strongly to business ambition and are part of a co-ordinated business support offer.
How we will make a difference
Activity will confront market failures to do with public goods (trained workers may be poached by other
companies) and imperfect information (the value of skills is not fully recognised). These prevent the
degree of upskilling that is required, whilst institutional, cultural and policy barriers about skills acquisition
and structures also need to be addressed.
We will collaborate with the Leeds City Region LEP and Humber LEP, and work through the Skills Funding
Agency and Big Lottery as well as local partners to enhance skills, employment and inclusion.
Core Activities
We will focus on six Core Activities:
a) Increase productivity by investing in the workforce - There is a need to upskill the workforce,
especially where there are skills gaps, and to meet the needs of growing and locally important sectors.
Needs include science, engineering and technical skills in fields such as agri-tech, food, energy and
vehicle/ component manufacture (e.g. caravans, coaches, aircraft), as well as customer skills in the
visitor economy and care skills linked to an ageing population. Higher level skills will be included in
upskilling activity where appropriate. We will also consider the case for new or upgraded
infrastructure (e.g. college buildings or training centres) where that will enhance take up and delivery
of training and benefit workforce skills.

18
b) Build competitive advantage through higher level skills – We will seek to ensure both that there is an
improving stock of people with higher level skills, and that businesses make best use of them to
enhance growth and productivity. That includes postgraduates who are especially important to
innovation, R&D and our Smart Specialisation approach.
c) Increase employability by connecting business to education – Businesses make clear that
‘employability skills’ are vital. These skills include a good attitude, basic skills such as English and
Maths, and ‘soft’ skills like communication, teamwork and creativity. There will be value in rolling out
existing good practice such as the Employability Charters in Scarborough and the Humber into
education across the LEP area. That will mainstream employability into teaching and curriculums, and
make links to work experience and careers information, advice and guidance (IAG). Achieving all that
will require good relationships between businesses, education and skills providers (including schools,
FE and HE) and work to enable businesses (including SMEs) to influence what is taught. It is widely
recognised that IAG is problematic. It needs to be high quality, impartial and tuned in to the
opportunities and needs in local businesses and growth sectors. This will be reflected in relevant
activity and a ‘careers inspiration’ approach that motivates as well as informs young people.
d) Support high quality apprenticeships and internships – We will increase and better match the supply
of and demand for apprenticeships. Apprenticeships must be an attractive and high quality option for
young people, and support should be provided to employers to make taking on an apprentice easier,
and to encourage other high quality work experience (e.g. internships and placements). That will
include ensuring there is ‘apprenticeship hub’ or equivalent provision across the LEP area to make it
easier for employers to take on apprentices, and enhancing the quality, range and flexibility of
apprenticeship provision – including more high level apprenticeships.
e) Build skills, attitude and ambition to help people access jobs – There are pockets of deprivation and
unemployment on the Yorkshire Coast in particular, but these issues affect people throughout our
area, even in seemingly prosperous communities. Barriers to employment include confidence and
ambition, health, personal and family issues, skills, poor work experience, and travel difficulties to
work or college. Working with people to address these issues will help them to build employability
skills and get a job, widen the labour pool for employers, and build inclusive communities. Youth
unemployment is a particular problem, so this group and those who are not in employment,
education or training (or at risk of becoming so) will be a priority.
f) Develop strong communities and active inclusion – Sustainable solutions require community input
and ownership, and we will focus on a community led approach to enhancing inclusion and
employability. This will utilise and strengthen the capacity available through the voluntary and
community sector, which is more concentrated in this LEP area than elsewhere in Yorkshire.
g) Deliver a skills capital programme - Our approach is two pronged; first to get all FE college
infrastructure up to a suitable standard. Businesses must see FE colleges as a quality delivery partner,
whilst students need to make career choices based on economic opportunity and quality of training
and not on quality of premises. Secondly we will seek to enhance training/learning facilities where
these enable FE colleges (and other relevant training centres) to meet specific sector needs in line
with our strategy.

19
Outcome Indicators and Benefits to Business
The overall outcomes that will benefit from this activity are employment rates, productivity and growth.
Specific results and outputs from activities that contribute to these overall outcomes include:
Apprenticeships started and completed
Proportion of the population with qualifications at NVQ levels 2, 3, 4 and 5
Businesses reporting skills improvements in the workforce and reduced skills gaps
Number of people who participate in skills and learning activity
Number of unemployed people accessing employment
Young people engaged and numbers not in employment, education or training
Associated benefits for businesses and the economy include more people to recruit from with good
employability skills, ease of recruiting apprentices, more demand from skilled young people to work in
local businesses, and more influence over what is taught in schools, colleges and universities.

20
Priority 4: Successful and Distinctive Places
Goal: Enhanced growth and opportunities in targeted locations.
We will ensure a high quality of environment and life goes hand in hand with good economic growth and
housing across the LEP area - consistent with the vision of attracting entrepreneurs and the skilled
employees they will need. We will realise strategic opportunities to unlock and transform growth and
development prospects in prioritised locations to benefit local economic and the entire LEP area.
Objectives:
Unlock major growth opportunities
New development in response to economic shocks and closures
Environmental quality and community needs
Action Table
Core Activities Core Theme (EU)*
Actions (See Note)
Delivery Route
Lead Partner(s)
Resource Streams
[a] Strategic investments in the A1/A19 corridor
Limited
i) Unlock strategic housing and employment sites
Local Authorities LA, HCA, Growth Deal
ii) Drive growth in bio-economy & agri-tech
See Priority 2
[b] Ensure a strong and growing coastal economy (The Yorkshire Coast)
Environment (for ii and iii)
i) Exploit opportunities from major investment in the coast
Scarborough BC/ East Riding C
LA, Growing Places, Growth Deal
ii) Tackle housing demand and affordability
Scarborough BC/ East Riding C
HCA/Growth Deal
iii) Implement flood prevention measures, capitalising on green and blue infrastructure
Environment Agency
ERDF
[c] Strengthen economic links with neighbouring cities
Environment i) Provide major employment sites Local Authorities LA, Growing Places, Growth Deal
ii) Increase the range and availability of housing
Local Authorities HCA/Growth Deal
[d] Sustainable growth in the Dales, Moors and Wolds
Environment Low carbon LEADER
i) Maximise the strengths of Market Towns
Local Authorities Growth Deal / EAFRD
ii) Raise the quality of the visitor infrastructure
Local Authorities / Private Sector / National Parks
EAFRD / Growth Deal
iii) Optimise the potential of the environmental economy
Local Authorities / Private Sector/ DEFRA Agencies
EAFRD / Growth Deal
[e] Business led investments in market towns
SMEs Environment LEADER
i) to be determined through local/ community led approaches
Private sector Private sector, ERDF/EAFRD
[Note: Discussion with local partners and evidence based prioritisation is ongoing regarding potential actions. The detail of specific schemes will
be further developed and assessed during early 2014 before clear priorities are included in the final version of this Strategic Economic Plan and
the Local Growth Deal Implementation Plan. Reference to schemes here is illustrative and not exhaustive or final, and reference to Growth Deal
funding here (and in P5) is to indicate it as one possible vehicle to support delivery. Other developments in local areas not covered in the above
table include those relating to Sand Hutton/FERA expansion, and to transport and ICT, which are covered in priorities 2 and 5 respectively]

21
Why this is a priority
Our market and coastal towns and the centres
of York and Harrogate are where business,
people and place issues come together. We are
a large geographical area with both areas of
opportunity and need. Our area contains a
number of overlapping and interlocking
functional economic areas. These areas are
what make York, North Yorkshire and East
Riding distinctive, each having its own assets
and opportunities to build future growth.
These form the basis of this priority but they all
have some common market failures and
barriers when it comes to growth.
The nature of York, North Yorkshire and East
Riding means that there are physical
constraints or resource capacity issues that
raise the cost of development beyond the
point of its financial viability. The LEP and its
partners can play an important role in ensuring
that any barriers that may be preventing
strategic sites or locally based investment taking place is unlocked.
Our area faces some real challenges in the future such as the changes to the MOD establishments, further
reductions in public sector employment, the isolation and accessibility of our upland rural economies and
the difficulties faced by our coastal towns. However there are some significant opportunities such as
excellent north-south connectivity, an outstanding landscape and coastline, high quality and attractive
cities and towns and new growth opportunities to exploit. Investment in the infrastructure to unlock this
potential is therefore critical.
The seven Local Economic Areas described in the economic geography and evidence section of this
strategy have driven place proposals under this Priority, with areas brought together where they have
strong similarities and relationships. That is the basis for the four core activities whereby proposals for
the York & connected and A1/A19 corridor areas are brought together, as are the West Yorkshire
connected and Hull & Humber connected areas (‘City Links’), and the Dales and Moors & Wolds areas.
The Yorkshire Coast remains as a distinctive area for proposals in its own right.
How we will make a difference
Our Infrastructure Programme will focus on specific instances where a market failure is preventing or
delaying development, often to do with a mismatch between the costs necessary to allow development
(e.g. transport, energy infrastructure, flood prevention or land remediation costs) and the expected
returns.
Catterick town centre
Catterick Garrison is one of the largest armed forces
bases in the UK. The population of the Garrison and
its neighbouring ‘villages’ is as large as most of the
towns across the LEP area. However it has no real
town centre.
The 150,000 sq ft town centre scheme will transform a
former sports ground and will include major retail
units, a five-screen cinema, cafes, restaurants and
bars, and a 60-bed hotel with 400 car parking spaces.

22
These often relate to public goods and externalities and we will appraise the business case and extent of
market failures before focusing on schemes that offer the best value, most strategic and sustainable
benefits. We will seek exemplary low carbon and environmental performance in built developments. Our
area contains localities with significant flood risks, such as in parts of East Riding. We will work with
partners to mitigate flood risks in priority areas where they threaten growth and development, adopting a
sustainable approach.
We will collaborate with the Leeds City Region LEP and the Humber LEP on development opportunities
that fall within both their LEP areas and our own, and with local authorities, the private sector, the HCA
and Government funding streams on specific proposals.
A full supporting paper on housing5, combining evidence and its implications for strategic priorities
supports this strategy, prepared through close partnership working between the LEP and the North
Yorkshire & York Strategic Housing Board/East Riding of Yorkshire Council. Evidence from the paper is
summarised in section 3bv, whilst its key pointers on policy have supported and will inform delivery of the
core activities set out here. Relevant detail includes that on planning policy and the status of local plans,
housing strategies and their priorities, local investment plans and governance structures.
Core Activities
We will focus on five Core Activities:
a) Strategic Investments in the A1/A19 corridor - Through the central part of our area we have a growth
corridor consisting of the A1(M)/A19 and East Coast Mainline. That includes York, the key economic
driver for the area. It is an area with excellent connectivity and with real growth opportunities where
future investment in high quality infrastructure is essential to enable growth. However it is not
without its challenges; the area has significant public sector employment both within public
authorities and agencies and also defence, where areas such as Northallerton and Ripon face
significant loses whilst Catterick will become one of the largest armed forces bases in the UK. We need
to overcome the infrastructure barriers faced by businesses and investors to ensure this area meets
its growth potential and that opportunities are maximised.
b) Ensure a strong and growing coastal economy – The Yorkshire Coast has one of the finest coastlines
in Britain, with famous seaside towns such as Scarborough, Bridlington, Whitby and Filey. All of which
have seen significant change over the years and have had to look towards raising the quality of their
visitor offer whilst also looking to new economic opportunities, such as offshore wind, potash mining
and creative and digital industries. There is a need to invest in the infrastructure to enable new
employment and housing land to be made available, new facilities exploit new growth opportunities,
and improvements to raise the quality of the coastal visitor offer. As well as on rivers, flood risks can
be marked in areas close to the coast and to the Humber estuary. We will respond to these pressures
where they affect economic success and future development, adopting a sustainable approach that
fully utilises and takes account of green and blue infrastructure.
5 The Contribution of Housing to Economic Growth in the York, North Yorkshire and East Riding LEP area, 16 December 2013

23
c) Strengthening economic links with neighbouring cities – Our City Links area is almost surrounded by
major urban conurbations and economic centres that each hold opportunities for growth. The
south/east of our area could benefit from the investment going into Hull and the Humber ports area,
particularly around the renewables industries. The south /west is linked to the financial and
commercial centre of Leeds. The north has connections to the engineering industries of the Tees
Valley. Investment is needed to enable further employment land and opportunities to be met within
the main towns.
d) Sustainable growth in the Dales, Moors and Wolds - We have significant rural upland areas covering
the Yorkshire Dales, North York Moors and Yorkshire Wolds, outstanding landscapes with small towns
acting as service hubs for jobs and visitors. But these are areas with future challenges where
investment is needed to ensure sustainable economic communities rather than large scale growth.
e) Business led investments in market towns – the LEP area has well over 30 market towns and these
are pivotal to our distinctive identify, quality of life and economic prospects. We will support local
business led action tuned to the needs of the market towns and communities they are based within,
and designed to attract and retain visitors and customers.
Outcome Indicators and Benefits to Business
The overall outcomes that will benefit from this activity are land developed or opened up for
development, new investment and jobs. Specific results and outputs from activities that contribute to
these overall outcomes include:
• Ha of land opened up for development
• Business space created or improved
• Housing sites enabled
• New investment attracted to the area
• Jobs created
• Infrastructure site development including green infrastructure
Associated benefits for businesses and the economy include ensuring high quality, distinctive and
outstanding places continues to support growth, as well as better access to premises, market
opportunities, customers and workers (linked to affordable housing availability).

24
Priority 5 – A well connected economy
Goal: Businesses with strong connections to their customers and markets
We will strive to ensure that businesses across our area are well connected to their customers, markets
and workforce. Our transport, mobile and broadband network must not act as a barrier to growth but
instead be an enabler for thriving, prosperous places where businesses are able to grow.
Objectives:
Fast, reliable journeys between key centres
Transport that underpins both growth and low carbon goals
Access to UK and international markets
Action Table
Core Activities Core Theme (EU)*
Actions (SEE NOTE BELOW) Delivery Route
Lead Partner(s) Resource Streams
[a] Improve east – west connections
n/a i) A64 York – Scarborough Transport Authorities /Highways Agency
Tbc
ii) York – Harrogate – Leeds Rail NYCC/Network Rail NYLTB
iii) York – Scarborough Rail LAs/ Network rail/First Transpennine
Tbc
[b] Invest to ensure the existing transport network promotes growth and low carbon goals
n/a i) York Outer Ringroad CYC
LCR
ii) Catterick Town Centre Transport Authorities
Private Sector / Growth Deal
iii) North Northallerton Level Crossing (see Priority 4)
Transport Authorities/District Council
Private Sector / Growth Deal
iv) Bedale Bypass Transport Authorities
DfT/NYCC
v) ensure a safe and reliable highways network supports growth and investment
Transport Authorities
Transport authorities/ Growth Deal
[c] Ensure world class ICT and broadband
ICT i) Rural Business Parks Superfast North Yorkshire
Growth deal
ii) East Riding East Riding Council Growth Deal
iii) 4G
Tbc
[NOTE: This is a preliminary list of Actions. Local Authorities, through the Transport Board, have identified an
initial long-list of schemes which will be further assessed and whittled by them to finalise priorities. Not all
schemes will require Growth Deal support (e.g. Bedale bypass) whilst others are covered in place based rather
than transport elements of the Implementation Plan (e.g. North Northallerton).

25
Aided by significant investment from BDUK and Europe
(ERDF) along with investment from BT, Superfast North
Yorkshire will deliver superfast broadband by the end
of 2014.
90% of homes and businesses will have access to the
benefits of fibre broadband and the remaining
premises in the project area will have access to at least
2Mbps. To capitalise on this opportunity a support
programme works alongside the roll out, ensuring
businesses are able to take advantage of the
technology.
Why this is a priority
North Yorkshire and the East Riding are large areas with a dispersed population, and sizeable distances
between many of their settlements. This can help to reduce congestion to some extent, but means that
the economies of many places suffer from their remoteness from raw materials, markets and workforces.
North-South connectivity is generally good, but East-West connections are often poor and there are
specific transport problems and pinch points in our major centres and off the major motorway network.
Whilst accepted that significant
improvements to the road and rail network
are not appropriate in our rural areas they
have for years suffered from a lack of
connectivity to the telecommunications
network. Good broadband and mobile
communications provides a real opportunity
for new investment and growth across our
rural communities.
A targeted approach is therefore required
which directs attention and resources to
correcting a number of key access issues,
and which combines transport and
broadband based approaches. Transport
decisions will include consideration of
sustainable, low carbon options including rail
and bus services and cycling where feasible.
Access to the Humber ports is good, especially from East Riding and Selby; access to airports is less so.
There is quick rail access to London via York and Northallerton, and in the long term connection to the
high speed rail terminal in Leeds from York will be important.
How we will make a difference
We will collaborate with the Leeds City Region LEP and Humber LEP, and work through the Devolved Local
Transport Bodies and local partners in delivering Core Activities. In particular, Highways Agency, Transport
Authorities and Network Rail are critical partners to be able to deliver both funding and delivery
mechanisms.
A full supporting paper on transport6, combining evidence and its implications for strategic priorities
supports this strategy. That includes principles and justification for action overall and under five headings:
Improving east-west road and rail connections
Managing urban traffic and transport congestion and addressing pinch points
Enhancing the reliability of our current transport networks
Improving access to superfast broadband
Identifying and addressing specific local transport issues
6 LEP Strategic Economic Plan – Transport, North Yorkshire Local Transport Body, December 2013

26
The content of the supporting paper has informed and will be used to guide implementation of the Core
Activities detailed here.
Core Activities
We will focus on three Core Activities:
a) Improving east – west connections - Whilst north – south links (especially in the central corridor with
the A1(M) and East Coast Main Line) are generally good, east - west links (e.g. the A64) are relatively
poor. This constrains the economic performance of towns such as Scarborough, Bridlington, Whitby
and Skipton. Improving these links will be crucial to boosting the economies of these towns and their
surrounding areas. The York-Harrogate-Leeds rail line is a priority for investment and included within
this core activity. Ensuring rail access on key routes (e.g. Scarborough- Leeds) maintains its
competitiveness compared to journeys by car and lorry will be important to low carbon goals. The
relevant section of the supporting Transport Body paper provides further detail on east-west
connections.
b) Invest to ensure the existing transport network promotes growth - Urban traffic congestion,
especially in the two major centres of York and Harrogate, continues to cause problems for businesses
and growth. Managing urban traffic congestion will allow our towns to continue to be the focal points
for wider local economies. Specific, localised transport issues and pinch points, such as level crossings
on major ‘A’ roads or overcapacity motorway junctions, lead to long and unreliable journey times.
Equally, specific traffic issues can constrain major opportunities such as expansion at Sand
Hutton/FERA, or the potential potash mine near Whitby. Addressing these pinch points will help
businesses through shorter and more predictable journey times for both goods and their workforce. A
well maintained and effective transport network also supports continued economic growth,7 as does a
sustainable approach that promotes low carbon travel options and reduced congestion. Three
sections of the supporting Transport Body paper provide further detail relevant to this activity; those
focused on managing urban traffic, congestion and pinch points, on the reliability of current transport
networks, and on addressing specific local transport issues.
c) Ensure world class ICT and broadband - Whilst superfast broadband is being rolled out across much
of York and North Yorkshire, gaps remain, notably in business parks at the edge of market towns and
across parts of the East Riding. Closing these gaps, and those in the East Riding, plus 4G access in the
future, will be critical in supporting future business growth and competitiveness across our area. The
relevant section of the supporting Transport Body paper provides further detail on improving access
to superfast broadband.
Outcome Indicators and Benefits to Business
The overall outcomes that will benefit from this activity are related to increased investment and improved
connectivity. Specific results and outputs from activities that contribute to these overall outcomes
include:
• Access to broadband and mobile technology
7“an efficient transport system depends on effective maintenance” (Transport – an engine for growth, Department for Transport,
August 2013)

27
• Resources secured for transport
• Transport improvements
• More reliable and faster travel times
• New investment as a result of transport improvements
• Jobs created
• Reduction in greenhouse gas emissions from sustainable transport options
Associated benefits for businesses and the economy include ensuring that businesses have good access to
customers, markets and a skilled workforce.
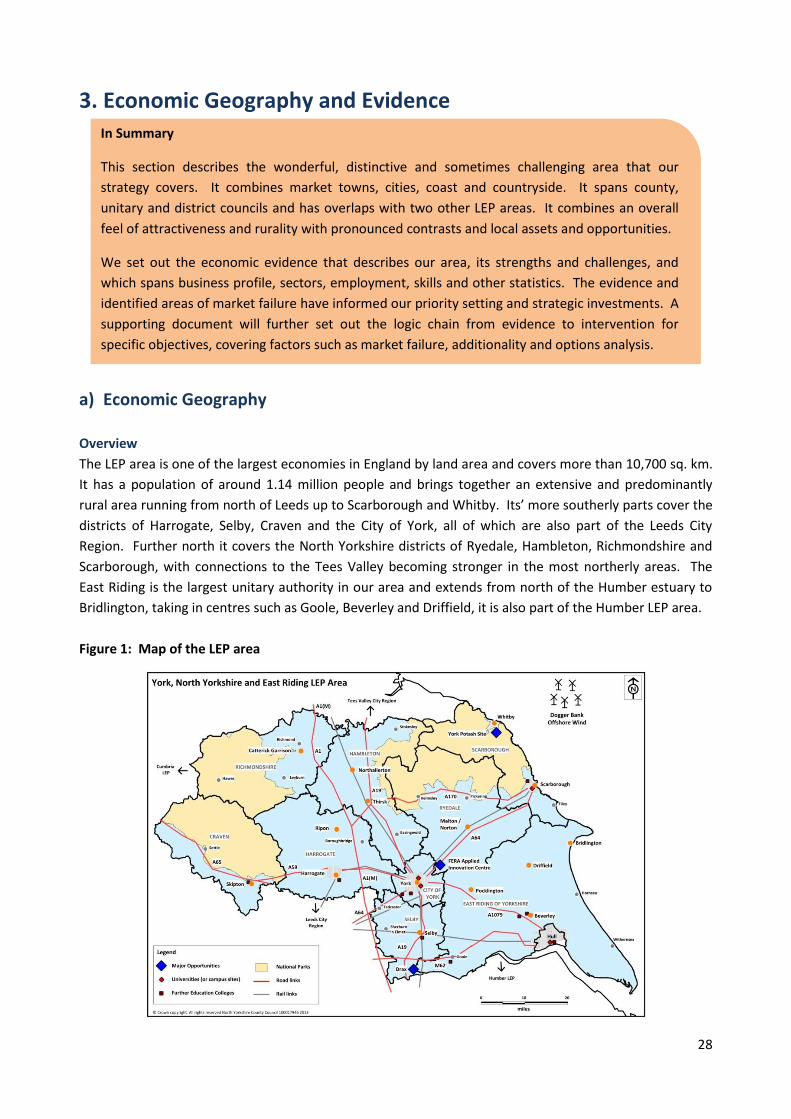
28
3. Economic Geography and Evidence
a) Economic Geography
Overview
The LEP area is one of the largest economies in England by land area and covers more than 10,700 sq. km.
It has a population of around 1.14 million people and brings together an extensive and predominantly
rural area running from north of Leeds up to Scarborough and Whitby. Its’ more southerly parts cover the
districts of Harrogate, Selby, Craven and the City of York, all of which are also part of the Leeds City
Region. Further north it covers the North Yorkshire districts of Ryedale, Hambleton, Richmondshire and
Scarborough, with connections to the Tees Valley becoming stronger in the most northerly areas. The
East Riding is the largest unitary authority in our area and extends from north of the Humber estuary to
Bridlington, taking in centres such as Goole, Beverley and Driffield, it is also part of the Humber LEP area.
Figure 1: Map of the LEP area
In Summary
This section describes the wonderful, distinctive and sometimes challenging area that our
strategy covers. It combines market towns, cities, coast and countryside. It spans county,
unitary and district councils and has overlaps with two other LEP areas. It combines an overall
feel of attractiveness and rurality with pronounced contrasts and local assets and opportunities.
We set out the economic evidence that describes our area, its strengths and challenges, and
which spans business profile, sectors, employment, skills and other statistics. The evidence and
identified areas of market failure have informed our priority setting and strategic investments. A
supporting document will further set out the logic chain from evidence to intervention for
specific objectives, covering factors such as market failure, additionality and options analysis.

29
Our area’s economy presents a combination of strengths, assets and unfulfilled potential (as section 2b
details). Employment, basic skills and business survival rates are above average and we have strong
business sectors such as food and agri-tech/agriculture, energy and the visitor economy. Yet our
productivity and GVA levels are below what we would expect given our size and skills base. There are also
considerable differences at a local level that are masked by overall statistics. Our area includes localities
that have surprisingly high and sometimes hidden deprivation. Elsewhere certain sectors, such as
manufacturing and engineering, have localised hotspots. As our most urban area, the City Of York also
has distinct features, for instance connected to its business base and university and science based assets.
Local Economic Areas
York, North Yorkshire and East Riding functions as a whole economic area, with similarities, shared
interests and connections across our terrain. But it is far from homogeneous. Our geography combines
seven local economic areas, each with its own distinctive features, assets and opportunities. These are
complicated because they do not have clear boundaries, overlap with each other and often contain parts
of multiple local authority districts. Nevertheless they are real entities recognised by people and
businesses based there. Understanding and working with the grain of this geography is vital if we are to
get the best from it.
The schematic map and table that follow show how these areas relate to one another and set out the
main towns and local authority districts within each.
Figure 2: Schematic map of Local Economic Areas
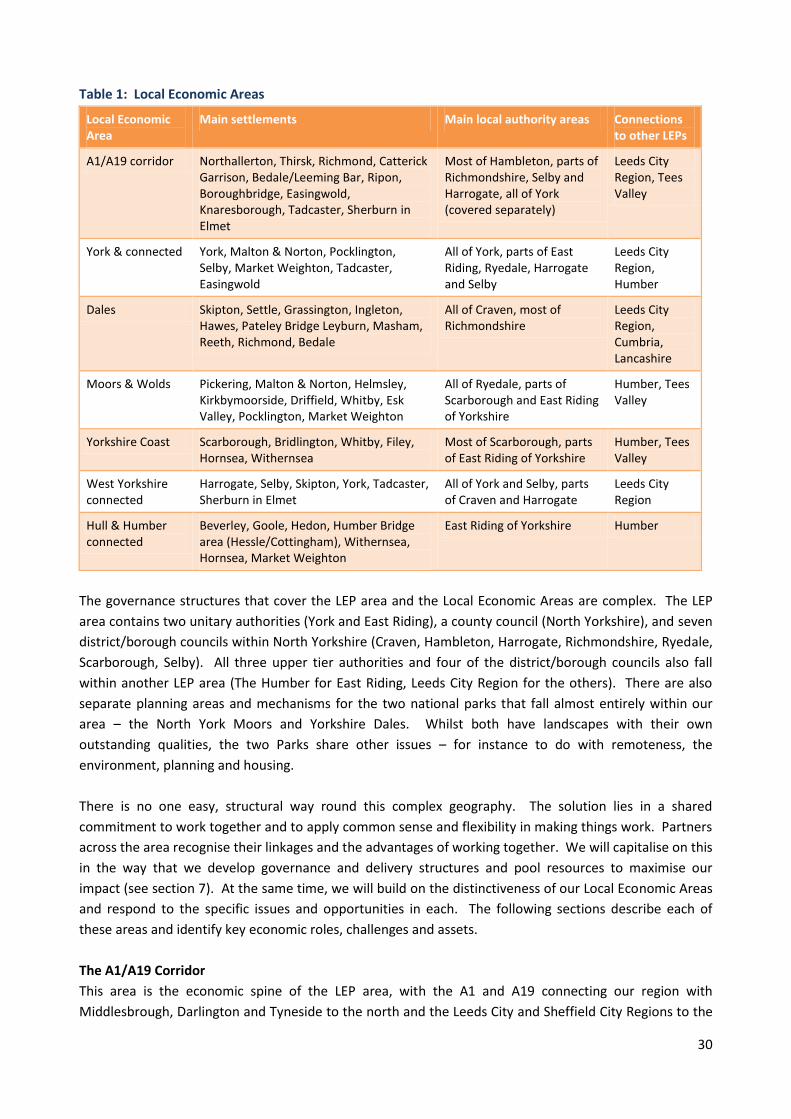
30
Table 1: Local Economic Areas
Local Economic Area
Main settlements Main local authority areas Connections to other LEPs
A1/A19 corridor Northallerton, Thirsk, Richmond, Catterick Garrison, Bedale/Leeming Bar, Ripon, Boroughbridge, Easingwold, Knaresborough, Tadcaster, Sherburn in Elmet
Most of Hambleton, parts of Richmondshire, Selby and Harrogate, all of York (covered separately)
Leeds City Region, Tees Valley
York & connected York, Malton & Norton, Pocklington, Selby, Market Weighton, Tadcaster, Easingwold
All of York, parts of East Riding, Ryedale, Harrogate and Selby
Leeds City Region, Humber
Dales Skipton, Settle, Grassington, Ingleton, Hawes, Pateley Bridge Leyburn, Masham, Reeth, Richmond, Bedale
All of Craven, most of Richmondshire
Leeds City Region, Cumbria, Lancashire
Moors & Wolds Pickering, Malton & Norton, Helmsley, Kirkbymoorside, Driffield, Whitby, Esk Valley, Pocklington, Market Weighton
All of Ryedale, parts of Scarborough and East Riding of Yorkshire
Humber, Tees Valley
Yorkshire Coast Scarborough, Bridlington, Whitby, Filey, Hornsea, Withernsea
Most of Scarborough, parts of East Riding of Yorkshire
Humber, Tees Valley
West Yorkshire connected
Harrogate, Selby, Skipton, York, Tadcaster, Sherburn in Elmet
All of York and Selby, parts of Craven and Harrogate
Leeds City Region
Hull & Humber connected
Beverley, Goole, Hedon, Humber Bridge area (Hessle/Cottingham), Withernsea, Hornsea, Market Weighton
East Riding of Yorkshire Humber
The governance structures that cover the LEP area and the Local Economic Areas are complex. The LEP
area contains two unitary authorities (York and East Riding), a county council (North Yorkshire), and seven
district/borough councils within North Yorkshire (Craven, Hambleton, Harrogate, Richmondshire, Ryedale,
Scarborough, Selby). All three upper tier authorities and four of the district/borough councils also fall
within another LEP area (The Humber for East Riding, Leeds City Region for the others). There are also
separate planning areas and mechanisms for the two national parks that fall almost entirely within our
area – the North York Moors and Yorkshire Dales. Whilst both have landscapes with their own
outstanding qualities, the two Parks share other issues – for instance to do with remoteness, the
environment, planning and housing.
There is no one easy, structural way round this complex geography. The solution lies in a shared
commitment to work together and to apply common sense and flexibility in making things work. Partners
across the area recognise their linkages and the advantages of working together. We will capitalise on this
in the way that we develop governance and delivery structures and pool resources to maximise our
impact (see section 7). At the same time, we will build on the distinctiveness of our Local Economic Areas
and respond to the specific issues and opportunities in each. The following sections describe each of
these areas and identify key economic roles, challenges and assets.
The A1/A19 Corridor
This area is the economic spine of the LEP area, with the A1 and A19 connecting our region with
Middlesbrough, Darlington and Tyneside to the north and the Leeds City and Sheffield City Regions to the

31
south. The corridor takes in towns including Northallerton, Ripon, Richmond, Thirsk and Boroughbridge,
as well as the City of York (although that is treat as a separate area of its own given its size and distinct
role).
Economically this area is important for businesses that require rapid access to the trunk road and rail
networks, with the two food based business parks at Leeming Bar and Melmerby (both full to capacity) a
good example. There is also a concentration of public sector and defence activity in the area. This creates
both challenge and opportunities. Cuts to local authorities and other public sector bodies will have
significant employment impacts in the areas affected. Northallerton is a prime example, where
Government Agencies are moving out, the prison is due for closure and the two local authorities based
within the town, the County Council and Hambleton District Council, are shedding large numbers of jobs.
In Ripon, the closure of the Royal Engineers barracks will have economic shockwaves, but it also opens up
new opportunities for growth in the town. Similarly the creation of a town centre at Catterick Garrison,
one of the largest armed forces base in Europe, could have sizeable benefits.
The A1/A19 will be one of the most attractive bases for new development because of its transport
connections, including the East Coast Mainline Rail, and because of its predominantly flat terrain. A good
example is the new £100 million five star destination ‘resort’ at Flaxby, which will include high quality spa,
restaurant, hotel and leisure facilities and prides itself on easy access to Yorkshire’s attractions, including
local ones such as Knaresborough, Fountains Abbey, Newby Hall and Lightwater Valley.
York & connected
The City of York is the largest centre in our area. It is in an important entity in its own right and exerts an
influence over much the of LEP area. The York & connected area takes in the places where this influence
is strongest – towns such as Malton & Norton, Pocklington, Selby, Market Weighton, Tadcaster and
Easingwold.
The city itself is a major asset, and has been voted the nation’s most beautiful and the best city to live in.
It has two universities, including leading edge R&D strengths and enjoys excellent rail links to London and
Scotland as well as to the coast and to Leeds and Manchester (a route where journeys will be more rapid
with planned improvements). The planned HS2 rail terminal in Leeds will also connect to York. The city
has important road links too, although it suffers congestion problems in the city centre and on its outer
ring road. The city’s economic structure differs from that of the wider LEP area. It has more large
businesses, less land based industry, and more businesses in the finance and insurance, education, and
professional, scientific & technical sectors. But it shares a pronounced tourism sector and, despite some
high profile closures, some important engineering and manufacturing strengths.
Economically there are paradoxes - GVA per head and productivity in the city have significantly declined
relative to averages for England and the rest of the LEP area. Yet in other respects the city is buoyant –
with healthy employment levels, skills and incomes in much (but not all) of the city. The York & connected
area also presents huge opportunities, including being at the heart of BioVale proposals for the
biorenewables industry.
Features and developments outside of York itself include the major energy industry concentration around
Drax power station near Selby, which is converting to biofuels co-firing and has leading proposals for
carbon capture and storage. In Malton & Norton, there are example of excellent engineering companies
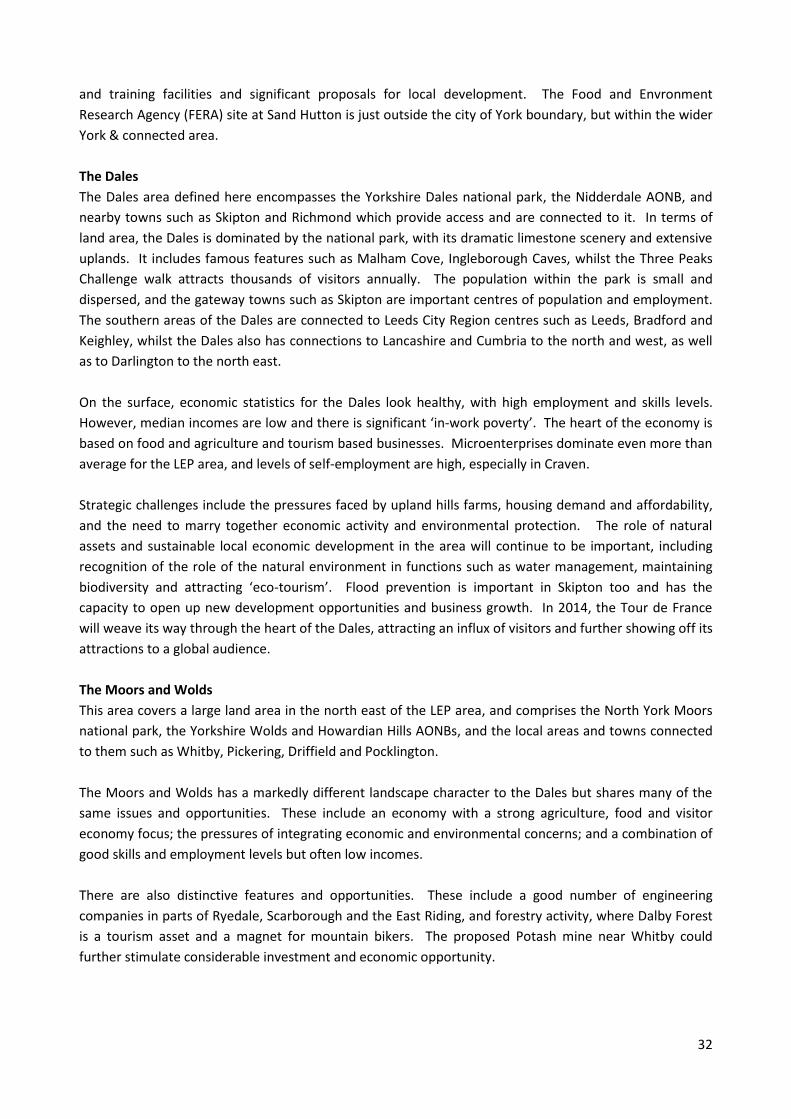
32
and training facilities and significant proposals for local development. The Food and Envronment
Research Agency (FERA) site at Sand Hutton is just outside the city of York boundary, but within the wider
York & connected area.
The Dales
The Dales area defined here encompasses the Yorkshire Dales national park, the Nidderdale AONB, and
nearby towns such as Skipton and Richmond which provide access and are connected to it. In terms of
land area, the Dales is dominated by the national park, with its dramatic limestone scenery and extensive
uplands. It includes famous features such as Malham Cove, Ingleborough Caves, whilst the Three Peaks
Challenge walk attracts thousands of visitors annually. The population within the park is small and
dispersed, and the gateway towns such as Skipton are important centres of population and employment.
The southern areas of the Dales are connected to Leeds City Region centres such as Leeds, Bradford and
Keighley, whilst the Dales also has connections to Lancashire and Cumbria to the north and west, as well
as to Darlington to the north east.
On the surface, economic statistics for the Dales look healthy, with high employment and skills levels.
However, median incomes are low and there is significant ‘in-work poverty’. The heart of the economy is
based on food and agriculture and tourism based businesses. Microenterprises dominate even more than
average for the LEP area, and levels of self-employment are high, especially in Craven.
Strategic challenges include the pressures faced by upland hills farms, housing demand and affordability,
and the need to marry together economic activity and environmental protection. The role of natural
assets and sustainable local economic development in the area will continue to be important, including
recognition of the role of the natural environment in functions such as water management, maintaining
biodiversity and attracting ‘eco-tourism’. Flood prevention is important in Skipton too and has the
capacity to open up new development opportunities and business growth. In 2014, the Tour de France
will weave its way through the heart of the Dales, attracting an influx of visitors and further showing off its
attractions to a global audience.
The Moors and Wolds
This area covers a large land area in the north east of the LEP area, and comprises the North York Moors
national park, the Yorkshire Wolds and Howardian Hills AONBs, and the local areas and towns connected
to them such as Whitby, Pickering, Driffield and Pocklington.
The Moors and Wolds has a markedly different landscape character to the Dales but shares many of the
same issues and opportunities. These include an economy with a strong agriculture, food and visitor
economy focus; the pressures of integrating economic and environmental concerns; and a combination of
good skills and employment levels but often low incomes.
There are also distinctive features and opportunities. These include a good number of engineering
companies in parts of Ryedale, Scarborough and the East Riding, and forestry activity, where Dalby Forest
is a tourism asset and a magnet for mountain bikers. The proposed Potash mine near Whitby could
further stimulate considerable investment and economic opportunity.

33
The Yorkshire Coast
The Yorkshire Coast stretches from Staithes and Whitby down to Spurn Head and the Humber estuary,
taking in coastal settlements and resorts such as Scarborough, Bridlington, Filey, Hornsea and Withernsea.
It overlaps with areas of the Moors & Wolds and the Hull & Humber connected areas and has links to both
the Tees Valley and Humber LEP areas.
Economically, coastal areas, present some of the greatest regeneration needs in the LEP area, with
unemployment, deprivation and skills issues in most towns, and most acute in the south of the Yorkshire
Coast. As the tourism market has changed, so resorts need to widen and upgrade their offer, and to
strengthen non tourism related aspects of their economies.
In Scarborough tourism activity is combined with a significant manufacturing and engineering base.
Successful events such as the Scarborough Engineering Week and the Employability Charter are looking to
help to equip a new generation with the skills needed in the industry, and at the same time investments
such as a £15m water park, and the continuing rise of the surfing scene will continue to enhance its
attractiveness to visitors. Other Yorkshire Coast opportunities include potash mining and offshore wind,
with potential to service turbines from Yorkshire Coast harbours such as Bridlington or Whitby. Coastal
erosion and sea level rise present threats to stretches of the coast, and other areas such as Flamborough
Head are important for birdlife and conservation. A long term sustainable approach to development that
balances needs and looks at the future roles of settlements will be important.
West Yorkshire Connected
This area includes the major centre of Harrogate and important market towns such as Selby, Skipton,
Tadcaster and Sherburn in Elmet. It includes all of the local authority areas of York and Selby and much of
Craven and Harrogate. All four are also part of the Leeds City Region. Links to West Yorkshire, especially
Leeds and Bradford, are stronger than elsewhere in the LEP, with more and faster road and rail
connections and significant commuting flows.
Nevertheless the area does not look wholly to the south. It is its own place and has much in common with
the rest of North Yorkshire – including a rural landscape, attractive market towns, high levels of self-
employment and a pronounced food and agriculture sector. The combination of a North Yorkshire base
and good access to Leeds is a winner for many, resulting in high demand to locate in the area, high house
prices and some of the highest earnings in the LEP area.
Opportunities and challenges include tackling the congestion which restricts growth in Harrogate
(including through better rail links to Leeds and sustainable transport policies), making the most of the
International Conference & Exhibition Centre, taking advantage of low carbon energy opportunities, and
development potential at sites in Skipton and Selby.
Hull & Humber Connected
This area includes East Riding settlements with a connection to the Hull economy, including a ring of
places just outside the Hull boundary (e.g. Beverley, Hedon, Cottingley, Brough), some of them close to
the Humber Bridge. It stretches out to include the towns of Goole, Market Weighton, Hornsea and
Withernsea and has overlaps with the Moors & Wolds, York & connected, and Yorkshire Coast economic
areas. It contains a mixture of flourishing settlements and areas of high unemployment and regeneration
challenges – notably in coastal settlements such as Hornsea and Withernsea.

34
Many of the area’s economic opportunities relate to the Humber LEP, its ports and growth of the
renewable energy industry around them, especially offshore wind. Wider energy opportunities such as in
biorenewables also connect to the land area, the ports, and the chemicals industry.
Connections between Local Economic Areas
Whilst the seven areas are all distinct entities, there are also similarities between some of them which can
be taken advantage of in planning programmes of action. Notably, the seven areas can be sandwiched
into four areas which are the basis for core activities as described in Priority 4. These four areas are:
A1/A19 Corridor – widened to include the York Connected area which it encompasses
The Dales, Moors & Wolds – which combines the Dales to the west and Moors & Wolds to the east
City Links – combining the West Yorkshire Connected and Hull & Humber Connected areas
The Yorkshire Coast – as described with no changes
b) Statistical Economic Evidence
As well as the qualitative evidence described in the sections on local economic areas, statistics are
available about the economic performance of the LEP area. These are often (if not always) available down
to local authority district level, but rarely at a more tailored or detailed level, such as for rurality, local
wards and neighbourhoods, or the local economic areas that have been discussed.
i) Population and Land Area
York, North Yorkshire and East Riding is the largest LEP area in England by land area (10,718 sq. km) but
also has lower population density than most – 106 people per sq. km. Its population is 1.14m. Table 2
shows how this is spread across local authority areas, forecasts for population growth, and ageing
population statistics.
Table 2: Population trends, projections and age profile by area
Population Population growth (%) % aged 65+
Area 2005 2012 2021 (projected)
2005-2012 2011-2021
2011 2021 (projected)
East Riding of Yorkshire
329,400 335,900 358,600 2.0% 7.1% 21.6 26.1
York 189,200 200,000 213,000 5.7% 7.6% 17.0 19.4
Craven 54,700 55,500 57,000 1.5% 1.8% 22.9 29.1
Hambleton 85,300 89,700 93,000 5.2% 3.3% 21.7 27.2
Harrogate 154,000 158,600 166,000 3.0% 4.4% 19.6 23.7
Richmondshire 49,300 53,900 54,000 9.3% 1.9% 17.2 22.0
Ryedale 52,500 52,100 54,000 -0.8% 3.8% 23.4 28.1
Scarborough 108,200 108,600 111,000 0.4% 1.8% 23.5 27.7
Selby 78,500 84,100 93,000 7.1% 10.7% 17.0 20.8
North Yorkshire 582,500 602,600 628,000 3.5% 4.5% 20.7 25.2
Total LEP area 1,101,100 1,138,500 1,199,600 3.4% 5.8% 20.3 24.4
England 50.47m 53.50m 57.69m 6.0% 8.6% 16.4 18.7
(source: Interim 2011 based Subnational Population Projections, ONS)

35
Key points are that:
Just over a half of the LEP area’s population is in North Yorkshire, with the remainder split between
East Riding and York. The most populated districts within North Yorkshire are Harrogate and
Scarborough.
The LEP area’s population is forecast to grow by 8.6% between 2011 and 2021, with the highest rate
of growth by some way being in Selby, the only area forecast to see growth above England average.
Projected growth is next highest in York and the East Riding and lowest in Scarborough and Craven.
Just over 20% of the LEP population is 65+, four percentage points (and 25%) higher than the England
average. This gap is expected to grow with the LEP area 65+ population rising by four percentage
points – not far off double the national increase. The LEP areas with the highest proportion of people
aged 65+ now, and the greatest projected rises in this group in the future, are the Dales, Moors &
Wolds and Yorkshire Coast areas. The lowest proportions are in York and Selby.
More widely the age profile of the population in the LEP area is older than nationally. In England,
13.7% of the population is aged 20-29, and 20.6% is aged 30-44. In the LEP area, these proportions
are 11.3% and 18.1% respectively, whereas our proportion of people in the 45-64 and 65+ age bands
is higher than England average.
ii) Growth, Productivity and Economic Forecasts
The tables show total GVA (output) and GVA per head for the LEP area as a whole and the three upper tier
local authority areas within it. They are based on national statistics which are not broke down to local
area (modelled growth forecasts do that in the following subsection).
Table 3: Total GVA (£million) – 2005-2011
2005 2006 2007 2008 2009 2010 2011
England 947,218 997,356 1,056,933 1,080,363 1,063,683 1,099,713 1,124,881
LEP area 16,689 17,522 18,353 18,652 18,231 18,856 19,336
North Yorkshire 8,692 9,192 9,680 9,877 9,659 10,006 10,322
York 3,843 3,943 4,098 4,134 4,026 4,098 4,134
East Riding 4,154 4,387 4,575 4,641 4,546 4,752 4,880
Table 4: £GVA per head – 2005-2011
2005 2006 2007 2008 2009 2010 2011
England 18,769 19,647 20,681 20,992 20,531 21,054 21,349
North Yorkshire 14,922 15,708 16,429 16,643 16,161 16,685 17,148
York 20,309 20,647 21,288 21,212 20,253 20,242 20,103
East Riding 12,611 13,238 13,701 13,809 13,488 14,030 14,349
Key points are:

36
The LEP economy was worth £19.3 billion in 2011, a rise of 15.9% on 2005 compared to a rise of 18.8%
in England. However the LEP area grew marginally faster than England average between 2009-2011.
Below the headline LEP level data there are marked differences across the LEP area. GVA growth in
North Yorkshire and East Riding were actually on a par with national trends with a rise of 18.8% in
North Yorkshire and 17.5% in East Riding. Those figures are more than double the equivalent rise in
York – 7.6%.
GVA per head data is not available for the whole LEP area, but the same trends are evident as for total
GVA in the three upper tier areas. Rises of 13.8% and 14.9% between 2005 and 2011 in East Riding
and North Yorkshire respectively were slightly above national average (13.7%). The same figure fell by
1.0% in York.
Productivity statistics are only available at upper tier local authority level and are shown based on GVA
per hour worked (for those in work) compared to an England average index of 100.
Table 5: Productivity
GVA per hour worked 2005 2006 2007 2008 2009 2010 2011
East Riding of Yorkshire 94.4 93.4 92.0 91.0 89.9 88.9 88.0
York 101.9 100.1 98.1 95.0 92.2 89.0 87.4
North Yorkshire CC 84.8 83.9 83.0 82.9 82.0 81.6 81.5
(Source: nominal GVA per hour worked, by NUTS 3 subregions, ONS)
Key points are:
Productivity is significantly below England average across all three parts of the LEP area, just over 80%
of England average in North Yorkshire, and nearer to 90% in York and East Riding.
Productivity has declined consistently between 2005 and 2011 relative to England average. It is
unclear how much that is due to economic structure and lower value sectors compared to national
average, or to efficiency in the workplace. The decline has been particularly pronounced in York.
Productivity per worker figures (not shown above) which also take into account hours worked are also
well below national average and declining.
The Regional Econometric Model (REM) uses calculations, assumptions and trend data to estimate how
GVA output data varies by local authority area and makes forecasts for future growth. Table 5 shows the
modelled data for 2011 (output for all industry sectors) and forecasts for 2016 and 2021, whilst Figure 3
shows the forecast percentage change over time compared to UK average based on this data. Forecasts
do not take into account local interventions and policies that may enhance growth, such as major Regional
Growth Fund projects or investments in the pipeline.

37
Table 6: Growth Forecast by Area
Output £million
Area 2011 2016 2021
Craven 1,101 1,105 1,228
East Riding 4,695 4,972 5,357
Hambleton 1,541 1,602 1,731
Harrogate 3,111 3,322 3,617
Richmondshire 663 690 743
Ryedale 855 891 968
Scarborough 1,538 1,584 1,712
Selby 1,254 1,282 1,367
York 3,970 4,066 4,372
LEP area 18,728 19,515 21,095 (source: Regional Econometric Model, provided by Experian for REIU, September 2013)
Figure 3: Change in output by locality 2011-2021 (REM data)
Key points are that:
Growth forecasts for the LEP area are positive but modest and significantly below UK average
Growth is expected to be slow to 2016 but to pick up between 2016 and 2021
Within the LEP area, the highest growth forecasts are for Harrogate, East Riding and Ryedale, with the
lowest forecasts for Selby and Craven
0.4%
5.9%
4.0%
6.8%
4.0%
4.3%
3.0%
2.2%
2.4%
4.2%
6.9%
11.6%
14.1%
12.3%
16.2%
12.1%
13.2%
11.3%
9.0%
10.1%
12.6%
19.4%
Craven
East Riding
Hambleton
Harrogate
Richmondshire
Ryedale
Scarborough
Selby
York
LEP area
UK
change in output (£million) by area
% change 11-21 %change 11-16

38
iii) Business Profile – stock and size profile, self-employment and start up and closure rates
Table 7: Businesses by size profile
Area Micro (<10) Small (10-49) Medium (50-249) Large (>250) Total
No. % No. % No. % No. % No.
Craven 2,850 90.2 260 8.2 40 1.3 10 0.3 3,160
Hambleton 4,330 90.7 390 8.2 45 0.9 10 0.2 4,775
Harrogate 7,155 90.0 650 8.2 120 1.5 25 0.3 7,950
Richmondshire 2,295 91.4 195 7.8 20 0.8 0 0.0 2,510
Ryedale 2,975 90.3 275 8.3 40 1.2 5 0.2 3,295
Scarborough 3,340 87.5 425 11.1 45 1.2 5 0.1 3,815
Selby 2,865 90.8 250 7.9 35 1.1 5 0.2 3,155
York 5,045 86.8 630 10.8 110 1.9 30 0.5 5,815
East Riding 10,960 90.1 1,035 8.5 150 1.2 20 0.2 12,165
Total LEP area 41,815 89.7 4,110 8.8 605 1.3 110 0.2 46,640
England 1.63m 88.7 170,430 9.2 30,140 1.6 7,680 0.4 1,842,680
(source: IDBR, 2012)
Key points are that:
The vast majority of businesses in the LEP area (90%) are micro-businesses with less than 10
employees. 98.5% are small or micro in the LEP area.
Proportionately, the LEP area has less medium and large businesses than England, with around four
fifths as many medium businesses and only a half as many large businesses as national average.
The size profile of businesses varies. York has more medium and large businesses than elsewhere.
Parts of the West Yorkshire connected area (Harrogate and Craven) have the next highest proportions
of larger businesses, but both are still below national average. In most other areas 1.2%-1.5% of
businesses are medium or large, with that figure falling to 0.8% in Richmondshire.
There are similarities between self-employment and running a business, with self-reliance, enterprise and
the ability to bring in income fundamental to both. Moreover, self-employment can be a step towards
running a business.

39
Table 8: Self-employment levels (April 2012 - March 2013)
Area Number self-employed Rate (%)
East Riding of Yorkshire 19,800 9.5
York 12,900 9.2
Craven 4,500 13.2
Hambleton 7,600 14.4
Harrogate 13,400 13.6
Richmondshire 2,100 6.6
Ryedale 3,200 9.5
Scarborough 7,400 11.8
Selby 8,400 15.9
North Yorkshire 46,600 12.7
Total LEP area 79,200 11.1
England 3,274,500 9.7
(Source: Annual Population Survey Resident Analysis)
Key points are:
Self employment is significantly above national average, especially in North Yorkshire. It is highest in
Craven, Selby and Hambleton, all of which have a predominantly rural character. Rates are low in
Richmondshire, and that may in part reflect the large number of armed services personnel stationed
within the district who clearly cannot be self-employed.
With some exceptions, self-employment tends to be higher in the more rural areas, where the
proportion of businesses that are micro-enterprises is often also higher. Four districts stand out as
above average on both counts – Hambleton, Selby, Harrogate and Craven - pointing to a
concentration in the West Yorkshire connected area excepting York.
Business Start-up and Survival rates
Table 9: Business Stock, Birth, Death and Survival Rates
Survival Rate
Area Active businesses
Births rate (per 10,000 pop aged
16+)
Births rate (% of
stock)
Deaths rate (% of
stock)
Net % change: births - deaths
1 year (2010)
3 year (2008)
Craven 2,770 48.7 8.1 7.0 1.1 91.1 63.3
Hambleton 3,970 45.0 8.4 7.9 0.5 91.9 65.5
Harrogate 7,905 60.4 9.9 8.7 1.3 87.3 62.0
Richmondshire 2,085 43.2 9.1 7.9 1.2 89.2 62.9
Ryedale 2,615 44.9 7.5 8.8 -1.3 89.5 65.3
Scarborough 3,840 37.7 9.0 8.9 0.1 82.8 55.3
Selby 3,075 43.2 9.6 9.3 0.3 89.1 62.2
East Riding of Yorkshire
12,050 39.4 9.1 9.4 -0.3 89.5 60.4
York 6,470 39.5 10.1 9.5 0.6 88.7 61.9
Total LEP area 44,780 43.8 9.2 8.9 0.4 88.7 61.6
England 2,040,980 54.0 11.4 9.9 1.5 86.8 57.9 (source: Business Demography, year is most recently available for each field - 2011 unless stated otherwise)

40
Table 10: Change in business start rate and business stock over time
Births rate (per 10,000 pop aged 16+) Net % change: births - deaths
2005 2007 2009 2011 2005 2007 2009 2011
Area
Craven 70.5 71.0 53.1 48.7 1.2 2.6 -0.9 1.1
Hambleton 54.5 59.1 44.3 45.0 0.7 2.0 -2.2 0.5
Harrogate 63.4 69.1 58.3 60.4 1.0 2.7 -1.1 1.3
Richmondshire 59.2 58.3 34.6 43.2 3.3 3.9 -2.9 1.2
Ryedale 62.6 61.6 46.1 44.9 1.5 1.9 -1.1 -1.3
Scarborough 50.3 47.1 33.6 37.7 0.6 -0.1 -2.5 0.1
Selby 58.0 57.1 48.0 43.2 1.7 2.8 0.2 0.3
East Riding of Yorkshire
57.5 52.2 39.8 39.4 3.2 1.6 -2.9 -0.3
York 48.3 43.2 33.9 39.5 1.1 1.6 -0.9 0.6
Total LEP area 56.7 54.9 42.3 43.8 1.8 1.9 -1.8 0.4
England 59.2 59.5 49.6 54.0 2.1 2.4 -1.9 1.5 (source: Business Demography)
Key points are:
Business start rates declined markedly between 2005 and 2011 in the LEP area, with the drop off in
start rates coinciding with the economic downturn and recession in 2008/9. The rate did though start
to creep upwards in 2011. Business closures also outnumbered starts in 2009; in other years the
balance has been positive.
The overall rate of business starts in the LEP area is well below national average, with the England
business birth rate 23% higher than that for the LEP area in 2011. This gap has increased sharply over
time; the national figure was only 4% higher than that for the LEP in 2005. The biggest single factor in
this gap appears to be business start rates picking up sharply nationally in 2011, but much more
modestly in the LEP area.
At a local level, Harrogate stands out as having had the best performance on business formation over
time, with start-up rates holding up much better over time than elsewhere, and now well above
England average. The lowest business formation rates are in the east of the LEP area – York, East
Riding and Scarborough. Craven appears to have had a notable drop in business starts but this is in
part compensated for by a low business death rate.
One and three year business survival rates in the LEP area are above average – so overall less
businesses start, but those that do are more robust than average. That trend is true across most local
areas with little variation – although survival rates are highest in Ryedale and Hambleton, and
significantly lower in Scarborough than elsewhere.
Other sources8 conclude that activity to promote new business start-ups can succeed, but that progress is
not quick, easy or guaranteed. They stress dual approaches around enterprise education and culture, and
start up support and that enterprise promotion is a long term game that is about the type of economy
that is sought as well as its scale.
8 Les Newby with Kate Parry, Bea Jefferson and Alex McWhirter, Enterprise – helping new business to start and survive, Learning
Legacy Module 5, Yorkshire Forward, July 2011

41
iv) Sectoral Profile
Table 11: Number of businesses by sector and local area within the LEP
2012 IDBR enterprises LEP area Craven H’ton H’gate R’mond Ryedale S’boro Selby York E.Riding
Agriculture, forestry & fishing
7,945 715 1,280 1,025 700 1,020 615 465 240 1,885
Production 2,700 160 265 410 120 210 210 210 280 835
Construction 5,535 365 460 835 275 320 470 380 725 1,705
Motor trades 1,535 80 160 245 75 115 105 135 190 430
Wholesale 1,990 140 215 410 75 125 135 175 190 525
Retail 3,950 290 320 675 170 240 455 240 530 1,030
Transport & storage 1,480 95 115 180 70 70 95 170 145 540
Accommodation & food services
3,425 220 270 460 195 225 565 185 520 785
Information & communication
1,810 115 125 435 60 80 75 120 370 430
Finance & insurance 720 35 70 175 15 25 35 40 160 165
Property 1,595 105 145 340 90 75 120 85 260 375
Professional, scientific & technical
5,945 330 620 1,365 225 300 265 425 1,005 1,410
Business admin & support services
2,710 195 255 515 145 165 180 210 375 670
Public admin &defence 215 15 25 30 20 10 20 20 15 60
Education 640 30 60 120 35 25 40 45 115 170
Health 1,620 85 140 265 60 85 180 90 270 445
Arts, entertainment, recreation, other services
2,815 185 250 465 175 205 245 160 425 705
TOTAL 46,630 3,160 4,775 7,950 2,505 3,295 3,810 3,155 5,815 12,165 (source: IDBR, 2012)
Table 12: Location Quotients – concentration of industry sectors within local areas
LEP area Craven H’ton H’gate R’mond Ryedale S’boro Selby York E.Riding
% LQ LQ LQ LQ LQ LQ LQ LQ LQ LQ Agriculture, forestry & fishing
17 3.4 4.6 5.4 2.6 5.6 6.2 3.2 3.0 0.8 3.1
Production 6 0.9 0.8 0.9 0.8 0.8 1.0 0.9 1.1 0.8 1.1
Construction 12 1.0 0.9 0.8 0.9 0.9 0.8 1.0 1.0 1.0 1.1
Motor trades 3 1.0 0.8 1.1 1.0 1.0 1.1 0.9 1.4 1.0 1.1
Wholesale 4 0.9 0.9 0.9 1.0 0.6 0.8 0.7 1.1 0.7 0.9
Retail 9 1.0 1.1 0.8 1.0 0.8 0.8 1.4 0.9 1.0 1.0
Transport & storage 3 1.0 1.0 0.8 0.7 0.9 0.7 0.8 1.7 0.8 1.4
Accommodation & food services
7 1.3 1.2 1.0 1.0 1.3 1.2 2.5 1.0 1.5 1.1
Information & communication
4 0.5 0.5 0.3 0.7 0.3 0.3 0.2 0.5 0.8 0.4
Finance& insurance 2 0.7 0.5 0.7 1.0 0.3 0.3 0.4 0.6 1.2 0.6
Property 3 0.9 0.9 0.8 1.2 1.0 0.6 0.8 0.7 1.2 0.8
Professional, scientific & technical
13 0.7 0.6 0.8 1.0 0.5 0.5 0.4 0.8 1.0 0.7
Business admin & support services
6 0.8 0.9 0.8 0.9 0.8 0.7 0.7 1.0 0.9 0.8
Public admin & defence
1 2.1 2.2 2.4 1.7 3.7 1.4 2.4 2.9 1.2 2.3
Education 1 0.8 0.6 0.8 0.9 0.9 0.5 0.6 0.9 1.2 0.9
Health 4 0.8 0.7 0.7 0.8 0.6 0.6 1.2 0.7 1.1 0.9
Arts, entertainment, recreation
6 0.9 0.8 0.7 0.8 1.0 0.9 0.9 0.7 1.0 0.8
(source: IDBR, 2012)

42
A Location Quotient score of 1.0 means a sector has the same representation locally as national average;
higher numbers show sectors to be more pronounced locally than nationally, with the converse true for
scores below 1.0. For example a score of 3.0 would mean a sector is three times more concentrated
locally than national average, and indicate a degree of local clustering and concentration.
Key points are:
The agriculture, forestry and fishing sector stands out as having by far the highest LQ across the LEP
area, with three and a half times as many businesses in the sector as would be expected based on
national average. For the Moors & Wolds and Dales areas, that figure is notably higher and around
five or even six times national average. Only in York is the sector’s LQ below national average. Even
in less remote areas such as the A1/A19 corridor and West Yorkshire connected areas, the LQ is likely
to be in the region of 3.0-4.0.
Public administration and defence also has a high LQ at 2.1 across the LEP area, which presents some
risks given a declining public sector. The sector’s LQ rises to 3.7% in Richmondshire – reflecting the
impact of Catterick Garrison on its economy. Other notable local figures include Selby, Scarborough,
and Hambleton – where there is a concentration of public sector jobs in North Yorkshire County
Council and the prison, which are set for cuts and closure respectively.
No one industry sector describes tourism related activities explicitly, but the accommodation & food
services sector provides a reasonable proxy. This has an LQ of 1.3 across the LEP area, showing it is
above national average but not considerably so. This figure is fairly consistent across the LEP area
except in York where it rises to 1.5, and in Scarborough where it is 2.5. That illustrates the importance
of the sector to the Yorkshire Coast.
Manufacturing and engineering most closely correlate to the ‘production’ sector in the table. Overall,
the LEP area has an LQ of 0.9 for the sector, just slightly below national average. That figure does not
vary greatly across the LEP area, but does rise to around 1.1 in some of the more eastern parts of the
area, notably East Riding, Selby and Ryedale.
It is hard to get reliable sector data for Energy overall, or for its low carbon components such as
biorenewables and wind energy, because of the relatively small size of the sector. However, data for
York and North Yorkshire9 shows the ‘Energy and Water’ subsector to have an LQ of around 1.5 – the
second highest of those it described. East Riding analysis10 also notes the importance of the sector
and its concentration in the Goole and Selby area especially, where it accounts for 2.5% of jobs
compared to 0.4% in England. The BioVale proposal (see section 5, Priority 2) makes clear the
concentration of biorenewables assets and expertise in the LEP area, with valuable connections also
to the Humber and Leeds City Region.
There are local concentrations of some sectors, but these tend to be modestly pronounced and
limited to a single area, such as transport & storage in Selby and retail in Scarborough. The LEP area is
underrepresented in the financial and insurance; information & communication; and professional,
scientific & technical sectors everywhere except Harrogate and York.
9 York and North Yorkshire Economic Assessment, YNYPU, October 2010
10 East Riding of Yorkshire Local Economic Assessment (data from 2008)

43
v) Innovation, Exports and Investment
There are data difficulties with all of these headings, with no standard data and comparable national data
sets available that cover the LEP or local authority geographies within it. However there is regional level or
national data around innovation and some survey based data on exports.
Exports
Business surveys in the LEP area (as part of skills research) and conducted elsewhere suggest that
around 11% of businesses are likely to export11 and more expect to do so in the future. Specific skills
needs arise in relation to export, for example researching market opportunities or overseas contacts.
Based on national trends and those observable from surveys in Leeds City Region, it is likely that a
significantly higher proportion of businesses will export if they are larger sized, foreign owned,
members of business networks or manufacturers.
Innovation
The preliminary findings of the Witty Review12 put forward the proposition that understanding of
sectoral strengths, including local competitive advantage and clusters of associated activity, should be
a key element of regional or local growth policy. This strategy adopts that approach and the principle
of working in partnership with other localities and with universities that the review also recommends.
The evidence makes clear that both local collaboration with universities (and other centres of
expertise) and engagement with centres elsewhere is important to ensure businesses are connected
to the expertise that can best help them to innovate and grow.
The Witty Review findings chime with the central tenets of the Smart Specialisation approach, which is
based on “a process of developing a vision, identifying competitive advantage, setting strategic
priorities and making use of smart policies to maximise the knowledge-based development potential of
any region”13. In essence it is about economic development through targeted support for research
and innovation rather than ‘spreading the jam too thinly’.
The UK lags behind its major competitors in terms of business investment in Research & Development
(R&D). UK business spends 1.09% of GDP on R&D, compared with 1.42% in France, 1.89% in the US,
1.94% in Germany and 2.61% in Japan.
Within the UK, Yorkshire and Humber has historically had one of the lowest levels of innovation based
on R&D investment – business R&D has been around 0.5% of GVA14 (compared to 1.5% for England
overall) and it has had less patents granted than all but two other English regions. Figure 4 backs this
up with statistics on the share of ‘innovation active businesses’ across the countries and regions of the
UK - Yorkshire & Humber shows one of the lowest innovation levels of all UK regions
11
Leeds City Region Trade and Investment Strategy, 2013 12
Independent Review of Universities and Growth: preliminary findings, July 2013 13
http://s3platform.jrc.ec.europa.eu/home?CFID=7d41ff53-1a73-41f1-86f5-0cad9583f1d9&CFTOKEN=0 (accessed 10/9/2013) 14
From BIS, Regional Performance Indicators, 2009 (data referred to spans from 1998-2007)

44
Figure 4: Proportion of Innovation Active Businesses in UK Nations and Regions
Within innovation active businesses in the region, the proportion of expenditure on in-house R&D
activity (56%) is much higher than any other English region (typically it is less than 40%), while
expenditure on external R&D (0.9%) and external knowledge (0.5%) is well below average. At least 7%
of innovation expenditure is spent on these two areas combined in most UK regions, and in some it is
above 50%. This implies a reluctance or inability to easily access external expertise.
Around 40% of businesses do not innovate because they feel previous innovations make it
unnecessary or they see no need for it in current market conditions. For the 30% of business who
don’t innovate because of factors constraining innovation the key barriers highlighted are cost,
availability of finance and economic risks.
Whilst some of these statistics are dated and not LEP area specific, they do suggest we are likely to face a
major innovation challenge, and to have the potential to perform much better. The fact that the LEP area
has some pronounced areas of R&D excellence and assets, not least linked to the University of York,
points to a potential solution for technically focused areas of innovation. There is a particular
concentration of expertise in the fields of agri-tech and biorenewables and this is further reviewed in the
detail of Priority 2 of this strategy (Section 5).

45
vi) Employment, Inclusion and Incomes
Table 13: Economic Activity Rate
Apr 2004 - Mar 2005 Apr 2012 - Mar 2013
Number Rate (%) Number Rate (%)
East Riding of Yorkshire 152,800 75.1 151,600 72.8
North Yorkshire 276,400 77.7 286,800 78.4
York 95,900 77.0 104,700 75.1
Craven 26,600 81.2 27,600 81.0
Hambleton 42,200 79.8 42,000 79.4
Harrogate 77,300 82.4 81,000 82.3
Richmondshire 21,300 74.3 23,800 75.3
Ryedale 25,200 79.3 26,000 77.7
Scarborough 46,100 70.2 44,400 71.2
Selby 37,800 75.2 42,100 79.4
LEP area 525,100 76.8 543,200 76.1
England 23,435,300 72.9 24,017,000 71.1
Key points are:
Economic activity rates in the LEP area are generally well above national average – five percentage
points higher.
Rates vary significantly, with the Yorkshire Coast areas having lower figures than the best performing
areas of Harrogate and Craven – but still not below national average. Nevertheless there are likely to
be areas with much lower employment at a local level.
Current rates are generally similar to those in 2004/5, although with modest reductions in York,
Ryedale and in East Riding, and the most notable increase in Selby.
Unemployment and Youth Unemployment
Table 14: JSA Claimant Unemployment Rate (% of working age and 18-24, resident population)
Area Unemployment (all working age) Unemployment (aged 18-24)
2005 2008 2011 2012 2013 2005 2008 2011 2012 2013
East Riding of Yorkshire 1.7 1.5 3.1 3.3 2.7 3.9 3.5 7.5 8.6 6.7
York 1.3 1.3 2.4 2.5 1.9 1.5 1.7 3.1 2.9 2.0
Craven 0.7 0.9 2.0 2.1 1.7 2.0 2.0 4.7 4.9 3.3
Hambleton 0.8 1.0 1.8 1.8 1.4 2.1 2.8 4.3 3.8 2.7
Harrogate 0.8 0.9 1.9 1.9 1.3 1.6 1.7 4.4 3.8 2.3
Richmondshire 0.9 0.8 1.6 1.7 1.4 1.6 1.5 2.2 2.5 2.0
Ryedale 0.9 0.9 1.9 1.9 1.5 2.2 2.0 4.6 5.3 4.0
Scarborough 2.0 2.2 3.6 4.0 3.6 3.8 4.1 6.2 7.6 5.6
Selby 1.4 1.3 2.8 2.8 2.3 3.7 3.6 6.6 6.6 4.9
North Yorkshire 1.1 1.2 2.3 2.4 1.9 2.5 2.6 4.7 4.9 3.5
LEP area 1.3 1.3 2.6 2.7 2.2 2.6 2.6 5.0 5.2 3.9
England 2.1 2.1 3.6 3.7 3.4 4.3 4.2 6.7 7.1 6.0
Key points are:
Overall, unemployment rates are notably lower than (around two thirds of) England average. They
remain well above the rate in 2005-2008 period, but fell between 2012 and 2013.

46
Scarborough has the highest unemployment rates in the LEP area, although these are still only around
England average. Unemployment is below 2% nearly everywhere else in North Yorkshire.
Youth unemployment follows largely the same trends as total unemployment and has consistently
been around double the overall unemployment rate. However, it varies more, with rates highest in
East Riding of Yorkshire and lowest in York and Richmondshire. There is a substantial difference
between the number of unemployed people in East Riding (around 1,600) and smaller North Yorkshire
districts (barring Scarborough and Selby) where the figure is typically 100-200 people.
Analysis of young people who are not in employment, education or training sheds further light on
potential exclusion issues, which could stretch over generations if unchecked.
Table 15: Proportion of young people Not in Employment, Education or Training (‘NEET’)
2005 2006 2007 2008 2009 2010 2011 2012
North Yorkshire 4.9 4.8 3.8 4.8 4.4 4.4 4.5 4.8
York 5.2 5.9 3.8 4.2 4.3 3.7 5.6 4.3
East Riding n/a n/a n/a n/a 5.6 5.5 n/a n/a
England 10.9 7.7 6.7 6.7 6.35 n/a n/a n/a
Key points are that:
Overall, NEET levels are below national average. However, they have reduced little over time
compared to notable falls nationally. Levels appear to be highest in East Riding and broadly similar in
York and North Yorkshire, but with variation in individual years.
Incomes and Rurality
Research published by JRF15 shows that people living in rural areas typically spend 10-20% more on
everyday requirements than in urban areas, with transport and domestic fuel the major elements of
additional cost.
Whilst nationally, rural incomes are slightly higher than in urban areas16 the same is not true in the LEP
area or Yorkshire and Humber more widely. Rural incomes locally are more variable, complex, and often
lower than the headline statistics suggest. Districts such as Harrogate and Selby, which combine towns
and rurality, and have good access to Leeds, do have some of the highest average earnings in the region
(although they still have significant numbers who are low paid or not in work). However, more intensively
rural and remote rural districts such as Craven, Hambleton, Ryedale and Richmondshire have some of the
lowest median incomes in Yorkshire. These are typically in the region of £340-£355 per week, lower for
instance than in every district in South Yorkshire and all but one in West Yorkshire.
15
Noel Smith, Abigail Davis and Donald Hirsch, A minimum income standard for rural areas, Loughborough University Centre for Research in Social Policy, published by Joseph Rowntree Foundation, November 2010 16
Data from http://www.poverty.org.uk/r09/index.shtml (accessed July 2013) and based on source data from: DWP, Households below average income, updated September 2010.

47
These median figures indicate the earnings of a typical worker, as they are the mid-point of the earnings
range in an area. However, they can be overshadowed by reporting of mean (often described as average)
earnings which can be distorted by very high earnings at the top end. Districts such as Craven, Hambleton
and Ryedale are broadly in line with regional mean earnings, and reporting of this data rather than
medians can hide the relatively low earnings that are the reality for most people living and working there.
Four of the five local authority districts with the lowest earnings in Yorkshire and Humber are in North
Yorkshire (based on 25th percentile earnings – see below).
Table 16 shows mean and median earnings for those in paid employment17 and includes all of Yorkshire
and Humber to allow comparison of areas within our LEP area with comparators. The 25th percentile
figures show what somebody would earn if they were a quarter of the way up from being the lowest paid
person in their district.
Table 16: Gross Weekly Pay (£ for all employee jobs (2012) – mean, median and 25th percentile
Area Weekly pay – median (£)
(and rank 1=highest)
Weekly pay – mean (£)
(and rank 1=highest)
Weekly pay - lower earner (£ 25
th
percentile)
LEP area districts
York 387 (8) 486 (3) 239 (8)
Craven 354 (15) 441 (11) 198 (15)
Hambleton 356 (14) 445 (8) 188 (18)
Harrogate 408 (3) 513 (1) 254 (4)
Richmondshire 353 (16) 421 (14) 157 (21)
Ryedale 343 (18) 444 (9) 189 (17)
Scarborough 334 (20) 399 (19) 183 (20)
Selby 424 (1) 507 (2) 259 (2=)
East Riding of Yorkshire 398 (6) 481 (4) 240 (6=)
Regional comparators
Kingston upon Hull 319 (21) 361 (21) 194 (16)
North East Lincolnshire 341 (19) 392 (20) 184 (19)
North Lincolnshire 404 (5) 473 (5) 249 (5)
Barnsley 387 (7) 434 (13) 240 (6=)
Doncaster 362 (12) 409 (17) 228 (11)
Rotherham 360 (13) 417 (16) 227 (12)
Sheffield 376 (9) 441 (12) 225 (13)
Bradford 362 (11) 419 (15) 231 (9)
Calderdale 415 (2) 465 (7) 267 (1)
Kirklees 371 (10) 442 (10) 230 (10)
Leeds 408(4) 473 (6) 259 (2=)
Wakefield 345 (17) 402 (18) 212 (14)
Yorkshire and Humber 375 442 231
England 412 499 249
The data makes clear that sizeable areas of the LEP area have good skills and employment levels but low
wages – there is extensive ‘in-work poverty’. This is especially the case in more remote areas such as the
17
Data source: Annual Survey of Hours and Earnings, ONS, 2012 (provisional results)

48
Dales and Moors. Low wages are confounded by higher livings costs and a lack of local support services
and facilities.
vii) Skills and Qualifications
Skills are a driver of productivity and there is extensive evidence linking higher levels of skills to economic
performance18. Skilled people, including leaders and managers, enable businesses to get started, to
perform better and to innovate. The reverse is also true – unskilled workers can hold companies back.
For instance in UK manufacturing, lower skill levels were found to have a direct and negative effect on
labour productivity and on the types of machinery chosen, the way that machinery was used and the
introduction of new technology. Some studies19 suggest that a year’s additional education can raise
productivity by 5%-9% and 6%-12% in the manufacturing and service sectors respectively.
The following chart and table describe skills levels across the LEP area over time compared to England
average and how skills vary by locality and level.
Figure 5: Change in Qualification over time in LEP area compared to England
18
For a summary of studies on the connection between higher skills and productivity, see: https://almanac.ukces.org.uk/productivity/What%20is%20the%20impact%20of%20productivity%20on%20company%20perf/Forms/AllItems.aspx (accessed 6/9/2013) 19
Lynch and Black, Beyond the incidence of training, evidence from a national employers survey, NBER working paper 5231, 1995
0
10
20
30
40
50
60
70
80
2008 2009 2010 2011 2012 2008 2009 2010 2011 2012
England YNYER
NVQ Level
4+
3+
2+

49
Table 17: Qualifications by Area and Skills Level
% of the working age population with qualifications levels (Jan 2012-Dec 2012)20
Area NVQ level 4+ NVQ level 3+ NVQ level 2+ No qualifications
Craven 44.2 65.6 82.5 4.9
Hambleton 41.2 55.8 71.9 9.1
Harrogate 39.4 56.6 76.8 10.4
Richmondshire 35.4 60.2 79.5 5.5
Ryedale 35.6 51.7 68.2 7.9
Scarborough 23.3 49.8 65.2 21.1
Selby 41.0 67.1 78.0 6.4
North Yorkshire 36.9 57.5 74.2 10.3
East Riding of Yorkshire 31.3 53.6 72.6 10.0
York 41.3 65.6 79.8 6.4
YNYER LEP 36.1 57.9 74.8 9.5
England 34.2 54.9 71.8 9.5
GAP: YNYER % - England%
1.9% 3.0% 8.0% 0.0%
A number of messages emerge from analysis of current skills levels across the LEP area:
Overall skills levels in the LEP area compare favourably to national average at all levels. However, the
extent to which the LEP outperforms England average is greater at lower skills levels – eight
percentage points at NVQ Level 2 (five good GCSEs or equivalent) compared to two percentage points
at NVQ Level 4 (degree equivalent).
Skills levels in the LEP area have improved over time at all levels. For instance, the proportion with
NVQ4+ has risen from 30.6% to 36.1% between 2008 and 2012. However, skills at all levels have
improved at a faster rate in England, meaning the LEP area’s skills advantage is gradually eroding.
Qualifications vary considerably across the LEP area. Areas such as Selby, Craven and York stand out
as having the highest skills levels and perform well above national average. Skills in Hambleton,
Harrogate and Richmondshire are also often above the LEP average, although that varies by skill level.
Performance is weakest and below national average in Scarborough, with East Riding also having skills
that are slightly below national average at NVQ Levels 3+ and 4+. In terms of the Local Economic
Areas, it is the West Yorkshire connected area, the Dales and York that do best on skills, whilst
Yorkshire Coast faces the greatest challenges.
The proportion of people without any qualifications was highest in Scarborough in 2012 (although this
data is ‘spiky’ in nature and variable by year, so should be treat with caution).
Qualifications levels are not the only aspect of skills that affect performance. Employability skills are
frequently cited by employers as their key requirement, and are sometimes a major frustration.
Discussion about employability skills and work experience dominated the workshops on skills held at
consultation events on this strategy. Recent skills research in the LEP area21 also found employability skills
to be a key issue, and the CBI cite it as a key issue for business success in a changing world. Whilst there is
wide agreement about the importance of employability skills, interpretation of what they actually are
20
Source is Annual Population Survey Resident Analysis 21
Ekosgen, Skills Strategy Research and Les Newby Associates et al., Skills Research in York, North Yorkshire and East Riding, SFA/Skills Enhancement Fund, August 2012

50
varies. Based on consultation and in line with CBI thinking22, we identify three main aspects to
employability skills:
Attitude skills such as ambition, desire to work, and ability to turn up and complete tasks on time
Basic skills required in the workplace such as English and Maths
‘Soft’ skills such as teamwork, creativity, communication, customer skills and emotional intelligence
There are good examples of projects to enhance employability in the LEP area in Scarborough as well as in
Hull and the Humber area. These adopt slightly different approaches but have both gained very positive
responses and there is scope for further roll out of these or similar initiatives, building on national good
practice and taking into account the extent of gaps in employability skills provision.
A major piece of skills research in the LEP area23 was undertaken in 2012 and this identified business skills
issues and potential economic needs based on forecast data.
Key Points from this skills research were that:
Significant future employment demands will present skills needs, based on a combination of baseline
economic growth, major initiatives, and ‘replacement demand’. In total 30,000 recruits were forecast
to be required between 2011 and 2015, with that figure rising to 91,000 by 2020.
Replacement demand (i.e. replacing workers who have retired) accounts for the bulk of the expected
employment needs, - 20,000 workers by 2015 and 67,000 by 2020. It will involve a mixture of
upskilling needs within businesses and recruitment of new employees with the right skills. The largest
volume of replacement demand needs is in large sectors such as health, business services, retail and
education. Other sectors with a high proportion of over 55s in the workforce (e.g. metals, transport
equipment) have a more concentrated but smaller scale need.
Survey results showed that 17% of businesses currently employ apprentices – but 22% planned to
employ one in the next three years. Apprenticeships and other models that combine learning and
practical work experience were popular with employers and expected to grow. The main reasons for
not employing apprentices were lack of business need or that the business was too small.
Only 17% of firms said they employed graduates, with another 4% expecting to do so in the next three
years. That is a low figure and suggests application of high level skills could be improved.
30% of firms said they did not plan to provide any formal training – a higher figure than in
neighbouring LEP areas - and suggesting that business could be more aware of the value of skills.
Specific, sector based skills gaps did not emerge strongly in the research, although in other areas
specialist engineering and software development skills emerged as needs. However, employers did
stress the importance of job-specific and ICT skills, work readiness and generic employability skills.
Further data and analysis of apprenticeship take up and skills levels will be added to the final strategy.
22
http://www.cbi.org.uk/business-issues/education-and-skills/in-focus/employability/ (accessed 6/9/2013) 23
Skills Research in York, North Yorkshire and East Riding, Ekosgen, Skills Strategy Research and Les Newby Associates et al for SFA/Skills Enhancement Fund, August 2012

51
viii) Low Carbon Performance
Table 18: Per capita carbon emission by source and locality
Total Emissions (tonnes CO2/person)
Emissions breakdown by source (2011)
Area 2005 2011 % reduction 05-11
industrial domestic road transport
East Riding 11.3 9.1 19.5% 4.4 2.2 2.4
Craven 9.3 7.8 16.1% 2.5 2.4 2.8
Hambleton 11.8 10.2 13.6% 2.9 2.3 4.7
Harrogate 9.9 8.6 13.1% 2.7 2.4 3.4
Richmondshire 10.7 9.1 15.0% 2.3 2.2 4.6
Ryedale 11.5 10.1 12.2% 3.7 2.5 3.3
Scarborough 7.6 6.4 15.8% 2.5 2.3 1.6
Selby 15.5 11.6 25.2% 5.6 2.2 3.8
York 7.0 5.3 24.3% 1.9 1.9 1.4
Yorkshire & Humber 10.3 8.2 20.4% 4.1 2.0 2.0
England 8.5 6.7 21.2% 2.7 2.0 1.9 (source: Local CO2 emissions estimates, Ricardo-AEA for DECC, July 2013)
Total CO2 emissions from the LEP area in 2011 were 9,488 Kt CO2, a 15% reduction on the 2005 level.
Emissions were fairly evenly split between industrial, domestic and road transport, meaning that all three
sources need to be targeted to secure the continuing and sizeable reductions required to contribute to
national carbon reduction targets. CO2 per capita is not available for the whole LEP area, but local
estimates are.
Key points are that:
CO2 per capita has reduced in all areas between 2005-2011, typically between 12-25%. In most
places, reductions have been significantly below the national and regional averages. The main
exceptions are York and Selby which have both cut CO2 by around a quarter.
In more rural areas, the main reason for higher than average CO2 emissions is road transport – that is
particularly notable in Hambleton and Richmondshire. Domestic emissions are consistently just above
national average everywhere but York. Industrial emissions vary significantly. They are highest in
Selby and East Riding, reflecting concentrations of heavy industry in the Hull and connected area, and
Ryedale also has relatively high levels.
Concerted CO2 reduction will require emissions reduction to be factored into business operations
(e.g. through resource efficiency), housing (e.g. domestic retrofit) and transport decisions (e.g.
promotion of public transport and cycling based options where feasible).
ix) Transport and Connectivity
A full supporting paper on transport, combining evidence and its implications for strategic priorities
supports this strategy, prepared by the North Yorkshire Local Transport Body24. This section summarises
key points of evidence in overview and applied to five specific themes.
24
LEP Strategic Economic Plan – Transport, North Yorkshire Local Transport Body, December 2013

52
It is widely recognised that transport and connectivity have a direct impact on economic performance and
business success. Transport is an enabler of growth and it can help stronger economies in the LEP area to
grow further and weaker ones to recover. The key to business connectivity is quick, easy and reliable
access for the flow of goods and services. Well managed transport networks that achieve this, with
minimal congestion, enable businesses to become more competitive and reduce transport costs
Consequently, investment in transport can lead to sustainable economic growth25.
In parts of the LEP area transport links are good, particularly north to south links, including the A1 (M)
corridor, East Coast Main Line (ECML) and A19 corridor (although the A19 suffers severe congestion into
and out of York (north and south) and on the key route between Selby and York). East to west transport
links across the LEP area are less well developed and there is a need for investment in key corridors. Poor
longer distance connections between towns, large urban centres and the national transport networks can
lead to long and often unpredictable journey times, making access to labour markets more difficult and
supply and distribution of business goods and services unreliable. Targeted investments in transport
infrastructure can unlock specific growth sites and address congestion or pinch points on the network.
Equally, appropriate investment in existing road and rail infrastructure is required to prevent deterioration
of transport networks/services from constraining economic performance in the LEP area (as recognised by
the Government in ‘Transport – an engine for growth’.)
Investments in transport improvements that will impact on the LEP area economy have already been
secured. The Bedale, Aiskew and Leeming Bar bypass will provide a link from the A684 north of Bedale to
the A684 east of Leeming Bar and link in to the recently upgraded A1 (M). Furthermore, funding has been
allocated by the LEP to upgrade a section of the Leeds – Harrogate – York rail line between Knaresborough
and Cattal. It will move the line will from one track to two tracks and facilitate the doubling of train
frequencies on this important and congested connection into the Leeds City Region. This is part of an
ambitious improvement package and there is a strong case for electrification of the line.
Local Sustainable Transport Fund money has also been secured to support continued economic
development. Examples include work to reduce congestion in Harrogate; park and ride, better bus and
workforce travel initiatives in York; and the introduction of sustainable travel options and Park & Ride in
Whitby which will benefit the east coast tourism economy. Further investment in transport schemes in
the area continues to be needed and sustainable transport can be critical in unlocking growth. There are
opportunities to address congestion issues in urban areas, such as York and Harrogate, through
improvements to bus services, and better information to customers, as well as opportunities around
electric vehicles and cycling, linked to the tourism economy and the legacy from the Tour de France stages
in the LEP area in 2014.
Of the major internal movements within the LEP area a significant number involve trips to and from York.
The major external movements involve trips to and from West Yorkshire and the Tees Valley City Region.
Hence there is a need to work with neighbouring LEPs to address strategic cross-boundary transport
priorities. The 2011 census demonstrates that within the LEP area 71% of commuters travel to work by
road, so there is a clear need to invest an appropriate level of resource in the highway network. More
specifically, there is key evidence and needs to consider under five main headings which are now set out.
25
Transport – an engine for growth, Department of Transport, August 2013

53
East-West Road and Rail Connections
North to south transport links within the LEP area are generally good. This is especially true in the central
‘A1/A19 Corridor’ which includes the A1 (M) and ECML railway which provide very good connections to
markets in the rest of the LEP area and beyond. However, areas that are peripheral to this central
corridor, especially the Coast and Dales and Moors tend to be constrained by their distance from these
strategic transport links – which limits access to labour markets, materials and markets, and the
agglomeration benefits that arise from connection with urban areas such as West Yorkshire.
The economies of these peripheral areas are often disadvantaged by both physical distance from the
central area and by the quality of the available transport links. For example Scarborough and Bridlington
are approximately 55 miles from the A1 (M) by road and the situation is similar for rail links to the ECML.
They are also disadvantaged by the relatively poor quality of many of the links which lead to slow and
unreliable journey times. For example train services between York and Scarborough take approximately
50 minutes to cover 40 miles, whilst the average journey time on the A64 between Scarborough and York
is approximately 60 minutes (and notably more in summer). The situation is similar on other east west
links in the LEP area.
Important east to west rail connections include the York – Harrogate – Leeds line, the York – Scarborough
line and the Leeds – Selby – Hull line. As well as providing long distance rail links across the LEP area they
provide important routes into the neighbouring Leeds City Region and Humber ports area. East to west
links are also important in exploiting new economic opportunities such as the potential potash mine in
Whitby. Key routes which act as barriers to growth and would benefit from improvements are:
The A64 connecting the Leeds City Region to the A1 (M), York and onwards to Malton and
Scarborough. This is especially poor on the sections east of York which is predominantly single
carriageway, with some dual carriageway sections, and is operating above its designed capacity.
The A1079 which connects northern areas of North Yorkshire and York to Hull and the Humber ports
via Market Weighton and Beverley, and also provides the main link to the University of York campus.
The A59 which connects York and Harrogate via the A1 (M) and onwards to Skipton and East
Lancashire. Sections of this road are operating above its designed capacity.
Other important road connections include the A166 / A614 York to Bridlington, the A170 Thirsk to
Scarborough and the A171 Guisborough to Whitby roads.
The identified road links carry multi-purpose local traffic such as agricultural vehicles, long distance heavy
goods traffic and, especially on the A64 and A1079, a large proportion of holiday and caravan traffic in the
summer months. A key issue on all of these east to west road links is therefore the lack of overtaking
opportunities leading to ‘convoying’ of traffic behind slow moving vehicles such as tractors, caravans and
HGV’s, for long distances. Identifying and delivering targeted improvements to provide greater overtaking
opportunities is hence important to improving journey time reliability and journey times.
Managing Urban Traffic, Transport Congestion and Pinch Points

54
Congestion in urban areas and at localised pinch points can affect connectivity by causing longer and/or
unpredictable journey times, impacting on access to labour markets and movement of goods and services.
Connectivity can influence business decisions to locate to or remain in a particular area and areas with
unpredictable or long journey times and higher transport costs making locations less attractive. Key
congestion pinch point issues in the LEP area include:
York has high peak hour traffic flows on the main routes into, out of, and around the city which cause
regular congestion and delays. The A1237 York Outer Ring Road has over 30,000 vehicles travelling on
it per day – guidelines suggest dual carriageway status for that volume. The inability of this route to
cope with higher traffic flows is limiting development in the city.
Harrogate / Knaresborough suffers localised urban congestion issues and capacity constraints on both
the strategic highway network and on the rail route between York, Harrogate and Leeds. The arterial
routes in Harrogate are frequently blocked with high levels of vehicles and at peak times there are
often delays of around 20 minutes travelling into the town centre.
Seasonal peaks in traffic in coastal towns such as Scarborough and Bridlington and on key east to west
road links, such as the A64.
Pinch points across York, North Yorkshire and East Riding such as level crossings on key routes or over
capacity motorway junctions which constrain future development.
Transport schemes that address pinch points and improve journey speed and reliability have the potential
to unlock new business development, create jobs and GVSA and also to reduce vehicle emissions.
Schemes with such potential and which would benefit from investment include:
A1237 Northern Outer Ring Road – increased capacity through dualling the carriageway at certain
locations and junction upgrades would address severe congestion, improve journey time and
reliability, facilitating future development and improving road links to the east coast economies.
A1 (M) / A59 (J47) Allerton Park – a key strategic junction and freight route
Upgrading the existing Tadcaster A64 / A162 junction to permit all vehicle movements.
Alleviate the constraint at Starbeck Level crossing to reduce congestion in the area.
Enhancing the Reliability of Current Transport Networks
Whilst targeted improvements to transport networks and infrastructure can help the economy grow it is
equally, if not more important, to ensure reliable levels of performance of the existing networks and
infrastructure in the LEP area. Failure to do so will lead to poorer physical communications which will act
as a constraint on economic growth and may even lead to a shrinking of local economies. Assets that
need to be sustained include:
The level of rail services to/from stations throughout the LEP area
Access to internal and overseas flights and ferry services from the regional airports/ports
commercial inter-urban bus routes that connect local service centres and major towns and cities (e.g.
high volume services into York, Harrogate and Scarborough and into neighbouring urban areas such as
the Tees Valley, West Yorkshire and the Hull/Humber area).
Highway maintenance of over 13,000km of road in the LEP area – which is more effective and creates
less disruption if carried out in a planned rather than reactive manner.

55
Due to long term national underfunding of road maintenance and the impact of a series of harsh winters,
the condition of many roads across the LEP area, particularly in rural areas, has been deteriorating. It is
currently estimated that there is a total backlog of £280m of maintenance works on category 4 rural roads
within North Yorkshire. Targeted improvements of the key transport links between service centres and
their feeder villages will ensure more convenient, reliable and safe business journeys, encourage
businesses to start up and grow in rural areas, and support land based industries such as forestry.
Access to Superfast Broadband
As well as transport links, e-connectivity (including broadband internet) is an important factor in business
success. In this respect, the LEP area’s large geographical area and low population density can mean that
commercial organisations are not implementing the broadband infrastructure required for many North
Yorkshire businesses and residents, especially in more remote areas. Whilst significant progress has been
made in rolling out superfast broadband there are still a number of ‘not-spots’ where it is not available.
Risks from not addressing these which will impact on business growth and competiveness include:
Businesses will struggle to trade and to access all but local markets, whilst business parks will not
attract tenants
Opportunities for home-based or remote working will be lost without internet access.
Employers will find it harder to recruit the best staff
Digitally excluded areas will become less desirable places to live
A report commissioned by Connecting North Yorkshire and carried out by Regeneris Consulting provides
further evidence of the potential economic impact and estimated that planned investment in superfast
broadband has the potential to generate GVA over 15 years of between £8.8m - £337.2m
Specific Local Transport Issues
At a local level, transport limitations can act as a barrier that prevents strategic sites or local investments
from coming forward. There are often transport based opportunities to unlock this potential growth
through targeted investments in transport infrastructure. Exploiting these can help to deliver outputs of
land opened up for development, new investment and jobs.
Within the LEP area, examples include the junction upgrade at the Sand Hutton/FERA site. Other
interventions, such as the new link road at the North Northallerton site, will open up land for
development creating business space and enabling a key housing site. Other locations require a package
of improvements because without intervention the current transport network could not cope with the
associated growth in traffic. For example, there are serious capacity issues affecting local connectivity
along the A6136 and a package of junction improvements is required to increase capacity and facilitate
the growth of Catterick Garrison town centre. There is also a need for a package of essential junction
improvements in Harrogate and Knaresborough in order to bring forward the housing and employment
sites identified in the Harrogate District Local Plan.

56
x) Housing
A full supporting paper on housing26, combining evidence and its implications for strategic priorities
supports this strategy, prepared through close partnership working between the LEP and the North
Yorkshire & York Strategic Housing Board/East Riding of Yorkshire Council. This section summarises key
points of evidence from this document.
The LEP area is a very attractive place to live, with outstanding countryside and coast, the historic centres
of York and Harrogate, and many delightful market towns. This creates pressure from commuters,
retirees and second and holiday homes owners wishing to buy properties, and impacts on housing
availability, communities, land prices and affordability. Reflecting that, the housing markets in the LEP
area have remained strong despite the national economic downturn, with high house prices compared to
regional and national comparators.
The overall housing market has ‘dual market’ characteristics. An upper tier functions over a wider area
extending into the Leeds City Region, Tees Valley and Hull/Humber conurbations, whilst a second tier is
far more local and links rural communities to local service centres and employment.
There is a danger that the lack of housing growth in the LEP area will constrain local economic growth.
New housing provision in all sections of the housing market has an important role in promoting and
supporting economic growth. It can support local businesses, communities and families and allow
employment and housing markets to function together. A 2012 study from CCHPR27 established that
every £1 invested in the construction of new homes generates £2.84 in local spending. Further research28
indicates that 2.3 person years of direct employment is created for every new house built in addition to an
equivalent number in other sectors - a total of around 4.5 person years of employment per house built.
the University of York29 found that inability to access homeownership has resulted in recruitment and
retention difficulties, particularly for key workers in high cost areas as staff relocate to less expensive
areas to access housing. The rural nature of much of our area means that these issues are more acute.
We are increasingly hearing of many smaller, rural businesses that struggle to attract a workforce and of
communities struggling to meet local needs, such as for care workers, farm workers, teachers, etc. Local
wages are traditionally low (see table 16) and property prices and rental levels in our rural areas high.
LEP Area Housing Markets in Context: Demand and Need
The national ‘What Homes Where?’ toolkit (howmanyhomes.org) provides information on the number of
extra households predicted to form to 2026 in each Local Authority based on 2008 household projections
and assuming past trends continue. The information for the LEP area is presented in table 19 and predicts
the formation of over 85,000 new households between now and 2026 (around 6,000 per year). Further
homes may be required, for example, to provide housing for those who are not adequately housed at
present (e.g. concealed households) or to make allowance for empty and second homes.
26
The Contribution of Housing to Economic Growth in the York, North Yorkshire and East Riding LEP area, 16 December 2013
27
‘Funding Future Homes – an evidence base’ 2012 28
The Case for Housing Savilles and Oxford Economics 2010 29
Rapid Evidence Assessment of the economic and social consequences of worsening housing affordability University of York 2009

57
Table 19: New Household Formation
Extra Households Per year 2013 to 2026
York 1285
Ryedale 265
Hambleton 335
Richmondshire 235
Scarborough 470
Selby 530
Craven 325
Harrogate 335
East Riding 2239
Total 6,019
Although household formation is only one element of new home requirements, this information
evidences the quantum of homes which may be needed to satisfy demand if households form at the rates
predicted. The size and shape of housing markets are driven by household migration patterns and travel
to work areas and so are driven by employment locations and incomes.
As well as considering the overall number of homes needed, the North Yorkshire Strategic Housing
Partnership and East Riding Council produced Strategic Housing Market Assessments (SHMAs) in 2011.
These are developed in line with government guidance and map the strategic pattern of housing markets
in the sub region and quantify housing need in each Local Authority area. From the SHMAs, Local
Authorities in the LEP area have developed approaches around overall housing numbers, set planning
strategy and affordable housing policies to address the needs and context.
Local Housing Markets
For North Yorkshire, the SHMA identified five main market sub areas:
Leeds City Region
York
Vales and Tees
Remote Rural
Coastal
High levels of housing market containment were identified within Richmondshire, Ryedale, York and Selby
and there were also wider links identified with the Leeds City Region, Tees Valley and Coastal areas. The
East Riding market is inextricably linked to the cities and markets of Hull and York through migration and
travel-to work patterns. It is therefore important to consider their spatial aspirations and the implications
that this may have for East Riding. There are also relationships with areas of Selby and similar issues and
challenges in the East Riding coastal markets as there are present in Scarborough.
The East Riding SHMA identified a total of six housing market sub-areas.
Wolds
Bridlington
Beverly
Goole
Hull Borders
Holderness

58
The City of Hull SHMA (2009 update) recognises the interrelated nature of the Hull and East Riding housing and employment markets and that the Hull housing market spans both areas. There has been a historic outflow of households from Hull to East Riding which requires intervention to rebalance the markets.
The SHMAs include a calculation of housing need using the methodology set out in the CLG Guidance.
This indicates that authorities in the LEP area would need to provide for a net annual affordable housing
need of approximately 4,000 homes pa over the next five years in order both to clear the existing backlog
of households in need and meet future arising household need. This requirement for affordable housing
is distributed across the individual authorities. In absolute terms East Riding has the highest annual need
at 1,000 new affordable homes with the City of York, Harrogate and Scarborough having the next highest
levels of annual need for new affordable properties (790, 507 and 457 respectively).
The research shows that the shortfall is mainly in smaller properties across all authorities. This is not
surprising, as the stock profile of many of the authorities is skewed towards larger family properties across
all tenures. Since the time of the research, this is likely to have been exacerbated by the introduction of
Welfare Reform and new rules on payment of housing benefit for households in under occupation.
The following tables provide further statistics on housing and housing markets in the LEP area.
Figure 6: Dwelling Types
Source: ONS – Neighbourhood Statistics
Around 40% of homes in Hambleton, Ryedale and Selby are detached (compared to 30% for the LEP area). Reflecting their economic history, Craven and York have higher than average levels of terraced housing.
NY & ER Dwelling Types 2011
0%
5%
10%
15%
20%
25%
30%
35%
40%
England Yorkshire and The
Humber
NY, Y & ER
Detached
Semi-Detached
Terraced (Including End-Terrace)
Flat, Maisonette or Apartment

59
Figure 7: Household Types
Source: ONS – Neighbourhood Statistics
Similar to the national and regional figures, one person households make up around 30% of all households in the LEP area. Those aged 65 and over make up one quarter of all households. Households with no children make up a slightly higher proportion than in the comparator areas.
Figure 8: Average House Prices
Source: HM Land Registry
The most recent HM Land Registry House Price Index for the Authorities in the LEP area (Q1 2013) shows that the average house price (£205,800) is above the average for England and Wales, with only East Riding and Scarborough being below the national average price.
NY & ER Household Types
0%
5%
10%
15%
20%
25%
England Yorkshire and The
Humber
Y, NY & ER
One Person 65+
One Person Other
One Family All Aged 65+
Married/Civil Partnership/Cohabiting No Children
Married/Civil Partnership/Cohabiting Dependent Children
Married/Civil Partnership/Cohabiting Non-Dependent
Children
Lone Parent Dependent Children
Lone Parent Non-Dependent Children
All Full-Time Students
Other All Aged 65 and Over
Other Household
Average House Price
£0 £50,000 £100,000 £150,000 £200,000 £250,000 £300,000
East Riding
York
Harrogate
Hambleton
Richmondshire
Ryedale
Craven
Selby
Scarborough
NY Y& ER Ave
England & Wales

60
Table 20: Housing Affordability
Source: DCLG, Table 577
House Price to Income Ratio, 2012
Craven 7.40
East Riding of Yorkshire 6.13
Hambleton 8.51
Harrogate 8.77
Richmondshire 7.55
Ryedale 8.23
Scarborough 6.30
Selby 5.93
York 6.80

61
c) Conclusions and Implications
Our area’s economy presents a combination of strengths, assets and unfulfilled potential. Employment,
skills and business survival rates are above average and we have strong business sectors such as food and
agriculture, energy and the visitor economy. Yet our productivity, GVA and business formation levels are
below what we would expect.
Considerable differences at a local level are masked by overall statistics. Our area includes localities that
have significant deprivation, most notably on the Yorkshire Coast, but also in hidden pockets throughout.
More remote parts of our area – such as the Dales, Moors & Wolds - have both high self-employment
levels and, perhaps surprisingly, low levels of income. Elsewhere certain sectors, such as manufacturing
and engineering, have localised hotspots. The City Of York also has distinct features, for instance
connected to its business base and university and science based assets. Parts of the wider West Yorkshire
connected area also have excellent performance on particular measures, such as skills in Harrogate, Selby
and Craven, and business formation levels in Harrogate. We need to make more of our distinctive
strengths to combat low GVA and drive future success.
The implications of this analysis have informed our approach, and there is a clear line of sight from the
evidence and emerging opportunities to the priorities and activities within this strategy. They include:
Our high proportion of small and microbusinesses means that if we are to improve GVA and
productivity, then there must be a strong (but not exclusive) focus on these businesses across sectors,
including tourism and farm based businesses. Our low and falling business formation rates will be a
significant long term weakness unless they are reversed, but our quality of life and locational benefits
could make our area an attractive one for entrepreneurs – see Priority 1
Food manufacturing and agriculture is our most pronounced sector. Its scale far exceeds national
average and it accounts for a sizeable number of businesses and jobs. It can perform better than it is
doing now and major investments and innovation programmes have the potential to drive that
improvement. The energy and especially biorenewables sector here is also pronounced. It includes
key national assets which can drive expansion and enhance food and energy security – see Priority 2
Qualifications levels are good but our lead over national average is reducing. Improving employability
skills and qualifications (especially at higher levels), combined with better apprenticeship
opportunities and responsiveness to specific business and sector based needs, will help to drive
growth and prosperity. Upskilling and support for those who are unemployed can also help to tackle
pockets of deprivation (e.g. in coastal towns and parts of Selby, Colburn and York), underpin growth
and ensure the talents of our whole population are utilised – see Priority 3
Our distinctive and predominantly rural geography combines a wealth of market towns, and more
national parks and areas of outstanding countryside and coast than practically anywhere else in
England. It includes distinctive local economic areas, each of which have opportunities to unlock and
drive growth. These include major investments and site specific opportunities to address market
failures, including on the Yorkshire Coast, in the A1/A19 corridor, and in the York & connected, West
Yorkshire connected, and Hull & Humber connected areas to the south of our area. There are also
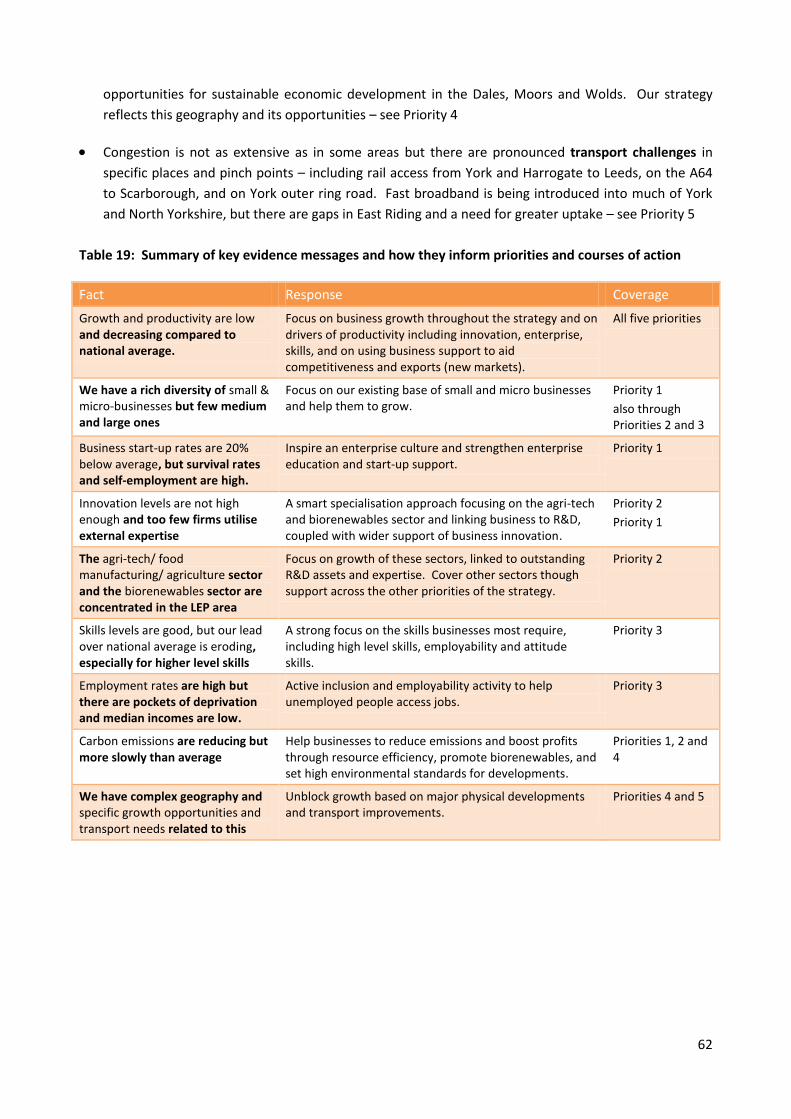
62
opportunities for sustainable economic development in the Dales, Moors and Wolds. Our strategy
reflects this geography and its opportunities – see Priority 4
Congestion is not as extensive as in some areas but there are pronounced transport challenges in
specific places and pinch points – including rail access from York and Harrogate to Leeds, on the A64
to Scarborough, and on York outer ring road. Fast broadband is being introduced into much of York
and North Yorkshire, but there are gaps in East Riding and a need for greater uptake – see Priority 5
Table 19: Summary of key evidence messages and how they inform priorities and courses of action
Fact Response Coverage
Growth and productivity are low and decreasing compared to national average.
Focus on business growth throughout the strategy and on drivers of productivity including innovation, enterprise, skills, and on using business support to aid competitiveness and exports (new markets).
All five priorities
We have a rich diversity of small & micro-businesses but few medium and large ones
Focus on our existing base of small and micro businesses and help them to grow.
Priority 1
also through Priorities 2 and 3
Business start-up rates are 20% below average, but survival rates and self-employment are high.
Inspire an enterprise culture and strengthen enterprise education and start-up support.
Priority 1
Innovation levels are not high enough and too few firms utilise external expertise
A smart specialisation approach focusing on the agri-tech and biorenewables sector and linking business to R&D, coupled with wider support of business innovation.
Priority 2
Priority 1
The agri-tech/ food manufacturing/ agriculture sector and the biorenewables sector are concentrated in the LEP area
Focus on growth of these sectors, linked to outstanding R&D assets and expertise. Cover other sectors though support across the other priorities of the strategy.
Priority 2
Skills levels are good, but our lead over national average is eroding, especially for higher level skills
A strong focus on the skills businesses most require, including high level skills, employability and attitude skills.
Priority 3
Employment rates are high but there are pockets of deprivation and median incomes are low.
Active inclusion and employability activity to help unemployed people access jobs.
Priority 3
Carbon emissions are reducing but more slowly than average
Help businesses to reduce emissions and boost profits through resource efficiency, promote biorenewables, and set high environmental standards for developments.
Priorities 1, 2 and 4
We have complex geography and specific growth opportunities and transport needs related to this
Unblock growth based on major physical developments and transport improvements.
Priorities 4 and 5

63
Why Intervene? - The Importance of Market Failure
Economic interventions only make sense where evidence shows both that there is an opportunity or need,
and that something can be done to make a difference. This is intrinsically linked to the concept of ‘market
failure’. Market failure exists when the competitive outcome of markets is not efficient from the point of
view of society as a whole - in essence, factors that prevent the economy from working as well as it should
do. There are six main types of market failure that provide a reason for intervention in relation to local
economic development and the actions within this plan:
Externalities – these are essentially spillover effects where the consequences of market operation or a
firm’s action are not fully borne by businesses themselves. Externalities can be positive – e.g. one
firm’s R&D may be shared by others, or negative – such as pollution. This is relevant to innovation
activity in Priority 1 and 2 of this strategy and to low carbon activity.
Barriers to entry – a functioning market relies on healthy competition. So if barriers prevent
businesses from entering or competing in a market they will harm its operation. This is pertinent to
Priority 1 of this strategy on business start-ups, and also relevant to trade and export activity.
Imperfect information and uncertainty – gaps in information and perceptions may lead to the ‘wrong’
decisions being made, related to ‘merit goods’ and ‘demerit goods’ where consumers (which for this
strategy could be businesses assessing whether to take up advice, or students choosing a course)
underestimate or overestimate the value of a product. This is relevant to a number of areas of this
strategy, including business support products, skills and training, technology and resource efficiency.
Public goods – are those that cannot be easily restricted to a paying customer as others will benefit
when they are made available – e.g. good town planning, roads maintenance or breakthroughs in
basic science. Public goods are often entwined with public services or policy relating to areas such as
education, transport infrastructure and health. Whilst they are not goods brought to market, their
provision (or lack of) can have a significant impact on economic performance. This is relevant to
Priority 5 of this strategy in relation to transport and ICT as well as to Priority 3 in relation to
education.
Factor immobility – is where barriers prevent a factor of production, such as labour, from being
efficiently employed, for instance because of the costs or difficulties of travel. This is relevant in
relation to Priority 3 of this strategy on employment and skills.
Equity issues – occur where markets generate an ‘unacceptable’ distribution of income with social exclusion consequences which a government may choose to change. This is most relevant to Priority 3 of this strategy.
The nature and extent of market failures will have a crucial bearing on priorities for action by the LEP and
its partners. We will focus interventions where market failure is evident, and market failure based
rationales for action are included in the detail of each priority.
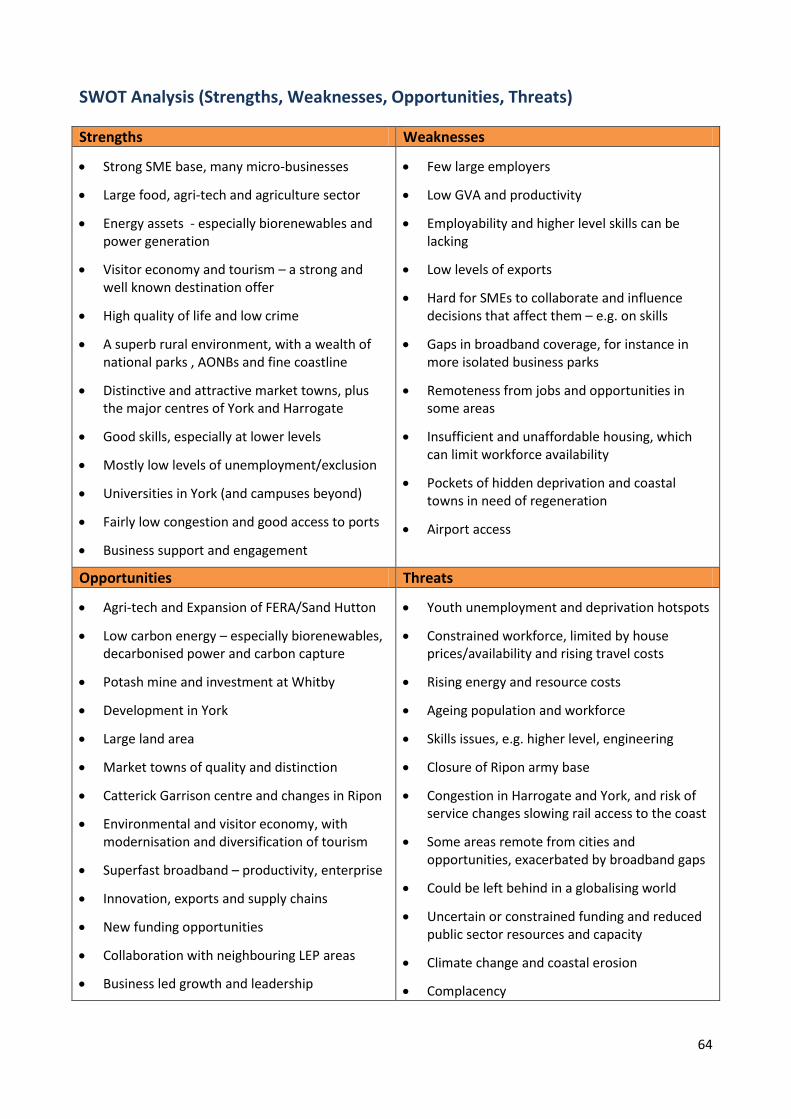
64
SWOT Analysis (Strengths, Weaknesses, Opportunities, Threats)
Strengths Weaknesses
Strong SME base, many micro-businesses
Large food, agri-tech and agriculture sector
Energy assets - especially biorenewables and power generation
Visitor economy and tourism – a strong and well known destination offer
High quality of life and low crime
A superb rural environment, with a wealth of national parks , AONBs and fine coastline
Distinctive and attractive market towns, plus the major centres of York and Harrogate
Good skills, especially at lower levels
Mostly low levels of unemployment/exclusion
Universities in York (and campuses beyond)
Fairly low congestion and good access to ports
Business support and engagement
Few large employers
Low GVA and productivity
Employability and higher level skills can be lacking
Low levels of exports
Hard for SMEs to collaborate and influence decisions that affect them – e.g. on skills
Gaps in broadband coverage, for instance in more isolated business parks
Remoteness from jobs and opportunities in some areas
Insufficient and unaffordable housing, which can limit workforce availability
Pockets of hidden deprivation and coastal towns in need of regeneration
Airport access
Opportunities Threats
Agri-tech and Expansion of FERA/Sand Hutton
Low carbon energy – especially biorenewables, decarbonised power and carbon capture
Potash mine and investment at Whitby
Development in York
Large land area
Market towns of quality and distinction
Catterick Garrison centre and changes in Ripon
Environmental and visitor economy, with modernisation and diversification of tourism
Superfast broadband – productivity, enterprise
Innovation, exports and supply chains
New funding opportunities
Collaboration with neighbouring LEP areas
Business led growth and leadership
Youth unemployment and deprivation hotspots
Constrained workforce, limited by house prices/availability and rising travel costs
Rising energy and resource costs
Ageing population and workforce
Skills issues, e.g. higher level, engineering
Closure of Ripon army base
Congestion in Harrogate and York, and risk of service changes slowing rail access to the coast
Some areas remote from cities and opportunities, exacerbated by broadband gaps
Could be left behind in a globalising world
Uncertain or constrained funding and reduced public sector resources and capacity
Climate change and coastal erosion
Complacency
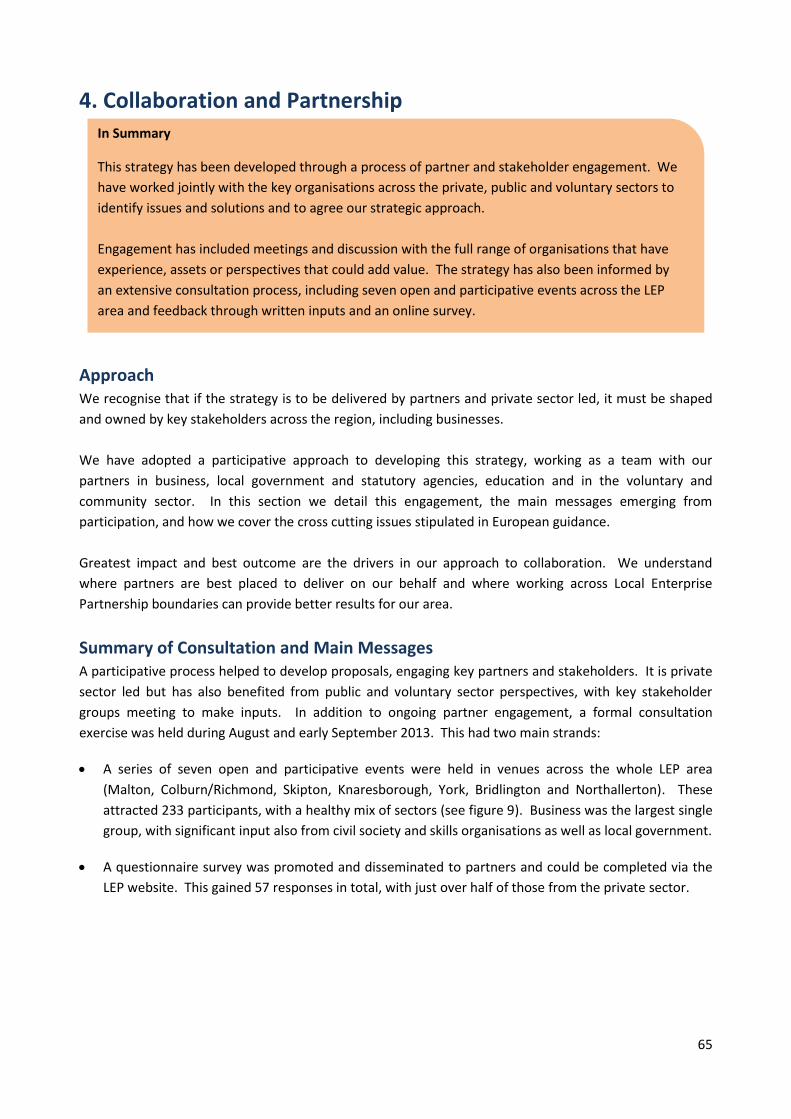
65
4. Collaboration and Partnership
Approach We recognise that if the strategy is to be delivered by partners and private sector led, it must be shaped
and owned by key stakeholders across the region, including businesses.
We have adopted a participative approach to developing this strategy, working as a team with our
partners in business, local government and statutory agencies, education and in the voluntary and
community sector. In this section we detail this engagement, the main messages emerging from
participation, and how we cover the cross cutting issues stipulated in European guidance.
Greatest impact and best outcome are the drivers in our approach to collaboration. We understand
where partners are best placed to deliver on our behalf and where working across Local Enterprise
Partnership boundaries can provide better results for our area.
Summary of Consultation and Main Messages A participative process helped to develop proposals, engaging key partners and stakeholders. It is private
sector led but has also benefited from public and voluntary sector perspectives, with key stakeholder
groups meeting to make inputs. In addition to ongoing partner engagement, a formal consultation
exercise was held during August and early September 2013. This had two main strands:
A series of seven open and participative events were held in venues across the whole LEP area
(Malton, Colburn/Richmond, Skipton, Knaresborough, York, Bridlington and Northallerton). These
attracted 233 participants, with a healthy mix of sectors (see figure 9). Business was the largest single
group, with significant input also from civil society and skills organisations as well as local government.
A questionnaire survey was promoted and disseminated to partners and could be completed via the
LEP website. This gained 57 responses in total, with just over half of those from the private sector.
In Summary
This strategy has been developed through a process of partner and stakeholder engagement. We
have worked jointly with the key organisations across the private, public and voluntary sectors to
identify issues and solutions and to agree our strategic approach.
Engagement has included meetings and discussion with the full range of organisations that have
experience, assets or perspectives that could add value. The strategy has also been informed by
an extensive consultation process, including seven open and participative events across the LEP
area and feedback through written inputs and an online survey.
66
Figure 9: Attendees at consultation events by sector
The response to the consultation draft of the strategy through the seven events was energetic and
positive. There was widespread agreement with its overall direction and priorities and most of its
content. In addition, a number of strategic points were raised repeatedly, with support from those
present. The main points were to add or enhance content on:
i) Business start ups and enterprise
ii) Upskilling the current workforce
iii) Supporting employment and social inclusion, including third sector engagement
iv) Low carbon and the ‘green economy’
A log of more specific and detailed points was recorded and these specifics will be fed into the strategy
where they are uncontroversial, obviously enhance the strategy or add value, and do not undermine or
significantly dilute the main priorities and deliverables. Points included details about transport and place
based approaches, and there has been extensive discussion about these with relevant organisations such
as local authorities and the North Yorkshire Transport Partnership.
A log of detailed consultation points will be written up and made available within the final draft of the
strategy.
The consultation survey attracted responses across sectors as shown in figure 10 – a half of responses
were from the private sector.
47%
39%
6% 6%
2%
Event attendees by sector
Business
Local authority/ public sector
Skills & education
Voluntary
Other / unknown

67
Figure 10: Respondents to the consultation survey by sector
Survey respondents were asked whether they agreed or disagreed with the direction and deliverables of
each (consultation draft) priority and the overall vision. Figure 11 shows the results
Figure 11: Agreement or Disagreement with Strategy Priorities
There was overall agreement with the priorities and their direction and deliverables. For four of the five
priorities, most of those who agreed with them did so ‘broadly’ rather than ‘strongly’. The exception was
the priority on workforce skills which gained nearly as much strong support (43%) as broad support. The
priorities on connection to markets and growth in towns and the City of York had the next highest levels of
strong support – 27% and 29% respectively. Very few respondents disagreed with any of the priorities
and none ‘disagreed strongly’.
Business engagement Business has been at the heart of our LEP plans and 40 business networks have signed a MOU to work
with the LEP to deliver our existing plan. We have engaged closely with the networks in developing the
content of this strategy. In particular, the Federation of Small Businesses, Leeds, York & North Yorkshire
38%
12% 19%
26%
5%
Suvey responses by sector
Business
Business network
Public sector
Voluntary/community sector
Individual
0
0
0
4
0
2
4
11
9
22
18
11
13
11
89
91
78
78
89
85
85
0 10 20 30 40 50 60 70 80 90 100
An economy well connected to markets
Workforce with the skills business needs
Driving growth in towns and York
Food manufacture/agri/biorenewables
Ambitious small and micro businesses
The right set of priorities for our area
Overall Vision
% broadly or strongly agreeing % neutral or uncertain % broadly or strongly disagreeing

68
Chamber of Commerce, Institute of Directors, National Farmers Union and Welcome to Yorkshire have
been core members of a task and finish group which has developed the business growth content of the
strategy. Additionally, an invitation to participate in the consultation survey and events was sent to all the
business networks. As previously detailed, business was the largest single group attending events and
completing the questionnaire survey - almost a half of all respondents were from business.
Additionally, we have consulted with and retain strong relationships with publicly funded business support
providers including the Manufacturing Advisory Service, UKTI, Growth Accelerator and Superfast North
Yorkshire.
Local authorities and the public sector We have worked closely with a range of existing agencies and structures to develop this strategy, building
on existing plans and working in partnership with the range of organisations involved in them, often from
the public sector. We will retain these relationships through the delivery of the strategy. We aim to
coordinate resources and to build shared capacity to deliver greatest impact and deliver best value for
money across the region.
We have worked with a wide range of public sector partners, at a range of levels from leaders and chief
executives through to practitioner/officer level. Public sector organisations, especially local authorities,
made extensive inputs during consultation, through the events and survey as well as fortnightly meetings
with local authority economic development officers. A Skills Task Group that included public sector
agencies, as well as business, was established to inform and guide establishment of skills priorities.
Annex A summarises the public sector partners who have helped develop the strategy.
The Voluntary and Community Sector (‘Civil Society’) We have worked with key third sector organisations, notably Your Consortium, who provide an overall
voice for the sector to inform strategy preparation. We have also engaged with groups across the sector
through the consultation process and gained valuable input, including but not limited to specific areas of
expertise such as social inclusion, employment, sustainable development and social enterprise.
Examples of third sector groups attending consultation events included local charities and community
trusts, local LEADER group participants, Rural Action Yorkshire and CVS groups.
Partnership and collaboration with other LEP areas We can achieve better results by working with neighbouring Local Economic Partnerships and will strive to
do so. Already we have forged strong working relationships with neighbouring LEPs and discussed how
our strategies and delivery can align. Key connections for specific LEP areas are set out below.
Leeds City Region
Our LEP boundary overlaps with Leeds City Region. The City of York, along with the districts of Harrogate,
Selby and Craven work in partnership with both our LEP and Leeds City Region. We are fully supportive of
the City Region and their aspirations and recognise the benefits of a prosperous Leeds City Region to the
businesses and people of North Yorkshire and the City of York.

69
Through their city deal, the City Region are best placed to make large strategic investments in
infrastructure. We will work in partnership and support the City Region to invest to unblock key sites such
as York Central and to address strategic transport issue such as the congestion around York Outer Ring
Road.
Our role around major infrastructure is one of support and enabling. For example, we are investing in
improvements to the York – Harrogate –Leeds rail line, which will build capacity now, but also support the
longer term City Region plans for electrification of the line. Additionally, on behalf of Leeds City Region,
we are delivering an Apprentice Hub in Harrogate, Selby and Craven and will continue to work together on
the apprentice and skills agenda. We are best placed to lead on supporting small business, the visitor
economy and addressing rural issues in the overlapping areas.
A core strand of our strategy is to capitalise on our strength in agri-tech and biorenewables. The Biovale
proposal builds on this, recognising the strength of the food manufacturing sector in Leeds City Region as
a key partner in our growth plans.
Humber Local Enterprise Partnership
We also share an overlapping boundary with Humber Local Enterprise Partnership, with East Riding of
Yorkshire a key member of both LEPs.
The Humber LEP has secured a major Enterprise Zone focused on the Humber Port and the opportunity of
offshore wind. Whilst the proposed wind farm at Dogger Bank is off the coast of North Yorkshire,
manufacture and construction can only take place in the deep port of the Humber and we wholeheartedly
support their work to deliver this major investment.
The benefits from offshore wind will be felt beyond the Humber and across the Yorkshire Coast. The
Humber LEP are focused on delivering this, which we fully support. However, coming out from the
opportunity are common issues on which we will collaborate. Firstly, the offshore wind industry coupled
with Potash developments in our LEP area, present a major skills challenge, particularly around
engineering skills. We will work together to develop local skills to support these emerging opportunities.
We will also work together, through the Humber North Bank Partnership, to invest in the Yorkshire Coast,
addressing historic issues of coastal deprivation whilst investing in key infrastructure to drive growth in
our seaside towns. We are best placed to lead the rural agenda and, as with Leeds City Region, our
Biovale proposal recognises the strength and value the Humber Ports and related businesses can add to
our growth plans. Collaboration and joint working will be an integral part of our development plans.
Tees Valley LEP
Whilst we do not overlap with Tees Valley LEP area, we share several common issues and both markets
and travel to work patterns provide a strong relationship. We have a history or working together on the
Community Led Local Development LEADER programme and this will continue.
Additionally the potential multi-billion potash development in Whitby will provide supply chain
opportunities across both areas. We will collaborate to ensure we maximise the potential of this
opportunity.
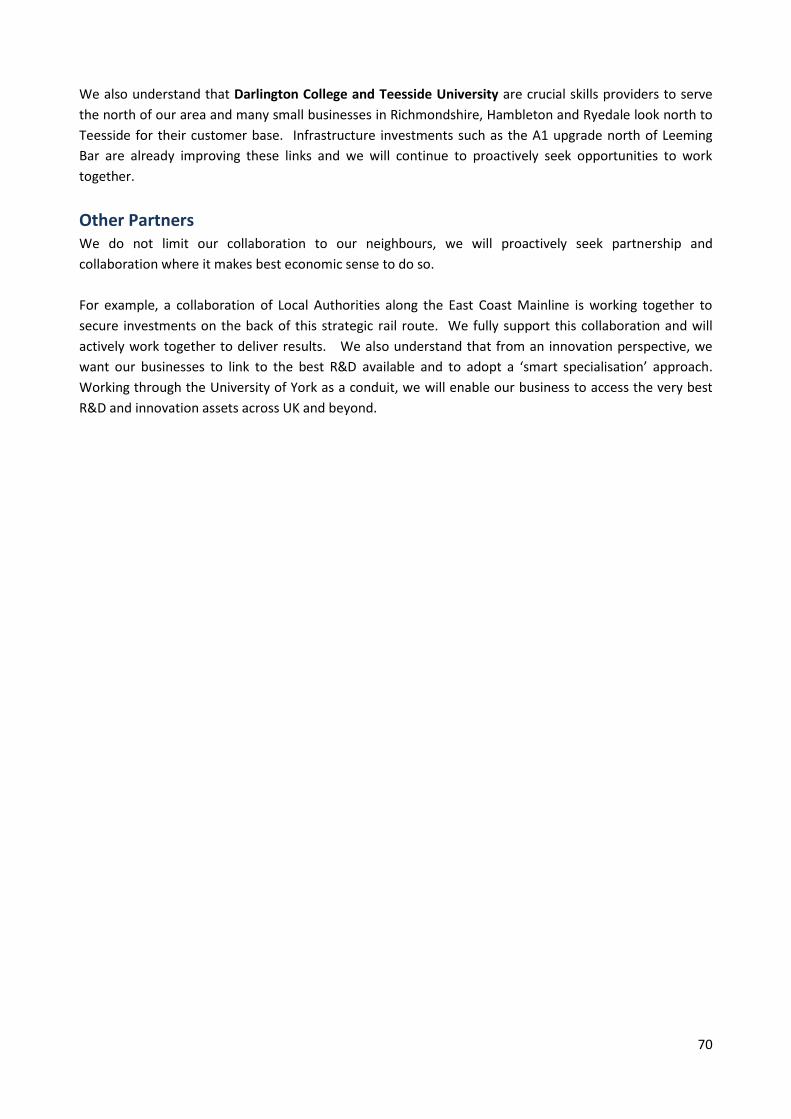
70
We also understand that Darlington College and Teesside University are crucial skills providers to serve
the north of our area and many small businesses in Richmondshire, Hambleton and Ryedale look north to
Teesside for their customer base. Infrastructure investments such as the A1 upgrade north of Leeming
Bar are already improving these links and we will continue to proactively seek opportunities to work
together.
Other Partners We do not limit our collaboration to our neighbours, we will proactively seek partnership and
collaboration where it makes best economic sense to do so.
For example, a collaboration of Local Authorities along the East Coast Mainline is working together to
secure investments on the back of this strategic rail route. We fully support this collaboration and will
actively work together to deliver results. We also understand that from an innovation perspective, we
want our businesses to link to the best R&D available and to adopt a ‘smart specialisation’ approach.
Working through the University of York as a conduit, we will enable our business to access the very best
R&D and innovation assets across UK and beyond.

71
5. Cross Cutting Issues – Sustainable Development and Low
Carbon, Social Inclusion and Equalities, Innovation and
Community Led Local Development
Approach A number of key issues cannot be framed within a single component of this strategy; to be meaningfully
applied they need to run right through it, affecting both the content of actions and the way they are
delivered. Based on partner engagement, evidence and guidance, we have identified four such themes:
Sustainable Development and Low Carbon
Social Inclusion and Equalities
Innovation – Social Innovation and Smart Specialisation
Community Led Local Development
a) Sustainable Development and Low Carbon Ambitions This theme incudes three elements:
integrating social, environmental and economic aspects of development to ensure that it contributes
to quality of life now and in the future;
protecting and enhancing the environment, and
responding to climate change by both reducing carbon emissions and adapting to a changing climate –
for instance through flood prevention.
The LEP and this strategy is committed to all three goals and will put in place actions and mechanisms to
take them forward in line with the UK Government’s principles for Sustainable Development30. We will
work with relevant partners and experts to put this into practice, including our three Local Nature
Partnerships, both National Park Authorities (covering the North York Moors and the Yorkshire Dales) and
third sector environmental organisations.
Content on sustainable development, including low carbon, is covered within each of the priorities of the
strategy (see annex B). Over and above that content the following general principles and commitments
apply to strategic decision making and project development:
Contribute to the carbon reduction goals in the LEP area (and beyond), including through shifts in
energy generation and energy efficiency measures;
30
These are: Living within environmental limits; Ensuring a strong, healthy and just society; Achieving a sustainable economy; Using sound science responsibly; and promoting good governance.
In Summary
The Strategy takes account of and contributes to the EU cross cutting themes of sustainable
development and equality, and the processes of social innovation and community led local
development. In this section we set out how these (and related) themes will be proactively taken
forward and implemented.

72
Consider and adopt ‘adaptation’ measures in response to a changing climate and related pressures,
including flood risk, coastal erosion and impacts on land use, health, habitats and industry;
Promote mechanisms such as resource efficiency which reduce environmental impacts and enhance
economic competitiveness;
Value and where possible enhance ‘green and blue infrastructure’ such as habitats, water courses and
features, and important landscapes and the ‘ecosystems services’ they provide such as climate
regulation, amenity value and flood prevention;
Pursue supply chain development and procurement approaches that deliver environmental benefits,
for instance through the way in which use of local goods and services can reduce distances travelled
and CO2 emissions;
Take opportunities to encourage sustainable and low carbon transport, for instance through
promoting of cycling, walking and public transport, and use of ICT and local services to avoid
unnecessary or long journeys;
Apply the polluter pays principle to all activities; and
Set demanding environmental standards for buildings and infrastructure – BREEAM ‘excellent’ for new
build, BREEAM ‘very good’ for refurbishment, and CEEQUAL ‘very good’ for infrastructure projects.
b) Social Inclusion and Equalities This theme includes two main strands: anti-discrimination policies in line with the Equality Act, 201031;
and wider strategic and project level activity to support social inclusion.
The LEP is committed to the three key elements under the Public Sector Equality Duty in relation to our
decision making and delivery, those being:
To eliminate unlawful discrimination
To advance equality of opportunity
To foster good relations
We will seek evidence on the economic and employment circumstances of different groups and use that
information in targeting of activity. Readily available evidence includes that on youth unemployment and
that is set out in the evidence section and has been used to inform priority setting.
More broadly, we will look to ensure that people from all groups and all areas across York, North
Yorkshire and East Riding benefit from economic growth and opportunities, and to narrow gaps between
those who are most and least disadvantaged32. That will include action to:
Support those who are unemployed to get a job, through improvement of skills and employability and
connection to opportunities;
Create more opportunities for local employment, through business growth and job creation, and
encouragement of apprenticeships and other mechanisms that help local people to access them;
Support community led development and third sector (‘civil society’) capacity to support social
inclusion, employment and wellbeing;
31
The equality duty covers nine groups with protected characteristics: age, disability, gender reassignment, marriage and civil partnership, pregnancy and maternity, race, religion or belief, sex and sexual orientation. 32
See for instance the report of the York Fairness Commission, 2012, for relevant principles and approaches

73
Ensure connections to the Health and Wellbeing boards that support economic activity and wellbeing;
and
Ensure that the needs of social enterprise are covered in mainstream business support.
We have worked and consulted with Your Consortium and others in the third sector in the preparation of
this strategy and will continue and deepen working relationships as we move forward. That will for
instance include ensuring that the sector is represented on the LEP area’s Skills and Employability Board,
and consideration of a place on the main LEP Board when its membership is reviewed.
c) Innovation – Social Innovation and Smart Specialisation Innovation, whether defined in strict technical terms or as the wider capacity to do things differently and
better, is vital to economic success and social progress. It is all the more important in an era of tight
finances where cost effectiveness and efficiency are paramount, and in a global market where innovation
is crucial to market share, profitability and growth. Reflecting this content, the LEP area will pursue
innovation in three main ways: social innovation, smart specialisation and wider business innovation.
Social innovation – is the process of finding and implementing new ways to tackle problems facing society
or groups within it, drawing on local communities and the third sector as well as businesses, individuals
and researchers. At this stage we are not proposing a specific social innovation project. However we will
keep opportunities to apply the concept under review, especially in relation to (ESF related) employability,
inclusion, health and wellbeing challenges, and to low carbon and climate change imperatives where
community engagement and exchange of ideas can help to develop new solutions.
Smart specialisation – is about making economic development effective through focusing it on the most
pronounced and concentrated R&D assets and sectoral strengths in our area. Our area’s stand out R&D
and sectoral strengths mirror each other and are in the area of agri-tech and biorenewables, and their
wider application within low carbon, food manufacturing and agricultural industry. To put due focus on
this area it is singled out as Priority 2 within this strategy, with focus on application of sector specific
innovation strengths.
Business innovation – Whilst sector focused innovation activity is a key priority, that will reach a small
proportion of our economy overall. The evidence section makes clear that there is a far wider ‘innovation
deficit’ within businesses across the region, and a second strand of innovation activity will address this
without undermining the more concentrated activity focused on agri-tech and biorenewables. This will
cover the need for innovation based on technical expertise and R&D, and more general application of new
ideas and approaches to improve products, services and business performance. This is a core activity
within Priority 1 of this strategy, linked to SME support and to connecting businesses to expertise across
the UK.
Community Led Local Development Community Led Local Development (CLLD) is a specific, locally driven approach to development, often (but
not necessarily) linked to EU funding. It is defined as a sub-regional process which can “mobilse and
involve local communities to contribute to achieving the Europe 2020 Strategy goals of smart, sustainable
and inclusive growth”.

74
This approach has been operating across the LEP area through LEADER in rural areas, Fisheries Local
Action Groups (FLAGS) in coastal areas, and across our market towns through community led area
partnerships and town teams. In our experience CLLD can focus on and make a real difference to the
economic growth of smaller local areas.
The knowledge and lessons learned gained through these existing CLLD programmes in our LEP area (and
others) and the community led groups involved in it is valuable in informing how it can provide an
effective mechanism to stimulate growth in the future. One conclusion is that the CLLD approach has the
potential to benefit localities across the LEP area (e.g. market towns), not just the more remote and
coastal areas where it has generally been applied to date. Other lessons are that CLLD activity needs to be
focused on clear local priorities and link proposed activities to anticipated outcomes.
Type of activity
Activity undertaken through CLLD activity will be aligned to the overall priorities and programmes set out
in this strategy. These will include measures to address:
urban and coastal deprivation
rural isolation and accessibility; and
local community capacity and social enterprise development
CLLD can help to tie together broad thematic priorities local place based needs. Hence whilst it includes a
focus on places (Priority 4) it also links to issues such as skills (priority 3), access to work and training
(priority 5) and business support and social enterprise (priority 1).
Why do we want to use CLLD?
Community Led Local Development can make a real difference to the lives of local people and businesses
across York, North Yorkshire and East Riding by:
providing a unique long term investment opportunity of up to seven years, with the benefits of the
investment remaining within the designated local area;
empowering local communities to identify challenges in their area and tailor their own innovative
solutions; and
increasing local interest and engagement by supporting projects to work with the community –
improving partnership working and ability to access and effectively use both European and wider
funding streams.
Where?
York, North Yorkshire and East Riding is a large geography with specific issues affecting different local
areas. Analysis of economic geography and evidence (see section 2) highlights a series of economic
geographies based around common issues. Together with the existing LEADER and FLAG areas these will
form the basis of the CLLD approach in the future.
At this interim stage, our working proposals are for a CLLD areas geography that is aligned as follows:-
Dales, Moors & Wolds

75
• Yorkshire Dales – Current LEADER area but with the addition of its neighbouring market towns and
service centres
• North York Moors – Current LEADER area but with addition of its neighbouring market towns
• Wolds, Wetlands and Waterways - Current LEADER area but with addition of its neighbouring market
towns
Yorkshire Coast
Coastal strip (East Riding up to Filey) – Current FLAG but extending north to include Filey
Scarborough Town – new LAG, area with high levels of disadvantage
A1/A19 Corridor
Northallerton/Thirsk – new LAG but with existing local community partnership, area significantly
affected by major reductions in public sector employment, but in a location with potential growth
opportunities;
West Yorkshire Connected (collaboration with the Leeds City Region)
Skipton – New LAG based on high growth business opportunities
Hull and Humber Connected (collaboration with Humber LEP)
Selby/ Goole/Thorne – New LAG in collaboration with Humber LEP, Leeds City Region and Sheffield
City region)
Hull Fringe – New LAG
York & Connected (collaboration with the Leeds City Region)
York LAG
Delivery and collaboration
At this stage the potential Local Action Groups and areas suggested above need further refinement and
development locally. This will involve collaboration between key partners, stakeholders, including across
local boundaries and with and neighbouring LEPs. A process will be established to develop these
proposals further, with each area preparing a Local Development Strategy.
It is proposed that the maximum 5% (approx. £5m) of the YNYER ESIF allocation is attributed to CLLD
approach, with the level for each LAG area determined through the development of their Local
Development Strategies. Section 6 on funding allocations provides further detail.

76
6. Resources and Funding Allocations
Overview - influence and resources Making the impact we seek requires a mixture of investment and influence. Both can be mechanisms for
getting new or different things delivered, and it is important to make the most of both routes.
The influencing role of the strategy, the LEP board and senior partners is pivotal. Making the case for our
area to national decision makers, showing what we can deliver, and changing how things are done
nationally and how far they are delegated locally can have a real impact.
Where influence or new approaches are not enough on their own to effect the progress we seek, we will
use the whole array of available resources to do so. Those include existing public and private resources,
new private sector investments, and Government funds such as Regional Growth Fund and Growing
Places.
There are two other major funding streams which LEPs will play a central role in and for which this
strategy plays a key role in setting our local priorities:
The Single Local Growth Fund
EU Strategic Investment Funds
The sections that follow set out our proposals for allocating EU Strategic Investment Funds (and not
other sources of funding). They match up the EU requirements and core themes for funding with the
priorities and activities in this strategy. Proposals for the Single Growth Fund are detailed in the
supporting Local Growth Deal Implementation Plan (available in draft in December 2013 and to developed
refined and finalised in 2014) rather than specified in this strategy document.
Table 21 sets out funding allocations at a strategic level for EU Strategic and Investment funds. It is based
on five ‘strategic programmes’, which correspond to the five Priorities in the strategy. Allocations are
further split between the relevant Objectives within this strategy. Annex C sets out how these Objectives
related to the more detailed deliverables within the strategy. A detailed and separate spreadsheet
provides further detail on the spend profile allocations, including market failure based rationales, outputs
and sources of match funding.
Based on guidance, our understanding is that Government will make an allocation of Technical Assistance
for ERDF and ESF available to LEPs to support the preparation and administration of the European Growth
Programme, and that this will be additional to the funding allocated to priorities in table 21. Allocations in
the table are made on that assumption, hence specific technical assistance figures are not included.
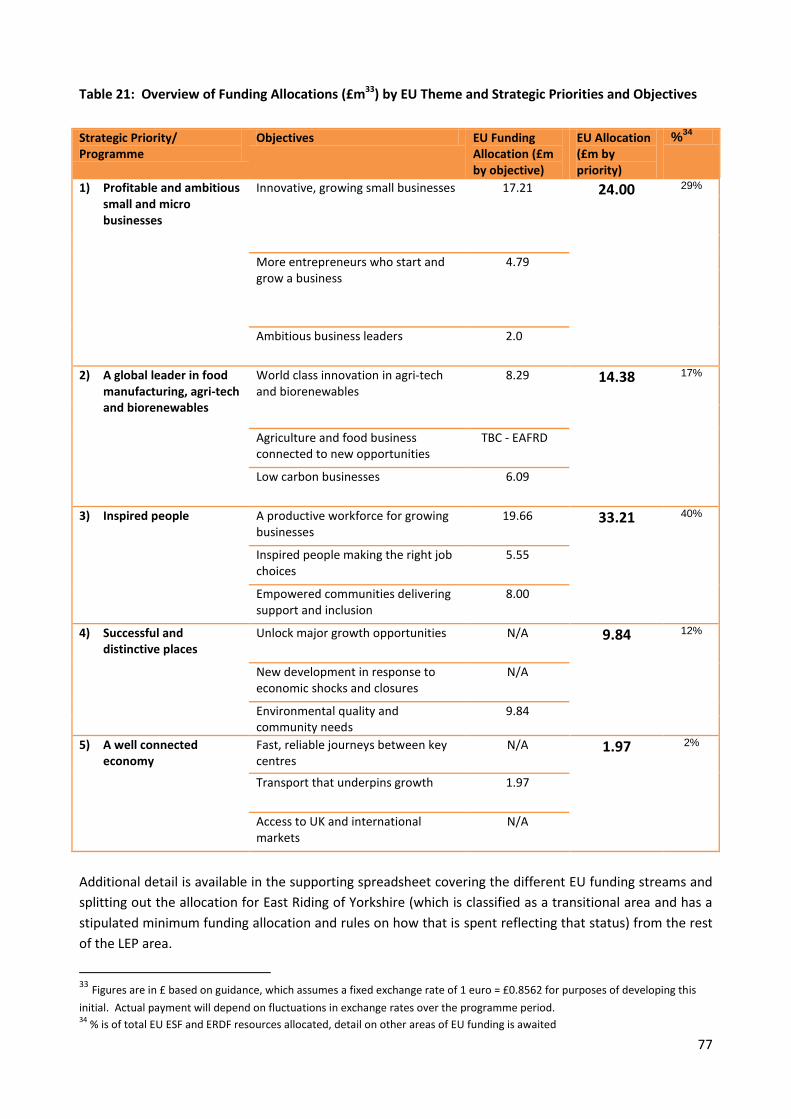
77
Table 21: Overview of Funding Allocations (£m33) by EU Theme and Strategic Priorities and Objectives
Strategic Priority/ Programme
Objectives EU Funding Allocation (£m by objective)
EU Allocation (£m by priority)
%34
1) Profitable and ambitious small and micro businesses
Innovative, growing small businesses 17.21 24.00 29%
More entrepreneurs who start and grow a business
4.79
Ambitious business leaders 2.0
2) A global leader in food manufacturing, agri-tech and biorenewables
World class innovation in agri-tech and biorenewables
8.29 14.38 17%
Agriculture and food business connected to new opportunities
TBC - EAFRD
Low carbon businesses 6.09
3) Inspired people A productive workforce for growing businesses
19.66 33.21 40%
Inspired people making the right job choices
5.55
Empowered communities delivering support and inclusion
8.00
4) Successful and distinctive places
Unlock major growth opportunities N/A 9.84 12%
New development in response to economic shocks and closures
N/A
Environmental quality and community needs
9.84
5) A well connected economy
Fast, reliable journeys between key centres
N/A 1.97 2%
Transport that underpins growth 1.97
Access to UK and international markets
N/A
Additional detail is available in the supporting spreadsheet covering the different EU funding streams and
splitting out the allocation for East Riding of Yorkshire (which is classified as a transitional area and has a
stipulated minimum funding allocation and rules on how that is spent reflecting that status) from the rest
of the LEP area.
33 Figures are in £ based on guidance, which assumes a fixed exchange rate of 1 euro = £0.8562 for purposes of developing this
initial. Actual payment will depend on fluctuations in exchange rates over the programme period. 34
% is of total EU ESF and ERDF resources allocated, detail on other areas of EU funding is awaited

78
Results/Outputs table
The spreadsheet contains details of expected outputs at a detailed level, including for the five
Priorities/Programmes and the Objectives within them. Table 22 sets out the total outputs across all five
programmes/priorities.
Table 22: Programme Level Outputs
Output Targets 2014-2020
ERDF Indicators Target
Number of enterprises receiving support. 2750
Number of new enterprises supported. 250
Number of jobs created 1650
Number of enterprises cooperating with research entities. 150
Number of enterprises supported to introduce new-to-the-market products. 40
Number of enterprises supported to introduce new-to-the-firm products. 50
Additional enterprises accessing ICT products and services including broadband. 100
Private investment matching public support to enterprises. Tbd
Number of companies supported with business resource efficiency. Tbd
Estimated GHG reductions. Tbd
Infrastructure site development including green infrastructure (hectares) Tbd
ESF Indicators
Target
Total number of participants (a. + b. + c.) 7450
a. Number of unemployed (including long-term unemployed) participants. 3050
b. Number of inactive participants. 1550
c. Number of employed (including self-employed) participants. 2850
Number of participants aged 15-24. 2000
EAFRD Indicators
Target
Jobs created in supported projects To be confirmed
Total participants trained To be confirmed

79
Community Led Local Development (CLLD) - Indicative Allocation
It is proposed that the maximum 5% (approx. £5m) of the YNYER ESIF allocation is attributed to CLLD
approach. The level for each Local Action Group (LAG) area will be determined through the development
of their Local Development Strategies. However the following provides a summary of how this allocation
may be distributed and the collaboration that will take place with other LEPs. This relates only to the
ESF/ERDF element of funding.
Potential LAGs Notes LEP Collaboration Indicative allocation
Yorkshire Dales
North York Moors
Wolds
Coastal (FLAG)
ESF/ERDF used to top up
LEADER/FLAG to cover market
towns/coastal towns.
£1m
Skipton New LCR £0.5m
Scarborough New - £1m
Selby/Goole/Thorne New LCR/SCR/Humber £0.5m
York New LCR £0.5m
Hull Fringe New Humber £0.5m
Northallerton/Thirsk New - £1m
The ‘Opt In’ model
The Opt-in model has been developed to allow Local Enterprise Partnerships to access both match funding
and administrative support from key national programmes whilst retaining influence and strategic control
of how services funded by European Structural and Investment Funds are delivered locally. In the delivery
of key activities set out in this Strategy it is proposed to draw on the opt-in offers of the following.
Strategic Priority/ Programme
Objectives Opt-in organisation EU Allocation (£m)
1) Profitable and ambitious small and micro businesses
Innovative, growing small businesses UKTI MAS
3.00 3.00
2) A global leader in food manufacturing, agri-tech and biorenewables
World class innovation in agri-tech and biorenewables
Link to MAS and UKTI opt-ins above
3) Inspired people A productive workforce for growing businesses
Skills Funding Agency
DWP
Big Lottery
20.00
5.00
2.00
Inspired people making the right job choices
Empowered communities delivering support and inclusion

80
7. Delivery and Governance
This section sets out overall governance principles and particular details required for managing European
funding programmes. Further details on governance, business planning, prioritisation and appraisal
mechanisms are covered in the supporting Local Growth Deal Implementation Plan.
Partnership principles The York, North Yorkshire and East Riding LEP Board brings together businesses, universities and local
authorities and will take overall responsibility for the strategy and driving progress. Delivery will be
through collaboration:
Where businesses already have plans to grow we will let them get on with the job. We will only
become involved where we can help to remove barriers to delivery or to enhance the scale and pace
of progress.
Where local partners have established shared goals and delivery mechanisms we will use these as a
foundation. We will concentrate on using our influence to ensure that priorities maximise economic
benefits and to secure resources for their implementation.
Where there are existing resources or organisations outside the LEP area that we can make good use
of, we will do so. That will involve collaborating with delivery organisations and neighbouring LEP
areas where they can cost effectively deliver for or with us.
The LEP will ensure the right skill sets exist and work with the most appropriate organisations to
deliver priorities.
Our preference is for using existing bodies to manage funds and day to day delivery where appropriate.
The role of the LEP and its governance structures will be to set the vision and outcomes which will guide
allocation of resources at a project level, and to ensure results meet expectations. The LEP Board will
approve investment funds at a strategic programme level and these programmes will then be managed
through Programme Board structures.
Several organisations who are delivering national programmes have offered a series of ‘Opt-Ins’. These
allow the LEP to benefit from the expertise and capacity of national providers whilst also providing match
funding required by EU funds. The LEP proposes to take advantage of the following opt-ins
UK Trade & Investment
Manufacturing Advisory Service
Skills Funding Agency
Big Lottery
DWP

81
Governance This strategy is owned and will be delivered by the region as a whole. The development of the strategy
involved a series of Task & Finish Groups of key regional players, with representatives from the public,
private and voluntary and community sectors, the higher education sector, skills and Local Strategic
Partnerships all of whom consulted widely within their constituent communities in order to develop a
consensus around priorities for action.
The Task Groups remit was to:
Agree the economic analysis
Determine the strategy, priorities and indicative actions
At a senior level the overall LEP Board will provide overall leadership and guide key decisions, including
the balance between themes/programmes and strategic review. Given its make up and expertise the LEP
Board will also play the role of a Programme Board leading on Business Growth elements of the strategy
(priorities 1 and 2). Two other Boards – a Skills Programme Board and an Infrastructure Programme Board
will feed into the LEP Board and lead on the relevant priorities. They will be provide local management
and ensure partners are engaged in delivery of the programme and monitoring of performance. The box
summarises the priorities that each Board will have ownership of and manage:
EU Priority Programme Name Programme Board
Overall Strategic direction and performance
management
LEP Board
Profitable and ambitious small and micro
business
A global leader in food manufacturing, agri-tech
and biorenewables
Inspired People Skills Programme Board
Successful and distinctive places Infrastructure Programme Board
A well connected economy
The following sub-sections provide a high level overview of key elements of our approach to governance.
Ensuring Openness and Transparency
An open approach is important to the LEP. Each Programme Board will develop an annual delivery plan
maintain a working relationship with a range of existing structures to ensure collaboration and
partnership working across the region. The annual delivery plan, agendas and minutes will be published
and made available electronically and via the LEP Website. Additionally an annual report will be published
detailing investments made and progress against objectives.
Membership and Decision Making
The three Boards are at different stages of establishment. The LEP Board is well established and is due to
be reviewed. The Skills Board is due to be established by the end of 2013, informed by proposals from a

82
Skills Task & Finish Group which reported in September 2013. The Infrastructure Board will combine
partnerships that already exists but needs to be formed in its own right. The final version of this strategy
will include membership of these Boards as an annex. Board membership will be reviewed on an annual
basis to ensure they remain effective and representative of the region.
Wherever possible decision will be made by consensus, however if this is not possible, a majority vote will
prevail with the Chair having the casting vote. Those with observer status at a meeting would n to be
eligible to vote.
Managing Conflict of Interest
All members of the LEP Thematic-boards will be required to submit details of all entities in which they
have an interest and to publicly declare any vested interest or conflict of interest in any discussion or
project which will be discussed within LEP Business. Where appropriate, members will be asked to leave
the room whilst discussions and decisions are made.
Technical Assistance
Technical assistance will be used to fulfil a secretariat role and to retain a strategic overview of the EU
Programmes, reporting to the LEP Board. It will also support delivery, intelligence and monitoring.
Project Approval and Procurement Processes This EU Structural Investment Funds Investment Framework integrates a range of EU funds. These are:
• European Regional Development Fund (ERDF)
• European Social Fund (ESF)
• European Agricultural Fund for Rural Development (EAFRD) and
• European Fisheries Fund (EFF)
Wherever possible we will use an integrated approach, bringing different strands of funding together to
achieve greatest impact and value for money. We will develop and agree clear appraisal mechanisms for
strategic assessment of proposals seeking to use Single Local Growth Fund or European funds. These will
be objective and robust, but also as simple and streamlined as possible and proportionate to the sum of
money involved.
Role of the LEP
Our role will be to advise on and endorse proposals; projects will then be submitted to the National
Managing Authority, who will ensure eligibility and make final funding decisions. We will retain a close
working relationship with the Managing Authority to ensure applications are eligible and of a high quality.

83
Delivery of EU funded projects will be a five stage process:
LEP role Stage 1 LEP Publish the annual delivery plan and commission activity
Stage 2 Local Appraisal
Managing
Authority role
Stage 3 National Appraisal
Stage 4 Contracting
LEP role Stage 5 Monitoring & evaluation
Publication of opportunities
The investment framework will be published along with an annual business plan detailing priority actions
and investments. Access to this information will be via a range of online and offline mechanisms and
detailed in the LEP communications plan.
Local Selection criteria
All investments will need to demonstrate they are responding to local need, contribute to the strategic
priorities of the LEP and cross cutting themes, and deliver value for money. The procedure for selecting
operations may take a variety of forms. For example:
Open bidding: where an open invitation is published for applications for the support of LEP priorities; or
Limited bidding: where a limited number of project sponsors are identified and invited to bid for the support
of operations or sets of targets or outputs that meet a specified priority; or
Non-competitive selection: where a single project sponsor (or perhaps two or more) is either selected as
appearing to be the only suitable and capable vehicle for delivering the desired outcomes or outputs and
they are invited to submit an application for financial assistance.
The LEP will ensure that all processes and criteria take full account of the need to secure compliance with
the requirements of the Public Procurement Regulations (which implement EC Public Procurement
Directives) or the need for suitable competitive tendering where the Regulations do not apply.
Principles and selection criteria will include those based on:
Strategic fit
Market Failure
Additionally
Outcomes & Outputs
Value for Money
Contribution to Cross Cutting Themes
Evidence of Private sector involvement
Evidence of Match funding
Environmental Standards
Submitting to the Managing Authority
Once approved by the LEP Programme Board, Technical Assistance will support applicants to develop a full
application for submission to the Managing Authority. The final decision on approval rests with the
Managing Authority and the contract for delivery will be between the Managing Authority and the
Applicant.

84
Process Overview
Loca
l Str
ate
gic
Fit
Man
agin
g A
uth
ori
ty
Go
vern
ance
& L
ega
l ch
eck
s
Commissioning Activity LEP Board commission
projects/programmes to deliver LEP ESIF Strategy
Local Strategic Fit
LEP Board assesses proposals against selection criteria
Full Application Support
LEP Local Growth Team supports succesful projects to
develop full applications
National Appriasal
Projects are submitted to the Managing Authority for full appraisal and contracting
Contracting Managing Authothority
contracts direct with the applicant
Monitoring
LEP will monitor progress, reporting performance and
impact
Investment Plan
Published

85
Financial Instruments
The region is considering the possibilities for using the instruments proposed by the Commission and
the European Investment Bank to support the implementation of the next programming period. In
particular, the programme may utilise ‘JEREMIE’ (Joint European Resources for Micro to Medium
Enterprises) to create a new source of capital for businesses that have difficulty accessing alternative
forms of finance. The Programme also contains the option of taking up the JESSICA (Joint European
Support for Sustainable Investment in Cities Areas) facility for urban and/or community development.
Capacity, management and pooling of resources
Given the context of stretched and reducing public finances, it is imperative that we put in place the most
cost effective structures possible to manage finances and strategy delivery. In practice, that will mean
making the most of existing resources, collaboration and a pooling approach to drive efficiencies.
Our collaborative approach will also ensure that bureaucracy in setting up and managing projects is
avoided where an existing initiative or structure can simply be extended instead.
Despite a lean and collaborative approach, there will be significant additional tasks that need to be
completed, for instance around strategy management and delivery, project development and appraisal,
monitoring and intelligence, and partnership development. The LEP is in the process of reviewing its
capacity and formulating proposals for appropriate structures which bring together or pool local resources
where this adds value. This will include consideration of how, for example, economic development
resources across local authority areas can work together as part of the LEP to deliver economies of scale,
drive collaboration, and to support LEP development at the same time as serving local needs.
Building Local Capacity
A local growth team will be created, bringing together partners from different organisations to deliver the
LEP strategy. The core secretariat will be funded via local authority contributions, Central government
funding and EU Technical Capacity.
EU Technical Assistance will be utilised to support the strategy development, management and delivery of
the EU Strategic Investment Framework.
Single Local
Growth Fund
Local Authority
Contributions
Local Growth Team
&
Feasibility / development funding
LEP Capacity
Fund
Technical
Capacity

86
Local Growth Team
Chief Operatig Officer
Business Growth
Business Support
Agri-Food & Biorenewables
Supply Chains
MAS
International
UKTI
Skills
Community Led Development
Business skills
SFA
Higher level Skills
Universities
Social Inclusion
BIG Lottery
Employability DWP
Infrastructure
Investment Manager
Local Authority Economic Dev
Housing Board
Devolved Local Transport Board
Policy, Research & Intelligence
Research Officer
BIS Local
DEFRA / RDPE
Homes Communities
Agency
Stakeholder
Support Comms Officer

87
Measuring success Outcome indicators will be measured to track success at a number of levels:
The overall outcome indicators we will measure are:
Jobs - (the output of jobs created and the outcome of employment rate)
GVA (the output of additional GVA and the outcome of GVA per capita)
Carbon emissions (the output of emissions reduced and outcome of CO2 emissions per capita)
For these outcomes we will seek:
a) Improved absolute performance year on year – i.e. numbers going in the right direction
b) Improved performance compared to national average
Additional output/results indicators are stipulated for each of the five priorities, and projects will need to
show their performance against output indicators set when the projects are developed and agreed. These
micro-level indicators are important to ensure cost effective results.
It is also important to see the big picture in monitoring our progress. Therefore we propose the following
ten ‘2020 tests’ as the best way of assessing whether we have made the difference we set out to. These
cover the breadth of the strategy including overall goals, the five priorities and cross cutting issues.
2020 Outcome Tests
1. Is GVA and productivity per head increasing and the gap to national average closing?
2. Is there a stronger culture of enterprise with more business starting and survival rates high?
3. Has there been a revolution in innovation, with far more firms accessing R&D and developing new
processes, products and markets – including exports?
4. Have the FERA/Sand Hutton expansion and BioVale proposals been delivered, with the LEP area a
genuine global leader in agri-tech and biorenewables?
5. Are employers more content with the quality of their workforces and of young recruits?
6. Have we increased our lead in high level skills compared to national average and are businesses
making good use of these skills?
7. Have the major developments set out been delivered and boosted the performance of local areas?
8. Are journey times faster and more reliable on key routes where improvements are prioritised and is
ICT access and uptake keeping pace with the levels expected in a modern economy?
9. Are employment rates back to pre-recessionary levels and high amongst all groups and areas, with
median incomes improving compared to national average?
10. Are carbon emission per capita falling at least as fast as nationally, with more businesses benefiting
from greater resource efficiency?

88
Metrics will be developed to allow progress against these tests to be tracked on an annual basis, including
new monitoring mechanisms where required. Progress will also be set in the content of wider health,
wellbeing and environmental goals to ensure it is part of a long term and sustainable approach.
Review and evaluation
Things are changing fast so we will combine resolve around our overall strategic direction and priorities
with flexibility to adapt to a changing context and new opportunities. We will ensure we have access to
good economic intelligence across the LEP area. And we will build evaluation and learning into projects of
significant scale, sharing and using the lessons learned to enhance the cost effectiveness of future
projects. We will review the overall strategy and progress towards outcomes on an annual basis, and
complete a full review of it as and when appropriate.
We recognise the value of evaluation and the benefits that stem from ongoing evaluation that is able to
track projects from early in their development onwards. We are committed to communicating the
learning from evaluation and across the programme more widely, and sharing learning both within and
beyond the LEP area so that economic development approaches can become ever more effective.

89
Annex A: Public sector partners involved in strategy development
The following public sector organisations were involved in developing the strategy:
Organisation Area of engagement
North Yorkshire County Council Engagement at leader, Chief Executive and Officer
level across the whole strategy with co-production of
the spatial elements with the partners.
City of York Council
East Riding of Yorkshire Council
Scarborough Borough Council
Harrogate District Council
Ryedale District Council
Craven District Council
Hambleton District Council
Richmondshire District Council
Selby District Council
North Yorkshire & York Housing Board Spatial investments and strategic sites
Homes & Communities Agency Strategic sites
Humber North Bank Partnership Coastal investment and key sectors
North Yorkshire Devolved Local Transport Body Transport
University of York & Yorkshire Universities Business Support, Agri Tech/Bio renewables and
Innovation
Skills Funding Agency Skills
North Yorkshire College Principles Skills
North York Moors National Park Rural, environmental, agriculture, business
engagement & community led development
Yorkshire Dales National Park Rural, environmental, agriculture, business
engagement & community led development
North Yorkshire Local Nature Partnership Environmental assets
North Yorkshire Flood Partnership Flood alleviation and environment
Environment Agency Flood alleviation and environment
Health & Wellbeing Board Social Inclusion
Big Lottery Social Inclusion and Opt In
Yorkshire Rural & Farming Network Rural, Business Support and Agri-tech
Department for Business Innovation & Skills Whole strategy
Department for Environment, Farming & Rural
Affairs
Whole strategy
Department for Transport Transport
Department for Communities & Local
Government
Whole strategy

90
Annex B: Cross Cutting Issues by Priority
The following subsections highlight how each of the five priorities take forward the cross cutting themes
of Sustainable Development, Social Inclusion and Equalities and the processes of Social Innovation and
Smart Specialisation.
Priority 1 - Profitable and ambitious small and micro businesses that are able to grow
By supporting business growth we will increase the stock of local jobs and reduce unemployment,
recognising that for most people the most important route to higher quality of life is through
employment. The social enterprise sector is rapidly growing, providing valuable employment along with
providing services to society. Our support programmes will be as relevant to social enterprises as for-
profit businesses, and may be delivered by social enterprises.
Our approach will hard-wire long term sustainability, given it will be driven by demand and build the
capacity of the business community. We recognise that most of the organisations providing support for
businesses have outlived several publically backed economic development approaches. Whilst our
approach majors on supporting growth, we also recognise the importance of boosting economic resilience
and safeguarding employment in some instances. We will also provide support for businesses providing
key public goods that the market alone will not deliver, such as resource efficiency activity and the high
quality landscape which is the foundation of our tourism economy.
Priority 2: A UK leader in food manufacturing, agriculture and biorenewables
This Priority will support environmental and low carbon goals through its promotion of biorenewable
rather than oil based products, low carbon energy more widely, and resource efficiency and renewable
energy in food and farm businesses. There are also good opportunities for locally driven and third sector
led initiatives to deliver low carbon goals, as well as employment and training opportunities within the
food manufacturing and agriculture and biorenewables industries, many of them spread across the LEP
area and including remote rural communities.
Priority 3: Skills for Business and Employability
Much of this activity is focused directly on employment and inclusion and will reach the most
disadvantaged and excluded people. A focus on business needs, on better matching supply and demand,
and building community capacity will help to ensure long term sustainability. Responding to low carbon
and other environmental skills needs will ensure activity contributes to environmental imperatives.
Priority 4: Investing in our places to unlock growth
Much of this activity is place based and so it is important that it is driven and supported by local interests
and communities. Community Led Local Development can deliver real benefits in securing local
ownership of projects and uniting efforts behind them, and we will establish structures and partnerships
that enable communities (including the third sector) to drive local development, such as through the
LEADER programme.
A sustainable approach will also seek high environmental standards in developments, including excellent
energy ratings for new buildings, minimisation of carbon emission and waste, and sustainable transport

91
and water management policies. Climate change adaptation needs (e.g. flood risks) should also be
factored into planning and development.
Priority 5 – A well connected economy
Transport is one of the main sources of carbon emissions in the LEP area, and so reducing these emissions
will be important to meeting emissions reduction goals and facilitating a sustainable approach. This is
challenging as emissions are highest in more remote areas where car dependence is higher and journeys
are often longer. In practice, the best potential for reducing traffic, congestion and emission will be
through:
Facilitating sustainable travel choices for short trips, especially in flatter areas (e.g. around York, the
A1/A19 corridor, parts of East Riding) where cycling, walking and public transport are all options
Enhancing public transport on key routes between the main centres of population
Using ICT and provision of local services/facilities to reduce the need to travel
Promoting car sharing, greener driving and lower polluting vehicles (including motorbikes/mopeds)
Ensuring non-car based options exist is also important for social inclusion reasons and for those without
access to a car, for instance those who cannot afford to drive or not able to. This will become more
important given an ageing population and the rising costs of motoring. Additionally, it is important to
promote workforce mobility and to enable young people especially to access work and training
opportunities. Innovative solutions are required and social innovation approaches may provide one route
to them.
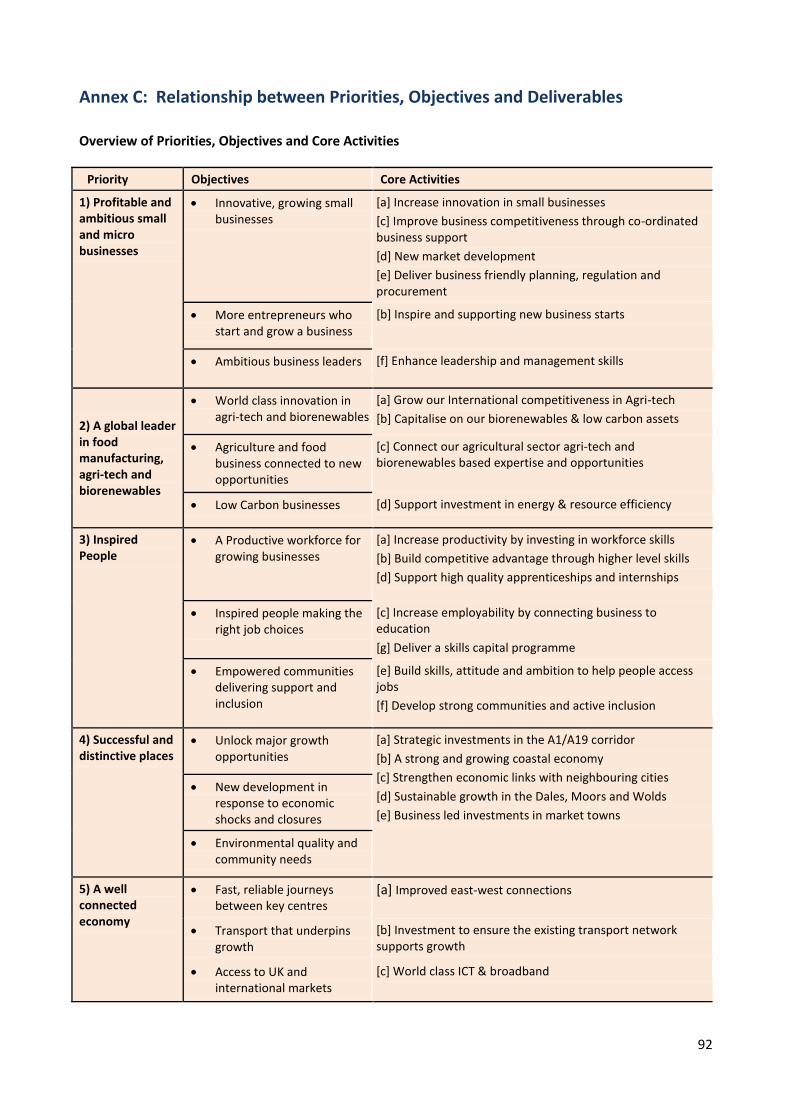
92
Annex C: Relationship between Priorities, Objectives and Deliverables
Overview of Priorities, Objectives and Core Activities
Priority Objectives Core Activities
1) Profitable and ambitious small and micro businesses
Innovative, growing small businesses
[a] Increase innovation in small businesses
[c] Improve business competitiveness through co-ordinated business support
[d] New market development
[e] Deliver business friendly planning, regulation and procurement
More entrepreneurs who start and grow a business
[b] Inspire and supporting new business starts
Ambitious business leaders [f] Enhance leadership and management skills
2) A global leader in food manufacturing, agri-tech and biorenewables
World class innovation in agri-tech and biorenewables
[a] Grow our International competitiveness in Agri-tech
[b] Capitalise on our biorenewables & low carbon assets
Agriculture and food business connected to new opportunities
[c] Connect our agricultural sector agri-tech and biorenewables based expertise and opportunities
Low Carbon businesses [d] Support investment in energy & resource efficiency
3) Inspired People
A Productive workforce for growing businesses
[a] Increase productivity by investing in workforce skills
[b] Build competitive advantage through higher level skills
[d] Support high quality apprenticeships and internships
Inspired people making the right job choices
[c] Increase employability by connecting business to education
[g] Deliver a skills capital programme
Empowered communities delivering support and inclusion
[e] Build skills, attitude and ambition to help people access jobs
[f] Develop strong communities and active inclusion
4) Successful and distinctive places
Unlock major growth opportunities
[a] Strategic investments in the A1/A19 corridor
[b] A strong and growing coastal economy
[c] Strengthen economic links with neighbouring cities
[d] Sustainable growth in the Dales, Moors and Wolds
[e] Business led investments in market towns
New development in response to economic shocks and closures
Environmental quality and community needs
5) A well connected economy
Fast, reliable journeys between key centres
[a] Improved east-west connections
Transport that underpins growth
[b] Investment to ensure the existing transport network supports growth
Access to UK and international markets
[c] World class ICT & broadband
Related Documents