z Strategic and Financial Analysis of Auriga Industries A/S (Strategisk og finansiel analyse af Auriga Industries A/S) MSc Economics and Business Administration Master Thesis Written by: Michal Nielsen – MSc FIR Klaus Thøger Pedersen – MSc ASC Number of pages: 117 Number of characters: 272,626 Supervisor: Kristian Sørensen Hand-in date: 17.05.2016

Welcome message from author
This document is posted to help you gain knowledge. Please leave a comment to let me know what you think about it! Share it to your friends and learn new things together.
Transcript

z
Strategic and Financial Analysis of Auriga Industries A/S
(Strategisk og finansiel analyse af Auriga Industries A/S)
MSc Economics and Business
Administration
Master Thesis
Written by:
Michal Nielsen – MSc FIR
Klaus Thøger Pedersen – MSc ASC
Number of pages: 117
Number of characters: 272,626
Supervisor: Kristian Sørensen
Hand-in date: 17.05.2016
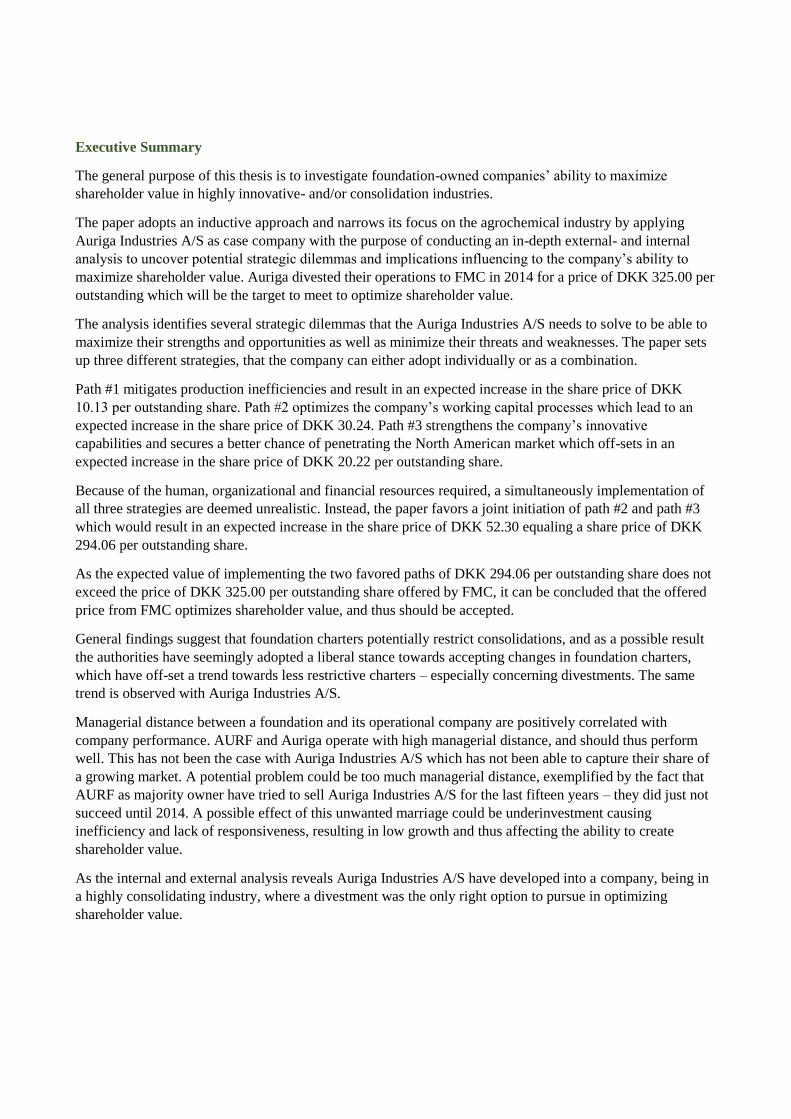
Executive Summary
The general purpose of this thesis is to investigate foundation-owned companies’ ability to maximize
shareholder value in highly innovative- and/or consolidation industries.
The paper adopts an inductive approach and narrows its focus on the agrochemical industry by applying
Auriga Industries A/S as case company with the purpose of conducting an in-depth external- and internal
analysis to uncover potential strategic dilemmas and implications influencing to the company’s ability to
maximize shareholder value. Auriga divested their operations to FMC in 2014 for a price of DKK 325.00 per
outstanding which will be the target to meet to optimize shareholder value.
The analysis identifies several strategic dilemmas that the Auriga Industries A/S needs to solve to be able to
maximize their strengths and opportunities as well as minimize their threats and weaknesses. The paper sets
up three different strategies, that the company can either adopt individually or as a combination.
Path #1 mitigates production inefficiencies and result in an expected increase in the share price of DKK
10.13 per outstanding share. Path #2 optimizes the company’s working capital processes which lead to an
expected increase in the share price of DKK 30.24. Path #3 strengthens the company’s innovative
capabilities and secures a better chance of penetrating the North American market which off-sets in an
expected increase in the share price of DKK 20.22 per outstanding share.
Because of the human, organizational and financial resources required, a simultaneously implementation of
all three strategies are deemed unrealistic. Instead, the paper favors a joint initiation of path #2 and path #3
which would result in an expected increase in the share price of DKK 52.30 equaling a share price of DKK
294.06 per outstanding share.
As the expected value of implementing the two favored paths of DKK 294.06 per outstanding share does not
exceed the price of DKK 325.00 per outstanding share offered by FMC, it can be concluded that the offered
price from FMC optimizes shareholder value, and thus should be accepted.
General findings suggest that foundation charters potentially restrict consolidations, and as a possible result
the authorities have seemingly adopted a liberal stance towards accepting changes in foundation charters,
which have off-set a trend towards less restrictive charters – especially concerning divestments. The same
trend is observed with Auriga Industries A/S.
Managerial distance between a foundation and its operational company are positively correlated with
company performance. AURF and Auriga operate with high managerial distance, and should thus perform
well. This has not been the case with Auriga Industries A/S which has not been able to capture their share of
a growing market. A potential problem could be too much managerial distance, exemplified by the fact that
AURF as majority owner have tried to sell Auriga Industries A/S for the last fifteen years – they did just not
succeed until 2014. A possible effect of this unwanted marriage could be underinvestment causing
inefficiency and lack of responsiveness, resulting in low growth and thus affecting the ability to create
shareholder value.
As the internal and external analysis reveals Auriga Industries A/S have developed into a company, being in
a highly consolidating industry, where a divestment was the only right option to pursue in optimizing
shareholder value.
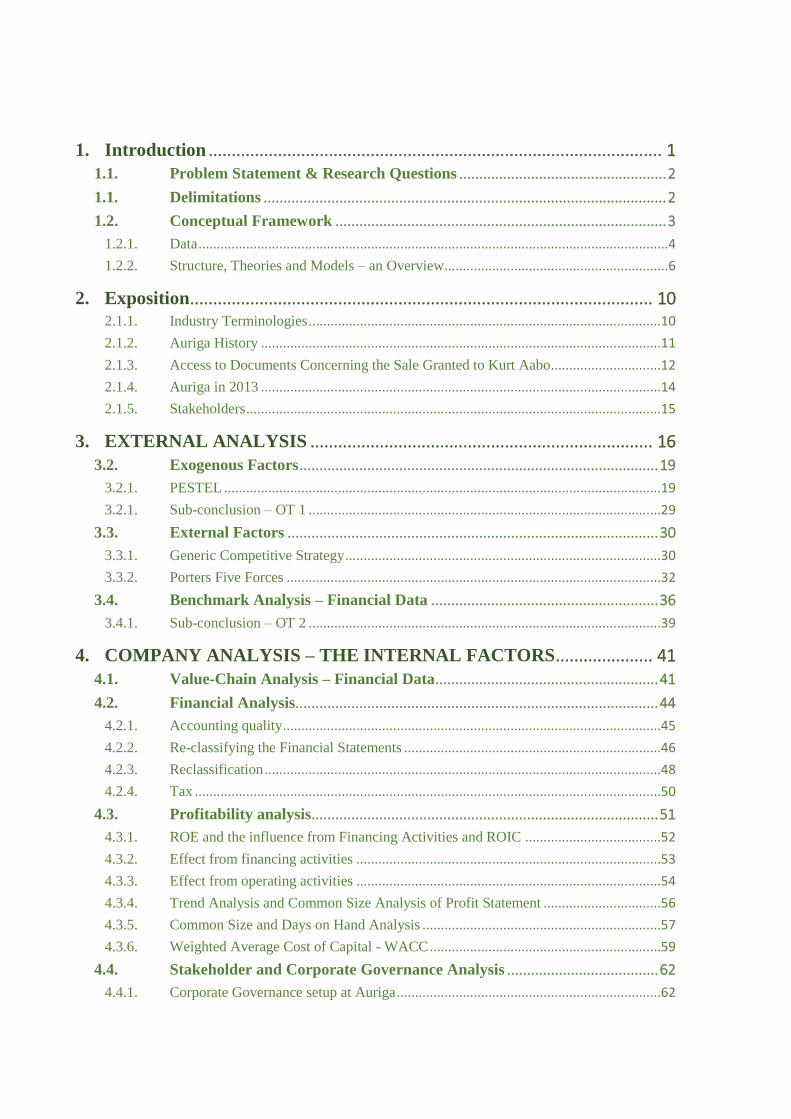
1. Introduction .................................................................................................. 1
1.1. Problem Statement & Research Questions .................................................... 2
1.1. Delimitations ..................................................................................................... 2
1.2. Conceptual Framework ................................................................................... 3
1.2.1. Data ................................................................................................................................ 4
1.2.2. Structure, Theories and Models – an Overview ............................................................. 6
2. Exposition .................................................................................................... 10
2.1.1. Industry Terminologies ................................................................................................10
2.1.2. Auriga History .............................................................................................................11
2.1.3. Access to Documents Concerning the Sale Granted to Kurt Aabo ..............................12
2.1.4. Auriga in 2013 .............................................................................................................14
2.1.5. Stakeholders .................................................................................................................15
3. EXTERNAL ANALYSIS .......................................................................... 16
3.2. Exogenous Factors .......................................................................................... 19
3.2.1. PESTEL .......................................................................................................................19
3.2.1. Sub-conclusion – OT 1 ................................................................................................29
3.3. External Factors ............................................................................................. 30
3.3.1. Generic Competitive Strategy ......................................................................................30
3.3.2. Porters Five Forces ......................................................................................................32
3.4. Benchmark Analysis – Financial Data ......................................................... 36
3.4.1. Sub-conclusion – OT 2 ................................................................................................39
4. COMPANY ANALYSIS – THE INTERNAL FACTORS ..................... 41
4.1. Value-Chain Analysis – Financial Data........................................................ 41
4.2. Financial Analysis ........................................................................................... 44
4.2.1. Accounting quality .......................................................................................................45
4.2.2. Re-classifying the Financial Statements ......................................................................46
4.2.3. Reclassification ............................................................................................................48
4.2.4. Tax ...............................................................................................................................50
4.3. Profitability analysis ....................................................................................... 51
4.3.1. ROE and the influence from Financing Activities and ROIC .....................................52
4.3.2. Effect from financing activities ...................................................................................53
4.3.3. Effect from operating activities ...................................................................................54
4.3.4. Trend Analysis and Common Size Analysis of Profit Statement ................................56
4.3.5. Common Size and Days on Hand Analysis .................................................................57
4.3.6. Weighted Average Cost of Capital - WACC ...............................................................59
4.4. Stakeholder and Corporate Governance Analysis ...................................... 62
4.4.1. Corporate Governance setup at Auriga ........................................................................62

4.4.2. Corporate Governance and Stakeholder analysis ........................................................66
4.5. Risk Management Analysis ........................................................................... 73
4.5.1. Theoretical Terms and Aspects on Risk ......................................................................73
4.5.2. Risk in a Corporate Setting ..........................................................................................74
4.5.3. General Risks in Auriga ...............................................................................................77
4.5.4. Strategic Risks Management Analysis.........................................................................79
4.5.5. Risk Management Effectiveness ..................................................................................80
4.6. Sub-conclusion – Internal Factors (SW) ...................................................... 85
5. STRATEGIC ASSESSMENT ................................................................... 88
5.1. SWOT .............................................................................................................. 88
5.1.1. Opportunities ...............................................................................................................88
5.1.2. Threats .........................................................................................................................89
5.1.1. Strengths ......................................................................................................................89
5.1.2. Weaknesses ..................................................................................................................90
6. STRATEGIC DILEMMAS ....................................................................... 91
6.1. Setting Value Drivers ..................................................................................... 91
6.2. TOWS Matrix ................................................................................................. 93
7. FORECASTING & SCENARIO ANALYSIS ........................................ 95
7.1. Setting Up the Strategic Paths ....................................................................... 95
7.1.1. Free cash flow (FCFF/FCFE) ......................................................................................95
7.1.2. DCF-model – Point of Origin Scenario .......................................................................96
7.1.3. The Paths - Basic Assumptions ...................................................................................98
7.2. Paths to Optimize Auriga as an Autonomous Entity .................................. 98
7.2.1. Path #1 – Update Production Facilities to Improve Efficiency ...................................98
7.2.2. Path #2 – Initiate Projects to Optimize Working Capital Management .....................101
7.2.3. Path #3 – Joint Venture/Collaboration with US Based Chemtura .............................104
7.2.4. Path #4 - Combining the Paths ..................................................................................108
7.3. Assessment of divestment relative to Auriga’s strategic opportunities ... 109
8. Discussion .................................................................................................. 112
9. Conclusion ................................................................................................. 116
10. List of Litterature: ................................................................................... 118
10.1. Books, Articles and Scientific Research Papers ........................................ 118
10.2. Annual Reports: ........................................................................................... 122
10.3. Homepages .................................................................................................... 123
11. List of Tables, Figures and Graphs ........................................................ 126

12. Appendix ................................................................................................... 128
1
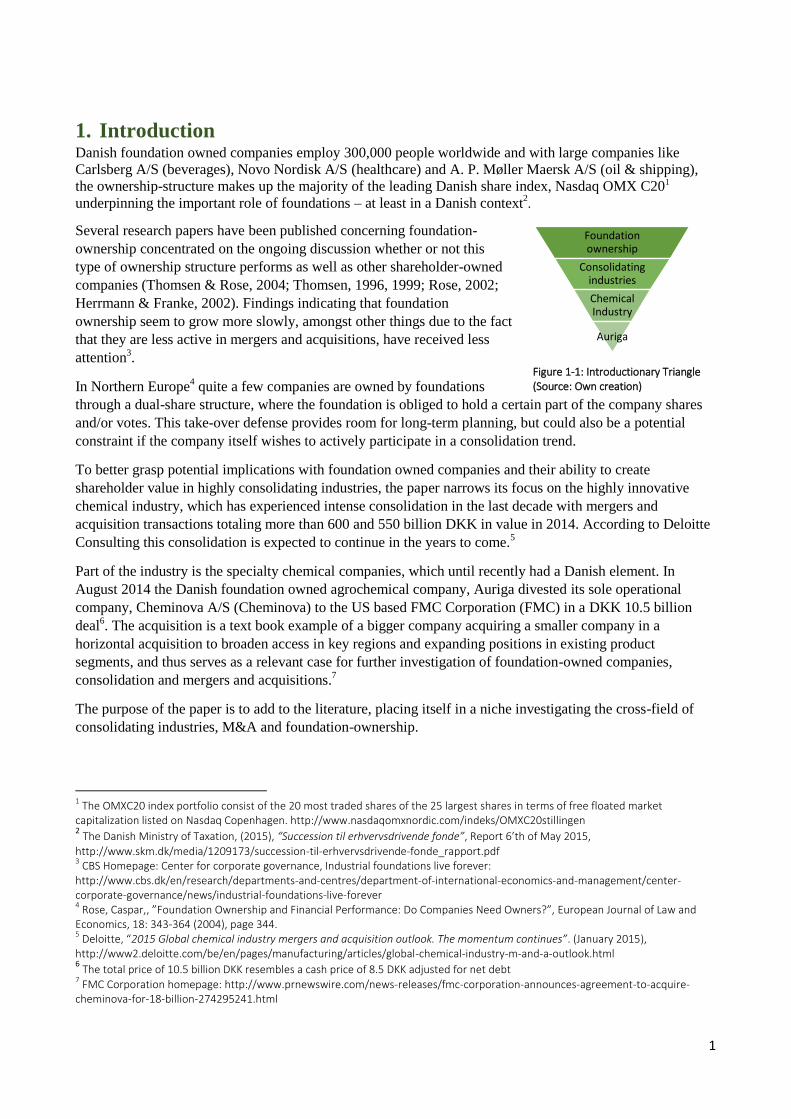
Figure 1-1: Introductionary Triangle (Source: Own creation)
1. Introduction Danish foundation owned companies employ 300,000 people worldwide and with large companies like
Carlsberg A/S (beverages), Novo Nordisk A/S (healthcare) and A. P. Møller Maersk A/S (oil & shipping),
the ownership-structure makes up the majority of the leading Danish share index, Nasdaq OMX C201
underpinning the important role of foundations – at least in a Danish context2.
Several research papers have been published concerning foundation-
ownership concentrated on the ongoing discussion whether or not this
type of ownership structure performs as well as other shareholder-owned
companies (Thomsen & Rose, 2004; Thomsen, 1996, 1999; Rose, 2002;
Herrmann & Franke, 2002). Findings indicating that foundation
ownership seem to grow more slowly, amongst other things due to the fact
that they are less active in mergers and acquisitions, have received less
attention3.
In Northern Europe4 quite a few companies are owned by foundations
through a dual-share structure, where the foundation is obliged to hold a certain part of the company shares
and/or votes. This take-over defense provides room for long-term planning, but could also be a potential
constraint if the company itself wishes to actively participate in a consolidation trend.
To better grasp potential implications with foundation owned companies and their ability to create
shareholder value in highly consolidating industries, the paper narrows its focus on the highly innovative
chemical industry, which has experienced intense consolidation in the last decade with mergers and
acquisition transactions totaling more than 600 and 550 billion DKK in value in 2014. According to Deloitte
Consulting this consolidation is expected to continue in the years to come.5
Part of the industry is the specialty chemical companies, which until recently had a Danish element. In
August 2014 the Danish foundation owned agrochemical company, Auriga divested its sole operational
company, Cheminova A/S (Cheminova) to the US based FMC Corporation (FMC) in a DKK 10.5 billion
deal6. The acquisition is a text book example of a bigger company acquiring a smaller company in a
horizontal acquisition to broaden access in key regions and expanding positions in existing product
segments, and thus serves as a relevant case for further investigation of foundation-owned companies,
consolidation and mergers and acquisitions.7
The purpose of the paper is to add to the literature, placing itself in a niche investigating the cross-field of
consolidating industries, M&A and foundation-ownership.
1 The OMXC20 index portfolio consist of the 20 most traded shares of the 25 largest shares in terms of free floated market
capitalization listed on Nasdaq Copenhagen. http://www.nasdaqomxnordic.com/indeks/OMXC20stillingen 2 The Danish Ministry of Taxation, (2015), “Succession til erhvervsdrivende fonde”, Report 6’th of May 2015,
http://www.skm.dk/media/1209173/succession-til-erhvervsdrivende-fonde_rapport.pdf 3 CBS Homepage: Center for corporate governance, Industrial foundations live forever:
http://www.cbs.dk/en/research/departments-and-centres/department-of-international-economics-and-management/center-corporate-governance/news/industrial-foundations-live-forever 4 Rose, Caspar,, ”Foundation Ownership and Financial Performance: Do Companies Need Owners?”, European Journal of Law and
Economics, 18: 343-364 (2004), page 344. 5 Deloitte, “2015 Global chemical industry mergers and acquisition outlook. The momentum continues”. (January 2015),
http://www2.deloitte.com/be/en/pages/manufacturing/articles/global-chemical-industry-m-and-a-outlook.html 6 The total price of 10.5 billion DKK resembles a cash price of 8.5 DKK adjusted for net debt
7 FMC Corporation homepage: http://www.prnewswire.com/news-releases/fmc-corporation-announces-agreement-to-acquire-
cheminova-for-18-billion-274295241.html
Foundation ownership
Consolidating industries
Chemical Industry
Auriga

2
1.1. Problem Statement & Research Questions8
With the stage set in the introduction the paper will investigate foundation-owned companies’ ability to
maximize shareholder value in highly innovative- and/or consolidating industries.
To structure the investigation, the paper will answer the following research questions:
I. Based on exogenous, external and internal factors assess which strategic dilemmas are facing Auriga
and thus alternative strategic options for the company?
II. Investigate if the divestment maximized shareholder value after the takeover?
III. Deduce possible structural changes and governance implications which can be learned from the
horizontal acquisition of a foundation owned company?
1.1. Delimitations This section will explain the boundaries of the paper.
The focal point of the paper will be on issues relating to the target less so deal with internal issues with the
acquirer.
Because Auriga is a foundation owned company, touching upon governance issues is key, and this topic will
therefore be an important part of the paper. Issues related to the legal acceptance of the change in the
foundational object of clause will not be addressed as this subject is more suitable for a paper focusing on
legal issues rather than this paper focusing on economic, financial and governance issues.
Figure 1-2: Focus of the Paper (Source: Own creation)
The environmental and competitive environment analyses will only cover key points concerning the different
markets and regions. Auriga operates in more than 25 countries divided into 4 regions and a detailed
description of each country/region is not possible, both due to information not publicly disclosed and the
formal- and time constraints regarding the paper.
Production methods and products are not described in detail – both since information is not disclosed and
because of the industry being rather complex which would involve specialized knowledge with both authors
and readers.
Some of the material and references used is originally published in Danish. Texts and citations have been
translated to the best of our ability, and if any details, contrary to expectations has been lost in translation
process it is the Danish text which is applicable.
The time period for most analyses in this paper is 8 to 10 years, as it provides a reasonable period for
analyzing trends. Expanding the ex-post period analyzed is not believed to provide further value to the ex-
ante projections that will be conducted later in the paper.
8 Ankersborg, Vibeke & Watt, Merete, “Tænk selv! Videnskabsteori og undersøgelsesdesign i samfundsvidenskab” (2007), Forlaget
Politiske Studier, page 9. Model used for developing the problem.

3
The last full-year Auriga owned Cheminova was 2013, why this is also the “cut-off year” of the paper. This
means that the paper to a high degree uses historical information, and that information and events since then
could potentially have influenced/motivated the description, analysis and conclusions of this paper.
It could be argued that the paper should be written in past-tense but it is written in present-time, as 2013 is
the “cut-off year” in all instances.
1.2. Conceptual Framework A global company is a complex entity and
creating a holistic picture, incorporating the
external business environment as well as the
company’s internal state, framework and
processes is a coherent process, bridging from
market and industry understanding to
organizational setup and internal financial
analysis. As a result, the paper is compelled to
draw on and make use of a wide variety of
models and theoretical approaches of
structural, managerial and financial origin.
Together, the different elements create the
focal point that enables the paper to answer
the problem.
The paper will adopt an inductive and
positivistic mindset as the aim of the paper is
to use a case company for as a reference for
potential general implications with foundation-owned companies operating in highly innovative- and/or
consolidating sectors. This is done mainly through observable and quantifiable findings.
The use of a case-company enables the paper to center the analysis in the framework where the value-
creation takes place, and provides the opportunity to conduct a qualitative and quantitative in-depth study
with the purpose of uncovering internal processes and implications that potentially could affect a company’s
ability to create shareholder value.
The methodology will be dynamic and explorative, with a time-frame that mainly covers the ex-post period
from 2003 – 2013, though later sections of the paper also conducts ex-ante projections beyond 2013.
The paper will take the overall perspective of all shareholders, and answer the research questions from the
viewpoint of this particular group of stakeholders.
It is important to note, that the case company as a specific entity has unique features, but also that there could
be other potential case companies, which just as well could have served the same purpose – both in regards
to a specific industry as well as a specific company.
Auriga has been chosen as case-company because it exists in an industry which is both highly R&D focused
and that experiences a high degree of consolidation. Both are elements that put pressure on cash flow and
liquidity which can be contradictory with charters and capabilities of foundations.
Another reason for choosing Auriga as case-company is that the board of directors and the shareholders have
deemed the divestment to FMC as the transaction that maximizes shareholder value and conversely that
Auriga did not have the relevant potential to continue as an independent company.
Figure 1-3: Model and Theories Applied to Create Focal
Point (Source: Own creation)
4
The external approach – hereunder the use of a large industry sample, will be used to develop a quantitative
perspective on the agrochemical industry in which the case-company operates.
The paper applies both quantitative and qualitative measures and thus constructs a framework of a
combination perspective. Data and findings will continuously be visualized by the use of graphs, tables and
figures, and presented for the reader in the sections where the information is most relevant.
Put together, the scope of the paper is to combine theories and methods that best fit the constraint of the
paper and the information and data available. To avoid an endless discloser of models and theories applied at
this point, each relevant theory and model is described in the chapter where it is applied.
The structure is visualized in figure 1.4.
To clarify the conceptual framework used in the problem statement a brief description the three main
concepts is listed below.
Maximizing shareholder value: Creating the highest possible risk adjusted return in monetary value to
individuals or organizations possessing part of the company. On a more operational level shareholder value
can be defined as Market Value Added (MVA), Total Value ex Total Capital, Net Present Value or Present
Value of Future EVA9. This paper will adopt a less restrictive definition and define shareholder value as the
present value of free cash flows to the firm, deducted net interest bearing debt, equaling estimated value of
outstanding shares or the value per share when deducting the number of outstanding shares.
Highly innovative industries: The conceptual framework of highly innovative industries can be measured
in many different ways. The paper adopts the wide OECD definition on innovation: “An innovation is the
implementation of a new or significantly improved product (good or service), or process, a new marketing
method, or a new organizational method in business practices, workplace organization or external
relations”10
.
The main criterion in this paper is that a large amount of resources in the form of monetary value is required
to maintain or increase a company’s position in the industry. How this monetary value is specifically
distributed or used is not addressed. When e.g. measuring innovative capabilities in the peer analysis, R&D
spending is solely used as a reference point for the degree of resources allocated to the matter.
Highly consolidating industries: The main criterion when defining a consolidating industry is that the
industry is characterized by an ongoing transition from many small companies to a few larger companies.
This change forces companies within the industry to either find a niche, be the acquirer or be targeted for
acquisitions. In highly consolidating industries, economics of scale11
is of importance, and mergers and
acquisitions are therefore a necessity for the long-term survival.
1.2.1. Data
The data used in the paper is primarily of quantitative character, and can be divided into two overall groups –
detailed accounting data on Auriga, and more wide-spread financial data on the agrochemical industry as a
whole. Each group of data will be commented on in the following – both in regards to gathering and
processing the data as well as checking for validity and reliability.
9 Stuart III, G. Bennet, “EVA, Fact and Fantasy”, Stern Stewart & Co., BankAmerica – Journal of Applied Corporate Finance, page 72
and 74(Materialesamling efterår 2014 – Køb og salg af virksomheder, Cand. Merc. R80, Bind 1, Academic books page 130 and 132 10
OECD, “Guidelines for Collecting and Interpreting Innovation Data”, (2005) OECD Publishing, third edition - page 46. http://www.oecd-ilibrary.org/docserver/download/9205111e.pdf?expires=1462037616&id=id&accname=guest&checksum=20B46D37F9B2E326BA64F4C45ACD178B 11
Brealey, Myers & Allen, “Principles of Corporate Finance”, Global Edition, McGraw Hill Irwin, ISBN:978-0-07-131417-6 – page.823.
5
1.2.1.1. Specific Auriga Data
The detailed accounting data on Auriga where extracted from Orbis International which is a database on 200
million companies across the globe powered by Bureau van Dijk12
. Setting up the data for further analysis,
the data was spot checked against annual reports downloaded from the Auriga company website. As the
sample was short of several items, these items were found in the annual reports and added to the sample
manually.
The data was subsequently processed in Excel by the use of financial analysis, trend analysis, common size
analysis etc. to uncover the company’s financial and operational abilities.
It is acknowledged that e.g. annual reports come with a certain degree of subjectivity, and that companies to
some degree uses “fabrication”13
in order to produce a certain picture of the company. But as the rules
regulating financial statements from listed companies are rather fierce, it is believed that the data in general
are of high quality, providing a “true and fair view” of the current state.
It is believed that the data is of as high quality as possible, and that the results produced from the data is
reliable, and valid as another paper applying the same data would reach similar results.
1.2.1.2. Industry Data
The industry data sample was extracted from Reuters Datastream Professional14
for the purpose of
establishing a picture of the characteristics and levels of the different financial ratios in the agrochemical
industry
The initial sample consisted of a total of 54 companies within the agrochemical industry. To secure a high
degree of consistency, companies where Datastream was not able to provide a complete set of data, both in
regards to the time period and the different items, where excluded from the sample. A total of 27 companies
where deducted as there were no financial data available at all – mostly because companies being either
privately or state owned. Another 11 companies were deducted due to incomplete financial data, resulting in
a net sample of a total of 16 companies. Of the 16 companies 6 are categorized as tier 1 companies, and 10 as
tier 2 companies – the latter including Auriga.
The sample has been processed in Excel to calculate a wide variety of financial ratios covering both the
individual year as well as median numbers for both Auriga, tier 1 companies, tier 2 companies and the
industry as a whole. The Median has been applied to meet skewness and outliers in the data. When
processing the data, cross-references have been performed to avoid mistakes in calculating the different
ratios.
Assessing the size of the sample, it is believed to be large enough, to be able to show relevant industry trends
relative to Auriga, and the scrupulous work processing the data secures a high validity measuring what the
data is supposed to measure.
The sample is also subject to the calculation of both descriptive statistics and correlations. From a statistical
point of view, the paper could have wished for a larger sample, as a sample of 11 data points on each
company and a total of 176 data points for the entire industry, a degree of bias cannot be excluded.
12
Bureau Van Dijk homepage: http://www.bvdinfo.com/en-gb/home 13
Skærbæk, Peter, (2005) “Annual Reports as Interaction Devices: The Hidden Construction of Mediated Communication”, Financial Accountability & Management, 21 (4), November 2005, 0267-4424. 14
Thomson Reuters Datastream Professional is a powerful tool that integrates economic research and strategy with cross assets analysis to seamlessly bring together top down and bottom up in one single integrated application, https://forms.thomsonreuters.com/datastream/

6
Other sources of information are written literature on different economic subjects - e.g. books and working
papers published in well reputed financial journals. Also homepages will be applied, but it goes for both
sources of data that a sound source of criticism will be applied, to secure reliable conclusions. The use of
newspaper articles will be minimized, but cannot be completely avoided.
The next section will provide an overview of the further developments and structure of the paper.
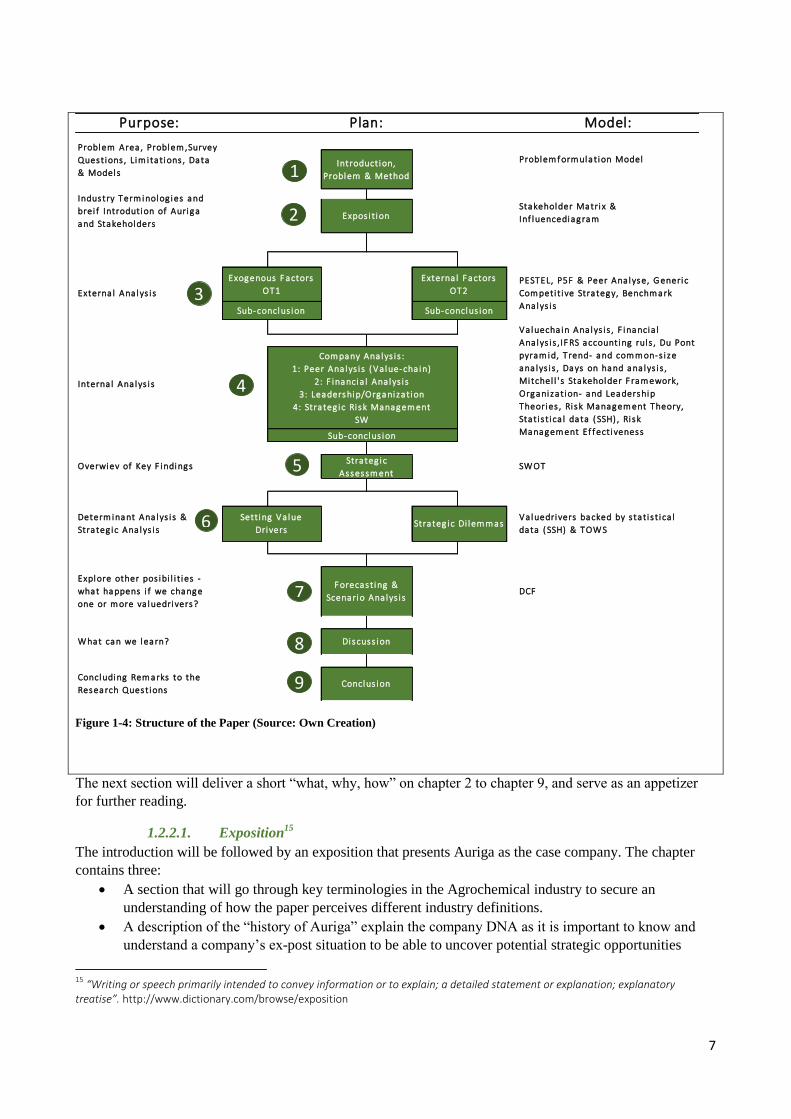
1.2.2. Structure, Theories and Models – an Overview
The paper consists of nine chapters with one or more sub-sections plus chapter 10 to chapter 12 with
formalia, and makes use of a top down approach where the environment analyzed continuously narrows in.
The left-side of the model explains the purpose of each chapter, the mid-section visualized the plan/structure
of the chapter, and the right-side lists the tools used for solving the purpose of the specific chapter.
7
Figure 1-4: Structure of the Paper (Source: Own Creation)
The next section will deliver a short “what, why, how” on chapter 2 to chapter 9, and serve as an appetizer
for further reading.
1.2.2.1. Exposition15
The introduction will be followed by an exposition that presents Auriga as the case company. The chapter
contains three:
A section that will go through key terminologies in the Agrochemical industry to secure an
understanding of how the paper perceives different industry definitions.
A description of the “history of Auriga” explain the company DNA as it is important to know and
understand a company’s ex-post situation to be able to uncover potential strategic opportunities
15
“Writing or speech primarily intended to convey information or to explain; a detailed statement or explanation; explanatory treatise”. http://www.dictionary.com/browse/exposition
Expos i t ionStakeholder Matri x &
Inf luencediagram
Purpose: Plan: Model:
Introduction,
Problem & Method
Problem Area , Problem ,Survey
Questions , Lim i tations , Data
& Models
Industry Term inolog ies and
brei f Introdution of Auriga
and Stakeholders
Problem f orm ulation Model
Conclus ion
Va luedrivers backed by s ta ti s t i ca l
data ( SSH) & TOW S
DCF
Strateg ic
Assessm entSW OT
Strateg ic Di lem m as
F orecasting &
Scenario Ana lys i s
Di scuss ion
Sub-conclus ion
PESTEL, P5F & Peer Ana lyse, G eneric
Com peti t i ve Strategy, Benchm ark
Ana lys i s
Exogenous F actors
OT1
Externa l F actors
OT2
Sub-conclus ion
Com pany Ana lys i s :
1: Peer Ana lys i s ( Va lue-cha in)
2: F inancia l Ana lys i s
3: Leadership/Organization
4: Stra teg ic Ri sk Managem ent
SW
Valuecha in Ana lys i s , F inancia l
Ana lys i s , IF RS accounting rul s , Du Pont
pyram id, Trend- and com m on-s i ze
ana lys i s , Days on hand ana lys i s ,
Mi tchel l ' s Stakeholder F ram ework,
Organization- and Leadership
Theories , Ri sk Managem ent Theory,
Sta ti s t i ca l data ( SSH) , Ri sk
Managem ent Ef f ecti veness
Concluding Rem arks to the
Research Questions
Externa l Ana lys i s
Sub-conclus ion
Interna l Ana lys i s
Overwiev of Key F indings
Determ inant Ana lys i s &
Strateg ic Ana lys i s
Sett ing Va lue
Drivers
Explore other pos ibi l i t ies -
what happens i f we change
one or m ore va luedrivers?
W hat can we learn?
1
2
3
4
5
6
7
8
9
8
An overview of the “2013 Auriga” at the time for the divestment including a stakeholder overview,
to provide basic information on the company and the gallery of characters involved.
External Analysis – Exogenous and External factors
The idea of this chapter is to define the different factors affecting the company. The section will start out
with a description of the different markets in which Auriga operates, subsequently followed by an analysis of
bot exogenous and external factors, by the use of the following theories and models:
PESTEL analysis, to uncover exogenous elements affecting the industry as a whole. As there are
many macro factors influencing a global company, the PESTEL framework will categorize and
identify key strategic elements to take into consideration in later stages of the paper when identifying
trends that will make its way into the competitive environment16
.
Porters Generic strategy to identify Auriga’s current strategic path
The Porters Five Forces (P5F) framework has been chosen because it uncovers the competitive
environment and the degree of attractiveness of being part of the agrochemical industry. Besides the
apparent benefit of casting light on the competitive environment, it is stated that at least parts of the
framework are present in every business analysis, as well as the competitive environment is believed
to have great impact on a company’s performance.17
The P5F will be complemented with an industry peer-analysis on financial ratios that will be
calculated as averages over an eleven-year period and at the same time divided into the two main
tiers in the industry – tier 1 and tier 2. The purpose is to uncover at what levels the different piers
operate and to cast light on potential differences, if any. This information will be helpful in
evaluating key figures in later chapters of the paper.
Each of the two sections will be rounded off with a sub-conclusion named OT 1 and OT 2 resembling the
Opportunities and Threats in the SWOT analysis which will be described in a later section.
Company Analysis – Internal Factors
This chapter will set out with a financial value-chain analysis on Auriga and its peers, produced on 2013-
data. The value-chain will contain the following building blocks; production, Sale & distribution (S&D),
Administration, R&D and depreciation. The point is to recap the newest financial information at the time for
the divestment, to assess where in the value-chain Auriga is superior to its competitors, and where Auriga
has room for improvement.
The Value-chain analysis will be followed by a complete in-depth financial analysis with a full scale
reformulation of profit statement and balance sheet to bring forth a true picture of the company´s core
profitability and cash-flow generating capabilities18
. Profitability will be analyzed using the “Du Pont
pyramid”19
combined with trend-, common-size- and peer-analysis20
.
16
Henry, Anthony, “Understanding Strategic Management” (2008), Oxford University Press, ISBN: 978-0-19-928830-4, page 51. 17
Henry, Anthony, “Understanding Strategic Management” (2008), Oxford University Press, ISBN: 978-0-19-928830-4, page 61 og 68. 18
Christian V. Petersen & Thomas Plenborg “Financial Statement Analysis” FT Prentice Hall Financial Times, ISBN: 978-273-75235-6,
Page 68. 19
Christian V. Petersen & Thomas Plenborg “Financial Statement Analysis” FT Prentice Hall Financial Times, ISBN: 978-273-75235-6, Page 94 and 120. 20
20 Christian V. Petersen & Thomas Plenborg “Financial Statement Analysis” FT Prentice Hall Financial Times, ISBN: 978-273-75235-
6, Page 111.
9
The next section will describe the overall governance structure of Auriga and perform an analysis of the key
stakeholders identified in the exposition. Mitchell’s Stakeholder Typology framework21
will be applied to
assess the salience of different stakeholders on the basis of three attributes: power, legitimacy and urgency in
relation to the divestment and the possible future strategic opportunities. When assessing different
stakeholders, it is natural at the same time to also touch upon the organizational structure and different
corporate governance issues that potentially could affect the company, its operations and its future strategy.
The section will furthermore draw on different leadership and organizational theories.
Innovation is a key factor in securing the strategic options that are to be the basis for future growth. The
strategic risk management section will describe and analyze different risk measures - among these the risk
management effectiveness relative to industry peers. The section will be based on the findings of Torben
Juul Andersen, Professor at the Department of International Economics and Management, and his article
from 2009; “Effective risk management outcomes: exploring effects of innovation and capital structure”.
The section will be rounded off with a sub-conclusion named SW resembling the Strengths and Weaknesses
in the SWOT analysis which will be put together in the following chapter.
Strategic Assessment
The essentials from both external sub-conclusions and the internal sub-conclusion will be listed in a SWOT
analysis framework, in the well-known internal strengths and weaknesses and the external opportunities and
threats. The section joins the forces of both the financial analysis and the strategic analysis, and rounds-up
the ex-post parts of the paper. Blue numbers will identify operational value drivers extracted from the
exogenous analysis, red numbers operational value drivers from the external analysis and black numbers
operational value drivers from the internal analysis. Each entry will be accompanied by an impact
assessment and a short description of which financial items it effects.
Setting the Value Drivers
This chapter kicks-off the ex-ante looking part of the paper and will identify key financial value drivers
which define the underling fundamental development of Auriga. Each financial value driver will be
connected to relevant operational value drivers identified in the exogenous, external and internal analysis.
Each entry will contain the same numbers and colors used in the sub conclusions and the SWOT analysis,
thus making it easy to recognize its origin. The financial value drivers recognized will later be applied in a
DCF model to calculate three different strategic scenarios and a fourth combining all three scenarios.
Strategic Dilemmas
Drawing on elements defined in the SWOT, this section will assess and combine strengths, weaknesses,
opportunities and threats, by applying the TOWS-matrix to structure forward looking strategic dilemmas.
Each entry can be traced back to the SWOT analysis and the three sub conclusions by number and color.
Forecasting & Scenario Analysis
This section starts with a brief description of models applied and next, on the basis on the strategic and
financial analysis, investigates three different strategic opportunities/paths for Auriga to follow. The three
paths are subsequently combined in a fourth path, hereby investigating Auriga’s full potential as a stand-
alone entity. Lastly an analysis of the divestment relative to Auriga’s different strategic options/paths is
executed. Sensitivity analysis to supplement DCF calculations and the offered price from FMC could have
proven useful but due to the limitations of the paper it has been discarded.
21
Ronald K. Mitchell et. al.,, ”The Academy of Management Review”, Vol 22, No. 4 (Oct. 1997), pp. 853 – 886, Academy of Management, http://www.jstor.org/stable/259247 - page 874

10
Discussion and Conclusion
Lastly the findings in the analysis and the chosen path will be discussed and put into perspective for future
situations and improvements in similar cases.
2. Exposition22 The exposition provides an introduction of Auriga and thus creates a foundation for moving on to the
external analysis in chapter 3 and the internal analysis chapter 4.
2.1.1. Industry Terminologies
This initial section will provide brief description of the most important terminologies in the agrochemical
industry.
Agrochemical is the term for a range of products, used for the purpose of enhancing or securing yields in the
agricultural industry. Agrochemicals can be divided into two main categories; pesticides and fertilizers.23
According to the European Commission a pesticide is; “…something that prevents, destroys, or controls a
harmful organism ('pest') or disease, or protects plants or plant products during production, storage and
transport”24
. The term includes; herbicides, fungicides, insecticides as the most commonly used pesticides in
the agricultural industry. Herbicides are used to kill or inhibit unwanted plants (weeds) that compete with the
wanted plants (crops) for light, water and nutrition25
. Herbicides can be non-selective with the same effect on
all plants, or selective by which the herbicide only affects certain weeds26
. A Fungicide kills or prevents
growth of fungi’s or fungal spores and an insecticide kills, harm, repel or mitigate pests that might attack and
harm crops27
.
The main product segments within the Agrochemical industry are described below:
Crop
protection
Production of different kind of pesticides a described above
Seed treatment Development of crop protection products which are applied directly on the seed before it
is sown.
Hybrid seed Development of new and better seeds by crossing two different, but related plants in a
controlled environment - Almost the same as cross-pollination of two related plants -
only done much faster. A big advantage/disadvantage with hybrid seeds are that seeds
from the crops planted do not have the same characteristic as the seed planted and
therefore are not suitable for use.
GMO Seed28
Often referred to as traits. The two main groups within this segment are:
Development of new crops which are genetically modified to resist specific pesticide
products so that the spraying of the pesticide does not harm the crop. E.g. Monsanto have
22
Gyldendal, Den Store Danske homepage: http://denstoredanske.dk/Natur_og_milj%C3%B8/Milj%C3%B8_og_forurening/Vandmilj%C3%B8,_spildevand_og_olieforurening/Cheminova & Cheminova homepage, http://www.cheminova.dk/dk/om_os/historie/ & Danmarkshistorien .dk by Aarhus Universitet - http://danmarkshistorien.dk/leksikon-og-kilder/vis/materiale/cheminova-auriga-1938-2014/?no_cache=1 and webpage of Auriga. 23
P. Hough, “The Trading and Use of Agrochemicals”, Department of Law, Middlesex University London, Springer Science, page 2, http://www.springer.com/gp/book/9789400774537?wt_mc=ThirdParty.SpringerLink.3.EPR653.About_eBook#aboutBook 24
European Commission homepage on Pesticides: http://ec.europa.eu/food/plant/pesticides/index_en.htm 25
The Essential Chemical Industry – online homepage: (18th March 2013) Crop Protection Chemicals, CIEC Promoting Science at the University of York, http://www.essentialchemicalindustry.org/materials-and-applications/crop-protection-chemicals.html 26
Auriga Industries A/S annual report 2011, page 12. 27
The Essential Chemical Industry – online homepage: (18th March 2013) Crop Protection Chemicals, CIEC Promoting Science at the University of York, http://www.essentialchemicalindustry.org/materials-and-applications/crop-protection-chemicals.html 28
GMO = Genetically Modified Organism
11
developed crops that can tolerate Rond-Up and other type of Glyphosate products29
.
Development of new crops which are capable of protecting themselves against pests and
fungi and which have improved nutrient uptake30
. Seeds from crops grown with patented
GMO seeds are often not allowed to be planted, as this violates the manufacturing
companies’ right to the seeds31
.
To understand the dynamics of the industry it is important to distinguish between tier 1 companies and tier 2
companies:
Tier 1 companies are defined by possessing the capabilities and the resources to research and
discover new active ingredients and by having a global market presence. Tier 1 companies are large
corporations often with divisions outside the agrochemical industry.
Tier 2 companies are defined by capabilities to produce/synthesize off-patented active ingredients,
develop new products based on off-patented active ingredients, and a global market presence. Auriga
is considered to be a tier 2 company.
Active ingredients are the main substance in pesticides and many pesticide products contain more than one
active ingredient. In order to produce pesticide products, active ingredients are mixed with different inert
ingredients which among other things can help increase shelf-life, attract pests or helps spread the product
more evenly on surfaces.32
The different key active ingredients used in the industry can be seen in appendix
1.
Tier 1 companies have the capital and knowhow to research and develop new active ingredients that can be
used in new pesticides. E.g. in the 1970s, US company Monsanto patented the active ingredient Glyphosate
which was used in their Herbicide block-buster Roundup. Today their patent has expired, making is possible
for other players to produce and mix their own Glyphosate products. Today Glyphosate is still the most
widely used active ingredient in the agrochemical industry33
.
Formulation is a process wherein active ingredients produced by the company or bought from third parties
are mixed with other chemicals and additives to produce pesticide products designed for various uses in the
agriculture industry.
2.1.2. Auriga History
This section will briefly describe the origin of Auriga and the path the company has traveled to become the
company it was up until the divestment to FMC in 2014. The purpose is to create a basic understanding of
the company and its history which will prove useful in later chapters. The description will briefly touch upon
the 2013 key figures of the company. For a complete history of Auriga – including “The early days” see
appendix 2 and appendix 12 for an overview of Auriga’s stock price development
2.1.2.1.1. Recent history
In the 1990s competition was fierce and in search for new ways to increase topline growth and mitigate risk
Cheminova aimed to diversify their business into new markets. This change of strategy had already started in
1987 with the acquisition of the Fur based Skamol A/S which manufactures and markets thermal insulating
29
Monsanto, Annual Report 2015 – page 4 30
Monsanto, Annual Report 2015 – page 4 31
Monsanto homepage: http://www.monsanto.com/newsviews/pages/why-does-monsanto-sue-farmers-who-save-seeds.aspx 32
National Pesticide Information Center homepage: http://npic.orst.edu/ingred/ 33
Ecochem homepage: http://www.ecochem.com/ENN_glyphosate.html
12
materials for a wide range of heat intensive industries. Not a line of business with a fit to the current value
chain.
Ten years later in 1997, Cheminova closed two other significant acquisitions when acquiring the last 70% of
the share capital in Hardi International A/S and Indian Lupin Agrochemicals. Hardi International A/S
produced sprayers for the agriculture industry. Before the acquisition Hardi International A/S performed at
an acceptable level, but after the change of ownership the performance decreased and on serval occasions
Auriga had to inject additional capital. Acquisition of Indian Lupin Agrochemicals gave access to new
production facilities in India and helped penetrate the Indian growth market.
A few years later the company changed the name of the holding company to Auriga.
In 2006 the company decided on a major strategic change with the public announcement of initiating process
towards divesting both Skamol A/S and Hardi International A/S, ending a diversification strategy that started
20 years earlier. The realization was that keeping a continuous strong position in the agrochemical market
would demand a full focus on this key area34
.
The divestment was effectuated in 2007 with Skamol A/S being sold with an acceptable profit and Hardi
International A/S with a loss. The divestments had a total negative effect on the 2007 annual report35
.
Post the strategy change Auriga continued developing and expanding their markets with the acquisitions of
Uruguayan Abielux S.A. and German Stähler, opening of representation offices in Thailand, Kenya, Croatia
and Romania and partnering up with Libanese AgriNova, granting them distribution rights to the Cheminova
product portfolio in the Middel East, Turkey, North Africa and the Gulf area36
.
2.1.3. Access to Documents Concerning the Sale Granted to Kurt Aabo
I order for Auriga to divest Cheminova to FMC Corporate, AURF had to change the instrument of
foundation, to be allowed to deviate from the clause of being the sole owner of A-shares. A change of the
clause has to be accepted by the Danish Business Authority – confer the Law on Foundations clause 21
section 3.37
Former Information Manager with Auriga38
, Kurt Aabo39
has been granted access to documents concerning
the acceptance of changing the instrument of foundation. To see documents provide by Kurt Aabo see
appendix 3.
The key points and documents will be described in the following sections.
2.1.3.1. First Application for Changing the Instrument of Foundation
On the 8’th of September 1998 the law firm; “Pedersen & Jantzen” applied, on behalf of the Aarhus
Research Foundation, for the Danish Business Authority’s approval of a change in the instrument of
foundations article 7 section 4 which stipulates that the foundation at all time is to possess at least 51% of the
total voting rights in Cheminova Holding A/S. The argument for changing the instrument of foundation is
34
Auriga Industries A/S, Annual Report 2006, page 1 35
Auriga Industries A/S, Annual Report 2007, page 1 36
AgriNova homepage: http://www.agrinova-sal.com/profile.html 37
Retsinformation homepage: https://www.retsinformation.dk/forms/r0710.aspx?id=163656. Please note that a change to the law has been proposed and enacted by parliment on the 3’rd of June 2014. 38
Sperling, Anna von “Cheminova skal stå skoleret for ministeren”, Information on the 16’th of November 2008 https://www.information.dk/2007/07/cheminova-staa-skoleret-ministeren & Kamstrup, Lars, ”Aktionær: Ejer har et ansvar ved salg af Cheminova”, Dagbladet Holstedbro-Struer on the 30’th of August 2014, http://m.dagbladet-holstebro-struer.dk/lemvig/aktionaer-ejer-har-et-ansvar-ved-salg-af-cheminova 39
Aabo, Kurt, Søndervej 5, 6280 Højer, telephone number: 40569930, email: [email protected]
13
that the industry is experiencing a consolidating trend, which results in several challenges for the company
as:
Large competitors have advantage in economics of scale enforcing them to develop their own
patented products.
The Large competitors have a broader product palette with products supplementing each other
The large competitors dominate the net of distributers
Large competitors are able to carry out a price policy that could be a problem for the company
It is expected that the industry will move towards having five dominant players, and that it in these market
conditions would be beneficial to be able to enter a strategic alliance to secure own economics of scale. Such
an alliance would make it difficult to be able to continue as the majority shareholder.
The Danish Business Authority approves the application in a letter dated 30’th of October 2008, with a
notion that if a deal is made, the foundation has to account for its current status, and account for how the deal
will affect the foundations object of clause.
Negotiations concerning the sale was conducted, but without a fruitful result.
See the original documents in appendix 5
2.1.3.2. Second Application Clarifying the Earlier Approval
On the 5’th of December 2008, the law firm “Kromann Reumert” made an application with the Danish
Business Authority as a continuation of the approval from the 30’th of October 2008, to clarify the notion
concerning the two issues that was to be accounted for in the case of a sale, and confirm that the notion does
not influence the approval of the possible change in the object of clause.
The application is answered on the 22’nd of January 2009, where the Danish Business authority confirms,
that the last notion does not influence the essence of the approval to change the instrument of foundations
article 7, section 4.
Considerations concerning the sale were terminated due to the development of the financial crisis.
See the original documents in appendix 6
2.1.3.3. Renewal of Earlier Approvals
In a letter dated 17’th of June 2014, the law firm “Kromann Reumert” applies for renewal of earlier
approvals concerning changing the instrument of foundations article 7, section 4.
The background to the application is that the board of directors with Auriga has initiated a process to
uncover strategic opportunities in a consolidating market – including the possibility of a sale.
It is stated, that the wish from the board of directors to divest Cheminova is in line with the foundations own
analysis concerning the asset structure of the foundation, and the foundation being a suitable owner for
Cheminova.
The foundations argument for renewal of earlier applications is that a divestment of Cheminova could
provide the foundation with a better return on its investments, minimize its total risk, and secure or even
increase the basis for endowments.
The foundation concludes the following:
The risk of having a large share of its asset base tied up in a single stock is not optimal
The agrochemical industry is experiencing intense consolidation trends which make economics of
scale even more important in the future.
14
If you as a company is not an active player in the consolidation in the industry, you are at risk to be
bought
The foundation does not have the resources to support a future consolidation of Cheminova, which
does not make the foundation the right owner of Cheminova.
The application is enclosed in a memorandum produced by the board of directors of Cheminova dated 14’th
of May, which argues, that Cheminova currently is in a strong position to proactively lead discussion on
value creating consolidation, and that the company will risk marginalization over time and loose its
competitive advantage, if it does not use this momentum.
The application is further backed by a memorandum also dated the 14’th of May produced by the accountant
of the foundation, “PwC” that also concludes the Cheminova has gone through a positive development in the
last two years, and that the timing of a sale of Cheminova in 2014 to secure the endowments are good.
The Danish Business Authority approves the request, to change the Instrument of Foundation article 7,
section 4, on the 19’th of June 2014 with the notion, that they are to be presented of the sales agreement
before a sale is final. See the original documents in appendix 7,8,9,10 and 11.
The conditional sale to FMC mentioned in the introduction is announced in a company announcement dated
the 8’th of September 2014, and announced final
2.1.4. Auriga in 2013
In 2013 Auriga is a global enterprise with a large palate of products within herbicides, fungicides and
insecticides mainly distributed to countries in Europa and the Americas.
The company slogan “Helping you grow” has a two-fold meaning. Firstly Auriga wants to produce new and
innovative solutions within crop protection to secure the yield of farmers. Secondly Auriga wants to create
value for all stakeholders – being economically, professionally or humanitarian.
The company employs 2,200 people whereas 850 are employed in Denmark, mainly at the headquarters in
Harboøre.
In 2013 Auriga’s revenue summed close to DKK 6.6 billion producing a net income of DKK 290 million.
The company had subsidiaries in 24 countries, representation offices in another 4 countries, production
facilities in Denmark and India and formulation sites in UK, Germany Australia and Italy. For an overview
of Auriga’s global business units from 1996 to 2013 see appendix 13.
15
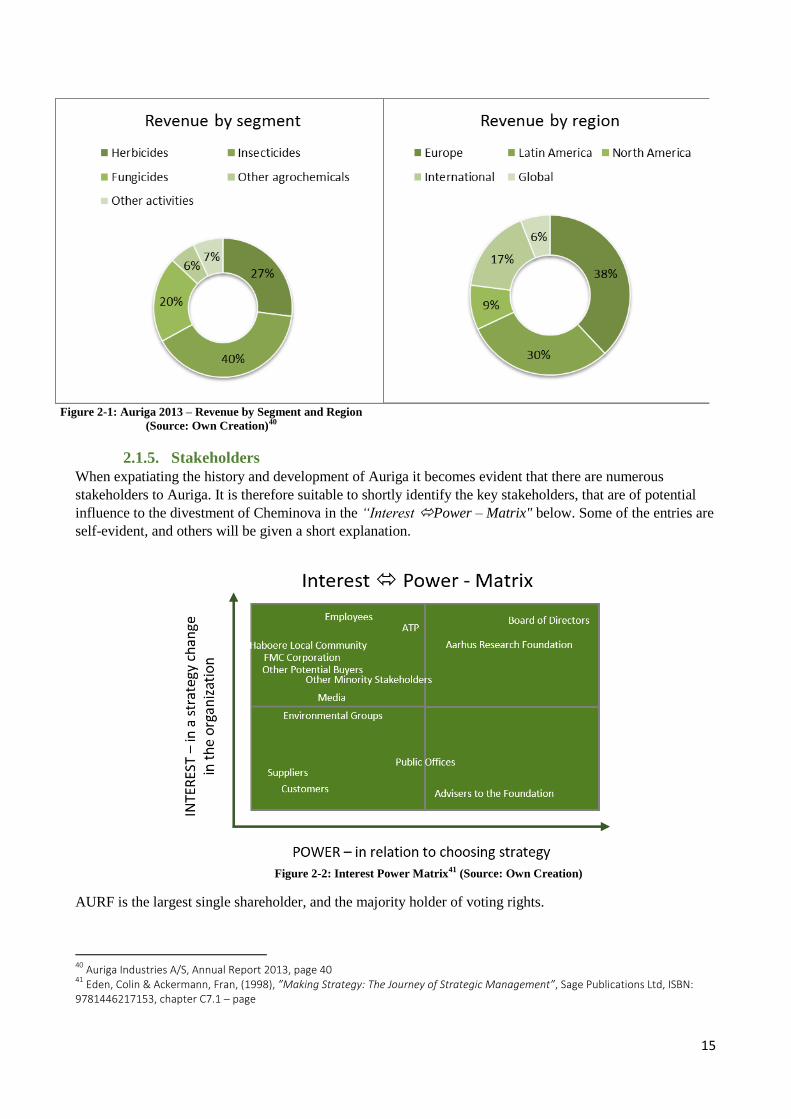
2.1.5. Stakeholders
When expatiating the history and development of Auriga it becomes evident that there are numerous
stakeholders to Auriga. It is therefore suitable to shortly identify the key stakeholders, that are of potential
influence to the divestment of Cheminova in the “Interest Power – Matrix" below. Some of the entries are
self-evident, and others will be given a short explanation.
Figure 2-2: Interest Power Matrix41 (Source: Own Creation)
AURF is the largest single shareholder, and the majority holder of voting rights.
40
Auriga Industries A/S, Annual Report 2013, page 40 41
Eden, Colin & Ackermann, Fran, (1998), ”Making Strategy: The Journey of Strategic Management”, Sage Publications Ltd, ISBN: 9781446217153, chapter C7.1 – page
Figure 2-1: Auriga 2013 – Revenue by Segment and Region
(Source: Own Creation)40
16
ATP as the second largest shareholder and because of their size and expertise believed to be a weighty
partner in the companies they choose to invest in.
Advisers to the foundation are professional consultancy houses and law firms that are hired as advisers on
different matters concerning the future strategic considerations.
Environmental groups are believed to have an interest of the future of a chemical company.
FMC as the acquirer of Cheminova.
3. EXTERNAL ANALYSIS
This chapter will conduct an analysis of the external and endogenous factors, by applying a PESTEL
analysis, a Porters Five Forces analysis, and a peer-analysis based on industry numbers.
But first and foremost the different markets where Auriga is present will shortly be described in the
following.
3.1.1.1.1. Global overview
Auriga operates its global activities from their head office in Harboøre, Denmark.
The company produces active ingredients at production facilities in Denmark and India and micro nutrition
formulations are produced in Headland, Great Britain. The company furthermore has formulation and
packaging plants with subsidiaries in India, Australia, Germany, Italy and Great Britain.
The next sections will go through the main characteristics of the different regions defined by Auriga42
.
42
Auriga Industries A/S, Annual Report 2010, page 12-13

17
Figure 3-1: Global Overview – Auriga Industries A/S
(Source: Own Creation with data from Auriga Industries A/S Annual Report 2013, pages 39 and 62)
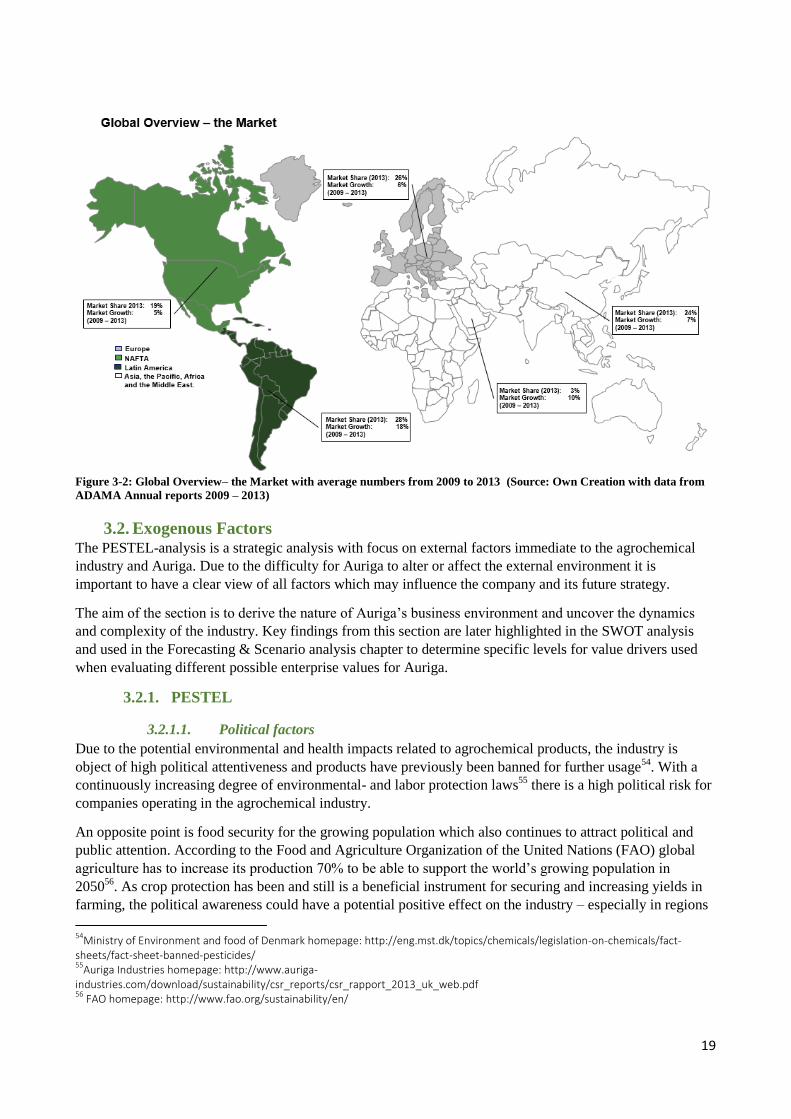
3.1.1.1.2. Europe
The European market makes up around 26%43
of the world market of pesticides and approximately 38%44
of
Auriga’s revenue. The crop structure of Europe is rather dispersed with both the big corn crops but also
wine, fruits and vegetables. The region is strictly regulated concerning the use of GMO crops – see the
PESTEL analysis in chapter 3. A typical farm in Nord and Central Europe is between 50-80 hectares in size
concentrated on few crops, while a farm in south Europe typical has 5-30 hectares with many different crops.
In Nord and Central Europe wholesale and retail is often merged where in south Europe distribution is more
fragmented with many small distributors and retailers45
.
Despite the sometimes difficult weather situations and a pressured market for glyphosate Auriga has
experienced growth in the years up till 2014. The growth is primarily driven by launching new products,
better market penetration with new subsidiaries in Austria and Serbia and opening of representation offices
in Romania and Croatia.
Besides their headquarters and production facilities in Denmark Auriga holds a wide network of subsidiaries,
representation offices and formulation plants throughout the region.
3.1.1.1.3. Latin America
The region includes Brazil, Argentina, Colombia, Mexico and the rest of Central- and South America, with
Brazil and Argentina accounting for 80% of the regions market-value. Latin American makes up around
28%46
of the world market of pesticides and approximately 30%47
of Auriga’s revenue in 2013. The most
43
ADAMA, Annual Report 2013, page 25 44
Auriga Industries A/S, Annual Report 2013, page 39 (2,522,089/6,597,749) 45
Auriga Industries A/S, Annual Report 2012, page 12 46
ADAMA, Annual Report 2013, page 25 47
Auriga Industries A/S, Annual Report 2013, page 39 (1,984,867/6,597,749)

18
used crops are corn, maize and soybean. Auriga holds subsidiaries in Columbia, Argentina, Uruguay and in
the main market of Brazil. A typical farm in North Brazil if often more the 50,000 hectares and equipped
with high technical devises enabling farmers to be highly effective. Distribution is done directly to big farms
and cooperatives and through wholesale and retailers.
Auriga has experienced growth in revenue in Latin America in the years leading up to 2014. The main
reasons are better direct present with products being sold directly to both big farms in Brazil and Argentina
and small farmers in Mexico, launch of new differentiated products, increase of farmed areas and good
weather conditions.
The region is characterized by long payment terms which affected Auriga’s revenue negatively in 2009 when
they implemented a stricter credit policy48
. The region is also characterized by a general decline in sale of
glyphosate products.
3.1.1.1.4. North America
The region includes US and Canada. North American makes up around 19%49
of the world market but only
approximately 9%50
of Auriga’s revenue in 2013. Major crops in the region are corn, maize and soybeans.
Auriga has subsidiaries in both US and Canada. A typical farm is between 500 – 2,000 hectares and highly
effective. Distribution is much alike in North and Central Europe, just much bigger. Wholesale and retail is
characterized by a few big companies with a large amount of shops.
North America has experienced increased glyphosate resistance and therefor new differentiated products,
especially to crops like soy and cotton51
are considered key elements in raising revenue.
Auriga experienced difficult years in 2009-2011 due to declining sale of glyphosate products, poor inventory
management and difficult weather conditions in Texas. Opposite in 2012-2013 Auriga experienced two-digit
growth figures due to registration and launch of new differentiated products - amongst others based on the
active ingredients flutriafol and gamma-cyhalotrhin.
3.1.1.1.5. International
The region includes India, Australia, Asia, the Middle East and Africa. Asia accounts for 24%52
of the world
market and approximately 17%53
of Auriga’s revenue in 2013. Auriga holds subsidiaries in China, Taiwan,
Russia and India. Auriga has a production plant in India, an associated company in Lebanon and
representation offices in Kenya and Ukraine. In Australia, Auriga has a formulation and packaging plant and
the company states that they hold good relations with established distributers. In India, which is the main
market for Auriga in this region, a typical farm is 1.2 hectares in size and family owned. Distribution is
characterized by a large amount of independent wholesalers’ and larger farmers buying pesticides in the
cities and selling to smaller farmers in their local village.
This high growth region presents a highly volatile development from year to year due to a tricky monsoon in
Asia and political instability in especially the Middle East.
Market share and market growth in the different geographical areas are stated in the figure below:
48
Auriga Industries A/S, Annual Report 2009, page 8 49
ADAMA, Annual Report 2013, page 25 50
Auriga Industries A/S, Annual Report 2013, page 39 (604,927/6,597,749) 51
Auriga Industries A/S, Annual Report 2009, page 13 52
ADAMA, Annual Report 2013, page 25 53
Auriga Industries A/S, Annual Report 2013, page 39 (1,095,902/6,597,749)
19
Figure 3-2: Global Overview– the Market with average numbers from 2009 to 2013 (Source: Own Creation with data from
ADAMA Annual reports 2009 – 2013)
3.2. Exogenous Factors The PESTEL-analysis is a strategic analysis with focus on external factors immediate to the agrochemical
industry and Auriga. Due to the difficulty for Auriga to alter or affect the external environment it is
important to have a clear view of all factors which may influence the company and its future strategy.
The aim of the section is to derive the nature of Auriga’s business environment and uncover the dynamics
and complexity of the industry. Key findings from this section are later highlighted in the SWOT analysis
and used in the Forecasting & Scenario analysis chapter to determine specific levels for value drivers used
when evaluating different possible enterprise values for Auriga.
3.2.1. PESTEL
3.2.1.1. Political factors
Due to the potential environmental and health impacts related to agrochemical products, the industry is
object of high political attentiveness and products have previously been banned for further usage54
. With a
continuously increasing degree of environmental- and labor protection laws55
there is a high political risk for
companies operating in the agrochemical industry.
An opposite point is food security for the growing population which also continues to attract political and
public attention. According to the Food and Agriculture Organization of the United Nations (FAO) global
agriculture has to increase its production 70% to be able to support the world’s growing population in
205056
. As crop protection has been and still is a beneficial instrument for securing and increasing yields in
farming, the political awareness could have a potential positive effect on the industry – especially in regions
54
Ministry of Environment and food of Denmark homepage: http://eng.mst.dk/topics/chemicals/legislation-on-chemicals/fact-sheets/fact-sheet-banned-pesticides/ 55
Auriga Industries homepage: http://www.auriga-industries.com/download/sustainability/csr_reports/csr_rapport_2013_uk_web.pdf 56
FAO homepage: http://www.fao.org/sustainability/en/
20
like the Americas, Africa and Asia with high population growth. Changes in agricultural subsidies and tax on
both crops and pesticides can also affect the industry for agrochemicals.
The industry is also influenced by grass-root- and non-government organizations (NGO) like Greenpeace
and WWF. These organizations lobby for their diametrical cause by providing information on potential
hazards related to the production and use of pesticides and GMO techniques, herby influencing the
governmental apparatus.57
The political environment of Auriga’s main regions; Europe and Latin America will be expanded in the
following.
Europe is a region of industrialized countries with developed democracies, strong governments and high
public awareness concerning health and environmental issues. Successively the political environment for the
agrochemical industry is assessed stricter compared to other parts of the world. Likewise, the expected
demographic development of the region with a declining population does not raise high political concerns
regarding food scarcity. In Europe, the interest organization of ECPA represents the agrochemical industry
with 21 companies, 32 national associations and 26,000 people employed in the industry.
In Latin America and region International where several countries are undergoing rapid transformation
shifting from developing- to industrialized countries, and where most democracies still are young and fragile,
the political awareness is primarily focused on increasing farm productivity and to a lesser extent on health
and environmental issues. The political focus on farm productivity is to a large extent driven by a great part
of the populations living in poverty which makes it necessary for politicians, to focus on keeping food prices
at an affordable level58
. The political environments in these countries are assessed to be friendlier for the
agrochemical industry compared to e.g. Europe and the US.
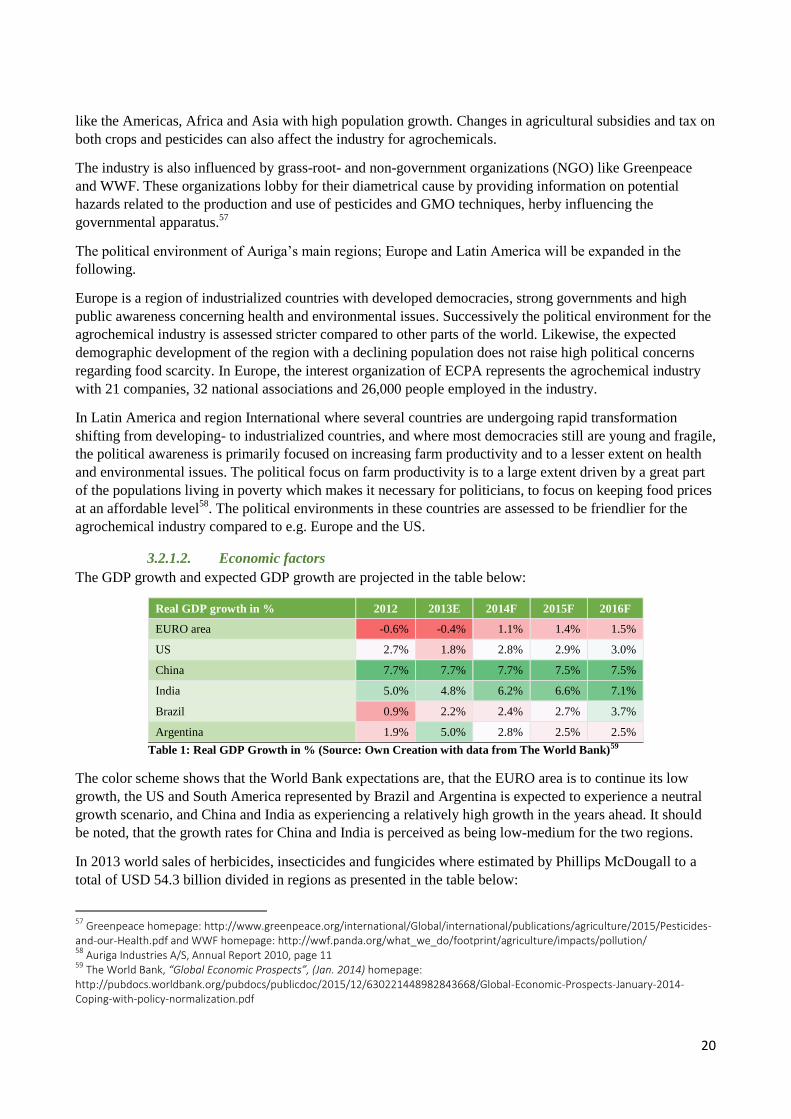
3.2.1.2. Economic factors
The GDP growth and expected GDP growth are projected in the table below:
Real GDP growth in % 2012 2013E 2014F 2015F 2016F
EURO area -0.6% -0.4% 1.1% 1.4% 1.5%
US 2.7% 1.8% 2.8% 2.9% 3.0%
China 7.7% 7.7% 7.7% 7.5% 7.5%
India 5.0% 4.8% 6.2% 6.6% 7.1%
Brazil 0.9% 2.2% 2.4% 2.7% 3.7%
Argentina 1.9% 5.0% 2.8% 2.5% 2.5%
Table 1: Real GDP Growth in % (Source: Own Creation with data from The World Bank)59
The color scheme shows that the World Bank expectations are, that the EURO area is to continue its low
growth, the US and South America represented by Brazil and Argentina is expected to experience a neutral
growth scenario, and China and India as experiencing a relatively high growth in the years ahead. It should
be noted, that the growth rates for China and India is perceived as being low-medium for the two regions.
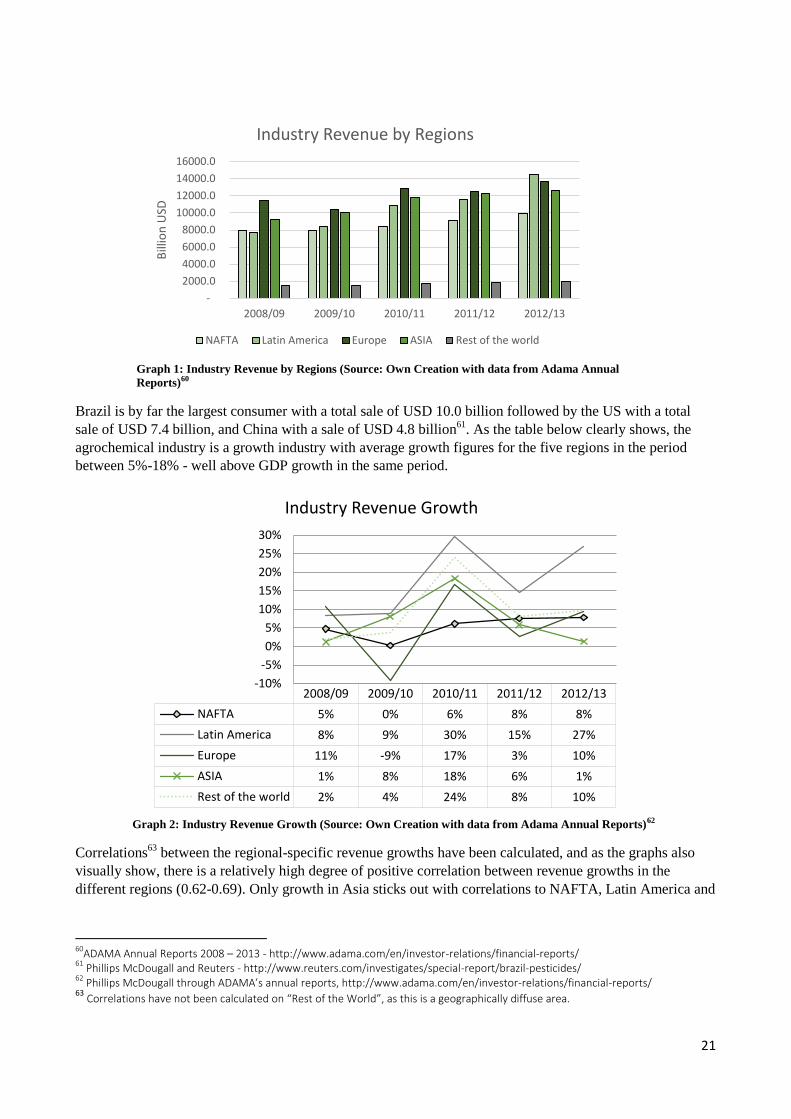
In 2013 world sales of herbicides, insecticides and fungicides where estimated by Phillips McDougall to a
total of USD 54.3 billion divided in regions as presented in the table below:
57
Greenpeace homepage: http://www.greenpeace.org/international/Global/international/publications/agriculture/2015/Pesticides-and-our-Health.pdf and WWF homepage: http://wwf.panda.org/what_we_do/footprint/agriculture/impacts/pollution/ 58
Auriga Industries A/S, Annual Report 2010, page 11 59
The World Bank, “Global Economic Prospects”, (Jan. 2014) homepage: http://pubdocs.worldbank.org/pubdocs/publicdoc/2015/12/630221448982843668/Global-Economic-Prospects-January-2014-Coping-with-policy-normalization.pdf
21
Graph 1: Industry Revenue by Regions (Source: Own Creation with data from Adama Annual
Reports)60
Brazil is by far the largest consumer with a total sale of USD 10.0 billion followed by the US with a total
sale of USD 7.4 billion, and China with a sale of USD 4.8 billion61
. As the table below clearly shows, the
agrochemical industry is a growth industry with average growth figures for the five regions in the period
between 5%-18% - well above GDP growth in the same period.
Graph 2: Industry Revenue Growth (Source: Own Creation with data from Adama Annual Reports)62
Correlations63
between the regional-specific revenue growths have been calculated, and as the graphs also
visually show, there is a relatively high degree of positive correlation between revenue growths in the
different regions (0.62-0.69). Only growth in Asia sticks out with correlations to NAFTA, Latin America and
60
ADAMA Annual Reports 2008 – 2013 - http://www.adama.com/en/investor-relations/financial-reports/ 61
Phillips McDougall and Reuters - http://www.reuters.com/investigates/special-report/brazil-pesticides/ 62
Phillips McDougall through ADAMA’s annual reports, http://www.adama.com/en/investor-relations/financial-reports/ 63
Correlations have not been calculated on “Rest of the World”, as this is a geographically diffuse area.
-
2000.0
4000.0
6000.0
8000.0
10000.0
12000.0
14000.0
16000.0
2008/09 2009/10 2010/11 2011/12 2012/13
Bill
ion
USD
Industry Revenue by Regions
NAFTA Latin America Europe ASIA Rest of the world
2008/09 2009/10 2010/11 2011/12 2012/13
NAFTA 5% 0% 6% 8% 8%
Latin America 8% 9% 30% 15% 27%
Europe 11% -9% 17% 3% 10%
ASIA 1% 8% 18% 6% 1%
Rest of the world 2% 4% 24% 8% 10%
-10%
-5%
0%
5%
10%
15%
20%
25%
30%
Industry Revenue Growth
22
Europe of 0.12, 0.47 and 0.22 respectively. Thus, seeking diversified revenue across different regions would
eventually have to involve the Asian region.
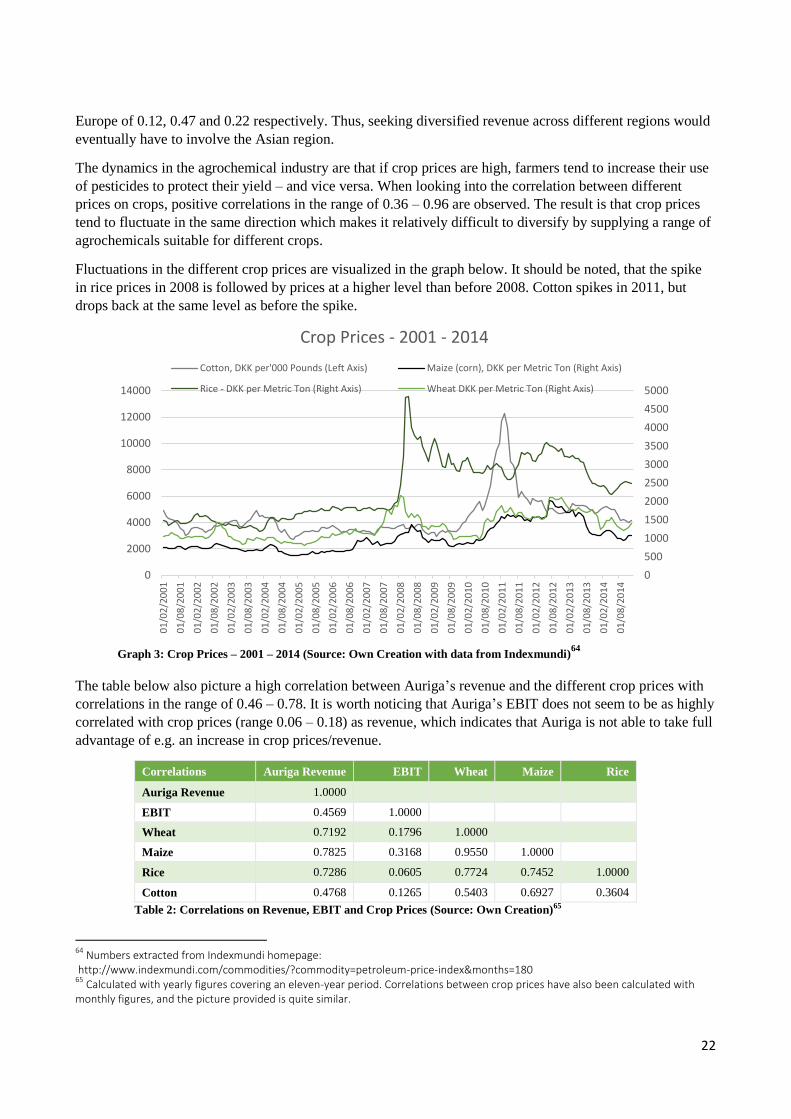
The dynamics in the agrochemical industry are that if crop prices are high, farmers tend to increase their use
of pesticides to protect their yield – and vice versa. When looking into the correlation between different
prices on crops, positive correlations in the range of 0.36 – 0.96 are observed. The result is that crop prices
tend to fluctuate in the same direction which makes it relatively difficult to diversify by supplying a range of
agrochemicals suitable for different crops.
Fluctuations in the different crop prices are visualized in the graph below. It should be noted, that the spike
in rice prices in 2008 is followed by prices at a higher level than before 2008. Cotton spikes in 2011, but
drops back at the same level as before the spike.
Graph 3: Crop Prices – 2001 – 2014 (Source: Own Creation with data from Indexmundi)
64
The table below also picture a high correlation between Auriga’s revenue and the different crop prices with
correlations in the range of 0.46 – 0.78. It is worth noticing that Auriga’s EBIT does not seem to be as highly
correlated with crop prices (range 0.06 – 0.18) as revenue, which indicates that Auriga is not able to take full
advantage of e.g. an increase in crop prices/revenue.
Correlations Auriga Revenue EBIT Wheat Maize Rice
Auriga Revenue 1.0000
EBIT 0.4569 1.0000
Wheat 0.7192 0.1796 1.0000
Maize 0.7825 0.3168 0.9550 1.0000
Rice 0.7286 0.0605 0.7724 0.7452 1.0000
Cotton 0.4768 0.1265 0.5403 0.6927 0.3604
Table 2: Correlations on Revenue, EBIT and Crop Prices (Source: Own Creation)65
64
Numbers extracted from Indexmundi homepage: http://www.indexmundi.com/commodities/?commodity=petroleum-price-index&months=180 65
Calculated with yearly figures covering an eleven-year period. Correlations between crop prices have also been calculated with monthly figures, and the picture provided is quite similar.
0
500
1000
1500
2000
2500
3000
3500
4000
4500
5000
0
2000
4000
6000
8000
10000
12000
14000
01
/02
/20
01
01
/08
/20
01
01
/02
/20
02
01
/08
/20
02
01
/02
/20
03
01
/08
/20
03
01
/02
/20
04
01
/08
/20
04
01
/02
/20
05
01
/08
/20
05
01
/02
/20
06
01
/08
/20
06
01
/02
/20
07
01
/08
/20
07
01
/02
/20
08
01
/08
/20
08
01
/02
/20
09
01
/08
/20
09
01
/02
/20
10
01
/08
/20
10
01
/02
/20
11
01
/08
/20
11
01
/02
/20
12
01
/08
/20
12
01
/02
/20
13
01
/08
/20
13
01
/02
/20
14
01
/08
/20
14
Crop Prices - 2001 - 2014
Cotton, DKK per'000 Pounds (Left Axis) Maize (corn), DKK per Metric Ton (Right Axis)
Rice - DKK per Metric Ton (Right Axis) Wheat DKK per Metric Ton (Right Axis)

23
Overall global economic growth will also affect revenue in the agrochemical industry. High economic
growth will increase the pace of people gaining higher disposable income and moving up to the middleclass
while low economic growth will slow it down. The swift in consumption of meat (see social factors)
followed by a development in economic class is per say expected to take place in developing countries
mainly located in Latin America, Asia, Eastern Europe and Africa but the economic effect will likewise
impact the big exporting countries and regions like US and China.
With Auriga having presence in most of above exporting countries and the countries where the increase in
living standard is expected to take place the company is in a good position to benefit from this development.
Another important factor driving the development of companies in the agrochemical industry is the prices on
raw materials.
Graph 4: Raw Material Prices (Source: Own Creation with data from Indexmundi)66
Visualized in the graph are two types of raw materials that are connected with the raw materials used by
Auriga – Rock Phosphate for glyphosate production and crude oil as a proxy for petroleum that are used in
the pesticide production67
.
The list of raw materials is long, and the chosen two are the ones it has been possible to get prices on, why
they will serve as a proxy for the raw materials in general. Visually the two materials seem to follow a
similar trend, which is confirmed by the correlation calculated to 0.63.
The materials are rather volatile with Rock Phosphate priced in the range of 350 DKK per metric ton in 2001
to almost 2,400 in 2008 to end around 650 in 2014. And crude oil (price index) in the range from around 50
in 2001 to above 200 in 2009 and back again to around 50 in 2014.
66
Numbers extracted from Indexmundi homeage: http://www.indexmundi.com/commodities/?commodity=petroleum-price-index&months=180 67
Madehow homepage: http://www.madehow.com/Volume-1/Pesticide.html
0
50
100
150
200
250
300
0
500
1000
1500
2000
2500
01
/02
/20
01
01
/10
/20
01
01
/06
/20
02
01
/02
/20
03
01
/10
/20
03
01
/06
/20
04
01
/02
/20
05
01
/10
/20
05
01
/06
/20
06
01
/02
/20
07
01
/10
/20
07
01
/06
/20
08
01
/02
/20
09
01
/10
/20
09
01
/06
/20
10
01
/02
/20
11
01
/10
/20
11
01
/06
/20
12
01
/02
/20
13
01
/10
/20
13
01
/06
/20
14
Raw Material Prices
Rock Phosphate - DKK per Metric Ton (Left Axis)
Crude Oil (Petroleum), Price Index (Right Axis)
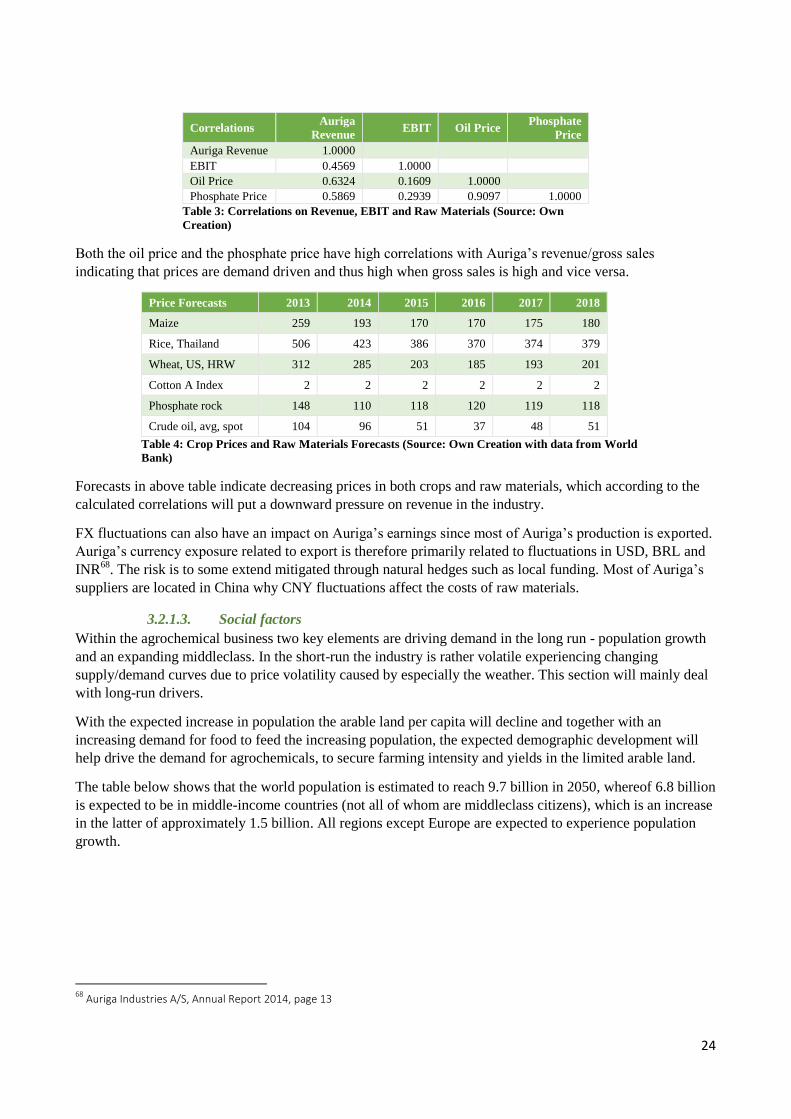
24
Correlations Auriga
Revenue EBIT Oil Price
Phosphate
Price
Auriga Revenue 1.0000
EBIT 0.4569 1.0000
Oil Price 0.6324 0.1609 1.0000
Phosphate Price 0.5869 0.2939 0.9097 1.0000
Table 3: Correlations on Revenue, EBIT and Raw Materials (Source: Own
Creation)
Both the oil price and the phosphate price have high correlations with Auriga’s revenue/gross sales
indicating that prices are demand driven and thus high when gross sales is high and vice versa.
Price Forecasts 2013 2014 2015 2016 2017 2018
Maize 259 193 170 170 175 180
Rice, Thailand 506 423 386 370 374 379
Wheat, US, HRW 312 285 203 185 193 201
Cotton A Index 2 2 2 2 2 2
Phosphate rock 148 110 118 120 119 118
Crude oil, avg, spot 104 96 51 37 48 51
Table 4: Crop Prices and Raw Materials Forecasts (Source: Own Creation with data from World
Bank)
Forecasts in above table indicate decreasing prices in both crops and raw materials, which according to the
calculated correlations will put a downward pressure on revenue in the industry.
FX fluctuations can also have an impact on Auriga’s earnings since most of Auriga’s production is exported.
Auriga’s currency exposure related to export is therefore primarily related to fluctuations in USD, BRL and
INR68
. The risk is to some extend mitigated through natural hedges such as local funding. Most of Auriga’s
suppliers are located in China why CNY fluctuations affect the costs of raw materials.
3.2.1.3. Social factors
Within the agrochemical business two key elements are driving demand in the long run - population growth
and an expanding middleclass. In the short-run the industry is rather volatile experiencing changing
supply/demand curves due to price volatility caused by especially the weather. This section will mainly deal
with long-run drivers.
With the expected increase in population the arable land per capita will decline and together with an
increasing demand for food to feed the increasing population, the expected demographic development will
help drive the demand for agrochemicals, to secure farming intensity and yields in the limited arable land.
The table below shows that the world population is estimated to reach 9.7 billion in 2050, whereof 6.8 billion
is expected to be in middle-income countries (not all of whom are middleclass citizens), which is an increase
in the latter of approximately 1.5 billion. All regions except Europe are expected to experience population
growth.
68
Auriga Industries A/S, Annual Report 2014, page 13
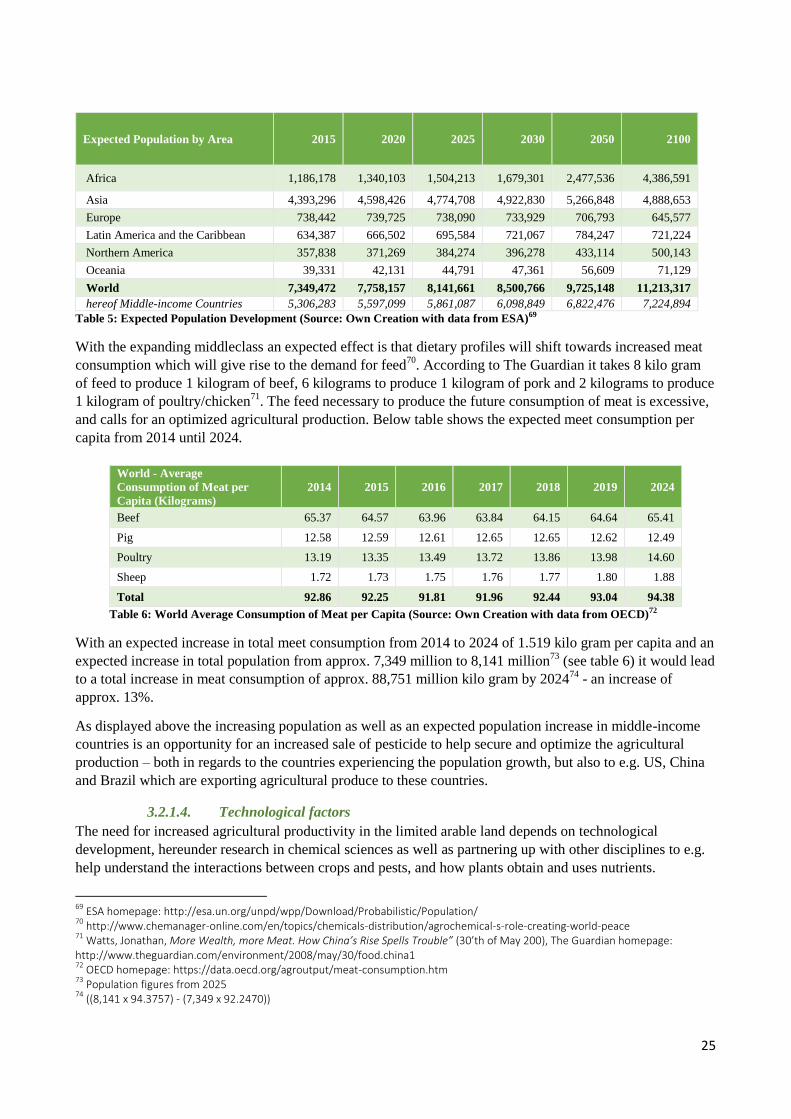
25
Expected Population by Area 2015 2020 2025 2030 2050 2100
Africa 1,186,178 1,340,103 1,504,213 1,679,301 2,477,536 4,386,591
Asia 4,393,296 4,598,426 4,774,708 4,922,830 5,266,848 4,888,653
Europe 738,442 739,725 738,090 733,929 706,793 645,577
Latin America and the Caribbean 634,387 666,502 695,584 721,067 784,247 721,224
Northern America 357,838 371,269 384,274 396,278 433,114 500,143
Oceania 39,331 42,131 44,791 47,361 56,609 71,129
World 7,349,472 7,758,157 8,141,661 8,500,766 9,725,148 11,213,317
hereof Middle-income Countries 5,306,283 5,597,099 5,861,087 6,098,849 6,822,476 7,224,894
Table 5: Expected Population Development (Source: Own Creation with data from ESA)69
With the expanding middleclass an expected effect is that dietary profiles will shift towards increased meat
consumption which will give rise to the demand for feed70
. According to The Guardian it takes 8 kilo gram
of feed to produce 1 kilogram of beef, 6 kilograms to produce 1 kilogram of pork and 2 kilograms to produce
1 kilogram of poultry/chicken71
. The feed necessary to produce the future consumption of meat is excessive,
and calls for an optimized agricultural production. Below table shows the expected meet consumption per
capita from 2014 until 2024.
World - Average
Consumption of Meat per
Capita (Kilograms)
2014 2015 2016 2017 2018 2019 2024
Beef 65.37 64.57 63.96 63.84 64.15 64.64 65.41
Pig 12.58 12.59 12.61 12.65 12.65 12.62 12.49
Poultry 13.19 13.35 13.49 13.72 13.86 13.98 14.60
Sheep 1.72 1.73 1.75 1.76 1.77 1.80 1.88
Total 92.86 92.25 91.81 91.96 92.44 93.04 94.38
Table 6: World Average Consumption of Meat per Capita (Source: Own Creation with data from OECD)72
With an expected increase in total meet consumption from 2014 to 2024 of 1.519 kilo gram per capita and an
expected increase in total population from approx. 7,349 million to 8,141 million73
(see table 6) it would lead
to a total increase in meat consumption of approx. 88,751 million kilo gram by 202474
- an increase of
approx. 13%.
As displayed above the increasing population as well as an expected population increase in middle-income
countries is an opportunity for an increased sale of pesticide to help secure and optimize the agricultural
production – both in regards to the countries experiencing the population growth, but also to e.g. US, China
and Brazil which are exporting agricultural produce to these countries.
3.2.1.4. Technological factors
The need for increased agricultural productivity in the limited arable land depends on technological
development, hereunder research in chemical sciences as well as partnering up with other disciplines to e.g.
help understand the interactions between crops and pests, and how plants obtain and uses nutrients.
69
ESA homepage: http://esa.un.org/unpd/wpp/Download/Probabilistic/Population/ 70
http://www.chemanager-online.com/en/topics/chemicals-distribution/agrochemical-s-role-creating-world-peace 71
Watts, Jonathan, More Wealth, more Meat. How China’s Rise Spells Trouble” (30’th of May 200), The Guardian homepage: http://www.theguardian.com/environment/2008/may/30/food.china1 72
OECD homepage: https://data.oecd.org/agroutput/meat-consumption.htm 73
Population figures from 2025 74
((8,141 x 94.3757) - (7,349 x 92.2470))

26
In recent years the development of new active ingredients has slowed down and the industry has to turned its
focus on solving weed, insect and fungal issues with existing active ingredients. In 1995 a total of 34
companies worldwide where involved in R&D of new agrochemical active ingredients. In 2002 the number
was only 1775
.
Due to the large amount of new active ingredients launched in the 1960’ies many patented active ingredients
are expected go off patent in the coming years76
. Auriga has the capabilities to develop new formulation
processes and differentiated end-products containing mixtures of off-patent active ingredients which they can
subsequently patent. Alternatively, Auriga can choose to follow a generic strategy a simply copy the off-
patent active ingredients and the related products. For an overview of agrochemical active ingredient
introductions since 1650 see appendix 14
The breakthroughs achieved in the field of biotechnology in the past decade points to being the most
significant factor in increasing farming intensity and yields now and in the future. The use of biotech plants
can help increase yields by reducing the degree of crops lost due to diseases and pests - and can also decrease
the amount of pesticides needed. In the US the focus has dramatically shifted to biotechnology development
(GMO’s) in the last fifteen years from accounting from 5%-20% of all crops planted to 65% - 90% of all
crops planted – se figure in appendix 15 (Adoption of genetically engineered crops in US)
Because Auriga does not have capabilities within biotechnology (GMO crops), they have to monitor the
development carefully as it might pose a substitutional threat the use of revenue of their pesticides. It might
also be an opportunity since research indicates that GMO crops only requires fewer pesticides the first few
years, after which the need for pesticides is higher than for conventional crops.77
Seed coating technology is a technology that applies pesticides directly to the seed before it is sown. With
seed coating technology a much smaller amount of pesticides is needed in order to archive the same effect as
with conventional spraying. Auriga has expertise within the field of seed coating and offers a few products in
this special segment.
The table below shows the pesticide and biotech split on different industry players.
75
Phillips McDougall, “R&D trends for chemical crop protection products and the position of the European Market”, page 10
(September 2013), https://issuu.com/cropprotection/docs/r_and_d_study_2013_v1.8_webversion_ 76
United Phosphorus, Annual Report 2014, page 36 77
Hoffmann, Beth, “GMO Crops Mean More Herbicide, Not Less” (2’th of July 2013), Forbes http://www.forbes.com/sites/bethhoffman/2013/07/02/gmo-crops-mean-more-herbicide-not-less/#2715e4857a0bae1bfa5a371f
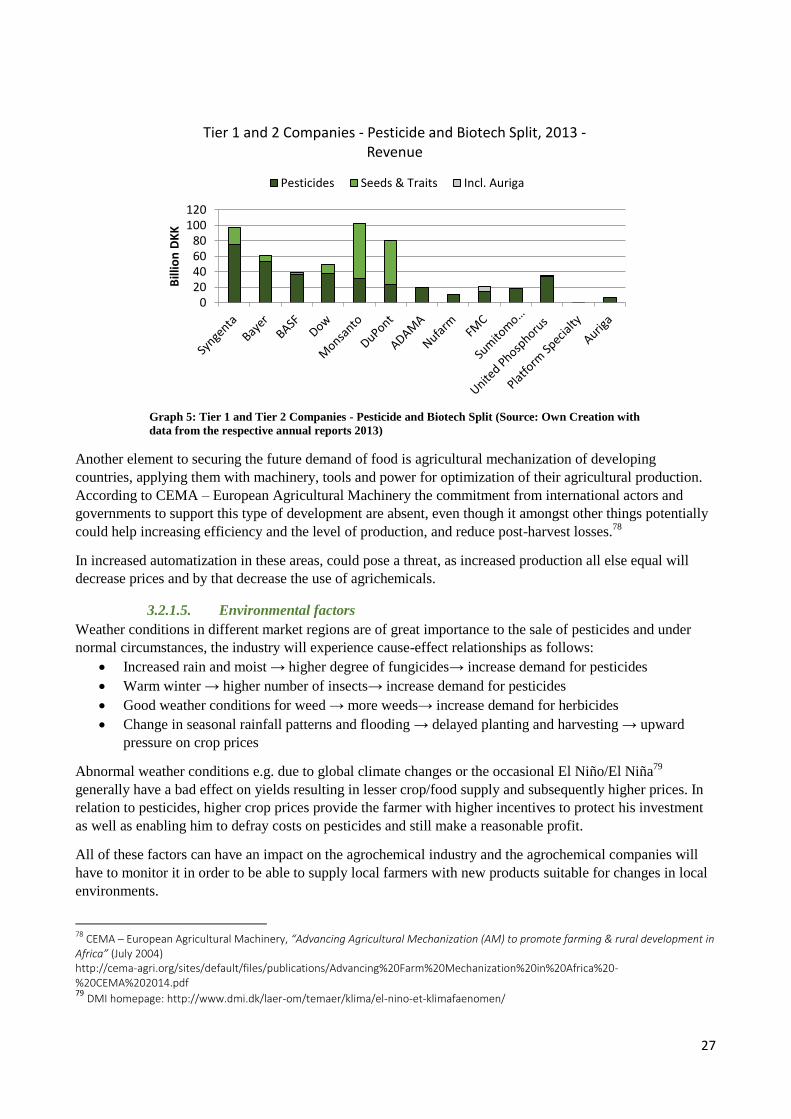
27
Graph 5: Tier 1 and Tier 2 Companies - Pesticide and Biotech Split (Source: Own Creation with
data from the respective annual reports 2013)
Another element to securing the future demand of food is agricultural mechanization of developing
countries, applying them with machinery, tools and power for optimization of their agricultural production.
According to CEMA – European Agricultural Machinery the commitment from international actors and
governments to support this type of development are absent, even though it amongst other things potentially
could help increasing efficiency and the level of production, and reduce post-harvest losses.78
In increased automatization in these areas, could pose a threat, as increased production all else equal will
decrease prices and by that decrease the use of agrichemicals.
3.2.1.5. Environmental factors
Weather conditions in different market regions are of great importance to the sale of pesticides and under
normal circumstances, the industry will experience cause-effect relationships as follows:
Increased rain and moist → higher degree of fungicides→ increase demand for pesticides
Warm winter → higher number of insects→ increase demand for pesticides
Good weather conditions for weed → more weeds→ increase demand for herbicides
Change in seasonal rainfall patterns and flooding → delayed planting and harvesting → upward
pressure on crop prices
Abnormal weather conditions e.g. due to global climate changes or the occasional El Niño/El Niña79
generally have a bad effect on yields resulting in lesser crop/food supply and subsequently higher prices. In
relation to pesticides, higher crop prices provide the farmer with higher incentives to protect his investment
as well as enabling him to defray costs on pesticides and still make a reasonable profit.
All of these factors can have an impact on the agrochemical industry and the agrochemical companies will
have to monitor it in order to be able to supply local farmers with new products suitable for changes in local
environments.
78
CEMA – European Agricultural Machinery, “Advancing Agricultural Mechanization (AM) to promote farming & rural development in Africa” (July 2004) http://cema-agri.org/sites/default/files/publications/Advancing%20Farm%20Mechanization%20in%20Africa%20-%20CEMA%202014.pdf 79
DMI homepage: http://www.dmi.dk/laer-om/temaer/klima/el-nino-et-klimafaenomen/
020406080
100120
Bill
ion
DK
K
Tier 1 and 2 Companies - Pesticide and Biotech Split, 2013 -Revenue
Pesticides Seeds & Traits Incl. Auriga
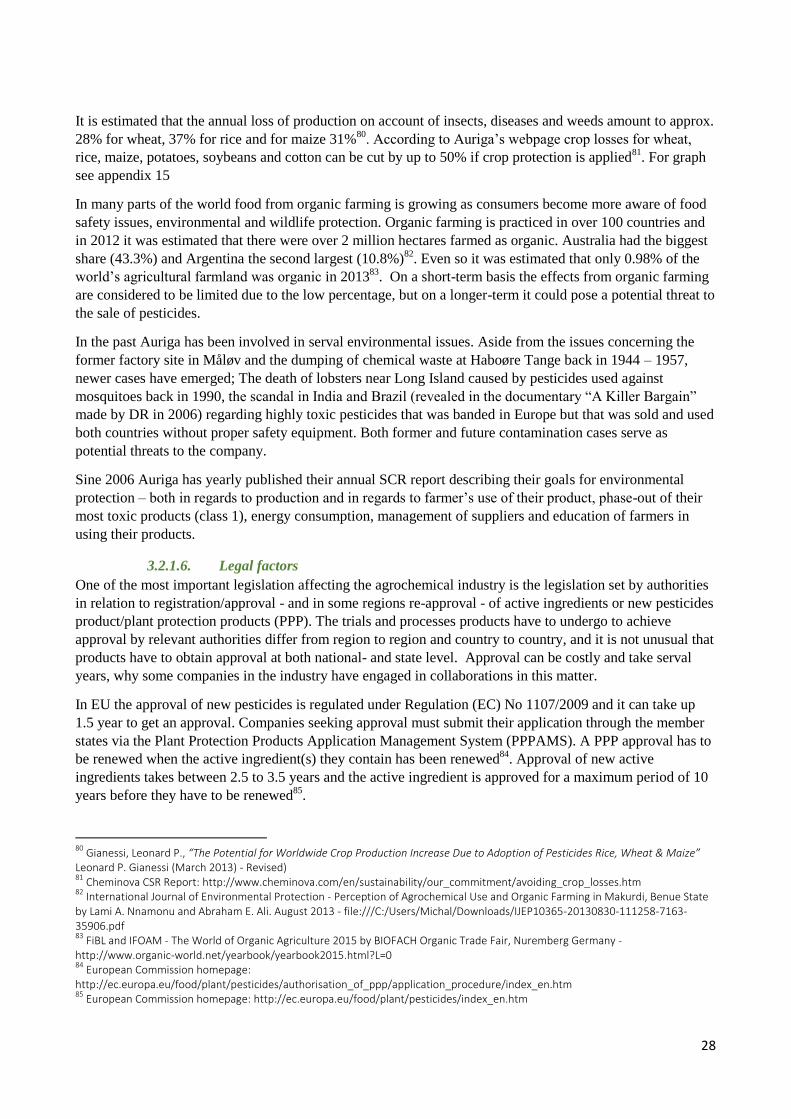
28
It is estimated that the annual loss of production on account of insects, diseases and weeds amount to approx.
28% for wheat, 37% for rice and for maize 31%80
. According to Auriga’s webpage crop losses for wheat,
rice, maize, potatoes, soybeans and cotton can be cut by up to 50% if crop protection is applied81
. For graph
see appendix 15
In many parts of the world food from organic farming is growing as consumers become more aware of food
safety issues, environmental and wildlife protection. Organic farming is practiced in over 100 countries and
in 2012 it was estimated that there were over 2 million hectares farmed as organic. Australia had the biggest
share (43.3%) and Argentina the second largest (10.8%)82
. Even so it was estimated that only 0.98% of the
world’s agricultural farmland was organic in 201383
. On a short-term basis the effects from organic farming
are considered to be limited due to the low percentage, but on a longer-term it could pose a potential threat to
the sale of pesticides.
In the past Auriga has been involved in serval environmental issues. Aside from the issues concerning the
former factory site in Måløv and the dumping of chemical waste at Haboøre Tange back in 1944 – 1957,
newer cases have emerged; The death of lobsters near Long Island caused by pesticides used against
mosquitoes back in 1990, the scandal in India and Brazil (revealed in the documentary “A Killer Bargain”
made by DR in 2006) regarding highly toxic pesticides that was banded in Europe but that was sold and used
both countries without proper safety equipment. Both former and future contamination cases serve as
potential threats to the company.
Sine 2006 Auriga has yearly published their annual SCR report describing their goals for environmental
protection – both in regards to production and in regards to farmer’s use of their product, phase-out of their
most toxic products (class 1), energy consumption, management of suppliers and education of farmers in
using their products.
3.2.1.6. Legal factors
One of the most important legislation affecting the agrochemical industry is the legislation set by authorities
in relation to registration/approval - and in some regions re-approval - of active ingredients or new pesticides
product/plant protection products (PPP). The trials and processes products have to undergo to achieve
approval by relevant authorities differ from region to region and country to country, and it is not unusual that
products have to obtain approval at both national- and state level. Approval can be costly and take serval
years, why some companies in the industry have engaged in collaborations in this matter.
In EU the approval of new pesticides is regulated under Regulation (EC) No 1107/2009 and it can take up
1.5 year to get an approval. Companies seeking approval must submit their application through the member
states via the Plant Protection Products Application Management System (PPPAMS). A PPP approval has to
be renewed when the active ingredient(s) they contain has been renewed84
. Approval of new active
ingredients takes between 2.5 to 3.5 years and the active ingredient is approved for a maximum period of 10
years before they have to be renewed85
.
80
Gianessi, Leonard P., “The Potential for Worldwide Crop Production Increase Due to Adoption of Pesticides Rice, Wheat & Maize” Leonard P. Gianessi (March 2013) - Revised) 81
Cheminova CSR Report: http://www.cheminova.com/en/sustainability/our_commitment/avoiding_crop_losses.htm 82
International Journal of Environmental Protection - Perception of Agrochemical Use and Organic Farming in Makurdi, Benue State by Lami A. Nnamonu and Abraham E. Ali. August 2013 - file:///C:/Users/Michal/Downloads/IJEP10365-20130830-111258-7163-35906.pdf 83
FiBL and IFOAM - The World of Organic Agriculture 2015 by BIOFACH Organic Trade Fair, Nuremberg Germany - http://www.organic-world.net/yearbook/yearbook2015.html?L=0 84
European Commission homepage: http://ec.europa.eu/food/plant/pesticides/authorisation_of_ppp/application_procedure/index_en.htm 85
European Commission homepage: http://ec.europa.eu/food/plant/pesticides/index_en.htm

29
EU also has some of the world’s strictest regulation for GMO food and cultivation of GMO crops. Crops are
only allowed after strict risk ascension and today only one GMO crop - MON 810 from Monsanto is
cultivated in EU86
. In Latin America, Auriga’s second biggest region GMO is allowed in most countries87
and in North America up to 90% of some crops are GMO.
Approval and re-approval in EU is assessed by many companies in the agrochemical industry88
as the hardest
and many companies therefor apply for approval her and then reuse tests and gathered material when
applying in countries with fewer requirements. Requirements in the US are considered less harsh with Latin
America and Asia having even lesser harsh requirements89
.
3.2.1. Sub-conclusion – OT 1
From the analysis of exogenous factors, 11 factors are identified as affecting Auriga’s future gross sales and
one factor as affecting cost of goods sold (Price on raw materials). The ten factors affecting Auriga’s future
gross sales and cost of gods sold are listed below but additional two factors are considered to affect Auriga’s
gross sales as well - FX fluctuations and the weather. Because the available forecasts on FX predict a rather
flat development in the years ahead this factor is not included in the following. Weather, being impossible to
predict more than a couple of weeks ahead, would thus not add value in a forecasting scenario. Opposite is
long-term climate changes included.
The ten operational value-drivers affecting Auriga financial value-drivers and thus the offered price on
Auriga are listed below with an assessment of impact:
Threats Impact
①Political Awareness
The Industry experiences high political awareness concerning environmental and
health issues, especially in the EU whereas politicians in Latin America and Asia are
more occupied on securing future food supply.
Low
③Fluctuating crop Prices
High crop prices tend to increase farmers use of pesticides – and vice versa. Crop
prices are primarily affected by the weather. Crop prices have a correlation with
Auriga’s revenue from 0.48 - 0.78.
High
⑦GMO Technology
High use of GMO crops in the Americas currently poses a threat, as GMO crops
partly substitutes pesticides. The threat could be eminent if current bands on GMO
crops in EU and other countries are lifted.
Low
⑨Legal Requirements
Legal requirements are expected to increase going forward which poses a higher
threat for tier 2 companies, then tier 1, since they have a smaller markets to absorb
registrations costs. Legal requirements in EU are stricter than in the US, which again
have stricter requirements than Latin America and Asia.
Medium
86
European-Parliament – article - Q & A: GMO-dyrkning i EU, date 02-09-2014 - http://www.europarl.europa.eu/pdfs/news/public/story/20140902STO57801/20140902STO57801_da.pdf 87
ISAAA - GM Approval Database - http://www.isaaa.org/gmapprovaldatabase/default.asp 88
Monsanto, Annual Report 2013, page 9 and 30 89
Prada, Paulo, “Why Brazil has a big appetite for risky pesticides”, 2nd
of April 2015, Reuters http://www.reuters.com/investigates/special-report/brazil-pesticides/
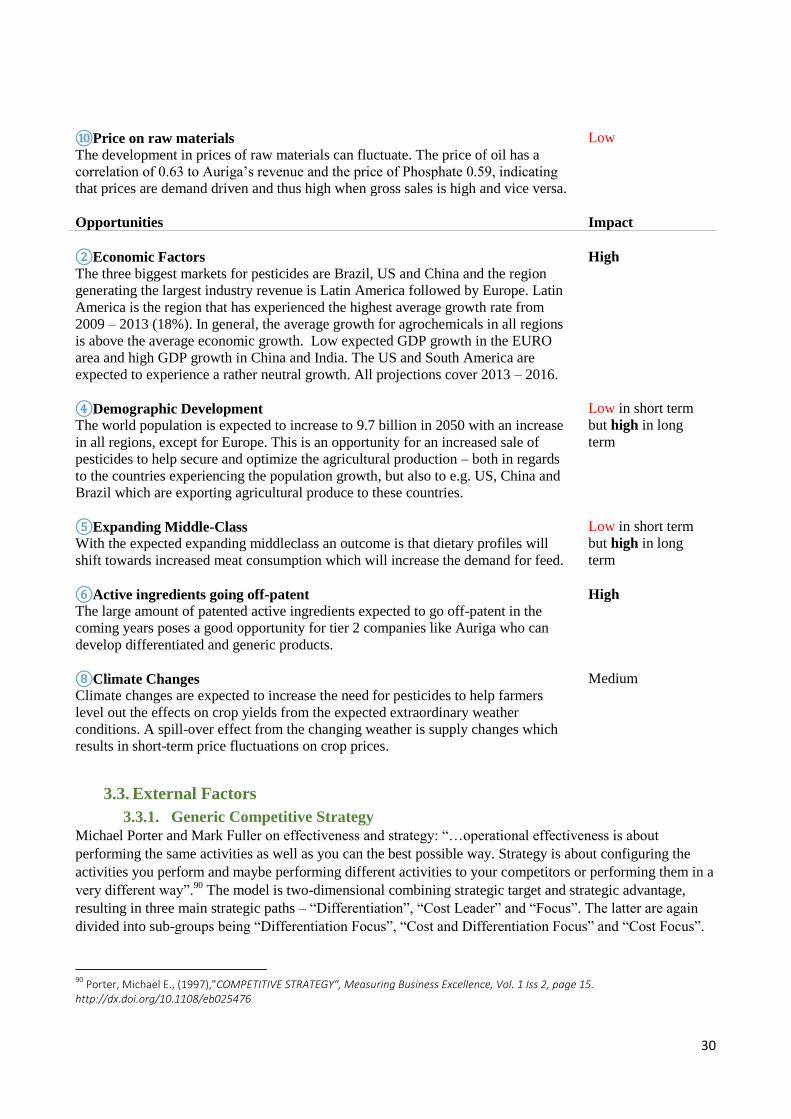
30
⑩Price on raw materials
The development in prices of raw materials can fluctuate. The price of oil has a
correlation of 0.63 to Auriga’s revenue and the price of Phosphate 0.59, indicating
that prices are demand driven and thus high when gross sales is high and vice versa.
Low
Opportunities
Impact
②Economic Factors
The three biggest markets for pesticides are Brazil, US and China and the region
generating the largest industry revenue is Latin America followed by Europe. Latin
America is the region that has experienced the highest average growth rate from
2009 – 2013 (18%). In general, the average growth for agrochemicals in all regions
is above the average economic growth. Low expected GDP growth in the EURO
area and high GDP growth in China and India. The US and South America are
expected to experience a rather neutral growth. All projections cover 2013 – 2016.
High
④Demographic Development
The world population is expected to increase to 9.7 billion in 2050 with an increase
in all regions, except for Europe. This is an opportunity for an increased sale of
pesticides to help secure and optimize the agricultural production – both in regards
to the countries experiencing the population growth, but also to e.g. US, China and
Brazil which are exporting agricultural produce to these countries.
Low in short term
but high in long
term
⑤Expanding Middle-Class
With the expected expanding middleclass an outcome is that dietary profiles will
shift towards increased meat consumption which will increase the demand for feed.
Low in short term
but high in long
term
⑥Active ingredients going off-patent
The large amount of patented active ingredients expected to go off-patent in the
coming years poses a good opportunity for tier 2 companies like Auriga who can
develop differentiated and generic products.
High
⑧Climate Changes
Climate changes are expected to increase the need for pesticides to help farmers
level out the effects on crop yields from the expected extraordinary weather
conditions. A spill-over effect from the changing weather is supply changes which
results in short-term price fluctuations on crop prices.
Medium
3.3. External Factors
3.3.1. Generic Competitive Strategy
Michael Porter and Mark Fuller on effectiveness and strategy: “…operational effectiveness is about
performing the same activities as well as you can the best possible way. Strategy is about configuring the
activities you perform and maybe performing different activities to your competitors or performing them in a
very different way”.90
The model is two-dimensional combining strategic target and strategic advantage,
resulting in three main strategic paths – “Differentiation”, “Cost Leader” and “Focus”. The latter are again
divided into sub-groups being “Differentiation Focus”, “Cost and Differentiation Focus” and “Cost Focus”.
90
Porter, Michael E., (1997),"COMPETITIVE STRATEGY", Measuring Business Excellence, Vol. 1 Iss 2, page 15. http://dx.doi.org/10.1108/eb025476
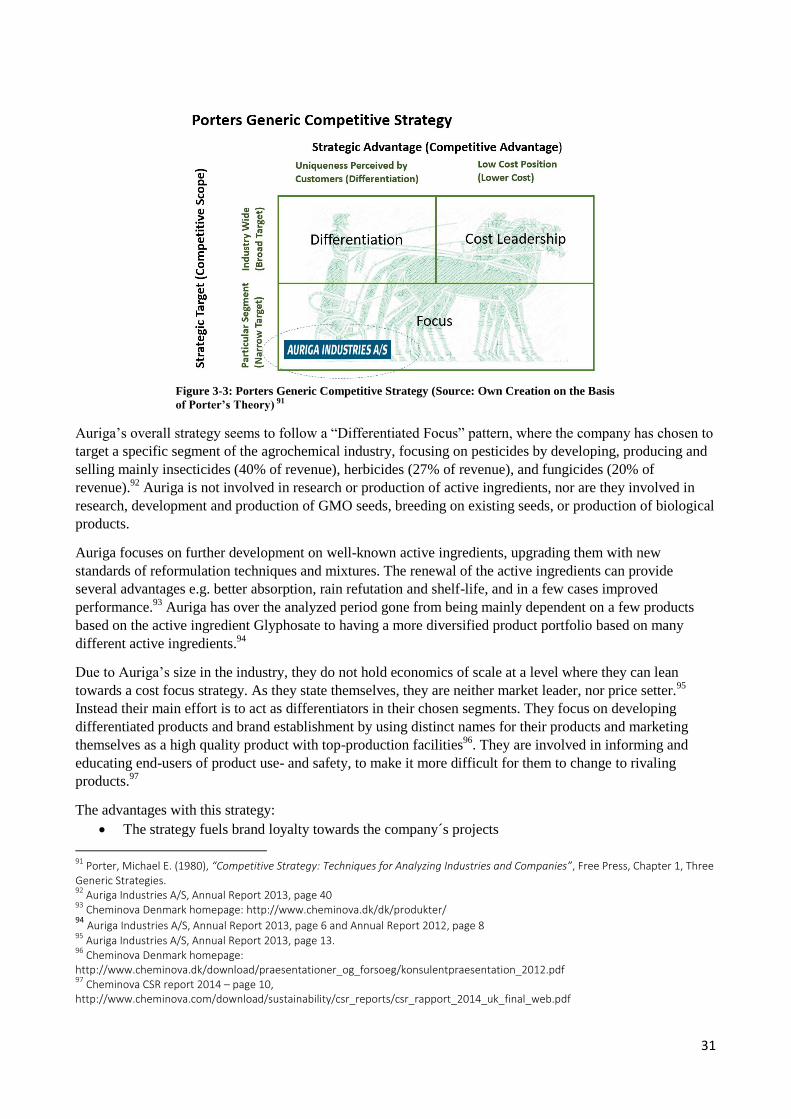
31
Figure 3-3: Porters Generic Competitive Strategy (Source: Own Creation on the Basis
of Porter’s Theory) 91
Auriga’s overall strategy seems to follow a “Differentiated Focus” pattern, where the company has chosen to
target a specific segment of the agrochemical industry, focusing on pesticides by developing, producing and
selling mainly insecticides (40% of revenue), herbicides (27% of revenue), and fungicides (20% of
revenue).92
Auriga is not involved in research or production of active ingredients, nor are they involved in
research, development and production of GMO seeds, breeding on existing seeds, or production of biological
products.
Auriga focuses on further development on well-known active ingredients, upgrading them with new
standards of reformulation techniques and mixtures. The renewal of the active ingredients can provide
several advantages e.g. better absorption, rain refutation and shelf-life, and in a few cases improved
performance.93
Auriga has over the analyzed period gone from being mainly dependent on a few products
based on the active ingredient Glyphosate to having a more diversified product portfolio based on many
different active ingredients.94
Due to Auriga’s size in the industry, they do not hold economics of scale at a level where they can lean
towards a cost focus strategy. As they state themselves, they are neither market leader, nor price setter.95
Instead their main effort is to act as differentiators in their chosen segments. They focus on developing
differentiated products and brand establishment by using distinct names for their products and marketing
themselves as a high quality product with top-production facilities96
. They are involved in informing and
educating end-users of product use- and safety, to make it more difficult for them to change to rivaling
products.97
The advantages with this strategy:
The strategy fuels brand loyalty towards the company´s projects
91
Porter, Michael E. (1980), “Competitive Strategy: Techniques for Analyzing Industries and Companies”, Free Press, Chapter 1, Three Generic Strategies. 92
Auriga Industries A/S, Annual Report 2013, page 40 93
Cheminova Denmark homepage: http://www.cheminova.dk/dk/produkter/ 94
Auriga Industries A/S, Annual Report 2013, page 6 and Annual Report 2012, page 8 95
Auriga Industries A/S, Annual Report 2013, page 13. 96
Cheminova Denmark homepage: http://www.cheminova.dk/download/praesentationer_og_forsoeg/konsulentpraesentation_2012.pdf 97
Cheminova CSR report 2014 – page 10, http://www.cheminova.com/download/sustainability/csr_reports/csr_rapport_2014_uk_final_web.pdf
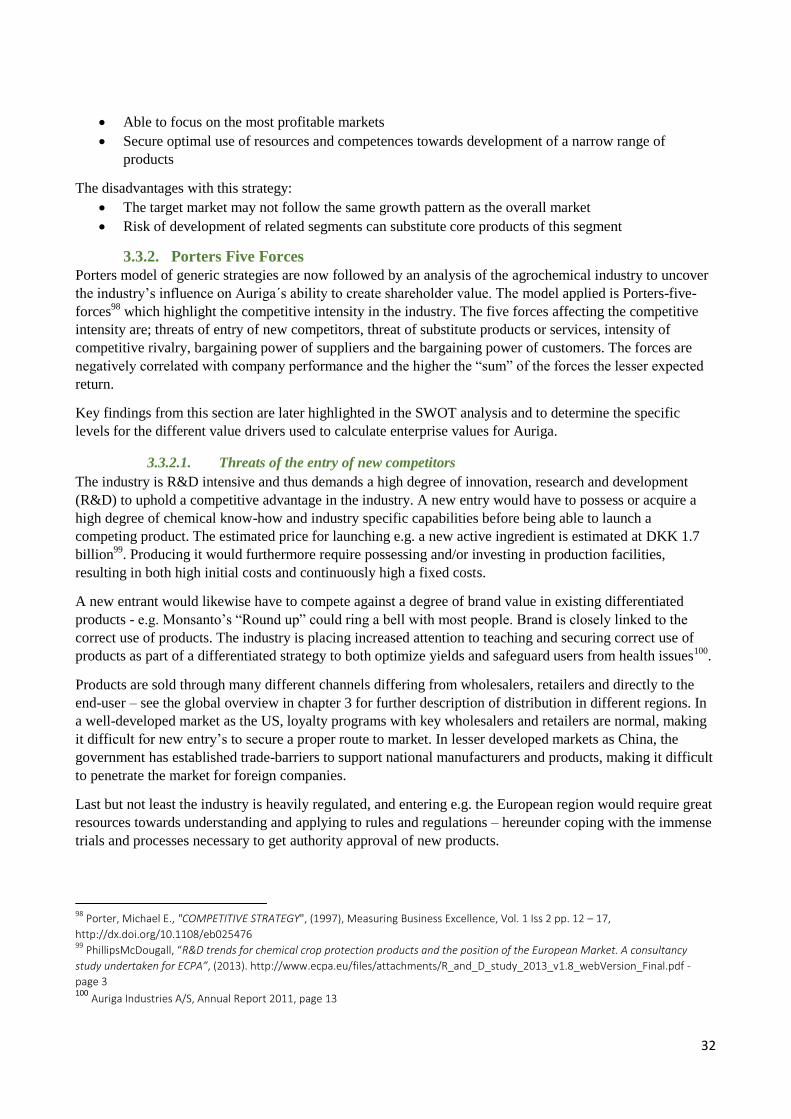
32
Able to focus on the most profitable markets
Secure optimal use of resources and competences towards development of a narrow range of
products
The disadvantages with this strategy:
The target market may not follow the same growth pattern as the overall market
Risk of development of related segments can substitute core products of this segment
3.3.2. Porters Five Forces
Porters model of generic strategies are now followed by an analysis of the agrochemical industry to uncover
the industry’s influence on Auriga´s ability to create shareholder value. The model applied is Porters-five-
forces98
which highlight the competitive intensity in the industry. The five forces affecting the competitive
intensity are; threats of entry of new competitors, threat of substitute products or services, intensity of
competitive rivalry, bargaining power of suppliers and the bargaining power of customers. The forces are
negatively correlated with company performance and the higher the “sum” of the forces the lesser expected
return.
Key findings from this section are later highlighted in the SWOT analysis and to determine the specific
levels for the different value drivers used to calculate enterprise values for Auriga.
3.3.2.1. Threats of the entry of new competitors
The industry is R&D intensive and thus demands a high degree of innovation, research and development
(R&D) to uphold a competitive advantage in the industry. A new entry would have to possess or acquire a
high degree of chemical know-how and industry specific capabilities before being able to launch a
competing product. The estimated price for launching e.g. a new active ingredient is estimated at DKK 1.7
billion99
. Producing it would furthermore require possessing and/or investing in production facilities,
resulting in both high initial costs and continuously high a fixed costs.
A new entrant would likewise have to compete against a degree of brand value in existing differentiated
products - e.g. Monsanto’s “Round up” could ring a bell with most people. Brand is closely linked to the
correct use of products. The industry is placing increased attention to teaching and securing correct use of
products as part of a differentiated strategy to both optimize yields and safeguard users from health issues100
.
Products are sold through many different channels differing from wholesalers, retailers and directly to the
end-user – see the global overview in chapter 3 for further description of distribution in different regions. In
a well-developed market as the US, loyalty programs with key wholesalers and retailers are normal, making
it difficult for new entry’s to secure a proper route to market. In lesser developed markets as China, the
government has established trade-barriers to support national manufacturers and products, making it difficult
to penetrate the market for foreign companies.
Last but not least the industry is heavily regulated, and entering e.g. the European region would require great
resources towards understanding and applying to rules and regulations – hereunder coping with the immense
trials and processes necessary to get authority approval of new products.
98
Porter, Michael E., "COMPETITIVE STRATEGY", (1997), Measuring Business Excellence, Vol. 1 Iss 2 pp. 12 – 17,
http://dx.doi.org/10.1108/eb025476 99
PhillipsMcDougall, “R&D trends for chemical crop protection products and the position of the European Market. A consultancy
study undertaken for ECPA”, (2013). http://www.ecpa.eu/files/attachments/R_and_D_study_2013_v1.8_webVersion_Final.pdf -
page 3 100
Auriga Industries A/S, Annual Report 2011, page 13
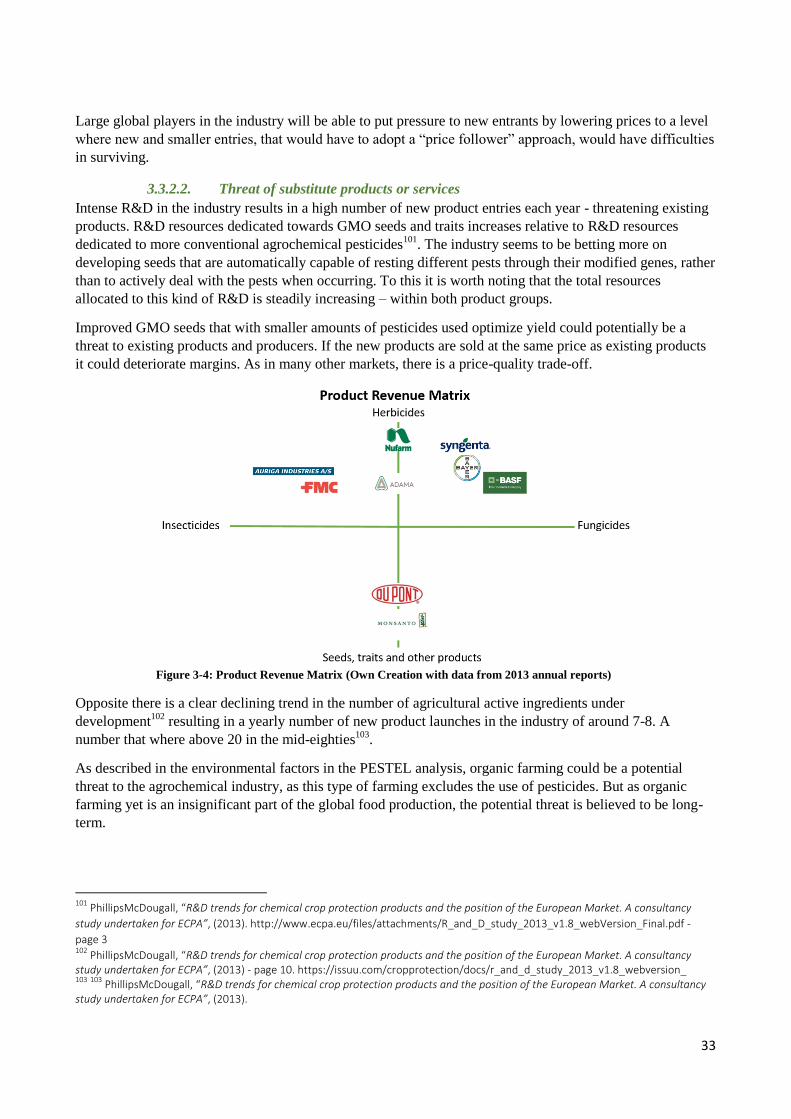
33
Large global players in the industry will be able to put pressure to new entrants by lowering prices to a level
where new and smaller entries, that would have to adopt a “price follower” approach, would have difficulties
in surviving.
3.3.2.2. Threat of substitute products or services
Intense R&D in the industry results in a high number of new product entries each year - threatening existing
products. R&D resources dedicated towards GMO seeds and traits increases relative to R&D resources
dedicated to more conventional agrochemical pesticides101
. The industry seems to be betting more on
developing seeds that are automatically capable of resting different pests through their modified genes, rather
than to actively deal with the pests when occurring. To this it is worth noting that the total resources
allocated to this kind of R&D is steadily increasing – within both product groups.
Improved GMO seeds that with smaller amounts of pesticides used optimize yield could potentially be a
threat to existing products and producers. If the new products are sold at the same price as existing products
it could deteriorate margins. As in many other markets, there is a price-quality trade-off.
Figure 3-4: Product Revenue Matrix (Own Creation with data from 2013 annual reports)
Opposite there is a clear declining trend in the number of agricultural active ingredients under
development102
resulting in a yearly number of new product launches in the industry of around 7-8. A
number that where above 20 in the mid-eighties103
.
As described in the environmental factors in the PESTEL analysis, organic farming could be a potential
threat to the agrochemical industry, as this type of farming excludes the use of pesticides. But as organic
farming yet is an insignificant part of the global food production, the potential threat is believed to be long-
term.
101
PhillipsMcDougall, “R&D trends for chemical crop protection products and the position of the European Market. A consultancy
study undertaken for ECPA”, (2013). http://www.ecpa.eu/files/attachments/R_and_D_study_2013_v1.8_webVersion_Final.pdf -
page 3 102
PhillipsMcDougall, “R&D trends for chemical crop protection products and the position of the European Market. A consultancy study undertaken for ECPA”, (2013) - page 10. https://issuu.com/cropprotection/docs/r_and_d_study_2013_v1.8_webversion_ 103
103
PhillipsMcDougall, “R&D trends for chemical crop protection products and the position of the European Market. A consultancy study undertaken for ECPA”, (2013).
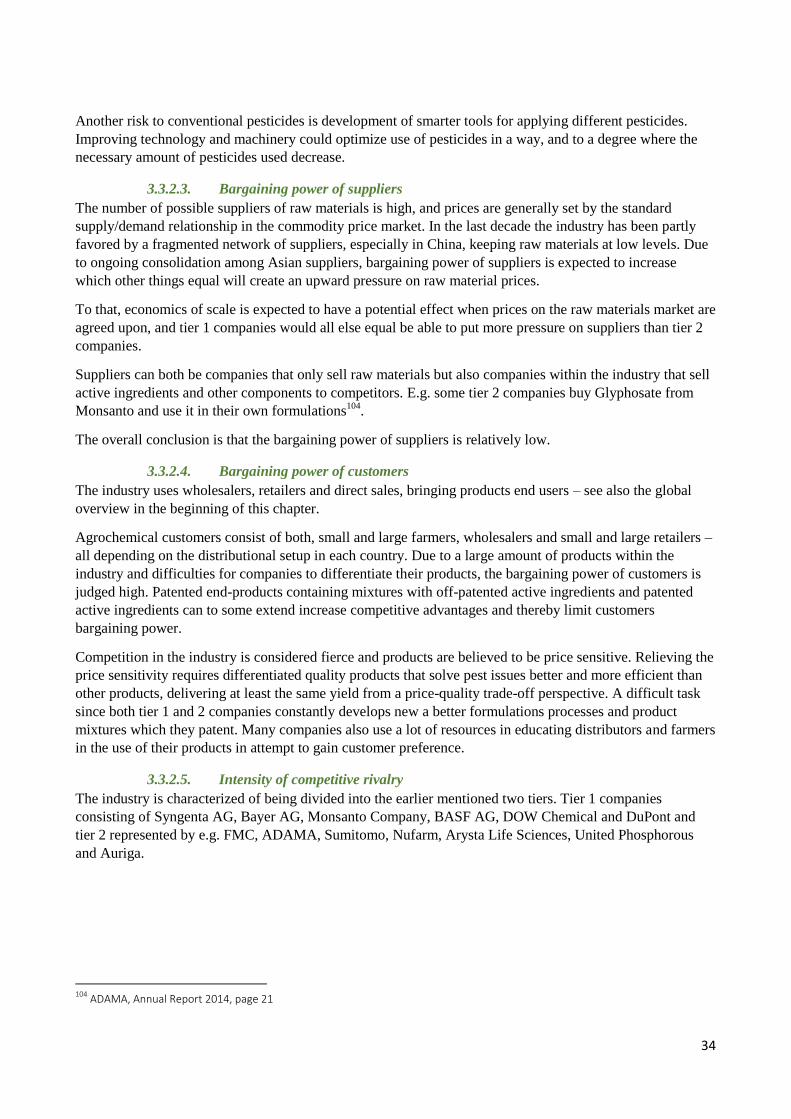
34
Another risk to conventional pesticides is development of smarter tools for applying different pesticides.
Improving technology and machinery could optimize use of pesticides in a way, and to a degree where the
necessary amount of pesticides used decrease.
3.3.2.3. Bargaining power of suppliers
The number of possible suppliers of raw materials is high, and prices are generally set by the standard
supply/demand relationship in the commodity price market. In the last decade the industry has been partly
favored by a fragmented network of suppliers, especially in China, keeping raw materials at low levels. Due
to ongoing consolidation among Asian suppliers, bargaining power of suppliers is expected to increase
which other things equal will create an upward pressure on raw material prices.
To that, economics of scale is expected to have a potential effect when prices on the raw materials market are
agreed upon, and tier 1 companies would all else equal be able to put more pressure on suppliers than tier 2
companies.
Suppliers can both be companies that only sell raw materials but also companies within the industry that sell
active ingredients and other components to competitors. E.g. some tier 2 companies buy Glyphosate from
Monsanto and use it in their own formulations104
.
The overall conclusion is that the bargaining power of suppliers is relatively low.
3.3.2.4. Bargaining power of customers
The industry uses wholesalers, retailers and direct sales, bringing products end users – see also the global
overview in the beginning of this chapter.
Agrochemical customers consist of both, small and large farmers, wholesalers and small and large retailers –
all depending on the distributional setup in each country. Due to a large amount of products within the
industry and difficulties for companies to differentiate their products, the bargaining power of customers is
judged high. Patented end-products containing mixtures with off-patented active ingredients and patented
active ingredients can to some extend increase competitive advantages and thereby limit customers
bargaining power.
Competition in the industry is considered fierce and products are believed to be price sensitive. Relieving the
price sensitivity requires differentiated quality products that solve pest issues better and more efficient than
other products, delivering at least the same yield from a price-quality trade-off perspective. A difficult task
since both tier 1 and 2 companies constantly develops new a better formulations processes and product
mixtures which they patent. Many companies also use a lot of resources in educating distributors and farmers
in the use of their products in attempt to gain customer preference.
3.3.2.5. Intensity of competitive rivalry
The industry is characterized of being divided into the earlier mentioned two tiers. Tier 1 companies
consisting of Syngenta AG, Bayer AG, Monsanto Company, BASF AG, DOW Chemical and DuPont and
tier 2 represented by e.g. FMC, ADAMA, Sumitomo, Nufarm, Arysta Life Sciences, United Phosphorous
and Auriga.
104
ADAMA, Annual Report 2014, page 21
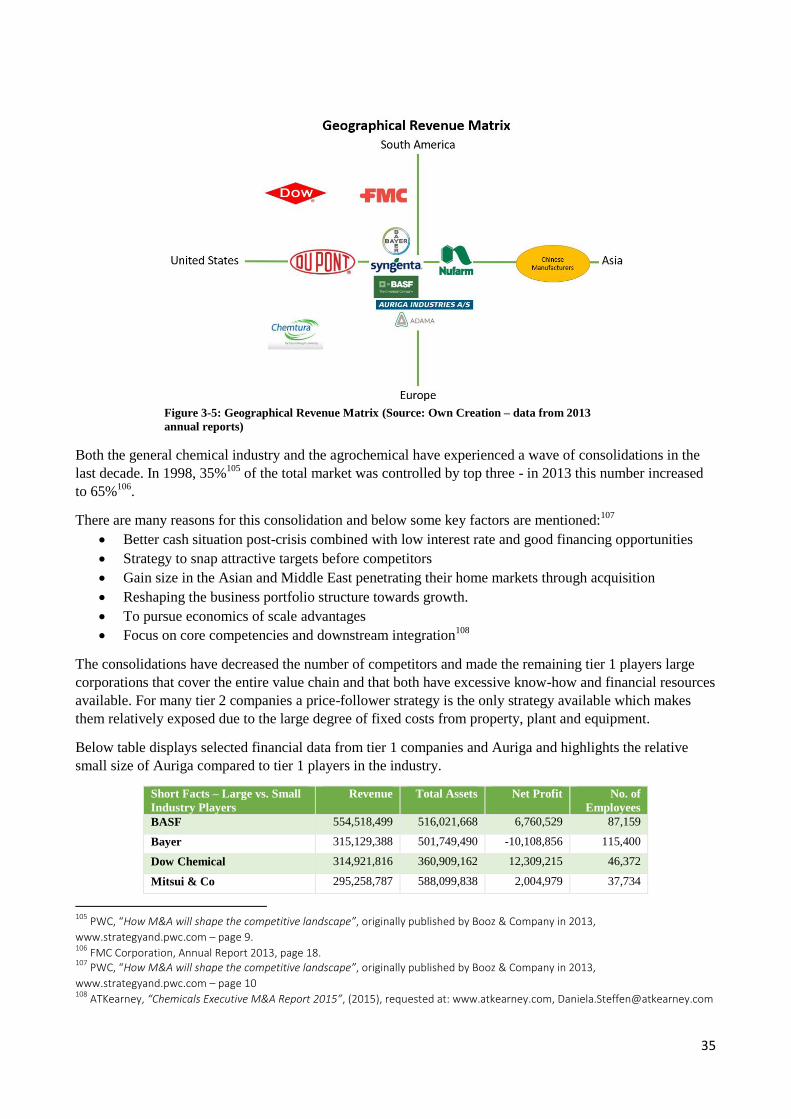
35
Figure 3-5: Geographical Revenue Matrix (Source: Own Creation – data from 2013
annual reports)
Both the general chemical industry and the agrochemical have experienced a wave of consolidations in the
last decade. In 1998, 35%105
of the total market was controlled by top three - in 2013 this number increased
to 65%106
.
There are many reasons for this consolidation and below some key factors are mentioned:107
Better cash situation post-crisis combined with low interest rate and good financing opportunities
Strategy to snap attractive targets before competitors
Gain size in the Asian and Middle East penetrating their home markets through acquisition
Reshaping the business portfolio structure towards growth.
To pursue economics of scale advantages
Focus on core competencies and downstream integration108
The consolidations have decreased the number of competitors and made the remaining tier 1 players large
corporations that cover the entire value chain and that both have excessive know-how and financial resources
available. For many tier 2 companies a price-follower strategy is the only strategy available which makes
them relatively exposed due to the large degree of fixed costs from property, plant and equipment.
Below table displays selected financial data from tier 1 companies and Auriga and highlights the relative
small size of Auriga compared to tier 1 players in the industry.
Short Facts – Large vs. Small
Industry Players
Revenue Total Assets Net Profit No. of
Employees
BASF 554,518,499 516,021,668 6,760,529 87,159
Bayer 315,129,388 501,749,490 -10,108,856 115,400
Dow Chemical 314,921,816 360,909,162 12,309,215 46,372
Mitsui & Co 295,258,787 588,099,838 2,004,979 37,734
105
PWC, “How M&A will shape the competitive landscape”, originally published by Booz & Company in 2013,
www.strategyand.pwc.com – page 9. 106
FMC Corporation, Annual Report 2013, page 18. 107
PWC, “How M&A will shape the competitive landscape”, originally published by Booz & Company in 2013,
www.strategyand.pwc.com – page 10 108
ATKearney, “Chemicals Executive M&A Report 2015”, (2015), requested at: www.atkearney.com, [email protected]
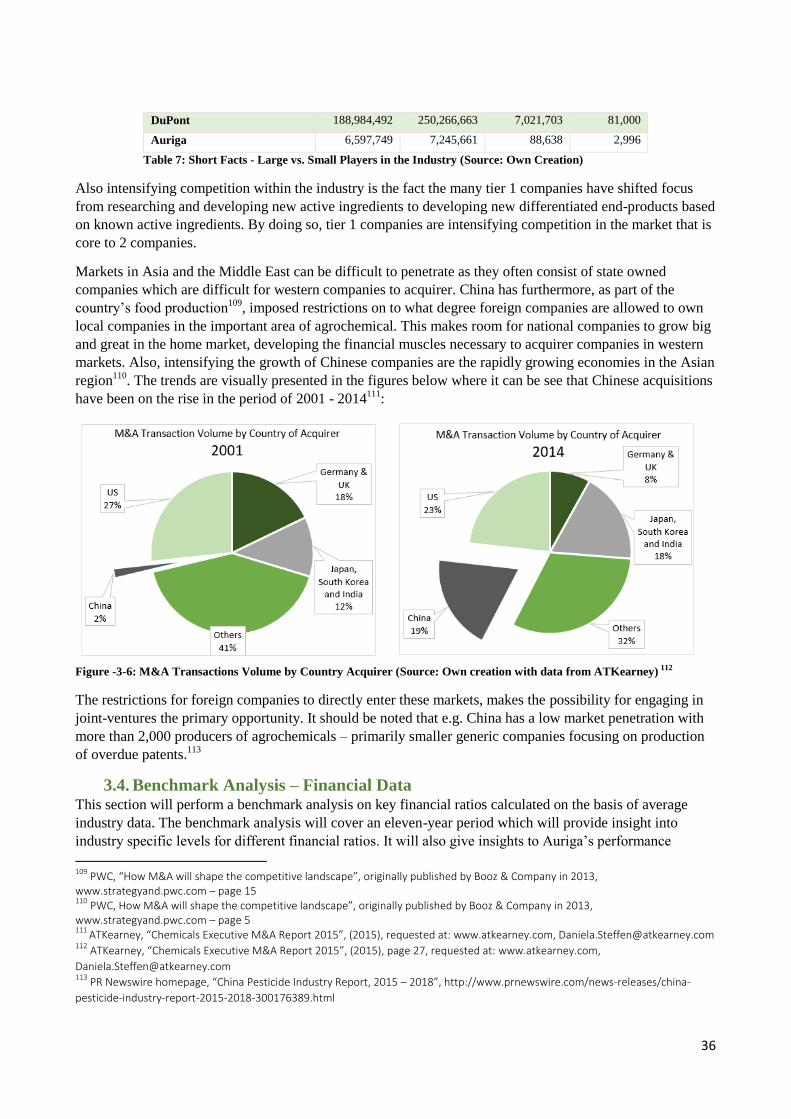
36
DuPont 188,984,492 250,266,663 7,021,703 81,000
Auriga 6,597,749 7,245,661 88,638 2,996
Table 7: Short Facts - Large vs. Small Players in the Industry (Source: Own Creation)
Also intensifying competition within the industry is the fact the many tier 1 companies have shifted focus
from researching and developing new active ingredients to developing new differentiated end-products based
on known active ingredients. By doing so, tier 1 companies are intensifying competition in the market that is
core to 2 companies.
Markets in Asia and the Middle East can be difficult to penetrate as they often consist of state owned
companies which are difficult for western companies to acquirer. China has furthermore, as part of the
country’s food production109
, imposed restrictions on to what degree foreign companies are allowed to own
local companies in the important area of agrochemical. This makes room for national companies to grow big
and great in the home market, developing the financial muscles necessary to acquirer companies in western
markets. Also, intensifying the growth of Chinese companies are the rapidly growing economies in the Asian
region110
. The trends are visually presented in the figures below where it can be see that Chinese acquisitions
have been on the rise in the period of 2001 - 2014111
:
Figure -3-6: M&A Transactions Volume by Country Acquirer (Source: Own creation with data from ATKearney) 112
The restrictions for foreign companies to directly enter these markets, makes the possibility for engaging in
joint-ventures the primary opportunity. It should be noted that e.g. China has a low market penetration with
more than 2,000 producers of agrochemicals – primarily smaller generic companies focusing on production
of overdue patents.113
3.4. Benchmark Analysis – Financial Data This section will perform a benchmark analysis on key financial ratios calculated on the basis of average
industry data. The benchmark analysis will cover an eleven-year period which will provide insight into
industry specific levels for different financial ratios. It will also give insights to Auriga’s performance
109
PWC, “How M&A will shape the competitive landscape”, originally published by Booz & Company in 2013, www.strategyand.pwc.com – page 15 110
PWC, How M&A will shape the competitive landscape”, originally published by Booz & Company in 2013, www.strategyand.pwc.com – page 5 111
ATKearney, “Chemicals Executive M&A Report 2015”, (2015), requested at: www.atkearney.com, [email protected] 112
ATKearney, “Chemicals Executive M&A Report 2015”, (2015), page 27, requested at: www.atkearney.com,
PR Newswire homepage, “China Pesticide Industry Report, 2015 – 2018”, http://www.prnewswire.com/news-releases/china-
pesticide-industry-report-2015-2018-300176389.html
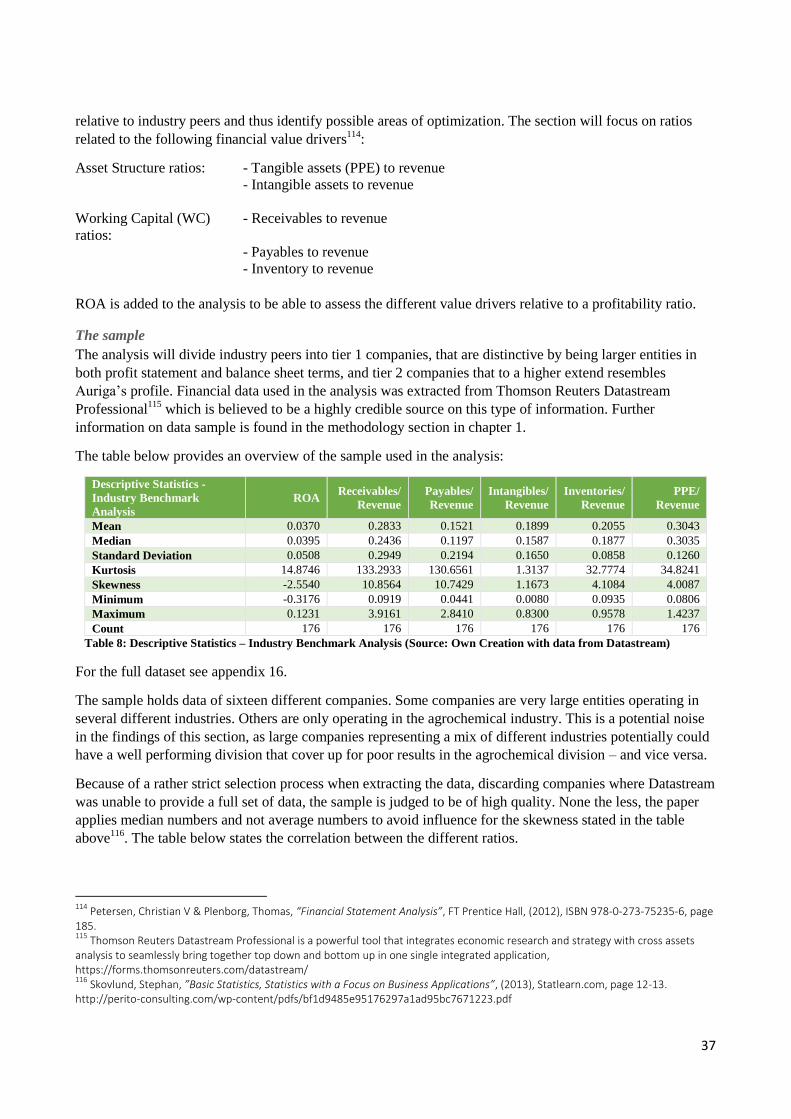
37
relative to industry peers and thus identify possible areas of optimization. The section will focus on ratios
related to the following financial value drivers114
:
Asset Structure ratios: - Tangible assets (PPE) to revenue
- Intangible assets to revenue
Working Capital (WC)
ratios:
- Receivables to revenue
- Payables to revenue
- Inventory to revenue
ROA is added to the analysis to be able to assess the different value drivers relative to a profitability ratio.
The sample
The analysis will divide industry peers into tier 1 companies, that are distinctive by being larger entities in
both profit statement and balance sheet terms, and tier 2 companies that to a higher extend resembles
Auriga’s profile. Financial data used in the analysis was extracted from Thomson Reuters Datastream
Professional115
which is believed to be a highly credible source on this type of information. Further
information on data sample is found in the methodology section in chapter 1.
The table below provides an overview of the sample used in the analysis:
Descriptive Statistics -
Industry Benchmark
Analysis
ROA Receivables/
Revenue
Payables/
Revenue
Intangibles/
Revenue
Inventories/
Revenue
PPE/
Revenue
Mean 0.0370 0.2833 0.1521 0.1899 0.2055 0.3043
Median 0.0395 0.2436 0.1197 0.1587 0.1877 0.3035
Standard Deviation 0.0508 0.2949 0.2194 0.1650 0.0858 0.1260
Kurtosis 14.8746 133.2933 130.6561 1.3137 32.7774 34.8241
Skewness -2.5540 10.8564 10.7429 1.1673 4.1084 4.0087
Minimum -0.3176 0.0919 0.0441 0.0080 0.0935 0.0806
Maximum 0.1231 3.9161 2.8410 0.8300 0.9578 1.4237
Count 176 176 176 176 176 176
Table 8: Descriptive Statistics – Industry Benchmark Analysis (Source: Own Creation with data from Datastream)
For the full dataset see appendix 16.
The sample holds data of sixteen different companies. Some companies are very large entities operating in
several different industries. Others are only operating in the agrochemical industry. This is a potential noise
in the findings of this section, as large companies representing a mix of different industries potentially could
have a well performing division that cover up for poor results in the agrochemical division – and vice versa.
Because of a rather strict selection process when extracting the data, discarding companies where Datastream
was unable to provide a full set of data, the sample is judged to be of high quality. None the less, the paper
applies median numbers and not average numbers to avoid influence for the skewness stated in the table
above116
. The table below states the correlation between the different ratios.
114
Petersen, Christian V & Plenborg, Thomas, “Financial Statement Analysis”, FT Prentice Hall, (2012), ISBN 978-0-273-75235-6, page 185. 115
Thomson Reuters Datastream Professional is a powerful tool that integrates economic research and strategy with cross assets analysis to seamlessly bring together top down and bottom up in one single integrated application, https://forms.thomsonreuters.com/datastream/ 116
Skovlund, Stephan, ”Basic Statistics, Statistics with a Focus on Business Applications”, (2013), Statlearn.com, page 12-13. http://perito-consulting.com/wp-content/pdfs/bf1d9485e95176297a1ad95bc7671223.pdf
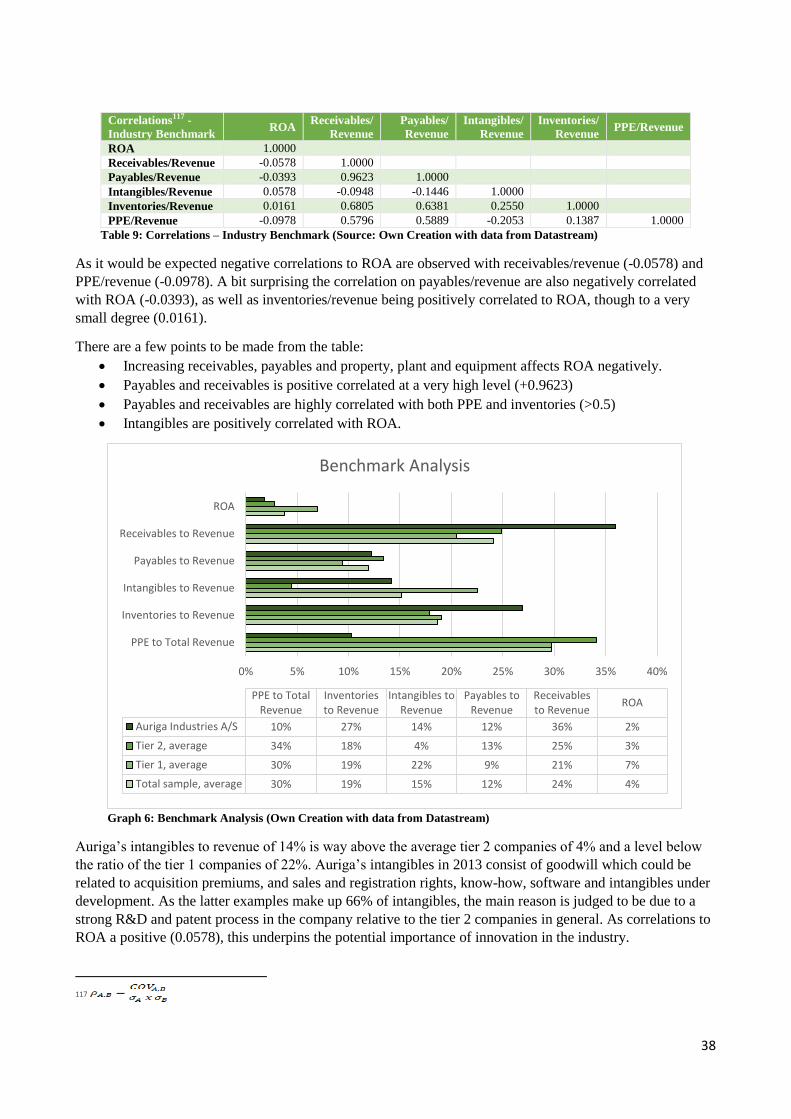
38
Correlations117 -
Industry Benchmark ROA
Receivables/
Revenue
Payables/
Revenue
Intangibles/
Revenue
Inventories/
Revenue PPE/Revenue
ROA 1.0000
Receivables/Revenue -0.0578 1.0000
Payables/Revenue -0.0393 0.9623 1.0000
Intangibles/Revenue 0.0578 -0.0948 -0.1446 1.0000
Inventories/Revenue 0.0161 0.6805 0.6381 0.2550 1.0000
PPE/Revenue -0.0978 0.5796 0.5889 -0.2053 0.1387 1.0000
Table 9: Correlations – Industry Benchmark (Source: Own Creation with data from Datastream)
As it would be expected negative correlations to ROA are observed with receivables/revenue (-0.0578) and
PPE/revenue (-0.0978). A bit surprising the correlation on payables/revenue are also negatively correlated
with ROA (-0.0393), as well as inventories/revenue being positively correlated to ROA, though to a very
small degree (0.0161).
There are a few points to be made from the table:
Increasing receivables, payables and property, plant and equipment affects ROA negatively.
Payables and receivables is positive correlated at a very high level (+0.9623)
Payables and receivables are highly correlated with both PPE and inventories (>0.5)
Intangibles are positively correlated with ROA.
Graph 6: Benchmark Analysis (Own Creation with data from Datastream)
Auriga’s intangibles to revenue of 14% is way above the average tier 2 companies of 4% and a level below
the ratio of the tier 1 companies of 22%. Auriga’s intangibles in 2013 consist of goodwill which could be
related to acquisition premiums, and sales and registration rights, know-how, software and intangibles under
development. As the latter examples make up 66% of intangibles, the main reason is judged to be due to a
strong R&D and patent process in the company relative to the tier 2 companies in general. As correlations to
ROA a positive (0.0578), this underpins the potential importance of innovation in the industry.
117
0% 5% 10% 15% 20% 25% 30% 35% 40%
PPE to Total Revenue
Inventories to Revenue
Intangibles to Revenue
Payables to Revenue
Receivables to Revenue
ROA
PPE to TotalRevenue
Inventoriesto Revenue
Intangibles toRevenue
Payables toRevenue
Receivablesto Revenue
ROA
Auriga Industries A/S 10% 27% 14% 12% 36% 2%
Tier 2, average 34% 18% 4% 13% 25% 3%
Tier 1, average 30% 19% 22% 9% 21% 7%
Total sample, average 30% 19% 15% 12% 24% 4%
Benchmark Analysis
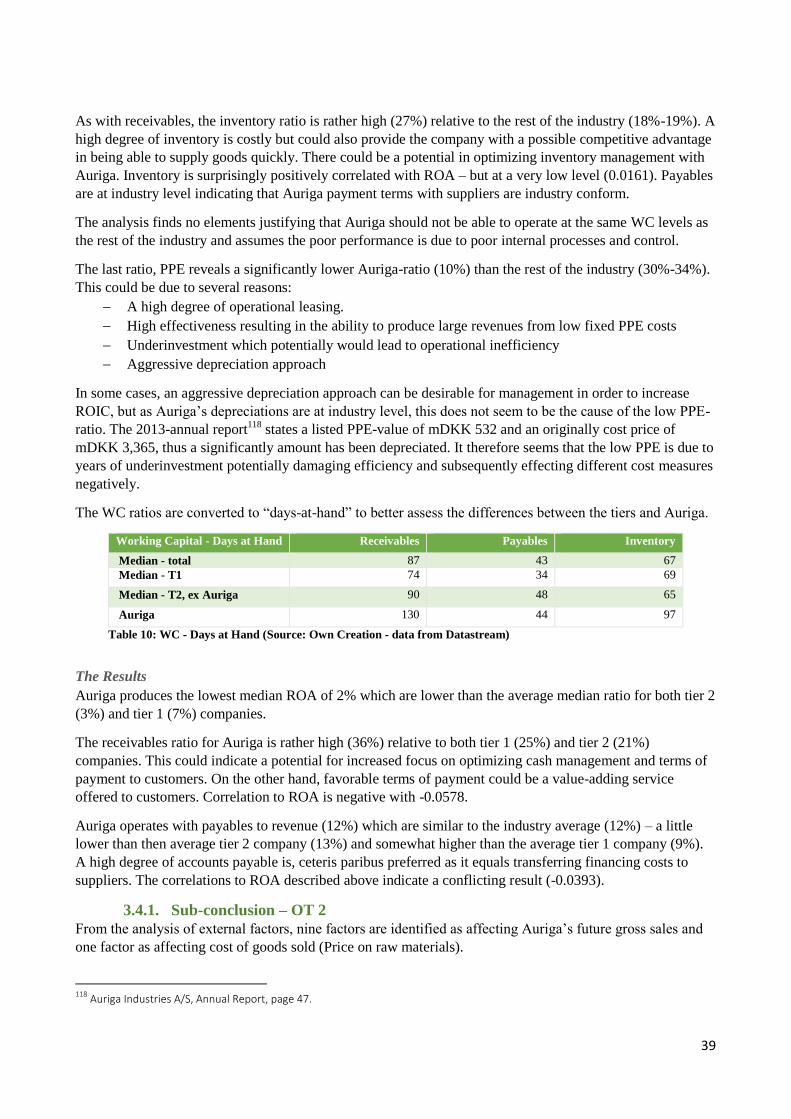
39
As with receivables, the inventory ratio is rather high (27%) relative to the rest of the industry (18%-19%). A
high degree of inventory is costly but could also provide the company with a possible competitive advantage
in being able to supply goods quickly. There could be a potential in optimizing inventory management with
Auriga. Inventory is surprisingly positively correlated with ROA – but at a very low level (0.0161). Payables
are at industry level indicating that Auriga payment terms with suppliers are industry conform.
The analysis finds no elements justifying that Auriga should not be able to operate at the same WC levels as
the rest of the industry and assumes the poor performance is due to poor internal processes and control.
The last ratio, PPE reveals a significantly lower Auriga-ratio (10%) than the rest of the industry (30%-34%).
This could be due to several reasons:
A high degree of operational leasing.
High effectiveness resulting in the ability to produce large revenues from low fixed PPE costs
Underinvestment which potentially would lead to operational inefficiency
Aggressive depreciation approach
In some cases, an aggressive depreciation approach can be desirable for management in order to increase
ROIC, but as Auriga’s depreciations are at industry level, this does not seem to be the cause of the low PPE-
ratio. The 2013-annual report118
states a listed PPE-value of mDKK 532 and an originally cost price of
mDKK 3,365, thus a significantly amount has been depreciated. It therefore seems that the low PPE is due to
years of underinvestment potentially damaging efficiency and subsequently effecting different cost measures
negatively.
The WC ratios are converted to “days-at-hand” to better assess the differences between the tiers and Auriga.
Working Capital - Days at Hand Receivables Payables Inventory
Median - total 87 43 67
Median - T1 74 34 69
Median - T2, ex Auriga 90 48 65
Auriga 130 44 97
Table 10: WC - Days at Hand (Source: Own Creation - data from Datastream)
The Results
Auriga produces the lowest median ROA of 2% which are lower than the average median ratio for both tier 2
(3%) and tier 1 (7%) companies.
The receivables ratio for Auriga is rather high (36%) relative to both tier 1 (25%) and tier 2 (21%)
companies. This could indicate a potential for increased focus on optimizing cash management and terms of
payment to customers. On the other hand, favorable terms of payment could be a value-adding service
offered to customers. Correlation to ROA is negative with -0.0578.
Auriga operates with payables to revenue (12%) which are similar to the industry average (12%) – a little
lower than then average tier 2 company (13%) and somewhat higher than the average tier 1 company (9%).
A high degree of accounts payable is, ceteris paribus preferred as it equals transferring financing costs to
suppliers. The correlations to ROA described above indicate a conflicting result (-0.0393).
3.4.1. Sub-conclusion – OT 2
From the analysis of external factors, nine factors are identified as affecting Auriga’s future gross sales and
one factor as affecting cost of goods sold (Price on raw materials).
118
Auriga Industries A/S, Annual Report, page 47.
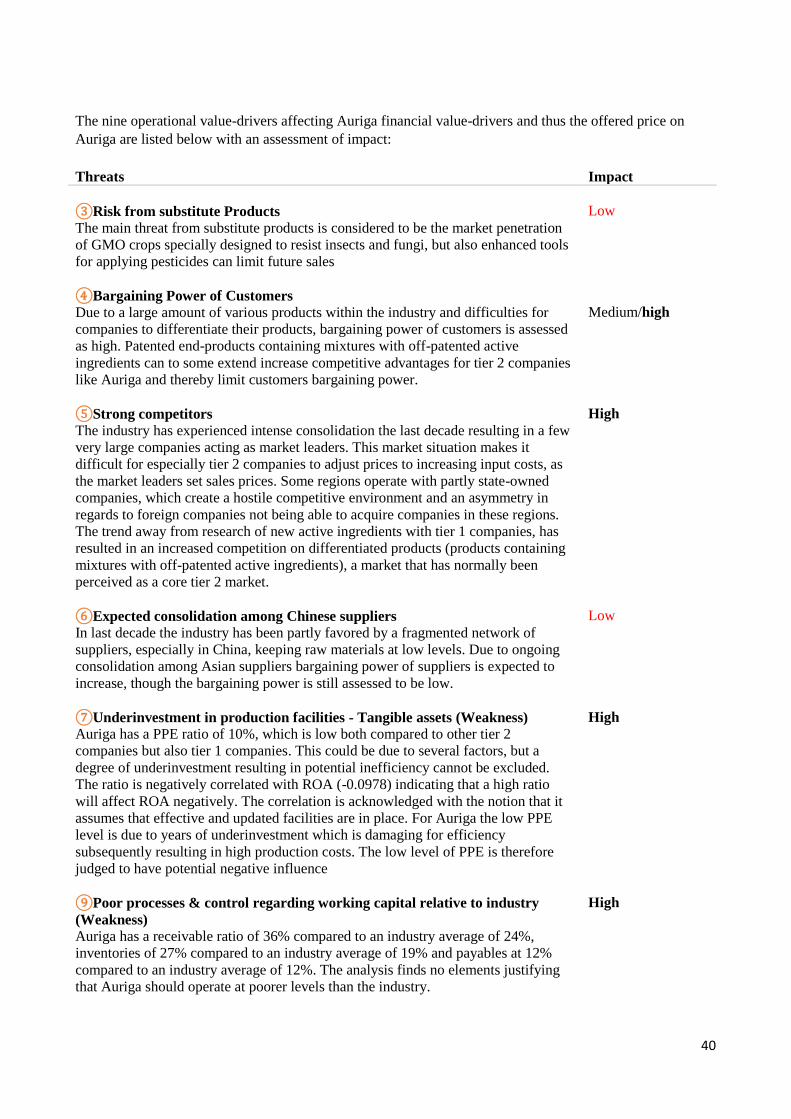
40
The nine operational value-drivers affecting Auriga financial value-drivers and thus the offered price on
Auriga are listed below with an assessment of impact:
Threats Impact
③Risk from substitute Products
The main threat from substitute products is considered to be the market penetration
of GMO crops specially designed to resist insects and fungi, but also enhanced tools
for applying pesticides can limit future sales
Low
④Bargaining Power of Customers
Due to a large amount of various products within the industry and difficulties for
companies to differentiate their products, bargaining power of customers is assessed
as high. Patented end-products containing mixtures with off-patented active
ingredients can to some extend increase competitive advantages for tier 2 companies
like Auriga and thereby limit customers bargaining power.
Medium/high
⑤Strong competitors
The industry has experienced intense consolidation the last decade resulting in a few
very large companies acting as market leaders. This market situation makes it
difficult for especially tier 2 companies to adjust prices to increasing input costs, as
the market leaders set sales prices. Some regions operate with partly state-owned
companies, which create a hostile competitive environment and an asymmetry in
regards to foreign companies not being able to acquire companies in these regions.
The trend away from research of new active ingredients with tier 1 companies, has
resulted in an increased competition on differentiated products (products containing
mixtures with off-patented active ingredients), a market that has normally been
perceived as a core tier 2 market.
High
⑥Expected consolidation among Chinese suppliers
In last decade the industry has been partly favored by a fragmented network of
suppliers, especially in China, keeping raw materials at low levels. Due to ongoing
consolidation among Asian suppliers bargaining power of suppliers is expected to
increase, though the bargaining power is still assessed to be low.
Low
⑦Underinvestment in production facilities - Tangible assets (Weakness)
Auriga has a PPE ratio of 10%, which is low both compared to other tier 2
companies but also tier 1 companies. This could be due to several factors, but a
degree of underinvestment resulting in potential inefficiency cannot be excluded.
The ratio is negatively correlated with ROA (-0.0978) indicating that a high ratio
will affect ROA negatively. The correlation is acknowledged with the notion that it
assumes that effective and updated facilities are in place. For Auriga the low PPE
level is due to years of underinvestment which is damaging for efficiency
subsequently resulting in high production costs. The low level of PPE is therefore
judged to have potential negative influence
High
⑨Poor processes & control regarding working capital relative to industry
(Weakness)
Auriga has a receivable ratio of 36% compared to an industry average of 24%,
inventories of 27% compared to an industry average of 19% and payables at 12%
compared to an industry average of 12%. The analysis finds no elements justifying
that Auriga should operate at poorer levels than the industry.
High
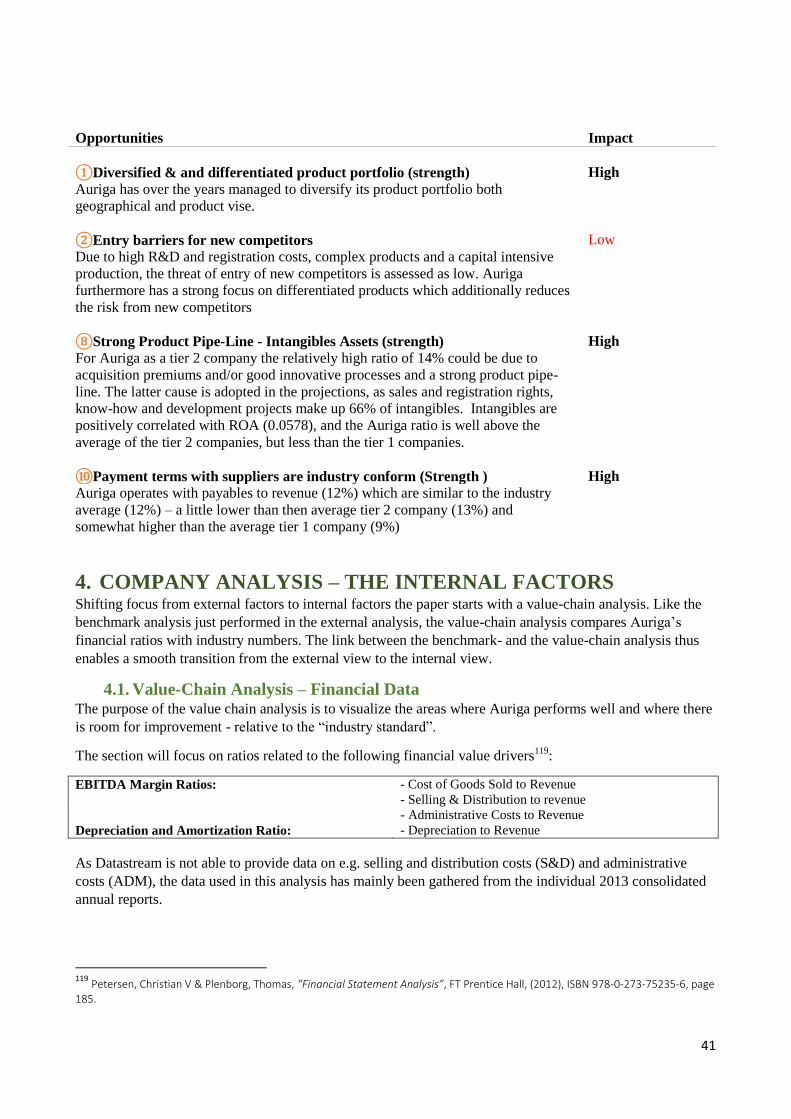
41
Opportunities
Impact
①Diversified & and differentiated product portfolio (strength)
Auriga has over the years managed to diversify its product portfolio both
geographical and product vise.
High
②Entry barriers for new competitors
Due to high R&D and registration costs, complex products and a capital intensive
production, the threat of entry of new competitors is assessed as low. Auriga
furthermore has a strong focus on differentiated products which additionally reduces
the risk from new competitors
Low
⑧Strong Product Pipe-Line - Intangibles Assets (strength)
For Auriga as a tier 2 company the relatively high ratio of 14% could be due to
acquisition premiums and/or good innovative processes and a strong product pipe-
line. The latter cause is adopted in the projections, as sales and registration rights,
know-how and development projects make up 66% of intangibles. Intangibles are
positively correlated with ROA (0.0578), and the Auriga ratio is well above the
average of the tier 2 companies, but less than the tier 1 companies.
High
⑩Payment terms with suppliers are industry conform (Strength )
Auriga operates with payables to revenue (12%) which are similar to the industry
average (12%) – a little lower than then average tier 2 company (13%) and
somewhat higher than the average tier 1 company (9%)
High
4. COMPANY ANALYSIS – THE INTERNAL FACTORS Shifting focus from external factors to internal factors the paper starts with a value-chain analysis. Like the
benchmark analysis just performed in the external analysis, the value-chain analysis compares Auriga’s
financial ratios with industry numbers. The link between the benchmark- and the value-chain analysis thus
enables a smooth transition from the external view to the internal view.
4.1. Value-Chain Analysis – Financial Data The purpose of the value chain analysis is to visualize the areas where Auriga performs well and where there
is room for improvement - relative to the “industry standard”.
The section will focus on ratios related to the following financial value drivers119
:
EBITDA Margin Ratios: - Cost of Goods Sold to Revenue
- Selling & Distribution to revenue
- Administrative Costs to Revenue
Depreciation and Amortization Ratio: - Depreciation to Revenue
As Datastream is not able to provide data on e.g. selling and distribution costs (S&D) and administrative
costs (ADM), the data used in this analysis has mainly been gathered from the individual 2013 consolidated
annual reports.
119
Petersen, Christian V & Plenborg, Thomas, “Financial Statement Analysis”, FT Prentice Hall, (2012), ISBN 978-0-273-75235-6, page 185.
42
The sample consists of a total of fifteen companies including Auriga – six tier 1 companies, and nine tier 2
companies. A larger sample would have been preferred, but especially the Asian companies do not reveal
detailed information on e.g. cost of goods sold (CoGS), S&D, and depreciation levels. Since the total sample
is relatively small descriptive statistics are not applied. In the case of NipponSoda and Sumitomo, e.g. R&D
costs were not disclosed in their annual reports. The data was instead as an exception extracted from
Datastream
For companies with staggered fiscal year the annual report ending either 30’th of November 2013 or 31’th of
March 2014 has been applied.
A degree of bias cannot be excluded as the different entries are calculated and measured differently with the
individual companies. But as this is believed to be minor differences, the data set is still expected be valid
and reliable and able to provide a useful picture of how Auriga performs relative to the industry peers from a
value-chain approach.
A few entries will be given a short comment below:
Revenue: Total consolidated revenue ex. tax and other operating income, but including
subsidies, as subsidies are perceived to be a part of the competitive environment, as
e.g. Indian companies receives rather large subsidies each year – confer UPL annual
report 2013.
Depreciation: To keep a focus on the company’s operational activities, this entry holds only
depreciation of property, plant and equipment and not e.g. amortization of
intangibles.
S&D and Adm120
: S&D and Adm. is a collective item in many annual reports and it has, in many cases,
not been possible to split the information into two separate entries why they have
been marked “N/A”. As of this an extra column has been added holding both the
S&D and Adm. costs.
A data overview is presented in the table below:
120
S&D = sales and distribution costs, and ADM = administrative costs
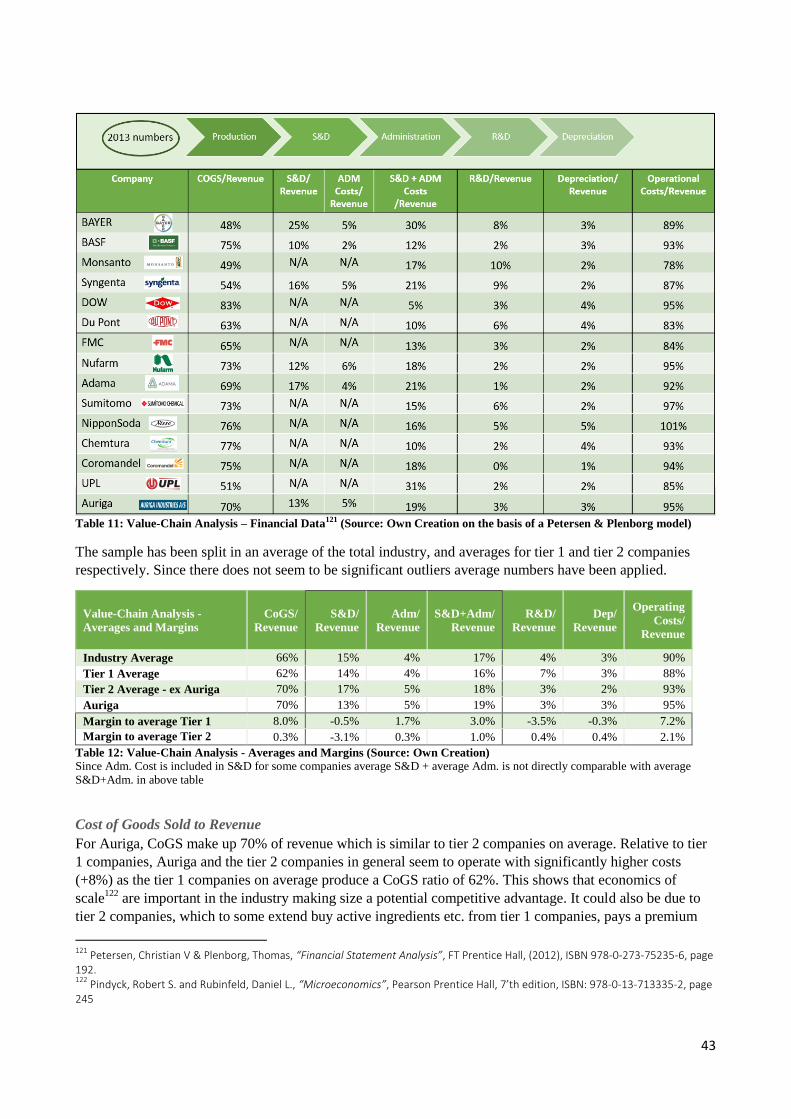
43
Table 11: Value-Chain Analysis – Financial Data121 (Source: Own Creation on the basis of a Petersen & Plenborg model)
The sample has been split in an average of the total industry, and averages for tier 1 and tier 2 companies
respectively. Since there does not seem to be significant outliers average numbers have been applied.
Value-Chain Analysis -
Averages and Margins
CoGS/
Revenue
S&D/
Revenue
Adm/
Revenue
S&D+Adm/
Revenue
R&D/
Revenue
Dep/
Revenue
Operating
Costs/
Revenue
Industry Average 66% 15% 4% 17% 4% 3% 90%
Tier 1 Average 62% 14% 4% 16% 7% 3% 88%
Tier 2 Average - ex Auriga 70% 17% 5% 18% 3% 2% 93%
Auriga 70% 13% 5% 19% 3% 3% 95%
Margin to average Tier 1 8.0% -0.5% 1.7% 3.0% -3.5% -0.3% 7.2%
Margin to average Tier 2 0.3% -3.1% 0.3% 1.0% 0.4% 0.4% 2.1%
Table 12: Value-Chain Analysis - Averages and Margins (Source: Own Creation)
Since Adm. Cost is included in S&D for some companies average S&D + average Adm. is not directly comparable with average
S&D+Adm. in above table
Cost of Goods Sold to Revenue
For Auriga, CoGS make up 70% of revenue which is similar to tier 2 companies on average. Relative to tier
1 companies, Auriga and the tier 2 companies in general seem to operate with significantly higher costs
(+8%) as the tier 1 companies on average produce a CoGS ratio of 62%. This shows that economics of
scale122
are important in the industry making size a potential competitive advantage. It could also be due to
tier 2 companies, which to some extend buy active ingredients etc. from tier 1 companies, pays a premium
121
Petersen, Christian V & Plenborg, Thomas, “Financial Statement Analysis”, FT Prentice Hall, (2012), ISBN 978-0-273-75235-6, page 192. 122
Pindyck, Robert S. and Rubinfeld, Daniel L., “Microeconomics”, Pearson Prentice Hall, 7’th edition, ISBN: 978-0-13-713335-2, page 245
44
compared to the production price and thus have higher GoGS. The poor level likewise shows a high degree
of inefficiency which is in tune with the low PPE ratio described in the benchmark analysis in chapter 3.
Sales, Distribution and Administrative Costs to Revenue
Auriga seems to operate with relatively low S&D costs being 0.5 percentage points lower than the tier 1
companies and 3.1 percentage points lower than the tier 2 companies. Turning to Adm. costs Auriga operates
with costs slightly higher than both tier 1 and tier 2 companies. It should be noted that these results rely on
only six observations – three from each tier.
Looking at the collected entry of both S&D and Adm. the picture from CoGS is recognized. Auriga operates
with costs that are 3 percentage points higher than tier 1 companies, and 1 percentage points higher than tier
2 companies. Auriga’s annual report disclose no information It as to why Auriga has higher costs, but it is
assumed that higher S&D and adm. costs are due to Auriga being more inefficient and having poorer cost
control relative to the industry.
R&D to Revenue
Tier 1 companies seem to allocate more resources to R&D purposes than both Auriga (+3.5 percentage
points) and tier 2 companies in general (+3.1 percentage points). This finding underpins the fact that tier 2
companies do not engage in e.g. development of new active ingredients. The lower allocation of resources to
R&D compared to the industry can be due to many different reasons, but a fair assumption is that it is
primarily driven by high yearly dividend payments and thus a missing long term perspective from the
majority owner – AURF.123
Depreciation
Concerning depreciation, there are only vague differences with Auriga at a level 0.3% lower than the tier 1
companies and 0.4% higher than the tier 2 companies in general.
Total Operating Costs
Summing the results from downstream operations into a concluding ratio of total operating costs to revenue
reveals, that Auriga seems to perform poorer than both the tier 1 companies with costs that are 7.2% higher,
and the tier 2 companies with costs that are 2.1% higher.
In absolute numbers a total operating costs ratio at the level of tier 2 companies would increase the Auriga
operating income with approximately 132 million DKK124
.
4.2. Financial Analysis The objective of this chapter is to conduct a thorough analysis of Auriga’s financial performance and thus
display a true and fair view of the company’s historic financial performance which can be used to forecast
future earnings. The structure of the analysis will shortly be commented on below.
When the financial statements have been cleared from “noise”, it can be reclassified, separating operating
activities from financing activities. And subsequently key financial figures and value drivers can be
calculated and evaluated.
The financial analysis will include a period bridging from 2005 - 2013, totaling 9 years. The period has been
chosen to grasp Auriga’s performance in the economic boom ending in 2007/2008 and following financial
rescission. By doing so it is possible to asses Auriga’s capabilities in different business cycles. The year
2014 is not included in the analysis, as the divestment of Cheminova was concluded in September that year.
123
Auriga Industries A/S, Annual Reports from 2005-2013 and the Annual Report 2010, page 17 124
2% of 6.597 billion (2013 revenue) = 131,9 million DKK
45
4.2.1. Accounting quality
In financial reports, recognition, measurement and classification of accounting items are highly subjective
and even standards applied from IFRS are subject to estimates and management appraisal and thus biased125
.
A critical assessment of accounting data and quality is therefore necessary to distinguish permanent value
creating activities from “noise” caused by shift in accounting policies, shift in accounting estimates and
transitory items etc. In order structure the analysis of accounting quality it has been divided into three sub-
section; Accounting Policies, Consistency in Accounting Estimates and Permanent vs. Transitory Items.
Accounting Policies
The starting point when analyzing accounting policies is the independent auditor’s report. It must be
representative of a true and fair view in accordance with International Financial Reporting Standards (IFRS)
adopted by EU and Denmark, and audits from the accountants’ statements must not have resulted in any
qualifications. All Auriga’s financial statements in the period of 2005 to 2013 have “clean” audits
statements126
.
Subsequently the financial statements have to be cleared from changes arising from shifts in financial
policies due to mandatory amendments applied by IFRS .
In 2005 Auriga shifted account policy to IFRS and the applied accounting standard has been used in all nine
years analyzed. Since IFRS constantly seeks to optimize reporting and consequently amendments new
mandatory standards for reporting, changes in accounting policies have still accrued in the analyzed period.
None of the amendments that can be viewed in appendix 27, significantly alters the financial figures as they
are generally updates on how financial figures are presented, thus none of them have been implemented
retrospectively.
Consistency in Accounting Estimates
IFRS is a conceptual framework which leaves room for subjective estimates by which management and other
stakeholders can seek to present a better or worse view of the company’s performance than the actual.
In our analysis of consistency in accounting estimates we have paid special attention to changes in
recognition of revenue, non-recurring and special items (restructuring charges, gains and losses on sale of
assets etc.), capitalization of expenses, changes in goodwill due to annual impairment tests as required by
IFRS. None of above estimates has changed significantly and thus none of them have been identified as “red
flags”.
Permanent Versus Transitory Items
Transitory items are accounting figures which are non-recurring and thus do not present any valuable
information about the future prospects of the company and its ability to produce earnings.
Penman (2010) defines earnings quality as:
“Quality of earnings is the degree to which current earnings serves as an indication of future earnings”127
Sine transitory items are not continuous and thus serve as a bad indication of future earnings they need to be
eliminated when analyzing financial statements for forecasting use.
The changes made to the financial statements concerning transitory items are described below.
125
Petersen, Christian V & Plenborg, Thomas, “Financial Statement Analysis”, FT Prentice Hall, (2012), ISBN 978-0-273-75235-6, page 16 126
Auriga Industries A/S, Fiancial Report’s 2005 - 2013 127
Petersen, Christian V & Plenborg, Thomas, “Financial Statement Analysis”, FT Prentice Hall, (2012), ISBN 978-0-273-75235-6, page 334
46
2006 - Cost of tDKK 100,000 due to Complaints - Insecticide in Brazil
The cost is considered to be a part of Auriga’s operating risk since product complaints due to missing effects
or malfunctions are a part of doing business. The cost is thus not eliminated, but transferred from
administration to special items to illustrate that it is not an overhead cost.
2012 – Auriga Sentenced to Pay tDKK 95,232 to Former Customer
Due to a court ruling concerning Auriga’s early termination of a sales contract, the company is sentenced to
pay a compensation of mDKK 91 to the former client. Even though the cost is related to Auriga’s operating
business, it is assessed to be a contractual related issue and not a recurring cost and thus it is eliminated128
.
2013 -Income of mDKK 56 from Divestment of Stähler Schweiz
Auriga does not disclose information on why Stähler Schweiz (Stähler) is divested in 2013, but Auriga
continues to cooperate with Stähler after the divestment maintaining the company as a distributor of Auriga’s
products. Since Stähler Schweiz is an agrochemical company the proceeds from divesting the company is
considered to be part of Auriga’s operating business.
4.2.2. Re-classifying the Financial Statements
In order to get a better knowledge of Auriga’s ability to create value from its operating activities it is
necessary to separate operating activities from financing activities. The purpose of separating operating
activities from financing activities is to better understand the sources of value creation in the company’s
operating activities129
. It is the value creating abilities within Auriga’s core operating activities that makes
them unique and that creates the basis for adding value in future periods.
Before reclassifying the financial statements some important preliminary adjustments are performed to
secure a better structure of the reclassification.
4.2.2.1. Preliminary Adjustments
Since Auriga in different stages have owned companies with activities outside the company’s core operating
activities and because these adjustments are comprehensive, it has be necessary to separate financial figures
relating to those companies into separate accounts before reclassifying the financial statements. The financial
figures are likewise adjusted for operational leases before final reclassifying.
These preliminary adjustments are clustered for Hardi International A/S (Hardi) and Skamol A/S (Skamol)
which Auriga owned until 2007 and separately for Auriga Ejendomme A/S which Auriga owned until 2012.
Lastly the financial figures are adjusted for operational leases.
Hardi International A/S and Skamol A/S
In the financial statements for Auriga in 2005 and 2006 Hardi and Skamol are fully consolidated in the
financial figures of Auriga and in the 2007 revenue, income and expenses until the date of divestment are
included in the income statements under discontinuing operations.
128 Note: The judgement can be discussed as it depends on the type of contracts signed by Auriga and to whether or not the type of
contract is common in the agrochemical business. Because this information is not disclosed and it is expected that Auriga’s contract
are in line with other contract in the agrochemical business the cost is assessed to be transitory.
129 Petersen, Christian V & Plenborg, Thomas, “Financial Statement Analysis”, FT Prentice Hall, (2012), ISBN 978-0-273-75235-6, page
68
47
Hardi produce and sell sprayers used by farmers to apply pesticides on crops and the company where sold to
Excel Industries November 30, 2007. Skamol produce and sell thermal insulating materials for heat intensive
industries and were sold to the Private Equity fund, Polaris in July 2, 2007130
.
As both Hardi and Skamol were sold in 2007, and since the activities in both companies are not considered
part of Auriga’s core business the financial figures for Auriga in 2005, 2006 and 2007 are adjusted
accordingly as being a financial item.
Income Statement
In the income statement items relating to Hardi and Skamol are deducted from revenue, income and
expenses, and two new entries labeled; “Net, Income Hardi International A/S” and “Net, Income Skamol
A/S” are created. By doing so, activities from both companies are separated from Auriga’s financial figures
and compounded into one account for each company. In the financial figures for 2007, a realized loss of
tDKK 191,662 related to the divestment of Hardi and a realized profit of tDKK 76,260 related to the
divestment of Skamol are moved to “Net, Income Hardi International A/S” and Net, Income Skamol A/S”.
Also, operating income from both companies until the date of sale is transferred to those items. For
calculations see appendix 28
Due to the lack of disclosure in the financial statements, and due to the fact that both Hardi and Skamol’s
core operations are focused away from the core operations of Auriga, intercompany transactions between the
two companies and Auriga are assessed to be limited (if any) and therefore not accounted for when revenue,
income and expenses are subtracted from Auriga’s consolidated figures.
Balance Sheet
Items in the balance sheets are likewise cleared for assets, equity and liabilities relating to Hardi and Skamol.
The figures subtracted are then compounded into separate accounts labeled “Assets Hardi International
A/S/Skamol A/S”, “Equity Hardi International A/S/Skamol A/S” and “Liabilities Hardi International
A/S/Skamol A/S” respectively. For calculations see appendix 29
4.2.2.2. Auriga Ejendomme A/S
When Auriga acquired Hardi, the company owned its domicile property located in Taastrup. Later, in 2007
when Hardi was divested, the property remained in the Auriga group under the name; “Auriga Ejendomme
A/S”. In 2008 the property is transferred from account “Land and buildings” to “Investment property” in the
financial statement. Auriga Ejendomme A/S is then subsequently sold in June, 2012. For calculations see
appendix 29.
Since income and expenses, assets and liabilities are fully consolidated in Auriga’s financial statements
bridging from 2008 until 2012 the same procedure used to separate financial figures relation to Hardi and
Skamol is used to isolate Auriga’s core operating facilities.
Impairment losses in 2008 of mDKK 20 related to the property in Taastrup is transferred from depreciations
to the new items labeled “Net, Income Auriga Ejendomme A/S”. For calculations see appendix 29.
4.2.2.3. Operational Leasing
When reclassifying Auriga’s financial statements for analytical use it is necessary to adjust for leases
classified as operating leases. Otherwise, companies that make use of a high degree of operational leases will
appear less capital intensive compared to peers and key financial figures will be affected. Leases classified as
operating leases differs from financial leases because they are not recognized in the balance sheet.
130
Auriga Industries A/S – financial report 2007, Note 9, page 37
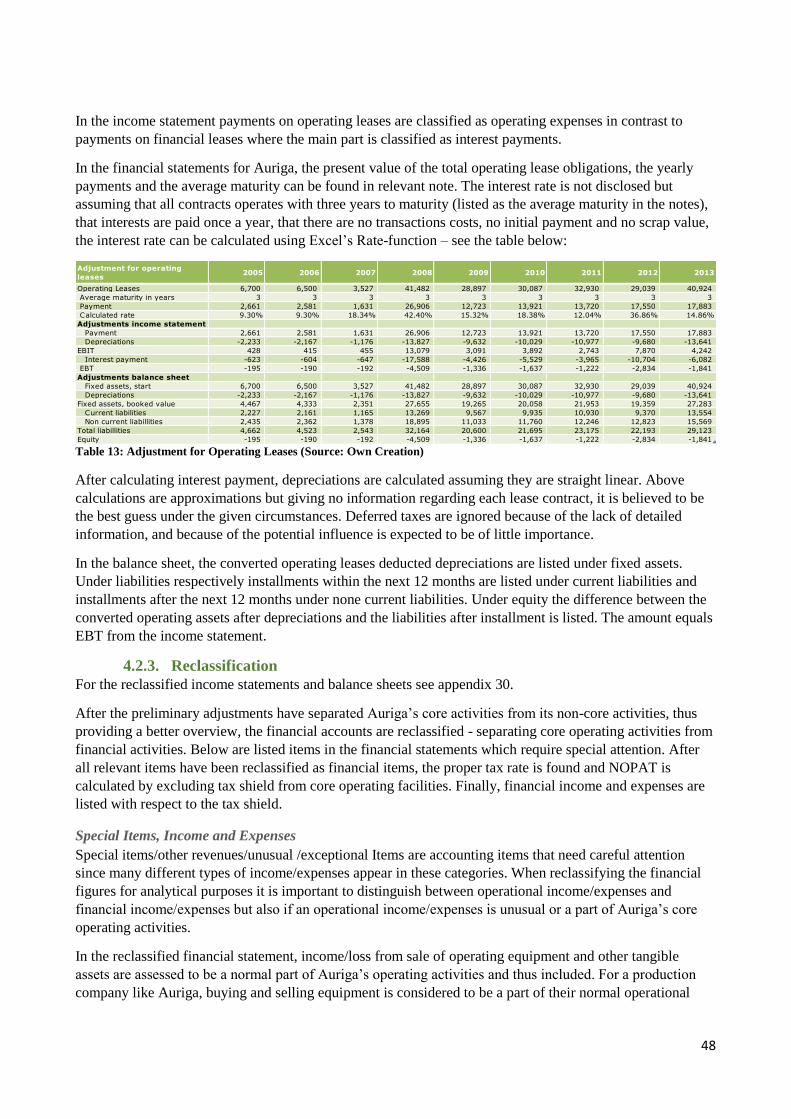
48
In the income statement payments on operating leases are classified as operating expenses in contrast to
payments on financial leases where the main part is classified as interest payments.
In the financial statements for Auriga, the present value of the total operating lease obligations, the yearly
payments and the average maturity can be found in relevant note. The interest rate is not disclosed but
assuming that all contracts operates with three years to maturity (listed as the average maturity in the notes),
that interests are paid once a year, that there are no transactions costs, no initial payment and no scrap value,
the interest rate can be calculated using Excel’s Rate-function – see the table below:
Table 13: Adjustment for Operating Leases (Source: Own Creation)
After calculating interest payment, depreciations are calculated assuming they are straight linear. Above
calculations are approximations but giving no information regarding each lease contract, it is believed to be
the best guess under the given circumstances. Deferred taxes are ignored because of the lack of detailed
information, and because of the potential influence is expected to be of little importance.
In the balance sheet, the converted operating leases deducted depreciations are listed under fixed assets.
Under liabilities respectively installments within the next 12 months are listed under current liabilities and
installments after the next 12 months under none current liabilities. Under equity the difference between the
converted operating assets after depreciations and the liabilities after installment is listed. The amount equals
EBT from the income statement.
4.2.3. Reclassification
For the reclassified income statements and balance sheets see appendix 30.
After the preliminary adjustments have separated Auriga’s core activities from its non-core activities, thus
providing a better overview, the financial accounts are reclassified - separating core operating activities from
financial activities. Below are listed items in the financial statements which require special attention. After
all relevant items have been reclassified as financial items, the proper tax rate is found and NOPAT is
calculated by excluding tax shield from core operating facilities. Finally, financial income and expenses are
listed with respect to the tax shield.
Special Items, Income and Expenses
Special items/other revenues/unusual /exceptional Items are accounting items that need careful attention
since many different types of income/expenses appear in these categories. When reclassifying the financial
figures for analytical purposes it is important to distinguish between operational income/expenses and
financial income/expenses but also if an operational income/expenses is unusual or a part of Auriga’s core
operating activities.
In the reclassified financial statement, income/loss from sale of operating equipment and other tangible
assets are assessed to be a normal part of Auriga’s operating activities and thus included. For a production
company like Auriga, buying and selling equipment is considered to be a part of their normal operational
Adjustment for operating
leases2005 2006 2007 2008 2009 2010 2011 2012 2013
Operating Leases 6,700 6,500 3,527 41,482 28,897 30,087 32,930 29,039 40,924
Average maturity in years 3 3 3 3 3 3 3 3 3
Payment 2,661 2,581 1,631 26,906 12,723 13,921 13,720 17,550 17,883
Calculated rate 9.30% 9.30% 18.34% 42.40% 15.32% 18.38% 12.04% 36.86% 14.86%
Adjustments income statement
Payment 2,661 2,581 1,631 26,906 12,723 13,921 13,720 17,550 17,883
Depreciations -2,233 -2,167 -1,176 -13,827 -9,632 -10,029 -10,977 -9,680 -13,641
EBIT 428 415 455 13,079 3,091 3,892 2,743 7,870 4,242
Interest payment -623 -604 -647 -17,588 -4,426 -5,529 -3,965 -10,704 -6,082
EBT -195 -190 -192 -4,509 -1,336 -1,637 -1,222 -2,834 -1,841
Adjustments balance sheet
Fixed assets, start 6,700 6,500 3,527 41,482 28,897 30,087 32,930 29,039 40,924
Depreciations -2,233 -2,167 -1,176 -13,827 -9,632 -10,029 -10,977 -9,680 -13,641
Fixed assets, booked value 4,467 4,333 2,351 27,655 19,265 20,058 21,953 19,359 27,283
Current liabilities 2,227 2,161 1,165 13,269 9,567 9,935 10,930 9,370 13,554
Non current liabillities 2,435 2,362 1,378 18,895 11,033 11,760 12,246 12,823 15,569
Total liabillities 4,662 4,523 2,543 32,164 20,600 21,695 23,175 22,193 29,123
Equity -195 -190 -192 -4,509 -1,336 -1,637 -1,222 -2,834 -1,841
49
business, and thus income/loss from selling equipment must be considered part of normal operating
activities. The account also includes compensations, public subsidies and other operating related
transactions/items.
Associated Companies - Income/Loss and Shareholdings
In 2005, Auriga was holding equity investments in United Moler ApS and Damolin A/S which produces
absorbents, soil conditioner and cat litter, and NCM Core A/S which produces safety doors. The equity
investments where all related to Auriga’s ownership of Skamol. Additionally Auriga was also part of a joint
venture corporation in Pytech Chemicals GmbH (Pytech). When Skamol was sold in 2007, so where the
equity investments - except for Damolin A/S which was sold to the private equity fond; Erhvervsinvest II in
2010.
Since activities in all of above mentioned associated companies are not considered to be a part of Auriga’s
core business, profit and loss throughout the period analyzed, are not included in the operational income, but
recognized as financial profit or losses. Shareholdings are likewise assessed to be financial assets.
The joint-venture company, Pytech that develops and distributes active ingredients which are considered to
be part of Auriga’s core business, is likewise listed under associated companies. Since the company is owned
through a joint venture, its financial figures are proportionate consolidated into the financial figures for
Auriga up until the company became fully owned in 2008131
.
According to IAS 31, proportionate consolidated is:
“Under proportionate consolidation, the balance sheet of the venturer includes its share of the assets that it controls
jointly and its share of the liabilities for which it is jointly responsible. The income statement of the venturer includes its
share of the income and expenses of the jointly controlled entity. [IAS 31.33]”132
.
Because the activities in Pytech are considered within the scope of Auriga’s core activities no adjustments
are made in the income statement or balance sheet.
In 2012 Auriga acquires a 35% stake in Agrinova OPOO in Lebanon. The company is a distributor of
agrochemicals, and as the activities is considered to be within the scope of Auriga’s core activities133
,
income/loss from the company is included in the operational income. Shareholdings and receivables related
to Agrinova OPOO, Lebanon are likewise assessed as operating assets.
Deferred tax
Auriga does not disclose if deferred tax is related to operating activities or financing, but because deferred
tax is often related to operating activities it has been classified as an operating item.
Accounts Receivable
Accounts Receivable has been classified as an operating item since they are believed to be related to
Auriga’s operating activities. The financial statements provide no information of the receivables being
interest bearing indicating a financial item.
131
Cheminova acquires full ownership of Pytech Chemicals GmbH from Dow AgroSciences, company announcement from Auriga Industries, February 27, 2008 132
Deloitte webpage - http://www.iasplus.com/en/standards/ias/ias31 133
Agrinova OPOOO is a distributor of agrochemicals, http://www.agrinova-sal.com/profile.html
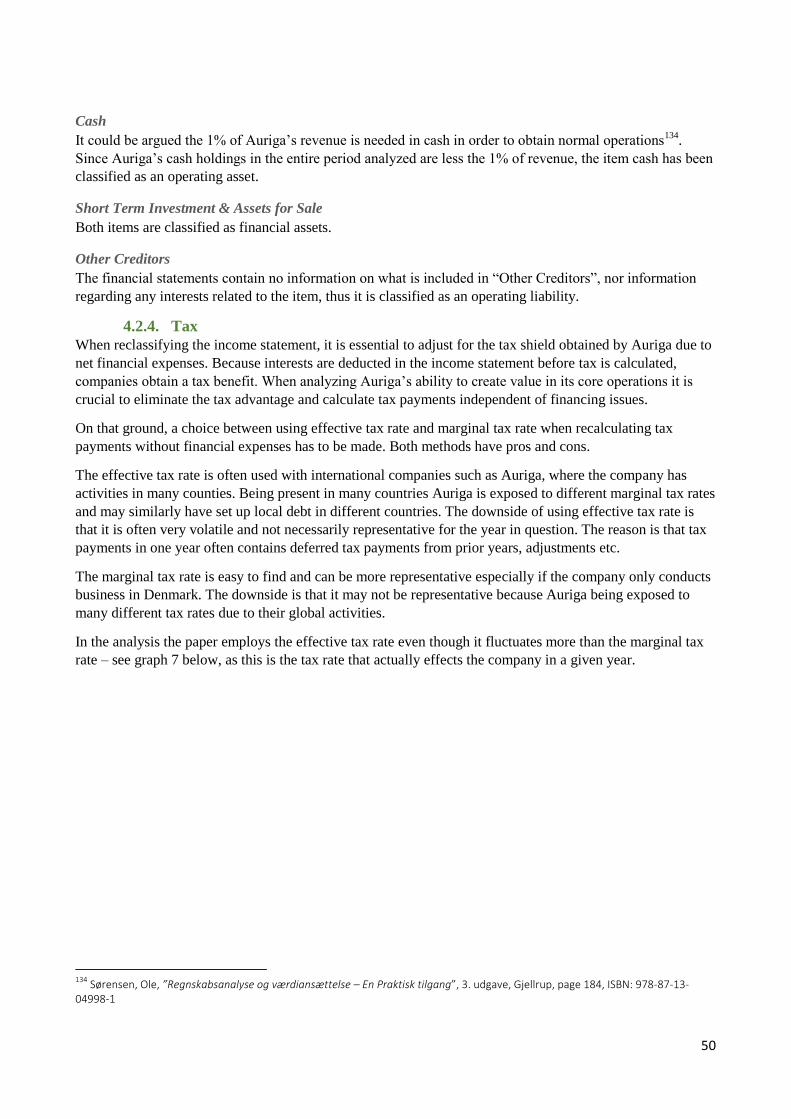
50
Cash
It could be argued the 1% of Auriga’s revenue is needed in cash in order to obtain normal operations134
.
Since Auriga’s cash holdings in the entire period analyzed are less the 1% of revenue, the item cash has been
classified as an operating asset.
Short Term Investment & Assets for Sale
Both items are classified as financial assets.
Other Creditors
The financial statements contain no information on what is included in “Other Creditors”, nor information
regarding any interests related to the item, thus it is classified as an operating liability.
4.2.4. Tax
When reclassifying the income statement, it is essential to adjust for the tax shield obtained by Auriga due to
net financial expenses. Because interests are deducted in the income statement before tax is calculated,
companies obtain a tax benefit. When analyzing Auriga’s ability to create value in its core operations it is
crucial to eliminate the tax advantage and calculate tax payments independent of financing issues.
On that ground, a choice between using effective tax rate and marginal tax rate when recalculating tax
payments without financial expenses has to be made. Both methods have pros and cons.
The effective tax rate is often used with international companies such as Auriga, where the company has
activities in many counties. Being present in many countries Auriga is exposed to different marginal tax rates
and may similarly have set up local debt in different countries. The downside of using effective tax rate is
that it is often very volatile and not necessarily representative for the year in question. The reason is that tax
payments in one year often contains deferred tax payments from prior years, adjustments etc.
The marginal tax rate is easy to find and can be more representative especially if the company only conducts
business in Denmark. The downside is that it may not be representative because Auriga being exposed to
many different tax rates due to their global activities.
In the analysis the paper employs the effective tax rate even though it fluctuates more than the marginal tax
rate – see graph 7 below, as this is the tax rate that actually effects the company in a given year.
134
Sørensen, Ole, ”Regnskabsanalyse og værdiansættelse – En Praktisk tilgang”, 3. udgave, Gjellrup, page 184, ISBN: 978-87-13-04998-1
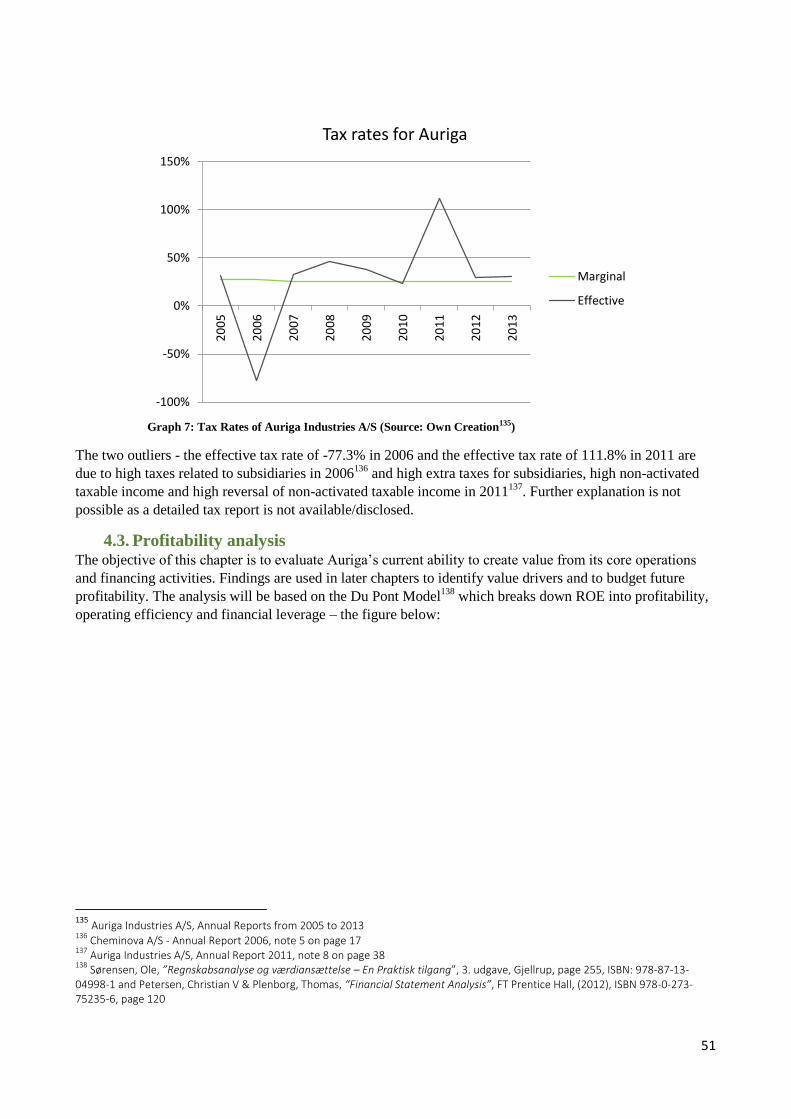
51
Graph 7: Tax Rates of Auriga Industries A/S (Source: Own Creation135)
The two outliers - the effective tax rate of -77.3% in 2006 and the effective tax rate of 111.8% in 2011 are
due to high taxes related to subsidiaries in 2006136
and high extra taxes for subsidiaries, high non-activated
taxable income and high reversal of non-activated taxable income in 2011137
. Further explanation is not
possible as a detailed tax report is not available/disclosed.
4.3. Profitability analysis The objective of this chapter is to evaluate Auriga’s current ability to create value from its core operations
and financing activities. Findings are used in later chapters to identify value drivers and to budget future
profitability. The analysis will be based on the Du Pont Model138
which breaks down ROE into profitability,
operating efficiency and financial leverage – the figure below:
135
Auriga Industries A/S, Annual Reports from 2005 to 2013 136
Cheminova A/S - Annual Report 2006, note 5 on page 17 137
Auriga Industries A/S, Annual Report 2011, note 8 on page 38 138
Sørensen, Ole, ”Regnskabsanalyse og værdiansættelse – En Praktisk tilgang”, 3. udgave, Gjellrup, page 255, ISBN: 978-87-13-04998-1 and Petersen, Christian V & Plenborg, Thomas, “Financial Statement Analysis”, FT Prentice Hall, (2012), ISBN 978-0-273-75235-6, page 120
-100%
-50%
0%
50%
100%
150%
20
05
20
06
20
07
20
08
20
09
20
10
20
11
20
12
20
13
Tax rates for Auriga
Marginal
Effective
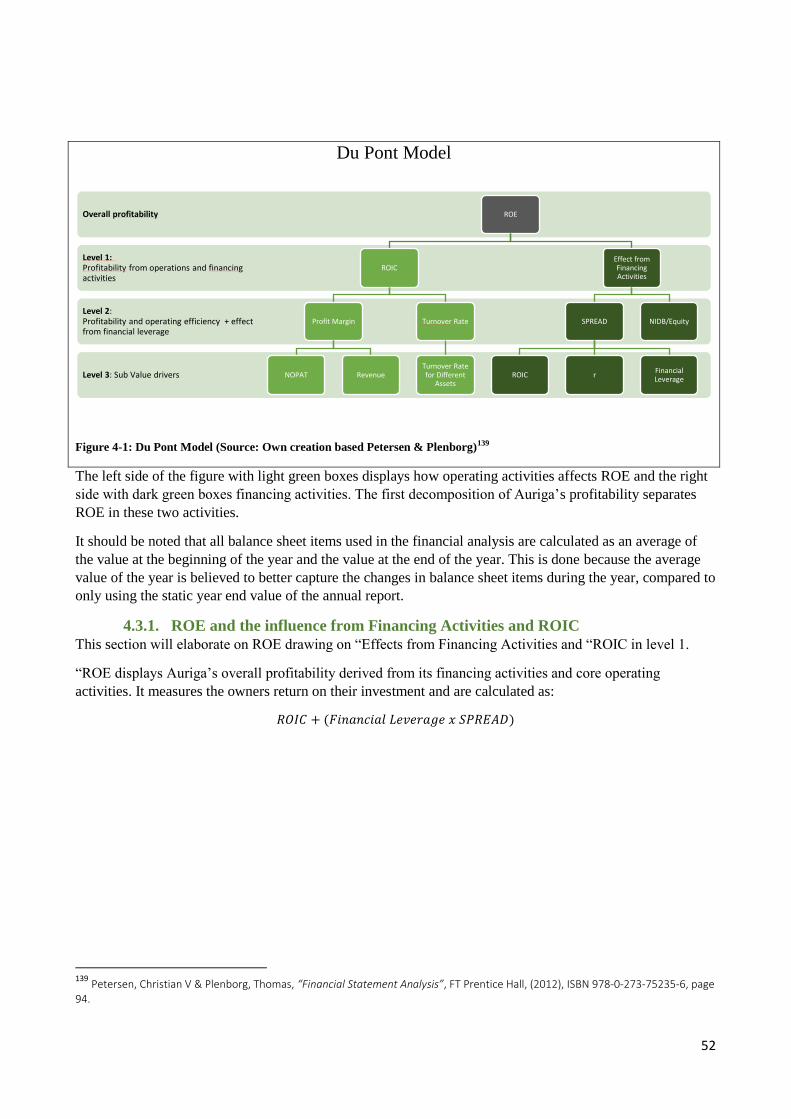
52
Du Pont Model
Figure 4-1: Du Pont Model (Source: Own creation based Petersen & Plenborg)139
The left side of the figure with light green boxes displays how operating activities affects ROE and the right
side with dark green boxes financing activities. The first decomposition of Auriga’s profitability separates
ROE in these two activities.
It should be noted that all balance sheet items used in the financial analysis are calculated as an average of
the value at the beginning of the year and the value at the end of the year. This is done because the average
value of the year is believed to better capture the changes in balance sheet items during the year, compared to
only using the static year end value of the annual report.
4.3.1. ROE and the influence from Financing Activities and ROIC
This section will elaborate on ROE drawing on “Effects from Financing Activities and “ROIC in level 1.
“ROE displays Auriga’s overall profitability derived from its financing activities and core operating
activities. It measures the owners return on their investment and are calculated as:
𝑅𝑂𝐼𝐶 + (𝐹𝑖𝑛𝑎𝑛𝑐𝑖𝑎𝑙 𝐿𝑒𝑣𝑒𝑟𝑎𝑔𝑒 𝑥 𝑆𝑃𝑅𝐸𝐴𝐷)
139
Petersen, Christian V & Plenborg, Thomas, “Financial Statement Analysis”, FT Prentice Hall, (2012), ISBN 978-0-273-75235-6, page 94.
Level 3: Sub Value drivers
Level 2: Profitability and operating efficiency + effect from financial leverage
Level 1: Profitability from operations and financing activities
Overall profitability ROE
ROIC
Profit Margin
NOPAT Revenue
Turnover Rate
Turnover Rate for Different
Assets
Effect from Financing Activities
SPREAD
ROIC r Financial Leverage
NIDB/Equity
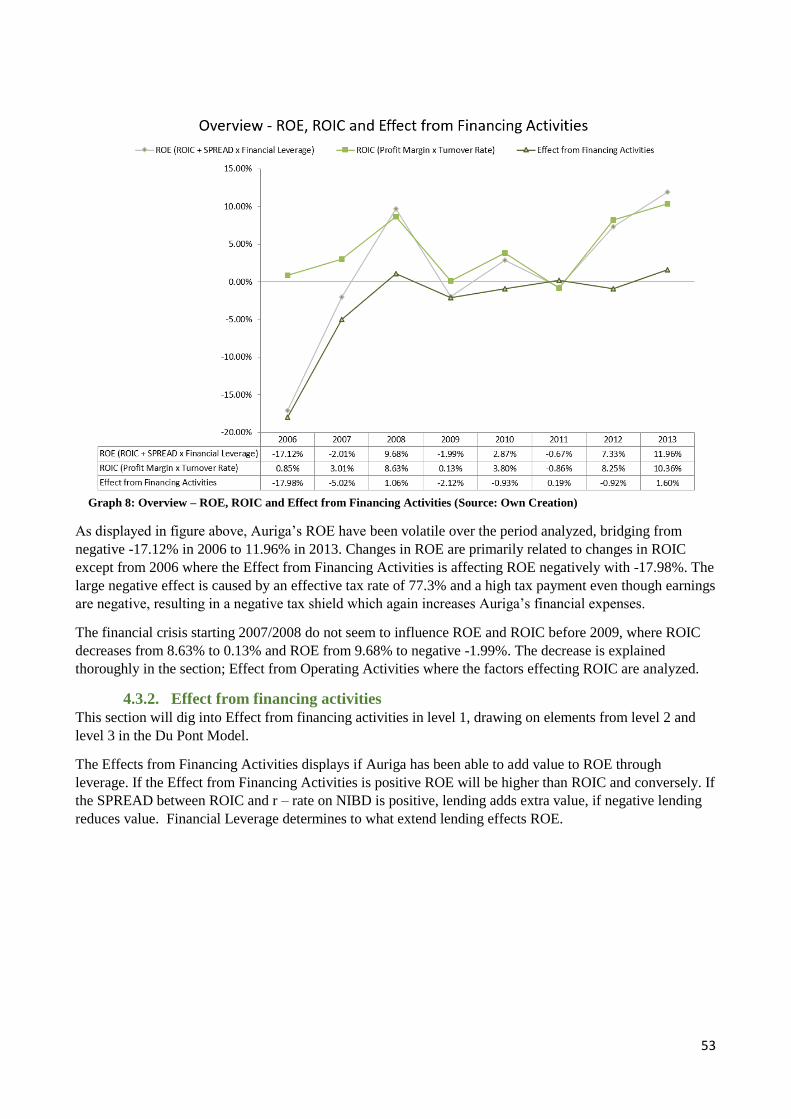
53
Graph 8: Overview – ROE, ROIC and Effect from Financing Activities (Source: Own Creation)
As displayed in figure above, Auriga’s ROE have been volatile over the period analyzed, bridging from
negative -17.12% in 2006 to 11.96% in 2013. Changes in ROE are primarily related to changes in ROIC
except from 2006 where the Effect from Financing Activities is affecting ROE negatively with -17.98%. The
large negative effect is caused by an effective tax rate of 77.3% and a high tax payment even though earnings
are negative, resulting in a negative tax shield which again increases Auriga’s financial expenses.
The financial crisis starting 2007/2008 do not seem to influence ROE and ROIC before 2009, where ROIC
decreases from 8.63% to 0.13% and ROE from 9.68% to negative -1.99%. The decrease is explained
thoroughly in the section; Effect from Operating Activities where the factors effecting ROIC are analyzed.
4.3.2. Effect from financing activities
This section will dig into Effect from financing activities in level 1, drawing on elements from level 2 and
level 3 in the Du Pont Model.
The Effects from Financing Activities displays if Auriga has been able to add value to ROE through
leverage. If the Effect from Financing Activities is positive ROE will be higher than ROIC and conversely. If
the SPREAD between ROIC and r – rate on NIBD is positive, lending adds extra value, if negative lending
reduces value. Financial Leverage determines to what extend lending effects ROE.

54
Graph 9: Effect from Financing Activities (Source: Own Creation)
As shown in above figure, changes in Effect from Financing Activities is to a large extend explained by
changes in the SPREAD between ROIC and r – the calculated rate on NIBD. Financial Leverage is relatively
constant around 0.50, with a small decline over the 8 years, except from in 2006 where Financial Leverage is
0.75, driven by a low equity.
In the years from 2007 until 2013 Effects from Financing Activities are more modest bridging from -5.02%
in 2007 to 1.60% in 2013, making the effects from financing negative in 5 out of 8 years analyzed.
It should be noted that the financial expenses, and therefore r to a large degree is biased in 2007, 2008 and
2012 due to reclassification of large income and balance items as financial activities.
In 2007 tDKK 99,666 in negative income from the sale of Hardi and Skamol are reclassified as financial
expenses increasing the negative Effect from financing activities.
In 2008 negative income from Auriga Ejendomme A/S primarily related to impairment loss of mDKK 20,
has a large negative impact of Auriga’s financial expenses since income from Auriga Ejendomme A/S is
assessed not to be a part of Auriga’s core operating activities and therefore a classified as financing
activities.
In 2012 payment of tDKK 95,232 to former customer is classified as financing activities adding to the
negative Effect from financing activities.
If no reclassifications where performed, the calculation of r, and subsequently the SPREAD would might
have proven to be more positive. Auriga does not disclose their average lending rate in any of their annual
reports so a comparison is not possible.
4.3.3. Effect from operating activities
ROIC can be calculated by multiplying Profit Margin with Turnover Rate for invested capital as shown in
graph 10 below or alternatively by dividing NOPAT with Invested Capital.
ROIC measures Auriga’s return on the capital invested on their operating activities, and comparing it with
WACC reveals if Auriga has been able to meet the costs on the capital provided and created shareholder
value. If ROIC is higher than WACC Auriga has added value and vice versa.
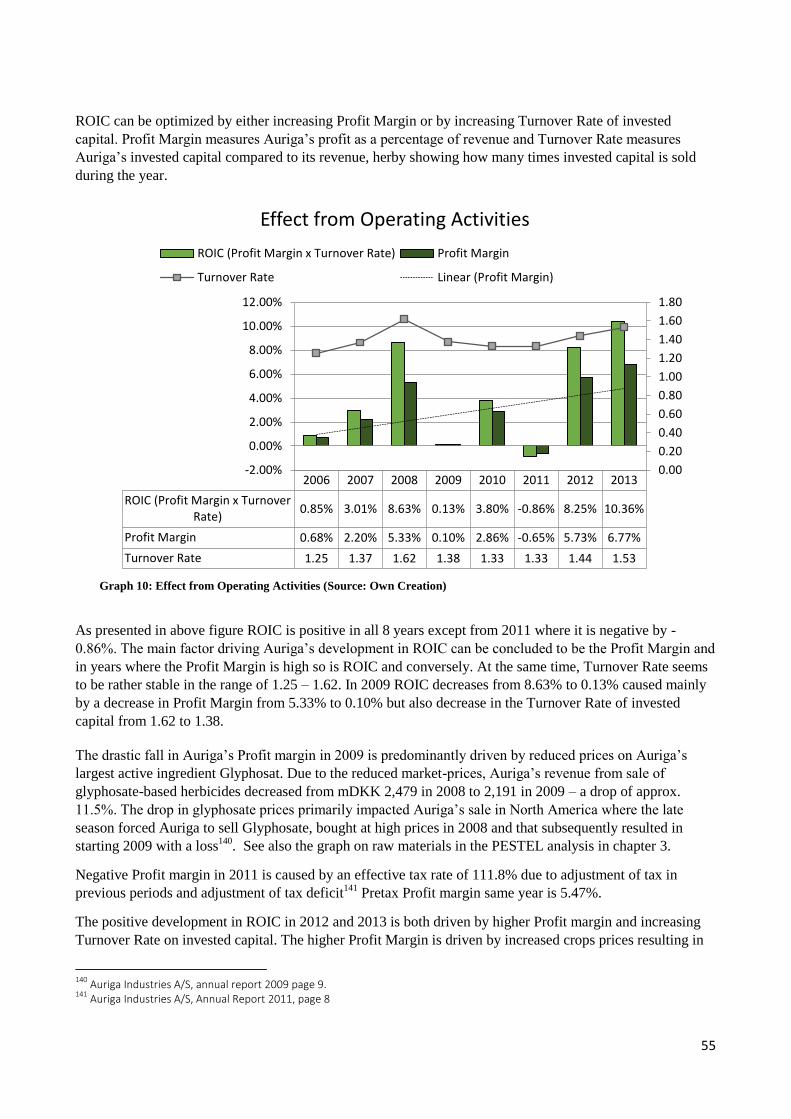
55
ROIC can be optimized by either increasing Profit Margin or by increasing Turnover Rate of invested
capital. Profit Margin measures Auriga’s profit as a percentage of revenue and Turnover Rate measures
Auriga’s invested capital compared to its revenue, herby showing how many times invested capital is sold
during the year.
Graph 10: Effect from Operating Activities (Source: Own Creation)
As presented in above figure ROIC is positive in all 8 years except from 2011 where it is negative by -
0.86%. The main factor driving Auriga’s development in ROIC can be concluded to be the Profit Margin and
in years where the Profit Margin is high so is ROIC and conversely. At the same time, Turnover Rate seems
to be rather stable in the range of 1.25 – 1.62. In 2009 ROIC decreases from 8.63% to 0.13% caused mainly
by a decrease in Profit Margin from 5.33% to 0.10% but also decrease in the Turnover Rate of invested
capital from 1.62 to 1.38.
The drastic fall in Auriga’s Profit margin in 2009 is predominantly driven by reduced prices on Auriga’s
largest active ingredient Glyphosat. Due to the reduced market-prices, Auriga’s revenue from sale of
glyphosate-based herbicides decreased from mDKK 2,479 in 2008 to 2,191 in 2009 – a drop of approx.
11.5%. The drop in glyphosate prices primarily impacted Auriga’s sale in North America where the late
season forced Auriga to sell Glyphosate, bought at high prices in 2008 and that subsequently resulted in
starting 2009 with a loss140
. See also the graph on raw materials in the PESTEL analysis in chapter 3.
Negative Profit margin in 2011 is caused by an effective tax rate of 111.8% due to adjustment of tax in
previous periods and adjustment of tax deficit141
Pretax Profit margin same year is 5.47%.
The positive development in ROIC in 2012 and 2013 is both driven by higher Profit margin and increasing
Turnover Rate on invested capital. The higher Profit Margin is driven by increased crops prices resulting in
140
Auriga Industries A/S, annual report 2009 page 9. 141
Auriga Industries A/S, Annual Report 2011, page 8
2006 2007 2008 2009 2010 2011 2012 2013
ROIC (Profit Margin x TurnoverRate)
0.85% 3.01% 8.63% 0.13% 3.80% -0.86% 8.25% 10.36%
Profit Margin 0.68% 2.20% 5.33% 0.10% 2.86% -0.65% 5.73% 6.77%
Turnover Rate 1.25 1.37 1.62 1.38 1.33 1.33 1.44 1.53
0.00
0.20
0.40
0.60
0.80
1.00
1.20
1.40
1.60
1.80
-2.00%
0.00%
2.00%
4.00%
6.00%
8.00%
10.00%
12.00%
Effect from Operating Activities
ROIC (Profit Margin x Turnover Rate) Profit Margin
Turnover Rate Linear (Profit Margin)
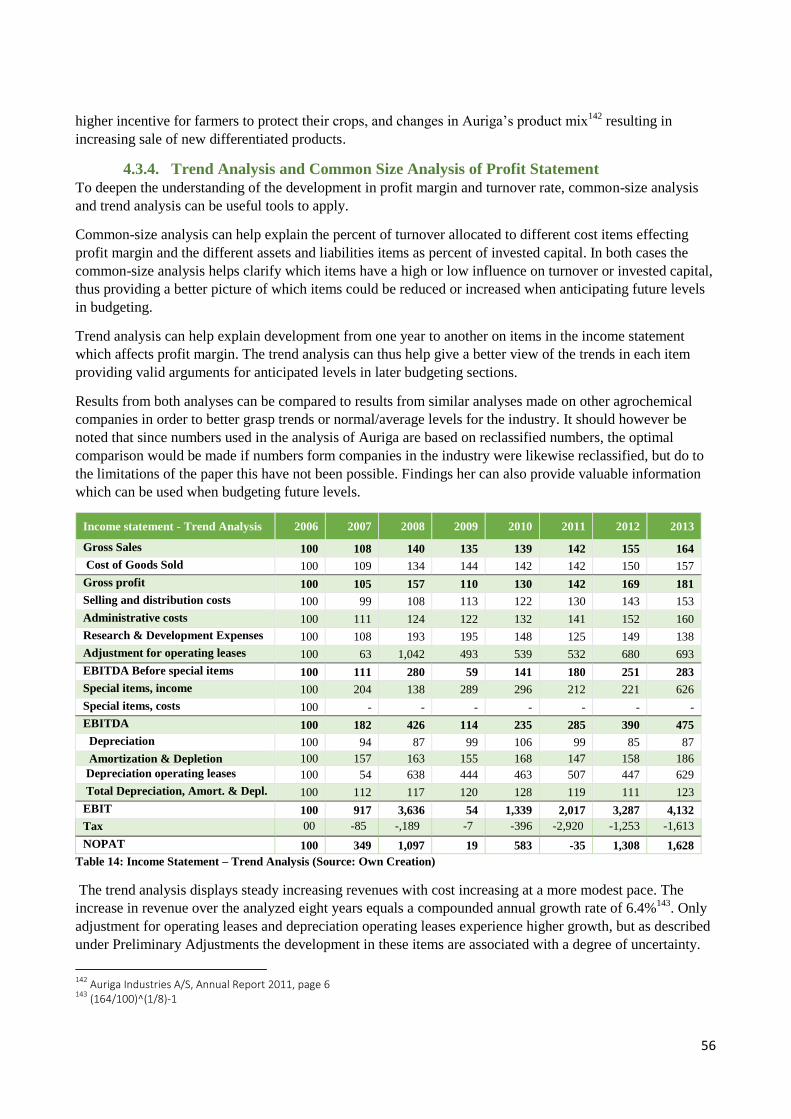
56
higher incentive for farmers to protect their crops, and changes in Auriga’s product mix142
resulting in
increasing sale of new differentiated products.
4.3.4. Trend Analysis and Common Size Analysis of Profit Statement
To deepen the understanding of the development in profit margin and turnover rate, common-size analysis
and trend analysis can be useful tools to apply.
Common-size analysis can help explain the percent of turnover allocated to different cost items effecting
profit margin and the different assets and liabilities items as percent of invested capital. In both cases the
common-size analysis helps clarify which items have a high or low influence on turnover or invested capital,
thus providing a better picture of which items could be reduced or increased when anticipating future levels
in budgeting.
Trend analysis can help explain development from one year to another on items in the income statement
which affects profit margin. The trend analysis can thus help give a better view of the trends in each item
providing valid arguments for anticipated levels in later budgeting sections.
Results from both analyses can be compared to results from similar analyses made on other agrochemical
companies in order to better grasp trends or normal/average levels for the industry. It should however be
noted that since numbers used in the analysis of Auriga are based on reclassified numbers, the optimal
comparison would be made if numbers form companies in the industry were likewise reclassified, but do to
the limitations of the paper this have not been possible. Findings her can also provide valuable information
which can be used when budgeting future levels.
Income statement - Trend Analysis 2006 2007 2008 2009 2010 2011 2012 2013
Gross Sales 100 108 140 135 139 142 155 164
Cost of Goods Sold 100 109 134 144 142 142 150 157
Gross profit 100 105 157 110 130 142 169 181
Selling and distribution costs 100 99 108 113 122 130 143 153
Administrative costs 100 111 124 122 132 141 152 160
Research & Development Expenses 100 108 193 195 148 125 149 138
Adjustment for operating leases 100 63 1,042 493 539 532 680 693
EBITDA Before special items 100 111 280 59 141 180 251 283
Special items, income 100 204 138 289 296 212 221 626
Special items, costs 100 - - - - - - -
EBITDA 100 182 426 114 235 285 390 475
Depreciation 100 94 87 99 106 99 85 87
Amortization & Depletion 100 157 163 155 168 147 158 186
Depreciation operating leases 100 54 638 444 463 507 447 629
Total Depreciation, Amort. & Depl. 100 112 117 120 128 119 111 123
EBIT 100 917 3,636 54 1,339 2,017 3,287 4,132
Tax 00 -85 -,189 -7 -396 -2,920 -1,253 -1,613
NOPAT 100 349 1,097 19 583 -35 1,308 1,628
Table 14: Income Statement – Trend Analysis (Source: Own Creation)
The trend analysis displays steady increasing revenues with cost increasing at a more modest pace. The
increase in revenue over the analyzed eight years equals a compounded annual growth rate of 6.4%143
. Only
adjustment for operating leases and depreciation operating leases experience higher growth, but as described
under Preliminary Adjustments the development in these items are associated with a degree of uncertainty.
142
Auriga Industries A/S, Annual Report 2011, page 6 143
(164/100)^(1/8)-1

57
Likewise, as shown below in the Common Size Analysis the costs related to these items account for a small
part of Auriga’s revenue.
Income statement - Common Size Analysis 2006 2007 2008 2009 2010 2011 2012 2013
Gross Sales 100 100 100 100 100 100 100 100
Cost of Goods Sold -72 -73 -68 -77 -74 -72 -69 -69
Gross profit 28 27 32 23 26 28 31 31
Selling and distribution costs -14 -13 -11 -12 -12 -13 -13 -13
Administrative costs -5 -5 -4 -4 -5 -5 -5 -5
Research & Development Expenses -3 -3 -4 -4 -3 -3 -3 -3
Adjustment for operating leases - - - - - - - -
EBITDA Before special items 6 7 13 3 7 8 10 11
Special items, income - 1 - 1 1 1 1 2
Special items, costs -2 - - - - - - -
Income from associated companies - - - - - - - -
EBITDA 4 7 13 4 7 9 11 13
Depreciation -3 -2 -2 -2 -2 -2 -2 -1
Amortization & Depletion -1 -2 -1 -1 -1 -1 -1 -1
Depreciation operating leases - - - - - - - -
Total Depreciation, Amort. & Depl. -4 -4 -3 -4 -4 -3 -3 -3
EBIT 1 3 10 - 4 5 8 10
Tax - -1 -5 - -1 -6 -2 -3
NOPAT 1 2 5 - 3 -1 6 7
Table 15: Income Statement - Common Size Analysis (Source: Own Creation)
The common-size analysis shows that CoGS constitutes the largest cost item accounting for approx.
69%/70% of revenue in 2013, thus being the prime influential item affecting profit margin. It also shows that
CoGS has been developing positively since 2009. S&D costs is situated around 13%, administration cost at
5%, R&D expenses at 3% and depreciation and amortization at 3% All other costs are fairly steady in all
years.
The volatility in cost of goods sold as percent of gross sales in 2008 and 2009 is mainly caused by volatility
in revenue/gross sales (see trend analysis). In 2008 sales prices increases more than CoGS, thus decreasing
goods sold as percent of revenue decreases. In 2009 sales prices decrease (due to reduced prices on
Glyphosate as previously described in chapter Effect from Operating Activities on ROE) while CoGS still
increases, thus increasing CoGS relative to revenue.
4.3.5. Common Size and Days on Hand Analysis
The analysis of the turnover rate of invested capital heads out with a common-size analysis to highlight the
most important components. Hereafter follows a days on hand analysis which describes the development in
the different items.
Invested Capital – Common Size 2006 2007 2008 2009 2010 2011 2012 2013
INVESTED CAPITAL Common-size
Intangibles, Total 22.1 14.4 15.7 17.4 20.7 23.4 25.2 29.4
Property, Plant & Equipment, Total 14.6 14.6 14.5 14.1 13.6 13.6 13.4 13.3
Deferred Tax Assets 2.8 2.9 0.8 1.7 3.3 3.6 4.3 4.4
NON CURRENT ASSETS, TOTAL 39.5 31.9 30.9 33.2 37.6 40.6 42.9 47.1
Inventory, total 36.8 35.2 47.5 42.6 37.9 36.1 36.1 40.4
Accounts Receivable, total 38.9 42.2 38.7 43.7 47.8 49.7 48.7 46.1
Shareholdings Associated Companies
0.1 0.1

58
Receivables Affiliated Companies
0.2 0.4
Other Receivables, Total 11.0 8.5 8.9 9.2 6.1 6.2 7.1 8.7
Cash or Equivalent 5.9 15.9 5.9 5.9 6.1 6.3 9.1 8.1
CURRENT ASSETS, TOTAL 92.6 101.7 100.9 101.4 98.0 98.3 101.1 103.5
Other Non-Current Liabilities 2.2 2.0 1.2 1.1 1.1 1.1 2.3 1.6
Trade Creditors 14.4 16.8 17.2 17.2 20.9 23.6 25.6 32.2
Other Creditors 15.0 13.4 11.4 15.0 12.1 13.0 7.8 14.4
Income Tax Payable 0.6 1.0 1.3 0.8 1.2 1.0 0.8 2.0
Other Current Liabilities
0.4 0.9 0.4 0.3 0.3 7.5 0.4
NON INTEREST BEARING DEBT, TOTAL 32.1 33.6 31.9 34.6 35.6 38.9 44.0 50.6
INVESTED CAPITAL 100.0 100.0 100.0 100.0 100.0 100.0 100.0 100.0
Table 16: Invested Capital - Common Size (Source: Own Creation)
Above figure shows Auriga’s different components as a percentage of invested capital. The table is included
as it provides a good overview of which balance items that make up the largest share of the total invested
capital.
The common-size analysis reveals that Intangibles Assets (29%), Inventory (40%) and Accounts Receivables
(46%) constitute the main part of the total invested capital. And that the main item helping to decrease
invested capital is trade creditors/payables (32%)
The days on hand analysis displays the number of days each item in the balance sheet ties up capital. From
the figure it can be seen that especially Intangibles have an increased trend in days on hand, whereas
Inventory and Accounts Receivables has decreased. Also, it can be seen that Trade Creditors/payables days
on hand has improved from 40 days in 2005 to 74 days in 2013.
Days On Hand Analysis 2005 2006 2007 2008 2009 2010 2011 2012 2013
INVESTED CAPITAL Days on hand
Intangibles, Total 55 63 38 38 47 58 63 64 67
Property, Plant & Equipment, Total 38 42 38 35 38 38 37 34 31
Deferred Tax Assets 9 8 8 2 5 9 10 11 10
NON CURRENT ASSETS, TOTAL 102 113 84 75 90 105 109 109 108
Inventory, Total 103 105 93 115 116 106 97 92 93
Accounts Receivable, Total 126 111 111 94 119 133 134 124 106
Shareholdings Associated Companies
0 0
Other Receivables, Total 25 31 22 22 25 17 17 18 20
Cash or Equivalent 27 17 42 14 16 17 17 23 18
CURRENT ASSETS, TOTAL 281 265 267 244 275 273 265 257 237
Other Non-Current Liabilities 8 6 5 3 3 3 3 6 4
Trade Creditors 40 41 44 42 47 58 64 65 74
Other Creditors 43 43 35 28 41 34 35 20 33
Income Tax Payable 3 2 3 3 2 3 3 2 5
Other Current Liabilities
1 2 1 1 1 19 1
NON INTEREST BEARING DEBT, TOTAL 94 92 88 77 94 99 105 112 116
INVESTED CAPITAL 289 286 263 242 272 278 269 255 229
Table 17: Days On Hand Analysis (Source: Own Creation)
The increasing trend in Intangibles is partly due to the implementation of both a new ERP- system
(Enterprise Resource Planning) and a global project management system in 2010, which enables Auriga to
activate costs related to project development144
. The item “Projects under Development” included in
intangibles is the main driver behind the increase. Even though this development offsets an increase in
Auriga’s invested capital, the change is believed to be positive. The reason is that the trend simply
constitutes that Auriga’s development projects progresses to a point, where they are able to meet relevant
144
Auriga Industries A/S, Annual Report 2010, page 26
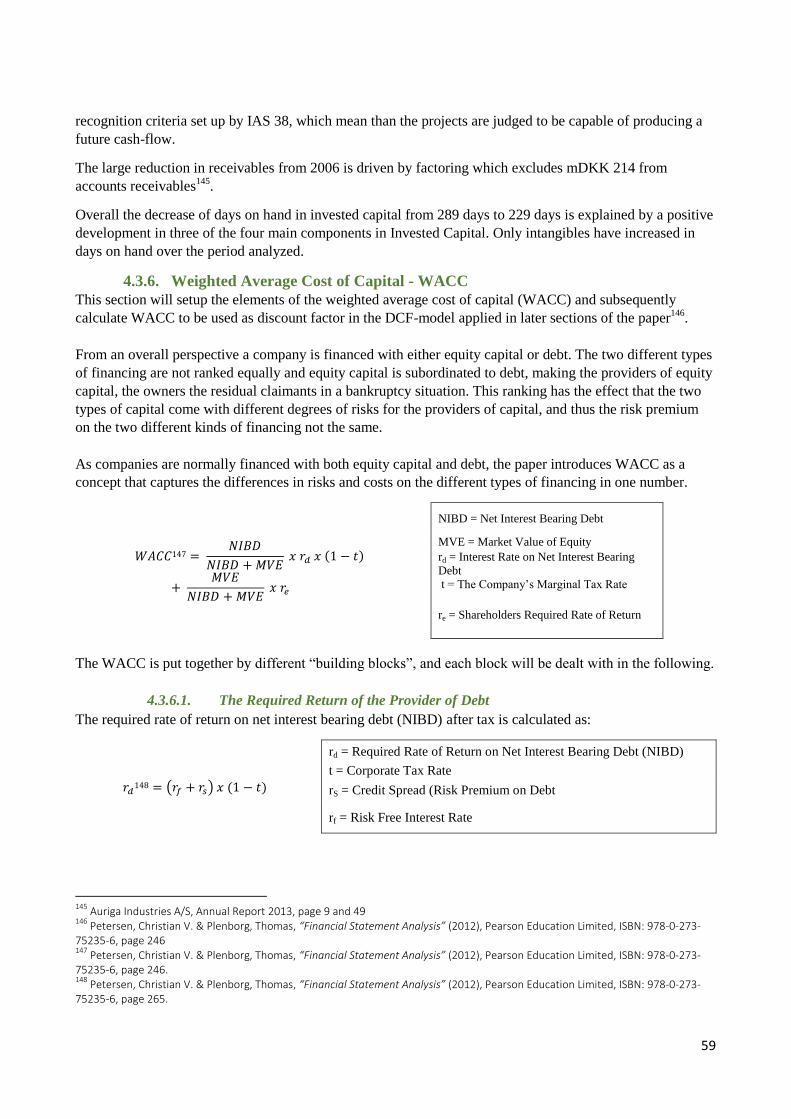
59
recognition criteria set up by IAS 38, which mean than the projects are judged to be capable of producing a
future cash-flow.
The large reduction in receivables from 2006 is driven by factoring which excludes mDKK 214 from
accounts receivables145
.
Overall the decrease of days on hand in invested capital from 289 days to 229 days is explained by a positive
development in three of the four main components in Invested Capital. Only intangibles have increased in
days on hand over the period analyzed.
4.3.6. Weighted Average Cost of Capital - WACC
This section will setup the elements of the weighted average cost of capital (WACC) and subsequently
calculate WACC to be used as discount factor in the DCF-model applied in later sections of the paper146
.
From an overall perspective a company is financed with either equity capital or debt. The two different types
of financing are not ranked equally and equity capital is subordinated to debt, making the providers of equity
capital, the owners the residual claimants in a bankruptcy situation. This ranking has the effect that the two
types of capital come with different degrees of risks for the providers of capital, and thus the risk premium
on the two different kinds of financing not the same.
As companies are normally financed with both equity capital and debt, the paper introduces WACC as a
concept that captures the differences in risks and costs on the different types of financing in one number.
𝑊𝐴𝐶𝐶147 = 𝑁𝐼𝐵𝐷
𝑁𝐼𝐵𝐷 + 𝑀𝑉𝐸 𝑥 𝑟𝑑 𝑥 (1 − 𝑡)
+ 𝑀𝑉𝐸
𝑁𝐼𝐵𝐷 + 𝑀𝑉𝐸 𝑥 𝑟𝑒
NIBD = Net Interest Bearing Debt
MVE = Market Value of Equity
rd = Interest Rate on Net Interest Bearing
Debt
t = The Company’s Marginal Tax Rate
re = Shareholders Required Rate of Return
The WACC is put together by different “building blocks”, and each block will be dealt with in the following.
4.3.6.1. The Required Return of the Provider of Debt
The required rate of return on net interest bearing debt (NIBD) after tax is calculated as:
𝑟𝑑148 = (𝑟𝑓 + 𝑟𝑠) 𝑥 (1 − 𝑡)
rd = Required Rate of Return on Net Interest Bearing Debt (NIBD)
t = Corporate Tax Rate
rS = Credit Spread (Risk Premium on Debt
rf = Risk Free Interest Rate
145
Auriga Industries A/S, Annual Report 2013, page 9 and 49 146
Petersen, Christian V. & Plenborg, Thomas, “Financial Statement Analysis” (2012), Pearson Education Limited, ISBN: 978-0-273-75235-6, page 246 147
Petersen, Christian V. & Plenborg, Thomas, “Financial Statement Analysis” (2012), Pearson Education Limited, ISBN: 978-0-273-75235-6, page 246. 148
Petersen, Christian V. & Plenborg, Thomas, “Financial Statement Analysis” (2012), Pearson Education Limited, ISBN: 978-0-273-75235-6, page 265.
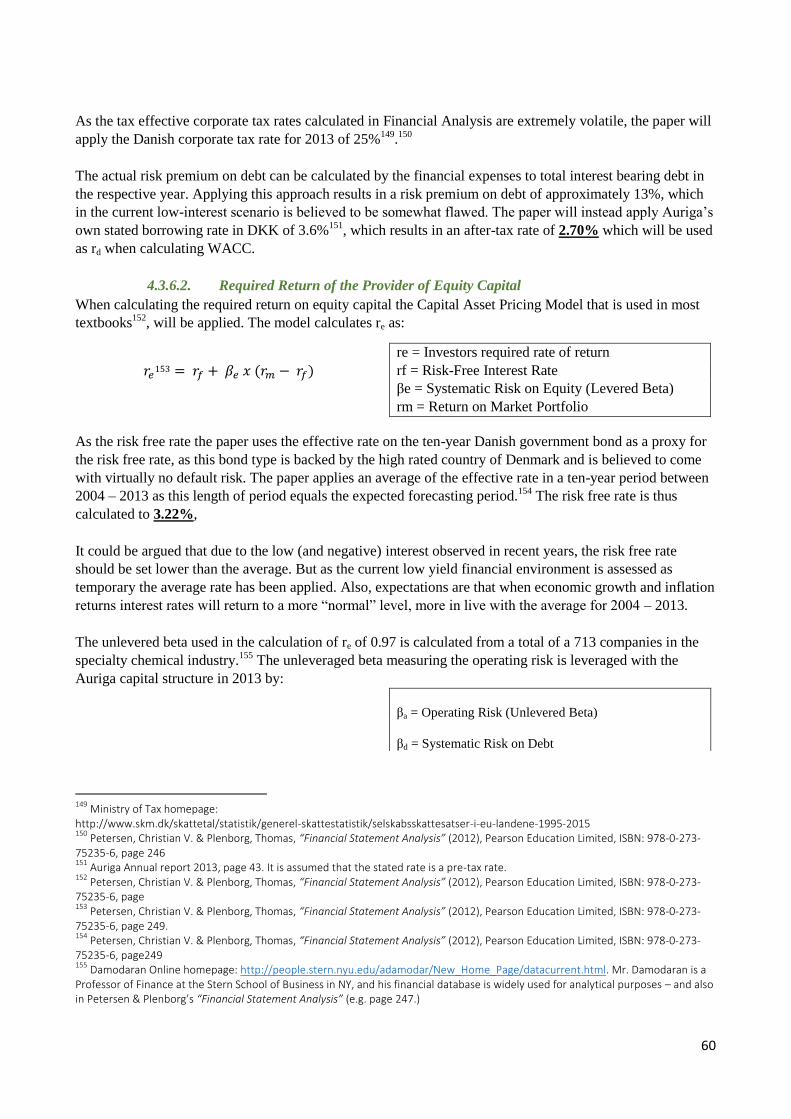
60
As the tax effective corporate tax rates calculated in Financial Analysis are extremely volatile, the paper will
apply the Danish corporate tax rate for 2013 of 25%149
.150
The actual risk premium on debt can be calculated by the financial expenses to total interest bearing debt in
the respective year. Applying this approach results in a risk premium on debt of approximately 13%, which
in the current low-interest scenario is believed to be somewhat flawed. The paper will instead apply Auriga’s
own stated borrowing rate in DKK of 3.6%151
, which results in an after-tax rate of 2.70% which will be used
as rd when calculating WACC.
4.3.6.2. Required Return of the Provider of Equity Capital
When calculating the required return on equity capital the Capital Asset Pricing Model that is used in most
textbooks152
, will be applied. The model calculates re as:
𝑟𝑒153 = 𝑟𝑓 + 𝛽𝑒 𝑥 (𝑟𝑚 − 𝑟𝑓)
re = Investors required rate of return
rf = Risk-Free Interest Rate
βe = Systematic Risk on Equity (Levered Beta)
rm = Return on Market Portfolio
As the risk free rate the paper uses the effective rate on the ten-year Danish government bond as a proxy for
the risk free rate, as this bond type is backed by the high rated country of Denmark and is believed to come
with virtually no default risk. The paper applies an average of the effective rate in a ten-year period between
2004 – 2013 as this length of period equals the expected forecasting period.154
The risk free rate is thus
calculated to 3.22%,
It could be argued that due to the low (and negative) interest observed in recent years, the risk free rate
should be set lower than the average. But as the current low yield financial environment is assessed as
temporary the average rate has been applied. Also, expectations are that when economic growth and inflation
returns interest rates will return to a more “normal” level, more in live with the average for 2004 – 2013.
The unlevered beta used in the calculation of re of 0.97 is calculated from a total of a 713 companies in the
specialty chemical industry.155
The unleveraged beta measuring the operating risk is leveraged with the
Auriga capital structure in 2013 by:
βa = Operating Risk (Unlevered Beta)
βd = Systematic Risk on Debt
149
Ministry of Tax homepage: http://www.skm.dk/skattetal/statistik/generel-skattestatistik/selskabsskattesatser-i-eu-landene-1995-2015 150
Petersen, Christian V. & Plenborg, Thomas, “Financial Statement Analysis” (2012), Pearson Education Limited, ISBN: 978-0-273-75235-6, page 246 151
Auriga Annual report 2013, page 43. It is assumed that the stated rate is a pre-tax rate. 152
Petersen, Christian V. & Plenborg, Thomas, “Financial Statement Analysis” (2012), Pearson Education Limited, ISBN: 978-0-273-75235-6, page 153
Petersen, Christian V. & Plenborg, Thomas, “Financial Statement Analysis” (2012), Pearson Education Limited, ISBN: 978-0-273-75235-6, page 249. 154
Petersen, Christian V. & Plenborg, Thomas, “Financial Statement Analysis” (2012), Pearson Education Limited, ISBN: 978-0-273-75235-6, page249 155
Damodaran Online homepage: http://people.stern.nyu.edu/adamodar/New_Home_Page/datacurrent.html. Mr. Damodaran is a Professor of Finance at the Stern School of Business in NY, and his financial database is widely used for analytical purposes – and also in Petersen & Plenborg’s “Financial Statement Analysis” (e.g. page 247.)
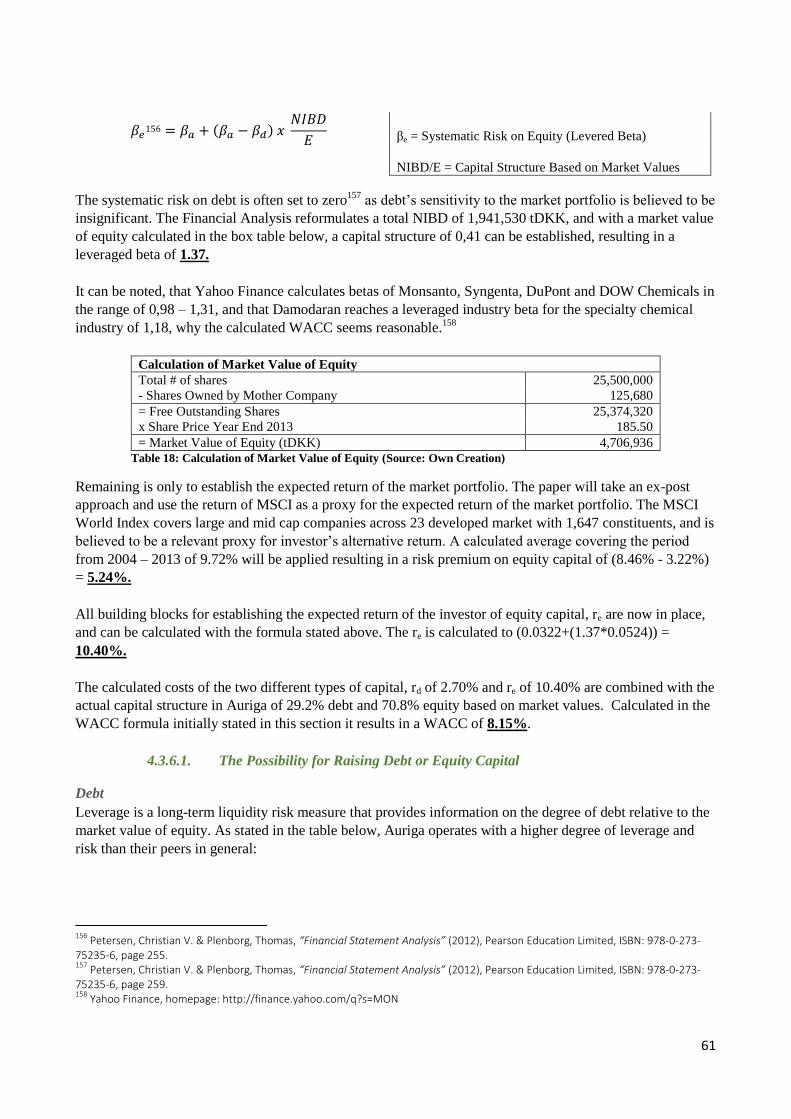
61
𝛽𝑒156 = 𝛽𝑎 + (𝛽𝑎 − 𝛽𝑑) 𝑥
𝑁𝐼𝐵𝐷
𝐸 βe = Systematic Risk on Equity (Levered Beta)
NIBD/E = Capital Structure Based on Market Values
The systematic risk on debt is often set to zero157
as debt’s sensitivity to the market portfolio is believed to be
insignificant. The Financial Analysis reformulates a total NIBD of 1,941,530 tDKK, and with a market value
of equity calculated in the box table below, a capital structure of 0,41 can be established, resulting in a
leveraged beta of 1.37.
It can be noted, that Yahoo Finance calculates betas of Monsanto, Syngenta, DuPont and DOW Chemicals in
the range of 0,98 – 1,31, and that Damodaran reaches a leveraged industry beta for the specialty chemical
industry of 1,18, why the calculated WACC seems reasonable.158
Calculation of Market Value of Equity
Total # of shares 25,500,000
- Shares Owned by Mother Company 125,680
= Free Outstanding Shares 25,374,320
x Share Price Year End 2013 185.50
= Market Value of Equity (tDKK) 4,706,936
Table 18: Calculation of Market Value of Equity (Source: Own Creation)
Remaining is only to establish the expected return of the market portfolio. The paper will take an ex-post
approach and use the return of MSCI as a proxy for the expected return of the market portfolio. The MSCI
World Index covers large and mid cap companies across 23 developed market with 1,647 constituents, and is
believed to be a relevant proxy for investor’s alternative return. A calculated average covering the period
from 2004 – 2013 of 9.72% will be applied resulting in a risk premium on equity capital of (8.46% - 3.22%)
= 5.24%.
All building blocks for establishing the expected return of the investor of equity capital, re are now in place,
and can be calculated with the formula stated above. The re is calculated to (0.0322+(1.37*0.0524)) =
10.40%.
The calculated costs of the two different types of capital, rd of 2.70% and re of 10.40% are combined with the
actual capital structure in Auriga of 29.2% debt and 70.8% equity based on market values. Calculated in the
WACC formula initially stated in this section it results in a WACC of 8.15%.
4.3.6.1. The Possibility for Raising Debt or Equity Capital
Debt
Leverage is a long-term liquidity risk measure that provides information on the degree of debt relative to the
market value of equity. As stated in the table below, Auriga operates with a higher degree of leverage and
risk than their peers in general:
156
Petersen, Christian V. & Plenborg, Thomas, “Financial Statement Analysis” (2012), Pearson Education Limited, ISBN: 978-0-273-75235-6, page 255. 157
Petersen, Christian V. & Plenborg, Thomas, “Financial Statement Analysis” (2012), Pearson Education Limited, ISBN: 978-0-273-75235-6, page 259. 158
Yahoo Finance, homepage: http://finance.yahoo.com/q?s=MON
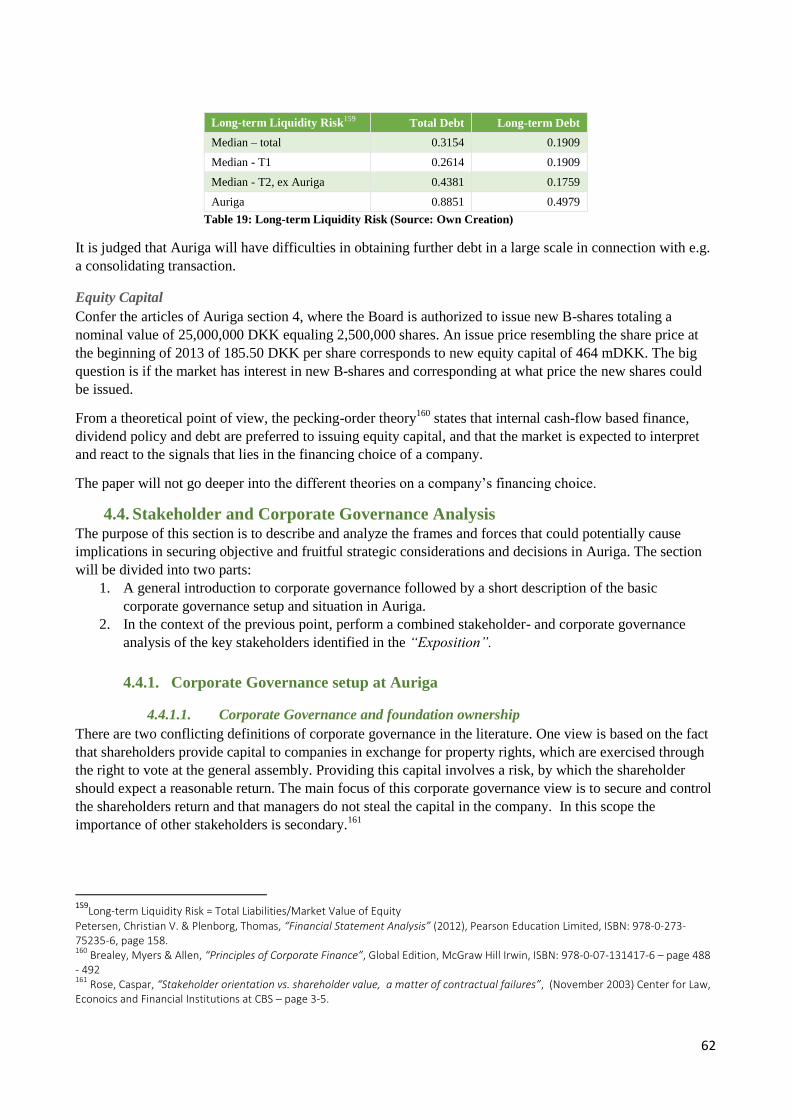
62
Long-term Liquidity Risk159 Total Debt Long-term Debt
Median – total 0.3154 0.1909
Median - T1 0.2614 0.1909
Median - T2, ex Auriga 0.4381 0.1759
Auriga 0.8851 0.4979
Table 19: Long-term Liquidity Risk (Source: Own Creation)
It is judged that Auriga will have difficulties in obtaining further debt in a large scale in connection with e.g.
a consolidating transaction.
Equity Capital
Confer the articles of Auriga section 4, where the Board is authorized to issue new B-shares totaling a
nominal value of 25,000,000 DKK equaling 2,500,000 shares. An issue price resembling the share price at
the beginning of 2013 of 185.50 DKK per share corresponds to new equity capital of 464 mDKK. The big
question is if the market has interest in new B-shares and corresponding at what price the new shares could
be issued.
From a theoretical point of view, the pecking-order theory160
states that internal cash-flow based finance,
dividend policy and debt are preferred to issuing equity capital, and that the market is expected to interpret
and react to the signals that lies in the financing choice of a company.
The paper will not go deeper into the different theories on a company’s financing choice.
4.4. Stakeholder and Corporate Governance Analysis The purpose of this section is to describe and analyze the frames and forces that could potentially cause
implications in securing objective and fruitful strategic considerations and decisions in Auriga. The section
will be divided into two parts:
1. A general introduction to corporate governance followed by a short description of the basic
corporate governance setup and situation in Auriga.
2. In the context of the previous point, perform a combined stakeholder- and corporate governance
analysis of the key stakeholders identified in the “Exposition”.
4.4.1. Corporate Governance setup at Auriga
4.4.1.1. Corporate Governance and foundation ownership
There are two conflicting definitions of corporate governance in the literature. One view is based on the fact
that shareholders provide capital to companies in exchange for property rights, which are exercised through
the right to vote at the general assembly. Providing this capital involves a risk, by which the shareholder
should expect a reasonable return. The main focus of this corporate governance view is to secure and control
the shareholders return and that managers do not steal the capital in the company. In this scope the
importance of other stakeholders is secondary.161
159
Long-term Liquidity Risk = Total Liabilities/Market Value of Equity
Petersen, Christian V. & Plenborg, Thomas, “Financial Statement Analysis” (2012), Pearson Education Limited, ISBN: 978-0-273-75235-6, page 158. 160
Brealey, Myers & Allen, “Principles of Corporate Finance”, Global Edition, McGraw Hill Irwin, ISBN: 978-0-07-131417-6 – page 488 - 492 161
Rose, Caspar, “Stakeholder orientation vs. shareholder value, a matter of contractual failures”, (November 2003) Center for Law, Econoics and Financial Institutions at CBS – page 3-5.
63
A different and broader corporate governance view also includes other stakeholders that have a relation to
the company - e.g. employees, the local community, customers, suppliers etc. The argument is that the
externalities that could affect these other stakeholders potentially could be huge, and that the welfare of these
shareholders should not be ignored. Tirole captures this holistic approach with; “The design of institutions
that induce or force management to internalize the welfare of stakeholders”.162
This paper will lean towards the latter view that deals with corporate governance as the framework, that
balance the interests of many different stakeholders in a company, and which incorporates a broader duty of
loyalty for the management. However, it still applies the understanding that shareholders providing the
capital are of relative high importance.
In Denmark there is appointed a “Committee on Corporate Governance Recommendations” which has the
purpose of working for developing good corporate governance practices in listed Danish companies. Their
recommendations are “soft-law” and there are no sanctions for not complying.
The committee states, that the purpose of corporate governance is to support value creation and accountable
management, and thus to contribute to the long-term success of companies.163
The recommendation widely
uses the term “stakeholders” and not the narrower term “shareholder/investor” which seems to indicate, that
the recommendations also apply the broader approach.
And how does this corporate governance play out in the case of Auriga?
Auriga operates with a dual share structure. 100% of the A shares are owned, and has to be owned by AURF
and as the A-shares has to make up 51% of the total voting rights, the foundation will at all time possess the
majority of votes and technically be in control the company - confer the foundation charter article 7164
. All
together the foundation owns 39% of the total share capital, and holds 83% of all voting rights. Opposite the
second largest single shareholder, ATP which owns 6% of the total share capital and 2% of the total voting
rights. The remaining share capital is primarily owned by institutional investors.
With this structure Auriga is in principle foundation owned since AURF holds the majority votes and thus
can dictate the strategic and financial direction of the company.
In a principal agent context this share structure can be problematic because the A and B share structure
serves as a take-over defense which eliminates the market for corporate control. Foundations are self-
governing independent institutions without owners or members, they are perpetual in nature and only
corresponds to legal regulation and the foundation charter. In a standard principal-agent context a foundation
is not a viable construct, as the agency costs potentially are too large.
A potential principal-agent issue when a large investor is present, often an institutional investor, is that
minority investors expect that the large investor does the monitoring, because the costs of not monitoring
will hit the large investors the hardest. And for each extra cost unit the large investor allocates to monitor the
company, part of the costs will also benefit the small time investors. A problem arises when the large
investor does not monitor as expected. Then there is a risk of no one doing the monitoring, leaving all the
power to management/board of directors. Other potential principal-agent cost could be risk of empire
building, large management benefits, financial slack etc.
162
Rose, Caspar, “Stakeholder orientation vs. shareholder value a matter of contractual failures”, (November 2003) Center for Law, Econoics and Financial Institutions at CBS – page 3-5. 163
Committee on Corporate Governance, “Recommendations on Corporate Governance”, (May 2013) 164
Instrument of foundation, Aarhus Research Foundation, paragraph 4. http://auff.au.dk/fonden/fundats/ - article 7.
64
Several empirical based research papers have proven otherwise, and the general indication is that companies
operating under the foundation construct perform as well or even slightly better than companies operating
under other shareholder constructs.165
Different reasons are discussed in the literature166
:
Unprotected firms are more shortsighted, e.g. by allocating fewer resources to R&D purposes that
harm the profitability and growth in the long-run, and protected firms vice-versa.
Protected firms do not have to respond to take-over pressure
Management in protected firms like Auriga has incentives to invest in firm specific assets like
employees and by that boosting performance in the long-run.
Protected firms e.g. operating under a foundation ownership are monitored by other things than the
market for corporate control – e.g. institutional investors or financial institution as debt holders.
Management in protected firms has incentives to profit maximize to secure results and their own
managerial reputation.
If the foundation owned company is listed the company is legally obliged to see to the interests of all
its shareholders including their minority shareholders, and in a holistic corporate governance context
also other stakeholders being employees etc., and by that in principle operate as any other listed
company.
Employees have a sense of job security under foundation ownership as they do not have to fear
being acquired by a foreign company with a different culture167
4.4.1.2. Organizational setup - Auriga
According to the 2013 annual report, page 24, Auriga has an organizational construction with eight members
of the global executive committee plus the CEO. Members are responsible for either Geographical Units e.g.
“Europe” or “Latin America” or for functional units like “Finance” or “Production and Logistics”. This setup
is a matrix structure with a mix of divisional and functional units168
.
The different geographical divisions hold a wide variety of tasks, e.g.:169
Local sale and marketing
Distribution and logistical planning, in some regions this includes formulation and packaging on the
company’s own facilities.
Registration of new products and defense of existing approved licenses.
Identification of new opportunities through cooperation with local farmers.
Financial controlling, including liquidity and credit management.
The construct potentially provides high organizational flexibility, easy flow of information and decentralized
decision making, without losing the benefits of the specialized functional units.
Potential downsides with this structure are that local managers refer to two directors which could have
different opinions and expectations, making it unclear or/and difficult for local managers to understand roles
and responsibilities.
165
Rose, Caspar, “Foundation Ownership and Financial Performance: Do Companies Need Owners”, (2004) European Journal of Law
and Ecnomics, 18, page 344 and 356. 166
Rose, Caspar, “Corporate Financial Performance and the Use of Takeover Defences”, (2002), European Journal of Law and Economics, 13, page 105. 167
Politiken homepage: http://politiken.dk/oekonomi/ECE27783/den-doede-haand-roerer-paa-sig/ 168
Auriga Industries A/S, Annual Report 2009, page 9 169
Auriga Industries A/S, Annual Report 2010, page 12.
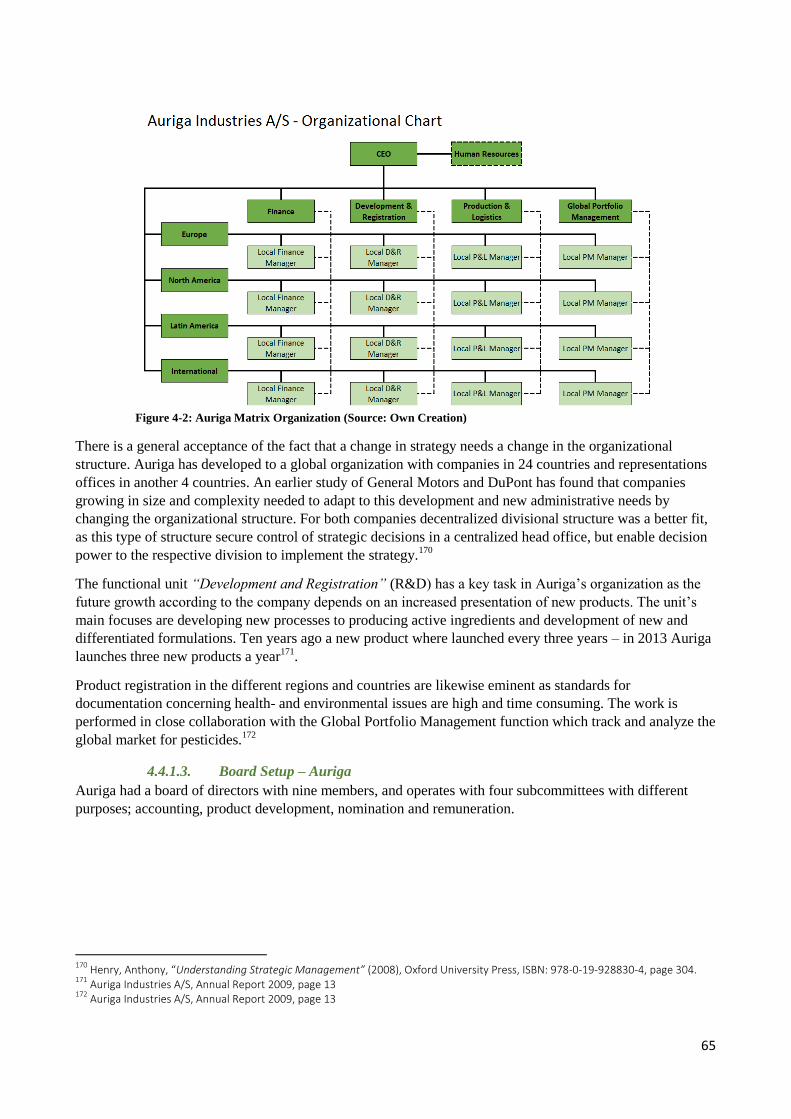
65
Figure 4-2: Auriga Matrix Organization (Source: Own Creation)
There is a general acceptance of the fact that a change in strategy needs a change in the organizational
structure. Auriga has developed to a global organization with companies in 24 countries and representations
offices in another 4 countries. An earlier study of General Motors and DuPont has found that companies
growing in size and complexity needed to adapt to this development and new administrative needs by
changing the organizational structure. For both companies decentralized divisional structure was a better fit,
as this type of structure secure control of strategic decisions in a centralized head office, but enable decision
power to the respective division to implement the strategy.170
The functional unit “Development and Registration” (R&D) has a key task in Auriga’s organization as the
future growth according to the company depends on an increased presentation of new products. The unit’s
main focuses are developing new processes to producing active ingredients and development of new and
differentiated formulations. Ten years ago a new product where launched every three years – in 2013 Auriga
launches three new products a year171
.
Product registration in the different regions and countries are likewise eminent as standards for
documentation concerning health- and environmental issues are high and time consuming. The work is
performed in close collaboration with the Global Portfolio Management function which track and analyze the
global market for pesticides.172
4.4.1.3. Board Setup – Auriga
Auriga had a board of directors with nine members, and operates with four subcommittees with different
purposes; accounting, product development, nomination and remuneration.
170
Henry, Anthony, “Understanding Strategic Management” (2008), Oxford University Press, ISBN: 978-0-19-928830-4, page 304. 171
Auriga Industries A/S, Annual Report 2009, page 13 172
Auriga Industries A/S, Annual Report 2009, page 13
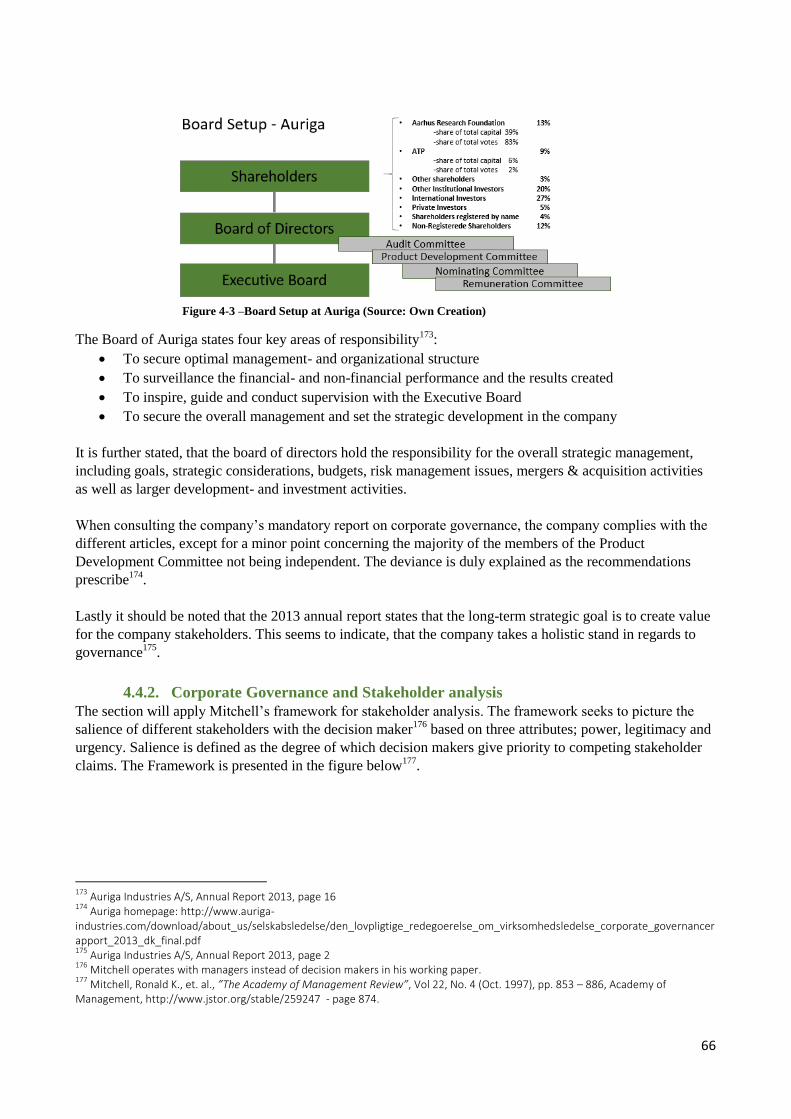
66
Figure 4-3 –Board Setup at Auriga (Source: Own Creation)
The Board of Auriga states four key areas of responsibility173
:
To secure optimal management- and organizational structure
To surveillance the financial- and non-financial performance and the results created
To inspire, guide and conduct supervision with the Executive Board
To secure the overall management and set the strategic development in the company
It is further stated, that the board of directors hold the responsibility for the overall strategic management,
including goals, strategic considerations, budgets, risk management issues, mergers & acquisition activities
as well as larger development- and investment activities.
When consulting the company’s mandatory report on corporate governance, the company complies with the
different articles, except for a minor point concerning the majority of the members of the Product
Development Committee not being independent. The deviance is duly explained as the recommendations
prescribe174
.
Lastly it should be noted that the 2013 annual report states that the long-term strategic goal is to create value
for the company stakeholders. This seems to indicate, that the company takes a holistic stand in regards to
governance175
.
4.4.2. Corporate Governance and Stakeholder analysis
The section will apply Mitchell’s framework for stakeholder analysis. The framework seeks to picture the
salience of different stakeholders with the decision maker176
based on three attributes; power, legitimacy and
urgency. Salience is defined as the degree of which decision makers give priority to competing stakeholder
claims. The Framework is presented in the figure below177
.
173
Auriga Industries A/S, Annual Report 2013, page 16 174
Auriga homepage: http://www.auriga-industries.com/download/about_us/selskabsledelse/den_lovpligtige_redegoerelse_om_virksomhedsledelse_corporate_governancerapport_2013_dk_final.pdf 175
Auriga Industries A/S, Annual Report 2013, page 2 176
Mitchell operates with managers instead of decision makers in his working paper. 177
Mitchell, Ronald K., et. al., ”The Academy of Management Review”, Vol 22, No. 4 (Oct. 1997), pp. 853 – 886, Academy of Management, http://www.jstor.org/stable/259247 - page 874.
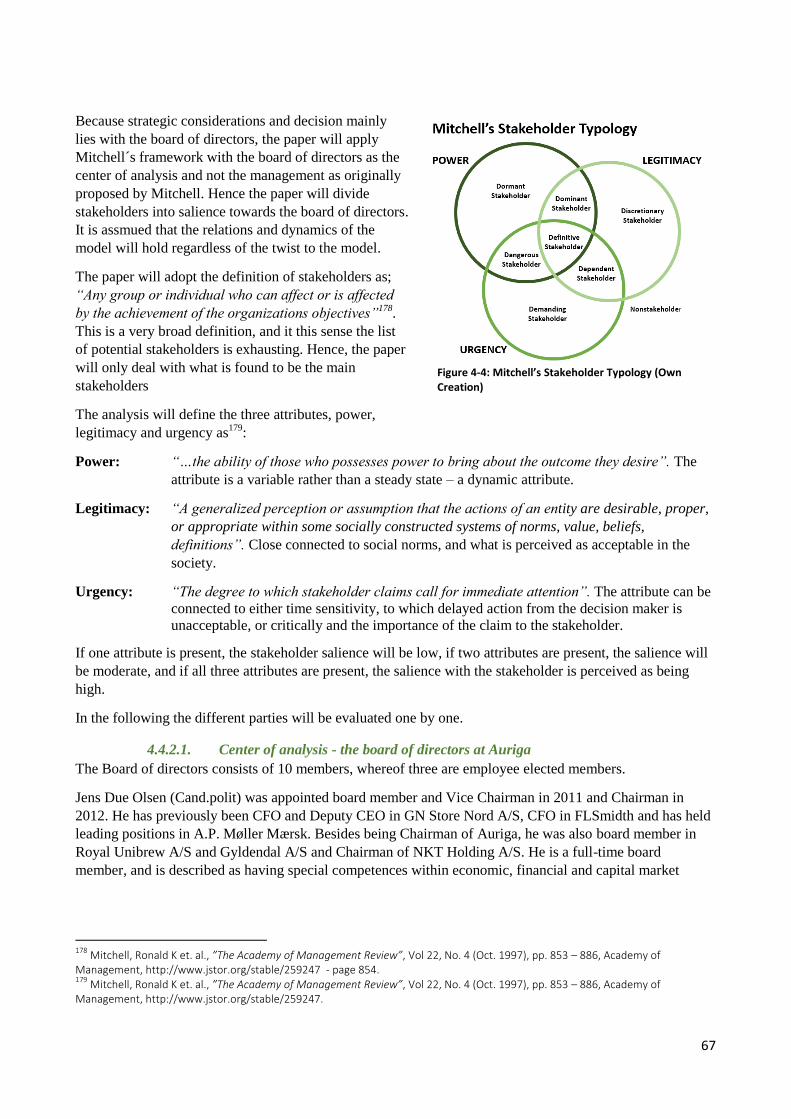
67
Because strategic considerations and decision mainly
lies with the board of directors, the paper will apply
Mitchell´s framework with the board of directors as the
center of analysis and not the management as originally
proposed by Mitchell. Hence the paper will divide
stakeholders into salience towards the board of directors.
It is assmued that the relations and dynamics of the
model will hold regardless of the twist to the model.
The paper will adopt the definition of stakeholders as;
“Any group or individual who can affect or is affected
by the achievement of the organizations objectives”178
.
This is a very broad definition, and it this sense the list
of potential stakeholders is exhausting. Hence, the paper
will only deal with what is found to be the main
stakeholders
The analysis will define the three attributes, power,
legitimacy and urgency as179
:
Power: “…the ability of those who possesses power to bring about the outcome they desire”. The
attribute is a variable rather than a steady state – a dynamic attribute.
Legitimacy: “A generalized perception or assumption that the actions of an entity are desirable, proper,
or appropriate within some socially constructed systems of norms, value, beliefs,
definitions”. Close connected to social norms, and what is perceived as acceptable in the
society.
Urgency: “The degree to which stakeholder claims call for immediate attention”. The attribute can be
connected to either time sensitivity, to which delayed action from the decision maker is
unacceptable, or critically and the importance of the claim to the stakeholder.
If one attribute is present, the stakeholder salience will be low, if two attributes are present, the salience will
be moderate, and if all three attributes are present, the salience with the stakeholder is perceived as being
high.
In the following the different parties will be evaluated one by one.
4.4.2.1. Center of analysis - the board of directors at Auriga
The Board of directors consists of 10 members, whereof three are employee elected members.
Jens Due Olsen (Cand.polit) was appointed board member and Vice Chairman in 2011 and Chairman in
2012. He has previously been CFO and Deputy CEO in GN Store Nord A/S, CFO in FLSmidth and has held
leading positions in A.P. Møller Mærsk. Besides being Chairman of Auriga, he was also board member in
Royal Unibrew A/S and Gyldendal A/S and Chairman of NKT Holding A/S. He is a full-time board
member, and is described as having special competences within economic, financial and capital market
178
Mitchell, Ronald K et. al., ”The Academy of Management Review”, Vol 22, No. 4 (Oct. 1997), pp. 853 – 886, Academy of Management, http://www.jstor.org/stable/259247 - page 854. 179
Mitchell, Ronald K et. al., ”The Academy of Management Review”, Vol 22, No. 4 (Oct. 1997), pp. 853 – 886, Academy of Management, http://www.jstor.org/stable/259247.
Figure 4-4: Mitchell’s Stakeholder Typology (Own Creation)
68
issues, as well as within general management from experience in a range of different industries180
. As a
potentially strong chairman of a company, he has been called every CEO’s worst nightmare181
.
Of the remaining nine board members, three are employee elected members with either practical oriented or
research oriented roles at Auriga, one is a PhD. at the department of Chemistry at Aarhus University and one
owns an agricultural estate and is present in agricultural organizations. Four has experience from
management positions and board work in international listed companies.
Board remuneration is a fixed rate as recommended by the Committee on Corporate Governance
Recommendations.
A full board overview can be viewed in appendix 18
4.4.2.2. Management at Auriga – (moderate to high)
In the years before Auriga received the acquisition bid from FMC Corporation there had been replacement in
the top management. In 2013, CEO, Kurt Pedersen Kaalund, who had been in the company since 1989, was
fired due to disagreements concerning the future executive composition and structure182
. It is further stated in
the Q3 2013 telephone conference183
, that: “I think in reality the board and the CEO have to agree on what
is the right team to run and govern the company. We have debated it with –this with Kurt for a while. In fact,
I even believe that the debate was there before I joined the company as the Vice Chairman and later as the
Chairman. We have been in disagreement about the size and competition184
of the Executive Team of Auriga
Industries. We have in the board offered a very transparent and a very thorough approach also using outside
advice to try to reconcile our differences, and I think in spite of this process and in spite of the conclusions,
at least the way we perceive them in the board, we have not been able to reconcile our differences”.
A clear signal of what seem to be differences that have been going on for some time, and with the board as
the expected “winner” exercising their duty and right to “hire and fire”.
The differences lead to the appointment of President of Region Europe, Jaime Gómez-Arnau as new CEO.
Jaime Gómez-Arnau is an agronomist of education and had been President of Cheminova Region Europe
since 2003, and also had experience from management positions in several international agrochemical
companies. Commenting on his competences is without the scope of the paper, but the appointment could be
seen as hiring the company guy to secure a sort of continuation in the executive board.
Also in 2013, CFO, Jesper Barslund Jacobsen was replaced with CFO, René Schneider. René Schneider was
at the same time added a second members of the executive board. René Schneider had experience as former
CFO and from several management positions in international companies, e.g. Novo Nordisk and
Neurosearch. The appointment, and the change in the executive board, could be viewed as a wish with the
board of directors to hire outside expertise for challenges ahead.
Leading up to the divestment there has been replacement in what normally is perceived as the two most
important positions, the CEO and the CFO.
It can be noted that Kurt Pedersen Kaalund in August 2014 where appointed CEO in the privately owned US
based agrochemical company, Albaugh LLC.
180
Royal Unibrew A/S homepage: http://investor.dk.royalunibrew.com/directors.cfm 181
Juel, Frederik M, ”Han er topchefernes skræk”, Berlingske Business, Friday the 14’th of November 2014. http://www.business.dk/navne/han-er-topchefernes-skraek 182
Auriga third quarter company announcement on the 13’th of November 2013 – page 3, file:///C:/Users/KlausTh%C3%B8gerPedersen/Downloads/AURIGA_DK_Q3_2013_FINAL.pdf 183
Transcript from the Auriga Q3 Report 2013 held on the 13’th of November 2013 at 2:00 p.m. http://www.auriga-industries.com/download/investor/financial_reports/2013/dk/transcript_111313.pdf 184
The transcript should probably have been: “composition” and not “competition”
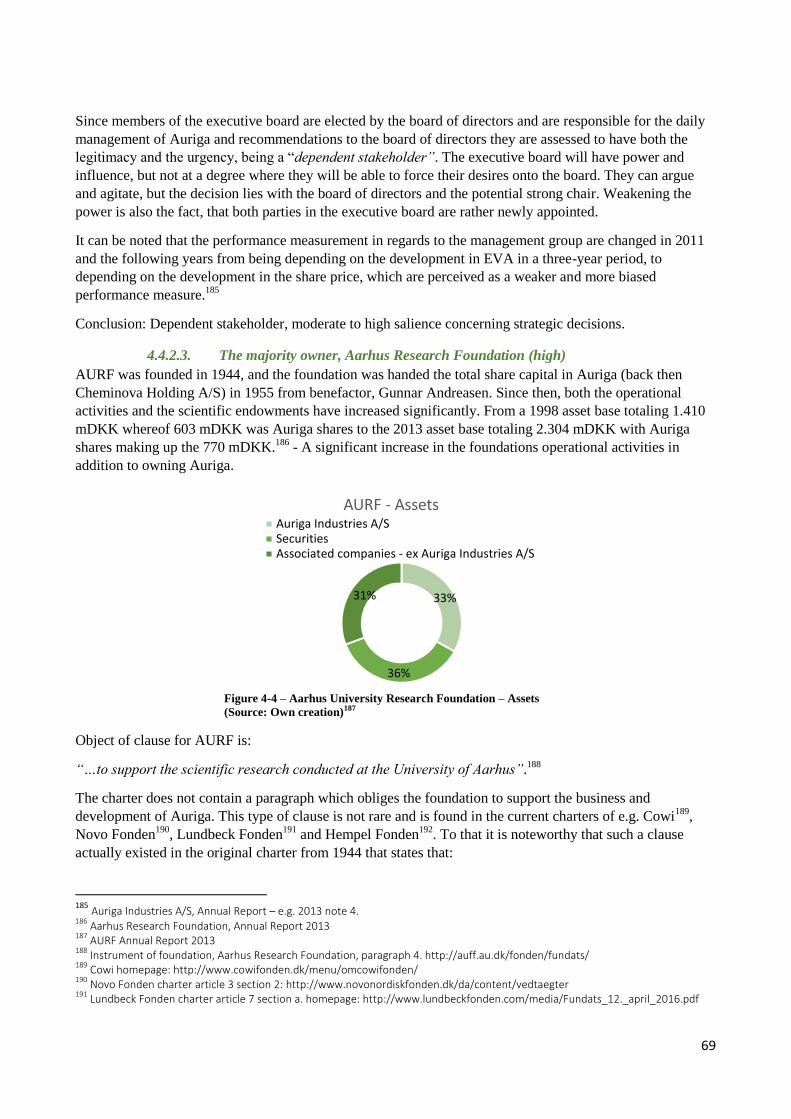
69
Since members of the executive board are elected by the board of directors and are responsible for the daily
management of Auriga and recommendations to the board of directors they are assessed to have both the
legitimacy and the urgency, being a “dependent stakeholder”. The executive board will have power and
influence, but not at a degree where they will be able to force their desires onto the board. They can argue
and agitate, but the decision lies with the board of directors and the potential strong chair. Weakening the
power is also the fact, that both parties in the executive board are rather newly appointed.
It can be noted that the performance measurement in regards to the management group are changed in 2011
and the following years from being depending on the development in EVA in a three-year period, to
depending on the development in the share price, which are perceived as a weaker and more biased
performance measure.185
Conclusion: Dependent stakeholder, moderate to high salience concerning strategic decisions.
4.4.2.3. The majority owner, Aarhus Research Foundation (high)
AURF was founded in 1944, and the foundation was handed the total share capital in Auriga (back then
Cheminova Holding A/S) in 1955 from benefactor, Gunnar Andreasen. Since then, both the operational
activities and the scientific endowments have increased significantly. From a 1998 asset base totaling 1.410
mDKK whereof 603 mDKK was Auriga shares to the 2013 asset base totaling 2.304 mDKK with Auriga
shares making up the 770 mDKK.186
- A significant increase in the foundations operational activities in
addition to owning Auriga.
Figure 4-4 – Aarhus University Research Foundation – Assets
(Source: Own creation)187
Object of clause for AURF is:
“…to support the scientific research conducted at the University of Aarhus”.188
The charter does not contain a paragraph which obliges the foundation to support the business and
development of Auriga. This type of clause is not rare and is found in the current charters of e.g. Cowi189
,
Novo Fonden190
, Lundbeck Fonden191
and Hempel Fonden192
. To that it is noteworthy that such a clause
actually existed in the original charter from 1944 that states that:
185
Auriga Industries A/S, Annual Report – e.g. 2013 note 4. 186
Aarhus Research Foundation, Annual Report 2013 187
AURF Annual Report 2013 188
Instrument of foundation, Aarhus Research Foundation, paragraph 4. http://auff.au.dk/fonden/fundats/ 189
Cowi homepage: http://www.cowifonden.dk/menu/omcowifonden/ 190
Novo Fonden charter article 3 section 2: http://www.novonordiskfonden.dk/da/content/vedtaegter 191
Lundbeck Fonden charter article 7 section a. homepage: http://www.lundbeckfonden.com/media/Fundats_12._april_2016.pdf
33%
36%
31%
AURF - Assets Auriga Industries A/SSecuritiesAssociated companies - ex Auriga Industries A/S
70
“The foundation capital is the total number of shares in Cheminova A/S with exception of two shares of
5.000 DKK which belong to the Chair of Aarhus University and the Chancellor of Aarhus University, and its
income is the profit from this company after amounts necessary to consolidate and develop the company”.193
The original charter stipulates that company profits ex resources necessary to grow and develop the company
are to benefit the foundation. The flow of resources is one way – from the Auriga to the foundation for
scientific research purposes.
The original charter further states that:
“the dissolvement of Cheminova are only allowed if all reserves are used, and that going concern would
lead to insolvency”.194
A similar passage is also not found in the current charter, and together with the holding structure created in
1990 the initial trammels was loosened to a degree where a divestment eventually was possible legally. The
share capital of Auriga is divided into A-shares and B-shares, and according to the object of clause, the
AURF instructed to:
“…at all times own the total amount of A-shares in the company, and that the voting rights attached to the
A-share capital at all times are to control at least 51% of the total voting rights…”195
By this clause AURF will, as earlier mentioned, always possess the voting majority in Auriga and as a result
be in full control concerning important decisions. In 2013, AURF owned 39% of the total share capital, and
83% of the total voting rights.196
The board of directors in AURF must be represented by a minimum of six and a maximum of ten members.
The university Dean is automatically a member. The remaining nine members has to be part of the research
at Aarhus University (AU) with the notion that one member can be an administrative employee, one member
can be a student, and 1-2 persons can be other individuals with knowledge about corporate-, board- or
research related issues. The appointment should secure competences within financials, law and corporate
management.197
See a full Board overview in appendix 17.
Members of the board of directors are all connected to Aarhus University and consist mostly of professors
from a wide range of different departments. There are two professors from finance and economics related
departments and one professor from law.
AURF has a huge task in assessing and securing different research related issues in relation to e.g.
endowments, but at the same time rather huge task at business management being owners of different
smaller entities and a rather large entity in Auriga. In the light of these two very different tasks, it should be
noted, that the university had not found it necessary, to appoint external members with professional business
management experience. The remuneration levels for members of the board of directors at AURF are not
mentioned in the annual reports, or in the yearly descriptions.
It could be the case that the remuneration offered, are at levels where it is hard to attract competent persons,
or opposite, that the remunerations are at a level where the foundation uses it as a kind of collegial benefits
and that this is the argument for holding the seats internally.
192
Hempel Fonden charter article 3 section 2: http://www.hempelfonden.dk/hempel-fonden/fundats/ 193
See the original charter in Danish paragraph 3 in appendix XXXXX 194
See the original charter in Danish paragraph 3 in appendix XXXXX 195
Instrument of foundation, Aarhus Research Foundation, paragraph 7. http://auff.au.dk/fonden/fundats/ 196
Aarhus Research Foundation, annual report 197
Instrument of foundation, Aarhus Research Foundation, paragraph 9. http://auff.au.dk/fonden/fundats/
71
It can be noted that it has not been possible to find information on the remuneration, on any of members of
the board of directors of AURF, as there is no explanation of the adopted praxis which goes against the
Recommendations on foundation governance.198
In an email dated the 1’th of March (see appendix 31) the
foundation explains, that 2015 is the first year that they will comply with the “comply or explain” code, and
that the yearly statement, including the remuneration praxis, will be available on the 25’th of May this year.
It cannot be excluded, that a situation with a board of directors consisting of mostly university professors,
potentially could have resulted in a strong Chairman in Auriga. As observed in both the Brazil case and the
case concerning cleaning Harboøre Tange, the foundation backed the management. At the same time, it
cannot be excluded, that the foundation in longer periods have been a rather in-active owner, operating with
a main scope of securing endowments, and developing their other investments, including the development of
a real estate portfolio. Especially when thinking of the fact that the foundation, in cooperation with
management, have been working on a sale since 1998, and that this fact potentially could have removed their
focus from Auriga and to development their other business areas.
The analysis has created a picture of an inactive majority owner, that have received yearly dividends no
matter the profit, that have grown their own operational activities and which continuously have changed the
charter and corporate construct to unlock the possibility to of selling/divesting Auriga.
Either way, the foundation is assessed to be a “definitive stakeholder” as AURF possesses both the power to
push through their wishes upon the board, the legitimacy as the largest share owner and holder of the
majority voting rights, and the urgency if something threatens their investment or reputation. In periods
where the board of directors in Auriga administrates their mandate in an acceptable manner, AURF could be
seen as a “dominant stakeholder”, but in a case of urgency the “definitive stakeholder” will quickly reveal
itself.
Conclusion: Definitive stakeholder with high salience.
4.4.2.4. The other large shareholder, ATP (high)
ATP was the only large institutional investor in Auriga, and their main scope is to create good and stabile
return in their pension funds. As a pension fund managing more than 700 billion DKK199
, ATP is a powerful
player200
in the Danish business environment, and often acts as an active and social responsible investor as
they comply with UN’s global impact and the six-pillar principals for responsible investments supported by
UN.201
From a principal-agent and monitoring perspective, ATP acting as the only large institutional investor, with
controls of 5.96% of the total share capital and 1.63% of the voting rights, has acted as an active powerful
investor in several occasions. ATP acting as an active investor, when Auriga supposedly where supporting
sale of a high toxic product in Brazil in 2006202
, and again on the general assembly in 2014 voting against a
suggestion concerning cleaning the waste spill on Harboøre Tange near Auriga production facilities in
Harboøre, Denmark203
- A “definitive stakeholder” with power, legitimacy and urgency in the matter.
198
Komitéen for god Fondsledelse homepage,”Recommandations on foundation governance”, point 3. https://godfondsledelse.dk/english. 199
ATP homepage: https://www.atp.dk/atp-som-investor/pensions-investments 200
Kirketerp, Simon, Børsen, “Se listen over verdens mest magtfulde finansfolk – Dansker indtager 3. pladsen”, 10´th of November 2015 201
ATP homepage: https://www.atp.dk/samfundsansvar/atps-politik-for-samfundsansvar 202
Thomsen, Claus Blok, Politiken, “FN langer ud efter Cheminova”, 26´th of November 2006 and Birgitte Raben and Claus Blok Thomsen, Politiken, “Cheminova stopper salg af gift til ulande”, 1´th of December 2006. 203
Summary of the annual general meeting at Auriga on the 30´th of April 2015. http://www.auriga-industries.com/download/investor/annual_general_meeting/2015/auriga_agm_referat.pdf
72
Urgency could be removed making them a “dominant stakeholder” in the case where the management
exercises their mandate correctly according to ATP, but as observed in several occasions, they are to be seen
as a professional active investor with a rather constant presence of urgency.
It should be mentioned that their power is not as strong as the power of AURF, as ATP was not involved in
the fifteen years sale process to the same degree as the foundation.
Conclusion: Definitive stakeholder with high salience.
4.4.2.5. Harboøre local community and the employees (medium) 204
Auriga and the production facility at Harboøre Tange are by far the largest company in Lemvig municipal
and are currently employ 850 employees. In the two nearby cities, Lemvig and Thyborøn there are 7,000 and
2,500 citizens accordingly, so 850 employees are a relative high number in this relation.
A divestment of Cheminova to another company would create uncertainty of the Cheminova position in
Harboøre, and if larger cuts are to be executed, would mean a great deal for the local community and
business life, as well as for employees in other geographical regions.
The local community and the employees is a “dependent stakeholder” with urgency and legitimacy as the
company is very important for their interests. The community has no real power to enforce their will or
desires, but the urgency can still affect decisions in some ways - Mitchell calls it the mosquito noise in the
ear of the board of directors.205
Employees has power to some degree and could use the “weapon” of stop
working to influence things, but will still not be able to force through their will.
This group are able to cause a lot of trouble if evolve into emerging concern groups206
.
It is important to note, that the three employee elected members on the board of directors are not
representing the employees but the company as a whole. Still there is empirical evidence that suggests, that
employee elected members are more employee and society oriented than non-employee elected members207
Post buying Cheminova, FCM has fired around 10% of the total work force in the Harboøre area. And with
the announcement of opening its European headquarters and R&D facility in Hørsholm just north of
Copenhagen with approximately 300 employees, further job-drain of the Harboøre are could probably be
expected. 208
Conclusion: Dependent stakeholder with medium salience.
4.4.2.6. Media and Kurt Aabo (medium):
The media has as a point of origin both no urgency towards Auriga and their strategic considerations, and no
power towards affecting the strategic direction – a “nonstakeholder” with low salience.
But as a part of the three-part power structure in society, this stakeholder always holds a legitimacy that can
be triggered. And if the stakeholder starts to stir up things around the company, especially when being a
chemical company with a history, urgency could quickly arise, and with that the potential of acquiring some
kind of power to impose a will.
204
Lemvig Kommune, http://www.godegrunde.nu/Kommunefakta.aspx?ID=172 205
Mads Thyrsted Laursen og Peter Nicolaisen, Folkebladetlemvig.dk, Cheminovas historie: Derfor er den uundværlig” 14. maj 2013, http://folkebladetlemvig.dk/holstebro/cheminovas-historie-derfor-er-den-uundvaerlig 206
Skærbæk & Tryggestad, “The Role of Accounting Devices in Performing Corporate Strategy”, Accounting, Organizations and Society, Vol 35, Issue 1, January 2010 pp 108-124. 207
Rose, Caspar, The Challenges of Employeee-Appointed Board Members for Corporate Governance: The Danish Evidence” (2008), European Business Organization Law Review 9, page 230-231. 208
FMC Corporation homepage, company announcement 07.30.2015. http://phx.corporate-ir.net/phoenix.zhtml?c=117919&p=irol-newsArticle&ID=2072943
73
As seen in relation to both the Brazil case mentioned earlier, and the case with cleaning up the waste at
Høfde 42, this stakeholder is able to potentially affect things, wakening up other stakeholders as the
municipal/government below.
Conclusion: Nonstakeholder with low salience in origin but with the ability to quickly change to being first a
dependent stakeholder and second a definitive stakeholder.
4.4.2.7. Public Offices – e.g. the Danish Business Authority (low)
This stakeholder is categorized as a “dormant stakeholder” in the origin. The public offices possess power as
the society by law grants them a certain mandate in different issues.
The stakeholder also naturally holds a degree of legitimacy as part of the public and social construct, and can
quickly evolve to a dominant and definitive stakeholder with medium to high salience. As observed in
relation to the sale, this stakeholder approval of the change in the instrument of foundation was crucial for
moving on with the strategy to divest Cheminova.
Conclusion: Dormant stakeholder with low salience.
4.5. Risk Management Analysis209 This section will focus on the important strategic risk management which holds an organizations ability to
adapt and respond to emerging changes in the market. Key to succeed in this quest is amongst other things
research, development and innovation competences, to be able to benefit from future uncertainties and
opportunities in an industry. As the agrochemical industry invests considerable resources into R&D, this type
of analysis could prove useful in later sections by uncovering how Auriga is positioned relative to its peers
from a risk management perspective.
4.5.1. Theoretical Terms and Aspects on Risk
This section will start with describing different terms and theories concerning risk.
Risk is an omnipresent factor and because of an infinite number of different versions of risk, it is nonetheless
extremely hard to capture in a simple manner. In 1987 The Society for Risk Analysis states in their
newsletter that they after two years of work, was unable to arrive at a single definition of risk, and had to
develop no less than thirteen different propositions210! An example of a conventional and straight-forward
perception is that risk is the probability of an undesired event occurring, simply put as:
Risk = Probability of an accident x Consequence in lost money/deaths211
Risk is often perceived as a negative event, but this paper views risk from a broader perspective. The coin
has two sides, and as there are risks to be avoided, there are risks to be exploited, and companies will have to
prepare for both scenarios. The latter – the upside risk is essential when dealing with strategic risk
management.
At a general level three different images of risk can be defined:212
Risks
Uncertainties
209
Pedersen, Klaus Thøger, “Risk Management in a food and beverage context – Is Carlsberg A/S on top of the risk agenda?”, third semester elective project in the course: Managing Risk, Uncertainty and the Unknowable: Responding to Emergent Change, handed in 12.04.2015. 210
The Society for Risk Analysis, (1987), ”Risk newsletter”, volume 7, number 3, September 1987. 211
Damodaran, A. 2008. Strategic Risk Management, Chapter 11 in Strategic Risk Taking: A Framework of Risk Management,
Wharton School Publishing, page 5. A similar definition is stated by Kaplan as: risk = uncertainty + damage, Stanley Kaplan and B.
John Garrick, On The Quantitative Definition of Risk, Risk Analysis Vol. 1 no 1, 1981, Society for Risk Analysis pages 12. 212
Andersen, Torben Juul & Schrøder, Peter Winther, “Strategic Risk Management Practice”, Cambridge University Press, 2010 – 4’th
printing, ISBN 978-0-521-13215-2, page 117
74
The unknowable’s/unpredictable’s
Some risks can be identified and quantified and with this quantitative information, it is possible to take steps
to minimize or avoid the unwanted risks exposures – e.g. a currency risk being hedged with derivatives. In
the discipline of avoiding risks, previous events are used to predict future events, and because of the
measurability, the corporate world use immense resources on capturing it. More about this in the next
section, “Risk in a Corporate Setting”.
Uncertainties are opposite a more unique and abrupt, why it cannot be identified and quantified with
precision. This characteristic makes this risk image difficult to meet in advance.
Thirdly, there is the unknowable/unpredictable that is impossible to foresee and meet in advance. But a
company can still prepare for the unpredictable by creating and sustaining an adaptable and responsive
organization, where risk management is imbedded in the company culture.
The difference between the three above-mentioned exposures was captured by former United States
Secretary of Defense, Donald Rumsfeld, on Defense Department Briefing on February 12, 2002:
“…because as we know, there are known knowns; there are things we know we know. We also know there are known
unknowns; that is to say we know there are some things we do not know. But there are also unknown unknowns — the
ones we don't know we don't know.”213
4.5.2. Risk in a Corporate Setting214
In a corporate context, risk can be divided into several sub-categories that are either mainly influenced by
exogenous factors that cannot be affected or endogenous factors which can be managed. Nonetheless, it is
important to note, that each of the sub-categories can bear characteristics from each of the above mentioned
risk images:
Hazards – being e.g. natural catastrophes or terrorist acts – exogenously affected
Economic risks – being e.g. interest rates and general demand – exogenously affected
Operational risks – being e.g production malfunction and legal exposures – endogenously affected
Strategic risks – being e.g. competitor moves, technology improvement, political and social changes –
exogenously affected.
Hazards are difficult to meet, and has a low likelihood of occurring but when they do they often have a big
impact. Responses to hazards are general preparedness or risk transfer through insurance contracts.
Economic risks are exogenously affected but can in some cases be hedged with financial derivatives or
portfolio diversification. In many cases, the focus of risk management is on the endogenously affected
operational risks that can be measured, quantified and avoided. The operational risks can be managed with
control and continuous learning.
4.5.2.1. The Biggest Risk of All – Strategic Risk
When addressing the risk of destroying company value, the strategic risk has proven to be the most
important risk category. The figure below on the relative importance of risk categories shows, that strategic
risk is the biggest threat to company value, while being the source of 58% of the biggest one-month drop
above 25% in shareholder value among Fortune 1000 companies.
213
Former United States Secretary of Defense, Donald Rumsfeld, Defense Department Briefing on February 12, 2002: https://www.youtube.com/watch?v=jtkUO8NpI84 214
Andersen, Torben Juul & Schrøder, Peter Winther, “Strategic Risk Management Practice”, Cambridge University Press, 2010 – 4’th
printing, ISBN 978-0-521-13215-2, page 78-80
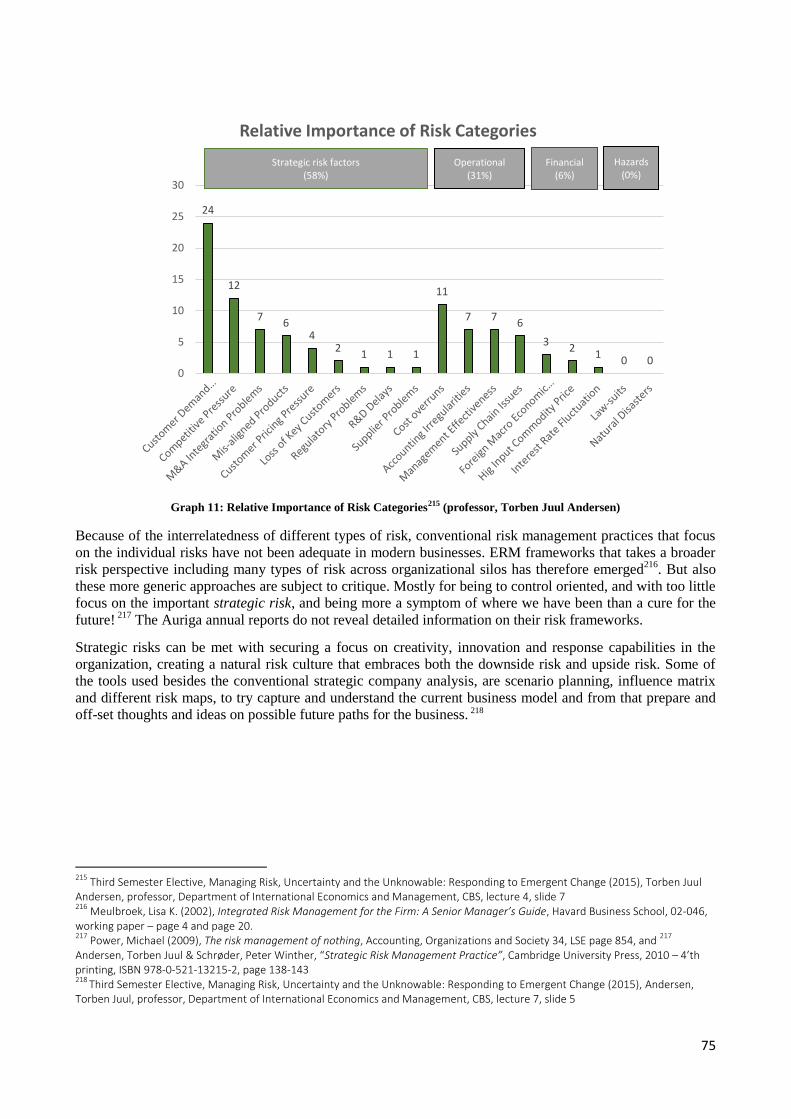
75
Graph 11: Relative Importance of Risk Categories215 (professor, Torben Juul Andersen)
Because of the interrelatedness of different types of risk, conventional risk management practices that focus
on the individual risks have not been adequate in modern businesses. ERM frameworks that takes a broader
risk perspective including many types of risk across organizational silos has therefore emerged216
. But also
these more generic approaches are subject to critique. Mostly for being to control oriented, and with too little
focus on the important strategic risk, and being more a symptom of where we have been than a cure for the
future! 217
The Auriga annual reports do not reveal detailed information on their risk frameworks.
Strategic risks can be met with securing a focus on creativity, innovation and response capabilities in the
organization, creating a natural risk culture that embraces both the downside risk and upside risk. Some of
the tools used besides the conventional strategic company analysis, are scenario planning, influence matrix
and different risk maps, to try capture and understand the current business model and from that prepare and
off-set thoughts and ideas on possible future paths for the business. 218
215
Third Semester Elective, Managing Risk, Uncertainty and the Unknowable: Responding to Emergent Change (2015), Torben Juul Andersen, professor, Department of International Economics and Management, CBS, lecture 4, slide 7 216
Meulbroek, Lisa K. (2002), Integrated Risk Management for the Firm: A Senior Manager’s Guide, Havard Business School, 02-046, working paper – page 4 and page 20. 217
Power, Michael (2009), The risk management of nothing, Accounting, Organizations and Society 34, LSE page 854, and 217
Andersen, Torben Juul & Schrøder, Peter Winther, “Strategic Risk Management Practice”, Cambridge University Press, 2010 – 4’th printing, ISBN 978-0-521-13215-2, page 138-143 218
Third Semester Elective, Managing Risk, Uncertainty and the Unknowable: Responding to Emergent Change (2015), Andersen, Torben Juul, professor, Department of International Economics and Management, CBS, lecture 7, slide 5
24
12
7 6
4 2
1 1 1
11
7 7 6
3 2
1 0 0
0
5
10
15
20
25
30
Relative Importance of Risk Categories
Strategic risk factors (58%)
Operational (31%)
Financial (6%)
Hazards (0%)
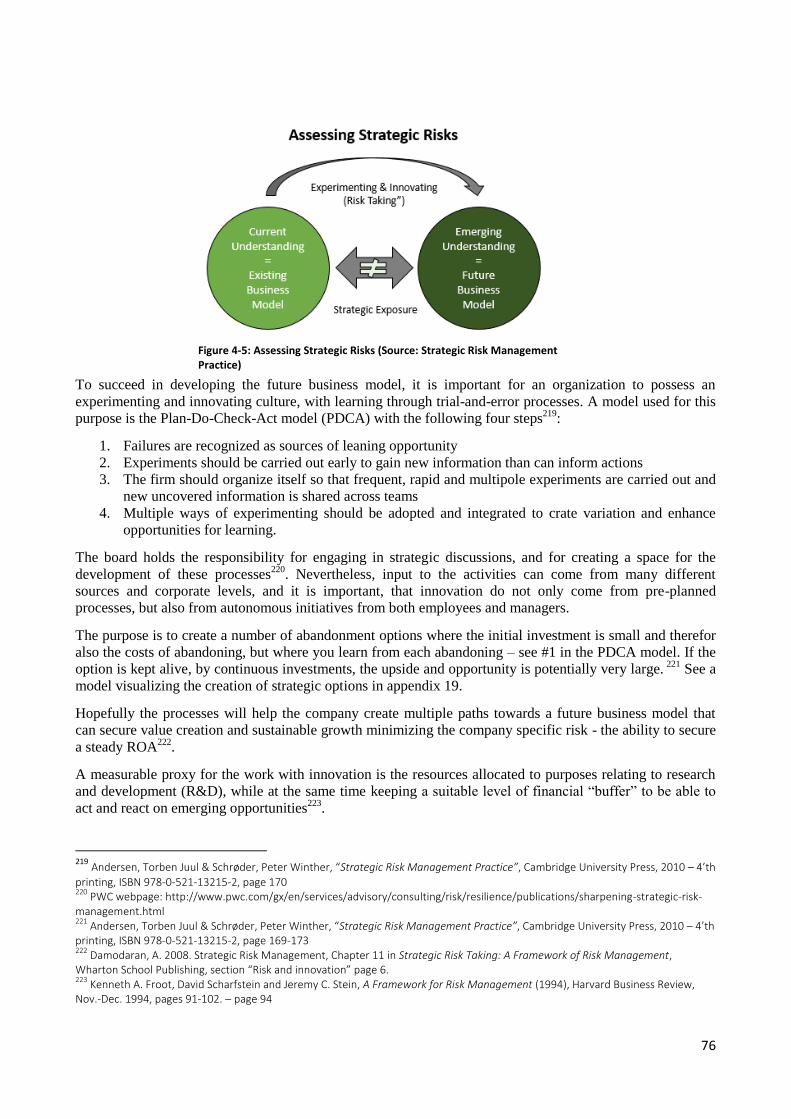
76
To succeed in developing the future business model, it is important for an organization to possess an
experimenting and innovating culture, with learning through trial-and-error processes. A model used for this
purpose is the Plan-Do-Check-Act model (PDCA) with the following four steps219
:
1. Failures are recognized as sources of leaning opportunity
2. Experiments should be carried out early to gain new information than can inform actions
3. The firm should organize itself so that frequent, rapid and multipole experiments are carried out and
new uncovered information is shared across teams
4. Multiple ways of experimenting should be adopted and integrated to crate variation and enhance
opportunities for learning.
The board holds the responsibility for engaging in strategic discussions, and for creating a space for the
development of these processes220
. Nevertheless, input to the activities can come from many different
sources and corporate levels, and it is important, that innovation do not only come from pre-planned
processes, but also from autonomous initiatives from both employees and managers.
The purpose is to create a number of abandonment options where the initial investment is small and therefor
also the costs of abandoning, but where you learn from each abandoning – see #1 in the PDCA model. If the
option is kept alive, by continuous investments, the upside and opportunity is potentially very large. 221
See a
model visualizing the creation of strategic options in appendix 19.
Hopefully the processes will help the company create multiple paths towards a future business model that
can secure value creation and sustainable growth minimizing the company specific risk - the ability to secure
a steady ROA222
.
A measurable proxy for the work with innovation is the resources allocated to purposes relating to research
and development (R&D), while at the same time keeping a suitable level of financial “buffer” to be able to
act and react on emerging opportunities223
.
219
Andersen, Torben Juul & Schrøder, Peter Winther, “Strategic Risk Management Practice”, Cambridge University Press, 2010 – 4’th
printing, ISBN 978-0-521-13215-2, page 170 220
PWC webpage: http://www.pwc.com/gx/en/services/advisory/consulting/risk/resilience/publications/sharpening-strategic-risk-management.html 221
Andersen, Torben Juul & Schrøder, Peter Winther, “Strategic Risk Management Practice”, Cambridge University Press, 2010 – 4’th printing, ISBN 978-0-521-13215-2, page 169-173 222
Damodaran, A. 2008. Strategic Risk Management, Chapter 11 in Strategic Risk Taking: A Framework of Risk Management, Wharton School Publishing, section “Risk and innovation” page 6. 223
Kenneth A. Froot, David Scharfstein and Jeremy C. Stein, A Framework for Risk Management (1994), Harvard Business Review, Nov.-Dec. 1994, pages 91-102. – page 94
Figure 4-5: Assessing Strategic Risks (Source: Strategic Risk Management Practice)
77
In Torben Juul Andersen’s article; Effective risk management outcomes: exploring effects of innovation and
capital structure from 2009, a sample of a thousand companies from different industries are analyzed. The
analysis findings a significant positive link between risk management effectiveness (RME) in the form for
exploiting opportunities and avoiding large economic downturns, and company performance. The results are
enhanced with investments in innovation and by the presence of low leverage.224
The RME measure is calculated as:
𝑅𝑀𝐸 = 𝑆𝑡𝑎𝑛𝑑𝑎𝑟𝑑 𝑑𝑒𝑣𝑖𝑎𝑡𝑖𝑜𝑛 𝑜𝑓 𝑟𝑒𝑣𝑒𝑛𝑢𝑒
𝑆𝑡𝑎𝑛𝑑𝑎𝑟𝑑 𝑑𝑒𝑣𝑖𝑎𝑡𝑖𝑜𝑛 𝑜𝑓 𝑝𝑟𝑜𝑓𝑖𝑡 (𝑅𝑂𝐴)
The idea is that the numerator being the standard deviation of sales/revenue serves as a proxy for the market
risk that is affected by e.g. changes in interest rates, geopolitical events, the global growth rates or the
weather – exogenous affected risks that influences all companies in the industry and on the specific market.
The denominator, the standard deviation of profit (ROA) serves as a proxy for the company specific risks –
how good is the specific company at turning revenue into profit by adjusting costs when revenue is under
pressure.
A high RME indicates a good ability to adapt to changes in the business environment, and a low RME
indicates a poor ability to adapt to changes. A Strategic Risk Management Du Pont Model visualizing the
dynamics can be seen in appendix 20.
The exogenous risks have been described and analyzed in the PESTEL section in chapter 3, and concerning
the endogenous risks, issues related to the denominator; “Total Assets” have been dealt with in the
benchmark and financial analysis. Turning to the numerator affecting the endogenous risks, several bullets
has been dealt with in the value-chain analysis, and as so the next section will go into detail to the missing
pieces, being available cash, leverage and R&D to reach a conclusion on RME on both Auriga and the two
tiers.
As a final remark it is worth noticing, that the findings in many ways goes against core corporate finance
theory, where you on the basis of the Miller & Modigliani theorem’s deals with trade-offs concerning225
:
Leveraging the company to benefit from cheaper debt financing with respect to bankruptcy costs.
Decrease financial slack to e.g. avoid the risk of empire building contra the liquidity trap
4.5.3. General Risks in Auriga
This section will leave the theoretical aspects, and perform an analysis of Auriga’s 3general risk setup,
followed by a section that will go deeper into RME related ratios, calculated from the data set described in
the methodology section in chapter 1.
As a first step it is useful to take a look on what the Recommendations on Corporate Governance say on risk
management:
“Effective risk management and an effective internal control system contribute to reducing strategic and
business risk, to ensuring observance of current rules and regulations and to ensuring the quality of the
basis for management decisions and financial reporting. It is essential that the risks are identified and
communicated, and that the risks are managed appropriately.
As so, deciding on the risk appetite of the firm, and developing and securing clear guidelines and
frameworks for risk management should lie with the board of directors. According to the company’s
mandatory report on corporate governance, they comply on all counts226
.
224
Andersen, Torben Juul (2009), Effective risk management outcomes: exploring effects of innovation and capital structure, Journal of Strategy and Management, Vol. 2 Iss 4 pp. 352 – 379 225
Brealey, Myers & Allen. Principles of Corporate Finance. (2011). Global Edition 10E. McGraw Hill – pages 449-453.
78
It can be noted that the company does not have appointed a risk committee, and that the risk management
issues a dealt with by the audit committee, which subsequently presents relevant risk issues to the board of
directors.
Auriga does not reveal a lot of details on their risk management setup, but the 2013 annual reports explain
some of their thoughts on risk, and list what the company perceives as the six biggest risk factors in the next
twelve months. They divide their main risks into the following four groups227
:
Industry- and market related risks (also a financial risk category)
Operational- and Compliance Risks
Financial Risks
Strategic Risks
Industry- and market related risk (linked to the nominator in the RME ratio) Here they mention that the
agrochemical business is sensitive to changes in the global economy – especially in changes in the
agricultural sector, weather conditions, and changes in crop prices and the availability and price fluctuations
on raw materials.
Key risks in this group for 2014 are price volatility in raw materials. Increasing prices on raw materials
makes it necessary to increase product prices. Due to local market conditions product price increases are not
always possible or it comes with a delay, as Auriga is neither market leader nor price decider. This situation
puts pressure on the company’s ability to meet the expected returns. To meet these risks, the company tries
to minimize the use of big suppliers of raw materials, as well as spreading suppliers geographically.
Last but not least, the company talks about the risk of missing out on the necessary organic growth due to
lack of market penetration in North America where the company is rather weak in its market share. The
company plan is to allocate resources to the sales organizations and new product launches to secure success.
Operational- and compliance related risks that include unwanted risks in relation environmental, health and
regulatory issues. The company meets the risk by attaining relevant risk certificates, and by upholding an
insurance program that partly transfers the financial risk for bigger impacts.
An expected primary risk in 2014 in this risk group is loss of reputation because of lack of complying with
business and production ethics. To meet the risk, ongoing evaluation of e.g. environmental and social effects
around the production facilities are conducted.
Failing to further diversify the regional mix by failing in further penetration of the US market would limit the
company’s ability to meet organic growth rates above market levels.
The US market makes up 19% of the total market for crop protections, and has an 8% growth in 2013. See
also the PESTEL analysis in chapter 3.
Financial risks hold risks towards mainly FX and tax related issues. Revenue is mainly denoted in USD,
EUR, BRL, INR, AUD, GBP, CHF, PLN and MXN while production costs are mainly denoted in DKK.
Exposure in the most important exchange rates a hedged with forward contracts and options with maturities
between six and eighteen months. Exposures in local exchange rates are hedged in the relevant subsidiaries,
and intragroup transactions are usually hedged with swaps. The total portfolio of exchange rate contracts had
an average time to maturity of 1 month, and amounted to a total value of 984 million DKK relative to a total
balance of 6,341 million DKK. See also the PESTEL analysis in chapter 3.
226
Auriga, “Den lovpligtige redegørelse for virksomhedsledelse”, http://www.auriga-industries.com/download/investor/financial_reports/2015/auriga__corporate_governancerapport_2014_dk.pdf 227
Auriga Industries, Annual Report 2013, page 12-13
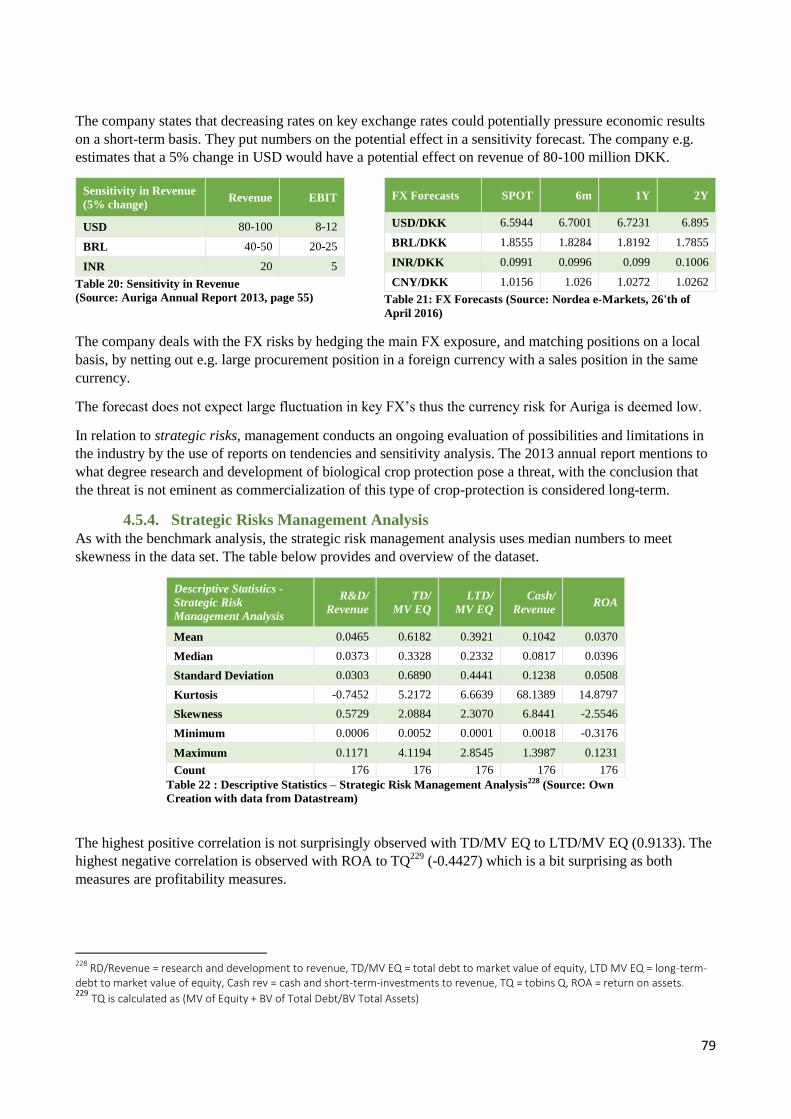
79
The company states that decreasing rates on key exchange rates could potentially pressure economic results
on a short-term basis. They put numbers on the potential effect in a sensitivity forecast. The company e.g.
estimates that a 5% change in USD would have a potential effect on revenue of 80-100 million DKK.
Sensitivity in Revenue
(5% change) Revenue EBIT
USD 80-100 8-12
BRL 40-50 20-25
INR 20 5
Table 20: Sensitivity in Revenue
(Source: Auriga Annual Report 2013, page 55)
FX Forecasts SPOT 6m 1Y 2Y
USD/DKK 6.5944 6.7001 6.7231 6.895
BRL/DKK 1.8555 1.8284 1.8192 1.7855
INR/DKK 0.0991 0.0996 0.099 0.1006
CNY/DKK 1.0156 1.026 1.0272 1.0262
Table 21: FX Forecasts (Source: Nordea e-Markets, 26'th of
April 2016)
The company deals with the FX risks by hedging the main FX exposure, and matching positions on a local
basis, by netting out e.g. large procurement position in a foreign currency with a sales position in the same
currency.
The forecast does not expect large fluctuation in key FX’s thus the currency risk for Auriga is deemed low.
In relation to strategic risks, management conducts an ongoing evaluation of possibilities and limitations in
the industry by the use of reports on tendencies and sensitivity analysis. The 2013 annual report mentions to
what degree research and development of biological crop protection pose a threat, with the conclusion that
the threat is not eminent as commercialization of this type of crop-protection is considered long-term.
4.5.4. Strategic Risks Management Analysis
As with the benchmark analysis, the strategic risk management analysis uses median numbers to meet
skewness in the data set. The table below provides and overview of the dataset.
Descriptive Statistics -
Strategic Risk
Management Analysis
R&D/
Revenue
TD/
MV EQ
LTD/
MV EQ
Cash/
Revenue ROA
Mean 0.0465 0.6182 0.3921 0.1042 0.0370
Median 0.0373 0.3328 0.2332 0.0817 0.0396
Standard Deviation 0.0303 0.6890 0.4441 0.1238 0.0508
Kurtosis -0.7452 5.2172 6.6639 68.1389 14.8797
Skewness 0.5729 2.0884 2.3070 6.8441 -2.5546
Minimum 0.0006 0.0052 0.0001 0.0018 -0.3176
Maximum 0.1171 4.1194 2.8545 1.3987 0.1231
Count 176 176 176 176 176
Table 22 : Descriptive Statistics – Strategic Risk Management Analysis228 (Source: Own
Creation with data from Datastream)
The highest positive correlation is not surprisingly observed with TD/MV EQ to LTD/MV EQ (0.9133). The
highest negative correlation is observed with ROA to TQ229
(-0.4427) which is a bit surprising as both
measures are profitability measures.
228
RD/Revenue = research and development to revenue, TD/MV EQ = total debt to market value of equity, LTD MV EQ = long-term-debt to market value of equity, Cash rev = cash and short-term-investments to revenue, TQ = tobins Q, ROA = return on assets. 229
TQ is calculated as (MV of Equity + BV of Total Debt/BV Total Assets)
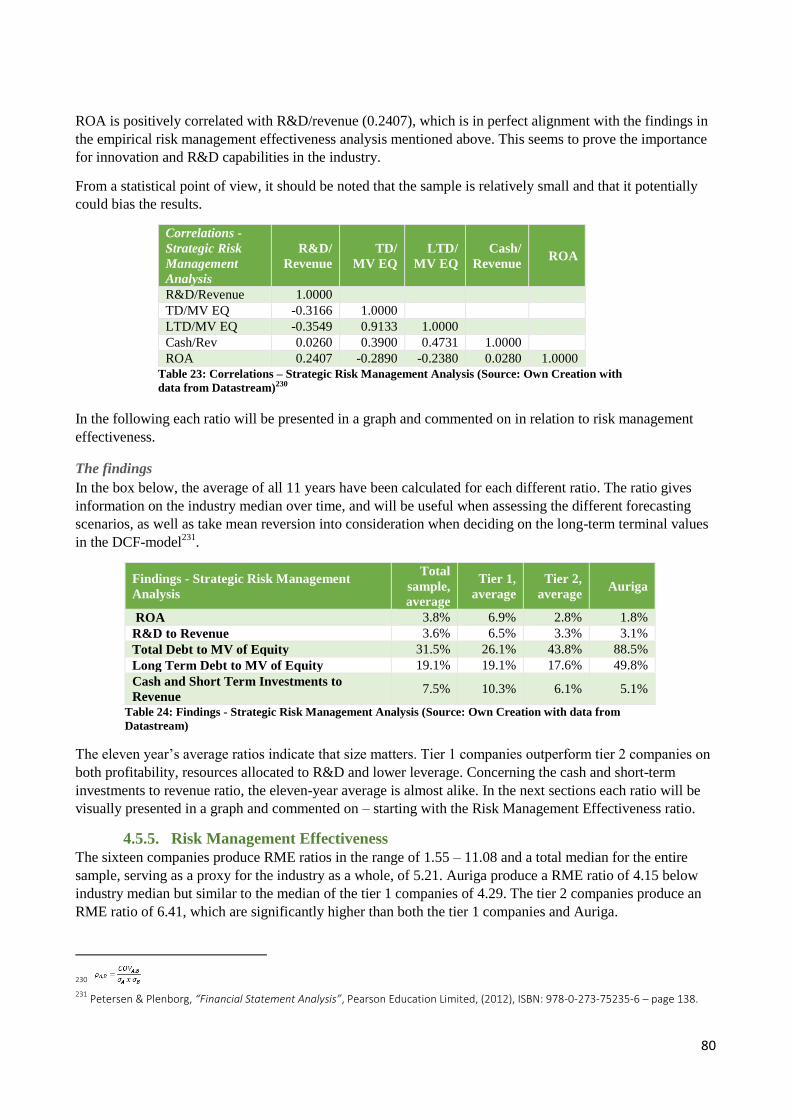
80
ROA is positively correlated with R&D/revenue (0.2407), which is in perfect alignment with the findings in
the empirical risk management effectiveness analysis mentioned above. This seems to prove the importance
for innovation and R&D capabilities in the industry.
From a statistical point of view, it should be noted that the sample is relatively small and that it potentially
could bias the results.
Correlations -
Strategic Risk
Management
Analysis
R&D/
Revenue
TD/
MV EQ
LTD/
MV EQ
Cash/
Revenue ROA
R&D/Revenue 1.0000
TD/MV EQ -0.3166 1.0000
LTD/MV EQ -0.3549 0.9133 1.0000
Cash/Rev 0.0260 0.3900 0.4731 1.0000
ROA 0.2407 -0.2890 -0.2380 0.0280 1.0000
Table 23: Correlations – Strategic Risk Management Analysis (Source: Own Creation with
data from Datastream)230
In the following each ratio will be presented in a graph and commented on in relation to risk management
effectiveness.
The findings
In the box below, the average of all 11 years have been calculated for each different ratio. The ratio gives
information on the industry median over time, and will be useful when assessing the different forecasting
scenarios, as well as take mean reversion into consideration when deciding on the long-term terminal values
in the DCF-model231
.
Findings - Strategic Risk Management
Analysis
Total
sample,
average
Tier 1,
average
Tier 2,
average Auriga
ROA 3.8% 6.9% 2.8% 1.8%
R&D to Revenue 3.6% 6.5% 3.3% 3.1%
Total Debt to MV of Equity 31.5% 26.1% 43.8% 88.5%
Long Term Debt to MV of Equity 19.1% 19.1% 17.6% 49.8%
Cash and Short Term Investments to
Revenue 7.5% 10.3% 6.1% 5.1%
Table 24: Findings - Strategic Risk Management Analysis (Source: Own Creation with data from
Datastream)
The eleven year’s average ratios indicate that size matters. Tier 1 companies outperform tier 2 companies on
both profitability, resources allocated to R&D and lower leverage. Concerning the cash and short-term
investments to revenue ratio, the eleven-year average is almost alike. In the next sections each ratio will be
visually presented in a graph and commented on – starting with the Risk Management Effectiveness ratio.
4.5.5. Risk Management Effectiveness
The sixteen companies produce RME ratios in the range of 1.55 – 11.08 and a total median for the entire
sample, serving as a proxy for the industry as a whole, of 5.21. Auriga produce a RME ratio of 4.15 below
industry median but similar to the median of the tier 1 companies of 4.29. The tier 2 companies produce an
RME ratio of 6.41, which are significantly higher than both the tier 1 companies and Auriga.
230
231 Petersen & Plenborg, “Financial Statement Analysis”, Pearson Education Limited, (2012), ISBN: 978-0-273-75235-6 – page 138.
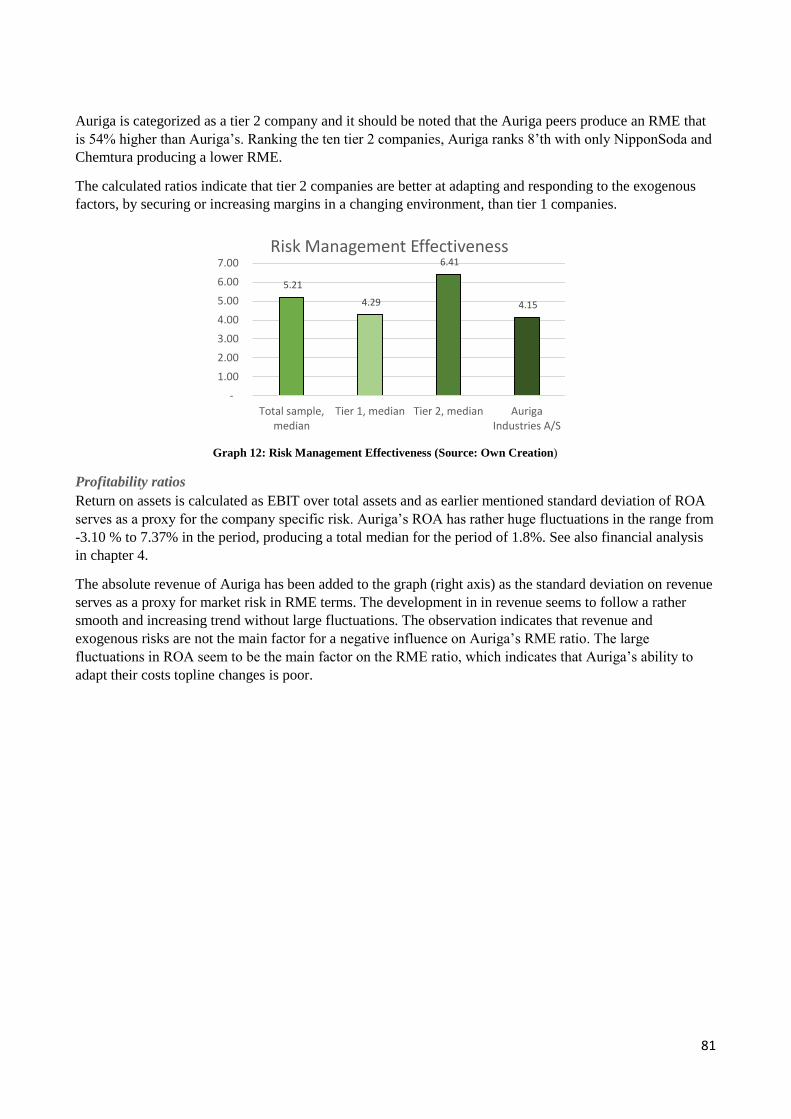
81
Auriga is categorized as a tier 2 company and it should be noted that the Auriga peers produce an RME that
is 54% higher than Auriga’s. Ranking the ten tier 2 companies, Auriga ranks 8’th with only NipponSoda and
Chemtura producing a lower RME.
The calculated ratios indicate that tier 2 companies are better at adapting and responding to the exogenous
factors, by securing or increasing margins in a changing environment, than tier 1 companies.
Graph 12: Risk Management Effectiveness (Source: Own Creation)
Profitability ratios
Return on assets is calculated as EBIT over total assets and as earlier mentioned standard deviation of ROA
serves as a proxy for the company specific risk. Auriga’s ROA has rather huge fluctuations in the range from
-3.10 % to 7.37% in the period, producing a total median for the period of 1.8%. See also financial analysis
in chapter 4.
The absolute revenue of Auriga has been added to the graph (right axis) as the standard deviation on revenue
serves as a proxy for market risk in RME terms. The development in in revenue seems to follow a rather
smooth and increasing trend without large fluctuations. The observation indicates that revenue and
exogenous risks are not the main factor for a negative influence on Auriga’s RME ratio. The large
fluctuations in ROA seem to be the main factor on the RME ratio, which indicates that Auriga’s ability to
adapt their costs topline changes is poor.
5.21
4.29
6.41
4.15
-
1.00
2.00
3.00
4.00
5.00
6.00
7.00
Total sample,median
Tier 1, median Tier 2, median AurigaIndustries A/S
Risk Management Effectiveness
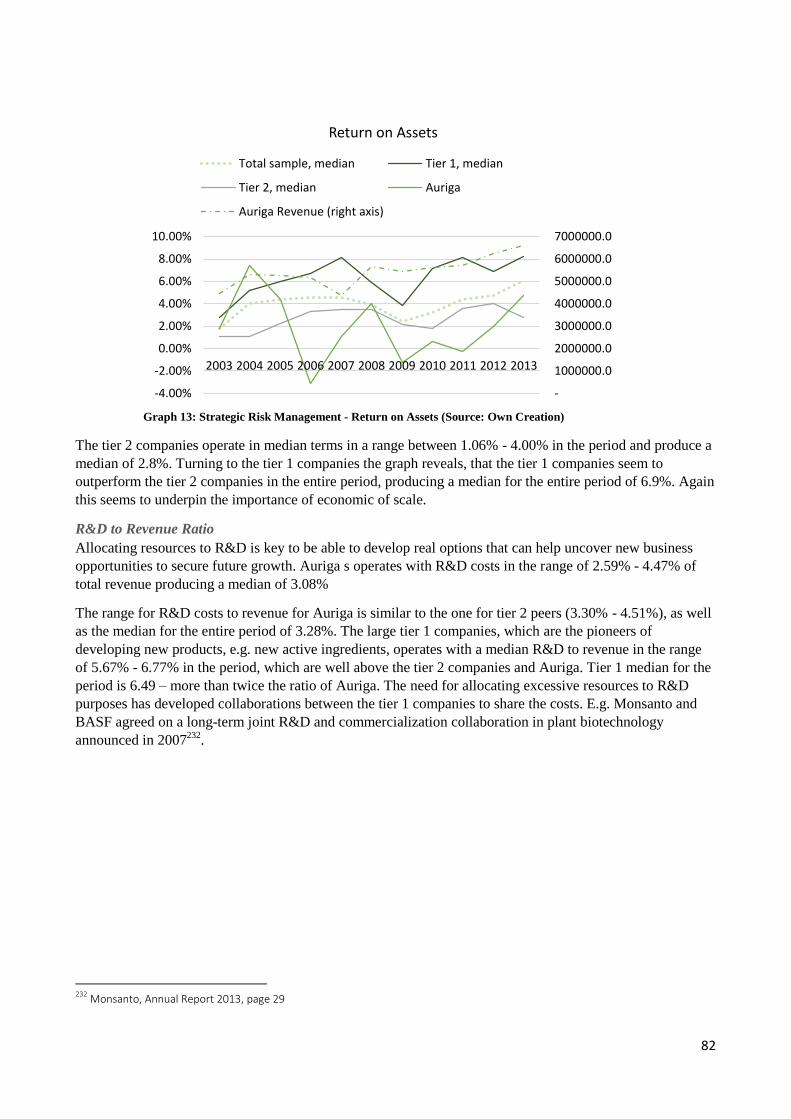
82
Graph 13: Strategic Risk Management - Return on Assets (Source: Own Creation)
The tier 2 companies operate in median terms in a range between 1.06% - 4.00% in the period and produce a
median of 2.8%. Turning to the tier 1 companies the graph reveals, that the tier 1 companies seem to
outperform the tier 2 companies in the entire period, producing a median for the entire period of 6.9%. Again
this seems to underpin the importance of economic of scale.
R&D to Revenue Ratio
Allocating resources to R&D is key to be able to develop real options that can help uncover new business
opportunities to secure future growth. Auriga s operates with R&D costs in the range of 2.59% - 4.47% of
total revenue producing a median of 3.08%
The range for R&D costs to revenue for Auriga is similar to the one for tier 2 peers (3.30% - 4.51%), as well
as the median for the entire period of 3.28%. The large tier 1 companies, which are the pioneers of
developing new products, e.g. new active ingredients, operates with a median R&D to revenue in the range
of 5.67% - 6.77% in the period, which are well above the tier 2 companies and Auriga. Tier 1 median for the
period is 6.49 – more than twice the ratio of Auriga. The need for allocating excessive resources to R&D
purposes has developed collaborations between the tier 1 companies to share the costs. E.g. Monsanto and
BASF agreed on a long-term joint R&D and commercialization collaboration in plant biotechnology
announced in 2007232
.
232
Monsanto, Annual Report 2013, page 29
-
1000000.0
2000000.0
3000000.0
4000000.0
5000000.0
6000000.0
7000000.0
-4.00%
-2.00%
0.00%
2.00%
4.00%
6.00%
8.00%
10.00%
2003 2004 2005 2006 2007 2008 2009 2010 2011 2012 2013
Return on Assets
Total sample, median Tier 1, median
Tier 2, median Auriga
Auriga Revenue (right axis)
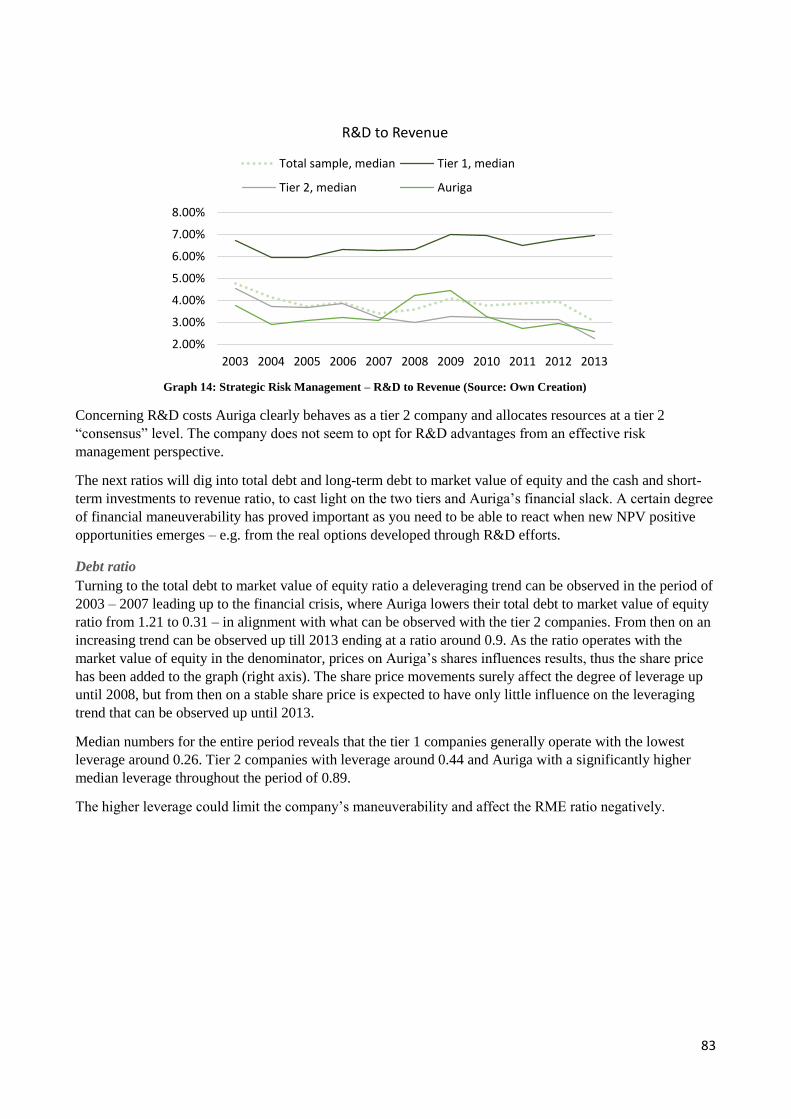
83
Graph 14: Strategic Risk Management – R&D to Revenue (Source: Own Creation)
Concerning R&D costs Auriga clearly behaves as a tier 2 company and allocates resources at a tier 2
“consensus” level. The company does not seem to opt for R&D advantages from an effective risk
management perspective.
The next ratios will dig into total debt and long-term debt to market value of equity and the cash and short-
term investments to revenue ratio, to cast light on the two tiers and Auriga’s financial slack. A certain degree
of financial maneuverability has proved important as you need to be able to react when new NPV positive
opportunities emerges – e.g. from the real options developed through R&D efforts.
Debt ratio
Turning to the total debt to market value of equity ratio a deleveraging trend can be observed in the period of
2003 – 2007 leading up to the financial crisis, where Auriga lowers their total debt to market value of equity
ratio from 1.21 to 0.31 – in alignment with what can be observed with the tier 2 companies. From then on an
increasing trend can be observed up till 2013 ending at a ratio around 0.9. As the ratio operates with the
market value of equity in the denominator, prices on Auriga’s shares influences results, thus the share price
has been added to the graph (right axis). The share price movements surely affect the degree of leverage up
until 2008, but from then on a stable share price is expected to have only little influence on the leveraging
trend that can be observed up until 2013.
Median numbers for the entire period reveals that the tier 1 companies generally operate with the lowest
leverage around 0.26. Tier 2 companies with leverage around 0.44 and Auriga with a significantly higher
median leverage throughout the period of 0.89.
The higher leverage could limit the company’s maneuverability and affect the RME ratio negatively.
2.00%
3.00%
4.00%
5.00%
6.00%
7.00%
8.00%
2003 2004 2005 2006 2007 2008 2009 2010 2011 2012 2013
R&D to Revenue
Total sample, median Tier 1, median
Tier 2, median Auriga
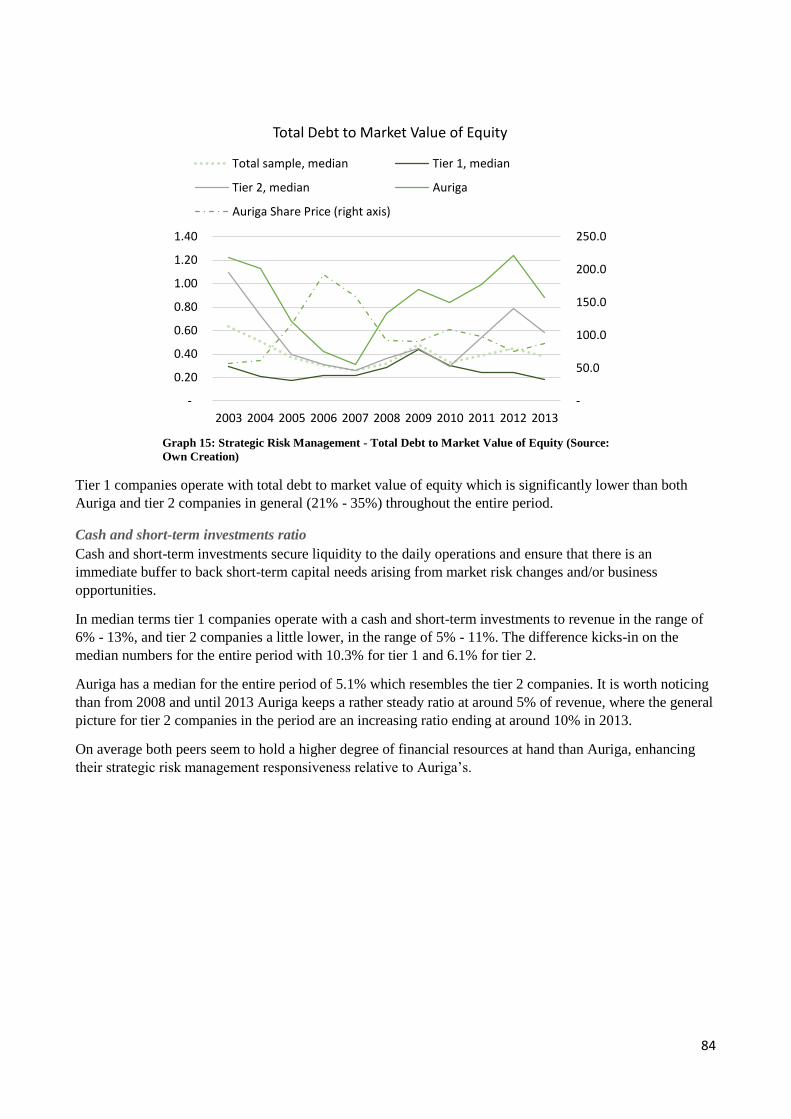
84
Graph 15: Strategic Risk Management - Total Debt to Market Value of Equity (Source:
Own Creation)
Tier 1 companies operate with total debt to market value of equity which is significantly lower than both
Auriga and tier 2 companies in general (21% - 35%) throughout the entire period.
Cash and short-term investments ratio
Cash and short-term investments secure liquidity to the daily operations and ensure that there is an
immediate buffer to back short-term capital needs arising from market risk changes and/or business
opportunities.
In median terms tier 1 companies operate with a cash and short-term investments to revenue in the range of
6% - 13%, and tier 2 companies a little lower, in the range of 5% - 11%. The difference kicks-in on the
median numbers for the entire period with 10.3% for tier 1 and 6.1% for tier 2.
Auriga has a median for the entire period of 5.1% which resembles the tier 2 companies. It is worth noticing
than from 2008 and until 2013 Auriga keeps a rather steady ratio at around 5% of revenue, where the general
picture for tier 2 companies in the period are an increasing ratio ending at around 10% in 2013.
On average both peers seem to hold a higher degree of financial resources at hand than Auriga, enhancing
their strategic risk management responsiveness relative to Auriga’s.
-
50.0
100.0
150.0
200.0
250.0
-
0.20
0.40
0.60
0.80
1.00
1.20
1.40
2003 2004 2005 2006 2007 2008 2009 2010 2011 2012 2013
Total Debt to Market Value of Equity
Total sample, median Tier 1, median
Tier 2, median Auriga
Auriga Share Price (right axis)
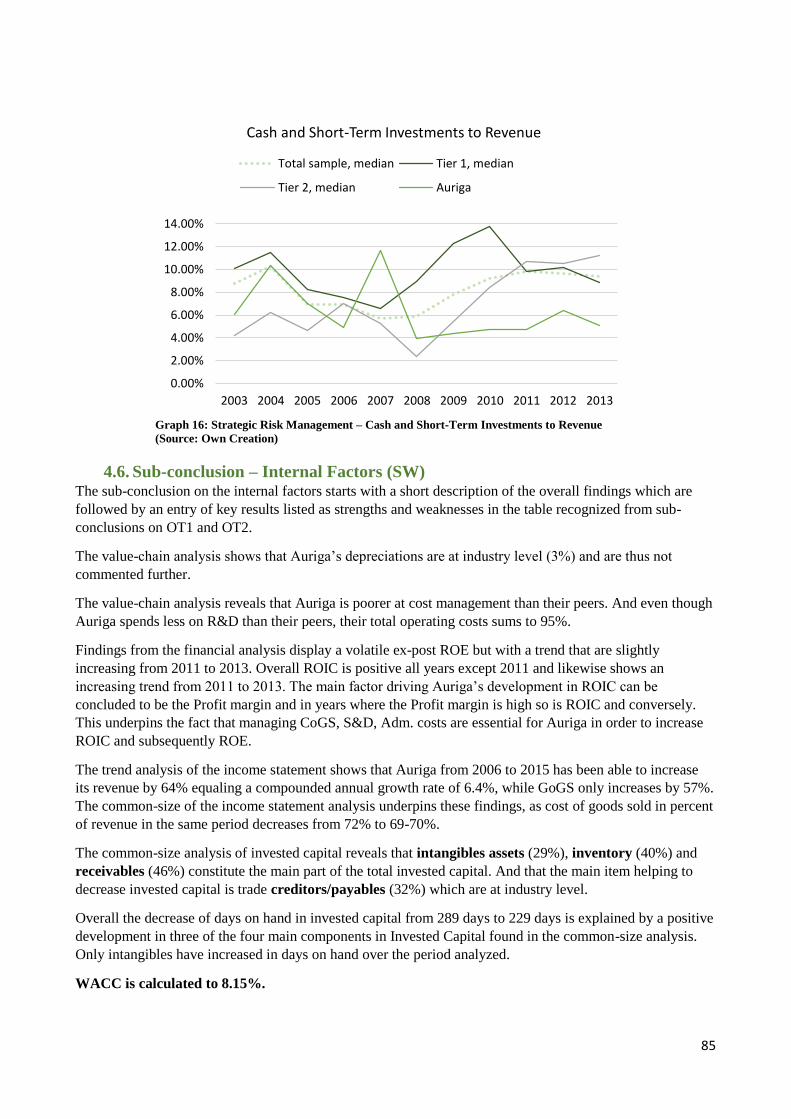
85
Graph 16: Strategic Risk Management – Cash and Short-Term Investments to Revenue
(Source: Own Creation)
4.6. Sub-conclusion – Internal Factors (SW) The sub-conclusion on the internal factors starts with a short description of the overall findings which are
followed by an entry of key results listed as strengths and weaknesses in the table recognized from sub-
conclusions on OT1 and OT2.
The value-chain analysis shows that Auriga’s depreciations are at industry level (3%) and are thus not
commented further.
The value-chain analysis reveals that Auriga is poorer at cost management than their peers. And even though
Auriga spends less on R&D than their peers, their total operating costs sums to 95%.
Findings from the financial analysis display a volatile ex-post ROE but with a trend that are slightly
increasing from 2011 to 2013. Overall ROIC is positive all years except 2011 and likewise shows an
increasing trend from 2011 to 2013. The main factor driving Auriga’s development in ROIC can be
concluded to be the Profit margin and in years where the Profit margin is high so is ROIC and conversely.
This underpins the fact that managing CoGS, S&D, Adm. costs are essential for Auriga in order to increase
ROIC and subsequently ROE.
The trend analysis of the income statement shows that Auriga from 2006 to 2015 has been able to increase
its revenue by 64% equaling a compounded annual growth rate of 6.4%, while GoGS only increases by 57%.
The common-size of the income statement analysis underpins these findings, as cost of goods sold in percent
of revenue in the same period decreases from 72% to 69-70%.
The common-size analysis of invested capital reveals that intangibles assets (29%), inventory (40%) and
receivables (46%) constitute the main part of the total invested capital. And that the main item helping to
decrease invested capital is trade creditors/payables (32%) which are at industry level.
Overall the decrease of days on hand in invested capital from 289 days to 229 days is explained by a positive
development in three of the four main components in Invested Capital found in the common-size analysis.
Only intangibles have increased in days on hand over the period analyzed.
WACC is calculated to 8.15%.
0.00%
2.00%
4.00%
6.00%
8.00%
10.00%
12.00%
14.00%
2003 2004 2005 2006 2007 2008 2009 2010 2011 2012 2013
Cash and Short-Term Investments to Revenue
Total sample, median Tier 1, median
Tier 2, median Auriga

86
Findings from the strategic risk management analysis pinpoint the following key risks:
Industry- and market related risks
Holds changes in the global economy – especially concerning weather conditions, changes in crop prices and
the availability and price fluctuations on raw materials and missing out on organic growth due to lack of
market penetration in North America. This risk group is assessed as high.
Operational- and compliance related risks
Include environmental, health and regulatory issues hereunder loss of reputation due to lack of complying
with company ethics. The risk group is assessed as medium.
Financial risks
Holds risks towards mainly FX (USD, EUR, BRL, INR, AUD, GBP, CHF, PLN and MXN) and tax related
issues. Forecasts are rather neutral why the risk is assessed as low.
The factor effecting RME is ROA which have been very volatile ex-post and which indicate that Auriga’s
ability to adapt costs to topline changes is poor. ROA is effected by both total assets (which are dealt with in
the peer analysis) and net profit. The latter is linked to the following ratios:
Resources allocated to R&D purposes, where Auriga operates with a median ratio similar to tier 2
companies of 3.08%. Tier 1 companies operate with a median of 6.49%.
Auriga operates with a leverage that is significantly higher than both tiers which potentially risks
them of missing out on opportunities because of little financial maneuverability.
The same goes with their financial slack (cash and short-term investments) which are a little
lower than the median for tier 2 and significantly lower than the one of tier 1
The 12 key operational value-drivers found in the internal company analysis are listed below with an
assessment of their individual impact:
Strengths Impact
④Increase in Project under Development - Intangibles Assets
Projects under Development is the main driver behind the increase from 55 to 67
days on hand and the increase is mainly related to development projects judged to be
capable of producing a future cash-flow.
Medium
⑤ Improved management of inventory Days on hand for inventory decreases over the period analyzed from 103 to 93,
displaying that Auriga has improved management of their inventory
Medium
⑥Improved management of receivables
Days on hand for receivables likewise decreases over that period analyzed from 126
to 106. Part of the reduction is due to the use of factoring.
Medium
⑦ Improved payment terms to suppliers Days on hand for payables has improved from 40 days in 2005 to 74 days in 2013,
indicating that Auriga has been able to increase their terms of payment.
Medium
⑪Board of directors and management
With Jens Due Olsen as chairman of the board of eight other competent members, it
is assessed as being competent. The management team is likewise asses as
competent with the President of Region Europe, Jaime Gómez-Arnau appointed as
new CEO in 2013 and CFO René Schneider at the same time.
High
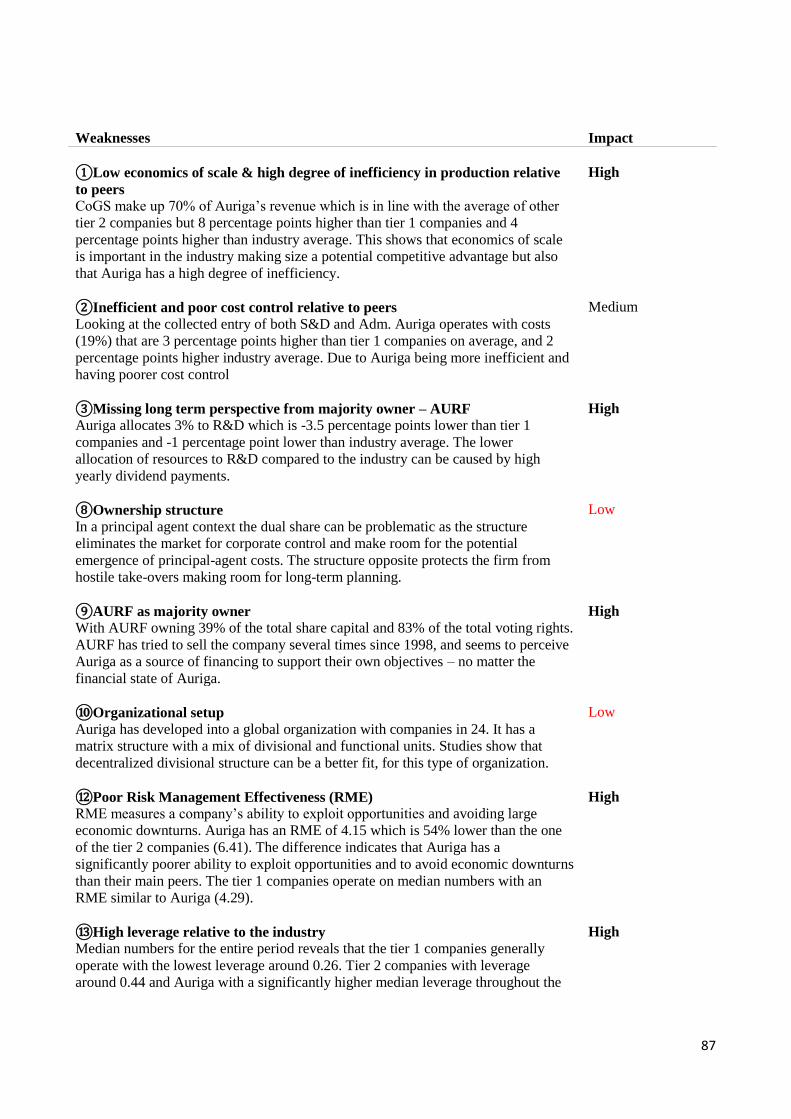
87
Weaknesses Impact
①Low economics of scale & high degree of inefficiency in production relative
to peers
CoGS make up 70% of Auriga’s revenue which is in line with the average of other
tier 2 companies but 8 percentage points higher than tier 1 companies and 4
percentage points higher than industry average. This shows that economics of scale
is important in the industry making size a potential competitive advantage but also
that Auriga has a high degree of inefficiency.
High
②Inefficient and poor cost control relative to peers
Looking at the collected entry of both S&D and Adm. Auriga operates with costs
(19%) that are 3 percentage points higher than tier 1 companies on average, and 2
percentage points higher industry average. Due to Auriga being more inefficient and
having poorer cost control
Medium
③Missing long term perspective from majority owner – AURF
Auriga allocates 3% to R&D which is -3.5 percentage points lower than tier 1
companies and -1 percentage point lower than industry average. The lower
allocation of resources to R&D compared to the industry can be caused by high
yearly dividend payments.
High
⑧Ownership structure
In a principal agent context the dual share can be problematic as the structure
eliminates the market for corporate control and make room for the potential
emergence of principal-agent costs. The structure opposite protects the firm from
hostile take-overs making room for long-term planning.
Low
⑨AURF as majority owner
With AURF owning 39% of the total share capital and 83% of the total voting rights.
AURF has tried to sell the company several times since 1998, and seems to perceive
Auriga as a source of financing to support their own objectives – no matter the
financial state of Auriga.
High
⑩Organizational setup Auriga has developed into a global organization with companies in 24. It has a
matrix structure with a mix of divisional and functional units. Studies show that
decentralized divisional structure can be a better fit, for this type of organization.
Low
⑫Poor Risk Management Effectiveness (RME)
RME measures a company’s ability to exploit opportunities and avoiding large
economic downturns. Auriga has an RME of 4.15 which is 54% lower than the one
of the tier 2 companies (6.41). The difference indicates that Auriga has a
significantly poorer ability to exploit opportunities and to avoid economic downturns
than their main peers. The tier 1 companies operate on median numbers with an
RME similar to Auriga (4.29).
High
⑬High leverage relative to the industry
Median numbers for the entire period reveals that the tier 1 companies generally
operate with the lowest leverage around 0.26. Tier 2 companies with leverage
around 0.44 and Auriga with a significantly higher median leverage throughout the
High
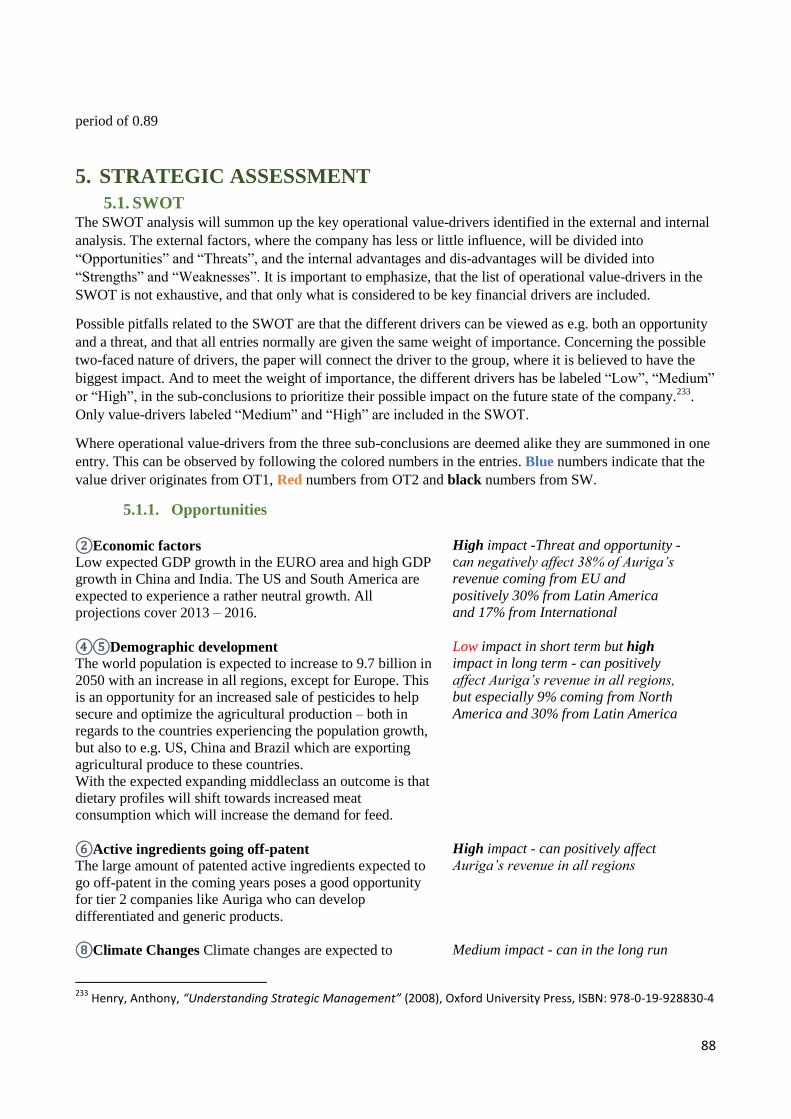
88
period of 0.89
5. STRATEGIC ASSESSMENT
5.1. SWOT The SWOT analysis will summon up the key operational value-drivers identified in the external and internal
analysis. The external factors, where the company has less or little influence, will be divided into
“Opportunities” and “Threats”, and the internal advantages and dis-advantages will be divided into
“Strengths” and “Weaknesses”. It is important to emphasize, that the list of operational value-drivers in the
SWOT is not exhaustive, and that only what is considered to be key financial drivers are included.
Possible pitfalls related to the SWOT are that the different drivers can be viewed as e.g. both an opportunity
and a threat, and that all entries normally are given the same weight of importance. Concerning the possible
two-faced nature of drivers, the paper will connect the driver to the group, where it is believed to have the
biggest impact. And to meet the weight of importance, the different drivers has be labeled “Low”, “Medium”
or “High”, in the sub-conclusions to prioritize their possible impact on the future state of the company.233
.
Only value-drivers labeled “Medium” and “High” are included in the SWOT.
Where operational value-drivers from the three sub-conclusions are deemed alike they are summoned in one
entry. This can be observed by following the colored numbers in the entries. Blue numbers indicate that the
value driver originates from OT1, Red numbers from OT2 and black numbers from SW.
5.1.1. Opportunities
②Economic factors
Low expected GDP growth in the EURO area and high GDP
growth in China and India. The US and South America are
expected to experience a rather neutral growth. All
projections cover 2013 – 2016.
High impact -Threat and opportunity -
can negatively affect 38% of Auriga’s
revenue coming from EU and
positively 30% from Latin America
and 17% from International
④⑤Demographic development The world population is expected to increase to 9.7 billion in
2050 with an increase in all regions, except for Europe. This
is an opportunity for an increased sale of pesticides to help
secure and optimize the agricultural production – both in
regards to the countries experiencing the population growth,
but also to e.g. US, China and Brazil which are exporting
agricultural produce to these countries.
With the expected expanding middleclass an outcome is that
dietary profiles will shift towards increased meat
consumption which will increase the demand for feed.
Low impact in short term but high
impact in long term - can positively
affect Auriga’s revenue in all regions,
but especially 9% coming from North
America and 30% from Latin America
⑥Active ingredients going off-patent
The large amount of patented active ingredients expected to
go off-patent in the coming years poses a good opportunity
for tier 2 companies like Auriga who can develop
differentiated and generic products.
High impact - can positively affect
Auriga’s revenue in all regions
⑧Climate Changes Climate changes are expected to
Medium impact - can in the long run
233
Henry, Anthony, “Understanding Strategic Management” (2008), Oxford University Press, ISBN: 978-0-19-928830-4
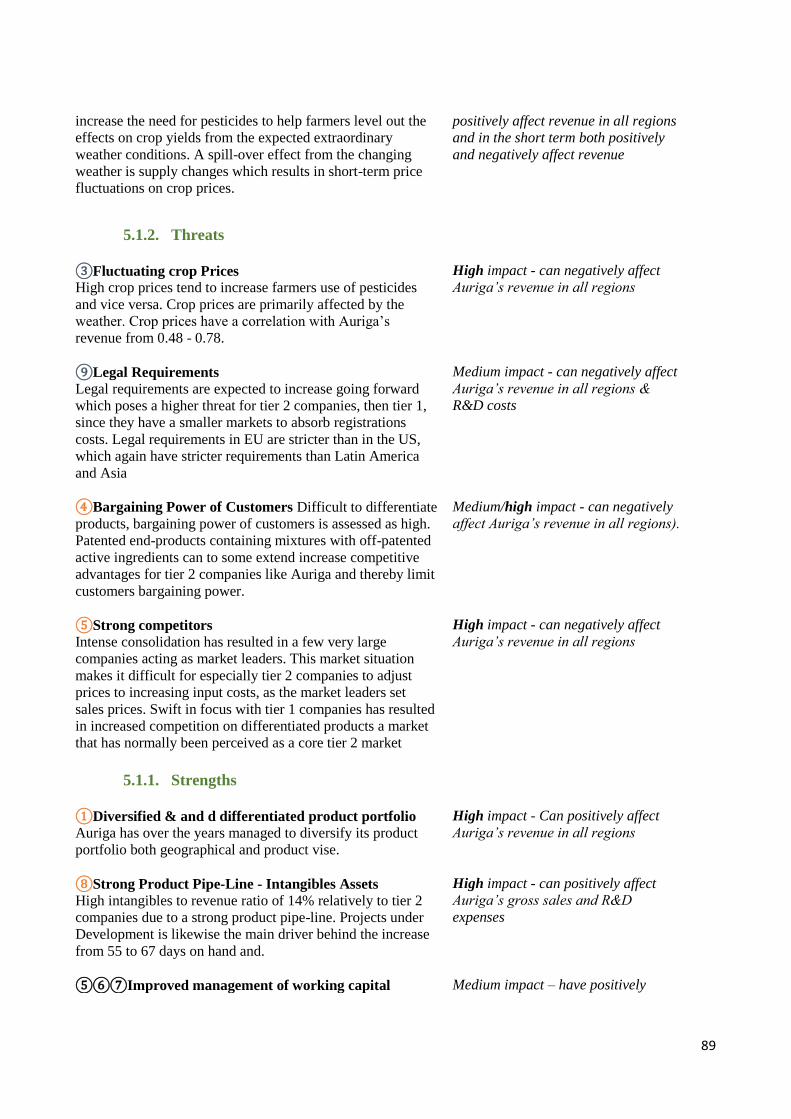
89
increase the need for pesticides to help farmers level out the
effects on crop yields from the expected extraordinary
weather conditions. A spill-over effect from the changing
weather is supply changes which results in short-term price
fluctuations on crop prices.
positively affect revenue in all regions
and in the short term both positively
and negatively affect revenue
5.1.2. Threats
③Fluctuating crop Prices
High crop prices tend to increase farmers use of pesticides
and vice versa. Crop prices are primarily affected by the
weather. Crop prices have a correlation with Auriga’s
revenue from 0.48 - 0.78.
High impact - can negatively affect
Auriga’s revenue in all regions
⑨Legal Requirements
Legal requirements are expected to increase going forward
which poses a higher threat for tier 2 companies, then tier 1,
since they have a smaller markets to absorb registrations
costs. Legal requirements in EU are stricter than in the US,
which again have stricter requirements than Latin America
and Asia
Medium impact - can negatively affect
Auriga’s revenue in all regions &
R&D costs
④Bargaining Power of Customers Difficult to differentiate
products, bargaining power of customers is assessed as high.
Patented end-products containing mixtures with off-patented
active ingredients can to some extend increase competitive
advantages for tier 2 companies like Auriga and thereby limit
customers bargaining power.
Medium/high impact - can negatively
affect Auriga’s revenue in all regions).
⑤Strong competitors
Intense consolidation has resulted in a few very large
companies acting as market leaders. This market situation
makes it difficult for especially tier 2 companies to adjust
prices to increasing input costs, as the market leaders set
sales prices. Swift in focus with tier 1 companies has resulted
in increased competition on differentiated products a market
that has normally been perceived as a core tier 2 market
High impact - can negatively affect
Auriga’s revenue in all regions
5.1.1. Strengths
①Diversified & and d differentiated product portfolio Auriga has over the years managed to diversify its product
portfolio both geographical and product vise.
High impact - Can positively affect
Auriga’s revenue in all regions
⑧Strong Product Pipe-Line - Intangibles Assets
High intangibles to revenue ratio of 14% relatively to tier 2
companies due to a strong product pipe-line. Projects under
Development is likewise the main driver behind the increase
from 55 to 67 days on hand and.
High impact - can positively affect
Auriga’s gross sales and R&D
expenses
⑤⑥⑦Improved management of working capital
Medium impact – have positively
90
facilities Days on hand for inventory decreases over the period
analyzed from 103 to 93. Days on hand for receivables
likewise decreases over that period analyzed from 126 to 106
(Part of the reduction is due to the use of factoring). Days on
hand for payables has improved from 40 days in 2005 to 74
days in 2013
affected Auriga’s WC facilities
⑪Board of directors and management
With Jens Due Olsen as chairman of the board of eight other
competent members, it is assessed as being competent. The
management team is likewise asses as competent with the
President of Region Europe, Jaime Gómez-Arnau appointed
as new CEO in 2013 and CFO René Schneider at the same
time.
High impact – can positively affect
Auriga in all aspects
5.1.2. Weaknesses
⑦Underinvestment in production facilities - Tangible
assets Auriga has a PPE ratio of 10%, which is low relative to the
industry. For Auriga the low PPE level is due to years of
underinvestment which is damaging for efficiency,
subsequently resulting in high production costs.
High impact - can negatively affect
Auriga’s cost of goods sold &
Tangible assets
⑨⑩Poor processes & control regarding working capital
relative to industry Auriga has a receivables ratio of 36%
compared to an industry average of 24%, inventories of 27%
compared to an industry average of 19% and payables at 12%
compared to an industry average of 12%. The analysis finds
no elements justifying that Auriga should operate at poorer
levels than the industry.
High impact –high receivables and
inventories ratios negatively affects
Auriga’s financial performance
①②Low economics of scale & high degree of
inefficiency in production relative to peers
CoGS make up 70% of Auriga’s revenue which is 8
percentage points higher than tier 1 companies and 4
percentage points higher than industry average. This shows
that economics of scale are important but also that Auriga has
a high degree of inefficiency. S&D and Adm. costs make up
19% of Auriga’s revenue which are 3 percentage points
higher than tier 1 companies on average, and 2 percentage
points higher industry average
High impact - negatively affects
Auriga’s GoGS
Medium impact - negatively affects
Auriga’s S&D and Adm. costs
③⑨AURF as majority owner (Low R&D)
Auriga allocates 3% to R&D which is -3.5 percentage points
lower than tier 1 companies and -1 percentage point lower
than industry average. The low allocation of resources to
R&D compared to the industry can be caused by high yearly
dividend payments. AURF has likewise tried to sell the
company several times since 1998, and seems to perceive
Auriga as a source of financing to support their own
High impact – can negatively affect
Auriga in all aspects, but especially
concerning investments & R&D
91
objectives – no matter the financial state of Auriga
⑫Poor Risk Management Effectiveness (RME) Auriga has an RME of 4.15 which is 54% lower than the one
of the tier 2 companies (6.41). The difference indicates that
Auriga has a significantly poorer ability to exploit
opportunities and to avoid economic downturns than their
main peers
High impact – can negatively affect
Auriga in all aspects
⑬High leverage relative to the industry
Median numbers for the entire period reveals that the tier 1
companies generally operate with the lowest leverage around
0.26. Tier 2 companies with leverage around 0.44 and Auriga
with a significantly higher median leverage throughout the
period of 0.89.
High – can negatively affect Auriga in
all aspects
6. STRATEGIC DILEMMAS
6.1. Setting Value Drivers Strategic value drivers also called operational value drivers are strategic initiatives that are set in motion to
improve the value of the company – e.g. entrance to new markets, out-sourcing of production or initiation of
new processes. The strategic value driver will affect one or more financial value drivers e.g. growth, margins
and investment ratios in a positive direction to increase cash-flow and by that the company value. As
visualized in the figure, the linkage is that it is the strategic/operational initiative that affects the financial
value driver and not the other way around.
Table 25 visualizes the different key strategic and financial value drivers identified as affecting Auriga. The
financial value drivers, e.g. “Growth in Gross Sales” and “CoGS”, are positioned in column to the far left.
The next three columns imitate the structure of the paper, starting with external OT1 and OT2 strategic value
drivers followed by the internal SW value drivers.
The OT2 strategic value drivers marked with a “*” is due to the fact that they are judged as being internal
factors, but which are identified and described in the external OT2 sub-conclusion.
The lines attach the different strategic value drivers onto each financial value driver – no matter if they are
external or internal. This provides an overview of which strategic value drivers that affects which financial
value drivers.
A colored arrow indicating whether or not the influence is negative or positive is furthermore attached to
each strategic value driver, as well as the assessed impact. Colored numbers, as see in the sub-conclusions
and the SWOT, are likewise displayed.

92
Table 25: Value Drivers (Source: Own Creation)
Va
lue
-dri
ve
r #
OT
1 -
Op
era
tio
na
l v
alu
e d
riv
ers
#O
T 2
- O
pe
rati
on
al
va
lue
dri
ve
rs #
SW
- O
pe
rati
on
al
va
lue
dri
ve
rs
Gro
wt
in G
ross
Sa
les
①P
oli
tica
l a
wa
ren
es
s
↓↕
Low
①*
Div
ers
ifie
d &
an
d d
dif
fere
nti
ate
d p
rod
uct
po
rtfo
lio
↑
Hig
h⑧
Ow
ne
rsh
ip s
tru
ctu
re (
list
ed
he
re,
bu
t ca
n i
mp
act
all
fin
an
cia
l va
lue
-dri
vers
)
↓Lo
w
②E
con
om
ic f
act
ors
↑↕
Hig
h②
En
try
ba
rrie
rs f
or
ne
w c
om
pe
tito
rs↑
Low
⑩O
rga
niz
ati
on
al
se
tup
(li
ste
d h
ere
, b
ut
can
imp
act
all
fin
an
cia
l va
lue
-dri
vers
)
↓Lo
w
③F
luct
ua
tin
g c
rop
pri
ces
↓H
igh
③R
isk
fro
m s
ub
sti
tute
pro
du
cts
↓Lo
w⑪
Bo
ard
of
dir
ect
ors
an
d m
an
ag
em
en
t (l
iste
d
he
re,
bu
t ca
n i
mp
act
all
fin
an
cia
l va
lue
-dri
vers
)
↑H
igh
④D
em
og
rap
hic
de
velo
pm
en
t ↑
Low
/hig
h
④B
arg
ain
ing
po
we
r o
f cu
sto
me
rs
↓M
ed
ium
/hig
h⑫
Po
or
Ris
k M
an
ag
em
en
t E
ffe
ctiv
en
es
s (
RM
E)
(lis
ted
he
re,
bu
t ca
n i
mp
act
all
fin
an
cia
l va
lue
-
dri
vers
)
↓H
igh
⑤E
xpa
nd
ing
mid
dle
-cla
ss
↑
Low
/hig
h
⑤S
tro
ng
co
mp
eti
tors
↓H
igh
⑬H
igh
le
vera
ge
re
lati
ve t
o t
he
in
du
str
y (l
iste
d
he
re,
bu
t ca
n i
mp
act
all
fin
an
cia
l va
lue
-dri
vers
)
↓H
igh
⑥A
ctiv
e I
ng
red
ien
ts g
oin
g o
ff-
pa
ten
t
↑H
igh
⑦G
MO
Te
chn
olo
gy
↓Lo
w
⑧C
lim
ate
ch
an
ge
s
↑M
ed
ium
⑨Le
ga
l re
qu
ire
me
nts
↓M
ed
ium
Co
GS
⑩P
rice
on
ra
w m
ate
ria
ls
↕Lo
w⑥
Exp
ect
ed
co
ns
oli
da
tio
n a
mo
ng
Ch
ine
se
su
pp
lie
rs
↓Lo
w①
Low
eco
no
mic
s o
f s
cale
& h
igh
de
gre
e o
f
ine
ffic
ien
cy i
n P
rod
uct
ion
re
lati
ve t
o p
ee
rs
↓H
igh
⑦*
Un
de
rin
ves
tme
nt
in p
rod
uct
ion
fa
cili
tie
s-
Ta
ng
ible
as
se
ts
↓H
igh
S&
D C
ost
s②
Ine
ffic
ien
t a
nd
po
or
cos
t co
ntr
ol
rela
tive
to
pe
ers
↓M
ed
ium
Ad
m.
Co
sts
②In
eff
icie
nt
an
d p
oo
r co
st
con
tro
l re
lati
ve t
o p
ee
rs ↓
Me
diu
m
R&
D E
xp
en
ses
⑨Le
ga
l re
qu
ire
me
nts
↓M
ed
ium
③M
iss
ing
lo
ng
te
rm p
ers
pe
ctiv
e f
rom
ma
jori
ty
ow
ne
r -
AU
RF
↓H
igh
⑨A
UR
F a
s m
ajo
rity
ow
ne
r (L
ow
R&
D)
↓H
igh
No
n-C
urr
en
t A
sse
ts⑦
*U
nd
eri
nve
stm
en
t in
pro
du
ctio
n f
aci
liti
es
- T
an
gib
le
as
se
ts
↓H
igh
④In
cre
as
e i
n P
roje
ct u
nd
er
De
velo
pm
en
t -
Inta
ng
ible
s a
ss
ets
↑M
ed
ium
⑧*
Str
on
g p
rod
uct
pip
e-l
ine
- I
nta
ng
ible
s A
ss
ets
↑
Hig
h
Inv
en
tory
, T
ota
l⑨
*P
oo
r p
roce
ss
es
& c
on
tro
l o
f In
ven
tory
re
lati
ve t
o
Ind
us
try
↓H
igh
⑤Im
pro
ved
ma
na
ge
me
nt
of
inve
nto
ry
↑M
ed
ium
Re
ceiv
ab
les,
To
tal
⑨*
Po
or
pro
ces
se
s &
co
ntr
ol
of
rece
iva
ble
re
lati
ve t
o
ind
us
try
↓H
igh
⑥Im
pro
ved
ma
na
ge
me
nt
of
rece
iva
ble
s
↑M
ed
ium
Pa
ya
ble
s, T
ota
l⑩
*P
aym
en
t te
rms
wit
h s
up
pli
ers
are
in
du
str
y co
nfo
rm↕
Hig
h⑦
Imp
rove
d p
aym
en
t te
rms
to
su
pp
lie
rs↑
Me
diu
m
Imp
act
Imp
act
Imp
act
* =
pe
rce
ive
d a
s in
tern
al
fact
ors
bu
t d
esr
ibe
d i
n t
he
OT
2 s
ub
-co
ncl
usi
on
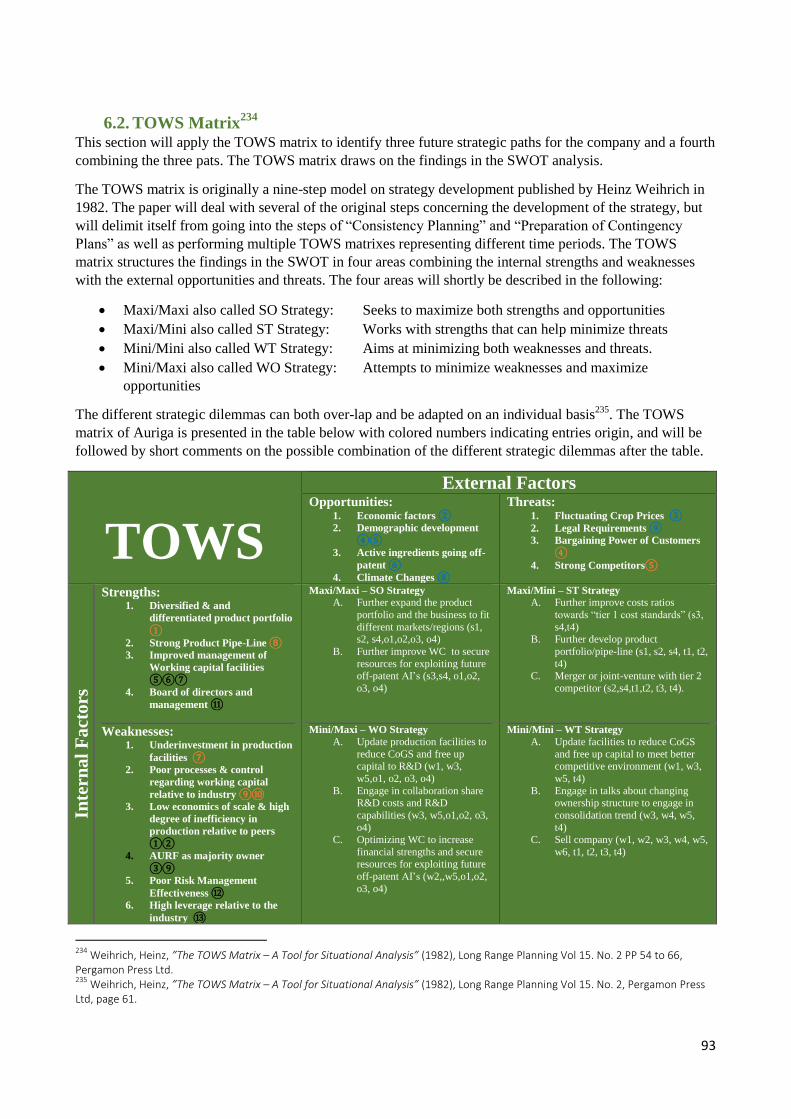
93
6.2. TOWS Matrix234
This section will apply the TOWS matrix to identify three future strategic paths for the company and a fourth
combining the three pats. The TOWS matrix draws on the findings in the SWOT analysis.
The TOWS matrix is originally a nine-step model on strategy development published by Heinz Weihrich in
1982. The paper will deal with several of the original steps concerning the development of the strategy, but
will delimit itself from going into the steps of “Consistency Planning” and “Preparation of Contingency
Plans” as well as performing multiple TOWS matrixes representing different time periods. The TOWS
matrix structures the findings in the SWOT in four areas combining the internal strengths and weaknesses
with the external opportunities and threats. The four areas will shortly be described in the following:
Maxi/Maxi also called SO Strategy: Seeks to maximize both strengths and opportunities
Maxi/Mini also called ST Strategy: Works with strengths that can help minimize threats
Mini/Mini also called WT Strategy: Aims at minimizing both weaknesses and threats.
Mini/Maxi also called WO Strategy: Attempts to minimize weaknesses and maximize
opportunities
The different strategic dilemmas can both over-lap and be adapted on an individual basis235
. The TOWS
matrix of Auriga is presented in the table below with colored numbers indicating entries origin, and will be
followed by short comments on the possible combination of the different strategic dilemmas after the table.
TOWS
External Factors Opportunities:
1. Economic factors ②
2. Demographic development
④⑤
3. Active ingredients going off-
patent ⑥
4. Climate Changes ⑧
Threats: 1. Fluctuating Crop Prices ③
2. Legal Requirements ⑨
3. Bargaining Power of Customers
④
4. Strong Competitors⑤
Inte
rnal
Fa
cto
rs
Strengths: 1. Diversified & and
differentiated product portfolio
①
2. Strong Product Pipe-Line ⑧
3. Improved management of
Working capital facilities
⑤⑥⑦
4. Board of directors and
management ⑪
Maxi/Maxi – SO Strategy
A. Further expand the product
portfolio and the business to fit
different markets/regions (s1, s2, s4,o1,o2,o3, o4)
B. Further improve WC to secure
resources for exploiting future off-patent AI’s (s3,s4, o1,o2,
o3, o4)
Maxi/Mini – ST Strategy
A. Further improve costs ratios
towards “tier 1 cost standards” (s3,
s4,t4) B. Further develop product
portfolio/pipe-line (s1, s2, s4, t1, t2,
t4) C. Merger or joint-venture with tier 2
competitor (s2,s4,t1,t2, t3, t4).
Weaknesses: 1. Underinvestment in production
facilities ⑦
2. Poor processes & control
regarding working capital
relative to industry ⑨⑩
3. Low economics of scale & high
degree of inefficiency in
production relative to peers
①②
4. AURF as majority owner
③⑨
5. Poor Risk Management
Effectiveness ⑫
6. High leverage relative to the
industry ⑬
Mini/Maxi – WO Strategy
A. Update production facilities to
reduce CoGS and free up capital to R&D (w1, w3,
w5,o1, o2, o3, o4)
B. Engage in collaboration share R&D costs and R&D
capabilities (w3, w5,o1,o2, o3,
o4) C. Optimizing WC to increase
financial strengths and secure
resources for exploiting future
off-patent AI’s (w2,,w5,o1,o2,
o3, o4)
Mini/Mini – WT Strategy
A. Update facilities to reduce CoGS
and free up capital to meet better competitive environment (w1, w3,
w5, t4)
B. Engage in talks about changing ownership structure to engage in
consolidation trend (w3, w4, w5,
t4) C. Sell company (w1, w2, w3, w4, w5,
w6, t1, t2, t3, t4)
234
Weihrich, Heinz, ”The TOWS Matrix – A Tool for Situational Analysis” (1982), Long Range Planning Vol 15. No. 2 PP 54 to 66, Pergamon Press Ltd. 235
Weihrich, Heinz, ”The TOWS Matrix – A Tool for Situational Analysis” (1982), Long Range Planning Vol 15. No. 2, Pergamon Press Ltd, page 61.
94
Table 26: TOWS Matrix (Source: Own Creation on the basis of model by Weihrich)236
The two first combinations focuses on the internal possibilities, and the third and fourth combination focuses
on external possibilities. Each of the combinations will be combined with relevant financial and strategic
value drivers.
Path #1 – Update Production Facilities to Improve Efficiency
This strategy is a “WO strategy A” and will “Update production facilities to reduce CoGS and free up capital
to R&D”.
The strategic dilemma emerging from path 1 is the effect of years of underinvestment has left the company
inefficient resulting in higher CoGS than their competitors as well as adding to a poor risk management
effectiveness. The weaknesses are eminent as strong competitors are threating the competitive advantage of
Auriga. The solution is investing in production facilities to meet the former and to better exploit the
opportunities in the industry
Path #2 - Initiate Project to Optimize Working Capital Management
This strategy is a “SO strategy B” and a “WO strategy C” and will “Further improve WC to secure resources
for exploiting future off-patent AI’s” and “Optimizing WC to increase financial strengths and secure
resources for exploiting future off-patent”.
This combination applies initiating internal improvement processes concerning cash-management and
inventory management to push-down ratios that are off industry standards. The strategy will meet the
weaknesses related the poor levels of several WC ratios which limits liquidity and resources available to
R&D purposes resulting in poor RME. Benefitting from the board of directors and management group that
have already proved capable of smaller improvement of WC ratios will help succeed with the strategy.
Path #3 – Joint Venture/Collaboration with US Based Chemtura
This strategy is a “SO strategy A”, a “ST strategy C” and a “WO strategy B” and will “Further expand the
product portfolio and the business to fit different markets/regions”, engage in “Merger or joint-venture with
tier 2 competitor” and “Engage in collaboration share R&D costs and R&D capabilities”.
This combination of dilemmas will maximize opportunities by activating a capable board of directors and
management group to take advantage of Auriga’s current diversified and differentiated products portfolio
and strong product pipe-line, by entering a joint venture or collaboration with a strategic partner. This will
result in a probable reinforcement the company’s innovative capabilities as well as opening up for new
products and markets. The result will be a potential strengthen diversification in the product palette that will
help the company to better cope with the threats of fluctuating crop prices and changing legal requirements.
Differentiation will similarly help minimize the bargaining power of customers, as well as creating a
competitive advantage in a fierce environment.
Path #4 - Combining the Paths
This path will combine the three paths, mitigating all four threats and four of six weaknesses and activate all
strengths and opportunities.
The next chapter will elaborate on the three combinations drawing on the potential value-drivers stated
earlier in this chapter.
236
Weihrich, Heinz, “The TOWS Matrix – A Tool for Situational Analysis”, (1982), Long Range Planning Vol 15, No 2, pp 54-666, Pergamon Press Ltd.
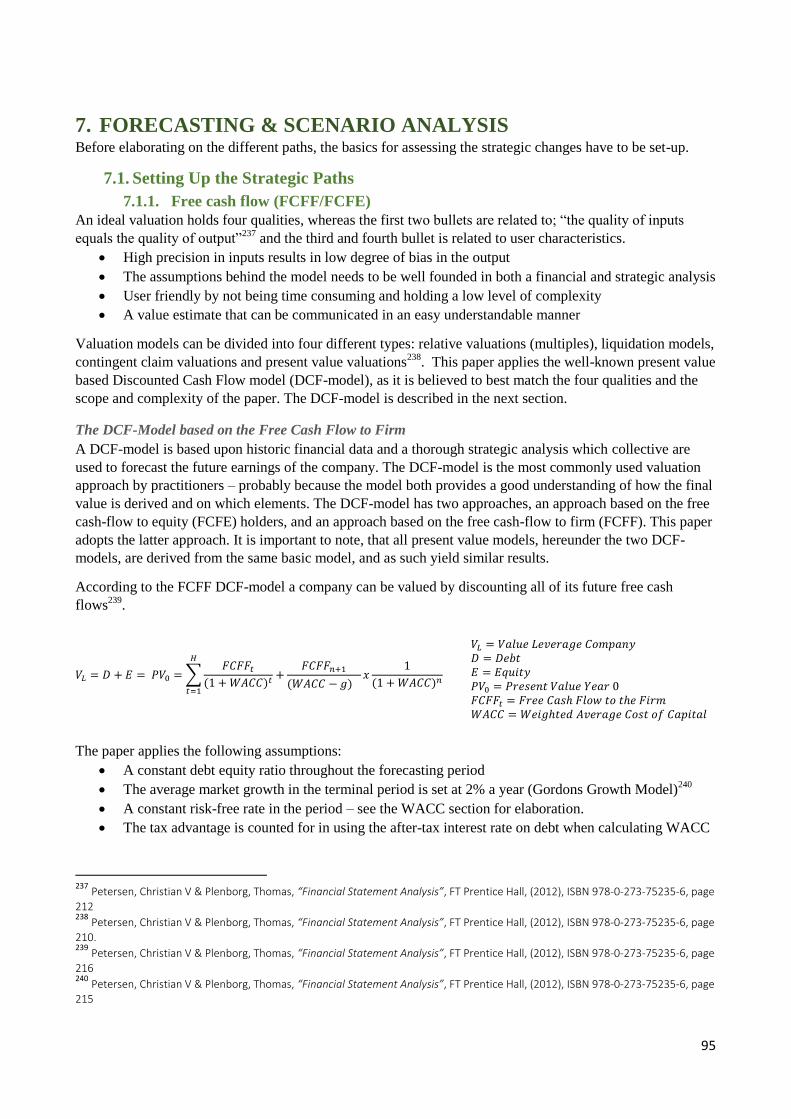
95
7. FORECASTING & SCENARIO ANALYSIS Before elaborating on the different paths, the basics for assessing the strategic changes have to be set-up.
7.1. Setting Up the Strategic Paths
7.1.1. Free cash flow (FCFF/FCFE)
An ideal valuation holds four qualities, whereas the first two bullets are related to; “the quality of inputs
equals the quality of output”237
and the third and fourth bullet is related to user characteristics.
High precision in inputs results in low degree of bias in the output
The assumptions behind the model needs to be well founded in both a financial and strategic analysis
User friendly by not being time consuming and holding a low level of complexity
A value estimate that can be communicated in an easy understandable manner
Valuation models can be divided into four different types: relative valuations (multiples), liquidation models,
contingent claim valuations and present value valuations238
. This paper applies the well-known present value
based Discounted Cash Flow model (DCF-model), as it is believed to best match the four qualities and the
scope and complexity of the paper. The DCF-model is described in the next section.
The DCF-Model based on the Free Cash Flow to Firm
A DCF-model is based upon historic financial data and a thorough strategic analysis which collective are
used to forecast the future earnings of the company. The DCF-model is the most commonly used valuation
approach by practitioners – probably because the model both provides a good understanding of how the final
value is derived and on which elements. The DCF-model has two approaches, an approach based on the free
cash-flow to equity (FCFE) holders, and an approach based on the free cash-flow to firm (FCFF). This paper
adopts the latter approach. It is important to note, that all present value models, hereunder the two DCF-
models, are derived from the same basic model, and as such yield similar results.
According to the FCFF DCF-model a company can be valued by discounting all of its future free cash
flows239
.
𝑉𝐿 = 𝐷 + 𝐸 = 𝑃𝑉0 = ∑𝐹𝐶𝐹𝐹𝑡
(1 + 𝑊𝐴𝐶𝐶)𝑡 +𝐹𝐶𝐹𝐹𝑛+1
(𝑊𝐴𝐶𝐶 − 𝑔)𝑥
1
(1 + 𝑊𝐴𝐶𝐶)𝑛
𝐻
𝑡=1
The paper applies the following assumptions:
A constant debt equity ratio throughout the forecasting period
The average market growth in the terminal period is set at 2% a year (Gordons Growth Model)240
A constant risk-free rate in the period – see the WACC section for elaboration.
The tax advantage is counted for in using the after-tax interest rate on debt when calculating WACC
237
Petersen, Christian V & Plenborg, Thomas, “Financial Statement Analysis”, FT Prentice Hall, (2012), ISBN 978-0-273-75235-6, page
212 238
Petersen, Christian V & Plenborg, Thomas, “Financial Statement Analysis”, FT Prentice Hall, (2012), ISBN 978-0-273-75235-6, page
210. 239
Petersen, Christian V & Plenborg, Thomas, “Financial Statement Analysis”, FT Prentice Hall, (2012), ISBN 978-0-273-75235-6, page
216 240
Petersen, Christian V & Plenborg, Thomas, “Financial Statement Analysis”, FT Prentice Hall, (2012), ISBN 978-0-273-75235-6, page 215
𝑉𝐿 = 𝑉𝑎𝑙𝑢𝑒 𝐿𝑒𝑣𝑒𝑟𝑎𝑔𝑒 𝐶𝑜𝑚𝑝𝑎𝑛𝑦
𝐷 = 𝐷𝑒𝑏𝑡
𝐸 = 𝐸𝑞𝑢𝑖𝑡𝑦
𝑃𝑉0 = 𝑃𝑟𝑒𝑠𝑒𝑛𝑡 𝑉𝑎𝑙𝑢𝑒 𝑌𝑒𝑎𝑟 0
𝐹𝐶𝐹𝐹𝑡 = 𝐹𝑟𝑒𝑒 𝐶𝑎𝑠ℎ 𝐹𝑙𝑜𝑤 𝑡𝑜 𝑡ℎ𝑒 𝐹𝑖𝑟𝑚
𝑊𝐴𝐶𝐶 = 𝑊𝑒𝑖𝑔ℎ𝑡𝑒𝑑 𝐴𝑣𝑒𝑟𝑎𝑔𝑒 𝐶𝑜𝑠𝑡 𝑜𝑓 𝐶𝑎𝑝𝑖𝑡𝑎𝑙
96
It should be noted that it is important to adjust WACC if the company’s risk is altered, e.g. if Auriga choses
to conduct business in new and riskier markets.
7.1.2. DCF-model – Point of Origin Scenario
To establish a common ground for the forecasting and scenario analysis a “Point of Origin Scenario” is set
up. The purpose is to imitate the projections of “The Market” on the 12’ th of June 2014 - the day before the
company announcement concerning initiation of “strategic considerations”241
, where a closing price of the
Auriga share of DKK 246,50 was observed.
The offset of the scenario is 2013-numbers except for:
“Growth in Gross Sale”, which is set as the average ex-post “Growth in Gross Sale” in the period
bridging from 2005 – 2013, of 6.8% in the forecasting and terminal period.
“Non-current Assets as a Percentage of Gross Sales”, which is set as the average “Non-current
Assets as a Percentage of Gross Sales” in the period of 2005 – 2013 of 27.6% in the forecasting
period. In the terminal period the value is lowered to 26.6%
The modification alters the EBITDA margin from 12.7% in 2013 to 11.3% in 2014 and 2015 where after it
increased to 11.6% throughout the rest of the forecasting period and in the terminal period
The model calculates an enterprise value of Auriga of tDKK 8,075,954 which ex NIBD of tDKK 1,941,530
results in an estimated value of tDKK 6,134,424 of the outstanding shares equaling a value of DKK 241.76
per share. See the full model in appendix 21.
241
Euroinvestor hompage: Auriga company announcement on the 13’th of June 2014.
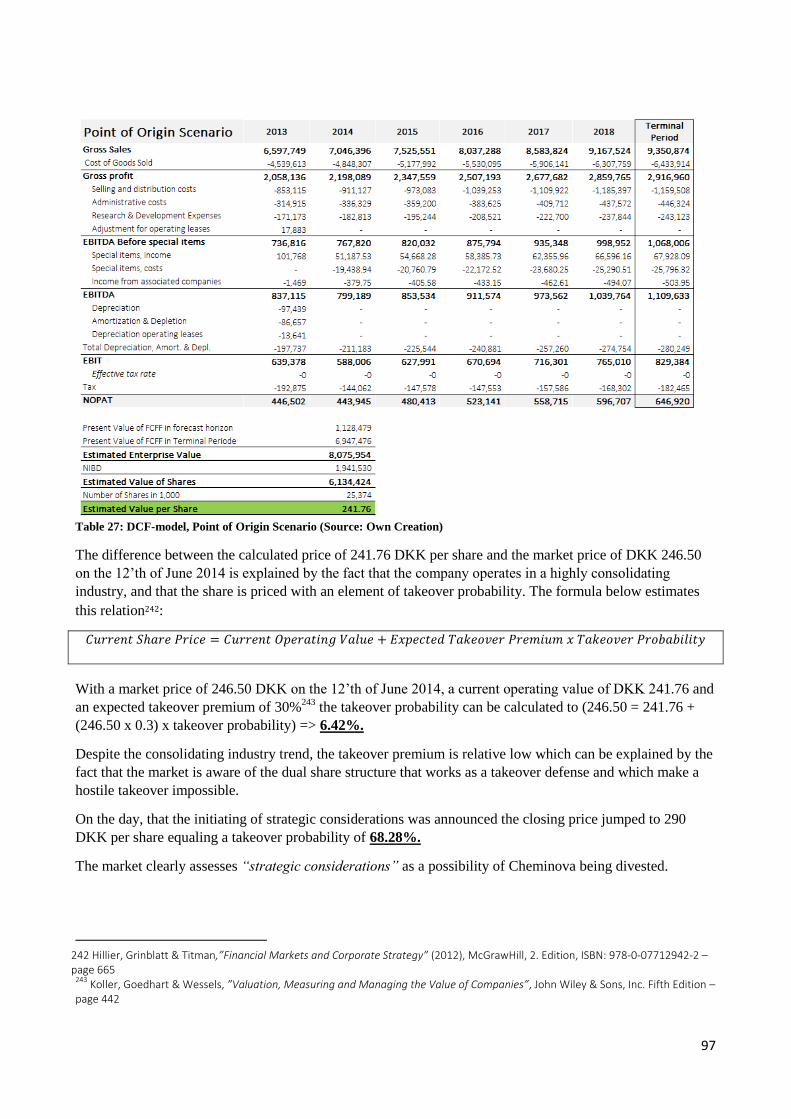
97
Table 27: DCF-model, Point of Origin Scenario (Source: Own Creation)
The difference between the calculated price of 241.76 DKK per share and the market price of DKK 246.50
on the 12’th of June 2014 is explained by the fact that the company operates in a highly consolidating
industry, and that the share is priced with an element of takeover probability. The formula below estimates
this relation242:
𝐶𝑢𝑟𝑟𝑒𝑛𝑡 𝑆ℎ𝑎𝑟𝑒 𝑃𝑟𝑖𝑐𝑒 = 𝐶𝑢𝑟𝑟𝑒𝑛𝑡 𝑂𝑝𝑒𝑟𝑎𝑡𝑖𝑛𝑔 𝑉𝑎𝑙𝑢𝑒 + 𝐸𝑥𝑝𝑒𝑐𝑡𝑒𝑑 𝑇𝑎𝑘𝑒𝑜𝑣𝑒𝑟 𝑃𝑟𝑒𝑚𝑖𝑢𝑚 𝑥 𝑇𝑎𝑘𝑒𝑜𝑣𝑒𝑟 𝑃𝑟𝑜𝑏𝑎𝑏𝑖𝑙𝑖𝑡𝑦
With a market price of 246.50 DKK on the 12’th of June 2014, a current operating value of DKK 241.76 and
an expected takeover premium of 30%243
the takeover probability can be calculated to (246.50 = 241.76 +
(246.50 x 0.3) x takeover probability) => 6.42%.
Despite the consolidating industry trend, the takeover premium is relative low which can be explained by the
fact that the market is aware of the dual share structure that works as a takeover defense and which make a
hostile takeover impossible.
On the day, that the initiating of strategic considerations was announced the closing price jumped to 290
DKK per share equaling a takeover probability of 68.28%.
The market clearly assesses “strategic considerations” as a possibility of Cheminova being divested.
242 Hillier, Grinblatt & Titman,”Financial Markets and Corporate Strategy” (2012), McGrawHill, 2. Edition, ISBN: 978-0-07712942-2 – page 665
243 Koller, Goedhart & Wessels, ”Valuation, Measuring and Managing the Value of Companies”, John Wiley & Sons, Inc. Fifth Edition –
page 442
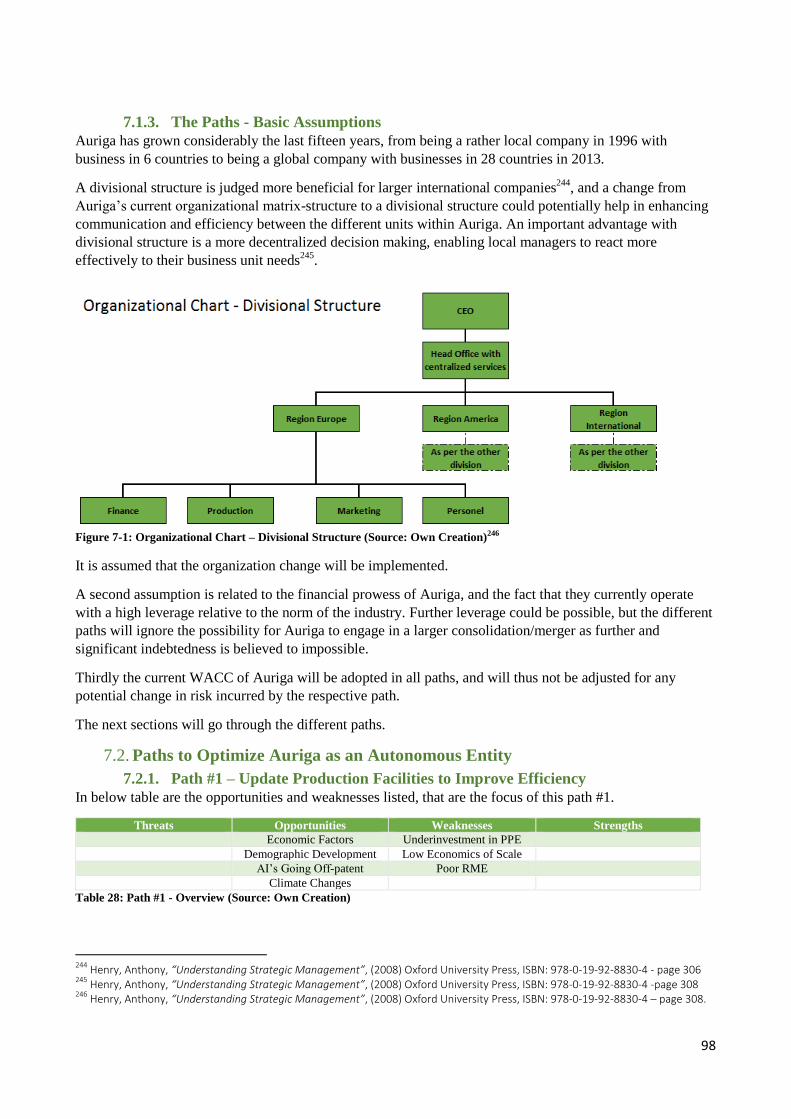
98
7.1.3. The Paths - Basic Assumptions
Auriga has grown considerably the last fifteen years, from being a rather local company in 1996 with
business in 6 countries to being a global company with businesses in 28 countries in 2013.
A divisional structure is judged more beneficial for larger international companies244
, and a change from
Auriga’s current organizational matrix-structure to a divisional structure could potentially help in enhancing
communication and efficiency between the different units within Auriga. An important advantage with
divisional structure is a more decentralized decision making, enabling local managers to react more
effectively to their business unit needs245
.
Figure 7-1: Organizational Chart – Divisional Structure (Source: Own Creation)246
It is assumed that the organization change will be implemented.
A second assumption is related to the financial prowess of Auriga, and the fact that they currently operate
with a high leverage relative to the norm of the industry. Further leverage could be possible, but the different
paths will ignore the possibility for Auriga to engage in a larger consolidation/merger as further and
significant indebtedness is believed to impossible.
Thirdly the current WACC of Auriga will be adopted in all paths, and will thus not be adjusted for any
potential change in risk incurred by the respective path.
The next sections will go through the different paths.
7.2. Paths to Optimize Auriga as an Autonomous Entity
7.2.1. Path #1 – Update Production Facilities to Improve Efficiency
In below table are the opportunities and weaknesses listed, that are the focus of this path #1.
Threats Opportunities Weaknesses Strengths
Economic Factors Underinvestment in PPE
Demographic Development Low Economics of Scale
AI’s Going Off-patent Poor RME
Climate Changes
Table 28: Path #1 - Overview (Source: Own Creation)
244
Henry, Anthony, “Understanding Strategic Management”, (2008) Oxford University Press, ISBN: 978-0-19-92-8830-4 - page 306 245
Henry, Anthony, “Understanding Strategic Management”, (2008) Oxford University Press, ISBN: 978-0-19-92-8830-4 -page 308 246
Henry, Anthony, “Understanding Strategic Management”, (2008) Oxford University Press, ISBN: 978-0-19-92-8830-4 – page 308.
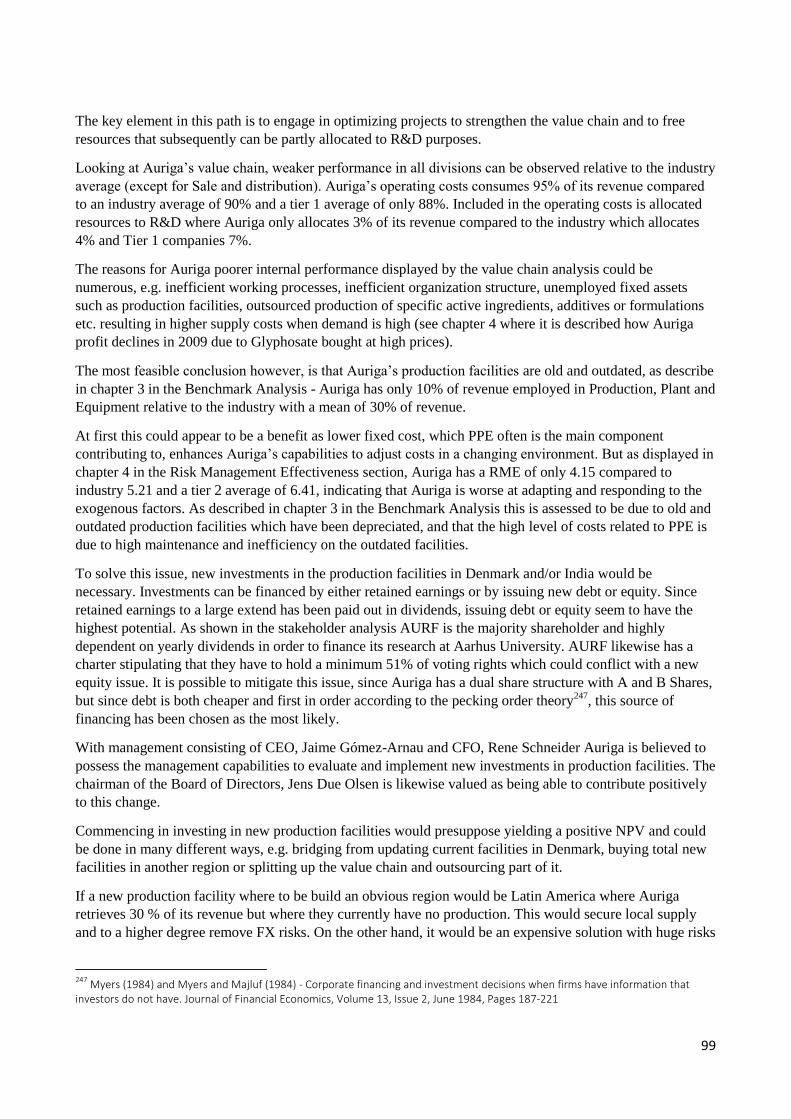
99
The key element in this path is to engage in optimizing projects to strengthen the value chain and to free
resources that subsequently can be partly allocated to R&D purposes.
Looking at Auriga’s value chain, weaker performance in all divisions can be observed relative to the industry
average (except for Sale and distribution). Auriga’s operating costs consumes 95% of its revenue compared
to an industry average of 90% and a tier 1 average of only 88%. Included in the operating costs is allocated
resources to R&D where Auriga only allocates 3% of its revenue compared to the industry which allocates
4% and Tier 1 companies 7%.
The reasons for Auriga poorer internal performance displayed by the value chain analysis could be
numerous, e.g. inefficient working processes, inefficient organization structure, unemployed fixed assets
such as production facilities, outsourced production of specific active ingredients, additives or formulations
etc. resulting in higher supply costs when demand is high (see chapter 4 where it is described how Auriga
profit declines in 2009 due to Glyphosate bought at high prices).
The most feasible conclusion however, is that Auriga’s production facilities are old and outdated, as describe
in chapter 3 in the Benchmark Analysis - Auriga has only 10% of revenue employed in Production, Plant and
Equipment relative to the industry with a mean of 30% of revenue.
At first this could appear to be a benefit as lower fixed cost, which PPE often is the main component
contributing to, enhances Auriga’s capabilities to adjust costs in a changing environment. But as displayed in
chapter 4 in the Risk Management Effectiveness section, Auriga has a RME of only 4.15 compared to
industry 5.21 and a tier 2 average of 6.41, indicating that Auriga is worse at adapting and responding to the
exogenous factors. As described in chapter 3 in the Benchmark Analysis this is assessed to be due to old and
outdated production facilities which have been depreciated, and that the high level of costs related to PPE is
due to high maintenance and inefficiency on the outdated facilities.
To solve this issue, new investments in the production facilities in Denmark and/or India would be
necessary. Investments can be financed by either retained earnings or by issuing new debt or equity. Since
retained earnings to a large extend has been paid out in dividends, issuing debt or equity seem to have the
highest potential. As shown in the stakeholder analysis AURF is the majority shareholder and highly
dependent on yearly dividends in order to finance its research at Aarhus University. AURF likewise has a
charter stipulating that they have to hold a minimum 51% of voting rights which could conflict with a new
equity issue. It is possible to mitigate this issue, since Auriga has a dual share structure with A and B Shares,
but since debt is both cheaper and first in order according to the pecking order theory247
, this source of
financing has been chosen as the most likely.
With management consisting of CEO, Jaime Gómez-Arnau and CFO, Rene Schneider Auriga is believed to
possess the management capabilities to evaluate and implement new investments in production facilities. The
chairman of the Board of Directors, Jens Due Olsen is likewise valued as being able to contribute positively
to this change.
Commencing in investing in new production facilities would presuppose yielding a positive NPV and could
be done in many different ways, e.g. bridging from updating current facilities in Denmark, buying total new
facilities in another region or splitting up the value chain and outsourcing part of it.
If a new production facility where to be build an obvious region would be Latin America where Auriga
retrieves 30 % of its revenue but where they currently have no production. This would secure local supply
and to a higher degree remove FX risks. On the other hand, it would be an expensive solution with huge risks
247
Myers (1984) and Myers and Majluf (1984) - Corporate financing and investment decisions when firms have information that investors do not have. Journal of Financial Economics, Volume 13, Issue 2, June 1984, Pages 187-221
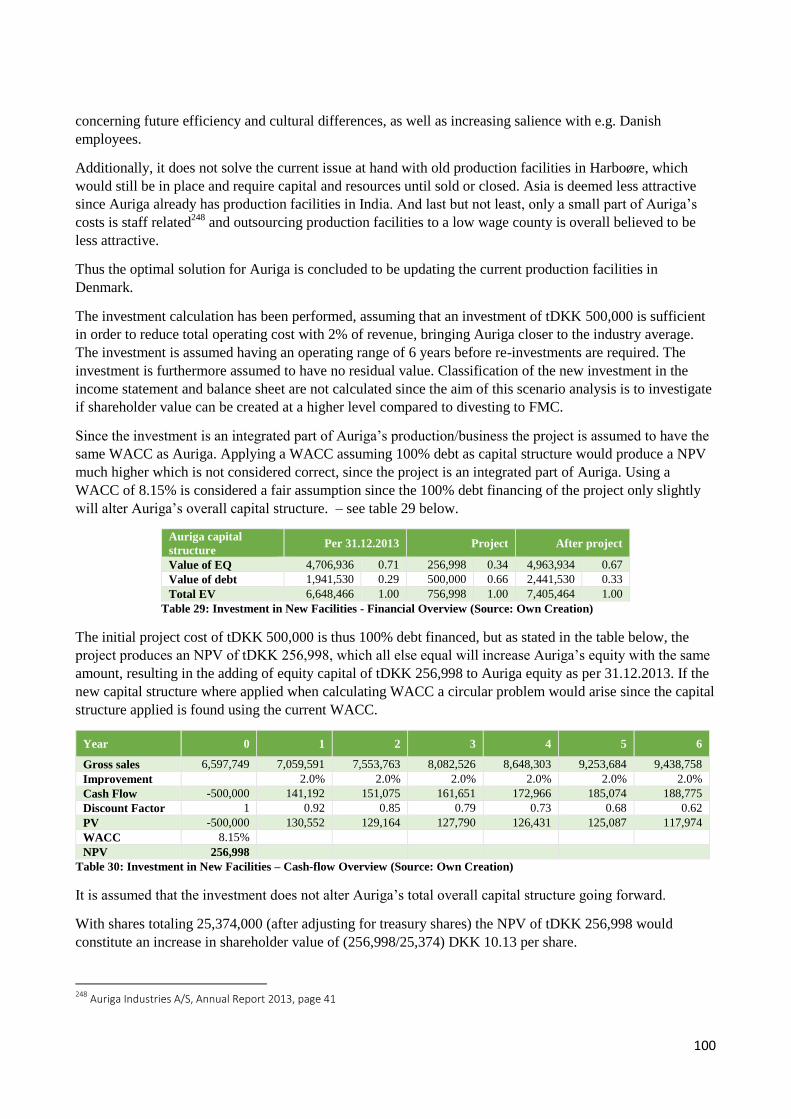
100
concerning future efficiency and cultural differences, as well as increasing salience with e.g. Danish
employees.
Additionally, it does not solve the current issue at hand with old production facilities in Harboøre, which
would still be in place and require capital and resources until sold or closed. Asia is deemed less attractive
since Auriga already has production facilities in India. And last but not least, only a small part of Auriga’s
costs is staff related248
and outsourcing production facilities to a low wage county is overall believed to be
less attractive.
Thus the optimal solution for Auriga is concluded to be updating the current production facilities in
Denmark.
The investment calculation has been performed, assuming that an investment of tDKK 500,000 is sufficient
in order to reduce total operating cost with 2% of revenue, bringing Auriga closer to the industry average.
The investment is assumed having an operating range of 6 years before re-investments are required. The
investment is furthermore assumed to have no residual value. Classification of the new investment in the
income statement and balance sheet are not calculated since the aim of this scenario analysis is to investigate
if shareholder value can be created at a higher level compared to divesting to FMC.
Since the investment is an integrated part of Auriga’s production/business the project is assumed to have the
same WACC as Auriga. Applying a WACC assuming 100% debt as capital structure would produce a NPV
much higher which is not considered correct, since the project is an integrated part of Auriga. Using a
WACC of 8.15% is considered a fair assumption since the 100% debt financing of the project only slightly
will alter Auriga’s overall capital structure. – see table 29 below.
Auriga capital
structure Per 31.12.2013 Project After project
Value of EQ 4,706,936 0.71 256,998 0.34 4,963,934 0.67
Value of debt 1,941,530 0.29 500,000 0.66 2,441,530 0.33
Total EV 6,648,466 1.00 756,998 1.00 7,405,464 1.00
Table 29: Investment in New Facilities - Financial Overview (Source: Own Creation)
The initial project cost of tDKK 500,000 is thus 100% debt financed, but as stated in the table below, the
project produces an NPV of tDKK 256,998, which all else equal will increase Auriga’s equity with the same
amount, resulting in the adding of equity capital of tDKK 256,998 to Auriga equity as per 31.12.2013. If the
new capital structure where applied when calculating WACC a circular problem would arise since the capital
structure applied is found using the current WACC.
Year 0 1 2 3 4 5 6
Gross sales 6,597,749 7,059,591 7,553,763 8,082,526 8,648,303 9,253,684 9,438,758
Improvement
2.0% 2.0% 2.0% 2.0% 2.0% 2.0%
Cash Flow -500,000 141,192 151,075 161,651 172,966 185,074 188,775
Discount Factor 1 0.92 0.85 0.79 0.73 0.68 0.62
PV -500,000 130,552 129,164 127,790 126,431 125,087 117,974
WACC 8.15%
NPV 256,998
Table 30: Investment in New Facilities – Cash-flow Overview (Source: Own Creation)
It is assumed that the investment does not alter Auriga’s total overall capital structure going forward.
With shares totaling 25,374,000 (after adjusting for treasury shares) the NPV of tDKK 256,998 would
constitute an increase in shareholder value of (256,998/25,374) DKK 10.13 per share.
248
Auriga Industries A/S, Annual Report 2013, page 41
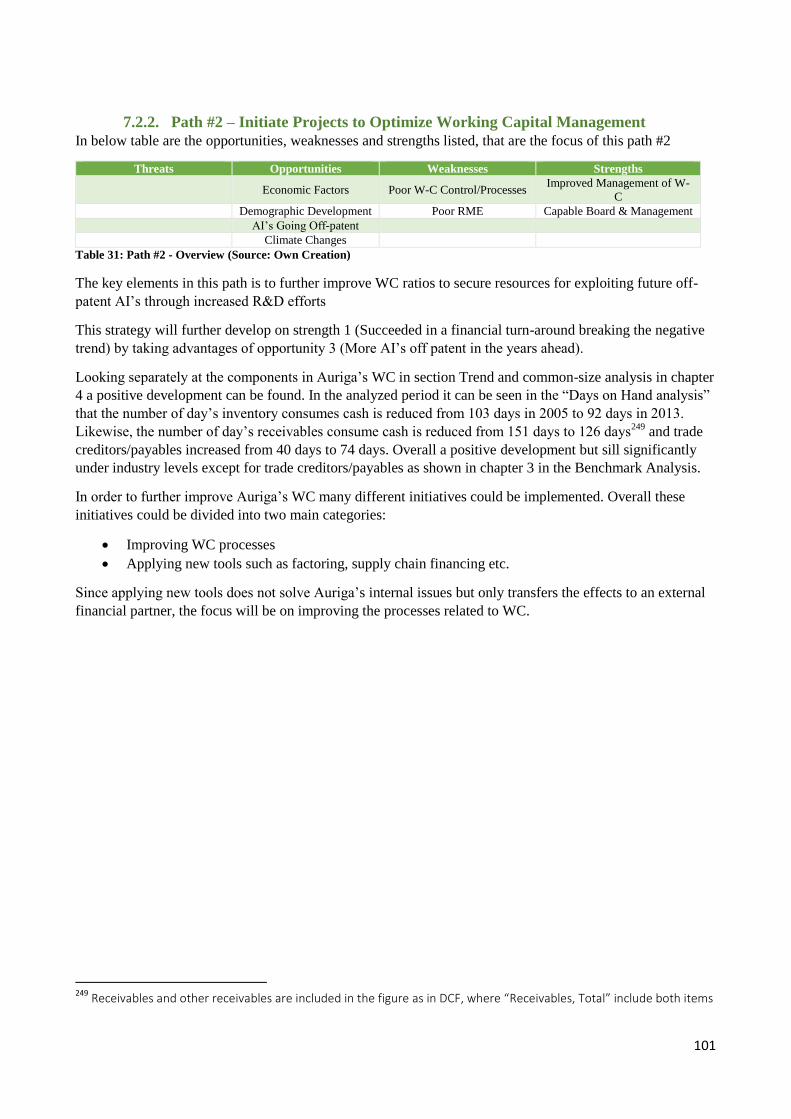
101
7.2.2. Path #2 – Initiate Projects to Optimize Working Capital Management
In below table are the opportunities, weaknesses and strengths listed, that are the focus of this path #2
Threats Opportunities Weaknesses Strengths
Economic Factors Poor W-C Control/Processes Improved Management of W-
C
Demographic Development Poor RME Capable Board & Management
AI’s Going Off-patent
Climate Changes
Table 31: Path #2 - Overview (Source: Own Creation)
The key elements in this path is to further improve WC ratios to secure resources for exploiting future off-
patent AI’s through increased R&D efforts
This strategy will further develop on strength 1 (Succeeded in a financial turn-around breaking the negative
trend) by taking advantages of opportunity 3 (More AI’s off patent in the years ahead).
Looking separately at the components in Auriga’s WC in section Trend and common-size analysis in chapter
4 a positive development can be found. In the analyzed period it can be seen in the “Days on Hand analysis”
that the number of day’s inventory consumes cash is reduced from 103 days in 2005 to 92 days in 2013.
Likewise, the number of day’s receivables consume cash is reduced from 151 days to 126 days249
and trade
creditors/payables increased from 40 days to 74 days. Overall a positive development but sill significantly
under industry levels except for trade creditors/payables as shown in chapter 3 in the Benchmark Analysis.
In order to further improve Auriga’s WC many different initiatives could be implemented. Overall these
initiatives could be divided into two main categories:
Improving WC processes
Applying new tools such as factoring, supply chain financing etc.
Since applying new tools does not solve Auriga’s internal issues but only transfers the effects to an external
financial partner, the focus will be on improving the processes related to WC.
249
Receivables and other receivables are included in the figure as in DCF, where “Receivables, Total” include both items
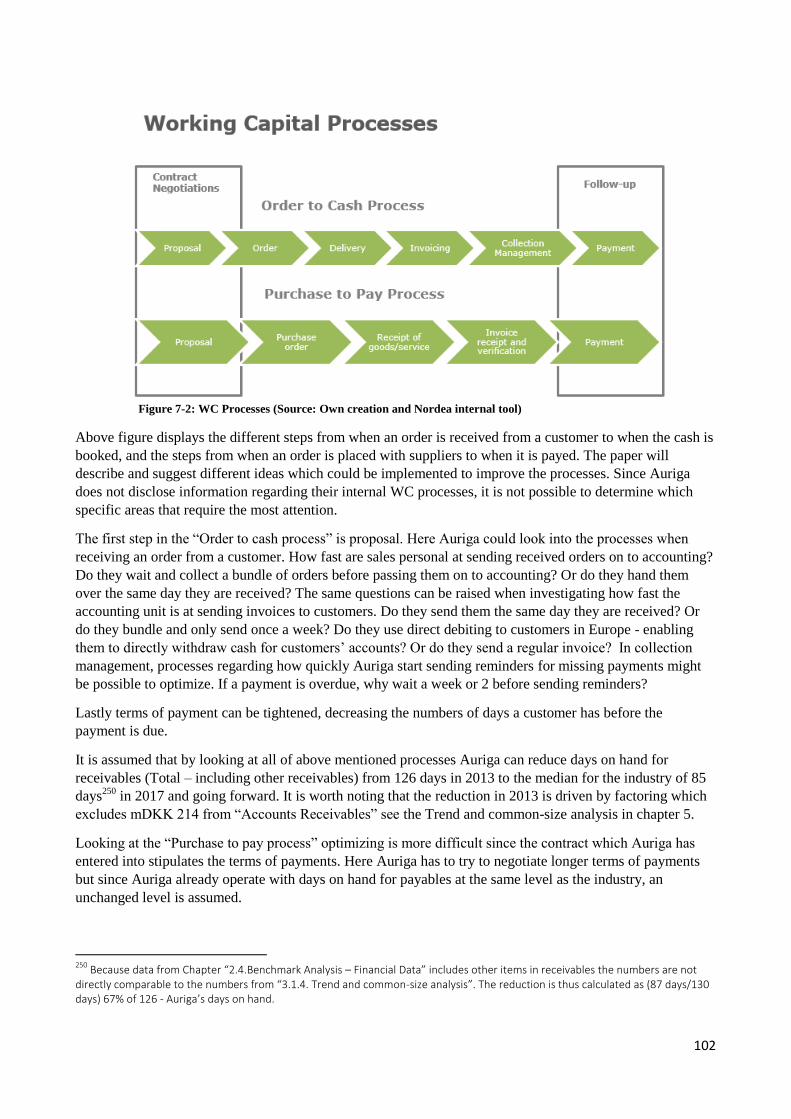
102
Figure 7-2: WC Processes (Source: Own creation and Nordea internal tool)
Above figure displays the different steps from when an order is received from a customer to when the cash is
booked, and the steps from when an order is placed with suppliers to when it is payed. The paper will
describe and suggest different ideas which could be implemented to improve the processes. Since Auriga
does not disclose information regarding their internal WC processes, it is not possible to determine which
specific areas that require the most attention.
The first step in the “Order to cash process” is proposal. Here Auriga could look into the processes when
receiving an order from a customer. How fast are sales personal at sending received orders on to accounting?
Do they wait and collect a bundle of orders before passing them on to accounting? Or do they hand them
over the same day they are received? The same questions can be raised when investigating how fast the
accounting unit is at sending invoices to customers. Do they send them the same day they are received? Or
do they bundle and only send once a week? Do they use direct debiting to customers in Europe - enabling
them to directly withdraw cash for customers’ accounts? Or do they send a regular invoice? In collection
management, processes regarding how quickly Auriga start sending reminders for missing payments might
be possible to optimize. If a payment is overdue, why wait a week or 2 before sending reminders?
Lastly terms of payment can be tightened, decreasing the numbers of days a customer has before the
payment is due.
It is assumed that by looking at all of above mentioned processes Auriga can reduce days on hand for
receivables (Total – including other receivables) from 126 days in 2013 to the median for the industry of 85
days250
in 2017 and going forward. It is worth noting that the reduction in 2013 is driven by factoring which
excludes mDKK 214 from “Accounts Receivables” see the Trend and common-size analysis in chapter 5.
Looking at the “Purchase to pay process” optimizing is more difficult since the contract which Auriga has
entered into stipulates the terms of payments. Here Auriga has to try to negotiate longer terms of payments
but since Auriga already operate with days on hand for payables at the same level as the industry, an
unchanged level is assumed.
250
Because data from Chapter “2.4.Benchmark Analysis – Financial Data” includes other items in receivables the numbers are not directly comparable to the numbers from “3.1.4. Trend and common-size analysis”. The reduction is thus calculated as (87 days/130 days) 67% of 126 - Auriga’s days on hand.
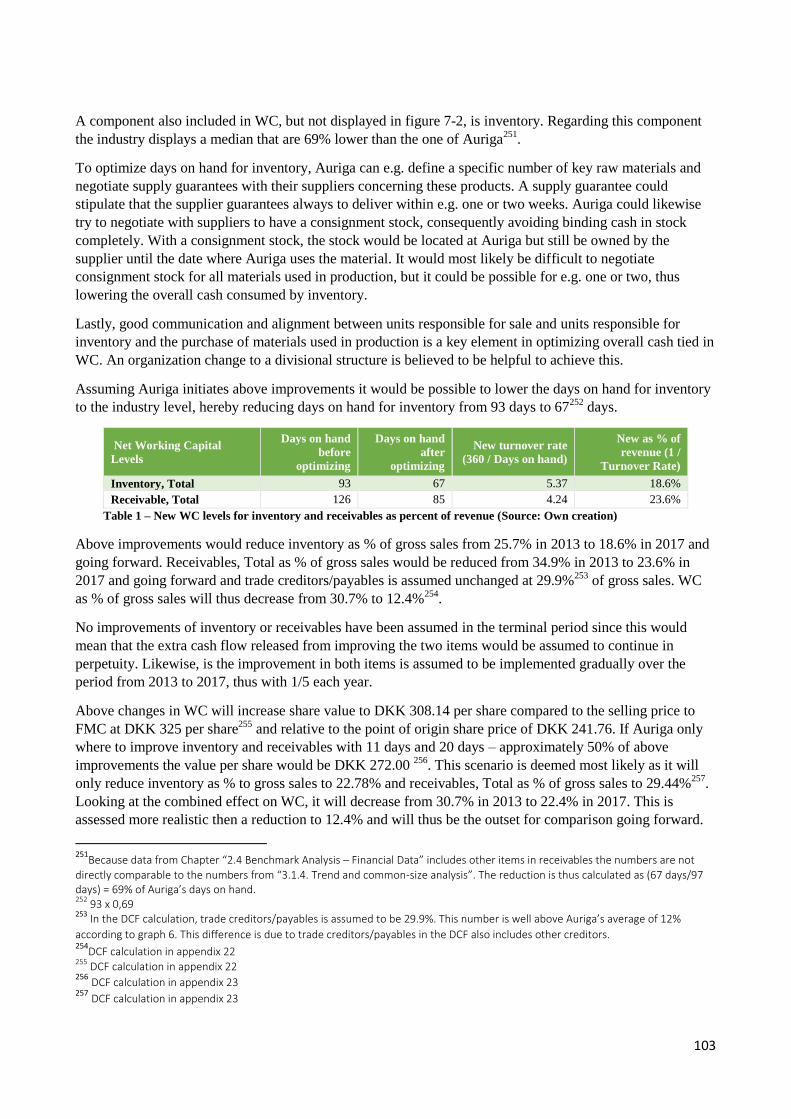
103
A component also included in WC, but not displayed in figure 7-2, is inventory. Regarding this component
the industry displays a median that are 69% lower than the one of Auriga251
.
To optimize days on hand for inventory, Auriga can e.g. define a specific number of key raw materials and
negotiate supply guarantees with their suppliers concerning these products. A supply guarantee could
stipulate that the supplier guarantees always to deliver within e.g. one or two weeks. Auriga could likewise
try to negotiate with suppliers to have a consignment stock, consequently avoiding binding cash in stock
completely. With a consignment stock, the stock would be located at Auriga but still be owned by the
supplier until the date where Auriga uses the material. It would most likely be difficult to negotiate
consignment stock for all materials used in production, but it could be possible for e.g. one or two, thus
lowering the overall cash consumed by inventory.
Lastly, good communication and alignment between units responsible for sale and units responsible for
inventory and the purchase of materials used in production is a key element in optimizing overall cash tied in
WC. An organization change to a divisional structure is believed to be helpful to achieve this.
Assuming Auriga initiates above improvements it would be possible to lower the days on hand for inventory
to the industry level, hereby reducing days on hand for inventory from 93 days to 67252
days.
Net Working Capital
Levels
Days on hand
before
optimizing
Days on hand
after
optimizing
New turnover rate
(360 / Days on hand)
New as % of
revenue (1 /
Turnover Rate)
Inventory, Total 93 67 5.37 18.6%
Receivable, Total 126 85 4.24 23.6%
Table 1 – New WC levels for inventory and receivables as percent of revenue (Source: Own creation)
Above improvements would reduce inventory as % of gross sales from 25.7% in 2013 to 18.6% in 2017 and
going forward. Receivables, Total as % of gross sales would be reduced from 34.9% in 2013 to 23.6% in
2017 and going forward and trade creditors/payables is assumed unchanged at 29.9%253
of gross sales. WC
as % of gross sales will thus decrease from 30.7% to 12.4%254
.
No improvements of inventory or receivables have been assumed in the terminal period since this would
mean that the extra cash flow released from improving the two items would be assumed to continue in
perpetuity. Likewise, is the improvement in both items is assumed to be implemented gradually over the
period from 2013 to 2017, thus with 1/5 each year.
Above changes in WC will increase share value to DKK 308.14 per share compared to the selling price to
FMC at DKK 325 per share255
and relative to the point of origin share price of DKK 241.76. If Auriga only
where to improve inventory and receivables with 11 days and 20 days – approximately 50% of above
improvements the value per share would be DKK 272.00 256
. This scenario is deemed most likely as it will
only reduce inventory as % to gross sales to 22.78% and receivables, Total as % of gross sales to 29.44%257
.
Looking at the combined effect on WC, it will decrease from 30.7% in 2013 to 22.4% in 2017. This is
assessed more realistic then a reduction to 12.4% and will thus be the outset for comparison going forward.
251
Because data from Chapter “2.4 Benchmark Analysis – Financial Data” includes other items in receivables the numbers are not
directly comparable to the numbers from “3.1.4. Trend and common-size analysis”. The reduction is thus calculated as (67 days/97 days) = 69% of Auriga’s days on hand. 252
93 x 0,69 253
In the DCF calculation, trade creditors/payables is assumed to be 29.9%. This number is well above Auriga’s average of 12%
according to graph 6. This difference is due to trade creditors/payables in the DCF also includes other creditors. 254
DCF calculation in appendix 22 255
DCF calculation in appendix 22 256
DCF calculation in appendix 23 257
DCF calculation in appendix 23
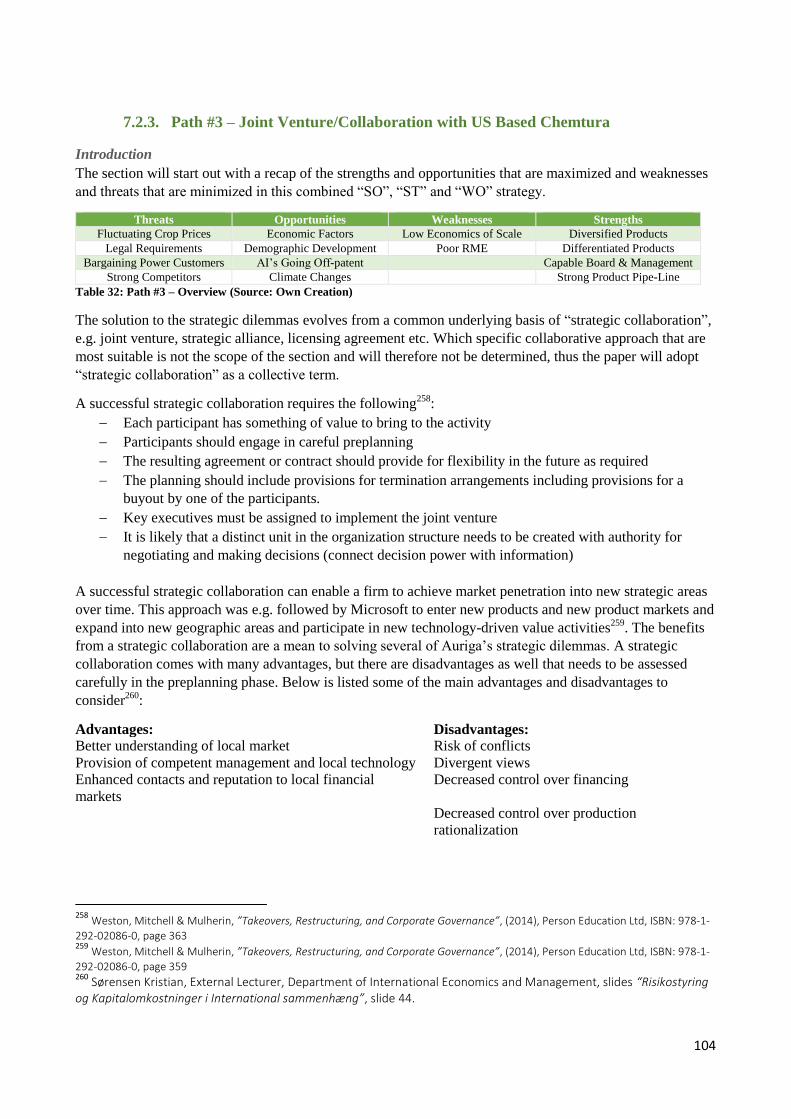
104
7.2.3. Path #3 – Joint Venture/Collaboration with US Based Chemtura
Introduction
The section will start out with a recap of the strengths and opportunities that are maximized and weaknesses
and threats that are minimized in this combined “SO”, “ST” and “WO” strategy.
Threats Opportunities Weaknesses Strengths
Fluctuating Crop Prices Economic Factors Low Economics of Scale Diversified Products
Legal Requirements Demographic Development Poor RME Differentiated Products
Bargaining Power Customers AI’s Going Off-patent Capable Board & Management
Strong Competitors Climate Changes Strong Product Pipe-Line
Table 32: Path #3 – Overview (Source: Own Creation)
The solution to the strategic dilemmas evolves from a common underlying basis of “strategic collaboration”,
e.g. joint venture, strategic alliance, licensing agreement etc. Which specific collaborative approach that are
most suitable is not the scope of the section and will therefore not be determined, thus the paper will adopt
“strategic collaboration” as a collective term.
A successful strategic collaboration requires the following258
:
Each participant has something of value to bring to the activity
Participants should engage in careful preplanning
The resulting agreement or contract should provide for flexibility in the future as required
The planning should include provisions for termination arrangements including provisions for a
buyout by one of the participants.
Key executives must be assigned to implement the joint venture
It is likely that a distinct unit in the organization structure needs to be created with authority for
negotiating and making decisions (connect decision power with information)
A successful strategic collaboration can enable a firm to achieve market penetration into new strategic areas
over time. This approach was e.g. followed by Microsoft to enter new products and new product markets and
expand into new geographic areas and participate in new technology-driven value activities259
. The benefits
from a strategic collaboration are a mean to solving several of Auriga’s strategic dilemmas. A strategic
collaboration comes with many advantages, but there are disadvantages as well that needs to be assessed
carefully in the preplanning phase. Below is listed some of the main advantages and disadvantages to
consider260
:
Advantages: Disadvantages:
Better understanding of local market Risk of conflicts
Provision of competent management and local technology Divergent views
Enhanced contacts and reputation to local financial
markets
Decreased control over financing
Decreased control over production
rationalization
258
Weston, Mitchell & Mulherin, ”Takeovers, Restructuring, and Corporate Governance”, (2014), Person Education Ltd, ISBN: 978-1-
292-02086-0, page 363 259
Weston, Mitchell & Mulherin, ”Takeovers, Restructuring, and Corporate Governance”, (2014), Person Education Ltd, ISBN: 978-1-
292-02086-0, page 359 260
Sørensen Kristian, External Lecturer, Department of International Economics and Management, slides “Risikostyring og Kapitalomkostninger i International sammenhæng”, slide 44.
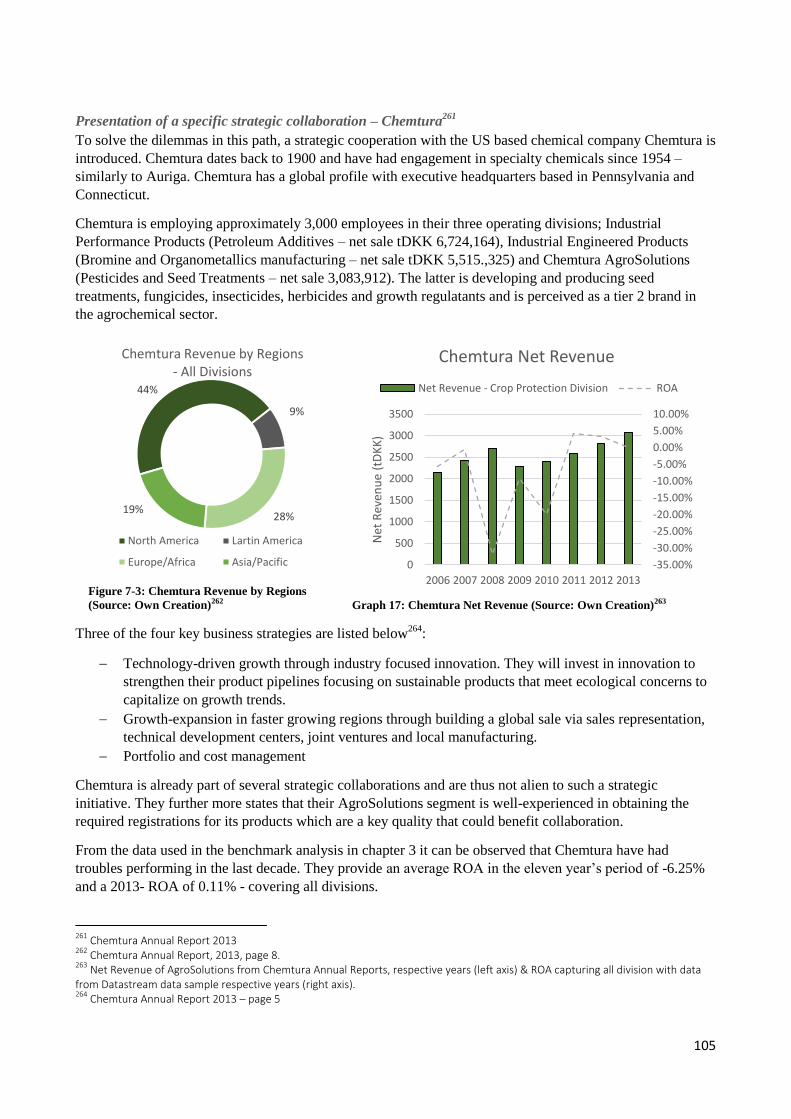
105
Presentation of a specific strategic collaboration – Chemtura261
To solve the dilemmas in this path, a strategic cooperation with the US based chemical company Chemtura is
introduced. Chemtura dates back to 1900 and have had engagement in specialty chemicals since 1954 –
similarly to Auriga. Chemtura has a global profile with executive headquarters based in Pennsylvania and
Connecticut.
Chemtura is employing approximately 3,000 employees in their three operating divisions; Industrial
Performance Products (Petroleum Additives – net sale tDKK 6,724,164), Industrial Engineered Products
(Bromine and Organometallics manufacturing – net sale tDKK 5,515.,325) and Chemtura AgroSolutions
(Pesticides and Seed Treatments – net sale 3,083,912). The latter is developing and producing seed
treatments, fungicides, insecticides, herbicides and growth regulatants and is perceived as a tier 2 brand in
the agrochemical sector.
Figure 7-3: Chemtura Revenue by Regions
(Source: Own Creation)262
Graph 17: Chemtura Net Revenue (Source: Own Creation)263
Three of the four key business strategies are listed below264
:
Technology-driven growth through industry focused innovation. They will invest in innovation to
strengthen their product pipelines focusing on sustainable products that meet ecological concerns to
capitalize on growth trends.
Growth-expansion in faster growing regions through building a global sale via sales representation,
technical development centers, joint ventures and local manufacturing.
Portfolio and cost management
Chemtura is already part of several strategic collaborations and are thus not alien to such a strategic
initiative. They further more states that their AgroSolutions segment is well-experienced in obtaining the
required registrations for its products which are a key quality that could benefit collaboration.
From the data used in the benchmark analysis in chapter 3 it can be observed that Chemtura have had
troubles performing in the last decade. They provide an average ROA in the eleven year’s period of -6.25%
and a 2013- ROA of 0.11% - covering all divisions.
261
Chemtura Annual Report 2013 262
Chemtura Annual Report, 2013, page 8. 263
Net Revenue of AgroSolutions from Chemtura Annual Reports, respective years (left axis) & ROA capturing all division with data from Datastream data sample respective years (right axis). 264
Chemtura Annual Report 2013 – page 5
44%
9%
28% 19%
Chemtura Revenue by Regions - All Divisions
North America Lartin America
Europe/Africa Asia/Pacific -35.00%
-30.00%
-25.00%
-20.00%
-15.00%
-10.00%
-5.00%
0.00%
5.00%
10.00%
0
500
1000
1500
2000
2500
3000
3500
2006 2007 2008 2009 2010 2011 2012 2013
Net
Rev
enu
e (t
DK
K)
Chemtura Net Revenue
Net Revenue - Crop Protection Division ROA
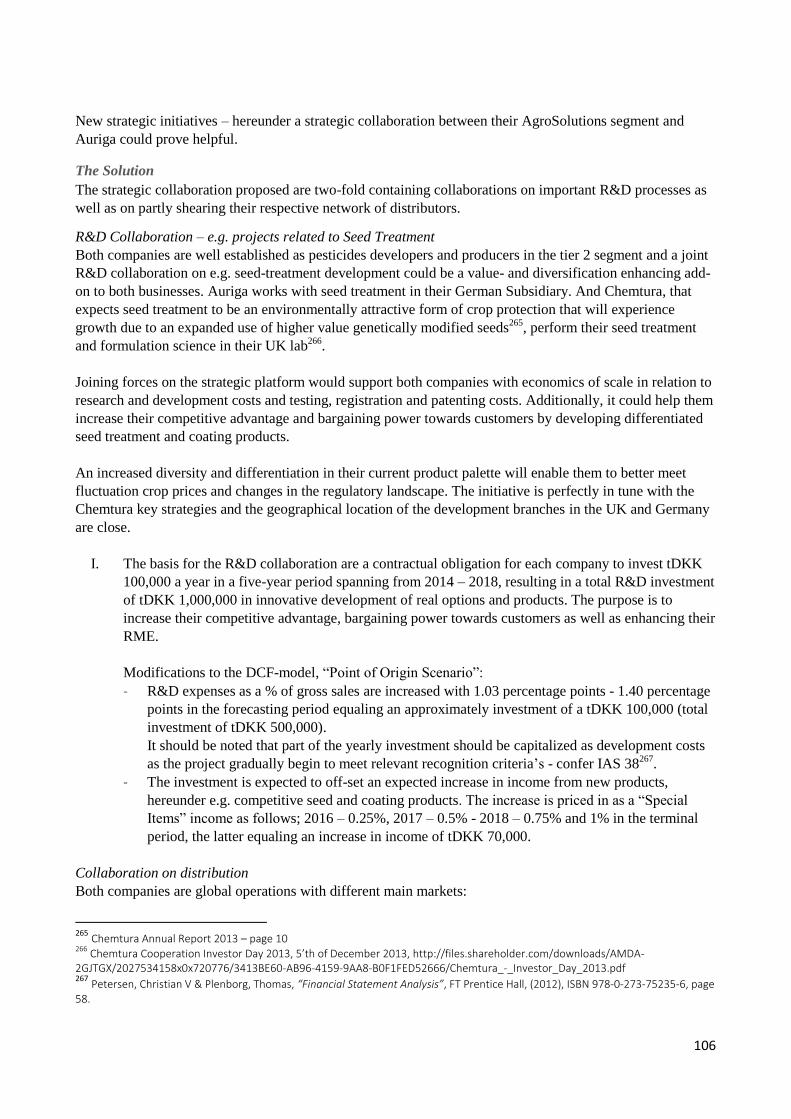
106
New strategic initiatives – hereunder a strategic collaboration between their AgroSolutions segment and
Auriga could prove helpful.
The Solution
The strategic collaboration proposed are two-fold containing collaborations on important R&D processes as
well as on partly shearing their respective network of distributors.
R&D Collaboration – e.g. projects related to Seed Treatment
Both companies are well established as pesticides developers and producers in the tier 2 segment and a joint
R&D collaboration on e.g. seed-treatment development could be a value- and diversification enhancing add-
on to both businesses. Auriga works with seed treatment in their German Subsidiary. And Chemtura, that
expects seed treatment to be an environmentally attractive form of crop protection that will experience
growth due to an expanded use of higher value genetically modified seeds265
, perform their seed treatment
and formulation science in their UK lab266
.
Joining forces on the strategic platform would support both companies with economics of scale in relation to
research and development costs and testing, registration and patenting costs. Additionally, it could help them
increase their competitive advantage and bargaining power towards customers by developing differentiated
seed treatment and coating products.
An increased diversity and differentiation in their current product palette will enable them to better meet
fluctuation crop prices and changes in the regulatory landscape. The initiative is perfectly in tune with the
Chemtura key strategies and the geographical location of the development branches in the UK and Germany
are close.
I. The basis for the R&D collaboration are a contractual obligation for each company to invest tDKK
100,000 a year in a five-year period spanning from 2014 – 2018, resulting in a total R&D investment
of tDKK 1,000,000 in innovative development of real options and products. The purpose is to
increase their competitive advantage, bargaining power towards customers as well as enhancing their
RME.
Modifications to the DCF-model, “Point of Origin Scenario”:
- R&D expenses as a % of gross sales are increased with 1.03 percentage points - 1.40 percentage
points in the forecasting period equaling an approximately investment of a tDKK 100,000 (total
investment of tDKK 500,000).
It should be noted that part of the yearly investment should be capitalized as development costs
as the project gradually begin to meet relevant recognition criteria’s - confer IAS 38267
.
- The investment is expected to off-set an expected increase in income from new products,
hereunder e.g. competitive seed and coating products. The increase is priced in as a “Special
Items” income as follows; 2016 – 0.25%, 2017 – 0.5% - 2018 – 0.75% and 1% in the terminal
period, the latter equaling an increase in income of tDKK 70,000.
Collaboration on distribution
Both companies are global operations with different main markets:
265
Chemtura Annual Report 2013 – page 10 266
Chemtura Cooperation Investor Day 2013, 5’th of December 2013, http://files.shareholder.com/downloads/AMDA-2GJTGX/2027534158x0x720776/3413BE60-AB96-4159-9AA8-B0F1FED52666/Chemtura_-_Investor_Day_2013.pdf 267
Petersen, Christian V & Plenborg, Thomas, “Financial Statement Analysis”, FT Prentice Hall, (2012), ISBN 978-0-273-75235-6, page 58.

107
Figure 7-4: Geographical Revenue – Auriga vs. Chemtura (Source: Own Creation)268
Auriga states in their 2013 annual report, that failing at penetrating the North American market is a key
risk269
. The revenue in this region currently makes up 9% of Auriga’s total revenue. The North America
region is Chemtura’s main market where they produce 44% of their consolidated revenue through a large
network of more than a 1,000 distributors outlets that sell directly to their customers270
.
A key strategic business driver with Chemtura is business growth in high-growth regions. Only 9% of
Chemturas consolidated revenue come from Latin America which have been and also is expected to be a
growth region in the years ahead. A total of 30% of Auriga’s total revenue are produced in Latin America,
and they have a strong presence foot-hold in the region.
Both companies have products that over-lap within pesticides, but there are also potential differences.
Chemtura states that they have developed products within high-value target crops such as tree and vine
fruits, ornamentals and nuts. Opposite, Auriga could potentially have products that are not part of
Chemtura’s North American product palette.
A joint distributor or licensing agreement in the areas could be beneficial for both parties, as it would help
both of them to penetrate their weak markets establishing their respective products and brands. Both
companies are believed to bring something to the table, and both companies will benefit from the product.
This is a ground stone in a successful strategic collaboration.
Distribution collaboration
I. The basis for the distribution collaboration are a contractual obligation for each company to
distribute the others products in North America and Latin America respectively. The products in
question would have to be specified and a profit-split of e.g. 50/50 would have to be decided.
Modifications to the DCF-model, “Point of Origin Scenario”:
Auriga’s current sale in North America totals to mDKK 594 (9%) and is believed to double
in 2019 due to the distribution collaboration. In the DCF-model the growth in gross sales are
268
Auriga Industries A/S, Annual Report 2013 and Chemtura Annual Report 2013 269
Auriga Industries A/S, Annual Report 2013, page 12. 270
Chemtura Annual Report 2013, page 11
0%
10%
20%
30%
40%
50%Europe
North America
Asia Pacific
Latin
Geographical Revenue, Auriga vs. Chemtura Auriga Chemtura
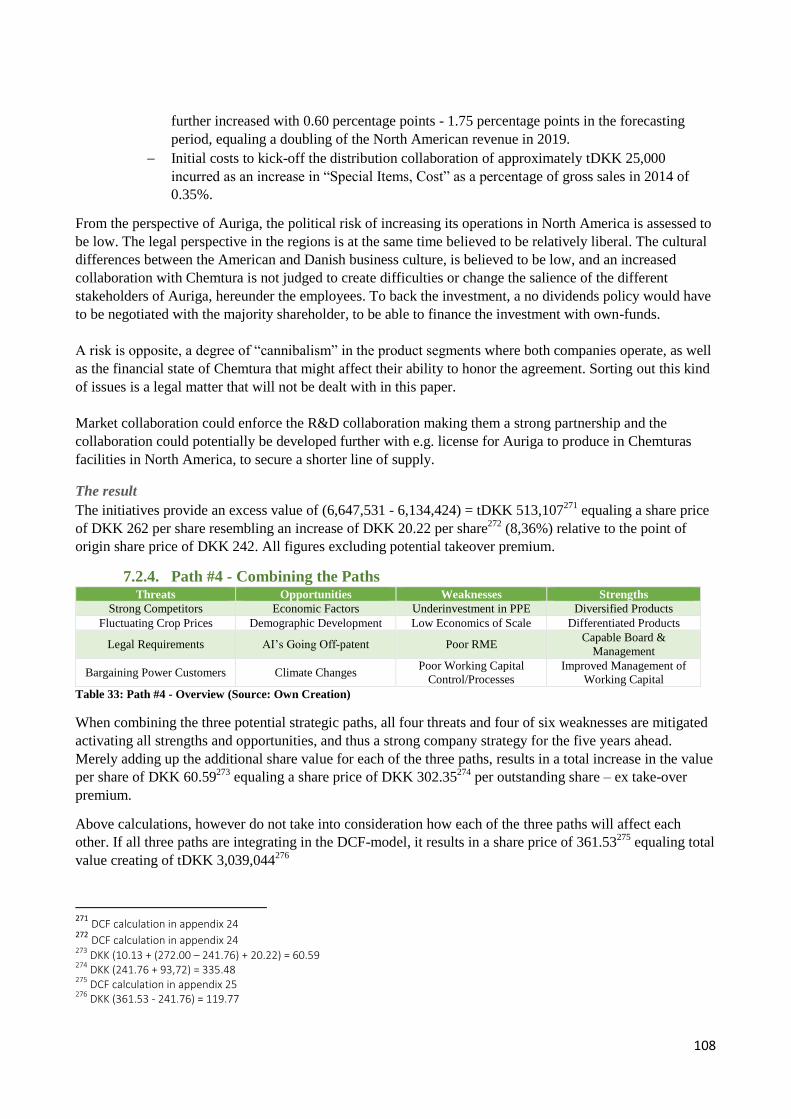
108
further increased with 0.60 percentage points - 1.75 percentage points in the forecasting
period, equaling a doubling of the North American revenue in 2019.
Initial costs to kick-off the distribution collaboration of approximately tDKK 25,000
incurred as an increase in “Special Items, Cost” as a percentage of gross sales in 2014 of
0.35%.
From the perspective of Auriga, the political risk of increasing its operations in North America is assessed to
be low. The legal perspective in the regions is at the same time believed to be relatively liberal. The cultural
differences between the American and Danish business culture, is believed to be low, and an increased
collaboration with Chemtura is not judged to create difficulties or change the salience of the different
stakeholders of Auriga, hereunder the employees. To back the investment, a no dividends policy would have
to be negotiated with the majority shareholder, to be able to finance the investment with own-funds.
A risk is opposite, a degree of “cannibalism” in the product segments where both companies operate, as well
as the financial state of Chemtura that might affect their ability to honor the agreement. Sorting out this kind
of issues is a legal matter that will not be dealt with in this paper.
Market collaboration could enforce the R&D collaboration making them a strong partnership and the
collaboration could potentially be developed further with e.g. license for Auriga to produce in Chemturas
facilities in North America, to secure a shorter line of supply.
The result
The initiatives provide an excess value of (6,647,531 - 6,134,424) = tDKK 513,107271
equaling a share price
of DKK 262 per share resembling an increase of DKK 20.22 per share272
(8,36%) relative to the point of
origin share price of DKK 242. All figures excluding potential takeover premium.
7.2.4. Path #4 - Combining the Paths Threats Opportunities Weaknesses Strengths
Strong Competitors Economic Factors Underinvestment in PPE Diversified Products
Fluctuating Crop Prices Demographic Development Low Economics of Scale Differentiated Products
Legal Requirements AI’s Going Off-patent Poor RME Capable Board &
Management
Bargaining Power Customers Climate Changes Poor Working Capital
Control/Processes
Improved Management of
Working Capital
Table 33: Path #4 - Overview (Source: Own Creation)
When combining the three potential strategic paths, all four threats and four of six weaknesses are mitigated
activating all strengths and opportunities, and thus a strong company strategy for the five years ahead.
Merely adding up the additional share value for each of the three paths, results in a total increase in the value
per share of DKK 60.59273
equaling a share price of DKK 302.35274
per outstanding share – ex take-over
premium.
Above calculations, however do not take into consideration how each of the three paths will affect each
other. If all three paths are integrating in the DCF-model, it results in a share price of 361.53275
equaling total
value creating of tDKK 3,039,044276
271
DCF calculation in appendix 24 272
DCF calculation in appendix 24 273
DKK (10.13 + (272.00 – 241.76) + 20.22) = 60.59 274
DKK (241.76 + 93,72) = 335.48 275
DCF calculation in appendix 25 276
DKK (361.53 - 241.76) = 119.77
109
Implementing three big projects simultaneously will require huge efforts and resources with both
management and employees for the whole five-year period.
Regarding organizational and human resources, e.g. implementing path #1 would alone require assessing
which production facilities to update, implementing new work processes, educating staff, testing, shutting
down production in longer or shorter periods etc. And if the target for optimization is the Indian facilities, the
salience of the Danish employees would definitely increase from medium to high, becoming a serious matter
that would require resources to control.
Likewise, it would necessitate large financial resources, as total investments of mDKK 1,000, financed by
retained earnings tDKK 500,000 and debt tDKK 500,000. This would increase NIBD to tDKK 2,441,530277
resulting in an increase in NIBD as % of invested capital from 46.3% to 60.1%. The initiatives will also
severely limit the possibility for dividends which clearly is a priority with the majority shareholder as well as
further increase the already relatively high leverage.
A more realistic scenario is to prioritize two of three strategic initiatives – e.g. the strategic collaboration
with Chemtura as this path has a long-term perspective, combined with the low hanging fruits of optimizing
WC facilities. These two strategic initiatives combined will increase the share price with DKK 52.30278
equaling a price of DKK 294.06279
resembling a total value creation of tDKK 1,327,060280
.
The combined strategy displayed above holding only two of three paths, will still require a high degree of
effort from all internal stakeholders and would as well constrain possible dividends to AURF (high salience)
Conversely the risks are more controllable since the initial investments and the down side when optimizing
WC facilities is limited. If Auriga fails to succeed with the WC initiatives, they will be back to status quo
losing only the internal resources allocated to the initiative. The execution of the combined strategy could be
strengthened by outscoring part of the implementation to an experienced consultancy company who would
increase costs but likewise increase the chance of success.
The Implementation of the strategic collaboration is judged to be of higher risk, and could as well as with
path #1 affect the salience and result in employees in Denmark opposing, since white collar jobs would be at
risk. The strategic collaboration could also increase Auriga’s overall risk and thereby the calculated WACC.
7.3. Assessment of divestment relative to Auriga’s strategic opportunities The section will start with an introduction and a short description of basic theoretical aspects on acquisitions
followed by an analysis of the divestment relative to Auriga’s different strategic options uncovered in the
previous sections.
The Sales Process
In a company announcement dated 13’th of June 2014 Auriga states that the company has commenced in
investigating their strategic options. This is defined as the starting signal for the sales process ahead281
.
In a letter dated 17’th of June 2014, the Danish law firm Kromann Reumert submits an application to the
Danish Business Authorities. The application concerns the reconfirmation of the acceptance of the
foundation voting for a sale that will result in the foundation no longer being the majority owner with the
277
DKK (1,941,530 + 500,000) 278
DKK (294.06 – 241.76) = 52.3 279
DCF calculation in appendix 26 280
DKK (52.3 x 25,374,000) = 1,327,060 281
Proinvestor hompage: Auriga company announcement 06.12.2014 http://www.proinvestor.com/aktienyt/760481/Auriga-Undersoegelse-af-strategiske-muligheder-igangsat
110
Danish Business Authority, as this will go against the current charter of the foundation. Memorandums from
the Board, Pwc and Gorissen Federspiel backing the sale are included.
The Danish Business Authority grant acceptance in a letter dated 19’th of June 2014, with the notion that a
final sales agreement is to be confirmed by the authority.
Following the acceptance, the Board of Directors began, together with its legal and financial advisers, a sale
process to divest Cheminova.
Continuous dialogue with AURF secured the aligning of interests and demands, as a number of potential
buyers including both financial- as well as strategic investors was invited to state their interest, and initiate
due diligence of legal, financial and environmental issues in preparation for submitting a binding offer.
The Board of Directors chose the best offer which was subsequently presented to AURF. Hereafter the
bidder was given access to further detailed and more sensitive information – the confirmatory due diligence,
followed by signing the final sales agreement and final confirmation by the Danish Business Authority.
The concluding tender offer282
was published in a company announcement dated 9’th of August where the
Board of Directors also recommend an acceptance of the sale283
.
It was further stated that neither the Board of Directors or general management have been granted special
advantages related to the preparation of the transaction or conditions in relation here with. See appendix 9 for
disclosure of internal company documents on the sales process.
Theoretical Aspects and Models
The strategic rationales for mergers or acquisitions are typically based on either:284
a) Improve the performance of the target company
b) Consolidate to remove excess capacity from an industry
c) Create market access for the target’s (or, in some cases, the buyer’s) products
d) Acquire skills or technologies more quickly or at lower cost than they could be build in-house.
e) Pick winners early and help them develop their business.
Today the predominant approach is the strategic acquisition or merger, where companies seek to exploit
synergies to make the joint forces more valuable than as individual entities285
. The strategic considerations
announced are wide-spread, but is predominately concentrated about cost-cutting!286
Mergers and acquisitions are rather cyclical in nature as booms rather than busts provide the environment of
growth and free flowing financing opportunities, but there are also highly consolidating industries, where
mergers and acquisitions seem to be at a continuous high level.
Whether or not mergers and acquisitions are a good idea depend on several factors, but it is the norm that the
share price of the target firm increases when a bid is announced, because of the premiums that are usually
paid by the acquirer for buying the shares of the existing equity holders. Are there more than one bidder,
282
SEC homepage: https://www.sec.gov/answers/tender.htm 283
Proinvestor hompage: Auriga company announcement 08.09.2014 http://www.proinvestor.com/aktienyt/773618/Auriga-Industries-AS-Cheminova-saelges-til-FMC-Corporation 284
Koller, Goedhart & Wessels, ”Valuation, Measuring and Managing the Value of Companies”, John Wiley & Sons, Inc. Fifth Edition – page 438. 285
Hillier, Grinblatt & Titman, ”Financial Markets and Corporate Strategy”, McGrawHill, 2. Edition, ISBN: 978-0-07712942-2 – page 649 286
Koller, Goedhart & Wessels, ”Valuation, Measuring and Managing the Value of Companies”, John Wiley & Sons, Inc. Fifth Edition – page 438.
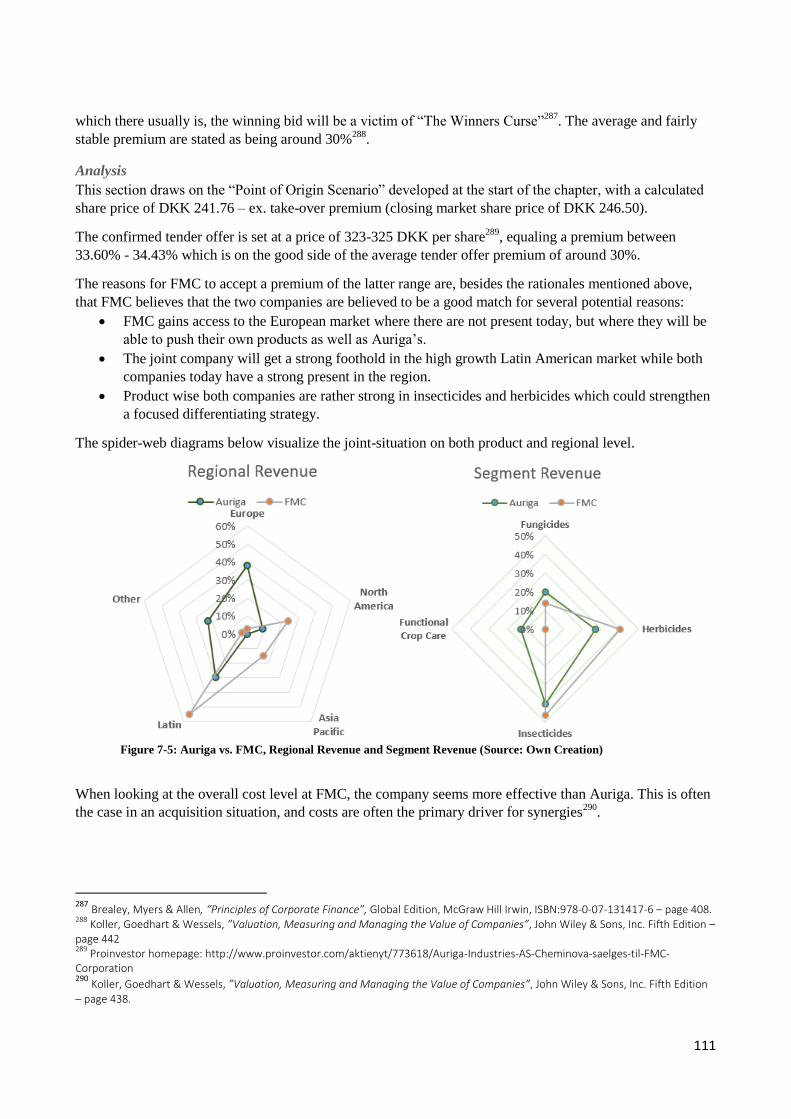
111
which there usually is, the winning bid will be a victim of “The Winners Curse”287
. The average and fairly
stable premium are stated as being around 30%288
.
Analysis
This section draws on the “Point of Origin Scenario” developed at the start of the chapter, with a calculated
share price of DKK 241.76 – ex. take-over premium (closing market share price of DKK 246.50).
The confirmed tender offer is set at a price of 323-325 DKK per share289
, equaling a premium between
33.60% - 34.43% which is on the good side of the average tender offer premium of around 30%.
The reasons for FMC to accept a premium of the latter range are, besides the rationales mentioned above,
that FMC believes that the two companies are believed to be a good match for several potential reasons:
FMC gains access to the European market where there are not present today, but where they will be
able to push their own products as well as Auriga’s.
The joint company will get a strong foothold in the high growth Latin American market while both
companies today have a strong present in the region.
Product wise both companies are rather strong in insecticides and herbicides which could strengthen
a focused differentiating strategy.
The spider-web diagrams below visualize the joint-situation on both product and regional level.
Figure 7-5: Auriga vs. FMC, Regional Revenue and Segment Revenue (Source: Own Creation)
When looking at the overall cost level at FMC, the company seems more effective than Auriga. This is often
the case in an acquisition situation, and costs are often the primary driver for synergies290
.
287
Brealey, Myers & Allen, “Principles of Corporate Finance”, Global Edition, McGraw Hill Irwin, ISBN:978-0-07-131417-6 – page 408. 288
Koller, Goedhart & Wessels, ”Valuation, Measuring and Managing the Value of Companies”, John Wiley & Sons, Inc. Fifth Edition – page 442 289
Proinvestor homepage: http://www.proinvestor.com/aktienyt/773618/Auriga-Industries-AS-Cheminova-saelges-til-FMC-Corporation 290
Koller, Goedhart & Wessels, ”Valuation, Measuring and Managing the Value of Companies”, John Wiley & Sons, Inc. Fifth Edition – page 438.
112
The Value Chain Analysis reveals that FMC operates with a CoGS level that is 5% better than Auriga. If
FMC are able to push costs and processed in a more effective direction, there could be synergies to harvest
on this ratio. Reasons could be better processes on procurement and more effective production processes.
That being said, a counter effect could be that Auriga potentially have old production equipment, as the
difference between cost price and reported value are rather large, resulting in a relative low PPE. The
depreciation is industry conform, and the difference cannot be fully explained here as details on the matter
are not disclosed.
FMC operates with S&D costs and administration costs at a total level of 13% which is significantly lower
than Auriga’s 19%. Potential synergies could be found here if FMC are able to apply their own processes
and efficiency to the Auriga operations.
Last but not least there could be potential synergies in their respective R&D efforts either decreasing the
total R&D cost and/or improving their R&D efforts for increased innovation.
Concluding remark
After having performed an in-depth external- and internal analysis as well as an assessment of the strategic
dilemmas facing Auriga, it is now possible to assess whether or not the price per share offered by FMC
optimizes shareholder value and thus should be accepted, by applying the following formula:
Divestment Price per Share > Operational Price per Share + Expected Value of Strategic Initiatives
DKK 325.00 > DKK 241.76 + DKK 52.30
𝐃𝐊𝐊 𝟑𝟐𝟓. 𝟎𝟎 > 𝟐𝟗𝟒. 𝟎𝟔
As the price and by that the shareholder value offered by FMC is higher than price (shareholder value) that
Auriga is able to generate as a stand-alone entity the offer from FMC should be accepted.
8. Discussion This section will discuss potential implications with foundation owned companies and their ability to create
shareholder value in innovative- and/or consolidating industries. The section will deal with both general
implications, as well as implications observed in the Auriga case company.
As stated numerous times in the paper, several empirical analysis indicate that foundation ownership
performs at least as well as companies operating under as wide-spread shareholder ownership291
. General
arguments for this are that foundations do not have to fear hostile take-overs and the short-term whims of
“the market” which makes it possible for them to think and plan in longer terms. Other factors like
managerial reputation and the demand from debt holders creates an environment where optimization and
profit-seeing still counts. Foundation ownership as a governance structure simply seems to work quite well
in practice! Never the less there seems to be a movement towards adjusting the charters to cope with a
changing business environment.
Novo CEO, Lars Rebien (health care) stated in an article in the Danish business newspaper, “Børsen” that
the company would like to be a part of the consolidation wave, but that the ownership structure292
only
makes it possible for them to buy companies smaller than themselves.293
Similar stories concerning
ownership structure effecting the room to maneuver is found with other foundation owned companies like
William Demant (hearing aids), where the CEO utter that foundation ownership is limiting the consolidation
291
It especially goes for the larger foundations. 292
Novo A/S is owned by Novo Nordisk Fonden which is a foundation. 293
Author unknown, ”Novo: Fondseje begrænser mulighed for konsolidering”, Berlingske Business, 09.06.2005 http://www.business.dk/investor/novo-fondseje-begraenser-mulighed-for-konsolidering
113
trend in the industry294
, and that the company need to look into collaboration opportunities rather that M&A
opportunities. Likewise is the situation with Rambøll (engineering) where the director of “Foreningen af
Rådgivende Ingeniører, FRI” deems that foundation ownership in Rambøll will become under pressure with
their current expansion plans.295
The latter statement is backed by an ongoing report of foundation ownership, which is looking into 118
Danish charters of industrial foundations in a period between 2010-2014. The report finds that the charters
differ considerably but that they are rather stable over time - except for changes concerning the allowance of
divestiture of the company, which 12% of the 118 foundations had changed in the period!296
The results are
backed by a report from the Danish law firm, Bech-Bruun (2011)297
, that also states that several large
foundation owned companies like Auriga have had their charter changed several times, e.g. in relation to
developing the dual-share structure and the holding company structure (see appendix 4 for initial charter of
AURF).
Comparing AURF’s initial charter with the current charter the same tendency can be observed.
The initial charters object of clause (§3) is supporting scientific research at AURF. The same article states
that the foundation income is the profit from Auriga298
after necessary resources are allocated to
consolidation and growth, and that the purpose of Auriga298
is to produce and trade of chemical products and
to develop and exploit new methods for chemical production.
The article (§3) set up a distinct connection between the foundation and Auriga, nevertheless it does not state
that the foundation has to support the company if it should end up in financial distress, though the statement
concerning foundation income could be interpreted as income to the foundation is second to necessary
consolidation of the company.
The clause further states that dissolving of Auriga298
is only allowed if all reserves are used and that going
concerning would lead to insolvency.
In the present charter, the linkage between AURF and Auriga is no longer present except for the entry
concerning devolvement that are still in place, but now with the holding company and not the operational
company as the center. It can be concluded that the grip of the charter has been loosened, in line with what is
the general observation.
A similar case could be Carlsberg, which in 2007 changed their charter so that they were no longer required
own 51% of the share capital, but only 25% of the share capital and 51% of the votes299
. Obviously this was
done to be able to consolidate the business with the 2008 acquisitions of Scottish & Newcastle together with
Heineken N.V.
8.1.1.1. Foundation Governance
The degree of foundational constraints could potentially affect the performance of the operational companies
owned by the foundation. The literature deals with a concept of; “Managerial Distance” which is a measure
294
Høgsbro, Simon, ”Demant parat til nye partnere”, Berlingske Business, 08.03.2003 http://www.b.dk/diverse/demant-parat-til-nye-partnere?redirected=true%3Fmobile%3Dfalse# 295
Marfelt, Birgittte, ”Rambøll er pisket til at købe vinder-virksomheder”, Ingeniøren, 19.03.2010. 296
Thomsen, Steen & Degn, Signe Marie, ”The Charters of Industrial Foundations”, Center for Corporate Governance, CBS, 12.02.2014 (STILL IN PROGRESS) – page 29., http://www.tifp.dk/wp-content/uploads/2015/04/Charters06.pdf 297
Bech-Bruun, “Fonde”(2011) http://www.bechbruun.com/-/media/Files/Videncenter/Nyhedsbreve/Corporate/2011/2011+-+Fonde+-+april.pdf 298
The Charter states Cheminova A/S and not Auriga, as the latter was developed together with adopting the holding structure in 1990. 299
Nilsson, Kirsten, ”Carlsberg gør klar til opkøb”, Politiken 04.27.2007 http://politiken.dk/oekonomi/ECE293353/carlsberg-goer-klar-til-opkoeb/
114
of the clarity and objectivity with which a foundation-owned company’s management are induced to focus
on the company’s profitability, determined off of five factors300
:
1) Board Separation: The degree of board overlap
between foundation and operating
company
Auriga has a single board
overlap with AURF in Karl
Anker Jørgensen
2) Public Float: Whether or not minority shares
are publicly traded on the Danish
stock exchange
The Auriga share was publicly
traded on the Copenhagen
stock exchange.
3) Outside Foundation
Investments:
Additional investments contribute
to managerial distance
AURF operated and still
operates with several sub
businesses besides Auriga.
4) Administrative
Independence:
Foundation administrative
independence of operating
company
AURF has its own
administrative headquarters in
Aarhus, 160 km from Haboøre
5) Charitable Purposes: Foundation purpose other than
managing the operating company
The foundation has a charitable
purpose in supporting the
research at Aarhus University,
and no obligation to support
Auriga/Cheminova.
AURF can check off all five determinants, and thus has a high degree of managerial distance to the operating
company. The construct resembles that of investor owned companies, since subjective decision making is
reduced due to board members in the AURF owing their loyalty to a different entity than the operating
company. Herby securing a correct organizational structure to minimize agency problems by separating
decision making and control such as separation of initiation, ratification, implementation and monitoring301
.
Results show that the degree of independence is positively correlated with company performance – the
higher the distance the higher the performance measured as ROA:
300
Hansmann, Henry & Thomsen, Steen, ”Virtual Ownership and Managerial Distance: The Governance of Industrial Foundations” (2012), prepared for the conference on Corporate Governance after the Crisis, Oxford, January 13-14, 2002, http://www.tifp.dk/wp-content/uploads/2011/11/Hansmann-Thomsen-21.pdf 301
Zimmermann, Jerold L., ”Accounting for Decision Making and Control”, McGraw-Hill Irwin, 7’th edition, ISBN: 978-0-07-813672-6 – page 151.
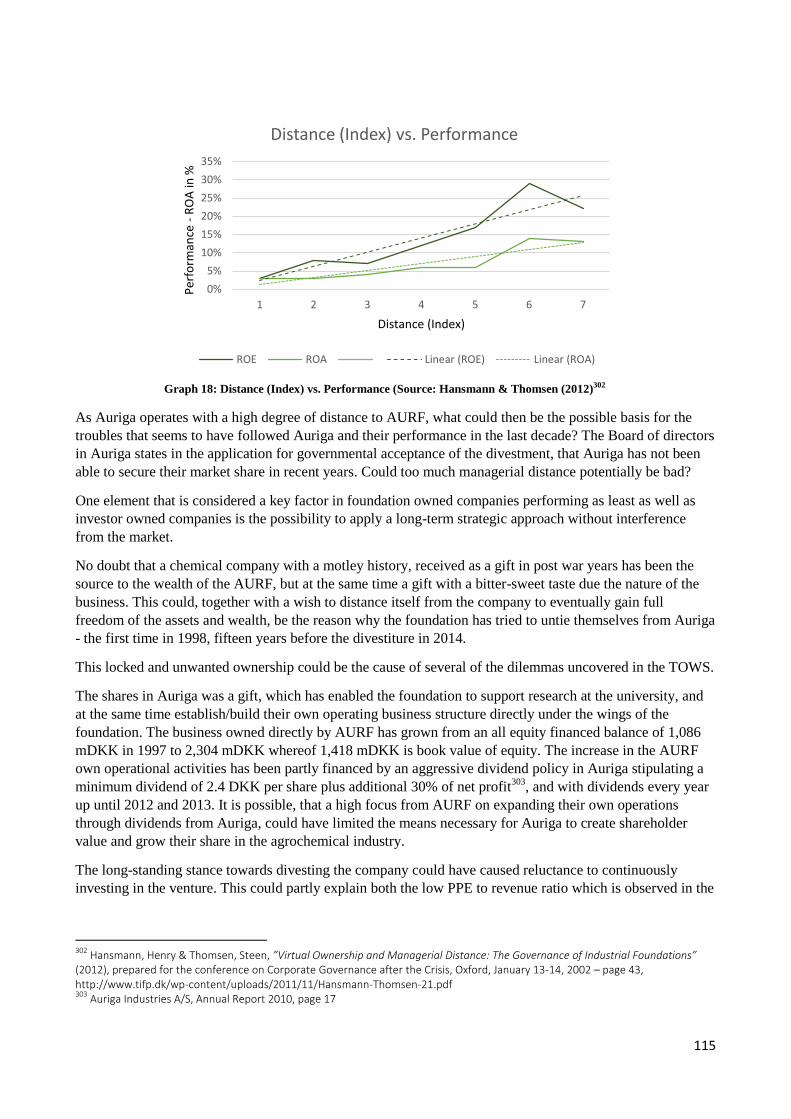
115
Graph 18: Distance (Index) vs. Performance (Source: Hansmann & Thomsen (2012)302
As Auriga operates with a high degree of distance to AURF, what could then be the possible basis for the
troubles that seems to have followed Auriga and their performance in the last decade? The Board of directors
in Auriga states in the application for governmental acceptance of the divestment, that Auriga has not been
able to secure their market share in recent years. Could too much managerial distance potentially be bad?
One element that is considered a key factor in foundation owned companies performing as least as well as
investor owned companies is the possibility to apply a long-term strategic approach without interference
from the market.
No doubt that a chemical company with a motley history, received as a gift in post war years has been the
source to the wealth of the AURF, but at the same time a gift with a bitter-sweet taste due the nature of the
business. This could, together with a wish to distance itself from the company to eventually gain full
freedom of the assets and wealth, be the reason why the foundation has tried to untie themselves from Auriga
- the first time in 1998, fifteen years before the divestiture in 2014.
This locked and unwanted ownership could be the cause of several of the dilemmas uncovered in the TOWS.
The shares in Auriga was a gift, which has enabled the foundation to support research at the university, and
at the same time establish/build their own operating business structure directly under the wings of the
foundation. The business owned directly by AURF has grown from an all equity financed balance of 1,086
mDKK in 1997 to 2,304 mDKK whereof 1,418 mDKK is book value of equity. The increase in the AURF
own operational activities has been partly financed by an aggressive dividend policy in Auriga stipulating a
minimum dividend of 2.4 DKK per share plus additional 30% of net profit303
, and with dividends every year
up until 2012 and 2013. It is possible, that a high focus from AURF on expanding their own operations
through dividends from Auriga, could have limited the means necessary for Auriga to create shareholder
value and grow their share in the agrochemical industry.
The long-standing stance towards divesting the company could have caused reluctance to continuously
investing in the venture. This could partly explain both the low PPE to revenue ratio which is observed in the
302
Hansmann, Henry & Thomsen, Steen, ”Virtual Ownership and Managerial Distance: The Governance of Industrial Foundations” (2012), prepared for the conference on Corporate Governance after the Crisis, Oxford, January 13-14, 2002 – page 43, http://www.tifp.dk/wp-content/uploads/2011/11/Hansmann-Thomsen-21.pdf 303
Auriga Industries A/S, Annual Report 2010, page 17
0%
5%
10%
15%
20%
25%
30%
35%
1 2 3 4 5 6 7
Per
form
ance
- R
OA
in %
Distance (Index)
Distance (Index) vs. Performance
ROE ROA Linear (ROE) Linear (ROA)
116
benchmark-analysis as well as the fact that the company allocates fewer resources to R&D purposes than
both tier 1 companies and tier 2 companies.
General under investment could potentially off-set both inefficiency in the production causing high
production costs (CoGS), and a low RME-ratio indicating a poorer responsiveness to strategic changes than
their peers.
Both the case company, the trend in changing the charters and the position with several CEO’s all indicate
that the possibility for changing charters are important if a foundation ownership is to meet potential
challenges in highly consolidating sectors, and that the rather liberal stance for relevant authorities towards
acceptance of charter changes are of importance297
.
9. Conclusion With the stage set in the introduction the paper has investigated foundation-owned companies’ ability to
maximize shareholder value in highly innovative- and/or consolidating industries in an inductive process
with Auriga as case company.
Auriga discloses a company announcement on the 13’th of June 2014 stating the initiation of “strategic
considerations”. This is perceived as the day that the market factors in Auriga’s possible divestiture of
Cheminova. The day before this announcement, on the 12’th of June 2014 the market prices the Auriga share
to DKK 246.50, which equals the operational value of Auriga calculated in the “Point of Origin” scenario of
DKK 241.76 plus a 6.42% takeover probability priced at DKK 4.74.
Several strategic dilemmas are facing Auriga - the most important ones are captured in three approaches:
First, inefficiency in production due to years of underinvestment has resulted in high CoGS relative to the
industry. The cure is to optimize strengths and opportunities to better mitigate the threat from strong
competitors. This is done by investing in PPE facilities in either India or Denmark to decrease CoGS to a
competitive level hereby freeing resources for innovative purposes. The debt financed investment is expected
to increase shareholder value with tDKK 256,998 equaling an increase of DKK 10.13 per outstanding share.
Second, poor receivables and inventory management processes have resulted in poor WC ratios demanding a
high degree of cash, limiting resources available for optimizing the opportunities of general economic
factors, the demographic development, AI’s going of patent and the expected climate change. The cure is to
initiate WC efficiency projects to lower especially accounts receivables and inventory and thus total invested
capital. The paper lists several specific initiatives as the means to reach an expected increase in share price of
DKK 30.24 per outstanding share equaling a total value creation of tDKK 767,308.
Third, poor RME and low economics of scale have resulted in weak economic performance in the last
decade where Auriga has had difficulties in securing their share of the agrochemical market. To minimize
the threat from strong competitors and better meet changing legal requirements and fluctuating crop prices,
strategic collaboration with US based Chemtura is proposed as a possible solution. The strategic
collaboration is thought as having to legs. One leg being R&D collaboration with an investment of tDKK
500,000 over a five-year period financed internally, strengthening Auriga’ innovative capabilities to secure
future growth. The other leg being collaboration in the respective distribution networks in Latin America and
North America, which would help Cheminova penetrate the North American Market. The two initiatives are
expected to off-set an increase in the total value of tDKK 513,107 equaling an increase in the share price of
DKK 20.22 per share.
Fourth, combining and implementing the three paths simultaneously offsets an increase in the total value of
and an increase in share price of DKK 361.53. This strategic option is however deemed unrealistic since it
117
would involve too many management resources and too many risks. A more convincing strategic option is to
only implement two of the three possible scenarios simultaneously and thereby limiting the financial
pressure as well as the potential risk of failure. The combination of a strategic collaboration with Chemtura
to increase R&D capabilities and growth sale in the North American regions and initiating WC efficiency
projects to lower especially receivables and inventory and hereby total invested capital are deemed most
feasible. The initiation of path #2 and path #3 will increase the current share price to DKK 294.06 per
outstanding share.
The divestment of Cheminova to FMC announced in September 2014 at a price of DKK 325 per share
equaling a take-over premium of 34.43% is assessed relative to the strategic opportunities uncovered in the
analysis. The result based of the in-depth internal- and external analysis as well as the uncovering of the
strategic dilemma facing Auriga is, that the company as a stand-alone entity is able to create value
resembling an increase in the share price of DKK 52.30 equaling a share price of DKK 294.06 per
outstanding share. As this share price is lower than the one offered by FMC, the conclusion is that the
offered price from FMC optimizes shareholder value, and thus should be accepted.
Several research papers conclude that foundation owned companies performs at least as well as shareholder
owned companies. A key argument for this is that foundation owned companies can plan on a long-term
basis without interference from the market. Still CEO’s are expressing that foundation charters restrict the
possibility for consolidation. Maybe caused by these concerns the authorities seem to have taken a liberal
approach towards the change of the otherwise stable foundation charters. Especially changes concerning the
allowance of divestitures are observed, with the possible purpose of increasing the maneuverability in
consolidating industries. Acceptance of such changes are assessed to be of importance for the potential value
creation in foundation owned companies.
When looking at Auriga and their majority shareholder of AURF, several differences between the initial and
current charter can be observed, and all changes seems to be towards a less restrictive setting – perfectly in
line with what is observed in other cases.
Likewise, distance between a foundation and its operational company seems to be a positive feature, as
managerial distance and company performance are positively correlated. AURF and Auriga can check off all
five determinants for managerial distance.
In the AURF/Auriga case managerial distance could be a potential problem as documents reveal that AURF
has tried to sell Auriga several times in the last fifteen years – they did just not succeed. An operational
company with a majority shareholder that for more than a decade have tried to release itself from the
company could serve as a potential problem. A possible effect of this unwanted marriage could be
underinvestment causing inefficiency and lack of RME resulting in difficulties in growing accordingly,
affecting the ability for the operational company to create shareholder value.
And as the internal and external analysis reveals Auriga have developed into a company, being in a highly
consolidating industry, where a divestment was the only right option to pursue in optimizing shareholder
value.

118
10. List of Litterature:
10.1. Books, Articles and Scientific Research Papers Andersen, Torben Juul & Schrøder, Peter Winther, “Strategic Risk Management Practice”, Cambridge
University Press, (2010) – 4’th printing, ISBN 978-0-521-13215-2
Andersen, Torben Juul (2009), Effective risk management outcomes: exploring effects of innovation and
capital structure, Journal of Strategy and Management, Vol. 2 Iss 4 pp. 352 – 379
Andersen, Torben Juul, professor, Third Semester Elective, Managing Risk, Uncertainty and the
Unknowable: Responding to Emergent Change (2015), Department of International Economics and
Management, CBS, lecture 4 and lecture 7.
Ankersborg, Vibeke & Watt, Merete, “Tænk selv! Videnskabsteori og undersøgelsesdesign i
samfundsvidenskab” (2007), Forlaget Politiske Studier, page 9. Model used for developing the problem.
ATKearney, “Chemicals Executive M&A Report 2015”, (2015), requested at: www.atkearney.com,
Author unknown, ”Novo: Fondseje begrænser mulighed for konsolidering” (9’th of June 2005) Berlingske
Business, http://www.business.dk/investor/novo-fondseje-begraenser-mulighed-for-konsolidering
Bech-Bruun, “Fonde”(2011)
Brealey, Myers & Allen “Principles of Corporate Finance”, Global Edition, McGraw Hill Irwin, ISBN:978-0-
07-131417-6
CEMA – European Agricultural Machinery, “Advancing Agricultural Mechanization (AM) to promote
farming & rural development in Africa” (July 2004)
Christian V. Petersen & Thomas Plenborg “Financial Statement Analysis” (2012) FT Prentice Hall Financial
Times, ISBN: 978-273-75235-6
Committee on Corporate Governance, “Recommendations on Corporate Governance”, (May 2013),
https://corporategovernance.dk/english
Damodaran, A. “Strategic Risk Taking: A Framework of Risk Management” (2008), Chapter 11, Wharton
School Publishing, page 5. A similar definition is stated by Kaplan as: risk = uncertainty + damage, Stanley
Kaplan and B. John Garrick, On The Quantitative Definition of Risk, Risk Analysis Vol. 1 no 1, (1981),
Society for Risk Analysis pages 12.
Deloitte, “2015 Global chemical industry mergers and acquisition outlook. The momentum continues”.
(January 2015), http://www2.deloitte.com/be/en/pages/manufacturing/articles/global-chemical-industry-m-
and-a-outlook.html
Eden, Colin & Ackermann, Fran,”Making Strategy: The Journey of Strategic Management”, (1998), Sage
Publications Ltd, ISBN: 9781446217153, chapter C7.1 – page
European Parliament, ”Q & A: GMO-dyrkning i EU”, (2nd of September 2014)
http://www.europarl.europa.eu/pdfs/news/public/story/20140902STO57801/20140902STO57801_da.pdf

119
FiBL and IFOAM, “The World of Organic Agriculture” (2015) by BIOFACH Organic Trade Fair,
Nuremberg Germany - http://www.organic-world.net/yearbook/yearbook2015.html?L=0
Gianessi, Leonard P., “The Potential for Worldwide Crop Production Increase Due to Adoption of Pesticides
Rice, Wheat & Maize” (March 2013) - Revised)
Hansmann, Henry & Thomsen, Steen, ”Virtual Ownership and Managerial Distance: The Governance of
Industrial Foundations” (2012), prepared for the conference on Corporate Governance after the Crisis,
Oxford, January 13-14, 2002, http://www.tifp.dk/wp-content/uploads/2011/11/Hansmann-Thomsen-21.pdf
Henry, Anthony “Understanding Strategic Management” (2008), Oxford University Press, ISBN: 978-0-19-
928830-4
Hillier, Grinblatt & Titman,”Financial Markets and Corporate Strategy” (2012), McGrawHill, 2. Edition,
ISBN: 978-0-07712942-2
Hoffmann, Beth, “GMO Crops Mean More Herbicide, Not Less” (2’th of July 2013), Forbes
http://www.forbes.com/sites/bethhoffman/2013/07/02/gmo-crops-mean-more-herbicide-not-
less/#2715e4857a0bae1bfa5a371f
Høgsbro, Simon,”Demant parat til nye partnere”, Berlingske Business, (8’th of March2003),
http://www.b.dk/diverse/demant-parat-til-nye-partnere?redirected=true%3Fmobile%3Dfalse#
http://cema-
agri.org/sites/default/files/publications/Advancing%20Farm%20Mechanization%20in%20Africa%20-
%20CEMA%202014.pdf
http://www.bechbruun.com/-/media/Files/Videncenter/Nyhedsbreve/Corporate/2011/2011+-+Fonde+-
+april.pdf
http://www.oecd-
ilibrary.org/docserver/download/9205111e.pdf?expires=1462037616&id=id&accname=guest&checksum=20
B46D37F9B2E326BA64F4C45ACD178B
Juel, Frederik M, ”Han er topchefernes skræk”, Berlingske Business, (Friday the 14’th of November) 2014.
http://www.business.dk/navne/han-er-topchefernes-skraek
Kamstrup, Lars, ”Aktionær: Ejer har et ansvar ved salg af Cheminova”, Dagbladet Holstedbro-Struer, (30’th
of August 2014), http://m.dagbladet-holstebro-struer.dk/lemvig/aktionaer-ejer-har-et-ansvar-ved-salg-af-
cheminova
Kenneth A. Froot, David Scharfstein and Jeremy C. Stein, A Framework for Risk Management (1994),
Harvard Business Review, Nov.-Dec. 1994, pages 91-102. – page 94
Kirketerp, Simon, Børsen, “Se listen over verdens mest magtfulde finansfolk – Dansker indtager 3. pladsen”,
(10´th of November 2015)
Koller, Goedhart & Wessels, ”Valuation, Measuring and Managing the Value of Companies”(2010), John
Wiley & Sons, Inc. Fifth Edition
Lambek, Bjørn, “Den døde hand rører på sig”, (6’th of March 2012), Politiken
http://politiken.dk/oekonomi/ECE27783/den-doede-haand-roerer-paa-sig
120
Mads Thyrsted Laursen og Peter Nicolaisen, Folkebladetlemvig.dk, Cheminovas historie: Derfor er den
uundværlig” (14’th of May 2013), http://folkebladetlemvig.dk/holstebro/cheminovas-historie-derfor-er-den-
uundvaerlig
Marfelt, Birgittte, ”Rambøll er pisket til at købe vinder-virksomheder” (19’th of March 2010), Ingeniøren.
Meulbroek, Lisa K. (2002), Integrated Risk Management for the Firm: A Senior Manager’s Guide, Havard
Business School, 02-046, working paper – page 4 and page 20.
Mitchell, Ronald K et. al., ”The Academy of Management Review”, Vol 22, No. 4 (Oct. 1997), pp. 853 –
886, Academy of Management, http://www.jstor.org/stable/259247.
Myers (1984) and Myers and Majluf (1984) - Corporate financing and investment decisions when firms have
information that investors do not have. Journal of Financial Economics, Volume 13, Issue 2, June 1984,
Pages 187-221
Nilsson, Kirsten, ”Carlsberg gør klar til opkøb”, Politiken (27’th of April 2007)
http://politiken.dk/oekonomi/ECE293353/carlsberg-goer-klar-til-opkoeb/
Nnamonu, Lami A. & Ali, “Abraham E. Perception of Agrochemical Use and Organic Farming in Makurdi,
Benue State” (Aug. 2013), International Journal of Environmental Protection Vol 3 Iss. 8, PP 48-52.
http://www.google.se/url?sa=t&rct=j&q=&esrc=s&source=web&cd=1&ved=0ahUKEwjOt5eU29nMAhUK
DywKHW_IAPYQFggcMAA&url=http%3A%2F%2Fwww.academicpub.org%2FDownLoadPaper.aspx%3F
paperid%3D14465&usg=AFQjCNGO2rFb2II0LaMtgFfesN4CKoLdZA
OECD, “Guidelines for Collecting and Interpreting Innovation Data”, (2005) OECD Publishing, third edition.
Oerke et al, Journal of Agricultural Science, (2006)
P. Hough, “The Trading and Use of Agrochemicals”,(2014) Department of Law, Middlesex University
London, Springer Science, page 2,
http://www.springer.com/gp/book/9789400774537?wt_mc=ThirdParty.SpringerLink.3.EPR653.About_eBoo
k#aboutBook
Pedersen, Klaus Thøger, “Risk Management in a food and beverage context – Is Carlsberg A/S on top of the
risk agenda?” (2015), third semester elective project in the course: Managing Risk, Uncertainty and the
Unknowable: Responding to Emergent Change, handed in 12’th of April 2015.
Phillips McDougall, “R&D trends for chemical crop protection products and the position of the European
Market” (September 2013), page 10
https://issuu.com/cropprotection/docs/r_and_d_study_2013_v1.8_webversion_
Pindyck, Robert S. and Rubinfeld, Daniel L., “Microeconomics” (2009) Pearson Prentice Hall, 7’th edition,
ISBN: 978-0-13-713335-2
Porter, Michael E "COMPETITIVE STRATEGY", (1997), Measuring Business Excellence, Vol. 1 Iss 2,
page 15. http://dx.doi.org/10.1108/eb025476
Porter, Michael E “Competitive Strategy: Techniques for Analyzing Industries and Companies”, (1980) Free
Press, Chapter 1, Three Generic Strategies.
Power, Michael (2009), The risk management of nothing, Accounting, Organizations and Society 34, LSE
page 854
121
PR Newswire, “China Pesticide Industry Report, 2015 – 2018”, (10’th of November 2015),
http://www.prnewswire.com/news-releases/china-pesticide-industry-report-2015-2018-300176389.html
Prada, Paulo, “Why Brazil has a big appetite for risky pesticides”, (2nd of April 2015), Reuters
http://www.reuters.com/investigates/special-report/brazil-pesticides/
PWC, “How M&A will shape the competitive landscape”, (2013) originally published by Booz & Company
in 2013, www.strategyand.pwc.com – page 9.
Raben, Birgitte & Thomsen, Claus Blok, Politiken, “Cheminova stopper salg af gift til ulande”, (1´th of
December 2006).
Ronald K. Mitchell et. al.,, ”The Academy of Management Review” (Oct. 1997), Vol 22, No. 4 pp. 853 –
886, Academy of Management, http://www.jstor.org/stable/259247 - page 874
Rose, Caspar, “Corporate Financial Performance and the Use of Takeover Defenses”, (2002), European
Journal of Law and Economics, 13, page 105.
Rose, Caspar, “Foundation Ownership and Financial Performance: Do Companies Need Owners”, (2004)
European Journal of Law and Economics, 18
Rose, Caspar, “Stakeholder orientation vs. shareholder value, a matter of contractual failures”, (November
2003) Center for Law, Economics and Financial Institutions at CBS
Rose, Caspar, The Challenges of Employeee-Appointed Board Members for Corporate Governance: The
Danish Evidence” (2008), European Business Organization Law Review 9, page 230-231.
Rose, Caspar,, ”Foundation Ownership and Financial Performance: Do Companies Need Owners?”,
European Journal of Law and Economics, 18: 343-364 (2004)
Skærbæk & Tryggestad, “The Role of Accounting Devices in Performing Corporate Strategy” (January
2010), Accounting, Organizations and Society, Vol 35, Issue 1, pp 108-124.
Skærbæk, Peter, (2005) “Annual Reports as Interaction Devices: The Hidden Construction of Mediated
Communication” (November 2005) Financial Accountability & Management, 21 (4), , 0267-4424.
Skovlund, Stephan, ”Basic Statistics, Statistics with a Focus on Business Applications”, (2013)
Retrieved from Statlearn.com: http://perito-consulting.com/wp-
content/pdfs/bf1d9485e95176297a1ad95bc7671223.pdf
Sørensen, Kristian, External Lecturer, “Risikostyring og Kapitalomkostninger i International sammenhæng”
(unknown), Department of International Economics and Management, slide 44.
Sørensen, Ole, ”Regnskabsanalyse og værdiansættelse – En Praktisk tilgang”, (2011) 3. udgave, Gjellrup,
page 184, ISBN: 978-87-13-04998-1
Sperling, Anna von “Cheminova skal stå skoleret for ministeren”, Information, (16’th of November 2008)
https://www.information.dk/2007/07/cheminova-staa-skoleret-ministeren &
Stuart III, G. Bennet, “EVA, Fact and Fantasy” (2000), Stern Stewart & Co., BankAmerica – Journal of
Applied Corporate Finance, page 72 and 74 (Materialesamling efterår 2014 – Køb og salg af virksomheder,
Cand. Merc. R80, Bind 1, Academic Books
122
The Danish Ministry of Taxation, (2015), “Succession til erhvervsdrivende fonde”, (6’th of May 2015)
http://www.skm.dk/media/1209173/succession-til-erhvervsdrivende-fonde_rapport.pdf
The Society for Risk Analysis (1987), ”Risk newsletter”, volume 7, number 3, September 1987.
The World Bank, “Global Economic Prospects”, (Jan. 2014) homepage:
http://pubdocs.worldbank.org/pubdocs/publicdoc/2015/12/630221448982843668/Global-Economic-
Prospects-January-2014-Coping-with-policy-normalization.pdf
Thomsen, Claus Blok, Politiken, “FN langer ud efter Cheminova”, (26´th of November 2006)
Thomsen, Steen & Degn, Signe Marie, ”The Charters of Industrial Foundations” (2014), Center for Corporate
Governance, CBS, 12.02.2014 (STILL IN PROGRESS) – page 29., http://www.tifp.dk/wp-
content/uploads/2015/04/Charters06.pdf
Watts, Jonathan, More Wealth, more Meat. How China’s Rise Spells Trouble” (30’th of May 2008), The
Guardian homepage: http://www.theguardian.com/environment/2008/may/30/food.china1
Weihrich, Heinz, ”The TOWS Matrix – A Tool for Situational Analysis” (1982), Long Range Planning Vol
15. No. 2 PP 54 to 66, Pergamon Press Ltd.
Weston, Mitchell & Mulherin, ”Takeovers, Restructuring, and Corporate Governance”, (2014), Person
Education Ltd, ISBN: 978-1-292-02086-0
Weston, Mitchell & Mulherin, ”Takeovers, Restructuring, and Corporate Governance”, (2014), Person
Education Ltd, ISBN: 978-1-292-02086-0, page 359
Zimmermann, Jerold L., ”Accounting for Decision Making and Control” (2010), McGraw-Hill Irwin, 7’th
edition, ISBN: 978-0-07-813672-6
10.2. Annual Reports: ADAMA
Auriga
BASF
Bayer
Chemtura
Coromandel
DOW
DuPont
FMC
Monsanto
NipponSoda
Nufarm
Sumitomo
Syngenta
United Phosphorous
UPL
123
10.3. Homepages AgriNova homepage:
http://www.agrinova-sal.com/profile.html
ATP homepage:
https://www.atp.dk/atp-som-investor/pensions-investments
Ballerup Kommune homepage:
http://www.ballerup.dk/sites/default/files/sbsys_copy2/Publication62/Enclosures/Hvidbog%201%20til%20K
ommuneplan%202013%20(2013-17865).pdf
Bureau Van Dijk homepage:
http://www.bvdinfo.com/en-gb/home
CBS Homepage:
http://www.cbs.dk/en/research/departments-and-centres/department-of-international-economics-and-
management/center-corporate-governance/news/industrial-foundations-live-forever
CHEManager International homepage:
http://www.chemanager-online.com/en/topics/chemicals-distribution/agrochemical-s-role-creating-world-
peace
Cowi homepage:
http://www.cowifonden.dk/menu/omcowifonden/
Damodaran Online homepage:
http://people.stern.nyu.edu/adamodar/New_Home_Page/datacurrent.html.
Deloitte homepage:
http://www.iasplus.com/en/standards/ias/
DMI homepage:
http://www.dmi.dk/laer-om/temaer/klima/el-nino-et-klimafaenomen/
Ecochem homepage:
http://www.ecochem.com/ENN_glyphosate.html
European Commission homepage on Pesticides: http://ec.europa.eu/food/plant/pesticides/index_en.htm
FAO homepage:
http://www.fao.org/sustainability/en/
ESA homepage:
http://esa.un.org/unpd/wpp/Download/Probabilistic/Population/
FMC Corporation homepage:
http://www.prnewswire.com/news-releases/fmc-corporation-announces-agreement-to-acquire-cheminova-
for-18-billion-274295241.html
Greenpeace homepage:
http://www.greenpeace.org/international/Global/international/publications/agriculture/2015/Pesticides-and-
our-Health.pdf and
124
Gyldendal, Den Store Danske homepage:
http://denstoredanske.dk/Natur_og_milj%C3%B8/Milj%C3%B8_og_forurening/Vandmilj%C3%B8,_spilde
vand_og_olieforurening/Cheminova & Cheminova homepage,
Hempel Fonden homepage:
http://www.hempelfonden.dk/hempel-fonden/fundats/
Indexmundi homepage:
http://www.indexmundi.com/commodities/?commodity=petroleum-price-index&months=180
ISAAA - GM Approval Database:
http://www.isaaa.org/gmapprovaldatabase/default.asp
Komitéen for god Fondsledelse homepage:
https://godfondsledelse.dk/english.
Lemvig Kommune homepage:
http://www.godegrunde.nu/Kommunefakta.aspx?ID=172
Lundbeck Fonden homepage:
http://www.lundbeckfonden.com/media/Fundats_12._april_2016.pdf
Madehow homepage:
http://www.madehow.com/Volume-1/Pesticide.html
Ministry of Environment and food of Denmark homepage:
http://eng.mst.dk/topics/chemicals/legislation-on-chemicals/fact-sheets/fact-sheet-banned-pesticides/
Ministry of Tax homepage:
http://www.skm.dk/skattetal/statistik/generel-skattestatistik/selskabsskattesatser-i-eu-landene-1995-2015
Monsanto homepage:
http://www.monsanto.com/newsviews/pages/why-does-monsanto-sue-farmers-who-save-seeds.aspx
National Pesticide Information Center homepage:
http://npic.orst.edu/ingred/
Nationalbanken homepage:
http://www.nationalbanken.dk/da/statistik/valutakurs/Sider/Default.aspx
Nasdaqomxnordic homepage:
http://www.nasdaqomxnordic.com/indeks/OMXC20stillingen
Novo Fonden hjemmeside :
http://www.novonordiskfonden.dk/da/content/vedtaegter
OECD homepage:
https://data.oecd.org/agroutput/meat-consumption.htm
European Commission homepage:
http://ec.europa.eu/food/plant/pesticides/authorisation_of_ppp/application_procedure/index_en.htm
Proinvestor hompage:
http://www.proinvestor.com/aktienyt/760481/Auriga-Undersoegelse-af-strategiske-muligheder-igangsat
125
PWC homepage:
http://www.pwc.com/gx/en/services/advisory/consulting/risk/resilience/publications/sharpening-strategic-
risk-management.html
Retsinformation homepage:
https://www.retsinformation.dk/forms/r0710.aspx?id=163656.
Royal Unibrew A/S homepage:
http://investor.dk.royalunibrew.com/directors.cfm
SEC homepage:
https://www.sec.gov/answers/tender.htm
The Essential Chemical Industry – online homepage:
http://www.essentialchemicalindustry.org/materials-and-applications/crop-protection-chemicals.html
WWF homepage:
http://wwf.panda.org/what_we_do/footprint/agriculture/impacts/pollution/
Yahoo Finance, homepage:
http://finance.yahoo.com/q?s=MON

126
11. List of Tables, Figures and Graphs
List of Tables
Table 1: Real GDP Growth in % ..................................................................................................................... 20
Table 2: Correlations on Revenue, EBIT and Crop Prices .............................................................................. 22
Table 3: Correlations on Revenue, EBIT and Raw Materials ......................................................................... 24
Table 4: Crop Prices and Raw Materials Forecasts ......................................................................................... 24
Table 5: Expected Population Development ................................................................................................... 25
Table 6: World Average Consumption of Meat per Capita ............................................................................. 25
Table 7: Short Facts - Large vs. Small Players in the Industry ....................................................................... 36
Table 8: Descriptive Statistics – Industry Benchmark Analysis ..................................................................... 37
Table 9: Correlations – Industry Benchmark .................................................................................................. 38
Table 10: WC - Days at Hand ......................................................................................................................... 39
Table 11: Value-Chain Analysis – Financial Data .......................................................................................... 43
Table 12: Value-Chain Analysis - Averages and Margins .............................................................................. 43
Table 13: Adjustment for Operating Leases .................................................................................................... 48
Table 14: Income Statement – Trend Analysis ............................................................................................... 56
Table 15: Income Statement - Common Size Analysis ................................................................................... 57
Table 16: Invested Capital - Common Size ..................................................................................................... 58
Table 17: Days On Hand Analysis .................................................................................................................. 58
Table 18: Calculation of Market Value of Equity ........................................................................................... 61
Table 19: Long-term Liquidity Risk ................................................................................................................ 62
Table 20: Sensitivity in Revenue ..................................................................................................................... 79
Table 21: FX Forecasts .................................................................................................................................... 79
Table 22 : Descriptive Statistics – Strategic Risk Management Analysis ....................................................... 79
Table 23: Correlations – Strategic Risk Management Analysis ...................................................................... 80
Table 24: Findings - Strategic Risk Management Analysis ............................................................................ 80
Table 25: Value Drivers .................................................................................................................................. 92
Table 26: TOWS Matrix .................................................................................................................................. 94
Table 27: DCF-model, Point of Origin Scenario ............................................................................................. 97
Table 28: Path #1 - Overview (Source: Own Creation) .................................................................................. 98
Table 29: Investment in New Facilities - Financial Overview ...................................................................... 100
Table 30: Investment in New Facilities – Cash-flow Overview .................................................................... 100
Table 31: Path #2 - Overview ........................................................................................................................ 101
Table 32: Path #3 – Overview ....................................................................................................................... 104
Table 33: Path #4 - Overview ........................................................................................................................ 108

127
List of Figures
Figure 1-1: Introductionary Triangle ................................................................................................................. 1
Figure 1-2: Focus of the Paper .......................................................................................................................... 2
Figure 1-3: Model and Theories Applied to Create Focal Point ....................................................................... 3
Figure 1-4: Structure of the Paper ..................................................................................................................... 7
Figure 2-1: Auriga 2013 – Revenue by Segment and Region ......................................................................... 15
Figure 2-2: Interest Power Matrix ................................................................................................................... 15
Figure 3-1: Global Overview – Auriga Industries A/S .................................................................................... 17
Figure 3-2: Global Overview– the Market with average numbers from 2009 to 2013 ................................... 19
Figure 3-3: Porters Generic Competitive Strategy .......................................................................................... 31
Figure 3-4: Product Revenue Matrix ............................................................................................................... 33
Figure 3-5: Geographical Revenue Matrix ...................................................................................................... 35
Figure 3-6: M&A Transactions Volume by Country Acquirer ....................................................................... 36
Figure 4-1: Du Pont Model .............................................................................................................................. 52
Figure 4-2: Auriga Matrix Organization ......................................................................................................... 65
Figure 4-3: Board Setup at Auriga .................................................................................................................. 66
Figure 4-4: Mitchell’s Stakeholder Typology ................................................................................................. 69
Figure 4-5: Aarhus University Research Foundation – Assets ........................................................................ 69
Figure 4-6: Assessing Strategic Risks ............................................................................................................. 76
Figure 7-1: Organizational Chart – Divisional Structure ................................................................................ 98
Figure 7-2: WC Processes ............................................................................................................................. 102
Figure 7-3: Chemtura Revenue by Regions .................................................................................................. 105
Figure 7-4: Geographical Revenue – Auriga vs. Chemtura .......................................................................... 107
Figure 7-5: Auriga vs. FMC, Regional Revenue and Segment Revenue ...................................................... 111
List of Graphs
Graph 1: Industry Revenue by Regions ........................................................................................................... 21
Graph 2: Industry Revenue Growth ................................................................................................................. 21
Graph 3: Crop Prices – 2001 – 2014 ............................................................................................................... 22
Graph 4: Raw Material Prices ......................................................................................................................... 23
Graph 5: Tier 1 and Tier 2 Companies - Pesticide and Biotech Split .............................................................. 27
Graph 6: Benchmark Analysis ......................................................................................................................... 38
Graph 7: Tax Rates of Auriga Industries A/S .................................................................................................. 51
Graph 8: Overview – ROE, ROIC and Effect from Financing Activities ....................................................... 53
Graph 9: Effect from Financing Activities ...................................................................................................... 54
Graph 10: Effect from Operating Activities .................................................................................................... 55
Graph 11: Relative Importance of Risk Categories ......................................................................................... 75
Graph 12: Risk Management Effectiveness .................................................................................................... 81
Graph 13: Strategic Risk Management - Return on Assets ............................................................................. 82
Graph 14: Strategic Risk Management – R&D to Revenue ............................................................................ 83
Graph 15: Strategic Risk Management - Total Debt to Market Value of Equity ............................................ 84
Graph 16: Strategic Risk Management – Cash and Short-Term Investments to Revenue .............................. 85
Graph 17: Chemtura Net Revenue................................................................................................................. 105
Graph 18: Distance (Index) vs. Performance ................................................................................................ 115
128
12. Appendix
List of Appendix
Appendix 1: Key Active Ingredients ............................................................................................................. 129
Appendix 2: Auriga History - The Early Days .............................................................................................. 130
Appendix 3: Email Dialogue with Kurt Aaboe Concerning Acess to Documents ........................................ 131
Appendix 4: Initial Charter AURF ................................................................................................................ 132
Appendix 5: Sales Attempt – 1998, Letter from Authorities dated 30’th of October 1998 .......................... 135
Appendix 6: Sales Attempt – 2009, Letter from Authorities dated 26’th of January 2009 ........................... 139
Appendix 7: Sales Attempt 2014, Letter to Authorities dated 17'th of June 2014 ........................................ 141
Appendix 8: Sales Attempt 2014, Letter from Authorities 19’th of June 2014 ............................................. 151
Appendix 9: Sales Attempt - 2014, Letter From to Authorities on the 5’th of September 2014 ................... 153
Appendix 10: Sales Attempt - 2014, PwC Memorandum ............................................................................. 158
Appendix 11: Sales Attempt – 2014, Board Memorandum .......................................................................... 163
Appendix 12: Auriga Stock Price Development - 1996 – 2014 ................................................................... 169
Appendix 13: Overview of Auriga's Global Business Units from 1996-2013 .............................................. 170
Appendix 14: Agrochemical Active Ingredient Introductions Since 1950 .................................................... 171
Appendix 15: Adoption of Genetically Engineered Crops in the US ............................................................ 171
Appendix 16: Bench-mark Data .................................................................................................................... 172
Appendix 17: AURF - Board Overview ....................................................................................................... 180
Appendix 18: Auriga – Board Overview ....................................................................................................... 180
Appendix 19: Creating Strategic Options ...................................................................................................... 181
Appendix 20: Strategic Risk Management Du Pont Analysis ....................................................................... 182
Appendix 21: Scenario Point of Origin ......................................................................................................... 183
Appendix 22: Scenario – Path #2 .................................................................................................................. 185
Appendix 23: Scenario - Path #2, 50% Improvement ................................................................................... 187
Appendix 24: Scenario – Path #3 .................................................................................................................. 189
Appendix 25: Scenario - Path #4 ................................................................................................................... 191
Appendix 26: Scenario - Path #2 and Path #3 ............................................................................................... 193
Appendix 27: IFRS Ammendments .............................................................................................................. 195
Appendix 28: Auriga Income Statement with Preliminary Adjustments ...................................................... 196
Appendix 29: Auriga Balance Sheet with Preliminary Adjustments ............................................................ 197
Appendix 30: Reclassified Income Statement & Balance Sheet ................................................................... 199
Appendix 31: Email Dialogue with AURF ................................................................................................... 201
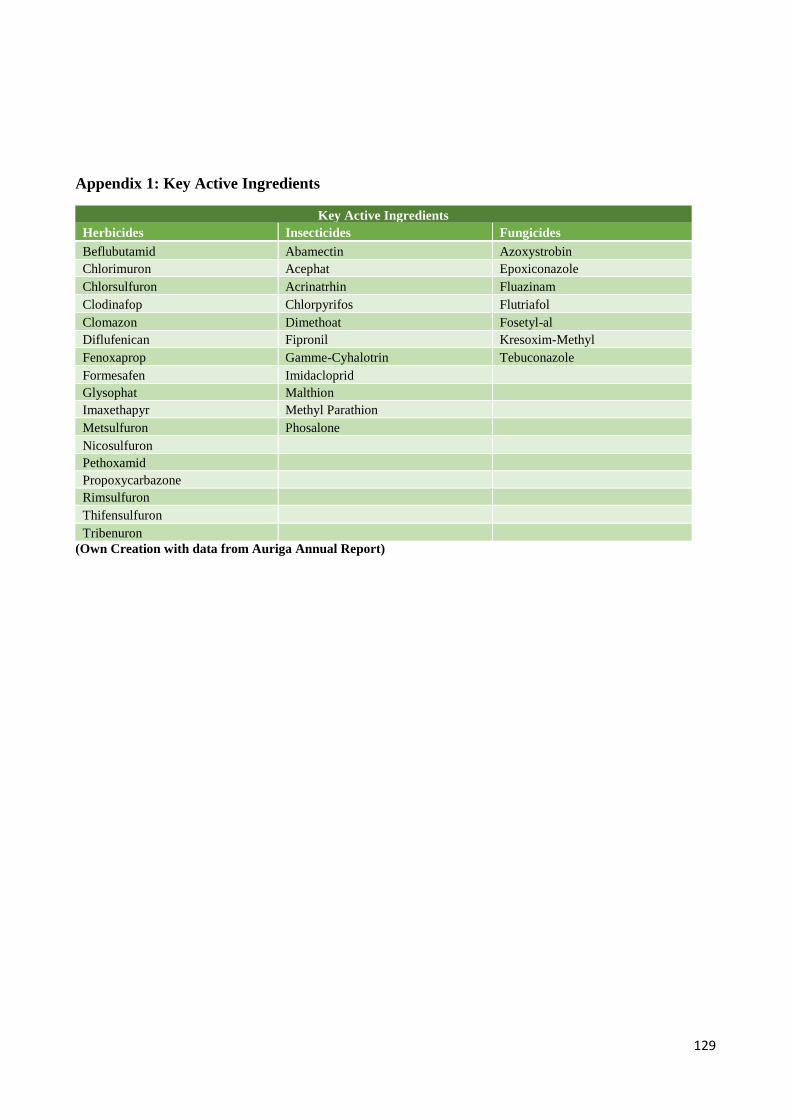
129
Appendix 1: Key Active Ingredients
Key Active Ingredients
Herbicides Insecticides Fungicides
Beflubutamid Abamectin Azoxystrobin
Chlorimuron Acephat Epoxiconazole
Chlorsulfuron Acrinatrhin Fluazinam
Clodinafop Chlorpyrifos Flutriafol
Clomazon Dimethoat Fosetyl-al
Diflufenican Fipronil Kresoxim-Methyl
Fenoxaprop Gamme-Cyhalotrin Tebuconazole
Formesafen Imidacloprid
Glysophat Malthion
Imaxethapyr Methyl Parathion
Metsulfuron Phosalone
Nicosulfuron
Pethoxamid
Propoxycarbazone
Rimsulfuron
Thifensulfuron
Tribenuron
(Own Creation with data from Auriga Annual Report)
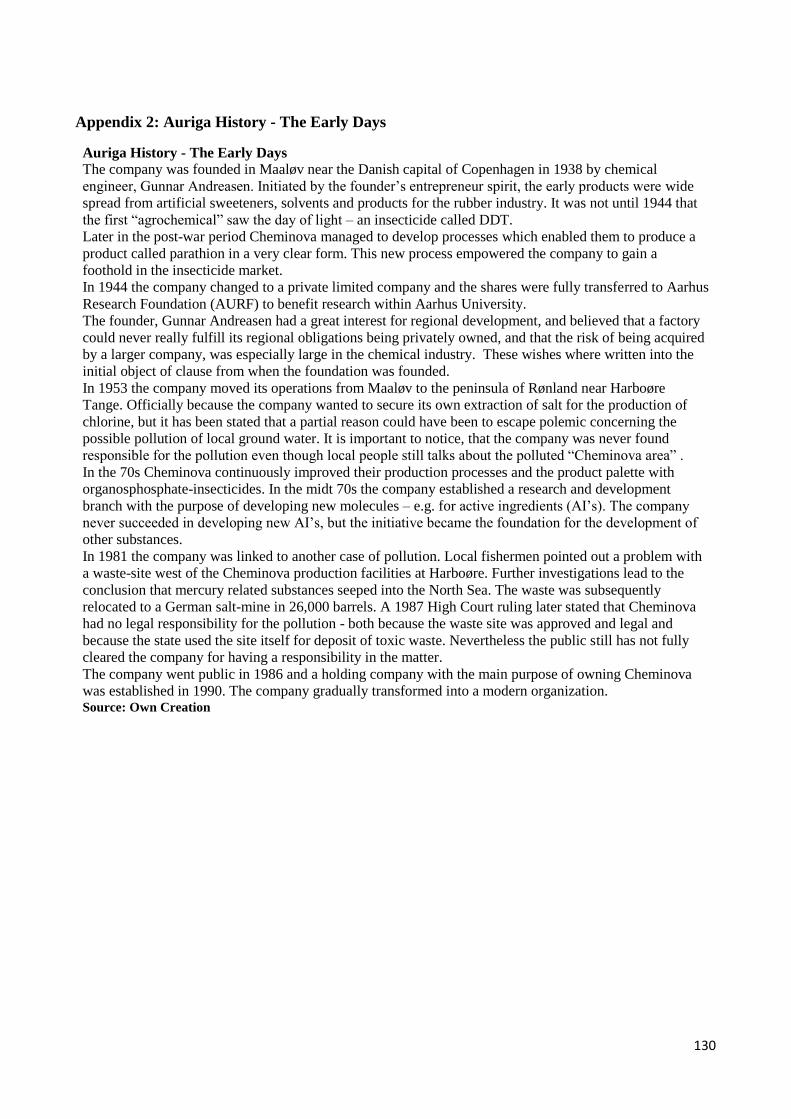
130
Appendix 2: Auriga History - The Early Days
Auriga History - The Early Days
The company was founded in Maaløv near the Danish capital of Copenhagen in 1938 by chemical
engineer, Gunnar Andreasen. Initiated by the founder’s entrepreneur spirit, the early products were wide
spread from artificial sweeteners, solvents and products for the rubber industry. It was not until 1944 that
the first “agrochemical” saw the day of light – an insecticide called DDT.
Later in the post-war period Cheminova managed to develop processes which enabled them to produce a
product called parathion in a very clear form. This new process empowered the company to gain a
foothold in the insecticide market.
In 1944 the company changed to a private limited company and the shares were fully transferred to Aarhus
Research Foundation (AURF) to benefit research within Aarhus University.
The founder, Gunnar Andreasen had a great interest for regional development, and believed that a factory
could never really fulfill its regional obligations being privately owned, and that the risk of being acquired
by a larger company, was especially large in the chemical industry. These wishes where written into the
initial object of clause from when the foundation was founded.
In 1953 the company moved its operations from Maaløv to the peninsula of Rønland near Harboøre
Tange. Officially because the company wanted to secure its own extraction of salt for the production of
chlorine, but it has been stated that a partial reason could have been to escape polemic concerning the
possible pollution of local ground water. It is important to notice, that the company was never found
responsible for the pollution even though local people still talks about the polluted “Cheminova area” .
In the 70s Cheminova continuously improved their production processes and the product palette with
organosphosphate-insecticides. In the midt 70s the company established a research and development
branch with the purpose of developing new molecules – e.g. for active ingredients (AI’s). The company
never succeeded in developing new AI’s, but the initiative became the foundation for the development of
other substances.
In 1981 the company was linked to another case of pollution. Local fishermen pointed out a problem with
a waste-site west of the Cheminova production facilities at Harboøre. Further investigations lead to the
conclusion that mercury related substances seeped into the North Sea. The waste was subsequently
relocated to a German salt-mine in 26,000 barrels. A 1987 High Court ruling later stated that Cheminova
had no legal responsibility for the pollution - both because the waste site was approved and legal and
because the state used the site itself for deposit of toxic waste. Nevertheless the public still has not fully
cleared the company for having a responsibility in the matter.
The company went public in 1986 and a holding company with the main purpose of owning Cheminova
was established in 1990. The company gradually transformed into a modern organization. Source: Own Creation
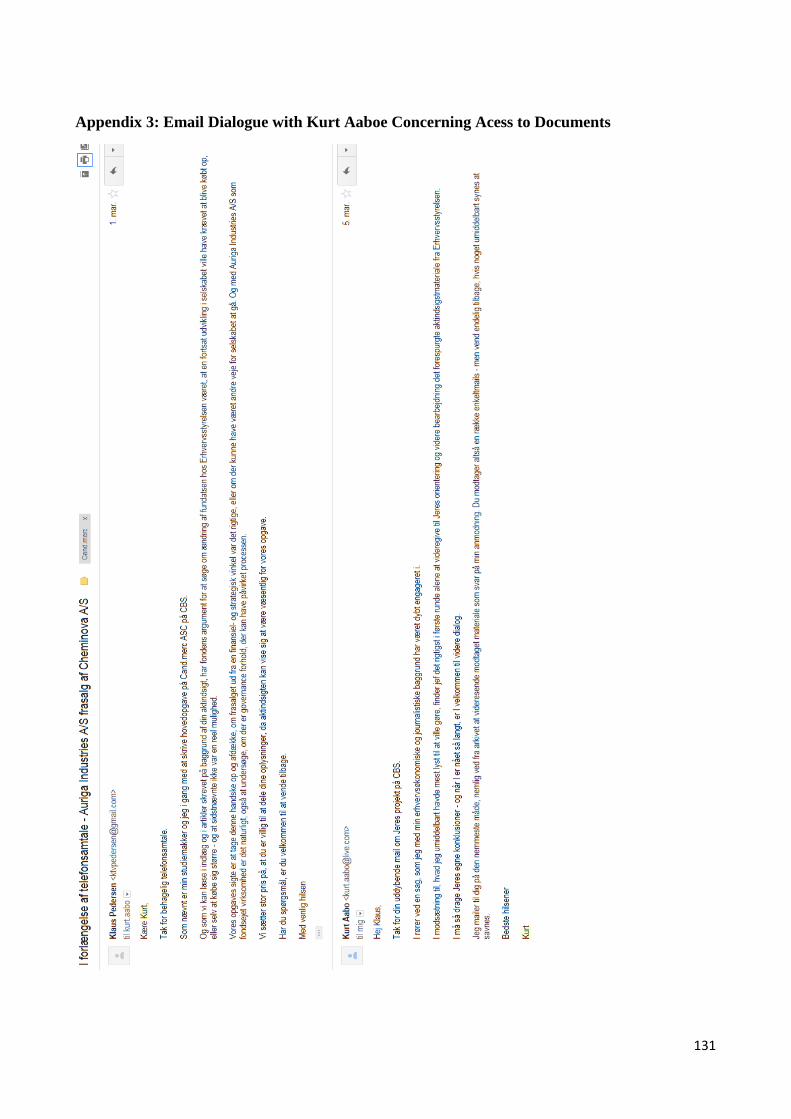
131
Appendix 3: Email Dialogue with Kurt Aaboe Concerning Acess to Documents
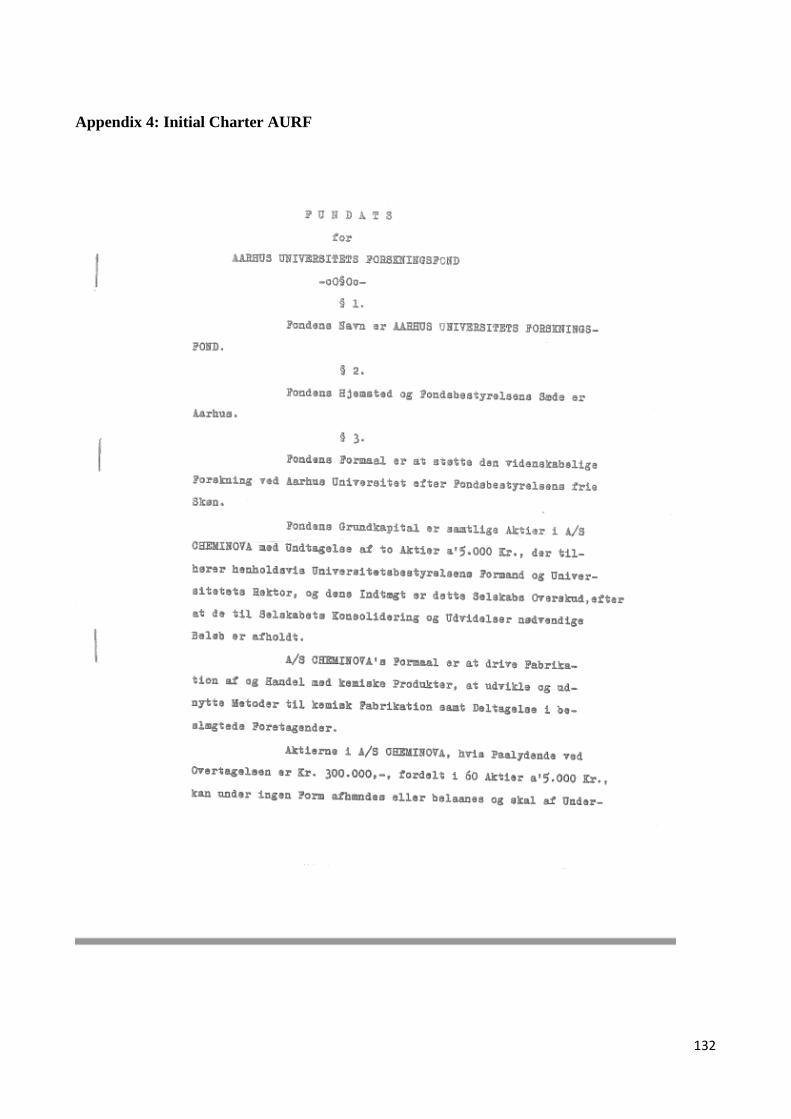
132
Appendix 4: Initial Charter AURF
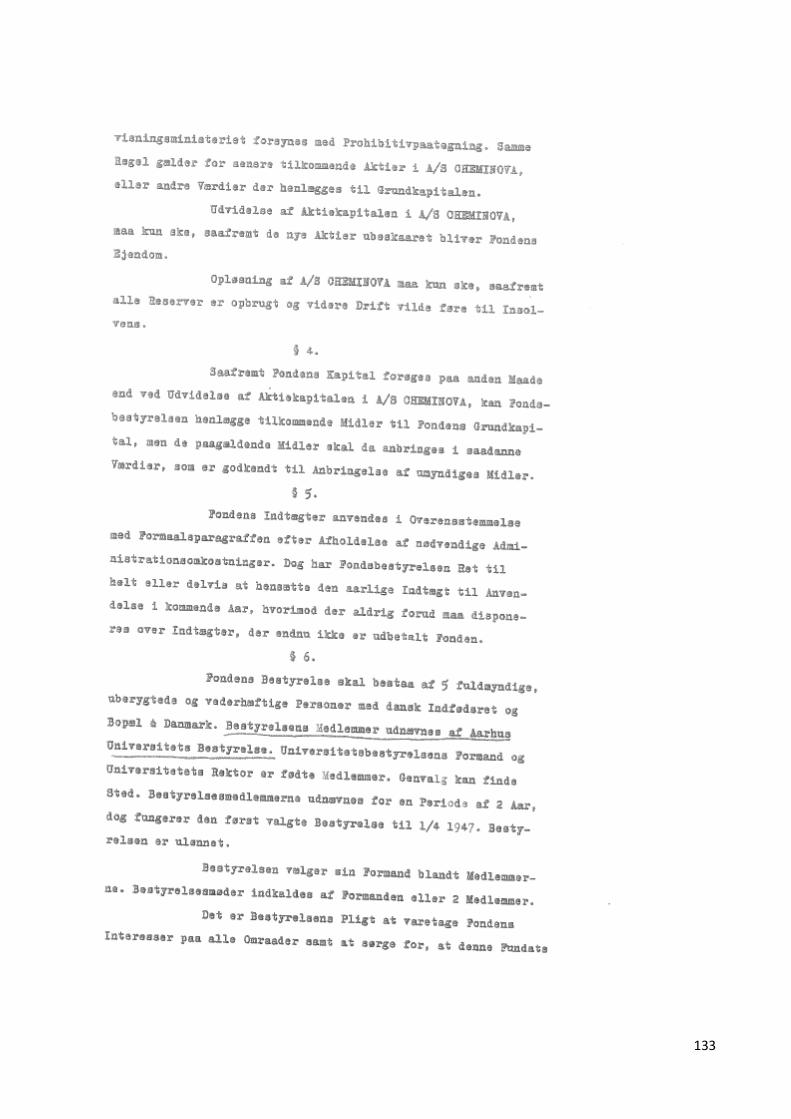
133
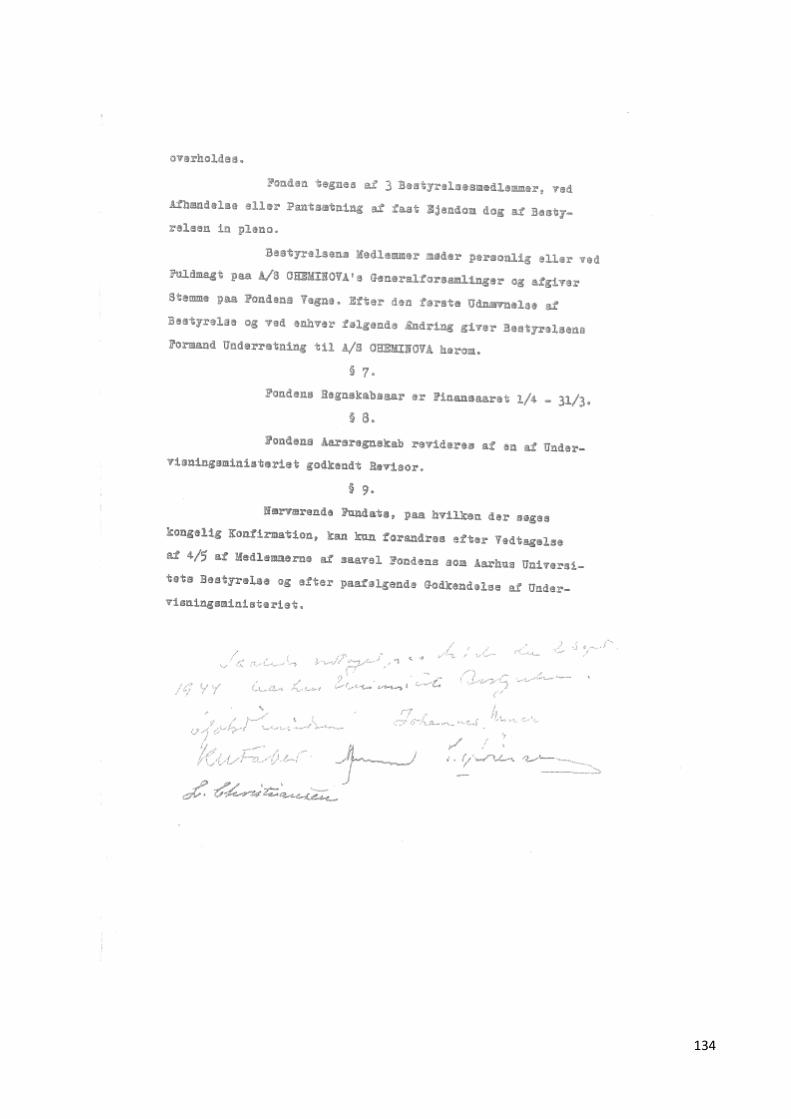
134
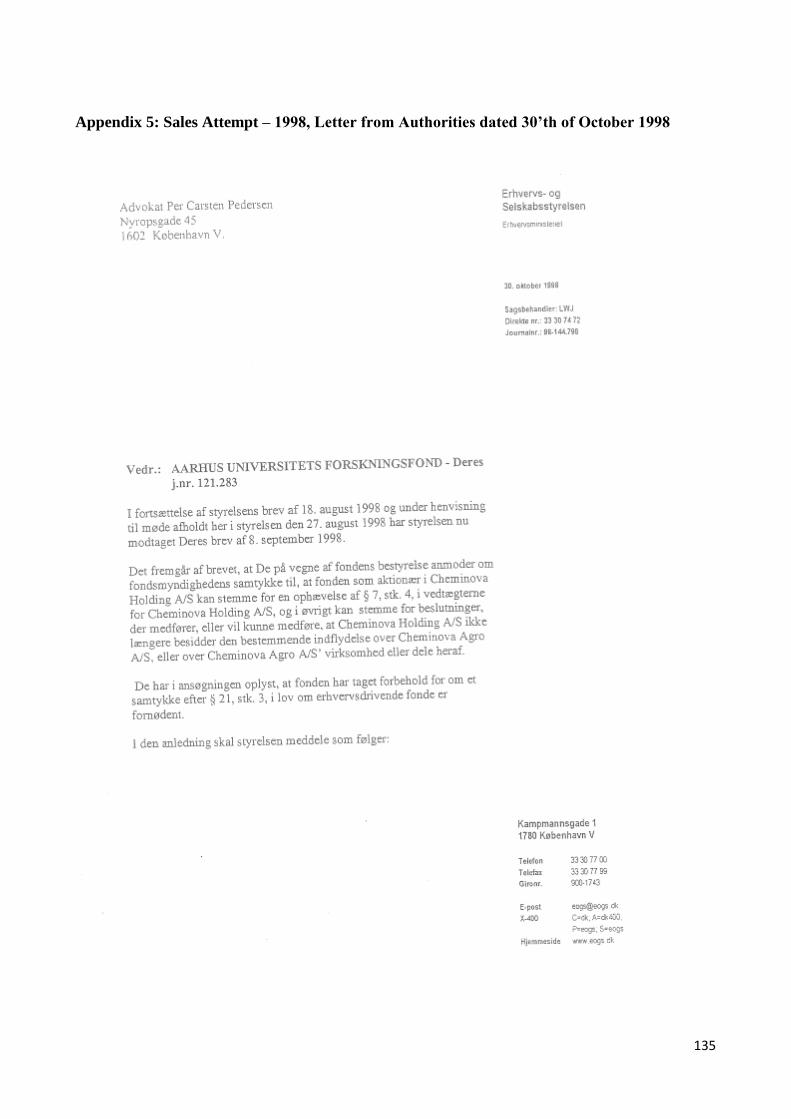
135
Appendix 5: Sales Attempt – 1998, Letter from Authorities dated 30’th of October 1998

136

137
138
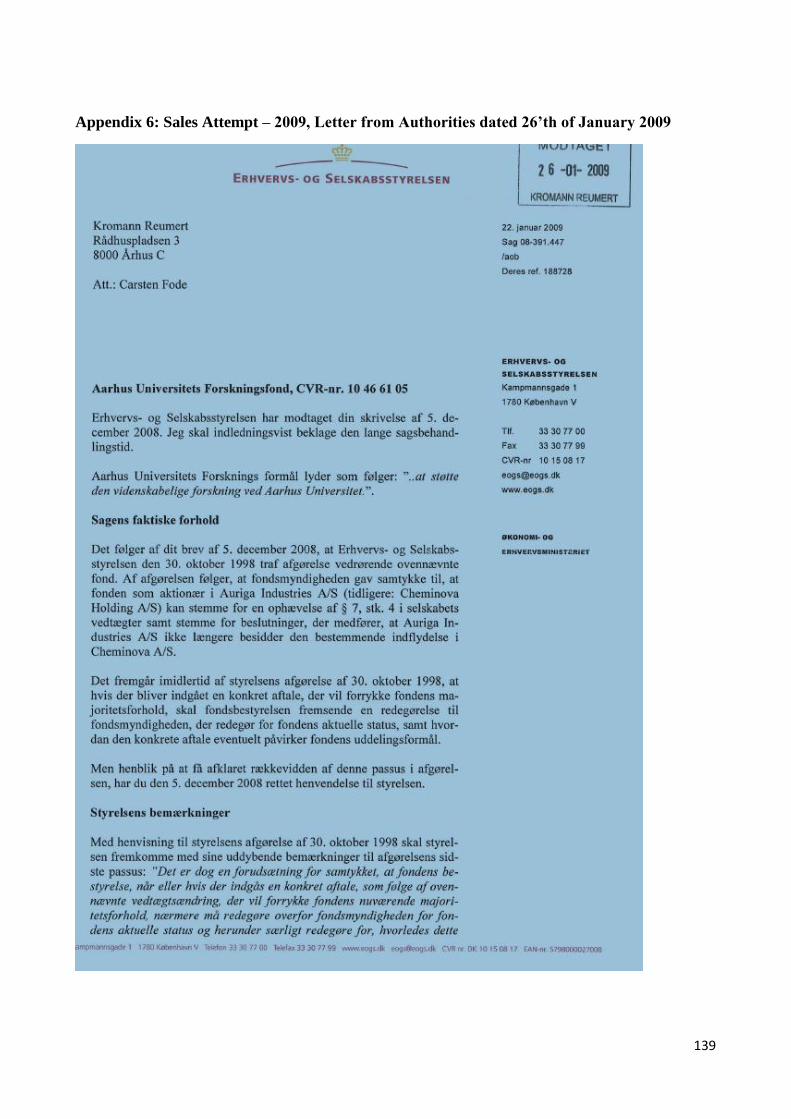
139
Appendix 6: Sales Attempt – 2009, Letter from Authorities dated 26’th of January 2009
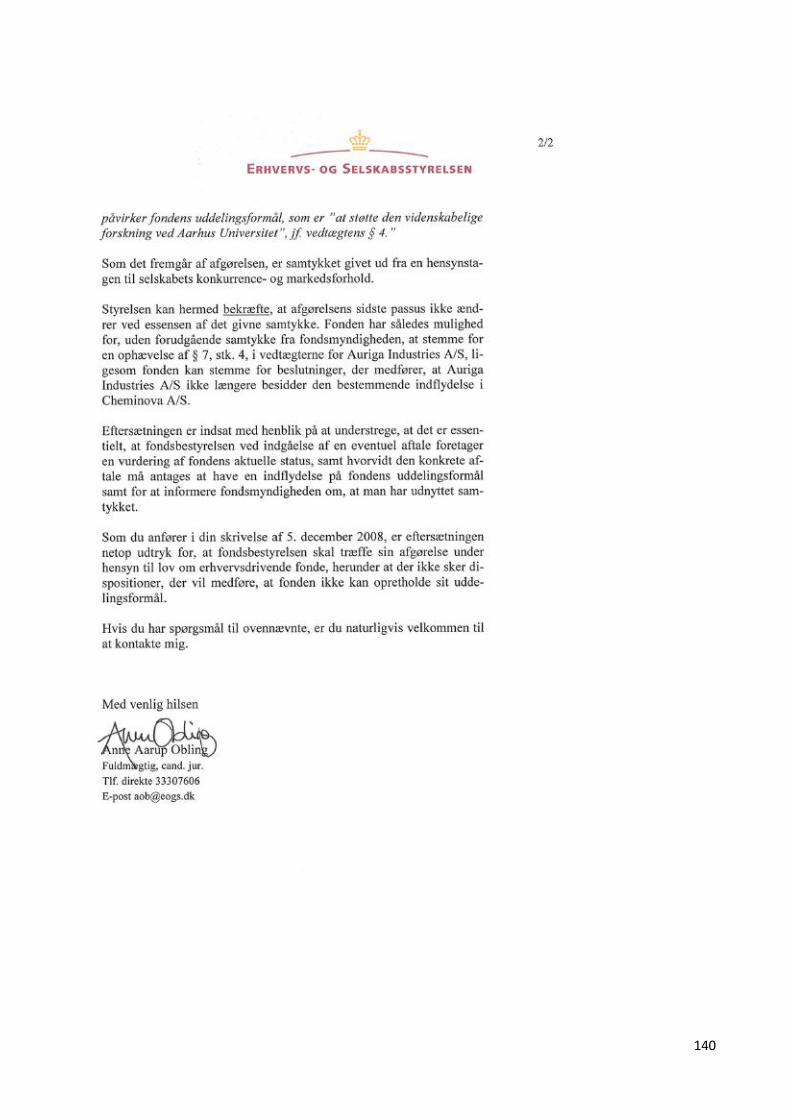
140
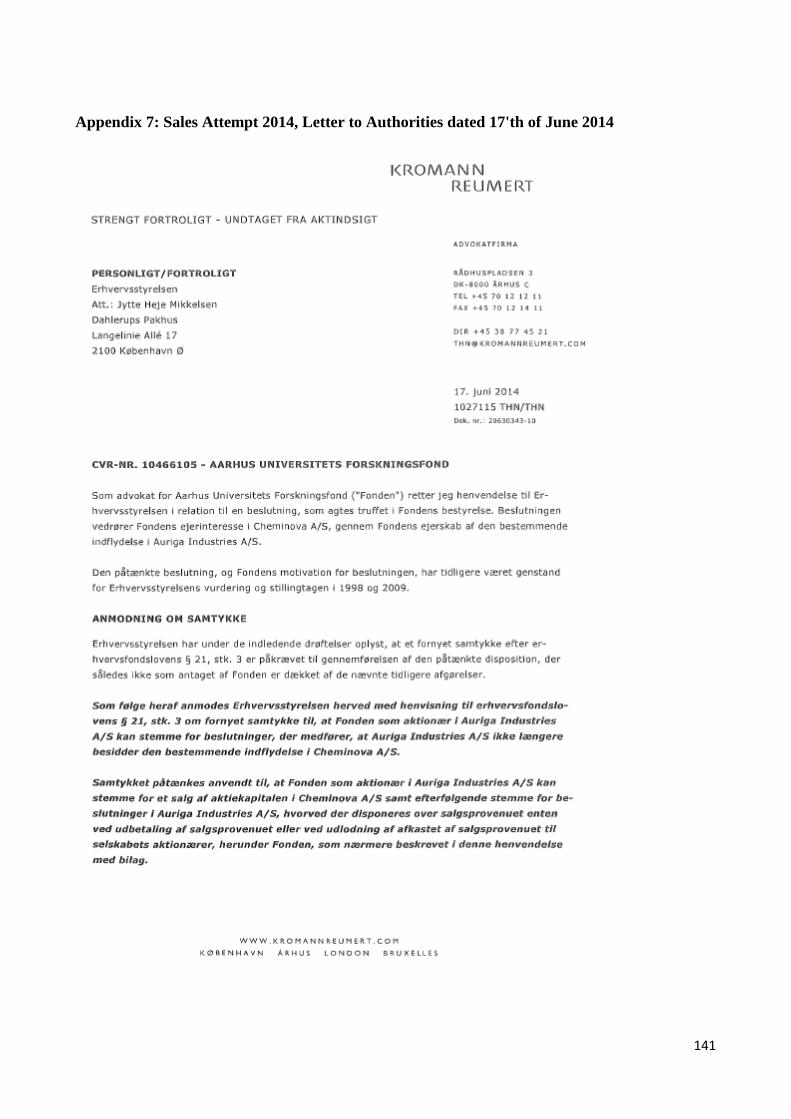
141
Appendix 7: Sales Attempt 2014, Letter to Authorities dated 17'th of June 2014
142
143
144
145
146

147
148

149
150
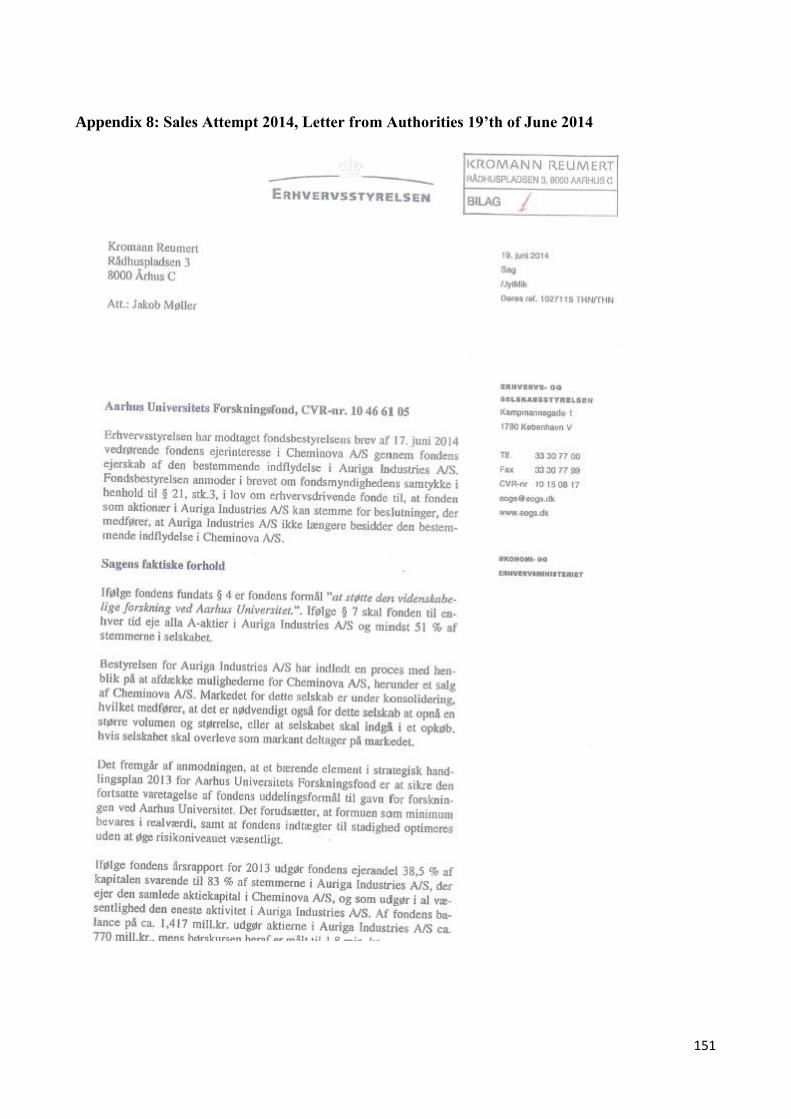
151
Appendix 8: Sales Attempt 2014, Letter from Authorities 19’th of June 2014
152
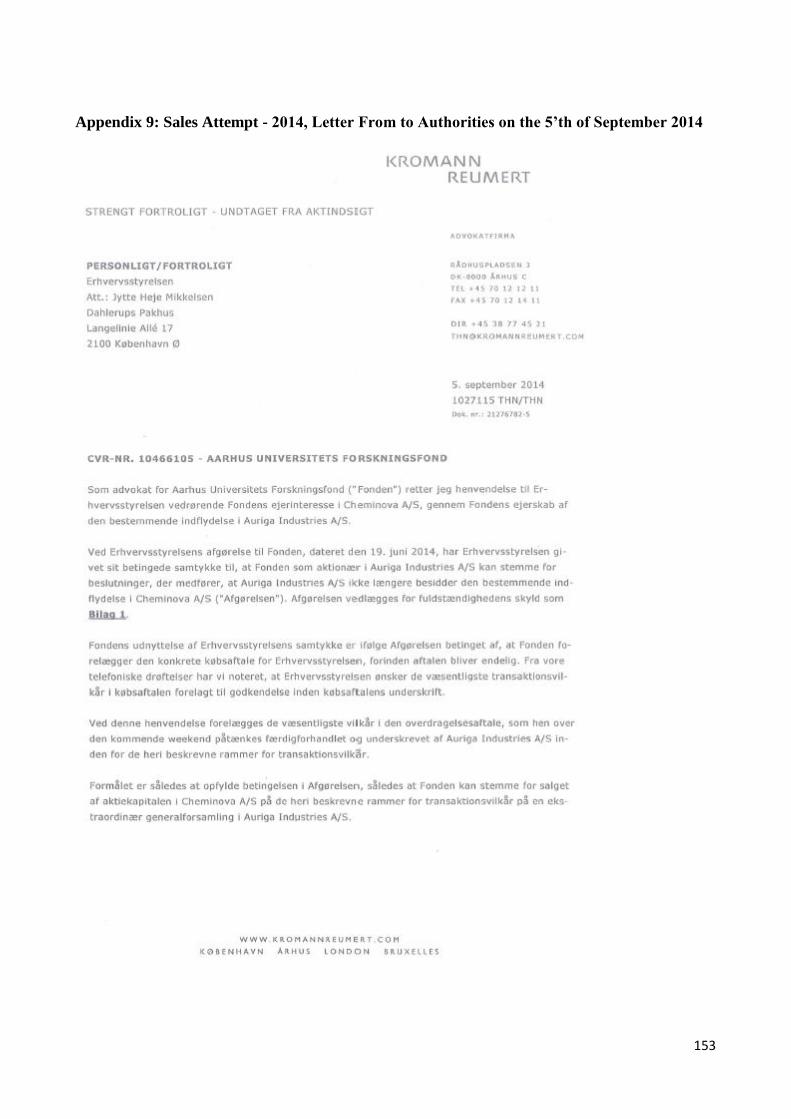
153
Appendix 9: Sales Attempt - 2014, Letter From to Authorities on the 5’th of September 2014
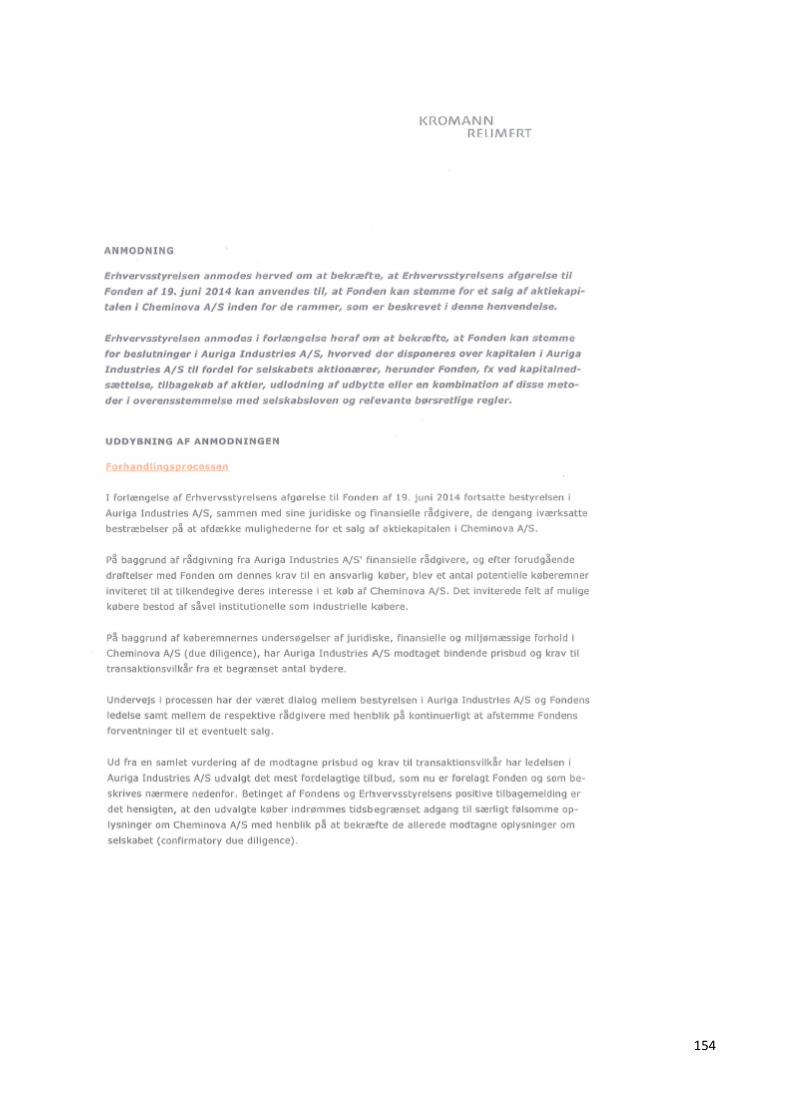
154
155
156
157

158
Appendix 10: Sales Attempt - 2014, PwC Memorandum
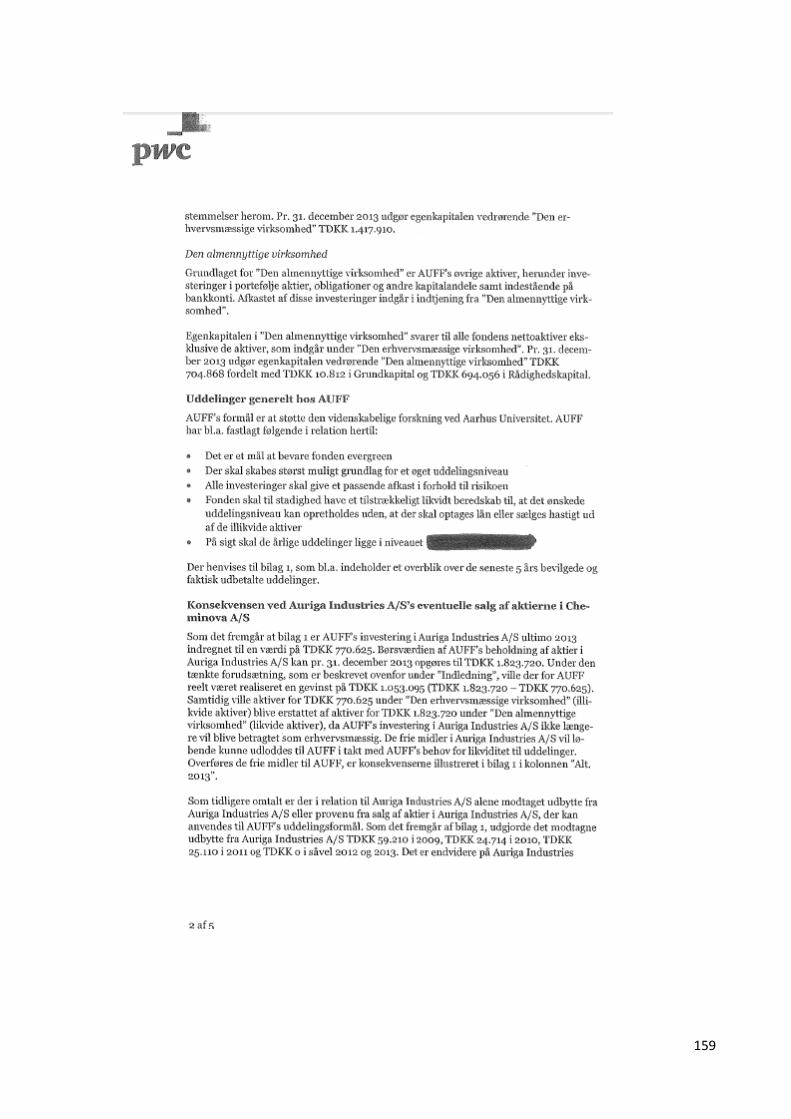
159
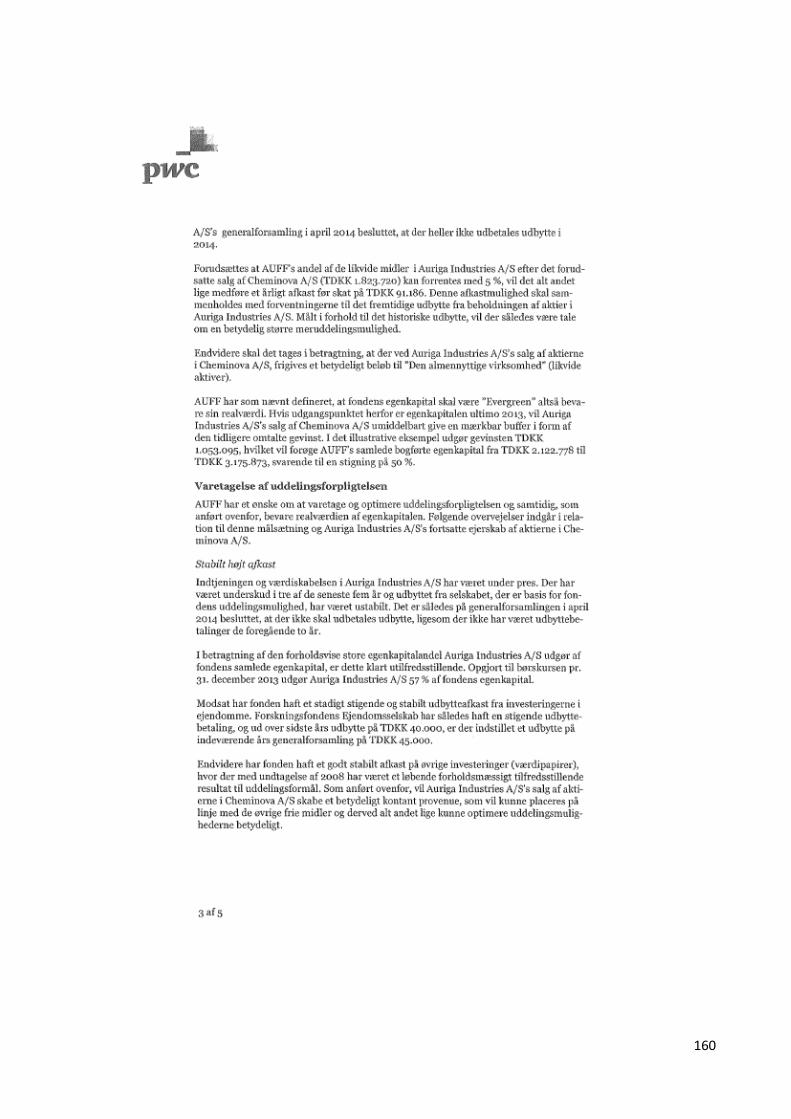
160
161
162
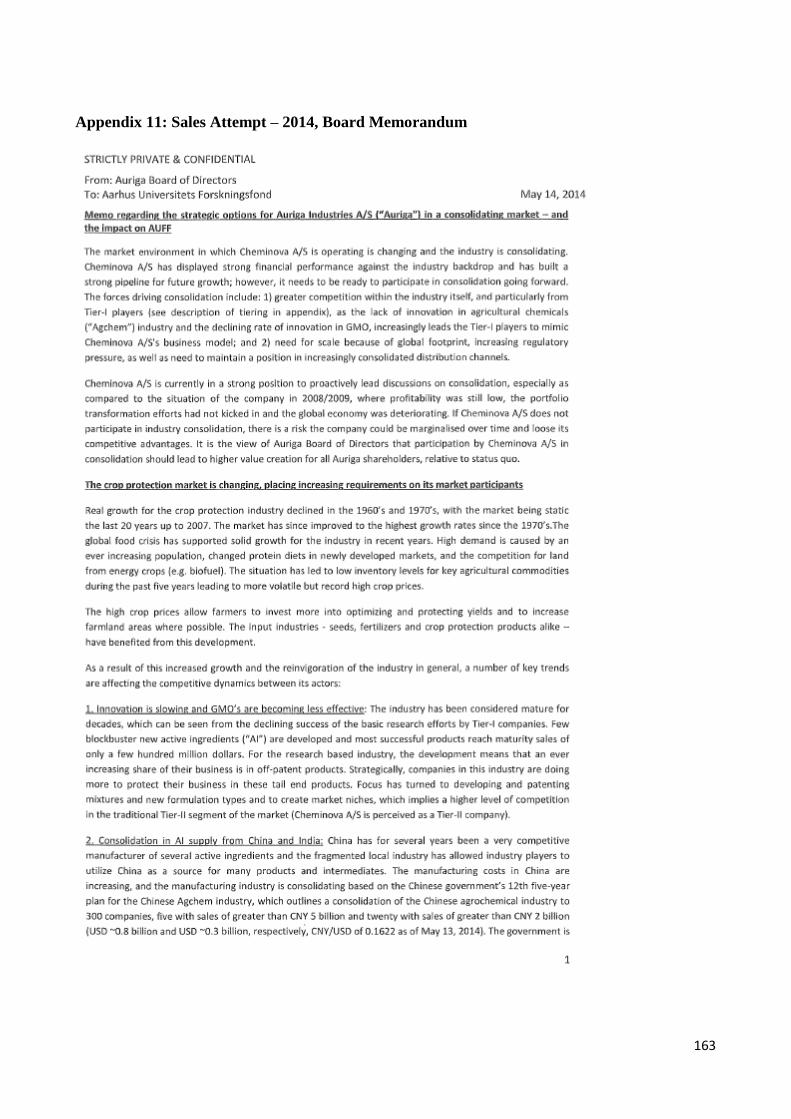
163
Appendix 11: Sales Attempt – 2014, Board Memorandum
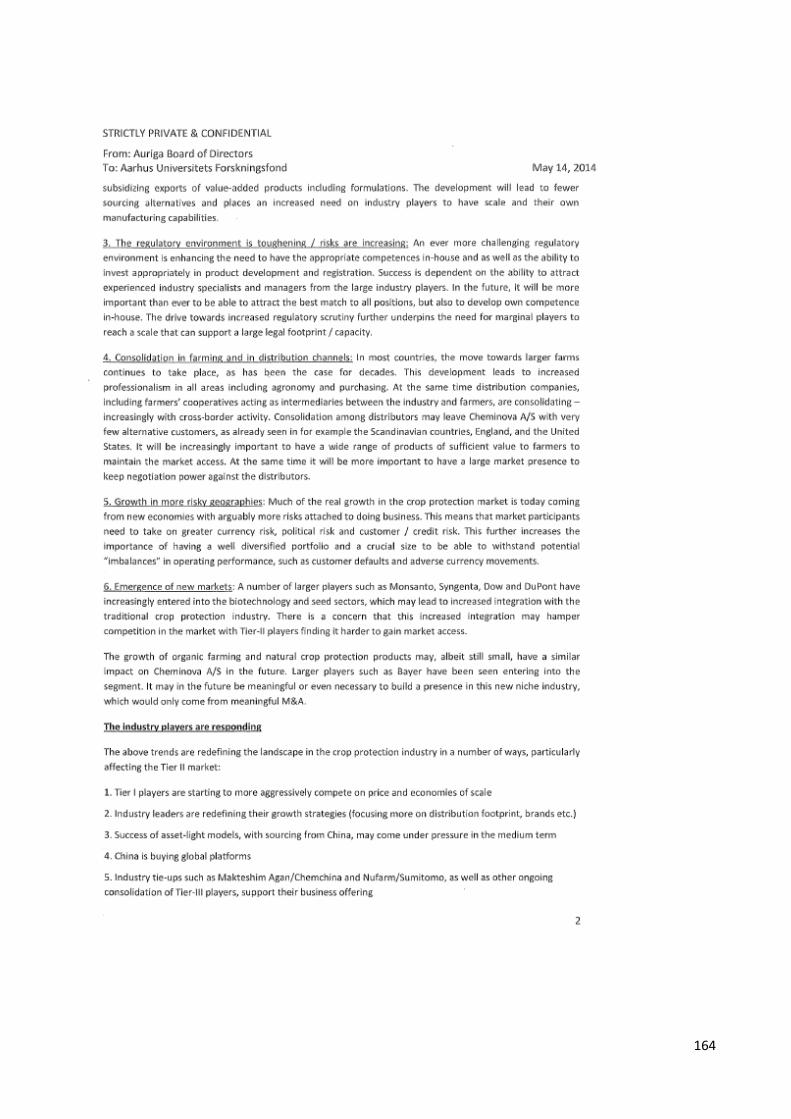
164
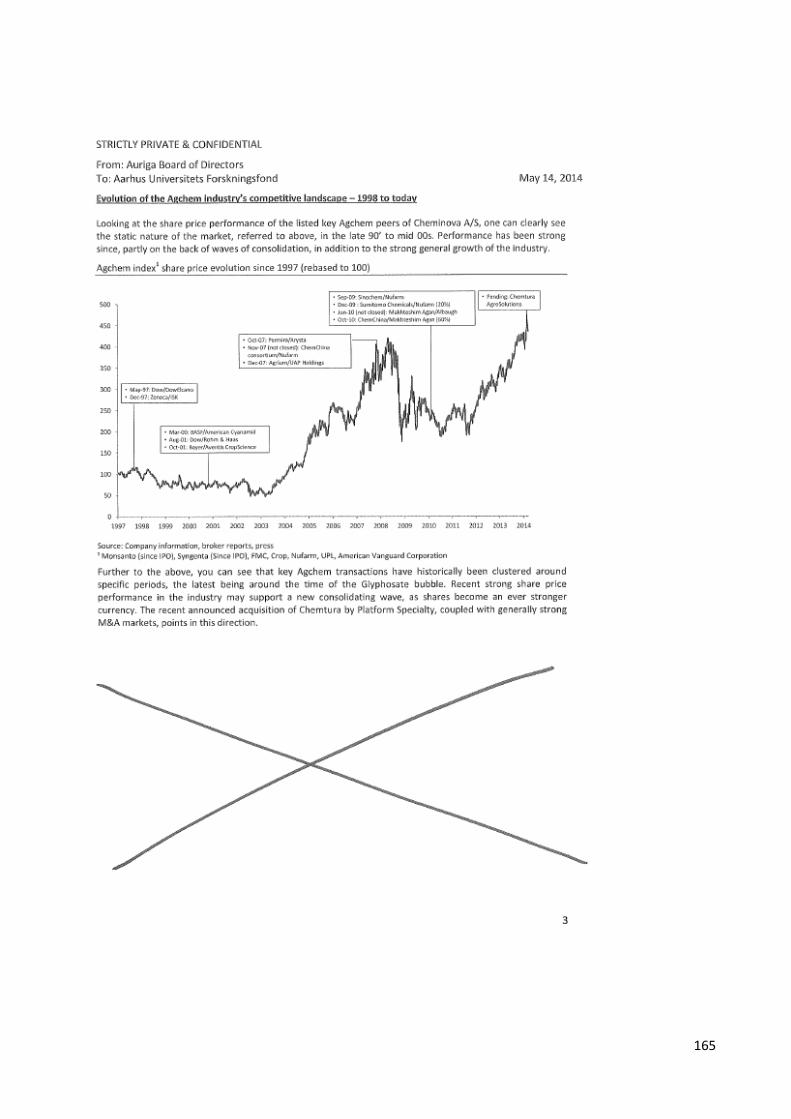
165
166
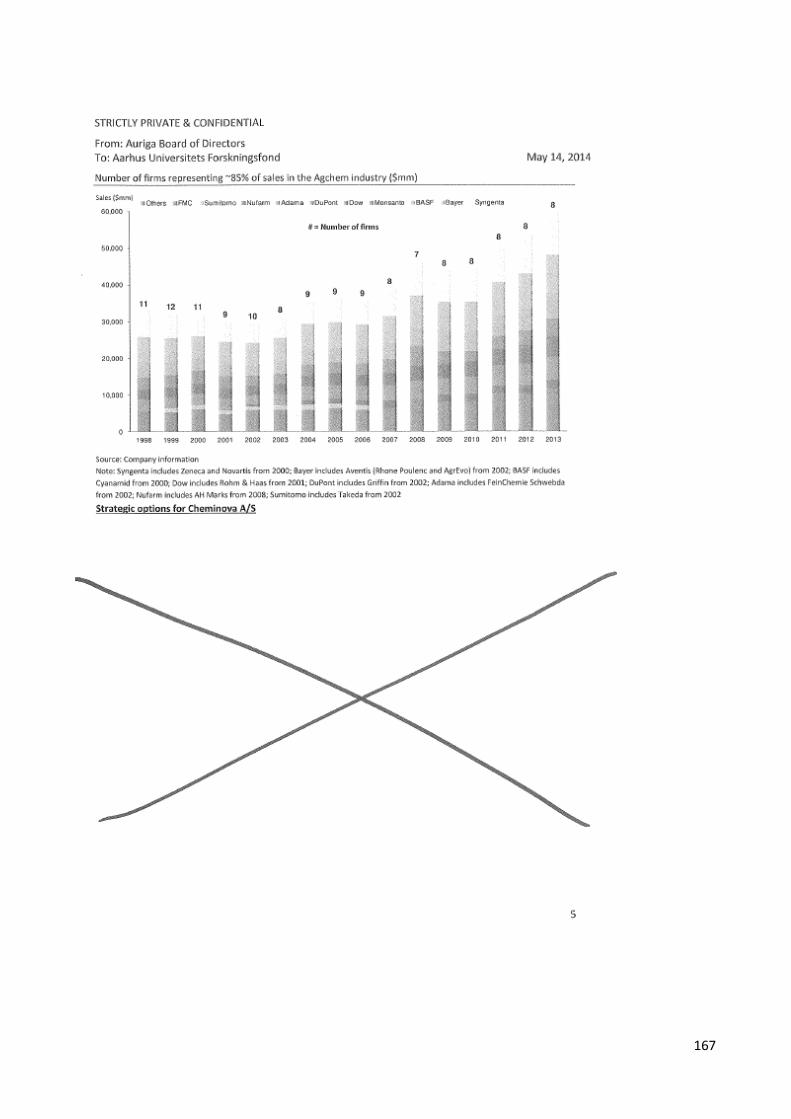
167
168
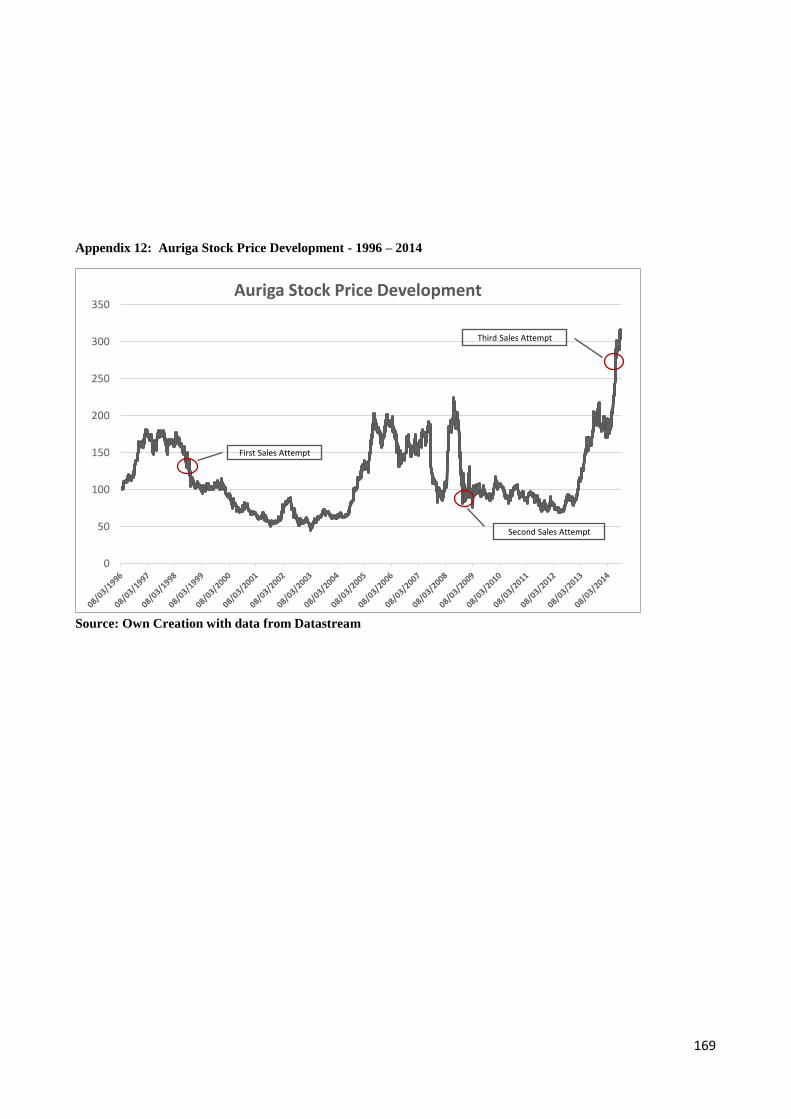
169
Appendix 12: Auriga Stock Price Development - 1996 – 2014
Source: Own Creation with data from Datastream
0
50
100
150
200
250
300
350Auriga Stock Price Development
First Sales Attempt
Third Sales Attempt
Second Sales Attempt

170
Appendix 13: Overview of Auriga's Global Business Units from 1996-2013
Source: Own Creation with data from annual reports
C ompany / year19 9 6 19 9 7 19 9 8 19 9 9 2 0 0 0 2 0 0 1 2 0 0 2 2 0 0 3 2 0 0 4 2 0 0 5 2 0 0 6 2 0 0 7 2 0 0 8 2 0 0 9 2 0 10 2 0 11 2 0 12 2 0 13
Cheminova, Agro A/S 100% 100% 100% 100% 100% 100% 100% 100% 100% 100% 100% 100% 100% 100% 100% 100% 100% 100%
Chem, USA 100% 100% 100% 100% 100% 100% 100% 100% 100% 100% 100% 100% 100% 100% 100% 100% 100% 100%
Agrodan, Spain 91% 91% 91% 91% 86% 86% 86% 86% 87% 87% 88% 90% 90% 93% 94% 94% 96% 96%
Chem, France 100% 100% 100% 100% 100% 100% 100% 100% 100% 100% 100% 100% 100% 100% 100% 100% 100% 100%
Chem, UK 100% 100% 100% 100% 100%
Chem, Hungary 100% 100% 100% 100% 100% 100% 51% 51% 100% 100% 100% 100% 100%
Chem, M exico 100% 100% 100% 100% 100% 100% 100% 100% 100% 100% 100% 100% 100% 100% 100% 100% 100% 100%
Chem, Italy 100% 100% 100% 100% 100% 100% 100% 100% 100% 100% 100% 100% 100% 100% 100% 100% 100% 100%
Lupin Agrochemicals 100% 100% 100%
Chem, Brazil 100% 100% 100% 100% 100% 100% 100% 100% 100% 100% 100% 100% 100% 100% 100% 100% 100%
Chem, India 100% 100% 100% 100% 100% 100% 100% 100% 100% 100% 100% 100% 100% 100% 100% 100%
Chem, Taiwan 100% 100% 100% 100% 100% 100% 100% 100% 100% 100% 100% 100% 100% 100% 100% 100%
Chem, Canada 100% 100% 100% 100% 100% 100% 100% 100% 100% 100% 100% 100% 100% 100% 100% 100%
Chemiplan, Argent ina 100% 100% 100% 100% 100% 100% 100% 100% 100% 100% 100% 100% 100% 100% 100%
Headland Agr, UK 51% 51% 51% 51% 51% 51% 100% 100% 100% 100% 100% 100% 100% 100%
Chem, Rusia 100% 100% 100% 100% 100% 100% 100% 100% 100% 100% 100% 100%
Pytech, Joint-venture 50% 50% 50% 50% 50% 50% 100% 100% 100% 100% 100% 100%
Croptech, Columbia 51% 51% 58% 100% 100% 100% 100% 100% 100%
Ospray, Australia 51% 59% 67% 72% 81% 90% 90% 100% 100%
Chem, Bulgaria 100% 100% 100% 100% 100% 100% 100% 100% 100%
Chem, Polska 100% 100% 100% 100% 100% 100% 100% 100% 100%
Abielux, Uruguay 100% 100% 100% 100% 100% 100% 100% 100%
Stähler, Germany 50% 75% 75% 75% 75% 100% 100%
Chem, Australia 100% 100% 100% 100% 100%
Chem, Serbia 100% 100% 100% 100% 100%
Chem, China 100% 100% 100% 100%
Agrinova, Libanon 35% 35%
Cheminova, Austria 100%
R ep o f f ices
Chem, Russia
Chem, Ukraine
Chem, China
Chem, Thailand
Chem, Kenya
Chem, Romania
Chem, Croat ia
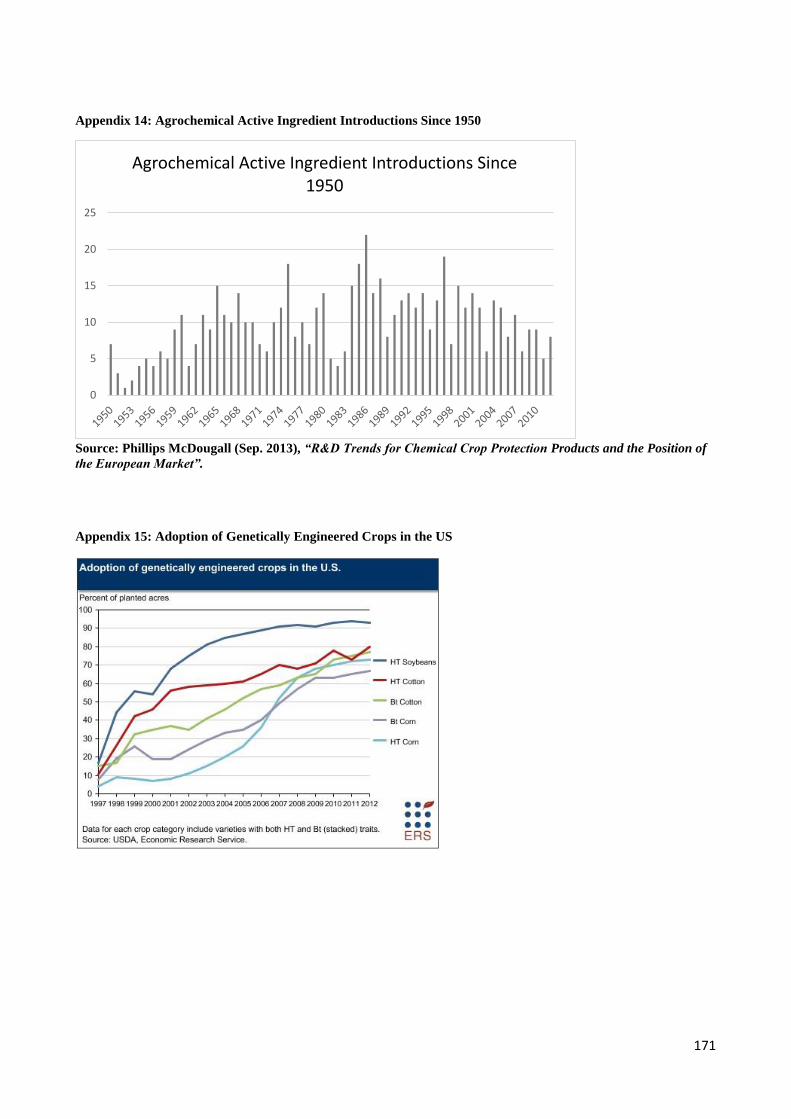
171
Appendix 14: Agrochemical Active Ingredient Introductions Since 1950
Source: Phillips McDougall (Sep. 2013), “R&D Trends for Chemical Crop Protection Products and the Position of
the European Market”.
Appendix 15: Adoption of Genetically Engineered Crops in the US
0
5
10
15
20
25
Agrochemical Active Ingredient Introductions Since 1950

172
Appendix 16: Bench-mark Data
(Source: Datastream)
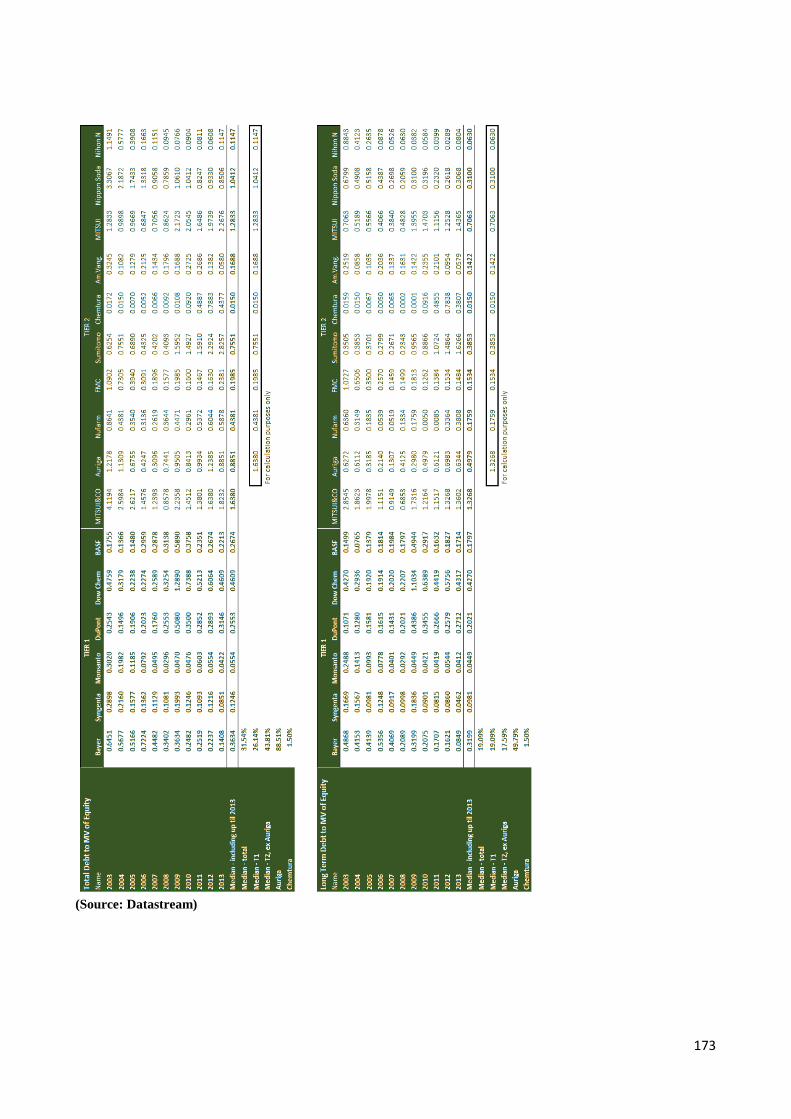
173
(Source: Datastream)
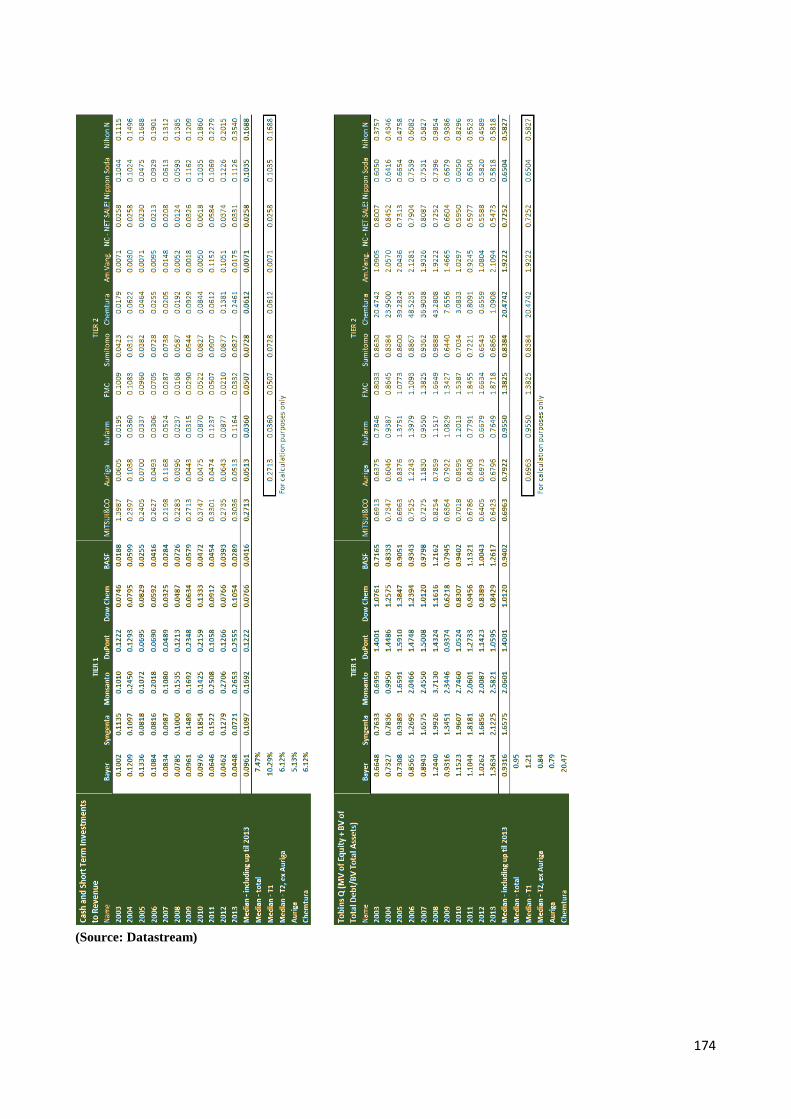
174
(Source: Datastream)

175
(Source: Datastream)
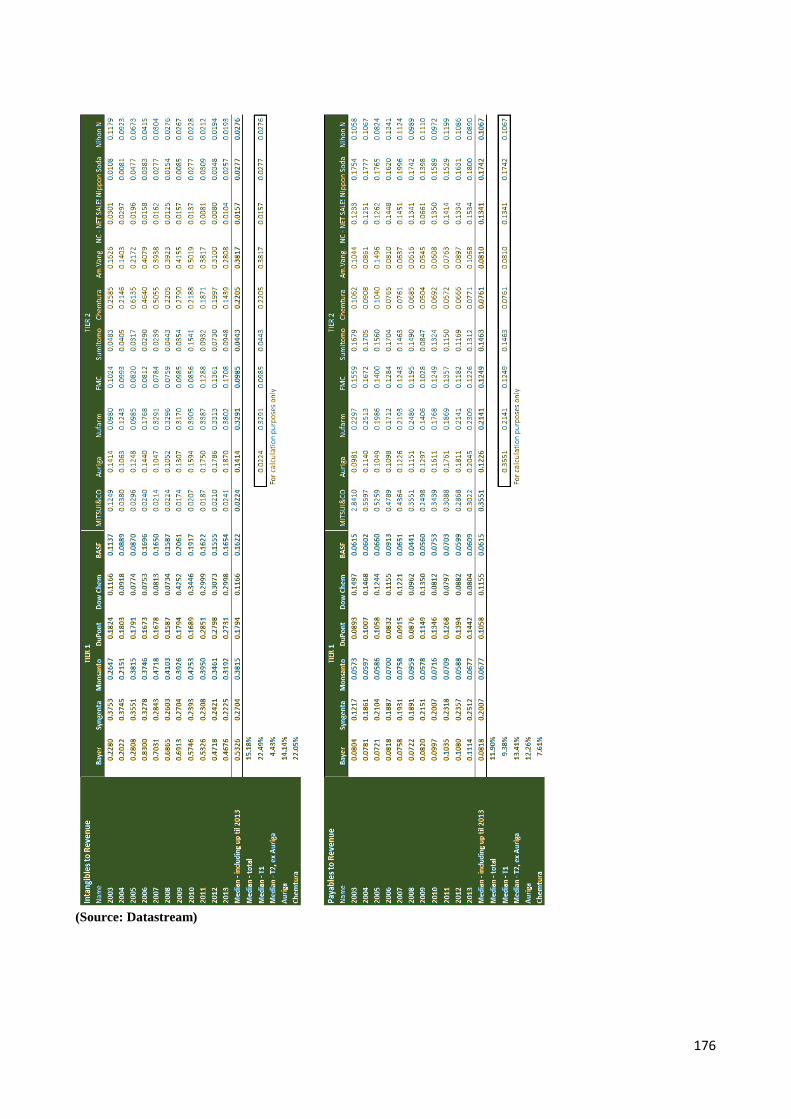
176
(Source: Datastream)
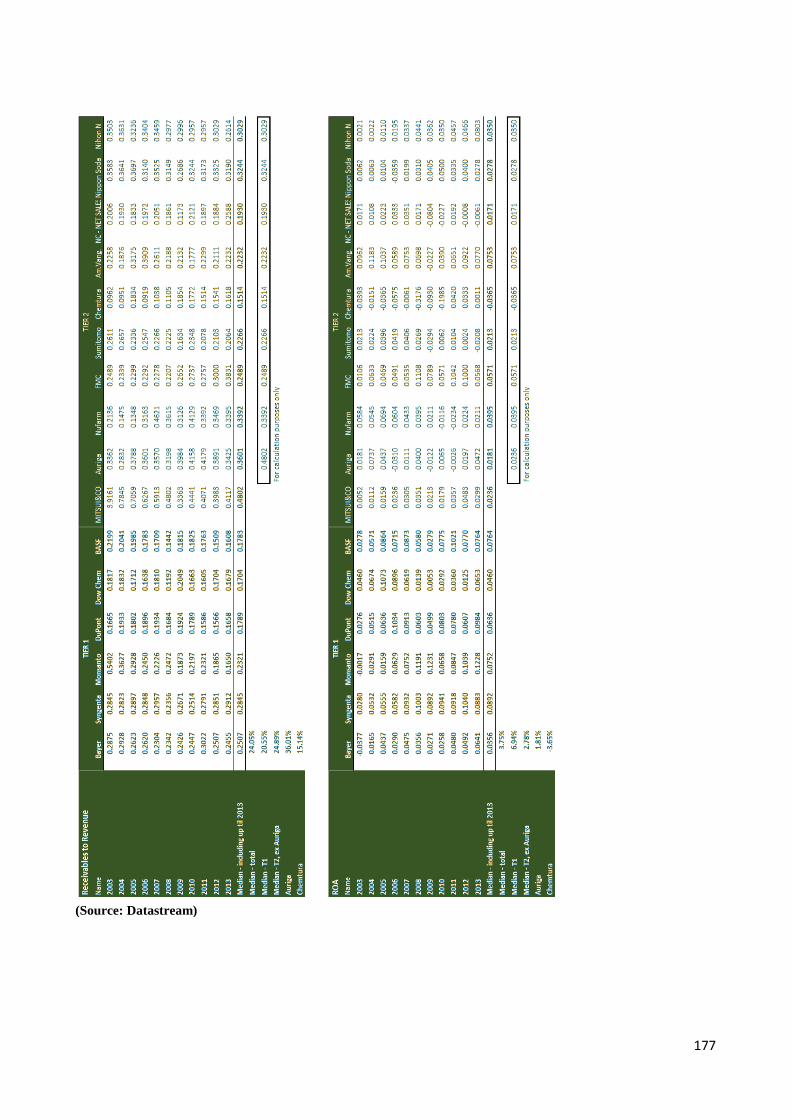
177
(Source: Datastream)
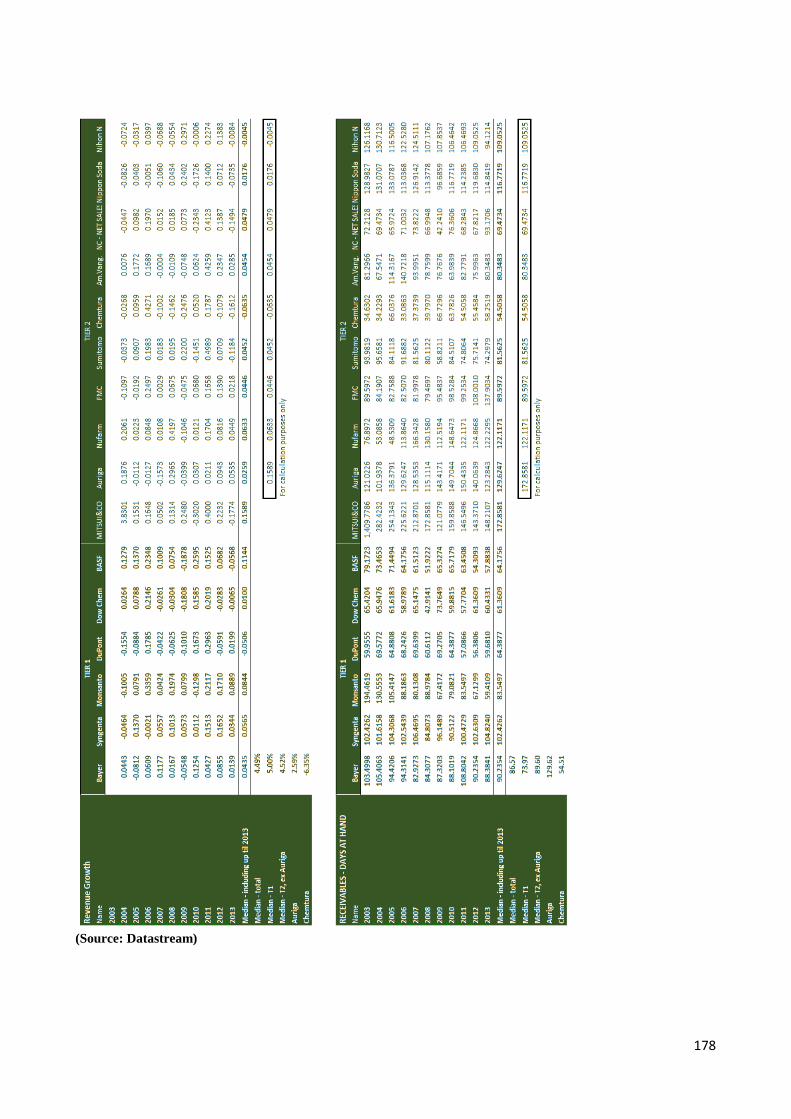
178
(Source: Datastream)
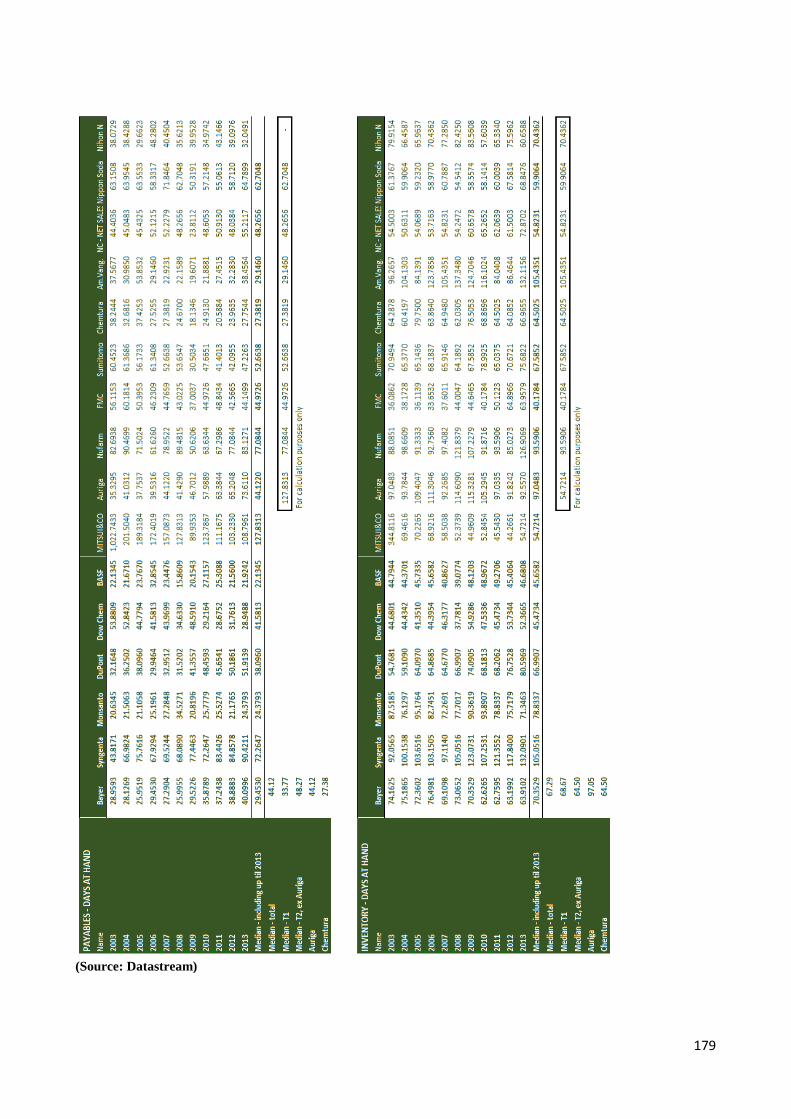
179
(Source: Datastream)
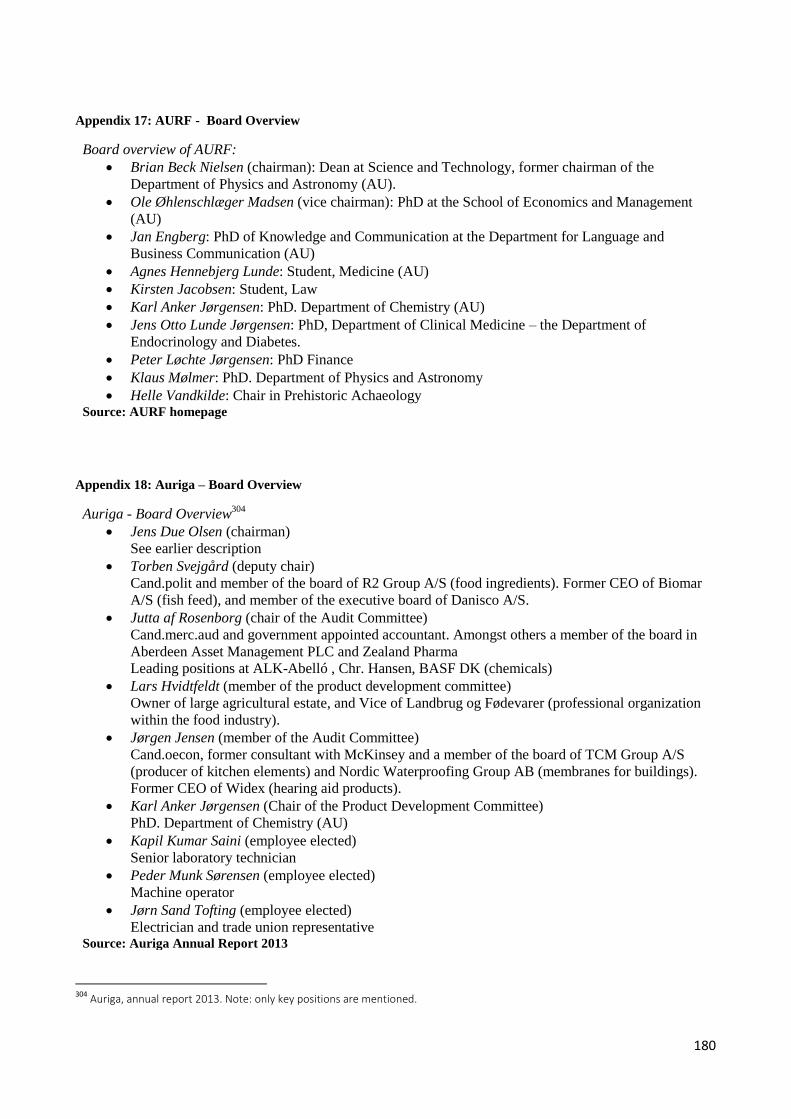
180
Appendix 17: AURF - Board Overview
Board overview of AURF:
Brian Beck Nielsen (chairman): Dean at Science and Technology, former chairman of the
Department of Physics and Astronomy (AU).
Ole Øhlenschlæger Madsen (vice chairman): PhD at the School of Economics and Management
(AU)
Jan Engberg: PhD of Knowledge and Communication at the Department for Language and
Business Communication (AU)
Agnes Hennebjerg Lunde: Student, Medicine (AU)
Kirsten Jacobsen: Student, Law
Karl Anker Jørgensen: PhD. Department of Chemistry (AU)
Jens Otto Lunde Jørgensen: PhD, Department of Clinical Medicine – the Department of
Endocrinology and Diabetes.
Peter Løchte Jørgensen: PhD Finance
Klaus Mølmer: PhD. Department of Physics and Astronomy
Helle Vandkilde: Chair in Prehistoric Achaeology Source: AURF homepage
Appendix 18: Auriga – Board Overview
Auriga - Board Overview304
Jens Due Olsen (chairman)
See earlier description
Torben Svejgård (deputy chair)
Cand.polit and member of the board of R2 Group A/S (food ingredients). Former CEO of Biomar
A/S (fish feed), and member of the executive board of Danisco A/S.
Jutta af Rosenborg (chair of the Audit Committee)
Cand.merc.aud and government appointed accountant. Amongst others a member of the board in
Aberdeen Asset Management PLC and Zealand Pharma
Leading positions at ALK-Abelló , Chr. Hansen, BASF DK (chemicals)
Lars Hvidtfeldt (member of the product development committee)
Owner of large agricultural estate, and Vice of Landbrug og Fødevarer (professional organization
within the food industry).
Jørgen Jensen (member of the Audit Committee)
Cand.oecon, former consultant with McKinsey and a member of the board of TCM Group A/S
(producer of kitchen elements) and Nordic Waterproofing Group AB (membranes for buildings).
Former CEO of Widex (hearing aid products).
Karl Anker Jørgensen (Chair of the Product Development Committee)
PhD. Department of Chemistry (AU)
Kapil Kumar Saini (employee elected)
Senior laboratory technician
Peder Munk Sørensen (employee elected)
Machine operator
Jørn Sand Tofting (employee elected)
Electrician and trade union representative Source: Auriga Annual Report 2013
304
Auriga, annual report 2013. Note: only key positions are mentioned.
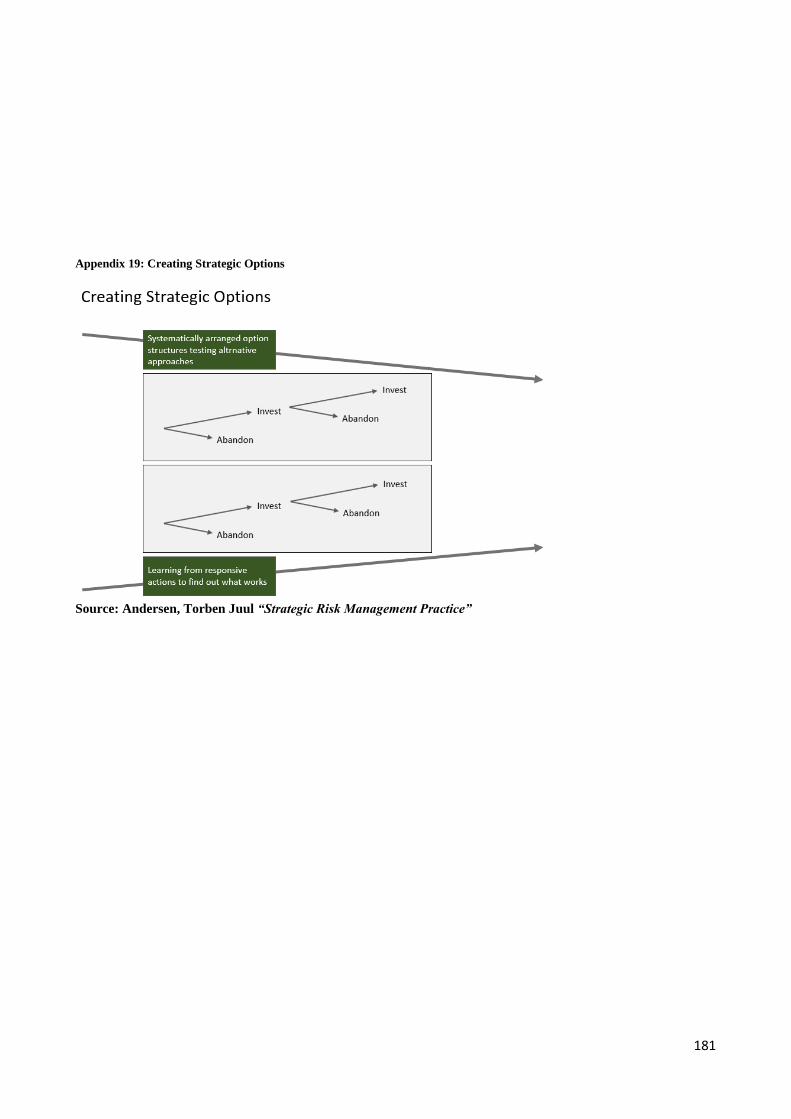
181
Appendix 19: Creating Strategic Options
Source: Andersen, Torben Juul “Strategic Risk Management Practice”
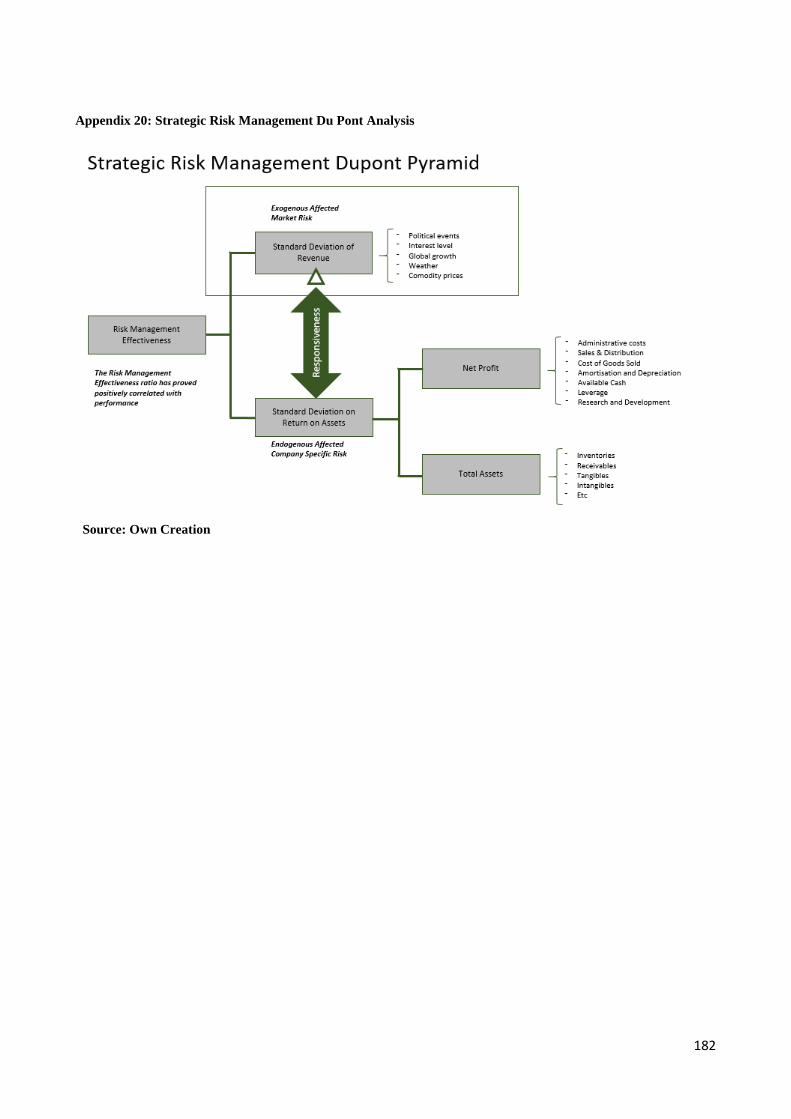
182
Appendix 20: Strategic Risk Management Du Pont Analysis
Source: Own Creation
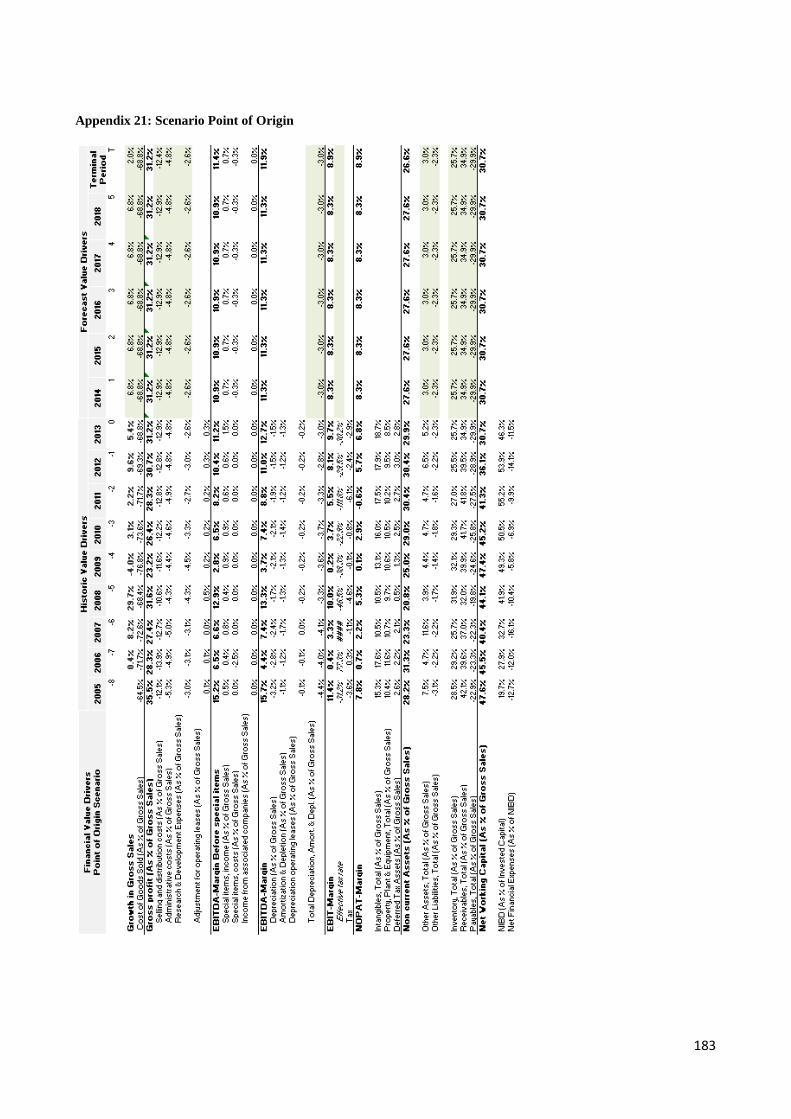
183
Appendix 21: Scenario Point of Origin
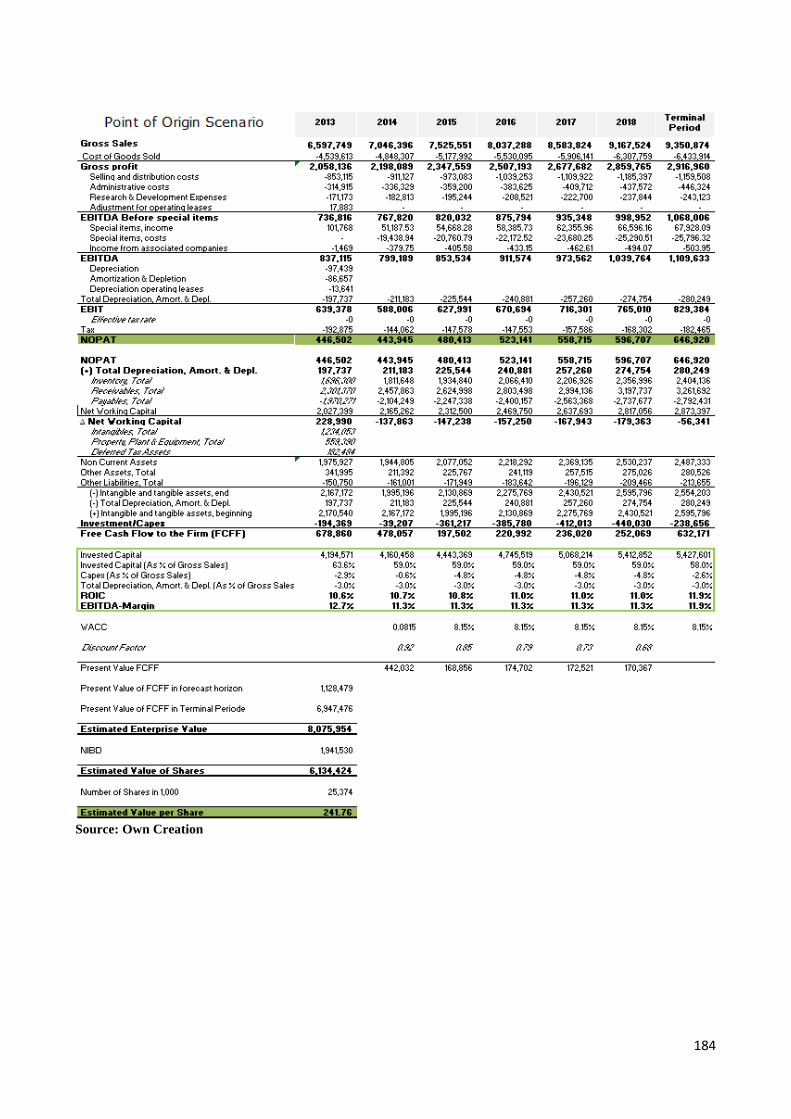
184
Source: Own Creation

185
Appendix 22: Scenario – Path #2
Source: Own Creation
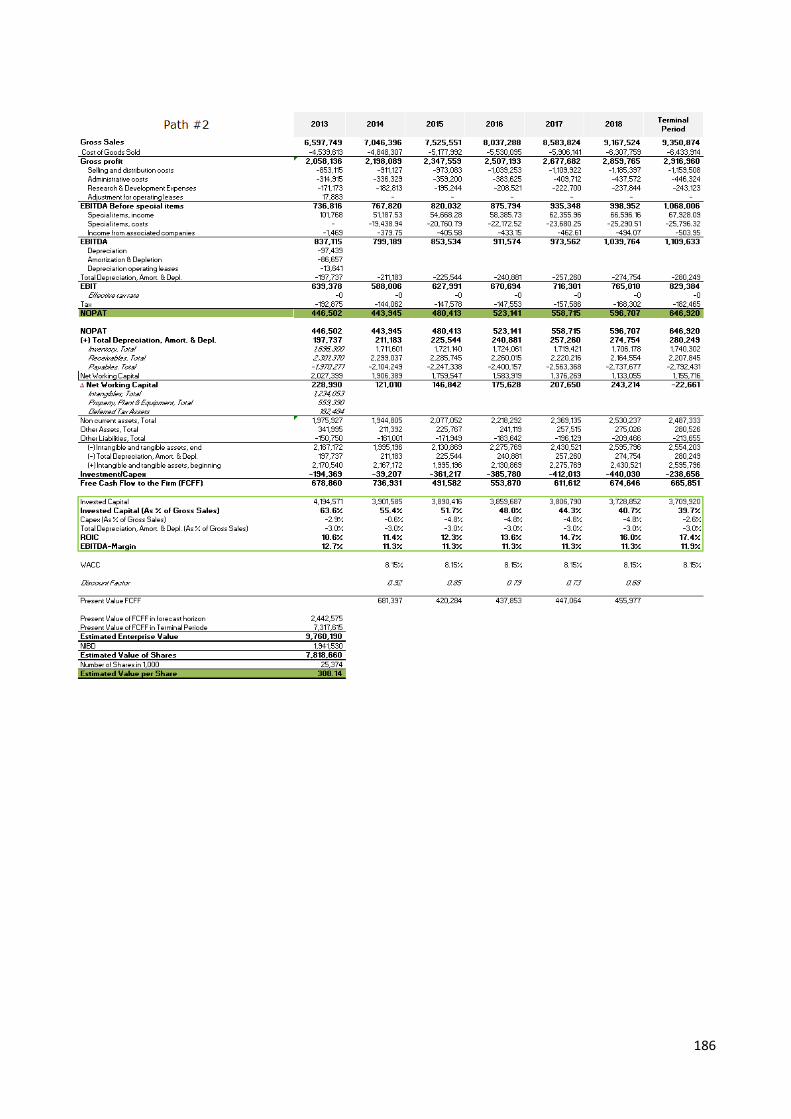
186
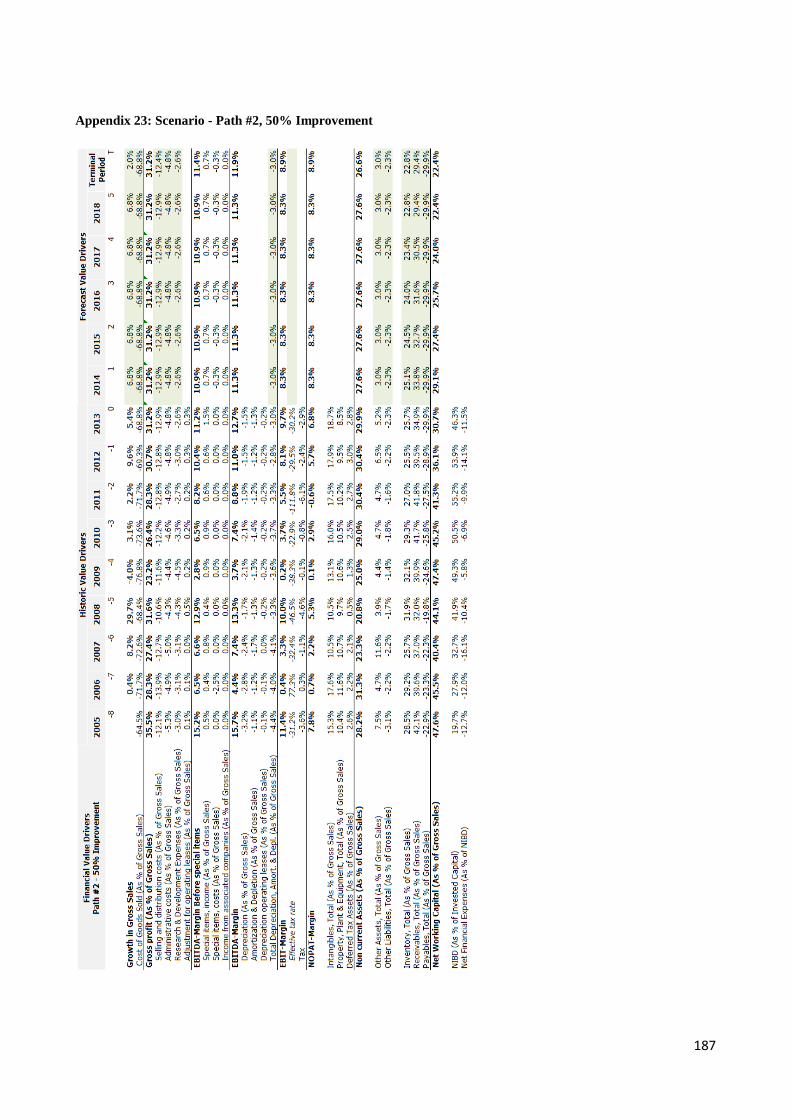
187
Appendix 23: Scenario - Path #2, 50% Improvement
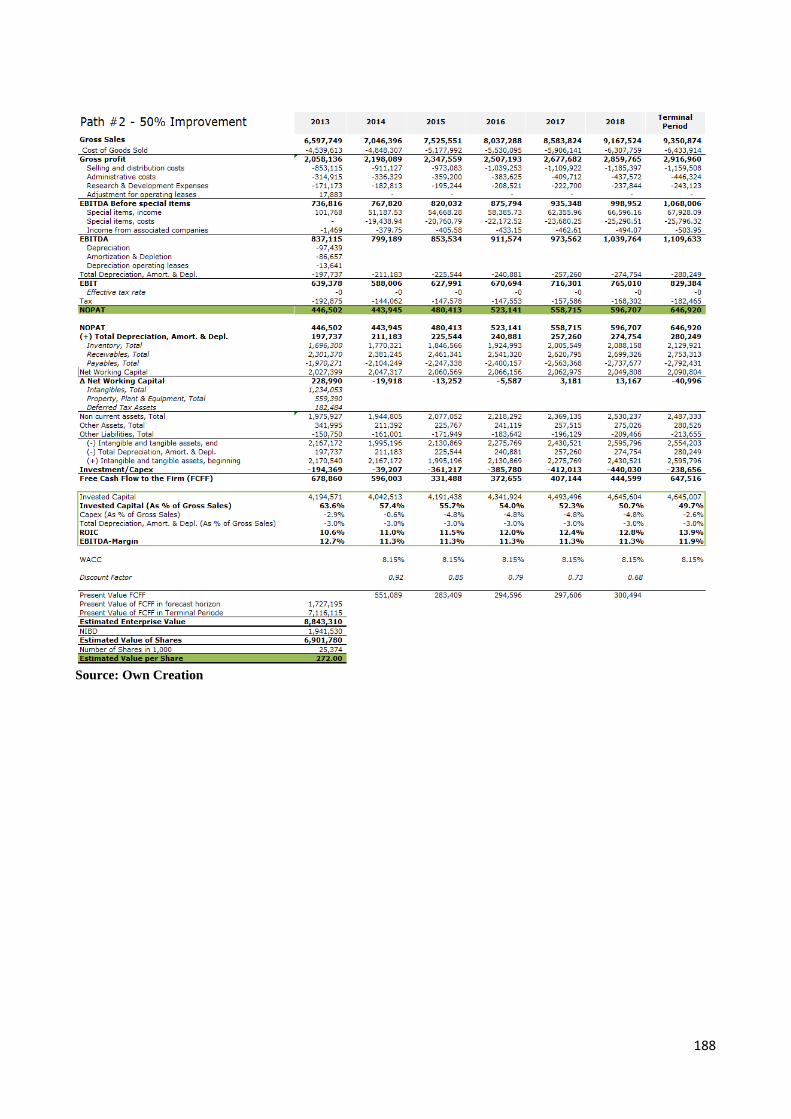
188
Source: Own Creation

189
Appendix 24: Scenario – Path #3 (Own creation)

190
Source: Own Creation

191
Appendix 25: Scenario - Path #4
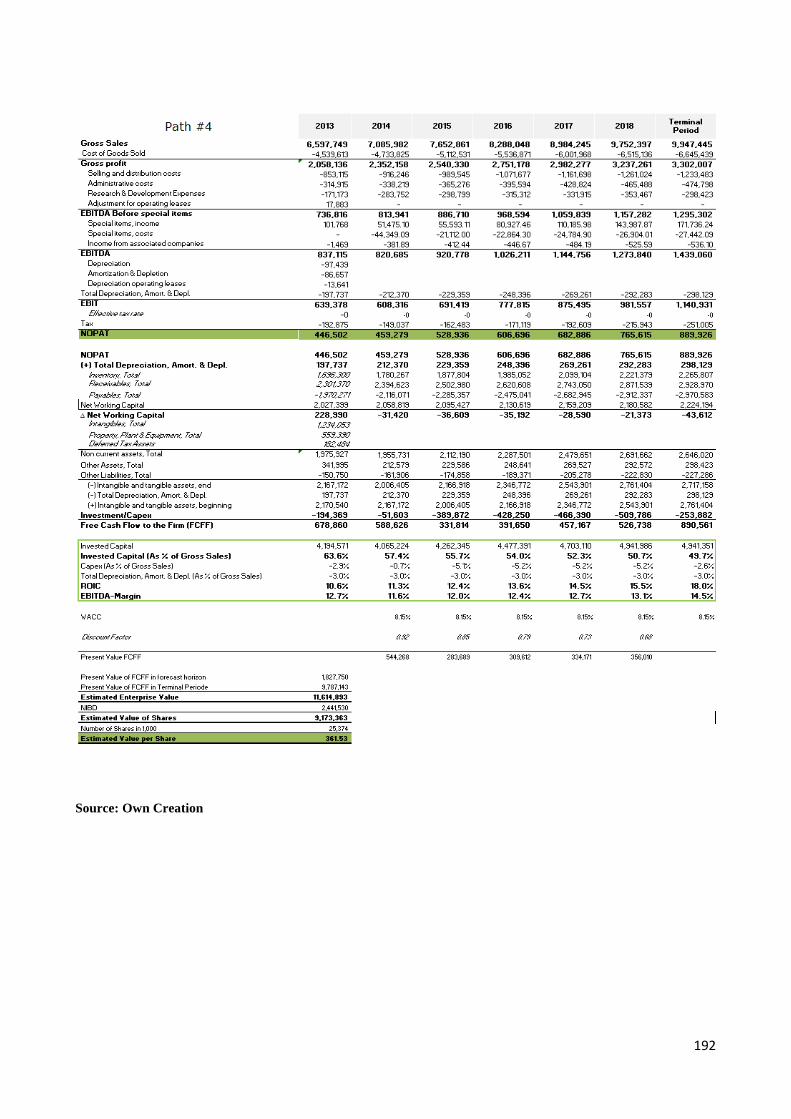
192
Source: Own Creation
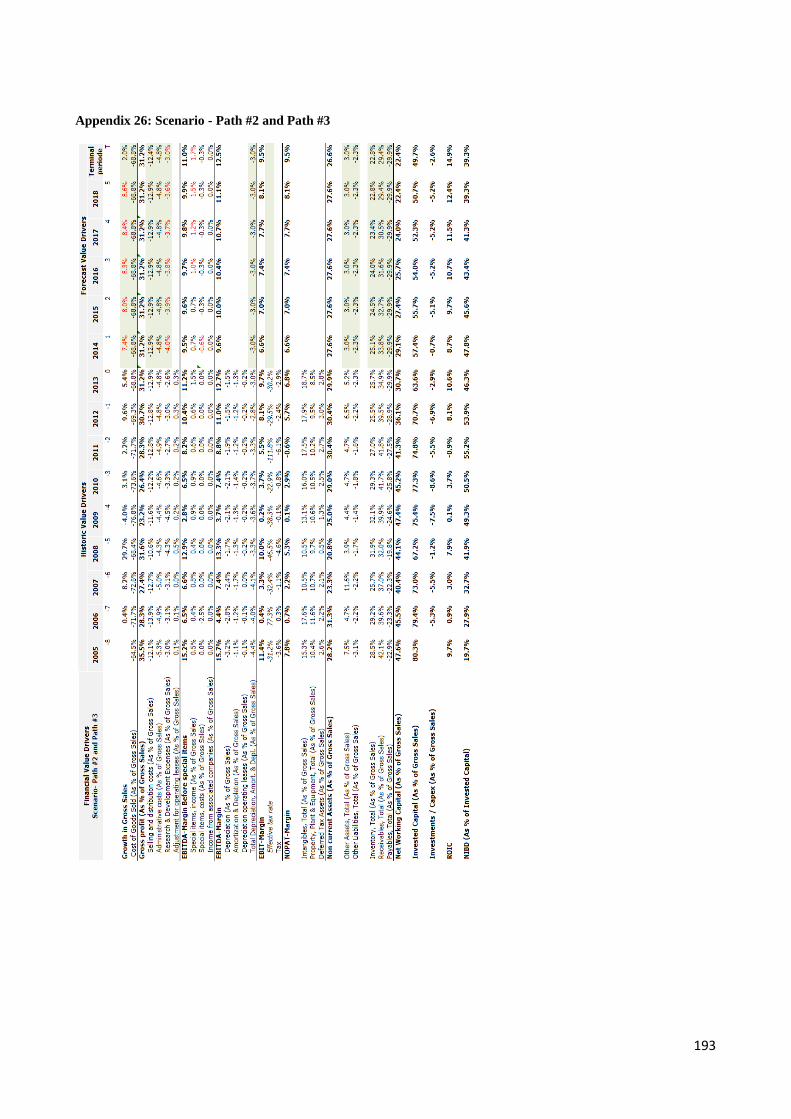
193
Appendix 26: Scenario - Path #2 and Path #3
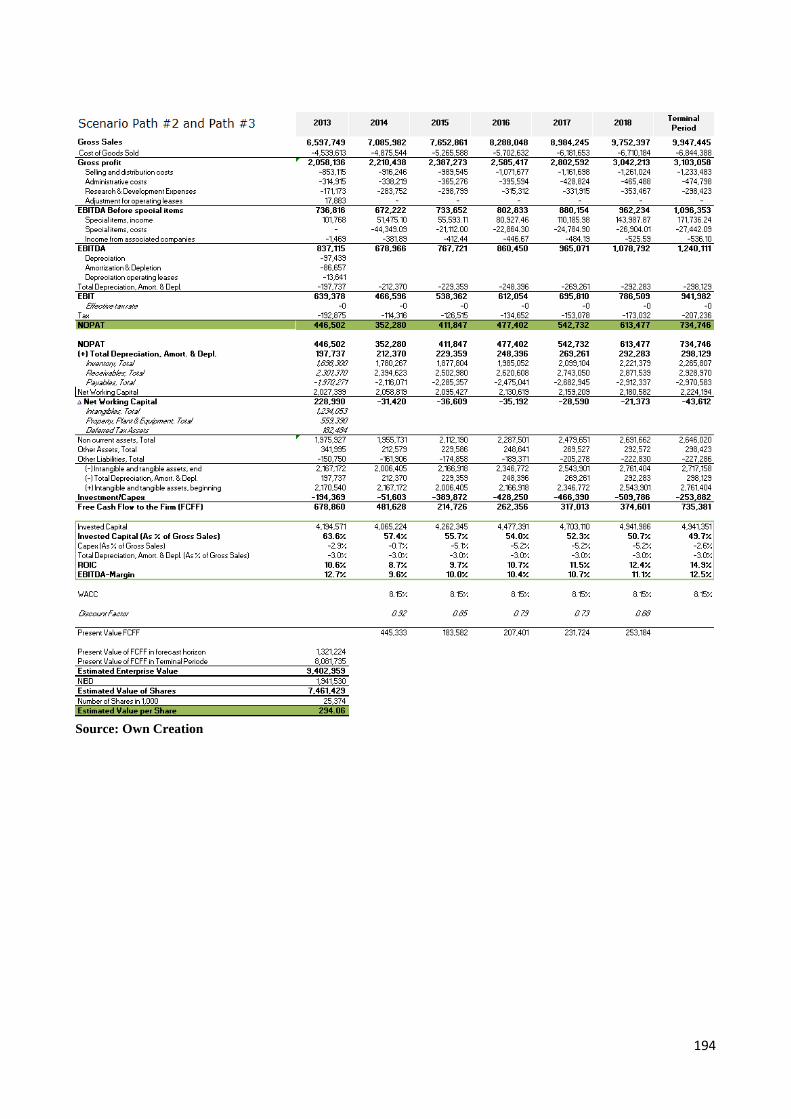
194
Source: Own Creation
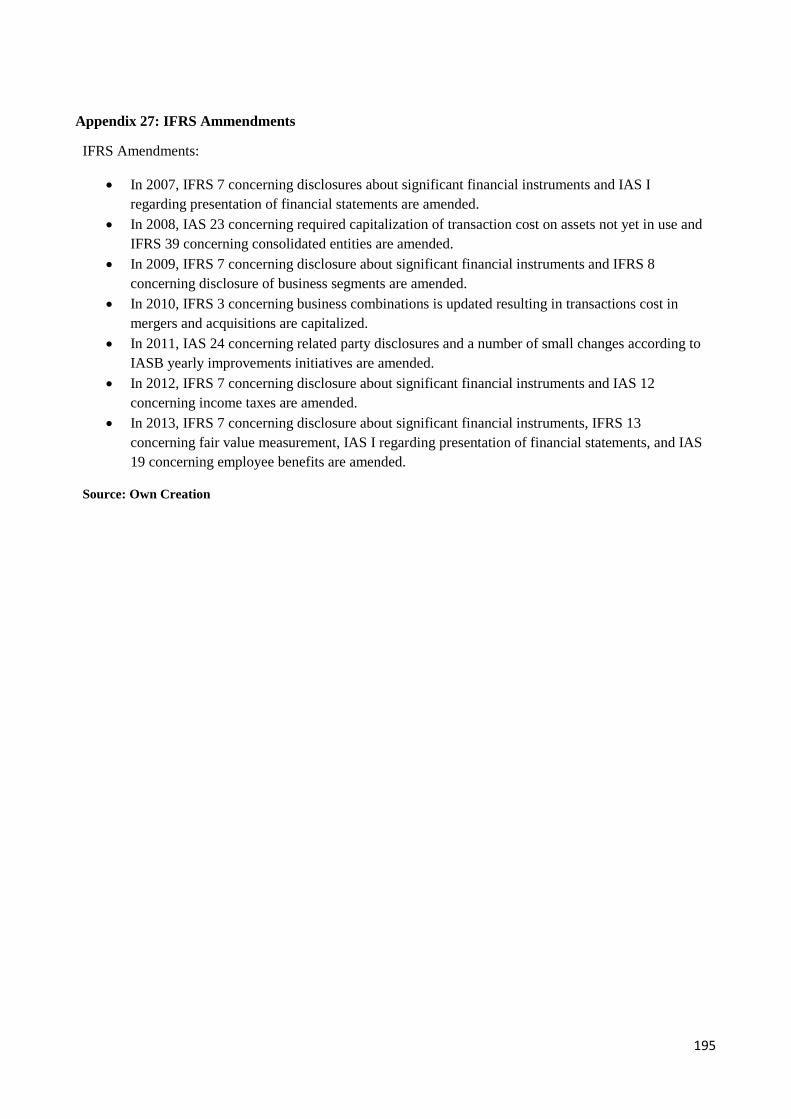
195
Appendix 27: IFRS Ammendments
IFRS Amendments:
In 2007, IFRS 7 concerning disclosures about significant financial instruments and IAS I
regarding presentation of financial statements are amended.
In 2008, IAS 23 concerning required capitalization of transaction cost on assets not yet in use and
IFRS 39 concerning consolidated entities are amended.
In 2009, IFRS 7 concerning disclosure about significant financial instruments and IFRS 8
concerning disclosure of business segments are amended.
In 2010, IFRS 3 concerning business combinations is updated resulting in transactions cost in
mergers and acquisitions are capitalized.
In 2011, IAS 24 concerning related party disclosures and a number of small changes according to
IASB yearly improvements initiatives are amended.
In 2012, IFRS 7 concerning disclosure about significant financial instruments and IAS 12
concerning income taxes are amended.
In 2013, IFRS 7 concerning disclosure about significant financial instruments, IFRS 13
concerning fair value measurement, IAS I regarding presentation of financial statements, and IAS
19 concerning employee benefits are amended.
Source: Own Creation
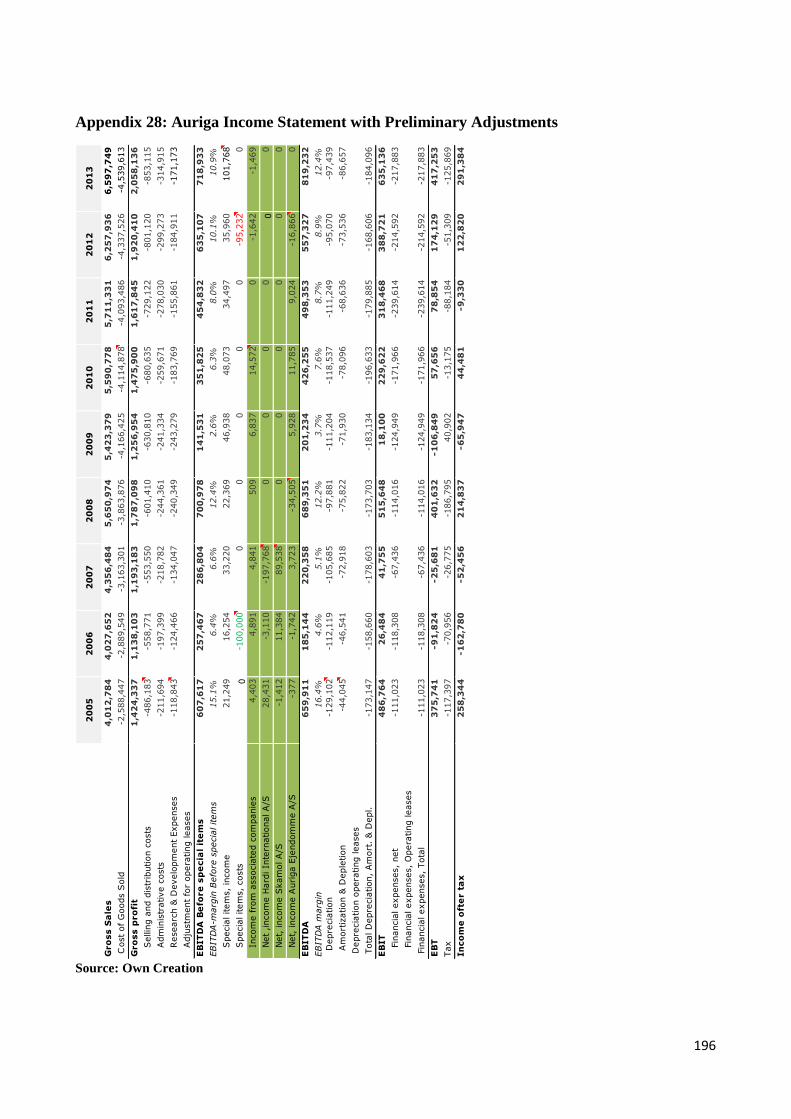
196
Appendix 28: Auriga Income Statement with Preliminary Adjustments
Source: Own Creation
20
05
20
06
20
07
20
08
20
09
20
10
20
11
20
12
20
13
Gro
ss S
ale
s4
,01
2,7
84
4,0
27
,65
24
,35
6,4
84
5,6
50
,97
45
,42
3,3
79
5,5
90
,77
85
,71
1,3
31
6,2
57
,93
66
,59
7,7
49
Cost
of
Goods S
old
-2,5
88,4
47
-2,8
89,5
49
-3,1
63,3
01
-3,8
63,8
76
-4,1
66,4
25
-4,1
14,8
78
-4,0
93,4
86
-4,3
37,5
26
-4,5
39,6
13
Gro
ss p
ro
fit
1,4
24
,33
71
,13
8,1
03
1,1
93
,18
31
,78
7,0
98
1,2
56
,95
41
,47
5,9
00
1,6
17
,84
51
,92
0,4
10
2,0
58
,13
6
Sellin
g a
nd d
istr
ibution c
osts
-486,1
83
-558,7
71
-553,5
50
-601,4
10
-630,8
10
-680,6
35
-729,1
22
-801,1
20
-853,1
15
Adm
inis
trative c
osts
-211,6
94
-197,3
99
-218,7
82
-244,3
61
-241,3
34
-259,6
71
-278,0
30
-299,2
73
-314,9
15
Researc
h &
Develo
pm
ent
Expenses
-118,8
43
-124,4
66
-134,0
47
-240,3
49
-243,2
79
-183,7
69
-155,8
61
-184,9
11
-171,1
73
Adju
stm
ent
for
opera
ting leases
EB
IT
DA
Be
fore
sp
ecia
l it
em
s6
07
,61
72
57
,46
72
86
,80
47
00
,97
81
41
,53
13
51
,82
54
54
,83
26
35
,10
77
18
,93
3
EB
ITD
A-m
arg
in B
efo
re s
pecia
l item
s15.1
%6.4
%6.6
%12.4
%2.6
%6.3
%8.0
%10.1
%10.9
%
Specia
l item
s,
incom
e21,2
49
16,2
54
33,2
20
22,3
69
46,9
38
48,0
73
34,4
97
35,9
60
101,7
68
Specia
l item
s,
costs
0-1
00,0
00
00
00
0-9
5,2
32
0
Incom
e f
rom
associa
ted c
om
panie
s4,4
03
4,8
91
4,8
41
509
6,8
37
14,5
72
0-1
,642
-1,4
69
Net
,incom
e H
ard
i In
tern
ational A
/S28,4
31
-3,1
10
-197,7
68
00
00
00
Net,
incom
e S
kam
ol A
/S-1
,412
11,3
84
89,5
38
00
00
00
Net,
incom
e A
uri
ga E
jendom
me A
/S-3
77
-1,7
42
3,7
23
-34,5
05
5,9
28
11,7
85
9,0
24
-16,8
66
0
EB
IT
DA
65
9,9
11
18
5,1
44
22
0,3
58
68
9,3
51
20
1,2
34
42
6,2
55
49
8,3
53
55
7,3
27
81
9,2
32
EB
ITD
A m
arg
in16.4
%4.6
%5.1
%12.2
%3.7
%7.6
%8.7
%8.9
%12.4
%
D
epre
cia
tion
-129,1
02
-112,1
19
-105,6
85
-97,8
81
-111,2
04
-118,5
37
-111,2
49
-95,0
70
-97,4
39
A
mort
ization &
Deple
tion
-44,0
45
-46,5
41
-72,9
18
-75,8
22
-71,9
30
-78,0
96
-68,6
36
-73,5
36
-86,6
57
Depre
cia
tion o
pera
ting leases
Tota
l D
epre
cia
tion,
Am
ort
. &
Depl.
-173,1
47
-158,6
60
-178,6
03
-173,7
03
-183,1
34
-196,6
33
-179,8
85
-168,6
06
-184,0
96
EB
IT
48
6,7
64
26
,48
44
1,7
55
51
5,6
48
18
,10
02
29
,62
23
18
,46
83
88
,72
16
35
,13
6
Fin
ancia
l expenses,
net
-111,0
23
-118,3
08
-67,4
36
-114,0
16
-124,9
49
-171,9
66
-239,6
14
-214,5
92
-217,8
83
Fin
ancia
l expenses,
Opera
ting leases
Fin
ancia
l expenses,
Tota
l-1
11,0
23
-118,3
08
-67,4
36
-114,0
16
-124,9
49
-171,9
66
-239,6
14
-214,5
92
-217,8
83
EB
T3
75
,74
1-9
1,8
24
-2
5,6
81
40
1,6
32
-1
06
,84
95
7,6
56
78
,85
41
74
,12
94
17
,25
3
Tax
-117,3
97
-70,9
56
-26,7
75
-186,7
95
40,9
02
-13,1
75
-88,1
84
-51,3
09
-125,8
69
In
co
me
oft
er t
ax
25
8,3
44
-1
62
,78
0-5
2,4
56
21
4,8
37
-6
5,9
47
44
,48
1-9
,33
01
22
,82
02
91
,38
4
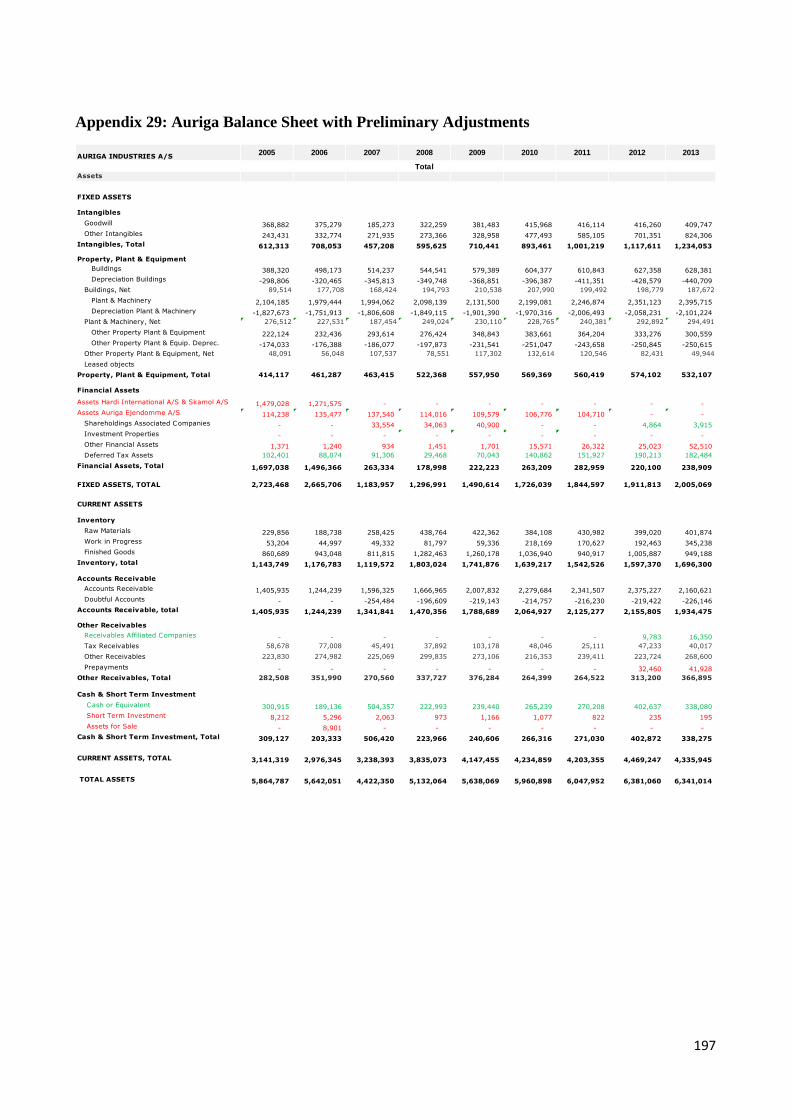
197
Appendix 29: Auriga Balance Sheet with Preliminary Adjustments
AURIGA INDUSTRIES A/S2005 2006 2007 2008 2009 2010 2011 2012 2013
Assets
FIXED ASSETS
Intangibles
Goodwill 368,882 375,279 185,273 322,259 381,483 415,968 416,114 416,260 409,747
Other Intangibles 243,431 332,774 271,935 273,366 328,958 477,493 585,105 701,351 824,306
Intangibles, Total 612,313 708,053 457,208 595,625 710,441 893,461 1,001,219 1,117,611 1,234,053
Property, Plant & Equipment
Buildings 388,320 498,173 514,237 544,541 579,389 604,377 610,843 627,358 628,381
Depreciation Buildings -298,806 -320,465 -345,813 -349,748 -368,851 -396,387 -411,351 -428,579 -440,709
Buildings, Net 89,514 177,708 168,424 194,793 210,538 207,990 199,492 198,779 187,672
Plant & Machinery 2,104,185 1,979,444 1,994,062 2,098,139 2,131,500 2,199,081 2,246,874 2,351,123 2,395,715
Depreciation Plant & Machinery -1,827,673 -1,751,913 -1,806,608 -1,849,115 -1,901,390 -1,970,316 -2,006,493 -2,058,231 -2,101,224
Plant & Machinery, Net 276,512 227,531 187,454 249,024 230,110 228,765 240,381 292,892 294,491
Other Property Plant & Equipment 222,124 232,436 293,614 276,424 348,843 383,661 364,204 333,276 300,559
Other Property Plant & Equip. Deprec. -174,033 -176,388 -186,077 -197,873 -231,541 -251,047 -243,658 -250,845 -250,615
Other Property Plant & Equipment, Net 48,091 56,048 107,537 78,551 117,302 132,614 120,546 82,431 49,944
Leased objects
Property, Plant & Equipment, Total 414,117 461,287 463,415 522,368 557,950 569,369 560,419 574,102 532,107
Financial Assets
Assets Hardi International A/S & Skamol A/S 1,479,028 1,271,575 - - - - - - -
Assets Auriga Ejendomme A/S 114,238 135,477 137,540 114,016 109,579 106,776 104,710 - -
Shareholdings Associated Companies - - 33,554 34,063 40,900 - - 4,864 3,915
Investment Properties - - - - - - - - -
Other Financial Assets 1,371 1,240 934 1,451 1,701 15,571 26,322 25,023 52,510
Deferred Tax Assets 102,401 88,074 91,306 29,468 70,043 140,862 151,927 190,213 182,484
Financial Assets, Total 1,697,038 1,496,366 263,334 178,998 222,223 263,209 282,959 220,100 238,909
FIXED ASSETS, TOTAL 2,723,468 2,665,706 1,183,957 1,296,991 1,490,614 1,726,039 1,844,597 1,911,813 2,005,069
CURRENT ASSETS
Inventory
Raw Materials 229,856 188,738 258,425 438,764 422,362 384,108 430,982 399,020 401,874
Work in Progress 53,204 44,997 49,332 81,797 59,336 218,169 170,627 192,463 345,238
Finished Goods 860,689 943,048 811,815 1,282,463 1,260,178 1,036,940 940,917 1,005,887 949,188
Inventory, total 1,143,749 1,176,783 1,119,572 1,803,024 1,741,876 1,639,217 1,542,526 1,597,370 1,696,300
Accounts Receivable
Accounts Receivable 1,405,935 1,244,239 1,596,325 1,666,965 2,007,832 2,279,684 2,341,507 2,375,227 2,160,621
Doubtful Accounts - - -254,484 -196,609 -219,143 -214,757 -216,230 -219,422 -226,146
Accounts Receivable, total 1,405,935 1,244,239 1,341,841 1,470,356 1,788,689 2,064,927 2,125,277 2,155,805 1,934,475
Other Receivables
Receivables Affiliated Companies - - - - - - - 9,783 16,350
Tax Receivables 58,678 77,008 45,491 37,892 103,178 48,046 25,111 47,233 40,017
Other Receivables 223,830 274,982 225,069 299,835 273,106 216,353 239,411 223,724 268,600
Prepayments - - - - - - - 32,460 41,928
Other Receivables, Total 282,508 351,990 270,560 337,727 376,284 264,399 264,522 313,200 366,895
Cash & Short Term Investment
Cash or Equivalent 300,915 189,136 504,357 222,993 239,440 265,239 270,208 402,637 338,080
Short Term Investment 8,212 5,296 2,063 973 1,166 1,077 822 235 195
Assets for Sale - 8,901 - - - - - - -
Cash & Short Term Investment, Total 309,127 203,333 506,420 223,966 240,606 266,316 271,030 402,872 338,275
CURRENT ASSETS, TOTAL 3,141,319 2,976,345 3,238,393 3,835,073 4,147,455 4,234,859 4,203,355 4,469,247 4,335,945
TOTAL ASSETS 5,864,787 5,642,051 4,422,350 5,132,064 5,638,069 5,960,898 6,047,952 6,381,060 6,341,014
Total
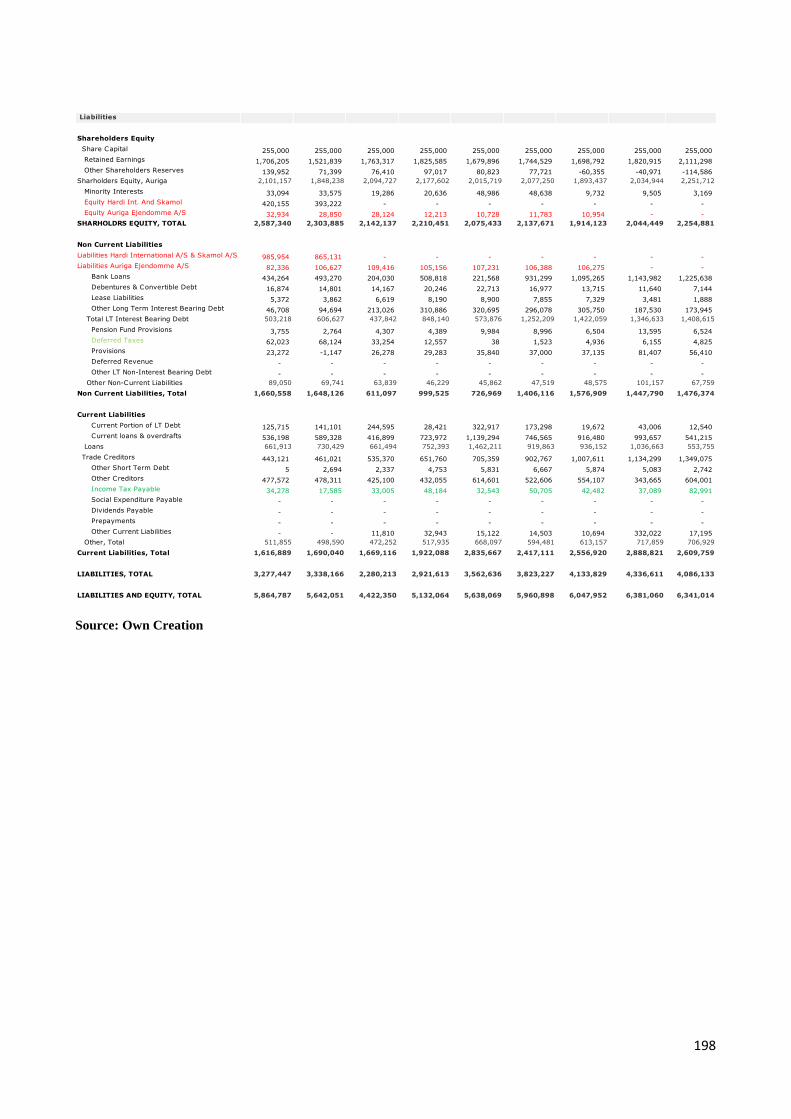
198
Source: Own Creation
Liabilities
Shareholders Equity
Share Capital 255,000 255,000 255,000 255,000 255,000 255,000 255,000 255,000 255,000
Retained Earnings 1,706,205 1,521,839 1,763,317 1,825,585 1,679,896 1,744,529 1,698,792 1,820,915 2,111,298
Other Shareholders Reserves 139,952 71,399 76,410 97,017 80,823 77,721 -60,355 -40,971 -114,586
Sharholders Equity, Auriga 2,101,157 1,848,238 2,094,727 2,177,602 2,015,719 2,077,250 1,893,437 2,034,944 2,251,712
Minority Interests 33,094 33,575 19,286 20,636 48,986 48,638 9,732 9,505 3,169
Equity Hardi Int. And Skamol 420,155 393,222 - - - - - - -
Equity Auriga Ejendomme A/S 32,934 28,850 28,124 12,213 10,728 11,783 10,954 - -
SHARHOLDRS EQUITY, TOTAL 2,587,340 2,303,885 2,142,137 2,210,451 2,075,433 2,137,671 1,914,123 2,044,449 2,254,881
Non Current Liabilities
Liabilities Hardi International A/S & Skamol A/S 985,954 865,131 - - - - - - -
Liabilities Auriga Ejendomme A/S 82,336 106,627 109,416 105,156 107,231 106,388 106,275 - -
Bank Loans 434,264 493,270 204,030 508,818 221,568 931,299 1,095,265 1,143,982 1,225,638
Debentures & Convertible Debt 16,874 14,801 14,167 20,246 22,713 16,977 13,715 11,640 7,144
Lease Liabilities 5,372 3,862 6,619 8,190 8,900 7,855 7,329 3,481 1,888
Other Long Term Interest Bearing Debt 46,708 94,694 213,026 310,886 320,695 296,078 305,750 187,530 173,945
Total LT Interest Bearing Debt 503,218 606,627 437,842 848,140 573,876 1,252,209 1,422,059 1,346,633 1,408,615
Pension Fund Provisions 3,755 2,764 4,307 4,389 9,984 8,996 6,504 13,595 6,524
Deferred Taxes 62,023 68,124 33,254 12,557 38 1,523 4,936 6,155 4,825
Provisions 23,272 -1,147 26,278 29,283 35,840 37,000 37,135 81,407 56,410
Deferred Revenue - - - - - - - - -
Other LT Non-Interest Bearing Debt - - - - - - - - -
Other Non-Current Liabilities 89,050 69,741 63,839 46,229 45,862 47,519 48,575 101,157 67,759
Non Current Liabilities, Total 1,660,558 1,648,126 611,097 999,525 726,969 1,406,116 1,576,909 1,447,790 1,476,374
Current Liabilities
Current Portion of LT Debt 125,715 141,101 244,595 28,421 322,917 173,298 19,672 43,006 12,540
Current loans & overdrafts 536,198 589,328 416,899 723,972 1,139,294 746,565 916,480 993,657 541,215
Loans 661,913 730,429 661,494 752,393 1,462,211 919,863 936,152 1,036,663 553,755
Trade Creditors 443,121 461,021 535,370 651,760 705,359 902,767 1,007,611 1,134,299 1,349,075
Other Short Term Debt 5 2,694 2,337 4,753 5,831 6,667 5,874 5,083 2,742
Other Creditors 477,572 478,311 425,100 432,055 614,601 522,606 554,107 343,665 604,001
Income Tax Payable 34,278 17,585 33,005 48,184 32,543 50,705 42,482 37,089 82,991
Social Expenditure Payable - - - - - - - - -
Dividends Payable - - - - - - - - -
Prepayments - - - - - - - - -
Other Current Liabilities - - 11,810 32,943 15,122 14,503 10,694 332,022 17,195
Other, Total 511,855 498,590 472,252 517,935 668,097 594,481 613,157 717,859 706,929
Current Liabilities, Total 1,616,889 1,690,040 1,669,116 1,922,088 2,835,667 2,417,111 2,556,920 2,888,821 2,609,759
LIABILITIES, TOTAL 3,277,447 3,338,166 2,280,213 2,921,613 3,562,636 3,823,227 4,133,829 4,336,611 4,086,133
LIABILITIES AND EQUITY, TOTAL 5,864,787 5,642,051 4,422,350 5,132,064 5,638,069 5,960,898 6,047,952 6,381,060 6,341,014
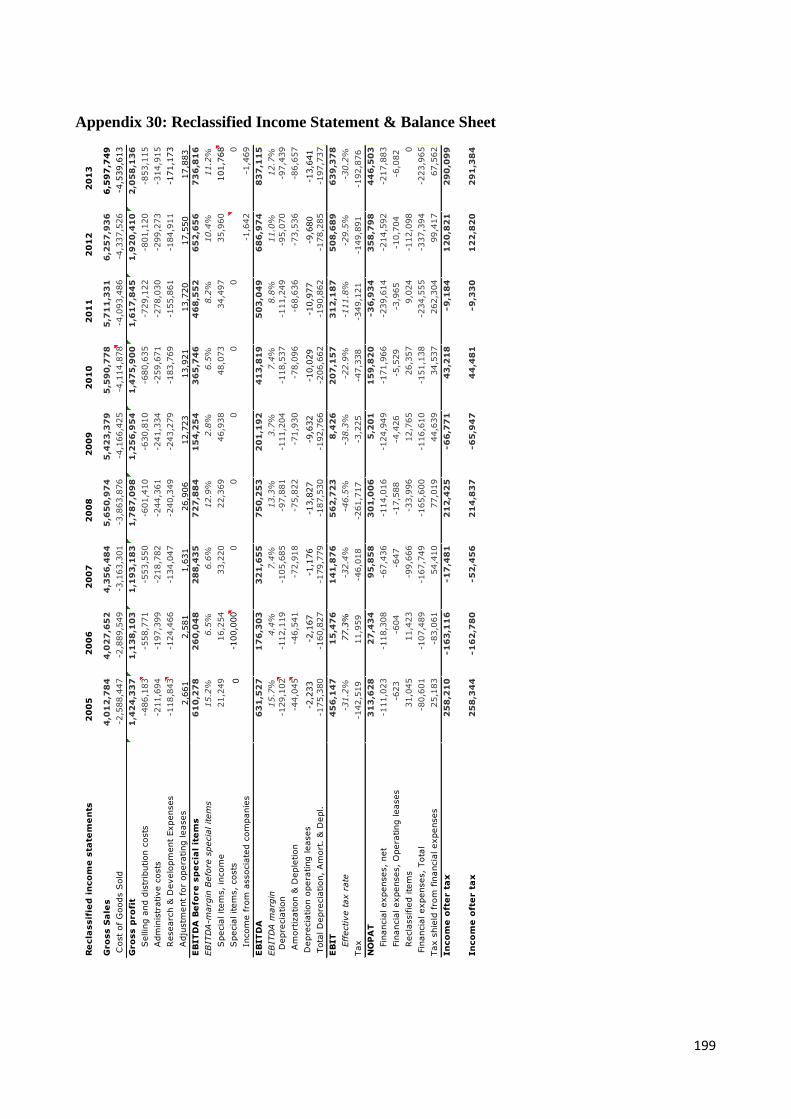
199
Appendix 30: Reclassified Income Statement & Balance Sheet
Re
cla
ssif
ied
in
co
me
sta
tem
en
ts
20
05
20
06
20
07
20
08
20
09
20
10
20
11
20
12
20
13
Gro
ss S
ale
s4
,01
2,7
84
4,0
27
,65
24
,35
6,4
84
5,6
50
,97
45
,42
3,3
79
5,5
90
,77
85
,71
1,3
31
6,2
57
,93
66
,59
7,7
49
Cost
of
Goods S
old
-2,5
88,4
47
-2,8
89,5
49
-3,1
63,3
01
-3,8
63,8
76
-4,1
66,4
25
-4,1
14,8
78
-4,0
93,4
86
-4,3
37,5
26
-4,5
39,6
13
Gro
ss p
ro
fit
1,4
24
,33
71
,13
8,1
03
1,1
93
,18
31
,78
7,0
98
1,2
56
,95
41
,47
5,9
00
1,6
17
,84
51
,92
0,4
10
2,0
58
,13
6
Sellin
g a
nd d
istr
ibution c
osts
-486,1
83
-558,7
71
-553,5
50
-601,4
10
-630,8
10
-680,6
35
-729,1
22
-801,1
20
-853,1
15
Adm
inis
trative c
osts
-211,6
94
-197,3
99
-218,7
82
-244,3
61
-241,3
34
-259,6
71
-278,0
30
-299,2
73
-314,9
15
Researc
h &
Develo
pm
ent
Expenses
-118,8
43
-124,4
66
-134,0
47
-240,3
49
-243,2
79
-183,7
69
-155,8
61
-184,9
11
-171,1
73
Adju
stm
ent
for
opera
ting leases
2,6
61
2,5
81
1,6
31
26,9
06
12,7
23
13,9
21
13,7
20
17,5
50
17,8
83
EB
IT
DA
Be
fore
sp
ecia
l it
em
s6
10
,27
82
60
,04
82
88
,43
57
27
,88
41
54
,25
43
65
,74
64
68
,55
26
52
,65
67
36
,81
6
EB
ITD
A-m
arg
in B
efo
re s
pecia
l item
s15.2
%6.5
%6.6
%12.9
%2.8
%6.5
%8.2
%10.4
%11.2
%
Specia
l item
s,
incom
e21,2
49
16,2
54
33,2
20
22,3
69
46,9
38
48,0
73
34,4
97
35,9
60
101,7
68
Specia
l item
s,
costs
0-1
00,0
00
00
00
00
Incom
e f
rom
associa
ted c
om
panie
s-1
,642
-1,4
69
EB
IT
DA
63
1,5
27
17
6,3
03
32
1,6
55
75
0,2
53
20
1,1
92
41
3,8
19
50
3,0
49
68
6,9
74
83
7,1
15
EB
ITD
A m
arg
in15.7
%4.4
%7.4
%13.3
%3.7
%7.4
%8.8
%11.0
%12.7
%
D
epre
cia
tion
-129,1
02
-112,1
19
-105,6
85
-97,8
81
-111,2
04
-118,5
37
-111,2
49
-95,0
70
-97,4
39
A
mort
ization &
Deple
tion
-44,0
45
-46,5
41
-72,9
18
-75,8
22
-71,9
30
-78,0
96
-68,6
36
-73,5
36
-86,6
57
Depre
cia
tion o
pera
ting leases
-2,2
33
-2
,167
-1
,176
-1
3,8
27
-9
,632
-1
0,0
29
-1
0,9
77
-9
,680
-1
3,6
41
Tota
l D
epre
cia
tion,
Am
ort
. &
Depl.
-175,3
80
-160,8
27
-179,7
79
-187,5
30
-192,7
66
-206,6
62
-190,8
62
-178,2
85
-197,7
37
EB
IT
45
6,1
47
15
,47
61
41
,87
65
62
,72
38
,42
62
07
,15
73
12
,18
75
08
,68
96
39
,37
8
Eff
ective t
ax r
ate
-31.2
%77.3
%-3
2.4
%-4
6.5
%-3
8.3
%-2
2.9
%-1
11.8
%-2
9.5
%-3
0.2
%
Tax
-142,5
19
11,9
59
-4
6,0
18
-2
61,7
17
-3,2
25
-4
7,3
38
-3
49,1
21
-149,8
91
-192,8
76
NO
PA
T3
13
,62
82
7,4
34
95
,85
83
01
,00
65
,20
11
59
,82
0-3
6,9
34
35
8,7
98
44
6,5
03
Fin
ancia
l expenses,
net
-111,0
23
-118,3
08
-67,4
36
-114,0
16
-124,9
49
-171,9
66
-239,6
14
-214,5
92
-217,8
83
Fin
ancia
l expenses,
Opera
ting leases
-623
-6
04
-6
47
-1
7,5
88
-4
,426
-5
,529
-3
,965
-1
0,7
04
-6
,082
Recla
ssifie
d ite
ms
31,0
45
11,4
23
-99,6
66
-33,9
96
12,7
65
26,3
57
9,0
24
-112,0
98
0
Fin
ancia
l expenses,
Tota
l-8
0,6
01
-107,4
89
-167,7
49
-165,6
00
-116,6
10
-151,1
38
-234,5
55
-337,3
94
-223,9
65
Tax s
hie
ld f
rom
fin
ancia
l expenses
25,1
83
-83,0
61
54,4
10
77,0
19
44,6
39
34,5
37
262,3
04
99,4
17
67,5
62
In
co
me
oft
er t
ax
25
8,2
10
-1
63
,11
6-1
7,4
81
21
2,4
25
-6
6,7
71
43
,21
8-9
,18
41
20
,82
12
90
,09
9
In
co
me
oft
er t
ax
25
8,3
44
-1
62
,78
0-5
2,4
56
21
4,8
37
-6
5,9
47
44
,48
1-9
,33
01
22
,82
02
91
,38
4
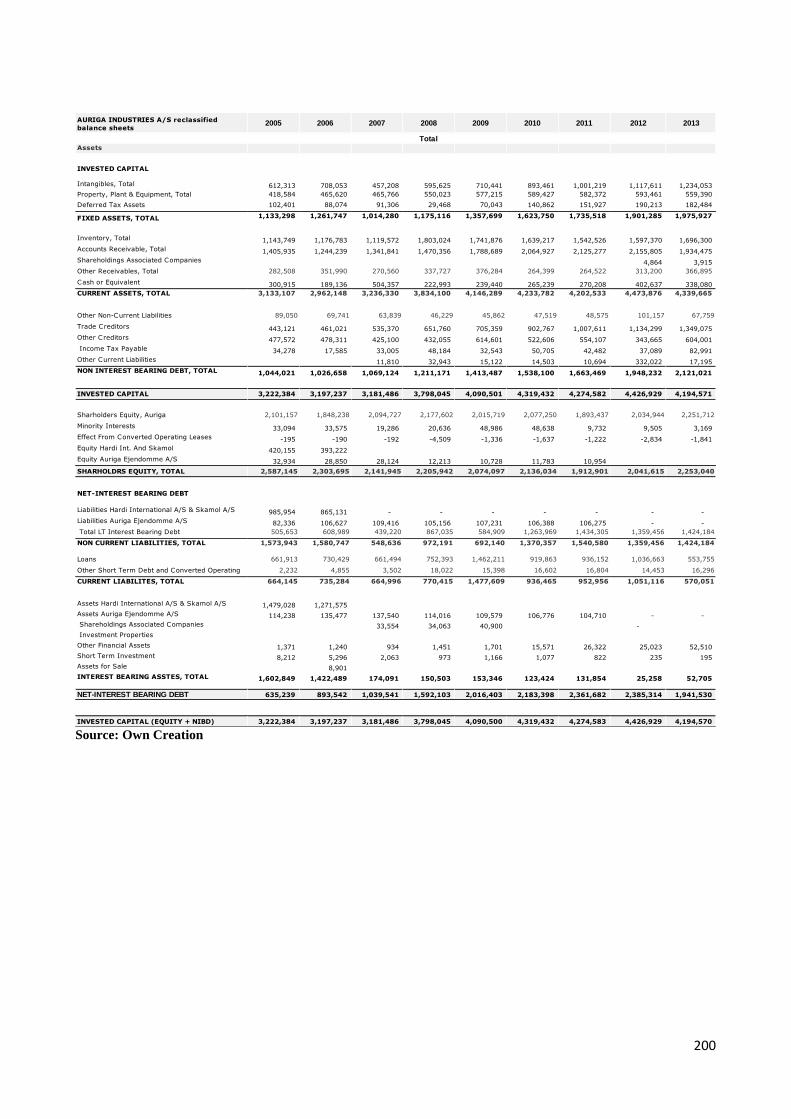
200
Source: Own Creation
AURIGA INDUSTRIES A/S reclassified
balance sheets2005 2006 2007 2008 2009 2010 2011 2012 2013
Assets
INVESTED CAPITAL
Intangibles, Total 612,313 708,053 457,208 595,625 710,441 893,461 1,001,219 1,117,611 1,234,053
Property, Plant & Equipment, Total 418,584 465,620 465,766 550,023 577,215 589,427 582,372 593,461 559,390
Deferred Tax Assets 102,401 88,074 91,306 29,468 70,043 140,862 151,927 190,213 182,484
FIXED ASSETS, TOTAL 1,133,298 1,261,747 1,014,280 1,175,116 1,357,699 1,623,750 1,735,518 1,901,285 1,975,927
Inventory, Total 1,143,749 1,176,783 1,119,572 1,803,024 1,741,876 1,639,217 1,542,526 1,597,370 1,696,300
Accounts Receivable, Total 1,405,935 1,244,239 1,341,841 1,470,356 1,788,689 2,064,927 2,125,277 2,155,805 1,934,475
Shareholdings Associated Companies 4,864 3,915
Other Receivables, Total 282,508 351,990 270,560 337,727 376,284 264,399 264,522 313,200 366,895
Cash or Equivalent 300,915 189,136 504,357 222,993 239,440 265,239 270,208 402,637 338,080
CURRENT ASSETS, TOTAL 3,133,107 2,962,148 3,236,330 3,834,100 4,146,289 4,233,782 4,202,533 4,473,876 4,339,665
Other Non-Current Liabilities 89,050 69,741 63,839 46,229 45,862 47,519 48,575 101,157 67,759
Trade Creditors 443,121 461,021 535,370 651,760 705,359 902,767 1,007,611 1,134,299 1,349,075
Other Creditors 477,572 478,311 425,100 432,055 614,601 522,606 554,107 343,665 604,001
Income Tax Payable 34,278 17,585 33,005 48,184 32,543 50,705 42,482 37,089 82,991
Other Current Liabilities - - 11,810 32,943 15,122 14,503 10,694 332,022 17,195
NON INTEREST BEARING DEBT, TOTAL 1,044,021 1,026,658 1,069,124 1,211,171 1,413,487 1,538,100 1,663,469 1,948,232 2,121,021
INVESTED CAPITAL 3,222,384 3,197,237 3,181,486 3,798,045 4,090,501 4,319,432 4,274,582 4,426,929 4,194,571
Sharholders Equity, Auriga 2,101,157 1,848,238 2,094,727 2,177,602 2,015,719 2,077,250 1,893,437 2,034,944 2,251,712
Minority Interests 33,094 33,575 19,286 20,636 48,986 48,638 9,732 9,505 3,169
Effect From Converted Operating Leases -195 -190 -192 -4,509 -1,336 -1,637 -1,222 -2,834 -1,841
Equity Hardi Int. And Skamol 420,155 393,222 - - - - - - -
Equity Auriga Ejendomme A/S 32,934 28,850 28,124 12,213 10,728 11,783 10,954 - -
SHARHOLDRS EQUITY, TOTAL 2,587,145 2,303,695 2,141,945 2,205,942 2,074,097 2,136,034 1,912,901 2,041,615 2,253,040
NET-INTEREST BEARING DEBT
Liabilities Hardi International A/S & Skamol A/S 985,954 865,131 - - - - - - -
Liabilities Auriga Ejendomme A/S 82,336 106,627 109,416 105,156 107,231 106,388 106,275 - -
Total LT Interest Bearing Debt 505,653 608,989 439,220 867,035 584,909 1,263,969 1,434,305 1,359,456 1,424,184
NON CURRENT LIABILITIES, TOTAL 1,573,943 1,580,747 548,636 972,191 692,140 1,370,357 1,540,580 1,359,456 1,424,184
Loans 661,913 730,429 661,494 752,393 1,462,211 919,863 936,152 1,036,663 553,755
Other Short Term Debt and Converted Operating
Leases
2,232 4,855 3,502 18,022 15,398 16,602 16,804 14,453 16,296
CURRENT LIABILITES, TOTAL 664,145 735,284 664,996 770,415 1,477,609 936,465 952,956 1,051,116 570,051
Assets Hardi International A/S & Skamol A/S 1,479,028 1,271,575 - - - - - - -
Assets Auriga Ejendomme A/S 114,238 135,477 137,540 114,016 109,579 106,776 104,710 - -
Shareholdings Associated Companies - - 33,554 34,063 40,900 - -
Investment Properties - - - - - - - - -
Other Financial Assets 1,371 1,240 934 1,451 1,701 15,571 26,322 25,023 52,510
Short Term Investment 8,212 5,296 2,063 973 1,166 1,077 822 235 195
Assets for Sale - 8,901 - - - - - - -
INTEREST BEARING ASSTES, TOTAL 1,602,849 1,422,489 174,091 150,503 153,346 123,424 131,854 25,258 52,705
NET-INTEREST BEARING DEBT 635,239 893,542 1,039,541 1,592,103 2,016,403 2,183,398 2,361,682 2,385,314 1,941,530
INVESTED CAPITAL (EQUITY + NIBD) 3,222,384 3,197,237 3,181,486 3,798,045 4,090,500 4,319,432 4,274,583 4,426,929 4,194,570
Total
201
Appendix 31: Email Dialogue with AURF
Related Documents