Pavement Performance Prediction Symposium Laramie, Wyoming July 20, 2007 Reflective Crack Mitigation Using an Asphalt Concrete Interlayer System

Welcome message from author
This document is posted to help you gain knowledge. Please leave a comment to let me know what you think about it! Share it to your friends and learn new things together.
Transcript

Pavement Performance Prediction SymposiumLaramie, Wyoming
July 20, 2007
Reflective Crack Mitigation Using an Asphalt Concrete Interlayer System

Topics
What? The ProblemThe Solution: Reflective Crack Relief System Specifications
Why?AdvantagesProject Results
The Future?

What? The Problem
Before Conventional HMA overlay6 months later

What? The Problem
Superpave didn’t address reflective crackingMany miles of pavement in poor conditionConventional HMA overlays not addressing needNCHRP 1-41: Models for Predicting Reflective Cracking in HMA Overlays (Texas A & M)Project 05-04 AAPTP: Techniques for Mitigation of Reflective Cracking on HMA Airfield PavementsTPF-5(146): Evaluation of Modified Performance Grade Binders in Thin Lift Maintenance Mixes, Surface Mix and a Reflective Crack Relief Layer Mix

Core from a 3 Year Old Overlay Over PCC(New Jersey Rt. 10)
HMA Overlay cracked throughto PCC joint
Path for water intrusion to base

The SolutionReflective Crack Relief System
Significantly delays reflective crackingImproving surfaceProtecting base
ImpermeableProtects pavement from moisture damage
Lengthens service life Recyclable

Before
The SolutionReflective Crack Relief System
After
Interlayer section
Control HMAoverlay
The crackstops here!
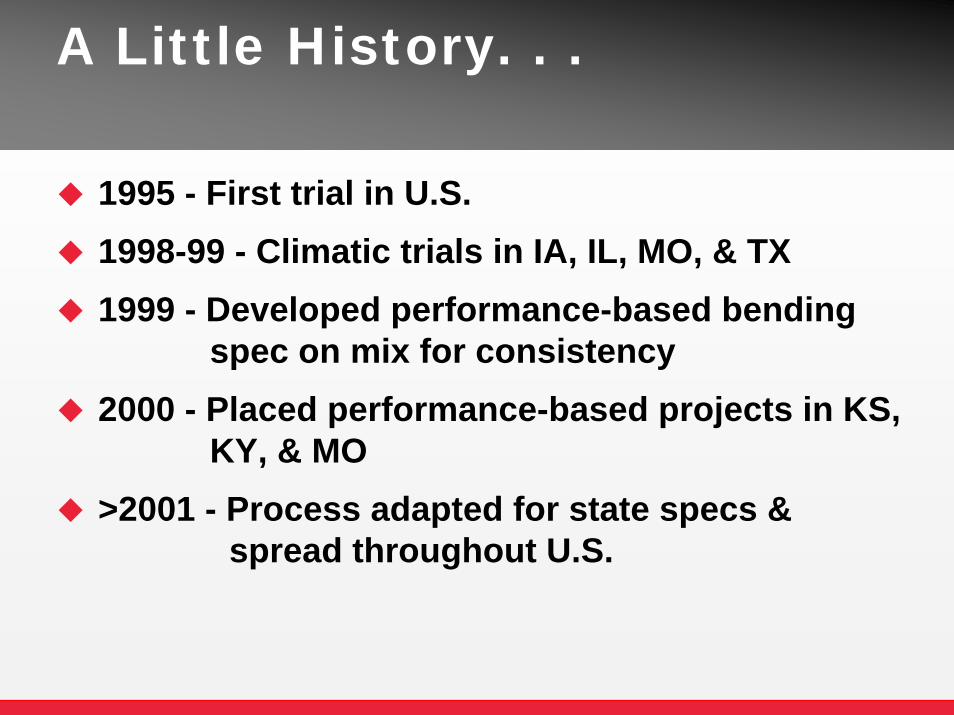
A Little History. . .
1995 - First trial in U.S.1998-99 - Climatic trials in IA, IL, MO, & TX1999 - Developed performance-based bending
spec on mix for consistency2000 - Placed performance-based projects in KS,
KY, & MO>2001 - Process adapted for state specs &
spread throughout U.S.

States with Reflective Crack Relief Interlayer System
Through 2006:585 lane-miles (4.0 million yd2) in 20 states

Overlay
InterlayerExisting PCC
The SolutionReflective Crack Relief System
InterlayerThin (1”) fine aggregate HMA Highly elastic PMACAsphalt-rich, impermeable
Overlay RecommendationSBS modified SHRP+ spec, 98% reliabilityMinimum thickness to protect interlayer

Overlay
Interlayer
Existing PCC
The SolutionReflective Crack Relief System
20 yr traffic<3 million ESALs = 1.5”3-10 million ESALs = 2.5”10-30 million ESALs = 3.0”>30 million ESALs = 3.5”
Thinner overlays possible withhigh stability interlayer option
Minimum Overlay Thickness Recommendations

Pavement Design Information
Structural value
Interlayer
Typical HMA Dense Mix
Structural Coefficient 0.20 0.35-0.44
Flexural Modulus @ 20°C, psi 200,000 400,000
Resilient Modulus @ 20°C, psi 493,000 740,000

Dynamic Modulus(Test Temp.=21.1oC)
Dynamic Modulus, E* Comparison of Interlayer and Typical HMA Dense Mix
0
200,000
400,000
600,000
800,000
1,000,000
1,200,000
1,400,000
1,600,000
0.1 10Test Frequency (Hz)
Dyn
amic
Mod
ulus
, E* (
psi)
Interlayer (psi) Typical HMA Dense Mix (psi)
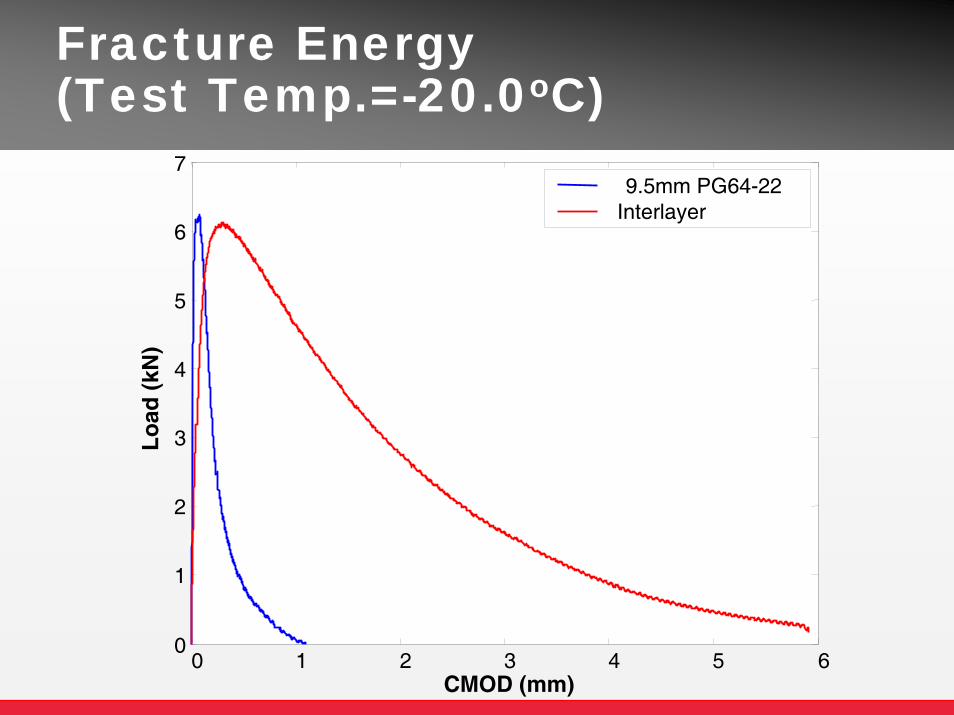
Fracture Energy(Test Temp.=-20.0oC)
0 1 2 3 4 5 60
1
2
3
4
5
6
7
CMOD (mm)
Lo
ad (
kN)
9.5mm PG64-22Interlayer

Protects Pavement Base from Moisture Damage
Permeability Tests on Field Samples
ASTM D 5084, Standard Test Method for Measurement of Saturated Porous Materials using a Flexible Wall Permeameter.
1.E-091.E-081.E-071.E-061.E-051.E-041.E-031.E-021.E-011.E+001.E+011.E+02
Interlayer& Overlay
Fabric &Overlay
HMA CleanSands
Gravel
Permeability(K) cm/sec

Surface Cracked, Interlayer IntactImpermeable Interlayer Protects Pavement
Core after 3.5 years
PCC Joint
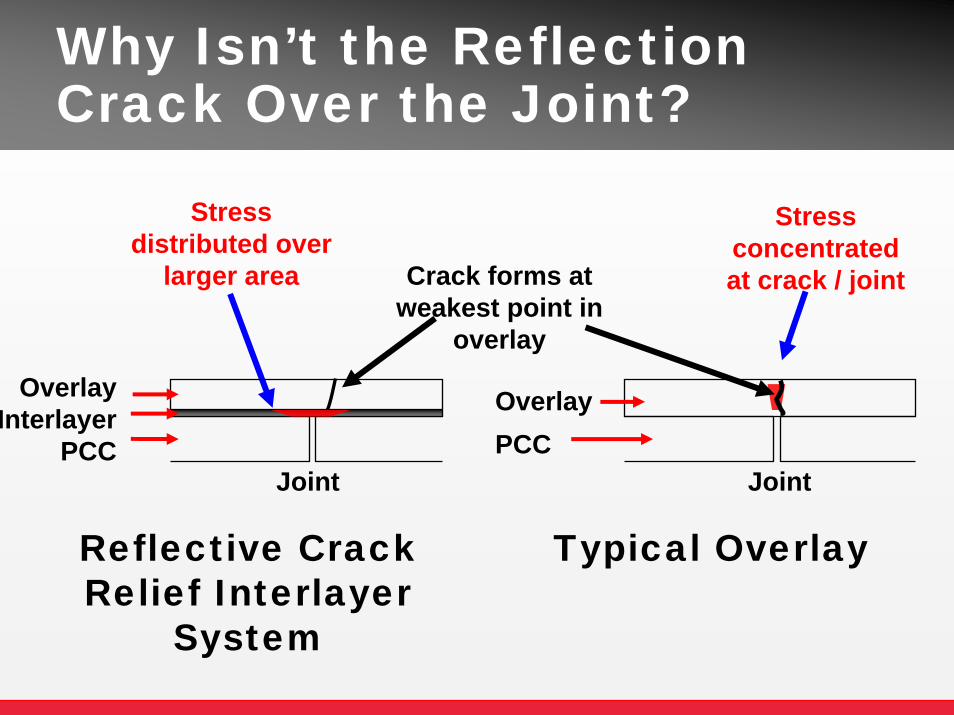
Why Isn’t the Reflection Crack Over the Joint?
Stress distributed over
larger area
Stress concentrated at crack / joint
Joint
Reflective Crack Relief Interlayer
System
OverlayInterlayer
PCCJoint
Typical Overlay
OverlayPCC
Crack forms at weakest point in
overlay

What Does That Mean for Performance?
OverlayInterlayerPCC
Overlay
PCC
Interlayer System Simple Overlay
CRACKED THROUGH TO BASERide is worse, structure is
compromised
CRACK OFFSETRide is better, structure is
intact
jointjoint

Core Analyses
61 Interlayer cores at overlay cracks51 not cracked through the interlayer10 cracked into interlayer
Over undoweled patches / failing joints
41 cracks offset; others not checkedNo path for water intrusion
Interlayer Section
Control Section
Cores from MO, WI, TX, KS, NJ, IL & IA projects
16 HMA cores at overlay cracks 15 cracked through to PCC jointDirect path for water intrusion

Interlayer Specifications Materials
Liquid AC BinderMinimum PGElastic recoverySeparation
Fine aggregateSand equivalency =45+Crushed & natural sandsGradation:
Sieve % Passing3/8 inch (9.5 mm) 100No. 4 (4.75 mm) 80 – 100No. 8 (2.36 mm) 60 – 85No. 16 (1.18 mm) 40 – 70No. 30 (600 μm) 25 – 55No. 50 (300 μm) 15 – 35No. 100 (150 μm) 8 – 20No. 200 (75 μm) 6 –14

Design Specifications Volumetrics
*Criteria for 9.5mm mixture, medium traffic.
Mix Design Comparison Typical interlayer
mix specs Superpave mix specs
SGC design (Superpave Gyratory Compactor)
SGC design (Superpave Gyratory Compactor)
50 gyrations *100 gyrations 0.5 – 2.5% air voids 4% air voids
16% min VMA *15% min VMA

Design SpecificationsPerformance Based Specs: Reflective Crack Resistance
Flexural Beam Fatigue Device, AASHTO T-321Tests mix’s ability to withstand repeated bendingData = number of loading cycles to failure (loss of strength)Run at 10x typical strain (deformation) to simulate reflective cracking caused by PCC joint movement

Performance Based Specification Highly Crack Resistant
100,000
6,000
2,000
0 20,000 40,000 60,000 80,000 100,000 120,000
PG 64-22 HMA
PG 76-28 HMA(PMAC)
InterlayerSpecification
Cycles to Failure at 2000 microstrain
AASHTO T-321, at test temperatureTest temperature determined by project climate

Design SpecificationsPerformance Based Specs: Hveem Stability
Resistance to rutting during construction18.0 minimum Hveem stabilityAlternative: maximum 10 mm rut depth using Asphalt Pavement Analyzer (APA)
AASHTO T-246

High Stability Interlayer
Designed forThinner overlaysHighly loaded pavements and thickness restrictions
City streets with curb & gutter restrictionsAirports
Higher stability specificationStronger aggregate structureIncreased rut resistanceSame fatigue resistance
InterlayerHigh
Stability Interlayer
Hveem Stability 18+ 28+
Design Traffic Loading, ESALs
Overlay Thickness Recommendations
< 3,000,000 1.5” 1.0”
3,000,000 – 10,000,000 2.5” 2.0”
2.5”3.0”
10,000,000 – 30,000,000 3.0”> 30,000,000 3.5”
High stability InterlayerRock County Airport, WI

Breathable Interlayer
Designed forBlister prone conditionsWhy blisters occur
pV=nRT (ideal gas law)Stability and fatigue specification are the sameSpecification changes in gradation and air voids

Pavement Preparation
Moderate & severe distresses repaired by doweled, full-depth patchLevel profile (mill or level with HMA)Surface sweptTack under & over the interlayer

Construction SpecificationsSurface preparation Test strip recommendedSpecified temperatures
MixingLaydownCompaction
Typical target density = 96% min. of GmmQC on mix & binder

Construction Recommendations
Compaction: 2 to 3 static steel wheeled rollersFirst roller close to paverTypically 5-6 passes
Density GaugeNormandy Drive, Ft. Riley, KS
LA I-20

Construction Recommendations
Recommend overlay interlayer immediately, but . . .
Designed to accommodate construction trafficMax 5 days trafficafter placement

Field Performance Analysis
Crack counting % reflective cracking =
length of cracks measuredlength of cracks before overlay
Core analysisCores from Interlayer and control sections

US36 Cameron, Missouri
Pavement before construction
Interlayer construction
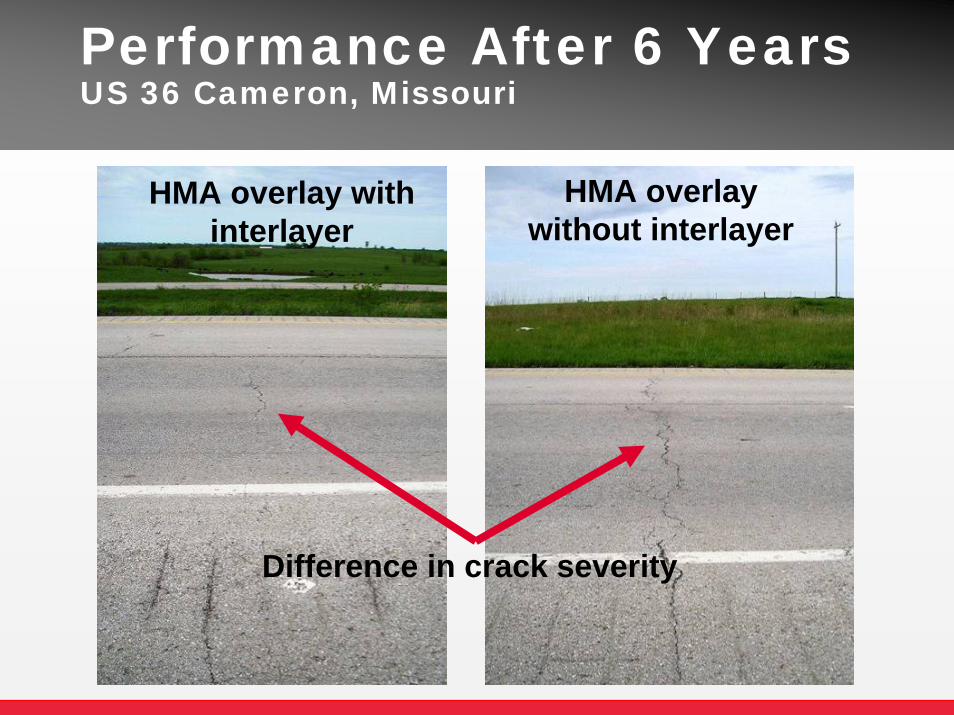
Performance After 6 YearsUS 36 Cameron, Missouri
HMA overlay with interlayer
HMA overlay without interlayer
Difference in crack severity

Performance After 6 YearsUS 36 Cameron, Missouri
HMA overlay with interlayer
HMA overlay without interlayer
Difference in longitudinal cracking from older PCC widening

Performance After 6 YearsUS 36 Cameron, Missouri
% Reflective Cracking
0%
20%
40%
60%
80%
100%
March,2001
Feb,2002
April,2003
Feb,2004
Aug,2005
May,2006
Interlayer SystemControl

IA-9 Decorah, Iowa Construction
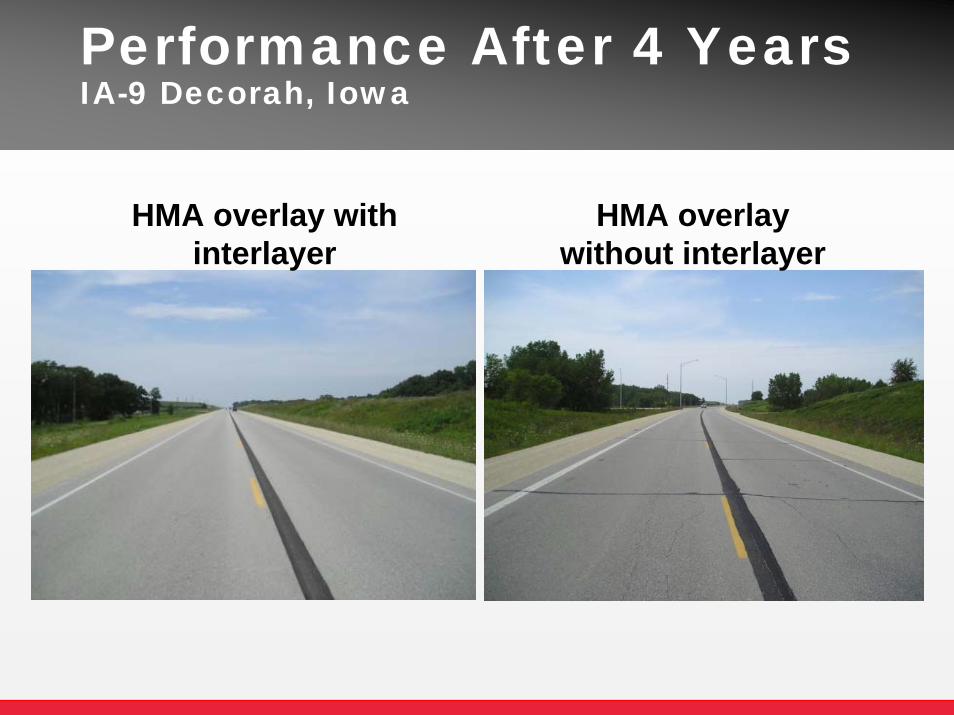
Performance After 4 YearsIA-9 Decorah, Iowa
HMA overlay with interlayer
HMA overlay without interlayer

Performance After 4 YearsIA-9, Decorah Iowa
0% 0% 0%
21%
4%
27%17%
29%
0%
20%
40%
60%
80%
100%
May, 2002 May, 2003 Feb, 2004 Aug, 2005
% Reflective Cracking
InterlayerSystemControl

Reflective Cracking Delay After 2 Years (2002 Projects)
% Reflective Cracking
0% 0% 0% 6% 1% 2% 5%20%
27%
0% 0%
22%9% 3%
17%
72%
44%
100%
0%20%40%60%80%
100%
LA SR 1 OK US69 IA CedarRapids
IA 1st Ave AR SH64 TX SH3 MI US27 SD SD14 WIMilwaukee
Project Location
Interlayer SectionControl Section
Lapham Blvd, Milwaukee
Interlayer
Control
Variables: joint spacing, climate, traffic, etc.

Reflective Cracking Delay After 3-4 Years (2001 Projects)
% Reflective Cracking
6% 1% 10% 0%
29%
76%
22% 20%0%
89%
54%
17%
57%
14%
0%20%40%60%80%
100%
IA Rt9 VA Rt17 China - WuShi Hwy
IA BusRt151 WI I94 KY I64* MO US36*
Project Location
Interlayer SectionControl Section
*after 5 winters (2000 projects)Variables: joint spacing, climate, traffic, etc.

Project Performance Summary
5%18%
0
20
40
60
80
100
% Cracking Per Year
% Reflective Cracking
Interlayer Section
Control Section
Interlayer improves overlay
performance
Data represents 15 projects built with control sections, up to 5 years old

Project Performance Summary
Average 67% improvement* in reflective cracking on Interlayer projects
(avg. 5% reflection cracking/year)
over control sections(avg. 18% reflection cracking/year)
Interlayer improves overlay performance
*Data represents 15 projects built with control sections, up to 5 years old

Summary Reflective Crack Relief Interlayer System Advantages
Significantly delays reflective crackingImproving surfaceProtecting base
ImpermeableLengthens service lifeRecyclable

The Future of the Reflective Crack Relief Interlayer
0%
20%
40%
60%
80%
100%
March,2001
Feb,2002
April,2003
Feb,2004
Aug,2005
InterlayerSystemControl
*Grant Opportunities for Academic Liaison with Industry

Integrated Approach
E1 E5
τ1 τ5
Field Data and Performance
Lab Testing Fracture Mechanics
Bulk Material Response
Computer Simulation

Field Investigation Projects
1. State Highway (IA-9) near Decorah, IA2. US-36 near Cameron, MO3. State Highway (LA-34) near Monroe, LA
Each project consists of:Control Section(s)Treated Section(s)
Projects have been visited at least once annually for crack count and visual distress identification

Project Locations (Climatic)

US-36 Cameron, MO
N
Interlayer Section12 Cores Sampled
Control Section12 Cores Sampled
2.40-in.(60 mm)Surface Course
2.30-in.(58 mm)Binder Course
Existing Old Pavement
Control Section2.00-in.(51 mm)Surface Course
2.10-in.(53 mm)Binder Course
1.00-in.(24 mm)Interlayer
Interlayer Section
Existing Old Pavement
EB

Critical Loading Conditions:
Simulations performed to evaluate the loading conditions in field which yield most crackingThermal Only:
Single Event (15 Hrs)5-Day Event
Thermal – Mechanical loading:Tire load at coolest temperatureMultiple tire loads at coolest temperatureTire loads at uniform interval over 5-Day coolingTire overload scenario

US36: Thermal-Mechanical Loading
Simulation results for single event cooling cycle with single tire load application is presented
Coolest event: Jan 25 – 26, 2003
Single 9-kip tire load applied at coolest pavement surface temperature (4:00 am)

Temperature Profile: Coolest Event
-11
-9
-7
-5
-3
-1
-20 -15 -10 -5 0 5 10Temperature (C)
Dep
th (
cm)
2:00 PM 4:00 PM6:00 PM 8:00 PM10:00 PM 12:00 AM2:00 AM 4:00 AM6:00 AM
Surface
Binder
0600 Hrs 1400 Hrs

US36, Control Section – Single Tire
Softening(Micro-
cracking/Damage)
PCC
Subgrade
Cracking
Surface Course
Binder Course
Interlayer
Control Interlayer

Current Studies
An accelerated pavement testing study is currently under wayA number of modeling variables will be calibrated and optimized using this accelerated pavement cracking studyLaboratory testing for mode-II fracture testing of asphalt concrete is being developedMore field sites may be studied in a follow-up project

Thank you.
Questions?
Related Documents