Strain softening and microstructural evolution of anorthite aggregates and quartz–anorthite layered composites deformed in torsion Shaocheng Ji a,d, * , Zhenting Jiang b , Erik Rybacki c , Richard Wirth c , David Prior b , Bin Xia d a De ´partement des Ge ´nies Civil, Ge ´ologique et des Mines, E ´ cole Polytechnique de Montre ´al, C.P. 6079, Succ. Centre-Ville, Montreal, QC, Canada H3C 3A7 b Department of Earth Sciences, University of Liverpool, L69 3BX, Liverpool, UK c GeoForschungsZentrum Potsdam, D-14473 Potsdam, Germany d Laboratory of Marginal Sea Geology, Guangzhou Institute of Geochemistry and South China Sea Institute of Oceanology, Chinese Academy of Sciences, Wushan, Guangzhou, PR China Received 20 November 2003; received in revised form 8 March 2004; accepted 15 March 2004 Abstract Torsion experiments of anorthite (An) aggregates and layered composites with equal volume fractions of quartz (Qtz) and An were performed in a gas-medium apparatus at a confining pressure of 400 MPa, temperatures from 1373 to 1473 K, and twist rates from 1.0 10 4 to 3.0 10 4 rad/s. Dense specimens were fabricated from An glass and Qtz crystalline powder using hot isostatic pressing (HIP) techniques. Both An aggregates and Qtz – An layered composites show a continuous strain weakening from a peak stress at c = 0.2 – 0.3 to c = 3.2, and steady-state flow has not reached under the experimental conditions. The weakening is even more pronounced in the layered composites than the monolithic aggregates, suggesting channeling or localization of flow into the weak material between strong layers. The sheared An specimens developed pervasively C – S – CV structures which are similar to those observed in natural ductile shear zones. TEM and electron backscattering diffraction (EBSD) fabric analyses suggest that grain boundary migration recrystallization-accommodated dislocation creep with (010)[100] as the dominant slip system was operating in the An. The strain softening may be due to the development of crystallographic preferred orientation (CPO), the operation of dynamic recrystallization and the formation of extremely fine- grained recrystallized material in the narrow CVshear bands. D 2004 Elsevier B.V. All rights reserved. Keywords: anorthite; quartz – anorthite composite; simple shear; crystallographic preferred orientation; flow strength 1. Introduction Plagioclase is the most abundant constituent in the continental and oceanic crust of the Earth [1]. It forms a continuous solid solution series ranging in compo- sition from albite (NaAlSi 3 O 8 ) to anorthite (CaAl 2 0012-821X/$ - see front matter D 2004 Elsevier B.V. All rights reserved. doi:10.1016/j.epsl.2004.03.021 * Corresponding author. Tel.: +1-514-3404711x5134; fax: +1- 514-3403970. E-mail address: [email protected] (S. Ji). www.elsevier.com/locate/epsl Earth and Planetary Science Letters 222 (2004) 377 – 390

Welcome message from author
This document is posted to help you gain knowledge. Please leave a comment to let me know what you think about it! Share it to your friends and learn new things together.
Transcript
www.elsevier.com/locate/epsl
Earth and Planetary Science Letters 222 (2004) 377–390
Strain softening and microstructural evolution of anorthite
aggregates and quartz–anorthite layered composites
deformed in torsion
Shaocheng Jia,d,*, Zhenting Jiangb, Erik Rybackic, Richard Wirthc,David Priorb, Bin Xiad
aDepartement des Genies Civil, Geologique et des Mines, Ecole Polytechnique de Montreal, C.P. 6079, Succ. Centre-Ville,
Montreal, QC, Canada H3C 3A7bDepartment of Earth Sciences, University of Liverpool, L69 3BX, Liverpool, UK
cGeoForschungsZentrum Potsdam, D-14473 Potsdam, GermanydLaboratory of Marginal Sea Geology, Guangzhou Institute of Geochemistry and South China Sea Institute of Oceanology,
Chinese Academy of Sciences, Wushan, Guangzhou, PR China
Received 20 November 2003; received in revised form 8 March 2004; accepted 15 March 2004
Abstract
Torsion experiments of anorthite (An) aggregates and layered composites with equal volume fractions of quartz (Qtz) and
An were performed in a gas-medium apparatus at a confining pressure of 400 MPa, temperatures from 1373 to 1473 K, and
twist rates from 1.0� 10� 4 to 3.0� 10� 4 rad/s. Dense specimens were fabricated from An glass and Qtz crystalline powder
using hot isostatic pressing (HIP) techniques. Both An aggregates and Qtz–An layered composites show a continuous strain
weakening from a peak stress at c = 0.2–0.3 to c = 3.2, and steady-state flow has not reached under the experimental conditions.
The weakening is even more pronounced in the layered composites than the monolithic aggregates, suggesting channeling or
localization of flow into the weak material between strong layers. The sheared An specimens developed pervasively C–S–CVstructures which are similar to those observed in natural ductile shear zones. TEM and electron backscattering diffraction
(EBSD) fabric analyses suggest that grain boundary migration recrystallization-accommodated dislocation creep with
(010)[100] as the dominant slip system was operating in the An. The strain softening may be due to the development of
crystallographic preferred orientation (CPO), the operation of dynamic recrystallization and the formation of extremely fine-
grained recrystallized material in the narrow CVshear bands.
D 2004 Elsevier B.V. All rights reserved.Keywords: anorthite; quartz–anorthite composite; simple shear; crystallographic preferred orientation; flow strength
0012-821X/$ - see front matter D 2004 Elsevier B.V. All rights reserved.
doi:10.1016/j.epsl.2004.03.021
* Corresponding author. Tel.: +1-514-3404711x5134; fax: +1-
514-3403970.
E-mail address: [email protected] (S. Ji).
1. Introduction
Plagioclase is the most abundant constituent in the
continental and oceanic crust of the Earth [1]. It forms
a continuous solid solution series ranging in compo-
sition from albite (NaAlSi3O8) to anorthite (CaAl2
S. Ji et al. / Earth and Planetary Science Letters 222 (2004) 377–390378
Si3O8). In this paper, we present our results on the
rheological behaviour, microstructures and crystallo-
graphic preferred orientation (CPO) in monolithic
anorthite (An) aggregates and layered composites
with equal volume fractions of quartz (Qtz) and An,
deformed in torsion at a confining pressure of 400
MPa and temperatures of 1373–1473 K. Three main
considerations in undertaking this study were as
follows.
(1) Tectonic deformation of the continental crust is
mainly controlled by the rheological behaviour of
the lower crust that is generally weaker than both
the overlying upper crust and the underlying upper
mantle [2–4]. To a first approximation, the
rheology of the lower crust, in which plagioclase
is volumetrically most important, can be taken to
be the rheology of plagioclase [1–3]. Thus, an
understanding of the evolution in microstructures
and CPO of plagioclase deformed under well-
defined conditions (T, P, stress and strain) is crucial
to constraining the rheological behaviour of
plagioclase. So far the interpretation of plagiocla-
se’s deformation and rheology in orogenic belts
has been largely hindered by the relatively limited
knowledge of mechanical and microstructural data
from laboratory tests [5–14]. For example, the
relative activity of different slip systems for
plagioclase under varying physical and chemical
conditions is still poorly known [10,14].
(2) Many ductile shear zones in high-grade metamor-
phic terranes that are representative of lower-
crustal rocks were active under approximately
simple shear (e.g., [15,16]). Almost all experi-
mental deformation studies on feldspar in the
ductile regime have been conducted in coaxial
deformation tests [5–8,10,11]. In conventional,
compression tests, strain is coaxial and the total
axial strain is generally limited to less than 0.4,
which corresponds to an equivalent shear strain of
about 1. This amount of strain is usually
insufficient to produce steady-state dislocation
creep microstructures [17–20]. Application of
experimental results obtained from coaxial com-
pression to tectonic interpretation of ductile shear
zones, where accumulated shear strains are often
very large (c>3), is thus limited. Also, in coaxial
compression tests, progressive deformation results
in a non-uniform stress state due to barrelling and/
or buckling of the sample [20]. The so-called
‘‘diagonal saw-cut’’ experiments, using a sample
wafer sandwiched between two rigid pistons cut at
30j or 45j [12,13] to their long axes, provide
valuable information about non-coaxial deforma-
tion and its effects on microstructure and CPO
evolution. However, this type of tests often
involves a significant component of flattening
across the shear zone and material extrusion into
the gaps at the piston-cut edges. Thus, true simple
shear deformation has not been produced in
previous ‘‘diagonal saw-cut’’ experiments. In
addition, the constraints brought into play by the
lateral offsets of the split pistons may complicate
the derivations of accurate strength data at high
strains. However, simple shear deformation can be
achieved in torsion experiments in the laboratory
[9,17–20].
(3) CPO of plagioclase can further our understanding
of its plastic deformation mechanisms, strain
geometry, kinematics and deformation conditions,
and enables us to evaluate its contribution to the
seismic anisotropy of the lower crust. In spite of
its importance, plagioclase has a much smaller
CPO database than olivine, quartz and calcite.
Reasons for this are primarily technical because
plagioclase is triclinic. Full crystallographic
orientations of plagioclase can be determined
using the U-stage method [21,22] only across
limited compositional ranges (An35–70 and
An90–100) [23]. Conventional X-ray goniometry
is not satisfactory for plagioclase CPO analysis
due to the large number of overlapping diffraction
peaks. Neutron diffraction goniometry has been
applied to the measurements of plagioclase CPO
[21,24]. However, relatively large volumes of
sample material are required (>1 cm3). Synchro-
tron X-ray goniometry was employed to investi-
gate the CPO of albite aggregates [25], but this
technique is expensive and not widely available.
Recent studies [9,10,26,27] showed the most
powerful technique for successfully measuring
plagioclase CPO to be electron backscattering
diffraction (EBSD) in a scanning electron micro-
scope (SEM). We have used this new technique to
collect representative plagioclase CPO data from
our undeformed and deformed samples.

Fig. 1. Undeformed, hot isostatic pressed layered Qtz–An
composite (a–b) and pure An aggregate (c). (a) Photograph, (b)
optical photomicrograph, and (c) SEM micrograph. Sections of (b)
and (c) were cut parallel to the cylinder axis.
S. Ji et al. / Earth and Planetary Science Letters 222 (2004) 377–390 379
2. Samples
Commercial powders of anorthite (An98.9Or0.2Ab0.9) glass with particle sizes ranging from 11 to 60
Am (Schott, Germany) and ground-up natural quartz
with a grain size ranging from 20 to 80 Am (Johnson-
Matthey, Germany) were used as the starting materials
[10,11]. Four categories of samples were prepared
using hot isostatic pressing (HIP) techniques. They
are layered composites (LC, Fig. 1a), particulate com-
posites (PC) of Qtz plus An, pure An (Fig. 1c) and pure
Qtz aggregates. LC samples contain alternating Qtz and
An layers with strong and sharp interfaces (Fig. 1b),
which was created during cold pressing and subse-
quently thinned during HIP. The layering in cylindrical
LC samples is characterized by the ratio of the diameter
(d) to the thickness (h) of material layers. The PC is a
homogeneous mixture with equal volume fractions of
Qtz and An.
The An glass and Qtz powders were encapsulated
in a steel jacket (diameter: 15 mm, length: 25 mm)
and cold-pressed under an axial stress of about 150
MPa. Each cold-pressed pellet was HIPed in a Pater-
son gas-medium apparatus at 1123 K for 1 h, 1323 K
for 1 h and then 1473 K for 3 h at a confining pressure
of 300 MPa to maximize densification of the powder,
to crystallize the glass, and to anneal the sample [8].
Porosity is < 1% in the hot-pressed An and PC
samples, 3–5% in the LC samples and 5–6% in the
pure Qtz aggregates.
Under coaxial compression, the Qtz aggregates, in
spite of their porosity of f 5–6%, do not yield at
1273–1373 K at confining pressure of 300 MPa and
strain rate 10� 5 s� 1 [10]. Even at 1473 K, the Qtz
aggregate still has compressive strength higher than
600 MPa. Under the laboratory conditions (1473 K,
300 MPa and 10� 5 s� 1), quartz is stronger than An
by a factor of 40 (at e= 0.15) to 51 (at e = 0.05) [10].From two typical HIPed samples from each cate-
gory, several polished thin sections were made in
order to characterize the microstructures and the water
content of undeformed materials using optical, SEM,
transmission electron microscope (TEM), Fourier
transform infrared spectrometer (FTIR) and EBSD
analyses.
The grain size (D) and aspect ratio (S) of a given
grain were obtained from measuring its length (L)
and (W) width from petrographic sections and SEM
photographs of polished sections for Qtz and An,
respectively. D ¼ffiffiffiffiffiffiffiffi
LWp
and S = L/W. Qtz displays a
normal grain size distribution ranging from 15 to 80
Am with an arithmetic mean of 45 Am. The An
grains display a log-normal size distribution ranging
from 0.4 to 9 Am with an arithmetic average of 2.1

Fig. 2. Preferred orientations of triclinic anorthite [001], [100], and
(010) for a undeformed, hot pressed, pure An aggregate. Notice
that the whole sphere, rather than a hemisphere, is necessary to
represent the distribution of the positive directions. Projections on
the (a) lower and (b) upper hemispheres. Stereonets are equal-area
plots; 130 measurements are used. The solid line is normal to the
cylinder axis.
S. Ji et al. / Earth and Planetary Science Letters 222 (2004) 377–390380
Am. The mean aspect ratios for Qtz and An are 2.0
and 2.2, respectively. No discernable shape preferred
orientation was observed for either Qtz or An in the
HIPed samples.
Qtz in the PC aggregates forms large grains (15–
80 Am) dispersed homogeneously within a continuous
matrix of An. Spherulites with radial fibers of An are
occasionally observed in pure An aggregates and An
layers of LC samples and have sizes up to 60 Am. In
the spherulites, anorthite fibers are generally tabular
on {010} with an elongation mainly along [001] and
to a lesser extent along [100]. However, no An
spherulites occur in PC samples. It is generally
accepted that spherulite texture results when the rate
of crystal growth exceeds that of crystal nucleation
[28]. Spherulites generally start from a nucleation
centre where the water content is relatively high
[11]. The volume fraction of spherulites in our An
aggregates is about 10%.
TEM (Philips CM200, GFZ-Potsdam, Germany)
operating at 200 kV shows that the grain boundaries
in the An aggregates are coherent and high-angle.
They are straight and clean, suggesting that the
crystallization and compaction were well done. A
small amount of melt (b 0.5 vol%) was observed in
triple junctions. Anorthite grains in the HIPed samples
are characterized by closely spaced growth twin
lamellae and low dislocation densities (f 1011
m� 2). The twins have their composition planes par-
allel to (010) and are mainly Albite, Carlsbad and
Carlsbad-Albite types.
EBSD patterns of An and Qtz were measured and
indexed using a SEM (Philips XL30) at Liverpool
University, and the software package Channel+ from
HKL Software Company [9,10,26,27]. The patterns
were recorded at 30-kV acceleration voltage and
nominal beam currents of 80 AA. No carbon coat
was used on the thin sections, which were chemical-
ly–mechanically polished to remove specimen sur-
face damage, because the coat degraded the EBSD
image quality. In most cases, more than five or six
bands were detected, allowing the bands to be indexed
unambiguously by the computer simulation. The mea-
surement uncertainty was given by the software as a
mean angular deviation (MAD) between detected
bands and simulated patterns. The indexing was not
accepted if the MAD value was larger than 2j. EBSDmeasurements showed a random CPO of both An
(Fig. 2) and Qtz in HIPed samples, as expected for
hydrostatic conditions.
FTIR measurements using a Bruker IFS-66v (GFZ-
Potsdam) showed a broad absorption band with a
maximum near 3550 cm� 1 for HIPed samples. The
spectra are typical for molecular water or hydroxyl
[29]. The pure An samples and An layers from LC
samples had a water content ranging from 8000 to
20000 H/106 Si with an average value of 13,000 H/
106 Si (f 0.08% wt.% H2O). The pure Qtz samples
and Qtz grains in PC samples contain very small
amounts of water ( < 400 H/106 Si). There was no
significant difference in water content of samples
before and after experimental deformation because
the samples were not vented. Thus, there was no
detected loss of water species through the Fe jacket
or the interface between the jacket and alumina
pistons during the mechanical tests [11]. These water
contents are lower than those found to produced
diffusion creep [30].
3. Mechanical data
Torsion tests, which allow simple shear deforma-
tion with r1 =� r3 inclined at 45j to the axis of
cylindrical samples [20], were carried out using a
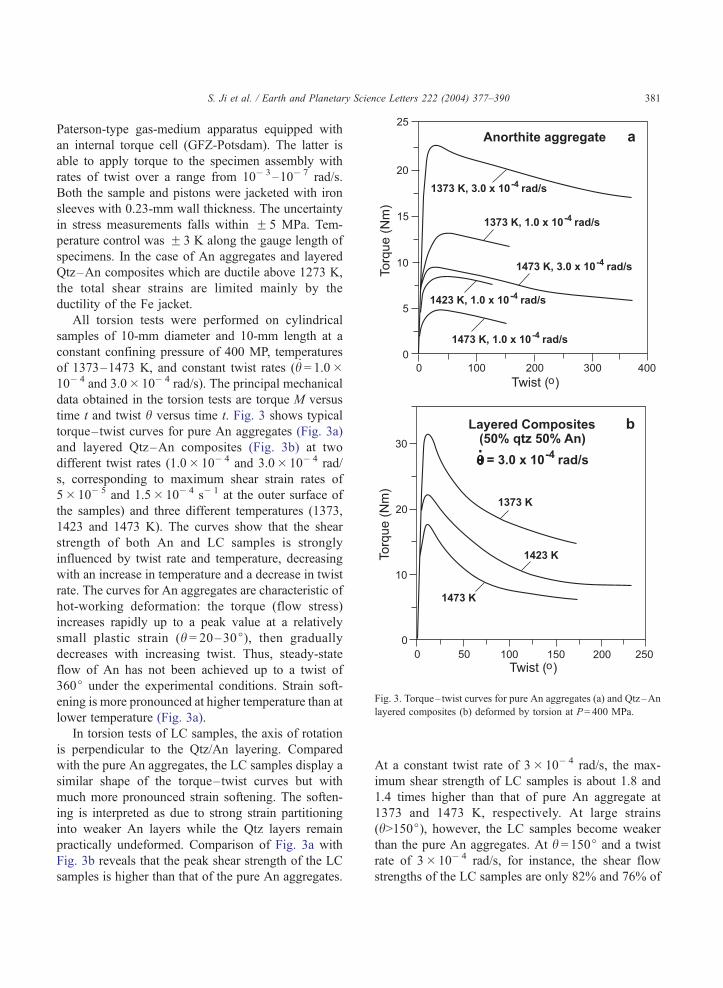
Fig. 3. Torque– twist curves for pure An aggregates (a) and Qtz–An
layered composites (b) deformed by torsion at P= 400 MPa.
S. Ji et al. / Earth and Planetary Science Letters 222 (2004) 377–390 381
Paterson-type gas-medium apparatus equipped with
an internal torque cell (GFZ-Potsdam). The latter is
able to apply torque to the specimen assembly with
rates of twist over a range from 10� 3–10� 7 rad/s.
Both the sample and pistons were jacketed with iron
sleeves with 0.23-mm wall thickness. The uncertainty
in stress measurements falls within F 5 MPa. Tem-
perature control was F 3 K along the gauge length of
specimens. In the case of An aggregates and layered
Qtz–An composites which are ductile above 1273 K,
the total shear strains are limited mainly by the
ductility of the Fe jacket.
All torsion tests were performed on cylindrical
samples of 10-mm diameter and 10-mm length at a
constant confining pressure of 400 MP, temperatures
of 1373–1473 K, and constant twist rates (h = 1.0�10� 4 and 3.0� 10� 4 rad/s). The principal mechanical
data obtained in the torsion tests are torque M versus
time t and twist h versus time t. Fig. 3 shows typical
torque–twist curves for pure An aggregates (Fig. 3a)
and layered Qtz–An composites (Fig. 3b) at two
different twist rates (1.0� 10� 4 and 3.0� 10� 4 rad/
s, corresponding to maximum shear strain rates of
5� 10� 5 and 1.5� 10� 4 s� 1 at the outer surface of
the samples) and three different temperatures (1373,
1423 and 1473 K). The curves show that the shear
strength of both An and LC samples is strongly
influenced by twist rate and temperature, decreasing
with an increase in temperature and a decrease in twist
rate. The curves for An aggregates are characteristic of
hot-working deformation: the torque (flow stress)
increases rapidly up to a peak value at a relatively
small plastic strain (h = 20–30j), then gradually
decreases with increasing twist. Thus, steady-state
flow of An has not been achieved up to a twist of
360j under the experimental conditions. Strain soft-
ening is more pronounced at higher temperature than at
lower temperature (Fig. 3a).
In torsion tests of LC samples, the axis of rotation
is perpendicular to the Qtz/An layering. Compared
with the pure An aggregates, the LC samples display a
similar shape of the torque–twist curves but with
much more pronounced strain softening. The soften-
ing is interpreted as due to strong strain partitioning
into weaker An layers while the Qtz layers remain
practically undeformed. Comparison of Fig. 3a with
Fig. 3b reveals that the peak shear strength of the LC
samples is higher than that of the pure An aggregates.
At a constant twist rate of 3� 10� 4 rad/s, the max-
imum shear strength of LC samples is about 1.8 and
1.4 times higher than that of pure An aggregate at
1373 and 1473 K, respectively. At large strains
(h>150j), however, the LC samples become weaker
than the pure An aggregates. At h = 150j and a twist
rate of 3� 10� 4 rad/s, for instance, the shear flow
strengths of the LC samples are only 82% and 76% of
S. Ji et al. / Earth and Planetary Science Letters 222 (2004) 377–390382
those of the pure An aggregates at 1373 and 1473 K,
respectively.
Six PC samples have been tested in torsion at
temperatures of 1373–1523 K and twist rates of
10� 4–10� 5 rad/s. However, slip occurred at the
bottom sample–piston interface due to loss of fric-
tional grip, and all tests failed. These LC samples
could be too strong to be sheared in torsion under the
experimental conditions.
4. Microstructures and CPO
The axial lines scribed on the outer surface of the
Fe jacket of torsion specimens were used to indicate
if heterogeneous strain took place during the tests.
For all the twisted An aggregates, the scribe lines are
straight and continuous, and the angle between the
specimen axis and the scribe lines (/) was fairly
constant along the length of the scribes, indicating
uniform deformation on the bulk specimen scale.
The latter reflects a homogeneous distribution of
temperature along the sample assembly and no
change in volume of the sample [20]. Furthermore,
surface shear strain (cs) measurements using the
scribe line angles and equation cs = tan / agreed
with the values calculated based on the amount of
twist and the specimen geometrical dimensions. In
contrast to observations for the An aggregates, the
scribe lines on the LC samples showed clear evi-
dence of strong flow localization into the An layers.
The scribe line of the An layers formed a large angle
with the specimen axis while the line of the Qtz
layers formed a very small angle with the specimen
axis. This indicates that the weak An layers absorbed
almost all the shear strain while the Qtz layers were
almost rigid.
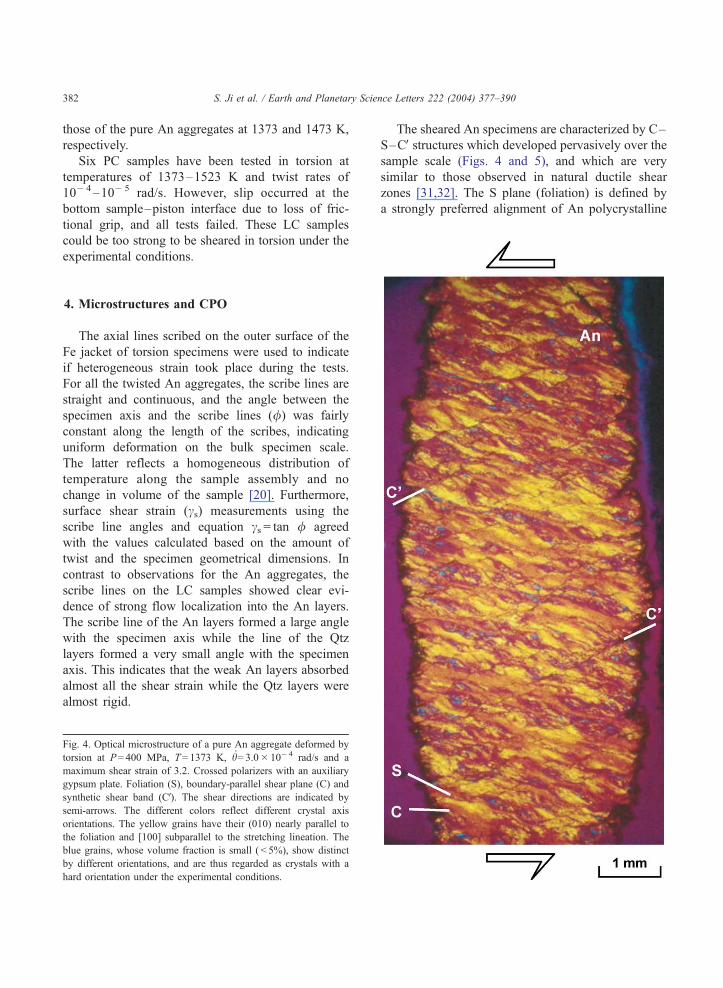
Fig. 4. Optical microstructure of a pure An aggregate deformed by
torsion at P= 400 MPa, T= 1373 K, h= 3.0� 10� 4 rad/s and a
maximum shear strain of 3.2. Crossed polarizers with an auxiliary
gypsum plate. Foliation (S), boundary-parallel shear plane (C) and
synthetic shear band (CV). The shear directions are indicated by
semi-arrows. The different colors reflect different crystal axis
orientations. The yellow grains have their (010) nearly parallel to
the foliation and [100] subparallel to the stretching lineation. The
blue grains, whose volume fraction is small ( < 5%), show distinct
by different orientations, and are thus regarded as crystals with a
hard orientation under the experimental conditions.
The sheared An specimens are characterized by C–
S–CVstructures which developed pervasively over the
sample scale (Figs. 4 and 5), and which are very
similar to those observed in natural ductile shear
zones [31,32]. The S plane (foliation) is defined by
a strongly preferred alignment of An polycrystalline

S. Ji et al. / Earth and Planetary Science Letters 222 (2004) 377–390 383
bands or ribbons. The latter display strong undulatory
extinction, and contain smaller grains with apparently
similar orientations (Fig. 4). C surfaces, which are
parallel to the shear plane and perpendicular to the
axis of torsion, are locally observed (Fig. 5a–b). In
high strain parts near the outer surface of sheared
samples, the polycrystalline bands are often obliter-
ated by intense dynamic recrystallization, which sig-
nificantly weakens the foliation (Fig. 5d). The angle
(b) between the S and C planes varied with the shear
strain (c) and is generally smaller than the theoretical
value calculated from c = 2ctg(2b) [33]. CVplanes areen echelon arrays of synthetic shear zones, which are
aligned about 15j to the boundary parallel shear plane
C and dissect and offset the foliation S.
Fig. 5. Optical photomicrographs of pure An aggregates deformed by t
Sigmoidal foliation (S) curves towards the boundary-parallel shear plane
domain bounded by the foliation (S) and the boundary-parallel shear plane
marked by narrow zones of recrystallized grains. (d) A completely recrys
elongated grains while the CVplane is defined by narrow zones of extrem
When the C surfaces are observed, the combination
of the S and C planes defines sigmoidal or fish-shaped
domains consistent with the imposed shear (Fig. 5a–
b); the shear strain is more concentrated along the
domain boundaries than the interior of the domains.
The sigmoidal structures are strikingly similar to those
commonly observed in natural shear zones [31,32].
The CVplanes represent a late disruption of an already
developed foliation. It is also observed that the CVplanes become more closely spaced with increasing
shear strain. At first glimpse, the CVplanes are fault-
like features since they accommodate shear displace-
ment as indicated by offset of markers such as the
foliation. However, microscopic observations show
these CVplanes are defined by very narrow zones of
orsion. The sinistral shear sense is indicated by semi-arrows. (a)
(C), consistent with the sinistral sense of shear. (b) A fish-shaped
(C) consistent with the sinistral sense of shear. (c) CVshear bands aretallized region (c=f 3.0) where foliation is marked by individual
ely fine recrystallized grains.

Fig. 6. Crystallographic preferred orientations of anorthite porphyr-
oclasts from a pure An aggregate deformed by torsion at P= 400
MPa, T= 1473 K, h= 3.0� 10� 4 rad/s and three different shear
strains: c = 1 (a), c = 2 (b), and c= 3 (c). C is the boundary-parallel
shear plane (horizontal line); X is parallel to the stretching lineation;
Z is the normal to the foliation (XY-plane). Notice that the whole
sphere, rather than a hemisphere, is necessary to represent the
distribution of the positive directions. [100] and [001] are projected
on the upper and lower hemispheres while the poles to (010) are
plotted on the lower hemisphere. Stereonets are equal-area plots.
One hundred thirty measurements are used.
S. Ji et al. / Earth and Planetary Science Letters 222 (2004) 377–390384
extremely fine recrystallized grains. Thus, the physi-
cal properties of these deformation zones are actually
not fault-like, and their mechanism is not one of
frictional stick-slip deformation. Instead, the CVshearis accomplished through a mechanism that involves
strong strain concentration due to localized dynamic
recrystallization.
It is observed, using cross polarizers with an
auxiliary gypsum plate [5,6], that anorthite grains
have a relatively uniform color except some porphyr-
oclasts (Fig. 4). These porphyroclasts are unfavour-
ably oriented with respect to the imposed shear and
hence remain as weakly deformed augen [15]. The
uniform color in the rest of the sample indicates a
strong CPO.
Because each sample deformed by torsion shows a
gradient of strain from the centre of rotation to the
outer edge of the sample, we calibrated the CPO
variation as a function of shear strain using a single
sample that deformed under the same T and P con-
ditions. The CPO of An from a pure An aggregate
achieved a maximum shear strain of 3.2 at 1473 K and
a twist rate of 3.0� 10� 4 rad/s was measured using
the EBSD technique. Although grid measurements
with 40-Am spacing were made across the thin sec-
tions, the recrystallized grains and particularly those
within the CV shear bands are too small to be mea-
sured. The CPO diagrams shown in Fig. 6 are thus
representative of the fabrics of the coarse porphyro-
clasts. The (010) poles and [100] directions developed
an obvious preferred orientation close, respectively, to
the normal to the foliation and to the stretching
lineation. The CPO strength increases first rapidly
from c = 0 to c= 1 and then increases slowly with
shear strain up to c = 3.Similar to An samples deformed by coaxial com-
pression [10] at the same conditions, the An aggre-
gates or layers deformed by torsion exhibit TEM
microstructures indicative of dislocation creep accom-
modated by grain boundary migration recrystalliza-
tion. The An grains display variable dislocation
densities with very high densities (>5� 1014 m� 2)
in relict grains and very low densities (5–8� 1011
m� 2 in recrystallized neograins (Fig. 7). Even within
the grains with very high dislocation densities, the
distribution of dislocations is heterogeneous, with
dislocations clustered along narrow planar zones that
are generally parallel to (010) planes. The planar
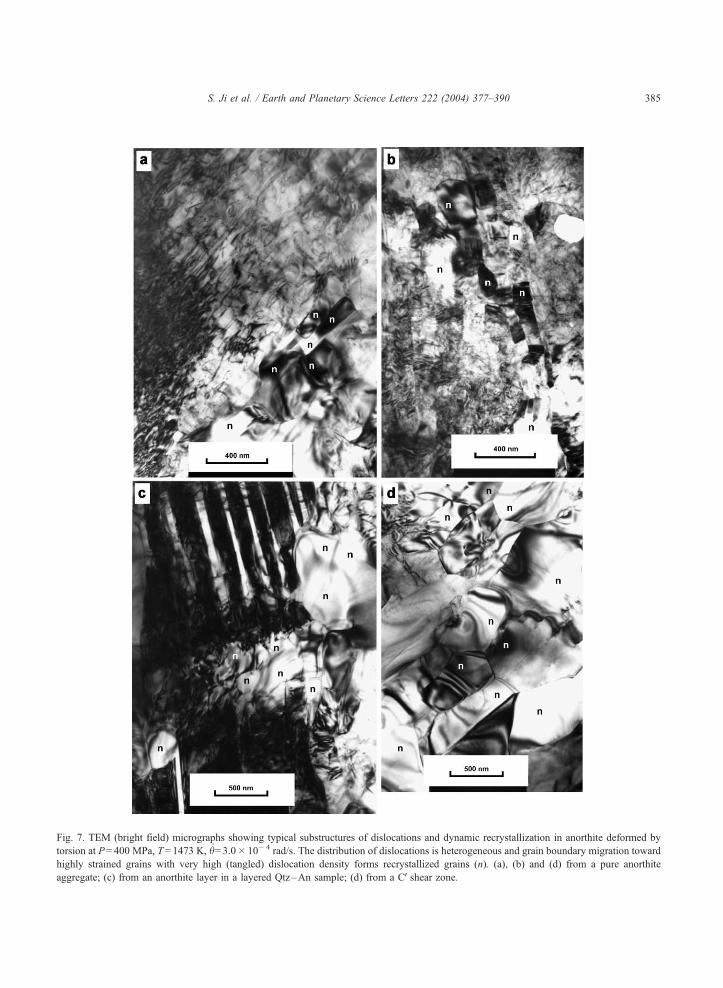
Fig. 7. TEM (bright field) micrographs showing typical substructures of dislocations and dynamic recrystallization in anorthite deformed by
torsion at P= 400 MPa, T= 1473 K, h= 3.0� 10� 4 rad/s. The distribution of dislocations is heterogeneous and grain boundary migration toward
highly strained grains with very high (tangled) dislocation density forms recrystallized grains (n). (a), (b) and (d) from a pure anorthite
aggregate; (c) from an anorthite layer in a layered Qtz–An sample; (d) from a CVshear zone.
S. Ji et al. / Earth and Planetary Science Letters 222 (2004) 377–390 385
S. Ji et al. / Earth and Planetary Science Letters 222 (2004) 377–390386
zones of high dislocation density indicate that the
(010) plane is the main slip plane under the conditions
of investigation. Furthermore, the deformed An de-
veloped strongly sutured grain boundaries with neo-
grains bulging from regions with very high dislocation
densities to areas with low dislocation densities (Fig.
7c). No well-developed subgrain boundaries or dislo-
cation walls have been observed. The microstructure
is similar to those typically observed in plagioclase
deformed at moderate and high temperatures [1,5–
7,10,16,22,34].
5. Discussion
5.1. CPO
Anorthite grains show a random CPO in unde-
formed, HIPed aggregates (Fig. 2). In both An aggre-
gates and LC samples deformed by torsion, however,
anorthite grains develop a strong CPO with the poles
to (010) rotated progressively to align parallel to the
foliation plane and the [100] axes tending to lie in the
foliation plane with the maximum concentration par-
allel to the stretching lineation (Fig. 6). Thus, the CPO
formed during the torsion rather than from the HIP,
and provided evidence for the dominance of disloca-
tion creep. Numerical models of simple shear [35,36],
in which only one slip system is available to each
grain, predict that the slip plane and the slip direction
align progressively close to the shear plane and shear
direction, respectively, with increasing shear strain.
Thus, the CPO pattern observed from the sheared An
aggregates is consistent with dislocation motion on
(010)[100] system, supporting that it is the easiest slip
system under the experimental conditions. The results
agree with our previous CPO measurements of An
aggregates deformed in coaxial compression at high
temperature where the porphyroclasts developed a
strong CPO with the poles to (010) parallel to j1and a girdle of [100] normal to j1 [10]. As shown in
Fig. 6, the An fabric strength increases nonlinearly
with increasing shear strain; a rapid increase occurs up
to c = 1 and then a relatively slow further increase
between c = 1 and c = 3 at the same twist rate
(3.0� 10� 4 rad/s). This trend could be caused by
the onset of grain boundary migration recrystallization
and development of CV shear bands at c>1 because
these processes made the strain preferentially parti-
tioned into the shear zones and left the rest of the
sample less deformed. Due to the lack of models for
CPO development and evolution with strain in triclin-
ic plagioclase using a relaxed Taylor theory or the
viscoplastic self-consistent theory [37,38], a more
quantitative interpretation of the CPO pattern and
strength is impossible at this time.
In anorthite, the strongest bonds are the Al–O
and Si–O tetrahedral or T–O bonds. The easiest
glide planes will be those intersecting the smallest
number of T–O bonds per unit area. Using this
criterion, the easiest glide planes in anorthite should
be (010) with two T–O bonds per unit cell, followed
by (001), (110), (110) and (101) with four each, and
then (100) and (111) with six [1,15]. The easiest slip
direction will have the shortest Burgers vector be-
cause these dislocations have the lowest energy and
are the most stable. If we restrict ourselves to
possible Burgers vectors in the easiest glide plane
(010), then we would expect 1/2[001] with!b = 0.7
nm which is dissociated and [100] with!b= 0.8 nm.
It has been observed that c-slip on (010) planes is
dominant in plagioclase in natural mylonites of
upper amphibolite and granulite facies [14–16,22–
24,34] while a-slip on (010) or (001) planes is
dominant in experimentally deformed mafic plagio-
clase [10,39]. Thus, a transition from dominantly c-
slip to a-slip may occur in plagioclase with increas-
ing temperature, strain rate and/or H2O content, and
decreasing confining pressure.
In triclinic anorthite, there are certainly not enough
independent slip systems to produce either homoge-
neous or arbitrary deformation in a polycrystalline
sample. Many features in our sheared samples such as
inhomogeneous dislocation density and grain bound-
ary migration recrystallization all indicate heteroge-
neous strain. High densities of dislocations result from
interaction between dominant (010)[100] system and
other secondary slip systems such as (010)[001],
(010)[101], (001) [100] and (110)[001]. If just one
dominant slip system and a few secondary slip sys-
tems can be activated, strain will lead to lattice
rotation and rapidly form strong CPO. The texture
analysis suggests that anorthite deforms largely by
slip on just one dominant system, (010)[100], while
grain boundary migration recrystallization plays a role
in relieving the strain incompatibilities which would

S. Ji et al. / Earth and Planetary Science Letters 222 (2004) 377–390 387
otherwise result from such limited slip systems. It
remains unclear if submicron-sized neograins in the CVshear bands develop a CPO because they are too small
to measure with EBSD.
5.2. Flow strength
Our study allows us to relate microstructures to
mechanical properties. For example, the significant
strain softening in pure An aggregates, which should
involve a change in deformation microstructure,
appears to be associated with the formation of CVshear bands and the operation of dynamic recrystalli-
zation. The An samples contain f 0.08 wt.% water;
half of it may be stored in the crystals [40] while
another half at the grain boundaries. The latter may
have diffused into CV shear bands during shear, just
like the melt segregated from olivine-basalt aggre-
gates deformed in shear into channels aligned syn-
thetically at 15–20j to the shear boundary [41]. The
diffusion of water into the CV shear bands leads to
dynamic recrystallization and hydrolytic weakening.
Since the spot size of the FTIR microscope is about 20
times larger than the average anorthite grain size, it
was impossible for us to quantify the relative concen-
tration of water in the CVshear bands with respect to
the rest of the samples. Moreover, grain boundary
sliding in the extremely fine recrystallized grains may
also make some contribution to the softening. The
submicron-sized neograins possess a much larger
fraction of atoms at grain boundaries than larger
original grains. The plastic deformation localized in
the CV zones may be caused by a large number of
small sliding events of atomic planes at the grain
boundaries, with only a minor part being caused by
dislocation activity in the grains. Recrystallization as a
mechanism of strain weakening in the regime of
dislocation creep has been documented in experimen-
tally deformed albite [1,5–7] and naturally deformed
plagioclase (e.g., [16,34]). We reproduced for the first
time recrystallization-induced strain softening in sim-
ple-sheared anorthite using a gas-medium apparatus
with high precisions in mechanical data.
Quartz is rheologically stronger than anorthite
under laboratory conditions. In natural felsic mylon-
ites deformed at greenschist to amphibolite grade,
however, quartz is generally weaker than feldspar. It
is well known that the relative strength contrast
between two mineralic phases may change with
deformation conditions such as temperature, strain
rate, water content, strain path and operative defor-
mation mechanism (see [10] for discussion). The
main objective of this study is to reveal some
fundamental principles in the rheology of polyphase
rocks. For example, layered samples with equal
volume fractions of Qtz and An have a higher peak
strength than the pure An aggregates at low shear
strain, but the flow stress for the first becomes lower
than the latter at high shear strains. Layered samples
display a greater degree of strain weakening than
pure weak-phase aggregates. The observed dramatic
weakening for the layered composites under layer-
parallel shear offers an important piece of evidence
supporting channel flow of weak materials between
strong layers, which is expected to prevail in the
deep continental crust [4]. Our results also provide a
reasonable explanation for localized deformation in
layered polyphase rocks.
5.3. Microstructures
The foliation (S) is dragged by the CVshear bands,indicating that the latter formed after the first. This
fact is consistent with the suggestion of Platt and
Vissers [42] from field observations of mylonites.
According to these authors, the foliation rotates pro-
gressively towards the shear zone boundary (C) with
increasing shear. When the angle between S and C
reaches a small value then shear is able to occur in
part along the S plane. This shear component results
in the onset of dynamic recrystallization in a series of
narrow shear zones (CV) at about 15j to the C plane;
the CV planes are synthetic relative to the sense of
overall shear. Hence, the S–CVstructure is a reliable
shear sense indicator.
Fig. 8 shows a typical structure in granulite facies
anorthositic mylonites from the Jotun Nappe in south-
ern Norway. The mylonites consist of plagioclase
(55–85%, An40–50), clinopyroxene and amphibole
(14–40%) and garnet (3–10%). The S plane is
remarked by strongly elongate plagioclase porphyro-
clasts that show clear evidence of intracrystalline
plastic deformation such as undulatory extinction,
deformation bands, kink band and serrated bound-
aries. The CVplanes are defined by narrow zones of
very fine recrystallized grains. The ribbon porphyr-
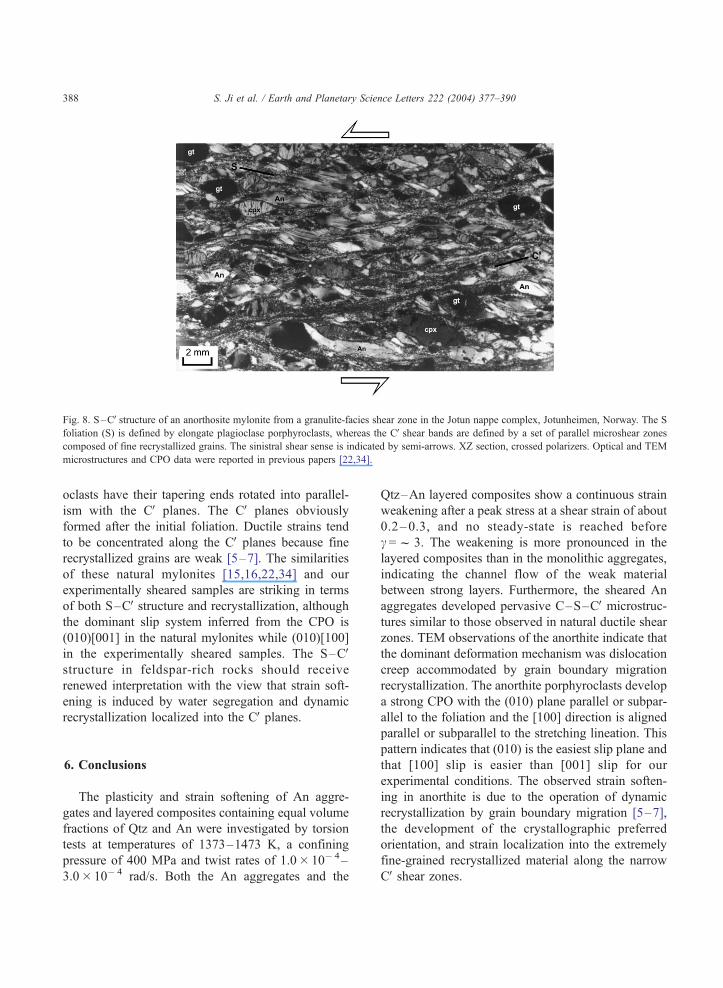
Fig. 8. S–CVstructure of an anorthosite mylonite from a granulite-facies shear zone in the Jotun nappe complex, Jotunheimen, Norway. The S
foliation (S) is defined by elongate plagioclase porphyroclasts, whereas the CVshear bands are defined by a set of parallel microshear zones
composed of fine recrystallized grains. The sinistral shear sense is indicated by semi-arrows. XZ section, crossed polarizers. Optical and TEM
microstructures and CPO data were reported in previous papers [22,34].
S. Ji et al. / Earth and Planetary Science Letters 222 (2004) 377–390388
oclasts have their tapering ends rotated into parallel-
ism with the CV planes. The CV planes obviously
formed after the initial foliation. Ductile strains tend
to be concentrated along the CVplanes because fine
recrystallized grains are weak [5–7]. The similarities
of these natural mylonites [15,16,22,34] and our
experimentally sheared samples are striking in terms
of both S–CVstructure and recrystallization, although
the dominant slip system inferred from the CPO is
(010)[001] in the natural mylonites while (010)[100]
in the experimentally sheared samples. The S–CVstructure in feldspar-rich rocks should receive
renewed interpretation with the view that strain soft-
ening is induced by water segregation and dynamic
recrystallization localized into the CVplanes.
6. Conclusions
The plasticity and strain softening of An aggre-
gates and layered composites containing equal volume
fractions of Qtz and An were investigated by torsion
tests at temperatures of 1373–1473 K, a confining
pressure of 400 MPa and twist rates of 1.0� 10� 4–
3.0� 10� 4 rad/s. Both the An aggregates and the
Qtz–An layered composites show a continuous strain
weakening after a peak stress at a shear strain of about
0.2–0.3, and no steady-state is reached before
c =f 3. The weakening is more pronounced in the
layered composites than in the monolithic aggregates,
indicating the channel flow of the weak material
between strong layers. Furthermore, the sheared An
aggregates developed pervasive C–S–CVmicrostruc-
tures similar to those observed in natural ductile shear
zones. TEM observations of the anorthite indicate that
the dominant deformation mechanism was dislocation
creep accommodated by grain boundary migration
recrystallization. The anorthite porphyroclasts develop
a strong CPO with the (010) plane parallel or subpar-
allel to the foliation and the [100] direction is aligned
parallel or subparallel to the stretching lineation. This
pattern indicates that (010) is the easiest slip plane and
that [100] slip is easier than [001] slip for our
experimental conditions. The observed strain soften-
ing in anorthite is due to the operation of dynamic
recrystallization by grain boundary migration [5–7],
the development of the crystallographic preferred
orientation, and strain localization into the extremely
fine-grained recrystallized material along the narrow
CVshear zones.
S. Ji et al. / Earth and Planetary Science Letters 222 (2004) 377–390 389
Acknowledgements
This study was supported by NSERC of Canada,
the Alexander von Humbodt Foundation of Germany,
and Guangzhou Institute of Geochemistry, Chinese
Academy of Sciences. We thank S. King, T. Tharp, J.
Tullis, M.E. Zimmerman for the comments and
suggestions. We are indebted to G. Dresen, A.
Dimanov, M.S. Paterson and J. Wheeler for the
helpful discussion, Michel Naumann for the technical
assistance with the high T and P experiments, Stefan
Gehrmann for the preparation of thin sections, and
Andre Lacombe for drawing the figures. This is
LITHOPROBE contribution no. 1362. [SK]
References
[1] J. Tullis, Experimental studies of deformation mechanisms
and microstructures in quartzo-feldspathic rocks, in: D.J.
Barber, P.G. Meredith (Ed.), Deformation Processes in Mi-
nerals, Ceramics and Rocks, Unwin Hyman, London, 1990,
pp. 190–227.
[2] G. Ranalli, Rheology of the Earth, Chapman & Hall, London,
1995, 413 pp.
[3] S.C. Ji, B. Xia, Rheology of Polyphase Earth Materials, Poly-
technic International Press, Montreal, Canada, 2002, 259 pp.
[4] C. Beaumont, R.A. Jamieson, M.H. Nguyen, B. Lee, Hima-
layan tectonics explained by extrusion of a low-viscosity
crustal channel coupled to focused surface denudation, Nature
414 (2001) 738–742.
[5] J. Tullis, R. Yund, Dynamic recrystallization of feldspar: a
mechanism for ductile shear zone deformation, Geology 13
(1985) 238–241.
[6] J. Tullis, L. Dell’Angelo, R. Yund, Ductile shear zones from
brittle precursors in feldspathic rocks: the role of dynamic
recrystallization, in: A. Duba, W. Durham, J. Handin, H. Wang
(Eds.), The Brittle –Ductile Transition, The Heard Volume,
Am. Geophys. Union Monogr. 56 (1990) 67–82.
[7] S.C. Ji, D. Mainprice, Experimental deformation of sintered
plagioclase above and below the order –disorder transition,
Geodin. Acta 1 (1987) 113–124.
[8] A. Dimanov, G. Dresen, X. Xiao, R. Wirth, Grain boundary
diffusion creep of synthetic anorthite aggregates: the effect of
water, J. Geophys. Res. 104 (1999) 10483–10497.
[9] S.C. Ji, Z. Jiang, R. Wirth, Crystallographic preferred orien-
tation (CPO) of experimentally sheared plagioclase aggre-
gates: implications for crustal heterogeneity (abstract), EOS
Trans.-Am. Geophys. Union 80 (1999) 916.
[10] S.C. Ji, R. Wirth, E. Rybacki, Z. Jiang, High-temperature
plastic deformation of quartz –plagioclase multilayers by
layer-normal compression, J. Geophys. Res. 105 (2000)
16651–16664.
[11] E. Rybacki, G. Dresen, Dislocation and diffusion creep of
synthetic anorthite aggregates, J. Geophys. Res. 105 (2000)
26017–26036.
[12] A. Post, J. Tullis, A recrystallized grain size piezometer for
experimentally deformed feldspar aggregates, Tectonophysics
303 (1999) 159–173.
[13] H. Stunitz, J. Tullis, Weakening and strain localization pro-
duced by syn-deformational reaction of plagioclase, Int. J.
Earth Sci. 90 (2001) 136–148.
[14] H. Stunitz, J.D. Fitz Gerald, J. Tullis, Dislocation generation,
slip systems and dynamic recrystallization in experimentally
deformed plagioclase single crystals, Tectonophysics 372
(2003) 215–233.
[15] S.C. Ji, D. Mainprice, F. Boudier, Sense of shear in high-
temperature movement zones from the fabric asymmetry of
plagioclase feldspars, J. Struct. Geol. 10 (1988) 73–81.
[16] R. Kruse, H. Stunitz, K. Kunze, Dynamic recrystallization
processes in plagioclase porphyroclasts, J. Struct. Geol. 23
(2001) 1781–1802.
[17] M. Bystricky, K. Kunze, L. Burlini, J.P. Burg, High shear
strain of olivine aggregates: rheological and seismic conse-
quences, Science 290 (2000) 1564–1567.
[18] M. Pieri, L. Burlini, K. Kunze, I. Stretton, D. Olgaard, Rhe-
ological and microstructural evolution of Carrara marble with
high shear strain: results from high temperature torsion experi-
ments, J. Struct. Geol. 23 (2001) 1393–1413.
[19] E. Rybacki, M.S. Paterson, R. Wirth, G. Dresen, Rheol-
ogy of calcite–quartz aggregates deformed to large strain
in torsion, J. Geophys. Res. 108 (2003) 2089 (doi: 10.1029/
2002JB001833).
[20] M.S. Paterson, D.L. Olgaard, Rock deformation tests to large
shear strains in torsion, J. Struct. Geol. 22 (2000) 1341–1358.
[21] H.R. Wenk, H.J. Bunge, E. Jansen, J. Pannetier, Preferred
orientation of plagioclase: neutron diffraction and U-stage
data, Tectonophysics 126 (1986) 271–284.
[22] S. Ji, D. Mainprice, Natural deformation fabrics of plagio-
clase: implications for slip systems and seismic anisotropy,
Tectonophysics 147 (1988) 145–163.
[23] S.C. Ji, X. Zhao, P. Zhao, On the measurement of plagioclase
petrofabric, J. Struct. Geol. 16 (1994) 1711–1718.
[24] Y.X. Xie, H.R. Wenk, S. Matthies, Plagioclase preferred orien-
tation by TOF neutron diffraction and SEM-EBSD, Tectono-
physics 370 (2003) 269–286.
[25] F. Heidelbach, A. Post, J. Tullis, Crystallographic preferred
orientation in albite samples deformed experimentally by dis-
location and solution precipitation creep, J. Struct. Geol. 22
(2000) 1649–1661.
[26] D. Prior, J. Wheeler, Feldspar fabrics in a greenschist facies
albite-rich mylonite from electron backscatter diffraction, Tec-
tonophysics 303 (1999) 29–49.
[27] Z.T. Jiang, D.J. Prior, J. Wheeler, Albite crystallographic pre-
ferred orientation and grain misorientation distribution in a
low-grade mylonite: implications for granular flow, J. Struct.
Geol. 22 (2000) 1663–1674.
[28] A. Spry, Metamorphic Textures, Pergamon, New York, 1983,
352 pp.
[29] R.D. Aines, G.R. Rossman, Water in minerals? J. Geophys.
Res. 89 (1984) 4059–4071.
S. Ji et al. / Earth and Planetary Science Letters 222 (2004) 377–390390
[30] J. Tullis, R.A. Yund, J. Farver, Deformation-enhanced fluid
distribution in feldspar aggregates and implications for ductile
shear zones, Geology 24 (1996) 63–66.
[31] D. Berthe, P. Choukroune, P. Jegouzo, Orthogneiss, mylonite
and non-coaxial deformation of granites: the example of the
South Armorican Shear Zone, J. Struct. Geol. 1 (1979) 31–42.
[32] A.W. Snoke, J. Tullis, V.R. Todd, Fault-Related Rocks: A
Photographic Atlas, Princeton Univ. Press, New Jersey,
1998, 617 pp.
[33] J.G. Ramsay, M.I. Huber, The Techniques of Modern Struc-
tural Geology, Vol. 1: Strain Analysis, Academic Press, Lon-
don, 1983, 307 pp.
[34] S.C. Ji, D. Mainprice, Recrystallization and fabric develop-
ment in plagioclase, J. Geol. 98 (1990) 65–79.
[35] A. Etchecopar, A plane kinematic model of previous defor-
mation in a polycrystalline aggregate, Tectonophysics 39
(1977) 121–139.
[36] A. Etchecopar, G. Vasseur, A 3-D kinematic model of fabric
development in polycrystalline aggregates: a comparison with
experimental and natural examples, J. Struct. Geol. 9 (1987)
705–717.
[37] H.R. Wenk, C.N. Tome, Modeling dynamic recrystallization
of olivine aggregates deformed in simple shear, J. Geophys.
Res. 104 (1999) 25513–25527.
[38] A. Tommasi, D. Mainprice, G. Canova, Y. Chastel, Visco-
plastic self-consistent and equilibrium-based modeling of
olivine lattice preferred orientations: implications for the
upper mantle anisotropy, J. Geophys. Res. 105 (2000)
7893–7908.
[39] M.E. Zimmerman, D.L. Kohlstedt, Melt segregation and
LPO in anorthite-basalt deformed in torsion, Eos, Trans.-Am.
Geophys. Union, Fall Meet. Suppl., Abstract 84 (2003)
F1045.
[40] H. Behrens, Structural, kinetic and thermodynamic properties
of hydrogen in feldspar, Kinetic Processes in Minerals and
Ceramics, EFS Workshop on Cation Ordering, Eur. Sci.
Found., Cambridge, UK, 1994, pp. 1–7.
[41] D.L. Kohlstedt, M.E. Zimmerman, Rheology of partially
molten mantle rocks, Annu. Rev. Earth Planet. Sci. 24
(1996) 41–62.
[42] J.P. Platt, R.L.M. Vissers, Extensional structures in anisotropic
rocks, J. Struct. Geol. 2 (1980) 397–410.
Related Documents