G.I. Kanel, S.V. Razorenov, E.B. Zaretsky and S.I. Ashitkov Joint Institute for High Temperatures of Russian Academy of Sciences, Moscow; Institute of Problems of Chemical Physics of Russian Academy of Sciences, Chernogolovka, Department of Mechanical Engineering, Ben Gurion University, Beer Sheva, Israel Strain rate, temperature and structure effects on the flow and fracture stresses of metals and alloys under shock- wave loading International Symposium on Current Problems in Solid Mechanics in honor of Professor R. J. Clifton Brown University Greek island of Symi, June 24-29, 2012

Welcome message from author
This document is posted to help you gain knowledge. Please leave a comment to let me know what you think about it! Share it to your friends and learn new things together.
Transcript
G.I. Kanel, S.V. Razorenov, E.B. Zaretsky and S.I. Ashitkov
Joint Institute for High Temperatures of Russian Academy of Sciences, Moscow;Institute of Problems of Chemical Physics of Russian Academy of Sciences,
Chernogolovka,Department of Mechanical Engineering, Ben Gurion University, Beer Sheva, Israel
Strain rate, temperature and structure effects on the flow and fracture stresses of metals and alloys under shock-
wave loading
International Symposium on Current Problems in Solid Mechanics in honor of Professor R. J. Clifton
Brown UniversityGreek island of Symi, June 24-29, 2012

Motivation
• The need of the basis for developing the models and constitutiverelationships which would be workable over wide range of strain rates, stresses and temperatures.
• The need of new information about basic mechanisms of plastic deformation and fracture at high strain rate.
• Approaching the ultimate values of the shear strength and tensile strength.
• Coupling with atomistic simulations.
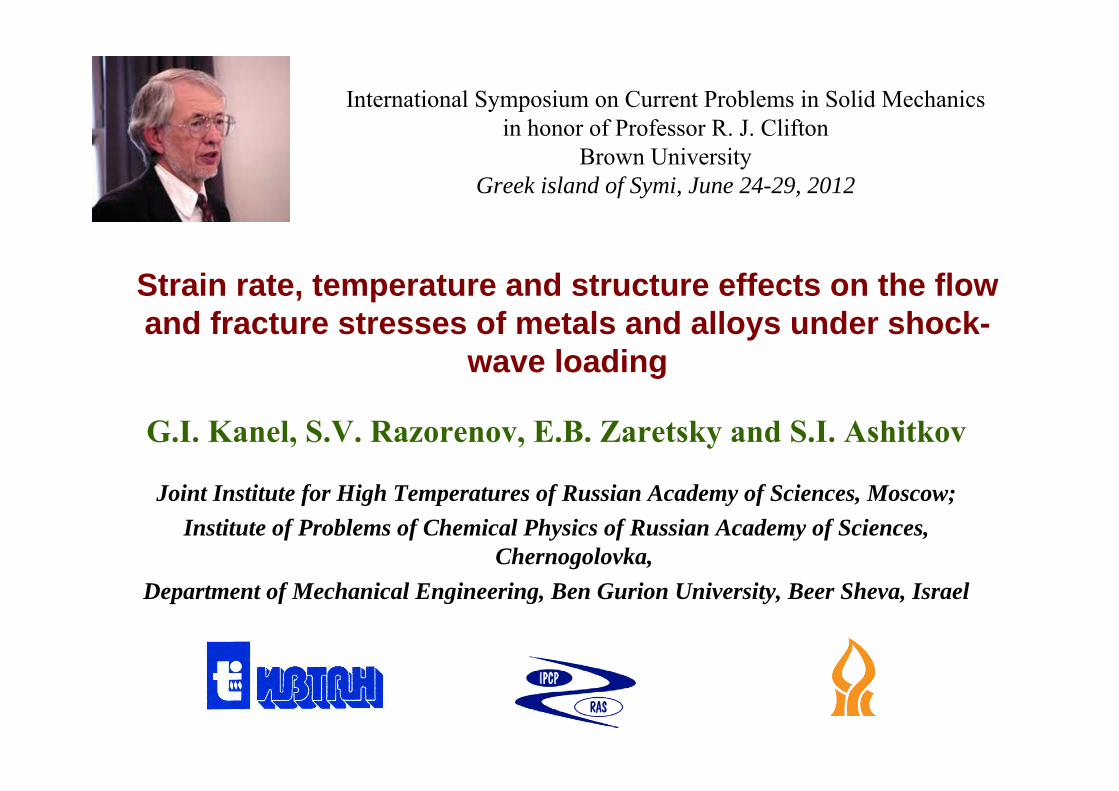
Strain rate and temperature effectsin general
• For low loading rates, plastic deformation is aided by thermal fluctuations. Dislocation motion is impeded at barriers and a combination of thermal agitation and applied stress is required to activate dislocations over the obstacles.
• In order to provide high rate of deformation one should apply so high stresses that are enough to overcome the usual dislocation barriers without any aid from thermal fluctuations.
• Under the high-rate conditions, viscous phonon drag becomes dominant in resistance to motion of dislocations. Since the phonon drag is proportional to the temperature, an increase of the flow stress with increasing temperature should occur at the highest strain rates.
Ideal shear strength
Shoc
k W
aves
Quasistatic, Hopkinson bars
Phonon drag controlled flow
Thermally activated flow
T2 > T1
T1
Flow
Stre
ss
Strain Rate
Frenkel’s estimation of the ideal shear strength:
τc ≈ G/2π (1926)
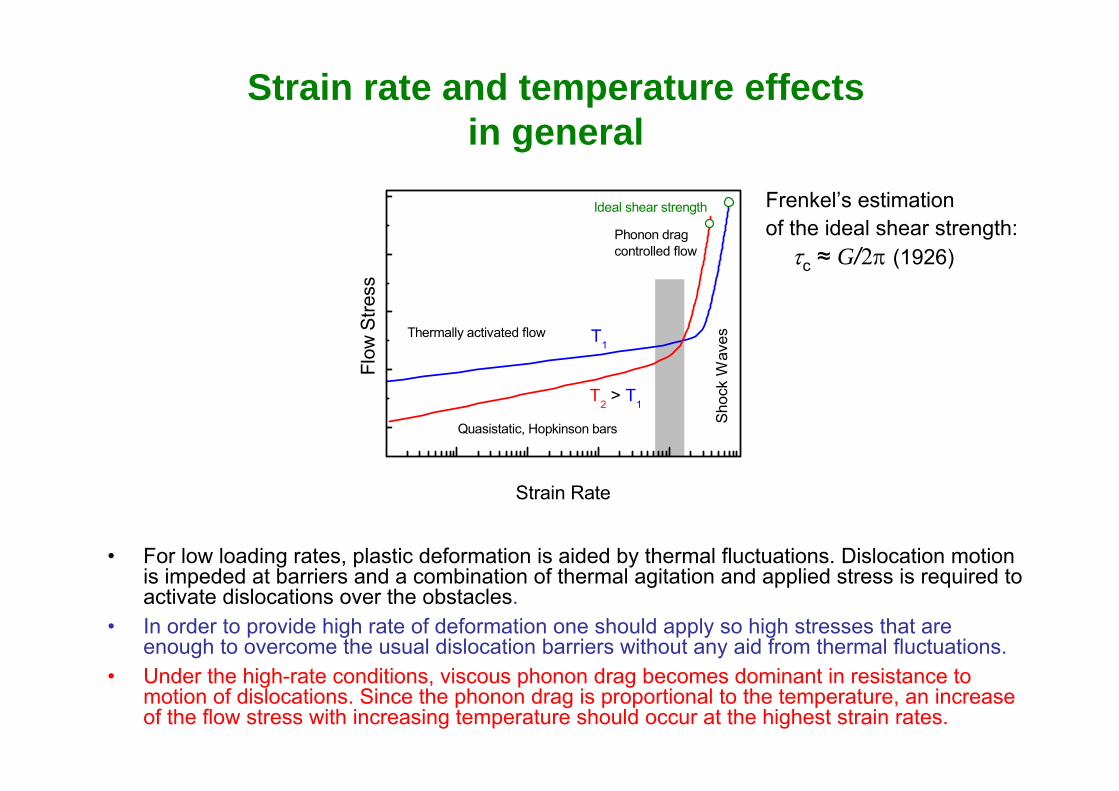
APPEARANCE OF MATERIAL PROPERTIES IN A FREE SURFACE VELOCITY HISTORY
Available loading conditions:
•Peak stresses: 0.1 − 100 GPa•Load durations: 10 ns −10 µs•Time resolution of the measurements:
≈ 1 ns
Hugoniot elastic limit: HEL = ρ0clufsHEL/2
Yield stress: Y = HEL (1-2ν)/(1-ν)
Spall strength: σsp = ρ0cb(∆ufs + δ)/2
Phase transition pressure:
pα→ε= ρ0D1ufs1/2
Sample
VISAR ufs(t)
Flyer plate
0.0 0.2 0.4 0.6 0.8 1.00.0
0.4
0.8
1.2Steel 40Kh
Spallsignal
∆ufs
Polymorphous transformation
Hugoniot elastic limit (HEL)
Free
Sur
face
Vel
ocity
, km
/s
Time (µsec)

Attenuators
Delay line
SHGTarget
Ti:S laser: τL=150 fs, λ=800 nm
CCD
Pump: 800nm, 150 fs
Probe: 400nm, 150 fs
Interferometer
Femtosecond interferometric microscopy for study laser-driven shock waves
Temporal resolution: 10-13 sSpatial resolution: 2 µmPhase measurement accuracy: ~ π/200 (1nm)
Initialbefore pump pulse
Transient1 ns delay after pump
Free surface displacement histories
0 50 100 150 2000
20
40
60
80 Al
1200 nm
760 nm
500 nm
Dis
plac
emen
t z,
nm
Time t, ps
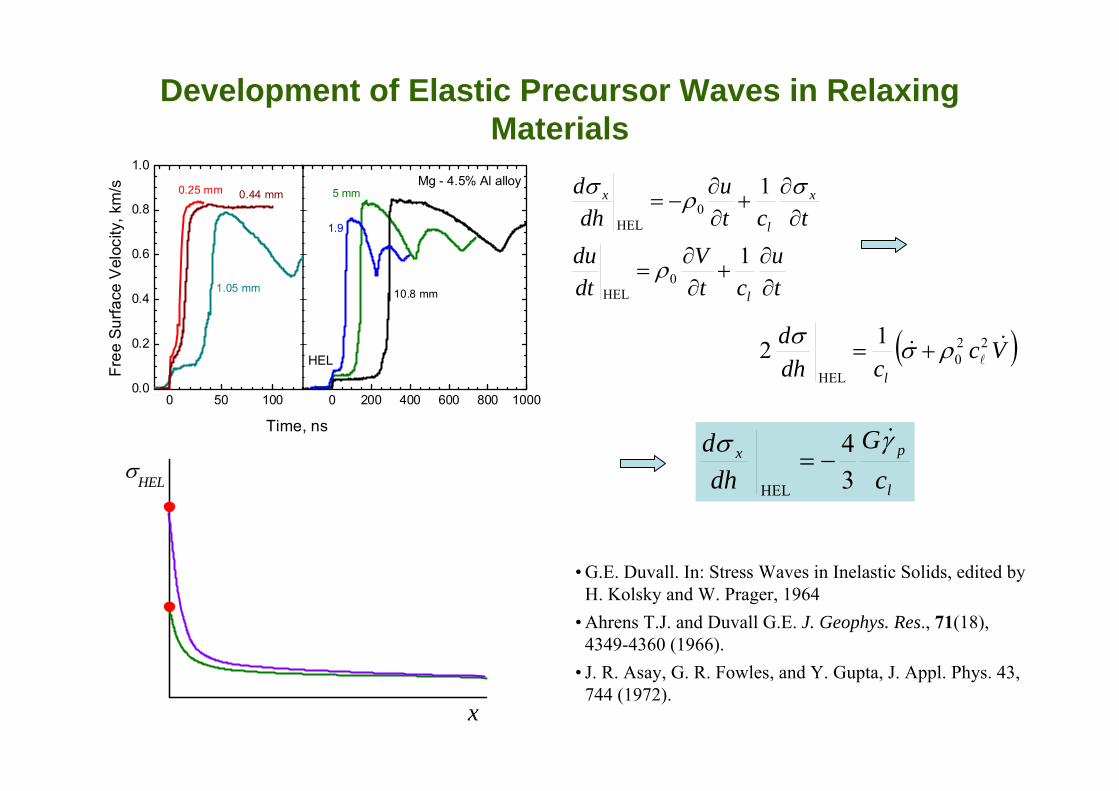
Development of Elastic Precursor Waves in Relaxing Materials
0 50 1000.0
0.2
0.4
0.6
0.8
1.0
0 200 400 600 800 1000
0.25 mm
1.05 mm
0.44 mm
Free
Sur
face
Vel
ocity
, km
/s
Time, ns
Mg - 4.5% Al alloy
HEL
1.9
5 mm
10.8 mm
tu
ctV
dtdu
tctu
dhd
l
x
l
x
∂∂
+∂∂
=
∂∂
+∂∂
−=
1
1
0HEL
0HEL
ρ
σρσ
( )Vccdh
dl
&&l22
0HEL
12 ρσσ +=
• G.E. Duvall. In: Stress Waves in Inelastic Solids, edited by H. Kolsky and W. Prager, 1964
• Ahrens T.J. and Duvall G.E. J. Geophys. Res., 71(18), 4349-4360 (1966).
• J. R. Asay, G. R. Fowles, and Y. Gupta, J. Appl. Phys. 43, 744 (1972).
l
px
cG
dhd γσ &
34
HEL
−=
x
σHEL
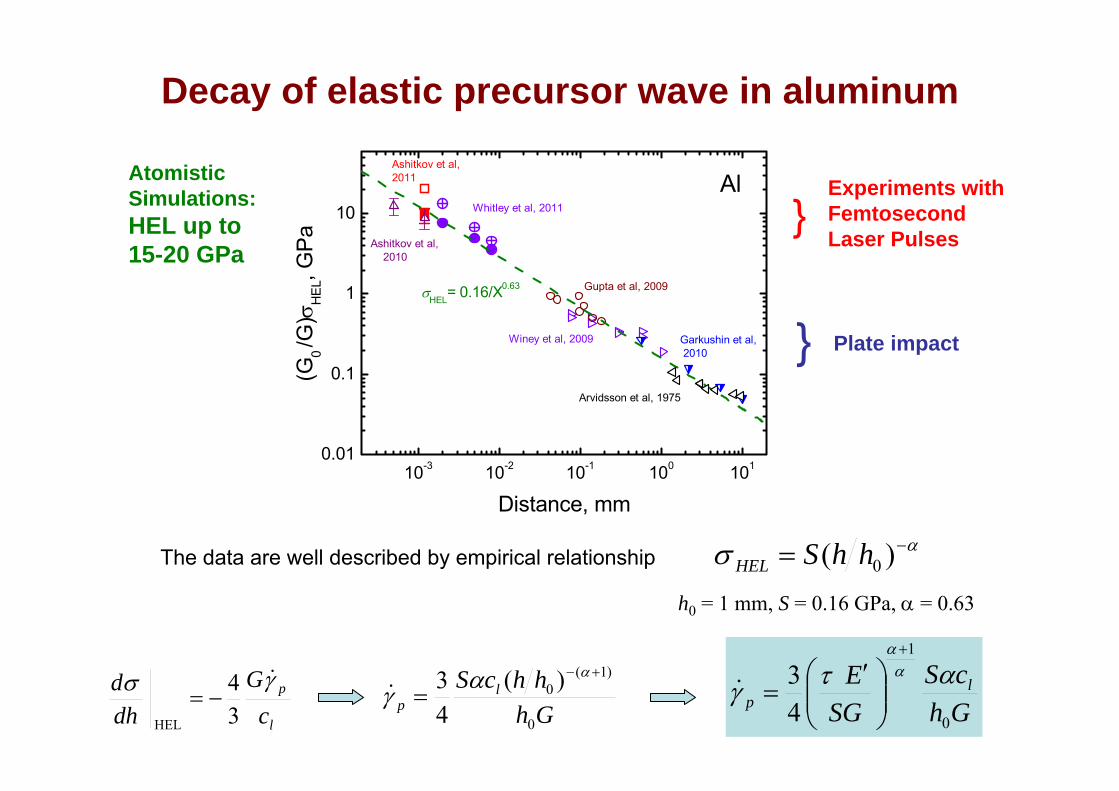
Decay of elastic precursor wave in aluminum
10-3 10-2 10-1 100 1010.01
0.1
1
10Ashitkov et al, 2010
Al
σHEL= 0.16/X0.63
Whitley et al, 2011
Gupta et al, 2009
Ashitkov et al,2011
Garkushin et al, 2010
Arvidsson et al, 1975
Winey et al, 2009
(G0 /G
)σH
EL, G
Pa
Distance, mm
The data are well described by empirical relationship ασ −= )( 0hhSHEL
h0 = 1 mm, S = 0.16 GPa, α = 0.63
l
p
cG
dhd γσ &
34
HEL
−=GhhhcS l
p0
)1(0 )(
43 +−
=ααγ& Gh
cSSG
E lp
0
1
43 ατγ
αα+
⎟⎟⎠
⎞⎜⎜⎝
⎛ ′=&
Experiments withFemtosecond Laser Pulses
Plate impact
}
}
AtomisticSimulations:HEL up to15-20 GPa
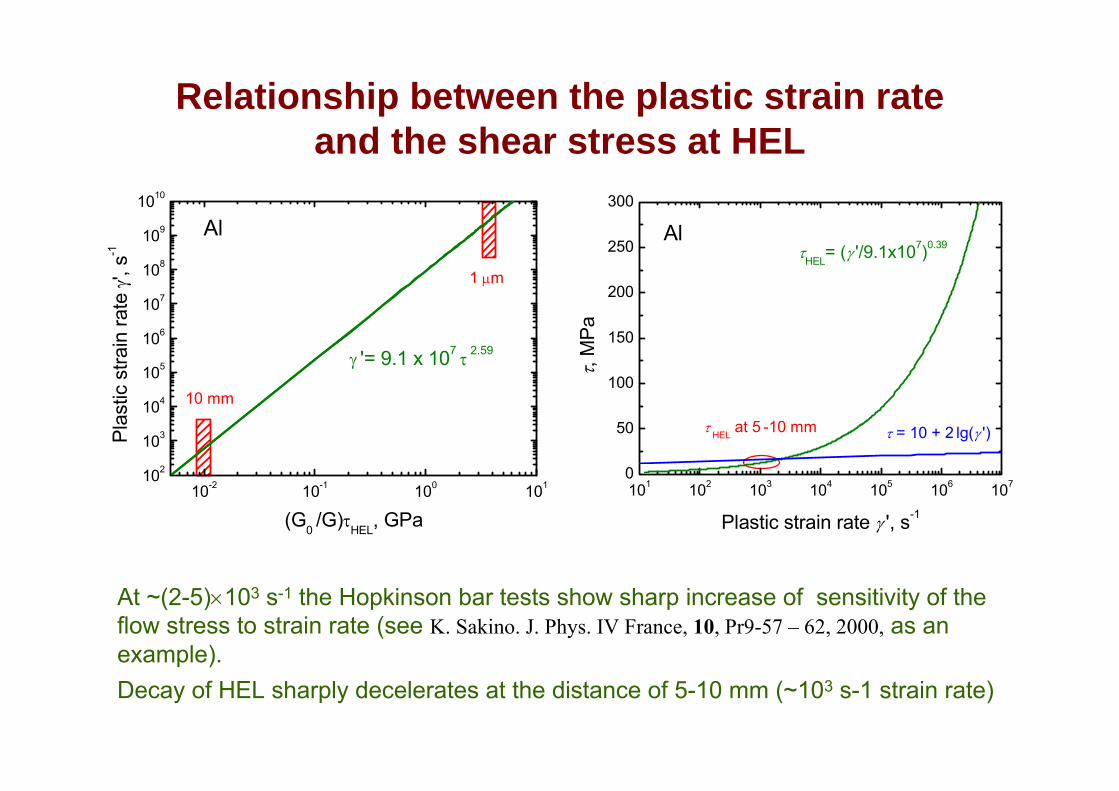
Relationship between the plastic strain rate and the shear stress at HEL
10-2 10-1 100 101102
103
104
105
106
107
108
109
1010
γ '= 9.1 x 10⁷ τ 2.59
1 µm
10 mm
Al
Plas
tic s
train
rate
γ', s
-1
(G0 /G)τHEL, GPa
At ~(2-5)×103 s-1 the Hopkinson bar tests show sharp increase of sensitivity of the flow stress to strain rate (see K. Sakino. J. Phys. IV France, 10, Pr9-57 – 62, 2000, as an example).Decay of HEL sharply decelerates at the distance of 5-10 mm (~103 s-1 strain rate)
101 102 103 104 105 106 1070
50
100
150
200
250
300
τ = 10 + 2 lg(γ ')τ HEL at 5 -10 mm
AlτHEL= (γ '/9.1x107)0.39
τ, M
Pa
Plastic strain rate γ ', s-1
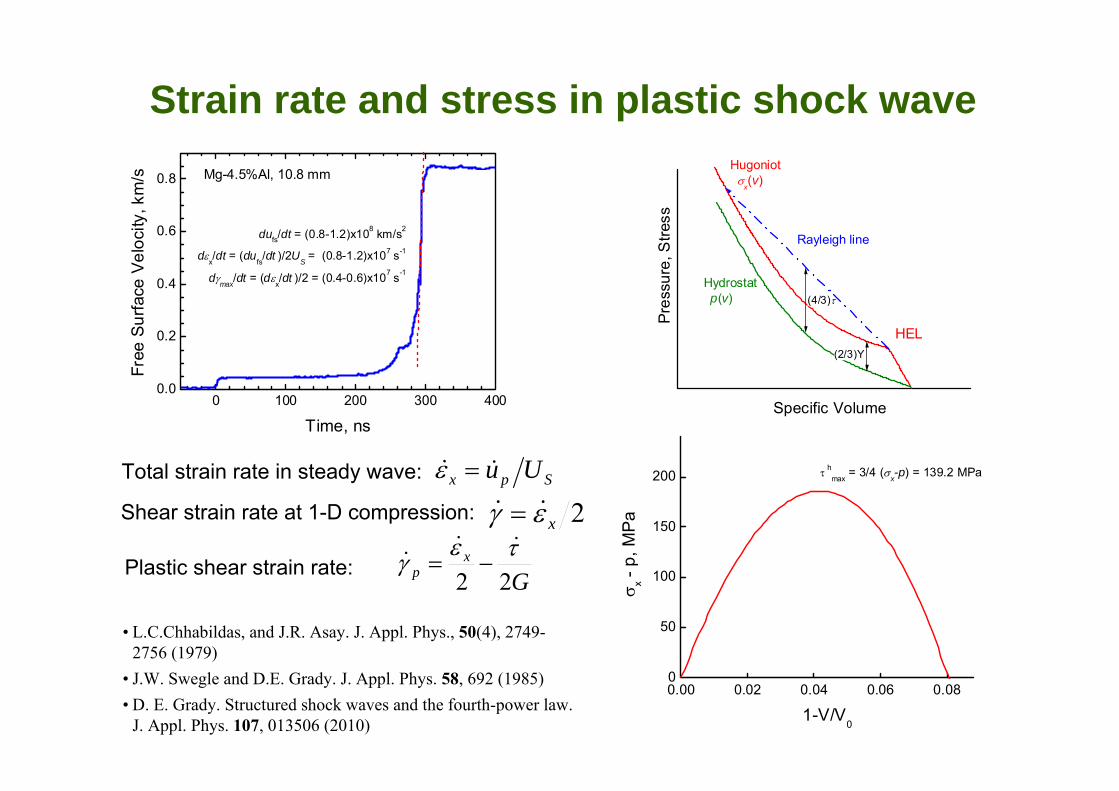
Strain rate and stress in plastic shock wave
0 100 200 300 4000.0
0.2
0.4
0.6
0.8
dγmax/dt = (dεx/dt )/2 = (0.4-0.6)x107 s-1
dεx/dt = (dufs/dt )/2US = (0.8-1.2)x107 s-1
dufs/dt = (0.8-1.2)x108 km/s2
Mg-4.5%Al, 10.8 mm
Free
Sur
face
Vel
ocity
, km
/s
Time, ns
0.00 0.02 0.04 0.06 0.080
50
100
150
200 τ hmax = 3/4 (σx-p) = 139.2 MPa
σ x - p
, MPa
1-V/V0
• L.C.Chhabildas, and J.R. Asay. J. Appl. Phys., 50(4), 2749-2756 (1979)
• J.W. Swegle and D.E. Grady. J. Appl. Phys. 58, 692 (1985)• D. E. Grady. Structured shock waves and the fourth-power law.
J. Appl. Phys. 107, 013506 (2010)
(4/3)τ
(2/3)Y
HEL
Hydrostat p(v)
Rayleigh line
Hugoniot σ
x(v)
Pres
sure
, Stre
ss
Specific Volume
Spx Uu&& =εTotal strain rate in steady wave:
2xεγ && =Shear strain rate at 1-D compression:
Gx
p 22τεγ&&
& −=Plastic shear strain rate:

Accelerated relaxation in plastic shock wave
• The strain rate in plastic shock wave is faster that at the HEL by an order of magnitude.
• Acceleration of plastic deformation is associated with multiplication of dislocations.
103 104 105 106 107
50
100
150
200
250
300
γ ' ~ τ 2
Mg-4.5%Al
10 mm
0.25 mm
In plastic shockat 5-10 mm
At HELτ = 11γ ' 0.24
τ, M
Pa
γ'p, s-1
Temperature effects
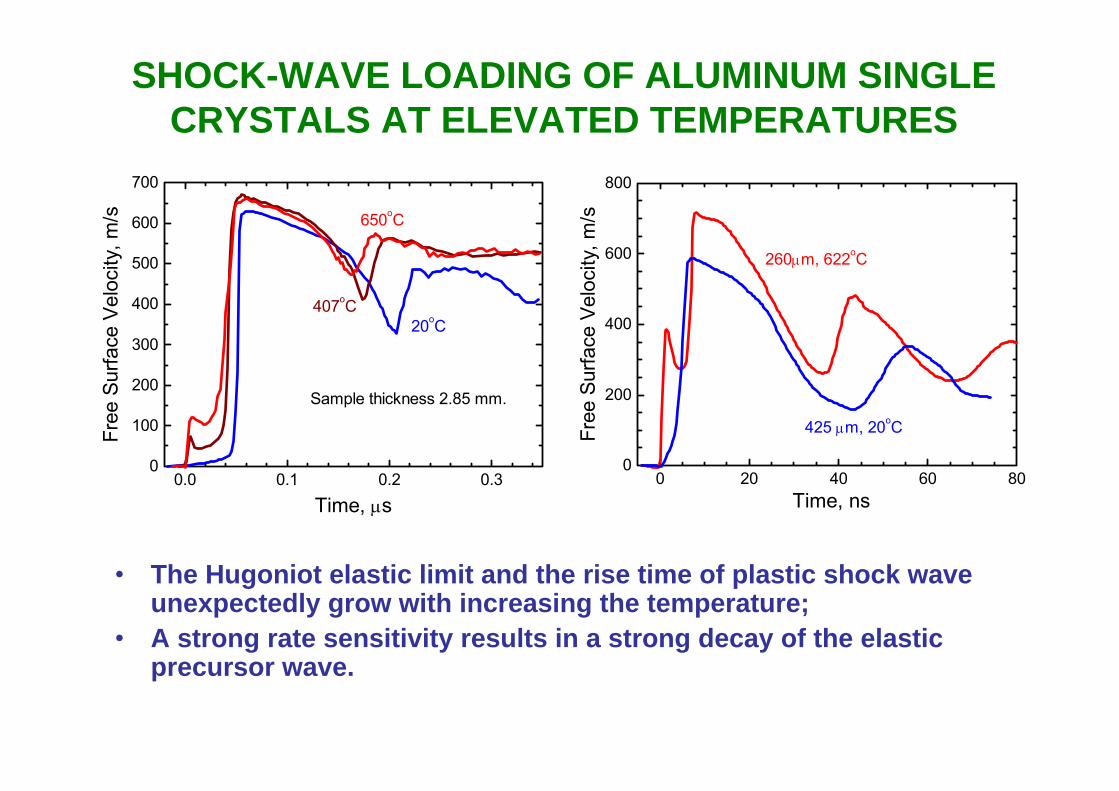
SHOCK-WAVE LOADING OF ALUMINUM SINGLE CRYSTALS AT ELEVATED TEMPERATURES
• The Hugoniot elastic limit and the rise time of plastic shock wave unexpectedly grow with increasing the temperature;
• A strong rate sensitivity results in a strong decay of the elastic precursor wave.
0.0 0.1 0.2 0.30
100
200
300
400
500
600
700
Sample thickness 2.85 mm.
407oC20oC
650oC
Free
Sur
face
Vel
ocity
, m/s
Time, µs0 20 40 60 80
0
200
400
600
800
260µm, 622oC
425 µm, 20oCFree
Sur
face
Vel
ocity
, m/s
Time, ns

Behavior of AD1 aluminum at ~600°C
0 50 100 150 2000
200
400
600AD1
5.37 mm20 oC
5.18 mm605 oC
Free
Sur
face
Vel
ocity
, m/s
Time, ns
0 100 200 300 400 5000
200
400
600
800
4
32
1
3 - 5.18 mm, 605oC
1 - 0.595 mm, 592oC
4 - 10.01 mm, 612oC
2 - 2.23 mm, 619oC
Free
Sur
face
Vel
ocity
, m/s
Time, ns
Increase in the HEL and rise time of plastic shock wave as compared to the room temperature data.

Initial flow stress at high strain rates and elevated temperatures
0.01 0.1 1 100.01
0.1
1
Al AD1
20oCσHEL= 0.625 / x
0.362600oC
σ HEL
, GPa
Distance, mm
101 102 103 104 105 106 10710
20
40
6080
100
200
400
Al AD1
20oC
600oC
She
ar s
tress
, MP
a
Plastic strain rate, s-1
Ultimate shear strength (“ideal strength”) should decrease with increasing the temperature.
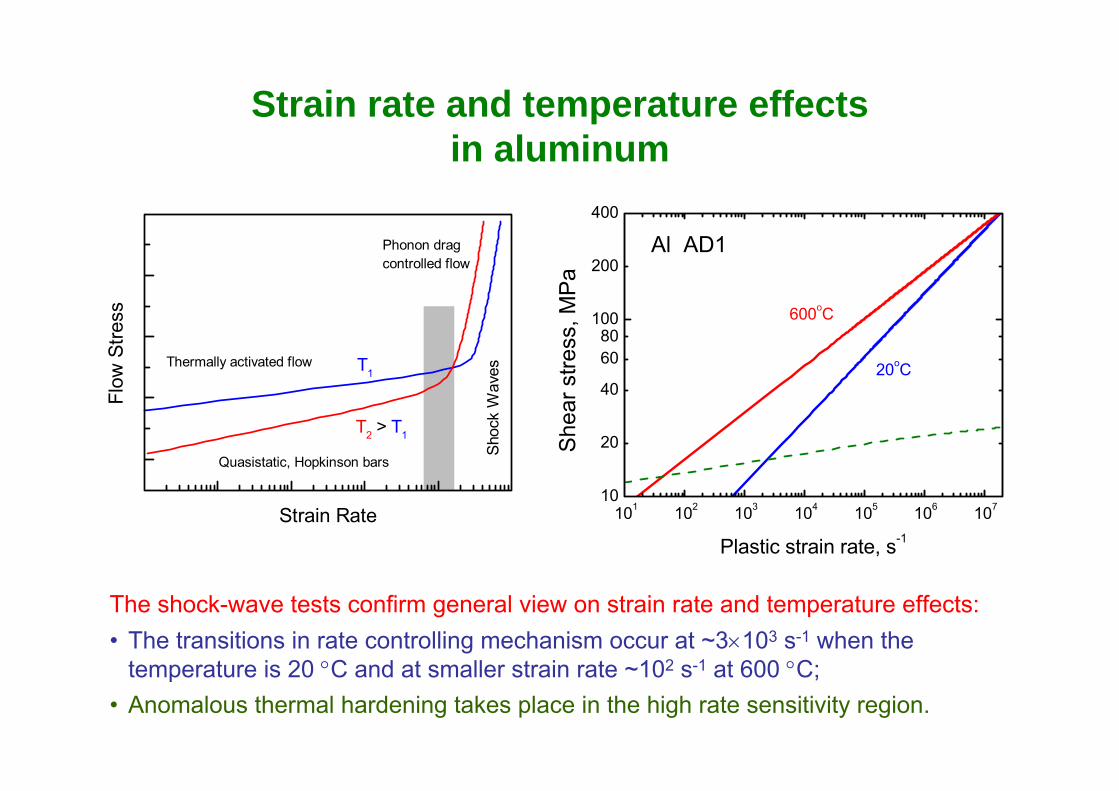
Strain rate and temperature effectsin aluminum
Shoc
k W
aves
Quasistatic, Hopkinson bars
Phonon drag controlled flow
Thermally activated flow
T2 > T1
T1
Flow
Stre
ss
Strain Rate
The shock-wave tests confirm general view on strain rate and temperature effects:• The transitions in rate controlling mechanism occur at ~3×10³ s-1 when the
temperature is 20 °C and at smaller strain rate ~102 s-1 at 600 °C;• Anomalous thermal hardening takes place in the high rate sensitivity region.
101 102 103 104 105 106 10710
20
40
6080
100
200
400
Al AD1
20oC
600oC
She
ar s
tress
, MP
aPlastic strain rate, s-1

Strain rate and temperature effectsin pure aluminum
103 104 105 106 1070
100
200
300
400
500
Al 99.99%
1+= α
α
γτ &ALinear
2 mm
0.1 mm
HELPlasticshock wave
932 K
300 K
932 K
800 K
500 K
300 K
τ = 10 + 2 lg(γ ')
She
ar s
tress
, MPa
Plastic strain rate, s-1
The linear dependences τ (T ) at fixed strain rates are in agreement with the mechanism of control of the dislocations motion by phonon friction.
200 400 600 800 10000
50
100
150
200
250
300
350
106 s-1
105 s-1
104 s-1
She
ar S
tress
, MP
a
Temperature, K

Relationship between the plastic strain rate and the shear stress at HEL
• The motion of dislocations sharply decelerates at ~100 MPa of the shear stress that is not compatible with the observed strong dependence γ’(τ).
• The dislocation density of 1015 m-2 is required to provide 109 s-1 strain rate with a sound-speed dislocation motion.
• Probably the process is mainly controlled by the rate of nucleation of dislocations (or shear bands).
Velocity as a function of the applied shear stress for an edge dislocation in aluminum.
D.L. Olmsted, .G. Hecto, W.A. Curtin and R.J. Clifton. Modelling Simul. Mater. Sci. Eng. 13, 371 (2005)
103
104
105
106
107
10 20 40 60 80100 200 400
2.7 < β < 4
βτγ B=&
Al 99.99%
2 mm
0.1 mm
932 K
800 K
500 K
300 K
Shear stress, MPa
Plas
tic s
train
rate
, s-1
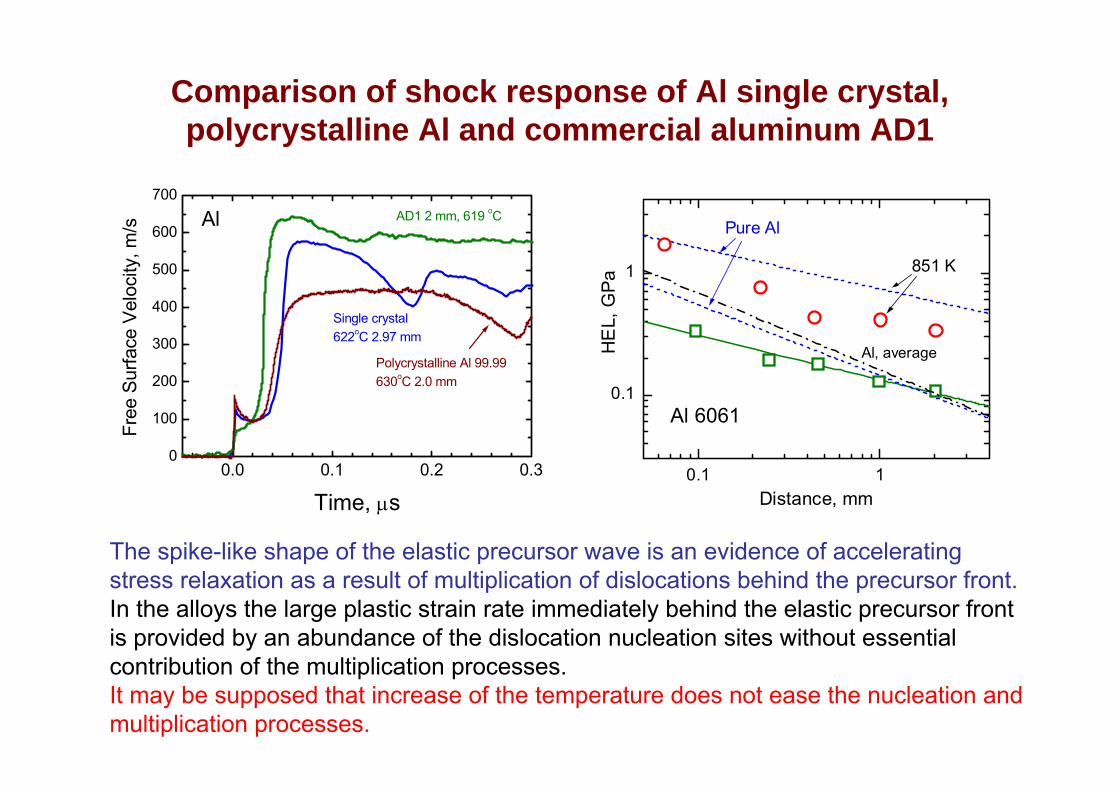
Comparison of shock response of Al single crystal, polycrystalline Al and commercial aluminum AD1
0.0 0.1 0.2 0.30
100
200
300
400
500
600
700
Al
Polycrystalline Al 99.99630oC 2.0 mm
AD1 2 mm, 619 oC
Single crystal622oC 2.97 mm
Free
Sur
face
Vel
ocity
, m/s
Time, µs
The spike-like shape of the elastic precursor wave is an evidence of accelerating stress relaxation as a result of multiplication of dislocations behind the precursor front.In the alloys the large plastic strain rate immediately behind the elastic precursor front is provided by an abundance of the dislocation nucleation sites without essential contribution of the multiplication processes. It may be supposed that increase of the temperature does not ease the nucleation and multiplication processes.
0.1 1
0.1
1
Al, average
851 K
Al 6061
Pure Al
HE
L, G
Pa
Distance, mm

D16 aluminum alloy (Al 2024)
0 50 100 150 2000
200
400
600
800
D16 (Al 2024)
0.5 mm5 mm
Free
Sur
face
Vel
ocity
, m/s
Time, ns
Weak precursor decayThe HEL of the alloy exceeds that of aluminum at the propagation distances more than 0.1 mm
10-3 10-2 10-1 100 1010.01
0.1
1
10
D16 (Al 2024)
Ashitkov et al, 2010
Al
σHEL= 0.16/X0.63
Whitley et al, 2011
Gupta et al, 2009
Ashitkov et al,2011
Garkushin et al, 2010
Arvidsson et al, 1975
Winey et al, 2009
(G0 /G
)σH
EL, G
PaDistance, mm

Shock behavior of iron at normal and elevated temperatures
0 100 200 300 400 500 6000.0
0.5
1.0
1.5
2.0
Y
HEL
Yiel
d S
tress
, GP
a
Temperature, oC
• Weak precursor decay• The yield stress decreases monotonously with heating
10-4 10-3 10-2 10-1 100 101
R.F. Smith et al, 2011
30
20
1086
4
2
1
HEL
Hug
onio
t Ela
stic
Lim
it, G
Pa
Distance, mm
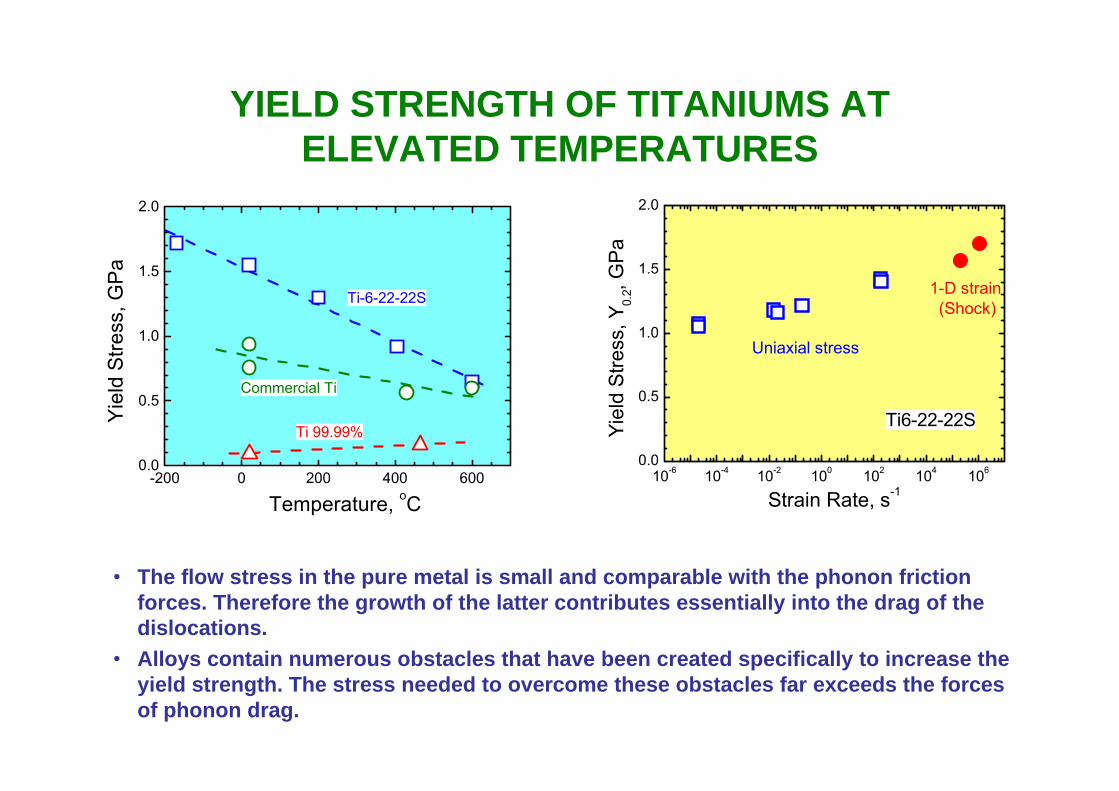
YIELD STRENGTH OF TITANIUMS AT ELEVATED TEMPERATURES
-200 0 200 400 6000.0
0.5
1.0
1.5
2.0
Commercial Ti
Ti 99.99%
Ti-6-22-22S
Yie
ld S
tress
, GP
a
Temperature, oC
• The flow stress in the pure metal is small and comparable with the phonon friction forces. Therefore the growth of the latter contributes essentially into the drag of the dislocations.
• Alloys contain numerous obstacles that have been created specifically to increase the yield strength. The stress needed to overcome these obstacles far exceeds the forces of phonon drag.
10-6 10-4 10-2 100 102 104 1060.0
0.5
1.0
1.5
2.0
Ti6-22-22S
1-D strain (Shock)
Uniaxial stress
Yiel
d St
ress
, Y0.
2, G
Pa
Strain Rate, s-1
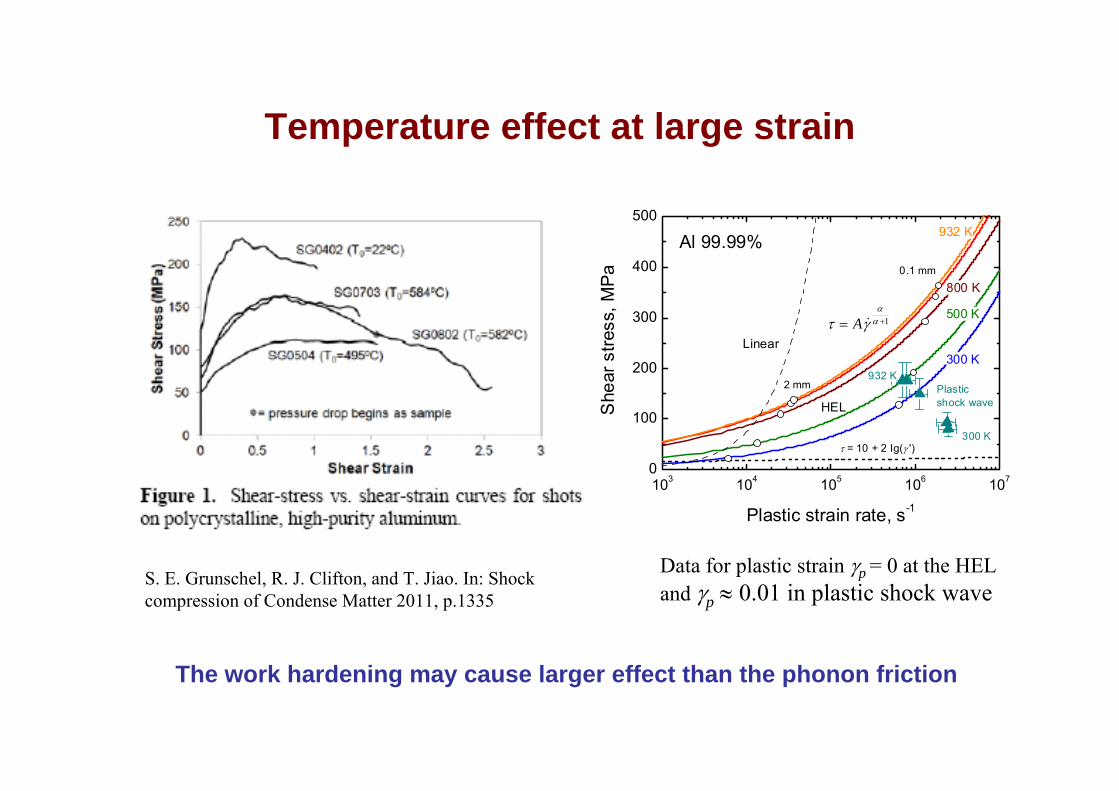
Temperature effect at large strain
S. E. Grunschel, R. J. Clifton, and T. Jiao. In: Shock compression of Condense Matter 2011, p.1335
The work hardening may cause larger effect than the phonon friction
103 104 105 106 1070
100
200
300
400
500
Al 99.99%
1+= α
α
γτ &ALinear
2 mm
0.1 mm
HELPlasticshock wave
932 K
300 K
932 K
800 K
500 K
300 K
τ = 10 + 2 lg(γ ')
She
ar s
tress
, MPa
Plastic strain rate, s-1
Data for plastic strain γp = 0 at the HELand γp ≈ 0.01 in plastic shock wave
Grain size effects

Armco iron
50 µm
50 µm
0 200 400 6000
50
100
150
200
250
300Armco iron, 2.7 mm
Forged
Fre
e Su
rface
Vel
ocity
, m/s
Time, ns
As received
0 25 50 750
100
200
300
400
500
600
Iron 0.2 mm thick
Armco, forged
Armco, as-received
Free
Sur
face
Vel
ocity
, m/s
Time, ns
Refinement of the grain structure results in twofold increase of and some smaller increase of the dynamic yield strength.

Coarse-grained and ultrafine-grained tantalum
0.00 0.05 0.10 0.15 0.200
100
200
300
400
500
0.00 0.05 0.10 0.15 0.20
CG, HR = 77 UFG, HR = 104
Free
sur
face
vel
ocity
, m/s
Time, µs
HEL
Distance
• In spite of larger hardness, ultrafine-grained tantalum demonstrates lower HEL and faster plastic compression.
• Obviously, in the UFG material the elastic precursor wave decays faster.
• Grain boundaries are the dislocation sources.
0.0 0.5 1.0 1.5 2.0 2.5
1.5
2.0
2.5
3.0
3.5
UFG
CG
HEL
, GPa
Sample Thickness, mm
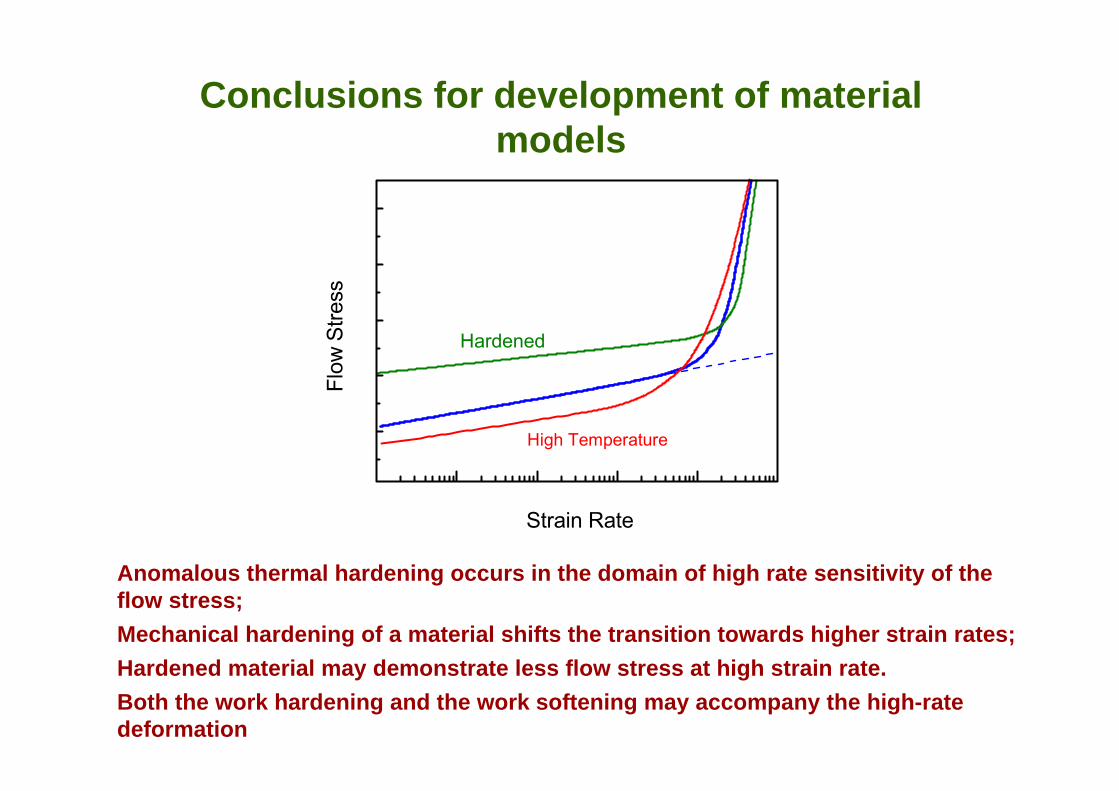
Conclusions for development of material models
Strain Rate
Flo
w S
tress
High Temperature
Hardened
Anomalous thermal hardening occurs in the domain of high rate sensitivity of the flow stress;Mechanical hardening of a material shifts the transition towards higher strain rates; Hardened material may demonstrate less flow stress at high strain rate. Both the work hardening and the work softening may accompany the high-rate deformation
Spall fracture

SPALL PHENOMENA UNDER SHOCK LOADING
Spalling is the process of internal rupture of a body due to tensile stresses generated as a result of a compression pulse reflected from the free surface.
σx
σx
Freesurface
x
Freesurface
x

The wave dynamics at reflection of a shock pulse from the free surface
∆ufs
uf
um
u0
ufs
t0
K
umu0
(tail)SpallStrength
0
C-
C+
C+
Riemann'sIsentropes
Hugoniot
u
p
Acoustic approach: fsoosp uc ∆ρ=σ21
The peak tensile stress just before the fracture corresponds to the intersection point K of the Riemann’s isentropes
t
x
K
C_
C+Sp
all
Free surface
Shock front
0
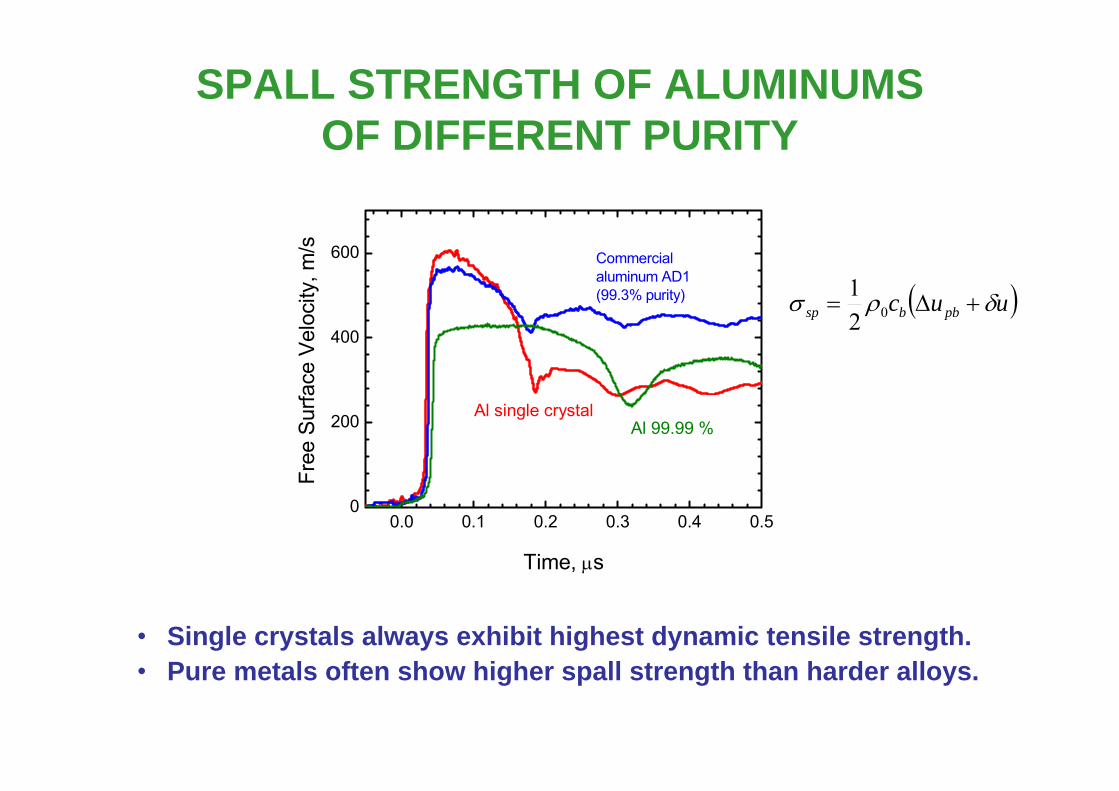
SPALL STRENGTH OF ALUMINUMS OF DIFFERENT PURITY
• Single crystals always exhibit highest dynamic tensile strength.• Pure metals often show higher spall strength than harder alloys.
0.0 0.1 0.2 0.3 0.4 0.50
200
400
600
Al 99.99 %
Commercial aluminum AD1(99.3% purity)
Al single crystal
Free
Sur
face
Vel
ocity
, m/s
Time, µs
( )uuc pbbsp δρσ +∆= 021

104 105 106 107
σ sp / σ id
WaterPMMA
Epoxy
0.04
0.06
0.08
0.50.4
0.3
0.2
0.1
CuAl
Fe
Mo
.V/V0, s
-1
APPROACHING THE IDEAL STRENGTH
• As much as 30 % of ideal strength is reached at load duration of a nanosecond range.
0,6 0,8 1,0 1,2-60
-40
-20
0
20
Water
PMMA
Mo
Fe
Cu
Al
Tension Compression
Pres
sure
, GPa
ρ/ρ0

Equations of State in the Negative Pressure Domain
0.21 – EOS (Speedy, 1982)0.22 – MD (Netz et al, 2001)0.28Water
1.34Epoxy1.39PMMA
13.5 – EOS (Faizullin and Skripov, 2007)
27.9 (Friakyz et al, 2003)27.7 (Černý and Pokluda, 2007)13.4 (Sin’ko and Smirnov, 2004)
31.6Iron
41.6 (Joshi and Gupta, 2007)42.9 (Černý and Pokluda, 2007)55Molybdenum
21.0 – EOS (Faizullin and Skripov, 2007)19.8 (Černý and Pokluda, 2007)23.3Copper
12.2 – EOS (Faizullin and Skripov, 2007)11.7 (Sin’ko and Smirnov, 2002)13.4Aluminum
σid at 300 K from EOS or MD, GPaσid ab initio, GPaEstimated
σid, GPaMatter
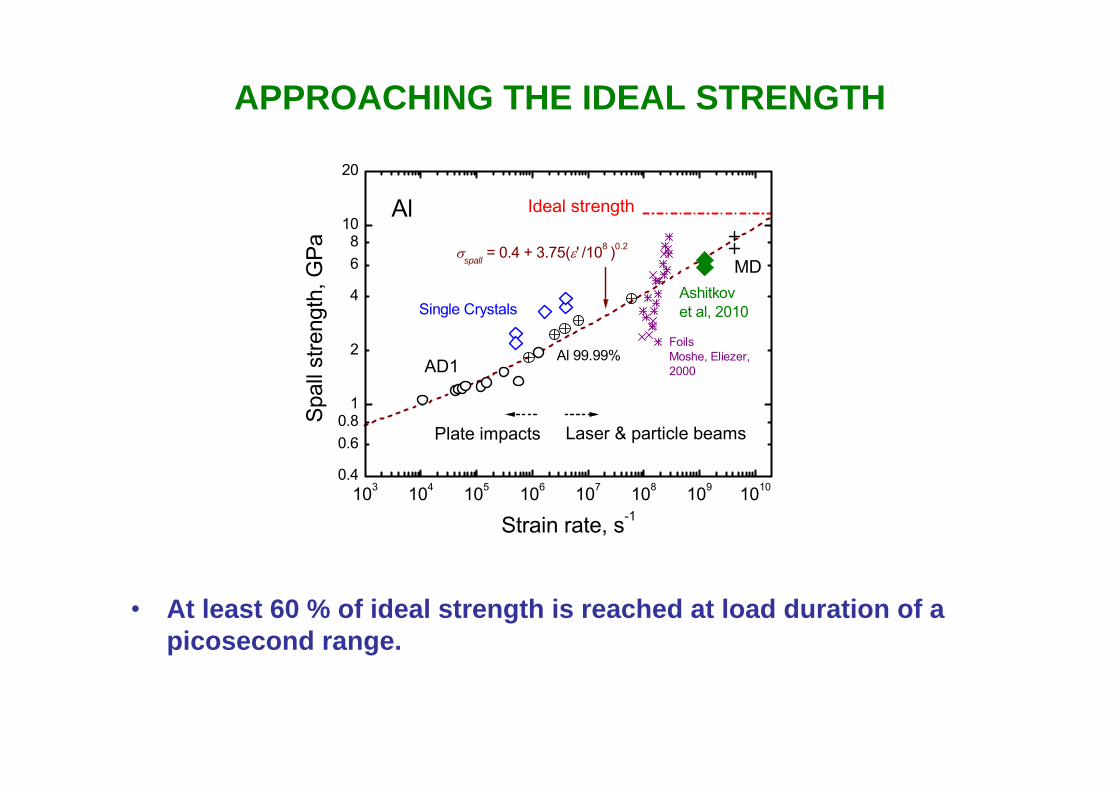
APPROACHING THE IDEAL STRENGTH
• At least 60 % of ideal strength is reached at load duration of apicosecond range.
103 104 105 106 107 108 109 10100.4
0.60.8
1
2
4
68
10
20
Al
FoilsMoshe, Eliezer, 2000
Ashitkov et al, 2010
MDσspall = 0.4 + 3.75(ε' /108 )0.2
Ideal strength
Plate impacts Laser & particle beams
Al 99.99%
Single Crystals
AD1
Spal
l stre
ngth
, GPa
Strain rate, s-1

Intragranular and intergranular fracture of Cu + 0.1%Si

Grain size effect on the spall strength.Armco iron and tantalum.
0 25 50 750
100
200
300
400
500
600
σsp
= 5.25 GPaSp.thick. 40 µm
σsp
= 3.62 GPaSp.thick. 33 µm
σsp
=6.80 GPaSp.thick. 43 µm
Iron 0.2 mm thick
Fe single crystalArmco, forged
Armco, as-received
Free
Sur
face
Vel
ocity
, m/s
Time, ns
0 200 400 6000
50
100
150
200
250
300
Single crystal, σsp = 4 GPa
Armco iron, 2.7 mm
Forgedσsp= 3.3 GPa
Fre
e Su
rface
Vel
ocity
, m/s
Time, ns
As received,σsp= 2.1 GPa
• Refinement of the grain structure results in increase of the spall strength.
• The spall strength does not correlate with the HEL.
0.00 0.05 0.10 0.15 0.200
100
200
300
400
500
0.00 0.05 0.10 0.15 0.20
Ta
CG, HR = 77 UFG, HR = 104
Free
sur
face
vel
ocity
, m/s
Time, µs
Ta
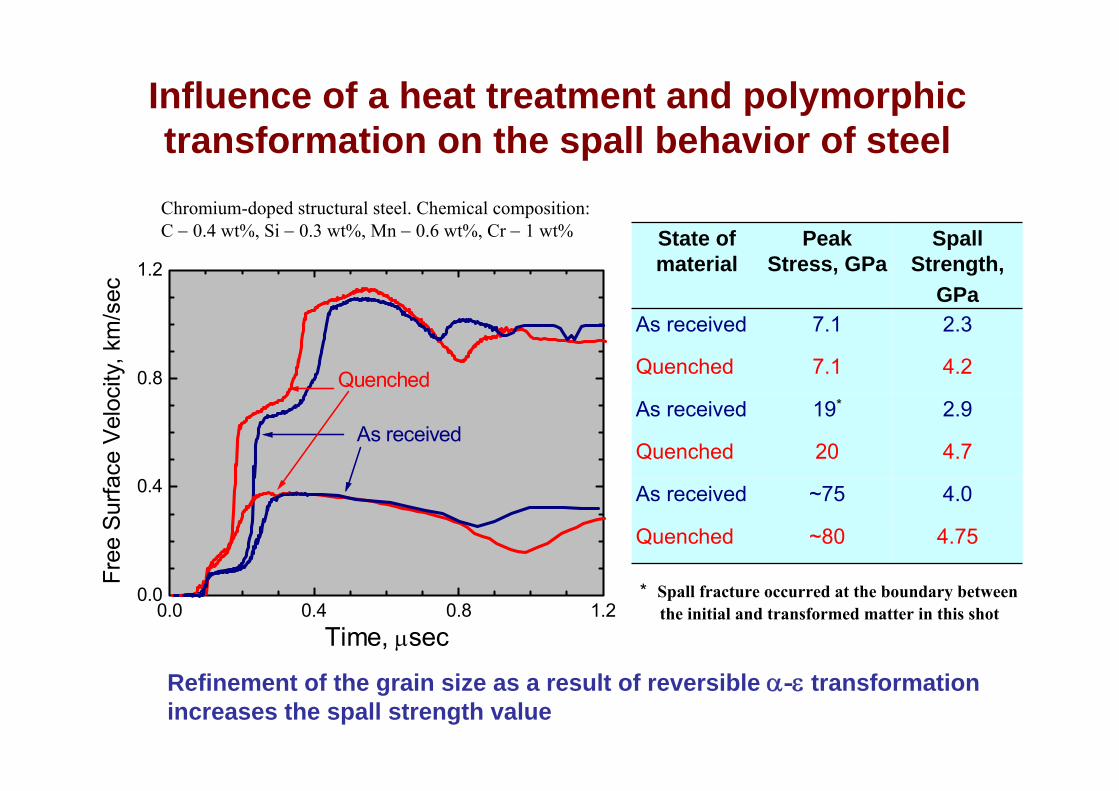
Influence of a heat treatment and polymorphic transformation on the spall behavior of steel
0.0 0.4 0.8 1.20.0
0.4
0.8
1.2
As received
Quenched
Free
Sur
face
Vel
ocity
, km
/sec
Time, µsec
Chromium-doped structural steel. Chemical composition:C − 0.4 wt%, Si − 0.3 wt%, Mn − 0.6 wt%, Cr − 1 wt%
4.75~80Quenched
4.0~75As received
4.720Quenched
2.919*As received
4.27.1Quenched
2.37.1As received
Spall Strength,
GPa
Peak Stress, GPa
State of material
* Spall fracture occurred at the boundary between the initial and transformed matter in this shot
Refinement of the grain size as a result of reversible α-ε transformation increases the spall strength value

SPALL STRENGTH OF SINGLE CRYSTALS AND POLYCRYSTALLINE METALS AT MELTING
• The strength of polycrystalline metals drops when the material begins to melt whereas single crystals maintain a high resistance to spall fracture when melting should start;
• In polycrystalline solids melting may start along grain boundaries at temperatures below the melting temperature of the crystal: pre-melting phenomenon;
• Superheated solid states were realized in the crystals under tension
0 100 200 300 400 500 600 7000
1
2
3
4
Zn (0001)
3.106s-1
5.105s-1
Al
Spal
l Stre
ngth
, GPa
Temperature, oC0,4 0,6 0,8 1,0
0,0
0,5
1,0
1,5
MgAl
Spal
l Stre
ngth
, GPa
- Magnesium Mg95- Aluminum AD1
Homologous Temperature T/Tm

Thank you for your attention!
Related Documents