ieee transactions on ultrasonics, ferroelectrics, and frequency control, vol. 54, no. 5, may 2007 987 Strain Imaging Using Conventional and Ultrafast Ultrasound Imaging: Numerical Analysis Suhyun Park, Student Member, IEEE, Salavat R. Aglyamov, W. Guy Scott, and Stanislav Y. Emelianov, Member, IEEE Abstract—In elasticity imaging, the ultrasound frames acquired during tissue deformation are analyzed to esti- mate the internal displacements and strains. If the defor- mation rate is high, high-frame-rate imaging techniques are required to avoid the severe decorrelation between the neighboring ultrasound images. In these high-frame-rate techniques, however, the broader and less focused ultra- sound beam is transmitted and, hence, the image qual- ity is degraded. We quantitatively compared strain im- ages obtained using conventional and ultrafast ultrasound imaging methods. The performance of the elasticity imag- ing was evaluated using custom-designed, numerical sim- ulations. Our results demonstrate that signal-to-noise ra- tio (SNR), contrast-to-noise ratio (CNR) and spatial res- olutions in displacement and strain images acquired using conventional and ultrafast ultrasound imaging are compa- rable. This study suggests that the high-frame-rate ultra- sound imaging can be reliably used in elasticity imaging if frame rate is critical. I. Introduction E lasticity imaging is based on the premise that tissue pathology can be noninvasively assessed through the quantification of tissue mechanical properties. Physicians have long thought that stiffness can be used as an indicator of possible cancerous lesions. The success of palpation as a diagnostic tool is the evidence of this. The ability to ac- curately and noninvasively quantify tissue elasticity offers the possibility of not only detecting but also diagnosing and even monitoring the tissue abnormalities [1], [2]. One of the approaches in elasticity imaging is based on ultrasound imaging of tissue during the externally or inter- nally applied deformation and measurement of the internal tissue motion using speckle tracking algorithms. If the de- formation rate is small or can be controlled (e.g., external Manuscript received May 23, 2006; accepted December 11, 2006. Support in part by National Institutes of Health under grants CA 110079, CA 112784, and EB 004963, and Army Medical Research and Material Command under grant DAMD17-02-1-0097 is grate- fully acknowledged. Authors would like to thank Texas Advanced Computing Center (TACC) for providing an access to a high speed computational cluster. S. Park, S. R. Aglyamov, and S. Y. Emelianov are with the Depart- ment of Biomedical Engineering, The University of Texas at Austin, Austin, TX 78712 (e-mail: [email protected]). S. R. Aglyamov also is with the Institute of Mathematical Problems of Biology, Russian Academy of Sciences, Pushchino, Moscow Region 142290 Russia. W. G. Scott is with Winprobe Corporation, North Palm Beach, FL 33408. Digital Object Identifier 10.1109/TUFFC.2007.344 deformation of breast or prostate imaging), the conven- tional ultrasound imaging can be used. In conventional ultrasound imaging, each transmitted ultrasound beam is focused at a specified depth, and the received beam is dy- namically focused at all ranges to form a high quality ultra- sound image. However, if the motion or deformation rate is high (e.g., shear wave or cardiac strain rate imaging), the severe decorrelation between the neighboring conventional ultrasound images necessitates alternative high-frame-rate imaging techniques such as parallel receive beamforming imaging [3], explososcan [4], [5], or ultrafast ultrasound imaging [6], [7]. In these imaging techniques, the transmit- ted broad (i.e., unfocused or weakly focused) ultrasound beam interrogates the entire volume. Then the backscat- tered ultrasound signal, received on the desired elements of the array transducer at once, is used to form several beams or the entire ultrasound image. Ultrafast imaging is an extreme of the high-frame-rate imaging because it transmits without focus using the whole transducer aper- ture then receives from the whole transducer aperture at once. Compared to the conventional imaging method, high- frame-rate imaging has an advantage of the reduced data acquisition time. However, the transmitted ultrasound beam is broad, and the quality of the high-frame-rate ul- trasound image is degraded. Although the transmit focus- ing in conventional imaging improves lateral resolution in the focal plane, the lateral resolution in the regions be- fore or after the focal plane is compromised because the focused beam diverges quickly outside of the focal zone [8], [9]. Thus, the overall image quality between conventional and high-frame-rate imaging is worthy of comparison. In this paper, we quantitatively compare the perfor- mance of elasticity imaging based on conventional and ultrafast ultrasound imaging methods. High-frame-rate imaging is applicable to both static elasticity imaging and the dynamic elasticity imaging. The static elasticity imag- ing is based on the estimation of mechanical properties of tissue from the strain images, and the dynamic elastic- ity imaging usually is based on the temporal analysis of the displacement images [6]. Thus, analysis of the signal- to-noise ratio (SNR), contrast-to-noise ratio (CNR), and spatial resolution of the displacement and strain images was performed. The quality of displacement and strain images obtained using conventional and ultrafast ultra- sound imaging modes was compared in the focal region 0885–3010/$25.00 c 2007 IEEE

Welcome message from author
This document is posted to help you gain knowledge. Please leave a comment to let me know what you think about it! Share it to your friends and learn new things together.
Transcript

ieee transactions on ultrasonics, ferroelectrics, and frequency control, vol. 54, no. 5, may 2007 987
Strain Imaging Using Conventional andUltrafast Ultrasound Imaging:
Numerical AnalysisSuhyun Park, Student Member, IEEE, Salavat R. Aglyamov, W. Guy Scott,
and Stanislav Y. Emelianov, Member, IEEE
Abstract—In elasticity imaging, the ultrasound framesacquired during tissue deformation are analyzed to esti-mate the internal displacements and strains. If the defor-mation rate is high, high-frame-rate imaging techniquesare required to avoid the severe decorrelation between theneighboring ultrasound images. In these high-frame-ratetechniques, however, the broader and less focused ultra-sound beam is transmitted and, hence, the image qual-ity is degraded. We quantitatively compared strain im-ages obtained using conventional and ultrafast ultrasoundimaging methods. The performance of the elasticity imag-ing was evaluated using custom-designed, numerical sim-ulations. Our results demonstrate that signal-to-noise ra-tio (SNR), contrast-to-noise ratio (CNR) and spatial res-olutions in displacement and strain images acquired usingconventional and ultrafast ultrasound imaging are compa-rable. This study suggests that the high-frame-rate ultra-sound imaging can be reliably used in elasticity imaging ifframe rate is critical.
I. Introduction
Elasticity imaging is based on the premise that tissuepathology can be noninvasively assessed through the
quantification of tissue mechanical properties. Physicianshave long thought that stiffness can be used as an indicatorof possible cancerous lesions. The success of palpation asa diagnostic tool is the evidence of this. The ability to ac-curately and noninvasively quantify tissue elasticity offersthe possibility of not only detecting but also diagnosingand even monitoring the tissue abnormalities [1], [2].
One of the approaches in elasticity imaging is based onultrasound imaging of tissue during the externally or inter-nally applied deformation and measurement of the internaltissue motion using speckle tracking algorithms. If the de-formation rate is small or can be controlled (e.g., external
Manuscript received May 23, 2006; accepted December 11, 2006.Support in part by National Institutes of Health under grants CA110079, CA 112784, and EB 004963, and Army Medical Researchand Material Command under grant DAMD17-02-1-0097 is grate-fully acknowledged. Authors would like to thank Texas AdvancedComputing Center (TACC) for providing an access to a high speedcomputational cluster.
S. Park, S. R. Aglyamov, and S. Y. Emelianov are with the Depart-ment of Biomedical Engineering, The University of Texas at Austin,Austin, TX 78712 (e-mail: [email protected]).
S. R. Aglyamov also is with the Institute of Mathematical Problemsof Biology, Russian Academy of Sciences, Pushchino, Moscow Region142290 Russia.
W. G. Scott is with Winprobe Corporation, North Palm Beach,FL 33408.
Digital Object Identifier 10.1109/TUFFC.2007.344
deformation of breast or prostate imaging), the conven-tional ultrasound imaging can be used. In conventionalultrasound imaging, each transmitted ultrasound beam isfocused at a specified depth, and the received beam is dy-namically focused at all ranges to form a high quality ultra-sound image. However, if the motion or deformation rate ishigh (e.g., shear wave or cardiac strain rate imaging), thesevere decorrelation between the neighboring conventionalultrasound images necessitates alternative high-frame-rateimaging techniques such as parallel receive beamformingimaging [3], explososcan [4], [5], or ultrafast ultrasoundimaging [6], [7]. In these imaging techniques, the transmit-ted broad (i.e., unfocused or weakly focused) ultrasoundbeam interrogates the entire volume. Then the backscat-tered ultrasound signal, received on the desired elementsof the array transducer at once, is used to form severalbeams or the entire ultrasound image. Ultrafast imagingis an extreme of the high-frame-rate imaging because ittransmits without focus using the whole transducer aper-ture then receives from the whole transducer aperture atonce.
Compared to the conventional imaging method, high-frame-rate imaging has an advantage of the reduced dataacquisition time. However, the transmitted ultrasoundbeam is broad, and the quality of the high-frame-rate ul-trasound image is degraded. Although the transmit focus-ing in conventional imaging improves lateral resolution inthe focal plane, the lateral resolution in the regions be-fore or after the focal plane is compromised because thefocused beam diverges quickly outside of the focal zone [8],[9]. Thus, the overall image quality between conventionaland high-frame-rate imaging is worthy of comparison.
In this paper, we quantitatively compare the perfor-mance of elasticity imaging based on conventional andultrafast ultrasound imaging methods. High-frame-rateimaging is applicable to both static elasticity imaging andthe dynamic elasticity imaging. The static elasticity imag-ing is based on the estimation of mechanical propertiesof tissue from the strain images, and the dynamic elastic-ity imaging usually is based on the temporal analysis ofthe displacement images [6]. Thus, analysis of the signal-to-noise ratio (SNR), contrast-to-noise ratio (CNR), andspatial resolution of the displacement and strain imageswas performed. The quality of displacement and strainimages obtained using conventional and ultrafast ultra-sound imaging modes was compared in the focal region
0885–3010/$25.00 c© 2007 IEEE

988 ieee transactions on ultrasonics, ferroelectrics, and frequency control, vol. 54, no. 5, may 2007
of the conventional ultrasound imaging, and for regionsoutside of the focal zone. The influence of electronic noiseis discussed. The paper concludes with the discussions ofthe trade-offs between conventional and ultrafast imagingmodes.
II. Materials and Methods
Three sets of custom-designed numerical simulationswere conducted to investigate the quality of the displace-ment and strain images obtained from ultrasound framesacquired using conventional and ultrafast imaging meth-ods. The first set of experiments was performed using asynthetic phantom consisting of 15 point scatterers. Pointtargets were used to analyze the behavior of the pointspread function (PSF) as function of the lateral and ax-ial position. Because ultrasound imaging system can beconsidered as a linear system, it is possible to charac-terize the properties of ultrasound beam using the PSF[10]. In the point target phantom, the five rows of threescatterers in each row were placed every 10 mm startingat 5 mm from the transducer surface. All scatterers hadthe same reflectivity. The second set of experiments wasperformed using a homogeneous phantom. Deformation ofthe phantom was applied from the top. Here, we assumedplane strain state such that axial displacement was lin-ear with depth, and the lateral displacement was calcu-lated based on tissue incompressibility. Lastly, a phantomwith a single, hard inclusion embedded into a homogeneousmedium was simulated. The 10-mm diameter circular le-sion, positioned at the center of the imaged region, had 50times more randomly distributed scatterers compared tothe background medium. For contrast in elasticity imag-ing, the inclusion was twice harder than the backgroundmaterial. To model the displacement and deformation ofthe phantom, a two-dimensional (2-D) analytic solution forincompressible, uniformly deformed body with cylindricalinclusion was used [11], [12].
The geometry of the phantom and imaging setup areshown in Fig. 1(a). For both tissue-mimicking phantoms,the transducer was positioned at the top of the phantom.Using the transducer itself, up to 6% surface deformationsof the phantom were applied in 0.3% increments. Thus foreach phantom, 20 frames were acquired using both con-ventional and ultrafast imaging methods.
Ultrasound modeling was based on linear acoustic wavepropagation. To simplify modeling, a far-field approxi-mation was used. Each element of the transducer (128-element linear array operating at 5 MHz) was assumed tobe a point source and detector with directivity of a 300-µmwide acoustic radiator [13]. The spatial impulse responseof the transducer was modeled as a three-cycle sinusoidwith Hanning-weighted envelope corresponding to a 60%fractional bandwidth. The backscattered ultrasound signalwas captured using 40 MHz sampling frequency. The size ofthe imaging region was 40 mm laterally and 50 mm axially.The signals from selected transmit-receive combinations oftransducer elements were simulated and beamformed for
conventional and ultrafast imaging separately. As atten-uation was not applied, the transmit-receive signals werenot depth dependent. The major challenge in simulatingthe ultrasound images is the computational load [13]. Toreduce the computation time, high-performance computercluster running Linux operating system was used. The ul-trasound models were implemented in C language. Thetime to obtain one frame from a synthetic phantom with15,000 scatterers was less than an hour.
In conventional imaging, the transmitted beam was fo-cused at a 25-mm depth. The transmit F-number (i.e., theratio of focal length to the aperture size [8]) was set to 2for point target phantom—such aggressive F-number wasused to clearly show the effect of focusing in transmit-ted ultrasound beam. For homogeneous phantom and thephantom with an inclusion, the transmit F-number was setto 3. In ultrafast imaging, the whole aperture consisting of128 elements was used to transmit unfocused, ultrasound-pulsed wave and to receive backscattered signals. In otherwords, plane wave with focus at infinity was transmittedwhile ultrasound echoes were continuously recorded. Toform an image using the captured RF signals, the delayand sum beamformer that accurately accounts for the de-lay distances between the transducer elements and thereconstructed point in the image was used. The beam-forming methods were the same for both conventional andultrafast imaging except that 128 transmit-receive com-binations were required to reconstruct 128 conventionalbeams, but 128 ultrafast beams were formed from a singletransmit-receive combination.
In both ultrasound imaging methods, Hanning apodiza-tion was applied, and the receive F-number was set to 2and kept constant during dynamic receive focusing, i.e.,the number of receiving elements was linearly increasedwith increased imaging depth. The time gain control(TGC) was applied, and images were log-scaled and dis-played using 20 dB dynamic range for point target phan-tom and 40 dB dynamic range for tissue phantoms. Forexample, simulated images of the phantom with inclusionfrom 33 mm lateral by 41 mm axial region, outlined by thedotted line in Fig. 1(a), are shown in Fig. 1(b) for conven-tional imaging and in Fig. 1(c) for ultrafast imaging. Thecomponents of the displacement vector and strain tensorwere estimated from a pair of beamformed RF images inwhich the reference frame was always the first image, i.e.,the frame acquired before the deformation was applied.The frame-to-frame displacements were estimated using a2-D, cross-correlation based speckle tracking method, inwhich the magnitude of the cross-correlation function wasused to obtain an integer estimate of the displacement,then interpolation and phase zero-crossing were used totrack subpixel lateral and axial displacements, correspond-ingly [1], [14], [15]. To reduce decorrelation artifacts, aHamming-window weighted kernel measuring 2.8 mm lat-erally and 1 mm axially was used in speckle tracking corre-lation process [14]. In addition, the correlation coefficientfunctions computed at adjacent positions were filtered us-ing Hanning-window weighting (2.8 mm lateral by 2 mm

park et al.: strain imaging with conventional and ultrafast imaging 989
Fig. 1. (a) Diagram of the phantom geometry and experimental setup. Overall, the imaging region was 40-mm laterally and 50-mm axially.Using the transducer itself, up to 6% surface deformations of the phantom were applied in 0.3% increments. Regions I, II, and III were usedfor displacement and strain data analysis. Ultrasound images from the region inside the dotted line (33-mm lateral by 41-mm axial) of asynthetic phantom with a single hard inclusion were obtained using (b) conventional imaging, and (c) ultrafast imaging.
axial) to reduce the probability of peak hopping and over-all error. Because weightings were applied for the correla-tion coefficients in spatial direction instead of correlationlag direction, it was not the same as the simple filteringof correlation coefficient function itself [14]. Axial strainimages were generated by taking the 1-D derivative of theaxial displacement estimates using 1.2 mm, 2-point centraldifference.
Standard references quantifying the quality of the dis-placement and strain images are SNR, CNR, and spatialresolution [1], [16]. The SNRs of the displacement andstrain images obtained using conventional and ultrafastimages of the homogeneous phantom were analyzed inthree regions of interests (ROIs) shown in Fig. 1(a). A cri-terion for SNR was defined by (1) (see next page), whereref is the displacement or strain data derived from the ana-lytical solution, and est is the displacement or strain datameasured using simulated ultrasound frames. The strainCNR was assessed using a phantom with a single hard in-clusion. Contrast is defined as the ratio of the strain withinthe inclusion to the strain in the homogeneous region [16].The CNR was given by:
CNR =2(s1 − s2)2
σ2s1
+ σ2s2
, (2)
where s1 and s2 represent the mean values of strain withinthe inclusion and the background, and σ2
s1and σ2
s2denote
the strain variances in those regions [17]. The relationshipbetween the SNR in the ultrasound images and the SNRof the displacement and strain images were investigated.To simulate the electrical noise of the ultrasound imagingsystem, image SNR was reduced by additive noise [18].Different levels of white Gaussian noise were added to the1st and 10th (3% applied strain) ultrasound frames, thusvarying the SNR of the ultrasound images from −9 dBto 33 dB with 6 dB interval. To analyze the effect of thefocusing, all SNR values were evaluated from three ROIs
(Region I, Region II, and Region III) as schematically de-picted in Fig. 1(a). Region I is located near the surface ofthe transducer, Region II is in the focal region (depth offield) of the conventional ultrasound image, and Region IIIis far from the transducer. Window size of each region was22 mm laterally and 1 mm axially. The axial length of theregion was narrow enough to fit within the depth of field(∼2 mm) of the conventional imaging. For consistency, thesize of the three regions was the same in both displacementand strain analyses. Also, a small region inside the inclu-sion at the center of the phantom and three small regionsfrom Region I, Region II (outside the inclusion), and Re-gion III were chosen for strain CNR analysis. To examinethe results statistically, mean and standard deviation ofSNR and CNR were calculated from 27 different windowsin a 23.5 mm laterally by 2.5 mm axially region.
III. Results and Discussion
The ultrasound images of phantom with 15 point scat-terers are shown in Fig. 2(a) for conventional imaging andin Fig. 2(b) for ultrafast imaging. In conventional imaging,the width of the imaged point target at the focal region(25 mm depth) is smaller than that in the other regions.In ultrafast imaging, however, the width of the point tar-get stays almost the same throughout the whole image.To quantitatively emphasize the differences, the scaled re-gions around focal zone (20 mm–30 mm) in images ob-tained using conventional and ultrafast imaging methodsare represented in Figs. 2(c) and (d), respectively. Theseimages are displayed using 25 dB dynamic range. Overall,the lateral extents of each point target are comparable inboth imaging methods, except at the focal region of theconventional imaging.
To characterize the beam properties of the ultrasoundimaging systems, the PSF was analyzed. The lateral pro-files of PSF at 5, 15, 25, 35, and 45 mm depth are shown in

990 ieee transactions on ultrasonics, ferroelectrics, and frequency control, vol. 54, no. 5, may 2007
SNRdisplacement/strain = 20 log10
⎛⎜⎜⎜⎜⎝
∑ROI
refdisplacement/strain/N√[ ∑ROI
(refdisplacement/strain − estdisplacement/strain
)2]
/N
⎞⎟⎟⎟⎟⎠ (1)
Fig. 2. Ultrasound images of point scatterers obtained using (a) conventional and (b) ultrafast imaging techniques. The imaged 40-mmlateral by 50-mm axial regions consisted of 15 point scatterers placed on a 10 mm by 10 mm grid starting 5 mm from the transducer surface.These images are displayed using 20 dB dynamic range. In conventional imaging, transmit focus was at 25 mm and F-number was set to 2.Ultrafast image does not have transmit focusing. Overall, the sizes of the point targets are comparable in conventional and ultrafast imagesexcept at the focal region. For further comparison, the regions around the focal zone (20 mm–30 mm) from (c) conventional and (d) ultrafastimages, respectively, are displayed using 25 dB dynamic range.
Fig. 3(a) and (b) for conventional and ultrafast imaging,respectively. Except for the transmit focal region locatedat 25 mm depth, the beam width at −6 dB level is ap-proximately 0.90 mm for both ultrafast and conventionalimaging. In the focal zone of the conventional imaging, the−6 dB beam width is 0.65 mm. Although the beam widthdoes not vary significantly between two imaging methods,the level of the side lobes of the conventional imaging issmaller than that of the ultrafast imaging. Clearly, the lat-eral resolution and image quality of the two imaging meth-ods are different. Also, PSF profile demonstrates that theultrasound beam in the conventional imaging is rapidlyconverging near focus, and diverging far from the focus.As expected, the axial length of the PSF does not varywith the axial distance because there is no influence of thefocus in axial direction. Furthermore, the axial PSFs inboth imaging methods are found similar as it is primarilydetermined by the frequency and bandwidth of the trans-ducer.
The SNRs of lateral and axial displacements and axialstrain were estimated using ultrasound images obtained
from a homogeneous phantom. The SNRs of axial displace-ment are presented in Fig. 4. Generally, the SNR of axialdisplacements obtained using either conventional or ultra-fast imaging is higher in Regions II and III compared toRegion I. However, the magnitude of axial displacement isprogressively larger from Region I to Region III; therefore,an increase of axial displacement SNR with depth was an-ticipated. In ultrafast imaging, SNR of axial displacementsis greater at larger depths. Nevertheless, axial displace-ment SNR obtained from conventional ultrasound imagesis nearly the same in Region II and III, which indicatesthat displacement SNR in Region II was further increaseddue to a focused transmit beam. Therefore, the quality ofaxial displacement estimates is affected by the transmitfocusing as is evident from SNR in the focal region of theconventional imaging. The error bars (plus/minus 1 stan-dard deviation) in Fig. 4 demonstrate that the variance ofdisplacement SNR of conventional imaging is smaller thanthat of ultrafast imaging. As the applied strain increases,however, the SNR difference between ultrafast and con-ventional imaging is tapered away.

park et al.: strain imaging with conventional and ultrafast imaging 991
Fig. 3. Lateral profiles of the PSF at 5, 15, 25, 35, and 45-mm depth for (a) conventional and (b) ultrafast imaging. At the focal region(25-mm depth) of the conventional imaging, the beam width is 0.65 mm. In other regions, the beam width at −6 dB level is approximately0.90 mm for both ultrafast and conventional imaging modes. The side lobes in conventional imaging are smaller than those in the ultrafastimaging.
Fig. 4. Axial displacement SNRs for three regions of the homogeneous phantom. Region II of the conventional imaging exhibits the highestSNR. Due to the distribution of the axial displacement within the imaging plane, Region I has lower magnitude of the axial displacementand, correspondingly, this region exhibits low displacement SNR compared to other regions. Similarly, Region III has larger displacementmagnitude elevating the displacement SNR in that region.
Lateral displacement SNR, presented in Fig. 5, is some-what similar in all three regions because the magnitude oflateral displacement does not significantly vary with depth.Generally, because the quality of lateral displacements isdiffraction limited, the conventional ultrasound imagingoutperforms ultrafast imaging. This is especially notice-able in focal region of the conventional imaging. Neverthe-less, the differences in lateral displacement SNRs betweentwo imaging modes are not significant, although ultrafastimaging has overall higher variance compared to that ofconventional imaging.
Axial strain map from analytical model and strain im-ages obtained using conventional and ultrafast imaging us-
ing the phantom with a single hard inclusion are presentedin Fig. 6. The analytical strain image in Fig. 6(a) clearlyindicates the presence of the inclusion. There also are ex-pected strain artifacts around the lesion [11]. The harderinclusion exhibits less strain compared to the surroundingsoft tissue. Strain maps obtained from conventional andultrafast images closely approximate the ideal axial straindistribution derived from the analytic model. The spatialresolution in conventional and ultrafast ultrasound imageswas not the same. But resolution in measured strain im-ages is quite comparable. This is due to the fact thatthe difference in the lateral resolution were smoothed outduring the speckle tracking process in which kernel size

992 ieee transactions on ultrasonics, ferroelectrics, and frequency control, vol. 54, no. 5, may 2007
Fig. 5. Lateral displacement SNRs from three regions in homogeneous phantom. Region II (i.e., focal region) of the conventional imaginghas the highest SNR.
Fig. 6. Strain images of a phantom with a single hard inclusion at 3% applied strain obtained from (a) an analytical model, (b) conventional,and (c) ultrafast ultrasound images. The harder inclusion exhibits less strain compared to the surrounding soft tissue. Measured strainimages correlate well with the strain map derived from the analytical solution.
slightly larger than the speckle spot size was used. De-creasing the kernel size and length of the correlation filtercan improve the spatial resolution of the strain images, butthe strain SNR will be reduced [14]. The measured strainimages exhibit a wavy pattern—this is strain-induced noisethat has two origins. The time delay is not an integer mul-tiple of sampling period, and it can introduce a cyclic biaserror. Also, short correlation kernel leads to the correlatednoise pattern [1]. The noise in strain images can be filteredout, but at the expense of spatial resolution.
To analyze the mechanical properties of tissue in staticelasticity imaging, axial strain is primarily used. Indeed,as presented in Fig. 5, lateral displacement SNR is lowcompared to axial displacement SNR. Therefore, the mea-sured axial component of the strain tensor has higher SNR.The SNRs of axial strain from three regions in a homoge-neous phantom are shown in Fig. 7. In ultrafast imaging,all three regions exhibit comparable strain SNR. Similarto the SNR of the lateral and axial displacements, the ax-ial strain SNR in Region II of the conventional imaging is
higher than that of ultrafast and other regions of conven-tional ultrasound imaging. Even though the strain imagequality is slightly better in the focal region in conventionalimaging, the difference in strain image quality is not signif-icant outside of this region. Although axial displacementSNRs in Regions I and III were different (Fig. 4) due todifferences in displacement magnitude, strain SNR in theseregions are almost the same because the strain magnitudeis nearly the same throughout the entire image. As is evi-dent from the error bars in Fig. 7, strain SNR in ultrafastimaging varies more compared to SNR of strain imagesobtained using conventional ultrasound imaging. This isespecially true for low-strain magnitude and in Region IIIin which axial displacement error is the most significant(Fig. 4).
The CNRs of the axial strain are shown in Fig. 8. Toobtain CNR, a phantom with a single, hard inclusion posi-tioned in the center of the phantom was used. The highestCNR is in the focal region of conventional imaging, andoverall the CNRs of the axial strain behave similar to the

park et al.: strain imaging with conventional and ultrafast imaging 993
Fig. 7. Axial strain SNRs for three regions of homogeneous phantom. Region II of the conventional imaging shows higher SNR compared toother regions of conventional imaging and all regions of ultrafast imaging. SNR of strain images obtained using ultrafast imaging is nearlythe same throughout the entire image.
SNRs of the axial displacement and strain images. How-ever, the presented estimates of CNR in Regions I and IIIare slightly different from CNR defined by (2). To calcu-late exact values of CNR in Regions I and III, the inclu-sion should be positioned in these regions. Nevertheless,the CNRs presented Fig. 8 represent upper limit of trueCNRs for Regions I and III.
The relationship between the noise in the ultrasoundimages and the SNR in the axial displacement and strainimages is depicted in Figs. 9 and 10, respectively. The ref-erence frame and 10th frame (3% applied strain) of the ho-mogeneous phantom were used because the quality of thedisplacement and strain images for both imaging meth-ods was reasonably high at this level of applied strain.As the ultrasound image SNR increases, the SNR of dis-placement and strain images also is improved. In RegionI, the noise affects the displacement SNR levels most sig-nificantly. Once the SNR of the ultrasound images reaches20 dB and higher, the changes of displacement/strain SNRare subtle. Standard deviations in displacement and strainSNRs are about 1–2 dB and less than 1 dB, correspond-ingly. Overall, ultrafast imaging shows higher variance, butthe differences are insignificant.
In our numerical analysis, far-field approximation wasused and the near-field effects were neglected. It is difficultto predict the behavior of ultrasound field of near-field dueto diffraction [13]. In ultrafast imaging, all elements of thetransducer array are used to transmit the unfocused ultra-sound beam at once, and the whole imaging region is ina near-field of the transducer [8]. In conventional imaging,only the region before the transmit focal zone is in thenear-field. After dynamic focusing of the received ultra-sound signals, however, near-field region does not extendfar from the transducer surface (< 100 µm). Thus, far-field approximation is appropriate to model, excluding thenear-field diffraction region of the transmitted ultrasoundbeam. Nevertheless, the far-field modeling reasonably well
describes the behavior of each imaging system. In exper-imental studies, results in near-field will be affected notonly by beam divergence but also by the diffraction.
In conventional imaging, narrower beam with tighttransmit focus improves spatial resolution in the focal re-gion. The penalty for the improved resolution is that thebeam diverges rapidly. Although the resolution is better ator near the focal depth, it can be considerably worse awayfrom the focal region [9]. Besides, the abrupt changes be-tween the focal region and the other region caused fromusing an excessively low F-number can lead to high decor-relation around the focal depth. Thus, a highly focused,transmitted ultrasound beam with a low F-number doesnot guarantee the best displacement and strain estimatesthroughout the entire image. Conventional imaging witha higher transmit F-number can avoid this decorrelationproblem, but then it will become similar to an ultrafastimaging. Therefore, there is a trade-off between the spatialresolution of the ultrasound image in the focal region andthe quality of the overall strain image. Ultrafast imagingdoes not have a transmit focus, and image quality is uni-form throughout the entire image. However, the displace-ment and strain estimates exhibit slightly lower SNR thanconventional imaging. In addition, ultrafast imaging is sus-ceptible to artifacts caused by hyper-echoic regions [19].
Due to its speed of acquisition, ultrafast ultrasoundimaging also can be used in multimodality imaging systemsto allow sufficient time for parallel image processing suchas Doppler, optoacoustic or photoacoustic, and elasticityimaging [4], [20]. Indeed, the goal of multimodal imagingis to provide both morphological (e.g., exact localizationand extent), and functional (e.g., metabolic activity, flow,function, or functional changes) properties requiring inte-gration of various imaging modes yet still capable of in-vivo imaging and accurate coregistration of the images.Clearly, fast data acquisition and imaging is one of theprerequisites of the multimodality imaging system.
994 ieee transactions on ultrasonics, ferroelectrics, and frequency control, vol. 54, no. 5, may 2007
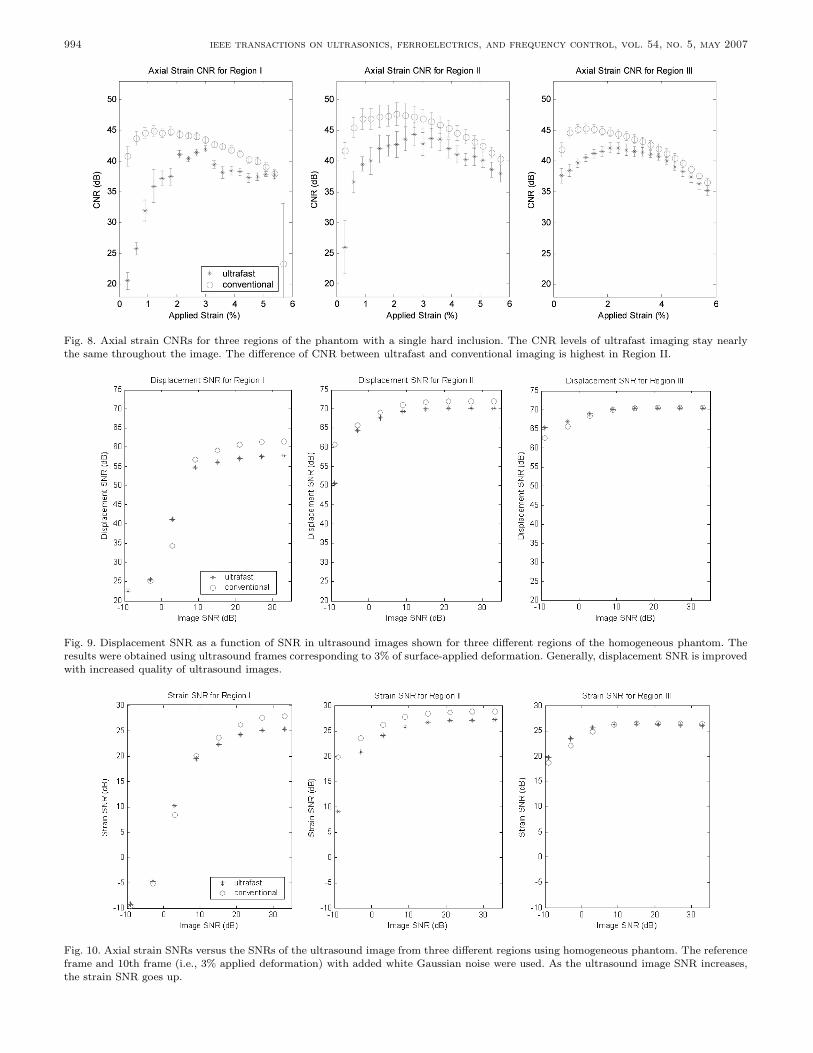
Fig. 8. Axial strain CNRs for three regions of the phantom with a single hard inclusion. The CNR levels of ultrafast imaging stay nearlythe same throughout the image. The difference of CNR between ultrafast and conventional imaging is highest in Region II.
Fig. 9. Displacement SNR as a function of SNR in ultrasound images shown for three different regions of the homogeneous phantom. Theresults were obtained using ultrasound frames corresponding to 3% of surface-applied deformation. Generally, displacement SNR is improvedwith increased quality of ultrasound images.
Fig. 10. Axial strain SNRs versus the SNRs of the ultrasound image from three different regions using homogeneous phantom. The referenceframe and 10th frame (i.e., 3% applied deformation) with added white Gaussian noise were used. As the ultrasound image SNR increases,the strain SNR goes up.

park et al.: strain imaging with conventional and ultrafast imaging 995
IV. Conclusions
The results of this study suggest that ultrafast and,generally, high-frame-rate ultrasound imaging can be reli-ably used for the elasticity imaging if frame rate is criti-cal to capture the fast-paced deformations. The displace-ment and strain estimates obtained using ultrafast ultra-sound imaging have tolerable levels of SNR, CNR, andaxial/lateral resolution.
References
[1] J. Ophir, S. K. Alam, B. Garra, F. Kallel, E. Konofagou, T.Krouskop, and T. Varghese, “Elastography: Ultrasonic estima-tion and imaging of the elastic properties of tissues,” Proc. Inst.Mech. Eng. [H], vol. 213, pp. 203–233, 1999.
[2] L. Gao, K. J. Parker, R. M. Lerner, and S. F. Levinson, “Imagingof the elastic properties of tissue–A review,” Ultrasound Med.Biol., vol. 22, pp. 959–977, 1996.
[3] M. O’Donnell, “Efficient parallel receive beam forming forphased array imaging using phase rotation,” in Proc. IEEE Ul-trason. Symp., 1990, pp. 1495–1498.
[4] D. P. Shattuck, M. D. Weinshenker, S. W. Smith, and O. T. vonRamm, “Explososcan: A parallel processing technique for highspeed ultrasound imaging with linear phased arrays,” J. Acoust.Soc. Amer., vol. 75, pp. 1273–1282, 1984.
[5] O. T. von Ramm, S. W. Smith, and J. H. G. Pavy, “High-speedultrasound volumetric imaging system—Part II: Parallel pro-cessing and image display,” IEEE Trans. Ultrason., Ferroelect.,Freq. Contr., vol. 38, pp. 109–115, 1991.
[6] M. Fink, L. Sandrin, M. Tanter, S. Catheline, S. Chaffai, J.Bercoff, and J. L. Gennisson, “Ultra high speed imaging of elas-ticity,” in Proc. IEEE Ultrason. Symp., 2002, pp. 1767–1776.
[7] B. Delannoy, R. Torquet, C. Bruneel, E. Bridoux, J. M. Rou-vaen, and H. LaSota, “Acoustical image reconstruction inparallel-processing analog electronic systems,” J. Appl. Phys.,vol. 50, pp. 3153–3159, 1979.
[8] D. A. Christensen, Ultrasonic Bioinstrumentation. New York:Wiley, 1988.
[9] J. L. Prince and J. M. Links, Medical Imaging Signals and Sys-tems. Upper Saddle River, NJ: Prentice-Hall, 2006.
[10] M. Sakhaei, A. Mahloojifar, and A. Malek, “Optimization ofpoint spread function in ultrasound arrays,” Ultrasonics, vol.44, pp. 159–165, 2006.
[11] A. R. Skovoroda, S. Y. Emelianov, A. P. Sarvazyan, and M.O’Donnell, “Theoretical analysis of verification of ultrasounddisplacement and strain imaging,” IEEE Trans. Ultrason., Fer-roelect., Freq. Contr., vol. 41, pp. 302–313, 1994.
[12] J. N. Goodier, “Concentration of stress around spherical andcylindrical inclusions and flaws,” J. Appl. Mech., vol. 55, pp.39–44, 1933.
[13] J. A. Jensen, “Field: A program for simulating ultrasound sys-tems,” Med. Biol. Eng. Comput., vol. 34, pp. 351–353, 1996.
[14] M. A. Lubinski, S. Y. Emelianov, and M. O’Donnell, “Speckletracking methods for ultrasonic elasticity imaging using short-time correlation,” IEEE Trans. Ultrason., Ferroelect., Freq.Contr., vol. 46, pp. 82–96, 1999.
[15] M. A. Lubinski, S. Y. Emelianov, K. R. Raghavan, A. E. Yagle,A. R. Skovoroda, and M. O’Donnell, “Lateral displacement esti-mation using tissue incompressibility,” IEEE Trans. Ultrason.,Ferroelect., Freq. Contr., vol. 43, pp. 247–255, 1996.
[16] S. Srinivasan, J. Ophir, and S. K. Alam, “Theoretical derivationof SNR, CNR and spatial resolution for a local adaptive strainestimator for elastography,” Ultrasound Med. Biol., vol. 30, pp.1185–1197, 2004.
[17] T. Varghese and J. Ophir, “An analysis of elastographiccontrast-to-noise ratio,” Ultrasound Med. Biol., vol. 24, pp. 915–924, 1998.
[18] W. F. Walker and G. E. Trahey, “A fundamental limit on de-lay estimation using partially correlated speckle signals,” IEEETrans. Ultrason., Ferroelect., Freq. Contr., vol. 42, pp. 301–308,1995.
[19] S. Park, J. Shah, S. R. Aglyamov, A. Karpiouk, S. Mallidi, A.Gopal, H. Moon, X. Zhang, W. G. Scott, and S. Y. Emelianov,“Integrated system for ultrasonic, photoacoustic, and elasticityImaging,” in Proc. SPIE Medi. Imaging Symp.: Ultrason. Imag-ing Signal Processing, 2006, vol. 6147, pp. H1–8.
[20] S. Y. Emelianov, S. R. Aglyamov, J. Shah, S. Sethuraman, W. G.Scott, R. Schmitt, M. Motamedi, A. Karpiouk, and A. Oraevsky,“Combined ultrasound, optoacoustic and elasticity imaging,” inProc. SPIE Photon. W. Symp.: Photons Plus Ultrasound: Imag-ing Sensing, 2004, pp. 101–112.
Suhyun Park received the B.S. and M.S. de-grees in electrical engineering from the EwhaWomans University, Seoul, South Korea, in1999 and 2001, respectively. From 2001 to2002, she worked in Mediaexcel Korea, Seoul,South Korea, as a software engineer, whereshe developed video codecs. In 2003, shejoined the Panscopic Imaging Laboratory ofthe Department of Biomedical Engineering atthe University of Texas, Austin, Texas, as apart-time student while working for Mediaex-cel, Austin, Texas. In 2004, she became a full-
time student, and is currently a Ph.D. candidate.Her research interests are in the areas of medical imaging includ-
ing ultrasound elasticity imaging and photoacoustic imaging.
Salavat R. Aglyamov received the B.S.and M.S. degrees in applied mathematics in1991 and 1993, respectively, from MoscowState University, Moscow, Russia. He receivedthe Ph.D. degree in biomechanics in 1999from the Institute of Theoretical and Exper-imental Biophysics, Pushchino, Moscow re-gion, Russia. From 1993 to the present he hasbeen working at the Institute of Mathemati-cal Problems in Biology, Pushchino, Moscowregion, Russia. From 2001 to 2002 he workedin the Biomedical Ultrasonics Lab at the Uni-
versity of Michigan, Ann Arbor, as a postdoctoral fellow, where hewas engaged in mathematical modeling of behavior of the soft bi-ological tissue under externally applied loading. He is currently aresearch associate in the Department of Biomedical Engineering atthe University of Texas at Austin.
His research interests are in the areas of tissue biomechanics, elas-ticity imaging, applied mathematics, and photoacoustics.
Stanislav Emelianov (M’94) received theB.S. and M.S. degrees in physics and acous-tics in 1986 and 1989, respectively, from theMoscow State University, Moscow, Russia,and the Ph.D. degree in physics in 1993from Moscow State University, and the In-stitute of Mathematical Problems of Biology,Pushchino, Moscow Region, Russia, of theRussian Academy of Sciences, Russia. In 1989,he joined the Institute of Mathematical Prob-lems of Biology, where he was engaged in both
mathematical modeling of soft tissue biomechanics and experimentalstudies of noninvasive visualization of tissue mechanical properties.Following his graduate work, he moved to the University of Michigan,Ann Arbor, as a postdoctoral fellow in the Bioengineering Program,and Electrical Engineering and Computer Science Department.
In 2002 he joined the faculty of the Department of BiomedicalEngineering at the University of Texas at Austin.
His research interests are in the areas of medical imaging for ther-apeutics and diagnostic applications, ultrasound microscopy, elastic-ity imaging, photoacoustic imaging, cellular/molecular imaging, andfunctional imaging.
Related Documents


![Super-resolution Axial Localization of Ultrasound Scatter ... · PALM (f-PALM) in ultrasound imaging, ultrafast Ultrasound Localization Microscopy (uULM) [23], [24]. By using uULM,](https://static.cupdf.com/doc/110x72/60633af02e764f3fb731b8b8/super-resolution-axial-localization-of-ultrasound-scatter-palm-f-palm-in-ultrasound.jpg)

