Geophys. J. Int. (2011) 187, 1270–1282 doi: 10.1111/j.1365-246X.2011.05234.x GJI Gravity, geodesy and tides Strain and stress fields in the Southern Apennines (Italy) constrained by geodetic, seismological and borehole data M. Palano, 1 F. Cannav` o, 1 L. Ferranti, 2 M. Mattia 1 and M.E. Mazzella 2 1 Istituto Nazionale di Geofisica e Vulcanologia, Sezione di Catania, Piazza Roma 2, 95123 Catania, Italy. E-mail: [email protected] 2 Dipartimento di Science della Terra, Universit` a degli Studi di Napoli “Federico II”, Largo San Marcellino, 10, Napoli, Italy Accepted 2011 September 9. Received 2011 September 9; in original form 2011 March 14 SUMMARY We present an improved evaluation of the current strain and stress fields in the Southern Apennines (Italy) obtained through a careful analysis of geodetic, seismological and borehole data. In particular, our analysis provides an updated comparison between the accrued strain recorded by geodetic data, and the strain released by seismic activity in a region hit by de- structive historical earthquakes. To this end, we have used nine years of GPS observations (2001–2010) from a dense network of permanent stations, a data set of 73 well-constrained stress indicators (borehole breakouts and focal mechanisms of moderate-to-large earthquakes) and published estimations of the geological strain accommodated by active faults in the re- gion. Although geodetic data are generally consistent with seismic and geological information, previously unknown features of the current deformation in southern Italy emerge from this analysis. The newly obtained GPS velocity field supports the well-established notion of a dominant NE–SW-oriented extension concentrated in a ∼50-km-wide belt along the topo- graphic relief of the Apennines, as outlined by the distribution of seismogenic normal faults. Geodetic deformation is, however, non-uniform along the belt, with two patches of higher strain-rate and shear-stress accumulation in the north (Matese Mountains) and in the south (Irpinia area). Low geodetic strain-rates are found in the Bradano basin and Apulia plateau to the east. Along the Ionian Sea margin of southern Italy, in southern Apulia and eastern Basilicata and Calabria, geodetic velocities indicate NW–SE extension that is consistent with active shallow-crustal gravitational motion documented by geological studies. In the west, along the Tyrrhenian margin of the Campania region, the tectonic geodetic field is disturbed by volcanic processes. Comparison between the magnitude of the geodetic and the seismic strain rates (computed using a long historical seismicity catalogue) allow detecting areas of high correlation, particularly along the axis of the mountain chain, indicating that most of the geodetic strain is released by earthquakes. This relation does not hold for the instrumental seismic catalogue, as a consequence of the limited time span covered by instrumental data. In other areas (e.g. Murge plateau in central Apulia), where seismicity is very low or absent, the yet appreciable geodetic deformation might be accommodated in aseismic mode. Overall, the excellent match between the stress and the strain-rate directions in much of the Apennines indicates that both earthquakes and ground deformation patterns are driven by the same crustal forces. Key words: Satellite geodesy; Plate motions; Neotectonics; Europe. 1 INTRODUCTION The present-day tectonic framework of the Apennines, which forms the backbone of the Italian peninsula, is the result of geodynamic processes related to the Neogene–Quaternary convergence between Africa and Eurasia (e.g. Dewey et al. 1989), coupled to a rapid roll-back of the Adriatic–Ionian slab (inset in Fig. 1; Malinverno & Ryan 1986; Royden et al. 1987; Doglioni 1991; Gueguen et al. 1998; Faccenna et al. 2001). Although thrusting is currently active on the Adriatic side of the Northern Apennines, in the Central and Southern Apennines it ceased during Late Pliocene–Early Pleistocene (Pat- acca et al. 1990). Starting in Tortonian (Late Miocene), extensional tectonics produced crustal thinning and ocean-floor spreading in the southern Tyrrhenian Sea, which rims the Apennines to the west (e.g. Sartori 1990). The extensional process dissected the Apennines and progressively migrated from the western to the eastern parts of the orogen following the shortening wave (Malinverno & Ryan 1986; Patacca et al. 1990). 1270 C 2011 The Authors Geophysical Journal International C 2011 RAS Geophysical Journal International

Welcome message from author
This document is posted to help you gain knowledge. Please leave a comment to let me know what you think about it! Share it to your friends and learn new things together.
Transcript
Geophys. J. Int. (2011) 187, 1270–1282 doi: 10.1111/j.1365-246X.2011.05234.x
GJI
Gra
vity
,ge
ode
syan
dtide
s
Strain and stress fields in the Southern Apennines (Italy) constrainedby geodetic, seismological and borehole data
M. Palano,1 F. Cannavo,1 L. Ferranti,2 M. Mattia1 and M.E. Mazzella2
1Istituto Nazionale di Geofisica e Vulcanologia, Sezione di Catania, Piazza Roma 2, 95123 Catania, Italy. E-mail: [email protected] di Science della Terra, Universita degli Studi di Napoli “Federico II”, Largo San Marcellino, 10, Napoli, Italy
Accepted 2011 September 9. Received 2011 September 9; in original form 2011 March 14
S U M M A R YWe present an improved evaluation of the current strain and stress fields in the SouthernApennines (Italy) obtained through a careful analysis of geodetic, seismological and boreholedata. In particular, our analysis provides an updated comparison between the accrued strainrecorded by geodetic data, and the strain released by seismic activity in a region hit by de-structive historical earthquakes. To this end, we have used nine years of GPS observations(2001–2010) from a dense network of permanent stations, a data set of 73 well-constrainedstress indicators (borehole breakouts and focal mechanisms of moderate-to-large earthquakes)and published estimations of the geological strain accommodated by active faults in the re-gion. Although geodetic data are generally consistent with seismic and geological information,previously unknown features of the current deformation in southern Italy emerge from thisanalysis. The newly obtained GPS velocity field supports the well-established notion of adominant NE–SW-oriented extension concentrated in a ∼50-km-wide belt along the topo-graphic relief of the Apennines, as outlined by the distribution of seismogenic normal faults.Geodetic deformation is, however, non-uniform along the belt, with two patches of higherstrain-rate and shear-stress accumulation in the north (Matese Mountains) and in the south(Irpinia area). Low geodetic strain-rates are found in the Bradano basin and Apulia plateauto the east. Along the Ionian Sea margin of southern Italy, in southern Apulia and easternBasilicata and Calabria, geodetic velocities indicate NW–SE extension that is consistent withactive shallow-crustal gravitational motion documented by geological studies. In the west,along the Tyrrhenian margin of the Campania region, the tectonic geodetic field is disturbedby volcanic processes. Comparison between the magnitude of the geodetic and the seismicstrain rates (computed using a long historical seismicity catalogue) allow detecting areas ofhigh correlation, particularly along the axis of the mountain chain, indicating that most of thegeodetic strain is released by earthquakes. This relation does not hold for the instrumentalseismic catalogue, as a consequence of the limited time span covered by instrumental data.In other areas (e.g. Murge plateau in central Apulia), where seismicity is very low or absent,the yet appreciable geodetic deformation might be accommodated in aseismic mode. Overall,the excellent match between the stress and the strain-rate directions in much of the Apenninesindicates that both earthquakes and ground deformation patterns are driven by the same crustalforces.
Key words: Satellite geodesy; Plate motions; Neotectonics; Europe.
1 I N T RO D U C T I O N
The present-day tectonic framework of the Apennines, which formsthe backbone of the Italian peninsula, is the result of geodynamicprocesses related to the Neogene–Quaternary convergence betweenAfrica and Eurasia (e.g. Dewey et al. 1989), coupled to a rapidroll-back of the Adriatic–Ionian slab (inset in Fig. 1; Malinverno &Ryan 1986; Royden et al. 1987; Doglioni 1991; Gueguen et al. 1998;Faccenna et al. 2001). Although thrusting is currently active on the
Adriatic side of the Northern Apennines, in the Central and SouthernApennines it ceased during Late Pliocene–Early Pleistocene (Pat-acca et al. 1990). Starting in Tortonian (Late Miocene), extensionaltectonics produced crustal thinning and ocean-floor spreading in thesouthern Tyrrhenian Sea, which rims the Apennines to the west (e.g.Sartori 1990). The extensional process dissected the Apennines andprogressively migrated from the western to the eastern parts of theorogen following the shortening wave (Malinverno & Ryan 1986;Patacca et al. 1990).
1270 C© 2011 The Authors
Geophysical Journal International C© 2011 RAS
Geophysical Journal International
Strain and stress in Southern Apennines 1271
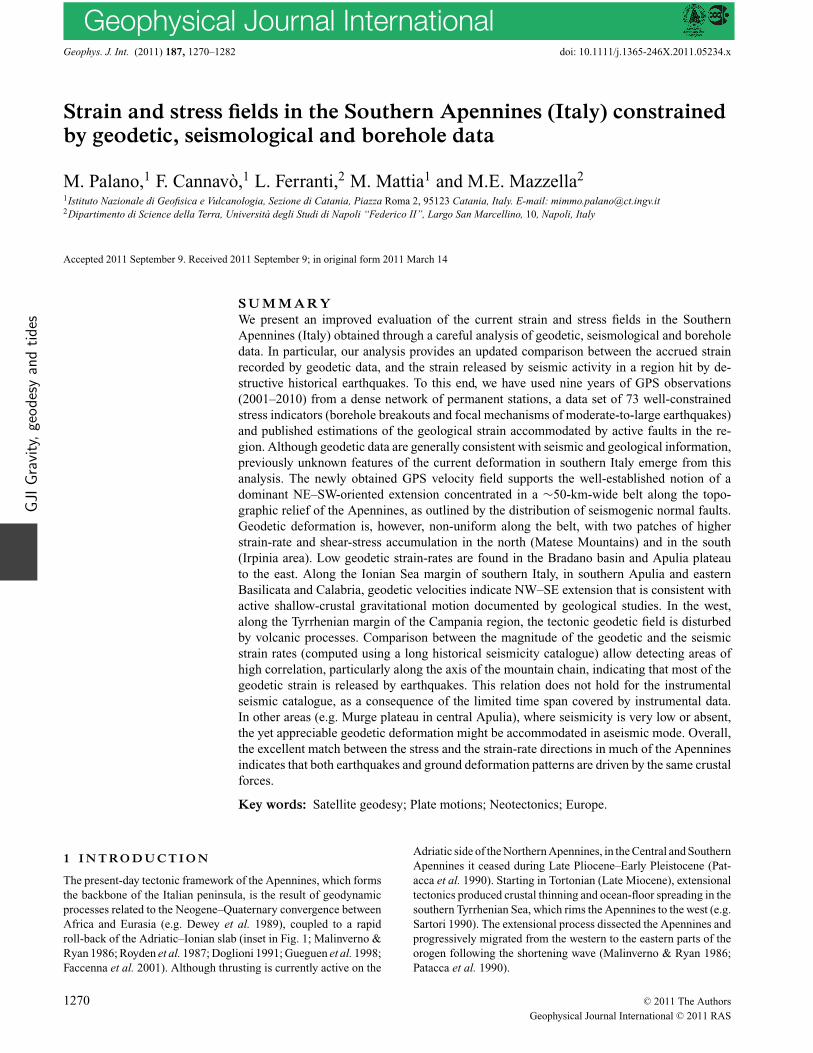
Figure 1. Simplified tectonic map of the Southern Apennines. Blue squares are historical earthquakes from CPTI Catalogue (CPTI Working Group 2004);Mi, macroseismic intensity. Yellow boxes show seismogenetic fault sources as described in the DISS database (http://diss.rm.ingv.it/diss). CGPS site used inthis work are also reported. CGN, Calabria GPS network; PGN, Puglia GPS network; SIPN, Smartnet-ItalPos network. Other abbreviations are as follows: CP,Campania Plain; Ga, Gargano; Ir, Irpinia; MD, Daunia Mountains; MM, Matese Mountains; Mu, Murge; PF, Phlegrean Fields; Pn, Pollino; Po, Potenza; Ro,Roccamonfina; Sa, Salento; Si, Sila; Sn, Sannio; Ta, Tavoliere; VdA, Val d’Agri; VdD, Vallo di Daino. Inset shows location of IGS stations introduced into theprocessing. Contour of the subducted Ionian Slab is also reported.
We can assess to what extent these processes are still activetoday through a joint appraisal of geodetic and seismological data,which indicate active extension along the topographic ridge of theApennines. The stress field, as indicated by earthquake focal mecha-nisms and borehole breakout analysis, is characterized by a prevail-ing NE–SW orientation of the minimum horizontal stress, Sh min,(Montone et al. 2004; Pondrelli et al. 2006). Through the analysisof historical earthquakes occurred in the last 700 years (Fig. 1),Selvaggi (1998) inferred a fairly constant 1.6 mm yr–1 rate ofNE–SW extension along the belt. Geodetic studies of strain rates insouthern Italy carried out over areas of 103–104 km2 and timescalesof 4–126 yr (e.g. Hunstad et al. 2003; Serpelloni et al. 2005; Fer-ranti et al. 2008) have specified NE–SW-oriented strain rates in therange of 1.7–5.0 mm yr–1. Thus, an agreement between geodeticmeasurements, which represent strain at the surface of the crust, andseismological strain estimation, related to forces acting within thecrust, exists in the Apennines only at the lower limit of the geodeticrate estimation.
Comparison of geodetic strain-rates and seismic-moment sum-mation can provide crucial insights into the seismic hazard of south-ern Italy (e.g. Hunstad et al. 2003; Jenny et al. 2006). It is wellacknowledged that when the seismic strain is lower than geode-tic strain, the excess geodetic strain can be released either through
earthquakes or in aseismic mode (e.g. Davies et al. 1997; Clarke etal. 1998). Although this approach can be applied to regions of activecontinental extension, such as, Greece and Italy, there are severaluncertainties regarding the physical significance of the strain-ratemismatch over varying spatial and timescales. Thus, constrainingthe real existence and the amount of the mismatch, which was sug-gested by previous regional analysis (e.g. Caporali et al. 2003),requires a high level of accuracy and spatially dense geodetic ob-servations. These two conditions were not fully met by existingstudies of the GPS velocity and strain-rate fields in southern Italy,which used sparse networks and mostly episodic GPS observations(Serpelloni et al. 2005; Ferranti et al. 2008).
In this paper, we have analysed continuous GPS (CGPS) datacollected between 2001 January and 2010 September on densegeodetic networks installed in southern Italy (Fig. 1) to providea more detailed spatial resolution of the GPS velocity and strain-rate fields with respect to published studies. In addition, with theaim of improving the understanding of active processes in the areaand the nature of their controlling forces, we have compared thegeodetic results with information obtained from seismological dataand geological studies of active faults. In particular, our analysisconfirms the mismatch between geodetic strain and released in-strumental seismic strain, and supplies an updated assessment of its
C© 2011 The Authors, GJI, 187, 1270–1282
Geophysical Journal International C© 2011 RAS
1272 M. Palano et al.
amount. When a longer (historical) seismicity catalogue is analysed,however, the mismatch is strongly attenuated and thus an excellentcorrelation emerges between geodetic and seismic strains.
2 B A C KG RO U N D S E T T I N G
The Southern Apennines fold-and-thrust belt accreted fromMiocene to Early Pleistocene during the westward-directed sub-duction of the Adriatic–Ionian lithospheric slab (Malinverno &Ryan 1986; Patacca et al. 1990). To the east, the Apulian sec-tor of the Adriatic margin served as the foreland to the migrat-ing thrust belt. The Apulia foreland has an average crustal thick-ness of ca. 30 km (Chiarabba & Amato 1996) and is character-ized by a Meso-Cenozoic carbonate platforms sedimentary cover(Mostardini & Merlini 1986; Ricchetti et al. 1988). Following thedemise of thin-skinned imbrication in the frontal thrust belt, deep-seated shortening continued into the Quaternary within the easternorogen and foreland causing rapid surface uplift (Ferranti & Oldow2005; Ferranti et al. 2009).
Since late Pliocene, extension related to opening of the Tyrrhe-nian Sea has affected the inner (western) sector of the Apennines,leading to the collapse of coastal and intermontane basins controlledby high-angle normal and oblique faults, which crosscut the pre-existing compressional structures (Cinque et al. 1993; Hippolyteet al. 1994; Ferranti & Oldow 1999). Since Middle Pleistocene,an array of active normal faults was nested along the axial part ofthe belt and includes the major recognized seismogenic structures(Fig. 1). In the west, within the Campania Plain, extension waslocally accompanied by volcanism, whose emplacement was con-trolled by the intersecting networks of high-angle faults (e.g. Orsiet al. 1996; Di Vito et al. 1999; De Vivo et al. 2001; Milia et al.2003; Milano et al. 2004).
Seismic tomography indicates the occurrence of an almost con-tinuous high-velocity zone beneath the entire Apennines, at a depthexceeding 200 km (e.g. Amato et al. 1993). At shallower depth(40–200 km), the evidence becomes more controversial and theinterpretation of the velocity anomaly pattern is still a matter ofdebate (Cimini & De Gori 2001). Furthermore, the regional gravityanomaly maps and Deep Seismic Soundings studies outline the ex-istence of a doubling of the Moho beneath the Southern Apennines,associated to the subduction processes (Morelli 2000; Tiberti et al.2005). In particular, the axial part of the mountain belt is character-ized by a relative gravity-low surrounded by areas with gravity-high.This pattern is likely related to the overlap of the Tyrrhenian andAdriatic Moho beneath the Apenninic chain (Speranza & Chiappini2002; Tiberti et al. 2005).
3 G P S DATA
We analysed CGPS data collected between 2001 January and 2010September by geodetic networks installed in southern Italy (Fig. 1).In the following, we describe the networks configuration and thestrategy adopted for processing the GPS data.
3.1 GPS networks and data processing
In 2004, the Istituto Nazionale di Geofisica e Vulcanologia (INGV)began the deployment of a permanent, integrated and real-timemonitoring CGPS network (Rete Integrata Nazionale GPS, RING;http://ring.gm.ingv.it) to improve the understanding of current de-formation and seismogenesis in Italy. Currently, RING consists of
about 130 stations with a large concentration along the Apennineswhere station spacing is of the order of 20–25 km. To increase thestation density in the study area, we included available sites fromother three networks, mostly used by surveyors, consultancies andagencies for mapping, engineering and cadastre purposes:
(1) The GNSS official network of the Puglia (administrative)Region, which comprises 12 stations covering the whole territoryof Puglia (http://gps.sit.puglia.it; Fig. 1).
(2) The Smartnet-ItalPos network installed and managed byLeica Geosystems S.P.A. (http://www.italpos.it). This network cov-ers large parts of the Italian territory and provides positioning ser-vices in applications related to mapping, engineering and cadas-tre. In our study area, the network covers the northwestern sector(Fig. 1).
(3) The Calabria GPS Network, installed since late 2006 andmanaged by the Lamont-Doherty Earth Observatory, the DalhousieUniversity, the University of Calabria and the UNAVCO Facility.The network comprises nine continuous GPS stations installed on atransect across Calabria for geodynamic research purposes (Fig. 1).
All GPS data were processed by using the GAMIT/GLOBK soft-ware (Herring et al. 2006) with IGS precise ephemerides and Earthorientation parameters (http://www.iers.org) to produce loosely con-strained daily solutions. To improve the overall configuration of thenetwork, data coming from eight continuously operating IGS sta-tions (AJAC, CAGL, GRAS, GRAZ, LAMP, MATE, MEDI andNOT1; see inset in Fig. 1) were also introduced into the process-ing. We, then, used the GLOBK software to combine these so-lutions and their covariance matrices with global solutions (IGS1,IGS2, IGS3, IGS4, IGS5, IGS6 and EURA) provided by the SOPAC(http://sopac.ucsd.edu). In this step, these solutions were combinedon a daily basis to create site time-series. Each time-series was anal-ysed for their noise properties, linear velocities, periodic signals andantenna jumps, using maximum likelihood estimation, according tothe strategy described in Nikolaidis (2002). Then, we aggregatedthe daily estimates over periods of 1 month to reduce the compu-tational burden and to better assess the long-term statistics of theobservations (McCaffrey et al. 2007; see Appendix A of Support-ing Information). Finally, by using the GLORG module of GLOBK(Herring et al. 2006), these monthly averaged solutions and theirfull covariance matrices were combined to estimate a long-termaverage-site velocity in the ITRF2005 reference frame (Altamimiet al. 2007) by minimizing the horizontal velocity of 13 stationswith over 10 years of continuous observations. In this step, wereweighted each solution such that the normalized long-term scat-ter in horizontal position for each group is unity. Finally, to accountfor correlated errors, we added to the assumed error in horizontalposition a random walk component of 0.5 mm yr–1/2 (Mao et al.1999; Dixon et al. 2000). As a final step, the ITRF2005 velocityfield was rotated into a fixed Central Europe frame (Nocquet &Calais 2003).
3.2 GPS velocity and strain-rate fields
The GPS velocity field in the Central Europe reference frame isreported in Fig. 2(a) with black and grey arrows indicating mo-tion of stations with over and under 2.5 yr of data coverage, re-spectively. Ideally, all velocities should be derived from at least2.5 yr of data, for seasonal signals not to significantly affect theestimation of velocities for the linear part of the signal (Blewitt &Lavallee 2002; Bos et al. 2010). For this reason, although the spatial
C© 2011 The Authors, GJI, 187, 1270–1282
Geophysical Journal International C© 2011 RAS
Strain and stress in Southern Apennines 1273
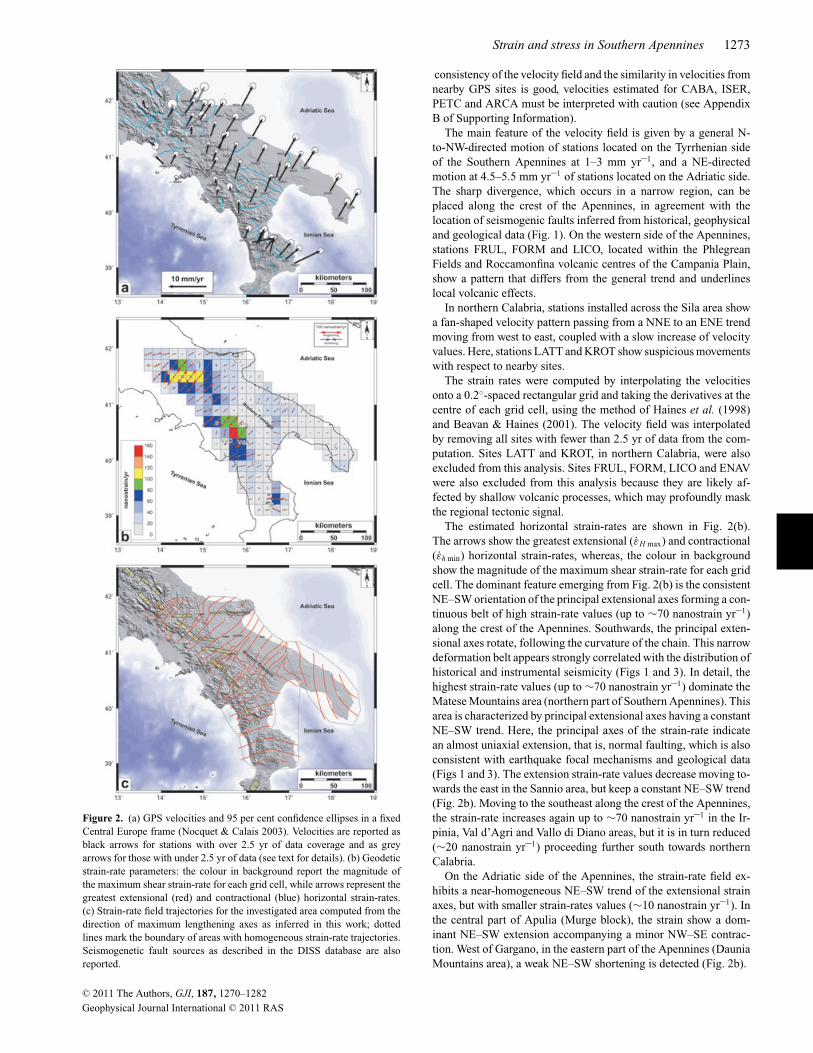
Figure 2. (a) GPS velocities and 95 per cent confidence ellipses in a fixedCentral Europe frame (Nocquet & Calais 2003). Velocities are reported asblack arrows for stations with over 2.5 yr of data coverage and as greyarrows for those with under 2.5 yr of data (see text for details). (b) Geodeticstrain-rate parameters: the colour in background report the magnitude ofthe maximum shear strain-rate for each grid cell, while arrows represent thegreatest extensional (red) and contractional (blue) horizontal strain-rates.(c) Strain-rate field trajectories for the investigated area computed from thedirection of maximum lengthening axes as inferred in this work; dottedlines mark the boundary of areas with homogeneous strain-rate trajectories.Seismogenetic fault sources as described in the DISS database are alsoreported.
consistency of the velocity field and the similarity in velocities fromnearby GPS sites is good, velocities estimated for CABA, ISER,PETC and ARCA must be interpreted with caution (see AppendixB of Supporting Information).
The main feature of the velocity field is given by a general N-to-NW-directed motion of stations located on the Tyrrhenian sideof the Southern Apennines at 1–3 mm yr–1, and a NE-directedmotion at 4.5–5.5 mm yr–1 of stations located on the Adriatic side.The sharp divergence, which occurs in a narrow region, can beplaced along the crest of the Apennines, in agreement with thelocation of seismogenic faults inferred from historical, geophysicaland geological data (Fig. 1). On the western side of the Apennines,stations FRUL, FORM and LICO, located within the PhlegreanFields and Roccamonfina volcanic centres of the Campania Plain,show a pattern that differs from the general trend and underlineslocal volcanic effects.
In northern Calabria, stations installed across the Sila area showa fan-shaped velocity pattern passing from a NNE to an ENE trendmoving from west to east, coupled with a slow increase of velocityvalues. Here, stations LATT and KROT show suspicious movementswith respect to nearby sites.
The strain rates were computed by interpolating the velocitiesonto a 0.2◦-spaced rectangular grid and taking the derivatives at thecentre of each grid cell, using the method of Haines et al. (1998)and Beavan & Haines (2001). The velocity field was interpolatedby removing all sites with fewer than 2.5 yr of data from the com-putation. Sites LATT and KROT, in northern Calabria, were alsoexcluded from this analysis. Sites FRUL, FORM, LICO and ENAVwere also excluded from this analysis because they are likely af-fected by shallow volcanic processes, which may profoundly maskthe regional tectonic signal.
The estimated horizontal strain-rates are shown in Fig. 2(b).The arrows show the greatest extensional (εH max) and contractional(εh min) horizontal strain-rates, whereas, the colour in backgroundshow the magnitude of the maximum shear strain-rate for each gridcell. The dominant feature emerging from Fig. 2(b) is the consistentNE–SW orientation of the principal extensional axes forming a con-tinuous belt of high strain-rate values (up to ∼70 nanostrain yr–1)along the crest of the Apennines. Southwards, the principal exten-sional axes rotate, following the curvature of the chain. This narrowdeformation belt appears strongly correlated with the distribution ofhistorical and instrumental seismicity (Figs 1 and 3). In detail, thehighest strain-rate values (up to ∼70 nanostrain yr–1) dominate theMatese Mountains area (northern part of Southern Apennines). Thisarea is characterized by principal extensional axes having a constantNE–SW trend. Here, the principal axes of the strain-rate indicatean almost uniaxial extension, that is, normal faulting, which is alsoconsistent with earthquake focal mechanisms and geological data(Figs 1 and 3). The extension strain-rate values decrease moving to-wards the east in the Sannio area, but keep a constant NE–SW trend(Fig. 2b). Moving to the southeast along the crest of the Apennines,the strain-rate increases again up to ∼70 nanostrain yr–1 in the Ir-pinia, Val d’Agri and Vallo di Diano areas, but it is in turn reduced(∼20 nanostrain yr–1) proceeding further south towards northernCalabria.
On the Adriatic side of the Apennines, the strain-rate field ex-hibits a near-homogeneous NE–SW trend of the extensional strainaxes, but with smaller strain-rates values (∼10 nanostrain yr–1). Inthe central part of Apulia (Murge block), the strain show a dom-inant NE–SW extension accompanying a minor NW–SE contrac-tion. West of Gargano, in the eastern part of the Apennines (DauniaMountains area), a weak NE–SW shortening is detected (Fig. 2b).
C© 2011 The Authors, GJI, 187, 1270–1282
Geophysical Journal International C© 2011 RAS
1274 M. Palano et al.
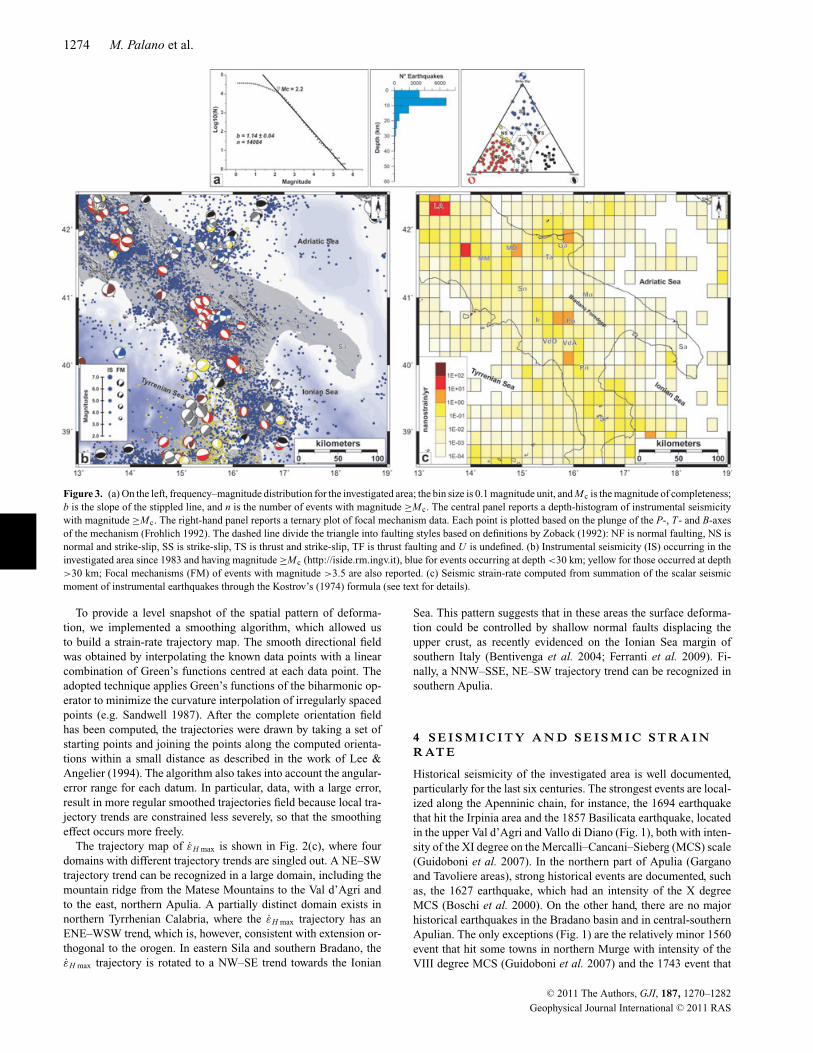
Figure 3. (a) On the left, frequency–magnitude distribution for the investigated area; the bin size is 0.1 magnitude unit, and Mc is the magnitude of completeness;b is the slope of the stippled line, and n is the number of events with magnitude ≥Mc. The central panel reports a depth-histogram of instrumental seismicitywith magnitude ≥Mc. The right-hand panel reports a ternary plot of focal mechanism data. Each point is plotted based on the plunge of the P-, T- and B-axesof the mechanism (Frohlich 1992). The dashed line divide the triangle into faulting styles based on definitions by Zoback (1992): NF is normal faulting, NS isnormal and strike-slip, SS is strike-slip, TS is thrust and strike-slip, TF is thrust faulting and U is undefined. (b) Instrumental seismicity (IS) occurring in theinvestigated area since 1983 and having magnitude ≥Mc (http://iside.rm.ingv.it), blue for events occurring at depth <30 km; yellow for those occurred at depth>30 km; Focal mechanisms (FM) of events with magnitude >3.5 are also reported. (c) Seismic strain-rate computed from summation of the scalar seismicmoment of instrumental earthquakes through the Kostrov’s (1974) formula (see text for details).
To provide a level snapshot of the spatial pattern of deforma-tion, we implemented a smoothing algorithm, which allowed usto build a strain-rate trajectory map. The smooth directional fieldwas obtained by interpolating the known data points with a linearcombination of Green’s functions centred at each data point. Theadopted technique applies Green’s functions of the biharmonic op-erator to minimize the curvature interpolation of irregularly spacedpoints (e.g. Sandwell 1987). After the complete orientation fieldhas been computed, the trajectories were drawn by taking a set ofstarting points and joining the points along the computed orienta-tions within a small distance as described in the work of Lee &Angelier (1994). The algorithm also takes into account the angular-error range for each datum. In particular, data, with a large error,result in more regular smoothed trajectories field because local tra-jectory trends are constrained less severely, so that the smoothingeffect occurs more freely.
The trajectory map of εH max is shown in Fig. 2(c), where fourdomains with different trajectory trends are singled out. A NE–SWtrajectory trend can be recognized in a large domain, including themountain ridge from the Matese Mountains to the Val d’Agri andto the east, northern Apulia. A partially distinct domain exists innorthern Tyrrhenian Calabria, where the εH max trajectory has anENE–WSW trend, which is, however, consistent with extension or-thogonal to the orogen. In eastern Sila and southern Bradano, theεH max trajectory is rotated to a NW–SE trend towards the Ionian
Sea. This pattern suggests that in these areas the surface deforma-tion could be controlled by shallow normal faults displacing theupper crust, as recently evidenced on the Ionian Sea margin ofsouthern Italy (Bentivenga et al. 2004; Ferranti et al. 2009). Fi-nally, a NNW–SSE, NE–SW trajectory trend can be recognized insouthern Apulia.
4 S E I S M I C I T Y A N D S E I S M I C S T R A I NR AT E
Historical seismicity of the investigated area is well documented,particularly for the last six centuries. The strongest events are local-ized along the Apenninic chain, for instance, the 1694 earthquakethat hit the Irpinia area and the 1857 Basilicata earthquake, locatedin the upper Val d’Agri and Vallo di Diano (Fig. 1), both with inten-sity of the XI degree on the Mercalli–Cancani–Sieberg (MCS) scale(Guidoboni et al. 2007). In the northern part of Apulia (Garganoand Tavoliere areas), strong historical events are documented, suchas, the 1627 earthquake, which had an intensity of the X degreeMCS (Boschi et al. 2000). On the other hand, there are no majorhistorical earthquakes in the Bradano basin and in central-southernApulian. The only exceptions (Fig. 1) are the relatively minor 1560event that hit some towns in northern Murge with intensity of theVIII degree MCS (Guidoboni et al. 2007) and the 1743 event that
C© 2011 The Authors, GJI, 187, 1270–1282
Geophysical Journal International C© 2011 RAS
Strain and stress in Southern Apennines 1275
struck southern Salento with intensity of the IX–X degree MCS(Boschi et al. 2000).
In southern Italy, the INGV instrumental catalogue (1983 todate) includes more than 38 000 events with hypocentre loca-tions usually having uncertainties of 1–2 km in the horizontal di-rection and 2–5 km in the vertical direction (http://www.ingv.it).To estimate the magnitude of completeness (M c) and b valuesof the catalogue for the investigated area, we analysed the earth-quake frequency–magnitude distribution. The Gutenberg–Richterlaw states that the number of earthquakes is related to their magni-tudes by the power-law relationship:
log10 N (M) = a − bM, (1)
where N(M) is the cumulative number of earthquakes with a mag-nitude equal to or greater than M (Gutenberg & Richter 1944). Thepower-law relationship breaks down at the M c, below which thenumber of detected earthquakes is usually considered incomplete.The b value in the Gutenberg–Richter power law is a measure ofthe ratio of the number of small earthquakes to the number of largeearthquakes and is typically in the range 0.6–1.4 with a global meanof about 1.0. The b value depends on factors, such as, material het-erogeneity (Mogi 1962) or applied shear stress (Scholz 1968). Lowb values, that is, a high proportion of large earthquakes, are inferredto indicate areas of crustal homogeneity and high stress, whereas,high b values indicate crustal heterogeneity and low stress. Someauthors have suggested that b can be related to the type of tectonicregime (Schorlemner et al. 2005).
The a and b values for southern Italy were estimated by usinga maximum likelihood estimation technique, obtaining a value of6.55 ± 0.15 (95 per cent of confidence) and 1.14 ± 0.04 for a and b,respectively (95 per cent of confidence). Mc was estimated by visualinspection of the distribution, which yielded a value of 2.2 (Fig. 3a).According to Schorlemner et al. (2005), the estimated value of bfor the investigated area would be typical of an extensional regime,in agreement with the current Apennines tectonic context.
In Fig. 3(b), we report the instrumental seismicity above the M c
threshold in southern Italy since 1983. The distribution of seismicityand the different types of focal solutions for the largest earthquakesoutline the lateral juxtaposition of two active deformation domains(Ferranti et al. 2008). On one hand, the bulk of seismicity is clusteredin a continuous, 50-km-wide belt following the Apenninic chain.Focal mechanisms are almost purely extensional (CMT catalogue;Pondrelli et al. 2006; Pasquale et al. 2009; Frepoli et al. 2011) witha fairly consistent NE–SW trend of the T-axis that is orthogonal tothe trend of the mountain belt (Fig. 3b). These events have generallyfocal depths concentrated around 10–15 km (Fig. 3a).
On the other hand, the style of deformation in the eastern beltand Apulia foreland is characterized by sparse seismic sequencescharacterized by events with moderate magnitude (1986 SannioMountains, Mmax = 3.5; 2002 Daunia Mountains, Mmax = 4.2; 1995Gargano, Mmax = 4.4; Pondrelli et al. 2003 and references therein;Mmax = maximum magnitude), which are mainly segregated inthe northern part of the region. These shocks generally have deeperhypocentral depths than the extensional earthquakes of the mountainchain. The clusters show an E–W alignment, which outlines thesurface and subsurface location of a broad system of right-lateralfaults connecting the Apennines to the Gargano block (Di Bucciet al. 2006). Focal mechanisms show prevailing strike-slip to thrustsolutions (Fig. 3b; Pondrelli et al. 2006; Del Gaudio et al. 2007).Southwards along the belt, strike-slip solutions are also found for thePotenza 1990 and 1991 sequences (Pondrelli et al. 2006). Towardsthe southern Apulian region, instrumental seismicity wanes.
Taking into account all crustal earthquakes (depth ≤30 km) oc-curring from 1983 to date with magnitude ≥M c, we computed theseismic strain rate εS over the investigated area. The seismic strain-rate εS of a seismically active area, can be obtained by summing thescalar seismic moment of earthquakes through the Kostrov’s (1974)formula, which gives a measure of the brittle deformation:
εS = 1
2μV �T
N∑
k=1
Mnw, (2)
where N is the number of events in the grid area, μ is the shear mod-ulus (taken here as 30 GPa), V is the deforming volume, Mn
w is theseismic moment of the nth earthquake from the N total earthquakesoccurring during the time interval �T . In this regard, earthquakemagnitudes were converted into scalar moments by the relationshiplog Mw = 1.5M + 16.27 proposed for the Italian region by Kiratzi(1994). The use of other relationships like those proposed by Bakun(1984) and Zuniga et al. (1988) did not change significantly theresults. We divided the investigated area into a 0.2◦-spaced rectan-gular grid (which encompasses and overlaps the grid adopted forthe geodetic strain-rate computation), and computed εS according toeq. (2) at the centre of each grid cell. The higher seismic strain-rateslie along the Apennines (Fig. 3c) in the same areas where the stronghistorical seismicity has occurred (Fig. 1), but the rate is generallylow. A significant seismic strain rate in the eastern domain is onlyappreciable in the Gargano and Daunia Mountains sectors, and, tothe south, in the Potenza areas, as a result of the recent seismicsequences (2002 and 1990–1991, respectively).
5 D I S C U S S I O N
The dense-network GPS data analysed in this work evidences anextensional strain field, which is concentrated in a ∼50-km-widebelt along the crest of the Apennines, and is consistent with the dis-tribution of the historical and instrumental seismicity and of knownand inferred seismogenic faults (Figs 1 and 3b). In the followingdiscussion, we outline the updated results of our study with respectto previous geodetic and geological work, and compare the geode-tic strain with the seismic budget of southern Italy with the aim ofsetting robust constraints on the relationship between surface strainand crustal elastic deformation.
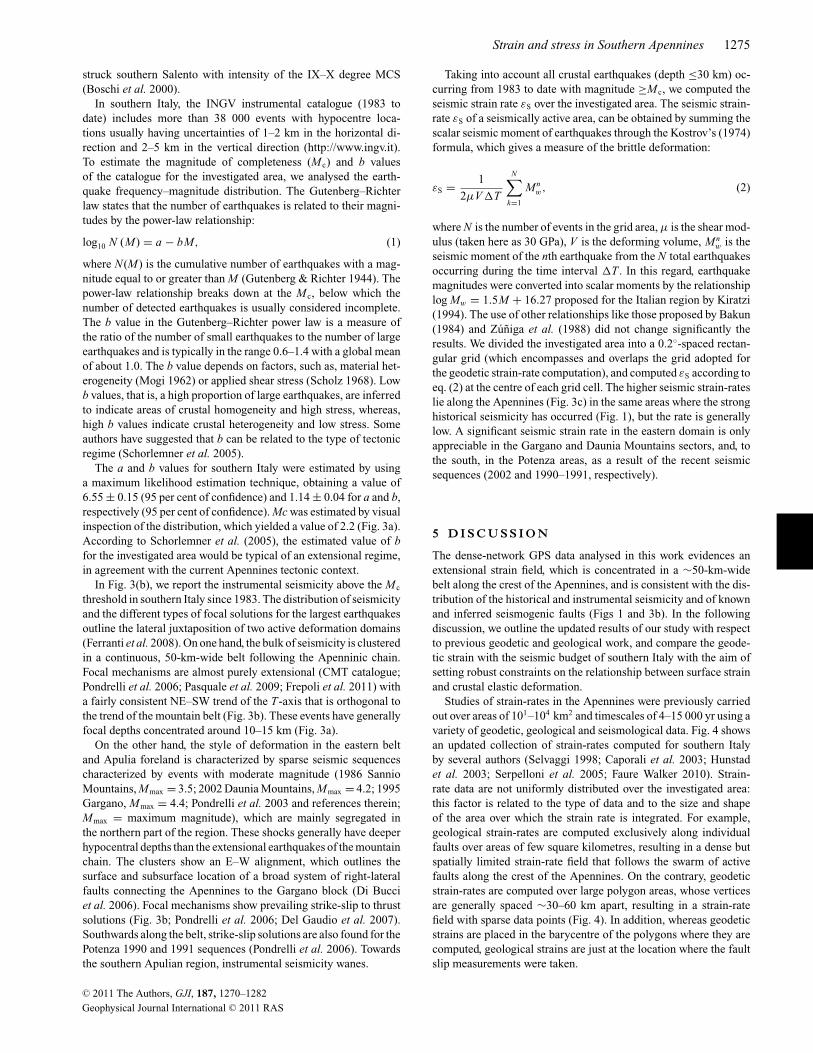
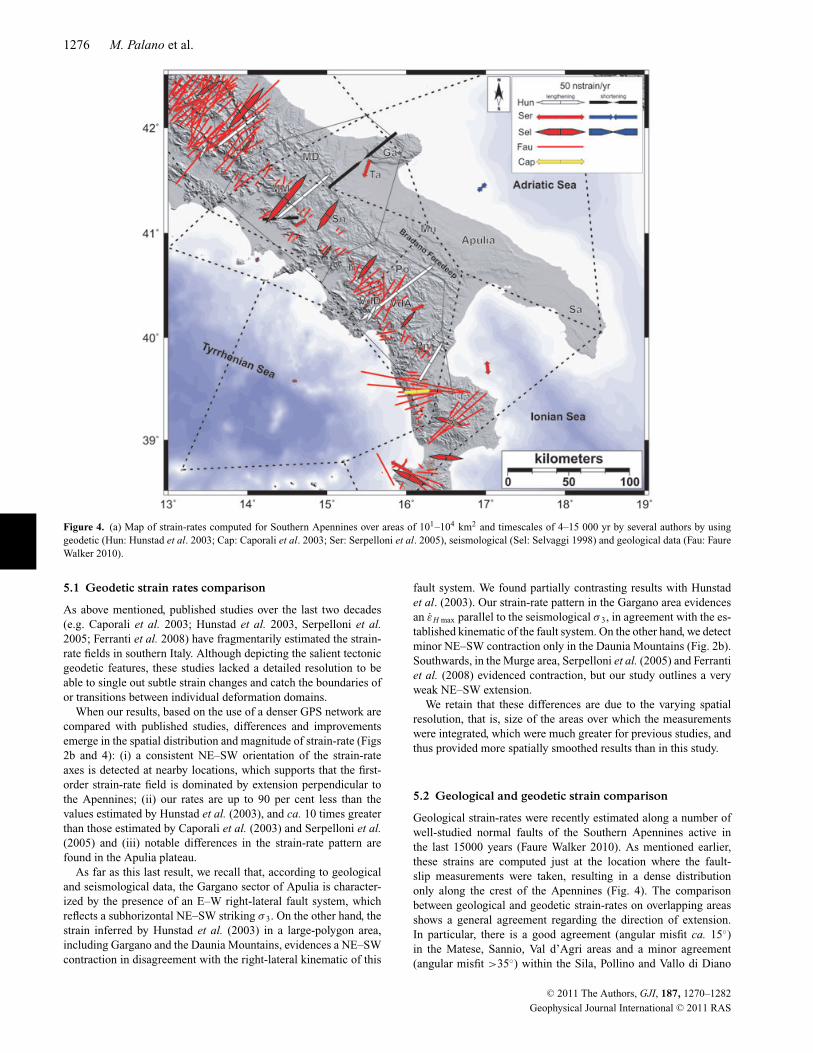
Studies of strain-rates in the Apennines were previously carriedout over areas of 101–104 km2 and timescales of 4–15 000 yr using avariety of geodetic, geological and seismological data. Fig. 4 showsan updated collection of strain-rates computed for southern Italyby several authors (Selvaggi 1998; Caporali et al. 2003; Hunstadet al. 2003; Serpelloni et al. 2005; Faure Walker 2010). Strain-rate data are not uniformly distributed over the investigated area:this factor is related to the type of data and to the size and shapeof the area over which the strain rate is integrated. For example,geological strain-rates are computed exclusively along individualfaults over areas of few square kilometres, resulting in a dense butspatially limited strain-rate field that follows the swarm of activefaults along the crest of the Apennines. On the contrary, geodeticstrain-rates are computed over large polygon areas, whose verticesare generally spaced ∼30–60 km apart, resulting in a strain-ratefield with sparse data points (Fig. 4). In addition, whereas geodeticstrains are placed in the barycentre of the polygons where they arecomputed, geological strains are just at the location where the faultslip measurements were taken.
C© 2011 The Authors, GJI, 187, 1270–1282
Geophysical Journal International C© 2011 RAS
1276 M. Palano et al.
Figure 4. (a) Map of strain-rates computed for Southern Apennines over areas of 101–104 km2 and timescales of 4–15 000 yr by several authors by usinggeodetic (Hun: Hunstad et al. 2003; Cap: Caporali et al. 2003; Ser: Serpelloni et al. 2005), seismological (Sel: Selvaggi 1998) and geological data (Fau: FaureWalker 2010).
5.1 Geodetic strain rates comparison
As above mentioned, published studies over the last two decades(e.g. Caporali et al. 2003; Hunstad et al. 2003, Serpelloni et al.2005; Ferranti et al. 2008) have fragmentarily estimated the strain-rate fields in southern Italy. Although depicting the salient tectonicgeodetic features, these studies lacked a detailed resolution to beable to single out subtle strain changes and catch the boundaries ofor transitions between individual deformation domains.
When our results, based on the use of a denser GPS network arecompared with published studies, differences and improvementsemerge in the spatial distribution and magnitude of strain-rate (Figs2b and 4): (i) a consistent NE–SW orientation of the strain-rateaxes is detected at nearby locations, which supports that the first-order strain-rate field is dominated by extension perpendicular tothe Apennines; (ii) our rates are up to 90 per cent less than thevalues estimated by Hunstad et al. (2003), and ca. 10 times greaterthan those estimated by Caporali et al. (2003) and Serpelloni et al.(2005) and (iii) notable differences in the strain-rate pattern arefound in the Apulia plateau.
As far as this last result, we recall that, according to geologicaland seismological data, the Gargano sector of Apulia is character-ized by the presence of an E–W right-lateral fault system, whichreflects a subhorizontal NE–SW striking σ 3. On the other hand, thestrain inferred by Hunstad et al. (2003) in a large-polygon area,including Gargano and the Daunia Mountains, evidences a NE–SWcontraction in disagreement with the right-lateral kinematic of this
fault system. We found partially contrasting results with Hunstadet al. (2003). Our strain-rate pattern in the Gargano area evidencesan εH max parallel to the seismological σ 3, in agreement with the es-tablished kinematic of the fault system. On the other hand, we detectminor NE–SW contraction only in the Daunia Mountains (Fig. 2b).Southwards, in the Murge area, Serpelloni et al. (2005) and Ferrantiet al. (2008) evidenced contraction, but our study outlines a veryweak NE–SW extension.
We retain that these differences are due to the varying spatialresolution, that is, size of the areas over which the measurementswere integrated, which were much greater for previous studies, andthus provided more spatially smoothed results than in this study.
5.2 Geological and geodetic strain comparison
Geological strain-rates were recently estimated along a number ofwell-studied normal faults of the Southern Apennines active inthe last 15000 years (Faure Walker 2010). As mentioned earlier,these strains are computed just at the location where the fault-slip measurements were taken, resulting in a dense distributiononly along the crest of the Apennines (Fig. 4). The comparisonbetween geological and geodetic strain-rates on overlapping areasshows a general agreement regarding the direction of extension.In particular, there is a good agreement (angular misfit ca. 15◦)in the Matese, Sannio, Val d’Agri areas and a minor agreement(angular misfit >35◦) within the Sila, Pollino and Vallo di Diano
C© 2011 The Authors, GJI, 187, 1270–1282
Geophysical Journal International C© 2011 RAS
Strain and stress in Southern Apennines 1277
area. Regarding the magnitude of the strain-rate, the geologicalestimates are in general lower than the geodetic ones, with theexception of the Sila area, where they are comparable in magnitudebut not in direction.
This result was already noted by Faure Walker (2010), whofound a broad consistency in direction between geological, geode-tic (Hunstad et al. 2003; Serpelloni et al. 2005) and seismic(Selvaggi 1998) strain-rates, but concluded that geological strain-rates are about 2.6 less than contemporary strain-rates over compa-rable areas.
5.3 Seismic and geodetic strain-rate comparison
To date, few studies have compared geodetic strain-rates and seis-mic moment summation rates to shed light on the seismic hazard ofsouthern Italy (e.g. Caporali et al. 2003; Hunstad et al. 2003; Jennyet al. 2006). In particular, a significant discrepancy between seismi-cally released and geodetic moment has already been documentedby Hunstad et al. (2003) and Caporali et al. (2003) for the wholeApennines using the strain rates derived from measurements of theItalian first-order triangulation network and the instrumental seis-micity. In these works, a general consistency in trend between thegeodetic and seismic principal strain-rates was observed, and thecombined uncertainties in the magnitudes of seismic and geode-tic strains were narrow enough to indicate discrepancies in strainmagnitude along the Apennines.
However, several limitations are encountered in this kind of anal-ysis. First, instrumental seismicity may not be an adequate measureof the seismically released strain because of the limited time spancovered. Of course, within regions of high seismicity, when straincalculated through seismic moment summation is lower than thatderived by geodetic measurements, future earthquakes may be im-pending on locked faults (e.g. Davies et al. 1997; Clarke et al.1998). A match between seismic and geodetic observations mayoccur at the longer timescale of the historical seismic record, buteven where this record exists it is commonly difficult to choosethe appropriate time interval or magnitude threshold for balanc-ing. In addition, several uncertainties exist in strain-rates computedthrough historical seismic moment summation due to the variableaccuracy of the information and the omitting of low-to-moderateseismicity release. Finally, geodetically observed strains may in-clude both elastic and anelastic components, and in many cases, itis difficult to differentiate the two without an a priori knowledgeof the rheology of the investigated crust. Because, only the elas-tic strain is responsible for earthquakes, comparison of geodeticstrain-rates and seismic-moment summation rates should not bal-ance in regions cut by creeping faults or where significant amountsof deformation take place plastically.
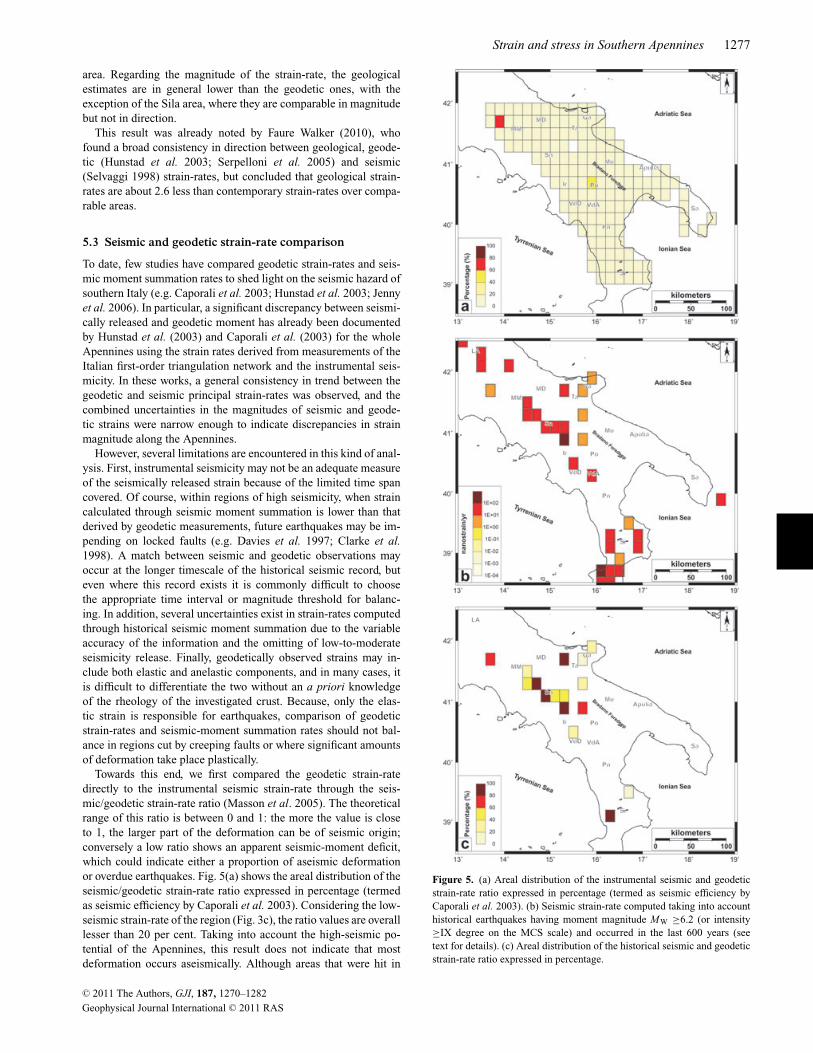
Towards this end, we first compared the geodetic strain-ratedirectly to the instrumental seismic strain-rate through the seis-mic/geodetic strain-rate ratio (Masson et al. 2005). The theoreticalrange of this ratio is between 0 and 1: the more the value is closeto 1, the larger part of the deformation can be of seismic origin;conversely a low ratio shows an apparent seismic-moment deficit,which could indicate either a proportion of aseismic deformationor overdue earthquakes. Fig. 5(a) shows the areal distribution of theseismic/geodetic strain-rate ratio expressed in percentage (termedas seismic efficiency by Caporali et al. 2003). Considering the low-seismic strain-rate of the region (Fig. 3c), the ratio values are overalllesser than 20 per cent. Taking into account the high-seismic po-tential of the Apennines, this result does not indicate that mostdeformation occurs aseismically. Although areas that were hit in
Figure 5. (a) Areal distribution of the instrumental seismic and geodeticstrain-rate ratio expressed in percentage (termed as seismic efficiency byCaporali et al. 2003). (b) Seismic strain-rate computed taking into accounthistorical earthquakes having moment magnitude MW ≥6.2 (or intensity≥IX degree on the MCS scale) and occurred in the last 600 years (seetext for details). (c) Areal distribution of the historical seismic and geodeticstrain-rate ratio expressed in percentage.
C© 2011 The Authors, GJI, 187, 1270–1282
Geophysical Journal International C© 2011 RAS
1278 M. Palano et al.
the past by large earthquakes (Fig. 1) spatially coincide with thedistribution of seismicity occurred since 1983 (Fig. 3b), the instru-mental seismicity catalogue time interval is simply too short to coverthe recurrence time of most of the large earthquakes (Galli et al.2008).
A long enough seismic strain-rate estimation in the SouthernApennines was computed by Selvaggi (1998) through the analysis ofhistorical earthquakes occurred along the Apennines in the last 700years (Fig. 4). Using this record, he inferred a NE–SW-oriented ex-tension fairly uniform along the belt. Our geodetic results (Fig. 2b)match the long-term seismic strain-rates quite well, both in orienta-tion and values, being only ca. 15 per cent greater in the south andlesser in the north. To check to what extent this mismatch maintains,we computed εS taking into account the large historical earthquakesreported in the CPTI04 catalogue (CPTI04 Working Group 2004).In particular, according to eq. (2) we estimated the seismic strainrate of the earthquakes having moment magnitude MW ≥6.2 (orintensity ≥IX degree on the MCS scale) and occurred in the last600 years, as for the investigated area the CPTI04 catalogue can beconsidered complete for MW ≥6.2 since 1400 AD (Stucchi et al.2011). Resulting seismic strain rate and areal distribution of the seis-mic/geodetic strain-rate ratio (expressed in percentage) are reportedin Figs 5(b) and (c), respectively.
A significant improvement in the comparison between geodeticand seismic strain-rate is observed. Generally, high seismic strain-rate (Fig. 5b) is found in the same areas where the geodetic maxi-mum strain-rates are high. In southern Italy, the seismic efficiencyis ranging in the 20–100 per cent interval. A near-continuous areacharacterized by a seismic efficiency >60 per cent can be recognizedalong the crest of Southern Apennines (Fig. 5c): higher values (>80per cent) are observed in a narrow axis stretching between SannioMountains and Irpinia. On the contrary, in the Matese Mountainsand between Irpinia and Pollino, the relatively smaller (20–40 percent) seismic efficiency might raise the possibility of impendingearthquakes.
In the eastern belt and Apulia plateau, a good correlation betweenhistorical seismicity and geodetic strain-rate is recognized in theGargano area. Conversely, in the rest of Apulia, although geodeticstrain is weak, but not null (Fig. 2b), seismic activity is not recorded(Fig. 3b). By considering the lack of historical earthquakes andactive faults (Fig. 1), and the existing geodetic strain of Murge, itis possible that creeping is occurring on the buried fault systemslimiting the block (Ferranti et al. 2008). Similarly, on the Ionian Seamargin of southern Italy, where geodetic strain is appreciable buthistorical and instrumental seismicity are scarce or absent, creepingon shallow extensional faults, which displace towards the IonianSea or deeper fold growth (Ferranti et al. 2009) may be reflected bygeodetic data.
5.4 Comparison of geodetic strain- and stress-directionaldata
As a final step, we compared our strain-rate trends with the Sh min
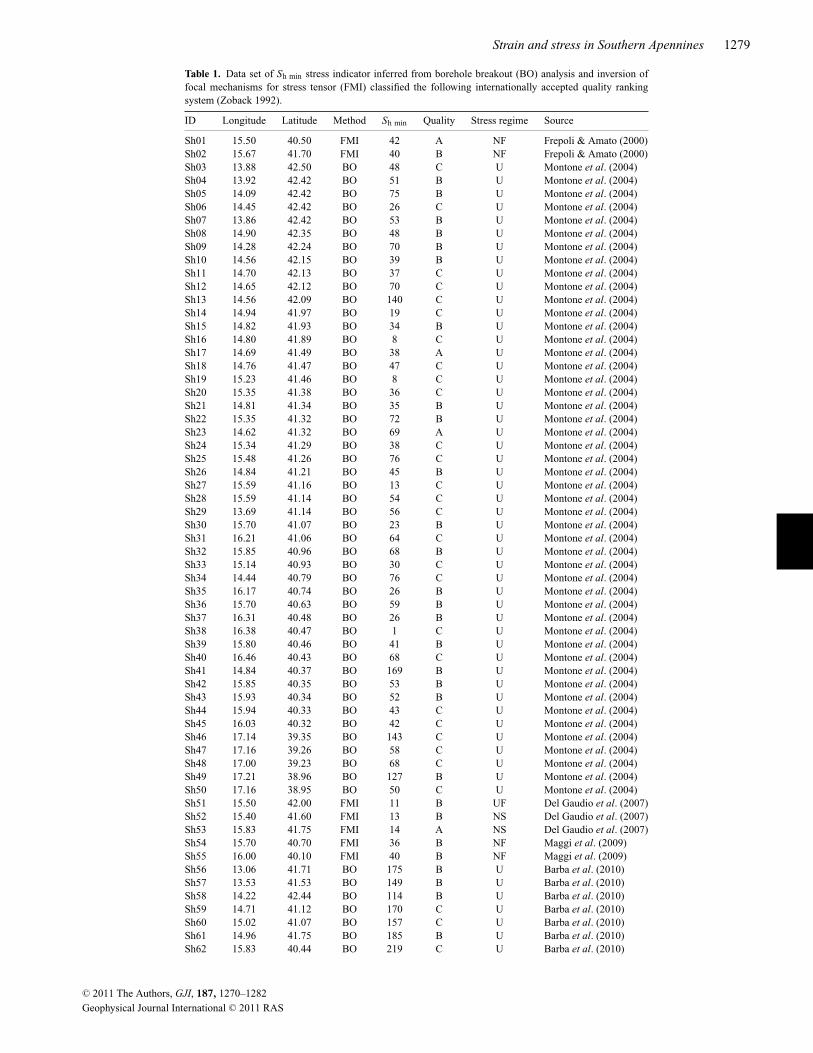
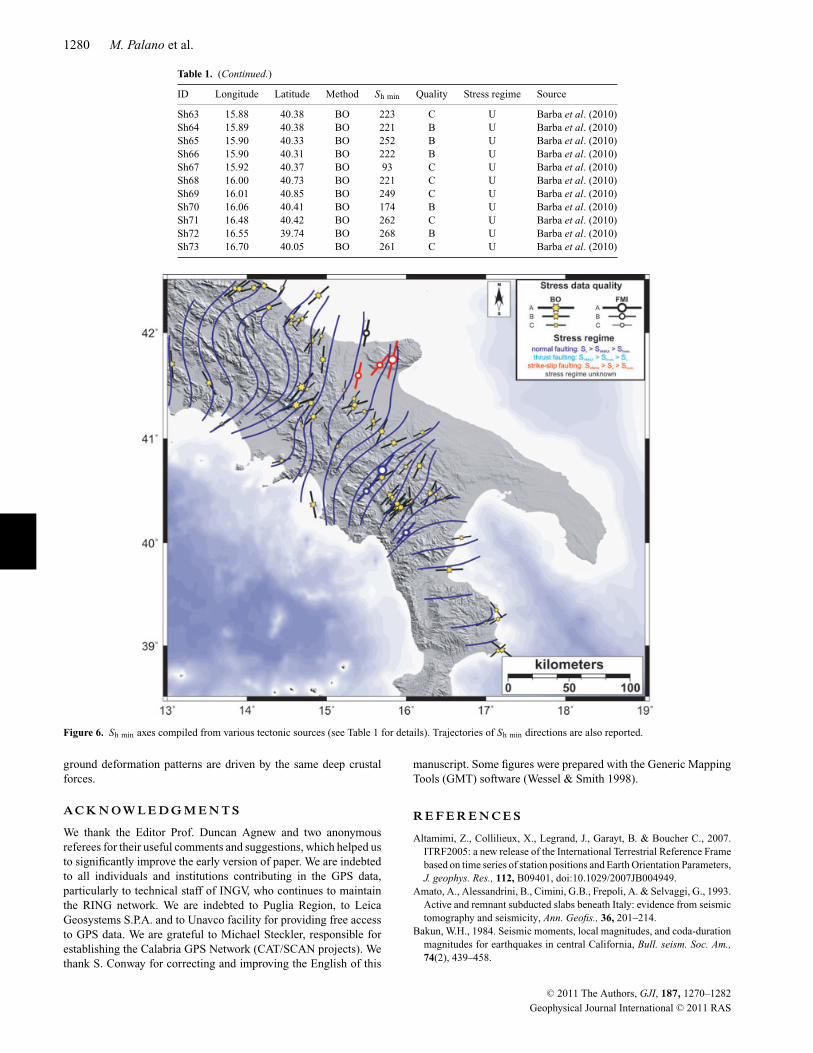
directions inferred from borehole breakout analysis and inversionfor stress tensor of earthquake focal mechanisms. To this end, wecompiled a multidisciplinary data set of 73 well-constrained stressindicators (Table 1) classified following the internationally acceptedquality ranking system (Zoback 1992). Although stress data are notuniformly distributed over the investigated area, they cover largeparts of the crest of the Apennines (Fig. 6), and span the 0.5–25 kmdepth interval sampling the whole seismogenic crust. The compar-
ison of the directions of stress (Fig. 6) and geodetic strain-rates(Fig. 2c) clearly shows that both the deep and shallow crust in theSouthern Apennines is extending in the direction of least compres-sion. This is the expected result for the perfectly elastic case, if thedeformation processes causing the earthquakes and the geodeticallydetermined surface deformation are the same.
It is important to note that we compared stresses at depth (from 0.5to 5 km for borehole breakouts and from 5 to 25 km for earthquakefocal mechanisms) with strain-rates observed at the surface; hence,we may expect some differences if there is a depth dependenceof the processes causing the stress and strain-rate fields. However,the excellent agreement between the observed stress and strain-ratedirections indicates that both earthquakes and ground deformationpatterns are driven by the same crustal and possibly lithosphericforces.
6 C O N C LU D I N G R E M A R K S
We presented new geodetic velocity and strain-rate fields resultingfrom the combination of different GPS networks collected in theSouthern Apennines between 2001 January and 2010 September,achieving a higher spatial resolution with respect to published stud-ies. The geodetic data provide a deformation pattern consistent withindependent seismic (i.e. distribution of historical and instrumentalseismicity; focal mechanisms) and geological information on thedistribution and style of active tectonics. In particular, our veloc-ity and strain-rate results confirm some known features of activedeformation in the Southern Apennines such as (i) the dominantNE–SW-oriented extension concentrated in a ∼50-km-wide beltalong the topographic relief; (ii) the presence of an active, E–W-oriented deformation belt stretching from the Daunia Mountains inthe Apennines to the Gargano area in northern Apulia and (iii) lowgeodetic strain rates along the remaining Apulian area, but with asignificant increase in Murge.
The comparison between our results and previously publishedstrain-rate fields evidences a broad agreement between the orienta-tion of geodetic, geological and seismological strain axes. However,the agreement between their magnitudes, particularly between seis-mological and geodetic strains, is appreciable only at the lower limitof the geodetic rates.
We compared seismic and geodetic strain-rates over the investi-gated area through the seismic efficiency parameters. To this aim,we computed the seismic strain-rate trough the Kostrov’s (1974)formula over a ca. 30-yr time-window covered by instrumentalseismicity and a ca. 600-yr time-window covered by historical seis-micity. Although the short time-window is characterized by lowvalues (0–20 per cent) of seismic efficiency, the analyses performedon the long time-window allow us to detect a near-continuous areaalong the Apennines ridge between Irpinia and Matese Mountainswhich is characterized by a seismic efficiency up to 100 per cent,evidencing as the larger part of the deformation occurs in seismicmode. We detected also some areas (e.g. between Irpinia, Pollino,Vallo di Diano and Val d’Agri, and between Matese and DauniaMountains), where the seismic efficiency is low (0–20 per cent).On these areas, the apparent seismic moment deficit could indicateoverdue earthquakes. Elsewhere, like along the Ionian Sea marginof southern Italy, the scarce historical and instrumental seismicitycompared to the significant geodetic strain may indicate a dominantproportion of aseismic deformation.
Finally, taking into account both punctual data and trajectorymaps, we observed an excellent agreement between the stress andthe strain-rate directions: this indicates that both earthquakes and
C© 2011 The Authors, GJI, 187, 1270–1282
Geophysical Journal International C© 2011 RAS
Strain and stress in Southern Apennines 1279
Table 1. Data set of Sh min stress indicator inferred from borehole breakout (BO) analysis and inversion offocal mechanisms for stress tensor (FMI) classified the following internationally accepted quality rankingsystem (Zoback 1992).
ID Longitude Latitude Method Sh min Quality Stress regime Source
Sh01 15.50 40.50 FMI 42 A NF Frepoli & Amato (2000)Sh02 15.67 41.70 FMI 40 B NF Frepoli & Amato (2000)Sh03 13.88 42.50 BO 48 C U Montone et al. (2004)Sh04 13.92 42.42 BO 51 B U Montone et al. (2004)Sh05 14.09 42.42 BO 75 B U Montone et al. (2004)Sh06 14.45 42.42 BO 26 C U Montone et al. (2004)Sh07 13.86 42.42 BO 53 B U Montone et al. (2004)Sh08 14.90 42.35 BO 48 B U Montone et al. (2004)Sh09 14.28 42.24 BO 70 B U Montone et al. (2004)Sh10 14.56 42.15 BO 39 B U Montone et al. (2004)Sh11 14.70 42.13 BO 37 C U Montone et al. (2004)Sh12 14.65 42.12 BO 70 C U Montone et al. (2004)Sh13 14.56 42.09 BO 140 C U Montone et al. (2004)Sh14 14.94 41.97 BO 19 C U Montone et al. (2004)Sh15 14.82 41.93 BO 34 B U Montone et al. (2004)Sh16 14.80 41.89 BO 8 C U Montone et al. (2004)Sh17 14.69 41.49 BO 38 A U Montone et al. (2004)Sh18 14.76 41.47 BO 47 C U Montone et al. (2004)Sh19 15.23 41.46 BO 8 C U Montone et al. (2004)Sh20 15.35 41.38 BO 36 C U Montone et al. (2004)Sh21 14.81 41.34 BO 35 B U Montone et al. (2004)Sh22 15.35 41.32 BO 72 B U Montone et al. (2004)Sh23 14.62 41.32 BO 69 A U Montone et al. (2004)Sh24 15.34 41.29 BO 38 C U Montone et al. (2004)Sh25 15.48 41.26 BO 76 C U Montone et al. (2004)Sh26 14.84 41.21 BO 45 B U Montone et al. (2004)Sh27 15.59 41.16 BO 13 C U Montone et al. (2004)Sh28 15.59 41.14 BO 54 C U Montone et al. (2004)Sh29 13.69 41.14 BO 56 C U Montone et al. (2004)Sh30 15.70 41.07 BO 23 B U Montone et al. (2004)Sh31 16.21 41.06 BO 64 C U Montone et al. (2004)Sh32 15.85 40.96 BO 68 B U Montone et al. (2004)Sh33 15.14 40.93 BO 30 C U Montone et al. (2004)Sh34 14.44 40.79 BO 76 C U Montone et al. (2004)Sh35 16.17 40.74 BO 26 B U Montone et al. (2004)Sh36 15.70 40.63 BO 59 B U Montone et al. (2004)Sh37 16.31 40.48 BO 26 B U Montone et al. (2004)Sh38 16.38 40.47 BO 1 C U Montone et al. (2004)Sh39 15.80 40.46 BO 41 B U Montone et al. (2004)Sh40 16.46 40.43 BO 68 C U Montone et al. (2004)Sh41 14.84 40.37 BO 169 B U Montone et al. (2004)Sh42 15.85 40.35 BO 53 B U Montone et al. (2004)Sh43 15.93 40.34 BO 52 B U Montone et al. (2004)Sh44 15.94 40.33 BO 43 C U Montone et al. (2004)Sh45 16.03 40.32 BO 42 C U Montone et al. (2004)Sh46 17.14 39.35 BO 143 C U Montone et al. (2004)Sh47 17.16 39.26 BO 58 C U Montone et al. (2004)Sh48 17.00 39.23 BO 68 C U Montone et al. (2004)Sh49 17.21 38.96 BO 127 B U Montone et al. (2004)Sh50 17.16 38.95 BO 50 C U Montone et al. (2004)Sh51 15.50 42.00 FMI 11 B UF Del Gaudio et al. (2007)Sh52 15.40 41.60 FMI 13 B NS Del Gaudio et al. (2007)Sh53 15.83 41.75 FMI 14 A NS Del Gaudio et al. (2007)Sh54 15.70 40.70 FMI 36 B NF Maggi et al. (2009)Sh55 16.00 40.10 FMI 40 B NF Maggi et al. (2009)Sh56 13.06 41.71 BO 175 B U Barba et al. (2010)Sh57 13.53 41.53 BO 149 B U Barba et al. (2010)Sh58 14.22 42.44 BO 114 B U Barba et al. (2010)Sh59 14.71 41.12 BO 170 C U Barba et al. (2010)Sh60 15.02 41.07 BO 157 C U Barba et al. (2010)Sh61 14.96 41.75 BO 185 B U Barba et al. (2010)Sh62 15.83 40.44 BO 219 C U Barba et al. (2010)
C© 2011 The Authors, GJI, 187, 1270–1282
Geophysical Journal International C© 2011 RAS
1280 M. Palano et al.
Table 1. (Continued.)
ID Longitude Latitude Method Sh min Quality Stress regime Source
Sh63 15.88 40.38 BO 223 C U Barba et al. (2010)Sh64 15.89 40.38 BO 221 B U Barba et al. (2010)Sh65 15.90 40.33 BO 252 B U Barba et al. (2010)Sh66 15.90 40.31 BO 222 B U Barba et al. (2010)Sh67 15.92 40.37 BO 93 C U Barba et al. (2010)Sh68 16.00 40.73 BO 221 C U Barba et al. (2010)Sh69 16.01 40.85 BO 249 C U Barba et al. (2010)Sh70 16.06 40.41 BO 174 B U Barba et al. (2010)Sh71 16.48 40.42 BO 262 C U Barba et al. (2010)Sh72 16.55 39.74 BO 268 B U Barba et al. (2010)Sh73 16.70 40.05 BO 261 C U Barba et al. (2010)
Figure 6. Sh min axes compiled from various tectonic sources (see Table 1 for details). Trajectories of Sh min directions are also reported.
ground deformation patterns are driven by the same deep crustalforces.
A C K N OW L E D G M E N T S
We thank the Editor Prof. Duncan Agnew and two anonymousreferees for their useful comments and suggestions, which helped usto significantly improve the early version of paper. We are indebtedto all individuals and institutions contributing in the GPS data,particularly to technical staff of INGV, who continues to maintainthe RING network. We are indebted to Puglia Region, to LeicaGeosystems S.P.A. and to Unavco facility for providing free accessto GPS data. We are grateful to Michael Steckler, responsible forestablishing the Calabria GPS Network (CAT/SCAN projects). Wethank S. Conway for correcting and improving the English of this
manuscript. Some figures were prepared with the Generic MappingTools (GMT) software (Wessel & Smith 1998).
R E F E R E N C E S
Altamimi, Z., Collilieux, X., Legrand, J., Garayt, B. & Boucher C., 2007.ITRF2005: a new release of the International Terrestrial Reference Framebased on time series of station positions and Earth Orientation Parameters,J. geophys. Res., 112, B09401, doi:10.1029/2007JB004949.
Amato, A., Alessandrini, B., Cimini, G.B., Frepoli, A. & Selvaggi, G., 1993.Active and remnant subducted slabs beneath Italy: evidence from seismictomography and seismicity, Ann. Geofis., 36, 201–214.
Bakun, W.H., 1984. Seismic moments, local magnitudes, and coda-durationmagnitudes for earthquakes in central California, Bull. seism. Soc. Am.,74(2), 439–458.
C© 2011 The Authors, GJI, 187, 1270–1282
Geophysical Journal International C© 2011 RAS
Strain and stress in Southern Apennines 1281
Barba, S., Carafa, M. M.C., Mariucci, M.T., Montone, P. & Pierdo-minici, S., 2010. Present-day stress-field modelling of southern Italyconstrained by stress and GPS data, Tectonophysics, 482, 193–204,doi:10.1016/j.tecto.2009.10.017.
Beavan, J. & Haines, J., 2001. Contemporary horizontal velocity and strainrate fields of the Pacific-Australian plate boundary zone through NewZealand, J. geophys. Res., 106, 741–770.
Bentivenga, M., Coltorti, M., Prosser, G. & Tavarnelli, E., 2004. A newinterpretation of terraces in the Taranto gulf: the role of the extensionalfaulting, Geomorphology, 60, 383–402.
Blewitt, G. & Lavallee, D., 2002. Effect of annual signals on geodeticvelocity, J. geophys. Res., 107(B7), 2145, doi:10.1029/2001JB000570.
Bos, M.S., Bastos, L. & Fernandes, R.M.S., 2010. The influence of seasonalsignals on the estimation of the tectonic motion in short continuous GPStime-series, J. Geodyn., 49, 205–209, doi:10.1016/j.jog.2009.10.005.
Boschi, E., Guidoboni, E., Ferrari, G., Valensise, G., Mariotti, D. &Gasperini, P., 2000. Catalogue of strong Italian earthquakes from 461B.C. to 1997, Ann. Geofis., 43, 609–868.
Caporali, A., Martin, S. & Missironi, M., 2003. Average strain rate in theItalian crust inferred from a permanent GPS network—II: strain rateversus seismic and structural geology, Geophys. J. Int., 155(1), 254,doi:10.1046/j.1365-246X.2003.02035.x.
Chiarabba, C. & Amato, A., 1996. Crustal velocity structure of the Apen-nines (Italy) from P-wave travel time tomography, Ann. Geofis., 39(6),1133–1148.
Cimini, G.B. & De Gori, P., 2001. Nonlinear P-wave tomography of sub-ducted lithosphere beneath central-southern Apennines (Italy), Geophys.Res. Lett., 28(23), 4387–4390.
Cinque, A., Patacca, E., Scandone, P. & Tozzi, M., 1993. Quaternary kine-matic evolution of the southern Apennines: relationship between surfacegeological features and deep lithospheric structures, Ann. Geofis., 36(2),249–260.
Clarke P.J. et al., 1998. Crustal strain in central Greece from repeatedGPS measurements in the interval 1989–1997, Geophys. J. Int., 135,195–214.
CPTI Working Group (ING; GNDT; SGA; SSN), 2004. Catalogo Paramet-rico Dei Terremoti Italiani, Editrice Compositori, Bologna, available athttp://emidius.mi.ingv.it/CPTI04.
Davies R., England, P., Parsons, B., Billiris, H., Paradissis, D. & Veis, G.,1997. Geodetic strain of Greece in the interval 1892–1992, J. geophys.Res., 102(B11), 24 571–24 588.
De Vivo, B., Rolandi, G., Gans, P.B., Calvert, A., Bohrson, W.A., Spera,F.J. & Belkin, H.E., 2001. New constraints on the pyroclastic eruptivehistory of the Campanian volcanic Plain (Italy), Miner. Petrol., 73(1–3),47–65.
Del Gaudio, V., Pierri, P., Frepoli, V., Calcagnile, G., Venisti, N. &Cimini, G.B., 2007. A critical revision of the seismicity of the NorthenApulia (Adriatic microplate? Southern Italy) and implications for theidentification of seismogenic structures, Tectonophysics, 436, 9–35,doi:10.1016/j.tecto.2007.02.013.
Dewey, J.F., Helman, M.L., Turco, E., Hutton, D.H.W., Knott, S.D., 1989.Kinematics of the western Mediterranean Alpine Tectonics, Geol. Soc.Spec. Publ., 45, 265–283, doi:10.1144/GSL.SP.1989.045.01.15.
Di Bucci, D., Ravaglia, A., Seno, S., Toscani, G., Fracassi, U. & Valensise, G.,2006. Seismotectonics of the southern Apennines and Adriatic foreland:insights on active regional E-W shear zones from analogue modeling,Tectonics, 25, TC4015, doi:10.1029/2005TC001898.
Di Vito, M.A., Isaia, R., Orsi, G., Southon, J., de Vita, S., D’Antonio, M.,Pappalardo, L. & Piochi, M., 1999. Volcanism and deformation since12,000 years at the Campi Flegrei caldera (Italy), J. Volc. Geotherm. Res.,91, 221–246.
Dixon, T.H., Miller, M.M., Farina, F., Wang, H. & Johnson D., 2000. Present-day motion of the Sierra Nevada block and some tectonic implicationsfor the Basin and Range province: North American Cordillera, Tectonics,19, 1–24.
Doglioni, C., 1991. A proposal for the kinematic modelling of W-dippingsubductions—possible applications to the Tyrrenian-Apennines system,Terra Nova, 3, 423–434, doi:10.1111/j.1365-3121.
Faccenna, C., Becker, T.W., Lucente, F.P., Jolivet, L. & Rossetti, F., 2001. His-tory of subduction and back-arc extension in the central Mediterranean,Geophys. J. Int., 145, 809–820.
Faure Walker, J., 2010. Mechanics of continental extension from Quaternarystrain fields in the Italian Apennines, PhD thesis, University CollegeLondon.
Ferranti, L. & Oldow, J.S., 1999. History and tectonic implications of low-angle detachment faults and orogen-parallel extension, Picentini Moun-tains, southern Apennines fold and thrust belt, Italy, Tectonics, 18(3),498–526.
Ferranti, L. & Oldow, J.S., 2005. Latest Miocene to quaternary horizontaland vertical displacement rates during simultaneous contraction and ex-tension in the Southern Apennines orogen, Italy, Terra Nova, 17, 209–214.
Ferranti, L. et al., 2008. Active deformation in Southern Italy, Sicily andsouthern Sardinia from GPS velocities of the Peri-Tyrrhenian GeodeticArray (PTGA), Boll. Soc. Geol. Ital., 127(2), 299–316.
Ferranti, L., Santoro, E. Mazzella, E., Monaco, C. & Morelli, D., 2009.Active transpression in the northern Calabria Apennines, Southern Italy,Tectonophysics, 476, 226–251, doi:10.1016/j.tecto.2008.11.010.
Frepoli, A. & Amato, A., 2000. Spatial variation in stresses in peninsu-lar Italy and Sicily from background seismicity, Tectonophysics, 317,109–124, doi:10.1016/S0040-1951(99)00265-6.
Frepoli, A., Maggi, C., Cimini, G.B., Marchetti, A. & Chiappini, M., 2011.Seismotectonic of Southern Apennines from recent passive seismic ex-periments, J. Geodyn., 51(1–2), 110–124, doi:10.1016/j.jog.2010.02.007.
Frohlich, C., 1992. Triangle diagrams: ternary graphs to display similarityand diversity of earthquake focal mechanisms, Phys. Earth planet. Inter.,75, 193–198, doi:10.1016/0031-9201(92)90130-N.
Galli, P., Galadini F. & Pantosti D., 2008. Twenty years of paleoseismologyin Italy, Earth-Sci. Rev., 88, 89–117, doi:10.1016/j.earscirev.2008.01.001.
Gueguen, E., Doglioni, C. & Fernandez, M., 1998. On the post-25 Mageodynamic evolution of the western Mediterranean, Tectonophysics, 298,259–269.
Guidoboni, E., Ferrari, G., Mariotti, D., Comastri, A., Tarabusi, G. & Valen-sise, G., 2007. CFTI4Med, Catalogue of Strong Earthquakes in Italy (461B.C.–1997) and Mediterranean Area (760 B.C.-500), Ist. Naz. di Geofis.e Vulcanol., Bologna, available at http://storing.ingv.it/cfti4med.
Gutenberg, R., & Richter, C.F., 1944. Frequency of earthquakes inCalifornia, Bull. seism. Soc. Am., 34, 185–188.
Haines, A.J., Jackson, A., Holt, W. E. & Agnew, D.C., 1998. Representingdistributed deformation by continuous velocity fields, Sci. Rep 98/5, Inst.of Geol. and Nucl. Sci., Wellington, New Zeland.
Herring T.A., King, R.W. & McClusky, S.C., 2006. GPS Analysis at MIT,GAMIT Reference Manual, Release 10.3, Department of Earth, Atmo-spheric and Planetary Sciences, Massachusetts Institute of Technology,Cambridge, MA.
Hunstad I., Selvaggi G., D’Agostino N., England P., Calrke P. & PierozziM., 2003. Geodetic strain in peninsular Italy between 1875 and 2001,Geophys. Res. Lett., 30(4), 1181–1184.
Hyppolite, J.C., Angelier, J. & Roure, F., 1994. A major geodynamic changerevealed by quaternary stress patterns in the Southern Apennines (Italy),Tectonophysics, 230, 199–210.
Jenny, S., Goes, S., Giardini, D. & Kahle, H.G., 2006. Seismic potential ofsouthern Italy. Tectonophysics, 415, 81–101.
Kiratzi, A.A., 1994. Active seismic deformation in the Italian peninsula andSicily, Ann. Geofis., 37(1), 27–45.
Kostrov, B., 1974. Seismic moment and energy of earthquakes and seismicflow of rock, Izv., Phys. Solid Earth, 1, 23–40.
Lee, J.C. & Angelier, J., 1994. Paleostress trajectories maps based on theresults of local determinations: the “lissage” program, Comput. Geosci.,20(2), 161–191.
Maggi, C., Frepoli, A., Cimini, G.B., Console, R. & Chiappini M., 2009.Recent seismicity and crustal stress field in the Lucanian Apennines andsurrounding areas (Southern Italy): seismotectonic implications, Tectono-physics, 463, 130–144, doi:10.1016/j.tecto.2008.09.032.
Malinverno, A. & Ryan, W.B.F., 1986. Extension in the Tyrrhenian Sea andshortening in the Apennines as result of arc migration driven by sinkingof the lithosphere, Tectonics, 5(2), 227–245.
C© 2011 The Authors, GJI, 187, 1270–1282
Geophysical Journal International C© 2011 RAS
1282 M. Palano et al.
Mao, A., Harrison, C.G.A. & Dixon, T.H., 1999. Noise in GPS coordinatetime series, J. geophys. Res., 104, 2797–2816.
Masson, F., Chery, J., Hatzfeld, D., Martinod, J., Vernant, P., Tavakoli, F.& Ghafory-Ashtiani M., 2005. Seismic versus aseismic deformation inIran inferred from earthquakes and geodetic data, Geophys. J. Int., 160,217–226, doi:10.1111/j.1365-246X.2004.02465.x.
McCaffrey, R. et al., 2007. Fault locking, block rotation and crustal de-formation in the Pacific Northwest, Geophys. J. Int., 169, 1315–1340,doi:10.1111/j.1365-246X.2007.03371.x.
Milano G., Petrazzuoli, S. & Ventura, G., 2004. Effects of the hydrothermalcirculation on the strain field of the Campanian Plain (southern Italy),Terra Nova, 16, 205–209.
Milia A., Torrente, M.M., Russo, M. & Zuppetta, A., 2003. Tectonics andcrustal structure of the Campania continental margin: relationships withvolcanism, Miner. Petrol., 79, 33–47.
Mogi, K., 1962. Magnitude-frequency relation for elastic shocks accompa-nying fractures of various materials and some related problems in earth-quakes, Bull. Earthq. Res. Inst. Univ. Tokyo, 40, 831–853.
Montone, P., Mariucci, M.T., Pondrelli, S. & Amato, A., 2004. An improvedstress map for Italy and surrounding regions (Central Mediterranean),J. geophys. Res., 109, B10410, doi:10.1029/2003JB002703.
Morelli, C., 2000. The themes of crustal research in Italy and the role ofDSS-WA seismics, Boll. Soc. Geol. Ital., 119, 141–148.
Mostardini, F. & Merlini, S., 1986. Appennino centro-meridionale. SezioniGeologiche e Proposta di Modello Strutturale, Mem. Soc. Geol. Ital., 35,177–202.
Nikolaidis, R., 2002. Observation of geodetic and seismic deformation withthe Global Positioning System, PhD thesis, Scripps Inst. of Oceanogr.,La Jolla, California.
Nocquet, J. M. & Calais, E., 2003. Crustal velocity field of western Europefrom permanent GPS array solutions, 1996–2001, Geophys. J. Int., 154,72–88.
Orsi, G., deVita, S. & Di Vito, M., 1996. The restless, resurgent Campi Fle-grei nested caldera (Italy): constraints on its evolution and configuration,J. Volc. Geotherm. Res., 74, 179–214.
Pasquale, G., DeMatteis, R., Romeo, A. & Maresca, R., 2009. Earthquakefocal mechanisms and stress inversion in the Irpinia Region (SouthernItaly), J. Seismol., 13(1), 107–124, doi:10.1007/s10950-008-9119-x.
Patacca, E., Sartori, R. & Scandone, P., 1990. Tyrrhenian basin and Apen-ninic arcs. Kinematic relations since late Tortonian times, Mem. Soc.Geol. Ital., 45, 425–451.
Pondrelli, S., Di Luccio, F., Fukuyama, E., Mazza, S., Olivieri, M. & Pino,N.A., 2003. Fast determination of moment tensors for the recent Molise(southern Italy) seismic sequence, ORFEUS Electron. Newslett., 5(1), 2.
Pondrelli, S., Salimbeni, S., Ekstrom, G., Morelli, A., Gasperini, P. &Vannucci, G., 2006. The Italian CMT dataset from 1977 to thepresent, Phys. Earth planet. Inter., 159(3–4), 286–303, doi:10.1016/j.pepi.2006.07.008.
Ricchetti, G., Ciaranfi, N., Luperto Sinni, E., Mongelli, F. & Pieri, P., 1988.Geodinamica ed evoluzione sedimentaria dell’Avampaese Apulo, Mem.Soc. Geol. Ital., 41, 57–82.
Royden L., Patacca E. & Scandone P., 1987. Segmentation and configurationof subducted lithosphere in Italy: an important control on thrust-belt andforedeep-basin evolution, Geology, 5, 714–717.
Sandwell, D.T., 1987. Biharmonic spline interpolation of Geos-3 and Seasataltimeter data, Geophys. Res. Lett., 14, 139–142.
Sartori, R., 1990. The main results of ODP Leg 107 in the frame of Neo-gene to Recent evolution of the perityrrhenian area, Proc. Ocean Drill.Program, Sci. Results, 107, 715–730.
Scholz, C.H., 1968. The frequency-magnitude relation of microfracturing inrock and its relation to earthquakes, Bull. seism. Soc. Am., 58(1), 399–415.
Schorlemner, D., Wiemer, S. & Wyss, M., 2005. Variations in earthquake-size distribution across different stress regimes, Nature, 437, 539–542.
Selvaggi, G., 1998. Spatial distribution of horizontal seismic strain in theApennines from historical earthquakes, Ann. Geofis., 41, 241–251.
Serpelloni, E., Anzidei, M., Baldi, P., Casula, G. & Galvani, A., 2005.Crustal velocity and strain-rate fields in Italy and surrounding regions:new results from the analysis of permanent and non permanent GPSnetworks, Geophys. J. Int., 161, 861–880.
Speranza, F. & Chiappini, M., 2002. Thick-skinned tectonics in the exter-nal Apennines, Italy: new evidence from magnetic anomaly analysis, J.geophys. Res., 107(B11), 2290, doi:10.1029/2000JB000027.
Stucchi, M., Meletti, C., Montaldo, V., Crowley, H., Calvi, G. M. &Boschi, E., 2011. Seismic Hazard Assessment (2003–2009) for theItalian Building Code, Bull. seism. Soc. Am., 101(4), 1885–1911,doi:10.1785/0120100130.
Tiberti, M.M., Orlando, L., Bucci, D., Bernarbini, M. & Parotto,M., 2005. Regional gravity anomaly map and crustal model ofthe Central-Southern Apennines (Italy), J. Struct. Geol., 40, 73–91,doi:10.1016/j.jog.2005.07.014.
Wessel, P. & Smith, W.H.F., 1998. New, improved version of GenericMapping Tools released, EOS, Trans. Am. geophys. Un., 79(47),579, doi:10.1029/98EO00426.
Zoback, M. L., 1992. First- and second-order patterns of stress in thelithosphere: the World Stress Map Project, J. geophys. Res., 97(B8),11 703–11 728.
Zuniga, F.R., Wyss, M. & Scherbaum F., 1988. A moment-magnitude rela-tion for Hawaii, Bull. seism. Soc. Am., 78, 370–373.
S U P P O RT I N G I N F O R M AT I O N
Additional Supporting Information may be found in the online ver-sion of this article:
Appendix A. Monthly North and East coordinates time as resultingfrom the daily aggregation according to (McCaffrey et al. 2007). Foreach plot we removed the linear trend according to values reportedin Appendix B. The error bars show the 95 per cent confidenceinterval. Ordinate units are millimetres.Appendix B. Site code, geodetic coordinates, east and north ve-locity components referred to a fixed Central Europe frame (Noc-quet & Calais 2003) and associated errors (95 per cent of con-fidence) are reported for all GPS stations included in the pro-cessing. For each site, the correlation between the east and northcomponents of velocity (RHO) and the observation history is alsoreported.Appendix C. Map showing the grid geometry (in red) used in thestrain-rate computation. The velocity field was interpolated at eachknot of this grid, which is 0.2◦ spaced by removing (i) all sites withfewer than 2.5 yr of data (CABA, ISER, PETC and ARCA); (ii)all sites located from Rome to the Bay of Naples (ENAV, FRUL,FORM and LICO) because distant from the rest of the network,and two of them are likely affected by local deformations and (iii)LATT and KROT sites because showing suspicious movements withrespect to nearby sites. Black arrows represent observed velocity;white arrows represent the interpolated velocity. The strain-rateswere computed at the centre of each grid cell, using the method ofHaines et al. (1998).
Please note: Wiley-Blackwell is not responsible for the content orfunctionality of any supporting materials supplied by the authors.Any queries (other than missing material) should be directed to thecorresponding author for the article.
C© 2011 The Authors, GJI, 187, 1270–1282
Geophysical Journal International C© 2011 RAS
Related Documents