Strategies for Financial Sustainability 2018-19 DESIGNING A SUSTAINABLE, LONG-TERM REVENUE MODEL FOR TURN BACK TIME By: Marc Printz

Welcome message from author
This document is posted to help you gain knowledge. Please leave a comment to let me know what you think about it! Share it to your friends and learn new things together.
Transcript
Table
Str
ate
gie
s f
or
Fin
an
cia
l S
usta
inab
ilit
y
2018-19
DESIGNING
A SUSTAINABLE, LONG-TERM
REVENUE MODEL FOR
TURN BACK TIME
By: Marc Printz
Page | ii
b
Designing a Sustainable, Long-Term Revenue Model for
Turn Back Time
________________________________________________________________________________________________________________________________________________________________________________________
A Major Qualifying Project Report
Submitted to the Faculty of:
WORCESTER POLYTECHNIC INSTITUTE
In partial fulfillment of the requirement for the
Degree of Bachelor of Science for:
Marc Printz
February 20, 2019
Submitted to:
Professor Michael Elmes
This project report is submitted to the faculty of WPI as evidence of completion of a degree
requirement. The views and opinions expressed herein are those of the authors and do not necessarily
reflect the positions or opinions of WPI. WPI routinely publishes these reports on its website without
editorial or peer review. For more information about the projects program at WPI, please see
http://www.wpi.edu/Academics/Projects
Page | iii
Abstract
Turn Back Time (TBT) is a non-profit organization in Central Massachusetts on a mission to improve the
lives of children by getting them back to nature. Research suggests that exposure to nature has many
long-term benefits for children and promotes better health, greater empathy, and long term success. The
focus of this project was to propose a plan to help TBT achieve greater financial sustainability. I
investigated various strategies and made recommendations to help the organization run more efficiently
and profitably, grow new sources of revenue, and transform itself into a long-term sustainable enterprise
with programs that effectively address the problem of nature deficit in children.
Page | iv
Executive Summary
“For a new generation, nature is more abstraction than reality. Increasingly, nature is something to
watch, to consume, to wear -- to ignore” (Louv, 2008, p.6). Children’s exposure to nature has been
steadily decreasing over the past decades due to busier schedules, decreased accessibility to greenspaces,
a shift in parenting styles, and newer distractions (i.e. tv and computers). Nature deficit is important
because a growing body of research has found evidence that “just as children need good nutrition and
adequate sleep, they may very well need contact with nature” (Moss, 2012, p.7). Researchers have found
connections between an exposure to nature and reductions in symptoms of ADHD, stress, nature
knowledge deficit, depression, vitamin D deficiency, short-sightedness, asthma, declining emotional
resilience, the lack of ability to assess risk and declining physical activity (Kuo, 2004; Nature
Conservancy, 2011; Briggs, 2016; Presland, 2015; Moss, 2012; McCurdy, 2010). All these health
problems are attributable, at least in part, “to a decrease in the time children spent outdoors compared
with previous generations” (Moss, 2012, p.5).
Turn Back Time (TBT) is a non-profit organization on a mission to improve the lives of children
through nature exploration, farm education and outdoor play; to get children back to nature. While the
organization’s successes have resulted in increased demand for its summer day-camp and preschool
programs, their financial model is not sustainable. In 2017 they operated at a loss of $2,500.
Furthermore, the Director’s salary was only $19,200. While the salary did increase to $30,000 in 2018,
the organization must continue raising it so that it is competitive enough that they may hire a new
director when the current one retires. Also, the organization must hire additional personnel so that it may
operate more effectively and grow.
Through the use of online research, data analysis and interviews I investigated strategies that TBT may
use to achieve financial sustainability. I have categorized these strategies as Run, Grow and Transform.
These three categories pertain to: running the organization efficiently and effectively in its current state,
growing its program offerings, and transforming it from a ‘start-up’ to an established nonprofit.
Specifically, each category looked at the following:
Run Grow Transform
Minimizing Expenses Grant-Writing Developing an Endowment Fund
Pricing of their Services New Programs Supplementing the Current
Director Role Web-Page Loading Speeds Fundraiser Event
Design and Content of
their Website
Membership System
Donation Structure
Targeted Promoting for
Individual Donors
I determined that TBT would not only break-even, but be able to boost director wages and hire a
Fundraising Director just by implementing the following data-supported changes: minimize their
expenses, increase the prices of their services to match the industry average, renovate their web-page to
Page | v
improve loading speed and design. The other Run-Grow-Transform changes would also increase annual
revenue (by way of business-related activity or donations), but I was unable to predict the exact amount.
By implementing my recommended changes TBT would not only break-even financially, but could
reinvest the additional income in new strategies to grow the organization for long-term success. In the
Recommendations section, I lay out a basic roadmap for how exactly TBT may go about this.
In summary, this project is a discussion of how a nonprofit may grow from a startup, to a mature
organization. This is a worthwhile contribution to literature because while there is a wealth of
information on how to grow for-profit organizations from startup to maturity, there is relatively little for
nonprofits.
Page | vi
Acknowledgements
This project would not have been possible without the aid and support of several individuals. I am
grateful for the opportunity to work with the following:
Lisa Burris, Director of Turn Back Time: For being both the project’s sponsor and providing
valuable information that helped develop the project.
My Advisor, Michael B Elmes: For his continual guidance and constructive feedback
throughout the project.
Bill McAvoy, Vice-President of University Advancement at Worcester Polytechnic Institute:
For his advice on best practices when developing a small, young nonprofit and strategies for
achieving financial sustainability.
I would also like to extend my appreciation to the board members, staff, volunteers and others helping
Turn Back Time address the international crisis that is Nature Deficit.
Page | vii
Table of Contents
Abstract................................................................................................................................................... iii
Executive Summary .................................................................................................................................. iv
Acknowledgements .................................................................................................................................. vi
1.0 Introduction ........................................................................................................................................ 1
2.0 Literature Review ................................................................................................................................. 2
2.1 Nature Deficit Disorder ..................................................................................................................... 2
2.1.1 Health Impacts ........................................................................................................................... 3
Short-Term Effects .......................................................................................................................... 3
Long-Term Effects .......................................................................................................................... 7
2.1.2 Nature Knowledge Deficit ......................................................................................................... 10
The Literature ............................................................................................................................... 11
The effects.................................................................................................................................... 11
2.1.3 Access to Nature ...................................................................................................................... 12
Geography .................................................................................................................................... 12
Parenting Styles ............................................................................................................................ 13
Conflicting interests ....................................................................................................................... 13
2.2. Movement to Get Kids Back into Nature .......................................................................................... 14
2.2.1 The Last Child in the Woods....................................................................................................... 14
2.2.2 No Child Left Inside .................................................................................................................. 15
2.4 Non-Profit Funding Models ............................................................................................................. 16
2.3.1 Funding Models ....................................................................................................................... 16
2.3.2 Donations ................................................................................................................................ 18
Individual Giving .......................................................................................................................... 18
2.4 Turn Back Time .............................................................................................................................. 21
2.4.1 Overview ................................................................................................................................. 22
2.3.2 Past Projects ............................................................................................................................ 22
2.4.3 Financial Model ........................................................................................................................ 22
3.0 Methodology ..................................................................................................................................... 24
3.1 Run ............................................................................................................................................... 25
Minimizing Expenses .................................................................................................................... 25
Pricing of their Services ................................................................................................................. 25
Web-Page Loading Speeds ............................................................................................................. 26
Design and Content of their Website ................................................................................................ 26
Donation Structure ........................................................................................................................ 26
Targeted Promoting for Individual Donors ....................................................................................... 27
Page | viii
3.2 Grow ............................................................................................................................................. 27
Grant Writing ............................................................................................................................... 27
New Programs .............................................................................................................................. 27
Fundraiser Event ........................................................................................................................... 28
Membership Program .................................................................................................................... 28
3.3 Transform ...................................................................................................................................... 28
Endowment Fund .......................................................................................................................... 28
Supplementing the Current Director Role ......................................................................................... 29
4.0 Results & Discussion ........................................................................................................................... 30
4.1 Run ............................................................................................................................................... 30
Minimizing Expenses .................................................................................................................... 30
Pricing of their Services ................................................................................................................. 31
Web-Page Loading Speed .............................................................................................................. 35
Design and Content on Website ...................................................................................................... 36
Donation Structure ........................................................................................................................ 37
Targeted Promoting for Donations ................................................................................................... 37
4.2 Grow ............................................................................................................................................. 39
Grant Writing ............................................................................................................................... 39
New Programs .............................................................................................................................. 39
Fundraiser Events .......................................................................................................................... 41
Membership Program .................................................................................................................... 42
4.3 Transform ......................................................................................................................................... 42
Endowment Fund .......................................................................................................................... 42
Supplementing the Current Director Role ......................................................................................... 43
5.0 Recommendations ............................................................................................................................. 44
5.1 Financial Predictions of Recommendations ....................................................................................... 44
5.2 Other Recommendations ................................................................................................................ 46
Business-related Income................................................................................................................. 46
Donations ..................................................................................................................................... 47
Future Projects .............................................................................................................................. 48
Questions to Consider .................................................................................................................... 49
Works Cited ............................................................................................................................................ 51
References .............................................................................................................................................. 57
Appendix A- Funding Models ................................................................................................................ 57
Appendix B- Turn Back Time 2017 Income Statement ............................................................................. 60
Appendix C- Membership benefits and prices offered by similar organizations ............................................ 61
Page | 1
1.0 Introduction
“For a new generation, nature is more abstraction than reality. Increasingly, nature is something to
watch, to consume, to wear -- to ignore” (Louv, 2008, p.6). When Richard Louv published his book,
Last Child in the Woods: Saving Our Children From Nature-Deficit Disorder, he unknowingly began a
movement to get children back to the outdoors. A nationwide poll in the United States (2011) found that
children spend less than 10% of their day outdoors, and likely much less. The results of a 2016 national
survey in the United Kingdom were even more sobering: 74% of children spent less than one hour
playing outdoors; this was less than the United Nations’ guidelines for prisoners, which require “at least
one hour of suitable exercise in the open air daily” (Carrington, 2016, p.1). This deficit is critical
because a growing body of research has found evidence that “just as children need good nutrition and
adequate sleep, they may very well need contact with nature” (Moss, 2012, p.7). Children’s exposure to
nature has been steadily decreasing over the past decades due to busier schedules, decreased
accessibility to greenspaces, a shift in parenting styles, and newer distractions (i.e. tv and computers).
Through various independent studies in both the United States and Europe, researchers have found
connections between an exposure to nature and reductions in symptoms of ADHD, stress, nature
knowledge deficit, depression, vitamin D deficiency, short-sightedness, asthma, declining emotional
resilience, the lack of ability to assess risk and declining physical activity (Kuo, 2004; Nature
Conservancy, 2011; Briggs, 2016; Presland, 2015; Moss, 2012; McCurdy, 2010). Research has found
that all these health problems are attributable, at least in part, “to a decrease in the time children spent
outdoors compared with previous generations” (Moss, 2012, p.5).
Turn Back Time (TBT) is a non-profit organization on a mission to improve the lives of children
through nature exploration, farm education and outdoor play; to get children back to nature. Established
in 2011 by the Burris family, TBT operates a 58-acre homestead in Paxton, Massachusetts. Services
offered include farm and nature focused pre-school, homeschool trips, after-school classes and a multi-
week summer day-camp program. While Turn Back Time’s success has resulted in increased demand
for its summer day-camp and preschool programs, their financial model is not sustainable. Most funds
for their new barn, which has increased the organization’s capacity to run programs, came from the
retirement savings of the organization’s founding family, the Burris family. This couple works overtime
and receives relatively little pay. They are in their late 50s/ early 60s and will be looking to retire in the
coming years. TBT is also understaffed due to a lack in revenue.
My task for this project was to review their financial model and to make recommendations for a
achieving a sustainable financial future, accounting for the eventuality that the founders will retire.
Specifically, I determined which funding model suites the non-profit best, investigated TBT’s business-
related income and expenses, analyzed the potential impact of the website’s loading speed and design on
donations, identified zip codes to target for acquiring new donors, compared current program offerings
of TBT to similar organizations, investigated creating an endowment fund and presented a potential
annual fundraiser event.
Page | 2
2.0 Literature Review
To best understand the role of Turn Back Time, a local non-profit, in the international
movement of getting kids out into nature, Chapter 2.0 has been organized by discussions on
nature deficit, the movement to get kids into nature, Turn Back Time itself, and non-profit
funding models. Section 2.1 will define nature deficit and its implications on health and
knowledge. It will also cover how and why children’s’ access to nature has changed. Section
2.2 presents the rising international movement to get children back out into nature to correct
these nature deficits. Section 2.3 introduces Turn Back Time, their mission, history, past
university projects that have been done, and their current financial model. Section 2.4 will
outline successful strategies across the non-profit industry for developing a sustainable revenue
model.
2.1 Nature Deficit Disorder
Nature Deficit Disorder (NDD) is, according to Dr. Ross Cameron of the Department of
Landscape at Sheffield University, “a coverall to describe the things of where we used to have
natural processes, natural experiences in our lives, and that seem to be becoming less
common” (Brigs, 2016, p.1). In other words, it is a term to evoke the loss of communication
with other living things (nature), not a clinically recognized condition. NDD is a symptom of
the current lifestyle where people spend more time indoors, becoming more alienated from
nature. This alienation results in many consequences with respect to personal health and
knowledge of the natural world. Overall, “children who learn outdoors know more, understand
more, feel better, behave better, work more cooperatively, and are physically healthier” (Moss,
2012, p.9). The phrase “Nature Deficit Disorder” was coined by Richard Louv is his book The
Last Child in the Woods.
The following section begins with looking at the impacts, both short-term and long-term, of
nature deficiency in children. Impacts have been divided into two sections: health and
knowledge. The section will conclude by investigating reasons for changes in children’s access
to nature to explain why nature deficiency has become such a prominent issue.
Page | 3
2.1.1 Health Impacts
Short-Term Effects
Attention Deficit Hyperactivity Disorder (ADHD): The Center for Disease Control in the
United States labels ADHD as a “serious public health problem” (Kuo & Taylor, 2004,
p.1580), citing
the large estimated prevalence of the disorder; the significant impairment in the areas of school
performance and socialization; the chronicity of the disorder; the limited effectiveness of
current interventions to attend to all the impairments associated with ADHD; and the inability
to demonstrate that intervention provides substantial benefits for long-term outcomes.”
(Kuo & Taylor, 2004, p.1580).
As alluded to, current treatments offer only limited relief from symptoms and often carry
serious side effects. Long term studies have shown that children with ADHD, compared to
those without, are more impaired in psychosocial, educational and neurophysical functions,
and have higher risks for antisocial disorders, major depression and anxiety disorders as adults
(Xu & Liu, 2018). The issue with ADHD is twofold: ADHD prevalence is on the rise, and,
currently there is no effective treatment.
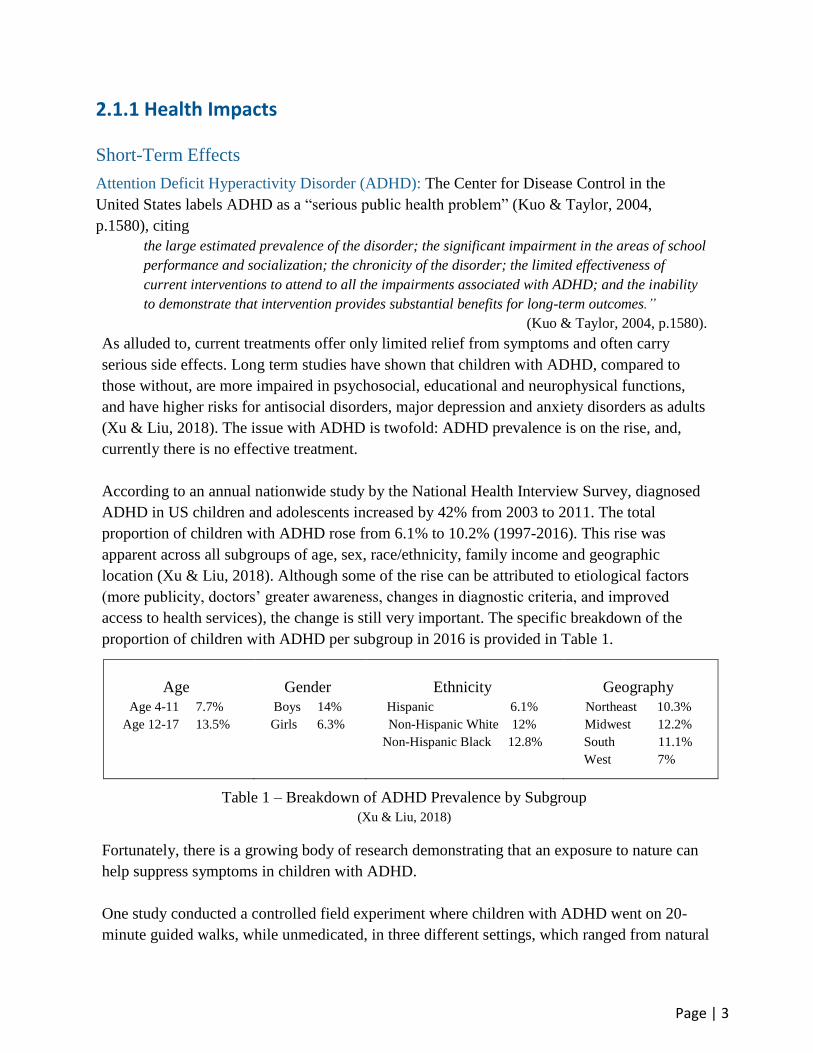
According to an annual nationwide study by the National Health Interview Survey, diagnosed
ADHD in US children and adolescents increased by 42% from 2003 to 2011. The total
proportion of children with ADHD rose from 6.1% to 10.2% (1997-2016). This rise was
apparent across all subgroups of age, sex, race/ethnicity, family income and geographic
location (Xu & Liu, 2018). Although some of the rise can be attributed to etiological factors
(more publicity, doctors’ greater awareness, changes in diagnostic criteria, and improved
access to health services), the change is still very important. The specific breakdown of the
proportion of children with ADHD per subgroup in 2016 is provided in Table 1.
Age
Age 4-11 7.7%
Age 12-17 13.5%
Gender
Boys 14%
Girls 6.3%
Ethnicity
Hispanic 6.1%
Non-Hispanic White 12%
Non-Hispanic Black 12.8%
Geography
Northeast 10.3%
Midwest 12.2%
South 11.1%
West 7%
Table 1 – Breakdown of ADHD Prevalence by Subgroup
(Xu & Liu, 2018)
Fortunately, there is a growing body of research demonstrating that an exposure to nature can
help suppress symptoms in children with ADHD.
One study conducted a controlled field experiment where children with ADHD went on 20-
minute guided walks, while unmedicated, in three different settings, which ranged from natural
Page | 4
to urban. Prior, they would complete 15 minutes of puzzle-like tasks to simulate attentional
fatigue from school or work. Afterwards, a single evaluator, who was unaware of the study’s
conditions, administered objective measures of attention. The study found that children
performed significantly better on these measures after walking in the greenest setting than either
of the other two (Kuo & Taylor, 2004).
Another study conducted a national online survey to determine if the salutary effects of nature
apply to a wider range of ages, community sizes and geographic regions. In the study, parents
rated the after-effects of common after-school and weekend activities in different setting on
their child’s symptoms. The three surroundings measured were green outdoors (any mostly-
natural area, such as a park, farm or green backyard), built outdoors (any mostly-human-made
area, such a parking lot, downtown area, and non-green neighborhood space), and indoors. The
study selected four easily observable symptoms from the official ADHD diagnostic criteria:
ability to stay focused on unappealing tasks; difficulty in completing tasks; ability to listen and
follow directions; and difficulty in resisting distractions. The study found that “green out-door
activities significantly reduced symptoms” (p.1583) when done individually, in pairs or in larger
groups. The overall positive aftereffects were also greater than for indoor or built outdoor
activities (Kuo & Taylor, 2004). In fact, indoor activities significantly exacerbated symptoms
when in larger groups. These benefits occurred nationally, no matter the size of the community
the child lived in; their income bracket; gender; or demographic, or the activity. Furthermore,
because the same benefit was found for children with ADD but not hyperactivity, this suggests
that the salutary effects cannot be solely attributed to being able to “burn off” hyperactive
impulses. Interpreting these findings, for those
“whom medication is tolerable and effective, exposure to green settings might augment the
medication’s effects, offering a more complete relief of symptoms and helping children function
more effectively at school and at home. In addition, a green dose might conceivably reduce the
need for medication by 1 dose per day” (Kuo & Taylor, 2004, p. 1585). For those whom medication is ineffective, green doses may offer relief from symptoms.
Attention Fatigue: According to environmental psychologist Stephen Kaplan, “tasks and
situations that require one to deliberately direct attention or inhibit unwanted stimuli, thoughts
or impulses draw on a shared mechanism that is subject to fatigue” (p.1580). That mechanism
is the prefrontal cortex. Those with ADHD have both a smaller right prefrontal cortex and less
activity there. Similarly, prolonged or intense use of the prefrontal cortex in ‘healthy’ people
will cause fatigue, decreasing brain activity and making it increasingly difficult to pay
attention and inhibit impulses. The result is that “the behavior and performance of individuals
without ADHD temporarily take on many of the characteristic patterns of ADHD” (Kuo &
Taylor, 2004, p.1580). This is called attention fatigue. Symptoms are so similar that the ADD
evaluation scale is used for measuring attention fatigue.
Substantial research has shown that ADHD symptoms due to attention fatigue are reduced
Page | 5
after exposure to natural views and settings. This occurs because they engage the mind
effortlessly. It’s a systematic restoration effect on direct attention that causes the “rejuvenation
feeling” (Kuo & Taylor, 2004, p.1). Exposure to “natural settings” ranges from gardening,
restoring prairie ecosystems, and having grass and trees outside your window, to back packing
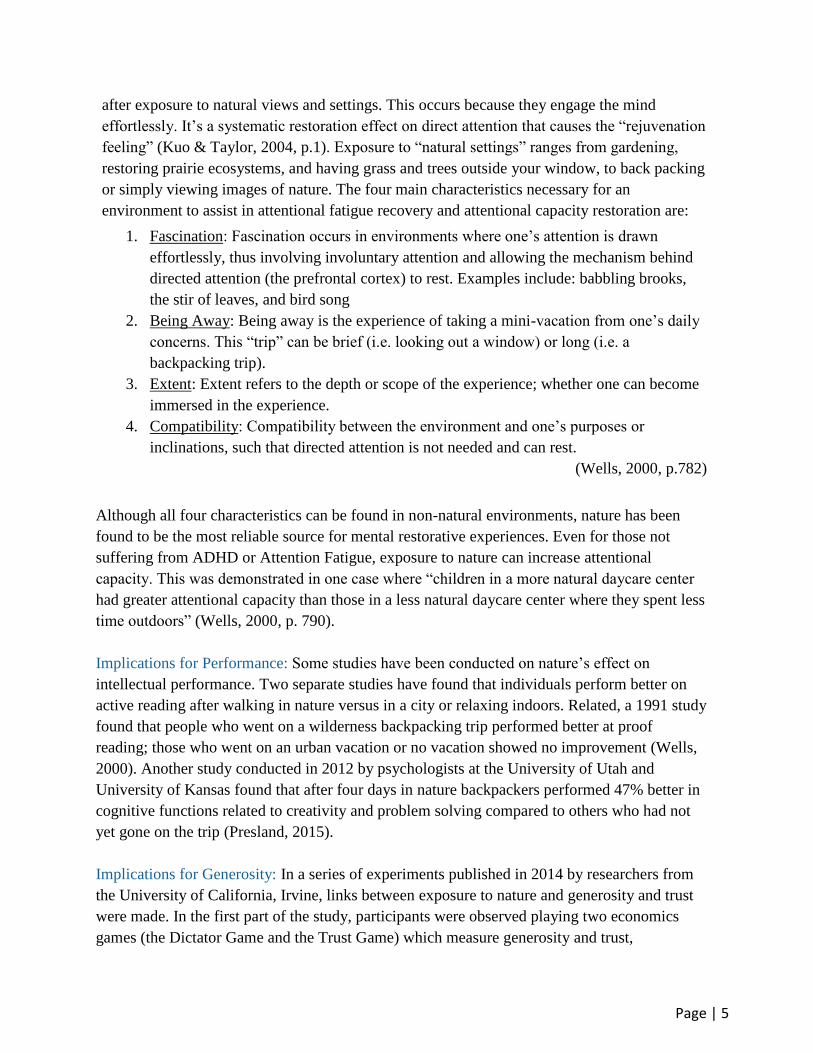
or simply viewing images of nature. The four main characteristics necessary for an
environment to assist in attentional fatigue recovery and attentional capacity restoration are:
1. Fascination: Fascination occurs in environments where one’s attention is drawn
effortlessly, thus involving involuntary attention and allowing the mechanism behind
directed attention (the prefrontal cortex) to rest. Examples include: babbling brooks,
the stir of leaves, and bird song
2. Being Away: Being away is the experience of taking a mini-vacation from one’s daily
concerns. This “trip” can be brief (i.e. looking out a window) or long (i.e. a
backpacking trip).
3. Extent: Extent refers to the depth or scope of the experience; whether one can become
immersed in the experience.
4. Compatibility: Compatibility between the environment and one’s purposes or
inclinations, such that directed attention is not needed and can rest.
(Wells, 2000, p.782)
Although all four characteristics can be found in non-natural environments, nature has been
found to be the most reliable source for mental restorative experiences. Even for those not
suffering from ADHD or Attention Fatigue, exposure to nature can increase attentional
capacity. This was demonstrated in one case where “children in a more natural daycare center
had greater attentional capacity than those in a less natural daycare center where they spent less
time outdoors” (Wells, 2000, p. 790).
Implications for Performance: Some studies have been conducted on nature’s effect on
intellectual performance. Two separate studies have found that individuals perform better on
active reading after walking in nature versus in a city or relaxing indoors. Related, a 1991 study
found that people who went on a wilderness backpacking trip performed better at proof
reading; those who went on an urban vacation or no vacation showed no improvement (Wells,
2000). Another study conducted in 2012 by psychologists at the University of Utah and
University of Kansas found that after four days in nature backpackers performed 47% better in
cognitive functions related to creativity and problem solving compared to others who had not
yet gone on the trip (Presland, 2015).
Implications for Generosity: In a series of experiments published in 2014 by researchers from
the University of California, Irvine, links between exposure to nature and generosity and trust
were made. In the first part of the study, participants were observed playing two economics
games (the Dictator Game and the Trust Game) which measure generosity and trust,
Page | 6
respectfully. Participants that were exposed to more beautiful nature scenes acted more
generously and trusting than those exposed to less beautiful scenes—the beauty of the scenes
was determined in a separate experiment. This seemed to be due to a corresponding increase in
positive emotion. In the second part of the study, participants were asked to fill out a survey
about their emotions while at a table with beautiful plants. Afterwards, participants were told
that the study was over, and they could either leave, or help make paper cranes for relief effort
in Japan. When there were more beautiful plants, both the likeliness of participants
volunteering, and the number of cranes made increased significantly. The researches once
again concluded that this was due to an increase in positive emotion elicited by the beauty of
nature, which results in prosocial behavior (Zhang & Piff, 2014). This theory was later
supported in a second study by Paul Piff, one of the authors of the previous experiment. Piff
found that if participants stared up a grove of very tall trees for a little as a minute—compared
to participants who stared up at high buildings—, they demonstrated more helpful behavior and
approached moral dilemmas more ethically. The change in behavior was due to a measurable
sense of awe felt by participants (Piff, Dietze, Feinberg, Stancato, Keltner, 2015).
Psychological implications: An experiment conducted in Japan in 2014 recorded participants’
heart rate variability (a measure of relaxation and stress), heart rate and blood pressure while
walking in a forest or urban center. Participants also filled out questionnaires about their moods,
stress levels and other psychological measures. The results showed that those walking in a forest
had significantly lower heart rates and higher heart rate variability, denoting more relaxation and
less stress. They also reported better moods and less anxiety than those who walked in an urban
center (Lee & Tsunetsugu, 2014). Thus, walking in nature has a beneficial effect on
cardiovascular and psychological health. A similar experiment conducted by Peter Aspinal at
Heriot-Watt Univerisity in Edinburgh, continuously monitored participants’ brains using mobile
electroencephalogram (EEG) while they walked through an urban, green setting. The EEG
readings indicated lower frustration, engagement and arousal, and higher meditation levels while
in the green area. It is this lower engagement and arousal, which encourages a more meditative
mindset, that allows the brain to rest and restore attention capacity. It is also this resting state,
free of distraction and multitasking, that allows for one to have the most break-through thoughts
(Aspinall & Mavros, 2013).
A separate study in Finland confirmed nature’s stress relieving effect. In the study, urban
dwellers reported significantly more stress relief after promenading in an urban park or
woodland, compared to those who walked through a city center (Tyrväinen & Ojala, 2014). This
connection was again confirmed by Roger Ulrich of Texas A&M University. In his study, after
viewing a stress-inducing movie, participants showed much quicker and more complete recovery
when they were exposed to videos of natural scenes (Tyrväinen & Ojala, 2014).
Continuing the discussion of nature improving one’s mood, a study from Stanford University
Page | 7
(2015), assessed participants on their emotional state and cognitive measures (such as short-term
memory) before and after walking in a natural or urban setting. The study found that participants
who walked in nature experienced less anxiety, rumination, and negative affect, as well as more
positive emotions, compared to the urban walkers. They also exhibited improved performance on
memory related tasks. A decrease in rumination (focused attention on negative aspects of
oneself) is important because it has been associated with depression and anxiety (Bratman &
Gretchen, 2015). This explains the findings of a study by the mental health organization MIND:
walking in nature reduced depression for 71% of participants, while a shopping center made 22%
of participants more depressed (Presland, 2015). Gregory Bratman, the author of the Stanford
experiment, followed up by taking fMRI scans of participants’ brains before and after walking in
a natural or urban setting to determine exactly how nature affects rumination. It turns out that
participants who walked in a natural versus an urban setting showed increased activity in the
subgenual prefrontal cortex. The deactivation of this area of the brain is affiliated with
depression, anxiety and other mental illnesses (Bratman & Hamilton, 2015). These results imply
that nature may be vital for our mental health.
Long-Term Effects
Implications in Creativity: In Section 2.1.1 (Short-term Effects), it was established that being in
nature has been shown to enhance cognitive functions related to creativity and problem solving
in the immediate. Researchers in the School of Psychology from the Victoria University of
Wellington went one step further. They tested Singaporean secondary students to determine if
people’s sense of connectedness with nature correlated with innovation and analytic-holistic
thinking. Specifically, they used studied cognitive styles such as Kirton’s adaption-innovation
(KAI) and analytic-holistic thinking (AHT). The study comprised of two smaller studies: one
used an online survey, the other used a pen and paper survey. Controlling for well-being effects,
the researchers found a significant correlation between nature connectedness and both innovative
and holistic thinking. Nature connectedness was also a significant predictor of innovative
thinking (Leong, Fischer, McClure, 2014). Thus, nature not only provides an immediate boost in
these cognitive function, but also a permanent, longer-term and potentially life-long advantage.
The Adventure Alternative (1984) by Colin Mortock offers some insight into why these
connections may exist.
According to Mortlock, because nature is unpredictable and challenges people’s comfort zone,
activities in nature may be considered outdoor adventures. Outdoor adventures often involve
physically demanding activity, risk, and opportunities for uplifting experiences (i.e. viewing a
beautiful view from a mountain). Thus, to connect with nature people need to be open to and
embrace this sense of adventure. Similarly, innovative thinkers need to be willing to work
hard, stay open to new experiences and accept risk, striving towards that eventual success
moment. Furthermore, to generate new ideas they must be open-minded (Mortlock, 1987).
Page | 8
The impact of nature enhancing innovative and holistic thinking is that it may result in more
innovators. In the modern era innovators and entrepreneurs are prized and rewarded (by both
recognition and monetary means). To maintain competitive advantage, increase market share,
or expand into new markets, companies are in a constant battle to innovate faster and better
than their rivals. Governments are also incentivized to nurture innovation to grow their
economy and assert themselves in international politics as global leaders. Innovators are also
critical to solving the largest global problems (i.e. climate change, poverty, world hunger,
energy sustainability, universal education). As discussed in the book Where Good Ideas Come
From: The Natural History of Innovation, by Steven Johnson, innovation is not something
that happens behind closed doors by a single genius. Instead, it flourishes when there are
numerous innovative minds that ideas can bounce off (Johnson, 2010). Thus, the finding that
nature connectedness enhances innovative and holistic thinking has great importance at a
global scale. Because of this and previously mentioned benefits from nature exposure,
businesses are beginning to have nature retreats, and introduce plants and natural light into
building design (Ramptom, 2013). Embracing plants in the workplace even topped design
trends in 2016 (Good Earth Plant Company, 2016). Amazon’s new offices in Seattle now
feature biospheres that resemble parks more than offices, tree-house meeting rooms, living
walls and more. Walking meetings are also now encouraged there. Apple’s new headquarters
in California features thousands of trees in a park-like design. Adobe, Clif Bar & Company,
QuickLeft, and call centers have also embraced the green (Birrane, 2016; Good Earth Plant
Company, 2016). There is still much to be desired, however. In 2016, 58% of respondents to
the Human Spaces Global Report said there were no live plants at their workplace and 47%
said there was no natural light (Birrane, 2016).
Psychological Implications: Section 2.1.1 covered that exposure to nature helps address many
psychological issues such as stress, attention deficit and one’s emotional state in the short term.
In parallel with a decline in exposure to nature, from 1974 to 1999 there was a significant rise in
clinically diagnosed health disorders amongst children ages 5-16 years old. In 1999, 10% of that
age group had a clinically diagnosed disorder (Moss, 2012). Other issues such as vitamin D
deficiency, short-sightedness, and asthma have risen, and children’s emotional resilience and
ability to assess risk have declined. Research has found that all these health illnesses are
attributable, at least in part, “to a decrease in the time children spent outdoors compared with
previous generations” (Moss, 2012, p.5). So, not only does nature alleviate these issues in the
short-term, but a lack of nature causes them in the long-term. It is also important to mention that,
as discussed in Section 2.1.1 Short-Term Effects: Attention Deficit Hyperactivity Disorder, an
exposure to nature helps alleviated symptoms of ADHD. In the long-term, this may have large,
positive implications for both the individual and society.
Page | 9
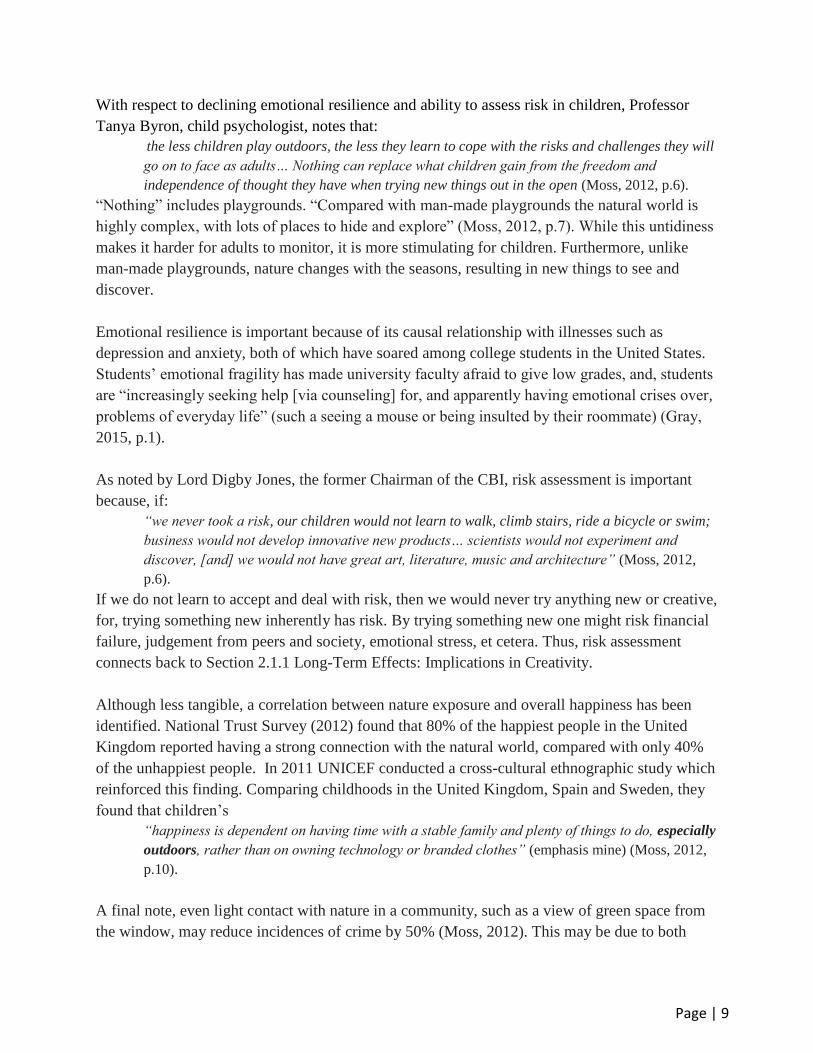
With respect to declining emotional resilience and ability to assess risk in children, Professor
Tanya Byron, child psychologist, notes that:
the less children play outdoors, the less they learn to cope with the risks and challenges they will
go on to face as adults… Nothing can replace what children gain from the freedom and
independence of thought they have when trying new things out in the open (Moss, 2012, p.6).
“Nothing” includes playgrounds. “Compared with man-made playgrounds the natural world is
highly complex, with lots of places to hide and explore” (Moss, 2012, p.7). While this untidiness
makes it harder for adults to monitor, it is more stimulating for children. Furthermore, unlike
man-made playgrounds, nature changes with the seasons, resulting in new things to see and
discover.
Emotional resilience is important because of its causal relationship with illnesses such as
depression and anxiety, both of which have soared among college students in the United States.
Students’ emotional fragility has made university faculty afraid to give low grades, and, students
are “increasingly seeking help [via counseling] for, and apparently having emotional crises over,
problems of everyday life” (such a seeing a mouse or being insulted by their roommate) (Gray,
2015, p.1).
As noted by Lord Digby Jones, the former Chairman of the CBI, risk assessment is important
because, if:
“we never took a risk, our children would not learn to walk, climb stairs, ride a bicycle or swim;
business would not develop innovative new products… scientists would not experiment and
discover, [and] we would not have great art, literature, music and architecture” (Moss, 2012,
p.6).
If we do not learn to accept and deal with risk, then we would never try anything new or creative,
for, trying something new inherently has risk. By trying something new one might risk financial
failure, judgement from peers and society, emotional stress, et cetera. Thus, risk assessment
connects back to Section 2.1.1 Long-Term Effects: Implications in Creativity.
Although less tangible, a correlation between nature exposure and overall happiness has been
identified. National Trust Survey (2012) found that 80% of the happiest people in the United
Kingdom reported having a strong connection with the natural world, compared with only 40%
of the unhappiest people. In 2011 UNICEF conducted a cross-cultural ethnographic study which
reinforced this finding. Comparing childhoods in the United Kingdom, Spain and Sweden, they
found that children’s
“happiness is dependent on having time with a stable family and plenty of things to do, especially
outdoors, rather than on owning technology or branded clothes” (emphasis mine) (Moss, 2012,
p.10).
A final note, even light contact with nature in a community, such as a view of green space from
the window, may reduce incidences of crime by 50% (Moss, 2012). This may be due to both
Page | 10
nature reducing residents’ stress and improving personal wellbeing, as well as inviting families
and children in the community to bond through use of the greenspace.
Physical Implications: According to the Center of Disease Control, 39.8% of US adults were
obese between 2015 and 2016. As a result, obesity-related conditions (heart disease, stroke,
type 2 diabetes and certain types of cancer) are the leading causes of preventable, premature
death (CDC, 2018). Furthermore, there has been a 10% decline in cardiorespiratory fitness in
one decade (Moss, 2012). It is widely accepted that exercise is an effective way to both
prevent and treat persons with these conditions. There is also clear evidence that a child’s
attitude towards exercise lays the foundation for their habits as adults (Moss, 2012). So, if
they come accustomed to and enjoy exercise when younger, they are more likely to continue
with these habits later in life, reducing their likelihood for obesity and obesity-related
conditions. When children play outside they do many physical tasks-they run, dig and climb
for hours-, as such, children who spend more time outdoors are more active (McCurdy, 2010).
“If you told them to do it they wouldn’t, but they want to because they are playing. You won’t
get that level of physical activity with anything else” (Moss, 2012, p.7). Compared to going to
the gym or training for a sport where exercise is the primary goal, exercise is a side benefit of
going outdoors, thus unintentional. In fact, research has shown that in places with good access
to green space people are 24% more likely to be active (Moss, 2012). This make it easier for
exercise to become part of adult habits since, as many people point out, exercise is not ‘fun’
for everyone. Representative of habit creation, obese youth have reported notably lower
participation rates in outdoor activities and being less interested in pursuing them in the future
(Nature Conservancy, 2011).
Children’ exercise has implications not just for the individual, but for the economy as well. In
2008 the estimated annual cost of obesity in the United States was $147 billion. Per person, the
medical cost for people with obesity was $1,429 higher than those of normal weight (CDC,
2018). Although not the primary reason for rising health care costs, it is part of the issue.
According to the same data set, men and women with college degrees have lower obesity
prevalence compared with those of less education (CDC, 2018). While a direct causal
relationship cannot be assumed, an exposure to nature as a child has been shown to boost
creativity, critical thinking, problem solving, emotional resilience, and one’s ability to assess
risk. Each of these attributes are important in acquiring a college degree, which is commonly
known to improve one’s economic standing. As discussed before, an exposure to nature affects
one’s adult exercise habits, which correlates with one’s risk for obesity. QED, it seems nature
exposure may, in part, explain this finding by the CDC.
2.1.2 Nature Knowledge Deficit
Besides impacting the psychological, physical and general health, and performance of
Page | 11
children, nature deficit also results in a lack of knowledge about nature. Over time this
amounts to people knowing more about the fictional worlds we create (i.e. Pokémon and
Doctor Who) than the real, natural world. The larger impact is that the less someone knows
about something, the less they are inclined to care about and protect it.
The Literature
In Britain, a survey of 4 to 11-year-old children investigated nature knowledge deficit by
showing participants two sets of 100 cards. One set had images of common species of local
plants or wildlife (i.e. adder, bluebell, heron, otter, puffin, wren), while the other was of common
species of Pokémon (i.e. arbok, beedrill, hitmonchan, omanyte, psyduck, wigglytuff). The results
were stark. Overall, the children were able to correctly name only 50% of the real species, but
80% of the Pokémon (Macfarlane, 2017). Furthermore, in 2008 a study found that only 33% of
children ages 8 to 11 could identify a magpie, but 90% could name a Dalek (from Doctor Who)
(Moss 2008). The knowledge disconnect is even apparent amongst students receiving biology
and zoology degrees in college. Although they study the material and may have interest in
environmental issues, few have practical, hands-on experience. As a result, most A-level biology
students cannot identify more than three wild plants (Moss, 2012).
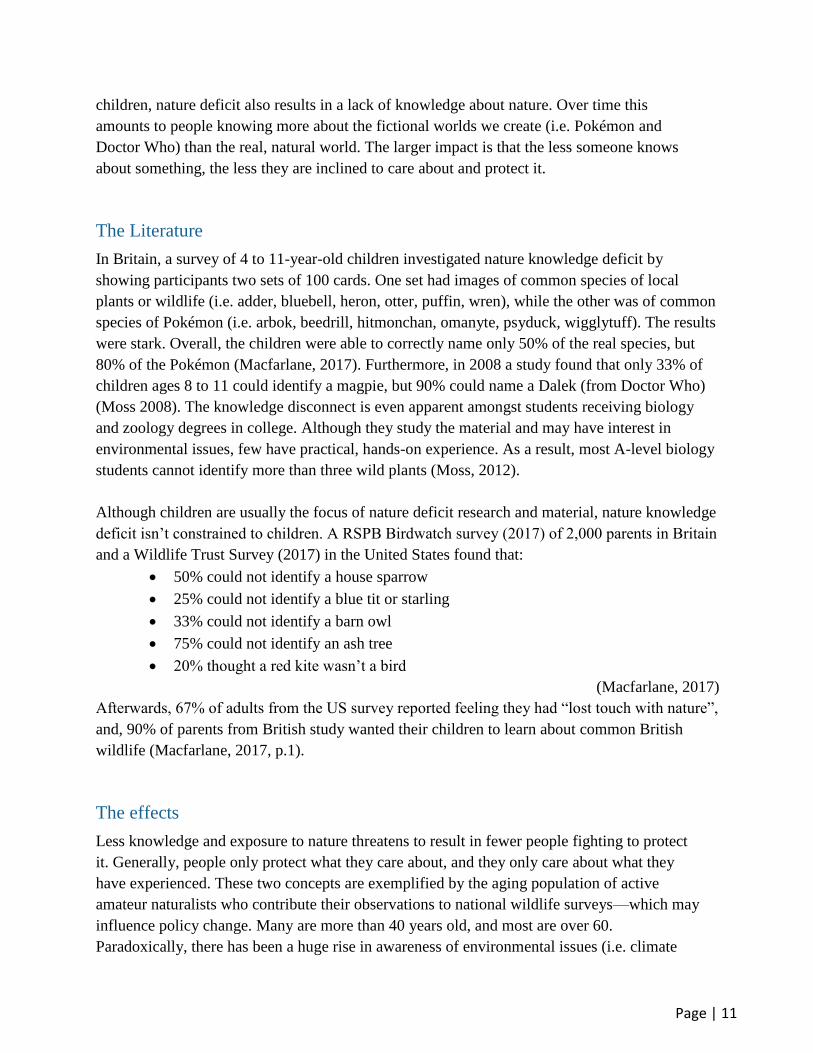
Although children are usually the focus of nature deficit research and material, nature knowledge
deficit isn’t constrained to children. A RSPB Birdwatch survey (2017) of 2,000 parents in Britain
and a Wildlife Trust Survey (2017) in the United States found that:
50% could not identify a house sparrow
25% could not identify a blue tit or starling
33% could not identify a barn owl
75% could not identify an ash tree
20% thought a red kite wasn’t a bird
(Macfarlane, 2017)
Afterwards, 67% of adults from the US survey reported feeling they had “lost touch with nature”,
and, 90% of parents from British study wanted their children to learn about common British
wildlife (Macfarlane, 2017, p.1).
The effects
Less knowledge and exposure to nature threatens to result in fewer people fighting to protect
it. Generally, people only protect what they care about, and they only care about what they
have experienced. These two concepts are exemplified by the aging population of active
amateur naturalists who contribute their observations to national wildlife surveys—which may
influence policy change. Many are more than 40 years old, and most are over 60.
Paradoxically, there has been a huge rise in awareness of environmental issues (i.e. climate
Page | 12
change, deforestation, pollution, ocean acidification). This paradox suggests that there has
been a decrease in people’s knowledge of the wildlife and natural environments they wish to
save (Moss, 2012).
2.1.3 Access to Nature
According to a two-year study by the English government, more than 1 in 9 children had not set
foot in a park, forest beach or other natural environment in at least 12 months. While 74% of
youth (under 16 years old) from white households visited a natural environment once per week,
just 56% of youth from BAME households (black, Asian, and minority ethnic) did. The decline
in children’s access to nature is mainly due to changes in geography, national parenting styles,
and conflicting interests of children due to new technologies.
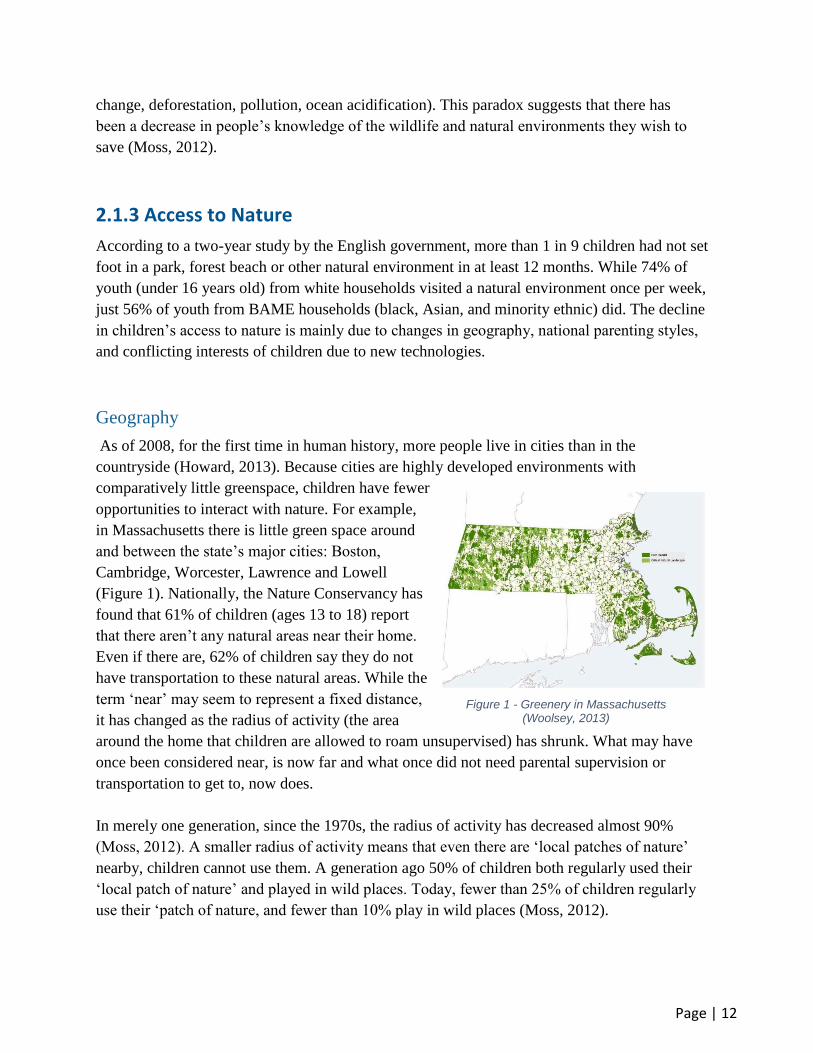
Geography
As of 2008, for the first time in human history, more people live in cities than in the
countryside (Howard, 2013). Because cities are highly developed environments with
comparatively little greenspace, children have fewer
opportunities to interact with nature. For example,
in Massachusetts there is little green space around
and between the state’s major cities: Boston,
Cambridge, Worcester, Lawrence and Lowell
(Figure 1). Nationally, the Nature Conservancy has
found that 61% of children (ages 13 to 18) report
that there aren’t any natural areas near their home.
Even if there are, 62% of children say they do not
have transportation to these natural areas. While the
term ‘near’ may seem to represent a fixed distance,
it has changed as the radius of activity (the area
around the home that children are allowed to roam unsupervised) has shrunk. What may have
once been considered near, is now far and what once did not need parental supervision or
transportation to get to, now does.
In merely one generation, since the 1970s, the radius of activity has decreased almost 90%
(Moss, 2012). A smaller radius of activity means that even there are ‘local patches of nature’
nearby, children cannot use them. A generation ago 50% of children both regularly used their
‘local patch of nature’ and played in wild places. Today, fewer than 25% of children regularly
use their ‘patch of nature, and fewer than 10% play in wild places (Moss, 2012).
Figure 1 - Greenery in Massachusetts (Woolsey, 2013)
Page | 13
Parenting Styles
As previously mentioned, a 2011 UNICEF study of childhood in the United Kingdom, Spain and
Sweden found that:
Children in all three countries told researchers that their happiness is dependent on having time
with a stable family and plenty of things to do, especially outdoors, rather than on owning
technology or branded clothes (Moss, 2012, p.10)
This was later supported by a Nature Conservancy study in which 66% of youth reported having
had a personal experience in nature. These youths were twice as likely to say that they preferred
spending time outdoors (Nature Conservancy, 2011). Despite this, parents say the feel
“tremendous pressure from society to buy material goods” (Moss, 2012, p.10). Thus, due to
societal peer pressure there seems to be a disconnect between what children desire and what
parents think they need to provide. Although not initially desired, once children have televisions,
video games, et cetera, they are likely to become drawn away from the outdoors by them.
Due to societal peer pressure parents today prioritize school, music lessons and athletics for their
children. This leads to a busy daily schedule allowing for little time in which their children may
play outside. Compounding, parents are less likely to see visiting nature as important as school
and other extracurricular, thus they feel less inclined to bring their children to greenspaces
(Barkham, 2016).
In 1971, 80% of children 7-8 years old walked to school, often alone or with friends. By the
1990s fewer than 10% of children did, and if so, it was almost always with their parents. Today
we live in age where concerned parents have called the police if they see a child walking alone.
This can also be attributed to societal peer pressure enforcing a mindset of overprotection and
“stranger danger” on parents. Richard Louv, author of The last Child in the Woods, argues that
this makes parents fearful of letting children go outside alone (Howard, 2013).
Children’s reduced access to nature, due to changing parenting styles, is subject to continue
declining. In households where the adults frequent nature, 82% of the children do, too. In
households where adults rarely or never visit nature, only 39% of the children do (Barkham,
2016). One might argue that children may develop the habit of visiting nature later in life, but
research shows that children who don’t connect with nature before the age of 12 are less likely as
adults to connect with nature (Moss, 2012). So, as fewer children today gain exposure to nature,
their children are even less likely to in the next generation; it is a compounding affect over
generations.
Conflicting interests
In a 1991 study, adults were asked to name the most significant place from their childhood; they
consistently named an outdoor place (Nancy, 2000). In those days, adults punished their children
Page | 14
by sending them to their room. Now, however, children retreat to their rooms willingly, drawn by
television, electronic video games, social media, and other technologies. As a result, in 2010
children spent an average of 53 hours per week using electronic devices (USA Today, 2010). In
the United States in 2011, most children used the computer, television or played video games
daily, while fewer than 10% spent any time outdoors daily. To put this into perspective, the “UN
guidelines for prisoners require ‘at least one hour of suitable exercise in the open air daily’”
(Carrington, 2016). As it is, children nationally are spending less time outdoors than prison
inmates.
2.2. Movement to Get Kids Back into Nature
This section presents a brief history of the movement to get children back into nature. First,
the section discusses the book The Last Child in the Woods, by Richard Louv, which is
credited with kicking off the movement. The section concludes by covering the No Child Left
Inside movement, including some of its successes in policy change.
2.2.1 The Last Child in the Woods
The Last Child in the Woods, by Richard Louv is largely credited with kicking off the
movement to get children back into nature. This was the first book to document decreased
exposure amongst children in the United States to nature, and how this deficit harms them.
Analyzing research, he concludes that direct exposure to nature is essential for healthy
childhood development and for the physical and emotional health of both children and adults.
After consistently hearing from adults that nature-deficit disorder applied to them, too, he
wrote another book called The Nature Principle, extending the idea of nature-deficit to adults.
Louv also coined the term “nature-deficit disorder”. In his words, it is defined as:
the loss of connection children increasingly feel with the natural world […] it is not a
clinically recognized condition […] but rather a a term to evoke a loss of communion with
other living things.” It affects “health, spiritual well-being, and many other areas, including
[people’s] ability to feel ultimately alive (Howard, 2013, p.1).
As problem-centered literature should, Louv also suggest solutions to the problems he
describes.
The book received wide, positive reception and was listed on the New York Times best seller
list for paper nonfiction. It also received the Audubon Medal for “sounding the alarm about
health and societal costs of children’s isolation from the natural world—and for sparking a
growing movement to remedy the problem” (Timm, 2008, p.1). Sally Jewell, the former head
of REI, even took an REI daypack filled with copies of the book to the White House and
handed them out to the President and staff.
Page | 15
The success of the book inspired Louv to co-found and chair the Children & Nature Network,
whose goal is to encourage and support people and organizations working to reconnect
children with nature. The movement has since expanded globally; nature preschools are taking
off, policies are being lobbied, and awareness is spreading. According to Louv the movement
has spread so quickly because no “matter what someone’s politics or religion is, they want to
tell [him] about the treehouse they had as a kid” (Howard, 2013, p.1). Essentially, “nobody
wants to be in the last generation where it’s considered normal for kids to go outdoors”
(Howard, 2013, p.1).
2.2.2 No Child Left Inside
The No Child Left Inside movement in the United States seeks to promote environmental
education through promotion and funding. The specific goal of the organization is to enhance
environmental literacy, as well as encourage understanding, analysis and problem solving to
environmental challenges between kindergarten and the 12th grade. The movement was
largely started in response to the book The Last Child in the Woods. Because of the
movement, in 2013 there were 112 regional, provincial or state campaigns in the United
States and Canada to get more children outdoors (Howard, 2013). States such as Colorado,
Connecticut, New Mexico, Washington, California, Illinoi, Massachusetts and Wisconsin
have endorsed the movement and established programs in local parks and schools to help
reconnect children with nature. The No Child Left Inside Coalition includes more than 2,200
local, regional and national organizations, including: Sierra Club, the National Audubon
Society, the National Wildlife Federation, the National Science Teachers Association, the
National Education Association, and hundreds of colleges, universities, businesses, zoos,
museums, arboretums, botanical gardens, and health care organizations (Jacobs, 2015).
In 2008, the No Child Left Inside Act (NCLI) was passed by the House of Representatives
but was never voted on by the Senate because it was referred to the Senate Committee on
Health, Education, Labor and Pensions. Then in 2009 it was referred to the Subcommittee on
Early Childhood, Elementary, and Secondary Education. It was also reintroduced to the
House in 2009 but was referred to the House Committee on Education and Labor. In 2015
Congressmen John Sarbanes and Mike Fitzpatrick reintroduced the NCLI to both the Senate
and House as an amendment to the Elementary and Secondary Education Act of 1965. The
act would require states to develop environmental literacy plans for K-12. To receive
implementation grants, states would have to pass environmental education standards and
teacher training prerequisites. The law was backed by 50 million citizens (of all geographical
and political backgrounds) and the No Child Left Inside Coalition. Provisions of NCLI were
also contained in the Every Student Succeeds Act, which was signed by President Obama on
Page | 16
December 10, 2015.
2.4 Non-Profit Funding Models
This chapter begins by introduces the various funding models that are commonly used in the
non-profit sector. In the for-profit sector the beneficiary is the funder (the customer receives ‘x’
by paying ‘y’); In the non-profit sector this is not necessarily true. As such, non-profits operate
using funding models, not business models. While a business model evaluates the cost structure
and value proposition to the beneficiary, a funding model focuses only on the funding, not on
the programs and services offered. Each funding model relies on a different combination of
revenue sources. The chapter will then discuss donations, breaking it apart into the revenue
streams it encompasses. The chapter will conclude by presenting trends in donations in the
United States.
2.3.1 Funding Models
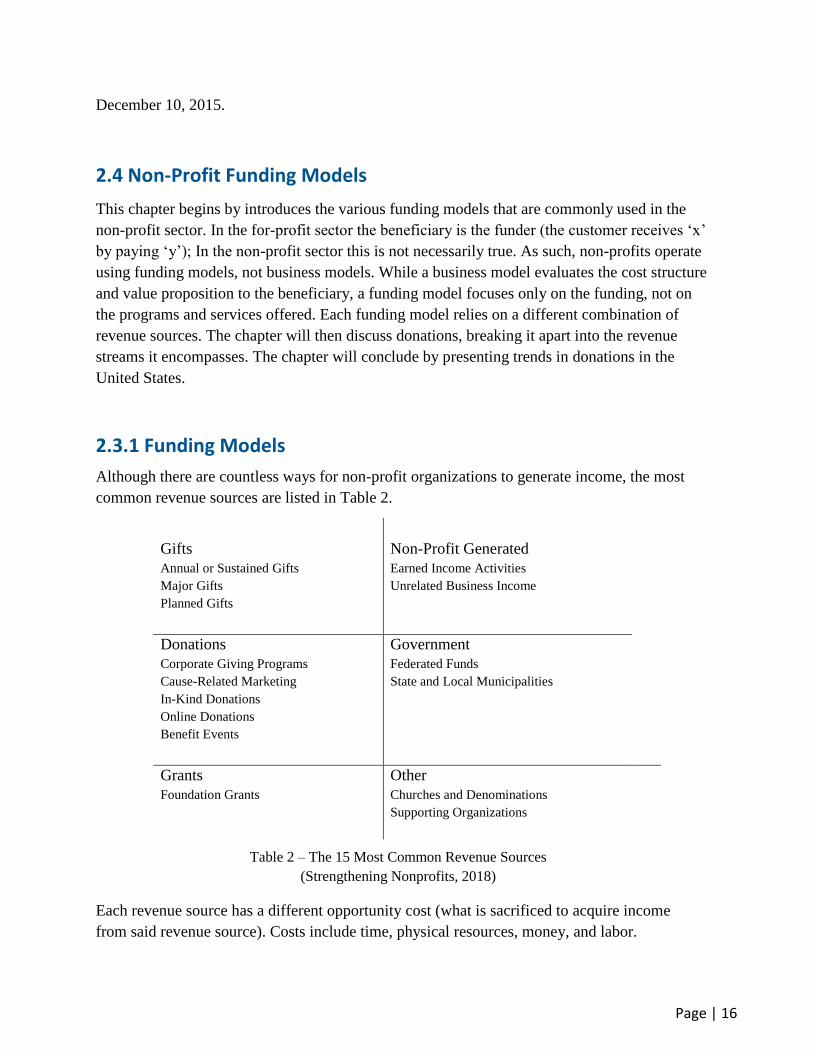
Although there are countless ways for non-profit organizations to generate income, the most
common revenue sources are listed in Table 2.
Gifts
Annual or Sustained Gifts
Major Gifts
Planned Gifts
Non-Profit Generated
Earned Income Activities
Unrelated Business Income
Donations
Corporate Giving Programs
Cause-Related Marketing
In-Kind Donations
Online Donations
Benefit Events
Government
Federated Funds
State and Local Municipalities
Grants
Foundation Grants
Other
Churches and Denominations
Supporting Organizations
Table 2 – The 15 Most Common Revenue Sources
(Strengthening Nonprofits, 2018)
Each revenue source has a different opportunity cost (what is sacrificed to acquire income
from said revenue source). Costs include time, physical resources, money, and labor.
Page | 17
Although each, ideally, increases a non-profit’s bottom line, some may have a higher return
than others (like return on investment). Returns are best measured in money gained from said
revenue source divided by the cost to acquire it. The success of different revenue streams
depends on the non-profit’s sector, resources, staff, actives, and mission (Strengthening
Nonprofits, 2018).
While there are countless combinations of revenue sources, a study from Stanford University
(2009) identified 10 non-profit models commonly used by the largest non-profits in the United
States. These models are not meant to prescribe a single approach for a funding model; they
are meant to guide non-profit leaders in designing the funding model they believe could best
support their organization’s growth. These models are also meant to aid leaders in easily
communicating and comparing their organization’s strategy and model, like existing
terminology in the for-profit sector (i.e. the “low-cost provider” strategy, the “fast follower”
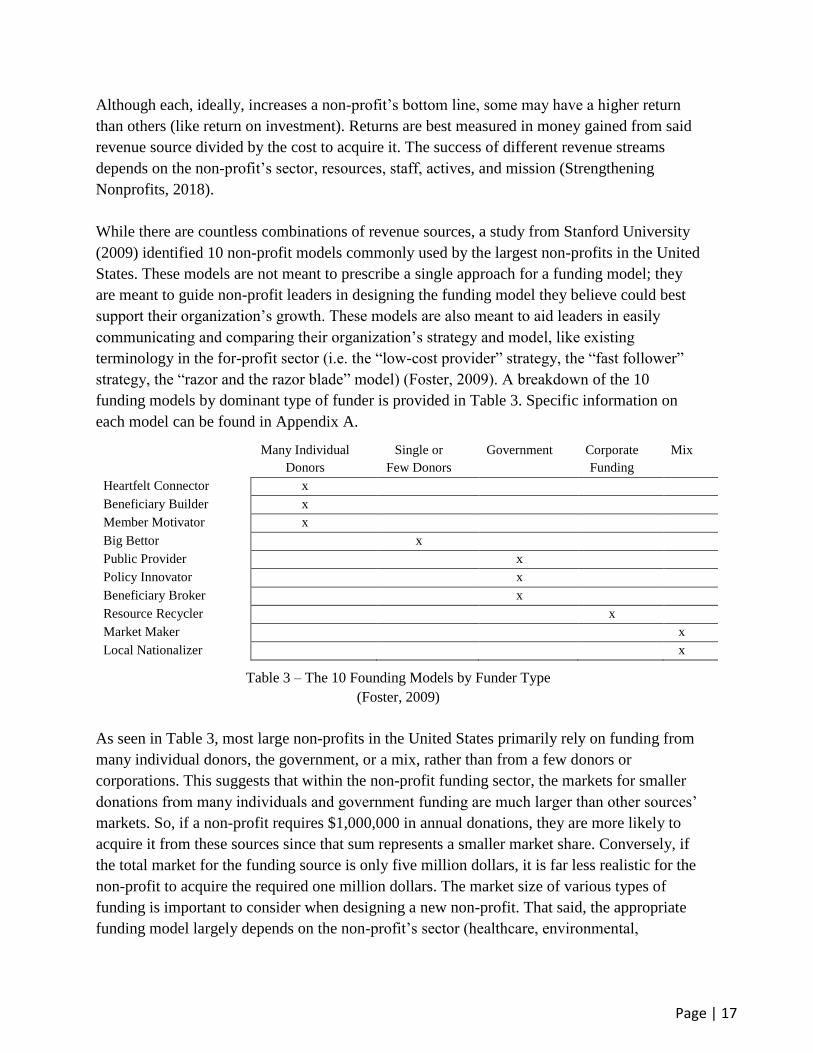
strategy, the “razor and the razor blade” model) (Foster, 2009). A breakdown of the 10
funding models by dominant type of funder is provided in Table 3. Specific information on
each model can be found in Appendix A.
Many Individual
Donors
Single or
Few Donors
Government Corporate
Funding
Mix
Heartfelt Connector x
Beneficiary Builder x
Member Motivator x
Big Bettor x
Public Provider x
Policy Innovator x
Beneficiary Broker x
Resource Recycler x
Market Maker x
Local Nationalizer x
Table 3 – The 10 Founding Models by Funder Type
(Foster, 2009)
As seen in Table 3, most large non-profits in the United States primarily rely on funding from
many individual donors, the government, or a mix, rather than from a few donors or
corporations. This suggests that within the non-profit funding sector, the markets for smaller
donations from many individuals and government funding are much larger than other sources’
markets. So, if a non-profit requires $1,000,000 in annual donations, they are more likely to
acquire it from these sources since that sum represents a smaller market share. Conversely, if
the total market for the funding source is only five million dollars, it is far less realistic for the
non-profit to acquire the required one million dollars. The market size of various types of
funding is important to consider when designing a new non-profit. That said, the appropriate
funding model largely depends on the non-profit’s sector (healthcare, environmental,
Page | 18
education, et cetera) and activities (as outlined in Appendix A).
2.3.2 Donations
Donations can be lumped into four broad sources: corporate giving, foundation giving,
individual giving and bequest giving—it is assumed that cause-related marketing can be
lumped under corporate giving; in-kind donations are part of both corporate and
individual giving; and online donations and benefit events are part of individual giving.
Bequest giving is similar to individual giving, except that donation occurs upon the
individual’s death.
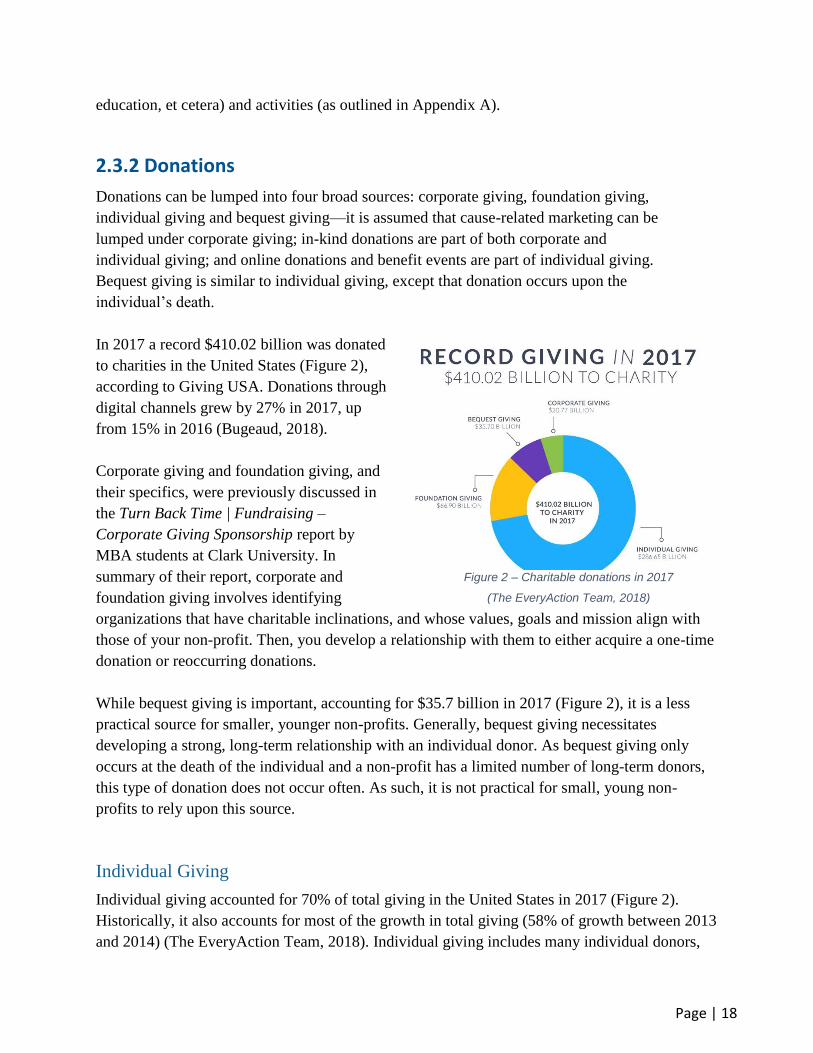
In 2017 a record $410.02 billion was donated
to charities in the United States (Figure 2),
according to Giving USA. Donations through
digital channels grew by 27% in 2017, up
from 15% in 2016 (Bugeaud, 2018).
Corporate giving and foundation giving, and
their specifics, were previously discussed in
the Turn Back Time | Fundraising –
Corporate Giving Sponsorship report by
MBA students at Clark University. In
summary of their report, corporate and
foundation giving involves identifying
organizations that have charitable inclinations, and whose values, goals and mission align with
those of your non-profit. Then, you develop a relationship with them to either acquire a one-time
donation or reoccurring donations.
While bequest giving is important, accounting for $35.7 billion in 2017 (Figure 2), it is a less
practical source for smaller, younger non-profits. Generally, bequest giving necessitates
developing a strong, long-term relationship with an individual donor. As bequest giving only
occurs at the death of the individual and a non-profit has a limited number of long-term donors,
this type of donation does not occur often. As such, it is not practical for small, young non-
profits to rely upon this source.
Individual Giving
Individual giving accounted for 70% of total giving in the United States in 2017 (Figure 2).
Historically, it also accounts for most of the growth in total giving (58% of growth between 2013
and 2014) (The EveryAction Team, 2018). Individual giving includes many individual donors,
Figure 2 – Charitable donations in 2017
(The EveryAction Team, 2018)
Page | 19
each contributing a small amount, and few donors, each contributing a large amount. While
different funding models rely on these two groups to a varying degree, both individual donor
types are initially acquired and retained in much the same way: online media and benefit events.
Overall, of those who donated to a nonprofit in 2016, 38% did so again in 2017. For small non-
profits, 29% of new donors and 55% of reoccurring donors gave again in 2017 (Bugeaud, 2018).
Thus, much of a non-profit’s marketing budget goes towards acquiring new donors and
converting new donors into reoccurring donors. To acquire a new donor, the donor must first
learn of the organization; to convert a new donor into a reoccurring donor, the donor must be
reminded of the organization and see evidence of work it is doing.
Online Media: Many people first learn of a non-profit through digital advertisements. Small non-
profits reported a 94% increase in total digital advertisement spending in 2017. Of that budget,
55% went towards social media advertising; the remainder went towards banner and search ads
(Bugeaud, 2018). As with for-profit companies, nonprofits run various advertisements, each with
different goals (i.e. acquiring donors/customers, lead generation, branding, awareness,
publicizing an important business update, et cetera). In 2017, the breakdown of the average non-
profit’s advertisements by goal were:
66% on direct fundraising and attracting new donors.
This included: retargeting visitors who abandoned donation pages, promoting emergency-response
pages, and sending fundraising posts to the organization’s own followers on social media.
25% on lead generation
This included engaging people to act by: signing petitions, sending letters to lawmakers, taking
quizzes, signing up for newsletters, or some other form of action.
5-10% on branding, awareness or educational ads
To gain awareness and donors, small non-profits tend to devote around 35% to this, rather than 5-10%.
Traditionally, the first place a community member may
interact with a non-profit is on their website. According to
M+R Benchmarks’ 2018 report, which analyzed 154 non-
profit organizations, 1% of non-profit website visitors joined
an email list and 1.1% completed a donation in 2017 (up
18% from 2016). On average, $1.13 was raised per website
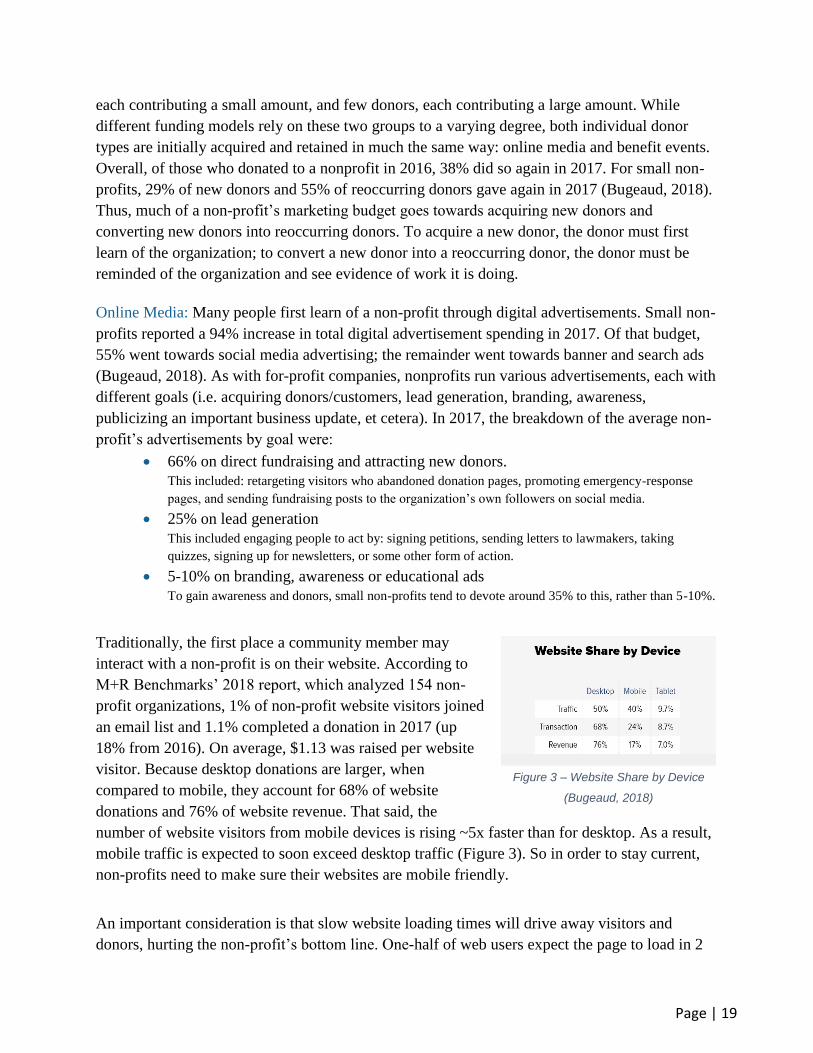
visitor. Because desktop donations are larger, when
compared to mobile, they account for 68% of website
donations and 76% of website revenue. That said, the
number of website visitors from mobile devices is rising ~5x faster than for desktop. As a result,
mobile traffic is expected to soon exceed desktop traffic (Figure 3). So in order to stay current,
non-profits need to make sure their websites are mobile friendly.
An important consideration is that slow website loading times will drive away visitors and
donors, hurting the non-profit’s bottom line. One-half of web users expect the page to load in 2
Figure 3 – Website Share by Device
(Bugeaud, 2018)
Page | 20
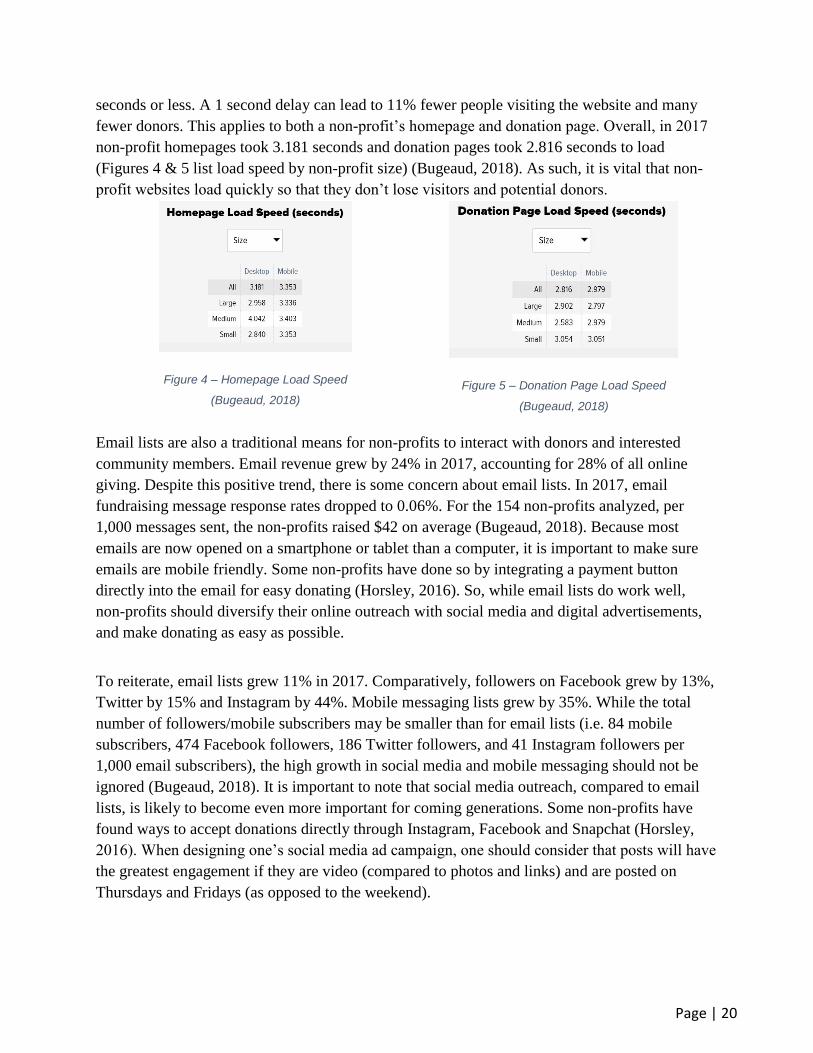
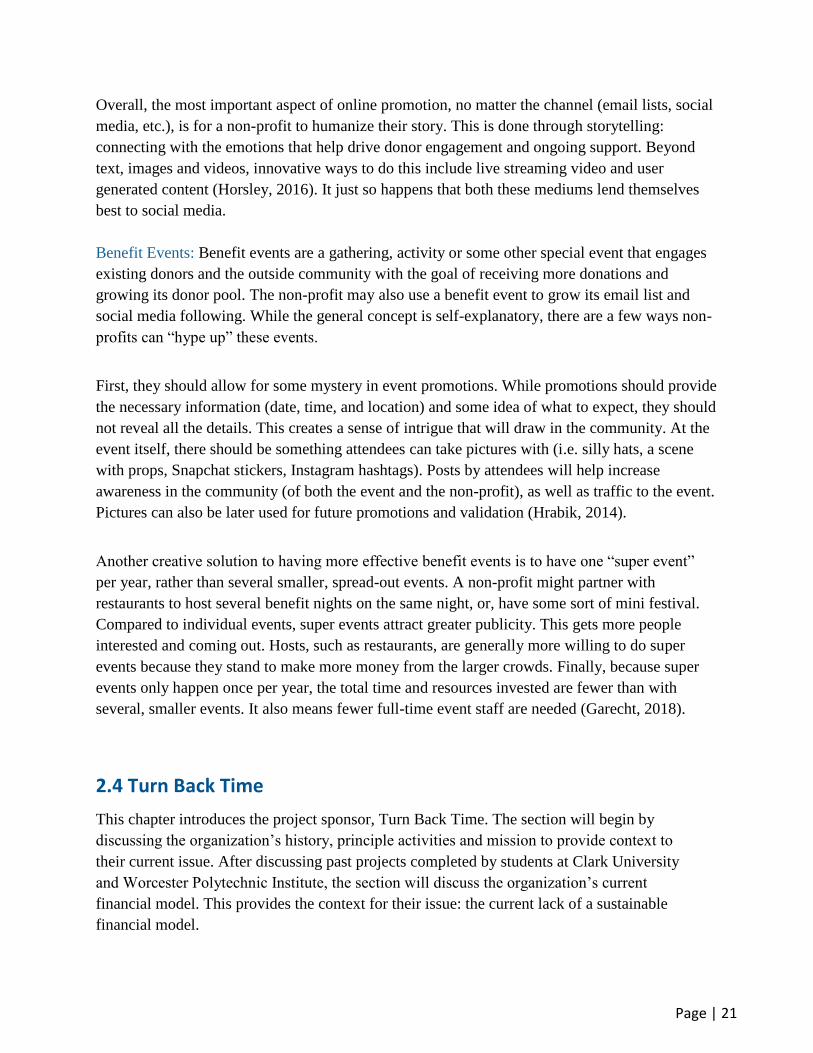
seconds or less. A 1 second delay can lead to 11% fewer people visiting the website and many
fewer donors. This applies to both a non-profit’s homepage and donation page. Overall, in 2017
non-profit homepages took 3.181 seconds and donation pages took 2.816 seconds to load
(Figures 4 & 5 list load speed by non-profit size) (Bugeaud, 2018). As such, it is vital that non-
profit websites load quickly so that they don’t lose visitors and potential donors.
Figure 4 – Homepage Load Speed
(Bugeaud, 2018)
Figure 5 – Donation Page Load Speed
(Bugeaud, 2018)
Email lists are also a traditional means for non-profits to interact with donors and interested
community members. Email revenue grew by 24% in 2017, accounting for 28% of all online
giving. Despite this positive trend, there is some concern about email lists. In 2017, email
fundraising message response rates dropped to 0.06%. For the 154 non-profits analyzed, per
1,000 messages sent, the non-profits raised $42 on average (Bugeaud, 2018). Because most
emails are now opened on a smartphone or tablet than a computer, it is important to make sure
emails are mobile friendly. Some non-profits have done so by integrating a payment button
directly into the email for easy donating (Horsley, 2016). So, while email lists do work well,
non-profits should diversify their online outreach with social media and digital advertisements,
and make donating as easy as possible.
To reiterate, email lists grew 11% in 2017. Comparatively, followers on Facebook grew by 13%,
Twitter by 15% and Instagram by 44%. Mobile messaging lists grew by 35%. While the total
number of followers/mobile subscribers may be smaller than for email lists (i.e. 84 mobile
subscribers, 474 Facebook followers, 186 Twitter followers, and 41 Instagram followers per
1,000 email subscribers), the high growth in social media and mobile messaging should not be
ignored (Bugeaud, 2018). It is important to note that social media outreach, compared to email
lists, is likely to become even more important for coming generations. Some non-profits have
found ways to accept donations directly through Instagram, Facebook and Snapchat (Horsley,
2016). When designing one’s social media ad campaign, one should consider that posts will have
the greatest engagement if they are video (compared to photos and links) and are posted on
Thursdays and Fridays (as opposed to the weekend).
Page | 21
Overall, the most important aspect of online promotion, no matter the channel (email lists, social
media, etc.), is for a non-profit to humanize their story. This is done through storytelling:
connecting with the emotions that help drive donor engagement and ongoing support. Beyond
text, images and videos, innovative ways to do this include live streaming video and user
generated content (Horsley, 2016). It just so happens that both these mediums lend themselves
best to social media.
Benefit Events: Benefit events are a gathering, activity or some other special event that engages
existing donors and the outside community with the goal of receiving more donations and
growing its donor pool. The non-profit may also use a benefit event to grow its email list and
social media following. While the general concept is self-explanatory, there are a few ways non-
profits can “hype up” these events.
First, they should allow for some mystery in event promotions. While promotions should provide
the necessary information (date, time, and location) and some idea of what to expect, they should
not reveal all the details. This creates a sense of intrigue that will draw in the community. At the
event itself, there should be something attendees can take pictures with (i.e. silly hats, a scene
with props, Snapchat stickers, Instagram hashtags). Posts by attendees will help increase
awareness in the community (of both the event and the non-profit), as well as traffic to the event.
Pictures can also be later used for future promotions and validation (Hrabik, 2014).
Another creative solution to having more effective benefit events is to have one “super event”
per year, rather than several smaller, spread-out events. A non-profit might partner with
restaurants to host several benefit nights on the same night, or, have some sort of mini festival.
Compared to individual events, super events attract greater publicity. This gets more people
interested and coming out. Hosts, such as restaurants, are generally more willing to do super
events because they stand to make more money from the larger crowds. Finally, because super
events only happen once per year, the total time and resources invested are fewer than with
several, smaller events. It also means fewer full-time event staff are needed (Garecht, 2018).
2.4 Turn Back Time
This chapter introduces the project sponsor, Turn Back Time. The section will begin by
discussing the organization’s history, principle activities and mission to provide context to
their current issue. After discussing past projects completed by students at Clark University
and Worcester Polytechnic Institute, the section will discuss the organization’s current
financial model. This provides the context for their issue: the current lack of a sustainable
financial model.
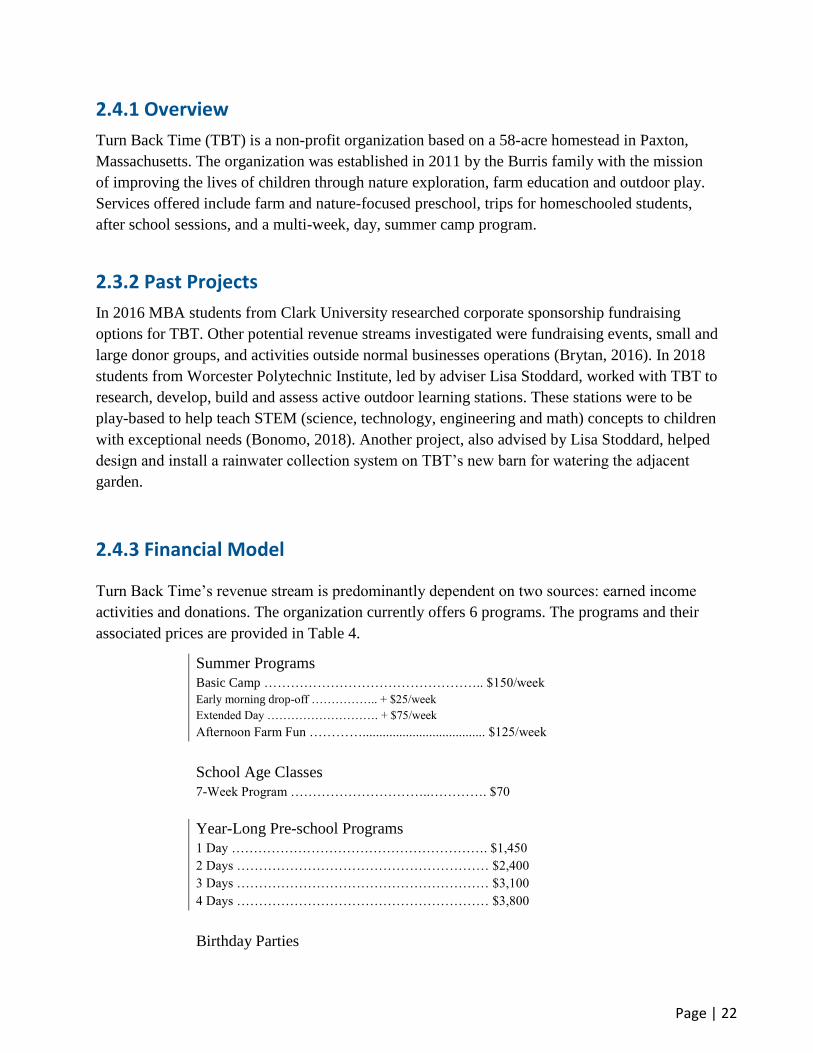
Page | 22
2.4.1 Overview
Turn Back Time (TBT) is a non-profit organization based on a 58-acre homestead in Paxton,
Massachusetts. The organization was established in 2011 by the Burris family with the mission
of improving the lives of children through nature exploration, farm education and outdoor play.
Services offered include farm and nature-focused preschool, trips for homeschooled students,
after school sessions, and a multi-week, day, summer camp program.
2.3.2 Past Projects
In 2016 MBA students from Clark University researched corporate sponsorship fundraising
options for TBT. Other potential revenue streams investigated were fundraising events, small and
large donor groups, and activities outside normal businesses operations (Brytan, 2016). In 2018
students from Worcester Polytechnic Institute, led by adviser Lisa Stoddard, worked with TBT to
research, develop, build and assess active outdoor learning stations. These stations were to be
play-based to help teach STEM (science, technology, engineering and math) concepts to children
with exceptional needs (Bonomo, 2018). Another project, also advised by Lisa Stoddard, helped
design and install a rainwater collection system on TBT’s new barn for watering the adjacent
garden.
2.4.3 Financial Model
Turn Back Time’s revenue stream is predominantly dependent on two sources: earned income
activities and donations. The organization currently offers 6 programs. The programs and their
associated prices are provided in Table 4.
Summer Programs
Basic Camp ………………………………………….. $150/week
Early morning drop-off …………….. + $25/week
Extended Day ………………………. + $75/week
Afternoon Farm Fun …………..................................... $125/week
School Age Classes
7-Week Program …………………………..…………. $70
Year-Long Pre-school Programs
1 Day …………………………………………………. $1,450
2 Days ………………………………………………… $2,400
3 Days ………………………………………………… $3,100
4 Days ………………………………………………… $3,800
Birthday Parties
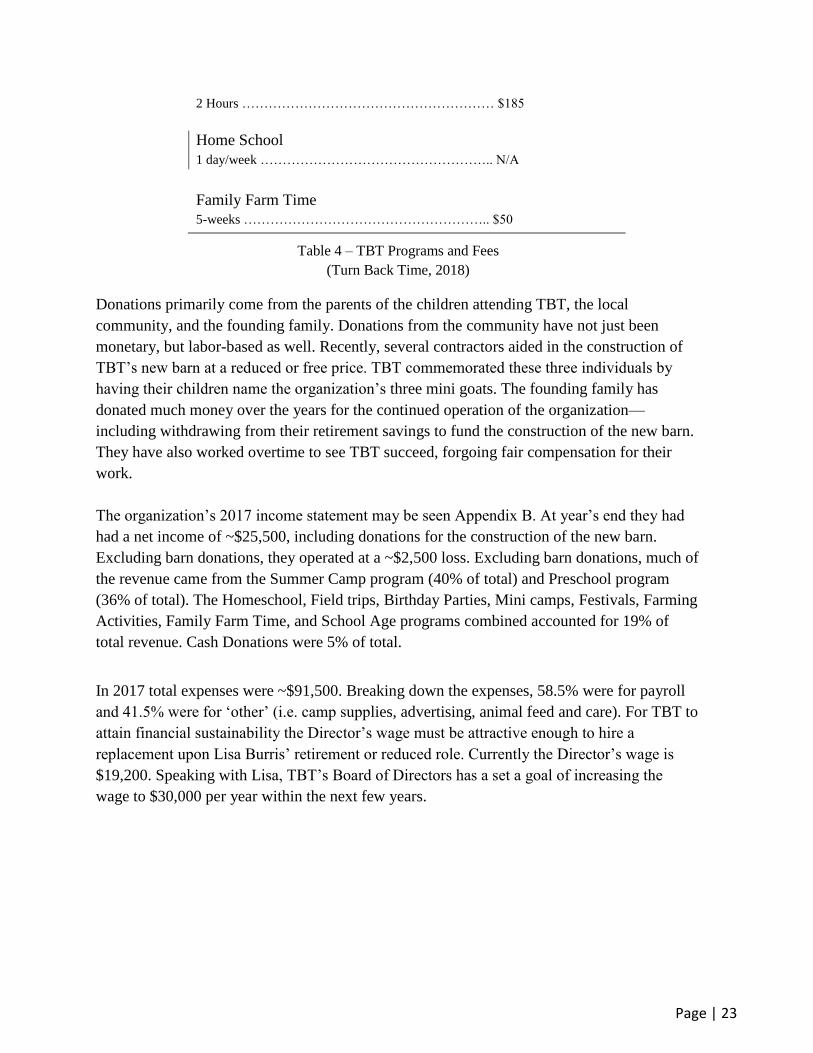
Page | 23
2 Hours ………………………………………………… $185
Home School
1 day/week …………………………………………….. N/A
Family Farm Time
5-weeks ……………………………………………….. $50
Table 4 – TBT Programs and Fees
(Turn Back Time, 2018)
Donations primarily come from the parents of the children attending TBT, the local
community, and the founding family. Donations from the community have not just been
monetary, but labor-based as well. Recently, several contractors aided in the construction of
TBT’s new barn at a reduced or free price. TBT commemorated these three individuals by
having their children name the organization’s three mini goats. The founding family has
donated much money over the years for the continued operation of the organization—
including withdrawing from their retirement savings to fund the construction of the new barn.
They have also worked overtime to see TBT succeed, forgoing fair compensation for their
work.
The organization’s 2017 income statement may be seen Appendix B. At year’s end they had
had a net income of ~$25,500, including donations for the construction of the new barn.
Excluding barn donations, they operated at a ~$2,500 loss. Excluding barn donations, much of
the revenue came from the Summer Camp program (40% of total) and Preschool program
(36% of total). The Homeschool, Field trips, Birthday Parties, Mini camps, Festivals, Farming
Activities, Family Farm Time, and School Age programs combined accounted for 19% of
total revenue. Cash Donations were 5% of total.
In 2017 total expenses were ~$91,500. Breaking down the expenses, 58.5% were for payroll
and 41.5% were for ‘other’ (i.e. camp supplies, advertising, animal feed and care). For TBT to
attain financial sustainability the Director’s wage must be attractive enough to hire a
replacement upon Lisa Burris’ retirement or reduced role. Currently the Director’s wage is
$19,200. Speaking with Lisa, TBT’s Board of Directors has a set a goal of increasing the
wage to $30,000 per year within the next few years.
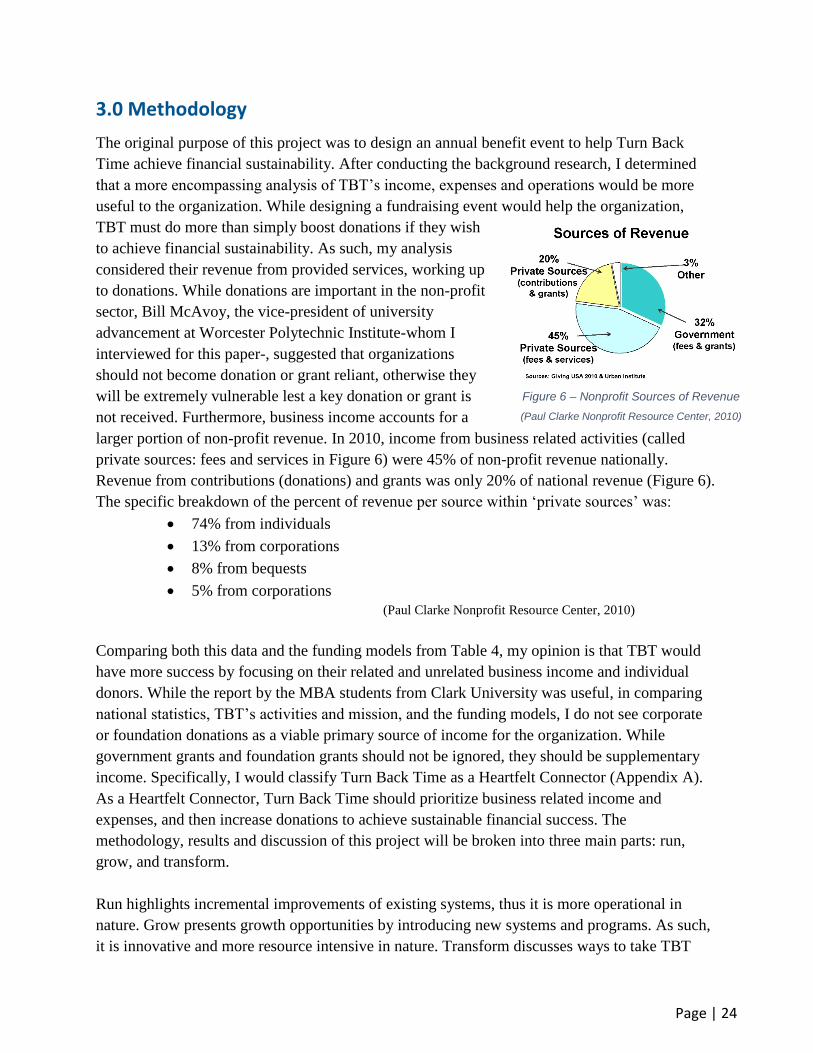
Page | 24
3.0 Methodology
The original purpose of this project was to design an annual benefit event to help Turn Back
Time achieve financial sustainability. After conducting the background research, I determined
that a more encompassing analysis of TBT’s income, expenses and operations would be more
useful to the organization. While designing a fundraising event would help the organization,
TBT must do more than simply boost donations if they wish
to achieve financial sustainability. As such, my analysis
considered their revenue from provided services, working up
to donations. While donations are important in the non-profit
sector, Bill McAvoy, the vice-president of university
advancement at Worcester Polytechnic Institute-whom I
interviewed for this paper-, suggested that organizations
should not become donation or grant reliant, otherwise they
will be extremely vulnerable lest a key donation or grant is
not received. Furthermore, business income accounts for a
larger portion of non-profit revenue. In 2010, income from business related activities (called
private sources: fees and services in Figure 6) were 45% of non-profit revenue nationally.
Revenue from contributions (donations) and grants was only 20% of national revenue (Figure 6).
The specific breakdown of the percent of revenue per source within ‘private sources’ was:
74% from individuals
13% from corporations
8% from bequests
5% from corporations
(Paul Clarke Nonprofit Resource Center, 2010)
Comparing both this data and the funding models from Table 4, my opinion is that TBT would
have more success by focusing on their related and unrelated business income and individual
donors. While the report by the MBA students from Clark University was useful, in comparing
national statistics, TBT’s activities and mission, and the funding models, I do not see corporate
or foundation donations as a viable primary source of income for the organization. While
government grants and foundation grants should not be ignored, they should be supplementary
income. Specifically, I would classify Turn Back Time as a Heartfelt Connector (Appendix A).
As a Heartfelt Connector, Turn Back Time should prioritize business related income and
expenses, and then increase donations to achieve sustainable financial success. The
methodology, results and discussion of this project will be broken into three main parts: run,
grow, and transform.
Run highlights incremental improvements of existing systems, thus it is more operational in
nature. Grow presents growth opportunities by introducing new systems and programs. As such,
it is innovative and more resource intensive in nature. Transform discusses ways to take TBT
Figure 6 – Nonprofit Sources of Revenue
(Paul Clarke Nonprofit Resource Center, 2010)
Page | 25
from its current “startup-like” stage to becoming an established, mature organization; to grow up.
As such, these three sections are meant to provide a holistic view of TBT’s current position and
their importance to the organization’s success.
3.1 Run
The first step to financial sustainability is to ensure that the organization operates smoothly and
profitably on a day to day basis. It is analogous to the responsibilities held by the Chief
Operating Officer in a for-profit business. In terms of innovation, it can be classified as
incremental innovation; efficiency is of primary importance. In this analysis ‘Run’ will look at:
- minimizing expenses
- pricing of their services
- web-page loading speed
- design and content of their website
- donation structure
- targeted promoting for donations
Minimizing Expenses
If TBT is able to reduce their annual expenses, they will inherently boost their bottom line and
require less income/fewer donations to break even. Savings from reducing expenses may be
reassigned to increasing salaries or hiring additional talent.
TBT’s past financial records are broken down by category, making it possible to determine what
areas are the most costly and, thus, which would have the largest impact on the organization’s
bottom line if they were reduced. As such, I identified expenses could be reduced by switching to
a different service provider or seeking specific donations from specific organizations.
Pricing of their Services
As stressed by Bill McAvoy, a non-profit must break even from their business-related income. If
they are reliant on donations or grants, then they are at risk for failure if a key donation or grant
is not received. As such, I compared TBT’s pricing for its programs to at least 20 organizations
across the country with similar program offerings. Specifically, I calculated the price per hour of
the different programs each organization offers (divide the program price by the number of days
it lasts, then by the number of hours per day). Tabulating this data in Excel, I then calculated the
mean price per hour that organizations in this industry charge for their services. This is a fair
comparison because it shows how much money the organization earns per hour of work—
Page | 26
essentially, what one hour of their time is worth. This information is useful for determining how
TBT compares to other nature programs. I included data for 22 nature programs (TBT included).
I also compared program prices to the average median household income for householders 25-44
years old for the local and surrounding counties and towns of each organization (using Income
By Zipcode which pulls data from the US Census Bureau and American Community Survey).
This approach makes sense because these programs receive campers not just from the local town,
but from surrounding towns and the rest of the county. Conducting a regression model, I was
able to determine if the prices charged correlated to the wealth of the parents whose children
attend the programs. To control for potential price differences by state, a few of the selected
organizations are located in Massachusetts.
Web-Page Loading Speeds
As covered in section 2.2.3 Donations, how quickly a non-profit’s webpage loads may affect the
number of site visitors and, thus, donors. First, I used tools that measure loading speed (i.e.,
Pingdom and WebPageTest) to compare across each of the organizations from the price
comparison. These tools also provided recommendations on how to improve a web page’s load
speed. Then, I attempted to extrapolate how many visitors TBT is losing due to loading speed
and how that may be impacting online donations.
Design and Content of their Website
A website’s design and content can have an enormous effect on a visitor’s understanding,
perception and willingness to donate to an organization. The website is oftentimes the first place
a newcomer will interact with an organization, thus it is critical to hook them quickly. They
should be able to easily identify who you are and what you do, find evidence of your past
success (to provide legitimacy) and learn how they can help. While I attempted to provide an
unbiased analysis of TBT’s website, website design is inherently a personal experience.
Donation Structure
When asked if there are any notable, current trends with respect to donating, Bill McAvoy
mentioned that, nationally, donors are no longer interested in general giving (letting the non-
profit decide where to allocate a donation); they want specific donations (where the donor
chooses what the money is used for). Taking this into account, I compared this national trend to
TBT’s current donation structure.
Page | 27
Targeted Promoting for Individual Donors
Another of Bill’s recommendations was to use income by zip code data (from the US Census
Bureau, American Community Survey and IRS tax records) to determine which local addresses
would be the best to mail invites to a fundraiser event and/or ask for a donation. Among the data
sets provided by the IRS, only in 2016 was there a column for both the total number of tax filings
(which may represent an individual, family or household) that recorded having donated in that
year, and the total amount that was donated. This data was broken down both by zip code and
income bracket. Using this data I determined which zip codes around TBT would be the most
worthwhile to target.
3.2 Grow
While operating efficiently is important, an organization cannot simply maintain status quo
without the risk of being surpassed or forgotten in today’s fast-paced world. An organization
must also consider growth for continued financial success. In the case of for-profit enterprises,
they must introduce new products and services to keep their customers interested to grow market
share. While non-profits are not competing for market share, they are competing for donation
dollars, community interest (for donations and support) and attention. In this analysis ‘Grow’
looked at:
- grant writing
- new programs
- fundraiser event
- membership system
Grant Writing
While grant writing is not the primary income source of a Heartfelt Connector, according to Bill,
grants can provide a fantastic supplementary income and should not be discounted.
New Programs
While conducting the program price comparison, I came across programs offered by the other
organizations that TBT does not. Some of these programs may be interesting to TBT to help
diversify and update their offerings. The programs may also help TBT target different
demographics, increasing their customer base and business-related income.
While TBT could develop their existing programs, which may attract more students, it would not
diversify their consumer base. The impact of developing existing programs versus developing
Page | 28
new programs was not studied in this analysis and remains as an important question for the
organization to consider.
Fundraiser Event
Drawing upon online resources, recommendations from those who have run similar events, and
my own experiences, I offered ideas for a potential fundraiser event. This event could be run
annually to garner publicity, recognize board members and significant donors, grow the email
alias, and gather donations.
Membership Program
Another of Bill’s recommendations for non-profits like TBT is to consider offering a
membership that provides certain benefits. I provided insight as to what the membership fees are
at the similar organizations, and what benefits they offer.
3.3 Transform
Now that the organization is operating efficiently and attracting donor and community interest
with new programs, it must ensure it has strong foundations to succeed during both the good and
bad times. ‘Transform’ refers to the idea of maturing from a ‘start-up-like’ non-profit, to an
established one that will stand the test of time. Strong foundations can be broken into two
categories: talent and monetary fall back. Talent means the organization has the necessary
personnel to implement and run the programs from the Run and Grow phases. Monetary fall
back refers to having a safety net in case revenue falls short one year or large, unexpected costs
arise. In this analysis ‘Transform’ looked at:
- developing an endowment fund
- supplementing the current director role with a second officer
Endowment Fund
As suggested by both online sources and Bill, establishing an endowment fund is critical to the
long-term success and maturing of a non-profit. I investigated both the benefits of having an
endowment and how TBT might go about starting one.
Page | 29
Supplementing the Current Director Role
For-profit enterprises operate with on externally facing officer (the CEO) and one internally
facing one (the COO). Having these two roles ensures that the organization can maintain both
internal and external excellence and growth. In the case of large, established non-profits, this
externally facing director is called the Fundraising Director. They are responsible for
communicating with potential and current donors (individuals, corporations and foundations),
planning fundraiser events, managing the website (which is externally facing), and applying for
grants. Bill spoke about this duality at length in our interview. I investigated potential
responsibilities for this new director, as well as how the new roles might impact the organization
financially.
Page | 30
4.0 Results & Discussion
4.1 Run
Minimizing Expenses
In 2017 Turn Back Time lost ~$2,300 to PayPal fees (Appendix B). This expense primarily
consists of transaction fees (2.9% + 30¢), an add-on feature that allows them to charge cards
from the website ($30/month) and advanced fraud protection ($10/month). PayPal also charges a
3.5% transaction fee for American Express card users. While one of their competitors, Stripe, has
the same transaction fee, charging cards on a website and advanced fraud protection are free.
Stripe does not charge any additional rate for American Express. Also, recurring billing is free
with Stripe, whereas for PayPal it’s $10/month. Alternatively, Skrill, another competitor, has a
transaction fee of only 1-2.9%. Thus, by switching to Stripe or Skrill, TBT could save at least
$500 annually on reoccurring monthly fees alone. If TBT decides to switch to Stripe, they should
hire a website developer to integrate it into the website. Part of the reason Stripe’s fees are lower
is because it counts on developers to do some of the integration themselves.
In 2017 TBT spent $550 on garden supplies and $2,870 on repair and maintenance. The
organization may wish to approach Home Depot, Lowes or a similar hardware store about
donating supplies. Similarly, to reduce the expense of animal feed and care, which was ~$8,300
in 2017, TBT could approach the Leicester Agway or a similar business for donations of feed.
Agway carries both animal feed and lawn/garden care supplies. Any donation would temporarily
help reduce these costs.
As the fundraising maxim goes, “ask for money, you’ll get advice. Ask for advice, you’ll get
money” (Koenig, 2019, p.1). When TBT approaches a corporation for donations, they may want
to first ask for advice instead. For example, rather than asking for a donation of animal feed,
TBT could ask the manager for advice on cheaper, alternative feed types or how to use the feed
more efficiently to reduce expense. By asking for advice the manager is made to feel valued and
important. Prior to making the Ask, however, TBT should first research the manager. “We don’t
convince donors. We help them realize that they already care” (Koenig, 2019, p.1). Developing
targeted questions and learning about the manager makes it easier to relate TBT’s mission and
issues to things that the manager already cares about. It is important in this conversation to use
silence as a tool. For example:
Fundraiser: “What’s the most important thing about the environment to you?”
Donor: “Well, I think the environmental damage is a pretty big problem. We’re hurting the
environment forever and we don’t even realize it!”
Fundraiser: “How interesting” [shuts up and looks genuinely interested]
Donor: [feels like they should keep talking because of the silence] “… yeah! It’s really crazy.
In fact, the other day I was thinking about when I was a kid and would go out and look as the
Page | 31
stars in the country and see meteors and all kinds of awesome stuff. But now that the city is so
big, and there’s so much light pollution and smog, when I go out with MY kids to our cabin
we’re lucky to see anything. It’s so sad.”
(Koenig, 2019, p.1)
Finally, the Ask should be well rehearsed, interesting (unlike plain, bullet point slides),
unambiguous and specific. This includes identifying a specific amount that TBT requests be
contributed to the cause. If the Ask comes as surprise to the prospect, then something is amiss
(Koenig, 2019).
Pricing of their Services
Table 5 shows the price (per hour) of programs offered at 22 nature-oriented organizations like
Turn Back Time. These calculations do not factor in add-on packages or taxes. Data is 2017
inflation-adjusted. I took the average of the median income for both the county and town(s)
where the nature camp is located.
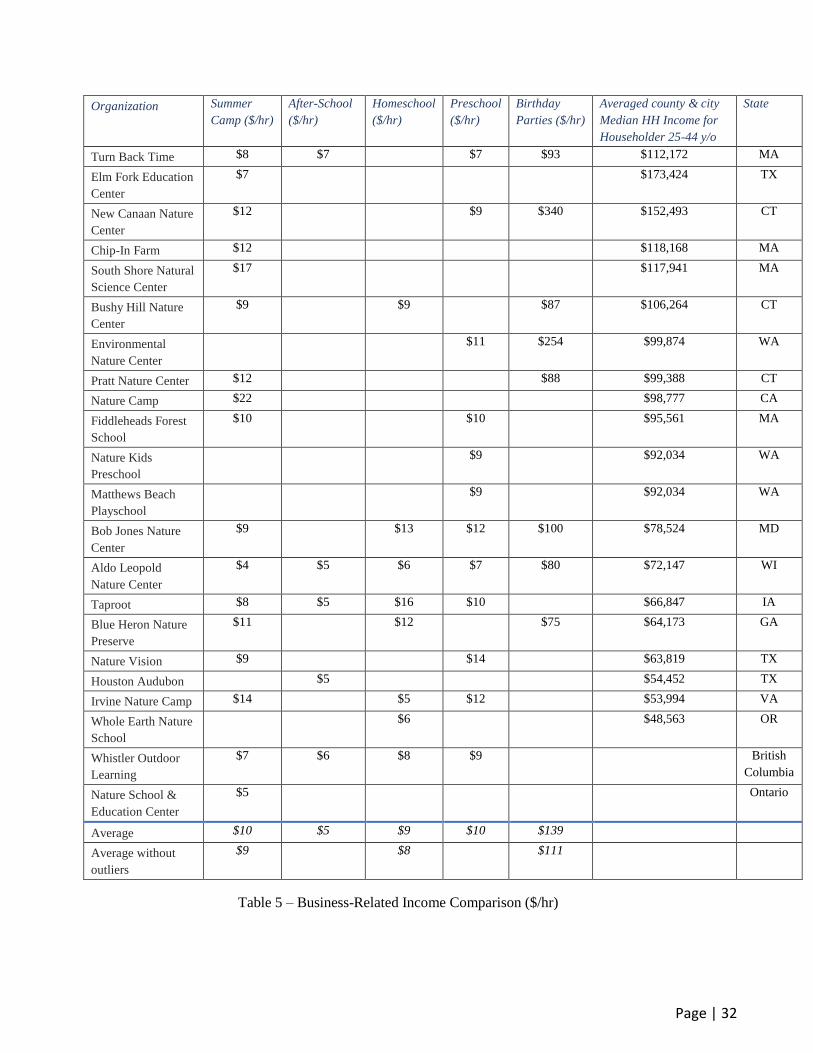
Page | 32
Organization Summer
Camp ($/hr)
After-School
($/hr)
Homeschool
($/hr)
Preschool
($/hr)
Birthday
Parties ($/hr)
Averaged county & city
Median HH Income for
Householder 25-44 y/o
State
Turn Back Time $8 $7 $7 $93 $112,172 MA
Elm Fork Education
Center
$7 $173,424 TX
New Canaan Nature
Center
$12 $9 $340 $152,493 CT
Chip-In Farm $12 $118,168 MA
South Shore Natural
Science Center
$17 $117,941 MA
Bushy Hill Nature
Center
$9 $9 $87 $106,264 CT
Environmental
Nature Center
$11 $254 $99,874 WA
Pratt Nature Center $12 $88 $99,388 CT
Nature Camp $22 $98,777 CA
Fiddleheads Forest
School
$10 $10 $95,561 MA
Nature Kids
Preschool
$9 $92,034 WA
Matthews Beach
Playschool
$9 $92,034 WA
Bob Jones Nature
Center
$9 $13 $12 $100 $78,524 MD
Aldo Leopold
Nature Center
$4 $5 $6 $7 $80 $72,147 WI
Taproot $8 $5 $16 $10 $66,847 IA
Blue Heron Nature
Preserve
$11 $12 $75 $64,173 GA
Nature Vision $9 $14 $63,819 TX
Houston Audubon $5 $54,452 TX
Irvine Nature Camp $14 $5 $12 $53,994 VA
Whole Earth Nature
School
$6 $48,563 OR
Whistler Outdoor
Learning
$7 $6 $8 $9 British
Columbia
Nature School &
Education Center
$5 Ontario
Average $10 $5 $9 $10 $139
Average without
outliers
$9 $8 $111
Table 5 – Business-Related Income Comparison ($/hr)
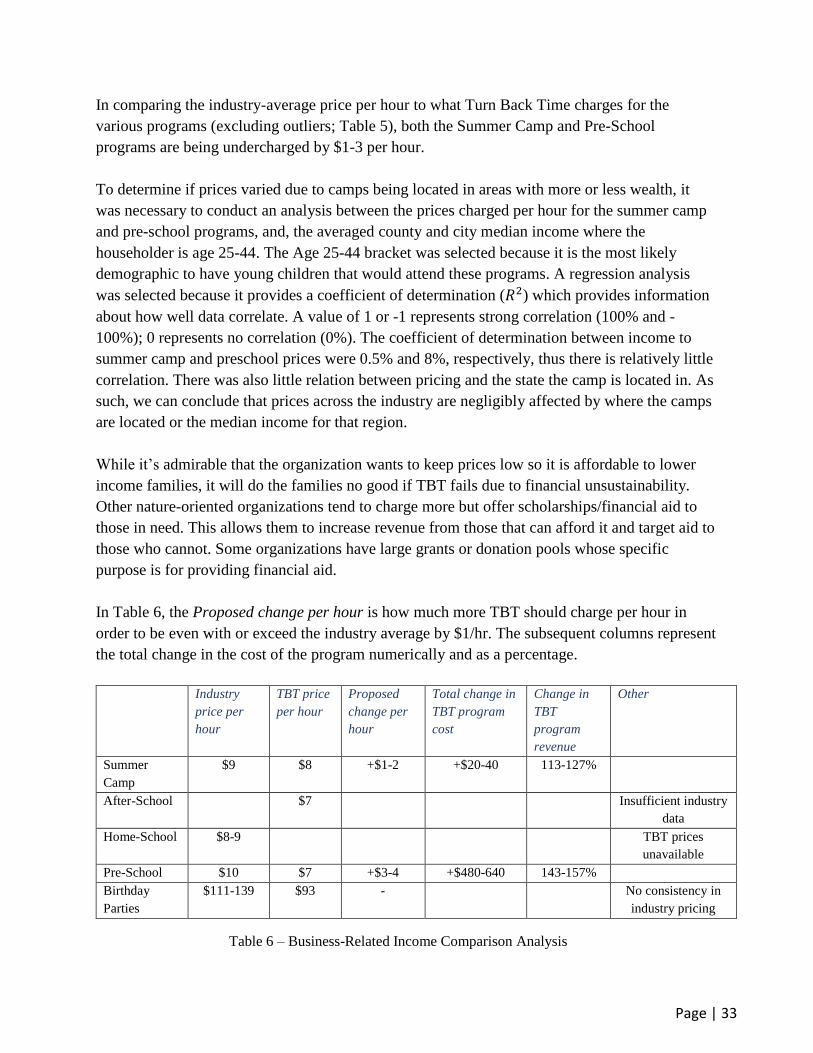
Page | 33
In comparing the industry-average price per hour to what Turn Back Time charges for the
various programs (excluding outliers; Table 5), both the Summer Camp and Pre-School
programs are being undercharged by $1-3 per hour.
To determine if prices varied due to camps being located in areas with more or less wealth, it
was necessary to conduct an analysis between the prices charged per hour for the summer camp
and pre-school programs, and, the averaged county and city median income where the
householder is age 25-44. The Age 25-44 bracket was selected because it is the most likely
demographic to have young children that would attend these programs. A regression analysis
was selected because it provides a coefficient of determination (𝑅2) which provides information
about how well data correlate. A value of 1 or -1 represents strong correlation (100% and -
100%); 0 represents no correlation (0%). The coefficient of determination between income to
summer camp and preschool prices were 0.5% and 8%, respectively, thus there is relatively little
correlation. There was also little relation between pricing and the state the camp is located in. As
such, we can conclude that prices across the industry are negligibly affected by where the camps
are located or the median income for that region.
While it’s admirable that the organization wants to keep prices low so it is affordable to lower
income families, it will do the families no good if TBT fails due to financial unsustainability.
Other nature-oriented organizations tend to charge more but offer scholarships/financial aid to
those in need. This allows them to increase revenue from those that can afford it and target aid to
those who cannot. Some organizations have large grants or donation pools whose specific
purpose is for providing financial aid.
In Table 6, the Proposed change per hour is how much more TBT should charge per hour in
order to be even with or exceed the industry average by $1/hr. The subsequent columns represent
the total change in the cost of the program numerically and as a percentage.
Industry
price per
hour
TBT price
per hour
Proposed
change per
hour
Total change in
TBT program
cost
Change in
TBT
program
revenue
Other
Summer
Camp
$9 $8 +$1-2 +$20-40 113-127%
After-School $7 Insufficient industry
data
Home-School $8-9 TBT prices
unavailable
Pre-School $10 $7 +$3-4 +$480-640 143-157%
Birthday
Parties
$111-139 $93 - No consistency in
industry pricing
Table 6 – Business-Related Income Comparison Analysis
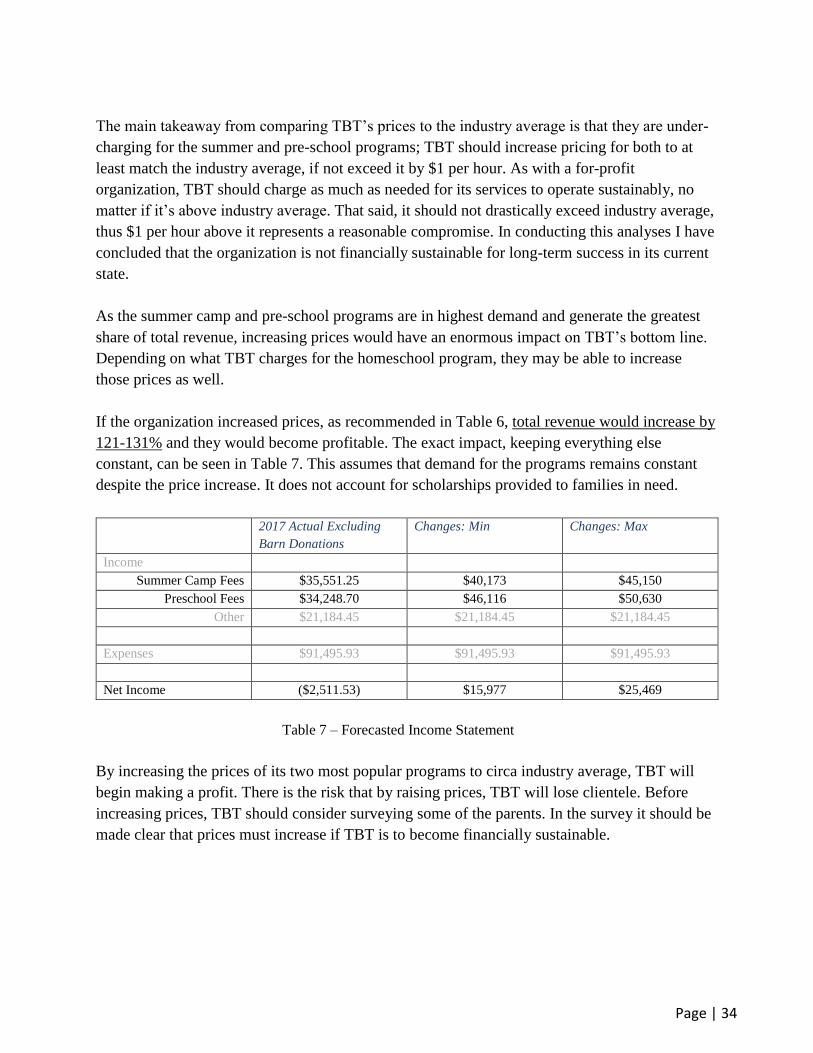
Page | 34
The main takeaway from comparing TBT’s prices to the industry average is that they are under-
charging for the summer and pre-school programs; TBT should increase pricing for both to at
least match the industry average, if not exceed it by $1 per hour. As with a for-profit
organization, TBT should charge as much as needed for its services to operate sustainably, no
matter if it’s above industry average. That said, it should not drastically exceed industry average,
thus $1 per hour above it represents a reasonable compromise. In conducting this analyses I have
concluded that the organization is not financially sustainable for long-term success in its current
state.
As the summer camp and pre-school programs are in highest demand and generate the greatest
share of total revenue, increasing prices would have an enormous impact on TBT’s bottom line.
Depending on what TBT charges for the homeschool program, they may be able to increase
those prices as well.
If the organization increased prices, as recommended in Table 6, total revenue would increase by
121-131% and they would become profitable. The exact impact, keeping everything else
constant, can be seen in Table 7. This assumes that demand for the programs remains constant
despite the price increase. It does not account for scholarships provided to families in need.
2017 Actual Excluding
Barn Donations
Changes: Min Changes: Max
Income
Summer Camp Fees $35,551.25 $40,173 $45,150
Preschool Fees $34,248.70 $46,116 $50,630
Other $21,184.45 $21,184.45 $21,184.45
Expenses $91,495.93 $91,495.93 $91,495.93
Net Income ($2,511.53) $15,977 $25,469
Table 7 – Forecasted Income Statement
By increasing the prices of its two most popular programs to circa industry average, TBT will
begin making a profit. There is the risk that by raising prices, TBT will lose clientele. Before
increasing prices, TBT should consider surveying some of the parents. In the survey it should be
made clear that prices must increase if TBT is to become financially sustainable.
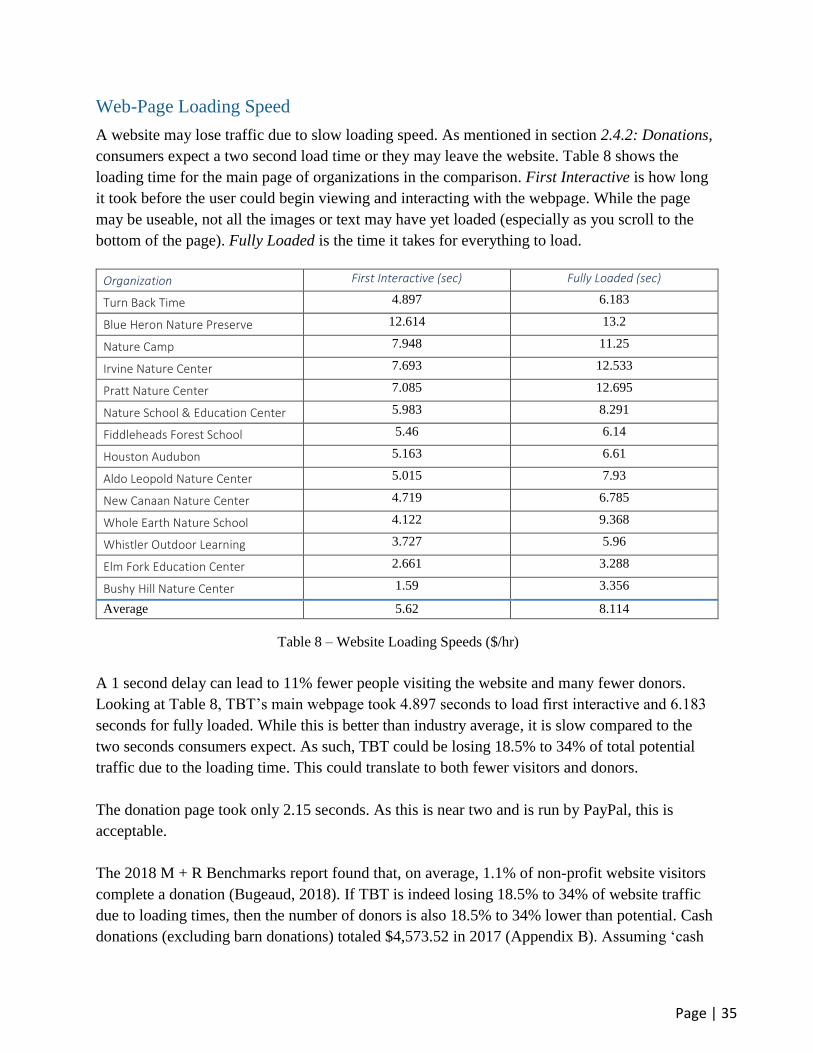
Page | 35
Web-Page Loading Speed
A website may lose traffic due to slow loading speed. As mentioned in section 2.4.2: Donations,
consumers expect a two second load time or they may leave the website. Table 8 shows the
loading time for the main page of organizations in the comparison. First Interactive is how long
it took before the user could begin viewing and interacting with the webpage. While the page
may be useable, not all the images or text may have yet loaded (especially as you scroll to the
bottom of the page). Fully Loaded is the time it takes for everything to load.
Organization First Interactive (sec) Fully Loaded (sec)
Turn Back Time 4.897 6.183
Blue Heron Nature Preserve 12.614 13.2
Nature Camp 7.948 11.25
Irvine Nature Center 7.693 12.533
Pratt Nature Center 7.085 12.695
Nature School & Education Center 5.983 8.291
Fiddleheads Forest School 5.46 6.14
Houston Audubon 5.163 6.61
Aldo Leopold Nature Center 5.015 7.93
New Canaan Nature Center 4.719 6.785
Whole Earth Nature School 4.122 9.368
Whistler Outdoor Learning 3.727 5.96
Elm Fork Education Center 2.661 3.288
Bushy Hill Nature Center 1.59 3.356
Average 5.62 8.114
Table 8 – Website Loading Speeds ($/hr)
A 1 second delay can lead to 11% fewer people visiting the website and many fewer donors.
Looking at Table 8, TBT’s main webpage took 4.897 seconds to load first interactive and 6.183
seconds for fully loaded. While this is better than industry average, it is slow compared to the
two seconds consumers expect. As such, TBT could be losing 18.5% to 34% of total potential
traffic due to the loading time. This could translate to both fewer visitors and donors.
The donation page took only 2.15 seconds. As this is near two and is run by PayPal, this is
acceptable.
The 2018 M + R Benchmarks report found that, on average, 1.1% of non-profit website visitors
complete a donation (Bugeaud, 2018). If TBT is indeed losing 18.5% to 34% of website traffic
due to loading times, then the number of donors is also 18.5% to 34% lower than potential. Cash
donations (excluding barn donations) totaled $4,573.52 in 2017 (Appendix B). Assuming ‘cash
Page | 36
donations’ are primarily via the website and scale linearly to website visitors, then TBT could
have received $850 to $1,560 more in cash donations if loading times had been faster.
Hiring a website developer to redo the website would cost several thousands of dollars, but
assuming TBT is planning to exist for decades to come, these changes would be well worth it;
TBT should try not to put off future profits to minimize present costs. Section 5.1 Financial
Predictions of Recommendations discusses potential strategies for reducing the cost of hiring a
web developer.
Design and Content on Website
Currently, it is very difficult to locate the “donate” button on TBT’s website. A visitor must
navigate away from the main page and then scroll; this most certainly has a negative impact on
visitors donating to TBT. Instead, the “donate” button should be placed in a fixed location (i.e.
the top right corner of the website or in the menu bar) which stays constant no matter which page
a visitor navigates to. The first step to acquiring more donations is making donating as easy as
possible.
Second, the main page should feature a brief video, in place of pictures, that tells the
organization’s story, mission and what they provide. The video should contain pictures and video
clips of the programs. Currently, the current front page is sparse on information, making it
difficult to figure out who TBT is and what it does; visitors must dig around the website to find
these details. This is extremely un-intuitive and may drive away traffic. Furthermore, visitors
will only donate if they know to whom they are donating and believe in what they are doing.
This information must be made extremely easy to find and clear to understand. It may be
worthwhile to hire or leverage connections to acquire a video professional to ensure TBT has a
high-quality video.
Third, the “Programs” drop down menu shows a different order of the programs than the actual
“programs” page. This should be changed to match, with the most popular programs at the top.
Also, prices, hours and dates should be made very clear on each program’s page. Currently
visitors must download a PDF which provides the information. This is an unnecessary extra step
which may drive away traffic. All the information available on the PDF should also be available
on the web page.
If TBT were to renovate their website following the recommendations under Web-Page Loading
Speed, they would likely increase their ‘cash donations’ by more than $850 to $1,560 annually.
These estimates assume 1.1% of website visitors complete a donation, as reported in the M+R
Benchmarks’ 2018 report (Bugeaud, 2018). My hypothesis is that due to the design of the main
page, information not being easy to find, and the location of the donation button, less than 1.1%
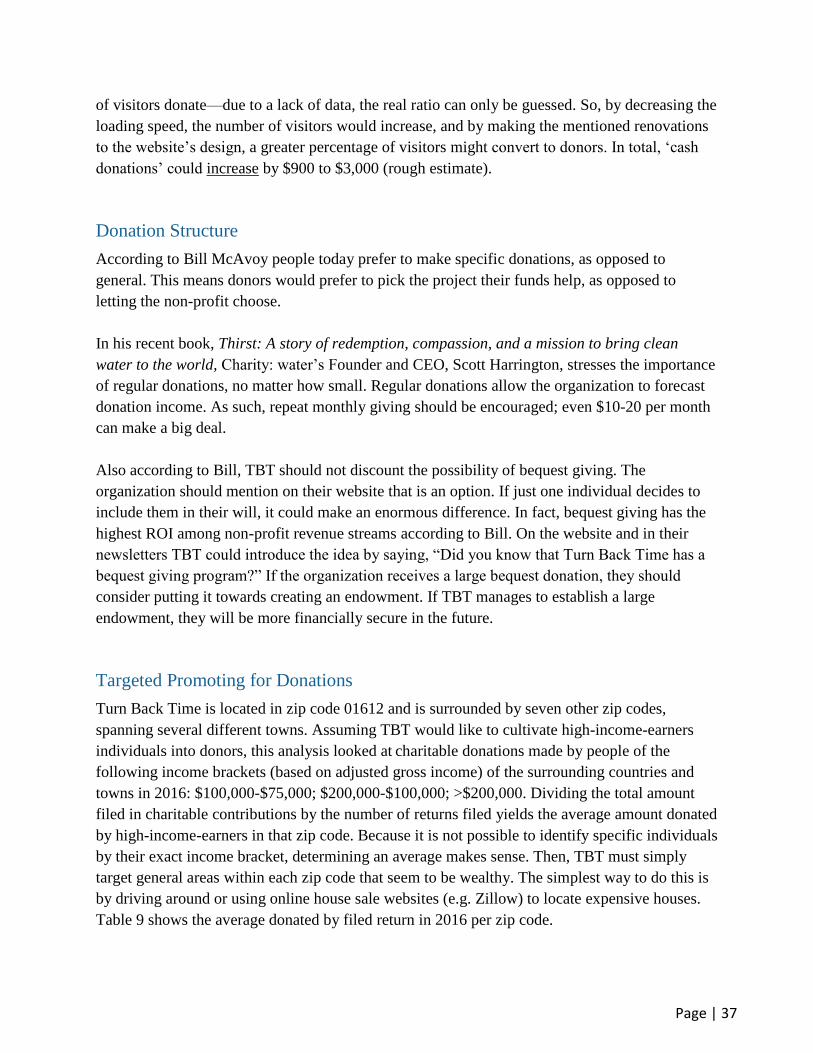
Page | 37
of visitors donate—due to a lack of data, the real ratio can only be guessed. So, by decreasing the
loading speed, the number of visitors would increase, and by making the mentioned renovations
to the website’s design, a greater percentage of visitors might convert to donors. In total, ‘cash
donations’ could increase by $900 to $3,000 (rough estimate).
Donation Structure
According to Bill McAvoy people today prefer to make specific donations, as opposed to
general. This means donors would prefer to pick the project their funds help, as opposed to
letting the non-profit choose.
In his recent book, Thirst: A story of redemption, compassion, and a mission to bring clean
water to the world, Charity: water’s Founder and CEO, Scott Harrington, stresses the importance
of regular donations, no matter how small. Regular donations allow the organization to forecast
donation income. As such, repeat monthly giving should be encouraged; even $10-20 per month
can make a big deal.
Also according to Bill, TBT should not discount the possibility of bequest giving. The
organization should mention on their website that is an option. If just one individual decides to
include them in their will, it could make an enormous difference. In fact, bequest giving has the
highest ROI among non-profit revenue streams according to Bill. On the website and in their
newsletters TBT could introduce the idea by saying, “Did you know that Turn Back Time has a
bequest giving program?” If the organization receives a large bequest donation, they should
consider putting it towards creating an endowment. If TBT manages to establish a large
endowment, they will be more financially secure in the future.
Targeted Promoting for Donations
Turn Back Time is located in zip code 01612 and is surrounded by seven other zip codes,
spanning several different towns. Assuming TBT would like to cultivate high-income-earners
individuals into donors, this analysis looked at charitable donations made by people of the
following income brackets (based on adjusted gross income) of the surrounding countries and
towns in 2016: $100,000-$75,000; $200,000-$100,000; >$200,000. Dividing the total amount
filed in charitable contributions by the number of returns filed yields the average amount donated
by high-income-earners in that zip code. Because it is not possible to identify specific individuals
by their exact income bracket, determining an average makes sense. Then, TBT must simply
target general areas within each zip code that seem to be wealthy. The simplest way to do this is
by driving around or using online house sale websites (e.g. Zillow) to locate expensive houses.
Table 9 shows the average donated by filed return in 2016 per zip code.
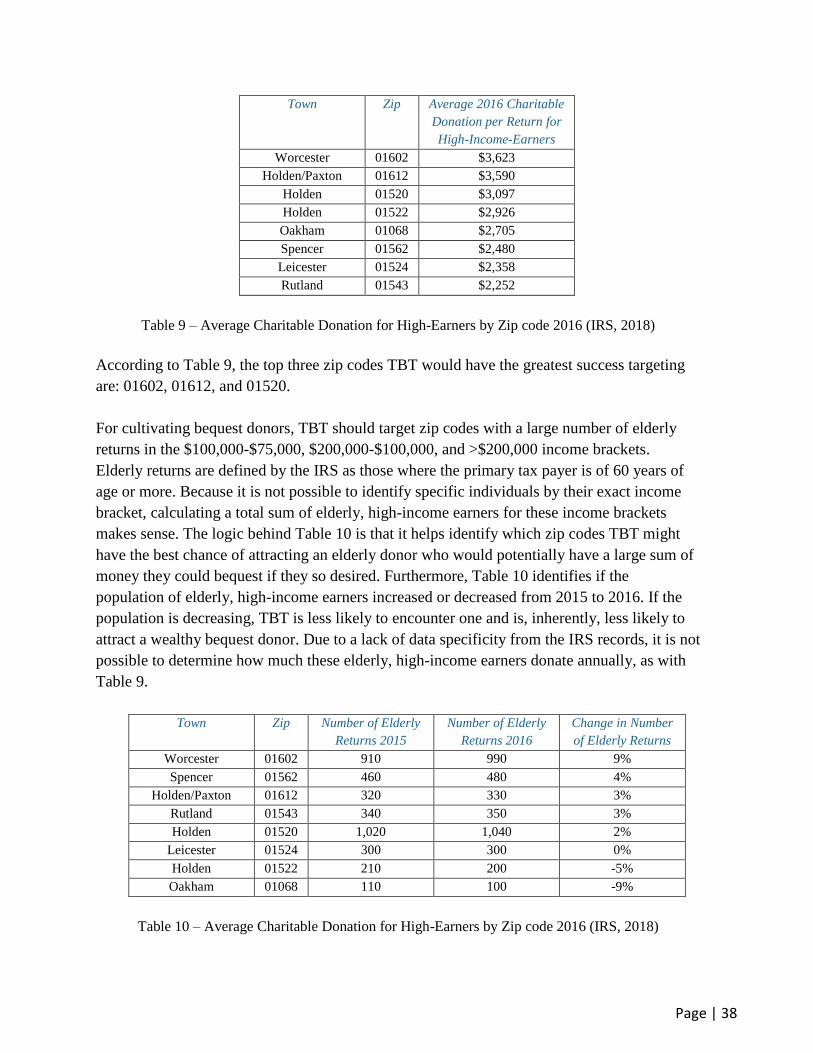
Page | 38
Town Zip Average 2016 Charitable
Donation per Return for
High-Income-Earners
Worcester 01602 $3,623
Holden/Paxton 01612 $3,590
Holden 01520 $3,097
Holden 01522 $2,926
Oakham 01068 $2,705
Spencer 01562 $2,480
Leicester 01524 $2,358
Rutland 01543 $2,252
Table 9 – Average Charitable Donation for High-Earners by Zip code 2016 (IRS, 2018)
According to Table 9, the top three zip codes TBT would have the greatest success targeting
are: 01602, 01612, and 01520.
For cultivating bequest donors, TBT should target zip codes with a large number of elderly
returns in the $100,000-$75,000, $200,000-$100,000, and >$200,000 income brackets.
Elderly returns are defined by the IRS as those where the primary tax payer is of 60 years of
age or more. Because it is not possible to identify specific individuals by their exact income
bracket, calculating a total sum of elderly, high-income earners for these income brackets
makes sense. The logic behind Table 10 is that it helps identify which zip codes TBT might
have the best chance of attracting an elderly donor who would potentially have a large sum of
money they could bequest if they so desired. Furthermore, Table 10 identifies if the
population of elderly, high-income earners increased or decreased from 2015 to 2016. If the
population is decreasing, TBT is less likely to encounter one and is, inherently, less likely to
attract a wealthy bequest donor. Due to a lack of data specificity from the IRS records, it is not
possible to determine how much these elderly, high-income earners donate annually, as with
Table 9.
Town Zip Number of Elderly
Returns 2015
Number of Elderly
Returns 2016
Change in Number
of Elderly Returns
Worcester 01602 910 990 9%
Spencer 01562 460 480 4%
Holden/Paxton 01612 320 330 3%
Rutland 01543 340 350 3%
Holden 01520 1,020 1,040 2%
Leicester 01524 300 300 0%
Holden 01522 210 200 -5%
Oakham 01068 110 100 -9%
Table 10 – Average Charitable Donation for High-Earners by Zip code 2016 (IRS, 2018)
Page | 39
Accounting for both the total number and change in the total number of elderly returns, the
top three zip codes TBT would have the greatest success targeting for bequest giving are:
01520, 01602, 01562.
Overall, the most effective zip codes to target for both individual giving and bequest giving
are: 01602 and 01520.
4.2 Grow
Grant Writing
Bill McAvoy identified grants as having one of the largest ROIs of all revenue streams for non-
profits. That said, Bill stressed that no matter the non-profit’s size or industry, they should
always breakeven from business-related income. If they do not, they become donation and grant
reliant, making them extremely vulnerable lest a key donation or grant is not received.
The grant writer position could be full-time, part-time, or even volunteer (such as a skilled stay-
at-home parent who is looking for work to do). This volunteer could even be a student’s parent;
in return for helping, their child could attend programs at a discounted rate.
New Programs
Children: In the spirit of Turn Back Time’s emphasis on getting more children back out into and
connected with nature, I recommend creating a fully immersive week-long nature camp. Most
children have never been completely immersed in nature (where they don’t hear cars, see
buildings and electrical lines, et cetera) for an extended period of time. This is partly due to
changing habits (e.g. children playing video games inside) and busier schedules (children and
their parents may not have several days to take off), but also because there are fewer places in
which you can be completely immersed (exemplified by Figure 1). TBT, however, has the
unique opportunity to offer such a program. A small plot could be designated as “base camp” in
the center of the organization’s 58 acres. Campers could stay the week in tents (keeping the
experience fully immersive), cook using a campfire (or back packing stoves) and collect water
from nearby ponds or streams (using backpacking/camping water filters). During the day they
could play games, identify trees, learn bird calls, go fishing, take walks, practice archery and
slingshots, learn meditation, et cetera. Keeping the camp small (10 people maximum), students
would have a unique, rewarding experience with nature that they will remember for years. In my
experience from hiking the Appalachian Trail, the most rewarding and personal experiences with
nature came from being completely immersed and surround by very few people. Furthermore,
being completely disconnected from a clock and defined schedule can be extremely liberating.
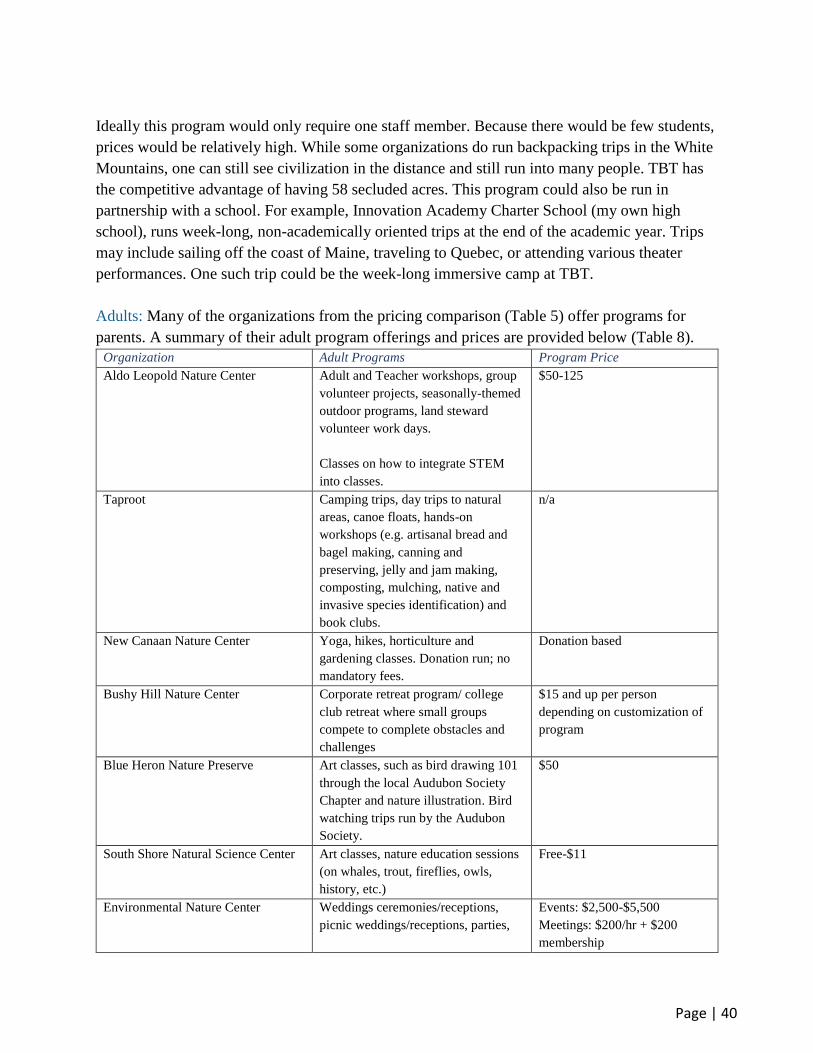
Page | 40
Ideally this program would only require one staff member. Because there would be few students,
prices would be relatively high. While some organizations do run backpacking trips in the White
Mountains, one can still see civilization in the distance and still run into many people. TBT has
the competitive advantage of having 58 secluded acres. This program could also be run in
partnership with a school. For example, Innovation Academy Charter School (my own high
school), runs week-long, non-academically oriented trips at the end of the academic year. Trips
may include sailing off the coast of Maine, traveling to Quebec, or attending various theater
performances. One such trip could be the week-long immersive camp at TBT.
Adults: Many of the organizations from the pricing comparison (Table 5) offer programs for
parents. A summary of their adult program offerings and prices are provided below (Table 8).
Organization Adult Programs Program Price
Aldo Leopold Nature Center Adult and Teacher workshops, group
volunteer projects, seasonally-themed
outdoor programs, land steward
volunteer work days.
Classes on how to integrate STEM
into classes.
$50-125
Taproot Camping trips, day trips to natural
areas, canoe floats, hands-on
workshops (e.g. artisanal bread and
bagel making, canning and
preserving, jelly and jam making,
composting, mulching, native and
invasive species identification) and
book clubs.
n/a
New Canaan Nature Center Yoga, hikes, horticulture and
gardening classes. Donation run; no
mandatory fees.
Donation based
Bushy Hill Nature Center Corporate retreat program/ college
club retreat where small groups
compete to complete obstacles and
challenges
$15 and up per person
depending on customization of
program
Blue Heron Nature Preserve Art classes, such as bird drawing 101
through the local Audubon Society
Chapter and nature illustration. Bird
watching trips run by the Audubon
Society.
$50
South Shore Natural Science Center Art classes, nature education sessions
(on whales, trout, fireflies, owls,
history, etc.)
Free-$11
Environmental Nature Center Weddings ceremonies/receptions,
picnic weddings/receptions, parties,
Events: $2,500-$5,500
Meetings: $200/hr + $200
membership
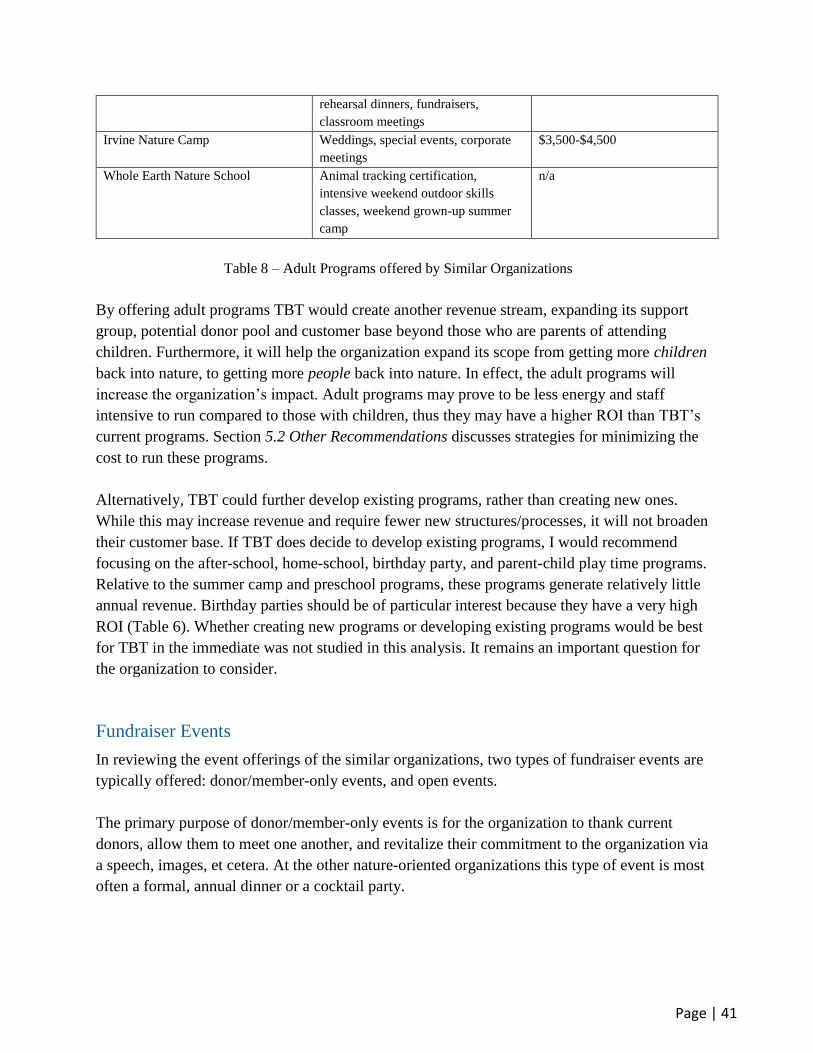
Page | 41
rehearsal dinners, fundraisers,
classroom meetings
Irvine Nature Camp Weddings, special events, corporate
meetings
$3,500-$4,500
Whole Earth Nature School Animal tracking certification,
intensive weekend outdoor skills
classes, weekend grown-up summer
camp
n/a
Table 8 – Adult Programs offered by Similar Organizations
By offering adult programs TBT would create another revenue stream, expanding its support
group, potential donor pool and customer base beyond those who are parents of attending
children. Furthermore, it will help the organization expand its scope from getting more children
back into nature, to getting more people back into nature. In effect, the adult programs will
increase the organization’s impact. Adult programs may prove to be less energy and staff
intensive to run compared to those with children, thus they may have a higher ROI than TBT’s
current programs. Section 5.2 Other Recommendations discusses strategies for minimizing the
cost to run these programs.
Alternatively, TBT could further develop existing programs, rather than creating new ones.
While this may increase revenue and require fewer new structures/processes, it will not broaden
their customer base. If TBT does decide to develop existing programs, I would recommend
focusing on the after-school, home-school, birthday party, and parent-child play time programs.
Relative to the summer camp and preschool programs, these programs generate relatively little
annual revenue. Birthday parties should be of particular interest because they have a very high
ROI (Table 6). Whether creating new programs or developing existing programs would be best
for TBT in the immediate was not studied in this analysis. It remains an important question for
the organization to consider.
Fundraiser Events
In reviewing the event offerings of the similar organizations, two types of fundraiser events are
typically offered: donor/member-only events, and open events.
The primary purpose of donor/member-only events is for the organization to thank current
donors, allow them to meet one another, and revitalize their commitment to the organization via
a speech, images, et cetera. At the other nature-oriented organizations this type of event is most
often a formal, annual dinner or a cocktail party.
Page | 42
While open events do allow donors to meet each other and for the organization to thank donors
in person, the primary purpose is to allow the organization to attract new people (either familiars
who have not yet donated, or, locals who did not yet know about the organization). This allows
the organization to expand its donor pool, grow its email list, and open the doors to new
opportunities.
Membership Program
According to Bill McAvoy, a membership program is a great way to generate a consistent
minimum level of annual revenue. By paying an annual fee, members receive discounts on
various programs, receive newsletters, may host on-site events, and are invited to member-only
events. TBT could offer different tiers of discounts for different bonuses (i.e. adult individual,
family, and benefactor). The benefits and pricing of the membership programs offered by the
other nature organizations from Table 5 are listed in Appendix C.
A more outlandish idea, TBT could partner with a food truck vendor to offer weekend brunch in
their barn. Members could receive discounted prices on the food or the brunch would only be
available to members.
4.3 Transform
Endowment Fund
The primary purpose of an endowment fund (or similar long-term fund) is to provide reliable,
long term income for a non-profit. The organization supplements their income with the interest
earned by the fund. Endowment funds serve the dual purpose of “impress[ing] donors, especially
generous donors. They know that your nonprofit manages its resources well, plans efficiently,
and will likely survive any crisis” (Stevenson, 2018, p.1). Donors may also appreciate giving a
gift that continues to give long into the future. Rather than a portion of current annual donations
being diverted towards the endowment fund, resulting in a smaller pool for immediate use,
endowment fund donations may actually grow total annual donations. Thus, TBT may not find
itself with fewer donations for immediate use if an endowment fund is introduced.
While TBT is small, it is never too soon to start. The personal finance book, The Richest Man in
Babylon, by George S. Clason, recommends putting aside 10% of one’s income (not profits) for
long-term investment.
This, then, is the third cure for a lean purse: to put each coin to laboring that it may produce its
kind even as the flocks of the field and help bring to thee income, a stream of wealth that shall
flow constantly into thy purse. (Clason, 1926, p.44)
Page | 43
While a personal finance book, this strategy would be extremely beneficial for both for-profit
and non-profit organizations, as well. As such, TBT should consider putting 10% of business-
related income aside for the endowment fund and/or savings (rainy-day fund).
Experts recommend that non-profits should have at least three times their annual expenses in
their endowment fund (Stevenson, 2018). In 2017 TBT expensed nearly $100,000, but assuming
TBT boosts the director salary and hires more staff, I would assume minimum annual
expenditure of $150,000. So, they should aim for having $450,000 in the endowment fund. At a
5% annual return, TBT would earn ~$17,360 annually, equivalent to 12% of their expenses
(Stevenson, 2018). This will take a while to accumulate, but is necessary for TBT to become a
long-term, sustainable non-profit. As such, this should not be delayed for current gain.
A trick in personal finance to reduce the amount sitting in savings, earning a low interest rate, is
to cycle money through a CD (certificate of deposit) ladder. One purchases a CD for x dollars for
y time period for each month of the year, this way one always has access to x dollars if need be,
but is earning high return on the other money. For example, if one purchased 12, $1,000 CDs,
they would always have access to $1,000, but be earning a high interest rate on the other $11,000
during that time. TBT could investigate implementing something similar for their savings.
To determine the specifics of how to create an endowment and how their annual savings should
be divided between the endowment and savings (rainy-day fund), the organization should consult
their financial adviser and board of directors.
Supplementing the Current Director Role
Bill’s most valuable recommendation for small nonprofits, such as TBT, is to have one executive
who is inward facing, and another than is outward facing. This is like the CEO-COO balance in a
for-profit corporation. This allows for one person to focus on the internal operations of the
organizations while the other focuses on building external relationships, attracting donations and
planning for events. In large, established nonprofits this second director is called the Fundraising
Director. Currently, TBT has no Fundraising Director. This new position would be in charge of
analyzing donor records, developing relationships with new donors, planning
fundraising/member-only events, and asking companies and foundations for donations.
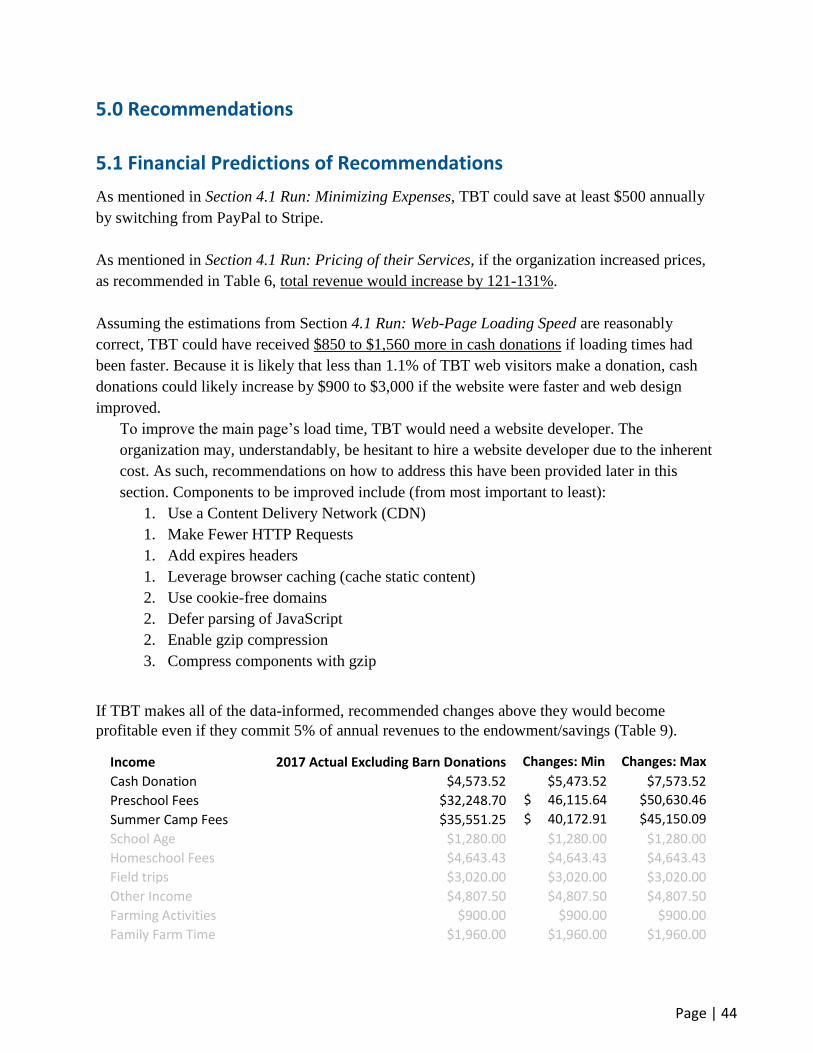
Page | 44
5.0 Recommendations
5.1 Financial Predictions of Recommendations
As mentioned in Section 4.1 Run: Minimizing Expenses, TBT could save at least $500 annually
by switching from PayPal to Stripe.
As mentioned in Section 4.1 Run: Pricing of their Services, if the organization increased prices,
as recommended in Table 6, total revenue would increase by 121-131%.
Assuming the estimations from Section 4.1 Run: Web-Page Loading Speed are reasonably
correct, TBT could have received $850 to $1,560 more in cash donations if loading times had
been faster. Because it is likely that less than 1.1% of TBT web visitors make a donation, cash
donations could likely increase by $900 to $3,000 if the website were faster and web design
improved.
To improve the main page’s load time, TBT would need a website developer. The
organization may, understandably, be hesitant to hire a website developer due to the inherent
cost. As such, recommendations on how to address this have been provided later in this
section. Components to be improved include (from most important to least):
1. Use a Content Delivery Network (CDN)
1. Make Fewer HTTP Requests
1. Add expires headers
1. Leverage browser caching (cache static content)
2. Use cookie-free domains
2. Defer parsing of JavaScript
2. Enable gzip compression
3. Compress components with gzip
If TBT makes all of the data-informed, recommended changes above they would become
profitable even if they commit 5% of annual revenues to the endowment/savings (Table 9).
Income 2017 Actual Excluding Barn Donations Changes: Min Changes: Max
Cash Donation $4,573.52 $5,473.52 $7,573.52
Preschool Fees $32,248.70 $ 46,115.64 $50,630.46
Summer Camp Fees $35,551.25 $ 40,172.91 $45,150.09
School Age $1,280.00 $1,280.00 $1,280.00
Homeschool Fees $4,643.43 $4,643.43 $4,643.43
Field trips $3,020.00 $3,020.00 $3,020.00
Other Income $4,807.50 $4,807.50 $4,807.50
Farming Activities $900.00 $900.00 $900.00
Family Farm Time $1,960.00 $1,960.00 $1,960.00
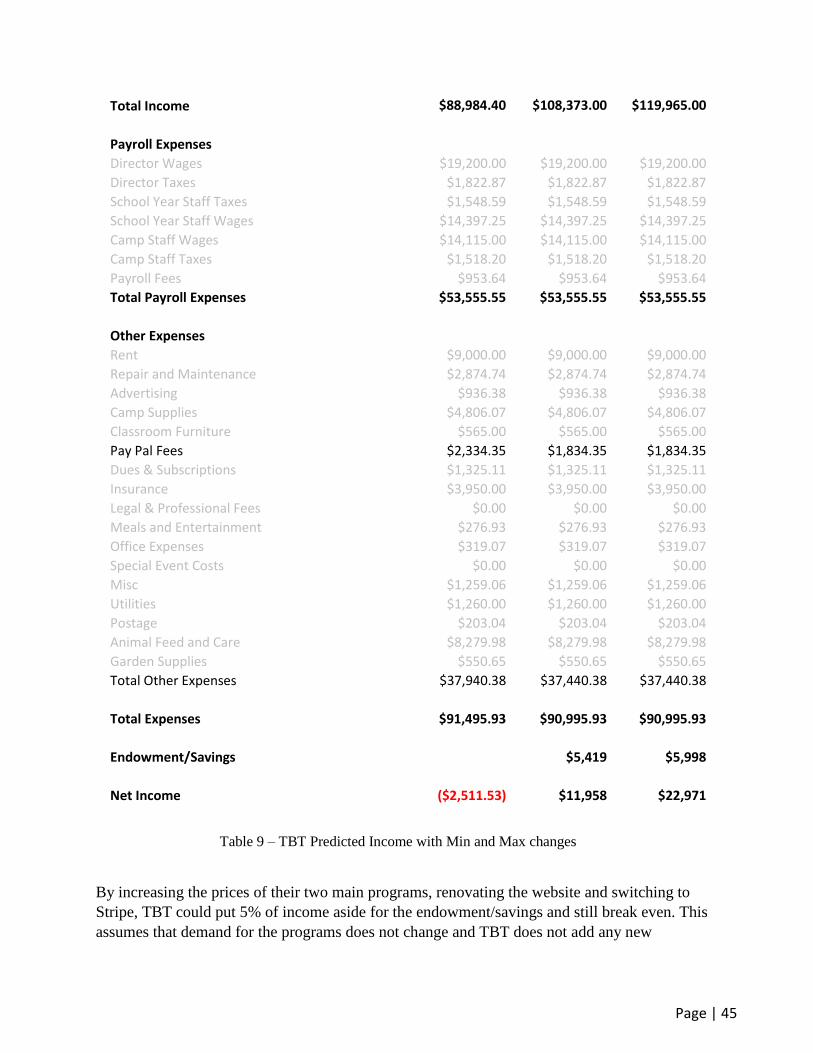
Page | 45
Total Income $88,984.40 $108,373.00 $119,965.00
Payroll Expenses Director Wages $19,200.00 $19,200.00 $19,200.00
Director Taxes $1,822.87 $1,822.87 $1,822.87
School Year Staff Taxes $1,548.59 $1,548.59 $1,548.59
School Year Staff Wages $14,397.25 $14,397.25 $14,397.25
Camp Staff Wages $14,115.00 $14,115.00 $14,115.00
Camp Staff Taxes $1,518.20 $1,518.20 $1,518.20
Payroll Fees $953.64 $953.64 $953.64
Total Payroll Expenses $53,555.55 $53,555.55 $53,555.55
Other Expenses Rent $9,000.00 $9,000.00 $9,000.00
Repair and Maintenance $2,874.74 $2,874.74 $2,874.74
Advertising $936.38 $936.38 $936.38
Camp Supplies $4,806.07 $4,806.07 $4,806.07
Classroom Furniture $565.00 $565.00 $565.00
Pay Pal Fees $2,334.35 $1,834.35 $1,834.35
Dues & Subscriptions $1,325.11 $1,325.11 $1,325.11
Insurance $3,950.00 $3,950.00 $3,950.00
Legal & Professional Fees $0.00 $0.00 $0.00
Meals and Entertainment $276.93 $276.93 $276.93
Office Expenses $319.07 $319.07 $319.07
Special Event Costs $0.00 $0.00 $0.00
Misc $1,259.06 $1,259.06 $1,259.06
Utilities $1,260.00 $1,260.00 $1,260.00
Postage $203.04 $203.04 $203.04
Animal Feed and Care $8,279.98 $8,279.98 $8,279.98
Garden Supplies $550.65 $550.65 $550.65
Total Other Expenses $37,940.38 $37,440.38 $37,440.38
Total Expenses $91,495.93 $90,995.93 $90,995.93
Endowment/Savings $5,419 $5,998
Net Income ($2,511.53) $11,958 $22,971
Table 9 – TBT Predicted Income with Min and Max changes
By increasing the prices of their two main programs, renovating the website and switching to
Stripe, TBT could put 5% of income aside for the endowment/savings and still break even. This
assumes that demand for the programs does not change and TBT does not add any new
Page | 46
programs, a membership system, a grant writer, or an annual fundraiser, and that introducing
targeted donating does not increase the amount donated. In the ‘minimum’ scenario, TBT could
use the ~$12,000 to hire a part-time Fundraising Director. In the ‘maximum’ scenario, TBT
could boost director wages to $25,000 and hire a part-time Fundraising Director for ~$18,000.
I have decreased the amount of annual income set aside for the endowment/savings to 5%
because boosting the director wages and introducing a CEO-COO balance are critical to TBT’s
short-term success. If the director’s wages are too low, the organization will be hard pressed to
hire a replacement when Lisa Burris, the current director, retires. Hiring a Fundraising Director
could have a great impact on TBT boosting their donations. A few large donations (from
individual or corporate giving, or bequest giving) or consistent small ones (from repeat giving or
membership fees) could total much great a sum than saving an additional 5% of annual income
for the endowment/savings. In way, hiring a Fundraising Director would be investing in future
financial security because of the programs they would maintain and create.
The Fundraising Director would be responsible for planning special events, contacting potential
individual and corporate donors, and mailing locals inviting them to the open fundraiser event.
Because it would be expensive to hire a programmer to implement the recommended changes to
the website, TBT may want the new Fundraising Director to have basic web design skills so that
they may update the website content themselves (it’d be part of their roles and responsibilities
since it is externally facing). TBT should either find a web developer that will work pro-bono on
making their website faster, a parent who is willing to do it for a discount on TBT services, or
hire students at WPI do it low-cost as a learning endeavor/resume builder. While I cannot speak
to how difficult it would be to find a pro-bono or parent developer, if TBT contacts the right
channels at WPI (e.g. the head of the computer science program at WPI) and there is some
financial incentive, they should not have a huge issue finding interested student developers. In
this way TBT will renovate their website without it being prohibitively expensive.
I highly recommend that TBT ask students’ parents if anyone would be willing and able to grant
write for TBT; in return they could receive a drastic discount on programs for their children.
5.2 Other Recommendations
While just as important, the following recommendations cannot be accounted for in financial
predictions. As such, their ROI are not concrete.
Business-related Income
I highly recommend that TBT offer adult programs. They would diversify their revenue stream,
expand their customer base and broaden their support group and donor pool. Those who attend
these programs may be willing to donate and/or include TBT in their will.
Page | 47
While TBT could hire new staff, partner with third party organizations (e.g. Mass Audubon
Society) or ask current parents and volunteers if they would be interested in creating and running
the adult programs. Thus, they would be offering these programs at minimal expense and
additional labor. Those who run the programs could earn a share of the revenue, receive
discounts on other programs offered, or simply volunteer their time. Alternatively, instead of
TBT offering the programs, they could rent out the space to outside organizations on specific
days and times.
Donations
Donation Structure: First, per the findings in Section 4.1 Run: Donation Structure, TBT should
establish three specific, funding projects:
1. Hiring a farmer
2. Student scholarships
3. Endowment Fund
While the latter two are operational in nature for long-term success, the first should always be for
a ‘new growth’ project to show donors that TBT has ambitious plans for future growth. All three
funding projects should be promoted on the website.
Alternatively, instead of offering student scholarships TBT could introduce a membership
benefit in which members receive a discount on the programs offered.
Fundraiser Event: Because TBT is a relatively young, small organization, I recommend that they
first work on establishing an open event to expand their network and potential donor pool. TBT
should invite everyone on the email list, post on social media, and mail physical invites to local
individuals (e.g. Section 4.1: Targeted Promoting for Donations) and companies—the board and
important donors would of course be invited.
To achieve the aforementioned goals for the annual fundraiser event (Section 4.2 Grow:
Fundraiser Event), based upon my own experiences of events that I have organized, helped run
or have attended, and my own ideas from reading Thirst: A story of redemption, compassion, and
a mission to bring clean water to the world, I propose the following:
What: a summer barbeque with live music.
Who: the event would be catered by food trucks and the music provided by a local
musician. I would recommend contacting Wootrucks (Marc Gallant,
[email protected]) for the food trucks. It would be worth inquiring if they
would provide the food pro-bono or if a percentage of sales could go to TBT. The
musician(s) could be a local, donor, or child’s parent who is in a band; if none of these
Page | 48
are options, I recommend Ben Knight (https://www.benknightlife.com/). Staff should
attend to take care of the children that attendees might bring. This allows parents to
mingle and eat free of worry while their children play.
Where: the barn would be a perfect location for people to eat and mingle. Outside, lawn
games would be provided (e.g. corn hole, crocket, badminton, frisbees, etc.).
When: June 29th
How: organizing such an event will highlight TBT’s need to hire an externally facing
executive member. This person would be largely responsible for managing the small
details.
Why: the event would be used to thank current donors, recognize board members, grow
the email list and accrue donations. This is also a perfect time to meet people who might
be potentially interested in volunteering to grant write, run adult programs, or help in
some other way. There should be an easily visible table where attendees can find a
clipboard for signing onto the email list and three bins for donations (hiring a farmer,
student scholarships, and the endowment). These bins should be transparent (e.g. empty
water jugs), allowing people to see donations accrue, adding social pressure to donate as
well. A small amount of money should be placed into each at the start of the event to “get
them started” (people are more likely to donate if they believe others have already
donated). At some point during the event key members of Turn Back Time should speak
about the organization, their accomplishments, how far they have come, and their future
aspirations (the work still to be done). If the organization feels particularly ambitious, a
fundraising goal for the event could be set and an inspiring video could be projected (see
Thirst: A story of redemption, compassion, and a mission to bring clean water to the
world by Scott Harrison, the CEO and founder of Charity: water).
Future Projects
This MQP project for Turn Back Time is only a starting place in helping the organization
become financially sustainable. This report acts as an over-arching review of the organization;
more specialized, topic-specific projects are needed in the future. These projects could either be
completed by the organization itself, or via future IQP/MQP projects. Potential topics that I
would recommend investigating include:
- Website design
This project would research and design an effective website for Turn Back Time. Project
members should consult the websites of the similar organizations, cutting edge nonprofits
Page | 49
(such as Charity: water), and experts on web design trends. The website should be able to
convey information to the viewer in an efficient and effective manner.
- Donor records data mining
Bill McAvoy recommended that TBT should analyze their donor records to determine if any
trends exist. One potential trend could be that a specific individual has been donating an
increasing amount annually. This may signify that the individual’s wealth has grown over the
years. As such, TBT may be able to approach them to inquire about making a larger donation
towards a specific project. Likewise, if an individual has been consistently donating the same
amount annually, they could approach the donor about increasing the donation by a small
amount ($10-20). If enough people increased their donation by a small amount, it could add
up to a large sum.
This project should also analyze donor records to determine the demographic distribution of
their donors (e.g. are most of the donations coming from parents). A detailed fundraising
plan should then be made for growing and diversifying their donor base.
Questions to Consider
In developing this analysis, I have identified a few questions that the organization should
consider:
- Does TBT see itself as offering programs to only children, or adults as well?
- While I strongly recommend introducing new programs as some point in time, for the
time being does it make more sense to develop existing programs or create new ones?
o Is there any evidence that developing existing programs will increase demand?
o Is the evidence that there would be demand for the new programs?
- Are the current board members asked to make annual donations to TBT? If so, are they
sufficiently large? If not, should they be?
o According to Bill McAvoy it is common for board members to be required to
donate a minimum sum to the organization annually. This provides the
organization with a minimum annual donation income stream.
- Is the organization open to making use of volunteer labor?
o Volunteers could help run the programs, maintain the farm (as opposed to hiring a
farmer), repair what needs to be fixed, design fundraising events, et cetera.
- At the earliest, when does Lisa Burris anticipate retiring?
o The organization should then plan on having everything in place to find a new
director for this date. This includes becoming financially self-sustaining, having a
Fundraising Director, starting an endowment, having an attractive Director salary,
Page | 50
and preparing all other materials so that the next director may easily continue
building the organization.
- Will increasing program prices reduce demand?
o To answer this question the organization may want to consult parents of existing
students. TBT should be honest with the parents about its financial situation and
that raising prices modestly would be necessary for the long-term survival of the
program.
Page | 51
Works Cited
Aspinall, P., Mavros, P., Coyne, R., & Roe, J. (2013). The urban brain: Analysing outdoor
physical activity with mobile EEG. British Journal of Sports Medicine,
doi:10.1136/bjsports-2012-091877
Barkham, P., & Aldred, J. (2016, Feb 10,). Concerns raised over number of children not
engaging with nature. The Guardian Retrieved from
https://www.theguardian.com/environment/2016/feb/10/concerns-raised-over-amount-of-
children-not-engaging-with-nature
Barry, G. (2017). 3 mistakes nonprofits make when crowdfunding. Retrieved from
https://nonprofithub.org/fundraising/3-mistakes-nonprofits-make-crowdfunding/
Bonomo, L., O'Connor, J., & Silkey, J. (2018). Designing and building active outdoor learning
stations: Teaching STEM concepts at a farm-nature preschool for children with
exceptional needs. (). Worcester, Massachusetts: Worcester Polytechnic Institute.
Bratman, G. N., Daily, G. C., Levy, B. J., & Gross, J. J. (2015). The benefits of nature
experience: Improved affect and cognition
doi://doi.org/10.1016/j.landurbplan.2015.02.005
Briggs, H. (2016, Nov 26,). All you need to know about nature deficit disorder. BBC News
Retrieved from https://www.bbc.co.uk/news/science-environment-38094186
Bugeaud, T., Benton, J., Valverde, W. & Midelfort, L. (2018). M+R benchmarks 2018.
Retrieved from https://mrbenchmarks.com/#
Building multiple revenue sources. Retrieved from
http://strengtheningnonprofits.org/resources/e-
learning/online/multiplerevenuesources/Print.aspx
Page | 52
Centers for Disease Control and Prevention. (2018). Overweight and obesity - adult obesity facts.
Retrieved from https://www.cdc.gov/obesity/data/adult.html
Clason, G. S. (1926). The richest man in babylon. New York, New York, USA: New American
Library.
DeAngelis, J., & Gorden, M. (2014). Food prices + gas prices = stressed consumers. Cnbc,
Retrieved from https://www.cnbc.com/2014/06/27/inflation-food-prices-gas-prices-
major-consumer-stress.html
Foster, W., Kim, P. & Christiansen, B. (2009). Ten nonprofit funding models. Retrieved from
https://ssir.org/articles/entry/ten_nonprofit_funding_models#
Garecht, J.Creative fundraising ideas for non profit organizations. Retrieved from
http://www.thefundraisingauthority.com/fundraising-ideas/fundraising-ideas-for-non-
profit-organizations/
Giving, U. (2018). See the numbers - giving USA 2018 infographic. Retrieved from
https://givingusa.org/tag/giving-usa-2018/
Good Earth Plant company. (2015). Bringing nature into the workplace tops design trends for
2016. Retrieved from http://www.goodearthplants.com/bringing-nature-into-the-
workplace-tops-design-trends-for-2016/
Gray, P. P. D. (2015). Declining student resilience: A serious problem for colleges. Psychology
Today, Retrieved from https://www.psychologytoday.com/us/blog/freedom-
learn/201509/declining-student-resilience-serious-problem-colleges
Gregory N. Bratman, J. Paul Hamilton, Kevin S. Hahn, Gretchen C. Daily, & James J. Gross.
(2015). Nature experience reduces rumination and subgenual prefrontal cortex activation.
Page | 53
Proceedings of the National Academy of Sciences of the United States of America,
112(28), 8567-8572. doi:10.1073/pnas.1510459112
Harrison, S. (2018). Thirst: A story of redemption, compassion, and a mission to bring clean
water to the world. New York, New York, USA: Currency.
Harvey, F. (2018). Carbon markets back from the brink of collapse, says world bank. The
Guardian, Retrieved from
https://www.theguardian.com/environment/2018/may/22/carbon-markets-back-from-the-
brink-of-collapse-says-world-bank
Hodges, J., Krukowska, E., & Carr, M. (2018). Europe's $38 billion carbon market is finally
doing its job. Bloomberg, Retrieved from
https://www.bloomberg.com/news/articles/2018-03-26/europe-s-38-billion-carbon-
market-is-finally-starting-to-work
Horsley, G. (2016). Three major nonprofit trends for 2017. Retrieved from
https://www.forbes.com/sites/forbesnonprofitcouncil/2016/12/13/three-major-nonprofit-
trends-for-2017/#16f196dc246d
Howard, B. (2013, June 30,). Connecting with nature boosts creativity and health. National
Geographic Retrieved from https://news.nationalgeographic.com/news/2013/06/130628-
richard-louv-nature-deficit-disorder-health-environment/
Hrabik, L. (2014). How to hype up your next fundraising event.
Ilene. (2011). 20 signs that A horrific global food crisis is coming. Zero Hedge, Retrieved from
https://www.zerohedge.com/article/20-signs-horrific-global-food-crisis-coming-0
Internal Revenue Services. (2018). Individual income tax ZIP code data. Retrieved from
https://www.irs.gov/statistics/soi-tax-stats-individual-income-tax-statistics-zip-code-data-
Page | 54
soi
Jacobs, D. (2015). Sarbanes, fitzpatrick reintroduce no child left inside act. Retrieved from
https://sarbanes.house.gov/media-center/press-releases/sarbanes-fitzpatrick-reintroduce-
no-child-left-inside-act
Jacobs, K. (2016). How rising food prices are affecting restaurants. Eat Out, Retrieved from
http://www.eatout.co.za/article/rising-food-prices-affecting-restaurants/
Juyoung Lee, Yuko Tsunetsugu, Norimasa Takayama, Bum-Jin Park, Qing Li, Chorong Song, . .
. Yoshifumi Miyazaki. (2014). Influence of forest therapy on cardiovascular relaxation in
young adults. Evidence - Based Complementary and Alternative Medicine, 2014,
834360-7. doi:10.1155/2014/834360
Kids these days - why is america's youth staying indoors? (2011). Retrieved from
https://www.nature.org/newsfeatures/kids-in-nature/kids-in-nature-poll.xml
Koenig, M. (2019). 7 tips on asking for donations -- it's intimidating we get it. Retrieved from
https://nonprofithub.org/fundraising/7-tips-on-asking-for-donations-its-intimidating-we-
get-it/
Kuo, F. E., & Faber Taylor, A. (2004). A potential natural treatment for attention-
deficit/hyperactivity disorder: Evidence from a national study. American Journal of
Public Health, 94(9), 1580-1586. doi:10.2105/AJPH.94.9.1580
Leong, L. Y. C., Fischer, R., & McClure, J. (2014). Are nature lovers more innovative? the
relationship between connectedness with nature and cognitive styles. Journal of
Environmental Psychology, 40, 57-63. doi:10.1016/j.jenvp.2014.03.007
Macfarlane, R. (2017, September 30,). Badger or bulbasaur - have children lost touch with
nature. The Guardian Retrieved from
Page | 55
https://www.theguardian.com/books/2017/sep/30/robert-macfarlane-lost-words-children-
nature
Mortlock, C. (1987). The adventure alternative. United Kingdom: Cicerone Press.
Paul Clarke Nonprofit Resource Center. (2011). Sources of nonprofit revenue. Retrieved from
https://pcnrc.org/2011/03/28/sources-of-nonprofit-revenue/
Piff, P. K., Dietze, P., Feinberg, M., Stancato, D. M., & Keltner, D. (2015). Awe, the small self,
and prosocial behavior. Journal of Personality and Social Psychology, 108(6), 883-899.
doi:10.1037/pspi0000018
Presland, C. (2015). 6 inspiring ways to get outdoors; because nature makes you more intelligent,
and boosts your creativity. Retrieved from https://authorunlimited.com/nature-boosts-
your-creativity/
Riots, instability spread as food prices skyrocket. (2008). Cnn, Retrieved from
http://www.cnn.com/2008/WORLD/americas/04/14/world.food.crisis/
Stephen Moss. (2012). Natural childhood. ().
Stevenson, S. C. (2018). How to start an endowment for your nonprofit. Retrieved from
https://www.thebalancesmb.com/how-to-start-an-endowment-for-your-nonprofit-
2502103
Suttie, J. (2016, March 2,). How nature can make you kinder, happier, and more creative. Greater
Good Magazine,
Timm, Brenda (January 24, 2008). "Author Richard Louv honored with the 50th Audubon
medal". Audubon. Retrieved 2008-09-17
Page | 56
The Everyaction Team. (2018). The nonprofit fundraising strategic plan guider. Retrieved from
https://blog.everyaction.com/nonprofit-fundraising-strategic-plan-guide
Turn Back Time. (2018). Programs. Retrieved from https://www.tbtinc.org/programs/
Tyrväinen, L., Ojala, A., Korpela, K., Lanki, T., Tsunetsugu, Y., & Kagawa, T. (2014). The
influence of urban green environments on stress relief measures: A field experiment.
Journal of Environmental Psychology, 38, 1-9. doi:10.1016/j.jenvp.2013.12.005
Ulrich, R. S., Simons, R. F., Losito, B. D., Fiorito, E., Miles, M. A., & Zelson, M. (1991). Stress
recovery during exposure to natural and urban environments
doi://doi.org/10.1016/S0272-4944(05)80184-7
USA Today. (2010). Kids' electronic media use jumps to 53 hours a week. USA Today,
Retrieved from http://usatoday30.usatoday.com/tech/news/2010-01-20-
1Avideokids20_ST_N.htm?obref=obnetwork
Wells, N. M. (2000). At home with nature. Environment and Behavior, 32(6), 775-795.
doi:10.1177/00139160021972793
Woolsey, H., Finton, A., DeNormandie, J. & Haggerty, S. (2013). Conserving the biodiversity of
massachusetts in a changing world. Retrieved from
https://www.terrain.org/2013/unsprawl/biomap2-conservation-road-map/
Zhang, J. W., Piff, P. K., Iyer, R., Koleva, S., & Keltner, D. (2014). An occasion for unselfing:
Beautiful nature leads to prosociality doi://doi.org/10.1016/j.jenvp.2013.11.008
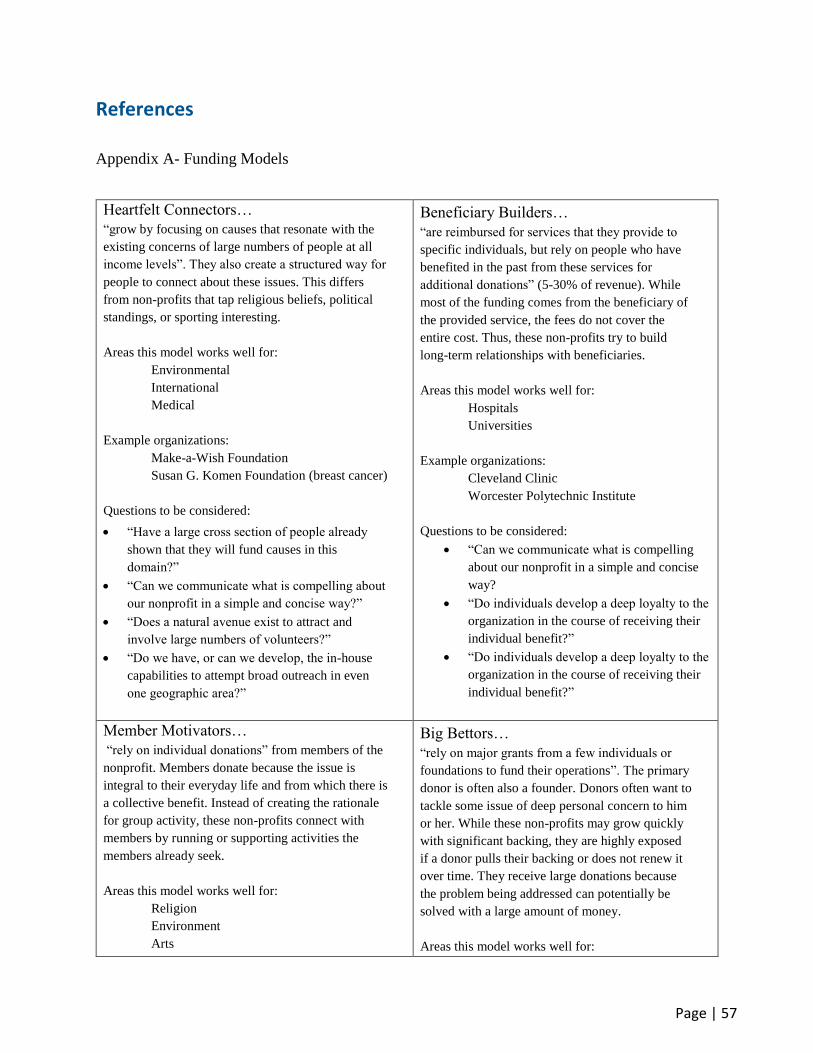
Page | 57
References
Appendix A- Funding Models
Heartfelt Connectors…
“grow by focusing on causes that resonate with the
existing concerns of large numbers of people at all
income levels”. They also create a structured way for
people to connect about these issues. This differs
from non-profits that tap religious beliefs, political
standings, or sporting interesting.
Areas this model works well for:
Environmental
International
Medical
Example organizations:
Make-a-Wish Foundation
Susan G. Komen Foundation (breast cancer)
Questions to be considered:
“Have a large cross section of people already
shown that they will fund causes in this
domain?”
“Can we communicate what is compelling about
our nonprofit in a simple and concise way?”
“Does a natural avenue exist to attract and
involve large numbers of volunteers?”
“Do we have, or can we develop, the in-house
capabilities to attempt broad outreach in even
one geographic area?”
Beneficiary Builders…
“are reimbursed for services that they provide to
specific individuals, but rely on people who have
benefited in the past from these services for
additional donations” (5-30% of revenue). While
most of the funding comes from the beneficiary of
the provided service, the fees do not cover the
entire cost. Thus, these non-profits try to build
long-term relationships with beneficiaries.
Areas this model works well for:
Hospitals
Universities
Example organizations:
Cleveland Clinic
Worcester Polytechnic Institute
Questions to be considered:
“Can we communicate what is compelling
about our nonprofit in a simple and concise
way?
“Do individuals develop a deep loyalty to the
organization in the course of receiving their
individual benefit?”
“Do individuals develop a deep loyalty to the
organization in the course of receiving their
individual benefit?”
Member Motivators…
“rely on individual donations” from members of the
nonprofit. Members donate because the issue is
integral to their everyday life and from which there is
a collective benefit. Instead of creating the rationale
for group activity, these non-profits connect with
members by running or supporting activities the
members already seek.
Areas this model works well for:
Religion
Environment
Arts
Big Bettors…
“rely on major grants from a few individuals or
foundations to fund their operations”. The primary
donor is often also a founder. Donors often want to
tackle some issue of deep personal concern to him
or her. While these non-profits may grow quickly
with significant backing, they are highly exposed
if a donor pulls their backing or does not renew it
over time. They receive large donations because
the problem being addressed can potentially be
solved with a large amount of money.
Areas this model works well for:
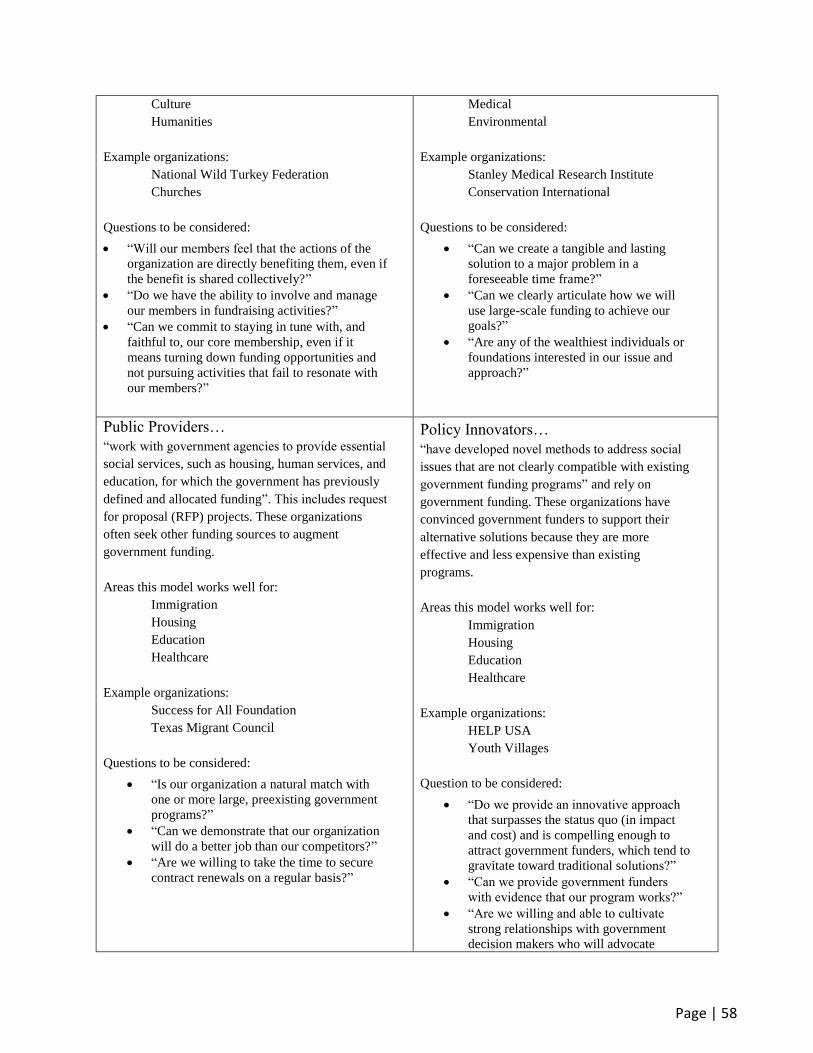
Page | 58
Culture
Humanities
Example organizations:
National Wild Turkey Federation
Churches
Questions to be considered:
“Will our members feel that the actions of the
organization are directly benefiting them, even if
the benefit is shared collectively?” “Do we have the ability to involve and manage
our members in fundraising activities?” “Can we commit to staying in tune with, and
faithful to, our core membership, even if it
means turning down funding opportunities and
not pursuing activities that fail to resonate with
our members?”
Medical
Environmental
Example organizations:
Stanley Medical Research Institute
Conservation International
Questions to be considered:
“Can we create a tangible and lasting
solution to a major problem in a
foreseeable time frame?”
“Can we clearly articulate how we will
use large-scale funding to achieve our
goals?”
“Are any of the wealthiest individuals or
foundations interested in our issue and
approach?”
Public Providers…
“work with government agencies to provide essential
social services, such as housing, human services, and
education, for which the government has previously
defined and allocated funding”. This includes request
for proposal (RFP) projects. These organizations
often seek other funding sources to augment
government funding.
Areas this model works well for:
Immigration
Housing
Education
Healthcare
Example organizations:
Success for All Foundation
Texas Migrant Council
Questions to be considered:
“Is our organization a natural match with
one or more large, preexisting government
programs?”
“Can we demonstrate that our organization
will do a better job than our competitors?”
“Are we willing to take the time to secure
contract renewals on a regular basis?”
Policy Innovators…
“have developed novel methods to address social
issues that are not clearly compatible with existing
government funding programs” and rely on
government funding. These organizations have
convinced government funders to support their
alternative solutions because they are more
effective and less expensive than existing
programs.
Areas this model works well for:
Immigration
Housing
Education
Healthcare
Example organizations:
HELP USA
Youth Villages
Question to be considered:
“Do we provide an innovative approach
that surpasses the status quo (in impact
and cost) and is compelling enough to
attract government funders, which tend to
gravitate toward traditional solutions?” “Can we provide government funders
with evidence that our program works?”
“Are we willing and able to cultivate
strong relationships with government
decision makers who will advocate
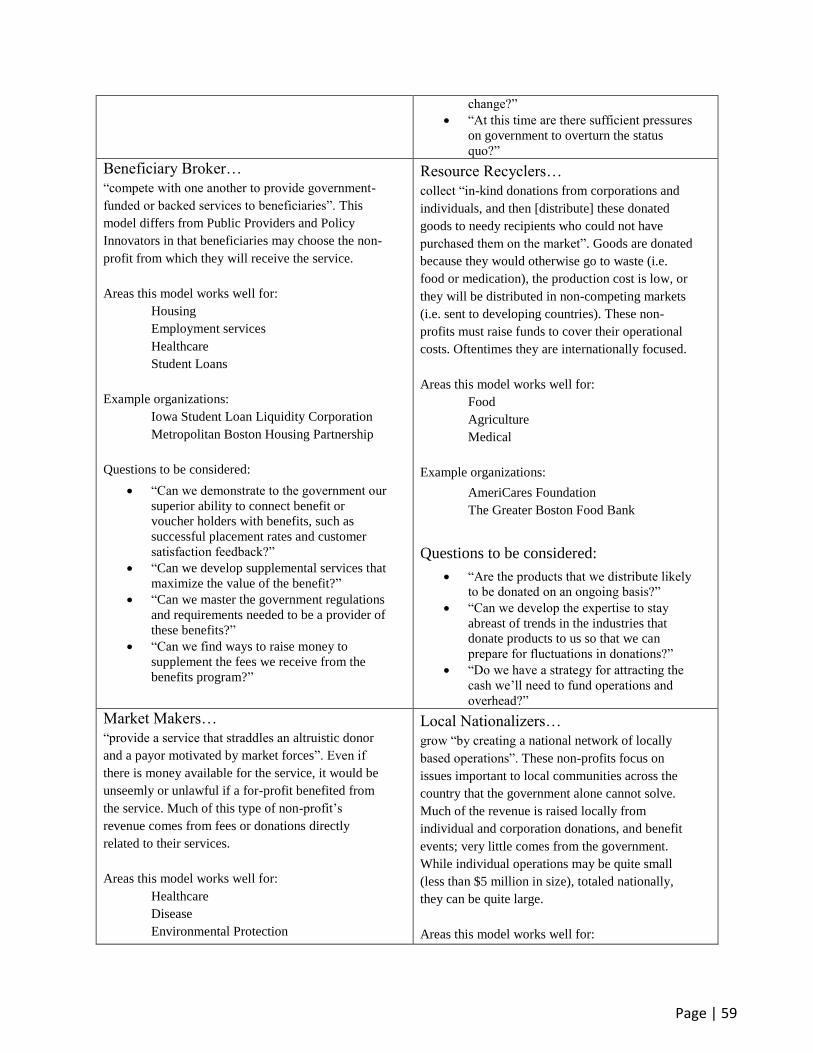
Page | 59
change?”
“At this time are there sufficient pressures
on government to overturn the status
quo?”
Beneficiary Broker…
“compete with one another to provide government-
funded or backed services to beneficiaries”. This
model differs from Public Providers and Policy
Innovators in that beneficiaries may choose the non-
profit from which they will receive the service.
Areas this model works well for:
Housing
Employment services
Healthcare
Student Loans
Example organizations:
Iowa Student Loan Liquidity Corporation
Metropolitan Boston Housing Partnership
Questions to be considered:
“Can we demonstrate to the government our
superior ability to connect benefit or
voucher holders with benefits, such as
successful placement rates and customer
satisfaction feedback?” “Can we develop supplemental services that
maximize the value of the benefit?” “Can we master the government regulations
and requirements needed to be a provider of
these benefits?” “Can we find ways to raise money to
supplement the fees we receive from the
benefits program?”
Resource Recyclers…
collect “in-kind donations from corporations and
individuals, and then [distribute] these donated
goods to needy recipients who could not have
purchased them on the market”. Goods are donated
because they would otherwise go to waste (i.e.
food or medication), the production cost is low, or
they will be distributed in non-competing markets
(i.e. sent to developing countries). These non-
profits must raise funds to cover their operational
costs. Oftentimes they are internationally focused.
Areas this model works well for:
Food
Agriculture
Medical
Example organizations:
AmeriCares Foundation
The Greater Boston Food Bank
Questions to be considered:
“Are the products that we distribute likely
to be donated on an ongoing basis?”
“Can we develop the expertise to stay
abreast of trends in the industries that
donate products to us so that we can
prepare for fluctuations in donations?”
“Do we have a strategy for attracting the
cash we’ll need to fund operations and
overhead?”
Market Makers…
“provide a service that straddles an altruistic donor
and a payor motivated by market forces”. Even if
there is money available for the service, it would be
unseemly or unlawful if a for-profit benefited from
the service. Much of this type of non-profit’s
revenue comes from fees or donations directly
related to their services.
Areas this model works well for:
Healthcare
Disease
Environmental Protection
Local Nationalizers…
grow “by creating a national network of locally
based operations”. These non-profits focus on
issues important to local communities across the
country that the government alone cannot solve.
Much of the revenue is raised locally from
individual and corporation donations, and benefit
events; very little comes from the government.
While individual operations may be quite small
(less than $5 million in size), totaled nationally,
they can be quite large.
Areas this model works well for:
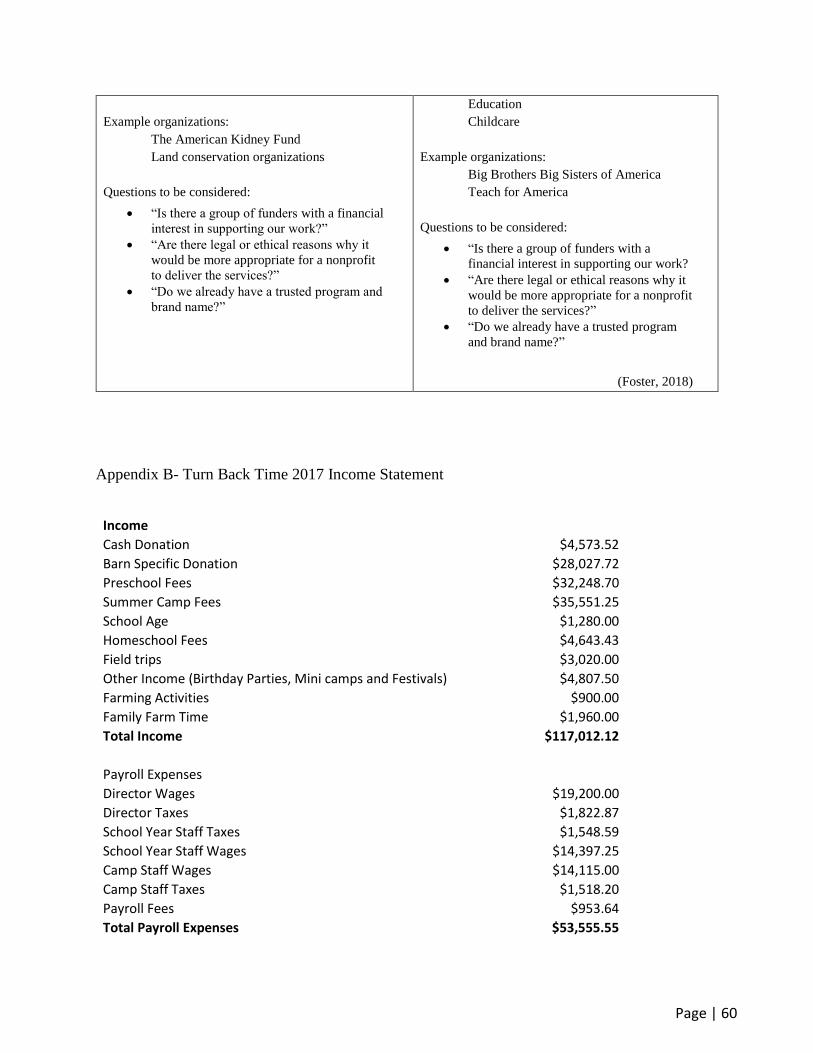
Page | 60
Example organizations:
The American Kidney Fund
Land conservation organizations
Questions to be considered:
“Is there a group of funders with a financial
interest in supporting our work?”
“Are there legal or ethical reasons why it
would be more appropriate for a nonprofit
to deliver the services?”
“Do we already have a trusted program and
brand name?”
Education
Childcare
Example organizations:
Big Brothers Big Sisters of America
Teach for America
Questions to be considered:
“Is there a group of funders with a
financial interest in supporting our work?
“Are there legal or ethical reasons why it
would be more appropriate for a nonprofit
to deliver the services?”
“Do we already have a trusted program
and brand name?”
(Foster, 2018)
Appendix B- Turn Back Time 2017 Income Statement
Income Cash Donation $4,573.52
Barn Specific Donation $28,027.72
Preschool Fees $32,248.70
Summer Camp Fees $35,551.25
School Age $1,280.00
Homeschool Fees $4,643.43
Field trips $3,020.00
Other Income (Birthday Parties, Mini camps and Festivals) $4,807.50
Farming Activities $900.00
Family Farm Time $1,960.00
Total Income $117,012.12
Payroll Expenses Director Wages $19,200.00
Director Taxes $1,822.87
School Year Staff Taxes $1,548.59
School Year Staff Wages $14,397.25
Camp Staff Wages $14,115.00
Camp Staff Taxes $1,518.20
Payroll Fees $953.64
Total Payroll Expenses $53,555.55
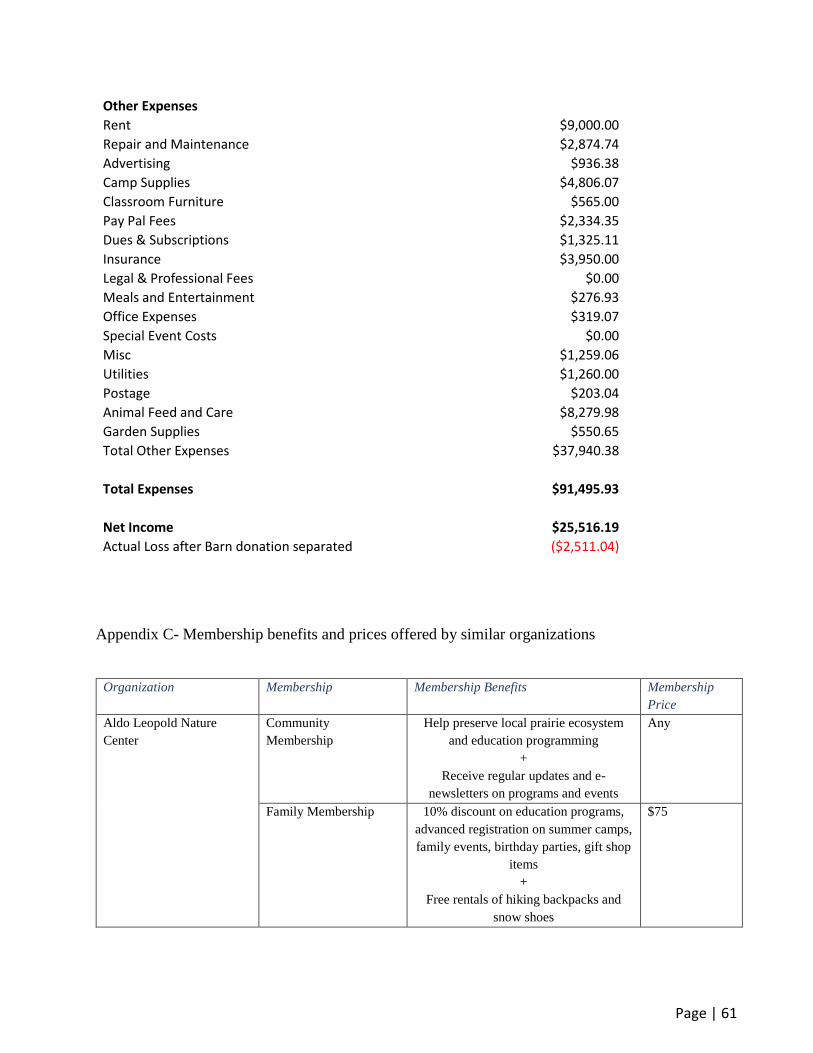
Page | 61
Other Expenses Rent $9,000.00
Repair and Maintenance $2,874.74
Advertising $936.38
Camp Supplies $4,806.07
Classroom Furniture $565.00
Pay Pal Fees $2,334.35
Dues & Subscriptions $1,325.11
Insurance $3,950.00
Legal & Professional Fees $0.00
Meals and Entertainment $276.93
Office Expenses $319.07
Special Event Costs $0.00
Misc $1,259.06
Utilities $1,260.00
Postage $203.04
Animal Feed and Care $8,279.98
Garden Supplies $550.65
Total Other Expenses $37,940.38
Total Expenses $91,495.93
Net Income $25,516.19
Actual Loss after Barn donation separated ($2,511.04)
Appendix C- Membership benefits and prices offered by similar organizations
Organization Membership Membership Benefits Membership
Price Aldo Leopold Nature
Center
Community
Membership
Help preserve local prairie ecosystem
and education programming
+
Receive regular updates and e-
newsletters on programs and events
Any
Family Membership 10% discount on education programs,
advanced registration on summer camps,
family events, birthday parties, gift shop
items
+
Free rentals of hiking backpacks and
snow shoes
$75
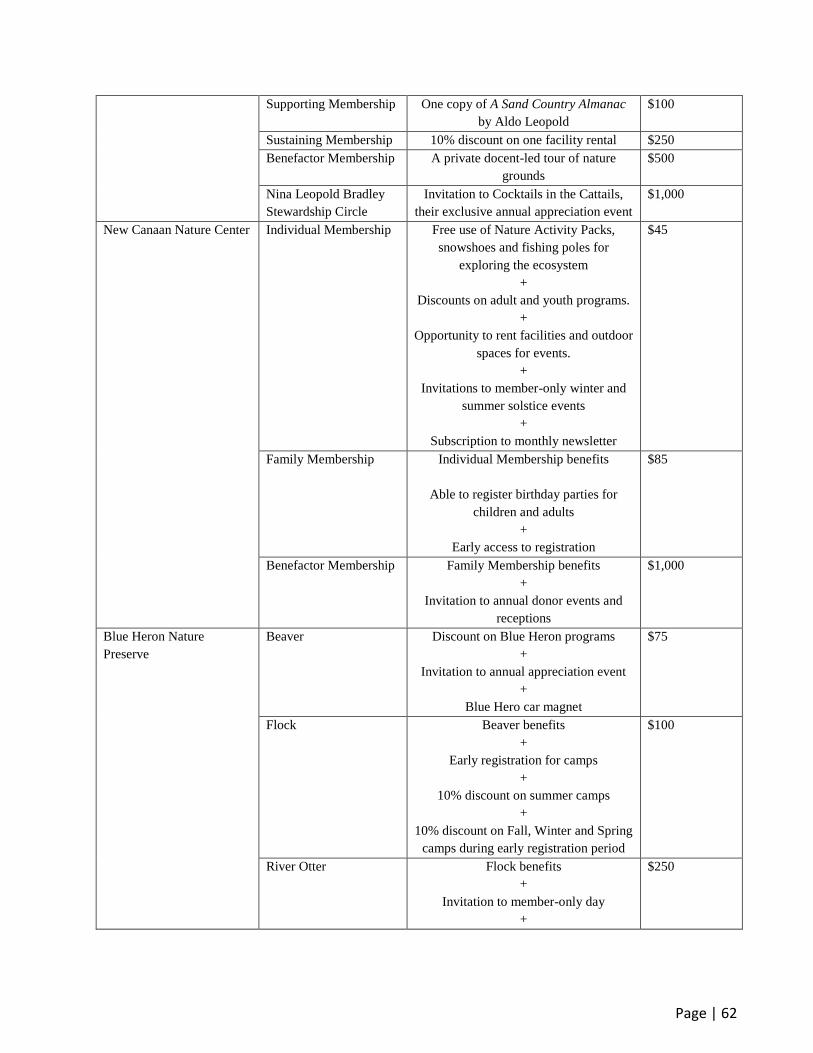
Page | 62
Supporting Membership One copy of A Sand Country Almanac
by Aldo Leopold
$100
Sustaining Membership 10% discount on one facility rental $250
Benefactor Membership A private docent-led tour of nature
grounds
$500
Nina Leopold Bradley
Stewardship Circle
Invitation to Cocktails in the Cattails,
their exclusive annual appreciation event
$1,000
New Canaan Nature Center Individual Membership Free use of Nature Activity Packs,
snowshoes and fishing poles for
exploring the ecosystem
+
Discounts on adult and youth programs.
+
Opportunity to rent facilities and outdoor
spaces for events.
+
Invitations to member-only winter and
summer solstice events
+
Subscription to monthly newsletter
$45
Family Membership Individual Membership benefits
Able to register birthday parties for
children and adults
+
Early access to registration
$85
Benefactor Membership Family Membership benefits
+
Invitation to annual donor events and
receptions
$1,000
Blue Heron Nature
Preserve
Beaver Discount on Blue Heron programs
+
Invitation to annual appreciation event
+
Blue Hero car magnet
$75
Flock Beaver benefits
+
Early registration for camps
+
10% discount on summer camps
+
10% discount on Fall, Winter and Spring
camps during early registration period
$100
River Otter Flock benefits
+
Invitation to member-only day
+
$250
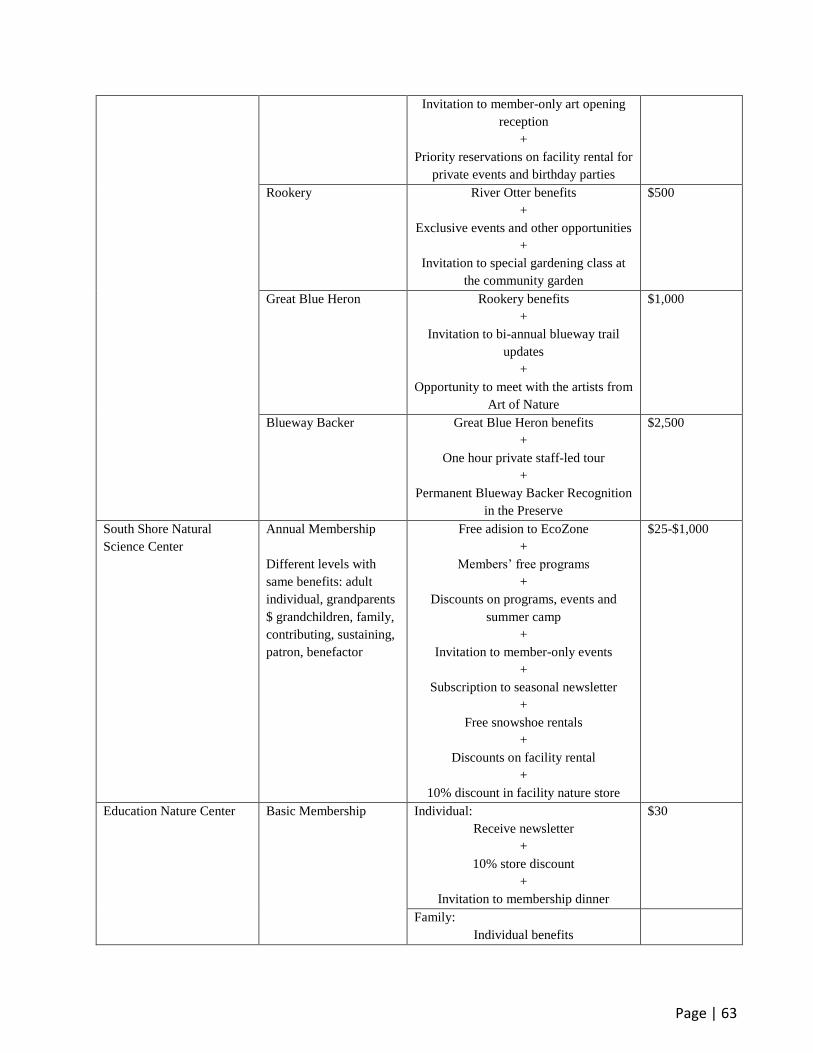
Page | 63
Invitation to member-only art opening
reception
+
Priority reservations on facility rental for
private events and birthday parties
Rookery River Otter benefits
+
Exclusive events and other opportunities
+
Invitation to special gardening class at
the community garden
$500
Great Blue Heron Rookery benefits
+
Invitation to bi-annual blueway trail
updates
+
Opportunity to meet with the artists from
Art of Nature
$1,000
Blueway Backer Great Blue Heron benefits
+
One hour private staff-led tour
+
Permanent Blueway Backer Recognition
in the Preserve
$2,500
South Shore Natural
Science Center
Annual Membership
Different levels with
same benefits: adult
individual, grandparents
$ grandchildren, family,
contributing, sustaining,
patron, benefactor
Free adision to EcoZone
+
Members’ free programs
+
Discounts on programs, events and
summer camp
+
Invitation to member-only events
+
Subscription to seasonal newsletter
+
Free snowshoe rentals
+
Discounts on facility rental
+
10% discount in facility nature store
$25-$1,000
Education Nature Center Basic Membership Individual:
Receive newsletter
+
10% store discount
+
Invitation to membership dinner
$30
Family:
Individual benefits
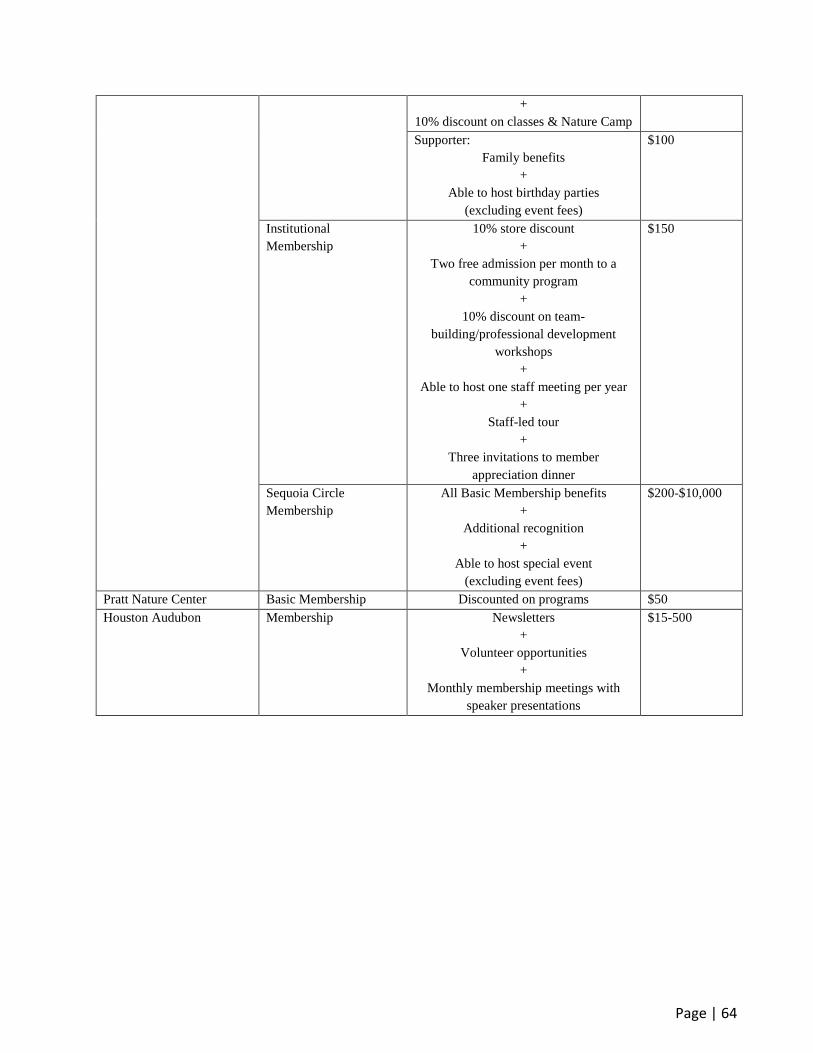
Page | 64
+
10% discount on classes & Nature Camp
Supporter:
Family benefits
+
Able to host birthday parties
(excluding event fees)
$100
Institutional
Membership
10% store discount
+
Two free admission per month to a
community program
+
10% discount on team-
building/professional development
workshops
+
Able to host one staff meeting per year
+
Staff-led tour
+
Three invitations to member
appreciation dinner
$150
Sequoia Circle
Membership
All Basic Membership benefits
+
Additional recognition
+
Able to host special event
(excluding event fees)
$200-$10,000
Pratt Nature Center Basic Membership Discounted on programs $50
Houston Audubon Membership Newsletters
+
Volunteer opportunities
+
Monthly membership meetings with
speaker presentations
$15-500
Related Documents