Biondo PLC2018 proceedings 11 Story Maps: A New Way to Make Your Polar Documentation Talk! STEFANO BIONDO Centre GéoStat, Bibliothèque, Université Laval, Québec, Canada Abstract Story maps have emerged in recent years as online tools for telling stories in an interactive and dynamic way. ey are used to represent places associated with the story being told, allowing audiences to follow in the footsteps of an explorer or migrant, retrace the evolution of a conflict, or better understand the impact of the mining industry on caribou migration, for example. By easily combining maps, text, images and multimedia content, story maps offer a valuable alternative for promoting maps, exploration books, postcards, photos, video recordings, and other items from our polar collections. Currently, there are a number of open and proprietary applications for creating story maps, including the one from Esri. is paper explains how the Esri Story Map application was used to present documentation related to the Coppermine Expedition conducted in the Canadian Arctic by Sir John Franklin between 1819 and 1822. e purpose of the paper is to share our experience with the applica- tion, showcase its benefits and limitations, and describe the skills required.

Welcome message from author
This document is posted to help you gain knowledge. Please leave a comment to let me know what you think about it! Share it to your friends and learn new things together.
Transcript

BiondoPLC2018 proceedings
11
Story Maps: A New Way to Make Your Polar
Documentation Talk!sTefano Biondo
Centre GéoStat, Bibliothèque, Université Laval, Québec, Canada
abstractStory maps have emerged in recent years as online tools for telling stories in an interactive and dynamic way. They are used to represent places associated with the story being told, allowing
audiences to follow in the footsteps of an explorer or migrant, retrace the evolution of a conflict, or better understand the impact of the mining industry on caribou migration, for example. By easily combining maps, text, images and multimedia content, story maps offer a valuable alternative for promoting maps, exploration books, postcards, photos, video recordings, and
other items from our polar collections. Currently, there are a number of open and proprietary applications for creating story maps, including the one from Esri.
This paper explains how the Esri Story Map application was used to present documentation related to the Coppermine Expedition conducted in the Canadian Arctic by Sir John Franklin between 1819 and 1822. The purpose of the paper is to share our experience with the applica-
tion, showcase its benefits and limitations, and describe the skills required.

BiondoPLC2018 proceedings
12
centre géostat and story MapsCentre GéoStat—Centre d’information géographique et statistique is a geographical and statistical infor-mation centre based at the Université Laval Library in Québec City, Canada. The centre identifies and reviews geography books, map statistics, atlases, aerial photographs and geospatial data. The library’s geo-graphic and cartographic collections include a subset pertaining to the North and Northern Studies, two areas in which Université Laval specializes. This brings me to how we used a story map application to promote polar information.
But first, what is a story map? Simply put, it is a way to tell a story with a map. A narrative or story map is a thematic map with text and images used to represent the different places associated with stories. Story maps can be used for multiple purposes: to retrace Richard Byrd’s second expedition to Antarctica or the route of an Inuit hunter, for example, or to view the evolution of a social phenomenon (e.g., the route taken by migrants, the ISIS campaign to take control of Iraq). Almost anything that evolves over space and time can be depicted with a story map application.
In recent years, online applications specially designed to create map stories have helped make storytell-ing maps more dynamic and interactive. These range from simple applications such as Tour Builder or Tripline for visualizing a narrative in a linear, place-by-place manner to more sophisticated applications for analyzing stories, like Neatline or Atlascine, as well as a handful of applications that can do both, such as Esri Story Map and MapStory (Coquard, 2017). From a documentation perspective, these applications represent a new way to highlight our polar collections. By easily combining maps, text, images and mul-timedia content, they offer a valuable alternative for promoting maps, exploration books, postcards, pho-tos, video recordings, interviews and other items from our holdings. Currently, there are a variety of open and proprietary applications for creating story maps, including the one from Esri.
esri story Map applicationWe chose the Esri Story Map application for our project for a variety of reasons. First, we are familiar with Esri products and have a campus-wide license for Esri applications, including ArcMap, the desktop map-ping software. Secondly, we have access to on-campus expertise in the Geomatics Department if we need help or advice. Third, we previously collaborated with researcher to produce a story map with Esri appli-cation called “Mining Development, Migratory Caribou and Land Use in Northern Quebec.”1 We also used Esri Story Map to create a presentation on Joë Bouchard and Stéfano Biondo’s adventures in Alaska, which we presented to our librarian colleagues after PLC 2016 in Fairbanks, Alaska.
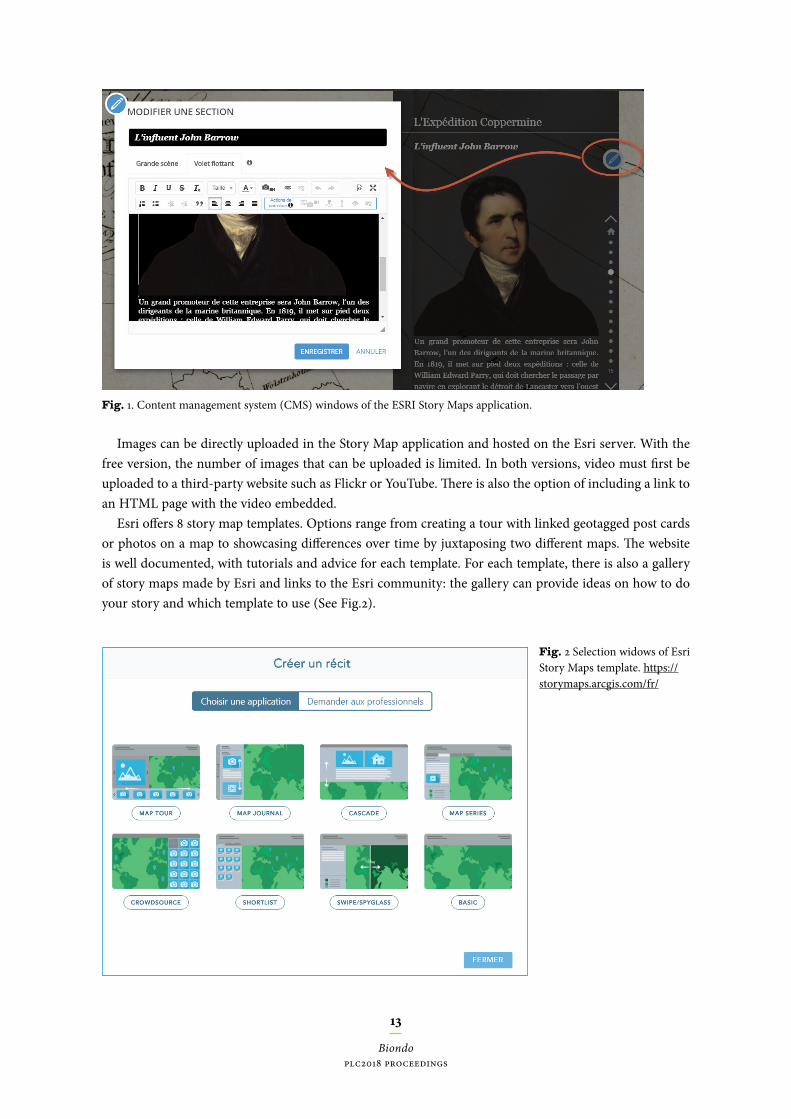
The Esri Story Map Application uses ArcGIS Online, another Esri online mapping platform, to create a variety of map styles that can be added to stories to create a more immersive user experience. It is also possible to add functionalities or widgets to a map using WebApp Builder. Examples include legend icons that can be used to activate or disable project layers or adjust layer opacity when comparing information, as well as ruler icons for calculating distances or area. The Story Map Application also offers a content management system (CMS) for integrating text, image, video and audio files (See Fig.1).
1. Mining Development, Migratory Caribou, and Land Use in Northern Québec http://ulaval.maps.arcgis.com/apps/Map-Journal/index.html?appid=93ca02e5154f40c4a6c7e586582e9caa&locale=en
BiondoPLC2018 proceedings
13
fig. 1. Content management system (CMS) windows of the ESRI Story Maps application.
Images can be directly uploaded in the Story Map application and hosted on the Esri server. With the free version, the number of images that can be uploaded is limited. In both versions, video must first be uploaded to a third-party website such as Flickr or YouTube. There is also the option of including a link to an HTML page with the video embedded.
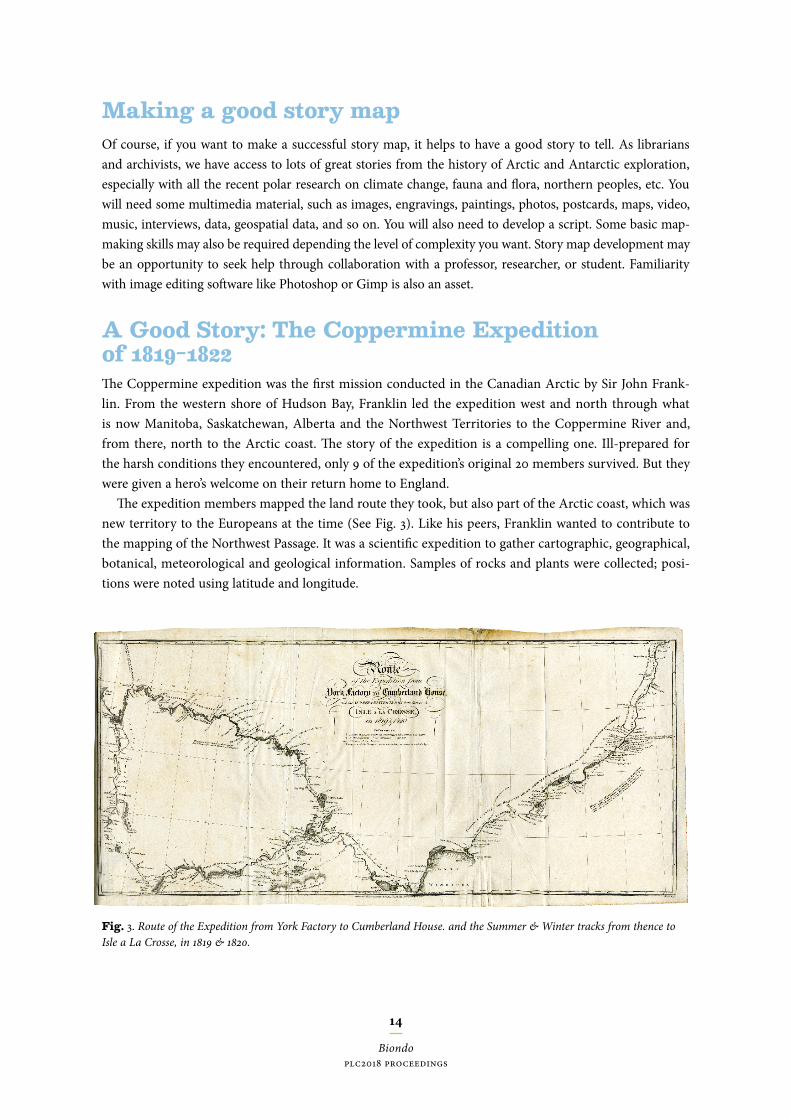
Esri offers 8 story map templates. Options range from creating a tour with linked geotagged post cards or photos on a map to showcasing differences over time by juxtaposing two different maps. The website is well documented, with tutorials and advice for each template. For each template, there is also a gallery of story maps made by Esri and links to the Esri community: the gallery can provide ideas on how to do your story and which template to use (See Fig.2).
fig. 2 Selection widows of Esri Story Maps template. https://storymaps.arcgis.com/fr/
BiondoPLC2018 proceedings
14
Making a good story mapOf course, if you want to make a successful story map, it helps to have a good story to tell. As librarians and archivists, we have access to lots of great stories from the history of Arctic and Antarctic exploration, especially with all the recent polar research on climate change, fauna and flora, northern peoples, etc. You will need some multimedia material, such as images, engravings, paintings, photos, postcards, maps, video, music, interviews, data, geospatial data, and so on. You will also need to develop a script. Some basic map-making skills may also be required depending the level of complexity you want. Story map development may be an opportunity to seek help through collaboration with a professor, researcher, or student. Familiarity with image editing software like Photoshop or Gimp is also an asset.
a good story: The coppermine expedition of 1819–1822The Coppermine expedition was the first mission conducted in the Canadian Arctic by Sir John Frank-lin. From the western shore of Hudson Bay, Franklin led the expedition west and north through what is now Manitoba, Saskatchewan, Alberta and the Northwest Territories to the Coppermine River and, from there, north to the Arctic coast. The story of the expedition is a compelling one. Ill-prepared for the harsh conditions they encountered, only 9 of the expedition’s original 20 members survived. But they were given a hero’s welcome on their return home to England.
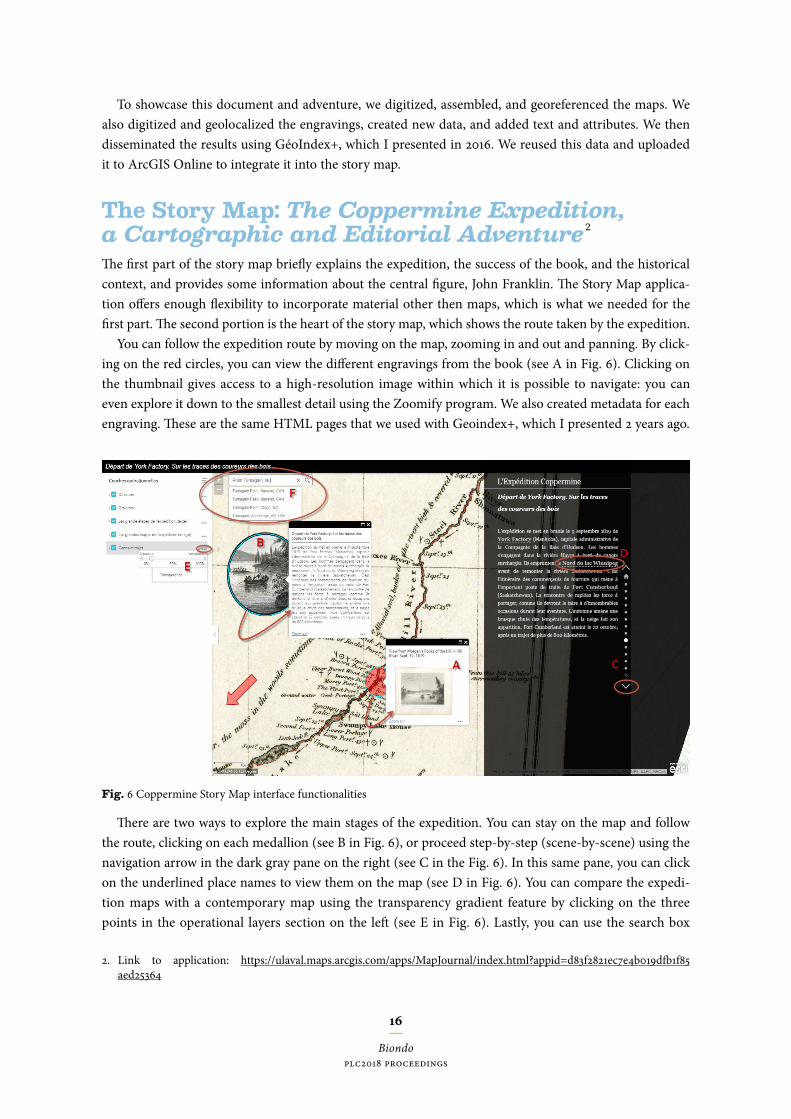
The expedition members mapped the land route they took, but also part of the Arctic coast, which was new territory to the Europeans at the time (See Fig. 3). Like his peers, Franklin wanted to contribute to the mapping of the Northwest Passage. It was a scientific expedition to gather cartographic, geographical, botanical, meteorological and geological information. Samples of rocks and plants were collected; posi-tions were noted using latitude and longitude.
fig. 3. Route of the Expedition from York Factory to Cumberland House. and the Summer & Winter tracks from thence to Isle a La Crosse, in 1819 & 1820.

BiondoPLC2018 proceedings
15
The members of the expedition party were adventurers of various origins: five British soldiers, a num-ber of French-Canadian voyageurs and several Indigenous people. The story of Franklin’s Coppermine expedition was published in 1823 under the title Narrative of a Journey to the Shores of the Polar Sea and is considered one of the greatest accounts of travel in the Far North.
fig. 4. Title page of the book Narrative of a Journey to the Shores of the Polar Sea owned by Université Laval. © Stéfano Biondo/Bibliothèque de l’Université Laval, 2016.
iconographic MaterialFranklin’s account is a magnificent book that became a classic of travel literature (or exploration narrative) very soon after its publication (see Fig.4). It contains four maps, three of which show the route taken by Franklin’s party and one the then new findings of Parry, Ross and Franklin. It also contains 31 engravings by Robert Hood and George Back, including 11 enhanced colour images (see Fig. 5).
fig. 5 A beautiful engraving entitled Portrait of Akaitcho and his Son drawn by Robert Hood. © Stéfano Biondo/Biblio thèque de l’Université Laval, 2016.
BiondoPLC2018 proceedings
16
To showcase this document and adventure, we digitized, assembled, and georeferenced the maps. We also digitized and geolocalized the engravings, created new data, and added text and attributes. We then disseminated the results using GéoIndex+, which I presented in 2016. We reused this data and uploaded it to ArcGIS Online to integrate it into the story map.
The story Map: The Coppermine Expedition, a Cartographic and Editorial Adventure2
The first part of the story map briefly explains the expedition, the success of the book, and the historical context, and provides some information about the central figure, John Franklin. The Story Map applica-tion offers enough flexibility to incorporate material other then maps, which is what we needed for the first part. The second portion is the heart of the story map, which shows the route taken by the expedition.
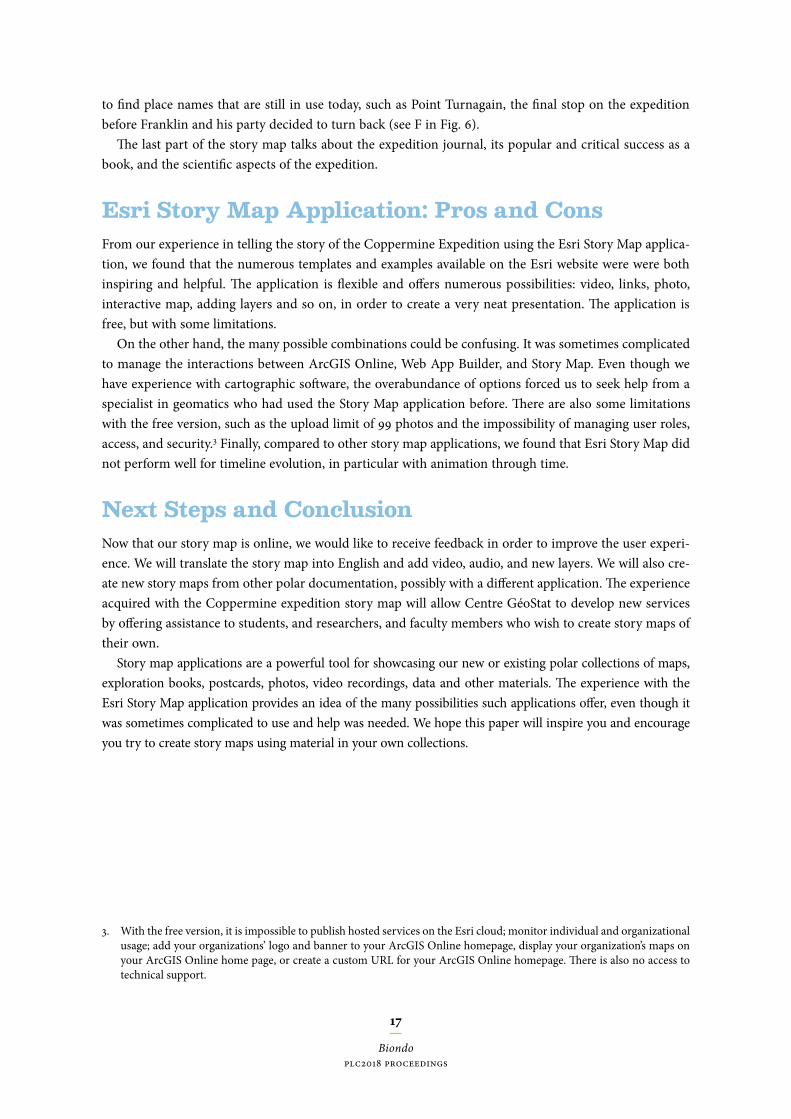
You can follow the expedition route by moving on the map, zooming in and out and panning. By click-ing on the red circles, you can view the different engravings from the book (see A in Fig. 6). Clicking on the thumbnail gives access to a high-resolution image within which it is possible to navigate: you can even explore it down to the smallest detail using the Zoomify program. We also created metadata for each engraving. These are the same HTML pages that we used with Geoindex+, which I presented 2 years ago.
fig. 6 Coppermine Story Map interface functionalities
There are two ways to explore the main stages of the expedition. You can stay on the map and follow the route, clicking on each medallion (see B in Fig. 6), or proceed step-by-step (scene-by-scene) using the navigation arrow in the dark gray pane on the right (see C in the Fig. 6). In this same pane, you can click on the underlined place names to view them on the map (see D in Fig. 6). You can compare the expedi-tion maps with a contemporary map using the transparency gradient feature by clicking on the three points in the operational layers section on the left (see E in Fig. 6). Lastly, you can use the search box
2. Link to application: https://ulaval.maps.arcgis.com/apps/MapJournal/index.html?appid=d83f2821ec7e4b019dfb1f85aed25364
BiondoPLC2018 proceedings
17
to find place names that are still in use today, such as Point Turnagain, the final stop on the expedition before Franklin and his party decided to turn back (see F in Fig. 6).
The last part of the story map talks about the expedition journal, its popular and critical success as a book, and the scientific aspects of the expedition.
esri story Map application: Pros and consFrom our experience in telling the story of the Coppermine Expedition using the Esri Story Map applica-tion, we found that the numerous templates and examples available on the Esri website were were both inspiring and helpful. The application is flexible and offers numerous possibilities: video, links, photo, interactive map, adding layers and so on, in order to create a very neat presentation. The application is free, but with some limitations.
On the other hand, the many possible combinations could be confusing. It was sometimes complicated to manage the interactions between ArcGIS Online, Web App Builder, and Story Map. Even though we have experience with cartographic software, the overabundance of options forced us to seek help from a specialist in geomatics who had used the Story Map application before. There are also some limitations with the free version, such as the upload limit of 99 photos and the impossibility of managing user roles, access, and security.3 Finally, compared to other story map applications, we found that Esri Story Map did not perform well for timeline evolution, in particular with animation through time.
next steps and conclusionNow that our story map is online, we would like to receive feedback in order to improve the user experi-ence. We will translate the story map into English and add video, audio, and new layers. We will also cre-ate new story maps from other polar documentation, possibly with a different application. The experience acquired with the Coppermine expedition story map will allow Centre GéoStat to develop new services by offering assistance to students, and researchers, and faculty members who wish to create story maps of their own.
Story map applications are a powerful tool for showcasing our new or existing polar collections of maps, exploration books, postcards, photos, video recordings, data and other materials. The experience with the Esri Story Map application provides an idea of the many possibilities such applications offer, even though it was sometimes complicated to use and help was needed. We hope this paper will inspire you and encourage you try to create story maps using material in your own collections.
3. With the free version, it is impossible to publish hosted services on the Esri cloud; monitor individual and organizational usage; add your organizations’ logo and banner to your ArcGIS Online homepage, display your organization’s maps on your ArcGIS Online home page, or create a custom URL for your ArcGIS Online homepage. There is also no access to technical support.
BiondoPLC2018 proceedings
18
Bibliography
Cacard, Sébastien and Dimitrovas, Stefanie (2011). Story Maps & Co. Un état de l’art de la cartographie des récits sur Internet/Story Maps & Co. The state of the art of online narrative cartography. M@ppemonde, 121. http://mappemonde.mgm.fr/rubriques/121/
Chaire de recherche sur le développement durable du Nord (2017). Développement minier, caribou migrateur et utilisation du territoire au Québec nordique / Mining Development, Migratory Caribou, and Land Use in Northern Québec. http://ulaval.maps.arcgis.com/apps/MapJournal/index.html?appid=e9855aa6ead44d3daaf26a51258bd727&locale=fr
Esri (2018). Cartes de narration. https://storymaps.arcgis.com/fr/Franklin, John. 1823. Narrative of a Journey to the Shores of the Polar Sea, in the Years 1819, 20, 21, and 22.
London: J. Murray. 768 p.Bibliothèque de l’Université Laval. 2012. Géoindex+ [Web Platform]. [http://geoindex-plus.bibl.ulaval.
ca/]Pearce, Margaret Wickens and HERMANN, Michael James (2010). Mapping Champlain’s Travels:
Restorative Techniques for Historical Cartography. Cartographica, 45, 1, pp. 32–46.
Related Documents