Department of Legislative Services Office of Policy Analysis Annapolis, Maryland December 12, 2013 Stormwater Remediation Fees in Maryland Presentation to the Senate Budget and Taxation Committee

Welcome message from author
This document is posted to help you gain knowledge. Please leave a comment to let me know what you think about it! Share it to your friends and learn new things together.
Transcript
Department of Legislative Services Office of Policy Analysis
Annapolis, Maryland December 12, 2013
Stormwater Remediation Fees in Maryland
Presentation to the Senate Budget and Taxation Committee

Outline • Overview of Stormwater Management • Local Fee Structure and Levels • Fees and Other Stormwater Revenues • Stormwater Cost Projections
• Policy Issues and Considerations
1
2
Overview of Stormwater Management
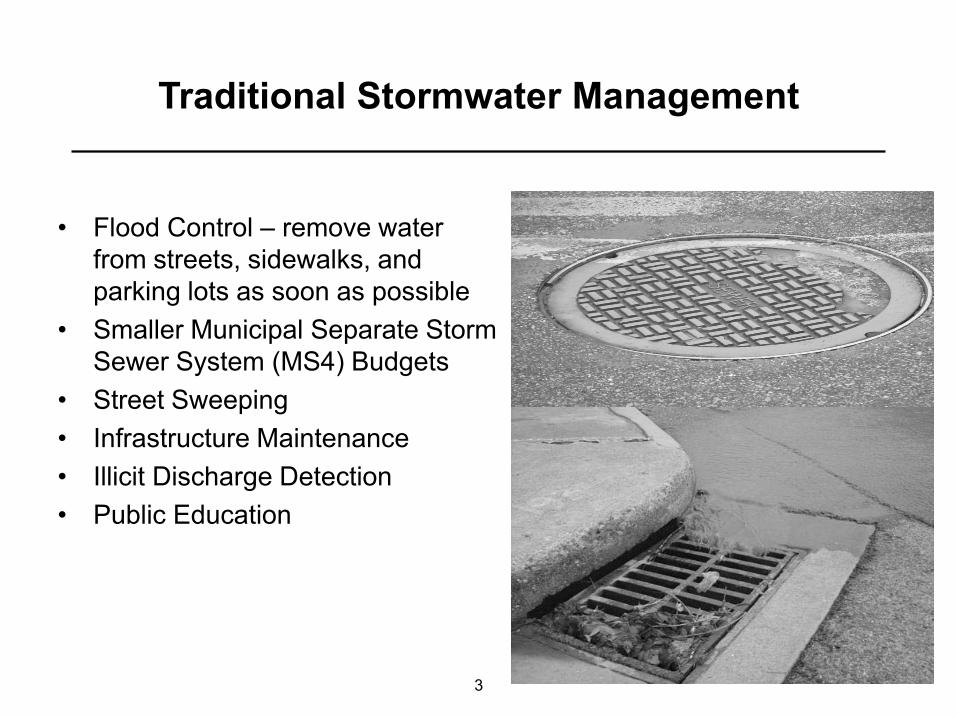
Traditional Stormwater Management
• Flood Control – remove water
from streets, sidewalks, and parking lots as soon as possible
• Smaller Municipal Separate Storm Sewer System (MS4) Budgets
• Street Sweeping • Infrastructure Maintenance • Illicit Discharge Detection • Public Education
3

Modern Stormwater Management
• Greater Environmental
Component • Environmental Site Design • Much Bigger MS4 Budgets • Restoration of % of Untreated
Impervious Surfaces • Show Compliance with Bay
Total Maximum Daily Load (TMDL)
• Plan with and Pay for Best Management Practices
4

Overview of Stormwater Management Policy
5
NPDES: National Pollutant Discharge Elimination System TMDL: Total Maximum Daily Load WIP: Watershed Implementation Plan
What Is NOT New What IS New The Federal Clean Water Act (1972) Bay TMDL (2010, but decades in making) Stormwater Utility Fees (early 1970s) The Phase II WIP (2012) Chesapeake Bay Program (1983) House Bill 987 (Chapter 151 of 2012) NPDES MS4 Permits (1990) Implementation of HB 987 (July 1, 2013)
Overlapping Stormwater Management Policies
• Chapter 151 of 2012 (House Bill 987) establishes funding for two existing, federally required, State-enforced environmental programs: (1) the local stormwater component of bay TMDL; and
(2) the MS4 permit, including the Maryland Department
of the Environment’s (MDE) requirement to restore a specified percentage (> 20%) of untreated impervious surfaces
6

7
Local Fee Structure and Levels
Chapter 151 of 2012
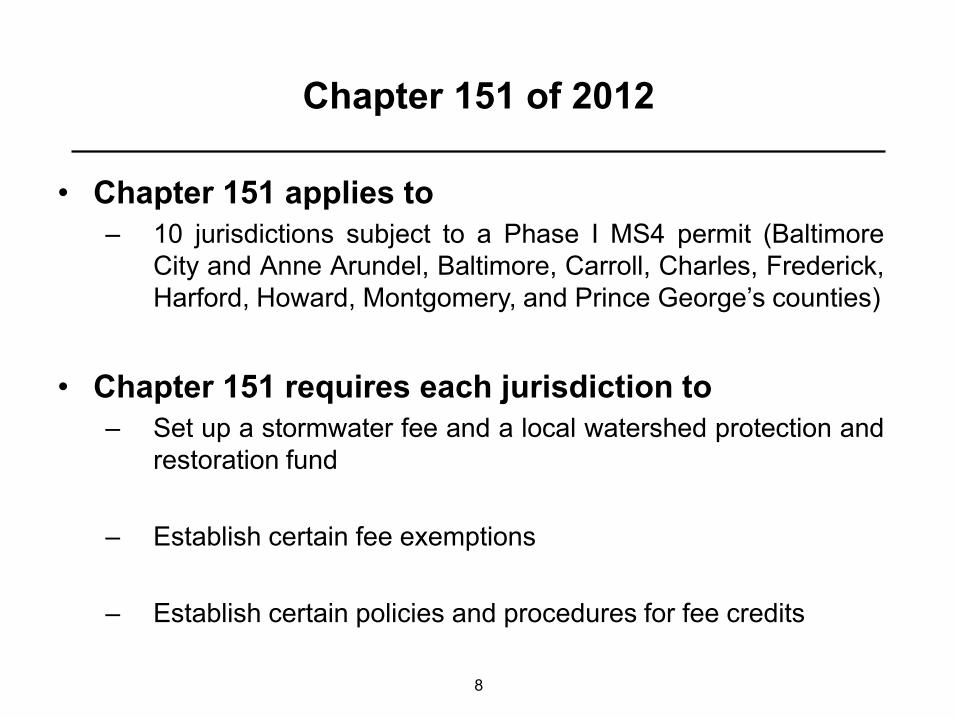
• Chapter 151 applies to – 10 jurisdictions subject to a Phase I MS4 permit (Baltimore
City and Anne Arundel, Baltimore, Carroll, Charles, Frederick, Harford, Howard, Montgomery, and Prince George’s counties)
• Chapter 151 requires each jurisdiction to
– Set up a stormwater fee and a local watershed protection and restoration fund
– Establish certain fee exemptions
– Establish certain policies and procedures for fee credits
8
Chapter 151 Fee Implementation
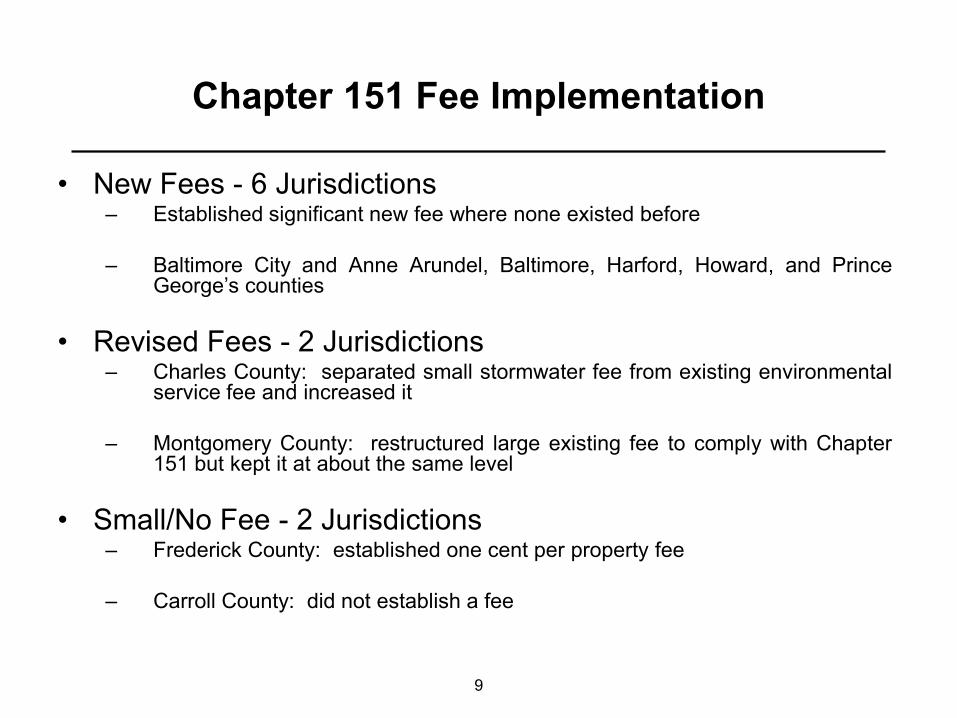
• New Fees - 6 Jurisdictions – Established significant new fee where none existed before – Baltimore City and Anne Arundel, Baltimore, Harford, Howard, and Prince
George’s counties
• Revised Fees - 2 Jurisdictions – Charles County: separated small stormwater fee from existing environmental
service fee and increased it – Montgomery County: restructured large existing fee to comply with Chapter
151 but kept it at about the same level
• Small/No Fee - 2 Jurisdictions – Frederick County: established one cent per property fee
– Carroll County: did not establish a fee
9

Chapter 151 Residential Fee Structure and Collection
• Flat Fee Structure - 2 Jurisdictions – Charles and Frederick counties
• Graduated Fee Structure - 7 Jurisdictions
– Baltimore City and Anne Arundel, Baltimore, Harford, Howard, Montgomery, and Prince George’s counties
• No Fee Structure - 1 Jurisdiction
– Carroll County
• Fee Collection mechanism: 8 jurisdictions collecting on property tax bills; 1 jurisdiction through quarterly water bills
10

Chapter 151 Nonresidential Fees
• 2 jurisdictions have established a flat fee and 1 jurisdiction has chosen not to establish a fee
• Most jurisdictions have established a nonresidential fee rate based on the amount of impervious surface on the property, which is defined as equivalent residential unit (ERU) or impervious unit (IU)
• Fees per ERU or IU on a normalized basis are
– $392 – Prince George’s – $610 – Harford – $1,259 – Anne Arundel – $1,307 – Howard – $1,502 – Baltimore – $1,593 – Montgomery – $2,489 – Baltimore City
11

Chapter 151 Fee Characteristics
• Phase-ins – 4 Jurisdictions – Example: Anne Arundel County – for single-family properties and those multifamily
and nonresidential properties with a fee exceeding $500, charges will be phased in at 60% for fiscal 2014, 80% for fiscal 2015, and 100% beginning in fiscal 2016
• Exemptions – 9 Jurisdictions
– Example: Baltimore County – in addition to exemptions specified in HB 987, includes exemptions for unimproved properties and nonresidential agricultural properties
• Credits – 6 Jurisdictions
– Example: Montgomery County – offers credits against bill of up to 60% based on the type of stormwater practice installed and the volume of stormwater treated
• Rebates – 4 Jurisdictions
– Example: Howard County – certain properties may receive a one-time reimbursement for the installation of certain approved stormwater practices
• Nonprofit and Religious Fees – 5 Jurisdictions
– Example: Prince George’s County – exemption available; county is developing regulations that allow submission of an Alternative Compliance Plan
12
13
Fees and Other Stormwater Revenues
Estimated Chapter 151 of 2012 Fee Revenues
Jurisdiction Fiscal 2014
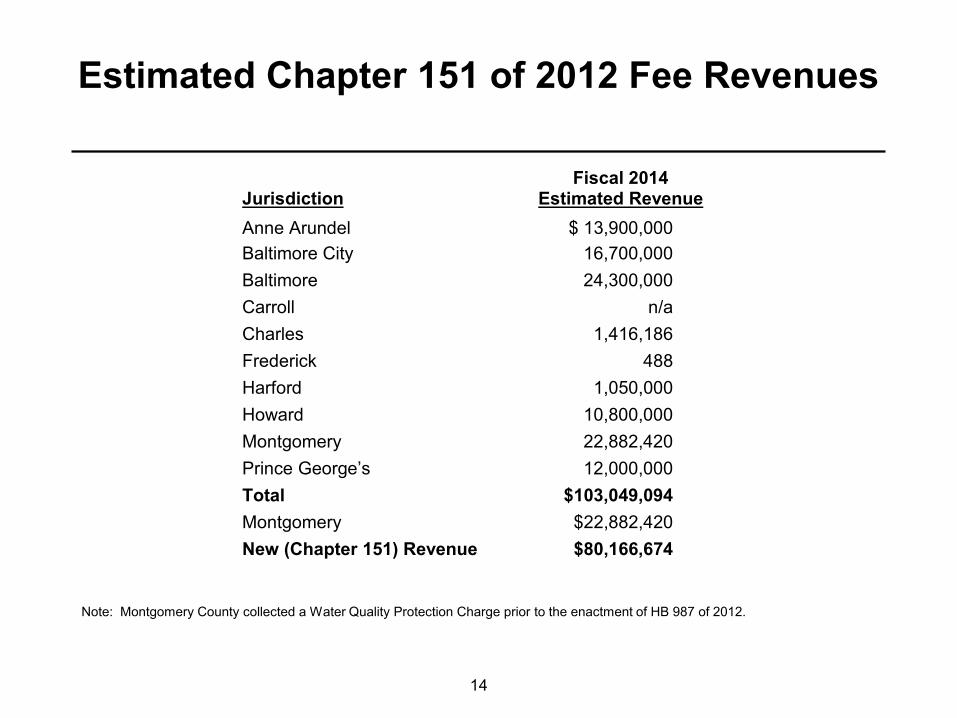
Estimated Revenue Anne Arundel $ 13,900,000 Baltimore City 16,700,000 Baltimore 24,300,000 Carroll n/a Charles 1,416,186 Frederick 488 Harford 1,050,000 Howard 10,800,000 Montgomery 22,882,420 Prince George’s 12,000,000 Total $103,049,094 Montgomery $22,882,420 New (Chapter 151) Revenue $80,166,674
Note: Montgomery County collected a Water Quality Protection Charge prior to the enactment of HB 987 of 2012.
14
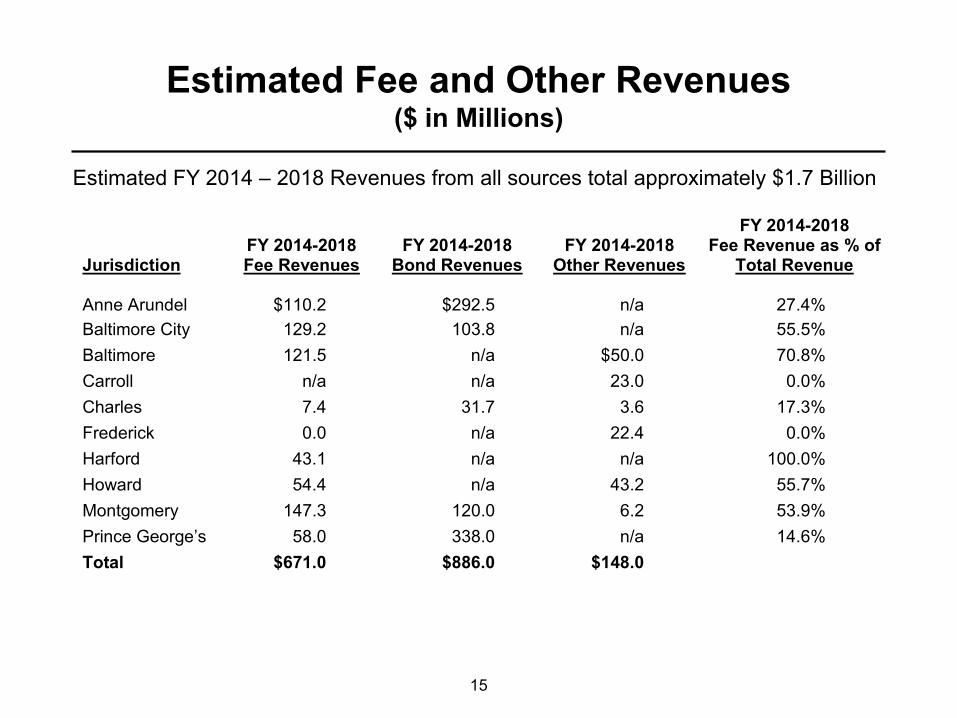
Estimated Fee and Other Revenues ($ in Millions)
Estimated FY 2014 – 2018 Revenues from all sources total approximately $1.7 Billion
15
Jurisdiction FY 2014-2018 Fee Revenues
FY 2014-2018 Bond Revenues
FY 2014-2018 Other Revenues
FY 2014-2018 Fee Revenue as % of
Total Revenue Anne Arundel $110.2 $292.5 n/a 27.4% Baltimore City 129.2 103.8 n/a 55.5% Baltimore 121.5 n/a $50.0 70.8% Carroll n/a n/a 23.0 0.0% Charles 7.4 31.7 3.6 17.3% Frederick 0.0 n/a 22.4 0.0% Harford 43.1 n/a n/a 100.0% Howard 54.4 n/a 43.2 55.7% Montgomery 147.3 120.0 6.2 53.9% Prince George’s 58.0 338.0 n/a 14.6% Total $671.0 $886.0 $148.0

Local Projections of Stormwater Management Costs
Jurisdiction Fiscal 2014-2018 Projected Costs
Projected Costs Annualized
Anne Arundel $402,700,000 $80,540,000 Baltimore City 228,500,000 45,700,000 Baltimore 167,000,000 33,400,000 Carroll 34,069,366 6,813,873 Charles 47,440,600 9,488,120 Frederick 112,000,000 22,400,000 Harford 90,000,000 18,000,000 Howard 210,000,000 42,000,000 Montgomery 332,904,709 66,580,942 Prince George’s 449,000,000 89,800,000 Total $2,073,614,675 $414,722,935
Source: Local jurisdictions; Department of Legislative Services
16

Local Stormwater Management Cost Projections and Impervious Surfaces
Average Annual Cost Per Acre of Impervious Surfaces
17
Acres of Untreated Impervious Surface
Projected Costs Annualized
Average Annual Cost Per Acre
Anne Arundel 14,887 $80,540,000 $5,410 Baltimore 23,373 45,700,000 1,955 Baltimore City 28,983 33,400,000 1,152 Carroll 6,449 6,813,873 1,057 Charles 2,607 9,488,120 3,639 Frederick 6,725 22,400,000 3,331 Harford 8,308 18,000,000 2,167 Howard 11,453 42,000,000 3,667 Montgomery 21,458 66,580,942 3,103 Prince George’s 22,020 89,800,000 4,078

Local Stormwater Management – Local Plans in Place to Fund at Least 80% of Estimated
Fiscal 2014-2018 Costs
Jurisdiction Total Revenues to
Expenditures Fee Revenues to
Expenditures Anne Arundel 100.0% 27.4% Baltimore City 102.0% 56.5% Baltimore 102.7% 72.8% Carroll 67.7% 0.0% Charles 89.9% 15.5% Frederick 20.0% 0.0% Harford 47.8% 47.8% Howard 46.5% 25.9% Montgomery 82.1% 44.2% Prince George’s 88.2% 12.9%
18
19
Policy Issues and Considerations
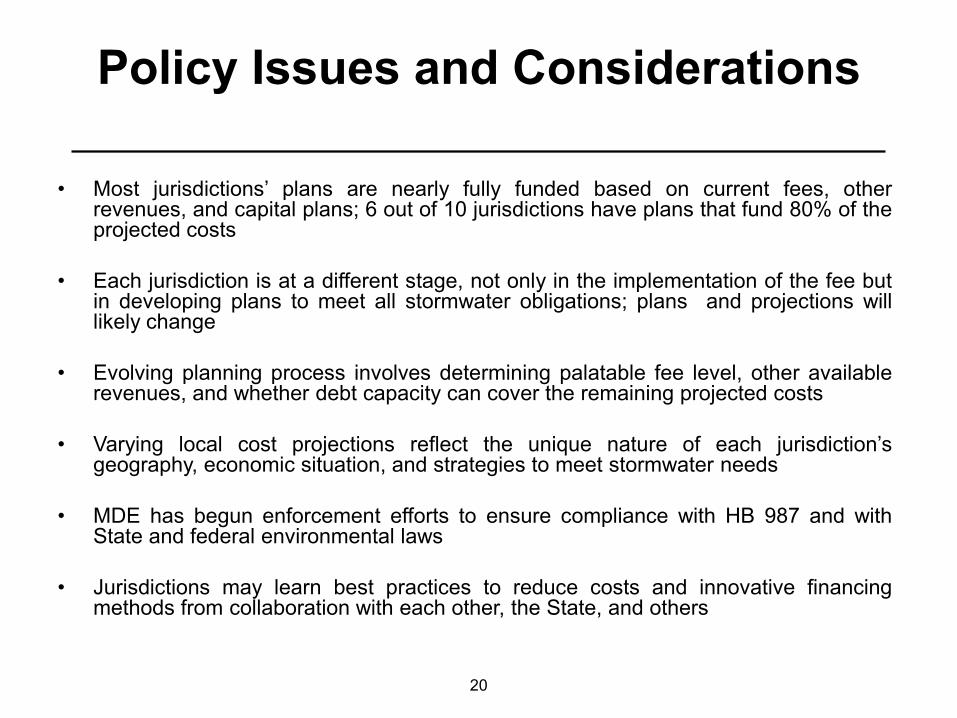
Policy Issues and Considerations
• Most jurisdictions’ plans are nearly fully funded based on current fees, other revenues, and capital plans; 6 out of 10 jurisdictions have plans that fund 80% of the projected costs
• Each jurisdiction is at a different stage, not only in the implementation of the fee but
in developing plans to meet all stormwater obligations; plans and projections will likely change
• Evolving planning process involves determining palatable fee level, other available
revenues, and whether debt capacity can cover the remaining projected costs • Varying local cost projections reflect the unique nature of each jurisdiction’s
geography, economic situation, and strategies to meet stormwater needs • MDE has begun enforcement efforts to ensure compliance with HB 987 and with
State and federal environmental laws • Jurisdictions may learn best practices to reduce costs and innovative financing
methods from collaboration with each other, the State, and others
20
Related Documents