Further info Appendix 2 Storm water analysis Page 1 of 15 Storm water Catchment Analysis Analysis index 1. Storm water attenuation tank sizing method 2. Consent notices for storm water attenuation tanks 3. Summary of sub catchments 4. Hydrological Analysis for Exploration Way catchment 5. Hydrological Analysis for Whitby lakes stream catchment 6. Impact on neighbours

Welcome message from author
This document is posted to help you gain knowledge. Please leave a comment to let me know what you think about it! Share it to your friends and learn new things together.
Transcript

Further info Appendix 2 Storm water analysis Page 1 of 15
Storm water Catchment Analysis
Analysis index
1. Storm water attenuation tank sizing method
2. Consent notices for storm water attenuation tanks
3. Summary of sub catchments
4. Hydrological Analysis for Exploration Way catchment
5. Hydrological Analysis for Whitby lakes stream catchment
6. Impact on neighbours

Further info Appendix 2 Storm water analysis Page 2 of 151 Storm water attenuation tank sizing method
All new lots are to use detention tanks to mitigate the effects of new impervious surfaces created by future building. It is proposed that the following chart be adopted from the Whangarei District Council as one acceptable solution to calculating detention tank sizes for this development.
(See http://www.wdc.govt.nz/WaterandWaste/Stormwater/Stormwater-Attenuation/Pages/Default.aspx for more detail)
With tropical storms, Whangarei have rainfall intensities that are typically 50% higher again than Porirua.This is demonstrated in the two charts below comparing Porirua and Whangarei rainfall intensities asprovided by the NIWA HIRDS system (http://hirds.niwa.co.nz).
So although well over designed for Porirua the above chart provides a quick indicator of a solution to mitigating storm water concentration on new impervious surfaces.
Further info Appendix 2 Storm water analysis Page 3 of 15
2 Consent notices for storm water attenuation tanks
Using the tank sizing method chart in the previous section one can see that for an increase in impervious surface of 250m2 for a new dwelling/hard stand footprint then a 3.5m diameter tank with approximately 17,000 litres of storage and 35mm diameter outlet would in theory mitigate the increased impervious area (even in Whangarei :-). Such a tank can be bought for under $3000.
It is proposed that each site in the development provide such detention tank (or appropriate alternative) mitigation for any new impervious surfaces. As the sites are big and most have extensive bush coverage, there are ample suitable locations to tuck an above ground tank away out of sight and surrounded by bush. Lot owners may opt for more expensive underground tanks or methods but good above ground tank locations have been selected and indicated in the previous diagram. It is anticipated that council will want to ensure future development has appropriate storm water mitigation via consent notice. This being the case the developer would like to allow purchasers a simple solution for calculation of appropriate tank size.
It is therefore proposed that a consent notice be placed on titles for lots 1 – 10 to the effect that approved storm water attenuation will be required for any new impervious surfaces and that the chart on the previous page provides one acceptable means of calculating the sizing of this attenuation.
As suggested in the consent application lots 8, 9 and 10 may be able to get away with flow dissipater/ soakage systems but as for any alternative these would need acceptable to council.
As the development sits at the top of several watersheds the natural storm water drains via several different discharge points as indicated on the overview diagram on the previous page. The different catchment analysis methods are summarised below.
Lot 10 dwelling is at the top of a large protected area of bush (Landscape protection zone) draining through several hundred meters of natural filter before reaching Duck creek. Any new impervious surfaces are proposed to be fully mitigated with detention tanks as discussed above. No further storm water analysis for this dwelling is included here.
Lot 9 (existing) dwelling and areas further south are not proposed to have new impervious surfaces or be greatly impacted by the development. This balance land naturally drains partly to the Whitby lakes stream and partly to the Duck creek through protected bush areas. No further storm water analysis of these areas is included here.
Lot 8 dwelling has an overland flow path through an area proposed for vegetation protection then an area already covenanted for vegetation protection and then to the Whitby lakes stream. Any new impervious surfaces are proposed to be fully mitigated with detention tanks as discussed above. No further storm water analysis is included here.
Drains to Duck Creek: A small area of the watershed affected by the development drains to Duck creek as shown in the previous diagram. There will be a slight and deliberate redirection of some of this flow back to its natural overland paths so as to ensure not to exasperate and hopefully reduce the current storm water issues suffered by 59 Exploration Way. The end point of this flow will still be Duck Creek. See later for further analysis of this area.
Drains to Whitby Lakes stream: The area shown in light blue on the previous diagram drains to the Whitbylakes stream. Mostly this exits the development land through a single dry gully into an area with existing vegetation protection. This gully leads to an existing 300mm diameter culvert under the neighbor's drivewaybefore continuing down to the stream. New impervious surfaces are to be mitigated with detention tanks etc before water is returned to its natural overland flow route to the gully. See later rational method analysis of this area.
Drains to Exploration Way: The area shown in green on the previous page drains to the Exploration Way kerb. This is the most problematic drainage but with the introduction of storm water attenuation tanks for dwellings and a new storm water detention basin the rational method calculations provided later indicate a reduction in peak flows to the kerb can be easily achieved. See later rational method analysis of this area.
Further info Appendix 2 Storm water analysis Page 4 of 15
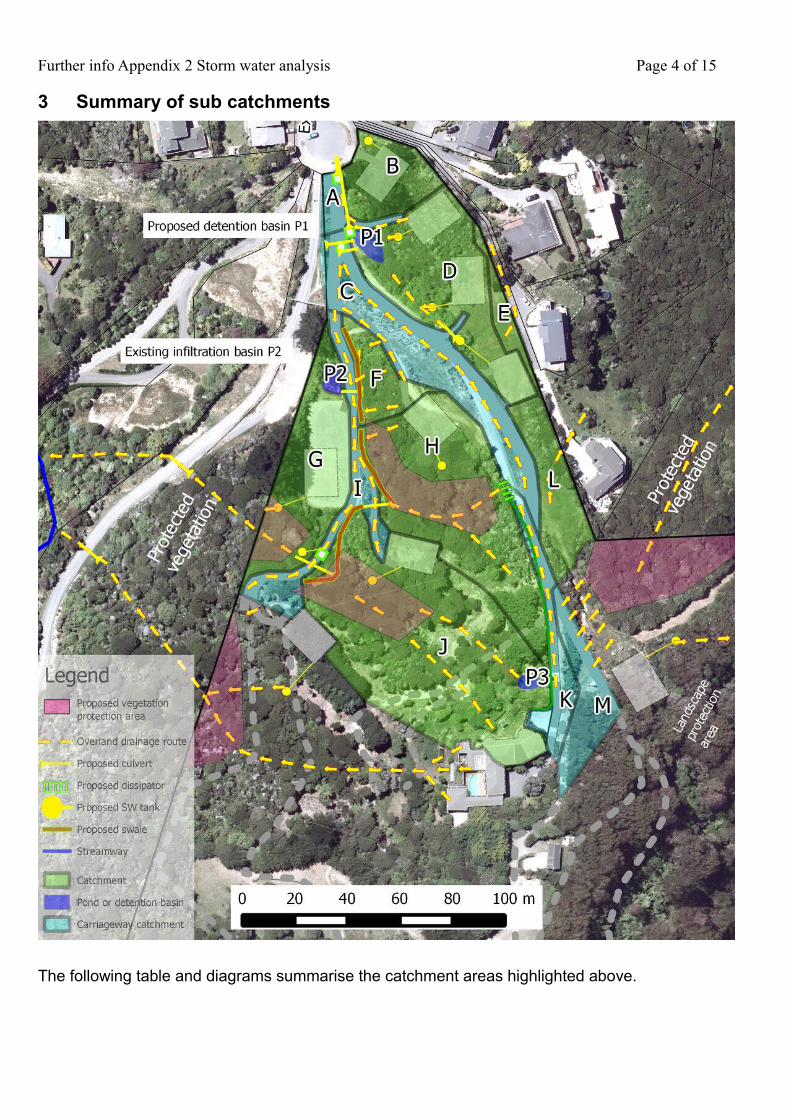
3 Summary of sub catchments
The following table and diagrams summarise the catchment areas highlighted above.
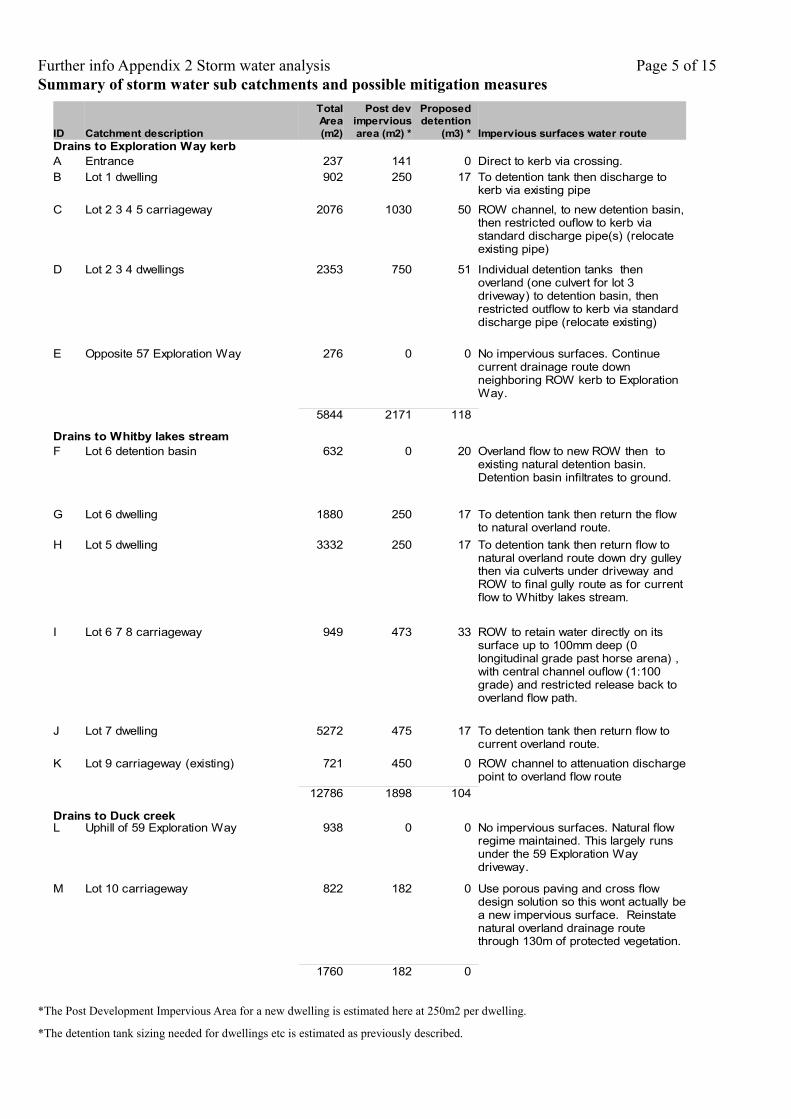
Further info Appendix 2 Storm water analysis Page 5 of 15Summary of storm water sub catchments and possible mitigation measures
*The Post Development Impervious Area for a new dwelling is estimated here at 250m2 per dwelling.
*The detention tank sizing needed for dwellings etc is estimated as previously described.
ID Catchment description Impervious surfaces water routeDrains to Exploration Way kerbA Entrance 237 141 0 Direct to kerb via crossing. B Lot 1 dwelling 902 250 17
C Lot 2 3 4 5 carriageway 2076 1030 50
D Lot 2 3 4 dwellings 2353 750 51
E Opposite 57 Exploration Way 276 0 0
5844 2171 118
F Lot 6 detention basin 632 0 20
G Lot 6 dwelling 1880 250 17
H Lot 5 dwelling 3332 250 17
I Lot 6 7 8 carriageway 949 473 33
J Lot 7 dwelling 5272 475 17
K Lot 9 carriageway (existing) 721 450 0
12786 1898 104
Drains to Duck creekL Uphill of 59 Exploration Way 938 0 0
M Lot 10 carriageway 822 182 0
1760 182 0
Total Area (m2)
Post dev impervious area (m2) *
Proposed detention
(m3) *
To detention tank then discharge to kerb via existing pipe
ROW channel, to new detention basin, then restricted ouflow to kerb via standard discharge pipe(s) (relocate existing pipe)
Individual detention tanks then overland (one culvert for lot 3 driveway) to detention basin, then restricted outflow to kerb via standard discharge pipe (relocate existing)
No impervious surfaces. Continue current drainage route down neighboring ROW kerb to Exploration Way.
Drains to Whitby lakes streamOverland flow to new ROW then to existing natural detention basin. Detention basin infiltrates to ground.
To detention tank then return the flow to natural overland route.
To detention tank then return flow to natural overland route down dry gulley then via culverts under driveway and ROW to final gully route as for current flow to Whitby lakes stream.
ROW to retain water directly on its surface up to 100mm deep (0 longitudinal grade past horse arena) , with central channel ouflow (1:100 grade) and restricted release back to overland flow path.
To detention tank then return flow to current overland route.
ROW channel to attenuation discharge point to overland flow route
No impervious surfaces. Natural flow regime maintained. This largely runs under the 59 Exploration Way driveway.
Use porous paving and cross flow design solution so this wont actually be a new impervious surface. Reinstate natural overland drainage route through 130m of protected vegetation.

Further info Appendix 2 Storm water analysis Page 6 of 15Catchments A, B: Entrance to right of way and Lot 1 dwelling
Catchment A: Entrance
Catchment A is the main entrance to the development. The crossing/discharge location is at the highest pointon the Exploration Way kerb so water flows both directions and thus down both sides of Exploration Way. This catchment is approximately 240m2 including a small component on the western neighbours property. Approximately 140m2 (being 22m of 6m wide ROW plus some driveway) of this area will be sealed under the proposal and will discharge to the kerb via a sump and standard pipe. No storm water detention is anticipated for this area. The storm water from further up the development that would normally discharge across this area will be diverted to a new detention pond (P1) as described later.
Currently this catchment has only 77m2 of sealed surface (22m of 3.5m wide ROW).
Catchment B: Lot 1 dwelling
Catchment B is the only lot in the development with direct frontage to Exploration Way. Currently this frontage has a sump that drains through twin 100mm pipes to the kerb. The twin pipes will no longer be required as the uphill water that currently flows to this road frontage will be diverted to the ponding area leaving only catchment B discharging directly to the road frontage. It is anticipated that the twin pipes in place will be left in place even though the loading requirement for them has gone.
If required by council appropriate detention tanks can be installed to compensate for new impervious surfaces on lot 1 which would further reduce the current storm water loads on the existing sump, pipes and crossing.

Further info Appendix 2 Storm water analysis Page 7 of 15Catchment C: Carriageway for lots 2 3 4 and 5
Catchment C has a total area of 2076m2 and includes the 164m of 5m wide carriageway plus a total of around 60m length of 3.5m wide driveways up to dwellings 2,3,4 and 5. This means 1030m2 of impervious surface as opposed to the 427m2 of driveway that currently exists in this catchment. It is proposed that catchment C drain to the a new detention basin (P1).

Further info Appendix 2 Storm water analysis Page 8 of 15Catchments D and E: Including lots 2, 3 and 4 dwellings
Catchment D: Lots 2, 3 and 4 dwellings
Catchment D is proposed to contain the dwellings for lots 2, 3 and 4 and each of these lots will individually mitigate any new impervious surfaces with appropriate detention tanks. Good locations are available on lots 2 and 3 to hide large above ground tanks in the retained native trees. The lot 4 tank location shown would not be as well hidden and a future owner may consider underground storage. The tanks shown above are 3.5m diameter and each would typically have a 40mm diameter or smaller outfall. A culvert will be requiredunder the driveway to the lot 3 dwelling. All drainage for this catchment will be to the new detention basin as shown (pump house to be removed).
Catchment E: Opposite 57 Exploration Way
This small area drains to the neighbour's right of way then to the Exploration Way kerb. A small reduction in this flow will probably occur as a result of new buildings diverting flows to detention tanks to the west.

Further info Appendix 2 Storm water analysis Page 9 of 15
4 Hydrological Analysis for Exploration Way Discharge
Catchment areas A, B, C, D and E will have pre and post development discharge to the Exploration Way road end. This analysis follows the recommendations in the Regional Standard for Water (http://www.pcc.govt.nz/Publications/Regional-Standard-for-Water-Services) and draws on data provided by NIWA's High Intensity Rainfall Design System HIRDS (http://hirds.niwa.co.nz). The estimation of surface water run off follows the rational method set out in “Verification Method E1/VM1” from the “Acceptable Solutions and Verification Methods For New Zealand Building Code Clause E1 Surface Water” (http://www.dbh.govt.nz/userfiles/file/publications/building/compliance-documents#E1).
The following parameters and assumptions have been used.
• Coefficients C for area moderation based on surface type
• Bush 0.45 Heavy clay soil bush cover (including slope correction +0.1) • Grass 0.5 Heavy clay soil grass cover (including slope correction +0.1)• Impervious 0.9 Concrete ROW, hardstand or slightly absorbent roofing (including
slope correction +0.05)• Time of concentration: 10min
• Porirua rainfall intensities at key Annual Exceedance Probabilities (AEP):
• Primary protection: AEP =10% for 10min duration intensity = 63mm/hr
• Secondary protection: AEP = 1% for 10min duration intensity = 103mm/hr
• PCC require provision for climate change: 16% increase in rainfall intensities
• PCC require provision for rainfall zone: 30% increase in rainfall intensities
• Design rainfall intensities with provision for climate change and zone
• Primary protection: 95mm/hr
• Secondary protection: 155mm/hr
The following pages provide calculations based on estimated areas for catchments. While the areas of roading are well established in the proposal, future areas of buildings, hard stands and cultivated vegetable gardens are necessarily broad brush. For each site a dwelling / hardstand area of 250m2 has been assumed. This potentially under estimates the impervious surfaces. On the other hand the intention is that all new built surfaces appropriately plan mitigation of concentration at the building permit stage. Also it is equally likely that the areas of grass have been over estimated and mitigating bush and gardens with higher absorption are likely to be planted by new owners.
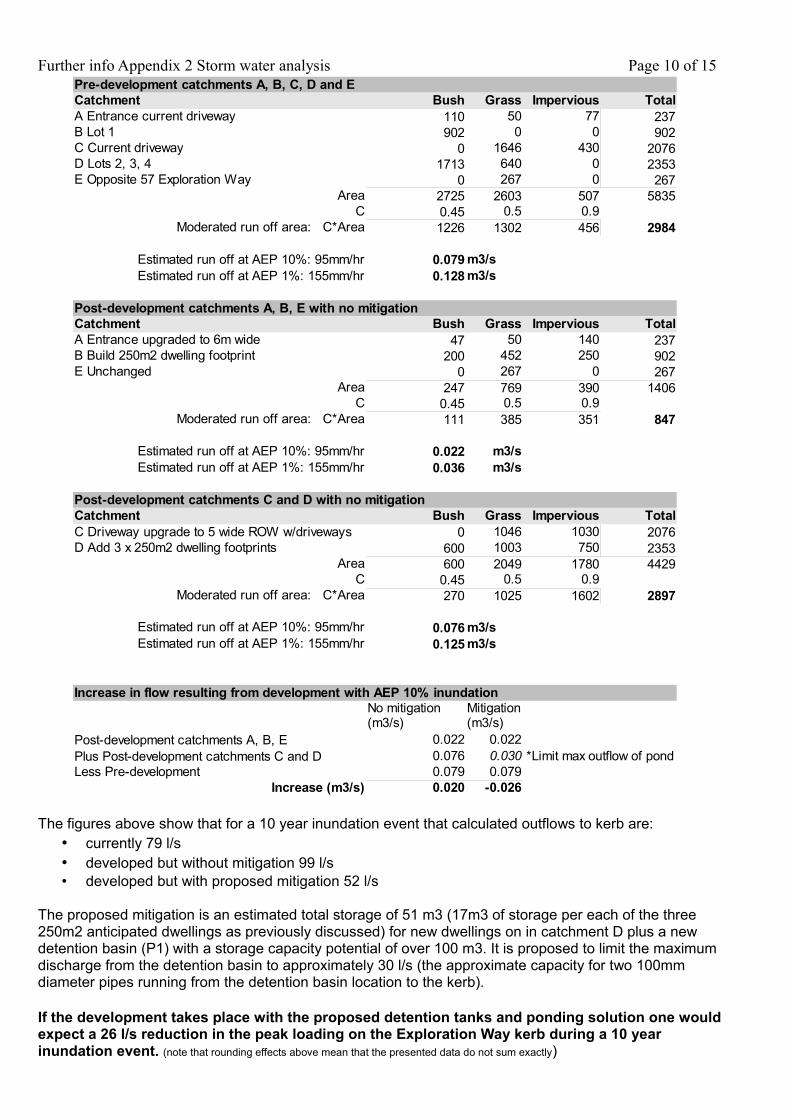
Further info Appendix 2 Storm water analysis Page 10 of 15
The figures above show that for a 10 year inundation event that calculated outflows to kerb are:• currently 79 l/s• developed but without mitigation 99 l/s• developed but with proposed mitigation 52 l/s
The proposed mitigation is an estimated total storage of 51 m3 (17m3 of storage per each of the three 250m2 anticipated dwellings as previously discussed) for new dwellings on in catchment D plus a new detention basin (P1) with a storage capacity potential of over 100 m3. It is proposed to limit the maximum discharge from the detention basin to approximately 30 l/s (the approximate capacity for two 100mm diameter pipes running from the detention basin location to the kerb).
If the development takes place with the proposed detention tanks and ponding solution one would expect a 26 l/s reduction in the peak loading on the Exploration Way kerb during a 10 year inundation event. (note that rounding effects above mean that the presented data do not sum exactly)
Pre-development catchments A, B, C, D and ECatchment Bush Grass Impervious TotalA Entrance current driveway 110 50 77 237B Lot 1 902 0 0 902C Current driveway 0 1646 430 2076D Lots 2, 3, 4 1713 640 0 2353E Opposite 57 Exploration Way 0 267 0 267
Area 2725 2603 507 5835C 0.45 0.5 0.9
Moderated run off area: C*Area 1226 1302 456 2984
0.079 m3/s0.128 m3/s
Post-development catchments A, B, E with no mitigation Catchment Bush Grass Impervious TotalA Entrance upgraded to 6m wide 47 50 140 237B Build 250m2 dwelling footprint 200 452 250 902E Unchanged 0 267 0 267
Area 247 769 390 1406C 0.45 0.5 0.9
Moderated run off area: C*Area 111 385 351 847
0.022 m3/s0.036 m3/s
Post-development catchments C and D with no mitigationCatchment Bush Grass Impervious Total
0 1046 1030 2076D Add 3 x 250m2 dwelling footprints 600 1003 750 2353
Area 600 2049 1780 4429C 0.45 0.5 0.9
Moderated run off area: C*Area 270 1025 1602 2897
0.076 m3/s0.125 m3/s
Increase in flow resulting from development with AEP 10% inundation
Post-development catchments A, B, E 0.022 0.022Plus Post-development catchments C and D 0.076 0.030Less Pre-development 0.079 0.079
Increase (m3/s) 0.020 -0.026
Estimated run off at AEP 10%: 95mm/hrEstimated run off at AEP 1%: 155mm/hr
Estimated run off at AEP 10%: 95mm/hrEstimated run off at AEP 1%: 155mm/hr
C Driveway upgrade to 5 wide ROW w/driveways
Estimated run off at AEP 10%: 95mm/hrEstimated run off at AEP 1%: 155mm/hr
No mitigation (m3/s)
Mitigation (m3/s)
*Limit max outflow of pond

Further info Appendix 2 Storm water analysis Page 11 of 15
The calculation above for a 10 year flood shows that if the outflow from the detention basin (P1) is limited to 30 l/s (twin 100mm pipes to kerb), a peak detained volume of 88 m3 may accumulate (blue line above). Asimilar calculation with outflow only limited to 15 l/s (a single 100mm pipe to kerb) indicates 149 m3 of water would temporarily accumulate.
The calculation uses HIRDS inundation data for Porirua (with Annual Exceedance Probability 10%) and increases this inflow by applying the PCC zone (+30%) and climate change (+16%) multipliers. The inflow area used is area C and D as moderated according to the rational method and calculated on the previous page(shown as “Post-development catchments C and D with no mitigation”). The discharge is assumed constant based on a one meter head through pipes although in reality the head will increase as the pond fills.
If the detention basin has an area of 100m2 (could easily fit up to 150m2 at the location) then storing 88m3 of water would only fill it to 0.88m depth in a 10 year storm event and it would be empty again in less than 3hours judging by the graph above.
The upstream dwelling detention tanks proposed (est 3 X 17 =51m3 total) would relieve a considerable part of the load calculated for the detention basin so it is unlikely that the any where near 88m3 of storage would be required at the basin. Final details of the detention basin design are to be discussed with and meet with PCC and geotechnical engineering approval.
Detention basin volume calculationModerated catchment area (C and D) 2897
With detention basin outflow rate limited to: (l/s) 30
Time Hours10min 0.17 18.2 27 80 18 61
20min 0.33 25.8 39 113 36 77
30min 0.50 31.6 48 138 54 84
60min 1 44.8 68 196 108 88
2hrs 2 58.9 89 257 216 41
6hrs 6 91 137 398 648 0
12hrs 12 119.7 181 523 1296 0
24hrs 24 157.5 238 688 2592 0
48hrs 48 187.2 282 818 5184 0
72hrs 72 207.1 312 905 7776 0
HIRDS inflow depth (mm)
PCC adjusted
inflow depth (mm)
Cumulative inflow (m3)
Cumulative outflow (m3)
Accumulated in pond (m3)
0.0 0.5 1.0 1.5 2.0 2.50
50
100
150
200
250
300
Detained volumeCatchment area: 2897m2
Outflow rate: 30 l/s
Cumulative inflow (m3)
Cumulative outflow (m3)
Accumulated in pond (m3)
Time in hours
Vo
lum
e (m
3)
Further info Appendix 2 Storm water analysis Page 12 of 15
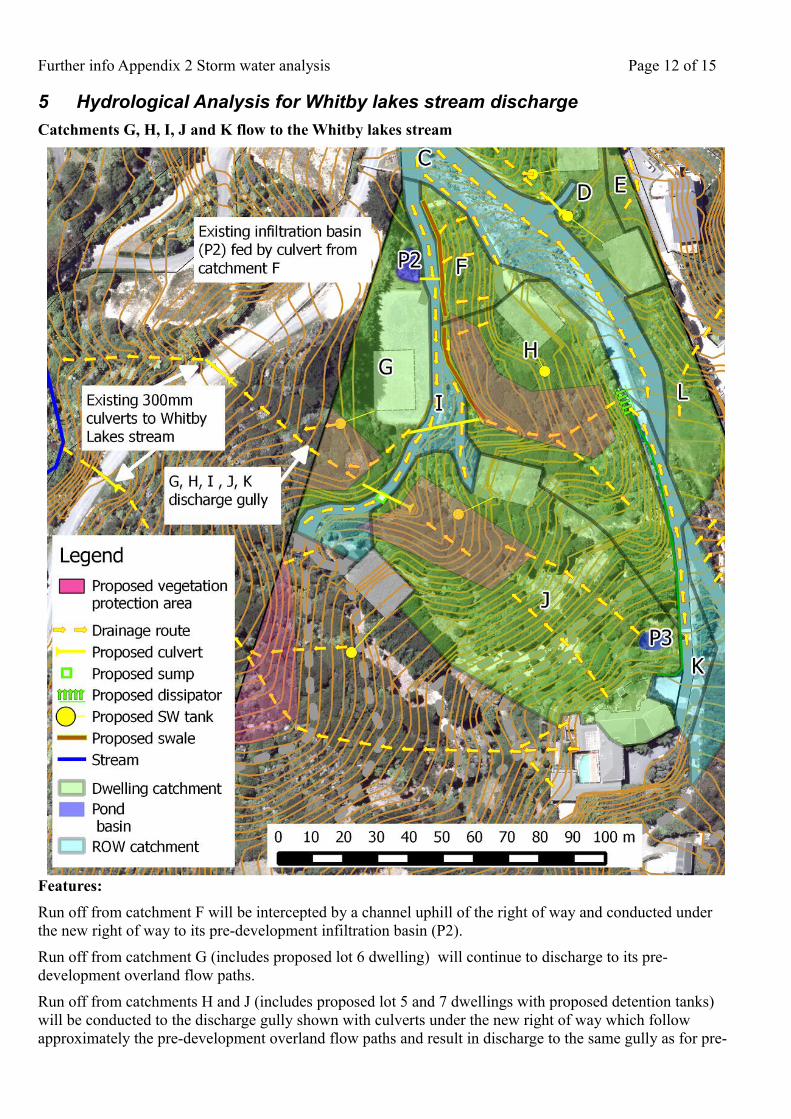
5 Hydrological Analysis for Whitby lakes stream discharge
Catchments G, H, I, J and K flow to the Whitby lakes stream
Features:
Run off from catchment F will be intercepted by a channel uphill of the right of way and conducted under the new right of way to its pre-development infiltration basin (P2).
Run off from catchment G (includes proposed lot 6 dwelling) will continue to discharge to its pre-development overland flow paths.
Run off from catchments H and J (includes proposed lot 5 and 7 dwellings with proposed detention tanks) will be conducted to the discharge gully shown with culverts under the new right of way which follow approximately the pre-development overland flow paths and result in discharge to the same gully as for pre-

Further info Appendix 2 Storm water analysis Page 13 of 15development.
Run off from catchment I (containing the mostly level proposed right of way across the existing horse arena)will flow to the discharge gully as shown. The northern part of this carriageway segment will divert some run off (about 180m2 worth) away from its pre-development destination ground infiltration. This will be a small new load on the discharge gully after appropriate attenuation. This diverted flow will continue on to the Whitby Lakes stream as before.
Run off from catchment K (containing the existing upper section of 68 Exploration Way driveway) will continue (with a small increase in catchment area) to discharge into the upper reaches of catchment H, then down to the Whitby lakes stream.
It is proposed that all elements of new impervious surface (including carriageways) are separately and locally mitigated in this catchment. All new dwellings should have appropriately sized detention tanks installed. The new carriageway will have appropriate detention (on its surface or otherwise within the easement area) to mitigate all concentration effects.
Rational method calculation of change in discharge
The calculations for the theoretical increase in run off if no mitigation is employed are given below.
The 17 l/s increase in peak (AEP 10%) run off to the discharge gully is expected to be fully mitigated with approximately 50m3 of dwelling detention tanks plus 30m3 of carriageway detention capability.
Pre-developmentCatchment Bush Grass Impervious TotalF North lot 5 that drains to existing infiltration basin 582 50 0 632G Contains lot 6 1280 600 0 1880H Contains lot 5 3350 0 0 3350I Contains ROW for lots 6, 7 and 8 837 200 0 1037J Contains lot 7 and part of existing lot 9 dwelling 4792 400 225 5192
271 450 450 721
Area 11112 1700 675 12812C 0.45 0.5 0.9
Moderated run off area: C*Area 5000 850 608 6458
0.170 m3/s0.278 m3/s
Post-developmentCatchment Bush Grass Impervious TotalF Unchanged 582 50 0 632G Dwelling added 1030 600 250 1880H Dwelling added 3100 0 250 3350I Right of way added 364 200 473 1037J Dwelling added 4792 400 475 5192K Unchanged 271 450 450 721
Area 10139 1700 1898 12812C 0.45 0.5 0.9
Moderated run off area: C*Area 4563 850 1708 7121
0.188 m3/s0.307 m3/s
Increase in flow resulting from development with AEP 10% inundationNo mitigation
Post-development AEP 10% 0.188Less Pre-development AEP 10% 0.170
Increase (m3/s) 0.017
Note: In Catchment G the horse arena has been nominally treated as surface type “Bush”.
K Contains upper section of existing driveway for 68 Exploration Way
Estimated run off at AEP 10%: 95mm/hrEstimated run off at AEP 1%: 155mm/hr
Estimated run off at AEP 10%: 95mm/hrEstimated run off at AEP 1%: 155mm/hr
Further info Appendix 2 Storm water analysis Page 14 of 156 Impact on Neighbours
The storm water analysis herein shows that with a 10% annual exceedance probability event, the proposed development should result in storm water flows that largely replicate the pre-development hydrological regime:
• The peak flow of storm water to Exploration Way will however be reduced (which is regarded as a good thing!).
• The peak flow of storm water to Whitby lakes stream should be similar to the present.
• The peak flow of storm water to Duck creek should be similar to the present.
• A (very) small amount of run off that used to flow to Exploration Way kerb via the (eastern) neighbour's right of way will now flow via the new detention basin (P1) (which is regarded as a goodthing).
• No immediate neighbours will be negatively affected.
• One immediate neighbour may be significantly positively affected as described below.
59 Exploration Way and actions to ensure no negative impact from the development.
The neighbour at 59 Exploration Way has informed the developer that they are very concerned with storm water run off and currently have issues. It is not clear if there may be some underground spring or other cause but it is proposed that a small change be made to the hydrological regime above this property to try to improve their situation. Rather than try to replicate the immediate pre-development environment it is proposed to take the opportunity to make the changes as described on the following page. It is hoped that these changes will be helpful and they will at the least ensure that there will be no negative effect from the development on 59 Exploration Way.

Further info Appendix 2 Storm water analysis Page 15 of 15Catchment Areas L and M flowing to Duck Creek.
Catchment MIt is proposed that the new carriagewaysited within this small catchment area useporous paving and provide for cross flowof water from the small area uphill of thecarriageway. It is intended to direct thiscross flow with minor landscaping so thatthe horse trail which has been divertingwater across area L no longer exists. Theresult will be that catchment M run offwill be returned to its natural route overmore than 100m of protected vegetationrather than end up passing under the 59Exploration Way driveway as presently.
Catchment LThis is the catchment immediately above59 Exploration Way and water appears toflow largely under the 59 ExplorationDriveway then down to Duck Creek. Thedevelopment will reduce the water flowingdown this route. No new impervioussurfaces are planned in this area.
Catchment KAlthough currently water from catchmentK appears to flow to the west, due to thelack of camber on the current driveway itis suspected that in extreme storm eventsthat some water flows more in a straightline from K to L (shown on the diagram tothe left). IF so, this may be contributing tothe storm water issues at 59 ExplorationWay. As a result the developer intends totake the opportunity for remedial action toimprove the camber/gutter to better ensurethe storm water diversion from catchmentK to the west.
Related Documents