Storage Performance Management Monitoring Storage Performance using NetApp Operations Manager Akshay Bhargava and Mukesh Nigam, Network Appliance Inc. January, 2007 | TR-3525 Executive Summary With IT infrastructures growing more complex, IT professionals need knowledge, skills, and tools to identify performance trends quickly and take corrective actions before bottlenecks arise. Network storage systems are a key element of IT infrastructure and can play a significant role in performance as observed by applications and end users. Storage systems consist of a number of critical resources including CPU, memory, network interfaces, and disk subsystems that can become constrained and impede performance. For ongoing performance monitoring, NetApp recommends focusing on I/O latency as the primary performance indicator. NetApp Operations Manager software (formerly known as DataFabric ® Manager, or DFM) provides an easy-to-use interface to graphically monitor the utilization of the most commonly stressed system resources. This guide documents a regular routine of storage performance monitoring and troubleshooting methodologies using Operations Manager that can be followed to track performance changes in a storage system and take corrective actions before they impact end users.

Welcome message from author
This document is posted to help you gain knowledge. Please leave a comment to let me know what you think about it! Share it to your friends and learn new things together.
Transcript

Storage Performance Management Monitoring Storage Performance using NetApp Operations Manager
Akshay Bhargava and Mukesh Nigam, Network Appliance Inc. January, 2007 | TR-3525
Executive Summary With IT infrastructures growing more complex, IT professionals need knowledge, skills, and tools to identify performance trends quickly and take corrective actions before bottlenecks arise. Network storage systems are a key element of IT infrastructure and can play a significant role in performance as observed by applications and end users. Storage systems consist of a number of critical resources including CPU, memory, network interfaces, and disk subsystems that can become constrained and impede performance. For ongoing performance monitoring, NetApp recommends focusing on I/O latency as the primary performance indicator. NetApp Operations Manager software (formerly known as DataFabric® Manager, or DFM) provides an easy-to-use interface to graphically monitor the utilization of the most commonly stressed system resources. This guide documents a regular routine of storage performance monitoring and troubleshooting methodologies using Operations Manager that can be followed to track performance changes in a storage system and take corrective actions before they impact end users.

2
Table of Contents Storage Performance Management ............................................................................................................................ 1
1. Introduction .......................................................................................................................................................... 4 1.1 Understanding Storage Performance............................................................................................................. 4 1.2 Focus on Latency ........................................................................................................................................... 5 1.3 Critical System Resources ............................................................................................................................. 5 1.4 NetApp Storage System Capabilities ............................................................................................................. 6 1.5 Performance Monitoring Tools ....................................................................................................................... 7 1.5.1 Operations Manager Architecture ............................................................................................................... 8
2. Using Operations Manager to Monitor NetApp Performance.............................................................................. 9 2.1 Performance Metrics ...................................................................................................................................... 9 2.1.1 Predefined Performance Views................................................................................................................... 9 2.1.2 User-Created Performance Views ............................................................................................................ 10 2.1.3 Protocol Category...................................................................................................................................... 11 2.1.4 Volume/Disk Category............................................................................................................................... 11 2.1.5 System Category....................................................................................................................................... 13 2.1.6 Network/Target Port Category .................................................................................................................. 14
3. Performance Troubleshooting............................................................................................................................ 15 3.1 Create Performance Views .......................................................................................................................... 16 3.2 Save Performance Baselines....................................................................................................................... 16 3.3 Perform Regular Monitoring ......................................................................................................................... 16 3.4 Identify the Source of a Problem.................................................................................................................. 17 3.4.1 Transient System Activities ....................................................................................................................... 17 3.4.2 Drill Down to Find the Bottleneck .............................................................................................................. 17 3.5 Correct the Problem ..................................................................................................................................... 18 3.6 Update Baseline Data .................................................................................................................................. 19
4. Troubleshooting Examples ................................................................................................................................ 19 4.1 Overloaded Disk Subsystem........................................................................................................................ 19 4.1.1 Initial Configuration.................................................................................................................................... 19 4.1.2 Baseline..................................................................................................................................................... 21 4.1.3 Overload.................................................................................................................................................... 22

3
4.1.4 Troubleshooting......................................................................................................................................... 22 4.1.5 Correcting the Overload ............................................................................................................................ 22 4.2 Overloaded Storage System CPU ............................................................................................................... 23 4.2.1 Initial Configuration.................................................................................................................................... 23 4.2.2 Baseline..................................................................................................................................................... 24 4.2.3 Overload.................................................................................................................................................... 26 4.2.4 Troubleshooting......................................................................................................................................... 26 4.2.5 Correcting the Overload ............................................................................................................................ 27
5. Conclusion ......................................................................................................................................................... 27 Appendix: Creating a Performance View............................................................................................................... 28 6. References and Additional Resources .............................................................................................................. 31 7. Acknowledgements............................................................................................................................................ 32 8. Revision History ................................................................................................................................................. 33

4
1. Introduction Analyzing performance issues in today’s complex data center environments can be a daunting task. When an end user sitting at his or her desktop system reports that application response has degraded, it may be the result of any element in the chain delivering information to the user, including the desktop itself, IP networks, middleware, database software, servers, storage networks, or storage systems.
With business infrastructures constantly growing more complex, IT professionals need the knowledge, skills, and tools to quickly identify potential bottlenecks in each element of the infrastructure and take corrective action, preferably before a problem becomes severe enough to be noticed. Of all the elements in the IT infrastructure, storage is one of the least understood, often resulting in storage systems that are either underconfigured or overconfigured for their dynamic workloads. The purpose of this document is to give readers the knowledge and tools to monitor and manage performance on NetApp storage systems, focusing on performance issues highlighted by Operations Manager1.
1.1 Understanding Storage Performance In a healthy storage deployment, applications request I/O from a storage system and receive a response to each I/O request within acceptable latency limits. When performance problems arise, latency—as experienced by the application or by the end user—rises to unacceptable levels, the result being that tasks take longer to execute, end users complain that response has slowed, or both. I/O performance problems typically appear over time as more capacity, more users, and more workload are added to existing storage systems, stressing system resources and causing latency to rise.
Figure 1) Storage problems arise over time as users, applications, and capacity are added to a storage system.
1 Operations Manager was formerly known as DataFabric Manager, or DFM. Many of the figures in this document were created using a version of the software branded with the earlier name.
Today Future
Users
Applications
Storage
5
What constitutes an acceptable latency depends on the application. For instance, database workloads typically require I/O read latency of 20 milliseconds or less for OLTP applications, whereas noninteractive applications such as backup and archival applications may operate with read latencies of up to 200 milliseconds. The requirements of other applications typically fall between these extremes. Acceptable latencies may also depend on specific usage requirements.
1.2 Focus on Latency NetApp focuses on latency because it is a very strong indicator of storage system workload. Other parameters are also important, such as throughput and transactions per second, but it is easy to detect small rises in latency. Although latency increases may not yet be large enough to noticeably affect end users or applications, they may indicate that a storage system is approaching a resource bottleneck. For this reason, focusing on latency is an essential part of getting an early indication of a performance problem.
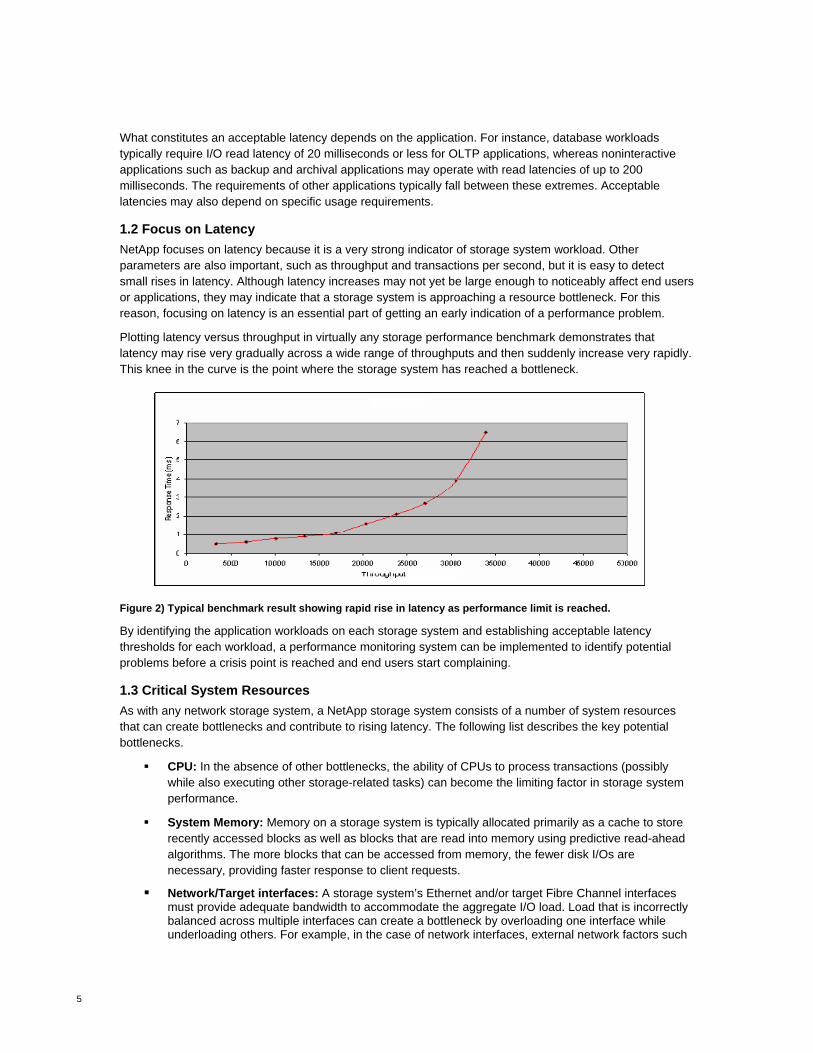
Plotting latency versus throughput in virtually any storage performance benchmark demonstrates that latency may rise very gradually across a wide range of throughputs and then suddenly increase very rapidly. This knee in the curve is the point where the storage system has reached a bottleneck.
Figure 2) Typical benchmark result showing rapid rise in latency as performance limit is reached.
By identifying the application workloads on each storage system and establishing acceptable latency thresholds for each workload, a performance monitoring system can be implemented to identify potential problems before a crisis point is reached and end users start complaining.
1.3 Critical System Resources As with any network storage system, a NetApp storage system consists of a number of system resources that can create bottlenecks and contribute to rising latency. The following list describes the key potential bottlenecks.
CPU: In the absence of other bottlenecks, the ability of CPUs to process transactions (possibly while also executing other storage-related tasks) can become the limiting factor in storage system performance.
System Memory: Memory on a storage system is typically allocated primarily as a cache to store recently accessed blocks as well as blocks that are read into memory using predictive read-ahead algorithms. The more blocks that can be accessed from memory, the fewer disk I/Os are necessary, providing faster response to client requests.
Network/Target interfaces: A storage system’s Ethernet and/or target Fibre Channel interfaces must provide adequate bandwidth to accommodate the aggregate I/O load. Load that is incorrectly balanced across multiple interfaces can create a bottleneck by overloading one interface while underloading others. For example, in the case of network interfaces, external network factors such

6
as retransmissions, out-of-order packets, and other factors may affect network interface throughput. This document discusses how to detect such problems; however fixing network problems is beyond the scope of this paper. Refer to the Network Management Guide for the particular Data ONTAP® release for more information.
Disk: The number of I/O transactions that each disk can deliver at an acceptable latency is constrained primarily by rotational speed. The faster the disk spins, the greater its performance. Disk capacities continue to grow at a 4X pace with little increase in transactional performance. Therefore, it’s not uncommon for a disk subsystem to have adequate capacity but inadequate performance. The ability of NetApp WAFL® (Write Anywhere File Layout) to aggregate write requests can significantly mask many disk performance characteristics to end users and applications. However, the availability of other system resources, such as system memory and CPU, can still impact disk performance.
If regular monitoring of latency detects a rise over time, the next step is to determine which of these resources is contributing to the problem. Under normal utilization, additional workload typically results in only incremental increases in latency. However, when a critical resource approaches maximum capacity, the increase in latency can be sudden and exponential.
The most common example is CPU. If CPU utilization is at 50% and 10% more load is added, latency may increase very little or not at all. However, if CPU utilization is at 90% and load is increased by 10%, latency may increase dramatically. The same is true for the other resources listed above. Most administrators are accustomed to monitoring CPU utilization, but the other resources are often overlooked as a potential cause of poor performance.
1.4 NetApp Storage System Capabilities The following factors affect the performance of NetApp storage systems.
Platform: Each NetApp model has a defined set of resources in terms of CPU capability, system memory, and onboard network/target interfaces. These resources are fixed on all systems, with the exception of resources that can use an expansion slot, such as additional network and target interfaces. If a storage system is routinely bottlenecked on a particular resource, add resources to expansion slots if applicable, offload some workloads to other storage systems, reschedule some workloads to off-peak times, or consider upgrading to a higher end platform.
Core Software: The version of Data ONTAP and the particular features that are in use on the storage system may also affect performance. For instance, the FlexVol® feature introduced in Data ONTAP 7G (7.0) makes it simpler to avoid disk hot spots when configuring volumes. Other features may increase or decrease demand on critical system resources. Starting with Data ONTAP 7.2, NetApp introduced FlexShare™ to allow relative workload prioritization on a storage system. The functionality described in this document pertains to Data ONTAP 7G and later releases.
Add-On Software: As with the core software components defined above, the use of add-on software such as SnapMirror®, SnapVault®, NDMP, and others can affect utilization of system resources. This has to be taken into account when establishing backup and replication schedules, etc. Certain features, such as FlexShare, can be used to prioritize the consumption of resources by these background tasks relative to users and applications.
7
Table 1) Add-on software and software features that may impact critical system resources.
Software Description Resource Utilization Impact
Auditing Auditing of CIFS operations. CPU and memory
FlexClone™ Writable copy of a FlexVol volume that consumes additional storage space only as new data is written.
Resources depend on workload to cloned volumes (CPU, memory, disk)
FlexShare Workload prioritization based on storage system volume. CPU and memory
MultiStore® Consolidate storage with separate and completely private logical partitions. Each storage partition maintains absolute separation from every other storage partition.
All resources
NDMP Network Data Management Protocol. Standard protocol for backing up network storage to either local or remote tape devices.
All resources
RAID Protects against single (RAID 4) or double disk failures (RAID-DP™).
Reconstruction impacts performance (CPU, memory, and disk)
Scanners WAFL scanners, such as reallocate, can improve performance in certain scenarios.
CPU, memory, and disk
Scrubs Periodic RAID scrubs check parity consistency and media errors on disks.
CPU, memory, and disk
SnapMirror Replicates data asynchronously across a network to a second system for disaster recovery or other purposes.
All resources
Snapshot™ Creates point-in-time copies of active volumes. Disk utilization (as the active file system changes)
SyncMirror®/ MetroCluster
Synchronous data replication for disaster recovery. Disk performance
Virus Scanning Scans CIFS write requests for viruses. CPU and memory
1.5 Performance Monitoring Tools NetApp integrates with a variety of performance monitoring tools that can be used to assess storage system performance. These range from graphical tools such as Operations Manager and Windows® Perfmon to more traditional utilities that can be executed from the command line interface (CLI).

8
Figure 3) Integration of various performance tools within Data ONTAP.
Data ONTAP has always maintained a variety of performance counters within the kernel. To make these counters more accessible, NetApp provides a Counter Manager layer within Data ONTAP. Counter Manager is queried by various Manage ONTAP™ APIs used by Operations Manager, as well as Windows Perfmon and various CLI tools. The Windows Perfmon capability that is built into Microsoft® Windows can be used to monitor performance counters in a customer’s existing management infrastructure. Manage ONTAP is a collection of application programming interfaces (APIs) for the Data ONTAP operating system that provides open access to NetApp solutions. Manage ONTAP enables integration between NetApp solutions and partner solutions, as well as simplified integration with in-house applications. Manage ONTAP is exposed within Data ONTAP through a number of interfaces such as SNMP, CLI, RPC, NDMP, and Data ONTAP APIs. 1.5.1 Operations Manager Architecture Operations Manager is a centralized management tool that allows multiple NetApp storage systems to be monitored from a single management console in real time, providing alerts and enabling performance trending and data archiving for historical analysis and much more. Operations Manager typically runs on a central administrative system, capable of polling multiple NetApp storage systems. Client software may reside on any management host on the network or even on the same management system as Operations Manager to obtain data about each NetApp system. The Performance Advisor client provides the ability to create customizable performance views and to save those views for historical reference. This paper explores using Operations Manager and the Performance Advisor client to monitor storage system performance.
Counter Manager (CM)
Performance Counters
CLI Commands
(stats)
Operations
Manager
Manage ONTAP APIs
Windows Perfmon Support
Windows Perfmon Clients
SMB calls
Other Performance Commands
(statit, sysstat)
Third Party
Management Tools
Auto-
support

9
2. Using Operations Manager to Monitor NetApp Performance Achieving consistent and acceptable performance from a NetApp storage system not only requires sizing the system correctly for given workloads, but also requires regular performance monitoring. Active monitoring provides an indicator of system health and can signal when tuning is necessary. Also, regular performance monitoring enables storage administrators to identify the normal operating range of performance metrics and to spot performance trends. The majority of performance issues do not occur spontaneously but rather as a result of gradual performance decline. Performance monitoring—with close attention to latency—enables storage administrators to identify many issues early and to take corrective action before end users or applications are impacted. In addition, performance monitoring assists in performance optimization and capacity planning.
2.1 Performance Metrics NetApp Data ONTAP maintains a number of performance metrics that can be accessed through various interfaces, including the NetApp Operations Manager Client called Performance Advisor, the Manage ONTAP API, and the command line interface (CLI). Performance Advisor can be used to create a graphical view of a given performance metric. These graphs are useful to identify and monitor performance trends. This document discusses performance monitoring primarily using Performance Advisor. Performance Advisor enables several common sets of performance metrics to be focused on a single storage system resource and allows these metrics to be organized into a performance view that captures the complete state of a resource and presents an easy-to-understand picture of the state of each resource.
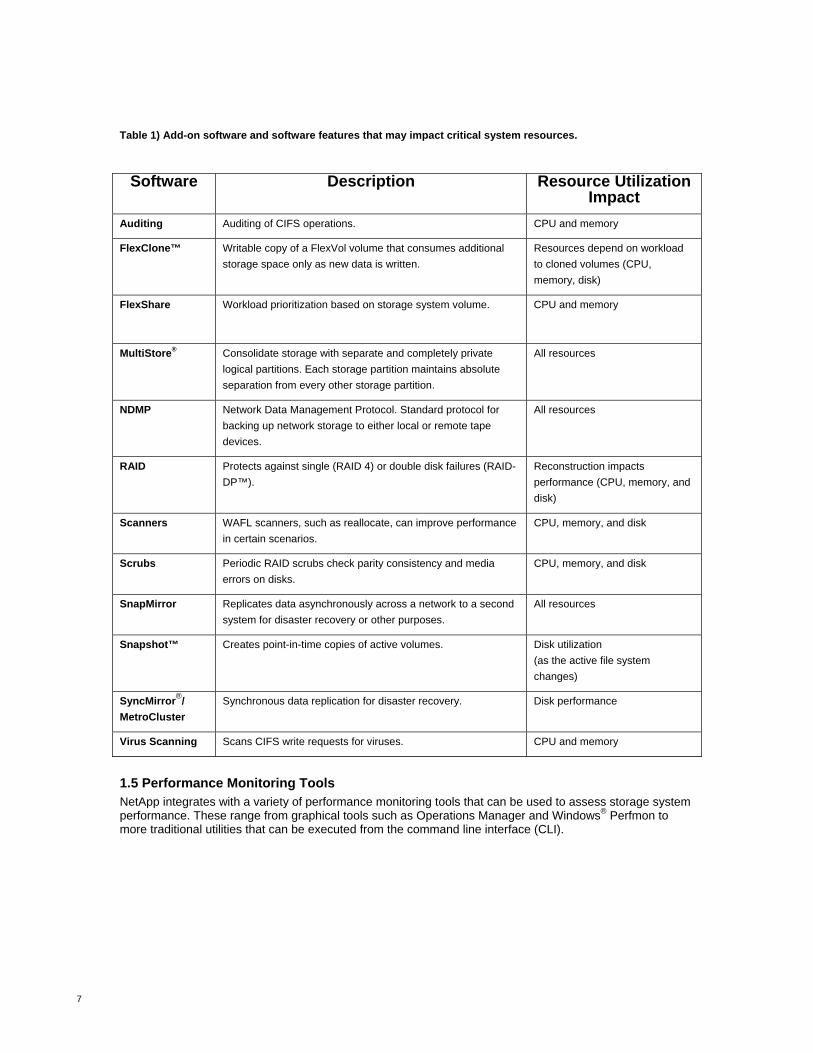
2.1.1 Predefined Performance Views NetApp Performance Advisor contains a number of predefined views that can be used to monitor performance. In the following list, views in bold type are the ones that have found to be most useful. Basic:
cifs_ops cpu_busy disk_data_read disk_data_written fcp_ops iscsi_ops net_data_recv net_data_sent nfs_ops
Response Time:
cifs_latency nfsv3_read_latency nfsv3_read_ops nfsv3_write_latency nfsv3_write_ops
Top Aggregates:
cp_reads total_transfers user_reads user_writes
Top LUNs:
read_ops write_ops other_ops
10
Top Volumes: read_ops: total_ops write_ops
These parameters are defined in the tables in the following sections.
Figure 4) Using a predefined performance view.
In addition, the view creation capabilities of Performance Advisor can be used to create comprehensive graphical views that contain any performance metric of interest. This capability is described in detail in the following sections.
2.1.2 User-Created Performance Views The following subsections detail commonly monitored resources grouped into performance categories. NetApp recommends that you create one or more performance views from each of the categories. These views also provide a performance baseline that is valuable in case problems occur in the future and that can be used to help troubleshoot performance problems. Several of the views described below should be monitored on a regular basis. A few sample graphs are provided along with recommended graphs to create and save for future monitoring. Appendix A describes how to use Performance Advisor to create custom performance views. As discussed in section 1, latency is the most important metric to monitor. Latency can be examined either on a per-protocol or a per-volume basis. Monitoring per-protocol latencies gives an indication of the performance experience for users of a particular protocol. For multiapplication/workload environments, monitoring per-volume latencies is a good proxy for monitoring the performance of each application. The key per-protocol and per-volume latency metrics are described in the following two sections.
11
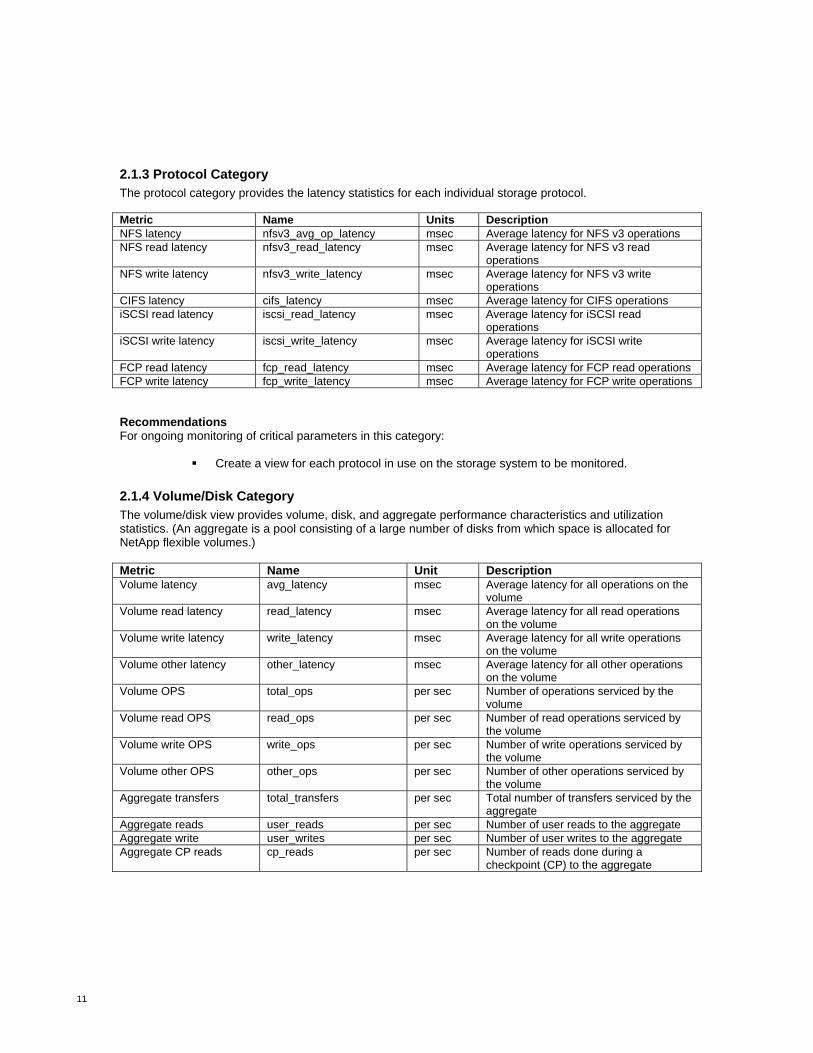
2.1.3 Protocol Category The protocol category provides the latency statistics for each individual storage protocol. Metric Name Units Description NFS latency nfsv3_avg_op_latency msec Average latency for NFS v3 operations NFS read latency nfsv3_read_latency msec Average latency for NFS v3 read
operations NFS write latency nfsv3_write_latency msec Average latency for NFS v3 write
operations CIFS latency cifs_latency msec Average latency for CIFS operations iSCSI read latency iscsi_read_latency msec Average latency for iSCSI read
operations iSCSI write latency iscsi_write_latency msec Average latency for iSCSI write
operations FCP read latency fcp_read_latency msec Average latency for FCP read operations FCP write latency fcp_write_latency msec Average latency for FCP write operations Recommendations For ongoing monitoring of critical parameters in this category:
Create a view for each protocol in use on the storage system to be monitored. 2.1.4 Volume/Disk Category The volume/disk view provides volume, disk, and aggregate performance characteristics and utilization statistics. (An aggregate is a pool consisting of a large number of disks from which space is allocated for NetApp flexible volumes.) Metric Name Unit Description Volume latency avg_latency msec Average latency for all operations on the
volume Volume read latency read_latency msec Average latency for all read operations
on the volume Volume write latency write_latency msec Average latency for all write operations
on the volume Volume other latency other_latency msec Average latency for all other operations
on the volume Volume OPS total_ops per sec Number of operations serviced by the
volume Volume read OPS read_ops per sec Number of read operations serviced by
the volume Volume write OPS write_ops per sec Number of write operations serviced by
the volume Volume other OPS other_ops per sec Number of other operations serviced by
the volume Aggregate transfers total_transfers per sec Total number of transfers serviced by the
aggregate Aggregate reads user_reads per sec Number of user reads to the aggregate Aggregate write user_writes per sec Number of user writes to the aggregate Aggregate CP reads cp_reads per sec Number of reads done during a
checkpoint (CP) to the aggregate
12
Recommendations For ongoing monitoring of critical parameters in this category:
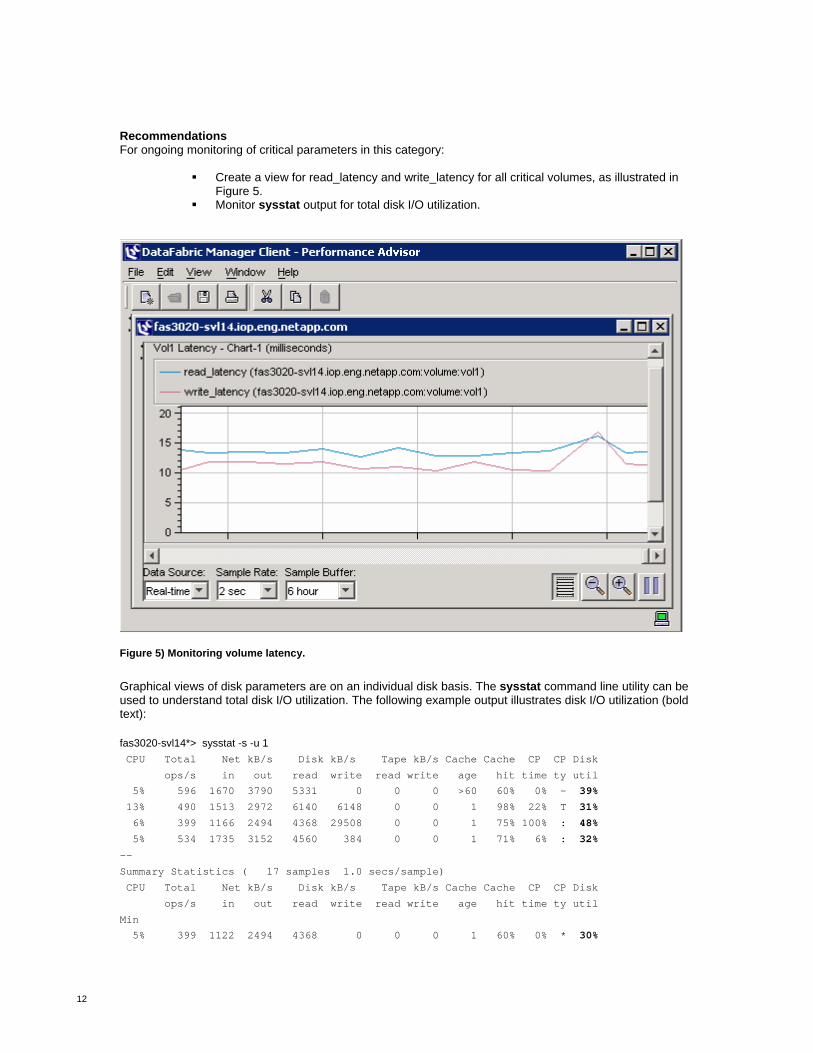
Create a view for read_latency and write_latency for all critical volumes, as illustrated in Figure 5.
Monitor sysstat output for total disk I/O utilization.
Figure 5) Monitoring volume latency. Graphical views of disk parameters are on an individual disk basis. The sysstat command line utility can be used to understand total disk I/O utilization. The following example output illustrates disk I/O utilization (bold text): fas3020-svl14*> sysstat -s -u 1 CPU Total Net kB/s Disk kB/s Tape kB/s Cache Cache CP CP Disk
ops/s in out read write read write age hit time ty util
5% 596 1670 3790 5331 0 0 0 >60 60% 0% - 39%
13% 490 1513 2972 6140 6148 0 0 1 98% 22% T 31%
6% 399 1166 2494 4368 29508 0 0 1 75% 100% : 48%
5% 534 1735 3152 4560 384 0 0 1 71% 6% : 32%
--
Summary Statistics ( 17 samples 1.0 secs/sample)
CPU Total Net kB/s Disk kB/s Tape kB/s Cache Cache CP CP Disk
ops/s in out read write read write age hit time ty util
Min
5% 399 1122 2494 4368 0 0 0 1 60% 0% * 30%

13
Avg
6% 563 1657 3507 5273 4377 0 0 >60 87% 15% * 36%
Max
15% 662 1906 4220 6406 29508 0 0 >60 98% 100% * 49%
2.1.5 System Category The system category provides a high-level overview of activity and resource utilization on a storage system. In particular, it focuses on CPU, network, and over-all disk utilization. Metric Name Units Description CPU utilization cpu_busy percent System CPU resource utilization Average CPU utilization avg_processor_busy percent Average processor utilization across all
processors in the system Total CPU utilization total_processor_busy percent Total processor utilization of all processors
in the system CPU count num_processors number Number of active processors in the system Network receive through put Net_data_recv KB per sec Network KB received per second Network send throughput net_data_sent KB per sec Network KB sent per second Disk read throughput disk_data_read KB per sec Disk KB read per second Disk write throughput disk_data_written KB per sec Disk KB written per second
Recommendations For ongoing monitoring of critical parameters in this category:
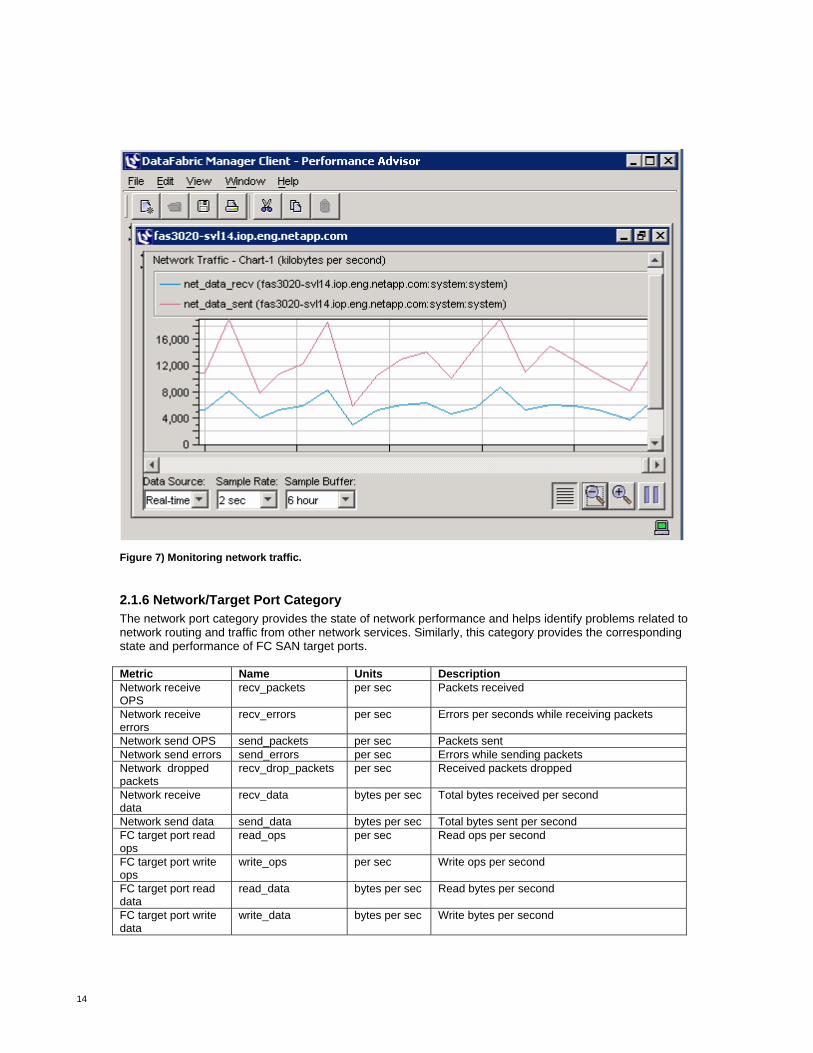
Create a view for cpu_busy, as illustrated in Figure 6. Create a view for net_data_recv and net_data_sent, as illustrated in Figure 7.
Figure 6) Monitoring CPU utilization over time.
14
Figure 7) Monitoring network traffic.
2.1.6 Network/Target Port Category The network port category provides the state of network performance and helps identify problems related to network routing and traffic from other network services. Similarly, this category provides the corresponding state and performance of FC SAN target ports. Metric Name Units Description Network receive OPS
recv_packets per sec Packets received
Network receive errors
recv_errors per sec Errors per seconds while receiving packets
Network send OPS send_packets per sec Packets sent Network send errors send_errors per sec Errors while sending packets Network dropped packets
recv_drop_packets per sec Received packets dropped
Network receive data
recv_data bytes per sec Total bytes received per second
Network send data send_data bytes per sec Total bytes sent per second FC target port read ops
read_ops per sec Read ops per second
FC target port write ops
write_ops per sec Write ops per second
FC target port read data
read_data bytes per sec Read bytes per second
FC target port write data
write_data bytes per sec Write bytes per second
15
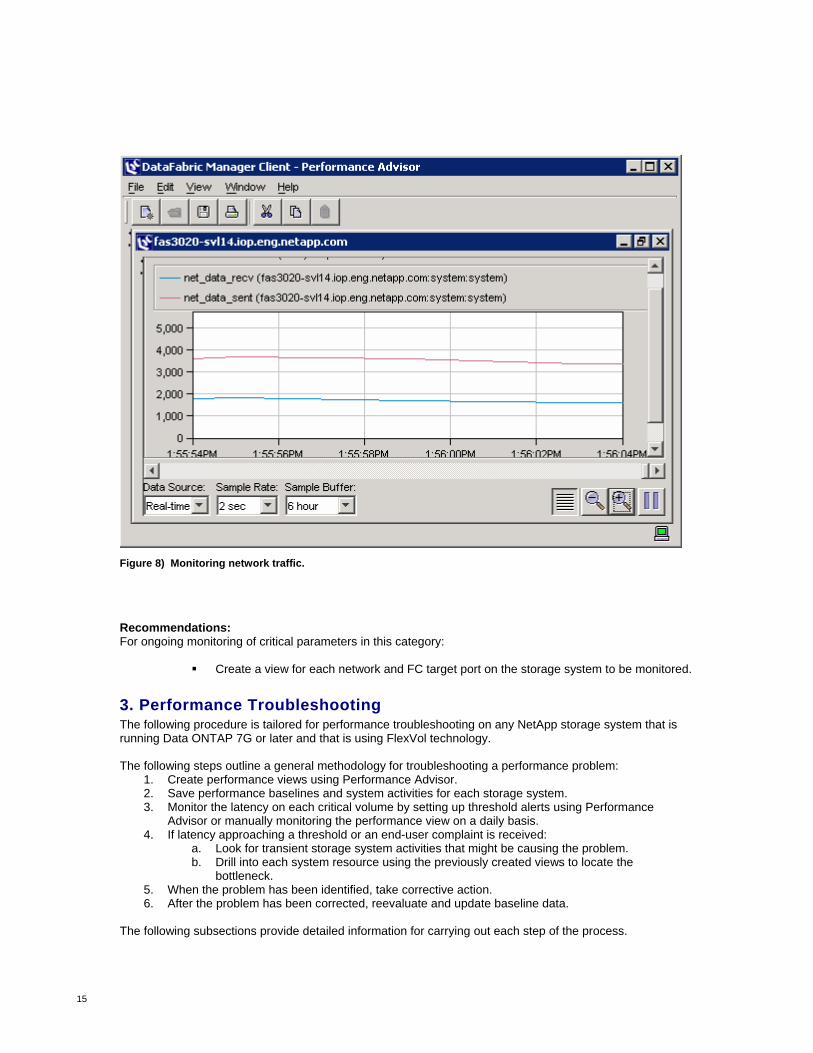
Figure 8) Monitoring network traffic.
Recommendations: For ongoing monitoring of critical parameters in this category:
Create a view for each network and FC target port on the storage system to be monitored.
3. Performance Troubleshooting The following procedure is tailored for performance troubleshooting on any NetApp storage system that is running Data ONTAP 7G or later and that is using FlexVol technology. The following steps outline a general methodology for troubleshooting a performance problem:
1. Create performance views using Performance Advisor. 2. Save performance baselines and system activities for each storage system. 3. Monitor the latency on each critical volume by setting up threshold alerts using Performance
Advisor or manually monitoring the performance view on a daily basis. 4. If latency approaching a threshold or an end-user complaint is received:
a. Look for transient storage system activities that might be causing the problem. b. Drill into each system resource using the previously created views to locate the
bottleneck. 5. When the problem has been identified, take corrective action. 6. After the problem has been corrected, reevaluate and update baseline data.
The following subsections provide detailed information for carrying out each step of the process.

16
3.1 Create Performance Views Following the recommendations and directions in section 2.0, create a representative sample of the recommended views for each storage system that needs to be monitored. Refer to Appendix A for details on how to create a custom view using Performance Advisor.
3.2 Save Performance Baselines To establish the baseline data for performance troubleshooting, leverage the performance views created in the previous step.
For each view, capture data under normal and peak load conditions for the storage system.
For views that measure latency (volume latency, protocol latency), establish an acceptable latency range based on SLAs with end users, application requirements, and/or end-user experience. For instance, Oracle typically recommends that I/O latency be no greater than 20 milliseconds for all operations.
To save performance views, select File > Save. To view saved views, select File > Open > Performance View File.
Figure 9) Saving a performance view.
3.3 Perform Regular Monitoring Once baselines are established, monitor the latency on each critical volume on a daily basis and other views on a regular basis. For each volume, compare the current latency to the baseline and established latency range.
17
If latency increases over time and approaches the established threshold value, investigate the source of the increase. If the threshold value is met or exceeded before action is taken, it may be too late to avoid end-user complaints. The more comprehensive the monitoring methodology, the less likely it is that unexpected performance issues will occur. Monitoring volume latency is a good starting point, but it will not catch all possible performance problems, even when they originate within the storage system. For instance, an overloaded IP network interface may cause users to see a slowdown even though volume latencies appear normal. For this reason, it is important to also monitor nonlatency views on a periodic basis. Some performance problems may originate outside the storage system. As stated previously, these are outside of the scope of this document. However, by understanding storage system performance through regular monitoring, storage can quickly and confidently be eliminated as the source of a user-observed performance problem. 3.4 Identify the Source of a Problem Once a developing performance problem is identified, either through regular monitoring or because of a user complaint:
1. Look for transient storage system activities that may be causing the problem. 2. Drill into each system resource.
The following two subsections elaborate on these steps. 3.4.1 Transient System Activities A number of transient system activities that occur both within the storage system and outside of the storage system can affect performance. Internal transient activities can include RAID reconstructions, SnapMirror transfers, NDMP, and others. (Refer to Table 1 for a comprehensive list.) Identify the activities that are currently occurring on the storage system under investigation and compare this list with the list of activities in Table 1.These activities may affect the system’s ability to service user and application I/O requests.
1. If one or more such activities are present, see if turning them off or throttling them improves performance. (Be sure that turning off or throttling the activities won’t adversely affect critical operations before proceeding.) System activities including RAID reconstruction, SnapMirror, and others have options for throttling resource consumption so that they do not interfere with other system activity.
2. For one-time or infrequent activities such as RAID reconstruction, consider the tradeoffs. It might be better to live with the performance impact to ensure that the reconstruction is completed in a timely fashion.
3. For regular activities such as Snapshot, SnapMirror, NDMP, and SnapVault, also consider altering the schedule so that the activity occurs when the system is less loaded.
3.4.2 Drill Down to Find the Bottleneck Drill into resource utilization in the following order. Even If a potential source of a problem has been found, it’s a good idea to continue through the procedure to make that sure nothing is overlooked.
1. CPU: Look at the total_cpu_busy graph: a. If CPU utilization < 90%, it’s okay. Continue troubleshooting. b. If CPU utilization > 90%, it’s a potential cause of the problem
2. Disk or loop: Look at sysstat output:
a. Review the total disk I/O utilization against the acceptable disk utilization threshold for the desired I/O latencies storage system. Note: Industry-accepted disk I/O utilization threshold begins at 70%.
b. If disk I/O utilization < utilization threshold, it’s okay. Continue troubleshooting.
18
c. If disk I/O utilization > utilization threshold, it may impact the I/O latencies of affected volumes.
d. In addition, if a disk problem is identified at the total system disk utilization level, check individual disks for hot spots using the statit command line utility. See the statit man page for details. Under normal use conditions, the FlexVol framework eliminates disk hot spots. However, if a very small aggregate (a few disks) is expanded slowly over time, hot spots may occur.
Keep in mind that each aggregate may consist of multiple volumes, not all of which may have been designated as critical volumes. As a result, not all volumes in each aggregate may be actively monitored. However, total traffic on the aggregate, including traffic to noncritical volumes, may be overloading the aggregate and affecting critical volumes. Note: In some cases, high disk utilization may be the result of loop (FCAL) saturation. This may not be readily recognizable just by looking at sysstat output and may require the use of statit. NetApp Global Services can assist with the diagnosis of loop saturation problems if necessary.
3. Networking, including network interface cards (NICs) and host bus adapters (HBAs):
a. View the network interface statistics using Performance Advisor. b. Look for total throughput approaching the maximum capability of the hardware on each
interface on each NIC and HBA. Total throughput can be calculated by adding the bytes/sec values from both the RECEIVE and TRANSMIT sections of the output. An interface should not be expected to deliver more than about 80% of its stated maximum performance on a sustained basis.
c. Look for unusually high error rates on each interface. If these steps do not identify the source of increased latency, it may be the result of a complicated performance issue that requires in-depth investigation. Contact NetApp Global Services for additional troubleshooting assistance. 3.5 Correct the Problem The following steps may be taken to correct problems isolated in the previous section. It may be possible and necessary to implement more than one of the changes for each stated solution to get satisfactory results. Overloaded CPU
Utilize NetApp FlexShare (Data ONTAP 7.2 and later) to give higher priority to critical workloads. Spread the workload across multiple storage systems to better balance the load. Stagger jobs during the course of the day. Upgrade to a higher end storage system.
Overloaded Disk
Increase the number of disks in the affected aggregates. On a large-capacity system with more than one aggregate in use, migrate data and rebalance the
load between aggregates for optimal load distribution. For example, if the affected aggregate contains two busy volumes and a second aggregate contains two underutilzed volumes, move a busy volume to the underutilized aggregate and move a quiet volume to the overutilized aggregate.
Overloaded Loop
Add Dualpath on a single controller or Multipath HA with Controller Failover (CFO) (requires Data ONTAP 7.0).
Increase the number of FCAL loops and distribute expansion shelves evenly across the FCAL loops.
Redistribute the disks in a volume or RAID group across multiple loops. Overloaded NIC or HBA
If the problem is due to throughput:
19
o NIC: balance the load across multiple network links o HBA: reduce the number of hosts connected through the HBA
If the problem is due to network errors, examine network connectivity including cables, switches, and ports.
3.6 Update Baseline Data Once corrective action has been taken and system performance has returned to acceptable margins, update all affected baseline data and continue the monitoring protocol. For instance, if an aggregate was expanded, capture new baseline latencies on all critical volumes on that aggregate.
4. Troubleshooting Examples The following test cases simulate common performance problems and then demonstrate how Performance Advisor performance views and CLI commands can be used to help diagnose the problem. The first example highlights a situation in which a storage system is disk constrained. The second example illustrates a scenario in which a storage system is CPU bound.
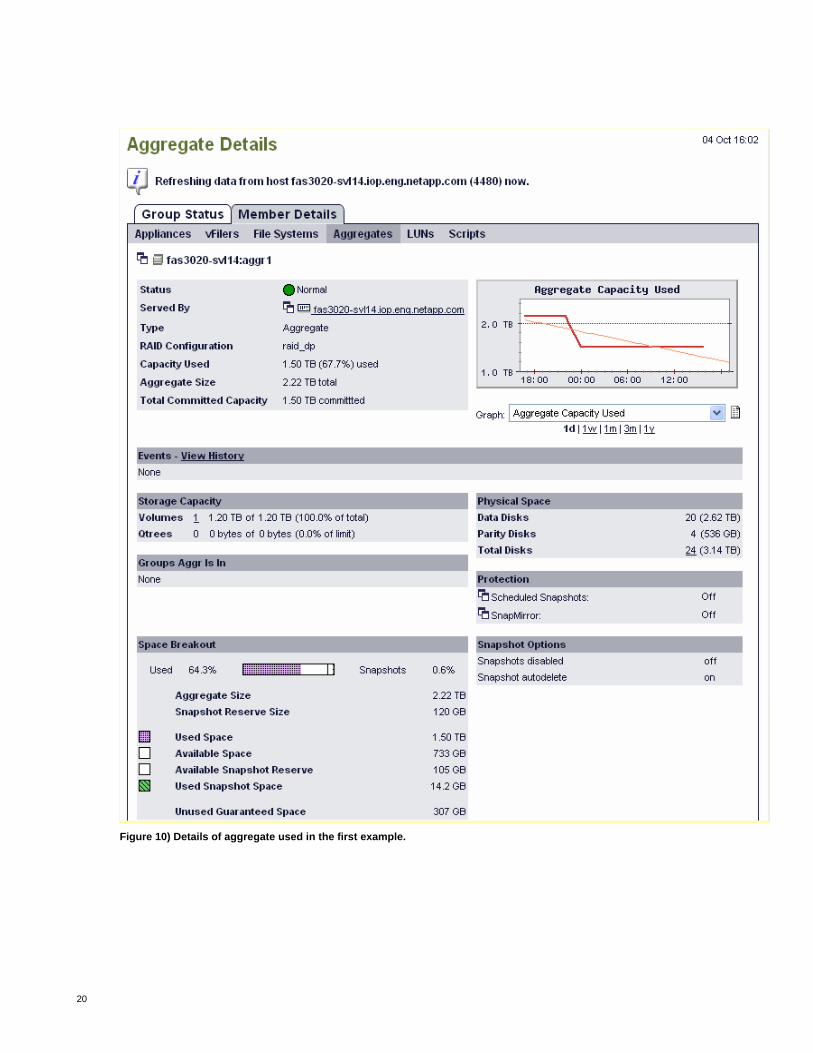
4.1 Overloaded Disk Subsystem For this example, a highly random workload that simulates a database workload with a large dataset (300GB) was used. This type of workload typically has a response time requirement of less than 20 milliseconds and tends to be very disk intensive, generating large numbers of disk IOPS. 4.1.1 Initial Configuration The initial configuration uses a NetApp FAS3020 with 24 disk drives in a 2.2TB aggregate. Multiple Linux® clients are used to generate load on the system using NFS.
20
Figure 10) Details of aggregate used in the first example.
21
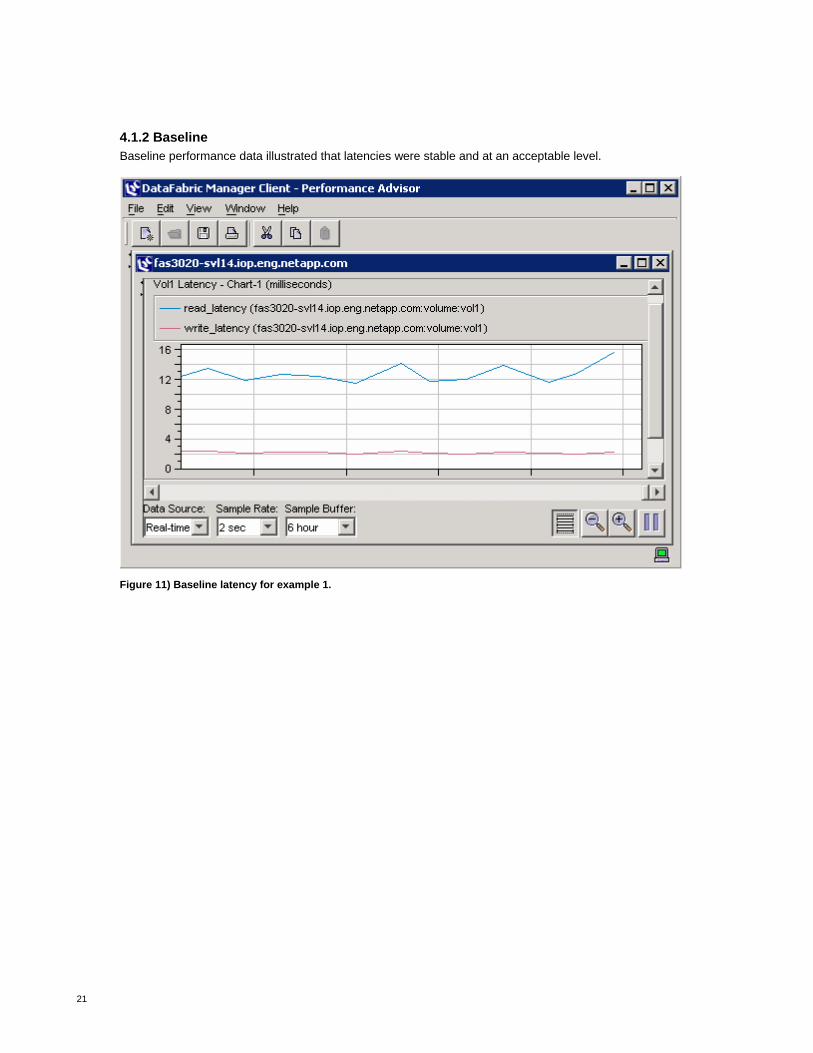
4.1.2 Baseline Baseline performance data illustrated that latencies were stable and at an acceptable level.
Figure 11) Baseline latency for example 1.
22
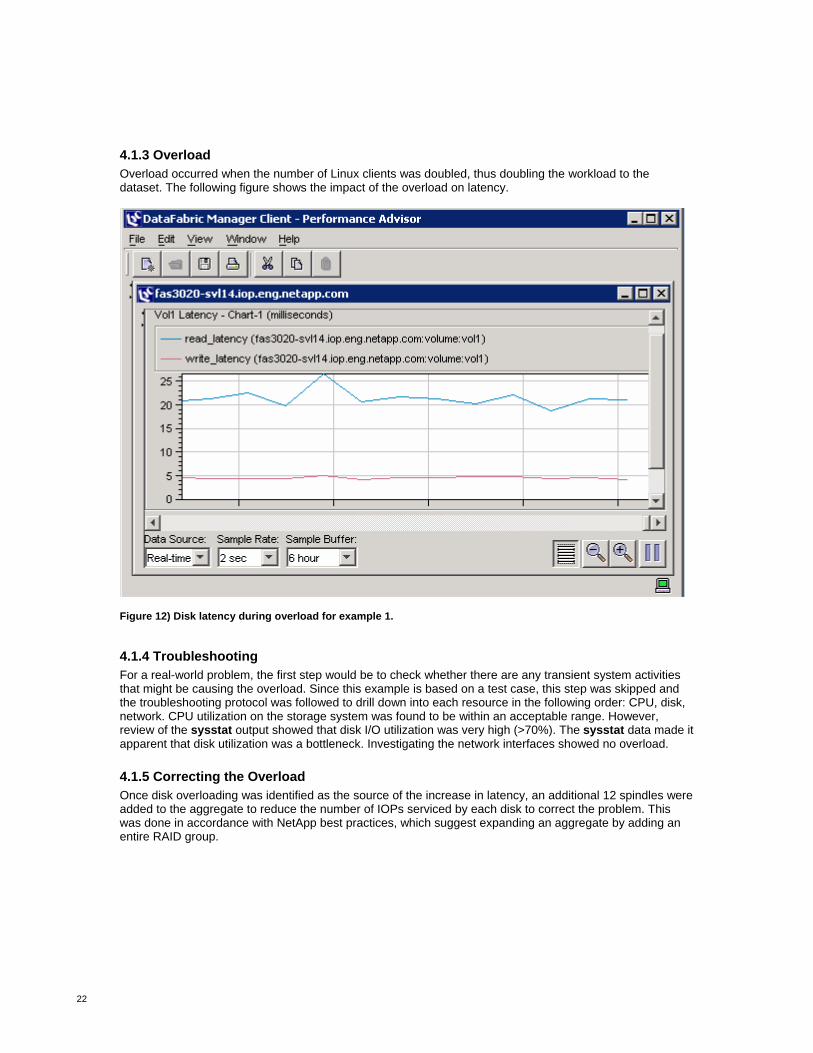
4.1.3 Overload Overload occurred when the number of Linux clients was doubled, thus doubling the workload to the dataset. The following figure shows the impact of the overload on latency.
Figure 12) Disk latency during overload for example 1.
4.1.4 Troubleshooting For a real-world problem, the first step would be to check whether there are any transient system activities that might be causing the overload. Since this example is based on a test case, this step was skipped and the troubleshooting protocol was followed to drill down into each resource in the following order: CPU, disk, network. CPU utilization on the storage system was found to be within an acceptable range. However, review of the sysstat output showed that disk I/O utilization was very high (>70%). The sysstat data made it apparent that disk utilization was a bottleneck. Investigating the network interfaces showed no overload. 4.1.5 Correcting the Overload Once disk overloading was identified as the source of the increase in latency, an additional 12 spindles were added to the aggregate to reduce the number of IOPs serviced by each disk to correct the problem. This was done in accordance with NetApp best practices, which suggest expanding an aggregate by adding an entire RAID group.
23
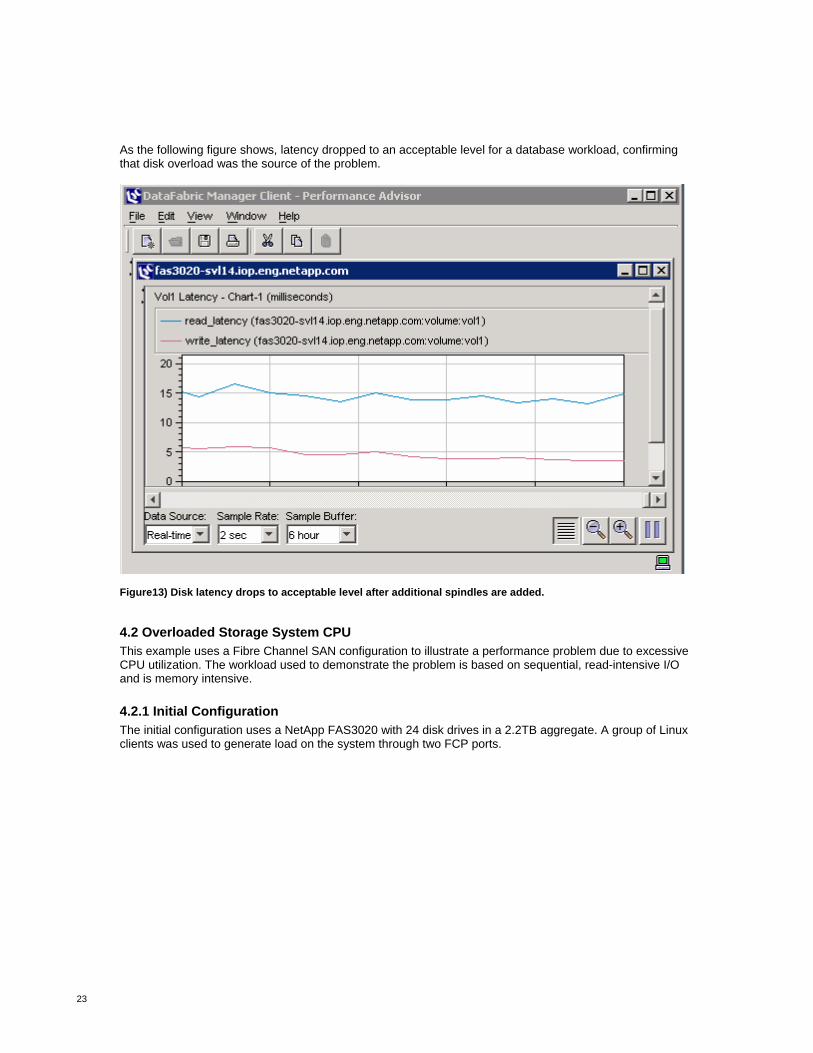
As the following figure shows, latency dropped to an acceptable level for a database workload, confirming that disk overload was the source of the problem.
Figure13) Disk latency drops to acceptable level after additional spindles are added.
4.2 Overloaded Storage System CPU This example uses a Fibre Channel SAN configuration to illustrate a performance problem due to excessive CPU utilization. The workload used to demonstrate the problem is based on sequential, read-intensive I/O and is memory intensive. 4.2.1 Initial Configuration The initial configuration uses a NetApp FAS3020 with 24 disk drives in a 2.2TB aggregate. A group of Linux clients was used to generate load on the system through two FCP ports.
24
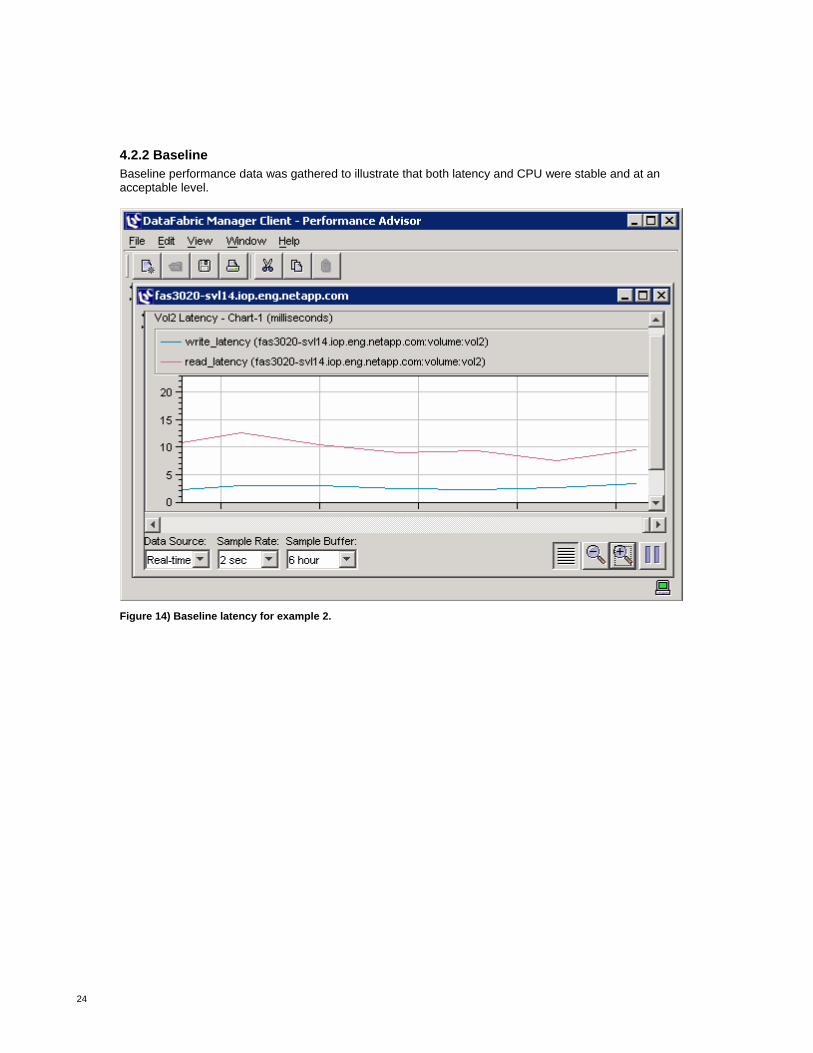
4.2.2 Baseline Baseline performance data was gathered to illustrate that both latency and CPU were stable and at an acceptable level.
Figure 14) Baseline latency for example 2.

25
Figure 15) Baseline CPU utilization for example 2.
26
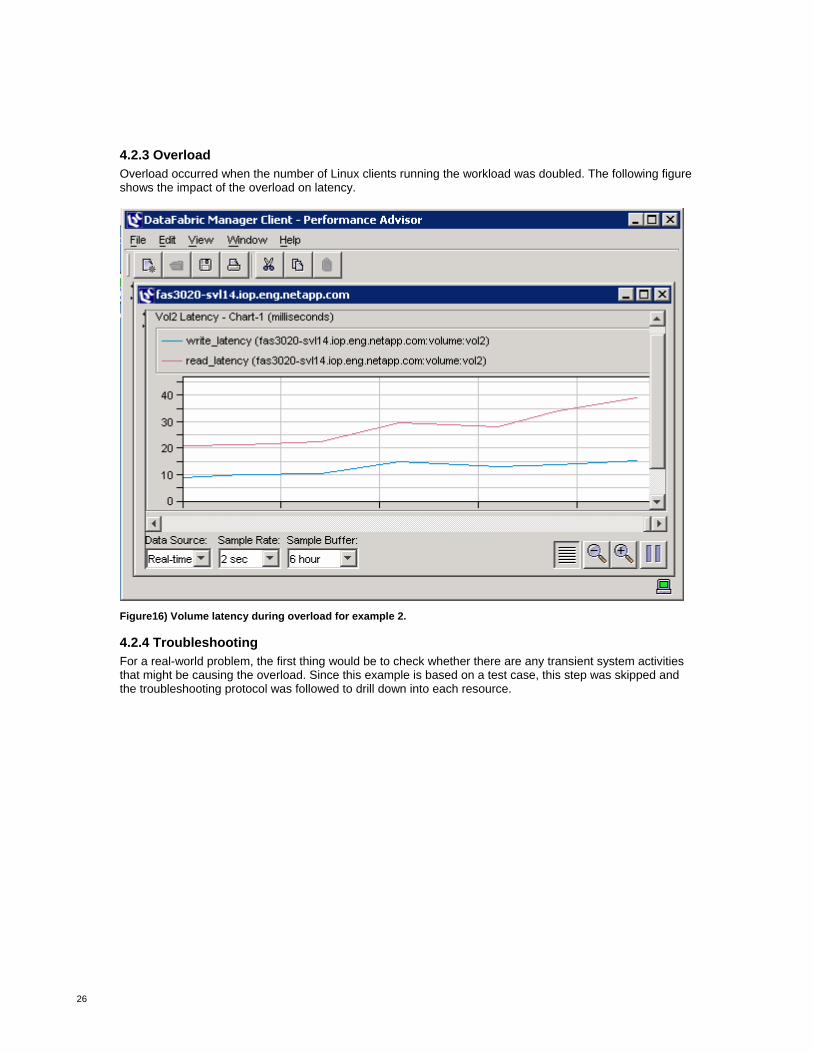
4.2.3 Overload Overload occurred when the number of Linux clients running the workload was doubled. The following figure shows the impact of the overload on latency.
Figure16) Volume latency during overload for example 2.
4.2.4 Troubleshooting For a real-world problem, the first thing would be to check whether there are any transient system activities that might be causing the overload. Since this example is based on a test case, this step was skipped and the troubleshooting protocol was followed to drill down into each resource.
27
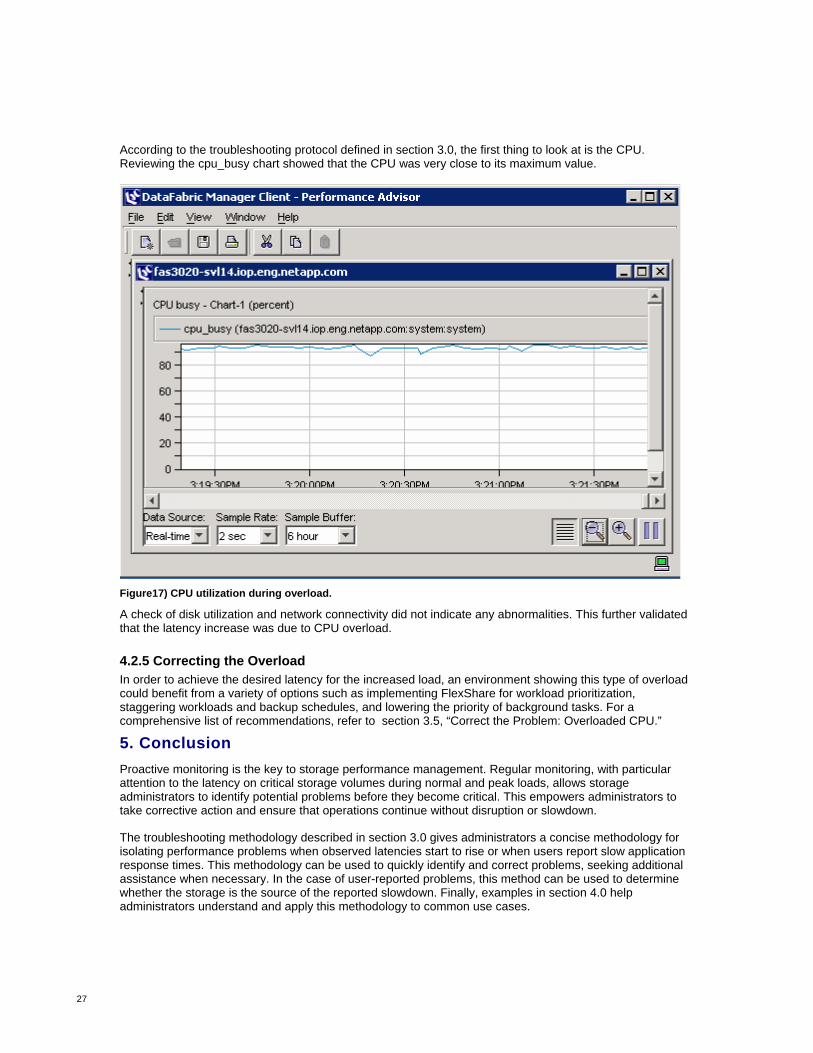
According to the troubleshooting protocol defined in section 3.0, the first thing to look at is the CPU. Reviewing the cpu_busy chart showed that the CPU was very close to its maximum value.
Figure17) CPU utilization during overload.
A check of disk utilization and network connectivity did not indicate any abnormalities. This further validated that the latency increase was due to CPU overload. 4.2.5 Correcting the Overload In order to achieve the desired latency for the increased load, an environment showing this type of overload could benefit from a variety of options such as implementing FlexShare for workload prioritization, staggering workloads and backup schedules, and lowering the priority of background tasks. For a comprehensive list of recommendations, refer to section 3.5, “Correct the Problem: Overloaded CPU.”
5. Conclusion
Proactive monitoring is the key to storage performance management. Regular monitoring, with particular attention to the latency on critical storage volumes during normal and peak loads, allows storage administrators to identify potential problems before they become critical. This empowers administrators to take corrective action and ensure that operations continue without disruption or slowdown.
The troubleshooting methodology described in section 3.0 gives administrators a concise methodology for isolating performance problems when observed latencies start to rise or when users report slow application response times. This methodology can be used to quickly identify and correct problems, seeking additional assistance when necessary. In the case of user-reported problems, this method can be used to determine whether the storage is the source of the reported slowdown. Finally, examples in section 4.0 help administrators understand and apply this methodology to common use cases.
28
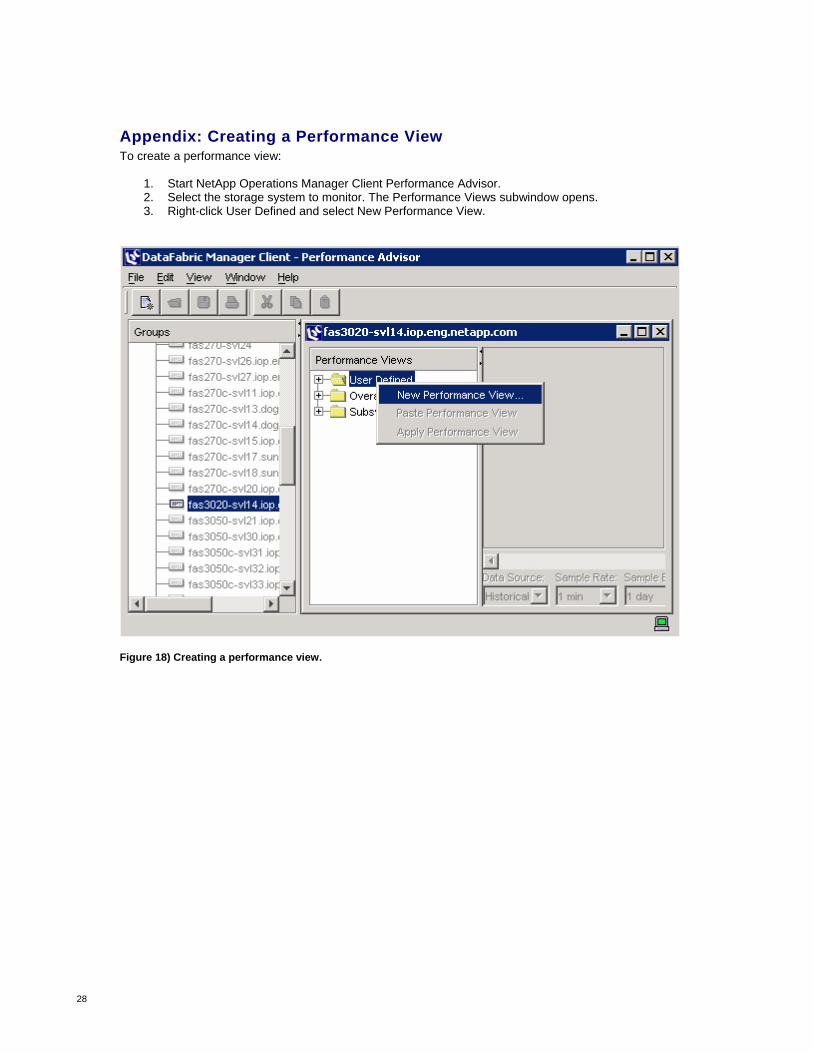
Appendix: Creating a Performance View To create a performance view:
1. Start NetApp Operations Manager Client Performance Advisor. 2. Select the storage system to monitor. The Performance Views subwindow opens. 3. Right-click User Defined and select New Performance View.
Figure 18) Creating a performance view.

29
4. The Performance View popup appears. Select Sample Rate and Sample Buffer, enter a name for
the view, and then click Add.
Figure 19) Naming a performance view.
30
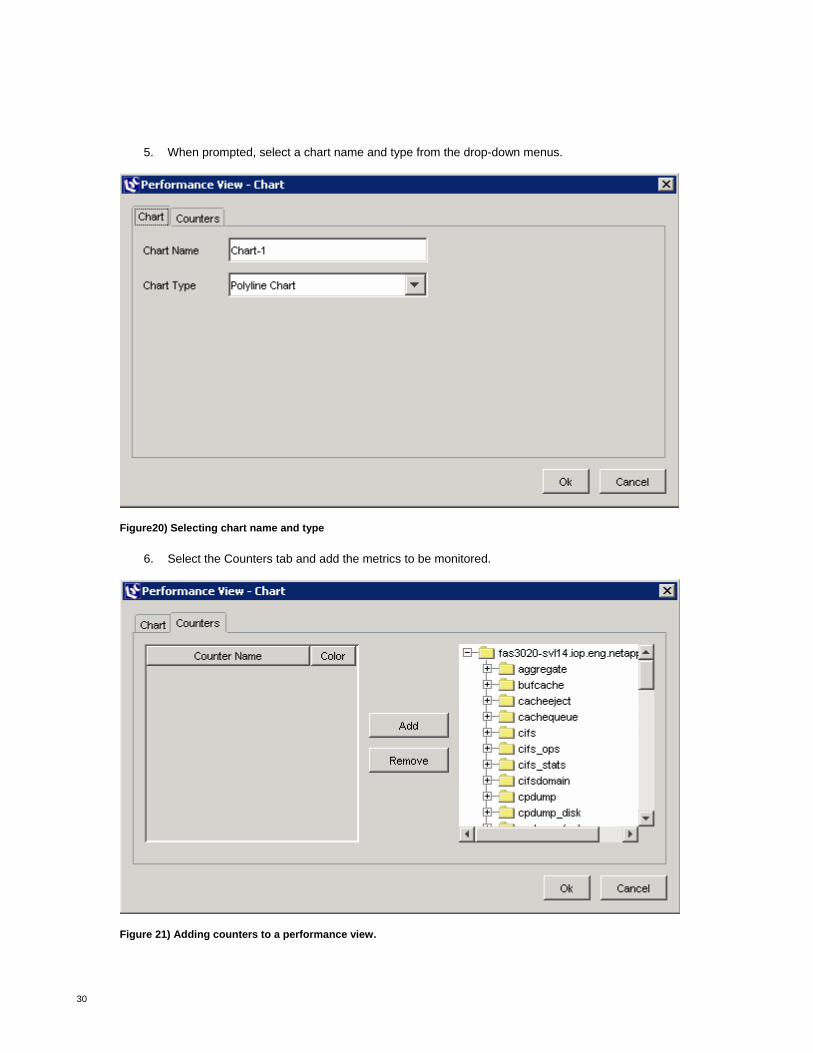
5. When prompted, select a chart name and type from the drop-down menus.
Figure20) Selecting chart name and type
6. Select the Counters tab and add the metrics to be monitored.
Figure 21) Adding counters to a performance view.
31
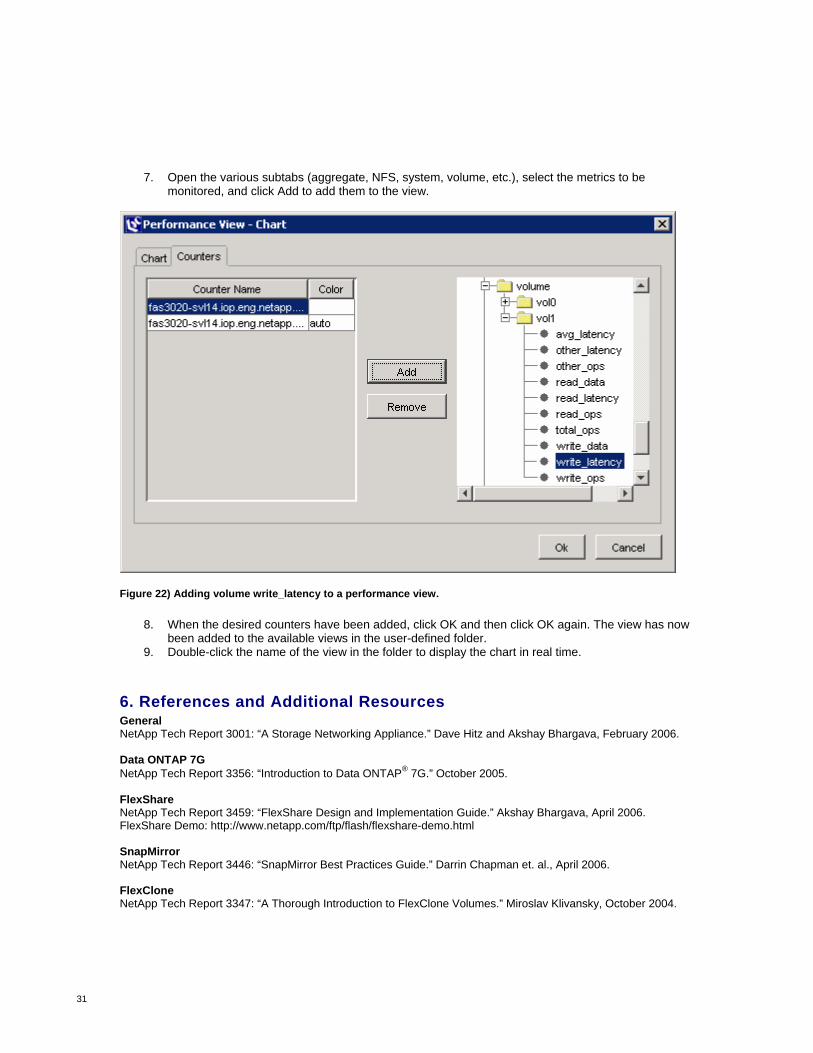
7. Open the various subtabs (aggregate, NFS, system, volume, etc.), select the metrics to be monitored, and click Add to add them to the view.
Figure 22) Adding volume write_latency to a performance view.
8. When the desired counters have been added, click OK and then click OK again. The view has now been added to the available views in the user-defined folder.
9. Double-click the name of the view in the folder to display the chart in real time.
6. References and Additional Resources General NetApp Tech Report 3001: “A Storage Networking Appliance.” Dave Hitz and Akshay Bhargava, February 2006. Data ONTAP 7G NetApp Tech Report 3356: “Introduction to Data ONTAP® 7G.” October 2005. FlexShare NetApp Tech Report 3459: “FlexShare Design and Implementation Guide.” Akshay Bhargava, April 2006. FlexShare Demo: http://www.netapp.com/ftp/flash/flexshare-demo.html SnapMirror NetApp Tech Report 3446: “SnapMirror Best Practices Guide.” Darrin Chapman et. al., April 2006. FlexClone NetApp Tech Report 3347: “A Thorough Introduction to FlexClone Volumes.” Miroslav Klivansky, October 2004.

32
RAID NetApp Tech Report 3437: “Storage Best Practices and Resiliency Guide.” NetApp Product Engineering, July 2006. NetApp Tech Report 3298: “RAID-DP: NetApp Implementation of RAID Double Parity for Data Protection.” Chris Lueth, December 2005. SyncMirror/MetroCluster NetApp Tech Report 3437: “Storage Best Practices and Resiliency Guide.” NetApp Product Engineering, July 2006. The following resources are available exclusively to customers with access to the NOW™ (NetApp on the Web) site. NDMP Data Protection Tape Backup and Recovery Guide, Section 5: http://now.netapp.com/NOW/knowledge/docs/ontap/rel72/pdfs/ontap/tapebkup.pdf MultiStore MultiStore Management Guide: http://now.netapp.com/NOW/knowledge/docs/ontap/rel72/pdfs/ontap/vfiler.pdf
RAID Storage Management Guide: http://now.netapp.com/NOW/knowledge/docs/ontap/rel72/pdfs/ontap/mgmtsag.pdf SyncMirror/MetroCluster http://now.netapp.com/NOW/knowledge/docs/ontap/rel72/pdfs/ontap/cluster.pdf
7. Acknowledgements Swami Ramany and Darrell Suggs made significant contributions to this paper.

33
8. Revision History
Date Name Description
01/08/07 Bhargava/Nigam Initial Version
© 2007 Network Appliance, Inc. All rights reserved. Specifications subject to change without notice. NetApp, the Network Appliance logo, DataFabric. Data ONTAP, FlexVol, MultiStore, SnapMirror, SnapVault, SyncMirror, and WAFL are registered trademarks and Network Appliance, FlexClone, FlexShare, Manage ONTAP, NOW, RAID-DP, and Snapshot are trademarks of Network Appliance, Inc. in the U.S. and other countries. Linux is a registered trademark of Linus Torvalds. Microsoft and Windows are registered trademarks of Microsoft Corporation. All other brands or products are trademarks or registered trademarks of their respective holders and should be treated as such.
www.netapp.com
Related Documents