Rajneesh Chaudhary (Graduate Student) & Brian G. Thomas Department of Mechanical Science and Engineering University of Illinois at Urbana-Champaign, IL Stopper rod tilt and effect on nozzle flow University of Illinois at Urbana-Champaign • Metals Processing Simulation Lab • R Chaudhary 2 Project Overview • Static stress analysis on stopper rod system has been carried using ANSYS. • Two forces have been considered on stopper rod, (1) vertically distributed load (Drag force, due to tundish velocity) (2) Buoyancy force (upward) • Effect of direction and change in velocity on the stopper tilt has been analyzed. • FLUENT has been used to model the effects of stopper rod tilt on asymmetry of the steel flow in the nozzle and its outlet ports.

Welcome message from author
This document is posted to help you gain knowledge. Please leave a comment to let me know what you think about it! Share it to your friends and learn new things together.
Transcript
Rajneesh Chaudhary (Graduate Student) &
Brian G. Thomas
Department of Mechanical Science and EngineeringUniversity of Illinois at Urbana-Champaign, IL
Stopper rod tilt and effect on nozzle flow
University of Illinois at Urbana-Champaign • Metals Processing Simulation Lab • R Chaudhary 2
Project Overview• Static stress analysis on stopper rod system has
been carried using ANSYS.
• Two forces have been considered on stopper rod, (1) vertically distributed load
(Drag force, due to tundish velocity)(2) Buoyancy force (upward)
• Effect of direction and change in velocity on the stopper tilt has been analyzed.
• FLUENT has been used to model the effects of stopper rod tilt on asymmetry of the steel flow in the nozzle and its outlet ports.
University of Illinois at Urbana-Champaign • Metals Processing Simulation Lab • R Chaudhary 3
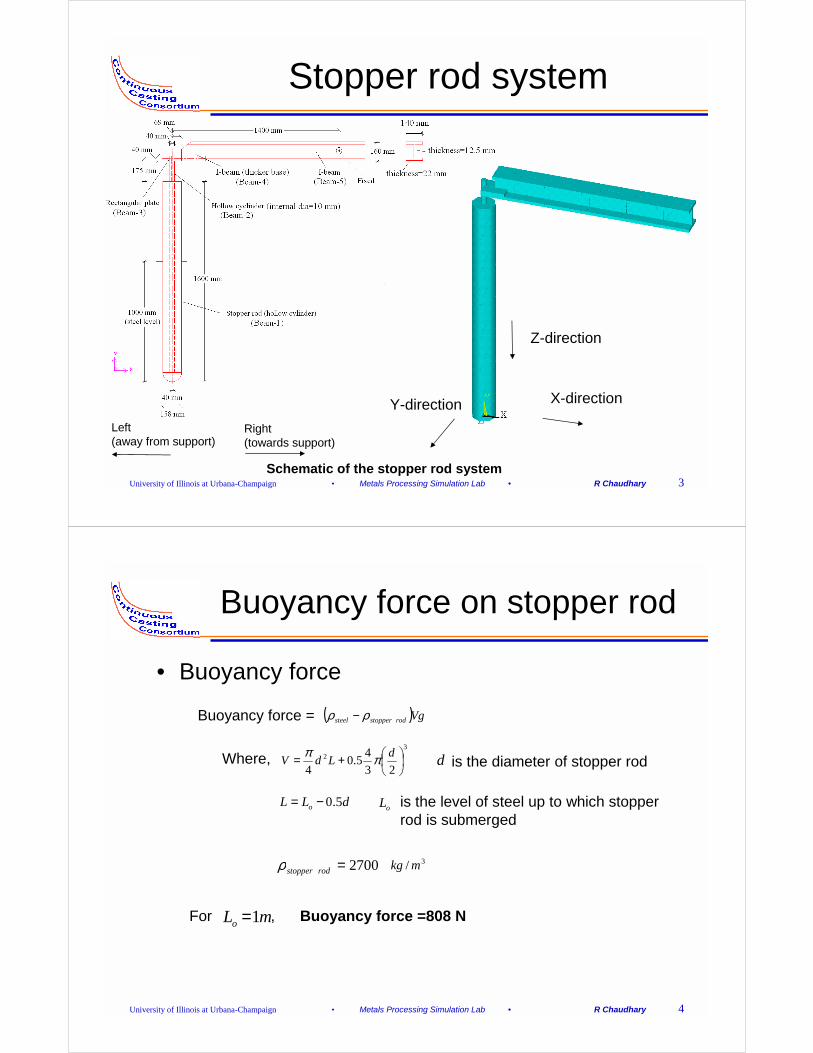
Stopper rod system
Schematic of the stopper rod system
Right (towards support)
Left (away from support)
Z-direction
X-directionY-direction
University of Illinois at Urbana-Champaign • Metals Processing Simulation Lab • R Chaudhary 4
Buoyancy force on stopper rod
• Buoyancy force
( )Vgrodstoppersteel ρρ −Buoyancy force =
32
2345.0
4
+= dLdV ππWhere, is the diameter of stopper rodd
0.5oL L d= − oL is the level of steel up to which stopper rod is submerged
2700=rodstopperρ 3/ mkg
For , Buoyancy force =808 N1oL m=
University of Illinois at Urbana-Champaign • Metals Processing Simulation Lab • R Chaudhary 5
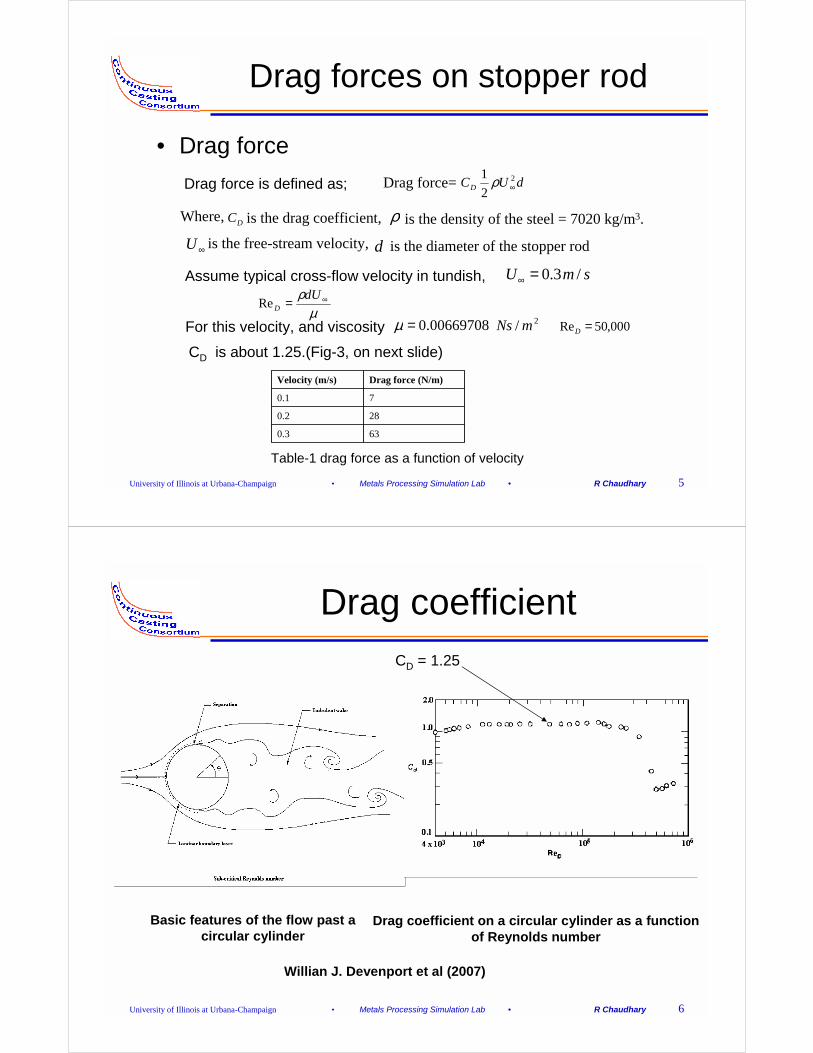
Drag forces on stopper rod
• Drag forceDrag force is defined as; Drag force= dUCD
2
21
∞ρ
DC ρ
∞U d
Where, is the drag coefficient, is the density of the steel = 7020 kg/m3. is the free-stream velocity, is the diameter of the stopper rod
Assume typical cross-flow velocity in tundish, smU /3.0=∞
µρ ∞=dU
DRe
For this velocity, and viscosity 000,50Re =D
CD is about 1.25.(Fig-3, on next slide)
630.3
280.2
70.1
Drag force (N/m)Velocity (m/s)
Table-1 drag force as a function of velocity
00669708.0=µ 2/ mNs
University of Illinois at Urbana-Champaign • Metals Processing Simulation Lab • R Chaudhary 6
Drag coefficient
Basic features of the flow past a circular cylinder
Drag coefficient on a circular cylinder as a function of Reynolds number
Willian J. Devenport et al (2007)
CD = 1.25

University of Illinois at Urbana-Champaign • Metals Processing Simulation Lab • R Chaudhary 7
Static structural analysis• BEAM188 line elements in ANSYS are used to solve
equations.
• Allow 6 degree of freedom.
• Cross-sections corresponding to different parts of geometry for various line elements have been taken into account.
• Structural properties of steel(E) Young’s modulus of steel=210 GPaPoisson’s ratio=0.3
(Reference http://en.wikipedia.org)
University of Illinois at Urbana-Champaign • Metals Processing Simulation Lab • R Chaudhary 8
Simulated cases
Yes0.3Back to front7
No0.3Back to front6
Yes0.1Back to front5
Yes0.3Right to left4
Yes0.1Right to left3
Yes0.3Left to right2
Yes0.1Left to right1
BuoyancyVelocity (m/s)Drag force directionCase No
Seven cases have been modelled using ANSYS
Cases considered

University of Illinois at Urbana-Champaign • Metals Processing Simulation Lab • R Chaudhary 9
Stopper rod cross sections for Beam Analysis
( )21
22 rrA −= π ( )4
14
24rrII yyxx −== π
cross-section area
158mm-OD and 41 mm-ID Stopper Rod (Beam 1)
40mm-OD and 10 mm-ID Connecting Rod (Beam 2)
moment of inertia through centroid
University of Illinois at Urbana-Champaign • Metals Processing Simulation Lab • R Chaudhary 10
Horizontal Support beam cross-sections for beam analysis
bhA =
12
3bhI xx =12
3hbI yy = ( ) ( )121212
333 hcbdbaI yy ++=
hcdbabA ++=( )
2
32
2
0623.02
1220623.0
0623.02
−+++
+
−+
−++=
dhach
hcdbd
dhaabIxx
cross-section area
moment of inertia through centroid
cross-section area moment of inertia through centroid
40 mm X 140 mm support plate (Beam 3) 160 mm X 140 mm (base 40, top 22, 12.5 mm vertical plate) support I-Beam (Beam 4)
a=22mm b=140mmc=12.5mmd=40mmh=98mm
b=140mmh=40mm
University of Illinois at Urbana-Champaign • Metals Processing Simulation Lab • R Chaudhary 11
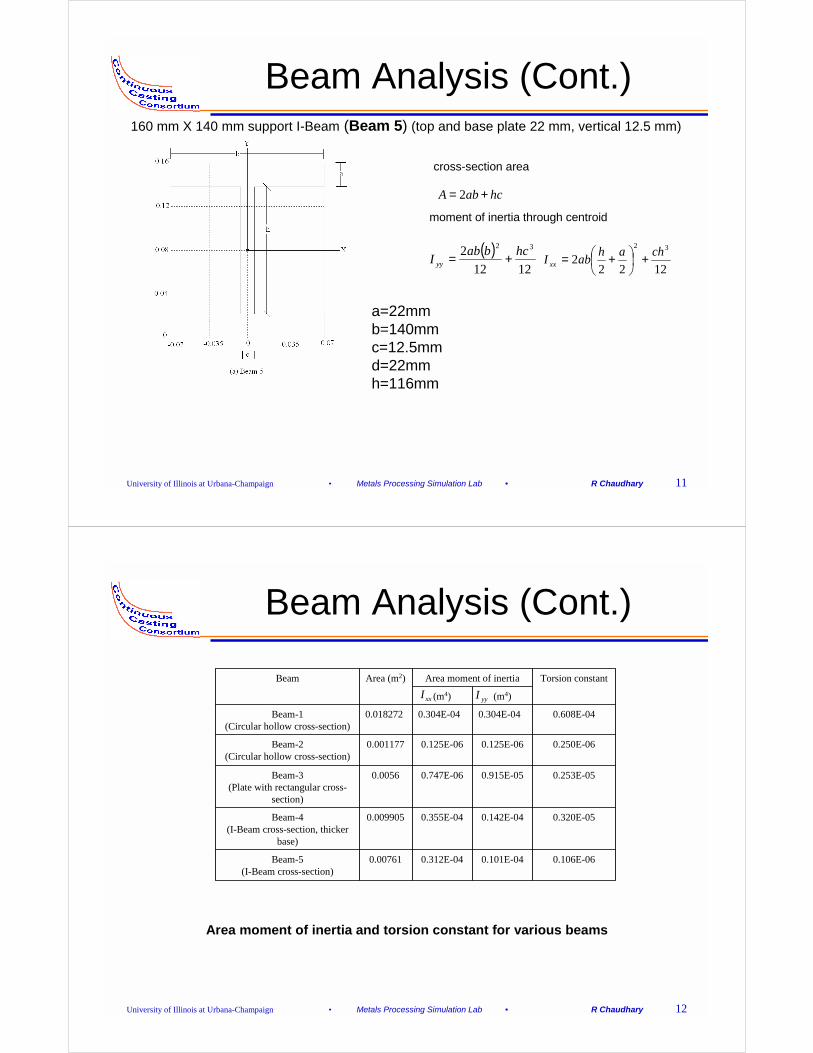
Beam Analysis (Cont.)
hcabA += 2
12222
32 chahabI xx +
+=
( )1212
2 32 hcbabI yy +=
cross-section area
moment of inertia through centroid
160 mm X 140 mm support I-Beam (Beam 5) (top and base plate 22 mm, vertical 12.5 mm)
a=22mm b=140mmc=12.5mmd=22mmh=116mm
University of Illinois at Urbana-Champaign • Metals Processing Simulation Lab • R Chaudhary 12
Beam Analysis (Cont.)
xxI yyI
0.106E-060.101E-040.312E-040.00761Beam-5(I-Beam cross-section)
0.320E-050.142E-040.355E-040.009905Beam-4(I-Beam cross-section, thicker
base)
0.253E-050.915E-050.747E-060.0056Beam-3(Plate with rectangular cross-
section)
0.250E-060.125E-060.125E-060.001177Beam-2(Circular hollow cross-section)
0.608E-040.304E-040.304E-040.018272Beam-1(Circular hollow cross-section)
(m4)(m4)
Torsion constantArea moment of inertiaArea (m2)Beam
Area moment of inertia and torsion constant for various beams
University of Illinois at Urbana-Champaign • Metals Processing Simulation Lab • R Chaudhary 13
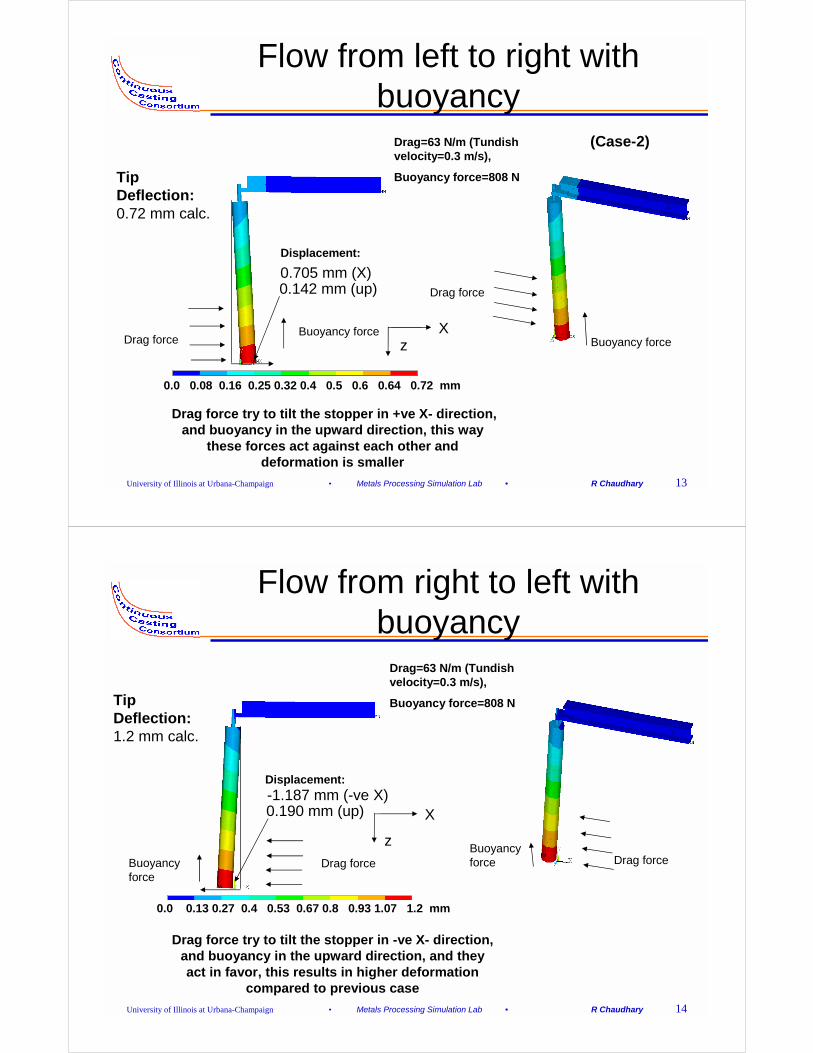
Flow from left to right with buoyancy
Drag force try to tilt the stopper in +ve X- direction, and buoyancy in the upward direction, this way
these forces act against each other and deformation is smaller
Drag forceBuoyancy force
Drag force
Buoyancy force
Displacement:
0.0 0.08 0.16 0.25 0.32 0.4 0.5 0.6 0.64 0.72 mm
Tip Deflection:0.72 mm calc.
Drag=63 N/m (Tundish velocity=0.3 m/s),
Buoyancy force=808 N
X
0.705 mm (X)0.142 mm (up)
z
(Case-2)
University of Illinois at Urbana-Champaign • Metals Processing Simulation Lab • R Chaudhary 14
Flow from right to left with buoyancy
Drag forceBuoyancy force
Drag forceBuoyancy force
Tip Deflection:1.2 mm calc.
0.0 0.13 0.27 0.4 0.53 0.67 0.8 0.93 1.07 1.2 mm
Drag=63 N/m (Tundish velocity=0.3 m/s),
Buoyancy force=808 N
Displacement:
X
z
-1.187 mm (-ve X)0.190 mm (up)
Drag force try to tilt the stopper in -ve X- direction, and buoyancy in the upward direction, and they act in favor, this results in higher deformation
compared to previous case
University of Illinois at Urbana-Champaign • Metals Processing Simulation Lab • R Chaudhary 15
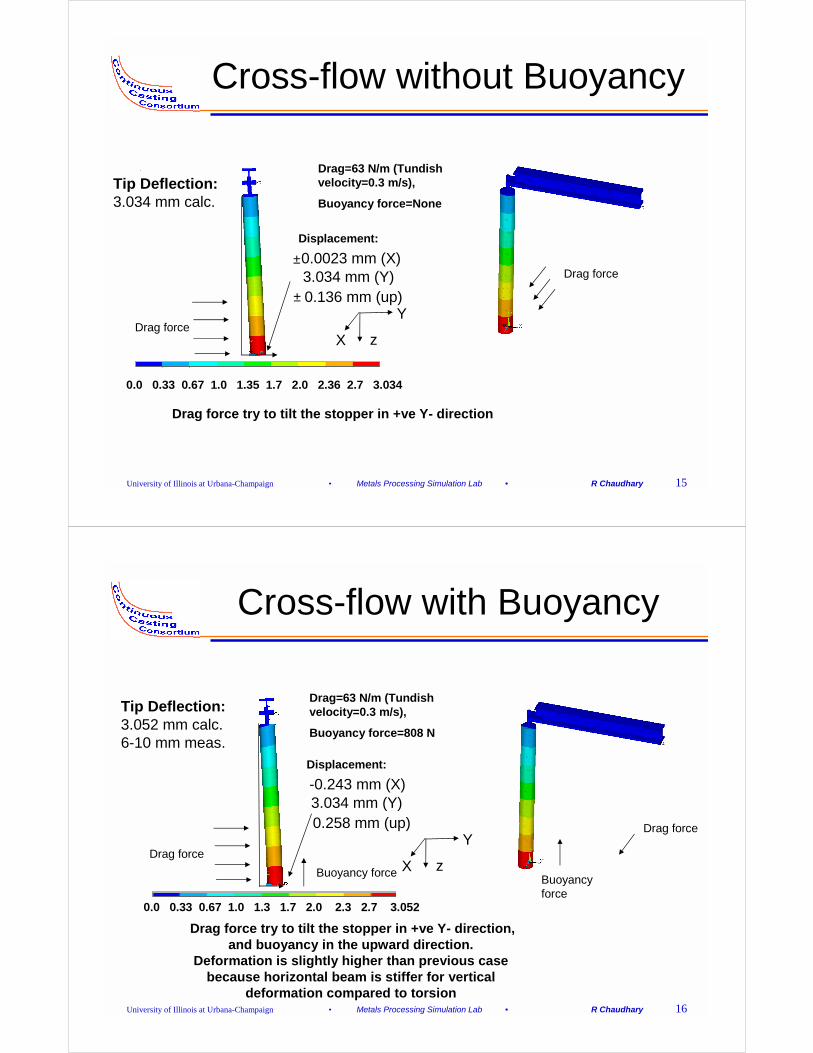
Cross-flow without Buoyancy
Drag force
Drag force
Tip Deflection:3.034 mm calc.
Displacement:
0.0 0.33 0.67 1.0 1.35 1.7 2.0 2.36 2.7 3.034
Drag=63 N/m (Tundish velocity=0.3 m/s),
Buoyancy force=None
z
Y
3.034 mm (Y)0.136 mm (up)
X
0.0023 mm (X)
±
±
Drag force try to tilt the stopper in +ve Y- direction
University of Illinois at Urbana-Champaign • Metals Processing Simulation Lab • R Chaudhary 16
Cross-flow with Buoyancy
Drag forceBuoyancy force
Drag force
Buoyancy force
Tip Deflection:3.052 mm calc.6-10 mm meas.
0.0 0.33 0.67 1.0 1.3 1.7 2.0 2.3 2.7 3.052
Drag=63 N/m (Tundish velocity=0.3 m/s),
Buoyancy force=808 N
Displacement:
3.034 mm (Y)0.258 mm (up)
-0.243 mm (X)
z
Y
X
Drag force try to tilt the stopper in +ve Y- direction, and buoyancy in the upward direction.
Deformation is slightly higher than previous case because horizontal beam is stiffer for vertical
deformation compared to torsion
University of Illinois at Urbana-Champaign • Metals Processing Simulation Lab • R Chaudhary 17
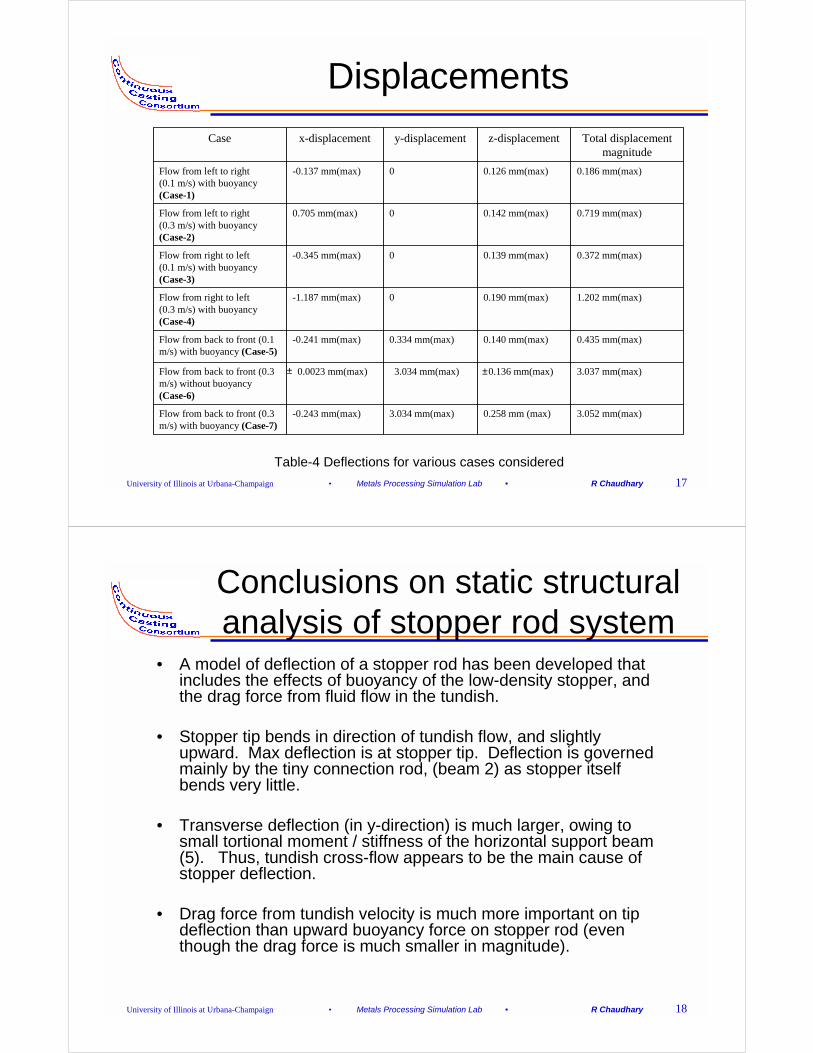
Displacements
Table-4 Deflections for various cases considered
± ±
3.052 mm(max)0.258 mm (max)3.034 mm(max)-0.243 mm(max)Flow from back to front (0.3 m/s) with buoyancy (Case-7)
3.037 mm(max)0.136 mm(max)3.034 mm(max)0.0023 mm(max)Flow from back to front (0.3 m/s) without buoyancy (Case-6)
0.435 mm(max)0.140 mm(max)0.334 mm(max)-0.241 mm(max)Flow from back to front (0.1 m/s) with buoyancy (Case-5)
1.202 mm(max)0.190 mm(max)0-1.187 mm(max)Flow from right to left(0.3 m/s) with buoyancy (Case-4)
0.372 mm(max)0.139 mm(max)0-0.345 mm(max)Flow from right to left(0.1 m/s) with buoyancy (Case-3)
0.719 mm(max)0.142 mm(max)00.705 mm(max)Flow from left to right(0.3 m/s) with buoyancy (Case-2)
0.186 mm(max)0.126 mm(max)0-0.137 mm(max)Flow from left to right(0.1 m/s) with buoyancy (Case-1)
Total displacement magnitude
z-displacementy-displacementx-displacementCase
University of Illinois at Urbana-Champaign • Metals Processing Simulation Lab • R Chaudhary 18
Conclusions on static structural analysis of stopper rod system
• A model of deflection of a stopper rod has been developed that includes the effects of buoyancy of the low-density stopper, and the drag force from fluid flow in the tundish.
• Stopper tip bends in direction of tundish flow, and slightly upward. Max deflection is at stopper tip. Deflection is governed mainly by the tiny connection rod, (beam 2) as stopper itself bends very little.
• Transverse deflection (in y-direction) is much larger, owing to small tortional moment / stiffness of the horizontal support beam (5). Thus, tundish cross-flow appears to be the main cause of stopper deflection.
• Drag force from tundish velocity is much more important on tip deflection than upward buoyancy force on stopper rod (even though the drag force is much smaller in magnitude).

University of Illinois at Urbana-Champaign • Metals Processing Simulation Lab • R Chaudhary 19
• Increasing velocity greatly increases deflection (square relationship, owing to effect on drag force)
• Measurements at POSCO estimate displacement at the bottom of stopper rod is 6-10 mm in transverse (y) direction (perpendicular to direction of stopper support).
• Calculated displacements are appear to be smaller than measured, perhaps due to – neglect of play in the joints. – thermal distortion, and measurement problems– Neglect of play and deflection of the vertical assembly that
supports and moves the stopper rod
Conclusions on static structural analysis of stopper rod system
University of Illinois at Urbana-Champaign • Metals Processing Simulation Lab • R Chaudhary 20
Effect of stopper tip deflection on asymmetric flow in the nozzle
• Fluent has been used to simulate 3-D turbulent steel flow in a nozzle with a tilted stopper rod.
Aligned Stopper Misligned Stopper

University of Illinois at Urbana-Champaign • Metals Processing Simulation Lab • R Chaudhary 21
Effect of the stopper rod tilt on nozzle flow
• Hexahedral mesh has been generated in 3-Dimensional computational domain in GAMBIT.
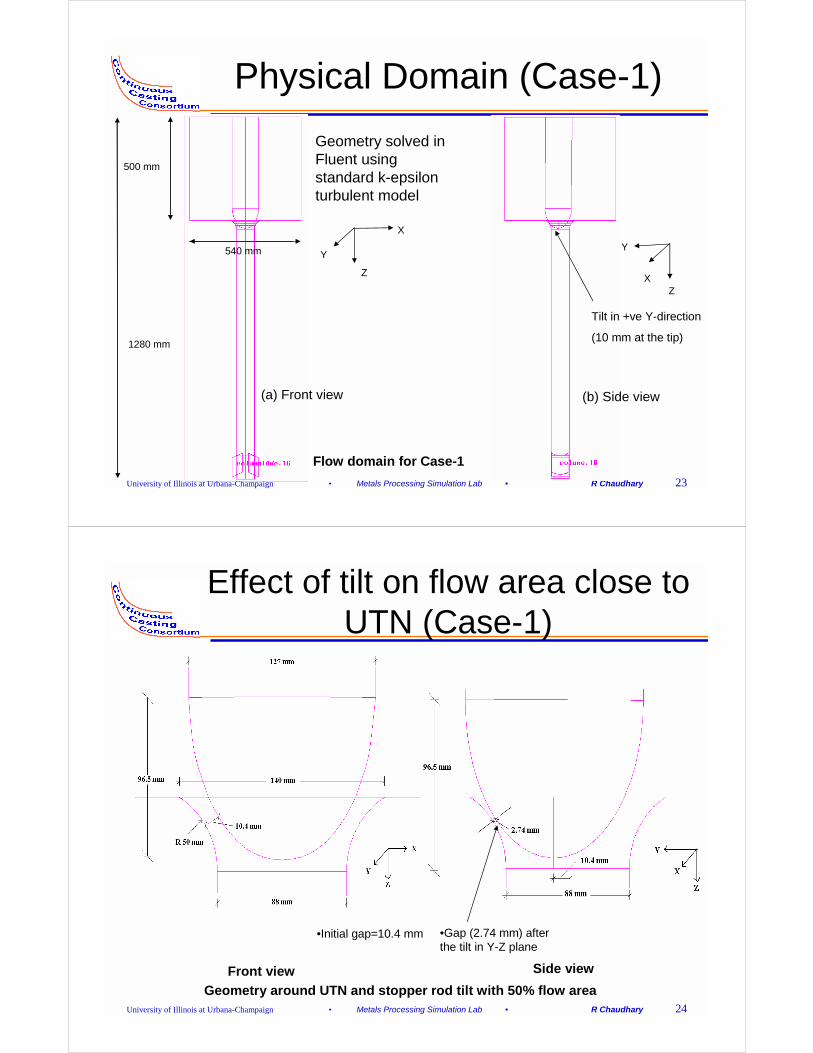
• Turbulence has been modeled using standard k-epsilon model. • 50% open flow area (minimum gap=10.4 mm) has been considered
before tilting the stopper rod in the flow domain.• A cylinder of diameter 540 mm and 500 mm height has been created
to partially model tundish flow for the inlet conditions. • Uniform velocity inlet conditions are applied on the circumference
and the top of this cylinder based upon a typical casting speed (1.56 m/min, 65.14 kg/s steel flow) and slab dimensions (250 mm X 1430 mm).
• Two cases have been considered.Case-1: stopper rod is tilted 10 mm in +ve y-direction (Towards NF)Case-2: Stopper rod is tilted 10 mm in -ve x-direction (Towards EF)
University of Illinois at Urbana-Champaign • Metals Processing Simulation Lab • R Chaudhary 22
Nozzle Geometry
!Height of the nozzle 1280 mm from top to bottom
!Bore diameter of nozzle 88 mm
!Outlet port cross-section 83 mm X 83 mm
!Angle of outlet port from horizontal 25o
!Stopper rod diam 127 mm till ~ 1000 mm
SEN and stopper rod
at Gwangyang works POSCO
University of Illinois at Urbana-Champaign • Metals Processing Simulation Lab • R Chaudhary 23
Physical Domain (Case-1)
Flow domain for Case-1
(b) Side view(a) Front view
Geometry solved in Fluent using standard k-epsilon turbulent model
500 mm
1280 mm
540 mm
X
Z
Y
ZX
Y
Tilt in +ve Y-direction
(10 mm at the tip)
University of Illinois at Urbana-Champaign • Metals Processing Simulation Lab • R Chaudhary 24
Effect of tilt on flow area close to UTN (Case-1)
Geometry around UTN and stopper rod tilt with 50% flow areaFront view Side view
•Gap (2.74 mm) after the tilt in Y-Z plane
•Initial gap=10.4 mm

University of Illinois at Urbana-Champaign • Metals Processing Simulation Lab • R Chaudhary 25
Physical Domain (Case-2)
Flow domain for Case-2
(b) Side view(a) Front view
500 mm
1280 mm
540 mm
Tilt in –ve X-direction
(10 mm at the tip)
X
Z
Y
ZX
Y
University of Illinois at Urbana-Champaign • Metals Processing Simulation Lab • R Chaudhary 26
Effect of tilt on flow area close to UTN (Case-2)
Geometry around UTN and stopper rod tilt with 50% flow area
(a) Front view (b) Side view•Gap (2.74 mm) after the tilt in Y-Z plane •Initial gap=10.4 mm
University of Illinois at Urbana-Champaign • Metals Processing Simulation Lab • R Chaudhary 27
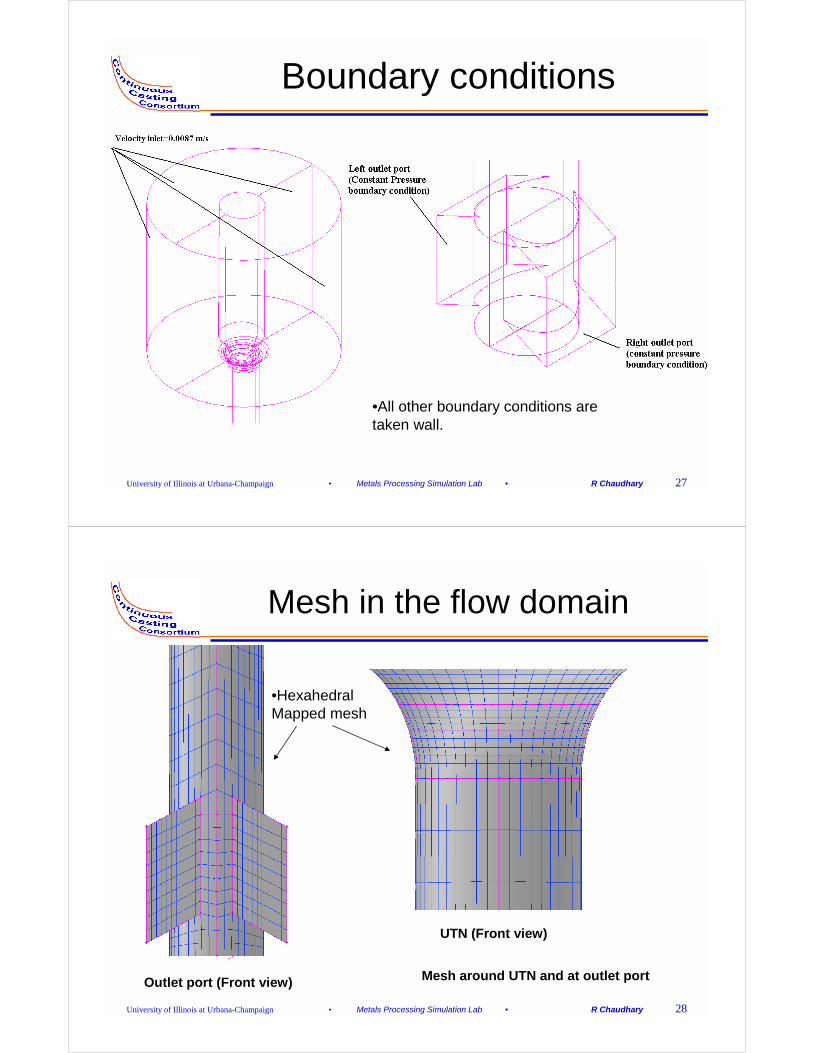
Boundary conditions
•All other boundary conditions are taken wall.
University of Illinois at Urbana-Champaign • Metals Processing Simulation Lab • R Chaudhary 28
Mesh in the flow domain
Mesh around UTN and at outlet port Outlet port (Front view)
UTN (Front view)
•Hexahedral Mapped mesh
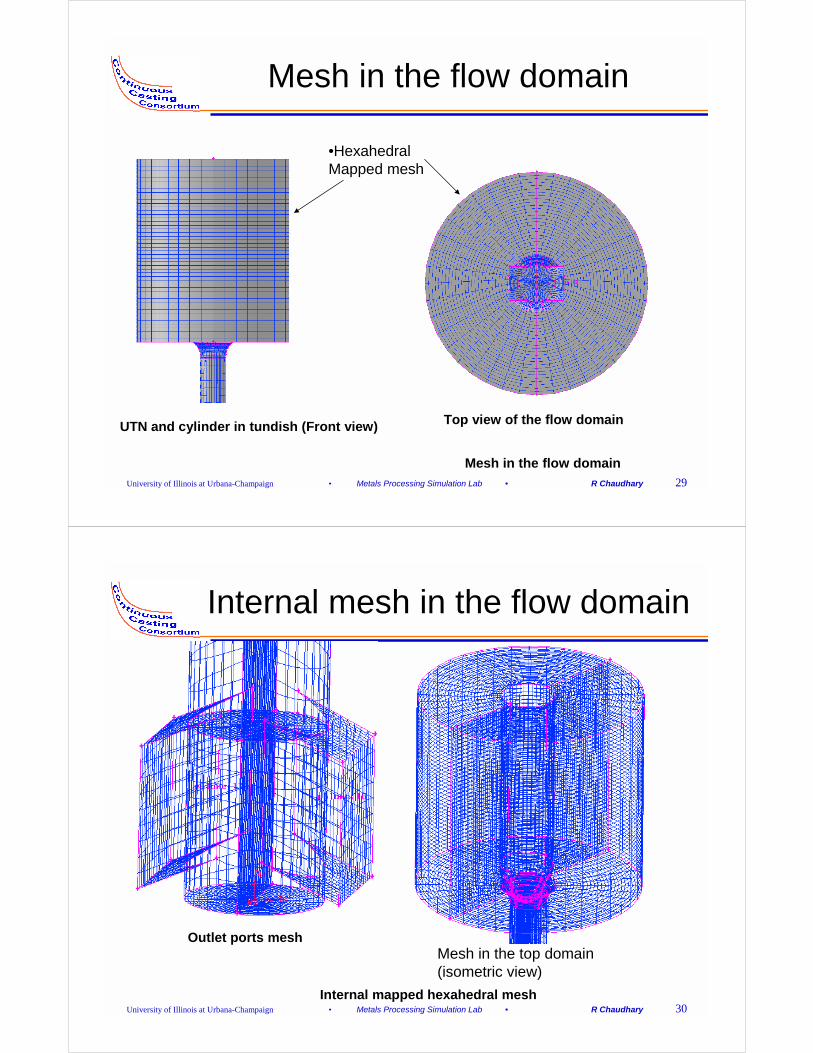
University of Illinois at Urbana-Champaign • Metals Processing Simulation Lab • R Chaudhary 29
Mesh in the flow domain
Mesh in the flow domain
UTN and cylinder in tundish (Front view) Top view of the flow domain
•Hexahedral Mapped mesh
University of Illinois at Urbana-Champaign • Metals Processing Simulation Lab • R Chaudhary 30
Internal mesh in the flow domain
Internal mapped hexahedral mesh
Outlet ports meshMesh in the top domain (isometric view)

University of Illinois at Urbana-Champaign • Metals Processing Simulation Lab • R Chaudhary 31
Convergence (Case-1) (Residuals)
Residuals and convergence criterion for Case-1
1e-03
University of Illinois at Urbana-Champaign • Metals Processing Simulation Lab • R Chaudhary 32
Velocity contours in the top region (Case-1)
Velocity magnitude contours in the top region
Front viewSide view (looking into port from NF)
Maximum velocity=3.44 m/s
Effect of asymmetry
symmetric
X
Z
Y
Z
High momentum of steel
Maximum velocity=3.10 m/s
Maximum velocity=3.27 m/s

University of Illinois at Urbana-Champaign • Metals Processing Simulation Lab • R Chaudhary 33
Velocity at the bottom of the domain
Velocity magnitude contours in the nozzle close to the outlet ports
Front view Side view
Effect of asymmetry at the bottom (circulating flow in Y-Z plane)
X
Z
Y
Z
Symmetry in X-Z plane
Higher momentum of steel coming from top due to asymmetry
University of Illinois at Urbana-Champaign • Metals Processing Simulation Lab • R Chaudhary 34
Velocity at outlet ports (Case-1)
Velocity magnitude
contours on outlet portsLeft outlet port
(Mass flow rate=32.91 kg/s)Right outlet port
(Mass flow rate=32.23 kg/s)
Symmetry between two ports
Front and back asymmetry

University of Illinois at Urbana-Champaign • Metals Processing Simulation Lab • R Chaudhary 35
Results (Case-1) (Cont.)
Pressure contours in the whole domain
Side viewFront view
X
Z
Y
Z
University of Illinois at Urbana-Champaign • Metals Processing Simulation Lab • R Chaudhary 36
Convergence (Case-2) (Residuals)
Residuals and convergence criterion for Case-2
1e-03
University of Illinois at Urbana-Champaign • Metals Processing Simulation Lab • R Chaudhary 37
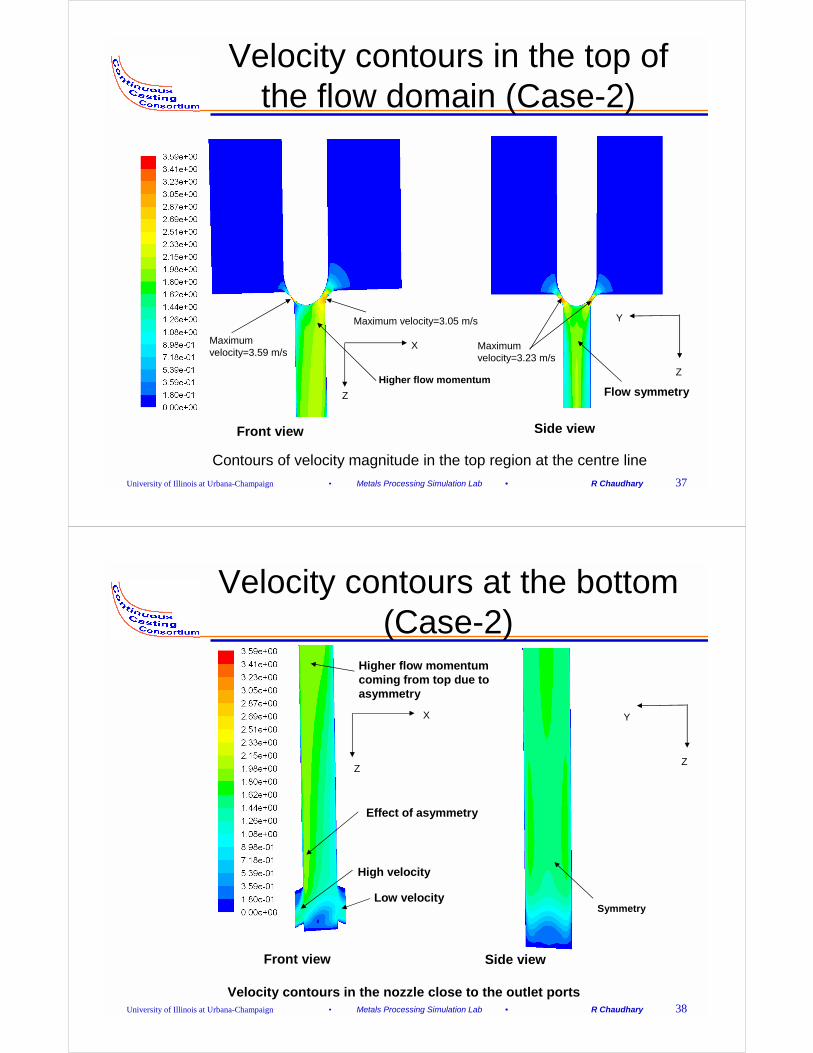
Velocity contours in the top of the flow domain (Case-2)
Contours of velocity magnitude in the top region at the centre line
Front view Side view
Maximum velocity=3.59 m/s
X
Z
Y
ZHigher flow momentum
Flow symmetry
Maximum velocity=3.05 m/s
Maximum velocity=3.23 m/s
University of Illinois at Urbana-Champaign • Metals Processing Simulation Lab • R Chaudhary 38
Velocity contours at the bottom (Case-2)
Velocity contours in the nozzle close to the outlet ports
Front view Side view
Effect of asymmetry
High velocity
Low velocity
X
Z
Y
Z
Higher flow momentum coming from top due to asymmetry
Symmetry

University of Illinois at Urbana-Champaign • Metals Processing Simulation Lab • R Chaudhary 39
Pressure contours in the whole domain (Case-2)
Pressure contours in the whole domain
Side viewFront view
X
Z
Y
Z
University of Illinois at Urbana-Champaign • Metals Processing Simulation Lab • R Chaudhary 40
Velocity contours at the outlet ports (Case-2)
Left outlet port
(34.57 kg/s)
Right outlet port
(30.57 kg/s)
Velocity contours on outlet ports
Effect of asymmetry, high velocity at the bottom compared to right outlet port
Front and back symmetry in both ports
University of Illinois at Urbana-Champaign • Metals Processing Simulation Lab • R Chaudhary 41
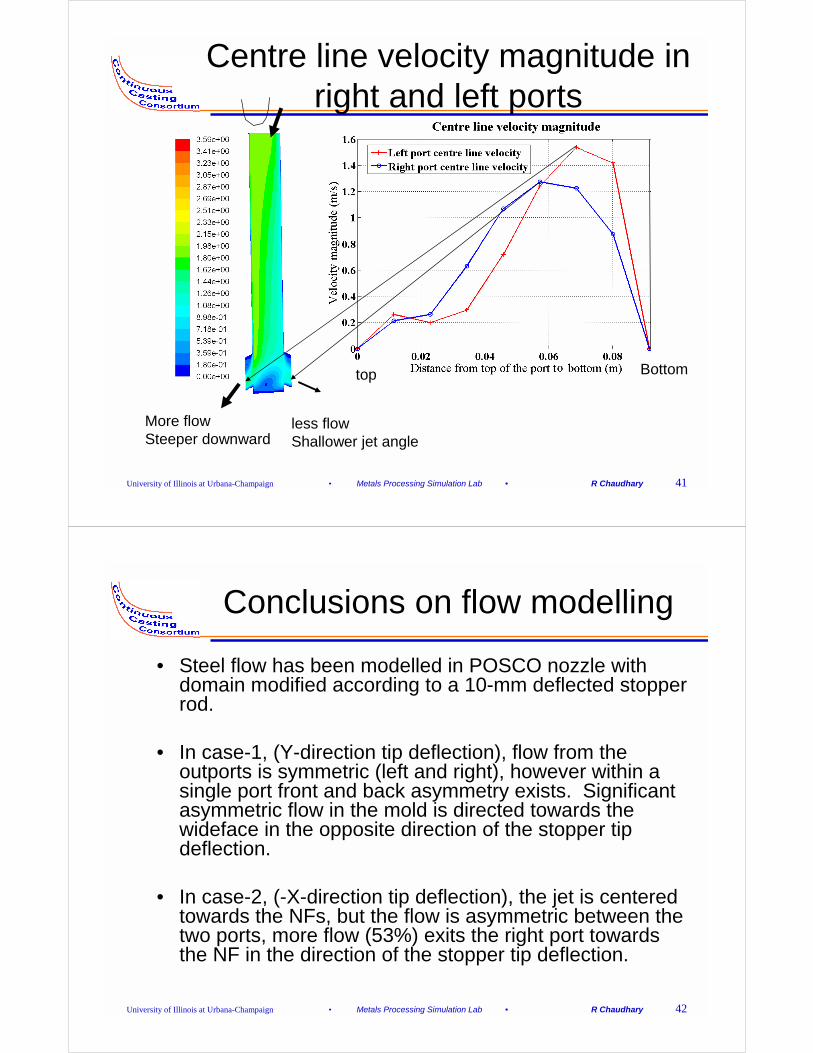
Centre line velocity magnitude in right and left ports
top Bottom
More flowSteeper downward
less flowShallower jet angle
University of Illinois at Urbana-Champaign • Metals Processing Simulation Lab • R Chaudhary 42
Conclusions on flow modelling
• Steel flow has been modelled in POSCO nozzle with domain modified according to a 10-mm deflected stopper rod.
• In case-1, (Y-direction tip deflection), flow from the outports is symmetric (left and right), however within a single port front and back asymmetry exists. Significant asymmetric flow in the mold is directed towards the wideface in the opposite direction of the stopper tip deflection.
• In case-2, (-X-direction tip deflection), the jet is centered towards the NFs, but the flow is asymmetric between the two ports, more flow (53%) exits the right port towards the NF in the direction of the stopper tip deflection.

University of Illinois at Urbana-Champaign • Metals Processing Simulation Lab • R Chaudhary 43
Conclusions on flow modelling
• In Case-1, velocity is maximum at the bottom and backside of the outlet ports.
• In Case-2, velocity and flow rate is higher at the outlet port opposite to the higher gap at UTN, which is due to higher momentum from the top.
• Reverse flow has been found in both cases at the top of the outlet port.
University of Illinois at Urbana-Champaign • Metals Processing Simulation Lab • R Chaudhary 44
Final conclusions• From the static structural analysis, cross flow has been found
producing maximum deformation at the tip of the stopper rod.
• Drag force is more crucial in deformation.
• Cross-flow/cross-deformation does not generate asymmetry between the two ports, but gives front and back asymmetry within same port.
• Although, front/back deformation is small, but has considerable effect on the flow asymmetry between two ports.
• Velocity is higher at the bottom of the outlet port opposite to the higher gap at UTN.

University of Illinois at Urbana-Champaign • Metals Processing Simulation Lab • R Chaudhary 45
Acknowledgments
• Prof. Brian G Thomas, Director, Continuous Casting Consortium at UIUC.
• Prof. Seon Hyo Kim, Postech.• Go Gi Lee, Visiting PhD student from Postech.• Posco and other continuous casting
consortium members.• Other Graduate students at Metal Processing
Simulation Laboratory, UIUC.• Fluent and ANSYS Inc.
Related Documents