Visit Stockholm AB [email protected] +46 8 508 280 00 www.visitstockholm.com Follow @visitstockholm on facebook, twitter and instagram gaylesbian.visitstockholm.com youtube.com/stockholm Photographer: Henrik Trygg Stockholm’s tourism industry: January 2019 The year of 2019 begins with a rise in the number of guest nights at commercial accommodation facilities in Stockholm County. Compared to the same period in 2018, there are 5% more guest nights in total – over 890,000 guest nights in January 2019 compared to 842,000 guest nights in January 2018. Both domestic and foreign bed nights are increasing, and the majority of the increase comes from the domestic market. The number of Nordic bed nights is 1% higher than during the same period last year where Finland increases their bed nights by 10% in January 2019, while both Norway and Denmark decrease a few percentages. There is a decline, -4%, for Europe excluding the Nordic countries in which the UK (-10%), France (- 20%), and Italy (-14%) lose percentages compared to January 2018. On the other hand, there is a 10% increase in non- European visits in which India shows an increase of 15 % compared to January 2018. Commercial overnight stays in Stockholm County January 2019, top 20 Target group Guest nights Change, % Target group Guest nights Change, % Total 891 425 5% Not Indicated 65 038 52% Sweden 608 373 7% Foreign 283 052 3% Ranking, Foreign Guest nights Change, % Ranking, Foreign Guest nights Change, % 1 Great Britain 22 362 -10% 11 China 6 941 6% 2 USA 18 372 -12% 12 The Netherlands 6 051 -13% 3 Germany 17 620 11% 13 Poland 5 723 38% 4 Norway 15 956 -2% 14 Spain 5 673 7% 5 Finland 12 604 10% 15 Australia 4 169 -11% 6 India 11 845 15% 16 Switzerland 3 665 -31% 7 Russia 9 892 -6% 17 Belgium 3 028 -13% 8 France 9 786 -20% 18 Ukraine 2 471 185% 9 Denmark 8 262 -2% 19 Thailand 2 246 24% 10 Italy 8 046 -14% 20 Lithuania 2 062 -22%

Welcome message from author
This document is posted to help you gain knowledge. Please leave a comment to let me know what you think about it! Share it to your friends and learn new things together.
Transcript
§
Visit Stockholm AB [email protected] +46 8 508 280 00 www.visitstockholm.com
Follow @visitstockholm on facebook, twitter and instagram
gaylesbian.visitstockholm.com youtube.com/stockholm
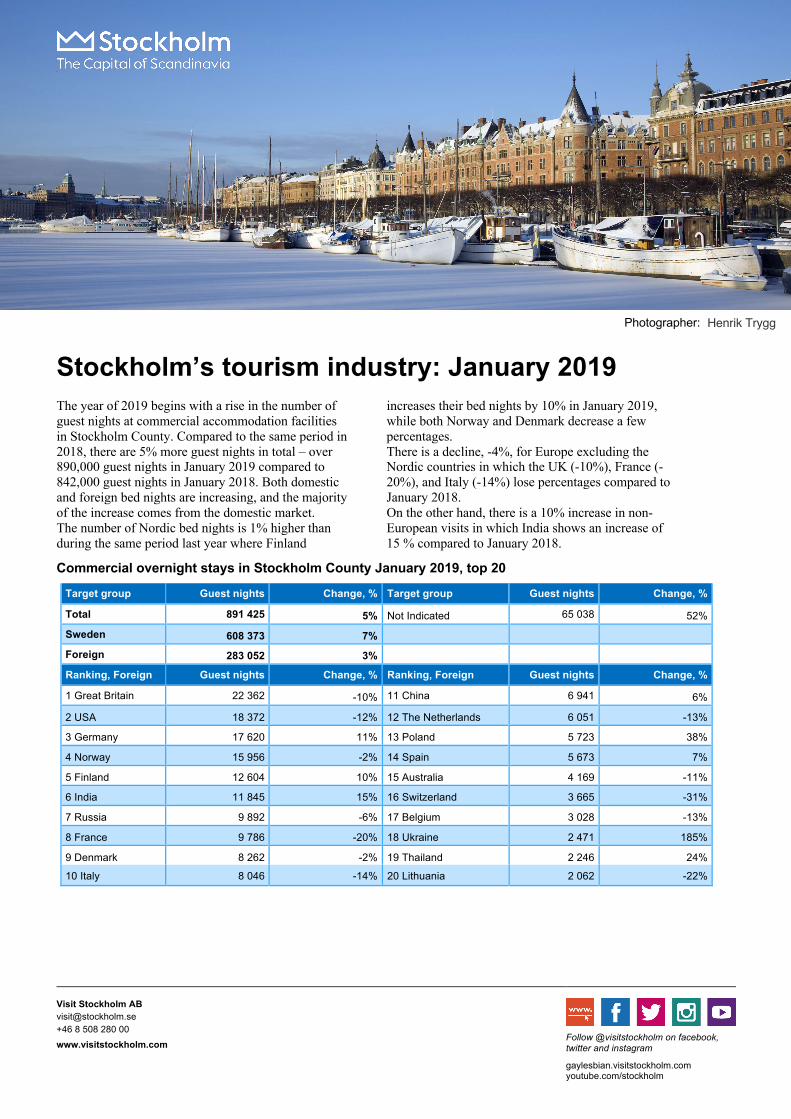
Photographer: Henrik Trygg
Stockholm’s tourism industry: January 2019 The year of 2019 begins with a rise in the number of guest nights at commercial accommodation facilities in Stockholm County. Compared to the same period in 2018, there are 5% more guest nights in total – over 890,000 guest nights in January 2019 compared to 842,000 guest nights in January 2018. Both domestic and foreign bed nights are increasing, and the majority of the increase comes from the domestic market. The number of Nordic bed nights is 1% higher than during the same period last year where Finland
increases their bed nights by 10% in January 2019, while both Norway and Denmark decrease a few percentages. There is a decline, -4%, for Europe excluding the Nordic countries in which the UK (-10%), France (-20%), and Italy (-14%) lose percentages compared to January 2018. On the other hand, there is a 10% increase in non-European visits in which India shows an increase of 15 % compared to January 2018.
Commercial overnight stays in Stockholm County January 2019, top 20
Target group Guest nights Change, % Target group Guest nights Change, %
Total 891 425 5% Not Indicated 65 038 52%
Sweden 608 373 7%
Foreign 283 052 3%
Ranking, Foreign Guest nights Change, % Ranking, Foreign Guest nights Change, %
1 Great Britain 22 362 -10% 11 China 6 941 6%
2 USA 18 372 -12% 12 The Netherlands 6 051 -13%
3 Germany 17 620 11% 13 Poland 5 723 38%
4 Norway 15 956 -2% 14 Spain 5 673 7%
5 Finland 12 604 10% 15 Australia 4 169 -11%
6 India 11 845 15% 16 Switzerland 3 665 -31%
7 Russia 9 892 -6% 17 Belgium 3 028 -13%
8 France 9 786 -20% 18 Ukraine 2 471 185%
9 Denmark 8 262 -2% 19 Thailand 2 246 24%
10 Italy 8 046 -14% 20 Lithuania 2 062 -22%
Visit Stockholm AB [email protected] +46 8 508 280 00 www.visitstockholm.com
Commercial overnight stays 2019 compared with previous year.
January 2019 YTD
Guest nights Change, % Guest nights Change, %
Stockholm County 891 425 5% 891 425 5% Domestic 608 373 7% 608 373 7%
Foreign 283 052 3% 283 052 3%
Nordic countries, excl. Sweden 37 391 1% 37 391 1%
Europe excl. Nordic countries 115 892 -4% 115 892 -4%
Non-European 129 769 10% 129 769 10%
City of Stockholm 595 137 7% 595 137 7% Domestic 366 652 13% 366 652 13%
Foreign 228 485 -1% 228 485 -1%
Nordic countries, excl. Sweden 28 556 0% 28 556 0%
Europe excl. Nordic countries 95 561 -5% 95 561 -5%
Non-European 104 368 3% 104 368 3%
Sweden 3 737 386 1% 3 737 386 1%
Commercial overnight stays: hotel, vacation villages, hostels, camping and commercially arranged private cottages and apartments. Source: Statistics Sweden and Swedish Agency for Economic and Regional Growth, preliminary data.
0100 000200 000
300 000400 000500 000600 000700 000800 000
900 0001 000 0001 100 0001 200 0001 300 0001 400 000
1 500 0001 600 0001 700 0001 800 000
Jan Feb Mar Apr May Jun Jul AugSep Oct Nov Dec
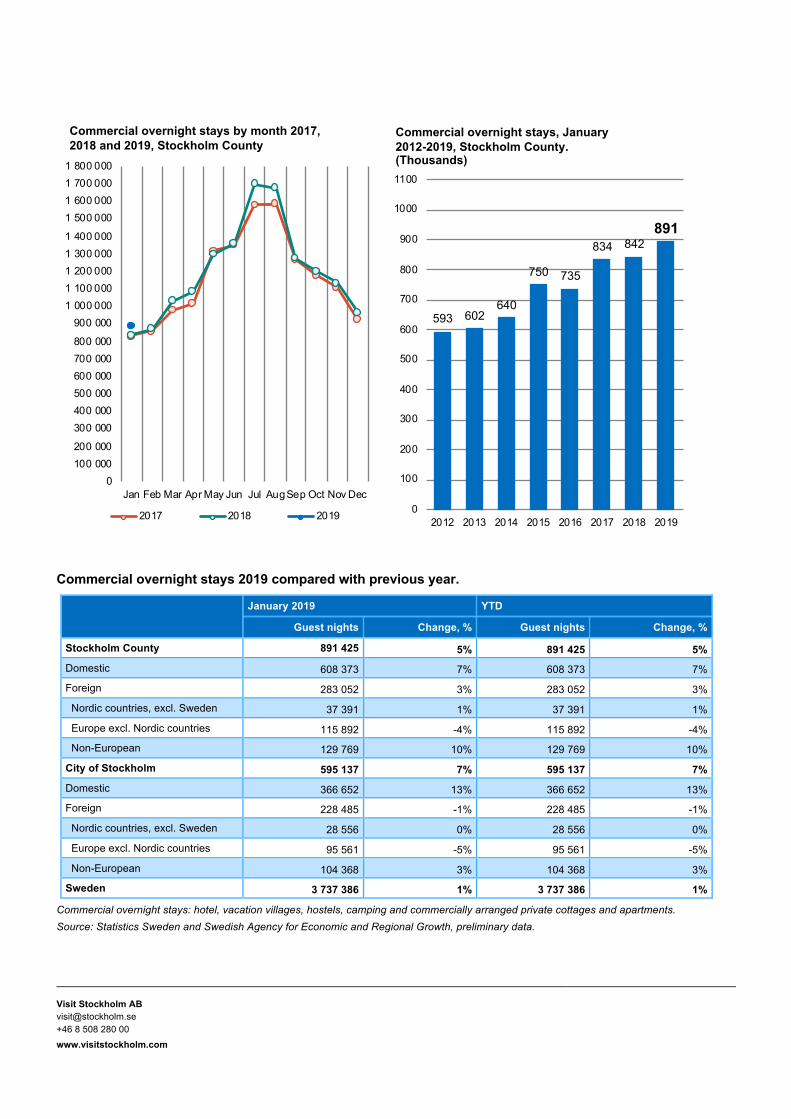
Commercial overnight stays by month 2017, 2018 and 2019, Stockholm County
2017 2018 2019
593 602640
750 735
834 842891
0
100
200
300
400
500
600
700
800
900
1000
1100
2012 2013 2014 2015 2016 2017 2018 2019
Commercial overnight stays, January2012-2019, Stockholm County. (Thousands)
Visit Stockholm AB [email protected] +46 8 508 280 00 www.visitstockholm.com
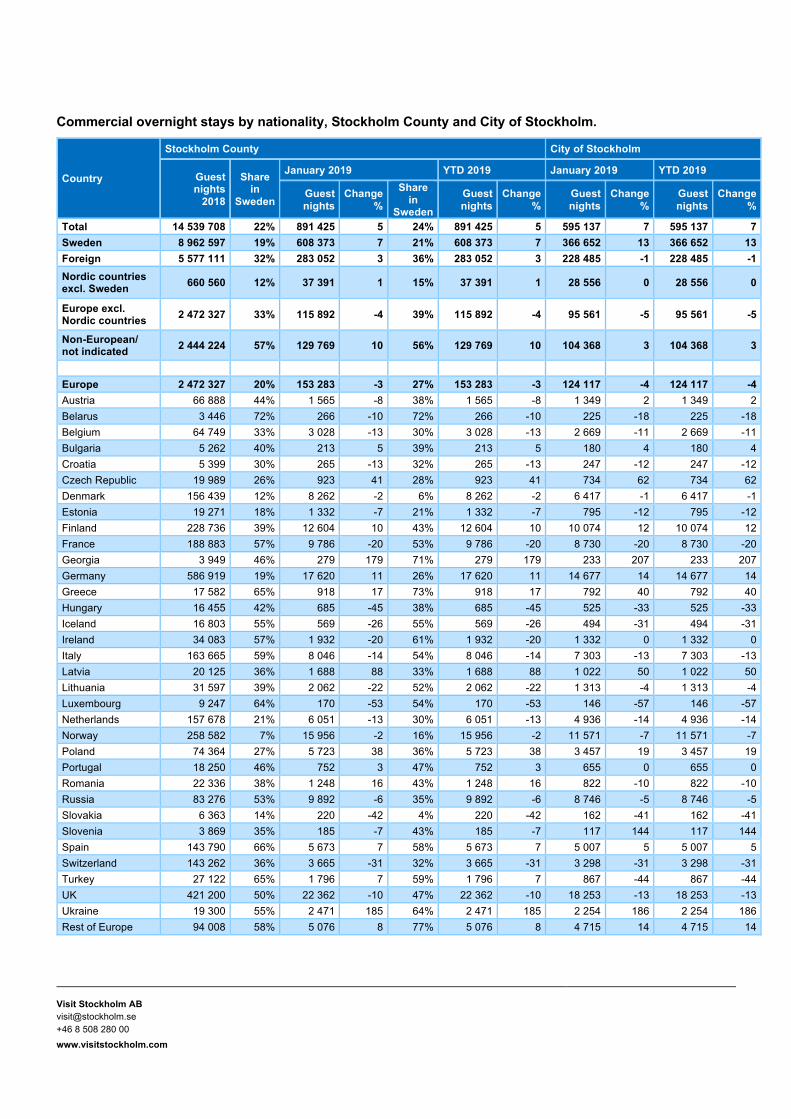
Commercial overnight stays by nationality, Stockholm County and City of Stockholm.
Country
Stockholm County City of Stockholm
Guest nights
2018
Share in
Sweden
January 2019 YTD 2019 January 2019 YTD 2019
Guest nights
Change %
Share in
Sweden Guest nights
Change %
Guest nights
Change %
Guest nights
Change %
Total 14 539 708 22% 891 425 5 24% 891 425 5 595 137 7 595 137 7 Sweden 8 962 597 19% 608 373 7 21% 608 373 7 366 652 13 366 652 13 Foreign 5 577 111 32% 283 052 3 36% 283 052 3 228 485 -1 228 485 -1 Nordic countries excl. Sweden 660 560 12% 37 391 1 15% 37 391 1 28 556 0 28 556 0
Europe excl. Nordic countries 2 472 327 33% 115 892 -4 39% 115 892 -4 95 561 -5 95 561 -5
Non-European/ not indicated 2 444 224 57% 129 769 10 56% 129 769 10 104 368 3 104 368 3
Europe 2 472 327 20% 153 283 -3 27% 153 283 -3 124 117 -4 124 117 -4 Austria 66 888 44% 1 565 -8 38% 1 565 -8 1 349 2 1 349 2 Belarus 3 446 72% 266 -10 72% 266 -10 225 -18 225 -18 Belgium 64 749 33% 3 028 -13 30% 3 028 -13 2 669 -11 2 669 -11 Bulgaria 5 262 40% 213 5 39% 213 5 180 4 180 4 Croatia 5 399 30% 265 -13 32% 265 -13 247 -12 247 -12 Czech Republic 19 989 26% 923 41 28% 923 41 734 62 734 62 Denmark 156 439 12% 8 262 -2 6% 8 262 -2 6 417 -1 6 417 -1 Estonia 19 271 18% 1 332 -7 21% 1 332 -7 795 -12 795 -12 Finland 228 736 39% 12 604 10 43% 12 604 10 10 074 12 10 074 12 France 188 883 57% 9 786 -20 53% 9 786 -20 8 730 -20 8 730 -20 Georgia 3 949 46% 279 179 71% 279 179 233 207 233 207 Germany 586 919 19% 17 620 11 26% 17 620 11 14 677 14 14 677 14 Greece 17 582 65% 918 17 73% 918 17 792 40 792 40 Hungary 16 455 42% 685 -45 38% 685 -45 525 -33 525 -33 Iceland 16 803 55% 569 -26 55% 569 -26 494 -31 494 -31 Ireland 34 083 57% 1 932 -20 61% 1 932 -20 1 332 0 1 332 0 Italy 163 665 59% 8 046 -14 54% 8 046 -14 7 303 -13 7 303 -13 Latvia 20 125 36% 1 688 88 33% 1 688 88 1 022 50 1 022 50 Lithuania 31 597 39% 2 062 -22 52% 2 062 -22 1 313 -4 1 313 -4 Luxembourg 9 247 64% 170 -53 54% 170 -53 146 -57 146 -57 Netherlands 157 678 21% 6 051 -13 30% 6 051 -13 4 936 -14 4 936 -14 Norway 258 582 7% 15 956 -2 16% 15 956 -2 11 571 -7 11 571 -7 Poland 74 364 27% 5 723 38 36% 5 723 38 3 457 19 3 457 19 Portugal 18 250 46% 752 3 47% 752 3 655 0 655 0 Romania 22 336 38% 1 248 16 43% 1 248 16 822 -10 822 -10 Russia 83 276 53% 9 892 -6 35% 9 892 -6 8 746 -5 8 746 -5 Slovakia 6 363 14% 220 -42 4% 220 -42 162 -41 162 -41 Slovenia 3 869 35% 185 -7 43% 185 -7 117 144 117 144 Spain 143 790 66% 5 673 7 58% 5 673 7 5 007 5 5 007 5 Switzerland 143 262 36% 3 665 -31 32% 3 665 -31 3 298 -31 3 298 -31 Turkey 27 122 65% 1 796 7 59% 1 796 7 867 -44 867 -44 UK 421 200 50% 22 362 -10 47% 22 362 -10 18 253 -13 18 253 -13 Ukraine 19 300 55% 2 471 185 64% 2 471 185 2 254 186 2 254 186 Rest of Europe 94 008 58% 5 076 8 77% 5 076 8 4 715 14 4 715 14
Visit Stockholm AB [email protected] +46 8 508 280 00 www.visitstockholm.com
Country
Stockholm County City of Stockholm
Guest nights
2018
Share in
Sweden
January 2019 YTD 2019 January 2019 YTD 2019
Guest nights
Change %
Share in
Sweden Guest nights
Change %
Guest nights
Change %
Guest nights
Change %
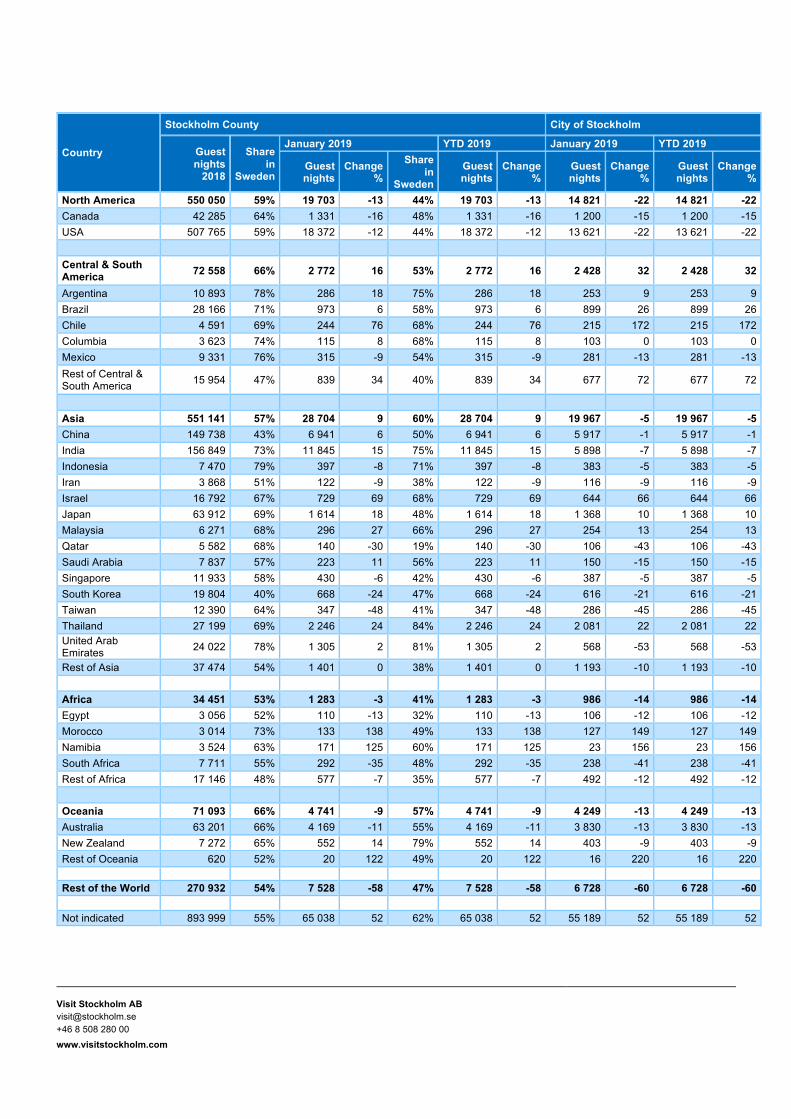
North America 550 050 59% 19 703 -13 44% 19 703 -13 14 821 -22 14 821 -22 Canada 42 285 64% 1 331 -16 48% 1 331 -16 1 200 -15 1 200 -15 USA 507 765 59% 18 372 -12 44% 18 372 -12 13 621 -22 13 621 -22 Central & South America 72 558 66% 2 772 16 53% 2 772 16 2 428 32 2 428 32
Argentina 10 893 78% 286 18 75% 286 18 253 9 253 9 Brazil 28 166 71% 973 6 58% 973 6 899 26 899 26 Chile 4 591 69% 244 76 68% 244 76 215 172 215 172 Columbia 3 623 74% 115 8 68% 115 8 103 0 103 0 Mexico 9 331 76% 315 -9 54% 315 -9 281 -13 281 -13 Rest of Central & South America 15 954 47% 839 34 40% 839 34 677 72 677 72
Asia 551 141 57% 28 704 9 60% 28 704 9 19 967 -5 19 967 -5 China 149 738 43% 6 941 6 50% 6 941 6 5 917 -1 5 917 -1 India 156 849 73% 11 845 15 75% 11 845 15 5 898 -7 5 898 -7 Indonesia 7 470 79% 397 -8 71% 397 -8 383 -5 383 -5 Iran 3 868 51% 122 -9 38% 122 -9 116 -9 116 -9 Israel 16 792 67% 729 69 68% 729 69 644 66 644 66 Japan 63 912 69% 1 614 18 48% 1 614 18 1 368 10 1 368 10 Malaysia 6 271 68% 296 27 66% 296 27 254 13 254 13 Qatar 5 582 68% 140 -30 19% 140 -30 106 -43 106 -43 Saudi Arabia 7 837 57% 223 11 56% 223 11 150 -15 150 -15 Singapore 11 933 58% 430 -6 42% 430 -6 387 -5 387 -5 South Korea 19 804 40% 668 -24 47% 668 -24 616 -21 616 -21 Taiwan 12 390 64% 347 -48 41% 347 -48 286 -45 286 -45 Thailand 27 199 69% 2 246 24 84% 2 246 24 2 081 22 2 081 22 United Arab Emirates 24 022 78% 1 305 2 81% 1 305 2 568 -53 568 -53
Rest of Asia 37 474 54% 1 401 0 38% 1 401 0 1 193 -10 1 193 -10 Africa 34 451 53% 1 283 -3 41% 1 283 -3 986 -14 986 -14 Egypt 3 056 52% 110 -13 32% 110 -13 106 -12 106 -12 Morocco 3 014 73% 133 138 49% 133 138 127 149 127 149 Namibia 3 524 63% 171 125 60% 171 125 23 156 23 156 South Africa 7 711 55% 292 -35 48% 292 -35 238 -41 238 -41 Rest of Africa 17 146 48% 577 -7 35% 577 -7 492 -12 492 -12 Oceania 71 093 66% 4 741 -9 57% 4 741 -9 4 249 -13 4 249 -13 Australia 63 201 66% 4 169 -11 55% 4 169 -11 3 830 -13 3 830 -13 New Zealand 7 272 65% 552 14 79% 552 14 403 -9 403 -9 Rest of Oceania 620 52% 20 122 49% 20 122 16 220 16 220 Rest of the World 270 932 54% 7 528 -58 47% 7 528 -58 6 728 -60 6 728 -60 Not indicated 893 999 55% 65 038 52 62% 65 038 52 55 189 52 55 189 52
Related Documents