i STOCK SPLITS AND ADVERSE SELECTION by SARA SOLTANIZADEH Master of Business Administration, Universiti Teknologi Malaysia, 2014 Bachelor of Science in Computer Engineering, Islamic Azad University, Iran, 2008 and ABHISHEK ROKADE Master of Management Studies (Finance), Mumbai University, India, 2011 Bachelor of Technology (Electrical Engineering), V.J.T.I., India, 2009 PROJECT SUBMITTED IN PARTIAL FULFILLMENT OF THE REQUIREMENTS FOR THE DEGREE OF MASTER OF SCIENCE IN FINANCE In the Master of Science in Finance Program of the Faculty of Business Administration © Sara Soltanizadeh 2015 © Abhishek Rokade 2015 SIMON FRASER UNIVERSITY Fall 2015 All rights reserved. However, in accordance with the Copyright Act of Canada, this work may be reproduced, without authorization, under the conditions for Fair Dealing. Therefore, limited reproduction of this work for the purposes of private study, research, criticism, review and news reporting is likely to be in accordance with the law, particularly if cited appropriately.

Welcome message from author
This document is posted to help you gain knowledge. Please leave a comment to let me know what you think about it! Share it to your friends and learn new things together.
Transcript

i
STOCK SPLITS AND ADVERSE SELECTION
by
SARA SOLTANIZADEH
Master of Business Administration, Universiti Teknologi Malaysia, 2014
Bachelor of Science in Computer Engineering, Islamic Azad University, Iran, 2008
and
ABHISHEK ROKADE
Master of Management Studies (Finance), Mumbai University, India, 2011
Bachelor of Technology (Electrical Engineering), V.J.T.I., India, 2009
PROJECT SUBMITTED IN PARTIAL FULFILLMENT OF
THE REQUIREMENTS FOR THE DEGREE OF
MASTER OF SCIENCE IN FINANCE
In the Master of Science in Finance Program
of the
Faculty
of
Business Administration
© Sara Soltanizadeh 2015
© Abhishek Rokade 2015
SIMON FRASER UNIVERSITY
Fall 2015
All rights reserved. However, in accordance with the Copyright Act of Canada, this work
may be reproduced, without authorization, under the conditions for Fair Dealing.
Therefore, limited reproduction of this work for the purposes of private study, research,
criticism, review and news reporting is likely to be in accordance with the law, particularly
if cited appropriately.

ii
Approval
Name: Sara Soltanizadeh
Abhishek Rokade
Degree: Master of Science in Finance
Title of Project: STOCK SPLITS AND ADVERSE SELECTION
Supervisory Committee:
__________________________________________
Amir Rubin
Senior Supervisor
Associate Professor
__________________________________________
Alexander Vedrashko
Second Reader
Associate Professor
Date Approved: ___________________________________________

iii
Abstract
hat impact can the market expect from a stock split announcement? This
paper delves into the effect of stock split announcements on the immediate
excess return over the market for stocks in the US market by considering stock splits over
a span of 35 years from 1980 to 2014 across different industries. We find that the average
market reaction to stock splits announcement is 1.5%. We also find that excess return
over the market after stock split announcement is negatively correlated with firm size and
positively correlated with bid-ask spread upon the application of industry fixed effect and
year fixed effect. However, upon the application of firm fixed effect, these relationships
are not significant. In addition, we found that there is no significant relationship between
analyst forecast error and the excess return over the market.
Keywords: Stock split, adverse selection, bid-ask spread, excess return over the market,
analyst forecast error, market capitalization
W

iv
Acknowledgement
I would like to express my sincere gratitude to Prof. Amir Rubin for his guidance, patience,
commitment, and belief in our ability to complete the research. I greatly appreciate his
quest for perfection.
I would like to thank Prof Alexander Vedrashko for extending support to our thesis.
I would like to thank my research partner, Ms. Sara Soltanizadeh. Without Sara’s devotion
and meticulous approach, the research wouldn’t have progressed as well as it did.
I shall always be indebted to Simon Fraser University, the professors, and the staff for
imparting knowledge and providing an environment conducive to learning.
I would like to thank my parents, Mr. Hemant Rokade and Mrs. Snehalata Rokade for
their incessant and unconditional support in all walks of life.
- Abhishek Rokade
This dissertation would not have been possible without the guidance and the help of
several individuals who in one way or another contributed and extended their valuable
assistance in the preparation and completion of this study.
First and foremost, my utmost gratitude to Prof. Dr. Amir Rubin whose sincerity and
encouragement I will never forget. Words cannot express my appreciation for his
guidance and devoting ample care in every aspect of this job.
Secondly, I would like to thank Prof Alexander Vedrashko for providing valuable advice
to our thesis.
I would like to thank Mr. Abhishek Rokade, my research partner, for his dedicated hard
work and support. He has been my inspiration as we hurdle all the obstacles in the
completion this research work.
Last but not the least; I would like to thank my beloved parents Mr. Alireza Soltanizadeh
and Mrs. Maryam Bamdad, and my brother, Mr. Saeed Soltanizadeh for their support
throughout my life. I am sure I would not be who I am without them.
- Sara Soltanizadeh

v
Table of Contents
Approval ........................................................................................................................................................ ii
Abstract ........................................................................................................................................................ iii
Acknowledgement ....................................................................................................................................... iv
1. Introduction .............................................................................................................................................. 1
2. Literature Review ...................................................................................................................................... 2
2.1 Stock Split Announcement .................................................................................................................. 2
2.2 Adverse Selection and Asymmetry of Information ............................................................................. 3
2.3 Bid-ask Spread and Abnormal Excess Return ..................................................................................... 4
2.4 Analyst Forecast Error and Abnormal Excess Return .......................................................................... 5
2.5 Market Capitalization and Industry Classification .............................................................................. 5
3. Data and Methodology ............................................................................................................................. 7
3.1 Descriptive Statistics ........................................................................................................................... 8
4. Empirical Results ....................................................................................................................................... 9
5. Shortcomings in the Research ................................................................................................................ 12
6. Conclusion ............................................................................................................................................... 13
7. References .............................................................................................................................................. 14
8. Appendices .............................................................................................................................................. 16
8.1 Appendix I: Tables ............................................................................................................................. 16

vi
List of Tables
Table Number Page Number
Table 1 8
Table 2 9
Table 3 16
Table 4 17
Table 5 17
Table 6 18
Table 7 19
Table 8 20
Table 9 21

1
1. Introduction
If a stock split is just a change in number of shares that is exactly accounted for by a
reduction in price, why is it a popular event in equity markets? What are the incentives for
firms to do so? To answer these questions we explore previous literatures which have
focused on return and trading activity after stock split announcements and executions
(Angel, 1997; Desai, Nimalendran, & Venkataraman, 1998; Easley, O'hara, & Saar, 2001;
Nguyen & Wang, 2013).
According to Dyl and Elliott (2006) managers use stock splits to bring stock price to an
optimal range to increase the liquidity in order to make it attractive for small investors.
Schultz (2000) showed increase in number of trades and a change in trading behavior
from sell initiated trades to buy initiated trades after stock splits. By increasing the number
of shares outstanding and attracting more small investors, firms enhance ownership base
(Maloney & Mulherin, 1992) and as stated in Guo, Zhou, and Cai study (2008) that is what
affects the market value of the firm’s stock price. The other common cited reason for stock
splits is that managers try to convey good information about future performance of the
firm to the public (Kalay & Kronlund, 2014); this idea is based on managers having better
information than investors, which can explain the excess return over the market after
stock split announcement.
The motivation of this study is to conduct an empirical study on the abnormal price change
after stock split announcement and possible reasons behind it by investigating the effect
of firm size, bid-ask spread, and analyst forecast error on market reaction. All three
measures are typically used as proxies for information asymmetry. Furthermore, we
examine these relations for firms within various industries.
For this study, data of stock split in the US market over the period from 1980 to 2014 is
extracted from two data sources within the Wharton Research Data Services (WRDS)
database, namely The Center for Research in Security Prices (CRSP) and Thomson
Reuters Institutional Brokers Estimate System (I/B/E/S) and the sample industry
classification is based on North American Industry Classification System (NAICS). We
find an excess return of 1.5% over the market immediately after stock split announcement
for this period; this excess return is higher for smaller firms and lower for bigger ones,

2
suggesting that information asymmetry plays a role as smaller firms have more
information asymmetry than bigger firms. Furthermore, our analysis shows that excess
return over the market has positive correlation with bid-ask spread and no significant
relationship with analyst forecast error.
The paper is organized as follows: Section 2 is the literature review. Data gathering and
research methodology are presented in Section 3. Section 4 shows empirical results and
their description. Limitation of study is provided in Section 5 and Section 6 concludes.
2. Literature Review
2.1 Stock Split Announcement
Stock-split is a corporate action in which the firm divides its shares based on a certain
multiple, typically two. In theory, while the number of share increases, the dollar value of
the company should not change as a stock split should not change the future cash-flows,
and hence the result of a two factor split will be a double of the shares outstanding with a
corresponding split is share price. Considering it does not change the corporate real value
and there are costs associated with stock split implementation, in a perfect capital market,
there should be no motive for corporations to do so. However, the reality is different;
according to CRSP, there were 11516 stock splits in the U.S. market during the period
between 1980 and 2014.
Fama, Fisher, and Roll (1969) study is considered as the first contribution to the effects
of stock split announcement (SSA) on the share price. Since then, there are different
event studies on both the motivation and consequences of stock split. According to Guo,
Zhou, and Cai (2008) signaling hypothesis, trading range, liquidity hypothesis, and tick
size hypothesis are the three main motivations for stock split. The signaling hypothesis
implies that management is sending a signal of income increase or that managers believe
their firm is undervalued. This hypothesis assumes there is asymmetry of information
between management and investors and management tries to convey good information
to investors by the stock split. Previous studies such as Brennan and Hughes (1991),
Ikenbery, Rankine and Stice (1996), Conroy and Harris (1999) found support for the

3
signaling hypothesis by taking stock splits excess return over the market as an evidence
of success to deliver positive information. In this we do a similar analysis.
Trading range or liquidity hypotheses state that management tends to set the price at
optimal trading range that results in increase the liquidity. Prior research found that the
number of transactions and trading volume increases after splits. Furthermore investors’
trading behavior changes from sell initiated trades to buy initiated trades (Schultz, 2000).
The tick size hypothesis suggests managers try to keep tick size relative to stock price.
As stated in previous literatures, this hypothesis recommends that stock split provides
optimal tick size that attracts uninformed investors, as liquidity providers, to buy the stock
(Nguyen & Wang, 2013; Schultz, 2000).
2.2 Adverse Selection and Asymmetry of Information
According to self-selection theory introduced by Ikenberry et al. (1996), managers chose
to split their stock if they have a positive view about firm’s future performance. Kalay and
Kronlund (2014) suggested that there is a common basis for all hypothesis associated
with the rationale behind splits: all explanations are somewhat related to the idea that
managers believe that the firm is doing well and they want to keep their share price in a
certain range.
Prior researches divided investors into two groups namely, informed and uninformed (or
noise traders). The latter are believed to loss from trading with informed investors.
Bharath, Pasquariello and Wu (2009) presented that investors with an intimate relation
with the firm such as employees, suppliers, and traders have better information than other
investors. Hence, there is asymmetry of information between market participants.
Some research findings support to the hypothesis that stock split reduces information
asymmetry (Brennan & Hughes, 1991). On the other hand, Easley, O’hara, and Saar
(2001) found no appreciable change in information asymmetry after stock split
announcement since stock split announcement increase both informed and uninformed
trading. Similarly, short interest changes surrounding splits have been suggested as a
measure for quantifying the level of signaling (Kadiyala and Ventsuypens, (2002),
however, their result provide only weak evidence of the information value in stock splits.

4
Doran (2011) conveyed that in the absence of wrong signaling costs, managers of both
undervalued and overvalued firms would announce stock split that eventually results to
eliminate stock split announcement informative value. Heinkel (1994) offered the risk of
reputation loss as the cost of wrong signaling.
There are measures that have been found to be sensitive to corporate events, they have
been used to measure asymmetry of information such as effective bid-ask spread
(George, Kaul, & Nimalendran, 1991), analyst forecast error (McNichols & Dravid, 1990),
return volume coefficient (Llorente, Michaely, Saar, & Wang, 2002), and the probability of
informed trading (Easley, Kiefer, O'hara, & Paperman, 1996). In this study, after checking
whether there is any excess return over the market after stock split announcement, we
check the effect of two of these variables: analyst forecast error and bid-ask spread
2.3 Bid-ask Spread and Abnormal Excess Return
Maloney and Mulherin (1992) suggested liquidity-based explanation for the excess return
over the market since there is some negative effect after split announcement such as
increase in bid-ask spread, and volatility. There are two categories of liquidity
measurement namely, friction measures such as return and bid-ask spread and activity
measures such as trading volume, and number of shareholders.
Glosten and Milgorm (1985) in their sequential model of the market maker’s pricing
defined two components of bid-ask spread as adverse selection component due to
information asymmetry and transitory component result of inventory costs, specialist
monopoly power, and clearing cost. We predict there is positive correlation between bid-
ask spread and excess return over the market; the higher the spread, the higher the
expected excess return over the market. Higher bid-ask spread means higher asymmetry
of information, which also means lower liquidity.
According to Dyl and Elliott (2006), stock splits and consequently the decrease in share
price especially attract small or uninformed investors and enhance ownership base that
increases liquidity of stock and decrease trading cost (Dyl & Elliott, 2006). On the other
hand, Easley, O’hara, and Saar (2001) concluded that stock splits announcements does
not enhance the execution quality of trade since the increase in the cost of executing
5
market orders, and the resulting larger spread outweighed the increase in the number of
executed limit orders.
2.4 Analyst Forecast Error and Abnormal Excess Return
McNichols and Dravid (1990) tested whether stock split acts as a signal of information
regarding company earning and/or future cash flow. They used analyst forecast error,
computed as first annual earnings reported after stock split less than the median of
analyst forecasted earning prior to split scaled by that median, as a measure of
management private information. They found that management choice of split factor
conveys information regarding company future earnings cash flow and investors revise
their beliefs according to it. Kalay and Kronlund (2014) found analyst consensus
estimates rise after stock split announcements by measuring the revision in analyst EPS
forecasts (ΔEPS/P). Moreover, they presented evidence that when fewer numbers of
analysts follow a firm or when market capitalization is lower, analyst forecast revision after
stock split announcement is higher; hence, they conclude stock splits announcement
reduces asymmetry of information for firms with more opaque information environment.
We expect analyst forecast error to have a positive correlation with excess return over
the market; higher analyst forecast error means higher asymmetry of information and as
a result, higher excess return over the market after stock split announcements. According
to signaling hypothesis, one of the stock split motivations is to convey a positive
expectation about company profit by managers, the information which is not known or
clear for public, and to reduce asymmetry of information. Hence, for the companies with
higher analyst error forecast and higher information asymmetry environment, we predict
higher excess return over the market after stock split announcement.
2.5 Market Capitalization and Industry Classification
As (Atiase, 1980) suggested, we know less about smaller firms considering they have
fewer announcement published in the financial press. Other studies (P. Brown, Kleidon,

6
& Marsh, 1983; Grinblatt, Masulis, & Titman, 1984) suggested log-linear relation between
firm size and excess return as a result of stock split announcement; in other words split
announcements are expected to create greater market interest for small firms than larger
ones. According to Brennan and Hughes (1991), number of analysts following the firm
has negative correlation with excess return over the market after stock split
announcement. More recently, Chan, Menkveld, and Yang (2008) In their study of
information asymmetry and asset price in Chinese stock market pointed out two issues
regarding market capitalization of the firms; firstly, larger companies display greater
financial disclosure as information costs are typically lower for large firms and
consequently less information asymmetry and secondly, larger firms have more liquid
domestic and foreign market.
Similarly, we expect negative correlation between market capitalization and excess return
over the market; the bigger companies with higher market capitalization usually tend to
give more information to the public and a larger number of analysts follow them. As a
result, there should be less information asymmetry and as we discussed earlier when
there is less asymmetry of information, share price should be less sensitive to stock split
announcements. But, for the smaller companies for which less information is available in
the market, we predict to see a larger market reaction.
Zhang (2006) used firm size and firm age among other proxies to measure information
asymmetry and found both are negatively correlated and significant; firms with longer
history in mature industries have more information available.
In another study, Aboody & Lev (2000) suggested that insider trading gain in R&D
intensive firms is significantly higher than firms without R&D. They conclude that R&D is
a major contributor to information asymmetry. Hence, we can predict that information
asymmetry in new industries as well as high-tech industries with more complex
product/production to be higher. As stated in Aboody and Lev study (2000), industries
with low level of concentration and imperfect competition have significantly higher excess
return over the markets after stock split announcement than those in industries with high
level of concentration.

7
3. Data and Methodology
This research focusses on the impact of a stock split announcement on the return of a
stock. We consider the stock return on the day of the announcement and the day after
the announcement. In order to execute the above mentioned analyses, we require data
at a daily level to measure the impact of the event precisely.
For the study, we have included data for firms in the US undergoing stock splits over a
35 year period from 1980 to 2014. The data for variables used in our analysis is pulled
from two data sources within the Wharton Research Data Services (WRDS) database,
namely The Center for Research in Security Prices (CRSP) and Thomson Reuters
Institutional Brokers Estimate System (I/B/E/S).
Our data includes firms from 19 different industries as classified by the North American
Industry Classification System (NAICS). In order to check for the veracity of data pulled
from CRSP, we cross-checked a few numbers from CRSP with the stock data from the
Bloomberg terminal.
An important issue to consider is endogeneity owing to the nature of the data.
Endogeneity is defined as the phenomenon where there exists a correlation between the
independent variable and the error term. In order to eliminate the endogeneity problem,
we use the average of a 15-day period before the stock split announcement for the
calculation of the bid-ask spread. For calculating the excess return over the market, we
compute the sum of difference between the stock return and the market return on the day
of the stock split announcement and the day after the announcement. Hence, the excess
return is calculated as the sum of the return on the day of the stock split announcement
and the day after. The idea behind taking the sum of the returns and excess returns over
two days is to include the possibility of an evening announcement. For the analyst forecast
error, we are interested only in the deviation of the values from the ideal expected value
of zero. Hence, we ignore the sign of the error by using the absolute value in the
calculation and measure only on the magnitude of the error (in % terms).
Table-1 summarizes the different variables used in the study and the sources from which
the data for the same was extracted.

8
Table 1
Description of analysis related factors
Variable Variable definition Source
Market Capitalization
Market capitalization for a stock is defined as the product of shares outstanding and the share price
CRSP
Spread (%) Spread is defined as the mean of difference between the ask price and bid price for a stock over the 15-day period before the announcement of split. This difference is divided by the sum of the bid price and ask price.
CRSP
Excess Return over the market (%)
Excess Return over the market for a stock is defined as the sum of the differences between the stock return and value-weighted return over the announcement day and the day after the announcement day
CRSP
Return (%) Return for a stock is defined as the sum of the returns over the announcement day and the day after the announcement
CRSP
Analyst Forecast Error (%)
The absolute difference between analysts’ consensus forecast latest and prior to the stock split announcement of the annual EPS estimate and the actual value, all divided by the absolute value of the actual.
I/B/E/S
Industry The industries are classified as per the conventions defined by NAICS.
CRSP
The firm-specific variables such as market capitalization, spread, return, excess return
over the market, and the industry classification are all derived from CRSP data source
while the variables pertaining to analyst forecasted return (used to calculate the analyst
forecast error) are derived from I/B/E/S data source. The two datasets are then merged
to carry out the analysis based on the common variables namely, company, ticker and
the date. The tool we used for data analysis is STATA.
3.1 Descriptive Statistics
Table-2 provides the descriptive statistics of the dependent and independent variables
used in the study. As reported below, the table indicates vital measures such as mean,
median, standard deviation, maximum value, and minimum value for each of the
variables. The values in the table correspond to the data of those firms that have
undergone a stock split over the period 1980-2014.

9
Table 2
Variable Mean Median Std Dev Max Min
Market Capitalization $ 2.49 billion
$ 210 billion
$ 13.71 billion
$ 450 billion
$ .518 million
Spread (%) 1.360 0.824 1.558 8.150 0.004
Excess Return over market (%) 1.5 1.0 4.9 19.0 -18.6
Abnormal Return (%) 1.6 1.1 5.0 19.5 -19.3
Analyst Forecast Error (%) 25.290 7.183 58.181 305.405 0.000
4. Empirical Results
Table-3 presents the breakdown of our sample based on market capitalization of the firms
and their industries. The majority of the firms in our sample are small cap, 9653 out of
11516. According to industry classification, Finance and Insurance industry,
Manufacturing industry, and Real Estate, Rental and Leasing have the most number of
stock splits respectively. On the other hand, the lowest number of stock splits happened
in Public Administration industry with only 3 stock splits over the 35-year time period.
Table-3 here (see Appendix - I)
At first we run t-test on both return and excess return over the market to determine
whether both the returns are statistically significant after stock split announcement.
Table-4 (see Appendix I) shows us the deviation of the mean of returns (1.63%) and
excess return over the markets (1.50%) from the expected value of zero with 95 percent
confidence interval. In addition, t-statistic for both return and excess return over the
market are high (35.4517 and 33.3124) and greater the t-statistic, greater the evidence
against our null hypothesis; hence, we reject the null hypothesis that mean is equal to
zero. The result also shows the daily return and daily excess return are behaving almost
the same way and this is similar to Brown and Warner (1985) contribution on daily stock
return properties and the effect of these characteristics on event study.

10
The mean difference from zero is an indicator of a spike in the return values on and after
the day of a stock split announcement which could be of interest to investors. Thus, even
though stock splits do not change the intrinsic value of a company, they enable investors
to take advantage of the small margin.
Table-4 here (see Appendix - I)
Next, we run two-sample t-test to capture the difference between means of expected
excess return over the market for firms with different sizes. Table-5 (see Appendix I)
summarizes the results of the two-sample t-test; the mean for small cap firms is 1.55%
higher than the mean for mid-cap 1.2626% and large cap 1.2580%. In addition, the table
highlightins that the difference between means of small-cap and mid-cap returns is
greater than the difference between mean of large-cap and mid-cap returns. Thus, we
can conclude that the stock split announcement has a bigger impact on smaller firms than
the bigger firms. This can be attributed to the attention of more investors and analysts
towards bigger firms and the regular dissemination of news and updates from those big
firms in comparison to smaller firms.
Table-5 here (see Appendix - I)
As the third step to capture the return of stock split event, we categorize our sample based
on the data gathered from the CRSP data base for industry classification and run one-
sample t-test on excess return over the market for each industry separately. Table-6 (see
Appendix I) outlines the excess return over the market for the different industries in
descending order of the average deviation from the expected value of zero. Our analysis
shows that the maximum mean and consequently excess return over the market for the
Art, Entertainment, and Recreation industry is 2.67% which is more than five times the
least mean, 0.48% for the Utilities industry. This exhibits that government-owned public
companies have lower asymmetry of information owing to regular public disclosures and
news updates.
Table-6 here (see Appendix - I)
11
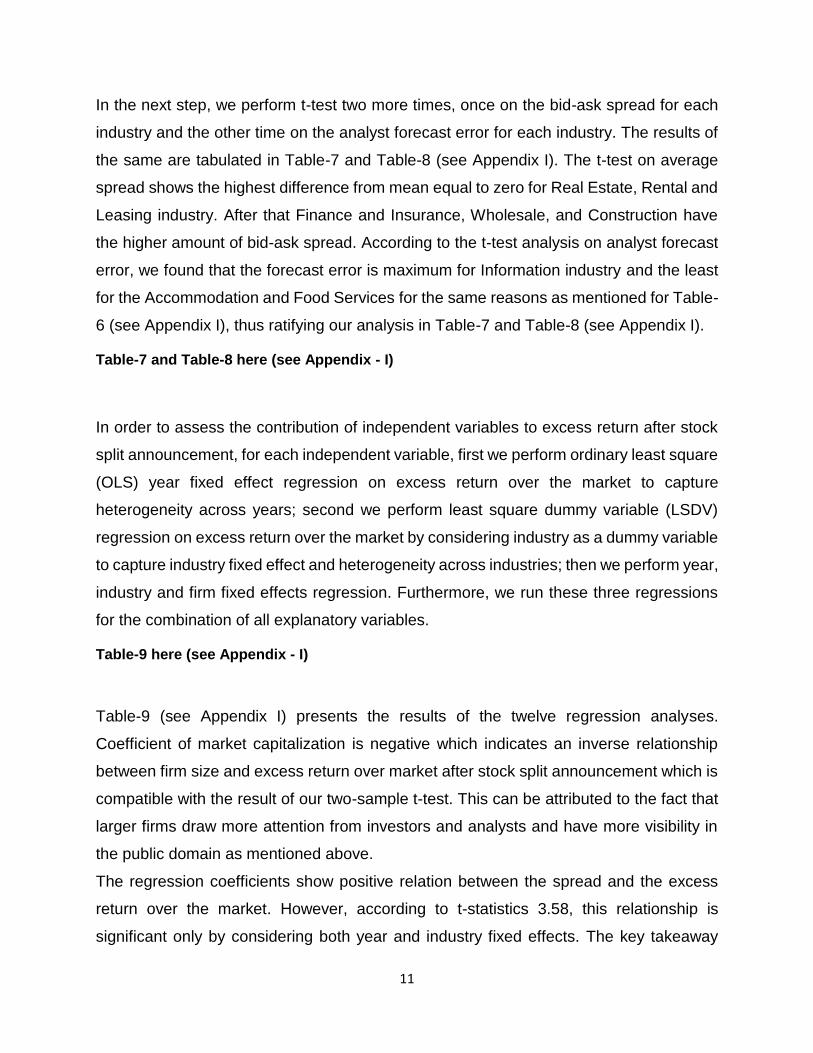
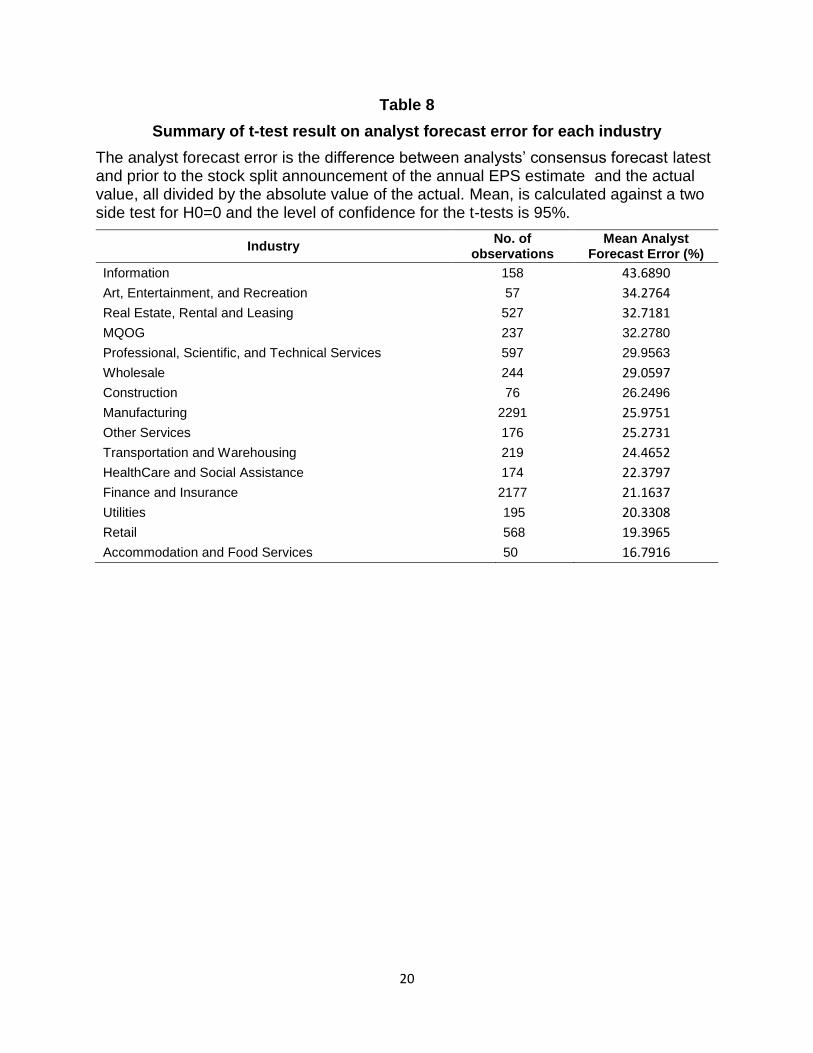
In the next step, we perform t-test two more times, once on the bid-ask spread for each
industry and the other time on the analyst forecast error for each industry. The results of
the same are tabulated in Table-7 and Table-8 (see Appendix I). The t-test on average
spread shows the highest difference from mean equal to zero for Real Estate, Rental and
Leasing industry. After that Finance and Insurance, Wholesale, and Construction have
the higher amount of bid-ask spread. According to the t-test analysis on analyst forecast
error, we found that the forecast error is maximum for Information industry and the least
for the Accommodation and Food Services for the same reasons as mentioned for Table-
6 (see Appendix I), thus ratifying our analysis in Table-7 and Table-8 (see Appendix I).
Table-7 and Table-8 here (see Appendix - I)
In order to assess the contribution of independent variables to excess return after stock
split announcement, for each independent variable, first we perform ordinary least square
(OLS) year fixed effect regression on excess return over the market to capture
heterogeneity across years; second we perform least square dummy variable (LSDV)
regression on excess return over the market by considering industry as a dummy variable
to capture industry fixed effect and heterogeneity across industries; then we perform year,
industry and firm fixed effects regression. Furthermore, we run these three regressions
for the combination of all explanatory variables.
Table-9 here (see Appendix - I)
Table-9 (see Appendix I) presents the results of the twelve regression analyses.
Coefficient of market capitalization is negative which indicates an inverse relationship
between firm size and excess return over market after stock split announcement which is
compatible with the result of our two-sample t-test. This can be attributed to the fact that
larger firms draw more attention from investors and analysts and have more visibility in
the public domain as mentioned above.
The regression coefficients show positive relation between the spread and the excess
return over the market. However, according to t-statistics 3.58, this relationship is
significant only by considering both year and industry fixed effects. The key takeaway

12
here is that, for stocks that can be valued well (lower spread) it is difficult for investors to
exploit the spread and make bigger excess return over the markets.
The third step in regression analysis is the regression on analyst forecast error and
excess return over the market for year fixed effect, industry fixed effect, and firm fixed
effect. Surprisingly, based on t-statistics there is no significant relation between the
analyst forecast error and the excess return over the market.
In the final stage of our data analysis, we consider all the independent variables to
quantify their collective impact on the excess return over the market; we get almost the
same result except the coefficient for bid-ask spread is negative and as shown by t-
statistic, there is no significant relationship between spread and excess return over the
market.
Furthermore, by looking at the t-statistics we can find once we applied firm fixed effect,
we do not find any significant relationship between our independent variables and excess
return over the market.
5. Shortcomings in the Research
Although we have carefully analyzed the data, our research has some shortcomings
owing to the data availability issues.
Firstly, for the analyst forecast error calculation, we extracted the data from I/B/E/S
database. We consider the consensus forecast numbers at the firm level just before the
announcement of the stock split. Having said that, the analyst forecast numbers weren’t
available for all companies. Owing to this, we had to skip such firms and perform the
analysis on the reduced dataset. Hence, even though, we could see that our results are
in line with the expectations and research studies performed previously, our observations
may not be as compelling as they should be.
Secondly, the data available was restricted only to the US market. This did not enable us
to perform an analysis across different markets. Hence, the results could be biased
towards the characteristics of the stock market in the US. However, it is not much of a
concern as the methodology would remain the same for any other market.

13
Third, we haven’t included frictional costs in the return calculations used in our analysis.
We believe, it could result in a slightly different value of the realized return. The reason
for not including frictional costs was the unavailability of the data and besides, frictional
costs are never consistent.
6. Conclusion
In this event study we investigated the existence of excess return over the market after
stock split announcement for the 35 years period from 1980 to 2014 in the US stock
market. In addition, based on the main explanations of firms’ motivation on stock split,
signaling hypothesis to reduce asymmetry of information, we examine the contribution of
two factors namely bid-ask spread and analyst forecast error on the hypothetical excess
return over the market for firms with different market capitalization and within different
industries.
According to the result of our statistical analysis, we found 1.5 % excess return over the
market immediately after stock split announcement; this excess return over the market
has negative correlation with firm size which means bigger the firm, lower the excess
return over the market. Besides, the result offers higher return for Art, Entertainment, and
Recreation industry, Information industry and Scientific and Technical services.
Our analysis shows a positive correlation between bid-ask spread and excess return over
the market. Based on these findings, we conclude that higher the spread, implying both
higher adverse selection and less liquidity, higher is the excess return over the market
immediately after the stock split announcement.
The above results are valid upon the application of industry fixed effect and year fixed
effect; however, once we applied firm fixed effect, we did not find any significant
relationship between market capitalization or bid-ask spread and excess return over the
market. This result could be due to some firm characteristics which are either observable
or non-observable in the market and may require further research.
In addition, although the correlation between analyst forecast error and excess return
over the market is negative, this relationship is not significant..

14
7. References Aboody, David, & Lev, Baruch. (2000). Information asymmetry, R&D, and insider gains. Journal of Finance,
2747-2766. Angel, James J. (1997). Tick size, share prices, and stock splits. The Journal of Finance, 52(2), 655-681. Atiase, Rowland Kwame. (1980). Predisclosure informational asymmetries, firm capitalization, financial
reports, and security price behavior: University of California, Berkeley. Bharath, Sreedhar T, Pasquariello, Paolo, & Wu, Guojun. (2009). Does asymmetric information drive
capital structure decisions? Review of Financial Studies, 22(8), 3211-3243. Brennan, Michael J, & Hughes, Patricia J. (1991). Stock prices and the supply of information. The Journal
of Finance, 46(5), 1665-1691. Brown, Philip, Kleidon, Allan W, & Marsh, Terry A. (1983). New evidence on the nature of size-related
anomalies in stock prices. Journal of Financial Economics, 12(1), 33-56. Brown, Stephen J, & Warner, Jerold B. (1985). Using daily stock returns: The case of event studies. Journal
of financial economics, 14(1), 3-31. Chan, Kalok, Menkveld, Albert J, & Yang, Zhishu. (2008). Information asymmetry and asset prices:
Evidence from the China foreign share discount. The Journal of Finance, 63(1), 159-196. Conroy, Robert M, & Harris, Robert S. (1999). Stock splits and information: The role of share price.
Financial Management, 28-40. Desai, Anand S, Nimalendran, Mahendrarajah, & Venkataraman, Subu. (1998). Changes in trading activity
following stock splits and their effect on volatility and the adverse‐information component of the bid‐ask spread. Journal of Financial Research, 21(2), 159-183.
Doran, David T. (2011). Stock splits and false signaling cost within a management reputation framework. Journal of Applied Business Research (JABR), 11(3), 115-126.
Dyl, Edward A, & Elliott, William B. (2006). The Share Price Puzzle*. The Journal of Business, 79(4), 2045-2066.
Easley, David, Kiefer, Nicholas M, O'hara, Maureen, & Paperman, Joseph B. (1996). Liquidity, information, and infrequently traded stocks. The Journal of Finance, 51(4), 1405-1436.
Easley, David, O'hara, Maureen, & Saar, Gideon. (2001). How stock splits affect trading: A microstructure approach. Journal of Financial and Quantitative Analysis, 36(01), 25-51.
Fama, Eugene F, Fisher, Lawrence, Jensen, Michael C, & Roll, Richard. (1969). The adjustment of stock prices to new information. International economic review, 10(1), 1-21.
George, Thomas J, Kaul, Gautam, & Nimalendran, Mahendrarajah. (1991). Estimation of the bid–ask spread and its components: A new approach. Review of Financial Studies, 4(4), 623-656.
Glosten, Lawrence R, & Milgrom, Paul R. (1985). Bid, ask and transaction prices in a specialist market with heterogeneously informed traders. Journal of financial economics, 14(1), 71-100.
Grinblatt, Mark S, Masulis, Ronald W, & Titman, Sheridan. (1984). The valuation effects of stock splits and stock dividends. Journal of financial economics, 13(4), 461-490.
Guo, Fang, Zhou, Kaiguo, & Cai, Jinghan. (2008). Stock splits, liquidity, and information asymmetry—An empirical study on Tokyo Stock Exchange. Journal of the Japanese and International Economies, 22(3), 417-438.
Heinkel, R. (1994). A theory of credibility: Truthtelling in a rational expectations, infinite horizon model: Working paper, University of British Columbia, Vancouver, BC, Canada.
Ikenberry, David Lawrence, Rankine, Graeme, & Stice, Earl K. (1996). What do stock splits really signal? Journal of Financial and Quantitative analysis, 31(3).
Kadiyala, Padma, & Vetsuypens, Michael R. (2002). Are stock splits credible signals? Evidence from short-interest data. Financial Management, 31-49.

15
Kalay, Alon, & Kronlund, Mathias. (2014). The market reaction to stock split announcements: earnings information after all. Available at SSRN 1027543.
Llorente, Guillermo, Michaely, Roni, Saar, Gideon, & Wang, Jiang. (2002). Dynamic volume‐return relation of individual stocks. Review of Financial studies, 15(4), 1005-1047.
Maloney, Michael T, & Mulherin, J Harold. (1992). The effects of splitting on the ex: A microstructure reconciliation. Financial Management, 44-59.
McNichols, Maureen, & Dravid, Ajay. (1990). Stock dividends, stock splits, and signaling. Journal of Finance, 857-879.
Nguyen, Nhut H, & Wang, David Y. (2013). Stock dividends in China: signalling or liquidity explanations? Accounting & Finance, 53(2), 513-535.
Schultz, Paul. (2000). Stock splits, tick size, and sponsorship. The Journal of Finance, 55(1), 429-450. Zhang, X. (2006). Information uncertainty and stock returns. The Journal of Finance, 61(1), 105-137.

16
8. Appendices
8.1 Appendix I: Tables
The sample includes all the stock split announcements in the US market over period 1980 to 2014.
Market cap is equal to the share price multiplied by number of shares outstanding on the day which stock split is announced. Small market cap are splits of firms with a market cap of less than $2 billion, medium market cap are splits of firms with a market cap of between $2 billion to $10 billion, while large market cap are splits of firms with market cap of above $10 billion.
The industry classification is based on North American Industry Classification System (NAICS) which includes 19 different industries.
Table 3
Number of splits
Market Cap
Small 9653
Medium 1349
Large 514
Industry
Agriculture, Forestry, Fishing, and Hunting 19
Mining, Quarrying, Oil and Gas Extraction 299
Construction 103
Manufacturing 3070
Transportation and Warehousing 253
Information 257
Utilities 280
Wholesale 365
Retail 712
Finance and Insurance 3700
Real Estate, Rental and Leasing 1074
Accommodation and Food Services 65
Art, Entertainment, and Recreation 83
HealthCare and Social Assistance 221
Professional, Scientific, and Technical Services 750
Administrative, Support, Waste Management, and Remediation Services 16
Educational Services 12
Public Administration 3
Other Services 234
Total (across all industries) 11516

17
Table 4 Summary of t-test result for return
Return is the cumulative return over the split announcement day and the day after the announcement day and excess return is return minus the value-weighed return. Mean, standard deviation and t-statistic of each t-test are calculated against a two side test for H0=0.
Variable Mean (%) Std. Dev. t-statistic
Excess Return 1.5048 4.8474 33.3124
Return 1.6343 4.9472 35.4517
Table 5
Summary of two-sample t-test result for excess return over the market based on market capitalization: Small, Mid, Large
Variables are defined in Table 1 or 2. Mean, standard error and t-statistic of each t-test are calculated against a two side test for H0: diff=0; diff = mean (small) – mean (mid) and for the second test diff = mean (mid) – mean (large) and the level of confidence for the t-tests is 95%.
* Number of observation for two-sample t-test is the combined number of observations.
MktCap # of Observation Mean (%) Std. Err. t-statistic
Small 9653 1.5517 0.0501 30.9853
Mid 1349 1.2626 0.1219 10.3552
Large 514 1.2580 0.1922 6.5464
Diff (Small , Mid) 11002* 0.2892 0.1415 2.0435
Diff (Mid , Large) 1863* 0.0045 0.2304 0.0197

18
Table 6
Summary of one-sample t-test result on excess return over the market for each industry
Variables are defined in previous tables. The industries with less than 50 observations are omitted.
Industry No. of
observation Mean (%)
Art, Entertainment, and Recreation 83 2.670
Manufacturing 3070 2.080
Professional, Scientific, and Technical Services 750 2.040
Other Services 234 1.980
Construction 103 1.870
Wholesale 365 1.830
Retail 712 1.760
HealthCare and Social Assistance 221 1.550
Information 257 1.440
Accommodation and Food Services 65 1.320
Real Estate, Rental and Leasing 1074 1.240
Mining, Quarrying, Oil and Gas Extraction 299 1.190
Transportation and Warehousing 253 1.040
Finance and Insurance 3700 0.970
Utilities 280 0.480

19
Table 7
Summary of t-test result on spread for each industry
Spread is equal to the difference between bid and ask price of company share from an average of 15 days prior to the announcement day divided by the sum of bid price and ask price. Mean, is calculated against a two side test for H0=0 and the level of confidence for the t-tests is 95%.
Industry No. of
observations Mean Spread (%)
Real Estate, Rental and Leasing 1074 1.9143
Finance and Insurance 3700 1.7435
Wholesale 365 1.5165
Constructon 103 1.1937
Manufacturing 3070 1.1245
Utilities 280 1.1226
Art, Entertainment, and Recreation 83 1.0936
Accommodation and Food Services 65 1.0926
HealthCare and Social Assistance 221 1.0626
Other Services 234 1.0273
Information 257 0.9972
Retail 712 0.9735
Professional, Scientific, and Technical Services 750 0.8835
Transportation and Warehousing 253 0.7665
Mining, Quarrying, Oil and Gas Extraction 299 0.6900
20
Table 8
Summary of t-test result on analyst forecast error for each industry
The analyst forecast error is the difference between analysts’ consensus forecast latest and prior to the stock split announcement of the annual EPS estimate and the actual value, all divided by the absolute value of the actual. Mean, is calculated against a two side test for H0=0 and the level of confidence for the t-tests is 95%.
Industry No. of
observations Mean Analyst
Forecast Error (%)
Information 158 43.6890
Art, Entertainment, and Recreation 57 34.2764
Real Estate, Rental and Leasing 527 32.7181
MQOG 237 32.2780
Professional, Scientific, and Technical Services 597 29.9563
Wholesale 244 29.0597
Construction 76 26.2496
Manufacturing 2291 25.9751
Other Services 176 25.2731
Transportation and Warehousing 219 24.4652
HealthCare and Social Assistance 174 22.3797
Finance and Insurance 2177 21.1637
Utilities 195 20.3308
Retail 568 19.3965
Accommodation and Food Services 50 16.7916

0
Table 9 Regression Analysis
The dependent variable is cumulative excess return over the split announcement day and the day after the announcement day, where excess return is return minus the value-weighed return. The regression analysis is ran 12 times; for each independent variable three times, once with year fixed effects, second time with both year and industry fixed effects, and the third time for year , industry, and firm fixed effect and then for all three variable. t-statistics are provided in parentheses. *,**,*** present significant t-statistic at 90%, 95%, and 99% respectively. ****When firm fixed effect were applied, industry fixed effect were omitted because of collinearity.
1 2 3 4 5 6 7 8 9 10 11 12
Market cap (log) -0.0007 -0.0014 -0.0004 -0.0010 -0.0014 -0.0008
( -2.65)*** ( -5.18)*** (-0.22)
(-2.61)*** (-3.63)*** (-0.37)
Bid-ask spread
0.0004 0.0012 0.0005
-0.0011 -0.0005 -0.0011
-1.28 (3.58)*** -0.43
(-1.48) (-0.70) (-0.050)
Analyst forecast error
-0.000001 -0.000003 -0.000003 -0.000003 -0.000008 -0.000003
(-0.11) (-0.36) (-0.15) (-0.28)*** (-0.87) (-0.14)
Intercept 0.0279 0.0697 0.0137 0.0145 0.0418 0.0065 0.0145 0.0503 0.0059 0.0356 0.0793 0.0205
(5.72)*** (5.72)*** -0.43 (23.06)*** (3.78)*** -0.49 (26.08)*** (3.54)*** -0.45 (4.39)*** (4.85)*** -0.51
Firm Fixed Effects****
yes
yes
yes
yes
Industry Fixed Effects
yes yes
yes yes
yes yes
yes yes
Year Fixed Effects
yes Yes Yes yes Yes Yes yes Yes Yes yes Yes Yes
Observations 11516 11516 11516 11516 11516 11516 7773 7773 7773 7773 7773 7773
Number of firms
R-squared 0.0085 0.021 0.5173 0.008 0.0198 0.5173 0.0066 0.0149 0.5694 0.0075 0.0168 0.5695
Related Documents


![Road Blockage Due To Flood Condition · [1] Siddhartha Rokade ,P.K.Agarwal and Rajnish hrivastava,”ffect of subsurface drainage on performance of flexible Pavements,2012 [2] “valuating](https://static.cupdf.com/doc/110x72/605a0aab295ba110246e94c5/road-blockage-due-to-flood-condition-1-siddhartha-rokade-pkagarwal-and-rajnish.jpg)


