STOCHASTIC MODEL OF LITHIUM ION CONDUCTION IN POLY(ETHYLENE OXIDE) L. Gitelman 1 , A. Averbuch 2 , M. Nathan 3 , Z. Schuss 4 , D. Golodnitsky 5 1 Faculty of Applied Mathematics, Technion, Haifa 32000, Israel 2 School of Computer Science, Tel Aviv University, Tel Aviv 69978, Israel 3 School of Electrical Engineering, Tel Aviv University, Tel Aviv 69978, Israel 4 Department of Mathematics, Tel Aviv University, Tel Aviv 69978, Israel 5 School of Chemistry, Tel Aviv University, Tel Aviv 69978, Israel August 17, 2009 Abstract We develop, analyze, and simulate a physical model of Li + -ion conduction inside polyethylene oxide (PEO) helical tubes, which are the solvent of LiI salt. The current is due to diffusion and electric interactions with a permanent external field, the PEO charges, and ion-ion interactions. Potential barriers are created in the PEO by loops in structure. We calculate the energy of configurations of one or two lithium ions in the loop and derive an explicit expression for the activation energy. We use Kramers’ formula to calculate the conductivity as function of mechanical stretching, which lowers the barrier and causes an exponential rise in the output conductivity. 1 Introduction In [1] and [2] we developed a model of lithium ion conduction in dilute and concentrated polymer electrolytes (LiI : P (EO) n (3 ≤ n ≤ 100)), based on an analogy between protein channels of biological membranes that conduct Na + ,K + , and other ions [6], and the PEO helical chain that conducts Li + ions. There are, however, significant differences between them: while protein channels are embedded in the cell membrane and their nearly rectilinear pores are aligned, the PEO molecules contain loops and their directions are random (see Figure 1.1). When a voltage drop exists between the terminals of the loop, ions have to diffuse up potential gradients in order to traverse the loop and reach the cathode. Diffusion over potential barriers gives rise to an Arrhenius-type relation between voltage and current [11]. Unfolding the loops by mechanical 1

Welcome message from author
This document is posted to help you gain knowledge. Please leave a comment to let me know what you think about it! Share it to your friends and learn new things together.
Transcript
STOCHASTIC MODEL OF LITHIUM IONCONDUCTION IN POLY(ETHYLENE OXIDE)
L. Gitelman1, A. Averbuch2, M. Nathan3,Z. Schuss4, D. Golodnitsky5
1 Faculty of Applied Mathematics, Technion, Haifa 32000, Israel
2School of Computer Science, Tel Aviv University, Tel Aviv 69978, Israel
3School of Electrical Engineering, Tel Aviv University, Tel Aviv 69978, Israel
4Department of Mathematics, Tel Aviv University, Tel Aviv 69978, Israel
5School of Chemistry, Tel Aviv University, Tel Aviv 69978, Israel
August 17, 2009
Abstract
We develop, analyze, and simulate a physical model of Li+-ion conduction insidepolyethylene oxide (PEO) helical tubes, which are the solvent of LiI salt. The currentis due to diffusion and electric interactions with a permanent external field, the PEOcharges, and ion-ion interactions. Potential barriers are created in the PEO by loops instructure. We calculate the energy of configurations of one or two lithium ions in the loopand derive an explicit expression for the activation energy. We use Kramers’ formula tocalculate the conductivity as function of mechanical stretching, which lowers the barrierand causes an exponential rise in the output conductivity.
1 Introduction
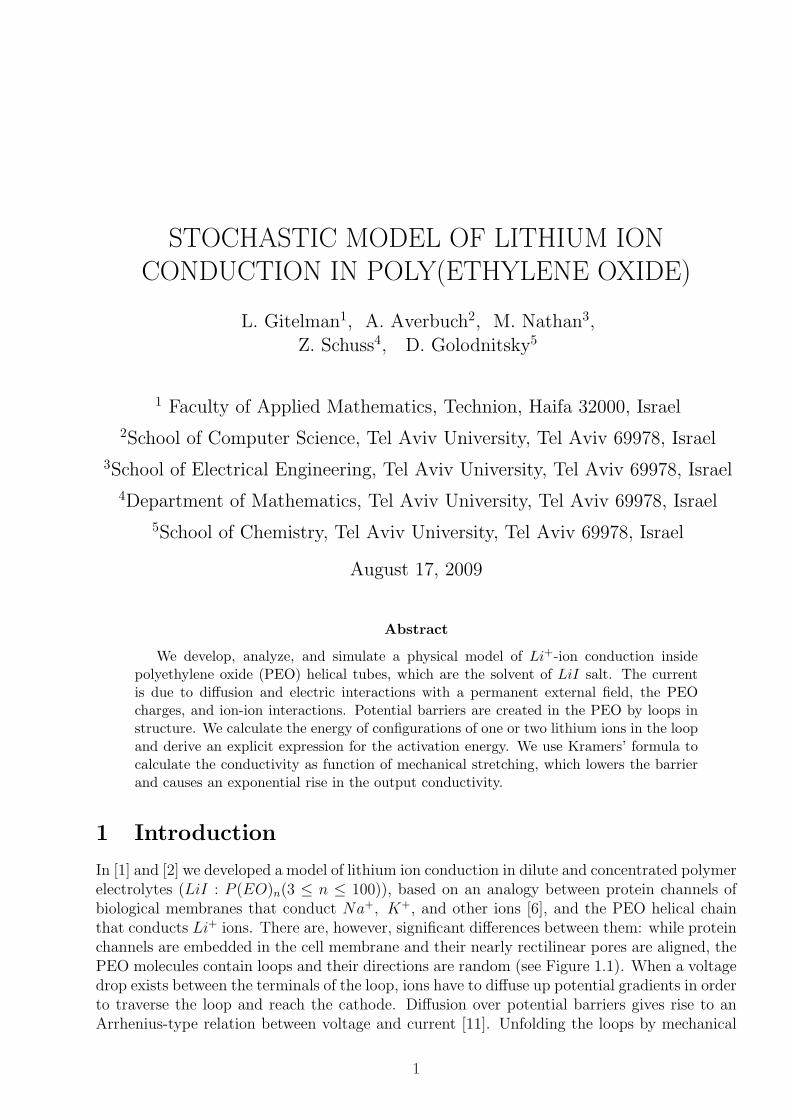
In [1] and [2] we developed a model of lithium ion conduction in dilute and concentrated polymerelectrolytes (LiI : P (EO)n(3 ≤ n ≤ 100)), based on an analogy between protein channels ofbiological membranes that conduct Na+, K+, and other ions [6], and the PEO helical chainthat conducts Li+ ions. There are, however, significant differences between them: while proteinchannels are embedded in the cell membrane and their nearly rectilinear pores are aligned, thePEO molecules contain loops and their directions are random (see Figure 1.1). When a voltagedrop exists between the terminals of the loop, ions have to diffuse up potential gradients in orderto traverse the loop and reach the cathode. Diffusion over potential barriers gives rise to anArrhenius-type relation between voltage and current [11]. Unfolding the loops by mechanical
1
stretching can, therefore, affect the conductivity of a PEO electrolyte in a decisive fashion.While [2] presents simulations of PEO loops with various degrees of stretching, our purposein this paper is to elucidate, both analytically and numerically, the effect of stretching andconcentration on PEO conductivity.
To make this paper self-contained, we recall some basic facts from [2]. In our model thePEO chains adopt a helical conformation with all C −O bonds trans and C − C bonds eithergauche or gauche minus [5]. We assume that there are no ionic cross-links between chains andthere are only weak van der Waals interactions. Typically, the composition of polymer-saltcomplex is 3 : 1. Changing the polymer-salt ratio from 3 : 1 to 1 : 1 has a profound influenceon the PE structure [5]. The polymer chain conformation changes from helical to a stretchedzigzag arrangement and the cations are coordinated by only two ether oxygens and four anions.The anions coordinate simultaneously cations, which are themselves associated with differentPEO chains. As a result, there is extensive inter-chain cross-linking in the 1 : 1 complexes.
Increasing the polymer-salt ratio from 3 : 1 to 6 : 1 has an equally profound influence onthe crystal structure (see [5]). The cations are arranged in rows, where each row is locatedwithin a cylindrical tunnel formed by two PEO chains. Each chain forms the surface of a halfcylinder and the two chains interlock on each side to complete the cylindrical arrangement.The anions do not coordinate the cations, but are instead located outside the PEO cylinder inthe inter-chain space. The anions are also arranged in rows.
On passing from the crystalline to the amorphous state, the structure is largely retainedwith only a loss of register between the chains, leading to disruption of the long range order [5].In particular, it appears that the PEO chain retains its helical conformation while the cationsremain inside the helices and are associated with their anions. The fact that in both 3 : 1and 6 : 1 compositions the cations remain within tunnels defined by the PEO chains suggeststhat cation transport occurs preferentially along such tunnels, with the rate limiting step beingtransfer between tunnels, in agreement with [4].
Figure 1.1: Left panel: The helical loop, Right panel: Closeup of the loop
2 The physical model
We assume that the as-cast PEO under consideration consists of long helical chains of smallradius, whose axes are oriented randomly. The axis of each chain is bent many times, forming arandom helix. We consider one turn of such a helix and assume it is a circular loop (see Figure
2
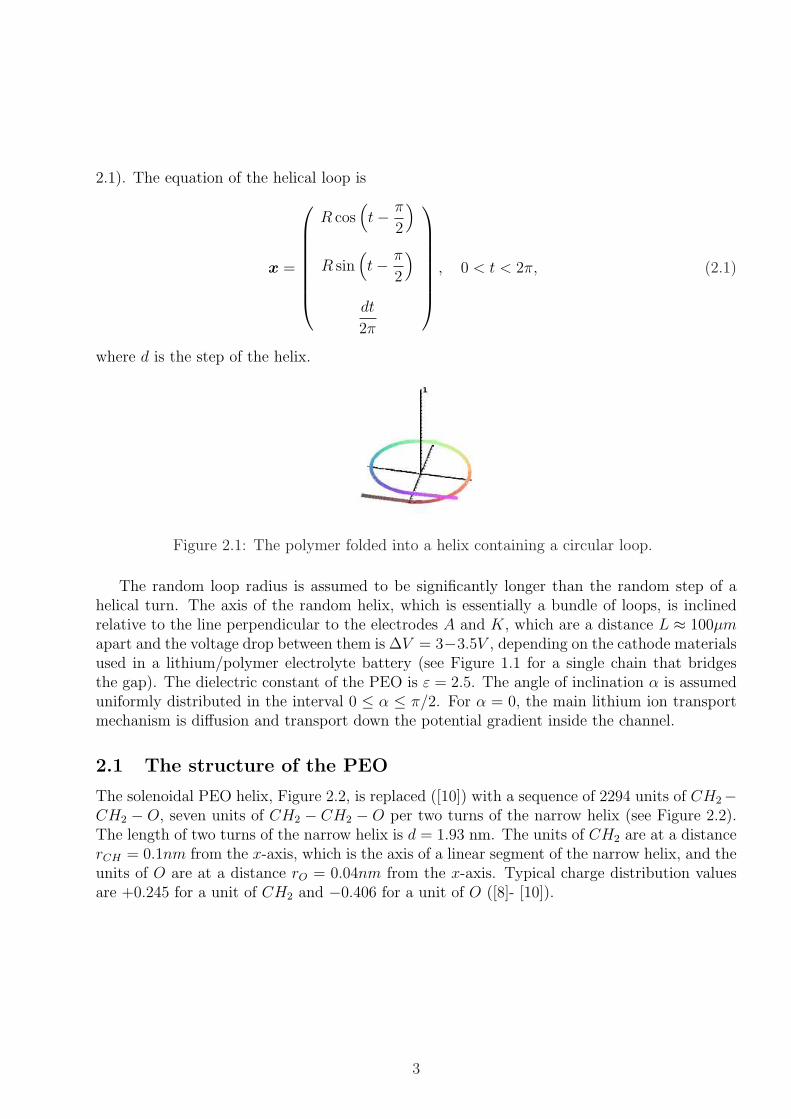
2.1). The equation of the helical loop is
x =
R cos(t− π
2
)
R sin(t− π
2
)
dt
2π
, 0 < t < 2π, (2.1)
where d is the step of the helix.
Figure 2.1: The polymer folded into a helix containing a circular loop.
The random loop radius is assumed to be significantly longer than the random step of ahelical turn. The axis of the random helix, which is essentially a bundle of loops, is inclinedrelative to the line perpendicular to the electrodes A and K, which are a distance L ≈ 100µmapart and the voltage drop between them is ∆V = 3−3.5V , depending on the cathode materialsused in a lithium/polymer electrolyte battery (see Figure 1.1 for a single chain that bridgesthe gap). The dielectric constant of the PEO is ε = 2.5. The angle of inclination α is assumeduniformly distributed in the interval 0 ≤ α ≤ π/2. For α = 0, the main lithium ion transportmechanism is diffusion and transport down the potential gradient inside the channel.
2.1 The structure of the PEO
The solenoidal PEO helix, Figure 2.2, is replaced ([10]) with a sequence of 2294 units of CH2−CH2 − O, seven units of CH2 − CH2 − O per two turns of the narrow helix (see Figure 2.2).The length of two turns of the narrow helix is d = 1.93 nm. The units of CH2 are at a distancerCH = 0.1nm from the x-axis, which is the axis of a linear segment of the narrow helix, and theunits of O are at a distance rO = 0.04nm from the x-axis. Typical charge distribution valuesare +0.245 for a unit of CH2 and −0.406 for a unit of O ([8]- [10]).
3
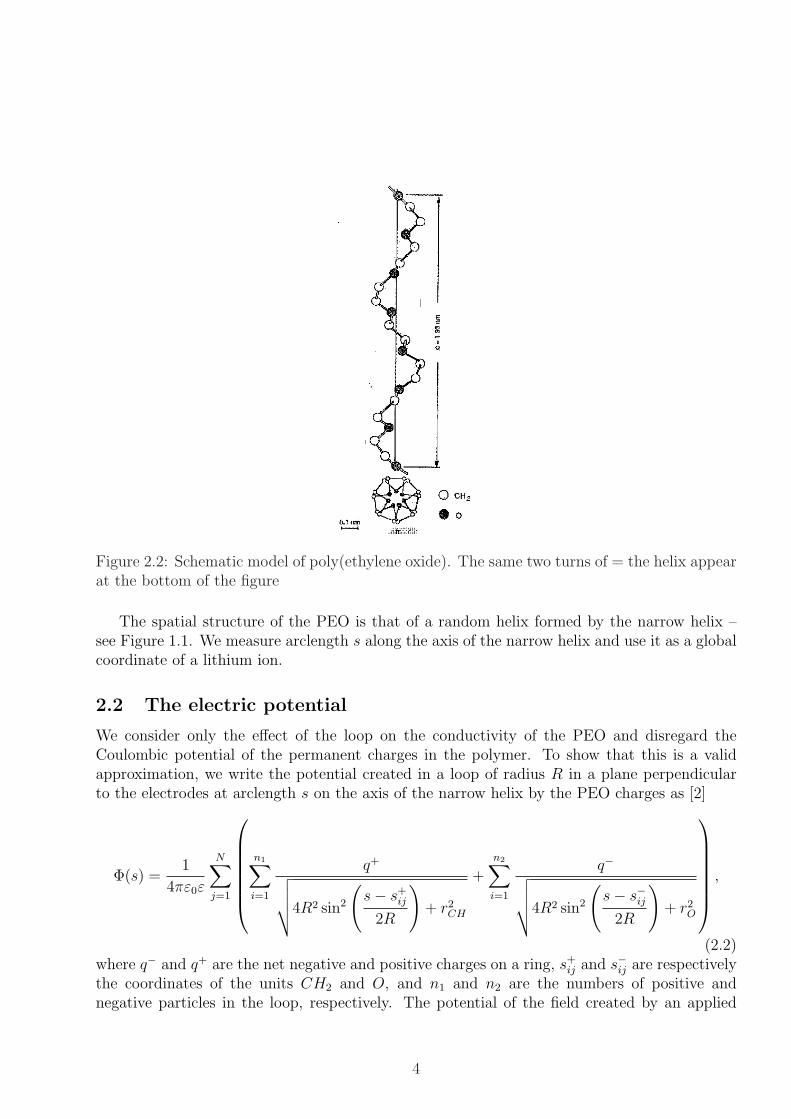
Figure 2.2: Schematic model of poly(ethylene oxide). The same two turns of = the helix appearat the bottom of the figure
The spatial structure of the PEO is that of a random helix formed by the narrow helix –see Figure 1.1. We measure arclength s along the axis of the narrow helix and use it as a globalcoordinate of a lithium ion.
2.2 The electric potential
We consider only the effect of the loop on the conductivity of the PEO and disregard theCoulombic potential of the permanent charges in the polymer. To show that this is a validapproximation, we write the potential created in a loop of radius R in a plane perpendicularto the electrodes at arclength s on the axis of the narrow helix by the PEO charges as [2]
Φ(s) =1
4πε0ε
N∑j=1
n1∑i=1
q+
√√√√4R2 sin2
(s− s+
ij
2R
)+ r2
CH
+
n2∑i=1
q−√√√√4R2 sin2
(s− s−ij
2R
)+ r2
O
,
(2.2)where q− and q+ are the net negative and positive charges on a ring, s+
ij and s−ij are respectivelythe coordinates of the units CH2 and O, and n1 and n2 are the numbers of positive andnegative particles in the loop, respectively. The potential of the field created by an applied
4

external voltage in a direction perpendicular to the plane of the electrodes, is
ΨE(s) = −VK − VA
εLx sin η = −ER cos
( s
R
)sin η,
where E =VK − VA
εLand η is the angle between the plane of the loop and the plane of the elec-
trodes. We write the configuration space coordinates of the lithium and iodide ions respectivelyas
s = (s1, s2, . . . , sL), s′ = (s′1, s′2, . . . , s
′L).
The potential of the electric field acting on the n-th lithium ion at sn in the loop, including theCoulombic potential of the inter-ionic forces, is
ΨLi+(s, s′) =1
4πε0ε
∑
i6=n
qLi+
2R
∣∣∣∣sin(
sn − si
2R
)∣∣∣∣+
1
4πε0ε
L∑i=1
qI−√4R2 sin2
(sn − s′i
2R
)+ r2
CH
+ Φ(sn) + ΨE(sn)
and that of the force acting on the n-th iodide ion at s′n is
ΨI−(s, s′) =1
4πε0ε
L∑i=1
qLi+√4R2 sin2
(s′n − si
2R
)+ r2
CH
+1
4πε0ε
∑
i6=n
qI−
2R
∣∣∣∣sin(
s′n − s′i2R
)∣∣∣∣
+ Φ(s′n) + ΨE(s′n).
A more complex configuration consists of N linear segments of lengths Si, inclined at angles0 ≤ αi ≤ π/2, (i = 1, 2, . . . , N), and N − 1 circular loops of radii Ri, attached at the ends ofthe linear segments at angles 0 ≤ ηi ≤ π/2, (i = 1, 2, . . . , N − 1), respectively. The endpointsof the linear segments are the arclengths
λk =k−1∑i=1
Si + 2πk−1∑i=1
Ri, µk =k∑
i=1
Si + 2πk−1∑i=1
Ri, (k = 1, 2 . . . , N)
and the arclengths in the loops are µk ≤ s ≤ λk+1, (k = 1, 2, . . . , N − 1). Note that λ1 = 0 andΨE(λ1) = VA, and ΨE(λk+1) = ΨE(µk). The electric potential of the applied voltage is
ΨE(s) = (2.3)
−E(s− λk) cos αk + ΨE(λk) if λk ≤ s ≤ µk, k = 1, . . . , N
−ERk
[cos
(s− µk
Rk
)− 1
]sin ηk + ΨE(µk) if µk < s ≤ λk+1, k = 1, . . . , N − 1.
5
A simplified potential of the ion-ion Coulombic forces contains only interactions of ions thatare in the same segment or the same loop. Thus the simplified potential of the electric fieldacting on the n-th lithium ion in the linear segment λk ≤ sn ≤ µk is
ΨLi+(s, s′) =1
4πε0ε
∑
λk≤si≤µk, i6=n
qLi+
|sn − si| +1
4πε0ε
∑
λk≤s′i≤µk
qI−√(sn − s′i)2 + r2
CH
+ Φ(sn) + ΨE(sn)
and that of the force acting on the n-th iodide ion at λk ≤ s′n ≤ µk is
ΨI−(s, s′) =1
4πε0ε
∑
λk≤si≤µk
qLi+√(s′n − si)2 + r2
CH
+1
4πε0ε
∑
λk≤s′i≤µk, i 6=n
qI−
|s′n − s′i|
+ Φ(s′n) + ΨE(s′n).
The simplified potential of the electric field acting on the n-th lithium ion in the loop µk ≤sn ≤ λk+1 is
ΨLi+(s, s′) = Φ(sn) + ΨE(sn) + (2.4)
1
4πε0ε
∑
µk≤si≤λk+1, i 6=n
qLi+
2R
∣∣∣∣sin(
sn − si
2R
)∣∣∣∣+
1
4πε0ε
∑
µk≤s′i≤λk+1
qI−√4R2 sin2
(sn − s′i
2R
)+ r2
CH
and that of the force acting on the n-th iodide ion at µk ≤ s′n ≤ λk+1 is
ΨI−(s, s′) = Φ(s′n) + ΨE(s′n) + (2.5)
1
4πε0ε
∑
µk≤si≤λk+1
qLi+√4R2 sin2
(s′n − si
2R
)+ r2
CH
+1
4πε0ε
∑
µk≤s′i≤λk+1, i6=n
qI−
2R
∣∣∣∣sin(
s′n − s′i2R
)∣∣∣∣.
We have assumed here that the iodide is located at the distance rCH from the axis of the helix.Figure 2.3 indicates that the potential barrier for the passage of a lithium ion through the loopis dominated by the applied potential and not by the Coulombic potential of the permanentcharges, if the radius is sufficiently large. Henceforward, we disregard the Coulombic potential.
6

0 0.1 0.2 0.3 0.4 0.5 0.6 0.7 0.8 0.9 1−1
−0.5
0
0.5
Normalized Length
Nor
mal
ized
Pot
entia
l
0 0.1 0.2 0.3 0.4 0.5 0.6 0.7 0.8 0.9 1−1
0
1
2
Nor
mal
ized
Pot
entia
l
Figure 2.3: The potential Φ(s)+ΨE(s) (eqs.(2.2), (2.2)) for N = 13, α = 0, η = π/5 (consistingof N = 11 = for the loop and N = 2 for two line segments) in an unstretched (top) and forstretched (bottom) N = 13, α = 0, η = 0 = (consisting of N = 4 for the loop and N = 9 for twoline segments). The local extrema of the potential correspond to the leftmost and rightmostpoints on the loop in Figure 2.1.
2.2.1 Energy of one lithium and one iodide ion in the loop
According to (2.4) and (2.5), the non-dimensional potential energy of the configurations of onelithium at central angle x and one iodide ion at central angle y is
U(x, y) =Φ(x, y) + ΨE(x, y)
∆V= −ρ
[cos
(x− π
2
)− cos
(y − π
2
)]
− 10−6
ρ
√sin2 x− y
2+ δ2(x− y)2 + ρ2
CH
, 0 < x < 2π, x < y < 2π,
where the dimensionless radius of the loop is ρ = R/L, the constant
q+
8πε0ε∆V L≈ 10−6
is dimensionless, δ = d/2R is the dimensionless step, and ρCH = rCH/2R is the dimensionlessradius of the pore. For simplicity, we keep the fixed values δ = 0.1 and ρCH = 10−4, althoughthey change by stretching, and investigate the energy landscape for ρ = 9× 10⁻⁴, 1× 10⁻², 2×10⁻², and 3 × 10⁻². All calculations are done for T = 300oK and ∆V = 3.5V olt, so thatkBT/q+ ≈ 0.026 and q+∆V/kBT ≈ 134.6.
The energy landscapes and energy contours of the configurations of a pair of lithium andiodide ions in the loop are given in figures 2.4-2.11 for the three chosen values of ρ. Thestructure of the energy landscape changes as ρ, that is, as the molecule is stretched and the
7

radius R decreases. Figure 2.4 shows that for large ρ there is a potential trap for the pair, inwhich the ions are well separated and do not form a dipole. This configuration is created whena lithium ion enters the loop from the anode side and the iodide enters from the cathode side,by moving with the field. The other stable configuration is created when the ions form a dipoleand diffuse together out of the loop (along the diagonal in Figure 2.5), without any barrier.The two stable configurations are separated by an energy barrier given in figure 3.3.
Figure 2.4: Energy landscape of the configurations of one lithium ion at central angle x and oneiodide ion at central angle y in a loop of type Figure 2.1 with non-dimensional radius ρ = 0.03.The energy barrier height is about 8kBT .
8

Figure 2.5: Energy contours of the landscape Figure 2.4.
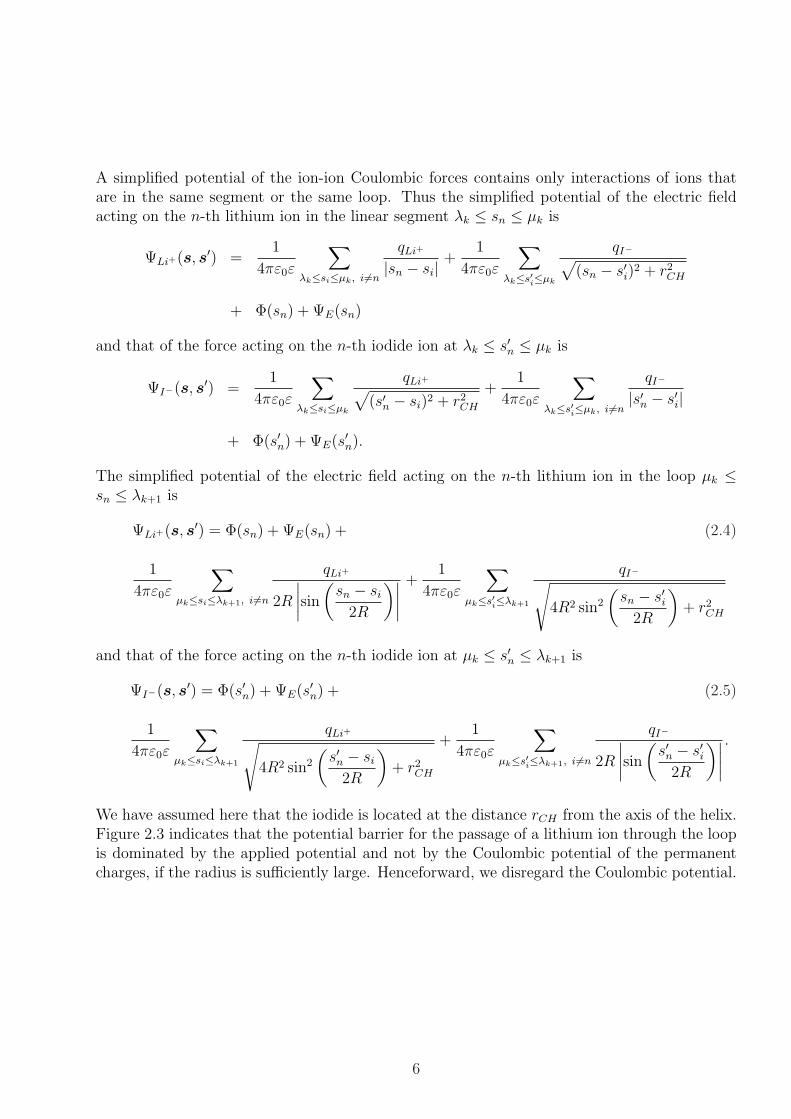
As the effective radius of the loop is decreased to ρ = 0.02 (Figure 2.6), the barrier heightdrops to about 5kBT and it is easier to diffuse into the other stable state, where the ions forma dipole (the diagonal in Figure 2.7). Finally, as the effective radius is decreased to ρ = 0.0009,the local minimum disappears (Figure 2.10) and there is no barrier. As the two ions enter theloop, they slide down the potential slope to form a dipole (the diagonal in Figure 2.11) andexit the loop by unopposed diffusion.
When there are several lithium ions in the loop, they form dipoles with the external iodideand neutralize each other. But as one lithium ion leaves into the cathode and a new one entersfrom the anode, the situation described above is repeated and effectively we see only one lithiumand one iodide ions that do not form a dipole, as described above.
9

Figure 2.6: Energy landscape of one lithium and one iodide ion in the helical loop of Figure2.1 with non-dimensional radius ρ = 0.02. The energy barrier height is about 5kBT .
10
Figure 2.7: Contours of the landscape Figure 2.6. Once over the barrier near the diagonal, thelithium-iodide dipole leaves the loop by free Brownian motion along the diagonal.
11
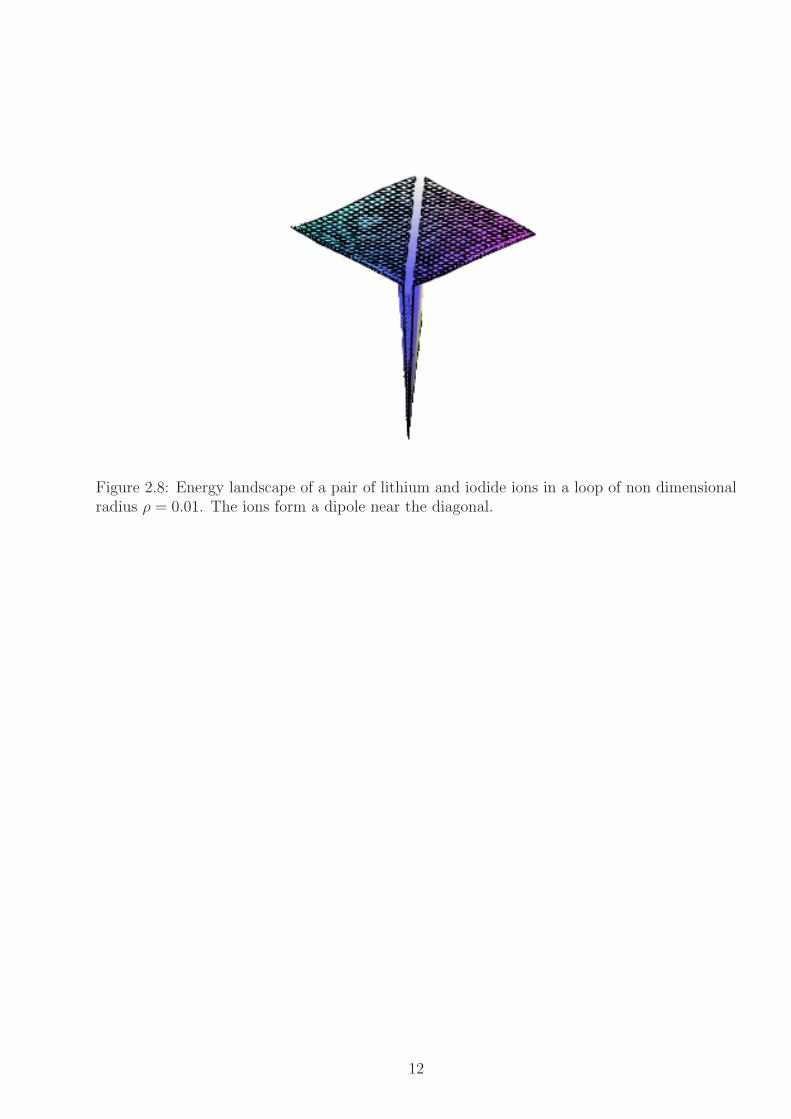
Figure 2.8: Energy landscape of a pair of lithium and iodide ions in a loop of non dimensionalradius ρ = 0.01. The ions form a dipole near the diagonal.
12

Figure 2.9: Contours of the landscape Figure 2.8. The trap is shallow and the dipole is formedalmost instantaneously.
13

Figure 2.10: Energy landscape of a pair of lithium and iodide ions in a loop of non dimensionalradius ρ = 0.0009. There is no trap and the ions form a dipole near the diagonal.
14

Figure 2.11: Contours of the landscape Figure 2.10. The saddle point disappears when thenon-dimensional radius is ρ = 0.0009.
15
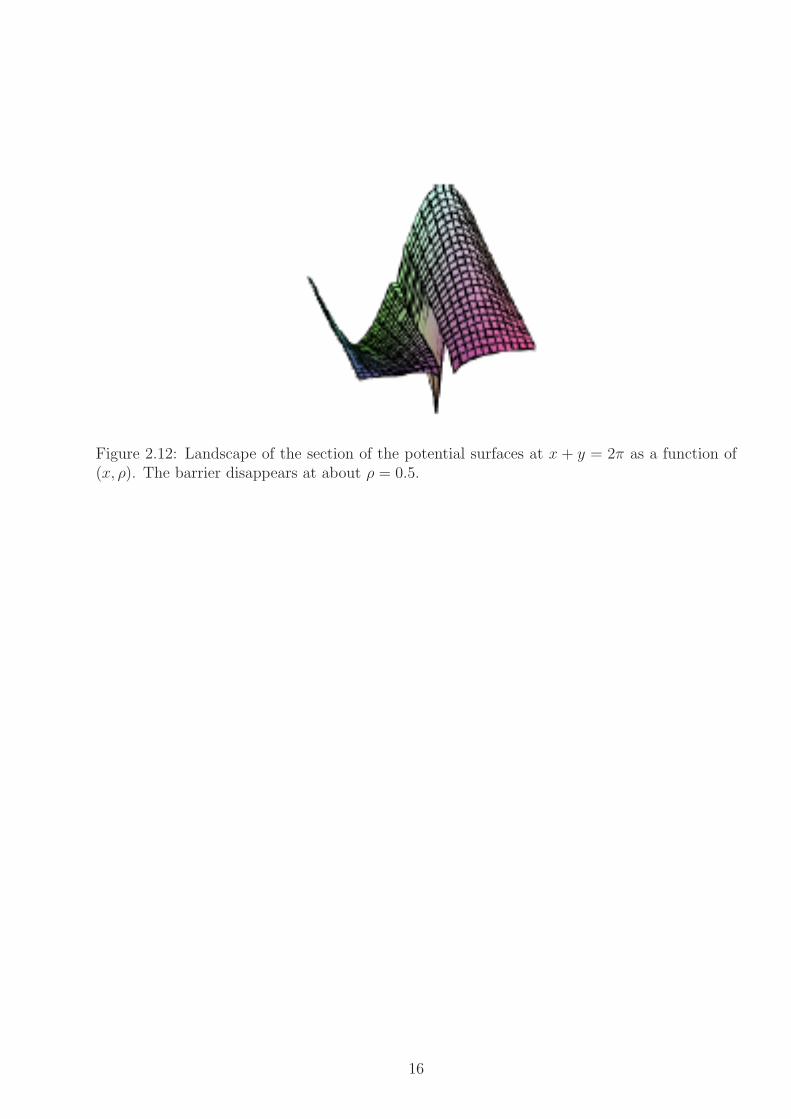
Figure 2.12: Landscape of the section of the potential surfaces at x + y = 2π as a function of(x, ρ). The barrier disappears at about ρ = 0.5.
16

Figure 2.13: Contours of the landscape in Fig. 2.12.
3 The conductivity
The basic electrochemistry of the lithium-ion battery involves only the transfer of lithium ionsbetween the two insertion electrodes. Typical lithium-ion battery consists of a carbon-basednegative electrode (anode) and a lithium transition metal oxide positive electrode (cathode).Upon charging, lithium ions are extracted from the positive electrode material and inserted intothe negative electrode material. Upon discharging, the reverse process is taking place. Afterformation of thin passivating film on the electrodes, named solid electrolyte interphase, SEI([3]) anions do not participate in the interfacial electrochemical reactions.
When a lithium ion intercalates to the cathode the PEO is no longer electrically neutral,because the iodide stays in the space between molecules. As a new lithium ion enters the loopfrom the anode side, an uncompensated iodide ion is drawn into the loop from the cathode sideand the pair is kept apart by the external field and the other ions form dipoles. To exit theloop the separated lithium and iodide ions have to overcome the potential barrier that keepsthem apart and then diffuse out of the loop as a dipole, as described above. Thus the current
17
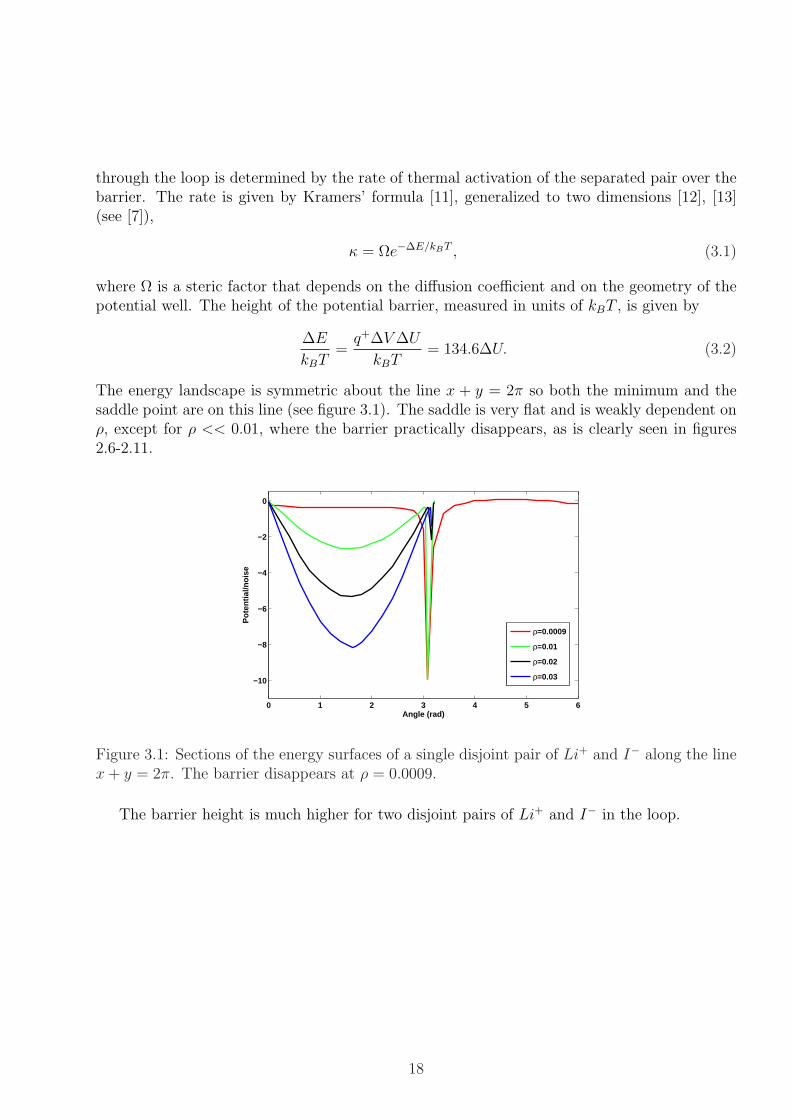
through the loop is determined by the rate of thermal activation of the separated pair over thebarrier. The rate is given by Kramers’ formula [11], generalized to two dimensions [12], [13](see [7]),
κ = Ωe−∆E/kBT , (3.1)
where Ω is a steric factor that depends on the diffusion coefficient and on the geometry of thepotential well. The height of the potential barrier, measured in units of kBT , is given by
∆E
kBT=
q+∆V ∆U
kBT= 134.6∆U. (3.2)
The energy landscape is symmetric about the line x + y = 2π so both the minimum and thesaddle point are on this line (see figure 3.1). The saddle is very flat and is weakly dependent onρ, except for ρ << 0.01, where the barrier practically disappears, as is clearly seen in figures2.6-2.11.
0 1 2 3 4 5 6
−10
−8
−6
−4
−2
0
Angle (rad)
Pot
entia
l/noi
se
ρ=0.0009
ρ=0.01
ρ=0.02
ρ=0.03
Figure 3.1: Sections of the energy surfaces of a single disjoint pair of Li+ and I− along the linex + y = 2π. The barrier disappears at ρ = 0.0009.
The barrier height is much higher for two disjoint pairs of Li+ and I− in the loop.
18
0 0.5 1 1.5 2 2.5 3 3.5−35
−30
−25
−20
−15
−10
−5
0
Angle (rad)
Pot
entia
l/noi
se
ρ=0.002ρ=0.01ρ=0.02ρ=0.03
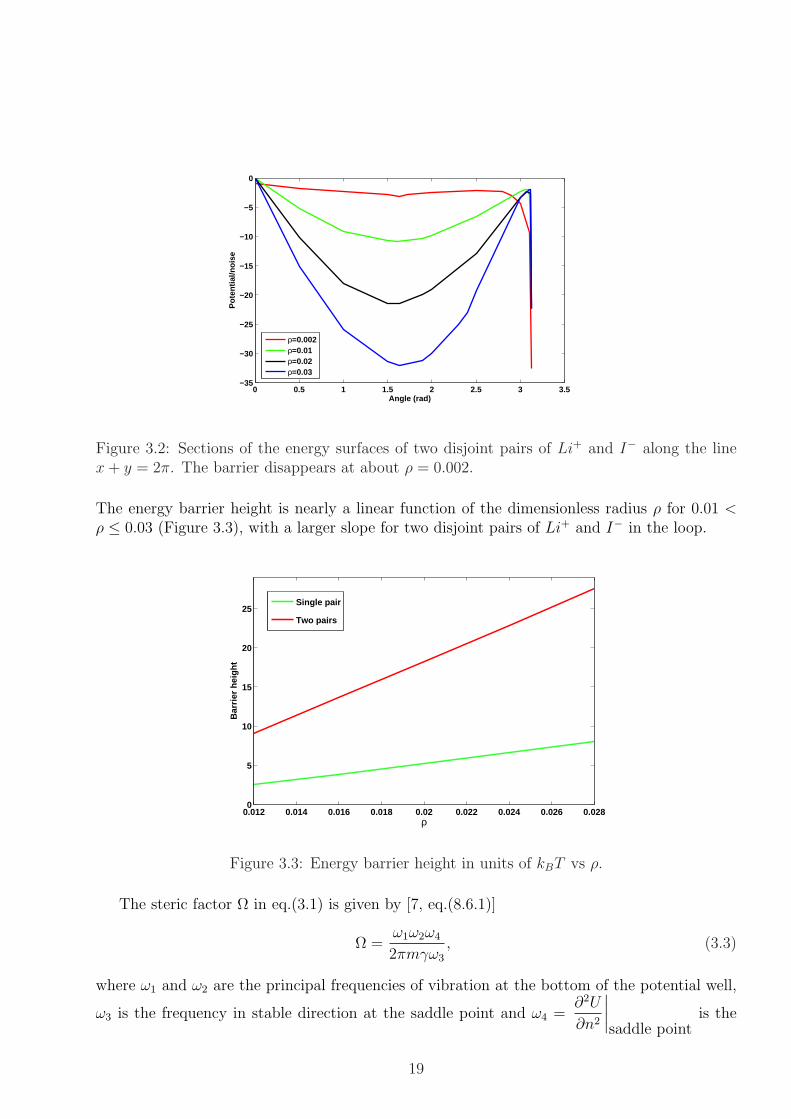
Figure 3.2: Sections of the energy surfaces of two disjoint pairs of Li+ and I− along the linex + y = 2π. The barrier disappears at about ρ = 0.002.
The energy barrier height is nearly a linear function of the dimensionless radius ρ for 0.01 <ρ ≤ 0.03 (Figure 3.3), with a larger slope for two disjoint pairs of Li+ and I− in the loop.
0.012 0.014 0.016 0.018 0.02 0.022 0.024 0.026 0.0280
5
10
15
20
25
ρ
Bar
rier
hei
gh
t
Single pair
Two pairs
Figure 3.3: Energy barrier height in units of kBT vs ρ.
The steric factor Ω in eq.(3.1) is given by [7, eq.(8.6.1)]
Ω =ω1ω2ω4
2πmγω3
, (3.3)
where ω1 and ω2 are the principal frequencies of vibration at the bottom of the potential well,
ω3 is the frequency in stable direction at the saddle point and ω4 =∂2U
∂n2
∣∣∣∣saddle point
is the
19
frequency of imaginary vibration in the unstable direction at the saddle point. More specifically,ω2
1 and ω22 are the eigenvalues of the matrix
∂2U(x, y)
∂x2
∂2U(x, y)
∂x∂y
∂2U(x, y)
∂x∂y
∂2U(x, y)
∂y2
∣∣∣∣∣∣∣∣∣∣(x, y) = bottom of well
, (3.4)
and
ω23 =
∂2U(x, y)
∂s2
∣∣∣∣(x, y) = saddle point
, ω24 = − ∂2U(x, y)
∂n2
∣∣∣∣(x, y) = saddle point
, (3.5)
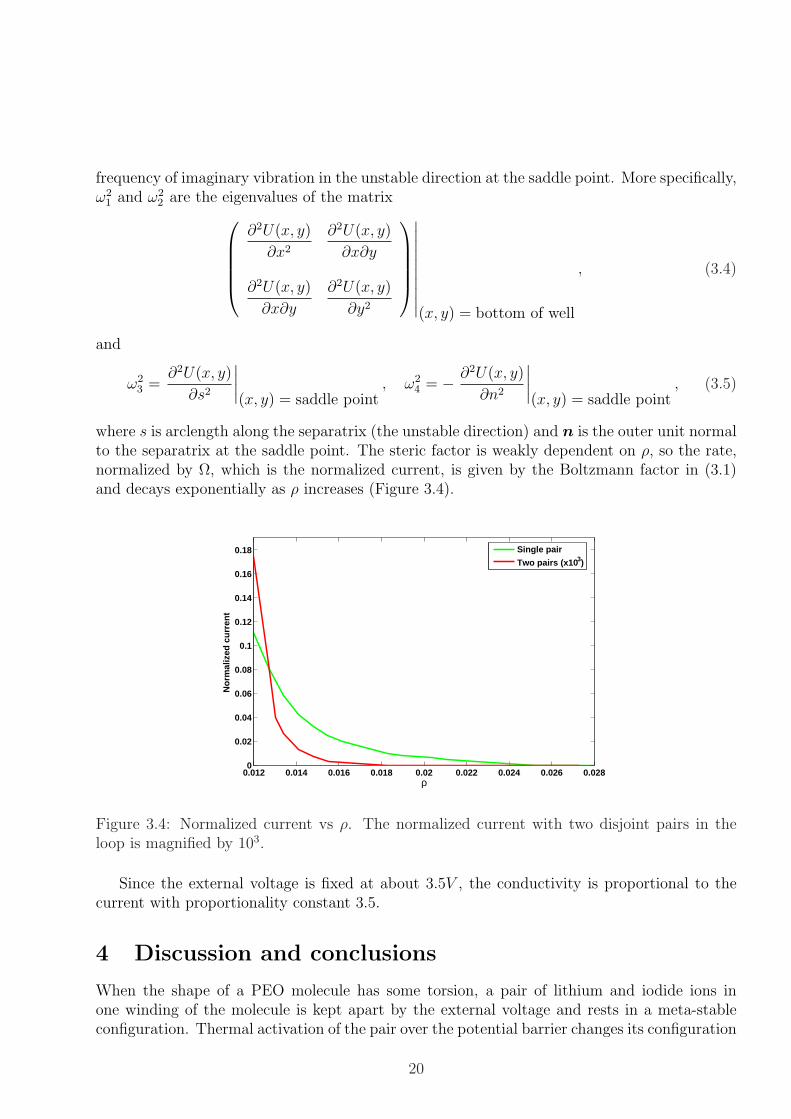
where s is arclength along the separatrix (the unstable direction) and n is the outer unit normalto the separatrix at the saddle point. The steric factor is weakly dependent on ρ, so the rate,normalized by Ω, which is the normalized current, is given by the Boltzmann factor in (3.1)and decays exponentially as ρ increases (Figure 3.4).
0.012 0.014 0.016 0.018 0.02 0.022 0.024 0.026 0.0280
0.02
0.04
0.06
0.08
0.1
0.12
0.14
0.16
0.18
ρ
No
rmal
ized
cu
rren
t
Single pair
Two pairs (x103)
Figure 3.4: Normalized current vs ρ. The normalized current with two disjoint pairs in theloop is magnified by 103.
Since the external voltage is fixed at about 3.5V , the conductivity is proportional to thecurrent with proportionality constant 3.5.
4 Discussion and conclusions
When the shape of a PEO molecule has some torsion, a pair of lithium and iodide ions inone winding of the molecule is kept apart by the external voltage and rests in a meta-stableconfiguration. Thermal activation of the pair over the potential barrier changes its configuration
20
to an electrically neutral dipole, which then leaves the winded loop by unopposed diffusion. Thedetermining factor in the process of lithium conduction in a lithium/polymer electrolyte batteryis therefore the activation rate. This observation indicates that PEO conductivity is much likethat in ionic crystals and is therefore given by the Nernst-Einstein type formula (3.1) [14]. Adetailed derivation of this formula is given in [7, Chapter 8].
The calculation of the potential barrier and current for a loop with two disjoint pairs of Li+
and I− in the loop are analogous to those for a single pair, as detailed above. The slope of thepotential barrier height vs ρ is higher for two disjoint pairs in the loop. This indicates thatstretching is more effective at higher concentrations.
The analysis of this scenario can explain the dramatic changes in conductivity observed inthe simulations of [2]. The exponential dependence of the activation rate on the loop radiuscan lead to the 40-fold increase in conductivity of the stretched polymer.
4.1 Experimental results
Machine stretching of the polymer electrolyte films with different concentration of LiI salt inPEO matrix has been carried out at room temperature at constant rate of 10.6 mm/min.
The ionic conductivity of polymer electrolyte in the longitudinal direction has been measuredin situ. During stretching the length of the film increases. This is followed by alignment of thehelixes of the polymer chains and favors the ionic transport of lithium cation inside the helices.In addition, longitudinal orientation of helices promotes the cation jump from helix to helix.
On stretching the conductivity orthogonal to film plane decreases, that once again showedthat stretching orders the structure of LiI : P (EO)n polymer electrolytes. The higher is thespeed of stretching, the lower is the conductivity enhancement.
4.2 Numerical results
We capture in our model this stretching-induced onset of order by representing the main geo-metrical features of the polymer molecule in terms of randomly oriented linear segments andcircular loops and their transformation by stretching (see Fig. 1.1). Linear segments tendto align in the direction of stretching and the radii of circular loops decrease. The effect ofconformational changes on conductivity is captured in our simplified model of Li+/I− motion.The percentage of stretching corresponds to change changes in ρ in our model from 0.16 downto 0.0001.
21

0 50 100 150
10−6
10−5
Stretching (%)
Con
duct
ivity
(S
/cm
2 )Simulation n=20
Experimental n=20
Simulation n=40
Simulation n=100
Figure 4.1: Simulation conductivity (S/cm2) vs stretching at concentration ratios LiI :P (EO)20 at room temperature
The simulation results show good agreement with experimental data of the effect of stretch-ing on the longitudinal conductivity of LiI : P (EO)20, LiI : P (EO)7, LiI : P (EO)9 at roomtemperature (Figs. 4.1 and 4.2). The agreement is not only in the correct trend (increase ofthe conductivity with stretching, slope of the graph), but also in the absolute values of the con-ductivity. While the simulations accounts for the qualitative observations, the good agreementwith experimental data supports the validity of our model.
In Fig. 4.1 relevant to this concentration, the curves corresponding to smaller salt concen-tration are presented also, for LiI : P (EO)40 and LiI : P (EO)100. There are no experimentaldata relevant to this concentrations.
22

0 100 200 300 400 500 60010
−7
10−6
10−5
Stretching (%)
Con
duct
ivity
(S
/cm
2 )
Simulation n=7
Experimental n=7
Simulation n=9
Experimental n=9
Figure 4.2: Simulation conductivity (S/cm2) vs stretching at concentration ratios LiI : P (EO)7
at room temperature
The experimental and numerical data collected on Fig. 4.1, correspond to concentrationsfrom n = 20 to n = 100. The conductivity enhancement (slope of the graph) is higher in themore concentrated polymer electrolyte. This indicates that stretching is more effective at higherconcentrations, which is explained by the fact that the slope of the potential barrier height vsρ is higher for two disjoint pairs in the loop, as shown in the Fig. 3.3. Figure 4.2 shows similarresults for LiI : P (EO)7 and LiI : P (EO)9. However, due to the peculiarities of the structureof these polymers, they have to be studied separately. For LiI : P (EO)n, n = 20 ÷ 100, thePEO chains adopt helical conformations with all C − O bonds trans and C − C bonds eithergauche or gauche minus. Each PEO chain is associated with a dedicated set of cations andanions that do not coordinate to any other chain. In other words, there is no ionic cross-linkingbetween chains, only weak van der Waals interactions.
Increasing the polymer:salt ratio from 3:1 to 6:1 has a profound influence on the crystalstructure (see [5]). The cations are arranged in rows with each row being located within acylindrical tunnel formed by two PEO chains. The chains are not helical. Each chain forms thesurface of a half cylinder and the two chains interlock on each side to complete the cylindricalarrangement. The anions do not coordinate the cations but are instead located outside thedimensions of the PEO cylinder in the inter chain space.
The stretched LiI : P (EO)7 polymer electrolyte has highly elastic rubber structure, therelaxation of which in the process of stretching starts immediately after release of the load.To achieve nonreversible structural changes the film of LiI : P (EO)7 electrolyte was keptunder the load at about 65oC for at least 12 h. The LiI : P (EO)9 polymer electrolyte behavessimilarly on stretching; its rubber properties, however, are less pronounced. Dilute polymerelectrolyte LiI : P (EO)20 was only partially stretched, because its structure does not allowfurther stretching.
In our simplified model we assume that the stretched polymer adopts a modified helical
23
structure, similar to that of an extended salt-free PEO helix, but no cylindrical tunnel is formedby two PEO chains. Everything else is in line with experimental data. In this conformation, allthe CH2 groups face outward. This facilitates wagging and twisting out-of-plane deformations.In the aligned conformation of the helix the oxygen atoms are directed inward, lining the tunnelcavity, thus favoring cation transport. Despite its simplicity, our model indicates that LiI :P (EO)7 has the maximum conductivity enhancement in the stretch, as seen from experimentaldata. This is attributed to highly aligned cylindrical tunnels for Li+ transport in double PEOchains coordinating the cations, as suggested by [5] and tends to support the validity of ourmodel.
If the cation/polymer substructure is maintained, then in both the 3:1 and 6:1 compositionsthe cations remain within tunnels defined by the PEO chains. If this is the case, then a randomarrangement of chains, such as might be envisaged in a simple amorphous polymer, is notconducive to ion transport. Instead, by organizing chains in a more aligned fashion, transportalong and between chains is facilitated.
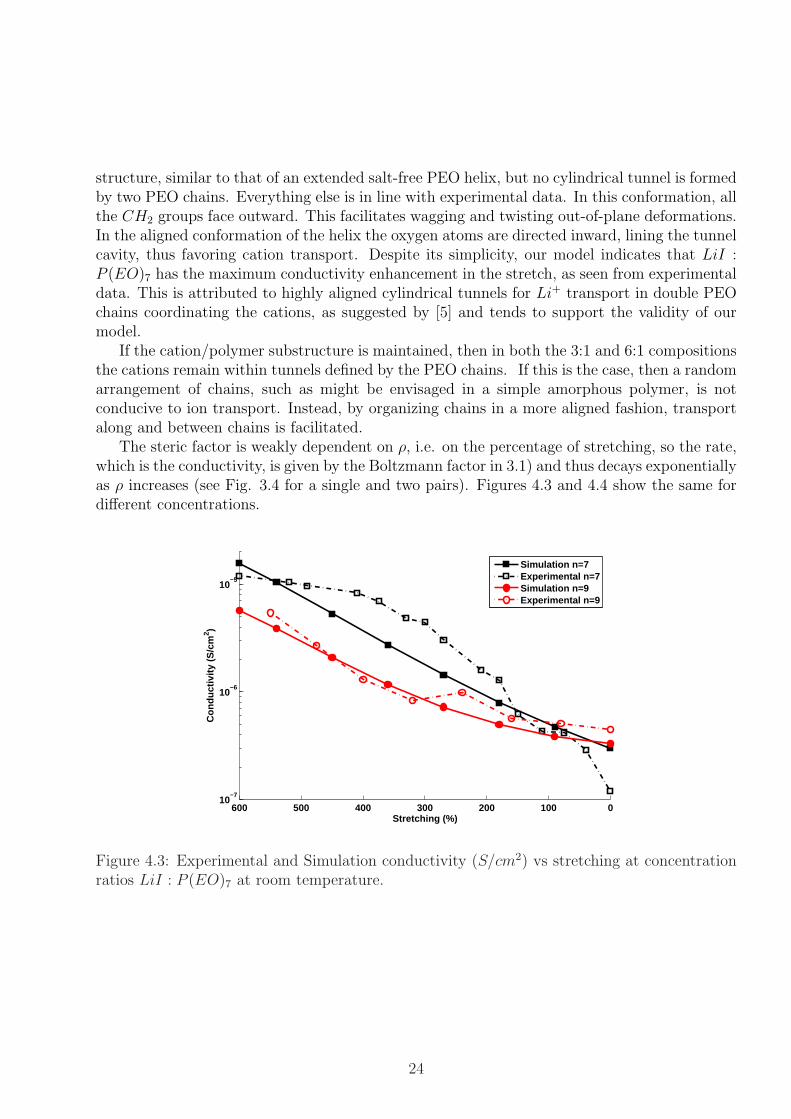
The steric factor is weakly dependent on ρ, i.e. on the percentage of stretching, so the rate,which is the conductivity, is given by the Boltzmann factor in 3.1) and thus decays exponentiallyas ρ increases (see Fig. 3.4 for a single and two pairs). Figures 4.3 and 4.4 show the same fordifferent concentrations.
010020030040050060010
−7
10−6
10−5
Stretching (%)
Con
duct
ivity
(S
/cm
2 )
Simulation n=7Experimental n=7Simulation n=9Experimental n=9
Figure 4.3: Experimental and Simulation conductivity (S/cm2) vs stretching at concentrationratios LiI : P (EO)7 at room temperature.
24
050100150
10−6
10−5
Stretching (%)
Con
duct
ivity
(S
/cm
2 )Simulation n=20
Experimental n=20
Simulation n=40
Simulation n=100
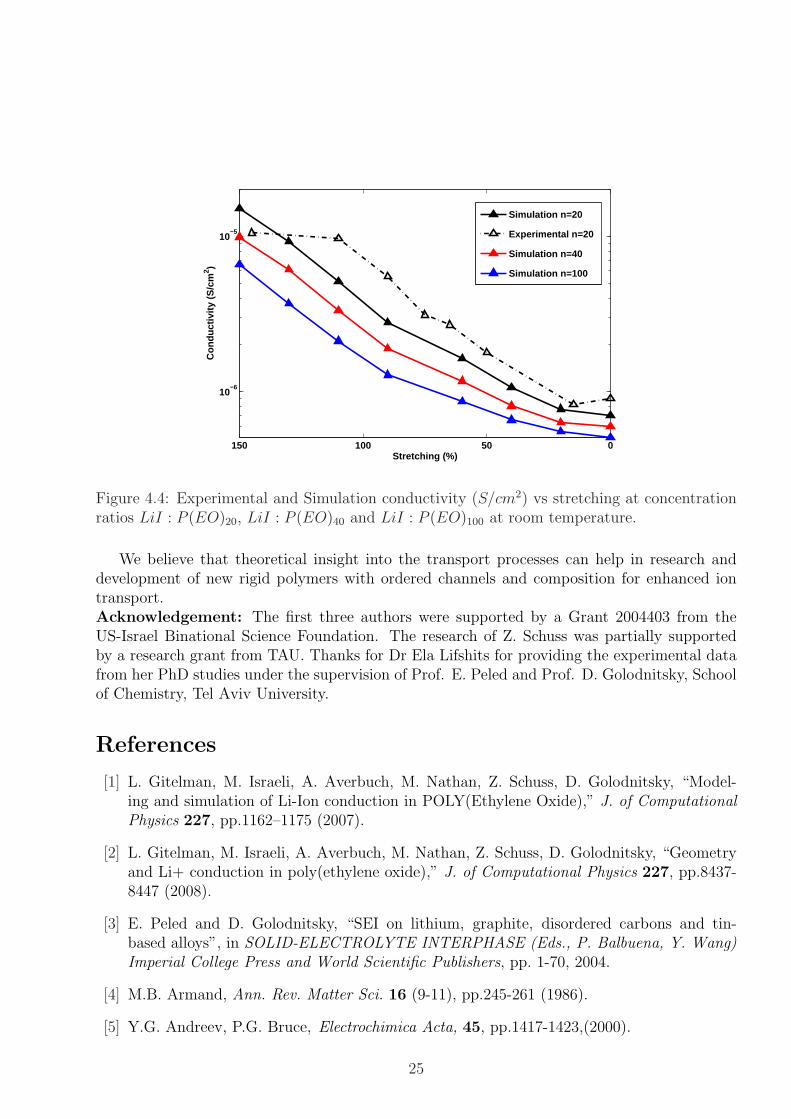
Figure 4.4: Experimental and Simulation conductivity (S/cm2) vs stretching at concentrationratios LiI : P (EO)20, LiI : P (EO)40 and LiI : P (EO)100 at room temperature.
We believe that theoretical insight into the transport processes can help in research anddevelopment of new rigid polymers with ordered channels and composition for enhanced iontransport.Acknowledgement: The first three authors were supported by a Grant 2004403 from theUS-Israel Binational Science Foundation. The research of Z. Schuss was partially supportedby a research grant from TAU. Thanks for Dr Ela Lifshits for providing the experimental datafrom her PhD studies under the supervision of Prof. E. Peled and Prof. D. Golodnitsky, Schoolof Chemistry, Tel Aviv University.
References
[1] L. Gitelman, M. Israeli, A. Averbuch, M. Nathan, Z. Schuss, D. Golodnitsky, “Model-ing and simulation of Li-Ion conduction in POLY(Ethylene Oxide),” J. of ComputationalPhysics 227, pp.1162–1175 (2007).
[2] L. Gitelman, M. Israeli, A. Averbuch, M. Nathan, Z. Schuss, D. Golodnitsky, “Geometryand Li+ conduction in poly(ethylene oxide),” J. of Computational Physics 227, pp.8437-8447 (2008).
[3] E. Peled and D. Golodnitsky, “SEI on lithium, graphite, disordered carbons and tin-based alloys”, in SOLID-ELECTROLYTE INTERPHASE (Eds., P. Balbuena, Y. Wang)Imperial College Press and World Scientific Publishers, pp. 1-70, 2004.
[4] M.B. Armand, Ann. Rev. Matter Sci. 16 (9-11), pp.245-261 (1986).
[5] Y.G. Andreev, P.G. Bruce, Electrochimica Acta, 45, pp.1417-1423,(2000).
25
[6] B. Hille, Ionic Channels of Excitable Membranes, Sinauer and Assoc., NY 1993.
[7] Z. Schuss, Theory and Applications of Stochastic Differential = Equations, Wiley, NY1980.
[8] A. Aabloo and J. Thomas, Solid State Ionics 143, pp. 83-87, (2001).
[9] B. A. Ferreira, A. T. Bernardes and W. B. De Almeida, Journal of Molecular Structure(Theochem) 539, pp.93-99 (2001).
[10] H. Tadokoro, Journal Polym. Sci. C, Copyright (1966), John Wiley and Sons, Inc.
[11] H. Kramers, Physica (Utrecht) 7, pp. 284 (1940).
[12] H.C. Brinkman, Physica (Utrecht) 22, pp.149–155, (1956).
[13] J.S. Langer, Ann. Phys. (N.Y.) 54, pp.258–275 (1969).
[14] L. Girifalco, Atomic Migration in Crystals, Blaisdell, Waltham, Mass. 1964.
26
Related Documents