INPUT-OUTPUT AND HYBRID LCA Stochastic decision modeling for sustainable pavement designs Murat Kucukvar & Mehdi Noori & Gokhan Egilmez & Omer Tatari Received: 25 April 2013 /Accepted: 10 February 2014 # Springer-Verlag Berlin Heidelberg 2014 Abstract Purpose In the USA, several studies have been conducted to analyze the energy consumption and atmospheric emissions of Warm-mix Asphalt (WMA) pavements. However, the direct and indirect environmental, economic, and social impacts, termed as Triple-Bottom-Line (TBL), were not addressed suf- ficiently. Hence, the aim of this study is to develop TBL- oriented sustainability assessment model to evaluate the envi- ronmental and socio-economic impacts of pavements con- structed with different types of WMA mixtures and compare them to a conventional Hot-mix Asphalt (HMA). The types of WMA technologies investigated in this research include Asphamin® WMA, Evotherm™ WMA, and Sasobit® WMA. Methods To achieve this goal, supply and use tables published by the U.S. Bureau of Economic Analysis were merged with 16 macro-level sustainability metrics. A hybrid TBL-LCA model was built to evaluate the life-cycle sustainability per- formance of using WMA technologies in construction of asphalt pavements. The impacts on the sustainability were calculated in terms of socio-economic (import, income, gross operating surplus, government tax, work-related injuries, and employment) and environmental (water withdrawal, energy use, carbon footprint, hazardous waste generation, toxic re- leases into air, and land use). A stochastic compromise pro- gramming model was then developed for finding the optimal allocation of different pavement types for the U.S. highways. Results and discussion WMAs did not perform better in terms of environmental impacts compared to HMA. Asphamin® WMA was found to have the highest environmental and socio-economic impacts compared to other pavement types. Material extractions and processing phase had the highest contribution to all environmental impact indicators that shows the importance of cleaner production strategies for pavement materials. Based on stochastic compromised programming results, in a balanced weighting situation, Sasobit® WMA had the highest percentage of allocation (61 %); while only socio-economic aspects matter, Asphamin® WMA had the largest share (57 %) among the asphalt pavements. The opti- mization results also supported the significance of an in- creased WMA use in the U.S. highways. Conclusions This research complemented previous LCA studies by evaluating pavements not only from environmental emissions and energy consumption standpoint, but also from socio-economic perspectives. Multi-objective optimization re- sults also provided important insights for decision makers when finding the optimum allocation of pavement alternatives based on different environmental and socio-economic priori- ties. Consequently, this study aimed to increase awareness of the inherent benefits of economic input–output analysis and multi-criteria decision making through application to emerg- ing sustainable pavement practices. Keywords Economic input–output analysis . Life-cycle sustainability assessment . Multi-criteria decision making . Pavements . Triple bottom line 1 Introduction 1.1 The U.S. highways and warm-mix asphalts The U.S. road system has one of the greatest network sizes and usage densities in the world with its immense statistics such as four million miles of network size and three million Responsible editor: Marzia Traverso M. Kucukvar : M. Noori : O. Tatari (*) Department of Civil, Environmental, and Construction Engineering, University of Central Florida, Orlando, FL 32816, USA e-mail: [email protected] G. Egilmez Department of Industrial and Manufacturing Engineering, North Dakota State University, Fargo, ND 58102, USA Int J Life Cycle Assess DOI 10.1007/s11367-014-0723-4

Welcome message from author
This document is posted to help you gain knowledge. Please leave a comment to let me know what you think about it! Share it to your friends and learn new things together.
Transcript
INPUT-OUTPUTAND HYBRID LCA
Stochastic decision modeling for sustainable pavement designs
Murat Kucukvar & Mehdi Noori & Gokhan Egilmez &
Omer Tatari
Received: 25 April 2013 /Accepted: 10 February 2014# Springer-Verlag Berlin Heidelberg 2014
AbstractPurpose In the USA, several studies have been conducted toanalyze the energy consumption and atmospheric emissions ofWarm-mix Asphalt (WMA) pavements. However, the directand indirect environmental, economic, and social impacts,termed as Triple-Bottom-Line (TBL), were not addressed suf-ficiently. Hence, the aim of this study is to develop TBL-oriented sustainability assessment model to evaluate the envi-ronmental and socio-economic impacts of pavements con-structed with different types of WMA mixtures and comparethem to a conventional Hot-mix Asphalt (HMA). The types ofWMA technologies investigated in this research includeAsphamin® WMA, Evotherm™WMA, and Sasobit® WMA.Methods To achieve this goal, supply and use tables publishedby the U.S. Bureau of Economic Analysis were merged with16 macro-level sustainability metrics. A hybrid TBL-LCAmodel was built to evaluate the life-cycle sustainability per-formance of using WMA technologies in construction ofasphalt pavements. The impacts on the sustainability werecalculated in terms of socio-economic (import, income, grossoperating surplus, government tax, work-related injuries, andemployment) and environmental (water withdrawal, energyuse, carbon footprint, hazardous waste generation, toxic re-leases into air, and land use). A stochastic compromise pro-gramming model was then developed for finding the optimalallocation of different pavement types for the U.S. highways.Results and discussion WMAs did not perform better in termsof environmental impacts compared to HMA. Asphamin®
WMA was found to have the highest environmental andsocio-economic impacts compared to other pavement types.Material extractions and processing phase had the highestcontribution to all environmental impact indicators that showsthe importance of cleaner production strategies for pavementmaterials. Based on stochastic compromised programmingresults, in a balanced weighting situation, Sasobit® WMAhad the highest percentage of allocation (61 %); while onlysocio-economic aspects matter, Asphamin® WMA had thelargest share (57 %) among the asphalt pavements. The opti-mization results also supported the significance of an in-creased WMA use in the U.S. highways.Conclusions This research complemented previous LCAstudies by evaluating pavements not only from environmentalemissions and energy consumption standpoint, but also fromsocio-economic perspectives. Multi-objective optimization re-sults also provided important insights for decision makerswhen finding the optimum allocation of pavement alternativesbased on different environmental and socio-economic priori-ties. Consequently, this study aimed to increase awareness ofthe inherent benefits of economic input–output analysis andmulti-criteria decision making through application to emerg-ing sustainable pavement practices.
Keywords Economic input–output analysis . Life-cyclesustainability assessment . Multi-criteria decisionmaking .
Pavements . Triple bottom line
1 Introduction
1.1 The U.S. highways and warm-mix asphalts
The U.S. road system has one of the greatest network sizesand usage densities in the world with its immense statisticssuch as four million miles of network size and three million
Responsible editor: Marzia Traverso
M. Kucukvar :M. Noori :O. Tatari (*)Department of Civil, Environmental, and Construction Engineering,University of Central Florida, Orlando, FL 32816, USAe-mail: [email protected]
G. EgilmezDepartment of Industrial and Manufacturing Engineering, NorthDakota State University, Fargo, ND 58102, USA
Int J Life Cycle AssessDOI 10.1007/s11367-014-0723-4
vehicle miles travelled per year (Highway Statistics 2010).Due to having such a wide network and immense usagecharacteristics, U.S. roads require tremendous new pavementconstruction, which results in a considerable amount of ex-penditures. On the other hand, since there is a rapidly growingtrend in total Vehicle Miles Travelled—VMT (i.e., VMT hasbeen doubled in the last 30 years), highway system capacityextension also constitutes a significant expenditure that comesalong with maintenance expenditures (Highway Statistics2010). All in all, the growing pattern in travel trends put avital burden on the U.S. economy that is about $146 billionannually as highway maintenance and safety expenditure(Spending and Funding for Highways 2011). On the otherhand, paving such a huge road network and keeping it main-tained results in severe environmental burdens. In this context,there are various environmental impact categories that areaddressed in previous studies (Horvath and Hendrickson1998; Santero et al. 2011).
The U.S. highways are responsible for high resource con-sumption and environmental emissions, which make the sus-tainable pavement systems necessary for building greenerroads. In this regard, warm-mix asphalt (WMA) has gaineda tremendous interest and considered one of the most envi-ronmental friendly technologies for producing asphalt pave-ments (Rubio et al. 2012). WMAs have been gained popular-ity in terms of its eligibility of being produced at a lowertemperature thus cutting process energy by 30 % (Larsenet al. 2004). WMA technologies show benefits for the envi-ronment because it produces asphalt at temperatures 20–40°lower in comparison to conventional hot-mix asphalt (Rubioet al. 2013). Among WMAs, Aspha-min® is a manufacturedsynthetic zeolite that improves the mix workability and ag-gregate coating at lower temperatures is realized. Sasobit® is awax-type additive of coal gasification that melts in the asphaltbinder at high temperatures. As a result, a reduction in theviscosity during mixing is achieved. However, EvothermTM
uses a high-residue emulsion, which results in the improve-ment of the adhesion of the asphalt to the aggregate and theenhancement in mixture workability (Chowdhury and Button2008). A reduction in energy requirements associated with theproduction of EvothermTM mixture of up to 55 % has beenreported (Kristjánsdóttir et al. 2007). Although these reportsshow the significance of using different WMA additives to-wards achieving reduced energy consumption, a life cycle-based assessment model, which expands the system boundaryof process life cycle inventories, will be vital for understand-ing the real impacts of WMA in pavement construction.
1.2 Life cycle sustainability assessment
With the increasing concerns related to integration of socialand economic dimensions of the sustainability into LCA,traditional LCA approach has been transformed into a new
concept, which is also called as Life Cycle SustainabilityAssessment (LCSA). This concept was suggested by Klöpffer(2008) and Life Cycle Cost (LCC) and Social Life CycleAssessment (SLCA) methods were integrated into the LCAframework (Finkbeiner et al. 2010; Traverso et al. 2012;Zamagni et al. 2012). In parallel with the current trend inLCA, this study envisions a comprehensive LCSA frameworkwhich evaluates the social, economic, and environmentalimpacts from a broader perspective: direct (on-site) and indi-rect (supply chain) burdens. Economic input–output (EIO)analysis is utilized in order to provide a holistic frameworkto trace the impacts across the supply chains in addition todirect impacts related to asphalt production processes. Sincerecent trends also emphasize the inclusion of three pillars ofsustainability as economy, society, and the environment, theproposed sustainability scope perfectly fits to the needs ofsuch a comprehensive sustainability assessment understand-ing (Guinée et al. 2011).
EIO analysis is a well-known tool that is commonly used toexpand the system boundary of process life cycle inventoriesand thus analyses the supply chain wide resource require-ments and environmental impacts of products or systems(Hendrickson et al. 2006; Suh et al. 2004). EIO analysis wastheorized and developed by Wassily Leontief in 1970s, basedon his earlier works in the late 1930s, for which he receivedthe Nobel Prize (Leontief 1970). In the literature, EIO meth-odology has been used to analyze a wide range of policyissues in environmental, economic, and social areas, andseveral researchers utilized the EIO model for analyzing thesustainability impacts of infrastructures, energy technologies,sectors, international trade, and household demand (Egilmezet al. 2013; Huang et al. 2009; Huppes et al. 2006; Lenzenet al. 2012; Kucukvar and Tatari 2011; Kucukvar and Tatari2012; Weber and Matthews 2007; Wiedmann et al. 2011).
Assessing pavement designs from a life cycle perspectiveis crucial and necessary to have a holistic understanding aboutthe complete picture so as to make long term successfulpolicies (Santero et al. 2011). Several applications of LCAare available in the literature to analyze WMAs (Jamshidiet al. 2013; Jullien et al. 2011; Hassan 2010). In general, theresults of those studies indicated that the emissions and energyconsumption of the mixing process were reduced during theproduction and placement of WMAmixtures when comparedto hot-mix asphalt (HMA). In addition to that, WMA pave-ment sections showed similar performance to those construct-ed with HMAmixtures. Although previously mentioned LCAstudies have quantified some of the potential environmentalimpacts of WMAs, the role of the entire upstream supplychain during the production of asphalt additives, binders,metallic and nonmetallic minerals, and fuels used in differentHMA and WMA mixtures, and related socio-economic im-pacts associated with utilization of these resources were gen-erally excluded due to selection of smaller system boundaries.
Int J Life Cycle Assess
A first detailed ecologically-based LCA (Eco-LCA) studywas conducted by Tatari et al. (2012) where natural resourceconsumption and atmospheric emissions of various WMAswere analyzed and compared with HMA using the Eco-LCAsoftware, which was developed by the Center for Resilience atOhio State University (OSU—The Ohio State University2009). The results of this study revealed that WMAs do notalways have a better environmental performance than HMA,and there is significant variability among WMA technologies.In addition, material extraction and production phase wasresponsible for the highest amounts of ecological resourceconsumption. However, due to the large impacts on economyand the society, it is still necessary to account for the direct andindirect socio-economic implications of pavement construc-tion. While environmentally extended EIO models can quan-tify environmental burdens, the Triple BottomLine (TBL) EIOmodel is capable to quantify not only environmental pressures,but also social and economic impacts. This can be achieved byusing an integrated approach, which integrates economic andsocial indicators of the sustainability into EIO framework as anaddition to environment. TBL concept focuses on the threemain pillars of sustainability: environment, economy, and so-ciety (Elkington 1998). In the literature, Foran et al. (2005a)developed a first comprehensive EIO-based TBL model of theindustrial sectors of an entire economy for the Australia. Thismodel integrated the EIO tables with environmental, econom-ic, and social metrics for sectors in which all up-stream impactsare included. Although they are not for pavement constructionand other heavy civil infrastructures, several studies wereconducted using the EIO analysis by presenting first examplesof TBL accounting in the EIO context (Foran et al. 2005b;Wiedmann and Lenzen 2009).
In addition, the World Input Output Database (WIOD)established a strong foundation for a multi-regional input–output (MRIO) framework by presenting supply and usetables for 40 countries, covering around 85 % of the worldeconomy. This project was supported by the EU’s 7th Frame-work Program that presents the derivation of internationaltrade and transport margins together with detailed supplyand use tables at the world level. Together with extensivesatellite accounts including environmental and socio-economic indicators, these databases can provide the neces-sary input to several types of EIO models that can be used toevaluate trade-offs between socio-economic and environmen-tal objectives (Streicher and Stehrer 2012). Furthermore, theGlobal Trade Analysis Project (GTAP) also produces an ex-tensive database of trade-linked input–output tables for theworld economy, which involves about 57 sectors and 87regions in the world (Hertwich and Peters 2009). AlthoughGTAP is an extremely important tool for the modeling of therole of international trade in goods and services, environmen-tal extensions are still limited to some energy and carbonindicators (Tukker et al. 2009).
In the literature, several studies have used EIO modeling toquantify the environmental implications of pavements fromcradle to grave (Cas and Mukherjee 2011; Park et al. 2003;Treloar et al. 2004). In addition, the Pavement Life-CycleAssessment Tool for Environmental and Economic Effects(PaLATE) was built to estimate the environmental burdensand life cycle costs associated with the pavement construction.This excel-based tool combined the EIO-LCA data with ad-ditional process-specific inventory to create a hybrid LCAframework (Santero et al. 2010). On the other hand, the scopesof current pavement LCA models are bounded by the mostcommonly used environmental impact categories such aswater and energy use, atmospheric emissions, and waste;however, little attention paid to large scale economic andsocial implications of pavements. Hence, there is still a strongneed to evaluate macro-level direct and indirect socio-economic implications of new WMA technologies for morecomprehensive sustainability assessment. As classified in pre-vious input–output databases and studies, import, income,gross operating surplus, government tax, injuries, and em-ployment are considered as key socio-economic indicators(Foran et al. 2005a; Foran et al. 2005b; Hendrickson et al.2006; GTAP 2008; Wiedmann et al. 2009; WIOD 2012).Using these indicators, this study aims to build a hybridLCA model for evaluating not only environmental burdensbut also socio-economic impacts of pavements constructedwith different types of WMAmixtures and compare them to aconventional HMA design. To realize this goal, an industry-by-industry input–output model is utilized for assessing pave-ment sustainability. This model has been created by Kucukvarand Tatari (2013), which was initially used to quantify thesustainability implications of seven different U.S. constructionsectors including buildings and heavy civil infrastructures.The types of WMA technologies analyzed in this researchinvolve: Asphamin® WMA, EvothermTM WMA, andSasobit® WMA.
1.3 Multi-criteria decision making
Multi-criteria Decision Making (MCDM) is a branch of ageneral class of operations research models which are usedto solve decision making problems where multiple criteria andalternatives exist. Since, the optimal solution can be differentbased on each criteria, considering all criteria and providingan overall decision support to decision makers have been acritical topic of interest for researchers and practitioners. Thereare typically two types of MCDM categories, namely: Multi-attribute Decision Making (MADM) and Multi-objective De-cision Making (MODM). The objectives can be used to selectthe best alternative or grouping alternatives into predefinedpreference sets based on the performance over multiple-criteria (Figueira et al. 2005). In general, MADM is an ap-proach employed to solve problems including selection from
Int J Life Cycle Assess
among a finite number of alternatives (Rao 2007). On theother hand, inMODMproblems, the goal is design rather thanselect by considering the tradeoffs within design constraints(Chang 2011). There are several types of MCDM modelsincluding weighted sum method (WSM), weighted productmethod (WPM), analytical hierarchy process (AHP), prefer-ence ranking organization method for enrichment evaluation(PROMETHEE), elimination and choice translating reality(ELECTRE), the technique for order preference by similarityto ideal solutions (TOPSIS), multi-attribute utility theory(MAUT), and compromise programming (Wang et al. 2009).Application of MCDM approaches has been extended tovarious areas including finance (Zopounidis and Doumpos2002), environmental policy making (Greening and Bernow2004), sustainable energy planning (Pohekar andRamachandran 2004), and supplier selection (Ho et al. 2010).
Normalization and weighting are widely used methods incombined applications of LCA and MCDM. Normalization isa life cycle impact assessment tool (LCIA) that is used toexpress impact indicator data in a way that can be comparedamong impact categories. This procedure simply normalizesthe impact results dividing by a selected reference value (ISO14042). In addition, weighting, which is also referred to asvaluation, is a step of LCIA in order to assign weights to thedifferent environmental impact categories based on their im-portance. In general, weighting includes several activities suchas identifying the priorities of decision makers, determiningweights to assign on each impact category, and applyingweights to impact categories (ISO 14042). Although, subjec-tivity makes weighting a challenge, weighting techniques areutilized for decision-making such as the Analytical HierarchyProcess (AHP) and Delphi method. For a discussion ofweighting methods for LCA, please see Finnveden (1997)and Bengtsson (2001).
MCDMmodels have been extensively applied to LCA. Togive a few examples, Kohn (2010) applied an integration ofMCDA and LCA to a case study of switchgrass production asa biofuel in the state of California. In other research, MCDMis coupled with LCA to solve decision conflicts in compositematerial selection (Milani et al. 2011). Boufateh et al. (2011)usedMCDM to analyze the results of LCA for different textileproducts. Linkov and Seager (2011) presented an approach forusing MCDM to integrate uncertain information collectedf rom r isk ana lys i s and LCA in the contex t ofnanomanufacturing and management of contaminated sedi-ments. In addition, Liu et al. (2012) combined risk assessmentand LCAwith MCDM. The researchers applied this method-ology to a case study in waste recycling facility to assess itsenvironmental aspects. Kiran and Rao (2013) also proposedan integration of LCA with MCDM for planning, designing,and commissioning of green buildings. Related to construc-tion of pavements, literature includes only a handful of worksrelated to highway management and pavement treatment or
restoration. For instance, Filippo et al. (2007) proposed aFuzzy MCDM for ranking environmentally valid highwayrestoration by priority. The proposed approach supports deci-sions on which road segments require the restoration relatedworks and services. In another work, an AHP-based MCDMapproach was utilized for the Highway Development andManagement Tools (Casifo et al. 2002). Several attributesincluding social benefits, environmental effects, safety im-pacts, and strategic importance of roads are incorporated intoa unified decision-making framework. Additionally, evalua-tion of sustainable drainage systems within the context of anoverall decision-support framework is studied. Several tech-nical, ecological, social, and economic factors are integratedinto aMCDM framework (Ellis et al. 2004). However, there isonly one found in the literature that considers LCA andMCDM as an integrated decision making framework for roadconstruction. In this work, Giustozzi et al. (2012) studied theevaluation of the environmental impact of road maintenanceactivities using MCDM. Life cycle cost of maintenance activ-ities are coupled with environmental impacts and incorporatedinto the MCDM framework.
Such integration of decision analysis techniques with LCAin fact can provide a very critical guidance to decision makers,which can contribute to the development of sustainable pave-ment strategies significantly. Although the LCAmethods haverecently gained interest in pavement research, such integrationof LCA of pavement alternatives withMCDM can play a vitalrole for the evaluation of life cycle performance-based sus-tainable pavement systems. Therefore, this study proposes anintegration of TBL-LCA with MCDM in order to assess thesocio-economic and environmental implications of pavementalternatives and optimize the allocation of pavement mixturesconsidering a set of conflicting objectives.
2 Methods
In this research, the life cycle phases of materials extractionand processing, transportation of pavement materials, asphaltmixing process, and construction of pavements have beenincluded within the scope. The use phase is not includedbecause pavement sections were constructed with equivalentperformances. First, the TBL-LCA model is built by usingnumerous environmental and socio-economic sustainabilityindicators. Second, the life cycle inventory of pavement de-signs are presented with corresponding data sources. Third,sustainability impacts of the HMA and WMAs have beencalculated. Fourth, MODM model, namely compromise pro-gramming, is developed to solve the multi-objective optimi-zation problem which has the tradeoffs between environmen-tal and socio-economic indicators. This optimization model isbuilt upon obtained LCA results to determine the optimalasphalt pavement allocation strategy for a functional unit of
Int J Life Cycle Assess

one-km pavement using sustainability weights ranging be-tween 0 and 1. Finally, the findings are summarized, and thelimitations are pointed out.
2.1 TBL-LCA model
This research analyses the life cycle sustainability implica-tions of different pavement systems using EIO-based sustain-ability accounting framework. The holistic sustainability as-sessment framework is developed by combining the supplyand use tables published by the U.S. Bureau of EconomicAnalysis (BEA—Bureau of Economic Analysis 2002) withthe selected environmental and socio-economic sustainabilitymetrics. In this research, the supply and use tables are con-verted into a symmetric industry-by-industry input–outputtable. This conversion is applied since Leontief’s basic in-put–output methodology presents the financial flows betweenindustrial sectors without distinguishing between primary andsecondary products produced by sectors. However, using thismethod, it is possible to account for the fact that some indus-tries can produce more than one commodity, such as second-ary products and by-products (Wachsmann et al. 2009). Forexample, hydrogen can be produced as a by-product in petro-leum refineries, which can also be produced separately bychemical manufacturing industry as a primary product (UN1999). In this context, the Eurostat manual presents severalmethods used to convert supply and use tables into symmetrictables (Eurostat manual of supply and use and input–outputtables 2008).
In this article, we present an input–output based approachfor calculating the sustainability performance of pavements.To realize this goal, industry-by-industry input–output meth-odology has been utilized. This format was also used inprevious TBL-EIO models developed for the US, UK, andAustralian economies (Foran et al. 2005a; Kucukvar andTatari 2013; Wiedmann et al. 2009). In these models, theinput–output multipliers represented the total impacts, whichare direct plus indirect (supply chain) embodiments per unit offinal demand of commodities produced by industrial sectors.An industry-by-industry TBL-LCA model has been used forpavement analysis. Then, a vector of total sustainability im-pacts is formulated as follows:
r ¼ Edir I−DBð Þ−1h i
f ð1Þ
In Eq. 1, r is the total impacts vector that represents totalsustainability impacts per unit of final demand, and Edir
represents a diagonal matrix, which accounts for the directsustainability impact per dollar of output, I refers to theidentity matrix, and f is the total final demand vector forcommodities produced by industries. In addition, B is theinput requirements for products per unit of output of anindustry matrix, and D is the market-share matrix. Also, the
term [(I-DB)−1] represents the total requirement matrix, whichis also known as the Leontief inverse and DB is the directrequirement matrix, which is denoted as A matrix in theLeontief’s model (Miller and Blair 2009). For more explana-tion about the integration of the supply and use tables intoindustry-by-industry input–output model and calculation ofthe net sustainability impacts, please see the reference paperpublished by Kucukvar and Tatari (2013).
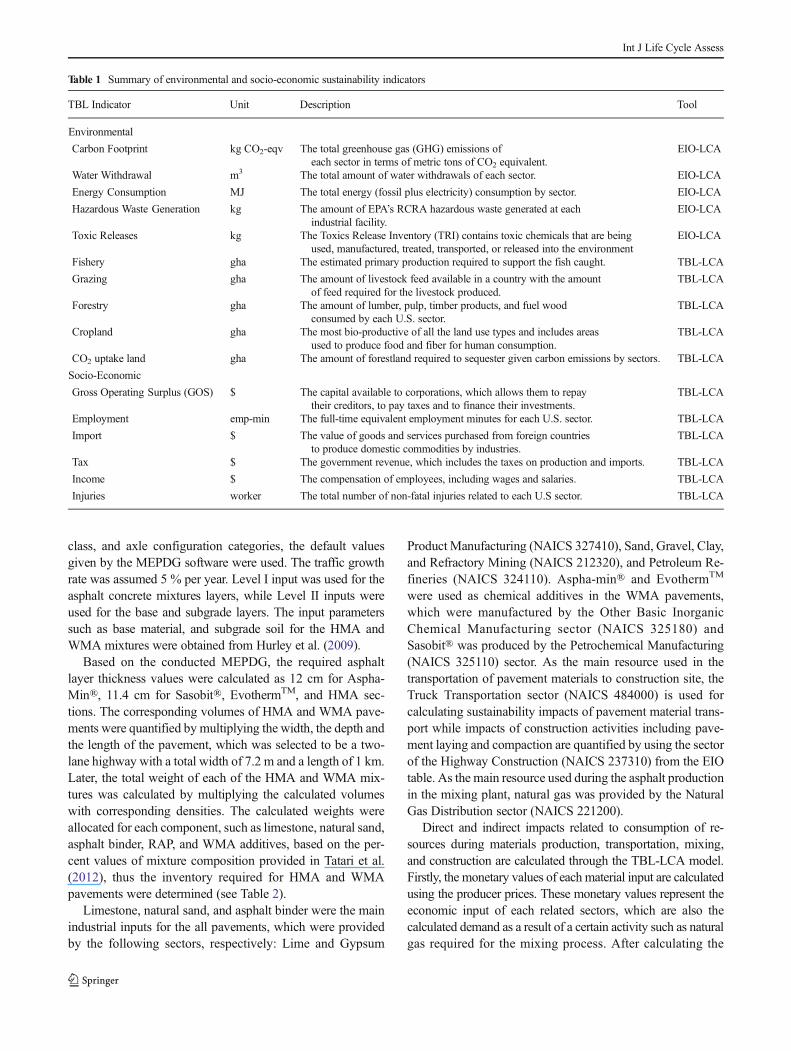
2.2 Sustainability indicators
In this paper, the purpose is to develop a comprehensive EIObased sustainability accounting framework. Therefore, severalindicators are intended to be used. The summary of the select-ed sustainability indicators are provided in Table 1 with de-tails. These sustainability indicators are used as multipliers inthe EIO framework to quantify each of the 426 sectors’sustainability impacts. To obtain the aforementioned multi-pliers, several publicly available data sources including Bu-reau of Economic Analysis (BEA—Bureau of EconomicAnalysis 2002), Energy Information Administration (EIA2011), Bureau of Labor Statistics (BLS—Bureau of LaborStatistics 2002), Global Footprint Network (GFN 2010), andCarnegie Mellon’s EIO-LCA software (CMU 2002) are uti-lized (For a more detailed explanation of the indicator selec-tion, see Kucukvar and Tatari (2013).
2.3 Pavement design and life cycle inventory
In this paper, four pavement sections were designed consider-ing intermediate traffic volume and a generic design structure,which consisted of an asphalt surface layer and a base courselayer. In terms of the thickness of the base course layer, 25 cmwas taken as reference value for all four sections. In thesurface layer of the first three sections, Aspha-Min®,Sasobit®, and EvothermTM WMA mixtures were used. Onthe other hand, a conventional HMA mixture was used in thefourth section (see Tatari et al. (2012) for more informationabout the properties of HMA and WMA mixtures). TheMechanistic Empirical Pavement Design Guide (MEPDG)software was used to conduct the pavement analyses. Duringthe pavement analyses, the thickness of the asphalt layer thatis required for each section to have an international roughnessindex (IRI) value of 433 cm/km at the end of the design periodwas determined. In this context, the IRI is the terminal valuerecommended by the Federal Highway Administration(FHWA) and used in the MEPDG (FHWA 1998).
The basic assumptions made are as follows. A 30-yeardesign period was used during the pavement analysis. Theinitial two-way average annual daily truck traffic (AADTT)was assumed to be 2,000 vehicles/day considering 50% trucksin the design direction and 95 % trucks in the design lane. Forthe vehicle class distribution, number of axles per truck of each
Int J Life Cycle Assess
class, and axle configuration categories, the default valuesgiven by the MEPDG software were used. The traffic growthrate was assumed 5 % per year. Level I input was used for theasphalt concrete mixtures layers, while Level II inputs wereused for the base and subgrade layers. The input parameterssuch as base material, and subgrade soil for the HMA andWMA mixtures were obtained from Hurley et al. (2009).
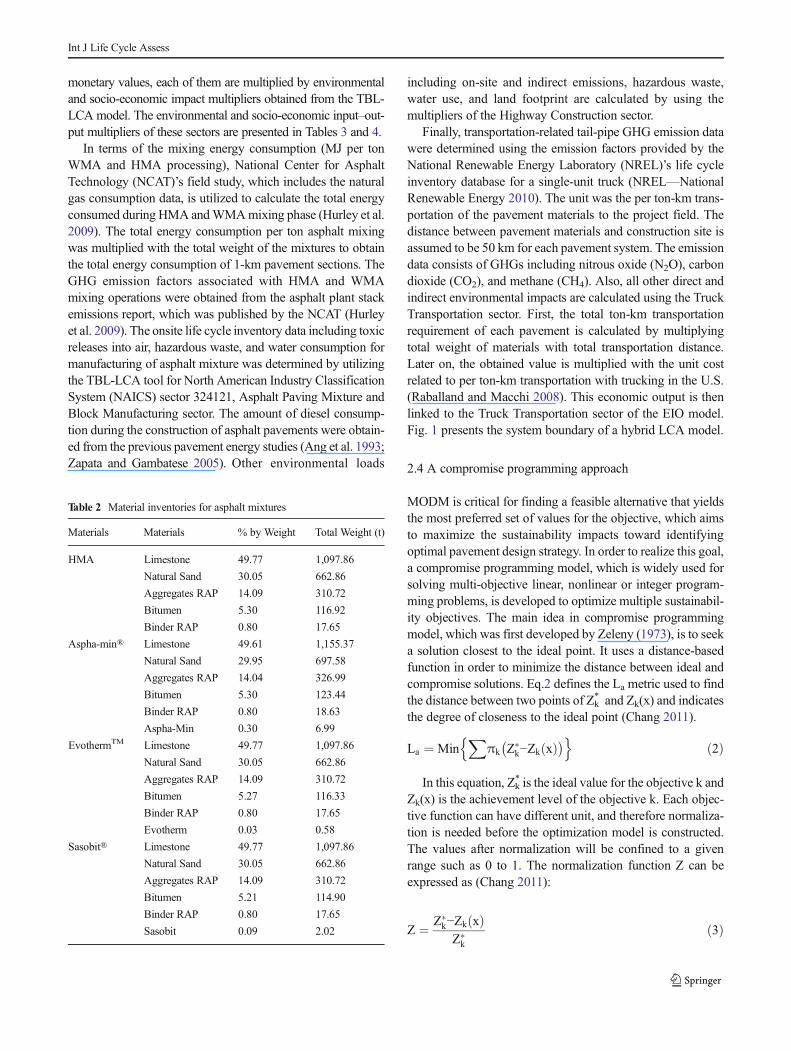
Based on the conducted MEPDG, the required asphaltlayer thickness values were calculated as 12 cm for Aspha-Min®, 11.4 cm for Sasobit®, EvothermTM, and HMA sec-tions. The corresponding volumes of HMA and WMA pave-ments were quantified by multiplying the width, the depth andthe length of the pavement, which was selected to be a two-lane highway with a total width of 7.2 m and a length of 1 km.Later, the total weight of each of the HMA and WMA mix-tures was calculated by multiplying the calculated volumeswith corresponding densities. The calculated weights wereallocated for each component, such as limestone, natural sand,asphalt binder, RAP, and WMA additives, based on the per-cent values of mixture composition provided in Tatari et al.(2012), thus the inventory required for HMA and WMApavements were determined (see Table 2).
Limestone, natural sand, and asphalt binder were the mainindustrial inputs for the all pavements, which were providedby the following sectors, respectively: Lime and Gypsum
Product Manufacturing (NAICS 327410), Sand, Gravel, Clay,and Refractory Mining (NAICS 212320), and Petroleum Re-fineries (NAICS 324110). Aspha-min® and EvothermTM
were used as chemical additives in the WMA pavements,which were manufactured by the Other Basic InorganicChemical Manufacturing sector (NAICS 325180) andSasobit® was produced by the Petrochemical Manufacturing(NAICS 325110) sector. As the main resource used in thetransportation of pavement materials to construction site, theTruck Transportation sector (NAICS 484000) is used forcalculating sustainability impacts of pavement material trans-port while impacts of construction activities including pave-ment laying and compaction are quantified by using the sectorof the Highway Construction (NAICS 237310) from the EIOtable. As the main resource used during the asphalt productionin the mixing plant, natural gas was provided by the NaturalGas Distribution sector (NAICS 221200).
Direct and indirect impacts related to consumption of re-sources during materials production, transportation, mixing,and construction are calculated through the TBL-LCA model.Firstly, the monetary values of each material input are calculatedusing the producer prices. These monetary values represent theeconomic input of each related sectors, which are also thecalculated demand as a result of a certain activity such as naturalgas required for the mixing process. After calculating the
Table 1 Summary of environmental and socio-economic sustainability indicators
TBL Indicator Unit Description Tool
Environmental
Carbon Footprint kg CO2-eqv The total greenhouse gas (GHG) emissions ofeach sector in terms of metric tons of CO2 equivalent.
EIO-LCA
Water Withdrawal m3 The total amount of water withdrawals of each sector. EIO-LCA
Energy Consumption MJ The total energy (fossil plus electricity) consumption by sector. EIO-LCA
Hazardous Waste Generation kg The amount of EPA’s RCRA hazardous waste generated at eachindustrial facility.
EIO-LCA
Toxic Releases kg The Toxics Release Inventory (TRI) contains toxic chemicals that are beingused, manufactured, treated, transported, or released into the environment
EIO-LCA
Fishery gha The estimated primary production required to support the fish caught. TBL-LCA
Grazing gha The amount of livestock feed available in a country with the amountof feed required for the livestock produced.
TBL-LCA
Forestry gha The amount of lumber, pulp, timber products, and fuel woodconsumed by each U.S. sector.
TBL-LCA
Cropland gha The most bio-productive of all the land use types and includes areasused to produce food and fiber for human consumption.
TBL-LCA
CO2 uptake land gha The amount of forestland required to sequester given carbon emissions by sectors. TBL-LCA
Socio-Economic
Gross Operating Surplus (GOS) $ The capital available to corporations, which allows them to repaytheir creditors, to pay taxes and to finance their investments.
TBL-LCA
Employment emp-min The full-time equivalent employment minutes for each U.S. sector. TBL-LCA
Import $ The value of goods and services purchased from foreign countriesto produce domestic commodities by industries.
TBL-LCA
Tax $ The government revenue, which includes the taxes on production and imports. TBL-LCA
Income $ The compensation of employees, including wages and salaries. TBL-LCA
Injuries worker The total number of non-fatal injuries related to each U.S sector. TBL-LCA
Int J Life Cycle Assess
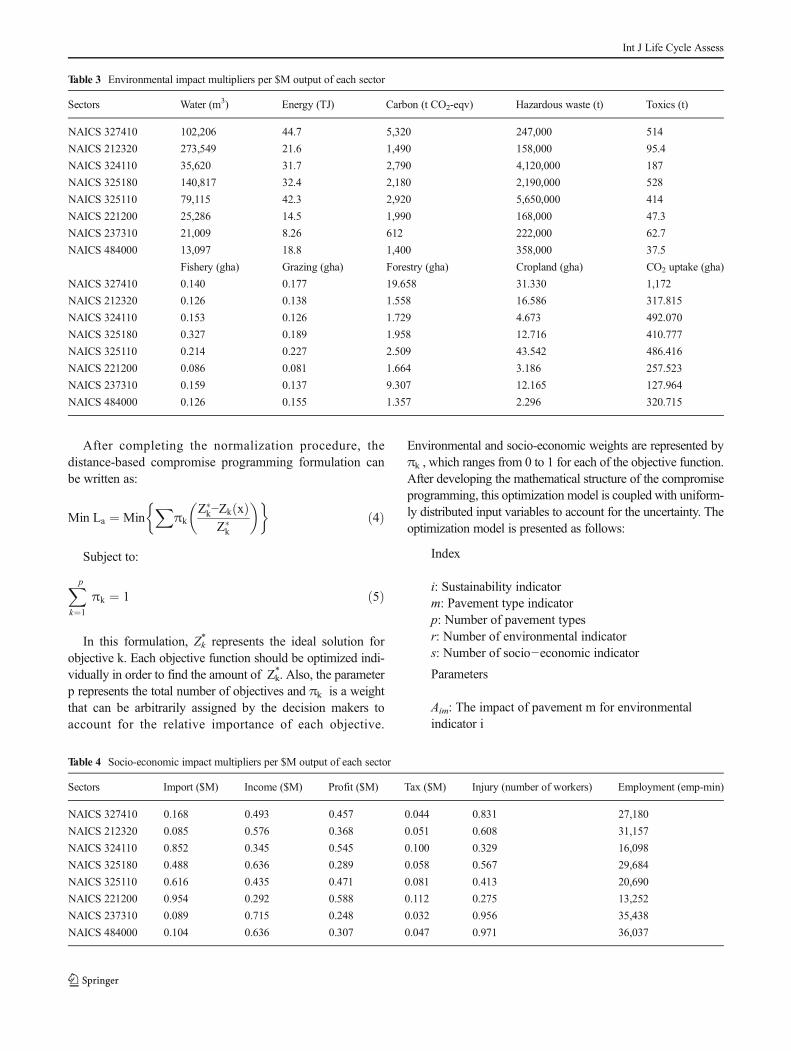
monetary values, each of them are multiplied by environmentaland socio-economic impact multipliers obtained from the TBL-LCA model. The environmental and socio-economic input–out-put multipliers of these sectors are presented in Tables 3 and 4.
In terms of the mixing energy consumption (MJ per tonWMA and HMA processing), National Center for AsphaltTechnology (NCAT)’s field study, which includes the naturalgas consumption data, is utilized to calculate the total energyconsumed during HMA andWMAmixing phase (Hurley et al.2009). The total energy consumption per ton asphalt mixingwas multiplied with the total weight of the mixtures to obtainthe total energy consumption of 1-km pavement sections. TheGHG emission factors associated with HMA and WMAmixing operations were obtained from the asphalt plant stackemissions report, which was published by the NCAT (Hurleyet al. 2009). The onsite life cycle inventory data including toxicreleases into air, hazardous waste, and water consumption formanufacturing of asphalt mixture was determined by utilizingthe TBL-LCA tool for North American Industry ClassificationSystem (NAICS) sector 324121, Asphalt Paving Mixture andBlock Manufacturing sector. The amount of diesel consump-tion during the construction of asphalt pavements were obtain-ed from the previous pavement energy studies (Ang et al. 1993;Zapata and Gambatese 2005). Other environmental loads
including on-site and indirect emissions, hazardous waste,water use, and land footprint are calculated by using themultipliers of the Highway Construction sector.
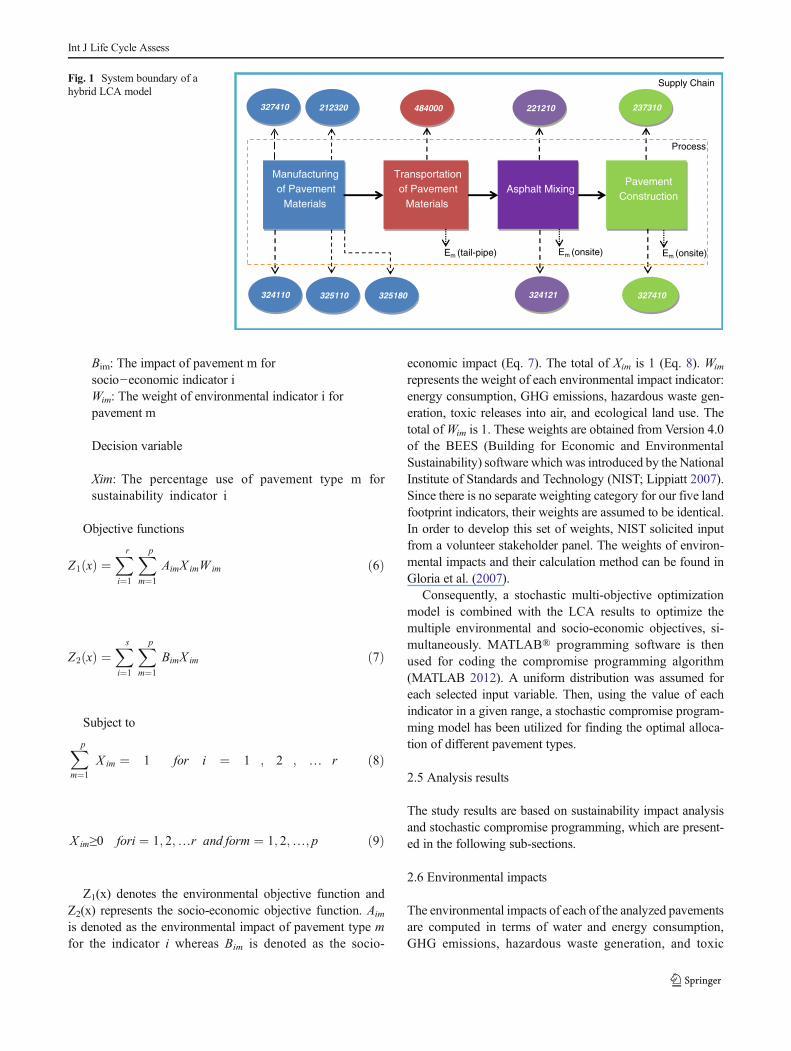
Finally, transportation-related tail-pipe GHG emission datawere determined using the emission factors provided by theNational Renewable Energy Laboratory (NREL)’s life cycleinventory database for a single-unit truck (NREL—NationalRenewable Energy 2010). The unit was the per ton-km trans-portation of the pavement materials to the project field. Thedistance between pavement materials and construction site isassumed to be 50 km for each pavement system. The emissiondata consists of GHGs including nitrous oxide (N2O), carbondioxide (CO2), and methane (CH4). Also, all other direct andindirect environmental impacts are calculated using the TruckTransportation sector. First, the total ton-km transportationrequirement of each pavement is calculated by multiplyingtotal weight of materials with total transportation distance.Later on, the obtained value is multiplied with the unit costrelated to per ton-km transportation with trucking in the U.S.(Raballand and Macchi 2008). This economic output is thenlinked to the Truck Transportation sector of the EIO model.Fig. 1 presents the system boundary of a hybrid LCA model.
2.4 A compromise programming approach
MODM is critical for finding a feasible alternative that yieldsthe most preferred set of values for the objective, which aimsto maximize the sustainability impacts toward identifyingoptimal pavement design strategy. In order to realize this goal,a compromise programming model, which is widely used forsolving multi-objective linear, nonlinear or integer program-ming problems, is developed to optimize multiple sustainabil-ity objectives. The main idea in compromise programmingmodel, which was first developed by Zeleny (1973), is to seeka solution closest to the ideal point. It uses a distance-basedfunction in order to minimize the distance between ideal andcompromise solutions. Eq.2 defines the La metric used to findthe distance between two points of Zk
* and Zk(x) and indicatesthe degree of closeness to the ideal point (Chang 2011).
La ¼ MinX
πk Z�k−Zk xð Þ� �n o
ð2Þ
In this equation, Zk* is the ideal value for the objective k and
Zk(x) is the achievement level of the objective k. Each objec-tive function can have different unit, and therefore normaliza-tion is needed before the optimization model is constructed.The values after normalization will be confined to a givenrange such as 0 to 1. The normalization function Z can beexpressed as (Chang 2011):
Z ¼ Z�k−Zk xð ÞZ�k
ð3Þ
Table 2 Material inventories for asphalt mixtures
Materials Materials % by Weight Total Weight (t)
HMA Limestone 49.77 1,097.86
Natural Sand 30.05 662.86
Aggregates RAP 14.09 310.72
Bitumen 5.30 116.92
Binder RAP 0.80 17.65
Aspha-min® Limestone 49.61 1,155.37
Natural Sand 29.95 697.58
Aggregates RAP 14.04 326.99
Bitumen 5.30 123.44
Binder RAP 0.80 18.63
Aspha-Min 0.30 6.99
EvothermTM Limestone 49.77 1,097.86
Natural Sand 30.05 662.86
Aggregates RAP 14.09 310.72
Bitumen 5.27 116.33
Binder RAP 0.80 17.65
Evotherm 0.03 0.58
Sasobit® Limestone 49.77 1,097.86
Natural Sand 30.05 662.86
Aggregates RAP 14.09 310.72
Bitumen 5.21 114.90
Binder RAP 0.80 17.65
Sasobit 0.09 2.02
Int J Life Cycle Assess
After completing the normalization procedure, thedistance-based compromise programming formulation canbe written as:
Min La ¼ MinX
πkZ�k−Zk xð ÞZ�k
� �� �ð4Þ
Subject to:
Xk¼1
p
πk ¼ 1 ð5Þ
In this formulation, Zk* represents the ideal solution for
objective k. Each objective function should be optimized indi-vidually in order to find the amount of Zk
*. Also, the parameterp represents the total number of objectives and πk is a weightthat can be arbitrarily assigned by the decision makers toaccount for the relative importance of each objective.
Environmental and socio-economic weights are represented byπk , which ranges from 0 to 1 for each of the objective function.After developing the mathematical structure of the compromiseprogramming, this optimization model is coupled with uniform-ly distributed input variables to account for the uncertainty. Theoptimization model is presented as follows:
Index
i: Sustainability indicatorm: Pavement type indicatorp: Number of pavement typesr: Number of environmental indicators: Number of socio−economic indicator
Parameters
Aim: The impact of pavement m for environmentalindicator i
Table 3 Environmental impact multipliers per $M output of each sector
Sectors Water (m3) Energy (TJ) Carbon (t CO2-eqv) Hazardous waste (t) Toxics (t)
NAICS 327410 102,206 44.7 5,320 247,000 514
NAICS 212320 273,549 21.6 1,490 158,000 95.4
NAICS 324110 35,620 31.7 2,790 4,120,000 187
NAICS 325180 140,817 32.4 2,180 2,190,000 528
NAICS 325110 79,115 42.3 2,920 5,650,000 414
NAICS 221200 25,286 14.5 1,990 168,000 47.3
NAICS 237310 21,009 8.26 612 222,000 62.7
NAICS 484000 13,097 18.8 1,400 358,000 37.5
Fishery (gha) Grazing (gha) Forestry (gha) Cropland (gha) CO2 uptake (gha)
NAICS 327410 0.140 0.177 19.658 31.330 1,172
NAICS 212320 0.126 0.138 1.558 16.586 317.815
NAICS 324110 0.153 0.126 1.729 4.673 492.070
NAICS 325180 0.327 0.189 1.958 12.716 410.777
NAICS 325110 0.214 0.227 2.509 43.542 486.416
NAICS 221200 0.086 0.081 1.664 3.186 257.523
NAICS 237310 0.159 0.137 9.307 12.165 127.964
NAICS 484000 0.126 0.155 1.357 2.296 320.715
Table 4 Socio-economic impact multipliers per $M output of each sector
Sectors Import ($M) Income ($M) Profit ($M) Tax ($M) Injury (number of workers) Employment (emp-min)
NAICS 327410 0.168 0.493 0.457 0.044 0.831 27,180
NAICS 212320 0.085 0.576 0.368 0.051 0.608 31,157
NAICS 324110 0.852 0.345 0.545 0.100 0.329 16,098
NAICS 325180 0.488 0.636 0.289 0.058 0.567 29,684
NAICS 325110 0.616 0.435 0.471 0.081 0.413 20,690
NAICS 221200 0.954 0.292 0.588 0.112 0.275 13,252
NAICS 237310 0.089 0.715 0.248 0.032 0.956 35,438
NAICS 484000 0.104 0.636 0.307 0.047 0.971 36,037
Int J Life Cycle Assess
Bim: The impact of pavement m forsocio−economic indicator iWim: The weight of environmental indicator i forpavement m
Decision variable
Xim: The percentage use of pavement type m forsustainability indicator i
Objective functions
Z1 xð Þ ¼Xi¼1
r Xm¼1
p
AimX imW im ð6Þ
Z2 xð Þ ¼Xi¼1
s Xm¼1
p
BimX im ð7Þ
Subject to
Xm¼1
p
X im ¼ 1 for i ¼ 1 ; 2 ; … r ð8Þ
X im≥0 fori ¼ 1; 2;…r and form ¼ 1; 2;…; p ð9Þ
Z1(x) denotes the environmental objective function andZ2(x) represents the socio-economic objective function. Aimis denoted as the environmental impact of pavement type mfor the indicator i whereas Bim is denoted as the socio-
economic impact (Eq. 7). The total of Xim is 1 (Eq. 8). Wim
represents the weight of each environmental impact indicator:energy consumption, GHG emissions, hazardous waste gen-eration, toxic releases into air, and ecological land use. Thetotal ofWim is 1. These weights are obtained from Version 4.0of the BEES (Building for Economic and EnvironmentalSustainability) software which was introduced by the NationalInstitute of Standards and Technology (NIST; Lippiatt 2007).Since there is no separate weighting category for our five landfootprint indicators, their weights are assumed to be identical.In order to develop this set of weights, NIST solicited inputfrom a volunteer stakeholder panel. The weights of environ-mental impacts and their calculation method can be found inGloria et al. (2007).
Consequently, a stochastic multi-objective optimizationmodel is combined with the LCA results to optimize themultiple environmental and socio-economic objectives, si-multaneously. MATLAB® programming software is thenused for coding the compromise programming algorithm(MATLAB 2012). A uniform distribution was assumed foreach selected input variable. Then, using the value of eachindicator in a given range, a stochastic compromise program-ming model has been utilized for finding the optimal alloca-tion of different pavement types.
2.5 Analysis results
The study results are based on sustainability impact analysisand stochastic compromise programming, which are present-ed in the following sub-sections.
2.6 Environmental impacts
The environmental impacts of each of the analyzed pavementsare computed in terms of water and energy consumption,GHG emissions, hazardous waste generation, and toxic
Manufacturing of Pavement
Materials
Transportation of Pavement
MaterialsAsphalt Mixing
Pavement Construction
Process
Supply Chain
Em (tail-pipe) Em (onsite)Em (onsite)
327410 212320
324110 325180
484000 237310
327410
221210
324121325110
Fig. 1 System boundary of ahybrid LCA model
Int J Life Cycle Assess
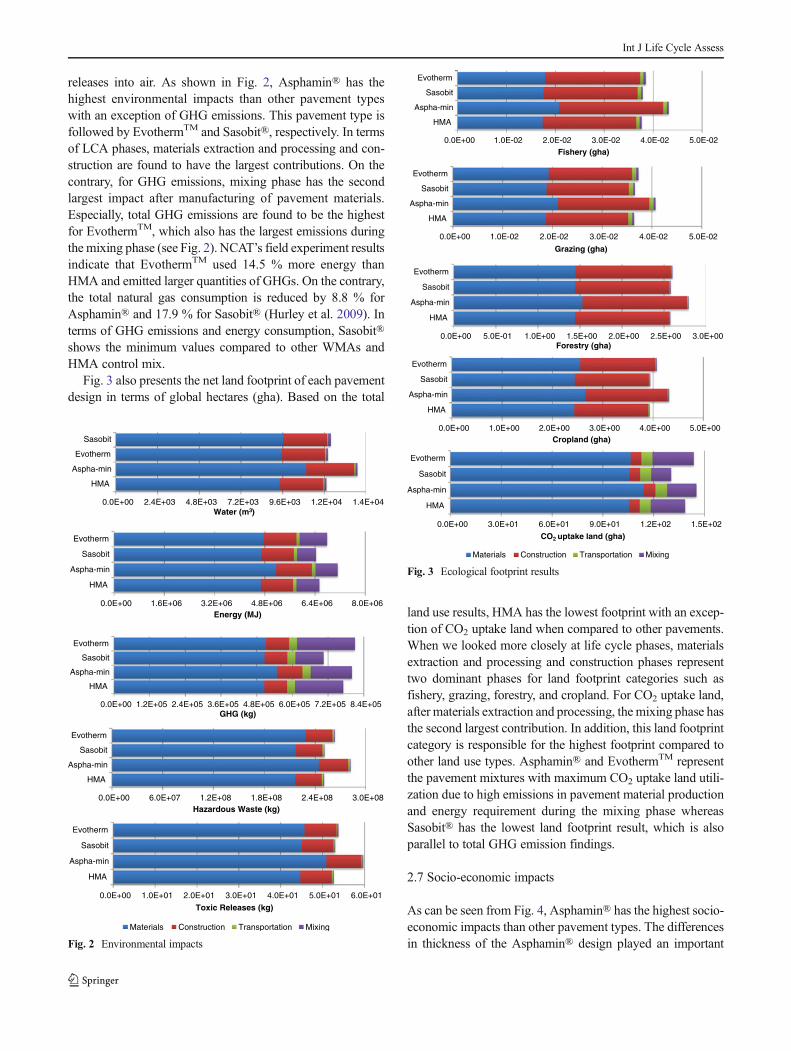
releases into air. As shown in Fig. 2, Asphamin® has thehighest environmental impacts than other pavement typeswith an exception of GHG emissions. This pavement type isfollowed by EvothermTM and Sasobit®, respectively. In termsof LCA phases, materials extraction and processing and con-struction are found to have the largest contributions. On thecontrary, for GHG emissions, mixing phase has the secondlargest impact after manufacturing of pavement materials.Especially, total GHG emissions are found to be the highestfor EvothermTM, which also has the largest emissions duringthe mixing phase (see Fig. 2). NCAT’s field experiment resultsindicate that EvothermTM used 14.5 % more energy thanHMA and emitted larger quantities of GHGs. On the contrary,the total natural gas consumption is reduced by 8.8 % forAsphamin® and 17.9 % for Sasobit® (Hurley et al. 2009). Interms of GHG emissions and energy consumption, Sasobit®shows the minimum values compared to other WMAs andHMA control mix.
Fig. 3 also presents the net land footprint of each pavementdesign in terms of global hectares (gha). Based on the total
land use results, HMA has the lowest footprint with an excep-tion of CO2 uptake land when compared to other pavements.When we looked more closely at life cycle phases, materialsextraction and processing and construction phases representtwo dominant phases for land footprint categories such asfishery, grazing, forestry, and cropland. For CO2 uptake land,after materials extraction and processing, the mixing phase hasthe second largest contribution. In addition, this land footprintcategory is responsible for the highest footprint compared toother land use types. Asphamin® and EvothermTM representthe pavement mixtures with maximum CO2 uptake land utili-zation due to high emissions in pavement material productionand energy requirement during the mixing phase whereasSasobit® has the lowest land footprint result, which is alsoparallel to total GHG emission findings.
2.7 Socio-economic impacts
As can be seen from Fig. 4, Asphamin® has the highest socio-economic impacts than other pavement types. The differencesin thickness of the Asphamin® design played an important
0.0E+00 2.4E+03 4.8E+03 7.2E+03 9.6E+03 1.2E+04 1.4E+04
HMA
Aspha-min
Evotherm
Sasobit
Water (m3)
0.0E+00 1.2E+05 2.4E+05 3.6E+05 4.8E+05 6.0E+05 7.2E+05 8.4E+05
HMA
Aspha-min
Sasobit
Evotherm
GHG (kg)
0.0E+00 6.0E+07 1.2E+08 1.8E+08 2.4E+08 3.0E+08
HMA
Aspha-min
Sasobit
Evotherm
Hazardous Waste (kg)
0.0E+00 1.0E+01 2.0E+01 3.0E+01 4.0E+01 5.0E+01 6.0E+01
HMA
Aspha-min
Sasobit
Evotherm
Toxic Releases (kg)
Materials Construction Transportation Mixing
0.0E+00 1.6E+06 3.2E+06 4.8E+06 6.4E+06 8.0E+06
HMA
Aspha-min
Sasobit
Evotherm
Energy (MJ)
Fig. 2 Environmental impacts
0.0E+00 1.0E-02 2.0E-02 3.0E-02 4.0E-02 5.0E-02
HMA
Aspha-min
Sasobit
Evotherm
Fishery (gha)
0.0E+00 1.0E-02 2.0E-02 3.0E-02 4.0E-02 5.0E-02
HMA
Aspha-min
Sasobit
Evotherm
Grazing (gha)
0.0E+00 5.0E-01 1.0E+00 1.5E+00 2.0E+00 2.5E+00 3.0E+00
HMA
Aspha-min
Sasobit
Evotherm
Forestry (gha)
0.0E+00 1.0E+00 2.0E+00 3.0E+00 4.0E+00 5.0E+00
HMA
Aspha-min
Sasobit
Evotherm
Cropland (gha)
0.0E+00 3.0E+01 6.0E+01 9.0E+01 1.2E+02 1.5E+02
HMA
Aspha-min
Sasobit
Evotherm
CO2 uptake land (gha)
Materials Construction Transportation Mixing
Fig. 3 Ecological footprint results
Int J Life Cycle Assess
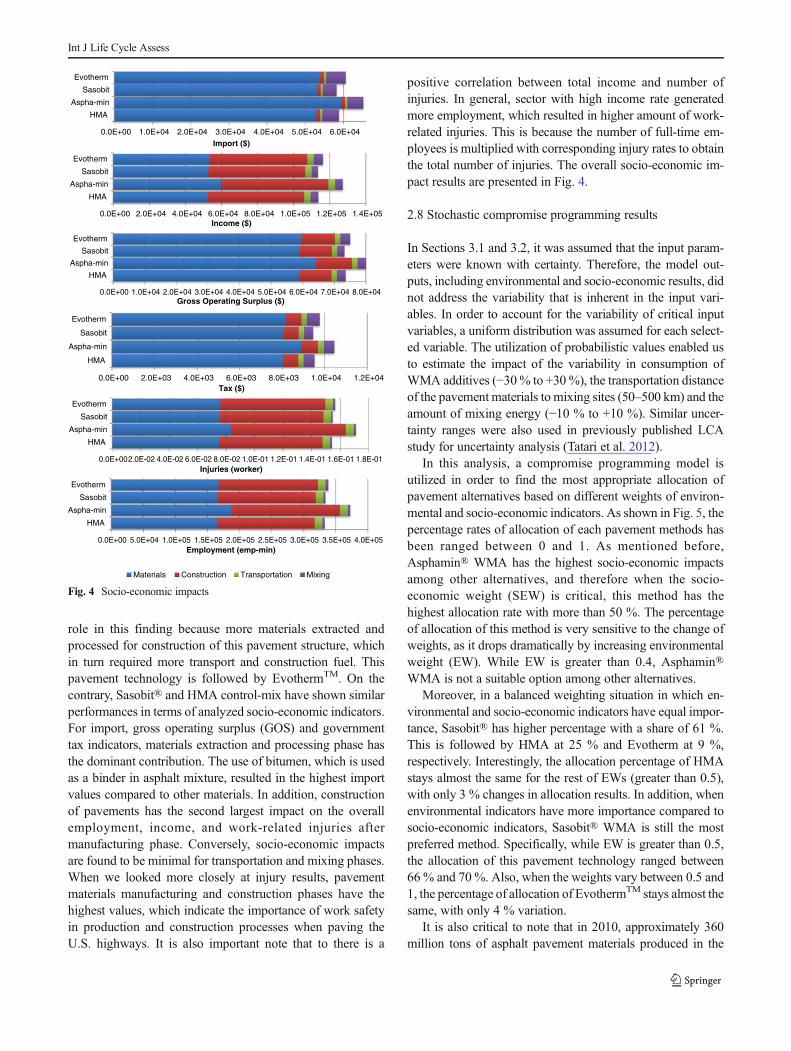
role in this finding because more materials extracted andprocessed for construction of this pavement structure, whichin turn required more transport and construction fuel. Thispavement technology is followed by EvothermTM. On thecontrary, Sasobit® and HMA control-mix have shown similarperformances in terms of analyzed socio-economic indicators.For import, gross operating surplus (GOS) and governmenttax indicators, materials extraction and processing phase hasthe dominant contribution. The use of bitumen, which is usedas a binder in asphalt mixture, resulted in the highest importvalues compared to other materials. In addition, constructionof pavements has the second largest impact on the overallemployment, income, and work-related injuries aftermanufacturing phase. Conversely, socio-economic impactsare found to be minimal for transportation and mixing phases.When we looked more closely at injury results, pavementmaterials manufacturing and construction phases have thehighest values, which indicate the importance of work safetyin production and construction processes when paving theU.S. highways. It is also important note that to there is a
positive correlation between total income and number ofinjuries. In general, sector with high income rate generatedmore employment, which resulted in higher amount of work-related injuries. This is because the number of full-time em-ployees is multiplied with corresponding injury rates to obtainthe total number of injuries. The overall socio-economic im-pact results are presented in Fig. 4.
2.8 Stochastic compromise programming results
In Sections 3.1 and 3.2, it was assumed that the input param-eters were known with certainty. Therefore, the model out-puts, including environmental and socio-economic results, didnot address the variability that is inherent in the input vari-ables. In order to account for the variability of critical inputvariables, a uniform distribution was assumed for each select-ed variable. The utilization of probabilistic values enabled usto estimate the impact of the variability in consumption ofWMA additives (−30% to +30%), the transportation distanceof the pavement materials to mixing sites (50–500 km) and theamount of mixing energy (−10 % to +10 %). Similar uncer-tainty ranges were also used in previously published LCAstudy for uncertainty analysis (Tatari et al. 2012).
In this analysis, a compromise programming model isutilized in order to find the most appropriate allocation ofpavement alternatives based on different weights of environ-mental and socio-economic indicators. As shown in Fig. 5, thepercentage rates of allocation of each pavement methods hasbeen ranged between 0 and 1. As mentioned before,Asphamin® WMA has the highest socio-economic impactsamong other alternatives, and therefore when the socio-economic weight (SEW) is critical, this method has thehighest allocation rate with more than 50 %. The percentageof allocation of this method is very sensitive to the change ofweights, as it drops dramatically by increasing environmentalweight (EW). While EW is greater than 0.4, Asphamin®WMA is not a suitable option among other alternatives.
Moreover, in a balanced weighting situation in which en-vironmental and socio-economic indicators have equal impor-tance, Sasobit® has higher percentage with a share of 61 %.This is followed by HMA at 25 % and Evotherm at 9 %,respectively. Interestingly, the allocation percentage of HMAstays almost the same for the rest of EWs (greater than 0.5),with only 3 % changes in allocation results. In addition, whenenvironmental indicators have more importance compared tosocio-economic indicators, Sasobit® WMA is still the mostpreferred method. Specifically, while EW is greater than 0.5,the allocation of this pavement technology ranged between66 % and 70 %. Also, when the weights vary between 0.5 and1, the percentage of allocation of EvothermTM stays almost thesame, with only 4 % variation.
It is also critical to note that in 2010, approximately 360million tons of asphalt pavement materials produced in the
0.0E+00 1.0E+04 2.0E+04 3.0E+04 4.0E+04 5.0E+04 6.0E+04
HMA
Aspha-min
Sasobit
Evotherm
Import ($)
0.0E+00 2.0E+04 4.0E+04 6.0E+04 8.0E+04 1.0E+05 1.2E+05 1.4E+05
HMA
Aspha-min
Sasobit
Evotherm
Income ($)
0.0E+00 1.0E+04 2.0E+04 3.0E+04 4.0E+04 5.0E+04 6.0E+04 7.0E+04 8.0E+04
HMA
Aspha-min
Sasobit
Evotherm
Gross Operating Surplus ($)
0.0E+00 2.0E+03 4.0E+03 6.0E+03 8.0E+03 1.0E+04 1.2E+04
HMA
Aspha-min
Sasobit
Evotherm
Tax ($)
0.0E+002.0E-02 4.0E-02 6.0E-02 8.0E-02 1.0E-01 1.2E-01 1.4E-01 1.6E-01 1.8E-01
HMA
Aspha-min
Sasobit
Evotherm
Injuries (worker)
0.0E+00 5.0E+04 1.0E+05 1.5E+05 2.0E+05 2.5E+05 3.0E+05 3.5E+05 4.0E+05
HMA
Aspha-min
Sasobit
Evotherm
Employment (emp-min)
Materials Construction Transportation Mixing
Fig. 4 Socio-economic impacts
Int J Life Cycle Assess
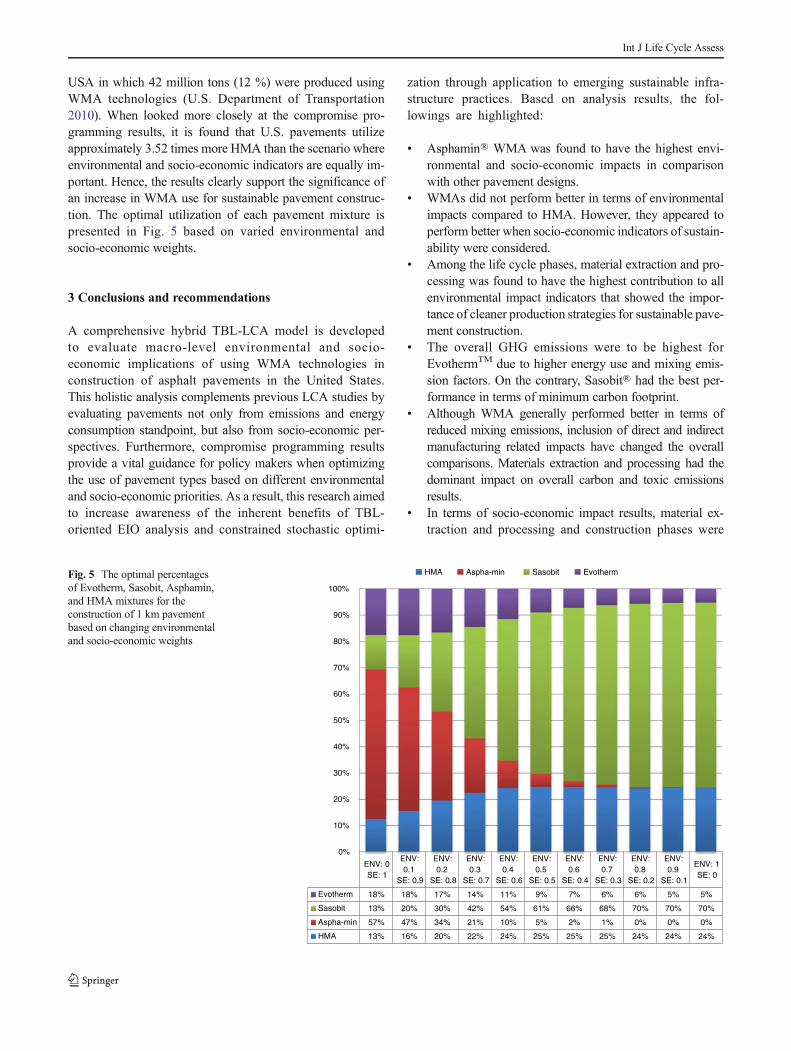
USA in which 42 million tons (12 %) were produced usingWMA technologies (U.S. Department of Transportation2010). When looked more closely at the compromise pro-gramming results, it is found that U.S. pavements utilizeapproximately 3.52 times more HMA than the scenario whereenvironmental and socio-economic indicators are equally im-portant. Hence, the results clearly support the significance ofan increase in WMA use for sustainable pavement construc-tion. The optimal utilization of each pavement mixture ispresented in Fig. 5 based on varied environmental andsocio-economic weights.
3 Conclusions and recommendations
A comprehensive hybrid TBL-LCA model is developedto evaluate macro-level environmental and socio-economic implications of using WMA technologies inconstruction of asphalt pavements in the United States.This holistic analysis complements previous LCA studies byevaluating pavements not only from emissions and energyconsumption standpoint, but also from socio-economic per-spectives. Furthermore, compromise programming resultsprovide a vital guidance for policy makers when optimizingthe use of pavement types based on different environmentaland socio-economic priorities. As a result, this research aimedto increase awareness of the inherent benefits of TBL-oriented EIO analysis and constrained stochastic optimi-
zation through application to emerging sustainable infra-structure practices. Based on analysis results, the fol-lowings are highlighted:
& Asphamin® WMA was found to have the highest envi-ronmental and socio-economic impacts in comparisonwith other pavement designs.
& WMAs did not perform better in terms of environmentalimpacts compared to HMA. However, they appeared toperform better when socio-economic indicators of sustain-ability were considered.
& Among the life cycle phases, material extraction and pro-cessing was found to have the highest contribution to allenvironmental impact indicators that showed the impor-tance of cleaner production strategies for sustainable pave-ment construction.
& The overall GHG emissions were to be highest forEvothermTM due to higher energy use and mixing emis-sion factors. On the contrary, Sasobit® had the best per-formance in terms of minimum carbon footprint.
& Although WMA generally performed better in terms ofreduced mixing emissions, inclusion of direct and indirectmanufacturing related impacts have changed the overallcomparisons. Materials extraction and processing had thedominant impact on overall carbon and toxic emissionsresults.
& In terms of socio-economic impact results, material ex-traction and processing and construction phases were
ENV: 0SE: 1
ENV:0.1
SE: 0.9
ENV:0.2
SE: 0.8
ENV:0.3
SE: 0.7
ENV:0.4
SE: 0.6
ENV:0.5
SE: 0.5
ENV:0.6
SE: 0.4
ENV:0.7
SE: 0.3
ENV:0.8
SE: 0.2
ENV:0.9
SE: 0.1
ENV: 1SE: 0
Evotherm 18% 18% 17% 14% 11% 9% 7% 6% 6% 5% 5%
Sasobit 13% 20% 30% 42% 54% 61% 66% 68% 70% 70% 70%
Aspha-min 57% 47% 34% 21% 10% 5% 2% 1% 0% 0% 0%
HMA 13% 16% 20% 22% 24% 25% 25% 25% 24% 24% 24%
0%
10%
20%
30%
40%
50%
60%
70%
80%
90%
100%
HMA Aspha-min Sasobit EvothermFig. 5 The optimal percentagesof Evotherm, Sasobit, Asphamin,and HMA mixtures for theconstruction of 1 km pavementbased on changing environmentaland socio-economic weights
Int J Life Cycle Assess
found to have the largest contributions when compared tomixing and transportation of pavement materials.
& Stochastic compromise programming results also indicatethat when environmental indicators have more impor-tance, Sasobit® is favored. On the other hand, if onlysocio-economic aspects were considered, Asphamin®WMA had the highest percentage of allocation comparedto other WMA types.
& In a balanced weighting scenario where environmentaland socio-economic weights were equal (EW, 50 %;SEW, 50 %), Sasobit® was allocated at 61 %, HMA at25 %, and EvothermTM at 9 %. In all the cases, HMAmixture was also allocated that is ranging from 13 % to24 %.
& When considering current HMA consumption amounts inthe U.S. highways, it is likely to conclude that there is astrong need on increasing the percentage share of WMAmixtures in order to achieve more balanced sustainabilityperformance goals for future. This policy recommenda-tion is proven by the optimization model findings.
& The main lesson learnt from this study is that even thoughmixing phase is important, it should not be the onlycriteria to evaluate the overall sustainability performanceof WMA and HMA pavements. The supply chain, whichincludes the contribution of all indirect economic sectorsfor materials extraction and processing, is also critical for amore holistic analysis. In addition, extending the systemboundary by considering the interactions between U.S.sectors helps us to capture all indirect impacts that mightminimize errors related to using narrow system boundariesfor impact analysis.
Although a hybrid TBL-LCA model is developed, uncer-tainty in the LCA results and limitations of the current EIOmethod should be taken into account by decision makers. Thefirst is that, this paper used a single-nation input–output modelrather than a global multi-regional input–output (MRIO)framework. Hence, current results have some important un-certainties related to using domestic technology assumptionfor imported materials. Current input–output model can beextended beyond the boundary of the U.S. economy to ac-count for the global impacts of the pavement construction byconsidering the role of the imported products such as bitumen,fuels, and WMA additives. The importance of using MRIOmodels can be found in the literature (Hertwich and Peters2009; Kanemoto et al. 2011; Tukker et al. 2009).
While the current work used a high-resolution U.S. supplyand use tables (discerning 426 sectors), there is aggregation-related uncertainties in the final results since several subsec-tors are evaluated under the same main sector. These uncer-tainties can be minimized by using more specific processinventory data for products analyzed under highly aggregatedsector like chemical product manufacturing. Another
important limitation was also related to transportation becausecurrent paper used the truck transportation sector to calculatesustainability impacts of pavement material transport. Trucktransportation is a very non-homogeneous service sector thatcomprises several establishments primarily engaged in pro-viding general freight. The detailed LCA of freight transpor-tation by modes is critical and can be found in the literature(Facanha and Horvath 2007).
Inevitably, variability ranges chosen for mixing energy,transportation distance, and WMA additive consumption arealso subject to uncertainties. With changing variability ranges,MODM model might give different results for the allocationof WMAs. Furthermore, another greatest weakness ofMODM model is the subjectivity of the weighting step thatis needed to value the different environmental impact catego-ries. Although weighting is widely used in LCA, theweighting stage is the least developed of the impact assess-ment steps which can be improved by using multi-criteriaevaluation techniques such as panel methods or AHP(Hermann et al. 2007; Gloria et al. 2007). For future research,authors also suggest to evaluate other WMA technologiessuch as Synthetic Zeolite and WAM-Foam as more sustain-ability indicators become readily available using moreprocess-specific life cycle inventory data.
References
Ang B, Fwa T, Ng T (1993) Analysis of process energy use of asphalt-mixing plants. Energ 18(7):769–777
BEA (Bureau of Economic Analysis) (2002) Benchmark input–outputdata. U.S. Bureau of Economic Analysis. Retrieved from <http://www.bea.gov/industry/io_benchmark.htm> Accessed 15 March2013
BLS (Bureau of Labor Statistics) (2002) Industry injury and illness data.Retrieved from <http://www.bls.gov/iif/oshsum.htm>. Accessed 15March 2013
Bengtsson M (2001) Weighting in practice. Implications for the use oflife‐cycle assessment in decision‐making. J Ind Ecol 4:47–60
Boufateh I, Perwuelz A, Rabenasolo B, Jolly-Desodt AM (2011)Multiplecriteria decision-making for environmental impacts optimization. IntJ Bus Perf Supp Chain Model 3(1):28–42
Cas D, Mukherjee A (2011) Calculation of greenhouse gas emissions forhighway construction operations by using a hybrid life-cycle assess-ment approach: case study for pavement operations. J Constr EngManage 137(11):1015–1025
Casifo S, Di Graziano A, Kerali HR, Odoki JB (2002) Multicriteriaanalysis method for pavement maintenance management. TranspTes Rec J Transp Res Board 1816:73–84
Chang NB (2011) Systems analysis for sustainable engineering.McGraw-Hill Professional Publishing, New Jersey, p 655
Chowdhury A, Button JW (2008) A Review of Warm Mix Asphalt.College Station, Texas, p 75
CMU (2002) EIO-LCA (Economic Input-Output Life CycleAssessment). http://www.eiolca.net/cgibin/dft/display.pl. Accessed15 February 2013
Int J Life Cycle Assess
Egilmez G, Kucukvar M, Tatari O (2013) Sustainability assessment ofU.S. manufacturing sectors: an economic input output-based frontierapproach. J Clean Prod 53:91–102
Elkington J (1998) Partnerships from cannibals with forks: the triplebottom line of 21st‐century business. J Environ Qual Manage 8(1):37–51
Ellis JB, Deutsch JC, Mouchel JM, Scholes L, Revitt M (2004)Multicriteria decision approaches to support sustainable drainageoptions for the treatment of highway and urban runoff. Sci Total Env334:251–260
Eurostat manual of supply, use and input–output tables (2008)Luxembourg
Facanha C, Horvath A (2007) Evaluation of life-cycle air emissionfactors of freight transportation. Environ Sci Technol 41(20):7138–7144
FHWA (1998) Life-cycle cost analysis in pavement design - PavementDivision Interim Technical Bulletin
Figueira J, Greco S, Ehrgott M (2005) Multiple criteria decision analysis:state of the art surveys, vol 78. Springer, New York
Filippo S, Martins Ribeiro PC, Kahn Ribeiro S (2007) A fuzzy multi-criteria model applied to the management of the environmentalrestoration of paved highways. Transp Res Part D Transp Env12(6):423–436
Finkbeiner M, Schau EM, Lehmann A, Traverso M (2010) Towards lifecycle sustainability assessment. Sustain 2(10):3309–3322
Finnveden G (1997) Valuation methods within LCA – where are thevalues? Int J Life Cycle Assess 2:163–169
Foran B, Lenzen M, Dey C (2005a) Balancing Act: a triple-bottom-lineanalysis of the Australian economy. CSIRO, Australia, p 75
Foran B, Lenzen M, Dey C, Bilek M (2005b) Integrating sustainablechain management with triple bottom line accounting. Ecol Econ52(2):143–157
Giustozzi F, Crispino M, Flintsch G (2012) Multi-attribute life cycleassessment of preventive maintenance treatments on road pave-ments for achieving environmental sustainability. Int J Life Assess17(4):409–419
Global Footprint Network (2010) National footprint accounts: ecologicalfootprint and bio-capacity. Retrieved February 15, 2013, from http://www.footprintnetwork.org/en/index.php/GFN/page/footprint_for_nations
Gloria TP, Lippiatt BC, Cooper J (2007) Life cycle impact assessmentweights to support environmentally preferable purchasing in theUnited States. Environ Sci Technol 41(21):7551–7557
Greening LA, Bernow S (2004) Design of coordinated energy andenvironmental policies: use of multi-criteria decision-making.Energ Policy 32(6):721–735
GTAP (2008) Global Trade Analysis Project. Version 7. Department ofAgricultural Economics, Purdue University, US. Retrieved fromhttps://www.gtap.agecon.purdue.edu/databases/default.asp
Guinée JB, Heijungs R, Huppes G, Zamagni A, Masoni P, Buonamici R,Ekvall T, Rydberg T (2011) Life cycle assessment: past, present, andfuture. Environ Sci Technol 45:90–96
Hassan M (2010) Evaluation of the environmental and economic impactsof warm-mix asphalt using life-cycle assessment. Int J Constr EduRes 6(3):238–250
Hendrickson CT, Lave LB, Matthews S (2006) Environmental life cycleassessment of goods and services: an input–output approach, 1stedn. Resources for the Future, Washington DC
Hermann BG, Kroeze C, Jawjit W (2007) Assessing environmentalperformance by combining life cycle assessment, multi-criteriaanalysis and environmental performance indicators. J Clean Prod15(18):1787–1796
Hertwich EG, Peters GP (2009) Carbon footprint of nations: a global,trade-linked analysis. Environ Sci Technol 43(16):6414–6420
Highway Statistics (2010) Retrieved from http://www.fhwa.dot.gov/policyinformation/statistics/2010/vmt422.cfm
Ho W, Xu X, Dey PK (2010) Multi-criteria decision making approachesfor supplier evaluation and selection: a literature review. Euro J OperRes 202(1):16–24
Horvath A, Hendrickson C (1998) Comparison of environmental impli-cations of asphalt and steel-reinforced concrete pavements. TransRes Record 1626:105–113
Huang YA, Lenzen M, Weber CL, Murray J, Matthews HS (2009) Therole of input–output analysis for the screening of corporate carbonfootprints. Econ Syst Res 21(3):217–242
Huppes G, Koning A, Suh S, Heijungs R, Oers L, Nielsen P, Guinée JB(2006) Environmental impacts of consumption in the EuropeanUnion: high-resolution input–output tables with detailed environ-mental extensions. J Ind Ecol 10(3):129–146
Hurley GC, Prowell BD, Kvasnak AN (2009) Ohio field trial of warmmix asphalt technologies: construction summary. Auburn, AL
ISO (14042) Environmental management—life cycle assessment—lifecycle impact assessment. Geneva: International StandardOrganization
Jamshidi A, Hamzah MO, You Z (2013) Performance of warm-mixasphalt containing Sasobit®: state-of-the-art. Constr Buil Mater 38:530–553
Jullien A, Baudru Y, Tamagny P, Olard F, Zavan D (2011) A comparisonof environmental impacts of hot and half-warmmix asphalt. Routes/Roads, Belgium, p 350
Kanemoto K, Lenzen M, Peters GP, Moran D, Geschke A (2011)Frameworks for comparing emissions associated with production,consumption, and international trade. Environ Sci Technol 46(1):172–179
Kiran BA, Rao PN (2013) Life cycle assessment (LCA) andmulti-criteriadecisionmaking (MCDM) for planning, designing and commission-ing of green buildings. Int J Adv Trends in Compute Sci Eng 2(1):476–479
Klöpffer W (2008) Life cycle sustainability assessment of products. Int JLife Cycle Assess 13:89–95
Kohn JL (2010) Multiple criteria decision analysis for the selection of aland use impact method for a life cycle assessment of switchgrass asa bioenergy feedstock in the Pee Dee region of South Carolina.Doctoral dissertation, Clemson University
Kristjánsdóttir Ó, Muench ST, Michael L, Burke G (2007) Assessingpotential for warm-mix asphalt technology adoption. Trans Res RecJ Trans Res Board 2040:91–99
Kucukvar M, Tatari O (2013) Towards a triple bottom-line sustainabilityassessment of the U.S. construction industry. Int J Life Cycl Assess18(5):958–972
Kucukvar M, Tatari O (2011) A comprehensive life cycle analysis ofcofiring algae in a coal power plant as a solution for achievingsustainable energy. Energ 36(11):6352–6357
Kucukvar M, Tatari O (2012) Ecologically based hybrid life cycle anal-ysis of continuously reinforced concrete and hot-mix asphalt pave-ments. Transp Res Part D Trans Environ 17(1):86–90
Larsen O, Moen O, Robertus C, Koenders B (2004) WAM Foam asphaltproduction at lower operating temperatures as an environmentallyfriendly alternative to HMA. Proceedings of the 3rd Eurasphalt andEurobitume Congress (Vol. 1). Vienna
Lenzen M, Moran D, Kanemoto K, Foran B, Lobefaro L, Geschke A(2012) International trade drives biodiversity threats in developingnations. Nature 486(7401):109–112
Leontief W (1970) Environmental repercussions and the economic struc-ture: an input–output approach. Rev Econ Stat 52:262–271
Linkov I, Seager TP (2011) Couplingmulti-criteria decision analysis, life-cycle assessment, and risk assessment for emerging threats. EnvironSci Technol 45(12):5068–5074
Lippiatt BC (2007) BEESRG 4.0: Building for Environmental andEconomic Sustainability Technical Manual and User Guide
Liu KFR, Ko CY, Fan C, Chen CW (2012) Combining risk assessment,life cycle assessment, and multi-criteria decision analysis to estimate
Int J Life Cycle Assess
environmental aspects in environmental management system. Int JLife Cycle Assess 17(7):845–862
MATLAB (2012) Version 7.14.0. Natick. The MathWorks Inc,Massachusetts
Milani AS, Eskicioglu CK, Robles KB, Bujun K, Hosseini-Nasab H(2011) Multiple criteria decision making with life cycle assessmentfor material selection of composites. Express Polymer Lett 5(12):1062–1074
Miller RE, Blair PD (2009) Input–output analysis: foundations andextensions (2nd ed.). Cambridge, MA
NREL—National Renewable Energy Laboratory (2010) U.S. life-cycleinventory database. Retrieved March 5, 2013, from https://www.lcacommons.gov/nrel/search
OSU- The Ohio State University (2009) Eco-LCA software, ecologicallybased life cycle assessment, 1997 U.S. benchmark model.Columbus,OH
Park K, Hwang Y, Seo S, Seo H (2003) Quantitative assessment ofenvironmental impacts on life cycle of highways. J Constr EngManage 129(1):25–31
Pohekar SD, Ramachandran M (2004) Application of multi-criteria de-cision making to sustainable energy planning—A review. RenewSustain Energ Rev 8(4):365–381
Rao RV (2007) Introduction to Multiple Attribute Decision-making(MADM) Methods. Decision Making in the ManufacturingEnvironment: Using Graph Theory and Fuzzy Multiple AttributeDecision Making Methods, pp 27–41
Raballand G, Macchi P (2008) Transport prices and costs: the need torevisit donors’ policies in transport in Africa, Washington, D.C.from:ipl.econ.duke.edu/bread/papers/0809conf/Raballand.pdf
RubioMC,Martínez G, Baena L,Moreno F (2012)Warmmix asphalt: anoverview. J Clean Prod 24:76–84
Rubio MC, Moreno F, Martínez-Echevarría MJ, Martínez G, VázquezJM (2013) Comparative analysis of emissions from the manufactureand use of hot and half-warm mix asphalt. J Clean Prod 41:1–6
Santero NJ, Masanet E, Horvath A (2010) Life-cycle assessment ofpavements: a critical review of existing liteature and research.Portland Cement Association, Skokie, Illinois, USA
Santero NJ, Masanet E, Horvath A (2011) Life-cycle assessment ofpavements. Part I Crit Rev Res Conser Recy 55(9–10):801–809
Spending and Funding for Highways. (2011) (p. 8). Retrieved from http://www.cbo.gov/sites/default/files/cbofiles/ftpdocs/120xx/doc12043/01-19-highwayspending_brief.pdf
Streicher G, Stehrer H (2012)Whither Panama? Constructing a consistentand balanced world SUT system including international trade andtransport margins. 7th EU-framework project, World Input–outputDatabase: construction and applications, Vienna, Austria
Suh S, Lenzen M, Treloar GJ, Hondo H, Horvath A, Huppes G, Jolliet Oet al (2004) System boundary selection in life-cycle inventoriesusing hybrid approaches. Environ Sci Technol 38(3):657–664
Tatari O, Nazzal M, Kucukvar M (2012) Comparative sustainabilityassessment of warm-mix asphalts: a thermodynamic based hybridlife cycle analysis. Res Conser Recy 58:18–24
Traverso M, Finkbeiner M, Jørgensen A, Schneider L (2012) Life cyclesustainability dashboard. J Ind Ecol 16(5):680–688
Treloar GJ, Love PE, Crawford RH (2004) Hybrid life-cycle inventoryfor road construction and use. J Constr Eng Manage 130(1):43–49
Tukker A, Poliakov E, Heijungs R, Hawkins T, Neuwahl F, Rueda-Cantuche JM, Bouwmeester M (2009) Towards a global multi-regional environmentally extended input–output database. EcolEcon 68(7):1928–1937
UN (1999) Studies in methods: handbook of national accounting. UnitedNations Department for Economic and Social Affairs, StatisticsDivision, New York, USA
U.S. Department of Transportation (2010)Warm-mix asphalt technlogiesand research. RetrievedMarch 30, 2013, from U.S. Bureau of LaborStatistics. (2002). Industry injury and illness data. Retrieved January5, 2012, from http://www.bls.gov/iif/oshsum.htm. Accessed 30March 2013
Wachsmann U, Wood R, Lenzen M, Schaeffer R (2009) Structuraldecomposition of energy use in Brazil from 1970 to 1996. AppEnerg 86(4):578–587
Wang JJ, Jing YY, Zhang CF, Zhao JH (2009) Review on multi-criteriadecision analysis aid in sustainable energy decision-making. RenewSustain Energ Rev 13(9):2263–2278
Weber CL, Matthews HS (2007) Embodied environmental emissions inU.S. international trade, 1997–2004. Environ Sci Technol 41(14):4875–4881
Wiedmann T, Lenzen M (2009) Environmental management accountingfor cleaner production. Unravelling the impacts of supply chains: anew triple-bottom-line accounting approach and software tool (S.Schaltegger, M. Bennett, R. L. Burritt, & C. Jasch, Eds.) Eco-Eff IndSci 24:65–90
Wiedmann T, Lenzen M, Barrett JR (2009) Companies on the scale:comparing and benchmarking the sustainability performance ofbusinesses. J Ind Ecol 13(3):361–383
Wiedmann T, Suh S, Feng K, Lenzen M, Acquaye A, Scott K, Barrett JR(2011) Application of hybrid life cycle approaches to emergingenergy technologies–the case of wind power in the UK. EnvironSci Technol 45(13):5900–5907
WIOD (2012) World input–output database: construction and applica-tions, FP7 Research Project, 2009–2012. Retrieved from www.wiod.org
Zamagni A, Guinée J, Heijungs R, Masoni P (2012) Life cycle sustain-ability analysis. Life cycle assessment handbook: a guide for envi-ronmentally sustainable production. pp 453–474
Zapata P, Gambatese JA (2005) Energy consumption of asphalt andreinforced concrete pavement materials and construction. J InfraSyst 11(1):9–20
Zeleny M (1973) In: Cochrane JL, Zeleny M (eds) Compromise pro-gramming in multiple criteria decision making. University of SouthCarolina Press, Columbia, SC, pp 262–301
Zopounidis C, DoumposM (2002) Multi-criteria decision aid in financialdecision making: methodologies and literature review. J Mult-Criteria Dec Analy 11(4–5):167–186
Int J Life Cycle Assess
Related Documents


