Stillaguamish River Watershed Fecal Coliform, Dissolved Oxygen, pH, Mercury, and Arsenic Total Maximum Daily Load (Water Cleanup Plan) Submittal Report April 2005 Publication No. 05-10-044

Welcome message from author
This document is posted to help you gain knowledge. Please leave a comment to let me know what you think about it! Share it to your friends and learn new things together.
Transcript

Stillaguamish River Watershed Fecal Coliform, Dissolved Oxygen,
pH, Mercury, and Arsenic Total Maximum Daily Load
(Water Cleanup Plan)
Submittal Report
April 2005
Publication No. 05-10-044


Stillaguamish River Watershed Fecal Coliform, Dissolved Oxygen,
pH, Arsenic, and Mercury Total Maximum Daily Load
(Water Cleanup Plan)
Submittal Report
Sally Lawrence and Joe Joy Washington State Department of Ecology
Water Quality Program, Northwest Regional Office, Bellevue, and Environmental Assessment Program, Olympia, WA.
April 2005 Waterbody Numbers: (see Tables 8 & 9)
Publication Number: 05-10-044

This report is available on the Department of Ecology home page on the World Wide Web at http://www.ecy.wa.gov/biblio/05
This submittal report revises an earlier TMDL technical report published by Ecology in July 2004 and available on the World Wide Web at: http://www.ecy.wa.gov/biblio/0403017.html. For additional copies of this publication, please contact: Department of Ecology Publications Distributions Office
Address: PO Box 47600, Olympia WA 98504-7600 E-mail: [email protected] Phone: (360) 407-7472
Refer to Publication Number 05-10-044
Adams
AsotinBenton
ChelanClallam
Clark
Columbia
Cowlitz
Douglas
Ferry
Franklin Garfield
Grant
GraysHarbor
Island
Jefferson
King
Kitsap
Kittitas
Klickitat
Lewis
Lincoln
Mason
Okanogan
Pacific
PendOreille
Pierce
San Juan
Skagit
Skamania
Snohomish
Spokane
Stevens
Thurston
WahkiakumWallaWalla
Whatcom
Whitman
Yakima
Northwest425-649-7000
Southwest360-407-6300
Eastern509-329-3400
Central509-575-2490
Headquarters (Lacey) 360-407-6000If you are speech or hearing impaired, call 711 or 1-800-833-6388 for TTY
RegionalOfficelocation
Spokane
Yakima
Lacey
Bellevue
Any use of product or firm names in this publication is for descriptive purposes only and does not imply endorsement by the author or the Department of Ecology. The Department of Ecology is an equal-opportunity agency and does not discriminate on the basis of race, creed, color, disability, age, religion, national origin, sex, marital status, disabled veteran’s status, Vietnam-era veteran’s status, or sexual orientation.
If you need this information in an alternate format, please contact us at 360-407-6764. If you are a person with a speech or hearing impairment, call 711 or 800-833-6388 for TTY.

Stillaguamish Bacteria and DO TMDL Submittal Report Page i
Table of Contents Page
List of Figures .................................................................................................................... iii
List of Tables .......................................................................................................................v
Definitions.......................................................................................................................... ix
Executive Summary ........................................................................................................... xi
Introduction..........................................................................................................................1
Background..........................................................................................................................5 Setting ..............................................................................................................................5 Flows..............................................................................................................................11 Water Withdrawals ........................................................................................................15 Potential Pollutant Sources ............................................................................................16
Applicable Water Quality Criteria .....................................................................................21
Water Quality and Resource Impairments .........................................................................25 Beneficial Uses and Section 303(d) Listings .................................................................25 Water Quality Assessments Since 1998 ........................................................................30
Analytical Framework .......................................................................................................32 Fecal Coliform ...............................................................................................................32 Dissolved Oxygen..........................................................................................................35 pH...................................................................................................................................39 Arsenic and Mercury......................................................................................................40 Seasonal Variation and Critical Conditions...................................................................40
Technical Analysis.............................................................................................................41 Flows and Rainfall .........................................................................................................44 Fecal Coliform ...............................................................................................................47 Dissolved Oxygen..........................................................................................................66 pH...................................................................................................................................81 Arsenic and Mercury......................................................................................................86
Loading Capacity ...............................................................................................................95 Fecal Coliform ...............................................................................................................95 Dissolved Oxygen........................................................................................................100 pH.................................................................................................................................105 Arsenic and Mercury....................................................................................................106
Wasteload and Load Allocations .....................................................................................109 Fecal Coliform .............................................................................................................109 Dissolved Oxygen........................................................................................................112 pH.................................................................................................................................114 Arsenic and Mercury....................................................................................................115
Margin of Safety ..............................................................................................................116

Page ii Stillaguamish Bacteria and DO TMDL Submittal Report
Summary Implementation Strategy .................................................................................117 Implementation Overview ...........................................................................................117 Implementation Plan Development..............................................................................119
Approach for Non Point Sources .............................................................................120 Approach for Point Sources .....................................................................................122 Identified Needs and Early Action Proposals ..........................................................124 Cost Estimates for Water Cleanup Projects .............................................................126 Organizations with Programs to Improve Water Quality ........................................126
Reasonable Assurances................................................................................................132 Adaptive Management .................................................................................................133 Monitoring Strategy .....................................................................................................134
Recommendations for Monitoring...........................................................................135 Initial Monitoring Needs..........................................................................................135 Organizations that Monitor Water Quality ..............................................................136
Potential Funding Sources ...........................................................................................137
References Cited ..............................................................................................................138
Appendix A. Public Participation Including Responses to Comments...................... A-145
Appendix B. Wastewater Treatment Plants Point Sources – Descriptions.................B-155
Appendix C. Monitoring Locations for Ecology July 2004 Technical Study ............C-171
Appendix D. Equations and Examples of Calculations ............................................. D-179
Appendix E. Watershed Projects Already Implemented by Local Organizations......E-189
Appendix F. NPDES Permitted Facilities in Stillaquamish Watershed .....................F-201

Stillaguamish Bacteria and DO TMDL Submittal Report Page iii
List of Figures
Figure 1. Generalized land cover in the study area........................................................................ 3
Figure 2. Annual average precipitation in the Stillaguamish River watershed ............................. 7
Figure 3. Surface hydrogeology of the Stillaguamish River watershed. ....................................... 8
Figure 4. Land ownership in the Stillaguamish River watershed. ................................................. 9
Figure 5. Flow gauging stations in the Stillaguamish River watershed....................................... 12
Figure 6. A daily mean discharge hydrograph for the Stillaguamish River ................................ 13
Figure 7. Locations of monitoring probes in the Stillaguamish River from Arlington to I-5...... 37
Figure 8. Water quality monitoring sites used for storm-event and synoptic surveys................. 43
Figure 9. Fecal coliform monitoring sites located in and around northern Port Susan.. ............. 44
Figure 10. Estimated discharge record for the Stillaguamish River near Silvana . ..................... 47
Figure 11. Bacteria count and loads collected at I-5 ................................................................... 50
Figure 12. Ba teria statistical trends in the South Fork Stillaguamish River............................... 51
Figure 13. Thirty sample running average bacteria counts at site PS-2, Port Susan. .................. 52
Figure 14. Comparison of monthly median bacteria counts in Port Susan with estimated bacteria loads from the Stillaguamish River......................................................... 54
Figure 15. Comparison of modeled bacteria counts with data for the lower Stillaguamish River .............................................................................................................. 57
Figure 16. A box-plot summarizing monthly fecal coliform loads from data collected by Ecology at the Stillaguamish River at Interstate 5................................................................ 61
Figure 17. Monthly dissolved oxygen measurements collected at Portage Creek at 212th NE . .............................................................................................................................. 70
Figure 18. Diel dissolved oxygen data recorded by probes deployed in the Stillaguamish River between Arlington and Interstate 5. ..................................................... 73
Figure 19. Total phosphorus load in South Fork Stillaguamish River at Arlington, 1979 to 2002 ........................................................................................................................ 76
Figure 20. Simulations of maximum and minimum dissolved oxygen (DO) profiles in the mainstem Stillaguamish River.. ............................................................................................ 77
Figure 21. Monthly pH statistics from the South Fork Stillaguamish River at Arlington .......... 82
Figure 22. Total recoverable (TR) arsenic concentrations from samples collected at sites in the Stillaguamish River basin ........................................................................................... 89
Figure 23. Correlations between total recoverable arsenic (TR Arsenic) and mercury (Hg) in whole water samples from four sites in the Stillaguamish River basin. ........................... 91
Figure 24. Mercury concentrations for samples collected in the Stillaguamish River basin....... 92

Page iv Stillaguamish Bacteria and DO TMDL Submittal Report
Figure 25. Modeled dissolved oxygen concentrations in the Stillaguamish River from the confluence of the forks to Port Susan ................................................................................. 103
Figure 26. Total phosphorus load trend in monthly data collected by Ecology at the North Fork Stillaguamish River ......................................................................................... 106
Figure 27. Relationship between total suspended solids and mercury from sample sites on the mainstem Stillaguamish River. ................................................................................ 107
Figure C-1. Sites in the lower river basin monitored for fecal coliform bacteria, dissolved oxygen and other conventional parameters. ................................................... C-175
Figure C-2. Sites along mainstem of Stillaguamish River monitored for fecal coliform bacteria, dissolved oxygen, and other conventional parameters .................................... C-176
Figure C-3. Sites along the North and South Forks of the Stillaguamish River monitored for fecal coliform bacteria, dissolved oxygen, pH, and other conventional parameters ..... C-177
Stillaguamish Bacteria and DO TMDL Submittal Report Page v
List of Tables Table ES-1. Summary of Loading Capacity and Wasteload and Load Allocations for
Stillaguamish Reaches ......................................................................................................... xiv
Table ES-2. Recommended Fecal Coliform Limits and Wasteload Allocations for Three Wastewater Treatment Plants with NPDES Permits ........................................................... xvi
Table ES-3. Summary of Loading Capacity and Wasteload and Load Allocations for Stillaguamish Reaches with Fecal Coliform Impairments.................................................. xvii
Table ES-4. Load Allocations for Stillaguamish Reaches with pH Impairments......................... xx
Table ES-5. Load Allocations for Stillaguamish Reaches with Mercury Impairments................ xx
Table 1. Stillaguamish River basin (Water Resource Inventory Area 5) and Port Susan (WRIA 6) water bodies on the 1998 Section 303(d) list for TMDL evaluations. .................. 2
Table 2. Mean daily discharge (in cfs) by month for two long-term USGS gage stations on the North Fork and South Fork Stillaguamish River. ...................................................... 13
Table 3. Summary of the annual 7-day, 10-year (7Q10), low-flow statistics for USGS gauging stations in the Stillaguamish River basin. ............................................................... 15
Table 4. Summary of consumptive water rights in the Stillaguamish River watershed .............. 16
Table 5. Bird population data for northeast Port Susan, Livingston Bay, and the Stillaguamish River delta...................................................................................................... 20
Table 6. Current state water quality and National Toxics Rule criteria used to determine if Stillaguamish River basin waters and Port Susan are supporting beneficial uses ................ 22
Table 7. Recommended EPA nutrient criteria for Level III ecoregions, Puget Sound and North Cascades, in aggregate Ecoregion II (EPA, 2000). .................................................... 24
Table 8. Stillaguamish River basin water bodies on the 1996 and/or 1998 Section 303(d) list for fecal coliform bacteria, dissolved oxygen, arsenic or pH ......................................... 27
Table 9. Stillaguamish Basin water bodies previously unlisted but found through TMDL to be impaired. ...................................................................................................................... 28
Table 10. General timing of life-stages of Stillaguamish basin salmon species.......................... 29
Table 11. Flow statistics for the North Fork Stillaguamish River near Arlington comparing period of record data to water years 2000 and 2001............................................................. 45

Page vi Stillaguamish Bacteria and DO TMDL Submittal Report
Table 12. Fecal coliform statistics calculated for 30 consecutive samples collected by the Stillaguamish Tribe prior to June 27, 2002 at 16 sites.......................................................... 53
Table 13. Fecal coliform results from samples collected from freshwater and marine waters in and around northern Port Susan . ............................................................. 55
Table 14. Fecal coliform results at selected sites in the Stillaguamish River basin for samples collected during two, 2-day storm-event surveys in 2001. ................................................... 58
Table 15. Statistical summary of fecal coliform samples collected weekly from seven beach sites in the Stillaguamish River basin......................................................................... 60
Table 16. Bird population data for northeast Port Susan, Livingston Bay, and the Stillaguamish River delta, and estimates of the daily fecal coliform load............................ 62
Table 17. Statistical summaries of fecal coliform samples collected from sites in the Stillaguamish River basin during this TMDL daily load study ............................................ 64
Table 18. A summary of dissolved oxygen concentrations from grab samples collected in the Stillaguamish River basin. ......................................................................................... 67
Table 19. Comparison of key characteristics during three diel dissolved oxygen (DO) surveys on the Stillaguamish River below Arlington. .......................................................... 74
Table 20. Headwater, point source, and tributary input values used to evaluate Stillaguamish River dissolved oxygen in the model simulations under critical low-flow conditions......... 79
Table 21. Summary of instantaneous pH measurements made in the Stillaguamish River basin. ........................................................................................................................... 83
Table 22. Total recoverable and dissolved arsenic concentrations and total suspended solids concentrations collected from sites on the Stillaguamish River. .......................................... 86
Table 23. Total recoverable arsenic (TR As), total suspended solids (TSS), and flow data at two sites in the Stillaguamish River basin. ....................................................... 87
Table 24. Total recoverable mercury concentrations from sites on the Stillaguamish River ..... 90
Table 25. Quarterly mercury, total suspended solids, and discharge data collected in 2002 from North Fork Stillaguamish River near Darrington............................................... 92
Table 26. Fecal coliform statistical summaries for freshwater monitoring sites along the mainstem Stillaguamish River and major forks and tributaries............................................ 96
Table 27. Fecal coliform critical condition summaries for tributaries to the Old Stillaguamish Channel near Stanwood. ....................................................................................................... 97

Stillaguamish Bacteria and DO TMDL Submittal Report Page vii
Table 28. Fecal coliform critical condition summary for West Pass, South Pass, and small tributaries to Port Susan. ....................................................................................................... 97
Table 29. Estimated average daily fecal coliform loads to Port Susan from various sources for the months of June through December............................................................... 98
Table 30. Fecal coliform target geometric means calculated from statistics derived for 30 consecutive samples collected by the Stillaguamish Tribe prior to June 27, 2002............... 99
Table 31. Dissolved oxygen minimum concentrations estimated for reaches in the Stillaguamish River basin based on considerations of local natural and pollutant sources.101
Table 32. Summary of simulations of Arlington WWTP input and Stillaguamish River minimum dissolved oxygen responses during critical low-flow conditions....................... 103
Table 33. Stillaguamish River basin and Port Susan tributaries listed in Section 303(d) in 1998. ............................................................................................................................. 109
Table 34. Additional Stillaguamish River basin and Port Susan tributaries not listed in Section 303(d) in 1998........................................................................................................ 110
Table 35. Fecal coliform (FC) wasteload allocations for stormwater discharge permit holders, Snohomish County and the Washington State Department of Transportation. .... 111
Table 36. Recommended fecal coliform limits and wasteload allocations (WLA) for three wastewater treatment plants with NPDES permits. ............................................................ 112
Table 37. Estimates of the BOD5 loading capacities, load allocations (LA), and wasteload allocations (WLA) for six sites in the Stillaguamish River basin....................................... 113
Table 38. Load allocations for Total Phosphorus in the North Fork Stillaguamish River to reduce periphyton biomass and address elevated pH measurements. ............................ 115
Table 39. Preliminary Proposals for Improving Water Quality.................................................. 125
Table 40. Schedule for Detailed Implementation Plan (DIP) and Adaptive Management........ 134
Table B1. Arlington NPDES permit limits ............................................................................ B-157
Table B2. Indian Ridge Corrections Center NPDES permit limits ....................................... B-158
Table B3. Warm Beach Conference Center NPDES permit limits, interim.......................... B-159
Table B4. Warm Beach Conference Center NPDES permit limits, final .............................. B-159
Table B5. Twin City Foods State Waste Discharge permit limits......................................... B-161

Page viii Stillaguamish Bacteria and DO TMDL Submittal Report
Table B-6. Fecal Coliform Data Used to Determine Arlington WWTP Permit Limits ........ B-161
Table B-7. Fecal Coliform Data Used for Permit Limit Calculations for Indian Ridge Corrections Facility......................................................................................................... B-164
Table B-8. Fecal Coliform Data Used to Determine Warm Beach WWTP Permit Limits .... B-166
Table B-9. Fecal Coliform Data Used to Determine WWTP Permit Limits .......................... B-167
Table C-1. Locations of monitoring stations. ........................................................................ C-173
Table D1. Mean concentration estimates and percent imperviousness for various land uses.......................................................................................................................... D-185
Table D2. Land use assumptions for individual sub-basins as percentages. ......................... D-185
Table D-3. Example of Wasteload Allocation Calculation for BOD ..................................... D-186
Table E-1. Recent City of Arlington Projects Addressing Impaired Waters in Stillaguamish Watershed .................................................................................................E-191
Table E-2. 2002-2004 Stillaguamish BankSavers Riparian Planting in Stillaguamish Watershed (Stillaguamish Tribe) ..............................................................E-196
Table E-3. Portage Creek Watershed Revegetation Sites - The BankSavers Project (Stillaguamish Tribe) .......................................................................................................E-197
Table E-4. Recent Snohomish County/Partner Projects Addressing Impaired Waters in Stillaguamish Watershed .................................................................................................E-198
Table E-5. Snohomish Conservation District: 2004 Public Education Projects in Stillaguamish Watershed .................................................................................................E-199
Table E-6. Snohomish Conservation District: 2004 Projects in Stillaguamish Watershed ....E-199
Table F-1. NPDES permitted facilities in Stillaguamish Basin with active permits that discharge directly to surface water. .............................................................F-203
Stillaguamish Bacteria and DO TMDL Submittal Report Page ix
Definitions 303(d) list: § 303(d) of Clean Water Act requires states to establish a list of water bodies that do not meet water quality standards. Now called the Washington State Water Quality Assessment.
Background (Natural Bckground Levels): Surface water quality that was present before any human-caused pollution (WAC 173-201A).
Best Management Practices (BMPs): The schedules of activities, prohibitions of practices, maintenance procedures, and structural and/or managerial practices, that when used singly or in combination, prevent or reduce the release of pollutants and other adverse impacts to waters of Washington State.
Clean Water Act (CWA): Federal Act passed in 1972 that contains provisions to restore and maintain the quality of the nation’s waters. § 303(d) establishes the TMDL program.
Fecal Coliform (FC): Bacteria present in intestinal tracts and feces of warm-blooded animals. FC are “indicator” organisms that suggest the possible presence of disease-carrying organisms. Concentrations are measured in colony-forming units per 100 milliliters of water (cfu/100mL).
Geometric Mean: Like the arithmetic mean, mode and median, an “average” that can be calculated for a set of values. The geometric mean is the antilogarithm of the arithmetic mean of the logarithms of the individual sample values. Commonly reported for fecal coliform data.
Hyporheic Zone: The volume of saturated sediment beneath and beside streams and rivers where ground water and surface water mix.
Load Allocation (LA): The portion of a receiving waters’ loading capacity attributed to one of its existing or future nonpoint sources of pollution or to natural background sources.
Loading Capacity: The greatest amount of contaminant loading that a water body can receive and still meet water quality standards.
Municipal Separate Storm Sewer Systems (MS4): A system of pipes, ditches, or other stormwater conveyances under the jurisdiction of a municipality (such as Snohomish County and Washington State Department of Transportation).
National Pollutant Discharge Elimination System (NPDES): National program for issuing, modifying, revoking, reissuing, terminating, monitoring and enforcing permits, and imposing and enforcing pretreatment requirements under the Clean Water Act.
Nonpoint Source: Generally any unconfined and diffuse source of contamination, such as stormwater or snowmelt runoff or atmospheric pollution. Legally, any source of water pollution that does not meet the legal definition of “point source” in §502(14) of the Clean Water Act.
90th percentile: An estimated portion of a sample population based on a statistical determination of distribution characteristics. The 90th percentile value is a statistically derived

Page x Stillaguamish Bacteria and DO TMDL Submittal Report
estimate of the division between 90 percent of samples, which should be less than the value, and 10 percent of samples, which are expected to exceed the value.
Pathogen: Disease-causing microorganisms such as bacteria, protozoa, viruses.
Phase I Stormwater Permit: The first phase of stormwater regulation required under the federal Clean Water Act covering medium and large municipal separate storm sewer systems and construction sites of five or more acres.
Phase II Stormwater Permit: The second phase of stormwater regulation required under the Clean Water Act covering smaller municipal separate storm sewer systems (MS4s) and construction sites over one acre.
Point Source: Sources of pollution that discharge at a specific location from pipes, outfalls, and conveyance channels from either municipal wastewater treatment plants, municipal stormwater facilities, or industrial waste treatment facilities. Point sources can also include pollutant loads contributed by tributaries to main receiving water body.
Pollution: Contamination or other alteration of the physical, chemical or biological properties of waters of the state; including change in temperature, taste, color, turbidity or odor of the waters, or such discharge of any liquid, gaseous, solid, radioactive, or other substance into any waters of the state that is likely to create a nuisance or render such waters harmful, detrimental, or injurious to the public health, safety, and welfare; or to domestic, commercial, industrial, agricultural, recreational, or other legitimate beneficial uses, or to livestock, wild animals, birds, fish, or other aquatic life.
Pollution Identification and Correction (PIC) Project: Water quality improvement project focused on a single sub watershed developed by Kitsap Health District to address fecal coliform contamination in streams. Involves public outreach, detailed water quality monitoring, source identification and correction under Kitsap County regulatory programs.
Stormwater: Water that runs off roads, pavement, and roofs during rainfall or snow melt; can also come from hard or saturated grass surfaces such as lawns, pastures, playfields, and from gravel roads and parking lots.
Total Maximum Daily Load (TMDL): The amount of a pollutant that a stream, lake, estuary, or other water body can accept without violating state water quality standards. TMDLs can be expressed in terms of mass per time, toxicity, or other appropriate measures that relate to a state’s water quality standard.
Wasteload Allocation (WLA): The portion of a receiving water’s loading capacity allocated to one of its existing or future point sources of pollution and covered by the NPDES Program. WLAs constitute a type of water quality-based effluent limitation.
Watershed: A drainage area or basin in which all land and water areas drain or flow toward a central collector such as a stream, river, or lake at a lower elevation.

Stillaguamish Bacteria and DO TMDL Submittal Report Page xi
Executive Summary The total maximum daily load (TMDL) for the Stillaguamish River watershed and Port Susan in Snohomish County, Washington addresses water quality impairments for fecal coliform bacteria, dissolved oxygen, pH, arsenic, and mercury. Washington Department of Ecology (Ecology) has determined loading capacity and established load allocations and wasteload allocations (summarized in Tables ES-1 through ES-5) for the impaired water bodies in accordance with state water quality regulations and in accordance with Ecology’s 1997 Memorandum of Agreement with U.S. Environmental Protection Agency. Recreational and commercial shellfish harvesting are the beneficial uses to be protected by reducing fecal coliform loading to Port Susan marine waters. The load reductions needed to protect these beneficial uses are established through load and wasteload allocations for a number of different point and nonpoint sources. At present, Port Susan waters do not meet state Department of Health criteria for commercial shellfish harvest. Freshwater and nearshore marine primary and secondary contact recreational uses will also be protected with these allocations, and the health of aquatic life will be protected by allocations addressing pH, dissolved oxygen, and mercury impairments. The waters of Port Susan, the mainstem Stillaguamish River, its major forks and a number of tributaries and smaller creeks are impaired with excess fecal coliform bacteria. This analysis identified seasonal critical conditions that varied with location but most often included both summer dry and fall rainy periods, approximately June through December. The Statistical Rollback Method was used to determine the bacteria reductions needed for each impaired reach to meet water quality standards. A total of 34 water bodies or stream reaches require reductions in bacteria. Reaches requiring the greatest reductions (90 percent or more) are Glade Bekken Creek, Lake Martha Creek, Unnamed Creek #456 in the Warm Beach residential area, March Creek, and Warm Beach Dike Pond. Although many of the fecal coliform impairments result from non-point pollution, some stream reaches are likely affected by stormwater runoff from municipalities that have NPDES Phase I stormwater permits or that will be covered by the future NPDES Phase II permit. Based on guidance from EPA (Wayland and Hanlon, 2002), these municipalities are given wasteload allocations for fecal coliform bacteria in this TMDL. According to the EPA guidance, the wasteload allocations for stormwater will typically be reflected in the stormwater permits not as numeric effluent limits but as Best Management Practices (BMPs). The waters of Portage Creek, Pilchuck Creek, mainstem Stillaguamish below Arlington, March Creek, Kackman Creek, Warm Beach Creek, and Dike Pond are impaired at times with insufficient dissolved oxgyen. Seasonal critical conditions for dissolved oxygen occur during late summer and early fall low-flow periods. For all water bodies except the mainstem, current point and nonpoint loading of oxygen-consuming organic matter (biochemical oxygen demand, or BOD) delivered from various land uses was estimated using the Simple Method Model for estimating urban stormwater loads. Load and wasteload allocations were established by apportioning the loading capacities accordingly. Two local jurisdictions (Snohomish County and
Page xii Stillaguamish Bacteria and DO TMDL Submittal Report
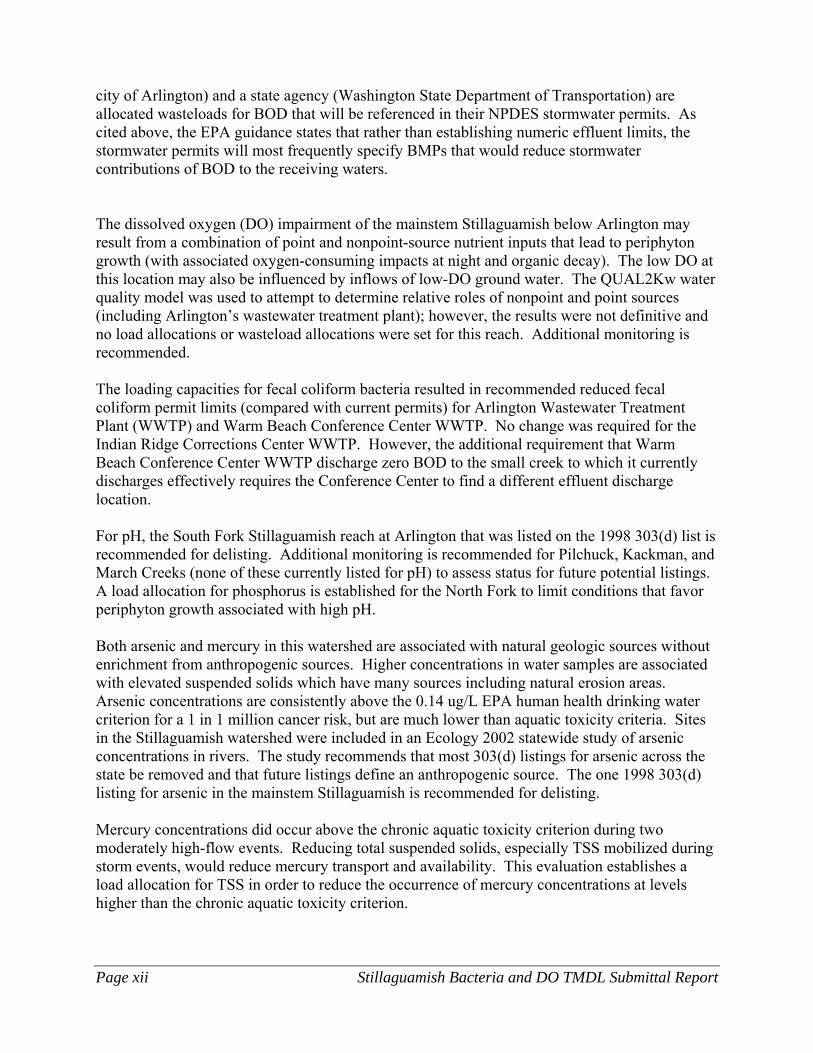
city of Arlington) and a state agency (Washington State Department of Transportation) are allocated wasteloads for BOD that will be referenced in their NPDES stormwater permits. As cited above, the EPA guidance states that rather than establishing numeric effluent limits, the stormwater permits will most frequently specify BMPs that would reduce stormwater contributions of BOD to the receiving waters. The dissolved oxygen (DO) impairment of the mainstem Stillaguamish below Arlington may result from a combination of point and nonpoint-source nutrient inputs that lead to periphyton growth (with associated oxygen-consuming impacts at night and organic decay). The low DO at this location may also be influenced by inflows of low-DO ground water. The QUAL2Kw water quality model was used to attempt to determine relative roles of nonpoint and point sources (including Arlington’s wastewater treatment plant); however, the results were not definitive and no load allocations or wasteload allocations were set for this reach. Additional monitoring is recommended. The loading capacities for fecal coliform bacteria resulted in recommended reduced fecal coliform permit limits (compared with current permits) for Arlington Wastewater Treatment Plant (WWTP) and Warm Beach Conference Center WWTP. No change was required for the Indian Ridge Corrections Center WWTP. However, the additional requirement that Warm Beach Conference Center WWTP discharge zero BOD to the small creek to which it currently discharges effectively requires the Conference Center to find a different effluent discharge location. For pH, the South Fork Stillaguamish reach at Arlington that was listed on the 1998 303(d) list is recommended for delisting. Additional monitoring is recommended for Pilchuck, Kackman, and March Creeks (none of these currently listed for pH) to assess status for future potential listings. A load allocation for phosphorus is established for the North Fork to limit conditions that favor periphyton growth associated with high pH. Both arsenic and mercury in this watershed are associated with natural geologic sources without enrichment from anthropogenic sources. Higher concentrations in water samples are associated with elevated suspended solids which have many sources including natural erosion areas. Arsenic concentrations are consistently above the 0.14 ug/L EPA human health drinking water criterion for a 1 in 1 million cancer risk, but are much lower than aquatic toxicity criteria. Sites in the Stillaguamish watershed were included in an Ecology 2002 statewide study of arsenic concentrations in rivers. The study recommends that most 303(d) listings for arsenic across the state be removed and that future listings define an anthropogenic source. The one 1998 303(d) listing for arsenic in the mainstem Stillaguamish is recommended for delisting. Mercury concentrations did occur above the chronic aquatic toxicity criterion during two moderately high-flow events. Reducing total suspended solids, especially TSS mobilized during storm events, would reduce mercury transport and availability. This evaluation establishes a load allocation for TSS in order to reduce the occurrence of mercury concentrations at levels higher than the chronic aquatic toxicity criterion.

Stillaguamish Bacteria and DO TMDL Submittal Report Page xiii
A number of conservative assumptions were made during TMDL analyses, which provide the required Margin of Safety for the analysis. This TMDL includes a Summary implementaion strategy to guide implementation of water cleanup programs and actions to restore these impaired waters. Implementing agencies and organizations in the watershed will use existing regulations and programs to reduce high bacteria concentrations, address dissolved oxygen deficits and pH excursions, and reduce mercury concentrations. The wasteload allocations for wastewater treatment plants and jurisdictions with NPDES municipal separate stormwater permits will be referenced as requirements in the next re-issuance of these NPDES permits. For the wastewater treatment plants, the requirements will be in the form of effluent discharge limits, however, for the stormwater permittees, the requirements will likely be in the form of Best Management Practices. Among new local programs that will help meet this TMDL’s goals are a funding initiative by Snohomish County to increase the local health district’s capability to investigate potential septic system failures; the Stillaguamish Tribe’s initiative to acquire sufficient funds to redirect the course of the North Fork around the toe of the Steelhead Haven landslide, thus reducing sediment inputs; and ongoing riparian restoration programs by the city of Arlington; the Stilly-Snohomish Fisheries Enhancement Group, the Stillaguamish Tribe, and the Snohomish County Stillaguamish Steward. Ecology will make Centennial Clean Water Fund grant monies available for competitive Stillaguamish Basin restoration and water quality related projects and will award extra ranking points for projects that help implement approved TMDLs. Ecology will provide organizational support for local efforts through an annual review of water quality monitoring results and by following an adaptive management strategy to evaluate and redirect implementation measures as appropriate. Ecology will also use its authority under Chapter 90.48 RCW to enforce water quality regulations whenever applicable best management practices are not being implemented and Ecology has reason to believe that individual sites or facilities are causing pollution. It is estimated that it will take eight years for the projects and programs developed under the implementation plan to result in measurable progress in water quality, so the target date for this TMDL is 2013.

Page xiv Stillaguamish Bacteria and DO TMDL Submittal Report
Table ES-1. Summary of Loading Capacity and Wasteload and Load Allocations for Stillaguamish Reaches with both Fecal Coliform and Dissolved Oxygen Impairments
Water Body WBID Parameter Current
Load (cfu/day)
Loading Capacity: Target Geometric Mean
(cfu) or Estimated Potential Minimum Dissolved Oxygen
(mg/L) (or BOD in lb/day)
Total % Reduction Required
Percent of Load
(estimate)
Wasteload or Load
Allocation
NPDES Permit Holder or Nonpoint
Source
19 3.6 x 10⁸ Arlington 0.4 7.5 x 10⁶ Snohomish Cty 1.2 2.2 x 10⁷ WSDOT
Fecal Coliform 9.35 x 10¹⁰ 10 cfu/100 mL 98
79.4 1.5 x 10⁹ Nonpoint 2 (0.7) Arlington
0.1 (0.02) Snohomish Cty 0.2 (0.06) WSDOT 33 (10) Background
March Creek WI88QF
Dissolved Oxygen (BOD5 in lb/day) 6.5 mg/L
(31)
66 (20) Nonpoint
3.6 2.1 x 10⁸ Snohomish County Fecal Coliform 1.79 x 10¹⁰ 33 cfu/100 mL 68
96.4 5.5 x 10⁹ Nonpoint
6
(0.6) Snohomish
County 50 (5) Background
Kackman Creek at 252nd XB43NX
Dissolved Oxygen (BOD5 in lb/day) 7 mg/L
(10)
40 (4) Nonpoint
2.9 2.0 x 10⁹ Snohomish County
1.8 1.3 x 10⁹ WSDOT Fecal Coliform 4.16 x 10¹¹ 25 cfu/100 mL 83
95.3 6.7 x 10¹⁰ Nonpoint
4
(12) Snohomish
County 3 (8) WSDOT
70 (210) Background
Portage Creek at 212th NE OT80TY
Dissolved Oxygen (BOD5 in lb/day) 6.5 mg/L
(300)
23 (70) Nonpoint

Stillaguamish Bacteria and DO TMDL Submittal Report Page xv
Table ES-1 (continued). Summary of Loading Capacity and Wasteload and Load Allocations for Stillaguamish Reaches with both Fecal Coliform and Dissolved Oxygen Impairments
Water Body WBID Parameter Current Load
(cfu/day)
Loading Capacity: Target Geometric Mean
(cfu) or Estimated Potential Min.
Dissolved Oxygen (mg/L)
(or BOD in lb/day)
Total % Reduction Required
Percent of Load
(estimate)
Wasteload or Load
Allocation
Source or NPDES Permit
Holder
39 4.4 x 10¹⁰ Arlington Fecal Coliform 3.69 x 10¹¹ 45 cfu/100 mL 69 61 7.0 x 10¹⁰ Nonpoint 57 (142) Arlington 40 (100) Background
Portage Creek at 43rd NE
OT80TY
Dissolved Oxygen (BOD5 in lb/day)
7 mg/L (250)
3 (8) Nonpoint 2.5 9.0 x 10⁹ Snohomish
County 16.5 6.0 x 10¹⁰ WSDOT
Fecal Coliform 4.89 x 10¹¹ 38 cfu/100 mL 26
81 2.9 x 10¹¹ Nonpoint 3 (27) Snohomish
County 20 (179) WSDOT 39 (350) Background
Pilchuck Creek at Jackson Gulch Rd
VJ74AO
Dissolved Oxygen (BOD5 in lb/day)
8 mg/L (890)
37 (330) Nonpoint Fecal Coliform 3.11 x 10¹⁰ 47 cfu/100 mL 81 100 5.9 x 10⁹ Nonpoint
7 (1.4) Snohomish County
0 (0) Warm Beach WWTP
Warm Beach Creek above
WWTP
SH96KX Dissolved Oxygen (BOD5 in lb/day)
8 mg/L (20)
93 (18.6) Background

Page xvi Stillaguamish Bacteria and DO TMDL Submittal Report
Table ES-1 (continued). Summary of Loading Capacity and Wasteload and Load Allocations for Stillaguamish Reaches with both Fecal Coliform and Dissolved Oxygen Impairments
Water Body WBID Parameter Current Load
(cfu/day)
Loading Capacity: Target Geometric Mean
(cfu) or Estimated Potential Minimum Dissolved Oxygen
(mg/L) (or BOD in lb/day)
Total % Reduction Required
Percent of Load
(estimate)
Wasteload or Load
Allocation
Source or NPDES Permit
Holder
4.3 1.5 x 10⁸ Snohomish County
Fecal Coliform 4.23 x 10¹⁰ 14 cfu/100 mL 92
95.7 3.2 x 10⁹ Nonpoint 5 (1.4)* Snohomish Cty
67 (20) Background
Warm Beach Dike Pond
(includes BOD loading from Warm Beach Creek, above)
SH96KX
Dissolved Oxygen (BOD5 in lb/day)
6.5 mg/L (30)
27 (8) Nonpoint *Load allocation of 1.4 lb BOD/day for Snohomish County carried from entry above for Warm Beach Creek
Table ES-2. Recommended Fecal Coliform Limits and Wasteload Allocations for Three Wastewater Treatment Plants with NPDES Permits
Current FC Permit Proposed Permit Facility Name cfu/100 mL cfu/100 mL WLA cfu/day
Indian Ridge Corrections Center WWTP 100 100 8.0 x 10⁸
Arlington WWTP 200 / 400 39 / 128 3.0 x 10⁹
Warm Beach Conference Center WWTP* 200 / 400 47 / 100 1.3 x 10⁸
Warm Beach Conference Center WWTP** - 11 / 26 3.1 x 10⁷
* Assuming discharge to Warm Beach Creek at current maximum monthly flow of 0.075 MGD, and the discharge is allowed under special considerations. ** Assuming discharge to Hat Slough near the South Branch with maximum monthly flow of 0.075 MGD.

Stillaguamish Bacteria and DO TMDL Submittal Report Page xvii
Table ES-3. Summary of Loading Capacity and Wasteload and Load Allocations for Stillaguamish Reaches with Fecal Coliform Impairments A. Port Susan and Discharges to Port Susan
Water Body WBID Current Bacteria Load
(cfu/day)
Loading Capacity: Target Geometric
Mean (cfu/100 mL)
Total Percent Reduction Required
Percent of Load
(estimate)
Wasteload or Load
Allocation
Source or NPDES Permit Holder
Port Susan 390KRD Note 1 14 61 100 Note 1 Nonpoint
6.9 1.1 x 10⁸ Snohomish County Unnamed Creek #0456 LU17DC 5.17 x 10¹⁰ 11 97
93.1 1.4 x 10⁹ Nonpoint
8.8 4.5 x 10⁸ Snohomish County Lake Martha Creek IJ55EP 6.38 x 10¹⁰ 23 92
91.2 4.6 x 10⁹ Nonpoint
Warm Beach Slough IE90YH Note 1 10 64 100 Note 1 Nonpoint
Agricultural Drain to Warm Beach Dike Pond
SH96KX 8.86 x 109 13 89 100 9.8 x 10⁸ Nonpoint
Twin City Foods Drain #4 WC93GU Note 1 18 88 100 Note 1 Nonpoint
West Pass of Old Stillaguamish Channel
XF13JD 6.1 x 10¹⁰ 3 97 100 9.0 x 10⁸ Nonpoint
South Pass of Old Stillaguamish Channel
UJ01AO 2.45 x 10¹¹ 11
75 100 6.1 x 10¹⁰ Nonpoint
Hat Slough (Stillaguamish River) at Marine Drive
ZO73WL 5.79 x 10¹² 36 36 100 3.71 x 10¹² Nonpoint
Note 1: Insufficient data to calculate load

Page xviii Stillaguamish Bacteria and DO TMDL Submittal Report
Table ES-3. Summary of Loading Capacity and Wasteload and Load Allocations for Stillaguamish Reaches with Fecal Coliform Impairments B. Old Stillaguamish Channel Tributaries*
Water Body WBID
Critical Condition Geometric
Mean (cfu/100 mL)
Loading Capacity: Target Geometric
Mean (cfu/100 mL)
Total Percent Reduction Required
Percent of Load
(estimate)
NPDES Permit Holder o Nonpoint Source
Douglas Slough AS64WF 40 13 68 100 Nonpoint
Irvine Slough HS19KT 730 7 99 100 Nonpoint
Jorgenson Slough (lower Church Creek) GH05SX 320 42 87 100 Nonpoint
Church Creek at Park GH05SX 147 38 74 100 Nonpoint
Miller Creek at Miller Rd KX60NO 311 28 91 100 Nonpoint
Twin City Foods Drain #1 JV77EY 406 24 94 100 Nonpoint
Twin City Foods Drain #2 JV77EY 285 3 99 100 Nonpoint
Twin City Foods Drain #3 JV77EY 1180 24 98 100 Nonpoint
Twin City Foods Drain #5 JV77EY 545 22 96 100 Nonpoint
* Discharges (flows) and fecal coliform loads will be calculated during development of the Old Stillaguamish Channel TMDL expected to be initiated in
fall 2006. Because measurements of fecal coliform concentration made in 2001 (during sampling for this Stillaguamish TMDL) were so high, these fecal coliform reductions are recommended to support immediate cleanup planning and implementation.

Stillaguamish Bacteria and DO TMDL Submittal Report Page xix
Table ES-3. Summary of Loading Capacity and Wasteload and Load Allocations for Stillaguamish Reaches with Fecal Coliform Impairments C. Stillaguamish Mainstem and Tributaries Below Arlington
Water Body WBID Current Bacteria
Load (cfu/day)
Loading Capacity: Target Geometric
Mean (cfu/100 mL)
Total Percent
Reduction Required
Percent of Load
(estimate)
Wasteload or Load
Allocation
NPDES Permit Holder or Nonpoint Source
6.5 3.9 x 10⁸ Snohomish County Glade Bekken FJ67XF 7.42 x 10¹⁰ 18 92 93.5 5.5 x 10⁹ Nonpoint
Stillaguamish River at I-5 QE93BW 6.27 x 10¹² 26 52 100 3.0 x 10¹² Nonpoint 5 7.0 x 10⁸ Snohomish County Fish Creek QJ28UC 7.4 x 10¹⁰ 32 81
95 1.3 x 10¹⁰ Nonpoint 2.3 1.6 x 10⁹ Snohomish County 1.2 8.6 x 10⁸ WSDOT
Armstrong Creek at Mouth VP67JK 1.01 x 10¹¹ 43 29
96.5 6.9 x 10¹⁰ Nonpoint Armstrong Creek below
Hatchery VP67JK Note 1 23 66 100 Note 1 Nonpoint
1.2 6.7 x 10⁷ Snohomish County Harvey Creek at Grandview HD76OJ 2.33 x 10¹⁰ 38 76 98.8 5.5 x 10⁹ Nonpoint
Note 1: Insufficient flow data to calculate load
D. North and South Forks of the Stillaguamish River and Jim Creek Water Body WBID Current
Bacteria Load
(cfu/day)
Loading Capacity: Target Geometric
Mean (cfu/100 mL)
Total Percent
Reduction Required
Percent of Load
(estimate)
Wasteload or Load
Allocation
NPDES Permit Holder or Nonpoint Source
2.1 2.5 x 10¹⁰ Snohomish County 1.5 1.8 x 10¹⁰ WSDOT
N Fork Stilly (at mouth) WO38NV 1.95 x 10¹² 28 38
96.4 1.2 x 10¹² Nonpoint 5.6 1.2 x 10¹¹ Arlington 2.9 6.0 x 10¹⁰ Snohomish County
S Fork Stilly (at mouth) SN06ZT 2.24 x 10¹² 40 7
91.5 1.9 x 10¹² Nonpoint 1.6 5.5 x 10⁹ Snohomish County Jim Creek at mouth JU33JU 4.0 x 10¹¹ 34 14
98.4 3.4 x 10¹¹ Nonpoint
Page xx Stillaguamish Bacteria and DO TMDL Submittal Report
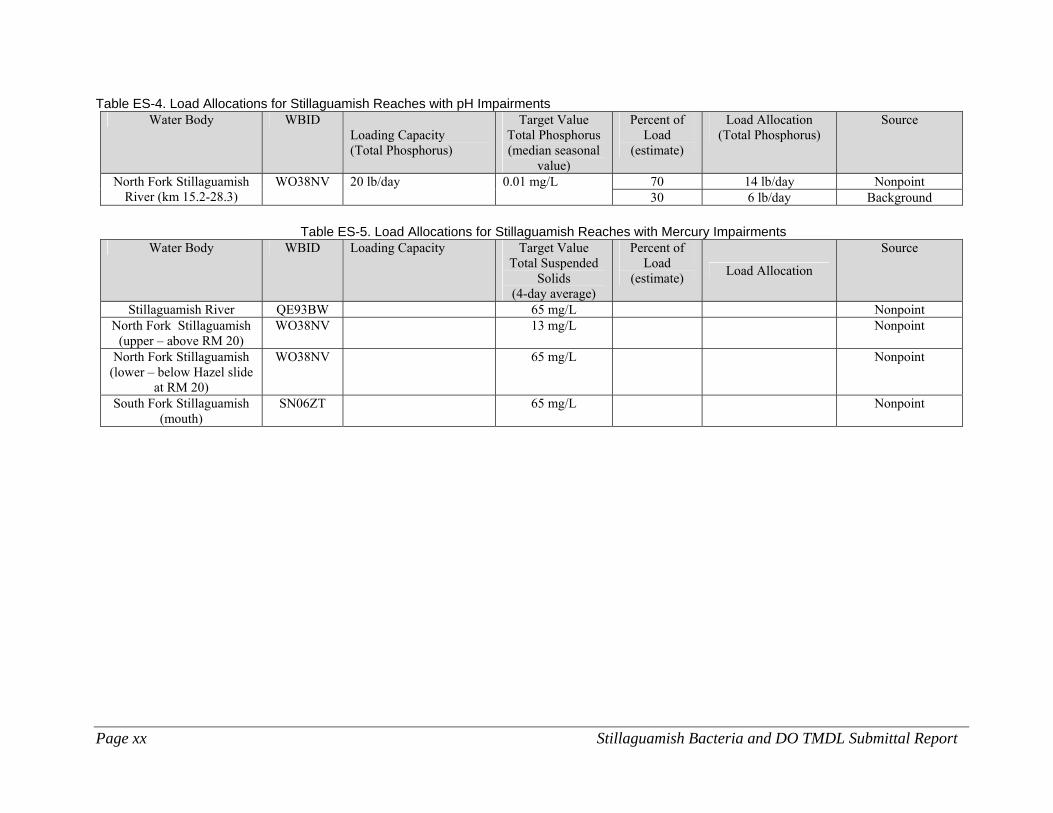
Table ES-4. Load Allocations for Stillaguamish Reaches with pH Impairments Water Body WBID
Loading Capacity (Total Phosphorus)
Target Value Total Phosphorus (median seasonal
value)
Percent of Load
(estimate)
Load Allocation (Total Phosphorus)
Source
70 14 lb/day Nonpoint North Fork Stillaguamish River (km 15.2-28.3)
WO38NV 20 lb/day 0.01 mg/L 30 6 lb/day Background
Table ES-5. Load Allocations for Stillaguamish Reaches with Mercury Impairments
Water Body WBID Loading Capacity Target Value Total Suspended
Solids (4-day average)
Percent of Load
(estimate) Load Allocation
Source
Stillaguamish River QE93BW 65 mg/L Nonpoint North Fork Stillaguamish
(upper – above RM 20) WO38NV 13 mg/L Nonpoint
North Fork Stillaguamish (lower – below Hazel slide
at RM 20)
WO38NV 65 mg/L Nonpoint
South Fork Stillaguamish (mouth)
SN06ZT 65 mg/L Nonpoint

Stillaguamish Fecal and DO TMDL Submittal Report Page 1
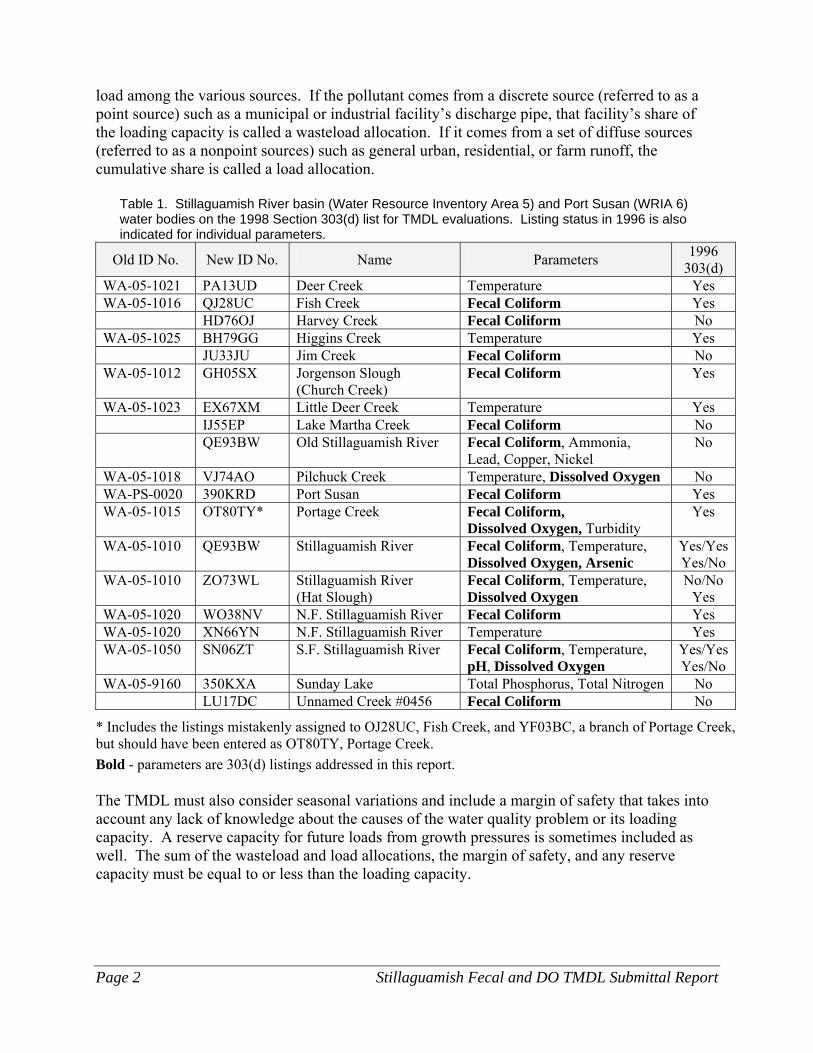
Introduction The Stillaguamish River basin includes portions of Snohomish and Skagit counties in Washington State (Figure 1). Several rivers and streams in the Stillaguamish River basin were on Washington State’s 1996 and 1998 Section 303(d) list because of violations of one or more water quality criteria (Table 1). In 2000, the Washington State Department of Ecology (Ecology) Water Quality Program selected the basin for a total maximum daily load (TMDL) assessment. Ecology’s Environmental Assessment Program was asked to design and conduct the TMDL evaluation. Two TMDL projects emerged, based on personnel resources and analytical approaches for the 303(d)-listed parameters: (1) a temperature TMDL (Pelletier and Bilhimer, 2004), and (2) this TMDL evaluation of fecal coliform, dissolved oxygen, pH, arsenic, and mercury. The TMDL analysis of listings for ammonia, lead, copper, and nickel in the Old Stillaguamish River (Table 1) was originally planned to be included in this evaluation (Joy, 2001). However, these analyses were postponed because of new infrastructure on the channel. (In 2003 the local Flood Congrol District installed a tide gate mecha ism in the channel to increase freshwater flow during the low-flow season. And in 2004 the city of Stanwood completed an upgrade of its wastewater treatment plant.) The Old Stilly Chanel TMDL field work and water qhality sampling will be initiated in summer 2006. New water quality data are required to better reflect current conditions in the channel, and to set load and wasteload allocations more accurately. Mercury was added to the list of possible pollutants in the basin, even though mercury was not on the 303(d) list. Local concern was generated by data presented in a report by the Puget Sound Water Quality Action Team (1998). Those data were collected by Ecology but also qualified as estimated values by Ecology (Joy, 2001). More recent mercury data were not available to make a proper water quality evaluation. Section 303(d) of the federal Clean Water Act mandates that the state establish TMDLs for surface waters that do not meet standards after application of technology-based pollution controls. The U.S. Environmental Protection Agency (EPA) has promulgated regulations (40 CFR 130) and developed guidance (EPA, 1991) for establishing TMDLs. Under the Clean Water Act, every state has its own water quality standards designed to protect, restore, and preserve water quality. Water quality standards consist of designated uses, such as cold water biota and drinking water supply, and criteria, usually numeric criteria, to achieve those uses. When a lake, river, or stream fails to meet water quality standards after application of required technology-based controls, the Clean Water Act requires the state to place the water body on a list of "impaired" water bodies and to prepare an analysis called a TMDL. The goal of a TMDL is to ensure the impaired water will attain water quality standards. A TMDL includes a written, quantitative assessment of water quality problems and of the pollutant sources that cause the problem. The TMDL determines the amount of a given pollutant that can be discharged to the water body and still meet standards (the loading capacity) and allocates that
Page 2 Stillaguamish Fecal and DO TMDL Submittal Report
load among the various sources. If the pollutant comes from a discrete source (referred to as a point source) such as a municipal or industrial facility’s discharge pipe, that facility’s share of the loading capacity is called a wasteload allocation. If it comes from a set of diffuse sources (referred to as a nonpoint sources) such as general urban, residential, or farm runoff, the cumulative share is called a load allocation.
Table 1. Stillaguamish River basin (Water Resource Inventory Area 5) and Port Susan (WRIA 6) water bodies on the 1998 Section 303(d) list for TMDL evaluations. Listing status in 1996 is also indicated for individual parameters.
Old ID No. New ID No. Name Parameters 1996 303(d)
WA-05-1021 PA13UD Deer Creek Temperature Yes WA-05-1016 QJ28UC Fish Creek Fecal Coliform Yes HD76OJ Harvey Creek Fecal Coliform No WA-05-1025 BH79GG Higgins Creek Temperature Yes JU33JU Jim Creek Fecal Coliform No WA-05-1012 GH05SX Jorgenson Slough
(Church Creek) Fecal Coliform Yes
WA-05-1023 EX67XM Little Deer Creek Temperature Yes IJ55EP Lake Martha Creek Fecal Coliform No QE93BW Old Stillaguamish River Fecal Coliform, Ammonia,
Lead, Copper, Nickel No
WA-05-1018 VJ74AO Pilchuck Creek Temperature, Dissolved Oxygen No WA-PS-0020 390KRD Port Susan Fecal Coliform Yes WA-05-1015 OT80TY* Portage Creek Fecal Coliform,
Dissolved Oxygen, Turbidity Yes
WA-05-1010 QE93BW Stillaguamish River Fecal Coliform, Temperature, Dissolved Oxygen, Arsenic
Yes/Yes Yes/No
WA-05-1010 ZO73WL Stillaguamish River (Hat Slough)
Fecal Coliform, Temperature, Dissolved Oxygen
No/No Yes
WA-05-1020 WO38NV N.F. Stillaguamish River Fecal Coliform Yes WA-05-1020 XN66YN N.F. Stillaguamish River Temperature Yes WA-05-1050 SN06ZT S.F. Stillaguamish River Fecal Coliform, Temperature,
pH, Dissolved Oxygen Yes/Yes Yes/No
WA-05-9160 350KXA Sunday Lake Total Phosphorus, Total Nitrogen No LU17DC Unnamed Creek #0456 Fecal Coliform No
* Includes the listings mistakenly assigned to OJ28UC, Fish Creek, and YF03BC, a branch of Portage Creek, but should have been entered as OT80TY, Portage Creek. Bold - parameters are 303(d) listings addressed in this report. The TMDL must also consider seasonal variations and include a margin of safety that takes into account any lack of knowledge about the causes of the water quality problem or its loading capacity. A reserve capacity for future loads from growth pressures is sometimes included as well. The sum of the wasteload and load allocations, the margin of safety, and any reserve capacity must be equal to or less than the loading capacity.

Stillaguamish Fecal and DO TMDL Submittal Report Page 3
Figure1. Generalized land cover in the study area

Page 4 Stillaguamish Fecal and DO TMDL Submittal Report

Stillaguamish Fecal and DO TMDL Submittal Report Page 5
Background
Setting The Stillaguamish River watershed covers 1770 km2 and extends from sea level to 2,086 meters in elevation on Whitehorse Mountain in the Squire Creek drainage. It is the fifth largest tributary to Puget Sound. The Stillaguamish River has two major forks at river kilometer 28.6 (river mile 17.8); the North Fork drains 736 km2, and the South Fork drains 660 km2. Average annual precipitation in the watershed ranges from about 80 cm/year (about 30 inches/year) at lower elevations to about 380 cm/year (150 inches/year) at higher elevations (Figure 2) (Pess et al., 1999). Headwater streams are typically steep (>0.2 m/m) and relatively small (bankfull width < 5 m, Pess et al., 1999). Channel slopes decrease dramatically (between 0.01 and 0.06 m/m) as streams traverse terraces carved into valley-filling glacial and alluvial deposits (Figure 3), and channels become larger as tributaries coalesce. The geology of the Stillaguamish basin has been briefly described in the Salmon Habitat Limiting Factors Analysis (Washington Conservation Commission, 1999): “The North Cascades include high grade Mid-Cretaceous to Paleocene melange rocks that dominate west of the Darrington Fault. East of the fault the dominant rock unit is the Darrington Phyllite, a metamorphic rock type that dominates the upper North Fork Stillaguamish. This rock is particularly prone to erosion, which is a major problem in this watershed. Crystalline rocks of the Oligocene Squire Creek stock form the south side of the North Fork and the north side of the upper South Fork Stillaguamish. Glacial outwash from the Puget Lobe of the Cordilleran ice sheet forms the terraces in the forks and the topography of the lower watershed. Younger alluvial deposits are inset within the terraces in the wider portions of the valleys of the forks. The mainstem of the Stillaguamish flows through an alluvium-floored valley 1.5-3 km wide, inset within terraces of glacial outwash. The clay, silt and sand deposits of glacial and lake origin are the main source of the significant sediment production in the watershed (Perkins and Collins 1997). In the steeper sloped areas, these deposits are particularly prone to landslides, which are a significant problem for fisheries in this drainage. “ Soils types vary widely but follow the patterns of the underlying geology. The valley soils over alluvial deposits tend to have low permeability; i.e., Hydrologic Group C and D soils predominate along the valley floors of the North Fork, lower South Fork, and along the mainstem and lower mainstem tributaries to Port Susan. More permeable Hydrologic Group A or B soils are found on the plateaus and hillsides. The mountainous upper watershed contributing to the forks are primarily public forest lands (Figure 4). The U.S. Forest Service manages 697 km2 (269 mi2) within the Mount Baker-Snoqualmie National Forest, and the Washington State Department of Natural Resources (DNR) manages 210 km2 (81 mi2). Timber harvesting and recreational uses predominate. Only inactive

Page 6 Stillaguamish Fecal and DO TMDL Submittal Report
and abandoned mines remain in once active metal mining areas near the headwaters of both forks (McKay, Jr., Norman, Shawver, and Teissere, 2001). Lower elevation forests (< 700m) are within the western hemlock zone (Franklin and Dyrness, 1973). Dominant conifer species in these forests are western hemlock, Douglas-fir, western red cedar, and Sitka spruce. Deciduous trees include red alder, black cottonwood, and bigleaf maple. Middle elevation forests (700-1300m) are in the silver fir zone, and higher elevations (> 1300m) are in the alpine fir zone. Granite Falls (population est. 2,915) and Darrington (population est. 1,385) have growth management areas that influence some residential development in the upper basin along the valley floors (Figure 1). Other small residential, business, and agricultural properties are scattered the length of the valleys. The U.S. Department of Defense controls approximately 18.1 km2 (7 mi2) in the Jim Creek sub-basin of the South Fork. The Indian Ridge Corrections Center with its wastewater facility is also located in the Jim Creek sub-basin. The South Fork enters a floodplain 6.4 km (4 miles) before the confluence with the North Fork. The mainstem at the confluence is at an elevation of 15.4 m (51 ft), and the gradient is fairly even to the mouth at Port Susan. Dikes are common along the length of the mainstem. The floodplain has visible evidence of historical meanders and sloughs. Port Susan is bounded on the north and west by Camano Island. It is a shallow, poorly flushed bay that extends from South Pass at Stanwood to Port Gardner at Everett. Low-density residential and agriculture are the most common land uses around the bay. No commercial shellfish harvesting operations are currently permitted in Port Susan, but recreational harvesting occurs. The primary riparian land use along the mainstem and lower reaches of the major forks is agriculture. The lower basin has diverse land uses, and most land is privately owned. Arlington (population est. 14,330) and Stanwood (population est. 4,190) have active urban growth areas. In 1995, Stienbarger (1995) estimated there were at least 909 commercial and non- commercial farms in the lower basin. Agriculture is still quite active in the lower basin, but conversions from agriculture to rural residential or non-commercial farm uses are becoming common along the Interstate 5 corridor. The DNR controls approximately 72.5 km2 (28 mi2) in the Pilchuck Creek sub-basin. Privately held forests are scattered throughout the upper reaches of other tributaries as well. The Stillaguamish Tribe, Sauk-Suiattle Tribe, and Tulalip Tribes have cultural and economic interests in the Stillaguamish River basin. The Stillaguamish Tribe offices are located in Arlington, the Sauk-Suiattle Tribe offices in Darrington, and the Tulalip Tribes offices on the Tulalip Indian Reservation immediately south of the basin.

Stillaguamish Fecal and DO TMDL Submittal Report Page 7
Squire Creek
Jim C
reek
Canyon Creek
Stillaguamish River
Pilchuck
Creek
North Fork Stillaguamish River
South Fork Stillaguamish River
Deer Creek
5 0 5 10 Kilometers
average annual precipitation (cm/year)80 - 120 cm/year120 - 160160 - 200200 - 240240 - 280280 - 320320 - 360360 - 400
Figure 2. Annual average precipitation in the Stillaguamish River watershed (data from www.daymet.org).

Page 8 Stillaguamish Fecal and DO TMDL Submittal Report
5 0 5 10 Kilometers
Hydrogeologic unitsAlluvial depositsAlpine glacial depositsBedrock depositsBog, marsh, and peat depositsLahar depositsPre-Fraser undifferentiated non-glacial deposits (predominately fine grained)Vashon advance outwash deposits (predominately coarse grained)Vashon recessional outwash deposits (predominately coarse grained)Vashon recessional outwash deposits (predominately fine grained)Vashon till deposits (predominately fine grained)Water bodies
major streams
Figure 3. Surface hydrogeology of the Stillaguamish River watershed.
Stillaguamish Fecal and DO TMDL Submittal Report Page 9
5 0 5 10 Kilometers
land ownershipprivatefederalstatetribe
major streams
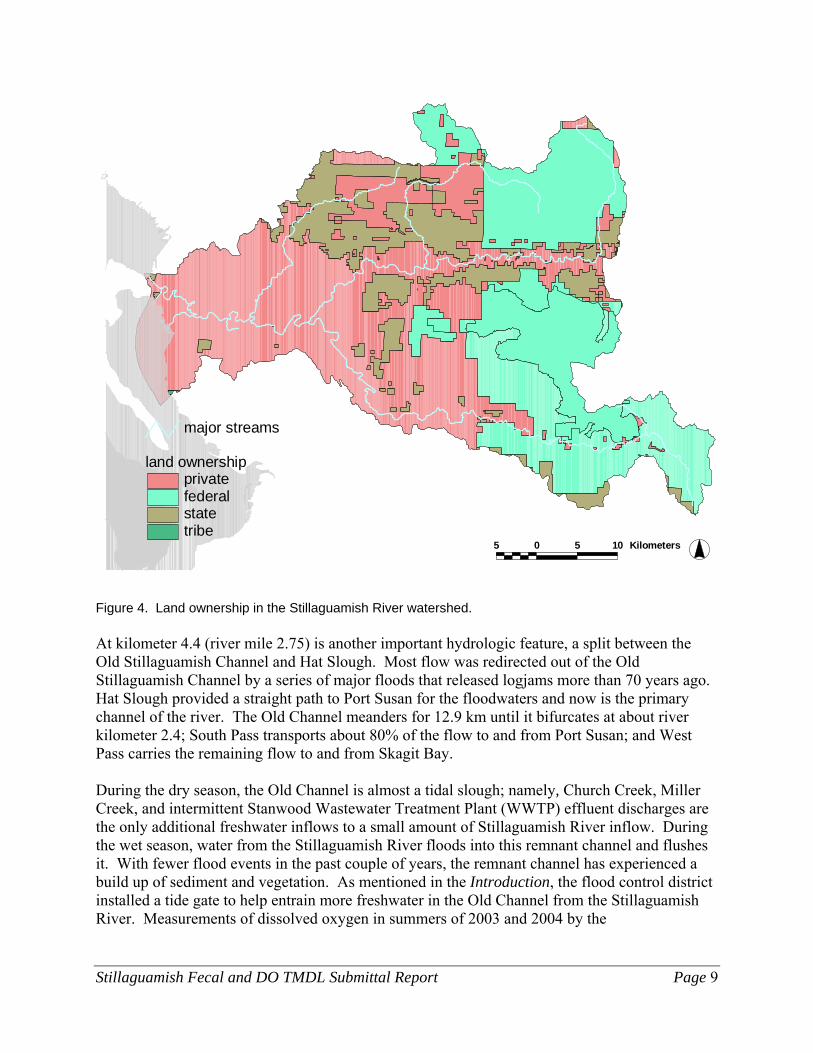
Figure 4. Land ownership in the Stillaguamish River watershed. At kilometer 4.4 (river mile 2.75) is another important hydrologic feature, a split between the Old Stillaguamish Channel and Hat Slough. Most flow was redirected out of the Old Stillaguamish Channel by a series of major floods that released logjams more than 70 years ago. Hat Slough provided a straight path to Port Susan for the floodwaters and now is the primary channel of the river. The Old Channel meanders for 12.9 km until it bifurcates at about river kilometer 2.4; South Pass transports about 80% of the flow to and from Port Susan; and West Pass carries the remaining flow to and from Skagit Bay. During the dry season, the Old Channel is almost a tidal slough; namely, Church Creek, Miller Creek, and intermittent Stanwood Wastewater Treatment Plant (WWTP) effluent discharges are the only additional freshwater inflows to a small amount of Stillaguamish River inflow. During the wet season, water from the Stillaguamish River floods into this remnant channel and flushes it. With fewer flood events in the past couple of years, the remnant channel has experienced a build up of sediment and vegetation. As mentioned in the Introduction, the flood control district installed a tide gate to help entrain more freshwater in the Old Channel from the Stillaguamish River. Measurements of dissolved oxygen in summers of 2003 and 2004 by the

Page 10 Stillaguamish Fecal and DO TMDL Submittal Report
Stillaguamish Fecal and DO TMDL Submittal Report Page 11
Stillaguamish Tribe suggests that the new tide gate may be associated with water quality improvement. Both Hat Slough and the Old Stillaguamish Channel via South Pass transport Stillaguamish River water to Port Susan. The Warm Beach area south of Hat Slough and Camano Island to the west also contribute run-off through several small drainages to Port Susan, and they are considered part of the Stillaguamish water quality management area. Port Susan is a relatively shallow and poorly flushed bay. For several years, commercial shellfish harvesting has been restricted or prohibited in the bay by the Washington State Department of Health because of fecal coliform contamination in the water column. Port Susan currently is not classified since shellfish are no longer commercially harvested.
Flows Ecology installed a network of flow gauging stations during 2001 as described in Pelletier and Bilhimer (2001) (Figure 5). The gauges were placed in coordination with U.S. Geological Survey (USGS) and Snohomish County gauge sites. The USGS currently gauges flows in the North Fork Stillaguamish River near Arlington (station 12167000) and in the South Fork Stillaguamish River near Granite Falls (station 12161000 - gage heights only). Some Ecology gage sites were placed at historical USGS sites to verify flow network relationships. Snohomish County also measures gauge heights at several sites, but the discharge volume records for these sites have not been determined. The USGS has historically gauged flows at several other stations in the watershed on an intermittent basis (Figure 5). Only one historical gauging station, the Stillaguamish River near Silvana, was established in the mainstem Stillaguamish River below the confluence of the forks. Continuous discharge data for the station (USGS #12167700) were only recorded over 15 months, but USGS and Ecology have kept rating curves current for instantaneous flow measurements. There are statistically strong correlations between flows at the long-term gages in the upper basin and the intermittent data collected at the Silvana gage site (Figure 6).

Page 12 Stillaguamish Fecal and DO TMDL Submittal Report
%U
%U%U
%U%U
%U
%U
%U #S
#S
#S
#S
#S
12161000
12162500
12164000
12165000
12166500
12167000
12167700
12168500
Squire Creek
Jim C
reek
Canyon Creek
Stillaguamish River
Pilchuc
k Creek
North Fork Stillaguamish River
South Fork Stillaguamish River
Deer Creek
05D01
05P01
05NF07
05SF02
05SF05
5 0 5 10 Kilometers
%U USGS flow gage#S Ecology flow gage
Figure 5. Flow gauging stations in the Stillaguamish River watershed.
Stillaguamish Fecal and DO TMDL Submittal Report Page 13
100
1000
10000
100000
Mar
-00
May
-00
Jul-0
0
Sep
-00
Nov
-00
Jan-
01
Mar
-01
May
-01
Jul-0
1
Sep
-01
Nov
-01
Date
Disc
harg
e (c
fs)
North ForkSilvana (est.)I-5 Instantaneous
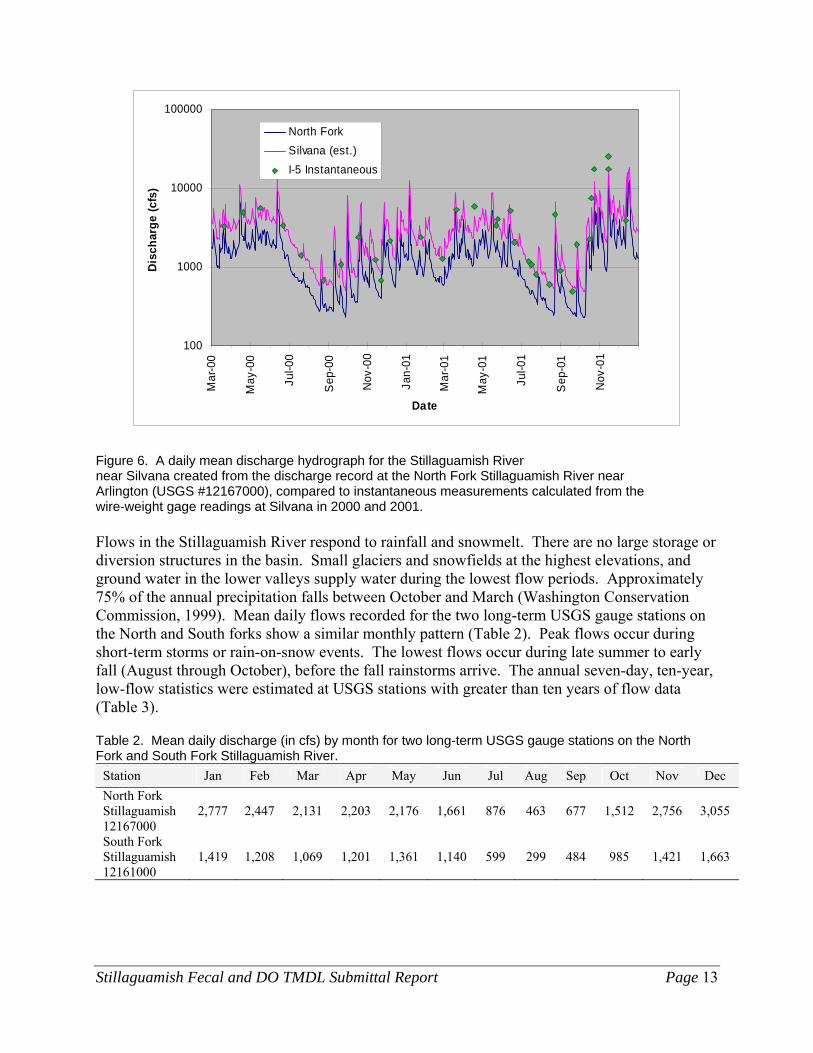
Figure 6. A daily mean discharge hydrograph for the Stillaguamish River near Silvana created from the discharge record at the North Fork Stillaguamish River near Arlington (USGS #12167000), compared to instantaneous measurements calculated from the wire-weight gage readings at Silvana in 2000 and 2001. Flows in the Stillaguamish River respond to rainfall and snowmelt. There are no large storage or diversion structures in the basin. Small glaciers and snowfields at the highest elevations, and ground water in the lower valleys supply water during the lowest flow periods. Approximately 75% of the annual precipitation falls between October and March (Washington Conservation Commission, 1999). Mean daily flows recorded for the two long-term USGS gauge stations on the North and South forks show a similar monthly pattern (Table 2). Peak flows occur during short-term storms or rain-on-snow events. The lowest flows occur during late summer to early fall (August through October), before the fall rainstorms arrive. The annual seven-day, ten-year, low-flow statistics were estimated at USGS stations with greater than ten years of flow data (Table 3).
Table 2. Mean daily discharge (in cfs) by month for two long-term USGS gauge stations on the North Fork and South Fork Stillaguamish River.
Station Jan Feb Mar Apr May Jun Jul Aug Sep Oct Nov Dec North Fork Stillaguamish 12167000
2,777 2,447 2,131 2,203 2,176 1,661 876 463 677 1,512 2,756 3,055
South Fork Stillaguamish 12161000
1,419 1,208 1,069 1,201 1,361 1,140 599 299 484 985 1,421 1,663

Page 14 Stillaguamish Fecal and DO TMDL Submittal Report

Stillaguamish Fecal and DO TMDL Submittal Report Page 15
Table 3. Summary of the annual 7-day, 10-year (7Q10), low-flow statistics for USGS gauging stations in the Stillaguamish River basin.
Station Station Name Period Drainage area (km2)
7Q10 low (1) cms (cfs)
12161000 South Fork Stillaguamish River near Granite Falls 1928 – 1980 308 2.237 (79) 12162500 South Fork Stillaguamish River above Jim Creek 1936 – 1957 515 3.427 (121) 12164000 Jim Creek near Arlington 1937 – 1957 120 0.193 (6.8) 12167000 North Fork Stillaguamish River near Arlington 1928 – 2001 679 4.956 (175)
(1) Calculated using Log Pearson III frequency factor or distribution-free methods (Aroner, 2002) Tributaries in the lower valley respond to storm events and ground water inflow. Residential development in some sub-basins may be creating ‘flashier’ hydrographic responses to storm events, and less extended seasonal storage from ground water.
Water Withdrawals Actual water withdrawals at any given time from streams in the Stillaguamish River watershed are not known, but information from the Water Rights Application Tracking database system (WRAT) was used as an indicator of the amounts of water that may be withdrawn. The water quantity potentially withdrawn from surface waters for consumptive use is about 2.2 cms from surface waters and 1.6 cms from ground water (Table 4). Irrigation represents the majority of the consumptive withdrawal from surface waters.

Page 16 Stillaguamish Fecal and DO TMDL Submittal Report
Table 4. Summary of consumptive water rights in the Stillaguamish River watershed (Pelletier and Bilhimer, 2004).
Total of all water right flows Tributaries (cfs) (cms)
Consumptive surface water withdrawals
Alder Brook 4.06 0.115 Armstrong Creek 0.84 0.024 Bulson Creek 0.02 0.001 Canyon Creek 0.12 0.003 Edwards Creek 3.93 0.111 Fish Creek 3.68 0.104 French Creek 0.02 0.001 Hat Slough 15.52 0.439 Jim Creek 0.64 0.018 Lake Cavanaugh 0.05 0.001 Lake Creek 0.39 0.011 Lake Martha 0.01 0.0003 March Creek 1.23 0.035 Miller Creek 0.01 0.0003 NF Stillaguamish River 26.43 0.748 Pilchuck Creek 0.54 0.015 Port Susan 1.10 0.031 Portage Creek 1.33 0.038 SF Stillaguamish River 7.64 0.216 South Pass 1.00 0.028 South Slough 5.80 0.164 Stillaguamish River 0.30 0.009 Other 6.62 0.187 Total 81.27 2.300 Total consumptive groundwater withdrawals 56.40 1.600
Potential Pollutant Sources There are several potential point and nonpoint sources in the basin that could contribute to the Stillaguamish basin Section 303(d) listings. Wastewater treatment plants (WWTPs) and dairies historically have been the focus of water quality actions in the lower basin and along the upper basin valleys to control bacteria, nutrients, and oxygen demand inputs. However, properties near Arlington and Stanwood are rapidly converting from agricultural to rural residential uses. Wastewater management practices and stormwater runoff issues in these areas of the basin have not necessarily meant a reduction of pollutant loads as much as a change in the delivery mechanisms and dispersal of pollutants sources. Point sources include WWTPs with distinct collection and discharge points where pollutants under permit can be monitored. Point sources in the Stillaguamish basin include the WWTPs at

Stillaguamish Fecal and DO TMDL Submittal Report Page 17
Arlington, Indian Ridge Correctional Facility, Warm Beach Christian Conference Center, Twin City Foods, and Stanwood. All have current National Pollutant Discharge Elimination System (NPDES) or State Waste Discharge permits. The operational units and permit limits for these facilities are described in Appendix A. All facilities are self-monitored and report to Ecology under current permit requirements. Most permits require effluent monitoring of pH, temperature, biochemical oxygen demand (BOD), total suspended solids, fecal coliform bacteria, and disinfection residuals. None of the facilities currently have permit limits on nutrient concentrations. Stillaguamish River basin point sources other than WWTPs that discharge to surface water under current NPDES permits are listed in Appendix F. The WWTPs have been improving over the years to reduce bacteria, biochemical oxygen demand, and ammonia inputs into receiving waters. Increased housing densities and expanding utilities within the municipal service areas also have required the municipal WWTPs to increase their treatment capacities. Arlington WWTP completed an upgrade of its facility in 1998, and Stanwood completed an upgrade in 2004. The Warm Beach Conference Center upgraded its lagoon system by adding a wetland treatment unit in 2003. The Indian Ridge facility underwent a change in operational management in 2000. Twin City Foods in Stanwood has used an upgraded treatment lagoon and land application system for food processing waste, non-contact cooling water, and repack water since 1998. Certain classes of stormwater systems are now considered point sources, although the contaminants are often released in an uncontrolled and dispersed manner. Snohomish County and the Washington State Department of Transportation (WSDOT) were required to implement a stormwater management program under Phase 1 of the NPDES and State Waste General Stormwater Permit process in 1995. Snohomish County has monitored and implemented improvements in several areas of the Stillaguamish basin with stormwater drainage and nonpoint runoff problems (Snohomish County, 2002). WSDOT and Snohomish County Public Works Department recognize that stormwater runoff from roads and adjacent properties have increasingly become a problem, especially along the Interstate 5 corridor. WSDOT has inventoried many highway stormwater drains located in Pilchuck Creek, Portage Creek, Church Creek, Harvey/Armstrong Creek, and North Fork Stillaguamish River sub-basins. Stormwater quality and quantity from roadway runoff and uncontrolled runoff from land adjacent to ditches and drains have probably always been a problem for the county and municipal collection systems. More recently, it has been identified as a problem in areas of the county where new residential development has occurred and where non-commercial farms are located. Storm water can be significant sources of fecal coliform bacteria, nutrients, metals, suspended solids, and oxygen demanding particles. Large and sudden quantities of stormwater runoff can disrupt natural hydrologic cycles and can ruin stream channel aquatic biota habitat. Snohomish County and the Snohomish Conservation District have been working together to mitigate stormwater contaminant loads. For example, Glade Bekken, a small sub-basin near the mouth of the Stillaguamish River, was host to a number of watershed restoration projects in 1998 designed, in part, to repair stream habitat degraded by stormwater runoff and to reduce stormwater loads of fecal coliform, nitrate, and suspended solids (Thornburgh, 2001).
Page 18 Stillaguamish Fecal and DO TMDL Submittal Report
Arlington and Granite Falls are required under Phase 2 of the Municipal General Stormwater Permit process to complete plans and implement programs. Storm water from the Arlington municipal area historically has been routed through several storm drains to the South Fork and mainstem Stillaguamish River, and to drainages in the Portage and March Creek sub-basins. Granite Falls is located mostly in the Pilchuck River sub-basin, but some stormwater may flow towards the South Fork Stillaguamish River. Both quantity and quality effect of storm water are issues for receiving water quality. Changes in land use may have affected seasonal flows in Portage Creek that have resulted in more serious and frequent flooding (Barlond, 2001). This is common in developing areas where impervious structures like homes and roads increase the amount of runoff to drains and streams. Arlington has made some improvements in its collection system and routing, and has worked with WSDOT in using wetlands for stormwater treatment and flood control in some areas (Blake, personal communication, 2002). Nonpoint sources do not have easily identified and distinct locations where pollutants are discharged and can be monitored. Nonpoint sources are usually associated with land uses such as timber harvesting, construction, agricultural production, intensive recreational activities, and urban runoff. Many types of nonpoint sources are intermittent because they are generated by rainfall in sufficient amounts to produce runoff. A significant source of nonpoint pollution in western Washington has historically been attributed to dairies and animal production facilities. A steady improvement in waste management and operational practices at these types of facilities over the past 25 years has reduced their pollutant loading in many basins. The Dairy Nutrient Management Act of 1998 required all dairies in the state to register and have certified nutrient management plans by December 31, 2003. Implementing and maintaining the management plans should reduce or eliminate pollutant loading from dairy operations. The current inventory shows 21 active dairies in the Stillaguamish basin with approximately 5100 cows and 2000 heifers and calves (Ecology, 2003a). Most of the dairies are located in the lower valley floodplain, but a few are located along the valley of the North Fork and clustered near Arlington in drainages to the South Fork. As of December 2004, all dairies had certified nutrient management plans. Only one dairy in the basin has a NPDES and state waste discharge general permit (WAG 01-3025B). It is located south of the Twin City Foods land application site between the Old Stillaguamish Channel and Hat Slough. There are fewer dairies in the basin now than in 1996. The 1996 dairy inventory listed 44 dairies with almost 8000 cows in the basin. By 1999 the number of active dairies in the basin was reduced to 31, with approximately 8000 cows and 3000 heifers and calves (Ecology, 2000). Now there are 21 active dairies. Two of the ten dairies that went out of business between 1999 and 2000 were in the South Fork sub-basin, and one was in the Pilchuck Creek sub-basin. The remaining eight were in the Portage Creek sub-basin and lower Stillaguamish floodplain between Arlington and Stanwood. Between 1990 and 2000, Snohomish County’s population increased by 30% (Washington State Office of Financial Management, 2003). Land use in the Stillaguamish River basin has changed as a result of that population growth. Properties are being converted from commercial

Stillaguamish Fecal and DO TMDL Submittal Report Page 19
agricultural and forestry uses to high and low density residential, non-commercial agriculture, and commercial/industrial uses. These land use conversions may not necessarily result in reduced loading of contaminants traditionally associated with commercial agriculture, e.g., bacteria, nutrients, suspended solids, and pesticides. Rural residential areas, non-commercial agricultural interests, and commercial/industrial uses can generate greater loads of these same pollutants. Increased contaminant loading can be related to poor animal-keeping practices on smaller lots – anything from a pet horse or family cow to a boarding stable. These sources, along with poorly maintained and failing on-site septic systems, can be directly discharged into waterways. Background concentrations of some contaminants in the basin complicate some aspects of the TMDL. Although inactive and abandoned mines could be potential sources of uncontrolled contamination, veins of arsenic and mercury-enriched bedrock in the headwater streams and aquifers of both forks may be responsible for some elevated concentrations of these metals. Riparian wetlands and groundwater seepage into small tributaries could be natural sources of lower dissolved oxygen concentrations during baseflow conditions. The diked flats used by Twin City Foods and the other farmlands in the lower Stillaguamish Valley provide an excellent wintering area for flocks of trumpeter swans, snow geese, and other waterfowl. The riparian areas, wetlands, sloughs, and tideflats of Port Susan provide an excellent habitat for seals and other wildlife, also a potential for significant seasonal bacteria loading. Relatively narrow veins of metal ore in the Cascade Mountains, where headwater streams of the basin originate, are also rich with arsenic and mercury. Where tributaries and snowmelt cross these veins, contamination is possible. One potential anthropogenic source for arsenic and mercury contamination may be historical mining operations in the mountains along the veins. Huntting (1956) shows several historical mines in the South Fork and North Fork Stillaguamish River basins where arsenic and mercury were of secondary value. Metal mining was most active in the late 1800s until the 1920s. No active mines are located in the headwaters. The Washington State Department of Natural Resources, Ecology, the EPA, and other federal agencies are making an inventory and monitoring water quality in these inactive and abandoned mining areas (Norman, 2000; Raforth, Norman, and Johnson, 2002). Another potential source of arsenic and mercury is ground water. Elevated groundwater arsenic concentrations have been a well-known problem in the Granite Falls area where completed wells are in contact with the bedrock formations or bedrock-derived material (Snohomish County Health District and Washington State Department of Health, 1991). The elevated arsenic concentrations in ground water are more widespread in Snohomish County than the Granite Falls area (Thomas, Wilkinson, and Embrey, 1997). Some wells in the Cascade foothills between Arlington and Granite Falls had elevated arsenic. Elevated mercury was detected in two of the wells north of Stanwood and another well in the North Fork valley. The sources of arsenic and mercury in these samples were not determined; sampling protocols and quality assurance were followed and acceptable. Wildlife can contribute a significant load of bacteria, nutrients, and oxygen-demanding substances when they are found in large numbers. The first small flocks of snow geese arrive on the Skagit-Fraser estuaries in late September and build in numbers throughout October and early

Page 20 Stillaguamish Fecal and DO TMDL Submittal Report
November. A small portion move on, and then the population is relatively stable until spring. This flock numbered about 41,100 during 1987-96 (WDFW, 2003). With other flocks of geese, swans, and ducks joining the snow geese, the populations of waterfowl wintering in the lower Stillaguamish waterways and adjacent fields are substantial. In Table 5, three to five years of Audubon bird counts and special inventories by the Washington Department of Fish and Wildlife in northeast Port Susan, Livingston Bay, and the lower Stillaguamish Delta were compiled and summarized by the Audubon Society (Cullinan, 2001).
Table 5. Bird population data for northeast Port Susan, Livingston Bay, and the Stillaguamish River delta (Cullinan, 2001).
Bird Season Sighted Average Number
Maximum Number
Trumpeter Swan
Winter 51 139
Snow Goose Winter 9,700 25,000 Ducks Winter 4,040 6,864 Eagle Winter 4 10 Merlin Winter 1 3 Falcon Winter 1 2 Shorebirds Fall Migration - 50,000 Shorebirds Winter 24,175 31,050 Shorebirds Spring Migration 34,350 50,000
About 300 harbor seals are residents of northern Port Susan. Their population has stabilized since 1993 or 1994 (Huber, personal communication, 2003). They haul-out on the tideflats in warmer months, pup in July and August, and stay around northern Port Susan throughout the year. In cooler months they spend most of their time in the water. Less is known about their dispersal within Port Susan during the winter months since they are in the water during the day, and lower tides (when they might move out of the water) occur at night.

Stillaguamish Fecal and DO TMDL Submittal Report Page 21
Applicable Water Quality Criteria The Water Quality Standards for Surface Waters of Washington State are published pursuant to Chapter 90.48 of the Revised Code of Washington (RCW) (Ecology, 1997). Ecology has the authority to adopt rules, regulations, and standards as necessary to protect the environment. Under the federal Clean Water Act, the EPA regional administrator must approve the water quality standards adopted by the state (Section 303 (c) (3)). State water quality standards designate certain characteristic uses for protection and specify the criteria necessary to protect those uses (Washington Administrative Code (WAC), Chapter 173-201A).
This report addresses impairments of characteristic uses caused by fecal coliform bacteria, dissolved oxygen, pH, arsenic, and mercury as pollutants. The characteristic uses designated by Washington State for protection in Stillaguamish River basin streams (Class AA and Class A) and for Port Susan (Class A marine waters) are as follows (Chapter 173-201A WAC):
"Characteristic uses. Characteristic uses shall include, but not be limited to, the following:
(i) Water supply (domestic, industrial, agricultural).
(ii) Stock watering.
(iii) Fish and shellfish:
Salmonid migration, rearing, spawning, and harvesting.
Other fish migration, rearing, spawning, and harvesting.
Clam and mussel rearing, spawning, and harvesting.
Crayfish rearing, spawning, and harvesting.
(iv) Wildlife habitat.
(v) Recreation (primary contact recreation, sport fishing, boating, and aesthetic enjoyment).
(vi) Commerce and navigation." Washington State has water quality criteria (Chapter 173-201A WAC) for fecal coliform bacteria, dissolved oxygen, pH, and metals to protect these characteristic uses (Table 6). Human-health criteria for arsenic and mercury are set by the EPA through the National Toxics Rule (40 CFR 131.36). The most recent version of Washington’s water quality standards was adopted in November 1997. Ecology submitted updated water quality standards to EPA for approval in July 2003. The new criteria cannot be implemented until they are approved by EPA. In a January 12, 2005 letter, EPA approved only a partial set of the recently adopted water quality standards; Table 6 reflects the current standards including the January 2005 approved standards.
Other sections of Chapter 173-201A WAC are pertinent to the parameters in the Stillaguamish TMDL. Chapter 173-201A-070, a section on antidegradation, states that existing beneficial uses shall be maintained and protected, and no further degradation is allowed, and also states that
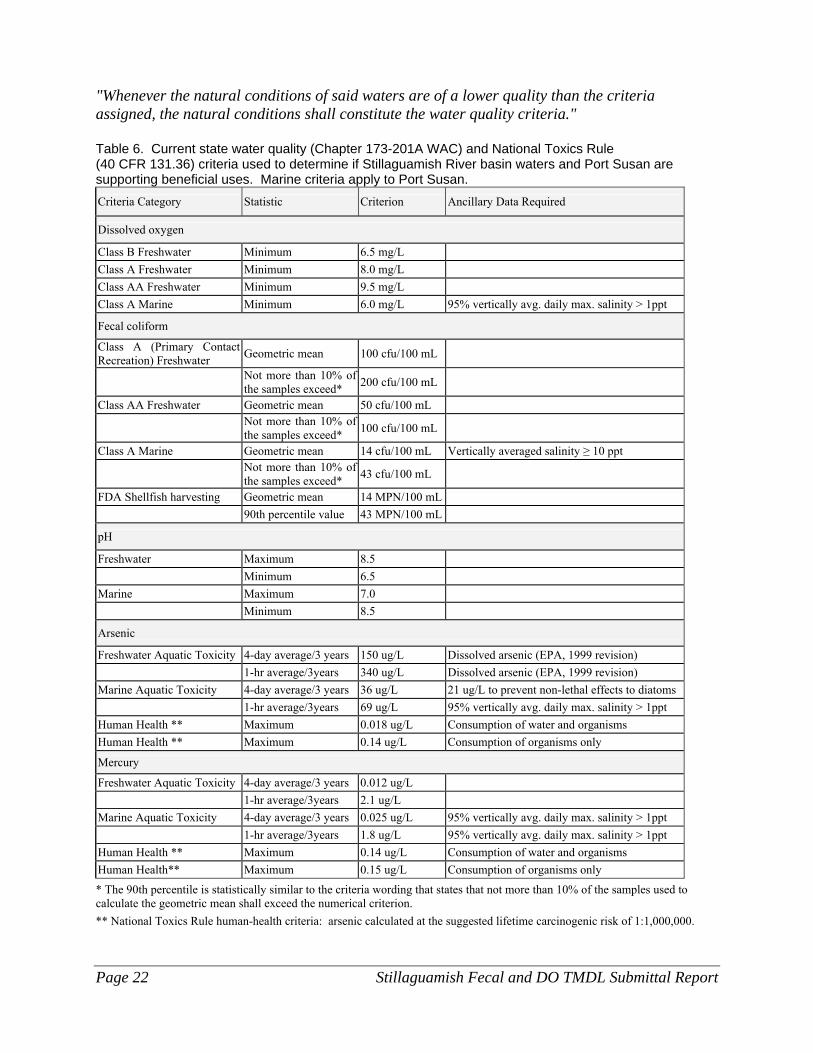
Page 22 Stillaguamish Fecal and DO TMDL Submittal Report
"Whenever the natural conditions of said waters are of a lower quality than the criteria assigned, the natural conditions shall constitute the water quality criteria." Table 6. Current state water quality (Chapter 173-201A WAC) and National Toxics Rule (40 CFR 131.36) criteria used to determine if Stillaguamish River basin waters and Port Susan are supporting beneficial uses. Marine criteria apply to Port Susan. Criteria Category Statistic Criterion Ancillary Data Required
Dissolved oxygen
Class B Freshwater Minimum 6.5 mg/L Class A Freshwater Minimum 8.0 mg/L Class AA Freshwater Minimum 9.5 mg/L Class A Marine Minimum 6.0 mg/L 95% vertically avg. daily max. salinity > 1ppt
Fecal coliform
Class A (Primary Contact Recreation) Freshwater Geometric mean 100 cfu/100 mL
Not more than 10% of the samples exceed* 200 cfu/100 mL
Class AA Freshwater Geometric mean 50 cfu/100 mL
Not more than 10% of the samples exceed* 100 cfu/100 mL
Class A Marine Geometric mean 14 cfu/100 mL Vertically averaged salinity ≥ 10 ppt
Not more than 10% of the samples exceed* 43 cfu/100 mL
FDA Shellfish harvesting Geometric mean 14 MPN/100 mL 90th percentile value 43 MPN/100 mL
pH
Freshwater Maximum 8.5 Minimum 6.5 Marine Maximum 7.0 Minimum 8.5
Arsenic
Freshwater Aquatic Toxicity 4-day average/3 years 150 ug/L Dissolved arsenic (EPA, 1999 revision) 1-hr average/3years 340 ug/L Dissolved arsenic (EPA, 1999 revision) Marine Aquatic Toxicity 4-day average/3 years 36 ug/L 21 ug/L to prevent non-lethal effects to diatoms 1-hr average/3years 69 ug/L 95% vertically avg. daily max. salinity > 1ppt Human Health ** Maximum 0.018 ug/L Consumption of water and organisms Human Health ** Maximum 0.14 ug/L Consumption of organisms only
Mercury
Freshwater Aquatic Toxicity 4-day average/3 years 0.012 ug/L 1-hr average/3years 2.1 ug/L Marine Aquatic Toxicity 4-day average/3 years 0.025 ug/L 95% vertically avg. daily max. salinity > 1ppt 1-hr average/3years 1.8 ug/L 95% vertically avg. daily max. salinity > 1ppt Human Health ** Maximum 0.14 ug/L Consumption of water and organisms Human Health** Maximum 0.15 ug/L Consumption of organisms only
* The 90th percentile is statistically similar to the criteria wording that states that not more than 10% of the samples used to calculate the geometric mean shall exceed the numerical criterion. ** National Toxics Rule human-health criteria: arsenic calculated at the suggested lifetime carcinogenic risk of 1:1,000,000.
Stillaguamish Fecal and DO TMDL Submittal Report Page 23
This is in recognition that non-anthropogenic sources like wetland and groundwater sources can influence local water quality conditions so that not all numeric criteria and standards are met at all times. In cases where dissolved oxygen concentrations are lower than the criteria due to natural conditions, Ecology TMDL policy (TMDL Workgroup, 1996) and the proposed state water quality criteria [Chapter 173-201A-200(1)(d)(i) WAC] allow up to 0.2 mg/L loss from cumulative anthropogenic sources. Chapter 173-201A also contains a narrative criterion for each classification that states: "Toxic, radioactive, or deleterious material concentrations shall be below those which have the potential either singularly or cumulatively to adversely affect characteristic water uses, cause acute or chronic conditions to the most sensitive biota dependent upon those waters, or adversely affect public health, as determined by the department." The narrative criteria statements acknowledge that measures of water quality other than those specifically addressed as numerical criteria can be used to measure compliance with the water quality standards. One example is that Washington State water quality standards do not have numeric nutrient criteria. The nutrients, nitrogen and phosphorus, are essential for plant growth and aquatic community health. However, when there is an overabundance of nutrients from point and nonpoint sources, aquatic plant growth can become over-stimulated, a process called cultural eutrophication. If natural re-aeration processes cannot compensate for plant respiration and production in areas affected by eutrophication, then dissolved oxygen concentrations plunge at night and become supersaturated during the day. These diel swings can be harmful to macroinvertebrates and fish. Fecal coliform criteria in marine waters are used to protect recreational uses and shellfish harvesting. The marine water criteria are similar for the two uses, but they are administered by two different state agencies in different ways.
• Washington State Department of Health (DOH) uses the fecal coliform criteria as one element of the shellfish harvest area certification process. According to DOH and Federal Drug Administration (FDA) regulations, fecal coliform samples can only be analyzed by the most probable number (MPN) method. To evaluate water quality compliance, DOH generates running geometric mean and 90th percentile statistics at each site from 30 consecutive samples. These statistics must consistently meet the FDA-mandated 14 MPN/100 mL and 43 MPN/100 mL criteria, respectively.
• Ecology uses samples analyzed by MPN or membrane filter (MF) methods. The Class A marine water criteria are applied to samples with salinities greater than 10 parts per thousand. There is no requirement for a minimum number of samples. Seasonal stratification of samples is required if compliance with the criteria can only be met when lower counts outside the season of concern are included in the sample set.
EPA has recommended nutrient criteria for rivers and streams to address cultural eutrophication (EPA, 2000). The criteria have been statistically derived for the Level III ecoregions of Puget Lowlands and North Cascades within aggregate Ecoregion II. The EPA recommends using the
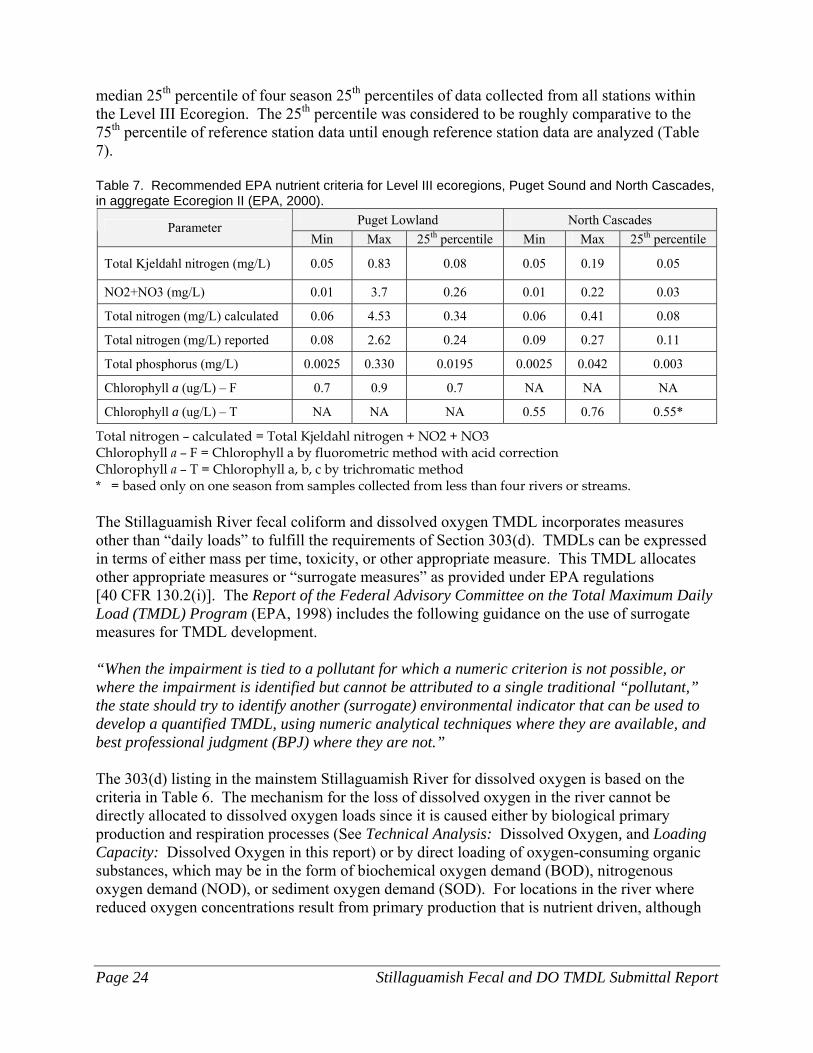
Page 24 Stillaguamish Fecal and DO TMDL Submittal Report
median 25th percentile of four season 25th percentiles of data collected from all stations within the Level III Ecoregion. The 25th percentile was considered to be roughly comparative to the 75th percentile of reference station data until enough reference station data are analyzed (Table 7). Table 7. Recommended EPA nutrient criteria for Level III ecoregions, Puget Sound and North Cascades, in aggregate Ecoregion II (EPA, 2000).
Puget Lowland North Cascades Parameter Min Max 25th percentile Min Max 25th percentile
Total Kjeldahl nitrogen (mg/L) 0.05 0.83 0.08 0.05 0.19 0.05
NO2+NO3 (mg/L) 0.01 3.7 0.26 0.01 0.22 0.03
Total nitrogen (mg/L) calculated 0.06 4.53 0.34 0.06 0.41 0.08
Total nitrogen (mg/L) reported 0.08 2.62 0.24 0.09 0.27 0.11
Total phosphorus (mg/L) 0.0025 0.330 0.0195 0.0025 0.042 0.003
Chlorophyll a (ug/L) – F 0.7 0.9 0.7 NA NA NA
Chlorophyll a (ug/L) – T NA NA NA 0.55 0.76 0.55*
Total nitrogen – calculated = Total Kjeldahl nitrogen + NO2 + NO3 Chlorophyll a – F = Chlorophyll a by fluorometric method with acid correction Chlorophyll a – T = Chlorophyll a, b, c by trichromatic method * = based only on one season from samples collected from less than four rivers or streams. The Stillaguamish River fecal coliform and dissolved oxygen TMDL incorporates measures other than “daily loads” to fulfill the requirements of Section 303(d). TMDLs can be expressed in terms of either mass per time, toxicity, or other appropriate measure. This TMDL allocates other appropriate measures or “surrogate measures” as provided under EPA regulations [40 CFR 130.2(i)]. The Report of the Federal Advisory Committee on the Total Maximum Daily Load (TMDL) Program (EPA, 1998) includes the following guidance on the use of surrogate measures for TMDL development. “When the impairment is tied to a pollutant for which a numeric criterion is not possible, or where the impairment is identified but cannot be attributed to a single traditional “pollutant,” the state should try to identify another (surrogate) environmental indicator that can be used to develop a quantified TMDL, using numeric analytical techniques where they are available, and best professional judgment (BPJ) where they are not.” The 303(d) listing in the mainstem Stillaguamish River for dissolved oxygen is based on the criteria in Table 6. The mechanism for the loss of dissolved oxygen in the river cannot be directly allocated to dissolved oxygen loads since it is caused either by biological primary production and respiration processes (See Technical Analysis: Dissolved Oxygen, and Loading Capacity: Dissolved Oxygen in this report) or by direct loading of oxygen-consuming organic substances, which may be in the form of biochemical oxygen demand (BOD), nitrogenous oxygen demand (NOD), or sediment oxygen demand (SOD). For locations in the river where reduced oxygen concentrations result from primary production that is nutrient driven, although

Stillaguamish Fecal and DO TMDL Submittal Report Page 25
dissolved oxygen concentration is the criterion to be met, the allocations will be to phosphorus and/or nitrogen loads. Where reduced oxygen conditions result from BOD loading from point and nonpoint sources, allocations will be for BOD, even though dissolved oxygen is the criterion to be met. In another case, fecal coliform compliance is measured by numeric criteria based on statistical attributes of counts at a site, i.e., both the geometric mean and “not more than 10% of the samples” at a site’s fecal coliform population must meet the criteria. An allocation of fecal coliform count loads is awkward and does not adequately address the criteria compliance requirements under various hydrologic conditions at the site. For example, a high fecal coliform count out of compliance under low-flow conditions may have a lower load than a lower count within compliance under higher flow conditions. Instead of managing fecal coliform sources by defining an acceptable load, Ecology has used the Statistical Rollback Method (Ott, 1995) to manage the distribution of fecal coliform counts (See Analytical Framework: Fecal Coliform). The approach has proven successful in past bacteria TMDL assessments (Cusimano, 1997; Joy, 2000; and Sargeant, 2002).
Water Quality and Resource Impairments
Beneficial Uses and Section 303(d) Listings Several beneficial uses may not be meeting their full potential because of water quality impairments in the Stillaguamish River basin. The most important uses identified by local groups are salmon spawning and rearing, recreation, and shellfish harvesting. Chinook salmon were listed as a threatened species under the federal Endangered Species Act in 1999. Coho salmon are a candidate species. Commercial shellfish harvesting in Port Susan is prohibited because the area has not been assessed by the Washington State Department of Health since the mid-1980s. The 1998 Section 303(d)-listed parameters for water bodies in the basin are indicators that these uses are impaired (Table 8); additional locations in the basin (Table 9) were found to be impaired during the technical study for this TMDL (Ecology July 2004). Low dissolved oxygen and low pH can impair fish and aquatic life communities. Arsenic concentrations above human-health criteria can be a threat to human consumers of water, fish, and shellfish. High fecal coliform bacteria counts threaten primary and secondary recreational uses of the water and prevent shellfish harvesting. Salmon use a variety of habitats in the Stillaguamish, the mainstem and major forks, large and small tributaries, beaver ponds, riparian wetlands and side channels, estuary sloughs, and salt marshes. Many of these habitats have been reduced severely from sedimentation of channels by natural landslides and from anthropogenic activities, e.g., diking and channelization, removal of riparian vegetation, and water quality degradation by land use activities (Washington Conservation Commission, 1999). Just under one-third (1432 km) of the total stream network is available habitat for anadromous fish (Washington Conservation Commission, 1999). Salmon are present throughout the year in many parts of the basin. Table 10 shows the

Page 26 Stillaguamish Fecal and DO TMDL Submittal Report
approximate timing of various life-stages of salmon species in the Stillaguamish (Washington Conservation Commission, 1999). Rearing of several species occurs throughout the year and in several types of habitats. Although the spawning period overlaps between species, salmon have specific spawning habitat requirements. For example, chinook salmon prefer the main channels of larger rivers while coho prefer smaller tributaries. Of the Section 303(d)-listed parameters in the Stillaguamish, dissolved oxygen, pH, and turbidity are the most likely to impair salmon health. Incubation is considered a particularly sensitive life-stage for salmon when adequate instream oxygen concentrations are essential to keep intergravel eggs aerated. Most of the salmon species, except for summer steelhead and char, spawn in areas that are on the Section 303(d) list for dissolved oxygen. Low pH (below 6.5) becomes a problem to salmon in any life stage when it makes metals and other pollutants more reactive and more toxic to the fish. Turbidity can reduce salmon spawning habitat when it indicates potential siltation of spawning and incubation areas. Elevated turbidities of long duration also can impair fish behavior and feeding, and can interfere with gill operation at particularly high turbidities.

Stillaguamish Fecal and DO TMDL Submittal Report Page 27
Table 8. Stillaguamish River basin water bodies on the 1996 and/or 1998 Section 303(d) list for fecal coliform bacteria, dissolved oxygen, arsenic or pH (Table revised from Ecology July 2004).
Old ID No. New ID No. Name 1996 Listings
1998 Listings
WA-05-1016 QJ28UC Fish Creek Fecal Coliform Fecal Coliform HD76OJ Harvey Creek Fecal Coliform JU33JU Jim Creek Fecal Coliform WA-05-1012 GH05SX Jorgenson Slough
(Church Creek) Fecal Coliform
Fecal Coliform
IJ55EP Lake Martha Creek Fecal Coliform WA-05-1018 VJ74AO Pilchuck Creek Dissolved Oxygen WA-PS-0020 390KRD Port Susan Fecal Coliform Fecal Coliform WA-05-1015 OT80TY
(Note 1) 0.00-2.61
Portage Creek at 212th St Bridge Fecal Coliform Fecal Coliform, Dissolved Oxygen
WA-05-1015 OT80TY 3.58-8.63
Portage Creek, several segments including 43rd Avenue Bridge
Dissolved Oxygen Dissolved Oxygen
WA-05-1010 QE93BW Stillaguamish River Fecal Coliform Fecal Coliform, Dissolved Oxygen WA-05-1010 ZO73WL Stillaguamish River
(Hat Slough) Dissolved Oxygen Fecal Coliform, Dissolved Oxygen
WA-05-1020 WO38NV N.F. Stillaguamish River Fecal Coliform Fecal Coliform WA-05-1050 SN06ZT S.F. Stillaguamish River Fecal Coliform Fecal Coliform WA-05-1040 SN06ZT S.F. Stillaguamish River Fecal Coliform LU17DC Unnamed Creek #0456 Fecal Coliform DELISTINGS WA-05-1010 QE93BW Stillaguamish River pH (see text page 81) Arsenic (see text page 105) WA-05-1050 SN06ZT S.F. Stillaguamish River Dissolved Oxygen
(Note 2; text page 80)
WA-05-1040 SN06ZT S.F. Stillaguamish River pH (Note 3) pH (Note 3)
Note 1: Includes the listings mistakenly assigned to QJ28UC, Fish Creek, and YF03BC, a branch of Portage Creek, that should have been entered as OT80TY, Portage Creek.
Note 2: Ecology July 2004 TMDL Technical Report: South Fork Stillaguamish above Granite Falls has been meeting standard for DO since 1995. Note 3: Original pH listing at Arlington (Ecology station 05A090) was based on two samples not meeting standard (two different dates in 1987 and 1991); TMDL sampling in 2001 showed no pH values below 6.5 and in summarizing data since 1991, no other occurrences reported below criterion.

Page 28 Stillaguamish Fecal and DO TMDL Submittal Report
Table 9. Stillaguamish Basin water bodies previously unlisted but found through TMDL to be impaired (revised from Ecology July 2004). ID No. Name Parameter ID No. Name Parameter FJ67XF Glade Bekken Fecal Coliform JV77EY Twin City Foods Drain # 1 Fecal Coliform VJ74AO Pilchuck Creek Fecal Coliform, Dissolved
Oxygen JV77EY Twin City Foods Drain # 2 Fecal Coliform
WI88QF March Creek Fecal Coliform, Dissolved Oxygen
JV77EY Twin City Foods Drain # 3 Fecal Coliform
VP67JK Armstrong Creek at Mouth Fecal Coliform WC93GU Twin City Foods Drain # 4 Fecal Coliform, Dissolved Oxygen
VP67JK Armstrong Creek below Hatchery
Fecal Coliform WC93GU Twin City Foods Drain # 5 Fecal Coliform
XB43NX Kackman Creek Fecal Coliform, Dissolved Oxygen
SH96KX Warm Beach Creek above WWTP
Fecal Coliform, Dissolved Oxygen
XF13JD West Pass – Old Stillaguamish Channel
Fecal Coliform SH96KX Agricultural Drain to Warm Beach Dike Pond
Fecal Coliform, Dissolved Oxygen
UJ01AO South Pass – Old Stillaguamish Channel
Fecal Coliform SH96KX Warm Beach Dike Pond Fecal Coliform, Dissolved Oxygen
AS64WF Douglas Slough Fecal Coliform IE90YH Warm Beach Slough Fecal Coliform HS19KT Irvine Slough Fecal Coliform QE93BW Stillaguamish River at I-5 Mercury GH05SX Church Creek at Park Fecal Coliform WO38NV North Fork Stillaguamish River pH, Mercury KX60NO Miller Creek at Miller Road Fecal Coliform SN06ZT South Fork Stillaguamish River Mercury

Stillaguamish Fecal and DO TMDL Submittal Report Page 29
Table 10. General timing of life-stages of Stillaguamish basin salmon species (Washington Conservation Commission, 1999)
Species Life Phase Jan Feb Mar Apr May Jun Jul Aug Sep Oct Nov Dec Chinook Upstream migration xxxxxxxxxxxxxxxxxxxxxxxxxxxxxxxx Spawning xxxxxxxxxxxxxxxxxx Incubation xxxxxxxxxxxx xxxxxxxxxxxxxxxxxxxxxxxxxxxxxxx Juvenile rearing xxxxxxxxxxxxxxxxxxxxxxxxxxxxxxxxxxxxxxxxxxxxxxxxxxxxxxxxxxxxxxxxxxxxxxxxxxxxxxxx Smolt outmigration xxxxxxxxxxxxxxxxxxxxxxx Coho Upstream migration xxxxxxxxxxxxxxxxxx Spawning xxxxxxxxxxxx xxxxxxxxxxxxxxxxxx Incubation xxxxxxxxxxxxxxxxxxxxxxxxxxxxxx xxxxxxxxxxxxxxxxxx Juvenile rearing xxxxxxxxxxxxxxxxxxxxxxxxxxxxxxxxxxxxxxxxxxxxxxxxxxxxxxxxxxxxxxxxxxxxxxxxxxxxxxxxx Smolt outmigration xxxxxxxxxxxxxxxxxxxxxxx Pink Upstream migration xxxxxxxxxx Spawning xxxxxxxxxxxxxxxxxx Incubation xxxxxxxxxxxxxxxxxxxxxxx xxxxxxxxxxxxxxxxxxxxxxxxxxxxxxx Juvenile rearing xxxxxxxxxxxxxxxxx Smolt outmigration xxxxxxxxxxxxxxxxx Chum Upstream migration xxxxxxxxxxxxxxxxxxxxxxxxx Spawning xxxx xxxxxxxxxxxxxxxxxx Incubation xxxxxxxxxxxxxxxxxxxxxxxxxx xxxxxxxxxxxxxxxxxx Juvenile rearing xxxxxxxxxxxxxxxxxxxx Smolt outmigration xxxxxxxxxxxxxxxxxxxxxxx Sockeye Upstream migration xxxxxxxxxxxxxxxxx Spawning xxxxxxxxxxxxxxxxxx Incubation xxxxxxxxxxxx xxxxxxxxxxxxxxxxxxxxxxxxx Juvenile rearing xxxxxxxxxxxxxxxxxxxxxxxxxxxxxxxxxxxxxxxxxxxxxxxxxxxxxxxxxxxxxxxxxxxxxxxxxxxxxxxxx Smolt outmigration xxxxxxxxxxxxxxxxxxxxxxx Summer Upstream migration xxxxxxxxxxxxxxxxxxxxxxxxxxxxxxxxxxxxxxxxxxx Steelhead Spawning xxxxxxxxxxxxxxxxxxxxx Incubation xxxxxxxxxxxxxxxxxxxxxxxxxxxx Juvenile rearing xxxxxxxxxxxxxxxxxxxxxxxxxxxxxxxxxxxxxxxxxxxxxxxxxxxxxxxxxxxxxxxxxxxxxxxxxxxxxxxxx Smolt outmigration xxxxxxxxxxxxxxxxx Winter Upstream migration xxxxxxxxxxxxxxxxxxxxxxxxxxxxx xxxxxxxxxx Steelhead Spawning xxxxxxxxxxxxxxxxxxxxx Incubation xxxxxxxxxxxxxxxxxxxxxxxxxxxxxx Juvenile rearing xxxxxxxxxxxxxxxxxxxxxxxxxxxxxxxxxxxxxxxxxxxxxxxxxxxxxxxxxxxxxxxxxxxxxxxxxxxxxxxxx Smolt outmigration xxxxxxxxxxxxxxxx Char Upstream migration xxxxxxxxxxxxxxxxxxxxxxxx Spawning xxxxxxxxxxxxx Incubation xxxxxxxxxxxxxxxxxxxxxxxxxxxxx xxxxxxxxxxxxxxxxxxxxxx Juvenile rearing xxxxxxxxxxxxxxxxxxxxxxxxxxxxxxxxxxxxxxxxxxxxxxxxxxxxxxxxxxxxxxxxxxxxxxxxxxxxxxxxx Smolt outmigration xxxxxxxxxxxxxxxxx Sea-run Upstream migration xxxxxxxxxxxxxxxxxxxxxxxxxxxxx Cutthroat Spawning xxxxxxxxxxxxxxxxxxxxxxx Incubation xxxxxxxxxxxxxxxxxxxxxxxxxxxxx Juvenile rearing xxxxxxxxxxxxxxxxxxxxxxxxxxxxxxxxxxxxxxxxxxxxxxxxxxxxxxxxxxxxxxxxxxxxxxxxxxxxxxxxx Smolt outmigration xxxxxxxxxxxxxxxxxxxxxxxx
Fisheries specialists have recommended many habitat and channel improvements to assist salmon recovery in the Stillaguamish basin (Stillaguamish Technical Advisory Group, 2000). Channel sedimentation, increased peak flows, extreme low flows, increased temperatures, and reduced dissolved oxygen were identified problems in the basin. The Salmon Habitat Limiting Factors Report (Washington Conservation Commission, 1999) for the Stillaguamish basin noted that nonpoint sources of pollution such as agricultural practices, on-site sewage disposal, development and urban runoff, and forest practices were major causes of water quality problems.

Page 30 Stillaguamish Fecal and DO TMDL Submittal Report
The Stillaguamish basin attracts many people for recreational opportunities. Salmon fishing is one obvious attraction to the river. Boating, riverside picnicking, and swimming occur all along the main forks and some tributaries. There are no designated swimming areas with lifeguards and bath houses. Full immersion swimming is probably limited to summer periods when air temperatures and water temperatures are highest. During the TMDL monitoring surveys, local swimming and wading areas were observed on the main branches of the river and on some tributaries, at most Washington Department of Fish and Wildlife (WDFW) access areas, public parks, and at some bridge crossings. Warm Beach Camp and Kayak Point Regional Park have boat launching areas on Port Susan, but no designated swimming areas are present. Commercial shellfish harvesting in Port Susan was closed by the Washington State Department of Health (DOH) in 1986 due to bacterial contamination. The area became unclassified when no commercial interest was taken in the beds, and the DOH stopped monitoring water quality. Recreational access for shellfish collection is limited, and the WDFW has recreational harvest limits, but none of the beaches have been closed for sanitary considerations under the DOH recreational shellfish monitoring program (www.doh.wa.gov/ehp/sf/recshell.htm).
Water Quality Assessments Since 1998 The data used for the 1998 Section 303(d) listings were collected from 1988 to 1997 (Ecology, 2000). Some water quality improvements were in progress by 1997. For example, data collected from 1991 to 1994 and analyzed by the Tulalip Tribes (O’Neal, Nelson, and DeNeve, 2001) showed only a weak improving trend in fecal coliform counts in the mainstem. By the late 1990s, improvements were more evident. Joy and Glenn (2000), Klopfer (2000), Thornburgh and Williams (2001), and Joy (2001) reviewed and assessed various data sets collected from the 1980s through 1999. According to their assessments, water quality had significantly improved in many parts of the basin, but criteria were not being met in others. Among the findings were the following:
• Fecal coliform (FC) counts at the Stillaguamish River at Interstate 5 had declined significantly since 1977. A significant improving step-trend was evident for data collected from 1989 to 1993 compared to 1994 through 1999 data. FC data collected from 1995 through 1999 met both parts of the state water quality criteria.
FC counts in Hat Slough at Marine Drive had decreased from 1994 to 1999. However, there was still a downstream increase in FC bacteria from the mainstem Stillaguamish River at Arlington to Hat Slough.
Dissolved oxygen (DO) concentrations were 0.5 – 1.0 mg/L lower at Hat Slough than at the Stillaguamish River at Arlington, but none of the concentrations had been below 8 mg/L from 1996 to 1999.
The Earth Tech (1997) study below the Arlington WWTP demonstrated that diel DO concentrations dropped below 8 mg/L (7.2 mg/L) in a pool reach four miles below the outfall. Water quality sampling and QUAL2E modeling analyses were performed. Periphyton productivity and respiration were the suggested causes rather than effluent biochemical oxygen demand or nitrogenous oxygen demand concentrations.

Stillaguamish Fecal and DO TMDL Submittal Report Page 31
Church Creek FC counts continued to be elevated throughout the year, but especially during storm events.
Glade Bekken, formerly Tributary 30, was monitored by Snohomish County during a watershed restoration project. FC counts had decreased in the creek, but did not meet criteria. DO concentrations have met the Class A criterion.
Portage Creek continued to have low DO concentrations that do not meet the Class A criterion during low-flow periods, and elevated FC counts that do not meet criteria throughout the year.
Pilchuck Creek DO concentrations have improved since 1995, and none of the concentrations through 1999 had been below 8 mg/L.
• FC data collected by Ecology from the South Fork Stillaguamish River at Arlington from 1995 through 1999 met both parts of the state water quality criteria.
• DO concentrations from the South Fork Stillaguamish River at Arlington have not been below 8 mg/L from 1995 through 1999, and no pH violations have been observed in the data since 1990.
• A 1995 step trend was evident that showed decreasing FC counts in the North Fork Stillaguamish River at Cicero. FC counts met Class A criteria.
• FC counts were in compliance with Class AA criteria in 1999 at both the North Fork at Darrington and at the South Fork at Granite Falls.
• The Stillaguamish Tribe has been sampling FC at several sites in northern Port Susan since summer 1998 (Klopfer, 2000). Most sites have shown slight improvements through 1999. Sites nearest to Hat Slough were not meeting marine water DOH FC criteria. The sites south (Warm Beach Point and Kayak Point) and the sites to the northwest (North Port Susan and Peripheral Site 4) appeared to be within DOH FC criteria. The site near Warm Beach Slough has experienced the worst bacterial water quality of the sites monitored.
Fecal coliform counts and dissolved oxygen and ammonia concentrations in the basin have been improving in several areas. Some of these improvements may have coincided with the federal Dairy Buyout Program in the mid-1980s that reduced the number of cows in most Puget Sound basins. Many more of the improvements reported through the 1990s coincide with implementation of the Stillaguamish Watershed Plan and work implemented by the Stillaguamish Clean Water District. In 1987, Ecology selected the Stillaguamish River basin as one of six “Early Action Watersheds” in the Puget Sound basin. As such, a watershed management committee was formed and received grant money to write the Stillaguamish Watershed Action Plan. The 1990 plan and accompanying technical supplement addressed the magnitude of various nonpoint sources of pollution and the actions needed to control and prevent problems from those sources. The Stillaguamish Clean Water District Board, the Stillaguamish Implementation and Review Committee, and the Flood Control District continue to direct and fund implementation of the tasks stated in the action plan, and respond to newer concerns for salmon habitat restoration. Snohomish County Surface Water Management, Snohomish Conservation District, the

Page 32 Stillaguamish Fecal and DO TMDL Submittal Report
Stillaguamish Tribe, the Tulalip Tribes, and other local groups have been working together to improve water quality by controlling and preventing nonpoint sources in the Stillaguamish basin and in Port Susan.
Analytical Framework The technical analysis of the data for this TMDL required the use of several mathematical procedures, mathematical models, and statistical equations. Some of the procedures and equations were used for all of the parameters examined; others were used only for specific parameters. The following section describes the analytical processes used for each parameter and any accompanying assumptions needed for the procedures. The procedures used to establish critical conditions and to evaluate seasonal variability are also described. The procedures, assumptions, and rationale create the technical framework that supports the findings and conclusions in Technical Analysis and Loading Capacity sections of this report. Fecal Coliform The Stillaguamish River basin has an extensive data set on which to evaluate historical and current bacterial conditions, establish trends, and identify critical conditions:
• The fecal coliform (FC) data at enough key freshwater sites are from long-term (greater than ten years) monitoring programs so that trends can be determined.
• The sampling at these sites has been monthly and random without bias to climatological or hydrological events.
• The basin is not under any manipulations from diversions or damming. Therefore, the distribution of FC counts should represent the major factors affecting FC counts at a particular site: source strength, dilution, die-off, and dispersion.
• The cumulative FC counts at most sites follow a lognormal distribution. The attributes of this data set are ideal for using the Statistical Rollback Method (Ott, 1995). The method is used to determine if FC distribution statistics for individual sites meet the water quality criteria in the Stillaguamish River basin. The method has been successfully applied by Ecology in other FC bacteria TMDL evaluations (Cusimano and Giglio, 1995; Pelletier and Seiders, 2000; Coots, 2002). Briefly, the geometric mean (approximately the median in a lognormal distribution) and 90th percentile statistics are calculated and compared to the FC criteria. If one or both of the population statistics do not meet the criteria, then the whole distribution is “rolled-back” to match the more restrictive of the two criteria. The 90th percentile criterion usually is the most restrictive. The new geometric mean and 90th percentile statistics then becomes the “target” statistics for the site. (The term target is used to distinguish these estimated numbers from the
Stillaguamish Fecal and DO TMDL Submittal Report Page 33
actual water quality criteria.) The amount a distribution of FC counts is “rolled-back” from the original statistics to the most restrictive criterion, and target statistic is calculated as the percent of FC reduction required to meet the FC loading capacity. A detailed graphical example and interpretation is shown in Appendix B. The rollback was applied to the most representative distribution after taking several analytical steps. Both step trends and monotonic trend analyses were performed on FC counts and discharge volumes to determine the most recent and stable data set, i.e. to ensure that high water and drought years are represented equally. Trend analyses, tests for seasonality, and statistical tests for lognormal distributions were performed using WQHYDRO, a statistical software package for environmental data analysis (Aroner, 2001). The geometric mean and 90th percentile statistics for various subsets of data were then calculated and compared to determine a critical season at each site, and to determine the target statistics. Port Susan FC data were evaluated using the 30-day running average and 90th percentile statistical analysis required by the Food and Drug Administration for commercial shellfish harvest areas. The statistical formula for deriving the 90th percentile is shown in Appendix B. Data were also evaluated to determine if a seasonal component was evident. The FC count comparisons between sites on an event basis and location of sites relative to the mouths of the Stillaguamish River (Hat Slough and South Pass) were investigated using regression analyses. FC field data collected during the September 2000 synoptic survey were used to calibrate the QUAL2Kw model for the lower Stillaguamish River (Arlington to Hat Slough). The model simulations of the September survey were helpful to:
• Characterize conditions of low dilution potential for FC point and nonpoint sources.
• Evaluate the relative impact of FC loading from monitored tributaries and point sources to the lower mainstem.
• Reveal residual loads from unidentified sources.
• Compare current FC loading from point, tributary, and nonpoint sources to simulations after recommended target FC reductions on those sources are achieved.
Pelletier and Bilhimer’s (2004) QUAL2Kw model for the Stillaguamish Basin Temperature TMDL provided the channel and flow foundation on which to include additional parameters for analysis. A detailed discussion of how local channel morphology, basin hydrology, and climatological data were incorporated into the model is found in Pelletier’s (2003) report. Bacteria counts were simulated in QUAL2Kw using the pathogen function (Chapra, 2001; Pelletier and Chapra, 2003). The model subjects bacteria input to die-off and settling. Die-off is a function of light exposure and a chosen temperature-dependent natural loss rate. The light’s killing effectiveness is a function of the intensity of the sunlight, atmospheric factors like clouds and haze, and the clarity and depth of the water. Losses by settling depend on the settling velocity chosen and the depth and velocity of the water. FC loading estimates from tributaries, point sources, and nonpoint sources were accomplished by first completing a flow balance for the lower mainstem. As part of the QUAL2Kw modeling, Pelletier and Bilhimer (2004) had calculated flow balances for the 2000-2002 TMDL study

Page 34 Stillaguamish Fecal and DO TMDL Submittal Report
period. Flow balances were estimated from field measurements and gage data of flows made by Ecology and the USGS, and weighted by annual average precipitation according to the sub-watershed areas. A flow balance spreadsheet of the stream networks for the Stillaguamish River, South Fork Stillaguamish River, North Fork Stillaguamish River, Deer Creek, and Pilchuck Creek was constructed to estimate surface water and groundwater inflows by interpolating between the gauging stations. Since discharge records are lacking for the lower 17 kilometers of the Stillaguamish River and the Old Stillaguamish Channel, an assumption was made that on average ten percent of the discharge in the Stillaguamish River is diverted to the Old Channel. Further assumptions were made that the Old Channel flow increases 2.5 percent from Church Creek and other drainage areas before half of the Old Channel is discharged through South Pass to Port Susan and the other half through West Pass to Skagit Bay. FC loads from Hat Slough and South Pass were estimated using an unbiased stratified ratio estimator equation from Thomann and Mueller (1987). The formula for the equation is shown in Appendix B. Annual, monthly, and seasonal FC loads were calculated from estimated discharge volumes at Interstate 5 and FC counts collected at Hat Slough and South Pass by staff from Ecology, the Stillaguamish Tribe, and Snohomish County Surface Water Management. FC loads from seals and birds were also estimated and compared to the Stillaguamish River loads. Seal FC loading estimates were based on average rates from Puget Sound studies (Calambokidis, McLaughlin, and Steiger, 1989) and from seal population estimates provided by the National Marine Fisheries Marine Mammal Program. Bird FC loads were estimated from Audubon bird counts in the Port Susan area (Cullinan, 2001), and from literature FC generation values for domesticated birds (ASAE, 1998). FC loads in stormwater are generated from a variety of sources. Data collected over the past 40 years have suggested that these sources vary in intensity and are often generally associated with certain land uses. In the past few years, stormwater-generated pollutants have come under closer scrutiny by regulating authorities. Certain jurisdictions are now being held responsible for the quality and quantity of stormwater discharged by their systems under the federal Clean Water Act. In 2002, a directive came from EPA requiring all TMDLs in jurisdictions with NPDES permits for stormwater systems to include the pollutant loads from those systems as wasteload allocations (Wayland and Hanlon, 2002). The directive came after sampling was completed for the Stillaguamish Basin TMDL, but Snohomish County and the Washington State Department of Transportation (WSDOT) have Phase I NPDES permits for their stormwater systems. Arlington and Granite Falls have submitted applications for stormwater permits under Phase II. Data were not collected during the TMDL study to specifically characterize the storm water from these NPDES permit sources. To comply with the EPA directive, stormwater FC loads from the five jurisdictions were estimated using the ‘Simple Method Model’ (Stormwater Center, 2004). The model requires the sub-basin drainage area and impervious cover, stormwater runoff pollutant concentrations, and annual precipitation. The land uses in each sub-basin were
Stillaguamish Fecal and DO TMDL Submittal Report Page 35
categorized as residential, commercial/industrial, agricultural, forest, and roadway. FC loads were calculated for each category to judge its relative importance to FC loading. The model equations are presented in Appendix B. Data inputs were obtained from Geographic Information System covers depicting land use types, road densities, drainage areas, and annual precipitation volumes. Estimates of pollutant concentrations for various land use types were taken from literature sources (Stormwater Center, 2004; Novotny and Olem, 1994; National Stormwater Database, 2004; Embrey, 2001). Snohomish County and WSDOT wasteload allocations were based on the contribution of each jurisdiction to the “Roadway” category. Conveyance of contaminants from adjacent land uses to the roadway ditches was not considered for this level of analysis. In contrast, municipal stormwater wasteload allocations were based on all land use categories within the urban boundary, not just the Roadway category. State highways through municipalities were subtracted from the municipal area and counted towards the WSDOT Roadway area. When NPDES permits are reissued, wastewater treatment plants with permits will have new effluent discharge limits based on the wasteload allocations established in this TMDL. Based on the EPA guidance (Wayland and Hanlon, 2002), NPDES stormwater permit holders will not be issued numeric effluent limits as a result of wasteload allocations set in this TMDL but rather will be expected to address the requirements through adoption of Best Management Practices (BMPs). Dissolved Oxygen Most dissolved oxygen (DO) data collected in the Stillaguamish River basin have been from instantaneous daytime ‘grab’ measurements during daytime hours. Seven freshwater areas were on the 1998 303(d) list based on data collected in this way. Since minimum DO concentrations in productive systems often occur before dawn, it is difficult to interpret these data in terms of a state criterion stated as a minimum concentration that is consistently to be exceeded (Table 6). Trend analyses also become more difficult if the time of day when samples were collected shifted between blocks of years. Taking multiple grab samples over the course of a day is one approach to estimate the diel range of DO concentrations. This can be very resource intensive in a large geographic area. Continuously recording DO probes deployed over a few days is another solution to the problem. This method was used at a limited number of sites because of the limited availability of the equipment. Without extensive data, the relative contribution of natural and anthropogenic sources to areas with depressed DO conditions becomes difficult to assess. The low DO concentrations could be related to factors other than excessive instream productivity, e.g., riparian wetlands, stormwater discharges, and low DO groundwater input. A multiple-step approach was taken to evaluate the instantaneous DO measurements collected at 36 freshwater sites. The lowest set of DO data at each site were referenced to season, time of

Page 36 Stillaguamish Fecal and DO TMDL Submittal Report
collection, flow, and accompanying temperature, pH, and nutrient data. Field observations were also taken into account. Sites were then divided into two categories:
1. DO data from high productivity systems: DO measurements collected during the growing season and under lower flow conditions with accompanying pH values above 7, and nutrient concentrations seasonally influenced by excessive biomass production.
2. DO data from systems influenced by other factors: DO measurements collected throughout the year with accompanying pH values less than 7, and nutrient concentrations less seasonally variable.
Low DO concentrations from the first group were evaluated according to Ecology TMDL guidelines by adding a 0.5 mg/L safety factor to the water quality criterion (TMDL Workgroup, 1997). The criterion plus safety factor was compared to the lowest 10th percentile DO value reported over the most representative period of record. For example, the lowest allowable 10th percentile concentration for a Class A water would be 8.5 mg/L, as applied to the instantaneous measurements collected over the period of record. The rank 10th percentile value was calculated using the EXCEL® percentile formula (Appendix B). The safety factor allows for the likelihood that DO values recorded during daylight hours are higher than those existing before dawn because of instream productivity. The rank 10th percentile value was chosen to represent the average daily DO concentration during critical conditions for a particular site. The second group of sites required more site-specific judgments about the ability of the water body to meet the criterion and beneficial uses. Fish habitat, soils, ground water quality, and wetlands data were reviewed. At these sites, anthropogenic source loadings of biochemical oxygen demand (BOD) were estimated using the Simple Method Model (Stormwater Center, 2004) results based on land use types in the sub-basin, relative to potential natural sources of low DO water like ground water or wetlands. Fecal coliform counts and other water quality data were considered for the pollutant loading assessments, so stormwater BOD wasteload allocations and background load allocations, as well as estimates of BOD load capacities, were based on the fecal reductions required to meet criteria.
Two point sources discharge to receiving waters identified as having potential DO limitations due to natural conditions; i.e., the DO minimum concentrations are naturally lower than the state DO criterion. Effluent from the Warm Beach Conference Center wastewater treatment plant (WWTP) currently discharges to Warm Beach Creek. Arlington WWTP discharges to the mainstem Stillaguamish River below the confluence of the North and South forks. As explained in the Applicable Water Quality Criteria section, anthropogenic source discharges are not allowed in areas that would further decrease DO concentrations more than 0.2 mg/L, so additional data analyses were conducted at these two sites. NPDES permit limits for BOD loads and ammonia (for nitrogenous oxygen demand) were evaluated for direct oxygen loss potential from both WWTPs in the two receiving waters. Effluent total nitrogen and phosphorus concentrations were also assessed as part of the Arlington WWTP impact assessment. The Arlington WWTP assessment required detailed critical condition determinations and modeling.

Stillaguamish Fecal and DO TMDL Submittal Report Page 37
Diel DO on the mainstem Stillaguamish River from the confluence of the North and South forks to Hat Slough was evaluated to analyze the impact of Arlington WWTP effluent on downstream reaches of the river. The QUAL2Kw model (Chapra, 2000) as modified by Pelletier (Pelletier and Chapra, 2003) was calibrated to the mainstem DO conditions observed during the three-day October 2001 TMDL survey. This set of survey data contained the following:
• Nutrient and field parameter measurements at nine sites on the mainstem from the confluence of the forks to Hat Slough, and sample analyses and field measurements from Arlington WWTP and four tributaries.
• Continuous DO, temperature, pH, and conductivity probe measurements taken at four sites in the reach (Figure 7).
• Periphyton biomass measurements at three sites.
Figure 7. Locations of four diel monitoring probes (broad crosses) in the Stillaguamish River from Arlington to Interstate 5 in September 2000 and October 2001. RKM = river kilometer
Arlington WWTP
Stillaguamish Rive
Portage Creek
Armstrong Creek
Interstate 5
RKM 17.7
RKM 21.7
RKM 24.0
RKM 28.5
March Creek

Page 38 Stillaguamish Fecal and DO TMDL Submittal Report

Stillaguamish Fecal and DO TMDL Submittal Report Page 39
The August 1997 survey by Earth Tech (1997) was used for model verification. The data set was much more limited, but the survey was conducted during a low-flow event close to what would be considered critical conditions (See Technical Analysis: Dissolved Oxygen, Critical Conditions). The diel DO output in QUAL2Kw is affected by DO saturation, re-aeration, photosynthetic and respiration processes, and carbon and nitrogen oxidation. DO saturation is calculated from temperature and barometric pressure. Several re-aeration formulas are available in the model that are automatically selected depending on depth and velocity ranges of a reach. Photosynthesis and respiration functions for periphyton, and heterotrophic bacteria respiration in the hyporheic zone were incorporated into this version of the model by Pelletier (Pelletier and Chapra, 2003). The modifications to the QUAL2Kw model are detailed in Appendix C. The model was set up to run critical conditions, and the results were compared to Class A criteria. The critical condition simulations included:
River discharge set to the estimated lowest seven-day average flow with an annual ten-year recurrence interval (7Q10) volume assuming a stabilized channel and biological condition, i.e., no spates during the previous 30 days that would scour periphyton and heterotrophic bacteria biomass.
• Upstream temperature, pH, and nutrients set at seasonal 90th percentile values, and DO and alkalinity set at seasonal 10th percentile values.
• Arlington WWTP discharge rates and effluent characteristics set to dry season maximums for Phase 1 and Phase 2 expansions (Earth Tech, 1996).
• Benthal or groundwater oxygen demand, or hyporheic exchange active in pool reaches.
• Periphyton biomass volumes set at highest levels observed in 2001. Simulations with and without point sources and suspected nonpoint sources, and with modified headwater characteristics, were compared. The pollutant load capacity for the Stillaguamish River was determined for compliance with DO standards after evaluating the various simulations (see Loading Capacity). pH The pH measurements taken in the basin create the same difficulty as the dissolved oxygen measurements for comparison to the state criteria; i.e., the instantaneous measurements do not necessarily account for diel maximum and minimum values in productive systems. In addition, low pH values in the basin appear to occur during stormwater events or in certain hydrologic environments, while high pH may be related to biomass production during low-flow events. Only the South Fork Stillaguamish River was on the 303(d) list for pH violations (less than 6.5), but other potential candidates were documented after evaluating data from 27 sites for this assessment (see Technical Analysis and Loading Capacity). Instantaneous pH measurements were assessed in a manner similar to the dissolved oxygen measurements. The pH data at all sites were reviewed in the context of other factors like season,
Page 40 Stillaguamish Fecal and DO TMDL Submittal Report
time of collection, and dissolved oxygen and nutrient concentrations. In addition, monitoring site locations were inspected to determine if upstream wetlands and groundwater influences were possible. Sites were separated into two groups: 1) those with potential high or low pH criteria violations from excessive instream productivity, and 2) those with low pH values potentially related to other factors. Although diel pH variability is not specifically addressed in the Ecology TMDL guidelines (TMDL Workgroup, 1997), the safety factor approach is reasonable for the first group of sites. In a biologically productive stream or river, the diel pH range can be determined by influences of instream respiration and productivity on the water carbonate buffering capacity. From the diel data that are available from the mainstem surveys, a safety factor of 0.2 standard units (s.u.) was chosen to cover the maximum diel range observed during TMDL surveys. The safety factor was applied to the 10th and 90th percentile pH for each site. The rank 10th and 90th percentile statistics were calculated using the EXCEL® percentile function (Appendix B). For example, sites located in Class A and Class AA waters in the first group with a rank 90th percentile pH value greater than 8.3, or a 10th percentile value less than 6.7 were considered threatened. Water quality standards for Class A and AA waters require pH values between 6.5 and 8.5 s.u. (Table 6). In the Stillaguamish basin, depressed rather than elevated pH values were more common at several sites. These sites also had low pH values at mid-day rather than in the early morning. Therefore, the diel pH range is probably not a function of instream productivity as much as from groundwater input or decomposition processes from upstream wetlands. At these sites, potential anthropogenic sources of depressed pH are listed and their impact estimated after reviewing and evaluating fecal coliform, biochemical oxygen demand, and nutrient data. The impact is compared to a range of groundwater pH values (Thomas, Wilkinson, and Embrey, 1997) or other data from the area.
Arsenic and Mercury Arsenic and mercury in the Stillaguamish River and two forks were assessed as concentrations and as loads based on six or more sampling events at four sites during the 2000-2002 TMDL study period (See Technical Analysis: Arsenic and Mercury). Additional arsenic data within the study period was also obtained for two sites in the basin from another Ecology study (Johnson, 2002). Concentrations of the two metals were compared to criteria (Table 6). Event arsenic and mercury loads were evaluated to identify potential sources. Discharge estimates for the load calculations were based on USGS gauging data and Pelletier’s (2003) water balance work described earlier. The loads of both metals were compared to each other and to total suspended solids loads using regression analyses to evaluate correlations and transport mechanisms.
Seasonal Variation and Critical Conditions Clean Water Act Section 303(d)(1) requires that TMDLs be established at level necessary to implement the applicable water quality standards with seasonal variations. The current regulation also states that determination of TMDLs shall take into account critical conditions for stream flow, loading, and water quality parameters [40 CFR 130.7(c)(1)]. Finally, Section 303(d)(1)(D) suggests consideration of normal conditions, flows, and dissipative capacity.
Stillaguamish Fecal and DO TMDL Submittal Report Page 41
The parameters and some geographic areas being evaluated in this Stillaguamish TMDL have different critical conditions and seasonal variations. The critical conditions for elevated fecal coliform counts and loads are different from the conditions when low dissolved oxygen concentrations are reported. In addition, the sources of fecal coliform contamination vary, so the critical condition for fecal coliform in the mainstem is different from the condition in some tributaries. The data records were evaluated to identify critical conditions for each parameter at specific sites. For example, trend analyses, tests for seasonality, and statistical tests for lognormal distributions were performed using WQHYDRO, a statistical software package for environmental data analysis (Aroner, 2001). Regression analyses were performed to test if various pollutants of concern were correlated with each other, with discharge volumes, with total suspended solids, or with climatological events. To simplify implementation of the TMDL, an attempt is made to define the critical condition in common to as many sites as possible for a parameter like fecal coliform or dissolved oxygen without jeopardizing beneficial uses at any specific site in the basin.
Technical Analysis This Technical Analysis section describes and presents analyses of the most recent data to establish the current water quality conditions in the basin, especially in those areas and for those parameters on the 1998 303(d) list (Table 1). The hydrological and climatological characteristics are first described under which the recent water quality data were collected. Then the results of fecal coliform, dissolved oxygen, pH, and arsenic and mercury sample data are discussed using the methods previously described in the Analytical Framework section of this report. The critical conditions determining the loading capacities and TMDLs for each parameter are also described. Data from several sources were combined to evaluate the current state of water quality in the Stillaguamish basin and Port Susan. Data from Ecology surveys conducted from 2000 to 2001 under the TMDL quality assurance project plan have been reviewed for their acceptability and published (Coffler, Gridley, and Joy, 2004). Quality assurance plans were in place for the 2000 to 2002 Snohomish County, Stillaguamish Tribe, and Ecology ambient monitoring programs. The collective database represents four types of monitoring to characterize different aspects of contaminant sources and transport mechanisms:
• Long-term data collection from the networks established over the past 30 years by Ecology, the Tulalip Tribes, the Stillaguamish Tribe, Snohomish County Surface Water Management, and the NPDES permit program.
• Medium-flow and storm-event synoptic sampling in 2000 and 2001 (Figure 8).
• Enhanced monthly sampling in 2001 in Port Susan and key tributaries based on the Stillaguamish Tribe Port Susan and tributary network (Figure 9).

Page 42 Stillaguamish Fecal and DO TMDL Submittal Report
• Short-term weekly monitoring of informal recreational beaches in summer 2000 (bacteria only).
The location and some data analyses of the long-term network sites and recreational beach sites were previously described and discussed in pre-TMDL work (Joy and Glenn, 2000; Joy, 2001). Current data are defined as samples and measurements taken from June 2000 through June 2002.

Stillaguamish Fecal and DO TMDL Submittal Report Page 43
#Y
#Y
#Y
%U%U%U
%U%U%U %U%U %U%U%U%U %U %U%U
%U%U%U %U%U %U %U%U%U %U %U%U%U%U%U%U%U %U%U%U%U
%U
%U
%U%U
%U
%U%U%U%U%U%U
%U%U%U
%U
%U
%U%U%U
Pilch
uck C
reek
Portage Creek
Old Channel
Hatt Slough Glad e Bekken
Har v
ey C
reek
Arm
stro
ng C
reek
South Fork Stillaguamish River
Nor th F
ork Sti llaguamish River
Arlington
Stanwood
Granite Falls
Warm Beach
N
EW
S
South Fork
North Fork
Pilchuck Creek
Main Stem
Monitoring SiteStillaguamish River
%U
Figure 8. Water quality monitoring sites in the Stillaguamish River basin used by Ecology for storm-event and synoptic surveys.

Page 44 Stillaguamish Fecal and DO TMDL Submittal Report
Figure 9. Fecal coliform monitoring sites located in and around northern Port Susan. Circles are sites monitored by the Stillaguamish Tribe; triangles are sites monitored by Ecology. Flows and Rainfall According to records from the Arlington Airport, the TMDL surveys took place during a wetter than normal summer season in 2001, and drier than normal fall season in 2000. Annual rainfall at Arlington was 39.55 inches in 2000, and 50.05 inches in 2001. The average rainfall over 40 years of complete records is 46.83 inches. The lowest annual rainfall, 30.3 inches, was recorded in 2002. The 2001 water year (October 2000 through September 2001) was among the lowest on record for river discharge (Table 11). The lowest annual mean daily flow was 1123 cfs in 1930, and the highest was 2883 cfs in 1997. The months of October through May had lower than average monthly flows. The 90th percentile average daily peak flows for water year (WY) 2000 and WY 2001 are low compared to 3720 cfs for the period of record. The North Fork mean daily discharge exceeded 3720 cfs on only seven days in WY 2001, and on only 17 days through the 2000-2002 TMDL study period. In contrast, both annual seven-day average low-flows for 2000 and 2001 were higher than the period of record’s seven-day average, ten-year, low-flow statistic
PS4-130
PS2-128
N. Port Susan-126
PS8-140
PS7-139PS9-148
PS5-137
PS6-138
PS3-129
S. Branch Pilings-123
Warm Beach Pt.-124
West Branch-121South Branch-122
Juniper Beach
South Pass
Twin City # 1
Twin City # 4 (170)
Hat Slough - 120
Lake Martha Cr. (067)
Unnamed Cr # 0456
Warm Beach Slough - 127
Warm Beach Sites
Stanwood Camano Island
Stillaguamish River
Lake Martha
Old Stillaguamish Channel
Port Susan
Kayak Point - 125
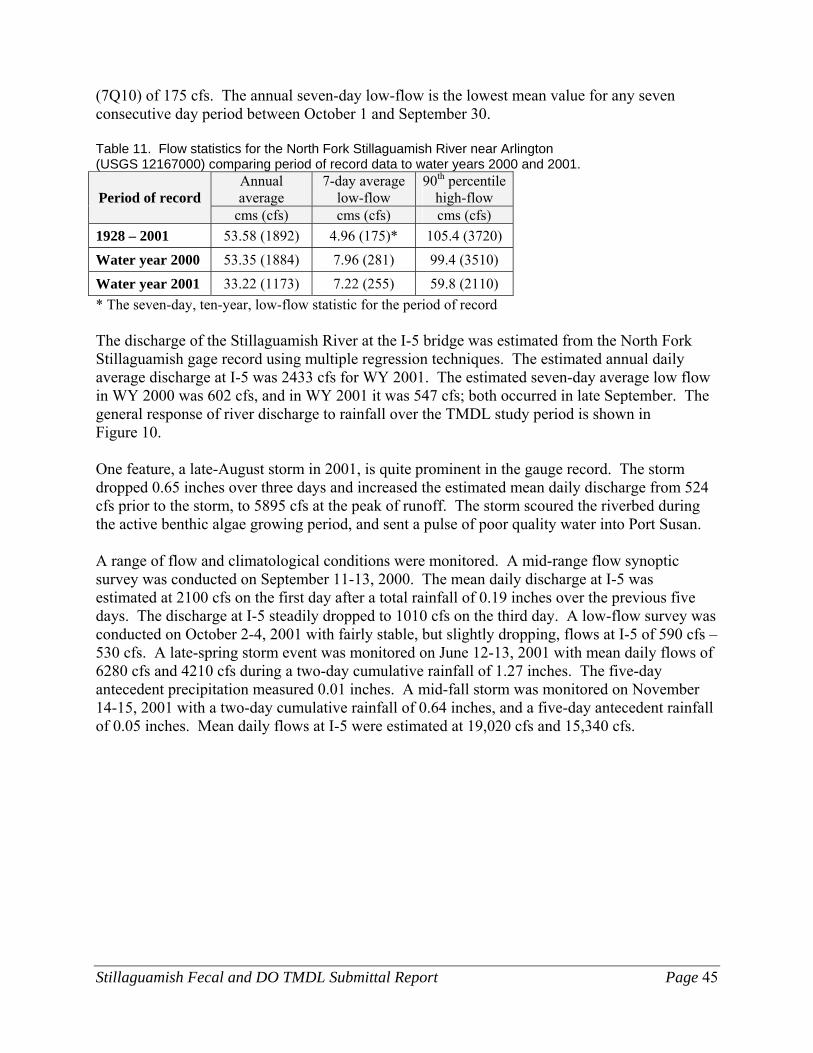
Stillaguamish Fecal and DO TMDL Submittal Report Page 45
(7Q10) of 175 cfs. The annual seven-day low-flow is the lowest mean value for any seven consecutive day period between October 1 and September 30. Table 11. Flow statistics for the North Fork Stillaguamish River near Arlington (USGS 12167000) comparing period of record data to water years 2000 and 2001.
Annual average
7-day average low-flow
90th percentile high-flow Period of record
cms (cfs) cms (cfs) cms (cfs) 1928 – 2001 53.58 (1892) 4.96 (175)* 105.4 (3720)
Water year 2000 53.35 (1884) 7.96 (281) 99.4 (3510)
Water year 2001 33.22 (1173) 7.22 (255) 59.8 (2110) * The seven-day, ten-year, low-flow statistic for the period of record The discharge of the Stillaguamish River at the I-5 bridge was estimated from the North Fork Stillaguamish gage record using multiple regression techniques. The estimated annual daily average discharge at I-5 was 2433 cfs for WY 2001. The estimated seven-day average low flow in WY 2000 was 602 cfs, and in WY 2001 it was 547 cfs; both occurred in late September. The general response of river discharge to rainfall over the TMDL study period is shown in Figure 10. One feature, a late-August storm in 2001, is quite prominent in the gauge record. The storm dropped 0.65 inches over three days and increased the estimated mean daily discharge from 524 cfs prior to the storm, to 5895 cfs at the peak of runoff. The storm scoured the riverbed during the active benthic algae growing period, and sent a pulse of poor quality water into Port Susan. A range of flow and climatological conditions were monitored. A mid-range flow synoptic survey was conducted on September 11-13, 2000. The mean daily discharge at I-5 was estimated at 2100 cfs on the first day after a total rainfall of 0.19 inches over the previous five days. The discharge at I-5 steadily dropped to 1010 cfs on the third day. A low-flow survey was conducted on October 2-4, 2001 with fairly stable, but slightly dropping, flows at I-5 of 590 cfs – 530 cfs. A late-spring storm event was monitored on June 12-13, 2001 with mean daily flows of 6280 cfs and 4210 cfs during a two-day cumulative rainfall of 1.27 inches. The five-day antecedent precipitation measured 0.01 inches. A mid-fall storm was monitored on November 14-15, 2001 with a two-day cumulative rainfall of 0.64 inches, and a five-day antecedent rainfall of 0.05 inches. Mean daily flows at I-5 were estimated at 19,020 cfs and 15,340 cfs.

Page 46 Stillaguamish Fecal and DO TMDL Submittal Report

Stillaguamish Fecal and DO TMDL Submittal Report Page 47
100
1000
10000
100000
Mar-00 May-00 Aug-00 Nov-00 Feb-01 May-01 Aug-01 Nov-01
Date
Disc
harg
e (c
fs)
0
0.1
0.2
0.3
0.4
0.5
0.6
0.7
0.8
0.9
1
Daily
Rai
nfal
l (in
ches
)
<------------------------------------ TMDL Survey Events ------------------------------->
Figure 10. Estimated discharge record for the Stillaguamish River near Silvana (continuous line) and daily rainfall (vertical spikes) recorded at Arlington Airport during Ecology’s TMDL surveys, July 2000 to November 2001. Fecal Coliform Current Conditions and Trends Fecal coliform (FC) counts and loads in the 2000 – 2001 TMDL sampling period at some sites were more variable than in previous years. Data from the Stillaguamish River at Interstate 5 (I-5) are typical (Figure 11). FC data at I-5 collected in the 2001 water year, when most sampling took place, had a lower than usual median count and load, but a higher than usual 75th percentile and maximum count. The wetter than normal summer and fall of 2001 and drier than normal fall of 2000, along with a low water year in 2001, probably exerted an influence on the increased variability in FC run-off, but resulted in a lower median FC load at I-5. Some of the apparent increases at other sites can be explained as database artifacts from more intensive monitoring activity, especially with the inclusion of storm-event data. However, FC count and load increases appeared to carry through to the 2002 water year at I-5 (Figure 11), when monitoring at other sites returned to routine sampling intervals.

Page 48 Stillaguamish Fecal and DO TMDL Submittal Report

Stillaguamish Fecal and DO TMDL Submittal Report Page 49
Elevated FC counts in 2001 were responsible for interrupting improving trends at several sites. The Stillaguamish River at I-5, North Fork Stillaguamish River at Cicero, Pilchuck Creek, Stillaguamish River at Hat Slough, Stillaguamish River below Arlington, South Fork Stillaguamish River at Arlington, and Armstrong Creek below the Hatchery had decreasing FC bacteria trends since the mid-1990s that were all negatively affected by poor bacterial water quality during the TMDL survey years. For example, data collected three to five years before and after 1998 at the South Fork Stillaguamish River at Arlington suggested there was a statistically significant decline in FC counts (Figure 12 – lower graph). There was no longer a statistically significant difference after including counts from 2001 (Figure 12 – upper graph). Despite the increases in 2001 FC counts, water quality criteria were met most of the time at sites along the mainstem and forks. FC counts in the upper North and South forks continued to be well within FC criteria during all sampling surveys. The elevated FC counts observed in the 1990s at several sites along the upper North Fork that were responsible for the 303(d) listings of those reaches did not occur during the 2000-2002 TMDL study period. Some of the sources causing bacteria contamination may have been eliminated from those reaches. Usually water quality in the mainstem below the confluence of the forks was well within the Class A FC criteria. Elevated counts occurred only after significant storm events. The influence of these events will be discussed later in this report (see next section, Synoptic Surveys and Storm Events). Several tributaries on the 1998 303(d) list for FC criteria violations continued to be out of compliance with standards based on the TMDL survey data. Trend analyses suggested that Fish Creek and Jim Creek had shown improvement over previous years, while Harvey Creek, Jorgenson Slough (Church Creek), Lake Martha Creek, Portage Creek, and Unnamed Creek had experienced no change or appeared to be worse. Of these smaller tributaries on the 303(d) list, only Jim Creek met FC criteria based on data collected in 2000 – 2001.
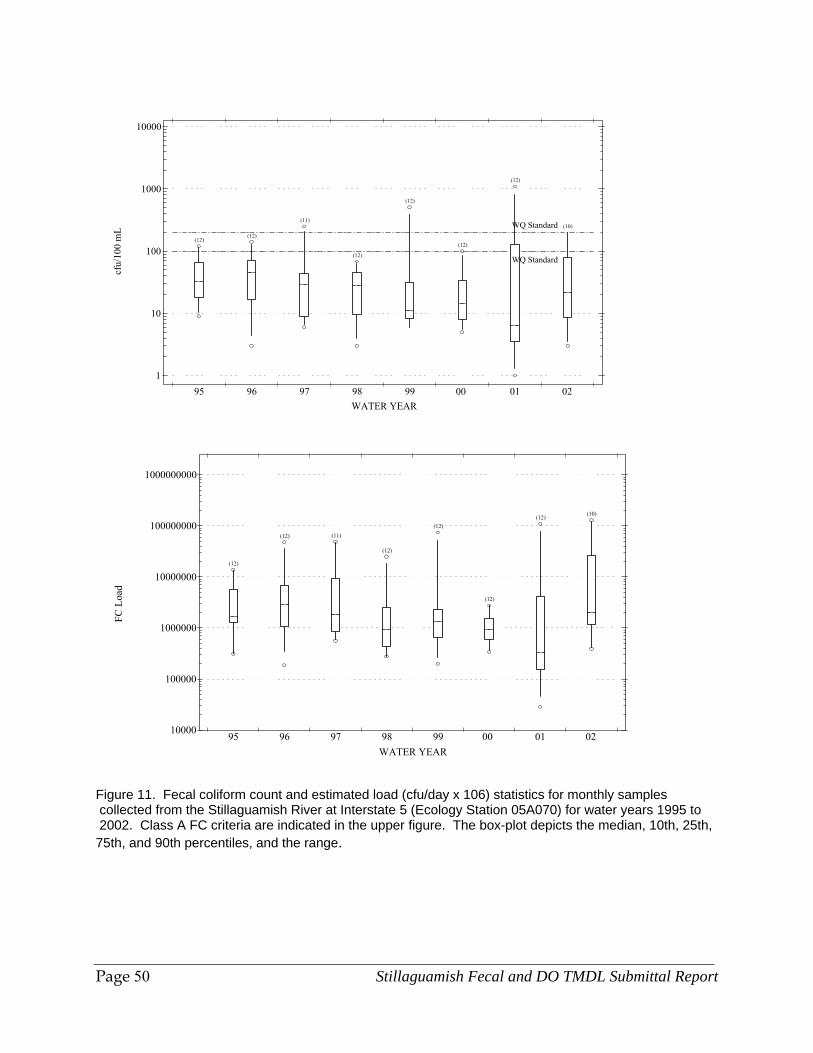
Page 50 Stillaguamish Fecal and DO TMDL Submittal Report
cfu/
100
mL
WATER YEAR
1
10
100
1000
10000
95 96 97 98 99 00 01 02
WQ Standard
WQ Standard
(12)(12)
(11)
(12)
(12)
(12)
(12)
(10)
FC L
oad
WATER YEAR
10000
100000
1000000
10000000
100000000
1000000000
95 96 97 98 99 00 01 02
(12)
(12) (11)
(12)
(12)
(12)
(12) (10)
Figure 11. Fecal coliform count and estimated load (cfu/day x 106) statistics for monthly samples collected from the Stillaguamish River at Interstate 5 (Ecology Station 05A070) for water years 1995 to 2002. Class A FC criteria are indicated in the upper figure. The box-plot depicts the median, 10th, 25th, 75th, and 90th percentiles, and the range.

Stillaguamish Fecal and DO TMDL Submittal Report Page 51
Feca
l col
iform
(cfu
/100
mL)
YEAR
SF Stillaguamish at Arlington Step Trend '94-'98 and '99-'02
1
2
10
20
100
200
1000
94 95 96 97 98 99 00 01 02
Y = -4.500NOT Signif 80%2xP = 0.2553
S.Wilcoxon-Mann-Whitney Test& S.Hodges-Lehmann Estimator
WQ Standard
WQ Standard
Feca
l col
iform
(cfu
/100
mL)
YEAR
1
2
10
20
100
200
1000
94 95 96 97 98 99 00 01 02
Y = -8.000Signif 95%2xP = 0.0112
S.Wilcoxon-Mann-Whitney Test& S.Hodges-Lehmann Estimator
WQ Standard
WQ Standard
Figure 12. Two graphs of data from the South Fork Stillaguamish River that show the influence of the 2000-2001 monitoring year on Stillaguamish fecal coliform statistical trends (see text).

Page 52 Stillaguamish Fecal and DO TMDL Submittal Report
Other tributaries, not on the 303(d) list, were identified with FC criteria violations based on the TMDL data set. These included Glade Bekken, Miller Creek, Warm Beach Creek including the Pasture Drain and pond, Douglas Slough, Irvine Slough, Pilchuck Creek, March Creek, Kackman Creek, and several drains near Port Susan. Port Susan Area Port Susan was added to the TMDL study area in 2001 (Joy, 2001). Port Susan coliform data collected by the Stillaguamish Tribe exhibited an increase at sites in 2001 after showing improvements between 1998 and 2000. The Washington State Department of Health (DOH) Food Safety and Shellfish Programs uses 30-sample running geometric means and 90th percentile statistics to judge the suitability of bacteriological water quality in commercial shellfish harvest areas (Appendix B). The DOH only uses the most probable number (MPN) type of FC analysis to calculate the statistics (see Applicable Water Quality Criteria). These statistics appeared to be coming within the acceptable criteria (a geometric mean of 14 MPN/100 mL and a 90th percentile of 43 MPN/100 mL) at several sites early in 2000. By late 2001, PS-2, off the mouth of Hat Slough (Figure 13), and many other sites were no longer approaching these criteria. The apparent trend was then recognized as part of a repeating seasonal pattern from fall storm-event loading.
1
10
100
1000
Nov
-98
Jan-
99
Mar
-99
May
-99
Jul-9
9
Sep
-99
Nov
-99
Jan-
00
Mar
-00
May
-00
Jul-0
0
Sep
-00
Nov
-00
Jan-
01
Mar
-01
May
-01
Jul-0
1
Sep
-01
Nov
-01
Jan-
02
Mar
-02
May
-02
Date
MPN
/100
mL
FC data 30-sample geometric mean 30-sample 90th percentile
43 MPN/100 mL
14 MPN/100 mL
Figure 13. Fecal coliform sample results from site PS-2 of the Stillaguamish Tribe monitoring program in Port Susan. Commercial shellfish harvest criteria (14 MPN/100 mL geometric mean and 43 MPN/100 mL 90th percentile) used by the Washington State Department of Health are compared to the running 30-sample statistics.

Stillaguamish Fecal and DO TMDL Submittal Report Page 53
Table 12 shows the summary statistical data from all 16 Port Susan sites monitored by the Stillaguamish Tribe. Four sites met the 30-sample criteria in June 2002 (based on samples collected since September 2000). The sites were all located more than 5.6 km (3.5 mi) out from the mouth of Hat Slough (Figure 9): Kayak Point, Warm Beach Point, North Port Susan, and Peripheral Site #4 (PS-4). The statistics for sites PS-5 through PS-9 are based on fewer than ten samples, so they cannot be compared to the others. The South Branch Pilings site was very close to meeting the criteria, with a geometric mean of 12 MPN/100 mL and a 90th percentile of 44 MPN/100 mL. It lies only 3.8 km (2.4 mi) away from Hat Slough. All other sites close to Hat Slough or near-shore discharge areas like Warm Beach Slough failed the criteria. Table 12. Fecal coliform statistics calculated for 30 consecutive samples collected by the Stillaguamish Tribe prior to June 27, 2002 at 16 sites in Port Susan and Hat Slough. Geometric mean and 90th percentile are in MPN/100 mL. Site Name Site Number
Hat Slough
120
West Branch
121
South Branch
122
South Branch Pilings
123
West Branch Point 124
Kayak Point
125
North Port
Susan 126
West Branch Slough
127 Geometric Mean
15 27 24 12 6.1 4.2 3.3 28
90th percentile 64 98 102 44 31 20 12 100 30-sample status (6/27/02) Fail Fail Fail Pass Pass Pass Fail
Site Name Site Number
PS-2 128
PS-3 129
PS-4 130
PS-5 137
PS-6 138
PS-7 139
PS-8 140
PS-9 148
Geometric Mean
21 14 5.7 21 19 32 15 3.9
90th percentile 107 74 27 148 117 125 119 13 30-sample status (6/27/02) Fail Fail Pass * * * * *
* Insufficient data to determine status (n<10).
The Stillaguamish Tribe did not increase their sampling frequency or focus on storm events during the 2000-2002 TMDL study period. This provides further evidence that changes in data sampling intensity were not the primary cause of the increased FC counts recorded
throughout the basin. In fact, the data strongly suggest that seasonal factors and increased basin run-off influenced bacteriological quality in the bay.
Correlation analysis was not successful in showing a consistent link between monthly or seasonal FC counts or loads from the Stillaguamish River (Hat Slough and South Pass) and their respective counts at the Port Susan sites. However, FC counts in the bay appeared to respond to loading from the river; i.e., river loads and the monthly bay-wide median FC counts followed similar rising and falling patterns (Figure 14). Most apparent are the peak loading months of June and November that correspond to bay-wide FC count increases in response to more frequent storm events. The surprise August 2001 storm event that became part of the database also influenced the average August FC load.

Page 54 Stillaguamish Fecal and DO TMDL Submittal Report
0.0
5.0
10.0
15.0
20.0
25.0
30.0
35.0
40.0
Jan Feb Mar Apr May Jun Jul Aug Sep Oct Nov Dec
Month
Feca
l Col
iform
(MP
N/10
0 m
L)
1.0E+10
1.0E+11
1.0E+12
1.0E+13
1.0E+14
Feca
l col
iform
load
(cfu
/day
)
Median FC Count Marine Criterion Stillaguamish River Load
14 MPN/100 mL
Figure 14. Monthly median fecal coliform (FC) counts from sites in Port Susan compared to estimated FC loads from the Stillaguamish River (Hat Slough and South Pass) for 1998 -2002. The FC loading months that affect water column FC counts in the bay appear to occur in the fall. Preliminary analyses showed that some failing sites in Table 12, such as PS-2 and PS-3, have seasonal FC counts (January - August) that produce geometric means and 90th percentiles within or nearly within the criteria. More data are necessary to confidently predict the seasonal FC loading effects on temporal FC counts in the bay. The FC contributions of small drainages and the Stillaguamish River were compared. Samples were collected by Ecology from 12 sites along the northeastern shore of Port Susan as Stillaguamish Tribe researchers were collecting samples in the bay. FC samples were collected monthly from February to November 2001 from South Pass, Juniper Beach, Hat Slough, and several small freshwater tributaries to Port Susan (Figure 9). These data are summarized in Table 13. Enterococci data also were collected and are summarized in Appendix D. Data at the 12 sites were highly variable, but a seasonal component was common in all data. Counts were lowest at all sites in February when all samples met FC criteria. On the other hand, counts were high at all sites during the August 2001 storm event when none met FC criteria. The two drains monitored from the Twin City Foods sprayfields had especially high counts in July and August. FC counts at the Warm Beach pump pond and three sites associated with it (Warm Beach Creek, Pasture drain, and Warm Beach WWTP outfall) gradually increased in April and stayed elevated through November. Lake Martha Creek had low counts until August, and then

Stillaguamish Fecal and DO TMDL Submittal Report Page 55
had elevated counts the rest of the 2000-2002 study period. Counts from Unnamed Creek #0456 south of Lake Martha Creek were sporadic after March, and the creek bed was dry in July and September. Table 13. Fecal coliform results from samples collected from freshwater and marine waters in and around northern Port Susan from February to November 2001.
Fecal Coliform (cfu/100 mL) Sites to and in Port Susan
Number of Samples
Geometric Mean
90th Percentile*
Juniper Beach (Marine) 9 15 92 South Pass (Marine) 10 29 125 Twin City Foods Drain #1 9 513 3780 Twin City Foods Drain #4** 9 149 1670 Hat Slough at Marine Dr. 10 30 197 Warm Beach Creek above outfall 10 46 457 Warm Beach WWTP outfall 9 53 829 Pasture Drain to Pump Pond 10 182 1000 Pond or discharge to Slough 10 230 1130 Lake Martha Creek at Soundview Dr. 10 82 694 Unnamed Creek #0456 7 350 3640
Class A Marine Water Criteria 14 43 Class A Freshwater Criteria 100 200 * The 90th percentile values are based on the FDA method assuming a lognormal distribution (Appendix B). ** Drain #4 never discharged surface water to Hat Slough; the tide gate was always blocked with silt. Bold values do not meet criteria. The elevated bacteria counts in these small tributaries are potential sources of contamination to local recreational shellfish beds and to people enjoying beachside recreation, but their cumulative loading to Port Susan is minor compared to the Stillaguamish River. For example, the dike pond below Warm Beach Conference Center appears to influence Warm Beach Slough (site 127) results collected by the Stillaguamish Tribe (Table 12). The pond also discharges near other sources like Lake Martha Creek and Unnamed Creek. Together the three could pose a health risk at any time of the year because they are very accessible to people. Their influence on the FC counts at Warm Beach Point (site 124) and South Branch Pilings (site 123) farther out in Port Susan is less certain because these two sites were meeting or nearly meeting criteria (Table 12). Discharge volumes measured in all of the tributaries were usually less than 0.03 cms (1 cfs) during the surveys, so daily loads were a minute fraction of those from Hat Slough and South Pass. Some of the sites discharge only periodically through tide gates and by pumps, so their overall FC loading would be difficult to estimate. In one case, no surface water discharge to open water was observed; the tide gate between Hat Slough and Twin City Drain #4 was sealed with silt the entire study period. It appears that FC loads arriving from the Stillaguamish basin and small tributaries around the bay degrade bacteriological water quality. Some sources are active throughout the year, but

Page 56 Stillaguamish Fecal and DO TMDL Submittal Report
Port Susan FC counts increase in June and again from September through December. This coincides with several possible sources of bacteria:
• Rainstorms and increased discharge from the Stillaguamish River usually occur in the spring and fall. FC loads from the drainage basin are carried farther into the bay with larger freshwater volumes.
• The river and surrounding areas may be carrying the ‘first flush’ of bacterial contaminants accumulated over the drier summer months.
• Large flocks of snow geese, other waterfowl, and shorebirds arrive in September on migrations or to winter along the lower reaches of the river in and around Port Susan. Spring migration brings large flocks of shorebirds.
• More severe winds arrive in the spring and autumn. Winds and wave action could re-suspend contaminated sediment in the lower reaches of the river or estuary that was deposited earlier in the season.
• Flooding is not uncommon during these months. Agricultural and residential lands lying in the flooded areas can contribute FC loads from freshly manured fields, inundated septic systems, and other sources.
Synoptic and Storm-event Surveys The synoptic and storm-event surveys demonstrated that FC densities in the river responded to changes in surrounding land use and to storm runoff. Synoptic sampling conducted during an average flow event characterized the change in bacterial quality along the Stillaguamish River during a period of low surface runoff in the basin. Although the storm events were not monitored synoptically, they provide useful information about the response of FC in the river to periods of rainfall and high surface runoff. During the synoptic survey in September 2000, discharge in the river decreased over the three days. The estimated mean daily flow at the Interstate 5 (I-5) site dropped from 59.5 cms (2100 cfs) to 28.6 cms (1010 cfs). FC sample results in the mainstem on all three days were 100 cfu/100 mL or less, and samples taken from sites up both forks were below 40 cfu/100 mL. Portage Creek and Arlington WWTP had FC counts greater than 100 cfu/100 mL. The FC counts decreased at most mainstem sites over the three days. The estimated FC load at the I-5 site decreased by 75% between the first and third day. After considering natural FC sample variability and a range of die-off rates, FC count increased in reaches that could not be attributed to tributary inputs. Significant and fairly consistent chloride and nutrient increases also occurred in reaches between Arlington and Armstrong Creek (km 27.7 to 24.7), on the North and South Branch below I-5, and between Silvana and Marine Drive (km 9.7 to 4.2) during the three days. Unidentified sources (e.g., unmonitored tributaries, drains, or nonpoint sources) along these reaches of the mainstem were suspected. The unidentified sources were simulated using the QUAL2Kw model by adding sources with a loading equivalent to one-third to four times the size of Portage Creek’s FC load. The actual
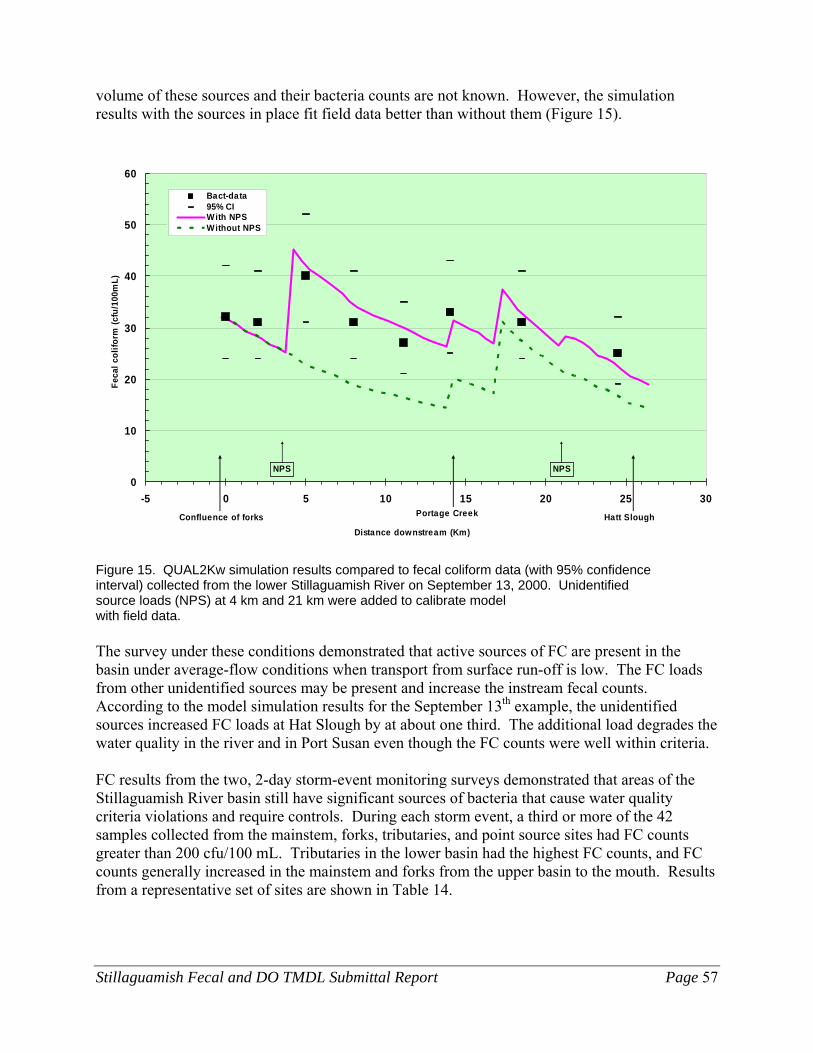
Stillaguamish Fecal and DO TMDL Submittal Report Page 57
volume of these sources and their bacteria counts are not known. However, the simulation results with the sources in place fit field data better than without them (Figure 15). \
0
10
20
30
40
50
60
-5 0 5 10 15 20 25 30
Distance downstream (Km)
Feca
l col
iform
(cfu
/100
mL)
Bact-data95% CIWith NPSWithout NPS
Confluence of forks Hatt SloughPortage Creek
NPS NPS
Figure 15. QUAL2Kw simulation results compared to fecal coliform data (with 95% confidence interval) collected from the lower Stillaguamish River on September 13, 2000. Unidentified source loads (NPS) at 4 km and 21 km were added to calibrate model with field data. The survey under these conditions demonstrated that active sources of FC are present in the basin under average-flow conditions when transport from surface run-off is low. The FC loads from other unidentified sources may be present and increase the instream fecal counts. According to the model simulation results for the September 13th example, the unidentified sources increased FC loads at Hat Slough by at about one third. The additional load degrades the water quality in the river and in Port Susan even though the FC counts were well within criteria. FC results from the two, 2-day storm-event monitoring surveys demonstrated that areas of the Stillaguamish River basin still have significant sources of bacteria that cause water quality criteria violations and require controls. During each storm event, a third or more of the 42 samples collected from the mainstem, forks, tributaries, and point source sites had FC counts greater than 200 cfu/100 mL. Tributaries in the lower basin had the highest FC counts, and FC counts generally increased in the mainstem and forks from the upper basin to the mouth. Results from a representative set of sites are shown in Table 14.

Page 58 Stillaguamish Fecal and DO TMDL Submittal Report
Table 14. Fecal coliform results at selected sites in the Stillaguamish River basin for samples collected during two, 2-day storm-event surveys in 2001.
June 12 June 13 November 14 November 15 Site (cfu/100 mL) (cfu/100 mL)
South Fork below Granite Falls 92 17 28 22 Jim Creek at Jordan Road 320 150 160 20 South Fork at Twin Rivers 310 31 92 26 North Fork at C-Post Bridge 67 4 37 17 North Fork at Twin Rivers 240 43 Not accessible 40 Arlington WWTP 36 26 80 440 Stillaguamish River below Arlington 540 38 330 37 Armstrong Creek below Hatchery 2,800 75 200 170 March Creek 18,000 3,300 550 900 Stillaguamish River at Interstate 5 520 100 380 34 Portage Creek at 212th 6,300 770 350 1,600 Pilchuck Creek at Jackson Gulch 950 75 140 43 Stillaguamish River below Silvana 360 160 190 60 Glade Bekken at Terrace Road 52,000 2,500 360 310 Stillaguamish River at Hat Slough 680 130 380 110
As might have been expected, the FC counts from the forested and less developed upper basin forks were much lower than from the more developed lower mainstem. Since the two forks comprise approximately 80% of the watershed area and deliver about 80% of the annual discharge, the bacterial quality of the water from the upper basin has a large influence on the lower mainstem. As observed in the historical data by Thornburgh and Williams (2001), FC counts in the lower basin generally increase downstream from Arlington to Hat Slough. Samples collected at sites located near the confluence of the forks (S. Fork at Twin Rivers and N. Fork at Twin Rivers) had higher FC counts than upstream sites (Table 14). FC counts at both Twin Rivers sites were greater than 200 cfu/100 mL on the first day of the June storm survey. FC counts at the sites in the upper reaches of the South Fork and North Fork were usually two to ten times less than counts at the Twin Rivers confluence. This increase in FC bacteria may be related to the increased development along the lower reaches of the forks, and up more developed tributaries like Jim Creek. The samples collected on the first day of both storm events from nearly all of the mainstem sites downstream of the forks were greater than 200 cfu/100 mL. Most June FC counts were greater than 500 cfu/100 mL, and most November FC counts were greater than 300 cfu/100 mL (Table 14). The bacterial response in the two forks and the mainstem to these two storm events was of short duration; i.e., the FC counts returned to much lower levels on the second day of monitoring immediately after the peak flows had passed. At least one FC sample collected from each of the six lower valley tributary sites and from the Arlington WWTP effluent had a count greater than 200 cfu/100 mL during the storm events (Table 14). All samples collected during the storm events from March Creek, Portage Creek, and Glade Bekken were greater than 200 cfu/100 mL. FC counts greater than 1000 cfu/100 mL

Stillaguamish Fecal and DO TMDL Submittal Report Page 59
were reported in samples from these three creeks, Armstrong Creek, and Kackman Creek. All five tributaries have reaches with potential residential, agricultural, and roadway stormwater sources of FC. In contrast to the mainstem FC pattern, most tributary FC counts appeared to stay elevated for longer, or they experienced a lag in the peak FC count. For example, March Creek, Portage Creek, Kackman Creek, and Arlington WWTP had higher FC counts the second day of the November event, while mainstem FC counts had peaked the first day (Table 14). Pilchuck Creek, the largest tributary sub-basin in the lower basin, had a FC pattern similar to the mainstem and forks. Runoff from the large undeveloped areas in the Pilchuck and upper basin of the Stillaguamish River may provide water with low bacterial counts that can dilute the FC loads from more developed reaches and tributaries. The effect of the FC loads from tributaries, point sources, and suspected nonpoint sources on the Stillaguamish River was difficult to assess. Sampling rapidly changing hydrographs in a large basin with several tributaries and few available staff resources prevented a synoptic monitoring approach during the storms. Estimates based on the few samples collected indicated that Portage Creek and Pilchuck Creek delivered the largest FC tributary loads to the lower basin. FC loading from the Arlington WWTP was minor compared to the tributary loads because the WWTP discharge volumes were much lower than the tributary volumes. FC loads from other nonpoint sources along the lower mainstem were suspected, but they could not be estimated because of variability in the mainstem. Although the FC counts were much lower in November than in June, the estimated FC loads from the mainstem Stillaguamish River to Port Susan were much higher. During the June storm event, the Stillaguamish River at Interstate 5 (I-5) had an estimated mean daily flow of 7250 cfs. The FC count at I-5 was 520 cfu/100 mL, and at Hat Slough it was 680 cfu/100 mL. During the November storm, the estimated flow at I-5 was 19,000 cfs. The FC counts at I-5 and at Hat Slough were 380 cfu/100 mL A rough estimate would be that the November storm delivered about twice the FC load to Port Susan as the June storm on the first day. On the second day of the June storm, the FC load was about 13% of the first day’s load to Port Susan. A similar estimate was made for the November storm where the FC load on the second day dropped to about 15% of the first day’s load. Freshwater Recreation Area Sampling Ecology sampled for FC weekly for a five-week period in August and September 2000 at seven informal recreational bathing beaches. These data were presented earlier by Joy (2001), but are repeated here to demonstrate FC variability within a season and potential recreational use impacts. A statistical summary of the results of the TMDL freshwater beach survey is shown in Table 15.

Page 60 Stillaguamish Fecal and DO TMDL Submittal Report
Table 15. Statistical summary of fecal coliform samples (n=5) collected weekly from seven informal recreational beach sites in the Stillaguamish River basin from August 7 to September 5, 2000.
Fecal Coliform (cfu/100 mL) Informal Recreational Beach Sites Geometric Mean 90th percentile* Range S.F. Stillaguamish at Jordan 34 63 18 – 55 S.F. Stillaguamish at Twin Rivers 34 112 10 – 130 N.F. Stillaguamish at Twin Rivers 19 49 9 – 61 N.F. Stillaguamish at Whitman Br. 3 11 1 – 10 Stillaguamish River at Marine Dr. 27 74 9 – 74 Pilchuck Creek at Jackson Gulch 86 285 40 – 280 Church Creek at Stanwood Park 101 197 57 - 190 Current State Class A Criteria 100 200 * The 90th percentile values are based on the FDA method assuming a lognormal distribution (Appendix B). Bold values do not meet current Washington State FC criteria. Church Creek at Stanwood Park did not meet the geometric mean FC criterion, and the 90th percentile statistic was just under the 200 cfu/100 mL criterion. The Pilchuck Creek site FC densities did not meet the 90th percentile criterion. The other five sites met both parts of the FC criteria. Church Creek appeared to be the most popular area, but not by swimmers. Children were often seen playing near or in the creek. Pilchuck Creek and the Twin Rivers Park beaches (the confluence of the North and South forks of the Stillaguamish River) were more likely to have swimmers. According to these data, Pilchuck Creek swimmers and children playing in Church Creek would probably be at a slightly greater health risk. Critical Conditions and Loads The analyses of the FC distributions show that the critical season for meeting Class A criteria in the major forks, lower mainstem, and most tributary sites occurs from May through November. However, FC loads and counts are most likely to become elevated during storm events throughout the year. Although primary contact recreation is not popular during storm events or during all of this critical period, Washington State FC criteria apply to primary and secondary recreation uses. Exposure to waterborne bacteria during secondary recreational uses can occur at any time of the year. June and October through January appear to be the critical months for FC loading to Port Susan, resulting in fewer sites in the bay in compliance with DOH or Class A marine criteria (Figure 14). However, storm events can increase FC loading to Port Susan throughout the year. The available data support or suggest the following reasons for the critical season in fall:
Median FC loads at the Stillaguamish River at I-5 increase from 3.2 x 10¹¹ cfu/day in September to 4.5 x 10¹² cfu/day October, and then often remain elevated through the next few months (Figure 16).
A few more Port Susan monitoring sites meet Class A criteria, if only January - August data are used.

Stillaguamish Fecal and DO TMDL Submittal Report Page 61
The increasing frequency and intensity of storm events in the fall can dislodge and carry bacterial contaminants accumulated over the drier summer months.
Large flocks of snow geese, shorebirds, and waterfowl stop or winter along the lower reaches of the river and in the estuary beginning in September. These birds could be the source of a significant seasonal FC load (Table 16).
More severe winds arrive in the autumn. Winds and wave action re-suspend bacteria-contaminated sediment in the lower reaches of the river or estuary that was deposited earlier in the season. Scouring action by increased river and tributary flows could also re-suspend contaminated sediments previously delivered from upland areas.
Flooding is not uncommon during these months. Agricultural and residential lands lying in the flooded areas can contribute FC loads from manured fields, septic systems, and other sources.
FC L
oad
MONTH
10000
100000
1000000
10000000
100000000
1000000000
JAN FEB MAR APR MAY JUN JUL AUG SEP OCT NOV DEC
1994-2002 K-W 50%
(8) (8)
(8) (8)
(8)
(8)
(8)
(7)
(7)
(8) (7)
(8)
Figure 16. A box-plot summarizing monthly fecal coliform loads (cfu/day x 106) from data collected by Ecology at the Stillaguamish River at Interstate 5, #05A070, from 1994 to 2002. The box-plot depicts the median, 10th, 25th, 75th, and 90th percentiles, and the range.

Page 62 Stillaguamish Fecal and DO TMDL Submittal Report
Table 16. Bird population data for northeast Port Susan, Livingston Bay, and the Stillaguamish River delta (Cullinan, 2001), and estimates of the daily fecal coliform load.
Bird Season Sighted Average Population
Estimated FC Production (cfu/day) x 1012
Maximum Population
Estimated FC Production (cfu/day) x 1012
Trumpeter Swan
Winter 51 0.02 139 0.06
Snow Goose Winter 9,700 3.9 25,000 10 Ducks Winter 4,040 6.9 6,864 11.7 Shorebirds Fall Migration - - 50,000 40
Shorebirds Winter 24,175 20 31,050 25 Shorebirds Spring Migration 34,350 25 50,000 40
The estimated average seasonal FC loads contributed from the Stillaguamish River (Hat Slough and South Pass) to Port Susan during the 2000-2002 TMDL study period varied between 3.8 x 10¹² cfu/day for July through September, and 1.4 x 10¹³ cfu/day for October through December. The November storm event discharged an average of 1.1 x 10¹⁴ cfu/day over two days, demonstrating the importance of FC loading from short-term events. In Table 16, estimates of potential daily FC loads to Port Susan from wildfowl were calculated based on literature values for FC concentrations in fecal material and daily manure production from domestic ducks, geese, and chickens (ASAE, 1998). The daily or seasonal FC loadings from the various wildfowl to Port Susan depend on their accustomed habitat relative to water. For example, the geese and swans spend much of the time on fields and nearshore wetlands, so much of their FC loading would be through land delivery and runoff through drains and creeks. The shorebirds are more likely to spend more time on the tideflats, so FC loading would be a function of exposure of the feeding areas on tideflats and then tidal inundation. Ducks are probably the most pelagic of the species listed. Their FC loading would tend to be directly to the water column, although they might seek more protected sloughs during rougher weather. The contribution of seal fecal material to FC concentrations in the water column is not well documented. The contribution seals make to FC loads in Puget Sound harbors and bays can vary greatly (Calambokidis, McLaughlin, and Steiger, 1989). Bacterial densities in seal fecal material (1.7 to 55 x 109 cfu/day), dispersion of fecal wastes near haul-out areas, and flushing efficiency of the embayment can affect the FC loading from seals. If a seal produces 2.8 x 10¹⁰ cfu/day (average of the range quoted above), then 300 seals in Port Susan have the potential for contributing a daily fecal load of approximately 8.5 x 10¹² cfu/day to the bay. The loading from wildlife can be significant. If the average daily winter FC loading from seals and waterfowl were directly discharged to Port Susan, it would be more than the estimated daily average winter FC loading from the Stillaguamish River. Fortunately, only a fraction of the wildlife FC load is directly available to water since the wildlife are not in the water all of the time. Their seasonal impact on FC loading can still have an effect on areas of the bay. In an

Stillaguamish Fecal and DO TMDL Submittal Report Page 63
example from Massachusetts, researchers calculated that 67 percent of the annual FC load in Buttermilk Bay was from waterfowl; the loading was seasonal (December through March), but it was dispersed throughout the bay rather than concentrated in a single area (Weiskel, Howes, and Heufelder, 1996). The increases in FC loading in the fall season from the Stillaguamish River and from wildlife are also accompanied by internal Port Susan sources. Estuarine mud often has higher counts of bacteria and viruses than overlying water (Thomann and Mueller, 1987). Many researchers also have found that bacteria and viruses survive for longer periods in the mud than in open water. There is also evidence that lower salinities can also release bacteria that are adsorbed to sediment (Erkenbrecher, 1981). Rougher weather and higher river flows in fall can re-suspend contaminated sediments deposited at the mouth of the estuary during earlier periods. The lower salinities caused by increased freshwater input can also release more bacteria from the sediment into the water column. Estimating the FC loading from these sources would be difficult. The phenomenon is another potential source of loading to consider when assessing the water quality of Port Susan. Since re-suspension is a possible source of FC loading in Port Susan, the loading from surrounding rivers and streams throughout the year is important to consider. Summary of Fecal Coliform Results FC counts at most sites monitored under more than one agency (Ecology, Stillaguamish Tribes, Snohomish County, and Water and Wastewater Services at Warm Beach) operating from June 2000 to June 2001 were combined to get a comprehensive picture for the 2000-2002 TMDL study period. The geometric mean and 90th percentile statistics calculated for FC at most lower basin mainstem and tributary sites did not meet the state FC criteria (Table 17). The final determination of criteria compliance will be made after an analysis of critical conditions for each site in the Loading Capacity section of this report. According to the data collected during the TMDL study period, all sites located along the upper forks met Class A freshwater criteria, as did Hat Slough at the Boat Launch. Mainstem sites located below Arlington, at I-5, and Hat Slough at Marine Drive did not meet the 90th percentile criterion. Although some improvements were seen in several smaller tributaries, only samples from Jim Creek met both parts of the state criteria. Some of the creeks appear to have chronic FC sources. For example, data from Church Creek/Jorgenson Slough, Irvine Slough, Miller Creek, Portage Creek, Fish Creek, Glade Bekken, Kackman Creek, and Harvey Creek met neither the geometric mean nor the 90th percentile criteria. Data at other sites met the geometric mean criterion, but had episodic events with elevated FC counts more than 10 percent of the time, failing the second part of the state FC criteria. The two Hat Slough sites are only 230 meters apart, but the statistical results in Table 17 are quite different. The differences create some difficulties in characterizing the bacteriological quality of the reach. Several factors may contribute to the differences, including (1) two methods of analysis were used; the samples collected downstream at the Boat Launch were analyzed by MPN, and the upstream Marine Drive samples were analyzed by MF (see Applicable Water Quality Criteria for definitions of MPN and MF); (2) samples were collected at different times; and (3) the area is tidally influenced. The last factor may have caused a

Page 64 Stillaguamish Fecal and DO TMDL Submittal Report
difference because the samples at the Boat Launch were usually taken at high ebb tide, and the samples upstream at Marine Drive were not. Table 17. Statistical summaries of fecal coliform samples collected from sites in the Stillaguamish River basin during this TMDL daily load study (June 2000 to June 2002). Geometric mean and 90th percentile are in colony forming units/ 100 milliliters.
Site Number of samples
Geometric mean
90th percentile
Douglas Slough 42 44 808 Irvine Slough 13 680 16,205 Jorgenson Slough 27 295 1,863 Church Creek at Park 27 104 435 Miller Creek 17 326 1,715 Warm Beach Creek above WWTP 19 70 578 Agricultural Drain to Warm Beach 19 121 572 Warm Beach Dike Pond 19 189 1025 Lake Martha Creek 51 92 1,008 Hat Slough at Marine Drive 56 41 261 Hat Slough at Boat Launch 41 17 63 Glade Bekken 27 171 1,558 Pilchuck Creek 40 46 312 Portage Creek at 212th 32 236 2,032 Portage Creek at 43rd 19 149 722 Fish Creek 21 206 4310 Stillaguamish R. at Interstate 5 33 26 223 March Creek 7 475 8,760 Armstrong Creek at Mouth 4 46 209 Kackman Creek 10 165 669 Armstrong Creek at Hatchery 12 86 667 Harvey Creek at Grandview Road 6 317 1527 Stillaguamish R. below Arlington 12 48 412 Stillaguamish R. above Arlington 20 36 181 S.F. Stillaguamish at Arlington 35 27 156 Jim Creek at Mouth 12 55 190 Jim Creek at Whites Road 6 17 52 S.F. Stillaguamish at Granite Falls 30 6 40 N.F. Stillaguamish at Twin Rivers 9 33 116 N.F. Stillaguamish at Cicero 30 13 82 N.F. Stillaguamish at Whitman Br. 17 11 54 N.F. Stillaguamish at C-Post Br. 12 9 37 N.F. Stillaguamish at Darrington 25 8 47
* Bold values do not meet the fecal coliform criteria (Table 6)
Stillaguamish Fecal and DO TMDL Submittal Report Page 65
Some of the summary statistics verify findings made during other TMDL tasks. For example, the synoptic survey indicated FC counts increased downstream in both forks, and also in some reaches from the confluence of the forks to Port Susan. Also, storm-event data demonstrated that runoff can seriously increase FC counts in waters throughout the basin, but the smaller tributaries are affected most severely. Finally, some sites like Pilchuck Creek occasionally experience FC counts above 200 cfu/100 mL during the summer recreational season, as well as during storm events throughout the year. Port Susan water quality will depend on the freshwater sites coming into more consistent compliance with FC criteria. The Port Susan sites farther away from the mouth of Hat Slough and South Pass were more likely to meet marine water criteria. The increased FC loading from the Stillaguamish basin during seasonal storm events, especially in the fall, have an effect on Port Susan FC counts. Additional FC loading from small tributaries around the bay, internal re-suspension of bacteria-contaminated sediment, a resident seal population, and the arrival of large numbers of migratory waterfowl may increase bacteria counts in Port Susan. The following conclusions and additional observations were reached from evaluating the FC density data collected in 2000 and 2002 relative to past data.
• The FC bacteria data sets for the upper South Fork, upper North Fork, and Hat Slough at the boat launch meet freshwater Class A criteria (Table 17).
• More than 10 percent of the FC counts at sites just below the confluence of the forks, below Arlington, and at I-5 are greater than 200 cfu/100 mL. It is unlikely that Arlington WWTP effluent is a primary source of elevated FC in this area since its FC load is small. Data collected from sites above the outfall indicate a FC problem during storm runoff events.
• FC count reductions along the mainstem and in the two forks occurred after 1995 and 1996. Decreasing trends at many sites were interrupted by increased FC counts reported in 2001. This may suggest that improvements since 1996 have not consistently reduced FC counts in those areas.
• The elevated FC counts in Port Susan are usually associated with short pulse storm events during the spring and through the fall. The fall storms and increased discharge to Port Susan prevent many of the sites in the bay from complying with Class A marine water criteria.
• Only one of the tributaries evaluated in the basin met both parts of the state Class A FC criteria: Jim Creek. Only six sites on other tributaries had geometric mean counts below 100 cfu/100 mL: Pilchuck Creek at Jackson Gulch Road, the mouth of Armstrong Creek and below the hatchery, Lake Martha Creek, Warm Beach Creek, and Douglas Slough.
• Glade Bekken experienced a significant improvement in FC counts in 1999 to 2001 compared to 1996 to 1998. This may be a result of Snohomish Conservation District and Snohomish County Surface Water Management efforts upstream of Silvana Terrace Road.
• FC counts collected at Portage Creek at 212th, the last crossing before the confluence with the Stillaguamish River, appear to have increased significantly in 2001 and 2002. No trend was observed in the data from Portage Creek upstream at 43rd. A major tributary, Fish Creek, showed significant improvement in FC counts from 1997 to 2002 compared to

Page 66 Stillaguamish Fecal and DO TMDL Submittal Report
1994 to 1996. This suggests that a FC source is located between 212th and these upstream monitoring sites.
• FC counts in March Creek appear to increase greatly during storm events, but the data set is too small to totally characterize an annual pattern.
• Although geometric mean FC counts at the mouth of Armstrong Creek and below the hatchery met the Class A criteria, the counts upstream in Kackman Creek and Harvey Creek did not meet any part of the criteria.
• Unidentified sources may be increasing FC counts in the mainstem: between Arlington and Armstrong Creek, on the North Branch below I-5, and between Silvana and Marine Drive.
• Port Susan FC counts were decreasing in 1999, but they increased at many sites in 2000 to 2002. FC loads arriving from the Stillaguamish basin and small tributaries around the bay in September through December appear to degrade bacteriological water quality.
• Intermittent discharges from pump systems (Irvine Slough and Warm Beach Dike Pond) and drains with tide gates could be significant sources of local FC loading in the lower Stillaguamish River and in localized areas like Warm Beach Slough.
Dissolved Oxygen Current Conditions and Trends Most dissolved oxygen (DO) data collected in the Stillaguamish River basin have been from instantaneous daytime ‘grab’ measurements. The 303(d) listings for low DO were based on instantaneous measurements made in Pilchuck Creek and Portage Creek (both Class A), the South Fork above Granite Falls (Class AA), and the mainstem Stillaguamish River below Silvana and in Hat Slough (Class A). The listings were based on samples collected in 1994-1996. A diel study conducted below the Arlington WWTP by Earth Tech (1997) consultants found that DO concentrations at RKM 21.7 (RM 13.5) upstream of the Interstate 5 bridge dropped to 7.2 mg/L in the early morning, and rose to 11 mg/L in the late afternoon in August 1997. The consultants modeled the effluent biochemical oxygen demand (BOD) from the Arlington WWTP. The model demonstrated that effluent BOD and nitrogenous oxygen demand1 had little effect on instream DO concentrations. They considered oxygen demand from periphyton biomass respiration the primary cause of low diel DO concentrations during a survey. Data from this study were not included in the 1998 303(d) database, so the reach was not listed. Ecology, Snohomish County, and the Stillaguamish Tribe collected a combination of instantaneous and diel DO measurements in the basin during the 2000-2002 TMDL study period. Results from instantaneous measurements taken at 36 sites in the basin are summarized in Table 18. The sites were located along the North and South forks, the mainstem Stillaguamish River, several tributaries to the mainstem, and small drainages to Port Susan south of Hat Slough.
1 Nitrogenous oxygen demand is a term used to describe the biochemical oxidation of ammonia to nitrite and nitrate.

Stillaguamish Fecal and DO TMDL Submittal Report Page 67
Table 18. A summary of dissolved oxygen concentrations from grab samples collected in the Stillaguamish River basin by Ecology, Snohomish County, and the Stillaguamish Tribe from June 2000 to June 2002.
Site Number of Samples
Concentration Range (mg/L)
10th Percentile concentration
Twin City Foods Drain #4 (silted shut) 8 1.2 – 18.8 3.3 Warm Beach Creek above WWTP outfall 7 3.8 – 8.4 3.9 Pasture Drain to Pump Pond 6 4.1 – 12.0 4.7 Pond or discharge to Warm Beach Slough 7 3.0 – 9.1 3.8 Lake Martha Creek 10 8.8 – 12.1 9.4 Unnamed Creek #0456 7 8.6 – 11.8 8.7 Hat Slough at Marine Drive 49 8.0 – 13.2 9.0 Stillaguamish River at Old Channel split 2 5.7, 10.1 - Glade Bekken at Silvana Terrace Road 33 7.5 – 14.0* 9.5 Stillaguamish River below Silvana 7 9.8 – 13.2 9.9 Stillaguamish River (Cook or South Slough) 11 10.2 – 12.8 10.4 Stillaguamish River (North Channel) at Silvana 7 9.4 – 12.9 9.6 Pilchuck Creek at Jackson Gulch Road 37 7.6 – 13.6 8.5 Portage Creek at 212th 32 5.1 – 12.2 5.5 Portage Creek at 15th 10 3.7 – 7.2 4.2 Portage Creek at 43rd 25 6.4 – 11.4 6.8 Krueger Creek at Burns Road 5 8.4 – 11.6 9.5 Portage Creek at Highway 9 10 8.8 – 11.6 9.3 Prairie Creek at 69th and 204th 9 9.7 – 14.2 10.4 Fish Creek 24 9.2 – 14.0 9.8 Stillaguamish River at Interstate 5 37 9.1 – 14.4 9.7 March Creek at 220th NE 6 4.8 – 8.0 4.8 Armstrong Creek at Mouth 3 9.5 – 10.3 9.7 Kackman Creek at 252nd 6 6.6 – 9.0 7.0 Armstrong Creek at Hatchery 6 9.3 – 11.6 9.5 Harvey Creek at Grandview Road 9 9.8 – 11.8 10.0 Stillaguamish River above Arlington 32 8.9 – 13.4 9.9 S.F. Stillaguamish at Arlington 38 9.5 – 14.6 9.9 Jim Creek at Mouth 4 10.4 – 12.5 10.7 S.F. Stillaguamish at Jordan Walkway 9 10.0 – 12.5 10.1 S.F. Stillaguamish at Granite Falls (Class AA) 28 10.0 – 14.3 10.7 N.F. Stillaguamish at Twin Rivers 10 9.8 – 11.6 10.3 N.F. Stillaguamish at Cicero 32 10.1 – 14.3 10.8 N.F. Stillaguamish at Whitman bridge 9 10.8 – 11.6 11.0 N.F. Stillaguamish at C-Post bridge 4 10.7 – 13.0 10.8 N.F. Stillaguamish at Darrington 25 10.8 – 14.0 11.2
Bold values do not meet the dissolved oxygen criteria. * Glade Bekken had only a single violation of the criteria, so it does not meet the 303(d) listing policy (see text).

Page 68 Stillaguamish Fecal and DO TMDL Submittal Report
The data summarized in Table 18 do not include all of the data collected during the 2000-2002 TMDL study period. DO data from the Old Stillaguamish Channel and its tributaries will be discussed in a future report. Several mainstem sites were only monitored a few times. Data at these sites were not summarized because they were all well within the DO criterion, and they are available in the Data Summary Report (Coffler, Gridley, and Joy, 2004). Data obtained from continuously recording DO probes will be discussed later in this report (Dissolved Oxygen in the Stillaguamish River below Arlington). Based on the combined data, 11 sites did not meet the Class A criterion of 8 mg/L (Table 18). The lowest DO concentrations at all sites were reported from measurements made during the months of May through October. Applying a 0.5 mg/L safety factor to the 10th percentile concentration to account for diel, minimum DO concentrations did not identify any additional sites (see Analytical Framework for explanation). All but one of the sites are located on tributaries or drains to the lower Stillaguamish River or to Port Susan.
• Twin City Foods Drain #4
• Warm Beach Creek above the Warm Beach WWTP outfall
• Pasture Drain and Pond (2 sites) to Warm Beach Slough
• Pilchuck Creek
• Portage Creek (3 sites)
• March Creek
• Kackman Creek
• Stillaguamish River at the Old Channel Split All appear to have fecal coliform contamination problems as well, according to the statistical summaries in Table 17. Past monitoring data have been used to place the lower Stillaguamish River on the 1998 303(d) list. During low-flow periods, the lower Stillaguamish River from around RKM 4.8 (RM 3) to Hat Slough can experience short-term depressed DO concentrations. Some of the reaches below the Marine Drive bridge may be influenced by low-DO marine water from Port Susan (Klopfer, 2000). Upstream of the bridge, the unusually low DO concentrations at midday are caused by deoxygenated water from the Old Stillaguamish Channel flowing back into the main river channel. This was observed during the September 13, 2000 synoptic survey (Coffler, Gridley, and Joy, 2004). The DO concentration near the bifurcation point of the two channels (Site #05TMS3) was 5.72 mg/L. DO concentrations in the Old Stillaguamish Channel have been as low as 2.6 mg/L at the Norman Road bridge (Site #05TOC4), and five-day BOD concentrations of 3 - 5 mg/L were recorded (Coffler, Gridley, and Joy, 2004). The Stillaguamish River reach affected is limited to the right side of the main channel and is dependent on the following factors:
• The tidal volume and tidal stage timing differences in the Old Channel and Hat Slough.
• The oxygen depletion in the upper reaches of the Old Stillaguamish Channel.

Stillaguamish Fecal and DO TMDL Submittal Report Page 69
• The direction, dilution, and dispersion characteristics of the Stillaguamish River. In late 2002, a tide gate was installed in the Old Stillaguamish Channel to operate during the low–flow season starting in 2003 (SIRC, 2002). The gate is designed so that water is allowed to pass from the Stillaguamish River to the Old Stillaguamish Channel, but not in the reverse direction. If the tide gate works as designed, low DO water will not reach the mainstem and Hat Slough from the Old Channel. The low DO concentration problem in the Old Stillaguamish Channel and the effectiveness of the tide gate will be addressed in a future report. Glade Bekken had a single DO measurement below 8 mg/L in May 2001, but the 10th percentile value of the data set was well above the 8.5 mg/L concentration of concern. Past studies by Snohomish County have not found DO violations along the mainstem of the creek (Thornburgh, 2001). The 303(d) listing policy for Ecology requires violations from instantaneous data to occur at least three times (Ecology, 2002). Therefore, Glade Bekken should be monitored more intensively in the future, but should not be considered for a load capacity analysis at this time. Pilchuck Creek was on the 1998 303(d) list for DO based on data collected by Snohomish County prior to 1995. Pilchuck Creek had three excursions below 8 mg/L within the current monitoring period (2000 – 2002), the first since 1994 – 1995 when it was listed. Two excursions below the criterion in Pilchuck Creek were on consecutive days in August 2000 (7.89 and 7.9 mg/L), and the third was in May 2001 (7.56 mg/L). The August values were at 80% saturation. The May concentration was at 69% saturation. The rank 10th percentile DO concentration for Pilchuck Creek is 8.5 mg/L based on instantaneous samples collected by Snohomish County and Ecology, just at the concentration recommended to account for diel minima within the DO criterion. No other water quality parameters were out of compliance with criteria during the three events that would help to identify the source(s) of the low DO concentrations. Pilchuck Creek data, collected since 1994, showed an improving DO trend in Pilchuck Creek until it was interrupted in 2000. Temperature data continue to show a significant cooling trend. Temperature is often a controlling factor for DO concentrations because lower water temperatures will increase DO solubility. In some cases, lower temperatures can also indicate the influence of local groundwater infiltration. The Pilchuck monitoring site at Jackson Gulch bridge is located in a floodplain, near the confluence with the Stillaguamish River, and downstream of Interstate 5. During the low-flow season, the monitoring site on Pilchuck Creek is a large, slow pool. The pool could be a source of sediment oxygen demand or heterotrophic bacteria activity in a hyporheic exchange zone (see Dissolved Oxygen in the Stillaguamish River below Arlington). The oxygen demand could be from a mix of autochthonous (generated within the stream) and allochthonous (delivered to the stream) materials. Wetland areas and ground water could also contribute water with naturally low oxygen concentrations. Oxygen-demanding wastes could come from upstream from anthropogenic and natural sources. Reaches immediately upstream of the sampling site drain forested lands, with scatterings of wetlands, agriculture, and residential areas. All of these land uses have sources of organic material that can be delivered to the creek and can contribute to oxygen demand. Manure from

Page 70 Stillaguamish Fecal and DO TMDL Submittal Report
livestock operations has historically been a source of excessive oxygen-demanding pollutants in the basin. The four dairies listed in 1996 in the Pilchuck Creek sub-basin are no longer active, but there are non-commercial farms and equestrian centers in the lower watershed (Thornburgh and Williams, 2001). A Washington State Department of Transportation (WSDOT) map shows several stormwater outfalls to Pilchuck Creek from Interstate 5 and the Jackson Gulch interchange upstream of the sampling site. Storm water from several arterial county roads, including Jackson Gulch Road, also enter the creek or its tributaries. Two reaches of Portage Creek were on the 1998 303(d) list (Table 1). Portage Creek has a long history of low DO concentrations in its lower reaches during the daylight hours. The low DO concentration can occur from May through November (Figure 17). Data collected at sites from 1989 to 1995 in these lower reaches caused the 1998 303(d) listings.
mg/
L
MONTH
4
5
6
7
8
9
10
11
12
13
JAN FEB MAR APR MAY JUN JUL AUG SEP OCT NOV DEC
1997-2002 K-W 99%
WQ Standard
(5)
(4) (5)
(4)
(4)
(4)
(4) (4)
(4)
(5)
(5)
(5)
Figure 17. A box-plot of monthly dissolved oxygen measurements collected at Portage Creek at 212th NE by the Snohomish County Surface Water Management Program from October 1997 to April 2002. The monthly range of measurements is compared to the 8 mg/L Class A criterion. The box-plot depicts the median, 10th, 25th, 75th, and 90th percentiles, and the range.
Instantaneous DO measurements made at sites in upper Portage Creek, Prairie Creek, and Fish Creek met the Class A criterion (Table 18). Of the seven sites in the Portage Creek sub-basin, three had DO measurements out of compliance with criteria. All three are located on slow winding reaches of Portage Creek after it drops from the plateau to the Stillaguamish River floodplain – the same reaches on the 303(d) list. Taken together, all DO data collected from 1994 to 2002 at the two lowest sites at 43rd and 212th appear to show significant improvement. However, a part of the improvement may be the result of a shift to collecting samples later in the day that occurred since 1998. Since DO

Stillaguamish Fecal and DO TMDL Submittal Report Page 71
concentrations tend to increase over the day, measurements taken before noon will usually be lower than those taken in the afternoon. Closer investigation showed that some improvement in morning DO concentrations was observed in the database. All DO concentrations at 212th measured before noon in May through November since 1998 were over 5 mg/L; prior to 1998, 66% were below 5 mg/L. A similar pattern of improvement was seen at 43rd where DO concentrations measured before noon since 1998 were an average of 0.8 mg/L higher, and at Fish Creek where concentrations were an average of 1.2 mg/L higher. The trend is not good when data are examined seasonally. For example, DO concentrations taken at 212th from May through November since 1998 have shown a statistically significant decreasing trend, similar to the increasing fecal coliform and decreasing temperature trends at the same site. The results may suggest that surface flows are decreasing and that ground water is becoming a greater portion of the surface flows during these months. Less water may be available to handle pollutant loads. Unfortunately, surface discharge data have not been collected in the sub-basin to further analyze this theory and determine if there has been decreasing summer flows. The low DO concentrations and elevated fecal coliform counts do not appear to be correlated, but they suggest that pollutant sources are still active in the sub-basin. Land use in the Portage Creek sub-basin has been changing. Only one of the seven dairies present in 1996 remains active in the lower sub-basin. Residential, non-commercial farm, and commercial developments have been increasing on the eastern plateau in and around Arlington. Prairie Creek and upper Portage Creek receive storm water through several outfalls that drain the developed areas served by Arlington. Also, WSDOT geographic information system coverages (www.wsdot.wa.gov) show several stormwater outfalls to Portage Creek from Interstate 5 and Highway 9. The Fish Creek watershed on the plateau to the west has also seen increased non-commercial farm and residential development activity. Portage Creek, March Creek, Twin City Foods Drain #4, Kackman Creek, and the Warm Beach Creek set of sites appeared to have chronic DO problems. The 10th percentile DO concentrations are well below 8 mg/L. All of these creeks and drains are slow-moving and shallow during the low-flow period. All sites are located downstream of areas that are wetlands or have hydric soils – potentially influenced by low-DO ground water and anaerobic subsurface water derived from riparian wetlands. However, all also have elevated fecal coliform counts (Table 17) and elevated nutrient concentrations that may indicate sources of oxygen-demanding wastes are present. Manured fields and animal access areas had been sources of contaminants to Portage Creek in a 1988 – 89 study (Plotnikoff, 1991). Stormwater runoff from Arlington, WSDOT, or Snohomish County systems may also be a source of oxygen-demanding pollutants in some of these creeks. Warm Beach Creek has similar origins and hydrology to Lake Martha Creek and Unnamed Creek #0456 that did not exhibit low DO concentrations. However, the creek has several potential sources of oxygen-demanding pollutants just upstream of the WWTP. The horse stables and duck pond located on Warm Beach Creek could be sources of manure upstream of the WWTP outfall. The Snohomish Conservation District has been working with the Warm Beach Conference Center to manage the wastes better at the horse stables.

Page 72 Stillaguamish Fecal and DO TMDL Submittal Report
The Dike Pond to Warm Beach Slough receives water from the Pasture Drain, effluent from the Conference Center WWTP, and Warm Beach Creek. The WWTP discharges an average of 10 lbs/day of BOD to the creek, sometimes with very little or no dilution. The Pasture Drain connects to a network of drains to the north. The low DO concentrations in the Pasture Drain could be ground water or nonpoint sources related to agricultural and residential activities. The pond retention time is highly variable, and algal respiration, duckweed, and oxygen-demanding wastes settled to the bottom probably contribute to reduced water column DO concentrations. Salinities in the Pasture Drain and Dike Pond may indicate saltwater inundation. Water density differences in the Dike Pond could reduce mixing and aeration. Coho salmon and winter steelhead use Portage Creek and Kackman Creek; coho also use March Creek (WCC, 1999). Tide gates may prevent fish from entering Twin City Foods Drain #4 and the Warm Beach Creek system, and they are not shown as supporting salmon (WCC, 1999). Coho spawning and egg incubation occurs from October through May, so the most serious periods of depressed DO concentrations may be avoided. Winter steelhead spawning and incubation span November through July, so the late incubation period would be most critical for attaining adequate DO in these streams. Juvenile salmon using the streams as rearing habitat over the year could require refuge elsewhere if DO concentrations drop for extended periods below 5 mg/L. Monitoring data collected along the two main forks in the upper basin met the Class AA and Class A criteria (Table 18). The South Fork Stillaguamish at Granite Falls reach was on the 303(d) list in 1998. The Stillaguamish Tribe data set for the North Fork Stillaguamish near Darrington recorded a low DO measurement prior to 1996, but a single event is not frequent enough to qualify for the 303(d) list. The site on the South Fork at Granite Falls in Class AA waters met the criterion of 9.5 mg/L, as did the site on the North Fork at Darrington just downstream of Class AA waters. The estimated 10th percentile DO concentrations also meet the concentration recommended to account for diel minimums within the DO criterion (Table 18). Dissolved Oxygen in the Stillaguamish River below Arlington The mainstem Stillaguamish River reaches between the confluence of the forks at Arlington and Interstate 5 (Figure 7) that were identified as having pre-dawn DO concentrations less than 8 mg/L in the Earth Tech (1997) study were investigated during this TMDL study. Continuously recording probes were deployed in September 2000 and October 2001 to record DO, temperature, pH, and conductivity over 48-hour periods. The probes were not deployed in August 2000 or 2001 (usually the peak autotrophic growth period) because of mid-summer spates (short-duration, high-flow events) and equipment scheduling difficulties. Two very different DO conditions were recorded (Figure 18). Where September 2000 DO conditions below Arlington were well within the Class A criterion, the October 2001 survey had similar DO conditions to the Earth Tech (1997) August 1997 survey (Figure 18 and Table 19).

Stillaguamish Fecal and DO TMDL Submittal Report Page 73
Stillaguamish River - September 11-13, 2000
8.0
9.0
10.0
11.0
12.0
1100
00
1400
00
1700
00
2000
00
2300
0020
000
5000
080
000
1100
00
1400
00
1700
00
2000
00
2300
0020
000
5000
080
000
1100
00
Time ->
D.O
. (m
g/L)
RKM 28.5RKM 24RKM 21.7
Stillaguamish River - October 2-4, 2001
7.0
8.0
9.0
10.0
11.0
12.0
1200
00
1500
00
1800
00
2100
00 030
000
6000
090
000
1200
00
1500
00
1800
00
2100
00 030
000
6000
090
000
1200
00
1515
00
Time ->
D.O
. (m
g/L)
RKM 28.5RKM 24RKM 21.7RKM 17.7
Figure 18. Diel dissolved oxygen (DO) data recorded by probes deployed in the Stillaguamish River between Arlington and Interstate 5. Site locations are shown in Figure 7.
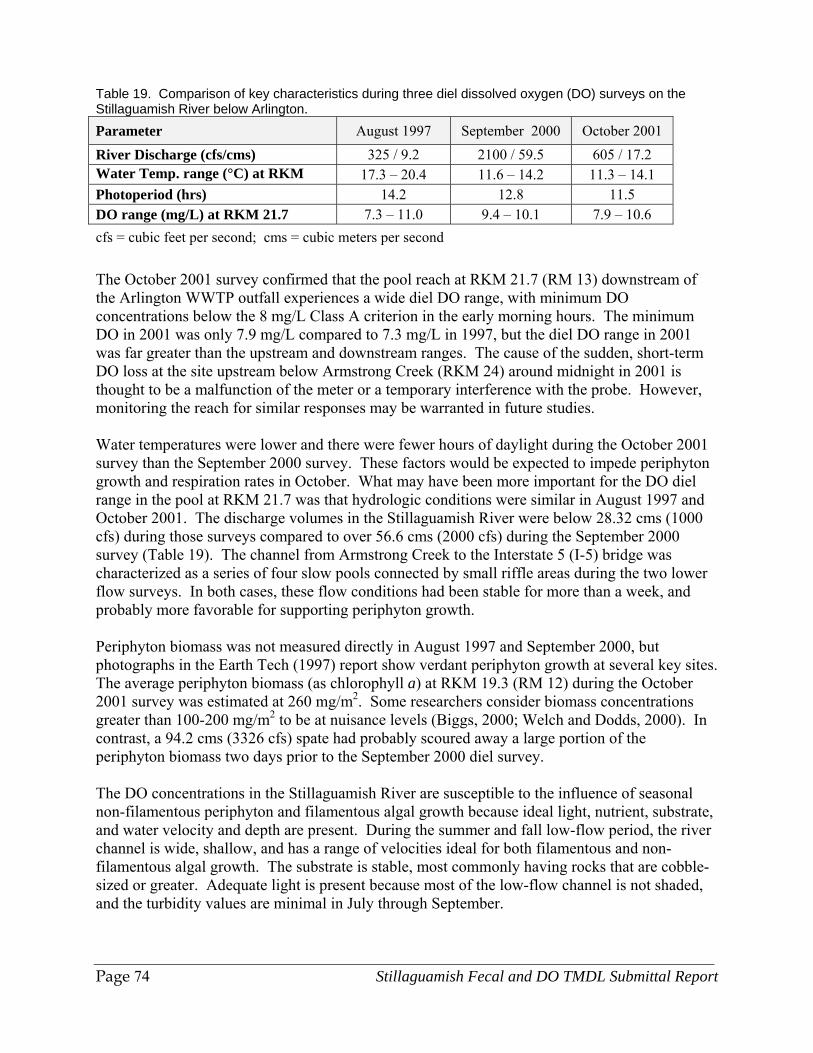
Page 74 Stillaguamish Fecal and DO TMDL Submittal Report
Table 19. Comparison of key characteristics during three diel dissolved oxygen (DO) surveys on the Stillaguamish River below Arlington.
Parameter August 1997 September 2000 October 2001 River Discharge (cfs/cms) 325 / 9.2 2100 / 59.5 605 / 17.2 Water Temp. range (°C) at RKM 17.3 – 20.4 11.6 – 14.2 11.3 – 14.1 Photoperiod (hrs) 14.2 12.8 11.5 DO range (mg/L) at RKM 21.7 7.3 – 11.0 9.4 – 10.1 7.9 – 10.6 cfs = cubic feet per second; cms = cubic meters per second The October 2001 survey confirmed that the pool reach at RKM 21.7 (RM 13) downstream of the Arlington WWTP outfall experiences a wide diel DO range, with minimum DO concentrations below the 8 mg/L Class A criterion in the early morning hours. The minimum DO in 2001 was only 7.9 mg/L compared to 7.3 mg/L in 1997, but the diel DO range in 2001 was far greater than the upstream and downstream ranges. The cause of the sudden, short-term DO loss at the site upstream below Armstrong Creek (RKM 24) around midnight in 2001 is thought to be a malfunction of the meter or a temporary interference with the probe. However, monitoring the reach for similar responses may be warranted in future studies. Water temperatures were lower and there were fewer hours of daylight during the October 2001 survey than the September 2000 survey. These factors would be expected to impede periphyton growth and respiration rates in October. What may have been more important for the DO diel range in the pool at RKM 21.7 was that hydrologic conditions were similar in August 1997 and October 2001. The discharge volumes in the Stillaguamish River were below 28.32 cms (1000 cfs) during those surveys compared to over 56.6 cms (2000 cfs) during the September 2000 survey (Table 19). The channel from Armstrong Creek to the Interstate 5 (I-5) bridge was characterized as a series of four slow pools connected by small riffle areas during the two lower flow surveys. In both cases, these flow conditions had been stable for more than a week, and probably more favorable for supporting periphyton growth. Periphyton biomass was not measured directly in August 1997 and September 2000, but photographs in the Earth Tech (1997) report show verdant periphyton growth at several key sites. The average periphyton biomass (as chlorophyll a) at RKM 19.3 (RM 12) during the October 2001 survey was estimated at 260 mg/m2. Some researchers consider biomass concentrations greater than 100-200 mg/m2 to be at nuisance levels (Biggs, 2000; Welch and Dodds, 2000). In contrast, a 94.2 cms (3326 cfs) spate had probably scoured away a large portion of the periphyton biomass two days prior to the September 2000 diel survey. The DO concentrations in the Stillaguamish River are susceptible to the influence of seasonal non-filamentous periphyton and filamentous algal growth because ideal light, nutrient, substrate, and water velocity and depth are present. During the summer and fall low-flow period, the river channel is wide, shallow, and has a range of velocities ideal for both filamentous and non-filamentous algal growth. The substrate is stable, most commonly having rocks that are cobble-sized or greater. Adequate light is present because most of the low-flow channel is not shaded, and the turbidity values are minimal in July through September.

Stillaguamish Fecal and DO TMDL Submittal Report Page 75
Nutrients are supplied from natural watershed sources by recycling processes within the river system and from anthropogenic sources. The dissolved forms of nutrients are more available for autotrophic algae and periphyton use. Phosphorus appears to be the limiting nutrient for periphyton growth based on nitrogen-to-phosphorus (N/P) ratios and QUAL2Kw model simulations. Ratios greater than 10:1 generally indicate phosphorus is the limiting nutrient for algal biomass growth, and under 10:1 indicates nitrogen limitation. The monthly median N/P ratios as dissolved inorganic nitrogen (DIN) to soluble reactive phosphorus (SRP) in the South Fork Stillaguamish River (Ecology Station 05A090) was 38:1 to 143:1 (Ecology, 2002). In the North Fork Stillaguamish River (05B070) the range of ratios has been 22:1 to 119:1. At Interstate 5 (05A070), the monthly median ratios of 39:1 to 149:1 are greater than 20 throughout the year, and similar to the South Fork ratios. Total phosphorus loading into the upper mainstem reaches is important because bacteria can mineralize some of the bound phosphorus into more usable forms by autotrophs. Total phosphorus concentrations and loads appear to have been increasing since 1980 according to trend analyses of data collected by Snohomish County Surface Water Management above Arlington (MSAR) and by Ecology at I-5 (05A070), South Fork at Arlington (05A090), South Fork at Granite Falls (05A110), and the North Fork at Cicero (05B090) (Figure 19). The total phosphorus loads at North Fork at Cicero, South Fork at Arlington, and at I-5 have increased without concomitant increases in discharge volumes. Some caution is necessary in interpreting phosphorus trend data because the analytical detection limits for phosphorus have changed over the past decade. Arlington WWTP, several tributaries, and nonpoint sources discharge additional phosphorus to the river between the confluence of the forks and Interstate 5. Arlington WWTP effluent is the major contributor of phosphorus, especially as SRP, into the reach during the low-flow season. Based on the few TMDL synoptic surveys during the summer and fall.
• 56% to 78% of the total phosphorus load comes from upstream
• 15% to 33% comes from the Arlington WWTP
• 1.5% to 2% comes from Armstrong Creek
• 0.2% comes from March Creek
• 1.6% to 14% comes from unidentified nonpoint sources or instream sources Given the ideal conditions for periphyton growth in the Stillaguamish River, very little phosphorus and nitrogen is needed to stimulate periphyton growth to nuisance levels if low flows are stable for more than a week. For example, the average periphyton biomass measured as chlorophyll a in July 2001 was 88 mg/m2 at the confluence of the two forks at RKM 28.5 (RM 18) above the Arlington WWTP outfall. The concentration of SRP in the water column then was less than 5 ug/L (~ 25 lbs/day), total phosphorus was 12 ug/L (75 lbs/day), and DIN, primarily as nitrate, was 72 ug/L (451 lbs/day). The total phosphorus and nitrate concentrations are higher than the North Cascades Ecoregion reference levels, but lower than the Puget Lowland Ecoregion levels suggested by EPA in Table 8.

Page 76 Stillaguamish Fecal and DO TMDL Submittal Report
Tota
l Pho
spho
rus L
oad
(lbs/
day)
YEAR
1 2
1020
100 200
10002000
10000 20000
100000
ALL SEASONS Seasonal Sen SlopeStand/Crit
79 85 90 95 00 02
SEASONAL KENDALL (SKWOC)Slope = 2.89511 Signif 99%2xP = 0.0039
Figure 19. A graph of the increasing total phosphorus load recorded at the South Fork Stillaguamish River at Arlington from 1979 to 2002 (Ecology site #05A090). Arlington WWTP phosphorus input was estimated to be about 2 mg/L SRP (13 lbs/day) and 2.3 mg/L DIN (15.4 lbs/day) during the same survey. The average periphyton biomass measured downstream at RKM 19.3 (RM 12) was 151 mg/m2. The nutrients in the water column also increased, he SRP concentration was 5 ug/L, total phosphorus was 17 ug/L, and DIN was 91 ug/L. The increases in periphyton biomass and the water column nutrient increases were greater than would have been expected from Arlington WWTP effluent, Armstrong Creek, and March Creek. Comparing data analysis and QUAL2Kw model simulations to field observations, it appeared that the low DO and increased nutrient conditions in the mainstem Stillaguamish pools were affected by more complex processes than periphyton biomass production and respiration. QUAL2Kw simulations suggested that periphyton growth and biomass influence a part of the diel DO range. However, to match the full range of the field data, an additional oxygen demand from another process in the model was necessary. Earth Tech (1997) had found it necessary to add a sediment oxygen demand factor to make their QUAL2E model simulations match their field data. Groundwater input, sediment oxygen demand, decaying periphytic materials, or respiration by heterotrophic bacteria in the saturated gravel bed material below or along the river channel are possible sources of additional oxygen demand and nutrients.

Stillaguamish Fecal and DO TMDL Submittal Report Page 77
Some of the channel and valley features of this reach of the Stillaguamish River suggest that the interaction between surface water and water in the channel bed may be occurring. The processes within the channel bed, called hyporheic processes, have been identified in other parts of the Stillaguamish River (Vervier and Naiman, 1992) and in many rivers like it with channels of coarse alluvial materials (Naegeli and Uehlinger, 1997; Uehlinger, 2000). The hyporheic zone features heterotrophic bacteria communities capable of using oxygen to decompose organic materials, much like a trickling filter in a WWTP. As the bacteria break down the organic material, they release nitrogen and phosphorus in the dissolved inorganic form. QUAL2Kw simulations of the DO data collected in 1997 (Earth Tech, 1997) were run with and without the hyporheic functions (Figure 20). When the hyporheic function was added to the QUAL2Kw model (Pelletier and Bilhimer, 2004) in the reaches between the first pool at RKM 25 and Interstate 5, the DO, pH, and mineralized nutrient simulations fit the field data much better. As a verification test, simulations of the October 2001 field data responded in a similar way. Several adjustments to respiration, productivity, and hyporheic exchange rates different from the 1997 values were necessary to match the water column data that suggested these model functions were site and time specific.
6
7
8
9
10
11
12
13
29 27 25 23 21 19 17
River Kilometer
DO
(mg/
L)
With HyporheicNo Hyporheic1997 Field Data
ArlingtonM arch Creek I-5 Bridge
Figure 20. QUAL2Kw simulations of maximum and minimum dissolved oxygen (DO) profiles in the mainstem Stillaguamish River compared to diel DO data collected by Earth Tech in August 1997. The effect of simulating hyporheic respiration in QUAL2Kw is demonstrated in the dashed lines.

Page 78 Stillaguamish Fecal and DO TMDL Submittal Report
The potential influence of the hyporheic zone to water quality and stream ecology in certain systems has just recently been brought out of academics into applied research (Jones and Mulholland, 2000). Unfortunately, the quantities of surface water and ground water entering the hyporheic zone were not measured in the Stillaguamish River study, and the exact locations of where water enters and exits are not known. The rates of bacterial growth and respiration rates and nutrient mineralization rates were not measured either. Although the hyporheic model does address some questions about the data, there are many uncertainties concerning the heterotrophic bacteria functions, and there may be other valid explanations for the processes observed in the Stillaguamish. The October 2001 diel monitoring results indicate the DO criterion violation may be limited to the one pool since DO concentrations in the next pool downstream at RKM 17.7 (RM 11) were significantly above 8 mg/L. However, a more extensive area may be affected under critical conditions such as experienced during a seven-day, ten-year, low-flow event. Although the DO concentrations are not critically low (less than 5 mg/L) in the pool reach at RKM 21.7 (RM 13.5) during any of the surveys, they may pose an impediment to aquatic life during critical conditions. The riffle and glide reaches upstream and downstream of the pool are essential spawning areas for pink and chinook salmon (WCC, 1999). Low DO concentrations have not been documented in these reaches. The area is also a rearing area for most of the salmon species present in the basin. Critical Conditions DO critical conditions generally occurred during the summer and fall low-flow season, although the mechanisms for the DO decline differed by site. The mainstem critical condition for low DO concentrations occurs during a stable low-flow, with both biomass growth and benthal demand mechanisms in place. Tributary sites experience depressed DO concentrations as discharge volumes decline in the summer and fall. Higher water temperatures that might lower oxygen solubility have not occurred at these sites when low DO concentrations have been recorded. In the mainstem Stillaguamish River at RKM 21.7, the largest diel ranges accompanied by DO minima below 8 mg/L seem to occur when the following situations coincide.
• Abundant nutrients are available in the water column
• Discharge decreases for a week or more below 28.32 cms (1000 cfs) so retention time through pools increases
• Water clarity increases allowing increased periphyton growth
• Periphyton biomass is not interrupted or scoured away or disrupted by spates, e.g., large storm events
• Groundwater inputs, or chemical and gas exchanges from hyporheic and heterotrophic bacteria respiration processes, interact with water in pool reaches
The TMDL capacity of the mainstem to maintain adequate DO concentrations was evaluated at the lowest seven-day average flow with an annual ten-year recurrence interval (7Q10) approximately 9.38 cms (330 cfs) at the confluence of the forks. The annual 7Q10 statistic for
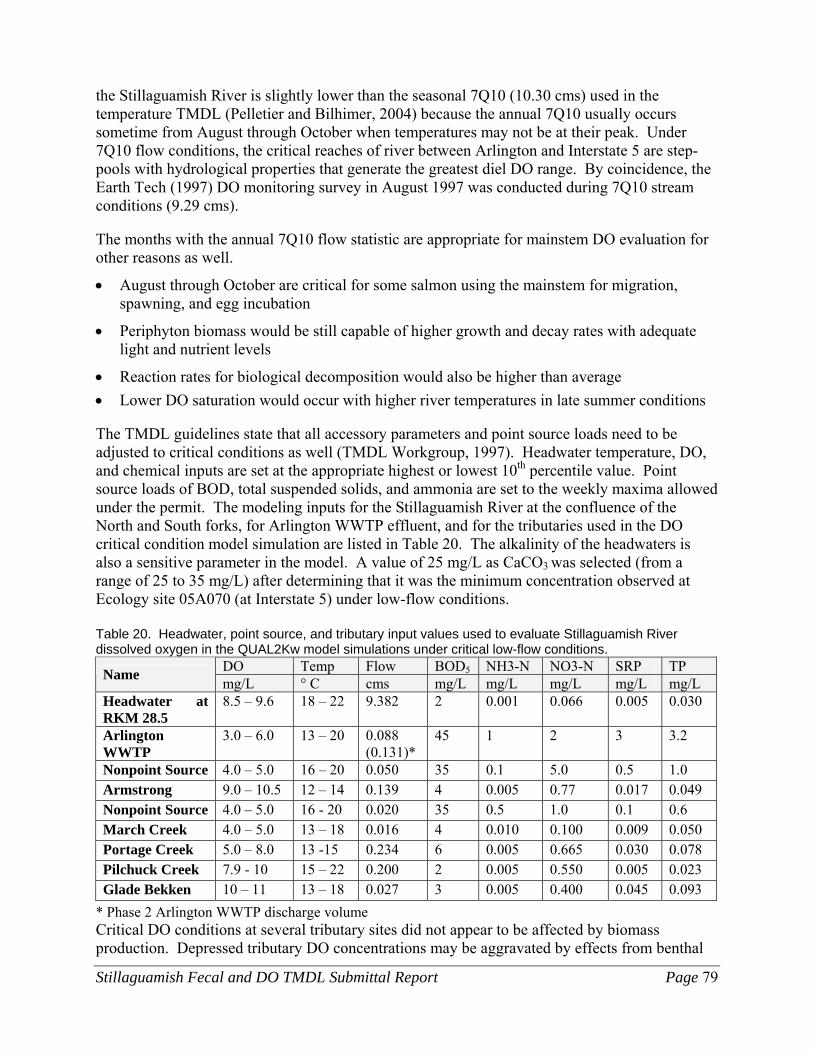
Stillaguamish Fecal and DO TMDL Submittal Report Page 79
the Stillaguamish River is slightly lower than the seasonal 7Q10 (10.30 cms) used in the temperature TMDL (Pelletier and Bilhimer, 2004) because the annual 7Q10 usually occurs sometime from August through October when temperatures may not be at their peak. Under 7Q10 flow conditions, the critical reaches of river between Arlington and Interstate 5 are step-pools with hydrological properties that generate the greatest diel DO range. By coincidence, the Earth Tech (1997) DO monitoring survey in August 1997 was conducted during 7Q10 stream conditions (9.29 cms). The months with the annual 7Q10 flow statistic are appropriate for mainstem DO evaluation for other reasons as well.
• August through October are critical for some salmon using the mainstem for migration, spawning, and egg incubation
• Periphyton biomass would be still capable of higher growth and decay rates with adequate light and nutrient levels
• Reaction rates for biological decomposition would also be higher than average • Lower DO saturation would occur with higher river temperatures in late summer conditions The TMDL guidelines state that all accessory parameters and point source loads need to be adjusted to critical conditions as well (TMDL Workgroup, 1997). Headwater temperature, DO, and chemical inputs are set at the appropriate highest or lowest 10th percentile value. Point source loads of BOD, total suspended solids, and ammonia are set to the weekly maxima allowed under the permit. The modeling inputs for the Stillaguamish River at the confluence of the North and South forks, for Arlington WWTP effluent, and for the tributaries used in the DO critical condition model simulation are listed in Table 20. The alkalinity of the headwaters is also a sensitive parameter in the model. A value of 25 mg/L as CaCO3 was selected (from a range of 25 to 35 mg/L) after determining that it was the minimum concentration observed at Ecology site 05A070 (at Interstate 5) under low-flow conditions. Table 20. Headwater, point source, and tributary input values used to evaluate Stillaguamish River dissolved oxygen in the QUAL2Kw model simulations under critical low-flow conditions.
DO Temp Flow BOD5 NH3-N NO3-N SRP TP Name mg/L ° C cms mg/L mg/L mg/L mg/L mg/L Headwater at RKM 28.5
8.5 – 9.6 18 – 22 9.382 2 0.001 0.066 0.005 0.030
Arlington WWTP
3.0 – 6.0 13 – 20 0.088 (0.131)*
45 1 2 3 3.2
Nonpoint Source 4.0 – 5.0 16 – 20 0.050 35 0.1 5.0 0.5 1.0 Armstrong 9.0 – 10.5 12 – 14 0.139 4 0.005 0.77 0.017 0.049 Nonpoint Source 4.0 – 5.0 16 - 20 0.020 35 0.5 1.0 0.1 0.6 March Creek 4.0 – 5.0 13 – 18 0.016 4 0.010 0.100 0.009 0.050 Portage Creek 5.0 – 8.0 13 -15 0.234 6 0.005 0.665 0.030 0.078 Pilchuck Creek 7.9 - 10 15 – 22 0.200 2 0.005 0.550 0.005 0.023 Glade Bekken 10 – 11 13 – 18 0.027 3 0.005 0.400 0.045 0.093
* Phase 2 Arlington WWTP discharge volume Critical DO conditions at several tributary sites did not appear to be affected by biomass production. Depressed tributary DO concentrations may be aggravated by effects from benthal

Page 80 Stillaguamish Fecal and DO TMDL Submittal Report
demand, oxygen-demanding pollutants from point and nonpoint sources, or inputs from ground water or wetlands with low DO concentrations during low-flow periods. Seasonal low flows appeared to contribute to the severity of the DO problems in some creeks. Summary of Dissolved Oxygen Results DO measurements during the 2000-2002 TMDL study period reveal that there are a few reaches in some water bodies in the Stillaguamish River basin that experience DO minima below 8 mg/L. Most of these reaches are located in smaller tributaries or drains in the lower Stillaguamish River floodplain. Data from two mainstem reaches of the Stillaguamish River also did not meet criteria. Low DO measurements are more prevalent in the summer/fall low-flow period. DO concentrations at several sites appeared to have improved since 1994. Although the South Fork Stillaguamish River above Granite Falls was previously listed on the 1998 303(d) list, it appears to have been meeting Class AA (minimum of 9.5 mg/L) criteria since 1995. Data from 12 water body reaches did not meet the DO criterion for Class A waters (minimum of 8.0 mg/L). Portage Creek and the lower Stillaguamish River (RM 3) were on the 1998 303(d) list. The 12 sites are:
• Twin City Foods Drain #4
• Warm Beach Creek above the Warm Beach WWTP outfall
• Agricultural Pasture Drain to Warm Beach Dike Pond
• Warm Beach Dike Pond to Warm Beach Slough
• Pilchuck Creek at Jackson Gulch Road
• Portage Creek at 212th NE
• Portage Creek at 15th NE
• Portage Creek at 43rd NE
• March Creek from mouth to 220th NE
• Kackman Creek at 252nd NE
• Stillaguamish River at RKM 21.7 (RM 13.5)
• Stillaguamish River at the bifurcation with the Old Stillaguamish Channel at RKM 4.8 (RM 3)
The lowest DO oxygen concentrations at all sites were reported from measurements made during the months of May through October. Several of the sites with low DO were measured in small streams with slow-moving reaches located in the floodplain. In addition to possible anthropogenic sources of oxygen demand, low-DO ground water, wetlands drainage, and hyporheic zone processes may naturally depress instream DO concentrations below 8 mg/L during the low-flow period. It is likely that DO concentrations around Stillaguamish River RKM 4.8 (RM 3) occasionally fall below the Class A criterion because the Old Stillaguamish River Channel reverses flow and

Stillaguamish Fecal and DO TMDL Submittal Report Page 81
discharges low-DO water back into the main channel during some tidal cycles under low-flow conditions. DO conditions in the reach may improve if a tide gate installed on the Old Stillaguamish Channel prevents the reverse flow into the Stillaguamish River. The situation at RKM 21.7 (RM 13.5) of the Stillaguamish River is more complex and involves periphyton growth and hyporheic respiration or some other mechanism. The DO minima below 8 mg/L have been recorded in one pool reach after low-flow conditions have been maintained for more than a week. The Arlington WWTP, upper basin inputs, tributaries, and other potential sources of nutrients and BOD upstream of the reach may aggravate the DO depression. pH Current Conditions and Trends Mainstem Stillaguamish River was listed for pH on the 1996 303(d) list based on three excursions beyond the standard at the Ecology long term monitoring station 05A070 at I-5 bridge, in October 1987, December 1989, and January 1990. In subsequent years prior to data review for the 1998 303(d) list, there were no further impairments, so this was not included on the 1998 list. For this study, additional samples in this reach were collected at TMDL stations 05TMS11 and 05TPILUP during 2001; no pH excursions were measured (Ecology August 2004); therefore, as noted in Table 8, this evaluation recommends delisting this reach for pH. The South Fork Stillaguamish River was the only water body in the basin on the 1998 303(d) list as pH-impaired. The listing was based on two Ecology instantaneous measurements in the South Fork at Arlington recorded in 1987 and 1991 (Ecology, 2000). The pH values were lower than the 6.5 standard units (s.u.) Class A criterion (6.4 s.u. on both occasions). The pH measurements taken at the site have not fallen below 6.5 s.u. since 1991 (Figure 21). One reason for the apparent improvement may be that the monitoring time changed in 1993 from the morning to the afternoon. As with dissolved oxygen, pH values tend to increase in the afternoon and decrease at night in response to aquatic production and respiration. However, the data still meet the criterion after applying a 0.2 s.u. safety factor to the 10th percentile statistic to account for estimating maximum pH values based on instantaneous measurements (see Analytical Framework). Another reason may be that an event or instream condition was monitored that has not occurred during any monitoring run since. For example, a source of stormwater upstream of the site may have been eliminated. And finally, pH is not easily measured in low-conductivity water. Low-ionic buffers and better liquid-filled probes were not used by Ecology until the mid-1990s when quality control measures became stricter. Since these changes, there is higher confidence in the accuracy of the pH measurements. Ecology and Snohomish County collected a combination of instantaneous and diel pH measurements throughout the basin during the 2000-2002 TMDL study period. The Stillaguamish Tribe stopped measuring pH at its sites in 1999 (Klopfer, 2000). Most of the pH measurements were taken throughout the Stillaguamish River basin in the same manner as the dissolved oxygen measurements. These instantaneous measurements exhibit the same limitations for interpretation as the dissolved oxygen measurements; i.e., the diel minima and

Page 82 Stillaguamish Fecal and DO TMDL Submittal Report
maxima in productive systems usually occur very early in the morning and late in the afternoon or early evening. A summary of data for 27 sites is presented in Table 21. The calculated 90th and 10th percentile values are listed in the table as well. As previously explained, the percentile values are used to apply a 0.2 s.u. safety factor to estimate the maximum diel range in highly productive systems.
pH
WATER YEAR
6.0
6.5
7.0
7.5
8.0
8.5
80 85 90 95 00 02
WQ Standard
WQ Standard
(12)(12)
(12)
(12)
(12)(12) (9) (12)
(12) (8)
(12)
(12)
(12)
(11)(12)
(12)
(12)
(11) (12)(12)
(9)
Figure 21. Monthly pH statistics from the South Fork Stillaguamish River at Arlington (Ecology 05A090) from 1980 to 2000 shown as a box-plot. Class A pH criteria are shown. The box-plot depicts the median, 10th, 25th, 75th, and 90th percentiles, and the range. The number of samples used for each box is in the parenthesis above the box. The pH data collected by Ecology and Snohomish County monitoring programs suggest low pH may be a problem at several sites in the basin. Sites reporting pH measurements below 6.5 s.u., or 10th percentile values below 6.7 s.u., were as follows:
• Stillaguamish River above Arlington below the confluence of the North and South forks
• Kackman Creek
• Pilchuck Creek at Jackson Gulch
• March Creek
• South Fork Stillaguamish River at Granite Falls

Stillaguamish Fecal and DO TMDL Submittal Report Page 83
The Stillaguamish Tribe monitoring program also had reported low pH values at Pilchuck Creek, Portage Creek, the South Fork Stillaguamish River at Jordan bridge, the North Fork Stillaguamish at Whitman bridge, and at Swede Haven bridge prior to 1996. None of the sites had had pH values under 6.5 s.u. from 1996 to 1999. The tribal program stopped measuring pH at some of the sites in 1999 (Klopfer, personal communication, 2002). Table 21. Summary of instantaneous pH measurements made in the Stillaguamish River basin by Ecology, Snohomish County, and the Stillaguamish Tribe from June 2000 to June 2002.
Site Number of Samples
Concentration Range (standard units)
10th and 90th Percentile
Church Creek at Park 30 7.0 – 7.9 7.1 7.8 Hat Slough at Marine Drive 43 6.5 – 7.8 6.9 7.5 Glade Bekken at Silvana Terrace Road 32 6.8 – 7.9 7.1 7.6 Pilchuck Creek at Jackson Gulch Road 38 6.5 – 8.1 6.6 7.5 Portage Creek at 212th 33 6.6 – 7.6 6.8 7.3 Portage Creek at 43rd 25 7.0 – 7.5 7.1 7.4 Fish Creek 24 6.6 – 7.8 6.8 7.6 Stillaguamish River at Interstate 5 38 6.9 – 7.8 7.1 7.7 March Creek at 220th NE 6 6.5 – 7.2 6.5 7.2 Armstrong Creek at Mouth 3 7.4 – 7.5 7.4 7.5 Kackman Creek at 252nd 6 6.2 -7.6 6.3 7.2 Armstrong Creek at Hatchery 6 6.8 – 7.7 6.9 7.5 Stillaguamish River above Arlington 32 6.4 – 7.7 6.9 7.6 S.F. Stillaguamish at Arlington 42 7.0 – 8.4 7.1 7.8 Jim Creek at Mouth 4 6.9 – 7.4 7.0 7.3 S.F. Stillaguamish at Jordan Walkway 12 6.6 – 8.1 6.9 7.9 S.F. Stillaguamish at Granite Falls 30 6.4 – 8.1 7.1 7.8 N.F. Stillaguamish at Twin Rivers 13 6.9 – 8.2 7.0 7.9 N.F. Stillaguamish at Cicero 33 7.0 – 8.2 7.0 7.8 N.F. Stillaguamish at Whitman bridge 10 6.9 – 8.3 6.9 8.3 N.F. Stillaguamish at C-Post bridge 5 6.9 – 7.6 6.9 7.4 N.F. Stillaguamish at Darrington 25 7.0 – 8.0 7.3 7.6
The low pH value of 6.4 s.u. recorded by Ecology at the South Fork Stillaguamish below Granite Falls occurred on the first day of monitoring during the November 2001 storm event monitored during this TMDL. The next day of the storm event the pH was 7.05 s.u. Storm water from Granite Falls could be of some concern here. However, since only one pH violation of criterion was detected in the reach (including Ecology site 05A110), it does not qualify under the 303(d) listing criteria (Ecology, 2002). Additional monitoring should be considered during storm events, but actions through a TMDL are not warranted at this time. High pH values, over 8.5 s.u., were not reported at any site during the 2000-2002 TMDL study period, although pH values above 8.0 were recorded at several sites on the North and South forks. The 90th percentile pH value for the North Fork at Whitman bridge of 8.3 s.u. was at the safety factor for productive systems. The high pH values were recorded on three consecutive weeks in August 2000 during the TMDL recreation beach bacteria survey (Coffler, Gridley, and Joy, 2004). The samples were all collected in the late morning or early afternoon, whereas pH maxima usually occur in the late afternoon or early evening.

Page 84 Stillaguamish Fecal and DO TMDL Submittal Report
The low buffering capacity (low alkalinity) of the system could make it susceptible to swings in pH over acceptable levels. In past years, the Stillaguamish Tribe documented high pH values in the North Fork and other sites in the basin (Klopfer, 2000). Periodically during summer low-flow conditions, Ecology site 05B070, the North Fork Stillaguamish River at Cicero, has recorded pH values greater than 8.5 s.u. along with supersaturated dissolved oxygen concentrations in 1997 and 1999 (Ecology, 2003a). The channel and hydrological characteristics of the North Fork are as ideal as the mainstem for periphyton growth. Total phosphorus concentrations on the North Fork have not shown significant increases since 1994, but they may have increased since the 1980s; the data quality from the earlier period is not high. However, an increase in periphyton biomass production stimulated by nutrients in a poorly-buffered system could cause seasonal episodes of the elevated pH levels. As the periphyton grow, they use carbon and shift the carbonate balance from acidic to basic pH values. During respiration processes at night, the shift is back from basic to acidic pH values. The lowest pH values at most sites throughout the basin usually occurred in November through April. Senescing organic matter washing through or into the stream and river channels could create declining pH as bacteria decompose the organic material; western Washington rainwater (median pH ~ 5.3) could be another source. Some of the low pH values (5.2 – 6.3 s.u.) recorded by the Stillaguamish Tribe throughout the basin in 1994 and 1995 were measured during storm events (Klopfer, 2000). The low pH values reported by Snohomish County at the Stillaguamish River above Arlington occurred during storm events. Low pH values were more common at this site from 1999 to 2000 (Snohomish County, 2002). The 10th percentile value for 49 pH data collected from 1999 to 2002 is 6.6. Random sampling that include more storm events in one year, changes in upstream water quality, or changes in measuring technique can influence the data and statistics. Arlington and Washington Department of Transportation (WSDOT) have stormwater outfalls upstream of the site on the South Fork. The site qualifies for the 303(d) list and will have allocations based on stormwater contributions. The pH values recorded at a few tributary sites (Pilchuck, Kackman, March) are low enough to require closer scrutiny. As mentioned in the dissolved oxygen discussion, Pilchuck Creek and March Creek have Snohomish County and WSDOT stormwater outfalls upstream of the monitoring sites. The low pH values have been recorded during winter months of the year when organic decomposition processes rather than instream productivity may be active. It is uncertain how much local wetlands, groundwater input, and hydric soils contribute to the low pH values, and how much can be attributed to waste inputs. At all, except Pilchuck Creek, elevated fecal coliform counts and nutrient concentrations accompanied the low pH.

Stillaguamish Fecal and DO TMDL Submittal Report Page 85
Groundwater pH values in the areas of interest have ranges of 6.0 to 8.6 s.u., depending upon the aquifer source. For example, water to the Portage Creek basin that runs through the Vashon recessional outwash aquifer has a median pH value of 6.2 s.u. (Thomas, Wilkinson, and Embrey, 1997). A majority of pH values measured at Kackman Creek have been below 6.5 s.u. Stillaguamish Tribe pH monitoring data from 1996 to 1999 and six of Ecology’s 2000- 2001 TMDL surveys suggested low pH values are common at the site. The TMDL monitoring occurred during or shortly after storm events, but discharge volumes were less than 0.14 cms (5 cfs). The Stillaguamish Tribe monitoring reported that low pH values occurred during November through May. Kackman Creek also experiences chronic low dissolved oxygen concentrations during storm events and summer low-flow periods; fecal coliform counts seem to be related to storm events. Ground water with low pH would be a source during a dry winter season in Kackman Creek. Upstream wetlands, agricultural sources, and stormwater could also be sources in wetter periods. Critical Conditions The critical hydrologic and biological conditions for high pH in Stillaguamish freshwater systems would occur during the same season as for low dissolved oxygen (August to October). The potential for elevated pH at some sites in the Stillaguamish basin would most likely be a result of biomass production during low flow during the growing season. Nutrients, light, and substrate are limiting factors for periphyton growth and its effect on pH. The alkalinity and carbon cycling of the water body is another controlling factor for pH. The North Fork Stillaguamish at Whitman bridge was the only site reporting a potential high pH problem, but ambient monitoring data suggests there may be pH problems downstream to Cicero during low-flow conditions. Low pH values in parts of the basin occurred during the winter, especially during storm events but also during low-flow periods. The critical conditions causing a depressed pH response may be from an influx of low pH water and oxygen-demanding substances of natural or anthropogenic origin. Anthropogenic and natural sources can contribute during low-flow conditions or during storm events. Summary of pH Results The pH-limited 303(d)-listed site, South Fork Stillaguamish River at Arlington, has met criteria since 1991 according to Ecology monthly monitoring data and data collected during the TMDL monitoring surveys. Two sites have had unacceptable pH measurements below the 6.5 s.u. criterion.
• Stillaguamish River above Arlington had low pH values associated with storm events.
• Kackman Creek at 252nd had low pH at all times of the year. Natural and anthropogenic sources may be contributing to the low values.

Page 86 Stillaguamish Fecal and DO TMDL Submittal Report
A 0.2 s.u. safety value is applied to the 10th and 90th percentile pH statistics to estimate diel minima and maxima caused by instream productivity or other factors. The statistics at three sites did not meet the safety value categories.
• The North Fork Stillaguamish from Whitman bridge to Cicero may have maximum pH values greater than 8.5 s.u. from biomass productivity.
• March Creek may have low pH values resulting from stormwater runoff, wetland drainage, ground water, and nonpoint source pollutants.
• Pilchuck Creek may have low pH values from stormwater runoff, decomposing materials delivered to the water bodies from nonpoint sources, or instream decomposition processes.
Storm events in November through April are associated with lower pH values in the river and several streams in the basin. Low-pH rainwater, subsurface flow through hydric soils and wetlands, and surface stormwater pollutants are possible sources of the decreased pH. The impact of storm water and nonpoint sources need to be identified and controlled. Arsenic and Mercury Current Conditions - Arsenic The 1998 303(d) listing for arsenic in the Stillaguamish River was initially from data in the Ecology database that was coded improperly; no detectable concentrations of arsenic were reported at the Stillaguamish River at Interstate 5 (Ecology 05A070) between 1991 and 1996. Recently, better methods have been developed to analyze arsenic in natural waters. Using these low-detection limit methods, Johnson (2002) demonstrated that arsenic is commonly detected in Washington State rivers at concentrations less than those causing acute or chronic aquatic toxicity, but greater than the human-health criteria based on a 1:1,000,000 carcinogenic risk. Ecology sampled several sites in the Stillaguamish River basin for total recoverable and dissolved arsenic in 2000 and 2001. The sampling focused on the North and South forks near their confluence and the mainstem at I-5 and at Marine Drive (Table 22). In addition, Arlington WWTP effluent was sampled three times, and Portage Creek was sampled once.
Table 22. Total recoverable (TR As) and dissolved (Diss. As) arsenic concentrations and total suspended solids (TSS) concentrations collected from sites on the Stillaguamish River during Ecology’s TMDL surveys.
North Fork Stillaguamish River*
South Fork Stillaguamish River at Confluence
Stillaguamish River at Interstate 5
Hat Slough at Marine Drive
Date TR As ug/L
Diss. As ug/L
TSS mg/L
TR As. ug/L
Diss. As ug/L
TSS mg/L
TR As. ug/L
Diss. As ug/L
TSS mg/L
TR As. ug/L
Diss. As ug/L
TSS mg/L
10/5/00 - - - 0.5 U 0.5 U 14 - - - 0.5 U 0.5 U 4 1/31/01 1.1 0.38 31 4.1 0.5 335 2.4 0.8 187 2.7 0.95 164 5/8/01 0.43 0.4 5 0.44 0.39 10 0.6 0.37 9 0.47 0.41 9 6/12/01 1.02 0.42 78 3.27 0.55 524 1.4 0.44 203 0.82 0.45 40 7/12/01 0.75 0.78 2 0.68 0.63 9 0.67 0.67 4 0.65 0.65 2

Stillaguamish Fecal and DO TMDL Submittal Report Page 87
North Fork Stillaguamish River*
South Fork Stillaguamish River at Confluence
Stillaguamish River at Interstate 5
Hat Slough at Marine Drive
Date TR As ug/L
Diss. As ug/L
TSS mg/L
TR As. ug/L
Diss. As ug/L
TSS mg/L
TR As. ug/L
Diss. As ug/L
TSS mg/L
TR As. ug/L
Diss. As ug/L
TSS mg/L
10/3/01 0.96 0.91 12 0.84 0.8 - 0.88 0.81 6 - - - 10/16/01 0.7 0.65 5 0.61 0.53 18 0.67 0.56 15 0.66 0.55 11
* Samples were collected at confluence on 6/12 and 10/3; all others were collected at the Cicero monitoring site. U = not detected at the concentration listed ug/L = microgram/liter mg/L = milligram/liter The values in the table are total recoverable and dissolved arsenic. Organic and inorganic arsenic were not speciated in the samples. The dissolved fraction of arsenic was about 80% to 100% of the total recoverable fraction except during storm events with higher total suspended sediment (TSS) concentration, e.g., on 1/31/01 and 6/12/01 when dissolved arsenic was 15% -60% of the total fraction. As observed elsewhere in the state, none of the concentrations exceed the aquatic toxicity criteria in Table 6. However, all the data are in violation of the National Toxics Rule (40 CFR 131.36) (NTR) human-health criteria. Total recoverable arsenic concentrations were generally higher in the South Fork than in the North Fork Stillaguamish, but no significant difference was observed between dissolved arsenic concentrations from the two forks. Arsenic concentrations remained unchanged down the mainstem Stillaguamish River between I-5 and Marine Drive. Arlington WWTP effluent total recoverable arsenic was consistently around 0.85 ug/L (range 0.83 – 0.91 ug/L), similar to average concentrations in the North and South forks. Portage Creek, sampled during the June 2001 storm event had a total arsenic concentration of 2.73 ug/L, similar to the concentration of arsenic sample collected from the South Fork on that day (Table 22). Two other independent monitoring studies with data pertinent to arsenic in the Stillaguamish basin were conducted during the TMDL evaluation period. Johnson (2002) sampled and evaluated water column concentrations of arsenic from several sites in Washington. Among those rivers sampled were the North Fork Stillaguamish near Darrington and the Stillaguamish River at Silvana (Table 23). Table 23. Total recoverable arsenic (TR As), total suspended solids (TSS), and flow data at two sites in the Stillaguamish River basin (Johnson, 2002).
NF Stillaguamish near Darrington (05B110) Stillaguamish River at Silvana (05A070)
Date TR As (ug/L)
TSS (mg/L)
Flow (cfs) Date TSS
(mg/L) TR As (ug/L)
Flow (cfs)
7/17/01 0.75 0.5 72 7/17/01 9 0.41 1090 8/21/01 0.68 0.5 41 8/22/01 279 2.65 4278 9/18/01 0.69 1 41 9/19/01 2 0.93 488 10/23/01 1 201 1549 10/23/01 588 1.6 17215 11/14/01 1.5 284 6909 11/14/01 1290 2.48 26322 12/11/01 0.27 2 405 12/11/01 56 0.99 3893 1/22/02 0.23 2 - 1/22/02 47 0.88 3808

Page 88 Stillaguamish Fecal and DO TMDL Submittal Report
NF Stillaguamish near Darrington (05B110) Stillaguamish River at Silvana (05A070)
2/27/02 2.03 16 706 2/27/02 27 0.7 5281 3/19/02 0.3 2 366 3/19/02 15 0.57 3551 4/23/02 0.22 4 597 4/22/02 59 0.78 3422 5/22/02 0.21 3 706 5/22/02 11 0.41 7674 6/19/02 0.19 6 533 6/19/02 11 0.37 6774
Johnson’s (2002) arsenic concentrations at the Stillaguamish River at Interstate 5 (Silvana) are similar to those detected during the TMDL surveys. Just as in the TMDL surveys, the arsenic concentrations in Johnson’s samples increased during storm events and as TSS increased. Based on the concentrations found in rivers in Washington State and in other background sources like rainwater, Johnson concluded that typical river concentrations of arsenic would not meet the NTR human-health criteria. He recommended that most of the Section 303(d) listings for arsenic be removed, and that future listings should clearly define an anthropogenic source. Abandoned and inactive mines in the upper basin may be of some concern as a potential source of arsenic contamination. Raforth, Norman, and Johnson (2002) sampled Glacier Creek above and below an abandon mine in the Monte Cristo District. The mine is not located in the South Fork Stillaguamish River sub-basin, but it is just over the ridge in the South Fork Sauk River. The concentrations of total recoverable arsenic in Glacier Creek above and below the waste rock dump area were greater than 0.3 ug/L. Loading analysis revealed that the concentration coming from a combination of the waste rock dump area and two tributaries was approximately 11 – 12 ug/L arsenic. Stream sediment samples also were enriched upstream and downstream of the waste rock dump when compared to quality guidelines (Raforth, Norman, and Johnson, 2002). Ground water is another potential source of arsenic in the Stillaguamish basin. The median total arsenic concentration for 295 groundwater samples collected in the western part of Snohomish County by USGS in 1993 and 1994 was 2 ug/L (Thomas, Wilkinson, and Embrey, 1997). Fifty-two wells, representing all seven geohydrologic units, had total arsenic concentrations greater than 10 ug/L. Five samples exceeded the EPA drinking water standard for arsenic of 50 ug/L. All five were taken from wells located between Granite Falls and Arlington. Based on the five TMDL monitoring events with data from all four sites, the average arsenic load delivered from the two forks accounted for approximately 80% of the average arsenic load calculated for Marine Drive. This was similar to the percentage of discharge delivered from the upper basins. Grouping results from all TMDL sites, TSS concentrations appeared to be correlated with total recoverable arsenic concentrations even though most of the arsenic was in the dissolved form at low TSS concentrations (Figure 22). The strong correlation between TSS and arsenic at the grouped sites suggest that source materials of arsenic and TSS are probably the same. Arsenic concentrations above the human-health criteria appear to be in all compartments of the Stillaguamish basin hydrology. The arsenic loading estimates, groundwater testing, and the arsenic and TSS analyses indicate that source materials of arsenic are the same throughout the basin. The limited number of available data suggests that no arsenic enrichment takes place

Stillaguamish Fecal and DO TMDL Submittal Report Page 89
between these upper and lower basin sites. Enrichment from abandoned and inactive mines in the upper basin was not detected. The South Fork Stillaguamish River had slightly higher concentrations of arsenic than the North Fork, and there were more mines in the South Fork sub-basin with yields of arsenic (Huntting, 1956). However, groundwater concentrations from wells in the South Fork basin were higher than other areas (Thomas, Wilkinson, and Embrey, 1997).
y = 0.6843e0.0041x
R2 = 0.7393
0
1
2
3
4
5
6
7
1 10 100 1000
TSS (mg/L)
As
(ug/
L)
Figure 22. Correlation between water column total suspended solids (TSS) concentrations and total recoverable (TR) arsenic concentrations from samples collected at sites in the Stillaguamish River basin: North Fork Stillaguamish at Cicero and Twin Rivers, South Fork Stillaguamish at the mouth, Stillaguamish River at Interstate 5 (I-5), and Hat Slough at Marine Drive. Current Conditions - Mercury Mercury was investigated because two samples collected at the Stillaguamish River at I-5 (Ecology 05A070) in 1995 had concentrations greater than the freshwater aquatic chronic toxicity criterion of 0.012 ug/L. Both samples had accompanying TSS and turbidity values that were elevated, and river flows were greater than 141.6 cms (5000 cfs). One of the mercury results did not meet quality assurance criteria, so no 303(d) listing for mercury was made based on these samples.

Page 90 Stillaguamish Fecal and DO TMDL Submittal Report
During the TMDL surveys, samples were collected for total mercury at the same times and sites as arsenic. The total mercury results are shown in Table 24. Most results met aquatic toxicity and human-health criteria. However, samples collected at most sites during storm events on 1/31/01 and 6/12/01 did not meet the 0.012 ug/L freshwater chronic toxicity criterion. The criterion is a four-day average, so it is unknown if the criterion was actually violated during the two events. Table 24. Total recoverable mercury concentrations (ug/L) collected from sites on the Stillaguamish River during Ecology’s TMDL surveys. (Total suspended solids concentrations associated with these samples are shown in Table 22.)
Date North Fork Stillaguamish River *
South Fork Stillaguamish River at Confluence
Stillaguamish River at Interstate 5
Stillaguamish River at Marine Drive (Hat Slough)
10/5/00 - 0.0021 - 0.002 U 1/31/01 0.0063 0.0261 J 0.0217 J 0.0216 J 5/8/01 0.0034 0.0029 0.003 0.0046 6/12/01 0.016 0.0497 0.019 0.01 7/12/01 0.002 U 0.0025 0.0026 0.0036 10/3/01 0.0032 0.0029 0.0043 10/16/01 0.0054 0.0059 0.0064 0.0076
* Samples were collected at confluence on 6/12 and 10/3; all others were collected at the Cicero monitoring site. U = not detected at the concentration listed. J = estimated concentration Bold values exceed the freshwater aquatic chronic toxicity criterion of 0.012 ug/L. Mercury appeared to be correlated with arsenic and TSS. Mercury concentrations were highly correlated with arsenic concentrations at Hat Slough, I-5, and the South Fork (Figure 23). The North Fork correlation was not as strong. The correlation between mercury and TSS suggests that suspended sediment may be the source of the mercury (Figure 24). Mercury increased with increased TSS and increasing discharge volumes during storm events. Based on the five monitoring events with data from all four sites, the average mercury load delivered from the two forks accounted for approximately 50% of the average mercury load calculated for Marine Drive. This was different from the arsenic loading analyses. The results might suggest that a higher proportion of mercury was generated in the lower basin than in the upper basin based on drainage area, but the source of mercury is unknown. The data were not consistent in showing if the gain in mercury occurred between Arlington and I-5, or between I-5 and Hat Slough. However, the key to controlling mercury concentrations does appear to be controlling TSS concentrations. Mercury samples were collected from Arlington WWTP effluent and Portage Creek during the 2000-2002 TMDL study period. The three Arlington WWTP effluent samples analyzed for mercury had concentrations from 0.0034 to 0.0096 ug/L. These concentrations are similar to the average concentrations in the North and South forks of the Stillaguamish (Table 24). The mercury sample collected from the effluent on June 12 was 0.0034 ug/L, far lower than the river

Stillaguamish Fecal and DO TMDL Submittal Report Page 91
mercury concentrations at that time. Portage Creek was sampled during the June 2001 storm event. The mercury concentration of 0.018 ug/L was similar to the mainstem Stillaguamish River at I-5 during that event. Both were greater than the 0.012 ug/L aquatic toxicity criterion and contained high TSS concentrations.
0.001
0.01
0.1
0.1 1 10
TR Arsenic (ug/L)
Hg (u
g/L)
SF I-5 Hatt NF
Figure 23. Correlations between total recoverable arsenic (TR Arsenic) and mercury (Hg) in whole water samples from four sites in the Stillaguamish River basin: North Fork Stillaguamish at Cicero and Twin Rivers (NF, r2=0.23), South Fork Stillaguamish at the mouth (SF, r2=0.73), Stillaguamish River at Interstate 5 (I-5, r2=0.89), and Hat Slough at Marine Drive (Hatt, r2=0.93).

Page 92 Stillaguamish Fecal and DO TMDL Submittal Report
y = 0.0011x0.5704
R2 = 0.8269
0.001
0.01
0.1
1
1 10 100 1000
TSS (mg/L)
Hg (u
g/L)
Chronic toxicity criterion
Figure 24. Relationship between total suspended solids (TSS) and mercury (Hg) concentrations for samples collected in the Stillaguamish River basin. The 0.012 ug/L chronic aquatic toxicity criterion for mercury is shown.
Mercury was also collected quarterly in 2002 by Ecology’s monitoring program at the North Fork Stillaguamish near Darrington (05B110). One of four samples did not meet the freshwater chronic toxicity criterion (Table 25).
Table 25. Quarterly mercury, total suspended solids, and discharge data collected in 2002 from Ecology site 05B110, North Fork Stillaguamish River near Darrington.
Date Mercury (ug/L) TSS (mg/L) Discharge (cfs) 02/27/02 0.015 16 706 04/23/02 0.0048 4 597 06/19/02 0.0032 6 533 08/21/02 0.0020 1 111
Mercury concentrations were elevated in the February sample during a moderate flow event, five days after a storm (USGS records for North Fork Stillaguamish near Arlington). The TSS concentration of 16 mg/L was in the upper quartile of monthly measurements taken near Darrington since 1992. The sources of mercury in the upper watershed are similar to those for arsenic, and are found in several compartments of the basin hydrology. Abandoned and inactive mines in the upper basin may be of some concern as a potential source of contamination. The concentration of total mercury in Glacier Creek (in the Sauk River basin) above the waste rock dump area was

Stillaguamish Fecal and DO TMDL Submittal Report Page 93
0.0042 ug/L during a high-flow condition, and less than the detection limit of 0.002 ug/L during a low-flow condition (Raforth, Norman, and Johnson, 2002). The downstream concentrations increased to 0.0058 ug/L during the high-flow event; no mercury was detected during the low-flow condition. Loading analysis of the Glacier Creek data revealed that the concentration coming from a combination of the waste rock dump area and two tributaries was approximately 0.006 ug/L mercury. Stream sediment samples also were enriched upstream, but not downstream, of the waste rock dump when compared to quality guidelines (Raforth, Norman, and Johnson, 2002). Another potential basin-wide source of mercury is rainwater. Rainwater samples collected in Washington by the National Atmospheric Deposition Program in 2001 contained an average concentration of 0.006 ug/L mercury. This concentration is higher than many of the values in Table 24. Ground water is another potential source of mercury in the Stillaguamish basin. Mercury concentrations (0.2 - 1.2 ug/L) were detected by USGS in three wells in the Stillaguamish basin at a reporting limit of 0.1 ug/L (Thomas, Wilkinson, and Embrey, 1997). The EPA drinking water limit for mercury is 2 ug/L. Two of the samples were from wells near Stanwood; the other was from a well in the North Fork Stillaguamish River basin. The source of mercury in these samples was not discerned. Fish collected in Port Susan have shown detectable, but not elevated, mercury tissue burdens (West, O’Neill, Lippert, and Quinnell, 2001). Mercury was detected in all three English sole collected in Port Susan. Concentrations were 0.06 to 0.07 mg/Kg, far below the 1.0 mg/Kg action level for mercury. Critical Conditions – Arsenic and Mercury Total recoverable arsenic and mercury concentrations were highest during high-flow conditions accompanying elevated suspended solids concentrations. Arsenic and mercury loads were highly correlated with TSS loads. Arsenic concentrations are consistently greater than the EPA human-health criteria, so no condition is more critical than another to meet these criteria. Reducing TSS may reduce arsenic concentrations, but not to levels below the criteria. Mercury concentrations only exceeded the freshwater chronic toxicity criterion during storm events. Therefore, storm events producing high TSS over more than four days would be a critical condition for mercury loading and chronic criteria violations. Summary of Arsenic and Mercury Results Arsenic concentrations in the Stillaguamish River basin are typical for Washington State waters, i.e., they are high enough to violate human-health criteria based on carcinogenic risk, but are far below levels harmful to aquatic organisms. Water column arsenic appears to be in the dissolved form except when elevated TSS concentrations are present. There is a high correlation between

Page 94 Stillaguamish Fecal and DO TMDL Submittal Report
arsenic loads and TSS loads at all sites. The regressions and loading comparisons appeared to show that there was no arsenic enrichment in the lower basin, and that arsenic was distributed evenly throughout the basin. The contributions of abandoned and inactive mining areas and ground water are not known. Mercury concentrations in the Stillaguamish basin were below criteria except during two storm events. It is unknown if mercury concentrations exceed the chronic toxicity criteria for aquatic life over four consecutive days. Most storm events in the basin are of a shorter duration. Mercury loads are highly correlated with TSS loads throughout the basin. Mercury concentrations are also highly correlated with arsenic concentrations at lower basin sites. According to loading estimates, the lower basin contributed approximately half of the mercury load calculated at Hat Slough. Low-level mercury concentrations are found in rainwater. The contributions of abandoned and inactive mining areas and ground water are not known.

Stillaguamish Fecal and DO TMDL Submittal Report Page 95
Loading Capacity
Fecal Coliform The fecal coliform bacteria (FC) loading capacities of waters within the Stillaguamish River basin and surrounding northern Port Susan are determined by protecting the most critical beneficial uses in those waters. The loading capacities are directly related to the bacteria distribution represented by the acceptable geometric mean and 90th percentile counts stated in the criteria. The following uses were considered the most critical uses for protection for various types of water of the basin.
• Protecting recreational bathing provides the most restrictive criteria for the rivers and streams in the upper Stillaguamish basin. The loading capacities are represented as Class A or AA freshwater criteria.
• Small freshwater streams discharging directly to Port Susan must meet the freshwater recreational bathing criteria, but they also must not result in violation of more restrictive Class A marine water criteria to protect recreation use or shellfish harvesting. The loading capacities for these sites are better represented by freshwater Class AA criteria to reduce actual mass loading of FC to Port Susan beaches during critical periods.
• Port Susan sites must meet state Class A marine water criteria and Washington State Department of Health (DOH) commercial shellfish harvest criteria; the latter criteria are usually more stringent. The loading capacities of Port Susan sites are the FC population distribution characteristics compared to criteria based on the 30-sample DOH method.
Seasonal analysis of data ensured that the loading capacities at each site are focused on critical FC loading and transport mechanisms. The loading capacity of each site was evaluated by using the statistical analyses described earlier. The 90th percentile was the most restrictive statistic at all sites not meeting criteria. Using the Statistical Rollback Method described earlier, FC geometric mean targets were calculated for sites not meeting the FC criteria. In theory, if the geometric mean target is met, then only 10% of a sample set should exceed the applicable FC criterion, e.g., 200 cfu/100 mL for Class A freshwater, or 43 MPN/100 mL for Class A marine water. Only six of 22 freshwater sites currently meet their loading capacities and both parts of the FC criteria under all conditions examined and for the most stable period of record (Table 26). All are located in the upper basin, and are highlighted in the table. The status of some sites is different from what was in Table 17 because of critical condition factors. The Stillaguamish River at Interstate 5, and the South Fork and the North Fork Stillaguamish River at Twin Rivers, met FC criteria on the first round of statistical analyses. However, all three sites showed signs of excessive FC loading from unidentified sources during storm events in 2001-2002. The lower reaches of the two forks could be responding to increased development near Arlington. The QUAL2Kw model simulations, storm-event data, and synoptic survey data also suggest there are FC loads from unidentified sources along reaches between Arlington and
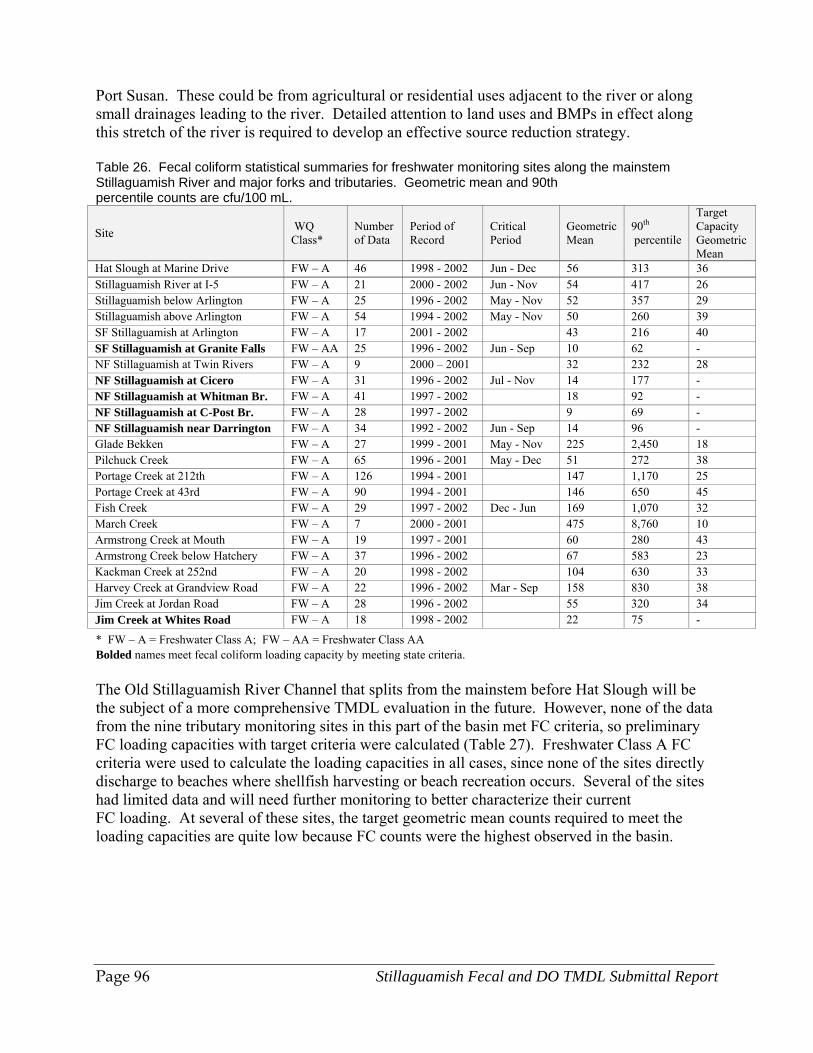
Page 96 Stillaguamish Fecal and DO TMDL Submittal Report
Port Susan. These could be from agricultural or residential uses adjacent to the river or along small drainages leading to the river. Detailed attention to land uses and BMPs in effect along this stretch of the river is required to develop an effective source reduction strategy. Table 26. Fecal coliform statistical summaries for freshwater monitoring sites along the mainstem Stillaguamish River and major forks and tributaries. Geometric mean and 90th percentile counts are cfu/100 mL.
Site WQ Class*
Number of Data
Period of Record
Critical Period
Geometric Mean
90th percentile
Target Capacity Geometric Mean
Hat Slough at Marine Drive FW – A 46 1998 - 2002 Jun - Dec 56 313 36 Stillaguamish River at I-5 FW – A 21 2000 - 2002 Jun - Nov 54 417 26 Stillaguamish below Arlington FW – A 25 1996 - 2002 May - Nov 52 357 29 Stillaguamish above Arlington FW – A 54 1994 - 2002 May - Nov 50 260 39 SF Stillaguamish at Arlington FW – A 17 2001 - 2002 43 216 40 SF Stillaguamish at Granite Falls FW – AA 25 1996 - 2002 Jun - Sep 10 62 - NF Stillaguamish at Twin Rivers FW – A 9 2000 – 2001 32 232 28 NF Stillaguamish at Cicero FW – A 31 1996 - 2002 Jul - Nov 14 177 - NF Stillaguamish at Whitman Br. FW – A 41 1997 - 2002 18 92 - NF Stillaguamish at C-Post Br. FW – A 28 1997 - 2002 9 69 - NF Stillaguamish near Darrington FW – A 34 1992 - 2002 Jun - Sep 14 96 - Glade Bekken FW – A 27 1999 - 2001 May - Nov 225 2,450 18 Pilchuck Creek FW – A 65 1996 - 2001 May - Dec 51 272 38 Portage Creek at 212th FW – A 126 1994 - 2001 147 1,170 25 Portage Creek at 43rd FW – A 90 1994 - 2001 146 650 45 Fish Creek FW – A 29 1997 - 2002 Dec - Jun 169 1,070 32 March Creek FW – A 7 2000 - 2001 475 8,760 10 Armstrong Creek at Mouth FW – A 19 1997 - 2001 60 280 43 Armstrong Creek below Hatchery FW – A 37 1996 - 2002 67 583 23 Kackman Creek at 252nd FW – A 20 1998 - 2002 104 630 33 Harvey Creek at Grandview Road FW – A 22 1996 - 2002 Mar - Sep 158 830 38 Jim Creek at Jordan Road FW – A 28 1996 - 2002 55 320 34 Jim Creek at Whites Road FW – A 18 1998 - 2002 22 75 -
* FW – A = Freshwater Class A; FW – AA = Freshwater Class AA Bolded names meet fecal coliform loading capacity by meeting state criteria. The Old Stillaguamish River Channel that splits from the mainstem before Hat Slough will be the subject of a more comprehensive TMDL evaluation in the future. However, none of the data from the nine tributary monitoring sites in this part of the basin met FC criteria, so preliminary FC loading capacities with target criteria were calculated (Table 27). Freshwater Class A FC criteria were used to calculate the loading capacities in all cases, since none of the sites directly discharge to beaches where shellfish harvesting or beach recreation occurs. Several of the sites had limited data and will need further monitoring to better characterize their current FC loading. At several of these sites, the target geometric mean counts required to meet the loading capacities are quite low because FC counts were the highest observed in the basin.

Stillaguamish Fecal and DO TMDL Submittal Report Page 97
Table 27. Fecal coliform critical condition summaries for tributaries to the Old Stillaguamish Channel near Stanwood. Geometric mean and 90th percentile counts are cfu/100 mL.
Site WQ Class*
Number of Data
Period of Record
Geometric Mean
90th percentile
Target Capacity Geometric Mean
Douglas Slough FW – A 70 1999 - 2002 40 620 13 Irvine Slough FW – A 13 2000 - 2001 730 16,500 7 Jorgenson Slough FW – A 31 1994 - 2001 320 1,580 42 Church Creek at Park FW – A 97 1994 - 2001 147 770 38 Miller Creek at Miller Road FW – A 21 2000 - 2002 311 2,350 28 Twin City Foods Drain #1 FW – A 17 2001 406 3,550 24 Twin City Foods Drain #2 FW – A 5 2001 285 23,100 3 Twin City Foods Drain #3 FW – A 4 2001 1180 9,550 24 Twin City Foods Drain #5 FW – A 6 2001 545 4,743 22
* FW – A = Freshwater Class A The several small freshwater tributaries discharging directly to Port Susan require more stringent criteria than Class A because their influence on the bacteriological quality of local recreational shellfish beds needs to be minimized. Therefore, their FC loading capacities should be Class AA: a geometric mean of 50 cfu/100 mL, and a 90th percentile count of less than 100 cfu/100 mL (Table 28). The following three tributaries are recommended to be given targets to comply with a loading capacity based on Class AA freshwater criteria: Unnamed Creek #0456, Lake Martha Creek, and Warm Beach Dike Pond. Loading capacities for the two sites upstream of the Warm Beach Dike Pond – the Agricultural Drain and Warm Beach Creek – were calculated using Class AA criteria as well.
Table 28. Fecal coliform critical condition summary for West Pass, South Pass, and small tributaries to Port Susan. Geometric mean and 90th percentile counts are cfu/100 mL.
Site WQ Class*
Number of Data
Period of Record
Critical Period
Geometric Mean
90th percentile
Target Capacity
Geometric Mean
West Pass of Old Stillaguamish MW - A 17 2000 - 2001 85 1,250 3 South Pass of Old Stillaguamish MW - A 26 2000 - 2001 42 150 11 Twin City Foods Drain #4 FW - A 9 2001 149 1,670 18 Warm Beach Creek above WWTP FW - AA 10 2001 - 2002 Jun - Nov 253 543 47 Agricultural Drain to Warm Beach FW - AA 12 2001 - 2002 May - Nov 120 900 13 Warm Beach Dike Pond FW - AA 12 2001 - 2002 May - Nov 172 1,300 14 Warm Beach Slough MW - A 75 1998 - 2002 29 118 10 Lake Martha Creek FW - AA 58 1996 - 2002 May - Oct 288 1,220 23 Unnamed Creek # 0456 FW - AA 7 2001 350 3,600 11
* MW - A = Marine Water Class A; FW - A = Freshwater Class A; FW - AA = Freshwater Class AA; The critical period for FC counts in Hat Slough at Marine Drive occurred from June through December (Table 26). The data collected by Ecology and Snohomish County at the Marine Drive site consistently exhibited freshwater conditions. The target loading capacity is based on Class A freshwater criteria. South Pass is another FC loading source to northern Port Susan from the Stillaguamish basin. It usually qualified as a marine site based on salinity, even though the highest FC counts were recorded during low salinity storm flows. The FC target capacity was set to meet the Class A marine water standards (Table 28). West Pass to Skagit Bay was treated in the same manner.

Page 98 Stillaguamish Fecal and DO TMDL Submittal Report
The current upstream cumulative FC loads to Hat Slough were estimated and compared to estimated FC loads if the TMDL targets in Table 26 were met. The estimates were based on average daily loads derived from critical seasonal flows and the current and target geometric mean statistics. A natural die-off factor was not included in the calculations. The estimates suggest that if the targets are attained, the FC loads at Marine Drive will be reduced by 75%, quite adequate for meeting the 36% reduction required to meet Class A criteria at that site. The analysis also suggests that meeting the targets for the North and South forks, and mainstem targets below Arlington and at the Interstate 5 bridge, will be essential to reduce the FC loads by 75%. The cumulative tributary FC load reductions will account for 20% of the overall load reduction. The other 55% will be from other reductions along the mainstem. Another simple estimate was made of the average daily FC loads to Port Susan for the months of June through December (Table 29). Hat Slough, South Pass, Warm Beach drainages, and wildlife sources were included in the estimate to consider a rough order of magnitude comparison between sources. The estimates of the wildlife loads have a large margin of error but demonstrate their potential importance as a background source. The estimates suggest an overall FC load reduction to Port Susan of 37%, and a 77% reduction from freshwater sources. Table 29. Estimated average daily fecal coliform loads to Port Susan from various sources for the months of June through December. Load estimates are shown for 2000 – 2002, current period, and for a time in the future when fecal coliform TMDL targets are met.
Current Loading (cfu/day)
Post-TMDL Loading (cfu/day)
Hat Slough 12 x 1012 2.9 x 10¹² South Pass 1 x 10¹² 0.2 x 10¹² Warm Beach Drainages 0.2 x 10¹² 0.01 x 10¹²
Birds 5.2 x 10¹² 5.2 x 10¹² Seals 8.5 x 10¹² 8.5 x 10¹²
Total 27 x 1012 17 x 1012 cfu = coliform-forming units per day. Data collected by the Stillaguamish Tribe in Hat Slough at the boat launch approximately 0.5 kilometers downstream from Marine Drive yielded a 30-day sample geometric mean of 15 MPN/100 mL (Table 30). Farther downstream were the South and West branches with geometric mean densities higher than in Hat Slough. The sites on the two branches were given target capacity geometric mean FC densities based on the DOH 30-sample criteria to reduce loading between the Stillaguamish Tribe Hat Slough site and Port Susan. Some Port Susan sites were not meeting DOH 30-sample criteria for commercial harvest areas. The statistics for the last 30 samples are shown in Table 30. They are not significantly different from the statistics derived from the whole set of samples collected by the Stillaguamish Tribe since 1998. The loading capacities for Port Susan sites were calculated by using the Statistical Rollback Method so that the criteria of a 90th percentile of 43 MPN/100 mL and a geometric mean of 14 MPN/100 mL will be met:

Stillaguamish Fecal and DO TMDL Submittal Report Page 99
• The loading capacities represented by the geometric mean targets are generally around 10 MPN/100 mL to meet the 90th percentile criterion of 43 MPN/100 mL.
• Kayak Point, Warm Beach Point, and North Port Susan meet criteria.
• The number of samples for PS-5 through PS-9 and Juniper Beach are inadequate for a 30-sample calculation.
• The FC reductions required for Port Susan sites vary from 2% to 60%. Table 30. Fecal coliform target geometric means calculated from statistics derived for 30 consecutive samples collected by the Stillaguamish Tribe prior to June 27, 2002 at 16 sites in Port Susan and the Stillaguamish River estuary. Geometric mean and 90th percentile counts are MPN/100 mL.
Site Name Hat Slough
West Branch
South Branch
SB Pilings
WB Slough PS-2 PS-7** PS-6**
Site Number 120 121 122 123 127 128 139 138 Geometric Mean 15 27 24 12 28 21 32 19 90th percentile 64 98 102 44 100 107 125 117 Target Capacity Geometric Mean NR* 12 11 11 12 8 11 7
* NR = none required ** Less than 30 samples available to calculate statistics. SB = South Branch; WB = Warm Beach; PS = Port Susan A 77 percent reduction in freshwater FC loads to Port Susan is estimated if FC loading capacities are met in the Stillaguamish River, its tributaries, and the Warm Beach drainages. The freshwater FC loads are the likely cause of criteria violations in Port Susan since seals and birds are present in winter and spring when criteria in the bay are often met. Estimated FC reductions required for sites in Hat Slough, the Stillaguamish River estuary, and Port Susan are close to 60 percent in Hat Slough and are as low as 2 percent in the estuary. The level of freshwater FC load reduction should allow sites in Port Susan to meet water quality criteria for shellfish harvesting.
Site Name PS-3 PS-5** PS-8** PS-4 PS-9** WB
Point Kayak Point
NP Susan
Juniper Beach**
Site Number 129 137 140 130 148 124 125 126 - Geometric Mean 14 21 15 5.7 3.9 6.1 4.2 3.3 15 90th percentile 74 148 119 27 13 31 20 12 65 Target Capacity Geometric Mean 8 6 6 NR NR NR NR NR 10

Page 100 Stillaguamish Fecal and DO TMDL Submittal Report
Dissolved Oxygen The dissolved oxygen (DO) loading capacities of waters within the Stillaguamish River basin are determined by protecting the most critical beneficial uses in those waters. The loading capacities are directly related to the minimum DO concentration stated in the criteria, or to natural conditions as defined in Chapter 173-201A-070 WAC. Salmonid spawning is considered the most critical beneficial use in the Stillaguamish River basin requiring adequate oxygen concentrations. Salmonid rearing and migration, and life support for other fish and aquatic communities, require less stringent oxygen concentrations. Twelve reaches in the basin were identified as not meeting the Class A water quality criterion of 8 mg/L. Two reaches are on the mainstem Stillaguamish River, and the other ten are on tributaries to the Stillaguamish River or to Port Susan. One reach on the 1998 303(d) list – South Fork Stillaguamish at Granite Falls (Class AA at 9.5 mg/L) was found not to have DO impairment. This evaluation recommends this water body segment be taken off the 303(d) list. These three sites will be required to meet the minimum Class A DO criteria of 8 mg/L.
• The Stillaguamish River above Hat Slough has experienced low DO in the past because deoxygenated water from the Old Stillaguamish Channel has flowed back into the main river channel. A tide gate installed in 2003 should prevent the problem from occurring in the future and keep minimum freshwater DO concentrations above 8 mg/L. Incoming marine water may occasionally lower DO concentrations in Hat Slough to 6.5 mg/L.
• Warm Beach Creek above the WWTP outfall has several likely upstream sources of BOD, ammonia, and oxygen-demand. Although insufficient flow volumes may be a significant factor for making DO measurements in the summer, any flowing water in the creek should be free of oxygen-demanding contaminants so that the 8.0 mg/L Class A criterion will be met.
• DO concentrations measured at Pilchuck Creek at Jackson Gulch Road have been infrequently below 8 mg/L. Removing or reducing documented nonpoint and stormwater sources upstream of the site should bring DO back into compliance.
Two ‘natural condition’ issues concerning the DO results have made it difficult to evaluate minimum potential concentrations at the other nine sites:
• The floodplain reaches of some tributaries to the lower Stillaguamish River and ditches through diked lands have naturally low DO from surrounding wetlands and valley groundwater inputs. Several of the reaches also exhibit low pH (near 6.5) and cool water temperatures that also indicate wetland or groundwater inputs. However, nonpoint sources also may contribute to some of the low DO conditions in these tributaries. Fecal coliform criteria are not met in these reaches, but low DO concentrations and elevated FC counts are not strongly correlated at any of the monitoring sites.
• The seasonally low DO conditions in the Stillaguamish River between Arlington and I-5 appear to be dominated by some sort of benthic demand. QUAL2Kw model results suggest that areas of hyporheic exchange are causing DO depressions in one or two pools in the reach. These processes are difficult to model, and the DO loss due to natural conditions may be more significant than that caused by upstream source nutrient and BOD inputs.

Stillaguamish Fecal and DO TMDL Submittal Report Page 101
At most of these sites, an estimate of the best potential minimum DO concentration is necessary because DO is suspected of being naturally lower than the Class A criterion of 8 mg/L. The estimated minimum concentrations are listed in Table 31. The concentrations were based on best professional judgment after considering natural and anthropogenic inputs. More detailed data and the removal of nonpoint sources of pollutants will be required before the natural DO minima for these systems can be fully determined.
Table 31. Dissolved oxygen minimum concentrations estimated for reaches in the Stillaguamish River basin based on considerations of local natural and pollutant sources. The load capacities as BOD5 are estimated from reductions of nonpoint sources.
Site Waterbody ID Number
Concentration Range (mg/L)
Potential Minimum DO at Critical Period (mg/L)
Load Capacity BOD5 (lbs/day)
Twin City Foods Drain #4 - 1.2 – 18.8 6.5 (a) Warm Beach Creek above WWTP Outfall SH96KX 3.8 – 8.4 8 20 Pasture Drain to Pump Pond SH96KX 4.1 – 12.0 6.5 10 Pond or Discharge to Warm Beach Slough SH96KX 3.0 – 9.1 6.5 30 Pilchuck Creek at Jackson Gulch Road VJ74AO 7.6 – 13.6 8 890 Portage Creek at 212th OT80TY 5.1 – 12.2 6.5 300 Portage Creek at 15th OT80TY 3.7 – 7.2 6.5 280 Portage Creek at 43rd OT80TY 6.4 – 11.4 7 250 March Creek at 220th NE WI88QF 4.8 – 8.0 6.5 30 (b) Kackman Creek at 252nd XB43NX 6.6 – 9.0 7 10 Stillaguamish River below Arlington QE93BW 7.3 – 14.1 7 (c) Stillaguamish River above Hat Slough QE93BW 5.7 – 13.2 8 (d)
(a) Twin City Foods Drain #4 could not be estimated because the drainage area was not known, and water in the drain was never running (b) A 75% reduction in BOD5 for March Creek was estimated rather than using the 98% reduction required for fecal coliform to meet standards (c) Analysis using QUAL2Kw modeling (pp. 100 – 103) indicates data are not sufficient to determine load capacity (d) Tidegate at upper end Old Stilly Channel expected to reduce input of low-Dissolved Oxygen water into mainstem (Hat Slough). An estimate of oxygen demand from anthropogenic sources is required to estimate the best potential minimum DO concentration. In this analysis, the presence of elevated fecal coliform bacteria and nutrients was assumed to come from the same anthropogenic sources as excess oxygen demand. All of the tributaries in Table 31 require fecal coliform reductions. These reductions were used as relative gages of BOD reduction. The Simple Method model (Stormwater Center, 2004) that calculates runoff pollutant loads from various land uses was used to estimate current BOD5 loading. The model estimates of current loads were checked against loads generated from mean flow statistics and the few available BOD5 sample data, and were found to be similar in magnitude. The loading capacities were estimated by applying reductions based on the fecal coliform loading capacities (Tables 26, 27, 28, and 30). The loading capacities yield average BOD5 concentrations around 1 mg/L compared to 1.5 to 3 mg/L BOD5 estimated for current conditions.

Page 102 Stillaguamish Fecal and DO TMDL Submittal Report
The estimated potential minimum DO concentrations in Table 31 are no lower than the Class B 6.5 mg/L minimum DO concentration in Washington State Chapter 173-201A WAC to protect fish and aquatic life, and salmonid life stages other than embryo and larval development. Portage Creek, March Creek, and Kackman Creek have been identified as coho salmon or winter steelhead habitat (WCC, 1999). All of the monitoring sites on these creeks are located in large, slow pools or in grass-choked channels that would not be considered good spawning habitat. The estimated DO concentrations may be adequate for salmon egg development and for fry survival and growth. The adequacy of DO concentrations for egg development and fry viability is dependent on sediment porosity and the velocity of the water reaching the egg or fry (Warren, 1971). The Class A criterion of 8 mg/L will provide more than adequate DO through coho and steelhead redds in most, but not all, cases,. However, egg and fry can survive and thrive at lower water column DO concentrations (greater than 5 mg/L) if redds are placed in porous gravels and water velocities that allow good circulation of DO and nutrients (Warren, 1971). Coho spawning and egg incubation occurs from October through May, so the most serious periods of minimum DO concentrations may be avoided. Winter steelhead spawning and egg incubation in Portage Creek and Kackman Creek span November to July, so the late incubation period would be most critical for attaining adequate DO in spawning areas of these streams. Investigating the quality and location of spawning areas in these creeks was beyond the scope of this TMDL evaluation. The relationships between DO concentrations and salmon egg and fry survival at this level of detail have not been made. More complete assessments will be required to ensure that DO is not a habitat-limiting factor in spawning areas. An attempt was made to determine the loading capacities of phosphorus, BOD, ammonia, and nitrogen for the Stillaguamish River between Arlington and Interstate 5. The QUAL2Kw model (Chapra and Pelletier, 2003) was used to simulate the effects of carbon, nitrogen, and phosphorus loads on DO under low-flow critical conditions (Table 20). Heterotrophic bacteria and periphyton growth, and hyporheic exchange functions used to simulate conditions recorded in August 1997 and October 2001, were included. The input values and coefficients used in the model are available in Appendix C. The nutrient and BOD loads from Arlington WWTP and nonpoint sources were varied successively to compare their effects on DO changes in downstream reaches. These were compared to the minimum DO concentrations under simulated natural conditions (no anthropogenic inputs). Headwater nutrient loads were also varied in the set of simulations. The results of these simulations are summarized in Table 32. An example of two DO profiles is shown in Figure 25.

Stillaguamish Fecal and DO TMDL Submittal Report Page 103
Table 32. Summary of QUAL2Kw simulations of Arlington WWTP input and Stillaguamish River minimum dissolved oxygen (DO) responses during critical low-flow conditions.
Arlington WWTP effluent Downstream Response
BOD5 SRP NH3 NO3 Minimum DO Model Simulations
mg/L mg/L mg/L mg/L mg/L 1 1997 Arlington Loading (0.024 cms) 10.8 2.6 0.8 9.7 6.5 2 2001 Arlington Loading (0.052 cms) 8 3.5 0.6 2 6.4 3 Arlington Phase I permit (0.088 cms) 45 3.0 1.0 2 6.3 4 Arlington Phase II permit (0.131 cms) 45 3.0 1.0 2 6.2 5 Arlington Phase I - BOD modified 10 3.0 1.0 2 6.4 6 Option 5 + SRP modified 10 1.0 1.0 2 6.4 7 Arlington Phase I – no SRP 10 0 1.0 2 6.5 8 No Arlington WWTP but NPS present 0 0 0 0 6.6 9 Arlington Phase I but no NPS present 10 1.0 1.0 2 6.7 10 No Arlington WWTP or direct NPS 0 0 0 0 6.9 11 10 + Headwaters nutrient reductions * 0 0 0 0 7.2 12 11 + Arlington Phase I modified 10 1.0 1.0 2 7.0 13 12 + NPS present 10 1.0 1.0 2 6.7
* Nutrients reduced to North Cascades Ecoregion reference concentrations (Table 8) NPS - Unidentified nonpoint source loads
Figure 25. Two QUAL2Kw model simulations showing the range of diel dissolved oxygen concentrations in the Stillaguamish River from the confluence of the forks to Port Susan. Simulation 5 and 7 conditions are described in Table 32.
5.0
6.0
7.0
8.0
9.0
10.0
11.0
12.0
28.5 26.5 24.5 22.5 20.5 18.5 16.5 14.5 12.5 10.5 8.5 6.5 4.5 2.5
River Kilometer
Dissolved Oxygen (mg/L)
Simulation 5Simulation 7
Confluence Interstate 5 Old Channel
River Flow Direction

Page 104 Stillaguamish Fecal and DO TMDL Submittal Report
In all simulations, the minimum DO concentration located around RKM 20 was far lower than any DO observed in the 1997 and 2001 field surveys. For example, the 6.5 mg/L DO minimum in the August 1997 loading scenario (Simulation 1) is nearly 1 mg/L lower than what was observed in the field at that time. Slightly higher water temperatures and headwater concentrations of nutrients required for the critical conditions settings may have caused the difference. However, even natural background (Simulations 10 and 11) results, with anthropogenic (point and nonpoint) sources of phosphorus and carbon absent as natural conditions, were 0.8 and 1.2 mg/L below the Class A DO criterion. The scenarios with anthropogenic sources (Simulations 1- 9, 12, 13) result in DO concentrations 0.2 – 0.7 mg/L lower than the natural background scenarios. The simulation results suggest that the instream processes, represented in QUAL2Kw by periphyton biomass growth and the heterotrophic bacteria growth in the hyporheic zone, may be the dominant factors controlling minimum DO concentrations during low-flow conditions. How periphyton and heterotrophic bacteria biomass are affected by the combination of carbon, ammonia, nitrogen, and phosphorus loads cannot be confidently determined at this time. The instream processes are too biologically and physically dynamic. Extrapolating a single model calibration of these processes to critical conditions and calculating loading capacities for BOD, phosphorus, and nitrogen is not technically defensible at this time. For example, the DO results in the model are very sensitive to both the initial biomass and growth rates of periphyton and heterotrophic bacteria, and their placement along the reach. Since the model is only quasi-dynamic, the initial periphyton biomass had to be set near the value measured when the greatest DO range was measured, and the growth rates had to be calibrated to field data. Heterotrophic bacteria initial biomass and rate values were added by trial-and-error calibration. Biggs (2000) showed that the number of days for biomass accrual had more of an effect than nutrient concentrations on maximum chlorophyll a biomass, but both were important factors. The same is possibly true for the heterotrophic communities as well. Since changes in the accumulation rates of periphyton biomass and heterotrophic bacteria biomass have not been quantified for the Stillaguamish system, the initial biomass of these populations at the onset of critical conditions is uncertain. As stated earlier, when the Washington State DO standard cannot be met under natural conditions, the natural condition becomes the DO criterion (Chapter 173-201A-070 WAC). It is Ecology’s policy that effluents cannot cause more than a 0.2 mg/L loss of DO in areas where natural conditions are lower than standards (TMDL Workgroup, 1996). The results in Table 32 suggest that Arlington WWTP effluent and nonpoint sources in the reach may reduce DO by 0.2 mg/L or greater. The survey data and research literature suggest that carbon and phosphorus loading to the reach stimulates periphyton growth. However, the margin of error in the simulations is too great to determine if 0.2 mg/L is a significant additional loss compared to background because of the complex biological processes in the reach. The QUAL2Kw model predicted a potential minimum DO concentration at RKM 21.7 (RM 13.5) in the Stillaguamish River between Arlington and the Interstate 5 bridge of 6.9 to 7.2 mg/L under critical conditions (Simulations 10 and 11, Table 32). Therefore, a minimum

Stillaguamish Fecal and DO TMDL Submittal Report Page 105
DO concentration of 7 mg/L should be attainable under critical conditions if upstream, nonpoint source, and point source nutrient inputs are managed and controlled. DO concentrations below 7.3 mg/L have not been detected outside of the single pool area, so the spatial extent of the 7 mg/L minimum would be very limited. As described previously in the tributary DO discussion, salmon spawning and rearing area and other beneficial uses in the reach should be protected at this minimum DO target. pH As with dissolved oxygen, the contaminant loading capacities for water bodies with pH criteria violations vary by cause. The Stillaguamish basin water bodies with pH values higher than the 8.5 criterion probably have excessive aquatic biomass with high productivity. Nutrient loading is controlled to reduce biomass in these cases and to lower diel pH maxima. In water bodies with pH values lower than the 6.5 criterion, the causes could be from several natural or anthropogenic causes. Anthropogenic loading of low pH water or organic contaminants that increase decomposition processes needs to be reduced to increase pH to natural conditions. The areas in the Stillaguamish basin with low pH criterion violations are observed either seasonally or during storm events. The ability of these water bodies to meet the pH criterion once anthropogenic sources of oxygen demand or low pH water are reduced is not known. The loading capacities cannot be calculated. The following sites should be reassessed to determine natural seasonal or event-based pH conditions once the anthropogenic sources of oxygen-demand or low pH stormwater are reduced or eliminated as fecal coliform and dissolved oxygen loading capacities are met.
• Stillaguamish River above Arlington at the confluence of the North and South forks
• Pilchuck Creek
• Kackman Creek
• March Creek The North Fork Stillaguamish River at Whitman bridge to Cicero bridge (NFRKM 28.3 to NFRKM 15.2) was the only location where seasonal episodes of pH maxima over criteria are recorded. The TMDL data collected did not specifically find pH values over the 8.5 s.u. criterion, but historical data at Cicero and frequency of data near 8.5 s.u. are strong indications that this does occur. Nutrients increases since 1995 are not apparent from data in this reach, but some increases may have occurred since the 1980s. The nutrient loading capacity for the North Fork Stillaguamish was not explored in depth because the problem in the area was not previously identified on the 303(d) list. However, trend analyses on data collected at Ecology 05B070, North Fork Stillaguamish at Cicero, suggests a significant increasing trend in total phosphorus loads at the site since 1980 (Figure 26). According to Ecology monthly monitoring data, phosphorus loads have not increased upstream at the site near Darrington (05B110), and pH there has been well within criteria. Sources of phosphorus between 05B110 (RKMNF 48.3) and Cicero bridge (RKMNF 15.2), starting above Whitman bridge (RKMNF 28.3), have not been specifically identified. Potential nonpoint sources of phosphorus include residential, highway, and agricultural runoff.
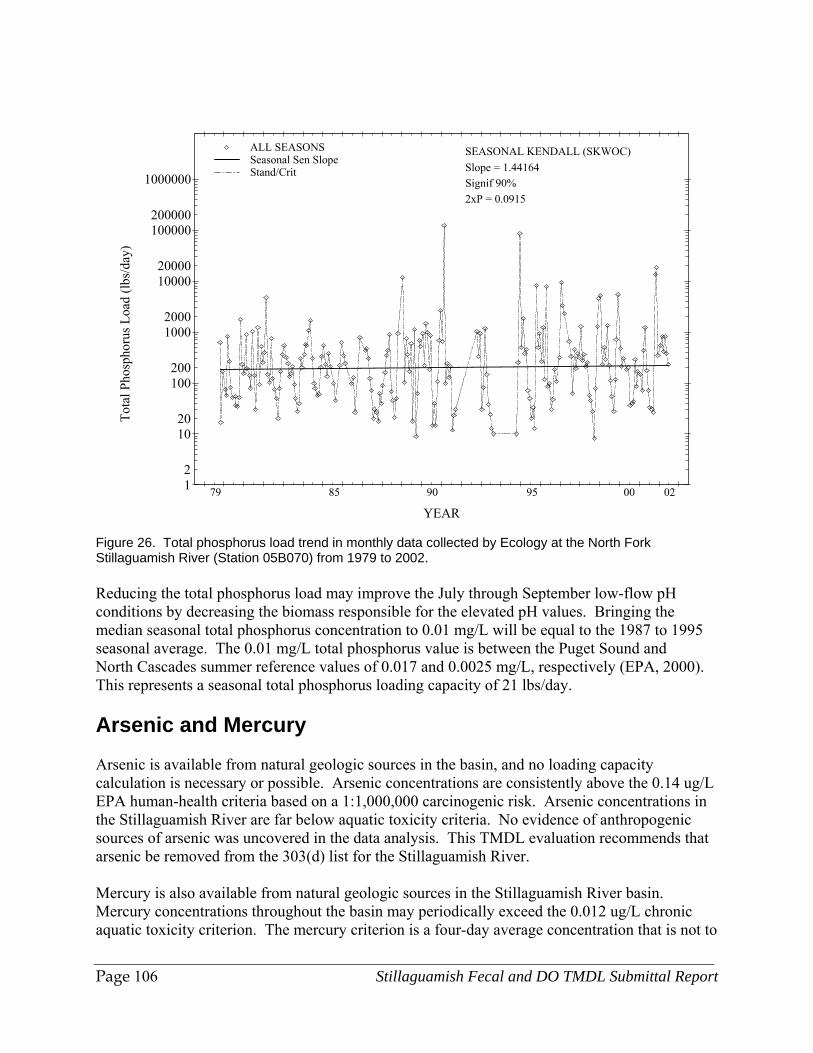
Page 106 Stillaguamish Fecal and DO TMDL Submittal Report
Tota
l Pho
spho
rus L
oad
(lbs/
day)
YEAR
1 2
1020
100 200
10002000
10000 20000
100000200000
1000000
ALL SEASONS Seasonal Sen SlopeStand/Crit
79 85 90 95 00 02
SEASONAL KENDALL (SKWOC)Slope = 1.44164 Signif 90%2xP = 0.0915
Figure 26. Total phosphorus load trend in monthly data collected by Ecology at the North Fork Stillaguamish River (Station 05B070) from 1979 to 2002. Reducing the total phosphorus load may improve the July through September low-flow pH conditions by decreasing the biomass responsible for the elevated pH values. Bringing the median seasonal total phosphorus concentration to 0.01 mg/L will be equal to the 1987 to 1995 seasonal average. The 0.01 mg/L total phosphorus value is between the Puget Sound and North Cascades summer reference values of 0.017 and 0.0025 mg/L, respectively (EPA, 2000). This represents a seasonal total phosphorus loading capacity of 21 lbs/day. Arsenic and Mercury Arsenic is available from natural geologic sources in the basin, and no loading capacity calculation is necessary or possible. Arsenic concentrations are consistently above the 0.14 ug/L EPA human-health criteria based on a 1:1,000,000 carcinogenic risk. Arsenic concentrations in the Stillaguamish River are far below aquatic toxicity criteria. No evidence of anthropogenic sources of arsenic was uncovered in the data analysis. This TMDL evaluation recommends that arsenic be removed from the 303(d) list for the Stillaguamish River. Mercury is also available from natural geologic sources in the Stillaguamish River basin. Mercury concentrations throughout the basin may periodically exceed the 0.012 ug/L chronic aquatic toxicity criterion. The mercury criterion is a four-day average concentration that is not to

Stillaguamish Fecal and DO TMDL Submittal Report Page 107
be exceeded more than once every three years. Samples were not collected over four-day periods to measure exact compliance with the criterion. Mercury concentrations collected near the mouths of the North and South forks, and two sites in the mainstem Stillaguamish River, were correlated with total suspended solids (TSS) concentrations. Reducing TSS, especially TSS mobilized during storm events, would reduce mercury transport and availability. The correlation between TSS and mercury concentrations is shown in Figure 27.
y = 0.0011x0.5704
R2 = 0.8269
0.001
0.01
0.1
1
1 10 100 1000
TSS (mg/L)
Hg
(ug/
L)
Chronic toxicity criterion
Figure 27. Relationship between total suspended solids (TSS) and mercury (Hg) in samples collected by Ecology from two sites on the Stillaguamish River, two sites on the lower North Fork Stillaguamish River, and at the mouth of the South Fork Stillaguamish River. The EPA 0.012 ug/L chronic aquatic toxicity criterion is also shown. A target TSS concentration to limit mercury concentrations greater than the aquatic toxicity criterion could be based on the regression equation relating TSS in mg/L to mercury in ug/L: Mercury = 0.0011 x TSS 0.5704 An average four-day TSS concentration of 65 mg/L would limit the mercury concentration to 0.012 ug/L. The TSS concentrations are not well correlated with discharge at any of the sites. Sudden increases in runoff generally create increases in TSS. The TSS concentrations in the lower portion of the two forks and in the mainstem Stillaguamish River often peak much greater than 65 mg/L during storm events, but usually drop rapidly over the next couple of days.

Page 108 Stillaguamish Fecal and DO TMDL Submittal Report
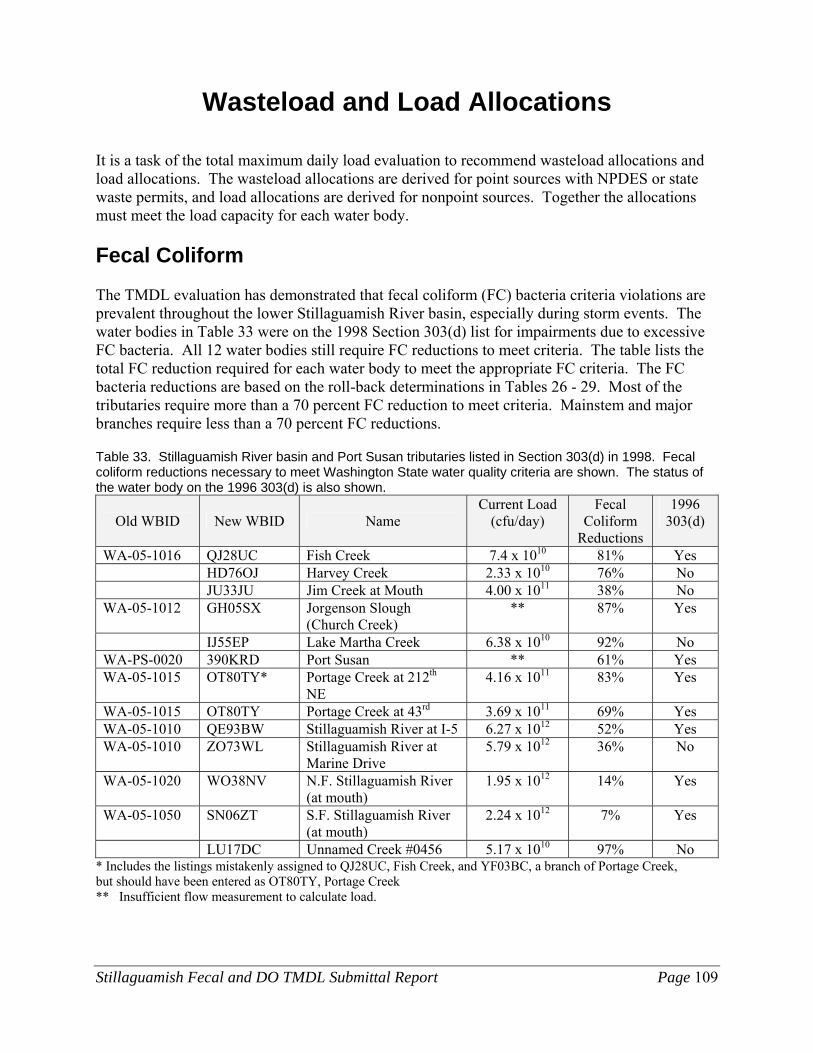
Stillaguamish Fecal and DO TMDL Submittal Report Page 109
Wasteload and Load Allocations It is a task of the total maximum daily load evaluation to recommend wasteload allocations and load allocations. The wasteload allocations are derived for point sources with NPDES or state waste permits, and load allocations are derived for nonpoint sources. Together the allocations must meet the load capacity for each water body. Fecal Coliform The TMDL evaluation has demonstrated that fecal coliform (FC) bacteria criteria violations are prevalent throughout the lower Stillaguamish River basin, especially during storm events. The water bodies in Table 33 were on the 1998 Section 303(d) list for impairments due to excessive FC bacteria. All 12 water bodies still require FC reductions to meet criteria. The table lists the total FC reduction required for each water body to meet the appropriate FC criteria. The FC bacteria reductions are based on the roll-back determinations in Tables 26 - 29. Most of the tributaries require more than a 70 percent FC reduction to meet criteria. Mainstem and major branches require less than a 70 percent FC reductions. Table 33. Stillaguamish River basin and Port Susan tributaries listed in Section 303(d) in 1998. Fecal coliform reductions necessary to meet Washington State water quality criteria are shown. The status of the water body on the 1996 303(d) is also shown.
Old WBID New WBID Name Current Load
(cfu/day) Fecal
Coliform Reductions
1996 303(d)
WA-05-1016 QJ28UC Fish Creek 7.4 x 10¹⁰ 81% Yes HD76OJ Harvey Creek 2.33 x 10¹⁰ 76% No JU33JU Jim Creek at Mouth 4.00 x 10¹¹ 38% No WA-05-1012 GH05SX Jorgenson Slough
(Church Creek) ** 87% Yes
IJ55EP Lake Martha Creek 6.38 x 10¹⁰ 92% No WA-PS-0020 390KRD Port Susan ** 61% Yes WA-05-1015 OT80TY* Portage Creek at 212th
NE 4.16 x 10¹¹ 83% Yes
WA-05-1015 OT80TY Portage Creek at 43rd 3.69 x 10¹¹ 69% Yes WA-05-1010 QE93BW Stillaguamish River at I-5 6.27 x 10¹² 52% Yes WA-05-1010 ZO73WL Stillaguamish River at
Marine Drive 5.79 x 10¹² 36% No
WA-05-1020 WO38NV N.F. Stillaguamish River (at mouth)
1.95 x 10¹² 14% Yes
WA-05-1050 SN06ZT S.F. Stillaguamish River (at mouth)
2.24 x 10¹² 7% Yes
LU17DC Unnamed Creek #0456 5.17 x 10¹⁰ 97% No * Includes the listings mistakenly assigned to QJ28UC, Fish Creek, and YF03BC, a branch of Portage Creek, but should have been entered as OT80TY, Portage Creek ** Insufficient flow measurement to calculate load.

Page 110 Stillaguamish Fecal and DO TMDL Submittal Report
This TMDL evaluation identified 23 additional tributaries or tributary reaches, drains, and sloughs that do not meet the FC criteria. Water bodies in Table 34 were not on the 1998 Section 303(d) list for FC bacteria, but require FC reductions to meet state criteria and fully support beneficial uses. Most of the water bodies in Table 34 require FC reductions greater than 70%. A few of the water bodies in Table 34 were on the 1998 303(d) list for dissolved oxygen, pH, or temperature. Others have been known to local groups as potential problems for several years, but have not been included in the 305(b) statewide assessment. Table 34. Additional Stillaguamish River basin and Port Susan tributaries not listed in Section 303(d) in 1998. Fecal coliform reductions necessary to meet Washington State water quality criteria are shown.
Name Water Quality Classification
Current Load (cfu/day)
Fecal Coliform Reductions
Glade Bekken FW - A 7.42 x 10¹⁰ 92% Pilchuck Creek FW - A 4.89 x 10¹¹ 26% March Creek FW - A 9.35 x 10¹⁰ 98% Armstrong Creek at Mouth FW - A 1.01 x 10¹¹ 29% Armstrong Creek below Hatchery FW - A * 66% Kackman Creek FW - A 1.79 x 10¹⁰ 68% West Pass of Old Stillaguamish FW/MW - A 6.1 x 10¹⁰ 97% South Pass of Old Stillaguamish FW/MW - A 2.45 x 10¹¹ 75% Douglas Slough FW/MW - A * 68% Irvine Slough FW/MW - A * 99% Church Creek at Park FW - A * 74% Miller Creek at Miller Road FW - A * 91% Twin City Foods Drain #1 FW/MW - A * 94% Twin City Foods Drain #2 FW/MW - A * 99% Twin City Foods Drain #3 FW/MW - A * 98% Twin City Foods Drain #4 FW/MW - A * 88% Twin City Foods Drain #5 FW/MW - A * 96% Warm Beach Creek above WWTP FW - AA 3.11 x 10¹⁰ 81% Agricultural Drain to Warm Beach FW - AA 8.86 x 1009 89% Warm Beach Dike Pond FW - AA 4.23 x 10¹⁰ 92% Warm Beach Slough MW - A * 64%
* Insufficient flow measurements to quantify the load. Ten of the water bodies in Table 34, and Jorgenson Slough (Church Creek) in Table 33, are tributaries to, or located in, the Old Stillaguamish Channel sub-basin. As stated earlier in this report, a more complete analysis of the Old Stillaguamish Channel will be conducted at a later date when the effects of the new tide gate and upgraded Stanwood Wastewater Treatment Plant (WWTP) can be evaluated. The FC load reductions for the 11 water bodies listed in the tables are accurate and can be considered general load allocations. Implementation of nonpoint source controls should not be delayed in these sub-basins. The major source of FC contamination in most of the water bodies in Tables 32 and 33 is nonpoint runoff from mixed land uses. The TMDL evaluation did not identify the FC load associated with specific properties or land uses for these water bodies. Therefore, most of the required reductions are load allocations to general nonpoint sources.
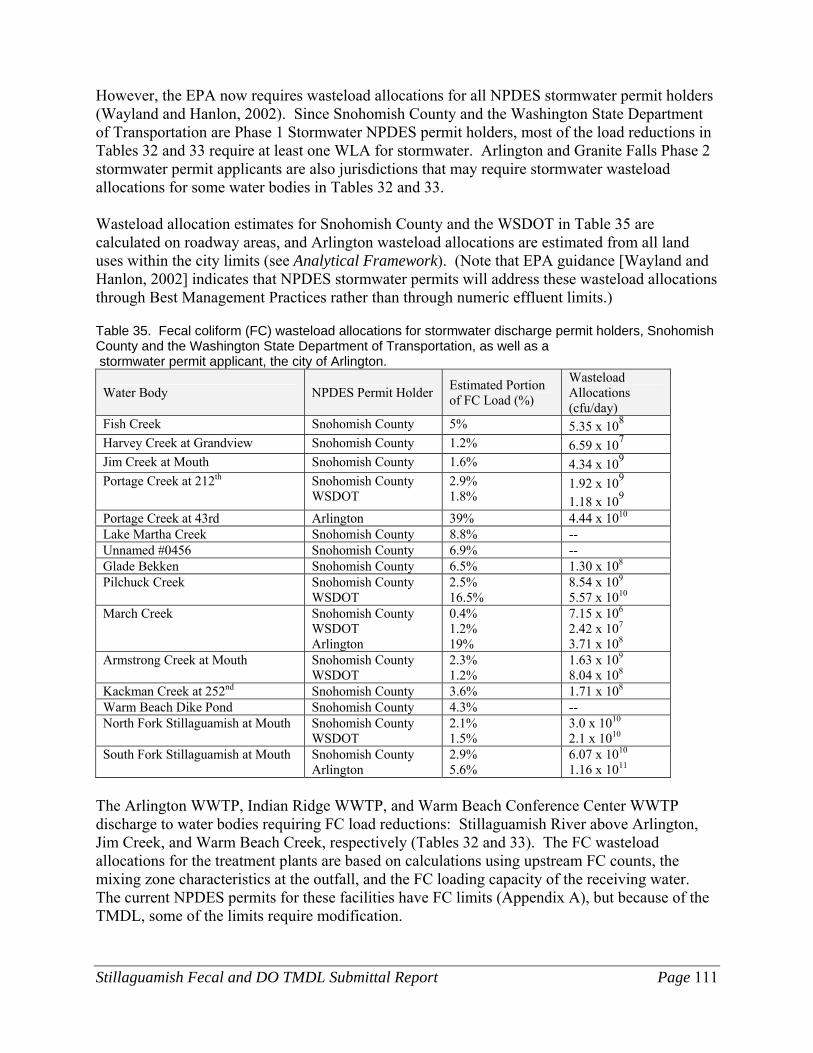
Stillaguamish Fecal and DO TMDL Submittal Report Page 111
However, the EPA now requires wasteload allocations for all NPDES stormwater permit holders (Wayland and Hanlon, 2002). Since Snohomish County and the Washington State Department of Transportation are Phase 1 Stormwater NPDES permit holders, most of the load reductions in Tables 32 and 33 require at least one WLA for stormwater. Arlington and Granite Falls Phase 2 stormwater permit applicants are also jurisdictions that may require stormwater wasteload allocations for some water bodies in Tables 32 and 33. Wasteload allocation estimates for Snohomish County and the WSDOT in Table 35 are calculated on roadway areas, and Arlington wasteload allocations are estimated from all land uses within the city limits (see Analytical Framework). (Note that EPA guidance [Wayland and Hanlon, 2002] indicates that NPDES stormwater permits will address these wasteload allocations through Best Management Practices rather than through numeric effluent limits.)
Table 35. Fecal coliform (FC) wasteload allocations for stormwater discharge permit holders, Snohomish County and the Washington State Department of Transportation, as well as a stormwater permit applicant, the city of Arlington.
Water Body NPDES Permit Holder Estimated Portion of FC Load (%)
Wasteload Allocations (cfu/day)
Fish Creek Snohomish County 5% 5.35 x 10⁸ Harvey Creek at Grandview Snohomish County 1.2% 6.59 x 10⁷ Jim Creek at Mouth Snohomish County 1.6% 4.34 x 10⁹ Portage Creek at 212th Snohomish County
WSDOT 2.9% 1.8%
1.92 x 10⁹ 1.18 x 10⁹
Portage Creek at 43rd Arlington 39% 4.44 x 10¹⁰ Lake Martha Creek Snohomish County 8.8% -- Unnamed #0456 Snohomish County 6.9% -- Glade Bekken Snohomish County 6.5% 1.30 x 10⁸ Pilchuck Creek Snohomish County
WSDOT 2.5% 16.5%
8.54 x 10⁹ 5.57 x 10¹⁰
March Creek Snohomish County WSDOT Arlington
0.4% 1.2% 19%
7.15 x 10⁶
2.42 x 10⁷ 3.71 x 10⁸
Armstrong Creek at Mouth Snohomish County WSDOT
2.3% 1.2%
1.63 x 10⁹ 8.04 x 10⁸
Kackman Creek at 252nd Snohomish County 3.6% 1.71 x 10⁸ Warm Beach Dike Pond Snohomish County 4.3% -- North Fork Stillaguamish at Mouth Snohomish County
WSDOT 2.1% 1.5%
3.0 x 10¹⁰ 2.1 x 10¹⁰
South Fork Stillaguamish at Mouth Snohomish County Arlington
2.9% 5.6%
6.07 x 10¹⁰ 1.16 x 10¹¹
The Arlington WWTP, Indian Ridge WWTP, and Warm Beach Conference Center WWTP discharge to water bodies requiring FC load reductions: Stillaguamish River above Arlington, Jim Creek, and Warm Beach Creek, respectively (Tables 32 and 33). The FC wasteload allocations for the treatment plants are based on calculations using upstream FC counts, the mixing zone characteristics at the outfall, and the FC loading capacity of the receiving water. The current NPDES permits for these facilities have FC limits (Appendix A), but because of the TMDL, some of the limits require modification.

Page 112 Stillaguamish Fecal and DO TMDL Submittal Report
In most cases, the compliance point for FC is at the edge of the chronic mixing zone boundary (Bailey, 2002). Indian Ridge WWTP can meet the downstream FC target on Jim Creek under current permit limits of 100 cfu/100 mL (Table 36). However, since the FC water quality above the Arlington WWTP and Warm Beach Conference Center WWTP do not meet FC criteria in their respective receiving waters, the effluent from these facilities cannot increase the FC concentration or load. Therefore, adjustments to the FC limits in their NPDES permits are necessary (Table 36). These concentration limits must be met at the end of the outfall.
Table 36. Recommended fecal coliform limits and wasteload allocations (WLA) for three wastewater treatment plants with NPDES permits.
Current FC Permit Proposed Permit Facility Name cfu/100 mL cfu/100 mL WLA
cfu/day Indian Ridge Corrections Center WWTP 100 100 8.0 x 10⁸ Arlington WWTP 200 / 400 39 / 128 3.0 x 10⁹ Warm Beach Conference Center WWTP* 200 / 400 47 / 100 1.3 x 10⁸ Warm Beach Conference Center WWTP** - 11 / 26 3.1 x 10⁷ * Assuming discharge to Warm Beach Creek at current maximum monthly flow of 0.075 MGD, and the discharge is allowed under special considerations. ** Assuming discharge to Hat Slough near the South Branch with maximum monthly flow of 0.075 MGD. Warm Beach WWTP effluent quality has improved according to 2002 monitoring reports (Ecology, 2003a) and additional data from the facility manager (Wynn, 2002) for 2002. The Warm Beach WWTP facility has added a wetlands treatment system that should further reduce the effluent FC and the variability from this source. The outfall location for the improved facility has not yet been determined. If the outfall remains in Warm Beach Creek, the effluent would be required to meet the TMDL target concentrations at the end of the outfall because the channel is dry during some summer periods. Municipal effluent discharges under 0.5 million gallons per day (MGD) are allowed to intermittent low-land streams if the effluent quality can meet Class A water quality criteria (Bailey, 2002). It is uncertain how this applies to TMDL modified intermittent streams. If the Warm Beach WWTP outfall is moved to Hat Slough near South Branch, Table 36 shows the FC permit limits would be more restrictive than in Warm Beach Creek. This is because of the geometric mean target for the South Branch reach is 11 cfu/100 mL (Table 30). Dissolved Oxygen Loading capacity analyses were conducted for nine reaches representing five tributaries in the Stillaguamish River basin (Table 31). Estimated potential minimum DO concentrations are shown in the table to acknowledge that in some cases, and at certain times, natural DO conditions may be below the 8 mg/L Class A criterion. Wasteload allocations for point sources with NPDES permits, and load allocations for nonpoint sources, were calculated for the five tributaries where appropriate (Table 37). (Note that EPA guidance [Wayland and Hanlon, 2002] indicates that NPDES stormwater permits will address these wasteload allocations through Best Management Practices rather than through numeric effluent limits.)
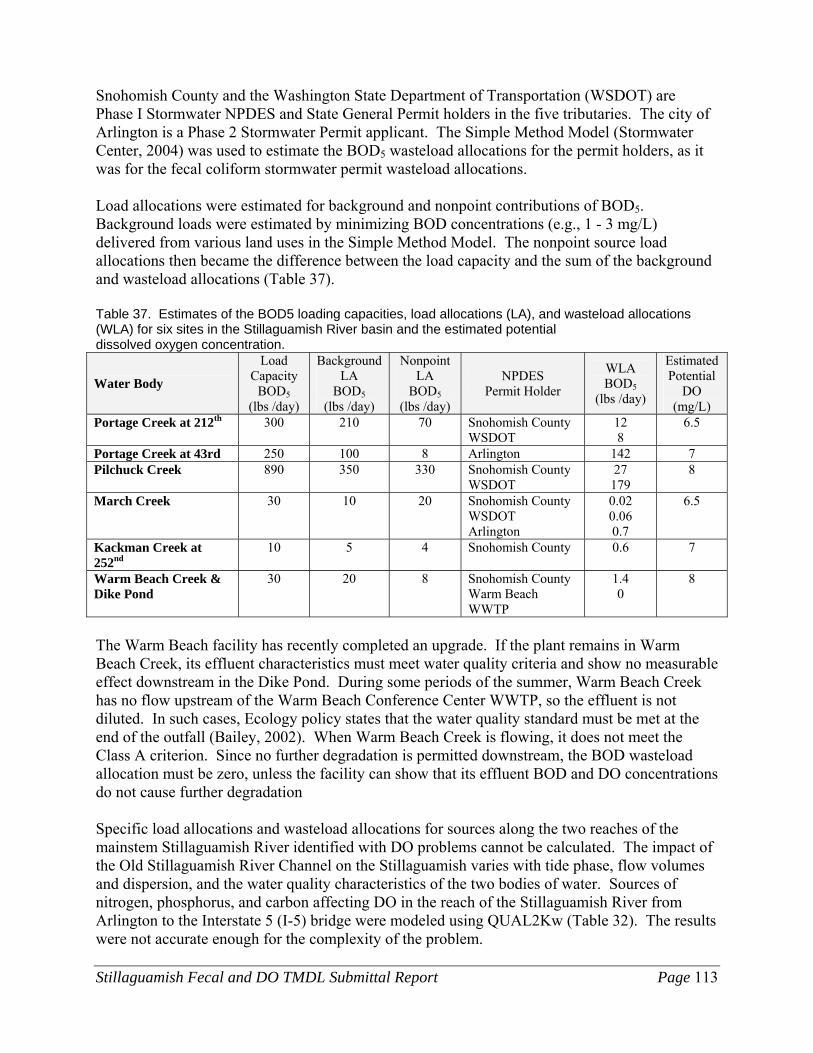
Stillaguamish Fecal and DO TMDL Submittal Report Page 113
Snohomish County and the Washington State Department of Transportation (WSDOT) are Phase I Stormwater NPDES and State General Permit holders in the five tributaries. The city of Arlington is a Phase 2 Stormwater Permit applicant. The Simple Method Model (Stormwater Center, 2004) was used to estimate the BOD5 wasteload allocations for the permit holders, as it was for the fecal coliform stormwater permit wasteload allocations. Load allocations were estimated for background and nonpoint contributions of BOD5. Background loads were estimated by minimizing BOD concentrations (e.g., 1 - 3 mg/L) delivered from various land uses in the Simple Method Model. The nonpoint source load allocations then became the difference between the load capacity and the sum of the background and wasteload allocations (Table 37). Table 37. Estimates of the BOD5 loading capacities, load allocations (LA), and wasteload allocations (WLA) for six sites in the Stillaguamish River basin and the estimated potential dissolved oxygen concentration.
Water Body
Load Capacity
BOD5 (lbs /day)
Background LA
BOD5 (lbs /day)
Nonpoint LA
BOD5 (lbs /day)
NPDES Permit Holder
WLA BOD5
(lbs /day)
Estimated Potential
DO (mg/L)
Portage Creek at 212th 300 210 70 Snohomish County WSDOT
12 8
6.5
Portage Creek at 43rd 250 100 8 Arlington 142 7 Pilchuck Creek 890 350 330 Snohomish County
WSDOT 27
179 8
March Creek 30 10 20 Snohomish County WSDOT Arlington
0.02 0.06 0.7
6.5
Kackman Creek at 252nd
10 5 4 Snohomish County 0.6 7
Warm Beach Creek & Dike Pond
30 20 8 Snohomish County Warm Beach WWTP
1.4 0
8
The Warm Beach facility has recently completed an upgrade. If the plant remains in Warm Beach Creek, its effluent characteristics must meet water quality criteria and show no measurable effect downstream in the Dike Pond. During some periods of the summer, Warm Beach Creek has no flow upstream of the Warm Beach Conference Center WWTP, so the effluent is not diluted. In such cases, Ecology policy states that the water quality standard must be met at the end of the outfall (Bailey, 2002). When Warm Beach Creek is flowing, it does not meet the Class A criterion. Since no further degradation is permitted downstream, the BOD wasteload allocation must be zero, unless the facility can show that its effluent BOD and DO concentrations do not cause further degradation Specific load allocations and wasteload allocations for sources along the two reaches of the mainstem Stillaguamish River identified with DO problems cannot be calculated. The impact of the Old Stillaguamish River Channel on the Stillaguamish varies with tide phase, flow volumes and dispersion, and the water quality characteristics of the two bodies of water. Sources of nitrogen, phosphorus, and carbon affecting DO in the reach of the Stillaguamish River from Arlington to the Interstate 5 (I-5) bridge were modeled using QUAL2Kw (Table 32). The results were not accurate enough for the complexity of the problem.

Page 114 Stillaguamish Fecal and DO TMDL Submittal Report
The load allocation of water with low DO concentrations from the Old Stillaguamish River Channel to the mainstem Stillaguamish River is zero. If the newly-installed tide gate at the bifurcation point does not eliminate the flow of deoxygenated water from the Old Stillaguamish Channel, then a new load allocation will be determined when the dissolved oxygen TMDL is completed for the Old Channel. Loading capacity analyses of the Stillaguamish River between Arlington and the I-5 bridge concluded that loading under natural conditions could not be calculated at this time using the QUAL2Kw model. The analyses also showed that although they could not be accurately quantified, low-flow period loads of nutrients and BOD from the upper basin, Arlington WWTP, unidentified nonpoint sources, Armstrong Creek, and March Creek have an effect on the DO concentrations in the reach (Table 32). A target minimum DO concentration of 7 mg/L was recommended to protect beneficial uses in the reach, and to stimulate management plans and activities limiting anthropogenic inputs of carbon, nitrogen, and phosphorus when the dissolved oxygen is completed for the Old Chanel (approximately 2007 to 2008). Nutrient (carbon, nitrogen, and phosphorus) loads affecting the reach will require closer management to minimize DO losses in the river and to meet the estimated potential 7 mg/L concentration during the critical season. For example, Arlington WWTP effluent appears to have an effect on downstream DO concentrations and stimulates periphyton biomass production. The current NPDES permit for the Arlington WWTP five-day BOD load has technology-based limits, and nitrogen and phosphorus loads are not addressed. If seasonal permit limits were ‘performance-based’ to better reflect the effluent BOD5 quality since the 1998 upgrade (less than 10 mg/L) and if nitrogen and phosphorus monitoring and treatment planning were written into the permit, then better management alternatives for the effluent treatment and disposal could be developed when natural conditions in the river are better defined. Phosphorus loading in both the lower North Fork and the South Fork Stillaguamish has increased according to trend analyses performed on the Ecology monthly monitoring data. The QUAL2Kw model simulations also suggested that nonpoint and tributary sources in the reach can be significant during low-flow periods. The DO target may not be met until nutrient loads from these sources are reduced or excluded. Phosphorus reductions are also recommended to decrease pH maxima in the North Fork Stillaguamish River. The Clean Water District’s nonpoint management plans and implementation activities should direct resources at the phosphorus loading problem in this area. pH The following sites should be reassessed to determine natural seasonal or event-based pH conditions once the anthropogenic sources of oxygen-demand or low pH stormwater are reduced or eliminated as fecal coliform and dissolved oxygen loading capacities are met:
• Stillaguamish River above Arlington at the confluence of the North and South forks
• Pilchuck Creek
• Kackman Creek
• March Creek

Stillaguamish Fecal and DO TMDL Submittal Report Page 115
Meeting conditions for natural conditions may be indirectly attained when targets for fecal coliform or dissolved oxygen are met. Stormwater wasteload allocations and nonpoint load allocations have already been set in the three tributaries to meet loading capacities for dissolved oxygen and fecal coliform (Tables 35 and 37). The fecal coliform loading reductions for the mouths of the South Fork and North Fork Stillaguamish River, and their accompanying stormwater wasteload allocations, should be sufficient to bring pH values into compliance at the confluence of the forks above Arlington during storm events (Tables 33 and 35). Since the potential sources of low pH from decomposition of organic materials are similar to those that may contain fecal bacteria and oxygen-demand, the reductions in place should help attain the best potential pH values. Wetland drainage and groundwater inputs should be included as part of the determination of natural conditions in the tributaries, as should seasonal instream organic material cycling processes. The North Fork Stillaguamish River at Whitman bridge to Cicero bridge (NFRKM 28.3 to NFRKM 15.2) is affected by elevated pH values. Reducing the total phosphorus load may improve the July through September low-flow pH conditions by decreasing the periphyton biomass responsible for the elevated pH values. Bringing the median seasonal total phosphorus concentration to 0.01 mg/L and reducing the median seasonal load from 41 lbs/day to 20 lbs/day will be equal to the 1987 to 1995 seasonal average. The load is allocated to background (6 lbs/day) and nonpoint sources (14 lbs/day). Table 38. Load allocations for Total Phosphorus in the North Fork Stillaguamish River to reduce periphyton biomass and address elevated pH measurements. Water Body Loading Capacity
(Total Phosphorus) Background Load Non-Point Load Target Value
Total Phosphorus North Fork Stillaguamish River (km 15.2-28.3)
20 lb/day 6 lb/day 14 lb/day 0.01 mg/L (median seasonal value)
Arsenic and Mercury Arsenic and mercury in the basin are from natural sources without enrichment from anthropogenic sources. The metals are highly associated with suspended solids. Both the South Fork and North Fork have documented natural erosion areas with total suspended solids (TSS) loads that have created sedimentation problems in downstream channel reaches (WCC, 1999). Continued work reducing the TSS loading from these areas and basin-wide would help decrease arsenic and mercury loading. No amount of reduction would allow arsenic concentration to meet EPA human-health criteria. Therefore, all loads for arsenic and mercury are allocated to background. To better manage incidental mercury from sediment, a target TSS concentration to limit mercury concentrations greater than the aquatic toxicity criterion could be based on the regression equation relating TSS in mg/L to mercury in ug/L: Mercury = 0.0011 x TSS 0.5704 An average four-day TSS concentration of 65 mg/L would limit the mercury concentration to 0.012 ug/L. The TSS concentrations are not well correlated with discharge at any of the sites.
Page 116 Stillaguamish Fecal and DO TMDL Submittal Report
Sudden increases in runoff generally create increases in TSS. A TSS loading capacity was not developed. Based on very few samples collected from the North Fork Stillaguamish near Darrington (n=4), the TSS surrogate concentration of 65 mg/L would not be appropriate there. Based on a linear correlation (r2 = 0.93) for the four data points, a TSS concentration of 13 mg/L for the North Fork near Darrington would limit mercury to 0.012 ug/L. A four-day average TSS concentration of less than 13 mg/L at these sites should result in mercury concentrations within the chronic toxicity criterion.
Margin of Safety This TMDL evaluation requires a list of implicit and explicit expressions margins of safety (MOS) used to determine the loading capacity, load allocations, and wasteload allocations. The MOS magnitude varies with the confidence in the data available and the analytical tools used. The MOS is the means by which the analysis accounts for the uncertainty about the relationship between pollutant loads and the receiving water quality (EPA, 2001). To protect beneficial uses to the fullest extent, a conservative approach must be taken so that an error in load allocations and wasteload allocations does not cause impairment of the water body. The following are conservative assumptions that implicitly or explicitly contribute to an MOS.
• The statistical rollback method was applied to fecal coliform data from the most critical season, and the resultant target geometric means are more stringent than the Washington State criterion of 100 cfu/100 mL. This is an explicit assumption for the MOS.
• Since the variability in fecal coliform counts during the critical season when storm-event data are included is usually quite high, the targets are more restrictive. This is especially true at sites with fewer than 20 data. These factors are implicit contributions to the MOS.
• The fecal coliform loading capacities and target geometric means for the North Fork Stillaguamish River at Twin Rivers and the Stillaguamish River at Interstate 5 were conservatively calculated to include the loading from unidentified sources located along upstream reaches. These are implicit contributions to the MOS.
• The fecal coliform loading capacities and target geometric means for three small tributaries that discharge directly to Port Susan are based on more restrictive Class AA freshwater criteria rather than Class A criteria. This is an explicit contribution to the MOS.
• The cumulative freshwater fecal coliform loads to Port Susan during the critical season will be reduced by 77 percent under the TMDL targets, even if instream die-off is not considered. Port Susan sites require fecal coliform reductions of 2 percent – 60 percent. The difference is an explicit MOS.
• The treatment plant wasteload allocations for fecal coliform do not consider dilution in a mixing zone during a 7seven-day, ten-yr (7Q10), low-flow event at full permit capacity. This is an explicit MOS.
• The targets for minimum dissolved oxygen concentrations in areas considered to have natural sources of low dissolved oxygen are set to be protective of supporting most phases of the salmon life cycle under the worst habitat conditions. Therefore, sites located in areas with

Stillaguamish Fecal and DO TMDL Submittal Report Page 117
better habitat and water movement should have all phases of the life cycle protected. This is an implicit MOS.
• The stormwater model assumes that 90 percent of the rainfall creates runoff, and the concentrations of fecal coliform and BOD are in the upper range of mean values in technical literature. In western Washington, the low intensity of many rain events does not deliver runoff. Therefore, higher fecal coliform and BOD loads are predicted by the model than are actually delivered. The wasteload allocations and load allocations based on these model results are probably more restrictive. This is an implicit assumption for the MOS.
• Some of the sites recommended for pH TMDL-related activities were identified by applying a 0.2 standard unit (s.u.) safety factor to the 10th and 90th percentile statistics. The application of the safety factor is an explicit addition to the margin of safety.
Summary Implementation Strategy
Implementation Overview The purpose of this summary implementation strategy (SIS) is to describe how the waters addressed by the Stillaguamish River Watershed Fecal Coliform, Dissolved Oxygen, pH, Arsenic and Mercury Total Maximum Daily Load Study (Ecology, July 2004) can achieve water quality standards. This SIS complies with the federal mandate of the Clean Water Act (CWA), state laws to control point and non-point source pollution, and with the Memorandum of Agreement between the U.S. Environmental Protection Agency and Washington State Department of Ecology (EPA, 1997). The Ecology TMDL study addresses stream reaches in the Stillaguamish watershed and marine waters of Port Susan that were placed either in 1996 or 1998 on the state’s list of impaired waters (303[d] list, now called the Water Quality Assessment); see Table 8. As required by federal water quality regulations, these waters then must be evaluated through the total maximum daily load (TMDL) process, which develops an estimate of the amount of a particular pollutant that a water body can handle without violating state water quality standards. Implementation, the second part of the TMDL process, starts with writing a summary implementation strategy, or plan of activities and programs to be carried out to reduce the pollutants. In this Strategy, implementing agencies and organizations in the Stillaguamish watershed will use existing regulations and programs to reduce high bacteria concentrations and address dissolved oxygen deficits and elevated pH. In addition, this SIS identifies additional resources that will be needed to reduce pollutants and improve water quality. After EPA approves this TMDL, these agencies and organizations will work with other interested parties to help Ecology develop a detailed implementation plan. The plan will recommend specific actions to take so that the river, its tributaries, and Port Susan can meet water quality standards in the future. A preliminary list of proposed implementing activities and initiatives, and a description of the adaptive management process, are the start for the detailed implementation plan and are included this strategy.

Page 118 Stillaguamish Fecal and DO TMDL Submittal Report
The target date for meeting water quality standards for fecal coliform bacteria, dissolved oxygen, and pH is 2013 (8 years). This estimate is based on the likely need for a series of water quality monitoring efforts focusing on specific sub watersheds to better target failing septics and other nonpoint sources of bacteria, biochemical oxygen demand (BOD), and nutrients, with time required following identification for corrections to be implemented. This estimated target date also considers the time required for funding and planning of large, technically complex projects to address sediment loading. Impairments Leading to the TMDL, and TMDL Development The Stillaguamish River, several of its tributaries, and Port Susan were included on Washington State’s 1996 and 1998, 303(d) lists because of violations of one or more water quality criteria (Table 8). This document includes the TMDL study that was conducted to address those listings and that includes recommendations for specific reductions of pollutants so that these waters, and additional water bodies found to be impaired during the study (Table 9), will meet water quality standards. Figures showing the location of monitoring sites in the lower watershed and Port Susan, along the mainstem, and on the North Fork and South Fork are provided in Appendix C. Monitoring was conducted in 2000 and 2001 for conventional parameters including fecal coliform bacteria, and dissolved oxygen. Most monitoring was conducted monthly. However, additional monitoring targeted storm events, to assess impacts of stormwater on river water quality, and diurnal sampling was conducted in some reaches in order to assess day and night changes in dissolved oxygen. The study recommends reductions (load allocations) in fecal coliform bacteria from non-point sources at 34 locations throughout the watershed (Tables 33 and 34). Land uses associated with these locations include urban areas where stormwater may be a purveyor of bacteria; residential areas not served by sewers, where on-site septic system failures may contribute; and farms ranging from small “hobby” farms with few animals to livestock and dairy operations. Some of the locations requiring fecal coliform bacteria reductions receive stormwater drainage either from adjacent roadways or city stormwater infrastructure. Jurisdictions with responsibility for stormwater drainage include Washington State Department of Transportation (WSDOT) and Snohomish County, which have NPDES Phase I stormwater permits; and the city of Arlington, which will be a permittee under Ecology’s Phase II NPDES Municipal Stormwater Permit, expected to be issued in 2005. These three jurisdictions are assigned wasteload allocations (WLAs) for fecal coliform bacteria (Table 35). This means they will be required to implement best management practices (BMP) to reduce fecal coliform bacteria in their stormwater runoff in the watersheds listed in Table 35. In addition to the WLAs for fecal coliform for stormwater permittees, the TMDL recommends WLAs for WWTPs in the watershed (Table 36). Dissolved oxygen is the second parameter of concern in the watershed evaluated in this TMDL. Initially five locations in the watershed were included on the 1998 303(d) list (Table 8); however, additional monitoring conducted during the study indicated that other locations exhibit

Stillaguamish Fecal and DO TMDL Submittal Report Page 119
low dissolved oxygen during low flow periods. As a result, nine locations are identified in the study as requiring reductions in biolochemical oxygen demand (BOD). Six of these receive stormwater drainage, so wasteload allocations (WLA) have been assigned to Snohomish County; city of Arlington; and/or WSDOT, depending on which of these stormwater permittees is responsible for drainage infrastructure at the six locations (Table 37). The remaining three locations are affected by nonpoint BOD loading only (also Table 37). The TMDL study results for pH suggest that low pH values in Pilchuck, Kackman, and March Creeks, are storm event related. The study recommends continued monitoring to confirm this relationship. The low pH values likely result from decomposition of organic material introduced to the river and creeks through storm runoff. It is expected that the wasteload allocations will reduce inputs that are also supplying organic material. Similarly, the efforts required to reduce nonpoint sources of bacteria are likely to be effective in reducing some organic loading to the river. As a result, no load allocations were established to address the low pH measurements. Review of the data that led to the 1996 and 1998 pH listings for the South Fork Stillaguamish at Arlington has led to a recommendation that this reach be de-listed. The elevated pH measurements made in North Fork Stillaguamish River between Whitman Bridge and Cicero generally occurred during July-September (low flow season). Reductions in total phosphorus loading are required through load allocations (Table 38); reducing this load is expected to decrease the periphyton biomass responsible for the elevated pH values. For arsenic and mercury, the additional measurements collected during the course of the study were evaluated with respect to the geology of the region. Both arsenic and mercury are highly associated with suspended solids. Both appear to reflect natural background sources in the basin; no other sources were identified. Consistent with a statewide review of arsenic that recommends delisting unless an anthropogenic source is identified, this TMDL recommends delisting arsenic. For mercury, which under moderate flow conditions was measured at some locations at concentrations above the 4-day chronic toxicity criterion, a load allocation was set for total suspended solids (TSS). Ongoing work in the watershed to reduce TSS loading from natural and human-caused erosion should result in reduced concentrations of mercury.
Implementation Plan Development The TMDL studies addressing fecal coliform bacteria, dissolved oxygen, and pH impairments in the Stillaguamish watershed (Ecology July 2004) include recommendations for programs and actions that will help improve water quality and enable these waters to meet state water quality standards. This section relates these needed programs and actions to the local agencies, Tribes and watershed organizations that can undertake them. These organizations have influence, regulatory authority, information, resources or other involvement in administering natural resource programs in the Stillaguamish watershed. Through meetings with these organizations in 2005 and 2006, Ecology will coordinate development of the detailed implementation plan. A preliminary list of projects, some requiring new funding, have been identified that will begin to address the pollutant reductions required by this plan.

Page 120 Stillaguamish Fecal and DO TMDL Submittal Report
Approach for Non Point Sources For nonpoint sources, the TMDL establishes load allocations (LAs) to each river segment and tributary so that these water bodies will meet standards. (For some locations, allocations needed to be established for both point sources and nonpoint sources.) The percent reductions in fecal coliform bacteria, and nutrient or BOD loads in the case of dissolved oxygen (DO), are those required for the water body to meet standards under critical conditions of flow and season, which were identified for each parameter in the TMDL (see Tables 33-38). This section summarizes recommendations for reducing nonpoint sources, through a variety of BMPs appropriate for different types of sources, to achieve the TMDL goal of meeting water quality standards for fecal coliform bacteria and dissolved oxygen. Fecal Coliform Bacteria The major source of fecal coliform contamination in most of the water bodies in the watershed is nonpoint runoff from mixed land uses. Additional investigation is required to determine whether sources are failing septic systems, improper management of manure, pet waste, sewage infrastructure failure, stormwater, or wildlife. It can take time to resolve and correct fecal coliform contamination of waters in mixed land use situations, i.e., where the immediate sources of bacteria have not been identified. However, where funding is available and local agencies are committed to resolving these issues, significant reductions in stream fecal coliform have been achieved. An example is Kitsap County Health District’s Dogfish Creek project in Poulsbo, Kitsap County (KCHD, 2004). Funded partly by an Ecology Centennial Grant, the project included three years of sampling, public outreach, coordination with Kitsap Conservation District to address potential livestock sources, a door-to-door survey of 145 homes for potential septic system failures, work with individual property owners to repair or replace septic systems, and review of potential stormwater drainage impacts. Over the four-year effort, the annual geometric mean measurement of fecal coliforms was reduced from 243 to 62 in the main channel of Dogfish Creek. The 36 locations in the Stillaguamish watershed identified as requiring reductions in nonpoint sources of fecal coliform (Tables 8 and 9) can be grouped into eight sub watersheds for “community outreach/source identification and correction” projects similar to KCHD’s Dogfish Creek project.
• Warm Beach residential area including Martha Lake Creek and unnamed creek #0456.
• Nonpoint polluted water bodies in vicinity of Warm Beach Camp and Conference Center.
• Tributaries to Old Stillaguamish Channel: Jorgenson Slough/Church Creek, Irvine Slough, West Pass and South Pass. (Prior to development of Old Stilly Channel TMDL, water quality in these tributaries should be addressed through nonpoint source identification and correction.)
• Glade Bekken Creek.
• Pilchuck Creek.

Stillaguamish Fecal and DO TMDL Submittal Report Page 121
• March-Fish-Portage Creeks-Stillaguamish mainstem (both up- and downstream of I-5).
• Harvey-Armstrong-Kackman Creeks.
• Lower North Fork, lower South Fork, and Jim Creek.
Depending on the sources identified by carrying out these more geographically focused projects, the ultimate corrections will likely include repair and replacement of failing on-site septic systems and agricultural best management practices. Some of the creek systems in the above groupings have stormwater drainages; potential corrective actions (best management practices) for these systems are noted below. Dissolved Oxygen Water quality monitoring data from the Ecology July 2004 TMDL study included measurements of dissolved oxygen that were lower than the water quality standard during low flow, often late summer or early fall periods (critical seasonal condition) at the following.
• Warm Beach Creek above WWTP, and a pasture drain and pumped drainage from a stormwater collection pond in the floodplain adjacent to the Warm Beach Camp and Conference Center WWTP.
• Stillaguamish River at bifurcation with Old Stillaguamish Channel.
• Pilchuck Creek at Jackson Gulch Road.
• Portage Creek – several locations.
• March Creek.
• Kackman Creek.
• Stillaguamish River below Arlington (RM 13). Low dissolved oxygen is often correlated with warm stream temperature; however, in the locations listed above there may be contributing factors of:
• High nutrient loading leading to growth of periphyton (algae) that consume more oxygen during night-time respiration than they produce during day-time photosynthesis.
• High organic loading that carries a high biological oxygen demand.
• Significant inflow of ground water, which often has low dissolved oxygen. Some of the reaches with dissolved oxygen impairments will likely be improved through working with livestock owners to ensure that nutrients associated with manure are not reaching the river and creeks. Nutrients can also be associated with on-site septic waste or with fertilizer use. Riparian streambank and channel improvements that improve flow, filter nutrients from adjacent land uses, and add shade, can improve dissolved oxygen conditions. Where high groundwater inflow that is depleted in dissolved oxygen is causing the impairment, it is a natural condition not subject to remediation or load allocations.

Page 122 Stillaguamish Fecal and DO TMDL Submittal Report
In the case of the low DO location at RM 13 in the mainstem below Arlington, the TMDL study suggests that multiple causes, including a potential role played by nutrients from the Arlington WWTP, may contribute. To attempt to sort out these causes and design solutions that will be effective, a two year monitoring study of nutrient and fecal loading from stormwater, the WWTP, and in the South Fork above Arlington is being planned by Ecology with assistance from the city of Arlington. Local and Tribal governments can provide support for maintaining and increasing the riparian integrity of streams in the watershed through education of citizens and adoption and enforcement of critical areas ordinances and shoreline management plans that protect riparian buffers. pH Occurrences of elevated pH in the North Fork Stillaguamish (see page 105, Loading Capacity section) may be associated with high levels of periphyton production. Reducing nutrient inputs, particularly phosphorus, by educating landowners along this reach of the river about BMPs and proper septic maintenance should begin to correct this problem. Metals – Arsenic and Mercury Because of the strong association of mercury and arsenic concentrations in the river with suspended solids, measures that address the river’s high sediment load should be assigned high priority in implementation planning and grant application processes. These should include better erosion control measures and projects that divert the river’s course away from some of the large landslides that continuously supply sediment to the river, Approach for Point Sources This TMDL assigns wasteload allocations to point sources of fecal coliform bacteria (WWTPs, Table 36) and to point sources of BOD loading. This reduces dissolved oxygen in streams below roadways (jurisdictions with NPDES Phase I and future Phase II stormwater permits, Table 37). (Current WWTP permit information and the basis for proposed limits developed in this TMDL are provided in Appendix B.) Note that wastewater treatment plant permits will reflect these TMDL requirements in a different way than the NPDES stormwater permits. While the WWTP permits are expected to incorporate the numeric effluent limits recommended in this TMDL when the permit is reissued, stormwater permits are not expected to have numeric limits related to the wasteload allocations. EPA guidance (Wayland and Hanlon, 2002) indicates that stormwater permittees will address TMDL requirements through Best Management Practices. Because the loading capacities of the river and streams in this study were determined for critical conditions of warm stream temperature and low flow in late summer and fall, the WLAs are established for these critical seasonal conditions. Arlington WWTP The TMDL proposes that Arlington WWTP permit limits for fecal coliform be reduced from 200/400 (maximum monthly average and maximum weekly average cfu/100 ml) to 39/128 (monthly/weekly). This Strategy suggests that the appropriate time for the new limit to be

Stillaguamish Fecal and DO TMDL Submittal Report Page 123
included in the permit is in the next permit cycle (2008). This will provide a three-year period to assess changes in the loading of fecal coliform bacteria in the receiving waters and allow time for BMPS related to stormwater quality and cleanup of nonpoint sources upstream to be implemented. If these other sources of fecal coliform are not reduced so that the river meets water quality standards by 2008, then the proposed reduced permit limits will be applied during re-issuance of the permit. Because the dissolved oxygen minimum 6.8 km downstream cannot be directly attributed to the WWTP, there is no change proposed for the current permit limit for biolochemical oxygen demand (BOD). New information from a two-year nutrient, fecal coliform and stormwater monitoring program during the seasonal low flow period (see Identified Needs and Early Action Proposals) will help determine whether additional treatment is needed at this facility. Warm Beach Christian Conference Center WWTP This TMDL allocates a zero-BOD wasteload allocation to the Warm Beach Christian Conference Center WWTP discharge due to low dissolved oxygen in the receiving waters (a small creek that drains to a flood control district drainage pond). As a result, the conference center is conducting a feasibility study of two alternative discharge locations: a piped discharge to Hat Slough near the South Branch channel, and a land-based drip irrigation system. The WWTP is operating under an extended discharge permit. The permit will be reissued in 2005. Indian Ridge Corrections Center WWTP No change is proposed to the current permit limits for Indian Ridge WWTP, because the condition of the receiving waters (Jim Creek) at the point of discharge is not impaired. Stormwater – City of Arlington The city of Arlington is expected to be one of a number of smaller cities throughout Washington State that will be covered under Ecology’s Phase II NPDES Municipal Stormwater Permit. Arlington filed its permit application in 2003; the Phase II permit is expected to be issued in 2006. Based on this TMDL, Arlington will need to develop as part of its municipal stormwater program a strategy for addressing:
• The fecal coliform reductions required for Portage Creek at 43rd, March Creek;, and South Fork Stillaguamish at mouth.
• The dissolved oxygen impairments at the Portage Creek and March Creek locations. To ensure that the storm drains do not convey excessive bacteria, nutrients, and oxygen-demanding material, the city should make sure that pollution-prevention steps are taken (illicit discharge detection, pet waste stations, more frequent street cleaning, and/or storm vault cleaning) or that treatment occurs prior to discharge.

Page 124 Stillaguamish Fecal and DO TMDL Submittal Report
Stormwater – Snohomish County Snohomish County is covered by Ecology’s Phase I NPDES Municipal Stormwater Permit. Under the load allocations derived from road area in this TMDL, Snohomish County must address pollutants in stormwater drainage as specified in the following:
• Fecal coliform reductions required for Fish, Harvey, Jim, Portage, Lake Martha, Unnamed #0456, Glade Bekken, Pilchuck, March, Armstrong, and Kackman creeks, and Warm Beach Dike Pond, and North Fork and South Fork of the Stillaguamish River at their confluence.
• Dissolved oxygen impairments at Portage, Pilchuck, March, Kackman and Warm Beach creeks.
To ensure that the county road storm drains do not convey excessive bacteria, nutrients, and oxygen-demanding material, the county should take pollution-prevention actions such as illicit discharge detection, retrofits of residential stormwater detention facilities, reviews of road maintenance and stormwater detention BMPs, and identification and implementation of drainage infrastructure improvements. Stormwater – WSDOT Washington State Department of Transportation (WSDOT) is a jurisdiction covered by Ecology’s Phase I NPDES Municipal Stormwater Permit. Based on this TMDL, WSDOT will need to show that it has taken steps to address:
• Fecal coliform reductions required for Portage, Pilchuck, March and Armstrong creeks, and North Fork of the Stillaguamish River at its confluence with South Fork.
• Dissolved oxygen impairments at Portage, Pilchuck, and March creeks. To ensure that the state highway storm drains do not convey excessive bacteria, nutrients, and oxygen-demanding material, WSDOT should make sure that pollution-prevention steps are taken (illicit discharge detection, more frequent highway cleaning, working with local governments to ensure that pet waste, farming practices, and septic systems are being appropriately managed) or that treatment occurs prior to discharge. Identified Needs and Early Action Proposals Stillaguamish watershed organizations, agencies, and Tribes are actively engaged in projects that will directly or indirectly lead to improvements in river and stream water quality. Appendix E includes a preliminary tabulation of projects that have recently been completed. However, despite this indication that much worthwhile effort is ongoing in the watershed, the five-year review of data that was undertaken in this TMDL suggests that fecal coliform impairments are widespread and not readily solved. It is likely that while improvements are occurring in some areas, other changes in the watershed may be associated with degradation of water quality. Such changes include the effects of population growth, increasing housing density, and increases in impervious area. And despite fewer commercial livestock operations, an increase has occurred in hobby farms, which could be associated with negative impacts on water quality.

Stillaguamish Fecal and DO TMDL Submittal Report Page 125
High priority actions that could indirectly lead to fecal coliform reductions are:
• Commitment by the Snohomish Health District to securing funding so that this agency, with its regulatory authority over septic systems will have the resources to assist source-identification monitoring/fecal reduction efforts in seven sub watersheds. Health District staff have indicated that if data are available to narrow down potential fecal coliform sources to a very small number of properties - 2 to 5 - then district sanitarians could carry out the necessary investigation and enforcement actions (K. Plemel, personal communication, September 2004).
• Understanding by property owners of their responsibility to properly maintain on-site septic systems. Additional basin-wide education and outreach will be necessary.
Projects recently funded or proposed for future funding are listed in Table 39. Table 39. Preliminary Proposals for Improving Water Quality
Project Title River Segment
Parameter Addressed
Organization Date Started/Completed
Steelhead Haven Landslide Remediation
North Fork Temperature, turbidity, arsenic and mercury (metals associated with sediments)
Stillaguamish Tribe
Approved for CCWF 2004; Salmon Recovery Funds Dec 2005
Snohomish County Septic Systems
Pilot projects to include 2 Stillaguamish sub watersheds
Fecal coliform bacteria
Snohomish Cty SWM with Snohomish Health District
Submitted for FY06 Centennial Clean Water Funds; rated well in Jan 2005 Project Rankings
Harvey Armstrong & Fish Creeks Sub watersheds
Harvey, Kackman, Armstrong, Fish Creeks
Fecal coliform bacteria
Snohomish Conservation District
Submitted for FY06 Centennial Clean Water Funds; rated well in Jan 2005 Project Rankings
Portage Creek Water Quality Improvement
Portage Creek Dissolved oxygen and fecal coliform bacteria
Stillaguamish Tribe
Funded (Centennial Grant program)
Receiving Water Quality and Stormwater Loading Study
Mainstem Stillaguamish River and 2 storm outfalls
Dissolved oxygen and fecal coliform bacteria
City of Arlington and Ecology
Proposed for FY06 Ecology funding and city of Arlington resources
Revisions to City Wastewater and Stormwater Comprehensive Plans; City Water Conservation Plan and Watershed & Wellhead Protection Plan
Mainstem Stillaguamish River and Portage Creek
Dissolved oxygen and fecal coliform bacteria
City of Arlington
2005

Page 126 Stillaguamish Fecal and DO TMDL Submittal Report
Cost Estimates for Water Cleanup Projects This section provides some approximate costs associated with the water quality improvement projects that are likely to be undertaken to implement this strategy. We did not attempt to estimate the cost of programs that may need to be undertaken by NPDES permittees, the WWTPs and jurisdictions covered by stormwater permits. The cost of addressing nonpoint fecal coliform pollution throughout the watershed, using a grant-funded approach to conduct source identification/public outreach/septic correction and agriculture BMP projects can be calculated (similar to Kitsap County Health District’s Pollution Identification and Correction [PIC] program):
o 7 sub watersheds x $176,000 per sub watershed = $1.23 million
(The figure of $176,000 is the approximate cost of one Kitsap County PIC project [Dogfish Creek] that achieved fecal coliform cleanup for about ten stream-miles; note that project costs vary with number of monitoring stations needed, housing density, type of septic and sewage infrastructure, and other variables.) This cost estimate is provided to give some indication of the level of effort and financial investment that may be required to meet the goals of the TMDL. In some cases, certain types of water quality improvements can be accomplished for less money using volunteer labor or through county-wide educational programs that are not as localized as a PIC project. Information and ideas about more cost-effective ways to accomplish these projects are welcome. Organizations with Programs to Improve Water Quality Tribes, local agencies, and Stillaguamish watershed organizations have ongoing programs that will assist in making improvements to water quality in the Stillaguamish basin. This section describes the capabilities of each organization as they relate to on-the-ground water quality projects that will reduce fecal coliform bacteria, improve dissolved oxygen conditions, and reduce stream temperatures. Stillaguamish Implementation Review Committee (SIRC) The Stillaguamish Implementation Review Committee (SIRC) is a watershed-based local stakeholder group established in the early 1990s. Its mission is to restore and maintain a healthy, functioning Stillaguamish River watershed by providing a local forum in which agencies, organizations, communities, and the public can engage in a collaborative watershed-based process of decision-making and coordination. Its initial focus was to oversee implementation of the 1990 Stillaguamish Watershed Action Plan, which included 71 recommendations for controlling non-point pollution in the watershed. In the mid-1990s, the SIRC added salmon habitat restoration issues to its scope. Since 1999, with leadership from the Stillaguamish Tribe and Snohomish County, the SIRC has served as the local citizens’ committee for recommending prioritized lists of salmon habitat restoration

Stillaguamish Fecal and DO TMDL Submittal Report Page 127
projects to the Washington State Salmon Recovery Funding Board. The SIRC has final oversight authority for lead entity projects, including salmon habitat project lists and the habitat restoration work schedule. Currently, the following are member organizations of SIRC:
• City of Arlington
• City of Stanwood
• Stillaguamish Clean Water District Board
• Federation of Fly Fishers
• Mainstem Stillaguamish community
• North Fork Stillaguamish community
• South Fork Stillaguamish community
• Pilchuck Audubon Society
• Snohomish Conservation District
• Snohomish County Council
• Snohomish County Noxious Weed Control Board
• Snohomish County Planning and Development Services
• Snohomish County Surface Water Management
• Stillaguamish Flood Control District
• Stillaguamish Grange
• Stillaguamish Tribe
• Stillaguamish-Snohomish Fisheries Enhancement Task Force
• Twin City Foods
• Tulalip Tribes
• U.S. Forest Service
• Washington Dairy Federation
• Washington Dept. of Ecology
• Washington Dept. of Fish & Wildlife
• Washington Dept. of Natural Resources
• Washington Farm Forestry Association
• WSU Cooperative Extension In June 2004, SIRC issued the Stillaguamish WRIA 5 Draft Chinook Salmon Recovery Plan (SIRC, 2004) which recommends an integrated strategy for protecting and restoring Chinook
Page 128 Stillaguamish Fecal and DO TMDL Submittal Report
salmon populations. The strategy includes recommendations for habitat restoration projects, compliance and enforcement of existing regulations, policy and regulatory coordination, preliminary commitments and conditions to achieve recovery objectives. monitoring and adaptive management, and public outreach and coordination. Clean Water District The Lower Stillaguamish Clean Water District was established in 1993 by Snohomish County Ordinance 96-080, Title 25 A, to improve drainage, water quality, and fish habitat/shellfish beds. This establishment occurred after the state Department of Health indicated, in response to a request, that water quality would not be good enough to open shellfish beds to commercial harvest. Parcels in the district are assessed an annual fee. Currently 33 percent of fees is allocated to the Snohomish Conservation District to perform services to reduce pollution; 59.1 percent is allocated to water quality restoration activities administered by the Department of Public Works, including funding of the Stillaguamish Steward position; and 7.9 percent is allocated to Department of Public Works for local water quality restoration projects that are recommended by the Clean Water District Advisory Board. City of Arlington The city of Arlington, population 13,700, borders the South Fork Stillaguamish River and a short extent of the mainstem, totaling about one mile of shoreline. Just below the confluence of the two forks, the city operates a 2-mgd wastewater treatment facility (WWTP) that discharges treated effluent to the river and a drinking water treatment facility serving more than 4,000 connections. The city has adopted the 1992 Ecology Stormwater Manual and has applied for the Phase II General Municipal NPDES Stormwater permit. Arlington’s application shows that three out of twelve stormwater outfalls discharge directly to the mainstem Stillaguamish River and its South Fork (most other outfalls discharge to tributaries or ditches that also reach the river). The city’s stormwater management program includes an illicit discharge detection program. City staff are working with Ecology to develop a detailed water quality monitoring program that will address data gaps in the vicinity of the city’s WWTP identified in the Ecology July 2004 TMDL study. Through city efforts, vegetative plantings have been installed at 26 sites along about five miles of streambank within the city limits. These and other projects likely to lead to water quality improvements in the city’s drainages to the Stillaguamish are listed in Appendix E. Snohomish County Surface Water Management Snohomish County Surface Water Management (SWM) administers programs that contribute both to assessment of water quality in the Stillaguamish basin and programs that improve water quality. The SWM monitors water quality on a long-term basis at a number of sites county-wide and, as resources allow, may conduct special monitoring programs. The county has monitored eight sites in the Stillaguamish basin monthly for water quality since 1994. In addition, targeted monitoring programs have been conducted at locations within the basin to assess the effect of small farm BMPs and riparian restoration projects. In 2001 SWM conducted a one-time

Stillaguamish Fecal and DO TMDL Submittal Report Page 129
intensive fecal coliform sampling program targeting creeks, ditches, outfalls, and marine waters in the Warm Beach residential community in an effort to identify failing septic systems.
SWM programs that directly benefit water quality in the Stillaguamish watershed include the following:
• Snohomish County has a strong public outreach program, which consists of educational programs for students, teachers, and the general public. The county also has a native plant salvage program that generates hundreds of hours of volunteer time each year in watershed restoration projects. A full-time watershed steward is assigned to work with citizens on riparian restoration, small farm BMPs, and other water quality projects throughout the Clean Water District.
• Snohomish County adopted a Water Pollution Control Ordinance (Chapter 7.53 SCC) in March 1998. The ordinance prohibits the discharge of pollutants to Snohomish County Streams.
• Monthly monitoring of eight sites in the Stillaguamish basin for water quality since 1994; data are available on the internet at http://www.data.surfacewater.info. The county provides support to DOH to monitor South Skagit Bay for bacteria.
• As part of Phase I NPDES Municipal Stormwater Permit requirements, the county identifies and inspects selected storm sewer outfalls in the Stillaguamish watershed, inspects residential stormwater detention facilities, maintains its storm sewer system, and identifies and implements drainage infrastructure improvements.
Stillaguamish Tribe The Stillaguamish Tribe Natural Resources Department administers a number of programs that contribute to understanding of, and making improvements to, the watershed conditions that affect salmonid and other fish and shellfish resources of the Stillaguamish watershed and Port Susan. Programs include:
• Leadership and support for the Stillaguamish Implementation Review Committee and its goals of increasing salmonid populations and improving water quality throughout the basin.
• Water quality monitoring of Port Susan under a cooperative agreement with the Department of Health to determine commercial shellfish harvest classification.
• Water quality monitoring at a number of locations throughout the watershed, including a study of the effects of a flow enhancing structure on the upstream end of the Old Stilly Channel.
• Certification to negotiate CREP (Conservation Reserve Enhancement Program) contracts with landowners to plant riparian buffers and fence livestock away from streams to prevent or reduce fecal coliform pollution.
• Banksavers Program, a for-profit native plant nursery that maintains native plant nursery stock and manages riparian planting and maintenance projects.
• Operating a smolt trap on the Stillaguamish River to help determine numbers of coho and

Page 130 Stillaguamish Fecal and DO TMDL Submittal Report
Chinook smolts.
• Operating a hatchery on Harvey Creek. Snohomish Health District Snohomish Health District (SHD) has authority and requirements under Revised Code of Washington (RCW) to administer public health and on-site sewage programs in the county. In addition, Chapter 246-272 Washington Administrative Code (WAC) Rules and Regulations of the Washington State Board of Health for On-site Sewage Systems grants local health jurisdictions authority to administer the code. With this authority, SHD has established Snohomish Health District Sanitary Code Chapter 8.1: On-Site Sewage System Regulations, which includes rules and regulations covering:
• Permitting of site evaluations, OSS designs, and installations.
• Inspection of OSS installations during construction and at completion.
• Investigation of complaints related to improper sewage treatment and disposal.
• Maintaining an electronic database of existing OSS and As-Built drawings indexed by county property parcel number and street address. SHD intends to make this information available online in 2005.
The SHD also administers regulations affecting pet waste disposal; under Ch. 3.1, Solid Waste Handling Regulations, pet waste may be placed in the garbage; buried on site at a depth of one foot or greater; or flushed down the toilet provided the property is serviced by sewer rather than an on-site septic system. Snohomish Conservation District. The Snohomish Conservation District (SCD) works throughout Snohomish County and on Camano Island with landowners and livestock owners in developing resource management plans for surface water quality protection. The SCD provides information and services related to riparian and instream restoration, soils, and nutrient management. In addition to trained staff SCD can provide technical assistance in soil science, hydrology, forestry, wetlands, and engineering through the Natural Resource Conservation Service (NRCS). The SCD provides technical assistance, farm plans, and cost-share funds for the implementation of BMPs using state and federal funding sources. TMDL-related BMPs that are recommended and implemented include fencing livestock out of streams, improving pasture and nutrient management, installing gutters to keep water away from barnyard areas, composting and storage of manure, and planting riparian buffers. These BMPs help prevent the transport of mud, nutrients and manure to surface waters, and improve watershed health overall. The SCD implements riparian restoration through the Conservation Reserve and Enhancement Program (CREP) and conducts water quality monitoring. Additional services the SCD is interested in providing, should resources be available, would assist in achieving the goals of this TMDL. These include:

Stillaguamish Fecal and DO TMDL Submittal Report Page 131
• Water quality monitoring, education and outreach to landowners in sub-basins
• Focused BMP effectiveness monitoring
• Inventory of farms, including “animal census” information
• Expanded financial assistance programs for farm planning and BMP implementation Stilly-Snohomish Fisheries Enhancement Task Force The Stilly-Snohomish Fisheries Enhancement Task Force (SSFETF) is a 501(c) (3) nonprofit corporation based in Everett. The mission of SSFETF is to ensure the future of salmon in the Stillaguamish and Snohomish watersheds. Since its beginning in 1990, the Task Force has developed community partnerships and strategies for restoring salmon habitat. It has conducted a number of volunteer planting events and stream restoration projects in the Stillaguamish watershed, including projects on Portage Creek and Glade Bekken Creek near Silvana. Tulalip Tribes The Tulalip Tribes are a sovereign nation with land use authority within their reservation in Marysville. Usual and Accustomed fishing areas include Port Susan and the Stillaguamish River. The Tribes’ Water Quality and Fisheries Department has, in the past, conducted water quality monitoring in the watershed and has an interest in targeting priority areas of the watershed and assessing success of implementation activities. The Tribes have supported a number of water quality, aquatic habitat, and fisheries-related studies of the Stillaguamish River. Washington State Department of Agriculture (WSDA) WSDA administers the Dairy Nutrient Management Act (Ch. 90.64 RCW), which required dairy farmers to have approved dairy waste management plans by July 1, 2002 and to implement the plans by end of 2003. WSDA has responsibility for agricultural operations with NPDES permits, including Animal Feeding Operations (AFOs) and Concentrated Animal Feeding Operations (CAFOs). Under its regulations, WSDA has authority to inspect dairies and other permitted operations on a regular schedule. In 2004, a WSDA livestock program water quality inspection program for western Washington dairies and livestock facilities was initiated. The program had lapsed during transfer of the DNMA inspection program from Ecology. Stillaguamish-basin dairy inspections were resumed in fall 2004 (J. Canaan, personal communication). Washington Department of Health The Department of Health (DOH) Shellfish Division, under authority of Chapter 43.70 RCW, monitors marine water quality in commercial shellfish growing areas. Monitoring for fecal coliform bacteria is conducted monthly by the Stillaguamish Tribe at 16 sites in and adjacent to Port Susan under a cooperative agreement with DOH for shellfish harvest classification.

Page 132 Stillaguamish Fecal and DO TMDL Submittal Report
Ecology Washington State Department of Ecology has been delegated authority under the federal Clean Water Act by the U.S. EPA to establish water quality standards and enforce water quality regulations under Water Pollution Control Act, Chapter 90.48 RCW. In addition to this regulatory role, Ecology provides financial assistance to local governments, Tribes, and conservation districts for water quality projects and stream restoration. Projects that implement water cleanup plans are a high priority for funding. U.S. Environmental Protection Agency The EPA is responsible for reviewing and approving Ecology’s TMDLs and enforcement of the Clean Water Act. EPA provides funding for states and tribes to implement the Clean Water Act. Reasonable Assurances
The goal of the Stillaguamish Watershed Water Cleanup Plan for bacteria, dissolved oxygen, pH, arsenic, and mercury is for the waters of the basin to meet the state’s Class A and AA water quality standards for these parameters. The following rationale helps provide reasonable assurance that the Stillaguamish Watershed water quality goals will be met by 2013. There is considerable interest and local commitment to improving and protecting water quality and restoring salmon habitat of the Stillaguamish River, for example:
• The Stillaguamish Implementation Review Committee has identified water quality as one of its highest priorities as it seeks to protect and restore salmonid habitat throughout the watershed. Local government agencies and individual citizens are well represented and involved at SIRC meetings and at Clean Water District meetings. Given a choice of three levels of effort to achieve 30 percent of Technical Recovery Team planning targets, the SIRC in spring 2004 voted to use the “ambitious approach,” suggesting a high level of commitment by both agencies and individuals.
• The Stilly-Snohomish Fisheries Enhancement Task Force is successful in attracting a substantial number of volunteers to planting and other restoration activities and in providing educational programs for schools.
• Snohomish County SWM took the lead in writing a Centennial Grant proposal that will in part provide funds for septic surveys to be conducted by a Snohomish Health District registered sanitarian. Snohomish Health District has agreed to be a subcontractor on the project and to provide qualified staff for the surveys, and the proposal ranked high on the state’s list in January 2005.
• Snohomish County’s Stillaguamish Steward is experienced and successful in marketing restoration projects to private landowners and developing landowner agreements for riparian improvements.
• After a lapse of two years in water quality inspections of dairies in Snohomish County, due to transfer of the Dairy Nutrient Management Program from Ecology to Washington State Dept of Agriculture, inspections were resumed in fall 2004.

Stillaguamish Fecal and DO TMDL Submittal Report Page 133
• Snohomish Conservation District (SCD) will continue to provide technical assistance and best management practices implementation for Stillaguamish Basin small farms and agricultural activities. SCD has proposed a Centennial Grant project (submitted fall 2005; likely to receive FY 2006 funding) to provide small farm BMP education in the Harvey-Kackman-Armstrong and March and Fish Creek sub-watersheds.
• Whenever applicable BMPs are not being implemented and Ecology has reason to believe that individual sites or facilities are causing pollution in violation of RCW 90.48.080, Ecology may pursue orders, directives, permits, or enforcement actions to gain compliance with the state’s water quality standards. Ecology will enforce water quality regulations under Chapter 90.48 RCW.
Adaptive Management Implementation of the Stillaguamish River Watershed TMDL will be adaptively managed such that the river’s main stem, Hat Slough, North and South Forks, listed creeks and marine waters of Port Susan will meet Washington State’s water quality standards by 2013. Adaptive management of the implementation activities and programs could include adjusting best management practices, modifying stream sampling frequency and/or locations, conducting special inspections in identified source areas, helping develop and fund water quality projects that address the pollutant targets of this TMDL, local education initiatives, and other means of conforming management measures to current information on the impairment. If water quality standards are met without attaining the load allocation reductions specified in this document, then the objectives of this TMDL are met and no further reductions are needed. One of the more difficult-to-achieve objectives of this TMDL is to make measurable progress in reducing the sediment load carried by the Stillaguamish to address the mercury impairments in North and South forks. The landslides along North and South forks that contribute excessive sediment to this river system have their origins in both natural and anthroporphic processes. As Ecology works with local organizations to reduce the impacts of these landslides on the river, this agency may need to revisit and redefine this objective in the light of financial and technical feasibility of projects to reduce sediment inputs. Adaptive management will follow this process:
(1) The detailed implementation plan (DIP), to be developed by Ecology with review and participation of local agencies and organizations, will prioritize locations for addressing water quality problems, assign local responsibility, list cleanup activities needed to address the problem, and develop a schedule for the activities.
(2) The detailed implementation plan will also identify locations within the Stillaguamish watershed where additional monitoring is needed to identify sources.
(3) Ecology will facilitate an annual review of water quality data and cleanup activities with participation by local organizations and agencies, including Snohomish County Surface Water Management, the Stillaguamish and Tulalip Tribes, the city of Arlington, Snohomish Conservation District, and other partner watershed organizations.

Page 134 Stillaguamish Fecal and DO TMDL Submittal Report
(4) Ecology’s tracking of implementation (cleanup) activities will be accomplished through this annual review or by individual consultation with the responsible organization. A summary spreadsheet will be developed to assist in tracking. This summary spreadsheet will be linked to a GIS map tool to locate cleanup activities as appropriate. It is expected that some cleanup activities, such as education and outreach programs, will be county-wide or watershed-wide and will be tracked only on the spreadsheet.
(5) Based on the annual review of water quality data and cleanup activities, adjustments will be made to the detailed implementation plan (DIP) to ensure that the plan’s sampling locations and prioritized cleanup activity list continue to be effective. The updated DIP will be made available to local organizations so that their budgeted programs and grant applications will reflect any changes in priority locations, priority cleanup actions, and identified education and outreach needs.
(6) Effectiveness monitoring by Ecology is expected to be conducted as soon as 2011 or as late as 2013, six to eight years after publication of the detailed implementation plan. The decision to schedule effectiveness monitoring will depend on best professional judgment that measurable improvement in water quality has occurred, based on the annual review of water quality data and implementation tracking,.
(7) Should implementation occur more quickly, effectiveness monitoring would be conducted prior to 2011.
Table 40. Schedule for Detailed Implementation Plan (DIP) and Adaptive Management
Task Responsible Organization Target Date Pre-DIP review of monitoring programs & sample locations
Ecology with local organizations June 2005
Pre-DIP review of water quality data/Prioritize actions
Ecology with local organizations August 2005
Preliminary list of cleanup actions Ecology with local organizations October 2005 First annual review of water quality data/Review & discuss actions
Ecology with local organizations June 2006
Detailed Implementation Plan Ecology with local organizations Fall 2006 Second, 3rd, 4th and 5th annual reviews of water quality data/Review & discuss actions
Ecology with local organizations June 2007, 2008, 2009, 2010
Effectiveness monitoring Ecology 2011 Monitoring Strategy
EPA (1991) guidance calls for a monitoring program for evaluating progress on TMDLs. Monitoring is an important tool for assessing the progress or success of implementation measures based on the total maximum daily load (TMDL) recommendations. Post-implementation monitoring is required in the TMDL process to ensure that water quality standards are being attained and that implementation measures are effective. If water quality standards are not met after the TMDL has been established, then adjustments to the load and wasteload allocations may be required, or implementation activities may require modification.

Stillaguamish Fecal and DO TMDL Submittal Report Page 135
Successful TMDL evaluations require several types of monitoring data. Water quality, aquatic resources, land use, and implementation activity data are needed to evaluate the progress of the TMDL. The details of the location, type, and timing of data collection and TMDL compliance schedule will be provided in the detailed implementation plan. The following sections provide recommendations and strategies for water quality monitoring and implementation activity tracking. Recommendations for Monitoring Tributary, mainstem, and Port Susan compliance with fecal coliform standards and reduction
goals should be measured at the sites where data were used to generate the reduction goals. Storm-event data should be included but not over-represented in the record.
Intensive monitoring to identify sources and problem reaches are very helpful, but data used in those investigations should not be blended with routine monitoring data to determine the overall progress of TMDL-related activities.
Port Susan fecal coliform data should continue to be collected under the authority of the Washington State Department of Health, following the water quality monitoring protocols established under the National Shellfish Sanitation Program (NSSP, 2003).
Dissolved oxygen data should be collected over day and night cycles during critical periods at sites identified as not meeting standards. If multiple samples are not possible, then samples should be collected early in the morning close to sunrise to record minimum concentrations.
Reaches upstream of dissolved oxygen, pH, and fecal coliform monitoring sites should be characterized for ground water, wetland, stormwater, and nonpoint source inputs. Reaches upstream and downstream of monitoring sites should have salmon and general aquatic habitat assessments.
Salmon productivity and habitat-limiting factors in Portage, March, Pilchuck, and Kackman creeks, as well as Glade Bekken sub-basin, need documentation.
Mainstem Stillaguamish River primary productivity response and hyporheic exchange rate changes related to seasonal low flows require more spatial and temporal definition. The relationships of these physical and biological changes to dissolved oxygen, pH, and nutrients need better understanding.
Nonpoint sources active during dry or runoff conditions along the mainstem Stillaguamish River and its two major forks need to be identified and removed.
Stormwater conveyance infrastructures and stormwater quantity and quality need better characterization to establish more accurate stormwater load and wasteload allocations.
• Wastewater treatment plants should include phosphorus and nitrogen monitoring of effluent and receiving waters, especially during critical conditions.
Initial Monitoring Needs The detailed implementation plan, to be developed by Ecology with review and participation of local agencies and organizations, will prioritize locations for addressing water quality problems,

Page 136 Stillaguamish Fecal and DO TMDL Submittal Report
assign local responsibility, list cleanup activities needed to address the problem, and develop a schedule for the activities. Ecology will facilitate an annual review of water quality data and cleanup activities with participation by local organizations and agencies, including Snohomish County Surface Water Management, the Stillaguamish and Tulalip Tribes, the city of Arlington, Snohomish Conservation District, and other partner watershed organizations. The changes in land use and the measures used to reduce the impact of land uses on water quality should be inventoried, evaluated, and tracked. This will require commitment on the part of partner organizations such as Snohomish County because of the extensive effort this could entail. Ecology’s tracking of implementation (cleanup) activities will be accomplished through the annual review or by individual consultation with the responsible organization. A summary spreadsheet will be developed to assist in tracking. This summary spreadsheet will be linked to a GIS map tool to locate cleanup activities as appropriate. It is expected that some cleanup activities, such as education and outreach programs, will be county-wide or watershed-wide and will be tracked only on the spreadsheet. Organizations that Monitor Water Quality Organizations with capability and experience in monitoring water quality in the Stillaguamish watershed include:
• Snohomish County Surface Water Management
• Stillaguamish Tribe Natural Resources Department
• City of Arlington
• Tulalip Tribes
• Stilly-Snohomish Fisheries Enhancement Task Force
• Snohomish Conservation District Ongoing water quality monitoring in the basin is conducted by Snohomish County Surface Water Management and the Stillaguamish Tribe. Also, Ecology long term river monitoring stations are located at:
• Stillaguamish River near Silvana (05A070
• South Fork Stillaguamish River at Arlington (05A090)
• South Fork Stillaguamish River near Granite Falls (05A110)
• North Fork Stillaguamish River at Cicero (05B070)
• North Fork Stillaguamish River near Darrington (05B110)

Stillaguamish Fecal and DO TMDL Submittal Report Page 137
Potential Funding Sources The Centennial Clean Water Fund, Section 319 grants under the federal Clean Water Act, and State Revolving Fund loans are available to fund activities by jurisdictions to help implementation of the TMDL. CCWF in spring 2004 awarded the Stillaguamish Tribe funds for the Steelhead Haven Landslide Project that will reduce sediment loading and protect the river from the shallowing and widening (causing increased exposure to solar radiation) effects of this landslide. Additional Salmon Recovery Funds have been awarded to this project. Snohomish County, with assistance from the Snohomish Health District, applied in fall 2004 for Centennial Funds for the Snohomish County Septic Systems project, which would include pilot projects in two sub watersheds of the Stillaguamish. Non-governmental organizations can apply for 319 grant funding. Should additional funding be necessary to reach standards, Ecology will work with the local organizations to prepare appropriate scopes of work, to implement this TMDL, and to assist with applying for grant opportunities as they arise. Grants through Ecology’s Centennial Clean Water Fund, Section 319, and State Revolving Fund loans continue to provide resources to fund implementation activities identified in the TMDL. The Puget Sound Water Quality Action Team administers Public Involvement and Education grants. The Conservation District provides technical assistance and BMP cost-sharing funding using local (Clean Water District), state and federal funds, as available. The Stillaguamish Tribe and the conservation district write CREP plans and work with landowners to get riparian buffers installed with funds from the Farm Service Agency and the Washington Conservation Commission. The federal Natural Resources Conservation Service provides some technical assistance and also administers the Environmental Quality Incentive Program (EQIP), which provides cost share funds for BMPs on agricultural sites. Stream restoration activities are eligible for salmon restoration grants through various sources. The Lower Stillaguamish Clean Water District is supported through a fee assessment on property owners in the lower part of the watershed for projects related to drainage and improved water quality in Port Susan for shellfish and fish. Besides the portion administered by Snohomish County Surface Water Management for drainage and other improvement projects, some Clean Water District fees go to Snohomish Conservation District (above paragraph); also a Discretionary Fund of approximately $45,000 is available annually for on-the-ground projects to improve water quality and aquatic habitat. The Clean Water District Citizens Advisory Board is charged with reviewing grant applications for these funds.
Page 138 Stillaguamish Fecal and DO TMDL Submittal Report
References Cited APHA et al., 1998. Standard Methods for the Examination of Water and Wastewater. Twentieth edition. American Public Health Association, American Water Works Association, and Water Pollution Control Federation. Washington D.C. Aroner, E., 1995. WQHYDRO: Water Quality/Hydrology/Graphics and Analysis System. Portland, OR. ASAE, 1998. Manure Production and Characteristics. Standard ASAE D384.1 DEC99. American Society of Agricultural Engineers, St. Joseph, MI. Bailey, G., 2002. Permit Writer’s Manual. Revised July 2002. Washington State Department of Ecology, Water Quality Programs, Olympia, WA Publication 92-109. http://www.ecy.wa.gov/biblio/92109.html. Barlond, O., 2001. Photographs and notes on flooding in the Portage Creek sub-basin in 2000 and 2001. Email digital photographs sent on various dates. Biggs, B.J.F., 2000. Eutrophication of streams and rivers: dissolved nutrient-chlorophyll relationships for benthic algae. Journal North American Benthological Society 19(1):17-31. Blake, B., 2002. Personal communication. City of Arlington, Arlington, WA. Calambokidis, J., B.D. McLaughlin, and G.H. Steiger, 1989. Bacterial Contamination Related to Harbor Seals in Puget Sound, Washington. Cascadia Research Collective report to Jefferson County and Washington State Department of Ecology, Olympia, WA. 74 pgs. Canaan, J. 2004. Personal communication (email) from Jeff Canaan, WSDA Livestock Nutrient Management Program, regarding water quality inspections of livestock facilities in Snohomish County, Oct. 1, 2004, with S. Lawrence, Ecology Northwest Regional Office. Chapra, S.C., 1997. Surface Water Quality Modeling. McGraw-Hill Companies, Inc. Chapra, S.C., 2001. Water-Quality Modeling Workshop for TMDLs, Washington State Department of Ecology, Olympia, WA, June 25-28, 2001. Connolly, P.J., 2001. Stillaguamish River Watershed Restoration. 1999 Annual Report. Edited by P.J. Connolly, U.S. Geological Survey, Columbia River Research Laboratory, Cook, WA. Prepared for Bonneville Power Administration, Environment, Fish and Wildlife, Portland, OR, Project Number: 1998-019-01. Cullinan, T., 2001. Important Bird Areas of Washington. Washington Audubon and Washington Department of Fish and Wildlife, Olympia, WA. Cusimano, R., 1997. Water Quality Assessment of Tributaries to the Snohomish River and Nonpoint Source Pollution TMDL Study. Washington State Department of Ecology, Olympia, WA. Publication No. 97-334. 52 pgs. http://www.ecy.wa.gov/biblio/97334.html

Stillaguamish Fecal and DO TMDL Submittal Report Page 139
DNR (Washington State Department of Natural Resources). 1999. Forests and Fish Report, April 29, 1999: Report to the Forest Practices Board and the Governor’s Salmon Recovery Office by DNR, Ecology, representatives of Tribes, and federal agencies. Dodds, W.K. and E.B. Welch, 2000. Establishing nutrient criteria in streams. Journal of the North American Benthological Society 19(1):186-196. Earth Tech, 1997. City of Arlington Stillaguamish River Water Quality Monitoring Report. Prepared for the City of Arlington by Earth Tech Consultants. December 1997. Bellevue, WA. 24 pgs. + appendices. Ecology, August 2004. Data Summary: Stillaguamish River watershed fecal coliform, dissolved oxygen, pH, mercury and arsenic Total Maximum Daily Load study. Joe Joy, Sarah Coffler, and Kimberly Gridley. Washington State Department of Ecology, Environmental Assessment Program, Olympia, WA. Publication No. 04-03-037.
Ecology, July 2004. Stillaguamish River Watershed Fecal Coliform, Dissolved Oxygen, pH, Mercury and Arsenic Total Maximum Daily Load Study. Joe Joy, Washington State Department of Ecology, Environmental Assessment Program, Olympia, WA. Publication No. 04-03-017. http://www.ecy.wa.gov/biblio/0403017.html Ecology, March 2004. Stillaguamish River Watershed Temperature Total Maximum Daily Load Study. Greg Pelletier, Washington State Department of Ecology, Environmental Assessment Program, Olympia, WA. Publication No. 04-03-010. http://www.ecy.wa.gov/biblio/0403010.html. Ecology, 2003a. Ecology Environmental Information Management System data. Washington State Department of Ecology, Olympia, WA. Ecology, 2003b. http://www.ecy.wa.gov/programs/eap/models/ Ecology, 2002. Proposed Chapter 173-201A. December 19, 2002. Washington State Department of Ecology, Olympia, WA. http://www.ecy.wa.gov/programs/wq/swqs/rev_rule.html Ecology. 2001. Stillaguamish River Basin and Port Susan Total Maximum Daily Load Evaluation Update: Quality Assurance Project Plan. Joe Joy, Washington State Department of Ecology, Environmental Assessment Program, Olympia, WA. December 2001. Publication No. 01-03-065. 61 pgs. http://www.ecy.wa.gov/biblio/0103065.html Ecology, 2001. Stillaguamish River Temperature Total Maximum Daily Load: Quality Assurance Project Plan. Greg Pelletier and Dustin Bilhimer, Environmental Assessment Program, July 30, 2001. Ecology, 2001. Stormwater Management Manual for Western Washington, Washington State Department of Ecology, Water Quality Program, Olympia, WA, August 2001. Ecology, 2000. Final 1998 Section 303(d) List – WRIA 5 Data Decision Matrix. Washington State Department of Ecology, Water Quality Program, Olympia, WA.

Page 140 Stillaguamish Fecal and DO TMDL Submittal Report
Ecology, 2000. Washington's Water Quality Management Plan to Control Nonpoint Source Pollution, Washington State Department of Ecology, Water Quality Program, Olympia, WA 98504-7710, June. 2000. Ecology, 1998. Setting standards for the bacteriological quality of Washington’s surface waters – preliminary review draft discussion paper, January 1998. Washington State Department of Ecology, Water Quality Program, Olympia, WA. 32 pgs. Ecology, 1994. Watershed Approach to Water Quality Management: Needs Assessment for Skagit/Stillaguamish Watershed. June 1994. Prepared by S. Messman, G. Dorf, B. Duffy; Northwest Regional Office Water Quality Program. Embrey, S., 2001. Microbiological quality of Puget Sound basin streams and identification of contaminant sources. Journal of the American Water Resources Association 37(2): 407-421. EPA, 2000. Ambient Water Quality Criteria Recommendations Information supporting the development of State and Tribal nutrient criteria: Rivers and Streams in Nutrient Ecoregion II. EPA 822-B-00-015 December 2000. U.S. Environmental Protection Agency, Office of Water, Washington, D.C. EPA, 2001. Protocol for Developing Pathogen TMDLs, U. S. Environmental Protection Agency, EPA 841-R-00-002, Washington, D. C., 90 pp. and appendices. EPA, 1999. National Recommended Water Quality Criteria – Corrected. U.S. Environmental Protection Agency, Office of Water, Washington, D.C. EPA 882-Z-99-001. EPA, 1998. Report of the Federal Advisory Committee on the Total Maximum Daily Load (TMDL) Program. The National Advisory Council for Environmental Policy and Technology (NACEPT). U.S. Environmental Protection Agency, Office of the Administrator. EPA 100-R-98-006. EPA, 1997. Memorandum of Agreement Between the USEPA and Washington State Department of Ecology Regarding the Implementation of Section 303(d) of the Federal Clean Water Act, U. S. Environmental Protection Agency, 1997, 22 pp. EPA, 1991. Guidance for Water Quality-based Decisions: The TMDL Process. U.S. Environmental Protection Agency. EPA 440/4-91-001. EPA, 1986. Quality Criteria for Water. U.S. Environmental Protection Agency, Office of Water, Washington, D.C. EPA 440/5-86-001. Erkenbrecher, Jr., C.W., 1981. Sediment bacterial indicators in an urban shellfishing subestuary of the lower Chesapeake Bay. Applied and Environmental Microbiology 42(3):484-492. Gilbert, R.O., 1987. Statistical Methods for Environmental Pollution Monitoring. Van Nostrand Reinhold Company, New York, NY.

Stillaguamish Fecal and DO TMDL Submittal Report Page 141
Huber, H., 2003. Personal communication. National Marine Fisheries Service. Huntting, M.T., 1956. Inventory of Washington Minerals: Part II Metallic Minerals, Volume 2 -– Maps. Bulletin No. 37. Washington State Department of Conservation and Development, Division of Mines and Geology, Olympia, WA. Jezorek, I. and P.J. Connolly, 2001. Stillaguamish River Watershed Project 1999 Annual Report, Report H: Flow, Temperature, and Habitat Conditions in the Stillaguamish River Watershed. USGS Columbia River Research Laboratory, Cook, WA. Johnson, A., 2002. Results and Recommendations from Monitoring Arsenic Levels in 303(d)-listed Rivers in Washington. Washington State Department of Ecology, Olympia, WA. Publication No. 02-03-045. 20 pgs. http://www.ecy.wa.gov/biblio/0203045.html Joy, J. and N. Glenn, 2000. Stillaguamish River Basin Pre-TMDL Assessment. March 2000, unpublished. Washington State Department of Ecology, Olympia, WA. 8 pgs. + figures Kitsap County Health District. 2004. Dogfish Creek Final Report. 27 pp. http://www.kitsapcountyhealth.com/environmenta_health/water_quality/docs/MonotoringReportDocs/2004_report_dogfish_creek.pdf Klopfer, D., 2000. Unpublished data collected by the Stillaguamish Tribe, Arlington, WA. Presented in Everett, WA. Klopfer, D., 2002. Personal communication. Stillaguamish Tribe, Arlington, WA. Knight, K. 2004. Personal communication (email) to S. Lawrence, Washington Dept. of Ecology, Oct. 22, 2004. Kris Knight, Restoration Site Supervisor, The BankSavers Project, Stillaguamish Tribe, Arlington, WA. McKay, Jr., D., D.K. Norman, M.A. Shawver, and R.F. Teissere, 2001. Directory of Mines, 2001. Washington State Department of Natural Resources, Division of Geology and Earth Resources, Olympia , WA. Information Circular 94. August 2001. Naegeli, M.W. and U. Uehlinger, 1997. Contribution of the hyporheic zone to ecosystem metabolism in a pre-alpine gravel-bed river. Journal of North American Benthological Society 16 (4): 794-804. National Shellfish Sanitation Program. 2003. Guide to Control of Molluscan Shellfish. www.cfsan.fda.gov/~ear/nss2-toc.html National Stormwater Quality Database, 2004. Phase I NPDES MS4 monitoring database established by Robert Pitt, Alex Maestre, and Renee Morquecho of the University of Alabama. http://unix.eng.ua.edu/~rpitt/Research/ms4/mainms4.shtml Norman, D.K., 2000. Washington’s Inactive and Abandoned Metal Mine Inventory and Database. Washington Geology, 28:1/2. September 2000. Pgs. 16-18.

Page 142 Stillaguamish Fecal and DO TMDL Submittal Report
Novotny, V. and H. Olem, 1994. Water Quality Prevention, Identification, and Management of Diffuse Pollution. Van Nostrand Reinhold, New York, NY. Ott, W., 1995. Environmental Statistics and Data Analysis. Lewis Publishers, New York, NY. Paulsen, K., K. Thornburgh, and K. Rawson, 1991. Stillaguamish River Volunteer Water Quality Monitoring Project. Tulalip Tribes Fisheries Department, Progress Report No. 91-4. Marysville, WA. Pelletier G. and S. Chapra, 2003. QUAL2Kw – Documentation and user manual for a modeling framework to simulate stream water quality. Draft 4-September 2003. Washington State Department of Ecology, Olympia, WA. 138 pgs. Pelletier, G. and D. Bilhimer, 2001. Quality Assurance Project Plan: Stillaguamish River Temperature Total Maximum Daily Load. Washington State Department of Ecology, Olympia WA. Plotnikoff, R., 1991. Portage Creek: Nonpoint Source Pollution Effects on Quality of the Water Source. Publication No. 95-300. Washington State Department of Ecology, Olympia, WA. 94 pgs. Puget Sound Water Quality Action Team, 1998. 1998 Puget Sound Update: Sixth Report of the Puget Sound Ambient Monitoring Program. Olympia, WA. Raforth, R.L., D.K. Norman, and A. Johnson, 2002. Second Screening Investigation of Water and Sediment Quality of Creeks in Ten Washington Mining Districts, with Emphasis on Metals. Washington State Department of Ecology, Olympia, WA. Publication No. 02-03-024. 94 pgs. http://www.ecy.wa.gov/biblio/0203024.html. Randolph, D., 2000. Personal communication. City of Arlington, Arlington, WA. Sargeant, D., 2002. Dungeness River and Matriotti Creek Fecal Coliform Bacteria Total Maximum Daily Load Study. Washington State Department of Ecology, Olympia, WA. Publication No. 02-03-014. 46 pgs. http://www.ecy.wa.gov/biblio/0203014.html SIRC. 2004. Draft Chinook Salmon Recovery Plan for Stillaguamish Watershed – WRIA 5. June 30, 2004. Prepared by Jones & Stokes, Bellevue, WA for Stillaguamish Implementation Review Committee (SIRC) and Puget Sound Shared Strategy Snohomish County, 2002. NPDES Municipal Stormwater Discharge Permit 2001 Annual Report. Snohomish County Public Works, Surface Water Management Division, Everett, WA. 59 pgs. Snohomish County Health District and Washington State Department of Health, 1991. Seasonal Study of Arsenic in Ground Water, Snohomish County. Washington State Department of Health, Environmental Health Programs, Office of Toxic Substances, Olympia, WA. 40 pgs.

Stillaguamish Fecal and DO TMDL Submittal Report Page 143
Stienbarger, D., 1995. Inventory and Evaluation of Livestock Operations and the Potential for Non-point Pollution in the Stillaguamish Clean Water District. Snohomish Conservation District, Everett, WA. 26 pgs. Stormwater Center, 2004. Simple Method to Calculate Urban Stormwater Loads. http://www.stormwatercenter.net. Go to “Monitor/Assess.” Select “Rapid Assessment Methods” to get to Simple Method. 4 pgs + tables. Thomann, R.V. and J.A. Mueller, 1987. Principles of Surface Water Quality Modeling and Control. Harper and Row, New York, NY. Thomas, B.E., J.M. Wilkinson, and S.S. Embrey, 1997. The Ground-water System and Ground-water Quality in Western Snohomish County, Washington. U.S. Geological Survey Water-Resources Investigations Report 96-4312. Tacoma, WA. 218 pgs. Thornburgh, K. 2004. Personal communication (email) from Kathy Thornburgh, Snohomish County Surface Water Management Biologist regarding Snohomish County Centennial Grant proposal, “Snohomish County Septic Systems,” September 2, 2004, with S. Lawrence, Ecology Northwest Regional Office. Thornburgh, 2001. Glade Bekken Watershed Restoration and Monitoring. Snohomish County Public Works, Surface Water Management Program, Everett, WA. 34 pgs Thornburgh and Williams, 2001. State of the Waters, 2000: Water Quality in Snohomish County’s Rivers, Streams, and Lakes. Snohomish County Public Works, Surface Water Management Program, Everett, WA. TMDL Workgroup, 1997. Total Maximum Daily Load Development Guidelines. Washington State Department of Ecology, Environmental Assessment Program, Olympia, WA. Publication No. 97-315. 30 pgs. http://www.ecy.wa.gov/biblio/97315.html Uehlinger, U., 2000. Resistance and resilience of ecosystem metabolism in a flood-prone river system. Freshwater Biology 45: 319-332. USDA Forest Service and USDI Bureau of Land Management. 1994. Record of Decision for Amendments to Forest Service and Bureau of Land Management Planning Documents within the Range of the Northern Spotted Owl. Portland, Oregon. 73p. USFDA, 2000. National Shellfish Sanitation Program Model Ordinance. U.S. Food and Drug Administration Center for Food Safety and Applied Nutrition, Office of Seafood. 1999 Revision released November 3, 2000. Washington, D.C. http://www.cfsan.fda.gov/~ear/nsspotoc.html USGS, 1997. The ground-water system and ground-water quality in western Snohomish County, Washington. U.S. Geological Survey, Water Resources Investigations Report 96-4312, Tacoma, WA.

Page 144 Stillaguamish Fecal and DO TMDL Submittal Report
Vervier, P. and R.J. Naiman, 1992. Spatial and temporal fluctuations of dissolved organic carbon in subsurface flow of the Stillaguamish River (Washington, USA). Archives Hydrobiologie 123(4): 401-412. Warren, C.E., 1971. Biology and Water Pollution Control. W.B. Saunders Company. Philadelphia, PA. Washington State Office of Financial Management, 2003. 2003 Population Trends for Washington State, September 2003, Olympia, WA. Wayland, R.H. and J.A. Hanlon, 2002. Establishing Total Maximum Daily Load (TMDL) Wasteload Allocations (WLAs) for Storm Water Sources and NPDES Permit Requirements Based on those WLAs, U. S. EPA, Office of Water, Memorandum to Water Directors EPA Regions 1 – 10, Washington, D.C., November 22, 2002, 6 pp. WCC, 1999. Salmon and Steelhead Habitat Limiting Factors Water Resource Inventory Area 5, Stillaguamish Watershed. Washington State Conservation Commission, Olympia, WA. Weiskel, P.K., B.L. Howes, and G.R. Heufelder, 1996. Coliform contamination of a coastal embayment: sources and transport pathways. Environmental Science and Technology 30, 6:1872-1881. West, J., S. O’Neill, G. Lippert, and S. Quinnell, 2001. Toxic Contaminants in Marine and Anadromous Fishes from Puget Sound, Washington. Washington Department of Fish and Wildlife, Olympia, WA. 311 pgs.

Stillaguamish Fecal and DO TMDL Submittal Report Page A-145
Appendix A. Public Participation Including
Responses to Comments

Page A-146 Stillaguamish Fecal and DO TMDL Submittal Report

Stillaguamish Fecal and DO TMDL Submittal Report Page A-147
Public Participation In 2000 through 2004, Ecology developed TMDLs for fecal coliform bacteria, dissolved oxygen and temperature in the Stillaguamish watershed. (A chronology is provided below.) Data collection and analysis benefited greatly from suggestions and interpretation from local watershed participants. The final TMDL studies include water quality data provided by the Stillaguamish Tribe and Snohomish County Surface Water Management, among others. During writing of the TMDL studies, Ecology water quality scientists and the TMDL lead presented results and recommendations for implementation to local organizations, Tribes and government agencies at a number of meetings at TMDL meetings convened by Ecology in the watershed. Watershed residents have learned about the TMDL water cleanup plans in other ways. News releases were issued by Ecology’s Northwest Regional Office when the temperature TMDL study was published in March and when the fecal coliform bacteria, dissolved oxygen, pH, mercury, and arsenic TMDL study was published in July 2004. The latter news release led to an article by reporter Christopher Schwarzen, “Bacteria, other pollutants in Stillaguamish targeted,” in the Snohomish County edition, Seattle Times, on September 8, 2004. The draft TMDL summary implementation strategy was presented at a public meeting in Arlington on November 9, 2004, from 4 to 8 p.m. The public comment period on the draft, which was posted on Ecology’s WRIA 5 TMDL website, extended from November 3 to December 17, 2004 to allow for public and local agency review and feedback. Public notice for the commencement of the public comment period and public meeting consisted of a mailed Focus Sheet and legal advertisement in the Arlington and Everett newspapers on November 3, 2004. Ecology’s responses to comments are provided in this appendix following the chronology of TMDL development. Chronology of Non-Point Water Quality Planning and TMDLs for the Stillaguamish Watershed Development of the Stillaguamish TMDL for fecal coliform bacteria, dissolved oxygen, pH, arsenic and mercury, and the second TMDL for temperature, have their early origins in the Stillaguamish Watershed Action Plan (January 1990). This “Nonpoint Action Plan” was developed under WAC 400-12 under a Centennial Fund grant to Snohomish County. To provide for strong public involvement in development of the watershed plan, a Citizens Advisory Committee (CAC) was formed. This CAC has continued its commitment to watershed planning and improvement. Now, renamed the Stillaguamish Implementation Review Committee (SIRC), the committee is the lead entity for salmon restoration planning in the watershed and has continued to provide strong support for and coordination of water quality improvements. Ecology’s TMDL process in the Stillaguamish includes the milestones listed below, followed by approximate dates for completing the TMDL in 2005 through 2007.

Page A-148 Stillaguamish Fecal and DO TMDL Submittal Report
June 1994—Ecology Water Quality Needs Assessment for Skagit/Samish/Stillaguamish Watersheds identified a “Lower Stillaguamish & Portage Creek TMDL for DO, turbidity and FC” as a medium priority future project (Ecology 1994). March 2000—Pre-TMDL Assessment completed. 2001—Quality Assurance Project Plans completed for Temperature TMDL study (July) and for Fecal Coliform, Dissolved Oxygen, pH, Arsenic and Mercury TMDL study (December). June 2000 – June 2002—Data for TMDLs based on water quality sampling by Ecology with additional data provided by the Stillaguamish Tribe and Snohomish County Surface Water Management. Airplane-based aerial surveys of Stillaguamish Watershed for infrared sensing of water temperature took place on September 7 and 8, 2001. 2003 and 2004—Analysis of TMDL data. Computer models were used to evaluate loadings affecting dissolved oxygen conditions in river under critical low flow condition; also to model effects of changes in riparian vegetation, water withdrawals, channel width changes and riparian microclimate changes on stream temperature under critical low flow conditions. November 2003—Ecology reviewed a directive by EPA to include estimates of stormwater contributions in TMDLs and assign Wasteload Allocations to current and future NPDES stormwater permittees (Snohomish County; City of Arlington; and Washington State Department of Transportation.) 2003 and 2004—Watershed meetings on progress of the TMDL study. November 4, 2004—Draft Summary Implementation Strategy distributed by email to watershed advisory group, local agencies, Tribes and made available online at Ecology’s WRIA 5 TMDL website. November 9, 2004—Public meeting on Draft TMDL Summary Implementation Strategy. December 17, 2004—Public comment period closed. February 2005—TMDL Summary Implementation Strategy to be submitted to EPA for approval. 2005 - 2007—TMDL Detailed Implementation Plan to be developed by Ecology with watershed organizations.

Stillaguamish Fecal and DO TMDL Submittal Report Page A-149
From: Altose, Larry Sent: Thursday, December 09, 2004 6:15 PM To: Lawrence, Sally (ECY); Hirschey, Steve Cc: Garland, Dave; Palenshus, DouGlas; Beitel, Judy; Swenson, Dan Subject: News; Stanwood-Camano News; 11-2-04; Stilly
_________________________________ Larry Altose, Public Information Wash. Dept. of Ecology, NW Region 425-649-7009

Page A-150 Stillaguamish Fecal and DO TMDL Submittal Report
Response to Comments
Comments received during the public review period November 9 – December 17, 2004, are paraphrased below followed by Ecology’s responses. Many comments were addressed by adopting recommended text changes in this submittal report; those that were not are included here. Responses to comments on the In Stream Flow Rule Presentation for the Stillaguamish River were provided by Ecology Northwest Regional Office’s Water Resources Program. Comment. Recommendations in the plan that discuss pollutants other than bacteria, dissolved oxygen, or temperature, or any recommendations that discuss nutrients, are inappropriate. Response: Temperature, fecal coliform, and dissolved oxygen were the major pollutants evaluated in the Stillaguamish River Watershed TMDL studies. However, nutrients, pH, arsenic, mercury, suspended sediment, channel structure, riparian conditions, and instream flows were all discussed in the studies. Nutrients, including load allocations, were specifically discussed in relation to dissolved oxygen and pH conditions in the Stillaguamish River mainstem and its two major forks in the conventional contaminants report. Suspended sediment reductions were recommended to reduce mercury and arsenic concentrations in the convention contaminants report, and to reduce temperatures from channel filling and bank erosion (channel widening) effects in the temperature report. Comment: Reference to nutrients associated with septic waste is extraneous to discussion. Reference to ground water depleting oxygen in surface waters should also explain that this is a natural condition and not subject to remediation or load allocations. Response: The sentence may require a bit more elaboration, but it is not extraneous to the discussion. The reference to nutrients from poorly maintained or constructed on-site septic system waste relates to the set of bullets on the previous page where the potential relationship between nutrients and low dissolved oxygen conditions is mentioned. We agree that it would be correct to mention that ground water with depressed oxygen would not require remediation; however, it would be included as a background load that could influence other wasteload or load allocations to the water body. Comment: References to sediment as a pollutant in the TMDL are not appropriate. Response: This fecal coliform and dissolved oxygen TMDL addresses arsenic and mercury in the watershed as well as fecal coliform bacteria, pH and dissolved oxygen. The analysis demonstrated that arsenic and mercury tend to be associated with sediment particles. Measures that reduce the overall sediment load in the river are recommended for their effect in reducing arsenic and mercury as well. Comment: We feel that it is inappropriate to include any recommendations that discuss nutrients in the plan. Remove references to pollutants not specifically addressed in this TMDL. Response: The response to Comment 1 applies to this comment as well. Nutrient controls were addressed in the conventional contaminants report to control depressed dissolved oxygen and

Stillaguamish Fecal and DO TMDL Submittal Report Page A-151
elevated pH in parts of the watershed. Phosphorus load allocations were set for the North Fork Stillaguamish River to control pH. Recommendations were also made in this report to conduct additional nutrient input characterizations in the lower North Fork and South Fork and in the confluence reach downstream to the Interstate 5 Bridge. The seasonal dissolved oxygen depression in that reach is thought to be influenced by nutrient loads. The implementation strategy could name these areas specifically, but it would be reasonable management recommendation for Snohomish County to characterize nutrients in stormwater discharged to other water bodies as well. Comment: Is the prevalence of beaver dams considered when setting load allocations for BOD to improve dissolved oxygen levels? Do we know how beaver dams affect DO and BOD? Response: Ecology did not investigate the relationship of beavers to stream oxygen concentrations. To investigate this, one would need to look at the effects of their biological BOD output as well as the effects of their hydrological modifications on the stream that would tend to increase re-aeration over the dam and settle out organic particulates commonly associated with BOD in the pool behind the dam. Comment: Kackman Creek is crossed by 252nd Street NE at two locations approximately 1500 feet apart. Which was the sampling location? Response: The sampling location is on the N (upstream) side of the road where the creek crosses a second time (the eastern of the two crossings). Comment: The TMDL addresses only problems associated with low flows and salmon, and ignores problems associated with high flows. Response: The TMDL includes an analysis of the seasonal variation and critical conditions associated with periods of more frequent or higher exceedances of water quality standards. Fecal coliform bacteria problems in some of the parts of the watershed were more prevalent during the wet season, when flows are higher. As a result, wasteload allocations were developed for Phase I NPDES municipal stormwater permittees (Snohomish County and WSDTOT) and for future Phase II stormwater permittee City of Arlington. Typical best management practices to reduce bacteria are those that infiltrate stormwater or delay and dampen storm flows by using stormwater detention ponds, which have the additional beneficial effect of settling out particles that bacteria may be associated with. Comment: Stanwood WWTP is not assigned any Waste Load Allocations. Response: Stanwood WWTP and other discharges to the Old Stillaguamish Channel will be evaluated in a future Old Stillaguamish Channel TMDL. Comment: The percentages in “Estimated portions of FC Load” column in Table 35 total to 136.8% and we assume this allows for some loss to die-off and deposition so that it totals (with point and background loads) 100 percent of the total load that may be delivered to Port Susan (or other limiting location).
Page A-152 Stillaguamish Fecal and DO TMDL Submittal Report
Response: This column of percentages is not intended to be summed and therefore do not add up to 100 percent. Wasteload allocations were assigned at all sampling locations in the watershed where:
• The reach required fecal coliform reductions in order to meet standards. • The reach receives stormwater drainage from a Phase I or future Phase II stormwater
permittee.
For each of these reaches, the amount of roadway area and/or adjacent land that would drain to each location was estimated using topographic information. Estimates of the amount of fecal coliform characteristic of roadways and other land uses were developed using a national stormwater database, as explained in Appendix C (the Simple Method). For example, a small percentage (5 percent) of the FC Load is assigned to Snohomish County for Fish Creek in Table 35 based on the runoff and the associated FC load for roadways up-drainage from the site. The remaining 95 percent of the load at this site is estimated to be from non-point sources, not from other point sources. Comment: The “Wasteload Allocations” assigned in Table 35 require discharge estimates to calculate loads. Ecology needs to inform stormwater permittees of appropriate methods for measurement of discharge and concentrations in order to calculate loads. This permittee questions whether the WLAs can be attained even if discharges had modest concentrations and low flow. Response: Ecology will work with, and review the proposals of, all stormwater permittees as they develop approaches for addressing the wasteload allocations. The development of the detailed implementation plan is an opportunity for permittees to propose stormwater monitoring and/or stormwater BMPs with rationale for their appropriateness for particular discharge locations. Comment: The Simple Method estimates stormwater runoff pollutant loads from small urban areas and is not the right model for characterizing larger urban and non-urban areas. A more sophisticated model such as HSPF may be needed to analyze a large and complex watershed like the Stillaguamish. Response: We recognize that the Simple Method model does not provide as accurate of a stormwater loading characterization as one would expect from a continuous simulation model like HSPF. As explained on pages 28 and 100 of the report, stormwater loading quantification for wasteload allocations (WLAs) was an additional task placed upon the Stillaguamish TMDL evaluation by the USEPA after the monitoring study was completed. The USEPA directive does ‘recognize that these allocations might be fairly rudimentary because of data limitations and variability in the system’ (Wayland and Hanlon, 2002). We believe that the Simple Method model addresses quantification of stormwater loads at a ‘screening level’ scale commensurate with the data currently available in the basin. The model is recommended by the USEPA as providing a ‘quick and reasonable estimate of pollutant loadings’ (USEPA, 1992). The model is a set of simple annual or seasonal pollutant loading equations that is a basic unit loading approach used for modeling urban or rural environments; many pollutant wash-off models of varying spatial scales are similarly constructed. Since the
Stillaguamish Fecal and DO TMDL Submittal Report Page A-153
numeric results do not go into the NPDES permit, the model ‘loads’ are only meant to suggest relative magnitude from various land use types – not necessarily a highly accurate accounting of loads. In all but two cases, ‘Roadway’ loads assigned to WSDOT and Snohomish County are less than 10 percent of the cumulative fecal coliform loads in most tributaries. These numbers do not appear to be outside of what might be expected, especially in a rural area where manure hauling takes place, and discarded diapers are frequently found along the roadways. Drainages from adjacent properties into the permit holder’s infrastructure are not closely managed and could be contributing loads as well. The NPDES permit will only list best management practices (BMPs) that will likely reduce the pollutant loads. WSDOT may already have BMPs in place on the drainage systems discharging to the listed water bodies in the Stillaguamish basin. These BMPs can be listed in the TMDL detailed implementation plan that will be written over the coming year. By listing these treatment practices and by better characterizing the potential impact of stormwater from WSDOT highways and facilities in future monitoring work, we can more accurately determine the pollutant loads. Comment: The impervious cover for Interstate 5 (80%) is overestimated since the area counted as roadway includes vegetated right-of-way – this makes WSDOT highways in the Stillaguamish watershed more rural in nature. The majority of the stormwater runoff in the Stillaguamish watershed is generated as sheet flow that infiltrates to ground water rather than surface runoff. Response: The impervious cover and runoff factor were purposefully set at the relatively high default values recommended in the model. TMDL evaluation protocols require conservative assumptions for margin of safety considerations, especially in cases where data specific to the source are absent. We used this conservative assumption since we did not receive specific information about the nature of the highway stormwater drainage systems in the Stillaguamish basin. We found aWSDOT geographical information system (GIS) coverage of outfall locations on Interstate 5 and major highways in the Stillaguamish basin, but information from WSDOT about the kind of treatment systems in place at these outfall, though requested, was not provided. On the other hand, we did not include potential pollutant discharges from adjacent land uses even though some may be entering the WSDOT stormwater systems. We made a conscious decision not to stack too many conservative assumptions in the analysis. Comment: The conveyance of pollutant loads to roadside ditches from adjacent land uses could be of greater significance than the contribution of the roadways themselves. Response: We agree. As noted in the previous two responses, this could well be the case and conservative coefficients were used to account for such loads. Unfortunately WSDOT, Snohomish County, and other jurisdictions under the stormwater permit system are responsible for these pollutant loads because they manage the conveyance system. It is up to the owner of the conveyance to ensure that pollutant loads from adjacent land uses are adequately treated. Comment: WSDOT is concerned with the process of assigning a wasteload allocation (WLA) based solely on NPDES permits for stormwater systems, particularly when there are no data to

Page A-154 Stillaguamish Fecal and DO TMDL Submittal Report
confirm the WLA. In rural jurisdictions with few or no permit holders other than WSDOT, and an inadequate data set to characterize nonpoint sources for load allocation, a WLA does not appear justified. Response: The TMDL evaluation attempts to use the best available data to address the potential sources of pollutants. The Stillaguamish River basin TMDL assigned estimated load allocations to both point and nonpoint sources as required by law. In almost every tributary system evaluated, nonpoint source load allocations were greater than point source wasteload allocations. The TMDL evaluation suggests that nonpoint sources will require more implementation work and greater pollutant reductions than the point sources to reduce pollutant loads in the basin. This would be expected in a rural basin. Comment: The Stormwater Management Manual for Western Washington (Ecology Publications 99-11 through 99-15) does not provide any best management practices that are designed for reduction of fecal coliform, nor does the 2004 Highway Runoff Manual. Will Ecology be establishing reductions in the fecal coliform WLA for WSDOT? If so, in order for Ecology to set meaningful goals for reducing fecal coliform in stormwater discharges, it will first need to establish a means of meeting those goals. Response: Though the stormwater management manuals don’t have BMPs that are specifically designed to reduce bacterial loads, some of the BMPs are more capable of doing so than others. Most of the treatment systems we have seen in the journal literature appear to take advantage of the tendency of bacteria to adsorb to certain types of sediment particles. Treatment systems that reduce sediment and allow water to percolate through soil or media may be the most effective. We also suggest that the stormwater management manuals are not the only reference tool available to WSDOT for exploring treatment systems to reduce fecal coliform bacteria. Agricultural engineers have evaluated the bacteria removal efficiencies of various BMP systems, e.g. riparian buffers, lagoons, wetlands, and settling ponds. The local Natural Resource Conservation Service office or county conservation district may be able to help you evaluate your treatment systems. Ecology staff looks forward to working with WSDOT staff in evaluating these processes. The Technology Assessment Protocol – Ecology (TAPE) system should be useful in this regard.

Stillaguamish Fecal and DO TMDL Submittal Report Page B-155
Appendix B. Wastewater Treatment Plants Point Sources – Descriptions, NPDES Permit Limits, and Data
Support

Page B-156 Stillaguamish Fecal and DO TMDL Submittal Report

Stillaguamish Fecal and DO TMDL Submittal Report Page B-157
Point Source Descriptions and NPDES Permit Limits Arlington Wastewater Treatment Plant The Arlington WWTP treatment plant discharges effluent to the Stillaguamish River just below the confluence of the North and South forks at RKM 28.6 (RM 17.8). The treatment processes include a mechanical screen and a vortex type grit chamber, biological treatment in sequencing batch reactors (SBRs), a flow equalization basin, and an ultraviolet (UV) disinfection system. Arlington WWTP effluent quality must meet secondary municipal treatment standards as specified in its NPDES permit (Table B1). The permit also requires monitoring of pH, fecal coliform bacteria, biochemical oxygen demand, total suspended solids, and discharge volume. Effluent monitoring of inorganic nitrogen, phosphorus, and metals is not required under the permit. However, Arlington does some independent monitoring to check unit processes in the facility (Randolph, personal communication, 2000). Table B1. Arlington NPDES permit limits
Parameter Limit
pH Shall be within the range of 6 to 9 standard units.
Fecal Coliform Bacteria
Monthly Geometric Mean = 200 organisms/100 mL Weekly Geometric Mean = 400 organisms/100 mL
BOD5 (concentration)
Average Monthly Limit is the most stringent of the following: - 30 mg/L - may not exceed fifteen percent (15%) of the average influent concentration Average Weekly Limit = 45 mg/L
Total Suspended Solids (concentration)
Average Monthly Limit is the most stringent of the following: - 30 mg/L - may not exceed fifteen percent (15%) of the average effluent concentration Average Weekly Limit = 45 mg/L
Parameter Design Quantity Monthly average flow (max. month) 2.0 MGD BOD5 influent loading (max. month) 4,600 lbs/day TSS influent loading (max. month) 3,100 lbs/day

Page B-158 Stillaguamish Fecal and DO TMDL Submittal Report
Indian Ridge Corrections Center Wastewater Facility Indian Ridge Corrections Center is a small facility formerly operated by the Washington State Department of Social and Health Services, but now operated by Snohomish County. The facility discharges effluent to Jim Creek approximately 4.8 kilometers (3 miles) above the confluence with the South Fork Stillaguamish River. The treatment process at the facility has operated since 1997, and it includes preliminary treatment through a mechanical fine screen, biological treatment in SBRs followed by ultraviolet (UV) disinfection system. The old facility was a package activated sludge WWTP. Table B2. Indian Ridge Corrections Center NPDES permit limits
Effluent Limitationsa: Outfall # 1 Parameter
Average Monthly Average Weekly
Biochemical Oxygen Demandb (5 day)
30 mg/L, 6 lbs/day
45 mg/L, 8 lbs/day
Total Suspended Solidsb 30 mg/L, 6 lbs/day
45 mg/L, 8 lbs/day
Fecal Coliform Bacteria 100/100 mL --------
pH Daily minimum is equal to or greater than 6, and the daily maximum is less than or equal to 9.
aThe average monthly and weekly effluent limitations are based on the arithmetic mean of the samples taken with the exception of fecal coliform, which is based on the geometric mean. bThe average monthly effluent concentration for BOD5 and Total Suspended Solids shall not exceed 30 mg/L or 15 percent of the respective monthly average influent concentrations, whichever is more stringent.
Parameter Design Quantity
Monthly average flow (max. month) 21,000 gpd BOD5 influent loading (max. month) 61 lbs/day Warm Beach Conference Center Wastewater Treatment Plant The Warm Beach Christian Camp and Conference Center is located on a bluff north of the unincorporated communc center accommodates groups throughout the year, but peak attendance is in summer. The center is planning to enlarge its facilities, so it is increasing its wastewater treatment capacity. The existing WWTP at the camp consists of biological treatment in two aerated lagoon cells followed by disinfection with calcium hypochlorite solution. The secondarily treated wastewater is discharged with subsurface drainage intercepted from around the lagoons to an unnamed stream tributary. NPDES permit limits are based on conventional technology for lagoon effluent (Table B3).

Stillaguamish Fecal and DO TMDL Submittal Report Page B-159
The tributary with treated effluent flows to a pond that also receives drainage water from low-lying lands to the north of the facility. Water from the pond is intermittently discharged to a slough leading to Port Susan via a pump and culvert through the dike. The tributary and pond are not on the Section 303(d) list. Part of Port Susan is on the list because of data collected from 1989 to 1991 (Paulsen et al., 1991) near the slough at Warm Beach The slough is located approximately 1.2 km (0.75 miles) south of Hat Slough. The center is just completing construction of a managed wetland treatment system to further treat effluent from the lagoons. The system has specific hydraulic and biological treatment areas to reduce various nutrients and bacteria. The NPDES permit limits for the new plant will be more stringent than for the current facility. The location of the outfall from the wetland has not been determined as of February 2003. Potential locations include the slough currently used and a channel from Hat Slough.
Table B3. Warm Beach Conference Center NPDES permit limits, interim Interim Effluent Limitationsa: Outfall # 1
Parameter Average Monthly Average Weekly
Biochemical Oxygen Demandb (5 day) (BOD5)
30 mg/L, 19 lbs/day 45 mg/L, 29 lbs/day
Total Suspended Solids (TSS) 75 mg/L, 47 lbs/day 112 mg/L, 70 lbs/day
Fecal Coliform Bacteria 200/100 mL 400/100 mL
pHc Daily minimum is equal to or greater than 6, and the daily maximum is less than or equal to 9.
Parameter Average Monthly Maximum Daily
Total Residual Chlorined,f --------- 2.0 mg/L
Notes: see notes below Table B4 Table B4. Warm Beach Conference Center NPDES permit limits, final
Final Effluent Limitationsa: Outfall # 1 Parameter
Average Monthly Average Weekly
Biochemical Oxygen Demandb (5 day) (BOD5)
30 mg/L, 19 lbs/day 45 mg/L, 29 lbs/day
Total Suspended Solids (TSS) 75 mg/L, 47 lbs/day 112 mg/L, 70 lbs/day
pHc Daily minimum is equal to or greater than 6, and the daily maximum is less than or equal to 9.
Fecal Coliform Bacteria 100/100 mL See footnote e below
Total Residual Chlorinef 8 ug/L 19 ug/L
Total Ammonia (NH3-N) 1.8 mg/L 3.5 mg/L
Parameter Average Monthly Minimum Daily
Dissolved Oxygen --------- 8.0 mg/L
aInterim effluent limitations were effective until April 30, 2003. Final effluent limitations became effective on May 1, 2003. See condition S8. “Compliance Schedule”. The average monthly and weekly effluent limitations are based on the arithmetic mean of the samples taken, with the exception of fecal coliform which is based on the geometric mean.

Page B-160 Stillaguamish Fecal and DO TMDL Submittal Report
bThe average monthly effluent concentration for BOD5 shall not exceed 30 mg/L or 15 percent of the monthly average influent concentration, whichever is more stringent. cIndicates the range of permitted values. When pH is continuously monitored, excursions between 5.0 and 6.0, or 9.0 and 10.0, shall not be considered violations provided no single excursion exceeds 60 minutes in length, and total excursions do not exceed 7 hours and 30 minutes per month. Any excursions below 5.0 and above 10.0 are violations if such values are attributable to inorganic chemical addition to the treatment process or to industrial contribution(s). The instantaneous maximum and minimum pH shall be reported monthly. dTotal residual chlorine shall be maintained which is sufficient to attain the interim fecal coliform limits specified above. Chlorine concentrations in excess of that necessary to reliably achieve the limits shall be avoided. eNo more than 10 percent of all samples obtained for calculating the monthly geometric mean value shall exceed 200 colonies/100 mL. fThe maximum daily value for total residual chlorine is the maximum of the daily values during a calendar month. The daily value is defined as the arithmetic mean of the sample measurements taken during a calendar day. The average monthly value for total residual chlorine is the arithmetic mean of the daily values during a calendar month. Twin City Foods Wastewater Treatment Plant Twin City Foods, located in Stanwood, pipes its process water, repack water, and vegetable unloading area drainage water to an 8.5 million gallon capacity lagoon located on reclaimed agricultural land between the Old Stillaguamish Channel and Hat Slough. Solids in the process water are screened-out at the plant for animal feed. Under the most recent permit, some winter repack water is discharged to the Stanwood WWTP, but that will discontinue when Stanwood upgrades its system. Sanitary wastewater also is routed to Stanwood. The Twin City Foods lagoon water is distributed by pumps and pipes to seven spray guns for land application to about 600 acres. Dairy manure is also applied to about 300 acres of the same application areas from a separate lagoon. The lagoon effluent application rate is agronomically determined for nitrogen uptake to protect ground water and surface water quality. The area is surrounded by dikes. Many of the fields are underlain with drainage tile at a depth of three feet to eighteen inches that drain to the deep ditches. The deep ditch network empties to the Old Stillaguamish Channel and Port Susan at several tide gates. Surface monitoring sites are located at a few of these tide gates.

Stillaguamish Fecal and DO TMDL Submittal Report Page B-161
Table B5. Twin City Foods State Waste Discharge permit limits TMDL Determinations of Permit Limits: Fecal Coliform Data and Calculations Parameter Limit
Flow Lagoon: 2.49 MGD Maximum
Stanwood WWTP: 0.075 MGD Maximum (300 gpm instantaneous peak)
and 0.060 MGD weekly average)
Fields: 19 inches/acre/year
pH Lagoon: between 6.5 and 8.5 standard units.
Stanwood WWTP: between 5 and 11 standard units
Nitrogen
Fields: 100 lbs/acre/year
BOD5 Stanwood WWTP: 125 lbs/day average
150 lbs/day maximum
The following seven tables provide a record of the fecal coliform data for receiving waters for each of the following wastewater treatment plants in the Stillaguamish basin: City of Arlington on the mainstem Stillaguamish River, Indian Ridge Corrections Facility on Jim Creek, and Warm Beach Conference Center south of Stanwood.
Table B-6. Fecal Coliform Data Used to Determine Arlington WWTP Permit Limits
FC Date Month log10 FC FC Date Month log10 FC FC Date Month log10 FC (cfu/100
mL) yyyymmdd 1 - 12 (cfu/100
mL) yyyymmdd 1 - 12 (cfu/100
mL) yyyymmdd 1 - 12
8 19940427 4 0.903089987 8 19940427 4 0.903089987 8 19940511 5 0.903089987
8 19940511 5 0.903089987 49 19941212 12 1.69019608 28 19940621 6 1.447158031
28 19940621 6 1.447158031 270 19950117 1 2.431363764 46 19940712 7 1.662757832
46 19940712 7 1.662757832 4 19950214 2 0.602059991 139 19940815 8 2.1430148
139 19940815 8 2.1430148 61 19950314 3 1.785329835 77 19940926 9 1.886490725
77 19940926 9 1.886490725 10 19950417 4 1 300 19941027 10 2.477121255
300 19941027 10 2.477121255 87 19951221 12 1.939519253 25 19941117 11 1.397940009
25 19941117 11 1.397940009 36 19960109 1 1.556302501 120 19950508 5 2.079181246
49 19941212 12 1.69019608 20 19960212 2 1.301029996 90 19950613 6 1.954242509
270 19950117 1 2.431363764 19960311 3 200 19950719 7 2.301029996
4 19950214 2 0.602059991 63 19960408 4 1.799340549 148 19950814 8 2.170261715
61 19950314 3 1.785329835 45 19961216 12 1.653212514 73 19950912 9 1.86332286
10 19950417 4 1 16 19970114 1 1.204119983 100 19951010 10 2
120 19950508 5 2.079181246 116 19970212 2 2.064457989 3 19951113 11 0.477121255
90 19950613 6 1.954242509 8 19970311 3 0.903089987 590 19960513 5 2.770852012
200 19950719 7 2.301029996 81 19970415 4 1.908485019 83 19960611 6 1.919078092
148 19950814 8 2.170261715 22 19971209 12 1.342422681 27 19960711 7 1.431363764

Page B-162 Stillaguamish Fecal and DO TMDL Submittal Report
Table B-6. Fecal Coliform Data Used to Determine Arlington WWTP Permit Limits
FC Date Month log10 FC FC Date Month log10 FC FC Date Month log10 FC (cfu/100
mL) yyyymmdd 1 - 12 (cfu/100
mL) yyyymmdd 1 - 12 (cfu/100
mL) yyyymmdd 1 - 12
73 19950912 9 1.86332286 11 19980101 1 1.041392685 91 19960814 8 1.959041392
100 19951010 10 2 9 19980318 3 0.954242509 100 19960917 9 2
3 19951113 11 0.477121255 15 19980426 4 1.176091259 3200 19961015 10 3.505149978
87 19951221 12 1.939519253 31 19981202 12 1.491361694 181 19961113 11 2.257678575
36 19960109 1 1.556302501 19990114 1 58 19970513 5 1.763427994
20 19960212 2 1.301029996 21 19990203 2 1.322219295 93 19970610 6 1.968482949
19960311 3 6 19990301 3 0.77815125 101 19970715 7 2.004321374
63 19960408 4 1.799340549 4 19990415 4 0.602059991 27 19971014 10 1.431363764
590 19960513 5 2.770852012 36 19991202 12 1.556302501 12 19971112 11 1.079181246
83 19960611 6 1.919078092 9 20000105 1 0.954242509 48 19980513 5 1.681241237
27 19960711 7 1.431363764 20000207 2 9 19980617 6 0.954242509
91 19960814 8 1.959041392 4 20000315 3 0.602059991 52 19980720 7 1.716003344
100 19960917 9 2 140 20000406 4 2.146128036 41 19980813 8 1.612783857
3200 19961015 10 3.505149978 3 20001213 12 0.477121255 70 19980923 9 1.84509804
181 19961113 11 2.257678575 8 20010110 1 0.903089987 26 19981007 10 1.414973348
45 19961216 12 1.653212514 20010207 2 17 19981102 11 1.230448921
16 19970114 1 1.204119983 22 20010314 3 1.342422681 28 19990506 5 1.447158031
116 19970212 2 2.064457989 42 20010411 4 1.62324929 96 19990609 6 1.982271233
8 19970311 3 0.903089987 63 20011206 12 1.799340549 14 19990712 7 1.146128036
81 19970415 4 1.908485019 20020109 1 30 19990802 8 1.477121255
58 19970513 5 1.763427994 90 20020212 2 1.954242509 30 19990913 9 1.477121255
93 19970610 6 1.968482949 11 20020313 3 1.041392685 40 19991013 10 1.602059991
101 19970715 7 2.004321374 14 19991104 11 1.146128036
27 19971014 10 1.431363764 Geomean 1.348503847 4 20000504 5 0.602059991
12 19971112 11 1.079181246 0.503510328 9 20000608 6 0.954242509
22 19971209 12 1.342422681 90th %tile 1.993802684 72 20000713 7 1.857332496
11 19980101 1 1.041392685 # of samples 34 63 20000808 8 1.799340549
9 19980318 3 0.954242509 19 20000912 9 1.278753601
15 19980426 4 1.176091259 16 20001004 10 1.204119983
48 19980513 5 1.681241237 84 20001108 11 1.924279286
9 19980617 6 0.954242509 280 20010509 5 2.447158031
52 19980720 7 1.716003344 24 20010604 6 1.380211242
41 19980813 8 1.612783857 120 20010705 7 2.079181246
70 19980923 9 1.84509804 610 20010806 8 2.785329835
26 19981007 10 1.414973348 27 20010905 9 1.431363764
17 19981102 11 1.230448921 34 20011003 10 1.531478917
31 19981202 12 1.491361694 24 20011105 11 1.380211242
19990114 1
21 19990203 2 1.322219295 Geomean 1.708157688 51 May to
6 19990301 3 0.77815125 0.546928708 November
4 19990415 4 0.602059991 90th %tile 2.40910152 257
28 19990506 5 1.447158031 # of samples 54
96 19990609 6 1.982271233
14 19990712 7 1.146128036
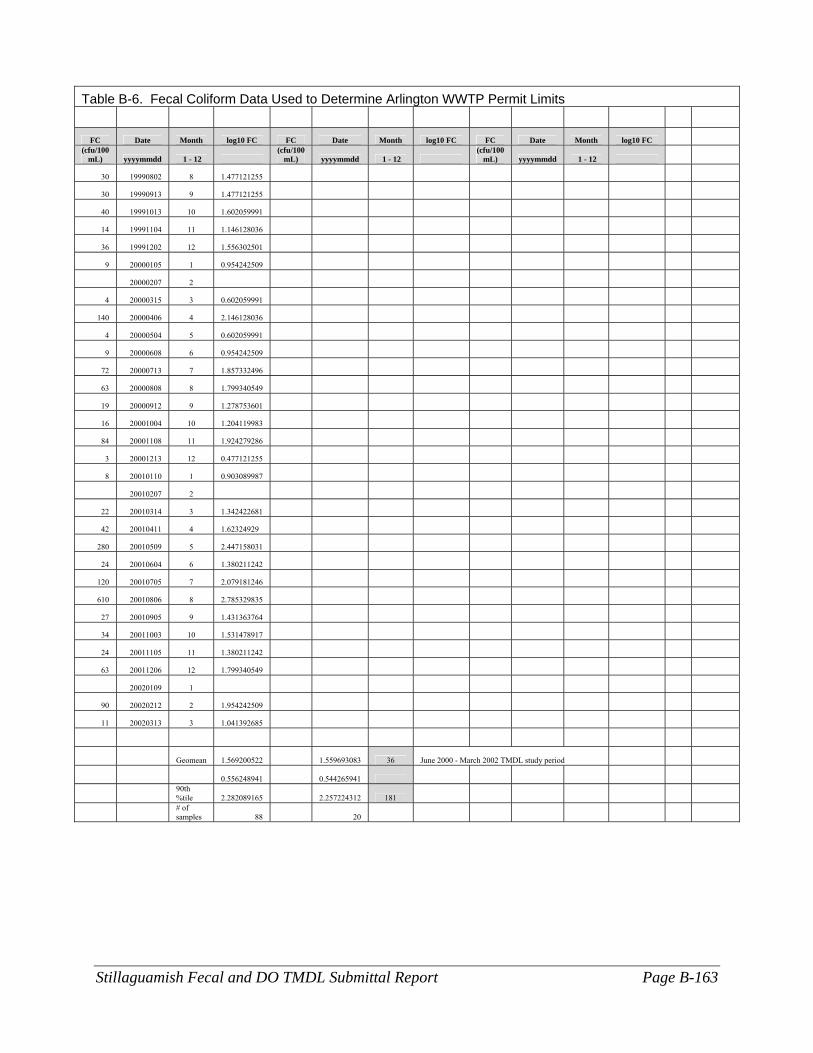
Stillaguamish Fecal and DO TMDL Submittal Report Page B-163
Table B-6. Fecal Coliform Data Used to Determine Arlington WWTP Permit Limits
FC Date Month log10 FC FC Date Month log10 FC FC Date Month log10 FC (cfu/100
mL) yyyymmdd 1 - 12 (cfu/100
mL) yyyymmdd 1 - 12 (cfu/100
mL) yyyymmdd 1 - 12
30 19990802 8 1.477121255
30 19990913 9 1.477121255
40 19991013 10 1.602059991
14 19991104 11 1.146128036
36 19991202 12 1.556302501
9 20000105 1 0.954242509
20000207 2
4 20000315 3 0.602059991
140 20000406 4 2.146128036
4 20000504 5 0.602059991
9 20000608 6 0.954242509
72 20000713 7 1.857332496
63 20000808 8 1.799340549
19 20000912 9 1.278753601
16 20001004 10 1.204119983
84 20001108 11 1.924279286
3 20001213 12 0.477121255
8 20010110 1 0.903089987
20010207 2
22 20010314 3 1.342422681
42 20010411 4 1.62324929
280 20010509 5 2.447158031
24 20010604 6 1.380211242
120 20010705 7 2.079181246
610 20010806 8 2.785329835
27 20010905 9 1.431363764
34 20011003 10 1.531478917
24 20011105 11 1.380211242
63 20011206 12 1.799340549
20020109 1
90 20020212 2 1.954242509
11 20020313 3 1.041392685
Geomean 1.569200522 1.559693083 36 June 2000 - March 2002 TMDL study period
0.556248941 0.544265941
90th %tile 2.282089165 2.257224312 181
# of samples 88 20

Page B-164 Stillaguamish Fecal and DO TMDL Submittal Report
Table B-7. Fecal Coliform Data Used for Permit Limit Calculations for Indian Ridge Corrections Facility
Jim Creek at Whites Rd (above WWTP): Collected by the Stillaguamish Tribe and Natural Resources Department
FC Date Month log10 FC
(cfu/100 mL) yyyymmdd 1 - 12
36 5/19/1998 5 1.5563025
270 7/28/1998 7 2.4313638
35 9/15/1998 9 1.544068
13 1/19/1999 1 1.1139434
5 3/9/1999 3 0.69897
14 5/11/1999 5 1.146128
28 7/20/1999 7 1.447158
59 9/21/1999 9 1.770852
20 11/16/1999 11 1.30103
17 1/12/2000 1 1.2304489
30 3/22/2000 3 1.4771213 FC Date Month log10 FC
4 5/24/2000 5 0.60206 (cfu/100
mL) yyyymmdd 1 - 12
55 7/11/2000 7 1.7403627 55 7/11/2000 7 1.7403627
16 11/15/2000 11 1.20412 16 11/15/2000 11 1.20412
4 3/15/2001 3 0.60206 4 3/15/2001 3 0.60206
24 11/15/2001 11 1.3802112 24 11/15/2001 11 1.3802112
14 3/15/2002 3 1.146128 14 3/15/2002 3 1.146128
23 6/15/2002 6 1.3617278 23 6/15/2002 6 1.3617278
Geomean 1.3196698 21 All
data Geomean 1.2391016 17 2000 to Critical Condition ---> 0.441165 0.3746736 2002 data
90th %tile 1.8850668 77
90th %tile 1.7192833 52
# of samples 18
# of samples 6
Jim Creek at Mouth: Collected by Stillaguamish Tribe Natural Resources and Ecology
FC Date Month log10 FC
(cfu/100 mL) yyyymmdd 1 - 12
22 4/22/1996 4 1.3424227
70 5/15/1996 5 1.845098
29 6/19/1996 6 1.462398
182 8/14/1996 8 2.2600714
710 9/18/1996 9 2.8512583
160 11/6/1996 11 2.20412
7 1/15/1997 1 0.845098
100 3/26/1997 3 2
55 5/21/1997 5 1.7403627
200 7/15/1997 7 2.30103
620 9/17/1997 9 2.7923917

Stillaguamish Fecal and DO TMDL Submittal Report Page B-165
Table B-7. Fecal Coliform Data Used for Permit Limit Calculations for Indian Ridge Corrections Facility
Jim Creek at Whites Rd (above WWTP): Collected by the Stillaguamish Tribe and Natural Resources Department
FC Date Month log10 FC
(cfu/100 mL) yyyymmdd 1 - 12
22 5/19/1998 5 1.3424227
220 7/28/1998 7 2.3424227
38 9/15/1998 9 1.5797836
11 1/19/1999 1 1.0413927
20 5/11/1999 5 1.30103
41 7/20/1999 7 1.6127839
28 9/21/1999 9 1.447158
21 11/16/1999 11 1.3222193
22 11/15/2000 11 1.3424227
20 3/15/2001 3 1.30103
320 6/12/2001 6 2.50515
150 6/13/2001 6 2.1760913
160 11/14/2001 11 2.20412
140 11/15/2001 11 2.146128
20 11/15/2001 11 1.30103
55 3/15/2002 3 1.7403627
55 6/15/2002 6 1.7403627
Geomean 1.7889343 62 April 1996 - June 2002 1.82852192 67 June 2000 - June 2002
0.5233068 0.45123574
90th %tile 2.4596043 288 2.40682565 255
# of samples 28 9
Using WQ Hydro: geomean = 55
90th percentile = 320
Table 26 values based on these more sophisticated statistical analyses
Jim Creek at Whites Rd (above WWTP): Collected by the Stillaguamish Tribe
(cfu/100 mL) yyyymmdd 1 - 12 (cfu/100
mL) yyyymmdd 1 - 12
70 5/15/1996 5 1.845098 22 4/22/1996 4 1.3424227
29 6/19/1996 6 1.462398 7 1/15/1997 1 0.845098
182 8/14/1996 8 2.2600714 100 3/26/1997 3 2
710 9/18/1996 9 2.8512583 11 1/19/1999 1 1.0413927
160 11/6/1996 11 2.20412 20 3/15/2001 3 1.30103
55 5/21/1997 5 1.7403627 55 3/15/2002 3 1.7403627
200 7/15/1997 7 2.30103
620 9/17/1997 9 2.7923917 Geomean 1.3783843 24 December
22 5/19/1998 5 1.3424227 0.429574 to April
220 7/28/1998 7 2.3424227 90th %tile 1.9289263 85

Page B-166 Stillaguamish Fecal and DO TMDL Submittal Report
Table B-7. Fecal Coliform Data Used for Permit Limit Calculations for Indian Ridge Corrections Facility
Jim Creek at Whites Rd (above WWTP): Collected by the Stillaguamish Tribe and Natural Resources Department
FC Date Month log10 FC
(cfu/100 mL) yyyymmdd 1 - 12
38 9/15/1998 9 1.5797836 # of samples 6
20 5/11/1999 5 1.30103
41 7/20/1999 7 1.6127839
28 9/21/1999 9 1.447158
21 11/16/1999 11 1.3222193
22 11/15/2000 11 1.3424227
320 6/12/2001 6 2.50515
150 6/13/2001 6 2.1760913
160 11/14/2001 11 2.20412
140 11/15/2001 11 2.146128
20 11/15/2001 11 1.30103
55 6/15/2002 6 1.7403627
Geomean 1.9009025 80 May - November
0.5089646
90th %tile 2.5531916 357
# of samples 22
b-Table B-8. Fecal Coliform Data Used to Determine Warm Beach WWTP Permit Limits
Warm Beach Conference Center WWTP -- Option (1) Discharge at Warm Beach
FC Date Month log10 FC (cfu/100
mL) yyyymmdd 1 - 12
4.5 20010227 2 0.65321251
17 20010329 3 1.23044892
2 20010419 4 0.30103
13 20010509 5 1.11394335
20 20020102 1 1.30103
26 20020206 2 1.41497335
20 20020306 3 1.30103
130 20020403 4 2.11394335
70 20020501 5 1.84509804
Geomean 1.84765471 70 All data
0.71326495
90th %tile 2.76177507 578

Stillaguamish Fecal and DO TMDL Submittal Report Page B-167
b-Table B-8. Fecal Coliform Data Used to Determine Warm Beach WWTP Permit Limits
Warm Beach Conference Center WWTP -- Option (1) Discharge at Warm Beach
# of samples 19
FC Date Month log10 FC FC Date Month log10 FC
(cfu/100
mL) yyyymmdd 1 - 12 (cfu/100
mL) yyyymmdd 1 - 12
240 20010606 6 2.38021124 4.5 20010227 2 0.6532125
79 20010711 7 1.89762709 17 20010329 3 1.2304489
350 20010822 8 2.54406804 2 20010419 4 0.30103
170 20010919 9 2.23044892 13 20010509 5 1.1139434
140 20011017 10 2.14612804 20 20020102 1 1.30103
130 20011119 11 2.11394335 26 20020206 2 1.4149733
310 20020605 6 2.49136169 20 20020306 3 1.30103
500 20020703 7 2.69897 130 20020403 4 2.1139434
560 20020807 8 2.74818803 70 20020501 5 1.845098
380 20020904 9 2.5797836 Dec-May
Geomean 1.2527455 18
Geomean 2.383073 242 June-Nov 0.5486904
Critical Condition -----------> 0.27828333
90th %tile 1.9559471 90
90th %tile 2.73972092 549 # of samples 9
# of samples 10
Using WQ Hydro: geomean = 253
90th percentile = 543
Table 26 values based on these more sophisticated statistical analyses
Table B-9. Fecal Coliform Data Used to Determine WWTP Permit Limits Warm Beach Conference Center WWTP - Option (2) Discharge at Hat Slough
Hat Slough West Branch South Branch South Branch 120* 121* 122* 122*
Date 7/27/1998 50 30 50 *120, 121 and 122 refer to 1.69897 8-27-98 33 77 62 Port Susan water quality 1.7923917 9-09-98 80 50 30 sample sites 1.4771213 9-23-98 80 50 23 1.3617278 10-07-98 80 80 130 2.1139434 10-21-98 50 50 110 2.0413927 11-10-98 50 50
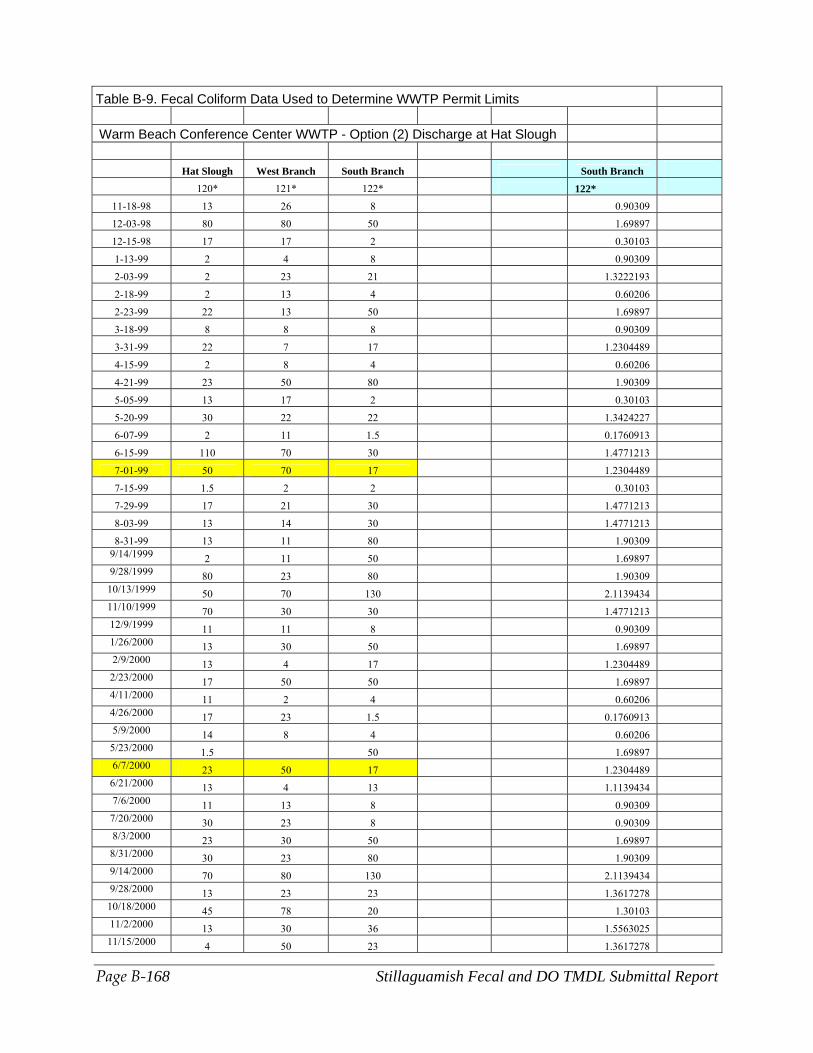
Page B-168 Stillaguamish Fecal and DO TMDL Submittal Report
Table B-9. Fecal Coliform Data Used to Determine WWTP Permit Limits Warm Beach Conference Center WWTP - Option (2) Discharge at Hat Slough
Hat Slough West Branch South Branch South Branch 120* 121* 122* 122*
11-18-98 13 26 8 0.90309 12-03-98 80 80 50 1.69897 12-15-98 17 17 2 0.30103 1-13-99 2 4 8 0.90309 2-03-99 2 23 21 1.3222193 2-18-99 2 13 4 0.60206 2-23-99 22 13 50 1.69897 3-18-99 8 8 8 0.90309 3-31-99 22 7 17 1.2304489 4-15-99 2 8 4 0.60206 4-21-99 23 50 80 1.90309 5-05-99 13 17 2 0.30103 5-20-99 30 22 22 1.3424227 6-07-99 2 11 1.5 0.1760913 6-15-99 110 70 30 1.4771213 7-01-99 50 70 17 1.2304489 7-15-99 1.5 2 2 0.30103 7-29-99 17 21 30 1.4771213 8-03-99 13 14 30 1.4771213 8-31-99 13 11 80 1.90309
9/14/1999 2 11 50 1.69897 9/28/1999 80 23 80 1.90309 10/13/1999 50 70 130 2.1139434 11/10/1999 70 30 30 1.4771213 12/9/1999 11 11 8 0.90309 1/26/2000 13 30 50 1.69897 2/9/2000 13 4 17 1.2304489 2/23/2000 17 50 50 1.69897 4/11/2000 11 2 4 0.60206 4/26/2000 17 23 1.5 0.1760913 5/9/2000 14 8 4 0.60206 5/23/2000 1.5 50 1.69897 6/7/2000 23 50 17 1.2304489 6/21/2000 13 4 13 1.1139434 7/6/2000 11 13 8 0.90309 7/20/2000 30 23 8 0.90309 8/3/2000 23 30 50 1.69897 8/31/2000 30 23 80 1.90309 9/14/2000 70 80 130 2.1139434 9/28/2000 13 23 23 1.3617278 10/18/2000 45 78 20 1.30103 11/2/2000 13 30 36 1.5563025 11/15/2000 4 50 23 1.3617278

Stillaguamish Fecal and DO TMDL Submittal Report Page B-169
Table B-9. Fecal Coliform Data Used to Determine WWTP Permit Limits Warm Beach Conference Center WWTP - Option (2) Discharge at Hat Slough
Hat Slough West Branch South Branch South Branch 120* 121* 122* 122*
11/29/2000 23 30 11 1.0413927 12/5/2000 2 1/25/2001 4 2/15/2001 11 17 23 1.3617278 2/27/2001 70 50 1.69897 3/14/2001 50 14 1.146128 3/29/2001 7 30 4 0.60206 4/19/2001 17 4/26/2001 23 8 0.90309 5/9/2001 7.8 1.5 2 0.30103 5/24/2001 23 30 1.4771213 6/6/2001 23 11 13 1.1139434 6/21/2001 23 23 1.3617278 7/11/2001 22 50 110 2.0413927 7/31/2001 11 50 50 1.69897 8/9/2001 50 30 50 1.69897 8/22/2001 240 240 130 2.1139434 9/5/2001 30 30 240 2.3802112 10/4/2001 23 130 50 1.69897 10/18/2001 17 50 50 1.69897 11/8/2001 8 11/19/2001 13 13 14 1.146128 12/5/2001 13 4 0.60206 1/17/2002 11 2/8/2002 13 2/28/2002 4 Geomean 1.3173102 213/5/2002 2 4 0.5420266 3/21/2002 22 22 90th %tile 2.0119715 1034/18/2002 2 50 # of samples 68 5/16/2002 13 13 5/29/2002 50 6/13/2002 30 70 6/27/2002 6/7/2000 23 50 17 1.2304489 6/21/2000 13 4 13 1.1139434 7/6/2000 11 13 8 0.90309 7/20/2000 30 23 8 0.90309 8/3/2000 23 30 50 1.69897 8/31/2000 30 23 80 1.90309 9/14/2000 70 80 130 2.1139434 9/28/2000 13 23 23 1.3617278 10/18/2000 45 78 20 1.30103 11/2/2000 13 30 36 1.5563025

Page B-170 Stillaguamish Fecal and DO TMDL Submittal Report
Table B-9. Fecal Coliform Data Used to Determine WWTP Permit Limits Warm Beach Conference Center WWTP - Option (2) Discharge at Hat Slough
Hat Slough West Branch South Branch South Branch 120* 121* 122* 122*
11/15/2000 4 50 23 1.3617278 11/29/2000 23 30 11 1.0413927 12/5/2000 2 1/25/2001 4 2/15/2001 11 17 23 1.3617278 2/27/2001 70 50 1.69897 3/14/2001 50 14 1.146128 3/29/2001 7 30 4 0.60206 4/19/2001 17 4/26/2001 23 8 0.90309 5/9/2001 7.8 1.5 2 0.30103 5/24/2001 23 30 1.4771213 6/6/2001 23 11 13 1.1139434 6/21/2001 23 23 1.3617278 7/11/2001 22 50 110 2.0413927 7/31/2001 11 50 50 1.69897 8/9/2001 50 30 50 1.69897 8/22/2001 240 240 130 2.1139434 9/5/2001 30 30 240 2.3802112 10/4/2001 23 130 50 1.69897 10/18/2001 17 50 50 1.69897 11/8/2001 8 11/19/2001 13 13 14 1.146128 12/5/2001 13 4 0.60206 1/17/2002 11 2/8/2002 13 2/28/2002 4 3/5/2002 2 4 3/21/2002 22 22 4/18/2002 2 50 5/16/2002 13 13 5/29/2002 50 6/13/2002 30 70 6/27/2002 Last 30 samples
Geomean 1.3844723 24 Critical Condition -----------> 0.4874862 90th %tile 2.0092347 102 # of samples 30
Stillaguamish Fecal and DO TMDL Submittal Report Page C-171
Appendix C. Monitoring Locations for Ecology July 2004
Technical Study

Page C-172 Stillaguamish Fecal and DO TMDL Submittal Report

Stillaguamish Fecal and DO TMDL Submittal Report Page C-173
Locations Locations of monitoring sites are provided in Table C-1 and shown in Figures C-1 through C-3. Additional information about the Ecology TMDL water quality monitoring between August 2000 and November 2001 is provided in Data Summary: Stillaguamish River Watershed Fecal Coliform, Dissolved Oxygen, pH, Mercury, and Arsenic Total Maximum Daily Load Study, on Ecology’s website at: http://www/ecy.wa.gov/biblio/0403037.html. Table C-1. Listing of monitoring stations
Station ID Station Name Latitude Longitude River Mile
River Kilometer Survey/s
05TARLIN2 Arlington WWTP effluent 48.2031 122.1279 - - C, D, E, H
05TARMST Armstrong Creek at the hatchery gauging station 48.2184 122.1362 1.0 1.6 E, H
05TCHUPK Church Creek at the park off Lindstrom Road 48.2413 122.3257 2.1 3.4 B
05TCHURH Church Creek/Jorgenson Slough at Marine Drive 48.2312 122.3466 0.5 0.8 A, F, G, H
05TCONFL1 Confluence of North and South Forks of the Stilliguamish River at Hwy. 9 48.2037 122.1286 17.8 28.6 C, D, E, I
05TCOOK Cook Slough at Hwy. 530 bridge near Silvana 48.1966 122.2438 7.8 12.6 C, D, E, H
05TDOUG4 Douglas Slough south of Hwy. 532 48.2399 122.3759 0.1 0.2 A, F, H
05TGLAD Glade Bekken at Silvana Terrace Road 48.2045 122.2902 0.5 0.8 C, D, E, H
05THARAR Mouth of Harvey Armstrong Creek 48.2105 122.1511 0.1 0.2 C, D, E
05TIRVIN Irvine Slough at dike pump station 48.2406 122.3689 0.1 0.2 A, F, H
05TJIMCK Jim Creek at Jordan Road 48.1988 122.0938 0.1 0.2 H
05TJUNIP Juniper Beach off Juniper Beach Road on Camano Island 48.2279 122.4082 - - J
05TKACK Kackman Creek at 252nd Street NE 48.2246 122.1616 0.9 1.4 E, H
05TMAR1 March Creek at Mouth 48.1929 122.1639 0.1 0.2 C, D, E
05TMARIN2 Mainstem Stillaguamish River at Hat Slough off Marine Drive 48.2109 122.3378 1.9 3.1 C, D, E, G, H, I
05TMARIN2 Mainstem Stillaguamish River at Hat Slough boat launch 48.2114 122.3391 1.7 2.7 B
05TMARSH Mouth of March Creek at 220th Street NE 48.1927 122.1655 0.9 1.4 H
05TMARTH Martha Lake Creek at Soundview Drive 48.1743 122.3609 0.1 0.2 I
05TMARTOL Martha Lake Creek outlet to Warm Beach 48.1754 122.3622 0.0 0.0 I
05TMILLR4 Miller Creek at Miller Road 48.2216 122.3179 0.2 0.2 A, F, H
05TMIXZO Mainstem Stillaguamish River below Arlington WWTP outfall 48.2030 122.1316 17.6 28.3 C, D, I
05TMS3 Mainstem Stillaguamish River at Old Channel diversion 48.2087 122.3225 2.8 4.4 C, D, E
05TMS6 Mainstem Stillaguamish River below Silvana 48.2034 122.2765 5.7 9.2 C, D, E
05TMS111, 2 Mainstem Stillaguamish River at Interstate 5 bridge 48.1970 122.2107 11.2 17.9 C, D, E, G, H
05TMS12 Mainstem Stillaguamish River at WDFWS access 48.1991 122.1931 12.1 19.5 I
05TMS131 Mainstem Stillaguamish River below March Creek 48.1916 122.1823 12.9 20.8 C, D, E
05TMS151 Mainstem Stillaguamish River below Armstrong Creek 48.2072 122.1544 14.9 24.0 C, D, E
05TMS17 Mainstem Stillaguamish River at Dike Road 48.1999 122.1481 17.0 27.4 C, D, E, H
05TNFCIC2, 3 North Fork Stillaguamish River at Cicero bridge 48.2679 122.0135 9.5 15.3 E, G, H
05TNFCPO2 North Fork Stillaguamish River at C-Post Bridge 48.2829 121.8304 21.0 33.8 E, H
05TNFTWI2 Mouth of the North Fork Stillaguamish River at Twin Rivers Park 48.2038 122.1274 0.1 0.2 B, C, D, E, H
05TNFWHI2 North Fork Stillaguamish River at Whitman Road bridge 48.2722 121.8879 17.6 28.3 B, E, H
05TNORTH North branch of the mainstem Stillaguamish River at Hwy. 530 bridge 48.2103 122.2470 7.5 12.1 C, D, E, H
05TOC1 Old Stillaguamish River Channel near Irvine Slough 48.2394 122.3684 1.4 2.3 A, F, H
05TOC2 Old Stillaguamish River Channel above the Stanwood WWTP outfall 48.2361 122.3564 3.4 5.5 A, F, H
05TOC3 Old Stillaguamish River Channel at the Marine Drive bridge 48.2257 122.3382 5.1 8.2 A, F, G, H
05TOC4 Old Stillaguamish River Channel at the Norman Road bridge 48.2132 122.3268 7.4 11.9 A, F, H
05TPILCH2 Pilchuck Creek at Jackson Gulch Road 48.2101 122.2255 0.1 0.2 C, D, E, H

Page C-174 Stillaguamish Fecal and DO TMDL Submittal Report
Station ID Station Name Latitude Longitude River Mile
River Kilometer Survey/s
05TPILDOWN Downstream of the mouth of Pilchuck Creek in North Stillaguamish Slough 48.2049 122.2281 9.3 15.0 D
0TPILUP Upstream of the mouth of Pilchuck Creek in North Stillaguamish Slough 48.2085 122.2195 9.5 15.3 D
05TPORT2 Portage Creek at the 212th Street bridge 48.1885 122.2335 1.1 1.8 C, D, E, H
05TSFGRA2 South Fork Stillaguamish below Granite Falls 48.0959 121.9739 33.5 53.9 E, H
05TSFJOR2 South Fork Stillaguamish at Jordan walkway bridge 48.1475 122.0386 26.1 42.0 B, E, H
05TSFTWI2 Mouth of the South Fork Stillaguamish River at Twin Rivers Park 48.2036 122.1273 0.1 0.2 B, C, D, E, G, H
05TSILVA Mainstem Stillaguamish River below Silvana off Norman Road 48.2083 122.2835 4.6 7.4 H
05TSOUTH South Pass at the end of Eide Road 48.2261 122.3857 0.5 0.8 A, F, H, I
05TSTAN4 Stanwood WWTP effluent 48.2362 122.3577 - - A, F, H
05TTCF1 Twin City Foods Drain # 1 at dike 48.2382 122.3761 0.1 0.2 A, F, H, I
05TTCF2 Twin City Foods Drain # 2 on Thomle Road 48.2261 122.3670 0.1 0.2 A, F, H
05TTCF34 Twin City Foods Drain # 3 on Thomle Road 48.2264 122.3627 0.1 0.2 A, F, H
05TTCF4 Twin City Foods Drain #4 to Hat Slough 48.1983 122.3626 0.1 0.2 C, D, I
05TTCF5 Twin City Foods Drain # 5 at footbridge above Thomle Road 48.2289 122.3524 0.2 0.3 A, F, H
05TUNIDE Unnamed Creek #0456 at the end of Soundview Drive 48.1647 122.3691 0.1 0.2 I
05TWAREF Warm Beach WWTP effluent at Warm Beach 48.1885 122.3501 - - I
05TWARSL Pump pond slough at Warm Beach 48.1886 122.3527 0.0 0.0 I
05TWARTG Field ditch to pump pond at Warm Beach 48.1889 122.3520 0.1 0.2 I
05TWARUP Warm Beach Creek upstream of WWTP outfall 48.1887 122.3496 0.2 0.3 I
05TWARUS Warm Beach Creek above camp stables 48.1901 122.3446 0.5 0.8 I
05TWEST West pass of Old Stillaguamish River Channel at Hwy. 532 bridge in Stanwood 48.2399 122.3854 1.0 1.6 A, F, H
1Continously recording probe deployed at these sites for Survey C. 2E. coli sampled at these sites in addition to fecal coliform and enterococcus. 3Samples taken at 05TNFTWI on 6/12/2001 and 10/3/2001. 4Sampled during June 2001 storm event only.

Stillaguamish Fecal and DO TMDL Submittal Report Page C-175
Figure C-1. Sites in the lower river basin including the Old Channel and mainstem monitored in 2000 and 2001 for fecal coliform bacteria, dissolved oxygen and other conventional parameters (Ecology TMDL Data Summary August 2004).

Page C-176 Stillaguamish Fecal and DO TMDL Submittal Report
Figure C-2. Sites along mainstem of Stillaguamish River monitored for fecal coliform bacteria, dissolved oxygen, and other conventional parameters (Ecology August 2004).
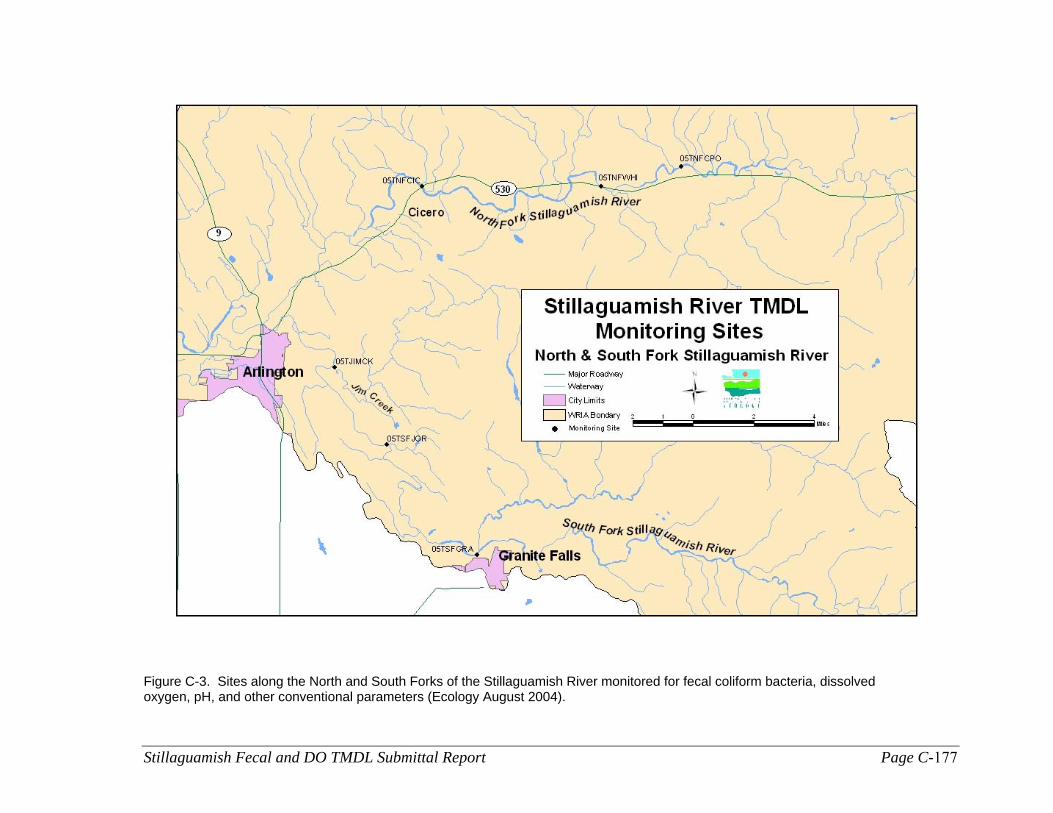
Stillaguamish Fecal and DO TMDL Submittal Report Page C-177
Figure C-3. Sites along the North and South Forks of the Stillaguamish River monitored for fecal coliform bacteria, dissolved oxygen, pH, and other conventional parameters (Ecology August 2004).

Page C-178 Stillaguamish Fecal and DO TMDL Submittal Report

Stillaguamish Fecal and DO TMDL Submittal Report Page D-179
Appendix D. Equations and Examples of Calculations

Page D-180 Stillaguamish Fecal and DO TMDL Submittal Report

Stillaguamish Fecal and DO TMDL Submittal Report Page D-181
Statistical Theory of Rollback The statistical rollback method proposed by Ott (1995) describes a way to use a numeric distribution of a water quality parameter to estimate the distribution after abatement processes are applied to sources. The method relies on basic dispersion and dilution assumptions and their effect on the distribution of a chemical or a bacterial population at a monitoring site downstream from a source. It then provides a statistical estimate of the new population after a chosen reduction factor is applied to the existing pollutant source. In the case of the TMDL, compliance with the most restrictive of the dual fecal coliform criteria will determine the reduction factor needed. As with many water quality parameters, fecal coliform (FC) counts collected over time at an individual site usually follows a lognormal distribution. That is, over the course of a year’s sampling period most of the counts are low, but a few are much higher. When monthly FC data are plotted on a logarithmic-probability graph (the open diamonds in Figure D-1), they appear to form nearly a straight line. The 50th percentile, an estimate of the geometric mean, and the 90th percentile, a representation of the level over which 10 percent of the samples lie, can be located along a line plotted from an equation estimating the original monthly FC data distribution. In the graphical example, these numbers are 75 cfu/100 mL and 383 cfu/100 mL, respectively. Using the statistical rollback method, the 90th percentile value is then reduced to 200 cfu/100 mL (Class A 90th percentile criterion), since 75 cfu/100 mL meets the Class A geometric mean criterion. The new distribution is plotted parallel to the original. The estimate of the geometric mean for this new distribution, located at the 50th percentile, is 39 cfu/100 mL. The result is a geometric mean target of a sample distribution that would likely have less than 10 percent of its samples over 200 cfu/100 mL. A 48 percent FC reduction is required from combined sources to meet this target distribution from the simple calculation: (383 - 200) / 383 = 0.477 * 100 = 48%. The following is a brief summary of the major theorems and corollaries for the statistical theory of rollback (STR) from Environmental Statistics and Data Analysis by Ott (1995).
1. If Q = the concentration of a contaminant at a source, and D = the dilution-diffusion factor, and X = the concentration of the contaminant at the monitoring site, then X = Q*D.
2. Successive random dilution and diffusion of a contaminant Q in the environment often result in a lognormal distribution of the contaminant X at a distant monitoring site.
3. The coefficient of variation (CV) of Q is the same before and after applying a “rollback”; i.e., the CV in the post-control state will be the same as the CV in the pre-control state. The rollback factor = r, a reduction factor expressed as a decimal (a 70% reduction would be a rollback factor of 0.3). The random variable Q represents a pre-control source output state and rQ represents the post-control state.
4. If D remains consistent in the pre-control and post-control states (long-term hydrological and climatic conditions remain unchanged), then CV(Q)*CV(D)=CV(X), and CV(X) will be the same before and after the rollback is applied.

Page D-182 Stillaguamish Fecal and DO TMDL Submittal Report
5. If X is multiplied by the rollback factor r, then the variance in the post-control state will be multiplied by r2, and the post-control standard deviation will be multiplied by r.
6. If X is multiplied by the rollback factor r, the quantiles of the concentration distribution will be scaled geometrically.
7. If any random variable is multiplied by a factor r, then its expected value and standard deviation also will be multiplied by r, and its CV will be unchanged. (Ott uses “expected value” for the mean.)
383 cfu/100 mL
90th-percentile Estimate of the Geometric Mean
200 cfu/100 mL
Original FC Distribution
Target Geometric Mean
Target 90th-percentile 39 cfu/100 mL
Required Reduction
75 cfu/100 mL
Figure D-1. Graphical demonstration of the statistical rollback method (Ott, 1995) used to calculate the fecal coliform TMDL target on the lower Nooksack River.

Stillaguamish Fecal and DO TMDL Submittal Report Page D-183
Statistical Formula for Deriving Percentile Values The 90th percentile value for a population can be derived in a couple of ways. The set of FC counts collected at a site were subjected to a statistically-based formula used by the federal Food and Drug Administration to evaluate growing areas for shellfish sanitation. The National Shellfish Sanitation Program Model Ordinance (USFDA, 2000) states: The estimated 90th percentile shall be calculated by:
(a) Calculating the arithmetic mean and standard deviation of the sample result logarithms (base 10).
(b) Multiplying the standard deviation in (a) by 1.28.
(c) Adding the product from (b) to the arithmetic mean.
(d) Taking the antilog (base 10) of the results in (c) to get the estimated 90th percentile.
(e) The most probable number (MPN) values that signify the upper or lower range of sensitivity of the MPN tests in the 90th percentile calculation shall be increased or decreased by one significant number.
The 90th percentile derived using this formula assumes a lognormal distribution of the FC data. The variability in the data is expressed by the standard deviation, and with some data sets it is possible to calculate a 90th percentile greater than any of the measured data. The 10th and 90th percentile values for pH and dissolved oxygen were calculated using the EXCEL® spreadsheet based on the rank order of the data set. The 10th percentile of a data set containing n data is estimated as at the kth ordered datum: k = ((n - 1)*0.1) + 1 Likewise, the 90th percentile is calculated: k = ((n - 1)*0.9) + 1 For example, given a simple data set of 10 datum in the following rank order: 6.94, 7.05, 7.07, 7.09, 7.3, 7.32, 7.42, 7.45, 7.52, 7.63 the 10th percentile is located at ((10 – 1)*0.1) + 1 = 1.9. Between rank 1 (6.94) and rank 2 (7.05), the 10th percentile is estimated as 7.04. The 90th percentile is located at ((10 – 1)*0.9) + 1 = 9.1. Between rank 9 (7.52) and rank 10 (7.63), the 90th percentile is estimated as 7.53. Beales Ratio Equation Beales ratio estimator from Principles of Surface Water Quality Modeling and Control by Thomann and Mueller (1987) provides a mass loading rate estimate of a pollutant. The formula

Page D-184 Stillaguamish Fecal and DO TMDL Submittal Report
for the unbiased stratified ratio estimator is used when continuous flow data are available for sites with less frequent pollutant sample data. The average load is then:
( ) ( )( )( ) ( ) ⎥
⎥⎥
⎦
⎤
⎢⎢⎢
⎣
⎡
⋅+
⋅+⋅⋅= 2211
11
cQ
ccQW
c
cpp
QSn
WQSnQWQW
where, pW is the estimated average load for the period,
p is the period,
pQ is the mean flow for the period,
cW is the mean daily loading for the days on which pollutant samples were collected,
cQ is the mean daily flow for days when samples were collected, n is the number of days when pollutant samples were collected.
The Simple Method to Calculate Urban Stormwater Loads L = Annual load in lbs R = Annual runoff in inches C = Pollutant concentration in mg/L A = Area in acres 0.226 = unit conversion factor L = 0.226 * R * C * A L = Annual load in billions of colonies C = Bacteria concentration in #/100 mL 1.03 E-3 = unit conversion factor L = 1.03 E-3 * R * C * A R = P * Pj * Rv P = Annual rainfall in inches Pj = Fraction of annual rainfall events that produce runoff (assumed 90%, although not necessarily true for western Washington storm intensities) Rv = Runoff coefficient Rv = 0.05 + 0.9Ia Ia = Percent impervious cover
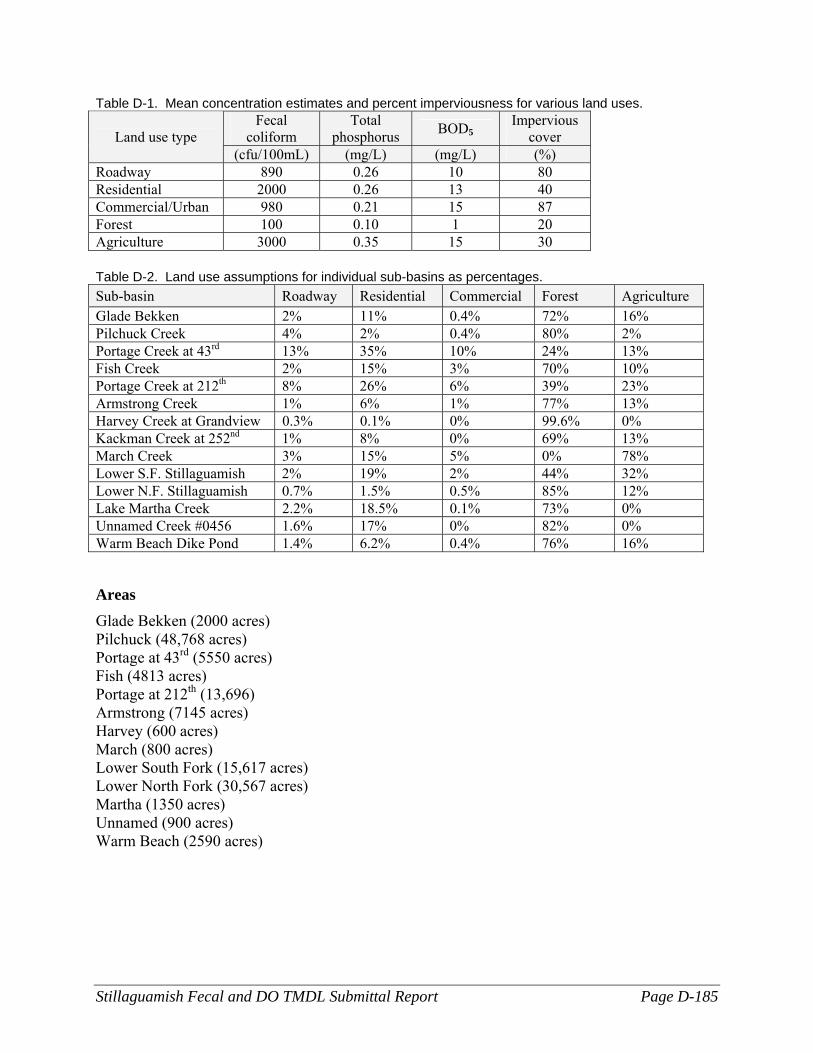
Stillaguamish Fecal and DO TMDL Submittal Report Page D-185
Table D-1. Mean concentration estimates and percent imperviousness for various land uses. Fecal
coliform Total
phosphorus BOD5 Impervious
cover Land use type (cfu/100mL) (mg/L) (mg/L) (%)
Roadway 890 0.26 10 80 Residential 2000 0.26 13 40 Commercial/Urban 980 0.21 15 87 Forest 100 0.10 1 20 Agriculture 3000 0.35 15 30 Table D-2. Land use assumptions for individual sub-basins as percentages. Sub-basin Roadway Residential Commercial Forest Agriculture Glade Bekken 2% 11% 0.4% 72% 16% Pilchuck Creek 4% 2% 0.4% 80% 2% Portage Creek at 43rd 13% 35% 10% 24% 13% Fish Creek 2% 15% 3% 70% 10% Portage Creek at 212th 8% 26% 6% 39% 23% Armstrong Creek 1% 6% 1% 77% 13% Harvey Creek at Grandview 0.3% 0.1% 0% 99.6% 0% Kackman Creek at 252nd 1% 8% 0% 69% 13% March Creek 3% 15% 5% 0% 78% Lower S.F. Stillaguamish 2% 19% 2% 44% 32% Lower N.F. Stillaguamish 0.7% 1.5% 0.5% 85% 12% Lake Martha Creek 2.2% 18.5% 0.1% 73% 0% Unnamed Creek #0456 1.6% 17% 0% 82% 0% Warm Beach Dike Pond 1.4% 6.2% 0.4% 76% 16%
Areas Glade Bekken (2000 acres) Pilchuck (48,768 acres) Portage at 43rd (5550 acres) Fish (4813 acres) Portage at 212th (13,696) Armstrong (7145 acres) Harvey (600 acres) March (800 acres) Lower South Fork (15,617 acres) Lower North Fork (30,567 acres) Martha (1350 acres) Unnamed (900 acres) Warm Beach (2590 acres)

Page D-186 Stillaguamish Fecal and DO TMDL Submittal Report
Table D-3. Example of Wasteload Allocation Calculation for BOD Portage Creek at 212th (Table 37, page 111)
13696 Acres Estimated total area draining to this part of Portage Creek
Road Residential Commercial Forest Agriculture A = Acres 1095.68 3560.96 821.76 5341.44 3150.08 Land Use 0.08 0.26 0.06 0.39 0.23 C = BOD mg/L 10 13 15 1 15 1. Calculate R (annual runoff in inches)
R=P x Pj x Rv Ia is a similar value to Rv, so Ia was substituted for Rv
P = Annual rainfall = 46.5 inches Ia 0.81 0.42 0.89 0.22 0.33 Rv 0.779 0.428 0.851 0.248 0.347 R 33.8985 17.577 37.2465 9.207 13.8105 2. Calculate total load for each land use type L = 0.226 x R x C x A L 83941 183892 103760 11114 147479 Total Load 530187 lbs.per year 1453 lbs per day % of Total Load 15.83% 34.68% 19.57% 2.10% 27.82% 3. Determine loading capacity for BOD based on similar reduction required for fecal coliform bacteria
Fecal coliform reduction required for this location was 147 (GM) to 25 (Target GM) = 83% reduction
Using an 80% reduction for BOD, it would be 1453 lb per day reduced to a target BOD load of 291 lb per day For this calculation, 291 lb per day was rounded to 300 lb per day loading capacity 4. Determine loading of BOD from background sources (undetermined) Assume values of 1.2 mg/L BOD from all land use types except Agriculture, assumed 3 mg/L BOD Road Residential Commercial Forest Agriculture A = Acres 1096 3561 822 5341 3150 Land Use 0.08 0.26 0.06 0.39 0.23 C = BOD mg/L 1.2 1.2 1.2 1.2 3 L 10073 16975 8301 13337 29496

Stillaguamish Fecal and DO TMDL Submittal Report Page D-187
Table D-3. Example of Wasteload Allocation Calculation for BOD Portage Creek at 212th (Table 37, page 111) Total Background Load 78181 lbs per year 214 lbs per day For this calculation, 214 rounded to 210 lbs per day 5. Determine loads from roadways to calculate WLAs; road drainage systems are under Stormwater Permits
Load from roadways based on 8% of 300 lb per day loading capacity 24 lb/day rounded to 20 lb per day
6. Determine loads from Nonpoint Sources by Subtraction Loading Capacity = Background LA + NonPoint LA + Roadways WLA 300 = 210 + Nonpoint LA + 20 Nonpoint LA = 70 lb/ day 7. Determine Snohomish County and WSDOT portions of roadways Wasteload Allocation Relative acreages of roadways under county jurisdiction vs. WSDOT jurisdiction was used to calculate allocations of 12 lb/day to Snohomish County and 8 lb/day to WSDOT, out of a total of 20 lb/day (Roadways: Snohomish County = 27% & WSDOT = 16.7%)

Page D-188 Stillaguamish Fecal and DO TMDL Submittal Report

Stillaguamish Fecal and DO TMDL Submittal Report Page E-189
Appendix E. Watershed Projects Already Implemented by
Local Organizations

Page E-190 Stillaguamish Fecal and DO TMDL Submittal Report

Stillaguamish Fecal and DO TMDL Submittal Report Page E-191
Table E-1. Recent City of Arlington Projects Addressing Impaired Waters in Stillaguamish Watershed Project Title River Segment Parameter
Addressed Organization Date Started/
Completed Comments
Public Education Signs at arterial-stream crossings Portage Cr General City of
Arlington 2002 Objective: watersheds, water
quality, fish Provide contact information for enforcement at task force projects
Temperature SSFETF, City of Arlington
2003
“Arlington Update” newsletter articles on water quality programs and actions
All basins in city limits
General City of Arlington
Quarterly
“Arlington Times” newspaper articles on watershed subjects
All basins in city limits
General City of Arlington
Regularly published, great support
Storm drain stenciling All basins in city limits
Dissolved Oxygen
City of Arlington
“Dump No Waste, Drains To Stream”
Watershed Protection program at airport and industrial center
Portage Cr (also Quilceda)
Temperature, Dissolved Oxygen
City of Arlington
2003 Engage businesses in BMPs and good housekeeping practices
Research and inspection of all septic systems at the airport
Portage creek springs
Ground water City of Arlington
1998-2000 Good opportunity to outreach and inventory airport businesses
Participated in the Portage Creek Stewardship program
Portage Cr Temperature, Dissolved Oxygen
City of Arlington
January – May 2003
Included planting, native plant salvage, speakers, bus tours
Public Participation Began operation of new state of the art Wastewater Treatment plant
All city, other than areas served by Marysville
Dissolved Oxygen, Fecal Coliform, BOD, COD
City of Arlington
1997 Management is researching methods to decrease impacts to fecal coliform and nutrients
Golf course ponds water quality improvements
Prairie Cr Temperature, Dissolved Oxygen, Nutrients
Gleneagle golf course, High School Vo-Tech, City of Arlington
Management changes to solve waters quality problems; High School vocational program for plantings
March Creek water quality investigation
March Cr Fecal Coliform, Dissolved Oxygen,
City of Arlington, landowners
Coordinated with landowners for monitoring access, gage installation, management history, pollution sources, improvement

Page E-192 Stillaguamish Fecal and DO TMDL Submittal Report
Project Title River Segment Parameter Addressed
Organization Date Started/ Completed
Comments
Public Education Temperature, Nutrients
alternatives
Citizen Advisory Committee on Stormwater
All basins in city limits
General City of Arlington
Ongoing Education and social needs
Planning and Development NPDES Phase II application All basins in city
limits General City of
Arlington 2003 On-time submittal
SCD Annexation General City of Arlington
2003 Annexed in to the Snohomish Conservation District
Adopted new Critical Areas regulations
All basins in city limits
Temperature, Dissolved Oxygen
City of Arlington
2003 Buffers up to 150’ on ESA habitats
Significant tree rules All basins in city limits
Temperature City of Arlington
Encourage forest retention
Low Impact Development All basins in city limits
Water Quantity
City of Arlington
Encourage LID designs where a viable option
Developed strict TESC standards All basins in city limits
Sediment City of Arlington
Require meeting project specific NPDES limits (see also Enforcement)
Identified Priority Protection Areas All basins in city limits
Temperature, Dissolved Oxygen
City of Arlington
Developed capital plan using Ecology’s wetland characterization method to identify 100’s of acres of wetlands and 3,000 feet of streambanks (see attached table E-2)
Enforcement Enforce TESC standards All basins in city
limits Sediment City of
Arlington Ongoing Code enforcement on
construction sites Construction project turbidity monitoring
All basins in city limits
Sediment City of Arlington
Mandate projects with sediment problems sample outfall for Turbidity
Operations and Maintenance Gleneagle pet waste station Prairie Cr Fecal City of First one installed; frequently

Stillaguamish Fecal and DO TMDL Submittal Report Page E-193
Project Title River Segment Parameter Addressed
Organization Date Started/ Completed
Comments
Public Education Coliform Arlington used
Prairie Creek Storm Detention System Cleaning
Prairie Cr General, Water Quantity
City of Arlington
2004 Restore capacity to reduce peak flows, address urban flooding and habitat issues
Riparian Restoration Numerous stream and wetland restoration projects (see attached Table A-2)
All basins in city limits
Temperature, Dissolved Oxygen
City of Arlington
Total 5.5 miles and >53acres; most recently Hecla wetland restoration _
Provided trees to landowners willing to plant along critical areas
City wide Temperature, Dissolved Oxygen
City of Arlington
Ongoing Estimated 500 trees 2003/4
Supplemental plantings and maintenance in existing riparian restoration projects
City wide Temperature, Dissolved Oxygen
Banksavers, City of Arlington
Ongoing Estimated 400 trees 2003/4
Prisoner crew plantings—new plus follow-up maintenance
City wide Temperature, Dissolved Oxygen
Oscar Cullem, City of Arlington
Ongoing 5 acres 2003/4
Portage Creek ponds vegetation enhancement
Portage Creek Temperature, Dissolved Oxygen
Pioneer Museum, City of Arlington
2003/4 Added vegetation around the ponds where feasible due to historical dikes
Golf course plantings near ponds Temperature, Dissolved Oxygen
Gleneagle golf course, High School Vo-Tech, City of Arlington
2003/4 Also see Public Participation
Wetland Creation / Acquisition Eagle Creek elementary school wetland creation
Eagle Cr Temperature, Nutrients
City of Arlington
3 acres
Pioneer elementary school wetland creation
Prairie Cr Temperature, Nutrients
City of Arlington
6 acres
Monitoring Illicit discharge detection and elimination
Fecal Coliform, Dissolved
City of Arlington
e.g., as discovered during sewer inspections

Page E-194 Stillaguamish Fecal and DO TMDL Submittal Report
Project Title River Segment Parameter Addressed
Organization Date Started/ Completed
Comments
Public Education Oxygen
Increase water quality staffing General City of Arlington
New hire in Utilities Department May 2004
Continuous water quality monitoring stations
Portage Cr, Prairie Cr
Temperature, Dissolved Oxygen
City of Arlington
Hydrolab Quanta monitors installed at 2 sites, some work yet to be done on Prairie
Stormwater outfall monitoring Largest stormwater outfall; discharge to mainstem Stilly
Fecal Coliform, Dissolved Oxygen, Temperature
City of Arlington
September 2003 Main old town outfall plus background conditions in River; monthly
Source water monitoring Mainstem Stilly Temperature, Turbidity, pH, Conductivity, Water Quantity
City of Arlington
Daily (mostly) by Water Department
Wastewater NPDES compliance effluent monitoring
Mainstem Stilly Fecal Coliform, Dissolved Oxygen, Temperature
City of Arlington
Wastewater additional effluent monitoring
Mainstem Stilly Total Phosphorus, Total Kjeldahl Nitrogen
City of Arlington
March Creek water quality investigation
March Cr Fecal Coliform, Dissolved Oxygen, Temperature
City of Arlington
Mapping, water quality sampling, survey cross-sections and culverts to evaluate potential alternatives for correcting deficiencies plus provide stormwater treatment; see also Public Participation
Support tribal monitoring programs Portage Cr Fecal Coliform
Stillaguamish Tribe, City of
Field or other support of Bacterioides, fecal coliform

Stillaguamish Fecal and DO TMDL Submittal Report Page E-195
Project Title River Segment Parameter Addressed
Organization Date Started/ Completed
Comments
Public Education Arlington genetics, septic system sources,
detergent monitoring programs; will push compliance for identified sources
Construction project turbidity monitoring
All basins in city limits
Sediment City of Arlington
Mandate projects with sediment problems sample outfall for Turbidity

Page E-196 Stillaguamish Fecal and DO TMDL Submittal Report
Table E-2. 2002-2004 Stillaguamish BankSavers Riparian Planting in Stillaguamish Watershed (Stillaguamish Tribe) Site Identifier Linear ft Miles
Avg. Buffer Width Acreage
# of Plants Water Body Project Partner
A 1650 30 1.1 1234 Unnamed trib to NF Stilly Snohomish Conservation District
B 1200 20 0.6 503Glade Bekken (Trib to Lower Stilly) Snohomish Conservation District
C 15650 50 18.0 2161 Old Stilly Channel Max Albert's Old Stilly Channel Project
D 600 15 0.2 500 Stilly Mainstem None E 1500 50 1.7 2059 Stilly Mainstem None F 1854 6.0 2500 Pilchuck Creek CREP project
G 1300 50 1.5 2005 Church Creek Snohomish County-SWM-Jake Jacobson
H 3320 25 1.9 326 Church Creek trib Snohomish County-SWM-Jake Jacobson
I 300 30 0.2 505 Church Creek trib Snohomish County-SWM-Jake Jacobson
J 1300 45 1.3 130 Old Stilly Channel Max Albert's Old Stilly Channel Project
K 400 60 0.6 110 Old Stilly Channel Max Albert's Old Stilly Channel Project
L 945 40 0.9 562 Stilly Mainstem None M 2660 20 1.2 1426 Unnamed trib to NF Stilly Stilly-Snohomish Task Force N 2000 80 3.7 1332 Old Stilly Channel CREP project O 1039 4.3 1487 Stilly Mainstem CREP project P 1800 300 12.4 1300 NF Stilly @ C-Post Bridge Stilly Tribe DNR Q 600 20 0.3 500 Trib to NF Stilly Snohomish Conservation District
R 3500 30 2.4 1700Harvey Creek/Kackman Creek Snohomish Conservation District
Totals for all projects 41618 7.9 58.3 20340

Stillaguamish Fecal and DO TMDL Submittal Report Page E-197
Table E-3. Portage Creek Watershed Revegetation Sites - The BankSavers Project (Stillaguamish Tribe)
# of
Plants # of
Plants Acres
Site # Planted to be
Planted Maintenance Services
Protected
Length of Project
Avg. Buffer Width/Fencing Installed Project Partner
1 2450.0 Yes 2.2 3200 ft 30 ft/4400 ft 2 2260.0 Yes 1.9 4150 ft 20 ft
3 3500 Yes 2.3 2000 ft 50 ft Snohomish County / NOAA grant
4 594.0 Yes 0.6 1300 ft 20 ft 5 4962.0 Yes 3.3 7110 ft 20 ft 6 1099.0 Yes 1.1 1200 ft 40 ft Stilly Tribe DNR
7 3576.0 Yes 3 Snohomish County Parks / Task Force
8 1365.0 Yes 1.5 1200 ft 60 ft Stilly-Snohomish Task Force 9 4611.0 Yes 3 2600 ft 50 ft Stilly Tribe DNR
10 889.0 Yes 1.4 3000 ft 20 ft 11 Yes 2.1 3000 ft 30 ft Stilly Snohomish Task Force 12 200.0 Yes 1.1 2000 ft 25 ft Stilly Snohomish Task Force 13 200.0 Yes 0.6 500 ft 50 ft Stilly Snohomish Task Force 14 270.0 2300 Yes 3.5 5100 ft 30 ft Stilly Snohomish Task Force
Totals 22476.0 5800 27.5
36360 (6.9 miles) 20 to 60/4400 ft

Page E-198 Stillaguamish Fecal and DO TMDL Submittal Report
Table E-4. Recent Snohomish County/Partner Projects Addressing Impaired Waters in Stillaguamish Watershed
Project Title River Segment Parameter Addressed
Organization Date Started/
Completed Pilchuck Creek
Trib80a Stillaguamish Tribe
Streambank Revegetation (many individual projects)
Indian, Church, Deer, Deforest, French, Jim, Jorgenson Slough, Portage, Porter, Prairie, Riley, Rock, Sills, Trafton II 05-0145
Temperature City of Arlington/Stillaguamish Tribe, Snohomish Conservation District, Stilly-Snohomish Fisheries Enhancement Task Force, Stillaguamish Flood Control District, WDFW, DNR, private landowners, Snohomish County
1994 - 2004
Flow Enhancement Structure
Old Stillaguamish Channel
Temperature, Dissolved Oxygen
Stillaguamish Flood Control District, Stillaguamish Tribe
2003
Riparian Repair/ Revegetation
South Fork, Church, Portage, Kackman, North Fork, Trib to North Fork near Trafton, Trib to South Fork off Burn Rd
Temperature, some Fecal Coliform locations
Snohomish County 2001-2004
Glade Bekken restoration
Glade Bekken watershed
Temperature, Dissolved oxygen, Fecal coliform
Snohomish County 1996-2001
Ambient monitoring
8 sites on mainstem and tributaries
Temperature, Dissolved oxygen, Fecal coliform
Snohomish County 1994-ongoing
Water quality complaint investigations
Clean Water District Temperature, Dissolved oxygen, Fecal coliform
Snohomish County 1994-ongoing
Church Creek restoration
Church Creek watershed
Temperature, Dissolved oxygen, Fecal coliform
Snohomish County 2000-ongoing
Dry Weather Outfall Monitoring
Clean Water District Temperature, DO, Fecal Coliform
Snohomish County 1998-Ongoing
Adult Education (e.g. Watershed Keepers, tours, community events)
Clean Water District Temperature, DO, Fecal Coliform
Snohomish County 1994 – ongoing
Streamside Landowner Workshops
Clean Water District Temperature, DO, Fecal Coliform
Snohomish County with Ecology funding
2003 - 2004
Streamside BMP Direct Mail campaign
Stillaguamish Basin Temperature, DO, Fecal Coliform
Snohomish County with Ecology funding
2004
Teacher and Youth Education
Most schools in CWD
Temperature, DO, Fecal Coliform
Snohomish County 1996 - ongoing

Stillaguamish Fecal and DO TMDL Submittal Report Page E-199
Table E-5. Snohomish Conservation District: 2004 Public Education Projects in Stillaguamish Watershed Project Title River Segment Parameter
AddressedOrganization Date
Started/ Completed
Comments
Spring Farm Clinic Lower watershed
General Snohomish CD 4/24/04 Held at Stanwood Grange
Ice Cream Social Lower watershed
General Snohomish CD 6/18/04 Held at private farm, Arlington
Silvana Fair (booth) Lower watershed
General Snohomish CD 7/31/04 At Silvana
Stanwood-Camano Fair (booth) Lower watershed
General Snohomish CD 8/6-8/8/04 In Stanwood
Festival of the River (booth) Lower watershed
General Snohomish CD 8/6/04 In Arlington
Fall Farm Workshop Lower watershed
General Snohomish CD 10/9/04 At Stanwood Grange
Table E-6. Snohomish Conservation District: 2004 Projects in Stillaguamish Watershed
Project Type River Segment Project Type River Segment Site visit/farm plan review Arlington Junction
South Planting/site visit/Nutrient management Hat Slough South
Site visit/farm plan review Arnot Road Drainages
Data collection & Evaluation/Meetings/Site visit/farm plan review
Hell-Hazel Drainages
Site visit/farm plan review Boulder Ridge Data Collection & Evaluation/ Nutrient Management/Site visit/farm plan review
Higgins Ridge Area
Fencing & Structural BMPs/Site visit/farm plan review
Burn Hill Road Drainages
Firebreak/Structural BMPs/Site visit/farm plan assistance
Jackson Gulch
Site visit/farm plan review Church Creek Structural BMPs/Site visit/farm plan review
Jim Creek
Site visit/farm plan review Deer Creek Nutrient management/Fencing/ Site visit/farm plan review
Jordan Road Drainages
Brush Management/Structural Ebey Hill Drainages Data Collection & Evaluation/Fencing/ Kackman Rd Drainages

Page E-200 Stillaguamish Fecal and DO TMDL Submittal Report
Project Type River Segment Project Type River Segment BMPs/Site visit/farm plan review Site visit/farm plan review Data collection/Site visit/farm plan review
Frailey Mountain Drainages
Structural BMPs/Data Collection & Evaluation/ Site visit/farm plan review/Nutrient management/Brush management
Pilchuck Creek
Site visit/farm plan review/Data collection, Structural BMPs/Tree & shrub establishment
Glade Bekken Fencing/ Site visit/farm plan review Silvana Terrace
Fund raising/ Site visit/farm plan review
Grandview Area Site visit/farm plan review Squire Creek
Data Collection/Fencing/Site visit/farm plan review
Harvey Armstrong Creek
Structural BMPs/Data Collection & Evaluation/ Site visit/farm plan review/Nutrient management/Brush management/Pest management
Stillaguamish Floodplain

Stillaguamish Fecal and DO TMDL Submittal Report Page F-201
Appendix F. NPDES Permitted Facilities in Stillaquamish
Watershed

Page F-202 Stillaguamish Fecal and DO TMDL Submittal Report

Stillaguamish Fecal and DO TMDL Submittal Report Page F-203
Table F-1. NPDES permitted facilities in Stillaguamish Basin with active permits that discharge directly to surface water. Facility Name Facility Type Permit Type Permit ID Limited Parameters Kwant Dairy Farm General WAG013025B WA DFW Arlington Hatchery
Fish General WAG133009D Total residual chlorine, flow, settleable solids, total suspended solids
WA DFW Whitehorse Ponds
Fish General WAG133008D Total residual chlorine, flow, settleable solids, total suspended solids
CMS 300 St Pit Industrial General WAG503285C Oil and grease, pH CUZ Concrete Products Inc
Industrial General WAG503338B Oil and grease, pH, total dissolved solids
Green Crow Corp. Industrial General WAG503358B Oil and grease, pH Lenz Enterprises Industrial General WAG503069C Oil and grease, pH Rinker Materials Arlington Pit
Industrial General WAG503058C Oil and grease, pH
Rinker Materials BNI Pit Industrial General WAG503317C Oil and grease Smokey Point Concrete Industrial General WAG503088C Oil and grease, pH Stanwood Redi Mix Inc Industrial General WAG503212C Oil and grease, pH
Related Documents


