DRAFT Stiffness, Strength, and Performance of Unbound Aggregate Material: Application of South African HVS and Laboratory Results to California Flexible Pavements Report produced under the auspices of the California Partnered Pavement Research Program by: H L Theyse CSIR Transportek PO Box 395 Pretoria, Republic of South Africa 0001 University of California Pavement Research Center July 2002

Welcome message from author
This document is posted to help you gain knowledge. Please leave a comment to let me know what you think about it! Share it to your friends and learn new things together.
Transcript

DRAFT
Stiffness, Strength, and Performance of Unbound Aggregate
Material: Application of South African HVS and Laboratory
Results to California Flexible Pavements
Report produced under the auspices of the California Partnered Pavement Research Program
by:
H L TheyseCSIR Transportek
PO Box 395Pretoria, Republic of South Africa
0001
University of CaliforniaPavement Research Center
July 2002

ii

iii
TABLE OF CONTENTS
Table of Contents........................................................................................................................... iii
List of Figures ................................................................................................................................. v
List of Tables ................................................................................................................................. ix
1.0 Introduction........................................................................................................................... 1
2.0 California and South Africa Aggregate ................................................................................ 3
2.1 California Specification..................................................................................................... 4
2.1.1 Source of the Material................................................................................................. 4
2.1.2 Gradation Requirements ............................................................................................. 4
2.1.3 Quality Requirements ................................................................................................. 5
2.2 South Africa Specification................................................................................................. 6
2.2.1 Source of the Material................................................................................................. 6
2.2.2 Gradation Requirements ............................................................................................. 7
2.2.3 Quality requirement .................................................................................................... 8
2.3 Comparison of the California and South Africa Aggregate Specifications....................... 9
2.3.1 Source of Material....................................................................................................... 9
2.3.2 Gradation Requirement............................................................................................. 10
2.3.3 Quality Requirement................................................................................................. 11
3.0 HVS Studies on Unbound Aggregate Base Layers............................................................. 19
3.1 The effective stiffness response of unbound aggregate under HVS testing .................... 20
3.2 Permanent Deformation Response of Unbound Aggregate Under HVS Testing ........... 28
3.3 Permeability of an Unbound Aggregate Base and Drainable Subbase on an HVS Test
Section ...................................................................................................................................... 33
4.0 Laboratory Studies on Unbound Aggregate ....................................................................... 37

iv
4.1 The Stiffness of Unbound Aggregate Under Laboratory Testing ................................... 37
4.2 Static Shear Strength Parameters of Unbound Aggregate............................................... 42
4.3 Permanent Deformation of Unbound Aggregate............................................................. 49
4.3.1 Factors Affecting the Stability of Unbound Aggregate Under Repeated Loading... 54
4.3.2 Empirical Modeling of the Plastic Deformation of Unbound Aggregate ................. 55
4.4 Compaction Potential of Unbound Aggregate................................................................. 59
5.0 Conclusions and recommendations..................................................................................... 65
6.0 References........................................................................................................................... 69
Appendix A................................................................................................................................... 71
Pavement and Instrumentation Detail of HVS Test Sections ....................................................... 71

v
LIST OF FIGURES
Figure 1. Comparison of the gradation envelopes for a 19-mm maximum size base layer
aggregate from California and a 26.5-mm maximum size base layer aggregate
from South Africa. ................................................................................................................ 10
Figure 2a. Comparison of California samples with South Africa gradation control points for a
26.5-mm maximum particle size aggregate. ......................................................................... 12
Figure 2b. Comparison of California samples with dense aggregate gradation control points for a
19-mm maximum particle size aggregate. ............................................................................ 12
Figure 3. Comparison of the gradation envelopes for Class 1 subbase aggregate (California) and
G4 aggregate (South Africa). ................................................................................................ 13
Figure 4. Combined CBR data for the three aggregates from California showing the relationship
between compaction moisture content and CBR. ................................................................. 15
Figure 5. CBR data for a G2 aggregate from South Africa showing the relationship between
compaction level and CBR. .................................................................................................. 15
Figure 6. The relationship between the bulk stress and effective stiffness modulus of natural
gravel and crushed stone aggregate. ..................................................................................... 25
Figure 7. The effect of traffic loading and degree of saturation on the stiffness of the crushed
stone aggregate from Road P157/2. ...................................................................................... 26
Figure 8. The relationship between the effective stiffness and bulk stress of crushed stone
aggregate from a number of HVS tests................................................................................. 26
Figure 9. The effective stiffness modulus of crushed stone aggregate for the
duration of HVS test 398a4................................................................................................... 28
Figure 10. Illustration of typical base permanent deformation (rutting) behavior. Note: PD =
permanent deformation (rut depth or permanent vertical strain). ......................................... 30
vi
Figure 11. Bedding-in plastic strain, plastic strain rate, and bearing capacity results for a number
of crushed stone aggregate layers determined from HVS testing......................................... 31
Figure 12. Gradation of the base and drainable subbase aggregate from
HVS Test Section 303a2....................................................................................................... 34
Figure 13. Permeability coefficient of the base and subbase aggregate from HVS Test Section
303a2 as a function of relative density (modified AASHTO compaction). ......................... 35
Figure 14. The observed and predicted values of the resilient modulus for a
crushed stone aggregate. ....................................................................................................... 40
Figure 15. The relationship between the cohesion, relative density, and degree of saturation for a
crushed stone aggregate. ....................................................................................................... 44
Figure 16. The relationship between the friction angle, relative density, and degree of saturation
for a crushed stone aggregate................................................................................................ 44
Figure 17a. Friction angle versus relative density for crushed stone and natural gravel aggregate;
component effect: compaction. ............................................................................................. 47
Figure 17b. Friction angle versus saturation for crushed stone and natural gravel aggregate;
component effect: saturation................................................................................................. 47
Figure 17c. Cohesion versus relative density for crushed stone and natural gravel aggregate;
component effect: compaction. ............................................................................................. 48
Figure 17d. Cohesion versus saturation for crushed stone and natural gravel aggregate;
component effect: saturation................................................................................................. 48
Figure 18a. Friction angle versus relative density for crushed stone aggregate;
component effect: compaction. ............................................................................................. 50

vii
Figure 18b. Friction angle versus saturation for crushed stone aggregate;
component effect: saturation................................................................................................. 50
Figure 18c. Cohesion versus relative density for crushed stone aggregate;
component effect: compaction. ............................................................................................. 51
Figure 18d. Cohesion versus saturation for crushed stone aggregate;
component effect: saturation................................................................................................. 51
Figure 19a. Friction angle and cohesion results plotted against relative density and degree of
saturation for natural gravel aggregate; component effect: compaction............................... 52
Figure 19b. Friction angle and cohesion results plotted against relative density and degree of
saturation for natural gravel aggregate; component effect: saturation.................................. 52
Figure 20. Stable and unstable permanent deformation response of
dynamic traxial test samples. ................................................................................................ 53
Figure 21. Effect of the degree of saturation on the stress ration level at which unstable
permanent deformation occurs.............................................................................................. 56
Figure 22. Equal values for the stress ratio generated at different values of absolute stress....... 58
Figure 23a. Stress ratio � N data set for crushed stone aggregate, 80.7 percent
relative density and 33.4 percent saturation.......................................................................... 60
Figure 23b. Stress ratio � N data set for crushed stone aggregate, 80.7 percent
relative density and 78 percent saturation............................................................................. 60
Figure 24a. Contour plot of the permanent deformation bearing capacity model for the unbound
aggregate tested by Theyse, 86 percent relative density, 70 percent saturation. .................. 61
Figure 24b. Contour plot of the permanent deformation bearing capacity model for the unbound
aggregate tested by Theyse, 86 percent relative density, 45 percent saturation. .................. 61

viii
Figure 24c. Contour plot of the permanent deformation bearing capacity model for the unbound
aggregate tested by Theyse, 88 percent relative density, 70 percent saturation. .................. 62
Figure 24d. Contour plot of the permanent deformation bearing capacity model for the unbound
aggregate tested by Theyse, 88 percent relative density, 45 percent saturation. .................. 62
ix
LIST OF TABLES
Table 1 Gradation Specification for Base Layer Aggregate ....................................................... 5
Table 2 Gradation Specification for Subbase Layer Aggregate.................................................. 5
Table 3 Quality Requirements for Base Layer Aggregate .......................................................... 6
Table 4 Quality Requirements for Subbase Layer Aggregate..................................................... 6
Table 5 Gradation Requirements for Base Layer Aggregate ...................................................... 7
Table 6 Quality Requirement for Base Aggregate ...................................................................... 8
Table 7 Quality Requirement for Subbase Aggregate................................................................. 9
Table 8 HVS Tests from which Data Was Utilized in This Study............................................ 21
Table 9 Back-calculated Effective Stiffness Moduli from Maree et al.(8) ............................... 22
Table 10 Back-calculated Effective Stiffness Moduli for Crushed Stone Aggregate................. 23
Table 11 Base Bedding-in Displacement, Deformation Rate, and Bearing Capacity Results for a
Number of Crushed Stone Aggregate Base Layers from HVS Test Sections ...................... 32
Table 12 Gradation, Density, and Moisture Content Properties of the Crushed Stone Aggregate
from the Base and Drainable Subbase Layers from Section 303a2...................................... 34
Table 13 Permeability Coefficient of the Base and Subbase Aggregate from HVS Test Section
303a2 as a Function of Relative Density (Modified AASHTO Compaction) ...................... 35
Table 14 Factors Affecting the Relationship between the Resilient Modulus and the Bulk Stress
Condition of Unbound Aggregate......................................................................................... 38
Table 15 Resilient Modulus Values for a Crushed Stone Aggregate at Different Combinations
of Density and Saturation...................................................................................................... 39
Table 16 Factors Affecting the Relationship Between the Resilient Modulus and the Bulk Stress
Condition of Unbound Aggregate......................................................................................... 42
Table 17 Cohesion (kPa) results for crushed stone aggregate..................................................... 43

x
Table 18 Friction Angle Results for the Crushed Stone.............................................................. 43
Table 19 Shear Strength Parameters of a Selection of Crushed Stone and
Natural Gravel Aggregate ..................................................................................................... 46
Table 20 Dynamic Triaxial Test Results from Maree (17) ......................................................... 55

1
1.0 INTRODUCTION
Caltrans specifies the use of a 75-mm Asphalt Treated Permeable Base (ATPB) layer as
standard practice for all new flexible pavement designs in California.(1) The ATPB acts as a
drainage layer beneath the asphalt concrete (AC) and is supported by an aggregate base layer.
However, the potential exists for water to enter the unbound aggregate base layer from the ATPB
layer through the prime coat that separates them. The stiffness, strength, and performance of
unbound aggregate layers are largely influenced by moisture content.
The assessment of the performance of two types of flexible pavement cross section, one
with and one without an ATPB layer, were included in the strategic plan of the CAL/APT
program (1994�2000). Goal 1 and Goal 5 of the CAL/APT project (continued in the Partnered
Pavement Research Program after 2000) consist of the evaluation of these two sections under dry
and wet base conditions, respectively.
The evaluation includes accelerated pavement testing using the Heavy Vehicle Simulator
(HVS) and laboratory testing. The test plan for Goal 5 (2) includes, �the evaluation of the effects
of compaction and water content on the stiffness of the aggregate base and subbase layers.� The
first objective of Goal 5 is to measure the effectiveness of the ATPB layer in the drained
pavement in preventing a decrease in stiffness and strength of the unbound layers. Those results
are included in References (3�6). It is, however, not only the degree of saturation of an unbound
aggregate that influences the performance of the material but also the level of compaction of the
material.
The objective of this report is to illustrate the effect of the level of compaction and the
degree of saturation on the stiffness, strength, and plastic deformation of unbound aggregate
layers based on information obtained from HVS and laboratory testing in South Africa. The
results will permit extrapolation of Goal 1 and Goal 5 results to other California materials and

2
structures. The information presented in this report also contributes towards the improved
understanding and modeling of the behavior of unbound aggregate material for mechanistic-
empirical design purposes.
The scope of the information presented herein is limited to the aggregate used for
pavement base and subbase layers. A comparison of California and South Africa specifications
for base and subbase aggregate material is presented to identify possible similar material
categories for which it is thought similar response and behavior will be exhibited.
HVS tests that were performed on pavements with unbound aggregate base layers were
identified and the deflection and permanent deformation responses of these test sections were
extracted from the CSIR HVS database to be evaluated in terms of the objective of this report.
Data from laboratory projects that were performed in association with the HVS program in South
Africa in addition to the HVS data are presented in order to facilitate a more detailed evaluation
of the effect of density and degree of saturation on the stiffness, strength, and plastic deformation
of unbound aggregate material.

3
2.0 CALIFORNIA AND SOUTH AFRICA AGGREGATE
The California and South Africa materials classification systems distinguish between
different aggregate classes or categories. In the case of the California material specification, a
distinction is made between aggregates for base and subbase layers. Three subbase aggregate
classes, ranging from Class 1 to Class 3, and two base aggregate classes, Class 2 and Class 3
aggregate, are defined. The definitions of these material classes are based on the gradation, a
shear resistance value (R-value), and sand equivalent value. Aggregate base materials also have
an additional durability specification.
The South Africa material classification system (7) places more emphasis on the source
of the aggregate than the layer in which it is used. A range of material categories is defined for
unbound pavement materials ranging from high quality crushed stone (G1 and G2) to in-situ
subgrade quality material (G10). These material classes are defined according to criteria for
gradation (gradation envelopes and a gradation modulus), Atterberg limits, bearing strength
(CBR), resistance to abrasion, and density requirements for different applications. Base and
subbase quality aggregate will typically fall in the upper material categories ranging from G1 to
G3 for processed crushed stone material and G4 to G6 for natural gravels.
Ideally, the comparison between the California and South Africa materials specifications
needs to be based on at least the following:
• Gradation requirements
• Activity (swell, plasticity, clay content, sand equivalent or any similar method of
quantification)
• Bearing strength (CBR or R-value)
• Density specifications

4
Unfortunately, the methods for determining the activity and bearing strength differ
between California and South Africa, which effectively reduces the basis for the comparison to
the gradation and density specification. A more detailed comparison may be possible if
correlations between CBR and R-value, and Sand Equivalent and Atterberg limits can be
established from the literature.
2.1 California Specification
2.1.1 Source of the Material
The aggregate for Class 2 and 3 aggregate base layers must be free from organic matter
and deleterious substances. The aggregate may contain material from reclaimed asphalt
concrete, portland cement concrete, lean concrete, cement treated base, or a combination of any
of these materials as long as the volume of the reclaimed material does not exceed 50 percent of
the total volume of the aggregate. The specification is not clear on the source for the other 50
percent of the aggregate, but it is assumed that it will be obtained from the crushing of rock or
natural gravel. The same criteria apply to the aggregate for subbase layers.
2.1.2 Gradation Requirements
The California gradation requirement for base and subbase aggregate is given in Tables 1
and 2, respectively. The gradation for Class 3 base aggregate must comply with the gradation of
either the 37.5- or 19.0-mm Class 2 aggregate or the gradation specified under special
provisions. There is no specification requirement for fractured particles.
5
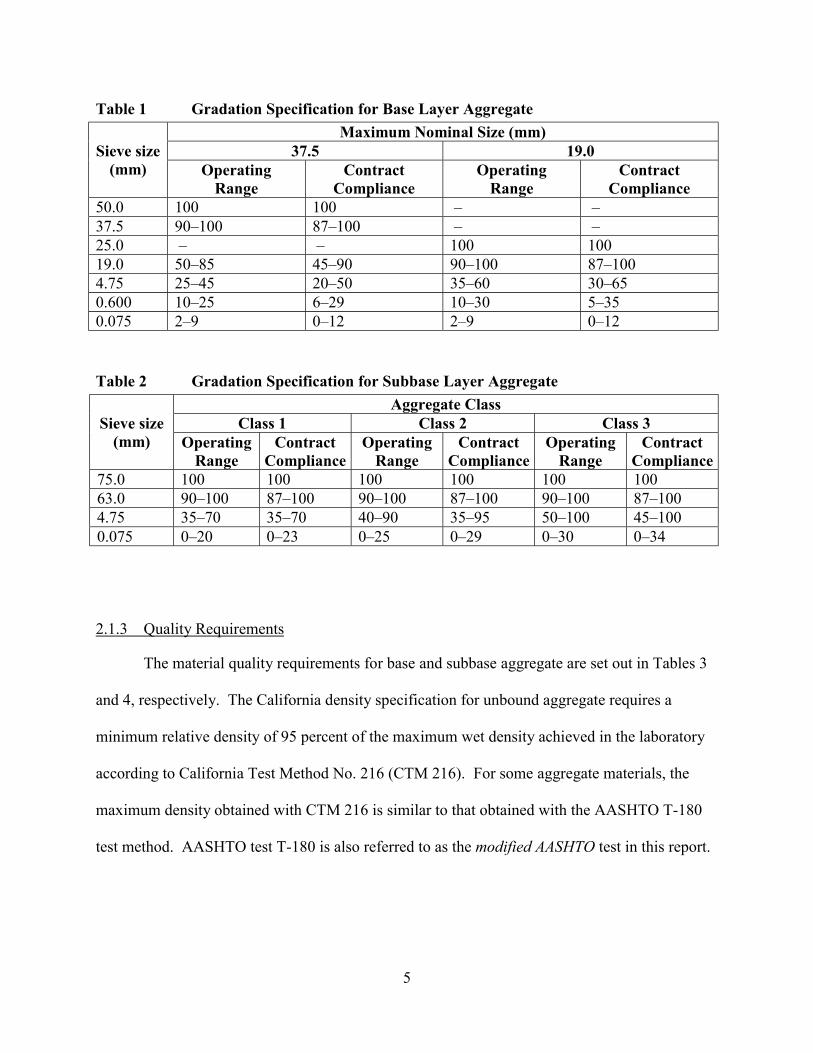
Table 1 Gradation Specification for Base Layer AggregateMaximum Nominal Size (mm)
37.5 19.0Sieve size(mm) Operating
RangeContract
ComplianceOperating
RangeContract
Compliance50.0 100 100 � �37.5 90�100 87�100 � �25.0 � � 100 10019.0 50�85 45�90 90�100 87�1004.75 25�45 20�50 35�60 30�650.600 10�25 6�29 10�30 5�350.075 2�9 0�12 2�9 0�12
Table 2 Gradation Specification for Subbase Layer AggregateAggregate Class
Class 1 Class 2 Class 3Sieve size(mm) Operating
RangeContract
ComplianceOperating
RangeContract
ComplianceOperating
RangeContract
Compliance75.0 100 100 100 100 100 10063.0 90�100 87�100 90�100 87�100 90�100 87�1004.75 35�70 35�70 40�90 35�95 50�100 45�1000.075 0�20 0�23 0�25 0�29 0�30 0�34
2.1.3 Quality Requirements
The material quality requirements for base and subbase aggregate are set out in Tables 3
and 4, respectively. The California density specification for unbound aggregate requires a
minimum relative density of 95 percent of the maximum wet density achieved in the laboratory
according to California Test Method No. 216 (CTM 216). For some aggregate materials, the
maximum density obtained with CTM 216 is similar to that obtained with the AASHTO T-180
test method. AASHTO test T-180 is also referred to as the modified AASHTO test in this report.

6
Table 3 Quality Requirements for Base Layer AggregateTest Parameter Operating Range Contract Compliance
Minimum ValueResistance (R-value) - 78Sand Equivalent 25 minimum 22Durability Index - 35
Table 4 Quality Requirements for Subbase Layer AggregateAggregate ClassTest
Parameter Class 1 Class 2 Class 3OperatingRange
ContractCompliance
OperatingRange
ContractCompliance
OperatingRange
ContractCompliance
SandEquivalent
21 min 18 min 21 min 18 min 21 min 18 min
Resistance(R-value)
� 60 min � 50 min � 40 min
2.2 South Africa Specification
2.2.1 Source of the Material
The South Africa material specification for base and subbase aggregate places more
emphasis on the source from which the aggregate is obtained and the way in which the aggregate
is processed. Distinction is made between the crushed stone used for the construction of a G1
high density layer, the crushed stone used for a G2 or G3 layer, and aggregate from a natural
gravel source.
2.2.1.1 Graded crushed stone G1
The material for a G1 crushed stone aggregate is obtained from crushing solid,
unweathered rock. All the faces of the aggregate particles will therefore be fractured. The
gradation of the material may only be adjusted by adding fines produced from the crushing of the
original parent rock.
7
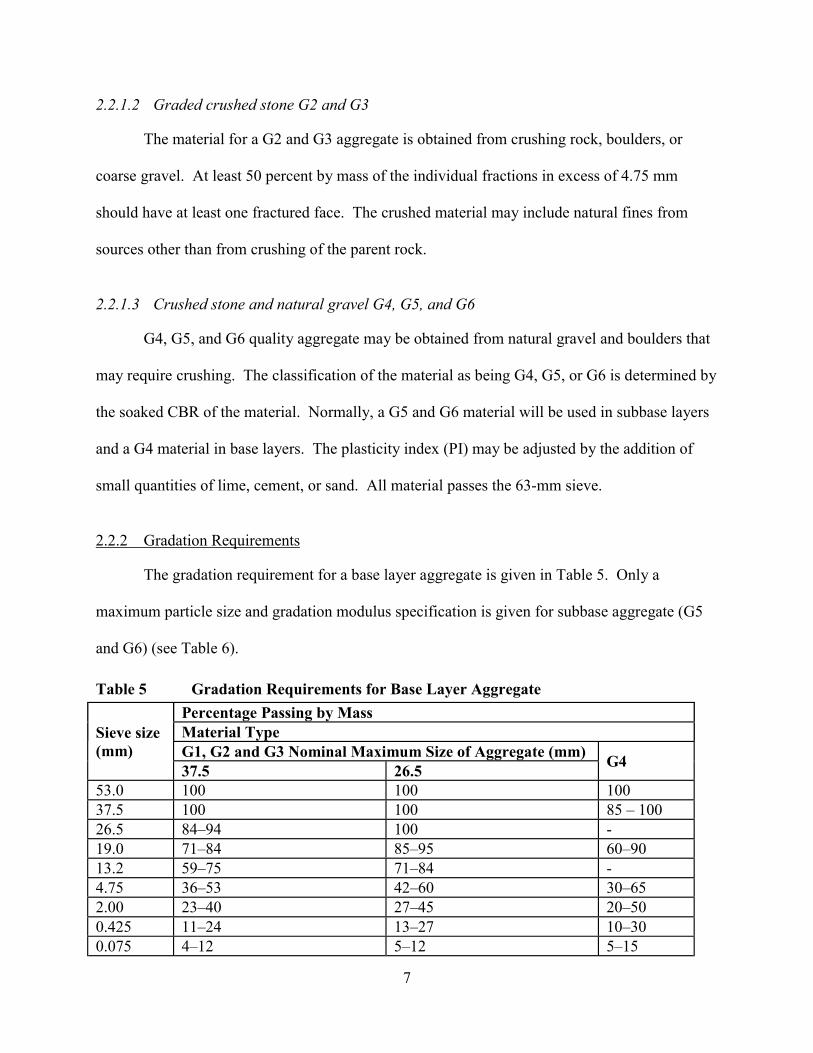
2.2.1.2 Graded crushed stone G2 and G3
The material for a G2 and G3 aggregate is obtained from crushing rock, boulders, or
coarse gravel. At least 50 percent by mass of the individual fractions in excess of 4.75 mm
should have at least one fractured face. The crushed material may include natural fines from
sources other than from crushing of the parent rock.
2.2.1.3 Crushed stone and natural gravel G4, G5, and G6
G4, G5, and G6 quality aggregate may be obtained from natural gravel and boulders that
may require crushing. The classification of the material as being G4, G5, or G6 is determined by
the soaked CBR of the material. Normally, a G5 and G6 material will be used in subbase layers
and a G4 material in base layers. The plasticity index (PI) may be adjusted by the addition of
small quantities of lime, cement, or sand. All material passes the 63-mm sieve.
2.2.2 Gradation Requirements
The gradation requirement for a base layer aggregate is given in Table 5. Only a
maximum particle size and gradation modulus specification is given for subbase aggregate (G5
and G6) (see Table 6).
Table 5 Gradation Requirements for Base Layer AggregatePercentage Passing by MassMaterial TypeG1, G2 and G3 Nominal Maximum Size of Aggregate (mm)
Sieve size(mm)
37.5 26.5 G4
53.0 100 100 10037.5 100 100 85 � 10026.5 84�94 100 -19.0 71�84 85�95 60�9013.2 59�75 71�84 -4.75 36�53 42�60 30�652.00 23�40 27�45 20�500.425 11�24 13�27 10�300.075 4�12 5�12 5�15
8
Table 6 Quality Requirement for Base AggregateMaterial TypeProperty G1 G2, G3 and G4
Minimum CBR (%) at 98 % mod. AASHTO compaction - 80Maximum swell (%) at 100 % mod. AASHTO compaction - 0.2Crushing strength: Minimum 10 % FACT� (kN)
Maximum ACV� (%)11029
110 (G2)*
29 (G2)*
Maximum Flakiness Index (%)§ 35 35Atterberg limits: maximum Liquid Limit (LL)**
maximum Plasticity Index (PI) ��
maximum Linear Shrinkage, % (LS) ��
2544
2563
Minimum compactionrequirements:
i) % Apparent Densityii) % mod. AASHTO compaction
86 - 88 -100 � 102 (G2)98 (G3, G4)
* Only applicable to G2 material, not G3 and G4 material.� 10% FACT (Fines Aggregate Crushing Value) is the the force in kN required to crush a sampleof aggregate passing the 13.2 mm and retained on the 9.5 mm sieve so that 10 percent of the totaltest sample will pass a 2.36 mm sieve.� The aggregate crushing value (ACV) of an aggregate is the mass of material, expressed as apercentage of the test sample which is crushed finer than a 2.36 mm sieve when a sample ofaggregate passing the 13.2 mm and retained on the 9.50 mm sieve is subjected to crushing undera gradually applied compressive load of 400 kN.§ Flakiness Index is a measure of the length to width ratio of aggregate particles** Liquid Limit is the moisture content of a soil expressed as a percentage of mass of the oven-dried soil, at the boundary between the liquid and plastic states. The moisture content at thisboundary is arbitrarily defined as the liquid limit and is the moisture content at a consistencydetermined by means of the standard liquid limit apparatus.�� Plasticity Index is the numerical difference between the liquid limit and the plastic limit of thesoil and indicates the magnitude of the range of moisture contents over which the soil is in aplastic condition.�� The linear shrinkage of a soil for the moisture content equivalent to the liquid limit, is thedecrease in one dimension, expressed as a percentage of the original dimension of the soil mass,when the moisture content is reduced from the liquid limit to an oven-dry state.
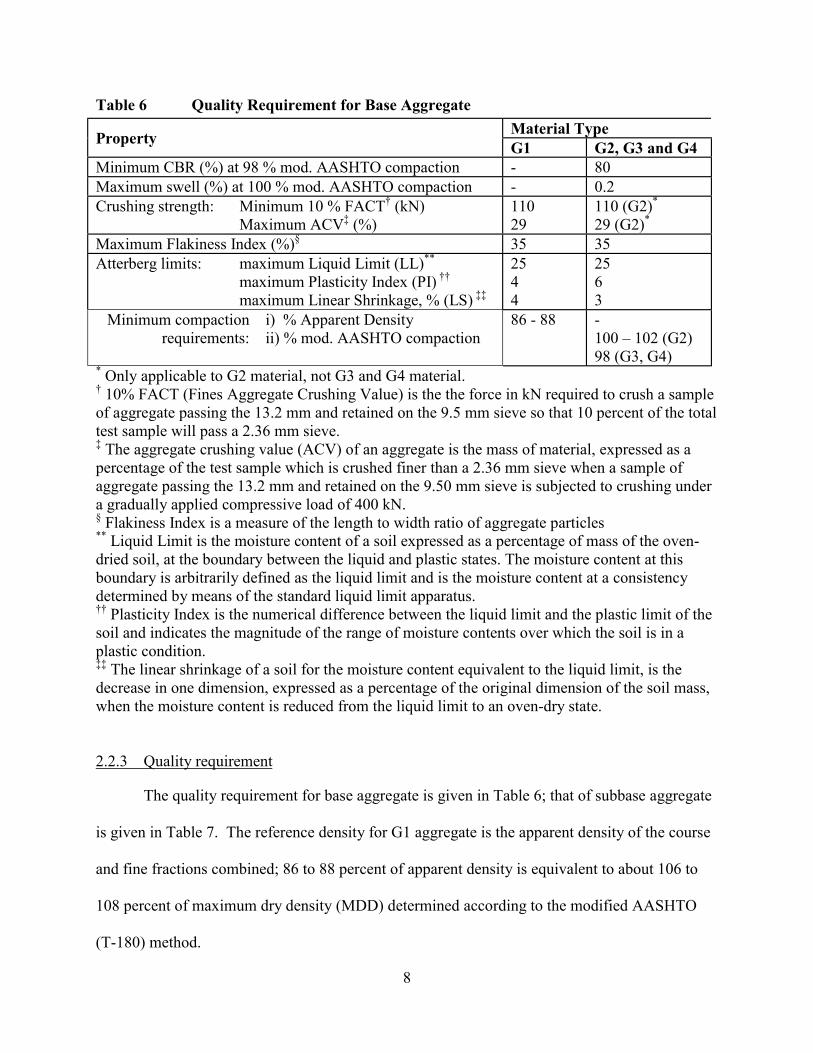
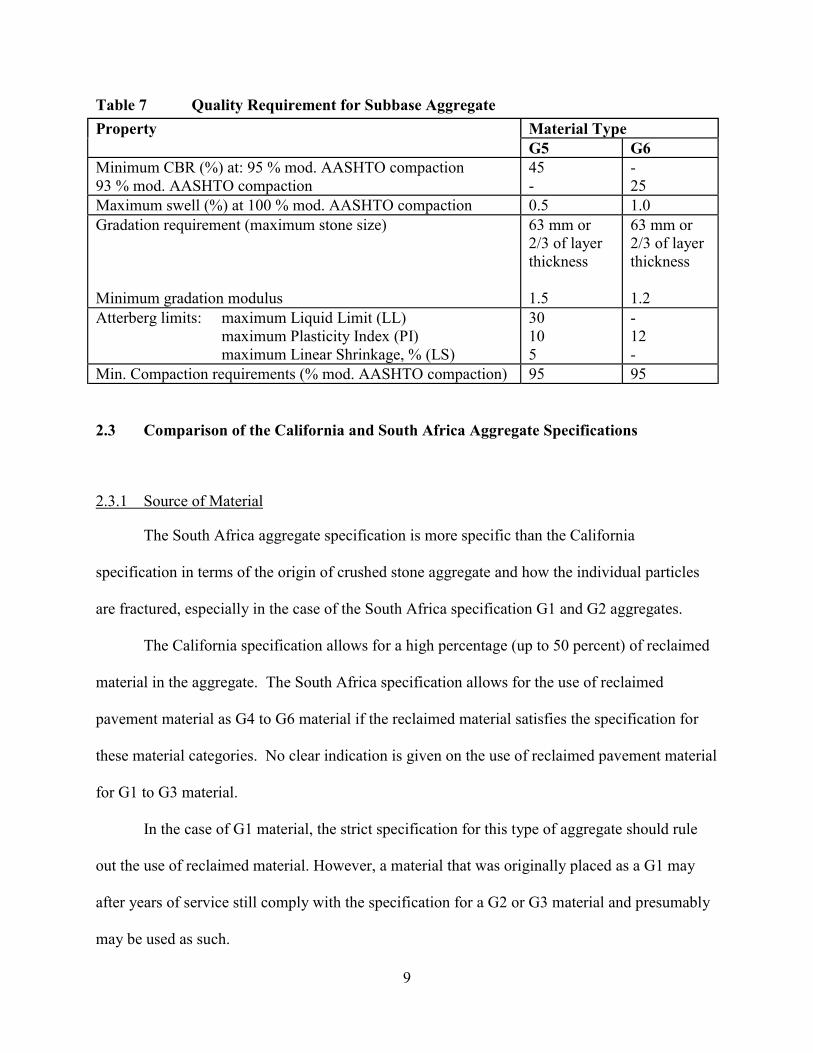
2.2.3 Quality requirement
The quality requirement for base aggregate is given in Table 6; that of subbase aggregate
is given in Table 7. The reference density for G1 aggregate is the apparent density of the course
and fine fractions combined; 86 to 88 percent of apparent density is equivalent to about 106 to
108 percent of maximum dry density (MDD) determined according to the modified AASHTO
(T-180) method.
9
Table 7 Quality Requirement for Subbase AggregateMaterial TypePropertyG5 G6
Minimum CBR (%) at: 95 % mod. AASHTO compaction93 % mod. AASHTO compaction
45-
-25
Maximum swell (%) at 100 % mod. AASHTO compaction 0.5 1.0Gradation requirement (maximum stone size)
Minimum gradation modulus
63 mm or2/3 of layerthickness
1.5
63 mm or2/3 of layerthickness
1.2Atterberg limits: maximum Liquid Limit (LL)
maximum Plasticity Index (PI)maximum Linear Shrinkage, % (LS)
30105
-12-
Min. Compaction requirements (% mod. AASHTO compaction) 95 95
2.3 Comparison of the California and South Africa Aggregate Specifications
2.3.1 Source of Material
The South Africa aggregate specification is more specific than the California
specification in terms of the origin of crushed stone aggregate and how the individual particles
are fractured, especially in the case of the South Africa specification G1 and G2 aggregates.
The California specification allows for a high percentage (up to 50 percent) of reclaimed
material in the aggregate. The South Africa specification allows for the use of reclaimed
pavement material as G4 to G6 material if the reclaimed material satisfies the specification for
these material categories. No clear indication is given on the use of reclaimed pavement material
for G1 to G3 material.
In the case of G1 material, the strict specification for this type of aggregate should rule
out the use of reclaimed material. However, a material that was originally placed as a G1 may
after years of service still comply with the specification for a G2 or G3 material and presumably
may be used as such.
10
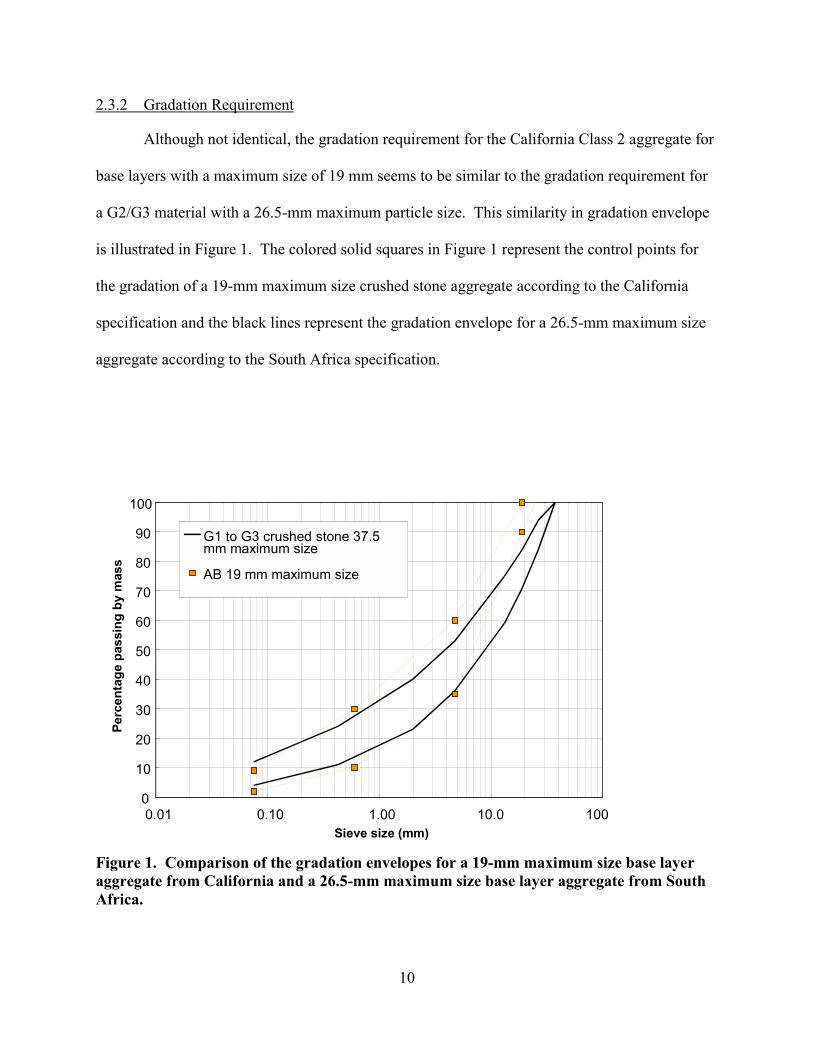
2.3.2 Gradation Requirement
Although not identical, the gradation requirement for the California Class 2 aggregate for
base layers with a maximum size of 19 mm seems to be similar to the gradation requirement for
a G2/G3 material with a 26.5-mm maximum particle size. This similarity in gradation envelope
is illustrated in Figure 1. The colored solid squares in Figure 1 represent the control points for
the gradation of a 19-mm maximum size crushed stone aggregate according to the California
specification and the black lines represent the gradation envelope for a 26.5-mm maximum size
aggregate according to the South Africa specification.
0
10
20
30
40
50
60
70
80
90
100
0.01 0.10 1.00 10.0 100Sieve size (mm)
Perc
enta
ge p
assi
ng b
y m
ass
G1 to G3 crushed stone 37.5mm maximum size
AB 19 mm maximum size
Figure 1. Comparison of the gradation envelopes for a 19-mm maximum size base layeraggregate from California and a 26.5-mm maximum size base layer aggregate from SouthAfrica.

11
Figure 2a shows the dry gradation of three actual aggregate samples obtained from
California base layers and sent to CSIR by the University of California Pavement Research
Center, plotted with the South Africa gradation control points for a 26.5-mm maximum size
crushed stone base layer aggregate as a reference. It is clear from this figure that the actual
gradation of the California aggregate complies with the South Africa specification except for the
larger particle sizes for which the actual gradation deviates slightly from the South Africa
specification. Figure 2b shows the dry gradation of the three samples plotted with the control
points for a dense aggregate gradation for a 19-mm maximum particle size material according to
the Talbot equation. The Talbot equation estimates the gradation that will result in the maximum
packing of particles for a given maximum aggregate size. It seems likely that the gradation of
the California aggregate is based on the dense aggregate gradation for a 19-mm maximum
particle size material.
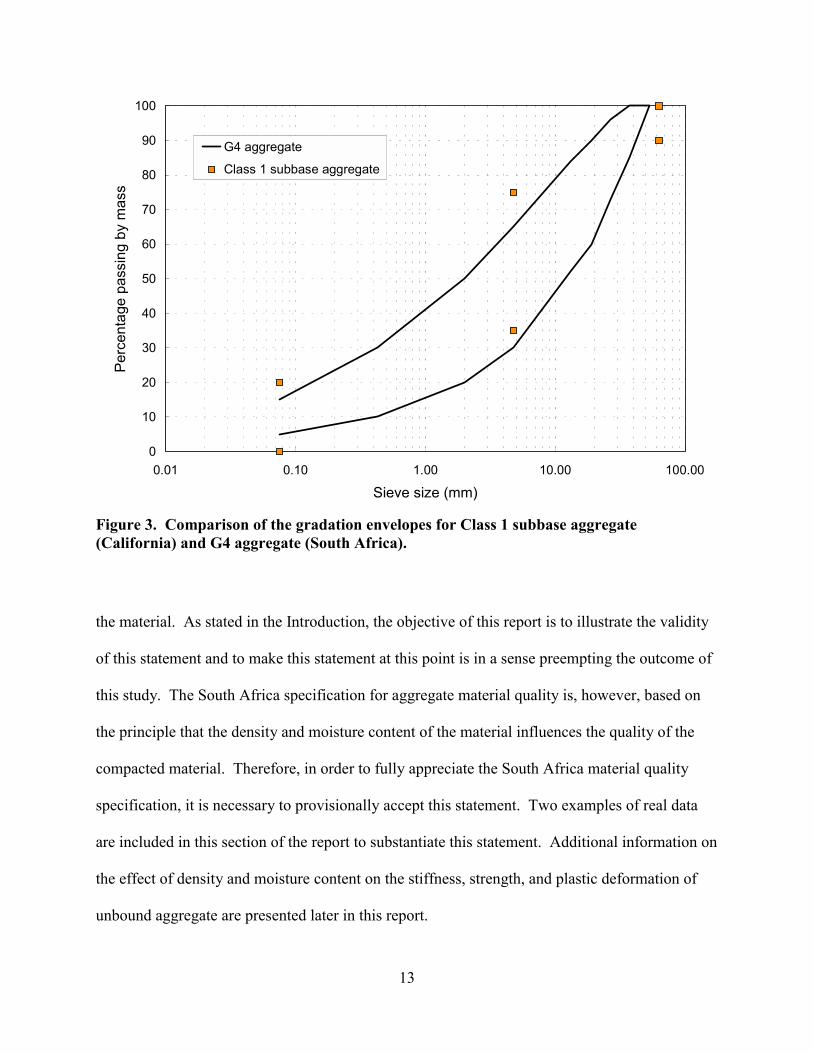
Figure 3 shows the South Africa gradation envelope for a G4 aggregate and the
California gradation control points for a Class 1 subbase aggregate plotted on the same graph.
Although not exactly the same, there are similarities between the South Africa and California
gradation specification. The South Africa specification limits the maximum particle size to 53
mm while the corresponding value for the California specification is 75 mm.
2.3.3 Quality Requirement
It is not possible to make a direct comparison between the quality criteria of California
and South Africa aggregate as the parameters that are used to quantify the quality of the material
differ between California and South Africa.
There are, however, two factors that largely influence the quality of compacted aggregate
material: 1) the density levels to which the material is compacted, and 2) the moisture content of

12
0
10
20
30
40
50
60
70
80
90
100
0.01 0.10 1.00 10.00 100.0Sieve size (mm)
Perc
enta
ge p
assi
ng b
y m
ass
Sample 1
Sample 2
Sample 3Grading control points for G1 toG3 crushed stone, 26.5 mm max size
Figure 2a. Comparison of California samples with South Africa gradation control pointsfor a 26.5-mm maximum particle size aggregate.
0
10
20
30
40
50
60
70
80
90
100
0.01 0.10 1.0 10.0 100Sieve size (mm)
Perc
enta
ge p
assi
ng b
y m
ass
Grading control points for G1 to G3crushed stone, 19 mm max sizeSample 1Sample 2Samp le 3
Figure 2b. Comparison of California samples with dense aggregate gradation controlpoints for a 19-mm maximum particle size aggregate.
13
0
10
20
30
40
50
60
70
80
90
100
0.01 0.10 1.00 10.00 100.00
Sieve size (mm)
Perc
enta
ge p
assi
ng b
y m
ass
G4 aggregate
Class 1 subbase aggregate
Figure 3. Comparison of the gradation envelopes for Class 1 subbase aggregate(California) and G4 aggregate (South Africa).
the material. As stated in the Introduction, the objective of this report is to illustrate the validity
of this statement and to make this statement at this point is in a sense preempting the outcome of
this study. The South Africa specification for aggregate material quality is, however, based on
the principle that the density and moisture content of the material influences the quality of the
compacted material. Therefore, in order to fully appreciate the South Africa material quality
specification, it is necessary to provisionally accept this statement. Two examples of real data
are included in this section of the report to substantiate this statement. Additional information on
the effect of density and moisture content on the stiffness, strength, and plastic deformation of
unbound aggregate are presented later in this report.
14
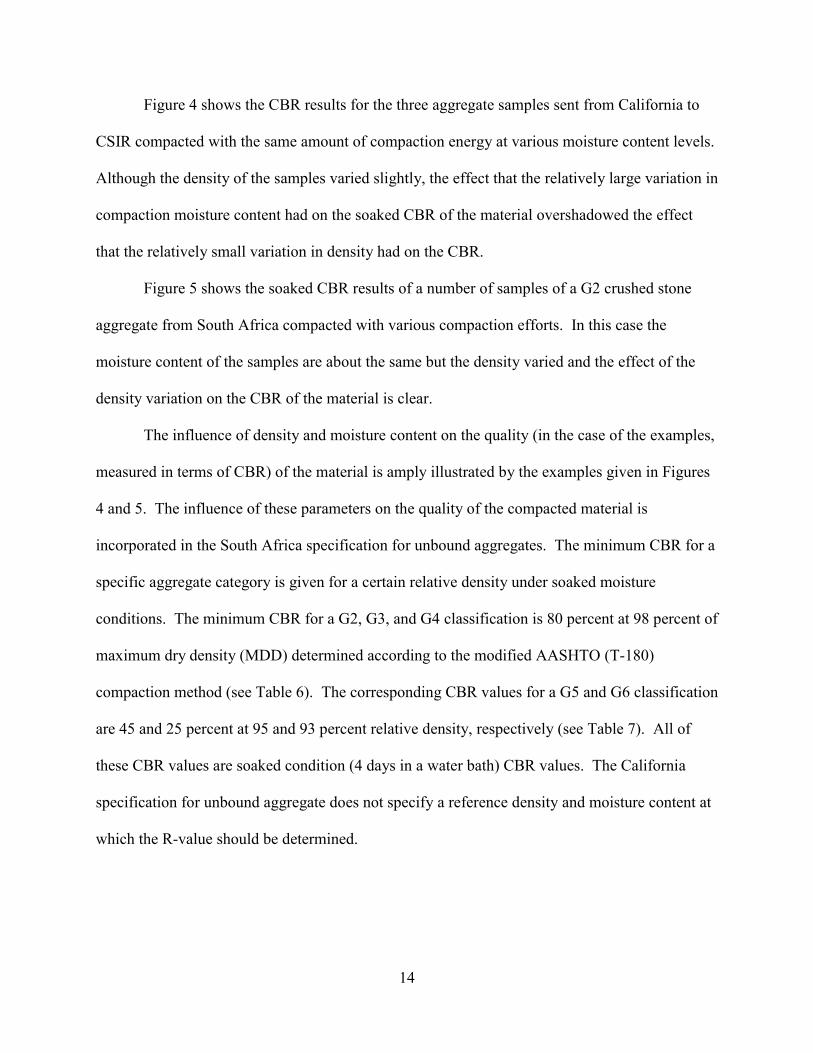
Figure 4 shows the CBR results for the three aggregate samples sent from California to
CSIR compacted with the same amount of compaction energy at various moisture content levels.
Although the density of the samples varied slightly, the effect that the relatively large variation in
compaction moisture content had on the soaked CBR of the material overshadowed the effect
that the relatively small variation in density had on the CBR.
Figure 5 shows the soaked CBR results of a number of samples of a G2 crushed stone
aggregate from South Africa compacted with various compaction efforts. In this case the
moisture content of the samples are about the same but the density varied and the effect of the
density variation on the CBR of the material is clear.
The influence of density and moisture content on the quality (in the case of the examples,
measured in terms of CBR) of the material is amply illustrated by the examples given in Figures
4 and 5. The influence of these parameters on the quality of the compacted material is
incorporated in the South Africa specification for unbound aggregates. The minimum CBR for a
specific aggregate category is given for a certain relative density under soaked moisture
conditions. The minimum CBR for a G2, G3, and G4 classification is 80 percent at 98 percent of
maximum dry density (MDD) determined according to the modified AASHTO (T-180)
compaction method (see Table 6). The corresponding CBR values for a G5 and G6 classification
are 45 and 25 percent at 95 and 93 percent relative density, respectively (see Table 7). All of
these CBR values are soaked condition (4 days in a water bath) CBR values. The California
specification for unbound aggregate does not specify a reference density and moisture content at
which the R-value should be determined.

15
0
50
100
150
200
250
300
350
4 4.5 5 5.5 6 6.5 7 7.5 8
Moisture content (%)
CB
R (%
)
Sample 1
Sample 2
Sample 3
Figure 4. Combined CBR data for the three aggregates from California showing therelationship between compaction moisture content and CBR.
0
20
40
60
80
100
120
140
160
95 95.5 96 96.5 97 97.5 98 98.5 99 99.5 100Relative Density (%)
CB
R (%
)
Figure 5. CBR data for a G2 aggregate from South Africa showing the relationshipbetween compaction level and CBR.

16
Because of the large influence of density on the quality of the compacted aggregate, the
South Africa specification requires certain minimum field compaction levels in terms of the
reference density for various aggregate classes. The minimum requirement for a G1 material is
86 percent of apparent density, which is equivalent to approximately 106 to 108 percent of the
modified AASHTO maximum dry density. The requirement for a G2 material is 100 percent of
the modified AASHTO maximum dry density and that of G3 and G4 materials 98 percent of the
modified AASHTO maximum dry density. For G5 and G6 material, the requirement is 95
percent of modified AASHTO maximum dry density.
The California specification requires field compaction to 95 percent of the reference
density determined according to CTM 216. This reference density is, however, a wet density and
not a dry density, as is the case for the South Africa specification. The maximum dry density
obtained with CTM 216 is about approximately the same as the maximum dry density obtained
with the modified AASHTO compaction method according to several comparisons performed at
the University of California Pavement Research Center. If the material in the field is therefore at
a moisture level above the optimum moisture content level for compaction, it will be possible to
satisfy the specification in terms of wet density while the dry density may be below 95 percent of
the dry maximum density.
In general, the field density requirement of the California specification is therefore much
lower than that of the South Africa specification for aggregate base materials and similar for
aggregate subbase materials.
To summarize, the following similarities and differences between California and South
Africa aggregate are anticipated based on the comparison of the specifications for the two
regions and limited data:

17
• Source of material: Although the California specification allows a large portion of
recycled material in all aggregate classes, the basic material for both California and
South Africa is obtained form crushed rock and boulders and natural gravel sources.
Therefore, in terms of the source of the material and hence the nature of the material,
California and South Africa aggregate are similar.
• Gradation: The gradation of a 19-mm maximum size Class 2 base aggregate in
California seems to be similar to the gradation of 26.5-mm maximum size G2 and G3
aggregate in South Africa, except for some slight deviation at the larger particle sizes.
The gradation specification for a Class 1 subbase aggregate seems similar to that of a
G4 material. Therefore, in terms of gradation, there are similarities between certain
classes of California and South Africa aggregate.
• Quality of compacted material: Although California and South Africa aggregate
are similar in terms of the source of the material and the gradation of certain
aggregate classes, the biggest difference between the aggregate for these two regions
seems to be the specified field density for aggregate base materials. At this point, a
direct comparison between the quality of the compacted aggregates is not possible
because of differences in the way that the quality is measured. The large difference in
specified field density between the California and South Africa specifications should
result in a large difference in the quality or bearing strength of the placed material.
Comparison of the three California samples sent to CSIR and South Africa unbound
aggregate indicates that they are similar in terms of the material consisting mostly of crushed
stone or gravel particles with one or more broken faces and some agreement in the particle size

18
distribution, at least for specific material classes, although broken faces are not specified in
California. The large differences between specified field densities for California and South
Africa do not change the basic nature of the aggregate material, but will change the way the
material responds to loading and long-term performance.
In addition to density, moisture content also has an influence on the behavior of unbound
aggregate material. Data from Heavy Vehicle Simulator (HVS) and laboratory testing performed
in South Africa prior to this study are used to illustrate the effect of the density and moisture
content of an unbound aggregate material on the stiffness, strength and performance of the
material. Because of the similarities between G2 and G4 material and certain California
aggregate classes, the information presented in this document on the stiffness, strength, and
plastic deformation of unbound aggregates is limited to these two South African material classes.

19
3.0 HVS STUDIES ON UNBOUND AGGREGATE BASE LAYERS
Several HVS tests have been performed in South Africa on pavements with unbound
aggregate base layers consisting of crushed stone or natural gravel. The majority of these tests
were performed on pavements with G2 crushed stone base layers and the results presented in this
section of the report are largely from these HVS tests. The Multi-depth Deflectometer (MDD)
system developed in South Africa and used extensively in association with the HVS provides the
opportunity to study the resilient and plastic deformation response of pavement layers under
HVS loading.
There are two requirements to enable a study of the resilient and plastic deformation of
the pavement�s layers from MDD data. First, the deflections at various depths below the surface
should be recorded at various stages during the test to enable back-calculation of the effective
stiffness of the layers. Second, the change in the offset of the MDD modules should be recorded
at various stages during the test to enable calculation of the permanent displacement of the MDD
modules. The permanent deformation of the pavement layers can then be calculated from the
permanent MDD displacement data. The change in offset of the MDD modules was, however,
only recorded from about the mid-1980s on CSIR test sections and therefore the plastic
deformation data is only available for a limited number of HVS tests.
Part of the aim of this report is not only to investigate the stiffness, strength, and
permanent deformation of unbound aggregate layers, but also to identify the factors affecting
these parameters and to quantify the effect they have on the parameters that are investigated.
There are three factors that determine the resilient and plastic response of unbound materials:
• the density of the compacted material,
• the moisture content of the compacted material, and

20
• the stress condition to which the material is subjected.
The deterioration of the material because of long-term traffic loading also causes a
reduction in the stiffness of an unbound aggregate material. The results from a previous study
conducted by Maree et al. (8) on the effect that the stress condition has on the stiffness of
crushed stone and natural gravel aggregate is used to illustrate the effect of the stress condition
on the stiffness of unbound aggregate. The depth deflection results from four HVS tests were
utilized during Maree�s study.
In addition to the Maree study, additional original work was performed for this report.
Several HVS sections with crushed stone base layers for which the depth deflection and
permanent MDD displacement data were available, were identified. The results from these HVS
tests were used to investigate the stiffness and permanent deformation of unbound aggregate.
Table 8 provides a summary of the HVS tests from which data was utilized in this report.
The one disadvantage of HVS testing compared to laboratory testing is that it is difficult
to control the moisture content and density of the material that is being tested under the large-
scale conditions of HVS testing. At best, the density and moisture content can be recorded
during the test but this information is usually limited to a few points on the test section and only
measured once or twice during the test, unless moisture content sensors are embedded in the test
section. It therefore becomes difficult to investigate the effect of density and moisture content on
the response of the pavement.
3.1 The effective stiffness response of unbound aggregate under HVS testing
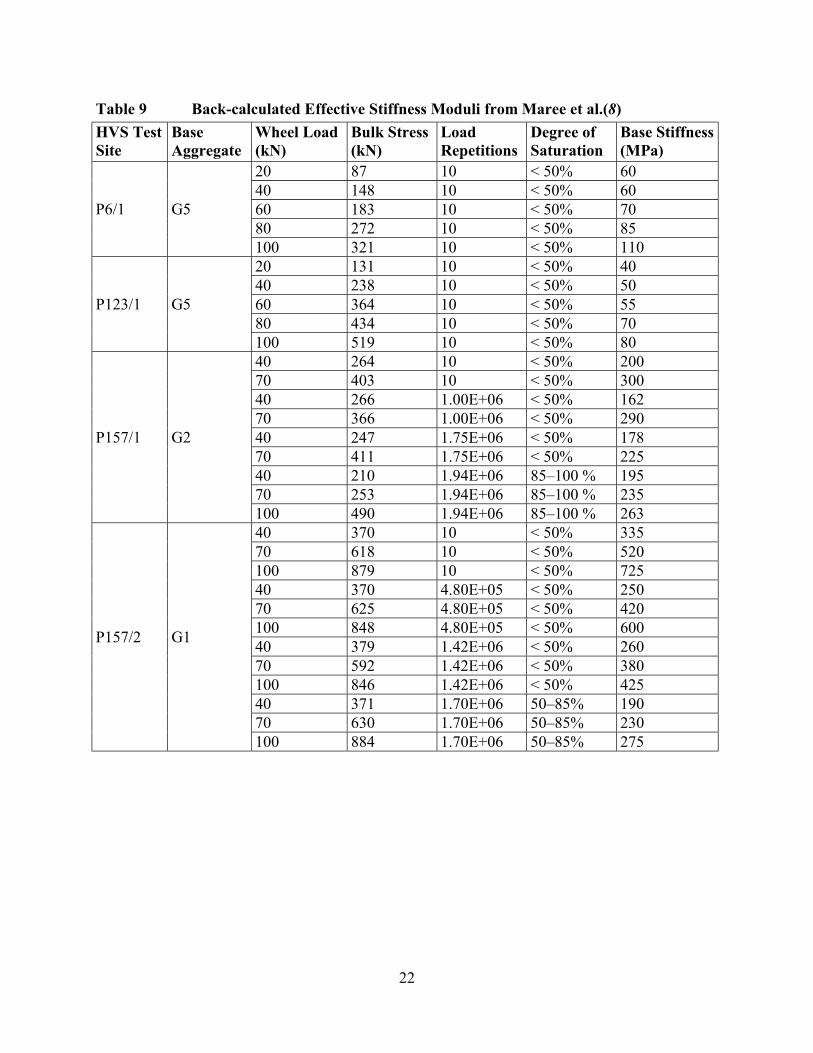
Table 9 gives a summary of the back-calculated effective stiffness data from the study by
Maree et al.(8) Table 10 contains a summary of the back-calculated effective stiffness data for

Table 8 HVS Tests from which Data Was Utilized in This StudyHVS Test No. Road No. Base Aggregate Pavement Structure Comments
42a4 � 45a4 Road P6/1 Natural gravel G5
40 mm asphalt concrete200 mm G5 base100 mm G8 subbase200 mm G9 selected subgrade
75a4 � 77a4 Road P123/1 Natural gravel G5
40 mm asphalt concrete200 mm G5 base150 mm G6 subbase200 mm G8 selected subgrade
101a4 Road P157/1 Crushed stone G2
30 mm asphalt concrete200 mm G2 base100 mm cemented subbase200 mm G7 selected subgrade
107a4 Road P157/2 Crushed stone G1
35 mm asphalt concrete140 mm G1 base255 mm cemented subbase125 mm modified G6 subgrade
Data from these test sections used byMaree et al. to illustrate the effect ofstress condition on the effectivestiffness of unbound aggregate.(8)
303a2 TR86 Crushed stone G2332a2 N2/11 Crushed stone G2341a2 TR9/7 Crushed stone G2327a3 N2/23 Crushed stone G2398a4 Road D2388 Crushed stone G2
See Appendix A for the structuraland instrumentation detail of thesetest sections
Data from these test sections used inthis report to study the resilient andplastic deformation response ofunbound aggregate.
21
22
Table 9 Back-calculated Effective Stiffness Moduli from Maree et al.(8)HVS TestSite
BaseAggregate
Wheel Load(kN)
Bulk Stress(kN)
LoadRepetitions
Degree ofSaturation
Base Stiffness(MPa)
20 87 10 < 50% 6040 148 10 < 50% 6060 183 10 < 50% 7080 272 10 < 50% 85
P6/1 G5
100 321 10 < 50% 11020 131 10 < 50% 4040 238 10 < 50% 5060 364 10 < 50% 5580 434 10 < 50% 70
P123/1 G5
100 519 10 < 50% 8040 264 10 < 50% 20070 403 10 < 50% 30040 266 1.00E+06 < 50% 16270 366 1.00E+06 < 50% 29040 247 1.75E+06 < 50% 17870 411 1.75E+06 < 50% 22540 210 1.94E+06 85�100 % 19570 253 1.94E+06 85�100 % 235
P157/1 G2
100 490 1.94E+06 85�100 % 26340 370 10 < 50% 33570 618 10 < 50% 520100 879 10 < 50% 72540 370 4.80E+05 < 50% 25070 625 4.80E+05 < 50% 420100 848 4.80E+05 < 50% 60040 379 1.42E+06 < 50% 26070 592 1.42E+06 < 50% 380100 846 1.42E+06 < 50% 42540 371 1.70E+06 50�85% 19070 630 1.70E+06 50�85% 230
P157/2 G1
100 884 1.70E+06 50�85% 275

23
Table 10 Back-calculated Effective Stiffness Moduli for Crushed Stone AggregateHVSTest
MDDPosition
Deflection WheelLoad (kN)
Average BulkStress (kPa)
Effective BaseModulus (kPa)
4 40 342 156303a2 12 40 335 37340 306 5553 60 450 59040 491 337341a2
7 60 707 43640 335 43370 734 708327a3 5100 899 71840 606 5458 70 889 58740 707 498398a4
12 70 999 52540 264 200101a4 Unknown 70 403 30040 370 33570 618 520107a4 Unknown100 879 725
the HVS tests performed on pavements with crushed stone base layers listed in Table 8. In some
cases, the depth deflection data from some of the MDD stacks on these test sections could not be
utilized for the back-calculation of effective stiffness moduli. These data sets were omitted from
the back-calculation process.
Maree primarily investigated the influence of the stress condition on the effective
stiffness of the base layer material, although the data presented by him also illustrate the effect of
an increase in the degree of saturation on the effective stiffness of the material. The stress par-
ameter that Maree used is the bulk stress based on the stress stiffening law given in Equation 1:
nR KM θ= (1)
Where MR = Resilient or effective stiffness modulus (MPa)θ = Bulk stress σ1 + σ2 + σ3 (kPa)σi = Principal stresses (kPa), i = 1 to 3K, n = Regression coefficients

24
Figure 6 shows the relationship between the effective stiffness modulus and the average
bulk stress for the natural gravel and crushed stone aggregate at the beginning of the HVS tests
from the work by Maree et al. The average bulk stress was calculated from the value of the bulk
stress at the top, middle and bottom of the aggregate layer.
From Figure 6, it is apparent that the effective stiffness of the natural gravel aggregate is
substantially lower than that of the crushed stone aggregate. The stiffness of both the natural
gravel and crushed stone aggregate increases with increasing bulk stress. The relationship
between the effective stiffness modulus and the bulk stress does not seem to be the same for the
two natural gravel aggregates unlike the similar relationship for the two crushed stone
aggregates.
Figure 7 shows the effect of traffic loading and degree of saturation (S) on the stiffness of
the crushed stone aggregate base of Road P157/2. The legend of Figure 7 refers to the number of
wheel load repetitions applied to the test section. The degree of saturation was less than 50
percent up to about 1.4 million load repetitions, after which water was applied to the test section
and the degree of saturation of the aggregate base layer was reported by Maree et al. as being
between 50 and 85 percent. Increases in both the traffic loading and degree of saturation caused
a decrease in the effective stiffness of the aggregate base layer. This trend of decreasing stiffness
with increasing traffic and moisture has manifested on most of the HVS tests on aggregate base
layers in South Africa.
Figure 8 shows the effective stiffness results for crushed stone aggregate from Table 10
plotted against the average bulk stress. Although there is a general increase in the effective
stiffness of the crushed stone aggregate with increasing bulk stress, a regression model of the
type listed in Equation 1 yields a poor correlation between the effective stiffness and the bulk

25
0
20
40
60
80
100
120
0 100 200 300 400 500 600Bulk Stress (kPa)
Effe
ctiv
e St
iffne
ss (M
Pa)
P6/1
P123/1
Figrue 6a. Natural gravel aggregate.
0
200
400
600
800
0 200 400 600 800 1000Bulk Stress (kPa)
Effe
ctiv
e St
iffne
ss (M
Pa)
P157/1
P157/2
Figure 6b. Crushed stone aggregate.
Figure 6. The relationship between the bulk stress and effective stiffness modulus ofnatural gravel and crushed stone aggregate.

26
0
200
400
600
800
200 400 600 800 1000Bulk Stress (kPa)
Effe
ctiv
e St
iffne
ss (M
Pa)
10 repetitions480 000 repetitions1.4 million repetitions1.7 million repetitions
Figure 7. The effect of traffic loading and degree of saturation on the stiffness of thecrushed stone aggregate from Road P157/2.
0
200
400
600
800
200 400 600 800 1000 1200Bulk Stress (kPa)
Effe
ctiv
e St
iffne
ss (M
Pa)
Figure 8. The relationship between the effective stiffness and bulk stress of crushed stoneaggregate from a number of HVS tests.
27
stress. This poor correlation is caused by the fairly large amount of variation in effective
stiffness at any given bulk stress value. The effect of variation in density and moisture content or
degree of saturation has not been isolated from the data in Figure 8 because of the difficulty
associated with determining the exact density and degree of saturation associated with each HVS
test and different points on the HVS test section. Laboratory test data presented in Section 4 of
this report illustrate the effect that density and degree of saturation have on the effective stiffness
of crushed stone aggregate.
Figure 9 provides additional information on the effect of increased traffic loading and
moisture content on the effective stiffness of a crushed stone aggregate base on HVS test section
398a4. The trafficking load sequence for test 398a4 consisted of 200,000 repetitions of a 40-kN
dual wheel load followed by 200,000 repetitions of a 70-kN dual wheel load. Water was allowed
to pond in 100-mm diameter holes drilled into the base layer next to one half of the HVS test
section for a further 100,000 repetitions of a 70-kN dual wheel load (similar to the wetting of
Goal 5 test sections in California [3�6]). The initial stiffness of the aggregate base layer was
between 600 and 900 MPa but this soon reduced to values between 400 and 600 MPa for the
duration of the 40-kN loading phase. Depth deflection data were recorded for a 40- and 70 -N
dual wheel load during the 70-kN trafficking load phase. The effective stiffness of the aggregate
base increased slightly under the effect of the highly overloaded 70-kN dual wheel load with the
modulus at a 70-kN deflection load being higher than at a 40-kN load, again confirming the
stress stiffening behavior of unbound aggregate. The effective stiffness of the aggregate base
layer reduced to values below 400 MPa for both wheel loads during the wet phase of the test,
highlighting the detrimental effect of moisture on the stiffness of an unbound aggregate layer.

28
0
200
400
600
800
1000
0 100000 200000 300000 400000 500000 600000Load Repetitions
Effe
ctiv
e st
iffne
ss (M
Pa)
MDD8 40 kNMDD12 40 kNMDD8 70 kNMDD12 70 kN
Figure 9. The effective stiffness modulus of crushed stone aggregate for the duration ofHVS test 398a4.
The low permeability of the crushed stone aggregate base largely prevented water from entering
the base layer.
3.2 Permanent Deformation Response of Unbound Aggregate Under HVS Testing
In addition to the depth deflection data, each MDD stack produced a set of permanent
vertical MDD displacement results. This is achieved by recording the voltage output from the
MDD modules at rest at various stages during the test. Various studies have been completed on
the analysis of the MDD displacement and permanent deformation data generated by an HVS
test.(7, 9, 10 ) In this case, the function listed in Equation 2 was fitted to the MDD displacement
data of the HVS tests listed in Table 8.

29
( )bNeaNmPD −−+= 1 (2)
Where PD = permanent vertical MDD displacementN = number of load repetitionsa,b,m = regression coefficientse = base of the natural logarithm
This function allows for two behavioral phases: an initial exponential bedding-in phase
and a long-term linear rate of increase in the permanent vertical MDD displacement as is
illustrated in Figure 10.
Equation 2 has an initial slope equal to the product of the two regression coefficients a
and b, a curvature determined by the value of b, an eventual linear slope equal to the regression
coefficient m, and an intercept with the Y-axis represented by the regression coefficient a. The
bedding-in phase, represented by the coefficient a and the eventual deformation rate, represented
by coefficient m are the two important parameters in the process of evaluating the permanent
MDD displacement data for an HVS test. Once the initial bedding-in (a) and the eventual rate of
permanent deformation (m) are known, it is possible to calculate the number of repetitions that
would be required to induce a certain amount of plastic strain in an unbound aggregate layer
bearing capacity.
Table 11 gives the bedding-in, eventual deformation rate, and the base bearing capacity
for 20 mm permanent base layer deformation for the HVS tests sections listed in Table 8 at a
number of MDD locations at which the permanent deformation of the aggregate base layer was
recorded.
The thickness of the base layers of the HVS test sections listed in Tables 8 and 11
differed and the results from Table 11 were converted to plastic strain values by dividing the
bedding-in deformation and the rate of deformation by the original thickness of the layer. Figure
11 shows the plastic deformation and base bearing capacity results obtained from this process.

30
N
PD
a
mN1
Eventualdeformationrate = m
a(1 - e )-bN
Initial deformation rate = ab
CurvatureBedding-indisplacement
Figure 10. Illustration of typical base permanent deformation (rutting) behavior.Note: PD = permanent deformation (rut depth or permanent vertical strain).
46.8
46.8
27.627.633.3
33.3
42.3
42.3
33.3
33.356.4
56.4
0
0.5
1
1.5
2
2.5
3
0 20 40 60 80 100 120
Dual Wheel Load (kN)
Even
tual
Pla
stic
Str
ain
Rat
e (%
/mill
ion
repe
titio
ns)
Figure 11a. Plastic strain rate.

31
27.6
46.8
46.8
56.4
56.433.333.3
42.3
42.333.333.3
0
0.2
0.4
0.6
0.8
1
1.2
1.4
1.6
1.8
2
0 20 40 60 80 100 120
Dual Wheel Load (kN)
Plas
tic S
trai
n B
eddi
ng-in
(%)
Figure 11b. Bedding-in plastic strain.
46.8
46.8
27.627.633.3
33.3
42.342.356.4
56.433.3
33.3
1.00E+05
1.00E+06
1.00E+07
1.00E+08
1.00E+09
0 20 40 60 80 100 120
Dual Wheel Load (kN)
Plas
tic S
trai
n B
eddi
ng-in
(%)
Figure 11c. Base bearing capacity for 20 mm plastic deformation of the base layer.
Figure 11. Bedding-in plastic strain, plastic strain rate, and bearing capacity results for anumber of crushed stone aggregate layers determined from HVS testing.

32
Table 11 Base Bedding-in Displacement, Deformation Rate, and Bearing CapacityResults for a Number of Crushed Stone Aggregate Base Layers from HVSTest Sections
HVSTestNo.
WheelLoad(kN)
RelativeDensity (%ModifiedAASHTO)
MoistureContent Ratio(%)
MDDLocation 1
MDDLocation 2
MDDLocation 3
Base Bedding-in Displacement (mm)303a2 100 97.8 27.6 0.30332a2 40 99.5 56.4 0.14 0.33341a2 60 101.0 42.3 0.67 0.56327a3 100 97.7 46.8 3.10 1.15398A4 40 98.8 33.3 0.30 0.34398A4 70 98.8 33.3 0.43 0.53
Base Eventual Deformation Rate(mm/million repetitions)
303a2 100 97.8 27.6 0.6 0.5332a2 40 99.5 56.4 0.7 1.2341a2 60 101.0 42.3 1.7 1.4327a3 100 97.7 46.8 2.3 4.7398A4 40 98.8 33.3 0.2 0.5398A4 70 98.8 33.3 0.3 0.8
Base Bearing Capacity (repetitions)303a2 100 97.8 27.6 3.57E+07 4.10E+07332a2 40 99.5 56.4 2.68E+07 1.64E+07341a2 40 101.0 42.3 1.05E+07 1.00E+07341a2 60 97.7 46.8 1.14E+07 1.44E+07327a3 100 98.8 33.3 7.34E+06 4.01E+06398A4 40 98.8 33.3 1.31E+08 3.93E+07398A4 70 6.52E+07 2.43E+07
The data labels associated with each of the data points indicate the moisture content of
the aggregate material expressed as a ratio of the field compaction water content over the
optimum compaction moisture content of the material (modified AASHTO compaction). An
increase in wheel load and moisture ratio causes an increase in the bedding-in plastic strain and
the eventual plastic strain rate of the unbound aggregate material.
No clear trend could be established between the density of the material and the plastic
deformation characteristics. The laboratory test results presented in Section 4 provide a better
33
opportunity for studying the effect of density and saturation on the permanent deformation
characteristics of unbound aggregate as these parameters are better controlled under laboratory
conditions.
3.3 Permeability of an Unbound Aggregate Base and Drainable Subbase on an HVSTest Section
It is evident from the data presented in Section 2 that the moisture content or degree of
saturation has an influence on the effective stiffness and permanent deformation of unbound
aggregate. The degree of saturation is in turn determined principally by the supply of water to
the material, and secondarily by the permeability of the material, which will allow or prevent the
moisture from entering the material.
Van der Merwe investigated the use of a permeable subbase drainage layer on HVS Test
Section 303a2.(11) The detail of the pavement structure for Section 303a2 is shown in Appendix
A. The subbase drainage layer was constructed from the same crushed stone aggregate used for
the base layer but the gradation was not adjusted to meet the requirement for G1 and G2
aggregate. The gradation of the base and subbase aggregate, which was basically from the same
source, influenced both the density to which the material could be compacted and the
permeability of the material. Table 12 provides information on the gradation, density, and
moisture content of the base and subbase layer aggregate for Section 303a4.
Figure 12 shows the gradation of the base and subbase aggregate compared to the
gradation envelope control points for a 37.5-mm maximum size aggregate for G1 to G3 material.
Table 13 lists the permeability coefficient of the base and subbase aggregate as a function of the
relative density of the material. The data from Table 13 is shown in Figure 13. The effect of
gradation and density on the permeability of unbound aggregate is clearly illustrated by the data

34
Table 12 Gradation, Density, and Moisture Content Properties of the Crushed StoneAggregate from the Base and Drainable Subbase Layers from Section 303a2
Pavement Layer Base DrainableSubbase
Maximum mod. AASHTO density(kg/m3) 2198 2027
Optimum moisture content (%) 7.7 9.9
Referencedensity andmoisturecontent Apparent density (kg/m3) 2658 2643
Sieve size (mm) Percentage passing (percent)37.5 100.0 100.026.5 85.3 85.019.0 69.0 70.013.2 56.0 55.74.75 35.0 29.72.0 25.5 18.70.45 16.5 10.0
Gradation
0.075 5.3 5.0Percent modified AASHTO maximumdry density 97.8 99.9
Percent apparent density 80.8 76.6
Field densityand moisturecontent Field moisture content (percent) 4.4 2.8
0
10
20
30
40
50
60
70
80
90
100
0.01 0.10 1.0 10 100Sieve Size (mm)
Perc
enta
ge P
assi
ng b
y M
ass
G1 to G3 crushed37.5 mm maxBas
Drainable
Figure 12. Gradation of the base and drainable subbase aggregate from HVS Test Section303a2.
35
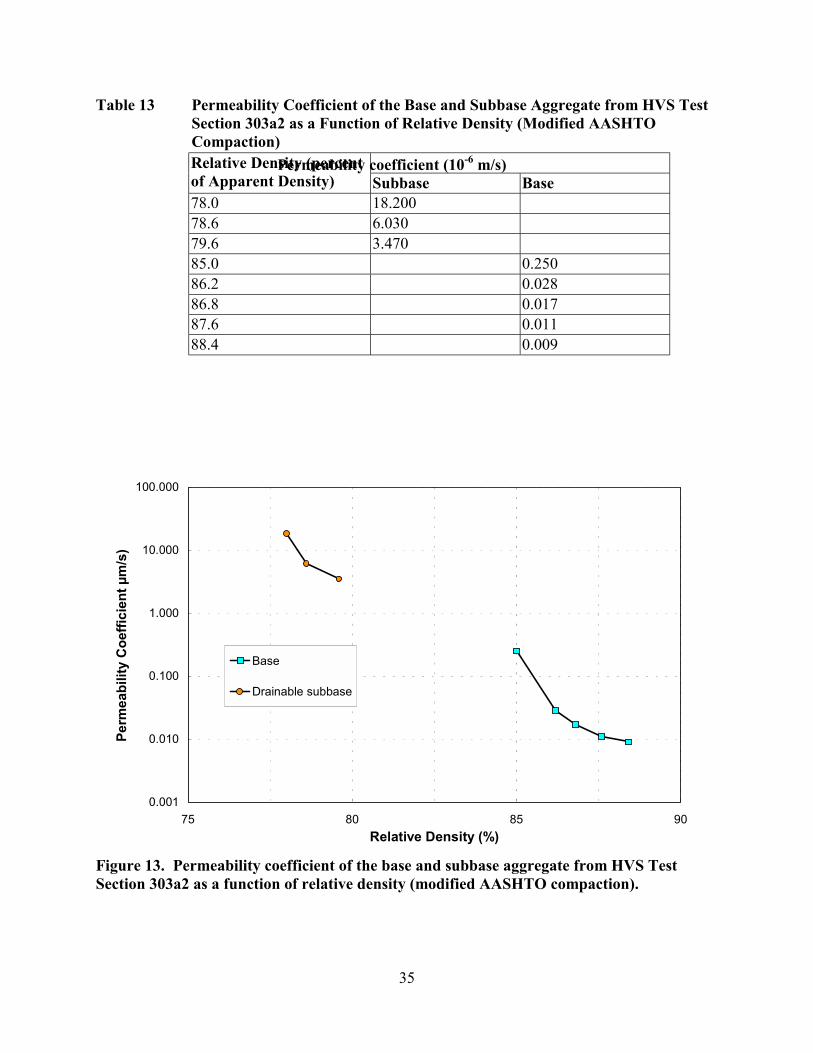
Table 13 Permeability Coefficient of the Base and Subbase Aggregate from HVS TestSection 303a2 as a Function of Relative Density (Modified AASHTOCompaction)
Permeability coefficient (10-6 m/s)Relative Density (percentof Apparent Density) Subbase Base78.0 18.20078.6 6.03079.6 3.47085.0 0.25086.2 0.02886.8 0.01787.6 0.01188.4 0.009
0.001
0.010
0.100
1.000
10.000
100.000
75 80 85 90Relative Density (%)
Perm
eabi
lity
Coe
ffici
ent µ
m/s
)
Base
Drainable subbase
Figure 13. Permeability coefficient of the base and subbase aggregate from HVS TestSection 303a2 as a function of relative density (modified AASHTO compaction).
36
in Figure 13. The subbase material had a much higher permeability than the base material and
the permeability of the base material reduced almost ten times with an associated increase in
relative density from 85 to 86.2 percent.
Van der Merwe concluded that the structural strength of an untreated drainage layer is
insufficient and the layer deformed under traffic. The permeability of the layer below the
drainage layer also needs to be low enough to prevent water from entering the layer below the
drainage layer. Although the permeability of the material below the drainage layer may be low
enough to prevent water from entering this layer, the effective permeability of the layer may be
much higher if cracks are present in the layer supporting the drainage layer.(11)

37
4.0 LABORATORY STUDIES ON UNBOUND AGGREGATE
The information in this section is largely based on three laboratory investigations of
unbound aggregate. Two of these studies conducted by Maree and Theyse concentrated on the
stiffness, static shear strength, and plastic deformation potential of unbound aggregate.(12, 13)
The third study conducted by Semmelink investigated the compaction potential of unbound
material including crushed stone and natural gravel aggregate.(14) Static and dynamic triaxial
testing formed the basis of the studies by Maree and Theyse.(12, 13)
4.1 The Stiffness of Unbound Aggregate Under Laboratory Testing
Maree investigated the effect of several variables on the relationship between the effective
stiffness or resilient modulus and the bulk stress given in Equation 2. Table 14 lists a summary
of his findings.
Maree concluded that the stress condition and degree of saturation are the most important
parameters determining the effective stiffness for crushed stone aggregate with density being the
third most important factor. He also speculated that the degree of saturation might become the
dominant factor in determining the effective stiffness of lower quality aggregate.
In addition to the stress-stiffening model from Equation 2, Maree also investigated the
model shown in Equation 3, which incorporates both a stress-stiffening and stress-softening
component linked to the octahedral normal and shear stress, respectively. This model is similar
to the one suggested by May and Witczak (15) and Uzan (16) shown in Equation 4. Maree
found a better correlation between the resilient modulus and the octahedral normal and shear
stress than between the resilient modulus and bulk stress alone.

38
Table 14 Factors Affecting the Relationship between the Resilient Modulus and theBulk Stress Condition of Unbound Aggregate
Influence onFactor Change in Factor K n MRDuration ofload pulse 0.1 to 1.0 s No effect No effect No effect
Frequency ofload pulse 0.3 to 1.0 Hz No effect No effect No effect
Number ofload cycles
Increase in loadcycles 0�20% higher No effect to a
slight reduction Up to a 20% increase
Load history - No effect No effect No effectConfiningpressure
Constant vs.pulsed
No uniqueeffect detected
No uniqueeffect detected
Constant pressure slightlyoverestimates MR
Sampledensity
increase from 82.6to 87.5% ofapparent density
100% increase 15% reduction 10% increase
Maximumparticle size 19.5 and 37.5 mm No effect No effect No effect
Percentagematerial <0.075 mm
Increase in fines Slight increase Slight increase Optimum at 9% fines
Particle shape Increase inangularity Not determined Not determined Slight increase
Surfacetexture More course Not determined Not determined Slight increase
Degree ofsaturation
increase from 20to 90%
Up to 80%decrease 25% increase Up to 60% decrease
( ) ( ) 321
koct
koctR kM τσ= (3)
Where MR = Resilient or effective stiffness modulus (MPa)θ = Bulk stress σ1 + σ2 + σ3 (kPa)σoct = Octahedral normal stress = θ/3 (kPa)τoct = Octahedral shear stress = 0.47 σd for the triaxial test (kPa)ki = Regression coefficients, i = 1 to 3
32
1
k
a
dk
aR pp
kM
= σθ (4)
Where MR = Resilient or effective stiffness modulus (MPa)θ = Bulk stress σ1 + σ2 + σ3 (kPa)σd = Deviator stress σ1 � σ3 (kPa)pa = Reference stress (kPa)ki = Regression coefficients, i = 1 to 3

39
Theyse tested a crushed stone aggregate in the repeated load triaxial test as part of a
laboratory project done in association with the HVS testing of several construction labor-
intensive base layers. Table 15 contains the secant modulus values representing the effective
stiffness or resilient modulus for a crushed stone aggregate obtained from dynamic triaxial tests
for different combinations of dry density and degree of saturation.
Table 15 Resilient Modulus Values for a Crushed Stone Aggregate at DifferentCombinations of Density and Saturation
Dry Density(% of apparentdensity)
Degree ofSaturation(%)
ConfiningStress(kPa)
Stress Ratio(% of maximumshear strength)
Resilient Modulusor Effective Stiffness(MPa)
84.50 100.00 80 73 35784.50 100.00 80 92 36084.50 100.00 80 51 37780.70 78.00 140 90 38084.50 100.00 140 74 39080.70 78.00 80 93 39280.70 78.00 140 52 44784.50 100.00 140 91 44784.50 100.00 140 53 46180.70 78.00 80 73 46880.70 33.40 80 94 47680.70 33.40 140 73 50280.70 78.00 140 74 51280.70 33.40 140 52 56480.70 33.40 140 93 56984.50 43.50 140 72 62084.50 43.50 140 52 651
Theyse investigated the effect of dry density and degree of saturation on the effective
stiffness of the crushed stone material in addition to the effect of the stress condition on the
effective stiffness. The stress condition is represented by the confining pressure, which will tend
to cause stress-stiffening behavior, and the stress ratio, which will cause a reduction in effective
stiffness as the maximum shear strength of the material is approached. The function in Equation

40
5 was fitted to the data from Table 15. Figure 14 shows a plot of the observed and predicted
values for the resilient modulus of the crushed stone aggregate that was tested.
SRSRDM R 87.082.072.204.1496.527 3 −+−+−= σ (5)
R2 = 81.2 % and Standard Error of Estimate (SEE) = 45.4 MPaWhere MR = Resilient modulus (MPa)
RD = Relative density (% of apparent density)S = Degree of saturation (%)σ3 = Confining pressure or minor principal stress (kPa)SR = Stress ratio (applied shear stress expressed as a percentage of the shear
strength of the material at the specific confining pressure)
The four variables � relative density, degree of saturation, confining stress and stress
ratio � explain about 81 percent of the variation in the effective stiffness of the crushed stone
aggregate. According to the regression model, an increase in the relative density and confining
pressure will result in an increase in the effective stiffness of the material. In addition, an
300
350
400
450
500
550
600
650
700
300 350 400 450 500 550 600 650 700
Measured Stiffness (MPa)
Pred
icte
d St
iffne
ss (M
Pa)
Figure 14. The observed and predicted values of the resilient modulus for a crushed stoneaggregate.
41
increase in the degree of saturation and stress ratio will result in a decrease in the effective
stiffness of the material. The rate of change in effective stiffness associated with a unit increase
in relative density is the highest, followed by the rate of decrease associated with the degree of
saturation. The rates of change associated with a unit change in confining pressure and stress
ratio are of the same order of magnitude. The relative density therefore appears to be the
variable that will most influence the effective stiffness. The range of practical values for the
relative density (80�88 percent or apparent density) is, however, much narrower than that of the
degree of saturation (30�100 percent) and the degree of saturation may therefore have the biggest
impact on the effective stiffness of the crushed stone material.
The range of laboratory stiffness values reported in Table 15 agrees well with the range
of HVS back-calculated effective stiffness values reported in Table 10 and shown in Figure 8,
except for two relatively low values from HVS Tests 101a4 and 303a2.
In summary, it appears that the range of effective stiffness values for crushed stone
aggregate may be expected to vary from about 350 to 700 MPa based on HVS and laboratory
results. A major portion of this variation in effective stiffness may be explained by variation in
the relative density and the degree of saturation of the material and stress condition imposed on
the material. Most of the more recent resilient modulus models for unbound aggregate allow for
a combination of stress-stiffening and stress-softening behavior for unbound aggregate. The
stress-stiffening behavior is normally associated with an increase in the confinement of the
material that may be quantified by the minor principle stress, the bulk stress, or the octahedral
normal stress. The stress-softening behavior is normally associated with the level of shear stress
imposed on the material and may be quantified by the deviator stress, octahedral shear stress, or

42
the stress ratio expressing the applied shear stress as a percentage of the shear strength of the
material for the given value of the minor principle stress.
4.2 Static Shear Strength Parameters of Unbound Aggregate
Maree (17) re-analyzed existing static triaxial data and performed additional static triaxial
tests on several crushed stone and natural gravel aggregates from which the influence of several
parameters on the static shear strength parameters of unbound aggregate were identified. Table
16 gives a summary of these parameters and their influence on the shear strength parameters.
Table 16 Factors Affecting the Relationship Between the Resilient Modulus and theBulk Stress Condition of Unbound Aggregate
Influence on:Factor Change in
Factor Shear Strength Cohesion Internal FrictionAngle
Density Increase Significantincrease
Significantincrease
Considerableincrease
Degree ofsaturation Reduction Significant
increaseSignificantincrease No effect
Shape ofgradationcurve
Change inTalbot n-valuefrom 0.5 to 0.3
Increase Considerableincrease Reduction
Maximumparticle size 9.5 to 37.5 mm Increase Increase Increase
1 to 9 % Increase Considerableincrease IncreasePercentage
fines 9 to 15 % Reduction Reduction ReductionPlasticity offines
Non-plastic toplastic Reduction Reduction Reduction
Type ofaggregate
Crushed stone tonatural gravel Reduction Significant
reductionSignificantreduction
Durability ofaggregate
High to lowdurability Reduction Reduction Reduction
Particleshape
From round toangular Increase No effect Increase
Surfacetexture Smooth to rough Increase Uncertain Increase
Type of fines Crusher dustreplaced by sand Reduction Significant
reduction No effect

43
Maree again concluded that density and moisture (or degree of saturation) are the two
most important parameters affecting the shear strength and shear strength parameters of unbound
aggregate.
Theyse (13) did extensive triaxial testing on a crushed stone aggregate to determine the
effect of relative density and degree of saturation on the shear strength parameters of the
material. Tables 17 and 18 show the cohesion and friction angle results as a function of the
moisture content and relative density in terms of percentage of apparent density. The moisture
content levels reported in Tables 17 and 18 were converted to degree of saturation values in
order to produce the relationships between the shear strength parameters, relative density, and
degree of saturation given in Equations 6 and 7 and illustrated in 15 and 16. These results, which
are valid for one specific crushed stone aggregate, indicate that the relative density and degree of
saturation affect both the friction angle and cohesion of the crushed stone aggregate.
Table 17 Cohesion (kPa) results for crushed stone aggregateCohesion (kPa)Moisture Content (%)Relative
Density (%) 3 5 781 94.9 68.1 28.183 120.5 35.6 25.785 102.8 51.1 43.0
Table 18 Friction Angle Results for the Crushed StoneFriction Angle (degrees)Moisture Content (%)Relative
Density (%) 3 5 781 53.1 48.6 49.483 51.4 50.7 50.185 54.6 51.4 47.7

44
0
50
100
150
200
250
8081
8283
84
2030
4050
6070
8090
100
Coh
esio
n (k
Pa)
Relative Density, RD (%)
Degre
e of S
atura
tion,
S (%)
Data0 50 100 150 200 250 300 350 400
Figure 15. The relationship between the cohesion, relative density, and degree ofsaturation for a crushed stone aggregate.
44
46
48
50
52
54
56
8081
8283
84
20
40
60
80
100
Fric
tion
Angl
e, φ
(o )
Relative Density, RD (%)Degree of S
aturation, S (%
)
Figure 16. The relationship between the friction angle, relative density, and degree ofsaturation for a crushed stone aggregate.
45
SRD eeC 30.212.120107.0 −= (6)
R2 = 79.9 %; SEE = 1.346
SRD 93.798.5539.9 −+=φ (7)
R2 = 70.4 %; SEE = 1.357
where:C = cohesion (kPa)RD = relative density (% of apparent density)S = saturation (%)φ = friction angle (degrees)
Table 19 contains the combined static triaxial test data from the work by Maree and
Theyse for both crushed stone and natural gravel aggregate. Figure 17 shows the friction angle
and cohesion results plotted against relative density and degree of saturation for the combined
data.
The friction angle data plotted against the relative density shows two distinct groupings
of the data (Figure 17a). The relative density of the natural gravels was mostly confined to a
narrow band of values between 73 and 75 percent of apparent density. The friction angle results
for the natural gravels do, however, vary by a substantial amount within this narrow relative
density band and there seems to be no correlation between the relative density and friction angle
results. In the case of the crushed stone aggregate, although there also seems to be a poor
correlation between friction angle and relative density, there is a general increase in the friction
angle with increasing relative density. There does not seem to be any correlation between the
degree of saturation and the friction angle for both the crushed stone and natural gravel
aggregates (Figure 17b).

46
Table 19 Shear Strength Parameters of a Selection of Crushed Stone and NaturalGravel Aggregate
MaterialClassification
RelativeDensity,(%)
Degree ofSaturation, (%)
FrictionAngle, (°)
Cohesion,(kPa)
G2 80.7 55.7 48.6 68.1G2 80.7 78.0 49.4 28.1G2 82.6 37.9 51.4 120.5G2 82.5 63.2 50.7 35.6G2 82.6 72.6 50.1 25.7G2 84.5 72.6 51.4 51.1G2 84.5 43.5 54.6 102.8G2 80.7 33.4 53.1 94.9G2 84.5 100.0 47.7 43.0G1 87.5 90.0 57.8 43.0G1 86.9 55.0 55.1 53.0G1 87.0 38.0 55.2 76.0G1 82.6 92.0 50.5 10.0G1 86.2 80.0 57.1 16.0G1 84.7 47.0 56.7 58.0G2 85.3 41.0 56.1 44.0G2 86.2 37.0 52.7 70.0G2 86.1 42.0 53.1 48.0G2 85.1 82.0 49.8 21.0G2 85.6 36.0 52.1 45.0G1 87.0 31.0 56.0 96.0G1 87.0 90.0 53.0 16.0G1 87.0 40.0 55.8 63.0G1 84.0 30.0 54.2 30.5G1 84.0 90.0 53.2 7.3G4 73.8 24.6 51.0 74.2G4 73.8 41.0 48.2 51.2G10 73.5 26.2 45.6 72.4G10 73.5 41.2 38.4 28.6G4 74.7 47.0 52.3 35.0G4/G5 73.5 70.0 49.8 18.0G5 74.5 73.0 41.0 4.0G5 72.7 46.0 43.6 18.0G5 73.1 51.0 38.0 36.0G5 73.5 77.0 43.0 43.0

47
35.0
40.0
45.0
50.0
55.0
60.0
70.0 75.0 80.0 85.0 90.0
Relative Density (%)
Fric
tion
angl
e (d
eg)
Crushed stoneNatural gravel
Figure 17a. Friction angle versus relative density for crushed stone and natural gravelaggregate; component effect: compaction.
35.0
40.0
45.0
50.0
55.0
60.0
20.0 30.0 40.0 50.0 60.0 70.0 80.0 90.0 100.0
Saturation (%)
Fric
tion
angl
e (d
eg)
Crushed stoneNatural gravel
Figure 17b. Friction angle versus saturation for crushed stone and natural gravelaggregate; component effect: saturation.

48
0.0
20.0
40.0
60.0
80.0
100.0
120.0
140.0
70.0 75.0 80.0 85.0 90.0
Relative Density (%)
Coh
esio
n (k
Pa)
Crushed stoneNatural gravel
Figure 17c. Cohesion versus relative density for crushed stone and natural gravelaggregate; component effect: compaction.
0.0
20.0
40.0
60.0
80.0
100.0
120.0
140.0
20.0 30.0 40.0 50.0 60.0 70.0 80.0 90.0 100.0
Saturation (%)
Coh
esio
n (k
Pa)
Crushed stoneNatural gravel
Figure 17d. Cohesion versus saturation for crushed stone and natural gravel aggregate;component effect: saturation.

49
Although the correlation between the degree of saturation and the cohesion of the
combined data seems to be poor, there is a general trend of decreasing cohesion associated with
an increasing degree of saturation (see Figure 17d). This is expected, as the cohesion should
increase with decreasing degree of saturation because of apparent cohesion caused by negative
pore water pressure or matric suction at the lower saturation values. There seems to be no clear
trend in the combined cohesion data plotted against the relative density (see Figure 17c).
Figure 18 shows similar plots to those in Figure 17, but for the friction angle and
cohesion data of the crushed stone aggregate alone. Again, although the correlation does not
seem to be very good, there seems to be a general increase in friction angle with increasing
relative density and a general reduction in cohesion with increasing degree of saturation. The
friction angle seems to be independent of the degree of saturation and the cohesion seems to be
independent of the relative density. These same trends hold for the friction angle and cohesion
data of the natural gravel aggregate plotted in Figure 19.
4.3 Permanent Deformation of Unbound Aggregate
Maree (17) and Theyse (13) performed repeated load or dynamic triaxial tests on
unbound aggregate in addition to the static triaxial tests to study the permanent deformation or
plastic strain behaviour of these materials. The terms permanent deformation and plastic strain
are used without distinction in this document. In general, permanent deformation refers to the
absolute change in the linear dimensions of the sample in units of linear displacement and the
plastic strain refers to the change in the linear dimensions expressed as a percentage of the
original dimensions.
Both researchers found that the permanent deformation response of the triaxial samples
were either stable, as shown in Figure 20a, or unstable, as shown in Figure 20b. Generally, for

50
G1G1 G1G1G1
G2G2G2G2
G2G1 G1
G1G1G1
G1
G2G2 G2
G2G2G2G2G2G2
0.0
20.0
40.0
60.0
80.0
100.0
120.0
140.0
70.0 72.0 74.0 76.0 78.0 80.0 82.0 84.0 86.0 88.0 90.0
Relative Density (%)
Fric
tion
angl
e (d
eg)
Figure 18a. Friction angle versus relative density for crushed stone aggregate; componenteffect: compaction.
G2G2
G2G2
G2
G2
G2
G2
G2
G1
G1G1
G1
G1G1G2
G2 G2
G2
G2
G1
G1
G1
G1G1
35.0
40.0
45.0
50.0
55.0
60.0
20.0 30.0 40.0 50.0 60.0 70.0 80.0 90.0 100.0
Saturation (%)
Fric
tion
angl
e (d
eg)
Figure 18b. Friction angle versus saturation for crushed stone aggregate; component effect:saturation.

51
G2
G2
G2
G2
G2
G2
G2
G2
G2 G1
G1
G1
G1G1
G1
G2
G2
G2
G2
G2
G1
G1
G1
G1
G1
0.0
20.0
40.0
60.0
80.0
100.0
120.0
140.0
70.0 72.0 74.0 76.0 78.0 80.0 82.0 84.0 86.0 88.0 90.0
Relative Density (%)
Coh
esio
n (k
Pa)
Figure 18c. Cohesion versus relative density for crushed stone aggregate; componenteffect: compaction.
G2
G2
G2
G2
G2
G2
G2
G2
G2G1
G1
G1
G1G1
G1
G2
G2
G2
G2
G2
G1
G1
G1
G1
G1
0.0
20.0
40.0
60.0
80.0
100.0
120.0
140.0
20.0 30.0 40.0 50.0 60.0 70.0 80.0 90.0 100.0
Saturation (%)
Coh
esio
n (k
Pa)
Figure 18d. Cohesion versus saturation for crushed stone aggregate; component effect:saturation.

52
G4
G4
G9
G9
G4
G4/G5
G5
G5
G5
G5
35.0
40.0
45.0
50.0
55.0
60.0
70.0 72.0 74.0 76.0 78.0 80.0 82.0 84.0 86.0 88.0 90.0
Relative Density (%)
Fric
tion
angl
e (d
eg)
Figure 19a. Friction angle and cohesion results plotted against relative density and degreeof saturation for natural gravel aggregate; component effect: compaction
G4
G4
G9
G9
G4
G4/G5
G5
G5
G5
G5
35.0
40.0
45.0
50.0
55.0
60.0
20.0 30.0 40.0 50.0 60.0 70.0 80.0 90.0 100.0
Saturation (%)
Fric
tion
angl
e (d
eg)
Figure 19b. Friction angle and cohesion results plotted against relative density and degreeof saturation for natural gravel aggregate; component effect: saturation.

53
0.000
0.500
1.000
1.500
0 5000 10000 15000 20000 25000 30000 35000 40000 45000 50000Repetitions
Perm
anen
t Def
orm
atio
n (m
m)
Regression Model
Data
Figure 20a. Stable permanent deformation response.
0
1
2
3
4
5
0 1000 2000 3000 4000 5000 6000 7000 8000 9000 10000Repetitions
Perm
anen
t Def
orm
atio
n (m
m)
Regression modelData
Figure 20b. Unstable permanent deformation response.
Figure 20. Stable and unstable permanent deformation response of dynamic traxial testsamples.

54
the stable case, the permanent deformation enters a phase of a linear rate of increase after about
10,000 load cycles and thereafter remains stable. The unstable condition associated with an
exponential increase in permanent deformation is normally entered within the first 10,000 load
repetitions. The unstable condition never occurred after 10,000 load repetitions for any of the
tests performed by Maree and Theyse.
Maree investigated the factors that determined whether a sample became unstable or
remained stable. Theyse attempted to model the magnitude of the plastic strain that would occur
in each of these cases using regression models. The factors having an influence on the
permanent deformation of unbound aggregate that were investigated by Maree and Theyse
included:
• the shear stress condition imposed on the material,
• the relative density of the material and
• the degree of saturation of the material.
4.3.1 Factors Affecting the Stability of Unbound Aggregate Under Repeated Loading
Maree used the ratio of the applied deviator stress to the maximum shear strength at a
given confining pressure as a measure of the imposed shear stress condition during a repeated
load triaxial test. Table 20 (17) gives a summary of the dynamic triaxial test results obtained by
Maree.
As far as the imposed shear stress condition is concerned, the data from Table 20
indicates that the stable permanent deformation condition is maintained at stress ratio values
between 58 and 93 percent of the static shear strength of the material. Maree concluded that the
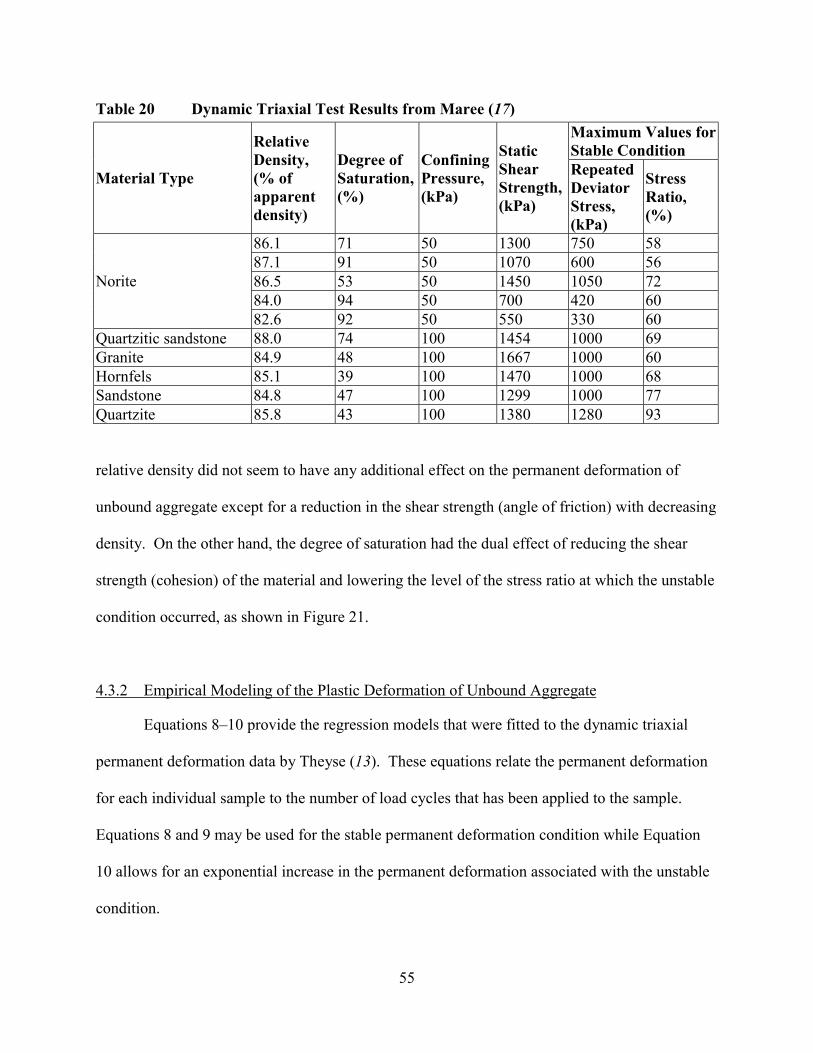
55
Table 20 Dynamic Triaxial Test Results from Maree (17)Maximum Values forStable Condition
Material Type
RelativeDensity,(% ofapparentdensity)
Degree ofSaturation,(%)
ConfiningPressure,(kPa)
StaticShearStrength,(kPa)
RepeatedDeviatorStress,(kPa)
StressRatio,(%)
86.1 71 50 1300 750 5887.1 91 50 1070 600 5686.5 53 50 1450 1050 7284.0 94 50 700 420 60
Norite
82.6 92 50 550 330 60Quartzitic sandstone 88.0 74 100 1454 1000 69Granite 84.9 48 100 1667 1000 60Hornfels 85.1 39 100 1470 1000 68Sandstone 84.8 47 100 1299 1000 77Quartzite 85.8 43 100 1380 1280 93
relative density did not seem to have any additional effect on the permanent deformation of
unbound aggregate except for a reduction in the shear strength (angle of friction) with decreasing
density. On the other hand, the degree of saturation had the dual effect of reducing the shear
strength (cohesion) of the material and lowering the level of the stress ratio at which the unstable
condition occurred, as shown in Figure 21.
4.3.2 Empirical Modeling of the Plastic Deformation of Unbound Aggregate
Equations 8�10 provide the regression models that were fitted to the dynamic triaxial
permanent deformation data by Theyse (13). These equations relate the permanent deformation
for each individual sample to the number of load cycles that has been applied to the sample.
Equations 8 and 9 may be used for the stable permanent deformation condition while Equation
10 allows for an exponential increase in the permanent deformation associated with the unstable
condition.
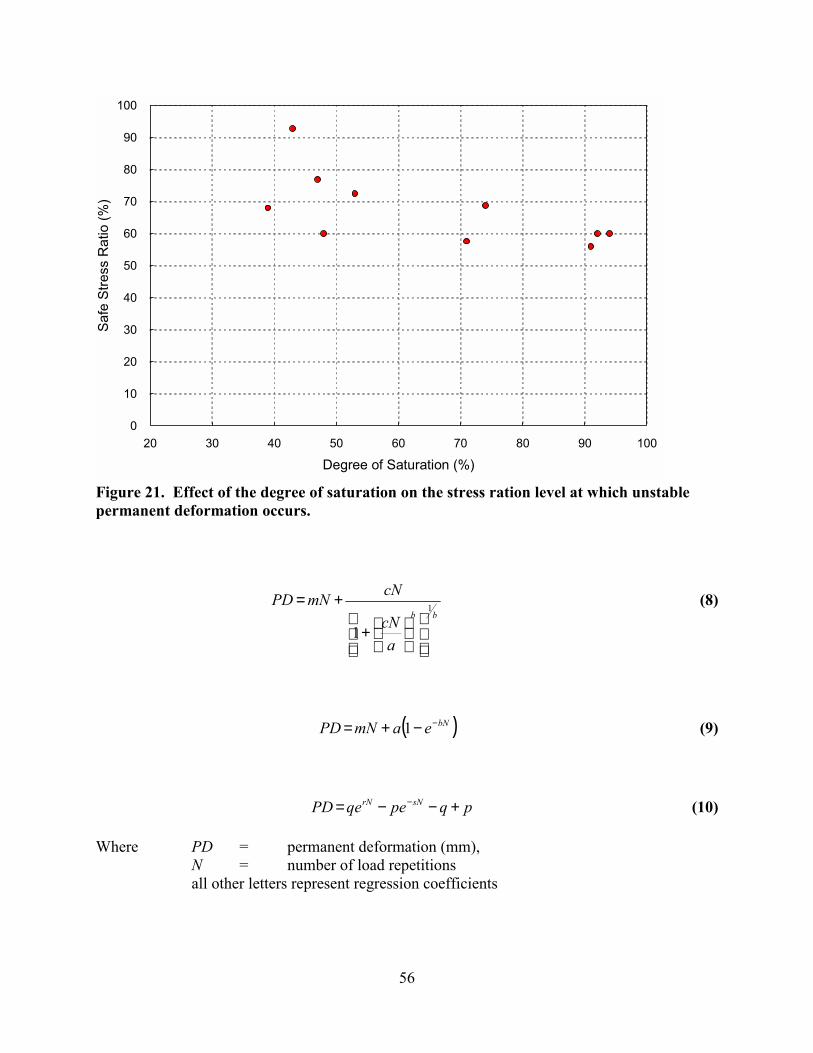
56
0
10
20
30
40
50
60
70
80
90
100
20 30 40 50 60 70 80 90 100
Degree of Saturation (%)
Safe
Stre
ss R
atio
(%)
Figure 21. Effect of the degree of saturation on the stress ration level at which unstablepermanent deformation occurs.
bb
acN
cNmNPD 1
1
+
+= (8)
( )bNeamNPD −−+= 1 (9)
pqpeqePD sNrN +−−= − (10)
Where PD = permanent deformation (mm),N = number of load repetitionsall other letters represent regression coefficients
57
Once the coefficients of the regression models relating the permanent deformation to the
number of load repetitions were known for each dynamic triaxial test, the number of load
repetitions required to induce certain levels of plastic strain in the test samples could be solved.
The plastic strain of the samples was calculated from the permanent deformation and original
dimensions of the samples. The dynamic tests for a specific combination of material type,
relative density, and degree of saturation were performed at various stress ratio levels, thus
making it possible to study the relationship between the number of load repetitions (N) required
to induce various levels of plastic strain and the stress condition (S) at which these load
repetitions are applied.
The stress parameter that was used by Theyse to represent the shear stress condition is
similar to the stress ratio used by Maree. The stress ratio, SR may be formulated in terms of
deviator stress as given by Equation 11 or major principal stress as given by Equation 12. These
two formulations result in slightly different calculated values of the stress ratio, however, these
differences are of little practical consequence. The theoretical maximum value of the stress ratio
is 1 when the applied shear stress equals the shear strength of the material. In practice, however,
it is possible to do repeated load tests at stress ratios even slightly above 1, if the duration of the
load pulses is kept short. The same numeric value for the stress ratio may also be generated at
different absolute stress values, as illustrated in Figure 22. The stress ratio is used as the stress
parameter in the discussions that follows in this section of the report.

58
++
−
+
−=
−−
=
245tan21
245tan 2
3
31
31
31
ϕϕσ
σσσσσσ
oo C
SR
a
m
a
(11)
++
+
−=
=
245tan2
245tan
'
23
31
1
1
ϕϕσ
σσσσ
oo C
SR
a
m
a
(12)
Where:σ = principal stress (kPa)τ = shear stress (kPa)φ = internal friction angle (°)C = cohesion (kPa)σ1
m = maximum allowable major principal stress (kPa) given C, φ and σ3σ1
w, σ1a = working or applied major principal stress (kPa)
σ3 = minor principal stress or confining pressure for the triaxial test(kPa)
Φ
Möhr-Coulomb failure envelope
ΦmbΦc
b ΦwbΦm
aΦca Φw
a
Internalfrictionangle, Ν
Stress ratio SR =Φm
a - Φca
Φwa - Φc
a
Φmb - Φc
bΦw
b - Φcb
Cohesion
Figure 22. Equal values for the stress ratio generated at different values of absolute stress.
59
Figure 23 shows typical examples of S-N (stress ratio - N) data sets for three plastic strain
levels (3, 7, and 13 percent) for crushed stone aggregate at 80.7 percent relative density (relative
to apparent density) and at 33.4 and 78 percent saturation. The large influence of the degree of
saturation on the number of load repetitions that can be sustained before a certain level of plastic
strain is induced in the material, is evident from the data shown in Figure 23. Dynamic triaxial
tests were also performed at 84.5 percent relative density and two levels of saturation to fully
investigate the effect of relative density and degree of saturation on the number of load cycles
that the crushed stone aggregate could sustain for different levels of plastic strain. The S-N data
for the four possible combinations of relative density and degree of saturation at which tests were
done were combined and a regression analysis was done for 3, 5, 7, 9 and 13 % plastic strain.
The regression model is given in Equation 13 and Figure 24 contains contour plots of the model
for different combinations of relative density and degree of saturation.
SRPSSRDN 02.007.007.029.043.13log −+−+−= (13)
R2 = 97.3 %; SEE = 0.313
Where:N = Number of load repetitionsRD = Relative density (%)S = Degree of saturation (%)PS = Plastic strain (%)SR = Stress ratio (%)
4.4 Compaction Potential of Unbound Aggregate
The plastic strain model for a crushed stone aggregate presented in the previous section
indicated that the density of unbound aggregate had a major influence on the plastic strain of the
aggregate when subjected to repeated loading. This section presents a brief overview on the
compaction potential of unbound aggregate from a study by Semmelink (14).
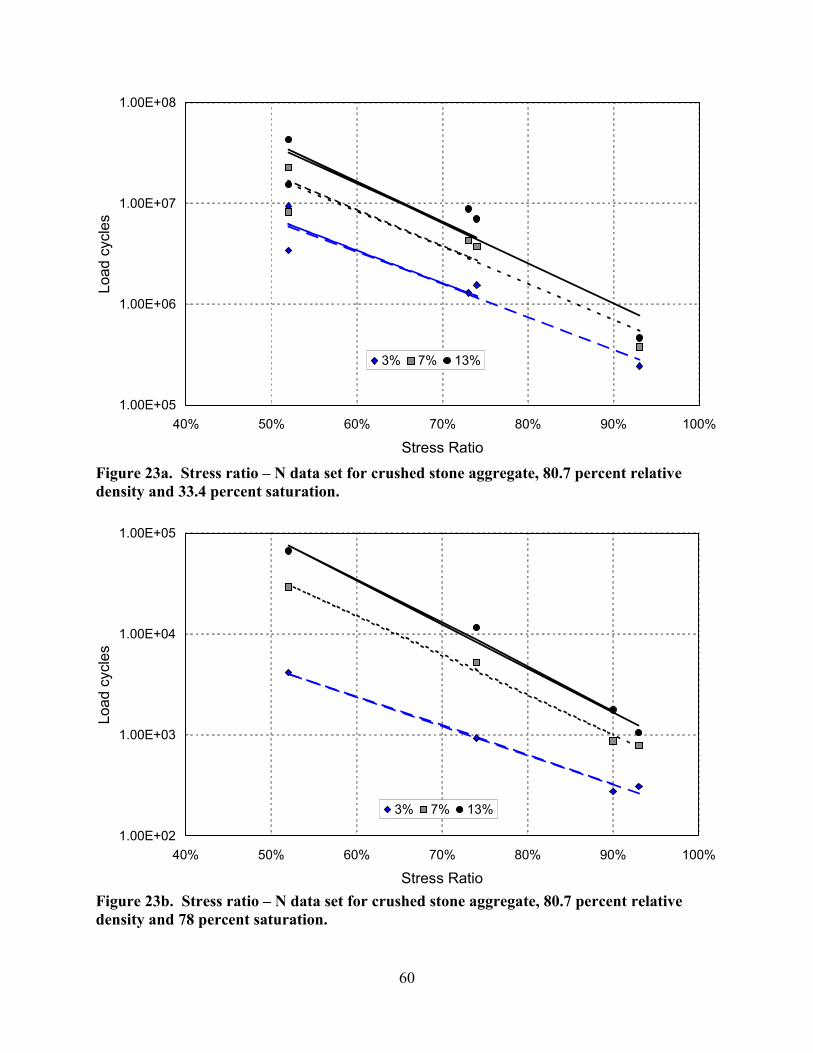
60
1.00E+05
1.00E+06
1.00E+07
1.00E+08
40% 50% 60% 70% 80% 90% 100%
Stress Ratio
Load
cyc
les
3% 7% 13%
Figure 23a. Stress ratio � N data set for crushed stone aggregate, 80.7 percent relativedensity and 33.4 percent saturation.
1.00E+02
1.00E+03
1.00E+04
1.00E+05
40% 50% 60% 70% 80% 90% 100%
Stress Ratio
Load
cyc
les
3% 7% 13%
Figure 23b. Stress ratio � N data set for crushed stone aggregate, 80.7 percent relativedensity and 78 percent saturation.
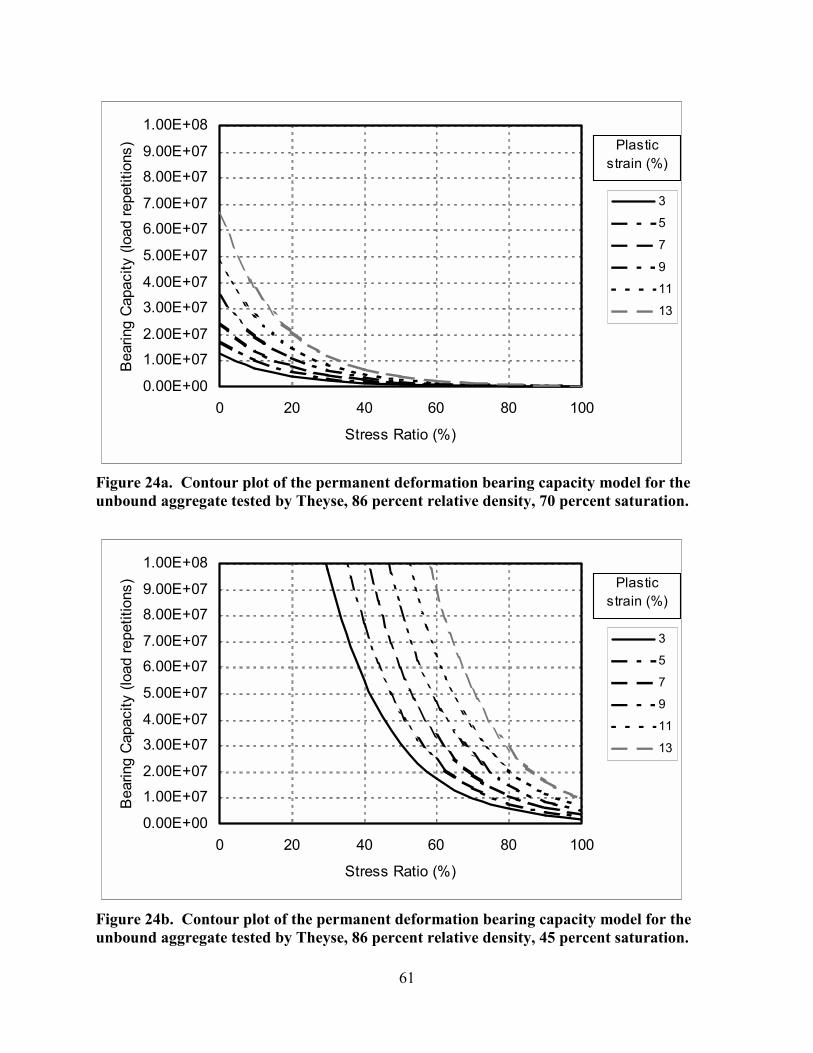
61
0.00E+00
1.00E+072.00E+07
3.00E+074.00E+07
5.00E+07
6.00E+077.00E+07
8.00E+079.00E+07
1.00E+08
0 20 40 60 80 100
Stress Ratio (%)
Bea
ring
Cap
acity
(loa
d re
petit
ions
)
3
5
7
9
11
13
Plastic strain (%)
Figure 24a. Contour plot of the permanent deformation bearing capacity model for theunbound aggregate tested by Theyse, 86 percent relative density, 70 percent saturation.
0.00E+00
1.00E+072.00E+07
3.00E+074.00E+07
5.00E+07
6.00E+077.00E+07
8.00E+079.00E+07
1.00E+08
0 20 40 60 80 100
Stress Ratio (%)
Bea
ring
Cap
acity
(loa
d re
petit
ions
)
3
5
7
9
11
13
Plastic strain (%)
Figure 24b. Contour plot of the permanent deformation bearing capacity model for theunbound aggregate tested by Theyse, 86 percent relative density, 45 percent saturation.

62
0.00E+00
1.00E+072.00E+07
3.00E+074.00E+07
5.00E+07
6.00E+077.00E+07
8.00E+079.00E+07
1.00E+08
0 20 40 60 80 100
Stress Ratio (%)
Bea
ring
Cap
acity
(loa
d re
petit
ions
)
3
5
7
9
11
13
Plastic strain (%)
Figure 24c. Contour plot of the permanent deformation bearing capacity model for theunbound aggregate tested by Theyse, 88 percent relative density, 70 percent saturation.
0.00E+00
1.00E+072.00E+07
3.00E+074.00E+07
5.00E+07
6.00E+077.00E+07
8.00E+079.00E+07
1.00E+08
0 20 40 60 80 100
Stress Ratio (%)
Bea
ring
Cap
acity
(loa
d re
petit
ions
)
3
5
7
9
11
13
Plastic strain (%)
Figure 24d. Contour plot of the permanent deformation bearing capacity model for theunbound aggregate tested by Theyse, 88 percent relative density, 45 percent saturation.

63
The compaction potential is the expected practical maximum compaction that can be
achieved for a given material. It is largely determined by the particle size distribution of the
material. A higher density can be achieved with a continuously graded material than with a
uniformly graded material of the same type. Semmelink therefore investigated the possibility of
developing empirical predictive models for the maximum achievable density of an unbound
aggregate, based on the particle size distribution of the material. The smallest sieve size used for
routine grading analysis in South Africa is the 0.075 mm sieve. Instead of using the actual
particle size distribution of the minus 0.075 mm fraction, which would have required hydrometer
testing, in his models Semmelink used the liquid limit (LL) and linear shrinkage (LS) to
characterize the minus 0.075 mm fraction material.
The approach followed by Semmelink deviates from that of Fuller and Talbot in the sense
that they prescribe the requirements that the grading of the material has to meet in order to
ensure that the maximum density is achieved. The grading of an aggregate from a natural source
is, however, a given and it is not always possible or economically feasible to alter the grading.
Semmelink therefore approached the problem with the aim of predicting the maximum
achievable density for a given particle size distribution. The level of compaction that is achieved
also depends on the compaction energy that is employed. Semmelink therefore developed
models for modified AASHTO and vibratory table compaction effort. Each of these compaction
methods has an optimum moisture content (OMC) associated with it. In addition to the density
models, Semmlink also developed predictive models for estimating the optimum compaction
moisture content for a given material and compaction effort.
The empirical models developed by Semmelink are:
82.10705.1154.101.2034.39 385.0 +−−+−= CLSCGFMDDvib

64
94.9931.1221.128.1973.33 385.0 +−−+−= CLSCGFMDDmod
63.716.1109.190.1514.23 385.0 −++−= CLSCGFOMCvib
80.086.255.0035.18.7 385.0 ++−+= CLSCGFOMCmod
Where:C = (percentage passing the 0.425 mm sieve/100)/(LL/100)0.1
GF = Σ(percentage passing a particular sieve size/nominal sieve size)/100 forthe 75 mm, 63 mm, 53 mm, 37.5 mm, 26.5 mm, 19 mm, 13.2 mm, 4.75mm, and 2 mm sieves
LS = linear shrinkageLL = liquid limit
All of the above models had correlation coefficients higher that 90 percent and provide
good estimates of the maximum achievable density of a material for which particle size
distribution and Atterberg limits are known.

65
5.0 CONCLUSIONS AND RECOMMENDATIONS
Although the methods of specification for unbound granular material in South Africa and
California differ, the basic materials seem to be similar for certain aggregate classes. The end
product that is placed in a pavement layer is, however, expected to have different stiffness,
strength, and performance levels because of the differences in specification. Data presented in
this document illustrate the effect of the moisture content and density of an unbound material on
the bearing strength of the material. The South Africa specification allows this to be taken into
consideration when an unbound granular material is used in different pavement layers. The
specification requires a higher density and bearing strength for layers closer to the pavement
surface than for layers deeper down. The California specification does not incorporate the
influence of density and moisture content on the bearing strength of the material. Furthermore,
the California method for determining the reference density for compaction control effectively
utilizes the wet density of the material. The following specific recommendations are therefore
made regarding the California specification for the use of unbound granular material in
pavements:
• The influence of density and moisture content on the bearing strength of the material
should be incorporated in the specification. Bearing strength requirements for
different pavement layers should be specified at specific density and moisture content
levels.
• It is strongly recommended that the method for determining the reference density for
compaction control should be changed to a method that utilizes dry density and that
the compaction effort for the test should be increased above the currently required 95

66
percent relative to CTM 216, or a modified wet density such as in the Bureau of
Reclamation manual (18).
As far as the effective stiffness of unbound granular material is concerned, HVS test
results indicate that there is an increase in stiffness associated with an increase in the stress
condition to which the unbound material is subjected. The correlation between resilient modulus
and the bulk stress determined from the back-calculation of depth deflection results is, however,
relatively poor although there is a general increase in resilient modulus as the bulk stress
increases. There are several possible explanations for the relatively poor correlation. The bulk
stress is calculated from linear elastic theory, which may lead to some error in the value of the
bulk stress. The laboratory test results presented in this report indicate a strong dependency of
the effective stiffness of unbound granular material on the density and moisture content of the
material. These factors are often difficult to quantify for HVS tests and their effects on the back-
calculated resilient modulus were not included in the correlation between the resilient modulus
and bulk stress calculated from HVS data. The following parameters were identified as having
an influence on the resilient response of unbound aggregate based on the HVS and laboratory
data presented:
• The dry density of the material expressed as a percentage of the solid density of
the material. The rate of change in the resilient modulus of unbound aggregate
associated with a unit change in the relative dry density of the material is higher than
the rate of change associated with changes in other parameters. The range of realistic
values for the dry density of unbound aggregate is, however, limited to a range of
values between about 78 and 88 percent of apparent density, thus limiting the overall
effect on the resilient modulus.
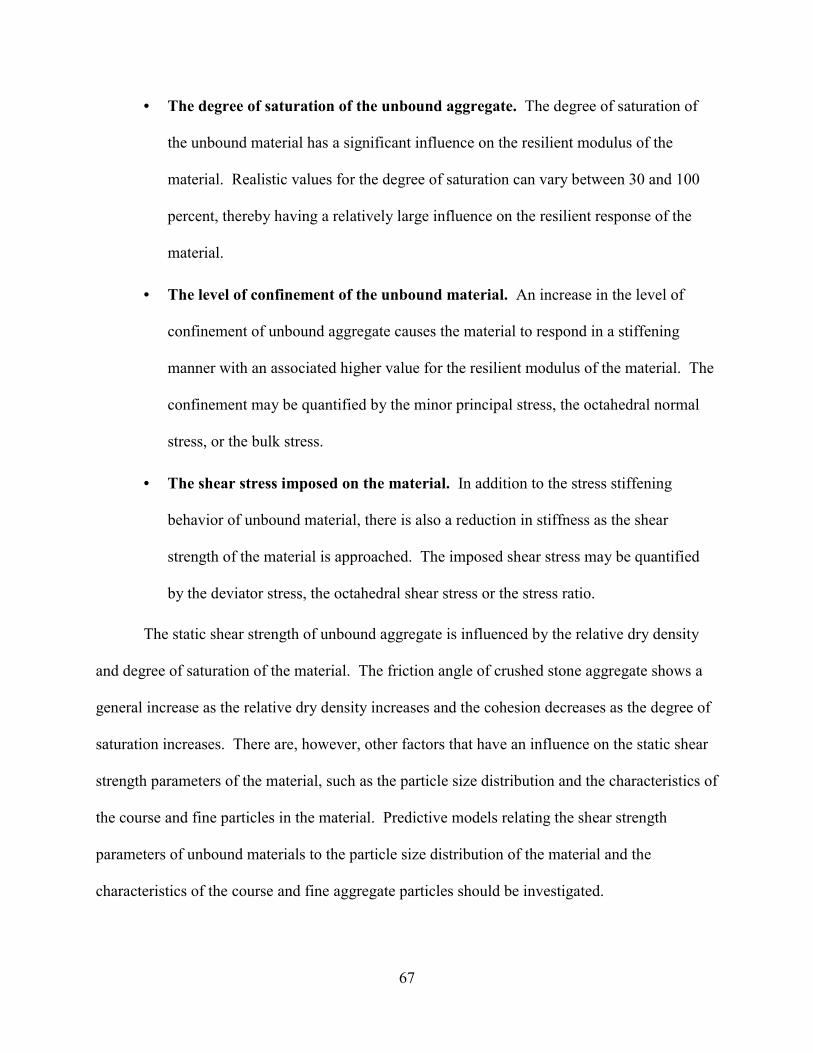
67
• The degree of saturation of the unbound aggregate. The degree of saturation of
the unbound material has a significant influence on the resilient modulus of the
material. Realistic values for the degree of saturation can vary between 30 and 100
percent, thereby having a relatively large influence on the resilient response of the
material.
• The level of confinement of the unbound material. An increase in the level of
confinement of unbound aggregate causes the material to respond in a stiffening
manner with an associated higher value for the resilient modulus of the material. The
confinement may be quantified by the minor principal stress, the octahedral normal
stress, or the bulk stress.
• The shear stress imposed on the material. In addition to the stress stiffening
behavior of unbound material, there is also a reduction in stiffness as the shear
strength of the material is approached. The imposed shear stress may be quantified
by the deviator stress, the octahedral shear stress or the stress ratio.
The static shear strength of unbound aggregate is influenced by the relative dry density
and degree of saturation of the material. The friction angle of crushed stone aggregate shows a
general increase as the relative dry density increases and the cohesion decreases as the degree of
saturation increases. There are, however, other factors that have an influence on the static shear
strength parameters of the material, such as the particle size distribution and the characteristics of
the course and fine particles in the material. Predictive models relating the shear strength
parameters of unbound materials to the particle size distribution of the material and the
characteristics of the course and fine aggregate particles should be investigated.

68
The permanent deformation of unbound granular material is affected by the following
parameters:
• the relative dry density of the material;
• the degree of saturation of the material, and
• the combined level of confining and shear stress imposed on the material. This
combined confining and shear stress condition is best represented by the stress ratio
concept as defined in this report. The stress ratio is, in turn, determined by the shear
strength parameters of the material, which depend on the relative dry density and
degree of saturation of the material.
Predictive models for the permanent deformation bearing capacity of unbound aggregate
incorporation the effect of relative dry density, degree of saturation, and stress ratio are presented
in this report. These models were calibrated for specific aggregates with a relatively high degree
of accuracy, but need to be extended to cover a wider range of materials used in California.

69
6.0 REFERENCES
1. California State Department of Transportation (Caltrans). Caltrans Highway DesignManual. Sacramento, California. November, 2001.
2. Caltrans. 1999. Test Plan for CAL/APT Goal 5. University of California at BerkeleyPavement Research Center, Transportek, and Dynatest Consulting, Inc.
3. Bejarano, M. O., J. T. Harvey, A. Ali, M. Russo, D. Mahama, D. Hung, and P. Preedonant.Performance of Drained and Undrained Flexible Pavement Structures under WetConditions Accelerated Test Data Test Section 543�Drained. Report prepared for CaliforniaDepartment of Transportation by the University of California Pavement Research Center.August 2002.
4. Bejarano, M. O., J. T. Harvey, A. Ali, M. Russo, D. Mahama, D. Hung, and P. Preedonant.Performance of Drained and Undrained Flexible Pavement Structures under WetConditions Accelerated Test Data Test Section 544�Undrained. Report prepared forCalifornia Department of Transportation by the University of California Pavement ResearchCenter. August 2002.
5. Bejarano, M. O., J. T. Harvey, A. Ali, M. Russo, D. Mahama, D. Hung, and P. Preedonant.Performance of Drained and Undrained Flexible Pavement Structures under WetConditions Accelerated Test Data Test Section 545�Undrained. Report prepared forCalifornia Department of Transportation by the University of California Pavement ResearchCenter. August 2002.
6. Bejarano, M. O., J. T. Harvey, A. Ali, D. Mahama, D. Hung, and P. Preedonant.Performance of Drained and Undrained Flexible Pavement Structures under Conditions ofSaturated Base - Accelerated Pavement Testing Evaluation Goal 5 HVS. Report prepared forCalifornia Department of Transportation by the University of California Pavement ResearchCenter. August 2002.
7. Shackelton M C. 1995. Modelling of the Permanent Deformation of Untreated PavementLayers. M Eng thesis, University of Pretoria, Republic of South Africa.
8. Maree, J H, van Zyl, N J W and Freeme, C R. 1982. �Effective Moduli and StressDependence of Pavement Materials as Measured in some Heavy Vehicle Simulator Tests.�Transportation Research Record 852, Transportation Research Board, Washington D.C., pp.52�60.
9. Wolff H. 1992. Elasto-Plastic Behaviour of Granular Pavement Layers in South Africa. Ph.D. thesis, University of Pretoria, Republic of South Africa.
10. Theyse H L. 1997. �Mechanistic Empirical Modelling of the Permanent Deformation ofUnbound Pavement Layers.� Proceedings of the Eighth International Conference on theStructural Design of Asphalt Pavements. Seattle, University of Washington, pp 1579�1594.
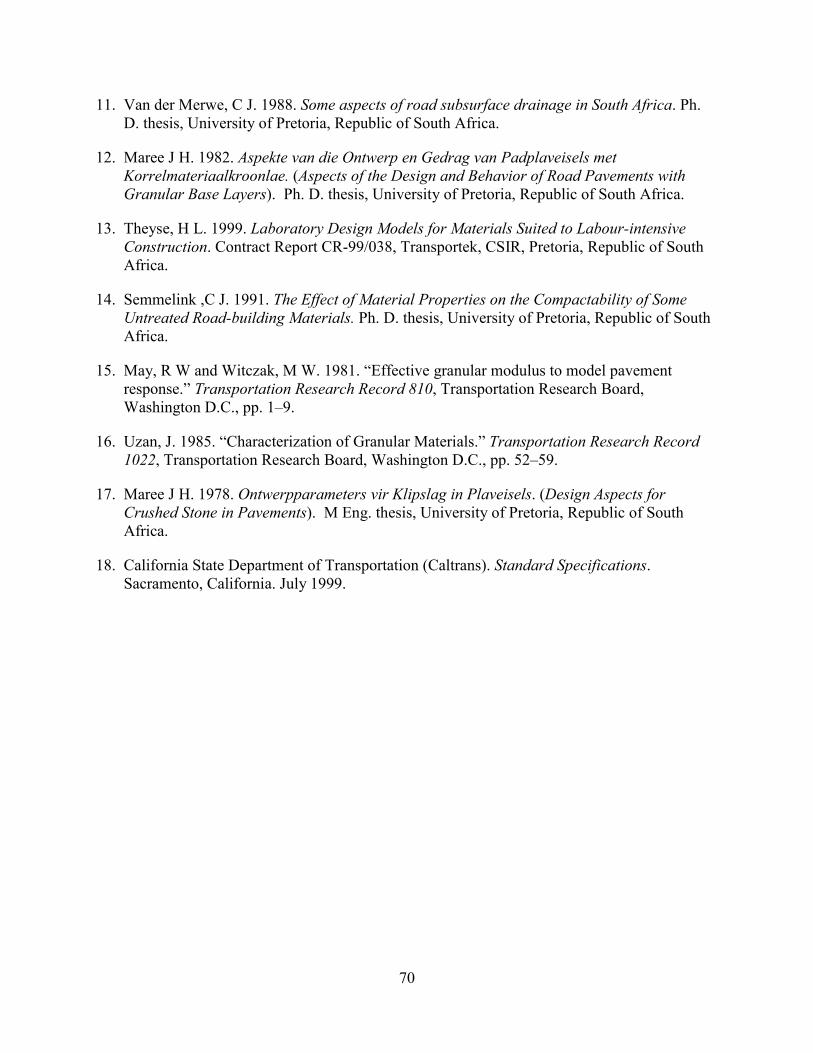
70
11. Van der Merwe, C J. 1988. Some aspects of road subsurface drainage in South Africa. Ph.D. thesis, University of Pretoria, Republic of South Africa.
12. Maree J H. 1982. Aspekte van die Ontwerp en Gedrag van Padplaveisels metKorrelmateriaalkroonlae. (Aspects of the Design and Behavior of Road Pavements withGranular Base Layers). Ph. D. thesis, University of Pretoria, Republic of South Africa.
13. Theyse, H L. 1999. Laboratory Design Models for Materials Suited to Labour-intensiveConstruction. Contract Report CR-99/038, Transportek, CSIR, Pretoria, Republic of SouthAfrica.
14. Semmelink ,C J. 1991. The Effect of Material Properties on the Compactability of SomeUntreated Road-building Materials. Ph. D. thesis, University of Pretoria, Republic of SouthAfrica.
15. May, R W and Witczak, M W. 1981. �Effective granular modulus to model pavementresponse.� Transportation Research Record 810, Transportation Research Board,Washington D.C., pp. 1�9.
16. Uzan, J. 1985. �Characterization of Granular Materials.� Transportation Research Record1022, Transportation Research Board, Washington D.C., pp. 52�59.
17. Maree J H. 1978. Ontwerpparameters vir Klipslag in Plaveisels. (Design Aspects forCrushed Stone in Pavements). M Eng. thesis, University of Pretoria, Republic of SouthAfrica.
18. California State Department of Transportation (Caltrans). Standard Specifications.Sacramento, California. July 1999.

71
APPENDIX A: PAVEMENT AND INSTRUMENTATION DETAIL OF HVS TESTSECTIONS

HVS-section Nr: Region: Road Nr: Year of test:Pavement structure Instrumentation detail Pavement material information
Test section point
MDD anchorat 3 m depth
MDD anchorat 3 m depthDepth (mm)
Layer Type
(UCS, CBR, MDD, OMC,etc) class
Material properties TRH14
Load sequence detail: Related reports:
303A2 Macleantown, Eastern Cape TR86 1986
van der Merwe C J, Horak E. 1986. East London HVS experimental sections: Objectives and
preliminary investigation. National Institute of Transport and Road Research (NITRR), CSIR.
(Technical Note TPC/1/86)
From To Wheel load Tyre pressure Water added
Repetitions Test information
0 411 413
411 413 531 896
100 kN 690 kPa
40 kN 520 kPa
No
Yes
0 2 4 6 8 10 12 14 16MDD
Topcap
MDD180
MDD330
MDD630
0
100
200
300
400
500
600
700
800
900
1000
MDDTopcap
MDD180
MDD330
MDD630
van der Merwe C J, de Villiers E M, Horak E. 1987. HVS aided evaluation of a drainable subbase
layer in the Eastern Cape. NITRR, CSIR. (Research Report RR486)
0 - 40
40 - 190
190 - 340
340 - 540
540 - 680
680 +
Asphalt
CrushedStone
Crushedstone drainage layer
Limestabilizedupper selected
4,4 (2,1)
2,8 (2,6)
8,1 (8,5)
7,1 (7,6)
AD = 2658 kg/cub mmDD = 2198 (2204), OMC = 7,7 (7,6)CBR = 176 @ 98 %GM = 2,56
AD = 2643 kg/cub mmDD = 2027 (2077), OMC = 9,9 (10,8)CBR = 52 @ 95 %GM = 2,67
Decomposed Dolorite, 4% limemDD = 2165 (2070), OMC = 10,4 (6,5)CBR = 82 @ 93 %GM = 2,32
Decomposed Dolorite, 1,5% limemDD = 2278 (2064), OMC = 8,0 (10,7)CBR = 27 @ 93 %GM = 2,36
mDD = 2197, OMC = 7,9CBR = 31 @ 93 %GM = 2,03
2149,6 (2153,3)80,8% AD
2025,0 (2037,5)76,6% AD
2158,5 (1993,4)
2241,5 (1964,9)
G2/G3
G5
C4
C5
G6In-situsubgrade
Limemodifiedlower selected
Data in brackets were collected during 1998, original (1986) data shown outside brackets
(kg/cub m)Density MC
(%)
Field
72
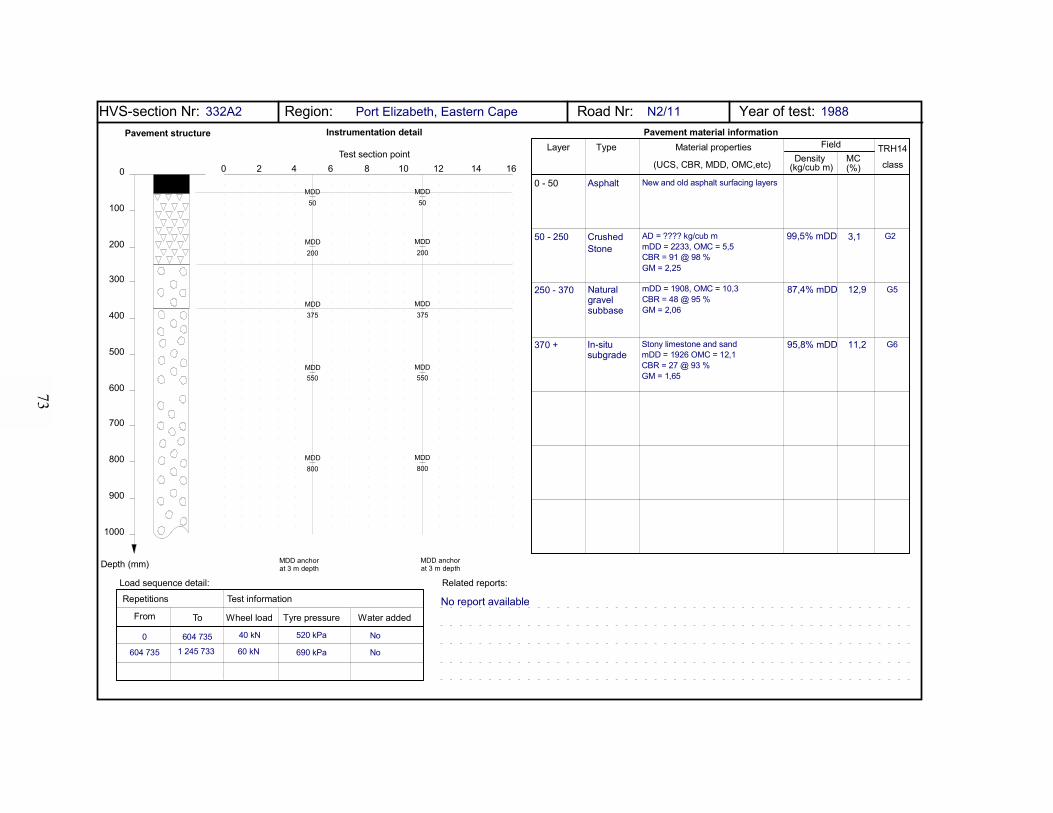
HVS-section Nr: Region: Road Nr: Year of test:Pavement structure Instrumentation detail Pavement material information
Test section point
MDD anchorat 3 m depth
MDD anchorat 3 m depthDepth (mm)
Layer Type
(UCS, CBR, MDD, OMC,etc) class
Material properties TRH14
Load sequence detail: Related reports:
332A2 Port Elizabeth, Eastern Cape N2/11 1988
No report availableFrom To Wheel load Tyre pressure Water added
Repetitions Test information
0 604 735
604 735 1 245 733
40 kN 520 kPa
60 kN 690 kPa
No
No
0 - 50
50 - 250
250 - 370
370 +
Asphalt
CrushedStone
Natural gravel subbase
In-situ subgrade
3,1
12,9
11,2
AD = ???? kg/cub mmDD = 2233, OMC = 5,5CBR = 91 @ 98 %GM = 2,25
mDD = 1908, OMC = 10,3CBR = 48 @ 95 %GM = 2,06
Stony limestone and sandmDD = 1926 OMC = 12,1CBR = 27 @ 93 %GM = 1,65
99,5% mDD
87,4% mDD
95,8% mDD
G2
G5
G6
0 2 4 6 8 10 12 14 16
MDD50
MDD375
MDD200
MDD550
MDD800
0
100
200
300
400
500
600
700
800
900
1000
MDD50
MDD375
MDD200
MDD550
MDD800
New and old asphalt surfacing layers
(kg/cub m)Density MC
(%)
Field
73
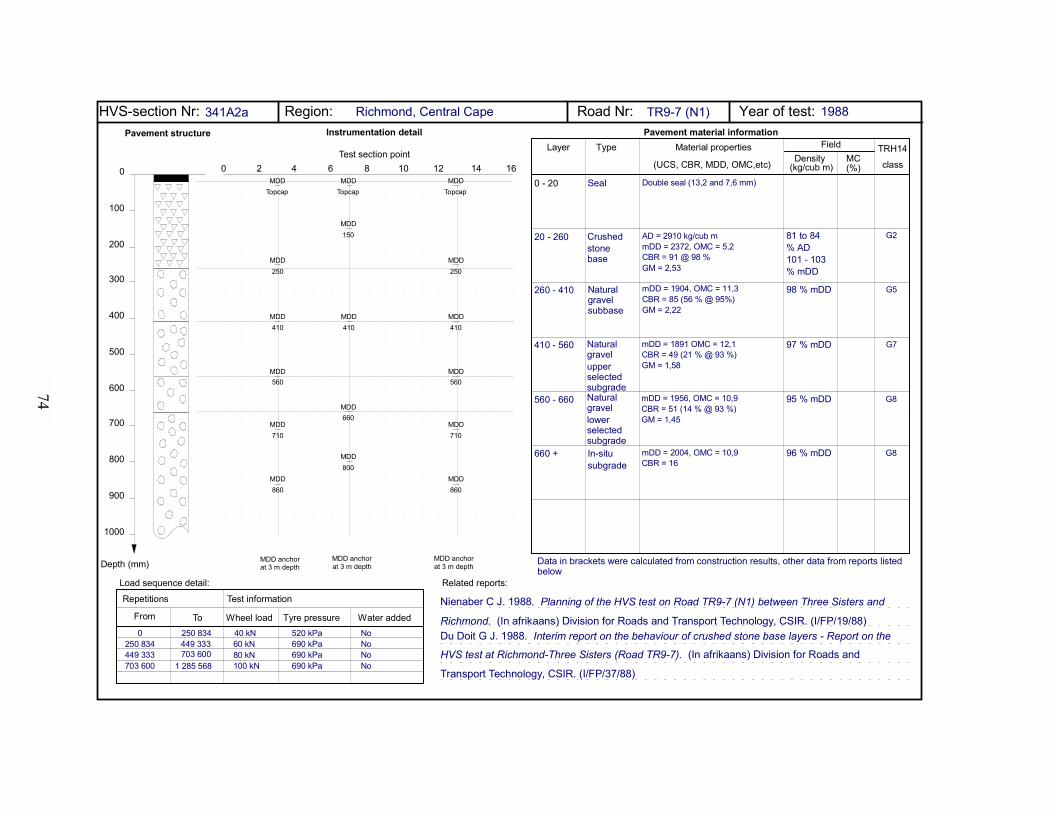
HVS-section Nr: Region: Road Nr: Year of test:Pavement structure Instrumentation detail Pavement material information
Test section point
MDD anchorat 3 m depth
MDD anchorat 3 m depthDepth (mm)
Layer Type
(UCS, CBR, MDD, OMC,etc) class
Material properties TRH14
Load sequence detail: Related reports:
341A2a Richmond, Central Cape TR9-7 (N1) 1988
Nienaber C J. 1988. Planning of the HVS test on Road TR9-7 (N1) between Three Sisters and
Richmond. (In afrikaans) Division for Roads and Transport Technology, CSIR. (I/FP/19/88)Du Doit G J. 1988. Interim report on the behaviour of crushed stone base layers - Report on the
HVS test at Richmond-Three Sisters (Road TR9-7). (In afrikaans) Division for Roads and
0 - 20
20 - 260
260 - 410
410 - 560
560 - 660
660 +
Seal
Crushedstone base
Natural gravel subbase
Natural gravelupper selected subgrade
AD = 2910 kg/cub mmDD = 2372, OMC = 5,2CBR = 91 @ 98 %GM = 2,53
mDD = 1904, OMC = 11,3CBR = 85 (56 % @ 95%)GM = 2,22
mDD = 1891 OMC = 12,1CBR = 49 (21 % @ 93 %)GM = 1,58
mDD = 1956, OMC = 10,9CBR = 51 (14 % @ 93 %)GM = 1,45
mDD = 2004, OMC = 10,9CBR = 16
81 to 84 % AD101 - 103% mDD
98 % mDD
97 % mDD
95 % mDD
G5
G7
G8
G8In-situsubgrade
Natural gravellower selected subgrade
Data in brackets were calculated from construction results, other data from reports listed below
Double seal (13,2 and 7,6 mm)
From To Wheel load Tyre pressure Water added
Repetitions Test information
0 250 834250 834 449 333
40 kN 520 kPa60 kN 690 kPa
NoNo
449 333 703 600 80 kN 690 kPa No703 600 1 285 568 100 kN 690 kPa No
0 2 4 6 8 10 12 14 16MDD
Topcap
MDD410
MDD250
MDD560
MDD860
0
100
200
300
400
500
600
700
800
900
1000
MDD710
MDDTopcap
MDD410
MDD250
MDD560
MDD860
MDD710
MDDTopcap
MDD410
MDD150
MDD660
MDD800
MDD anchorat 3 m depth
96 % mDD
G2
Transport Technology, CSIR. (I/FP/37/88)
(kg/cub m)Density MC
(%)
Field
74

HVS-section Nr: Region: Road Nr: Year of test:Pavement structure Instrumentation detail Pavement material information
Test section point0 2 4 6 8 10 12 14 16
MDD65
MDD230
MDD430
MDD615
MDD765
MDD anchorat 3 m depth
MDD65
MDD230
MDD430
MDD615
MDD765
MDD anchorat 3 m depth
0
100
200
300
400
500
600
700
800
900
1000
Depth (mm)
Layer Type
(UCS, CBR, MDD, OMC,etc) class
Material properties
0 - 80
TRH14
Load sequence detail:
From To Wheel load Tyre pressure Water added
Repetitions Test information
Related reports:
80 - 240
240 - 380
380 - 500
500 - 650
650 - 800
800 +
Asphalt
CrushedStone
Cement-treatedcrushedstone
Limestabilizedgravel
2,9
6,6
8,1
8,6
8,6
2260 (b) 2275 (a)
50 mm AS, 30 mm ACFlow = 3,9 mmStability = 4,1 kN
AD = 2696 kg/cub mmDD = 2260, OMC = 6,2CBR = 128 @ 98 %GM = 2,5
mDD = 2158, OMC = 8,1CBR = 127 @ 95 %GM = 2,4
mDD = 1978, OMC = 11,3CBR = 68 @ 95 %GM = 2,3
mDD = 2031, OMC = 9,0CBR = 31 @ 93 %GM = 2,0
mDD = 2058, OMC = 8,7CBR = 31 @ 93 %GM = 1,6
2280 (b)2370 (a)2209
2070 (b)2110 (a)2024
2110 (b)2140 (a)2017
2010 (b)2055 (a)1835
2015 (b)2040 (a)1835
G1
C3
C4
G6
G6
327A3 Umkomaas, KwaZulu-Natal N2 - 23 1988
0 708 000
708 000 1 069 000
1 069 000 1 669 000
100 kN 690 kPa
40 kN 520 kPa
100 kN 690 kPa
No
Yes, points 0 - 8
Wright, B G and Horak E. 1988. Report on the crushed stone section at Umgababa in Natal.
Division of Roads and Transport Technology, CSIR. (Unpublished report.)
Selectedsubgrade
In-situsubgrade
In-situsubgrade
Yes, points 0 - 8
(kg/cub m)Density MC
(%)
Field
75

HVS-section Nr: Region: Road Nr: Year of test:Pavement structure Instrumentation detail Pavement material information
Test section point
MDD anchorat 3 m depth
MDD anchorat 3 m depthDepth (mm)
Layer Type
(UCS, CBR, MDD, OMC,etc) class
Material properties TRH14
Load sequence detail: Related reports:
398A4 Cullinan, Gauteng Road 2388 1997
From To Wheel load Tyre pressure Water added
Repetitions Test information
MDD anchorat 3 m depth
Theyse H L. 1997. The construction of the HVS experimental sections on Road 2388 near Cullinan. Transportek, CSIR. (Confidential Contract Report CR-97/071)Theyse H L. 1999. Laboratory design models for materials suited to labour-intensive construction. Transportek, CSIR. (Confidential Contract Report CR-99/038)
0 2 4 6 8 10 12 14 16
MDD275
MDD575
MDD900
0
100
200
300
400
500
600
700
800
900
1000
MDD125
MDDTopcap
MDD575
MDD300
MDD900
MDD150
MDDTopcap
MDD275
MDD125
(kg/cub m)Density MC
(%)
Field
0 - 30 Asphalt
30 - 130
130 - 280
280 - 580
580 +
Cement-treatedgravelsubbase
Natural gravel selected subgrade
3,5
2,8
6,0
Sandstone conglomerate, 2,5% OPCreworked with 1,5% OPCmDD = 2154, OMC = 6,7UCS @ 100 = 2486 @ 97 = 1940GM = 2,2 PI = Non-plasticSandstone conglomeratemDD = 2155, OMC = 7,1CBR = 21 @ 93 %GM = 2,2 PI = Non-plastic
Sandstone conglomeratemDD = 2155, OMC = 7,1CBR = 21 @ 93 %GM = 2,2 PI =Non-plastic
214998 % mDD
2171101 % mDD
2204102 % mDD
G3
C3
G7
Natural gravel fill
G7
Crushed stone base
AD = 2664 kg/cub m, BD = 2565 kg/cub mmDD =2188, OFC = 7,5CBR = 111 @ 98%GM = 2,3 PI = Non-plastic
Fine continuous correction layer and medium continuous wearing course5% NATREF 60/70 B12 binderRice density = 2454 kg/cub m
23185,5 % voids
AC
0 200 000 40 kN 520 kPa No200 000 400 000 70 kN 670 kPa No400 000 536 653 70 kN 670 kPa Yes
76
Related Documents