WORKING PAPER SERIES NO 930 / SEPTEMBER 2008 STICKY INFORMATION PHILLIPS CURVES EUROPEAN EVIDENCE by Jörg Döpke, Jonas Dovern, Ulrich Fritsche and Jiri Slacalek

Welcome message from author
This document is posted to help you gain knowledge. Please leave a comment to let me know what you think about it! Share it to your friends and learn new things together.
Transcript

Format:
(210.00x
297.00
mm);Date:
Mar
13,2008
19:28:20;Output
Profile:SPOT
ISO
Coatedv2
(ECI);
Preflight:Failed
Work ing PaPer Ser i e Sno 930 / S ePtember 2008
Sticky informationPhilliPS curveS
euroPean evidence
by Jörg Döpke, Jonas Dovern, Ulrich Fritsche and Jiri Slacalek

WORKING PAPER SER IESNO 930 / SEPTEMBER 2008
In 2008 all ECB publications
feature a motif taken from the
10 banknote.
STICKY INFORMATION
PHILLIPS CURVES
EUROPEAN EVIDENCE 1
by Jörg Döpke 2, Jonas Dovern 3, Ulrich Fritsche 4 and Jiri Slacalek 5
This paper can be downloaded without charge fromhttp://www.ecb.europa.eu or from the Social Science Research Network
electronic library at http://ssrn.com/abstract_id=1219542.
1 We thank Sophocles Mavroeidis and Masao Ogaki for helpful comments and Christina Gerberding for her data on inflation and
GDP expectations.The views presented in this paper are the authors’, and do not necessarily reflect those
of DIW Berlin, the European Central Bank or IfW Kiel.
2 University of Applied Sciences, Department Economics, Geusaer Strasse, 06217 Merseburg, Germany;
e-mail: [email protected]
3 Kiel Institute for the World Economy (IfW Kiel), Düsternbrooker Weg 120, 24105 Kiel,
Germany; e-mail: [email protected]
4 University Hamburg, Department of Economics and Politics and DIW Berlin,
Von-Melle-Park 9, 20146 Hamburg, Germany;
e-mail: [email protected]
5 DG Research, European Central Bank, Kaiserstrasse 29, 60311
Frankfurt am Main, Germany; e-mail: [email protected]

© European Central Bank, 2008
Address Kaiserstrasse 29 60311 Frankfurt am Main, Germany
Postal address Postfach 16 03 19 60066 Frankfurt am Main, Germany
Telephone +49 69 1344 0
Website http://www.ecb.europa.eu
Fax +49 69 1344 6000
All rights reserved.
Any reproduction, publication and reprint in the form of a different publication, whether printed or produced electronically, in whole or in part, is permitted only with the explicit written authorisation of the ECB or the author(s).
The views expressed in this paper do not necessarily refl ect those of the European Central Bank.
The statement of purpose for the ECB Working Paper Series is available from the ECB website, http://www.ecb.europa.eu/pub/scientific/wps/date/html/index.en.html
ISSN 1561-0810 (print) ISSN 1725-2806 (online)

3ECB
Working Paper Series No 930September 2008
Abstract 4
Non-technical summary 5
1 Introduction 7
2 Sticky information Phillips curve 8
2.1 The model 8
2.2 The data 9
2.3 The results 11
3 Conclusion 14
References 15
Tables 18
European Central Bank Working Paper Series 20
CONTENTS

4ECBWorking Paper Series No 930September 2008
Abstract
We estimate the sticky information Phillips curve model of Mankiw
and Reis (2002) using survey expectations of professional forecasters
from four major European economies. Our estimates imply that in-
flation expectations in France, Germany and the United Kingdom are
updated about once a year, in Italy about once each six months.
Keywords: Inflation expectations, sticky information, Phillips curve,
inflation persistence
JEL classification: D84, E31
5ECB
Working Paper Series No 930September 2008
Non-technical Summary
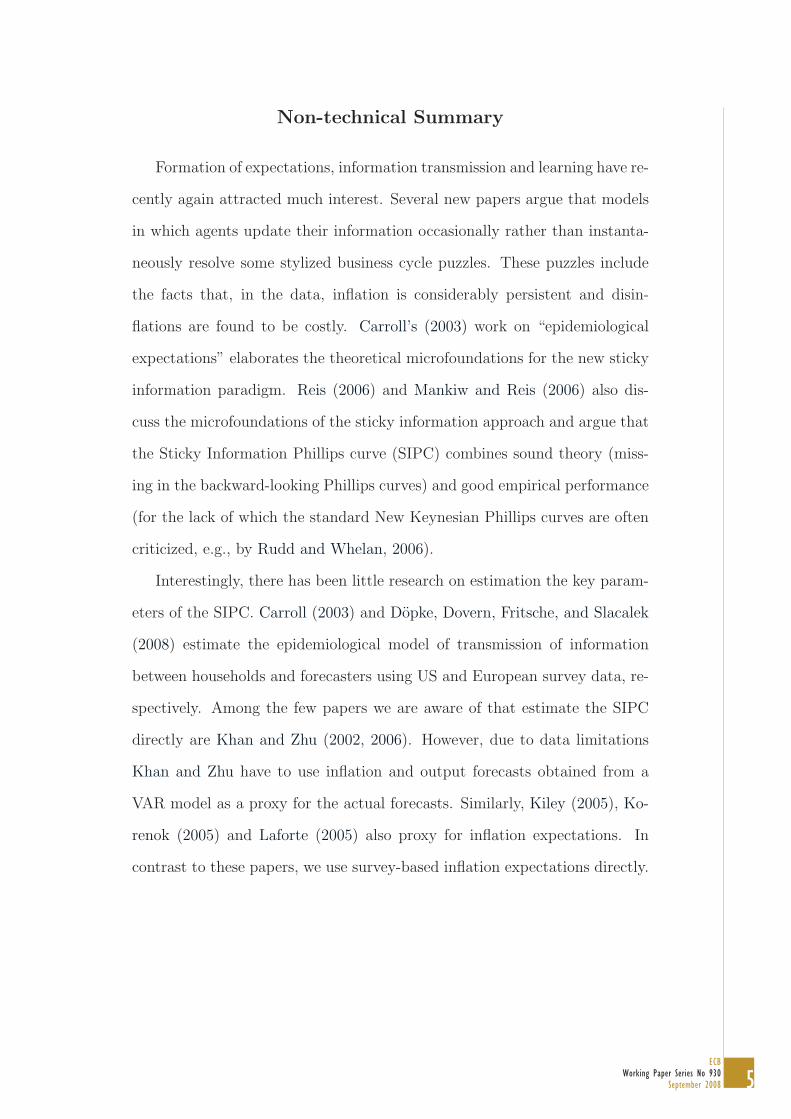
Formation of expectations, information transmission and learning have re-
cently again attracted much interest. Several new papers argue that models
in which agents update their information occasionally rather than instanta-
neously resolve some stylized business cycle puzzles. These puzzles include
the facts that, in the data, inflation is considerably persistent and disin-
flations are found to be costly. Carroll’s (2003) work on “epidemiological
expectations” elaborates the theoretical microfoundations for the new sticky
information paradigm. Reis (2006) and Mankiw and Reis (2006) also dis-
cuss the microfoundations of the sticky information approach and argue that
the Sticky Information Phillips curve (SIPC) combines sound theory (miss-
ing in the backward-looking Phillips curves) and good empirical performance
(for the lack of which the standard New Keynesian Phillips curves are often
criticized, e.g., by Rudd and Whelan, 2006).
Interestingly, there has been little research on estimation the key param-
eters of the SIPC. Carroll (2003) and Dopke, Dovern, Fritsche, and Slacalek
(2008) estimate the epidemiological model of transmission of information
between households and forecasters using US and European survey data, re-
spectively. Among the few papers we are aware of that estimate the SIPC
directly are Khan and Zhu (2002, 2006). However, due to data limitations
Khan and Zhu have to use inflation and output forecasts obtained from a
VAR model as a proxy for the actual forecasts. Similarly, Kiley (2005), Ko-
renok (2005) and Laforte (2005) also proxy for inflation expectations. In
contrast to these papers, we use survey-based inflation expectations directly.
6ECBWorking Paper Series No 930September 2008
Using recent data from four major European economies we estimate the
parameter (λ) that governs the amount of information stickiness. We find
that producers in France, Germany and the United Kingdom update their
information sets about once a year, those in Italy about once each six months.
These results are quite robust across the two estimation methods we use
(equation-by-equation estimation and seemingly unrelated regressions) and
the number of lags of right-hand side variables included. The estimates of λ
close to 0.3 are consistent with those of Dopke, Dovern, Fritsche, and Slacalek
(2008) except for Italy, whose λ they pin down to be comparable to the other
countries. Khan and Zhu find similar results for Canada, United Kingdom
and United States and Korenok (2005) for the United States. Kiley (2005)
reports that λ in his models ranges between 0.44 and 0.71 (in the US data).
7ECB
Working Paper Series No 930September 2008
1 Introduction
Formation of expectations, information transmission and learning have re-
cently again attracted much interest.1 Several new papers, including Mankiw
and Reis (2002, 2003, 2006), argue that models in which agents update their
information occasionally rather than instantaneously resolve some stylized
business cycle puzzles.2 These puzzles include the facts that, in the data,
inflation is considerably persistent and disinflations are found to be costly.3
Carroll’s (2003) work on “epidemiological expectations” elaborates the
theoretical microfoundations for the new sticky information paradigm. Reis
(2006) and Mankiw and Reis (2006) also discuss the microfoundations of the
sticky information approach and argue that the Sticky Information Phillips
curve (SIPC) combines sound theory (missing in the backward-looking Phillips
curves) and good empirical performance (for the lack of which the standard
New Keynesian Phillips curves are often criticized, e.g., by Rudd and Whe-
lan, 2006).
Interestingly, there has been little research on estimation the key param-
eters of the SIPC. Carroll (2003) and Dopke, Dovern, Fritsche, and Slacalek
(2008) estimate the epidemiological model of transmission of information
between households and forecasters using US and European survey data, re-
spectively. Among the few papers we are aware of that estimate the SIPC
1See Phelps (1969); Lucas (1973) for early work on these issues.2Alternative related channels that build in sluggishness in the frictionless rational ex-
pectations models include rational inattention (e.g., Sims, 2003) and learning (e.g., Branch,2004).
3Inflation persistence is documented in many papers including European Central Bank(2005) and Pivetta and Reis (2007). An important paper by Ball (1994) estimates thatthe costs of disinflation in advanced economies are substantial.

8ECBWorking Paper Series No 930September 2008
directly are Khan and Zhu (2002, 2006). However, due to data limitations
Khan and Zhu have to use inflation and output forecasts obtained from a
VAR model as a proxy for the actual forecasts. Similarly, Kiley (2005), Ko-
renok (2005) and Laforte (2005) also proxy for inflation expectations. In
contrast to these papers, we use survey-based inflation expectations directly.
Using recent data from four major European economies we estimate the
parameter (λ) that governs the amount of information stickiness. We find
that producers in France, Germany and the United Kingdom update their
information sets about once a year, those in Italy about once each six months.
These results are quite robust across the two estimation methods we use
(equation-by-equation estimation and seemingly unrelated regressions) and
the number of lags of right-hand side variables included. The estimates of λ
close to 0.3 are consistent with those of Dopke, Dovern, Fritsche, and Slacalek
(2008) except for Italy, whose λ they pin down to be comparable to the other
countries. Khan and Zhu find similar results for Canada, United Kingdom
and United States and Korenok (2005) for the United States. Kiley (2005)
reports that λ in his models ranges between 0.44 and 0.71 (in the US data).
2 Sticky Information Phillips Curve
2.1 The Model
Mankiw and Reis (2002) assume that each period, only a fraction λ of firms
gathers the up-to-date information about the current state of the economy
and re-computes and adjusts the optimal path of future prices. Remain-
9ECB
Working Paper Series No 930September 2008
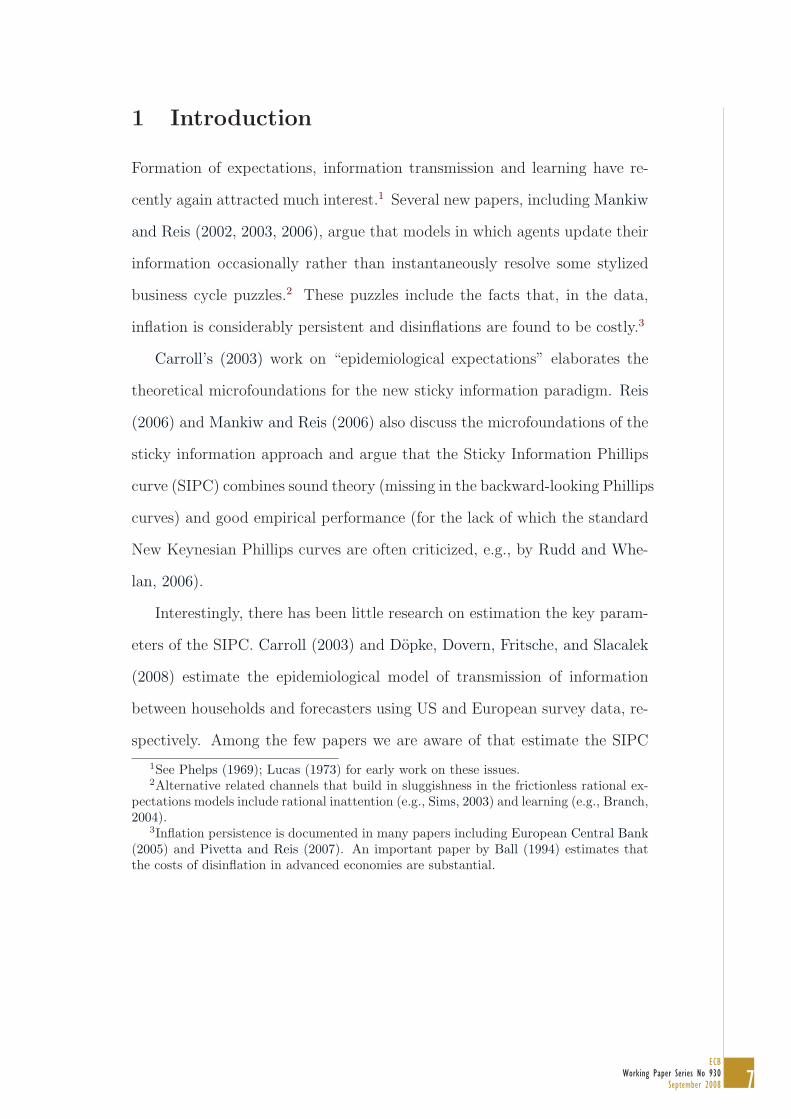
ing (1 − λ) firms continue using their previous plans and set prices based
on outdated information. The firm’s probability of information updating is
exogenously determined and independent of price adjustment history. Un-
der this assumption Mankiw and Reis derive the following closed economy
version of the SIPC:
πt =λα
1− λyt + λ
∞∑
j=0
(1− λ)j Et−1−j
(πt + αΔyt
)+ εt, (1)
where πt is the inflation rate and yt the output gap. Et(·) denotes the rational
(mathematical) expectation as of time t. The parameter α measures the
sensitivity of the optimal relative price to the current output gap and depends
on the structure of the economy (e.g., the preferences, technology, and the
market structure parameters).4
Note that in contrast to the standard (forward-looking) sticky price model,
in which current expectations of future state of the economy play an impor-
tant role, what matters in the sticky information model (1) are the past
expectations of the present events.
2.2 The Data
We use quarterly data between 1991Q4 and 2004Q4 for Germany, France,
Italy and the United Kingdom. The actual GDP and inflation series were
obtained from OECD’s Main Economic Indicators database.
The experts’ inflation and output forecasts were collected by Consen-
4The parameter α can be interpreted as a measure of the degree of real rigidity, see,e.g., Ball and Romer (1990).
10ECBWorking Paper Series No 930September 2008
sus Economics, a major London-based macroeconomic survey firm. Each
quarter since 1991 Consensus Economics publishes the consensus forecasts
constructed as the median of 20–30 individual predictions of major banks and
research institutes (in each country). The consensus forecasts are available
up to six quarters ahead, i.e, for quarters t + 1 through t + 6.5
We use the GDP growth forecasts to extract expectations as of time s
for the future output gap, Esyt+i, as follows. First, we have to bear in mind
that the expectations reported in the survey refer to year-on-year changes
rather than annualized quarterly changes as implied by the SIPC model.
Second, we base our proxy of the expected output gap on the expectations
of GDP growth EsΔy as follows. Denote yt and y∗t the log of output and
the log of potential output, respectively. For each time period, s, in our
sample, we construct a prolonged GDP time series, say ys(t), by setting
ys(t) = yt for t ≤ s and recursively computing ys(t+1) = yt−3 +EsΔyt−3,t+1,
ys(t + 2) = yt−2 + EsΔyt−2,t+2, . . . , ys(t + 5) = ys(t + 1) + EsΔyt+1,t+5, and
ys(t + 6) = ys(t + 2) + EsΔyt+2,t+6, where EsΔyi,j denotes the expectation
of GDP growth between time i and j formed at time s. We then apply
the Christiano and Fitzgerald (2003) band-pass filter on this prolonged time
series to decompose ys(t) into (log) potential output y∗s(t) and the cyclical
component: ys(t) = ys(t) − y∗s(t). We use the cyclical component ys(t) as a
proxy for the expected output gap. More specifically, we interpret the last
six observations of this series as the expectation as of time s of the output
5Consensus Economics started collecting forecasts in the late 1989. In the first twoyears, however, the survey only asked about forecasts for the calendar year growth rates,i.e., fixed-event forecasts.
11ECB
Working Paper Series No 930September 2008
gap in periods s + 1 through s + 6.6
For the expert expectations of the inflation rate we also face the first prob-
lem mentioned above that the expectations reported in the survey refer to
year-on-year changes rather than annualized quarterly changes. Analogously
to the previous paragraph, we compute annualized expected quarterly infla-
tion rates by prolonging the actual consumer price index time series based
on the expected year-to-year inflation rates and transforming this prolonged
series into expected quarterly inflation rates.
2.3 The Results
We assume that the updating firms each period simply adopt professional
forecasts to form rational expectations of inflation and output gap up to six
quarters ahead. Consequently, the infinite sum in equation (1) is truncated
alternatively at four and six lags.7 To increase the precision of estimates of
λ, on which we primarily focus, we impose that the parameter α lies between
0.10 and 0.20, a range considered plausible in the literature.8 We estimate
equation (1) first individually for each country using non-linear least squares
6To illustrate the procedure, suppose we are interested in output gap expectationsas of time s = 2000Q1. We assume the data on actual log GDP yt are known until2000Q1. The survey contains expected year-on-year growth rates for up to six quartersahead: E2000Q1Δy1999Q2,2000Q2,E2000Q1Δy1999Q3,2000Q3, . . . ,E2000Q1Δy2000Q3,2001Q3. Us-ing yt and the expected growth rates we recursively compute the prolonged GDP log-levelseries y2000Q1(t) until six quarters ahead (until t = 2001Q3). We then run the Christianoand Fitzgerald filter on y2000Q1(t), t = 1991Q4,. . . ,2001Q3 and decompose it into the trend(potential) y∗
2000Q1(t) and cyclical y2000Q1(t) components. Finally, we use the cycle obser-vations y2000Q1(t), t = 2000Q2,. . . ,2001Q3 as proxies for the expected output gaps until2001Q3 given the information as of 2000Q1.
7The results with 5 lags do not differ considerably and are available from the authorsupon request.
8We also estimated both parameters jointly. While the estimates of λ remain about thesame as in tables 1 and 2, α is estimated imprecisely. Therefore we impose α as suggestedby, e.g., Mankiw and Reis (2002) and Khan and Zhu (2006).
12ECBWorking Paper Series No 930September 2008
(in Table 1) and then jointly using seemingly unrelated regressions (SUR)
(in Table 2).
2.3.1 Equation-by-Equation Estimation
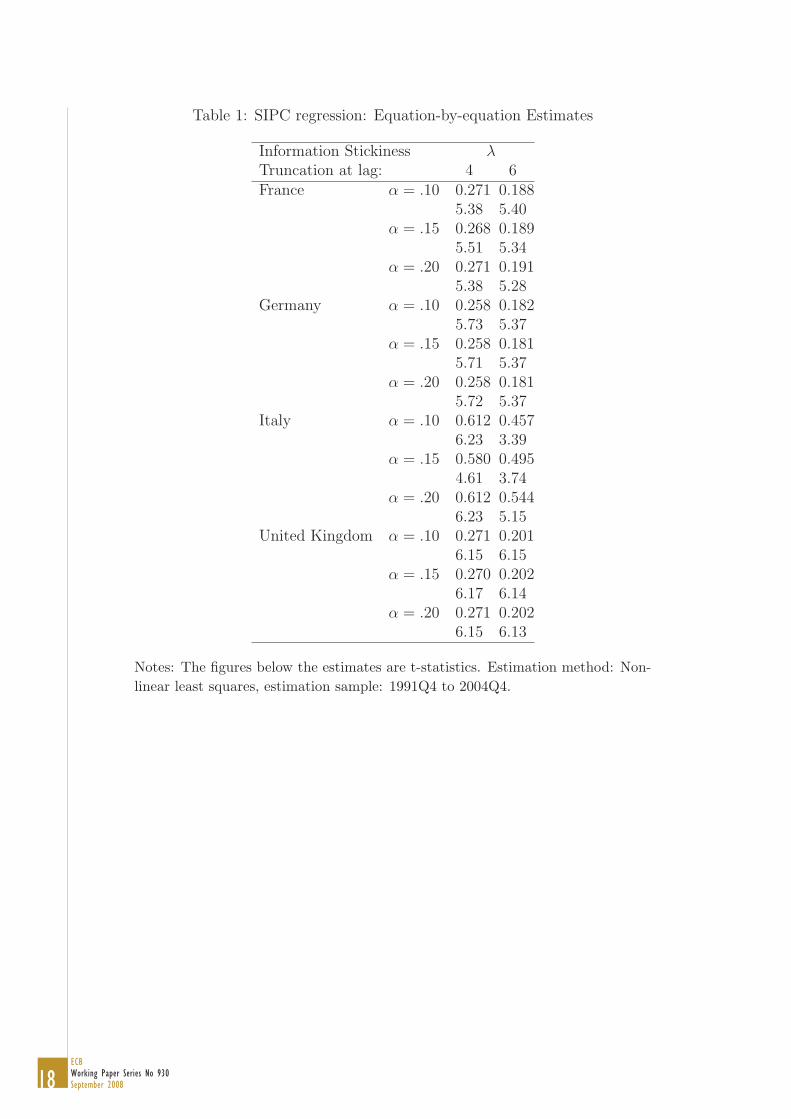
Table 1 summarizes the results of estimating relation (1) with truncation
lags n = 4 and 6 for values of α between 0.1 and 0.2 for Germany, France,
Italy, and the United Kingdom. As the theoretical model (1) does not have
a constant we exclude it in the empirical estimation.9
We find the following five key results. First, all estimates of λ are highly
significant for all parameterizations of the model. Given that we only esti-
mate one parameter, the t statistics—which range between 3.4 and 6.2—can
also be used as a measure of the overall significance of the model. Second,
for France, Germany, and the UK their values lie around 0.20 to 0.30. This
is about the size one would expect and in line with findings in Khan and Zhu
(2002), Dopke, Dovern, Fritsche, and Slacalek (2008) and Korenok (2005).
Third, there is a lot of homogeneity across these three countries. In the same
parametrizations, λs do not differ by more than 0.02. Fourth, the results for
Italy deviate quite substantially from the outcomes for the other countries: λ
is estimated around 0.5 to 0.6, which implies about twice as high frequency
of information updating as elsewhere in our sample.10 In addition, unlike
for other countries, the estimates for Italy are more sensitive with respect
to the values chosen for α. Finally, the models including up to 6 lags of the
sequence of expectation terms generally show a better fit to the data and
9If the constant is included it is insignificant.10The frequency of information updating is given by 1/λ.
13ECB
Working Paper Series No 930September 2008
smaller λ (this latter result is also evident from the results in Khan and Zhu,
2006). Both of these findings could be related to the smaller approximation
error of the specifications with 6 lags.
Our estimates of λ are typically a bit smaller than Carroll’s (2003) esti-
mates for the US. This indicates that the information transmission process
is somewhat slower in the three European countries considered here in this
study. This is in line with the evidence of Dopke, Dovern, Fritsche, and Sla-
calek (2008), who estimate the Carroll (2003) model for European countries,
and find the information updating process of households to be also somewhat
slower than for the US economy.
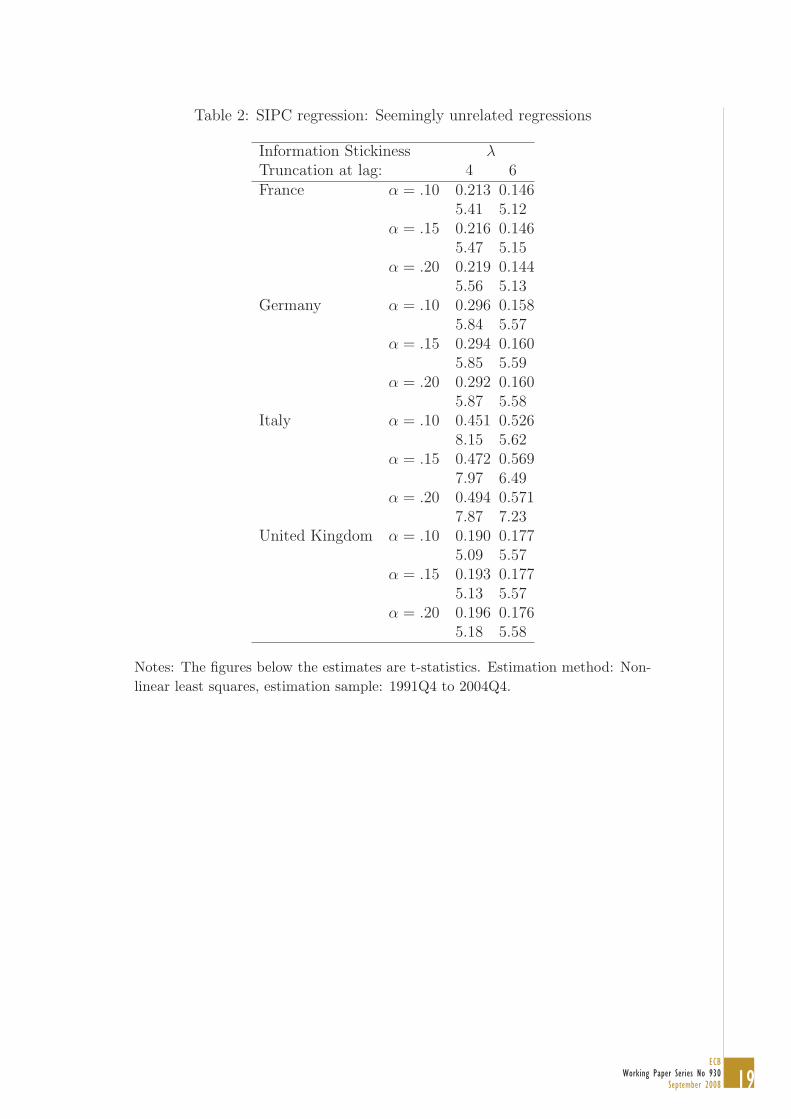
2.3.2 Seemingly Unrelated Regression (SUR) Estimation
As the residuals of the individual equations are substantially cross-correlated,11
we investigate in table 2 how using the SUR affects our baseline results ap-
proach to improve the efficiency of the estimation.
We again found that all coefficients highly significant and (with the ex-
ception of Italy) lie between 0.14 and 0.18 for truncation at lag 6 and between
0.19 and 0.30 for truncation at lag 4. In addition, the likelihood-ratio tests
confirm that we cannot reject the null hypothesis that the λs are equal for
France, Germany, and the UK.12 Obviously, the hypothesis that λ for Italy
is also equal to the parameters in the other three countries is rejected at
11The average cross-correlation of residuals between countries is 0.22; three of the sixcross-correlations are significantly different from zero at the 10 % significance level.
12We only present the test statistic for one particular value of α as for other specificationsthe outcomes are very similar. For α = 0.15 and truncation at lag 4, the LR-statistic is1.19 (p-value: 0.55). For α = 0.15 and truncation at lag 6, the LR-statistic is 0.84 (p-value:0.66).

14ECBWorking Paper Series No 930September 2008
any sensible significance level. A possible explanation for this finding of a
bigger λ in Italy is a higher level of and uncertainty about inflation in the
estimation sample in Italy compared to the other three countries: For much
of the estimation sample, roughly until 1996, the Italian inflation rate was
around 5 percent, a level which presumably caused inflation expectations to
be less anchored and the frequent information updating more beneficial.
Imposing equal λs across France, Germany, and the UK yields no big
surprises. For all parameterizations λ is highly significant and lies between
the individual country estimates. For truncation at lag 4 we find λ = 0.3
and for truncation at lag 6 we find λ = 0.16. The estimates again seem to
be robust to the particular value chosen for α.
3 Conclusion
This paper attempts to estimate the main parameter of the SIPC devel-
oped in Mankiw and Reis (2002) in four large European countries using
survey-based expectations. We find that λ—the fraction of firms with up-to-
date information—ranges between 0.15 and 0.3 for Germany, France and the
United Kingdom and between 0.5 and 0.6 for Italy in quarterly data. The
possible extensions of this work include investigating how the frequency of
updating varies across other countries and time periods or more generally
what other factors determine its size.
15ECB
Working Paper Series No 930September 2008
References
Ball, L., and D. Romer (1990): “Real Rigidities and the Nonneutrality of
Money,” Review of Economic Studies, 57(April), 539–552.
Ball, L. M. (1994): “What Determines the Sacrifice Ratio?,” in Monetary Policy,
ed. by N. G. Mankiw. University of Chicago Press.
Branch, W. A. (2004): “The Theory of Rationally Heterogeneous Expecta-
tions: Evidence from Survey Data on Inflation Expectations,” Economic Jour-
nal, 114(497), 592–621.
Carroll, C. D. (2003): “Macroeconomic Expectations of Households and Pro-
fessional Forecasters,” Quarterly Journal of Economics, 118(1), 269–298.
Christiano, L. J., and T. J. Fitzgerald (2003): “The Band Pass Filter,”
International Economic Review, 44(2), 435–466.
Dopke, J., J. Dovern, U. Fritsche, and J. Slacalek (2008): “The Dynam-
ics of European Inflation Expectations,” The B.E. Journal of Macroeconomics
(Topics), 8(37), Article 12.
European Central Bank (2005): “Inflation Persistence and Price Setting Behaviour
in the Euro Area,” report, European Central Bank, available at http://www.ecb.
int/home/pdf/research/inflationpersistencepricesettingreport.pdf.
Khan, H., and Z. Zhu (2002): “Estimates of the Sticky Information Phillips
Curve for the United States, Canada, and the United Kingdom,” Bank of
Canada woking paper 19, Bank of Canada.
(2006): “Estimates of the Sticky-Information Phillips Curve for the
United States,” Journal of Money, Credit & Banking, 38(1), 195–207.
16ECBWorking Paper Series No 930September 2008
Kiley, M. T. (2005): “A Quantitative Comparison of Sticky-Price and Sticky
Information Models of Price Setting?,” mimeo, Federal Reserve Board.
Korenok, O. (2005): “Empirical Comparison of Sticky Price and Sticky Infor-
mation Models,” mimeo, Virginia Commonwealth University.
Laforte, J.-P. (2005): “Pricing Models: A Bayesian DSGE approach for the US
Economy,” mimeo, Board of Governors of the Federal Reserve System.
Lucas, R. E. (1973): “Some International Evidence on Output-Inflation Trade-
offs,” American Economic Review, 63(3), 326–334.
Mankiw, N. G., and R. Reis (2002): “Sticky Information Versus Sticky Prices:
A Proposal to Replace the New Keynesian Phillips Curve,” Quarterly Journal
of Economics, 117, 1295–1328.
(2003): “Sticky Information: A model of Monetary Non-neutrality and
Structural Slumps,” in Knowledge, Information, and Expectation in Modern
Macroeconomics, ed. by P. Aghion, pp. 64–86, Cambridge, MA. MIT Press.
(2006): “Pervasive Stickiness,” American Economic Review, 96(2), 164–
169.
Phelps, E. S. (1969): “The New Microeconomics in Inflation and Employment
Theory,” American Economic Review, 59(2), 147–160.
Pivetta, F., and R. Reis (2007): “The persistence of inflation in the United
States,” Journal of Economic Dynamics and Control, 34(1), 1326–1358.
Reis, R. (2006): “Inattentive Producers,” Review of Economic Studies, 73(3),
793–821.
17ECB
Working Paper Series No 930September 2008
Rudd, J., and K. Whelan (2006): “Can Rational Expectations Sticky-Price
Models Explain Inflation Dynamics?,” American Economic Review, 96(1), 303–
320.
Sims, C. (2003): “Implications of Rational Inattention,” Journal of Monetary
Economics, 50(3), 665–690.
18ECBWorking Paper Series No 930September 2008
Table 1: SIPC regression: Equation-by-equation Estimates
Information Stickiness λTruncation at lag: 4 6France α = .10 0.271 0.188
5.38 5.40α = .15 0.268 0.189
5.51 5.34α = .20 0.271 0.191
5.38 5.28Germany α = .10 0.258 0.182
5.73 5.37α = .15 0.258 0.181
5.71 5.37α = .20 0.258 0.181
5.72 5.37Italy α = .10 0.612 0.457
6.23 3.39α = .15 0.580 0.495
4.61 3.74α = .20 0.612 0.544
6.23 5.15United Kingdom α = .10 0.271 0.201
6.15 6.15α = .15 0.270 0.202
6.17 6.14α = .20 0.271 0.202
6.15 6.13
Notes: The figures below the estimates are t-statistics. Estimation method: Non-linear least squares, estimation sample: 1991Q4 to 2004Q4.
19ECB
Working Paper Series No 930September 2008
Table 2: SIPC regression: Seemingly unrelated regressions
Information Stickiness λTruncation at lag: 4 6France α = .10 0.213 0.146
5.41 5.12α = .15 0.216 0.146
5.47 5.15α = .20 0.219 0.144
5.56 5.13Germany α = .10 0.296 0.158
5.84 5.57α = .15 0.294 0.160
5.85 5.59α = .20 0.292 0.160
5.87 5.58Italy α = .10 0.451 0.526
8.15 5.62α = .15 0.472 0.569
7.97 6.49α = .20 0.494 0.571
7.87 7.23United Kingdom α = .10 0.190 0.177
5.09 5.57α = .15 0.193 0.177
5.13 5.57α = .20 0.196 0.176
5.18 5.58
Notes: The figures below the estimates are t-statistics. Estimation method: Non-linear least squares, estimation sample: 1991Q4 to 2004Q4.
20ECBWorking Paper Series No 930September 2008
European Central Bank Working Paper Series
For a complete list of Working Papers published by the ECB, please visit the ECB’s website
(http://www.ecb.europa.eu).
904 “Does money matter in the IS curve? The case of the UK” by B. E. Jones and L. Stracca, June 2008.
905 “A persistence-weighted measure of core inflation in the euro area” by L. Bilke and L. Stracca, June 2008.
906 “The impact of the euro on equity markets: a country and sector decomposition” by L. Cappiello, A. Kadareja
and S. Manganelli, June 2008.
907 “Globalisation and the euro area: simulation based analysis using the New Area Wide Model” by P. Jacquinot and
R. Straub, June 2008.
908 “3-step analysis of public finances sustainability: the case of the European Union” by A. Afonso and C. Rault,
June 2008.
909 “Repo markets, counterparty risk and the 2007/2008 liquidity crisis” by C. Ewerhart and J. Tapking, June 2008.
910 “How has CDO market pricing changed during the turmoil? Evidence from CDS index tranches”
by M. Scheicher, June 2008.
911 “Global liquidity glut or global savings glut? A structural VAR approach” by T. Bracke and M. Fidora, June 2008.
912 “Labour cost and employment across euro area countries and sectors” by B. Pierluigi and M. Roma, June 2008.
913 “Country and industry equity risk premia in the euro area: an intertemporal approach” by L. Cappiello,
M. Lo Duca and A. Maddaloni, June 2008.
914 “Evolution and sources of manufacturing productivity growth: evidence from a panel of European countries” by
S. Giannangeli and R. Gόmez-Salvador, June 2008.
915 “Medium run redux: technical change, factor shares and frictions in the euro area” by P. McAdam and A.
Willman, June 2008.
916 “Optimal reserve composition in the presence of sudden stops: the euro and the dollar as safe haven currencies”
by R. Beck and E. Rahbari, July 2008.
917 “Modelling and forecasting the yield curve under model uncertainty” by P. Donati and F. Donati, July 2008.
918 “Imports and profitability in the euro area manufacturing sector: the role of emerging market economies”
by T. A. Peltonen, M. Skala, A. Santos Rivera and G. Pula, July 2008.
919 “Fiscal policy in real time” by J. Cimadomo, July 2008.
920 “An investigation on the effect of real exchange rate movements on OECD bilateral exports” by A. Berthou,
July 2008.
921 “Foreign direct investment and environmental taxes” by R. A. De Santis and F. Stähler, July 2008.
922 “A review of nonfundamentalness and identification in structural VAR models” by L. Alessi, M. Barigozzi and
M. Capasso, July 2008.
923 “Resuscitating the wage channel in models with unemployment fluctuations” by K. Christoffel and K. Kuester,
August 2008.
21ECB
Working Paper Series No 930September 2008
924 “Government spending volatility and the size of nations” by D. Furceri and M. Poplawski Ribeiro, August 2008.
925 “Flow on conjunctural information and forecast of euro area economic activity” by K. Drechsel and L. Maurin,
August 2008.
926 “Euro area money demand and international portfolio allocation: a contribution to assessing risks to price
stability” by R. A. De Santis, C. A. Favero and B. Roffia, August 2008.
927 “Monetary stabilisation in a currency union of small open economies” by M. Sánchez, August 2008.
928 “Corporate tax competition and the decline of public investment” by P. Gomes and F. Pouget, August 2008.
929 “Real convergence in Central and Eastern European EU Member States: which role for exchange rate volatility?”
by O. Arratibel, D. Furceri and R. Martin, September 2008.
930 “Sticky information Phillips curves: European evidence” by J. Döpke, J. Dovern, U. Fritsche and J. Slacalek,
September 2008.

Related Documents


