Social Science & Medicine ] (]]]]) ]]]–]]] ‘Stickiness’ and ‘inflow’ as proxy measures of the relative attractiveness of various sub-sectors of nursing employment Mohamad Alameddine , Audrey Laporte, Andrea Baumann, Linda O’Brien-Pallas, Barbara Mildon, Raisa Deber Postgraduate Medical Education Office, Faculty of Medicine, University of Toronto, Toronto, Ont., Canada Abstract Workplaces vary in their ability to recruit and retain workers. We introduce two new concepts which can be used as proxy measures of the relative attractiveness of a particular setting, where setting can be defined narrowly (e.g., a particular organization) or broadly (e.g., a sub-sector). ‘‘Stickiness’’ is defined as the transition probability that an employee stays in a given setting; ‘‘inflow’’ as the proportion of new employees. Using a longitudinal dataset of all nurses registered with the College of Nurses of Ontario, Canada 1993–2003, employment site was used to define consistent sectors and sub-sectors. Each nurse was assigned to one sector/sub-sector per year. Stickiness and inflow values were calculated for each sub-sector, and the trends across time were analyzed. Results show that despite shrinkage in the hospital sub-sectors, hospitals remained highly sticky. The expanding sub-sectors, in general, appear relatively unattractive to nurses; they couple medium/low stickiness with high inflow. Considerable variability across sub-sectors was evident. Stickiness and inflow were found to be useful as proxy measures of the relative attractiveness of the various sub-sectors of nursing employment over time. The concepts may be used for other workforces for which linked longitudinal data are available. r 2006 Elsevier Ltd. All rights reserved. Keywords: Turnover; Retention; Recruitment; Employment sectors–sub-sectors; Workplace attractiveness; Staff shortage; Canada; Nursing Background Workplaces differ in their ability to attract and retain workers. As The World Health Organization (WHO) has observed, achieving health goals re- quires an appropriately prepared health workforce (World Health Organization (WHO), 2006). At present, many countries report shortages of health human resources, particularly physicians and nurses (Canadian Nurses Association, 2002; Canadian Nursing Advisory Committee, 2002; Grinspun, 2003; Heitlinger, 2003; O’Brien-Pallas, Alksnis, & Wang, 2003); Canada is no exception (Simoens, Villeneuve, & Hurst, 2005). At the same time, healthcare is shifting its emphasis from hospitals to home and community, including downsizing hospi- tals. The current nursing shortage is likely to escalate competition for the existing supply. Reli- able information about the relative stability and ARTICLE IN PRESS www.elsevier.com/locate/socscimed 0277-9536/$ - see front matter r 2006 Elsevier Ltd. All rights reserved. doi:10.1016/j.socscimed.2006.05.014 Corresponding author. Tel.: +1 416 978 8421; fax: +1 416 978 7144. E-mail addresses: [email protected] (M. Alameddine), [email protected] (A. Laporte), [email protected] (A. Baumann), l.obrien.pallas@ utoronto.ca (L. O’Brien-Pallas), [email protected] (B. Mildon), [email protected] (R. Deber).

Welcome message from author
This document is posted to help you gain knowledge. Please leave a comment to let me know what you think about it! Share it to your friends and learn new things together.
Transcript

ARTICLE IN PRESS
0277-9536/$ - se
doi:10.1016/j.so
�Correspondfax: +1416 978
E-mail addr
(M. Alameddi
baumanna@mc
utoronto.ca (L
(B. Mildon), ra
Social Science & Medicine ] (]]]]) ]]]–]]]
www.elsevier.com/locate/socscimed
‘Stickiness’ and ‘inflow’ as proxy measures of the relativeattractiveness of various sub-sectors of nursing employment
Mohamad Alameddine�, Audrey Laporte, Andrea Baumann, Linda O’Brien-Pallas,Barbara Mildon, Raisa Deber
Postgraduate Medical Education Office, Faculty of Medicine, University of Toronto, Toronto, Ont., Canada
Abstract
Workplaces vary in their ability to recruit and retain workers. We introduce two new concepts which can be used as
proxy measures of the relative attractiveness of a particular setting, where setting can be defined narrowly (e.g., a particular
organization) or broadly (e.g., a sub-sector). ‘‘Stickiness’’ is defined as the transition probability that an employee stays in
a given setting; ‘‘inflow’’ as the proportion of new employees. Using a longitudinal dataset of all nurses registered with the
College of Nurses of Ontario, Canada 1993–2003, employment site was used to define consistent sectors and sub-sectors.
Each nurse was assigned to one sector/sub-sector per year. Stickiness and inflow values were calculated for each sub-sector,
and the trends across time were analyzed. Results show that despite shrinkage in the hospital sub-sectors, hospitals
remained highly sticky. The expanding sub-sectors, in general, appear relatively unattractive to nurses; they couple
medium/low stickiness with high inflow. Considerable variability across sub-sectors was evident. Stickiness and inflow were
found to be useful as proxy measures of the relative attractiveness of the various sub-sectors of nursing employment over
time. The concepts may be used for other workforces for which linked longitudinal data are available.
r 2006 Elsevier Ltd. All rights reserved.
Keywords: Turnover; Retention; Recruitment; Employment sectors–sub-sectors; Workplace attractiveness; Staff shortage; Canada;
Nursing
Background
Workplaces differ in their ability to attract andretain workers. As The World Health Organization(WHO) has observed, achieving health goals re-quires an appropriately prepared health workforce
e front matter r 2006 Elsevier Ltd. All rights reserved
cscimed.2006.05.014
ing author. Tel.: +1416 978 8421;
7144.
esses: [email protected]
ne), [email protected] (A. Laporte),
master.ca (A. Baumann), l.obrien.pallas@
. O’Brien-Pallas), [email protected]
[email protected] (R. Deber).
(World Health Organization (WHO), 2006). Atpresent, many countries report shortages of healthhuman resources, particularly physicians and nurses(Canadian Nurses Association, 2002; CanadianNursing Advisory Committee, 2002; Grinspun,2003; Heitlinger, 2003; O’Brien-Pallas, Alksnis, &Wang, 2003); Canada is no exception (Simoens,Villeneuve, & Hurst, 2005). At the same time,healthcare is shifting its emphasis from hospitals tohome and community, including downsizing hospi-tals. The current nursing shortage is likely toescalate competition for the existing supply. Reli-able information about the relative stability and
.

ARTICLE IN PRESSM. Alameddine et al. / Social Science & Medicine ] (]]]]) ]]]–]]]2
attractiveness of various workplaces is thus essen-tial, particularly for nurses, who constitute thebiggest workforce in hospitals and are increasinglybeing sought for jobs in the community (OntarioAssociation of Community Care Access Centres,2000; The Home Care Sector Study Corporation,2003).
Nurses may work in different settings, wheresetting can be defined narrowly (e.g., a particularjob in a particular organization), or more broadly(e.g., particular sub-sectors, such as acute hospitalsor public health units). If ‘‘a nurse is a nurse is anurse,’’ then setting is irrelevant; nursing will looklike a single market. However, nursing may insteadbe composed of a series of ‘sub-markets’ withrelatively little movement across settings. Under-standing health labor markets requires the ability toascertain the relative attractiveness of particularwork settings. Although researchers have provideda comprehensive overview of nursing demographyand work environment issues, little is known aboutmovement within or across employment sub-sectors.
Defining the attractiveness of a particular setting,however, can be problematic. One approach is toanalyze the perceptions of individual workersdirectly (e.g., via surveys). A common proxymeasure of attractiveness at the workplace level isthe concept of turnover, which assumes dissatisfiedworkers leave. The literature suggests that deter-mining the ‘right’ level of turnover is complex;excessively high levels may increase costs, decreaseproductivity, reduce staff morale, and impairpatient outcomes (Gifford, Zammuto, Goodan, &Hill, 2002; Gray, Philips, & Normand, 1996; Hayeset al., 2006; Ingersoll, Olsan, Drew-Cates, DeVin-ney, & Davies, 2002; Johnson & Buelow, 2003;Jones, 1990); excessively low levels forego costsavings and productivity gains from replacing olderby younger workers, innovation and better person-to-job match (Hayes et al., 2006).
Nonetheless, operationalizing turnover has pro-ven difficult. The lack of a consistent definition ofturnover and the variability in record-keepingmethods has considerably hampered attempts tocompare and generalize across studies, sectors orsub-sectors of employment (Tai, Bame, & Robin-son, 1998). Depending on the study, turnover hasbeen defined as leavers versus stayers, quittersversus non-quitters, intention-to-quit versus inten-tion-to-stay, new staff versus old staff and filledpositions versus vacant positions (Hinshaw &Atwood, 1983; Tai et al., 1998). From a policy
analytic viewpoint, these definitions of turnovermay also conflate the characteristics of a particularjob, a particular workplace, a particular sub-sector,and the profession as a whole.
Accordingly, we have developed two new con-cepts—stickiness and inflow—which we tested fortheir utility as proxies for differentiating theattractiveness of various settings, where setting canbe defined narrowly (e.g., a particular job in aparticular organization) or broadly (e.g., nursing vs.competing employment). In this paper, we definesetting in intermediate terms, as employment sub-sector, defined as the categorization employed bythe College of Nurses of Ontario (College of Nursesof Ontario (CNO), 2006); see Appendix A.
Definitions
‘‘Stickiness’’ and ‘‘Inflow’’
The concept ‘‘Stickiness’’ is defined as thetransition probability of a nurse working in a givensetting in year ‘‘t’’ remaining in the same setting inyear ‘‘t+1’’. In this paper, setting is defined assector or sub-sector; hence, stickiness is not identicalto turnover because a nurse moving from oneemployer to another within the same sub-sectorwould represent turnover for that employer but thatnurse would still be ‘‘sticky’’ in that sub-sector. (Ifsetting is defined more narrowly as the job orworkplace, then stickiness will be a variant ofturnover.) If one denotes the number of nursesworking in setting y in year t as Ny,t the number ofnurses working in setting y in year (t+1) as Ny,t+1
and the number of nurses working in setting y inboth years t and t+1 as Ny,t& t+1 then:
Stickinesst to tþ1 ¼ ½ðNy;t&tþ1=Ny;tÞ� � 100.
For example, if 1000 nurses worked in the ‘‘publichealth’’ sub-sector in 2000 and 700 of themremained in that sub-sector in 2001, then sticki-ness2000 to 2001 is
700
1000� 100 ¼ 70%.
Stickiness can be affected by a number of factorsincluding: (1) Reclassification (e.g., reclassifying anoutpatient clinic from ‘‘hospital’’ to ‘‘community’’without changing its activities or workforce couldnonetheless ‘move’ a nurse across sectors); (2)contraction/expansion of particular settings; (3)

ARTICLE IN PRESSM. Alameddine et al. / Social Science & Medicine ] (]]]]) ]]]–]]] 3
age structure (e.g. retirements); and (4) the relativeattractiveness of that setting.
One could compute an adjusted stickiness toexclude ‘involuntary’ departure from a shrinkingsetting with fewer jobs available by using as thedenominator the smaller of number employed inyear ‘‘t’’, or in year ‘‘t+1’’.
Adjusted Stickinesst to tþ1 ¼Ny;t&tþ1
minðNy;t Ny;tþ1Þ� 100.
For the data analyzed, shrinkage was notsufficient to greatly affect the stickiness data andwe report only unadjusted stickiness.
We defined the concept ‘‘Inflow’’ as the percen-tage of nurses that are working in a particularsetting in year ‘‘t’’, who were not working in thatsetting in year ‘‘t�1’’, i.e., were fresh additions tothat setting. Inflow is defined as
Inflowt ¼ ½ðNy;t �Ny;t&t�1Þ=Ny;t� � 100.
For example, if 1000 nurses worked in the ‘‘publichealth’’ sub-sector in 2001, of whom 800 hadworked there in year 2000, then inflow2001 is
ð1000� 800Þ
1000� 100 ¼ 20%.
Inflow, by definition, is higher in sub-sectors thatare expanding and or those that have a highturnover rate. Inflow may result from new additionsto the workforce (new graduates, immigration), butalso from nurses returning to the workforce, andfrom those switching sub-sectors. Depending uponthe available data and policy purposes, one couldthus distinguish among types of inflow; we have notdone so here.
Relationships can be postulated between sticki-ness, inflow, growth/shrinkage, and attractiveness.If stickiness is high, then a setting is attractive bydefinition since it successfully retained the majorityof its workers. Conversely, if a setting is sufficientlyunattractive, stickiness will be low (since workerswill seek alternative employment), and inflow high,irrespective of the changes in the size of workforcein that setting (since the setting will have to recruitnew workers). However, if a setting is attractive,stickiness and inflow will depend upon whether theworkforce in that setting is shrinking or expanding.Shrinking settings, by definition, will have relativelylow stickiness (since not all workers can retainemployment, even if they wished to do so).Expanding settings, if attractive, can exhibit bothhigh stickiness and high inflow.
As noted, one advantage of these concepts is thatsetting can be defined broadly or narrowly. Adisadvantage is that these concepts cannot reflectunfilled vacancies, since these are not reflected in thelongitudinal employment data.
To test whether these concepts can distinguishamong settings, the study used a longitudinaldataset of all nurses registered with CNO, between1993 and 2003. Ontario is a large industrial provincewith a population of 12,439,755; it contains38.8% of Canada’s population (Statistics Canada,2004). In 2003, it employed 35.1% of all Canadiannurses (Canadian Institute of Health Information,2005). Using this unique dataset, we computed thestickiness and inflow values for each sub-sector ofnursing employment for 1993 to 2003 in Ontario,Canada.
The database
Registration with the CNO is a prerequisite forRegistered Nurses (RNs) and Registered PracticalNurses (RPNs) to practice nursing in Ontario.Upon registration, each nurse is provided with aunique registration number; afterwards, nurses arerequired to fill out and submit an annual member-ship renewal to CNO in order to be eligible to work.Nurses have an incentive to keep their registrationactive even if they are temporarily out of work toavoid the requirements involved in reinstating theirregistration. The form includes designation of theworkplace sub-sector, which CNO aggregates intosectors.
Access to the anonymized CNO database wasprovided by the Nursing Health Services ResearchUnit at the University of Toronto. A sub-set of thedata containing a specified set of variables for allnurses registered was created for each year. Theresearch team then carefully checked the data forconsistency (definition of sub-sectors across years,age and employment status).
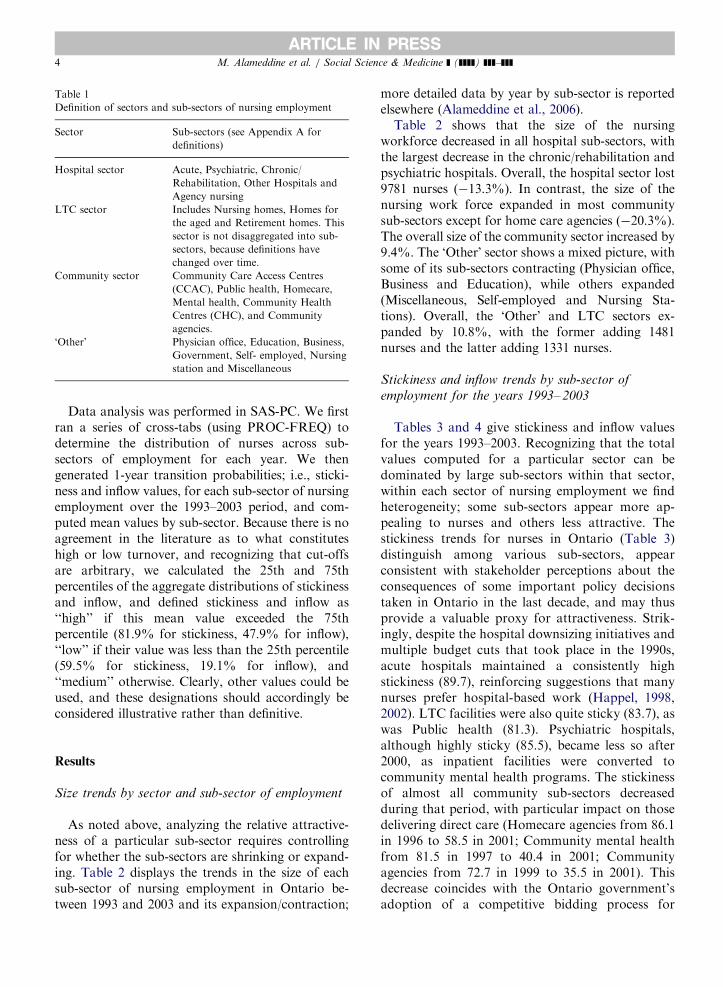
In this paper, we define setting in terms of thesector/sub-sector, as defined in the CNO registra-tion form (Table 1). For ease of presentation, theLTC sector is included with the Hospital sub-sectorsin Tables 2–4. Agency nursing, which the CNOrecently classified as a community sub-sector, butwhich largely serves hospitals, is also presented withthe hospital sub-sectors. The cleaned subsets for allyears were then merged to create a longitudinaldataset of all nurses registered with the College ofNurses of Ontario, Canada 1993–2003.
ARTICLE IN PRESS
Table 1
Definition of sectors and sub-sectors of nursing employment
Sector Sub-sectors (see Appendix A for
definitions)
Hospital sector Acute, Psychiatric, Chronic/
Rehabilitation, Other Hospitals and
Agency nursing
LTC sector Includes Nursing homes, Homes for
the aged and Retirement homes. This
sector is not disaggregated into sub-
sectors, because definitions have
changed over time.
Community sector Community Care Access Centres
(CCAC), Public health, Homecare,
Mental health, Community Health
Centres (CHC), and Community
agencies.
‘Other’ Physician office, Education, Business,
Government, Self- employed, Nursing
station and Miscellaneous
M. Alameddine et al. / Social Science & Medicine ] (]]]]) ]]]–]]]4
Data analysis was performed in SAS-PC. We firstran a series of cross-tabs (using PROC-FREQ) todetermine the distribution of nurses across sub-sectors of employment for each year. We thengenerated 1-year transition probabilities; i.e., sticki-ness and inflow values, for each sub-sector of nursingemployment over the 1993–2003 period, and com-puted mean values by sub-sector. Because there is noagreement in the literature as to what constituteshigh or low turnover, and recognizing that cut-offsare arbitrary, we calculated the 25th and 75thpercentiles of the aggregate distributions of stickinessand inflow, and defined stickiness and inflow as‘‘high’’ if this mean value exceeded the 75thpercentile (81.9% for stickiness, 47.9% for inflow),‘‘low’’ if their value was less than the 25th percentile(59.5% for stickiness, 19.1% for inflow), and‘‘medium’’ otherwise. Clearly, other values could beused, and these designations should accordingly beconsidered illustrative rather than definitive.
Results
Size trends by sector and sub-sector of employment
As noted above, analyzing the relative attractive-ness of a particular sub-sector requires controllingfor whether the sub-sectors are shrinking or expand-ing. Table 2 displays the trends in the size of eachsub-sector of nursing employment in Ontario be-tween 1993 and 2003 and its expansion/contraction;
more detailed data by year by sub-sector is reportedelsewhere (Alameddine et al., 2006).
Table 2 shows that the size of the nursingworkforce decreased in all hospital sub-sectors, withthe largest decrease in the chronic/rehabilitation andpsychiatric hospitals. Overall, the hospital sector lost9781 nurses (�13.3%). In contrast, the size of thenursing work force expanded in most communitysub-sectors except for home care agencies (�20.3%).The overall size of the community sector increased by9.4%. The ‘Other’ sector shows a mixed picture, withsome of its sub-sectors contracting (Physician office,Business and Education), while others expanded(Miscellaneous, Self-employed and Nursing Sta-tions). Overall, the ‘Other’ and LTC sectors ex-panded by 10.8%, with the former adding 1481nurses and the latter adding 1331 nurses.
Stickiness and inflow trends by sub-sector of
employment for the years 1993– 2003
Tables 3 and 4 give stickiness and inflow valuesfor the years 1993–2003. Recognizing that the totalvalues computed for a particular sector can bedominated by large sub-sectors within that sector,within each sector of nursing employment we findheterogeneity; some sub-sectors appear more ap-pealing to nurses and others less attractive. Thestickiness trends for nurses in Ontario (Table 3)distinguish among various sub-sectors, appearconsistent with stakeholder perceptions about theconsequences of some important policy decisionstaken in Ontario in the last decade, and may thusprovide a valuable proxy for attractiveness. Strik-ingly, despite the hospital downsizing initiatives andmultiple budget cuts that took place in the 1990s,acute hospitals maintained a consistently highstickiness (89.7), reinforcing suggestions that manynurses prefer hospital-based work (Happel, 1998,2002). LTC facilities were also quite sticky (83.7), aswas Public health (81.3). Psychiatric hospitals,although highly sticky (85.5), became less so after2000, as inpatient facilities were converted tocommunity mental health programs. The stickinessof almost all community sub-sectors decreasedduring that period, with particular impact on thosedelivering direct care (Homecare agencies from 86.1in 1996 to 58.5 in 2001; Community mental healthfrom 81.5 in 1997 to 40.4 in 2001; Communityagencies from 72.7 in 1999 to 35.5 in 2001). Thisdecrease coincides with the Ontario government’sadoption of a competitive bidding process for

ARTICLE IN PRESS
Table 2
Number of nurses working by sector/sub-sectors (1993–2003)
The hospital and LTC sectors
Year/sub-sector LTC sector Hospital sector
Acute Psychiatric Chronic/rehab Other
hospital
Agency
nursing
Hospital
total
Start (1993) 12373 59501 4451 6664 1842 1249 73707
End (2003) 13704 53207 3148 4674 1458 1439 63926
# change Start–End +1331 �6294 �1303 �1990 �384 +190 �9781
% change Start–End +10.8 �10.6 �29.3 �29.9 �20.8 +15.2 �13.3
Status Expand Contract Contract Contract Contract Expand Contract
The community sector
Year/sub-sector CCAC Public
health
Home care Mental
health
CHC Comm.
agency
Total
Start (1993, 1997 or 1999) 1668 (1999) 3705 6565 175 (1997) 791 470 (1999) 13366
End (2003) 2570 3435 5230 1220 1239 931 14625
# change Start–End +902 �270 �1335 +1045 +448 +461 +1259
% change Start–End +54.08 �7.3 �20.3 +597.14 +56.6 +98.0 +9.4
Status Expand Contract Contract Expand Expand Expand Expand
The ‘Other’ sector
Year/sub-sector Physician
office
Education Business Government/
assoc.
Self-
employed
Nursing
station
Miscell-
aneous
Total
Start (1993) 3939 2792 1434 1224 672 147 3476 13712
End (2003) 3457 2271 988 1307 1139 229 5802 15193
# change Start–End �482 �521 �446 +83 +467 +82 +2326 +1481
% change Start–End �12.2 �18.7 �31.1 +6.8 +69.5 +55.8 +66.9 +10.8
Status Contract Contract Contract Expand Expand Expand Expand Expand
M. Alameddine et al. / Social Science & Medicine ] (]]]]) ]]]–]]] 5
homecare contracts, which was intended to achieveefficiencies, and many claim placed downwardpressure on the wages and working conditions ofnurses in the community (Aronson, Denton, &Zeytinoglu, 2004; Baranek, Deber, & Williams,2004; Caplan, 2005; O’Brien-Pallas et al., 2003;Registered Nurses Association of Ontario, 1999;Shapiro, 1997).
The stickiness trends for the ‘Other’ sub-sectors, aheterogeneous group, fluctuate. Stickiness was highin sub-sectors that offer nurses a relatively high jobstability (e.g. Physician office and Educationalinstitutions), and low in others (e.g. Nursingstations serving remote areas).
Inflow trends by sub-sector of employment for the
years 1993– 2003
Inflow (Table 4) reflects both the general growth/shrinkage of a sub-sector, as well as its attractive-
ness. Thus, expanding sub-sectors by definitionshow higher inflow levels (e.g. community mentalhealth and community agencies); while relativelysticky sub-sectors have fewer openings to fill.Thus, as hospitals began to hire back nursesin 1999 following years of cuts, inflow increasedin all hospital sub-sectors, but this was moderatedby stickiness, such that there were lowerinflow values in the high stickiness sub-sectors(Acute hospital ¼ 9.7; Psychiatric hospitals ¼ 12.3)than in presumably less-attractive sub-sectors(Agency nurses ¼ 58.4). Sticky sub-sectorswhich did not grow (e.g., Public health) thus exhibitlower inflow (19.0). Within the ‘Other’ sector, thehighest inflow levels were accordingly reported inthe three sub-sectors with the lowest stickinessvalues (Nursing stations, Self-employed and Mis-cellaneous), and the lowest inflow levels in thestickier sub-sectors (Physician office, Education,Businesses).

ARTICLE IN PRESS
Table 3
Stickiness by year by sector/sub-sector (1993–2003)
The hospital and LTC sectors
Year/sub-sector LTC Sector Hospital sector
Acute Psychiatric Chronic/Rehab Other Agency nursing
93–94 81.8 90.6 89.7 70.2 42.7 37.5
94–95 82.1 89.3 88.2 64.3 56.1 23.0
95–96 85.0 90.3 88.9 65.1 51.2 35.3
96–97 89.6 91.8 91.3 84.1 78.4 65.9
97–98 86.0 89.7 88.6 79.4 81.6 56.6
98–99 83.3 89.5 85.0 77.7 75.3 49.8
99–00 86.7 93.8 90.5 83.7 83.7 52.3
00–01 81.3 91.0 85.6 70.1 76.2 45.4
01–02 79.6 83.2 67.0 55.9 52.6 34.2
02–03 82.0 87.7 73.4 68.2 51.6 35.1
Mean 82.5 89.7 85.5 71.9 64.0 42.7
The community sector
Year/sub-sector CCAC Public health Home care Mental health CHC Community agency
93–94 NA 76.8 72.6 NA 44.4 NA
94–95 NA 76.4 73.7 NA 48.1 NA
95–96 NA 61.5 76.7 NA 38.4 NA
96–97 NA 86.2 86.1 NA 75.2 NA
97–98 NA 87.1 79.5 81.5 78.3 NA
98–99 NA 80.6 64.2 79.1 66.1 NA
99–00 89.9 89.2 73.9 80.9 74.8 72.7
00–01 87.3 87.9 70.7 76.8 72.7 58.9
01–02 77.5 81.1 58.5 40.4 46.5 35.5
02–03 80.9 85.0 64.7 46.8 49.5 37.3
Mean 83.7 81.3 72.9 60.3 59.6 49.3
The ‘Other’ sector
Year/Sub-sector Physician office Education Business Government Self-employed Nursing station Miscellaneous
93–94 80.8 67.6 75.1 51.7 43.1 45.4 38.1
94–95 78.3 67.7 71.8 55.2 38.4 31.9 45.7
95–96 80.4 75.1 73.3 65.7 49.7 50.4 43.5
96–97 87.1 80.6 85.3 76.3 73.4 78.7 71.9
97–98 84.0 82.5 83.3 83.1 70.4 77.2 66.3
98–99 79.8 78.9 77.5 75.9 66.5 56.1 65.4
99–00 84.4 87.9 85.8 87.7 76.8 68.2 63.0
00–01 80.1 80.5 80.1 79.1 68.1 63.0 66.5
01–02 72.6 70.4 40.4 54.5 45.7 41.3 44.6
02–03 73.7 68.1 47.1 58.3 51.4 47.5 45.7
Mean 80.2 75.3 73.8 69.2 60.0 57.8 55.2
M. Alameddine et al. / Social Science & Medicine ] (]]]]) ]]]–]]]6
Discussion: relative attractiveness by sub-sector of
employment
Stickiness and inflow augment such concepts asturnover as proxies for attractiveness; they have theadvantage of allowing a more nuanced comparisonof settings, highlighting potential heterogeneity in
labor markets. In addition, they allow for theimplications of expansion/contraction of settings.For example, although we postulate that settingswith high stickiness can be judged attractive, inabsolute terms, those with medium-low stickinessmay reflect forced shrinkage. Thus, our adminis-trative data suggests that expanding settings with

ARTICLE IN PRESS
Table 4
Inflow by year by sector/ sub-sector (1993–2003)
The hospital and LTC sectors
Year/sub-sector LTC Sector Hospital sector
Acute Psychiatric Chronic/rehab Other Agency nurse
93–94 19.8 8.7 9.8 33.5 42.9 71.4
94–95 21.3 9.1 11.3 34.3 56.4 60.8
95–96 21.1 9.3 12.1 31.0 37.8 70.7
96–97 15.8 5.9 7.6 13.8 14.5 41.2
97–98 8.3 3.2 6.0 9.1 16.3 28.7
98–99 18.0 9.1 11.5 21.8 22.8 54.5
99–00 17.8 11.8 10.5 18.1 21.6 42.1
00–01 17.0 12.4 13.4 21.9 25.3 50.9
01–02 19.8 11.7 18.2 46.8 53.4 79.0
02–03 23.5 16.1 26.7 30.3 46.7 64.6
Mean 18.2 9.7 12.3 26.1 35.1 58.4
The community sector
Year/sub-sector CCAC Public health Homecare Mental health CHC Community agency
93–94 NA 22.7 31.7 NA 53.0 NA
94–95 NA 29.2 33.9 NA 54.0 NA
95–96 NA 24.3 31.1 NA 55.8 NA
96–97 NA 21.0 20.4 NA 34.6 NA
97–98 NA 12.7 16.4 34.3 23.9 NA
98–99 NA 12.1 28.1 54.9 36.6 NA
99–00 34.2 16.3 23.9 39.2 34.8 52.1
00–01 21.9 16.5 24.4 50.6 37.6 51.9
01–02 24.0 18.8 28.2 68.3 56.7 69.1
02–03 17.9 15.2 30.6 57.4 51.6 59.4
Mean 24.2 19.0 26.5 55.0 44.2 58.8
The ‘Other’ Sector
Year/sub-sector Physician office Education Business Government Self-employed Nursing station Miscellaneous
93–94 23.3 26.3 27.6 49.5 63.3 70.5 65.7
94–95 19.6 21.6 27.9 39.6 58.8 55.6 54.3
95–96 20.0 22.2 26.8 43.8 53.9 54.6 61.9
96–97 15.8 15.1 18.6 19.3 47.4 40.5 39.2
97–98 11.6 12.9 14.7 19.0 28.9 24.1 35.6
98–99 18.4 17.8 20.8 29.5 39.5 40.1 40.2
99–00 18.6 20.1 18.9 21.3 32.3 34.5 30.5
00–01 18.9 22.1 22.0 24.5 35.2 51.7 36.4
01–02 22.6 36.7 41.6 39.1 47.1 50.7 66.7
02–03 23.5 33.9 49.4 39.2 47.3 55.8 55.2
Mean 19.2 23.4 25.6 32.2 43.7 48.1 47.1
M. Alameddine et al. / Social Science & Medicine ] (]]]]) ]]]–]]] 7
relatively low stickiness (e.g. nursing stations) areunattractive, since they failed to retain their work-force even while expanding. Although directlymeasuring attractiveness would require individual-level survey data, future research could validatethese administrative-level proxies of attractivenessof settings against individual perceptions.
Where sub-sectors have relatively similar growthlevels, we note an inverse relationship betweenstickiness and inflow values (Table 5), suggestingthat less-attractive settings must recruit to compen-sate for the loss of experienced workers. Table 5 alsoreveals several cases where the expansion/contrac-tion of a setting results in relatively higher/lower

ARTICLE IN PRESS
Table 5
Ranking settings by mean stickiness and inflow (1993–2003)
Sub-sector/rank Mean stickiness Mean inflow
Acute 1 19
Psychiatric 2 18
CCAC 3 13
LTC 4 17
Public health 5 16
Physician office 6 15
Education 7 14
Business 8 11
Homecare agency 9 10
Chronic/rehab 10 12
Government/assoc. 11 9
Other hospitals 12 8
Community mental 13 3
Self-employed 14 7
CHC 15 6
Nursing station 16 4
Miscellaneous 17 5
Community agency 18 1
Agency nursing 19 2
M. Alameddine et al. / Social Science & Medicine ] (]]]]) ]]]–]]]8
inflow than would otherwise be found. For example,the transition matrixes showed that health systemrestructuring in Ontario led to new sub-sectors(CCAC, community mental health) which attractedtheir workers from established sub-sectors (homecare, psychiatric hospitals), and was reflected inhigher mean inflows.
Examining the size trends also enables compar-ison across settings with superficially similar at-tractiveness. For example, ‘‘Other hospitals’’ andCHCs have similar medium values for both sticki-ness (64.0 vs. 59.6) and inflow (35.1 vs. 44.2).However, the former sub-sector contracted by20.8%, while the latter expanded by 56.6%. Thus,we would conclude that CHCs are relatively lessattractive, having more difficulty retaining theirworkers even in an expanding environment.Although the CNO registration data does notallow us to determine why particular sub-sectorsare more or less attractive, it does suggest a numberof additional hypotheses for future research. Inthe Ontario data examined, the persistent dif-ferences in stickiness which we identified acrosssub-sectors, coupled with the fact that theless-attractive sub-sectors had higher inflow valuesand thus were the most likely to be hiringnew graduates, suggests a pressing need to under-stand and address the factors responsible forthe unattractiveness of particular nursing settings
and the implications, if any, for the long-termability to retain new nurses in nursing.
This analysis suggests that the two new concepts,stickiness and inflow, are useful proxy measures ofrelative attractiveness. The concepts are fairly easyto calculate, and can be defined at various levels ofsetting, ranging from individual jobs to employmentclassifications. Although we applied these conceptsto sectors/sub-sectors for Ontario nurses using theCNO registration database, similar analyses can beperformed for other workforces for which linkedlongitudinal data are available.
Appendix A
Employment sub-sector definitions
Sub-sector definitions are based primarily ondefinitions provided in the College of Nurses ofOntario Instruction Guide for the 2006 AnnualMembership Renewal (CNO, 2006). Because cate-gorization for certain sub-sectors varied over time,we have merged sub-sectors as required. Note thatCNO only began providing formal definitions ofsub-sectors in 2004; for the 1993–2003 period of thestudy, nurses selected their sub-sector without suchdefinitions. The naming and categorization of sub-sectors has varied slightly over time. For example,in 2004, CNO merged Agency nursing, Communityagencies and Home care into one sub-sectorcurrently named: Nursing/Staffing agency; it alsodeleted Nursing station as a separate sub-sector.The sectors/sub-sectors used in this study and theircurrent definitions are as follows.
LTC sector
This sector was not divided into sub-sectors,because the definitions of its sub-sectors havechanged over the time period analyzed. It includes:Long-Term Care Facility: ‘‘Facilities for peoplewho are not able to live independently or in theirown homes who require 24-h nursing services to beavailable to meet their personal care needs. (Long-term Care Centre, Nursing Home, Home for theAged);’’ plus Retirement Home: ‘‘A residentialcomplex that is occupied by persons who areprimarily 65 years of age or older, for the purposeof receiving care services, whether or not receivingthe services is the primary purpose of occupancy;’’plus Other Long-Term Care Facility: ‘‘Long-termcare facilities not listed in the above definitions.’’
ARTICLE IN PRESSM. Alameddine et al. / Social Science & Medicine ] (]]]]) ]]]–]]] 9
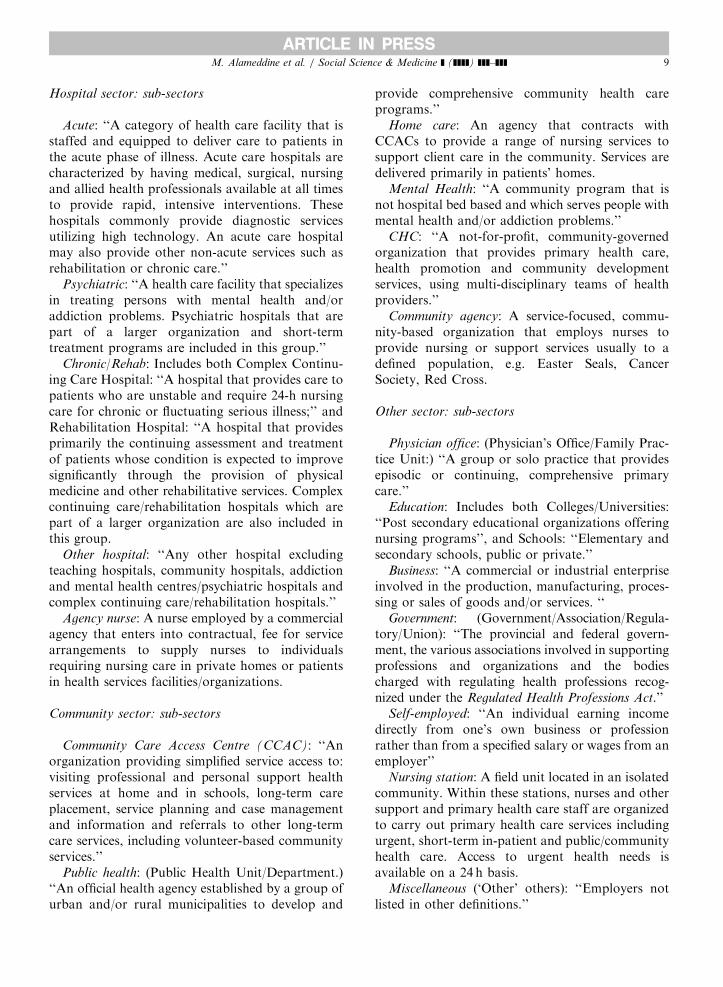
Hospital sector: sub-sectors
Acute: ‘‘A category of health care facility that isstaffed and equipped to deliver care to patients inthe acute phase of illness. Acute care hospitals arecharacterized by having medical, surgical, nursingand allied health professionals available at all timesto provide rapid, intensive interventions. Thesehospitals commonly provide diagnostic servicesutilizing high technology. An acute care hospitalmay also provide other non-acute services such asrehabilitation or chronic care.’’
Psychiatric: ‘‘A health care facility that specializesin treating persons with mental health and/oraddiction problems. Psychiatric hospitals that arepart of a larger organization and short-termtreatment programs are included in this group.’’
Chronic/Rehab: Includes both Complex Continu-ing Care Hospital: ‘‘A hospital that provides care topatients who are unstable and require 24-h nursingcare for chronic or fluctuating serious illness;’’ andRehabilitation Hospital: ‘‘A hospital that providesprimarily the continuing assessment and treatmentof patients whose condition is expected to improvesignificantly through the provision of physicalmedicine and other rehabilitative services. Complexcontinuing care/rehabilitation hospitals which arepart of a larger organization are also included inthis group.
Other hospital: ‘‘Any other hospital excludingteaching hospitals, community hospitals, addictionand mental health centres/psychiatric hospitals andcomplex continuing care/rehabilitation hospitals.’’
Agency nurse: A nurse employed by a commercialagency that enters into contractual, fee for servicearrangements to supply nurses to individualsrequiring nursing care in private homes or patientsin health services facilities/organizations.
Community sector: sub-sectors
Community Care Access Centre (CCAC): ‘‘Anorganization providing simplified service access to:visiting professional and personal support healthservices at home and in schools, long-term careplacement, service planning and case managementand information and referrals to other long-termcare services, including volunteer-based communityservices.’’
Public health: (Public Health Unit/Department.)‘‘An official health agency established by a group ofurban and/or rural municipalities to develop and
provide comprehensive community health careprograms.’’
Home care: An agency that contracts withCCACs to provide a range of nursing services tosupport client care in the community. Services aredelivered primarily in patients’ homes.
Mental Health: ‘‘A community program that isnot hospital bed based and which serves people withmental health and/or addiction problems.’’
CHC: ‘‘A not-for-profit, community-governedorganization that provides primary health care,health promotion and community developmentservices, using multi-disciplinary teams of healthproviders.’’
Community agency: A service-focused, commu-nity-based organization that employs nurses toprovide nursing or support services usually to adefined population, e.g. Easter Seals, CancerSociety, Red Cross.
Other sector: sub-sectors
Physician office: (Physician’s Office/Family Prac-tice Unit:) ‘‘A group or solo practice that providesepisodic or continuing, comprehensive primarycare.’’
Education: Includes both Colleges/Universities:‘‘Post secondary educational organizations offeringnursing programs’’, and Schools: ‘‘Elementary andsecondary schools, public or private.’’
Business: ‘‘A commercial or industrial enterpriseinvolved in the production, manufacturing, proces-sing or sales of goods and/or services. ‘‘
Government: (Government/Association/Regula-tory/Union): ‘‘The provincial and federal govern-ment, the various associations involved in supportingprofessions and organizations and the bodiescharged with regulating health professions recog-nized under the Regulated Health Professions Act.’’
Self-employed: ‘‘An individual earning incomedirectly from one’s own business or professionrather than from a specified salary or wages from anemployer’’
Nursing station: A field unit located in an isolatedcommunity. Within these stations, nurses and othersupport and primary health care staff are organizedto carry out primary health care services includingurgent, short-term in-patient and public/communityhealth care. Access to urgent health needs isavailable on a 24 h basis.
Miscellaneous (‘Other’ others): ‘‘Employers notlisted in other definitions.’’

ARTICLE IN PRESSM. Alameddine et al. / Social Science & Medicine ] (]]]]) ]]]–]]]10
Acknowledgments
This study was funded by a CIHR grant, ‘‘Wheredo nurses work? Work setting and work choice’’.Analysis was performed at the Nursing HealthServices Research Unit (NHSRU), Faculty ofNursing, University of Toronto. Additional supportwas provided by the M-THAC (from medicare tohome and community) Research Unit, University ofToronto. Special thanks to the staff of the NHSRUfor their help and advice, especially, Brad Milburn,Sping Wang, and Elisabeth Peereboom, and toCarey Levinton for programming assistance.
References
Alameddine, M., Laporte, A., Baumann, A., O’Brien-Pallas, L.,
Croxford, R., Wang, S., et al. (2006). Where are nurses
working? Employment patterns by sub-sector in Ontario,
Canada. Healthcare Policy, 3(1), 56–77.
Aronson, J., Denton, M., & Zeytinoglu, I. (2004). Market-
modeled home care in Ontario: Deteriorating working
conditions and dwindling community capacity. Canadian
Public Policy, 30(1), 111–125.
Baranek, P. M., Deber, R. B., & Williams, A. P. (2004). Almost
home: Reforming home and community care in Ontario.
Toronto: University of Toronto Press.
Canadian Institute of Health Information (2005). Canadian
regulated nursing professions database. Downloaded from
http://www.cihi.ca, Feb 29, 2006.
Canadian Nurses Association (2002). Planning for the Future:
Nursing Human Resource Projections. Downloaded from
http://cna-aiic.ca/, Oct 11, 2005.
Canadian Nursing Advisory Committee (2002). Our health, our
future: Creating quality workplaces for Canadian nurses.
Ottawa: Advisory Committee on Health Human Resources.
Caplan, E. (2005). Realizing the potential of home care:
Competing for excellence by rewarding results. A review of
the competitive bidding process used by Ontario’s community
care access centres to select providers of goods and services.
Toronto: CCAC Procurement Review.
College of Nurses of Ontario (CNO) (2006). 2006 Annual
membership renewal-instruction guide. Downloaded from
http://www.cno.org, Feb 27, 2006.
Gifford, B. D., Zammuto, R. F., Goodman, E. A., & Hill, K. S.
(2002). The relationship between hospital unit culture and
nurses’ quality of work life. Journal of Healthcare Manage-
ment, 47(1), 13–25.
Gray, A. M., Philips, V. L., & Normand, C. (1996). The costs of
nursing turnover: Evidence from the British National Health
Service. Health Policy, 36(3), 117–128.
Grinspun, D. (2003). Part-time and casual nursing work: The
perils of health-care restructuring. International Journal of
Sociology and Social Policy, 23(8/9), 54–70.
Happel, B. (1998). Student nurses’ attitudes towards a career in
community health. Journal of Community Health, 23(6),
269–279.
Happel, B. (2002). The role of nursing education in the
perpetuation of inequity. Nursing Education Today, 23(6),
9–10.
Hayes, L., O’Brien-Pallas, L., Duffield, C., Shamian, J., Buchan,
J., & Hughes, F. (2006). Nurse turnover: A literature review.
International Journal of Nursing Studies, 43(2), 237–263.
Heitlinger, A. (2003). The paradoxical impact of health care
restructuring in Canada on nursing as a profession. Interna-
tional Journal of Health Services, 33(1), 37–54.
Hinshaw, A., & Atwood, J. (1983). Nursing staff turnover, stress
and satisfaction: Models measures. Annual Review of Nursing
Research, 1(6), 133–153.
Ingersoll, G. L., Olsan, T., Drew-Cates, J., DeVinney, B. C., &
Davies, J. (2002). Nurses’ job satisfaction, organizational
commitment, and career intent. Journal of Nursing Adminis-
tration, 32(5), 250–263.
Johnson, J. E., & Buelow, J. R. (2003). Providing staff feedback
to nurse managers using internal resources. Journal of Nursing
Administration, 33(7/8), 391–396.
Jones, C. (1990). Staff nurse turnover costs: Part 1, a conceptual
model. Journal of Nursing Administration, 20(4), 18–23.
O’Brien-Pallas, L., Alksnis, C., & Wang, S. (2003). Bringing the
future into focus: Projecting RN retirement in Canada. Ottawa:
Canadian Institute for Health Information.
Ontario Association of Community Care Access Centres (2000).
Human resources: A looming crisis in the community care
system in Ontario. Human Resources Task Group, Position
Paper, July 26.
Registered Nurses Association of Ontario (1999). Reclaiming a
vision: Making long-term care community services work.
September, downloaded from http://www.rnao.org/pdf/
MediaReleases/ReclaimingAVision.pdf. Feb 15, 2006.
Shapiro, E. (1997). The cost of privatization: A case study of home
care in Manitoba. Ottawa: Canadian Centre for Policy
Alternatives.
Simoens, S., Villeneuve, M., & Hurst, J. (2005). Tackling Nurse
Shortages in OECD Countries. Organization for economic
cooperation and development. Working papers no. 19.
Statistics Canada (2004). The daily (December 21): Demographic
statistics. Downloaded from http://www.statcan.ca, Nov 12,
2005.
Tai, T. W., Bame, S. I., & Robinson, C. D. (1998). Review of
nursing turnover research, 1977–1996. Social Science and
Medicine, 47(12), 1905–1924.
The Home Care Sector Study Corporation (2003). Canadian
home care human resources study: Synthesis report. Ottawa.
World Health Organization (WHO) (2006). Working together for
health. The world health report 2006. Downloaded from http://
www.who.int/whr/2006/06_overview_en.pdf, April 07, 2006.
Related Documents