Stephen Pemberton TE-MPE-EE 1 DQLPUR Prototype Testing Initial Results: • Thermal Tests • Voltage Drop Off Tests

Stephen Pemberton TE-MPE-EE 1 DQLPUR Prototype Testing Initial Results: Thermal Tests Voltage Drop Off Tests.
Dec 24, 2015
Welcome message from author
This document is posted to help you gain knowledge. Please leave a comment to let me know what you think about it! Share it to your friends and learn new things together.
Transcript
Ste
phen
Pem
bert
on T
E-M
PE
-EE
1
DQLPUR Prototype Testing
Initial Results:
• Thermal Tests
• Voltage Drop Off Tests
Ste
phen
Pem
bert
on T
E-M
PE
-EE
2
Thermal Testing
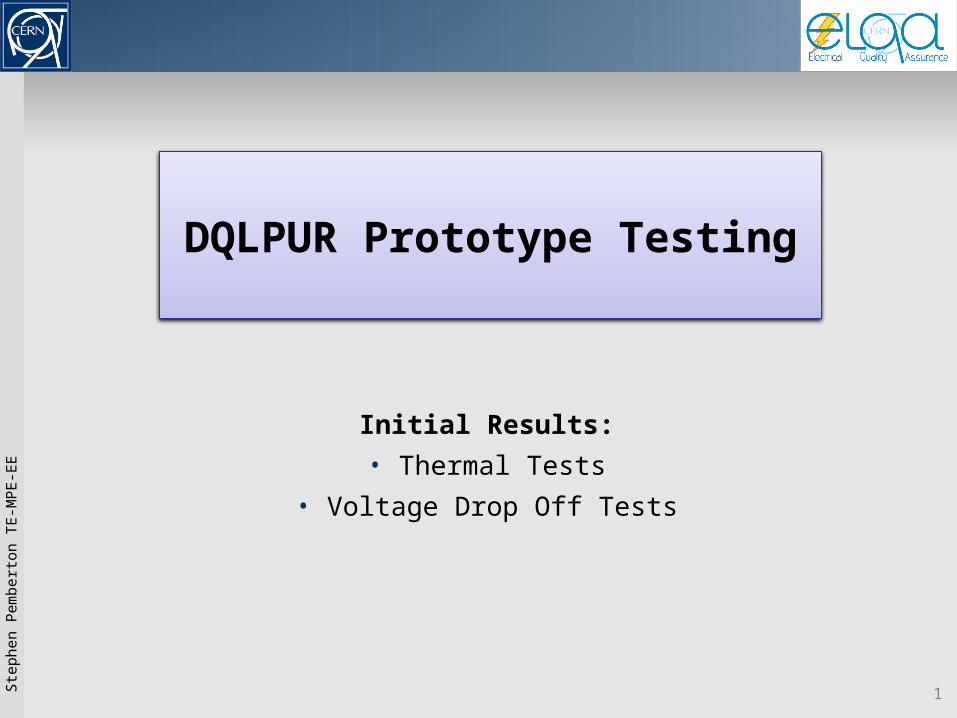
Type K T/C’s
External Heat sink
Power Supply
Pico TC-08
Resistor Bank
This is an initial report into the thermal and voltage characteristics of the prototype DQLPUR unit.
Twice the nominal current was pulled through one unit (to simulate the failure of one UPS) via a
bank of power resistors and coupled up to eight, type ‘K’ thermocouples for temperature
monitoring.
These thermocouples were used in conjunction with a Pico TC-08 measurement device which
relayed the data to a laptop.
Ste
phen
Pem
bert
on T
E-M
PE
-EE
3
Thermal Testing
The thermocouples were secured with heat resistant tape on various heat critical components.
The channel distribution was as follows:
Channel 1 = Toroidal Transformer (under rubber lip at center)
Channel 2 = Toroidal Transformer (under rubber lip at center, opposing side to Ch1)
Channel 3 = Regulator IC3
Channel 4 = Regulator IC2
Channel 5 = Bridge Rectifier D5 (on the card which is drawing the most
current) Channel 6 = Connector at rear of Power Supply (for general internal
temperature) Channel 7 = Bridge Rectifier D5 (on the card drawing the lower
current) Channel 8 = Ambient temperature external to the power supply
The temperatures were sampled at 1 sec intervals over the course of 24hrs.
The Power Supply was switched on 60secs after the temperature logging commenced to observe
the behavior of the supply when first switched on from cold.
All components stabilized with respect to temperature after 2.5 hrs.
Ste
phen
Pem
bert
on T
E-M
PE
-EE
4
Results of the 1st Thermal Test
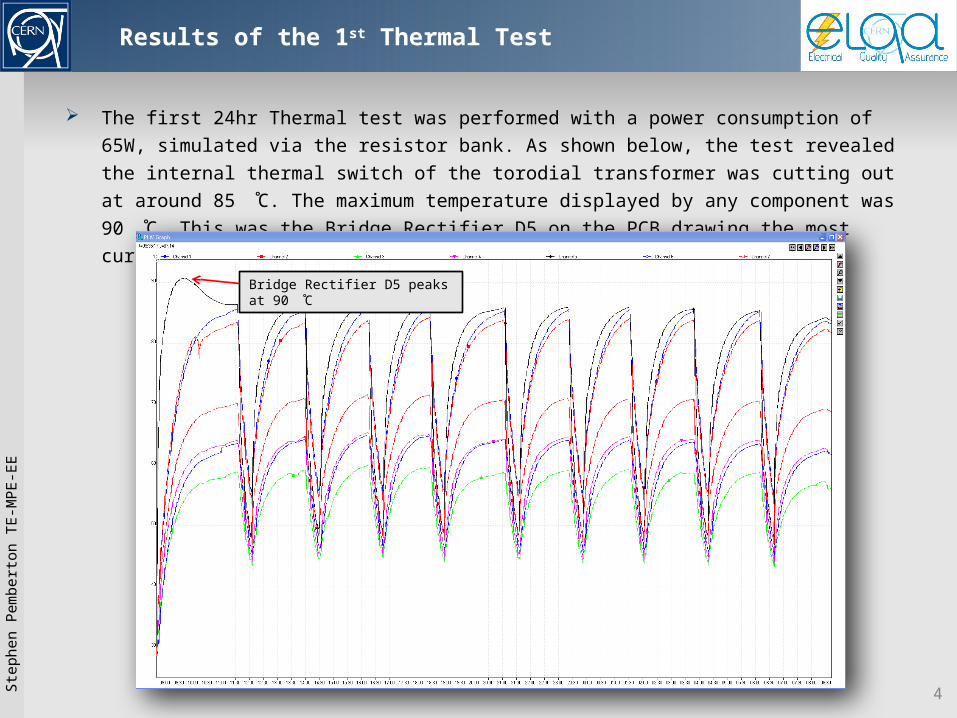
The first 24hr Thermal test was performed with a power consumption of 65W, simulated via the
resistor bank. As shown below, the test revealed the internal thermal switch of the torodial
transformer was cutting out at around 85 C. The maximum temperature displayed by any
component was 90 C. This was the Bridge Rectifier D5 on the PCB drawing the most current.
Bridge Rectifier D5 peaks at 90 C
Ste
phen
Pem
bert
on T
E-M
PE
-EE
5
Results of the 2st Thermal Test
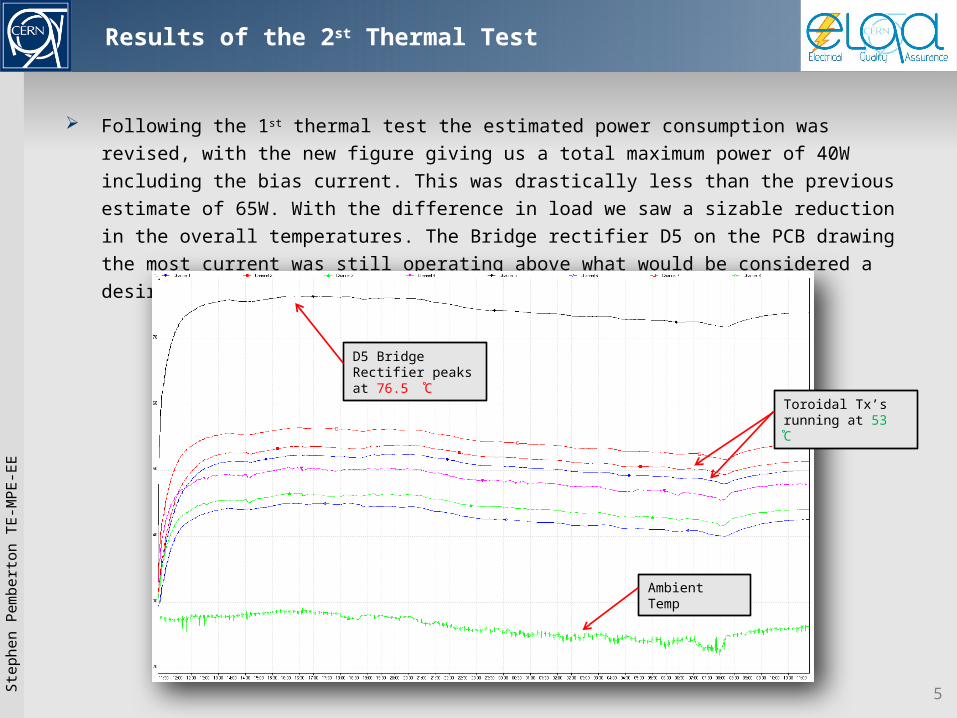
Following the 1st thermal test the estimated power consumption was revised, with the new figure
giving us a total maximum power of 40W including the bias current. This was drastically less than
the previous estimate of 65W. With the difference in load we saw a sizable reduction in the
overall temperatures. The Bridge rectifier D5 on the PCB drawing the most current was still
operating above what would be considered a desirable operating temperature.
Toroidal Tx’s running at 53 C
D5 Bridge Rectifier peaks at 76.5 C
Ambient Temp
Ste
phen
Pem
bert
on T
E-M
PE
-EE
6
3rd Thermal Test
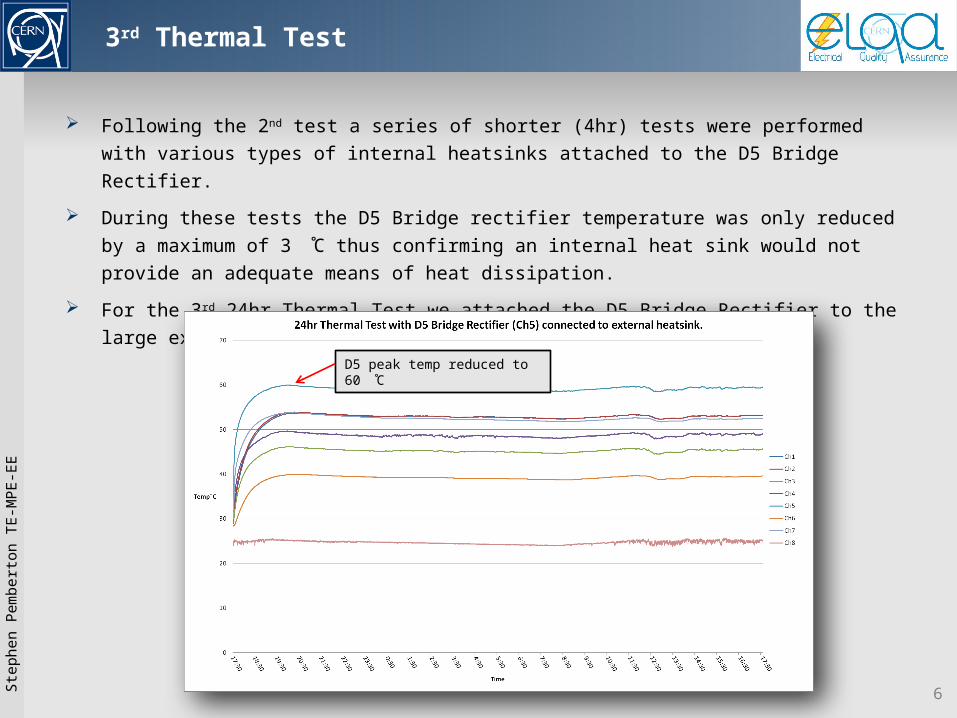
Following the 2nd test a series of shorter (4hr) tests were performed with various types of internal
heatsinks attached to the D5 Bridge Rectifier.
During these tests the D5 Bridge rectifier temperature was only reduced by a maximum of 3 C
thus confirming an internal heat sink would not provide an adequate means of heat dissipation.
For the 3rd 24hr Thermal Test we attached the D5 Bridge Rectifier to the large external heat sink
via jumper cables.
D5 peak temp reduced to 60 C
Ste
phen
Pem
bert
on T
E-M
PE
-EE
7
3rd Thermal test
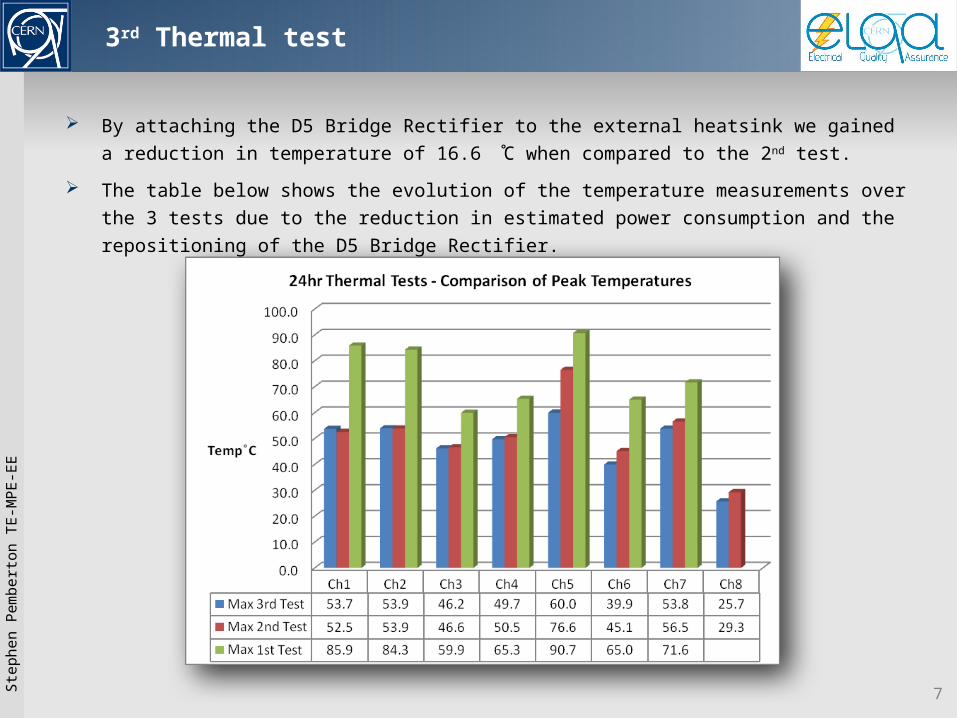
By attaching the D5 Bridge Rectifier to the external heatsink we gained a reduction in
temperature of 16.6 C when compared to the 2nd test.
The table below shows the evolution of the temperature measurements over the 3 tests due to
the reduction in estimated power consumption and the repositioning of the D5 Bridge Rectifier.
Ste
phen
Pem
bert
on T
E-M
PE
-EE
8
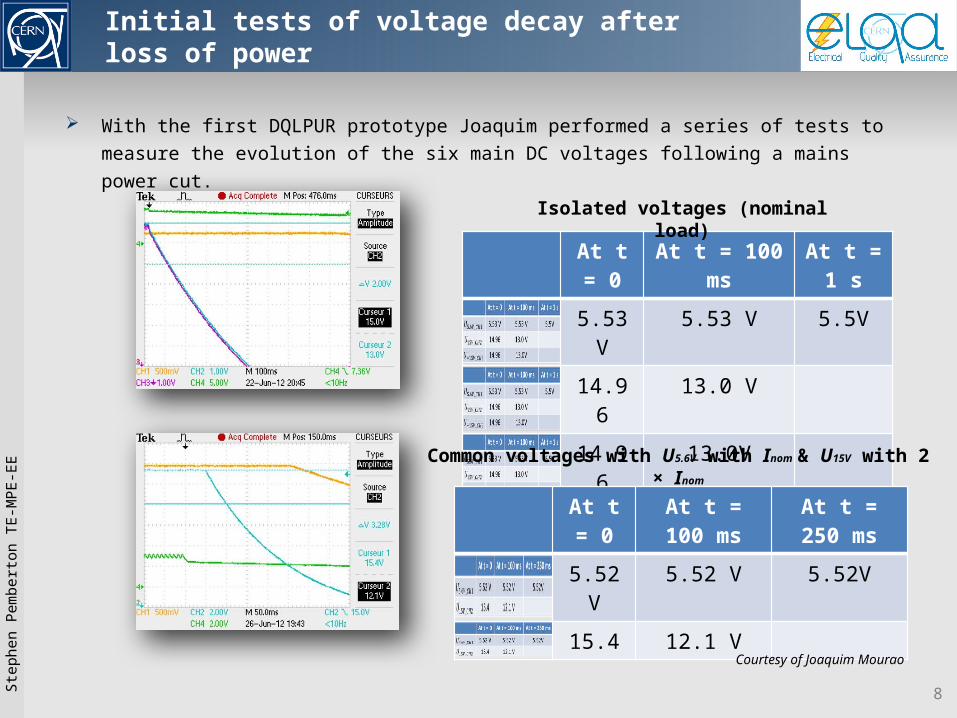
Initial tests of voltage decay after loss of power
At t = 0 At t = 100 ms At t = 1 s
5.53 V 5.53 V 5.5V
14.96 13.0 V
14.96 13.0V
At t = 0 At t = 100 ms At t = 250 ms
5.52 V 5.52 V 5.52V
15.4 12.1 V
With the first DQLPUR prototype Joaquim performed a series of tests to measure the evolution of
the six main DC voltages following a mains power cut.
Isolated voltages (nominal load)
Common voltages with U5.6V with Inom & U15V with 2 × Inom
Courtesy of Joaquim Mourao
Ste
phen
Pem
bert
on T
E-M
PE
-EE
9
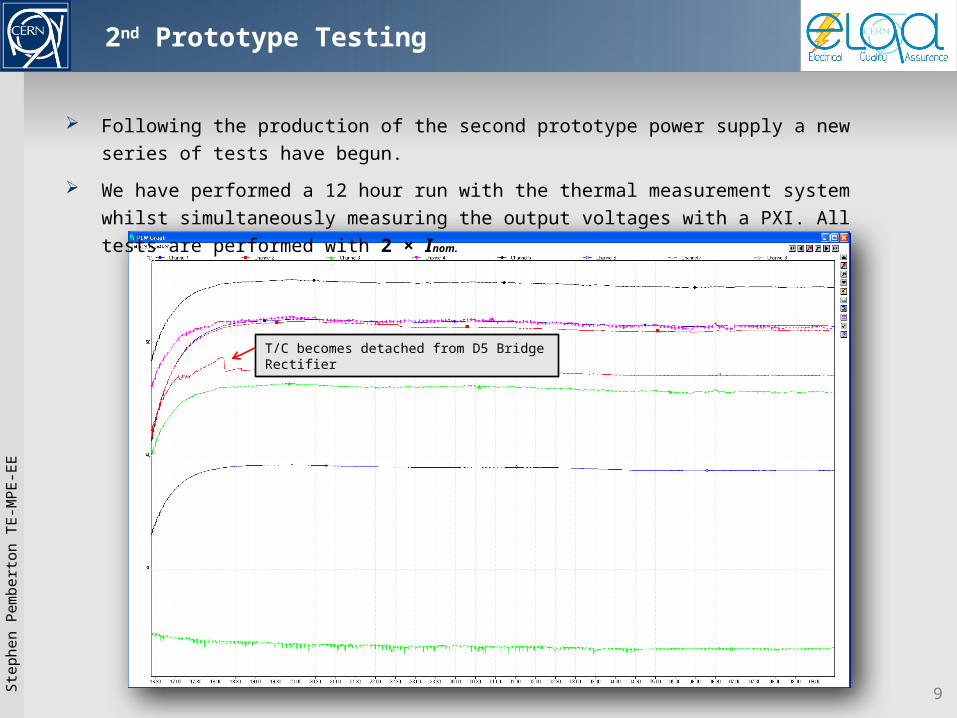
2nd Prototype Testing
Following the production of the second prototype power supply a new series of tests have begun.
We have performed a 12 hour run with the thermal measurement system whilst simultaneously
measuring the output voltages with a PXI. All tests are performed with 2 × Inom.
T/C becomes detached from D5 Bridge Rectifier
Ste
phen
Pem
bert
on T
E-M
PE
-EE
10
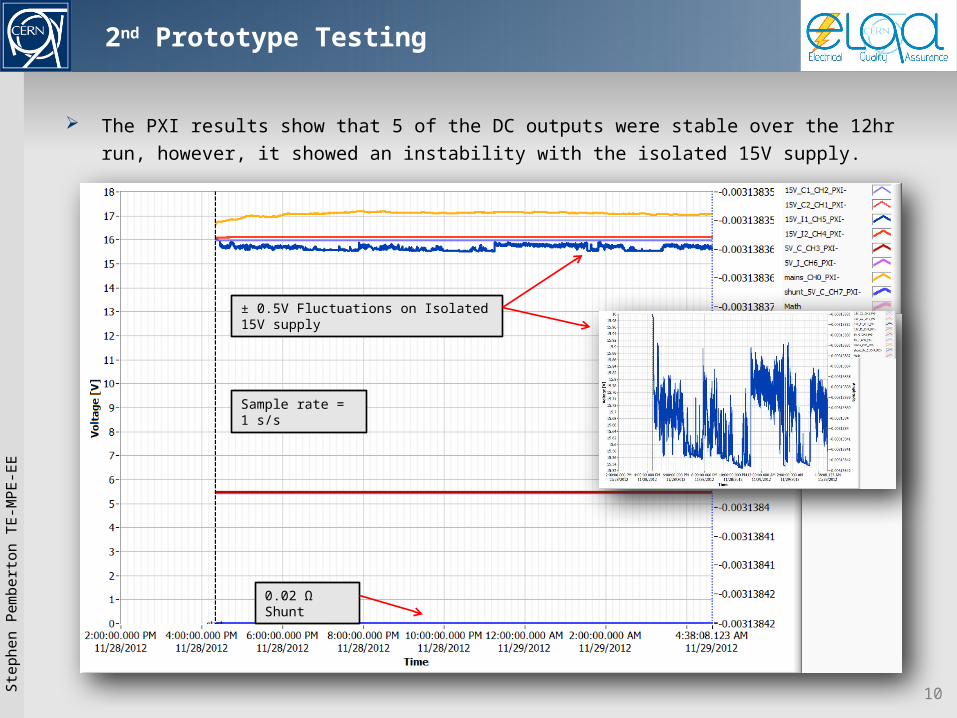
2nd Prototype Testing
The PXI results show that 5 of the DC outputs were stable over the 12hr run, however, it showed
an instability with the isolated 15V supply.
± 0.5V Fluctuations on Isolated 15V supply
0.02 Ω Shunt
Sample rate = 1 s/s
Ste
phen
Pem
bert
on T
E-M
PE
-EE
11
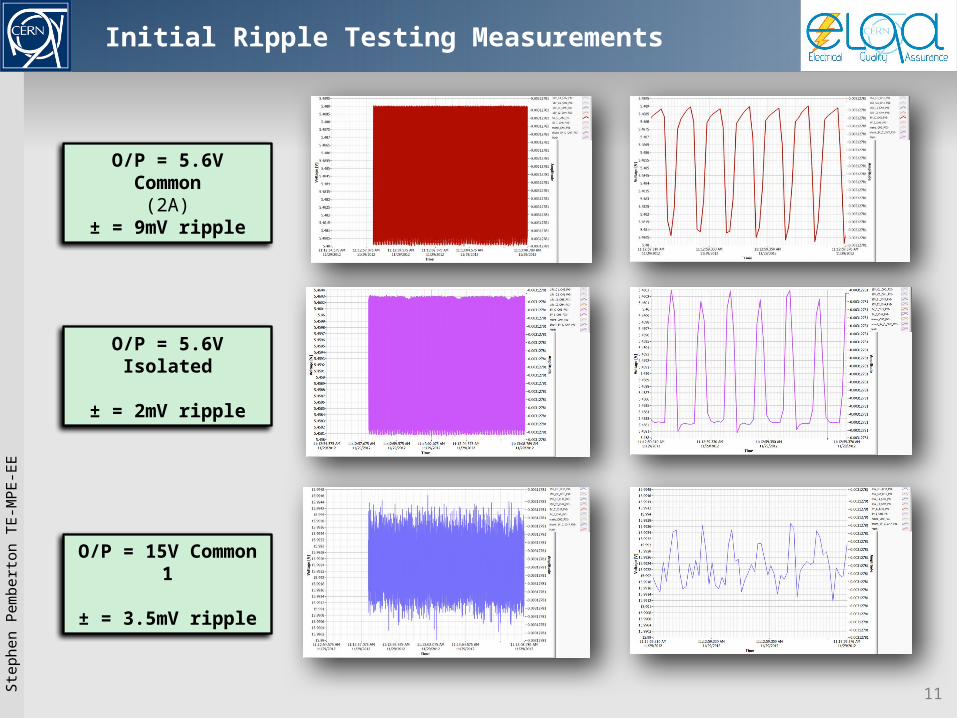
Initial Ripple Testing Measurements
O/P = 5.6V Common(2A)
± = 9mV ripple
O/P = 5.6V Isolated
± = 2mV ripple
O/P = 15V Common 1
± = 3.5mV ripple

Ste
phen
Pem
bert
on T
E-M
PE
-EE
12
Initial Ripple Testing Measurements
O/P = 15V Common 2
± = 3mV ripple
O/P = 15V Isolated 2
± = 3mV ripple
The measurements for the 1st isolated 15V supply are not shown as testing is ongoing to
establish the cause of the instability.
We are currently running the supply with additional measurement points directly soldered to the
O/P of the regulator as we suspect a connection or wiring issue within the O/P circuit.
Ste
phen
Pem
bert
on T
E-M
PE
-EE
13
Further Testing
Once we have rectified the instability with the 15V supply a retest of the 24hr thermal and voltage
measurements will be done.
Mains cut off testing will be done using the current test set-up.
We will also be performing some short-circuit testing of the supply.
Related Documents