102:3554-3572, 2009. First published Oct 7, 2009; doi:10.1152/jn.00535.2009 J Neurophysiol Stufflebeam, Matti Hämäläinen and Christopher I. Moore Stephanie R. Jones, Dominique L. Pritchett, Michael A. Sikora, Steven M. You might find this additional information useful... 112 articles, 47 of which you can access free at: This article cites http://jn.physiology.org/cgi/content/full/102/6/3554#BIBL including high-resolution figures, can be found at: Updated information and services http://jn.physiology.org/cgi/content/full/102/6/3554 can be found at: Journal of Neurophysiology about Additional material and information http://www.the-aps.org/publications/jn This information is current as of April 7, 2010 . http://www.the-aps.org/. American Physiological Society. ISSN: 0022-3077, ESSN: 1522-1598. Visit our website at (monthly) by the American Physiological Society, 9650 Rockville Pike, Bethesda MD 20814-3991. Copyright © 2005 by the publishes original articles on the function of the nervous system. It is published 12 times a year Journal of Neurophysiology on April 7, 2010 jn.physiology.org Downloaded from

Welcome message from author
This document is posted to help you gain knowledge. Please leave a comment to let me know what you think about it! Share it to your friends and learn new things together.
Transcript
102:3554-3572, 2009. First published Oct 7, 2009; doi:10.1152/jn.00535.2009 J NeurophysiolStufflebeam, Matti Hämäläinen and Christopher I. Moore Stephanie R. Jones, Dominique L. Pritchett, Michael A. Sikora, Steven M.
You might find this additional information useful...
112 articles, 47 of which you can access free at: This article cites http://jn.physiology.org/cgi/content/full/102/6/3554#BIBL
including high-resolution figures, can be found at: Updated information and services http://jn.physiology.org/cgi/content/full/102/6/3554
can be found at: Journal of Neurophysiologyabout Additional material and information http://www.the-aps.org/publications/jn
This information is current as of April 7, 2010 .
http://www.the-aps.org/.American Physiological Society. ISSN: 0022-3077, ESSN: 1522-1598. Visit our website at (monthly) by the American Physiological Society, 9650 Rockville Pike, Bethesda MD 20814-3991. Copyright © 2005 by the
publishes original articles on the function of the nervous system. It is published 12 times a yearJournal of Neurophysiology
on April 7, 2010
jn.physiology.orgD
ownloaded from

Quantitative Analysis and Biophysically Realistic Neural Modelingof the MEG Mu Rhythm: Rhythmogenesis and Modulationof Sensory-Evoked Responses
Stephanie R. Jones,1 Dominique L. Pritchett,2 Michael A. Sikora,1 Steven M. Stufflebeam,1 Matti Hamalainen,1
and Christopher I. Moore1,2
1Athinoula A. Martinos Center For Biomedical Imaging, Massachusetts General Hospital, Charlestown; and 2McGovern Institutefor Brain Research, Massachusetts Institute of Technology, Cambridge, Massachusetts
Submitted 17 June 2009; accepted in final form 3 October 2009
Jones SR, Pritchett DL, Sikora MA, Stufflebeam SM, HamalainenM, Moore CI. Quantitative analysis and biophysically realistic neuralmodeling of the MEG mu rhythm: rhythmogenesis and modulation ofsensory-evoked responses. J Neurophysiol 102: 3554–3572, 2009.First published October 7, 2009; doi:10.1152/jn.00535.2009. Varia-tions in cortical oscillations in the alpha (7–14 Hz) and beta (15–29Hz) range have been correlated with attention, working memory, andstimulus detection. The mu rhythm recorded with magnetoencepha-lography (MEG) is a prominent oscillation generated by Rolandiccortex containing alpha and beta bands. Despite its prominence, theneural mechanisms regulating mu are unknown. We characterized theongoing MEG mu rhythm from a localized source in the fingerrepresentation of primary somatosensory (SI) cortex. Subjects showedvariation in the relative expression of mu-alpha or mu-beta, whichwere nonoverlapping for roughly 50% of their respective durations onsingle trials. To delineate the origins of this rhythm, a biophysicallyprincipled computational neural model of SI was developed, withdistinct laminae, inhibitory and excitatory neurons, and feedforward(FF, representative of lemniscal thalamic drive) and feedback (FB,representative of higher-order cortical drive or input from nonlemnis-cal thalamic nuclei) inputs defined by the laminar location of theirpostsynaptic effects. The mu-alpha component was accurately mod-eled by rhythmic FF input at approximately 10-Hz. The mu-betacomponent was accurately modeled by the addition of approximately10-Hz FB input that was nearly synchronous with the FF input. Therelative dominance of these two frequencies depended on the delaybetween FF and FB drives, their relative input strengths, and stochas-tic changes in these variables. The model also reproduced key featuresof the impact of high prestimulus mu power on peaks in SI-evokedactivity. For stimuli presented during high mu power, the modelpredicted enhancement in an initial evoked peak and decreased sub-sequent deflections. In agreement, the MEG-evoked responsesshowed an enhanced initial peak and a trend to smaller subsequentpeaks. These data provide new information on the dynamics of the murhythm in humans and the model provides a novel mechanisticinterpretation of this rhythm and its functional significance.
I N T R O D U C T I O N
Two predominant rhythms are expressed in the neocortex inthe frequency range from 7 to 30 Hz: alpha (7–14 Hz) and beta(15–29 Hz). Modulation of alpha and beta activity is correlatedwith successful perception in humans and awake monkeys(Bauer et al. 2006; Donner et al. 2007; Hanslmayr et al. 2007;
Linkenkaer-Hansen et al. 2004; Mathewson et al. 2009; Maza-heri et al. 2009; Palva et al. 2005b; Pineda 2005; Schroeder andLakatos 2009a; Schubert et al. 2008; van Wijk et al. 2009;Wilke et al. 2006; Worden et al. 2000; Zhang and Ding 2009).Recent studies have emphasized a potential role for the activedeployment of these rhythms in the suppression of “distract-ing” sensory input (Jensen et al. 2002; Kelly et al. 2006;Mazaheri et al. 2009; Worden et al. 2000), presumably bysuppression of evoked responses in early sensory cortices.
The mu rhythm measured with magnetoencephalography(MEG) over Rolandic cortex shows alpha and beta components(Hari and Salmelin 1997; Tiihonen et al. 1989). This finding isin contrast to the Rolandic mu rhythm measured with electro-encephalography (EEG), in which only a dominant alphacomponent is typically observed (Kuhlman 1978; Zhang andDing 2009). This historical distinction is likely attributable todifferences in the recording techniques and has led to mixedusage of the term “mu” in the literature. This ambiguity innaming is indicative of the ongoing ambiguity with respect tothe statistical characteristics and neural origins of the murhythm. Despite the fact that much research has been devotedto localizing the source of this rhythm in the brain—and tounderstanding the cellular-level neural mechanisms creatingalpha and beta rhythms independently—the neural origin of theMEG mu complex remains unknown. In the present report, weinvestigated the two-component mu rhythm measured withMEG using experimental and modeling approaches. We referto these components throughout as mu-alpha and mu-beta.
One prominent view of the origin of the MEG mu rhythm,based on source localization of sensor data from human stud-ies, is that the mu-beta component is produced by the precen-tral motor cortex, whereas the mu-alpha component originatesfrom the postcentral somatosensory cortex (Hari and Salmelin1997; Salmelin and Hari 1994; Salmelin et al. 1995). Thesestudies focused on localizing late event-related desynchroniza-tion (ERD) of the rhythm after movement. More recent work,focused on spontaneous activity and early ERD, has shown thatboth components can be expressed in a single area (Brovelliet al. 2004; Gaetz and Cheyne 2006; Kopell et al. 2000; Pintoet al. 2003; Szurhaj et al. 2003), with intracerebral recordingsin humans suggesting a common source in primary somato-sensory (SI) cortex (Szurhaj et al. 2003).
Studies that have investigated the cellular-level neural mech-anisms inducing ongoing cortical alpha and beta rhythms havefocused on the origin of the two frequency bands separately. A
Address for reprint requests and other correspondence: S. R. Jones, MassGeneral Hospital, Athinoula A. Martinos Center for Biomedical Imaging,149 13th Street, Suite 2301, Charlestown, MA 02129 (E-mail: [email protected]).
J Neurophysiol 102: 3554–3572, 2009.First published October 7, 2009; doi:10.1152/jn.00535.2009.
3554 0022-3077/09 $8.00 Copyright © 2009 The American Physiological Society www.jn.org
on April 7, 2010
jn.physiology.orgD
ownloaded from

large body of experimental and computational work suggestsneocortical alpha emerges from an approximately 10-Hzthalamocortical rhythm (Andersen and Andersson 1968; Con-treras and Steriade 1995; Hughes and Crunelli 2005; Suffczyn-ski et al. 2001; Traub et al. 2005). Other evidence suggests thatneocortical alpha also depends on, or could emerge indepen-dently from, intrinsic properties in large layer V pyramidalneurons (Bollimunta et al. 2008; Jones et al. 2000; Pinto et al.2003; Silva et al. 1991) and/or the local activity of low-threshold spiking interneurons (Fanselow et al. 2008).
Fewer studies of the neural origins of the cortical betarhythm have been conducted. Slice recordings (Roopun et al.2006; Whittington et al. 2000) and computational models(Jensen et al. 2002; Kopell et al. 2000; Pinto et al. 2003;Roopun et al. 2006) have shown a beta-frequency range oscil-lation in isolated cortex that depends on the kinetics of theM-type potassium current in excitatory neurons, combinedwith GABAergic inhibition. Roopun et al. (2006) further foundthat axonal gap junctions were critical to the maintenance ofpharmacologically induced 20- to 30-Hz rhythms in slices fromsomatosensory cortex (referred to as a “beta 2” rhythm) andthat lower-frequency beta rhythms (13–17 Hz; “beta 1”) couldbe produced by period concatenation of higher-frequency beta(20–30 Hz) and gamma (30–50 Hz) oscillations (Kramer et al.2008; Roopun et al. 2008). In all of these studies, the betarhythm is argued to emerge from the activity of localized cellsin a single cortical circuit that are spiking nearly synchronouslyand that the frequency of these rhythms depends on intrinsicmembrane time constants.
Another body of research has suggested that beta activitymediates long-range communication between cortical areas,suggesting that intracortical projections may play a role in localbeta expression (Buschman and Miller 2007; Hanslmayr et al.2007; Roelfsema et al. 1997; Schubert et al. 2008; von Steinet al. 2000; Witham et al. 2007). For example, Von Stein et al.(2000) found coherence in beta-band activity between temporaland parietal EEG sensors during multimodel object represen-tation in humans, and Buschman and Miller (2007) betweenparietal and frontal indwelling electrodes during selective at-tention in monkeys. In support for a role of interareal projec-tions in the neocortex, Whitham et al. (2007) found interactionsbetween 20-Hz activity in somatosensory and motor areas thatdid not depend on intrinsic spiking (Witham and Baker 2007)and claimed there was oscillatory coupling across the centralsulcus. Brovelli et al. (2004) applied Granger causality analysisto 20-Hz oscillatory activity measured intracranially from mul-tiple cortical sites in the monkey and claimed that the betaactivity propagated from the primary somatosensory (SI) cor-tex to primary motor and parietal cortices. Nonlemniscal tha-lamic nuclei have also been proposed as relays for signaltransmission between neocortical areas (Sherman 2005). Suchthalamic nuclei are also ideally poised to generate oscillatorycoherence across multiple cortical areas (Llinas and Ribary2001). As such, beta activity related to long-range communi-cation could also arise, at least in part, from these projections.
Difficulty establishing the neural mechanisms generating theMEG mu rhythm comes in part from the fact that the sharedtemporal dynamics of the mu-alpha and mu-beta componentsare not well characterized. Tiihonen et al. (1989) observedqualitatively that the mu-alpha and mu-beta components do notalways overlap in time, suggesting they are not harmonics, but
did not quantify this assertion (Palva et al. 2005b; Tiihonenet al. 1989). Evidence for cross-frequency coupling of thesecomponents has also been reported (Palva et al. 2005b). Quan-tifying the degree to which mu-alpha and mu-beta co-occur andcovary in amplitude is crucial to understanding their relativeinterdependence and to constraining computational models oftheir origins.
An important related topic is delineation of the mechanisticunderpinnings of the impact of ongoing mu power on evokedsensory responses. This relation is particularly important, givenstudies showing that both ongoing mu power and SI tactile-evoked responses predict perception (Jones et al. 2007; Kulics1982; Linkenkaer-Hansen et al. 2004; Zhang and Ding 2009).In recent studies of mu-alpha, prestimulus power shows aninverted U-shaped relation to tactile detection (Linkenkaer-Hansen et al. 2004; Zhang and Ding 2009) and a similarrelationship was seen for mu-beta (Linkenkaer-Hansen et al.2004). In studies of the relationship between time-domainpeaks in tactile-evoked responses and detection, Kulics (1982)observed that greater evoked activity in the local field potential(LFP) near 70 ms predicted detection of tactile input bymonkeys with electrodes implanted in SI and that differencesin later activity (105–130 ms) were correlated with reactiontime. Similarly, in humans, Jones et al. (2007) showed thatgreater amplitude of components of the SI-evoked response70–130 ms poststimulus was a key predictor of detection.Zhang and Ding (2009) recorded greater late evoked compo-nents (�140 ms) in sensorimotor EEG electrodes on success-fully detected trials and Palva et al. (2005) showed greaterresponse 30–150 ms poststimulus for detection in sensorimo-tor MEG sensors.
Despite the links between prestimulus mu expression orevoked response amplitude and detection, the impact of spon-taneous mu on peaks in the time-domain tactile-evoked re-sponse (ER) has received limited attention. Nikouline et al.(2000) reported that large variation in the prestimulus mu-alpha band activity was related to “relatively stable” early parts(�60 ms; referred to as P35 and P60) of median nerve ERsrecorded using MEG, which showed a small positive correla-tion with greater alpha power predicting a larger early compo-nent (Nikouline et al. 2000). Zhang and Ding (2009) reportedthat for late components (�140 ms) of the tactile ER measuredwith EEG, there was a complex and largely parabolic relation-ship between mu-alpha power and evoked amplitude (Zhangand Ding 2009). Further, although mechanisms for changes inlater (�250 ms) components of median nerve (Nikulin et al.2007) and visual (Mazaheri and Jensen 2008) evoked re-sponses have been associated with baseline shifts and phaseresetting of alpha activity (Hanslmayr et al. 2007; Makeig et al.2002), to our knowledge no systematic study has been per-formed to delineate the specific impact of MEG mu power(containing alpha and beta components) on different aspects ofthe earlier tactile responses that have been linked to perceptualsuccess.
To investigate these questions, we recorded whole-head306-channel MEG data and applied an equivalent currentdipole inverse solution technique to look at activity from thehand area of SI, a technique that has been found to consistentlylocalize signals discretely to the anterior bank of the postcen-tral gyrus, area 3b (Jones et al. 2007). We studied the prestimu-lus mu rhythm generated by this somatosensory source and its
3555NEURAL MODELING OF THE MEG MU RHYTHM
J Neurophysiol • VOL 102 • DECEMBER 2009 • www.jn.org
on April 7, 2010
jn.physiology.orgD
ownloaded from

connection to peaks in the early (�175 ms) time-domain–evoked responses. On single trials, we observed that during theprestimulus time period high-power epochs of mu-alpha andmu-beta were not simultaneous in their emergence, but didco-occur at rates greater than chance. These findings suggestthat mu-alpha and mu-beta emerge from separable generatorswithin SI that share common elements. We did not exploreevoked poststimulus oscillations because our analysis of thisperiod was focused on the region in which our model hadpredictive power in the evoked response (0–175 ms).
We then implemented a biophysically principled laminarcortical model of SI to make specific predictions with respectto the underlying neural mechanisms inducing the mu rhythm,its modulations in prestimulus power, and their influence onearly peaks (�175 ms) in the time-domain tactile-evokedresponse. This model was expanded from our previous SImodel that accurately reproduced the different time-domain–evoked response components in SI measured with MEG. Themodel included pyramidal neurons and interneurons in thesupra- and infragranular layers. Importantly, this model alsoincluded thalamocortical feedforward (FF) input and inputs todistal dendrites that could arise from intracortical feedback(FB) or from nonlemniscal thalamic input.
Our results showed that the mutual generation of the mu-alpha and mu-beta components of the prestimulus rhythm, aswell as the relative separation of these components in time, canbe reproduced by the SI model. The data and model indicatedthese rhythms are not simple harmonics and are not regulatedby time constants of intrinsic membrane properties. The mu-alpha component was reproduced with an approximately 10-Hzstochastic thalamocortical FF input. Accurately capturing mu-beta and its interactions with mu-alpha, in contrast to previousmodeling studies emphasizing local cortical circuits and intrin-sic properties, required rhythmic supragranular input, consis-tent with FB from higher cortical areas and/or input fromnonlemniscal thalamic sources. To accurately reproduce theobserved mu-alpha and mu-beta emergence and statisticalinterdependence, this FB was simulated not as a 20-Hz signal,but rather as a stochastic approximately 10-Hz signal. Further,mu-beta was not achieved when the approximately 10-Hzsupragranular inputs were perfectly out of phase, as one mightexpect for generation of a 20-Hz oscillation, but rather almostperfectly aligned with the approximately 10-Hz FF input(�10-ms mean delay).
Investigation of the influence of prestimulus mu rhythm onthe gain of the early-evoked sensory response (0–175 ms) inthe model showed that mu power had a dominant effect on theinitial peaks of the time-domain signal (�70 ms). This predic-tion was confirmed in the MEG data. Further, the modelpredicted that a key impact of high mu on peaks of the earlyevoked response is enhanced recruitment of excitatory andinhibitory interneurons and that recruitment of the interneuronscaused suppression of subsequent (70–100 ms) components.
M E T H O D S
MEG experiment
MEG data were collected from 10 neurologically healthy, right-handed, 18- to 45-yr-old adults during performance of a tactile-detection paradigm. The experimental protocol was approved by theMassachusetts General Hospital Internal Review Board and each
subject gave informed consent prior to data acquisition. The stimulusparadigm and data acquisition are described in detail in Jones et al.(2007), which reported on tactile-evoked response components for 7of these subjects; data from an additional 3 subjects were collected forthe present report. Here, we outline key aspects of the experimentalparadigm and current data analysis methods.
STIMULUS PARADIGM. Brief taps were delivered to the subject’sright hand in the form of a single cycle of a 100-Hz sine wave (10-msduration) via a custom piezoelectric device. Subjects rested their handon a Delrin frame that held a piezoelectric transducer parallel to thefinger (Noliac ceramic multilayer bender plate: 32 � 7.8 � 1.88 mm).A deflection stroke drove a 7-mm-diameter Delrin contractor througha 1-cm circular rigid surround and into the fingertip.
The detection threshold of each subject was obtained prior toimaging using a parameter estimation by sequential testing (PEST)convergence procedure (Dai 1995; Leek 2001). During MEG record-ings, for 70% of presented trials, stimulus strength was maintained ata perceptual threshold level (50% detection) using a dynamic algo-rithm (see Jones et al. 2007). Suprathreshold stimuli (10% of all trials;350-�m deflection; 100% detection) and null trials (20%) wererandomly interleaved with the threshold stimuli. Trial duration was3 s. Each subject underwent eight runs with 120 trials. Trial onset wasindicated by a 60-dB, 2-kHz auditory cue delivered to both ears for2 s. During the auditory cue, the 10-ms finger-tap stimulus wasdelivered between 500 and 1,500 ms, in 100-ms intervals, from trialonset. The number of trials of a given latency to tap was randomlydistributed during each run. Following the cessation of the auditorycue, subjects reported detection or nondetection of the stimulus withbutton presses, using the second or third digit of the left hand,respectively. The auditory cue ended �500 ms after the tactilestimulus and 1,000 ms before the next trial began.
MEG DATA ACQUISITION. By use of a 306-channel MEG (Elekta-Neuromag Vectorview), neuromagnetic responses were recorded with306 sensors arranged in triplets of two planar gradiometers and amagnetometer at 102 sites. In addition to MEG, the vertical andhorizontal electrooculogram (EOG) signals were recorded with elec-trodes placed close to the left eye. Four head-position indicator (HPI)coils were placed on the subject’s head to coregister the subject’sanatomical magnetic resonance image (MRI) and the MEG sensors.The data were sampled at 600 Hz with the band-pass set to 0.01–200Hz. The responses were averaged on-line for quality control. In theoff-line analysis, the data were reaveraged using a band-pass of0.1–200 Hz. The chosen high-pass filter corner frequency was lowenough to retain possible slow variations in the dc level of the neuralsignals while eliminating low-frequency environmental noise. Inspec-tion of the localized SI spontaneous activity (see description of sourceanalysis in the following text) showed that it was stable through�10-s time windows during which there was modulation of the murhythm without dc offset. Epochs with EOG peak-to-peak amplitudeexceeding 150 �V were excluded from the analysis.
MEG SOURCE ANALYSIS. Source analysis was used to locate theprimary current-dipole source to contralateral SI and to find the timecourse of this source, taking into account the presence of other activeareas. This method was motivated by and described in greater detailin Jones et al. (2007), but is also described here. The SI contributionto the somatosensory-evoked field was isolated using the followingapproach. Because we did not observe consistent activity over theipsilateral secondary somatosensory cortex (SII), or in other brainareas, we modeled the data with two dipoles (contralateral SI and SII).This fit was then optimized by use of signal-space projection (SSP)(Tesche et al. 1995; Uusitalo and Ilmoniemi 1997). A least-squares fitwith the dipole forward solution was calculated through the use of aspherically symmetric conductor model (Hamalainen and Sarvas1989; Sarvas 1987). At the peak activity in the suprathreshold stim-ulus signals from one data run (average of 12 trials; mean � 68 ms,
3556 JONES ET AL.
J Neurophysiol • VOL 102 • DECEMBER 2009 • www.jn.org
on April 7, 2010
jn.physiology.orgD
ownloaded from

SD � 8 ms), we observed an initial equivalent current dipole (ECD).An anatomical MRI was then coregistered with the MEG, confirmingthis source localized to SI in 7 of 10 subjects. We then removed thecontribution of the SI ECD using the SSP method and the residualdata fit with a second ECD (Nishitani and Hari 2000; Tesche et al.1995; Uusitalo and Ilmoniemi 1997). In all fit data during peakresponses, the goodness-of-fit of the two-dipole model was �70%.We then removed the effect of the second ECD from the data usingSSP and refitted the SI ECD to the residual. The ECD localizationsfitted to the suprathreshold data were used to model all responses.Only the last 100 trials for a given response were considered foranalysis, to account for adaptation and learning effects with training.
Large baseline rhythmic activity interfered with the localization ofpeak responses for 2 of the 10 subjects. In these cases, the SI sourcewas placed in the finger representation of area 3b within the anteriorbank of the postcentral gyrus (Moore et al. 2000; Penfield andRasmussen 1950; Sastre-Janer et al. 1998; Uematsu et al. 1992; Whiteet al. 1997; Yousry et al. 1997) and the SII dipole source was placedin the parietal operculum. For one of the 10 subjects, anatomical MRIdata could not be obtained. In this case, SI dipole localization wasdetermined by field contours on the spherical head model, consistentwith the predicted position of contralateral SI. Removal of these 3subjects from our analysis did not have a significant impact on ourresults (see Fig. 3).
FREQUENCY DOMAIN ANALYSIS. Power spectral density (PSD)analyses (Figs. 3A and 7A) were calculated for frequencies from 1 to60 Hz using the Welch’s periodogram method as implemented inMatlab, with overlapping 0.5-s windows.
Time–frequency representations (TFRs) or spectrograms of the datawere calculated from 1 to 40 Hz on the SI ECD time courses byconvolving the signals with a complex Morlet wavelet of the form w(t,f0) � A exp(�t2/2�t
2) exp(2i�f0t), for each frequency of interest f0,where �t � m/2�f0 and i is the imaginary unit. The normalizationfactor was A � 1/(�t
�2�) and the constant m, defining the compro-mise between time and frequency resolution, was 7. TFRs of powerwere calculated as the squared magnitude of the complex wavelet-transformed data. The normalization factor used is such that the sumof the magnitude of the wavelet coefficients over all frequencies isone, unlike that preserving the sum of squared magnitudes of thewavelet coefficients used in, e.g., Tallon-Baudry et al. (1997). Ournormalization factor emphasizes higher frequencies with the distinctbenefit of allowing us to more clearly visualize the time course of 15-to 29-Hz mu-beta activity (e.g., compare Fig. 3, A and C). Thereforethe low-frequency activity (�7 Hz) is much less pronounced than thatin the traditional PSD plots.
POWER SORTING ALGORITHM. When sorting trials over mu (7–29Hz), mu-alpha (7–14 Hz), or mu-beta (15–29 Hz) power for analysisin Figs. 5, 7, and 9B, spectrograms (described earlier) calculated foreach trial were averaged over the frequency band of interest and thensorted from high to low power. The top and bottom 10% of the sortedtrials were excluded from further analysis.
CALCULATION OF SYMMETRY INDEX. The symmetry index of theoscillation waveform around zero, as shown in Fig. 6, was calculatedas follows. We first applied a band-pass of the entire mu frequencyrange (7–29 Hz) to the signal. We then found the local maxima(peaks) and minima (troughs) in the filtered data and identified thetime points corresponding to each peak and trough. These time pointswere used to obtain signal peak and trough values from the unfiltereddata. The symmetry index (SInd) was calculated as [abs (peak) �abs (trough)]/[abs (peak) � abs (trough)] (Galaburda et al. 1990). Apositive symmetry index indicates greater-amplitude peaks, a negativevalue indicates greater-amplitude troughs, and a zero value indicatesthat an oscillation was symmetric around zero.
Computational neural model
The computational neural modeling presented is expanded from ourprevious model of a laminar SI network, as described in detail in Joneset al. (2007) and the code is available to the public on the NEURONModelDB website (http://senselab.med.yale.edu/modeldb/ShowModel.asp?model�113732). Here, we describe key features of the model andits expansion.
SI CORTICAL COLUMN MODEL. Our simulated SI cortical columnnetwork consisted of 100 multiple-compartment excitatory pyramidalneurons (PNs) and 35 single-compartment inhibitory interneurons(INs) per layer (Thomson et al. 2002) in layers II/III and V, expandedfrom 10 PNs and 3 PNs in each layer in our previous model (Joneset al. 2007). Postsynaptic dendritic contact points of the local excita-tory and inhibitory synapses are depicted in Fig. 1A (see Jones et al.2007 for supporting literature). Connection lines are schematic rep-resentations of axonal-to-dendritic input. Axons were not explicitlymodeled. The PNs were arranged in a two-dimensional (2D) grid asshown in Fig. 1D. INs were interleaved evenly between every 2 PNs(not shown in Fig. 1D). Fast and slow excitatory (�-amino-3-hydroxy-5-methyl-4-isoxazolepropionic acid/N-methyl-D-aspartate [AMPA/NMDA]) and inhibitory (�-aminobutyric acid type A/type B[GABAA/GABAB]) synapses were simulated using an alpha functionthat was “turned on” by the soma of the presynaptic cell crossing avoltage threshold (mV � 0). The synaptic dynamics were defined by
FIG. 1. Schematic of primary somatosensory cortex (SI) computational model network architecture. A: local network synaptic connections betweenmultiple-compartment pyramidal neurons (PNs, green) and single-compartment inhibitory neurons (INs, red). Bold outlined dendrites were contacted.Within-layer PN-to-PN synapses (not shown) were also present on dark green outlined dendrites. B: excitatory feedforward (FF) input connections. Theblack arrow is only schematic because lemniscal thalamic input was not explicitly modeled. C: excitatory feedback (FB) input connections from presumedhigher-order cortical and/or nonspecific thalamic neurons. The FF and FB inputs were modeled as spike train generators with a predetermined temporalprofile and synaptic strength. D: schematic of expanded SI cortical column model containing a 2-dimensional grid of 100 PNs and 35 INs evenly spacedbetween every 2 PNs, in the supra- (PNs shown in orange) and infragranular layers (PNs shown in green); INs not shown. Each set of synaptic weightshad a Gaussian spatial profile (Table 1).
3557NEURAL MODELING OF THE MEG MU RHYTHM
J Neurophysiol • VOL 102 • DECEMBER 2009 • www.jn.org
on April 7, 2010
jn.physiology.orgD
ownloaded from

the following rise/decay time constants and reversal potentials, re-spectively: AMPA 0.5/5 ms, 0 mV; NMDA 1/20 ms, 0 mV; GABAA
0.5/5 ms, �80 mV; GABAB 1/20 ms, �80 mV. The conductance ofthe synaptic connections within the local network grid were definedwith a symmetric 2D Gaussian spatial profile, with a delay incorpo-rated into the synaptic connection between two cells defined by aninverse Gaussian (Jones 1986; Kaas and Garraghty 1991). The max-imum synaptic conductances and Gaussian weight space constants(WSCs, number of cells from center) are listed in Table 1 along withthe minimum synaptic delay and corresponding Gaussian delay spaceconstant (DSC).
SINGLE-CELL MORPHOLOGY AND PHYSIOLOGY. The morphologyand physiology of the INs in each layer were simulated with singlecompartments and contained fast sodium (INa) and potassium currents(IKdr) to create spiking activity. The PNs in layers II/III and V weresimulated with eight and nine segments, respectively, based on thereduction by Bush and Sejnowski (1993), and used a compartmentlength of 50 microns. The PNs in layer II/III produced an adaptingspike trains to injected current created by active currents in thesomatic and dendritic compartments, including a fast sodium current(INa), a delayed rectifier potassium current (IKdr), an adapting potas-sium current (IM), and a leak current (IL). The layer V PNs producedbursting responses to injected current (Fig. 1B) and contained thesame currents as those of the PNs in layer II/III, with the addition ofa calcium current (ICa), a potassium-activated calcium current (IKCa),and h- and T-currents in the somatic and dendritic compartments. SeeFig. 1B in Jones et al. (2007) for examples of spiking behavior. Alow-threshold calcium current (IT) and a hyperpolarization-activatedmixed cation current (Ih) are additions to our previous model. The IT
channel density was constant in all segments at 2 � 10�4 S/cm2. TheIh channel density was increased exponentially from the soma (whereit was set at 1 � 10�6 S/cm2) to apical dendrite, with a space constantof 3 � 10�3. This matches Ih densities observed in rat somatosensorycortex (Kole et al. 2006). For further details, supporting literature, andspecific parameters see Jones et al. (2007) and the web-available codeat http://senselab.med.yale.edu/modeldb/ShowModel.asp?model�113732.
SYNAPTIC ARCHITECTURE OF EXOGENOUS DRIVE TO SI. Exogenousdrives to the local network were simulated to reproduce 1) ongoingmu rhythms and 2) evoked responses in the model. In each case, theexogenous drive was excitatory only (Cauller and Connors 1994;Cauller et al. 1998; Guillery and Sherman 2002) and was defined bythe laminar location in SI of its synaptic effects based on generalprinciples of cortical circuitry (Douglas and Martin 2004; Fellemanand Van Essen 1991; Friedman and Jones 1980; Jones 2001; Rock-land and Pandya 1979). The sources of SI drive were modeled as spikegenerators with predefined temporal profiles and postsynaptic conduc-
tances that were distinct for the activity of ongoing rhythmic andevoked responses (described in the following text).
Feedforward (FF) drive emerged from the granular layer, layer IV,and contacted the supragranular L2/3 neurons, with a delayed andweaker connection to the infragranular layer V neurons (see Fig. 1Bfor specific poststimulus dendritic compartments). Activity in layer IVis modeled to reflect drive from the thalamus based on several studiesof intracranial laminar electrophysiological recordings of evokedresponses in SI, including responses to vibrissa and thalamic stimuliin rodents (Barth and Di 1991; Castro-Alamancos and Connors 1996;Di et al. 1990; Douglas and Martin 2004; Kandel and Buzsaki 1997),trigeminal stimulation in piglets (Ikeda et al. 2005), and to tactile(Cauller and Kulics 1991; Kulics and Cauller 1986) and median nervestimuli in awake monkeys (Lipton et al. 2006; Peterson et al. 1995).The maximal conductances onto INs were always twice as strong asthose onto PNs for all FF inputs (Giove et al. 2003). In our previousstudy, this FF drive was referred to as “granular layer output.” Fordescriptive purposes, we have changed the nomenclature in thecurrent study.
Feedback (FB) drive to the SI network contacted the distal apicaldendrites in the supragranular layers of each neural population (Fig.1C). This connection was representative of input from higher-ordercortical areas or nonspecific thalamic sources (Douglas and Martin2004; Felleman and Van Essen 1991; Friedman et al. 1980; Jacksonand Cauller 1998; Jones 2001; Rockland and Pandya 1979). In ourprevious study, this FB drive was referred to as “supragranular layerinput.”
Temporal dynamics and conductances of ongoing andevoked exogenous drive to SI
Stochastic ongoing rhythmic drive (Fig. 2) was generated bydelivering 10 “burst” spike trains, each consisting of two spikes withan interstimulus interval (ISI) of 10 ms, which was set based onexperimental evidence (Hughes and Crunelli 2005), to the SI networkin an FF synaptic activation pattern (Fig. 1C). To reproduce approx-imately 10-Hz input, all 10 bursts arrived nominally every 100 ms,with a Gaussian random distribution in arrival time for each burst(mean ISI of 100 ms; default variance of 400 ms). On every cycle, asimilar input pattern (same number of bursts and arrival time statis-tics) arrived to the SI network in an FB synaptic activation pattern(Fig. 1D), delayed from the FF input by a fixed amount. This drivingsequence is shown schematically in Fig. 2. The mean delay betweenthe approximately 10-Hz FF and FB ongoing inputs, the number ofprestimulus “bursts”/spike trains on each cycle (i.e., the “amplitude”of the input), the SD of the arrival time of each burst to the SI network(i.e., the “variance” of the input), and the maximal postsynapticconductance of the inputs were varied parametrically to investigatetheir separate influence on an expressed mu rhythm (Fig. 8).
Stochastic events in each simulation were regulated by the arrivaltime of each of the input bursts, for both FF and FB inputs. On eachcycle of the rhythmic input, the timing of each two-spike burst event(Fig. 2) was chosen from a Gaussian distribution, with mean fixed at100-ms intervals (e.g., 0, 100, 200 ms, etc.) and variance of 400 ms.With this mechanism, on every cycle the relative net postsynapticconductance of the FF and FB drives changed. All other parameterswere fixed for each simulation with default values of delay � 5 ms,number of input bursts � 10, variance of input bursts � 400 ms. Thedefault conductances for FF and FB inputs were as follows: low mu,maximal weight of 0.4 picosiemens (pS) onto PNs and 0.8 pS ontoINs; high mu, maximal weight of 0.6 pS onto PNs and 1.2 pS ontoINs. Synaptic weights and delays were distributed by a symmetric 2DGaussian spatial profile with maximal weight and minimal delay inthe center and WSC of 100 and DSC of 100 for all connections. Theminimal delay between the FF input and the layer II/III PNs and INswas 0 ms and the layer V PNs and INs was 1 ms. The drivingparameters for the ongoing rhythmic input in our model were all
TABLE 1. Local network synaptic connection parameters
Parameter
Maximal Conductance,�S AMPA/NMDA or
GABAA/GABAB WSC
MinimumSynaptic
Delay, ms DSC
L2/3e to L2/3e 0.0005/0.0005 3 1 3L2/3e to L2/3i 0.0005 3 1 3L2/3e to L5e 0.00025 3 1 3L2/3e to L5i 0.00025 3 1 3L2/3i to L2e 0.05/0.05 50 1 50L2/3i to L5e 0.001 50 1 50L2/3i to L2/3i 0.02 20 1 20L5e to L5e 0.005/0.0005 3 1 3L5e to L5i 0.0005 3 1 3L5i to L5e 0.025/0.025 70 1 70L5i to L5i 0.02 20 1 20
Targeted dendritic compartments are outlined in Fig. 1A. e, excitatory; i,inhibitory; WSC, weight space constant; DSC, delay space constant.
3558 JONES ET AL.
J Neurophysiol • VOL 102 • DECEMBER 2009 • www.jn.org
on April 7, 2010
jn.physiology.orgD
ownloaded from
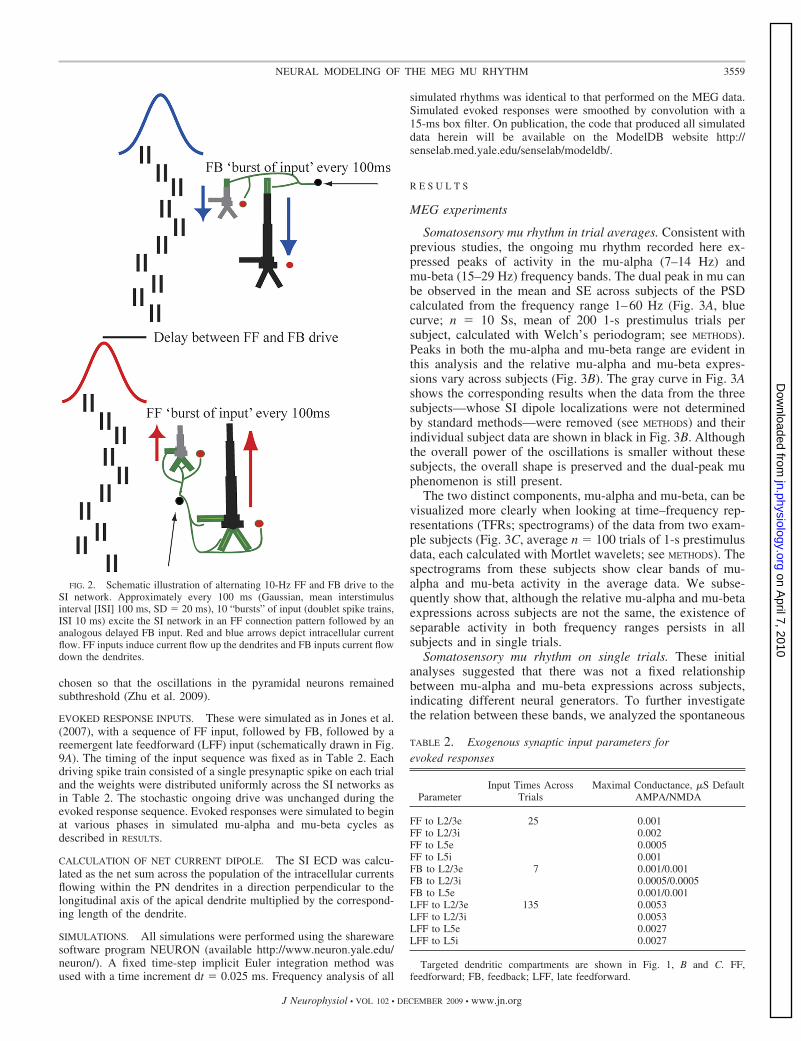
chosen so that the oscillations in the pyramidal neurons remainedsubthreshold (Zhu et al. 2009).
EVOKED RESPONSE INPUTS. These were simulated as in Jones et al.(2007), with a sequence of FF input, followed by FB, followed by areemergent late feedforward (LFF) input (schematically drawn in Fig.9A). The timing of the input sequence was fixed as in Table 2. Eachdriving spike train consisted of a single presynaptic spike on each trialand the weights were distributed uniformly across the SI networks asin Table 2. The stochastic ongoing drive was unchanged during theevoked response sequence. Evoked responses were simulated to beginat various phases in simulated mu-alpha and mu-beta cycles asdescribed in RESULTS.
CALCULATION OF NET CURRENT DIPOLE. The SI ECD was calcu-lated as the net sum across the population of the intracellular currentsflowing within the PN dendrites in a direction perpendicular to thelongitudinal axis of the apical dendrite multiplied by the correspond-ing length of the dendrite.
SIMULATIONS. All simulations were performed using the sharewaresoftware program NEURON (available http://www.neuron.yale.edu/neuron/). A fixed time-step implicit Euler integration method wasused with a time increment dt � 0.025 ms. Frequency analysis of all
simulated rhythms was identical to that performed on the MEG data.Simulated evoked responses were smoothed by convolution with a15-ms box filter. On publication, the code that produced all simulateddata herein will be available on the ModelDB website http://senselab.med.yale.edu/senselab/modeldb/.
R E S U L T S
MEG experiments
Somatosensory mu rhythm in trial averages. Consistent withprevious studies, the ongoing mu rhythm recorded here ex-pressed peaks of activity in the mu-alpha (7–14 Hz) andmu-beta (15–29 Hz) frequency bands. The dual peak in mu canbe observed in the mean and SE across subjects of the PSDcalculated from the frequency range 1–60 Hz (Fig. 3A, bluecurve; n � 10 Ss, mean of 200 1-s prestimulus trials persubject, calculated with Welch’s periodogram; see METHODS).Peaks in both the mu-alpha and mu-beta range are evident inthis analysis and the relative mu-alpha and mu-beta expres-sions vary across subjects (Fig. 3B). The gray curve in Fig. 3Ashows the corresponding results when the data from the threesubjects—whose SI dipole localizations were not determinedby standard methods—were removed (see METHODS) and theirindividual subject data are shown in black in Fig. 3B. Althoughthe overall power of the oscillations is smaller without thesesubjects, the overall shape is preserved and the dual-peak muphenomenon is still present.
The two distinct components, mu-alpha and mu-beta, can bevisualized more clearly when looking at time–frequency rep-resentations (TFRs; spectrograms) of the data from two exam-ple subjects (Fig. 3C, average n � 100 trials of 1-s prestimulusdata, each calculated with Mortlet wavelets; see METHODS). Thespectrograms from these subjects show clear bands of mu-alpha and mu-beta activity in the average data. We subse-quently show that, although the relative mu-alpha and mu-betaexpressions across subjects are not the same, the existence ofseparable activity in both frequency ranges persists in allsubjects and in single trials.
Somatosensory mu rhythm on single trials. These initialanalyses suggested that there was not a fixed relationshipbetween mu-alpha and mu-beta expressions across subjects,indicating different neural generators. To further investigatethe relation between these bands, we analyzed the spontaneous
TABLE 2. Exogenous synaptic input parameters forevoked responses
ParameterInput Times Across
TrialsMaximal Conductance, �S Default
AMPA/NMDA
FF to L2/3e 25 0.001FF to L2/3i 0.002FF to L5e 0.0005FF to L5i 0.001FB to L2/3e 7 0.001/0.001FB to L2/3i 0.0005/0.0005FB to L5e 0.001/0.001LFF to L2/3e 135 0.0053LFF to L2/3i 0.0053LFF to L5e 0.0027LFF to L5i 0.0027
Targeted dendritic compartments are shown in Fig. 1, B and C. FF,feedforward; FB, feedback; LFF, late feedforward.
FIG. 2. Schematic illustration of alternating 10-Hz FF and FB drive to theSI network. Approximately every 100 ms (Gaussian, mean interstimulusinterval [ISI] 100 ms, SD � 20 ms), 10 “bursts” of input (doublet spike trains,ISI 10 ms) excite the SI network in an FF connection pattern followed by ananalogous delayed FB input. Red and blue arrows depict intracellular currentflow. FF inputs induce current flow up the dendrites and FB inputs current flowdown the dendrites.
3559NEURAL MODELING OF THE MEG MU RHYTHM
J Neurophysiol • VOL 102 • DECEMBER 2009 • www.jn.org
on April 7, 2010
jn.physiology.orgD
ownloaded from
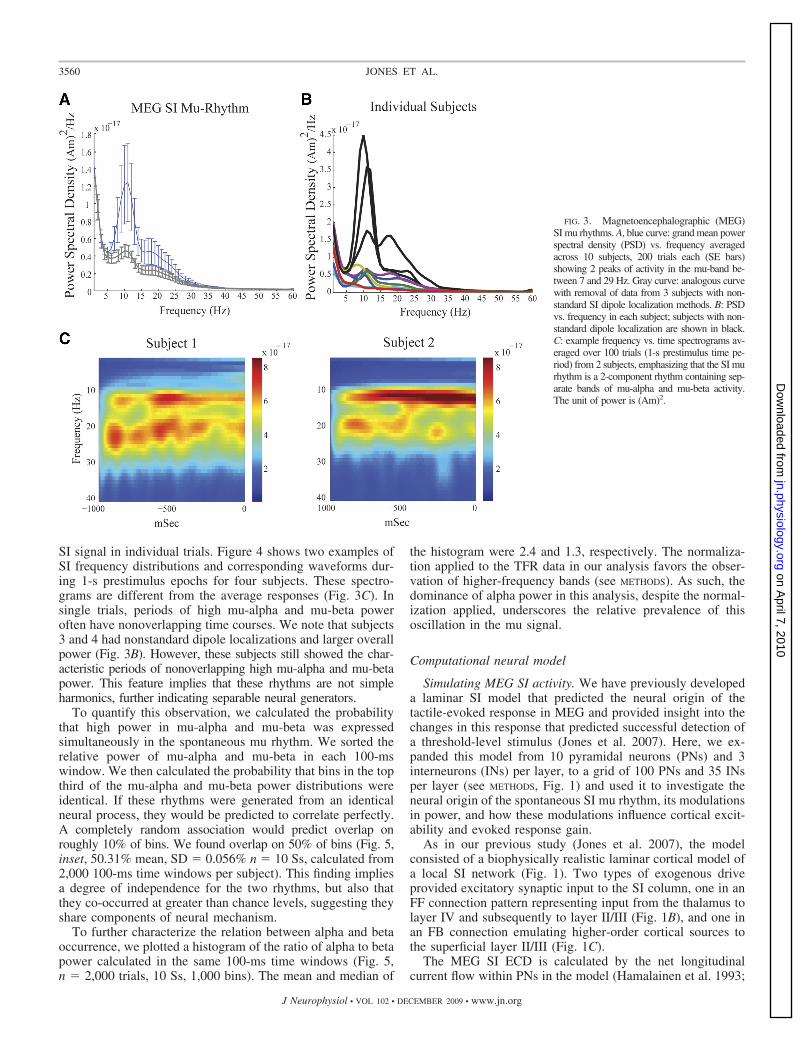
SI signal in individual trials. Figure 4 shows two examples ofSI frequency distributions and corresponding waveforms dur-ing 1-s prestimulus epochs for four subjects. These spectro-grams are different from the average responses (Fig. 3C). Insingle trials, periods of high mu-alpha and mu-beta poweroften have nonoverlapping time courses. We note that subjects3 and 4 had nonstandard dipole localizations and larger overallpower (Fig. 3B). However, these subjects still showed the char-acteristic periods of nonoverlapping high mu-alpha and mu-betapower. This feature implies that these rhythms are not simpleharmonics, further indicating separable neural generators.
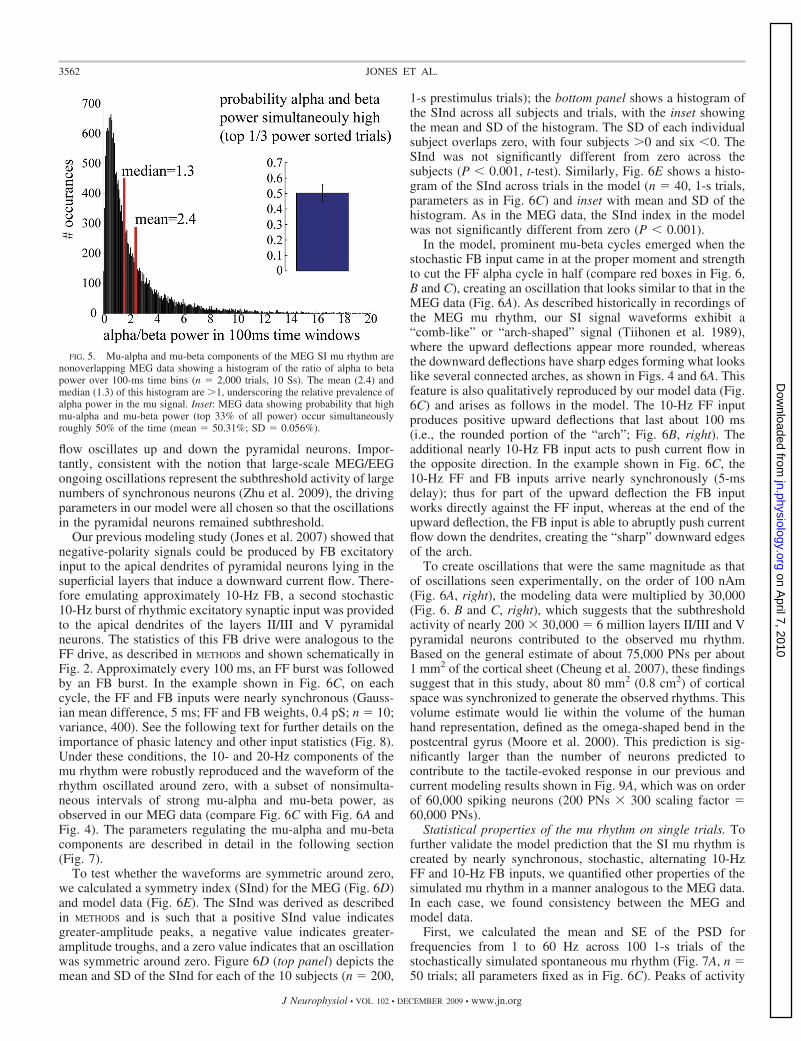
To quantify this observation, we calculated the probabilitythat high power in mu-alpha and mu-beta was expressedsimultaneously in the spontaneous mu rhythm. We sorted therelative power of mu-alpha and mu-beta in each 100-mswindow. We then calculated the probability that bins in the topthird of the mu-alpha and mu-beta power distributions wereidentical. If these rhythms were generated from an identicalneural process, they would be predicted to correlate perfectly.A completely random association would predict overlap onroughly 10% of bins. We found overlap on 50% of bins (Fig. 5,inset, 50.31% mean, SD � 0.056% n � 10 Ss, calculated from2,000 100-ms time windows per subject). This finding impliesa degree of independence for the two rhythms, but also thatthey co-occurred at greater than chance levels, suggesting theyshare components of neural mechanism.
To further characterize the relation between alpha and betaoccurrence, we plotted a histogram of the ratio of alpha to betapower calculated in the same 100-ms time windows (Fig. 5,n � 2,000 trials, 10 Ss, 1,000 bins). The mean and median of
the histogram were 2.4 and 1.3, respectively. The normaliza-tion applied to the TFR data in our analysis favors the obser-vation of higher-frequency bands (see METHODS). As such, thedominance of alpha power in this analysis, despite the normal-ization applied, underscores the relative prevalence of thisoscillation in the mu signal.
Computational neural model
Simulating MEG SI activity. We have previously developeda laminar SI model that predicted the neural origin of thetactile-evoked response in MEG and provided insight into thechanges in this response that predicted successful detection ofa threshold-level stimulus (Jones et al. 2007). Here, we ex-panded this model from 10 pyramidal neurons (PNs) and 3interneurons (INs) per layer, to a grid of 100 PNs and 35 INsper layer (see METHODS, Fig. 1) and used it to investigate theneural origin of the spontaneous SI mu rhythm, its modulationsin power, and how these modulations influence cortical excit-ability and evoked response gain.
As in our previous study (Jones et al. 2007), the modelconsisted of a biophysically realistic laminar cortical model ofa local SI network (Fig. 1). Two types of exogenous driveprovided excitatory synaptic input to the SI column, one in anFF connection pattern representing input from the thalamus tolayer IV and subsequently to layer II/III (Fig. 1B), and one inan FB connection emulating higher-order cortical sources tothe superficial layer II/III (Fig. 1C).
The MEG SI ECD is calculated by the net longitudinalcurrent flow within PNs in the model (Hamalainen et al. 1993;
FIG. 3. Magnetoencephalographic (MEG)SI mu rhythms. A, blue curve: grand mean powerspectral density (PSD) vs. frequency averagedacross 10 subjects, 200 trials each (SE bars)showing 2 peaks of activity in the mu-band be-tween 7 and 29 Hz. Gray curve: analogous curvewith removal of data from 3 subjects with non-standard SI dipole localization methods. B: PSDvs. frequency in each subject; subjects with non-standard dipole localization are shown in black.C: example frequency vs. time spectrograms av-eraged over 100 trials (1-s prestimulus time pe-riod) from 2 subjects, emphasizing that the SI murhythm is a 2-component rhythm containing sep-arate bands of mu-alpha and mu-beta activity.The unit of power is (Am)2.
3560 JONES ET AL.
J Neurophysiol • VOL 102 • DECEMBER 2009 • www.jn.org
on April 7, 2010
jn.physiology.orgD
ownloaded from
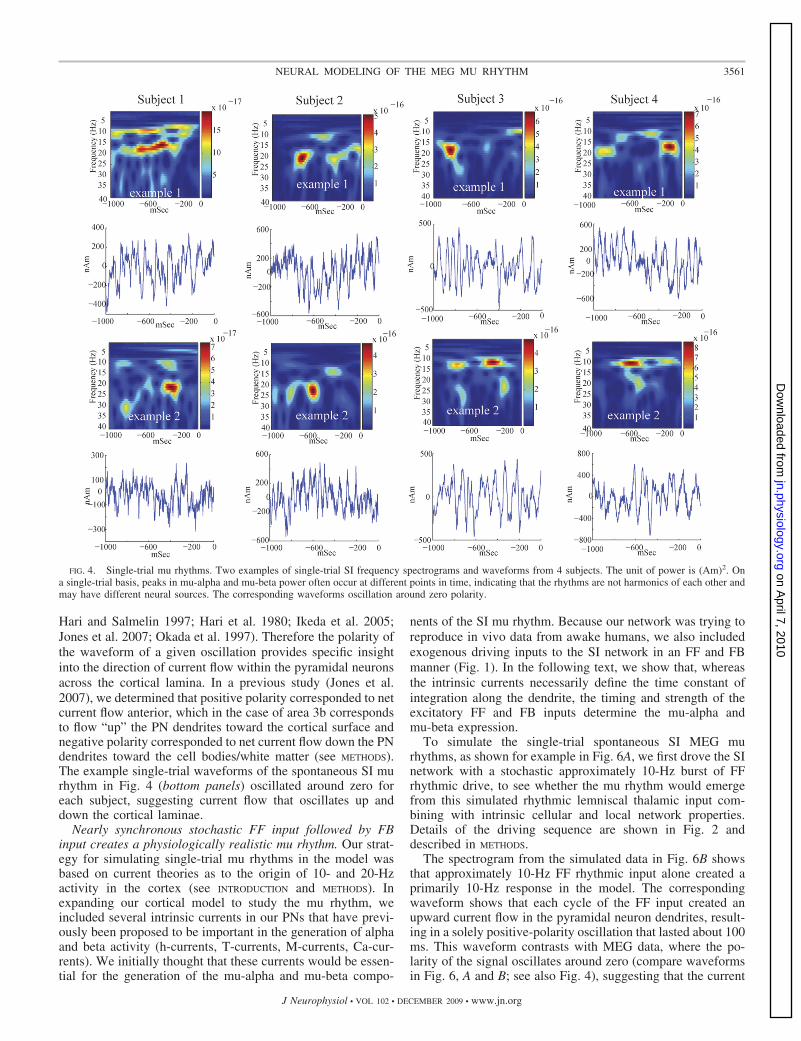
Hari and Salmelin 1997; Hari et al. 1980; Ikeda et al. 2005;Jones et al. 2007; Okada et al. 1997). Therefore the polarity ofthe waveform of a given oscillation provides specific insightinto the direction of current flow within the pyramidal neuronsacross the cortical lamina. In a previous study (Jones et al.2007), we determined that positive polarity corresponded to netcurrent flow anterior, which in the case of area 3b correspondsto flow “up” the PN dendrites toward the cortical surface andnegative polarity corresponded to net current flow down the PNdendrites toward the cell bodies/white matter (see METHODS).The example single-trial waveforms of the spontaneous SI murhythm in Fig. 4 (bottom panels) oscillated around zero foreach subject, suggesting current flow that oscillates up anddown the cortical laminae.
Nearly synchronous stochastic FF input followed by FBinput creates a physiologically realistic mu rhythm. Our strat-egy for simulating single-trial mu rhythms in the model wasbased on current theories as to the origin of 10- and 20-Hzactivity in the cortex (see INTRODUCTION and METHODS). Inexpanding our cortical model to study the mu rhythm, weincluded several intrinsic currents in our PNs that have previ-ously been proposed to be important in the generation of alphaand beta activity (h-currents, T-currents, M-currents, Ca-cur-rents). We initially thought that these currents would be essen-tial for the generation of the mu-alpha and mu-beta compo-
nents of the SI mu rhythm. Because our network was trying toreproduce in vivo data from awake humans, we also includedexogenous driving inputs to the SI network in an FF and FBmanner (Fig. 1). In the following text, we show that, whereasthe intrinsic currents necessarily define the time constant ofintegration along the dendrite, the timing and strength of theexcitatory FF and FB inputs determine the mu-alpha andmu-beta expression.
To simulate the single-trial spontaneous SI MEG murhythms, as shown for example in Fig. 6A, we first drove the SInetwork with a stochastic approximately 10-Hz burst of FFrhythmic drive, to see whether the mu rhythm would emergefrom this simulated rhythmic lemniscal thalamic input com-bining with intrinsic cellular and local network properties.Details of the driving sequence are shown in Fig. 2 anddescribed in METHODS.
The spectrogram from the simulated data in Fig. 6B showsthat approximately 10-Hz FF rhythmic input alone created aprimarily 10-Hz response in the model. The correspondingwaveform shows that each cycle of the FF input created anupward current flow in the pyramidal neuron dendrites, result-ing in a solely positive-polarity oscillation that lasted about 100ms. This waveform contrasts with MEG data, where the po-larity of the signal oscillates around zero (compare waveformsin Fig. 6, A and B; see also Fig. 4), suggesting that the current
FIG. 4. Single-trial mu rhythms. Two examples of single-trial SI frequency spectrograms and waveforms from 4 subjects. The unit of power is (Am)2. Ona single-trial basis, peaks in mu-alpha and mu-beta power often occur at different points in time, indicating that the rhythms are not harmonics of each other andmay have different neural sources. The corresponding waveforms oscillation around zero polarity.
3561NEURAL MODELING OF THE MEG MU RHYTHM
J Neurophysiol • VOL 102 • DECEMBER 2009 • www.jn.org
on April 7, 2010
jn.physiology.orgD
ownloaded from
flow oscillates up and down the pyramidal neurons. Impor-tantly, consistent with the notion that large-scale MEG/EEGongoing oscillations represent the subthreshold activity of largenumbers of synchronous neurons (Zhu et al. 2009), the drivingparameters in our model were all chosen so that the oscillationsin the pyramidal neurons remained subthreshold.
Our previous modeling study (Jones et al. 2007) showed thatnegative-polarity signals could be produced by FB excitatoryinput to the apical dendrites of pyramidal neurons lying in thesuperficial layers that induce a downward current flow. There-fore emulating approximately 10-Hz FB, a second stochastic10-Hz burst of rhythmic excitatory synaptic input was providedto the apical dendrites of the layers II/III and V pyramidalneurons. The statistics of this FB drive were analogous to theFF drive, as described in METHODS and shown schematically inFig. 2. Approximately every 100 ms, an FF burst was followedby an FB burst. In the example shown in Fig. 6C, on eachcycle, the FF and FB inputs were nearly synchronous (Gauss-ian mean difference, 5 ms; FF and FB weights, 0.4 pS; n � 10;variance, 400). See the following text for further details on theimportance of phasic latency and other input statistics (Fig. 8).Under these conditions, the 10- and 20-Hz components of themu rhythm were robustly reproduced and the waveform of therhythm oscillated around zero, with a subset of nonsimulta-neous intervals of strong mu-alpha and mu-beta power, asobserved in our MEG data (compare Fig. 6C with Fig. 6A andFig. 4). The parameters regulating the mu-alpha and mu-betacomponents are described in detail in the following section(Fig. 7).
To test whether the waveforms are symmetric around zero,we calculated a symmetry index (SInd) for the MEG (Fig. 6D)and model data (Fig. 6E). The SInd was derived as describedin METHODS and is such that a positive SInd value indicatesgreater-amplitude peaks, a negative value indicates greater-amplitude troughs, and a zero value indicates that an oscillationwas symmetric around zero. Figure 6D (top panel) depicts themean and SD of the SInd for each of the 10 subjects (n � 200,
1-s prestimulus trials); the bottom panel shows a histogram ofthe SInd across all subjects and trials, with the inset showingthe mean and SD of the histogram. The SD of each individualsubject overlaps zero, with four subjects �0 and six �0. TheSInd was not significantly different from zero across thesubjects (P � 0.001, t-test). Similarly, Fig. 6E shows a histo-gram of the SInd across trials in the model (n � 40, 1-s trials,parameters as in Fig. 6C) and inset with mean and SD of thehistogram. As in the MEG data, the SInd index in the modelwas not significantly different from zero (P � 0.001).
In the model, prominent mu-beta cycles emerged when thestochastic FB input came in at the proper moment and strengthto cut the FF alpha cycle in half (compare red boxes in Fig. 6,B and C), creating an oscillation that looks similar to that in theMEG data (Fig. 6A). As described historically in recordings ofthe MEG mu rhythm, our SI signal waveforms exhibit a“comb-like” or “arch-shaped” signal (Tiihonen et al. 1989),where the upward deflections appear more rounded, whereasthe downward deflections have sharp edges forming what lookslike several connected arches, as shown in Figs. 4 and 6A. Thisfeature is also qualitatively reproduced by our model data (Fig.6C) and arises as follows in the model. The 10-Hz FF inputproduces positive upward deflections that last about 100 ms(i.e., the rounded portion of the “arch”; Fig. 6B, right). Theadditional nearly 10-Hz FB input acts to push current flow inthe opposite direction. In the example shown in Fig. 6C, the10-Hz FF and FB inputs arrive nearly synchronously (5-msdelay); thus for part of the upward deflection the FB inputworks directly against the FF input, whereas at the end of theupward deflection, the FB input is able to abruptly push currentflow down the dendrites, creating the “sharp” downward edgesof the arch.
To create oscillations that were the same magnitude as thatof oscillations seen experimentally, on the order of 100 nAm(Fig. 6A, right), the modeling data were multiplied by 30,000(Fig. 6. B and C, right), which suggests that the subthresholdactivity of nearly 200 � 30,000 � 6 million layers II/III and Vpyramidal neurons contributed to the observed mu rhythm.Based on the general estimate of about 75,000 PNs per about1 mm2 of the cortical sheet (Cheung et al. 2007), these findingssuggest that in this study, about 80 mm2 (0.8 cm2) of corticalspace was synchronized to generate the observed rhythms. Thisvolume estimate would lie within the volume of the humanhand representation, defined as the omega-shaped bend in thepostcentral gyrus (Moore et al. 2000). This prediction is sig-nificantly larger than the number of neurons predicted tocontribute to the tactile-evoked response in our previous andcurrent modeling results shown in Fig. 9A, which was on orderof 60,000 spiking neurons (200 PNs � 300 scaling factor �60,000 PNs).
Statistical properties of the mu rhythm on single trials. Tofurther validate the model prediction that the SI mu rhythm iscreated by nearly synchronous, stochastic, alternating 10-HzFF and 10-Hz FB inputs, we quantified other properties of thesimulated mu rhythm in a manner analogous to the MEG data.In each case, we found consistency between the MEG andmodel data.
First, we calculated the mean and SE of the PSD forfrequencies from 1 to 60 Hz across 100 1-s trials of thestochastically simulated spontaneous mu rhythm (Fig. 7A, n �50 trials; all parameters fixed as in Fig. 6C). Peaks of activity
FIG. 5. Mu-alpha and mu-beta components of the MEG SI mu rhythm arenonoverlapping MEG data showing a histogram of the ratio of alpha to betapower over 100-ms time bins (n � 2,000 trials, 10 Ss). The mean (2.4) andmedian (1.3) of this histogram are �1, underscoring the relative prevalence ofalpha power in the mu signal. Inset: MEG data showing probability that highmu-alpha and mu-beta power (top 33% of all power) occur simultaneouslyroughly 50% of the time (mean � 50.31%; SD � 0.056%).
3562 JONES ET AL.
J Neurophysiol • VOL 102 • DECEMBER 2009 • www.jn.org
on April 7, 2010
jn.physiology.orgD
ownloaded from

emerge in the mu-alpha and mu-beta range. As in the grandaverage MEG data, the mu-alpha power has a higher peak inthis PSD analysis, but a second smaller peak in the mu-betarange is also present (compare Fig. 7A with Fig. 3A).
Second, we calculated the probability that, for a given100-ms time window, mu-alpha and mu-beta were in the topthird of trials sorted from low to high power in the model. Wefound that they co-occurred roughly 50% of the time (Fig. 7B,inset, 48.7% calculated from 100 100-ms time windows),
analogous to the mean of our grand-average MEG data (com-pare with Fig. 5, inset).
Third, we plotted a histogram of the ratio of alpha to betapower calculated in 100-ms time windows (Fig. 7B, grand total1,000 prestimulus time windows, 100 bins). We found that thedistribution of this histogram had the same qualitative shape asthat calculated from the MEG data (compare Figs. 7B and 5).Further, as in the MEG data, the mean (1.4) and median (1.1)of the histogram were �1. A further examination of the model
FIG. 6. Modeling SI mu rhythms with alternating nearly synchronous approximately 10-Hz FF and FB input. A: MEG data showing an example prestimulusSI mu rhythm from a single trial. B: simulating 10-Hz stochastic FF inputs only to SI (depicted schematically in Fig. 2) reproduces a strong 10-Hz MEG signaland very weak 20 Hz. The unit of power is (Am)2. C: alternating 10-Hz FF followed by 10-Hz FB inputs (5-ms delay) reproduces equal power, nonoverlapping,10- and 20-Hz components, with a waveform that oscillates around zero, analogous to the experimental MEG data. Red boxes show that mu-beta cycles emergewhen the FB input is strong enough to cut the mu-alpha oscillation in half. D, top: mean and SD of the symmetry index (SInd) of the MEG SI mu rhythmwaveform around zero, for each subject. Bottom: histogram of SInd across all subjects and trials. Inset: mean and SD of histogram. The SInd is not significantlydifferent from zero (P � 0.001). E: analogous histogram of SInd across trials in the model (n � 40, 1-s trials, parameters as in C), which is also not significantlydifferent from zero (P � 0.001). Inset: mean and SD of histogram.
FIG. 7. Mu-alpha and mu-beta componentsof model SI mu rhythms are nonoverlapping.A: PSD vs. frequency averaged across 50 trials(SE bars) showing 2 peaks of activity in themu-band between 7 and 29 Hz, in agreementwith the MEG data (compare with Fig. 3A).B: model data showing a histogram of the ratioof variance to power over 100-ms time win-dows (n � 1,000 trials). The mean (1.4) andmedian (1.1) of this histogram are �1, analo-gous to the MEG data (compare with MEGdata in Fig. 5). Inset: model data showingprobability that high mu-alpha and mu-betapower (top 33% of all power) occur simulta-neously roughly 50% of the time (mean �48.6%, calculated from 100 0.1-s time win-dows of simulated data; compare with MEGdata in Fig. 5, inset).
3563NEURAL MODELING OF THE MEG MU RHYTHM
J Neurophysiol • VOL 102 • DECEMBER 2009 • www.jn.org
on April 7, 2010
jn.physiology.orgD
ownloaded from
parameters controlling the relative dominance of alpha andbeta power is given in the following text (Fig. 8).
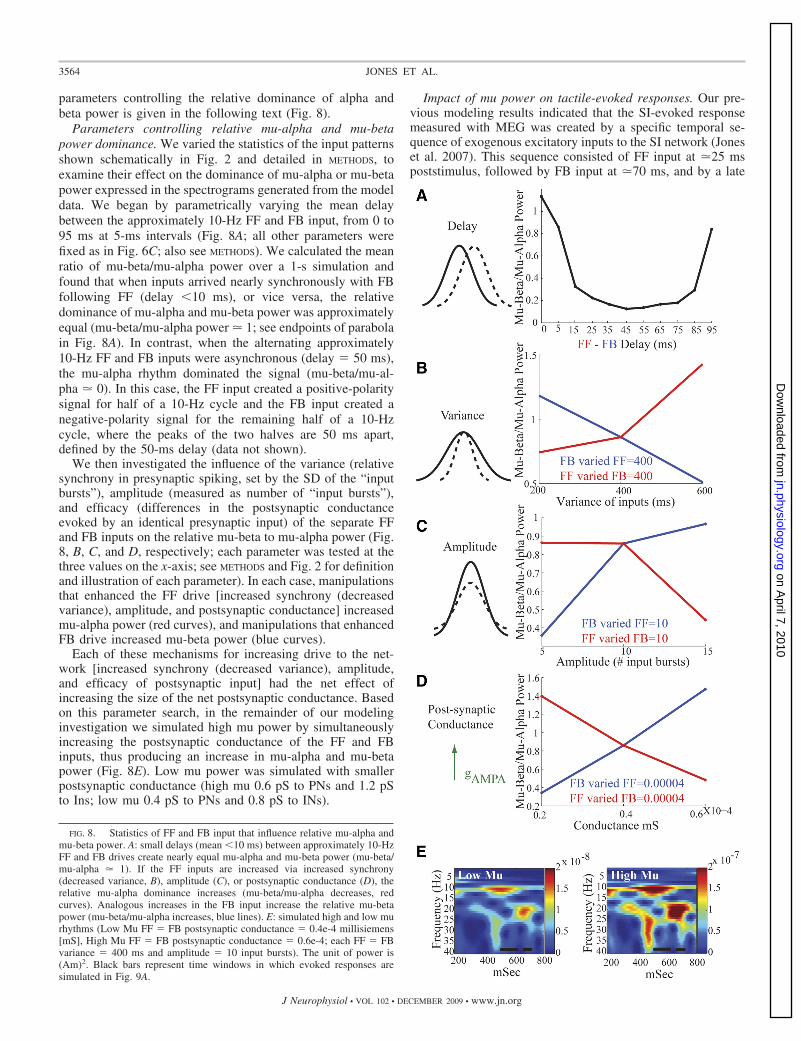
Parameters controlling relative mu-alpha and mu-betapower dominance. We varied the statistics of the input patternsshown schematically in Fig. 2 and detailed in METHODS, toexamine their effect on the dominance of mu-alpha or mu-betapower expressed in the spectrograms generated from the modeldata. We began by parametrically varying the mean delaybetween the approximately 10-Hz FF and FB input, from 0 to95 ms at 5-ms intervals (Fig. 8A; all other parameters werefixed as in Fig. 6C; also see METHODS). We calculated the meanratio of mu-beta/mu-alpha power over a 1-s simulation andfound that when inputs arrived nearly synchronously with FBfollowing FF (delay �10 ms), or vice versa, the relativedominance of mu-alpha and mu-beta power was approximatelyequal (mu-beta/mu-alpha power � 1; see endpoints of parabolain Fig. 8A). In contrast, when the alternating approximately10-Hz FF and FB inputs were asynchronous (delay � 50 ms),the mu-alpha rhythm dominated the signal (mu-beta/mu-al-pha � 0). In this case, the FF input created a positive-polaritysignal for half of a 10-Hz cycle and the FB input created anegative-polarity signal for the remaining half of a 10-Hzcycle, where the peaks of the two halves are 50 ms apart,defined by the 50-ms delay (data not shown).
We then investigated the influence of the variance (relativesynchrony in presynaptic spiking, set by the SD of the “inputbursts”), amplitude (measured as number of “input bursts”),and efficacy (differences in the postsynaptic conductanceevoked by an identical presynaptic input) of the separate FFand FB inputs on the relative mu-beta to mu-alpha power (Fig.8, B, C, and D, respectively; each parameter was tested at thethree values on the x-axis; see METHODS and Fig. 2 for definitionand illustration of each parameter). In each case, manipulationsthat enhanced the FF drive [increased synchrony (decreasedvariance), amplitude, and postsynaptic conductance] increasedmu-alpha power (red curves), and manipulations that enhancedFB drive increased mu-beta power (blue curves).
Each of these mechanisms for increasing drive to the net-work [increased synchrony (decreased variance), amplitude,and efficacy of postsynaptic input] had the net effect ofincreasing the size of the net postsynaptic conductance. Basedon this parameter search, in the remainder of our modelinginvestigation we simulated high mu power by simultaneouslyincreasing the postsynaptic conductance of the FF and FBinputs, thus producing an increase in mu-alpha and mu-betapower (Fig. 8E). Low mu power was simulated with smallerpostsynaptic conductance (high mu 0.6 pS to PNs and 1.2 pSto Ins; low mu 0.4 pS to PNs and 0.8 pS to INs).
Impact of mu power on tactile-evoked responses. Our pre-vious modeling results indicated that the SI-evoked responsemeasured with MEG was created by a specific temporal se-quence of exogenous excitatory inputs to the SI network (Joneset al. 2007). This sequence consisted of FF input at �25 mspoststimulus, followed by FB input at �70 ms, and by a late
FIG. 8. Statistics of FF and FB input that influence relative mu-alpha andmu-beta power. A: small delays (mean �10 ms) between approximately 10-HzFF and FB drives create nearly equal mu-alpha and mu-beta power (mu-beta/mu-alpha � 1). If the FF inputs are increased via increased synchrony(decreased variance, B), amplitude (C), or postsynaptic conductance (D), therelative mu-alpha dominance increases (mu-beta/mu-alpha decreases, redcurves). Analogous increases in the FB input increase the relative mu-betapower (mu-beta/mu-alpha increases, blue lines). E: simulated high and low murhythms (Low Mu FF � FB postsynaptic conductance � 0.4e-4 millisiemens[mS], High Mu FF � FB postsynaptic conductance � 0.6e-4; each FF � FBvariance � 400 ms and amplitude � 10 input bursts). The unit of power is(Am)2. Black bars represent time windows in which evoked responses aresimulated in Fig. 9A.
3564 JONES ET AL.
J Neurophysiol • VOL 102 • DECEMBER 2009 • www.jn.org
on April 7, 2010
jn.physiology.orgD
ownloaded from
feedforwad (LFF) input at �135 ms (shown schematically inFig. 9A, where each input consisted of single presynapticspikes per trial; see METHODS). The sequence that induced theSI-evoked signal may be interpreted as initial FF input from theperiphery through the lemniscal thalamus to granular layers,followed by FB input from higher-order cortex or nonspecificthalamic sources to the supragranular layers, followed by asecond wave of lemniscal thalamic input to the granular layers.
Here, we used our expanded model to investigate the effectsof prestimulus mu power on SI-evoked response magnitudeand timing. The evoked response input sequence was deliveredat several starting phases (SPs) within simulated high and lowprestimulus mu-alpha and mu-beta cycles (marked with blackbars in Fig. 8E) and results were averaged (Fig. 9A). The SP isdefined as the mean time of the initial lemniscal thalamic FFinput to the SI network, which was followed by FB input 45 mslater (mean SP �45 ms) and a subsequent LFF input 65 mslater (mean SP �65 ms). This sequence was delivered at 20different equally spaced SPs in the marked mu-alpha cycle and10 different equally spaced SPs in the marked mu-beta cycle;
the results were averaged over all 30 trials (see Table 2 fordefault postsynaptic conductances and input times of evokedresponse inputs).
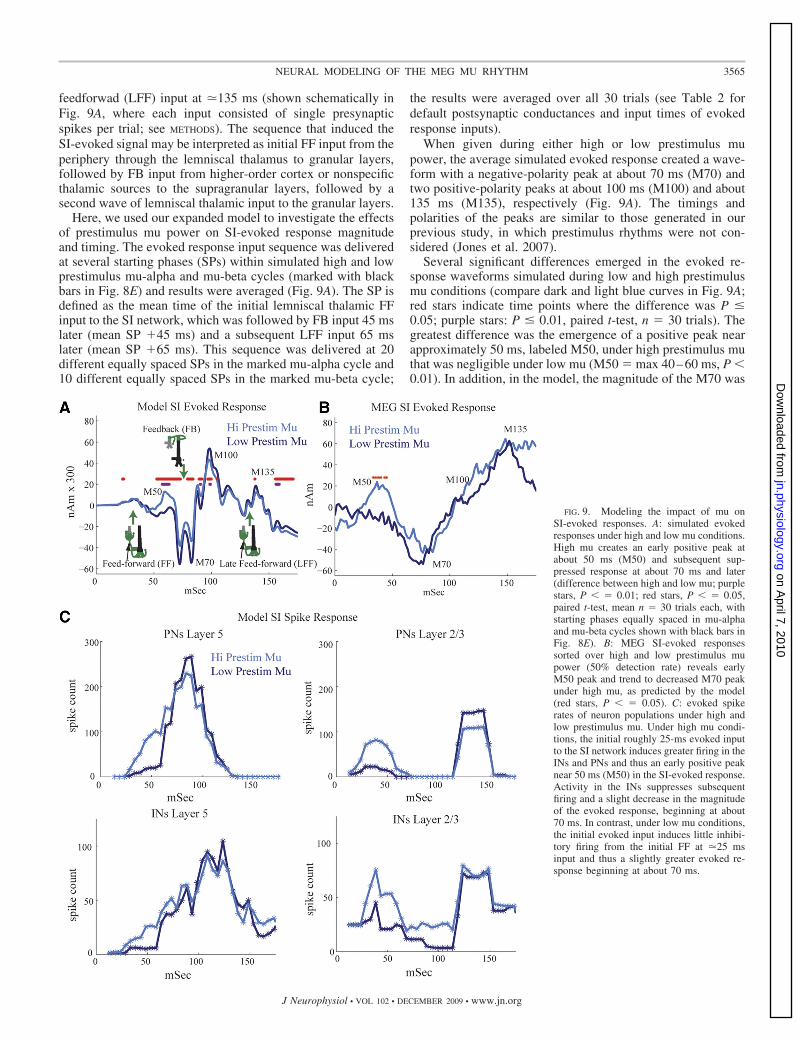
When given during either high or low prestimulus mupower, the average simulated evoked response created a wave-form with a negative-polarity peak at about 70 ms (M70) andtwo positive-polarity peaks at about 100 ms (M100) and about135 ms (M135), respectively (Fig. 9A). The timings andpolarities of the peaks are similar to those generated in ourprevious study, in which prestimulus rhythms were not con-sidered (Jones et al. 2007).
Several significant differences emerged in the evoked re-sponse waveforms simulated during low and high prestimulusmu conditions (compare dark and light blue curves in Fig. 9A;red stars indicate time points where the difference was P �0.05; purple stars: P � 0.01, paired t-test, n � 30 trials). Thegreatest difference was the emergence of a positive peak nearapproximately 50 ms, labeled M50, under high prestimulus muthat was negligible under low mu (M50 � max 40–60 ms, P �0.01). In addition, in the model, the magnitude of the M70 was
FIG. 9. Modeling the impact of mu onSI-evoked responses. A: simulated evokedresponses under high and low mu conditions.High mu creates an early positive peak atabout 50 ms (M50) and subsequent sup-pressed response at about 70 ms and later(difference between high and low mu; purplestars, P � � 0.01; red stars, P � � 0.05,paired t-test, mean n � 30 trials each, withstarting phases equally spaced in mu-alphaand mu-beta cycles shown with black bars inFig. 8E). B: MEG SI-evoked responsessorted over high and low prestimulus mupower (50% detection rate) reveals earlyM50 peak and trend to decreased M70 peakunder high mu, as predicted by the model(red stars, P � � 0.05). C: evoked spikerates of neuron populations under high andlow prestimulus mu. Under high mu condi-tions, the initial roughly 25-ms evoked inputto the SI network induces greater firing in theINs and PNs and thus an early positive peaknear 50 ms (M50) in the SI-evoked response.Activity in the INs suppresses subsequentfiring and a slight decrease in the magnitudeof the evoked response, beginning at about70 ms. In contrast, under low mu conditions,the initial evoked input induces little inhibi-tory firing from the initial FF at �25 msinput and thus a slightly greater evoked re-sponse beginning at about 70 ms.
3565NEURAL MODELING OF THE MEG MU RHYTHM
J Neurophysiol • VOL 102 • DECEMBER 2009 • www.jn.org
on April 7, 2010
jn.physiology.orgD
ownloaded from

smaller (M70 � min 50–100 ms, P � 0.05). There were alsoslight but significant differences between the M100 and M135peaks, and later [150–175] ms activity such that the magnitudewas larger under low mu conditions (M100 � max 75–125;M135 � max 125–175, mean 150–175 ms, P � 0.05; see Fig.9A). Predictions as to the underlying neural activity creatingthese differences are discussed in the following text (Fig. 9C).
We next related these predicted differences to the SI-evokedresponse waveforms in the MEG signal and found consistencybetween the model and experimental data. Figure 9B shows theMEG SI-evoked response sorted over high and low prestimulusmu trials for an equal number of hit-and-miss trials comprisinga 50% detection rate (n � 10 Ss, 30 high and low mu trials persubject). We found that the prestimulus mu power significantlyinfluenced the early evoked response (�70 ms), and showedtrends to a difference in the later components. As in the modeldata, a significant positive peak near 50 ms, labeled M50,emerged under high prestimulus mu (Fig. 9B, P � 0.05 markedwith red asterisks). This peak was followed by a trend thatapproached significance for a decreased M70 peak under highmu (M70 � min 60–75 ms, n � 7/10 Ss, P � 0.1 sign-test),followed by a late trend toward larger magnitude under highmu (mean 150–175 ms, n � 8/10 Ss, P � 0.055 sign-test).
The late trend to higher-magnitude response under high muconditions and the nonreturn to baseline between the M100 andM135 peaks, in the MEG data are discrepant with the modelresults. The nonreturn to baseline was also observed in ourprevious study (Jones et al. 2007) where the strengths of the FFand FB inputs in the current study were derived. One way thatthis difference could be rectified in the model is by assumingthat the late FF input at �135 ms synchronously drives agreater number of neurons. This effect can be achieved in themodel by multiplying by a separate increased scaling factor atthe late time points (�100 ms; data not shown). A large late FFinput that occurs �135 ms after the stimulus may arise as partof an induced poststimulus approximately 10-Hz thalamocor-tical oscillation, which may be stronger with high prestimulusmu. A strong induced 10-Hz oscillation is consistent with thenotion that the stimulus “phase resets” the 10-Hz component ofthe oscillation (Hanslamayer et al. 2007; Makeig et al. 2002).
Increased excitation and inhibition during high mu influ-ences the M50 and M70 and evoked response peaks. To betterunderstand how increased prestimulus drive during high-pre-stimulus mu rhythms created an initially larger M50 responsefollowed by a smaller M70 and later response between theM100 and M135 peaks, we examined the evoked spiking in thenetwork model. We plotted the mean number of spikes(smoothed over 5-ms bins) for the pyramidal and inhibitoryneuron populations in our network during high and low pre-stimulus mu power (Fig. 9C, pooled responses, 30 trials). Wefound that when the evoked response was simulated duringhigh mu power (light blue curves), the FF input at �25 msinduced more spiking in pyramidal and inhibitory neurons inlayers II/III and V compared with low mu (dark blue curves).Firing in the pyramidal cells to the initial FF approximately 25ms input peaked near 50 ms, creating the initial M50 positivepeak seen in the evoked response following high prestimulusmu (light blue curve, Fig. 9A). The positive polarity of the M50peak comes from back-propagation of action potentials up theapical dendrites of the pyramidal neurons (Jones et al. 2007).The strong early evoked inhibition suppresses the pyramidal
response to subsequent FB input at about 70 ms, creating adecreased response and less spiking under high mu conditions(compare �70 ms dark and light traces for L5 and L2/3 excitatorycells in Fig. 9C). In turn, the decreased activity in the E cellscreated a smaller M70 and later responses in the model (comparedark blue and light blue curves in Fig. 9A).
D I S C U S S I O N
We used MEG imaging and biophysically principled com-putational neural modeling to provide a detailed characteriza-tion of the mu-alpha and mu-beta components of the sponta-neous SI mu rhythm, investigate its neural origin, and inves-tigate its impact on early (0–175 ms) evoked responses. TheMEG recordings revealed an SI mu rhythm with mu-alpha andmu-beta components, whose relative expression was subjectdependent. On single trials, the mu-alpha and mu-beta compo-nents were not simultaneous in their emergence, but did co-occur at rates greater than chance.
Our model results led to the novel prediction that the SI murhythm arises from a stochastic nearly synchronous alternatingsequence of approximately 10-Hz FF followed by FB excita-tory input to SI. Simulating mu in this manner reproducedmany key features of the MEG data, including: a mu rhythmwith both mu-alpha and mu-beta components; a rhythm thatoscillates symmetrically around zero polarity; nonsimultaneityof mu-alpha and mu-beta components in time; and an enhancedearly (M50) peak in the tactile-evoked response under high mu.
The predicted enhancement in the early response when stimu-lus presentation coincided with epochs of high mu power wasobserved in our data. We note that the model was completed priorto running our analyses of rhythmogenesis or evoked responsemodulation and that the only model parameters available to ma-nipulation during analysis were those described in the text (pri-marily the strength and arrival synchrony of FB and FF signals).The convergence of experimental and model analysis given thisprincipled modeling approach supports the predictive value of theneural interpretation of model behavior.
To our knowledge, our results provide the first evidence that themu rhythm arises from the combination of two stochastic approx-imately 10-Hz rhythms that arrive to the SI network at differentlaminar locations corresponding to thalamic FF input and intra-cortical FB input. Because the rhythmic approximately 10-Hz FFand FB inputs and SI cortical structure in our model are defined bygeneral principles of cortical circuitry (Felleman and Van Essen1991; Hughes and Crunelli 2005), the predicted mechanisms maybe applicable to the generation of mu-alpha and/or mu-beta fre-quency rhythms observed in other cortical areas. Table 3 summa-rizes the results of our MEG findings, the corresponding predic-tions of our biophysical model, and the mechanistic interpretationof each finding from the model.
Importance of feedforward and feedback input
In expanding our previous SI model (Jones et al. 2007) tostudy mu rhythms, we included several pyramidal neuronintrinsic currents (see INTRODUCTION and METHODS) and localexcitatory and inhibitory interactions, hypothesizing that thesefactors would prove important for the generation of the mu-alpha and mu-beta components of the SI mu rhythm. Becauseour network was trying to reproduce in vivo data from awake
3566 JONES ET AL.
J Neurophysiol • VOL 102 • DECEMBER 2009 • www.jn.org
on April 7, 2010
jn.physiology.orgD
ownloaded from

humans, we also included exogenous driving inputs to SI in anFF and FB manner (Fig. 1). In contrast to our initial assump-tions, we found that although the intrinsic current kinetics inthe pyramidal neurons were essential to the time constant of thesubthreshold integration of current flow along the dendrites,the dominant time constants regulating mu-alpha and mu-betafrequency in the model were determined by the relativestrength and timing of the exogenous rhythmic excitatoryinputs that drive current flow up and down the pyramidalneuron dendrites (Fig. 8). These exogenous inputs were nec-essary to accurately reproduce 10- and 20-Hz components anddistribution of the awake human SI mu rhythm.
Intuitively, one might predict that alternating 10-Hz inputs ata 50-ms delay would ideally combine to generate a 20-HzMEG signal. However, our results suggest that the inputs mustarrive nearly simultaneously (�10 ms) for 20-Hz cycles toemerge. In this case, approximately 10-Hz current flow that isdriven up the pyramidal neuron dendrites (via FF input) is cutin half by current flow driven down the dendrites (via FB input)to create a 20-Hz cycle. With perfectly asynchronous (50-msdelay) FF and FB inputs, a dominant mu-alpha rhythm isproduced. This result, and the fact that stronger FF inputsincrease mu-alpha, whereas stronger FB inputs increase mu-beta (Fig. 8, B–D), leads to direct predictions as to the sourceof variability in mu-alpha or mu-beta expression across sub-
jects (Fig. 3B). We may surmise that subjects with dominantmu-alpha components possess stronger rhythmic FF inputand/or that the intracortical FB input arrives with a phase delaynear 50 ms. In contrast, we predict that subjects with dominantmu-beta components possess stronger FB input and/or nearlyperfectly aligned (�10-ms delay) FF and FB inputs.
Subthreshold oscillations and their relationto higher-frequency gamma rhythms
Several studies report that low-frequency alpha and/or betarange rhythms are directly coupled to higher-frequency gamma(40–80 Hz) rhythms. This effect has been observed in vivo inhumans in electrocorticographic data (Canolty et al. 2006),MEG data (Palva et al. 2005a), and intracranial cortical LFPrecordings (Lakatos et al. 2005; Schroeder and Lakatos 2009b).In our data, we do not see prominent gamma activity in theprestimulus time period (Fig. 3), likely due to the fact that ourMEG signal measures the subthreshold synchronous activity ofa large number of pyramidal neurons (Hamalainen et al. 1993;Zhu et al. 2009), estimated to be on the order of 6 million.Gamma rhythms are likely produced by a smaller subnetworkof spiking excitatory and inhibitory neurons (Cardin et al.2009; Kopell et al. 2000; Pinto et al. 2003; Vierling-Claassenet al. 2008; Whittington et al. 2000) and are thus not recorded
TABLE 3. Summary of MEG results, model reproductions, and predicted neural mechanisms
MEG Data Model Reproduction Predicted Neural Mechanisms
(1) Mu rhythm originating from SI with mu-alpha and mu-beta components (Fig. 3).
Net subthreshold intracellular current flow in layersII/III and V PNs (the simulated SI MEG signal)produced a mu rhythm with mu-alpha and mu-beta components (Fig. 6C).
The mu-alpha rhythm is generated by thalamiclemniscal input generating current flowpropagation up the PN dendrites primarilyaway from the soma. The mu-beta rhythmis generated by input from other corticalregions outside the hand representationexpressing a mu-alpha oscillation. Thisinput arrives in layers II/III and generatescurrent flow “down” PN dendrites towardthe soma. The arrival time of thisintracortical input is stochastic and nearlysynchronous in alternating with the ongoingapproximately 10-Hz FF thalamic input.Alternative distal dendritic inputs (e.g., fromnonspecific thalamic projections) could alsocontribute to mu-beta emergence.
(2) Mu rhythm oscillates around zero with bothcurrent polarities present (Figs. 4 and 6, Aand D).
Simulated mu rhythm exhibited current flow thatoscillates up and down the cortical layerssymmetrically around zero (Fig. 6, C and E).
Alternating excitatory synaptic drive todendrites in the infragranular layers (FF)and supragranular (FB) layers drivessubthreshold intracellular current flow upand down the PN dendrites.
(3) Mu-alpha and mu-beta components oftenoccurred at different times (Figs. 4 and 5).
Simulated mu rhythm contained mu-alpha and mu-beta components that had the same simultaneitycharacteristics as those of the MEG data (Figs.6C and 7B).
Stochastic in timing of each FF and FB “inputburst” (Fig. 2), arriving about every 100 ms,changes the relative dominance of the netFF and FB input strength on each cycle.Enhancing the FF inputs increases the mu-alpha power, whereas enhancing the FBinputs increases the mu-beta power (Fig. 8).
(4) As predicted initially by the model, tactileevoked responses during high prestimulusmu-, compared with low-mu conditions,exhibited an early M50 positive peak,followed by a trend toward a decreased M70peak (Fig. 9B).
Simulated SI evoked responses via a sequence ofFF (�25 ms post-stim) followed by FB (�70ms) and LFF input (�135 ms) input during highmu, compared with low mu (Fig. 8E) exhibitedan early M50 positive peak and a decreased M70peak (Fig. 9A).
High-mu states created an ongoingdepolarization in the PNs and INs, causinggreater firing in both populations to theinitial FF input. Back-propagation of actionpotentials in the PNs created the M50 peak.Recruited inhibition in turn decreased thesubsequent excitatory cell response to theapproximately 70-ms FB input, decreasingthe M70 peak (Fig. 9C).
3567NEURAL MODELING OF THE MEG MU RHYTHM
J Neurophysiol • VOL 102 • DECEMBER 2009 • www.jn.org
on April 7, 2010
jn.physiology.orgD
ownloaded from
in our signal. Further, due to the limited size of our network,the model cannot currently simultaneously reproduce bothlarge- and small-scale phenomena.
Coordination of ongoing 10- and 20-Hz activity betweenbrain areas
The prediction that the SI mu rhythm is driven by approxi-mately 10-Hz rhythmic FF and FB in the model implies that theSI mu rhythm is correlated with 10-Hz activity in lemniscalthalamic sources (providing FF inputs), as well as in higher-ordercortical sources (providing FB inputs) and/or nonlemniscal tha-lamic input. These hypotheses are consistent with several studiesthat report the existence of coherence in power (Schubert et al.2008; Zhang and Ding 2009) and phase-locking (Hanslmayr et al.2007; Palva et al. 2005a) between SI mu rhythms and alpha andbeta frequency activity in prefrontal cortex and other higher-ordercortical areas. Most significantly, Zhang and Ding (2009) recentlyapplied Granger causality analysis to 10-Hz activity measuredfrom EEG electrodes above somatosensory and prefrontal corticesand found that 10-Hz activity propagates from prefrontal cortex toSI. Palva et al. (2005) observed local cross-frequency phase syn-chrony between alpha- and beta-band oscillations widely acrossthe cortex, particularly over the somatomotor regions, during restconditions that increased with execution of mental arithmetictasks (see also Nikulin and Brismar 2006). Interareal 10- to 10-Hzphase synchrony (and even more so 10- to 20-Hz synchrony)increased with task demands with the strongest effects at longdistances. Hanslmayr et al. (2007) examined interareal within-frequency phase synchrony between EEG electrodes during avisual-perception task and found prestimulus alpha (8–12 Hz)phase synchrony mainly between frontal and parietal electrodesites that decreased with perception. Beta (20–30 Hz) phasesynchrony was also observed and increased with perception.Schubert et al. (2008) used EEG during a somatosensory percep-tual masking task and found that prestimulus beta activity (18–26Hz) in prefrontal and sensorimotor electrodes covaried such thatthey were both lower during perceived trials. These results em-phasize the cooperation of alpha- and beta-band activity across thebrain and support the prediction that the SI mu rhythm may arisefrom rhythmic interactions of 10-Hz oscillations projected to SI inan FB manner from higher-order areas. However, our FB inputscould also arise from nonspecific thalamic inputs oscillating witha slight phase shift from that of the lemniscal driver nucleus(Guillery and Sherman 2002; Hughes and Crunelli 2005; Jones2001). The prediction of near synchrony in inputs necessary togenerate beta may be better explained by a common thalamicsource, which may represent a different form of “feedback” ormay represent a distinct form of input.
Symmetric oscillations and their relation toevoked responses
Our finding that the prestimulus SI mu rhythm oscillates sym-metrically around zero is in contrast to previous studies that haveobserved nonsymmetric alpha-frequency oscillations that contrib-ute to the generation of late (�250 ms) components of sensory-evoked responses. Nikulin et al. (2007) reported baseline shifts inmu-alpha frequency activity in sensorimotor MEG sensors on thescalp. These shifts in the mean of the oscillation over time werereported to be responsible for late (�250 ms) components of
median nerve-evoked response. In another study, Mazaheri andJensen (2008) observed asymmetric amplitude modulations inposterior alpha activity that was proposed to contribute to slowcomponents (�300 ms) of visual-evoked responses over occipitalcortex. Both studies conjectured that the baseline shifts and asym-metric oscillations were likely due to differences in outward andinward neural currents producing the magnetic field, which theyposit are unlikely to be equal.
Our data and modeling results suggest that the net inwardand outward current flow, within pyramidal neurons across theSI network, are approximately balanced, creating a symmetricindex near zero in our signal (Fig. 6). The discrepancy betweenour results and those of Nikulin et al. (2007) and Mazaheri andJensen (2008) may arise from several areas. These studiesshowed that differences in the later components of evokedsensory responses (�250 ms) were tied to asymmetry in theprestimulus alpha oscillation. In our study, we investigatedonly the evoked response components �175 ms. Notably, inour data there is a late trend (135–175 ms) to a larger MEGSI-evoked response under high prestimulus mu that was notreproduced by the model. We conjecture that this trend mayarise from stronger poststimulus approximately 135-ms FFinputs to the network during high prestimulus mu conditions.This timing (�100 ms after the first evoked FF input arrives tothe network) is consistent with the idea that there is also astronger poststimulus evoked 10-Hz oscillation that is perhapsphase-locked (Hanslamayer et al. 2007; Makeig et al. 2002).Investigation of evoked poststimulus oscillations is not a focusof our study and we do not make any strong claims regardingthese phenomena here.
Further, we studied activity localized to a primary equivalentcurrent dipole in SI, whereas the other studies investigated sensordata. Both approaches have strengths. A benefit of dipole local-ization is that it provides a more concrete localization of a singlesignal source. Mazaheri and Jensen (2008) described the presenceof a bipolar field pattern in their asymmetry index measure thatwas indicative of the existence of a current dipole located betweenthe positive and negative signals. However, they did not investi-gate the location of the proposed dipole in the brain or find aconsistent direction of the dipole current across subjects, fromwhich inward and outward could be defined.
Last, we calculated the symmetry index of our signal acrossthe entire frequency band of the SI mu rhythm complex (7–29Hz), whereas the previous studies investigated asymmetries inactivity from signals that had been band-passed in the alpha orbeta range. Nikulin et al. (2007) used an independent compo-nent analysis to filter sensor data in the range of 8–13 Hz andinvestigated baseline shifts in the mean amplitude of thefiltered signal. Inspection of our signal over long time periods(10 s) showed modulation of the mu rhythm without such adc-offset effect (see METHODS). Mazaheri and Jensen (2008)band-passed their data using narrow width intervals from 5 to40 Hz (e.g., 8–12 Hz for alpha activity) and found peaks andtroughs in the band-passed data. The time points of the peakand trough values in the band-passed signal were used tocalculate the peak and trough values in the original signal fromwhich the symmetry index was calculated.
Our analysis methods for finding peaks and troughs in thedata are analogous to those of Mazaheri and Jensen (2008).However, in Fig. 6 we quantified the symmetry index frompeaks and troughs calculated from a broader band filter of our
3568 JONES ET AL.
J Neurophysiol • VOL 102 • DECEMBER 2009 • www.jn.org
on April 7, 2010
jn.physiology.orgD
ownloaded from
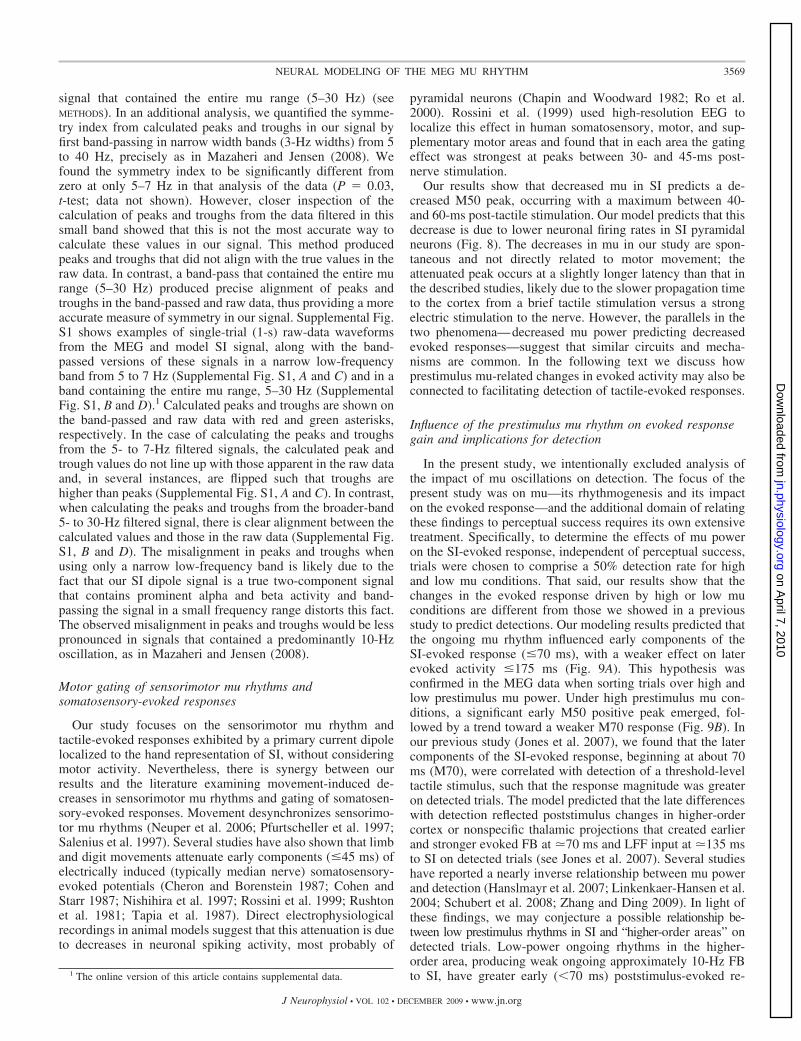
signal that contained the entire mu range (5–30 Hz) (seeMETHODS). In an additional analysis, we quantified the symme-try index from calculated peaks and troughs in our signal byfirst band-passing in narrow width bands (3-Hz widths) from 5to 40 Hz, precisely as in Mazaheri and Jensen (2008). Wefound the symmetry index to be significantly different fromzero at only 5–7 Hz in that analysis of the data (P � 0.03,t-test; data not shown). However, closer inspection of thecalculation of peaks and troughs from the data filtered in thissmall band showed that this is not the most accurate way tocalculate these values in our signal. This method producedpeaks and troughs that did not align with the true values in theraw data. In contrast, a band-pass that contained the entire murange (5–30 Hz) produced precise alignment of peaks andtroughs in the band-passed and raw data, thus providing a moreaccurate measure of symmetry in our signal. Supplemental Fig.S1 shows examples of single-trial (1-s) raw-data waveformsfrom the MEG and model SI signal, along with the band-passed versions of these signals in a narrow low-frequencyband from 5 to 7 Hz (Supplemental Fig. S1, A and C) and in aband containing the entire mu range, 5–30 Hz (SupplementalFig. S1, B and D).1 Calculated peaks and troughs are shown onthe band-passed and raw data with red and green asterisks,respectively. In the case of calculating the peaks and troughsfrom the 5- to 7-Hz filtered signals, the calculated peak andtrough values do not line up with those apparent in the raw dataand, in several instances, are flipped such that troughs arehigher than peaks (Supplemental Fig. S1, A and C). In contrast,when calculating the peaks and troughs from the broader-band5- to 30-Hz filtered signal, there is clear alignment between thecalculated values and those in the raw data (Supplemental Fig.S1, B and D). The misalignment in peaks and troughs whenusing only a narrow low-frequency band is likely due to thefact that our SI dipole signal is a true two-component signalthat contains prominent alpha and beta activity and band-passing the signal in a small frequency range distorts this fact.The observed misalignment in peaks and troughs would be lesspronounced in signals that contained a predominantly 10-Hzoscillation, as in Mazaheri and Jensen (2008).
Motor gating of sensorimotor mu rhythms andsomatosensory-evoked responses
Our study focuses on the sensorimotor mu rhythm andtactile-evoked responses exhibited by a primary current dipolelocalized to the hand representation of SI, without consideringmotor activity. Nevertheless, there is synergy between ourresults and the literature examining movement-induced de-creases in sensorimotor mu rhythms and gating of somatosen-sory-evoked responses. Movement desynchronizes sensorimo-tor mu rhythms (Neuper et al. 2006; Pfurtscheller et al. 1997;Salenius et al. 1997). Several studies have also shown that limband digit movements attenuate early components (�45 ms) ofelectrically induced (typically median nerve) somatosensory-evoked potentials (Cheron and Borenstein 1987; Cohen andStarr 1987; Nishihira et al. 1997; Rossini et al. 1999; Rushtonet al. 1981; Tapia et al. 1987). Direct electrophysiologicalrecordings in animal models suggest that this attenuation is dueto decreases in neuronal spiking activity, most probably of
pyramidal neurons (Chapin and Woodward 1982; Ro et al.2000). Rossini et al. (1999) used high-resolution EEG tolocalize this effect in human somatosensory, motor, and sup-plementary motor areas and found that in each area the gatingeffect was strongest at peaks between 30- and 45-ms post-nerve stimulation.
Our results show that decreased mu in SI predicts a de-creased M50 peak, occurring with a maximum between 40-and 60-ms post-tactile stimulation. Our model predicts that thisdecrease is due to lower neuronal firing rates in SI pyramidalneurons (Fig. 8). The decreases in mu in our study are spon-taneous and not directly related to motor movement; theattenuated peak occurs at a slightly longer latency than that inthe described studies, likely due to the slower propagation timeto the cortex from a brief tactile stimulation versus a strongelectric stimulation to the nerve. However, the parallels in thetwo phenomena—decreased mu power predicting decreasedevoked responses—suggest that similar circuits and mecha-nisms are common. In the following text we discuss howprestimulus mu-related changes in evoked activity may also beconnected to facilitating detection of tactile-evoked responses.
Influence of the prestimulus mu rhythm on evoked responsegain and implications for detection
In the present study, we intentionally excluded analysis ofthe impact of mu oscillations on detection. The focus of thepresent study was on mu—its rhythmogenesis and its impacton the evoked response—and the additional domain of relatingthese findings to perceptual success requires its own extensivetreatment. Specifically, to determine the effects of mu poweron the SI-evoked response, independent of perceptual success,trials were chosen to comprise a 50% detection rate for highand low mu conditions. That said, our results show that thechanges in the evoked response driven by high or low muconditions are different from those we showed in a previousstudy to predict detections. Our modeling results predicted thatthe ongoing mu rhythm influenced early components of theSI-evoked response (�70 ms), with a weaker effect on laterevoked activity �175 ms (Fig. 9A). This hypothesis wasconfirmed in the MEG data when sorting trials over high andlow prestimulus mu power. Under high prestimulus mu con-ditions, a significant early M50 positive peak emerged, fol-lowed by a trend toward a weaker M70 response (Fig. 9B). Inour previous study (Jones et al. 2007), we found that the latercomponents of the SI-evoked response, beginning at about 70ms (M70), were correlated with detection of a threshold-leveltactile stimulus, such that the response magnitude was greateron detected trials. The model predicted that the late differenceswith detection reflected poststimulus changes in higher-ordercortex or nonspecific thalamic projections that created earlierand stronger evoked FB at �70 ms and LFF input at �135 msto SI on detected trials (see Jones et al. 2007). Several studieshave reported a nearly inverse relationship between mu powerand detection (Hanslmayr et al. 2007; Linkenkaer-Hansen et al.2004; Schubert et al. 2008; Zhang and Ding 2009). In light ofthese findings, we may conjecture a possible relationship be-tween low prestimulus rhythms in SI and “higher-order areas” ondetected trials. Low-power ongoing rhythms in the higher-order area, producing weak ongoing approximately 10-Hz FBto SI, have greater early (�70 ms) poststimulus-evoked re-1 The online version of this article contains supplemental data.
3569NEURAL MODELING OF THE MEG MU RHYTHM
J Neurophysiol • VOL 102 • DECEMBER 2009 • www.jn.org
on April 7, 2010
jn.physiology.orgD
ownloaded from
sponses that in turn create greater FB to SI at nearly 70 ms ondetected trials.
Conclusion
In summary, our study is the first to characterize the inter-dependence of the mu-alpha and mu-beta components of the SIMEG measured mu rhythm on single trials. Our computationalmodel provides a novel mechanistic interpretation of the murhythm and its functional significance and presents the firstevidence that the SI mu rhythm may arise from a stochasticnearly synchronous alternating sequence of approximately10-Hz FF followed by FB input to the SI network. Importantly,specific predictions of our computational model are in agree-ment with the characteristics of the SI activity based on sourcemodeling of our MEG data.
A C K N O W L E D G M E N T S
We thank D. Ziegler and P. Hosseini-Varnamkhasti in the Brain andCognitive Science Department at Massachusetts Institute of Technology forexcellent technical support in implementation of data analysis methods, D.Vierling-Claassen and Q. Wan for thorough remarks on the manuscript, and M.Hines for continued support in NEURON software coding.
G R A N T S
This work was supported by National Institutes of Health Grants P41-RR-14075, K25-MH-072941, 1RO1-NS-045130-01, and T32-GM-007484; Na-tional Science Foundation Grant 0316933; the Athinoula A. Martinos Centerfor Biomedical Imaging; and the McGovern Institute for Brain Research.
R E F E R E N C E S
Andersen P, Andersson SA. Physiological Basis of the Alpha Rhythm. NewYork: Appleton-Century-Crofts, 1968.
Barth DS, Di S. Laminar excitability cycles in neocortex. J Neurophysiol 65:891–898, 1991.
Bauer M, Oostenveld R, Peeters M, Fries P. Tactile spatial attentionenhances gamma-band activity in somatosensory cortex and reduces low-frequency activity in parieto-occipital areas. J Neurosci 26: 490–501, 2006.
Bollimunta A, Chen Y, Schroeder CE, Ding M. Neuronal mechanisms ofcortical alpha oscillations in awake-behaving macaques. J Neurosci 28:9976–9988, 2008.
Brovelli A, Ding M, Ledberg A, Chen Y, Nakamura R, Bressler SL. Betaoscillations in a large-scale sensorimotor cortical network: directional influ-ences revealed by Granger causality. Proc Natl Acad Sci USA 101: 9849–9854, 2004.
Buschman TJ, Miller EK. Top-down versus bottom-up control of attention inthe prefrontal and posterior parietal cortices. Science 315: 1860–1862, 2007.
Bush PC, Sejnowski TJ. Reduced compartmental models of neocorticalpyramidal cells. J Neurosci Methods 46: 159–166, 1993.
Canolty RT, Edwards E, Dalal SS, Soltani M, Nagarajan SS, Kirsch HE,Berger MS, Barbaro NM, Knight RT. High gamma power is phase-lockedto theta oscillations in human neocortex. Science 313: 1626–1628, 2006.
Cardin JA, Carlen M, Meletis K, Knoblich U, Zhang F, Deisseroth K, TsaiLH, Moore CI. Driving fast-spiking cells induces gamma rhythm andcontrols sensory responses. Nature 459: 663–667, 2009.
Castro-Alamancos MA, Connors BW. Spatiotemporal properties of short-term plasticity sensorimotor thalamocortical pathways of the rat. J Neurosci16: 2767–2779, 1996.
Cauller LJ, Clancy B, Connors BW. Backward cortical projections toprimary somatosensory cortex in rats extend long horizontal axons in layerI. J Comp Neurol 390: 297–310, 1998.
Cauller LJ, Connors BW. Synaptic physiology of horizontal afferents tolayer I in slices of rat SI neocortex. J Neurosci 14: 751–762, 1994.
Cauller LJ, Kulics AT. The neural basis of the behaviorally relevant N1component of the somatosensory-evoked potential in SI cortex of awakemonkeys: evidence that backward cortical projections signal conscioustouch sensation. Exp Brain Res 84: 607–619, 1991.
Chapin JK, Woodward DJ. Somatic sensory transmission to the cortexduring movement: gating of single cell responses to touch. Exp Neurol 78:654–669, 1982.
Cheron G, Borenstein S. Specific gating of the early somatosensory evokedpotentials during active movement. Electroencephalogr Clin Neurophysiol67: 537–548, 1987.
Cheung AF, Pollen AA, Tavare A, DeProto J, Molnar Z. Comparativeaspects of cortical neurogenesis in vertebrates. J Anat 211: 164–176, 2007.
Cohen LG, Starr A. Localization, timing and specificity of gating of somato-sensory evoked potentials during active movement in man. Brain 110:451–467, 1987.
Contreras D, Steriade M. Cellular basis of EEG slow rhythms: a study ofdynamic corticothalamic relationships. J Neurosci 15: 604–622, 1995.
Dai H. On measuring psychometric functions: a comparison of the constant-stimulus and adaptive up-down methods. J Acoust Soc Am 98: 3135–3139,1995.
Di S, Baumgartner C, Barth DS. Laminar analysis of extracellular fieldpotentials in rat vibrissa/barrel cortex. J Neurophysiol 63: 832–840, 1990.
Donner TH, Siegel M, Oostenveld R, Fries P, Bauer M, Engel AK.Population activity in the human dorsal pathway predicts the accuracy ofvisual motion detection. J Neurophysiol 98: 345–359, 2007.
Douglas RJ, Martin KA. Neuronal circuits of the neocortex. Annu RevNeurosci 27: 419–451, 2004.
Fanselow EE, Richardson KA, Connors BW. Selective, state-dependentactivation of somatostatin-expressing inhibitory interneurons in mouse neo-cortex. J Neurophysiol 100: 2640–2652, 2008.
Felleman DJ, Van Essen DC. Distributed hierarchical processing in theprimate cerebral cortex. Cereb Cortex 1: 1–47, 1991.
Friedman DP, Jones EG. Focal projection of electrophysiologically definedgroupings of thalamic cells on the monkey somatic sensory cortex. BrainRes 191: 249–252, 1980.
Friedman DP, Jones EG, Burton H. Representation pattern in the secondsomatic sensory area of the monkey cerebral cortex. J Comp Neurol 192:21–41, 1980.
Gaetz W, Cheyne D. Localization of sensorimotor cortical rhythms inducedby tactile stimulation using spatially filtered MEG. Neuroimage 30: 899–908, 2006.
Galaburda A, Rosen G, Sherman G. Individual variability in corticalorganization: its relationship to brain laterality and implications for function.Neuropsychologica 28: 529–546, 1990.
Giove F, Mangia S, Bianciardi M, Garreffa G, Di Salle F, Morrone R,Maraviglia B. The physiology and metabolism of neuronal activation: invivo studies by NMR and other methods. Magn Reson Imaging 21: 1283–1293, 2003.
Guillery RW, Sherman SM. Thalamic relay functions and their role incorticocortical communication: generalizations from the visual system.Neuron 33: 163–175, 2002.
Hamalainen M, Hari R, Ilmoniemi RJ, Knuutila J, Lounasmaa OV.Magnetoencephalography: theory, instrumentation, and applications to non-invasive studies of the working human brain. Rev Mod Phys 65: 413–497,1993.
Hamalainen MS, Sarvas J. Realistic conductivity geometry model of thehuman head for interpretation of neuromagnetic data. IEEE Trans BiomedEng 36: 165–171, 1989.
Hanslmayr S, Aslan A, Staudigl T, Klimesch W, Herrmann CS, BaumlKH. Prestimulus oscillations predict visual perception performance betweenand within subjects. Neuroimage 37: 1465–1473, 2007.
Hari R, Aittoniemi K, Jarvinen ML, Katila T, Varpula T. Auditory evokedtransient and sustained magnetic fields of the human brain. Localization ofneural generators. Exp Brain Res 40: 237–240, 1980.
Hari R, Salmelin R. Human cortical oscillations: a neuromagnetic viewthrough the skull. Trends Neurosci 20: 44–49, 1997.
Hughes SW, Crunelli V. Thalamic mechanisms of EEG alpha rhythms andtheir pathological implications. Neuroscientist 11: 357–372, 2005.
Ikeda H, Wang Y, Okada YC. Origins of the somatic N20 and high-frequency oscillations evoked by trigeminal stimulation in the piglets. ClinNeurophysiol 116: 827–841, 2005.
Jackson ME, Cauller LJ. Neural activity in SII modifies sensory evokedpotentials in SI in awake rats. Neuroreport 9: 3379–3382, 1998.
Jensen O, Gelfand J, Kounios J, Lisman JE. Oscillations in the alpha band(9–12 Hz) increase with memory load during retention in a short-termmemory task. Cereb Cortex 12: 877–882, 2002.
3570 JONES ET AL.
J Neurophysiol • VOL 102 • DECEMBER 2009 • www.jn.org
on April 7, 2010
jn.physiology.orgD
ownloaded from

Jones EG. Connectivity of the primary sensory-motor cortex. In: CerebralCortex Sensory-Motor Areas and Aspects of Cortical Connectivity, edited byJones EG, Peters A. New York: Plenum, 1986, p. 113–183.
Jones EG. The thalamic matrix and thalamocortical synchrony. Trends Neu-rosci 24: 595–601, 2001.
Jones SR, Pinto DJ, Kaper TJ, Kopell N. Alpha-frequency rhythms desyn-chronize over long cortical distances: a modeling study. J Comput Neurosci9: 271–291, 2000.
Jones SR, Pritchett DL, Stufflebeam SM, Hamalainen M, Moore CI.Neural correlates of tactile detection: a combined MEG and biophysicallybased computational modeling study. J Neurosci 27: 10751–10764, 2007.
Kaas JH, Garraghty PE. Hierarchical, parallel, and serial arrangements ofsensory cortical areas: connection patterns and functional aspects. Curr OpinNeurobiol 1: 248–251, 1991.
Kandel A, Buzsaki G. Cellular-synaptic generation of sleep spindles, spike-and-wave discharges, and evoked thalamocortical responses in the neocortexof the rat. J Neurosci 17: 6783–6797, 1997.
Kelly SP, Lalor EC, Reilly RB, Foxe JJ. Increases in alpha oscillatory powerreflect an active retinotopic mechanism for distracter suppression duringsustained visuospatial attention. J Neurophysiol 95: 3844–3851, 2006.
Kole MH, Hallermann S, Stuart GJ. Single Ih channels in pyramidal neurondendrites: properties, distribution, and impact on action potential output.J Neurosci 26: 1677–1687, 2006.
Kopell N, Ermentrout GB, Whittington MA, Traub RD. Gamma rhythmsand beta rhythms have different synchronization properties. Proc Natl AcadSci USA 97: 1867–1872, 2000.
Kramer MA, Roopun AK, Carracedo LM, Traub RD, Whittington MA,Kopell NJ. Rhythm generation through period concatenation in rat somato-sensory cortex. PLoS Comput Biol 4: e1000169, 2008.
Kuhlman WN. Functional topography of the human mu rhythm. Electroen-cephalogr Clin Neurophysiol 44: 83–93, 1978.
Kulics AT. Cortical neural evoked correlates of somatosensory stimulusdetection in the rhesus monkey. Electroencephalogr Clin Neurophysiol 53:78–93, 1982.
Kulics AT, Cauller LJ. Cerebral cortical somatosensory evoked responses,multiple unit activity and current source-densities: their interrelationshipsand significance to somatic sensation as revealed by stimulation of theawake monkey’s hand. Exp Brain Res 62: 46–60, 1986.
Lakatos P, Shah AS, Knuth KH, Ulbert I, Karmos G, Schroeder CE. Anoscillatory hierarchy controlling neuronal excitability and stimulus process-ing in the auditory cortex. J Neurophysiol 94: 1904–1911, 2005.
Leek MR. Adaptive procedures in psychophysical research. Percept Psycho-phys 63: 1279–1292, 2001.
Linkenkaer-Hansen K, Nikulin VV, Palva S, Ilmoniemi RJ, Palva JM.Prestimulus oscillations enhance psychophysical performance in humans.J Neurosci 24: 10186–10190, 2004.
Lipton ML, Fu KM, Branch CA, Schroeder CE. Ipsilateral hand input toarea 3b revealed by converging hemodynamic and electrophysiologicalanalyses in macaque monkeys. J Neurosci 26: 180–185, 2006.
Llinas R, Ribary U. Consciousness and the brain. The thalamocorticaldialogue in health and disease. Ann NY Acad Sci 929: 166–175, 2001.
Makeig S, Westerfield M, Jung TP, Enghoff S, Townsend J, CourchesneE, Sejnowski TJ. Dynamic brain sources of visual evoked responses.Science 295: 690–694, 2002.
Mathewson KE, Gratton G, Fabiani M, Beck DM, Ro T. To see or not tosee: prestimulus alpha phase predicts visual awareness. J Neurosci 29:2725–2732, 2009.
Mazaheri A, Jensen O. Asymmetric amplitude modulations of brain oscilla-tions generate slow evoked responses. J Neurosci 28: 7781–7787, 2008.
Mazaheri A, Nieuwenhuis IL, van Dijk H, Jensen O. Prestimulus alpha andmu activity predicts failure to inhibit motor responses. Hum Brain Mapp 30:1791–1800, 2009.
Moore CI, Stern CE, Corkin S, Fischl B, Gray AC, Rosen BR, Dale AM.Segregation of somatosensory activation in the human rolandic cortex usingfMRI. J Neurophysiol 84: 558–569, 2000.
Neuper C, Wortz M, Pfurtscheller G. ERD/ERS patterns reflecting senso-rimotor activation and deactivation. Prog Brain Res 159: 211–222, 2006.
Nikouline VV, Wikstrom H, Linkenkaer-Hansen K, Kesaniemi M, Ilmoni-emi RJ, Huttunen J. Somatosensory evoked magnetic fields: relation topre-stimulus mu rhythm. Clin Neurophysiol 111: 1227–1233, 2000.
Nikulin VV, Brismar T. Phase synchronization between alpha and betaoscillations in the human electroencephalogram. Neuroscience 137: 647–657, 2006.
Nikulin VV, Linkenkaer-Hansen K, Nolte G, Lemm S, Muller KR, Ilmoni-emi RJ, Curio G. A novel mechanism for evoked responses in the humanbrain. Eur J Neurosci 25: 3146–3154, 2007.
Nishihira Y, Araki H, Funase K, Imanaka K. Selective modification ofsomatosensory evoked potential during voluntary finger movement in hu-mans. Percept Mot Skills 85: 259–266, 1997.
Nishitani N, Hari R. Temporal dynamics of cortical representation for action.Proc Natl Acad Sci USA 97: 913–918, 2000.
Okada YC, Wu J, Kyuhou S. Genesis of MEG signals in a mammalian CNSstructure. Electroencephalogr Clin Neurophysiol 103: 474–485, 1997.
Palva JM, Palva S, Kaila K. Phase synchrony among neuronal oscillations inthe human cortex. J Neurosci 25: 3962–3972, 2005a.
Palva S, Linkenkaer-Hansen K, Naatanen R, Palva JM. Early neuralcorrelates of conscious somatosensory perception. J Neurosci 25: 5248–5258, 2005b.
Penfield W, Rasmussen T. The Cerebral Cortex of Man: A Clinical Study ofLocalization and Function. New York: Macmillan, 1950.
Peterson NN, Schroeder CE, Arezzo JC. Neural generators of early corticalsomatosensory evoked potentials in the awake monkey. ElectroencephalogrClin Neurophysiol 96: 248–260, 1995.
Pfurtscheller G, Neuper C, Andrew C, Edlinger G. Foot and hand area murhythms. Int J Psychophysiol 26: 121–135, 1997.
Pineda JA. The functional significance of mu rhythms: translating “seeing”and “hearing” into “doing.” Brain Res Brain Res Rev 50: 57–68, 2005.
Pinto DJ, Jones SR, Kaper TJ, Kopell N. Analysis of state-dependenttransitions in frequency and long-distance coordination in a model oscilla-tory cortical circuit. J Comput Neurosci 15: 283–298, 2003.
Ro JY, Debowy D, Ghosh S, Gardner EP. Depression of neuronal firing ratesin somatosensory and posterior parietal cortex during object acquisition in aprehension task. Exp Brain Res 135: 1–11, 2000.
Rockland KS, Pandya DN. Laminar origins and terminations of corticalconnections of the occipital lobe in the rhesus monkey. Brain Res 179: 3–20,1979.
Roelfsema PR, Engel AK, Konig P, Singer W. Visuomotor integration isassociated with zero time-lag synchronization among cortical areas. Nature385: 157–161, 1997.
Roopun AK, Kramer MA, Carracedo LM, Kaiser M, Davies CH, TraubRD, Kopell NJ, Whittington MA. Period concatenation underlies interac-tions between gamma and beta rhythms in neocortex (Abstract). Front CellNeurosci 2: 1, 2008.
Roopun AK, Middleton SJ, Cunningham MO, LeBeau FE, Bibbig A,Whittington MA, Traub RD. A beta2-frequency (20–30 Hz) oscillation innonsynaptic networks of somatosensory cortex. Proc Natl Acad Sci USA103: 15646–15650, 2006.
Rossini PM, Babiloni C, Babiloni F, Ambrosini A, Onorati P, Carducci F,Urbano A. “Gating” of human short-latency somatosensory evoked corticalresponses during execution of movement. A high resolution electroencepha-lography study. Brain Res 843: 161–170, 1999.
Rushton DN, Rothwell JC, Craggs MD. Gating of somatosensory evokedpotentials during different kinds of movement in man. Brain 104: 465–491,1981.
Salenius S, Schnitzler A, Salmelin R, Jousmaki V, Hari R. Modulation ofhuman cortical rolandic rhythms during natural sensorimotor tasks. Neuro-image 5: 221–228, 1997.
Salmelin R, Hamalainen M, Kajola M, Hari R. Functional segregation ofmovement-related rhythmic activity in the human brain. Neuroimage 2:237–243, 1995.
Salmelin R, Hari R. Spatiotemporal characteristics of sensorimotor neuro-magnetic rhythms related to thumb movement. Neuroscience 60: 537–550,1994.
Sarvas J. Basic mathematical and electromagnetic concepts of the biomag-netic inverse problem. Phys Med Biol 32: 11–22, 1987.
Sastre-Janer FA, Regis J, Belin P, Mangin JF, Dormont D, Masure MC,Remy P, Frouin V, Samson Y. Three-dimensional reconstruction of thehuman central sulcus reveals a morphological correlate of the hand area.Cereb Cortex 8: 641–647, 1998.
Schroeder CE, Lakatos P. Low-frequency neuronal oscillations as instru-ments of sensory selection. Trends Neurosci 32: 9–18, 2009a.
Schroeder CE, Lakatos P. The gamma oscillation: master or slave? BrainTopogr 22: 24–26, 2009b.
Schubert R, Haufe S, Blankenburg F, Villringer A, Curio G. Now you’llfeel it, now you won’t: EEG rhythms predict the effectiveness of perceptualmasking. J Cogn Neurosci 21: 2407–2419, 2008.
3571NEURAL MODELING OF THE MEG MU RHYTHM
J Neurophysiol • VOL 102 • DECEMBER 2009 • www.jn.org
on April 7, 2010
jn.physiology.orgD
ownloaded from
Sherman SM. Thalamic relays and cortical functioning. Prog Brain Res 149:107–126, 2005.
Silva LR, Amitai Y, Connors BW. Intrinsic oscillations of neocortex gener-ated by layer 5 pyramidal neurons. Science 251: 432–435, 1991.
Suffczynski P, Kalitzin S, Pfurtscheller G, Lopes da Silva FH. Computa-tional model of thalamo-cortical networks: dynamical control of alpharhythms in relation to focal attention. Int J Psychophysiol 43: 25–40, 2001.
Szurhaj W, Derambure P, Labyt E, Cassim F, Bourriez JL, Isnard J,Guieu JD, Mauguiere F. Basic mechanisms of central rhythms reactivity topreparation and execution of a voluntary movement: a stereoelectroencepha-lographic study. Clin Neurophysiol 114: 107–119, 2003.
Tallon-Baudry C, Bertrand O, Delpuech C, Permier J. Oscillatory gamma-band (30–70 Hz) activity induced by a visual search task in humans.J Neurosci 17: 722–734, 1997.
Tapia MC, Cohen LG, Starr A. Selectivity of attenuation (i.e., gating) ofsomatosensory potentials during voluntary movement in humans. Electro-encephalogr Clin Neurophysiol 68: 226–230, 1987.
Tesche CD, Uusitalo MA, Ilmoniemi RJ, Huotilainen M, Kajola M,Salonen O. Signal-space projections of MEG data characterize both distrib-uted and well-localized neuronal sources. Electroencephalogr Clin Neuro-physiol 95: 189–200, 1995.
Thomson AM, West DC, Wang Y, Bannister AP. Synaptic connections andsmall circuits involving excitatory and inhibitory neurons in layers 2–5 ofadult rat and cat neocortex: triple intracellular recordings and biocytinlabelling in vitro. Cereb Cortex 12: 936–953, 2002.
Tiihonen J, Kajola M, Hari R. Magnetic mu rhythm in man. Neuroscience32: 793–800, 1989.
Traub RD, Contreras D, Cunningham MO, Murray H, LeBeau FE,Roopun A, Bibbig A, Wilent WB, Higley MJ, Whittington MA.Single-column thalamocortical network model exhibiting gamma oscil-lations, sleep spindles, and epileptogenic bursts. J Neurophysiol 93:2194 –2232, 2005.
Uematsu S, Lesser RP, Gordon B. Localization of sensorimotor cortex: theinfluence of Sherrington and Cushing on the modern concept. Neurosurgery30: 904–913, 1992.
Uusitalo MA, Ilmoniemi RJ. Signal-space projection method for separat-ing MEG or EEG into components. Med Biol Eng Comput 35: 135–140,1997.
van Wijk BC, Daffertshofer A, Roach N, Praamstra P. A role of betaoscillatory synchrony in biasing response competition? Cereb Cortex 19:1294–1302, 2009.
Vierling-Claassen D, Siekmeier P, Stufflebeam S, Kopell N. ModelingGABA alterations in schizophrenia: a link between impaired inhibition andaltered gamma and beta range auditory entrainment. J Neurophysiol 99:2656–2671, 2008.
von Stein A, Chiang C, Konig P. Top-down processing mediated byinterareal synchronization. Proc Natl Acad Sci USA 97: 14748 –14753,2000.
White LE, Andrews TJ, Hulette C, Richards A, Groelle M, Paydarfar J,Purves D. Structure of the human sensorimotor system. I. Morphology andcytoarchitecture of the central sulcus. Cereb Cortex 7: 18–30, 1997.
Whittington MA, Traub RD, Kopell N, Ermentrout B, Buhl EH. Inhibi-tion-based rhythms: experimental and mathematical observations on net-work dynamics. Int J Psychophysiol 38: 315–336, 2000.
Wilke M, Logothetis NK, Leopold DA. Local field potential reflects percep-tual suppression in monkey visual cortex. Proc Natl Acad Sci USA 103:17507–17512, 2006.
Witham CL, Baker SN. Network oscillations and intrinsic spiking rhythmic-ity do not covary in monkey sensorimotor areas. J Physiol 580: 801–814,2007.
Witham CL, Wang M, Baker SN. Cells in somatosensory areas showsynchrony with beta oscillations in monkey motor cortex. Eur J Neurosci26: 2677–2686, 2007.
Worden MS, Foxe JJ, Wang N, Simpson GV. Anticipatory biasing ofvisuospatial attention indexed by retinotopically specific alpha-band elec-troencephalography increases over occipital cortex. J Neurosci 20: RC63,2000.
Yousry TA, Schmid UD, Alkadhi H, Schmidt D, Peraud A, Buettner A,Winkler P. Localization of the motor hand area to a knob on the precentralgyrus. A new landmark. Brain 120: 141–157, 1997.
Zhang Y, Ding M. Detection of a weak somatosensory stimulus: role of theprestimulus mu rhythm and its top-down modulation. J Cogn Neurosci(April 28, 2009). doi:10.1162/jocn.2009.21247.
Zhu Z, Zumer JM, Lowenthal ME, Padberg J, Recanzone GH, KrubitzerLA, Nagarajan SS, Disbrow EA. The relationship between magnetic andelectrophysiological responses to complex tactile stimuli (Abstract). BMCNeurosci 10: 4, 2009.
3572 JONES ET AL.
J Neurophysiol • VOL 102 • DECEMBER 2009 • www.jn.org
on April 7, 2010
jn.physiology.orgD
ownloaded from
Related Documents