Steam reforming of methanol over x% Cu/ZneAl 400 500 based catalysts for production of hydrogen: Preparation by adopting memory effect of hydrotalcite and behavior evaluation D. Hammoud a,b,c , C. Gennequin a,b,* , A. Aboukaı¨s a,b , E. Abi Aad a,b a Universit e Lille Nord de France, F-59000 Lille, France b Universit e du Littoral C^ ote d'Opale, Unit e de Chimie Environnementale et Interactions sur le Vivant, E.A. 4492, MREI 1, 59140 Dunkerque, France c Conseil National de la Recherche Scientifique Libanais (CNRSL), Liban article info Article history: Received 19 June 2014 Received in revised form 8 September 2014 Accepted 15 September 2014 Available online 13 October 2014 Keywords: H 2 production Steam reforming of methanol (SRM) Reconstruction Cu/ZneAl Memory effect abstract A novel catalyst for hydrogen production from the catalytic process of methanol steam reforming could play an important role in hydrogen production to be used as a feed for fuel cell. Our study focuses on the preparation of copper supported on calcined hydrotalcite catalysts using the memory effect of zincealuminum hydrotalcite. Zincealuminum was calcined at 400 C and dipped in a copper nitrate aqueous solution. The steam reforming of methanol was studied in a fixed-bed reactor under mild conditions and a reaction tem- perature range of 200e350 C. The catalysts were characterized by XRD, SEM, TPR, chem- isorption N 2 O, TG/DTA, IR and N 2 adsorption techniques in order to identify their physical and chemical properties. The results evince the regeneration and the reconstruction of the layered structure that have a positive influence on the interactions between support and copper species. After activation by calcination at 500 C, the solids copper/zincealuminum (Cu/ZneAl 400 500) showed an interesting mixed oxides and were tested in the reaction of methanol steam reforming. The 10% Cu/ZneAl 400 500 exhibits the best catalytic activity about 75.44% of H 2 yield with 51.87% of methanol conversion at 250 C. Methanol con- version was found to be a strong function of catalyst reducibility and copper concentration. Also, reaction temperature depended strongly on the amount of Cu 2 O formed in the acti- vated catalyst. Copyright © 2014, Hydrogen Energy Publications, LLC. Published by Elsevier Ltd. All rights reserved. Introduction The growing world population leads to increase the demand of energy. To date, fossil fuels have been used as the main energy sources to support such demand. Unfortunately, fossil fuel reserves are expected to last no longer than 50e100 years. The shortage of energy is thus becoming a noticed problem for mankind, prompting worldwide searches for alternative energy resources [1]. * Corresponding author. Universit e Lille Nord de France, F-59000 Lille, France. E-mail address: [email protected] (C. Gennequin). Available online at www.sciencedirect.com ScienceDirect journal homepage: www.elsevier.com/locate/he international journal of hydrogen energy 40 (2015) 1283 e1297 http://dx.doi.org/10.1016/j.ijhydene.2014.09.080 0360-3199/Copyright © 2014, Hydrogen Energy Publications, LLC. Published by Elsevier Ltd. All rights reserved.

Welcome message from author
This document is posted to help you gain knowledge. Please leave a comment to let me know what you think about it! Share it to your friends and learn new things together.
Transcript

ww.sciencedirect.com
i n t e r n a t i o n a l j o u r n a l o f h y d r o g e n en e r g y 4 0 ( 2 0 1 5 ) 1 2 8 3e1 2 9 7
Available online at w
ScienceDirect
journal homepage: www.elsevier .com/locate/he
Steam reforming of methanol over x% Cu/ZneAl400 500 based catalysts for production of hydrogen:Preparation by adopting memory effect ofhydrotalcite and behavior evaluation
D. Hammoud a,b,c, C. Gennequin a,b,*, A. Aboukaıs a,b, E. Abi Aad a,b
a Universit�e Lille Nord de France, F-59000 Lille, Franceb Universit�e du Littoral Cote d'Opale, Unit�e de Chimie Environnementale et Interactions sur le Vivant,
E.A. 4492, MREI 1, 59140 Dunkerque, Francec Conseil National de la Recherche Scientifique Libanais (CNRSL), Liban
a r t i c l e i n f o
Article history:
Received 19 June 2014
Received in revised form
8 September 2014
Accepted 15 September 2014
Available online 13 October 2014
Keywords:
H2 production
Steam reforming of methanol (SRM)
Reconstruction
Cu/ZneAl
Memory effect
* Corresponding author. Universit�e Lille NorE-mail address: cedric.gennequin@univ-l
http://dx.doi.org/10.1016/j.ijhydene.2014.09.00360-3199/Copyright © 2014, Hydrogen Ener
a b s t r a c t
A novel catalyst for hydrogen production from the catalytic process of methanol steam
reforming could play an important role in hydrogen production to be used as a feed for fuel
cell. Our study focuses on the preparation of copper supported on calcined hydrotalcite
catalysts using the memory effect of zincealuminum hydrotalcite. Zincealuminum was
calcined at 400 �C and dipped in a copper nitrate aqueous solution. The steam reforming of
methanol was studied in a fixed-bed reactor under mild conditions and a reaction tem-
perature range of 200e350 �C. The catalysts were characterized by XRD, SEM, TPR, chem-
isorption N2O, TG/DTA, IR and N2 adsorption techniques in order to identify their physical
and chemical properties. The results evince the regeneration and the reconstruction of the
layered structure that have a positive influence on the interactions between support and
copper species. After activation by calcination at 500 �C, the solids copper/zincealuminum
(Cu/ZneAl 400 500) showed an interesting mixed oxides and were tested in the reaction of
methanol steam reforming. The 10% Cu/ZneAl 400 500 exhibits the best catalytic activity
about 75.44% of H2 yield with 51.87% of methanol conversion at 250 �C. Methanol con-
version was found to be a strong function of catalyst reducibility and copper concentration.
Also, reaction temperature depended strongly on the amount of Cu2O formed in the acti-
vated catalyst.
Copyright © 2014, Hydrogen Energy Publications, LLC. Published by Elsevier Ltd. All rights
reserved.
Introduction
The growing world population leads to increase the demand
of energy. To date, fossil fuels have been used as the main
d de France, F-59000 Lilleittoral.fr (C. Gennequin).80gy Publications, LLC. Publ
energy sources to support such demand. Unfortunately, fossil
fuel reserves are expected to last no longer than 50e100
years. The shortage of energy is thus becoming a noticed
problem for mankind, prompting worldwide searches for
alternative energy resources [1].
, France.
ished by Elsevier Ltd. All rights reserved.

Fig. 1 e Structure of hydrotalcite.
i n t e rn a t i o n a l j o u r n a l o f h y d r o g e n en e r g y 4 0 ( 2 0 1 5 ) 1 2 8 3e1 2 9 71284
Energy from hydrogen feeding to a fuel cell is one of the
most interesting alternative resources. A fuel cell unit gener-
ates electrical energy from an electrochemical reaction of
hydrogenwith oxygen, yielding an environmentally benign by
product, water [2,3]. The hydrogen fuel cell is claimed as an
alternative energy resource, with high efficiency [4]. In com-
parison with conventional internal combustion engines, fuel
cells have been extensively studied due to their attractive
properties, such as high power density, low emissions of
pollutants, low temperature operation and compactness. The
hydrogen used in fuel cells can replace fossil fuel. By
combining the hydrogen with fuel cells, it can be efficiently
used to convert the chemical energy into electricity. Among
the various types of fuel cells, the polymer electrolyte mem-
brane fuel cells (PEMFCs) are mostly used for small and me-
dium sizes stationary and mobile applications.
The alternative to the use of either liquid hydrogen or high
pressure hydrogen on board is to carry liquid fuels that have
high energy densities and covert those to a hydrogen-rich gas
(reformate) via an on-board fuel cell processor [5]. One of the
most favorable liquid fuels used to produce hydrogen on
board is methanol. This is due to the following superior ad-
vantages of using methanol in comparison to other liquid
fuels in particular with respect to the on-board reforming
process:
1. Low cost, boiling point, reforming temperature and atmo-
spheric pressure.
2. Simple molecule with high molar ratio of hydrogen to
carbon and as being easily stored.
3. Low CO concentration (CO is poison to the fuel cell
performance).
4. No emission of pollutants, such as NOx, SOx.
For the purpose of fuel-cell application, H2 can be extracted
from methanol through different processes [6]: decomposi-
tion, steam reforming and partial oxidation. The two last re-
actions produce a considerable amount of CO as a by product.
For the application of PEMFC, even traces of CO (>20 ppm) in
the reformed gas deteriorate a Pt electrode and the cell per-
formance is lowered dramatically. Hence, in order to utilize
hydrogen for fuel cells, it is highly desirable to develop a
process that can produce hydrogen without or with the min-
imum CO in the reformed gas. The reaction of steam
reforming of methanol (SRM) is shown in equation (1) [7]. This
reaction provides the highest hydrogen production among
other reforming reactions.
CH3OHþH2O/3H2 þ CO2 DH0 ¼ þ49:4 kJmol�1 (1)
In the literature, the most frequently tested catalysts for
SRM belong to the CueZnOeAl2O3 system, with quite high
copper content (30e50 wt% as CuO). In most cases, the
commercially available industrial low temperature water gas
shift catalysts are tested for SRM [8], although they have been
optimized for a different reaction. Hydrotalcite-type solids
(Fig. 1) have been proposed as possible precursors for such
catalysts. Hydrotalcite e like compounds, also known as
layered double hydroxides (LDH) or anionic clays, have a
layered structure derived from that of brucite, i.e. magnesium
hydrotalcite. To understand the structure of these
compounds, it is necessary to start from the structure of
brucite, Mg(OH)2, where octahedron of Mg2þ (6-fold coordi-
nated to OH�) share edges to form infinite sheets. These
sheets are stacked on top of each other and are held together
by hydrogen bonding. When Mg2þ ions are substituted by a
trivalent ion having not too different radius (such as Fe3þ for
pyroaurite and Al3þ for hydrotalcite, respectively), a positive
charge is generated in the hydroxyl sheet. This net positive
charge is compensated for by CO32� anions, which lie in the
interlayer region between the two brucite-like sheets. In the
free space of this interlayer the water of crystallization also
find a place. The most interesting properties of the oxides
obtained by calcination are the following [9]:
- High surface area,
- Basic properties,
- Formation of homogeneous mixtures of oxides with very
small crystal size, stable to thermal treatments, which by
reduction form small and thermally stable metallic
crystallites,
- “Memory effect”,
The calcination of hydrotalcite can lead foremost to the
formation of amorphous compounds followed by pre-spinel
oxides which can contribute to increase significantly the
specific surface area. It is known that hydrotalcite have basic
properties significantly lower than those of their mixed oxides
obtained by the thermal decomposition. The basic properties
of the decomposed phase depend on the report MII/MIII and on
the temperature of calcination. The basic sites are of type O2�,M2þeO3�, M2þeO2� and OH�. In general, the carbonates affect
the effective basicity of catalyst covering the most basic sites
which are no longer available for a possible interaction with
an acid reactant [9].
Ternary CuO/ZnO/Al2O3 catalysts have been widely
employed in the actual reforming process since the early
1960s. The catalyst was usually prepared by a co-precipitation
(cp-) method, resulting in the higher Cu metal dispersion and,
as a consequence, the higher catalytic activity [10]. However,
such type of catalysts are not sustainable enough in the

i n t e r n a t i o n a l j o u r n a l o f h y d r o g e n en e r g y 4 0 ( 2 0 1 5 ) 1 2 8 3e1 2 9 7 1285
reformer for PEFCs, since the deactivation took place due to an
oxidative sintering of Cu metal species especially during daily
startup and shutdown operation, which is inevitable for the
domestic use. We have applied an impregnation method of
copper solution on calcined support synthesized by hydro-
talcite route.
Few papers have reported the modification of Cu/ZnO/
Al2O3 catalysts by adopting a “memory effect” of hydrotalcite
that is the recovery of the original layered structure of LDH
from ex- LDH [11], possibly formed in the catalyst precursors.
As a result of the contact of the catalyst oxide formwithwater,
complex physicochemical processes occur, leading to the
reconstruction of the layered structure. As long as the tem-
perature of the thermal treatment of the LDHmaterial is lower
than the critical value [9], this structural memory effect is
feasible. Too high temperature results in the formation of
stable, highly crystalline oxide and spinel forms, from which
the HT-like structure cannot be recovered.
In the present work, we aim to study the performance of
various copper contents impregnated on ZneAleO mixed
oxides derived from the ZneAl hydrotalcite by adopting the
“memory effect” for the steam reforming of methanol (1).
Besides, the results of this study could lead to a better un-
derstanding of the influence of catalyst preparation in order to
develop efficient catalyst for hydrogen production from the
steam reforming process.
Materials and methods
Preparation of catalysts
Zn6Al2(OH)16CO3$4H2O precursor was prepared, respecting the
ratio with M2þ/M3þ ¼ 3, via hydrotalcite route by co-
precipitation (cp) as follows: an aqueous solution of
Zn(NO3)2$6H2O and Al(NO3)3$9H2O was dropped into an
aqueous solution of Na2CO3 with vigorous stirring and the pH
was simultaneously adjusted to 10 by addition of an aqueous
solution of NaOH (2 M) at 60 �C. The solution containing the
precipitate was aged at 60 �C for 1 h then dried for 24 h. The
obtained precipitate was filtered, washed with distilled water
(50 �C) and dried at 60 �C for 48 h. After that, it was calcined at
400 �C under a flow of air to form the oxide of zinc aluminum
denoted ZneAl 400 [12].
Copper impregnation has been done by adopting the
“memory effect” of ZneAl hydrotalcite as follows: 1.0 g of the
powder ZneAl calcined at 400 �C were dipped in 100 ml of
aqueous solution of copper nitrate Cu(NO3)2$3H2O with
different percentage weight x (x ¼ 1, 2, 5 and 10) for 1 h under
agitation at room temperature. This process was followed by
the drying treatments: first with a rotary evaporator, then in a
furnace with low humidity environment at 60 �C for 24 h.
During the dipping, ZneAl hydrotalcite was reconstructed
from ZneAleO mixed oxide due to the “memory effect”. The
samples were finally calcined at 500 �C under flow of air
(33 ml min�1, 1 �C/min, and 12 h at 500 �C) and were denoted x
% Cu/ZneAl 400 500.
Several physicochemical techniques as XRD, FT-IR, SEM,
TG-DTA, BET, N2O chemisorption and TPR were used to
characterize the synthesized catalysts.
Characterization
Powder X-ray diffraction (XRD) patterns were measured on a
Bruker D8 advance diffractometer equipped with a copper
anode (l ¼ 1.5406 A). The samples were scanned between
4� < 2q < 80� with the step size of D (2q) ¼ 0.02� and a count
time/step ¼ 6 s. The comparison with the JCPDS files allows
the indexing of the diffraction patterns.
Coupled thermogravimetric (TG) and differential thermal
(DTA) analyses were performed with a Netzsch STA 409
apparatus equipped with a microbalance in a flowing air.
Approximately 25 mg of sample was heated in an open plat-
inum crucible in air stream flow of 75 ml min�1, raising the
sample temperature to 1000 �C.The IR absorption spectra were recorded with an FT-IR
Equinox 55 Bruker spectrometer in the range 4000e400 cm�1
and a resolution of 4 cm�1. For the analysis of the skeletal
vibrations, KBr pressed disks were used. The “operando” FT-IR
spectra were recorded using a diffuse reflectance accessory
equipped with a high temperature cell (Harrick accessories).
The solid was heated under air from the ambient temperature
till 400 �C and the spectra were registered in function of
temperature in the range 4000e1000 cm�1 with 32 scans and a
resolution of 4 cm�1.
The morphology of powder is examined with a 438 VP
microscopy (LEO Cambridge). The samples were metallized
with goldepalladium.
BET surfaces of the samples were determined by nitrogen
adsorption at �196 �C (using thermo-electron Q surf M1
apparatus) preceded by outgassing for 30 min at 130 �C. Thesurface areas were calculated according to the method of
Brunauer, Emmett and Teller (BET).
The study of porosity was measured on Sorptomatic 1990
(Thermo Electron Corporation). The sample should be treated
under vacuum to remove all the impurities. It was heated at
350 �C to liberate pores fromwater and impurities. Then it was
dipped in liquid nitrogen at �196 �C and analyzed to deter-
mine the volume of adsorbed nitrogen.
An Altamira AMI 200 apparatus equipped with a TCD de-
tector was employed for TPR measurements. A pretreatment
of the sample under a flow of argon at 150 �C during 1 h is
recommended. TPR analyses were carried out on calcined
samples at a rate of 5 �C.min�1 using a 5% H2/Ar (30 ml.min�1)
mixture from 20 to 900 �C.The N2O-measurements are made at ambient pressure,
prior to each measurement, the sample was pretreated with
argon at 150 �C. Then a reduction with H2/Ar at 700 �C was
occurred. The reactor is then cooled for the N2O reaction and
then flushed with argon at 90 �C. A measurement is initiated
by switching from argon to N2O at 90 �C to oxidize copper at
surface of catalysts followed by flow of argon. A second TPR
from 90 to 400 �C is realized to reduce the copper oxidized at
the surface. The amount of N2O evolved can be accurately
computed from the H2-back-titration.
Experimental conditions of tests
The catalyst was pretreated in a flow of argon (25 ml.min�1) at
200 �C for 2 h. A long-shaped Pyrex glass tube with an inner
diameter of 8-mmwas used as a reactor. Typically a 70e80mg

Fig. 2 e XRD patterns of ZneAl HT and ZneAl 400.
i n t e rn a t i o n a l j o u r n a l o f h y d r o g e n en e r g y 4 0 ( 2 0 1 5 ) 1 2 8 3e1 2 9 71286
portion of catalyst was loaded into the reactor with a coaxially
centered thermocouple. The SRM reaction was carried out
using a fixed-bed flow reactor in the temperature range
200e350 �C at atmospheric pressure with H2O/CH3OH¼ 2. The
reaction was started by introducing the reactants to the
reactor (0.8 ml.h�1) into the preheater carried by argon
(25 ml.min�1) by means of a liquid pump. All the lines and
valves through the reactants feed, the entry; the exit of the
reactor and the gas chromatographs were heated to 160 �C to
prevent the condensation of water. The reaction was carried
out under stepwise increasing temperature from 200 to 300 �Cduring 3 h. The outflow gases were automatically analyzed by
on-line gas chromatograph (GC: Varian 3800). This GC was
equipped with Haysep Q (CO2, CH4) and molecular sieve (H2,
CO), Ar carrier gas and TCD. Also, the by products: formalde-
hyde (HCHO), formic acid (HCOOH) and methyl formate
(CH3OCHO) were analyzed by FID of the GC. This first heating
is intended to activate catalyst and identify the oxidation state
of copper after reaction. Copper species were reduced by H2
produced during reaction and simultaneously undergone a
reoxidation in the vaporized feed containing water.
The conversion of methanol and the selectivity of different
products were calculated by the following formulas:
Conversion %ð Þ ¼ 100�n0MeOH � nf
MeOH
n0MeOH
%SH2 ¼ 100* molarity of H2Pproducts of the reaction
%SCO2 ¼ 100* molarity of CO2Pproducts of the reaction
%SCO ¼ 100* molarity of COP
products of the reaction
The catalystswere characterized after activation by several
methods (XRD, N2O chemisorption, TG/DTA and IR).
At low temperature, the conversion of methanol was ab-
sent without reduction, it may be due to the non-presence of
the active species responsible of activation of reactants in
absence of reduction. For that, the reduction and oxidation
pre-treatment (first heating) was recommended to activate
the catalyst at low temperature before starting heating again
from 200 to 300 �C with the same steps mentioned above.
To follow the evolution of the non-converted reactants,
products and by-products, we have coupled a mass spec-
trometry to the GC, this operation helps us to identify the
mechanism reaction over the x% Cu/ZneAl 400 500
catalysts.
Fig. 3 e XRD patterns of ZneAl HT and dried impregnated
catalysts x% Cu/ZneAl 400.
Results and discussion
X-ray diffraction (XRD)
The diffractograms of the hydrotalcite ZneAl HT and the
calcined support ZneAl 400 are presented in Fig. 2. The XRD
pattern of ZneAl HT showed the presence of two phases:
hydrotalcite (JCPDS 37-0629) and Zn(OH)2 (JCPDS 01-0360).
After calcination at 400 �C, the hydrotalcite structure is not
detected but the formation of ZnO was revealed in agreement
with the file JCPDS 36-1451.
The XRD patterns of the four dried impregnated catalysts 1,
2, 5 and 10% Cu/ZneAl 400 are reported in Fig. 3. For compari-
son, theXRDof the ZneAlHT sample is also added. The support
presents the sharp peaks of hydrotalcite phase (JCPDS 37-0629)
at diffraction angles 2q ¼ 11.6, 23.3, 34.5 and 60.1� correspond-ing to the basal planes (003), (006), (009) and (110), respectively,
with a good crystalline order and the phase of Zn(OH)2 (JCPDS
01-0360) was detected. Furthermore, the patterns of impreg-
nated samples show the formation of two distinct crystalline
phases: ZnO (JCPDS 36-1451) and hydrotalcite. The presence of
this latter phase is related to the regeneration capacity by
“memory effect” of oxide derivative from hydrotalcite when it
contacts awater solution containing various anions (hydration)
and it depends on the previous calcination temperature. The
easier reconstruction of the support is obtained when samples
are calcined at low temperature [13].
The hydrotalcite phase (Fig. 1) in our samples is crystallized
in rhombohedral 3R symmetry. Ions like Cu2þ form compounds
characterized by the presence of cooperative Jahn-Teller

i n t e r n a t i o n a l j o u r n a l o f h y d r o g e n en e r g y 4 0 ( 2 0 1 5 ) 1 2 8 3e1 2 9 7 1287
effect: the distortion in the octahedral coordination structure
leads to a gain in energy. In the HT, until the Cu2þ/M(II) ratio is
lower than or equal to 1, the Cu2þ cations in the brucite sheet
are separate from one another, and copper arranges in an un-
distorted octahedral coordination typical of the brucite struc-
ture. When the ratio is higher than 1, the Cu2þ ions can be
situated in near-lying octahedra, and the formation of the
copper compound (with distorted octahedron) is energetically
preferred to that of HT. The Al3þ ions in the brucite-like sheet
remain distant one from the other, because of the repulsion of
positive charges. According to Brindley and Kikkawa [14], for
Alx with x higher than 0.33, the increased number of neigh-
boring Al octahedra leads to the formation of Al(OH)3 (not
detectable by X-ray measurements).
The parameters of the unit cell being a and c ¼ 3c0 (where c0
is the thickness of one layer constituted by a brucite-like sheet
and one interlayer) calculated from the first basal reflection
d003 and reported in Table 1 are similar to those reported in
bibliography [9].
The number, the size, the orientation and the strength of
the bonds between the anions and the hydroxyl groups of the
brucite-like layers determine the thickness of the interlayer.
This thickness is the difference between c0 and 4.8Å (thickness
of brucite layer) [15]. As shown in Table 1, the values of c0
correlated with the presence of several anions in interlayers
such as OH�, CO32� and NO3
�. The parameter c0 observed with
carbonate is related to the strong hydrogen bond that occurs
in the carbonate-containing HT [16]. In addition, the low value
of c0 observed with OH� is related to the similarity of its ionic
diameter with that of the water molecule, and to the strong
hydrogen bridges among the water and the OH� of the basic
layers; this leads to the best close-packed arrangement [15,17].
A partial reconstruction of hydrotalcite is suggested and a
part of the samples remained as ZnO oxide, the patterns of the
impregnated catalysts are not completely similar to the initial
support ZneAl HT and it was evidenced by the shift of
2q ¼ 11.6�. Nevertheless, we have noticed that the parameter
d003 increaseswith the augmentation of the copper content x%
in the samples, in parallel the peaks at 11.6� shifted to lower
Table 1 e “a” and “c” parameters of dried impregnated x%Cu/ZneAl 400 and comparison with literature.
Sample d003 (A) ¼ c0 d006 (A) c003 (A) d110 (A) a (A)
ZneAl HT 7.544 3.774 22.632 1.5345 3.0690
1% Cu/ZneAl
400
7.609 3.796 22.829 1.5366 3.0732
2% Cu/ZneAl
400
7.641 3.804 22.924 1.5732 3.0746
5% Cu/ZneAl
400
7.777 3.822 23.334 1.5399 3.0799
10% Cu/ZneAl
400
8.091 4.466 24.274 1.5398 3.0797
CueZneAl LDH
reference [9]
7.665 e 22.995 e 3.073
ZneAl LDH
reference [9]
7.625 22.877 3.108
CO32� 7.65
OH� 7.55
NO3� 8.79
values (Fig. 3). This observation is due to the change of the
ratio M2þ/M3þ supposed different from 3.
In addition, at low diffraction 2q ¼ 11.6�, an asymmetric
shoulder is formed; it is probably caused by the heterogeneity
of the layers in the regenerated hydrotalcite. During recon-
struction process, a quantitative exchange of anions as like
NO3� (from metal precursors) and OH� (from water) with car-
bonate ions can be realized which leads to the mixture of the
anionic interstitial layer and the apparition of the shoulder at
11.6�.On the other side, the value of the parameter “a” is not
affected by the nature of the anion; it depends on the distance
between the cations. It is possible that anion exchange can
take place during the reconstruction but the ionic radius of
Cu2þ(0.69 Å) and Zn2þ(0.74 Å) have a small difference and the
reconstruction was partial, for that no remarkable variation of
the “a” values was noted (Table 1).
For 10% Cu/ZneAl 400, a third phase is observed, it corre-
sponds to the Cu2(OH)3NO3 (JCPDS 75-1779).
During the aqueous impregnation by a copper solution on a
Zn(Al)O oxide resulting from the calcination of a hydrotalcite,
the reconstruction of the lamellar structure may be occurred
by a mechanism of dissolution and recrystallization [18]. This
mechanism involves though a cation exchange between the
ions Zn2þ and Cu2þ. Thus it is possible to find several types of
copper species dispersed on the support.
Scanning electron microscope (SEM)
The ZneAl HT, ZneAl 400 and x% Cu/ZneAl 400 were char-
acterized by SEM and showed in Fig. 4. The morphological
feature of hydrotalcite is distinguished by the form of plate-
like expected from its layered structure (Fig. 4a). After calci-
nation of ZneAl at 400 �C, the lamellar structure was partially
destroyed without maintaining the same morphology of the
original precursor which evidenced the topotactical nature of
the hydrotalcite decomposition step (Fig. 4b). After impreg-
nation of different content of copper on ZneAl 400, the sam-
ples consist of aggregates more or less developed platelet-
shaped crystals with different dimensions. This effect can be
attributed to the so-called “memory effect” of hydrotalcites.
The samples with low content of copper (1 and 2% Cu/ZneAl
400, Fig. 4c,d) show more lamellar structure than 5 and 10%
(Fig. 4e, f) where the morphology was more compact which
substantiate the reconstruction in different symmetries
already discussed in XRD (shift of the first peak at 2q ¼ 11.6�).
Infrared spectroscopy (IR)
An infrared study of the vibrational structure of impregnated
catalysts is presented in Fig. 5. For a better understanding of
the heterogeneity of the layer thickness of regenerated
hydrotalcite, the spectrum of ZneAl HT is shown for
comparison.
The structure of ZneAl HT is formed by brucite-type layers
(the same structure of brucite Mg(OH)2) and the isostructural
hydroxides of bivalent metals such as b-Zn(OH)2 with car-
bonate ions in the interlayer region [19]. Obviously, there are
two trivalent cations per carbonate ion. The water content is
also related to the amount of trivalent cations. In the OH

Fig. 4 e SEM images of (a) ZneAl HT; (b) ZneAl 400; (c) 1% Cu/ZneAl 400; (d) 2% Cu/ZneAl 400; (e) 5% Cu/ZneAl 400; (f) 10% Cu/
ZneAl 400.
i n t e rn a t i o n a l j o u r n a l o f h y d r o g e n en e r g y 4 0 ( 2 0 1 5 ) 1 2 8 3e1 2 9 71288
stretching region, three features in IR spectrum are expected,
i.e. the antisymmetric OH stretching of the brucite-type layers
and the antisymmetric OH stretchings of water molecules.
The position and the shape of the OH stretching modes,
centered at ~3450 cm�1, is such that weak H-bonding do likely
occur. The presence of water molecules is evidenced by the
broad OH stretching band in the region 3150e2650 cm�1 and
the H2O scissoring mode band at 1630 cm�1. The lack of
multiplicity of the strong band at 1359 cm�1, sharp and anti-
symmetric stretching of the carbonate ions, provides evidence
in this case of the full absence of nitrate ions, which may
remain as residuals of preparation salts.
The skeletal IR spectrum of ZneAl 400 (Fig. 5) shows well
evident bands at 791, 698 and 488 cm�1. The typical doublet at
791 and 698 cm�1 is due to the vibrations of “isolated” MO4
tetrahedra [20,21]. This material is actually a largely amor-
phous structure with some kind of intergrowth between the
wurtzite and the spinel phase. The ZnOwurtzite structure has
the hexagonal close packing of oxide ions and should form
more complex structures when combines with ZnAl2O4
spinel.We canmention that, in this respect, the ZneAl system
differs from the MgeAl system, the MgO structure (periclase
or rock-salt) has the same oxygen packing of MgAl2O4 spinel
(cubic close packing) and easily form solid solutions with it

Fig. 5 e Skeletal IR spectra of ZneAl, ZneAl 400 and dried
impregnated catalysts x% Cu/ZneAl 400 (KBr pressed disk).
Fig. 6 e DTA signal of ZneAl HT and dried impregnated
catalysts x% Cu/ZneAl 400.
i n t e r n a t i o n a l j o u r n a l o f h y d r o g e n en e r g y 4 0 ( 2 0 1 5 ) 1 2 8 3e1 2 9 7 1289
[19]. In addition, the bands observed between 1390 and
1500 cm�1 can be associated to the presence of remaining
carbonates which means that the decarbonization of the
hydrotalcite structure is not complete. This result is in
accordance with the observations of SEM.
These latter results confirm the hypothesis of the presence
of carbonate species highly coordinated to metallic centers
withmono and bi-dentate bonds and probably located as oxy-
carbonates. However, these latter may exist in weak concen-
trations or may be amorphous and escape the detection of
XRD. The presence of oxy-carbonates facilitates the phe-
nomena of reconstruction of hydrotalcite structure already
described in the paragraph 3.1. In fact, the presence of water
during the impregnation and the presence of residual car-
bonates on the support are sufficient to reform the lamellar
structure. The regeneration of hydrotalcite from its oxide is
possible and often known as “memory effect”.
After impregnation of copper on the support ZneAl 400,
the samples were characterized by IR. For 1 and 2% Cu/ZneAl
400, the weak asymmetric stretching mode of the carbonate
ions is found at 1362 cm�1 but clearly presents a shoulder at
higher frequency, near 1390 cm�1 detectable also for 5 and
10% Cu/ZneAl 400. The apparent splitting of this degenerate
asymmetric stretching mode of the carbonate ion may be due
to the strong decrease in symmetry down to C2V or lower, as
proposed by Frost et al. [22]. Some heterogeneity of the
neighboring of still highly symmetric carbonate ions is more
likely, possibly due to a non-completely random distribution
of carbonate and water in their interlayer positions, or due to
more than one crystallographic site for their positions [8].
The carbonate ions should also give rise to other modes:
the out-of-plane (oop) and the in-plane (ip) deformation. The
positions of these modes is quite constant in carbonate min-
erals in the ranges of 820e900 (879 cm�1 for the free ion, oop)
and 650e770 (680 cm�1 for the free ion, ip) [23]. A component is
found near 878 cm�1 which is prominent and can be assigned
to the out-of-plane deformation (oop) mode.
For the OH bending and metal oxygen vibrations of the
“brucite-type” layers, several IR active modes may exist. Two
transversal (TO) and longitudinal (LO) modes form the IR
modes. For brucite-type hydroxides, the lattice vibrationswith
the symmetry Eu is expected to be strongly coupled with the
deformations of the OHs (“librations”, Eu) [8]. The band
observed at 774 cm�1 and the shoulder distinguished at
966 cm�1 are attributed to the TO and LO components of the Eudeformations of the OHs that may have a relevant TO/LO
splitting [24]. The strong doublet with the components at 557
and 430 cm�1 can be due to the lattice modes metal-oxygen
with Eu symmetry. The band at 430 cm�1 is an overlapping
of vibrations attributed to AleO, [AlO6]3� translations or
ZneOH [confirmed by the presence of the phase Zn(OH)2detected in XRD (Fig. 3)] [25].
Thermal analysis (TG-DTA)
The DTA curves show the typical features of the thermal
decomposition of hydrotalcite phase in function of tempera-
ture (Fig. 6). Three endothermic peaks marked A, B and C are
clearly observed. In the literature [25], the decomposition of
hydrotalcite occurs in four steps. Thefirst one, attributed to the
loss of physisorbedwater, occurs below 70 �C and correlated to
peak A. The second step, situated between 150 and 200 �C, isbroad and can be attributed to the loss of water cointercalated
withanions in thehydrotalcite phase. It is associated to peakB.
Peak C, observed between 200 and 280 �C, combines two steps:
3 (dehydroxylation of brucite layer) and 4 (loss of interlayer
anions (carbonates, nitrates)) which are difficult to separate by
DTA due to their close temperatures. At 700 �C, only a mixture
of Zn and Cu oxides is present [19]. In addition, the loss of re-
sidual surface carbonate anions and/or dehydroxylationwater
can be observed around 600 �C [26,27].
On the other side, with increasing the content of copper
impregnated, the thermal stability increases by shifting the
destruction of the structure at higher temperature whence the
10% Cu/ZneAl 400 is the most stable. For this catalyst, the
shoulder observed at 230e250 �C may be due to the disap-
pearance of NO3� related to Cu2(OH)3NO3 shown in XRD and it
4000 3500 3000 2500 2000 1500 1000
1041
1302
1350
1497
1680
1630
1758
20282324
2500
23602857
2926
3583
332°C
320°C
308°C
298°C
278°C
269°C
259°C243°C228°C
Wave number (cm-1)4000 3500 3000 2500 2000 1500 1000
1040
10971226
1302
1497
175820162310
2500
440°C437°C
423°C
410°C394°C
377°C
375°C361°C342°C
332°C
3583
Wave number (cm-1)
(c) 10% Cu/Zn-Al HT (228- 332°C) (d) 10% Cu/Zn-Al HT (332- 440°C)
4000 3500 3000 2500 2000 1500 1000
1350 10451434
1650
17582053
2361
2857
2926
131°C117°C104°C
91°C79°C
65°C53°C
40°C31°C
3583
Wave number (cm-1)4000 3500 3000 2500 2000 1500 1000
1040
1434
13501497
1630
17582040
2376
2480
2857
2926
228°C220°C210°C197°C
183°C
169°C
157°C
142°C
131°C
3583
Wave number (cm-1)
(a) 10% Cu/Zn-Al HT (31- 131°C) (b) 10% Cu/Zn-Al HT (131- 228°C)
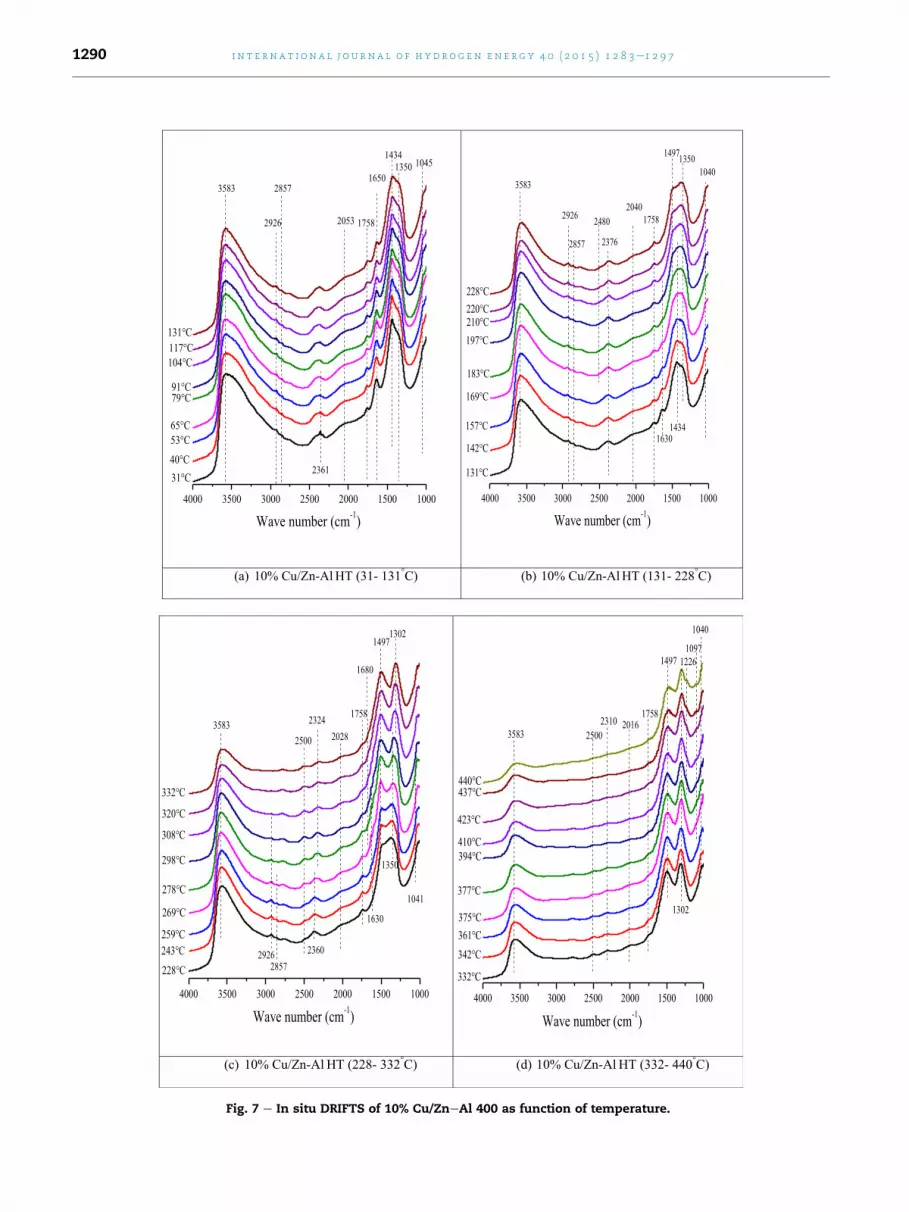
Fig. 7 e In situ DRIFTS of 10% Cu/ZneAl 400 as function of temperature.
i n t e rn a t i o n a l j o u r n a l o f h y d r o g e n en e r g y 4 0 ( 2 0 1 5 ) 1 2 8 3e1 2 9 71290

Fig. 8 e N2 adsorption isotherms of ZneAl 400 and 10% Cu/
ZneAl 400 500.
i n t e r n a t i o n a l j o u r n a l o f h y d r o g e n en e r g y 4 0 ( 2 0 1 5 ) 1 2 8 3e1 2 9 7 1291
is destroyed at high temperature. The collapse of the hydro-
talcite structure leads to the formation ofmetal oxides and the
destruction of hydrotalcites means the departure of water
molecules and CO2.
Diffuse Reflectance Infrared Fourier Transform Spectroscopy(DRIFTS)
To have more details on the thermal destruction of impreg-
nated catalysts, a follow of calcination of 10% Cu/ZneAl HT by
a Diffuse Reflectance Infrared Fourier Transform Spectros-
copy (DRIFTS) was carried out. This study aims to identify the
evolution of characteristic bands of regenerated hydrotalcite
during calcination in air from ambient temperature till 440 �C(Fig. 7).
The results show a vibrational band at 3450 cm�1, which is
attributed to OH stretching vibrations of hydroxyl groups in
the interlayer related to Cu, Zn and Al, and physically adsor-
bed water. The shoulder present at lower wave number
(~3150 cm�1) is induced by hydrogen bonding of H2O to CO32�
ions in the interlayer space. The corresponding HOH bending
vibration of interlayer water strongly coordinates to a cation
not incorporated in the hydrotalcite structure and located at
1758 cm�1. Another band at 1630 cm�1 may be due to HOH
bending of physically adsorbed water [28] or to H2O bending
vibration of interlayer [29].
The intensities of the interlayer water bands at 3150 and
1630 cm�1 gradually decrease with increasing temperature.
This means that increasing amounts of interlayer water in the
CueZneAleCO3 LDH are removed with increasing
temperature.
The presence of carbonate species is revealed by the band
at 1350 cm�1 which persists till 298 �C then it shifts towards a
lower wave number (1302 cm�1). The state of CO32� in the
hydrotalcite is distinctly different according to nature of
metals which constitute the structure. Another band centered
at 1434 cm�1 corresponding to the CO32� n3 begins to decrease
in size as temperature increases and disappears at 197 �C.Gradually a band at 1497 cm�1 attributed to carbonate begins
to appear at this temperature. This band diminishes as the
temperature increases; this is to be expected at the amount of
interlayer water diminishes and as a result, the entity of CO32�
begins to interact more strongly with the backbone of the
hydrotalcite itself. All these information obtained from
vibrational bands signify a rearrangement in the hydrotalcite
structure during calcination leading to its destruction.
Table 2 e Specific area, experimental weight loss anddispersion of different catalysts.Samples Specificarea(m2/g)
Experimentalweight loss (%)
Dispersion(%)
ZneAl HT 88 e e
ZneAl 400 167 e e
1% Cu/ZneAl 400 38 25.97 e
2% Cu/ZneAl 400 51 26.19 e
5% Cu/ZneAl 400 30 29.12 e
10% Cu/ZneAl 400 9 31.99 e
1% Cu/ZneAl 400 500 65 e 11.46
2% Cu/ZneAl 400 500 81 e 15.80
5% Cu/ZneAl 400 500 69 e 14.29
10% Cu/ZneAl 400 500 42 e 8.47
Calcination of solids at 500 �C and catalytic testsof steam reforming of methanol
Surface area and porosity
The N2 adsorption isotherms of ZneAl 400 and 10% Cu/ZneAl
400 500 are reported in Fig. 8. The two isotherms are of type III,
according to the IUPAC classification. This type is associated
to the solids which presentmacropores (size of pores >50 nm).
The multilayers are formed even at low pressures due to the
strong adsorbent/adsorbate interactions. The hysteresis is of
type H3 and it can be attributed to a capillary condensation
which occurred in a structure with pores in slot with non-
uniform size [30]. This result is in agreement with those of
scanning electron microscopy that showed for ZneAl 400 a
lamellar structure with the presence of sheets creating pores
in the form of slots.
BET surface areas are presented in Table 2. The calcination
of the support ZneAl HT increases the specific area from 88 to
167 m2/g due to the liberation of molecules of water and
adsorbed species by outgassing and treatment. After impreg-
nation of copper, the specific areas decrease for all the sam-
ples. These results are related to the structural change of
oxide of zinc aluminum accompanying the regeneration of
hydrotalcite phase. The evolution of specific surface may be
explained by the possibility of formation of dense layer of
hydrotalcite type on the surface which clogs the pores. On the
other hand, the specific areas of all catalysts increase after
calcination by clearing pores from water and impurities, as
example, the 10% Cu/ZneAl 400 500 recorded 42 m2 g�1
instead of 9 m2 g�1 when it was not calcined.
X-ray diffraction (XRD)
The regeneration of the hydrotalcite structure by “memory
effect” is proved by several characterizations. The activation

Fig. 9 e XRD patterns of calcined support and impregnated
samples x% Cu/ZneAl 400 500.
i n t e rn a t i o n a l j o u r n a l o f h y d r o g e n en e r g y 4 0 ( 2 0 1 5 ) 1 2 8 3e1 2 9 71292
of solids is realized by calcination of dried impregnated x%Cu/
ZneAl 400 at 500 �C to form CuO oxides which will participate
in the catalytic activity. XRD patterns of impregnated catalysts
and calcined support are reported in Fig. 9. Crystallization of
ZnO is present in all samples; while no phases containing
aluminum are initially detected. After decomposition of the
hydrotalcite phase, aluminum tends to remain in a mixed
oxide phase, which is amorphous at 400 �C. Only for 10% Cu/
ZneAl 400 500, CuO (JCPDS 48-1548) was detected with crys-
tallite size ¼ 49.8 nm.
IR study
The IR spectra of the support ZneAl 400 and the calcined
catalysts x% Cu/ZneAl 400 500 are regrouped in Fig. 10. The
water band observed at 1630 cm�1 is assigned to water
chemisorbed at outer surfaces. Furthermore, the shoulder at
1496 cm�1 signifies a weak splitting of the carbonate n3 band
indicative of rearrangements of carbonate ions after calcina-
tion [31]. Also, the weak band near 1069 cm�1, assigned to the
Fig. 10 e Skeletal IR spectra of ZneAl 400 and calcined
impregnated catalysts x% Cu/ZneAl 400 500.
symmetric n1 mode of carbonate, is due to the lowered sym-
metry of the interlayer carbonate ions by interaction with
neighboring atoms [32]. Besides, a very weak band around
791 cm�1 is probably assigned to absorption of spinel but the
XRD pattern does not reveal a crystalline spinel phase at
500 �C, suggesting that they are either amorphous or poorly
crystallized. So, there is no evidence to relate the band around
800 cm�1 for the spinel phase [31].
The transformation from the hydroxide phase to an
amorphous oxide and further to CuO can be noticed from the
changes in the spectral range 700e400 cm�1. The adsorption
band at 698 cm�1 is related to the so-called n1 and n2 vibra-
tional modes of isolated AlO4 or ZnO4 [25]. The CueO vibration
that confirmed the formation of CuO is not clearly visible at
494 cm�1 in the spectra of 10% Cu/ZneAl 400 500 [33].
TPR measurements
The results of TPR measurements of the impregnated cata-
lysts calcined at 500 �C are shown in Fig. 11. For all catalysts
samples, several reduction peaks and shoulders were seen
between 197 and 272 �C and these were attributed to the
reduction of different copper species. Although ZnO was not
reduced under our experimental conditions, partial reduction
of surface ZnO which may lead to the formation of a-brass (a
dilute alloy of zinc in copper) only a few layers thick on the
copper crystallites during the catalyst reduction, cannot be
ruled out. In fact, thermodynamic calculations [34] are in favor
of such a hypothesis, showing that the equilibrium zinc con-
tent in a surface a-brass is about 5% during catalyst reduction
at 300 �C.All catalysts present reduction peaks with asymmetric
shapes and shoulders towards higher temperature. This is
may be due to overlapping of several elemental reduction
processes arising from different Cu2þ species.
The TPR profile of pure CuO is characterized by a single
peak reported at 271 �C [35]. The TPR profiles of the catalyst at
lower content of copper (1 and 2% Cu) are represented by
single and broad reduction peaks centered at temperatures
272 and 253 �C, respectively. On the other hand, the peak
Fig. 11 e H2-TPR profiles of impregnated catalysts x% Cu/
ZneAl 400 calcined at 500 �C.

i n t e r n a t i o n a l j o u r n a l o f h y d r o g e n en e r g y 4 0 ( 2 0 1 5 ) 1 2 8 3e1 2 9 7 1293
shape in the TPR profiles of the catalysts at higher copper
loading (5 and 10% Cu) is changed gradually. In fact, the TPR
profile of 5% can be distinguished from 1 and 2% because,
close to the prominent peak at 247 �C, a shoulder appears in
the lower temperature side at 207 �C (Fig. 11). On increasing
further the copper content to 10%, the intensity of the shoul-
der decreases and it is divided into two peaks, the first
centered at 211 �C and the second at 197 �C.In our investigated catalysts prepared by impregnation, the
presence of ZnO affects the H2 reduction of copper. First of all,
the centered temperatures of reduction peaks in the TPR
profiles of 2, 5 and 10% shift towards lower temperatures than
the reduction temperature of pure CuO. This result points out
that, ZnO certainly promotes the copper reduction and it plays
the role of H2 activator besides being a dispersive agent, thus
enhancing the reduction of copper. It has been demonstrated
that both the higher and the lower copper loading catalysts
are formed by well-dispersed CuOeZnO particles which are in
intimate contact to each other [36,37]. It follows that the H2
activation and spill over would be improved by this extended
contact area between CuO and ZnO particles resulting in a
promoting effect of the copper reduction. Therefore, we sup-
posed that there are two reducible copper species in 5% Cu.
One is represented by small CuO particles which are homo-
genously dispersed and are interacting with the ZnO particles;
they reduce in correspondence of the peak around 247 �C and
show reactivity similar in the 2% Cu but at higher temperature
(253 �C). This suggests that dispersed CuO exists at low Cu
(small dust) which is not detectable in XRD. The second type is
represented by copper which experience evenmore enhanced
reduction peak. These copper species are more reactive
because they are in contact with the surface of the ZnO par-
ticles resulting in a strong interaction with them [35]. Partic-
ularly, the minor TPR peak observed at 197 �C is caused by
presence of granular CuO (probably formed by the calcination
at 500 �C of the phase Cu2(OH)3NO3 detected by XRD (Fig. 3)) in
10% Cu/ZneAl 400 500 [32]. Besides different copper species
such as CuO, CuAl2O4 and Cu2þ incorporated in octahedral
sites of the Al2O3 phase, some Cu (II) may exist as vicariant
species in the zinc oxide and zinc aluminate. These species
should be reduced at temperature higher than that of CuO [38]
and could be related to the small signal that appears at about
570 �C in TPR profiles. The shoulder observed in 5 and 10% Cu
may be rather attributed to the formation of Cu(I) as an in-
termediate in reduction of impregnated catalysts.
The step of the reconstruction is very important and the
degree of copper and zinc exchange influences the nature, the
dispersion of the copper species on the support and their
interaction with Zn and/or Al. Thus, the reconstruction of the
Table 3 e Conversion and selectivities of CO2, H2 and CO versucatalysts after reduction.
200 250
Catalysts SCO SCO2 SH2 Conv SCO SCO2 SH2
1% Cu/Zn�Al 400(500) e e 3.81 9.37 e e 19.0
2% Cu/Zn�Al 400(500) e e 74.47 1.79 e 23.42 74.4
5%Cu/Zn�Al 400(500) e 21.17 71.5 12.62 e 23.47 75.3
10% Cu/Zn�Al 400(500) e 22.51 74.08 8.24 e 23.82 75.4
support can generate high quantity of active surface copper
species.
Catalytic activity measurements for the steamreforming process
The performance of the catalysts for the steam reforming of
methanol is listed in Table 3. At 200 �C, all the catalysts were
active after reduction pre-treatment. When comparing the
conversion of the best catalysts, it is evident that the 10% Cu/
ZneAl 400 500 has the highest conversions at 250, 300 and
350 �C followed by the 5% Cu/ZneAl 400 500 (Fig. 12). At 350 �C,methanol conversion in presence of 10% Cu reaches 99.78%
and the hydrogen selectivity 75.07% is equal to the theoretical
stoichiometric of the reaction. Moreover, the formation of CO
begins at 300 �C and it rises with increasing temperature but
never exceeds 1.74% (Table 3). The lowest conversion was
obtained for 1% Cu/ZneAl 400 500.
Our study indicates that the increase in methanol con-
version with copper dispersion was not significant since the
10%Cu presents the bestmethanol conversionwithout having
the best copper dispersion (Table 2). Contrariwise, dispersion
of the catalytically active metal appears to affect the selec-
tivities of reaction products. In 10% Cu, the formation of large
crystallites of CuO which were detected by XRD prevents the
good dispersion of copper and leads to the formation of CO at
high temperature.
To understand the behavior of catalysts, we studied in
details the reducibility of copper which affects interestingly
the methanol conversion. It was noticed that methanol con-
version increases as catalyst reducibility increases. Catalyst
reducibility seems to be a more useful parameter than copper
load alone because it takes into account the effects of both
copper content and calcination temperature.
A deconvolution of the best catalyst 10% Cu was realized
between 150 and 400 �C, the zone area of steam reforming of
methanol (Fig. 13). The percentage of copper species reduced
at each centered temperature was calculated by a deconvo-
lution method and the results are the following: 32.1% at
197 �C, 29.8% at 211 �C and 38.1% at 259 �C. The high per-
centage of copper reduced till 211 �C (61.9%) is the reason of
the best activity of 10% Cu versus the remaining catalysts.
To evidence the necessity of activation of catalysts by pre-
treatment and to determine the oxidative state of copper after
pre-treatment, TPR and XRD analysis of activated catalysts
were performed.
Two peaks are observed in TPR profile of 10% Cu/ZneAl 400
500 after activation (Fig. 14). The first one at 144 �Cmay be due
s temperature of the impregnated x% Cu/ZneAl 400 500
300 350
Conv SCO SCO2 SH2 Conv SCO SCO2 SH2 Conv
2 12.37 e 22.86 75.49 32.12 0.23 23.6 75.14 65.99
8 21.68 0.15 23.88 75.01 58.56 0.47 24.03 75.31 88.33
5 33.74 0.18 24.29 75.12 75.11 0.86 24.54 74.57 99.55
4 51.87 0.39 24.01 75.19 92.80 1.74 23.17 75.07 99.78

Fig. 14 e TPR profile of 10% Cu/ZneAl 400 500 after
activation (First heating).
Fig. 12 e Curves of methanol conversion versus
temperature of the impregnated catalysts x% Cu/ZneAl 400
500, catalyst: 70e80 mg; flow rate: 0.013 ml.min¡1; H2O/
CH3OH ¼ 2.
i n t e rn a t i o n a l j o u r n a l o f h y d r o g e n en e r g y 4 0 ( 2 0 1 5 ) 1 2 8 3e1 2 9 71294
to the reduction of Cu2þ species. The other peak at ~195 �C is
characteristic of Cu2O [39]. The amount of copper reoxidized
to Cu2O was calculated from H2 consumption in the TPR ex-
periments. XRD pattern corroborates the results of TPR
(Fig. 15); it revealed the presence of Cu0, ZnO and Cu2O phases.
This latter phase was absent or not detected in remaining
catalysts. These results show that the activated catalysts
required the combination of Cu0 and Cuþ1 together and may
be Cu2þ because the first peak reduced at 144 �C in 10% Cu
after activation was not observed in the other catalysts. Also,
the catalytic activity depends on the composition of these
elements in the catalyst. It was reported that methanol con-
version increases with the amount of Cu2O species.
It has been mentioned in literature that an induction
period was needed before the catalysts became active. This
observation suggests that the Cuþ1 and Cu0 species present at
200 �C (during first heating) have a low activity, for that no
methanol conversion was observed. However, during the in-
duction period, a fraction of Cu0 was reoxidized to Cu2O as it
Fig. 13 e TPR deconvolution versus temperature of 10% Cu/
ZneAl 400 500.
was indicated earlier (Section experimental conditions of
tests) [39]. The CO2 produced during reaction and water
reactant are responsible of the reoxidation of Cu0 to Cuþ1.-
Therefore, the induction period could be taken as the time
required to produce an appropriate and active combination of
Cu0eCu2O for the reaction.
Products distribution
The products obtained from steam reforming of methanol in
presence of impregnated catalysts are H2, CO2, CO, methyl
formate (CH3OCHO), HCHO and HCOOH.
Although the first attempt at elucidating the nature of
methanol reforming mechanisms over various Cu-based cat-
alysts was conducted nearly three decades ago, the active
sites for H2 production from methanol reforming are always
controversial. Various mechanisms have been proposed
regarding different states such as metallic Cu0, or partially
reduced Cuþ1 or Cu0eCuþ1 couple.
Fig. 15 e XRD pattern of 10% Cu/ZneAl 400 500 after
activation (First heating).

i n t e r n a t i o n a l j o u r n a l o f h y d r o g e n en e r g y 4 0 ( 2 0 1 5 ) 1 2 8 3e1 2 9 7 1295
Four reactions schemes can be proposed for steam
reforming of methanol and these schemes may be further
complicated by the integration of carbon formation during the
reaction [40]:
1 MD-WGSR,
2 1-step SRM,
3 SRM-MD-reverse-WGSR,
4 Methyl formate,
The MD-WGSR [41] proposed the CO as primary product
formed frommethanol dehydrogenationwhichwas converted
into CO2 via WGSR. In the 1-step SRM scheme [6,42], the
dehydrogenation of methanol produced CO2 and H2. Also the
formation of CO appeared at temperature above 300 �C and
became significant when methanol was totally converted.
Agrell et al. concluded that CO production from the reverse-
WGSR can be obstructed by a short residence time in the
catalyst bed [43]. On the other hand, Peppley et al. claimed that
the entire MD, WGSR and SRM participated in the reaction
network [6,44]. They suggested that SRM and MD (a side reac-
tion) occurred in parallel and the products of SRM are
consecutively consumed in reverse-WGSR. This model
required thepresenceof twodistinct typesof catalyst sites: one
for both the SRM and reverse WGSR and second for the MD.
The temperature dependence of the product distribution
results in presence of 10% Cu/ZneAl 400 500 is shown in
Fig. 16. The production of both CO2 and H2 increases with
temperature whereas the formation of CO occurs above 250 �C(Fig. 16a). At the same time, if we follow the evolution of
methyl formate CH3OCHO, we can notice that its formation
Fig. 16 e Evolution of products and by products of meth
decreases above 250 �C (Fig. 16b). The formation of formic acid
is weak at low temperature and a small quantity of formal-
dehyde is produced. Depending on our results, a part of our
proposal reaction mechanism (Fig. 17) coincides with scheme
4 which was suggested by several researchers [45e47]. Two
molecules of methanol dehydrogenate to form methyl
formate which produces the formic acid by its reaction with
water. The decomposition of formic acid produces CO2 andH2.
These are the primary products of the system. The low
amount of formaldehyde may result from the dehydrogena-
tion of methanol. The other part of mechanism is determined
by formaldehyde which intervenes in production of CO2 and
H2. This supposition is released from the evolution of form-
aldehyde. Its formation, by dehydrogenation of methanol,
increases gradually with temperature and it goes down above
300 �C, then it reacts with water and produces formic acid
which decomposed to H2 and CO2. At the same time, the
methyl formate almost disappears without canceling defi-
nitely its presence and giving the possibility of formation of
formic acid that always persists at high temperature. Also, it is
supposed in this period that the rate of the decomposition of
methyl formate is slower than the dehydrogenation of
formaldehyde.
Just at high temperature, the detected low CO concentra-
tion can be attributed to the reverse-WGSR, whereby CO was
formed as secondary product. This could be due to the high
concentrations of CO2 and H2 produced from the SRM. Its
formation depends on the contact residence time.
Some researchers attributed the formation of methyl
formate to the dimerization of formaldehyde. In contrast,
other researchers disagreed on this route. A nucleophilic
anol steam reforming in function of temperature.

Fig. 17 e Suggestion of Reaction pathways of steam
reforming of methanol.
i n t e rn a t i o n a l j o u r n a l o f h y d r o g e n en e r g y 4 0 ( 2 0 1 5 ) 1 2 8 3e1 2 9 71296
transfer of H atom to carbonyl carbon in the formaldehyde
molecule is involved in Tishenko mechanism [48]. This step
requires the change of orbital configuration in formaldehyde
from trigonal sp2 to tetrahedral sp3 which is not easy.
Conclusion
Impregnation of ex-HTmixed oxides bywet impregnation and
with a carbonateecontaining aqueous solution favors the HT
recrystallization by “memory effect”. The “memory effect”
depends on both the impregnation solution and method be-
sides the calcination temperature of the parent layered double
hydroxide. The reformation of the HT phase was proved by
XRD, TG/DTA, SEM and IR analysis. After calcination of x%Cu/
ZneAl 400 at 500 �C, the HT phase was destructed and inter-
esting catalysts were generated with a high potential for H2
production in steam reforming of methanol.
The results of catalytic tests indicate that 10% Cu/ZneAl
400 500 is themost active for steam reforming. The conversion
of methanol over the impregnated catalysts depends on the
reducibility of copper species at low temperature and not on
their dispersion because 10% Cu the best catalyst has the
worst dispersion. Contrariwise, the dispersion influences the
selectivities of products as the production of CO which was
the highest for the best catalyst. Also reaction temperature
had tremendous effect on selectivities. Therefore, it is so
important to find a compromise between the dispersion and
the reducibility of copper species with a good catalytic activity
and low production of CO.
The characterizations after activation show that the cata-
lyst activity depends on the formation of Cu2O and Cu0 species
besides the possibility of remaining Cu2þ. Reaction efficiency
was found to be strong function of the amount of Cu2O formed
in the activated catalyst and this amount depended on copper
concentration.
HCHO, CH3OCHO and HCOOH were also produced during
steam reforming of methanol. A suggested mechanism of re-
action was elaborated according to our observations. Till date,
consensus on the surface reaction mechanisms involving
steam reforming of methanol has not been established. Con-
troversy should be resolved becausemechanism can be useful
for determining the role of the metal oxide, and ultimately for
designing an optimal catalyst formulation.
Acknowledgment
The authors wish to thank the CNRSL for financing support
and Dr. Lucie Courcot for her precious help in SEM analysis.
r e f e r e n c e s
[1] Shafiee S, Topal E. An econometrics view of worldwide fossilfuel consumption and the role of US. Energy Policy2008;36:775e86.
[2] Zhang FY, Advani SG, Prasad AK. Performance of a metallicgas diffusion layer for PEM fuel cells. J Power Sources2008;176:293e8.
[3] Kulikovsky AA. Direct methanol hydrogen fuel cell: themechanism of functioning. Electrochem Commun2008;10(9):1415e8.
[4] Edwards N, Ellis SR, Frost JC, Golunski SE, Keulen ANJ,Lindewald NG, et al. On-board hydrogen generation fortransportation applications: the HotSpot methanolprocessor. J Power Sources 1998;781:123e8.
[5] Nishida K, Atake I, Li D, Shishido T, Oumi Y, Sano T, et al.Effects of noble metal-doping on Cu/ZnO/Al2O3 catalysts forwater-gas shift reaction: catalyst preparation by adopting“memory effect” of hydrotacite. Appl Catal A Gen2008;337:48e57.
[6] Pepley BA, Amphlett JC, Kearns LM, Mann RF. Methanolsteam reforming on Cu/ZnO/Al2O3 catalysts”. Part.2. Acomprehensive kinetic model. Appl Catal A Gen1999;179:31e49.
[7] Shishido T, Yamamoto Y, Morioka H, Takaki K, Takehira K.Active Cu/ZnO and Cu/ZnO/Al2O3 catalysts prepared byhomogeneous precipitation method in steam reforming ofmethanol. Appl Catal A Gen 2004;263:249e53.
[8] Busca G, Costantino U, Marmottini F, Montanari T, Patrono P,Pinzari F, et al. Methanol steam reforming over ex-hydrotalcite CueZneAl catalysts. Appl Cata A Gen2006;310:70e8.
[9] Cavani F, Trifir�o F, Vaccari A. Hydrotalcite-type anionic clays: preparation, properties and aplications. Catal Today1991;11:173e301.
[10] Gin�es MJL, Amadeo N, Laborde M, Apesteguia CR. Activityand structure-sensivity of the water-gas shift reaction overCueZneAl mixed oxide catalysts. Appl Catal A Gen1995;131:283e96.
[11] Debecker DP, Gaigneaux EM, Busca G. Exploring, tuning andexploiting the basicity of hydrotalcites for applications inheterogeneous catalysis. J Chem Eur 2009;15:3920e35.
[12] Gennequin C, Siffert S, Cousin R, Aboukaıs A. CoeMgeAlhydrotalcite precursors for catalytic total oxidation ofvolatile organic compounds. Top Catal 2009;52:482e91.
[13] Gennequin C, Cousin R, Lamonier J-F, Siffert S, Aboukaıs A.Toluene total oxidation over Co supported catalystssynthesized using “memory effect” of MgeAl hydrotalcite.Cat Comm 2008;9:1639e43.
[14] Brindley GW, Kikkawa S. A crystal-chemical study of Mg,Aland Ni, N hydroxy-perchlorates and hydroxyl-carbonates.Amer. Min 1979;64:836e43.

i n t e r n a t i o n a l j o u r n a l o f h y d r o g e n en e r g y 4 0 ( 2 0 1 5 ) 1 2 8 3e1 2 9 7 1297
[15] Miyata S. The syntheses of hydrotalcite-like compounds andtheir structures and physico-chemical properties I: thesystems MgZþeAl3þeNO3, MgZþeAl3þeCl�,Mg2þeAl3þeClO4
�, Ni2þeAl3þeCl� and Zn2þeAl3þeCl�. ClaysClay Miner 1975;13:369e75.
[16] Bish DL. Anion-exchange in takovite: applications to otherhydroxide minerals. Bull Mineral 1980;103:170e5.
[17] Miyata S. Anion-exchange properties of hydrotalcite-likecompounds. Clays Clay Miner 1983;31:305e11.
[18] Gennequin C, Barakat T, Tidahy HL, Cousin R, Lamonier J-F,Aboukaıs A, et al. Use and observation of the hydrotalcite“memory effect” for VOC oxidation. Catal Today2010;157:191e7.
[19] Montanari T, Sisani M, Nocchetti M, Vivani R, ConcepcionHerrera Delgado M, Ramis G, et al. Zincealuminumhydrotalcites as precursors of basic catalysts: preparation,characterization and study of the activation of methanol.Catal Today 2010;152:104e9.
[20] Andres Verges M, Mifsud A, Serna CJ. Formation of rod-likezinc oxide microcrystals in homogeneous solutions. J ChemSoc Faraday Trans 1990;86:959e63.
[21] Busca G. Use of infrared spectroscopy methods in the field ofheterogeneous catalysts by metal oxides. In: Jackson SD,Hargreaves JSJ, editors. Metal oxide catalysis, vol. 1.WileyeVCH; 2009. p. 95e175.
[22] Frost RL, Ding Z, Martens WN, Johnson TE, Theo Kloprogge J.Molecular assembly in synthesised hydrotalcites of formulaCuxZn6�xAl2(OH)16(CO3)$4H2Oda vibrational spectroscopicstudy. Spectrochim Acta Part A 2003;59:321e8.
[23] White WB. In: Farmer VC, editor. The infrared spectra ofminerals. London: The Mineralogical Society; 1974. p. 226[Chapter 12].
[24] Pascale F, Tosoni S, Zicovich-Wiklson C, Ugliengo P,Orlando R, Dovesi R. Vibrational spectrum of brucite,Mg(OH)2: a periodic ab initio quantum mechanicalcalculation including OH anharmonicity. Chem Phys Lett2004;39:308e15.
[25] Turco M, Bagnasco G, Costantino U, Marmottini F,Montanari T, Ramis G, et al. Production of hydrogen fromoxidative steam reforming of methanol: I. Preparation andcharacterization of Cu/ZnO/Al2O3 catalysts from ahydrotalcite-like LDH precursor. J Catal 2004;228:43e55.
[26] Frost RL, Martens WN, Erickson KL. Thermal decompositionof the hydrotalcite Zn6Al2CO3(OH)16$4H2O e athermogravimetric analysis and hot stage Ramanspectroscopic study. J Therm Anal Calorim 2005;82(3):603e8.
[27] Benito P, Guinea I, Labajos FM, Rocha J, Rives V. Microwave-hydrothermally aged Zn, Al hydrotalcite-like compounds:influence of the composition and the irradiation conditions.Microporous Mesoporous Mater 2008;82:292e302.
[28] P�erez-Ramirez J, Mul G, Moulijn JA. In situ Fourier transforminfrared and laser Raman spectroscopic study of the thermaldecomposition of CoeAl and NieAl hydrotalcites. VibSpectrosc 2001;27:75e8.
[29] Yang W, Kim Y, Liu PKT, Sahimi M, Tsotsis TT. A study by insitu techniques of the thermal evolution of the structure of aMgeAleCO3 layered double hydroxide. Chem Eng Sci2002;57:2945e53.
[30] Uzio D. Analyse physico-chimique des catalyseursindustriels. Editions TECHNIP; 2001, ISBN 2-7108-0750-5.p. 6e19. Chapitre 1.
[31] kannan S, Rives V, Kn€ozinger H. High-temperaturetransformations of Cu-rich hydrotalcites. J Solid State Chem2004;177:319e31.
[32] Behrens M, Kasatkin I, Kuhl S, Weinberg G. Phase-pureCu,Zn,Al hydrotalcite-like materials as precursors for copperrich Cu/ZnO/Al2O3 catalysts. Chem Mater 2010;22:386e97.
[33] Goldsmith JA, Ross SD. The infra- red spectra of azurite andmalachite. Spectrochim Acta 1968;24A:2131e7.
[34] Atake I, Nishida K, Li D, Shishido T, Oumia Y, Sano T, et al.Catalytic behavior of ternary Cu/ZnO/Al2O3 systemsprepared by homogeneous precipitation in water-gas shiftreaction. J Mol Catal A Chem 2007;275:130e8.
[35] Fierro G, Lo Jacono M, Inversi M, Porta P, Cioci F, Lavecchia R.Study of the reducibility of copper in CuOeZnO catalysts bytemperature-programmed reduction. Appl Catal A Gen1996;137:327e48.
[36] Porta P, Dragone R, Lo Jacono M, Minelli G, Moretti G. Thereduction process of copper-zinc oxide (alumina) methanolcatalysts. Solid State Ionics 1989;32/33:1019e24.
[37] Moretti G, De Rossi S, Ferraris G. Characterization of welldispersed copper species on the surface of ZnO by X-rayphotoelectron spectroscopy. Appl Surf Sci 1990;45:341e9.
[38] Velu S, Suzuki K, Okazaki M, Kapoor MP, Osaki T, Ohashi F.Oxidative steam reforming of methanol over CuZnAl(Zr)-oxide catalysts for the selective production of hydrogen forfuel cells: catalyst characterization and performanceevaluation. J Catal 2000;194:373e84.
[39] Idem RO, Bakhshi N. Production of hydrogen from methanol.2. Experimental studies. Ind Eng Chem Res 1994;33:2056e65.
[40] Lwin Y, Daud WRW, Mohamad AB, Yaakob Z. Hydrogenproduction from steam-methanol reforming:thermodynamic analysis. Int J Hydrogen Energy2000;25:47e53.
[41] Santacesaria E, Carr�a S. Kinetics of a catalytic steamreforming of methanol in a CSTR reactor. Appl Catal1983;5:345e58.
[42] Geissler K, Newson E, Vogel F, Truong TB, Hottinger P,Wokaum A. Authothermal methanol reforming for hydrogenproduction in fuel cell applications. Phys Chem Chem Phys2001;3:289e93.
[43] Agrell J, Birgersson H, Boutonnet M. Steam reforming ofmethanol over a Cu/ZnO/Al2O3 catalyst: a kinetic analysisand strategies for suppression of CO formation. J PowerSources 2002;106:249e57.
[44] Peppley BA, Amphlett JC, Kearns LM, Mann RF. Methanol-steam reforming on Cu/ZnO/Al2O3. Part 1: the reactionnetwork. Appl Catal A Gen 1999;179:21e9.
[45] Jiang CJ, Trimm DL, Wainwright MS. Kinetic mechanism forthe reaction between methanol and water over aCueZnOeAl2O3 catalyst. Appl Catal A Gen 1993;97:145e58.
[46] Jiang CJ, Trimm DL, Wainwright MS. Kinetic study of steamreforming of methanol over copper-based catalysts. ApplCatal 1993;93:245e55.
[47] Breen JP, Ross JRH. Methanol reforming for fuel-cellapplications: development of zirconia-containing CueZneAlcatalysts. Catal Today 1999;51:521e33.
[48] Hussein GAM, Sheppard N, Zaki MI, Fahim RB. Infraredspectroscopic studies of the reactions of alcohols over groupIVB metal oxide catalysts. 2. Methanol over TiO2, ZrO2 andHfO2. J Chem Soc Faraday Trans 1991;87:2655e9.
Related Documents


