Steady-state flux optima A B R A x 1 x 2 R B D C Feasible flux distributions x 1 x 2 Max Z=3 at (x 2 =1, x 1 =0) R C R D x Balance Constraints: < 1 molecule/sec (external) = R B (because no net increase) + x 2 < 1 (mass conservation) >0 (positive rates) > 0 Z = 3R D + R C (But what if we really wanted to select for a fixed ratio of 3:1?)

Steady-state flux optima AB RARA x1x1 x2x2 RBRB D C Feasible flux distributions x1x1 x2x2 Max Z=3 at (x 2 =1, x 1 =0) RCRC RDRD Flux Balance Constraints:
Jan 02, 2016
Welcome message from author
This document is posted to help you gain knowledge. Please leave a comment to let me know what you think about it! Share it to your friends and learn new things together.
Transcript

Steady-state flux optima
A BRA
x1
x2
RB
D
C
Feasible fluxdistributions
x1
x2
Max Z=3 at (x2=1, x1=0)
RC
RD
Flux Balance Constraints:
RA < 1 molecule/sec (external)RA = RB (because no net increase)
x1 + x2 < 1 (mass conservation) x1 >0 (positive rates)
x2 > 0
Z = 3RD + RC
(But what if we really wanted to select for a fixed ratio of 3:1?)
FBA - Linear Program
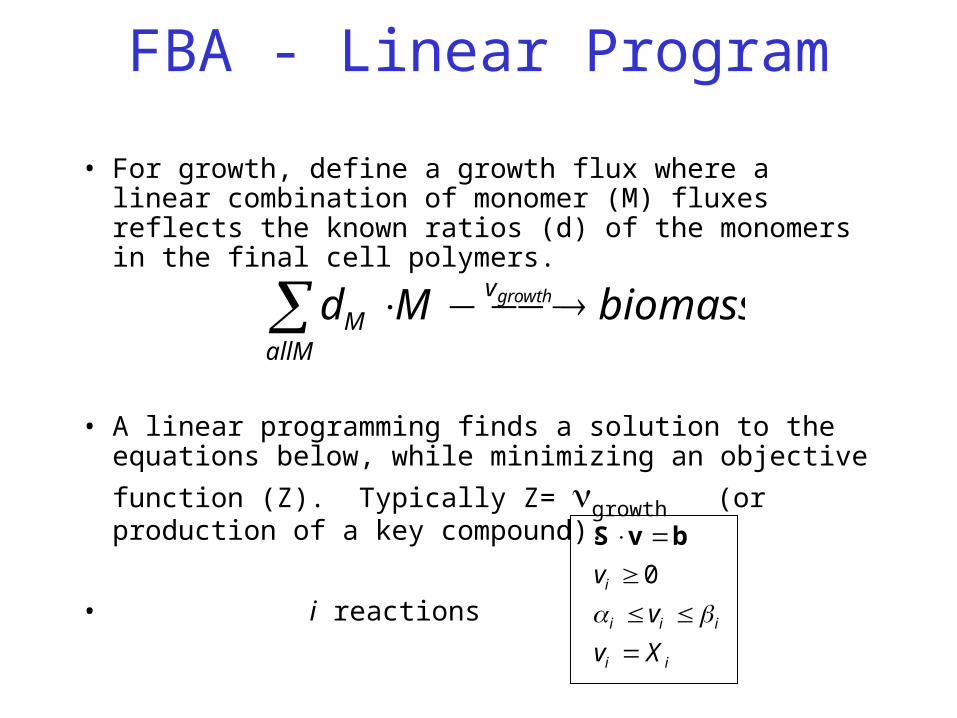
• For growth, define a growth flux where a linear combination of monomer (M) fluxes reflects the known ratios (d) of the monomers in the final cell polymers.
• A linear programming finds a solution to the equations below, while minimizing an objective function (Z).
Typically Z= growth (or production of a key compound).
• i reactions
biomassMd growthv
allMM
ii
iii
i
Xv
v
v
0
bvS

0 5 10 15 20 25 30 35 40 4510
-6
10-4
10-2
100
102
ACCOA
COA
ATP
FAD
GLY
NADH
LEU
SUCCOA
metabolites
coef
f. in
gro
wth
rea
ctio
nBiomass Composition

Flux ratios at each branch point yields optimal polymer composition for replication
x,y are two of the 100s of flux dimensions
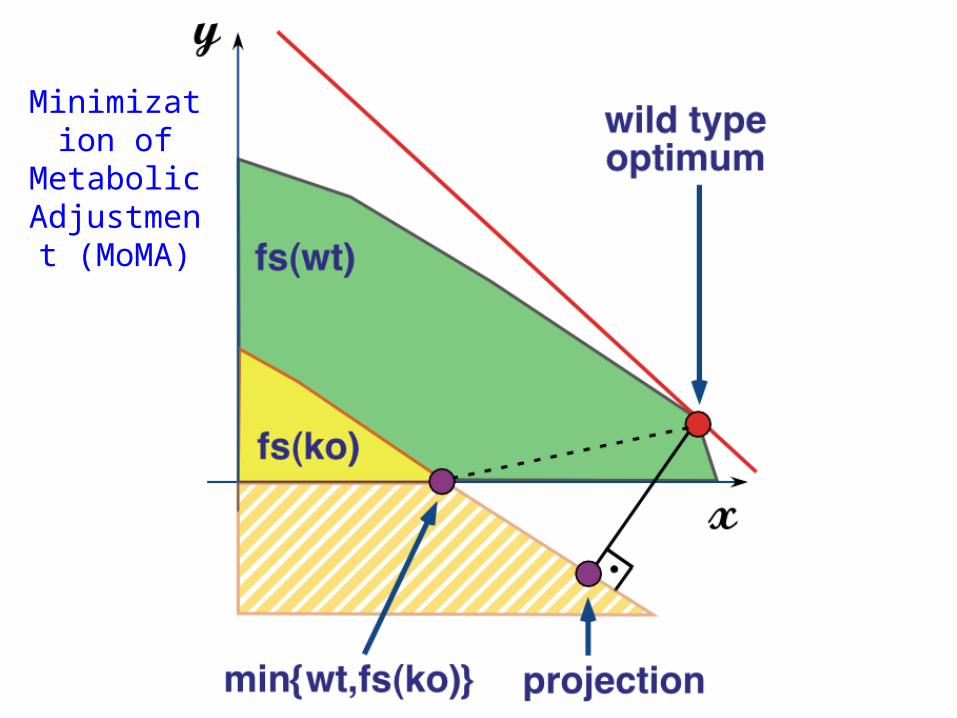
Minimization of Metabolic Adjustment
(MoMA)

Flux Data

0 50 100 150 2000
20
40
60
80
100
120
140
160
180
200
1
2
3
456
78
9
10
11121314
15
16
17 18
-50 0 50 100 150 200 250-50
0
50
100
150
200
250
1
2
3456
78
910
11121314
1516
17
18
Experimental Fluxes
Pre
dic
ted
Flu
xes
-50 0 50 100 150 200 250-50
0
50
100
150
200
250
1
2
3
456
78
910
111213
14
15
16
1718
pyk (LP)
WT (LP)
Experimental Fluxes
Pre
dic
ted
Flu
xes
Experimental Fluxes
Pre
dic
ted
Flu
xes
pyk (QP)
=0.91p=8e-8
=-0.06p=6e-1
=0.56P=7e-3
C009-limited

Competitive growth data: reproducibility
Correlation between two selection experiments
Badarinarayana, et al. Nature Biotech.19: 1060

Essential 142 80 62Reduced growth 46 24 22
Non essential 299 119 180 p = 4∙10-3
Essential 162 96 66Reduced growth 44 19 25
Non essential 281 108 173 p = 10-5
MOMA
FBA
Competitive growth data
2 p-values
4x10⁻³
1x10⁻⁵
Position effects Novel redundancies
On minimal media
negative small selection effect
Hypothesis: next optima are achieved by regulation of activities.
LP
QP
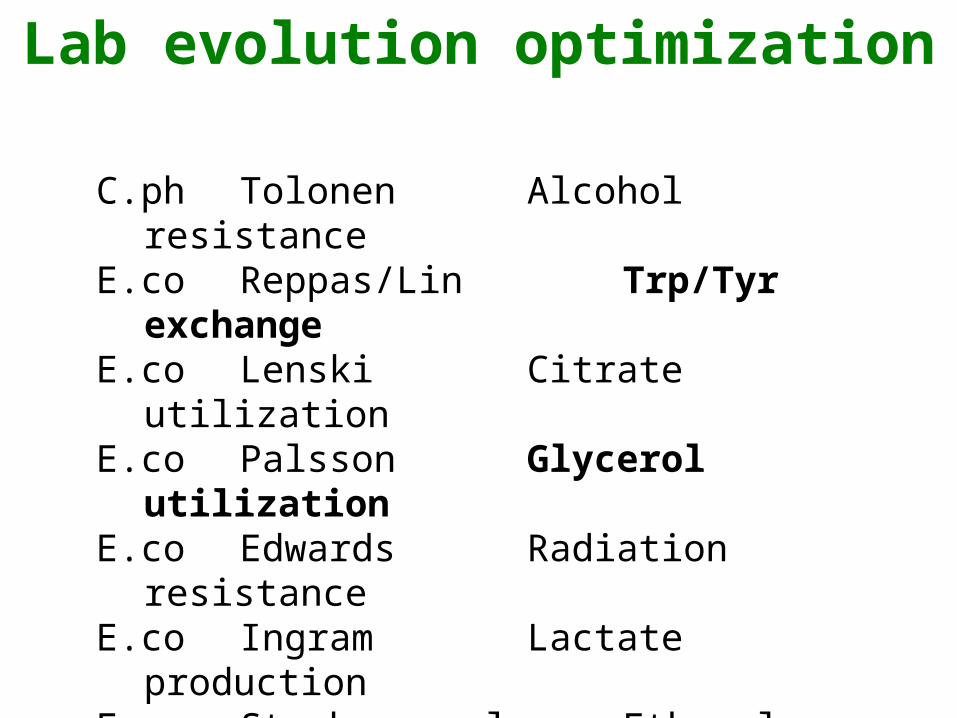
Lab evolution optimization
C.ph Tolonen Alcohol resistanceE.co Reppas/Lin Trp/Tyr exchangeE.co Lenski Citrate utilizationE.co Palsson Glycerol utilizationE.co Edwards Radiation resistanceE.co Ingram Lactate productionE.co Stephanopoulos Ethanol resistanceE.co Marliere ThermotoleranceM.tb J&J Diarylquinoline
resistanceE.co DuPont 1,3-propanediol
production

Non-optimal evolves to optimal
Ibarra et al. Nature. 2002 Nov 14;420(6912):186-9. Escherichia coli K-12 undergoes adaptive evolution to achieve in silico predicted optimal growth.

Cross-feeding symbiotic systems:aphids & Buchnera
• obligate mutualism• nutritional interactions: amino acids and vitamins• established 200-250 million years ago• close relative of E. coli with tiny genome (641kb)
Aphids
Internal view of the aphid. (by T. Sasaki)
Bacteriocyte
(Photo by T.
Fukatsu)
Buchnera (Photo by
M. Morioka)
http://buchnera.gsc.riken.go.jphttp://buchnera.gsc.riken.go.jp

Shigenobu et al. Genome sequence of the endocellular bacterial symbiont of aphids Buchnera sp.APS. Nature
407, 81-86 (2000).

14
Trp & Tyr (key pharma precursors)
Cross-feeding
synthetic ecosystem
(syntrophic co-culture)

trp/tyrA pair of genomes shows the best co-growth
Reppas, Lin & Church ; Shendure et al. Accurate Multiplex Polony Sequencing of an Evolved Bacterial Genome(2005) Science 309:1728
SecondPassage
First Passage
Covariance in lab evolution

0
1
2
3
4
5
6
7
8
0 10 20 30 40 50 60 70 80 90 100 110 120 130 140 150
# of passages
Do
ub
lin
g t
ime
(h
r)
Q1
Q3
Q2-1
Q2-2
EcNR1
Sequence monitoring of evolution(optimize transport & drug resistance)
Sequence
Reppas, Lin & Church

17
Evolved syntrophic strain pairs
Trp
Tyr

18
Reading lab-evolved genomessequenced across time & within each time-point
Independent lines of Trp & Tyr co-culture
5 OmpF: (pore: large,hydrophilic > small)
42R-> G,L,C, 113 D->V, 117 E->A
2 Promoter: (cis-regulator) -12A->C, -35 C->A
5 Lrp: (trans-regulator) 1b, 9b, 8b, IS2 insert, R->L in
DBD.
Reppas, Shendure, Porecca -12 -11 -10 -9 -8 -7 -6
At late times Tyr becomes prototrophic!

19
Resynthesis of mutant
combinations---
Additive effects insensitive to
order of mutation
Related Documents