Steady and unsteady experimental analysis of a turbocharger for automotive applications R. Bontempo, M. Cardone, M. Manna * , and G. Vorraro Dipartimento di Ingegneria Industriale, Universit`a degli Studi di Napoli Federico II, Via Claudio 21, 80125 Naples, Italy Abstract The paper describes the steady and unsteady performance characteristics of a small size turbocharger typically employed in automotive downsized engine applications. The analysis is carried out by experimental means using an innovative hot gas generator system specifically designed for turbocharger testing which is capable of delivering a wide range of flow rates with adequate thermodynamic characteris- tics. More in detail, the gas generator consists of a medium size direct injection compression ignition Internal Combustion Engine (ICE) feeding the turbine of the test article. To independently set the hot gas mass flow rate and the turbine in- let temperature, the operating parameters of the aforementioned ICE are specified through an electronic control unit in a fully automated manner. Compared to previously presented data [1](Energy Procedia, vol. 45, pp 1116- 1125, 2014), those reported herein have been collected with the help of newly in- stalled equipment and controlling software allowing for the estimation of the ther- mal power transferred from the turbocharger to the environment. In particular, thanks to a first law analysis, the collected measurements have shown that the al- gebraic sum of the thermal power transferred to the lubricating oil as well as to the environment is roughly speaking 20% - 30% of the compressor total enthalpy change per unit time. Moreover, it has been shown that evaluating the compressor efficiency through classical expression based on the adiabatic assumption leads to a 5–10% relative error. The improved experimental set up also allows for higher precision transient analysis both on the cold and hot side branch of the test article. While the steady- state performance maps of the turbocharger are readily obtained with the semi- automated testing procedure, the detailed analysis of the unsteady phenomena related for instance to the occurrence of mild and deep compressor surge events, * Corresponding author. E-mail address: [email protected]; tel: +39-081- 7683287 1 Energy Conversion and Managment, Vol. 99, pp 72-80, 2015 doi:10.1016/j.enconman.2015.04.025

Welcome message from author
This document is posted to help you gain knowledge. Please leave a comment to let me know what you think about it! Share it to your friends and learn new things together.
Transcript
Steady and unsteady experimental analysis ofa turbocharger for automotive applications
R. Bontempo, M. Cardone, M. Manna∗, and G. Vorraro
Dipartimento di Ingegneria Industriale, Universita degli Studi di Napoli Federico II,Via Claudio 21, 80125 Naples, Italy
Abstract
The paper describes the steady and unsteady performance characteristics of a smallsize turbocharger typically employed in automotive downsized engine applications.The analysis is carried out by experimental means using an innovative hot gasgenerator system specifically designed for turbocharger testing which is capable ofdelivering a wide range of flow rates with adequate thermodynamic characteris-tics. More in detail, the gas generator consists of a medium size direct injectioncompression ignition Internal Combustion Engine (ICE) feeding the turbine of thetest article. To independently set the hot gas mass flow rate and the turbine in-let temperature, the operating parameters of the aforementioned ICE are specifiedthrough an electronic control unit in a fully automated manner.
Compared to previously presented data [1](Energy Procedia, vol. 45, pp 1116-1125, 2014), those reported herein have been collected with the help of newly in-stalled equipment and controlling software allowing for the estimation of the ther-mal power transferred from the turbocharger to the environment. In particular,thanks to a first law analysis, the collected measurements have shown that the al-gebraic sum of the thermal power transferred to the lubricating oil as well as tothe environment is roughly speaking 20% - 30% of the compressor total enthalpychange per unit time. Moreover, it has been shown that evaluating the compressorefficiency through classical expression based on the adiabatic assumption leads toa 5–10% relative error.
The improved experimental set up also allows for higher precision transientanalysis both on the cold and hot side branch of the test article. While the steady-state performance maps of the turbocharger are readily obtained with the semi-automated testing procedure, the detailed analysis of the unsteady phenomenarelated for instance to the occurrence of mild and deep compressor surge events,
∗Corresponding author. E-mail address: [email protected]; tel: +39-081-7683287
1
Energy Conversion and Managment, Vol. 99, pp 72-80, 2015doi:10.1016/j.enconman.2015.04.025

2
are reproduced and thoroughly analysed using the rig in more advanced operatingmodes.Keywords: turbocharger, downsizing, turbocharger test rig.
Nomenclature
h static enthalpy
m mass flow
m long time averaged mass flow
n turbocharger revolutions per minute
p static pressure
p long time averaged static pressure
Q thermal power
T static temperature
W mechanical power
Greek symbols
ηis isentropic efficiency
ηpresumed presumed isentropic efficiency
Subscripts
b bearing
c compressor
corr corrected quantity
d delivery
ext used to indicate thermal powers transferred to the environment
h housing
oil oil
ref reference quantity
s suction
t turbine

1 Introduction 3
Superscripts
0 stagnation quantity
Acronyms
BSL best straight line
CGG cold gas generator
DCU data acquisition and control unit
DS deep surge
FS full scale
HGG hot gas generator
ICE internal combustion engine
MS mild surge
PID proportional-integral-derivative control
rms root mean square
rpm revolutions per minute
TS test section
1 Introduction
In recent years, turbocharging internal combustion engines has become a very pop-ular practice which is widely used to reduce the pollutant emissions and the fuelconsumption especially for downsized propulsion system [2–8]. Specifically, dif-ferent advantages can be achieved by coupling the downsizing and turbochargingtechniques with no prejudice on the delivered power. In fact, the reduction of theengine displacement gives rise to a decrease of the weight, of the cost and of themechanical friction losses. Moreover, at low loads, the throttle valve opening of adownsized spark ignition engine is generally bigger than the one of a conventionalICE delivering the same power, so that the associated pumping losses are reduced.Finally, the actual engine control systems are very often capable to avoid the typ-ical drawback of supercharged engines, that is, a marked tendency to detonation.Recently, in order to investigate the most important phenomena occurring in tur-bochargers, several experimental facilities have been designed and manufactured.For example, the commercial test benches developed by the automotive researchindustries AVL [9] and FEV [10] both adopt a combustion chamber to feed theturbine, offering a compact and fully transportable solution for steady flow analy-sis. On the other hand many experimental facilities have also been proposed and
1 Introduction 4
employed to study more advanced problems, like the unsteady and unstable tur-bocharger flow regimes. The aforementioned test rigs are also frequently used toprovide detailed experimental data for validation of numerical models. Lujan et al.[11] described a turbochargers research test bench capable of reproducing compres-sor maps under pulsating or continuous flow conditions. Galindo et al. [12] definedthe surge operating points by means of a special experimental setup in which theturbine is fed with a heavy duty diesel engine, while the centrifugal compressor isindependently processing its own mass flow rate. With the help of the same testrig, Serrano et al. [13] studied heat transfer phenomena in turbochargers whichare of particular importance for the correct determination of the real compressionwork. Rajoo and Martinez-Botas [14] investigated a variable geometry mixed flowturbine with a purposely designed pivoting nozzle vane ring equipped with a heaterto avoid the condensation of the water vapour during the expansion process withinthe turbine.
Another very research topic closely related to the analysis of turbochargersperformance is the estimate of the heat transfer effects. Bohn et al. [15] performeda conjugate flow and heat transfer investigation of a turbocharger including thecompressor, the oil cooled housing and the turbine. By means of a CFD basedmethod, the authors analysed several case-studies characterised by different valuesof the mass flow rate and of the turbine inlet temperature. From this parametricstudy a one dimensional model has also been developed and it was clearly shownthat the thermal energy transferred from the turbine to the compressor significantlyinfluences the compressor performance. Chesse et al. [16] presented the results ofthe experimental tests carried out on a hot air supplied turbocharger test bench.The data show that the difference with the adiabatic conditions is considerable,especially at low compressor power. Romagnoli and Martinez-Botas [17] analysedthe turbocharger behaviour operating under non-adiabatic conditions in order toassess the impact of the heat transfer phenomena on its performance. To this aim,a commercial turbocharger was directly installed on a 2.0 l diesel engine and themeasurements were carried out for a range of engine speeds and loads. Finally, aone dimensional heat transfer model was also implemented and validated againstexperimental data. Other works dealing with the heat transfer effects are due toAghaali and Angstrom [18, 19], Baines et al. [20], Bohn et al. [21, 22], Casey andFesich [23], Cormerais et al. [24], Hellstrom and Fuchs [25], Jung et al. [26], andSerrano et al. [27], but this list should not be regarded as exhaustive.
This paper deals with the analysis of the experimental results obtained througha turbocharger test bench in which a diesel engine is used as hot gas generatorsystem. In comparison to a previously published work [1], many improvements inthe rig layout and in the measuring chain are presented and discussed. In particular,three relevant aspects of the performance of a turbocharger can be more properlyanalysed through the actual configuration of the rig.
Firstly, both the compressor and the turbine stationary maps can be obtained ina semi-automated manner. Compared with those typically provided by the manu-facturer, the performance maps obtained with the present facility are more extendedboth in terms of rpm and mass flow rate span. This means that in the compressor
2 Experimental apparatus 5
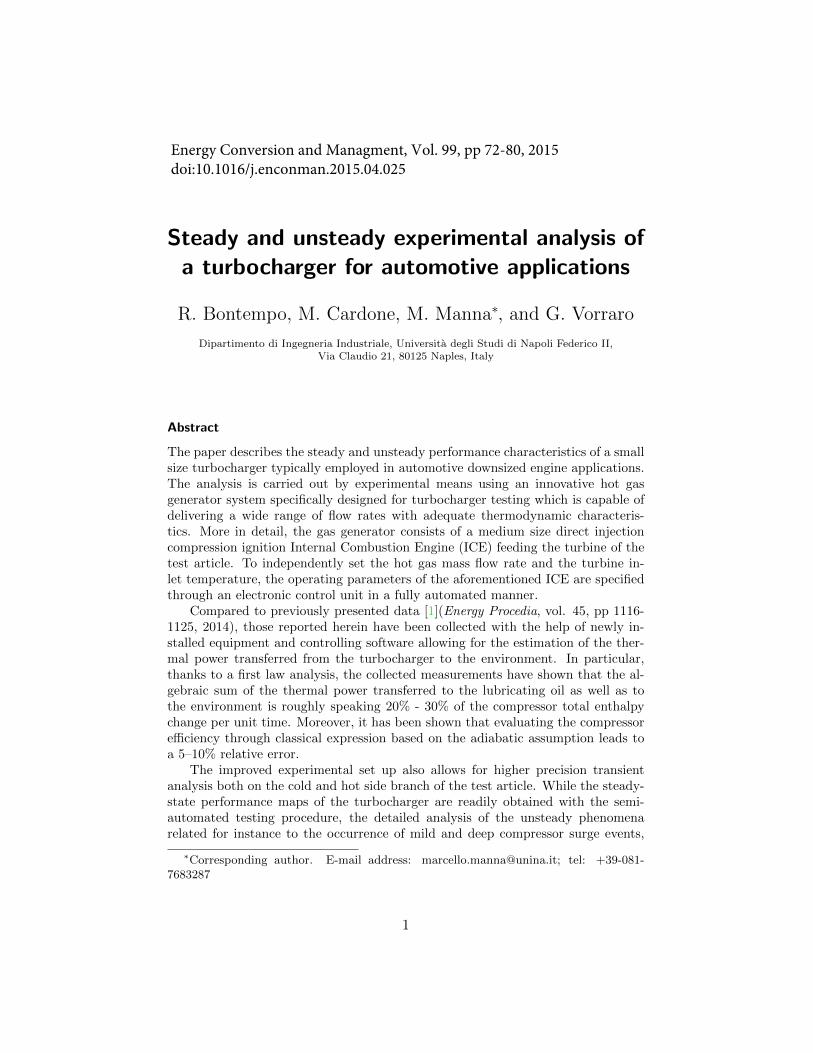
Fig. 1: Schematic view of the rig.
characteristic plane (pressure ratio versus mass flow), all desired rpm isolines canbe obtained and that the mass flow rate is spanned in the whole operating range,i.e. from choke to surge limit. Likewise, on the turbine side, all rpm isolines canbe also readily obtained, while the mass flow rate span is determined by the powerrange required to drive the compressor.
Secondly, thanks to a first law analysis of the whole turbocharger (see section4), the new experimental set-up also allows to estimate the heat transfer effects onthe evaluation of the efficiency through the classical adiabatic assumption.
Thirdly and lastly, the unsteady phenomena related for instance to the occur-rence of mild and deep compressor surge can also be thoroughly investigated.
In section 2 the revised outline of the rig is briefly summarised, while in sec-tion 3 the new measurement instrumentation is detailed. In section 4 a first lawthermodynamic analysis is carried out. This analysis, together with the collectedexperimental data, allows to quantify the discrepancy from the classical adiabaticassumption. Finally, in section 5, the results related to the three aspects anal-ysed in this paper (that is the construction of the steady state performance maps,the evaluation of the heat transfer effects and the analysis of mild and deep surgephenomena) are presented and discussed.
2 Experimental apparatus
As reported in Figure 1, the experimental facility consists of the following four sub-systems: a data acquisition and control unit (DCU), a test section (TS), a cold gasgenerator (CGG) and a hot gas generator (HGG). The latter relies on the use of adirect injection 2.5 l diesel engine which feeds the turbocharger turbine. Obviously,
3 The test section and instrumentation 6
the ICE has been deprived of its own turbocharger in order to preserve the exhaustgas energy quality, both in terms of temperature and pressure. The power deficitassociated to the turbocharger removal has been recovered supercharging the ICEwith the CGG system shown in Figure 1. In particular, the cold gas pressurizationis guaranteed by an ATLAS Copco GA55VSD two stage intercooled screw com-pressor requiring 55 kW at full load. A 2000 l tank is used to store the compressedair up to a maximum pressure of 12 bar, while the engine boost pressure can beset by means of a high performance regulator valve relying on a home-made inte-grated PID control system. Moreover, the CGG is also able to follow, in an fullyautomated manner, the boost pressure map of the original engine which has beenretrieved by means of an extensive measurement campaign previously carried out.Finally, the mechanical power delivered by the ICE is absorbed by a Borghi&Saverieddy current dynamometer that allows both for steady and unsteady operationalmodes.
3 The test section and instrumentation
The experimental tests have been conducted on a small automotive turbochargerequipping engines characterised by a power and displacement range of 50−130 HPand 0.4 − 1.2 l, respectively. The maximum rated value of the rotational speed is200 krpm.
The compressor is able to deliver a corrected mass flow within a 2.5−13 lb/minrange and a maximum pressure ratio of about 2.7, while the turbine mass flowspans a 4.8 − 6.9 lb/min range. Finally, the turbine expansion ratio in chokedconditions is approximately equal to 2.5. The compressor operates in an opencircuit with an inline backpressure control valve mounted on the delivery branchof the machine. The turbine expansion ratio can also be controlled operating abutterfly valve installed at the turbine exit manifold.
The turbo bearings are lubricated and cooled through a dedicated system con-sisting of a by-pass regulated gear pump operated in a closed circuit. A 20 l reser-voir, filled with a SAE 10W40 synthetic oil, is used as supplier and receiver. A heatexchanger and a electric heater for oil temperature control are also introduced in thecircuit. Given the strong viscosity-temperature dependence and the large amountof heat released from the turbine, a constant oil temperature, ensured with a closedloop active control system, is considered essential to improve the repeatability ofthe test campaigns.
In order to properly measure the relevant thermo-fluid dynamics quantitiescharacterising the steady and unsteady behaviour of the turbocharger, several sen-sors have been installed on the test article. To evaluate the compression and ex-pansion ratio, silicon piezo-resistive pressure transducers are located at the inletand at the outlet of the compressor and turbine pipes. Moreover, to analyse theperformance of the compressor wheel, a pressure sensor is also placed at the rotoroutlet. In particular, the water cooled EWCT-312M and the XTEL-190M Kulitetransducers equip the turbine and the compressor, respectively. The pressure rangeof all transducers is 0−500 kPa with 0.1% FS BSL. The main advantages that can
4 First law thermodynamic analysis 7
be gained by using these kind of sensors are the low intrusive character of the mea-surement due to the miniaturised sensing area, the absence of any external chargeamplifier and the high-frequency response granted by the silicon technology.
The temperature measurements are carried out with a few type K thermocou-ples (range: 0 − 1260 ◦C; accuracy: ±1.5 ◦C) located at the suction and deliverymanifolds of the compressor (probe diameter: 1.5 mm) and of the turbine (probediameter: 3.0 mm). Besides, a further thermocouple is also placed at the com-pressor rotor outlet. Generally, the frequency response of a standard thermocouplewith a 1.5 mm screen diameter is of the order of 1 Hz, which is too low to prop-erly acquire the main features of the unsteady and unstable phenomena occurringin the compressor. For this reason, the compressor temperature transducers havebeen deprived of their own metal screen and then recalibrated. By so doing thethermocouple junction is directly immersed in the fluid and, due to its reducedthermal capacity, it presents a higher frequency response.
Two Rosemount 3095MFA are used to measure the mass flow rates swallowedby the compressor and the turbine. The full scale of the previously mentionedinstruments is 900 kg/h, while the accuracy is better than 0.8% FS BSL. Once more,in order to better characterise the unsteady and unstable flow regime occurring inthe compressor, two one-directional fast response Bosch HFM-5 hot film metersare installed at the compressor inlet pipe. More in detail, the two transducers areopposite mounted to measure positive and negative mass flow rates, respectively.The frequency response of these transducers is 30 Hz with an accuracy better than3% FS.
The turbocharger rpm acquisition system is based on an eddy current sen-sor flush mounted on the compressor casing with a rotational speed capability of400 krpm.
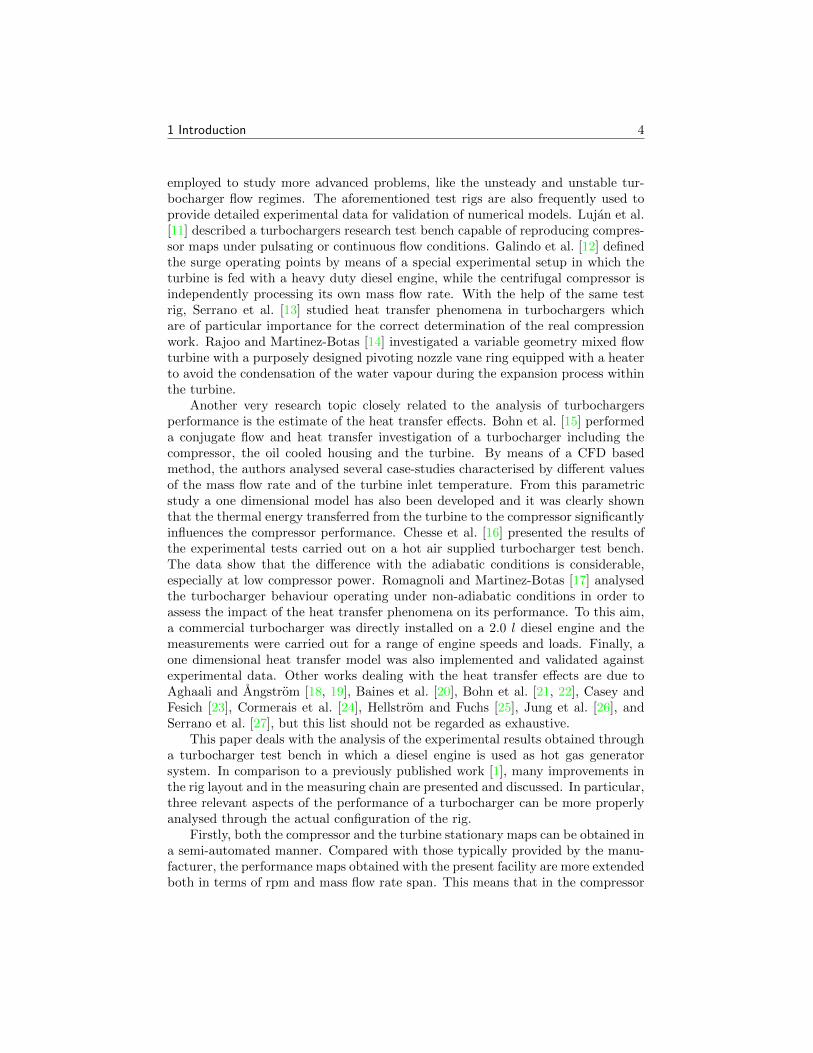
The National Instrument PCI-6133 DAQ is used to manage the high frequencyresponse signals, while the cFP-1808 Programmable Automation Controller is adoptedto collected the steady state ones. Finally, all the data flow is controlled and man-aged through a LabVIEW Virtual Instrument in-house developed code (see Figure2).
4 First law thermodynamic analysis
For small size turbochargers the heat transfer from one component to the other aswell as to the environment has a relevant impact on the performance, and standardadiabatic thermodynamic analysis may lead to severe work transfers erroneous es-timations. In fact, for an adiabatic process the work transfer from/to the fluidcan be estimated measuring the change in total enthalpy across the machine, i.e.the change in total temperature. Conversely, in a diabatic process the heat trans-fer from/to the fluid has to be taken into account if the correct work transfer isforeseen for power or efficiency evaluation. In order to investigate the effects ofthe thermal exchange on the turbocharger performance, a first law thermodynamicanalysis is conducted in this section. Then, in the next subsection 5.2, the results

4 First law thermodynamic analysis 8
Fig. 2: Virtual Instrument graphic unit interface; snapshot of the screen duringtesting.
4 First law thermodynamic analysis 9
𝑚 𝑐ℎ𝑐,𝑖𝑛0
𝑄 𝑐,𝑒𝑥𝑡
𝑊 𝐶
𝑄 𝑡,𝑒𝑥𝑡
𝑊 𝑇
𝑚 𝑐ℎ𝑐,𝑜𝑢𝑡0
𝑚 𝑡ℎ𝑡,𝑖𝑛0
𝑚 𝑡ℎ𝑡,𝑜𝑢𝑡0
𝑚 𝑜𝑖𝑙ℎ𝑜𝑖𝑙,𝑖𝑛0
𝑚 𝑜𝑖𝑙ℎ𝑜𝑖𝑙,𝑜𝑢𝑡0
𝑊 𝐵
𝑄 ℎ,𝑒𝑥𝑡
𝑄 𝑡 𝑄 𝑐
𝑄 𝑜𝑖𝑙
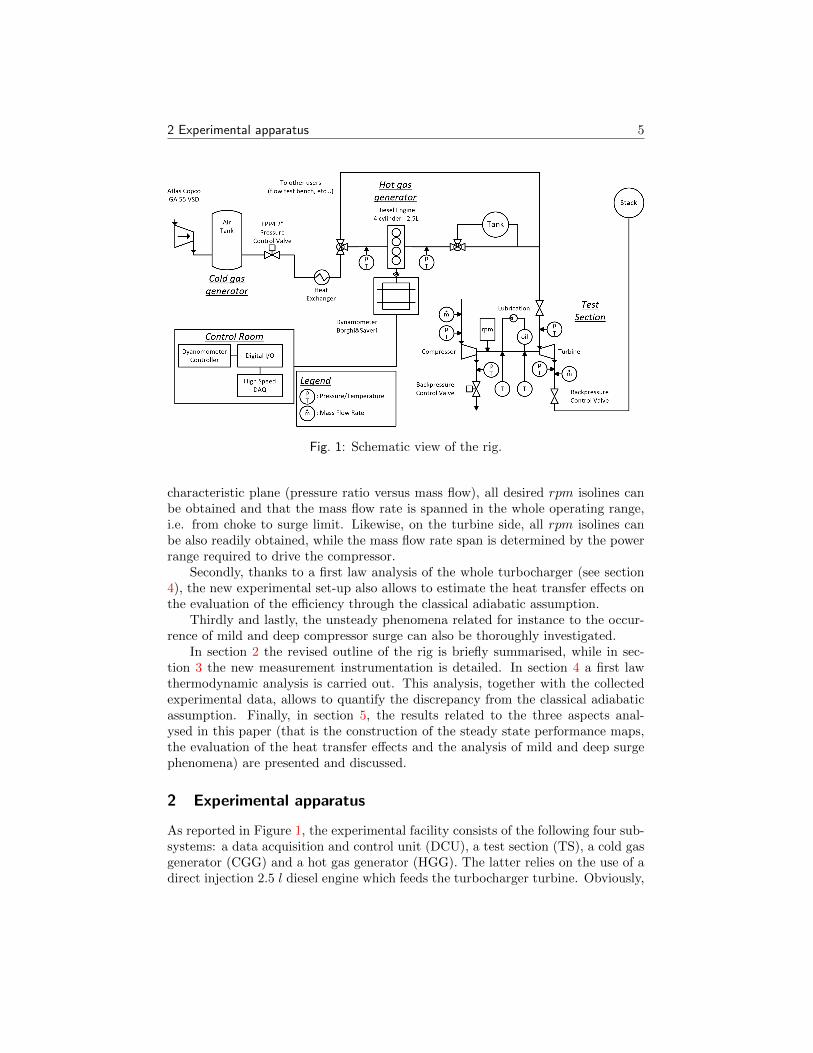
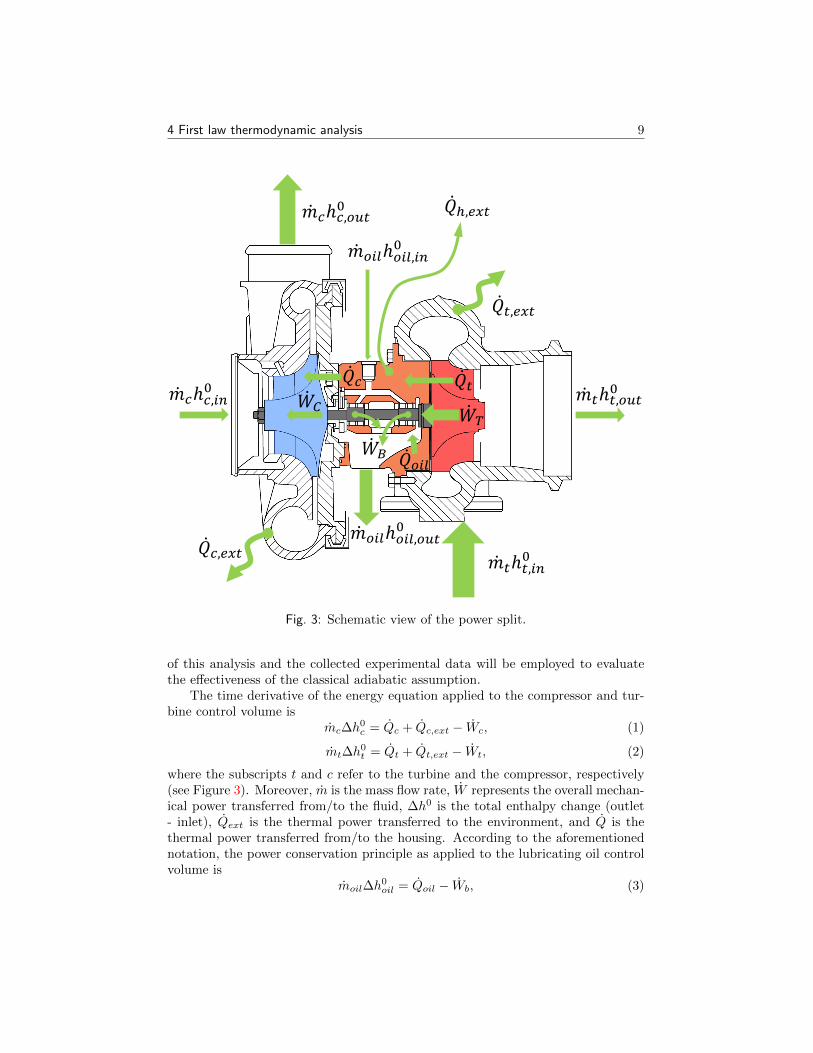
Fig. 3: Schematic view of the power split.
of this analysis and the collected experimental data will be employed to evaluatethe effectiveness of the classical adiabatic assumption.
The time derivative of the energy equation applied to the compressor and tur-bine control volume is
mc∆h0c = Qc + Qc,ext − Wc, (1)
mt∆h0t = Qt + Qt,ext − Wt, (2)
where the subscripts t and c refer to the turbine and the compressor, respectively(see Figure 3). Moreover, m is the mass flow rate, W represents the overall mechan-ical power transferred from/to the fluid, ∆h0 is the total enthalpy change (outlet- inlet), Qext is the thermal power transferred to the environment, and Q is thethermal power transferred from/to the housing. According to the aforementionednotation, the power conservation principle as applied to the lubricating oil controlvolume is
moil∆h0oil = Qoil − Wb, (3)

4 First law thermodynamic analysis 10
where Wb is the power loss due to the bearing friction. In equations (1)-(3) and inthe following the Clausius thermodynamics convention is adopted, i.e. the quantityQ is considered to be positive if the thermal power is added to the system, whilethe quantity W is considered to be positive if the mechanical power is delivered bythe system. Having said that, the quantities Wt, Wc, and Wb are considered to bepositive, negative and negative, respectively, while Qc,ext and Qt,ext are assumed
to be negative and, finally, Qoil is regarded as positive.The same principle can be applied to the housing control volume thus returning
Qt,h + Qc,h + Qh,ext + Qoil,h = 0. (4)
In the above equation, Qt,h, Qc,h, Qh,ext and Qoil,h denote the housing thermalpower exchange with the turbine, the compressor, the environment and the oil,respectively. Obviously, the quantity Qt in equation (2) is identical in magnitude tothe thermal power received by the housing, i.e. Qt = −Qt,h. Likewise, Qc = −Qc,h
and Qoil = −Qoil,h. Consequently, equation (4) can also be written as:
Qt + Qc − Qh,ext + Qoil = 0. (5)
Finally, the power equation for the overall turbocharger control volume reads
mt∆h0t + mc∆h
0c + moil∆h
0oil = Qext, (6)
whereQext = Qt,ext + Qc,ext + Qh,ext. (7)
The above equations can be further combined with each other. In particular,the sum of equations (2) and (1) returns
mt∆h0t + Wt + mc∆h
0c + Wc = Qt + Qt,ext + Qc + Qc,ext, (8)
which, with the help of equations (5) and (7), also gives
mt∆h0t + Wt + mc∆h
0c + Wc = −Qoil + Qext. (9)
Finally, by means of equation (3), the above expression can be cast in the followingform
mt∆h0t + Wt + mc∆h
0c + Wc = Qext − moil∆h
0oil − Wb, (10)
In an adiabatic process the left hand-side of equation (10) should be equalto zero (see equations (2) and (1)), whereas in a diabatic process occurring in aturbocharger it is usually negative. This can be readily understood observing thatthe term Qext (representing the overall thermal power released by the turbine,by the bearing housing and by the compressor to the environment) and the term−moil∆hoil are typically both negative.
In the next subsection 5.2, the above equations and the collected experimentaldata will be employed to appreciate the errors in the power and efficiency estima-tions under the adiabatic assumption.
5 Analysis of the results 11
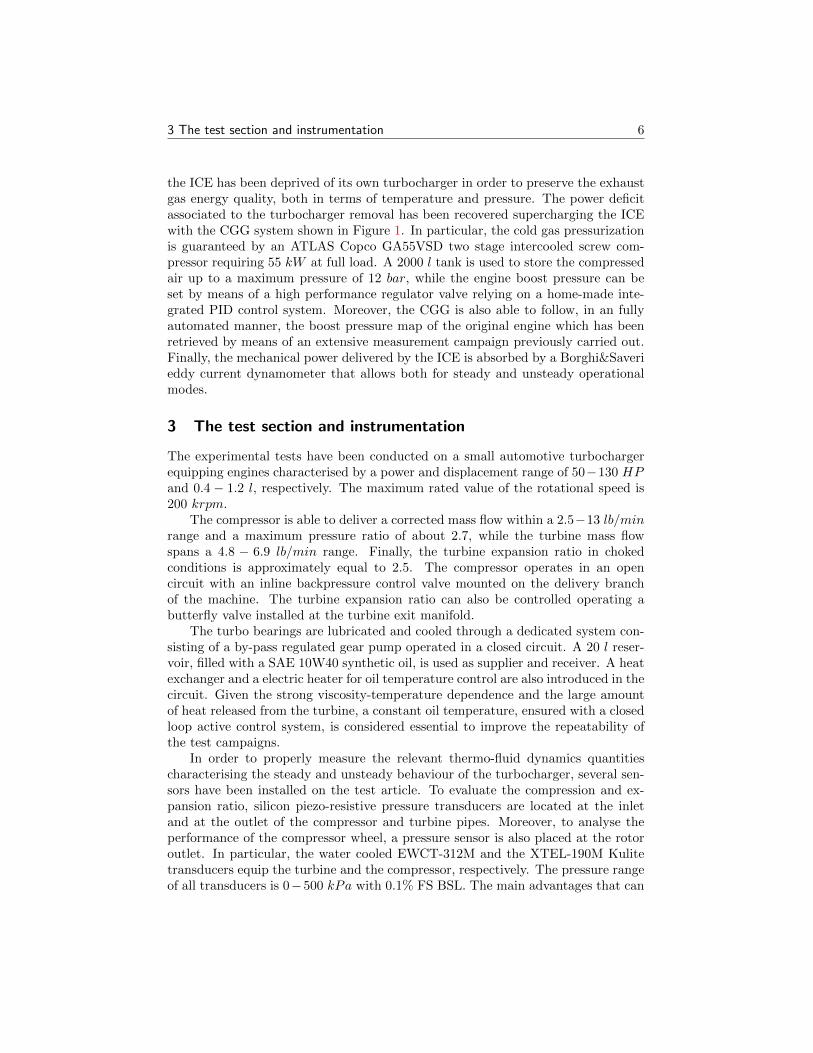
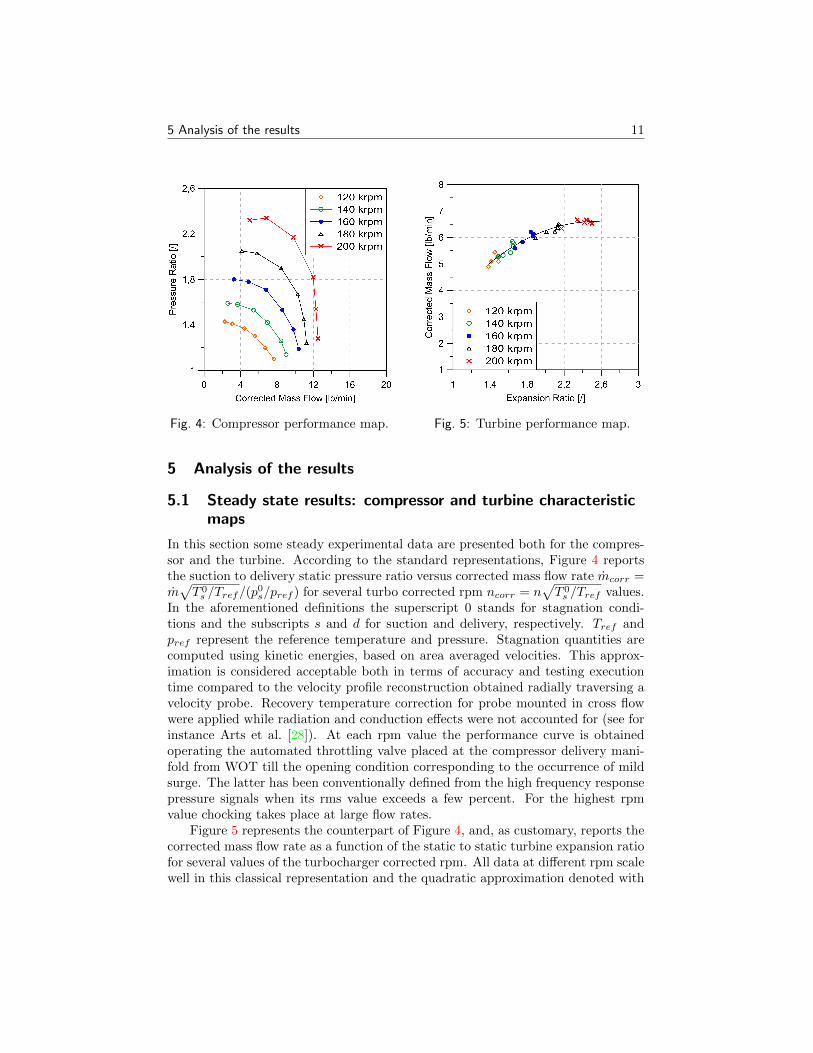
Fig. 4: Compressor performance map. Fig. 5: Turbine performance map.
5 Analysis of the results
5.1 Steady state results: compressor and turbine characteristicmaps
In this section some steady experimental data are presented both for the compres-sor and the turbine. According to the standard representations, Figure 4 reportsthe suction to delivery static pressure ratio versus corrected mass flow rate mcorr =m√T 0s /Tref/(p
0s/pref ) for several turbo corrected rpm ncorr = n
√T 0s /Tref values.
In the aforementioned definitions the superscript 0 stands for stagnation condi-tions and the subscripts s and d for suction and delivery, respectively. Tref andpref represent the reference temperature and pressure. Stagnation quantities arecomputed using kinetic energies, based on area averaged velocities. This approx-imation is considered acceptable both in terms of accuracy and testing executiontime compared to the velocity profile reconstruction obtained radially traversing avelocity probe. Recovery temperature correction for probe mounted in cross flowwere applied while radiation and conduction effects were not accounted for (see forinstance Arts et al. [28]). At each rpm value the performance curve is obtainedoperating the automated throttling valve placed at the compressor delivery mani-fold from WOT till the opening condition corresponding to the occurrence of mildsurge. The latter has been conventionally defined from the high frequency responsepressure signals when its rms value exceeds a few percent. For the highest rpmvalue chocking takes place at large flow rates.
Figure 5 represents the counterpart of Figure 4, and, as customary, reports thecorrected mass flow rate as a function of the static to static turbine expansion ratiofor several values of the turbocharger corrected rpm. All data at different rpm scalewell in this classical representation and the quadratic approximation denoted with
5 Analysis of the results 12
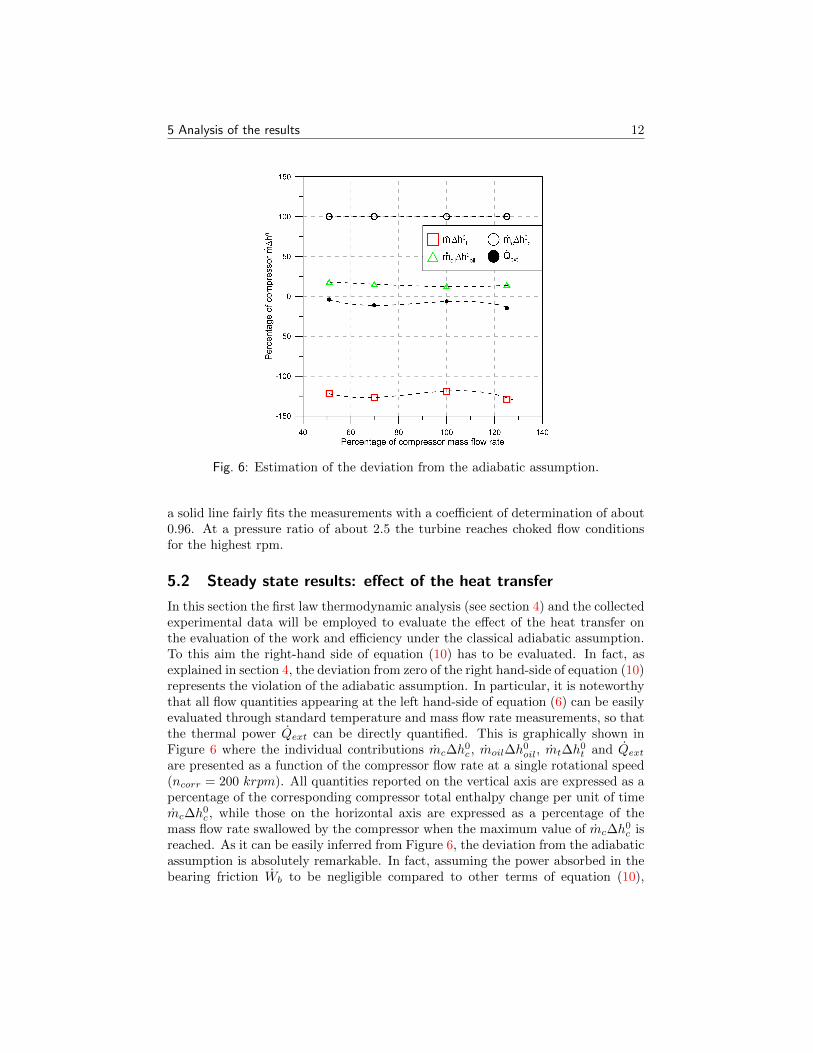
Fig. 6: Estimation of the deviation from the adiabatic assumption.
a solid line fairly fits the measurements with a coefficient of determination of about0.96. At a pressure ratio of about 2.5 the turbine reaches choked flow conditionsfor the highest rpm.
5.2 Steady state results: effect of the heat transfer
In this section the first law thermodynamic analysis (see section 4) and the collectedexperimental data will be employed to evaluate the effect of the heat transfer onthe evaluation of the work and efficiency under the classical adiabatic assumption.To this aim the right-hand side of equation (10) has to be evaluated. In fact, asexplained in section 4, the deviation from zero of the right hand-side of equation (10)represents the violation of the adiabatic assumption. In particular, it is noteworthythat all flow quantities appearing at the left hand-side of equation (6) can be easilyevaluated through standard temperature and mass flow rate measurements, so thatthe thermal power Qext can be directly quantified. This is graphically shown inFigure 6 where the individual contributions mc∆h
0c , moil∆h
0oil, mt∆h
0t and Qext
are presented as a function of the compressor flow rate at a single rotational speed(ncorr = 200 krpm). All quantities reported on the vertical axis are expressed as apercentage of the corresponding compressor total enthalpy change per unit of timemc∆h
0c , while those on the horizontal axis are expressed as a percentage of the
mass flow rate swallowed by the compressor when the maximum value of mc∆h0c is
reached. As it can be easily inferred from Figure 6, the deviation from the adiabaticassumption is absolutely remarkable. In fact, assuming the power absorbed in thebearing friction Wb to be negligible compared to other terms of equation (10),
5 Analysis of the results 13
Figure 6 also shows that the left hand-side of (10) is far from being zero since thealgebraic sum Qext − moil∆h
0oil is roughly speaking 20 - 30% of mc∆h
0c . Thus,
from this data set there is a tangible evidence that the adiabatic assumption isviolated to a considerable extent, so that the evaluation of the efficiencies basedon the equality W = −m∆h0 becomes questionable. In particular, the isentropicefficiency evaluated assuring the compression as an adiabatic process would read:
ηpresumed =Wc,is
Wc
=−mc∆h
0c,is
−mc∆h0c. (11)
Actually the real mechanical power Wc absorber by the compressor rotor differsfrom −mc∆h
0c due to the presence of the thermal power contribution Qc + Qc,ext,
as it can be easily inferred from equation (1). Consequently, the isentropic efficiencyshould be correctly evaluated through
η =Wc,is
Wc
=−mc∆h
0c,is
−mc∆h0c + (Qc + Qc,ext)(12)
and not by equation (11). The sum Qc + Qc,ext, appearing in equation (12), canbe further elaborated with the help of equations (8) and (9), thus obtaining
Qc + Qc,ext + Qt + Qt,ext = −Qoil + Qext,
which, by means of equations (6) and (3), yields
Qc + Qc,ext + Qt + Qt,ext = mt∆h0t + mc∆h
0c , (13)
where the bearing friction contribution Wb has been neglected. Note that the left-hand side of the above equation can be simply evaluated from standard temperatureand mass flow rate measurements. If it is assumed that the compressor thermalpower Qc + Qc,ext can be expressed as a fraction of mt∆h
0t + mc∆h
0c (see equation
(13)), i.e. Qc + Qc,ext = λ(mt∆h0t + mc∆h
0c), then the isentropic efficiency (12)
becomes:
η =Wc,is
Wc
=−mc∆h
0c,is
−mc∆h0c + λ(mt∆h0t + mc∆h0c), (14)
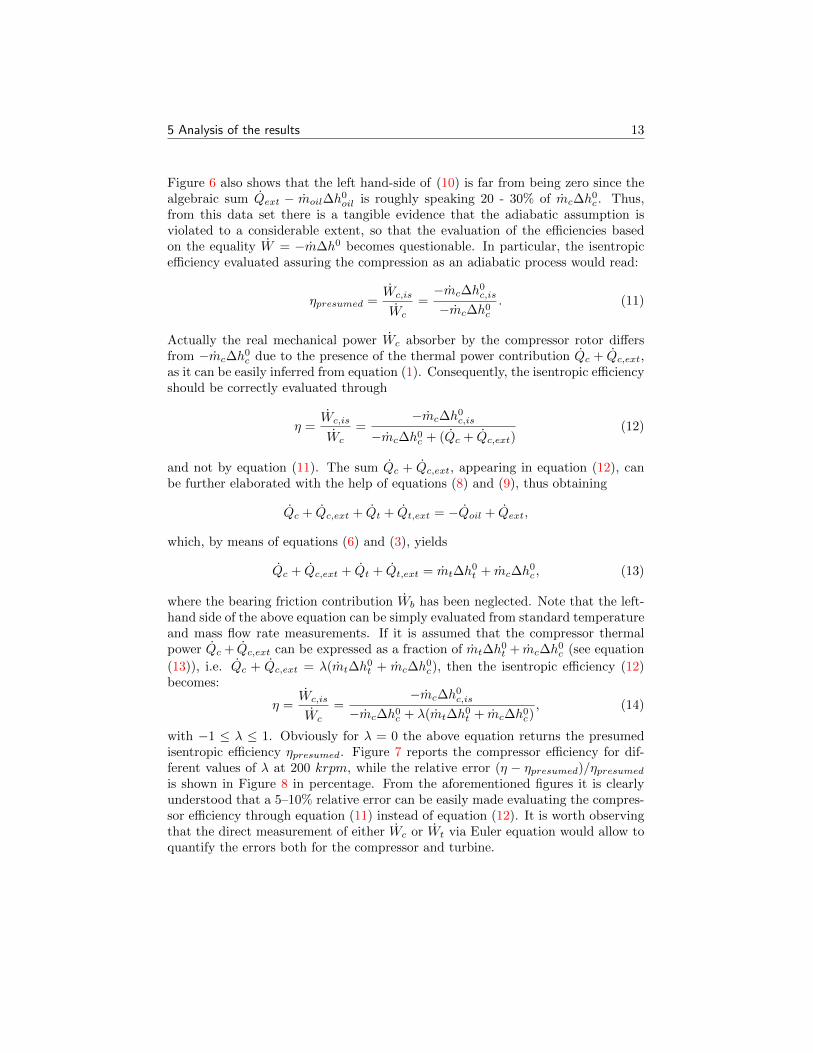
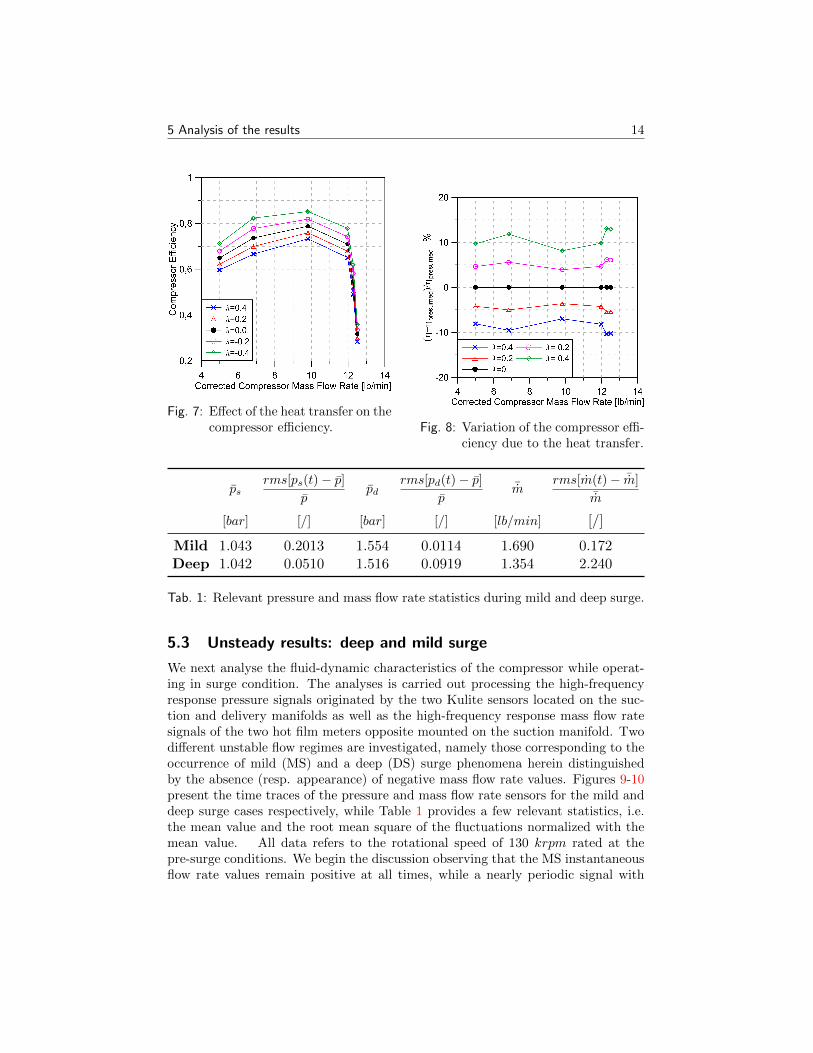
with −1 ≤ λ ≤ 1. Obviously for λ = 0 the above equation returns the presumedisentropic efficiency ηpresumed. Figure 7 reports the compressor efficiency for dif-ferent values of λ at 200 krpm, while the relative error (η − ηpresumed)/ηpresumed
is shown in Figure 8 in percentage. From the aforementioned figures it is clearlyunderstood that a 5–10% relative error can be easily made evaluating the compres-sor efficiency through equation (11) instead of equation (12). It is worth observingthat the direct measurement of either Wc or Wt via Euler equation would allow toquantify the errors both for the compressor and turbine.
5 Analysis of the results 14
Fig. 7: Effect of the heat transfer on thecompressor efficiency. Fig. 8: Variation of the compressor effi-
ciency due to the heat transfer.
psrms[ps(t) − p]
ppd
rms[pd(t) − p]
p¯m
rms[m(t) − ¯m]¯m
[bar] [/] [bar] [/] [lb/min] [/]
Mild 1.043 0.2013 1.554 0.0114 1.690 0.172Deep 1.042 0.0510 1.516 0.0919 1.354 2.240
Tab. 1: Relevant pressure and mass flow rate statistics during mild and deep surge.
5.3 Unsteady results: deep and mild surge
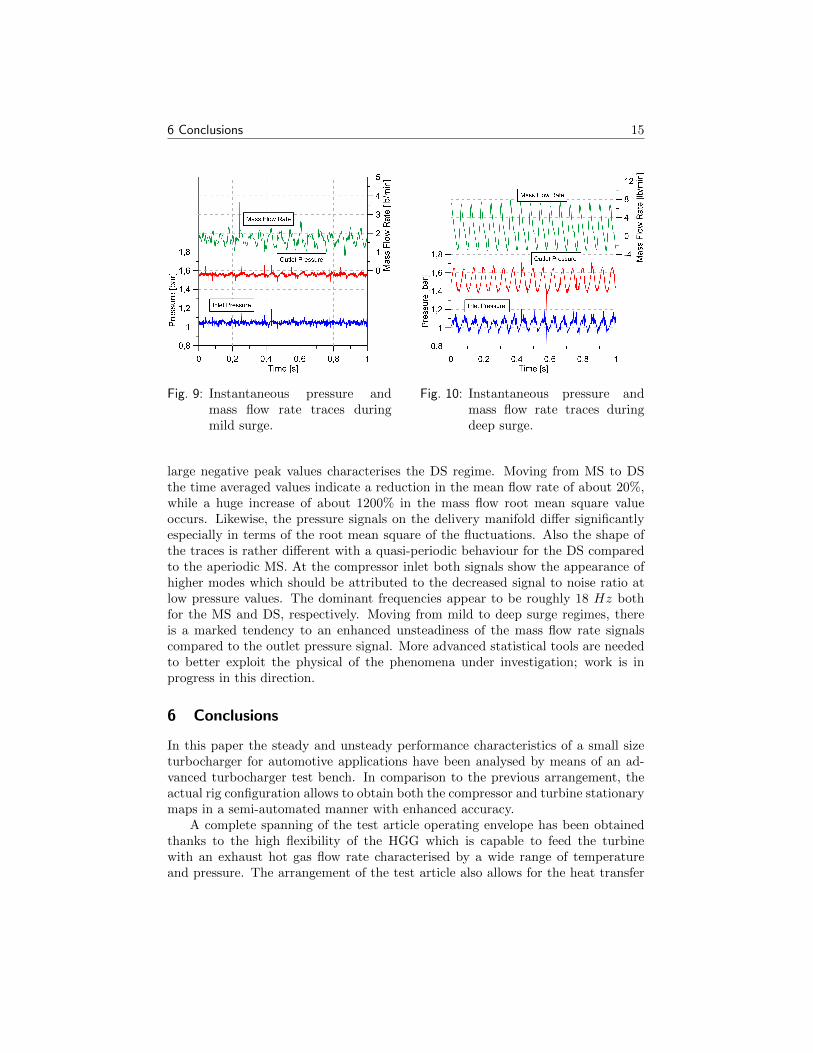
We next analyse the fluid-dynamic characteristics of the compressor while operat-ing in surge condition. The analyses is carried out processing the high-frequencyresponse pressure signals originated by the two Kulite sensors located on the suc-tion and delivery manifolds as well as the high-frequency response mass flow ratesignals of the two hot film meters opposite mounted on the suction manifold. Twodifferent unstable flow regimes are investigated, namely those corresponding to theoccurrence of mild (MS) and a deep (DS) surge phenomena herein distinguishedby the absence (resp. appearance) of negative mass flow rate values. Figures 9-10present the time traces of the pressure and mass flow rate sensors for the mild anddeep surge cases respectively, while Table 1 provides a few relevant statistics, i.e.the mean value and the root mean square of the fluctuations normalized with themean value. All data refers to the rotational speed of 130 krpm rated at thepre-surge conditions. We begin the discussion observing that the MS instantaneousflow rate values remain positive at all times, while a nearly periodic signal with
6 Conclusions 15
Fig. 9: Instantaneous pressure andmass flow rate traces duringmild surge.
Fig. 10: Instantaneous pressure andmass flow rate traces duringdeep surge.
large negative peak values characterises the DS regime. Moving from MS to DSthe time averaged values indicate a reduction in the mean flow rate of about 20%,while a huge increase of about 1200% in the mass flow root mean square valueoccurs. Likewise, the pressure signals on the delivery manifold differ significantlyespecially in terms of the root mean square of the fluctuations. Also the shape ofthe traces is rather different with a quasi-periodic behaviour for the DS comparedto the aperiodic MS. At the compressor inlet both signals show the appearance ofhigher modes which should be attributed to the decreased signal to noise ratio atlow pressure values. The dominant frequencies appear to be roughly 18 Hz bothfor the MS and DS, respectively. Moving from mild to deep surge regimes, thereis a marked tendency to an enhanced unsteadiness of the mass flow rate signalscompared to the outlet pressure signal. More advanced statistical tools are neededto better exploit the physical of the phenomena under investigation; work is inprogress in this direction.
6 Conclusions
In this paper the steady and unsteady performance characteristics of a small sizeturbocharger for automotive applications have been analysed by means of an ad-vanced turbocharger test bench. In comparison to the previous arrangement, theactual rig configuration allows to obtain both the compressor and turbine stationarymaps in a semi-automated manner with enhanced accuracy.
A complete spanning of the test article operating envelope has been obtainedthanks to the high flexibility of the HGG which is capable to feed the turbinewith an exhaust hot gas flow rate characterised by a wide range of temperatureand pressure. The arrangement of the test article also allows for the heat transfer
REFERENCES 16
analysis of the whole turbocharger assembly. Combining the power conservationprinciple as applied to the compressor, the turbine, the bearing housing and tothe overall turbocharger, it has been shown that the thermal power transferredto the lubricating oil as well as to the environment has a relevant impact on theperformance of the test article. In particular, it has been found that the algebraicsum of the aforementioned two thermal powers is roughly speaking 20% - 30% ofthe compressor total enthalpy change per unit of time mc∆h
0c . This also means
that the evaluation of both work transfer and efficiency under the assumption ofadiabatic flow is largely affected by errors. Specifically, it has been shown that a 5–10% relative error can be easily made evaluating the compressor efficiency throughclassical expression based on the adiabatic assumption. Finally, the rig also allowsthe acquisition of the high frequency pressure and flow rate fluctuations typicallyoccurring in unsteady phenomena like those characterising compressor surge. Ithas been documented that going from mild to deep surge regimes, the mass flowrate fluctuations increase more compared to the pressure ones.
Acknowledgements
This work has been developed within the F.A.R.O. project, funded by Polo delleScienze e delle Tecnologie of Universita degli Studi di Napoli “Federico II”. Thetechnical contribution provided by Rosario Moreschi to process the experimentaldata is greatly acknowledged. Salvatore De Cristofaro and Gennaro Stingo provideda tangible and tireless support while preparing, assembling and disassembling therig components.
References
[1] R. Bontempo, M. Cardone, M. Manna, and G. Vorraro. “Highly Flexi-ble Hot Gas Generation System for Turbocharger Testing”. In: EnergyProcedia 45C (2014), pp. 1116–1125. issn: 1876-6102. doi: 10.1016/j.egypro.2014.01.117. url: http://www.sciencedirect.com/science/article/pii/S1876610214001180.
[2] M. H. Padzillah, S. Rajoo, and R. F. Martinez-Botas. “Influence ofspeed and frequency towards the automotive turbocharger turbineperformance under pulsating flow conditions”. In: Energy Conversionand Management 80 (2014), pp. 416–428. doi: 10.1016/j.enconman.2014.01.047.
[3] M. S. Chiong, S. Rajoo, A. Romagnoli, A. W. Costall, and R. F.Martinez-Botas. “Integration of meanline and one-dimensional meth-ods for prediction of pulsating performance of a turbocharger turbine”.In: Energy Conversion and Management 81 (2014), pp. 270–281. doi:10.1016/j.enconman.2014.01.043.
REFERENCES 17
[4] J. Galindo, A. Tiseira, P. Fajardo, and L. M. Garcıa-Cuevas. “Devel-opment and validation of a radial variable geometry turbine modelfor transient pulsating flow applications”. In: Energy Conversion andManagement 85 (2014), pp. 190–203. doi: 10.1016/j.enconman.
2014.05.072.
[5] U. Kesgin. “Effect of turbocharging system on the performance ofa natural gas engine”. In: Energy conversion and management 46.1(2005), pp. 11–32. doi: 10.1016/j.enconman.2004.02.006.
[6] M. S. Chiong, S. Rajoo, R. F. Martinez-Botas, and A. W. Costall.“Engine turbocharger performance prediction: One-dimensional mod-eling of a twin entry turbine”. In: Energy Conversion and Management57 (2012), pp. 68–78. doi: 10.1016/j.enconman.2011.12.001.
[7] C. D. Rakopoulos, A. M. Dimaratos, E. G. Giakoumis, and D. C.Rakopoulos. “Evaluation of the effect of engine, load and turbochargerparameters on transient emissions of diesel engine”. In: Energy Con-version and Management 50.9 (2009), pp. 2381–2393. doi: 10.1016/j.enconman.2009.05.022.
[8] J. Galindo, J. R. Serrano, H. Climent, and O. Varnier. “Impact of two-stage turbocharging architectures on pumping losses of automotiveengines based on an analytical model”. In: Energy Conversion andManagement 51.10 (2010), pp. 1958–1969. doi: 10.1016/j.enconman.2010.02.028.
[9] url: https://www.avl.com/turbo-charger-testing.
[10] url: http://www.fev.com/what-we-do/engineering-services/turbocharging/.
[11] J. M. Lujan, V. Bermudez, J. R. Serrano, and C. Cervello. “Test benchfor turbocharger groups characterization”. In: SAE Technical Paper2002-01-0163 (2002). doi: 10.4271/2002-01-0163.
[12] J. Galindo, J. R. Serrano, C. Guardiola, and C. Cervello. “Surge limitdefinition in a specific test bench for the characterization of automo-tive turbochargers”. In: Experimental Thermal and Fluid Science 30.5(2006), pp. 449–462. doi: 10.1016/j.expthermflusci.2005.06.002.
[13] J. R. Serrano, P. Olmeda, A. Paez, and F. Vidal. “An experimentalprocedure to determine heat transfer properties of turbochargers”. In:Measurement Science and Technology 21.3 (2010), p. 035109. doi: 10.1088/0957-0233/21/3/035109.
REFERENCES 18
[14] S. Rajoo and R. Martinez-Botas. “Variable geometry mixed flow tur-bine for turbochargers: an experimental study”. In: International Jour-nal of Fluid Machinery and Systems 1.1 (2008), pp. 155–168.
[15] D. Bohn, T. Heuer, and K. Kusterer. “Conjugate flow and heat trans-fer investigation of a turbo charger”. In: Journal of engineering forgas turbines and power 127.3 (2005), pp. 663–669. doi: 10.1115/1.1839919.
[16] P. Chesse, D. Chalet, and X. Tauzia. “Impact of the Heat Transferon the Performance Calculations of Automotive Turbocharger Com-pressor”. In: Oil & Gas Science and Technology Rev. IFP Energiesnouvelles 66.5 (2011), pp. 791–800. doi: 10.2516/ogst/2011129.
[17] A. Romagnoli and R. Martinez-Botas. “Heat transfer analysis in a tur-bocharger turbine: An experimental and computational evaluation”.In: Applied Thermal Engineering 38 (2012), pp. 58–77. doi: 10.1016/j.applthermaleng.2011.12.022.
[18] H. Aghaali and H. E. Angstrom. Improving turbocharged engine simu-lation by including heat transfer in the turbocharger. Tech. rep. 2012-01-0703. SAE Technical Paper, 2012. doi: 10.4271/2012-01-0703.
[19] H. Aghaali and H. E. Angstrom. “Turbocharged SI-Engine Simulationwith Cold and Hot-Measured Turbocharger Performance Maps”. In:ASME Turbo Expo 2012: Turbine Technical Conference and Exposi-tion. American Society of Mechanical Engineers. 2012, pp. 671–679.doi: 10.1115/GT2012-68758.
[20] N. Baines, K. D. Wygant, and A. Dris. “The analysis of heat transferin automotive turbochargers”. In: Journal of Engineering for Gas Tur-bines and Power 132.4 (2010), p. 042301. doi: 10.1115/1.3204586.
[21] D. Bohn, T. Heuer, and K. Kusterer. “Conjugate flow and heat transferinvestigation of a turbo charger: Part I numerical results”. In: ASMETurbo Expo 2003, collocated with the 2003 International Joint PowerGeneration Conference. American Society of Mechanical Engineers.2003, pp. 715–722. doi: 10.1115/GT2003-38445.
[22] D. Bohn, N. Moritz, and M. Wolff. “Conjugate flow and heat trans-fer investigation of a turbo charger: Part II experimental results”. In:ASME Turbo Expo 2003, collocated with the 2003 International JointPower Generation Conference. American Society of Mechanical Engi-neers. 2003, pp. 723–729. doi: 10.1115/GT2003-38449.
REFERENCES 19
[23] M. V. Casey and T. M. Fesich. “The efficiency of turbocharger com-pressors with diabatic flows”. In: Journal of engineering for gas tur-bines and power 132.7 (2010), p. 072302. doi: 10.1115/1.4000300.
[24] M. Cormerais, P. Chesse, and J. F. Hetet. “Turbocharger heat transfermodeling under steady and transient conditions”. In: InternationalJournal of Thermodynamics 12.4 (2009), p. 193.
[25] F. Hellstrom and L. Fuchs. “Assessment of Heat Transfer Effects onthe Performance of a Radial Turbine using Large Eddy Simulation”.In: IMechE, 9th Conference on turbochargers and turbocharging. 2010.doi: 10.1243/17547164C0012010022.
[26] M. Jung, R. G. Ford, K. Glover, N. Collings, U. Christen, and M. J.Watts. Parameterization and transient validation of a variable geom-etry turbocharger for mean-value modeling at low and medium speed-load points. Tech. rep. 2002-01-2729. SAE Technical Paper, 2002. doi:10.4271/2002-01-2729.
[27] J. Serrano, P. Olmeda, F. Arnau, and A. Dombrovsky. General Proce-dure for the Determination of Heat Transfer Properties in Small Auto-motive Turbochargers. Tech. rep. 2014-01-2857. SAE Technical Paper,2014. doi: 10.4271/2014-01-2857.
[28] T. Arts, H. Boerrigter, M. Carbonaro, J. M. Charbonnier, G. Degrez,D. Olivari, M. L. Riethmuller, and R. A. Van den Braembussche. Mea-surement Techniques in Fluid Dynamics: an Introduction. von KarmanInstitute for Fluid Dynamics, 1994.
Related Documents