Park Station Sub-precinct Development Framework ISSUE 1 JUNE 2011 STATUS QUO Place Space Movement

Welcome message from author
This document is posted to help you gain knowledge. Please leave a comment to let me know what you think about it! Share it to your friends and learn new things together.
Transcript
Park Station Sub-precinct Development Framework
ISSUE 1 JUNE 2011
STATUS QUO
Place Space Movement
‘’Cities are composed of a number of networks, constituted of
layers, of services, built environments, social infrastructure,
cultural hubs, transport modes and economics systems.
Successful cities, have been able to combine the demands
of people of increased mobility on those systems by effective
and efficient transport systems; systems that work on a variety
of levels.’’
City Expert Witness, Dublin Public Hearing, January 2011

CONTENTS
Introduction
Dedication
1. Movement & Transport
2. Land Use
3. Urban Form
4. Environment
5. Socio-Economics
6. Infrastructure & Services
Summary
Lexicon
References
The Team
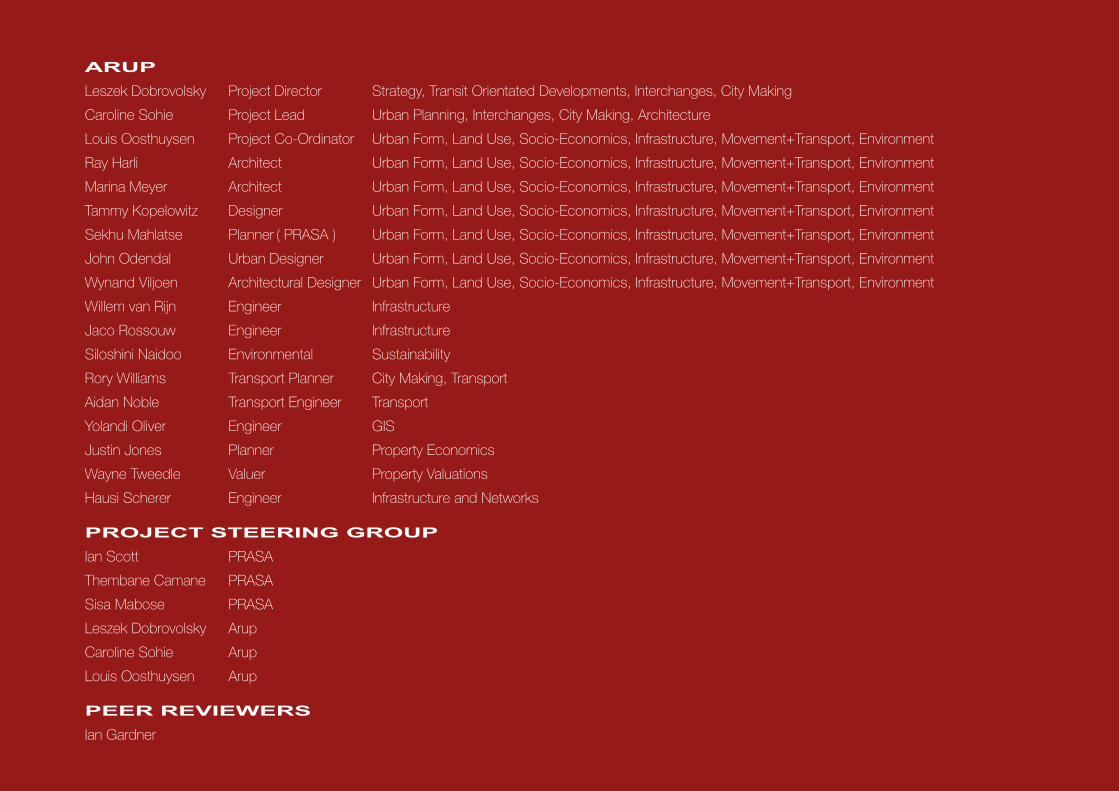
ARUPLeszek Dobrovolsky Project Director Strategy, Transit Orientated Developments, Interchanges, City Making
Caroline Sohie Project Lead Urban Planning, Interchanges, City Making, Architecture
Louis Oosthuysen Project Co-Ordinator Urban Form, Land Use, Socio-Economics, Infrastructure, Movement+Transport, Environment
Ray Harli Architect Urban Form, Land Use, Socio-Economics, Infrastructure, Movement+Transport, Environment
Marina Meyer Architect Urban Form, Land Use, Socio-Economics, Infrastructure, Movement+Transport, Environment
Tammy Kopelowitz Designer Urban Form, Land Use, Socio-Economics, Infrastructure, Movement+Transport, Environment
Sekhu Mahlatse Planner ( PRASA ) Urban Form, Land Use, Socio-Economics, Infrastructure, Movement+Transport, Environment
John Odendal Urban Designer Urban Form, Land Use, Socio-Economics, Infrastructure, Movement+Transport, Environment
Wynand Viljoen Architectural Designer Urban Form, Land Use, Socio-Economics, Infrastructure, Movement+Transport, Environment
Willem van Rijn Engineer Infrastructure
Jaco Rossouw Engineer Infrastructure
Siloshini Naidoo Environmental Sustainability
Rory Williams Transport Planner City Making, Transport
Aidan Noble Transport Engineer Transport
Yolandi Oliver Engineer GIS
Justin Jones Planner Property Economics
Wayne Tweedle Valuer Property Valuations
Hausi Scherer Engineer Infrastructure and Networks
PROJECT STEERING GROUPIan Scott PRASA
Thembane Camane PRASA
Sisa Mabose PRASA
Leszek Dobrovolsky Arup
Caroline Sohie Arup
Louis Oosthuysen Arup
PEER REVIEWERSIan Gardner

INTRODUCTION
Arup were appointed in 2011, by the Passenger Rail Agency of South Africa to investigate and develop an implementable framework and plan to rejuvenate the
area and develop a strategy for realising the assets that exist in the area.
The first Workstream of that body of Work is the Status Quo Analysis and Literature Study. This summary report outlines the Status Quo undertaken by Arup to
date.
“The busiest Transport Hub in Africa
...Park Station”

Two ladies that prepare food at the traditional
African Food Market south of Park Station.

Dedication
There are many contributors who make this commission possible, both
in terms of appointment and execution, however the Consultants wish to
acknowledge the work of all thought leaders and practitioners in the networks
of cities from infrastructure, through transport to population movements and
city making.
The authors wish to note the initial and passionate contribution of Robin
Riddall prior to the commission.
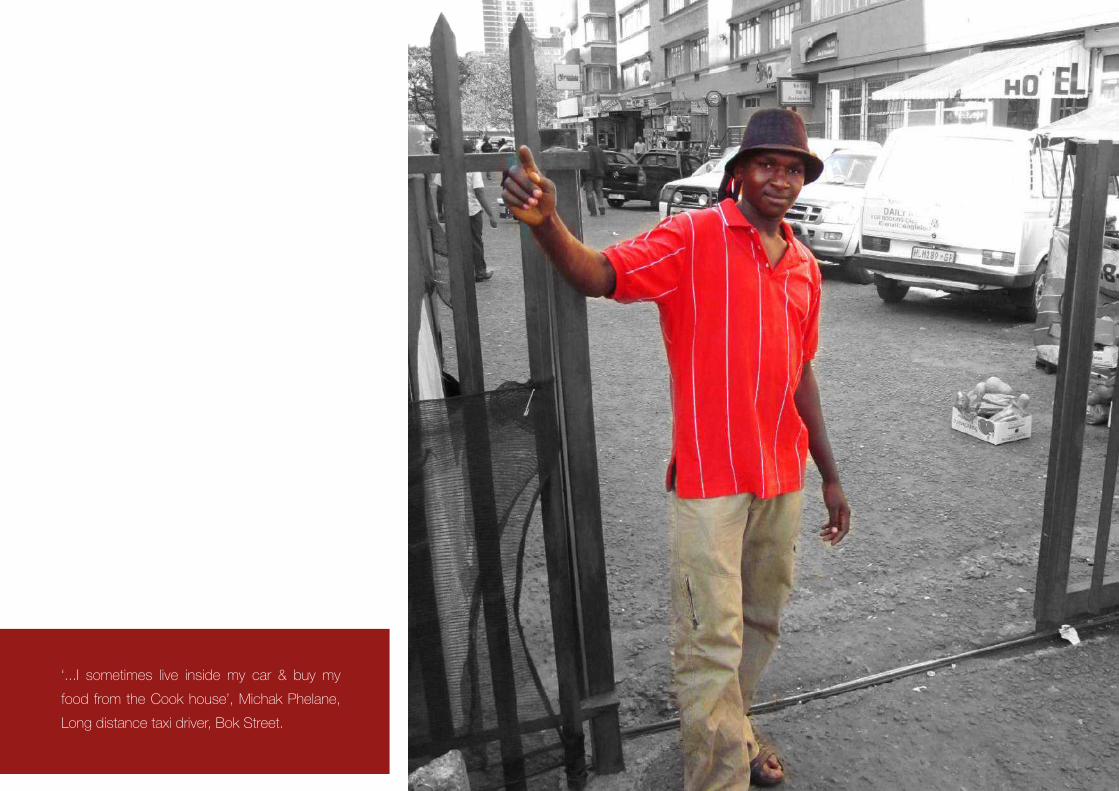
‘...I sometimes live inside my car & buy my
food from the Cook house’, Michak Phelane,
Long distance taxi driver, Bok Street.
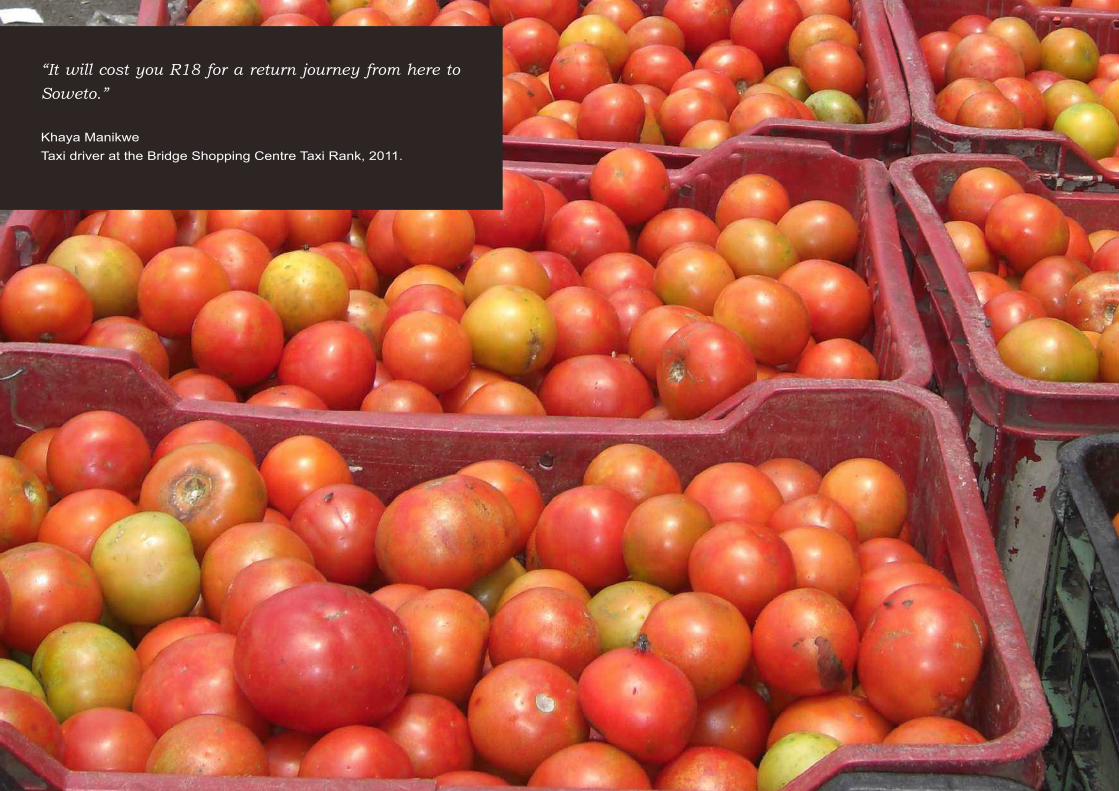
MOVEMENT & TRANSPORT STATUS QUO“It will cost you R18 for a return journey from here to Soweto.”
Khaya Manikwe Taxi driver at the Bridge Shopping Centre Taxi Rank, 2011.

MOVEMENT & TRANSPORT STATUS QUO 11
Park Station Sub-precinct Development Framework
CHAPTER 1
MOVEMENT &TRANSPORT
The efficient movement of people & goods in a sustainable & integrated manner which supports a public transport network.

MOVEMENT & TRANSPORT STATUS QUO
BACKGROUND
A number of sources have been synthesized and updated with new
information to enhance understanding of status quo, including:
• 2002 CPTR
• 2006 Arup pedestrian surveys and public transport route
• documentation
• 2009 Arcus Gibb surveys
• 2010 Arup on-site investigations
Information is compiled to the degree necessary to understand how
changes in land use and public transport facilities might alter movement in
the area, and is key to understanding how the movement system can be
harnessed to support planning objectives.
Context of the precinct
The precinct is part of what is effectively a wide-area transport interchange
that is operationally integrated, but poorly integrated in terms of infrastructure.
It is also an origin and a destination for trips, and thus accommodates a
wide variety of movements by various modes of transport.
The catchment area of this precinct varies according to the mode of
transport under consideration. Overall, its area of influence is metropolitan
wide, and indeed international. Transport operations are influenced by
significant historical decisions such as the lack of rail to the north, but also
by the emergence of various commercial activities that serve local, national
and international travellers.
There is a wide variety of travel markets in the precinct. Regular daily
commuters; weekly travellers; occasional long-distance visitors from other
countries (usually low-income); low- to middle-income travellers to other
provinces (bus, taxi and rail); and tourists. These each present their own
requirements and potential design responses.
Urban design and architecture can be used to support positive trends
and discourage negative ones, by guiding movement and improving
management of the system as a whole. For example, exemplary design and
management could limit traffic growth while activity and residential density
continue to grow.
Urban regeneration may alter movement patterns as well as volumes,
and past interventions have had varying degrees of success. Metro Mall,
for example, provides formalized space for small-scale traders, but is
hampered by a surrounding environment that is incompletely developed
and only partially supports small businesses. The design of Metro Mall itself,
as with many other taxi ranks, does not fully address the needs of operators
and passengers.
Introduction

MOVEMENT & TRANSPORT STATUS QUO 13
Transformation is underway in the public transport system, involving primarily
the BRT system and the Gautrain. These present new opportunities for
improving passenger services, and for the trading environment.
It is noted that all planning proposals to date consider alternative strategies
for accommodating the implications of the current metropolitan-level public
transport structure. No attempt has been made to investigate a realignment
of the role of the CBD as a major transfer hub in the city.
ROUTES
Pedestrians
Pedestrian routes are determined by a number of factors, including:
• Time of day (darkness and commercial activity)
• Condition and design of pedestrian facilities
• Whether related to public transport or not
• Conflict with other modes
• Whether a multipurpose or single purpose journey
Some of these factors will alter what would otherwise be the desired routes
of pedestrians, and the current state of infrastructure can have a negative
impact on both movement and commerce.
Transferring passengers are essentially filling in the gaps in public transport
service, while there are pedestrians also walking considerable distances to
nearby residential and business areas such as Hillbrow and Braamfontein.
Pedestrian routes have arisen organically in response to demand, but are
not formally planned as such, and in a number of locations are inadequate,
resulting in lack of clarity for those unfamiliar with the area, and conflict
between pedestrians and motorized vehicles. The general street grid is fine
enough for pedestrian movement, but is interrupted by barriers such as the
railway lines.
Minibus taxis
A number of formal routes exist in the CBD, but are influenced by the time of
day and the demand for transfers between public transport services. There
is a strong east-west movement on Plein and Bree Streets for boarding and
alighting. Many of the routes in and out of the CBD also have an east-west
orientation.
There may be a need to rationalize the location of ranks for various taxi
routes, and data collected previously by Arup provides a tool to assess
the impact that moving route termination points will have on pedestrian
movements.
Introduction

MOVEMENT & TRANSPORT STATUS QUO
Buses
In contrast to minibus taxis, most Metrobus routes have a north-south
orientation. The newer BRT routes establish a more integrated network,
allowing for more opportunities for transfers between services than was the
case in the past. This has implications for pedestrian patterns related to
transfers.
Routes of cross-border bus services have not been mapped, and are
dispersed (mainly to the north of Park Station).
Rail
As rail is oriented to the east, west and south – but not the north – there are
built-in conditions that result in the need for passenger transfers between
modes. The addition of Gautrain will not dramatically alter this pattern, as the
travel markets for Metrorail and Gautrain do not significantly overlap.
Private traffic
Congestion in the CBD tends to limit choice of routes available to private
vehicles, with certain streets avoided virtually altogether as a result of the
high density of public transport vehicles. The theoretical level of service
on many streets is acceptable, but the actual level of service is reduced
by friction related to pedestrians, traders and public transport operations.
Improved management of these activities can be expected to improve level
of service for general traffic.
INTEGRATED SYSTEM
Public transport Formal and informal transport:
There are two key aspects to informality in the minibus taxi industry as it
operates in this area:
• On-street boarding and alighting takes place in various informal
locations, where drivers respond to demand from passengers for more
convenient service, and where drivers prefer not to enter formal facilities
in order to reduce delays.
• Certain services have no formal facilities at all, but are ‘tolerated’ in
various locations in the CBD.
There is interaction between these informal activities and other formal
activities, and the degree of integration of the system as a whole is affected
by this interaction. Informal operations present challenges for planning, but
also provide an indicator of real demand that may not be accommodated
with formal facilities. One of the challenges in documenting the status quo
is that data collection exercises such as CPTR surveys do not adequately
account for informal and illegal activity.
This shortcoming introduces an element of unpredictably in attempts to
plan for public transport.
Introduction

MOVEMENT & TRANSPORT STATUS QUO 15
Role of transfers
Transfers between services create inconvenience as well as opportunity for
commerce. It is noted that integration of services can be achieved not only
by reducing walk distances, but also by providing more convenient and
safe walking environment. Currently there is not a good balance between
transfer distance and efficiency.
It is noted that mode choice varies in the AM and PM peak commuter
periods, depending on convenience for various trip purposes, origins and
destinations. Transfer activity therefore also varies by time of day. This in turn
affects the benefits of pedestrian footfall for informal and formal trade. The
area lacks a coherent strategy for accommodating pedestrians and traders
in a mutually beneficial arrangement.
Local and long distance
Long distance raises unique challenges related to transfers from local
services, accommodation and facilities for those waiting for departures.
Long distance bus services are distributed over a number of facilities, and
their operational integration with the rest of the system is impacted by the
poor quality pedestrian environment. The Park Station precinct plays a role
in this, as the station is strategically located on pedestrian routes between
long distance and local public transport facilities.
The location of long distance bus departure points is related to accommodation
– apart from formal hotels such as Formule One, many travellers rent space
in nearby flats. Any move to consolidate long distance bus facilities therefore
should consider this related industry in accommodation.
Suitability of facilities
Infrastructure does not fully support the optimal operation of public transport,
particularly minibus taxis. Demand for each mode in the morning is different
from the evening, and this variation needs to be considered in the design
of facilities.
An important challenge in facility design is accommodation of fluctuations in
demand. The Wanderers taxi rank, for example, experiences high demand
levels on Fridays and Sundays. There is no comprehensive strategy for
the management of public transport in the CBD, and this hinders effective
operations related to boarding, alighting and transfers, as well as vehicle
holding and maintenance. Suitability also relates to availability – certain
facilities, such as Park Station, are not open 24 hours and present challenges
for travellers who wait overnight for services.
Introduction

MOVEMENT & TRANSPORT STATUS QUO
Conflict and synergy
Potential conflict between public and private transport causes drivers to
avoid certain roads, resulting in the creation of de facto public transport
corridors with virtually no private transport. Conflict between pedestrians
and vehicles at certain intersections reduces available capacity and reduces
safety levels.
Land use
Location, mix and density of uses have an impact on movement and potential
synergies. Planning of land use needs to be integrated with transport to
optimise the system.
Continuity of the movement system
Poor urban design, maintenance and management have produced a
situation where there are discontinuities in the system, which influences
routes. Discontinuity can be physical, in the sense of missing or inadequate
infrastructure such as sidewalks, street furniture, lighting and so on; it can
also be operational, where conflict and safety influence users’ choices.
Special needs passengers have not been considered explicitly in the design
of the NMT system.
We have adopted ‘movement friction’ as a catch-all term to identify these
issues of discontinuity. In many cases this friction occurs at the interface
between different transport modes, such as at intersections or pedestrian
crossing locations. Elsewhere it is a result of conflict between activities,
such as where traders encroach on the movement of pedestrians.
Freight
Movement of goods in and around the precinct includes not only deliveries
to formal businesses, but also to informal traders and the movement of
luggage belonging to long-distance travellers.
Formal sector deliveries are hampered in some locations by on-street
trading (notably in Noord St and other areas with a high concentration of
informal trade).
In the informal sector, businesses have formed to meet delivery needs.
Storage locations have emerged, and individuals deliver goods to traders,
who must set up and close down each day. These deliveries use bakkies,
cars and non-motorised transport, and there is no coherent strategy to
accommodate this activity.
For both formal and informal activity, there are insufficient on- and off-street
loading areas.
Introduction

MOVEMENT & TRANSPORT STATUS QUO 17
INFRASTRUCTURE
Parking
In general, parking is inadequate in the CBD, and this situation is exacerbated
by other shortcomings in the system, for example taxis use parking bays as
holding areas because their facilities are inadequate.
There are several notable aspects to the parking situation around the Park
Station precinct.
One is the parking deck at the station itself, which is used to some extent
for dropping off and picking up of long distance passengers (bus and rail)
and for shopping in the area.
Another is parking garages. Some businesses have on-site parking,
or use public garages. A key challenge for transportation is to provide a
safe pedestrian environment for those walking between their parking and
destination.
Taxi ranks
Ranking and holding capacities are insufficient at formal facilities; on-street
taxi activity reduces road capacity; and enforcement is inadequate.
Signage
The various target markets for travel mentioned above have different signage
requirements. Regular daily commuters generally know how to get around,
but often have to do so by asking others. Weekly travellers may or may
not understand the transport industry and the options available to them.
Occasional long-distance visitors and tourists have the least understanding
and require much clearer design responses. In the subject precinct, not
only is signage generally of poor quality, but design of the urban space does
not provide an effective wayfinding environment.
Maintenance
The condition of transport infrastructure is a direct result of maintenance
activities, but influenced by informal activities that in many cases are in
contravention of legal or regulatory controls. Enforcement (or lack of it) is
a contributing factor to a degraded urban environment and the constraints
this presents for extracting value from the precinct.
Street furniture
No consistent approach to design or to the accommodation of traders. In
many locations, lighting is inadequate
Introduction
MOVEMENT & TRANSPORT STATUS QUO
SUSTAINABILITY
Sustainability generally relates to environment, resources, economic and
social conditions. In many respects these relate also to the institutional and
political context, as these two factors are important for setting objectives
and targets, and also determine the ability to maintain suitable conditions.
More specifically in relation to this project, the following key factors impact
on the sustainability of the transport system:
Design
Aspects such as surface treatment or the design of curbs can hinder
mobility; sustainable design will allow for the movement of intended users of
facilities. For example, people pushing trolleys or carts need free movement
on designated routes. Such routes have not been identified for a review
of design of surfaces, curbs and street furniture. Anything that hinders
pedestrian movement will also have a negative impact on public transport.
Maintenance
Obstacles to movement include the quality of surfaces, so things like
broken or missing surfaces will reduce the level of service and undermine
the sustainability of the transport system. Institutional capability to maintain
infrastructure therefore impacts on sustainability. Diversity and inconsistency
of designs in the CBD make maintenance more difficult.
Enforcement
Management of traders, parking and other activities can affect movement
on the street as well as the boarding and alighting of public transport
passengers. There are locations where law enforcement officers find it
difficult to carry out their duties, for example in the trading areas on Kazerne
in the mornings and Wanderers in the evenings. Illegal activities of public
transport operators also affect safety and the viability of operations. Currently,
design of public transport facilities is not adequate for operational needs,
and thus encourages inappropriate behaviour.
Operations
Illegal and inappropriate activity is usually an indicator of unsustainable
design or maintenance. Traders crowding pedestrians, or taxis off loading
passengers in the middle of streets, are examples, of behaviour that
indicates shortcomings in the system that place stress on the financial
sustainability of businesses.
Introduction

Long Distance bus driver on a break after driving
from Cape Town.

MOVEMENT & TRANSPORT STATUS QUO
SOURCE: Taxi & Rail: Arcus Gibb & ASM, 2010. Johannesburg Inner City Traffic & Transportation Study, JDA. Buses: Bus company websites
Major Cities
Cities with Airport
Rail
Cross Border Rail
Bus
Cross Border Bus
Taxi
Cross Border Taxi
N
Polokwane
Durban
Port ElizabethCape Town
NelspruitRustenburg
JohannesburgPark Station
Bloemfontein
PretoriaNAMIBIA
BOTSWANA
ZIMBABWE MOZAMBIQUE
SWAZILAND
SOUTH AFRICA
East London
Kimberly
Musina
Upington
Komatiport
LESOTHO
Vorcester
George
Figure 1.1
Destinations: National Rail, Bus & Taxi
MOVEMENT & TRANSPORT STATUS QUO 21
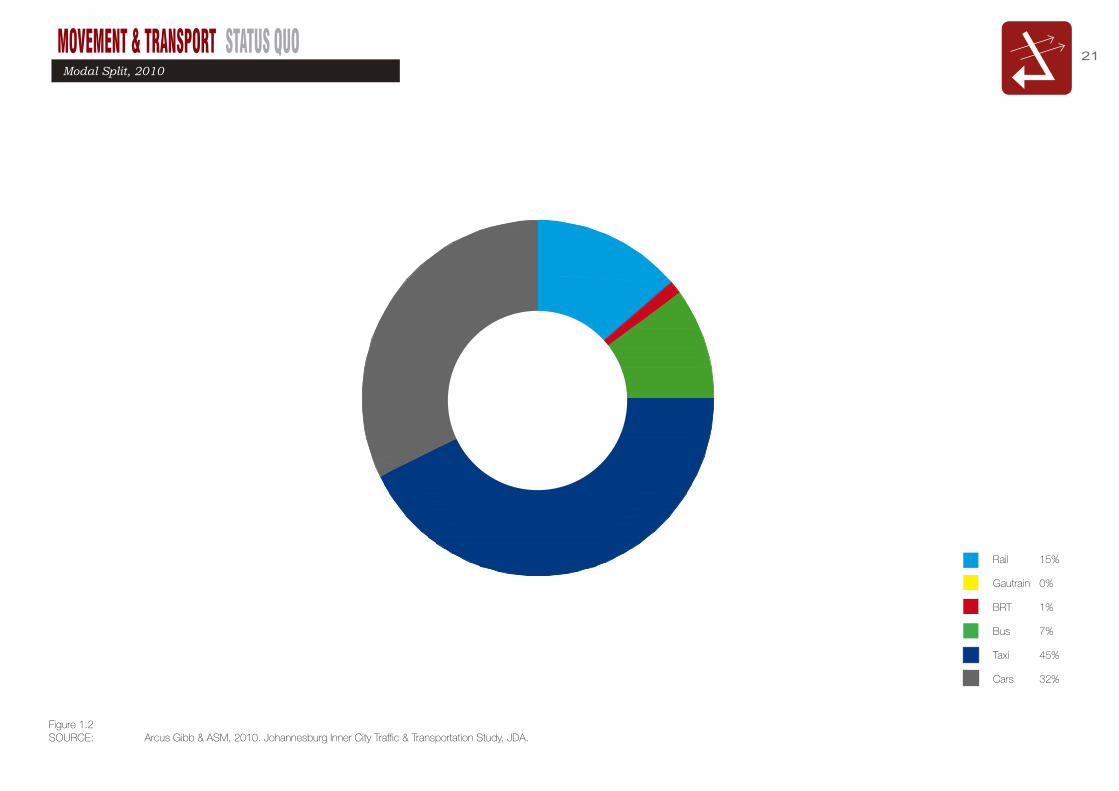
SOURCE: Arcus Gibb & ASM, 2010. Johannesburg Inner City Traffic & Transportation Study, JDA.
Rail 15%
Gautrain 0%
BRT 1%
Bus 7%
Taxi 45%
Cars 32%
Figure 1.2
Modal Split, 2010

MOVEMENT & TRANSPORT STATUS QUO
N
0 50 100 200
Metro Mall
Kaserne
Noord Street
The Bridge
Park Station
Wanderers
Wanderers Street
King George Street
Gautrain
Cross Border
Noord & Claim Street
Transport hubs
500m walking distance
1000m walking distance
1 2
3
4
5
6
7
8
9
10
11 2
3
4
5 6
7
89
10
1 1
10
10
Figure 1.3
Walking Distances from Transport Hubs

MOVEMENT & TRANSPORT STATUS QUO 23
0 50 100 200
N
SOURCE: ARUP, May 2011, Typical Traffic Volume map [AM peak]
0 - 500
500 - 1500
1500 - 3000
> 3000
Note: The traffic data has been extract from the City of Johannesburg SATURN traffic model & should be viewed as representative only of traffic volumes on the surrounding road network.
Figure 1.4
Movement of Vehicles: Typical Traffic Volume [AM peak]
MOVEMENT & TRANSPORT STATUS QUO
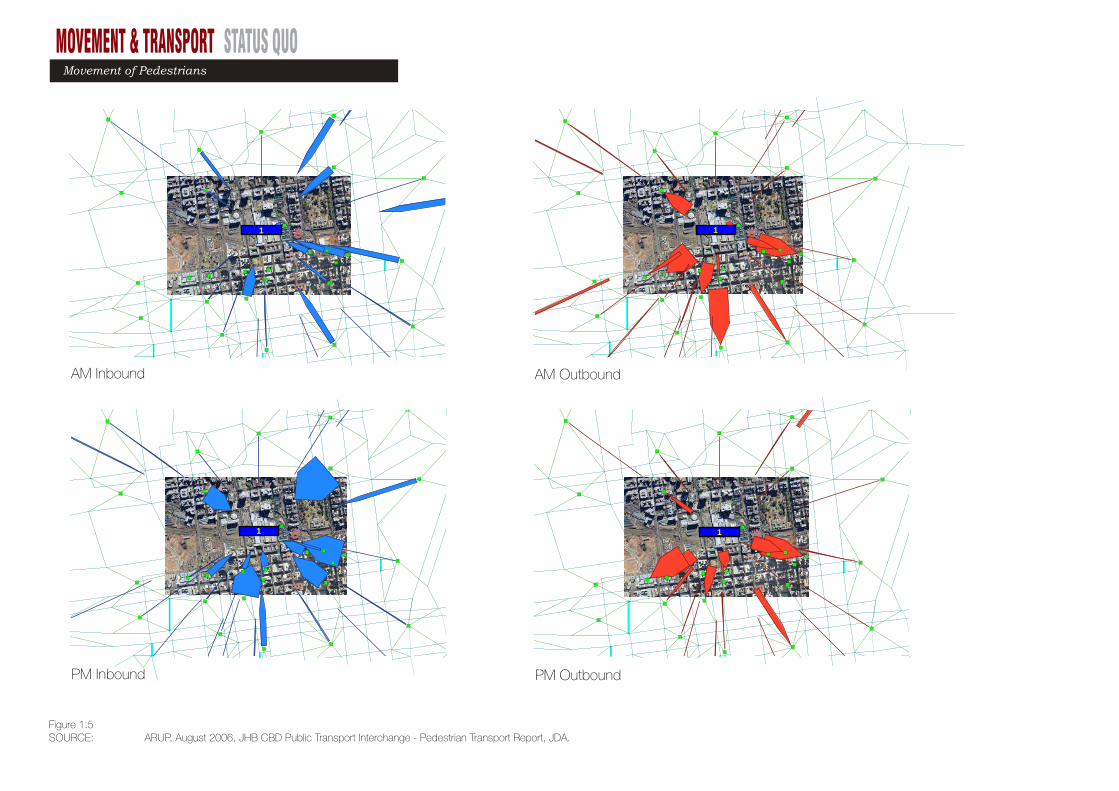
1
Desire lines for selected node(s) [total am 2hr peds]
Jhb CBD Pedestrian Model Scenario 1003: AM 2 Hour Factored Pedestrians 2006-08-06 17:35 (rory.williams) 500
10001500
20002500
1
Desire lines for selected node(s) [total am 2hr peds]
Jhb CBD Pedestrian Model Scenario 1003: AM 2 Hour Factored Pedestrians 2006-08-06 17:36 (rory.williams) 500
10001500
20002500
1
Desire lines for selected node(s) [PM total peds]
Jhb CBD Pedestrian Model Scenario 1004: PM 2 Hour Factored Pedestrians 2006-08-06 17:41 (rory.williams) 500
10001500
20002500
1
Desire lines for selected node(s) [PM total peds]
Jhb CBD Pedestrian Model Scenario 1004: PM 2 Hour Factored Pedestrians 2006-08-06 17:42 (rory.williams) 500
10001500
20002500
AM Inbound AM Outbound
PM Inbound PM Outbound
SOURCE: ARUP, August 2006, JHB CBD Public Transport Interchange - Pedestrian Transport Report, JDA.Figure 1.5
Movement of Pedestrians
MOVEMENT & TRANSPORT STATUS QUO 25
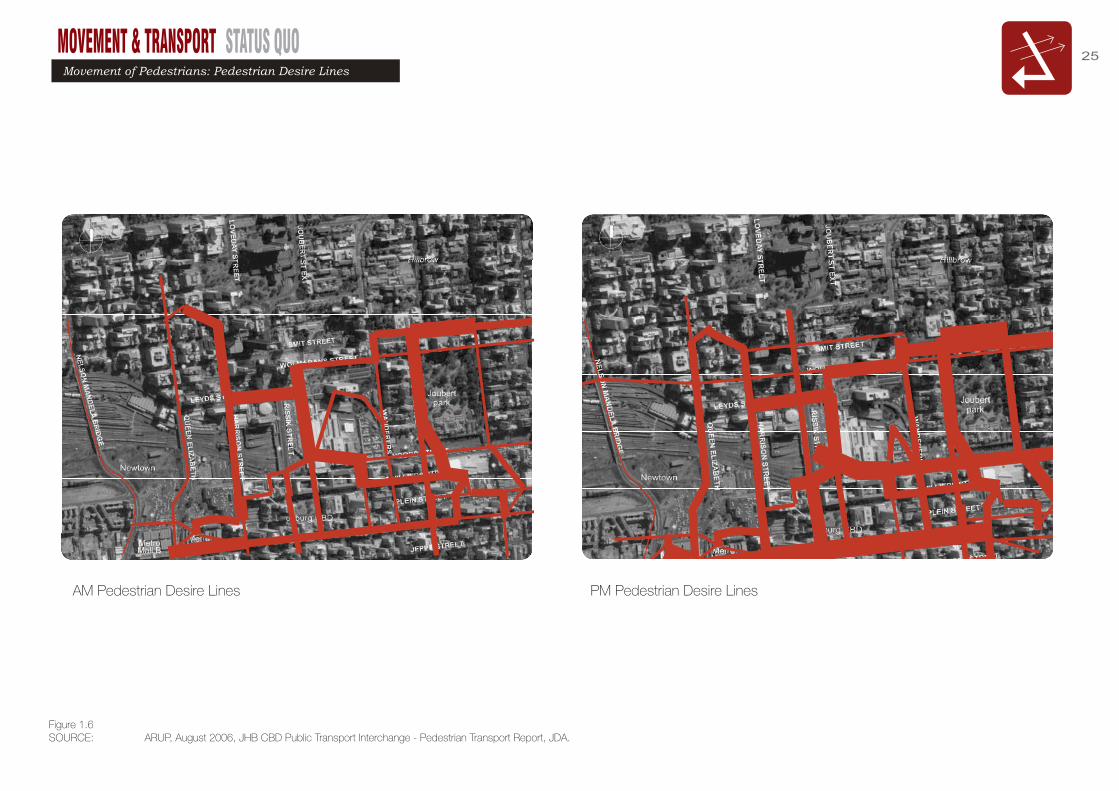
SOURCE: ARUP, August 2006, JHB CBD Public Transport Interchange - Pedestrian Transport Report, JDA.2 - 6
PARK STATION
National Station Precinct Planning Project Phase 1
Pedestrian movement in the area is heavily influenced by the location of taxi ranks and the station in relation to each other and the routes that serve them. The ranks and stations serve different geographic areas of Johannesburg and beyond the city. There is some overlap of the areas served, but generally passenger transfers in the CBD are needed to complete a significant proportion of commuting trips (around 80%) because of the areas served by taxi associations, specific routes, rail lines and busservices. Transfers are also influenced by other factors influencing mode choice, such as the perceived levels of safety, frequency of service, and the relative costs of different modes.
The strong taxi movement along Bree and Plein Streets, and north-west on access routes to Metro Mall, Park Station and Jack Mincerresult in a high level of disembarking activity along east-west streets such as Bree and Plein, and on north-south routes near the major ranks. Parts of Plein and Bree Streets are as heavily used for east-west walking as some of the north-south routes between the CBD and Braamfontein.
In the morning two hour peak period around 38 000 passengers enter and exit Park Station. The volumes at Jack Mincer are of the same magnitude whilst around 28 000 passengers enter and exit Metro Mall in the morning peak period.
Pedestrian Movements – Morning peak
STATUS QUO – MOBILITY
AM pedestrian desire lines
2 - 7
PARK STATION
National Station Precinct Planning Project Phase 1
The afternoon peak hour pedestrian movements are evenly split between eastbound and westbound. One third of people walking into the station to take the train in the AM peak are dropped off by taxis on Bree, Plein or Jeppe Streets.
Much of this taxi-related activity avoids the ranks altogether; and since the streets are not designed for it, there is a high level of pedestrian-vehicular conflict in a number of key locations.
The issue is not primarily of road capacity, but of safe boarding and alighting facilities that do not cause undue delay to drivers and passengers. Pedestrian flows are influenced not only by movement between formal public transport facilities, but also bylevels of comfort and security and the desire to undertake activities such as shopping.
Parts of Wanderers Street are avoided by many pedestrians who choose to walk through the long distance rank (east of Park Station), which is perceived to be safer.
There is a clear interaction between pedestrians and informal trade throughout the primary study area. Some of the trading areas are planned and formalised, while others have emerged as an organic response to the need for exposure.
In the evening two hour peak period around 57 000 passengers enter and exit Park Station. The volumes at Jack Mincer are significantly lower in the PM peak at around 21 000 passengers whilst around 42 000 passengers enter and exit Metro Mall in theevening peak period.
PM pedestrian desire lines
Pedestrian Movements - Afternoon peak
STATUS QUO – MOBILITY
NN
PM Pedestrian Desire LinesAM Pedestrian Desire Lines
Figure 1.6
Movement of Pedestrians: Pedestrian Desire Lines

MOVEMENT & TRANSPORT STATUS QUO
0 50 100 200
N
SOURCE: On site observations by ARUP & Google Streetview, April 2011.
one lane
two lanes
three lanes
four lanes
Park Station Sub-Precinct
Railway Lines
Prasa Assets
Study Area
Out of Study Area
Figure 1.7
Movement of Vehicles: Lane capacity & Direction

MOVEMENT & TRANSPORT STATUS QUO 27
0 50 100 200
N
SOURCE: Arcus Gibb & ASM, 2010. Johannesburg Inner City Traffic & Transportation Study, JDA.
Class 5
Class 4
Class 3
Class 3 roads
[mobility roads/collectors]
Connection between
neighbourhoods nodes & the
mobility spine network.
Class 4 roads
[ activity streets/local
distributors]
Roads within defined residential
areas or zones
Class 5 roads
[residential streets]
Roads within defined residential
areas or zones
Railway Lines
Prasa Assets
Study Area
Out of Study Area
Figure 1.8
Movement of Vehicles: Road Hierarchy

MOVEMENT & TRANSPORT STATUS QUO
0 50 100 200
N
SOURCE: On site observations by ARUP, April 2011.
Problematic
Intersection
Friction Area
[Pedestrian Vs Vehicles]
Railway Lines
Prasa Assets
Study Area
Out of Study Area
Figure 1.9
Areas of Modal Friction

MOVEMENT & TRANSPORT STATUS QUO 29
0 50 100 200
N
SOURCE: On site observations by ARUP, April 2011.
Congestion Points
Major Routes
Bridges
Railway Lines
Prasa Assets
Study Area
Out of Study Area
Figure 1.10
Status Quo - Congestion points

MOVEMENT & TRANSPORT STATUS QUO
0 50 100 200
N
SOURCE: Arcus Gibb & ASM, 2010. Johannesburg Inner City Traffic & Transportation Study, JDA.
Park Station Sub-Precinct
Railway Lines
Prasa Assets
Study Area
Out of Study Area
Figure 1.11
Key Pedestrian Movement around Park Station
MOVEMENT & TRANSPORT STATUS QUO 31
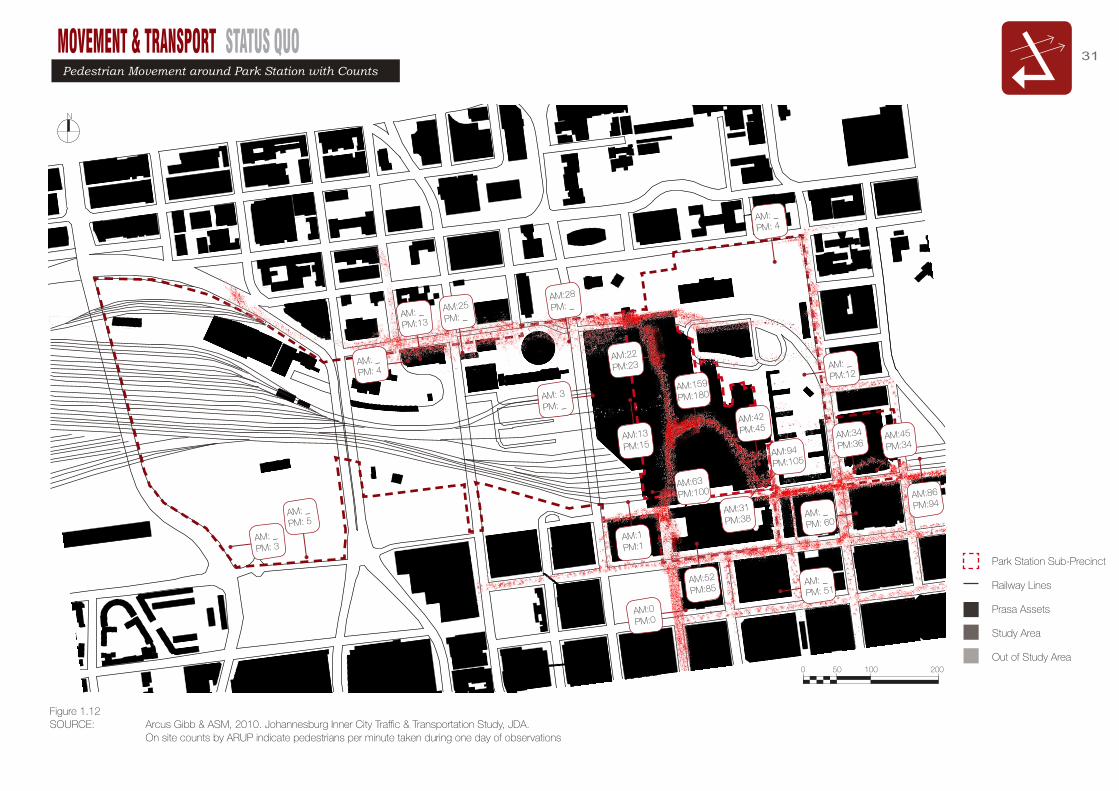
0 50 100 200
N
AM:63
PM:100
AM:22
PM:23
AM:1
PM:1
AM:159
PM:180
AM:13
PM:15
AM:42
PM:45
AM:94
PM:105
AM:31
PM:38
AM:25
PM: _
AM: _
PM: 4
AM: _
PM:12
AM:28
PM: _
AM: 3
PM: _
AM: _
PM: 4
AM: _
PM:13
AM: _
PM: 3
AM: _
PM: 5
AM:52
PM:85AM: _
PM: 51
AM:45
PM:34AM:34
PM:36
AM: _
PM: 60
AM:86
PM:94
SOURCE: Arcus Gibb & ASM, 2010. Johannesburg Inner City Traffic & Transportation Study, JDA. On site counts by ARUP indicate pedestrians per minute taken during one day of observations
Park Station Sub-Precinct
Railway Lines
Prasa Assets
Study Area
Out of Study Area
Figure 1.12
Pedestrian Movement around Park Station with Counts
AM:0
PM:0

MOVEMENT & TRANSPORT STATUS QUO
0 50 100 200
N
SOURCE: Arcus Gibb & ASM, 2010. Johannesburg Inner City Traffic & Transportation Study, JDA. On site counts by ARUP indicate pedestrians per minute taken during one day of observations
Park Station Sub-Precinct
Railway Lines
Prasa Assets
Study Area
Out of Study Area
Figure 1.13
Key Pedestrian Movement around Park Station

A Greyhound station manager.

MOVEMENT & TRANSPORT STATUS QUO
SOURCE: Arcus Gibb & ASM, 2010. Johannesburg Inner City Traffic & Transportation Study, JDA.
Mafikeng
Klerksdorp
Potchefstroom
Vanderbijlpark
Vereeniging
Volksrust
Springs
Pretoria
Hoedspruit
Nelspruit
Soweto
JohannesburgPark Station
Figure 1.14
Destinations: Regional Rail Destinations
MOVEMENT & TRANSPORT STATUS QUO 35
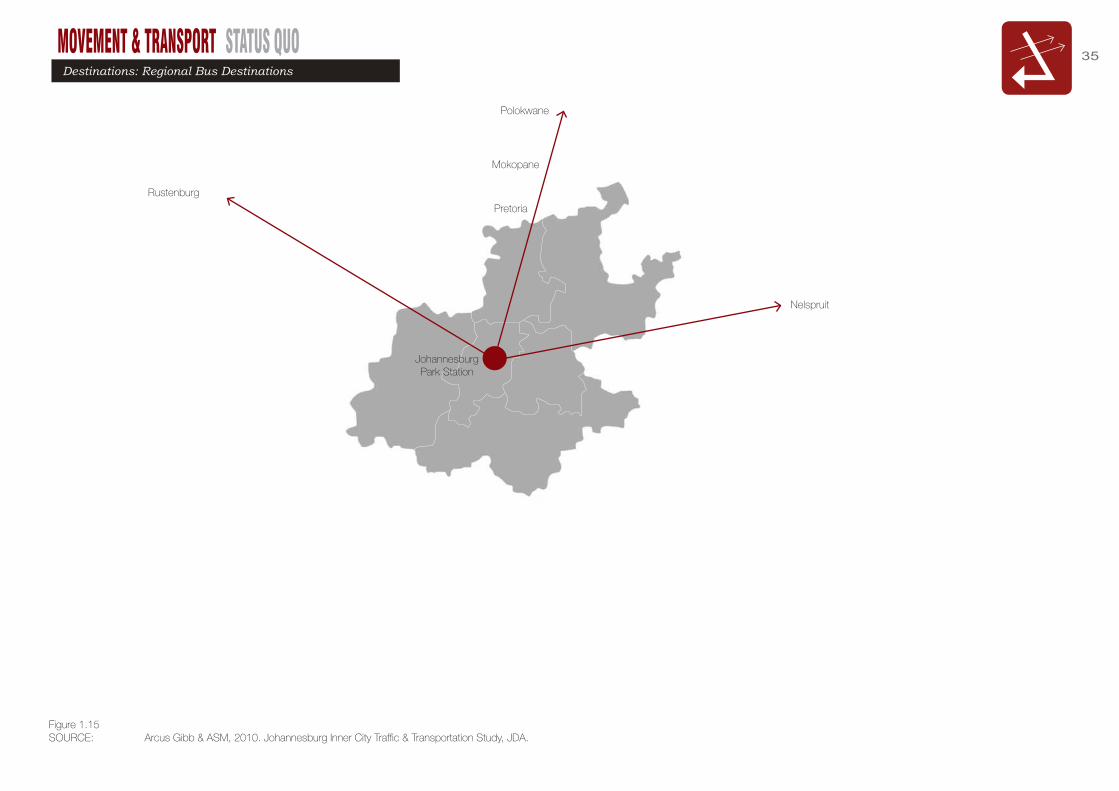
SOURCE: Arcus Gibb & ASM, 2010. Johannesburg Inner City Traffic & Transportation Study, JDA.
Pretoria
Polokwane
Mokopane
Nelspruit
Rustenburg
Figure 1.15
Destinations: Regional Bus Destinations
JohannesburgPark Station
MOVEMENT & TRANSPORT STATUS QUO
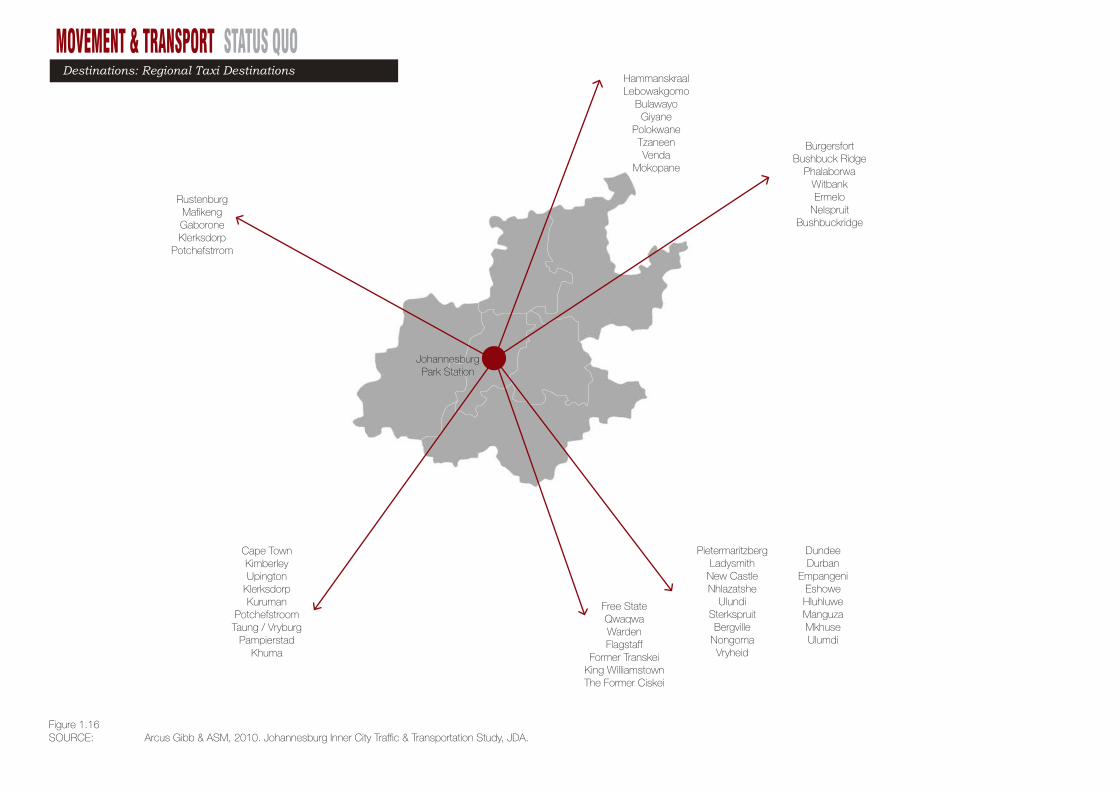
SOURCE: Arcus Gibb & ASM, 2010. Johannesburg Inner City Traffic & Transportation Study, JDA.
Cape TownKimberleyUpington
KlerksdorpKuruman
PotchefstroomTaung / Vryburg
PampierstadKhuma
RustenburgMafikengGaboroneKlerksdorp
Potchefstrrom
HammanskraalLebowakgomo
BulawayoGiyane
PolokwaneTzaneenVenda
Mokopane
BurgersfortBushbuck Ridge
PhalaborwaWitbankErmelo
NelspruitBushbuckridge
PietermaritzbergLadysmith
New CastleNhlazatshe
UlundiSterkspruitBergville
NongomaVryheid
Free StateQwaqwaWardenFlagstaff
Former TranskeiKing WilliamstownThe Former Ciskei
DundeeDurban
EmpangeniEshoweHluhluweManguzaMkhuseUlumdi
Figure 1.16
Destinations: Regional Taxi Destinations
JohannesburgPark Station
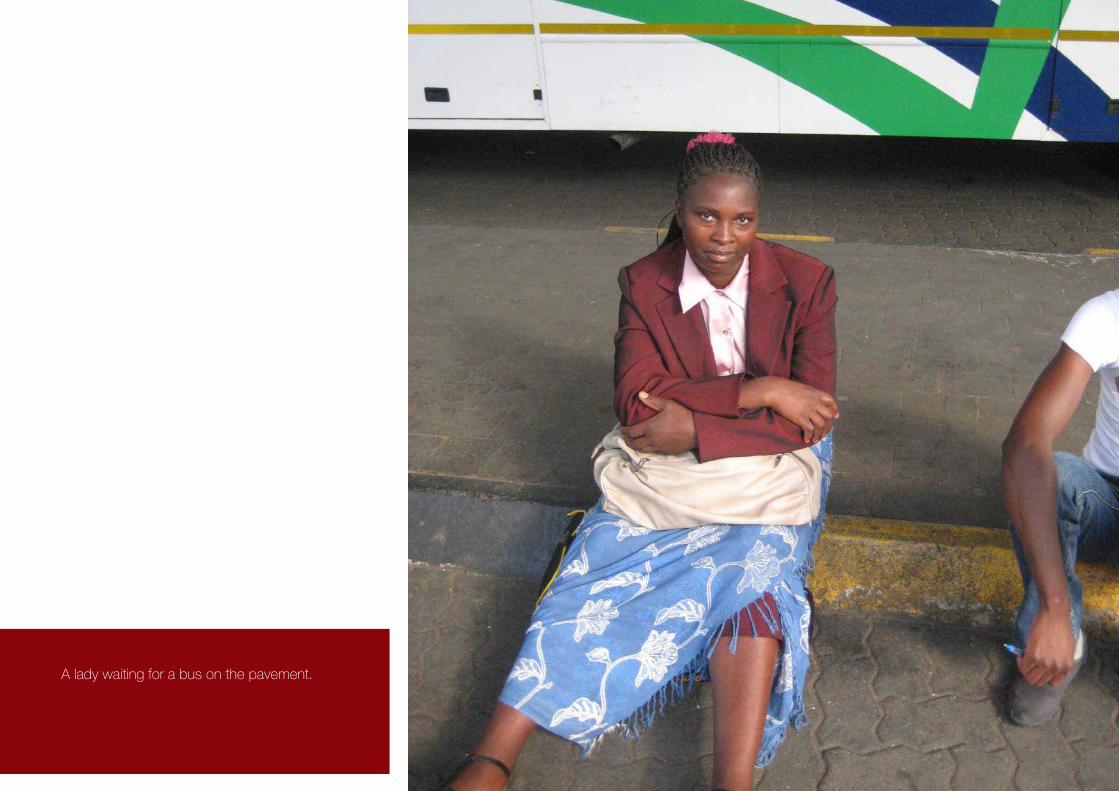
A lady waiting for a bus on the pavement.
MOVEMENT & TRANSPORT STATUS QUO
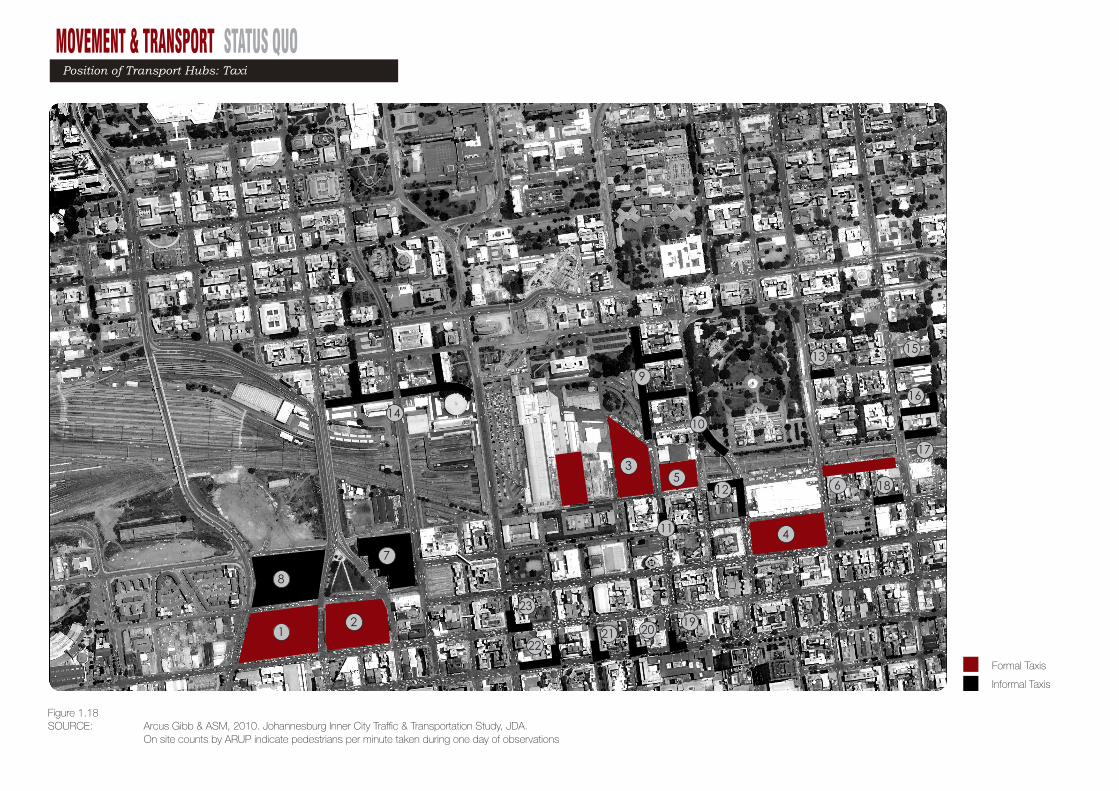
SOURCE: Arcus Gibb & ASM, 2010. Johannesburg Inner City Traffic & Transportation Study, JDA. On site counts by ARUP indicate pedestrians per minute taken during one day of observations
Formal Taxis
Informal Taxis
N
12
3
4
5 6
7
8
9
10
11
12
13
18
14
15
16
17
19202122
23
Figure 1.18
Position of Transport Hubs: Taxi
MOVEMENT & TRANSPORT STATUS QUO 39
Formal Taxis
Informal Taxis
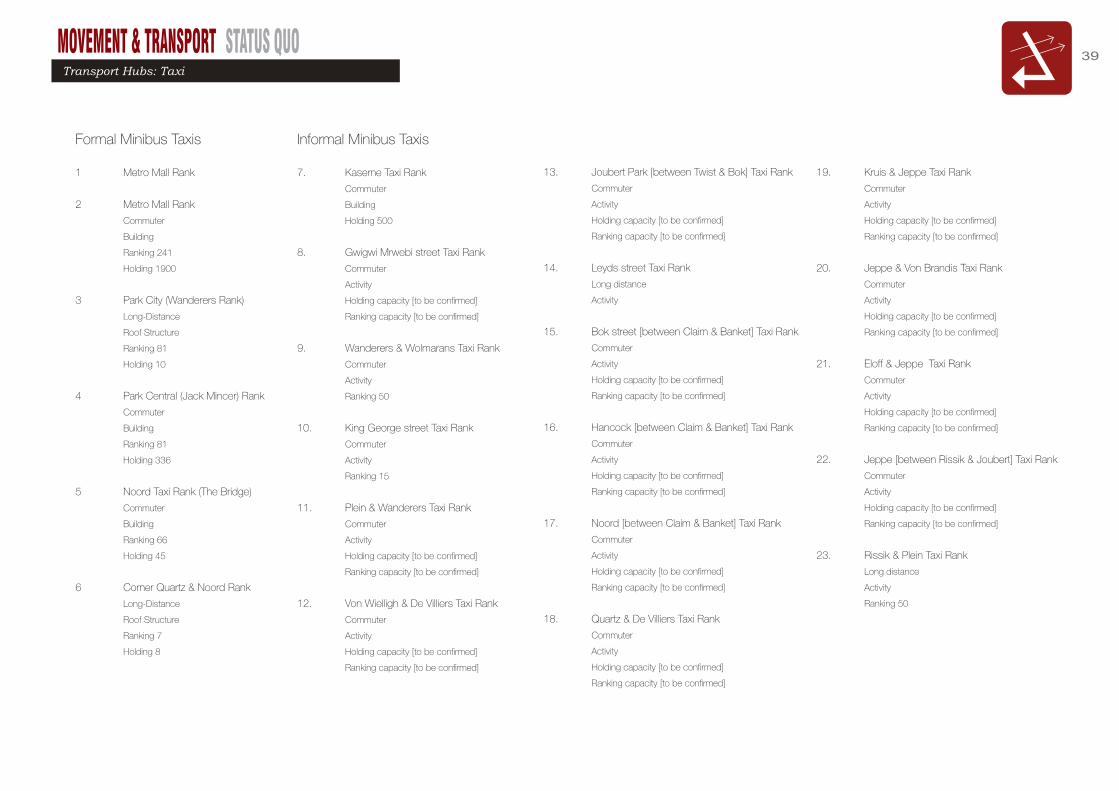
Formal Minibus Taxis
1 Metro Mall Rank
2 Metro Mall Rank
Commuter
Building
Ranking 241
Holding 1900
3 Park City (Wanderers Rank)
Long-Distance
Roof Structure
Ranking 81
Holding 10
4 Park Central (Jack Mincer) Rank
Commuter
Building
Ranking 81
Holding 336
5 Noord Taxi Rank (The Bridge)
Commuter
Building
Ranking 66
Holding 45
6 Corner Quartz & Noord Rank
Long-Distance
Roof Structure
Ranking 7
Holding 8
Informal Minibus Taxis
7. Kaserne Taxi Rank
Commuter
Building
Holding 500
8. Gwigwi Mrwebi street Taxi Rank
Commuter
Activity
Holding capacity [to be confirmed]
Ranking capacity [to be confirmed]
9. Wanderers & Wolmarans Taxi Rank
Commuter
Activity
Ranking 50
10. King George street Taxi Rank
Commuter
Activity
Ranking 15
11. Plein & Wanderers Taxi Rank
Commuter
Activity
Holding capacity [to be confirmed]
Ranking capacity [to be confirmed]
12. Von Wielligh & De Villiers Taxi Rank
Commuter
Activity
Holding capacity [to be confirmed]
Ranking capacity [to be confirmed]
13. Joubert Park [between Twist & Bok] Taxi Rank
Commuter
Activity
Holding capacity [to be confirmed]
Ranking capacity [to be confirmed]
14. Leyds street Taxi Rank
Long distance
Activity
15. Bok street [between Claim & Banket] Taxi Rank
Commuter
Activity
Holding capacity [to be confirmed]
Ranking capacity [to be confirmed]
16. Hancock [between Claim & Banket] Taxi Rank
Commuter
Activity
Holding capacity [to be confirmed]
Ranking capacity [to be confirmed]
17. Noord [between Claim & Banket] Taxi Rank
Commuter
Activity
Holding capacity [to be confirmed]
Ranking capacity [to be confirmed]
18. Quartz & De Villiers Taxi Rank
Commuter
Activity
Holding capacity [to be confirmed]
Ranking capacity [to be confirmed]
19. Kruis & Jeppe Taxi Rank
Commuter
Activity
Holding capacity [to be confirmed]
Ranking capacity [to be confirmed]
20. Jeppe & Von Brandis Taxi Rank
Commuter
Activity
Holding capacity [to be confirmed]
Ranking capacity [to be confirmed]
21. Eloff & Jeppe Taxi Rank
Commuter
Activity
Holding capacity [to be confirmed]
Ranking capacity [to be confirmed]
22. Jeppe [between Rissik & Joubert] Taxi Rank
Commuter
Activity
Holding capacity [to be confirmed]
Ranking capacity [to be confirmed]
23. Rissik & Plein Taxi Rank
Long distance
Activity
Ranking 50
Transport Hubs: Taxi
MOVEMENT & TRANSPORT STATUS QUO
Metro Mall / Bree Street Rank
Wanderers Rank
Park Central /Jack Mincer Rank
Bridge Rank
9 10 11
12 13
86
5
2
1
7
15
14
16
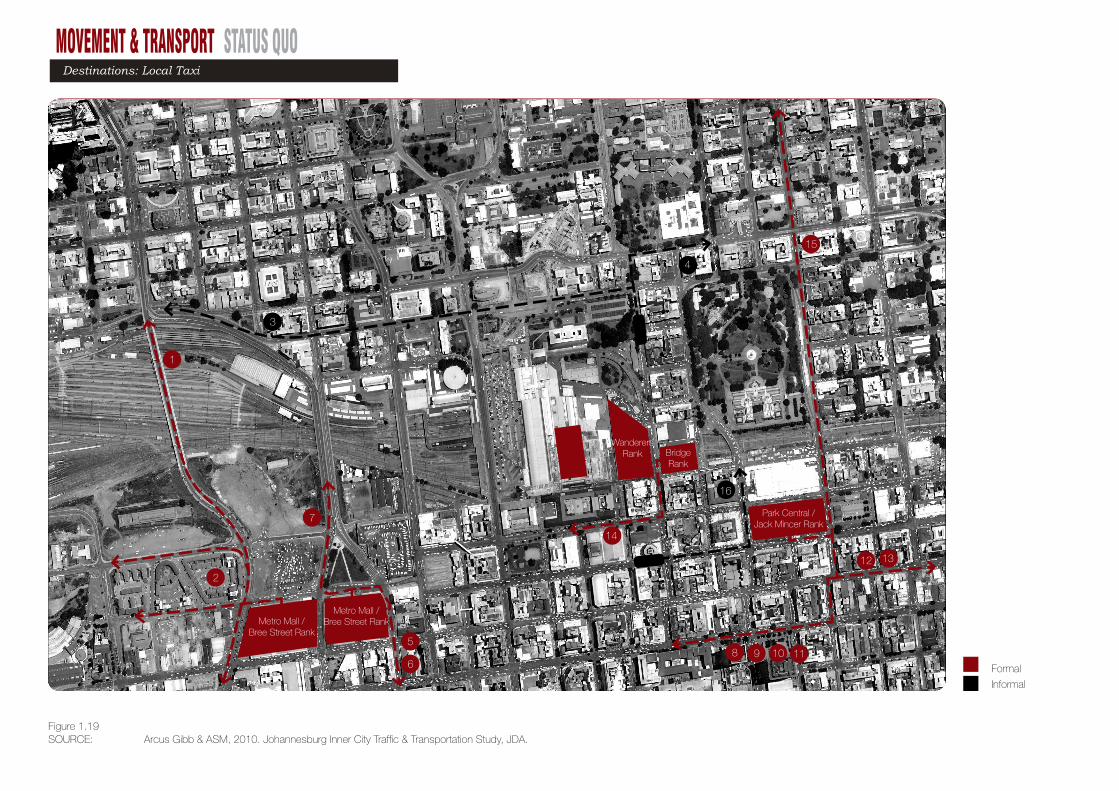
SOURCE: Arcus Gibb & ASM, 2010. Johannesburg Inner City Traffic & Transportation Study, JDA.
Metro Mall / Bree Street Rank
Formal
Informal
3
4
Figure 1.19
Destinations: Local Taxi
N

MOVEMENT & TRANSPORT STATUS QUO 41
Formal
Informal
SOURCE: Arcus Gibb & ASM, 2010. Johannesburg Inner City Traffic & Transportation Study, JDA.
Randburg
Strydom Park
Honey Dew
Fourways
Craighall
Greymount
Baragwanath
Diepkloof
Dobsonville
Eldorado Park
Klerkdorp
Meadowlands
Orlando
Semaome
Naledi
Zola
Protea Glen
Tshepisong
Rockville
Phefeni
Dube
Chiawelo
Dimville
Pinetown
Freedom Park
Lawley
Nancefield
Kagiso
Krugersdorp
Roodepoort
Westgate
Benoni
Brakpan
Springs
Imbalenhle
Orange Farm
Faraday
Yeoville
Nuturena
Southgate
Diepkloof (all zones)
Dube
Orlando
Rockville
Baragwanath
Booysens
Gold Reef City
Gold Sport
Heidelberg
Natalspruit
Rondebult
Spruitview
Vosloorus
Edenvale
Modderfontein
Eastgate
Eastleigh
Eastrand Mall
Everton
Leondale
Mailula Park
Villa Liza
Windmill Park
Halfway House
Kyalami
Midrand
Mabopane
Pretoria
Centurion
Alexandra
Bryanston
Fourways
Gallomanor
Highgate
Kelvin
Limbro Park
Lyndhurst
Lonehill
Morningside
Norwood
Parkmore
Rivonia
Sandton
Waterfront
WoodmeadDiepkloof (all zones)
Dobsonville
Dube
Eldorado Park
Orlando
Rockville
1
2
5
6
7
8
9
10
11
12
13
14
15
16 Yeoville
Berea
4
3
Destinations: Local Taxi
MOVEMENT & TRANSPORT STATUS QUO
1
2
3
4
5
6
7
8
9
1011
13
12
19
1614
15
1718
20
26
21 22
23
24
25
Formal Metered Taxis
Informal Metered Taxis
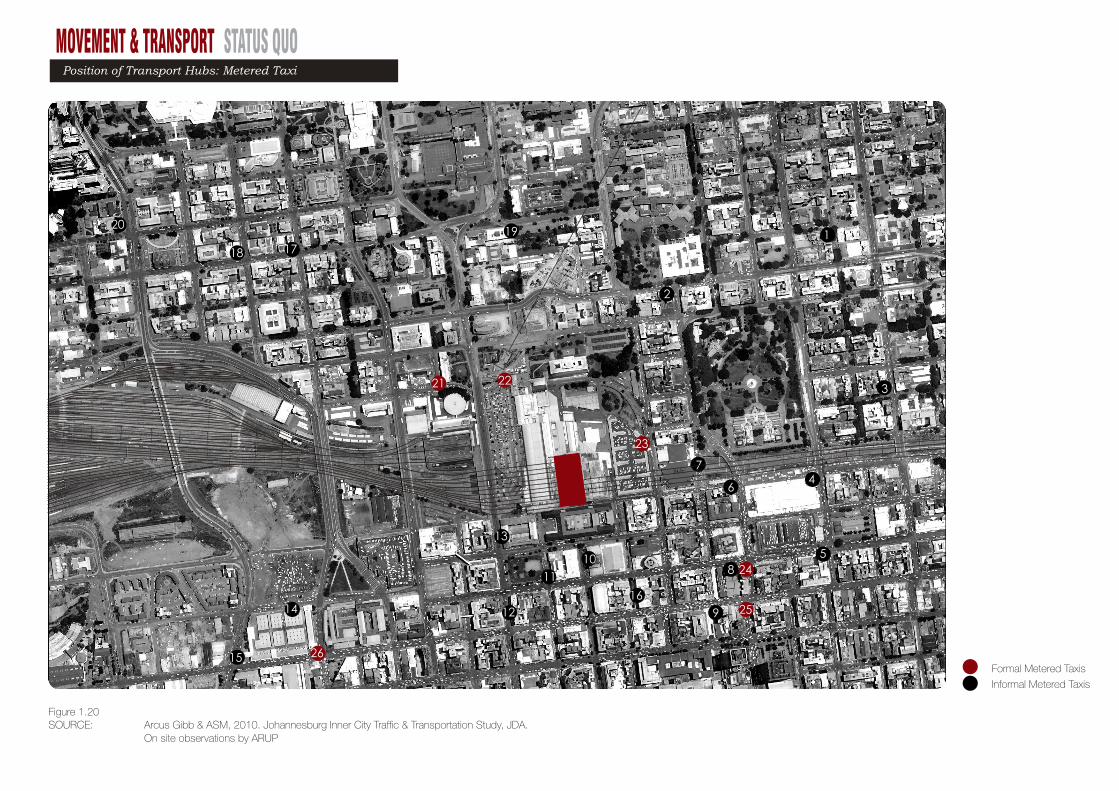
SOURCE: Arcus Gibb & ASM, 2010. Johannesburg Inner City Traffic & Transportation Study, JDA. On site observations by ARUP
N
Figure 1.20
Position of Transport Hubs: Metered Taxi
MOVEMENT & TRANSPORT STATUS QUO 43
Formal Metered Taxis
Informal Metered Taxis
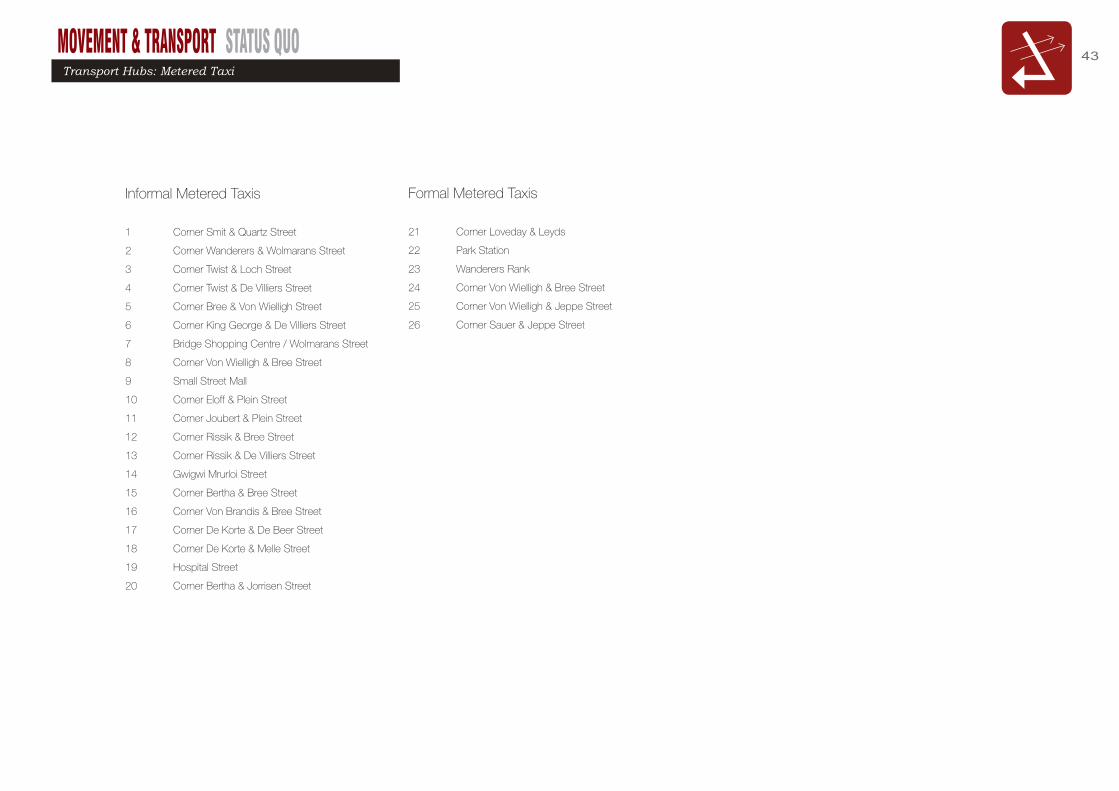
Informal Metered Taxis
1 Corner Smit & Quartz Street
2 Corner Wanderers & Wolmarans Street
3 Corner Twist & Loch Street
4 Corner Twist & De Villiers Street
5 Corner Bree & Von Wielligh Street
6 Corner King George & De Villiers Street
7 Bridge Shopping Centre / Wolmarans Street
8 Corner Von Wielligh & Bree Street
9 Small Street Mall
10 Corner Eloff & Plein Street
11 Corner Joubert & Plein Street
12 Corner Rissik & Bree Street
13 Corner Rissik & De Villiers Street
14 Gwigwi Mrurloi Street
15 Corner Bertha & Bree Street
16 Corner Von Brandis & Bree Street
17 Corner De Korte & De Beer Street
18 Corner De Korte & Melle Street
19 Hospital Street
20 Corner Bertha & Jorrisen Street
Formal Metered Taxis
21 Corner Loveday & Leyds
22 Park Station
23 Wanderers Rank
24 Corner Von Wielligh & Bree Street
25 Corner Von Wielligh & Jeppe Street
26 Corner Sauer & Jeppe Street
Transport Hubs: Metered Taxi

MOVEMENT & TRANSPORT STATUS QUO
SOURCE: Arcus Gibb & ASM, 2010. Johannesburg Inner City Traffic & Transportation Study, JDA.
Kru
gers
dorp
Win
dsor
Min
e
Luip
aard
svle
i
Prin
cess
Witp
oortj
ie
Hor
ison
Roo
depo
ort
Lam
wen
Bos
mon
t
Mar
aisb
urg
Uni
ted
Flor
ida
Ham
berg
Geo
rgin
a
Indu
stria
Wes
tbur
y
New
clar
e
Nal
edi
Pho
mol
ong
Ikw
esi
Dub
e
Ple
feni
INhl
azan
e
Mer
afe
Mzi
mhl
ope
Mlamlankunzi
Longdale
New Canada
Croesus
OrlandoNASREC
Cro
wn
Boo
ysen
sWestgate
Village main
Faraday
Park station
City deep
Benrose
Hillview
India
Gosforth Park
Lang
laag
te
Bra
amfo
ntei
n
May
fair
Gro
sven
or
Jepp
e
Doo
rnfo
ntei
n
Ellis
Par
k
Toor
onga
Drie
hoek
Cle
vela
nd
Gel
denh
uys
Den
ver
Geo
rge
Goc
h
Pre
side
nt
Refi
nery
Ger
mis
ton
Wes
tG
erm
isto
n S
outh
Web
ber
park
Hill
Ger
mis
ton
lake
Sim
pan Elsburg
DallasWatties
Union
Randwater
MpilisweniAngus
Natalspruit
Rooikop
Kliprivier
Daleside
Kookrus
Skansdam
Henley-on-Kip
Meyerton
Alloy
Redan
GrootvleiKragstasie
VereenigingLeeuhof terreinYskor
Anglers
Lawley
Kliptown
Tshlawelo
Midway
Lenz
Nancefield
Houtheuwel
Kwaggastroom
Eatonside
Residentia
Stretford
Grasmere
Midannadale
Kleigrond Leeu
hof
Dun
canv
ille
Wesrand
Maizelands
Vleikop
Oberholzer
Bank
Central
Millsite
Robinson
Homelake
Randfontein
Middelvlei
Welverdiend
Kle
rksd
orp
Gou
dryk
Suu
rbek
om
Wat
erw
orks
Gou
deon
Wes
tona
ria
Potchefstroom
Mafikeng
Pre
toria
Springs
Kutalo
Elsburg
Wadeville
Katlehong
Lindela
Pilot
Kwessie
Glenroy
Heidelberg
Kaydale
Driemanskap
Springs
Mapleton
Vosl
ooru
st
Kas
erne
Wes
t
Alb
erto
n
Spoornet
Metrorail
Stations
Figure 1.21
Destinations: Local Rail

MOVEMENT & TRANSPORT STATUS QUO 45
Spoornet
Metrorail
Stations
SOURCE: Arcus Gibb & ASM, 2010. Johannesburg Inner City Traffic & Transportation Study, JDA. On site observations by ARUP
N
Park Station
Park Station - Gautrain
Railway Station
Railway Line
1
2
2
1
Figure 1.22
Position of Transport Hubs: Rail

MOVEMENT & TRANSPORT STATUS QUO
SOURCE: Official websites: Putco, City of Johannesburg, Rea Vaya, March 2010
Putco
Metro
Rea Vaya [BRT]
Bronkhorstspruit
Mamelodi
Soshanguwe
Kaalfontein
Midrand
Towards Mpumalanga
Louis Botha Avenue
Germiston / Boksburg
Alexandra
Bellevue
YeovilleJoe Slovo Drive
Alberton
Eastgate
NaturenaEldorado Park
Dobsonville
Jabulani
Fairlands
Northgate
Strijdom Park
Beverly Gardens
Randburg
Sunninghill
Auckland Park
Northern Suburbs
Baragwanath
Soweto
Johannesburg
Park Station
Pretoria
Sandton
Lenasia
Figure 1.23
Destinations: Local Buses

MOVEMENT & TRANSPORT STATUS QUO 47
SOURCE: Arcus Gibb & ASM, 2010. Johannesburg Inner City Traffic & Transportation Study, JDA. On site observations by ARUP
Formal Bus Terminals
Informal Bus Terminals
N
Park StationLong Distance Bus Facility
Leyds StreetLong Distance Bus Facility
Corner Biccard & Wolmarans SreetLong Distance Bus Facility
1
2
3
1
23
Figure 1.24
Position of Transport Hubs: Bus

MOVEMENT & TRANSPORT STATUS QUO
BRT
Putco bus
Metro bus
BRT Station
Putco Bus Stop
Routes: Local Buses
SOURCE: Arcus Gibb & ASM, 2010. Johannesburg Inner City Traffic & Transportation Study, JDA. On site observations by ARUP
Figure 1.24
N

MOVEMENT & TRANSPORT STATUS QUO 49Transport Identity Cards
1. Transport accommodation
a. Accommodation list Taxi Rankb. Destination Long distancec. Capacity of the location Ranking: 81 bays, Holding: 10 bays, Maximum accumulation between 14:00 to 14:15 = 158 vehiclesd. Occupancy of the location 100%e. Conditions of the facility Goodf. Supply Under supply g. Interdependency to other transport activities Holding at Kazerne
2. Ownership
a. Land Owner / Landlord PRASAb. Formal vs. informal Formal
3. Operations
a. Overall management body of the facility [to be confirmed]b. Quantity of tenants / associations 7 taxi associationsc. Quantity of operators [to be confirmed]d. Vehicle seater types [to be confirmed]
4. Supporting activities
a. Type of activities No other activity c. Operating hours [to be confirmed]d. Passenger numbers 18 330 / day
5. Movement
a. Movement of people 70 % travelling home, 14% travelling to work, 2% shopping, 11% going on vacation, 3% unclassifiedb. Movement of freight & luggage Freight N/A - Luggage - Informal c. Parking provision N/A
6. Safety
a. Security measures [to be confirmed]b. Perceived safety Fair
Wanderers Taxi RankTransport Hub
Wanderers Taxi rank is located towards the south-
eastern corner of Park Station & predominantly
serves long distance & cross border travellers.
500m walking radius
SOURCE: Arcus Gibb & ASM, 2010. Johannesburg Inner City Traffic & Transportation Study, JDA. On site observations by ARUP
Figure 1.25

MOVEMENT & TRANSPORT STATUS QUO
The Bridge Taxi RankTransport Hub
The Bridge Taxi rank is located towards the south-
eastern corner of Park Station
500m walking radius
1. Transport accommodation
a. Accommodation list Taxi Rankb. Destination Sowetoc. Capacity of the location Ranking: 66 bays, Holding: 45 baysd. Occupancy of the location 100%e. Conditions of the facility Fairf. Supply Under supply g. Interdependency to other transport activities [to be confirmed]
2. Ownership
a. Land Owner / Landlord PRASA - long lease agreement in place with private entity b. Formal vs. informal Formal
3. Operations
a. Overall management body of the facility [to be confirmed]b. Quantity of tenants / associations [to be confirmed]c. Quantity of operators [to be confirmed]d. Vehicle seater types [to be confirmed]
4. Supporting activities
a. Type of activities Commercial c. Operating hours [to be confirmed]d. Passenger numbers [to be confirmed]
5. Movement
a. Movement of people Travelling home, Travelling to work, shoppingb. Movement of freight & luggage Freight N/A - Luggage - Informal c. Parking provision [to be confirmed]
6. Safety
a. Security measures Private b. Perceived safety Fair
Transport Identity Cards
SOURCE: Arcus Gibb & ASM, 2010. Johannesburg Inner City Traffic & Transportation Study, JDA. On site observations by ARUP
Figure 1.26

MOVEMENT & TRANSPORT STATUS QUO 51
Jack Mincer Taxi RankTransport Hub
Jack Mincer Taxi rank is located towards the
south-eastern side of Park Station
500m walking radius
1. Transport accommodation
a. Accommodation list Taxi Rankb. Destination [to be confirmed]c. Capacity of the location Ranking: 81 bays, Holding: 336 baysd. Occupancy of the location 100%e. Conditions of the facility Goodf. Supply Under supply g. Interdependency to other transport activities [to be confirmed]
2. Ownership
a. Land Owner / Landlord [to be confirmed]b. Formal vs. informal [to be confirmed]
3. Operations
a. Overall management body of the facility [to be confirmed]b. Quantity of tenants / associations [to be confirmed]c. Quantity of operators [to be confirmed]d. Vehicle seater types [to be confirmed]
4. Supporting activities
a. Type of activities No other activityc. Operating hours [to be confirmed]d. Passenger numbers [to be confirmed]
5. Movement
a. Movement of people [to be confirmed]b. Movement of freight & luggage [to be confirmed] c. Parking provision [to be confirmed]
6. Safety
a. Security measures [to be confirmed]b. Perceived safety [to be confirmed]
Transport Identity Cards
SOURCE: Arcus Gibb & ASM, 2010. Johannesburg Inner City Traffic & Transportation Study, JDA. On site observations by ARUP
Figure 1.27

MOVEMENT & TRANSPORT STATUS QUO
Kaserne Taxi RankTransport Hub
Kaserne Taxi rank is located towards the south-
western side of Park Station & predominantly is
used as a taxi holding facility
500m walking radius
1. Accommodation (ranking, holding, facilities, activity)
a. Accommodation list of the transport location Taxi Rank with Shopping Centre above b. Capacity of the location Holding: 500 bays, Maximum accumulation between 14:00 to 14:15 = 560 vehicles c. Occupancy of the location 520 taxisd. Conditions of the location & facilities Poore. Growth need of the location & facilities In Demand
2. Ownership
a. Land Owner / Landlord CoJb. Management & maintenance [to be confirmed]c. Formal vs. informal occupation / activity Formal
3. Operations & operating structure
a. Overall management body of the location / activities [to be confirmed]b. Quantity of tenants / associations for the location / activities 6 taxi associationsc. Taxi operators [to be confirmed]d. Vehicle numbers & types [to be confirmed]e. Seats [to be confirmed]
4. Activities
a. Interdependency to other locations / activities Ranking at Wanderers Taxi Rankb. Purpose of the transport location (transport & other activity) Taxi holding c. Other activities - formal vs. informal Informal support - cooking / trading
5. Activity Cycle
a. Operating hours of respective activities [to be confirmed]b. Activity cycles (daily / weekly / monthly) [to be confirmed]c. Passenger numbers vs. visitor numbers & cycles N/A
6. Movement
a. Movement of people to & from the transport location [to be confirmed]b. Movement & handling of Freight & luggage [to be confirmed]d. Parking provision N/A
7. Safety
a. Security measures [to be confirmed]b. Perceived safety Not safe
SOURCE: Arcus Gibb & ASM, 2010. Johannesburg Inner City Traffic & Transportation Study, JDA. On site observations by ARUP
Figure 1.28
MOVEMENT & TRANSPORT STATUS QUO 53
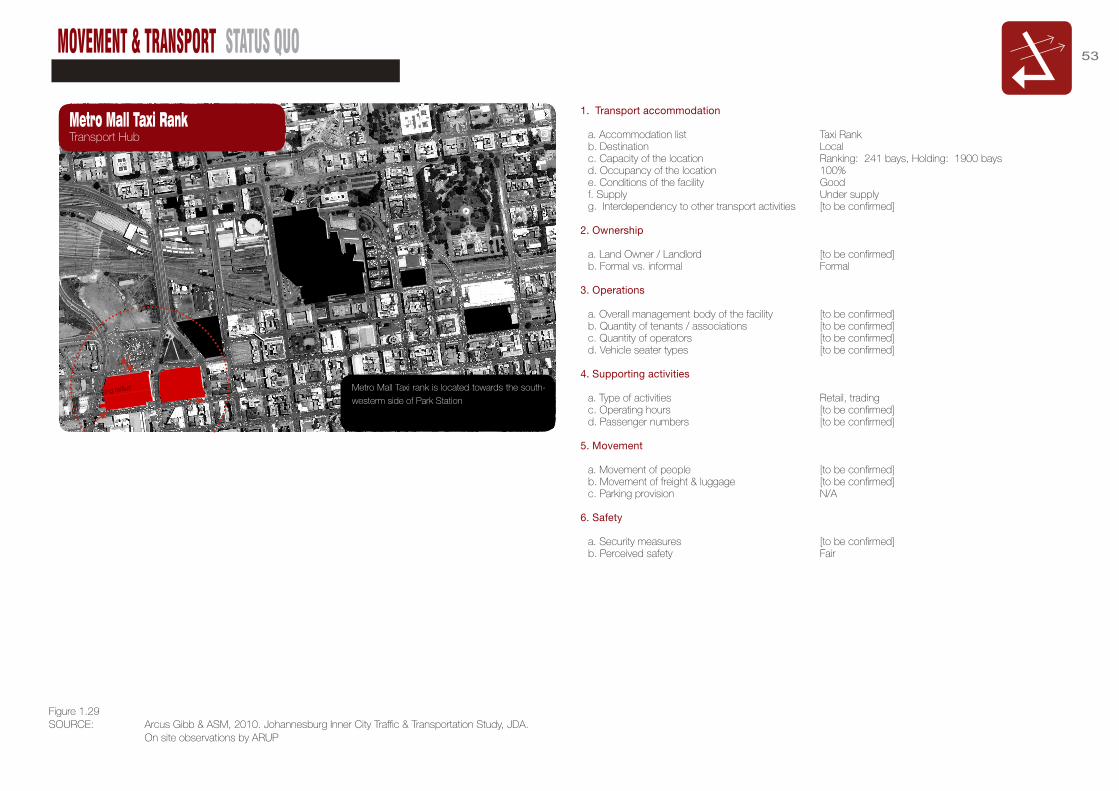
Metro Mall Taxi RankTransport Hub
Metro Mall Taxi rank is located towards the south-
westerm side of Park Station500m walking radius
1. Transport accommodation
a. Accommodation list Taxi Rankb. Destination Localc. Capacity of the location Ranking: 241 bays, Holding: 1900 baysd. Occupancy of the location 100%e. Conditions of the facility Goodf. Supply Under supply g. Interdependency to other transport activities [to be confirmed]
2. Ownership
a. Land Owner / Landlord [to be confirmed]b. Formal vs. informal Formal
3. Operations
a. Overall management body of the facility [to be confirmed]b. Quantity of tenants / associations [to be confirmed]c. Quantity of operators [to be confirmed]d. Vehicle seater types [to be confirmed]
4. Supporting activities
a. Type of activities Retail, trading c. Operating hours [to be confirmed]d. Passenger numbers [to be confirmed]
5. Movement
a. Movement of people [to be confirmed]b. Movement of freight & luggage [to be confirmed] c. Parking provision N/A
6. Safety
a. Security measures [to be confirmed]b. Perceived safety Fair
SOURCE: Arcus Gibb & ASM, 2010. Johannesburg Inner City Traffic & Transportation Study, JDA. On site observations by ARUP
Figure 1.29
MOVEMENT & TRANSPORT STATUS QUO
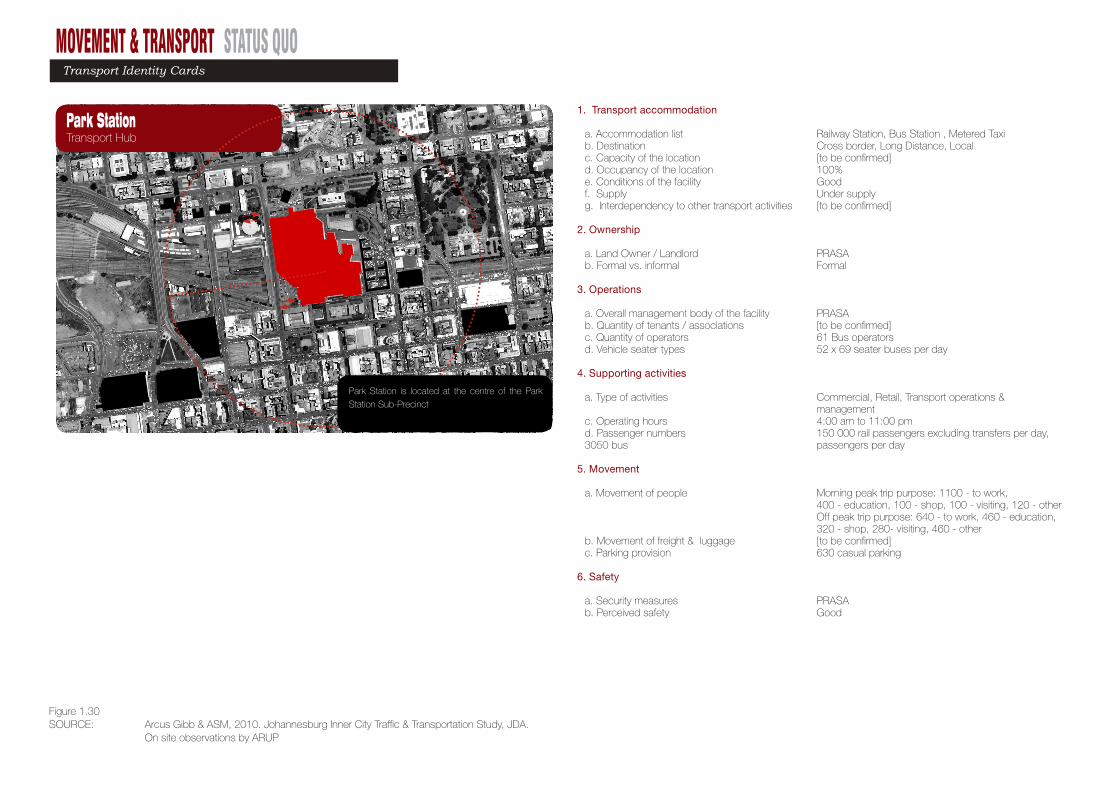
Park StationTransport Hub
Park Station is located at the centre of the Park
Station Sub-Precinct
1000m walking radius
1. Transport accommodation
a. Accommodation list Railway Station, Bus Station , Metered Taxi b. Destination Cross border, Long Distance, Local c. Capacity of the location [to be confirmed]d. Occupancy of the location 100%e. Conditions of the facility Goodf. Supply Under supply g. Interdependency to other transport activities [to be confirmed]
2. Ownership
a. Land Owner / Landlord PRASA b. Formal vs. informal Formal
3. Operations
a. Overall management body of the facility PRASA b. Quantity of tenants / associations [to be confirmed]c. Quantity of operators 61 Bus operators d. Vehicle seater types 52 x 69 seater buses per day
4. Supporting activities
a. Type of activities Commercial, Retail, Transport operations & management c. Operating hours 4:00 am to 11:00 pm d. Passenger numbers 150 000 rail passengers excluding transfers per day, 3050 bus passengers per day
5. Movement
a. Movement of people Morning peak trip purpose: 1100 - to work, 400 - education, 100 - shop, 100 - visiting, 120 - other Off peak trip purpose: 640 - to work, 460 - education, 320 - shop, 280- visiting, 460 - other b. Movement of freight & luggage [to be confirmed] c. Parking provision 630 casual parking
6. Safety
a. Security measures PRASAb. Perceived safety Good
Transport Identity Cards
SOURCE: Arcus Gibb & ASM, 2010. Johannesburg Inner City Traffic & Transportation Study, JDA. On site observations by ARUP
Figure 1.30

MOVEMENT & TRANSPORT STATUS QUO 55
Gautrain StationTransport Hub
Gautrain Station is located towards the northern
side of Park Station
500m walking radius
1. Transport accommodation
a. Accommodation list High Speed Railway Stationb. Destination Gauteng c. Capacity of the location Initial peak line 4590 pax/hour - with capacity to doubled. Occupancy of the location Not yet operational e. Conditions of the facility Under constructionf. Supply Under construction g. Interdependency to other transport activities [to be confirmed]
2. Ownership
a. Land Owner / Landlord [to be confirmed]b. Formal vs. informal Formal
3. Operations
a. Overall management body of the facility Gautrain b. Quantity of tenants / associations [to be confirmed] c. Quantity of operators 1 operatord. Vehicle seater types [to be confirmed]
4. Supporting activities
a. Type of activities No other activityc. Operating hours [to be confirmed]d. Passenger numbers forecast - 46320 daily users
5. Movement
a. Movement of people [to be confirmed]b. Movement of freight & luggage [to be confirmed] c. Parking provision 552 park & ride bays, 2 kiss & ride bays, 20 car hire bays
6. Safety
a. Security measures [to be confirmed]b. Perceived safety [to be confirmed]
Transport Identity Cards
SOURCE: Arcus Gibb & ASM, 2010. Johannesburg Inner City Traffic & Transportation Study, JDA. On site observations by ARUP
Figure 1.31
Transport Identity CardsTransport Identity Cards

MOVEMENT & TRANSPORT STATUS QUO
Zimbabwe Bus RankTransport Hub
Zimbabwe Bus rank is located towards the north
- western side of Park Station & predominantly
serves long distance & cross border travellers.
500m walking radius
1. Transport accommodation
a. Accommodation list Bus Rankb. Destination Long distancec. Capacity of the location [to be confirmed]d. Occupancy of the location 100%e. Conditions of the facility Goodf. Supply Under supply g. Interdependency to other transport activities [to be confirmed]
2. Ownership
a. Land Owner / Landlord [to be confirmed]b. Formal vs. informal Informal
3. Operations
a. Overall management body of the facility [to be confirmed]b. Quantity of tenants / associations [to be confirmed]c. Quantity of operators [to be confirmed]d. Vehicle seater types [to be confirmed]
4. Supporting activities
a. Type of activities Retail, trading c. Operating hours [to be confirmed]d. Passenger numbers [to be confirmed]
5. Movement
a. Movement of people [to be confirmed]b. Movement of freight & luggage [to be confirmed] c. Parking provision [to be confirmed]
6. Safety
a. Security measures [to be confirmed]b. Perceived safety Fair
Transport Identity Cards
SOURCE: Arcus Gibb & ASM, 2010. Johannesburg Inner City Traffic & Transportation Study, JDA. On site observations by ARUP
Figure 1.32

MOVEMENT & TRANSPORT STATUS QUO 57
1. Transport accommodation
a. Accommodation list Taxi Rankb. Destination Gauteng & Long distance c. Capacity of the location Ranking: 15 baysd. Occupancy of the location 100%e. Conditions of the facility N/Af. Supply Under supply g. Interdependency to other transport activities Holding at Kazerne
2. Ownership
a. Land Owner / Landlord CoJb. Formal vs. informal Informal
3. Operations
a. Overall management body of the facility [to be confirmed]b. Quantity of tenants / associations [to be confirmed] c. Quantity of operators 8 taxi operatorsd. Vehicle seater types [to be confirmed]
4. Supporting activities
a. Type of activities Street tradingc. Operating hours [to be confirmed]d. Passenger numbers [to be confirmed]
5. Movement
a. Movement of people [to be confirmed]b. Movement of freight & luggage [to be confirmed] c. Parking provision [to be confirmed]
6. Safety
a. Security measures [to be confirmed] b. Perceived safety Fair
SOURCE: Arcus Gibb & ASM, 2010. Johannesburg Inner City Traffic & Transportation Study, JDA. On site observations by ARUP
Figure 1.33
King GeorgeTransport Hub
King George is located towards the east of Park
Station
500m walking radius
Transport Identity Cards
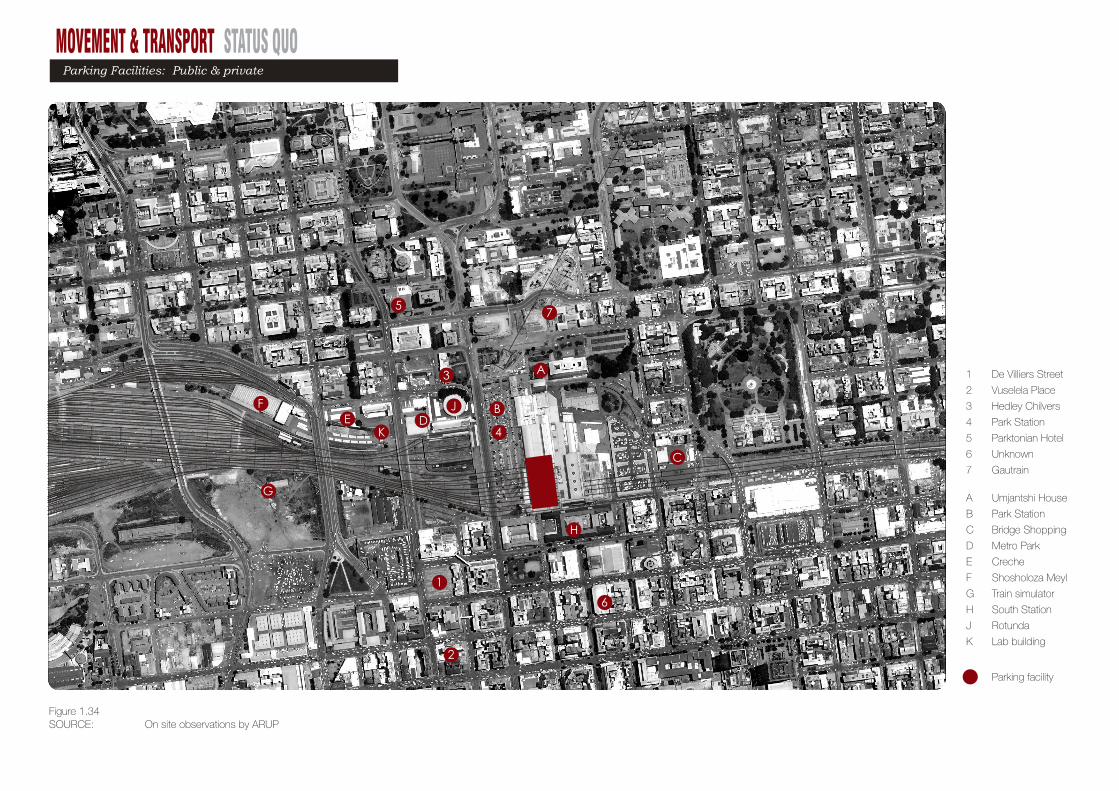
MOVEMENT & TRANSPORT STATUS QUOParking Facilities: Public & private
SOURCE: On site observations by ARUP Figure 1.34
2
7
N
16
4
Parking facility
De Villiers Street
Vuselela Place
Hedley Chilvers
Park Station
Parktonian Hotel
Unknown
Gautrain
1 2
3
4
5
6
7
3
5
Umjantshi House
Park Station
Bridge Shopping
Metro Park
Creche
Shosholoza Meyl
Train simulator
South Station
Rotunda
Lab building
A B
C
D
E
F
G
H J
K
A
B
C
DEF
G
H
J
K

MOVEMENT & TRANSPORT STATUS QUO 59
Parking facility
De Villiers Street
Vuselela Place
Hedley Chilvers
Park Station
Parktonian Hotel
Unknown
Gautrain
Name Operator Bays Usage per day Private/Public Covered/not covered Levels Cost per hour Activity cycle
1 2 De Villiers street Interpark 165 135 [80%] Semi public (131 bays) Covered (Car ports) Ground level R8/hour 7 am to 5pm
2 Vuselela place Interpark 105 77 [73%] Private Covered Basement R330/month 24hrs [access card holders]3 Hedley Chilvers Eskom 259 259[100%] Private Covered Ground level Eskom staff only 6am to 6pm4 Park Station Interpark 310 310[100%] Public Not covered Street level R6/hour 24 hours Interpark 267 140[52%] Public 60% Covered Ground level R6/hour 24 hours
5 Parktonian Hotel Interpark 400 292[73%] Semi public (199) Covered Parkade R6/hour, R20 overnight 24 hours6 Unknown Universal Not available Full [church services] Covered Parkade Free During church services Church7 Gautrain [Still under construction]
PRASA Asset Parking bays Name Bays Usage per day Private/Public Covered/not covered Levels Activity cycle
A Umjantshi House 412 256 [62%] Staff and visitors 90% covered Basement & ground level Office hoursB Park Station 130 130 [100%] Staff and Tenants Not covered Ground level and Rissik street level Office hours C Bridge Shopping 80 80 [100%] Tenants Covered Basement 5am to 18:00pm (tenants only)D Metro Park 168 168 [100%] Staff Covered Ground level Office hoursE Creche 67 67 [100%] Staff of Shosholoza Meyl Covered Ground level Office hoursF Shosholoza Meyl 119 119[100%] Staff Covered Ground level Office hours
G Train simulator [Still under construction] N/A H South Station No parking bays provided N/A J Rotunda No parking bays provided N/A K Lab Building No parking bays provided N/A
Umjantshi House
Park Station
Bridge Shopping
Metro Park
Creche
Shosholoza Meyl
Train simulator
South Station
Rotunda
Lab building
Parking facilities: Public & private

MOVEMENT & TRANSPORT STATUS QUO
Key Facts
Delivery frequency Daily, 5 - 6 trucks
Freight origin Alexandra, City Deep, Denver
Type of goods Variety
Type of vehicles Variety
Delivery bay Off street
TAXI RANK BUTCHERY Mr. Martin Ferreira
Key Facts
Delivery frequency Daily, busiest 15 trucks/day
Freight origin Durban & various Gauteng
origins
Type of goods Variety
Type of vehicles 1 - 18 ton
Delivery bay Dedicated delivery area
BOXER SUPERSTORESMr. Nathan
Key Facts
Delivery frequency Daily, 10 trucks
Freight origin Newtown Distribution Centre
Type of goods Variety
Type of vehicles 1 - 18 tons
Delivery bay Off street
CAMBRIDGE FOODSMr. Vuka Ngambosi
Key Facts
Delivery frequency Daily, 10 trucks
Freight origin Wynberg, Tembisa, City Deep,
Denver, Springs
Type of goods Variety
Type of vehicles 1 - 18 tons
Delivery bay Off street
PARK CITY SUPERMARKET Mr. Eduardo Defreitas
Freight Movement
SOURCE: On site observations by ARUP Figure 1.35
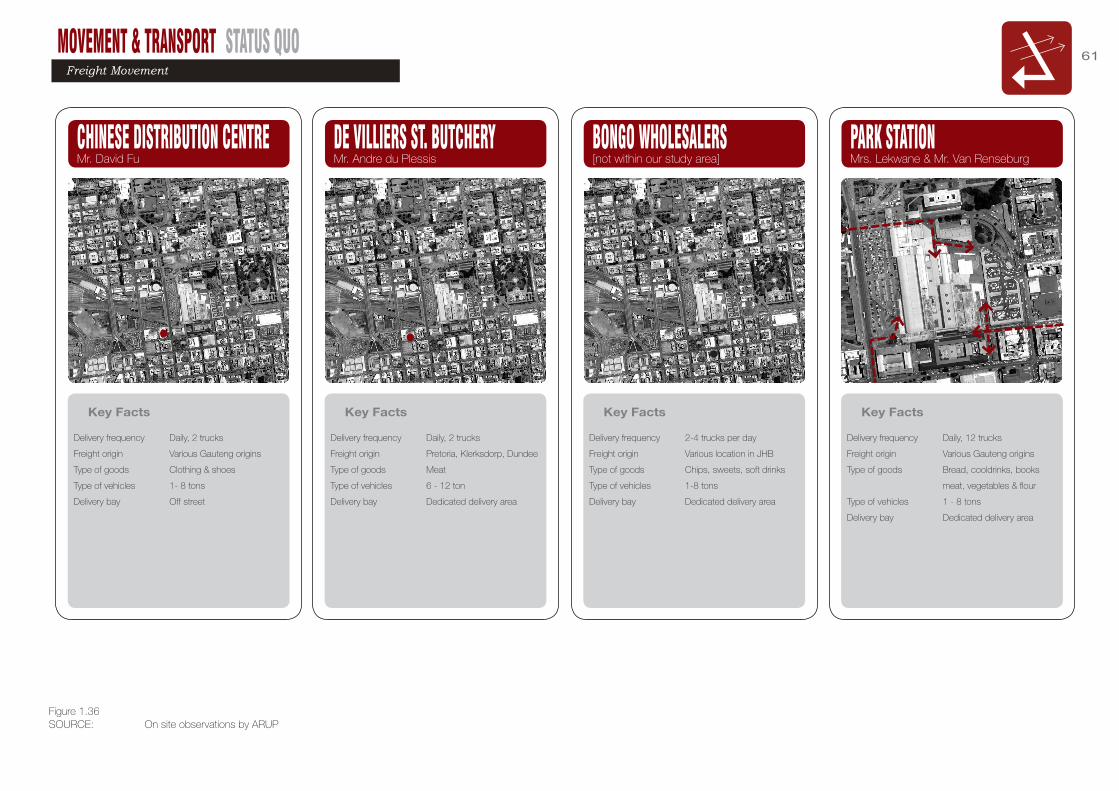
MOVEMENT & TRANSPORT STATUS QUO 61
Key Facts
Delivery frequency Daily, 12 trucks
Freight origin Various Gauteng origins
Type of goods Bread, cooldrinks, books
meat, vegetables & flour
Type of vehicles 1 - 8 tons
Delivery bay Dedicated delivery area
PARK STATIONMrs. Lekwane & Mr. Van Renseburg
Key Facts
Delivery frequency Daily, 2 trucks
Freight origin Various Gauteng origins
Type of goods Clothing & shoes
Type of vehicles 1- 8 tons
Delivery bay Off street
CHINESE DISTRIBUTION CENTRE Mr. David Fu
Key Facts
Delivery frequency Daily, 2 trucks
Freight origin Pretoria, Klerksdorp, Dundee
Type of goods Meat
Type of vehicles 6 - 12 ton
Delivery bay Dedicated delivery area
DE VILLIERS ST. BUTCHERY Mr. Andre du Plessis
Key Facts
Delivery frequency 2-4 trucks per day
Freight origin Various location in JHB
Type of goods Chips, sweets, soft drinks
Type of vehicles 1-8 tons
Delivery bay Dedicated delivery area
BONGO WHOLESALERS [not within our study area]
Freight Movement
SOURCE: On site observations by ARUP Figure 1.36

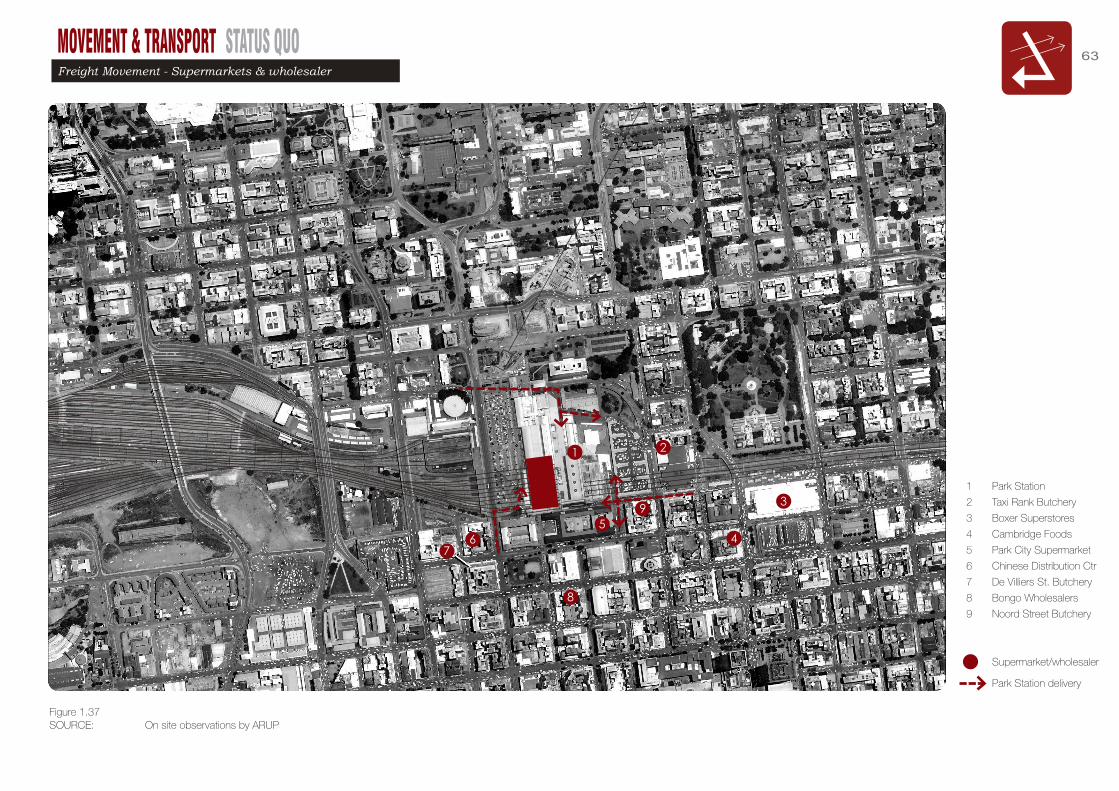
MOVEMENT & TRANSPORT STATUS QUO 63Freight Movement - Supermarkets & wholesaler
SOURCE: On site observations by ARUP Figure 1.37
6
2
3
N
45
7
8
1
Supermarket/wholesaler
Park Station delivery
Park Station
Taxi Rank Butchery
Boxer Superstores
Cambridge Foods
Park City Supermarket
Chinese Distribution Ctr
De Villiers St. Butchery
Bongo Wholesalers
Noord Street Butchery
1 2
3
4
5
6
7
8
9
9

“I would like to live closer to work but I am finding it difficult to find affordable accommodation. I could afford between R700 to R1000 per month.”
Vusi BrownGreyhound porter based at Park Station, 2011.

LAND USEPark Station Sub-precinct Development Framework
CHAPTER 2
The assessment of land potential, economic & social conditions in order to select the best land-use options.

LAND USE STATUS QUO
STRATEGIC CONTEXT
The character of the land uses are intrinsically linked with the role of the Sub-
precinct as the biggest transport interchange in the country. Incorporating
various transport modes such as rail, bus, taxi, car, it forms the heart to an
intricate network of linkages, connecting with a wide range of local, national
and international origins and destinations.
Its strategic location also makes the Sub-precinct into one of the places of
highest accessibility within the Gauteng City region.
Due to its central location at the heart of the Inner-city, the Sub-precinct also
has a significant role to play in connecting the various Inner-city precincts
with their own distinct identity, land-uses, socio-economic profile and role
within Johannesburg.
The complexity of the Sub-precinct’s strategic nature is clearly visible in
competing trends, fragmentation of functions, the continuous tension
between formal and informal activities as it aims to respond to a wide variety
of socio-economic factors.
This chapter provides an overview of the formal land uses only, however
it needs to be considered within a broader socio-economic context (refer
Chapter 5) to provide a more inclusive understanding of the dynamic and
rich mix of the uses on this site.
Introduction

Storage unit on wheels for a Hawker to keep and
transport his goods.
LAND USE STATUS QUO
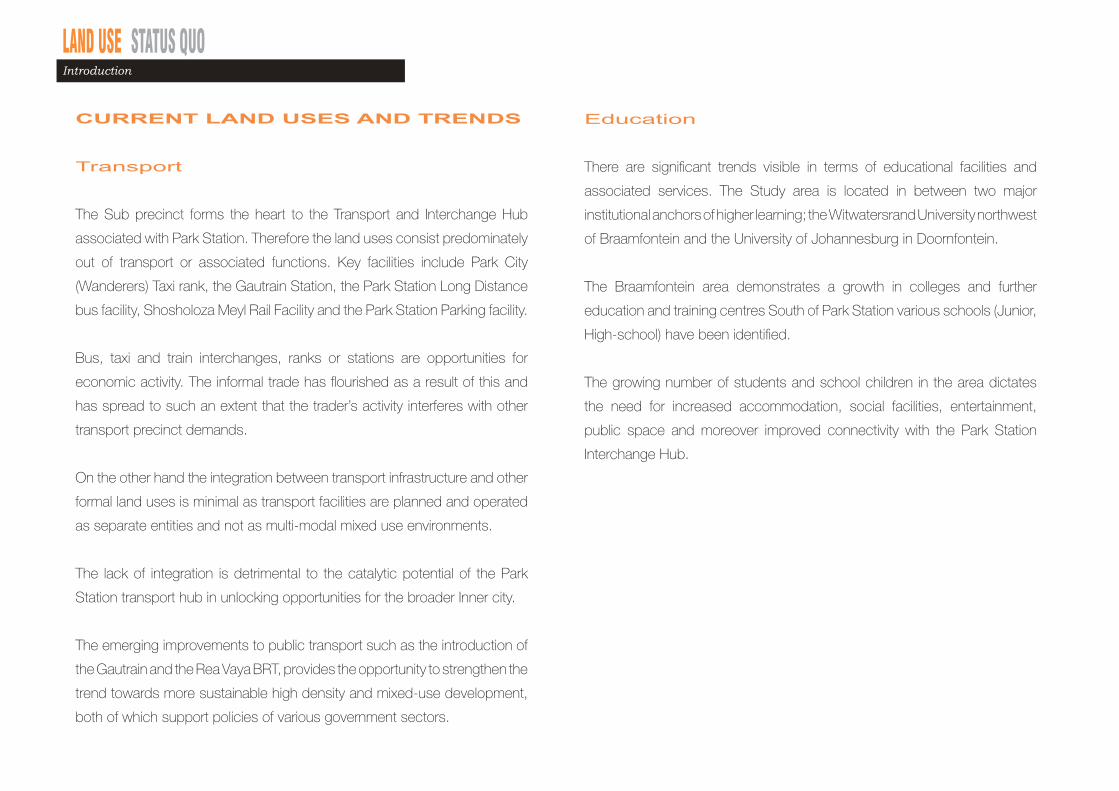
Education
There are significant trends visible in terms of educational facilities and
associated services. The Study area is located in between two major
institutional anchors of higher learning; the Witwatersrand University northwest
of Braamfontein and the University of Johannesburg in Doornfontein.
The Braamfontein area demonstrates a growth in colleges and further
education and training centres South of Park Station various schools (Junior,
High-school) have been identified.
The growing number of students and school children in the area dictates
the need for increased accommodation, social facilities, entertainment,
public space and moreover improved connectivity with the Park Station
Interchange Hub.
CURRENT LAND USES AND TRENDS
Transport
The Sub precinct forms the heart to the Transport and Interchange Hub
associated with Park Station. Therefore the land uses consist predominately
out of transport or associated functions. Key facilities include Park City
(Wanderers) Taxi rank, the Gautrain Station, the Park Station Long Distance
bus facility, Shosholoza Meyl Rail Facility and the Park Station Parking facility.
Bus, taxi and train interchanges, ranks or stations are opportunities for
economic activity. The informal trade has flourished as a result of this and
has spread to such an extent that the trader’s activity interferes with other
transport precinct demands.
On the other hand the integration between transport infrastructure and other
formal land uses is minimal as transport facilities are planned and operated
as separate entities and not as multi-modal mixed use environments.
The lack of integration is detrimental to the catalytic potential of the Park
Station transport hub in unlocking opportunities for the broader Inner city.
The emerging improvements to public transport such as the introduction of
the Gautrain and the Rea Vaya BRT, provides the opportunity to strengthen the
trend towards more sustainable high density and mixed-use development,
both of which support policies of various government sectors.
Introduction
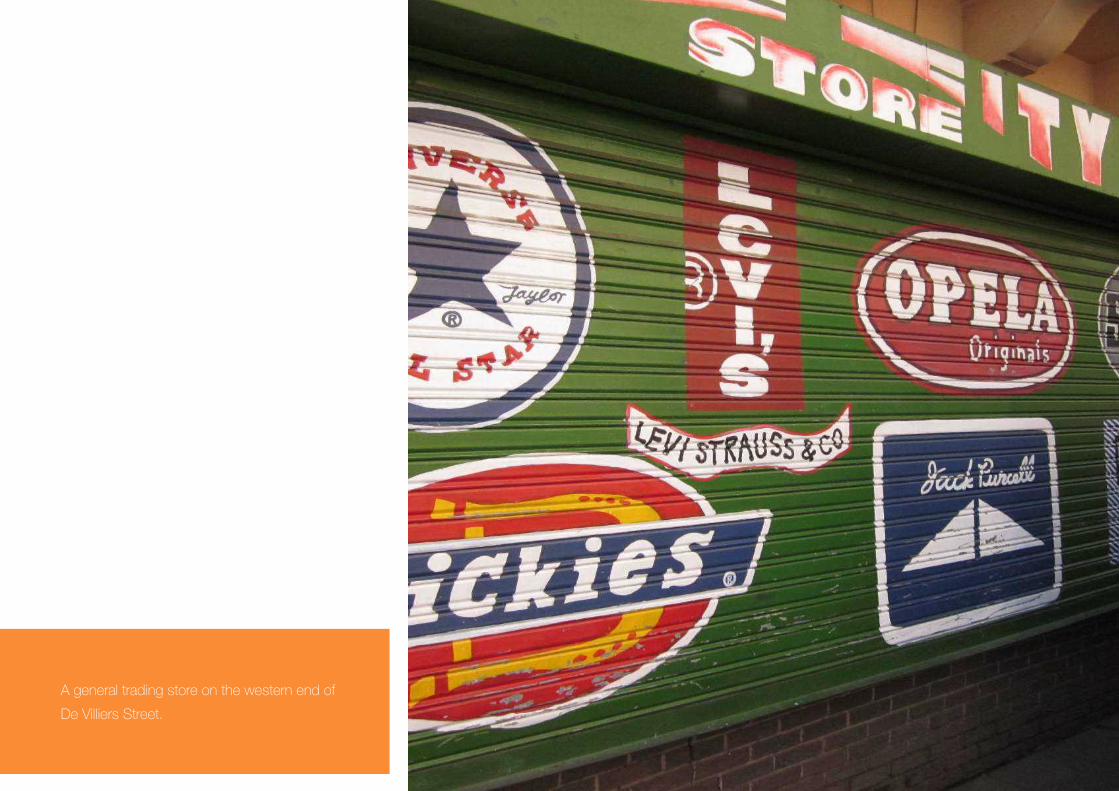
A general trading store on the western end of
De Villiers Street.

LAND USE STATUS QUO
Social infrastructure
There is a significant lack of social amenities to support the substantial
growth in residential accommodation. This includes a wide variety of land
uses such as public space, recreation, child care and education, gathering
spaces.
Existing community facilities are predominantly located on the South –East
side of the study area with linkages to the northern residential hub of Hillbrow.
Residential
Due to the significant demand for lower to middle income rental stock, there
is a growing trend within the Inner city to convert low grade commercial, light
industrial and older residential hotel buildings into rental accommodation
directed at the lower middle income and affordable housing market. This
trend is tangible in the area immediately south form Park Station and in
certain areas within Hillbrow.
There is further a growing demand for accommodation catering for both
student and young professionals. High rise developments in Braamfontein
are accommodating a growing student population, interspersed with
apartments for young professionals in predominantly mixed use buildings.
Retail and trading
The wholesale and retail sectors are significant to Johannesburg’s economy
with 20% of the City’s gross geographical product, second to the financial
and business services with 22%.1
Historically the Inner City represented the centre of department stores and
restaurants. Over years it has changed form and character towards spots
niche retail, wholesale, personal services, restaurants, fast food outlets,
small-scale and micro shops as well as large informal trade.
Johannesburg’s cross-border shopping phenomenon is significant with
an estimated 1 million shoppers annually contributing an estimated R17
billion to the City’s economy and another estimated R800 million is spent on
formal accommodation.
As a transport hub, the Park Station sub-precinct is at the heart of both
formal and informal economic linkages and performs a key role supporting
the Inner City as a significant retail node for township and Inner City residents
as well as cross border shoppers.
In terms of the study area, is the highest concentration of retail (formal and
informal) located to the south east of park Station (corner Noord Street and
Wanderers Street)? Other significant retails activity can be found spread
across the Braamfontein area.
Introduction

Customers buying liquor from the Emerald Sports
Bar in Koch Street.
LAND USE STATUS QUO
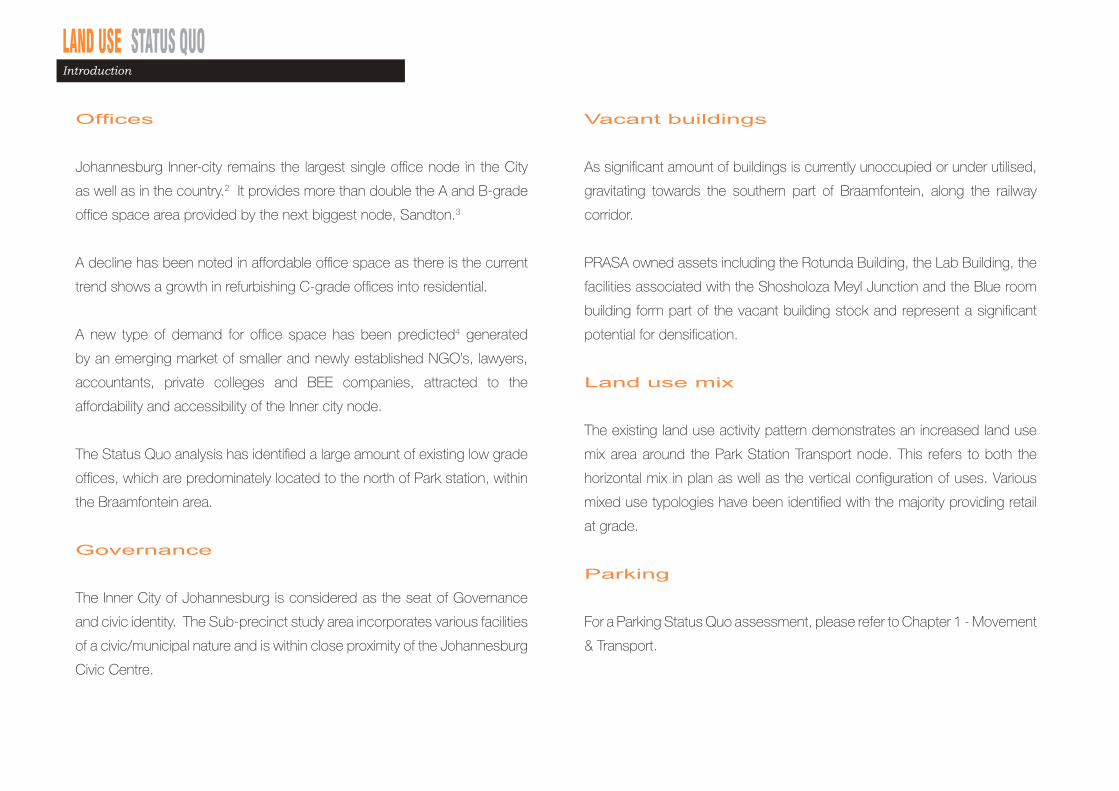
Vacant buildings
As significant amount of buildings is currently unoccupied or under utilised,
gravitating towards the southern part of Braamfontein, along the railway
corridor.
PRASA owned assets including the Rotunda Building, the Lab Building, the
facilities associated with the Shosholoza Meyl Junction and the Blue room
building form part of the vacant building stock and represent a significant
potential for densification.
Land use mix
The existing land use activity pattern demonstrates an increased land use
mix area around the Park Station Transport node. This refers to both the
horizontal mix in plan as well as the vertical configuration of uses. Various
mixed use typologies have been identified with the majority providing retail
at grade.
Parking
For a Parking Status Quo assessment, please refer to Chapter 1 - Movement
& Transport.
Offices
Johannesburg Inner-city remains the largest single office node in the City
as well as in the country.2 It provides more than double the A and B-grade
office space area provided by the next biggest node, Sandton.3
A decline has been noted in affordable office space as there is the current
trend shows a growth in refurbishing C-grade offices into residential.
A new type of demand for office space has been predicted4 generated
by an emerging market of smaller and newly established NGO’s, lawyers,
accountants, private colleges and BEE companies, attracted to the
affordability and accessibility of the Inner city node.
The Status Quo analysis has identified a large amount of existing low grade
offices, which are predominately located to the north of Park station, within
the Braamfontein area.
Governance
The Inner City of Johannesburg is considered as the seat of Governance
and civic identity. The Sub-precinct study area incorporates various facilities
of a civic/municipal nature and is within close proximity of the Johannesburg
Civic Centre.
Introduction

Formalised informal trading along a pedestrianised
area south of Park station.

LAND USE STATUS QUO
0 100 200
N
0 100 200
N
0 100 200
N
0 100 200
N
SOURCE: Johannesburg Inner City Traffic & Transportation Study, Report 1, March 2010. Braamfontein Scoping Study, September 2009, ARUP. On site observations by ARUP during the beginning of 2011.
Offices Transport Nodes
Formal Retail Residential
Park Station Sub-Precinct
Railway Lines
Prasa Assets
Study Area
Out of Study Area
Figure 2.1
Land Use

LAND USE STATUS QUO 75
0 100 200
N
0 100 200
N
0 100 200
N
0 100 200
N
SOURCE: Johannesburg Inner City Traffic & Transportation Study, Report 1, March 2010. Braamfontein Scoping Study, September 2009, ARUP. On site observations by ARUP during the beginning of 2011.
Civic / Municipal Facilities Entertainment
Educational Facilities Community Centre / Clinics Places of Worship
Park Station Sub-Precinct
Railway Lines
Prasa Assets
Study Area
Out of Study Area
Figure 2.2
Land Use

LAND USE STATUS QUO
SOURCE: Johannesburg Inner City Traffic & Transportation Study, Report 1, March 2010. On site observations by ARUP during the beginning of 2011.
0 50 100 200
N
Residential
Institutional
Religious
Vacant
Educational
Public Transport
Commercial
Retail
Mixed Use 1:
Ground Retail, Residential Above
Mixed Use 2:
Ground Retail, Church Above
Mixed Use 3:
Retail and Transport
Mixed Use 4:Ground Entertainment, Residential
Above
Park Station Sub-Precinct
Railway Lines
Prasa Assets
Study Area
Out of Study Area
Figure 2.3
Land Use
LAND USE STATUS QUO 77
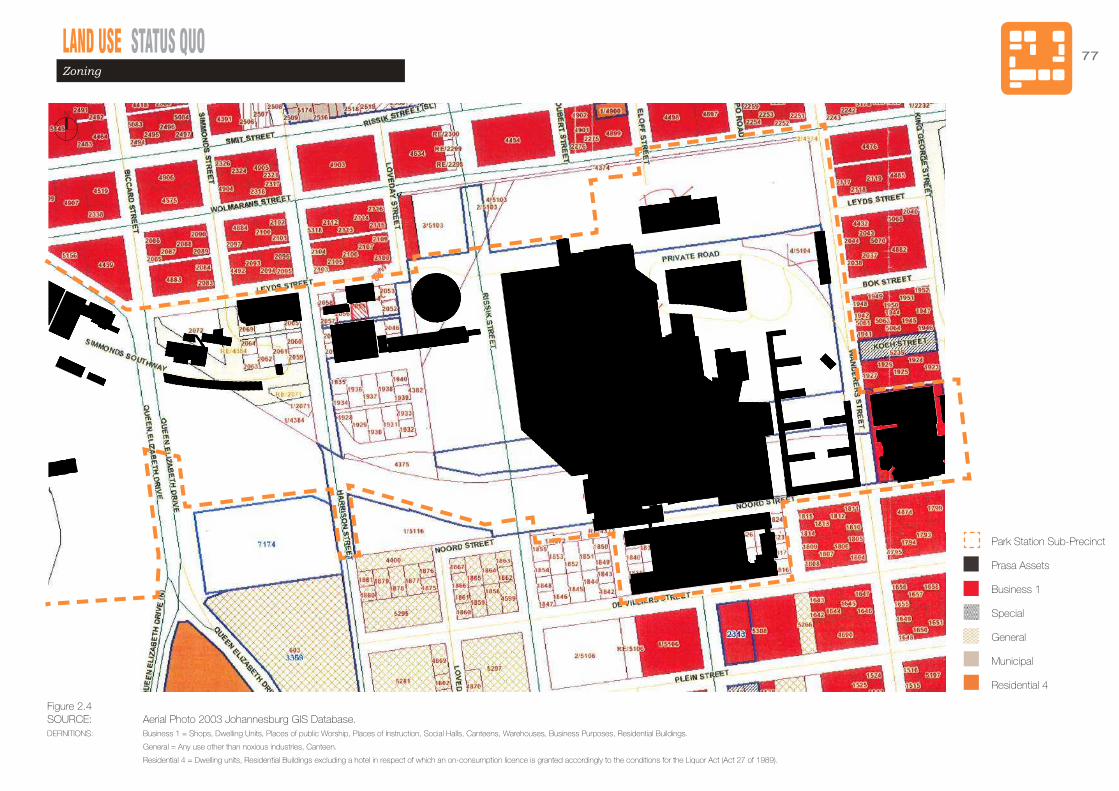
Park Station Sub-Precinct
Prasa Assets
Business 1
Special
General
Municipal
Residential 4
N
Figure 2.4SOURCE: Aerial Photo 2003 Johannesburg GIS Database. DEFINITIONS: Business 1 = Shops, Dwelling Units, Places of public Worship, Places of Instruction, Social Halls, Canteens, Warehouses, Business Purposes, Residential Buildings.
General = Any use other than noxious industries, Canteen.
Residential 4 = Dwelling units, Residential Buildings excluding a hotel in respect of which an on-consumption licence is granted accordingly to the conditions for the Liquor Act (Act 27 of 1989).
Zoning
LAND USE STATUS QUO
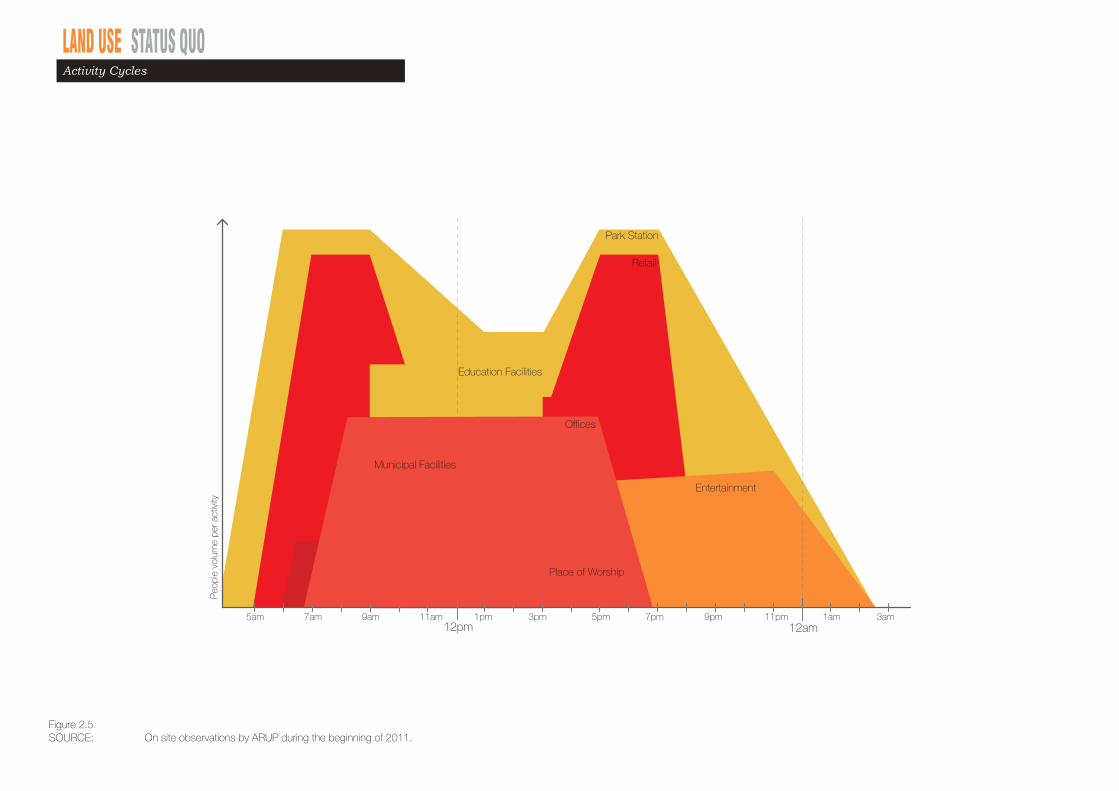
Park Station
Retail
Entertainment
Offices
5am 5pm 9pm 11pm 3am7am 9am 11am 1pm 3pm 7pm 1am
Peo
ple
volu
me
per a
ctiv
ity
12pm 12am
Municipal Facilities
Place of Worship
Education Facilities
SOURCE: On site observations by ARUP during the beginning of 2011.Figure 2.5
Activity Cycles
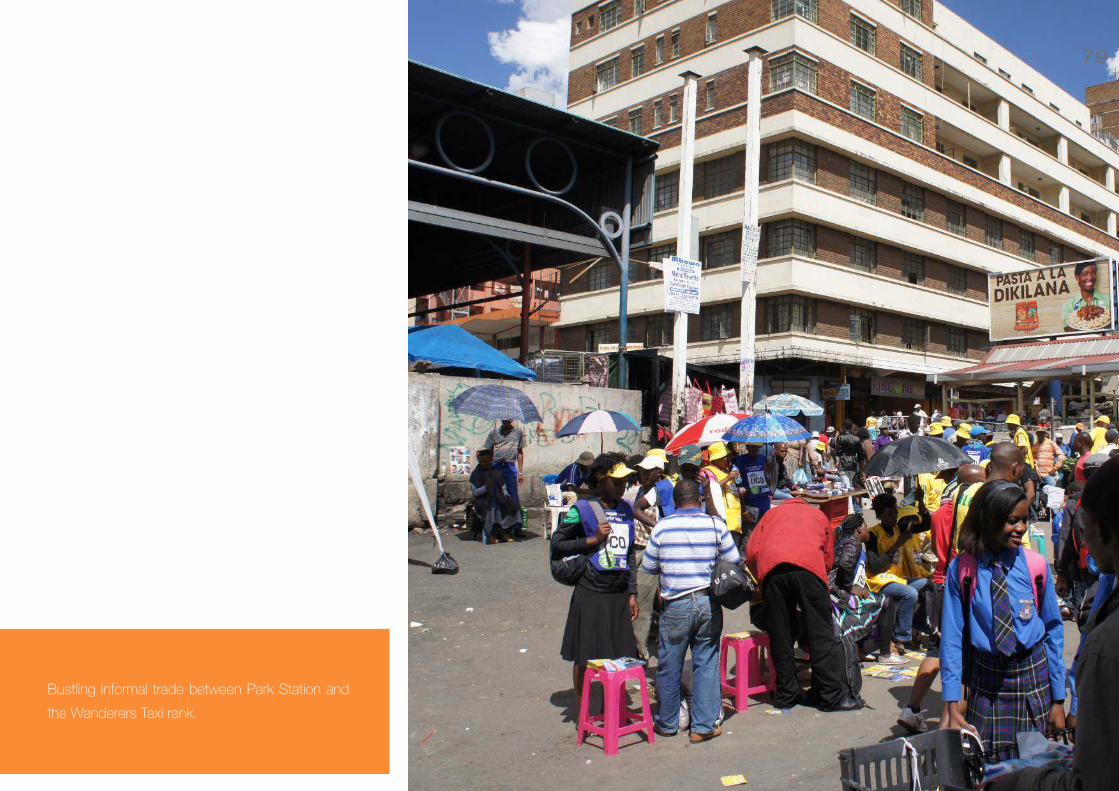
79
Bustling informal trade between Park Station and
the Wanderers Taxi rank.

LAND USE STATUS QUO
SOURCE: Johannesburg Inner City Traffic & Transportation Study, Report 1, March 2010. On site observations by ARUP during the beginning of 2011.
0 50 100 200
N
Vacant Buildings
Park Station Sub-Precinct
Railway Lines
Prasa Assets
Study Area
Out of Study Area
1 Bridge Shopping Centre
Wanderers Taxi Rank
Park Station
Cook House
Umjantshi House
Metro Park
Rotanda
Corner Harrison & Leyds
Platform 19
Lab Building
Shosholoza Meyl
Driver’s Simulation
2
3
4
5
6
7
8
912
3
4
5
6
7
10
11
8
9
1011
12
12
Figure 2.6
Vacant Buildings

LAND USE STATUS QUO 81
Vacant Buildings
SOURCE: On site observations by ARUP during the beginning of 2011.
0 50 100 200
N
Vacant Building
25% Occupied
50% Occupied
80% Occupied
100% Occupied
Park Station Sub-Precinct
Railway Lines
Prasa Assets
Study Area
Out of Study Area
Figure 2.7
Occupancy

LAND USE STATUS QUO
Key FactsKey FactsKey FactsKey Facts
Average Floors 6 - 10 Floors
Basement Parking Trend 1-2 Floors
General Location Trend South Eastern & North Western
Edge of Park Station
Average Floors 4 - 10 Floors
Basement Parking Trend 0-1 Floor
General Location Trend South Eastern
Edge of Park Station
Average Floors 4 - 10 Floors
Basement Parking Trend 0-1 Floor
General Location Trend Northern
Edge of Park Station
Average Floors 1 - 3 Floors
Basement Parking Trend None
General Location Trend North Eastern
Edge of Park Station
Adv
ertis
ing
Basement
Retail
Vacant
Basement
Retail
Residential
Basement
Retail
Office
Retail
Place of Worship
TYPE 2 Retail at Grade - Residential Above
TYPE 1 Retail at Grade - Vacant Above
TYPE 3 Retail at Grade - Office Above
TYPE 4 Retail at Grade - Place of Worship Above
Figure 2.8
Mixed Use Typologies
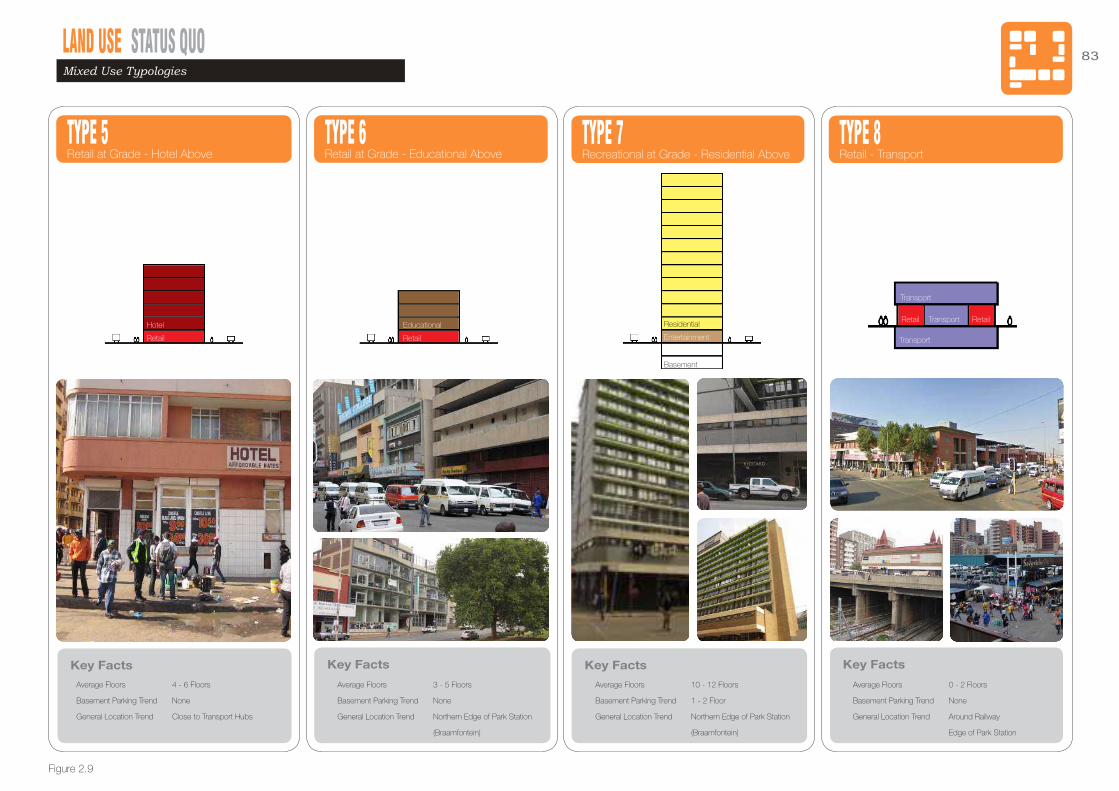
LAND USE STATUS QUO 83
Key Facts
To see all the details that are visible on the screen, use the Print link next to the map.
To see all the details that are visible on the screen, use the Print link next to the map.
Page 1 of 2Johannesburg, Gauteng, South Africa - Google Maps
2011/04/20http://maps.google.co.uk/
Key FactsKey FactsKey Facts
Average Floors 4 - 6 Floors
Basement Parking Trend None
General Location Trend Close to Transport Hubs
Average Floors 3 - 5 Floors
Basement Parking Trend None
General Location Trend Northern Edge of Park Station
(Braamfontein)
Average Floors 10 - 12 Floors
Basement Parking Trend 1 - 2 Floor
General Location Trend Northern Edge of Park Station
(Braamfontein)
Average Floors 0 - 2 Floors
Basement Parking Trend None
General Location Trend Around Railway
Edge of Park Station
Basement
Entertainment
Residential
Retail
Educational
Transport
Retail
Transport
Transport Retail
TYPE 5 Retail at Grade - Hotel Above
TYPE 6 Retail at Grade - Educational Above
TYPE 7 Recreational at Grade - Residential Above
TYPE 8 Retail - Transport
Figure 2.9
Retail
Hotel
Mixed Use Typologies
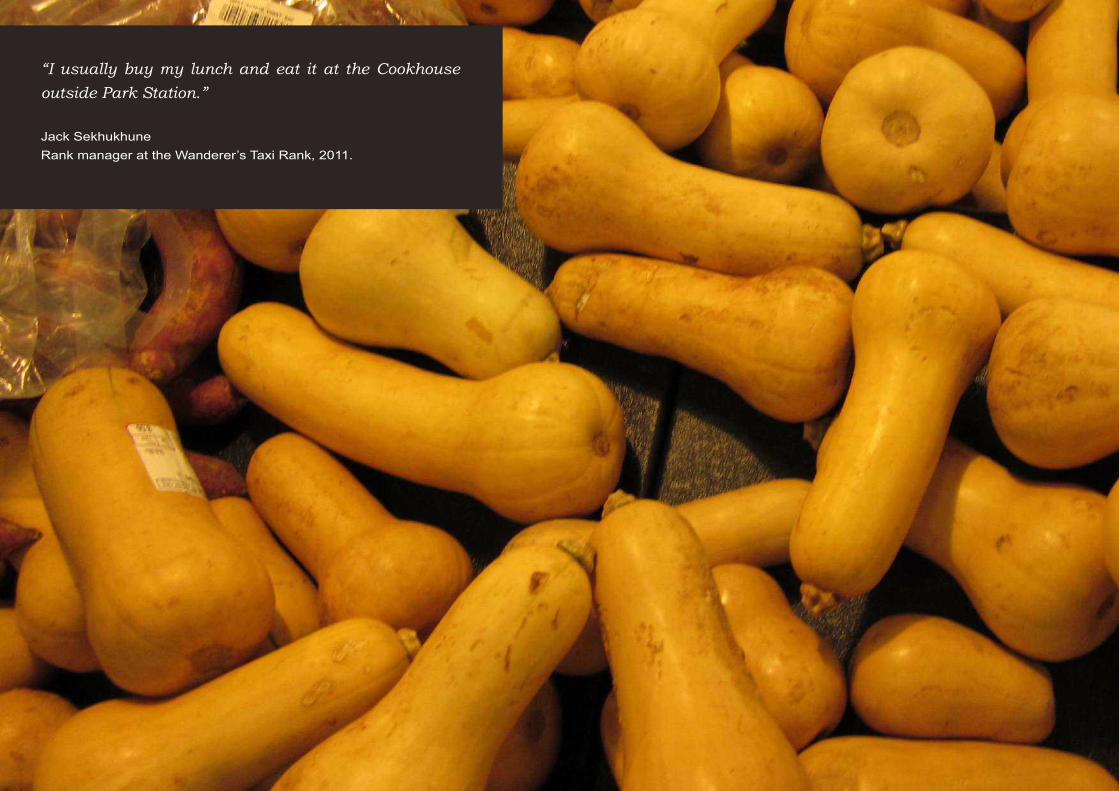
“I usually buy my lunch and eat it at the Cookhouse outside Park Station.”
Jack SekhukhuneRank manager at the Wanderer’s Taxi Rank, 2011.

URBAN FORMPark Station Sub-precinct Development Framework
CHAPTER 3
The physical layout & design of the city - density, layout the public realm & urban design issues.

URBAN FORM STATUS QUO
CONTEXT
The Park station Sub-precinct comprises approximately 40 ha. at the heart
of the Inner City, North of the Central Business District.
The site is dominated by the vast scale of the Park Station complex and is
structured along movement routes and transport related linkages at a local,
regional and cross border scale that underpin this multi-modal interchange.
On the other hand the site marks the divide between the northern and central
part of the city as the “river” of rail tracks generates a dramatic rupture of the
city fabric which is stitched together occasionally at critical locations where
major bridge infrastructure is straddling the vast railway lands.
These two elements reinforce the character of the precinct as being an
isolated island within the city, chaotic and undefined in parts, a sense
of forgotten wasteland in others, rigid and non-adaptable. However the
precinct is also considered to be vibrant, dynamic and providing the city a
continuous pulse of life and opportunity.
The site is in need of a framework that is flexible enough to incorporate
the constant socio-economic changes but on the other hand provides a
clear well-defined plan that enables integrated place making and future
densification. Park Station Precinct is to regain a renewed urban identity
that has the quality threshold and presence to reposition itself as an iconic
symbol and gateway to Johannesburg and a contemporary Southern Africa.
History and Heritage
By 1887, a year after the discovery of gold on the Witwatersrand, the
Zuid-Afrikaansche Republiek (ZAR) government in Pretoria had planned a
railway to Johannesburg. For this purpose it had set aside a strip of land
about a block wide north of Noord Street, and the most northerly of the first
stands surveyed by Jos. E. de Villiers and auctioned by Joost Heystek on
8 December 1886. A large portion of what was known as Kruger’s Park - at
that stage an empty piece of land north of Noord Street - was to become
known as the Wanderers’ Ground. By 1888, the railway line running between
Noord and Hancock Streets was already bridged west of Park Station.
Park Station
Park Station got its name from a tin shed in Noord Street which was known
as Park, written across the top, because of its proximity to Kruger’s Park.
The shed was constructed as a stop on the early railway line to Boksburg,
and became known as Park Halt in 1889/90. The Rand Tram, carrying a
few passengers but mainly coal from the Boksburg Collieries, used to stop
at this station.
Introduction
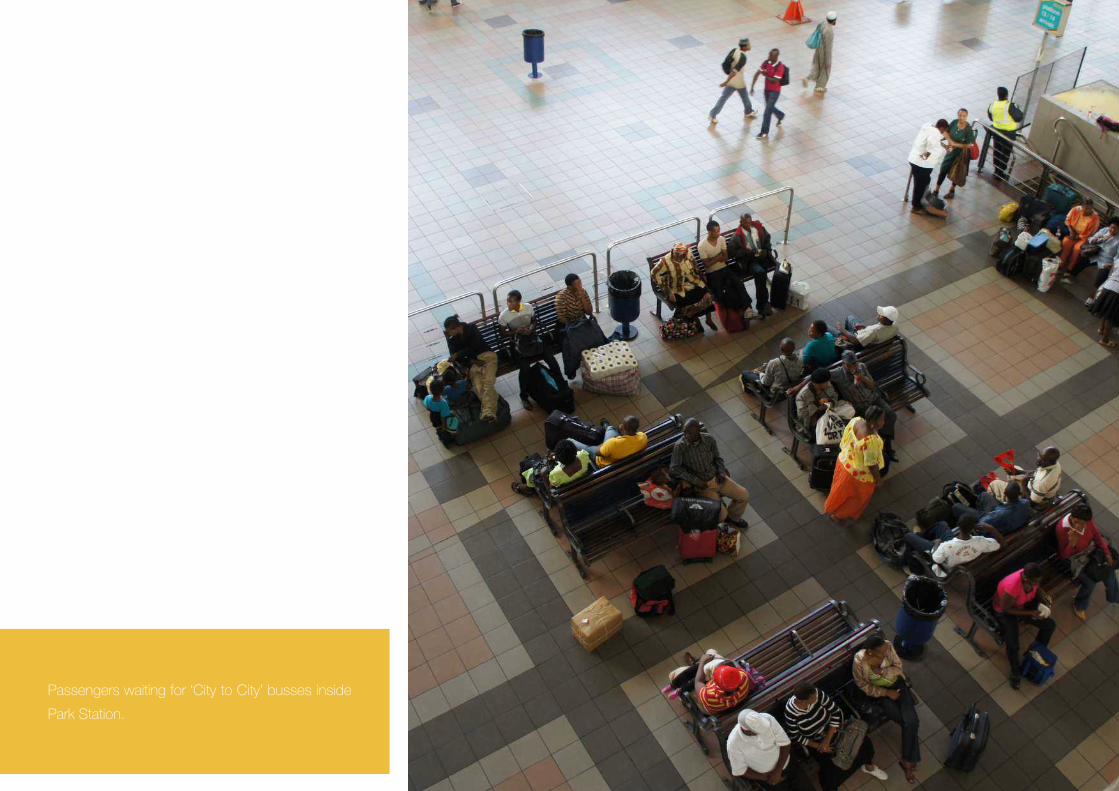
Passengers waiting for ‘City to City’ busses inside
Park Station.

URBAN FORM STATUS QUO
The Rail Barrier
The period 1900 to 1920 represented a transition of the fairly closed
Johannesburg town core to the extended city area of 1920 and beyond,
including the suburbs adjacent to the core. During this period the way was
prepared for the expansion of the city centre by better connections between
the areas north and south of the railway tracks. In 1906 a reinforced concrete
bridge was built across Twist Street while a number of subways were also
constructed, one of which was in Harrison Street, west of Park Station.
The Rail network - stages
Every year more trains conveyed ever more passengers along the railway
lines to and from Johannesburg. In 1932 when the new Johannesburg
Station was opened, the number was 16 million. Within then years it had
trebled to 50 million! As a result the need for a bigger station became urgent
long before the end of the 1930’s.
Seen from a historic contextual viewpoint, the Johan Rissik Bridge, together
with the Queen Elizabeth Bridge to the west were the new routes that
changed the map of Johannesburg in the period before the construction of
the elevated M1 and M2 motorways in the 1970s. In the 1950s and 1960s
the north was the ‘front door’ of the Central Business District, and the new
viaducts, linking the Central Business District with Braamfontein across the
tracks, transformed a reserve of railwaymen’s verandahed, semi-detached
cottages, with small hotels, saloon bars, flats and shopping streets into a
high-rise, high-density business area, the natural extension of the CBD.
The second stage meanwhile, of the new Station development – which
entailed the lowering of the level of the old part of the station and the
construction of more platforms and tracks - was completed in February
1954. The portion remodelled in the first construction phase then became
the new main-line station and the ‘old’ portion the suburban station. The
second and third stages involved the construction of a concrete cover over
the platforms and the concourses on top of those. These stages would
have been completed within a few years were it not for the fact that the
station was still being used by a substantial number of steam locomotives
and diesel units daily.
The slab over the suburban station was completed in 1965 and that over
the main-line tracks only in 1961. The Station was finally completed in 1965.
A single railway track eventually became a ‘steel river’ -comprising a
multitude of east-west oriented railway tracks to the north of Noord Street.
By as early as the mid-1890s the phenomenal expansion of railway services
in Johannesburg had already necessitated the lowering and bridging of the
‘steel river’ at various places east and west of Park Station.
The vestiges of this rich history are still present in numerous historical
building and locations around Park Station however sometimes totally
absorbed in the surrounding street activity. Some of the buildings are in a
dilapidated state and require urgent attention, others have been changed
to accommodate different functions throughout the years. The potential of
the heritage patrimony in the area, is not maximised nor legible within the
City context.
Introduction

High density formalised informal trade along
Wanderers Street.

URBAN FORM STATUS QUO
Legibility
The original station design of 1928 was build on the axis of Eloff Street,
considered as the “Avenue la gare”. The town access to the new station
was moved westwards to align with Joubert Street, creating a new north-
south axis that sidelined the old concourse.
The axes of the architectural layout of the new station complex were
predetermined by the established east-west axis of the main-line railway
traffic and by the north-south axis of the vehicle routes elevated above the
railway tracks. Up to today these N-S routes are framing the urban structure
for Park Station Precinct developments.
A string of volumetric buildings reinforce the north south axis centred on
Loveday Street to the North. Two detached administration blocks, the
eleven–storey South African Airways building on the west and, the sixteen-
storey Paul Kruger Building on the east – establish the counter-movements
of the east-west axis. The Rotunda building, which was an Airways arrival
point in the past, neatly occupies indeterminate space in front of the Airways
Building, introducing spherical geometry into the overall layout.
At the time of construction, the station complex reintroduced the third
dimension into Johannesburg’s townscape: buildings became visible as
geometric entities that occupy space and not as infill facades in corridor
streets – the Johannesburg norm.
The planning theory was based on creating unity in design; small and
large contrasting masses; and pedestrian precincts that restricted motor
vehicles to the periphery or to overpasses. The urban form didn’t change
much since its conception. In reality the buildings are too scattered, read as
separate entities and fail to balance their surroundings. The architecture is
not designed to handle and contain the vast open space.
The parking area placed prominently between the main concourse building
and Rissik Street bridge is a desolate, complicated civic platform. Although it
is prominent in scale and location, it does not contribute in terms of marking
or integrating the station within its context.
Due to its topographic location within the lower area of the city and due
to the open vistas across the railway land, the station precinct is one of
the most exposed locations within the city. Albeit its strategic location, the
station precinct does not appear to contribute to the urban morphology as
it fails to become fully anchored within its context.
Introduction
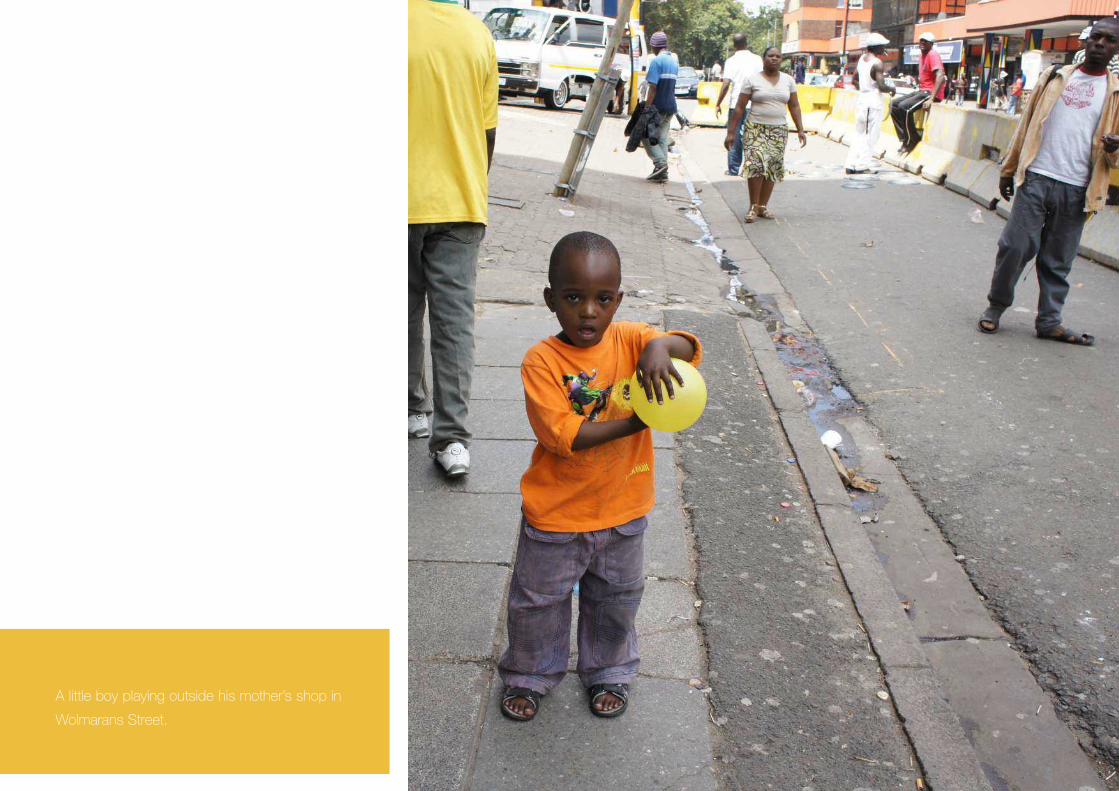
A little boy playing outside his mother’s shop in
Wolmarans Street.

URBAN FORM STATUS QUO
Architectural typology and associated
densities
The differences in grain and structure of the urban fabric surrounding the
precinct, reveal the different time periods in which the various areas have
been developed. Towards the south of Park station the “Working City Grid
Typology”, refers to the typical rational Johannesburg Grid, densely filled in
and with a perimeter facade of average 6 storeys high.
Towards the Newtown Area, West of the Precinct, the grid has been used
as an underlying reference framework however it has been built up with
much bigger city block of distinct shape and configuration of a medium
height of 6 to 8 storeys.
The urban fabric in the Hillbrow area also follows the grid arrangement
however with significantly higher densities and development heights of
predominately residential towers between 10 and 28 levels.
The fabric immediately north of Rissik Street, underwent transformation
between the 50’s and 60’s as a result of the new station development.
Urban development principles of the modern Movement were adopted and
created a grain of distinct building objects with higher allocation for public
space within the city scape.
The Braamfontein area, North-West from the Sub-Precinct, transformed
into a high density high rise (height of 6 to 8 storeys)business area during
the Park Station redevelopment. However recently the area is going through
a process of transformation and regeneration and smaller grain and more
fragmented infill activities are changing the face of the area.
Public realm and Pedestrian connectivity
Accessibility and ease of pedestrian movement are critical to the success
of the Park Station sub-precinct as a multi-modal transport hub. Albeit the
importance of pedestrian connectivity, challenges have been identified and
require solutions.
Challenges include: lack of sidewalks, sidewalks are used for holding
purposes by minibus taxis, informal trading obstructs flow of pedestrian
movement, lack of pedestrian signage to navigate the area, lack of legibility
of pedestrian facilities within the urban context, lack of access to public
transport, poor accommodation for movement of Special Needs Pedestrians
and commuters.
Within the study area, the Public green and hardscaped spaces are
functioning as isolated spaces. They are not or insufficiently integrated
within a broader NMT network which limits their contribution to the overall
public realm. The character and use of the spaces have been changing to
respond to its mutating socio-economic context. Lack of upkeep , security
Introduction
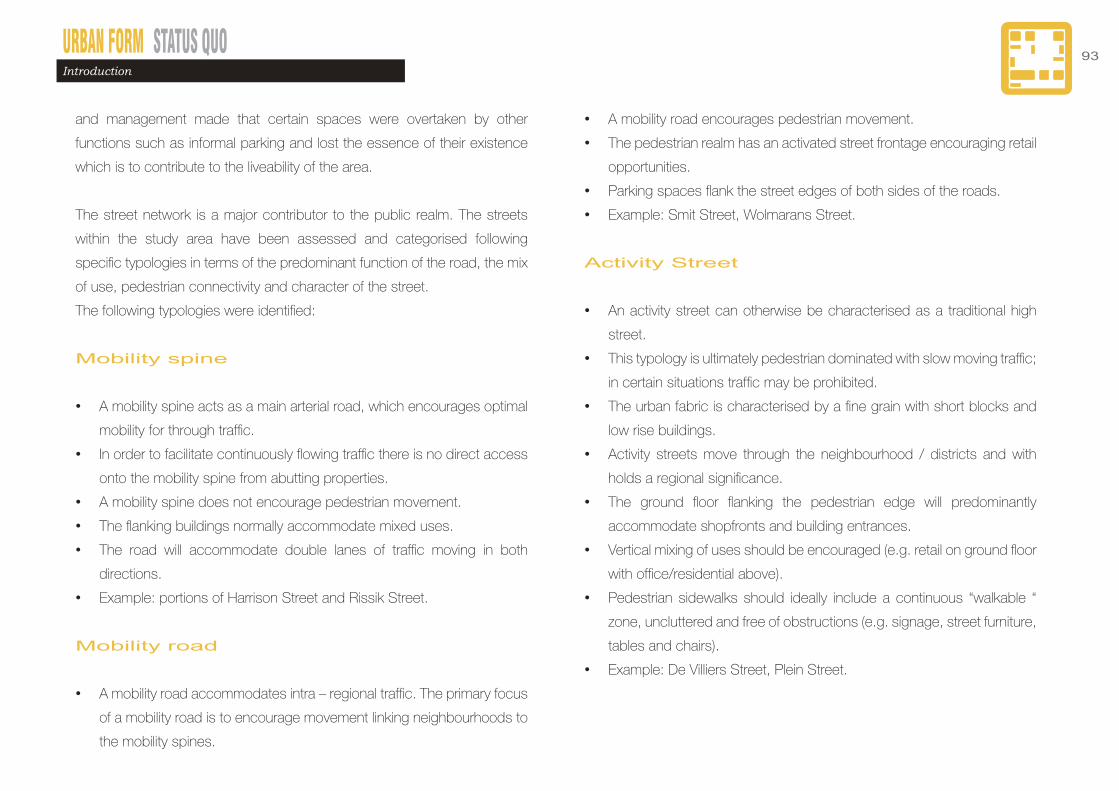
URBAN FORM STATUS QUO 93
and management made that certain spaces were overtaken by other
functions such as informal parking and lost the essence of their existence
which is to contribute to the liveability of the area.
The street network is a major contributor to the public realm. The streets
within the study area have been assessed and categorised following
specific typologies in terms of the predominant function of the road, the mix
of use, pedestrian connectivity and character of the street.
The following typologies were identified:
Mobility spine
• A mobility spine acts as a main arterial road, which encourages optimal
mobility for through traffic.
• In order to facilitate continuously flowing traffic there is no direct access
onto the mobility spine from abutting properties.
• A mobility spine does not encourage pedestrian movement.
• The flanking buildings normally accommodate mixed uses.
• The road will accommodate double lanes of traffic moving in both
directions.
• Example: portions of Harrison Street and Rissik Street.
Mobility road
• A mobility road accommodates intra – regional traffic. The primary focus
of a mobility road is to encourage movement linking neighbourhoods to
the mobility spines.
• A mobility road encourages pedestrian movement.
• The pedestrian realm has an activated street frontage encouraging retail
opportunities.
• Parking spaces flank the street edges of both sides of the roads.
• Example: Smit Street, Wolmarans Street.
Activity Street
• An activity street can otherwise be characterised as a traditional high
street.
• This typology is ultimately pedestrian dominated with slow moving traffic;
in certain situations traffic may be prohibited.
• The urban fabric is characterised by a fine grain with short blocks and
low rise buildings.
• Activity streets move through the neighbourhood / districts and with
holds a regional significance.
• The ground floor flanking the pedestrian edge will predominantly
accommodate shopfronts and building entrances.
• Vertical mixing of uses should be encouraged (e.g. retail on ground floor
with office/residential above).
• Pedestrian sidewalks should ideally include a continuous “walkable “
zone, uncluttered and free of obstructions (e.g. signage, street furniture,
tables and chairs).
• Example: De Villiers Street, Plein Street.
Introduction

URBAN FORM STATUS QUOIntroduction
Urban street
• The Urban Street accommodates residential development .It often
accommodates a retail plinth ensuring that the lower level of the
residential accommodation is situated off the ground. This ensures a
greater level of privacy.
• The urban street has a direct connection to flanking properties.
• The urban street promotes low speed traffic and provides parking on
either side of the street.
• The pavement is layered by, landscaping, street lighting and street
furniture aimed at creating a vibrant public realm.
• Example: Bok Street, Leyds Street
A sense of place
A sense of place is informed by a number of aspects such as the grain and
permeability of the urban fabric, the architecture, the height of buildings,
open spaces and the natural features of the land however it is also informed
by the local community and its visitors, the vibrancy, sense of unity and
culture specific to the area. The site analysis highlighted the richness and
diversity of the context surrounding Park Station. Certain areas have a very
clear and defined role such as being mainly a conduit for transport, a vibrant
retail hub, a community node or civic centre.
Other parts are less defined in terms of identity and sense of place as they
currently form the transition between one area and another such as the area
south of Braamfontein or the elongated land strip bordering the south of the
railways.
Building Conditions
An inventory was set up of the PRASA Asset base within the precinct
which details the provision, current use and state of the building stock.
The condition of the buildings range from very good to a dilapidates state
requiring immediate intervention to protect the building from further decay.
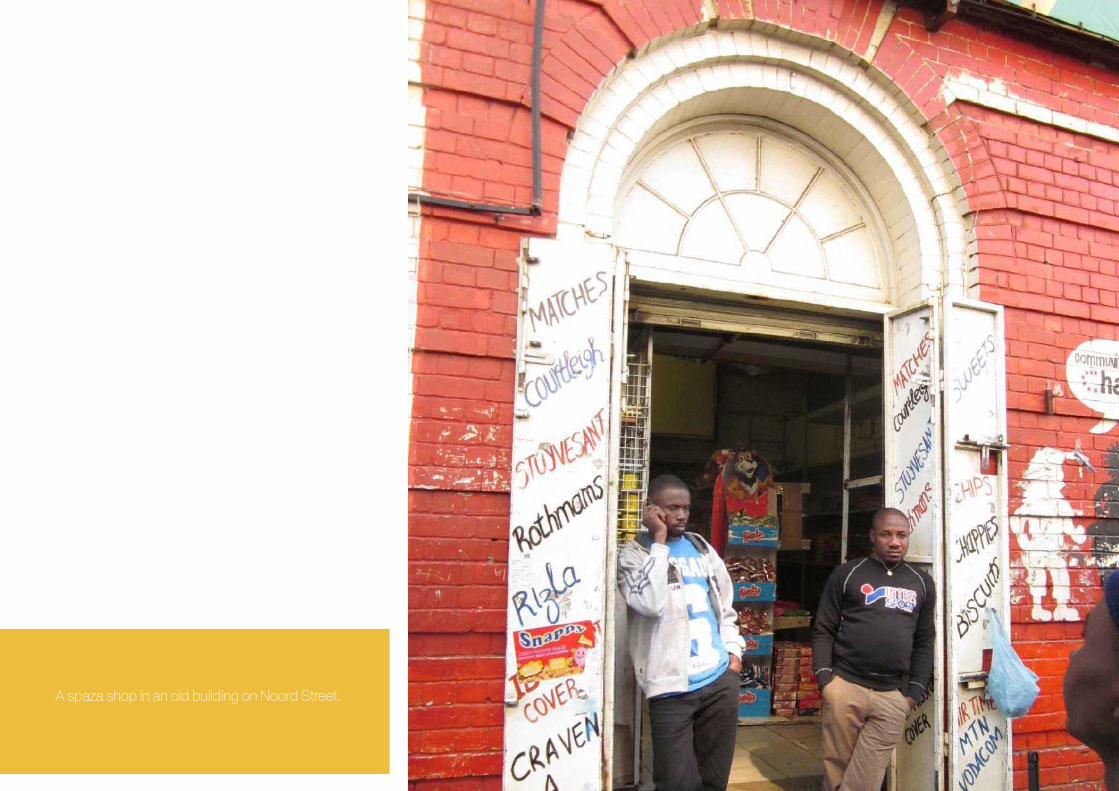
A spaza shop in an old building on Noord Street.
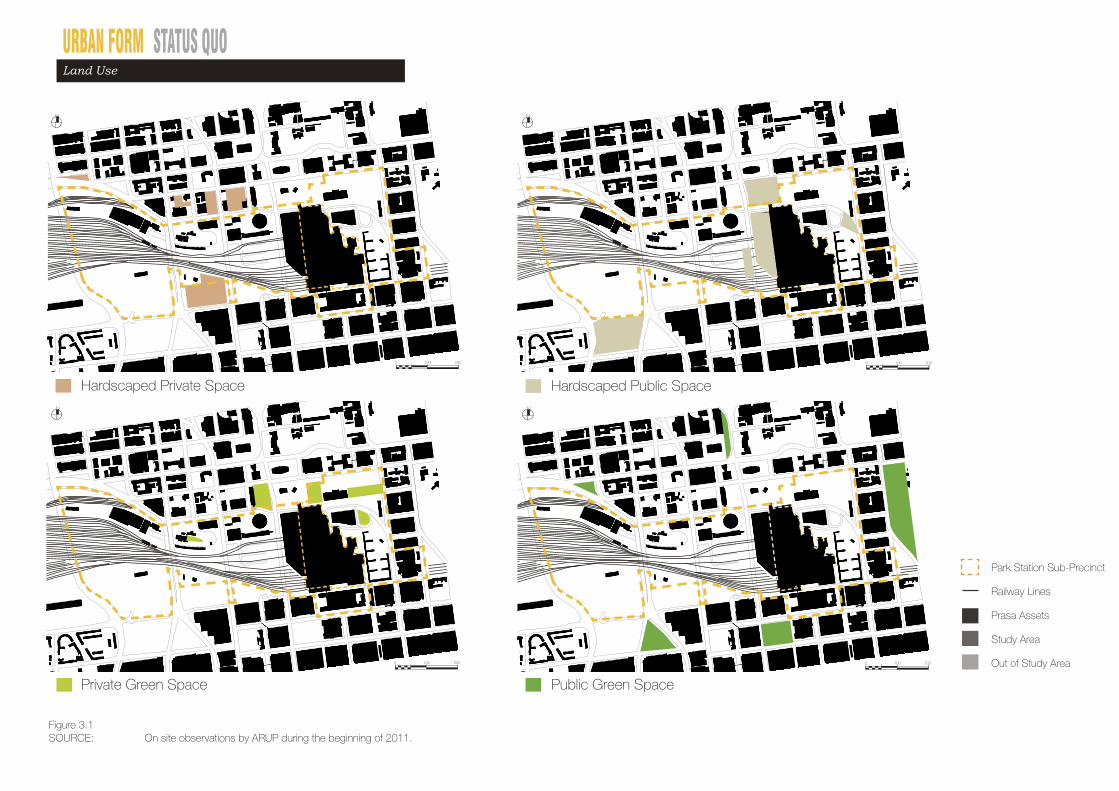
URBAN FORM STATUS QUO
N
0 100 200
0 100 200
N
SOURCE: On site observations by ARUP during the beginning of 2011.
Private Green Space Public Green Space
Hardscaped Private Space Hardscaped Public Space
Park Station Sub-Precinct
Railway Lines
Prasa Assets
Study Area
Out of Study Area
Figure 3.1
Land Use
NN
0 100 200
0 100 200

URBAN FORM STATUS QUO 97
SOURCE: On site observations by ARUP during the beginning of 2011.
0 50 100 200
N
Park Station Sub-Precinct
Railway Lines
Prasa Assets
Study Area
Out of Study Area
Open Space
Private Green Space
Public Green Space
Hardscaped Private Space
Hardscaped Public Space
Figure 3.2
Public Realm
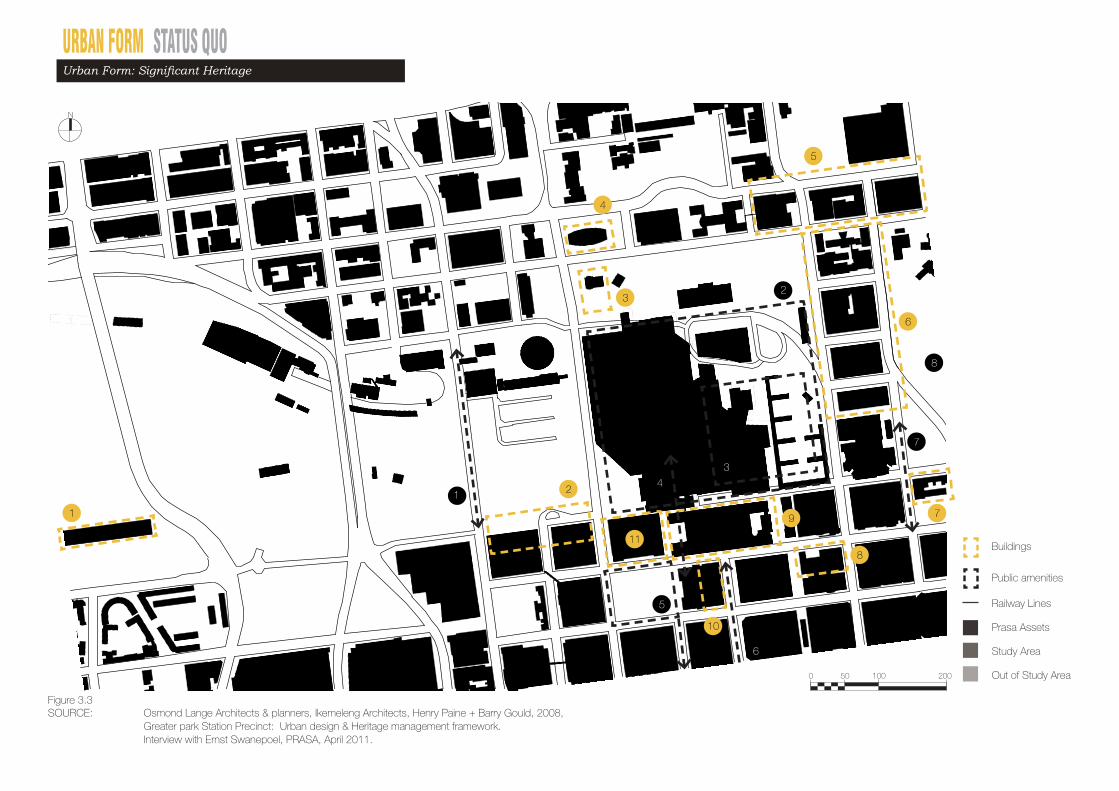
URBAN FORM STATUS QUO
0 50 100 200
N
Buildings
Public amenities
1
2
5
6
4
3
7
8
9
10
11
1
2
3
4
5
6
7
8
SOURCE: Osmond Lange Architects & planners, Ikemeleng Architects, Henry Paine + Barry Gould, 2008, Greater park Station Precinct: Urban design & Heritage management framework. Interview with Ernst Swanepoel, PRASA, April 2011.
Figure 3.3
Urban Form: Significant Heritage
Railway Lines
Prasa Assets
Study Area
Out of Study Area
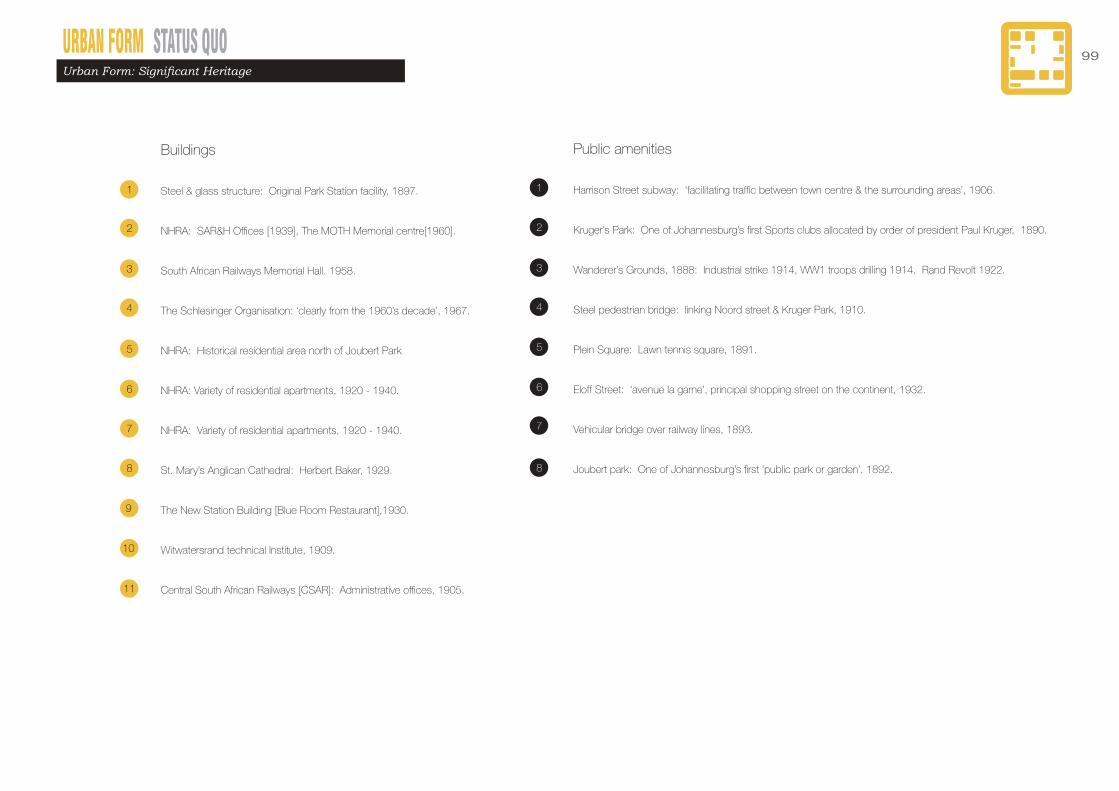
URBAN FORM STATUS QUO 99
Buildings
Steel & glass structure: Original Park Station facility, 1897.
NHRA: SAR&H Offices [1939], The MOTH Memorial centre[1960].
South African Railways Memorial Hall. 1958.
The Schlesinger Organisation: ‘clearly from the 1960’s decade’, 1967.
NHRA: Historical residential area north of Joubert Park
NHRA: Variety of residential apartments, 1920 - 1940.
NHRA: Variety of residential apartments, 1920 - 1940.
St. Mary’s Anglican Cathedral: Herbert Baker, 1929.
The New Station Building [Blue Room Restaurant],1930.
Witwatersrand technical Institute, 1909.
Central South African Railways [CSAR]: Administrative offices, 1905.
1
2
3
4
5
6
7
8
9
10
11
Public amenities
Harrison Street subway: ‘facilitating traffic between town centre & the surrounding areas’, 1906.
Kruger’s Park: One of Johannesburg’s first Sports clubs allocated by order of president Paul Kruger, 1890.
Wanderer’s Grounds, 1888: Industrial strike 1914, WW1 troops drilling 1914, Rand Revolt 1922.
Steel pedestrian bridge: linking Noord street & Kruger Park, 1910.
Plein Square: Lawn tennis square, 1891.
Eloff Street: ‘avenue la garne’, principal shopping street on the continent, 1932.
Vehicular bridge over railway lines, 1893.
Joubert park: One of Johannesburg’s first ‘public park or garden’, 1892.
1
2
3
4
5
6
7
8
Urban Form: Significant Heritage

URBAN FORM STATUS QUO
0 50 100 200
N
1920 - 1945
1946 - 1965
1966 - 1985
1986 - present
SOURCE: Osmond Lange Architects & planners, Ikemeleng Architects, Henry Paine + Barry Gould, 2008, Greater park Station Precinct: Urban design & Heritage management framework. Interview with Ernst Swanepoel, PRASA, April 2011.
Figure 3.4
Urban Form: Construction History
Railway Lines
Prasa Assets
Study Area
Out of Study Area
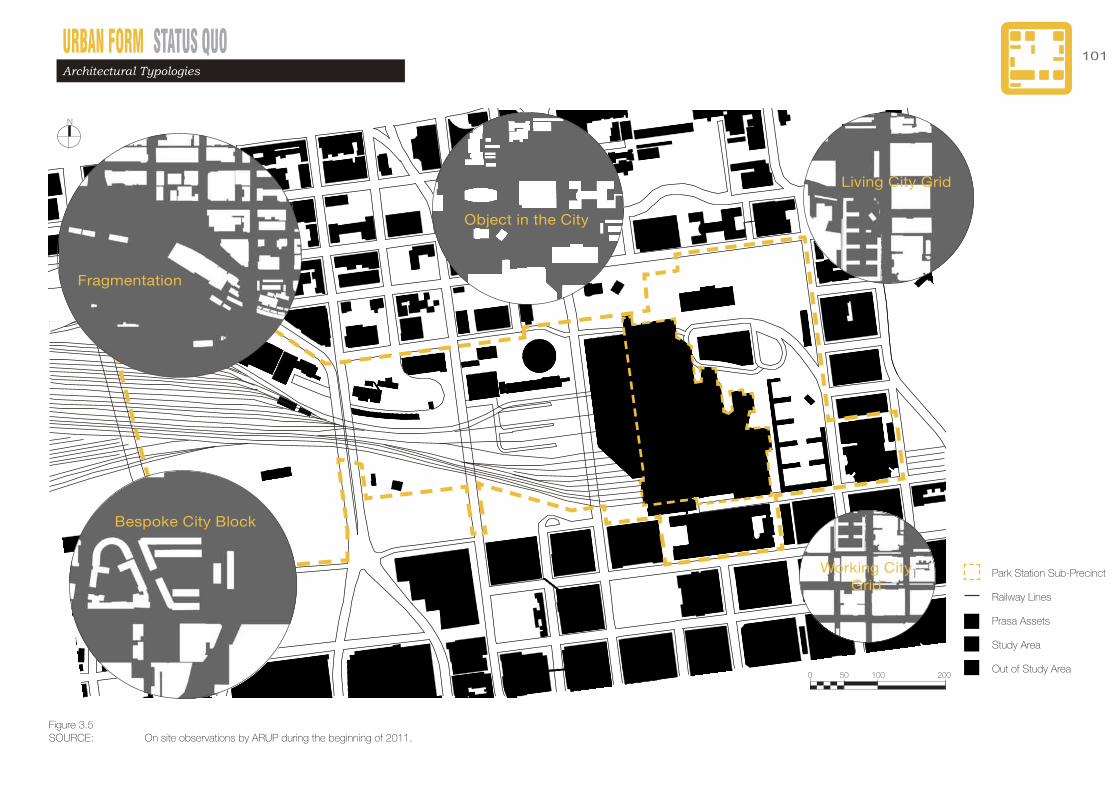
URBAN FORM STATUS QUO 101
SOURCE: On site observations by ARUP during the beginning of 2011.
0 50 100 200
N
Park Station Sub-Precinct
Railway Lines
Prasa Assets
Study Area
Out of Study Area
Fragmentation
Object in the City
Living City Grid
Bespoke City Block
Working City Grid
Figure 3.5
Architectural Typologies

URBAN FORM STATUS QUO
SOURCE: On site observations by ARUP during the beginning of 2011.
0 50 100 200
N
Park Station Sub-Precinct
Railway Lines
Prasa Assets
Out of Study Area
Hig
hLo
w
28 levels
1 level
Figure 3.6
Building Heights

URBAN FORM STATUS QUO 103
SOURCE: On site observations by ARUP during the beginning of 2011.
N
Park Station Sub-Precinct
Railway Lines
Prasa Assets
Out of Study Area
Hig
hLo
w
10.0 Floor area ratio
1.0 Floor area ratio
Figure 3.7
City Block Density
0 50 100 200
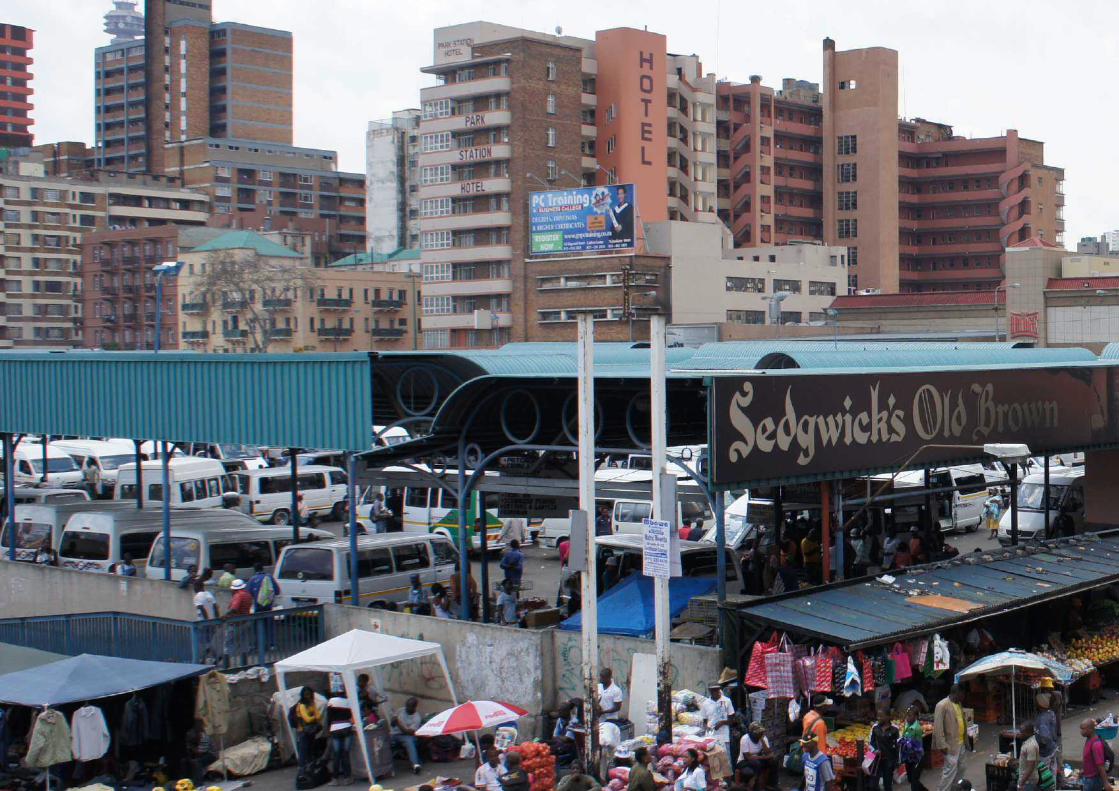
URBAN FORM STATUS QUO
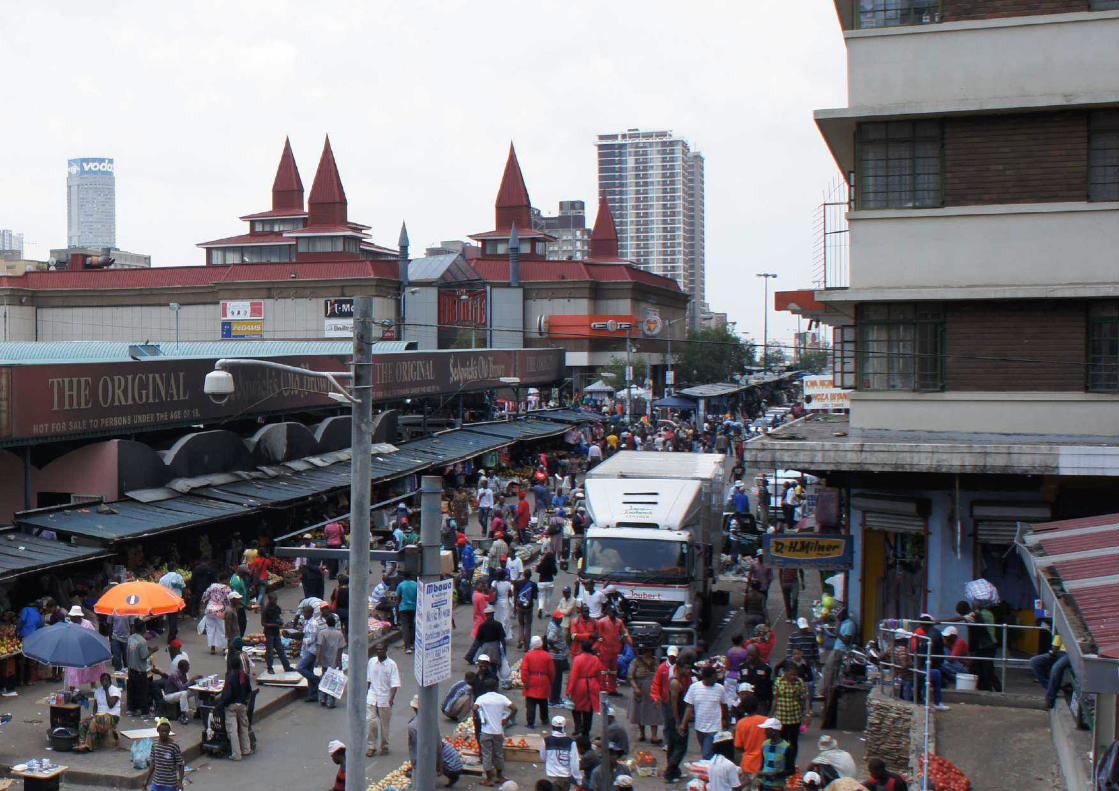
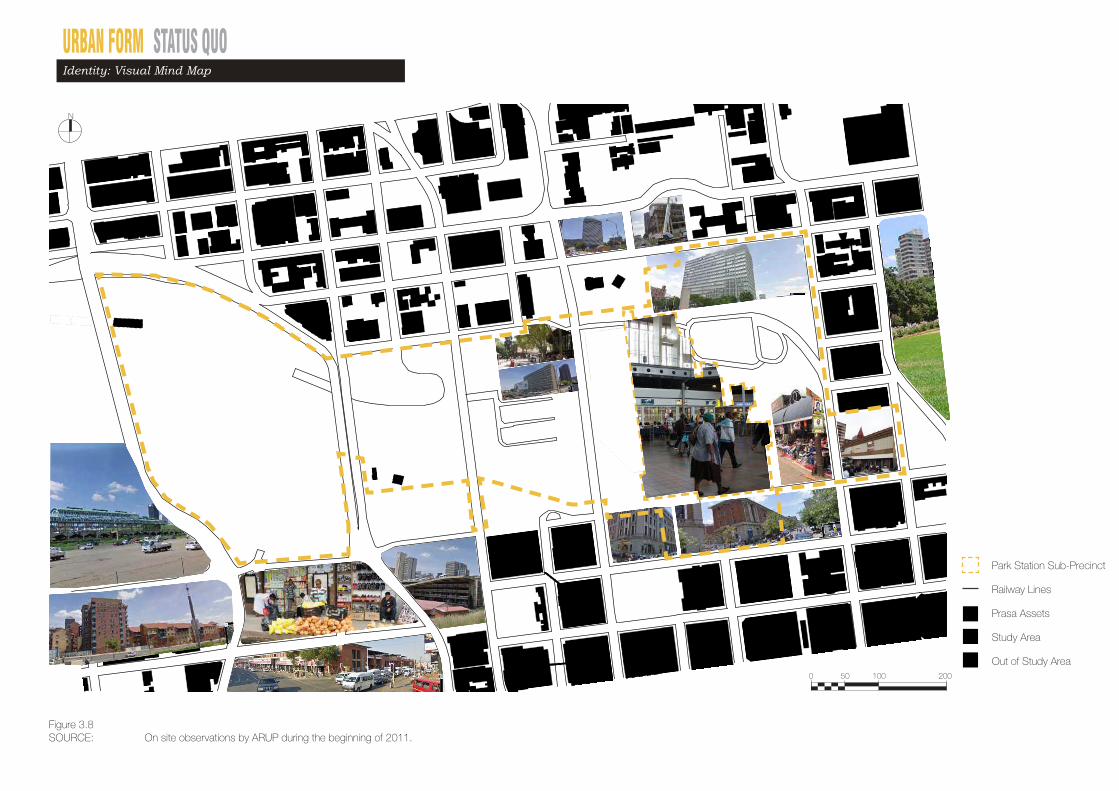
URBAN FORM STATUS QUO
SOURCE: On site observations by ARUP during the beginning of 2011.
To see all the details that are visible on the
screen, use the Print link next to the map.
To see all the details that are visible on the
screen, use the Print link next to the map.
Page 1 of 2
Johannesburg, Gauteng, South Africa - Google Maps
2011/04/20
http://maps.google.co.uk/
To see all the details that are visible on the
screen, use the Print link next to the map.
To see all the details that are visible on the
screen, use the Print link next to the map.
Page 1 of 2
Johannesburg, Gauteng, South Africa - Google Maps
2011/04/20
http://maps.google.co.uk/
To see all the details that are visible on the
screen, use the Print link next to the map.
To see all the details that are visible on the
screen, use the Print link next to the map.
Page 1 of 2
Johannesburg, Gauteng, South Africa - Google Maps
2011/04/20
http://maps.google.co.uk/
To see all the details that are visible on the screen, use the Print link next to the map.
To see all the details that are visible on the screen, use the Print link next to the map.
Page 1 of 2Johannesburg, Gauteng, South Africa - Google Maps
2011/04/20http://maps.google.co.uk/
To see all the details that are visible on the screen, use the Print link next to the map.
To see all the details that are visible on the screen, use the Print link next to the map.
Page 1 of 2Johannesburg, Gauteng, South Africa - Google Maps
2011/04/20http://maps.google.co.uk/
To see all the details that are visible on the
screen, use the Print link next to the map.
To see all the details that are visible on the
screen, use the Print link next to the map.
Page 1 of 2
Johannesburg, Gauteng, South Africa - Google Maps
2011/04/20
http://maps.google.co.uk/
To see all the details that are visible on the
screen, use the Print link next to the map.
To see all the details that are visible on the
screen, use the Print link next to the map.
Page 1 of 2
Johannesburg, Gauteng, South Africa - Google Maps
2011/04/20
http://maps.google.co.uk/0 50 100 200
N
Park Station Sub-Precinct
Railway Lines
Prasa Assets
Study Area
Out of Study Area
Figure 3.8
Identity: Visual Mind Map

URBAN FORM STATUS QUO 107
RETAIL RETAIL RETAIL RETAIL RETAIL RETAIL
RETAIL RETAIL RETAIL RETAIL RETAIL RETAIL
RETAIL RETAIL RETAIL RETAIL Clothes Food
Bags Shop Shop SHop People Talking Eating
Buying Clothes Food Bags Shop Shop SHop
People Talking Eating Buying Clothes Food
Bags Shop Shop SHop People Talking Eating
Buying RETAIL RETAIL RETAIL RETAIL RETAIL
RETAIL RETAIL RETAIL RETAIL RETAIL RETAIL
RETAIL RETAIL RETAIL RETAIL RETAIL Clothes
Food Bags Shop Shop SHop People Talking
Eating Buying Clothes Food Bags Shop Shop
SHop People Talking Eating Buying Clothes
RESIDENTIAL HOUSING YLIMAF ELGNIS ESU DNAL
MULTI-FAMILY UNIT
HIGH DENSITY LOW
DENSITY RESIDENTIAL
WORK OPPORTUNITIES
RESIDENTIAL HOUSING
LAND USE SINGLE
FAMILY MULTI-FAMILY
HIGH DENSITY LOW
DENSITY RESIDENTIAL
WORK OPPORTUNITIES
RESIDENTIAL HOUSING YLIMAF ELGNIS ESU DNAL
MULTI-FAMILY HIGH
DENSITY LOW DENSITY
RESIDENTIAL WORK
OPPORTUNITIES
TRANSPORT movement
passenger flow ARRIVAL baggage
waiting LONG DISTANCE
TRANSPORT movement
passenger flow ARRIVAL baggage
waiting LONG DISTANCE
TRANSPORT movement
passenger flow ARRIVAL baggage
waiting LONG DISTANCE
SOURCE: On site observations by ARUP during the beginning of 2011.
STATUS QUO - Sense of Place
0 50 100 200
N
Park Station Sub-Precinct
Railway Lines
Prasa Assets
Study Area
Out of Study Area
Neighbourhood Play
C O M M U N I T Y
Trees Walking CAFE ART StreetArt
Neighbourhood music walk
meeting COMMUNITY
Trees Walking
C A F E
M U S I C
RESIDENTIAL HOUSING YLIMAF ELGNIS ESU DNAL
MULTI-FAMILY UNIT
HIGH DENSITY LOW
DENSITY RESIDENTIAL
WORK OPPORTUNITIES
RESIDENTIAL HOUSING
LAND USE SINGLE
FAMILY MULTI-FAMILY
HIGH DENSITY LOW
DENSITY RESIDENTIAL
WORK OPPORTUNITIES
RESIDENTIAL HOUSING
LAND USE SINGLE FAMILY
MULTI-FAMILY HIGH
DENSITY LOW DENSITY
RESIDENTIAL WORK
OPPORTUNITIES
TRANSPORT movement
passenger flow ARRIVAL baggage
waiting LONG DISTANCE
TRANSPORT movement
passenger flow ARRIVAL baggage
waiting LONG DISTANCE
TRANSPORT movement
passenger flow ARRIVAL baggage
waiting LONG DISTANCE
EDGE INTERFACE TRANSITIONAL ZONE DOORSTEP BRINK EDGE BARRIER FRAME
EDGE INTERFACE EDGE INTERFACE TRANSITIONAL ZONE DOORSTEP BRINK EDGE
TRANSITIONAL ZONE DOORSTEP BRINK EDGE BARRIER FRAME EDGE INTERFACE
TRANSITIONAL EDGE INTERFACE TRANSITIONAL ZONE DOORSTEP BRINK EDGE
ZONE DOORSTEP BRINK EDGE BARRIER FRAME EDGE INTERFACE EDGE INTERFACE
TRANSITIONAL ZONE DOORSTEP BRINK EDGE BARRIER FRAME TRANSITIONAL ZONE
DOORSTEP BRINK EDGE BARRIER FRAME EDGE INTERFACE TRANSITIONAL ZONE
DOORSTEP BRINK EDGE BARRIER FRAME EDGE INTERFACE TRANSITIONAL ZONE
DOORSTEP BRINK EDGE BARRIER FRAME
WASTELAND
RECYCLED
FRONTIER Nameless no id
entity City Anonymity
City Anonymity City Anonymity City
Anonymity lack of Identity Nameless
Nameless no identity City Anonymity City
Anonymity City Anonymity
City Anonymity lack of Identity
Nameless
Nameless no identity C
ity Anonymity City
ytimynonA ytiC ytimynonA ytiC ytimynonA
lack ofIdentity Nameless Nameless
ytimynonA ytiC ytimynonA ytiC ytitnedi on
City Anonymity City Anonymity lack of
IVICG O V E R N M E N T
ETSYS LAGELPOWER POLITICAL
PRIVACY CITY
COUNCIL CIVIC
G O V E R N M E N T ETSYS LAGEL
POWER POLITICAL
PRIVACY CITY
COUNCIL CIVIC
G O V E R N M E N T
LEGAL SYSTEMS
POWER POLITICAL
PRIVACY CITY
EDGE INTERFACE TRANSITIONAL ZONE DOORSTEP BRINK EDGE BARRIER FRAME
EDGE INTERFACE EDGE INTERFACE TRANSITIONAL ZONE DOORSTEP BRINK EDGE
TRANSITIONAL ZONE DOORSTEP BRINK EDGE BARRIER FRAME EDGE INTERFACE
TRANSITIONAL EDGE INTERFACE TRANSITIONAL ZONE DOORSTEP BRINK EDGE
ZONE DOORSTEP BRINK EDGE BARRIER FRAME EDGE INTERFACE EDGE INTERFACE
TRANSITIONAL ZONE DOORSTEP BRINK EDGE BARRIER FRAME TRANSITIONAL ZONE
DOORSTEP BRINK EDGE BARRIER FRAME EDGE INTERFACE TRANSITIONAL ZONE
DOORSTEP BRINK EDGE BARRIER FRAME EDGE INTERFACE TRANSITIONAL ZONE
DOORSTEP BRINK EDGE BARRIER FRAME
WASTELAND RECYCLED FRONTIER
Nameless no identity City Anonymity
City Anonymity City Anonymity City
Anonymity lack of Identity Nameless
Nameless no identity City Anonymity City
Anonymity City Anonymity
City Anonymity lack of Identity Nameless
Nameless no identity City Anonymity City
ytimynonA ytiC ytimynonA ytiC ytimynonA
lack ofIdentity Nameless Nameless
ytimynonA ytiC ytimynonA ytiC ytitnedi on
City Anonymity City Anonymity lack of
CIVIC TNEMNREVOG SMETSYS LAGEL LACITILOP REWOPPRIVACY CITY
COUNCIL CIVIC TNEMNREVOG SMETSYS LAGEL LACITILOP REWOP
PRIVACY CITY
COUNCIL CIVIC TNEMNREVOG SMETSYS LAGEL LACITILOP REWOPPRIVACY CITY
Nameless no identity City Anonymity
City Anonymity City Anonymity City
Anonymity lack of Identity Nameless
Nameless no identity City Anonymity City
Anonymity City Anonymity City Anonymity lack of Identity N
ameless
Nameless no identity City Anonymity City
ytimynonA ytiC ytimynonA ytiC ytimynonA
lack ofIdentity Nameless Nameless
ytimynonA ytiC ytimynonA ytiC ytitnedi on
City Anonymity City Anonymity lack of
CIVIC TNEMNREVOG SMETSYS LAGEL LACITILOP REWOPPRIVACY CITY
COUNCIL CIVIC TNEMNREVOG SMETSYS LAGEL LACITILOP REWOP
PRIVACY CITY
COUNCIL CIVIC TNEMNREVOG SMETSYS LAGEL LACITILOP REWOPPRIVACY CITY
TRANSPORT movement
passenger flow ARRIVAL baggage
waiting LONG DISTANCE
TRANSPORT movement
passenger flow ARRIVAL baggage
waiting LONG DISTANCE
TRANSPORT movement
passenger flow ARRIVAL baggage
waiting LONG DISTANCERailwayRailway Railway Railw
SOURCE: On site observations by ARUP during the beginning of 2011.
N
Park Station Sub-Precinct
Railway Lines
Prasa Assets
Figure 3.9
Sense of Place

URBAN FORM STATUS QUO
SOURCE: On site observations by ARUP during the beginning of 2011.
Wits
Braamfontein
CivicPrecinct
Health Precinct
Joubert Park& JAG
Johannesburg CBD
NewtownCulturalPrecinct
Jewel City
Fashion District
Railway
Railway
Hillbrow
Figure 3.10
Contextual Visual Legibility

URBAN FORM STATUS QUO 109
Park Station Sub-Precinct
Railway Lines
Significant Landmarks
N
0 50 100 200
Viewing corridor
V
V
V
VV
V
SOURCE: On site observations by ARUP during the beginning of 2011.Figure 3.11
Legibility: Sight Lines


URBAN FORM STATUS QUO 111
SOURCE: On site observations by ARUP during the beginning of 2011.
0 50 100 200
N
Park Station Sub-Precinct
Railway Lines
Prasa Assets
Study Area
Out of Study Area
Mobility Spine
Mobility Road
Activity Street
Urban Street
Figure 3.12
Street Typologies

URBAN FORM STATUS QUO
Mobility Spine Mobility Road
Office / Residential aboveParking on both sides of the road
Main arterial roadPedestrian movement not encouraged
p p
Residential
Residential
Office
parking parking
Retail
SOURCE: On site observations by ARUP during the beginning of 2011.Figure 3.13
Street Typology Sections

URBAN FORM STATUS QUO 113
Urban Street Activity Street
4-6 Storey blocks with street entranceOverlooking the street
Active street frontageIntensive informal tradingPedestrian priority
SOURCE: On site observations by ARUP during the beginning of 2011.Figure 3.14
Street Typology Sections
p p
Residential
Residential
Residential
Residential
Residential
parking parking
Residential
Residential
Residential
Residential
Residential
Residential
Residential
Residential
Retail RetailResidential
Residential
Residential
Residential
Residential
Residential
Residential
RetailRetail

URBAN FORM STATUS QUO
0 50 100 200
N
Park Station Sub-Precinct
Railway Lines
Prasa Assets
Study Area
Out of Study Area
1 Bridge Shopping Centre
Wanderers Taxi Rank
Park Station
Cook House
Umjantshi House
Metro Park
Rotunda
Corner Harrison & Leyds
Platform 19
Lab Building
Shosholoza Meyl
Driver’s Simulation
2
3
4
5
6
7
8
912
3
4
5
6
7
10
11
8
910
11
12
12
Figure 3.15
Prasa Assets

The existing rail yard looking eastwards from
Harrison Street bridge.

URBAN FORM STATUS QUOPrasa Asset Conditions
PHYSICAL CONDITION
The current condition and supply of utility services is not meeting demand. Sewerage, stormwater & drainage provision are insufficient.
SECURITY CONCERNS
The security measures in place provide adequate protection inside the station. The periphery of the station near the entrance to platform 19 is being used by vagrants as sleeping quarters. Fires are being made on platform 19 which is causing smoke to rise into the main concourse of the station.
OTHER CONCERNS
Fire escape routes are blocked in the Tippet Building. There is concern that utility services from neighbouring properties surrounding the station are routed through the site.
PARK STATION Rate of Deterioration
LOW MED HIGH
Aerial photograph
Image 1
Image 2
PHYSICAL CONDITION
The building is an acceptable state with on-going refurbishment.
SECURITY CONCERNS
The building has good security measures in place.
OTHER CONCERNS
None
UMJANTSHI HOUSE Rate of Deterioration
LOW MED HIGH
Aerial photograph
Image 1
Image 2Axonometric Figure 3.16 Axonometric Figure 3.17

URBAN FORM STATUS QUO 117Prasa Asset Conditions
PHYSICAL CONDITION
The shopping centre is generally well maintained.
SECURITY CONCERNS
The management and private security personnel at the shopping centre provides adequate levels of safety and security.
OTHER CONCERNS
The basement level housing a polluted taxi rank is inadequately ventilated.
It was observed that the periphery of the site is highly polluted with debris, as a result this is blocking stormwater drains.
Manhole covers have been removed leaving haz-ardous openings in the pavements.
BRIDGE SHOPPING CENTRE Rate of Deterioration
LOW MED HIGH
Aerial photograph
Image 1
Image 2
PHYSICAL CONDITION
Stormwater discharge from the vaulted roof is blocked causing substantial ponding. Water ingress through the roof is causing damage internally. The lower levels are flooding. Concerns have been raised with regards to the structural integrity of the supporting frame holding up the water tanks.
SECURITY CONCERNS
The main hall and ancillary rooms are not secure and can be easily accessed by members of the public.
OTHER CONCERNS
A number of fire escape routes are blocked. A series of electrical distribution boards are damaged and exposed. Pests have infested the lower levels.
BLUE ROOM Rate of Deterioration
LOW MED HIGH
Aerial photograph
Image 1
Image 2Axonometric Figure 3.18 Axonometric Figure 3.19

URBAN FORM STATUS QUOPrasa Asset Conditions
PHYSICAL CONDITION
The building is rapidly deteriorating due to the ingress of rainwater through the damaged roof. This is destroying the floors, walls, ceilings and surface finishes. This water penetration extends into the basement of the building and is caus-ing substantial flooding and damage throughout. The concrete screed is crumbling and as a result a number of electrical cables and conduits have been exposed.
SECURITY CONCERNS
There are concerns that the perimeter of the building has been breeched after hours.
OTHER CONCERNS
Pests have infested the building throughout.
ROTUNDA Rate of Deterioration
LOW MED HIGH
Aerial photograph
Image 1
Image 2
PHYSICAL CONDITION
The Metro Park Building is generally in good con-dition. The training rooms located under Rissik Street are burnt out yet are in a stable condition.
SECURITY CONCERNS
Fires from vagrants occupying areas near Plat-form 19 below cause smoke to enter the Metro Park facility.
OTHER CONCERNS
None
METRO PARK Rate of Deterioration
LOW MED HIGH
Aerial photograph
Image 1
Image 2Axonometric Figure 3.20 Axonometric Figure 3.21

URBAN FORM STATUS QUO 119Prasa Asset Conditions
PHYSICAL CONDITION
The building is currently in a poor state with sub-stantial flooding occurring in the basement.
SECURITY CONCERNS
The building is secure with security guards in at-tendance 24 hours a day.
OTHER CONCERNS
There is a large amount of debris being deposited around the periphery of the building. There are a number of dangerously exposed electrical cables. Pests infestation is evident throughout.
LAB BUILDING Rate of Deterioration
LOW MED HIGH
Aerial photograph
Image 1
Image 2
PHYSICAL CONDITION
There is a substantial amount of water penetrat-ing the concrete slab above platform 19.
SECURITY CONCERNS
Platform 19 has insufficient levels of lighting. The entry points to Platform 19 on the eastern, western and platform sides are not secure and do not prevent unauthorised access.
OTHER CONCERNS
There is a major build-up of debris. There are a number of open manholes running the length of platform 19 which pose a potential hazard to pedestrians.
PLATFORM 19 Rate of Deterioration
LOW MED HIGH
Aerial photograph
Image 1
Image 2Axonometric Figure 3.22 Axonometric Figure 3.23

URBAN FORM STATUS QUOPrasa Asset Conditions
PHYSICAL CONDITION
The building is currently under construction and therefore does not pose immediate concerns.
SECURITY CONCERNS
The building is currently well managed by security personnel.
OTHER CONCERNS
Concern has been raised with the current electrical supply that is coupled to the same supply used for the rail lines.
SIMULATOR BUILDING Rate of Deterioration
LOW MED HIGH
Aerial photograph
Image 1
Image 2 Axonometric Figure 3.24
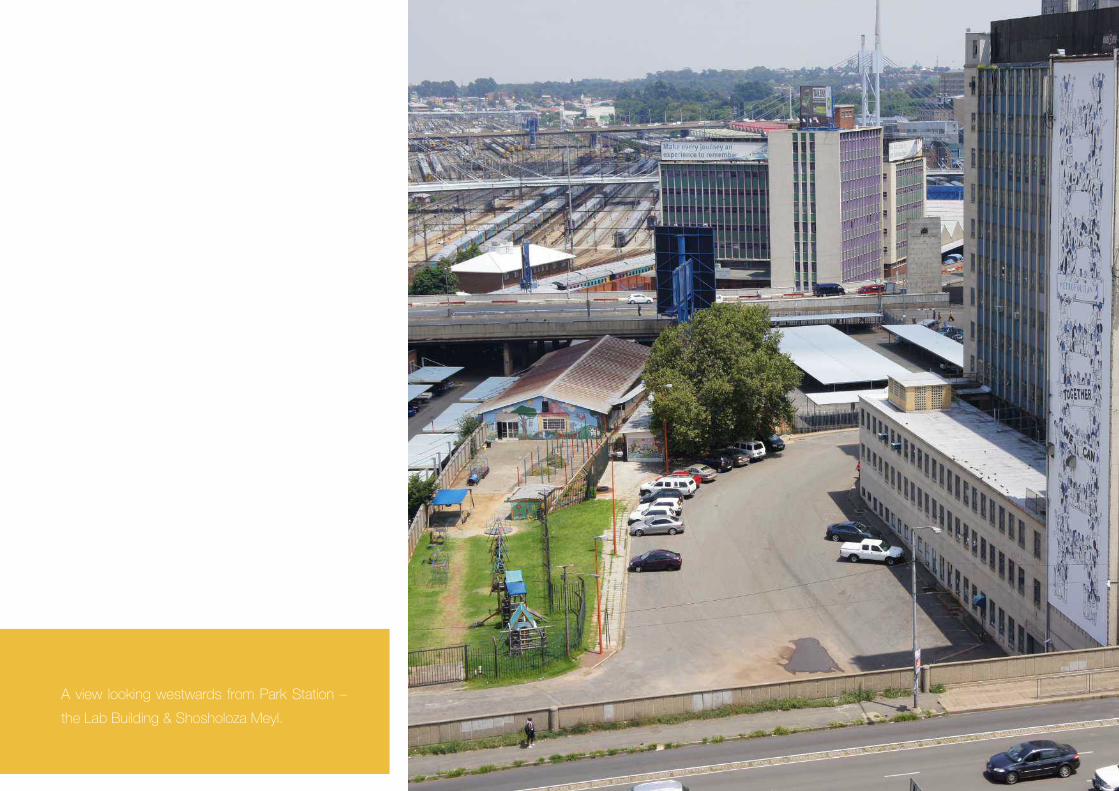
A view looking westwards from Park Station –
the Lab Building & Shosholoza Meyl.

“We collect discarded cardboard from the shops in the area and take it to a recycling depot in Braamfontein. They give us 65c per kilogram of cardboard.”
Recycled Cardboard Collector With a trolley on De Villiers Street, 2011.

ENVIRONMENTPark Station Sub-precinct Development Framework
CHAPTER 4
A material & spatial place that combines physical elements & energy in forms necessary for living, working & playing.

ENVIRONMENT STATUS QUO
Pollution levels
Analysis undertaken of pollution levels in Greater Johannesburg show
increased levels of pollution concentrated in a band from east to west
through the Johannesburg Central Business District. Increased pollution
occurs at different levels and is negatively impacting on the quality of life in
terms of air quality, noise levels, land pollution and water quality.
Air Quality
The deterioration of urban air quality has an effect on human health, climate
and the natural environment. Major contributors to air pollution within
Johannesburg include emissions from domestic fuel burning, vehicles,
industries, mining operations and waste disposal and incineration.
The ambient air quality of the City of Johannesburg is monitored from six
monitoring stations. The nearest air quality monitoring station to the CBD
is located in Newtown, situated south west from the Park Station Sub-
Precinct area.
In poorer residential areas, coal and wood burning for space heating and
cooking is a major cause of air pollution. For the CBD of Johannesburg,
and similarly the more affluent residential areas around the city, pollution is
caused mainly by vehicle emissions, windblown dust from the mining belt
to the south and emissions from the large industrial areas also to the south.
Another contributor to poor air quality in the City is the burning of rubbish.
Introduction
Noise levels
Diverse sources of noise in the City of Johannesburg are generated by parts
of the technologically advanced segment of the population. Contributors
range from entertainment, to motor vehicles, heavy goods trucks and
industrial machinery. The worst affected areas are around the CBD of
Johannesburg but in particular towards it’s north where national and major
roads are concentrated.
At the heart of the City, noise levels within the Park Station Sub-Precinct are
further increased by CBD activities. These activities include nightclubs and
leisure, factories, industries, and also religious ceremonies.
Land pollution
Poor waste management, illegal dumping and litter are some of the largest
contributors to land pollution. Within the Park Station Sub-Precinct area,
evidence of insufficient waste management is noticeable and in particular
around high areas of concentrated activity and as a result areas where
intense trading occurs.
Storm water drains are often blocked by rubbish and litter. Facilities provided
for traders do not sufficiently provide for the preparation of food and drains
often gets blocked from litter and fats produced through cooking.

A sunset over the Johannesburg skyline.
Google Images

ENVIRONMENT STATUS QUO
Water Quality
Unmanaged waste generated by activities within the CBD of Johannesburg
and overflowing and blocked sewer infrastructure are both contributors to
contamination of water affecting the Klip River catchment areas to the south
east of Soweto.
Waste management of the Park Station
Sub-Precinct area
Within the boundaries of the facilities owned and managed by PRASA,
internal cleaning of the facilities and waste collection is out sourced to private
service providers. Waste is collected from bins situated within the facilities
and moved in mobile bins by cleaning staff to a central collection point at
the eastern end of Platform 19. Waste is compacted and collected by an
appointed private service provider at least three times a week. Although
some of the waste is sorted for recycling at Platform 19, no formal policy
or strict measures for quality control are in place to monitor and ensure the
correct separation of waste. The majority of all waste is compacted together
on site.
Waste management policy within PRASA is currently being updated to
incorporate improved efficiency of responsible waste management. The
plan is not finalised and therefore not yet implemented. Waste management
of all areas outside the jurisdiction of PRASA is largely the responsibility of
the City. The areas around activity are marked by insufficient management
of waste and formal recycling and waste sorting facilities and infrastructure
is not provided for within the Park Station Sub-Precinct area.
Natural light penetration and sun angles
The more dense urban areas within the Park Station Sub-Precinct area are
situated towards its south eastern side. As a result, light penetration is less
in these areas where streets are defined by high buildings on both sides.
The identified street typology that illustrates this typical phenomenon is the
urban street typology.
Multi-level road infrastructure and bridges contribute to dark areas of public
realm below and in between structures, where light penetration is limited.
This is demonstrated through the typical mobile spine street typology.
Towards the north western side of the Sub-Precinct area the more generous
provision that exists for on grade road infrastructure, limits potential for
natural shading of areas by means trees and structures (such as building
overhangs and canopies). The Mobility Road street typology illustrates a
typical scenario where shading is restricted.
Active retail street edges provide shading in summer. Subject to surrounding
building heights, light penetration can penetrate buildings at street level even
during winter. A typical example of this is illustrated through the Activity
Street typology.
Introduction

A bird’s eye view over Wanderers Taxi rank &
the entrance to Platform 19.

ENVIRONMENT STATUS QUO
Energy and water consumption rates
The monitoring of energy and water consumption rates for the PRASA
facilities and assets is currently not in place. Municipal rates are based
on larger areas that do not differentiate between various facilities and
transport functions. This contributes to the difficulty of monitoring, and the
identification of problematic energy consumption and water wastage within
the Sub-Precinct area.
Climate
The City of Johannesburg falls within a summer rainfall region of South
Africa, receiving an average annual rainfall of 849 mm. The rainy seasons
are marked by frequent and short intervals of heavy rain storms.
The current average temperature of the City of Johannesburg ranges
from between 5 degrees to 25 degrees. Low and extreme temperatures
that goes below the average 5 degrees during winter pose challenging
conditions for long distance passengers that travel through the Sub-Precinct
and interchange between informal transport modes overnight. Passengers
often arrive late at night, and continue their journey during the early hours of
the following morning. Waiting facilities are limited for informal long distance
transport mode users when they cannot afford overnight accommodation
within the Sub-Precinct area.
Introduction
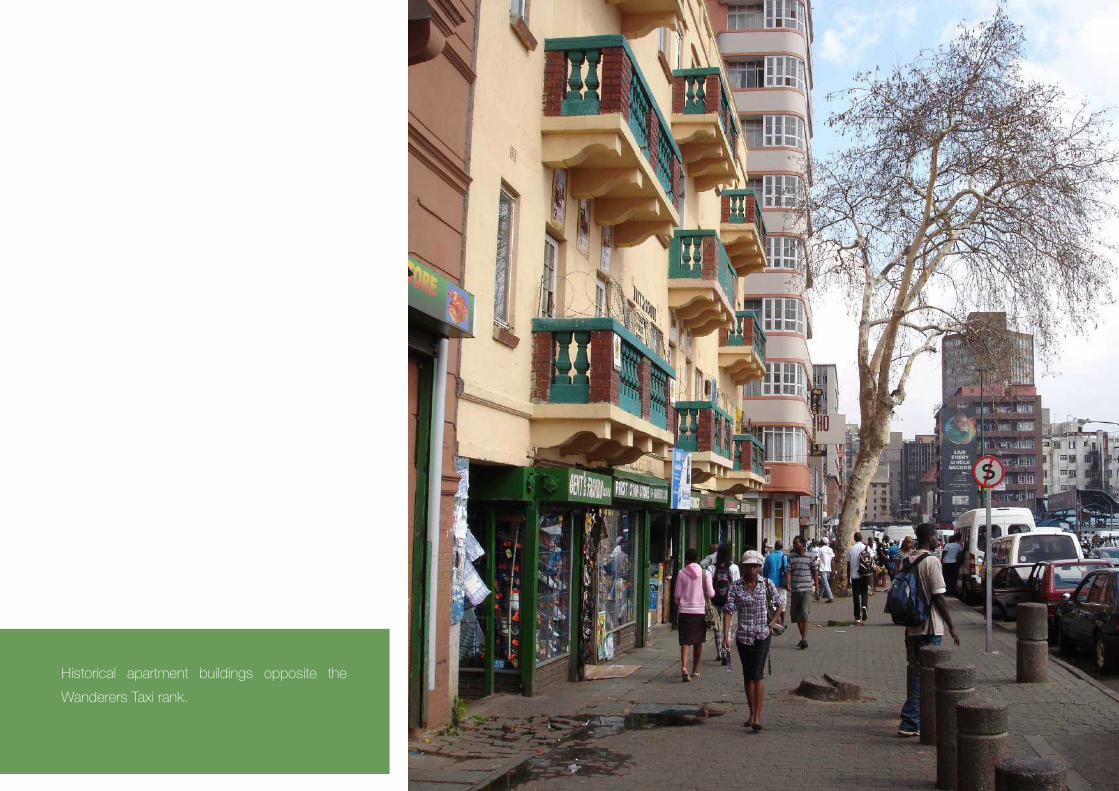
Historical apartment buildings opposite the
Wanderers Taxi rank.

ENVIRONMENT STATUS QUO
SOURCE: GIS Database ARUP
N
0 50 100 200
Park Station Sub-Precinct
Railway Lines
Prasa Assets
Highest Contour = 1765
Lowest = 1715
Natural Environment: Topography (5m Contours)
Figure 4.1

ENVIRONMENT STATUS QUO131
SOURCE: On site observations by ARUP during the beginning of 2011.
0 50 100 200
N
Park Station Sub-Precinct
Railway Lines
Prasa Assets
Study Area
Out of Study Area
PM AM
Solar Access
Summer Sun
Winter Sun
Highest Contour = 1765
Lowest = 1715
Natural Environment: Climate
Figure 4.2
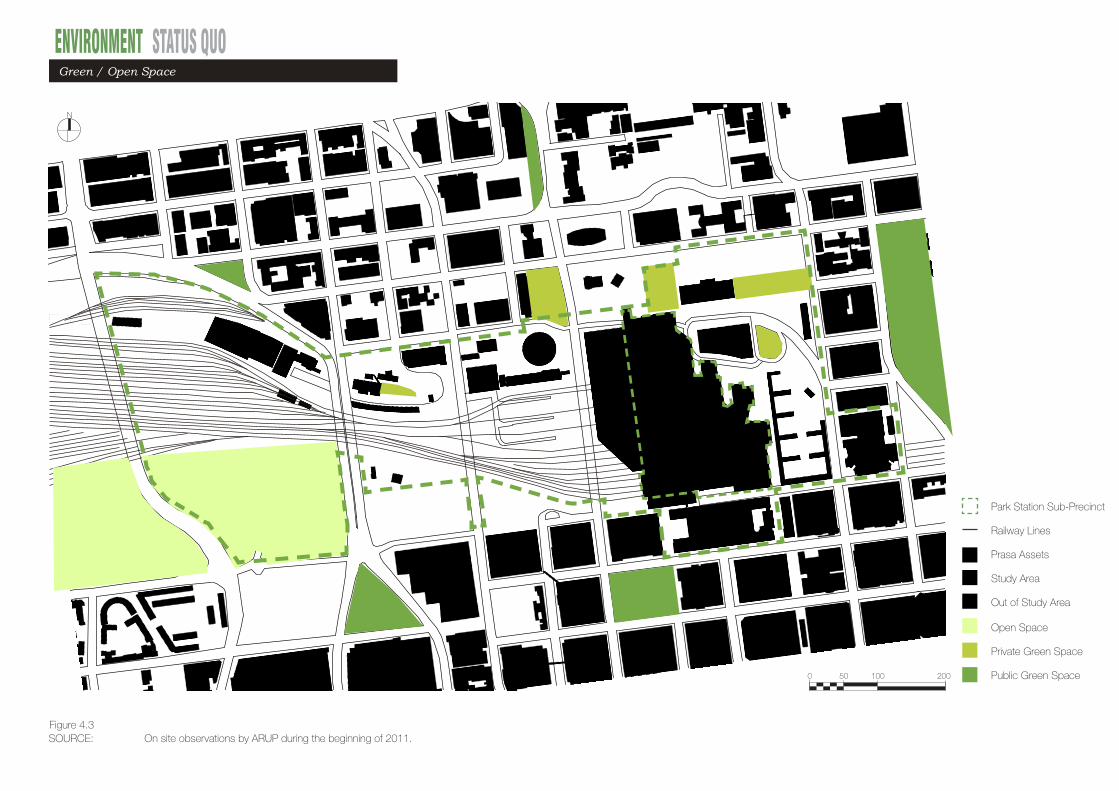
ENVIRONMENT STATUS QUO
SOURCE: On site observations by ARUP during the beginning of 2011.
0 50 100 200
N
Park Station Sub-Precinct
Railway Lines
Prasa Assets
Study Area
Out of Study Area
Open Space
Private Green Space
Public Green Space
Green / Open Space
Figure 4.3

ENVIRONMENT STATUS QUO133
Open Space
Private Green Space
Public Green Space 0 50 100 200
N
Park Station Sub-Precinct
Railway Lines
Prasa Assets
Study Area
Out of Study Area
William Kentridge Public Sculpture with
Public Green Space
Revamp of Existing Park
Crèche Private Green Space Private Green Space in Umjantshi HouseUnmarked Public Green SpaceGreen Space in front of
Platform 19 Entrance Joubert Park
Green / Open Space
Figure 4.4SOURCE: On site observations by ARUP during the beginning of 2011.

ENVIRONMENT STATUS QUO
Wits
Braamfontein
CivicPrecinct
Health Precinct
Joubert Park& JAG
JHB CBD
NewtownCulturalPrecinct
Jewel City
Fashion District
Railway
Railway
Wits
Braamfontein
CivicPrecinct
Health Precinct
Joubert Park& JAG
JHB CBD
NewtownCulturalPrecinct
Jewel City
Fashion District
Railway
Railway
Waste Pollution Noise Pollution
SOURCE: On site observations by ARUP during the beginning of 2011.
Pollution perceptions
Figure 4.5
max max

ENVIRONMENT STATUS QUO135
Temperature and rainfall trends for Johannesburg City
190
Climatology and Climate ChangeIntroduction
Climate change is the change in long term climate that are anticipated to result from the globally enhanced greenhouse
effect caused by increased levels of anthropogenic greenhouse gases in the atmosphere. Greenhouse gases include
carbon dioxide (CO2), methane (CH
4), nitrous oxide (N
2O) and water vapour. Of these, CO
2 and CH
4 are the major
contributors to climate change. Increased concentrations of these gases will result in global temperature changes which
will influence rainfall patterns and sea levels. According to the Intergovernmental Panel on Climate Change (IPCC)
between 1956 and 2005 average global temperatures increased at a rate of 0,13°C per decade (IPCC, 2007).
Model predictions indicate that South Africa will experience temperature increases of up to 3 to 4°C on average
throughout the year under the current economic development, population growth and energy-use trends. Rainfall is
expected to decrease in the western part of the country and in those regions that receive winter rains. The eastern part
of the country is expected to experience increases in early summer rainfall, though this will likely be followed up by some
drying in the late summer (Engelbrecht, 2005; Hewitson et al., 2005).
Future temperature and rainfall changes for Johannesburg are likely to follow a similar pattern. Modelled data from
three Global Circulation Models (GCMs) was used to obtain past (1961-2000) and future (2046-2065) temperature and
rainfall trends in the CoJ.
Temperature
In terms of temperature changes for the period 2046-2065, models indicate an increase in the daily minimum and
maximum temperatures. Modelled climatic data from three Global Circulation Models (GCMs) indicate daily minimum
temperature changes for this period ranging from 2 to 2,7°C from January to March, with increases of up to 3,5°C
possible for the remaining months of the year.
Expected increases for 2070-2100 indicate that minimum temperatures will increase by about 1 to 3°C in summer and
1 to 2°C in winter (refer to Figure 74). Maximum temperatures could see increases by about 3 to 4°C in summer and
2 to 4°C or greater in winter months (Engelbrecht, 2005).
35
30
25
20
15
10
5
0
Tem
per
atu
re °
C
Current average maximum temperature °C
Current average temperature °C
Current average minimum temperature °C
Jan Feb Mar Apr May Jun Jul Aug Sept Oct Nov Dec
Current and future temperature trends for the CoJ
Month
Figure 74: Current (1960-2000) and future (2070-2100) temperature trends (SoER, 2003; Engelbrecht, 2005).
192
Rainfall
Compared to temperature, rainfall is difficult to model as it is influenced by a number of factors which include a lack of
knowledge about atmospheric physics and dynamics and the impact of climatic events such as El-Nino. In addition,
individual climate models simulate rainfall differently.
The simulated rainfall change for 2070-2100 is shown in Figure 75. Simulations indicate that summer rainfall (December
to February) is expected to remain similar to present day with possible small increases of about 20% (Engelbrecht, 2005)
or 15 to 25 mm (Hewitson and Crane, 2006). The early winter season (March to May) could result in a continuum of
present quantities of rainfall with possible slight (20 – 30%) decreases (Engelbrecht, 2005). During winter, (June to
August), there is likely to be either very slight increases of between 5 and 10 mm in the mean monthly precipitation
(Hewitson and Crane, 2006) or a continuum of current rainfall conditions (Engelbrecht, 2005). The rainfall simulations
for spring (September to November) show a mixed picture, ranging from an approximate 40 – 80% decrease in rainfall
in September to a possible 40% increase in November (Engelbrecht, 2005).
180
160
140
120
100
80
60
40
20
0
Rai
nfa
ll (m
m)
Current average rainfall
Jan Feb Mar Apr May Jun Jul Aug Sept Oct Nov Dec
Current and future temperature trends for the CoJ
Month
Figure 75: Current (1960-2000) and future (2070-2100) rainfall trends (Engelbrecht, 2005; Hewitson and Crane, 2006)
Sources of Greenhouse Gases
The National Greenhouse Gas Inventory compiled for the years 1990-1994 identified CO2 to be the most significant
greenhouse gas for South Africa. CO2 contributed more than 80% of the total of the three main greenhouse gas
emissions (CO2, CH
4 and N
2O) for both 1990 and 1994. The main source of CO
2 was identified to be the energy sector
which generated 89,7% of the total CO2 emissions in 1990 and 91,1% of the total in 1994. Sources of CH
4 included
agriculture and energy fugitive emissions with enteric fermentation emissions from livestock the largest contributor
(40%) to CH4 emissions. Agriculture was the largest source of N2O emissions, which generated 77% in 1990 and 80%
in 1994 of the total N2O emissions.
Within the CoJ, emissions of greenhouse gases, in particular CO2 emissions are mainly related to the energy and
transportation sectors. The CoJ currently consumes 10% of the approximately 37 000 MW of electricity generated by
Eskom and contributes significantly to overall CO2 emissions. In the smaller scale, the burning of fossil fuels for heating
and cooking purposes in informal settlements in Johannesburg also generates CO2 emissions. The transportation sector
is also an important source of CO2 emissions as vehicles are the main mode of transport within the City. Since 1999, the
CoJ has shown a decline in the use of public transport such as trains and buses and an increase in the use of private
vehicles (State of Energy Report, 2008). Although emissions from individual cars are relatively low compared to industrial
sources, the cumulative impact of millions of vehicles on the roads makes this an important greenhouse gas source.
Current and future temperature trends for Johannesburg
Current and future rainfall trends for Johannesburg
SOURCE: State of the environment report - City of Johannesburg 2008Figure 4.6

ENVIRONMENT STATUS QUO
SOURCE: On site observations by ARUP during the beginning of 2011.
Sections 3 and 4 showing winter and summer sun angles
Figure 4.7
p p p p

ENVIRONMENT STATUS QUO137
Sections 1 and 2 showing winter and summer sun angles
SOURCE: On site observations by ARUP during the beginning of 2011.
SUMMER
WINTER
Figure 4.8
p p p p

SOCIO-ECONOMICS STATUS QUO“I would be willing to pay R200 per month for a formal trading stall.”
Simon VillankuluInformal trader selling vegetables on Wanderers Street, 2011.
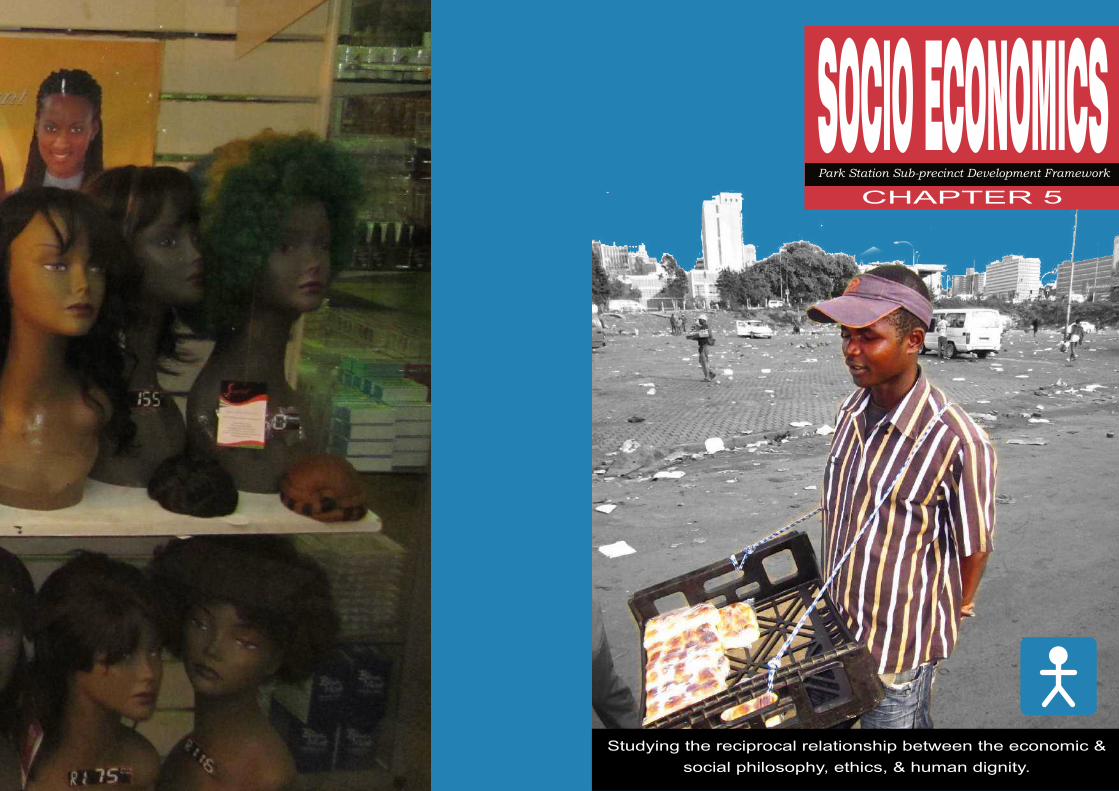
SOCIO-ECONOMICS STATUS QUO 139SOCIO ECONOMICSPark Station Sub-precinct Development Framework
CHAPTER 5
Studying the reciprocal relationship between the economic & social philosophy, ethics, & human dignity.

SOCIO-ECONOMICS STATUS QUO
The precinct is also a local node and offers a diverse range of goods,
services and amenities to the surrounding community.
The number of people living within a 1.5km radius (15mins walking time)
from Park Station was estimated a 83,818 in 2009. (Joburg inner city urban
design implementation plan, 2009), and with current demographic trends is
conservatively estimated at 100,000 in 2011.
The improvements in the Public Transport infrastructure, such as the Rea
Vaya BRT and the Gautrain aim to strengthen the Park station multi modal
transport offer and ultimately attract the medium and higher income groups
to public transport as a mode of choice. The key challenge for the Park
Station sub precinct is to present the right proposition for these user groups
whilst providing an inclusive solution for the most vulnerable communities
within the city.
The precinct represents a complex dynamic system of disparate however
strongly interwoven worlds, driven by their own social and economic
dimensions, focused on specific income groups, integrating diverse cultural
identities and led by creative entrepreneurship.
This rich and intricate network forms the platform to further strengthen and
grow the Park station sub-precinct into a strategic destination and gateway
at local and regional level and at an international scale.
Introduction
CONTEXT
The Park Station sub-precinct ( the area ) plays a critical role in the context
of a rapidly urbanising African environment, in terms of movement of people
and goods. It is the first point of entry into the City of Johannesburg; for
migrants entering into the country, for people migrating from rural areas and
smaller towns within the country and, further commuters and workers from
the surrounding city townships.
The precinct is a place of extremes.
As a multi-modal transport hub, it is the most accessible part of the urban
system for people who rely on public transport, including the poor.
It is an environment where opportunities for livelihood can be pursued. The
result is an accumulation of rural dwellers and cross border immigrants,
resulting in an uncontrolled explosion of the informal economy that is geared
to physical survival and poverty alleviation.
The Park Station sub-precinct is also deemed to be the logistic heart of
the Johannesburg trading activities. It is a centre of freight, a centre of
movement of goods ( from large bulk to retail commodities ) and a place of
movement of finance ( from physical money to barter goods ). It enables the
inner-city environment to be the continental shopping destination of choice
for retailers and shoppers from other African countries.
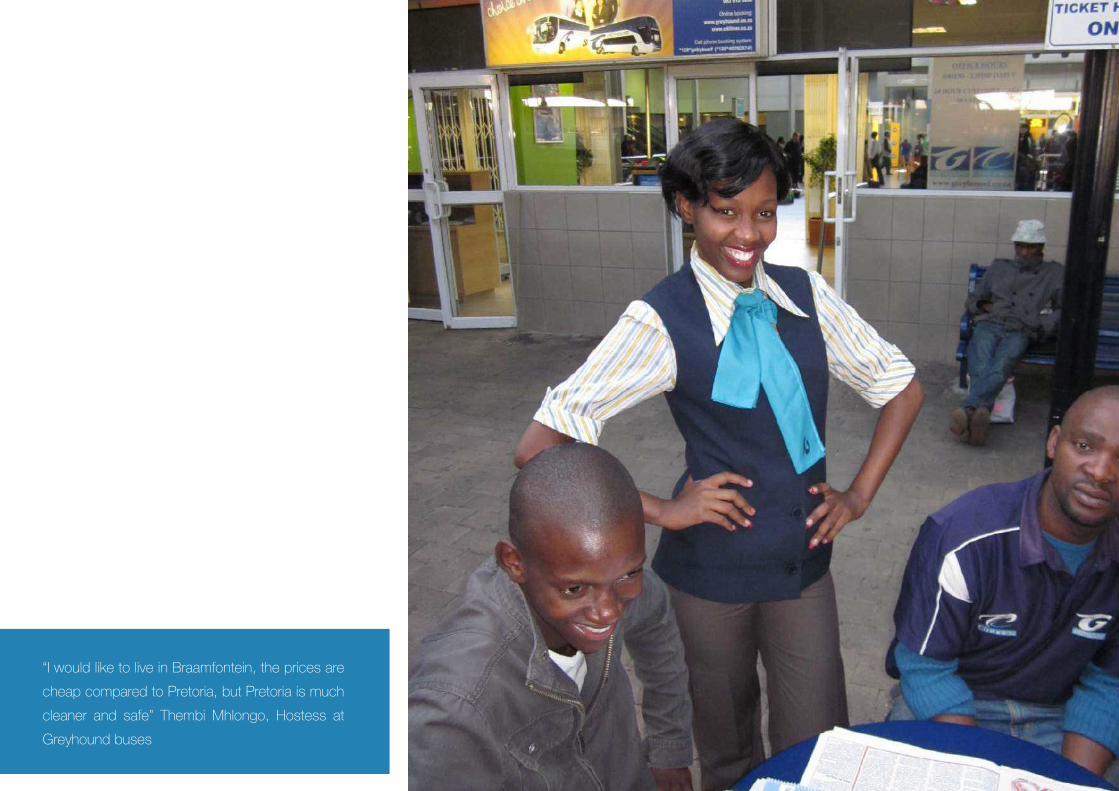
“I would like to live in Braamfontein, the prices are
cheap compared to Pretoria, but Pretoria is much
cleaner and safe” Thembi Mhlongo, Hostess at
Greyhound buses
SOCIO-ECONOMICS STATUS QUO
rate increased from 23,5% to 25,2% and from 21,7% to 27,1% respectively
for the national and Gauteng Province. Given that the City also accounts for
17% of total national employment levels, the 21.8% unemployment rate for
the City in 2009 would also have undergone a considerable increase, and
is estimated in excess of 25%.
Income groups
The Park Station Sub-precinct consists mainly out of 4 dominant income
group categories, being Households that have an average annual income
in the categories :
• R19,201 and R 38,400 which counts for approximately 25% of
the local population and forms the majority group.
• R 9,601-R19200 ( approx 20% )
• R 38,401-R76,800 ( approx 20% )
• “no income” ( approx 15% )
It is to be noted that due to the transient nature of the population of the
area and its increased levels of illegal immigrants, the numbers are to be
considered as an indication of trends only.
Employment varieties
The City of Johannesburg’s economy is driven by four economic sectors
which are:
• Finance and business services
• Community services
• Manufacturing
• Trade
These four economic sectors collectively account for more than 82% of
economic activity within the City. These sectors also account for the highest
levels of formal and informal employment.
Employment rates
The number of economically active people in the City of Johannesburg
increased from 1 993 373 in 1996 to 2 066 156 in 2008. Given the
economic upswing experienced from 2002 to 2008, the unemployment
rate in the City as per the official definition decreased from 25,3% in 2002 to
19,1% in 2008. This was in line with the national unemployment rate which
declined from 29,7% to 22,8% over the same period.
However, as a result of the recession and the slow recovery thereafter,
2010 data from Statistics South Africa show that the official unemployment
Introduction

Small business enterprise: selling fruits on
De Villiers Street.

SOCIO-ECONOMICS STATUS QUO
Informal vs formalised Informal
As part of the Inner City Charter ( initiated by the JDA ) process and linear
market was created along Hoek Street which provided pedestrianised
access and formally structured informal trading stalls ( including base
services such as water and electricity ). However, observations on site in
2011 have confirmed that the majority of the hawkers are trading along the
streets without formalised infrastructure.
Managed vs illegal activities
The majority of informal trading activities are managed by the Metropolitan
Trading Company (MTC), which is the City owned entity established to
manage the facilities the City has set aside for micro retailers and taxi
operators. The facilities monthly rental paid by the hawkers, vary from R50
to R150 per month, depending upon size and location of their trading area.
It was identified during 2011, that illegal trading pockets were operating
along Noord Street and De Villiers Street. These pockets of activity have
created a high level of tension, being raided on a regular basis by the
Metropolitan Police. It was also observed that Informal traders paying rental
compete with traders not paying rent by differentiation of their product
offering, such as an improved quality of products.
INFORMAL TRADE
Location
The transport hub located around Park Station provides for the conditions
and opportunities for livelihood to be pursued. Considered to be a catalyst
for entrepreneurial opportunities, it provides a foothold for the ever increasing
informal economy. Due to its ongoing growth and its unmanaged nature, it
has created a severe level of pressure to cope with the increase in demands
on services and infrastructure.
In 2009 there were an estimated 1,749 informal traders active in the greater
Park Station precinct, especially along De Villiers, King George, Noord,
Plein, Wanderers, Hoek and Twist Streets. (Joburg inner-city urban design
implementation plan, 2009)
Observations on site in 2011 indicate a focal point for informal trade
activities around the south –east corner of the sub-precinct, on the corner
of Wanderers Street with Noord Street. Towards the north of Park Station,
informal trading is concentrated along Leyds Street, capturing the SE-NW
pedestrian movement across the area, which includes the patronage for the
cross border buses traffic.
Introduction

Informal traders: a gentleman and a lady selling
freshly cooked peanuts and maize meal.

SOCIO-ECONOMICS STATUS QUO
Product cycle and operations
The analysis of the most common informal retail product cycles, demonstrates
the broader impact of the informal trading routes as the products are
bought and transported from major wholesalers outside of the immediate
environs. These major wholesalers are located at; City Deep, south east of
Johannesburg for purchasing dried fish and cellphones, Jumbo in Crown
Mines for bags and then, China City in Crown Mines for clothing and toys.
The on site interviews in 2011 indicate that there is no integrated strategy
between the informal traders in terms of delivery of goods.
There appears to be a serious lack of on street hawker storage facilities,
with the majority of the traders renting storage space at Platform 19 at Park
Station itself at R20/week for a pallet sized 889 × 1,156 mm.
Economic Progression
The informal trading activities in the area provide for the various stages
within the chain of economic progression. The variants in trading typologies
demonstrate this progression as the trading stalls become more sophisticated
and more localised as they progress on the economic value chain; starting
from a totally mobile body as a shopfront , to temporary type structures.
The permanent fixture and hawker stalls form the transition towards the
formalised retail bracket. This progression has been comprehensively
documented ( Refer to Formal and Informal Trading Typologies )
Patterns
Conglomerations of similar trade and product types have been identified,
specifically in concentrated trade of clothing, shoes, fresh produce, bags,
sweet & snacks and fish as well as in services related to hair dressing and
cooking.
It appears that these conglomerations have grown organically. On one hand
it appears to reinforce a sense of destination and identity as the potential
customer knows where to go for specific goods and has a bigger choice,
and on the other hand the traders themselves are interested in attracting
a larger audience and pool of people, and potential buyers and shoppers.
This trend appears to be reinforced by operational impacts and spin-offs,
such as shared storage facilities and locations, in creating a offering in itself.
Introduction

Informal trading: a gentleman repairing shoes on
Wanderers Street.

SOCIO-ECONOMICS STATUS QUO
Patterns
Within the configuration of formal retail, the patterns are not as tangible as
within the informal trade sector, however there are two patterns worthy of
noting. Firstly, there appears to be an interdependency between a number
of offerings; being, the liquor store, the tavern, the “buy and braai” shop
and the butcher, as these outlets are always positioned in close proximity
to each other.
Secondly, an unusual however frequently observed combination of goods
retail is the sale of linen and cell phones by the same shop and retailer.
Product cycle and operations
Goods being traded in the Park Station sub-precinct originate from a wide
range of locations being; food and fresh produce from Midrand and Soweto,
furniture from Selby, clothing and pharmaceutical products from Durban.
These are directly distributed to shops, mainly by van or pick up truck.
Delivery mainly occurs via secondary streets or in case of the Bridge
Shopping area to a specific delivery area. There is currently no apparent
formalised loading area for the retail activity within Park Station.
FORMAL TRADE
Location
As a local socio-economic node, the sub-precinct are contains ( besides of
informal activities ), a wide range of formal shops and an diverse offering of
services and community amenities.
It is of significance to note, that the highest concentration of formal retail
corresponds with the highest concentration of informal trading. The majority
of retail shopping and services are located in the vicinity of the corner of
Noord Street and Wanderers Street, anchored by the Bridge Shopping
Centre. The retail activity continues in a northerly direction along Wanderers
Street and its side streets. Formal retail is also present within the Park Station
building complex, focussed on convenience shopping for commuters.
There is no provision for destination shopping.
Economic Progression
The economic progression chain is also visible in the physical permutations
of the trading typologies from the start of a micro unit within another shop,
to a street or corner shop, to the typology of retail within a shopping centre.
The mirco-unit provides for unusual models of integration such as building
an extended counter within a shop, ‘a shop within a shop’ , activating the
shop façade by other retail activities or retrofitting space which was initially
not intended for retail purposes.
Introduction

Informal trading: selling fruits, opposite Wanderers
Taxi rank along Wanderers Street
SOCIO-ECONOMICS STATUS QUO
Locations of criminal activity
Areas attracting criminal activity shift to other locations as the Metro Police
and Prasa Cres security follow and respond to crime “hot spots”.
Liquor outlets are associated with criminal activity. Stolen goods are
often found around these areas and the outlets are considered to be the
rendezvous areas for criminals where potential crime victims, are identified
and targeted.
Kazerne is a taxi holding facility associated with crime and a current location
for criminals to conceal and hide stolen goods. Further, the areas below
the two bridges close to Kazerne, being the Queen Elizabeth Bridge and
Nelson Mandela Bridge are often locations for the further concealment by
criminals of stolen goods.
At night-time all areas outside the station are perceived as unsafe, and in
particular areas where lighting levels are either insufficient or not working or
not provided for.
Integration of formal and informal trading
Both formal and informal trading streams demonstrate a great level
of inventiveness and entrepreneurship to capture and maximise the
commercial opportunities related to the pedestrian footfall to and from the
various transport modes.
In certain locations there appears a symbiotic relationship between both
as the informal trade activates and inhabits edges of retail hubs that are
dormant.
Quality, safety and liveability
The observations in terms of quality, safety and liveability reflect key outcomes
of interviews with, Metrorail Police, Metro Police and Prasa Cres Security.
Dynamics
Incidents of crime occur where in the main significant accumulations of
people occur, creating areas of congestion as these areas are hard to
monitor and patrol.
Illegal gambling and drinking occurs at and around taxi holding areas such
as the Kazerne Taxi rank and the area to the North of Metro Mall.
Introduction

Five gentleman selling bags and clothes at the
informal Zimbabwean bus and taxi rank on Leyds
Street.
SOCIO-ECONOMICS STATUS QUO
These included :
• Pick pocketing; targeting local South Africans
• Luggage theft; foreigners are targeted by criminals posing as Park
Station registered porters or queuing marshals, leading foreigner
passengers astray and robbing them from their luggage.
• Selling of counterfeit goods
Illegal trading activities
The illegal trading activities :
• Trading of goods that are illegal i.e. foreign cigarettes, pirate goods,
stolen goods, counterfeit goods. It was noted that the Metro Police
Officers’ street trading units does not have the mandate to enforce
the Counterfeit Act.
• Illegal gambling - often associated with taxi holding
• Infringement of by-laws in terms of health and safety where cooking
and selling of prepared food occurs.
Health and safety of people is at risk around areas where food is prepared.
Often waste provision is not sufficient and where provided, drains get
blocked. Contamination of areas poses a risk.
It was stated that food sellers need to show certificate of acceptability to
health inspectors but that this is not currently controlled.
Patrolled areas
The external areas to the north east of Park Station is patrolled, with security
highly visible. Incidents of crime in this area are further less than elsewhere
and the area is perceived as “safer”.
During the night, Park Station and the Cookhouse (an enclosed food
court next to Park Station) is deemed to be a public “safe haven” for
passengers. When Park Station closes, long distance bus travellers are still
accommodated in specific waiting areas within the station building.
Other passengers have no allocated waiting facilities and use the Cookhouse,
as an area of safety.
Wanderers Taxi rank is controlled and all activity other than taxi operations
are not allowed in order to clear sight lines and improve visibility. Only
registered porters are allowed within the boundary of the rank.
Types of crime
It is appears that the criminal activity in general is not violent, which is
potentially as a result of the visibility and tangibility of security and police
in keeping violent crime under control. The type of crime in the area was
referred to as “common robberies”.
Introduction

Informal trading: three ladies selling dried fish on
Leyds Street, opposite St John’s Academy.

SOCIO-ECONOMICS STATUS QUO
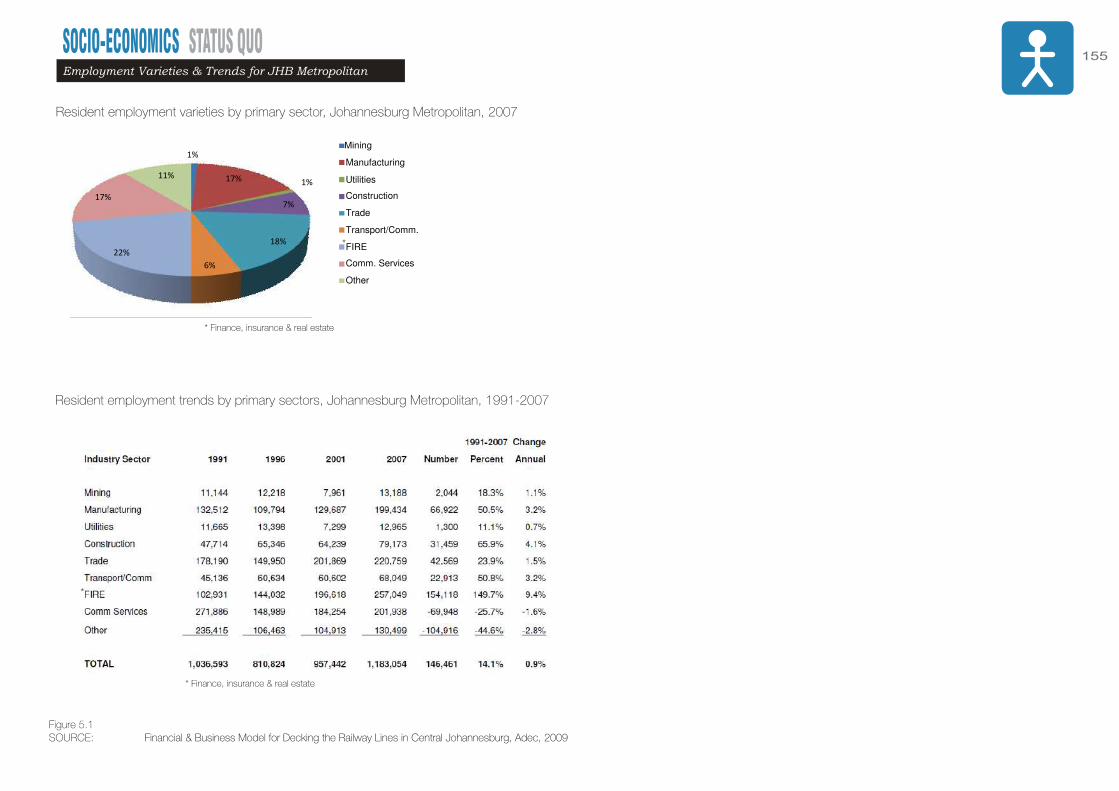
SOCIO-ECONOMICS STATUS QUO 155
African Development Economic Consultants ADEC
103 Algernon Road, Norwood, Johannesburg tel: (011)728-1965 Postal: Suite 131, Private Bag X5, Norwood 2117 2
Part 1. ECONOMIC OVERVIEW This Part 1 Report provides a brief overview of the metropolitan economy as context for the potential development of the decking site in Central Johannesburg. Key economic sectors are analyzed, in terms of GDP contribution and resident employment trends in Gauteng and within Johannesburg. Household income trends are also assessed. Other data relevant to the decking project that are analyzed in this section include baseline demographic trends, foreign & domestic tourism flows, and passenger projections for Gautrain and regional commuter rail systems. More detailed economic and demographic analyses relevant to individual land uses are conducted as part of the respective market analyses for those uses.
Economic Sectors Gauteng is the economic engine of South Africa. Furthermore, Johannesburg is one of the major business hubs of Africa, with the continent’s busiest airport and its highest concentration of financial resources. For these and other reasons, Johannesburg continues to attract thousands of people from throughout Africa seeking employment and a better life. Chart 1
Johannesburg has a relatively diverse economic base, which helps dampen the impacts of a serious downturn in any one sector. Almost 1.2 million residents are employed in a variety of economic sectors. Even so, Johannesburg’s economy, like that of New York, London, and Hong Kong, is dominated by financial services.
1%
17% 1%
7%
18%
6%22%
17%
11%
Mining
Manufacturing
Utilities
Construction
Trade
Transport/Comm.
FIRE
Comm. Services
Other
RESIDENT EMPLOYMENT BY SECTOR, JOHANNESBURG METRO, 2007 Sources: Statistics South Africa and ADEC.
Employment Varieties & Trends for JHB Metropolitan
SOURCE: Financial & Business Model for Decking the Railway Lines in Central Johannesburg, Adec, 2009
Resident employment varieties by primary sector, Johannesburg Metropolitan, 2007
Resident employment trends by primary sectors, Johannesburg Metropolitan, 1991-2007
* Finance, insurance & real estate
*
*
Figure 5.1
* Finance, insurance & real estate

SOCIO-ECONOMICS STATUS QUO
23
57
54
58
66
55
56
65
60
67
61
64
63
59
62
N17
N1/
20M
0
N12
K144.01
N1/20M
1589
K45.02
JULES STREET
VEREEN
IGIN
GR
OAD
K45.01
MAIN REEF ROAD
K122.0
1
MAIN ROAD
AG117-77369
K45
.04
CO
MA
RO
STREET
KLIPRIVER
ROAD
MARAISBURG ROAD
MARSHALL STREET
OLD POTCHEFSTROOM ROAD
NA
SR
EC
RO
AD
ALBERTON ROAD
K45
.03
COMMISSIONER STREET
BREE STREET
N1/20M
2353
RIFLE RANGE ROAD
N1/20M1061
N1/20M
1278
BROAD WAY
K57
.01
K130.01K87
EMPIRE ROAD
MASUPHA STREET
RO
SETTENVILLE
RO
AD
OXFORD
ROAD
BOOYSENS ROAD
SOUTH RAND ROAD
AF117-62315
LONG ROAD
RIS
SIK
STR
EE
T
TURF CLUB STREET
ROBERTS AVENUE
FIRST AVENUE
CO
MM
AND
OR
OAD
JUDITH ROAD
BARAG
WAN
ATHR
OAD
CH
UR
CH
STR
EE
T
RAND SHOW ROAD
N12 OFFRAMP
M1 SOUTH S
BELLAIRS DRIVE
OBSERVATORY AVENUE
PR
AIR
IES
TRE
ET
DUIKER ROAD
FUEL ROAD
LOW
ER
GE
RM
ISTO
N
MOLLIE ROAD
KINGSWAY
MAIN REEF
NORTH AVENUE
MARCIA STREET
TRE
UR
OA
DV
ICK
ER
SR
OA
D
CO
MA
RO
MO
OI LIN
K
LANGERMANN DRIVE
BEN NAUDE
HEIDELBERG ROAD
GORDON ROAD
SIEM
ERT
RO
AD
TUR
FFO
NTE
INR
OAD
N1/20M
1378
AG117-76376
BARTLETT ROADPA
RK
DR
IVE
XAV
IER
STR
EE
T
RIP
LEY
RO
AD
PERTH ROAD EAST
K57.01 OFFRAMP
N12 ONRAMP
AF117-62350
ANNET ROAD
ALAMEIN ROAD
AG117-62763
ST ANDREWS ROAD
NEWM
19FROM
MA
CR
OW
NW
OO
DR
OA
D
K85.02
PERTHROAD
TUR
FR
OA
D
SO
LOM
ON
STR
EE
T
AF117-62537
CHILV
ERS
STRE
ET
TENTHSTREET
N1
N3/
12M
3100
MA
RA
ISS
TRE
ET
M2 E RAMP
N17 ONRAMP
N12 OFFRAMP
K45.03
MAIN ROAD
VE
RE
EN
IGIN
GR
OA
D
KLIP
RIV
ER
RO
AD
K57.01
N1/20M
1589
SOUTH RAND ROAD
K122.01
N1/
20M
1278
MAIN ROAD
MAIN ROAD
N12 ONRAMP
MAIN ROAD
N12
N17
N12
N12
KLIP RIVERROAD
MAIN REEF ROAD
MA
INR
OA
DMAIN ROAD
N1/
20M
0
MAIN ROAD
ALBERTON ROAD
N1/
20M
1061
A
F
G
C E
D
B
±1:85,000
Locality Map
1,400 0 1,400700 Meters
CITY OF JOHANNESBURGREGION F
Corporate Geo-InformaticsTelephone: +27 11 407-6200
Email: [email protected]
Income per Ward 2001
Workspace:Date:Compiler:Source:Projection:Datum:
//cgissql/projects/Wardsprofileprj/Regions_New/RegionF/Wards_lncome.mxd13 October 2006Zodwa SangweniCity of JohannesburgTransverse Mercator Lo.29Hartebeeshoek 1994
ANNUAL HOUSEHOLDINCOME 2001
No income
R1 - R4800
R4801- R9600
R9601 - R19200
R19201- R38400
R38401 - R76800
R76801 - R153600
R153601 - R307200
R307201 - R614400
R614401 - R1228800
R1228801 - R2457600
Over R2457600
ANNUAL HOUSEHOLD INCOME - 2001WARD
NONo
incomeR1 - R4
800R4 801 -R9 600
R9 601 -R19 200
R19 201 -R38400
R38 401 -R76 800
R76 801 -R153 600
R153 601 -R307 200
R307 201 -R614 400
R614 401 -R1 228 800
R1 228 801 -R2 457 600 R2 457 601+
23 921 524 1281 1279 991 1138 1774 2339 1369 287 98 6054 408 273 1277 880 994 2162 3420 3190 1095 175 83 4755 971 335 1039 1408 1782 2045 1943 1175 286 61 38 1956 581 181 684 853 1086 1306 1437 1004 387 71 34 2857 1543 326 1023 1453 2230 1683 1556 1083 259 33 42 1058 1374 436 1090 1476 1587 1560 967 409 106 23 28 659 716 90 265 1016 1247 873 286 35 51 11 26 260 3216 213 931 2623 3303 2775 1078 312 77 26 15 161 2110 487 766 1588 1204 661 276 96 20 7 11 462 1032 115 419 1377 1871 1691 662 145 64 18 19 963 3110 302 836 2530 2953 2332 1011 204 89 18 14 164 3096 214 1040 2752 3590 2961 1610 523 132 47 29 1565 3470 501 912 1968 1767 1022 539 259 77 18 12 1366 1329 346 1042 1623 1540 1671 1870 1625 753 251 128 8267 2235 219 795 1841 2008 1855 1264 622 227 64 38 26Total 26,112 4,562 13,400 24,667 28,153 25,735 19,693 13,021 4,992 1,110 615 323
LegendRegions
National Roads
Major Roads
Provincial Roads
SOURCE: Johannesburg e-services website: eservices.joburg.org.za
23
57
54
58
66
55
56
65
60
67
61
64
63
59
62
N17
N1/
20M
0
N12
K144.01
N1/20M
1589
K45.02
JULES STREET
VEREEN
IGIN
GR
OAD
K45.01
MAIN REEF ROAD
K122.0
1
MAIN ROAD
AG117-77369
K45
.04
CO
MA
RO
STREET
KLIPRIVER
ROAD
MARAISBURG ROAD
MARSHALL STREET
OLD POTCHEFSTROOM ROAD
NA
SR
EC
RO
AD
ALBERTON ROAD
K45
.03
COMMISSIONER STREET
BREE STREET
N1/20M
2353
RIFLE RANGE ROAD
N1/20M1061
N1/20M
1278
BROAD WAY
K57
.01
K130.01K87
EMPIRE ROAD
MASUPHA STREET
RO
SETTENVILLE
RO
AD
OXFORD
ROAD
BOOYSENS ROAD
SOUTH RAND ROAD
AF117-62315
LONG ROAD
RIS
SIK
STR
EE
T
TURF CLUB STREET
ROBERTS AVENUE
FIRST AVENUE
CO
MM
AND
OR
OAD
JUDITH ROAD
BARAG
WAN
ATHR
OAD
CH
UR
CH
STR
EE
T
RAND SHOW ROAD
N12 OFFRAMP
M1 SOUTH S
BELLAIRS DRIVE
OBSERVATORY AVENUE
PR
AIR
IES
TRE
ET
DUIKER ROAD
FUEL ROAD
LOW
ER
GE
RM
ISTO
N
MOLLIE ROAD
KINGSWAY
MAIN REEF
NORTH AVENUE
MARCIA STREET
TRE
UR
OA
D
VIC
KE
RS
RO
AD
CO
MA
RO
MO
OI LIN
K
LANGERMANN DRIVE
BEN NAUDE
HEIDELBERG ROAD
GORDON ROAD
SIEM
ERT
RO
AD
TUR
FFO
NTE
INR
OAD
N1/20M
1378
AG117-76376
BARTLETT ROAD
PAR
KD
RIV
E
XAV
IER
STR
EE
T
RIP
LEY
RO
AD
PERTH ROAD EAST
K57.01 OFFRAMP
N12 ONRAMP
AF117-62350
ANNET ROAD
ALAMEIN ROAD
AG117-62763
ST ANDREWS ROAD
NEWM
19FROM
MA
CR
OW
NW
OO
DR
OA
D
K85.02
PERTHROAD
TUR
FR
OA
D
SO
LOM
ON
STR
EE
T
AF117-62537
CHILV
ERS
STRE
ET
TENTHSTREET
N1
N3/
12M
3100
MA
RA
ISS
TRE
ET
M2 E RAMP
N17 ONRAMP
N12 OFFRAMP
K45.03
MAIN ROAD
VE
RE
EN
IGIN
GR
OA
D
KLIP
RIV
ER
RO
AD
K57.01
N1/20M
1589
SOUTH RAND ROAD
K122.01
N1/
20M
1278
MAIN ROAD
MAIN ROAD
N12 ONRAMP
MAIN ROAD
N12
N17
N12
N12
KLIP RIVERROAD
MAIN REEF ROAD
MA
INR
OA
DMAIN ROAD
N1/
20M
0
MAIN ROAD
ALBERTON ROAD
N1/
20M
1061
A
F
G
C E
D
B
±1:85,000
Locality Map
1,400 0 1,400700 Meters
CITY OF JOHANNESBURGREGION F
Corporate Geo-InformaticsTelephone: +27 11 407-6200
Email: [email protected]
Income per Ward 2001
Workspace:Date:Compiler:Source:Projection:Datum:
//cgissql/projects/Wardsprofileprj/Regions_New/RegionF/Wards_lncome.mxd13 October 2006Zodwa SangweniCity of JohannesburgTransverse Mercator Lo.29Hartebeeshoek 1994
ANNUAL HOUSEHOLDINCOME 2001
No income
R1 - R4800
R4801- R9600
R9601 - R19200
R19201- R38400
R38401 - R76800
R76801 - R153600
R153601 - R307200
R307201 - R614400
R614401 - R1228800
R1228801 - R2457600
Over R2457600
ANNUAL HOUSEHOLD INCOME - 2001WARD
NONo
incomeR1 - R4
800R4 801 -R9 600
R9 601 -R19 200
R19 201 -R38400
R38 401 -R76 800
R76 801 -R153 600
R153 601 -R307 200
R307 201 -R614 400
R614 401 -R1 228 800
R1 228 801 -R2 457 600 R2 457 601+
23 921 524 1281 1279 991 1138 1774 2339 1369 287 98 6054 408 273 1277 880 994 2162 3420 3190 1095 175 83 4755 971 335 1039 1408 1782 2045 1943 1175 286 61 38 1956 581 181 684 853 1086 1306 1437 1004 387 71 34 2857 1543 326 1023 1453 2230 1683 1556 1083 259 33 42 1058 1374 436 1090 1476 1587 1560 967 409 106 23 28 659 716 90 265 1016 1247 873 286 35 51 11 26 260 3216 213 931 2623 3303 2775 1078 312 77 26 15 161 2110 487 766 1588 1204 661 276 96 20 7 11 462 1032 115 419 1377 1871 1691 662 145 64 18 19 963 3110 302 836 2530 2953 2332 1011 204 89 18 14 164 3096 214 1040 2752 3590 2961 1610 523 132 47 29 1565 3470 501 912 1968 1767 1022 539 259 77 18 12 1366 1329 346 1042 1623 1540 1671 1870 1625 753 251 128 8267 2235 219 795 1841 2008 1855 1264 622 227 64 38 26Total 26,112 4,562 13,400 24,667 28,153 25,735 19,693 13,021 4,992 1,110 615 323
LegendRegions
National Roads
Major Roads
Provincial Roads
Ward 59 & 60 demonstrating annual household income within the Park Station Sub-precinct
23
57
54
58
66
55
56
65
60
67
61
64
63
59
62
N17
N1/
20M
0
N12
K144.01
N1/20M
1589
K45.02
JULES STREET
VEREEN
IGIN
GR
OAD
K45.01
MAIN REEF ROAD
K122.0
1
MAIN ROAD
AG117-77369
K45
.04
CO
MA
RO
STREET
KLIPRIVER
ROAD
MARAISBURG ROAD
MARSHALL STREET
OLD POTCHEFSTROOM ROAD
NA
SR
EC
RO
AD
ALBERTON ROAD
K45
.03
COMMISSIONER STREET
BREE STREET
N1/20M
2353
RIFLE RANGE ROAD
N1/20M1061
N1/20M
1278
BROAD WAY
K57
.01
K130.01K87
EMPIRE ROAD
MASUPHA STREET
RO
SETTENVILLE
RO
AD
OXFORD
ROAD
BOOYSENS ROAD
SOUTH RAND ROAD
AF117-62315
LONG ROAD
RIS
SIK
STR
EE
T
TURF CLUB STREET
ROBERTS AVENUE
FIRST AVENUE
CO
MM
AND
OR
OAD
JUDITH ROAD
BARAG
WAN
ATHR
OAD
CH
UR
CH
STR
EE
T
RAND SHOW ROAD
N12 OFFRAMP
M1 SOUTH S
BELLAIRS DRIVE
OBSERVATORY AVENUE
PR
AIR
IES
TRE
ET
DUIKER ROAD
FUEL ROAD
LOW
ER
GE
RM
ISTO
N
MOLLIE ROAD
KINGSWAY
MAIN REEF
NORTH AVENUE
MARCIA STREET
TRE
UR
OA
D
VIC
KE
RS
RO
AD
CO
MA
RO
MO
OI LIN
K
LANGERMANN DRIVE
BEN NAUDE
HEIDELBERG ROAD
GORDON ROAD
SIEM
ERT
RO
AD
TUR
FFO
NTE
INR
OAD
N1/20M
1378
AG117-76376
BARTLETT ROAD
PAR
KD
RIV
E
XAV
IER
STR
EE
T
RIP
LEY
RO
AD
PERTH ROAD EAST
K57.01 OFFRAMP
N12 ONRAMP
AF117-62350
ANNET ROAD
ALAMEIN ROAD
AG117-62763
ST ANDREWS ROAD
NEWM
19FROM
MA
CR
OW
NW
OO
DR
OA
D
K85.02
PERTHROAD
TUR
FR
OA
D
SO
LOM
ON
STR
EE
T
AF117-62537
CHILV
ERS
STRE
ET
TENTHSTREET
N1
N3/
12M
3100
MA
RA
ISS
TRE
ET
M2 E RAMP
N17 ONRAMP
N12 OFFRAMP
K45.03
MAIN ROAD
VE
RE
EN
IGIN
GR
OA
D
KLIP
RIV
ER
RO
AD
K57.01
N1/20M
1589
SOUTH RAND ROAD
K122.01
N1/
20M
1278
MAIN ROAD
MAIN ROAD
N12 ONRAMP
MAIN ROAD
N12
N17
N12
N12
KLIP RIVERROAD
MAIN REEF ROAD
MA
INR
OA
DMAIN ROAD
N1/
20M
0
MAIN ROAD
ALBERTON ROAD
N1/
20M
1061
A
F
G
C E
D
B
±1:85,000
Locality Map
1,400 0 1,400700 Meters
CITY OF JOHANNESBURGREGION F
Corporate Geo-InformaticsTelephone: +27 11 407-6200
Email: [email protected]
Income per Ward 2001
Workspace:Date:Compiler:Source:Projection:Datum:
//cgissql/projects/Wardsprofileprj/Regions_New/RegionF/Wards_lncome.mxd13 October 2006Zodwa SangweniCity of JohannesburgTransverse Mercator Lo.29Hartebeeshoek 1994
ANNUAL HOUSEHOLDINCOME 2001
No income
R1 - R4800
R4801- R9600
R9601 - R19200
R19201- R38400
R38401 - R76800
R76801 - R153600
R153601 - R307200
R307201 - R614400
R614401 - R1228800
R1228801 - R2457600
Over R2457600
ANNUAL HOUSEHOLD INCOME - 2001WARD
NONo
incomeR1 - R4
800R4 801 -R9 600
R9 601 -R19 200
R19 201 -R38400
R38 401 -R76 800
R76 801 -R153 600
R153 601 -R307 200
R307 201 -R614 400
R614 401 -R1 228 800
R1 228 801 -R2 457 600 R2 457 601+
23 921 524 1281 1279 991 1138 1774 2339 1369 287 98 6054 408 273 1277 880 994 2162 3420 3190 1095 175 83 4755 971 335 1039 1408 1782 2045 1943 1175 286 61 38 1956 581 181 684 853 1086 1306 1437 1004 387 71 34 2857 1543 326 1023 1453 2230 1683 1556 1083 259 33 42 1058 1374 436 1090 1476 1587 1560 967 409 106 23 28 659 716 90 265 1016 1247 873 286 35 51 11 26 260 3216 213 931 2623 3303 2775 1078 312 77 26 15 161 2110 487 766 1588 1204 661 276 96 20 7 11 462 1032 115 419 1377 1871 1691 662 145 64 18 19 963 3110 302 836 2530 2953 2332 1011 204 89 18 14 164 3096 214 1040 2752 3590 2961 1610 523 132 47 29 1565 3470 501 912 1968 1767 1022 539 259 77 18 12 1366 1329 346 1042 1623 1540 1671 1870 1625 753 251 128 8267 2235 219 795 1841 2008 1855 1264 622 227 64 38 26Total 26,112 4,562 13,400 24,667 28,153 25,735 19,693 13,021 4,992 1,110 615 323
LegendRegions
National Roads
Major Roads
Provincial Roads
Figure 5.2
Average Household Income
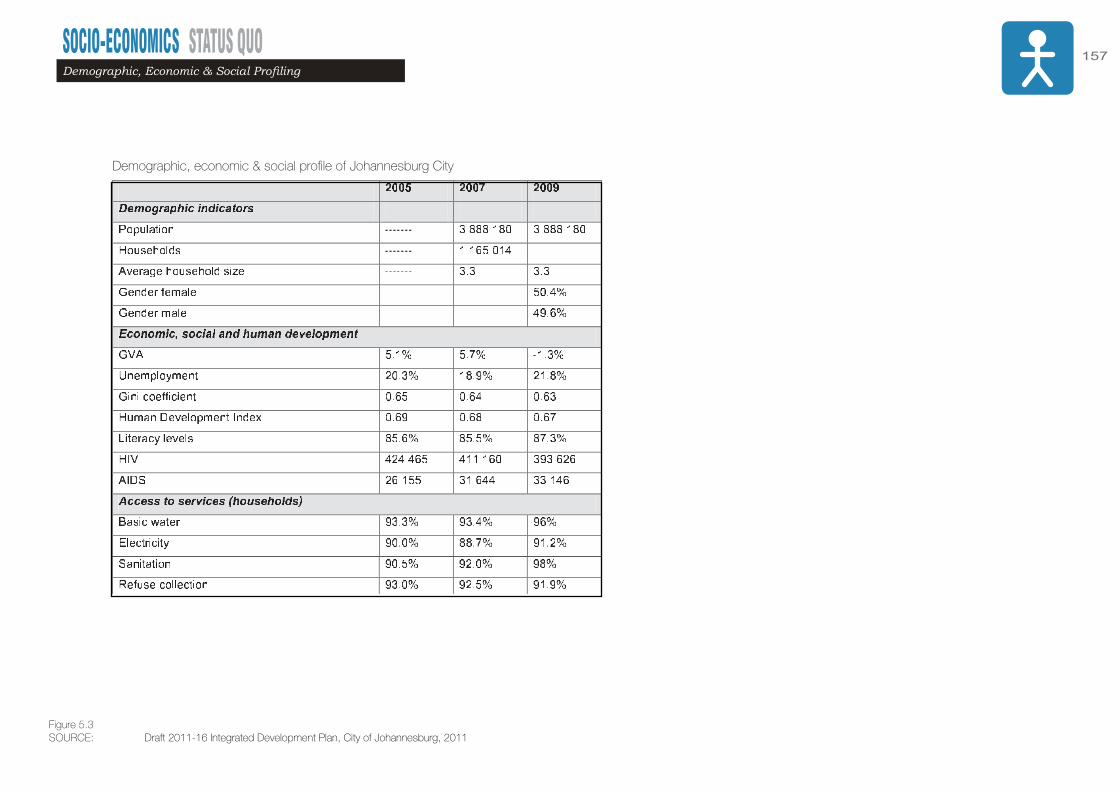
SOCIO-ECONOMICS STATUS QUO 157Demographic, Economic & Social Profiling
SOURCE: Draft 2011-16 Integrated Development Plan, City of Johannesburg, 2011
Demographic, economic & social profile of Johannesburg City
Figure 5.3

SOCIO-ECONOMICS STATUS QUO
SOURCE: Financial & Business Model for Decking the Railway Lines in Central Johannesburg, Adec, 2009
Average rental rates, inner city, Johannesburg 2004-2008
Average rental rates per sub-market, central Johannesburg 2009
Figure 5.4
2004 2008 Change Percent
Bachelor Flat 1,200 1,388 188 16%
1 Bed Flat 1,600 2,039 439 27%
2 Bed Flat 2,600 2,607 607 30%
3 Bed Flat 2,300 3,201 801 35%
Area Bachelor 1 Bed 2 Bed 3 Bed
Braamfontein 2,900 4,883 6,750 -
CBD 2,282 3,112 4,139 -
Doornfontein 1,700 3,200 4,700 -
Joubert Park 2,157 2,842 3,006 -
Fordsburg/Newtown - 2,672 3,459 4,218
Highlands/Yeoville 2,152 2,942 3,251 3,878
Hillbrow/Berea 2,088 2,463 2,939 4,384
Jeppestown/Troyeville 1,832 2,689 2,949 -
AVERAGE RENTAL 1,889 3,095 3,899 4,160
Residential Rental Rates
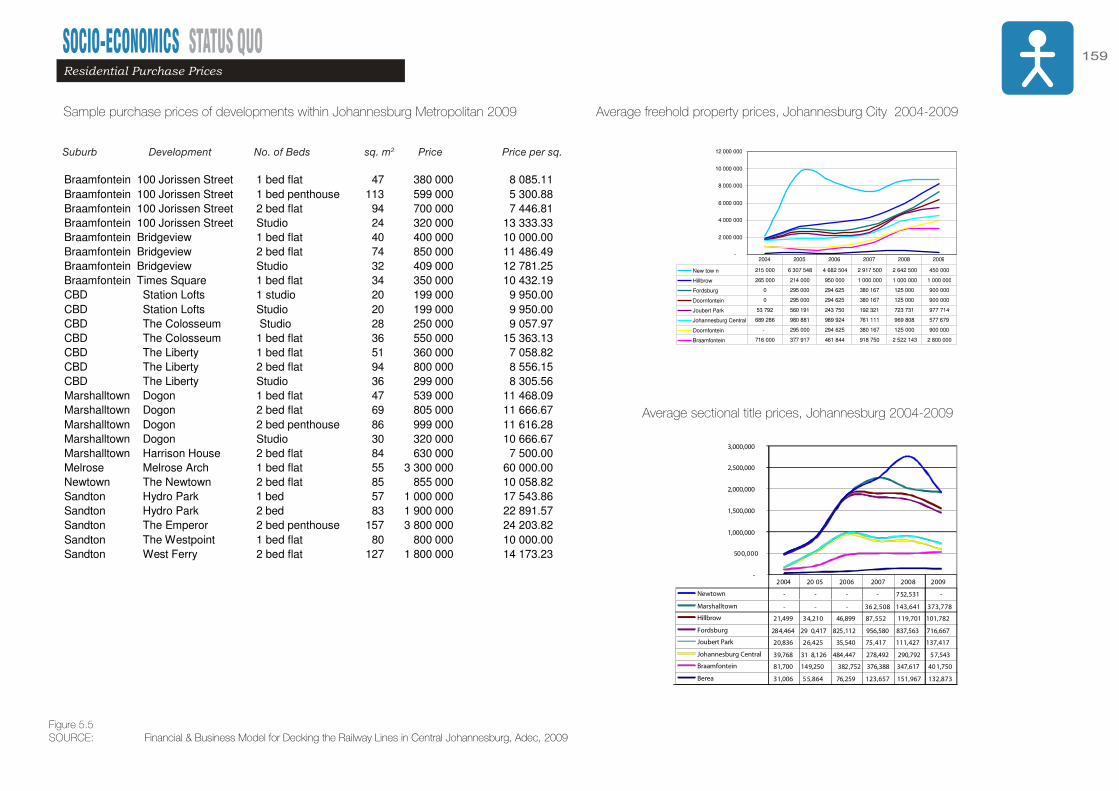
SOCIO-ECONOMICS STATUS QUO 159Residential Purchase Prices
SOURCE: Financial & Business Model for Decking the Railway Lines in Central Johannesburg, Adec, 2009
African Development Economic Consultants ADEC
103 Algernon Road, Norwood (Johannesburg). Tel (011) 728-1965 / 6690 Fax (011) 728-8371.
[email protected]. Suite 131, Private Bag X5, Norwood 2117 SOUTH AFRICA 51
Prices at comparable new developments are averaging R15,000 per square meter. However, price varies in large measure by location. A 36m flat 2
in the Colosseum (a project located in the central business district) is priced at R15,636 per sqm whereas a 57m 2 one-bed flat in Sandton is priced atR17,543 per sqm.
Table 34. PRICES OF COMPARABLE DEVELOPMENTS, JOHANNESBURG 2009
Suburb Development No. of Beds SQM Price Price Per SQM
Braamfontein 100 Jorissen Street 1 bed flat 47 380 000 8 085.11
Braamfontein 100 Jorissen Street 1 bed penthouse 113 599 000 5 300.88
Braamfontein 100 Jorissen Street 2 bed flat 94 700 000 7 446.81
Braamfontein 100 Jorissen Street Studio 24 320 000 13 333.33
Braamfontein Bridgeview 1 bed flat 40 400 000 10 000.00
Braamfontein Bridgeview 2 bed flat 74 850 000 11 486.49
Braamfontein Bridgeview Studio 32 409 000 12 781.25
Braamfontein Times Square 1 bed flat 34 350 000 10 432.19
CBD Station Lofts 1 studio 20 199 000 9 950.00
CBD Station Lofts Studio 20 199 000 9 950.00
CBD The Colosseum Studio 28 250 000 9 057.97
CBD The Colosseum 1 bed flat 36 550 000 15 363.13
CBD The Liberty 1 bed flat 51 360 000 7 058.82
CBD The Liberty 2 bed flat 94 800 000 8 556.15
CBD The Liberty Studio 36 299 000 8 305.56
Marshalltown Dogon 1 bed flat 47 539 000 11 468.09
Marshalltown Dogon 2 bed flat 69 805 000 11 666.67
Marshalltown Dogon 2 bed penthouse 86 999 000 11 616.28
Marshalltown Dogon Studio 30 320 000 10 666.67
Marshalltown Harrison House 2 bed flat 84 630 000 7 500.00
Melrose Melrose Arch 1 bed flat 55 3 300 000 60 000.00
Newtown The Newtown 2 bed flat 85 855 000 10 058.82
Sandton Hydro Park 1 bed 57 1 000 000 17 543.86
Sandton Hydro Park 2 bed 83 1 900 000 22 891.57
Sandton The Emperor 2 bed penthouse 157 3 800 000 24 203.82
Sandton The Westpoint 1 bed flat 80 800 000 10 000.00
Sandton West Ferry 2 bed flat 127 1 800 000 14 173.23
Source: African Development Economic Consultants (ADEC).
Braamfontein
Price is a key selling factor for new projects in Braamfontein. Units areselling at less than R500,000. The current and recent market in Braamfonteinis largely comprised of investors in the buy-to-let market, comprising 60 to70% of sales. The remaining 30 to 40% consist of owner-occupants. Investorsprefer to buy residential stock in this sub-market is because rental yields aresignificantly higher than in other locations and there is a demand for rentalstock.
For example, a one-bed flat in Sandton can fetch R1.0 million andrented for R6,000, generating a rental yield of 7%. By comparison, an investorcan buy a one-bed flat in Braamfontein for R350,000 and rent it R3,800,
Sample purchase prices of developments within Johannesburg Metropolitan 2009
African Development Economic Consultants ADEC
10 3 Algernon Road, Norwood (Johannesburg). Tel (011) 728-1965 / 6690 Fax (011) 728-8371. [email protected] . Suite 131, Private Bag X5, Norwood 2117 SOUTH AFR ICA
16
Chart 7
The Hillbrow sub-market has garnered the lowest prices i n sectional title properties. Part of the reason for the depressed prices in Hillbrow is thehigher risk associated with sectional title properties there . There are“dysfunctional” bodies corporate in some buildings, which jeopardises theinvestment value. Even then, prices for Hillbrow’s sectio nal title properties have increased by over 360% from R22,000 in 2004 to 1 02,000 by 2009.Some buyers have been able to circumvent the risk issue by identifying well-managed buildings. Most of the stock in this area is purch ased for rentaltenure because of the high yields that can be obtaine d from rentals in a tighthousing market.
Freeholds . There are relatively few freehold properties in In ner City Johannesburg, and many of these are multi-family bui ldings with singleownership (for rental apartments). Prices for these prop erties are relativelyhigh because they are oriented to commercial use and are situated onvaluable land. Prices for freehold properties have be en highest in the Braamfontein area and in nearby Hillbrow. The avera ge price in Braamfontein surpassed R1.0 million in 2007 and has continued to increase. Bycomparison, freehold properties in most other Inner Cit y sub-markets have remained below R1.0 million, which has become an art i�cial price ceiling inthose areas. Volatility in Newtown prices is likely due to the low number ofsales, each of which can skew the sub-market average wildl y. Whilst freeholdprices continued to increase in most Inner City sub- markets into 2009, it is
2004 20 05 2006 2007 2008 2009
Newtown - - - - 752,531 -
Marshalltown - - - 36 2,508 143,641 373,778
Hillbrow 21,499 34,210 46,899 87,552 119,701 101,782
Fordsburg 284,464 29 0,417 825,112 956,580 837,563 716,667
Joubert Park 20,836 26,425 35,540 75,417 111,427 137,417
Johannesburg Central 39,768 31 8,126 484,447 278,492 290,792 57,543
Braamfontein 81,700 149,250 382,752 376,388 347,617 4 0 1,750
Berea 31,006 55,864 76,259 123,657 151,967 132,873
-
500,000
1,000,000
1,500,000
2,000,000
2,500,000
3,000,000
AVERAGE SECTIONAL TITLE PRICES, JOHANNESBURG 2004-2Source: Lightstone and ADEC
African Development Economic Consultants ADEC
103 Algernon Road, Norwood (Johannesburg). Tel (011) 728-1965 / 6690 Fax (011) 728-8371.
[email protected]. Suite 131, Private Bag X5, Norwood 2117 SOUTH AFRICA 17
unlikely that this growth is sustainable given the downward shift change ineconomic conditions, the tighter financing requirements, and the de-escalation in sectional title markets.
Chart 8
Average property prices in the Doornfontein area have been on anupward trend with most of the increase (of over 600%) experienced since 2008. It is possible that property values have escalated due to speculationrelating to 2010 development in the nearby Ellis Park sports precinct.
The market for property in Hillbrow is characterised by significantlyhigher prices for freehold properties. From a risk management perspective, it is safer to purchase an entire rental building and manage it rather than topurchase individual units in a sectional title building. As such, freehold pricesare on average much higher than sectional titles. The number of freeholdproperty sales is low in Hillbrow because 98% of the residential stock is insectional title and only 2% comprising of freehold properties.
In Newtown, freehold prices have been increasing, with the peak pricesaveraging R972,000 in 2007. After 2008, however, freehold property priceshave fallen.
AVERAGEFREEHOLD PROPERTYPRICES, JOHANNESBURG 2004-2009
Source: Lightstone and ADEC
-
2 000 000
4 000 000
6 000 000
8 000 000
10 000 000
12 000 000
New tow n 215 000 6 307 548 4 682 504 2 917 500 2 642 500 450 000
Hillbrow 265 000 214 000 950 000 1 000 000 1 000 000 1 000 000
Fordsburg 0 295 000 2 94 625 3 80 167 125 000 900 000
Doornfontein 0 295 000 2 94 625 3 80 167 125 000 900 000
Joubert Park 53 792 560 191 2 43 750 1 92 321 723 731 977 714
Johannesburg Central 689 286 980 881 989 924 761 111 969 808 577 679
Doornfontein - 295 000 294 625 380 167 125 000 900 000
Braamfontein 716 000 377 917 461 844 918 750 2 522 143 2 800 000
2004 2 005 2 006 2007 2008 2009
Average freehold property prices, Johannesburg City 2004-2009
Average sectional title prices, Johannesburg 2004-2009
Figure 5.5
Suburb Development No. of Beds sq. m2 Price Price per sq.

SOCIO-ECONOMICS STATUS QUO
• Record data. Through analyzing Windeed records of actual sales
of properties in the study area, approximately 50 sales were
established to have happened in the study area from the period
1928 through to 2010.
• Sampling. A representative sample providing relevance, was
determined as being the most recent 30 of these sales, which
stretched from 1992 to 2010.
• Factoring. These actual sales prices were then factored through to
2011 values through multiplying the values with the recorded CPI
rates (as given by Stats SA) in a compounded manner.
• Sample refinement. Of the sample of 30 properties, there were
25 that had buildings and / or developments on them and 5 that
were open and / or vacant plots. The present values of the 25
properties with buildings on were then divided by the actual bulk
(gross leasable area of built form) on each property to obtain the
rate of value expressed a rate per bulk meter square (R/Bm2).
Of the sample of 30 properties there were 5 that were open and/or vacant
plots. The present values of these 5 properties were then divided by the
actual property size to get the rate per physical meter square (R/m2).
CONTEXT
The purpose of this section is to provide critical evidence to inform the value
of land and/or development bulk in the Sub-Precinct area. Establishing
reasonably reliable values from existing material was not readily available,
and a methodology was developed in order to provide rigour to the data
available.
Methodology : Objectives
The valuation data analysed emanating from PRASA correspondence and
also CoJ data, varied in statements from R 14,000 – R 10,000 /m2. The
purpose of the methodology was to establish a view ( based on empirical
research and data ) of property values expressed as a rate per bulk metre
square and as a rate per physical metre square in the immediate vicinity
of Park Station Johannesburg, in the area ( being the, Park Station Sub
Precinct Framework zone ).
Methodology : The process
The methodology used was to generate a representative sample of properties
in the study area of actual recorded sales and to use such records to inform
the present value of properties in the area. The methodology summary
stages are outlined as :
Land Value
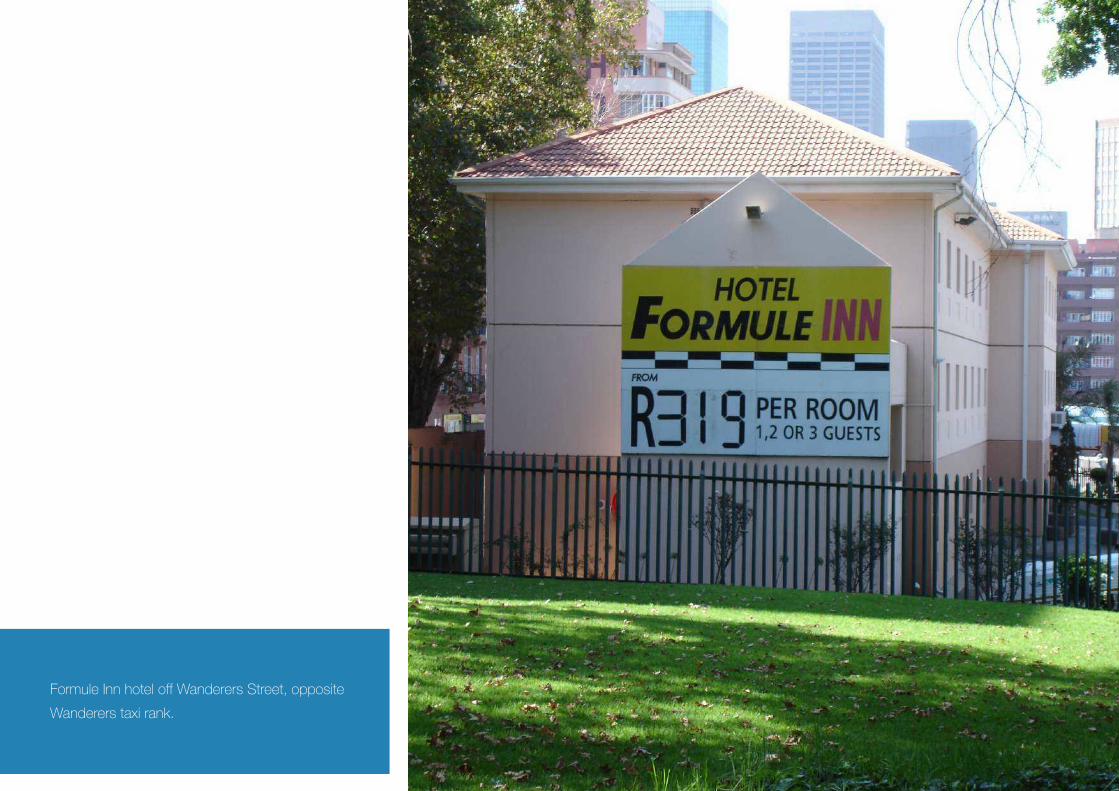
Formule Inn hotel off Wanderers Street, opposite
Wanderers taxi rank.

SOCIO-ECONOMICS STATUS QUO
While the market may place a degree of premium on built form immediately
adjacent to or in the actual Park Station precinct, it is highly unlikely that
such value would be close to the replacement cost of such bulk, unless
factors on the ground were to change significantly.
It also is worthwhile reflecting that the sales in the area and sample of
actual recorded sales, as shown by dates and prices, does not reflect the
same degree of market positioning by developers and property funds for
properties close to Gautrain stations, as happened in the case of other
Gautrain Station areas such as Hatfield, Sandton and Rosebank.
Outcomes and Results
The analysis demonstrated that the sample of 25 properties with buildings
had an average sale value of R1683/Bm2 and that the sample of 5 properties
that were open and / or vacant plots had an average sale value of R7068/
m2.
There were naturally some ‘outliers’ in the study, for example a property
that was a service station where the value of the property lies in the sale
of petroleum products and not the actual building. In order to get a more
representative indication of value and provide an element the two lowest
and the two highest values were removed from the sample of 25 properties
with buildings on. The result was that the average value dropped from
R1683/Bm2 to R1327/Bm2.
While this research does make assumptions such as the method of present
valuing property sales, using CPI, it does show that the market places a
rather low value on bulk in the study area, which is reflective of values falling
in the inner city due to inner city decay.
In contrast, the market does place a much higher value on buildings in
nodes such as Rosebank and Sandton, were market values have not been
adversely affected through decay and natural supply and demand factors.
Land Value

A gentleman and lady selling fruits on De Villiers
Street, opposite the South Station Building.

SOCIO-ECONOMICS STATUS QUO
SOURCE: Windeed
N
Park Station Sub-Precinct
Railway Lines
Figure 5.6
Land Ownership
0 50 100 200
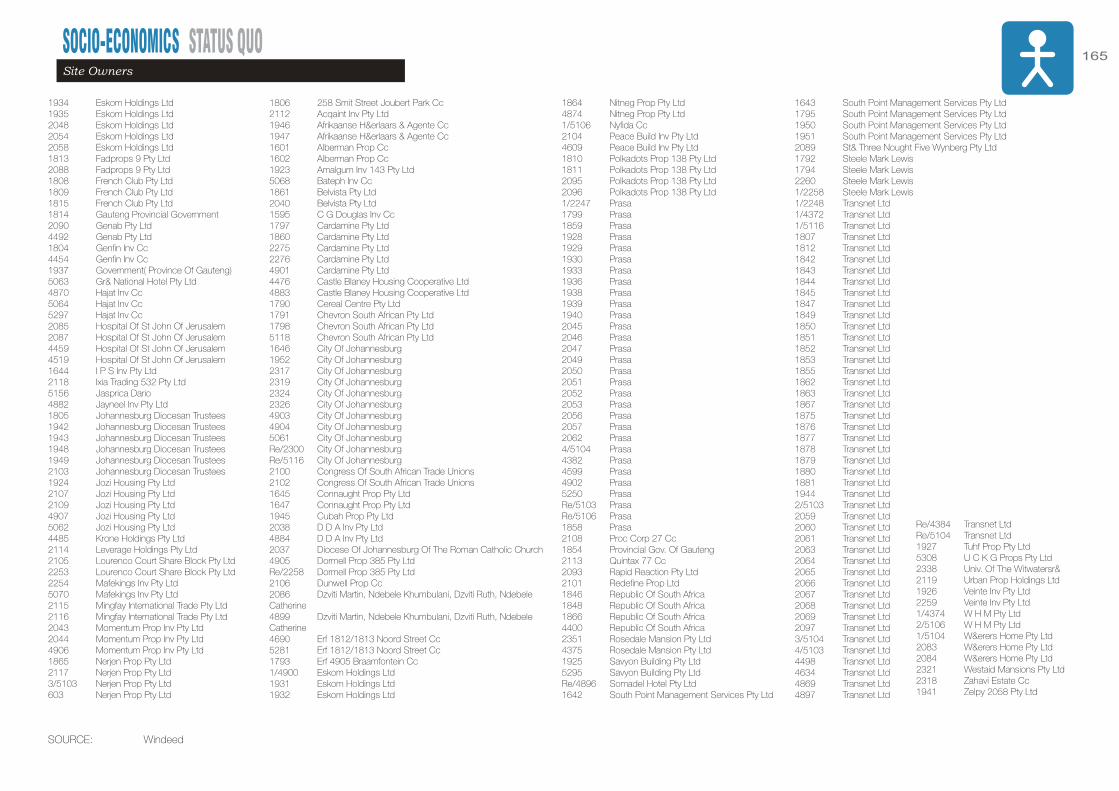
SOCIO-ECONOMICS STATUS QUO 165Site Owners
SOURCE: Windeed
1934 Eskom Holdings Ltd1935 Eskom Holdings Ltd2048 Eskom Holdings Ltd2054 Eskom Holdings Ltd2058 Eskom Holdings Ltd1813 Fadprops 9 Pty Ltd2088 Fadprops 9 Pty Ltd1808 French Club Pty Ltd1809 French Club Pty Ltd1815 French Club Pty Ltd1814 Gauteng Provincial Government 2090 Genab Pty Ltd4492 Genab Pty Ltd1804 Genfin Inv Cc4454 Genfin Inv Cc1937 Government( Province Of Gauteng)5063 Gr& National Hotel Pty Ltd4870 Hajat Inv Cc5064 Hajat Inv Cc5297 Hajat Inv Cc2085 Hospital Of St John Of Jerusalem2087 Hospital Of St John Of Jerusalem4459 Hospital Of St John Of Jerusalem4519 Hospital Of St John Of Jerusalem1644 I P S Inv Pty Ltd2118 Ixia Trading 532 Pty Ltd5156 Jasprica Dario4882 Jayneel Inv Pty Ltd1805 Johannesburg Diocesan Trustees1942 Johannesburg Diocesan Trustees1943 Johannesburg Diocesan Trustees1948 Johannesburg Diocesan Trustees1949 Johannesburg Diocesan Trustees2103 Johannesburg Diocesan Trustees1924 Jozi Housing Pty Ltd2107 Jozi Housing Pty Ltd2109 Jozi Housing Pty Ltd4907 Jozi Housing Pty Ltd5062 Jozi Housing Pty Ltd4485 Krone Holdings Pty Ltd2114 Leverage Holdings Pty Ltd2105 Lourenco Court Share Block Pty Ltd2253 Lourenco Court Share Block Pty Ltd2254 Mafekings Inv Pty Ltd5070 Mafekings Inv Pty Ltd2115 Mingfay International Trade Pty Ltd2116 Mingfay International Trade Pty Ltd2043 Momentum Prop Inv Pty Ltd2044 Momentum Prop Inv Pty Ltd4906 Momentum Prop Inv Pty Ltd1865 Nerjen Prop Pty Ltd2117 Nerjen Prop Pty Ltd3/5103 Nerjen Prop Pty Ltd603 Nerjen Prop Pty Ltd
1806 258 Smit Street Joubert Park Cc2112 Acqaint Inv Pty Ltd1946 Afrikaanse H&erlaars & Agente Cc1947 Afrikaanse H&erlaars & Agente Cc1601 Alberman Prop Cc1602 Alberman Prop Cc1923 Amalgum Inv 143 Pty Ltd5068 Bateph Inv Cc1861 Belvista Pty Ltd2040 Belvista Pty Ltd1595 C G Douglas Inv Cc1797 Cardamine Pty Ltd1860 Cardamine Pty Ltd2275 Cardamine Pty Ltd2276 Cardamine Pty Ltd4901 Cardamine Pty Ltd4476 Castle Blaney Housing Cooperative Ltd4883 Castle Blaney Housing Cooperative Ltd1790 Cereal Centre Pty Ltd1791 Chevron South African Pty Ltd1798 Chevron South African Pty Ltd5118 Chevron South African Pty Ltd1646 City Of Johannesburg1952 City Of Johannesburg2317 City Of Johannesburg2319 City Of Johannesburg2324 City Of Johannesburg2326 City Of Johannesburg4903 City Of Johannesburg4904 City Of Johannesburg5061 City Of JohannesburgRe/2300 City Of JohannesburgRe/5116 City Of Johannesburg2100 Congress Of South African Trade Unions2102 Congress Of South African Trade Unions1645 Connaught Prop Pty Ltd1647 Connaught Prop Pty Ltd1945 Cubah Prop Pty Ltd 2038 D D A Inv Pty Ltd4884 D D A Inv Pty Ltd2037 Diocese Of Johannesburg Of The Roman Catholic Church4905 Dormell Prop 385 Pty LtdRe/2258 Dormell Prop 385 Pty Ltd2106 Dunwell Prop Cc2086 Dzviti Martin, Ndebele Khumbulani, Dzviti Ruth, Ndebele Catherine4899 Dzviti Martin, Ndebele Khumbulani, Dzviti Ruth, Ndebele Catherine4690 Erf 1812/1813 Noord Street Cc5281 Erf 1812/1813 Noord Street Cc1793 Erf 4905 Braamfontein Cc1/4900 Eskom Holdings Ltd1931 Eskom Holdings Ltd1932 Eskom Holdings Ltd
1864 Nitneg Prop Pty Ltd4874 Nitneg Prop Pty Ltd1/5106 Nyfida Cc2104 Peace Build Inv Pty Ltd4609 Peace Build Inv Pty Ltd1810 Polkadots Prop 138 Pty Ltd1811 Polkadots Prop 138 Pty Ltd2095 Polkadots Prop 138 Pty Ltd2096 Polkadots Prop 138 Pty Ltd1/2247 Prasa1799 Prasa1859 Prasa1928 Prasa1929 Prasa1930 Prasa1933 Prasa1936 Prasa1938 Prasa1939 Prasa1940 Prasa2045 Prasa2046 Prasa2047 Prasa2049 Prasa2050 Prasa2051 Prasa2052 Prasa2053 Prasa2056 Prasa2057 Prasa2062 Prasa4/5104 Prasa4382 Prasa4599 Prasa4902 Prasa5250 PrasaRe/5103 PrasaRe/5106 Prasa1858 Prasa 2108 Proc Corp 27 Cc1854 Provincial Gov. Of Gauteng2113 Quintax 77 Cc2093 Rapid Reaction Pty Ltd2101 Redefine Prop Ltd1846 Republic Of South Africa1848 Republic Of South Africa1866 Republic Of South Africa4400 Republic Of South Africa2351 Rosedale Mansion Pty Ltd4375 Rosedale Mansion Pty Ltd1925 Savyon Building Pty Ltd 5295 Savyon Building Pty Ltd Re/4896 Somadel Hotel Pty Ltd1642 South Point Management Services Pty Ltd
1643 South Point Management Services Pty Ltd1795 South Point Management Services Pty Ltd1950 South Point Management Services Pty Ltd1951 South Point Management Services Pty Ltd2089 St& Three Nought Five Wynberg Pty Ltd1792 Steele Mark Lewis1794 Steele Mark Lewis2260 Steele Mark Lewis1/2258 Steele Mark Lewis1/2248 Transnet Ltd1/4372 Transnet Ltd1/5116 Transnet Ltd1807 Transnet Ltd1812 Transnet Ltd1842 Transnet Ltd1843 Transnet Ltd1844 Transnet Ltd1845 Transnet Ltd1847 Transnet Ltd1849 Transnet Ltd1850 Transnet Ltd1851 Transnet Ltd1852 Transnet Ltd1853 Transnet Ltd1855 Transnet Ltd1862 Transnet Ltd1863 Transnet Ltd1867 Transnet Ltd1875 Transnet Ltd1876 Transnet Ltd1877 Transnet Ltd1878 Transnet Ltd1879 Transnet Ltd1880 Transnet Ltd1881 Transnet Ltd1944 Transnet Ltd2/5103 Transnet Ltd2059 Transnet Ltd2060 Transnet Ltd2061 Transnet Ltd2063 Transnet Ltd2064 Transnet Ltd2065 Transnet Ltd2066 Transnet Ltd2067 Transnet Ltd2068 Transnet Ltd2069 Transnet Ltd2097 Transnet Ltd3/5104 Transnet Ltd4/5103 Transnet Ltd4498 Transnet Ltd4634 Transnet Ltd4869 Transnet Ltd4897 Transnet Ltd
Re/4384 Transnet LtdRe/5104 Transnet Ltd1927 Tuhf Prop Pty Ltd5308 U C K G Props Pty Ltd 2338 Univ. Of The Witwatersr& 2119 Urban Prop Holdings Ltd1926 Veinte Inv Pty Ltd2259 Veinte Inv Pty Ltd1/4374 W H M Pty Ltd2/5106 W H M Pty Ltd1/5104 W&erers Home Pty Ltd2083 W&erers Home Pty Ltd2084 W&erers Home Pty Ltd2321 Westaid Mansions Pty Ltd2318 Zahavi Estate Cc1941 Zelpy 2058 Pty Ltd

SOCIO-ECONOMICS STATUS QUO
Southpoint Management
Cardamine Pty Ltd
JHB Diocesan Trustees
City of Johannesburg
Polkadots Prop 138 Pty Ltd
Transnet
Prasa
SOURCE: Windeed
N
0 50 100 200
Park Station Sub-Precinct
Railway Lines
Prasa Assets
Figure 5.7
Major Ownership: More than 5 Erfs

SOCIO-ECONOMICS STATUS QUO 167
SOURCE: Windeed
Purchase Dates
N
0 50 100 200
Park Station Sub-Precinct
Railway Lines
Prasa Assets
1952-1994
1995-1999
2000-2004
2005-2010
Figure 5.8
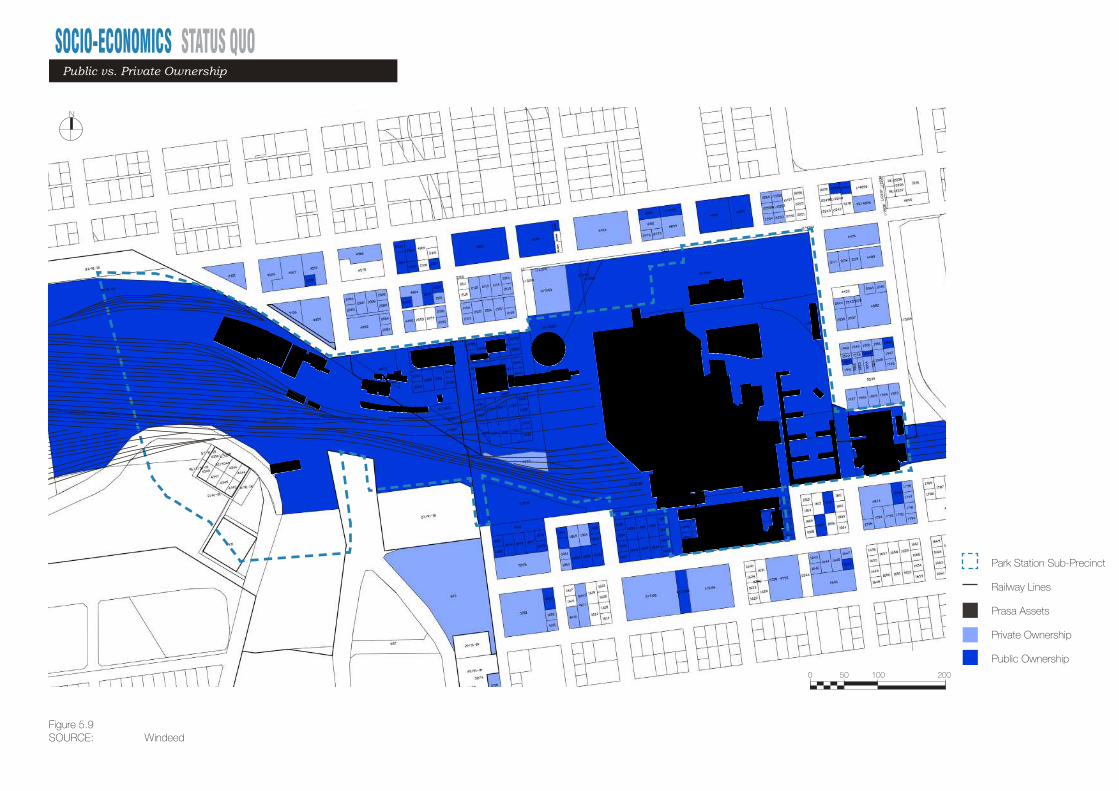
SOCIO-ECONOMICS STATUS QUO
SOURCE: Windeed
N
0 50 100 200
Park Station Sub-Precinct
Railway Lines
Prasa Assets
Private Ownership
Public Ownership
Figure 5.9
Public vs. Private Ownership
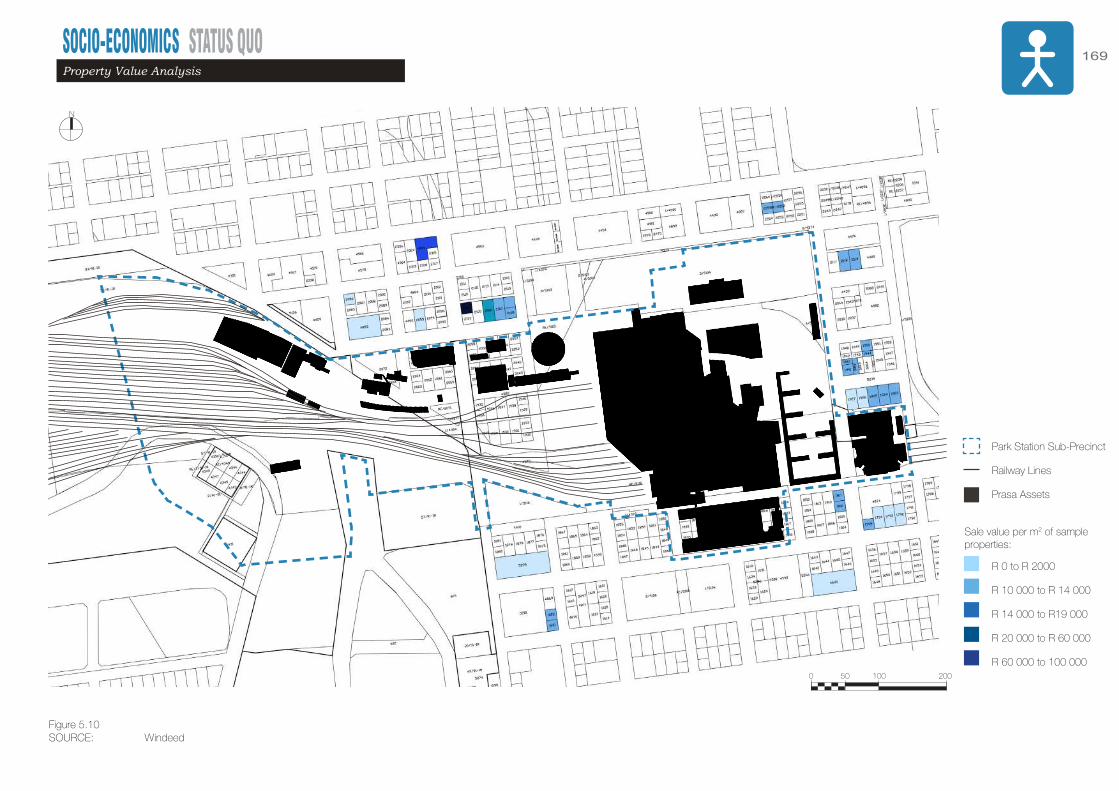
SOCIO-ECONOMICS STATUS QUO 169
SOURCE: Windeed
Property Value Analysis
N
0 50 100 200
Park Station Sub-Precinct
Railway Lines
Prasa Assets
R 0 to R 2000
R 10 000 to R 14 000
R 14 000 to R19 000
R 20 000 to R 60 000
R 60 000 to 100 000
Sale value per m2 of sample properties:
Figure 5.10

SOCIO-ECONOMICS STATUS QUO
SOURCE: Interviews with local police
0 50 100 200
N
Park Station Sub-Precinct
Railway Lines
Prasa Assets
Study Area
Out of Study Area
Criminal Activity
Patrolled Areas
1
2
2 2
7
5
6
4
3
Kazerne
Liquor outlets
Under Nelson Mandela
Under Queen Elizabeth
Cook House
Park Station
Wanderers Taxi Rank
1
2
3
4
5
6
7
Bridge
Bridge
Figure 5.11
Criminal Activity and Patrolled Areas

SOCIO-ECONOMICS STATUS QUO 171Safety Perceptions
0 50 100 200
N
Park Station Sub-Precinct
Railway Lines
Prasa Assets
Study Area
Out of Study Area
safe unsafe
SOURCE: On site observations by ARUP during the beginning of 2011Figure 5.12
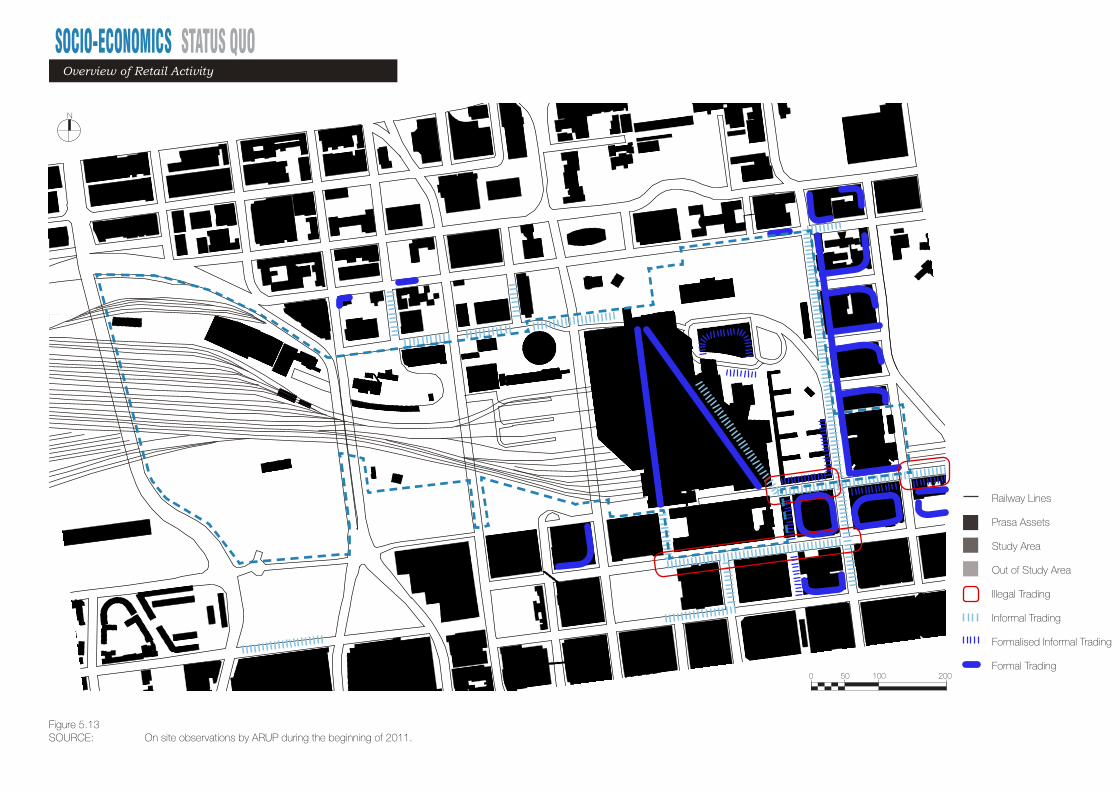
SOCIO-ECONOMICS STATUS QUO
N
SOURCE: On site observations by ARUP during the beginning of 2011.
Railway Lines
Prasa Assets
Study Area
Out of Study Area
Illegal Trading
Informal Trading
Formalised Informal Trading
Formal Trading0 50 100 200
Figure 5.13
Overview of Retail Activity

SOCIO-ECONOMICS STATUS QUO 173
0 50 100 200
N
Zones of Focus Analysis
Park Station Sub-Precinct
Railway Lines
Prasa Assets
Study Area
Out of Study Area
Zone 1
Zone 2
Zone 3
Zone 4
Zone 6
Zone 5
Formal Retail Activity Zone Demarcation
Figure 5.14
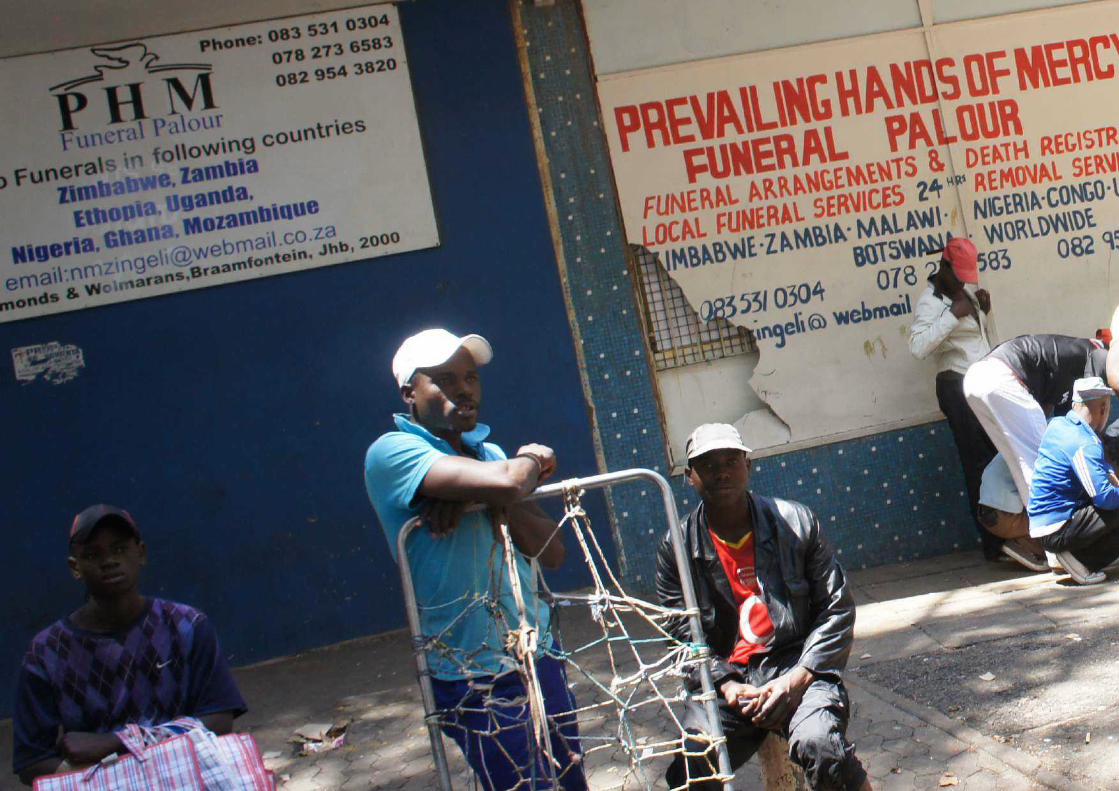
SOCIO-ECONOMICS STATUS QUO

SOCIO-ECONOMICS STATUS QUO 175
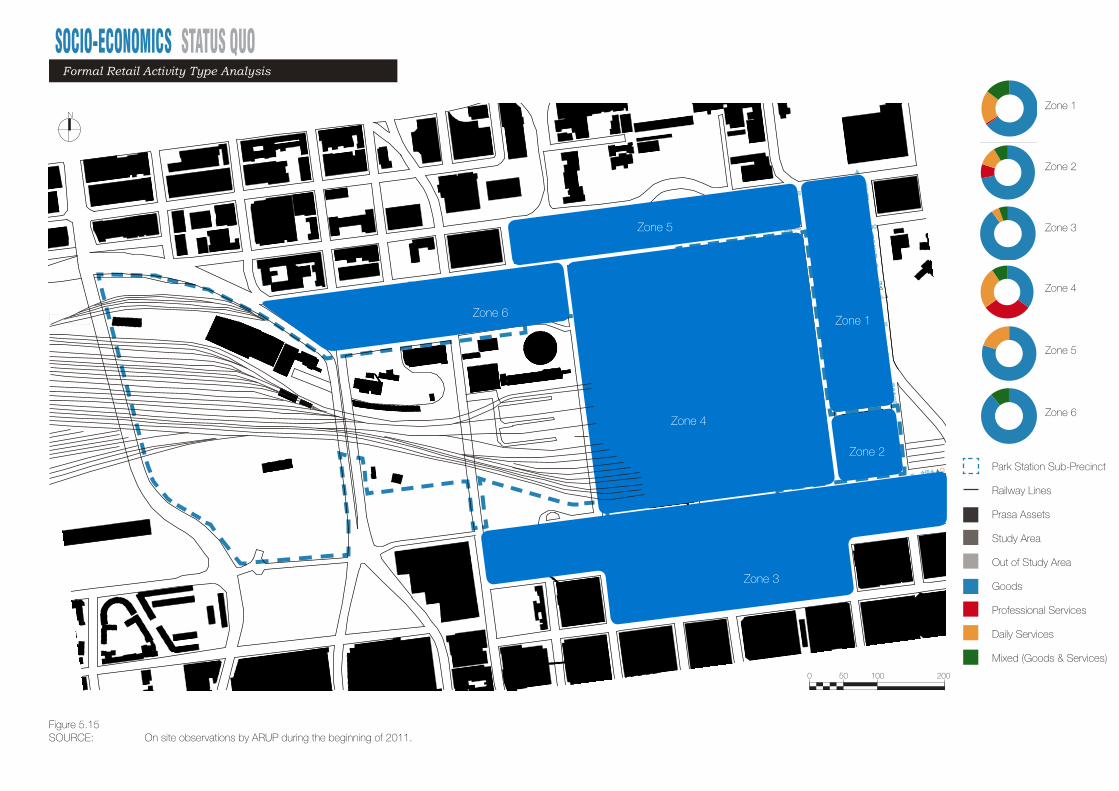
SOCIO-ECONOMICS STATUS QUO
SOURCE: On site observations by ARUP during the beginning of 2011.
0 50 100 200
N
Park Station Sub-Precinct
Railway Lines
Prasa Assets
Study Area
Out of Study Area
Goods
Professional Services
Daily Services
Mixed (Goods & Services)
Zone 1
Zone 2
Zone 3
Zone 4
Zone 5
Zone 6
Figure 5.15
Formal Retail Activity Type Analysis
Zone 4
Zone 2
Zone 5
Zone 1
Zone 3
Zone 6

SOCIO-ECONOMICS STATUS QUO 177Formal Retail Product Cycles
Selby
Daily
Zone 1 Zone 2 Zone 3 Zone 5Zone 4 Zone 4
Shop
Durban Durban MayfairCity DeepNationwide
2 / week3 / month 2 / week
Shop
Shop
Shop
Roodepoort
Shop
Zone 3
Soweto Midrand
Shop Shop
Daily Daily Daily
“Mr. Chips”“Fair Price Furniture” “Prems Pharmacy” “Pick ‘n Pack” “Unique Clothing” “Spec Station” “Take-aways”
SOURCE: On site observations by ARUP during the beginning of 2011.Figure 5.16
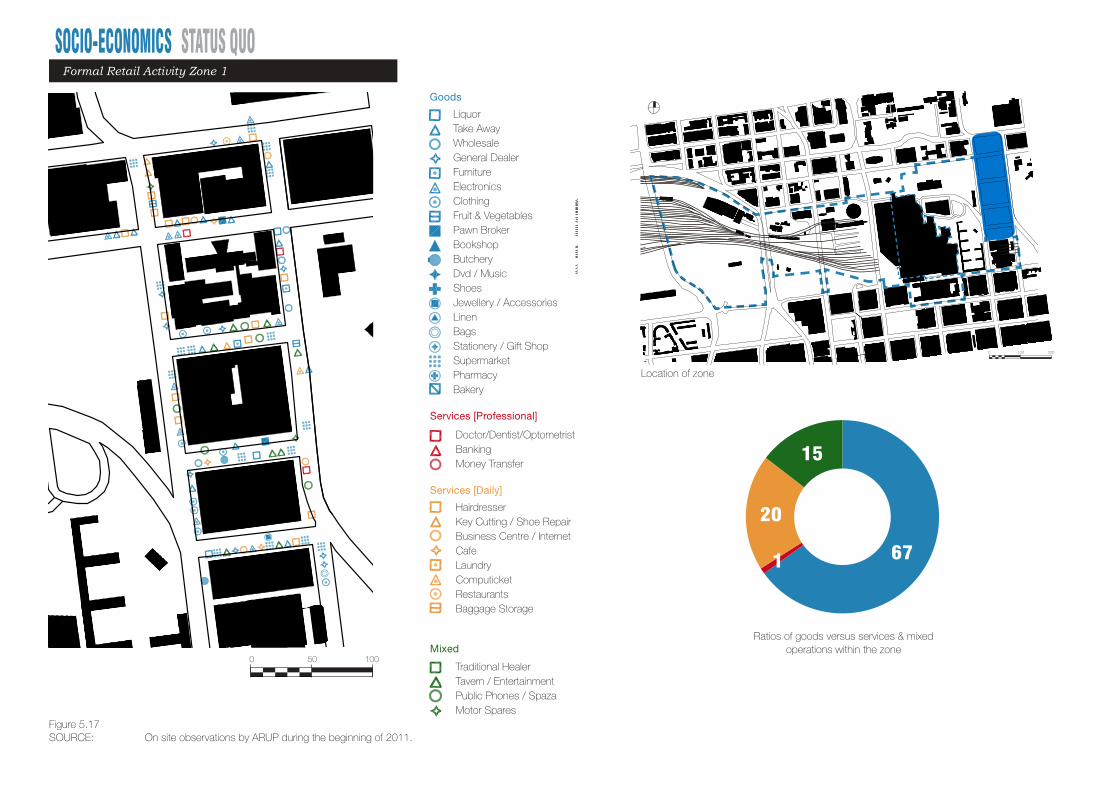
SOCIO-ECONOMICS STATUS QUO
0 100 200
0 50 100
LiquorTake AwayWholesaleGeneral DealerFurnitureElectronicsClothingFruit & VegetablesPawn BrokerBookshopButcheryDvd / MusicShoesJewellery / AccessoriesLinenBagsStationery / Gift ShopSupermarketPharmacyBakery
Doctor/Dentist/OptometristBankingMoney Transfer
HairdresserKey Cutting / Shoe RepairBusiness Centre / Internet CafeLaundryComputicketRestaurantsBaggage Storage
Traditional HealerTavern / EntertainmentPublic Phones / SpazaMotor Spares
Goods
Services [Professional]
Services [Daily]
Mixed
SOURCE: On site observations by ARUP during the beginning of 2011.
67
15
20
1
Ratios of goods versus services & mixed operations within the zone
Location of zone
Figure 5.17
Formal Retail Activity Zone 1
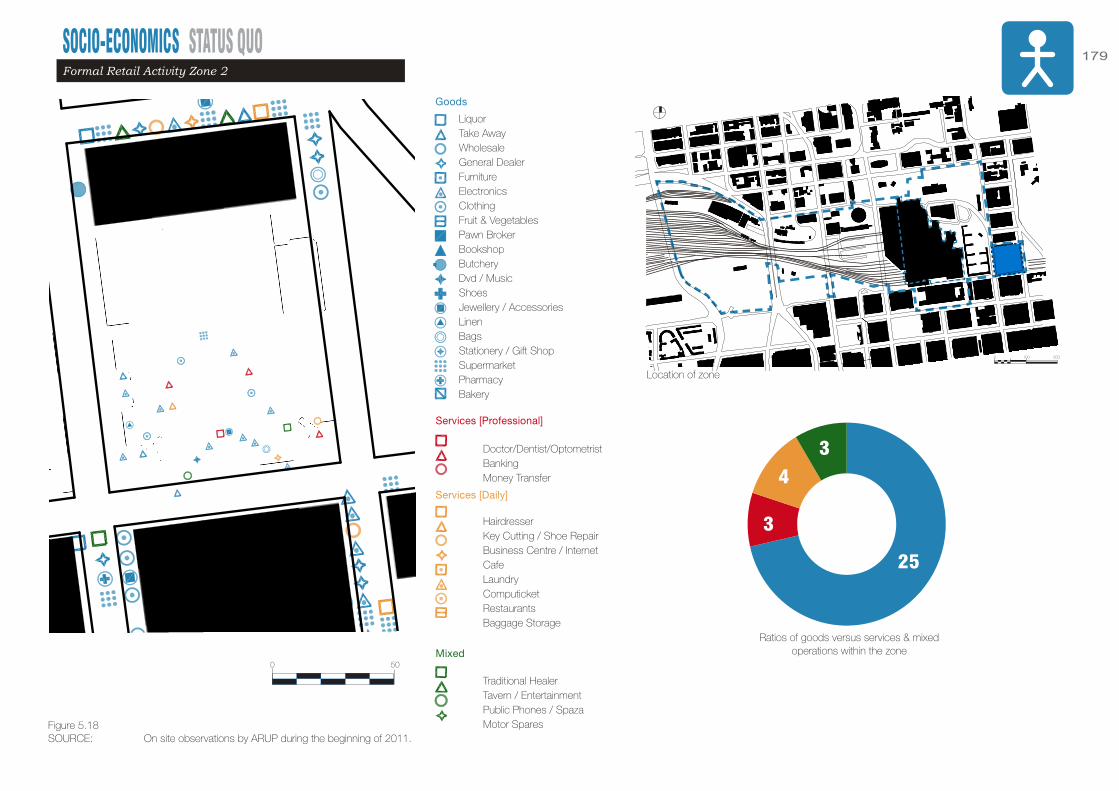
SOCIO-ECONOMICS STATUS QUO 179
0 50
Formal Retail Activity Zone 2
SOURCE: On site observations by ARUP during the beginning of 2011.
0 100 200
LiquorTake AwayWholesaleGeneral DealerFurnitureElectronicsClothingFruit & VegetablesPawn BrokerBookshopButcheryDvd / MusicShoesJewellery / AccessoriesLinenBagsStationery / Gift ShopSupermarketPharmacyBakery
Doctor/Dentist/OptometristBankingMoney Transfer
HairdresserKey Cutting / Shoe RepairBusiness Centre / Internet CafeLaundryComputicketRestaurantsBaggage Storage
Traditional HealerTavern / EntertainmentPublic Phones / SpazaMotor Spares
Goods
Services [Professional]
Services [Daily]
Mixed
25
3
4
3
Ratios of goods versus services & mixed operations within the zone
Location of zone
Figure 5.18
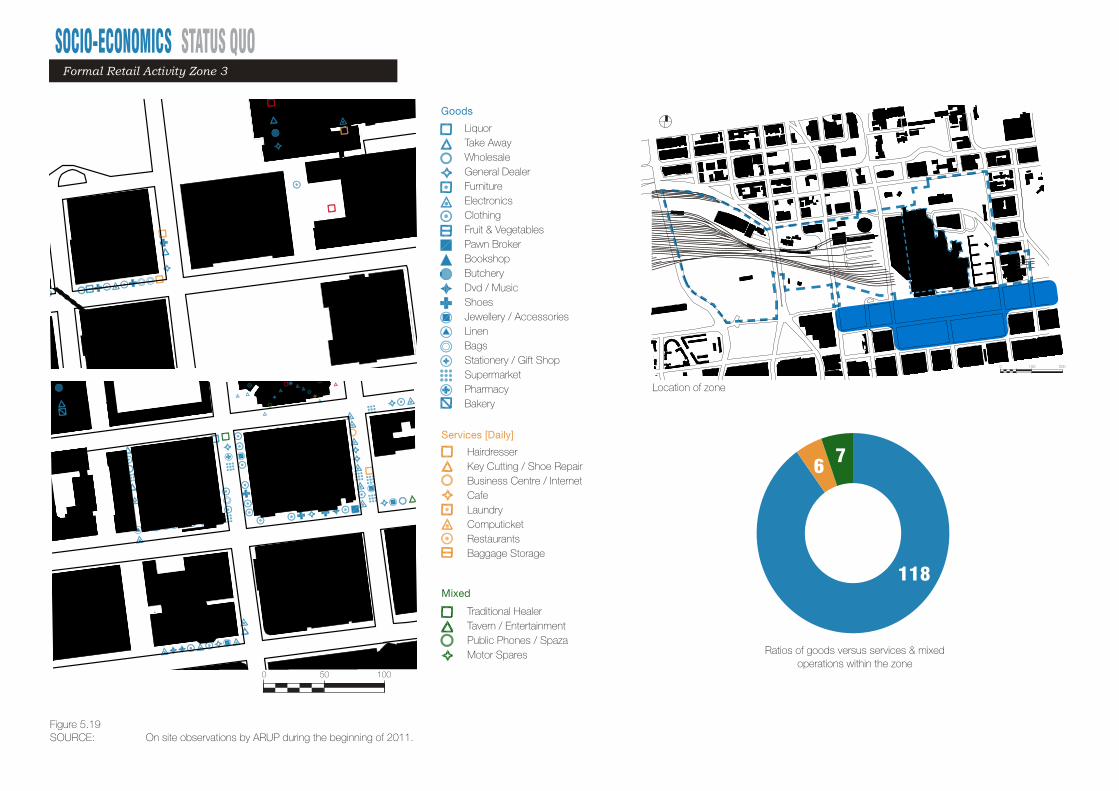
SOCIO-ECONOMICS STATUS QUO
0 50 100
0 100 200
LiquorTake AwayWholesaleGeneral DealerFurnitureElectronicsClothingFruit & VegetablesPawn BrokerBookshopButcheryDvd / MusicShoesJewellery / AccessoriesLinenBagsStationery / Gift ShopSupermarketPharmacyBakery
HairdresserKey Cutting / Shoe RepairBusiness Centre / Internet CafeLaundryComputicketRestaurantsBaggage Storage
Traditional HealerTavern / EntertainmentPublic Phones / SpazaMotor Spares
Goods
Services [Daily]
Mixed
118
6 7
SOURCE: On site observations by ARUP during the beginning of 2011.
Ratios of goods versus services & mixed operations within the zone
Location of zone
0 50 100 200
0 50 100 200
Figure 5.19
Formal Retail Activity Zone 3
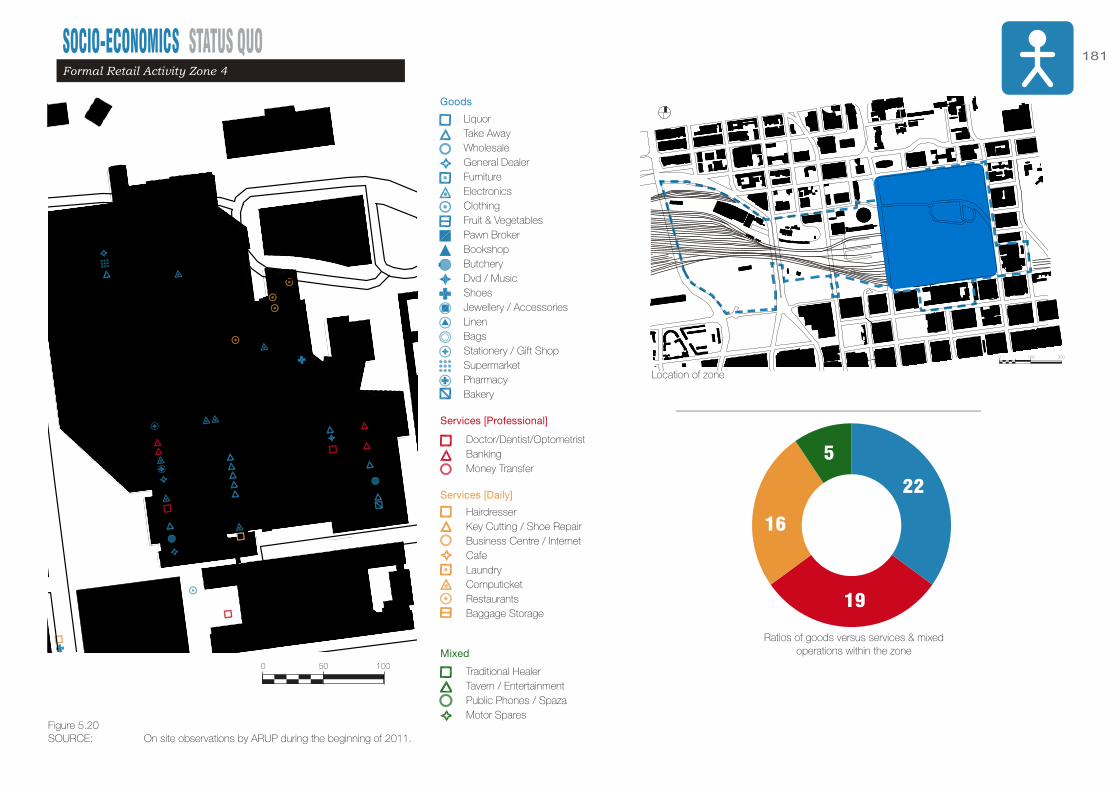
SOCIO-ECONOMICS STATUS QUO 181
0 50 100
Formal Retail Activity Zone 4
SOURCE: On site observations by ARUP during the beginning of 2011.
0 100 200
LiquorTake AwayWholesaleGeneral DealerFurnitureElectronicsClothingFruit & VegetablesPawn BrokerBookshopButcheryDvd / MusicShoesJewellery / AccessoriesLinenBagsStationery / Gift ShopSupermarketPharmacyBakery
Doctor/Dentist/OptometristBankingMoney Transfer
HairdresserKey Cutting / Shoe RepairBusiness Centre / Internet CafeLaundryComputicketRestaurantsBaggage Storage
Traditional HealerTavern / EntertainmentPublic Phones / SpazaMotor Spares
Goods
Services [Professional]
Services [Daily]
Mixed
19
22
5
16
Ratios of goods versus services & mixed operations within the zone
Location of zone
Figure 5.20

SOCIO-ECONOMICS STATUS QUO
0 50 100
SOURCE: On site observations by ARUP during the beginning of 2011.
0 100 200
LiquorTake AwayWholesaleGeneral DealerFurnitureElectronicsClothingFruit & VegetablesPawn BrokerBookshopButcheryDvd / MusicShoesJewellery / AccessoriesLinenBagsStationery / Gift ShopSupermarketPharmacyBakery
HairdresserKey Cutting / Shoe RepairBusiness Centre / Internet CafeLaundryComputicketRestaurantsBaggage Storage
Goods
Services [Daily]
4
1
Ratios of goods versus services & mixed operations within the zone
Location of zone
Figure 5.21
Formal Retail Activity Zone 5

SOCIO-ECONOMICS STATUS QUO 183Formal Retail Activity Zone 6
0 100 200
LiquorTake AwayWholesaleGeneral DealerFurnitureElectronicsClothingFruit & VegetablesPawn BrokerBookshopButcheryDvd / MusicShoesJewellery / AccessoriesLinenBagsStationery / Gift ShopSupermarketPharmacyBakery
Traditional HealerTavern / EntertainmentPublic Phones / SpazaMotor Spares
Goods
Mixed
0 50 100
8
1
SOURCE: On site observations by ARUP during the beginning of 2011.
Ratios of goods versus services & mixed operations within the zone
Location of zone
Figure 5.22

SOCIO-ECONOMICS STATUS QUO
Key Facts
Key Facts
Key Facts
Key Facts
Active ShopfrontType 1
Clip-on ShopfrontType 3
ConvertedType 2
Internal SubdivisionsType 4
On Grade
Operating Hours 06h00 - 18h00 mon-fri
Weekend Operation
Retrofit
YES NO
YES NO
YES NO
MOBILEOn Grade
Operating Hours 06h00-18h00 mon-fri
Weekend Operation
Retrofit
YES NO
YES NO
YES NO
On Grade
Operating Hours 06h30-19h00 mon-fri
Weekend Operation
Retrofit
YES NO
YES NO
YES NO
On Grade
Operating Hours 06h30-21h30 mon-fri
Weekend Operation
Retrofit
YES NO
YES NO
YES NO
Formal Trading Typologies
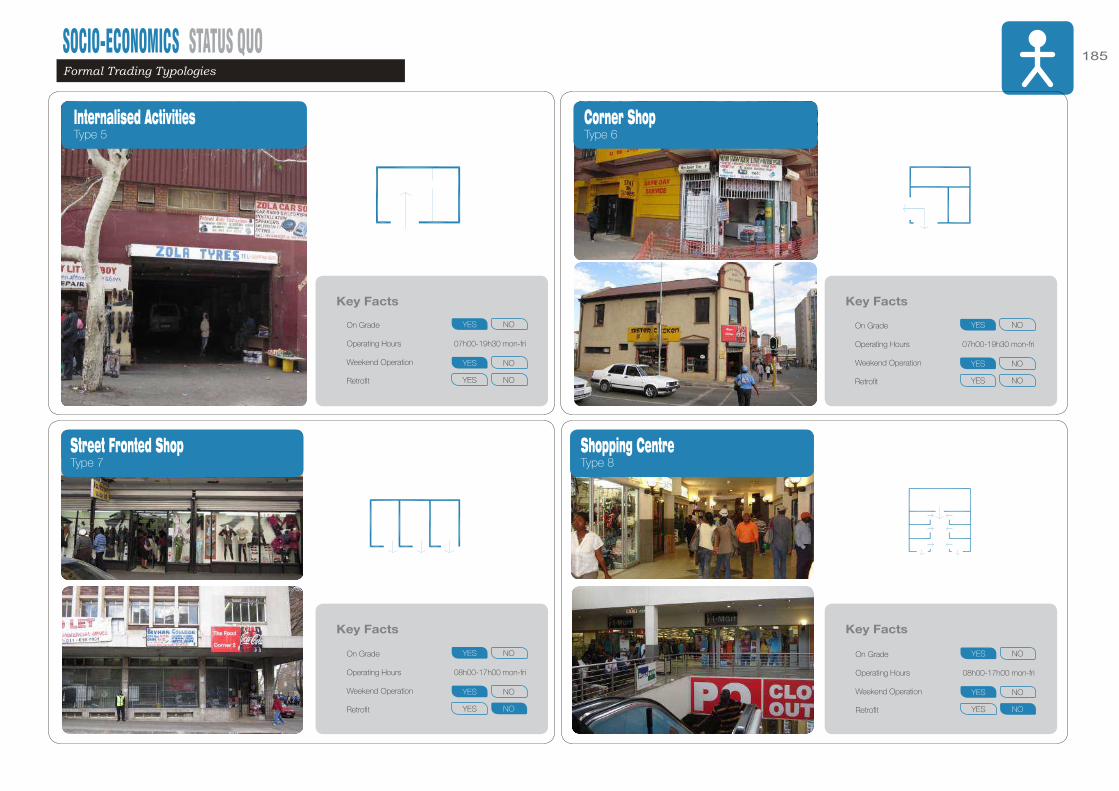
SOCIO-ECONOMICS STATUS QUO 185
Key Facts
Key Facts
Key Facts
Key Facts
Formal Trading Typologies
On Grade
Operating Hours 07h00-19h30 mon-fri
Weekend Operation
Retrofit
YES NO
YES NO
YES NO
On Grade
Operating Hours 08h00-17h00 mon-fri
Weekend Operation
Retrofit
YES NO
YES NO
YES NO
On Grade
Operating Hours 08h00-17h00 mon-fri
Weekend Operation
Retrofit
YES NO
YES NO
YES NO
On Grade
Operating Hours 07h00-19h30 mon-fri
Weekend Operation
Retrofit
YES NO
YES NO
YES NO
Internalised ActivitiesType 5
Street Fronted ShopType 7
Corner ShopType 6
Shopping CentreType 8

SOCIO-ECONOMICS STATUS QUOLocal Hawker’s Newspaper & Business Plan

A street beggar outside a shop in Hillbrow.

SOCIO-ECONOMICS STATUS QUO
N
0 50 100 200
SOURCE: On site observations by ARUP during the beginning of 2011.
Park Station Sub-Precinct
Railway Lines
Prasa Assets
Study Area
Out of Study Area
Goods
Services
Zone 1
Zone 2
Zone 3
Zone 4
Zone 5
Zone 6
Figure 5.23
Informal Retail Activity Type Analysis
Zone 1
Zone 2
Zone 3
Zone 5
Zone 6
Zone 4
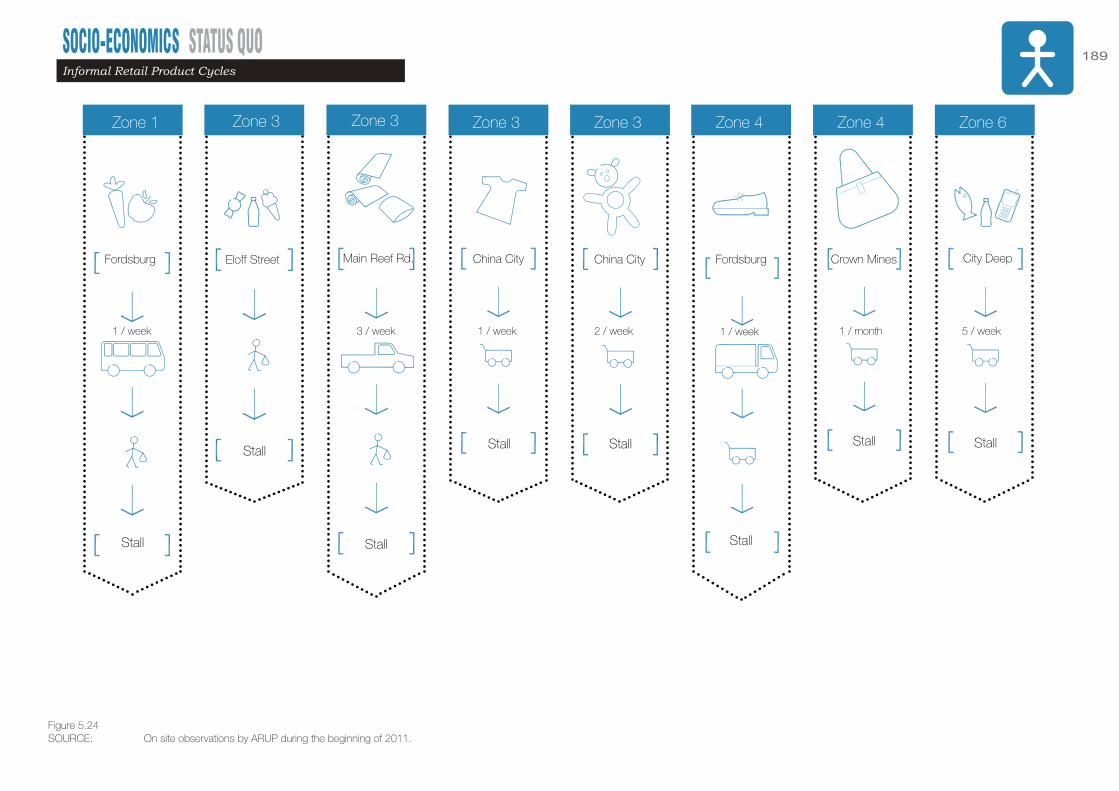
SOCIO-ECONOMICS STATUS QUO 189Informal Retail Product Cycles
Fordsburg
1 / week
Zone 1 Zone 3 Zone 3 Zone 3 Zone 3 Zone 6Zone 4 Zone 4
Stall
Eloff Street Main Reef Rd. China City Fordsburg Crown Mines City DeepChina City
3 / week 1 / week 2 / week 1 / week 1 / month 5 / week
Stall
Stall
Stall Stall
Stall
Stall Stall
SOURCE: On site observations by ARUP during the beginning of 2011.Figure 5.24
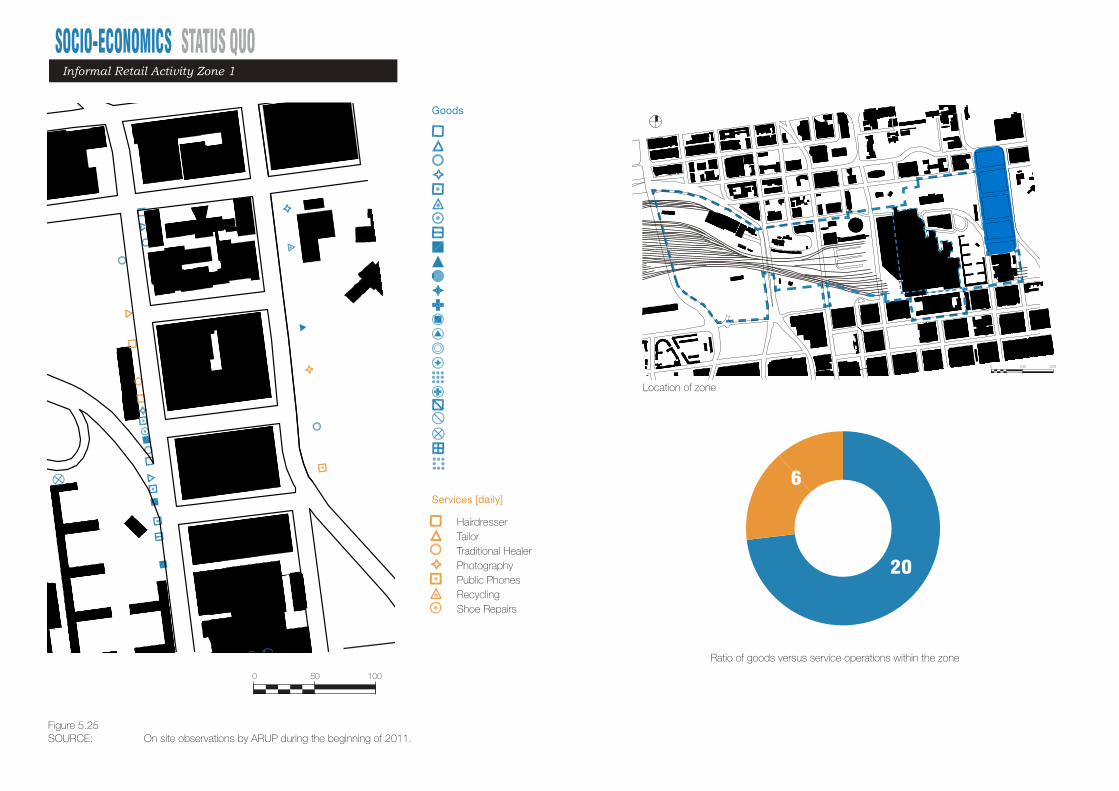
SOCIO-ECONOMICS STATUS QUO
0 100 200
0 50 100
HairdresserTailorTraditional HealerPhotographyPublic PhonesRecyclingShoe Repairs
Services [daily]
Goods
SOURCE: On site observations by ARUP during the beginning of 2011.
Ratio of goods versus service operations within the zone
Location of zone
6
20
Figure 5.25
Informal Retail Activity Zone 1
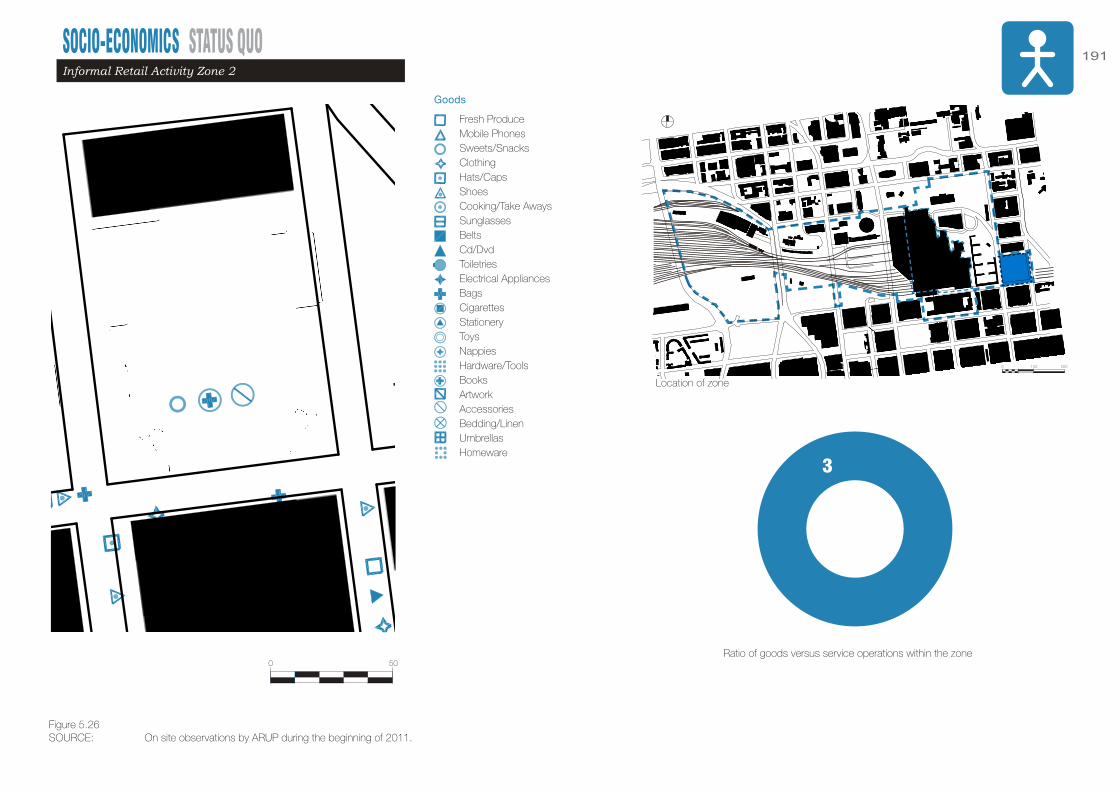
SOCIO-ECONOMICS STATUS QUO 191
0 100 200
Informal Retail Activity Zone 2
0 50
Fresh ProduceMobile PhonesSweets/SnacksClothingHats/CapsShoesCooking/Take AwaysSunglassesBeltsCd/DvdToiletriesElectrical AppliancesBagsCigarettesStationeryToysNappiesHardware/ToolsBooksArtworkAccessoriesBedding/LinenUmbrellasHomeware
HairdresserTailorTraditional HealerPhotographyPublic PhonesRecyclingShoe Repairs
Goods
SOURCE: On site observations by ARUP during the beginning of 2011.
Ratio of goods versus service operations within the zone
Location of zone
3
Figure 5.26

SOCIO-ECONOMICS STATUS QUO
0 50 100
Fresh ProduceMobile PhonesSweets/SnacksClothingHats/CapsShoesCooking/Take AwaysSunglassesBeltsCd/DvdToiletriesElectrical AppliancesBagsCigarettesStationeryToysNappiesHardware/ToolsBooksArtworkAccessoriesBedding/LinenUmbrellasHomeware
HairdresserTailorTraditional HealerPhotographyPublic PhonesRecyclingShoe Repairs
Services [daily]
Goods
0 100 200
SOURCE: On site observations by ARUP during the beginning of 2011.
Ratio of goods versus service operations within the zone
Location of zone
7
77
0 50 100 200
0 50 100 200
Figure 5.27
Informal Retail Activity Zone 3

SOCIO-ECONOMICS STATUS QUO 193Informal Retail Activity Zone 4
0 50 100
Fresh ProduceMobile PhonesSweets/SnacksClothingHats/CapsShoesCooking/Take AwaysSunglassesBeltsCd/DvdToiletriesElectrical AppliancesBagsCigarettesStationeryToysNappiesHardware/ToolsBooksArtworkAccessoriesBedding/LinenUmbrellasHomeware
HairdresserTailorTraditional HealerPhotographyPublic PhonesRecyclingShoe Repairs
Services [daily]
Goods
0 100 200
SOURCE: On site observations by ARUP during the beginning of 2011.
Ratio of goods versus service operations within the zone
Location of zone
1
10
Figure 5.28

SOCIO-ECONOMICS STATUS QUO
0 100 200
0 50 100
SOURCE: On site observations by ARUP during the beginning of 2011.
NOTE: There was no informal trading found in this zone.
Ratio of goods versus service operations within the zone
Location of zone
Figure 5.29
Informal Retail Activity Zone 5
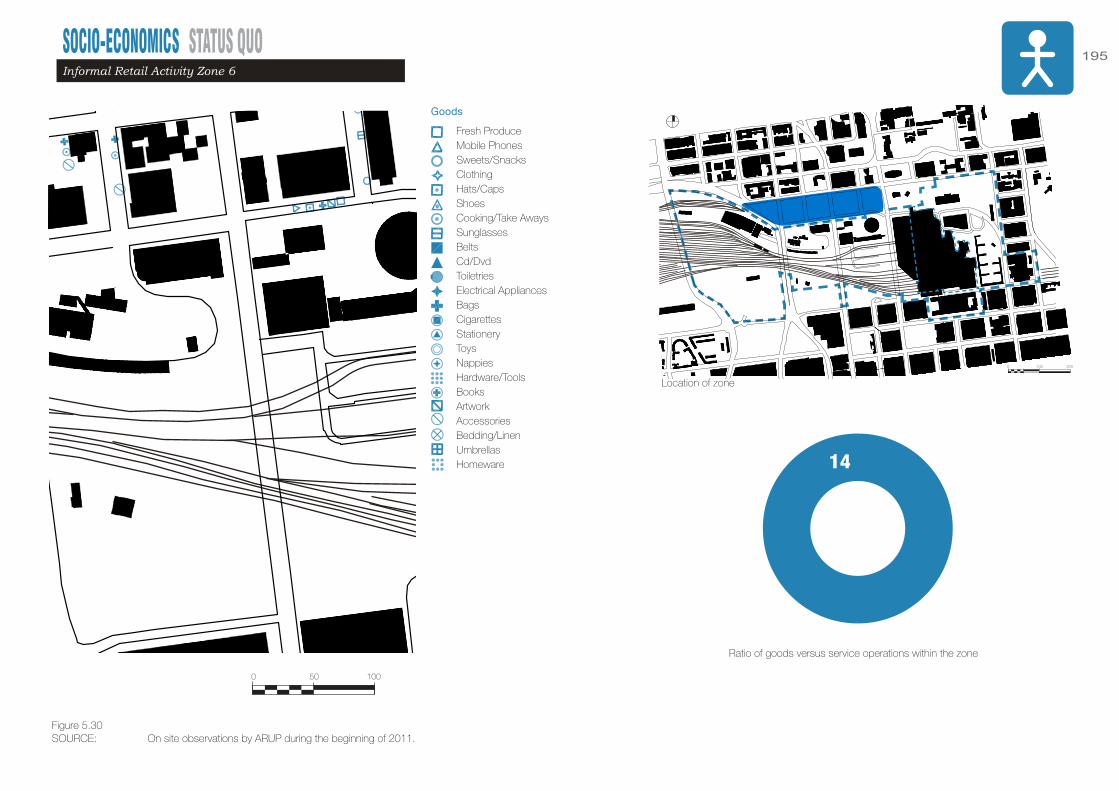
SOCIO-ECONOMICS STATUS QUO 195
0 100 200
Fresh ProduceMobile PhonesSweets/SnacksClothingHats/CapsShoesCooking/Take AwaysSunglassesBeltsCd/DvdToiletriesElectrical AppliancesBagsCigarettesStationeryToysNappiesHardware/ToolsBooksArtworkAccessoriesBedding/LinenUmbrellasHomeware
HairdresserTailorTraditional HealerPhotographyPublic PhonesRecyclingShoe Repairs
Goods
Informal Retail Activity Zone 6
0 50 100
SOURCE: On site observations by ARUP during the beginning of 2011.
Ratio of goods versus service operations within the zone
Location of zone
14
Figure 5.30
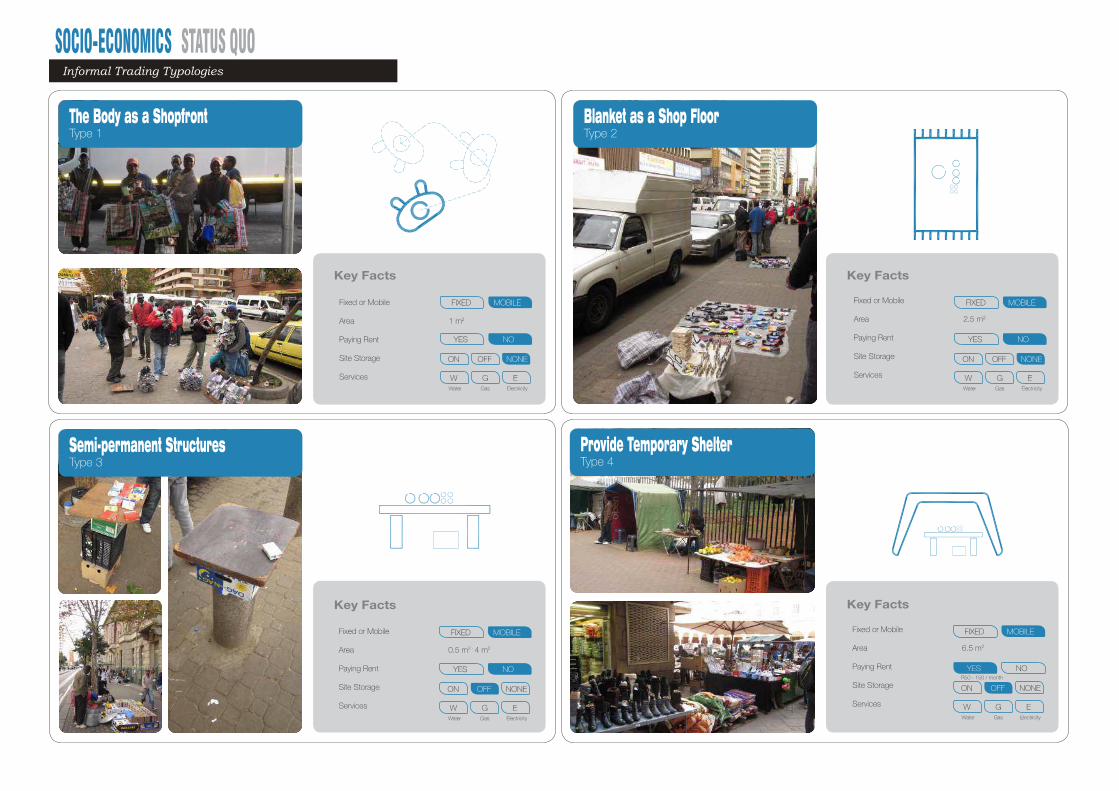
SOCIO-ECONOMICS STATUS QUO
Key Facts
Key Facts
Key Facts
Key Facts
Fixed or Mobile
Area 1 m2
Paying Rent
Site Storage
Services
FIXED MOBILE
YES NO
ON NONEOFF
W EGWater Gas Electricity
Fixed or Mobile
Area 2.5 m2
Paying Rent
Site Storage
Services
FIXED MOBILE
YES NO
ON NONEOFF
W EGWater Gas Electricity
Fixed or Mobile
Area 0.5 m2 - 4 m2
Paying Rent
Site Storage
Services
FIXED MOBILE
YES NO
ON NONEOFF
W EGWater Gas Electricity
Fixed or Mobile
Area 6.5 m2
Paying Rent
Site Storage
Services
FIXED MOBILE
YES NO
ON NONEOFF
W EGWater Gas Electricity
R50 - 150 / month
The Body as a ShopfrontType 1
Semi-permanent StructuresType 3
Blanket as a Shop FloorType 2
Provide Temporary ShelterType 4
Informal Trading Typologies

SOCIO-ECONOMICS STATUS QUO 197
Key Facts
Mobile TradingType 5
Permanent StructureType 6
Informal Trading Typologies
Fixed or Mobile
Area 1.5 m2
Paying Rent
Site Storage
Services
FIXED MOBILE
YES NO
ON NONEOFF
W EGWater Gas Electricity
Fixed or Mobile
Area 7 m2
Paying Rent
Site Storage
Services
FIXED MOBILE
YES NO
ON NONEOFF
W EGWater Gas Electricity
R150 - R300 / month
Key Facts
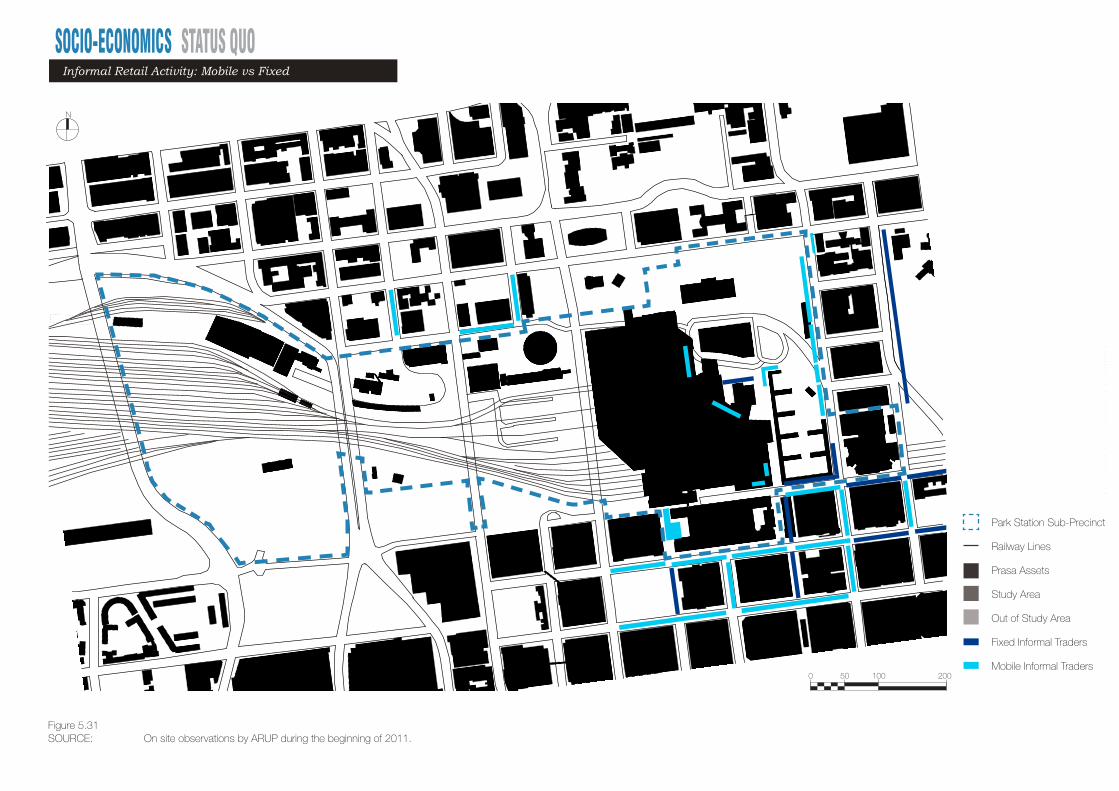
SOCIO-ECONOMICS STATUS QUO
0 50 100 200
N
Park Station Sub-Precinct
Railway Lines
Prasa Assets
Study Area
Out of Study Area
Fixed Informal Traders
Mobile Informal Traders
SOURCE: On site observations by ARUP during the beginning of 2011.Figure 5.31
Informal Retail Activity: Mobile vs Fixed
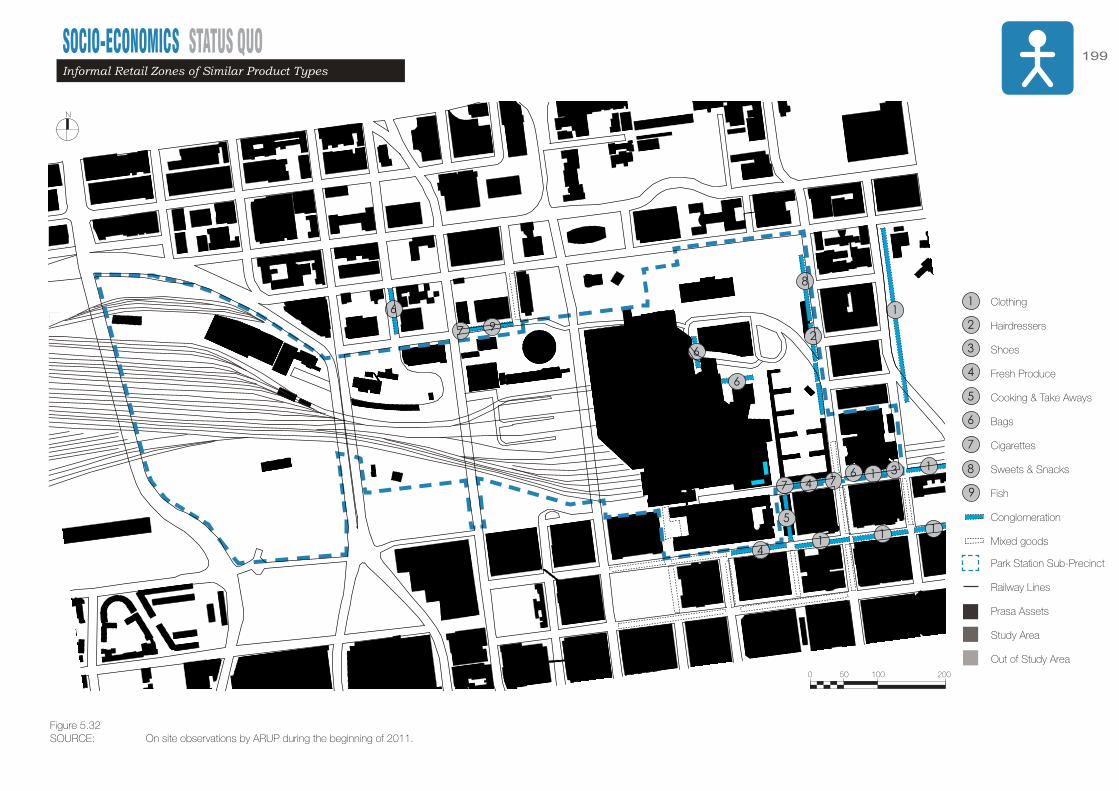
SOCIO-ECONOMICS STATUS QUO 199Informal Retail Zones of Similar Product Types
0 50 100 200
N
Park Station Sub-Precinct
Railway Lines
Prasa Assets
Study Area
Out of Study Area
SOURCE: On site observations by ARUP during the beginning of 2011.
Clothing
Hairdressers
Shoes
Fresh Produce
Cooking & Take Aways
Bags
Cigarettes
Sweets & Snacks
Fish
Conglomeration
Mixed goods
1
2
3
4
5
5
4
1
4
6
7
6
6
3
2
77
1
1
1 1
6 8
8
1
6
7
9
9
Figure 5.32


SOCIO-ECONOMICS STATUS QUO 201Trolley Pusher Routes
SOURCE: On site observations by ARUP in June 2011Figure 5.33
Route A
Route B
Route C
Route D
Route E
Route F
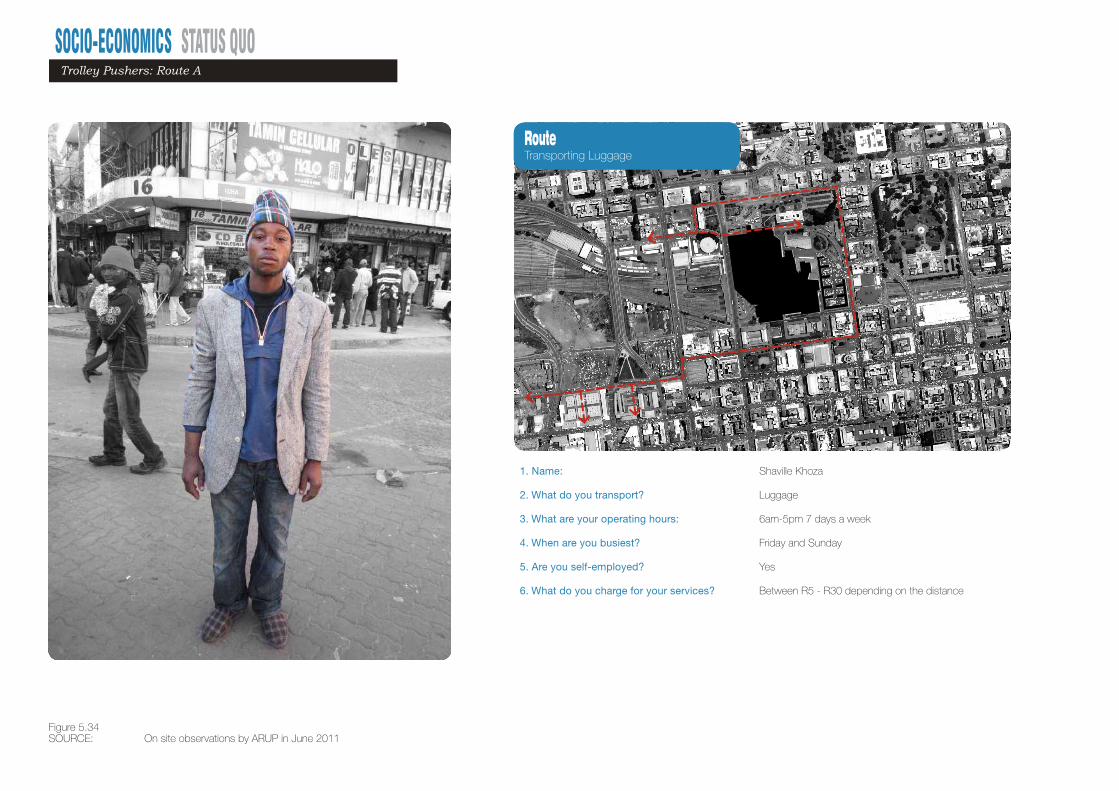
SOCIO-ECONOMICS STATUS QUO
1. Name: Shaville Khoza
2. What do you transport? Luggage
3. What are your operating hours: 6am-5pm 7 days a week 4. When are you busiest? Friday and Sunday
5. Are you self-employed? Yes
6. What do you charge for your services? Between R5 - R30 depending on the distance
SOURCE: On site observations by ARUP in June 2011
Trolley Pushers: Route A
RouteTransporting Luggage
Figure 5.34

SOCIO-ECONOMICS STATUS QUO 203
1. Name: Katlego Legodi
2. What do you transport? Fresh produce, assorted goods and luggage
3. What are your operating hours: 5am-6pm 7 days a week 4. When are you busiest? During public holidays and month end
5. Are you self-employed? Yes
6. What do you charge for your services? Typically I would charge R30 from Wanderers St. to Bree St.
SOURCE: On site observations by ARUP in June 2011
Trolley Pushers: Route B
RouteTransporting Goods and Luggage
Figure 5.35

SOCIO-ECONOMICS STATUS QUO
1. Name: Jabulani Mkhonazi
2. What do you transport? Fresh produce and assorted goods
3. What are your operating hours: 11am - 6pm 7 days per week 4. When are you busiest? Month end
5. Are you self-employed? Yes
6. What do you charge for your services? Between R20 - R50 depending on the distance
SOURCE: On site observations by ARUP in June 2011
RouteTransporting Goods
Trolley Pushers: Route C
Figure 5.36

SOCIO-ECONOMICS STATUS QUO 205
1. Name: Tendai Madamombe
2. What do you transport? Recycled cardboard
3. What are your operating hours: 7am - 6pm 7 days a week 4. When are you busiest? Friday, Saturday and month end
5. Are you self-employed? Yes
6. What do you charge for your services? I get 65c per kg of cardboard. 1 trolley carries 700kg of cardboard and it takes me about 3 days to fill up one trolley load. I drop off my cardboard at the Newtown recycling depot.
SOURCE: On site observations by ARUP in June 2011Figure 5.37
Trolley Pushers: Route D
RouteTransporting Recycled Cardboard

SOCIO-ECONOMICS STATUS QUO
1. Name: Sipho Nkosi
2. What do you transport? Luggage
3. What are your operating hours: 5am-8pm 7 days a week 4. When are you busiest? Friday and Saturday
5. Are you self-employed? Yes
6. What do you charge for your services? Between R10 - R35 depending on the distance
SOURCE: On site observations by ARUP in June 2011Figure 5.38
RouteTransporting Luggage
Trolley Pushers: Route E
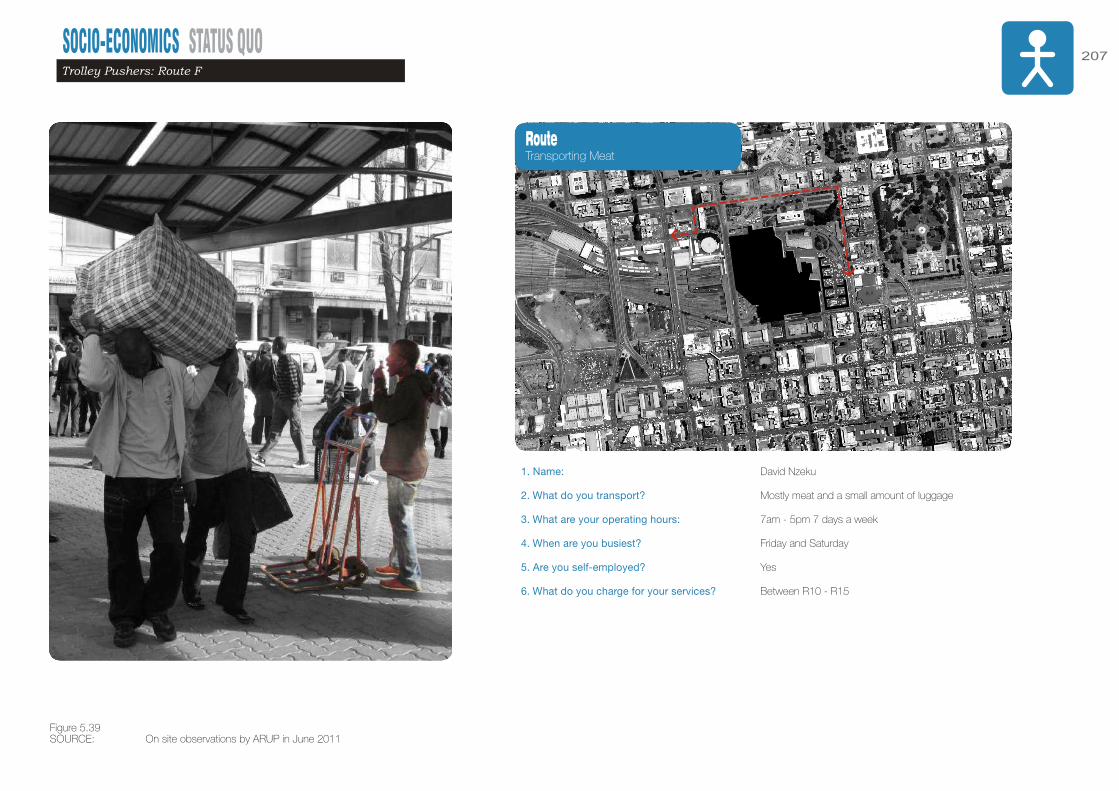
SOCIO-ECONOMICS STATUS QUO 207
1. Name: David Nzeku
2. What do you transport? Mostly meat and a small amount of luggage
3. What are your operating hours: 7am - 5pm 7 days a week 4. When are you busiest? Friday and Saturday
5. Are you self-employed? Yes
6. What do you charge for your services? Between R10 - R15
SOURCE: On site observations by ARUP in June 2011Figure 5.39
Trolley Pushers: Route F
RouteTransporting Meat

SOCIO-ECONOMICS STATUS QUO
1. Facility Type: Transport
2. What is transported: Passangers and Goods.
3. Frequency: Twice weekly 4. Facilities Waiting Area, Offices, Ticket Office, 2 Rooms for drivers
5. Other Amenities: Tavern with hotel above.
6. Known Issues: Tavern playing music 24/7 and negatively affecting hotel guests
Malawian Bus/Freight Facility
Location Map
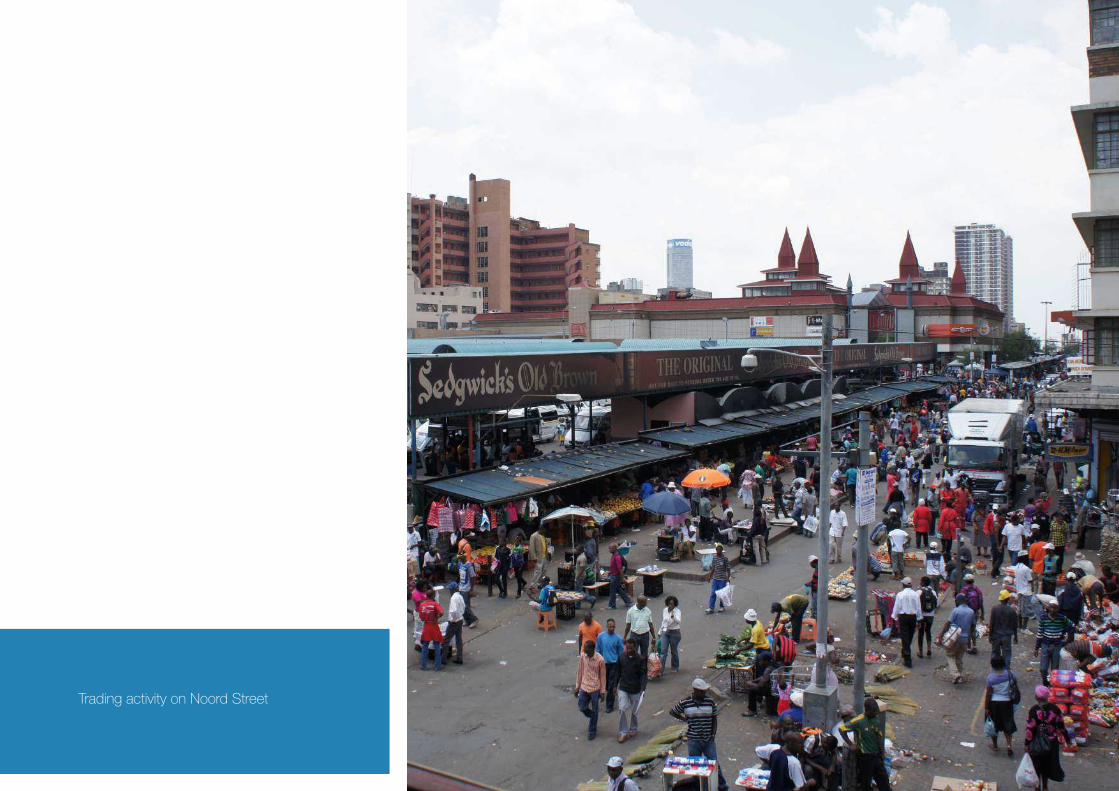
Trading activity on Noord Street

INFRASTRUCTURE & SERVICES STATUS QUO“There used to be a lot of crime on this street but this was greatly improved when the City installed CCTV cameras and put up the hijack hot-spot signs.”
Mohammed RamelSupermarket owner on Wanderer’s Street, 2011.

INFRASTRUCTURE & SERVICES STATUS QUO211INFRASTRUCTURE
& SERVICESPark Station Sub-precinct Development Framework
CHAPTER 6
The basic physical & organisational structures needed for the operations & facilities necessary for an economy to function.
INFRASTRUCTURE & SERVICES STATUS QUOIntroduction
The areas covered by the study are:
1. Braamfontein
2. Johannesburg City Centre
The specific buildings that are included in the study area are:
1. Park Station
2. Umjantshi House
3. Formula 1 Hotel
4. The Bridge Shopping Centre
5. Blue Room Building
6. Rotunda Building
7. Metro park and Training Facility
8. Corner Harrison and Leyds Street
9. Lab Building
10. Platform 19
11. Crèche
12. Shosholoza Meyl Junction
13. Train Simulator
Introduction
This chapter investigates infrastructure that may be affected by development
in and around the Park Station Sub-precinct site. The infrastructure
covered is water reticulation, sewer reticulation, road network, storm water
management, electrical distribution, telecommunication networks and gas
reticulation for the area.
Scope of work
The Park Station Sub-Precinct Development will affect various services in
and around the city centre study area. The scope of works for this study
includes:
• An investigation of the existing infrastructure systems in the study area
and a report on the available capacity.
• An investigation of planned future infrastructure systems from service
providers in the area of the development as well as affected areas.
• An investigation of the flood plain of the study area.

Two gentleman selling braaied gizzards on
the pavement at Corner Leyds and Harrison
Streets.
INFRASTRUCTURE & SERVICES STATUS QUO
Roads
Roads fall under the jurisdiction of the Johannesburg Roads Agency and
their norms and standards must be adhered to in future designs.
The existing bulk and link roads to the project area are in place and are
adequate to cater for the future and existing density demands. The Bulk
road infrastructure is the M1 to the West, the M2 to the South and the N3
to the East of the project area.
A historical restriction of the study area is the poor East – West movement
which may have to be addressed in the later design stages.
Service providers in these areas are City of Johannesburg Metropolitan
Municipality (COJ) which provides distribution networks for water, electricity
and provides sewer and stormwater management systems for the area,
Egoli Gas which provides gas reticulation, Johannesburg City Power
which provides bulk electricity supply, Eskom which provides reticulation,
Johannesburg Water Agency that supplies bulk water services to the area
and Telkom and Neotel who provide telecommunications.
Existing Infrastructure
All existing infrastructure, pipe sizes and alignments are shown on the
drawings.
It should be noted that the existing infrastructure has been investigated
to the relevant site boundaries only, no internal reticulations have been
investigated.
It should further be noted that the existing infrastructure can cater for the
existing Nett Floor Areas of the study area since this is currently the status
quo. Should the existing densities be increased, the existing infrastructure
will have to be reviewed and possibly upgraded to accommodate the
increased densities. If, however, the existing densities are maintained or
even reduced, the current infrastructure can be kept as is, no changes
would be required other than where services may have to be deviated to
suit the new developments.
Introduction

Rubbish dumped on the pavement in Bree
Street opposite Jack Mincer taxi rank.
INFRASTRUCTURE & SERVICES STATUS QUO
Water Reticulation
Water and Waste water falls under the jurisdiction of the Johannesburg
Water Agency and their design standards will be applicable to all future
developments.
Bulk water supply to the area is at full capacity and no spare capacity is
available, however, should future developments be designed to match the
current densities, the capacity will be adequate.
If densification is increased it will result in further storage requirements which
could be provided on site or by upgrading the existing reservoir capacity.
In this proposal on site storage in conjunction with rain and storm water
harvesting should be considered due to the sustainability opportunities
presented by this project, but Bulk storage will be from the existing Yeoville
reservoir system.
With water and storm water harvesting, water treatment plants and
purification works should be considered, the purification and treatment
works are very versatile and can be designed in package plants for ease
of future upgrading. Implementation of greywater and Blackwater systems
should be investigated nearer to the actual development taking place, these
measures could substantially reduce the cost of the water consumption
and may be a cost saving measure in the long term.
Stormwater
Storm water management also falls under the Johannesburg Roads Agency
jurisdiction.
The proposed development area has already reached near maximum
run-off capacity. Any increase in density would require the provision of
attenuation structures in order to control the inflow of storm water into the
bulk system, developments that provide suitable attenuation measures
should be put in place, these measures may be in the form of retention
ponds and storage ponds for storm water harvesting which could be used
for irrigation purposes, thus reducing overall water consumption.
Disposal of sediments collected in these ponds or tanks will be a maintenance
issue and will form part of the management of the future development.
It has been reported that a number of buildings are prone to flooding, this is a
recent phenomenon and can be attributed to poor maintenance in the form
of stolen or non-functional submersible pumps, blocked stormwater outlets
and other damaged or non-functional stormwater structures, essentially
due to a lack of maintenance.
Introduction
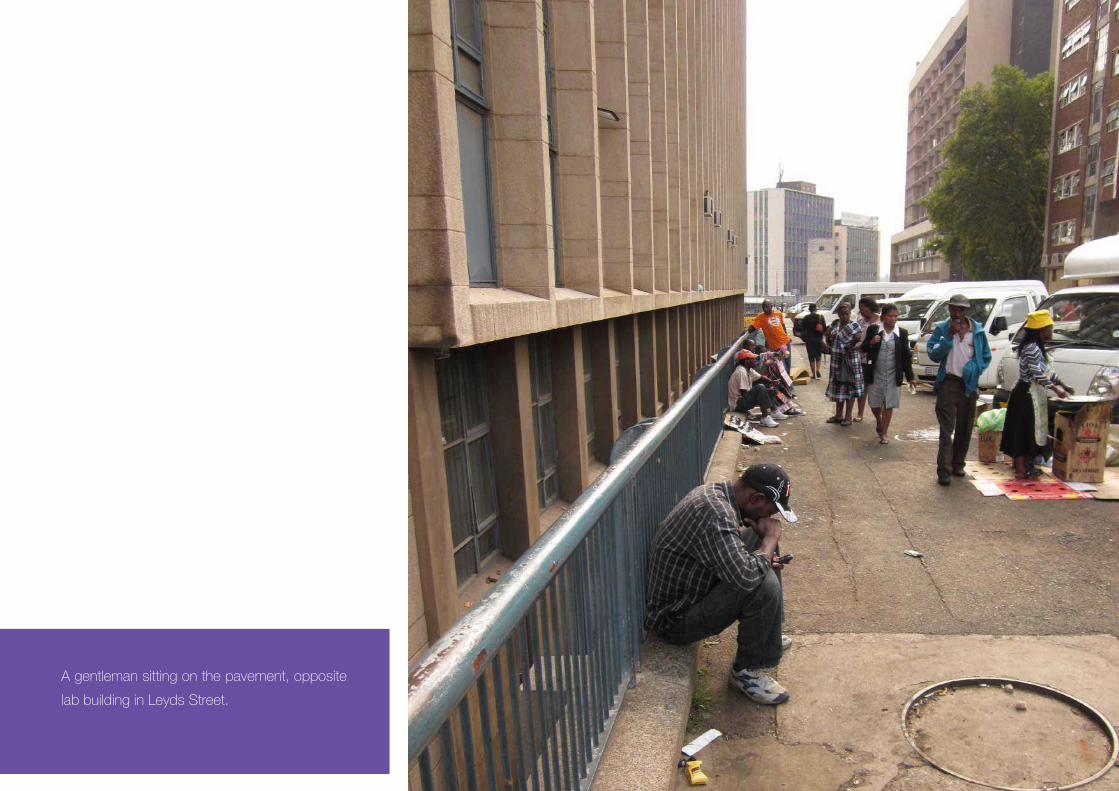
A gentleman sitting on the pavement, opposite
lab building in Leyds Street.

INFRASTRUCTURE & SERVICES STATUS QUO
Gas Reticulation
Bulk Gas reticulation in the area is managed by Egoli Gas and there is
currently spare capacity available.
Telecommunications
Current Land Line Service providers in the project area are Telkom and
Neotel.
There is no constraint on communications in the project area other than
the provision of reticulation sleeves and manholes in street reserves, the
material is normally provided by the service provider but must be installed
by the developer at the time.
Opportunity exists to make extensive use of satellite technology on the
communications networks.
Flood Plain
The flood plain of the study area is defined by three ridges in the area.
The first being the Witwatersrand Ridge which runs from the Fort, north of
the site along Hoofd street. The ridge to the east is defined by Jan Smuts
Street and to the west the ridge runs down from the Fort along Hospital
Street and then along King George Street until it finally connects to the
south side of the site.
Sewage Reticulation
No spare capacity exists within the existing Bulk and Link sewers within
the proposed development zone. The proposed development zone drains
towards the South of Johannesburg which is serviced by the Olifantsvlei
treatment works South of Soweto.
Purification Package Plants should be investigated nearer to the actual start
of the development. Should the current densities be maintained in the new
developments, the existing sewage infrastructure will be adequate, any
increase in densification over the current will require further upgrading or on
site treatment plants.
Electricity
Electricity in the area is managed by Johannesburg City Power.
Some spare Bulk capacity is available in the system but is variable and
dependant on the rate of development of other areas around the proposed
project area.
Sustainable opportunities exist for this development and may take the form
of Solar Energy Harvesting, innovating environmental lighting systems and
other forms of energy harvesting. Eskom Substations are indicated in the
drawing.
Introduction
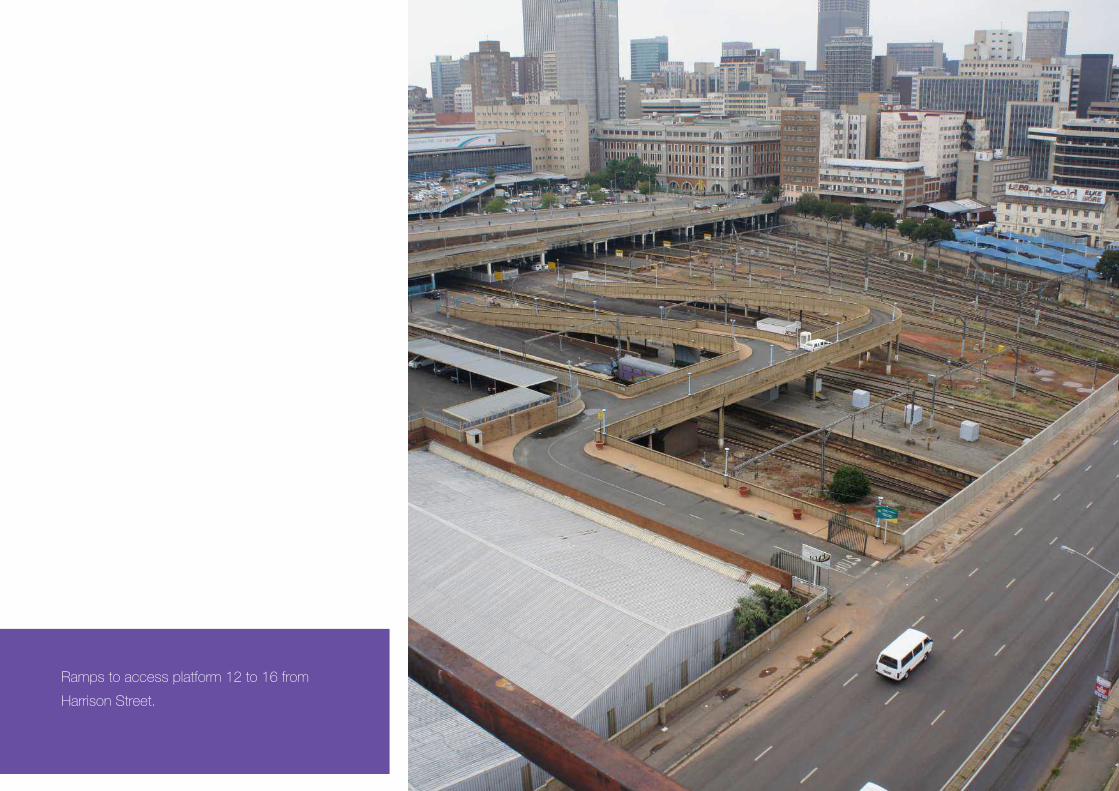
Ramps to access platform 12 to 16 from
Harrison Street.

INFRASTRUCTURE & SERVICES STATUS QUO
SOURCE: ARUP, March 2011, Infrastructure & services map.
Infrastructure & Services Combined
Figure 6.1

INFRASTRUCTURE & SERVICES STATUS QUO221
SOURCE: ARUP, March 2011, Infrastructure & services map.
Water Supply
Figure 6.2

INFRASTRUCTURE & SERVICES STATUS QUO
SOURCE: ARUP, March 2011, Infrastructure & services map.
Electricity
Figure 6.3

INFRASTRUCTURE & SERVICES STATUS QUO223
SOURCE: ARUP, March 2011, Infrastructure & services map.
Gas supply
Figure 6.4

INFRASTRUCTURE & SERVICES STATUS QUO
SOURCE: ARUP, March 2011, Infrastructure & services map.
Infrastructure & Services: Sewerage
Figure 6.5

INFRASTRUCTURE & SERVICES STATUS QUO225
SOURCE: ARUP, March 2011, Infrastructure & services map.
Infrastructure & Services: Watershed
Figure 6.6
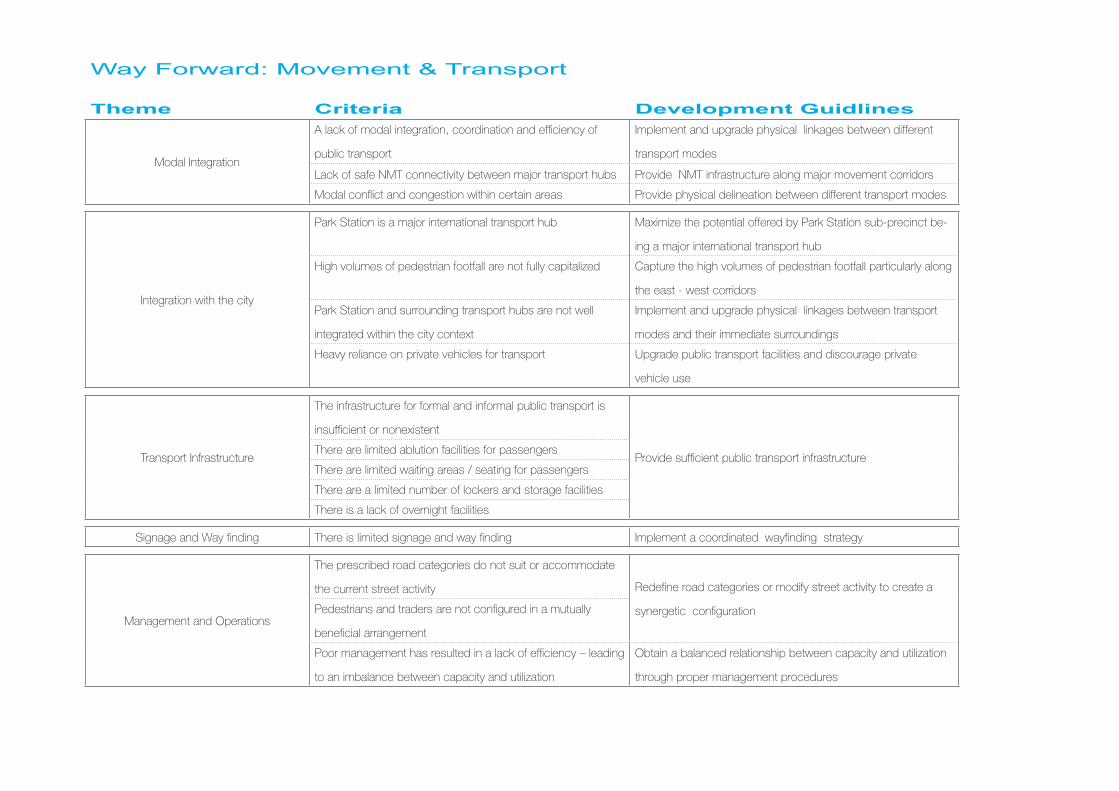
Way Forward: Movement & Transport
Theme Criteria Development Guidlines
Modal Integration
A lack of modal integration, coordination and efficiency of
public transport
Implement and upgrade physical linkages between different
transport modes
Lack of safe NMT connectivity between major transport hubs Provide NMT infrastructure along major movement corridors
Modal conflict and congestion within certain areas Provide physical delineation between different transport modes
Integration with the city
Park Station is a major international transport hub Maximize the potential offered by Park Station sub-precinct be-
ing a major international transport hub
High volumes of pedestrian footfall are not fully capitalized Capture the high volumes of pedestrian footfall particularly along
the east - west corridors
Park Station and surrounding transport hubs are not well
integrated within the city context
Implement and upgrade physical linkages between transport
modes and their immediate surroundings
Heavy reliance on private vehicles for transport Upgrade public transport facilities and discourage private
vehicle use
Transport Infrastructure
The infrastructure for formal and informal public transport is
insufficient or nonexistent
Provide sufficient public transport infrastructureThere are limited ablution facilities for passengers
There are limited waiting areas / seating for passengers
There are a limited number of lockers and storage facilities
There is a lack of overnight facilities
Signage and Way finding There is limited signage and way finding Implement a coordinated wayfinding strategy
Management and Operations
The prescribed road categories do not suit or accommodate
the current street activity Redefine road categories or modify street activity to create a
synergetic configurationPedestrians and traders are not configured in a mutually
beneficial arrangement
Poor management has resulted in a lack of efficiency – leading
to an imbalance between capacity and utilization
Obtain a balanced relationship between capacity and utilization
through proper management procedures

227Way Forward: Land Use
Themes Criteria Development Guidlines
Adaptability
The mixed use typologies in the sub precinct are the most
successful land use model
To increase the application of the mixed use typology (horizon-
tally and vertically)
There is currently a rich mix of activities onsite however it does
not cover a 24hour cycle
Extend the activity cycle
Buildings and spaces are underutilized due to a lack of flex-
ibility and adaptability of use
Assign different functions to spaces and buildings at various
times of the day
Synergy and Activation
There are a number of vacant or underutilized buildings in the
sub-precinct
Intensify and activate vacant buildings
There is a need for additional retail space Increase the provision of retail space
Conflict caused by incompatible grouping of uses Apply a suitable mix of uses
Hijacked and illegally occupied buildings Implement urban renewal projects & management of urban
decay PRASA assets are underutilized
Current zoning of PRASA assets are limiting Rezone existing PRASA assets to unlock future development
potential
There is insufficient integration between pedestrian movement
and land uses
Create synergy between movement and land use
Amenities
There is limited safe amenities for students after study hours Provide amenities related to students
There is a lack of amenities for passengers waiting to connect
or commute
Provide amenities for passengers
There is a significant need for low to middle income housing
in the area
Provide social and affordable housing
The existing community lacks sufficient social amenities Provide social amenities

Way Forward: Urban Form
Theme Criteria Development Guidlines
Legibility
A lack of legibility of significant buildings within the cityscape
and their immediate context.
Macro: scale, form, location, visibility
Micro: clearly demarked entrances, signage, lighting, universal
access for all
Implement a legibility strategy on micro & macro scale
DensityAvailable open land Densification of city blocks
Lack of vertical density Redevelop low density areas through vertical growth
Public Space
Poorly managed informal trade and high pedestrian volumes
causes congestion
Formalize the informal trade & implement a management
strategy along major pedestrian corridors
Public spaces are not integrated with the pedestrian move-
ment network
Integrate public space with the pedestrian movement
network through the provision of sufficient and safe NMT
infrastructure
Public spaces are unsafe, unfriendly and not livable Create safe public space through community surveillance
and activity
Public Realm
Current significant heritage buildings are not noticeable or
capitalized on
Market buildings and surrounding spaces of significant
heritage by upgrading and implementing a linked pedestrian
system
Existing heritage stock in a dilapidated condition Upgrade & maintain existing heritage stock
Poor condition of the urban environment Upgrade & maintain existing urban environment
There is limited way finding and signage Implement a coordinated wayfinding/signage strategy
Lighting is limited Implement a energy efficient lighting strategy
Street furniture is non existent Introduce street furniture along high volume pedestrian cor-
ridors
Pavements are in a poor condition and dangerous to walk Upgrade and widening of pavements along high volume
pedestrian corridors

229
Way Forward: Environment
Themes Criteria Development GuidlinesPublic Environment Poor infrastructure within the existing environment encourages
a lack of community, identity and responsibility
Upgrade the public environment infrastructure
Facilities below ground level are unsafe due to limited light
penetration
Implement a energy efficient lighting strategy and restruc-
ture physical space to allow for natural light penetration
Limited provision of public space Provide a variety of public space
Energy Resources Sustainable energy use is non existent Capitalize on sustainable energy resources
Increased pollution levels are negatively impacting on the qual-
ity of life in terms of air quality, noise levels, land pollution and
water quality.
Implement pollution reduction strategy
Lack of recycling facilities Provide recycling infrastructure and management
Management and Waste Disposal Waste recycling is not formalized Encourage and formalise waste recycling
Public environment is in a poor condition due to dumping and
lack of waste management
Provide additional waste collection points & implement a
waste management strategy
Insufficient environmental and waste management strategies
Insufficient infrastructure related to waste disposal
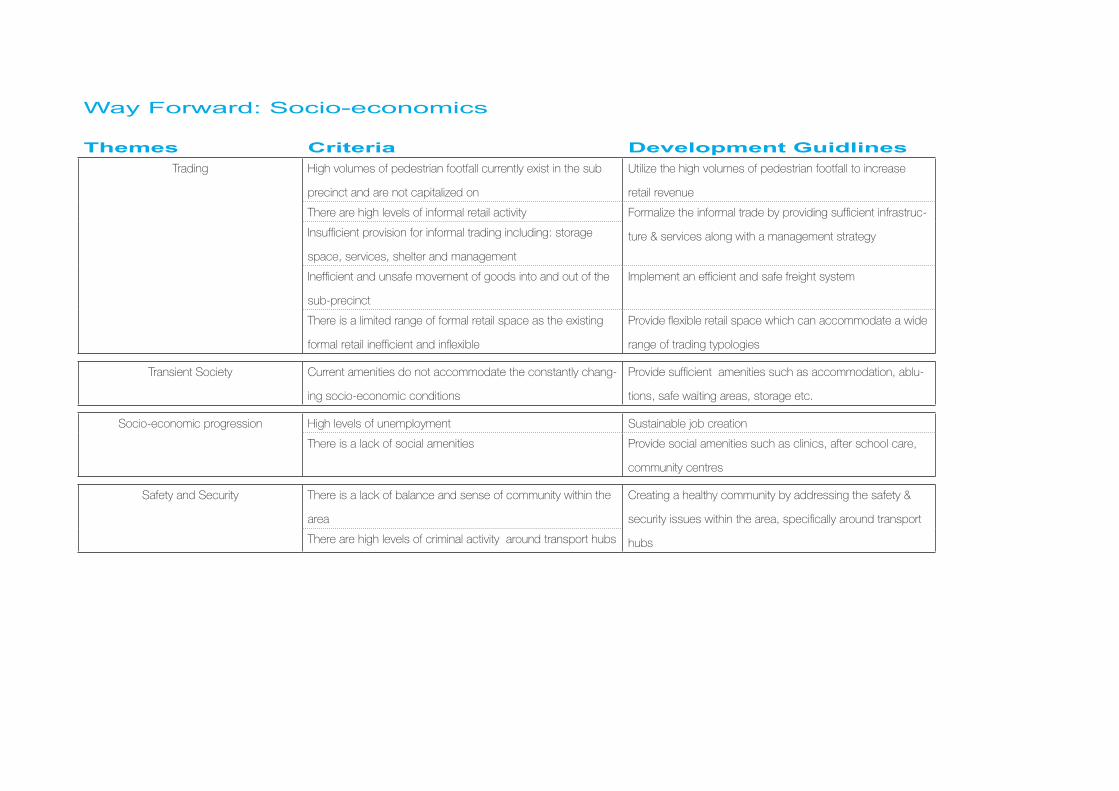
Way Forward: Socio-economics
Themes Criteria Development GuidlinesTrading High volumes of pedestrian footfall currently exist in the sub
precinct and are not capitalized on
Utilize the high volumes of pedestrian footfall to increase
retail revenue
There are high levels of informal retail activity Formalize the informal trade by providing sufficient infrastruc-
ture & services along with a management strategyInsufficient provision for informal trading including: storage
space, services, shelter and management
Inefficient and unsafe movement of goods into and out of the
sub-precinct
Implement an efficient and safe freight system
There is a limited range of formal retail space as the existing
formal retail inefficient and inflexible
Provide flexible retail space which can accommodate a wide
range of trading typologies
Transient Society Current amenities do not accommodate the constantly chang-
ing socio-economic conditions
Provide sufficient amenities such as accommodation, ablu-
tions, safe waiting areas, storage etc.
Socio-economic progression High levels of unemployment Sustainable job creation
There is a lack of social amenities Provide social amenities such as clinics, after school care,
community centres
Safety and Security There is a lack of balance and sense of community within the
area
Creating a healthy community by addressing the safety &
security issues within the area, specifically around transport
hubs There are high levels of criminal activity around transport hubs
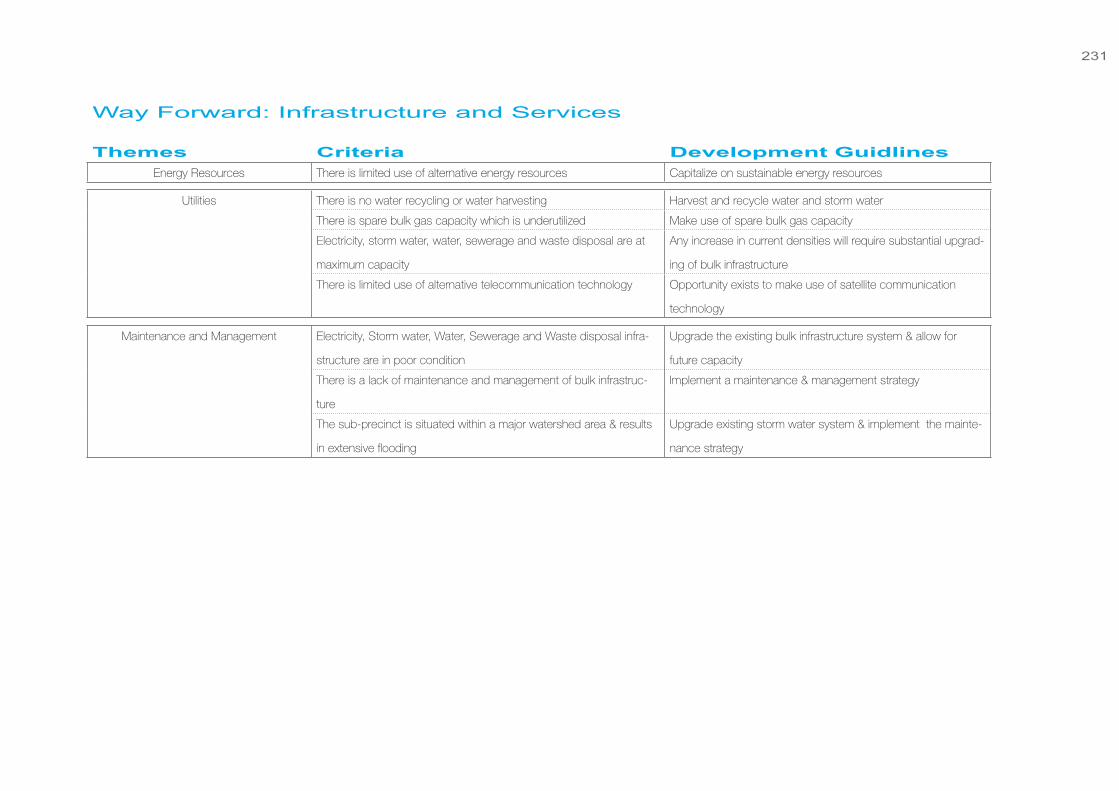
231
Way Forward: Infrastructure and Services
Themes Criteria Development GuidlinesEnergy Resources There is limited use of alternative energy resources Capitalize on sustainable energy resources
Utilities There is no water recycling or water harvesting Harvest and recycle water and storm water
There is spare bulk gas capacity which is underutilized Make use of spare bulk gas capacity
Electricity, storm water, water, sewerage and waste disposal are at
maximum capacity
Any increase in current densities will require substantial upgrad-
ing of bulk infrastructure
There is limited use of alternative telecommunication technology Opportunity exists to make use of satellite communication
technology
Maintenance and Management Electricity, Storm water, Water, Sewerage and Waste disposal infra-
structure are in poor condition
Upgrade the existing bulk infrastructure system & allow for
future capacity
There is a lack of maintenance and management of bulk infrastruc-
ture
Implement a maintenance & management strategy
The sub-precinct is situated within a major watershed area & results
in extensive flooding
Upgrade existing storm water system & implement the mainte-
nance strategy
I have made missteps along the way. But I have discovered the
secret that after climbing a great hill, one only finds that there
are many more hills to climb. I have taken a moment here to
rest, to steal a view of the glorious vista that surrounds me, to
look back on the distance I have come. But I can rest only for a
moment, for with freedom comes responsibilities, and I dare not
linger, for my long walk is not yet ended...
Nelson Mandela, 1995
Summary
The purpose of the Status Quo and Literature work-stream was to :
• Review previous studies and initiatives in the area in terms
of urban planning, development and data research,
covering the range from strategic through to detail.
• To identify, collate and review existing records from a
variety of sources covering; infrastructure, operations,
economic data and statistics.
• To identify knowledge and information gaps, and were
possible to complete those gaps, by means of on-site
research, interviews, observations and further analysis.
• To gain the most up-to-date picture of the current Status
Quo in the Park Station environs.
Process
It was never intended to produce a publishable report that
comprehensively documented the work undertaken, rather
it was intended as a data bank for the further work to be
undertaken.
The methodology undertaken by the research team, was
internally discussed and challenged at several thought and
topic workshops, in pressing to understand the essence of
the issues at hand.
The range of activities from; interviews, caucus meetings,
on-site investigations, surveys, documentation and
investigations to accumulate this data is vast, and arguably
now remains as one of the most comprehensive accounts
of the status quo of life, in the one of Africa’s greatest cities. Way Forward
This workstream, has reached a stage ( notwithstanding
certain data that was either; commercially sensitive,
confidential or either just unobtainable ), where a significant
enough body of evidence now exists in order to analytically
inform the next stages of the Framework.
The material collated will now be reviewed, analysed and
conclusions developed with the sole purpose of providing
evidence based conclusions and more importantly
prospective solutions in intelligently informing and guiding
the Development Framework Guidelines.
PARK STATION SUB-PRECINCT DEVELOPMENT FRAMEWORK

LEXICON
Acronym Title
Area The area of land that constitutes the Park Station Sub- Precinct Development Framework in and around Park Station itself
CoJ City of Johannesburg
MTC Metropolitan Trading Company
PRASA Passenger Rail Agency of South Africa
SANRAL South African National Roads Agency
DoT Department of Transport
GRO Gauteng Regional Observatory
JDA Johannesburg Development Agency
Metro Police Metropolitan Police
FOOT NOTES
Land Use
1. Johannesburg Inner City Regeneration Strategy Business Plan, 20042. JICBC, 20053. Inner City Regeneration Strategy Business Plan 2004-20074. JICBC,2004
Environment
5. PRASA Corporate Real Estate Solutions Waste Management Plan, First Issue 2010-10-14.
Socio-economics
6. Joburg Inner City Urban Design Implementation Plan, 2009
7. 2010 Data from Statistics South Africa
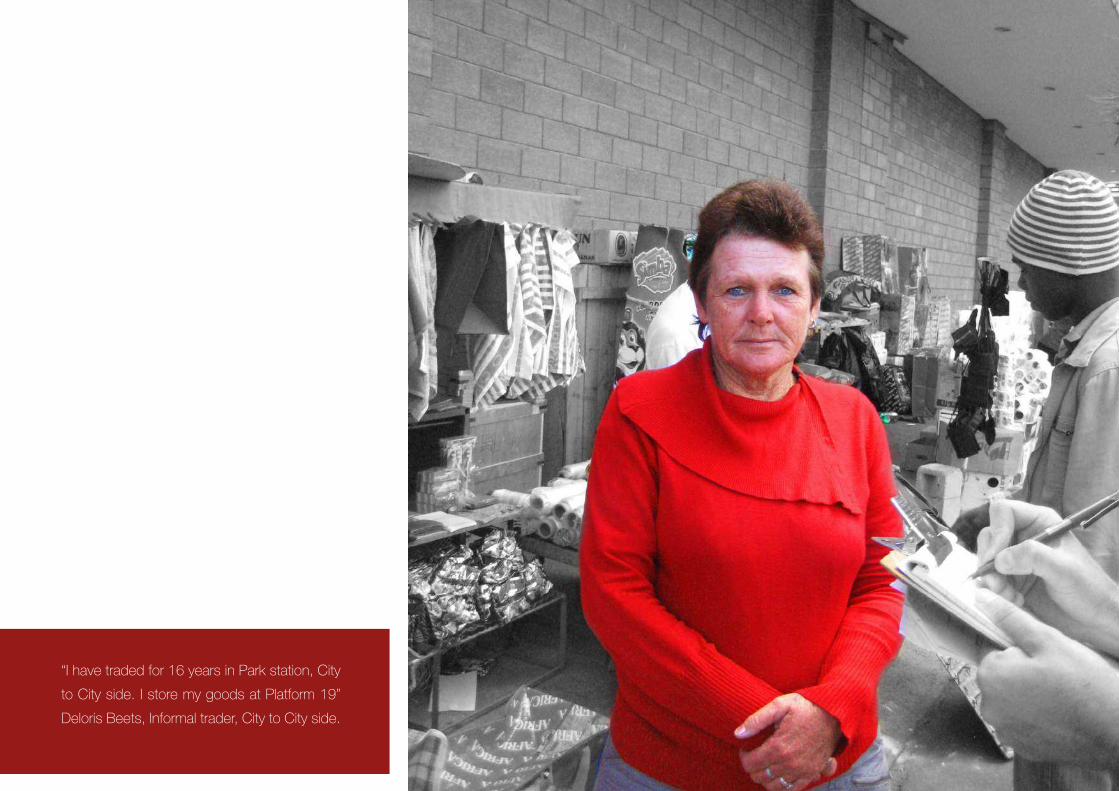
“I have traded for 16 years in Park station, City
to City side. I store my goods at Platform 19”
Deloris Beets, Informal trader, City to City side.

REFERENCES
Taxi & Rail: Arcus Gibb & ASM, 2010. Johannesburg Inner City Traffic & Transportation Study, JDA. Buses: Bus company websitesNote: The traffic data has been extract from the City of Johannesburg SATURN traffic model & should be viewed as representative only of traffic volumes on the surrounding road network.ARUP, August 2006, JHB CBD Public Transport Interchange - Pedestrian Transport Report, JDAOfficial websites: Putco, City of Johannesburg, Rea Vaya, March 2010Johannesburg Inner City Traffic & Transportation Study, Report 1, March 2010.Braamfontein Scoping Study, September 2009, ARUP.Aerial Photo 2003 Johannesburg GIS Database.GIS Database ARUPState of the environment report - City of Johannesburg 2008Osmond Lange Architects & planners, Ikemeleng Architects, Henry Paine + Barry Gould, 2008, Greater park Station Precinct: Urban design & Heritage management framework.Interview with Ernst Swanepoel, PRASA, April 2011.ARUP, March 2011, Infrastructure & services map.Financial & Business Model for Decking the Railway Lines in Central Johannesburg, Adec, 2009Johannesburg e-services website: eservices.joburg.org.zaDraft 2011-16 Integrated Development Plan, City of Johannesburg, 2011Windeed Program, 2011
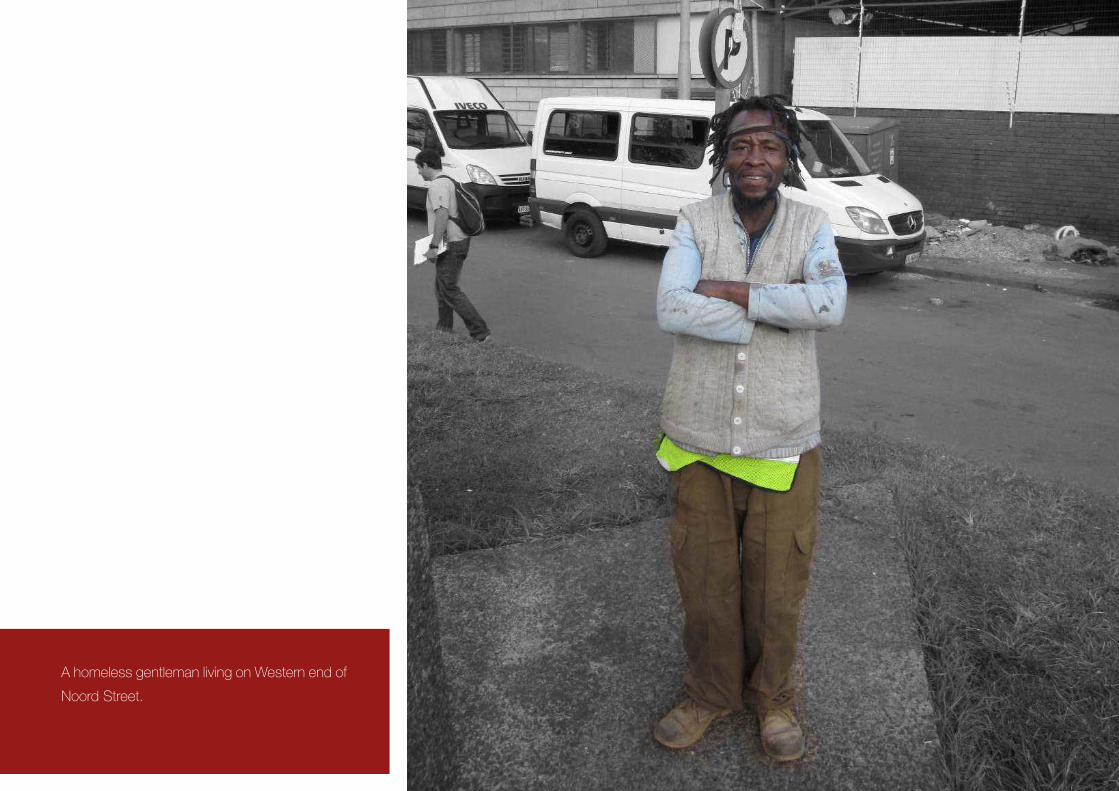
A homeless gentleman living on Western end of
Noord Street.

ARUP
Leszek Dobrovolsky Project Director Strategy, Transit Orientated Developments, Interchanges, City MakingCaroline Sohie Project Lead Urban Planning, Interchanges, City Making, ArchitectureLouis Oosthuysen Project Co-Ordinator Urban Form, Land Use, Socio-Economics, Infrastructure, Movement+Transport, EnvironmentRay Harli Architect Urban Form, Land Use, Socio-Economics, Infrastructure, Movement+Transport, EnvironmentMarina Meyer Architect Urban Form, Land Use, Socio-Economics, Infrastructure, Movement+Transport, EnvironmentTammy Kopelowitz Designer Urban Form, Land Use, Socio-Economics, Infrastructure, Movement+Transport, EnvironmentSekhu Mahlatse Planner ( PRASA ) Urban Form, Land Use, Socio-Economics, Infrastructure, Movement+Transport, Environment John Odendal Urban Designer Urban Form, Land Use, Socio-Economics, Infrastructure, Movement+Transport, EnvironmentWynand Viljoen Architectural Designer Urban Form, Land Use, Socio-Economics, Infrastructure, Movement+Transport, Environment Willem van Rijn Engineer InfrastructureJaco Rossouw Engineer InfrastructureSiloshini Naidoo Environmental SustainabilityRory Williams Transport Planner City Making, TransportAidan Noble Transport Engineer TransportYolandi Oliver Engineer GISJustin Jones Planner Property EconomicsWayne Tweedle Valuer Property Valuations
Hausi Scherer Engineer Infrastructure and Networks
PROJECT STEERING GROUP
Ian Scott PRASAThembane Camane PRASASisa Mabose PRASALeszek Dobrovolsky ArupCaroline Sohie Arup
Louis Oosthuysen Arup
PEER REVIEWERS
Ian Gardner

A woman selling cooked food on Noord Street.

1 June 2011
ISSUE DATE
Related Documents