Daniel A. Herman ASRC Aerospace Corporation, Cleveland, Ohio George C. Soulas and Michael J. Patterson Glenn Research Center, Cleveland, Ohio Status of the NEXT Long-Duration Test After 23,300 Hours of Operation NASA/TM—2009-215837 December 2009 AIAA–2009–4917 https://ntrs.nasa.gov/search.jsp?R=20100002893 2018-05-21T20:57:08+00:00Z

Welcome message from author
This document is posted to help you gain knowledge. Please leave a comment to let me know what you think about it! Share it to your friends and learn new things together.
Transcript

Daniel A. HermanASRC Aerospace Corporation, Cleveland, Ohio
George C. Soulas and Michael J. PattersonGlenn Research Center, Cleveland, Ohio
Status of the NEXT Long-Duration TestAfter 23,300 Hours of Operation
NASA/TM—2009-215837
December 2009
AIAA–2009–4917
https://ntrs.nasa.gov/search.jsp?R=20100002893 2018-05-21T20:57:08+00:00Z

NASA STI Program . . . in Profi le
Since its founding, NASA has been dedicated to the advancement of aeronautics and space science. The NASA Scientifi c and Technical Information (STI) program plays a key part in helping NASA maintain this important role.
The NASA STI Program operates under the auspices of the Agency Chief Information Offi cer. It collects, organizes, provides for archiving, and disseminates NASA’s STI. The NASA STI program provides access to the NASA Aeronautics and Space Database and its public interface, the NASA Technical Reports Server, thus providing one of the largest collections of aeronautical and space science STI in the world. Results are published in both non-NASA channels and by NASA in the NASA STI Report Series, which includes the following report types: • TECHNICAL PUBLICATION. Reports of
completed research or a major signifi cant phase of research that present the results of NASA programs and include extensive data or theoretical analysis. Includes compilations of signifi cant scientifi c and technical data and information deemed to be of continuing reference value. NASA counterpart of peer-reviewed formal professional papers but has less stringent limitations on manuscript length and extent of graphic presentations.
• TECHNICAL MEMORANDUM. Scientifi c
and technical fi ndings that are preliminary or of specialized interest, e.g., quick release reports, working papers, and bibliographies that contain minimal annotation. Does not contain extensive analysis.
• CONTRACTOR REPORT. Scientifi c and
technical fi ndings by NASA-sponsored contractors and grantees.
• CONFERENCE PUBLICATION. Collected papers from scientifi c and technical conferences, symposia, seminars, or other meetings sponsored or cosponsored by NASA.
• SPECIAL PUBLICATION. Scientifi c,
technical, or historical information from NASA programs, projects, and missions, often concerned with subjects having substantial public interest.
• TECHNICAL TRANSLATION. English-
language translations of foreign scientifi c and technical material pertinent to NASA’s mission.
Specialized services also include creating custom thesauri, building customized databases, organizing and publishing research results.
For more information about the NASA STI program, see the following:
• Access the NASA STI program home page at http://www.sti.nasa.gov
• E-mail your question via the Internet to help@
sti.nasa.gov • Fax your question to the NASA STI Help Desk
at 443–757–5803 • Telephone the NASA STI Help Desk at 443–757–5802 • Write to:
NASA Center for AeroSpace Information (CASI) 7115 Standard Drive Hanover, MD 21076–1320
Daniel A. HermanASRC Aerospace Corporation, Cleveland, Ohio
George C. Soulas and Michael J. PattersonGlenn Research Center, Cleveland, Ohio
Status of the NEXT Long-Duration TestAfter 23,300 Hours of Operation
NASA/TM—2009-215837
December 2009
AIAA–2009–4917
National Aeronautics andSpace Administration
Glenn Research CenterCleveland, Ohio 44135
Prepared for the45th Joint Propulsion Conference and Exhibitcosponsored by AIAA, ASME, SAE, and ASEEDenver, Colorado, August 2–5, 2009

Available from
NASA Center for Aerospace Information7115 Standard DriveHanover, MD 21076–1320
National Technical Information Service5285 Port Royal RoadSpringfi eld, VA 22161
Available electronically at http://gltrs.grc.nasa.gov
Level of Review: This material has been technically reviewed by technical management.
This report contains preliminary fi ndings, subject to revision as analysis proceeds.

NASA/TM—2009-215837 1
Status of the NEXT Long-Duration Test After 23,300 Hours of Operation
Daniel A. Herman
ASRC Aerospace Corporation Cleveland, Ohio 44135
George C. Soulas and Michael J. Patterson
National Aeronautics and Space Administration Glenn Research Center Cleveland, Ohio 44135
Abstract
The NASA’s Evolutionary Xenon Thruster (NEXT) program is developing the next-generation ion propulsion system with significant enhancements beyond the state-of-the-art in ion propulsion to provide future NASA science missions with enhanced mission capabilities at a low total development cost. As part of a comprehensive thruster service life assessment utilizing both testing and analyses, a Long-Duration Test (LDT) was initiated in June 2005, to verify the NEXT propellant throughput capability to a qualification-level of 450 kg, 1.5 times the anticipated throughput requirement of 300 kg per thruster from mission analyses. The LDT is being conducted with a modified, flight-representative NEXT engineering model ion thruster, designated EM3. As of July 2009, the thruster has accumulated 23,300 h of operation with extensive durations at the following input powers: 6.9, 4.7, 1.1, and 0.5 kW. The thruster has processed 427 kg of xenon surpassing the NSTAR propellant throughput demonstrated during the extended life testing of the Deep Space 1 flight spare ion thruster and approaching the NEXT development qualification throughput goal. The NEXT LDT has demonstrated a total impulse of 16.0106 N·s; the highest total impulse ever demonstrated by an ion thruster. Thruster performance tests are conducted periodically over the entire NEXT throttle table with input power ranging 0.5 to 6.9 kW. Thruster performance parameters including thrust, input power, specific impulse, and thruster efficiency have been nominal with little variation to date. The NSTAR first-failure mode, accelerator aperture erosion leading to electron backstreaming, has been mitigated in the NEXT design. The severe NSTAR discharge cathode assembly erosion has been mitigated by a graphite keeper in the NEXT thruster. Tracking of the NEXT first failure mode, charge-exchange ion impingement on the accelerator grid causing hexagonal groove erosion, is consistent with model predictions and indicates thruster life greater than or equal to 750 kg throughput. This paper presents the status, performance data, and wear characteristics of the NEXT LDT to date.
Nomenclature
JB beam current, A JNK neutralizer keeper current, A mC discharge cathode flowrate, sccm mM main plenum flowrate, sccm mN neutralizer cathode flowrate, sccm PIN thruster input power, kW TL throttle level VA accelerator grid voltage, V VB beam power supply voltage, V φ aperture or orifice diameter

NASA/TM—2009-215837 2
Introduction
The success of the NASA Solar Electric Propulsion Technology Applications Readiness (NSTAR) ion propulsion system (IPS) on the Deep Space 1 (DS1) and Dawn missions secured the future for ion propulsion on NASA missions (Refs. 1 to 4). Analyses conducted at NASA identified the need for a higher-power, higher total throughput capability ion propulsion system beyond the 2.3 kW NSTAR ion thruster targeted for robotic exploration of the outer planets. The NASA’s Evolutionary Xenon Thruster (NEXT) IPS, led by the NASA Glenn Research Center (GRC), is being developed to meet NASA’s future mission propulsion needs for a more-advanced, higher-power IPS. NEXT performance exceeds single or multiple NSTAR thrusters over most of the thruster input power range. The wet propulsion system mass has been reduced by higher-efficiency, higher-specific impulse, and lower specific mass. With a predicted throughput capability more than double that of NSTAR, fewer NEXT thrusters are required compared NSTAR. NEXT technology is applicable to a wide range of NASA solar system exploration missions, as well as earth-space commercial and other missions of national interest.
The NEXT system consists of a high-performance, 7 kW ion thruster; a high-efficiency, modular, 7 kW power processing unit (PPU)1 with an efficiency and a specific power greater the NSTAR PPU; a highly-flexible, advanced xenon propellant management system (PMS)2 that utilizes proportional valves and thermal throttles to reduce mass and volume; a lightweight engine gimbal3; and key elements of a digital control interface unit (DCIU)2 including software algorithms (Refs. 5 to 11). The NEXT thruster and component technologies demonstrate a significant advancement in technology beyond the state-of-the-art NSTAR thruster systems. Several key development milestones have been achieved including: environmental testing to qualification levels of engineering model hardware for the thruster and PMS; a single-string integration test of the highest fidelity (true engineering model) flight-like hardware including thruster, PMS, PPU, and DCIU simulator; a 3-string multithruster test on the PMS; and a 3-string multithruster test to characterize thruster and beam interactions (Refs. 5, 12 to 20). The environmental testing of the PPU is scheduled to be completed by the end of CY09. Environmental testing conditions were selected to encompass the required qualification levels for a broad range of NEXT mission applications.
Validation of the NEXT thruster service life capability is being addressed utilizing a combination of test and analyses. A NEXT service life assessment was conducted at NASA GRC employing several models to evaluate all known failure modes incorporating the results of the NEXT 2,000 h wear test (WT) conducted on a NEXT engineering model (EM) ion thruster at 6.9 kW input power (Refs. 21 and 22). The assessment predicts the earliest failure occurring sometime after 750 kg of xenon throughput, well beyond the mission-derived propellant throughput requirement of 300 kg (Ref. 22). To validate the NEXT thruster service life model and qualify the NEXT thruster, the NEXT Long-Duration Test (LDT) was initiated. The purpose of the NEXT LDT is to: (1) characterize thruster performance over the test duration, (2) measure the erosion rates of critical thruster components, (3) identify unknown life-limiting mechanisms, and (4) demonstrate 1.5 times the mission-derived propellant throughput requirement resulting in a qualification propellant throughput requirement of at least 450 kg. In addition to the NEXT LDT, multiple component-level lifetime tests and a prototype-model thruster wear test are underway to augment the results of the LDT (Ref. 23). The NEXT thruster service life analysis is being updated based upon the LDT data and component testing findings as well as being applied for potential mission opportunities to assess thruster wear and performance (Ref. 24).
Testing Hardware 1Power Processing Unit development led by L3 Comm ETI (Torrance, CA). 2Propellant Management System and DCIU simulator development led by Aerojet (Redmond, WA). 3Gimbal development led by the Jet Propulsion Laboratory and Swales Aerospace.

NASA/TM—2009-215837 3
The NEXT LDT is being conducted with an engineering model ion thruster, designated EM3, shown in Figure 1. The EM3 thruster has been modified to a flight-representative configuration. EM3 has utilizes prototype-model (PM) ion optics manufactured by Aerojet that are flight-like and a graphite discharge cathode keeper electrode (Ref. 10). Due to the complete NSTAR ELT discharge cathode keeper faceplate erosion and the NEXT EM 2,000 h wear test results, a graphite discharge cathode keeper is employed on EM3, similar to the NEXT PM thruster design, to mitigate keeper erosion. The NEXT EM3 thruster, shown in Figure 1, is nominally a 0.5 to 6.9 kW input power xenon ion thruster with dished, 2-grid ion optics. A beam extraction area 1.6 times NSTAR allows higher thruster input power while maintaining low voltages and ion current densities, thus maintaining thruster longevity. Additional description of the NEXT EM3 thruster design can be found in References 25 to 31.
The NEXT LDT is being conducted in the 2.7 m diameter by 8.5 m long Vacuum Facility 16 (VF-16) at NASA GRC, shown in Figure 2. VF-16 is equipped with 10 cryogenic pumps for nominal thruster operation providing a base pressure that is 310–7 torr and a measured pumping speed, corrected for xenon, of 180 kL/s. All interior surfaces downstream of the thruster are lined with 1.2 cm thick graphite paneling to reduce the backsputtered material flux to the thruster and test support hardware. The backsputter rate, nominally 3 μm/kh when the thruster is at full-power, is monitored by a quartz-crystal microbalance (QCM) positioned in the thruster exit plane at a radial position of 0.5 m from the edge of the thruster.
A computerized data acquisition and control system is used to monitor and record ion engine and facility operations. Data are sampled at a frequency range of 10 to 20 Hz and stored every minute during normal operation. Ion beam diagnostics include three staggered planar probes mounted onto a translation stage to measure radial ion current density profiles and beam divergence. Faraday probes are fixed at axial positions of 20, 173, and 238 mm downstream of the accelerator grid. An ExB probe, or Wien Filter, is positioned 7.6 m downstream of the thruster on centerline, yielding a doubly-to-singly charged ion signature in the far-field. The ExB probe design is described in Reference 32. Details of the support hardware and beam diagnostics are in References 21, 29, 33, and 34.
Figure 1.—NEXT EM3 in the LDT. Figure 2.—EM3 in VF-16 at GRC.

NASA/TM—2009-215837 4
Operating Conditions
The NEXT IPS is designed for solar electric propulsion applications that experience variation in power available as solar flux changes at various distances from the Sun throughout the mission. The IPS is designed to be throttled from 0.5 to 6.9 kW to accommodate this variation in available power. The thruster operation has been carried out in a mission-like throttling scheme with primary emphasis on wear mechanism model validation at the extremes of the NEXT throttle table. As such the thruster initially operated at full-power and has been throttled down in power, consistent with an outbound mission, with extended operations at 4 operating conditions thus far. The EM3 thruster is being operated in the NEXT LDT at discrete operating segments for extended durations to characterize erosion rates and performance as a function of time for each condition to be used in validating the thruster service life models. Long-term operating segment selections focused on operating conditions of interest with regard to wear characteristics and life-limiting phenomena. The executed/planned NEXT LDT throttling strategy is illustrated in Table 1 with completed operating segments shaded and the current operating segment in bold. It is anticipated that the throttled operation will be completed by the end of CY09 at which point the thruster will be throttled to the operating point with the shortest lifetime, i.e., full-input power. Planned segment operating durations are subject to change if erosion or performance trends differ from projections or project/mission needs dictate. The input power indicated is a nominal operating power requirement from the NEXT throttle table at the thruster beginning-of-life and may differ slightly from thruster to thruster (Ref. 26). This throttling strategy demonstrates operation over the extremes of the NEXT throttling table including: highest power (TL40), highest total accelerating voltage (TL40 and TL12), highest thermal load (TL37), condition with worst under-focusing at center-radius aperture location (TL37), condition with worst over-focusing at outer-radius locations (TL12), lowest power (TL1), lowest total accelerating voltage (TL1), lowest thermal load (TL1), most divergent beam (TL1), and the condition with the highest ratio of discharge cathode emission to discharge cathode flow rate (TL37).
TABLE 1.—NEXT LDT THROTTLING STRATEGY [Completed segments are shaded and current segment is in bold.]
TL level
PIN, kWa
JB, A
VB, V
Duration, kh
Throughput, kg
Accumulative throughput,
kg
Total impulse, N·s
Accumulative total impulse,
N·s 40 6.86 3.52 1800 13.0 264.7 264.7 1.09107 1.09107 37 4.71 3.52 1180 6.5 132.6 397.3 4.45106 1.54107 5 1.12 1.20 679 3.4 26.7 424.0 6.30105 1.60107 1 0.545 1.00 275 3.0 21.2 445.2 2.75105 1.63107 12 2.44 1.20 1800 3.0 23.3 468.5 8.66105 1.71107
Totals 28.9 468.5 1.71107 aNominal values
The thruster is periodically characterized over the entire throttle range covering 11 of 40 operating
conditions distributed across the NEXT throttle table. Performance characterization tests are conducted to assess performance of the thruster and thruster components at multiple power levels that envelope the entire NEXT throttle table, listed in Table A1 of the Appendix. Periodic component performance assessments of the discharge chamber, ion optics, and neutralizer cathode are performed at the various thruster operating conditions.
Thruster Performance
As of July 2009, the NEXT EM3 thruster has accumulated 23,300 h of operation. The NEXT thruster has processed 427 kg of xenon illustrated in Figure 3; surpassing the total propellant throughput processed by the DS1 flight spare in the NSTAR ELT (235 kg). The NEXT thruster has processed 5.8X and 1.8X the NSTAR throughput demonstrated during the DS1 mission and NSTAR ELT, respectively.

NASA/TM—2009-215837 5
Figure 3.—NEXT LDT propellant throughput data as a function of time with reference milestones.
Figure 4.—NEXT LDT and NSTAR ELT total impulse data as a function of time (Ref. 45). Figure 3 shows the NEXT LDT propellant throughput as a function of elapsed time with reference to the NSTAR ELT and flight DS1 thruster, the thruster throughput requirements from various mission analyses conducted using the NEXT propulsion system, and the NEXT project qualification level throughput— 450 kg (Refs. 35 to 37). The NEXT thruster has demonstrated a total impulse of 16.0106 N·s to date; the highest total impulse ever demonstrated by an ion thruster. The NEXT milestone is also the highest total impulse ever demonstrated by an electric propulsion device with an input power less than 10 kW (Ref. 38). The NEXT LDT total impulse demonstrated exceeded that of the 30,000 h NSTAR ELT in less than 1/3rd the thruster operating duration, shown in Figure 4. Performance of the thruster has been steady with minimal degradation.
The following section describes the observed trends in thruster performance during extended segment operation, illustrated as a continuous line, and during the performance characterization tests conducted periodically at operating conditions spanning the complete the NEXT throttle table, illustrated as discrete symbols.
Engine Performance
Thruster performance parameters that are important for mission planning such as thrust, specific impulse, input power, and efficiency are plotted as a function of time in Figures 5 to 8. Data are labeled by values of beam current and beam power supply voltage, which uniquely identify the operating condition in the NEXT throttle table. For thrust calculations, the beam divergence thrust correction factor and the total doubly-to-singly-charged ion current ratio ranged from 0.962 to 0.975 and 0.028 to 0.060, respectively, based upon the methodology developed for NSTAR thrusters (Ref. 39). The assumptions of constant beam divergence and charge-state used in the thrust calculations are supported by beam profile and ExB data obtained during the NEXT LDT. At the full-power operating condition, the beam
0
50
100
150
200
250
300
350
400
450
500
0 5 10 15 20 25
Prop
ella
nt T
hrou
ghpu
t, kg
.
Total Elapsed Time, kh
NEXT QualComet SSR (high T)Vesta-CeresNEXT LDTTitan LanderComet RendezvousSaturn DSDRM (high T)NSTAR ELTComet SSR (high Isp)Saturn DSDRM (high Isp)Neptune DSDRMNEAR Mission (high T)NEAR Mission (high Isp)NSTAR DS1

NASA/TM—2009-215837 6
Figure 5.—Calculated thrust data as a function of time.
Figure 6.—Specific impulse data as a function of time.
Figure 7.—Thruster input power data as a function of time.
0
50
100
150
200
250
0 5 10 15 20 25
Cal
cula
ted
Thr
ust,
mN
.
Total Elapsed Time, kh
Runtime Data3.52 A, 1800 V3.52 A, 1179 V2.70 A, 1800 V2.70 A, 1179 V2.00 A, 1800 V2.00 A, 1179 V1.20 A, 1800 V1.20 A, 1179 V1.20 A, 679 V1.20 A, 300 V1.00 A, 275 V
1000
1500
2000
2500
3000
3500
4000
4500
0 5 10 15 20 25
Spec
ific
Impu
lse,
s .
Total Elapsed Time, kh
Runtime Data2.00 A, 1800 V3.52 A, 1800 V2.70 A, 1800 V1.20 A, 1800 V2.00 A, 1179 V3.52 A, 1179 V2.70 A, 1179 V1.20 A, 1179 V1.20 A, 679 V1.20 A, 300 V1.00 A, 275 V
0
1
2
3
4
5
6
7
8
0 5 10 15 20 25
Thr
uste
r Inp
ut P
ower
, kW
.
Total Elapsed Time, kh
Runtime Data3.52 A, 1800 V2.70 A, 1800 V3.52 A, 1179 V2.00 A, 1800 V2.70 A, 1179 V2.00 A, 1179 V1.20 A, 1800 V1.20 A, 1179 V1.20 A, 679 V1.20 A, 300 V1.00 A, 275 V
NASA/TM—2009-215837 7
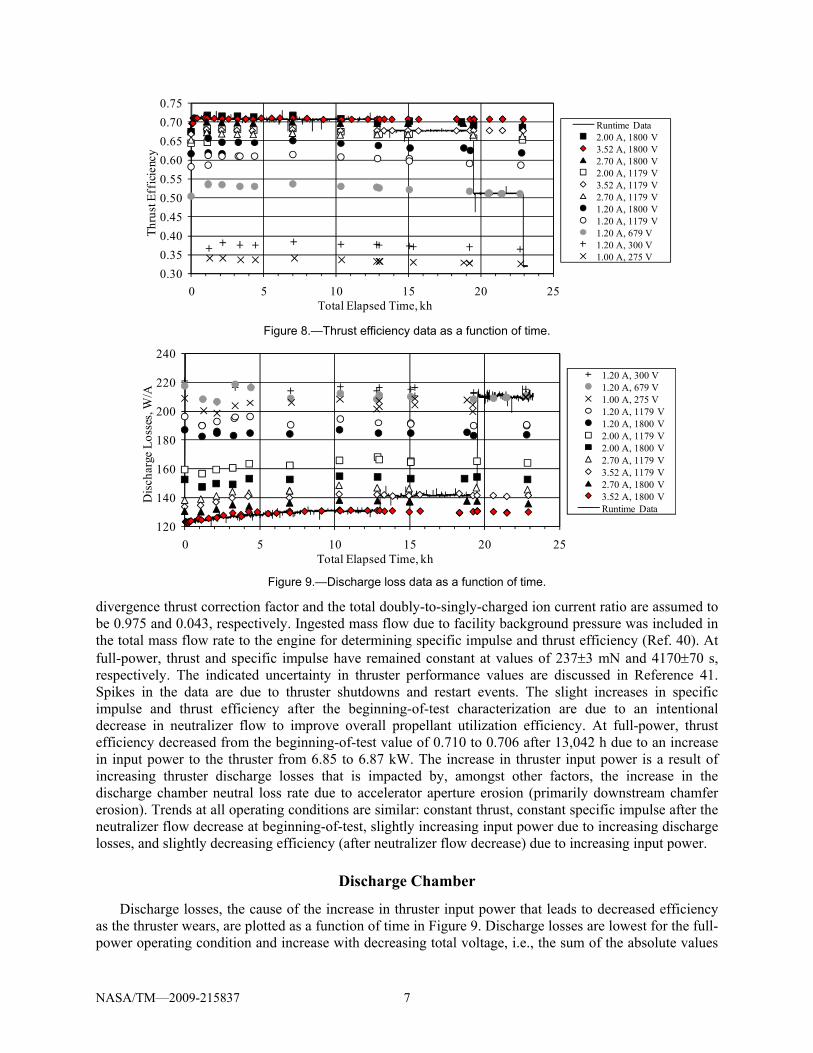
Figure 8.—Thrust efficiency data as a function of time.
Figure 9.—Discharge loss data as a function of time.
divergence thrust correction factor and the total doubly-to-singly-charged ion current ratio are assumed to be 0.975 and 0.043, respectively. Ingested mass flow due to facility background pressure was included in the total mass flow rate to the engine for determining specific impulse and thrust efficiency (Ref. 40). At full-power, thrust and specific impulse have remained constant at values of 2373 mN and 417070 s, respectively. The indicated uncertainty in thruster performance values are discussed in Reference 41. Spikes in the data are due to thruster shutdowns and restart events. The slight increases in specific impulse and thrust efficiency after the beginning-of-test characterization are due to an intentional decrease in neutralizer flow to improve overall propellant utilization efficiency. At full-power, thrust efficiency decreased from the beginning-of-test value of 0.710 to 0.706 after 13,042 h due to an increase in input power to the thruster from 6.85 to 6.87 kW. The increase in thruster input power is a result of increasing thruster discharge losses that is impacted by, amongst other factors, the increase in the discharge chamber neutral loss rate due to accelerator aperture erosion (primarily downstream chamfer erosion). Trends at all operating conditions are similar: constant thrust, constant specific impulse after the neutralizer flow decrease at beginning-of-test, slightly increasing input power due to increasing discharge losses, and slightly decreasing efficiency (after neutralizer flow decrease) due to increasing input power.
Discharge Chamber
Discharge losses, the cause of the increase in thruster input power that leads to decreased efficiency as the thruster wears, are plotted as a function of time in Figure 9. Discharge losses are lowest for the full-power operating condition and increase with decreasing total voltage, i.e., the sum of the absolute values
0.30
0.35
0.40
0.45
0.50
0.55
0.60
0.65
0.70
0.75
0 5 10 15 20 25
Thr
ust E
ffic
ienc
y .
Total Elapsed Time, kh
Runtime Data2.00 A, 1800 V3.52 A, 1800 V2.70 A, 1800 V2.00 A, 1179 V3.52 A, 1179 V2.70 A, 1179 V1.20 A, 1800 V1.20 A, 1179 V1.20 A, 679 V1.20 A, 300 V1.00 A, 275 V
120
140
160
180
200
220
240
0 5 10 15 20 25
Dis
char
ge L
osse
s, W
/A .
Total Elapsed Time, kh
1.20 A, 300 V1.20 A, 679 V1.00 A, 275 V1.20 A, 1179 V1.20 A, 1800 V2.00 A, 1179 V2.00 A, 1800 V2.70 A, 1179 V3.52 A, 1179 V2.70 A, 1800 V3.52 A, 1800 VRuntime Data

NASA/TM—2009-215837 8
of the beam and accelerator power supply voltages. That the discharge losses increases with decreasing total voltage for constant beam current is largely due to a decreasing screen grid ion transparency (Ref. 27). Full-power discharge loss, discharge power divided by the beam current, has risen from 123 to 131 W/A over 23,300 h of operation. Discharge losses leveled off after several thousands of hours of operation consistent with similar trends in accelerator aperture erosion and have remained constant since (Ref. 31). Modest increases in discharge losses, 6 percent, are observed for each of the operating conditions over the total test duration. Higher discharge loss variability is observed for lower power operating conditions that operate at higher discharge propellant utilization efficiencies where discharge loss variation is more sensitive to subtle flow variations.
The NEXT LDT gradual 6 percent increase in discharge losses is in contrast to the larger and more rapid beginning-of-test increase in discharge losses exhibited by the NSTAR thruster. NSTAR thruster full-power discharge losses, considerably higher (~50 W/A) than NEXT due primarily to the smaller discharge chamber, increased by 10 to 15 W/A within the first 500 h of operation in three separate wear test (Refs. 42 to 44). The reduced beginning-of-life increase in discharge losses in the NEXT design is a result of a flatter NEXT beam profile, thicker accelerator grid, smaller cusp ion optics, and more focused beamlets at the full-power operating condition. After 427 kg, the NEXT LDT full-power discharge losses increased by 8 W/A compared to the NSTAR ELT increase of 22 W/A after 210 kg (Refs. 45 and 46).
Discharge voltage and current data for each of the thruster performance operating conditions are shown in Figures 10 and 11, respectively. Discharge voltages have increased by approximately 1 V over the test duration of 23,300 h. Discharge currents have increased slightly, 0.5 A, after processing 427 kg.
Figure 10.—Discharge voltage data as a function of time.
Figure 11.—Discharge current data as a function of time.
22
23
24
25
26
27
28
0 5 10 15 20 25
Dis
char
ge V
olta
ge, V
.
Total Elapsed Time, kh
1.20 A, 300 V1.20 A, 679 V1.20 A, 1179 V1.20 A, 1800 V1.00 A, 275 V2.00 A, 1179 V2.00 A, 1800 V3.52 A, 1179 V2.70 A, 1179 V3.52 A, 1800 V2.70 A, 1800 VRuntime Data
7
9
11
13
15
17
19
21
0 5 10 15 20 25
Dis
char
ge C
urre
nt, A
.
Total Elapsed Time, kh
Runtime Data3.52 A, 1179 V3.52 A, 1800 V2.70 A, 1179 V2.70 A, 1800 V2.00 A, 1179 V2.00 A, 1800 V1.20 A, 679 V1.20 A, 300 V1.20 A, 1179 V1.20 A, 1800 V1.00 A, 275 V

NASA/TM—2009-215837 9
Figure 12.—Discharge keeper voltage data as a function of time.
Figure 13.—Thruster discharge cathode ignition data as a function of time.
Increased peak-to-peak variability in the discharge voltage is observed at low-power operating conditions due to sensitivity of the discharge cathode operation at higher discharge propellant utilization efficiencies and the result of an intermittent discharge keeper-to-common short that appeared after 13,875 h of operation (833 h after throttling to 4.7 kW). The shorting of the discharge keeper to common was an expected event based upon the findings from the NEXT 2,000 h WT and the HiPEP 2,000 h WT (Refs. 21 and 47). Post-test analyses measured tungsten (with traces of barium) material deposits on the upstream surface of the keeper faceplate near the orifice of 40 and 70 m thicknesses for the NEXT and HiPEP wear tests, respectively (Refs. 48 and 49). Assuming linear growth, extrapolation of these thicknesses for extended duration would have resulted in bridging the estimated operating gap between the NEXT LDT keeper and cathode face after an operating duration on the order of 10 to 20 kh. The short appeared in the NEXT LDT after 13.9 kh, within the bounds of the two deposition rates. It should be mentioned that the NEXT lifetime assessment also predicted a priori this shorting event and considered its impact on thruster service life (Refs. 22 and 24).
The NEXT LDT full-power discharge keeper ion saturation current and voltage are similar to the NEXT 2,000 h wear test values, thus it is anticipated that both test articles would be exposed to similar levels of ion impingement (Ref. 21). As a result of the thermally induced, intermittent keeper shorting events, limited ion saturation current data are available after the transition to 4.7 kW. Discharge keeper voltages for performance operating conditions are illustrated in Figure 12. Data with a keeper voltage near zero indicate operating conditions, higher discharge cathode emission currents, at which the keeper is shorted to cathode common.
Discharge cathode ignition durations, 202 total to date, are plotted as a function of elapsed time in Figure 13. With the exception of the post-facility-regeneration ignitions, all discharge cathode ignitions
0
1
2
3
4
5
6
7
0 5 10 15 20 25
Dis
char
ge K
eepe
r Vol
tage
, V .
Total Elapsed Time, kh
Runtime Data3.52 A, 1800 V3.52 A, 1179 V2.70 A, 1179 V2.70 A, 1800 V1.00 A, 275 V2.00 A, 1179 V2.00 A, 1800 V1.20 A, 300 V1.20 A, 679 V1.20 A, 1179 V1.20 A, 1800 V
Kpr Shorted (13,875 h)
0
5
10
15
20
25
30
35
0 5 10 15 20 25
Cat
hode
Igni
tion
Dur
atio
n, m
in
,
Total Elapsed Time, kh
DCA Post-Regen
DCAXenon purge during regens
Post-cryo repairs
4.7 kW (13,042 h)
1.1 kW (19,520 h)
0.5 kW (22,931 h)

NASA/TM—2009-215837 10
up to 13,042 h had been less than 5 min. After 2,000 h, the post-cryopump-regeneration ignition durations began to be increase with thruster operating time. The highest post-regeneration ignition duration, ~24 min, occurred following an extended period of thruster downtime for cryo-pump repairs. After 7,000 h of operation, a xenon purge of 4.00 sccm discharge cathode flow was maintained during the facility regenerations in order to maintain collisional flow inside the cathode tube. The purge flow effectively reduced the post-facility-regeneration ignition durations to their nominal values until another factor caused variable discharge ignitions. The exact cause of the post-regeneration increased ignition durations is unknown, but is a result of facility effects due to exposure to pressures up to 100 m torr during regenerations. One possibility is absorption of moisture on internal surfaces of the graphite keeper, which acts as a getter for moisture during the facility regeneration when facility pressure reaches 100 m torr. This moisture would not necessarily be driven off by the cathode conditioning sequence utilized prior to ignition. Metallic keepers previously used in NEXT and NSTAR thrusters would not collect moisture as effectively as carbon, thus this behavior was not previously observed. The absorbed moisture may be released during the subsequent cathode ignition exposing the emitter to higher levels of moisture and oxygen. This exposure may also contribute to the increasing discharge voltages previously discussed. The cathode purge flow may be reducing moisture absorption on the interior surfaces of the keeper and orifice. Regardless, a flight thruster in space would not experience this type of repeated exposure and therefore this issue is limited to ground-based testing.
After 369 h of operation at 4.7 kW, a transient, thermally-induced high-impedance was observed on the discharge cathode heater. The high-impedance is observed intermittently during cathode conditioning and ignition sequences, resulting in a momentary inability to draw the required heater current. As a result of this behavior, the discharge cathode ignition durations experienced large variability after 13,411 h of thruster operation. This behavior is due to the combined effects of a resistive layer formation between the heater sheath and cathode tube and a thermally-induced gap between the heater sheath and cathode tube both contributing to an intermittent break in the heater current return path. The high-impedance behavior followed a high-pressure event while the thruster was hot (causing resistive layer formation) and shortly after throttling to the new operating condition with a higher discharge cathode emission current (breaking of previously established diffusion bond and/or thermally induced gap formation). The EM discharge cathode design does not have a positive heater current return, instead relying upon a friction-fit between the heater sheath and heater tube. After the investigation, it was speculated that continued operating at the 4.7 kW operating condition could result in re-establishing a good current return path through diffusion bonding of the heater outer-sheath to the cathode tube. In fact a decrease in the long-duration ignitions, post-regeneration or not, was observed from 13 to 19 kh of operation presumably due to the diffusion bonding of the heater coil to the cathode tube. The NEXT PM design incorporates a positive heater current return via a physical, solid connection between the two surfaces that prevents this behavior from occurring (Ref. 10).
Since 21 kh of operation there have been 3 extended duration ignitions, i.e., longer than 6 min. These are due to the intermittent, thermally-induced discharge cathode keeper to common short. This keeper short has been observed on several occasions during the cathode ignition sequence and was observed during each of these 3 long-duration ignitions. When the keeper is shorted, the laboratory igniter pulse circuit is loaded down so it cannot provide the high-voltage pulse. In fact, the igniter pulse is attenuated by the long cabling lengths required for ground testing even at beginning-of-life. This attenuation would be reduced in space assuming the cable length from the thruster to power processor is considerable less than the 30 ft of cable typical for ground testing. In addition to the inability to supply the igniter pulse, the open-circuit discharge voltage is not being applied from keeper to common when the two are shorted together. Both of these factors would be present in flight if the keeper shorts to the cathode, since the power processor has a similar igniter pulse circuit, and have a deleterious effect on cathode ignition duration. In most instances, though, the discharge cathode ignition duration has been less than 6 min. even with the keeper shorted to cathode common.

NASA/TM—2009-215837 11
Neutralizer
Neutralizer keeper voltage, relative to neutralizer cathode common, has demonstrated a slight decrease over the duration of the test (Ref. 30). At full-power, the neutralizer keeper voltage decreased from 11.2 to 10.7 V. This minor decrease is likely due to erosion of the neutralizer cathode orifice plate. The coupling voltage, which is neutralizer cathode common relative to vacuum facility ground, has been steady at –10.20.2 V (at full-power) over the duration of the test. Neutralizer ignitions, 198 to date, have durations typically less than 4 min and all ignitions less than 6 min. The constant neutralizer ignition durations, even after facility regeneration, offers additional evidence to support the role of the graphite discharge cathode keeper in the observed increasing discharge cathode post-regeneration ignitions. The neutralizer cathode assembly (NCA) utilizes a metal keeper electrode that does not absorb moisture as effectively as graphite.
Relative to the NEXT technology development throttle table at the inception of the NEXT LDT, a loss in neutralizer flow margin has been observed, shown in Figure 14. A new throttle table (TT10), Table A1, accounts for the observed degradation experienced during the LDT and is now the baseline throttle table for the technology program and for mission analyses. Flow margin is defined as the difference between the neutralizer flow set point and the transition flow from spot to plume mode operation. Spot mode is characterized by low voltage and current oscillations, while plume mode is described by large fluctuations that can lead to increased erosion and reduced emitter life. Following the NSTAR criterion, plume mode operation is reached when peak-to-peak neutralizer keeper voltage oscillations exceed 5 V.
As Figure 14 illustrates, there is considerable flow margin at the full-power condition. Transition flow margin has decreased, based on beginning-of-life neutralizer flow rates, for all beam current conditions over the test duration. Motivated by the EM neutralizer low flow margin at beginning-of-life, design modifications have been incorporated into the PM neutralizer design yielding higher flow margin at low-power at the modest expense of ~1 V increase in the magnitude of the coupling voltage (Ref. 5). The beginning-of-life flow margins for the first NEXT PM thruster are shown in Figure 14. Since ~16 kh the neutralizer internal pressure has been monitored by a 100 torr capacitance manometer mounted downstream of the neutralizer mass flow controller. Figure 15 details the neutralizer pressure for the operating conditions since 16 kh. The data have not been adjusted for the pressure drop between the flow controller and the neutralizer; however, the trend is valid. At 4.7 kW a decreasing neutralizer pressure is observed. This decreasing neutralizer pressure is likely a result of the neutralizer orifice erosion and the main contributor to the loss of flow margin. The magnitude of the neutralizer pressure at 16 kh, indicates that considerable degradation in pressure had already occurred, consistent with the loss of flow margin. It is expected, based upon other NEXT tests, that the beginning-of-life of the NEXT neutralizer pressure at full-power would be 50 to 60 torr (Ref. 27).
Figure 14.—Neutralizer flow margin, between set flow and transition flow,
as a function of time for various beam currents (Ref. 5).
-1.0
-0.5
0.0
0.5
1.0
1.5
2.0
2.5
3.0
0 5 10 15 20 25
Neu
tral
izer
Flo
w M
argi
n, s
ccm
.
Total Elapsed Time, kh
Jb = 3.52 A
Jb = 2.70 A
Jb = 1.20 A
Jb = 2.00 A
Jb = 1.00 A
PM; Jb = 0 A
PM; Jb = 3.52 A
PM; Jb = 1.20 A
PM; Jb = 2.00 A
At 4.7 kW At 1.1 kW
At 0.5 kW

NASA/TM—2009-215837 12
Figure 15.—Neutralizer pressure downstream of mass flow controller as a function of time.
Ion Optics
An initial decrease in accelerator current was observed at the beginning of the test due to burn-in of the ion optics, primarily restricted to outer radii accelerator grid aperture enlargement (Ref. 30). After the beginning of the test, the accelerator current trends have been dominated by changes in the facility background pressure. The accelerator current for the NSTAR thruster on DS1 was ~25 percent less in space than the NSTAR data obtained during pre-flight measurements in a test facility operating with a background pressure level of 3.510–6 torr (Refs. 3, 37, and 42). Because the NEXT LDT is operating at comparable yet slightly higher operating background pressures, it is expected that the NEXT in space accelerator current would be reduced by 25 percent compared to those measured in this test facility.
Electron backstreaming margins, perveance margins, and screen grid ion transparencies throughout the wear test are plotted for each operating condition in Figures 16 to 18, respectively. Electron backstreaming limit is the highest accelerator voltage, lowest in magnitude, which will prevent beam plasma electrons from backstreaming through the ion optics. Electron backstreaming limits are determined by lowering the magnitude of the accelerator grid voltage until the indicated beam power supply current increases by 1 mA due to backstreaming electrons. The electron backstreaming margin is then the difference between the setpoint and the limit. Impingement-limited total voltage is a measure of the ion optics’ current extraction capability, and therefore a measure of its perveance. Perveance limits are determined from plots of accelerator current as a function of total voltage where the slope is –0.02 mA/V. The total voltage is defined as the sum of the beam power supply voltage and the absolute value of the accelerator grid voltage. Screen grid ion transparencies are calculated as described in Reference 50.
Electron backstreaming margin has been relatively constant for all operating conditions over the entire test duration; however, a slightly increasing trend is discernable. At full-power, the electron backstreaming margin has improved by ~5 V since the beginning of the test. The backstreaming margin has been observed to decrease slightly following perveance measurements indicating the cause of the improved margin may be the result of backsputtered deposition on the accelerator cusps, which is removed when the beamlets are defocused during perveance measurements. The source of the backsputtered material, evident from in-situ images, is carbon from the beam dump and vacuum facility walls due to the high-energy ion beam impingement. This behavior is an artifact of ground testing and would not be observed in space. Electron backstreaming and perveance margins have been nominal, within measurement error, over the duration of the test indicating no substantial change in accelerator aperture cusps or operating ion optics’ grid-gap. A modest decrease, approximately 1 percentage point, in screen grid ion transparency is observed over the duration of the test. Changes in electron backstreaming limit, perveance limit, and screen grid ion transparencies are not significant enough to degrade the ion optics’ performance and are less than or equal to those exhibited by the NSTAR ion optics during the 8,200 h wear test and NSTAR ELT (Refs. 43 and 45).
24
26
28
30
32
34
36
38
16 17 18 19 20 21 22 23 24
Neu
tral
izer
Pre
ssur
e, T
orr
.
Total Elapsed Time, kh
4.7 kW (13,042 h)
1.1 kW (19,520 h) 0.5 kW (22,929 h)

NASA/TM—2009-215837 13
Figure 16.—Thruster ion optics’ electron backstreaming margin data as a function of time.
Figure 17.—Thruster ion optics’ impingement-limited total voltage margin data as a function of time.
Figure 18.—Thruster ion optics’ screen grid ion transparency data as a function of time.
0
20
40
60
80
100
120
140
0 5 10 15 20 25
E-B
acks
trea
min
g M
argi
n, V
.
Total Elapsed Time, kh
1.20 A, 679 V
1.20 A, 1179 V
1.20 A, 1800 V
2.00 A, 1179 V
2.70 A, 1179 V
2.00 A, 1800 V
3.52 A, 1179 V
2.70 A, 1800 V
3.52 A, 1800 V
0
200
400
600
800
1000
1200
1400
1600
0 5 10 15 20 25
Perv
eanc
e M
argi
n, V
.
Total Elapsed Time, kh
1.20 A, 1800 V
2.00 A, 1800 V
2.70 A, 1800 V
3.52 A, 1800 V
1.00 A, 275 V
0.74
0.76
0.78
0.80
0.82
0.84
0.86
0.88
0.90
0.92
0 5 10 15 20 25
Scre
en G
rid
Ion
Tra
nspa
renc
y .
Total Elapsed Time, kh
2.70 A, 1800 V2.00 A, 1800 V3.52 A, 1800 V1.20 A, 1800 V1.20 A, 1179 V2.00 A, 1179 V2.70 A, 1179 V3.52 A, 1179 V1.20 A, 679 V1.20 A, 300 V1.00 A, 275 V

NASA/TM—2009-215837 14
Erosion
In-situ erosion images of the discharge cathode assembly (DCA), neutralizer cathode assembly (NCA), accelerator grid center-radius aperture (CRA), mid-radius aperture (MRA)—located 16 cm radially from center, outer-radius apertures (ORA), and ion optics’ cold grid-gap are obtained with CCD cameras mounted inside the vacuum chamber on a translation table. The camera mount is shown in Figure 19 along with the additional support hardware. Erosion of critical thruster components has been within modeling predictions and consistent with the NEXT service life assessment (Refs. 22, 24, and 31). Several of the NSTAR ELT-observed wear anomalies have been significantly reduced and in most cases eliminated. There has been no observed discharge cathode keeper orifice erosion, no measured increase in accelerator grid aperture cusps except for the outer edge apertures, and no measured change in the cold grid-gap of the ion optics for the NEXT engine—all of which were observed during the NSTAR ELT of the DS1 flight spare (Ref. 37). In fact, the NEXT design and operating conditions has eliminated the NSTAR first failure mode, accelerator grid barrel erosion leading to electron backstreaming. This is accomplished through the combination of an ion optics design that eliminates the decreasing grid-gap with time, a flatter beam profile, greater precision control of accelerator aperture tolerances during grid manufacturing, and selection of grid voltages. As a result, the NEXT throughput capability has been greatly increased as the first failure mode has been pushed from accelerator barrel erosion resulting in electron backstreaming to groove erosion of the accelerator grid due to charge-exchange ion sputtering resulting in the eventual structural failure of the accelerator grid. The results of the erosion measurements are discussed in the following sections.
Discharge Cathode Assembly (DCA)
Figure 20 shows the NEXT EM3 discharge cathode at 0 and 23,300 h of operation along with comparison photographs of the NSTAR ELT discharge cathode assembly. The NEXT discharge cathode faceplate has become slightly textured, but the discharge cathode orifice, cathode orifice chamfer, and keeper orifice diameters have not changed within the measurement error, as shown in Figure 21 normalized by the beginning-of-test values. During the NSTAR ELT, the keeper electrode was completely eroded away, exposing the discharge cathode and heater (Ref. 51). The NSTAR ELT keeper erosion was characterized by a widening of the keeper orifice in contrast to the NEXT 2,000 h and NSTAR 8,200 h wear tests, in which the most severe erosion was focused towards the mid-radius of the keeper faceplate (Refs. 21, 34, and 43). The primary function of the discharge cathode keeper is to protect the discharge cathode from excessive sputter erosion. The EM3 keeper material was changed to graphite, which has a sputter yield an order of magnitude lower than that of the molybdenum at 50 eV (Ref. 52). While the LDT results confirm that no enlargement of the keeper orifice has occurred, the erosion of the downstream face of the keeper is not measured in-situ. Discharge cathode keeper downstream surfaces
Figure 19.—Photograph of QCM, pinhole cameras, CCD image locations, and staggered Faraday probes.
NCA
16 cm Mid-radius Center radius Grid-gap DCA
Outer radius
QCM
Pinhole cameras Faraday probes

NASA/TM—2009-215837 15
from the NSTAR 8,200 h and NEXT 2,000 h wear tests were qualitatively similar with the deepest erosion at a radii of 55 to 60 and 40 percent of the total keeper radius, respectively (Refs. 21, 34, and 43). Scaling the NEXT 2,000 h wear test molybdenum discharge keeper erosion rate (depth of 17 percent of the keeper thickness after test) with the decrease in sputter yield of graphite compared to molybdenum gives a conservative estimate of wear through of the keeper after >87 kh at full-power (1800 kg) (Refs. 34, 52, and 53).
Neutralizer Cathode Assembly (NCA)
Figure 22 shows the neutralizer cathode assembly (NCA) pretest and image taken after 23,300 h of thruster operation. Texturing of the neutralizer cathode faceplate is observed and a darkening of the keeper is seen due to backsputtered carbon deposition from the facility. The NCA is located in the 12 o’clock position of the thruster so any erosion due to placement of the NCA in the high-energy beam would be seen in the bottom of the images taken, which appears pristine. Normalized measurements from the erosion images, shown in Figure 23, confirm no observed erosion of the NCA keeper orifice diameter or cathode orifice diameter, while the cathode orifice chamfer diameter has increased by ~20 percent over the test duration. No clogging of the neutralizer orifice has been observed even at the lowest neutralizer emission currents.
Though the neutralizer orifice does not show any erosion when imaging on centerline, indicating the minimum diameter, it is likely that the EM3 neutralizer orifice channel has eroded. Post-test neutralizer orifice channel erosion profiles were measured after the NSTAR 8,200 h wear test and NSTAR ELT indicating a bell-shaped erosion pattern opening larger towards the keeper (Refs. 37 and 43). The observed reduction in neutralizer flow margin with the NEXT LDT test duration suggests erosion of the orifice channel is occurring (Ref. 30).
Figure 21.—NEXT discharge cathode orifice diameters normalized to pretest values versus time.
0.90
0.95
1.00
1.05
1.10
1.15
1.20
1.25
1.30
0.70
0.75
0.80
0.85
0.90
0.95
1.00
1.05
1.10
0 5 10 15 20 25
DC
A K
eepe
r Ori
fice
.
DC
A C
atho
de O
rifi
ce .
Elapsed Time, kh
Cathode Orifice Cathode Orifice Chamfer Keeper Orifice
CK-CC short
6.9 kW 4.7 kW 1.1 kW 0.5 kW
Figure 20.—Discharge cathode assembly images for NEXT LDT (left) and NSTAR ELT (right) (Refs. 37,
45, 51, and 57.
Keeper
0 h 0 0 h 0 kg 30,352 h 235 kg
NEXT LDT Discharge Cathode NSTAR ELT Discharge Cathode Orifice Orifice
23,300 h 427 kg

NASA/TM—2009-215837 16
Accelerator Grid Apertures
Images of the accelerator grid at the center-radius (CRA), 16 cm or mid-radius (MRA), and outer-radius apertures (ORA) are obtained periodically throughout the wear test. Charge-exchange (CEX) erosion of the accelerator grid leads to the hexagonal groove erosion pattern observed. CEX production is most severe at the center of the grid where the current density profile is at a maximum. Erosion of the CRA showed formation of a hexagonal groove pattern within the first few hundred hours of operation. Figure 24 illustrates the pre-test and latest CRA images. The hexagonal groove pattern is clearly evident as well as the buildup of backsputtered carbon around the inside of the groove pattern. The CRA erosion measurements, normalized to the beginning-of-test value, are shown in Figure 25. Within the uncertainty of the measurement, no variation of CRA cusp has been detected. After 23,300 h, the CRA downstream diameter has increased by 15 percent. The erosion at the MRA and ORA locations are discussed in detail in References 31 and 54.
The lack of CRA cusp enlargement in the NEXT LDT is in sharp contrast to the observed trend during the NSTAR ELT. Figure 26 shows the normalized CRA cusp measurements for the NEXT LDT and NSTAR ELT illustrating the difference in CRA cusp erosion (Ref. 37). The NEXT PM ion optics beginning-of-test erosion is characterized by aperture downstream chamfering compared to the NSTAR ion optics aperture cusp and downstream erosion. The difference is due to the more highly focused beamlets and lower peak beam current densities at the NEXT full-power and 4.7 kW operating conditions. Aperture cusp enlargement leads to increased neutral losses, more variable performance parameters, and possible electron back-streaming. In fact, the first failure mode for the NSTAR thruster is
Figure 23.—Neutralizer cathode orifice diameter, orifice chamfer diameter, and keeper orifice
diameter normalized to pretest values as a function of time.
0.90
0.95
1.00
1.05
1.10
1.15
1.20
1.25
1.30
0.60
0.70
0.80
0.90
1.00
1.10
1.20
1.30
1.40
0 5 10 15 20 25
NC
A K
eepe
r Ori
fice
.
NC
A C
atho
de O
rifi
ce .
Elapsed Time, kh
Cathode Orifice Cathode Orifice Chamfer Keeper Orifice
6.9 kW 4.7 kW 1.1 kW 0.5 kW
Figure 22.—Neutralizer assembly erosion images.
0 h 0 kg 23,300 h 427 kg

NASA/TM—2009-215837 17
inability to prevent electron backstreaming due to accelerator aperture enlargement (Ref. 55). NEXT CRA cusp diameter erosion is expected to be most severe at the 4.7 kW operating condition (i.e., highest beam current density with lowest total voltage) and since no CRA cusp erosion is observed it is anticipated that for all other operating conditions there will be negligible cusp erosion.
Figure 25.—Accelerator grid center-radius cusp diameter and downstream diameter normalized to
pretest values as a function of time.
0.90
0.95
1.00
1.05
1.10
1.15
1.20
1.25
1.30
0.70
0.75
0.80
0.85
0.90
0.95
1.00
1.05
1.10
0 5 10 15 20 25
Acc
el C
RA
D/S
Acc
el C
ente
r Rad
ius C
usp
.
Elapsed Time, kh
Cusp
Downstream
4.7 kW6.9 kW 1.1 kW 0.5 kW
Figure 26.—Accelerator grid center-radius aperture cusp diameter for the NEXT LDT and NSTAR ELT (Refs. 37, 45, 51, and 57).
0.90
0.95
1.00
1.05
1.10
1.15
1.20
1.25
1.30
0 50 100 150 200 250 300 350 400 450
Non
-Dim
Acc
el C
RA
Cus
p .
Propellant Throughput, kg
NSTAR ELT
NEXT LDT
Figure 24.—Accelerator grid center-radius
aperture images with an applied red palette.
0 h 0 kg 23,300 h 427 kg

NASA/TM—2009-215837 18
Accelerator Groove Erosion
Erosion of the accelerator grid downstream surface by charge-exchange (CEX) ions results in a hexagonal pit and groove erosion pattern that will lead to the eventual structural failure of the accelerator grid. During the NSTAR ELT, the accelerator pit depth was measured during the first 10,000 h of operation with laser profilometer. Problems with the diagnostic precluded accurate measurement of pit depth afterwards. The post-test inspection revealed pit erosion through the thickness of the accelerator grid (Ref. 37). There are no discernable pits at the center-radius or any location on the accelerator grid for the NEXT LDT as illustrated in the erosion images such as Figures 24 and 27; however, grooves are clearly visible. To measure the NEXT LDT groove depth, a diagnostic technique was developed using the existing accelerator grid CCD cameras to determine the groove depth at the center-radius location (Ref. 56). The groove depth measurement has been obtained since 7,600 h of operation at least every 700 to 800 h and the results are presented in Figure 28. The measured increase in groove depth at full-power is consistent with the results from the NEXT 2,000 h WT and less than the NSTAR ELT pit depths for equivalent operating times, also shown in Figure 28 (Refs. 21, 34, 45, and 57). The groove erosion is expected to be linear with time, assuming operation at a fixed operating condition. Extrapolation of the groove depth trend at full-power, the most severe groove erosion as a function of hours of operation, indicate wear-through at a throughput of 700 to 800 kg. The wear of the groove through the accelerator grid does not in itself represent a failure of the thruster. Since throttling the thruster to lower powers, a noticeable groove erosion rate decrease has been observed as expected. This change is consistent with the model incorporated by the NEXT thruster service life assessment also shown in Figure 28 (Refs. 22 and 24).
Figure 28.—NEXT LDT accelerator grid center-radius groove erosion depth, percentage of total accelerator
grid thickness, as a function of time. Also shown is the post-test analysis of centerline groove depth from the NEXT 2,000 h WT and the NSTAR ELT pit depth with test duration (Refs. 21, 34, 37, and 57).
0
10
20
30
40
50
60
0 100 200 300 400
% A
ccel
erat
or D
epth
Ero
sion
Propellant Throughput, kg
NSTAR ELT Pit
Data: 6.9 kW
Model: 6.9 kW
Data: 4.7 kW
Model: 4.7 kW
Data: 1.1 kW
Model: 1.1 kW
NEXT 2 kh WT
Figure 27.—Accelerator grid-gap aperture images: CRA at t = 0 (left), CRA at t = 23,300 h (middle), and ~1 in. off-center from CRA at t = 23,300 h (right).

NASA/TM—2009-215837 19
Application of a model developed to predict the effect of backsputtering on grid erosion, with a 3 m/kh backsputter rate and center-radius aperture ion impingement current density, estimates a maximum of 10 percent reduction in erosion near the beam center, where pit and groove erosion rate is highest, during the NEXT LDT due to backsputtered carbon (Ref. 58). Additional analyses have been performed to predict the impact of the backsputtered carbon deposition on the accelerator grid utilizing the MICHELLE Particle-in-Cell (PIC) code (Ref. 59). The resulting analysis estimates a 30 percent reduction in the maximum groove erosion due to carbon deposition in the LDT (Ref. 59). From NSTAR data on DS1, the impingement accelerator current in space was ~25 percent less than the NSTAR data obtained during pre-flight measurements at 1.50 A beam current and 25.56 sccm total flow rate in a test facility operating with a background pressure level of 3.510–6 torr (Refs. 3, 37, and 42). The NEXT LDT is operating at slightly higher operating background pressures at full-power, resulting in measured NEXT accelerator currents that would be 25 percent larger than those in space and therefore accelerator grid erosion would be approximately 25 percent less in space. The combined effects of elevated background pressure in the test facility and backsputtered carbon deposition essentially cancel out and therefore the LDT groove wear is anticipated to be representative of thruster operation in space.
Ion Optics Grid-Gap
The gap between the screen and accelerator grids decreased over the course of both the NSTAR ELT and 8,200 WT (Refs. 43 and 45). Pre- and post-test grid-gap measurements from the NSTAR ELT and 8,200 h wear test indicated 30 and 12 percent reduction in the cold grid-gap, respectively (Ref. 37). It is not known how the grid-gap varied over the course of the tests because no data is available. Analysis of electron backstreaming data indicates the grid-gap change probably occurred slowly over the duration of the test (Ref. 37). Decreases in grid-gap cause an increase the electric field between the grids resulting in reduced electron backstreaming margin and increased arcing between the grids. The decreasing NSTAR grid-gap contributes to the first failure mode of the thruster, inability to prevent electron backstreaming.
A similar decrease in the cold grid-gap of 7 percent was also observed following the NEXT 2,000 h wear test, which utilized EM ion optics. To address this undesirable change, the NEXT PM ion optics assembly and mounting scheme were modified from the EM design specifically to address and eliminate the observed decreasing cold grid-gap with thruster operation. An in-situ diagnostic was implemented for NEXT to measure the centerline cold grid-gap to validate the PM ion optics design modifications. Within the measurement uncertainty, there has been no observed change in the NEXT LDT cold grid-gap, shown in Figure 29, which utilizes PM ion optics. This is supported by the lack of change in the electron backstreaming and perveance margins over the test duration.
Figure 29.—Cold centerline grid-gap data for the NEXT LDT, NEXT 2 kh WT, NSTAR ELT, and
NSTAR 8,200 h WT normalized to beginning-of-test values (Refs. 21, 34, 37, 43, and 57).
0.6
0.7
0.8
0.9
1.0
1.1
1.2
0 5 10 15 20 25 30 35
Opt
ics'
Col
d G
rid-
Gap
, Nor
mal
ized
.
Elapsed Time, kh
NEXT LDT: 6.9k WNEXT LDT: 4.7 kWNEXT LDT: 1.1 kWNEXT EM1 WTNSTAR WTNSTAR ELT

NASA/TM—2009-215837 20
Conclusion
The results of the NEXT Long-Duration Test (LDT) as of July 2009 are presented. The NEXT EM3 thruster has accumulated 23,300 h of operation, processed 427 kg of xenon, and demonstrated a total impulse of 16.0106 N·s. The NEXT thruster has surpassed the total throughput (1.8X) demonstrated by any ion thruster including the NSTAR flight spare thruster. The NEXT LDT total impulse is the highest ever demonstrated by an ion thruster. Thruster performance is characterized periodically over the throttling range of 0.5 to 6.9 kW, with calculated thrust of 26 to 237 mN, respectively. Overall thruster performance, which includes thrust, input power, specific impulse, and thrust efficiency, has remained constant with negligible signs of degradation. Perveance margins, electron backstreaming margins, and screen grid ion transparencies have been steady to date, with a modest improvement in electron backstreaming margin due to facility effects. Discharge losses have increased by 8 W/A at full-power due to increasing discharge voltage and current. Neutralizer transition flow margin has decreased due to orifice channel erosion and has been addressed by prototype-model neutralizer design modifications and updating the NEXT throttle table (TT10) with higher neutralizer flows at low input powers. Negligible erosion of the EM3 discharge and neutralizer cathodes has been observed, except the anticipated neutralizer orifice channel and discharge keeper faceplate erosion that are not measured. Negligible accelerator aperture cusp erosion and only slight over-focusing erosion at the very outer edge of apertures have been observed. The negligible change in ion optics cold grid-gap, combined with minimal accelerator aperture erosion, is consistent with the constant electron backstreaming and perveance performance margins. Failure to prevent electron backstreaming, the NSTAR thruster first failure mode, has been mitigated in the NEXT design and operating characteristics. Groove erosion, the NEXT first failure mode, has been measured as a function of operating condition with results consistent with thruster lifetime predictions.
Thruster modeling and groove erosion rate data indicate the onset of the NEXT first failure sometime after 750 kg throughput. The NEXT LDT is gradually progressing towards, and soon will demonstrate, the project qualification throughput of 450 kg propellant throughput.

NASA/TM—2009-215837 21
Appendix—NEXT Throttle Table
TABLE A1.—NEXT BEGINNING-OF-LIFE THROTTLE TABLE (TT10) WITH LDT PERFORMANCE [Operating conditions subset shaded and full-power wear test condition in bold.]
TL level PIN, kWa
JB, A
VB, V
VA, V
mM, sccm
mC, sccm
mN, sccm
JNK, A
40 6.86 3.52 1800 –210 49.6 4.87 4.01 3.00 39 6.05 3.52 1570 –210 49.6 4.87 4.01 3.00 38 5.46 3.52 1400 –210 49.6 4.87 4.01 3.00 37 4.71 3.52 1180 –200 49.6 4.87 4.01 3.00 36 6.06 3.10 1800 –210 43.5 4.54 4.01 3.00 35 5.35 3.10 1570 –210 43.5 4.54 4.01 3.00 34 4.82 3.10 1400 –210 43.5 4.54 4.01 3.00 33 4.14 3.10 1180 –200 43.5 4.54 4.01 3.00 32 5.29 2.70 1800 –210 37.6 4.26 3.50 3.00 31 4.67 2.70 1570 –210 37.6 4.26 3.50 3.00 30 4.22 2.70 1400 –210 37.6 4.26 3.50 3.00 29 3.64 2.70 1180 –200 37.6 4.26 3.50 3.00 28 3.22 2.70 1020 –175 37.6 4.26 3.50 3.00 27 4.62 2.35 1800 –210 32.4 4.05 3.50 3.00 26 4.08 2.35 1570 –210 32.4 4.05 3.50 3.00 25 3.68 2.35 1400 –210 32.4 4.05 3.50 3.00 24 3.18 2.35 1180 –200 32.4 4.05 3.50 3.00 23 2.82 2.35 1020 –175 32.4 4.05 3.50 3.00 22 4.01 2.00 1800 –210 25.8 3.87 2.50 3.00 21 3.54 2.00 1570 –210 25.8 3.87 2.50 3.00 20 3.21 2.00 1400 –210 25.8 3.87 2.50 3.00 19 2.78 2.00 1180 –200 25.8 3.87 2.50 3.00 18 2.47 2.00 1020 –175 25.8 3.87 2.50 3.00 17 3.25 1.60 1800 –210 20.0 3.70 2.75 3.00 16 2.88 1.60 1570 –210 20.0 3.70 2.75 3.00 15 2.61 1.60 1400 –210 20.0 3.70 2.75 3.00 14 2.27 1.60 1180 –200 20.0 3.70 2.75 3.00 13 2.02 1.60 1020 –175 20.0 3.70 2.75 3.00 12 2.44 1.20 1800 –210 14.2 3.57 3.00 3.00 11 2.16 1.20 1570 –210 14.2 3.57 3.00 3.00 10 1.96 1.20 1400 –210 14.2 3.57 3.00 3.00 9 1.70 1.20 1180 –200 14.2 3.57 3.00 3.00 8 1.52 1.20 1020 –175 14.2 3.57 3.00 3.00 7 1.42 1.20 936 –150 14.2 3.57 3.00 3.00 6 1.32 1.20 850 –125 14.2 3.57 3.00 3.00 5 1.12 1.20 679 –115 14.2 3.57 3.00 3.00 4 1.09 1.20 650 –144 14.2 3.57 3.00 3.00 3 0.789 1.20 400 –310 14.2 3.57 3.00 3.00 2 0.669 1.20 300 –410 14.2 3.57 3.00 3.00 1 0.545 1.00 275 –350 12.3 3.52 3.00 3.00
aNominal values at beginning of life

NASA/TM—2009-215837 22
References
1. Rayman, M.D., “The Successful Conclusion of the Deep Space 1 Mission: Important Results Without a Flashy Title,” Space Technology, vol. 23, pp. 185–196, 2003.
2. Lee, M., et al., “Deep Space 1 Mission and Observation of Comet Borrelly,” Deep Space 1 Mission and Observation of Comet Borrelly, 45th IEEE International Midwest Symposium on Circuits and Systems, Tulsa, OK, Aug. 4, 2002.
3. Polk, J.E., et al., “Performance of the NSTAR Ion Propulsion System on the Deep Space One Mission,” AIAA–2001–0965, 39th AIAA Aerospace Sciences Meeting and Exhibit Joint Propulsion Conference, Reno, NV, January 8–11, 2001.
4. Brophy, J.R., et al., “Dawn Ion Propulsion System- Initial Checkout after Launch,” AIAA–2008–4917, 44th AIAA/ASME/SAE/ASEE Joint Propulsion Conference & Exhibit, Hartford, CT, July 20–23, 2008.
5. Herman, D.A., et al., “Performance Evaluation of the Prototype-Model NEXT Ion Thruster,” AIAA–2007–5212 and NASA/TM—2008-215029, 43rd AIAA/ASME/SAE/ASEE Joint Propulsion Conference and Exhibit, Cincinnati, OH, July 8–11, 2007.
6. Pinero, L.R., et al., “Integration and Qualification of the NEXT Power Processing Unit,” AIAA–2007–5214, 43rd AIAA/ASME/SAE/ASEE Joint Propulsion Conference and Exhibit, Cincinnati, OH, July 8–11, 2007.
7. Patterson, M.J. and Benson, S.W., “NEXT Ion Propulsion System Development Status and Capabilities,” Conference Proceedings and NASA/TM—2008-214988, 2007 NASA Science Technology Conference, College Park, MD, June 19–21, 2007.
8. Snyder, J.S., et al., “Vibration Test of a Breadboard Gimbal for the NEXT Ion Engine,” AIAA–2006–4665, 42nd AIAA/ASME/SAE/ASEE Joint Propulsion Conference and Exhibit, Sacramento, CA, July 9–12, 2006.
9. Aadland, R.S., et al., “Development Status of the NEXT Propellant Management System,” AIAA–2004–3974, 40th AIAA/ASME/SAE/ASEE Joint Propulsion Conference and Exhibit, Fort Lauderdale, FL, July 11–14, 2004.
10. Hoskins, W.A., et al., “Development of a Prototype Model Ion Thruster for the NEXT System,” AIAA–2004–4111, 40th AIAA/ASME/SAE/ASEE Joint Propulsion Conference and Exhibit, Fort Lauderdale, FL, July 11–14, 2004.
11. Monheiser, J., et al., “Development of a Ground Based Digital Control Interface Unit (DCIU) for the NEXT Propulsion System,” AIAA–2004–4112, 40th AIAA/ASME/SAE/ASEE Joint Propulsion Conference and Exhibit, Fort Lauderdale, FL, July 11–14, 2004.
12. Soulas, G.C., et al., “NEXT Single String Integration Test Results,” AIAA–2009–4816, 45th AIAA/ASME/SAE/ASEE Joint Propulsion Conference & Exhibit, Denver, CO, Aug. 2–5, 2009.
13. Benson, S.W., et al., “NEXT Ion Propulsion System Progress Towards Technology Readiness,” AIAA–2008–5285, 44th AIAA/ASME/SAE/ASEE Joint Propulsion Conference & Exhibit, Hartford, CT, July 20–23, 2008.
14. Pinero, L.R., et al., “Performance of the NEXT Engineering Model Power Processing Unit,” AIAA–2007–5214, 43rd AIAA/ASME/SAE/ASEE Joint Propulsion Conference and Exhibit, Cincinnati, OH, July 8–11, 2007.
15. Anderson, J.R., et al., “Thermal Development Test of the NEXT PM1 Ion Engine,” AIAA–2007–5217, 43rd AIAA/ASME/SAE/ASEE Joint Propulsion Conference and Exhibit, Cincinnati, OH, July 8–11, 2007.
16. Snyder, J.S., et al., “Environmental Testing of the NEXT PM1 Ion Engine,” AIAA–2007–5275, 43rd AIAA/ASME/SAE/ASEE Joint Propulsion Conference and Exhibit, Cincinnati, OH, July 8–11, 2007.
17. Patterson, M.J., et al., “NEXT Multi-Thruster Array Test - Engineering Demonstration,” AIAA–2006–5180, 42nd AIAA/ASME/SAE/ASEE Joint Propulsion Conference and Exhibit, Sacramento, CA, July 9–12, 2006.

NASA/TM—2009-215837 23
18. Foster, J.E., et al., “Plasma Characteristics Measured in the Plume of a NEXT Multi-Thruster Array,” AIAA–2006–5181, 42nd AIAA/ASME/SAE/ASEE Joint Propulsion Conference and Exhibit, Sacramento, CA, July 9–12, 2006.
19. Aadland, R.S., et al., “Development Results of the NEXT Propellant Management System,” JANNAF 2005–0356DW, JANNAF 2nd Liquid Propulsion Subcommittee and 1st Spacecraft Propulsion Subcommittee Joint Meeting, Monterey, CA, December 5–8, 2005.
20. Patterson, M.J., et al., “NEXT Ion Propulsion System: Single-String Integration Test Results,” JANNAF Proceedings, Las Vegas, NV, May, 2004.
21. Soulas, G.C., et al., “NEXT Ion Engine 2000 Hour Wear Test Results,” AIAA–2004–3791, 40th AIAA/ASME/SAE/ASEE Joint Propulsion Conference and Exhibit, Fort Lauderdale, FL, July 11–14, 2004.
22. Van Noord, J.L., “Lifetime Assessment of the NEXT Ion Thruster,” AIAA–2007–5274, 43rd AIAA/ASME/SAE/ASEE Joint Propulsion Conference and Exhibit, Cincinnati, OH, July 8–11, 2007.
23. Herman, D.A., et al., “NASA’s Evolutionary Xenon Thruster (NEXT) Component Verification Testing,” AIAA–2008–4812, 44th AIAA/ASME/SAE/ASEE Joint Propulsion Conference and Exhibit, Hartford, CT, July 21–23, 2008.
24. Van Noord, J.L. and Herman, D.A., “Application of the NEXT Ion Thruster Lifetime Assessment to Thruster Throttling,” AIAA–2008–4526, 44th AIAA/ASME/SAE/ASEE Joint Propulsion Conference and Exhibit, Hartford, CT, July 21–23, 2008.
25. Patterson, M.J. and Benson, S.W., “NEXT Ion Propulsion System Development Status and Performance,” AIAA–2007–5199, 43rd AIAA/ASME/SAE/ASEE Joint Propulsion Conference and Exhibit, Cincinnati, OH, July 8–11, 2007.
26. Soulas, G.C. and Patterson, M.J., “NEXT Ion Thruster Performance Dispersion Analyses,” AIAA–2007–5213, 43rd AIAA/ASME/SAE/ASEE Joint Propulsion Conference and Exhibit, Cincinnati, OH, July 8–11, 2007.
27. Soulas, G.C., et al., “Performance Evaluation of the NEXT Ion Engine,” AIAA–2003–5278, 39th AIAA/ASME/SAE/ASEE Joint Propulsion Conference and Exhibit, Huntsville, AL, July 20–23, 2003.
28. Patterson, M.J., et al., “NEXT: NASA's Evolutionary Xenon Thruster,” AIAA–2002–3832, 38th AIAA/ASME/SAE/ASEE Joint Propulsion Conference and Exhibit, Indianapolis, IN, July 7–10, 2002.
29. Frandina, M.M., et al., “Status of the NEXT Ion Thruster Long Duration Test,” AIAA–2005–4065, 41st AIAA/ASME/SAE/ASEE Joint Propulsion Conference and Exhibit, Tucson, AZ, July 10–13, 2005.
30. Herman, D.A., et al., “Performance Characteristics of the NEXT Long-Duration Test after 16,550 h and 337 kg of Xenon Processed,” AIAA–2008–4527, 44th AIAA/ASME/SAE/ASEE Joint Propulsion Conference and Exhibit, Hartford, CT, July 21–23, 2008.
31. Herman, D.A., et al., “NEXT Long-Duration Test Plume and Wear Characteristics after 16,550 h of Operation and 337 kg of Xenon Processed,” AIAA–2008–4919, 44th AIAA/ASME/SAE/ASEE Joint Propulsion Conference and Exhibit, Hartford, CT, July 21–23, 2008.
32. Snyder, J.S., et al., “Single-String Integration Test Measurements of the NEXT Ion Engine Plume,” AIAA–2004–3790 and NASA/TM—2005-213196, 40th AIAA/ASME/SAE/ASEE Joint Propulsion Conference and Exhibit, Fort Lauderdale, FL, July 11–14, 2004.
33. Hickman, T.A., et al., “Overview of the Diagnostics for the NEXT Long Duration Test,” AIAA–2005–4064, 41st AIAA/ASME/SAE/ASEE Joint Propulsion Conference and Exhibit, Tucson, AZ, July 10–13, 2005.
34. Kamhawi, H., et al., “NEXT Ion Engine 2000 hour Wear Test Plume and Erosion Results,” AIAA–2004–3792, 40th AIAA/ASME/SAE/ASEE Joint Propulsion Conference and Exhibit, Fort Lauderdale, FL, July 11–14, 2004.
35. Brophy, J.R., et al., “The Ion Propulsion System for Dawn,” AIAA–2003–4542, 39th AIAA/ASME/SAE/ASEE Joint Propulsion Conference and Exhibit, Huntsville, AL, July 20–23, 2003.

NASA/TM—2009-215837 24
36. Brophy, J.R., et al., “Status of the Dawn Ion Propulsion System,” AIAA–2004–3433, 40th AIAA/ASME/SAE/ASEE Joint Propulsion Conference and Exhibit, Fort Lauderdale, FL, July 11–14, 2004.
37. Sengupta, A., et al., “The 30,000-Hour Extended-Life Test of the Deep Space 1 Flight Spare Ion Thruster,” NASA/TP—2004-213391, The Jet Propulsion Laboratory and NASA Glenn Research Center, Pasadena, March, 2005.
38. Myers, R.M., “Proceedings of the Nuclear Electric Propulsion Workshop, Volume 1: Introductory Material and Thruster Concepts, Section: “MPD Thruster Technology,” JPL D-9512 vol. 1, June 19–22, 1990.
39. Patterson, M.J., et al., “Performance of the NASA 30 cm Ion Thruster,” IEPC Paper 93-108, 23rd International Electric Propulsion Conference, Seattle, WA, Sept. 13–16, 1993.
40. Sovey, J.S., “Improved Ion Containment Using a Ring-Cusp Ion Thruster,” Journal of Spacecraft and Rockets, vol. 21, no. 5, pp. 488–495, Sept. - Oct. 1984.
41. Stueber, T. and Soulas, G.C., “Electrostatic Ion Thruster Diagnostic Uncertainty Analysis,” NASA/ TP—2007-214665, July, 2007.
42. Anderson, J.R., et al., “Results of an On-going Long Duration Ground Test of the DS1 Flight Spare Ion Engine,” AIAA–1999–2857, 35th AIAA/ASME/SAE/ASEE Joint Propulsion Conference and Exhibit, Los Angeles, CA, June 20–24, 1999.
43. Polk, J.E., et al., “An Overview of the Results From an 8200 Hour Wear Test of the NSTAR Ion Thruster,” AIAA–1999–2446, 35th AIAA/ASME/SAE/ASEE Joint Propulsion Conference and Exhibit, Los Angeles, CA, June 20–24, 1999.
44. Polk, J.E., et al., “A 1000 Hour Wear Test of the NASA NSTAR Ion Thruster,” AIAA–1996–2784, 32nd AIAA/ASME/SAE/ASEE Joint Propulsion Conference and Exhibit, Lake Buena Vista, FL, July 1–3, 1996.
45. Sengupta, A., et al., “An Overview of the Results from the 30,000 Hr Life Test of Deep Space 1 Flight Spare Engine,” AIAA–2004–3608, 40th AIAA/ASME/SAE/ASEE Joint Propulsion Conference and Exhibit, Fort Lauderdale, FL, July 11–14, 2004.
46. Anderson, J.R., et al., “Performance Characteristics of the NSTAR Ion Thruster During an On-Going Long Duration Ground Test,” 2000 IEEE Aerospace Conference Proceedings, vol. 4, pp. 123–148, March 2000.
47. Williams, G.J., “High-Power Electric Propulsion (HiPEP) 2,000-Hour Post-Test Report,” NEXT Internal Report, NASA Glenn Research Center, Cleveland, OH, September, 2006.
48. Britton, M., et al., “Destructive Analysis of the NEXT 2000-Hour Wear Test Hollow Cathode Assemblies,” NASA/TM—2005-213387, NASA Glenn Research Center, Cleveland, OH, July, 2005.
49. Williams, G.J., et al., “Results of the 2000 hr Wear Test of the HiPEP Ion Thruster With Pyrolitic Graphite Ion Optics,” AIAA–2006–4668, 42nd AIAA/ASME/SAE/ASEE Joint Propulsion Conference and Exhibit, Sacramento, CA, July 9–12, 2006.
50. Soulas, G.C., et al., “Performance of Titanium Optics on a NASA 30 cm Ion Thruster,” AIAA–2000–3814, 36th AIAA/ASME/SAE/ASEE Joint Propulsion Conference and Exhibit, Huntsville, AL, July 16–19, 2000.
51. Sengupta, A., et al., “Status of the Extended Life Test of the Deep Space 1 Flight Spare Ion Engine after 30,352 Hours of Operation,” AIAA–2003–4558, 39th AIAA/ASME/SAE/ASEE Joint Propulsion Conference and Exhibit, Huntsville, AL, July 20–23, 2003.
52. Doerner, R.P., et al., “Sputtering Yield Measurements During Low Energy Xenon Plasma Bombardment,” Journal of Applied Physics, vol. 93, no. 9, pp. 5816–5823, May 1, 2003.
53. Doerner, R.P. and Goebel, D.M., “Sputtering Yields of Ion Thruster Grid and Cathode Materials During Very Low Xenon Plasma Bombardment,” AIAA–2003–4561, 39th AIAA/ASME/SAE/ASEE Joint Propulsion Conference and Exhibit, Huntsville, AL, July 20–23.
54. Malone, S.P., “Investigation of NEXT Ion Optics Erosion Processes Using Computational Modeling,” JANNAF 2005-0356DV, JANNAF 2nd Liquid Propulsion Subcommittee and 1st Spacecraft Propulsion Subcommittee Joint Meeting, Monterey, CA, December 5–8, 2005.

NASA/TM—2009-215837 25
55. Brophy, J.R., “Propellant Throughput Capability of the Dawn Ion Thrusters,” IEPC–2007–279, 30th International Electric Propulsion Conference, Florence, Italy, September 17–20, 2007.
56. Herman, D.A., et al., “Status of the NEXT Ion Thruster Long-Duration Test After 10,100 h and 207 kg Demonstrated,” AIAA–2007–5272 and NASA/TM—2008-215030, 43rd AIAA/ASME/SAE/ASEE Joint Propulsion Conference and Exhibit, Cincinnati, OH, July 8–11, 2007.
57. Sengupta, A., et al., “Wear Characteristics From the Extended Life Test of the DS1 Flight Spare Ion Thruster,” IEPC Paper 03-0266, 28th International Electric Propulsion Conference, Toulouse, France, March 17–21, 2003.
58. Polk, J.E., et al., “The Effect of Carbon Deposition on Accelerator Grid Wear Rates in Ion Engine Ground Testing,” AIAA–2000–3662, 36th AIAA/ASME/SAE/ASEE Joint Propulsion Conference and Exhibit, Huntsville, AL, July 17–19, 2000.
59. Williams, G.J. and Gilland, J.H., “Modeling of the Accelerator Grid Erosion of the NASA Evolutionary Xenon Thruster (NEXT),” NEXT Internal Report, NASA Glenn Research Center, Cleveland, OH, September, 2007.

REPORT DOCUMENTATION PAGE Form Approved
OMB No. 0704-0188 The public reporting burden for this collection of information is estimated to average 1 hour per response, including the time for reviewing instructions, searching existing data sources, gathering and maintaining the data needed, and completing and reviewing the collection of information. Send comments regarding this burden estimate or any other aspect of this collection of information, including suggestions for reducing this burden, to Department of Defense, Washington Headquarters Services, Directorate for Information Operations and Reports (0704-0188), 1215 Jefferson Davis Highway, Suite 1204, Arlington, VA 22202-4302. Respondents should be aware that notwithstanding any other provision of law, no person shall be subject to any penalty for failing to comply with a collection of information if it does not display a currently valid OMB control number. PLEASE DO NOT RETURN YOUR FORM TO THE ABOVE ADDRESS.
1. REPORT DATE (DD-MM-YYYY) 01-12-2009
2. REPORT TYPE Technical Memorandum
3. DATES COVERED (From - To)
4. TITLE AND SUBTITLE Status of the NEXT Long-Duration Test After 23,300 Hours of Operation
5a. CONTRACT NUMBER
5b. GRANT NUMBER
5c. PROGRAM ELEMENT NUMBER
6. AUTHOR(S) Herman, Daniel, A.; Soulas, George, C.; Patterson, Michael, J.
5d. PROJECT NUMBER
5e. TASK NUMBER
5f. WORK UNIT NUMBER WBS 346620.04.08.02.02.01
7. PERFORMING ORGANIZATION NAME(S) AND ADDRESS(ES) National Aeronautics and Space Administration John H. Glenn Research Center at Lewis Field Cleveland, Ohio 44135-3191
8. PERFORMING ORGANIZATION REPORT NUMBER E-17097
9. SPONSORING/MONITORING AGENCY NAME(S) AND ADDRESS(ES) National Aeronautics and Space Administration Washington, DC 20546-0001
10. SPONSORING/MONITOR'S ACRONYM(S) NASA
11. SPONSORING/MONITORING REPORT NUMBER NASA/TM-2009-215837; AIAA-2009-4917
12. DISTRIBUTION/AVAILABILITY STATEMENT Unclassified-Unlimited Subject Category: 20 Available electronically at http://gltrs.grc.nasa.gov This publication is available from the NASA Center for AeroSpace Information, 443-757-5802
13. SUPPLEMENTARY NOTES
14. ABSTRACT The NASA’s Evolutionary Xenon Thruster (NEXT) program is developing the next-generation ion propulsion system with significant enhancements beyond the state-of-the-art in ion propulsion to provide future NASA science missions with enhanced mission capabilities at a low total development cost. As part of a comprehensive thruster service life assessment utilizing both testing and analyses, a Long-Duration Test (LDT) was initiated in June 2005, to verify the NEXT propellant throughput capability to a qualification-level of 450 kg, 1.5 times the anticipated throughput requirement of 300 kg per thruster from mission analyses. The LDT is being conducted with a modified, flight-representative NEXT engineering model ion thruster, designated EM3. As of July 2009, the thruster has accumulated 23,300 h of operation with extensive durations at the following input powers: 6.9, 4.7, 1.1, and 0.5 kW. The thruster has processed 427 kg of xenon surpassing the NSTAR propellant throughput demonstrated during the extended life testing of the Deep Space 1 flight spare ion thruster and approaching the NEXT development qualification throughput goal. The NEXT LDT has demonstrated a total impulse of 16.0×10⁶ N·s; the highest total impulse ever demonstrated by an ion thruster. Thruster performance tests are conducted periodically over the entire NEXT throttle table with input power ranging 0.5 to 6.9 kW. Thruster performance parameters including thrust, input power, specific impulse, and thruster efficiency have been nominal with little variation to date. The NSTAR first-failure mode, accelerator aperture erosion leading to electron backstreaming, has been mitigated in the NEXT design. The severe NSTAR discharge cathode assembly erosion has been mitigated by a graphite keeper in the NEXT thruster. Tracking of the NEXT first failure mode, charge-exchange ion impingement on the accelerator grid causing hexagonal groove erosion, is consistent with model predictions and indicates thruster life greater than or equal to 750 kg throughput. This paper presents the status, performance data, and wear characteristics of the NEXT LDT to date.15. SUBJECT TERMS Ion engines; Ion optics; Ion propulsion; Electric propulsion; Electrostatic propulsion; Plasma propulsion
16. SECURITY CLASSIFICATION OF: 17. LIMITATION OF ABSTRACT UU
18. NUMBER OF PAGES
31
19a. NAME OF RESPONSIBLE PERSON STI Help Desk (email:[email protected])
a. REPORT U
b. ABSTRACT U
c. THIS PAGE U
19b. TELEPHONE NUMBER (include area code) 443-757-5802
Standard Form 298 (Rev. 8-98)Prescribed by ANSI Std. Z39-18


Related Documents