Status of pollution in Indian estuaries M. D. Zingde

Welcome message from author
This document is posted to help you gain knowledge. Please leave a comment to let me know what you think about it! Share it to your friends and learn new things together.
Transcript

Status of
pollution in
Indian estuaries
M. D. Zingde

Sources of pollution
• Domestic wastewater (Sewage) Organic matter Nitrogen & phosphorus Pathogens, viruses, ….
• Agricultural runoff Nitrogen & phosphorus Pesticides
• Industrial effluents Organics (oil &grease, pigments, phenols, organic matter ….) Heavy metals SPM (mining, distilleries ….) Heat
• Transport Oil TBT

Hooghly : Impact of Farakka Barrage
Kolkota
Diamond H
Zone 1
Zone 2
Zone 3
Salinity (ppt) Zon
e Pre-Farakka Post-Farakka
1959-67 1975-1992 1 Trace 2.6 Trace 0.06 2 Trace 23.19 0.02 11.00 3 1.56 32.77 1.45 29.29
Phytoplankton Phytoplankto
n Zone 1 Zone 2 Zone 3
Pre Post
Pre Post
Pre
Post
Species (No) 79 44 67 40 50 33 Freshwater (%)
55 61 37 53 18 Low
Euryhaline (%)
35 39 41 38 40 High
Marine (%) 10 Nil 22 10 42 High
Estuaries, (1996) 710 Sinha et al (2004)

Hooghly : Impact of Farakka Barrage
Post-Farakka fisheries • Average annual catch increased by 213% • Marine and neritic species such as Liza parsia,
Eleutheronema tetradactylum, Coila spp, Tenualosa toli, Ilisha elongata and Harpodon nehereus declined / disappeared from Zones 1 &2
• Purely freshwater species Rita rita, Wallago atu, Mystus aor, Aila coila, Catla catla, Labeo rohita, Macrobrachium rosenbergii appeared in zones 1 &2
• Annual landings of prime fish hilsa (Tenualosa ilisha) increased sharply
• Several commercially non-important estuarine and marine species (Chanos chanos, Plotosuscanius, Megalops cyrinoides, Elops saurus etc) significantly declined Sinha et al (2004)

Domestic wastewater
Total sewage generated: 22,900 mld Treatment capacity: 13,500 mld Untreated sewage released to coastal areas : 5062 mld Total P : 12,755 t/y Total N : 82,125 t/y
Maharashtra • Ulhas • Mahim • Thane Creek • West Bengal • Hooghly – 860 mld Kerala • Kochi Backwaters – 260 mld • Ashtamudi estuary Tamil Nadu • Cooum • Ennore Gujarat • Sabarmati – 60 mld • Narmada • Tapi – 90 mld • Ambika Andhra Pradesh • Godavari
1300 mld Maharashtra
Kerala
Gujarat
Orissa
Pondicherry
Untreated sewage (mld) directly released in estuaries / creeks / sea
CPCB Report (2005)

Impacts of sewage High impact
Parameter LT HT DO (mg/l) 0 <3 NO3-N (µM) 0 >10
NO2-N (µM) 0 >10
NH4-N (µM) >20 <5
PO4-P (µM) >8 <5
Sulphides Present
Absent
Pathogens V high V high Macrobenthos
V poor V poor
Examples Inner Ambika (Summer) Inner Ulhas (Dry season) Mahim Cooum
Medium impact Parameter LT HT
DO (mg/l) 1-3 3-6 NO3-N (µM) >20 <10
NO2-N (µM) 5-10 <3
NH4-N (µM) 3-20 <3
PO4-P (µM) >5 <5
Sulphides Absent
Absent
Pathogens V high High Macrobenthos
Rich Rich
Examples Inner Tapi estuary (Dry season) Outer Ulhas (Dry season) Inner Thane Creek Kochi Backwaters (Dry season)
Most estuaries do not meet Water Quality Criteria for Fecal Coliform (100/100 ml) set by CPCB

Tapi estuary
Randher barage
Sewagw outfall (90 mld)
Umra
Hazira
Magdalla

Temporal and spatial variations (Tapi)
APN Project Report (2004) 153 Baperdekar, Ph D Thesis (2004)
Umra (15.12.2005) (COMAPS)
Mouth
Sewage

Tapi estuary
R² = 0.63
0 2 4 6 8
10 12 14
0 1 2 3 4
Salin
ity (p
su)
DO (ml/l)
R² = 0.71
0 2 4 6 8
10 12 14
0 5 10 15
Salin
ity (p
su)
Nitrate-N (µM)
R² = 0.82
0
2
4
6
8
10
12
14
0 10 20 30 40 50
Salin
ity (p
su)
Ammonium-N (µM)
0 1 2 3 4 5 6 7 8 9
10
0 10 20 30 40 50
Nitr
ite-N
(µM
)
Ammonium-N (µM)
R2=0.55
R² = 0.63
0
2
4
6
8
10
12
14
0 10 20 30 40 50
Nitr
ate-
N (µ
M)
Ammonium-N (µM)
R² = 0.46
0
2
4
6
8
10
12
14
0 2 4 6 8 10
Salin
ity (p
su)
Nitrite-N (µM)
Umra (15.12.2005)

Agricultural runoff Fertilizer
consumption Year Million t
1951-52 0.07 1971-72 2.7 1991-92 12.7 1999-00 18.0 2008-09 24.9
Fertilizer application 5 -163 kg/ha Total cropped area 196 million ha Assumed fertilizer application
125 kg/ha
N:P:K (National average) 7 : 2.7 : 1 Fertilizer loss through runoff
0.5 - 20 (av: 10) kg/ha
Estimated annual loss 1.96 million t N loss 1.3 million t P loss 0.4 million t
Agricultural Statistics, 2010 J Hydrology, 293 (2004), 375
Pesticide production (2007-08)
85,000 t
Application (Agri) 0.5 kg/ha DDT use since 1985
350,000 t
DDT (Present production)
7000 t
BHC banned 1997 PoPs banned 2004
Env Int. 31 (2005) 503

Nutrients Godavari estuary
Parameter Discharge (m3/s)
>2000 <200 Nil Salinity 0.07 9.96 22.29 DIN (µM) 38.9 18.0 9.0 DIP (µM) 4.98 1.23 0.46 SiO4 (µM) 63.5 37.8 18.6
Chl-a (mg/m3)
1.42 4.68 2.98
NCP (mM C/m2/d) -0.97 15.71 26.75
Variations in Chl a and NCP and high N:P ratios during dry period probably due to anthropogenic P and N ECSC. 85 (2009) 515
Parameter Season
Pre-M M Post-M Salinity 23.52 11.2 13.66 DIN (µM) 13.0 21.82 14.72 DIP (µM) 1.51 2.09 1.64 SiO4 (µM) 65.48 85.43 77.75
GPP ((mM C/m2/d)
439 328 382
Nitrate and phosphate levels comparable during period 1975 and 2001 J Mar Syst. 62 (2006) 9
Hooghly estuary
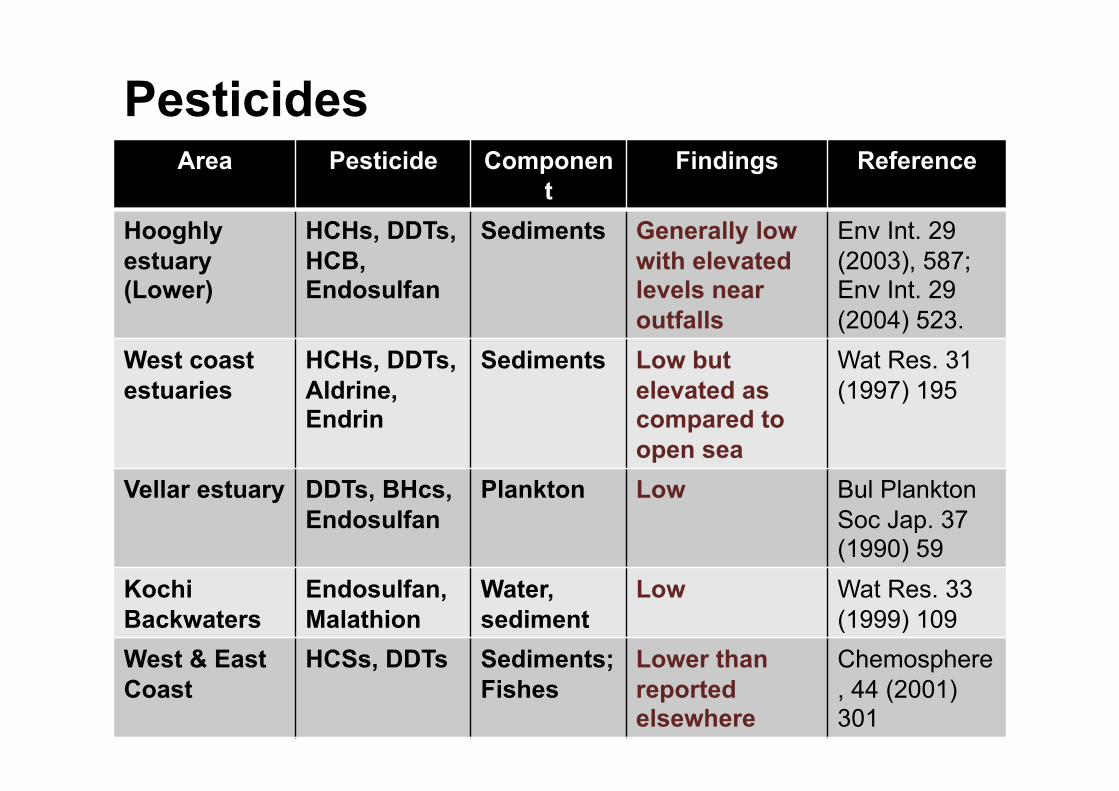
Pesticides Area Pesticide Componen
t Findings Reference
Hooghly estuary(Lower)
HCHs, DDTs, HCB, Endosulfan
Sediments Generally low with elevated levels near outfalls
Env Int. 29 (2003), 587; Env Int. 29 (2004) 523.
West coast estuaries
HCHs, DDTs, Aldrine, Endrin
Sediments Low but elevated as compared to open sea
Wat Res. 31 (1997) 195
Vellar estuary DDTs, BHcs, Endosulfan
Plankton Low Bul Plankton Soc Jap. 37 (1990) 59
Kochi Backwaters
Endosulfan, Malathion
Water, sediment
Low Wat Res. 33 (1999) 109
West & East Coast
HCSs, DDTs Sediments; Fishes
Lower than reported elsewhere
Chemosphere, 44 (2001) 301

Trace metals in sediments Estuary Enrichment Reference
Hooghly Cr, Ni, Cu, Zn, Cd, Pb, Hg, As
Env Int. 30 (2004) 1089
Baitarani Cr, Co, Cu, Ni, As J Hydrology, 193 (1997) 258
Brahmani Cr, Co, Cu, Ni, As J Hydrology, 193 (1997) 258
Mahanadi Cr, Co, Cu, Ni, As J Hydrology, 193 (1997) 258
Chilka Cr, Mn, pb J Coast Res. (2010) 860
Rushikulya Hg Sci Total Env. 96 (1990) 281
Ennore Cr, Cu, Cd Env Geo. 56 (2008) 207
Kochi Backwaters
Ni, Cu, Zn, Cd, Pb Int J Sci Tech. 6 (2009) 225
Mandovi-Zuari TBT; As Env Mon As. 165 (2010) 643; Fate Env As. (2003)
Amba Hg IJMS. 38 (2009) 89
Thane Creek Cr, Ni, Cu, Zn, Pb, Cd, Hg Chem Geo. 90 (1991)203
Ulhas Cr, Ni, Cu, Zn, Pb, Cd, Hg Chem Geo. 90 (1991)203
Tapi Cr, Zn, Pb Geochem J. 40 (2006) 522
Mindhola Cu, Zn, Pb MPB. 19 (1988) 540
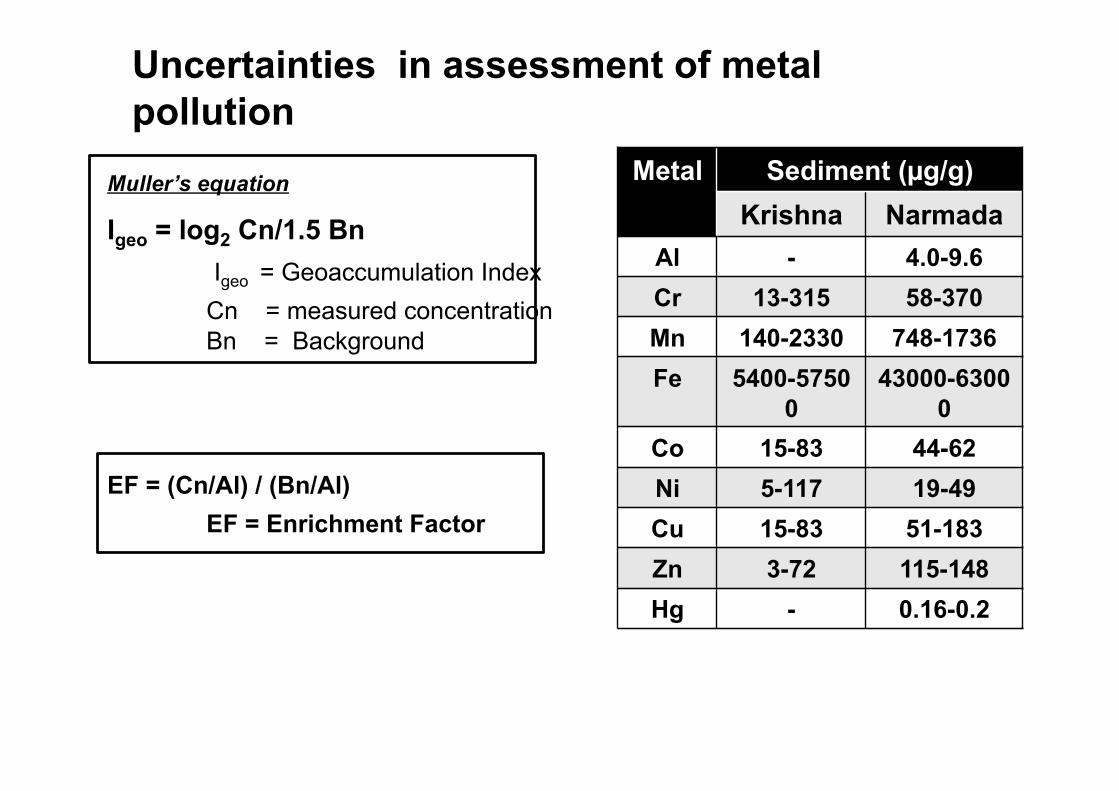
Uncertainties in assessment of metal pollution
Metal Sediment (µg/g) Krishna Narmada
Al - 4.0-9.6 Cr 13-315 58-370 Mn 140-2330 748-1736 Fe 5400-5750
0 43000-6300
0 Co 15-83 44-62 Ni 5-117 19-49 Cu 15-83 51-183 Zn 3-72 115-148 Hg - 0.16-0.2
Muller’s equation
Igeo = log2 Cn/1.5 Bn Igeo = Geoaccumulation Index Cn = measured concentration Bn = Background
EF = (Cn/Al) / (Bn/Al) EF = Enrichment Factor

General assessment of estuarine pollution
• Contamination of estuaries by untreated domestic wastewater is widespread, however, in absence of time-series studies the responses of native flora and fauna to modified environment are unclear.
• Agricultural runoff contributes to high nutrient loads in estuaries. Their impacts on estuarine ecology – particularly responses of plankton and the influence on the food chain needs to be investigated.
• Estuaries are generally free from contamination by chlorinated pesticides. India being signatory to Stockholm Convention on Persistent Organic Pollutants, their levels in estuaries is no more a concern.
• Sediments in some estuaries stretches are enriched in anthropogenic trace metals. However literature, though scanty, indicates their general non-availability for biological uptake.
• Information is largely lacking for several chemical pollutants such as PAHs, phenols, dyes and pigments etc.
Related Documents


![15.12.2005file:hia graz 2005_12_15.ppt[05-6]1 GVP-Veranstaltung in Graz, 15.12.2005 Erfahrungen mit GVP in Deutschland rainer.fehr@loegd.nrw.de Landesinstitut.](https://static.cupdf.com/doc/110x72/55204d7649795902118cb9e8/15122005filehia-graz-20051215ppt05-61-gvp-veranstaltung-in-graz-15122005-erfahrungen-mit-gvp-in-deutschland-rainerfehrloegdnrwde-landesinstitut.jpg)