Welcome message from author
This document is posted to help you gain knowledge. Please leave a comment to let me know what you think about it! Share it to your friends and learn new things together.
Transcript
Status of Final Inclusion& Way Forward - Bihar
2012-17
Poorest States Inclusive Growth Program
Disclaimer
“This document is funded by the UK Department for International Development (DFID) under the Poorest State Inclusive Growth Program. The views expressed are not necessarily those of DFID.”

3Status of Final Inclusion & Way Forward-Bihar 2012-17
Foreword 7
Preface 8
Executive Summary 9
Abbreviations 15
Chapter 1: Rationale of Access to Finance Status Report 17
1.1 Scope of Access to Finance Status Report 17
1.2 Approach and Methodology: 18
Chapter 2: Profile of Bihar 19
2.1 Socio- Economic Profile of the State 19
Chapter-3 Baseline: Current Status of Financial Services through different channels 23
3.1. Banking Channel 23
3.1.1. Outreach of banking facilities to poor households by Banks 23
3.1.2. Status of No-Frill Savings account: 28
3.1.3. Status of credit supply by Banks 31
3.2. NABARD: The SHG-Bank Linkage Programme 36
3.3. Primary Agricultural Credit Societies (PACS): 39
3.4. Bihar Rural Livelihoods Project – ‘JEEVIKA’ 39
3.5. Bihar Women Development Corporation (WDC) 42
3.6. Bihar MahilaSamakhya Society (BMSS) 43
3.7. Role of Post Office in Financial Inclusion 43
3.8.MFI Channel 44
3.8.1. Apex Institutions 46
3.8.2. Issues Confronting MFIs: Feedback from the Sector 47
3.9 Role of NGOs as Self Help Promoting Institutions 49
3.10 Federations and Producers Groups 49
Chapter-4: Other Financial Services 51
4.1. Micro-insurance 51
4.2. Health Insurance Scheme: 52
Table of Contents
4 Status of Final Inclusion & Way Forward-Bihar 2012-17
4.3. Crop Insurance 54
4.4. Status of Micro-Pensions: The Swavalamban Scheme 55
4.5. Status of Domestic Remittance 56
4.6. Role of Multilateral and Bi-lateral Organizations 56
Chapter 5: Facilitating Financial Inclusion: Challenges and Constraints 57
Chapter 6: Access to Finance in Bihar –VISION 2017 60
6.1. Introduction 60
6.2. Population and Poverty: 2017 60
6.3. Coverage of Microfinance 61
6.4. The Demand-Supply Gap 63
6.5. Institutional Framework for SHG Development 64
6.6. MFIs - Future Expansion Plans 65
6.7. Future Role of the Formal Banking System 66
6.8. Investment Requirement by the Microfinance Sector 67
6.9. Flow of Funds to Microfinance – Some Prospects 68
6.9. Projected Financial Resources 68
Chapter 7: Key Strategies and Concluding Remarks 69
5Status of Final Inclusion & Way Forward-Bihar 2012-17
TablesTable 2.1.Geographic Profile of Bihar 19
Table2.2 Demographic indicators of Bihar 20
Table 2.3. Relatively prosperous and backward district of Bihar 22
Table 3.1. Performance of RRBs 24
Table 3.2. Area wise branch details 24
Table 3.3. Key banking indicators (Amount in crore) 25
Table 3.4. Deposit, Advance & CD ratio classification of Bank 26
Table 3.5. District wise CD ratio as on 30th September’2013 27
Table 3.6. Status of NPAs & Write-off 28
Table 3.7. Performance under Financial Inclusion (Nos. of A/Cs) 29
Table 3.8.Coverage under Financial Inclusion 29
Table 3.9. Households availing Financial Services 30
Table 3.10 Comparativeperformance under ACP 31
Table 3.11. Sector Wise Performance 31
Table 3.12. Recovery Status (as on Sept’ 2013) 31
Table 3.13. Progress of KCC as on September, 2013 32
Table 3.14 Performance of SHGs in Bihar (March’13) 33
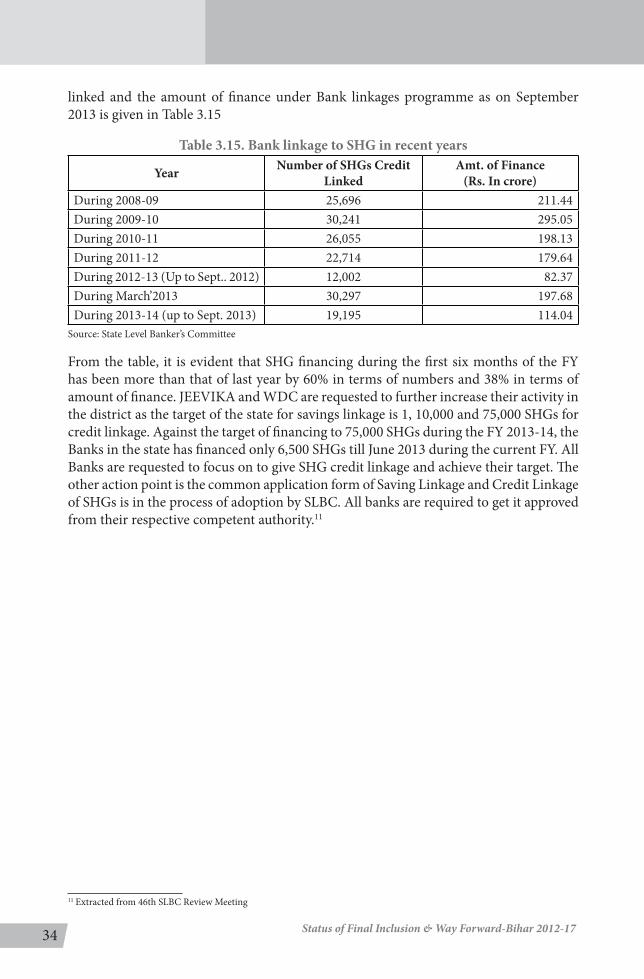
Table 3.15. Bank linkage to SHG in recent years 34
Table 3.16. Bank wise credit performance of SHG 35
Table 3.17 Microfinance through Banks (As on March 2013) 36
Table 3.18 Progress of SHG- Bank Linkage Programme by Selected States 36
Table 3.19 Extent of SHG-Bank Linkage, 2009-12 37
Table 3.20 Financing JLGs 38
Table 3.21 JEEVIKA - Experience of the State as on 30th September, 2013 41
Table 3.22.WDC Progress Update 42
Table3.23. Department of Posts, India – Bihar Circle, Patna – Data as on March, 2013 44
Table 3.24 Number of live accounts under MNREGA Scheme and amount disburse 44
Table 3.25 MFI in Bihar - Over 45

6 Status of Final Inclusion & Way Forward-Bihar 2012-17
Table3.26 Major MFIs in Bihar 45
Table 3.27. RGVN’s Microfinance Operations in Bihar 47
Table 3.28.Apex and Resource Institutions and their MFI Partners in Bihar 47
Table 4.1.Coverage of JBY in Bihar 52
Table 4.2.RSBY Coverage in Bihar 53
Table 4.3 District wise coverage of insurance companies 54
Table 4.4 District wise coverage of Agriculture Insurance Companies 55
Table 4.5. Crop insurance coverage 55
Table 6.1.Population and Poverty Estimates - 2012 and 2017 61
Table 6.2.Current and Projected SHG Coverage - 2012 and 2017 61
Table 6.3.Current and Projected Coverage of MFIs - 2012 and 2017 62
Table 6.4.Current and Projected Demand for Credit - 2012 and 2017 63
Table 6.5.Demand-Supply Gap in Microfinance – 2012 and 2017 63
Table 6.6.Requirement of Funds by the Microfinance Sector: 2012-17 67
Annexure:
Annexure 1State-wise Financial Inclusion Index 72
Annexure 2 District wise CD Ratio 73
Annexure 3: Bank Group wise and Area wise CD Ratio in Bihar 2011-12 74
Annexure 4: Demographic profile of Bihar (2001 & 2011) 75
Annexure 5: Poverty Ratio of Bihar & India 76
Annexure 6: District wise Per Capita Gross District Domestic Product at 2004-05 Prices (2006-07 to 2009-10) 76
Annexure 7: District wise Small Savings in Post Offices and Public Provident Fund (2009-10, 2010-11) 77
Annexure 8: District wise CD ratio as on 30th March’2013 78
Annexure 9 Recovery Position of All Banks as on 30.09.2013 79
Figures:
Figure2.1. Districts of Bihar 19
Figure 3.1. NABARD: SHG-Bank Linkage Program Distribution in Bihar: 2012 38

7Status of Final Inclusion & Way Forward-Bihar 2012-17
Foreword
Access to comprehensive financial services is a critical enabler and an effective tool for enhancing economic opportunities and reducing risks and vulnerability for the
low income and poor. While India has an extensive formal financial system with a wide banking network, the infrastructure has not responded to the financial needs of the poor to the desired extent. Over the last two decades, alternative models for reaching out to the rural poor (and more recently also the urban poor), mostly women, have been promoted and have succeeded in channelising credit to the unserved population on a bigger scale..However, given the overwhelming nature of this challenge, harmonized efforts need to be made by different channels and models.
The Poorest States Inclusive Growth (PSIG) programme supported by DFID, Govt. of U.K. and being implemented by Small Industries Development Bank of India (SIDBI) has the potential for making catalytic investments for supporting various initiatives and channels for financial inclusion and . The program aims to enhance the income and employment opportunities of poor households in four low-income States viz., Bihar, Odisha, Madhya Pradesh and Uttar Pradesh, and enable them to participate and benefit from the economic growth in India.
The core rationale for putting together the Status of Access to Finance Report for Bihar is to take stock of the current status and future projections in terms of demand and supply of financial services, identify gaps, helping greater clarity in roles and responsibilities of different stakeholders and enable resource planning, pooling and optimization. The team has held extensive consultations with various stakeholders in the State, and the document reflects their views and perspectives on the vision and way forward, in addition to reporting the data on the status.
I would like to thank the teams of PSIG at SIDBI and ACCESS ASSIST for their work in bringing together this document, as also to the Private Sector team at DFID India for their support and guidance. I hope that each of these stakeholders will take forward the vision and the way forward which they have helped to outline in this document.
N. K. MainiDMD, SIDBI.

8 Status of Final Inclusion & Way Forward-Bihar 2012-17
The Bihar Status of Financial Inclusion and way forward is the first in the series of reports being prepared for the states covered by DFID’s PSIG project and
association with this endeavour has been an immensely satisfying experience. The State itself represents an embodiment of hope and promise. Rapid growth in infrastructure, telecommunications over the last decade coupled with significant progress along several socio-economic dimensions including literacy, health and governance have created an enabling environment for achieving the goals of development including attaining 100% financial inclusion. Planned and effective implementation of Bihar’s Rural Livelihood Promotion Programme (BRLP) adds to the optimism.
This report provides an overview of the status of financial services in Bihar particularly with reference to the access to finance, challenges, plans for the future and recommendations to achieve the projected goals. Since inception, a consultative approach has been adopted to develop this document and many people have contributed, in many useful ways, towards its completion.
I would like to thank Mr. Deepak Shandilya from ACCESS ASSIST who worked painstakingly with me on the vision document. I would like to express my gratitude to all the senior officials of the Government of Bihar who set aside their precious time to share their vision of Bihar, which enriched the deliberations and provided many insights. The discussions with a cross section of stakeholders, over several days, helped to develop a better appreciation of the ground realities, especially in rural areas, and the associated challenges.
Contributions made by Mr. Indraneel Chattopadhyay, Mr. Satish Kumar Singh, Ms. Asha Chandra, Mr. Mukesh Chandra Sharan, Mr. R. R. Kalyan, Mr. Amit Sinha, Mr. Tarun Kumar Singh, Mr. Neelesh Sinha, Ms. Irina Sahana, Mr. Satyendra Singh, Mr. Mukul Jaiswal, Mr. S. R. Sinha, Ms. Rashmi Sinha, Mr. Subhendra Sanyal, Mr. Ganesh Prasad Singh, Mr. Ashok Kumar Sinha, Mr. Rakesh Aggarwal, Ms. Aparna, Mr. Tushar and Ms. Lalitha are deeply appreciated.
Two rounds of consultative meets were held in Patna (November 7th, 2011 and January 11, 2013) and I thank everyone for providing inputs to the deliberations. Dr. Puhazhendhi and Mr. Ratnesh Jha (UNDP) refined the document with pertinent suggestions, for which I am obliged.
My sincere thanks to the teams at DFID (Mr. Arif Ghauri, Mr. Shailesh Kumar and Ms. Ragini Chaudhary) and SIDBI (Mr. Prakash Kumar, Mr. Surendra Srivastava, Ms. Sonmani Choudhary, Ms Rita Jha), for their insightful comments. I express my personal and heartfelt thanks to Mr. D.K. Singh, Secretary, Forests and MD, BIADA, Govt of Bihar, for his unstinted support. Finally, I owe special thanks to Mr. Vipin Sharma and Ms. Radhika Agashe of ACCESS and ACCESS ASSIST for their trust and support throughout the duration of this assignment. It is hoped that this work does justice to the contributions of everyone associated with it and helps to address some critical issues in promoting financial inclusion for inclusive growth in the State.
Madhu Sharan
Preface

9Status of Final Inclusion & Way Forward-Bihar 2012-17
Purpose and Scope of the Document: The report on ‘Status of Financial Inclusion and way forward: 2012-2017 has been supported by DFID under its ‘PSIG’ programme,’
for women’s empowerment through financial inclusion in four low income states and enhancement of economic growth for access to financial services through private sector investment in eight low income states of India. The programme is being implemented by SIDBI. For effective planning and implementation, it has been deemed necessary to first develop Access to Finance Status Report for the designated states, to understand the existing coverage, gaps, challenges and projections for financial inclusion and, accordingly, augment the expansion of financial services.
The status report for ‘Financial Inclusion in’ Bihar is a step towards the above end. It attempts to outline the role, status and projections of financial services provided by all the stakeholders, namely, the Government and other agencies like NGOs, MFIs, apex institutions, private sector institutions including banks and multilateral organizations. An integral aim of the document is to understand the gaps and key constraints of the stakeholders in achieving their targeted goals and also to arrive at a demand-supply gap in access to finance in the State. Finally, the document seeks to assess the requirement of financial resources and institutional framework to achieve the targeted goal of financial inclusion of the State and recommends ways to address various issues and challenges in the process.
The Process and Methodology: The Access to Finance StatusReportof Bihar has been prepared by a dedicated team lead by a sector expert. While the duration of preparing the document was from October 2012 till January 2013, efforts have been taken to revise some of the data and figures up to September 2013. The methodology followed a systematic process of review of literature, field visits, data collection (both secondary and primary), interpretation and analysis of data, series of discussions with sector experts, stakeholder consultations and dissemination of findings for refining the document.
Preliminary one-on-one meetings with senior officials in the Ministry of Finance, Ministry of Rural Development, Department of Post & Telegraph, PFRDA in Government of India, New Delhi were conducted to understand the policies, programmes and services of financial inclusion in the country. These were contextualized with one-on-one meetings with senior Government officials in the Department of Finance, Rural development (Jeevika), Social Welfare (including WDC), Department of Posts and Telegraph in the Government of Bihar, Patna. Additionally several rounds of discussions with senior officials in SLBC, NABARD, SIDBI and LIC in Patna were undertaken to comprehend and analyze the coverage, projections and constraints in enhancing financial inclusion services through their departments. Interactions with several bank managers including those of commercial banks, MFIs, SHPIs helped to sharpen the understanding of financial inclusion in the State.
These were analyzed and presented before 2 large stakeholder consultative meetings in Patna and views of all the representatives were incorporated. Projections of the State Government’s and alternate channels goals of financial inclusion have been taken into account and all assumptions in arriving at a demand-supply gap in financial inclusion for 2017 have been vetted with the concerned stakeholders. Finally, the draft vision
Executive Summary
10 Status of Final Inclusion & Way Forward-Bihar 2012-17
document was sharedwith key stakeholders and sector experts for their feedback and their views have been included in the final document.
The Context- Bihar: The state of Bihar was reorganized on November 15, 2000 with 38 districts of undivided Bihar. Bihar is one of the poorest and most populous states in India. It is 12th largest in terms of geographical coverage and 3rd largest by population. The state has a population density of 1,102 persons/ km2compared to the country average of 382 persons/sq. km2. The state’s decadal population growth continues to be highest in the country at 25.07%. Approximately 88.7% of the population lives in the rural areas. The state lags behind the national average on most socio economic parameters. According to the poverty figures, Bihar has 33.74% people below poverty line. The rural poverty is estimated at 34.06% which in absolute terms is 320.40 lakh people. While Bihar ranks low on income and human development indicators, the last decade has seen considerable improvement in Governance, infrastructure and consequently economic growth. Bihar has been able to record an impressive growth rate of 12.11% in the 11th five year plan.
Status of Financial inclusion in Bihar: Over the past decade Bihar has shown progress on several economic indicators. Bihar’s impressive economic growth and performance have not yet found a resonance in the spread of banking and financial services and its share in the bank branches in the country has been constant at around 5% over the past few years.1
Many factors have combined together to make Bihar one of the most challenging terrains in the country for promoting financial inclusion. First, there is the challenge of numbers itself. Secondly, low level of urbanization coupled with limited livelihood opportunities in rural areas has further added to the task at hand. Regional imbalance, absence of large NGOs with proven capacity to organize and mobilize people and resources, skewed distribution of banking services and varied support extended by the district administration too have contributed to the complexity of the problem.
Bihar’s exposure to the banking services is very limited andhence per capita availability of financial services in Bihar is considered to be the lowest in the country. The current outreach of banks is through a total of 5,454 branches, and this network has been growing, with the appointment of Business Correspondent Agents (BCAs) and establishment of Ultra Small Branches (USBs). Under the ‘swabhiman scheme’, all 9206 villages in 38 districts of Bihar with a population over 2000 have been provided with banking facilities. As on September 2013, 9891 BC agents have been appointed.One BC is handling several villages through its network of agents.In Bihar, 2,242 villages have been covered by the banks with population of 1,600-2,000. But, 810 villages need more to be covered.
Banks have opened around 96 lakhs accounts across public (as per sensus-2011), private and regional rural banks. In Bihar 44% of the household avail banking services compared to the national average of 58%. The total NPA with Banks was 7.14% as on September’ 2013. Co-operative Banks have registered highest NPA of 7.69%.The Credit-Deposit (CD) ratio in Bihar remains at 40.52%, far below the national average of 78.1%. Further, the CD ratios across districts of Bihar show wide variation, from
1 Bihar has only 4 per cent of all the SHGs in India and the microfinance penetration index at 0.15 is very low compared to the national average of 0.27.

11Status of Final Inclusion & Way Forward-Bihar 2012-17
22.15% in Siwan to 56.02% in Kishanganj and less than 30% in 7 out of 38 districts.
The total credit supply to agriculture, small enterprise and other priority sector was Rs. 58,571.11 crore in the ending half year 2013. Major target achievement was made by RRBs.
SHG Bank linkage program in the state was accorded top priority by NABARD and several steps have been initiated in up-scaling the program. According to the statistics compiled by NABARD, by the end of March 2013, there were 2, 70, 923 SHGs in Bihar with bank savings to the tune of Rs. 88.7 crore. In 2012-13 the SHGs received loans worth Rs. 222.02 crore from commercial banks and RRBs. In addition to promoting SHGs, recently NABARD has also extended assistance to promote Joint Liability Groups (JLGs), and the number of JLG as on March 2013 is 33,698. Total NPA with Banks in the SHG-Bank linkage program is 6.49% and is slightly higher than the national average of 6.35%.
Bihar’s Rural Livelihood Promotion Society (BRLPS) has been appointed as nodal institution by the Government of Bihar to rollout the activities of NRLM (National Rural Livelihoods Mission)in the state and aims to form 1 million SHGs reaching out to 12.5 millionhouseholds in the state over a period of five years i.e. 2012-2017.
As on September, 2013, 99, 928 SHGs have been formed under ‘Jeevika,’ of which 73, 542 have been savings linked and 51, 335 credit linked with an amount of 254.32 crore mobilized from banks.
MFIs: In addition to the SHG-bank linkage model, access to finance is also provided by microfinance institutions (MFIs) in the state. As per the data compiled by Sa-Dhan (2013), there are over 21 MFIs having operations in the state working mainly in the backward districts (though presently a number of them have ceased to exist due to liquidity constraints). Their presence has become particularly noticeable in the past couple of years following the crisis in Andhra Pradesh and the consequent regulatory controls imposed by the AP government on MFIs there. Additionally, the overall environment in Bihar in terms of infrastructure (power, transport, communication and connectivity), technology, and governance including law and order has improved substantially during last three to four years making it viable for MFIs to work in the state. As per the Bharat Microfinance Report of Sa-Dhan, as on March 2013, the MFIs in Bihar have reached out to 1.25 million clients in 36 backward districts with a portfolio outstanding worth Rs. 8,953 million. Amongst the multi-state MFIs, Bandhan and SKS have the largest presence in Bihar with an outreach in almost 30 districts. Prominent home grown MFIs with noteworthy coverage are Saijja, CDOT and Nidaan.
Several other initiatives and programs like Women Development Corporation, Bihar Mahila Samakhya Society and RGVN have also been very actively promoting financial inclusion in the state.
Post office plays a critical role in financial inclusion. Of the total 9,060 post offices in Bihar, 8,587 are located in rural areas.
12 Status of Final Inclusion & Way Forward-Bihar 2012-17
In micro insurance, LIC is the main player.Since its inception, LIC were able to generate more than 700 lakhs as the premium from the people through run ‘Aam Aadmi Bima yojana,’. The government supported ‘Aam Aadmi Bima Yojana,’ has coverage of 1, 39,162 lives till September’2013. The JBY has been boosted in the recent period due to enrollment of ‘Jeevika,’ SHG members under this micro insurance policy scheme.
The poor are more vulnerable to the vagaries in their environment than any other economic group, given their limited or nonexistent reserves of liquid assets and uncertainty on the regularity and size of the source of household fund. As per information received from SLBC 46th review meeting, a total of 10,24,766 farmers have been provided the crop insurance cover, the sum insured being Rs.2,262.84 crores and the area covered being 10,57,807.68 hectares by Agriculture insurance Company of India Ltd and Cholamandalam. To ensure social security, 66.24 lakhs of households have been insured Rashtriya Swasthya Bima Yojana covering 55.09% of targeted population.
According to the 2001 census, Bihar and U.P. together account for 70% of the total migrants in India.The latest round of NSS (2007/08) survey reveals that Bihar is one of the top 5 states attracting more than half of the migrants. Migrants from Bihar remitted Rs 450 crore in 2006 through post offices
Projections of Access to Finance: It needs to be mentioned at the outset that all data and figures pertaining to access to finance in Bihar have been taken from recognized Government and sector reports and assumptions for 2017 have been based on trends of past 5 years recorded in government documents, sector reports, discussions with sector experts and consultative meetings with a cross section of stakeholders in Bihar.
In terms of the projected goal, the Government of Bihar aims to achieve 100% financial inclusion by ensuring that each family in rural area has at least one bank account.2
Additionally, the NRLM programme in Bihar, popularly known as ‘Jeevika,’aims to form 1 million SHGs during 2012-17 reaching out to 12.5 million households in the state.
Concerted efforts to augment financial services and to achieve the State’s vision of 100% financial inclusion are being made by the Government of Bihar through BRLP (Jeevika), SBLP, NABARD, LIC, PFRDA, post offices as well as alternate channels, i.e., microfinance organizations and private agencies.
According to National Commission of Population, Bihar’s population is projected to grow to 116 million over 2012-2017 with 87.7 per cent expected to stay in rural areas. It is estimated that by 2017, around 52.80% of the rural population will be poor while the urban poverty will be 35.40%. Considering the pace of the government’s financial inclusion drive, SHGs are expected to grow at 30 per cent in the first two years (2012-2014) and at 16 per cent in the subsequent three years (2014-2017). During 2012-17, even as there would be an increase in the number of poor households, the microfinance sector is expected to have increased coverage by leveraging the growth momentum envisioned in ‘Jeevika,’ and the increased pace of growth of MFIs.
2 Although, the DFS had notified a deadline of September 2012 for the same, it is hoped that this would become a reality at least by 2014.
13Status of Final Inclusion & Way Forward-Bihar 2012-17
By 2017, 11.75 million poor households would have access to microfinance wherein the SHG bank linkage would cover 9.42 million households and the MFIs, 0.88 million households. Thus, nearly 87.51 per cent of all poor households in the state would receive the microfinance services by 2017.
The current demand for creditper rural poor household and urban poor household has been estimated as Rs. 12,000 and Rs. 20,000 respectively. These are estimated to grow to Rs. 25,000 and Rs. 40,000 respectively by 2017. Additionally, per client credit availability from MFIs is expected to grow to Rs. 14,000 by 2017. During the consultative meet, it was felt that with increased focus on bank linkage by ‘Jeevika,’and through the initiatives of SLBC, approximately 60 per cent of SHGs would be credit linked by 2017.
Analysis of the present status of coverage and projected coverage by 2017 (including acknowledging the overlap of clients of SHG and MFIs) indicate that while approximately 88 per cent of poor households would have access to finance by 2017, only 29 per cent of their credit demand would be met by SHGs and MFIs. In other words, the gap in coverage of formal banking linkage of poor clients by 2017 is estimated as 12 per cent, and the gap in fulfilling their credit demand, a glaring 70 per cent.
Lack of concrete data in coverage and goals of financial services of insurance, pensions and remittances have made it difficult to estimate demand and supply of these services although there is an urgent need to expedite these services to help the poor tide over their multiple dimensions of poverty.
Concluding Remark
The vision projection for 2017 proposes comprehensive financial inclusion for low-income households in Bihar by 2017. In an enabling environment, concerted and coordinated efforts by all stakeholders including the private agencies will help to realize the goal of achieving 100% financial inclusion in the next five years. For this to become a reality, NABARD needs to assume a greater role in coordinating, training and capacity building of SHPIs/RRBs to enhance the process of financial inclusion of the excluded population.
Additionally, aggressive campaigning for schemes of financial inclusion, convergence among stakeholders to increase efficiency and effectiveness of the BC /BF Model; self-regulation by MFIs and prevention of overlap of services; synergy between the government and MFIs; focus on livelihood enhancement and sustainability of SHGs and promotion of federations/producer groups are some of the suggestions that evolved during the course of the stakeholders consultative meet to achieve greater coverage of financial inclusion in the State.
While the Government has been making progressive efforts to augment the process of financial inclusion, there are some worrisome trends like the unabated fall in the share of rural commercial bank branches, virtual stagnation in the growth of cooperative banks and insufficient reach of targeted credit programmes. Though the significance of microfinance as an effective channel for financial access to poor households is acknowledged in the policy and administrative circles, there are many bottlenecks to its

14 Status of Final Inclusion & Way Forward-Bihar 2012-17
expansion across districts. The main constraints arise from poor physical infrastructure, social and political conflicts, dearth of professional support agencies, dependence on grants in aid, and bankers’ indifference to SHGs. Comprehensive financial inclusion of the state, thus, depends crucially on the removal of constraints to inclusive and sustained economic development. For such development to happen, as the Economic Survey 2012-13 argues, there is an “urgent need for strengthening of physical infrastructures like roads and power, expanding human capital through education, skill and health, and finally, the promotion of the spirit of entrepreneurship”. The vision of comprehensive financial inclusion for Bihar, in other words, is intricately intertwined with the vision of the state’s socio economic development.

15Status of Final Inclusion & Way Forward-Bihar 2012-17
AABY Aam Admi Bima Yojana ACP Annual Credit PlanBC Business CorrespondentBCA Business Correspondent AgentsBF Business FacilitatorBGB Bihar Grameen BankBLF Block Level FederationCLF. Cluster level FederationBPL Below Poverty LineBRGF Backward Regions Grant FundBRLP Bihar Rural Livelihood Promotion CD Credit Deposit CIF Community Investment Fund CSO Civil Society Organizations DFID Department for International DevelopmentDFS Department of Financial Services DoP Department of PostGDI Gender Development IndexGDDP Gross District Domestic ProductGoB Government of BiharGoI Government of India IAP Integrated Action PlanJBY Janashree BimaYojana JLG Joint Liability GroupKCC Kisan Credit CardLIC Life Insurance Corporation LWE Left Wing ExtremismMBGB Madhya Bihar Gramin BankMDG Millennium Development GoalMMR Maternal Mortality rateMFIs Microfinance Institution
Abbreviations

16 Status of Final Inclusion & Way Forward-Bihar 2012-17
MNAIS Modified National Agricultural Insurance SchemeMPI Microfinance Penetration Index NABARD National Bank for Agriculture and Rural DevelopmentNBFC Non-Banking Financial Company NGO Non Governmental OrganisationNPS National Pension Scheme NRLM National Rural Livelihood Mission MGNREGS Mahatma Gandhi National Rural Employment Generation SchemePACS Primary Agricultural Credit Societies PFRDA Pension Fund Regulatory Development AuthorityRGVN Rashtriya Gramin Vikas NidhiRSBY Rashtriya Swasthya Bima Yojana RRB Regional Rural Banks SC Scheduled Caste SDTT Sir Dorabji Tata TrustSGSY Swarnjayanti Gram Swarojgar YojanaSHG Self Help groupSHPI Self Help Promoting InstitutionSIDBI Small Industries Development Bank of IndiaSLBC State Level Banker’s CommitteeST Scheduled Tribes UBGB Uttar Bihar Gramin BankUSB Ultra Small Branches VO Village Organizations WDC Women Development CorporationWBCIS Weather Based Crop Insurance SchemeWSHG Women Self Help Group
17Status of Final Inclusion & Way Forward-Bihar 2012-17
Bihar is the third populated state with a population of 103.8 million in 2011. The state is densely populated region, with no less than 1102 persons living per sq. km in its
area. As per the planning commission in its data for the year 2009-10, 53.5 percent of its population lives below poverty line to an all India average of 41.8 percent nationally. Nearly 90 percent of its population lives in the village where poverty ratio is higher at 55.3%3. The profile of poverty in Bihar is complex, with rural poverty incidence substantially higher than urban level; with a low urbanization rate, and poverty is predominantly rural. Rural poverty is associated with limited access to land and livestock, poor education and health care, poor financial services, high dependency on informal credit system, as also well paid occupations and social status. Bihar is also projected to fall well behind on most of the MDG targets for 2015, undermining national performance, although progress has been made in some areas, such as infant mortality, CDR, household access to improved water supply.
According to NABARD data, Financial Inclusion initiative in the state of Bihar is progressing and an important feedback is that sufficient demand for financial services at the village is already created, but such demand is still to be serviced. The institution still believes that opening an account in the banks is a torturous work for people especially in rural areas. The awareness level on FI was increased in recent years, but the preparedness of the supply side is still to be geared up. Specific drive is required to prepare financial service provider like MFIs, NGOs and Banks to reach the level of FI to the national standard. Bihar’s exposure to the banking services is very limited and hence, per capita availability of financial services in Bihar is considered to be one of the lowest in the country.
1.1 Scope of Access to Finance Status Report
The report will help to better structure a strategy for the sector’s up scaling in the state. Some of the expected outcomes of the initiatives are as below:
Establish a Baseline: The report will help to establish a baseline in terms of the current status of the sector in the state, plans and priorities of the various stakeholders, current levels of investments, current capabilities and capacities of various organizations, the quality of SHGs, among others. The report will help in taking stock of financial, human and institutional resources available and required to support the sector in the state.
Gap Analysis:The Access to Finance Status Report will analyze gaps in the sector in the state in terms of resources, capacities, quality, and resource agencies; understand supply side constraints and issues, infrastructure gaps, etc. and propose strategies and mechanisms to plug these gaps.
Roles and Responsibilities:The Access to Finance Status Report will help better articulate the roles and responsibilities of various stakeholders in up scaling the sector; understand their current roles and also incremental future potential roles. It will undertake a
3 http://planningcommission.gov.in/news/press_pov1903.pdf
Chapter 1: Rationale of Access to Finance Status Report

18 Status of Final Inclusion & Way Forward-Bihar 2012-17
meticulous stakeholder analysis to identify areas for coordination and convergence among various players in the sector.
Resource Planning: The Access to Finance Status Report will help in aggregating the resource requirements for up scaling the sector in the state. It will identify the existing flow of resources, the available avenues of resource flow and also undertake to assess the resource requirements to achieve the vision. This will support resource pooling and resource optimization.
Goal Setting: Based on the analysis, the Access to Finance Status Report will help in establishing short term milestones and a long term goal. The vision will be framed around various dimensions viz. physical outreach, financial widening as well as financial deepening, quality parameters, etc. The document will help to suggest key measures to achieve five year vision.
Coordination and Convergence: The Access to Finance Status Report will help in identifying the need for coordination and suggest mechanism for coordination to help in resource optimization. It will also identify the areas for convergence- between stakeholders, between resource flows, between programmes. This will help in better delivery of resources and help in bringing stakeholders to come together and engage in sector building in a concerted manner.
Tracking mechanism: The Access to Finance Status Report will help in better tracking the progress of the sector, given the clearly articulated short term and long term milestones. The targets can be adapted by SLBC review, review by Government and apex agencies like NABARD and SIDBI.
Thus a vision plan for the state will help provide the impetus for the financial inclusion movement within Bihar.
1.2 Approach and Methodology
The Access to Finance Status Report of Bihar has been configured in consultation with various stakeholders active in the financial inclusion sector. The document provides a comprehensive analysis of the present state of the sector and the contributions made by various stakeholders. Preparation of the report has involved a well-defined structured process undertaken by a dedicated team. The documentation process started with secondary data collection, consultation with key stakeholders and field visits. Consultation workshops were organised to collate the views and perceptions and long term plans of various players and State Government. Stakeholders consulted included government officials, apex financial institutions, commercial banks, research institutions, state level programmes, Women Development Corporation, Jeevika, many microfinance institutions and self-help promoting institutions (SHPIs) active in the state. The state financial inclusion projection and strategies have been formulated in consultation with various stakeholders. The draft report was shared with key stakeholders and sector experts, whose feedback was solicited and incorporated in the final document.

19Status of Final Inclusion & Way Forward-Bihar 2012-17
2.1 Socio - Economic Profile of the State
Bihar is the third most populous state in India accounting for 8.6 per cent (103.8 million) of the national population (Census, 2011). The state registered one of the
highest rates of population growth – more than two per cent per annum - between 2001 and 2011. In terms of geographical expanse it ranks 12th among all the states occupying less than three percent of the country’s area. As a result the state has the highest density of population with 1106 persons inhabiting every square kilometer of its land area.
The state shares its borders with Nepal in the north, Jharkhand in the south, West Bengal in the east and Uttar Pradesh in the west. Divided into 38 districts, Bihar lost its mineral rich regions to Jharkhand following the state bifurcation in 2000 (GoB, 2012). Approximately 88.7 percent of the population lives in the rural areas limiting the rate of urbanization to just 11 per cent. Decennial growth of the urban population (35 percent), however, has been significantly higher than that of the rural population (24 percent). The share of scheduled castes (SC) in the state’s total population is 15.7 percent, while the scheduled tribes (ST) constitute less than a percent.
Bihar comprises 38 districts that house 534 blocks, which in turn comprise 44,874 villages of which 38,475 are inhabited villages. Table2.1. gives further details about the geographic profile of Bihar.
Table 2.1. Geographic Profile of BiharIndicators Bihar India
Area (Total Sq.Km) 94,163 32,87,263
Total Districts 38 640
Total Blocks 534 5,767
Total Villages 44,874 6,40,867
The last decade has seen considerable improvement in governance, infrastructure and consequently economic growth. Simultaneously, an emphasis on education, especially of the girl child, has seen the state take great strides in literacy rates which has begun
Fig.2.1. Districts of Bihar
Chapter 2: Profile of Bihar
20 Status of Final Inclusion & Way Forward-Bihar 2012-17
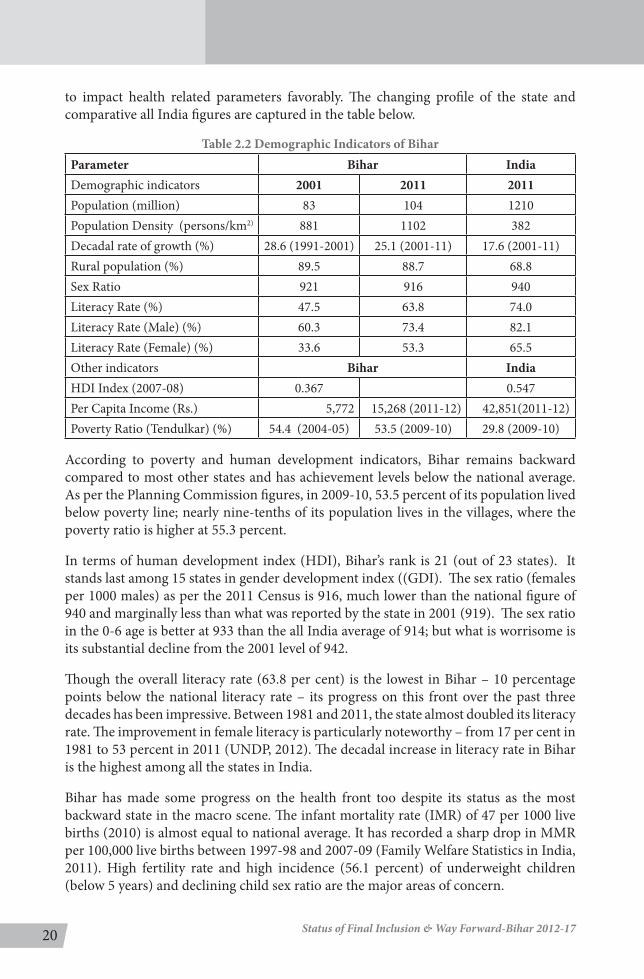
to impact health related parameters favorably. The changing profile of the state and comparative all India figures are captured in the table below.
Table 2.2 Demographic Indicators of BiharParameter Bihar India Demographic indicators 2001 2011 2011Population (million) 83 104 1210Population Density (persons/km2) 881 1102 382Decadal rate of growth (%) 28.6 (1991-2001) 25.1 (2001-11) 17.6 (2001-11)Rural population (%) 89.5 88.7 68.8Sex Ratio 921 916 940Literacy Rate (%) 47.5 63.8 74.0Literacy Rate (Male) (%) 60.3 73.4 82.1Literacy Rate (Female) (%) 33.6 53.3 65.5Other indicators Bihar IndiaHDI Index (2007-08) 0.367 0.547Per Capita Income (Rs.) 5,772 15,268 (2011-12) 42,851(2011-12)Poverty Ratio (Tendulkar) (%) 54.4 (2004-05) 53.5 (2009-10) 29.8 (2009-10)
According to poverty and human development indicators, Bihar remains backward compared to most other states and has achievement levels below the national average. As per the Planning Commission figures, in 2009-10, 53.5 percent of its population lived below poverty line; nearly nine-tenths of its population lives in the villages, where the poverty ratio is higher at 55.3 percent.
In terms of human development index (HDI), Bihar’s rank is 21 (out of 23 states). It stands last among 15 states in gender development index ((GDI). The sex ratio (females per 1000 males) as per the 2011 Census is 916, much lower than the national figure of 940 and marginally less than what was reported by the state in 2001 (919). The sex ratio in the 0-6 age is better at 933 than the all India average of 914; but what is worrisome is its substantial decline from the 2001 level of 942.
Though the overall literacy rate (63.8 per cent) is the lowest in Bihar – 10 percentage points below the national literacy rate – its progress on this front over the past three decades has been impressive. Between 1981 and 2011, the state almost doubled its literacy rate. The improvement in female literacy is particularly noteworthy – from 17 per cent in 1981 to 53 percent in 2011 (UNDP, 2012). The decadal increase in literacy rate in Bihar is the highest among all the states in India.
Bihar has made some progress on the health front too despite its status as the most backward state in the macro scene. The infant mortality rate (IMR) of 47 per 1000 live births (2010) is almost equal to national average. It has recorded a sharp drop in MMR per 100,000 live births between 1997-98 and 2007-09 (Family Welfare Statistics in India, 2011). High fertility rate and high incidence (56.1 percent) of underweight children (below 5 years) and declining child sex ratio are the major areas of concern.

21Status of Final Inclusion & Way Forward-Bihar 2012-17
As for economic indicators, Bihar has been hailed as a forward looking state with a fast growing economy. Between 2006-07 and 2010-11 the net state domestic product of the state and the per capita income (at 2004-05 prices) grew the fastest at a rate of 13.5 per cent and 11.8 percent per annum respectively. But as in the previous years, the state reported the lowest per capita income (Rs. 15,268) in 2011-12; it constituted just 12.8 percent of the average income earned in Delhi (Rs. 1, 19,032).
The economy of Bihar is predominantly agrarian that supports about 17 million people in terms of employment. The share of agriculture in overall employment has shown a significant fall from 73.6 percent in 2004-05 (61st Round of the National Sample Survey) to 63.8 percent in 2009-10 (NSSO 66th Round). The location of the state in the riverine plains of the Ganga basin area means that it can devote more land to agriculture compared to other states. As in 2008-09 net sown area forms 59.4 percent of the total geographical area. The average productivity of all important crops, i.e. rice, wheat, maize, pulses and vegetables & fruits has increased over the years. Floriculture has also picked up in recent times. Bihar has also managed to retain notified forest area spread of over seven percent.
The state’s economy has been undergoing gradual transformation over the past years away from primary sector activities in favor of the tertiary sector. The relative significance of the primary sector in terms of the share in the state domestic product has been on the decline since the early 2000s – from 36 percent in 2000-03 to 29 percent 2005-08 to 22 percent in 2008-11. Agriculture and animal husbandry alone lost their share substantially from 33 percent to 22 percent to 19 percent between 2000 and 2008. During the same period activities in the tertiary sector, especially, trade/hotel/restaurants, registered a significant increase from 53 percent to 61 percent (GoB, 2012).
The growth rate of agriculture and animal husbandry has also been much lower (around 4 percent) as compared to registered manufacturing, and service sector activities such as construction, communications, trade/hotels/and restaurants and banking and insurance services, all of which grew at rates between 15 percent and 27 percent during 2005-11. The unregistered units in Bihar account for more than half of the total industrial income and the performance of enterprises sector has been rather poor except for those engaged in food products, beverages and tobacco business.
Investment in infrastructure has been a priority and construction of roads (state highways, MDRs and rural roads) and bridges have received attention. Telecommunications too has seen robust growth and there has been a ten-fold increase in the number of connections in since 2005-06. Several power projects have been approved by the state government in the public-private-participation (PPP) mode to address the problem of very low per capita consumption of electricity. The state reports the lowest consumption of electricity per capita - 122.11 KWH – as against the national average of 778.71 KWH.
2.1.1 Regional Disparity within Bihar
Within a state there are pockets which are better off than other regions. For effective implementation of any program it is important to understand the economic disparity within the state.The problem of low per capita income in Bihar is accentuated by the fact that there exists considerable disparity across the districts in terms of their per capita

22 Status of Final Inclusion & Way Forward-Bihar 2012-17
income. The latest estimates of per capita GDDP relate to 2009-10 and these estimates have been presented in Appendix 12, along with estimates for 2006-07, 2007-08 and 2008-09. It can be seen from the table that, in 2009-10, Patna (Rs. 55,539), Munger (Rs. 18,669) and Bhagalpur (Rs. 14,396) were the most prosperous districts of Bihar. On the other end of the ranking ladder, the most economically backward districts are Sheohar (Rs. 5,522), Madhepura (Rs. 7,161) and Supaul (Rs. 7,213). Even if we exclude Patna which has the benefit of having the state capital region, the per capita income of Munger, the second most prosperous district, is about 3 times that of Sheohar.
Table 2.3. Relatively prosperous and backward district of BiharCriteria Top 3 districts Bottom 3 districts
Per Capita GDDP Patna, Munger and Bhagalpur Sheohar, Madhepura And SupaulConsumption of Petrol Patna, Muzaffarpur and East
ChamparanJamui, Sheohar and Lakhisarai
Consumption of Diesel Patna, Muzaffarpur and East Champaran
Kishanganj, Supaul AndLakh-isarai
Consumption of LPG Patna, Muzaffarpur and Bhagalpur
Kishanganj, Sheikhpura and Sheohar
The deposits in small savings kept in post offices and public provident fund across the districts can also be considered a shadow measure of relative prosperity of a particular district. The figures of such deposits are shown in Appendix 13 in the table, we have derived the triennium average of such deposits for the years 2009-10, 2010-11 and 2011-12, along with percentage share of district in total savings. Higher the percentage share of the district vis-à-vis its population share, higher is the prosperity count of the district. The relatively prosperous districts on this count are – Patna, Saran and Nalanda. At the other end, the relatively backward districts using this criterion are – Khagaria, Sheohar and Lakhisarai.

23Status of Final Inclusion & Way Forward-Bihar 2012-17
This section presents the current status of supply of financial services, from different categories of institutions. Banks represent the primary channel of savings and
credit services to SHGs, which may be formed by Self Help Promoting Institutions (or by banks themselves). Banks have also been extending loans to Joint Liability Groups, either directly or through Microfinance Institutions (MFIs). Banks have increased their outreach through a wide network of Business Correspondents in Bihar.
Similarly Primary Agricultural Credit Cooperative Societies (PACS) extend loans to their members, which are refinanced by the District/ State cooperative banks (and eventually, NABARD). Post offices extend savings services and insurance. Insurance companies offer their products through SHPIs or MFIs who also function as aggregators for pension. MFIs provide loans through JLGs and SHGs.
3.1. Banking Channel
The growth momentum that Bihar exhibits is yet to be translated into a widely networked system of banks and financial institutions. As per the Census 2011 only 44.4 per cent households in the state avail banking facility. The percentage is lower for rural households (42.5 percent) than their urban counterparts (62.4 per cent). The banking statistics data shows a fall in the number of commercial bank offices in the state from 5,001 in 1995 to 4,666 in 2012. With this the state’s share in bank offices nationally has come down by about three percentage points, from 7.8 percent to 4.6 percent. The number of employees with the scheduled commercial banks in the state in 2012 was about 13000 less than their number in 1995, which meant a one percent decline in employment over the period (RBI, 1998, 2011-12).
The total deposits of commercial banks in the state by end March 2012 stood at Rs. 1,423.08 billion and total credit at Rs.411.51 billion. With such a wide discrepancy between savings and advances, the credit deposit ratio is just 29.12, the lowest in the country. At the all India level, the state’s share in deposits is 2.3 percent and in credit, a meager 0.85 percent. It may, however, be noted that both deposits and credit grew by about 19 percent between 2010-11 and 2011-12. There has been another positive change in terms of decline in the population per bank office from 23,250 to 21,990 during this period. The other positive indication is the rise in both per capita deposit (from 12,193 to 14,271) and credit (from 3,537to 4,156) over 2010-12.
3.1.1 Outreach of banking facilities to poor households by Banks
In line with the PM’s statement and the Twelfth Five Year Plan that called for financial inclusion to be widespread, banks have been directed and have subsequently established branches across Bihar, as depicted in Fig 3.1.
As can be seen above, in rural areas Public sector banks and RRBs dominate. Private Banks, however, are more concentrated in the urban areas of the State. The private non-nationalized banks opened their branches mostly in urban and in a few cases in semi-urban areas; they had no presence in rural areas, except only one branch opened in 2012 by a private bank.
Chapter 3: Baseline - Current Status of Financial Services Through Different Channels

24 Status of Final Inclusion & Way Forward-Bihar 2012-17
The At the end of March 2013, 47.15 percent of the commercial bank offices in Bihar were located in rural areas, 27.52 percent in semi-urban areas and 25.33 percent in urban/metropolitan areas. As is the overall trend in the country since the 1990s, there has been a relative shift in the share of bank offices towards urban/metro areas in the state too. The share of rural branches has come down drastically from 70 percent in 1995 to 59.63 percent in 2013. All these indicate a gradual slowing down of the pace of financial intermediation in the state over the years. The Index of Financial Inclusion for Bihar for the period 2006-07 till 2009-10 did reflect this; the state ranked 21 among 24 states with a low index of 0.15 (Chattopadhyay, 2011)4.
Additionally, there are 290 cooperativebank branches operating in the state with 55% of its branches in the rural area. The deposits of state cooperative banks in Sept 2012-13 and 13-14 stood at Rs. 31,027 million and Rs. 33,109 millionrespectively. At the same time interval the CD ratio stood to be 85.18 and 80.96 respectively.
In comparison to the cooperative banking system, the regional rural bank network has performed reasonably well in the state. There has been an increase in the number of branches, deposits and credit in the case of RRBs between 2010-11, 2011-12 and 2012-13 (Table 3.1). While the credit deposit ratio rose by three percentage points – from 43.5 percent to 46.7 percent and then to 48.15 per cent – over the three years, the deposit-credit gap remains large. Thus, despite a large flow of deposits into the RRBs, less than half of it has been made available to the rural economy in the form of credit.
Table 3.1. Performance of RRBs
Particulars2010-11 2011-12 2012-13 Up to
Sept’2013
Annual Growth
rate
Q2 growth
rateNumber of branches 1,458 1,594 1,718 1,756 7.78% 2.21%Total deposits (Rs. million) 1,37,350 1,50,760 1,62,803.3 1,70,499.4 7.99% 4.72%Total credit (Rs. million) 59,790 70,440 78,971.8 87,947.6 12.11% 11.36%
Source: State Level Banker’s Committee
Area wise Branch details as on September’2013 is given in Table 3.2
Table 3.2. Area wise branch detailsBanks Rural Semi-urban Urban TotalCommercial Bank 1,591 953 864 3,408Cooperative Bank 160 56 74 290RRBs 1,487 206 63 1,756Total 3,238 1,215 1,001 5,454
Source: State level Bankers Committee
4 The Index of Financial Inclusion considers three basic dimensions of an inclusive financial system – banking penetration, availability of the banking services, and usage of the banking system. These dimensions are measured through three sets of indicators: the number of bank accounts as a proportion of the total population (penetration), the number of bank branches per 1000 adult population along with the number of branches per square km (availability), and volume of outstanding deposit and credit as proportion of the Net District Domestic Product (usage). See, Chattopadhyay (2011) for a detailed methodological discussion.

25Status of Final Inclusion & Way Forward-Bihar 2012-17
Some of the key Banking indicators in the state are presented in Table 3.3, where we can see gradual increase in CD ratio from 35.16 in Dec, 2011 to 40.52 in Sept. 2013. Share of advances to women is also increasing although the growth is very slow.
Table 3.3.Key Banking Indicators (Amount in crore)S.No Items Dec’11 Mar’12 Dec’12 March’13 Sept’13
1 Deposits 1,27,806.04 1,38,163.08 1,47,747.93 1,61,035.62 1,69,771.722 Advances 40,827.48 45,356.81 49,604.00 55,254.21 58,571.073 Advances includ-
ing advances grant-ed to units in Bihar by branches oper-ating outside Bihar
42,715.13 48,212.88 55,456.76 62,293.74 65,446.00
4 Advances includ-ing RIDF
44,940.88 50,703.87 58,235.65 65,364.22 68,791.00
5 CD ratio 35.16 36.70 39.42 40.59 40.526 Priority sector
advances28,299.05 32,247.11 36,513.41 38,969.39 43,119.28
7 Share of PSA in total adv (SI,no. 2)(%)
69.31% 71.10% 73.61% 70.53% 73.62%
8 Agriculture adv. 15,868.93 18,290.07 21,799.56 22,537.76 24,949.009 Share of agricul-
ture adv in total adv (sl no.2) (%)
38.87% 40.32% 43.95% 40.79% 42.60%
10 Adv. to women (disbursement)
1,193.89 1,840.76 2,038.04 2,338.08 1,950.44
11 Share of adv. to women in dis-bursement (%)
5.32% 5.68% 6.54% 7.50% 7.80%
12 Total no. of Branches
4,723 4,860 5,031 5,270 5,454
A Rural 2,819 2,898 2,825 3,143 3,238B Semi-Urban 1,025 1,070 1,264 1,149 1,215C Urban 879 892 942 978 1,001
Source: State Level Banker’s Committee

26 Status of Final Inclusion & Way Forward-Bihar 2012-17
The CD ratio status with respect to the bank classification is given in Table 3.4.
Table 3.4. Deposit, Advance & CD ratio classification of BankFigure as on Sept. 2013 (Amount in crore)
Bank Deposit Advances CD RatioCommercial bank 1,49,381 53,946 36.11Co-operative Bank 3,341 2,705 80.96RRBs 17,050 8,795 51.58Total 1,69,772 65,446 38.55RIDF ------ 3,345 ------Total (Advances + RIDF) 1,69,772 68,791 40.52Investment 6,591 -Grand Total (Adv + RIDF +I NV.) 1,69,772 75,352 44.38
Source: State Level Banker’s Committee
The Credit-Deposit (CD) ratio in Bihar remains at 40.52%, far below the national average of 78.1%5. CD ratio was highest (80.96%) for Cooperative Banks, followed by Regional Rural Banks (51.58%) and Commercial Banks (36.11%). Increase in CD ratio, especially for commercial bank is necessary to provide impetus to economic activities. According to the SLBC report, the CD ratio may improve further, if the state Government utilizes the total amount of Rs. 7669.98 crore sanctioned under RIDF, As on 30th September, 2013 only 44% of the amount sanctioned has been utilized by the Government of Bihar. Further, the CD ratios across districts of Bihar show wide variation, from 22.15% in Siwan to 56.02% in Kishanganj and less than 30% in 7 out of 38 districts.
5 Source: RBI’s Report on Trend And Progress of Banking in India 2012-13

27Status of Final Inclusion & Way Forward-Bihar 2012-17
Table 3.5. District wise CD ratio as on 30th September’2013(Amount in lakhs)
S.No Name of the district No. of Branches Deposit Advances CD Ratio
1 Araria 102 1,80,375 82,068 45.50%2 Arwal 38 77,829 21,610 27.77%3 Aurangabad 127 3,50,031 1,12,331 32.09%4 Banka 82 1,73,999 67,795 38.96%5 Begusarai 154 3,99,812 1,90,302 47.60%6 Bhagalpur 188 6,06,977 1,81,045 29.83%7 Bhojpur 163 4,78,718 1,19,378 24.94%8 Buxar 109 2,58,811 83,039 32.08%9 Darbhanga 197 4,86,695 1,82,699 37.54%10 East Champaran 222 4,06,878 1,88,285 46.28%11 Gaya 217 6,33,323 2,20,939 34.89%12 Gopalganj 137 3,42,749 1,06,024 30.93%13 Jamui 85 1,69,681 58,868 34.69%14 Jehanabad 63 1,41,085 46,006 32.61%15 Kaimur 88 1,86,544 98,379 52.74%16 Katihar 133 2,55.640 1,08,090 42.28%17 Khagaria 77 1,54,276 78,139 50.65%18 Kishanganj 70 1,09,283 61,216 56.02%19 Lakhisarai 55 1,28,643 41,757 32.46%20 Madhepura 86 1,70,582 60,282 35.34%21 Madhubani 232 3,78,869 1,13,438 29.94%22 Munger 93 3,01,567 72,379 24.00%23 Muzaffarpur 283 7,91,418 2,84,081 35.90%24 Nalanda 162 3,70,676 1,25,417 33.83%25 Nawada 99 1,92,306 74,958 38.98%26 Patna 617 5,61,2097 17,81,711 31.75%27 Purnea 146 2,85,695 1,57,879 55.25%28 Rohtas 156 4,18,595 1,75,866 42.01%29 Saharsa 76 1,78,348 67,502 37.85%30 Samastipur 198 4,28,021 1,72,075 40.20%31 Saran 179 5,36,304 1,33,776 24.94%32 Sheikhpura 37 78,139 25,987 33.26%33 Sheohar 28 42,227 17,050 40.38%34 Sitamarhi 142 2,70,450 1,04,099 38.49%35 Siwan 181 5,06,604 1,12,192 22.15%36 Supaul 91 1,66,447 64,907 39.00%37 Vaishali 176 4,23,774 1,32,619 31.29%38 West Champaran 165 2,83,705 1,32,920 46.85%
Total Of Bihar 5,454 1,69,77,173 58,57,108 37.14%Source: State Level Banker’s Committee
In absolute terms, the low CD ratio means that, if the current CD ratio of about 40.52 percent in thestate were to increase to the national level of around 78 percent,

28 Status of Final Inclusion & Way Forward-Bihar 2012-17
investments in the state would go up by as much as Rs. 56,000 crore, which is more than the current annual plan outlay of the state and would provide the much-needed impetus to economic activities. Even a modest CD ratio of 50 percent in Bihar would boost local investments by nearly Rs. 15,750 crore. The low disbursement of credit also indicates that either the industrial activities are stagnating or the credit requirements of the enterprises are being met at higher rates of interest from private lending agencies, eating into the profitability of enterprises in the state. This naturally is a serious hindrance to industrial growth in the state. Further, this also indicates flight of capital away from an already disadvantaged state.One of the factors contributing to the low credit flow has been the weak loan recovery rates. According to the NABARD Report for 2011-12, gross NPA for loans outstanding to SHGs has doubled since 2010-11.
Despite all these challenges Bihar has slowly established itself as a development-oriented state. Government’s focus on infrastructure, increasing literacy, women’s empowerment and achieving complete financial inclusion shall no doubt contribute to its objective of reducing poverty. The strategy of the Government of Bihar involves effective targeting of the poor, especially the most vulnerable groups of Scheduled Castes (SCs) and Scheduled Tribes (STs) in order to make growth inclusive. Above all, improvement in governance and law & order has made the climate conducive for investment and economic development.
NPAs and Write-Off: As on September 2013, overall position of NPAs and the amount of loans written off is as under
Table 3.6. Status of NPAs & Write-off(Rs. In crore)
Banks Total Adv. Total NPA % of NPA Amt. written offComm. Banks 47,072 3,596 7.64 64Co-op. Banks 2,705 208 7.69 0.0RRBs 8,795 380 4.33 86Total 58,571 4,184 7.14 150
Source: State Level Banker’s Committee
3.1.2. Status of No-Frill Savings account:
Among the villages/areas where some banking facility has been provided, villagers have begun to utilize the account facilities on offer; Table 3.7 represents the number of savings accounts opened by villagers under the Financial Inclusion (FI) drive and the amount mobilized. As per SLBC report, a total of 21, 47,631 no-frill accounts were opened during the half year of FY 2013-14. Thus a total of 1, 38, 62,251 No-frill accounts have opened. Out of these, 65, 79,307 accounts are operational, hence total operational account as on date is 49.61%. The Bank Wise Performance on No-Frill account is shown in annexure 10.

29Status of Final Inclusion & Way Forward-Bihar 2012-17
Table 3.7. Performance under Financial Inclusion (Nos. of A/Cs)Bank Wise Performance: No Frills Account as on 30th September’2013
(Amount in Lakhs)
Bank
No Frill A/C opened during
the current FY (through
Branch channel)
No Frill account
opened during the current
financial year (through BC
channel)
No Frill A/C opened during the current FY
through Branch Channel and BC
model)
Cumulative Achievement (Nos. of No Frill account
opened since inception)
Total No. of operational
No Frill A/Cs (Cumulative)
Commer-cial Bank
3,53,794 8,406 9,89,786 8,510 13,43,580 16,916 82,26,248 1,03,861 47,83,386 86,642
Coopera-tive Bank
0 0 0 0 0 0 0 0 0 0
Regional Rural Bank
4,54,608 12,756 3,49,443 156 8,04,051 12,912 56,36,003 46,438 17,95,921 2,463
Total 8,08,402 21,162 13,39,229 8,666 21,47,631 29,828 1,38,62,251 1,50,299 65,79,307 89,105Source: State level Banker’s Committee
In all, around 1.386 crore accounts have been opened across public, private, and Regional Rural Banks. Society for Advancement of Village Economy (SAVE) a Business Correspondent has shown some good achievements since its inception in districts of Bihar. They have a total of 600 CSP branches and have opened 4.8 lakhs account till date6.
In first phase, 9206 villages having population more than 2,000 were covered under financial inclusion by 31 March 2012 and in second phase 3,052 villages having population with 1,600-2,000 are identified to be covered by 31 March 2013. The Reserve Bank of India has instructed for providing the banking facilities to all the remaining unbanked villages with population below 2,000 by March 2016. Till September’ 2013, in 3,217 villages out of identified 27,343 such villages, the banking facilities have been provided. The details of coverage of villages under financial inclusion are given in Table 3.8.
Table 3.8. Coverage under Financial Inclusion
Particulars Population >5000
Population 1600-2000
Population >20007
Targeted No. of Villages 1,695 3,052 3,306Total Villages covered 1,630 2242 ----
Covered by Brick & Mortar Branches 142 00 ----Covered under USBs 1,488 -------- 1,625Covered through Branch & others ----- 228 ----Yet to be covered 65 810 1,681
Covered through BCA ------ 2,014 ----
Percentage Coverage 96.17% 73.46% 50.85%
6 The data has been received by official meeting at SLBC, Patna. This figure is approximate as on 31st of March’ 2013.7 The data is for the Progress in Extension of Banking Facilities in 15 LWE affected districts which was extracted from 46th review
meeting SLBC, Patna.

30 Status of Final Inclusion & Way Forward-Bihar 2012-17
Households (HH) availing Banking Services in India vis-à-vis Bihar
As per census 2011, the total number of Households as well as the number of Households availing banking services were enumerated which revealed the status at all India level and as in the state and is given in Table 3.9.
Table 3.9. Households availing Financial Services(in crore)
Rural Urban Total Rural Urban Total
Particulars India BiharTotal no. of Households (HH) 16.78 7.88 24.66 1.69 0.20 1.89No. of HH availing Banking Services 9.14 5.34 14.48 0.72 0.12 0.84% of HH availing Banking Services 54.4 67.8 58.7 42 62 44
(Source: Census of India’11)
A rough estimate of financial inclusion drive suggests provision of banking facilities to at least one crore more households which is a mammoth task for financial institutions in the State.
As on September 2013, 9,861 BC agents have been appointed. One BC is handling several villages through its network of agents.
Controlling Head of all banks operating in the State have been requested to put in concerted efforts for setting up Brick and Mortar branches/ USBs in all the identified villages with population above 5,000/10,000 at an early date.Till September, 2013, 1,630 such villages out of allotted 1695 villages have been covered. Out of 1630 covered villages, 142 villages have been covered by Brick & Mortar Branches and 1,488 villages have been covered by USBs.
Ministry of Home Affairs has identified 15 districts in Bihar as Left Wing Extremism (LWE) affected. The Planning Commission has also formulated guidelines for Integrated Action Plan (IAP) in some selected tribal and backward districts under the State component of Backward Regions Grant Fund (BRGF). 9 LWE districts (Arwal, Aurangabad, Gaya, Jamui, Jehanabad, Kaimur, Munger, Nawada&Rohtas) in Bihar also figure in the Planning Commission list for IAP. As per IAP guidelines, a committee headed by District Collector/District Magistrate and consisting of the Superintendent of Police of the District and District Forest Officer is responsible for implementation of the Scheme. Funding of Capital Cost for establishing the USBs, amounting to Rs. 1.40 lakhs per USB has been included by the Planning Commission as permissible project under IAP. LDMs of concerned 9 districts have been requested to approach the District Magistrate for funding of capital cost for the establishment of USBs in the identified villages having population over 2,000. Controlling Head of all Banks in Bihar have been requested to instruct their operating functionaries to coordinate with respective LDMs for funding of USBs in the identified villages having population above 2,000 in their respective districts under the guidelines for IAP.

31Status of Final Inclusion & Way Forward-Bihar 2012-17
All banks have also been requested to arrange to open bank accounts of all eligible persons including migrant laborers and street vendors/hawkers, who are working within 500 meters of the branches in urban and metro areas, through branch or CSPs so that financial inclusion and remittance in urban area could be facilitated. In this regard, the Lead District Managers of all districts have also been requested for initiating necessary steps and sensitizing the branches in their district so that account of all migrant laborers and street vendors/hawkers could be opened.
3.1.3 Status of credit supply by Banks
Comparative Performance under ACP (as on Sept’2013 vis-à-vis Sept’2012)
Table 3.10. Comparativeperformance under ACP(Rs. In Crore)
Banks 2013-14 2012-13 YOY increase in disb. (%)Target Ach. %Ach Target Ach % Ach
Commercial 47,938 19,114 39.87 38,028 14,825 38.98 29%Co-op 802 190 23.70 2,322 222 9.56% -14%RRBs 13,260 5,713 43.09 11,050 4,018 36.36 42%Total 62,000 25,018 40.35 51,400 19,065 37.09 31%
(Source: State level Banker’s Committee)
Credit disbursement by banks to different sectors such as agriculture, small enterprise and other priority sectorsis highlighted in Table 3.11.
SECTOR-WISE PERFORMANCE (as on Sept’2013)
Table 3.11. Sector Wise Performance (Rs. In Crore)Sector 2013-14 2012-13 YoY increase in
disbursementTarget Ach. % Ach Target Ach. % AchAgl. 30,286 12,026 39.71 25,400 8,631 33.98 39%MSE 4,821 2,806 58.21 3,400 2,055 60.45 37%OPS 5,723 2,316 40.47 4,600 1,696 36.86 37%TPS 40,830 17,149 42.00 33,400 12,382 37.07 38%NPS 21,170 7,869 37.17 18,000 6,683 37.83 18%Total 62,000 25,018 40.35 51,400 19,065 37.09 31%
(Source: State level Banker’s Committee)
Table 3.12. Recovery Status (as on Sept’ 2013)Bank Demand Raised (in cr) Amount recovered (in Cr) Recovery (%)Comm. Banks 10,920 6,560 60.07%C o-op Banks 643 198 30.82%RRBs 809 650 80.37%Total 12,372 7,408 59.88%
(Source: State level Banker’s Committee)

32 Status of Final Inclusion & Way Forward-Bihar 2012-17
The recovery percentage is at 59.88% of the total demand raised by Banks as on 30th September, 2013. There is a need to improve in the recovery status to drive the financing by the Banks in the state.
3.1.3.1 Status of Credit Supply through Kisan Credit Cards (KCC)
The Kisan Credit card is a facility accorded by the Government to farmers who can avail credit under a single window system. This includes short-term, long-term, and medium term credit. Farmers are issued a credit card and a passbook under this scheme. In Bihar, the scheme has ensured coverage of 83% across the span of the State, with RRBs achieving more than the target in renewal.The region-widespread of KCCs are given in Table 3.13.
Kisan Credit Cards (KCC): KCC is an important instrument of financial inclusion that enables the farmers to get loans over a three to five year period as revolving credit entitlement. This helps them gain control over cash flows while reducing transaction costs for both them and the banks. Up to end of March 2013, 3,84,386 KCCs (20.81 per cent more than the corresponding period in 2011-12) were sanctioned by commercial banks and RRBs and Cooperative Banks with credit support worth Rs. 59,650 million as on September’2012 (45.5 percent growth over the corresponding period in 2011-12).
The Banks operating in the state have sanctioned loans to total of 12,76,900 beneficiaries (New-4,68,013 & Renewal – 8,08,887) under KCC amounting to Rs. 8,001.95 crore up to the second quarter of FY 2013-14 while during the same period last year, only 8,94,490 beneficiaries were extended loans under KCC, the amount involved being Rs. 5,964.88 crore.8
Table 3.13. Progress of KCC as on September, 2013
BanksSanctioned (No.) Target (No.) % AchievementNew Renewal New Due for Renewal New Renewal
Comm. Banks 2,71,480 2,61,112 9,09,185 3,80,572 29.85 68.61RRBs 1,90,934 4,57,917 5,35,349 4,45,802 35.66 102.72Co-op. Banks 5,590 89,858 55,466 9,08,533 10.07 9.89Total 4,68,013 8,08,887 15,00,000 17,34,907 31.20 46.62
Source: State Level Banker’s Committee
8 The paragraph has been extracted from the 46th Review meeting of SLBC.
33Status of Final Inclusion & Way Forward-Bihar 2012-17
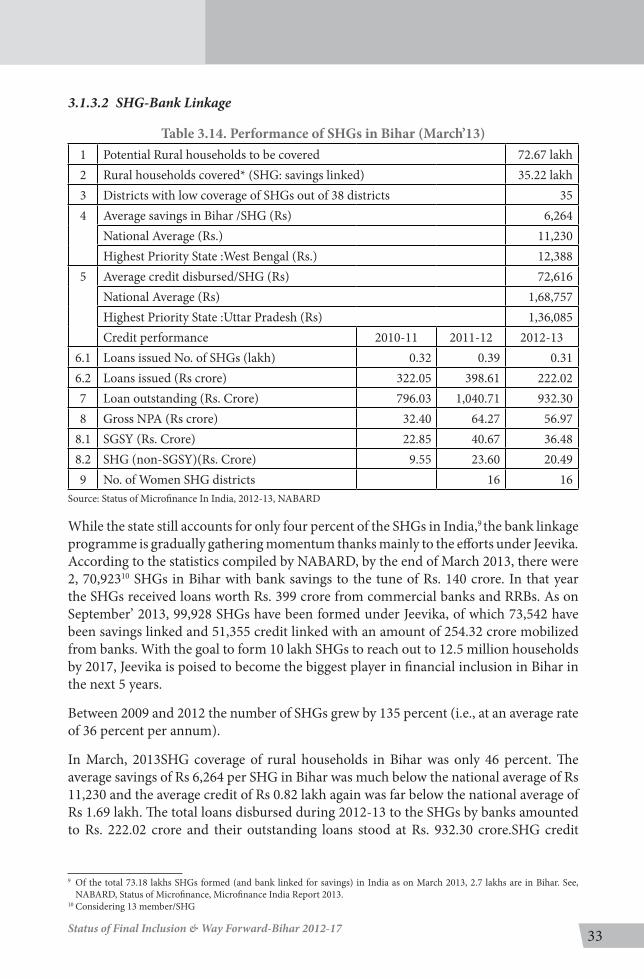
3.1.3.2 SHG-Bank Linkage
Table 3.14. Performance of SHGs in Bihar (March’13)1 Potential Rural households to be covered 72.67 lakh2 Rural households covered* (SHG: savings linked) 35.22 lakh3 Districts with low coverage of SHGs out of 38 districts 354 Average savings in Bihar /SHG (Rs) 6,264
National Average (Rs.) 11,230Highest Priority State :West Bengal (Rs.) 12,388
5 Average credit disbursed/SHG (Rs) 72,616National Average (Rs) 1,68,757Highest Priority State :Uttar Pradesh (Rs) 1,36,085Credit performance 2010-11 2011-12 2012-13
6.1 Loans issued No. of SHGs (lakh) 0.32 0.39 0.316.2 Loans issued (Rs crore) 322.05 398.61 222.027 Loan outstanding (Rs. Crore) 796.03 1,040.71 932.308 Gross NPA (Rs crore) 32.40 64.27 56.97
8.1 SGSY (Rs. Crore) 22.85 40.67 36.488.2 SHG (non-SGSY)(Rs. Crore) 9.55 23.60 20.499 No. of Women SHG districts 16 16
Source: Status of Microfinance In India, 2012-13, NABARD
While the state still accounts for only four percent of the SHGs in India,9 the bank linkage programme is gradually gathering momentum thanks mainly to the efforts under Jeevika. According to the statistics compiled by NABARD, by the end of March 2013, there were 2, 70,92310 SHGs in Bihar with bank savings to the tune of Rs. 140 crore. In that year the SHGs received loans worth Rs. 399 crore from commercial banks and RRBs. As on September’ 2013, 99,928 SHGs have been formed under Jeevika, of which 73,542 have been savings linked and 51,355 credit linked with an amount of 254.32 crore mobilized from banks. With the goal to form 10 lakh SHGs to reach out to 12.5 million households by 2017, Jeevika is poised to become the biggest player in financial inclusion in Bihar in the next 5 years.
Between 2009 and 2012 the number of SHGs grew by 135 percent (i.e., at an average rate of 36 percent per annum).
In March, 2013SHG coverage of rural households in Bihar was only 46 percent. The average savings of Rs 6,264 per SHG in Bihar was much below the national average of Rs 11,230 and the average credit of Rs 0.82 lakh again was far below the national average of Rs 1.69 lakh. The total loans disbursed during 2012-13 to the SHGs by banks amounted to Rs. 222.02 crore and their outstanding loans stood at Rs. 932.30 crore.SHG credit
9 Of the total 73.18 lakhs SHGs formed (and bank linked for savings) in India as on March 2013, 2.7 lakhs are in Bihar. See, NABARD, Status of Microfinance, Microfinance India Report 2013.
10 Considering 13 member/SHG
34 Status of Final Inclusion & Way Forward-Bihar 2012-17
linked and the amount of finance under Bank linkages programme as on September 2013 is given in Table 3.15
Table 3.15. Bank linkage to SHG in recent years
Year Number of SHGs Credit Linked
Amt. of Finance(Rs. In crore)
During 2008-09 25,696 211.44During 2009-10 30,241 295.05During 2010-11 26,055 198.13During 2011-12 22,714 179.64During 2012-13 (Up to Sept.. 2012) 12,002 82.37During March’2013 30,297 197.68During 2013-14 (up to Sept. 2013) 19,195 114.04
Source: State Level Banker’s Committee
From the table, it is evident that SHG financing during the first six months of the FY has been more than that of last year by 60% in terms of numbers and 38% in terms of amount of finance. JEEVIKA and WDC are requested to further increase their activity in the district as the target of the state for savings linkage is 1, 10,000 and 75,000 SHGs for credit linkage. Against the target of financing to 75,000 SHGs during the FY 2013-14, the Banks in the state has financed only 6,500 SHGs till June 2013 during the current FY. All Banks are requested to focus on to give SHG credit linkage and achieve their target. The other action point is the common application form of Saving Linkage and Credit Linkage of SHGs is in the process of adoption by SLBC. All banks are required to get it approved from their respective competent authority.11
11 Extracted from 46th SLBC Review Meeting

35Status of Final Inclusion & Way Forward-Bihar 2012-17
Table 3.16. Bank wise credit performance of SHGSelf Help Groups as on September, 2013 (Rs. In lakhs)
S.No. Name of the Institution Commercial Bank Target Sanction % AchievementLEAD BANKS No. No. Amount
1 State Bank Of India 11,325 2,289 738 20.212 Central Bank Of India 6,300 651 378 10.333 Punjab National Bank 8,280 2,931 1,695 35.404 Canara Bank 1,635 302 175 18.475 UCO Bank 3,195 238 113 7.456 Bank Of Baroda 2,040 286 141 14.027 Union Bank Of India 1,163 168 129 14.45
OTHER BANKS -8 Bank Of India 4,050 182 182 5.569 Allahabad Bank 2,745 80 80 4.9210 Andhra Bank 75 - 0.0011 Bank Of Maharashtra 0 0 012 Corporation Bank 135 0 013 DENA Bank 172 0 014 Indian Bank 480 83 39 17.2915 Indian Overseas Bank 210 4 1 1.9016 Oriental Bank Of Commerce 390 11 18 2.8217 Punjab & Sind Bank 22 0 0 -18 Syndicate Bank 465 22 9 4.7319 United Bank of India 1,275 36 17 2.8220 Vijaya Bank 60 0 0 0.0021 IDBI 195 0 0 0.00
SBI ASSOCIATES - -22 State Bank Of B & J 38 0 0 0.0023 State Bank Of Patiala 0 0 0 -
PRIVATE BANKS - - -24 ICICI Bank 248 - - -25 Federal Bank 0 - - -26 Jammu Kashmir Bank 0 - - -27 South Indian Bank 0 - - -28 ING Vysya Bank 0 - - -29 AXIS Bank 270 - - -30 HDFC Bank 577 - - -31 IndusInd Bank 75 - - -32 Karnataka Bank 0 - - -33 Kotak Mahindra 0 - - -
Total Commercial Bank 45,420 7,381 3,715 16.25CO-OPERATIVE BANKS
34 State Co-op Bank 0 - - -34 Bombay M. Co-op Bank 0 - - -36 TUCB 0 - - -
Total Cooperative Bank 0REGIONAL RURAL BANK
37 Madhya Bihar Gramin Bank 8,175 6,124 3,379 74.9138 Bihar Gramin Bank 4,605 3,445 2,961 74.8139 Uttar Bihar Gramin Bank 16,800 2,245 1,349 13.36
Total Of RRBs 29,580 11,814 7,689 39.94Total For Bihar 75,000 19,195 11,404 25.59
Source: 46th Review Meeting, SLBC, BIhar

36 Status of Final Inclusion & Way Forward-Bihar 2012-17
While comparing the performance of the commercial bank, Punjab National Bank has made maximum achievement in credit disbursement while there is satisfactory performance of MBGB and BGB in RRBs’ category in Q2 of financial year 2013-14.
If we see the overall performance of the Bank, the banks are now seeing the SHGs as a new mode of business. The attitude of the bank has changed in recent five years though 2012-13 financial years has shown decline of over 20%.12 The commercial bank has credit linked to more number of SHGs as compared to RRBs combined together.
Table 3.17. Microfinance through Banks (As on March 2013)
Bank S B A/C opened
Credit linked
Amount(in lakhs)
WSHG S B A/C
Credit linked
Amount (in lakhs)
Commercial Bank 28,700 18,417 10,619 26,331 16,827 9,761Co-operative Bank 0 0 0 0 0 0RRBsMBGB 6,132 4,325 3,495 3,987 2,811 2,728UBGB 8,172 5,845 3,740 8,172 5,845 3,740BGB 3,015 17,10 1,914 29,64 1,674 1,869Total 46,019 30,297 19,768 41,454 27,157 18,098
Source: State Level Banker’s committee
3.2 NABARD: The SHG-Bank Linkage Programme
Bihar is one among the 13 states that NABARD has prioritized for accelerated intervention for SHG promotion. As per the annual microfinance reports of the NABARD, Bihar made the maximum progress among these states in extending SHG coverage since 2009-10 as revealed from the growth rates (Table 3.18).
Table 3.18: Progress of SHG- Bank Linkage Programme by Selected StatesState Number of SHGs (cumulative) Growth rate (%)
2009 2010 2011 2012 2013 2009-10 2010-11 2011-12 Bihar 1,30,005 1,40,824 2,48,197 3,05,113 2,70,890 8.32 76.25 22.93Uttar Pradesh 3,91,906 4,29,760 4,70,157 4,71,184 4,03,932 9.66 9.4 0.21Jharkhand 49,753 79,424 87,205 89,603 85,334 59.64 9.8 2.75Orissa 4,41,960 5,03,172 5,21,152 5,40,029 5,22,837 13.85 3.57 3.62Rajasthan 1,92,479 2,13,295 2,33,793 2,51,654 2,31,763 10.81 9.61 7.64Madhya Pradesh
1,73,725 1,78,226 1,53,817 1,63,588 1,59,462 2.59 -13.7 6.35
Chhattisgarh 1,12,982 1,13,982 1,18,167 1,29,854 98,461 0.89 3.67 9.89West Bengal 6,09,439 6,47,059 6,66,314 6,85,448 5,86,846 6.17 2.98 2.87
Source: NABARD, Status of Microfinance in India (2009to 13)
It is evident that this decline is in spite of more number of new SHGs savings linked to banks during the year pointing to existing SHGs gone out of the Banks linkage programme
12 NABARD, Status of Microfinance in India 2012-13 Pg.11

37Status of Final Inclusion & Way Forward-Bihar 2012-17
during the year. This decline can be attributed to banks now reporting only operative Savings accounts of SHGs and in few instances of banks closing down accounts with ‘Nil’ balances in SHGs savings accounts. Further, as banks were advised to switch to system generated (core banking solution) reporting only, this has also led to “data cleansing” and more accurate reporting of operative (and not cumulative) SHG accounts. Besides, there has also been gradual decline in the number of SGSY groups savings linked with banks over the previous year with the gradual switch to NRLM by the Government.13
Table 3.19 presents the picture with respect to the role of different banking institutions in linking SHGs with savings and loan services. What is considered here is the average for the three year period 2009-12 as yearly changes over a very short period may not indicate any sustained patterns sector-wide. As is evident from Table 3.19, over the three year period the commercial banks in the state had mobilized large share of member savings compared to RRBs, but disbursed almost the same amount of loans. They, however, had greater loans outstanding than RRBs largely because of relatively larger average loan size (Rs. 65,968 per SHG as against Rs.35, 274 for RRBs).
Table 3.19. Extent of SHG-Bank Linkage, 2009-12
Institution type
Bank Linkage, 2009-12 (average of three years)
No. of SHGs
Savings (Rs.
million)
No. of SHGs
L oans disbursed (Rs.
million)
No. of SHGs
Loans outstand-ing (Rs. million)
Commercial Banks 1,17,634 761 17,477 1,564 68,684 4,531Cooperative Banks 0 0 0 0 0 0Regional Rural Banks 1,13,744 353 14,381 1,591 97,814 3,450Total 2,31,378 1,115 31,858 3,155 1,66,497 7,982
% share - 2009-12Institution type SHGs Savings SHGs Loans dis-
bursedSHGs Loans
outstand-ing
Commercial Banks 50.84 68.31 54.86 49.56 41.25 56.77Regional Rural Banks 49.16 31.69 45.14 50.44 58.75 43.23Total 100 100 100 100 100 100
Source: Economic Survey, Finance Dept., Govt. of Bihar
As on March 2013, NABARD has supported 370 NGOs /SHPIs with a grant release of 316.29 which has enabled 4,380 SHGs (out of the 12,850 SHGs formed) access credit linkage with banks.14 Additionally, in this financial year NABARD has not supported farmers clubs (working as SHPIs) with a grant support as on March 201315. NABARD’s goal is to support more farmers clubs to work as SHPIs with grant assistance. In terms of JLG promotion during the year 2012-13 12,759 JLGs were promoted making a cumulative 33,689 JLGs as on March 2013. Meanwhile, Rs. 117.37 crore of loan was disbursed making cumulative loan disbursement as on date March’ 2013 of 239.08 crore. 13 Extracted from NABARD Status of Microfinance in India 2012-13, Pg. 8 & 9.14 Status of Microfinance in India 2012-13, NABARD, Pg181.15 Status of Microfinance in India 2012-13, NABARD, Pg185
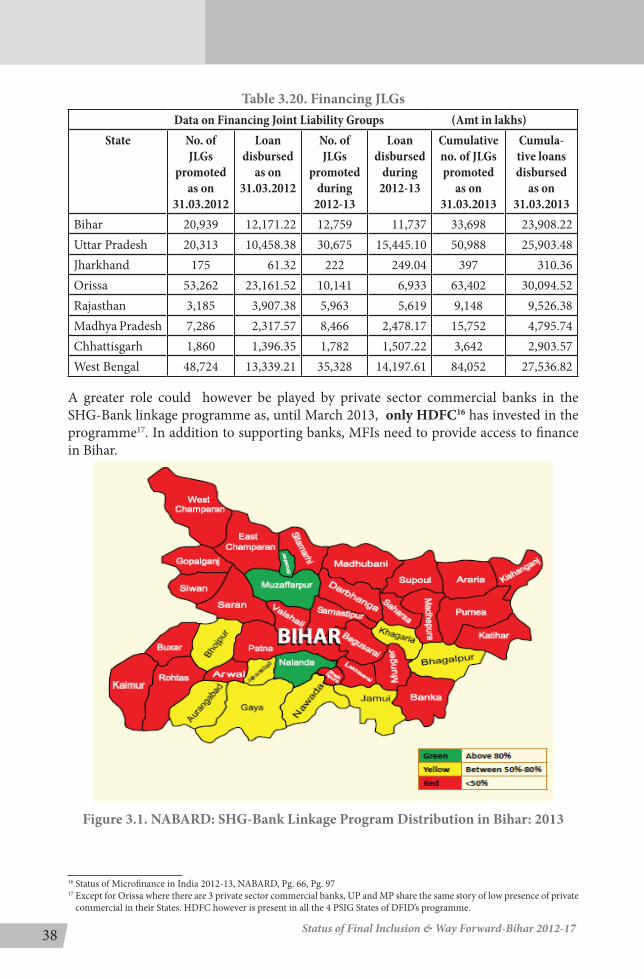
38 Status of Final Inclusion & Way Forward-Bihar 2012-17
Table 3.20. Financing JLGs Data on Financing Joint Liability Groups (Amt in lakhs)
State No. of JLGs
promoted as on
31.03.2012
Loan disbursed
as on 31.03.2012
No. of JLGs
promoted during
2012-13
Loan disbursed
during 2012-13
Cumulative no. of JLGs promoted
as on 31.03.2013
Cumula-tive loans disbursed
as on 31.03.2013
Bihar 20,939 12,171.22 12,759 11,737 33,698 23,908.22Uttar Pradesh 20,313 10,458.38 30,675 15,445.10 50,988 25,903.48Jharkhand 175 61.32 222 249.04 397 310.36Orissa 53,262 23,161.52 10,141 6,933 63,402 30,094.52Rajasthan 3,185 3,907.38 5,963 5,619 9,148 9,526.38Madhya Pradesh 7,286 2,317.57 8,466 2,478.17 15,752 4,795.74Chhattisgarh 1,860 1,396.35 1,782 1,507.22 3,642 2,903.57West Bengal 48,724 13,339.21 35,328 14,197.61 84,052 27,536.82
A greater role could however be played by private sector commercial banks in the SHG-Bank linkage programme as, until March 2013, only HDFC16 has invested in the programme17. In addition to supporting banks, MFIs need to provide access to finance in Bihar.
Figure 3.1. NABARD: SHG-Bank Linkage Program Distribution in Bihar: 2013
16 Status of Microfinance in India 2012-13, NABARD, Pg. 66, Pg. 9717 Except for Orissa where there are 3 private sector commercial banks, UP and MP share the same story of low presence of private
commercial in their States. HDFC however is present in all the 4 PSIG States of DFID’s programme.
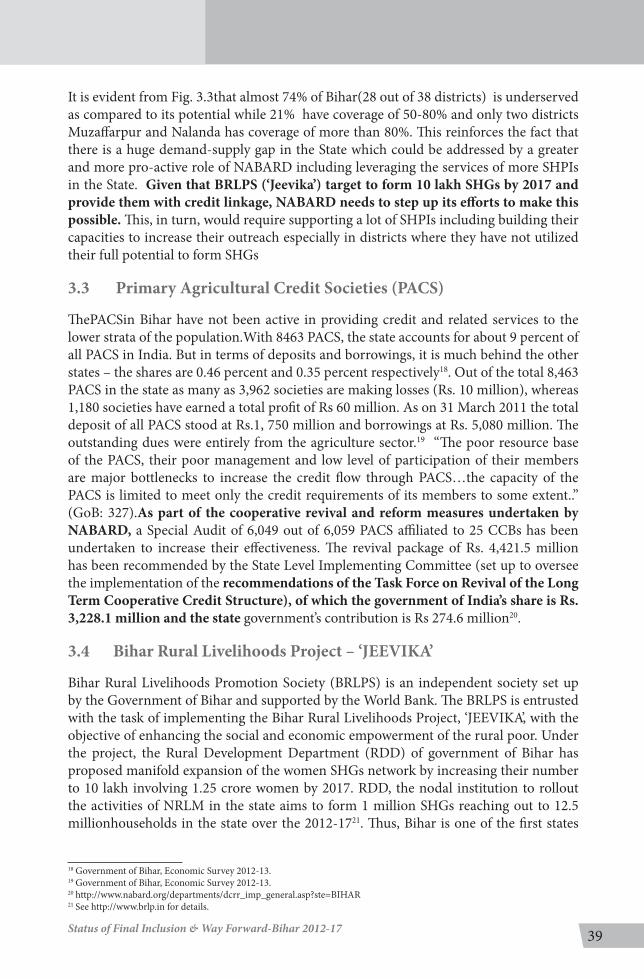
39Status of Final Inclusion & Way Forward-Bihar 2012-17
It is evident from Fig. 3.3that almost 74% of Bihar(28 out of 38 districts) is underserved as compared to its potential while 21% have coverage of 50-80% and only two districts Muzaffarpur and Nalanda has coverage of more than 80%. This reinforces the fact that there is a huge demand-supply gap in the State which could be addressed by a greater and more pro-active role of NABARD including leveraging the services of more SHPIs in the State. Given that BRLPS (‘Jeevika’) target to form 10 lakh SHGs by 2017 and provide them with credit linkage, NABARD needs to step up its efforts to make this possible. This, in turn, would require supporting a lot of SHPIs including building their capacities to increase their outreach especially in districts where they have not utilized their full potential to form SHGs
3.3 Primary Agricultural Credit Societies (PACS)
ThePACSin Bihar have not been active in providing credit and related services to the lower strata of the population.With 8463 PACS, the state accounts for about 9 percent of all PACS in India. But in terms of deposits and borrowings, it is much behind the other states – the shares are 0.46 percent and 0.35 percent respectively18. Out of the total 8,463 PACS in the state as many as 3,962 societies are making losses (Rs. 10 million), whereas 1,180 societies have earned a total profit of Rs 60 million. As on 31 March 2011 the total deposit of all PACS stood at Rs.1, 750 million and borrowings at Rs. 5,080 million. The outstanding dues were entirely from the agriculture sector.19 “The poor resource base of the PACS, their poor management and low level of participation of their members are major bottlenecks to increase the credit flow through PACS…the capacity of the PACS is limited to meet only the credit requirements of its members to some extent..” (GoB: 327).As part of the cooperative revival and reform measures undertaken by NABARD, a Special Audit of 6,049 out of 6,059 PACS affiliated to 25 CCBs has been undertaken to increase their effectiveness. The revival package of Rs. 4,421.5 million has been recommended by the State Level Implementing Committee (set up to oversee the implementation of the recommendations of the Task Force on Revival of the Long Term Cooperative Credit Structure), of which the government of India’s share is Rs. 3,228.1 million and the state government’s contribution is Rs 274.6 million20.
3.4 Bihar Rural Livelihoods Project – ‘JEEVIKA’
Bihar Rural Livelihoods Promotion Society (BRLPS) is an independent society set up by the Government of Bihar and supported by the World Bank. The BRLPS is entrusted with the task of implementing the Bihar Rural Livelihoods Project, ‘JEEVIKA’, with the objective of enhancing the social and economic empowerment of the rural poor. Under the project, the Rural Development Department (RDD) of government of Bihar has proposed manifold expansion of the women SHGs network by increasing their number to 10 lakh involving 1.25 crore women by 2017. RDD, the nodal institution to rollout the activities of NRLM in the state aims to form 1 million SHGs reaching out to 12.5 millionhouseholds in the state over the 2012-1721. Thus, Bihar is one of the first states
18 Government of Bihar, Economic Survey 2012-13.19 Government of Bihar, Economic Survey 2012-13.20 http://www.nabard.org/departments/dcrr_imp_general.asp?ste=BIHAR21 See http://www.brlp.in for details.

40 Status of Final Inclusion & Way Forward-Bihar 2012-17
to chalk out a comprehensive implementation plan under the State Rural Livelihood Project (SRLP).
3.4.1 Key Goals, Objectives and Components of JEEVIKA
The objective of the project is to improve livelihoods of the rural poor through social and economic mobilization and enable them to access credit, assets and services such as social safety nets from public and private sector agencies, including commercial banks. The project proposes to invest in building the capacity of public and private service providers and play a catalytic role in promoting development of micro finance and agribusiness sectors.
JEEVIKA has incorporated identification of existing innovations in various areas as one of its key elements and aims at supporting the development of processes, systems and institutions for scaling up such innovations. Stimulating productivity growth in key livelihood sectors and increasing employment generation are the other important goals of the project.
The key components of the project are:i) Formation and strengthening of SHGs, producers groups and federations;ii) Community investments funds comprising:(a) Initial Capitalization
Fund;(b) Livelihood Fund; (c) Health Risk Fund; and(d) Food Security Fund;
iii) Special technical assistance and development fund comprising:(a) Microfinance investment and technical assistance (MITA); and (b) Innovations and Partnerships with NGOs; and
iv) Project management comprising: (a) HR management;(b) Monitoring and Evaluation; and c) Communication.
The following are the key project impacts as on September, 2013:
12,22,824 poor households have been mobilized into 99,928 SHGs and 6,220 village organizations (VOs);
SHGs have leveraged 254.32 crores of credit from the commercial banks and RRBs;
Out of the total 6,220 VOs, 4,204 VOs manage the Food Security Fund Interventions and 4,458 VOs manage the Health Risk Fund Interventions;
3,18,666 farmers have adopted modern farming techniques, such as, system of rice intensification (SRI), system of wheat intensification (SWI) and participatory varietal selection and promotion (SVSP), and doubled yields;
391 new dairy cooperative societies (DCS) have been formed, increasing price gain by 30-35% on an average;
13,406 young people have been trained and placed in jobs through private sector partnerships.
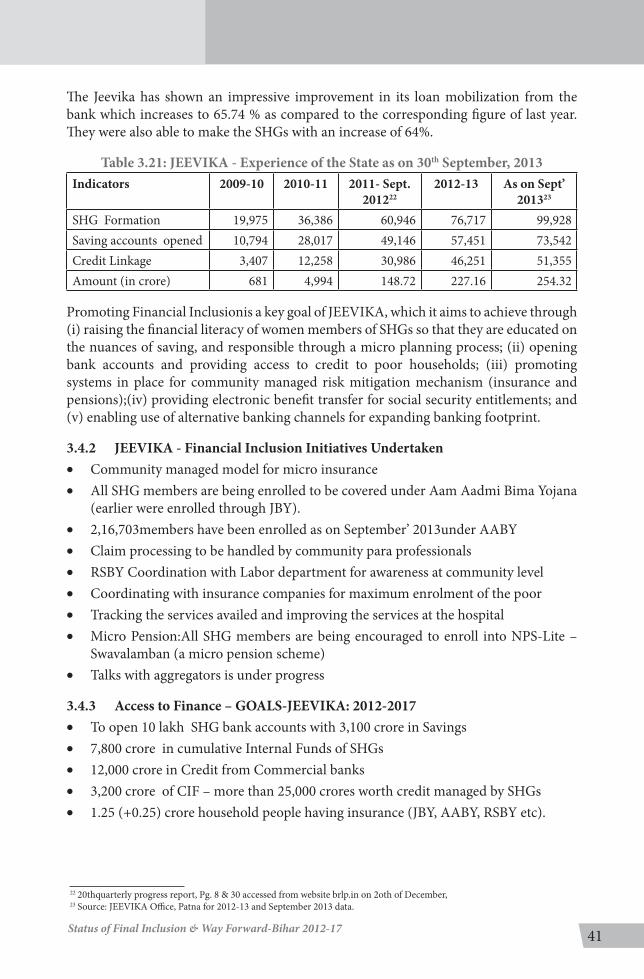
41Status of Final Inclusion & Way Forward-Bihar 2012-17
The Jeevika has shown an impressive improvement in its loan mobilization from the bank which increases to 65.74 % as compared to the corresponding figure of last year. They were also able to make the SHGs with an increase of 64%.
Table 3.21: JEEVIKA - Experience of the State as on 30th September, 2013Indicators 2009-10 2010-11 2011- Sept.
2012222012-13 As on Sept’
201323
SHG Formation 19,975 36,386 60,946 76,717 99,928Saving accounts opened 10,794 28,017 49,146 57,451 73,542Credit Linkage 3,407 12,258 30,986 46,251 51,355Amount (in crore) 681 4,994 148.72 227.16 254.32
Promoting Financial Inclusionis a key goal of JEEVIKA, which it aims to achieve through (i) raising the financial literacy of women members of SHGs so that they are educated on the nuances of saving, and responsible through a micro planning process; (ii) opening bank accounts and providing access to credit to poor households; (iii) promoting systems in place for community managed risk mitigation mechanism (insurance and pensions);(iv) providing electronic benefit transfer for social security entitlements; and (v) enabling use of alternative banking channels for expanding banking footprint.
3.4.2 JEEVIKA - Financial Inclusion Initiatives Undertaken • Community managed model for micro insurance• All SHG members are being enrolled to be covered under Aam Aadmi Bima Yojana
(earlier were enrolled through JBY).• 2,16,703members have been enrolled as on September’ 2013under AABY• Claim processing to be handled by community para professionals • RSBY Coordination with Labor department for awareness at community level • Coordinating with insurance companies for maximum enrolment of the poor • Tracking the services availed and improving the services at the hospital • Micro Pension:All SHG members are being encouraged to enroll into NPS-Lite –
Swavalamban (a micro pension scheme)• Talks with aggregators is under progress
3.4.3 Access to Finance – GOALS-JEEVIKA: 2012-2017• To open 10 lakh SHG bank accounts with 3,100 crore in Savings • 7,800 crore in cumulative Internal Funds of SHGs• 12,000 crore in Credit from Commercial banks• 3,200 crore of CIF – more than 25,000 crores worth credit managed by SHGs• 1.25 (+0.25) crore household people having insurance (JBY, AABY, RSBY etc).
22 20thquarterly progress report, Pg. 8 & 30 accessed from website brlp.in on 2oth of December,23 Source: JEEVIKA Office, Patna for 2012-13 and September 2013 data.

42 Status of Final Inclusion & Way Forward-Bihar 2012-17
3.5 Bihar Women Development Corporation (WDC)
As the nodal agency for empowering women, WDC came into existence on November 28, 1991 and was registered under the Societies Registration Act 1856.Its vision is to ensure overall survival, development, protection and participation of women and adolescent girls in the state. The WDC is currently implementing plans of action, programmes and schemes for advancement of women and adolescent girls with the support of Civil Society Organizations, Community Based Organizations and professional and technical Agencies. The main programmescoordinated by the Corporation are:
1. MukhyamantriNari Shakti Yojana (MNSY)2. MukhyamantriKanyaSurkshaYojana (MKSY)3. Dhanlakshmi Scheme
The MNSY programme launched in 2007-08 is anchored on organizing, nurturing, and capacity building of women’s’ institutions like SHGs and federations at village, cluster and block levels. In order to strengthen the SHGs at cluster level, the concept of community resource person (CRP), cluster coordinators and community book keepers have been added. Additionally, to inculcate best practices in funds management, safe guarding member savings and corpus, SHG audit has been introduced whereby the SHG members or their representatives are capacitated to conduct the audit. In each village or cluster organization, two to three trained community auditor’s help the SHGs maintain and audit their books of accounts.
WDC has partnered with the Reserve Bank of India for the purpose of educating SHG members on the importance of Financial Inclusion. A creatively designed booklet,‘Mera Sathi Bank has been introduced to help women in understanding the importance of banking and of properly maintaining their books of accounts.
In order to promote sustainable livelihood opportunities among SHG women MNSY with the help of local resources and SHG federations has developed feasible livelihood optionsaround which women in the villages have been trained.
Table 3.22.WDC Progress UpdateS.No Particulars Progress as on 30th September’20131 No. of working Districts 192 No. of working Blocks 693 No. of SHGs formed 53,5484 Total savings of SHG (in crore) 82.485 No. of VOs/Clusters Formed 1,8586 No. of Block level federations 697 No. of SHGs having Bank A/C 30,7858 No. of SHGs credit linked with Banks 13,7219 Total amount disbursed by Banks (in crore) 58.3910 Number of SHG members- Social security 2,37,918
Source: WDC, Patna, Bihar.

43Status of Final Inclusion & Way Forward-Bihar 2012-17
Box3.1: Block Level SHGs’ Federations:
One of the major priorities of the MNSY implementation is the promotion and nurturing of Block level SHGs’ Federations. At the end of March 2011, 1,558 Clusters, 90 village organizations and 63 federations have been nurtured under the MNSY. All the federations are registered under the Bihar Self Supporting Cooperative Act, 1996 and governed by an elected body of member SHGs. A total of 1, 09,656 SHGs have been linked with these federations and an amount of Rs. 12,062,160 is deposited as membership fee and share capital. A sum of Rs. 7, 52, 300 has been deposited with nationalized banks as corpus (fixed deposit) by the federations. The federations are engaged in various livelihood projects including agriculture/ allied activities, pottery, weaving, painting and petty shops.
They have a very structured management system to coordinate the multi-pronged activities by assuming the roles of SHPIs, MFIs and catalyststo help the poorclaim their entitlements.
It needs to be mentioned here that with Jeevika’s increasing mandate of forming 10 lakh SHGs in the State in the next five years (2012 -17) and to avoid duplication, there has been a restructuring of WDC’s profile in microfinance. From 2012 onwards, WDC has been playing the role of institution building and nurturing the existing federations of SHGs in 66 blocks while continuing its work actively in 18 blocks. WDC will continue to focus on social empowerment of women including health initiatives and holistic development of adolescent girls and women.
3.6 Bihar MahilaSamakhya Society (BMSS)
Bihar MahilaSamakhya Society (BMSS) has been working with SHGs since 1992 for promoting women’s empowerment through SHG federations. It is currently active in 124 blocks of 21 districts and covers 8,032 villages. It has promoted 10,345Groups consisting of 1, 99,938members with a total saving of Rs 83,266,471 as on September’2013. Federations have been promoted in a four-tier structure in 9 districts and are gradually taking over the operations of district level work of the Samakhya. Currently the federations are involved in providing non-financial services to their members and in facilitating bank linkage for SHGs. Additionally, they are involved in livelihood activities including jute bag making, painting, masala / sattu preparation, etc. The oldest federations promoted by BMMS are in Sitamarhi, Muzaffarpur, Rohtas and Bettiah.
3.7 Role of Post Office in Financial Inclusion
Apart from the state agencies and the banking/financial system, the postal department also performs an important role in providing a range of financial services to the rural poor. With 1, 55,015 post offices, the Department of Posts in India (DOP) have the most widely distributed postal network in the world. Of the total 9,060 post offices in Bihar, 8587 are located in rural areas. With an increased mandate in providing financial services, post offices could work as active agents of financial inclusion.

44 Status of Final Inclusion & Way Forward-Bihar 2012-17
Table 3.23. Department of Posts, India – Bihar Circle, Patna – Data as on March, 2013No. of Post Offices 2011-12 2012-13
Urban Rural Total Urban Rural TotalHead POs 30 1 31 30 1 31
Sub POs 398 616 1014 398 617 1015
Branch POs 45 7966 8011 45 7969 8014
Financial services offered by DOP include accepting deposits under small savings schemes, providing life insurance cover under Postal Life Insurance (PLI) and Rural Postal Life Insurance (RPLI) and providing retail services like bill collection, sale of forms etc. Additionally, it acts as an agent for the Government of India in discharging service like Mahatma Gandhi National Rural Employment Guarantee Scheme (MGNREGS) wage disbursement.As on March, 2013, excluding MNREGA accounts, there were 203.29 Lakh live accounts with the post office under Bihar circle and the amount in deposit was Rs. 10, 553 crore.
MGNREGA in Bihar is being implemented in all the 38 districts, 534 Blocks and 8,471 Gram Panchayats. MGNREGA payments across the country is been done by either bank account or post office account. As on March 2013, there were 65.92 lakhs live accounts with the post office under MNREGA Scheme in Bihar circleand the amount deposited in 2012-13 was Rs. 1,500 crore. The number of live account has been raised up to 66.36 lakh up to September, 2013 showing around 7% growth over March, 2013.
Table 3.24. Number of live accounts under MNREGA Scheme and amount disbursed
Scheme Number of Ac-counts (in Lakhs)
Amount Dis-bursed (in Rs.
Million)
Number of Accounts (in Lakhs)
Amount Disbursed (in Rs. Million)
2012-13 As on 30th Sept. 2013MNREGS 65.92 15,005 66.36 5,265.6
Source: Chief Postmaster General, Bihar Circle.
3.8 MFI Channel
In addition to the SHG-bank linkage model, access to finance is also provided by microfinance institutions (MFIs) in the state. As per the data compiled by Sa-Dhan there are 21 MFIs having operations in the state mainly in the backward districts. Their presence has become particularly noticeable in the past couple of years following the crisis in Andhra Pradeshand the consequent regulatory controls imposed by the AP government on MFIs there. Also, the overall environment in Bihar in terms of infrastructure (power, transport, communication and connectivity), technology, and governance including law and order has improved substantially during last three to four years making it viable for MFIs to work in the state.
As per the Bharat Microfinance Report of Sa-Dhan as on March 2013 there were 21 MFIs working in Bihar though after Andhra Crisis, many small MFIs have stopped working.

45Status of Final Inclusion & Way Forward-Bihar 2012-17
The MFIs reach out to 1.25 million clients in 36 backward districts with a portfolio outstanding worth Rs. 8953 million.
Table 3.25 MFIs in Bihar: Overview1 Total number of MFIs operating in the state 212 Total Client Outreach of MFIs (in million)1 1.253 Total portfolio outstanding (in million) 8,9534 MFI Loan disbursement (in million) 16,1005 No. of districts served by MFI 36
Source: BhâratMicro-finance Report, March 2013.
Table 3.26 presents brief profiles of a few prominent MFIs in the state.
Table 3.26. Major MFIs in Bihar
Sl. No
Name of the organi-zation
Year when operations
began
Legal status
No. of districts
Number of clients
Loan out-standing
(Rs. million)1 Bandhan (Bihar)# 2008 NBFC 33 6,51,280 5,9702 Cashpor# 2004 Section 25 11 1,75,545 1,583.143 Ujjivan* 2009 NBFC 6 56,349 589.634 Saija Finance Pvt Ltd 2008 NBFC 5 31,967 301.855 Samruddhi (BSFL) Bi-
har2010 NBFC 12 18,969 121.09
6 CDOT 2007 Society 3 13,399 102.787 Nidan 1996 Section 25 8 9,672 758 Centre for Promoting
Sustainable Livelihood (CPSL)
2003 Society 8 16,048 8.57
9 Gramin Jan Kalyan-Parishad
1992 Society 1 6,000 2
10 Arohan# 2006 NBFC 6 43,410 369.5
Source: Several MFIs, data as on Sept., 2013*Data as on March 2013# Data as on Dec. 2013
According to the 10 MFIs listed in the above table, (whose data has been received through various sources)together has an outreach of more than 1 million active borrowers with outstanding loans amounting to Rs. 9,242.47 million. Interestingly, only three among the listed MFIs (Saija, C-DOT and Nidan) are home grown.
According to MFIN data Bihar has shown 9.02% growth rate in GLP and ranked seventh compared to other states. During the same period Uttarakhand recorded highest growth with 21.02% followed by Punjab, Uttar Pradesh, Pondicherry and Sikkim. Bihar comprises of 5% of total industry portfolio. AP remains the top state in terms of GLP followed by West Bengal with 16% and 14% respectively; top five state (AP, West Bengal,

46 Status of Final Inclusion & Way Forward-Bihar 2012-17
Tamil Nadu, Karnataka and Maharashtra) accounts for 60% of the portfolio. In terms of the client outreach and loan amount disbursed out of total 6% comes under the Bihar coverage. Andhra Pradesh, Tamil Nadu, West Bengal, Karnataka is dominated in this indicator with a total coverage of approximately 60%.22
The sector experts as well as the big MFIs in the state anticipate client outreach to grow at an annual rate of 11 per cent in the coming 5 years. The expected outreach of MFIsis estimated to be1.91 million by 201723.
3.8.1 Apex Institutions
Apex institutions in the microfinance system are wholesale or second-tier institutional mechanisms, including international donors and NGOs that channel funds, with or without technical assistance or other supporting services, to retail MFIs (Levy, 2002). NABARD, Small Industries Development Bank of India (SIDBI) and RashtriyaGrameenVikasNidhi (RGVN) are the major apex institutions in the formal sector, while AnanyaFinance for Inclusive Growth Private Limited (an NBFC carved out of the Friends of Women’s World Banking India) is an apex that operates in the non-government sector.
SIDBI Foundation for Micro Credit (SFMC)
The SFMC was set up in 1999 by SIDBI with the mission to create a national network of strong, viable and sustainable MFIs to provide microfinance services to the poor, particularly, women. SFMC provides a complete range of financial and non-financial services such as loan funds, grant support, equity and institution building support to the retailing MFIs, including the second tier MFIs, to facilitate their development into financially sustainable entities and thus develop a robust network of service providers in the microfinance sector. It offers such support to both for-profit and not-for-profit MFIs. The focus is on MFIs that have a good track record of resource mobilization, capital adequacy and strong systems. They need to comply with the regulatory guidelines and responsible lending practices and demonstrate long termsustainability in terms of financial and operational efficiencies.SFMC also plays a significant role in advocating appropriate policies and regulations including acting as a platform for exchange of information across the sector.
SIDBI has supported fourhome grown MFIs in the state with loan and capacity building support. The total loan amount advanced amounts to Rs. 33.5 million as on July 2012. The multi-state MFIs with operations in Bihar also have received support from SIDBI, although separate data relating to such transactions is not available.
Ananya Finance
Ananya Finance for Inclusive Growth Private Limited (Ananya) is a registered Non-Banking Finance Company located at Ahmedabad. Set up in 2009 Ananya has inherited the wholesale micro lending programmeof the Friends of Women’s World Banking (India). It provides a range of financial products and services to its partner organizations, namely,
22 The data has been retrieved from MFIN Micrometer, issue 07 dated data as of Sept.30’ 2013. The data is the analysis of the MFI which is registered under MFIN. The data is for Q2 FY 2012-13.
23 No adjustment for overlap has been made in the portfolios of MFI clients although Sector expert N. Srinivasan (SOS, 2011) assumes a 35% overlap of among MFI clients.

47Status of Final Inclusion & Way Forward-Bihar 2012-17
credit, equity and technical assistance/ advisory services. In Bihar, AnanyaFinance, supports six MFIs: (i) Saija Finance Ltd; (ii) C-DOT; (iii) Bihar Development Trust; (iv) Trust Microfin Services; (v) Gramyasheel; and (vi) Intelle cash.
RashtriyaGramin Vikas Nidhi (RGVN)
RGVN works in 14 States of India including Bihar. It has 4 regional offices and 62 branch offices. It supports 2079 NGOs/CBOs with livelihood enhancement projects and 379 NGOs with microfinance interventions. With specific reference to Bihar, RGVN has supported 26 NGOs and 750 groups in 11 districts and disbursed Rs. 441 lakhsas on Sept. 2013.
Table 3.27. RGVN’s Microfinance Operations in BiharSl. No. Particulars Number as on Sept, 20131 No of Districts 112 No of NGOs Supporting 263 No of Groups (SHGs and JLGs) supporting 7504 Loans Disbursed (in lakh) 4415 Loans O/S (in lakh) 17.27
Apart from the above, there are other institutions that extend financial and capacity building/technical support to MFIs –NBFCs and NGOs – in the state. A summary of the key institutions and the supported MFIs through them is listed below in Table 3.28
Table 3.28.Apex and Resource Institutions and their MFI Partners in BiharS.No. Apex Institutions /Equity Providers Partner Organizations 1 SIDBI C-DOT, BDT, Trust Microfin, and RGVN 2 Ananya Finance Saija, C-DOT, BDT, Trust Microfin, Gramya-
sheel and Intellecash3 ACCION Saija Finance Pvt Ltd 4 Maanaveeya Saija Finance Pvt Ltd5 DiaVikas C-DOT
3.8.2. Issues Confronting MFIs: Feedback from the Sector
With a view to understand the status, progress and issues of MFIs in Bihar, seven major MFIs, namely SKS, Bandhan, Saija, C-DOT, Nidan, Cashpor and Ujjivan were interviewed. The main findings are stated below.
90 per cent of the MFIs follow the joint liability group (JLG) model for their operations while 10 per cent follow a combination of both the SHG and the JLG models.
The average loan size for most MFIs ranges from Rs. 7,000 to Rs. 14,000.
Repayment rate of all the 7 MFIs was over 99 per cent. There seemed to be no willful default by clients.
Four out of the seven MFIs used credit bureaus to verify clients.
All the seven MFIs affirmed that there was immense scope for microfinance operations in the state and sufficient space in the market for more MFIs to enter.

48 Status of Final Inclusion & Way Forward-Bihar 2012-17
Lack of access to technology due to shortage of power was the most commonly cited constraint to MFI growth.
Mobilizing bank finances was another common constraint mentioned by the MFIs. Most of them complained that banks had completely stopped lending to them, which has severely hampered their growth prospects. .
Good roads and governance were cited as key enabling factors in the growth of MFI operations.
Problem of law and order, including Naxalism, was not seen as a constraint by the MFIs, except SKS. Similarly, getting specialized staff did not appear to be a critical issue either.
Despite the growth of microfinance operations in the State over the last 3 years, concentration of operations in a few urban /semi urban centers leading to multiple borrowings among clients was cited to be an emerging concern by some MFIs.
MFIs as Business Correspondents (BCs) C-DOT:It has started as a pilot for CDOT in December 2011 has grown into a full-fledgedprogram with CDOT working as a BC for 4 nationalized Banks and 2 RRBs in 14 States of India. The banks include Punjab National Bank, Allahabad Bank, United Bank of India, UCO Bank, Pashchim Bengal KhetriyaGramin Bank (RRB) and Bihar KshetriyaGramin Bank (RRB). The organization has opened around 7 lakh accounts as on September 2013.C-DOT’s BC work in Bihar extends to 31 districts wherein it works actively for Allahabad Bank, UCO Bank & Bank of IndiaChallenges faced by CDOT are mainly i) lack of awareness at the branch level and coordination among bankers ii) technology issues like internet connections and money management at village level and iii)adoption of different models for transactions of banks.CASHPOR:As a BC for ICICI to provide savings service, Cashpor’s‘Eko India Financial Services Pvt. Ltd.’ is a technology service provider based on mobile banking services and is applicable to both clients and non-clients of Cashpor. Under the scheme, Cashpor provides services of account opening, depositing savings including facilitating transaction services to account holders on behalf of ICICI Bank. The scheme has been well received with over 70479 enrolled customers and a transaction volume of Rs 6.54 crore through 133 branches. Of late the bank has started offering Recurring Deposit and Term Deposit as well to its customers. Additionally, CMC worksas a BC for the financial inclusion programme of IndusInd Bank for expending credit to BPL households in select regions. The programme is technology based wherein the Bank has allocated a limit of Rs. 100 crore for disbursement to BPL households who meet the eligibility criteria in a select region. As on October 2012, CMC had extended credit to 24,107 clients with loan amount outstanding of Rs 27.40 core. Apart from offering these two schemes, CMC has also started working as an aggregator with PFRDA for offering NPS Lite pension scheme to their clients. The scheme is being piloted in Jaunpur and Chandauli districts of UP.

49Status of Final Inclusion & Way Forward-Bihar 2012-17
3.9 Role of NGOs as Self Help Promoting Institutions
In their study on the ‘Situational Analysis of SHG movement in Bihar,’ (2009), APMAS could list 285 NGO-SHPIs from their partner lists of PACS, NABARD, WDC, RGVN and Reach India. Unfortunately the number of such NGOs has not increased much since then. As per NABARD data there were only 370 SHPIs in the state as on 31 March 2013.With a grant assistance of Rs. 3.16 crore these SHPIs helped 4,380 SHGs access credit linkage with banks NABARD has been looking out for more NGOs for promoting the SHG-Bank linkage programme in Bihar. By end of March 2013, 3,108 JLGs had been credit linked with the help of JLG promoting institutions which availed grant support of Rs. 68.17 lakh. The target is to support 10,975 JLGs (with credit linkage) with a sanction amount of Rs 219 lakh by 2015.
Lack of presence of large NGOs in SHG promotion in Bihar is a cause of concern for RGVN too. “Only 10 per cent NGOs are able to grow their profiles and become sustainable enough to access loans from mainstream financial institutions, while the majority continue to work on a very small scale,” opined a senior official of RGVN.
Additionally, like the MFIs, the NGOs working towards SHG promotion in Bihar tend to be concentrated around major cities like Muzaffarpur, Bhagalpur, Gaya and Patna while the comparatively poorer districts of Sheikhpura, Sheohar, Lakhisarai, Arwal, and Madhepura have fewer number of NGOs promoting SHGs24
Given the high poverty level in the state and great demand for credit, especially, among the rural poor, NGOs should use their presence and experience of working in remote, rural areas and step up their efforts to promote financial inclusion. Additionally, NABARD needs to support more SHPIs/NGOs through training and capacity building to enable them to take on a more pro-active role in financial inclusion.
3.10 Federations and Producers Groups
Though small in number, there are some quality federations in the state, most of which have been formed by the Women’s Development Corporation, Bihar MahilaSamakhya Society (BMSS) and Action for Social Advancement (ASA).
While the WDC has formed 66 federations in all the blocks where it has operation, BMSS has formed a four-tier structure of federation in 9 districts of Bihar. The federations of both the organizations are involved in livelihood activities and work as SHPIs for financial inclusion.25
Further, ASA has been forming farmer producer groups as a pilot project for BRLP. As on September 2012, it has helped register seven producer companies in four districts of Bihar26. These producer companies are involved in agriculture and allied activities including seed procurement and vegetable cultivation.
24 “Situational analysis of SHG Movement in Bihar, Feb.2009, APMAS25 We have already discussed about the federations of WDC and BMSS in the previous chapter. Federations of BMSS are attached
as an annexure at the end of this chapter.26 The producer companies have been formed in Khagaria (2), Purnea (2), Munger (1), and Jamui (2) districts of Bihar.

50 Status of Final Inclusion & Way Forward-Bihar 2012-17
APMAS with the support of ITC has formed a producers company for dairy development in Munger district for small and marginal farmers. Over 600 individuals organized in community activity groups (CAG) and federated into and DCS are involved in production of milk. The federations are supported with supply of inputs, access to financial services and some degree of social security. The objective of the company is to expand its operations to include 1,250 CAGs comprising 18,750 individuals and increase production of milk to 50,000 LPD by the end of 2013. Additionally, it aims to suggest a suitable model for using milk producers as BCs for enabling financial inclusion in their areas of operation.
ITCs Rural Development Trust (ITC-RDT) has set up a cooperative-SewaUdyogikSwawlambiSahakriSamiti Limited (SUSSS Ltd) - of agarbatti production in Munger, wherein over 700 women work in six centers and 15 sub centers to produce over 15,000 kg of agarbattis per week which are marketed by ITC. These women earn Rs 1,200 -- 2,000 per month.
Formation of federations, cooperatives and producer companies would go a long way in ensuring sustainability of SHGs. It is noteworthy that ‘Jeevika’ proposes to work on a ‘saturation’ model by forming federations of SHGs who would work as SHPIs and focus on livelihood activities. The impact of ‘Jeevika’ federations, however, would be visible only after 2013 considering that their SHG formation itself is at a nascent stage.

51Status of Final Inclusion & Way Forward-Bihar 2012-17
Chapter 4: Other Financial Services
Information on insurance, pension and remittance services is not available state-wise; it is even rarer to find information about their outreach to the poor. In this section the
available information is scanned for some insights.
4.1 Micro-insurance
For a state with as high poverty levels as Bihar, micro insurance services, both of life and livelihood, assumes to be an integral component of financial inclusion. Unfortunately, not much has been done in this area either by the government or by private agencies although efforts are gradually being made towards it. LIC however is the prime agency doing micro insurance in the state.
The Government has plans to roll out micro-insurance services for SHG members through various schemes including ‘Jeevika’. Some private companies like Kotak Ma-hindra and Birla Sun life have come forward with customized micro insurance schemes for the poor.
The Life Insurance Corporation (LIC)is the prime provider of micro-insurance schemes for the rural poor in the state. It offers such schemes through NGOs, SHPIs and MFIs. The micro-insurance department of LIC offers two prime products, namely, JeevanMad-hur and JeevanMangal and has recently introduced a third product Jeevan Deep. Of the three, JeevanMadhur is most popular among SHG women as it is a flexible savings related life insurance plan, while JeevanMangal is a term assurance plan with return of premi-ums on maturity.
LIC also administers the two social security schemes of the Government of India, name-ly, JanashreeBimaYojana (JBY) and AamAdmiBimaYojana (AABY) meant for workers in the unorganized sector. Nodal agencies like panchayats, NGOs and SHGs could identify those members eligible for the schemes and also be the master policy holders for both the schemes. Jeevika too has tied up with LIC to provide both these schemes to its SHG members. Policy renewal by clients remains a challenge for the LIC, while the informal players (NGOs/SHPIs, MFIs) face serious fund constraints to operationalize social secu-rity schemes.
Table 4.1 shows that there has been an increase of nearly 43.25 per cent in both the num-ber of lives covered and in realization of premium incomeas compared to the progress of FY 2012-13 vis-à-vis half year end of FY 2013-14. In the state there are a few NGO who have micro-insurance as one of the product. This has resulted to less coverage of the fam-ily under AABY. The Government of Bihar is also concerned about the coverage of the poor household through any of the micro-insurance. The Government has extended sup-port for Anganwadi worker/Sahayika as one of the initiative towards micro-insurance.
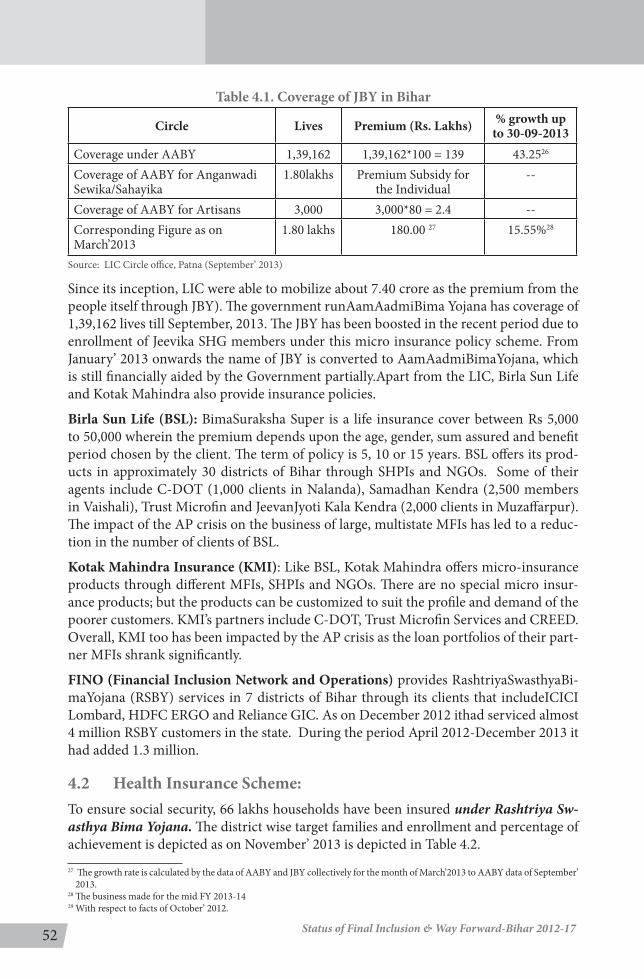
52 Status of Final Inclusion & Way Forward-Bihar 2012-17
Table 4.1. Coverage of JBY in Bihar
Circle Lives Premium (Rs. Lakhs) % growth up to 30-09-2013
Coverage under AABY 1,39,162 1,39,162*100 = 139 43.2526
Coverage of AABY for Anganwadi Sewika/Sahayika
1.80lakhs Premium Subsidy for the Individual
--
Coverage of AABY for Artisans 3,000 3,000*80 = 2.4 --Corresponding Figure as on March’2013
1.80 lakhs 180.00 27 15.55%28
Source: LIC Circle office, Patna (September’ 2013)
Since its inception, LIC were able to mobilize about 7.40 crore as the premium from the people itself through JBY). The government runAamAadmiBima Yojana has coverage of 1,39,162 lives till September, 2013. The JBY has been boosted in the recent period due to enrollment of Jeevika SHG members under this micro insurance policy scheme. From January’ 2013 onwards the name of JBY is converted to AamAadmiBimaYojana, which is still financially aided by the Government partially.Apart from the LIC, Birla Sun Life and Kotak Mahindra also provide insurance policies.
Birla Sun Life (BSL): BimaSuraksha Super is a life insurance cover between Rs 5,000 to 50,000 wherein the premium depends upon the age, gender, sum assured and benefit period chosen by the client. The term of policy is 5, 10 or 15 years. BSL offers its prod-ucts in approximately 30 districts of Bihar through SHPIs and NGOs. Some of their agents include C-DOT (1,000 clients in Nalanda), Samadhan Kendra (2,500 members in Vaishali), Trust Microfin and JeevanJyoti Kala Kendra (2,000 clients in Muzaffarpur). The impact of the AP crisis on the business of large, multistate MFIs has led to a reduc-tion in the number of clients of BSL.
Kotak Mahindra Insurance (KMI): Like BSL, Kotak Mahindra offers micro-insurance products through different MFIs, SHPIs and NGOs. There are no special micro insur-ance products; but the products can be customized to suit the profile and demand of the poorer customers. KMI’s partners include C-DOT, Trust Microfin Services and CREED. Overall, KMI too has been impacted by the AP crisis as the loan portfolios of their part-ner MFIs shrank significantly.
FINO (Financial Inclusion Network and Operations) provides RashtriyaSwasthyaBi-maYojana (RSBY) services in 7 districts of Bihar through its clients that includeICICI Lombard, HDFC ERGO and Reliance GIC. As on December 2012 ithad serviced almost 4 million RSBY customers in the state. During the period April 2012-December 2013 it had added 1.3 million.
4.2 Health Insurance Scheme: To ensure social security, 66 lakhs households have been insured under Rashtriya Sw-asthya Bima Yojana. The district wise target families and enrollment and percentage of achievement is depicted as on November’ 2013 is depicted in Table 4.2. 27 The growth rate is calculated by the data of AABY and JBY collectively for the month of March’2013 to AABY data of September’
2013. 28 The business made for the mid FY 2013-1429 With respect to facts of October’ 2012.
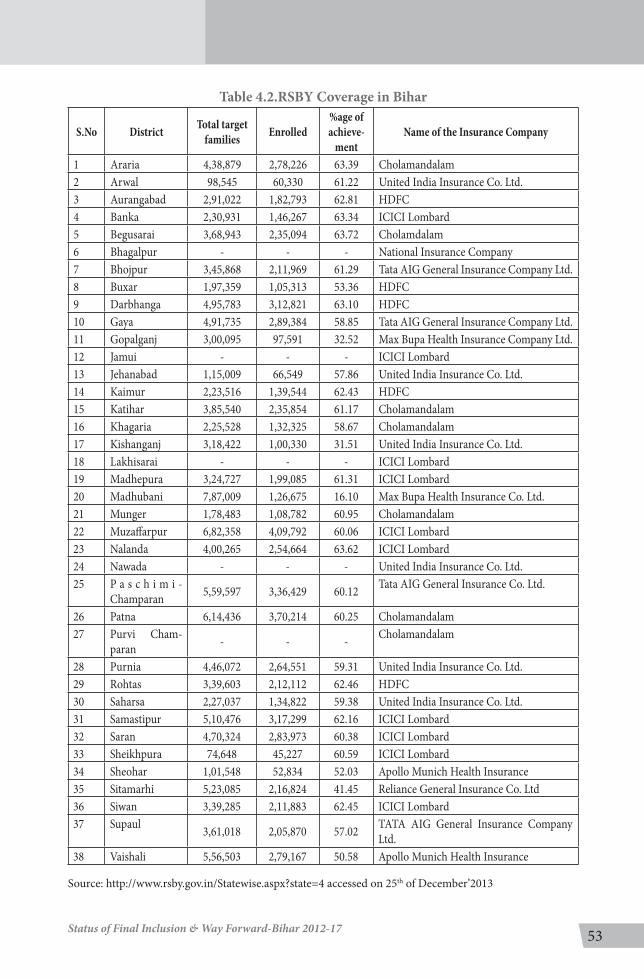
53Status of Final Inclusion & Way Forward-Bihar 2012-17
Table 4.2.RSBY Coverage in Bihar
S.No District Total target families Enrolled
%age of achieve-
mentName of the Insurance Company
1 Araria 4,38,879 2,78,226 63.39 Cholamandalam2 Arwal 98,545 60,330 61.22 United India Insurance Co. Ltd.3 Aurangabad 2,91,022 1,82,793 62.81 HDFC4 Banka 2,30,931 1,46,267 63.34 ICICI Lombard5 Begusarai 3,68,943 2,35,094 63.72 Cholamdalam6 Bhagalpur - - - National Insurance Company7 Bhojpur 3,45,868 2,11,969 61.29 Tata AIG General Insurance Company Ltd.8 Buxar 1,97,359 1,05,313 53.36 HDFC9 Darbhanga 4,95,783 3,12,821 63.10 HDFC10 Gaya 4,91,735 2,89,384 58.85 Tata AIG General Insurance Company Ltd.11 Gopalganj 3,00,095 97,591 32.52 Max Bupa Health Insurance Company Ltd.12 Jamui - - - ICICI Lombard13 Jehanabad 1,15,009 66,549 57.86 United India Insurance Co. Ltd.14 Kaimur 2,23,516 1,39,544 62.43 HDFC15 Katihar 3,85,540 2,35,854 61.17 Cholamandalam16 Khagaria 2,25,528 1,32,325 58.67 Cholamandalam17 Kishanganj 3,18,422 1,00,330 31.51 United India Insurance Co. Ltd.18 Lakhisarai - - - ICICI Lombard19 Madhepura 3,24,727 1,99,085 61.31 ICICI Lombard20 Madhubani 7,87,009 1,26,675 16.10 Max Bupa Health Insurance Co. Ltd.21 Munger 1,78,483 1,08,782 60.95 Cholamandalam22 Muzaffarpur 6,82,358 4,09,792 60.06 ICICI Lombard23 Nalanda 4,00,265 2,54,664 63.62 ICICI Lombard24 Nawada - - - United India Insurance Co. Ltd.25 P a s c h i m i -
Champaran 5,59,597 3,36,429 60.12 Tata AIG General Insurance Co. Ltd.
26 Patna 6,14,436 3,70,214 60.25 Cholamandalam27 Purvi Cham-
paran - - - Cholamandalam
28 Purnia 4,46,072 2,64,551 59.31 United India Insurance Co. Ltd.29 Rohtas 3,39,603 2,12,112 62.46 HDFC30 Saharsa 2,27,037 1,34,822 59.38 United India Insurance Co. Ltd.31 Samastipur 5,10,476 3,17,299 62.16 ICICI Lombard32 Saran 4,70,324 2,83,973 60.38 ICICI Lombard33 Sheikhpura 74,648 45,227 60.59 ICICI Lombard34 Sheohar 1,01,548 52,834 52.03 Apollo Munich Health Insurance35 Sitamarhi 5,23,085 2,16,824 41.45 Reliance General Insurance Co. Ltd36 Siwan 3,39,285 2,11,883 62.45 ICICI Lombard37 Supaul 3,61,018 2,05,870 57.02 TATA AIG General Insurance Company
Ltd.38 Vaishali 5,56,503 2,79,167 50.58 Apollo Munich Health Insurance
Source: http://www.rsby.gov.in/Statewise.aspx?state=4 accessed on 25th of December’2013

54 Status of Final Inclusion & Way Forward-Bihar 2012-17
The state has shown the target achievement of 50%-60% in almost all the districts except, Kishanganj, Gopalganj, Madhubani and Sitamarhi where the target achievement is far below the desird. A total of 9 insurance companies have been allotted for the district coverage under health security scheme.
Table 4.3. District wise coverage of insurance companies
S.No Name of the Insurance Company District Coverage No. of districts
1 Apollo Munich Health Insurance Sheohar, Vaishali 2
2 CholamandalamAraria, Begusarai, Katihar, Khagaria, Munger, Patna, Purvi Champaran 7
3 HDFCAurangabad, Buxar, Darbhanga, Kaimur, Rohtas 5
4 ICICI Lombard
Banka, Jamui, Lakhisarai, Madhepura, Muzaffarpur, Nalanda, Samastipur, Saran, Sheikhpura, Siwan 10
5Max Bupa Health Insurance Company Ltd. Gopalganj, Madhubani 2
6 National Insurance Company Bhagalpur 1
7Reliance General Insurance Co. Ltd Sitamarhi 1
8TATA AIG General Insurance Company Ltd.
Bhojpur, Gaya, Paschimi Champaran, Supaul 4
9United India Insurance Co. Ltd. Arwal, Jehanabad, Kishanganj,
Nawada, Purnia, Saharsa 6
Source: Analysis from the website source http://www.rsby.gov.in/Statewise.aspx?state=4 accessed on 25th of Decem-ber’2013
4.3 Crop Insurance
The Agriculture Insurance Company of India Ltd. 6,11,189 farmers have been covered under WBCIS Kharif 2013, 3,59,706 farmers have been extended the benefit of crop in-surance coverage under WBCIS Kharif 2013, 3,59,706 farmers have been extended the benefit of crop insurance coverage under MNAIS Kharif 2013. Thus a total of 9, 70,895 farmers have been provided the crop insurance cover, the sum insured being Rs. 2,143.08 crores and the area covered being 10, 04,580 hectares by Agriculture Insurance Com-pany of India Ltd. According to the information from 2 insurance companies, a total of 10, 24,766 farmers have been provided crop insurance cover, the sum insured being Rs. 2,262.84 Crore and the area covered being 10,57,807.68 hectare.
The Government of Bihar has distributed 38 districts of the state under the weather based crop insurance Scheme (WBCIS) for Rabi 2013-14 among eight insurance compa-nies vide their Notification No.4, 475 dated 29.10.2013.

55Status of Final Inclusion & Way Forward-Bihar 2012-17
Table 4.4. District wise coverage of Agriculture Insurance Companies
S.No Name of the Insur-ance Company Allotted district Area
1 Agriculture Insurance Company of India Ltd.
Supaul, Saran, Munger, Lakhisarai, Kaimur (Bhabhua), Jahanabad,Jamui,Gaya,Begusarai,Nawada,Kishanganj,Muzaffarpur,Madhubani
Entire District
2 IFFCO-TOKIO (GIC) Patna, Nalanda, Purnia, Buxar, Arwal, Sheikhpura
Entire District
3 HDFC Gopalganj, Siwan, Bhojpur& Darbhanga Entire District4 ICICI Lombard Samastipur, Rohtas, Aurangabad & Khagaria Entire District5 Cholamandalam Araria, Katihar, W. Champaran, E. Cham-
paran & Sitamarhi Entire District
6 TATA AIG Saharsa & Madhepura Entire District7 Future General India
Insurance Company Ltd.
Bhagalpur & Banka Entire District
8 Reliance GIC Ltd. Vaishali & Sheohar Entire District
Source: 46th Review meeting, SLBC, Bihar
Table4.5. Crop insurance coverage
Name of the insurance companyNo. Of farmers
Whose cropsInsured
Area(in ha.)
SumInsured(incr)
Agriculture Insurance Company OfIndia Ltd
9,70,895 10,04,580.11 2,143.08
Cholamandalam 5,3871 53,227.57 119.76Total 10,24,766 10,57,807.68 2,262.84
Source: 46th Review meeting, SLBC, Bihar
4.4 Status of Micro-Pensions: The Swavalamban Scheme
In addition to providing insurance services, offering pension schemes at an affordable cost to the poor is an integral aspect of financial inclusion. ‘Swavalamban,’ a co-con-tributory pension scheme is one such scheme launched by the Government of India in September 2010.
While some states like Andhra Pradesh, Karnataka, Gujarat and West Bengal have made considerable progress under the scheme, Bihar’s progress has been quite slow. As on March 2013 there were cumulative 29,187 subscriber registered with Swavalamban eli-gible subscriber being 13,793 with support of 17 Aggregators in the state. However, the state has the ambitious goal of reaching out to 2 lakh subscribers by 2017. All the mem-bers of the 10 lakh SHGs that Jeevika proposes to form that by 2017 would be enrolled into NPS-Lite. CDOT is a PFRDA aggregator in the state has covered around 4000 cus-tomers under NPS on March’13.SAIJA has enrolled 283 customers under NPS as on May’13.

56 Status of Final Inclusion & Way Forward-Bihar 2012-17
4.5 Status of Domestic RemittanceDespite being one of the top domestic remittance receiving states (along with Uttar Pradesh and Orissa), very few agencies in Bihar are involved in delivering remittance services30. Among the active agencies, only FINOand Ekoprovide remittance services in the state. While FINO provides financial services of banking (in association with ICICI Bank, Union Bank of India and Oriental Bank of Commerce), insurance and remittance in 23 districts of Bihar, EKO is active in 8 districts (Patna, Muzzafarpur, Darbhanga, Sheikhpura, Samastipur, Sitamarhi, Deoghar and Madhubani). FINO caters to about 1.7 million customers and is associated with the Bihar State Cooperative Producers Federa-tion (COMFED)to distribute the remuneration of milk producers.
Eko offers financial services including (i) opening of no frills savings bank accounts;(ii) withdrawal of deposits; (iv) remittances;(v) health payments to ASHA workers using mobile money transfer; and (vi) cash collection service for MFIs like Saija and CDOT31.
4.6 Role of Multilateral and Bi-lateral OrganizationsAs mentioned elsewhere in the chapter, the ambitious ‘Jeevika Project’ is supported by the World Bank, whereas IFC, a member of the World Bank Group, is helping a start-up microfinance institution Utkarsh to grow its operations to Bihar along with Uttar Pradesh. The company aims to reach out to estimated 2, 50,000 women borrowers by June 2013.
The Department for International Development (DFID) supported the implementa-tion the Poorest Areas Civil Society (PACS) Programmein Bihar and five other states (Maharashtra, Madhya Pradesh, Chhattisgarh, Uttar Pradesh, and Jharkhand), the pur-pose of which was to support and strengthens civil society organizations working for the rights and entitlements of the poorest sections. The first phase of the PACS pro-gramme(2001-08) covered 19,500 villages and 143 urban settlements in 94 districts spread across the six states. It was implemented through more than 140 funded projects, involving around 470 civil society organizations (CSOs). More than 17,500 community-based organizations (CBOs) were formed in the programme areas with a total member-ship of around 2, 11,000. About 80 per cent of CBOs were self-help groups (SHGs) with women forming majority of the membership. The PACS programme is in its second phase (2009-16), supporting civil society organizations (CSOs) to promote inclusive lo-cal, district and state policies.
Additionally, DFID is assisting SIDBI to implement the PSIG programme from 2012-19. The PSIG programme seeks to: (i) provide a range of financial services for women’s empowerment in the poorer states of Bihar, Madhya Pradesh, Orissa, Uttar Pradesh Ra-jasthan, Jharkhand, Chhattisgarh and West Bengal; and (ii) attract pro-poor investment from social investors who would seek poverty benefits along with profits. The programme intends to cover 12 million poor people - women forming three fourth of them - with financial services. Further, it aims to build policy and institutional environment that will encourage provision of financial services to poor people in a responsible manner.
30 As per NSSO data of 2007-08, Uttar Pradesh (20%), Orissa (14.65%) and Bihar (12%) are the top domestic remittance receiving states together constituting almost half of the domestic remittance flows in the country. This is primarily due to the substantial out-migration from these states to other parts of the country for employment.
31 Coverage of only remittance services of both FINO and Eko is not known. FINO’s projections for 2013-17 include offering 65 per cent of banking services, 40 per cent insurance and 30 per cent remittance services to customers.

57Status of Final Inclusion & Way Forward-Bihar 2012-17
Several factors have worked together to make Bihar one of the most difficult regions in the country for promoting financial inclusion. The most daunting challenge is the
large and growing population of the state with high incidence of poverty. This is further aggravated by structural inefficiencies arising from low level of urbanization, limited livelihood opportunities, intra-state development disparities, skewed distribution of banking services, glaring gaps in the provision of support by district level administration and the absence of efficient NGOs with proven capacity to mobilize and organize people and resources.
The specific challenges that the state faces with respect to financial inclusion are discussed below:
1. Dearth of Efficient SHGs
Recent years have seen both the state government and NABARD stepping up their efforts to form SHGs that could be credit linked. The phenomena of out migration and displacement on account of natural disasters (many districts in Bihar are flood prone), however, continue to impair this process leading to disruptions and reversals in progress.
In order to build a network of efficient and sustainable SHGs for expediting financial inclusion, sufficient investments must be made in their training and building. Also, it is important to develop SHG federations and capacitate them to take on the role of SHPIs. Such initiatives have not yet been accorded adequate attention in the state.
2. Lack of Awareness and Low Levels of Financial Literacy
A large proportion of the poor and low income households in Bihar lack the awareness regarding the various schemes/programmes of the government as also the working of the banking/ financial system. The persistence of very low levels of financial literacy among these households is another serious impediment to financial inclusion. The lack of knowledge regarding basic financial concepts and the lack of skills in prudently managing finance related decisions results in the inability of the poor and powerless households to negotiate better terms from banks and other financial institutions.
3. Absence of Efficient NGOs
In many parts of the country, NGOs with wide outreach have lent their expertise to mobilize the disadvantaged and low income sections of the population into SHGs. Many have also helped them develop skills, especially, those necessary for setting up and managing micro enterprises. Many of them act as SHPIs and extend support to SHGs in establishing linkages with banks. Such NGOs are not yet present in significant numbers in Bihar to make a visible impact in terms of developing a robust SHG network. While considerable progress has been made in SHG formation, not much effort has been put in to make them efficient and sustainable.
Chapter 5: Facilitating Financial Inclusion: Challenges and Constraints

58 Status of Final Inclusion & Way Forward-Bihar 2012-17
4. Uneven Spread of Bank Branches
The concentration of bank branches in urban and semi urban areas has meant that rural areas, where financial services are the most needed, continue to be underserved. Of the 168 bank branches opened in the state in 2012-13 as per the directives of the RBI to accelerate financial inclusion, 124 are in the urban and semi urban areas.
5. Conservative Attitude of the Banking Sector
The banking sector has largely been reluctant to expand lending in the state, which is reflected in the perennially low credit deposit ratio. The reluctance is due to factors like high delinquency rates, recent guidelines from RBI in the wake of Andhra crisis, limited scope for enterprise loans in the rural areas, dearth of credible entrepreneurs, and poor technology infrastructure.
6. Inefficienciesin the BC/BF Model
The BC model was introduced as an innovative measure to leverage the power of technology and local human resources for providing banking services at the doorstep of low income customers. The model’s viability arises from spreading the costs of delivery across multiple service channels that the BC can represent in any location. However, the experience shows that low remuneration and poor incentive structure has resulted in high turnover of BCs /BFs, especially, at the ultra-small branch level. The BC model is also ridden with layers of sub-contracting, which hampers it’s functioning and effectiveness. Although the government of Bihar has appointed 371 BCs and opened 1.39 crores no-frills accounts as on September, 2013, a large number of such accounts are either dormant or non-operative32. The success of the BC model is highly dependent on the kind of support provided by base branches, especially, for cash management, documentation and redressal of customer grievances. The absence of a bricks and mortar structure to support about 8-10 BCs at a reasonable distance of 2-3 km is another constraint to the effective engagement of these agents.
7. Inadequate Leveraging of Post Office Network
The sub optimal utilization of the post office system in the state to reach out to the excluded, unbanked population, especially, in the remote and rural areas deserves a close examination. With 8,587 post offices in rural areas, this channel has the ability to reach out to a large unbanked population. The fact that post offices in Bihar provide facilities for transfer of benefits for old age pensioners and MGNREGS beneficiaries is evidence enough of the role they can potentially play to promote financial inclusion in the state, either as a separate delivery channel or as a BC. It needs to be mentioned that training in computers has stated in many POs at the block and sub post office level. It is expected that core banking would start soon in the 31 head post offices in India, including Bihar.
32 Extracted from 46th Review Meeting Report of SLBC, Bihar

59Status of Final Inclusion & Way Forward-Bihar 2012-17
8. Changing Focus of MFI Sector Growth
The crisis in Andhra Pradesh compelled several large MFIs to expand their operations in other states to seize new business opportunities. Bihar has seen an influx of big MFIs in the last two years. However, these MFIs have concentrated their business in Patna and the districts that are contiguous to it, i.e. Muzzafarpur, Vaishali, Samastipur, Nalanda, Gaya and Nawada.
The comparatively poorer districts like Sitamarhi, Madhubani, Darbhanga, Champaran, Gopalganj, Siwan, Supaul, Araria, Purnia, Kathihar, Munger, Bhagalpur, Luckhisarai, Kishanganj, Buxar, and Bhabua are particularly neglected. The immediate concern is about the likely rise in instances of multiple lending, which could, in turn, result in a situation not dissimilar to the one that Andhra Pradesh had witnessed, wherein high levels of indebtedness resulted in defaults. Moreover, the lopsided expansion of microfinance activities and the resultant exclusion of equally, if not more needy, households in other regions would eventually exacerbate the divide in development that is already a major feature of Bihar’s economy.
Conclusion
Issues like poor law and order or paucity of specialized staff, which were serious concerns for Bihar five years ago, have eased over time. But, simultaneously, new challenges have merged.
The progress of financial inclusion efforts in Bihar depends critically on better coordination among the various stakeholders in the banking and financial institutional eco system of the state. Equally important is the nurturing of an environment that adequately rewards financial discipline as also efficient management of the scarce financial and developmental resources of the state. With NRLM emerging as the main vehicle of financial inclusion and livelihood promotion, it is all the more important to set standards and benchmarks for just and equitable allocation of resources across different regions within the state. For instance, there is an urgent need to augment the supply of financial resources to small and marginal farmers (accounting for 70 per cent of the poor in the state) to help them plan alternative livelihood options to cope with the situations of poverty and distress. The capacity of SHGs needs to be simultaneously strengthened so that they can help the poor households engage in sustainable livelihood activities33. Promoting such activities would require that loan sizes are customized to the investment needs of the borrowers.
The success of financial inclusion further depends on leveraging ICT. Hence, non-availability of power can be a serious operational constraint in many areas. This may also result in delayed capture of information relating to clients, thus, depriving them of seamless delivery of financial services while increasing the cost of transactions.
33 Economic Survey of Bihar 2012, Department of Finance, GoB, Patna.

60 Status of Final Inclusion & Way Forward-Bihar 2012-17
6.1 Introduction
Improved governance and favourable socio-economic climate coupled with focused attention on financial inclusion have resulted in significant growth of microfinance
in Bihar in the last few years. Developments in Andhra Pradesh in the last few years, too, have contributed to the growth of this sector in Bihar as many MFIs sought to increase their operations in other states, including Bihar. Recent developments in the sector, existing and proposed government and non-government initiatives for financial inclusion, future plans of key stakeholders including MFIs and the commencement of NRLM in the state should propel the growth of the microfinance sector in the next five years.
The government of Bihar envisions that through the use of appropriate technology, innovation and product diversification the state could achieve total financial inclusion wherein the banking sector would be able to reach out to every individual — those employed in the unorganised sector, the self-employed in the micro and small business, the small and marginal farmers (GoB, 2013: 307). In line with the vision of the Rangarajan Committee Report on Financial Inclusion (2007) to achieve comprehensive financial services to all poor households by 2015 and given that nearly 37 per cent of such households in Bihar are yet unbanked, the vision for microfinance in the state could be to achieve comprehensive financial inclusion for all below poverty line households by 2017.It is plausible to achieve this as the government is already making concerted efforts to augment access to financial services through BRLP (Jeevika), SBLP, NABARD, LIC, PFRDA, post offices as well as alternate channels, i.e., microfinance organizations and private agencies, which provide insurance and remittance services to the poor.
In this chapter, an attempt has been made to project the demand for credit by the poor households and the growth of microfinance in Bihar by 2017 by taking in account the expected population growth (both rural and urban), number of poor households, coverage of poor households through SHG-bank linkage programme (including BRLP), and MFIs. The analysis also highlights the gap between expected growth in coverage and the likely growth in demand for microfinance. The earlier chapters have discussed in detail the current reach and spread of microfinance in Bihar. The assumptions regarding the contextual factors have been validated through discussions with sector experts and consultative meetings with a cross section of stakeholders in Bihar.
6.2 Population and Poverty: 2017
According to National Commission of Population, Bihar’s population is projected to grow to 116 million over 2012-2017 with 87.7 per cent expected to stay in rural areas34. Going by the past trends and the likely impact of good governance and welfare programmes in the state, it is estimated that poverty ratios will decline by 2.5 per cent in rural areas and 4 per cent in urbanareas by 2017. However, there would still be an increase in the absolute number of poor and the number of poor households.
Chapter 6: Access to Finance in Bihar –VISION 2017
34 National Commission on Population, 2011
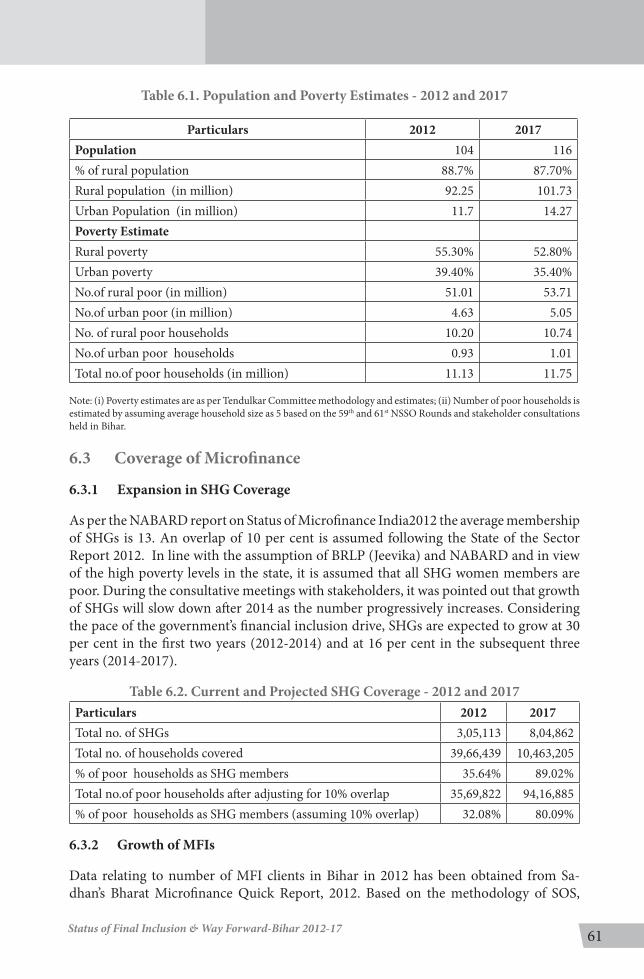
61Status of Final Inclusion & Way Forward-Bihar 2012-17
Table 6.1. Population and Poverty Estimates - 2012 and 2017
Particulars 2012 2017Population 104 116% of rural population 88.7% 87.70%Rural population (in million) 92.25 101.73Urban Population (in million) 11.7 14.27Poverty EstimateRural poverty 55.30% 52.80%Urban poverty 39.40% 35.40%No.of rural poor (in million) 51.01 53.71No.of urban poor (in million) 4.63 5.05No. of rural poor households 10.20 10.74No.of urban poor households 0.93 1.01Total no.of poor households (in million) 11.13 11.75
Note: (i) Poverty estimates are as per Tendulkar Committee methodology and estimates; (ii) Number of poor households is estimated by assuming average household size as 5 based on the 59th and 61st NSSO Rounds and stakeholder consultations held in Bihar.
6.3 Coverage of Microfinance
6.3.1 Expansion in SHG Coverage
As per the NABARD report on Status of Microfinance India2012 the average membership of SHGs is 13. An overlap of 10 per cent is assumed following the State of the Sector Report 2012. In line with the assumption of BRLP (Jeevika) and NABARD and in view of the high poverty levels in the state, it is assumed that all SHG women members are poor. During the consultative meetings with stakeholders, it was pointed out that growth of SHGs will slow down after 2014 as the number progressively increases. Considering the pace of the government’s financial inclusion drive, SHGs are expected to grow at 30 per cent in the first two years (2012-2014) and at 16 per cent in the subsequent three years (2014-2017).
Table 6.2. Current and Projected SHG Coverage - 2012 and 2017 Particulars 2012 2017Total no. of SHGs 3,05,113 8,04,862Total no. of households covered 39,66,439 10,463,205% of poor households as SHG members 35.64% 89.02%Total no.of poor households after adjusting for 10% overlap 35,69,822 94,16,885% of poor households as SHG members (assuming 10% overlap) 32.08% 80.09%
6.3.2 Growth of MFIs
Data relating to number of MFI clients in Bihar in 2012 has been obtained from Sa-dhan’s Bharat Microfinance Quick Report, 2012. Based on the methodology of SOS,

62 Status of Final Inclusion & Way Forward-Bihar 2012-17
2011, the overlap has been assumed as 35 per cent and necessary adjustments have been made. Given the high incidence of poverty in Bihar, 70 per cent of MFI clients in the state have been assumed to belong to poor households. After consultation with sector experts and taking in account the developments after the crisis in Andhra Pradesh, the MFIs’ client outreach in Bihar is estimated to grow at 11 per cent per annum during the period 2012-17.
The microfinance sector in Bihar grew at an accelerated pace over the period 2007-12 leading to an increase in the share of poor households having access to microfinance from 18.62 per cent in 2008 to 36.73 per cent in 2012 after adjusting for overlap. In 2012, of the 11.13 million poor households, 3.57 million got covered under the SHG bank linkage programme, whereas 0.52 million households were served by the MFIs.
During 2012-17, even as there would be an increase in the number of poor households, the microfinance sector is expected to have increased coverage by leveraging the growth momentum envisioned in ‘Jeevika’ and the increased pace of growth of MFIs. By 2017 11.75 million poor households would have access to microfinance – SHG bank linkage would cover 9.42 million households and MFIs, 0.88 million households. Thus, nearly 87.51 per cent of all poor households in the state would receive the microfinance services by 2017.
Table 6.3. Current and Projected Coverage of MFIs - 2012 and 2017MFIs 2012 2017
MFI clients who are poor 7,97,250 13,43,412% of poor households covered by MFIs 7.16 11.43Total number of poor clients after adjusting for 35% overlap 5,18,212 8,73,218
% ofpoor clients after adjusting for overlap 4.66 7.43
Total (SHGs + MFIs)
% of poor households covered by microfinance 42.80 100.45
% of poor households covered by microfinance after adjusting for overlap 36.73 87.51Coverage gap 63.27 12.49
The environment at the policy level is both conducive and enabling for growth of the sector and emerging technologies too afford opportunities to provide these services at the doorstep without opening bricks and mortar bank branches. There will be challenges, as outlined in the previous chapter but none appear to be insurmountable. Indeed, mobile wallets, smart cards and other similar innovative technologies may offer alternate means of achieving the goal.
It is, however, important to ascertain how much of the demand for credit of the poor households would be met by 2017, and we turn to that now.
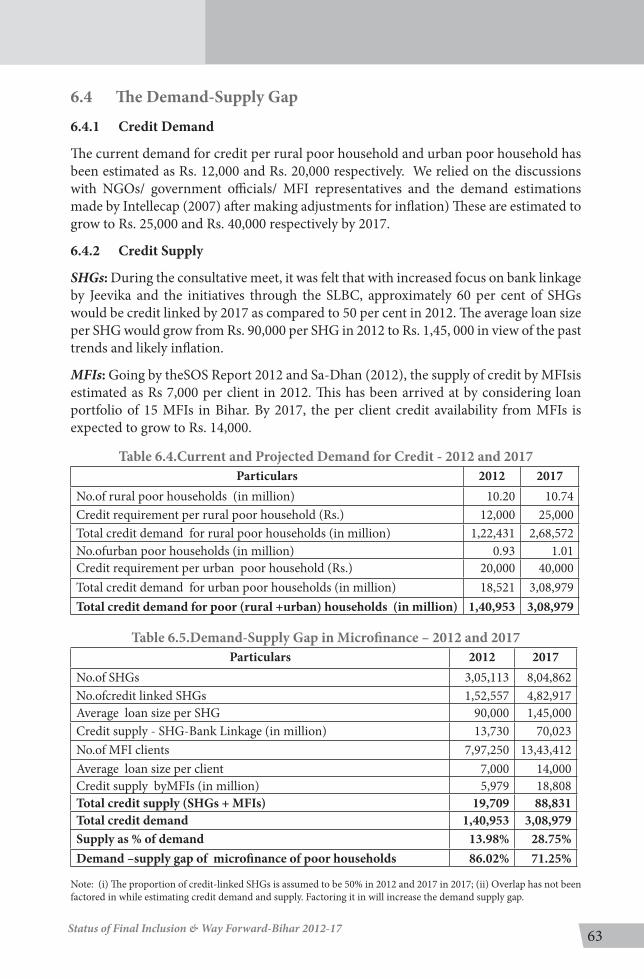
63Status of Final Inclusion & Way Forward-Bihar 2012-17
6.4 The Demand-Supply Gap
6.4.1 Credit Demand
The current demand for credit per rural poor household and urban poor household has been estimated as Rs. 12,000 and Rs. 20,000 respectively. We relied on the discussions with NGOs/ government officials/ MFI representatives and the demand estimations made by Intellecap (2007) after making adjustments for inflation) These are estimated to grow to Rs. 25,000 and Rs. 40,000 respectively by 2017.
6.4.2 Credit Supply
SHGs: During the consultative meet, it was felt that with increased focus on bank linkage by Jeevika and the initiatives through the SLBC, approximately 60 per cent of SHGs would be credit linked by 2017 as compared to 50 per cent in 2012. The average loan size per SHG would grow from Rs. 90,000 per SHG in 2012 to Rs. 1,45, 000 in view of the past trends and likely inflation.
MFIs: Going by theSOS Report 2012 and Sa-Dhan (2012), the supply of credit by MFIsis estimated as Rs 7,000 per client in 2012. This has been arrived at by considering loan portfolio of 15 MFIs in Bihar. By 2017, the per client credit availability from MFIs is expected to grow to Rs. 14,000.
Table 6.4.Current and Projected Demand for Credit - 2012 and 2017Particulars 2012 2017
No.of rural poor households (in million) 10.20 10.74Credit requirement per rural poor household (Rs.) 12,000 25,000Total credit demand for rural poor households (in million) 1,22,431 2,68,572No.ofurban poor households (in million) 0.93 1.01Credit requirement per urban poor household (Rs.) 20,000 40,000Total credit demand for urban poor households (in million) 18,521 3,08,979Total credit demand for poor (rural +urban) households (in million) 1,40,953 3,08,979
Table 6.5.Demand-Supply Gap in Microfinance – 2012 and 2017Particulars 2012 2017
No.of SHGs 3,05,113 8,04,862No.ofcredit linked SHGs 1,52,557 4,82,917Average loan size per SHG 90,000 1,45,000Credit supply - SHG-Bank Linkage (in million) 13,730 70,023No.of MFI clients 7,97,250 13,43,412Average loan size per client 7,000 14,000Credit supply byMFIs (in million) 5,979 18,808Total credit supply (SHGs + MFIs) 19,709 88,831Total credit demand 1,40,953 3,08,979Supply as % of demand 13.98% 28.75%Demand –supply gap of microfinance of poor households 86.02% 71.25%
Note: (i) The proportion of credit-linked SHGs is assumed to be 50% in 2012 and 2017 in 2017; (ii) Overlap has not been factored in while estimating credit demand and supply. Factoring it in will increase the demand supply gap.
64 Status of Final Inclusion & Way Forward-Bihar 2012-17
Analysis of the present status of coverage and projected coverage in 2017 suggests that while approximately 88 per cent of poor households would have access to finance by 2017, only 29 per cent of their credit demand would be met by SHGs and MFIs. In other words, the gap in coverage of formal banking linkage of poor clients by 2017 is estimated as 12 per cent, and the gap in fulfilling their credit demand, a glaring 70 per cent.
6.5 Institutional Framework for SHG Development
The Bihar government’s thinking on the status and future of microfinance is reflected in the following statement from the Economic Survey 2012-13.
“The conventional government anti-poverty programmes suffer from problems of delivery and areoften unsuccessful in making a serious dent on poverty, especially the kind of poverty caused by the absence of a credit support for the poor households. This is particularly true in Bihar where these programmes help only a fraction of the poverty-stricken population. In this scenario, microfinance is a potent alternative for poverty alleviation. The access to timely and adequate credit and other financial services for the weaker sections of the society at an affordable cost is essential for the overall economic development of the society. In this background, the Self Help Groups (SHGs) and the SHG-Bank Linkage Programme, implemented by scheduled commercial banks, regional rural banks and cooperative banks, have emerged as the major microfinance programme in the country”.
(Government of Bihar, Economic Survey 2012-13: 337)
It is clear that the government views SHGs as the vehicle for delivering myriad services as part of several government schemes and programmes. The ambitious target of forming a million SHGs to cover an estimated 13 million people may lead to an exponential growth in their formation. Simultaneously, the focus on forming federations can contribute to a larger numbers of SHGs being credit linked. However, the strategy to bridge the credit gap by promoting federations and capitalizing them needs to be examined closely. Federations do carry the advantages of economies of scale and collective bargaining. But as an additional layer in intermediation, they also add to the costs. For a state like Bihar, where the SHG movement itself is in nascent state, it may be premature to make investments in forming federations.
It is important to improve the quality of SHGs, especially because they are expected to grow exponentially in the coming 5 years. Also, more attention needs to be paid to develop RRBs and cooperative banks as SHPIs since they are closer to the clients and can provide necessary guidance to them while exercising adequate control. Incentivizing these banks to adopt new technology would result in strengthening the banking network.
The formal banking network comprising SCBs, RRBs and cooperative banks will have to play the most critical role in promoting the SHG-bank linkage programme, seen as the key to financial inclusion in Bihar. This, however, necessitates that more bank branches are opened in the rural areas and the bank staff sensitized and incentivized to provide necessary savings and credit linkage to SHGs. Similarly, by incentivizing banking correspondents/ facilitators appropriately, the target for financial inclusion can be achieved in the XII plan period.

65Status of Final Inclusion & Way Forward-Bihar 2012-17
However, uneven distribution of SHGs across the districts, poor infrastructure that restricts outreach and effective support to groups, extremist activities, caste conflicts, lack of experience and capacity among the NGOs and issues related to transition from grant-driven to revenue-based model would need to be addressed to ensure that intended outcomes are realized during the process of SHG formation and establishing SHG bank linkage.
6.6 MFIs - Future Expansion Plans
The influx of large multi-state MFIs in the recent past has transformed the scale of operations of microfinance sector in Bihar. These MFIs have already built up a substantial client base in the state and as on 31 July 2012, SKS with 2, 75,000 clients, Bandhan with 3, 89,000 clients and Cashpor with 189,858 clients were the leading players in the market. The outstanding loan portfolios of these MFIs were substantial at Rs. 1210 million, Rs. 2910 million and 1026 million respectively. The recent entrants have begun to catch up and the home grown MFIs such as CDOT (2007) and Saija Finance Pvt. Ltd (2008) had 34,000 and 18,850 clients respectively as on 31st July 2012 with an outstanding loan portfolio of Rs. 73 million and Rs. 230 million respectively. The ambitious plans of MFIs could bring nearly 1 million clients in their fold by 2017.
There is a concern that with large amounts earmarked for credit to SHGs in government schemes, the space available to MFIs may shrink. This is reflected in the lower than expected growth rate estimates. It is imperative, therefore, that MFIs offer a bouquet of financial services and not limit themselves to provision of credit alone. Further, they may also need to carve out a niche for themselves by adopting emerging technologies to lower their overhead costs.
The government of India’s task force on financial services in Bihar (Planning Commission, 2007) has accorded a prominent place to high quality private sector MFIs in delivering comprehensive financial services. The services provided by such MFIs, according to the task force, could be complemented by technology enabled, low cost direct service channels. It implies that along with the tightening of the regulatory framework it would become imperative to improve the quality of MFIs and facilitate their adoption of cost saving technologies through training and capacity building. Provision of revolving fund assistance and capital support from NABARD to MFIs would go a long way in augmenting the outreach and quality of MFI operations.
A word about the required regulatory mechanism is in order here. The crisis in the sector in Andhra Pradesh prompted the intervention of RBI that finally resulted in the drafting of a bill – the Microfinance Institutions Regulation and Development Bill - to regulate operations of MFIs. While decisions such as capping of interest rates may seem disruptive in the short term, well defined rules will necessarily have a benign influence on the sector in the long run. It may also lead to the development of an early warning system for the sector, which could benefit both the MFIs and their clients.

66 Status of Final Inclusion & Way Forward-Bihar 2012-17
6.7 Future Role of the Formal Banking System
Mainstream financial institutions such as banks have an important role to play in the future, not out of any social obligation, but as pure business proposition. The provision of simple, small, affordable products that provide security and safety of deposits, involve minimum paper work, permit frequent and small deposits, and provide quick and easy access to credit and other products including remittances can help inclusion of low-income households in the formal financial sector. Taking into account the, However, the existing financial products and services need to be designed to suit the requirements of the poorer households considering their peculiar situation characterized by irregularity of employment opportunities, seasonal inflow of income from agricultural operations and migration.
The state can benefit from the many measures that the RBI has put in place to accelerate financial inclusion. Apart from the introduction of non-frills accounts and simplification of KYC norms, the banks have been given the freedom to accept any evidence of identity and address that satisfies them35 from the customers including letters issued by the Unique Identification Authority of India containing details of name, address and the Aadhaar number. In January 2006, RBI permitted banks to engage BFs and BCs as intermediaries for providing financial and banking services. The BC model allows banks to provide doorstep delivery of services, especially cash in-cash out transactions, thus addressing the last-mile problem. With effect from September 2010, for-profit companies have also been allowed to be engaged as BCs. Banks have further been advised to implement EBT by leveraging ICT-based banking through BCs to transfer social benefits electronically to the bank account of the beneficiary thus reducing dependence on cash and lowering transaction costs.
To address the issue of uneven spread of bank branches, domestic SCBs have been granted permission since December 2009 to open branches in tier III to tier VI canters with a population of less than 50,000. It is mandated that at least a quarter of these branches are opened in unbanked rural areas. For every unbanked village having a population of over 2,000 a road map needs to be provided by leveraging ICT-based models.
The numbers released by the SLBC for Bihar indicate that, as against the target of opening 949 branches in the state during 2012-13, 680 branches were opened by various SCBs up to end October 2012 in villages with population above 5,000. Of these, 646 were ultra-small branches (USBs). Similarly, during the same period, four RRBs operating in the state opened 1,289 branches against the target of 1,695 branches.
Banks will undoubtedly have a critical role to play in the plans to achieve comprehensive financial inclusion in Bihar. In this context, the importance of the right mindset, cultural and attitudinal changes at the bank branch level and appropriate use of technologies cannot be overemphasized. It would help if banks institute systems of reward and recognition for individuals for their initiative, ideation, innovation and successful delivery of new products and services in rural areas.
35K.C.Chakrabarty, ‘Financial Inclusion: A Road India Needs to Travel’, www.livemint.com. Also available at http://rbi.org.in/scripts/BS_SpeechesView.aspx?Id=607

67Status of Final Inclusion & Way Forward-Bihar 2012-17
6.8 Investment Requirement by the Microfinance Sector
Formation of SHGs and establishment of banking linkages for them has been the key focus of state involvement in the microfinance sector. Over the next five years significant attention must be given to building the capacities of SHPIs. If we assume that 60 per cent of the estimated 8, 00,000 SHGs to be formed (i.e., 48,000 SHGs) would be credit-linked by 2017, and the cost of promotion per SHG is Rs.12, 000, the total investment that the SHPIs would be required to make over 2012-17 comes to be Rs. 5,760 million. An additional requirement of Rs. 500 million may be placed during the same period by SHG federations and other activities aimed at strengthening the existing SHGs. Capacity building and human resource development may require another Rs. 100 million worth investment. The major chunk of this investment will have to come from NABARD and government institutions.
As for MFIs, our consultations as well as evidence on the ground about the present level of credit flow suggest that by 2017 the local MFIs (those that are rooted in Bihar) would be responsible for nearly one fifth of the annual credit flow. With an estimated 1.34 million MFI clients, state level MFIs would be responsible for credit flows of Rs. 14,030 million by 2017. Assuming that these MFIs would require equity support of approximately 10 per cent of the annual credit flow, an additional Rs. 1,880 million would be needed. Again, if we assume that the next five years would mark the entry of 12 new state level MFIs, which would need assistance worth Rs. 5 million in the initial three years to acquire basic assets and technical assistance, an additional grant support of Rs. 60 million would need to be provided for.
Finally, as existing and new MFIs strive to scale up their operations, availability of a revolving fund of Rs. 500 million would help the sector to grow in a steady manner. It is assumed that multi-state MFIs operating in Bihar will bring in their own operational funds and hence their requirements have not been factored in these projections.
Thus, the total projected requirement of funds for the development of the MFI sector in Bihar over 2012-17 works out to be approximately Rs. 27,600 million as shown in Table 6.6.
Table 6.6.Requirement of Funds by the Microfinance Sector: 2012-17
Programme Fund Requirement till 2017(Rs. millions)
A. SHG/Federation Development1. Formation of SHGs 5,7602.Strengthening existing SHGs and formation of federations 5003. Capacity Building & HRD activities 100B. MFI Development1. Annual credit flow for state level MFIs 18,8002. Direct equity investment in MFIs 1,8803. Revolving fund requirement 5004. Grant support for incubating state level MFIs 60Total 27,600
Source- Bharat MF report

68 Status of Final Inclusion & Way Forward-Bihar 2012-17
6.9 Flow of Funds to Microfinance – Some Prospects
The presence of a clear road map for financial inclusion and the consistent efforts of the state government to accelerate the pace of development would mean that donor agencies would be interested in associating with microfinance and livelihood promotion efforts in Bihar. Some such signs are already visible. Private funders have a key role to play both as providers of funds and as advisors to start up MFIs to help them work as regulated entities committed to the upliftment of the poor.
Government’s decision to progressively dismantle the subsidy regime and introduce direct cash transfer to the targeted beneficiaries could ensure that new bank accounts opened as part of the drive to achieve financial inclusion might not remain dormant or inactive as has been the case till now. Electronic benefits transfer (EBT) which is being encouraged both in centrally sponsored schemes and state plan schemes could further support efforts of financial inclusion and also facilitate establishment of SHG bank linkage.
Convergence of government and non- government agencies could be a good starting point with the government focusing on expanding livelihood opportunities and other entities providing credit and other financial products. The requirement of credit is expected to grow as SHGs mature and need loans of higher amounts as well as repeat loans to upscale associated enterprises.
For the healthy growth of the sector, the NPAs need to be contained so that the poor repayment experience of schemes like SGSY is not repeated. It is imperative that microfinance sector develops on the principles of sound commercial prudence guided by a robust regulatory framework that promotes orderly growth and facilitates its integration with the lager financial sector. Such developments may attract financial investments as well as support in areas of training, capacity building and monitoring and information systems for local MFIs from bilateral and multilateral agencies, thus augmenting their lending activities. On their part, MFIs must reach out to the underserved population both in terms of geographies and categories and develop a bouquet of financial services including insurance (life and non-life), pension, investment, remittance and derivatives at affordable cost.
6.9 Projected Financial Resources
The primary requirement of fund shall be for initial setting up, incubation and to meet operational requirements of state level MFIs. There shall be equity and debt requirement of local MFIs which are expected to grow in numbers and participate more actively in providing credit to low income households. It is expected that they will cater to about one third of the total credit flow through this channel. The grant support required by these MFIs during the incubation phase, normally lasting three years, shall add to the requirement of funds. Simultaneously, it is expected that SHPIs shall play a major role in formation of SHGs. Since promotion of each SHG entails costs, the anticipated exponential growth in number of SHGs will require large funds as will the efforts to strengthen existing SHGs and form federations. Capacity building efforts, development of MIS, adoption of technology and the costs related to product design and service delivery should be added to the resource requirements detailed earlier to arrive at the total requirement of financial resources.

69Status of Final Inclusion & Way Forward-Bihar 2012-17
In order to make the vision of financial inclusion for Bihar articulated in this document a reality by 2017, the state must ensure an enabling environment and concerted and
coordinated efforts by all stakeholders. Outlined below are the key strategies that could help the state achieve its vision.
1. Concerted and Coordinated Effort of Government Departments and Alternative Channels: While the environment in Bihar is vibrant with key state government departments (such as the departments of finance, rural development, and social welfare), the agencies like NABARD, SIDBI, SLBC, funding organizations, MFIs and NGOs/SHPIs pursuing their goals of financial inclusion with great zeal and commitment. However, there seems to be lack of clarity and knowledge of each other’s work and programmes which could lead to overlapping and duplication of efforts.
A State level Coordination Committee (SLCC) needs to be set up to converge the services and efforts of all the stakeholders so that they work together to achieve the targeted goals. Each agency should leverage its key strengths and duplication of efforts must be avoided. The DFS could serve as the nodal agency to convene the SLCC.
2. Greater role for NABARD in Training and Capacity Building of SHPIs/RRBs: There is a need to fill the glaring gap in the supply of and demand for financial services in the state. While there are several NGOs working to promote SHGs in rural and remote areas, the absence of large NGOs who could manage large portfolios is a critical constraint.
NABARD should use its experience and expertise in the sector to guide, train and capacitate the NGOs for assuming a greater role in SHG-bank linkage programme, especially in credit linking the SHGs. Similarly NABARD could provide strategic direction to the RRBs to prioritize credit linkage of SHGs. Towards this, a comprehensive implementation plan with clear deliverables and timelines should be drawn up and funds earmarked.
Apex institutions like SIDBI should augment their support to resource agencies like RGVN and C-DOT to build the capacities of NGOs for handling large portfolios.
3. Aggressive campaigning for Financial Inclusion Schemes: It is unfortunate that most of the people, including those residing in urban areas, are unaware of the government schemes and are hence unable to benefit from them.
The DFS and other departments of the Bihar government need to take active and aggressive measures to publicize the various financial inclusion schemes through the media, especially, local TV channels, community radios and local newspapers. Publicity could also be created through the BCs through LDMs/FLCC in local newspapers. Additionally, posters and advertisements could be put up at the kiosks and market areas.
Chapter 7: Key Strategies and Concluding Remarks

70 Status of Final Inclusion & Way Forward-Bihar 2012-17
4. Convergence among stakeholders to increase efficiency and effectiveness of the BC /BF Model: Considering that 89 per cent of the population of Bihar resides in rural areas, the BC model needs to be effectively implemented if 100 per cent financial inclusion is to be achieved in the next five years. Convergence among the government and other stakeholders, especially the DFS, NABARD, public and private sector banks, LIC and other insurance companies, MFIs/SHPIs and NGOs is important to increase the types of products and services offered by BCs to make them sustainable. This would also require training the BCs in financial inclusion products and technologies so as to increase their effectiveness.
Additionally, among the three BC models, only the kiosk model seems to show some results while the remaining two are underutilized. It would be meaningful to undertake some research to test the relative viability and advantage of all the three models keeping in mind the socio-economic and geographic context of the state. Based on the findings of such an exercise, the consortium of stakeholders could prioritize the most viable model and strategize to increase the effectiveness of the other models.
5. Self-regulation by MFIs and prevention of overlap of services: Increasing number of MFIs in recent years in Bihar is a positive development both for the sector and the people. But they should spread themselves evenly to prevent overlap of services. As of now, the MFIs tend to concentrate on districts to the north and south of Patna (headquarter of most MFIs) leaving out the comparatively poorer districts of eastern Bihar out of banking coverage.
MFIs need to regulate themselves and followthe service area approach to prevent over-indebtedness due to multiple borrowings. They need to cover the underserved areas as well. Conscious efforts are needed to balance the development agenda with commercial viability and to evolve sustainable models of microfinance intermediation in the long run.
6. Synergy between the government and MFIs: For the sustainability of SHGs, the government and the MFIs should work in a collaborative mode. MFIs could support federations of ‘Jeevika’ by providing loans to the members at a reasonable rate of interest, which could be lowered as average overheads come down with increase in numbers.
The Government, on its part, could consider lowering the interest rates of bulk loans to MFIs, especially if the latter support SHG federations.
7. Focus on livelihood enhancement and sustainability of SHGs: For a state with high levels of poverty as Bihar, it is imperative to enhance sustainable livelihood activities for poverty reduction. Instead of just providing loans, the service providers should try and ensure that the loans translate into an income generating enterprise for the members/clients.
Promoting livelihood activities among the borrowers would require that loan size be customized to the needs of the borrowers. Providing large amounts of ‘community
71Status of Final Inclusion & Way Forward-Bihar 2012-17
funds’ may not always result in enhancement of livelihood activity for fear of it getting distributed evenly among the members. Customized loan sizes of Rs. 20,000 -25,000 per member(family) to invest in income generating assets may prove to be more beneficial for livelihood creation and, possibly, reduction of household poverty.
Additionally, training SHG members in financial literacywould go a long way in enhancing their competency and capability to promote livelihood activities.
8. Promotion of federations/producer groups: For the sustainability of SHGs and for expediting financial inclusion, it is important to work on a saturation mode, develop federations of SHGs and promote them as SHPIs. Additionally, cooperatives and producer groups should be formed by the government and alternative agencies and linked to diary /cottage industries. NABARD could extend support to the formation of federations on ‘saturation’ mode rather than just linking them to banks for credit.
Concluding Remarks
Starting from a low base, Bihar has made considerable progress in broad basing financial access since the mid-2000s. It has proactively pushed the financial inclusion agenda through formal banking institutions and adopted a positive and facilitative stance with respect to promoting alternative channels like SHGs and MFIs. However, such progressive efforts have also been accompanied by certain worrisome trends like the unabated fall in the share of rural commercial bank branches, virtual stagnation in the growth of cooperative banks and insufficient reach of targeted credit programmes. Though the significance of microfinance as an effective channel for financial access to poor households is acknowledged in the policy and administrative circles, there are many bottlenecks to its expansion across districts. The main constraints arise from poor physical infrastructure, social and political conflicts, dearth of professional support agencies, dependence on grants in aid, and bankers’ indifference to SHGs. Comprehensive financial inclusion of the state, thus, depends crucially on the removal of constraints to inclusive and sustained economic development. For such development to happen, as the Economic Survey 2012-13 argues, there is an “urgent need for strengthening of physical infrastructures like roads and power, expanding human capital through education, skill and health, and finally, the promotion of the spirit of entrepreneurship”. The vision of comprehensive financial inclusion for Bihar, in other words, is intricately intertwined with the vision of the state’s socio economic development.

72 Status of Final Inclusion & Way Forward-Bihar 2012-17
Annexure 1 State-wise Financial Inclusion Index
Name of State D1(Penetration)
D2 (Avail-ability) D3 (Usage)
Index of Financial Inclusion
(IFI)
IFI Rank
High Financial Inclusion (0.5 to 1)Kerala 0.7 0.81 0.28 0.51 1Maharashtra 0.62 0.29 1 0.53 2Karnataka 0.72 0.47 0.46 0.53 3Medium Financial Inclusion (0.3-0.5)
Tamil Nadu 0.7 0.43 0.38 0.48 4Punjab 0.45 0.69 0.29 0.45 5Andhra Pradesh 0.56 0.3 0.41 0.41 6Himachal Pradesh 0.42 0.4 0.18 0.33 8Sikkim 0.28 0.33 0.34 0.32 9Haryana 0.39 0.5 0.12 0.32 10Low Financial Inclusion (<0.3)West Bengal 0.24 0.38 0.23 0.28 11Gujarat 0.32 0.3 0.16 0.26 12Uttar Pradesh 0.28 0.31 0.15 0.24 13Meghalaya 0.21 0.28 0.14 0.21 14Tripura 0.31 0.22 0.08 0.2 15Orissa 0.26 0.23 0.11 0.2 16Rajasthan 0.25 0.22 0.12 0.19 17Arunachal Pradesh 0.2 0.16 0.14 0.17 18Mizoram 0.13 0.26 0.09 0.16 19Madhya Pradesh 0.18 0.21 0.08 0.16 20Bihar 0.15 0.24 0.08 0.15 21Assam 0.17 0.17 0.07 0.13 22Nagaland 0.03 0.04 0.07 0.05 23All India 0.27 0.22 0.55 0.33 7
Annexures

73Status of Final Inclusion & Way Forward-Bihar 2012-17
Annexure 2 Districtwise CD Ratio
District 2006-07 2007-08 2008-09 2009-10 2010-11 2011-12 2012-13(Sep’12)
Patna 32.18 27.64 25.11 24.18 26.53 31.33 32.29Nalanda 27.44 25.77 24.59 27.13 29.75 30.87 30.70Bhojpur 24.95 24.51 20.74 24.5 23.90 25.17 24.09Buxar 31.08 30.99 24.17 31.48 31.56 32.23 30.76Rohtas 39.79 40.5 36.24 36.02 38.37 40.04 39.43Kaimur 46.06 43.04 47.13 48.16 52.16 49.07 51.15Gaya 28.37 28.46 28.67 31.45 32.07 31.38 32.00Jehanabad 23.62 25.28 23.78 28.84 29.98 32.36 33.26Arawal 26.66 26.8 26.35 32.06 45.38 31.50 30.54Nawada 27.16 26.06 22.91 31.66 34.44 39.27 38.63Aurangabad 26.65 23.76 23.22 27.95 31.82 33.24 32.32Saran 26.18 23.12 23.85 26.25 24.35 24.35 23.63Siwan 22.07 20.68 18.78 20.08 21.63 21.10 21.71Gopalganj 29.12 30.19 25.68 25.65 28.66 28.43 28.27West Champaran 51.69 48.99 47.31 47.12 45.69 49.14 47.61East Champaran 43.68 42.34 36.87 38.94 44.07 42.25 41.31Muzaffarpur 36.21 34.29 43.33 45.34 35.69 33.20 32.59Sitamarhi 40.24 35.16 32.23 32.91 34.00 34.65 35.59Sheohar 30.06 29.44 38.29 42.31 34.09 36.81 32.51Vaishali 31.90 32.17 28.45 30.72 29.90 29.98 29.67Darbhanga 29.31 26.45 22.99 26.40 28.54 26.91 38.32Madhubani 32.68 30.32 25.55 28.32 29.40 30.59 29.43Samastipur 38.5 36.05 37.09 39.69 44.36 42.74 42.14Begusarai 44.95 40.32 35.59 37.83 39.63 38.95 41.86Munger 23.35 23.17 23.28 21.02 29.64 28.08 25.82Sheikhpura 27.61 26.72 24.94 29.77 28.60 28.93 26.62Lakhisarai 24.4 24.23 22.83 24.26 24.95 25.25 24.92Jamui 29.18 28.30 25.61 25.85 26.79 29.16 28.15Khagaria 38.34 32.70 32.37 36.55 36.05 39.84 37.88Bhagalpur 37.77 35.79 30.98 30.09 28.97 24.92 28.53Banka 44.62 40.55 33.86 35.83 35.15 36.45 36.98Saharsa 33.90 36.31 29.03 37.52 34.53 33.53 32.42Supaul 32.38 35.66 28.16 31.99 36.10 35.83 40.83Madhepura 42.63 42.29 26.43 28.06 43.39 31.78 34.13Purnea 51.33 51.53 45.09 49.79 53.12 50.92 46.99Kishanganj 53.17 52.77 49.1 49.85 53.34 50.65 49.93Araria 51.69 50.72 38.03 38.57 45.84 48.96 46.94Katihar 58.19 55.59 43.98 45.59 44.92 44.29 41.98

74 Status of Final Inclusion & Way Forward-Bihar 2012-17
Annexure 3: Bank Groupwise and Areawise CD Ratio in Bihar 2011-12
Bank Groups Area Deposits (Rs. Crore)
Credits (Rs. Crore)
CD Ratio Invest-ment (Rs.
Crore)
ICD Ratio
Commercial Bank
Rural 24,941 8,970 35.96 - -
Semi-Urban 31,188 9,341 29.95 - -Urban 64,038 17,587 27.46 - -Total 1,20,167 38,898 29.87 5598 34.53
RRBs Rural 10,970 5,435 49.54 - -Semi-Urban 2,778 1,068 38.45 - -Urban 1,436 538 37.45 - -Total 15,185 7,041 46.37 49 46.69
Cooperative Bank
Rural 0 0 0 - -Semi-Urban 1,587 797 50.25 - -Urban 1,244 1,621 130.34 - -Total 2,831 2,418 85.44 49 87.16
All Banks Rural 35,911 14,404 40.11 - -Semi-Urban 35,554 11,207 31.52 - -Urban 66,718 19,746 29.60 - -Total 1,38,183 45,357 32.82 5,696 36.95
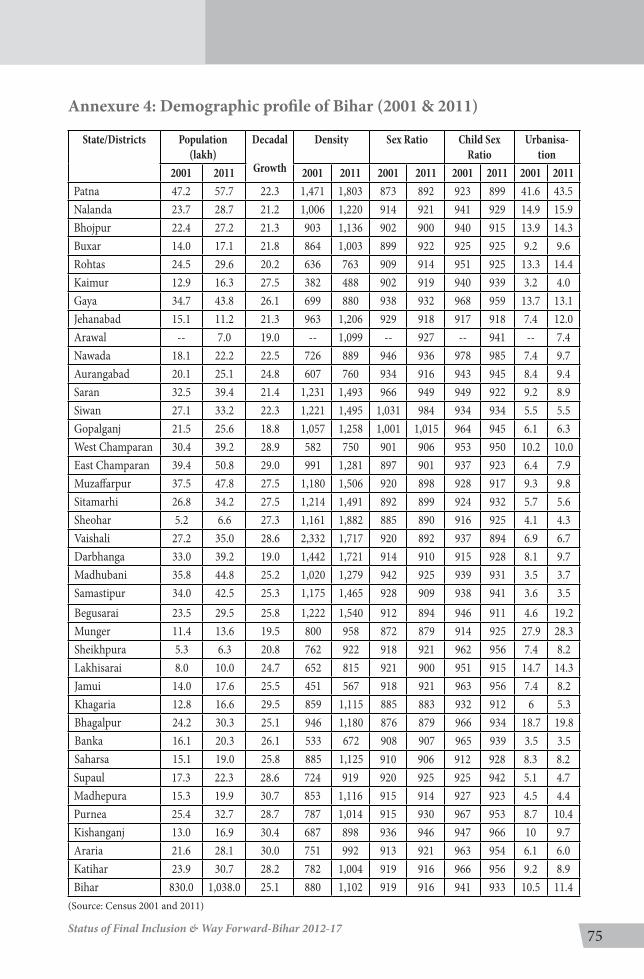
75Status of Final Inclusion & Way Forward-Bihar 2012-17
Annexure 4: Demographic profile of Bihar (2001 & 2011)
State/Districts Population (lakh)
Decadal
Growth
Density Sex Ratio Child Sex Ratio
Urbanisa-tion
2001 2011 2001 2011 2001 2011 2001 2011 2001 2011Patna 47.2 57.7 22.3 1,471 1,803 873 892 923 899 41.6 43.5Nalanda 23.7 28.7 21.2 1,006 1,220 914 921 941 929 14.9 15.9Bhojpur 22.4 27.2 21.3 903 1,136 902 900 940 915 13.9 14.3Buxar 14.0 17.1 21.8 864 1,003 899 922 925 925 9.2 9.6Rohtas 24.5 29.6 20.2 636 763 909 914 951 925 13.3 14.4Kaimur 12.9 16.3 27.5 382 488 902 919 940 939 3.2 4.0Gaya 34.7 43.8 26.1 699 880 938 932 968 959 13.7 13.1Jehanabad 15.1 11.2 21.3 963 1,206 929 918 917 918 7.4 12.0Arawal -- 7.0 19.0 -- 1,099 -- 927 -- 941 -- 7.4Nawada 18.1 22.2 22.5 726 889 946 936 978 985 7.4 9.7Aurangabad 20.1 25.1 24.8 607 760 934 916 943 945 8.4 9.4Saran 32.5 39.4 21.4 1,231 1,493 966 949 949 922 9.2 8.9Siwan 27.1 33.2 22.3 1,221 1,495 1,031 984 934 934 5.5 5.5Gopalganj 21.5 25.6 18.8 1,057 1,258 1,001 1,015 964 945 6.1 6.3West Champaran 30.4 39.2 28.9 582 750 901 906 953 950 10.2 10.0East Champaran 39.4 50.8 29.0 991 1,281 897 901 937 923 6.4 7.9Muzaffarpur 37.5 47.8 27.5 1,180 1,506 920 898 928 917 9.3 9.8Sitamarhi 26.8 34.2 27.5 1,214 1,491 892 899 924 932 5.7 5.6Sheohar 5.2 6.6 27.3 1,161 1,882 885 890 916 925 4.1 4.3Vaishali 27.2 35.0 28.6 2,332 1,717 920 892 937 894 6.9 6.7Darbhanga 33.0 39.2 19.0 1,442 1,721 914 910 915 928 8.1 9.7Madhubani 35.8 44.8 25.2 1,020 1,279 942 925 939 931 3.5 3.7Samastipur 34.0 42.5 25.3 1,175 1,465 928 909 938 941 3.6 3.5Begusarai 23.5 29.5 25.8 1,222 1,540 912 894 946 911 4.6 19.2Munger 11.4 13.6 19.5 800 958 872 879 914 925 27.9 28.3Sheikhpura 5.3 6.3 20.8 762 922 918 921 962 956 7.4 8.2Lakhisarai 8.0 10.0 24.7 652 815 921 900 951 915 14.7 14.3Jamui 14.0 17.6 25.5 451 567 918 921 963 956 7.4 8.2Khagaria 12.8 16.6 29.5 859 1,115 885 883 932 912 6 5.3Bhagalpur 24.2 30.3 25.1 946 1,180 876 879 966 934 18.7 19.8Banka 16.1 20.3 26.1 533 672 908 907 965 939 3.5 3.5Saharsa 15.1 19.0 25.8 885 1,125 910 906 912 928 8.3 8.2Supaul 17.3 22.3 28.6 724 919 920 925 925 942 5.1 4.7Madhepura 15.3 19.9 30.7 853 1,116 915 914 927 923 4.5 4.4Purnea 25.4 32.7 28.7 787 1,014 915 930 967 953 8.7 10.4Kishanganj 13.0 16.9 30.4 687 898 936 946 947 966 10 9.7Araria 21.6 28.1 30.0 751 992 913 921 963 954 6.1 6.0Katihar 23.9 30.7 28.2 782 1,004 919 916 966 956 9.2 8.9Bihar 830.0 1,038.0 25.1 880 1,102 919 916 941 933 10.5 11.4
(Source: Census 2001 and 2011)

76 Status of Final Inclusion & Way Forward-Bihar 2012-17
Annexure 5: Poverty Ratio of Bihar & India
State2004-05 2009-10 Reduction in poverty Ratio (in % Point)
Rural Urban Total Rural Urban Total Rural Urban TotalBihar 55.7 43.7 54.4 55.3 39.4 53.5 0.4 4.3 0.9India 42 25.5 37.2 33.8 20.9 29.8 8.2 4.6 7.4
Note: Poverty Ratio as per Tendulkar Committee Methodology
Annexure 6:District wise Per Capita Gross District Domestic Product at 2004-05 Prices (2006-07 to 2009-10)
(Rupees)District 2006-07 2007-08 2008-09 2009-10Patna 36,776 (1) 34,653 (1) 48,693 (1) 53,539 (1)Nalanda 6,625 (19) 7,132 (15) 9,103 (12) 9,887 (12)Bhojpur 6,826 (17) 7,429 (12) 10,083 (8) 10,324 (8)Buxar 6,383 (25) 7,226 (13) 8,915 (15) 8,995 (17)Rohtas 8,453 (6) 8,697 (5) 10,878 (6) 11,167 (6)Kaimur 6,530 (21) 6,776 (19) 8,364 (22) 7,957 (28)Gaya 6,977 (14) 7,177 (14) 9,094 (13) 9,649 (15)Jehanabad 5,978 (32) 6,305 (24) 8,532 (19) 8,599 (22)Arawal 5,318 (37) 5,730 (34) 6,982 (35) 7,395 (35)Nawada 5,364 (36) 5,579 (36) 7,359 (32) 7,730 (30)Aurangabad 6,227 (27) 6,171 (27) 7,864 (28) 8,350 (23)Saran 6,215 (28) 6,622 (21) 7,904 (27) 8,651 (21)Siwan 6,053 (30) 6,118 (28) 8,796 (16) 8,111 (25)Gopalganj 6,508 (22) 6,599 (22) 8,005 (26) 8,665 (20)West Champaran 7,674 (9) 7,650 (9) 9,395 (10) 9,910 (11)East Champaran 6,407 (24) 6,051 (30) 8,378 (21) 7,640 (31)Muzaffarpur 8,791 (5) 8,580 (6) 11,554 (5) 12,246 (5)Sitamarhi 5,466 (35) 5,575 (37) 7,252 (33) 7,550 (33)Sheohar 4,431 (38) 4,264 (38) 6,064 (38) 5,522 (38)Vaishali 7,155 (12) 7,056 (16) 9,544 (9) 10,063 (10)Darbhanga 6,699 (18) 6,737 (20) 8,476 (20) 9,131 (16)Madhubani 7,015 (13) 5,580 (35) 7,585 (30) 7,584 (32)Samastipur 6,604 (20) 6,575 (23) 8,665 (18) 8,970 (18)Begusarai 11,237 (3) 10,338 (4) 14,962 (3) 14,322 (4)Munger 11,844 (2) 12,399 (2) 16,996 (2) 18,669 (2)Sheikhpura 5,532 (34) 6,192 (26) 8,046 (24) 7,890 (29)Lakhisarai 7,299 (11) 7,677 (8) 10,154 (7) 11,084 (7)Jamui 7,851 (7) 8,080 (7) 9,348 (11) 10,242 (9)Khagaria 5,998 (31) 6,108 (29) 7,707 (29) 7,968 (27)Bhagalpur 10,042 (4) 10,492 (3) 13,300 (4) 14,396 (3)Banka 6,137 (29) 5,989 (33) 7,524 (31) 7,975 (26)Saharsa 7,649 (10) 7,474 (11) 8,687 (17) 9,770 (14)Supaul 6,351 (26) 6,021 (31) 6,726 (36) 7,213 (36)Madhepura 6,499 (23) 6,212 (25) 6,540 (37) 7,161 (37)Purnea 6,941 (16) 6,903 (18) 8,164 (23) 8,949 (19)Kishanganj 6,971 (15) 6,978 (17) 8,043 (25) 8,243 (24)Araria 5,856 (33) 6,014 (32) 7,183 (34) 7,547 (34)Katihar 7,822 (8) 7,498 (10) 8,995 (14) 9,802 (13)Bihar 8,773 8,641 11,313 11,944
Source:Directorate of Economics and Statistics, GOB

77Status of Final Inclusion & Way Forward-Bihar 2012-17
Annexure 7: District wise Small Savings in Post Offices and Public Provident Fund (2009-10, 2010-11)
(Rs. In crore)
District
Share of
popu-lation
2009-10 2010-11 2011-12
TriniumAverage ofAchieve-
ments(2009-12
Share ofAchieve-
ments (%)
Target Tar-get
Achieve-ment Target Achieve-
ment Target Achieve-ment
Patna 5.6 170 396 495 255 425 -31 207 12.0Nalanda 2.8 60 133 167 102 143 82 106 6.1Bhojpur 2.6 35 86 197 136 92 74 98 5.7Buxar 1.6 20 39 49 50 42 33 41 2.4Rohtas 2.9 30 64 80 67 69 32 54 3.2Kaimur 1.6 13 27 34 33 29 16 25 1.5Total 17.1 328 745 932 643 800 206 531 30.8Gaya 4.2 38 88 109 78 94 31 65 3.8Jehanabad 1.1 8 18 23 21 20 13 17 1.0Arawal 0.7 5 12 15 14 13 9 12 0.7Nawada 2.1 25 50 63 92 54 63 68 4.0Aurangabad 2.4 25 61 76 66 65 32 53 3.1Total 10.5 101 229 286 271 246 148 216 12.5Saran 3.8 75 128 160 155 137 121 135 7.8Siwan 3.2 40 66 83 86 71 68 73 4.2Gopalganj 2.5 35 42 53 53 46 40 45 2.6Total 9.5 150 237 296 295 254 230 254 14.7E. Champaran 3.8 32 60 75 65 65 22 49 2.8West Champaran 4.9 18 32 40 39 35 27 33 1.9Muzaffarpur 4.6 38 97 122 138 106 37 91 5.3Sitamarhi 3.3 15 27 34 36 30 5 23 1.3Sheohar 0.6 3 6 7 8 6 1 5 0.3Vaishali 3.4 35 77 97 83 83 53 71 4.1Total 20.6 141 300 375 368 325 145 271 15.7Darbhanga 3.8 45 80 100 75 86 35 63 3.7Madhubani 4.3 32 50 63 45 55 25 40 2.3Samastipur 4.1 28 43 53 57 46 32 44 2.5Total 12.2 105 172 216 177 187 92 147 8.5Begusarai 2.8 20 54 68 68 58 20 47 2.7Munger 1.3 17 39 49 34 42 25 33 1.9Sheikhpura 0.6 5 11 13 9 11 7 9 0.5Lakhisarai 1.0 5 11 13 9 11 7 9 0.5Jamui 1.7 8 14 17 15 15 13 14 0.8Khagaria 1.6 4 11 14 14 12 5 10 0.6Total 9.0 59 140 174 148 149 76 122 7.0Bhagalpur 2.9 23 57 71 74 61 40 57 3.3Banka 2.0 8 12 15 7 13 -2 6 0.3Total 4.9 31 68 86 81 74 38 62 3.6Saharsa 1.8 15 29 37 28 32 19 25 1.5Supaul 2.1 10 22 28 21 24 14 19 1.1Madhepura 1.9 10 22 28 21 24 15 19 1.1Total 5.8 35 74 93 69 80 47 63 3.7Purnea 3.2 20 30 37 25 32 6 20 1.2Kishanganj 1.6 7 15 18 10 9 5 10 0.6Araria 2.7 8 12 15 10 13 2 8 0.5Katihar 3.0 15 29 36 20 31 14 21 1.2Total 10.5 50 85 106 65 85 26 59 3.4Grand Total 100.1 1,000 2,050 2,564 2,116 2,200 1,009 1,725 100.0
Source: Economic Survey 2012-13. GoB

78 Status of Final Inclusion & Way Forward-Bihar 2012-17
Annexure 8: District wise CD ratio as on 30th March’2013(Amount in crores)
S.No Name of the district No. of Branches Deposit Advances CD Ratio1 Patna 574 51,69,688 17,12,553 33.132 Arwal 38 67,500 21,738 32.203 Aurangabad 126 3,10,774 1,08,572 34.944 Bhojpur 162 4,51,614 1,10,803 24.535 Buxar 107 2,49,165 78,859 31.656 Gaya 211 6,02,790 2,01,171 33.377 Jehenabad 61 1,25,394 42,280 33.728 Kaimur(Bhabhua) 87 1,75,217 95,655 54.599 Lakhisarai 53 1,25,165 35,158 28.0910 Nalanda 160 3,72,854 1,20,120 32.2211 Nawada 96 1,85,734 70,141 37.7612 Rohtas 152 4,07,930 1,64,005 40.2013 Araria 98 1,55,729 75,561 48.5214 Jamui 72 1,67,948 49,968 29.7515 Kishanganj 70 1,05,609 55,526 52.5816 Madhepura 81 1,66,050 61,600 37.1017 Purnea 137 2,67,287 1,44,982 54.2418 Saharsa 72 1,85,963 64,724 34.8019 Supaul 89 1,61,183 64,420 39.9720 Darbhanga 192 4,65,651 1,71,594 36.8521 E.champaran 217 4,08,913 1,77,892 43.5022 Gopalganj 136 3,37,607 93,556 27.7123 Madhubani 230 3,57,174 1,06,503 29.8224 Muzaffarpur 274 7,64,382 2,97,186 38.8825 Saran 174 5,29,313 1,21,526 22.9626 Siwan 177 4,93,879 1,07,079 21.6827 Vaishali 171 4,09,403 1,25,839 30.7428 W. Champaran 162 2,85,067 1,29,546 45.4629 Katihar 130 2,46,883 1,04,605 42.3730 Sheikhpura 36 75,978 22,658 29.8231 Banka 82 1,63,102 63,362 38.8532 Begusarai 142 3,83,715 1,73,609 45.2433 Bhagalpur 162 4,51,614 1,10,803 24.5334 Munger 90 3,03,295 64,448 21.2535 Sheohar 29 45,667 15,937 34.9036 Sitamarhi 136 2,41,599 93,929 38.8637 Khagaria 73 1,40,351 54,773 39.0338 Samastipur 196 4,21,710 1,57,748 37.41
Total 5270 1,61,03,562 55,25,421 34.31
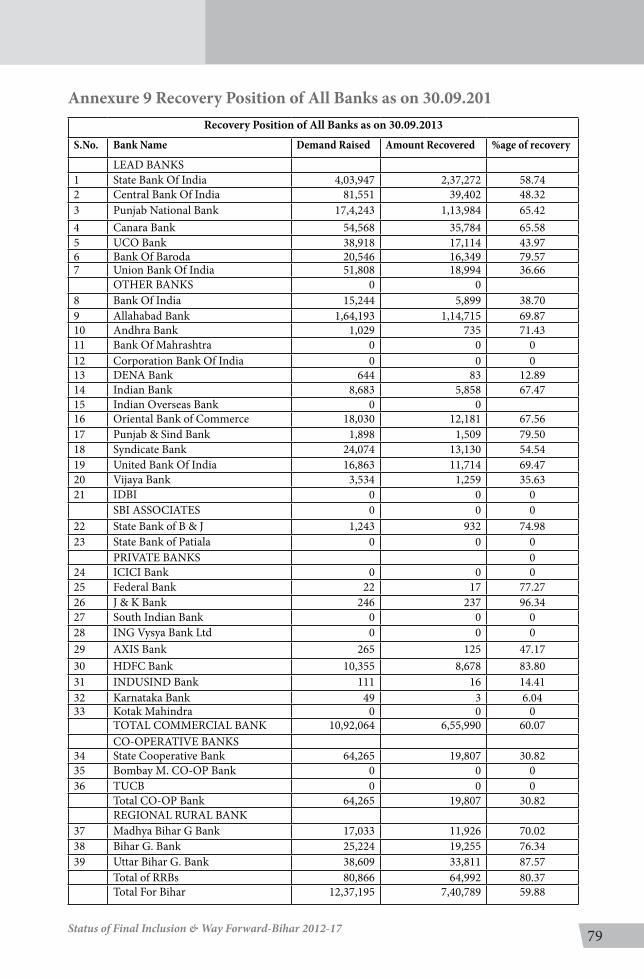
79Status of Final Inclusion & Way Forward-Bihar 2012-17
Annexure 9 Recovery Position of All Banks as on 30.09.201Recovery Position of All Banks as on 30.09.2013
S.No. Bank Name Demand Raised Amount Recovered %age of recovery
LEAD BANKS 1 State Bank Of India 4,03,947 2,37,272 58.742 Central Bank Of India 81,551 39,402 48.323 Punjab National Bank 17,4,243 1,13,984 65.424 Canara Bank 54,568 35,784 65.585 UCO Bank 38,918 17,114 43.976 Bank Of Baroda 20,546 16,349 79.577 Union Bank Of India 51,808 18,994 36.66 OTHER BANKS 0 08 Bank Of India 15,244 5,899 38.709 Allahabad Bank 1,64,193 1,14,715 69.8710 Andhra Bank 1,029 735 71.4311 Bank Of Mahrashtra 0 0 012 Corporation Bank Of India 0 0 013 DENA Bank 644 83 12.8914 Indian Bank 8,683 5,858 67.4715 Indian Overseas Bank 0 016 Oriental Bank of Commerce 18,030 12,181 67.5617 Punjab & Sind Bank 1,898 1,509 79.5018 Syndicate Bank 24,074 13,130 54.5419 United Bank Of India 16,863 11,714 69.4720 Vijaya Bank 3,534 1,259 35.6321 IDBI 0 0 0 SBI ASSOCIATES 0 0 022 State Bank of B & J 1,243 932 74.9823 State Bank of Patiala 0 0 0 PRIVATE BANKS 024 ICICI Bank 0 0 025 Federal Bank 22 17 77.2726 J & K Bank 246 237 96.3427 South Indian Bank 0 0 028 ING Vysya Bank Ltd 0 0 029 AXIS Bank 265 125 47.1730 HDFC Bank 10,355 8,678 83.8031 INDUSIND Bank 111 16 14.4132 Karnataka Bank 49 3 6.0433 Kotak Mahindra 0 0 0 TOTAL COMMERCIAL BANK 10,92,064 6,55,990 60.07 CO-OPERATIVE BANKS 34 State Cooperative Bank 64,265 19,807 30.8235 Bombay M. CO-OP Bank 0 0 036 TUCB 0 0 0 Total CO-OP Bank 64,265 19,807 30.82 REGIONAL RURAL BANK 37 Madhya Bihar G Bank 17,033 11,926 70.0238 Bihar G. Bank 25,224 19,255 76.3439 Uttar Bihar G. Bank 38,609 33,811 87.57 Total of RRBs 80,866 64,992 80.37 Total For Bihar 12,37,195 7,40,789 59.88

80 Status of Final Inclusion & Way Forward-Bihar 2012-17
Annexure 10 Recovery Position of All Banks as on 30.09.2013Bankwise Performance : No-Frill Account
As on 30.09.2013 Amt. in Lakhs
S. No Bank Name
No Frill A/C Opened during
the current finan-cial year (through Branch Channel)
No Frill A/C opened during the current financial year (through BC
Channel)
No Frill A/C Opened during the current FY
(through Branch Channel & BC
model)
Cumulative Achieve-ment (NFA opened
since inception)
Total No. of Operational NFA
(Cumulative)
% of Ac-
count opera-tional
A/C Amt. A/C Amt. A/C Amt. A/C Amt. A/C Amt. 1 State Bank Of India 11,194 114 5,69,631 7968 5,80,825 8,082 22,17,795 30,278 21,68,518 29,083 97.78
2Central Bank Of India 11,205 7 5,170 0 16,375 7 19,37,242 1,403 1,68,119 511 8.68
3 Punjab National Bank 1,29,696 2,283 3,4,917 80 1,64,613 2,363 13,63,877 43,512 1,05,8766 36,713 77.634 Canara Bank 37,284 193 14,853 63 52,137 256 3,53,602 9,807 2,81,565 9,158 79.635 UCO Bank 24,533 1,687 17,490 11 42,023 1,698 1,99,280 6,688 1,90,889 7,834 95.796 Bank Of Baroda 21,301 203 9,084 9 30,385 212 3,51,974 1,149 2,14,707 705 61.007 Union Bank Of India 52,067 4 21,556 0 73,623 4 45,963 2 1,12,895 2 245.628 Bank Of India 9,041 53 26,547 72 35,588 125 4,10,392 1,159 4,39,234 1,318 107.039 Allahabad Bank 31,570 53 35,024 41 66,594 94 1,48,708 4,638 37,865 65 25.46
10 Andhra Bank 3,174 31 0 0 3,174 31 3,174 31 0 0 0.0011 Bank Of Mahrashtra 57 670 0 0 57 670 57 7 0 0 0.00
12Corporation Bank Of India 2,455 99 0 0 2,455 99 3,755 56 0 0 0.00
13 DENA Bank 916 2 0 0 916 2 916 2 1,538 11 167.9014 Indian Bank 155 14 1,1142 124 11,297 138 19,233 250 19,233 250 100.0015 Indian Overseas Bank 0 0 2,551 3 2,551 3 20,636 26 20,636 26 100.00
16Oriental Bank of Commerce 1,928 71 3,803 0 5,731 71 31,785 645 31,785 645 100.00
17 Punjab & Sind Bank 886 2 0 0 886 2 3721 74 0 0 0.0018 Syndicate Bank 321 4 930 5 1251 9 19,613 125 17,994 124 91.7519 United Bank Of India 439 29 19,925 0 20,364 29 97,509 865 0 0 0.0020 Vijaya Bank 0 0 0 0 0 0 0 0 0 0 0.0021 IDBI 5,090 210 0 0 5,090 210 9,126 242 0 0 0.0022 State Bank of B & J 0 0 17 0 17 0 0 0 0 0 0.0023 State Bank of Patiala 21 2500 0 0 21 2,500 41 2500 224 0 546.3424 ICICI Bank 2,506 55 1,93,401 0 1,95,907 55 9,42,915 78 0 0 0.0025 Federal Bank 15 1 0 0 15 1 0 0 0 0 0.0026 J & K Bank 0 0 0 0 0 0 0 0 0 0 0.0027 South Indian Bank 93 2 0 0 93 2 148 4 37 1 25.0028 ING Vysya Bank Ltd 0 0 0 0 0 0 0 0 0 0 0.0029 AXIS Bank 0 0 23,745 134 23,745 134 25,060 136 0 0 0.0030 HDFC Bank 6,756 114 0 0 6,756 114 18,633 179 19,381 196 104.0131 INDUSIND Bank 766 2 0 0 766 2 766 2 0 0 0.0032 Karnataka Bank 0 0 0 0 0 0 2 0 0 0 0.0033 Kotak Mahindra 325 3 0 0 325 3 325 3 0 0 0.00
TOTAL COMMER-CIAL BANK 3,53,794 8,406 9,89,786 8,510 13,43,580 16,916 8,22,6248 1,03,861 47,83,386 86,642 58.15
CO-OPERATIVE BANKS 0 0 0 0 0 0.00
34State Cooperative Bank 0 0 0 0 0 0 0 0 0 0 0.00
35Bombay M. CO-OP Bank 0 0 0 0 0 0 0 0 0 0 0.00
36 TUCB 0 0 0 0 0 0 0 0 0 0 0.00 Total CO-OP Bank 0 0 0 0 0 0 0 0 0 0 0.00
REGIONAL RURAL BANK
37Madhya Bihar G Bank 37,276 31 29,468 31 66,744 62 11,79,958 467 11,18,604 746 94.80
38 Bihar G. Bank 16,325 36 64,032 108 80,357 144 4,12,661 1,717 4,21,374 1,700 102.1139 Uttar Bihar G. Bank 4,01,007 12,689 2,55,943 17 6,56,950 12,706 40,43,384 44,254 2,55,943 17 6.33
Total of RRBs 4,54,608 12,756 3,49,443 156 8,04,051 12,912 56,36,003 46,438 17,95,921 2,463 31.87 Total For Bihar 8,08,402 21,162 13,39,229 8,666 21,47,631 29,828 1,38,62,251 1,50,299 65,79,307 89,105 47.46

Related Documents