Statistics Problems and Review

Welcome message from author
This document is posted to help you gain knowledge. Please leave a comment to let me know what you think about it! Share it to your friends and learn new things together.
Transcript
Statistics Problems and Review

Types of Statistics Descriptive
Used to measure a trait or characteristic without generalizing beyond the group: used to describe
Inferential Used to make generalizations or inference from
the smaller sample to a larger population

0123456789
10#
of o
bser
vati
ons
0-99
100-
199
200-
299
300-
399
400-
499
500-
599
600-
699
700-
799
800-
899
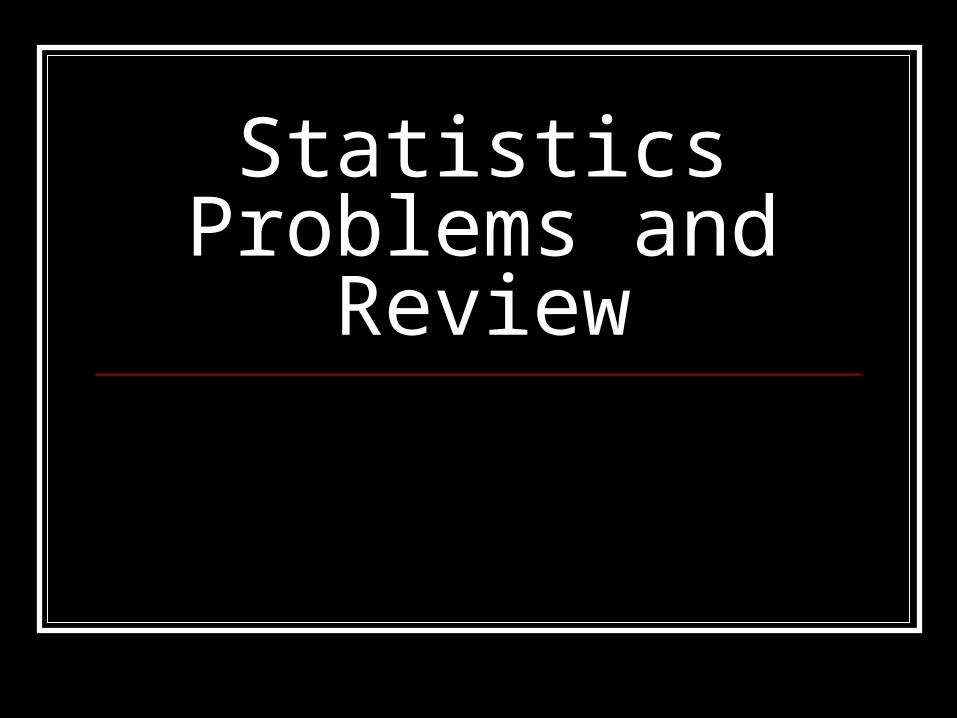
Prolactin (ng/mL)
Histogram – Preoperative Prolactin Levels
Problem #1
0123456789
10#
of o
bser
vati
ons
0-99
100-
199
200-
299
300-
399
400-
499
500-
599
600-
699
700-
799
800-
899
Prolactin (ng/mL)
Normal Distribution Histogram

0123456789
100-
99
100-
199
200-
299
300-
399
400-
499
500-
599
600-
699
700-
799
800-
899
Prolactin (ng/mL)
# of
obs
erva
tion
sNormal Distribution Histogram


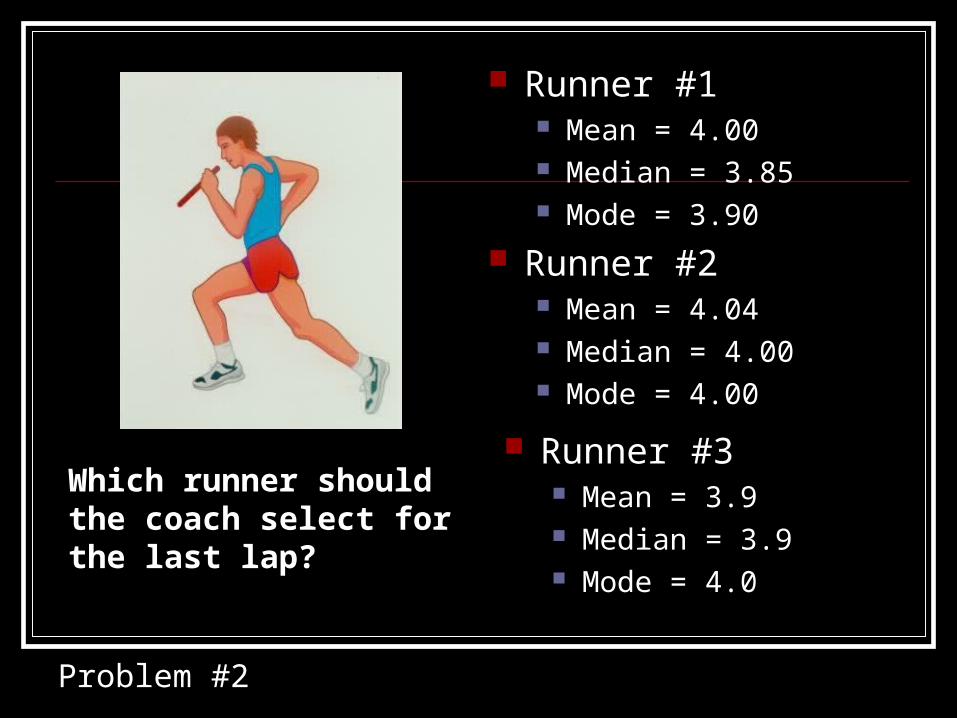
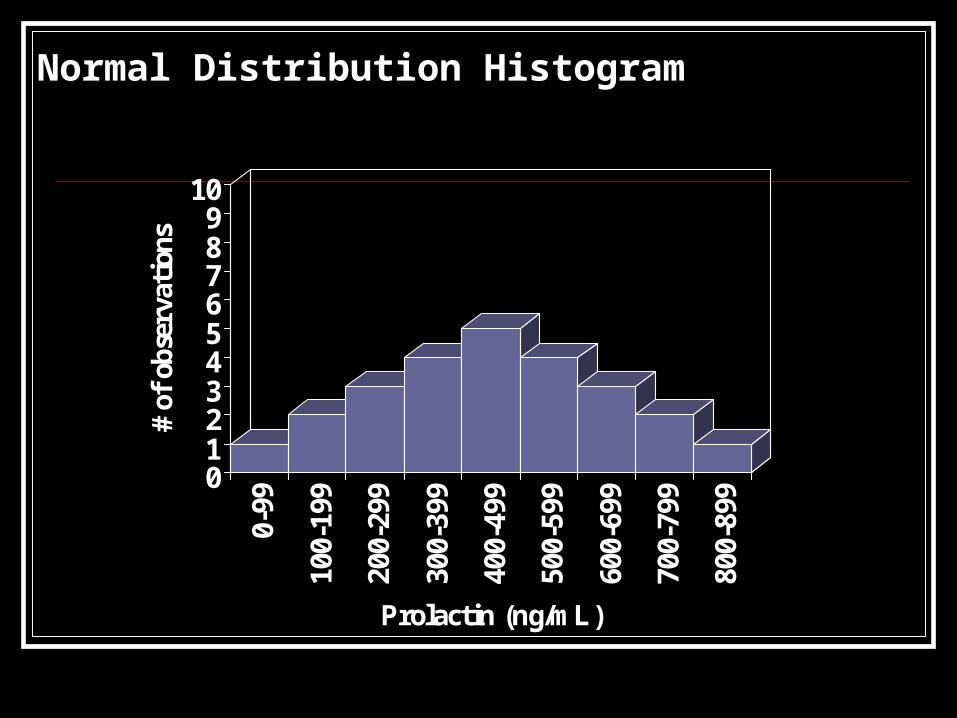
Runner #1 Mean = 4.00 Median = 3.85 Mode = 3.90
Runner #2 Mean = 4.04 Median = 4.00 Mode = 4.00
Runner #3 Mean = 3.9 Median = 3.9 Mode = 4.0
Which runner should the coach select for the last lap?
Problem #2
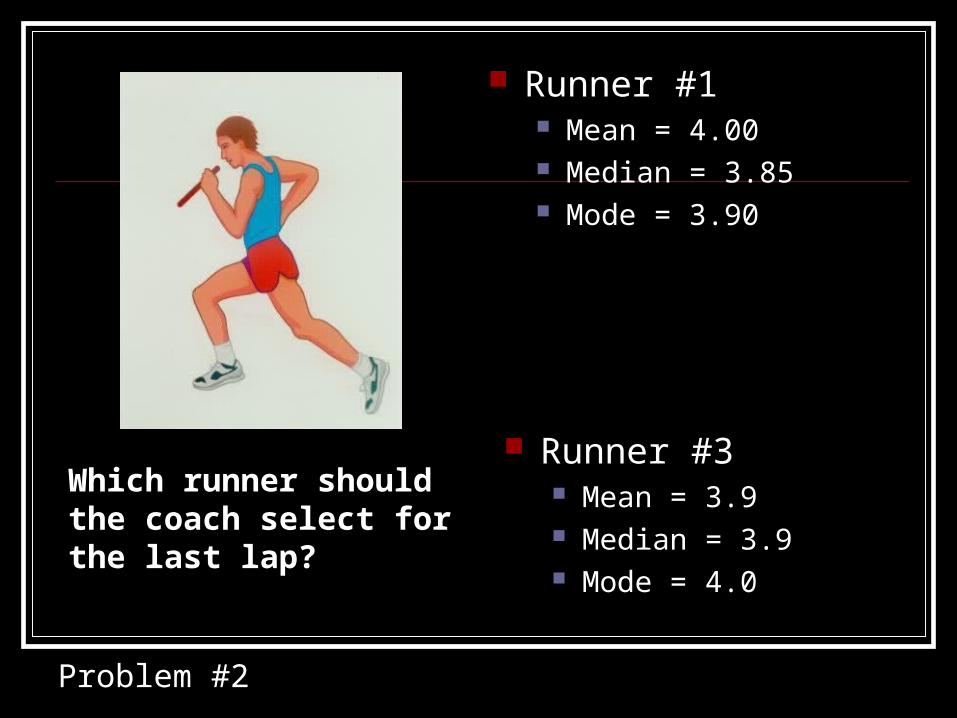
Runner #1 Mean = 4.00 Median = 3.85 Mode = 3.90
Runner #3 Mean = 3.9 Median = 3.9 Mode = 4.0
Which runner should the coach select for the last lap?
Problem #2
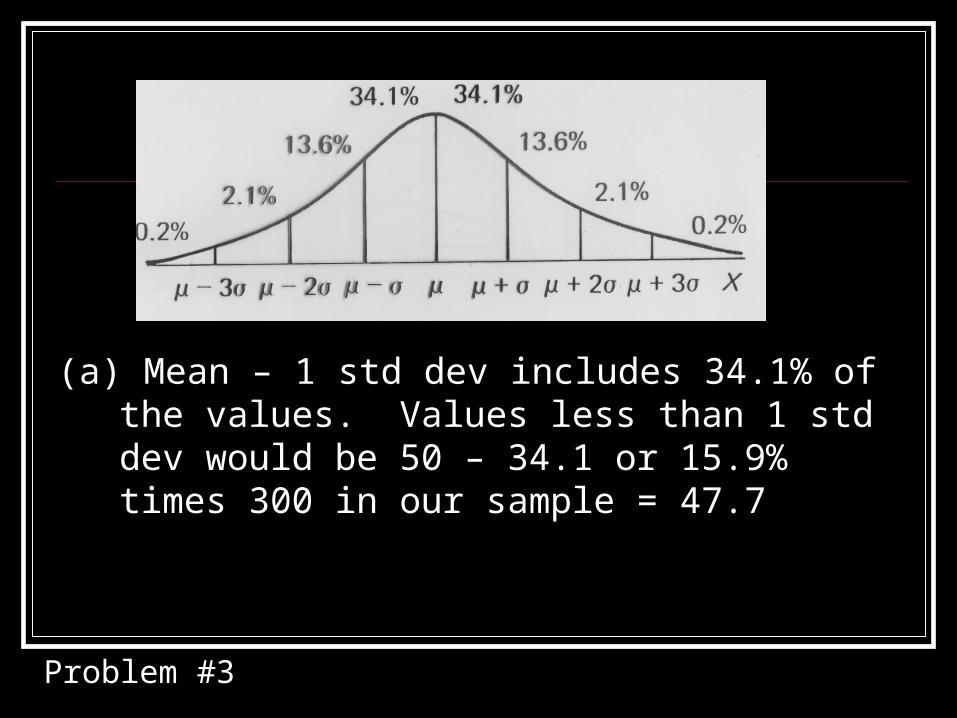
(a) Mean – 1 std dev includes 34.1% of the values. Values less than 1 std dev would be 50 – 34.1 or 15.9% times 300 in our sample = 47.7
Problem #3

(b) Mean + or – 1 std dev includes 68.2% of the values , 68.2% of 300 is 204.6.
Problem #3
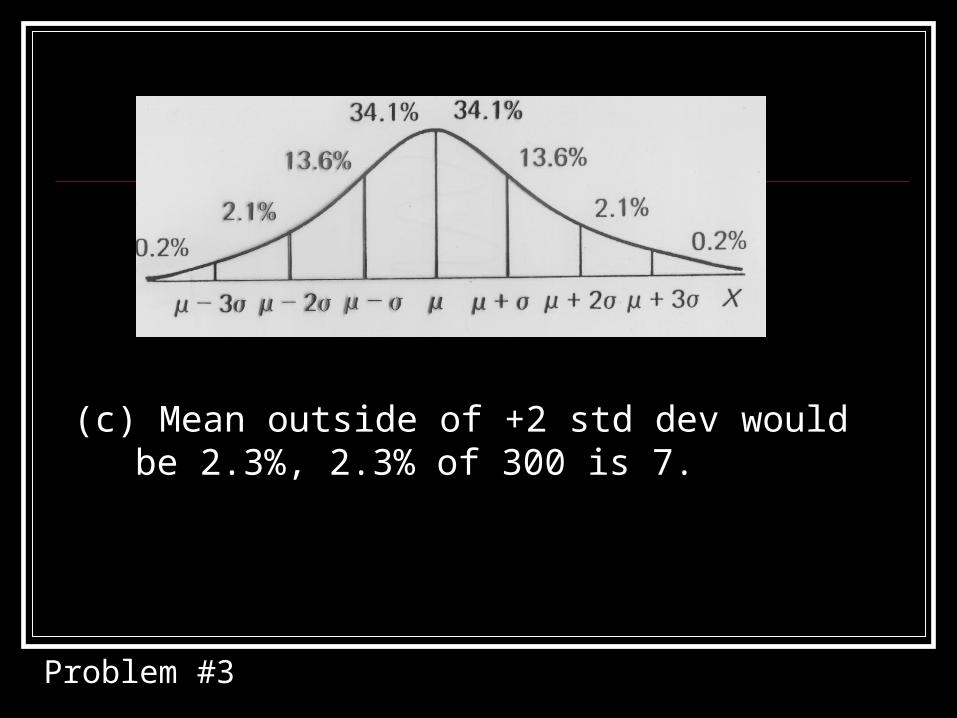
(c) Mean outside of +2 std dev would be 2.3%, 2.3% of 300 is 7.
Problem #3
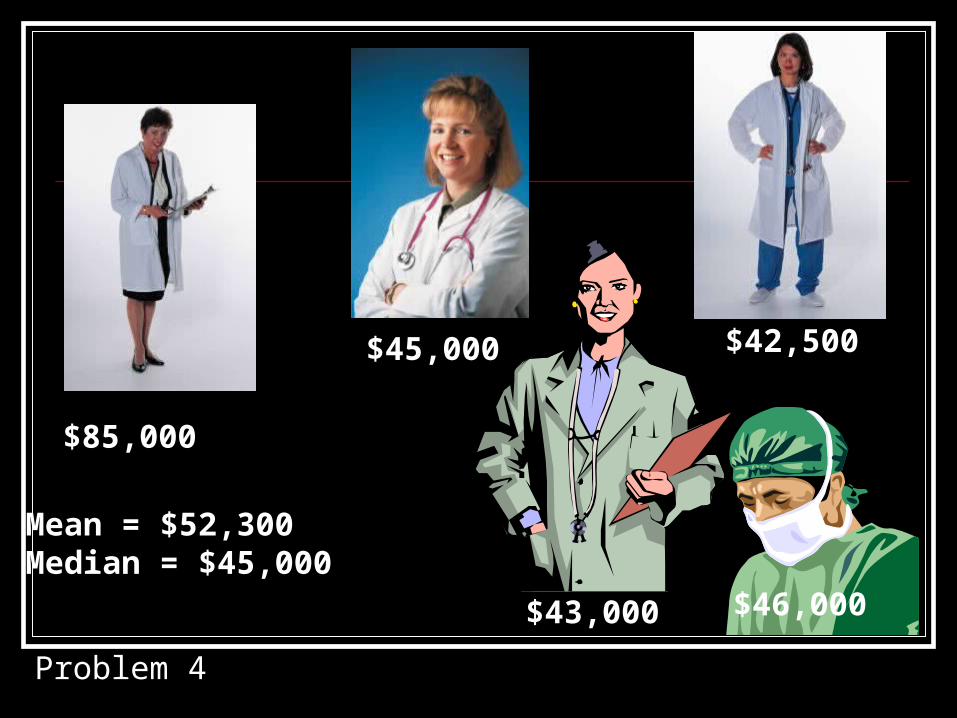
$85,000
$45,000 $42,500
$43,000 $46,000
Mean = $52,300Median = $45,000
Problem 4
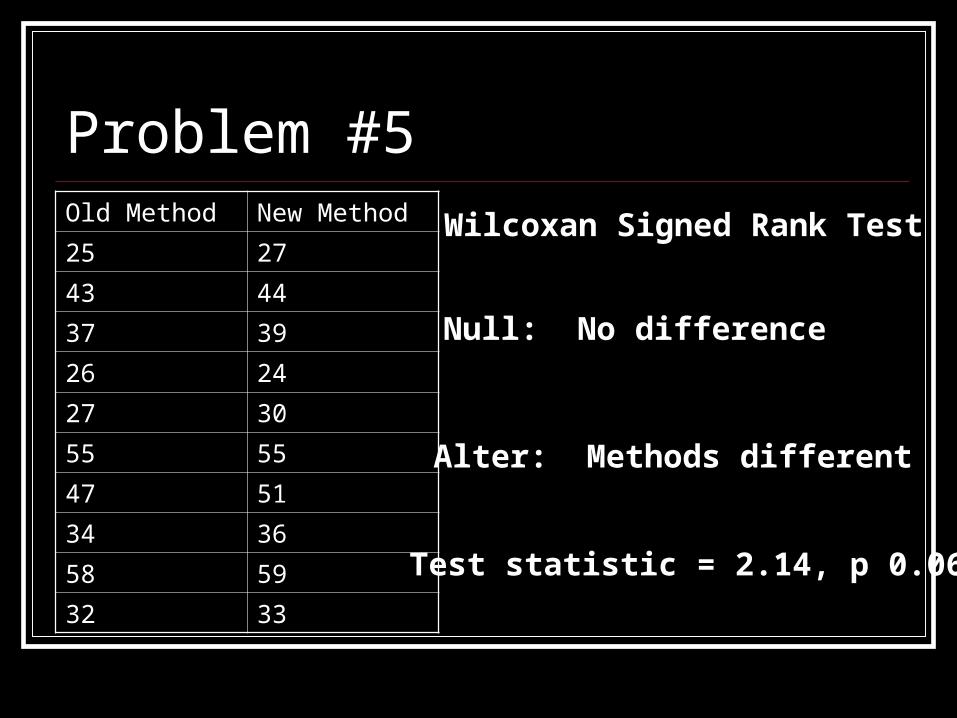
Problem #5Old Method New Method
25 27
43 44
37 39
26 24
27 30
55 55
47 51
34 36
58 59
32 33
Wilcoxan Signed Rank Test
Null: No difference
Alter: Methods different
Test statistic = 2.14, p 0.068
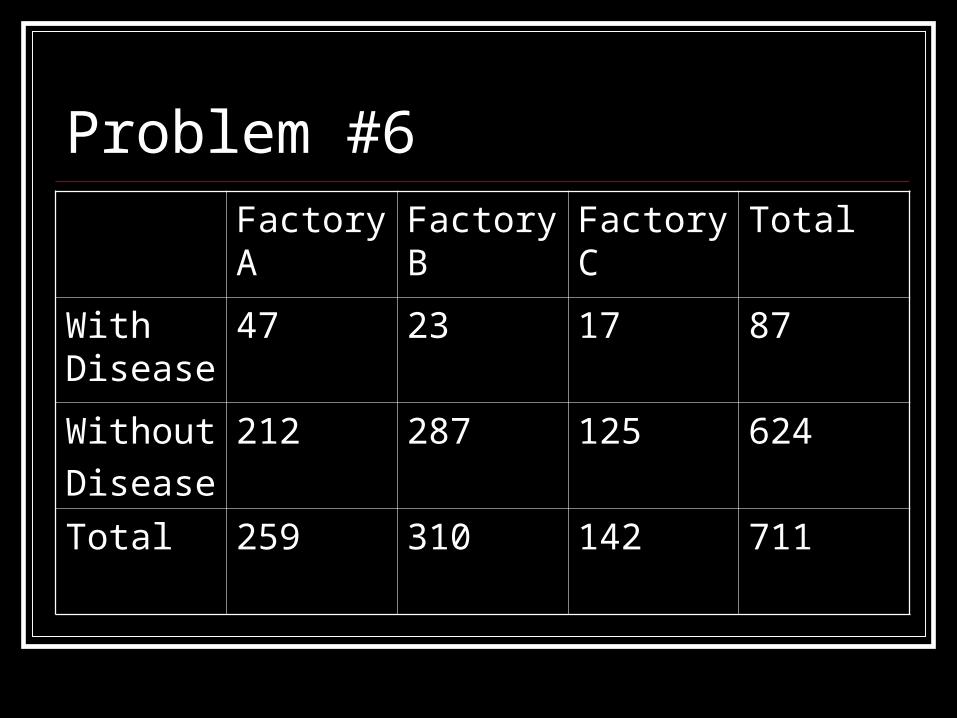
Problem #6Factory A
Factory B
Factory C
Total
With Disease
47 23 17 87
Without
Disease
212 287 125 624
Total 259 310 142 711

Problem #7Parameter New Treatment Control
Number 75 72
Gender
(% male)
51% 49%
Age in years
Mean (SD)
43 (8) 44 (10)

Problem #8
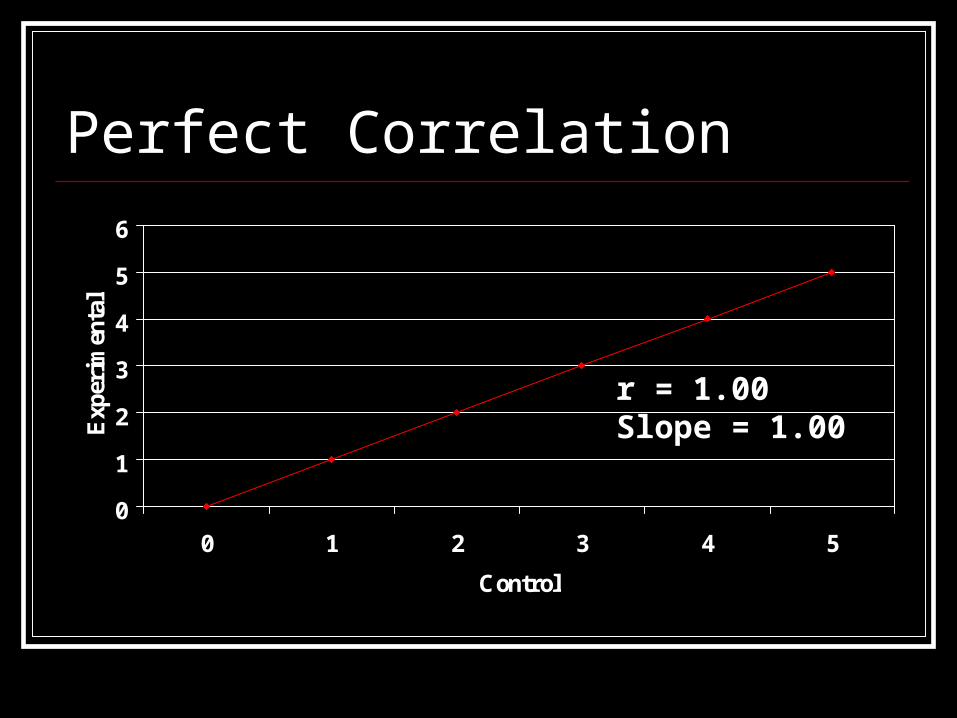
Perfect Correlation
0
1
2
3
4
5
6
0 1 2 3 4 5
Control
Exp
erim
enta
l
r = 1.00Slope = 1.00

Linear Correlation (r)Is There an Association? Measures linear relationship between 2
continuous variables. Interpreting r :
Absolute Value Linearof r Relationship0 - .25 poor.25 - .50 fair.50 - .75 good.75 – 1.0 very good

Problem #9 Mean weight loss:
Walking = 17.09 Cycling = 18.6 Swimming = -4 (gained)
Statistical Test – One Way ANOVA
Null hypothesis: No difference in weight loss among groups
Alter: There is a difference in at least one group
Related Documents