Statistics on Trade Volumes and Value Flowing Through South African Commercial Border Posts and Destination Countries 2020/2021

Welcome message from author
This document is posted to help you gain knowledge. Please leave a comment to let me know what you think about it! Share it to your friends and learn new things together.
Transcript
Statistics on Trade Volumes and Value
Flowing Through South African Commercial Border
Posts and Destination Countries
2020/2021
i | P a g e
TABLE OF CONTENTS
TABLE OF CONTENTS......................................................................................................................................................... i
LIST OF TABLES ................................................................................................................................................................ iii
LIST OF FIGURES .............................................................................................................................................................. iv
LIST OF ACRONYMS .......................................................................................................................................................... v
EXECUTIVE SUMMARY ................................................................................................................................................................................... vi
1. OVERVIEW OF THE REPORT ............................................................................................................................................................... 1
1.1. Introduction ............................................................................................................................................................ 1
1.2. Background ............................................................................................................................................................ 1
1.4. Objectives ............................................................................................................................................................... 2
1.5. Methodology ........................................................................................................................................................... 2
2. COUNTRY ANALYSIS .............................................................................................................................................................................. 3
2.1. Trade Value and volume by Border Posts ........................................................................................................... 3
2.2. Trade with Botswana ............................................................................................................................................. 4
2.2.1. Overview ................................................................................................................................................................4
2.2.2. RSA/Botswana commercial border posts ..............................................................................................................4
2.2.2.1. Grobler’s Bridge border post .......................................................................................................................5 2.2.2.2. Kopfontein border posts ..............................................................................................................................6 2.2.2.3. Ramatlabama border posts .........................................................................................................................6 2.2.2.4. Skilpadshek border posts ............................................................................................................................7 2.2.2.5. RSA’s exports and imports through Botswana commercial border posts ...................................................8
2.2.3. Conclusion ............................................................................................................................................. 13
2.3. Trade with eSwatini ............................................................................................................................................. 14
2.3.1. Overview ..............................................................................................................................................................14
2.3.2. RSA/eSwatini commercial border posts ...............................................................................................................14
2.3.2.1. Golela border posts ...................................................................................................................... 14 2.3.2.2. Jeppes Reef border posts ............................................................................................................. 15 2.3.2.3. Mahamba border posts ................................................................................................................. 16 2.3.2.4. Mananga border posts .................................................................................................................. 17 2.3.2.5. Nerston border posts .................................................................................................................... 18 2.3.2.6. Oshoek border posts ..................................................................................................................... 18 2.3.2.7. RSA’s exports and imports through eSwatini commercial border posts .............................................. 19
2.3.3. Conclusion ............................................................................................................................................. 25
2.5. Trade with Lesotho .............................................................................................................................................. 26
2.5.1. Overview ..............................................................................................................................................................26
2.5.2. RSA/Lesotho Commercial Border Posts ..............................................................................................................26
2.5.2.1. Caledonspoort border posts ........................................................................................................... 26 2.5.2.2. Ficksburg border posts .................................................................................................................. 27 2.5.2.3. Maseru Bridge border posts ........................................................................................................... 28 2.5.2.4. Qacha’s Nek border posts ............................................................................................................. 29
ii | P a g e
2.5.2.5. Van Rooyen’s Gate border posts ................................................................................................... 30 2.5.2.6. RSA’s exports and imports through Lesotho commercial border posts ............................................... 31
2.5.3. Conclusion ............................................................................................................................................. 37
2.7. Trade with Mozambique ...................................................................................................................................... 39
2.7.1. Overview ..............................................................................................................................................................39
2.7.2. Lebombo border posts .........................................................................................................................................39
2.7.2.1. South Africa’s exports to Mozambique ............................................................................................ 39 2.7.2.2. South Africa’s imports from Mozambique ........................................................................................ 41
2.7.3. Conclusion ............................................................................................................................................. 43
2.8. Trade with Namibia .............................................................................................................................................. 44
2.8.1. Overview ..............................................................................................................................................................44
2.8.2. Vioolsdrift Border Posts .......................................................................................................................................44
2.8.2.1. South Africa’s exports to Namibia ................................................................................................... 44 2.8.2.2. South Africa’s imports from Namibia ............................................................................................... 46
2.8.3. Conclusion ...........................................................................................................................................................48
2.9. Trade with Zimbabwe .......................................................................................................................................... 50
2.9.1. Overview ..............................................................................................................................................................50
2.9.2. Beitbridge Border Posts .......................................................................................................................................50
2.9.2.1. South Africa’s exports to Zimbabwe ............................................................................................... 50 2.9.2.2. South Africa’s imports from Zimbabwe ............................................................................................ 52
2.9.3. Conclusion ...........................................................................................................................................................53
3. TRADE VOLUMES AND VALUES BY COUNTRY ......................................................................................................................... 55
3.1. South Africa’s exports to neighbouring states ................................................................................................. 55
3.2. South Africa’s imports from neighbouring states ............................................................................................ 57
3.3. South Africa’s Trade Balance ............................................................................................................................. 59
4. SOUTH AFRICA’S TRADING WITH SADC STATES .................................................................................................................... 60
4.1. South Africa’s exports to SADC member states ............................................................................................... 60
4.2. South Africa’s imports from SADC member states .......................................................................................... 61
5. CONCLUSION .......................................................................................................................................................................................... 63
6. LIMITATIONS ............................................................................................................................................................................................ 64
7. RECOMMENDATIONS ........................................................................................................................................................................... 64
7.1. Report Compilation .............................................................................................................................................. 64
7.2. Enhancing Trade Flow and Efficiency ............................................................................................................... 64
iii | P a g e
LIST OF TABLES
Table 1: South Africa/Botswana border posts and operating times ..........................................................................................4
Table 2: Trade values of the RSA/Botswana Grobler’s Bridge border posts, (Rands) ..............................................................5
Table 3: Trade values of the RSA/Botswana Kopfontein border posts, (Rands) .......................................................................6
Table 4: Trade values of the RSA/Botswana Ramatlabama border posts, (Rands) ..................................................................7
Table 5: Trade values of the RSA/Botswana Skilpadshek border posts, (Rands) .....................................................................8
Table 6: RSA exports (value and volume) to Botswana ............................................................................................................9
Table 7: RSA exports (value and volume) through commercial border posts to Botswana, 2020 ...........................................10
Table 8: RSA imports (value and volume) from Botswana ......................................................................................................11
Table 9: RSA imports (value and volume) through commercial border posts from Botswana, 2020 .......................................12
Table 10: South Africa/eSwatini border posts and operating times .........................................................................................14
Table 11: Trade values of the RSA/eSwatini Golela border posts, (Rands) ............................................................................15
Table 12: Trade values of the RSA/eSwatini Jeppes Reef border posts, (Rands) ..................................................................16
Table 13: Trade values of the RSA/eSwatini Mahamba border posts, (Rands) ......................................................................16
Table 14: Trade values of the RSA/eSwatini Mananga border posts, (Rands) .......................................................................17
Table 15: Trade values of the RSA/eSwatini Nerston border posts, (Rands) ..........................................................................18
Table 16: Trade values of the RSA/eSwatini Oshoek border posts, (Rands) ..........................................................................19
Table 17: RSA exports (value and volume) to eSwatini ..........................................................................................................20
Table 18: RSA exports (value and volume) through commercial border posts to eSwatini, 2020 ...........................................21
Table 19: RSA imports (value and volume) from Botswana ....................................................................................................22
Table 20: RSA imports (value and volume) through commercial border posts from eSwatini, 2020 .......................................25
Table 21: South Africa/Lesotho commercial border posts and operating times ......................................................................26
Table 22: Trade values of the RSA/Lesotho Caledonspoort border posts, (Rands) ................................................................27
Table 23: Trade values of the RSA/Lesotho Ficksburg border posts, (Rands) ........................................................................28
Table 24: Trade values of the RSA/Lesotho Maseru bridge border posts, (Rands) ................................................................29
Table 25: Trade values of the RSA/Lesotho Qacha’s Nek border posts, (Rands) ...................................................................29
Table 26: Trade values of the RSA/Lesotho Van Rooyen’s Gate border posts, (Rands) ........................................................30
Table 27: RSA exports (value and volume) to Lesotho ...........................................................................................................31
Table 28: RSA exports (value and volume) through commercial border posts to Lesotho, 2020 ............................................33
Table 29: RSA imports (value and volume) from Lesotho .......................................................................................................34
Table 30: RSA imports (value and volume) through commercial border posts from Lesotho, 2020 ........................................37
Table 31: South Africa/Mozambique border posts and operating times .................................................................................39
Table 32: RSA exports (value and volume) to Mozambique ...................................................................................................40
Table 33: RSA exports (value and volume) to Mozambique, 2020..........................................................................................41
Table 35: RSA imports (value and volume) from Mozambique ...............................................................................................42
Table 36: RSA imports (value and volume) from Mozambique, 2020 .....................................................................................43
Table 37: South Africa/Namibia border posts and operating times ........................................................................................44
Table 38: RSA exports (value and volume) to Namibia ...........................................................................................................45
iv | P a g e
Table 39: RSA exports (value and volume) to Namibia, 2020 .................................................................................................46
Table 40: RSA imports (value and volume) from Namibia .......................................................................................................47
Table 41: RSA imports (value and volume) from Namibia, 2020 .............................................................................................48
Table 42: RSA exports (value and volume) to Zimbabwe .......................................................................................................50
Table 43: RSA exports (value and volume) to Zimbabwe, 2020 .............................................................................................51
Table 44: RSA imports (value and volume) from Zimbabwe ...................................................................................................52
Table 45: RSA imports (value and volume) from Zimbabwe, 2020 .........................................................................................53
Table 46: South Africa’s exports to neighbouring states .........................................................................................................55
Table 47: South Africa’s imports from neighbouring states .....................................................................................................58
Table 48: South Africa’s exports from SADC member states ..................................................................................................60
Table 49: South Africa’s imports from SADC member states ..................................................................................................61
LIST OF FIGURES
Figure 1: South Africa’s exports (value and volume) to Botswana ............................................................................................9
Figure 2: South Africa’s imports (value and volume) from Botswana ......................................................................................12
Figure 3: South Africa’s exports (value and volume) to eSwatini.............................................................................................20
Figure 4: South Africa’s imports (value and volume) from eSwatini ........................................................................................23
Figure 5: South Africa’s exports (value and volume) to Lesotho .............................................................................................32
Figure 6: South Africa’s imports (value and volume) from Lesotho .........................................................................................35
Figure 7: South Africa’s exports to Mozambique .....................................................................................................................40
Figure 8: South Africa’s imports (value and volume) from Mozambique .................................................................................42
Figure 9: South Africa’s exports to Namibia ............................................................................................................................45
Figure 10: South Africa’s imports (value and volume) from Namibia .......................................................................................47
Figure 11: South Africa’s exports to Zimbabwe .......................................................................................................................51
Figure 12: South Africa’s imports (value and volume) from Zimbabwe ...................................................................................52
Figure 13: South Africa’s exports to neighbouring countries (Rands)......................................................................................56
Figure 14: Volumes of goods ferried across commercial border posts, 2020 ..........................................................................57
Figure 15: South Africa’s imports from neighbouring countries (Rands) .................................................................................59
Figure 16: South Africa’s exports SADC countries ..................................................................................................................61
Figure 17: South Africa’s imports from SADC countries ..........................................................................................................62
v | P a g e
LIST OF ACRONYMS
BWP Botswana Pula
CT Carat
C-BRTA Cross-Border Road Transport Agency
DTI Department of Trade and Industry
KG Kilogram
LDC Least Development Countries
LI Liter
MC Microgram
ME Milligram
MW Megawatt
NO Number
NTB’s Non-Tariff Barriers
NULL Unclassified goods
PR Pair
RSA South Africa
RTMC Road Transport Management Corporation
SADC Southern African Development Community
SARS South African Revenue Service
SM Square meter
vi | P a g e
EXECUTIVE SUMMARY
The aim of this report is to provide a high-level statistics of trade volumes and commodities values, and
where possible trade volumes passing through strategic commercial border posts between South Africa
and neighbouring countries. The report also provides up to date information about trade with the
Southern African Development Community (SADC) member states.
The objectives of the report are to support the cross-border road transport industry with meaningful data
to increase knowledge of market trends; to support policy formulation; to develop sustainable means
for data collection, data management and data storage of the trade statistics; and to create an integrated
knowledge base of trade with SADC Member States to serve the industry’s stakeholders in improving
economic trends and competitiveness.
The methodology implemented by this report is primarily desktop research and using administrative
data from the South African Revenue Services (SARS). Secondary sources such as working papers,
journals and trade statistics information from relevant member states from the internet were also used.
The results of the report are presented in descriptive statistics in a form of tables, histograms and
figures; and a comparative analysis was also used conducted in terms of these countries’ performance
in trade flows.
According to the findings, South Africa exported 27,2 billion units of goods to the neighbouring countries
by road. South Africa exported the highest trade volumes to Mozambique that passed through the
Lebombo border posts, claiming a 50% share compared to the neighbouring countries. Thus, Lebombo
border post handled the highest number of total trade volumes (46%) that was an aggregate of both
exports and imports volumes.
Botswana became the second importer from South Africa by receiving about 24% (6,5 billion pieces of
goods) of the total trade volumes exported by South Africa. Skilpadshek border post handled about 9%
of the total trade volumes South Africa exported to the neighbouring countries, Kopfontein and
Ramatlabama border posts recorded about 6% of South Africa’s total trade volumes exported,
separately.
Botswana was found to be the major trade partner of South Africa in 2020 by listing the highest trade
value of 29% (R81,3 billion) from the total trade value of R278,9 billion of all commercial border posts
under study. Zimbabwe and Mozambique became the second and third trade partners with 25% and
21% amounting to R70 billion and R58 billion, respectively.
Zimbabwe registered the third importer of South Africa by importing approximately 12% (3,3 billion
pieces of goods) of South Africa’s total export volumes (27,2 billion pieces of goods) transported by
vii | P a g e
road. Beitbridge border post processed the same amount of trade volumes imported by Zimbabwe
excluding trade export volumes that transited to other countries.
ESwatini was found to be the principal exporter to South Africa by exporting about 38% (1,4 billion
pieces of goods) of the total trade volumes (3,7 billion pieces of goods), compared to the neighbouring
countries. Oshoek border post administered about 18% (683 million pieces of goods) of the total trade
volumes South Africa imported from the neighbouring countries, and it was found to be the foremost
border post that processed eSwatini’s exports destined to South Africa.
Botswana was the second exporter to South Africa since South Africa imported around 27% (999 million
pieces of goods) of its total import volumes (3,7 billion pieces of goods), transported by road.
Grobler’s bridge and Ramatlabama border post administered about 9% (349 million and 329 million
pieces of goods, separately) of South Africa’s total trade volumes imported from all neighbouring
countries and this made them the highest in handling South Africa’s imports compared to other
commercial border posts of Botswana in 2020.
Mozambique and Zimbabwe registered fourth and fifth exporting partners of South Africa by exporting
around 15% and 12% to South Africa, separately. Lebombo and Beitbridge border posts administered
the highest trade volumes imported by South Africa from Zimbabwe and Mozambique by 15% and 12%
of the total trade volumes imported by South Africa. These results infer that the highest freight traffic
flows incoming South Africa were from Mozambique and Zimbabwe.
Trade between South Africa and her neighbouring states in 2020 favoured South Africa since it exported
R238 billion worth of goods and imported R40,9 billion worth of goods, ensuing a trade surplus of R197
billion.
The universal fall of international trade between South Africa and her neighbouring states has been
exacerbated by coronavirus (COVID-19) that has resulted in mass production shutdowns and supply
chain disruptions due to border posts and ports closures in these countries under study and globally,
causing global ripple effects across all economic sectors in a rare “twin supply-demand shock” which is
a sharp, sudden change in the supply and demand for a product or a service. As South Africa is one of
the neighbouring countries’ biggest trading partners, the effects of COVID-19 are already being felt in
the SADC region and in the continent.
This report can be used by the C-BRTA and the Road Transport Management Corporation as a strategic
tool for the deployment of law enforcement personnel along the cross-border corridors. It plainly states
the movement of trade volumes inbound and outbound South Africa. The data used in this report can
viii | P a g e
be used to assess the correlation between the size of trade volumes versus the number of permits
issued to determine the factors that affect the source of revenue within the C-BRTA.
Ultimately, the report proposes that the C-BRTA improves the database of consignment notes in order
to update annual traffic flows, trade values and trade volumes; the C-BRTA must continue to develop
this research output for purposes of advising the Minister and better informing cross-border operations.
The agency should identify pragmatic methods of advocating some of the key thematic issues that will
emanate from this research output to relevant stakeholders. Lastly, the agency should engage and
collaborate with industry stakeholders who can assist with generating and validating cross border trade
and traffic data.
1 | P a g e
1. OVERVIEW OF THE REPORT
1.1. Introduction
The aim of this study is to provide a high-level statistics of trade volumes, values, commodities and,
where possible, trade volumes passing through strategic commercial border posts between South Africa
and neighbouring countries.
The development of this report is informed by the mandate and responsibilities of the Cross-Border
Road Transport Agency (C-BRTA) where it is required to generate reliable intelligence with respect to
cross-border operations in order to respond to challenges encountered and enhance data collection.
1.2. Background
Currently, South Africa has over fifty-three (53) official border ports, nineteen (19) of which are for
commercial purposes. Most of the trade between and among SADC member states takes place across
the nineteen border posts. There is also the subjective evidence, which postulates that trade has over
the years continued to increase to exponential levels. In some cases, it has been suggested that traffic
has even doubled, particularly at border posts such as Beitbridge (between South Africa and Zimbabwe)
and Lebombo (between South Africa and Mozambique). Be that as it may, there is the reality that the
C-BRTA is not armed with data that relates and reflects such growth to better inform its cross-border
road transport operations. This current reality has subsequently resulted in the following challenges:
i. Limiting the ability of the C-BRTA to advice the Minister of Transport, road transport operators,
and industry role players on trade and traffic movement per border posts
ii. Limiting the participation of the C-BRTA in infrastructure planning and development to better
respond to the needs of the road transport industry
iii. Limiting the ability of the C-BRTA in terms of appreciating the value that cross-border trade
contributes towards the domestic and regional economy
iv. Limiting the ability of the C-BRTA to plan appropriately for activities relating to border operations
(law enforcement inspection and traffic counts), due to the absence of data that relates to trade
and transport movements at these facilities.
Based on the above, it is therefore key that updated information be obtained with respect to trade and
traffic data passing through commercial border posts for purposes of ensuring the C-BRTA is better
positioned to advice the Minister of Transport and improve its operations, especially those that relate to
border posts. Therefore, the study covers five countries with their commercial border posts neighbouring
South Africa.

2 | P a g e
1.4. Objectives
The objectives of the report are as follows:
i. To support the cross-border road transport industry with meaningful data to increase knowledge
of market trends
ii. To support policy formulation, develop sustainable means for data collection, data management
and data storage of the trade statistics
iii. To create an integrated knowledge base of trade with SADC Member States to serve the
industry’s stakeholders in improving economic trends and competitiveness.
1.5. Methodology
The methodology adopted by this study was primarily desktop research and used data sources from the
South African Revenue Services (SARS). Secondary sources such as working papers, journals and
trade statistics information from relevant member states from the internet were also used.
The Report is structured as follows:
i. Introduction and background
ii. Country overview and trade analysis
iii. Identified Border posts trade statistics and analysis.
3 | P a g e
2. COUNTRY ANALYSIS
2.1. Trade Value and volume by Border Posts
Tables below show the trade volumes in different units of measure and values in Rands from 2018 to
2018 that passed across Botswana/South Africa commercial border posts. These tables also show the
value and volume in terms of exports and imports.
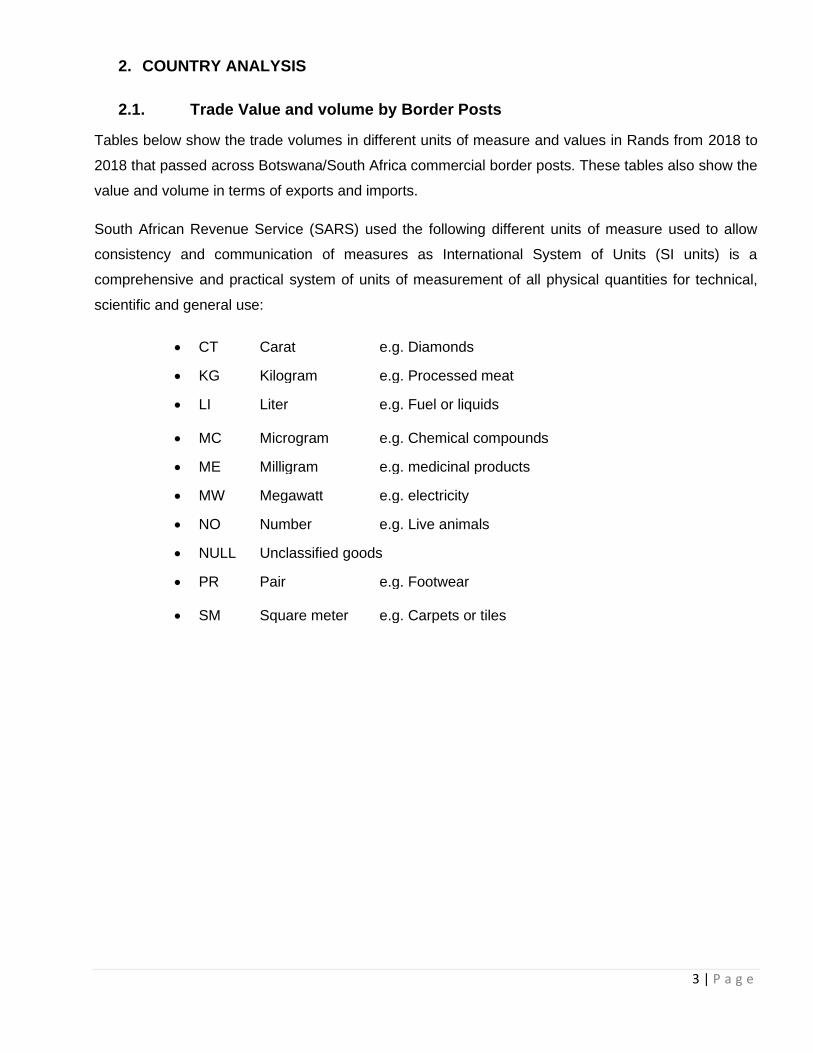
South African Revenue Service (SARS) used the following different units of measure used to allow
consistency and communication of measures as International System of Units (SI units) is a
comprehensive and practical system of units of measurement of all physical quantities for technical,
scientific and general use:
• CT Carat e.g. Diamonds
• KG Kilogram e.g. Processed meat
• LI Liter e.g. Fuel or liquids
• MC Microgram e.g. Chemical compounds
• ME Milligram e.g. medicinal products
• MW Megawatt e.g. electricity
• NO Number e.g. Live animals
• NULL Unclassified goods
• PR Pair e.g. Footwear
• SM Square meter e.g. Carpets or tiles
4 | P a g e
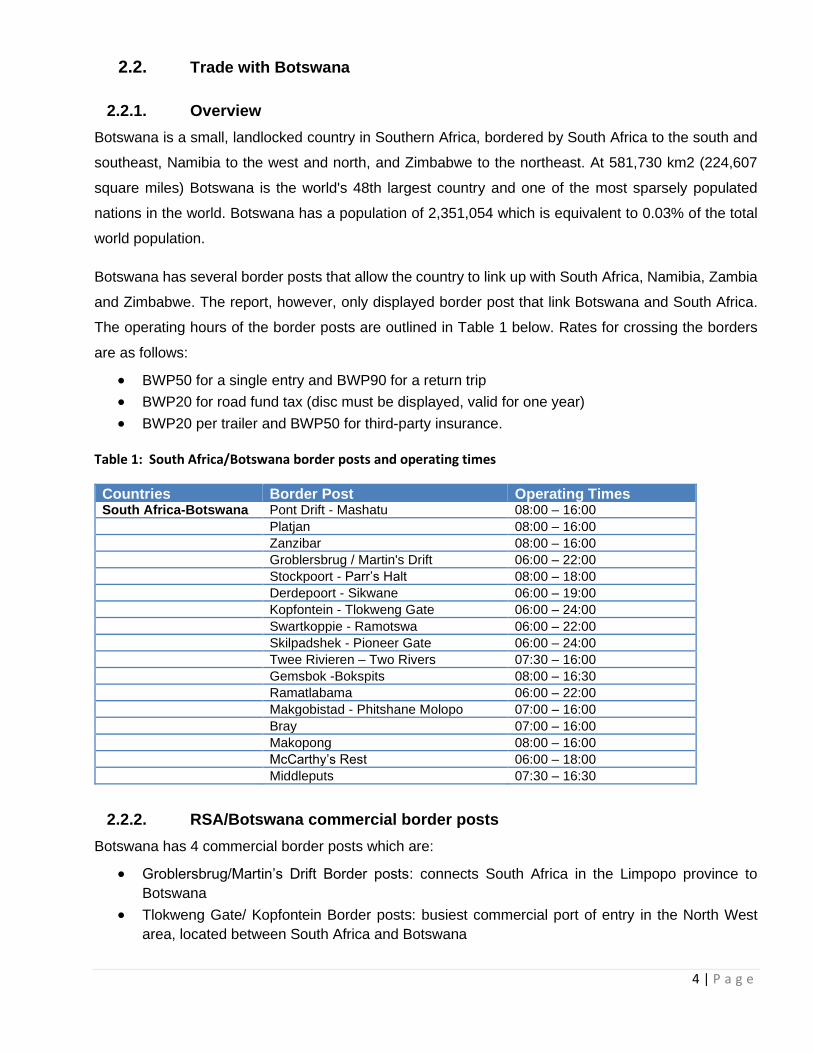
2.2. Trade with Botswana
2.2.1. Overview
Botswana is a small, landlocked country in Southern Africa, bordered by South Africa to the south and
southeast, Namibia to the west and north, and Zimbabwe to the northeast. At 581,730 km2 (224,607
square miles) Botswana is the world's 48th largest country and one of the most sparsely populated
nations in the world. Botswana has a population of 2,351,054 which is equivalent to 0.03% of the total
world population.
Botswana has several border posts that allow the country to link up with South Africa, Namibia, Zambia
and Zimbabwe. The report, however, only displayed border post that link Botswana and South Africa.
The operating hours of the border posts are outlined in Table 1 below. Rates for crossing the borders
are as follows:
• BWP50 for a single entry and BWP90 for a return trip
• BWP20 for road fund tax (disc must be displayed, valid for one year)
• BWP20 per trailer and BWP50 for third-party insurance.
Table 1: South Africa/Botswana border posts and operating times
Countries Border Post Operating Times South Africa-Botswana Pont Drift - Mashatu 08:00 – 16:00
Platjan 08:00 – 16:00
Zanzibar 08:00 – 16:00
Groblersbrug / Martin's Drift 06:00 – 22:00
Stockpoort - Parr’s Halt 08:00 – 18:00
Derdepoort - Sikwane 06:00 – 19:00
Kopfontein - Tlokweng Gate 06:00 – 24:00
Swartkoppie - Ramotswa 06:00 – 22:00
Skilpadshek - Pioneer Gate 06:00 – 24:00
Twee Rivieren – Two Rivers 07:30 – 16:00
Gemsbok -Bokspits 08:00 – 16:30
Ramatlabama 06:00 – 22:00
Makgobistad - Phitshane Molopo 07:00 – 16:00
Bray 07:00 – 16:00
Makopong 08:00 – 16:00
McCarthy’s Rest 06:00 – 18:00
Middleputs 07:30 – 16:30
2.2.2. RSA/Botswana commercial border posts
Botswana has 4 commercial border posts which are:
• Groblersbrug/Martin’s Drift Border posts: connects South Africa in the Limpopo province to
Botswana
• Tlokweng Gate/ Kopfontein Border posts: busiest commercial port of entry in the North West
area, located between South Africa and Botswana
5 | P a g e
• Pioneer Gate/Skilpadshek Border posts: located 52 kilometres north-west of Zeerust in North
West province. The Trans-Kalahari Corridor passes through Skilpadshek and it operates until
midnight
• Ramatlabama Border posts: This port of entry is approximately 25 kilometres north of Mafikeng
in the North West.
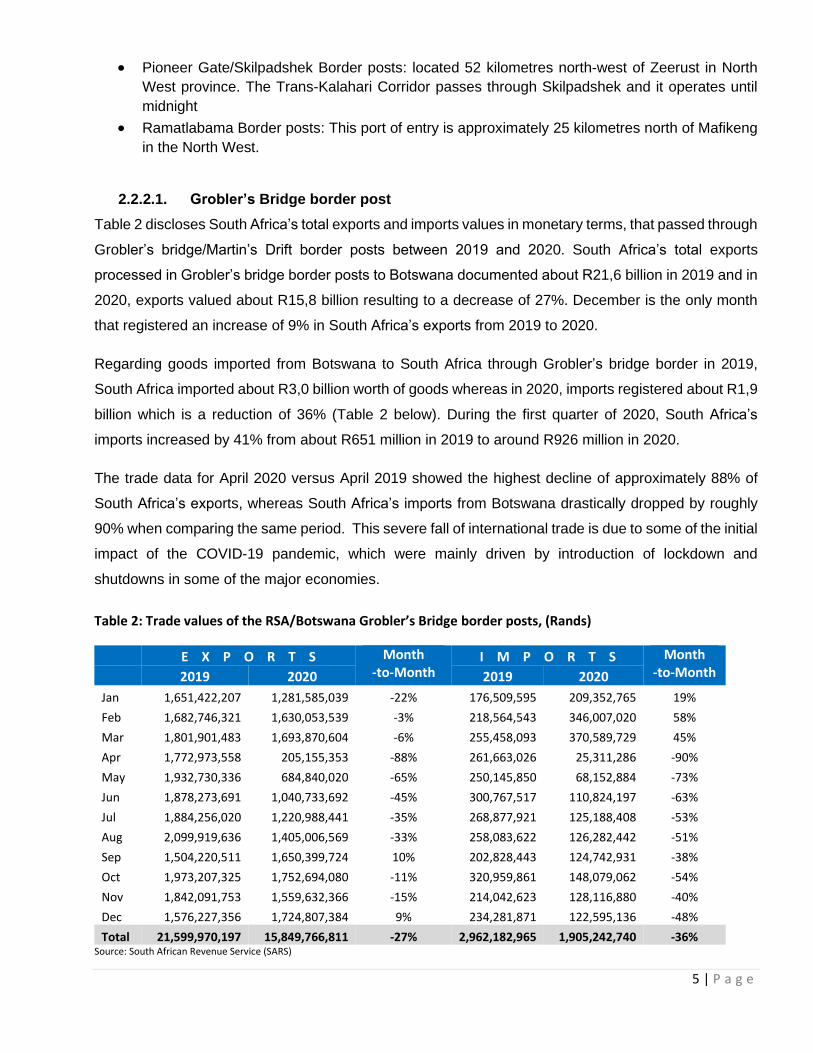
2.2.2.1. Grobler’s Bridge border post
Table 2 discloses South Africa’s total exports and imports values in monetary terms, that passed through
Grobler’s bridge/Martin’s Drift border posts between 2019 and 2020. South Africa’s total exports
processed in Grobler’s bridge border posts to Botswana documented about R21,6 billion in 2019 and in
2020, exports valued about R15,8 billion resulting to a decrease of 27%. December is the only month
that registered an increase of 9% in South Africa’s exports from 2019 to 2020.
Regarding goods imported from Botswana to South Africa through Grobler’s bridge border in 2019,
South Africa imported about R3,0 billion worth of goods whereas in 2020, imports registered about R1,9
billion which is a reduction of 36% (Table 2 below). During the first quarter of 2020, South Africa’s
imports increased by 41% from about R651 million in 2019 to around R926 million in 2020.
The trade data for April 2020 versus April 2019 showed the highest decline of approximately 88% of
South Africa’s exports, whereas South Africa’s imports from Botswana drastically dropped by roughly
90% when comparing the same period. This severe fall of international trade is due to some of the initial
impact of the COVID-19 pandemic, which were mainly driven by introduction of lockdown and
shutdowns in some of the major economies.
Table 2: Trade values of the RSA/Botswana Grobler’s Bridge border posts, (Rands)
E X P O R T S Month -to-Month
I M P O R T S Month -to-Month
2019 2020 2019 2020
Jan 1,651,422,207 1,281,585,039 -22% 176,509,595 209,352,765 19%
Feb 1,682,746,321 1,630,053,539 -3% 218,564,543 346,007,020 58%
Mar 1,801,901,483 1,693,870,604 -6% 255,458,093 370,589,729 45%
Apr 1,772,973,558 205,155,353 -88% 261,663,026 25,311,286 -90%
May 1,932,730,336 684,840,020 -65% 250,145,850 68,152,884 -73%
Jun 1,878,273,691 1,040,733,692 -45% 300,767,517 110,824,197 -63%
Jul 1,884,256,020 1,220,988,441 -35% 268,877,921 125,188,408 -53%
Aug 2,099,919,636 1,405,006,569 -33% 258,083,622 126,282,442 -51%
Sep 1,504,220,511 1,650,399,724 10% 202,828,443 124,742,931 -38%
Oct 1,973,207,325 1,752,694,080 -11% 320,959,861 148,079,062 -54%
Nov 1,842,091,753 1,559,632,366 -15% 214,042,623 128,116,880 -40%
Dec 1,576,227,356 1,724,807,384 9% 234,281,871 122,595,136 -48%
Total 21,599,970,197 15,849,766,811 -27% 2,962,182,965 1,905,242,740 -36% Source: South African Revenue Service (SARS)
6 | P a g e
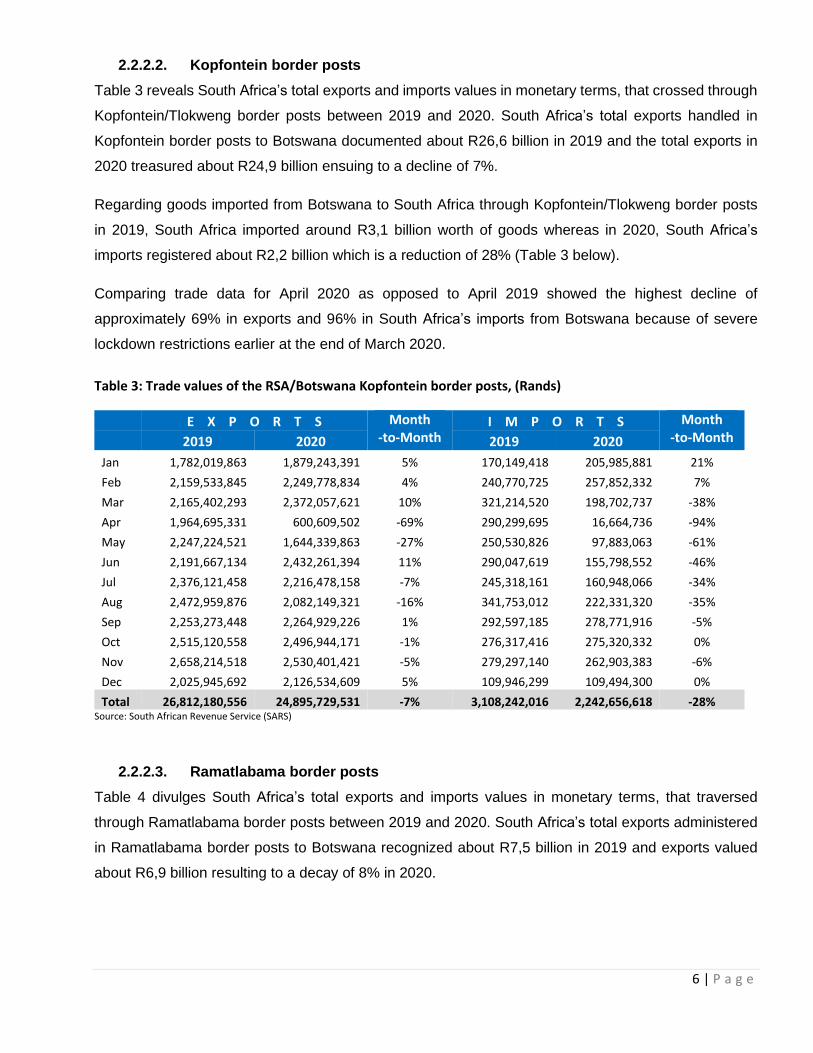
2.2.2.2. Kopfontein border posts
Table 3 reveals South Africa’s total exports and imports values in monetary terms, that crossed through
Kopfontein/Tlokweng border posts between 2019 and 2020. South Africa’s total exports handled in
Kopfontein border posts to Botswana documented about R26,6 billion in 2019 and the total exports in
2020 treasured about R24,9 billion ensuing to a decline of 7%.
Regarding goods imported from Botswana to South Africa through Kopfontein/Tlokweng border posts
in 2019, South Africa imported around R3,1 billion worth of goods whereas in 2020, South Africa’s
imports registered about R2,2 billion which is a reduction of 28% (Table 3 below).
Comparing trade data for April 2020 as opposed to April 2019 showed the highest decline of
approximately 69% in exports and 96% in South Africa’s imports from Botswana because of severe
lockdown restrictions earlier at the end of March 2020.
Table 3: Trade values of the RSA/Botswana Kopfontein border posts, (Rands)
E X P O R T S Month -to-Month
I M P O R T S Month -to-Month
2019 2020 2019 2020
Jan 1,782,019,863 1,879,243,391 5% 170,149,418 205,985,881 21%
Feb 2,159,533,845 2,249,778,834 4% 240,770,725 257,852,332 7%
Mar 2,165,402,293 2,372,057,621 10% 321,214,520 198,702,737 -38%
Apr 1,964,695,331 600,609,502 -69% 290,299,695 16,664,736 -94%
May 2,247,224,521 1,644,339,863 -27% 250,530,826 97,883,063 -61%
Jun 2,191,667,134 2,432,261,394 11% 290,047,619 155,798,552 -46%
Jul 2,376,121,458 2,216,478,158 -7% 245,318,161 160,948,066 -34%
Aug 2,472,959,876 2,082,149,321 -16% 341,753,012 222,331,320 -35%
Sep 2,253,273,448 2,264,929,226 1% 292,597,185 278,771,916 -5%
Oct 2,515,120,558 2,496,944,171 -1% 276,317,416 275,320,332 0%
Nov 2,658,214,518 2,530,401,421 -5% 279,297,140 262,903,383 -6%
Dec 2,025,945,692 2,126,534,609 5% 109,946,299 109,494,300 0%
Total 26,812,180,556 24,895,729,531 -7% 3,108,242,016 2,242,656,618 -28% Source: South African Revenue Service (SARS)
2.2.2.3. Ramatlabama border posts
Table 4 divulges South Africa’s total exports and imports values in monetary terms, that traversed
through Ramatlabama border posts between 2019 and 2020. South Africa’s total exports administered
in Ramatlabama border posts to Botswana recognized about R7,5 billion in 2019 and exports valued
about R6,9 billion resulting to a decay of 8% in 2020.

7 | P a g e
Concerning goods imported from Botswana to South Africa through Ramatlabama borders in 2019,
South Africa imported around R1,3 billion worth of goods whereas in 2020, South Africa’s imports
registered almost the same R1,3 million which is an increase of 1% (Table 4 below).
Associating trade data for April 2020 as opposed to April 2019, the decline was experienced from both
exports and imports with 24% and 60%, respectively. South Africa’s exports in 2020 weakened from
quarter 2 through the year till December, around the same period as in 2020. During quarter 1 and
quarter 4 in 2020, imports drastically increased and, in both quarter 2 and 3, a sharp decline was
recorded due to the prevailing COVID-19 lockdowns.
Table 4: Trade values of the RSA/Botswana Ramatlabama border posts, (Rands)
E X P O R T S Month -to-Month
I M P O R T S Month -to-Month
2019 2020 2019 2020
Jan 605,219,407 673,291,960 11% 52,172,790 126,969,602 143%
Feb 591,077,742 625,051,329 6% 80,350,559 218,300,919 172%
Mar 622,784,490 687,676,187 10% 125,404,511 255,439,822 104%
Apr 563,980,472 429,492,101 -24% 115,533,889 46,317,726 -60%
May 544,546,212 463,563,996 -15% 123,627,931 32,799,842 -73%
Jun 499,475,606 450,927,297 -10% 121,903,479 25,578,442 -79%
Jul 630,835,312 622,890,967 -1% 113,024,700 32,085,740 -72%
Aug 572,273,593 501,935,385 -12% 113,844,002 49,684,192 -56%
Sep 614,562,090 570,560,417 -7% 101,000,632 49,545,476 -51%
Oct 695,223,502 587,210,572 -16% 100,986,206 151,759,276 50%
Nov 866,412,850 667,440,217 -23% 143,642,331 158,997,643 11%
Dec 676,893,434 638,608,924 -6% 97,069,624 149,944,943 54%
Total 7,483,284,710 6,918,649,352 -8% 1,288,560,654 1,297,423,623 1% Source: South African Revenue Service (SARS)
2.2.2.4. Skilpadshek border posts
Table 5 depicts South Africa’s total exports and imports values in monetary terms, that crossed
Skilpadshek border posts in 2019 and 2020. South Africa’s total exports administered in Skilpadshek
border posts to Botswana documented about R39,4 billion in 2019 and in 2020, exports valued about
R26,3 billion resulting to a deterioration of 33%. The rate of change from 2019 to 2020 shows that only
Quarter 1 recorded an increase in exports whereas the rest of the quarters realized a decline with April
being the highest with negative 69%.
Regarding imports from Botswana to South Africa through Skilpadshek border posts, South Africa
imported around R3,8 billion worth of goods in 2019 whereas in 2020, South Africa’s imports registered
about R1,9 billion which is a reduction of 51% (Table 5 below). Imports that were processed in
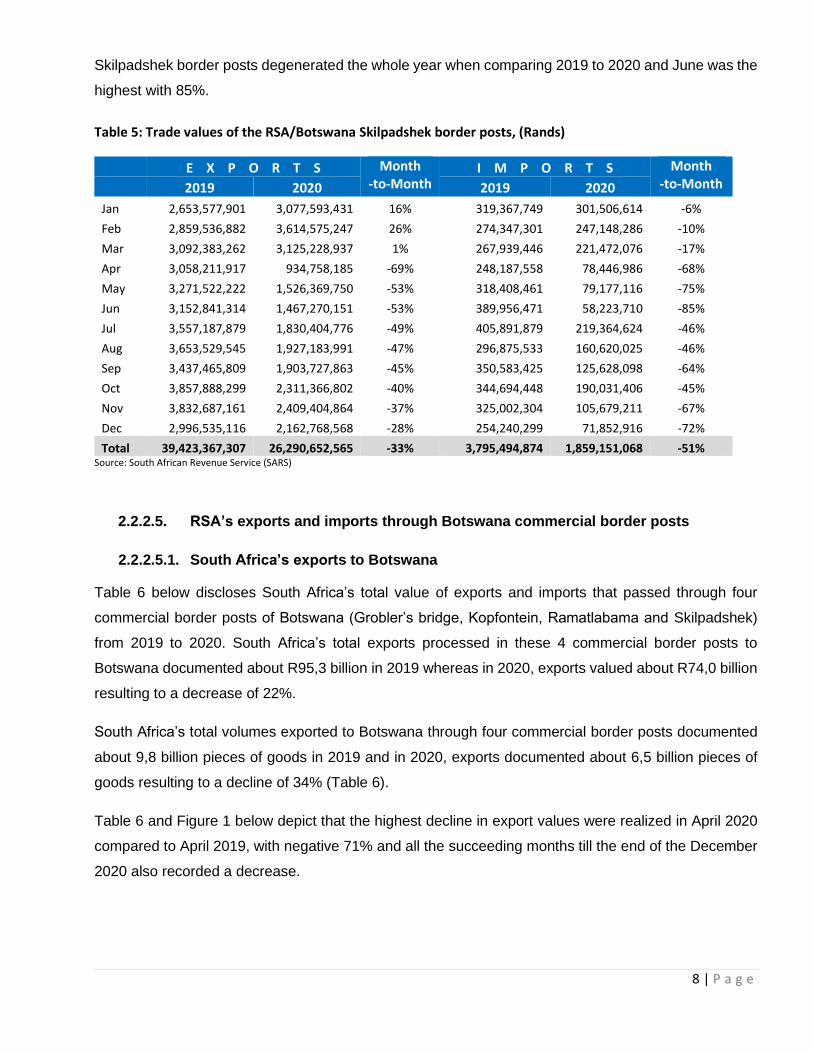
8 | P a g e
Skilpadshek border posts degenerated the whole year when comparing 2019 to 2020 and June was the
highest with 85%.
Table 5: Trade values of the RSA/Botswana Skilpadshek border posts, (Rands)
E X P O R T S Month -to-Month
I M P O R T S Month -to-Month
2019 2020 2019 2020
Jan 2,653,577,901 3,077,593,431 16% 319,367,749 301,506,614 -6%
Feb 2,859,536,882 3,614,575,247 26% 274,347,301 247,148,286 -10%
Mar 3,092,383,262 3,125,228,937 1% 267,939,446 221,472,076 -17%
Apr 3,058,211,917 934,758,185 -69% 248,187,558 78,446,986 -68%
May 3,271,522,222 1,526,369,750 -53% 318,408,461 79,177,116 -75%
Jun 3,152,841,314 1,467,270,151 -53% 389,956,471 58,223,710 -85%
Jul 3,557,187,879 1,830,404,776 -49% 405,891,879 219,364,624 -46%
Aug 3,653,529,545 1,927,183,991 -47% 296,875,533 160,620,025 -46%
Sep 3,437,465,809 1,903,727,863 -45% 350,583,425 125,628,098 -64%
Oct 3,857,888,299 2,311,366,802 -40% 344,694,448 190,031,406 -45%
Nov 3,832,687,161 2,409,404,864 -37% 325,002,304 105,679,211 -67%
Dec 2,996,535,116 2,162,768,568 -28% 254,240,299 71,852,916 -72%
Total 39,423,367,307 26,290,652,565 -33% 3,795,494,874 1,859,151,068 -51% Source: South African Revenue Service (SARS)
2.2.2.5. RSA’s exports and imports through Botswana commercial border posts
2.2.2.5.1. South Africa’s exports to Botswana
Table 6 below discloses South Africa’s total value of exports and imports that passed through four
commercial border posts of Botswana (Grobler’s bridge, Kopfontein, Ramatlabama and Skilpadshek)
from 2019 to 2020. South Africa’s total exports processed in these 4 commercial border posts to
Botswana documented about R95,3 billion in 2019 whereas in 2020, exports valued about R74,0 billion
resulting to a decrease of 22%.
South Africa’s total volumes exported to Botswana through four commercial border posts documented
about 9,8 billion pieces of goods in 2019 and in 2020, exports documented about 6,5 billion pieces of
goods resulting to a decline of 34% (Table 6).
Table 6 and Figure 1 below depict that the highest decline in export values were realized in April 2020
compared to April 2019, with negative 71% and all the succeeding months till the end of the December
2020 also recorded a decrease.
9 | P a g e
Table 6: RSA exports (value and volume) to Botswana
V A L U E Month -to-Month
V O L U M E Month -to-Month 2019 2020 2019 2020
Jan 6,692,239,378 6,911,713,821 3% 1,365,005,771 511,290,334 -63%
Feb 7,292,894,790 8,119,458,949 11% 453,730,102 577,916,324 27%
Mar 7,682,471,528 7,878,833,349 3% 575,838,128 519,217,427 -10%
Apr 7,359,861,278 2,170,015,141 -71% 636,331,099 200,479,840 -68%
May 7,996,023,291 4,319,113,629 -46% 505,945,200 523,020,490 3%
Jun 7,722,257,745 5,391,192,534 -30% 454,416,889 500,854,031 10%
Jul 8,448,400,669 5,890,762,342 -30% 1,205,539,197 377,653,575 -69%
Aug 8,798,682,650 5,916,275,266 -33% 535,017,116 378,407,818 -29%
Sep 7,809,521,858 6,389,617,230 -18% 1,238,889,698 394,210,951 -68%
Oct 9,041,439,684 7,148,215,625 -21% 555,290,129 431,746,651 -22%
Nov 9,199,406,282 7,166,878,868 -22% 1,773,367,381 1,262,631,107 -29%
Dec 7,275,601,598 6,652,719,485 -9% 501,622,578 815,463,125 63%
Total 95,318,800,751 73,954,796,239 -22% 9,800,993,286 6,492,891,673 -34% Source: South African Revenue Service (SARS)
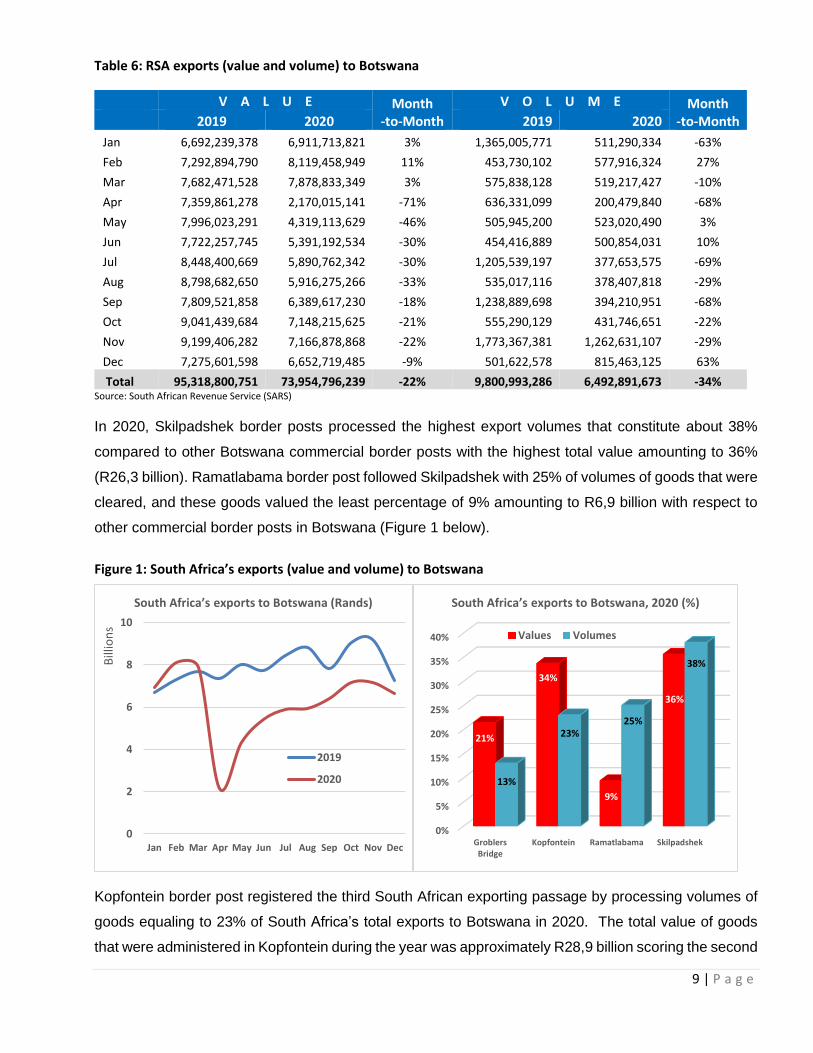
In 2020, Skilpadshek border posts processed the highest export volumes that constitute about 38%
compared to other Botswana commercial border posts with the highest total value amounting to 36%
(R26,3 billion). Ramatlabama border post followed Skilpadshek with 25% of volumes of goods that were
cleared, and these goods valued the least percentage of 9% amounting to R6,9 billion with respect to
other commercial border posts in Botswana (Figure 1 below).
Figure 1: South Africa’s exports (value and volume) to Botswana
Kopfontein border post registered the third South African exporting passage by processing volumes of
goods equaling to 23% of South Africa’s total exports to Botswana in 2020. The total value of goods
that were administered in Kopfontein during the year was approximately R28,9 billion scoring the second
0
2
4
6
8
10
Jan Feb Mar Apr May Jun Jul Aug Sep Oct Nov Dec
Bill
ion
s
South Africa’s exports to Botswana (Rands)
2019
2020
0%
5%
10%
15%
20%
25%
30%
35%
40%
GroblersBridge
Kopfontein Ramatlabama Skilpadshek
21%
34%
9%
36%
13%
23%25%
38%
South Africa’s exports to Botswana, 2020 (%)
Values Volumes

10 | P a g e
highest value totaling 34% after Skilpadshek. The last border post that processed the smallest volume
of goods was Grobler’s’ bridge with 13% and the respective value of the same goods was around R15,8
billion which was 21% of the total value of exported goods from South Africa to Botswana (Figure 1
above).
The highest volumes of South Africa’s exports to Botswana that traversed all Botswana commercial
border posts in 2020 were (Table 7):
i. Crude, Coal, Petroleum and Electricity with about 1,1 billion litres contributing 17,1%
ii. Salt, sulphur, stone and plastering material with about 934 million kilograms registering 14,4%
iii. Cell phones, Electrical Equipment and Machinery with 92,6 million pieces documenting 14,3%.
The highest valued goods that South Africa exported to Botswana in 2020 through all Botswana
commercial border posts in 2020 were (Table 7):
i. Crude, Coal, Petroleum and Electricity with about R7,4 billion recording 10,0%
ii. Vehicles and accessories valued R6,4 billion documenting 8,6%
iii. Catalytic Converters, Computers and Mechanical Appliances with R5,7 billion registering around
7,8%.
Table 7: RSA exports (value and volume) through commercial border posts to Botswana, 2020
V O L U M E S
Grobler’s Bridge Kopfontein Ramatlabama Skilpadshek Botswana
CT 4 212 60 276
KG 775,533,839 1,197,897,738 1,516,822,023 786,452,158 4,276,705,757
LI 86,541,172 197,098,771 128,729,128 816,807,469 1,229,176,540
MC 270,737 3,138,076 100,613 1,164,435 4,673,861
ME 12 337 349
NO 5,505,566 117,178,435 663,976 845,918,317 969,266,294
PR 1,004,204 4,985,066 4,415 1,863,644 7,857,329
SM 1,089,301 1,710,950 475,311 1,935,705 5,211,267
Exports 869,944,823 1,522,009,260 1,646,795,465 2,454,142,124 6,492,891,673
V A L U E (Rands)
Grobler’s Bridge Kopfontein Ramatlabama Skilpadshek Botswana
CT 382 4,479 90,296 95,157
KG 10,412,822,184 14,342,188,971 5,439,922,967 14,632,291,888 44,827,226,010
LI 653,539,278 1,540,396,417 848,799,164 5,767,900,078 8,810,634,937
MC 149,375,052 83,026,015 17,375,946 278,231,671 528,008,684
ME 27,260 65,107 92,367
NO 4,474,960,612 8,417,509,295 584,572,362 5,261,730,426 18,738,772,695
PR 93,236,645 406,974,308 600,435 222,709,522 723,520,910
SM 65,832,658 105,600,766 27,378,478 127,633,577 326,445,479
Exports 15,849,766,811 24,895,727,511 6,918,649,352 26,290,652,565 73,954,796,239 Source: South African Revenue Service (SARS)
11 | P a g e
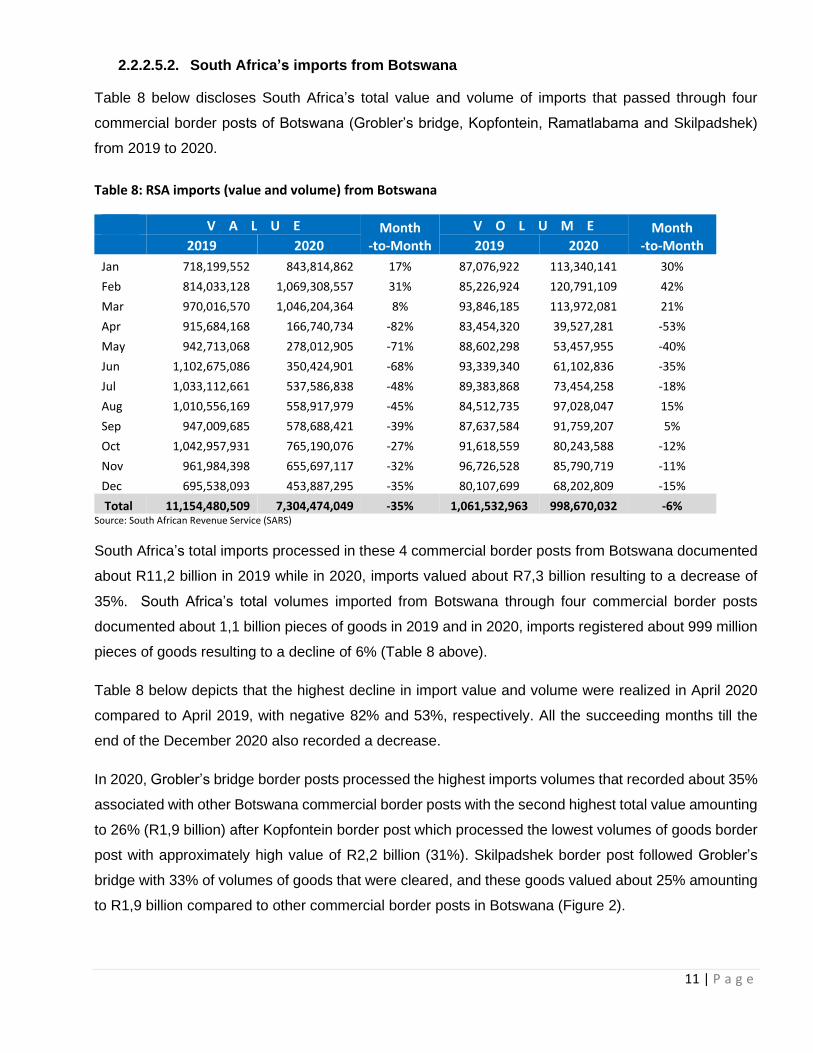
2.2.2.5.2. South Africa’s imports from Botswana
Table 8 below discloses South Africa’s total value and volume of imports that passed through four
commercial border posts of Botswana (Grobler’s bridge, Kopfontein, Ramatlabama and Skilpadshek)
from 2019 to 2020.
Table 8: RSA imports (value and volume) from Botswana
V A L U E Month -to-Month
V O L U M E Month -to-Month 2019 2020 2019 2020
Jan 718,199,552 843,814,862 17% 87,076,922 113,340,141 30%
Feb 814,033,128 1,069,308,557 31% 85,226,924 120,791,109 42%
Mar 970,016,570 1,046,204,364 8% 93,846,185 113,972,081 21%
Apr 915,684,168 166,740,734 -82% 83,454,320 39,527,281 -53%
May 942,713,068 278,012,905 -71% 88,602,298 53,457,955 -40%
Jun 1,102,675,086 350,424,901 -68% 93,339,340 61,102,836 -35%
Jul 1,033,112,661 537,586,838 -48% 89,383,868 73,454,258 -18%
Aug 1,010,556,169 558,917,979 -45% 84,512,735 97,028,047 15%
Sep 947,009,685 578,688,421 -39% 87,637,584 91,759,207 5%
Oct 1,042,957,931 765,190,076 -27% 91,618,559 80,243,588 -12%
Nov 961,984,398 655,697,117 -32% 96,726,528 85,790,719 -11%
Dec 695,538,093 453,887,295 -35% 80,107,699 68,202,809 -15%
Total 11,154,480,509 7,304,474,049 -35% 1,061,532,963 998,670,032 -6% Source: South African Revenue Service (SARS)
South Africa’s total imports processed in these 4 commercial border posts from Botswana documented
about R11,2 billion in 2019 while in 2020, imports valued about R7,3 billion resulting to a decrease of
35%. South Africa’s total volumes imported from Botswana through four commercial border posts
documented about 1,1 billion pieces of goods in 2019 and in 2020, imports registered about 999 million
pieces of goods resulting to a decline of 6% (Table 8 above).
Table 8 below depicts that the highest decline in import value and volume were realized in April 2020
compared to April 2019, with negative 82% and 53%, respectively. All the succeeding months till the
end of the December 2020 also recorded a decrease.
In 2020, Grobler’s bridge border posts processed the highest imports volumes that recorded about 35%
associated with other Botswana commercial border posts with the second highest total value amounting
to 26% (R1,9 billion) after Kopfontein border post which processed the lowest volumes of goods border
post with approximately high value of R2,2 billion (31%). Skilpadshek border post followed Grobler’s
bridge with 33% of volumes of goods that were cleared, and these goods valued about 25% amounting
to R1,9 billion compared to other commercial border posts in Botswana (Figure 2).

12 | P a g e
Ramatlabama border post registered the third South Africa’s importing passage in 2020 by processing
volumes of goods equaling to 20% (329 million pieces of goods) from Botswana. The total value of
goods that were administered in Ramatlabama during 2020 was approximately R1,3 billion scoring the
lowest with 18% after Skilpadshek (Figure 2).
Figure 2: South Africa’s imports (value and volume) from Botswana
The highest volumes of South Africa’s imports from Botswana that traversed all Botswana commercial
border posts in 2020 were (Table 9):
i. Crude, Coal, Petroleum and Electricity with about 300 million kilograms contributing 30,0%
ii. Salt, sulphur, stone and plastering material with about 201 million kilograms recording 20,1%
iii. Inorganic chemical compounds with 148 million kilograms documenting 14,8%.
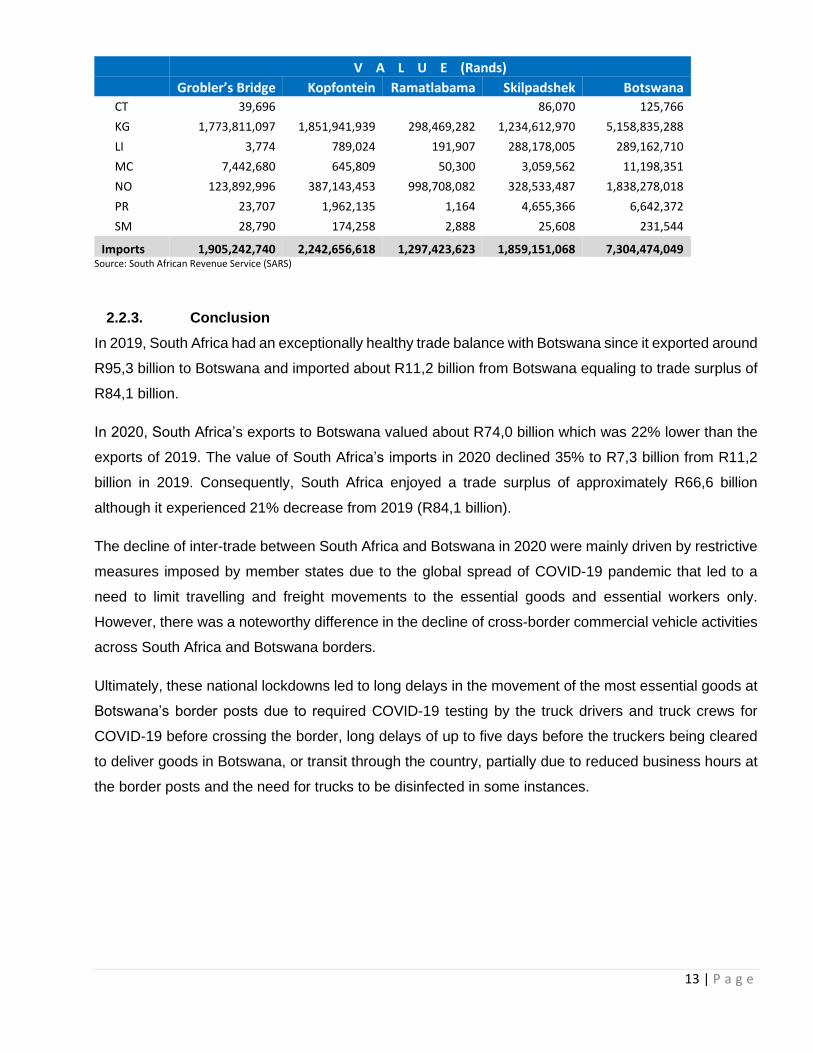
The highest valued goods that South Africa imported from Botswana in 2020 through all Botswana
commercial border posts were (Table 9):
i. Cell phones, Electrical Equipment and Machinery with approximately R1,3 billion registering
17,6%
ii. Live animals with R997 million recording 13,6%
iii. Copper and Articles Thereof with about R763 million contributing 10,4%.
Table 9: RSA imports (value and volume) through commercial border posts from Botswana, 2020
V O L U M E
Grobler’s Bridge Kopfontein Ramatlabama Skilpadshek Botswana
CT 65 12,550 12,615
KG 348,904,127 122,333,842 328,419,436 178,985,619 978,643,024
LI 278 84,623 191,703 18,657,488 18,934,091
MC 1,428 964 34 58,507 60,933
NO 73,965 621,908 137,841 129,013 962,727
PR 602 12,230 5 36,987 49,824
SM 1,221 5,511 25 61 6,817
Imports 348,981,686 123,059,077 328,749,044 197,880,225 998,670,032
0
200
400
600
800
1,000
1,200
Jan Feb Mar Apr May Jun Jul Aug Sep Oct Nov Dec
Mill
ion
s
South Africa's imports from Botswana (Rands)
2019
2020
0%
5%
10%
15%
20%
25%
30%
35%
GroblersBridge
Kopfontein Skilpadshek Ramatlabama
26%
31%
25%
18%
35%
12%
33%
20%
South Africa's imports from Botswana, 2020 (%)
ValuesVolumes
13 | P a g e
V A L U E (Rands)
Grobler’s Bridge Kopfontein Ramatlabama Skilpadshek Botswana
CT 39,696 86,070 125,766
KG 1,773,811,097 1,851,941,939 298,469,282 1,234,612,970 5,158,835,288
LI 3,774 789,024 191,907 288,178,005 289,162,710
MC 7,442,680 645,809 50,300 3,059,562 11,198,351
NO 123,892,996 387,143,453 998,708,082 328,533,487 1,838,278,018
PR 23,707 1,962,135 1,164 4,655,366 6,642,372
SM 28,790 174,258 2,888 25,608 231,544
Imports 1,905,242,740 2,242,656,618 1,297,423,623 1,859,151,068 7,304,474,049 Source: South African Revenue Service (SARS)
2.2.3. Conclusion
In 2019, South Africa had an exceptionally healthy trade balance with Botswana since it exported around
R95,3 billion to Botswana and imported about R11,2 billion from Botswana equaling to trade surplus of
R84,1 billion.
In 2020, South Africa’s exports to Botswana valued about R74,0 billion which was 22% lower than the
exports of 2019. The value of South Africa’s imports in 2020 declined 35% to R7,3 billion from R11,2
billion in 2019. Consequently, South Africa enjoyed a trade surplus of approximately R66,6 billion
although it experienced 21% decrease from 2019 (R84,1 billion).
The decline of inter-trade between South Africa and Botswana in 2020 were mainly driven by restrictive
measures imposed by member states due to the global spread of COVID-19 pandemic that led to a
need to limit travelling and freight movements to the essential goods and essential workers only.
However, there was a noteworthy difference in the decline of cross-border commercial vehicle activities
across South Africa and Botswana borders.
Ultimately, these national lockdowns led to long delays in the movement of the most essential goods at
Botswana’s border posts due to required COVID-19 testing by the truck drivers and truck crews for
COVID-19 before crossing the border, long delays of up to five days before the truckers being cleared
to deliver goods in Botswana, or transit through the country, partially due to reduced business hours at
the border posts and the need for trucks to be disinfected in some instances.
14 | P a g e
2.3. Trade with eSwatini
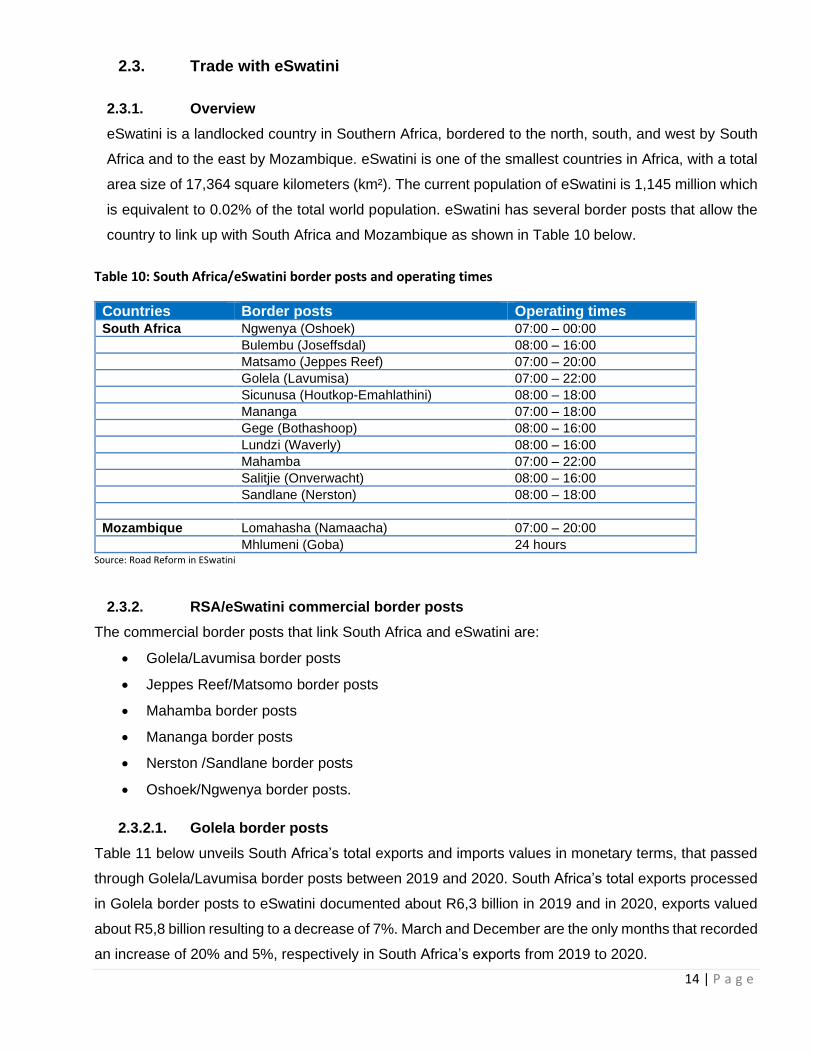
2.3.1. Overview
eSwatini is a landlocked country in Southern Africa, bordered to the north, south, and west by South
Africa and to the east by Mozambique. eSwatini is one of the smallest countries in Africa, with a total
area size of 17,364 square kilometers (km²). The current population of eSwatini is 1,145 million which
is equivalent to 0.02% of the total world population. eSwatini has several border posts that allow the
country to link up with South Africa and Mozambique as shown in Table 10 below.
Table 10: South Africa/eSwatini border posts and operating times
Countries Border posts Operating times South Africa Ngwenya (Oshoek) 07:00 – 00:00
Bulembu (Joseffsdal) 08:00 – 16:00
Matsamo (Jeppes Reef) 07:00 – 20:00
Golela (Lavumisa) 07:00 – 22:00
Sicunusa (Houtkop-Emahlathini) 08:00 – 18:00
Mananga 07:00 – 18:00
Gege (Bothashoop) 08:00 – 16:00
Lundzi (Waverly) 08:00 – 16:00
Mahamba 07:00 – 22:00
Salitjie (Onverwacht) 08:00 – 16:00
Sandlane (Nerston) 08:00 – 18:00
Mozambique Lomahasha (Namaacha) 07:00 – 20:00
Mhlumeni (Goba) 24 hours Source: Road Reform in ESwatini
2.3.2. RSA/eSwatini commercial border posts
The commercial border posts that link South Africa and eSwatini are:
• Golela/Lavumisa border posts
• Jeppes Reef/Matsomo border posts
• Mahamba border posts
• Mananga border posts
• Nerston /Sandlane border posts
• Oshoek/Ngwenya border posts.
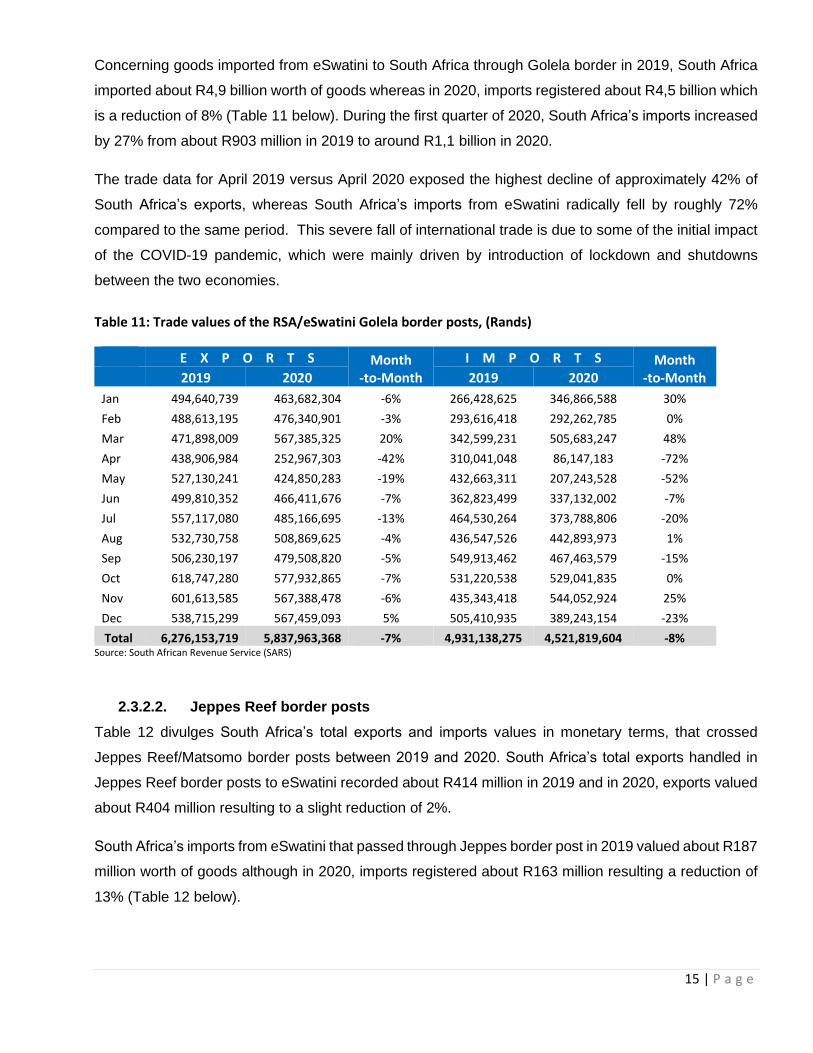
2.3.2.1. Golela border posts
Table 11 below unveils South Africa’s total exports and imports values in monetary terms, that passed
through Golela/Lavumisa border posts between 2019 and 2020. South Africa’s total exports processed
in Golela border posts to eSwatini documented about R6,3 billion in 2019 and in 2020, exports valued
about R5,8 billion resulting to a decrease of 7%. March and December are the only months that recorded
an increase of 20% and 5%, respectively in South Africa’s exports from 2019 to 2020.
15 | P a g e
Concerning goods imported from eSwatini to South Africa through Golela border in 2019, South Africa
imported about R4,9 billion worth of goods whereas in 2020, imports registered about R4,5 billion which
is a reduction of 8% (Table 11 below). During the first quarter of 2020, South Africa’s imports increased
by 27% from about R903 million in 2019 to around R1,1 billion in 2020.
The trade data for April 2019 versus April 2020 exposed the highest decline of approximately 42% of
South Africa’s exports, whereas South Africa’s imports from eSwatini radically fell by roughly 72%
compared to the same period. This severe fall of international trade is due to some of the initial impact
of the COVID-19 pandemic, which were mainly driven by introduction of lockdown and shutdowns
between the two economies.
Table 11: Trade values of the RSA/eSwatini Golela border posts, (Rands)
E X P O R T S Month -to-Month
I M P O R T S Month -to-Month 2019 2020 2019 2020
Jan 494,640,739 463,682,304 -6% 266,428,625 346,866,588 30%
Feb 488,613,195 476,340,901 -3% 293,616,418 292,262,785 0%
Mar 471,898,009 567,385,325 20% 342,599,231 505,683,247 48%
Apr 438,906,984 252,967,303 -42% 310,041,048 86,147,183 -72%
May 527,130,241 424,850,283 -19% 432,663,311 207,243,528 -52%
Jun 499,810,352 466,411,676 -7% 362,823,499 337,132,002 -7%
Jul 557,117,080 485,166,695 -13% 464,530,264 373,788,806 -20%
Aug 532,730,758 508,869,625 -4% 436,547,526 442,893,973 1%
Sep 506,230,197 479,508,820 -5% 549,913,462 467,463,579 -15%
Oct 618,747,280 577,932,865 -7% 531,220,538 529,041,835 0%
Nov 601,613,585 567,388,478 -6% 435,343,418 544,052,924 25%
Dec 538,715,299 567,459,093 5% 505,410,935 389,243,154 -23%
Total 6,276,153,719 5,837,963,368 -7% 4,931,138,275 4,521,819,604 -8% Source: South African Revenue Service (SARS)
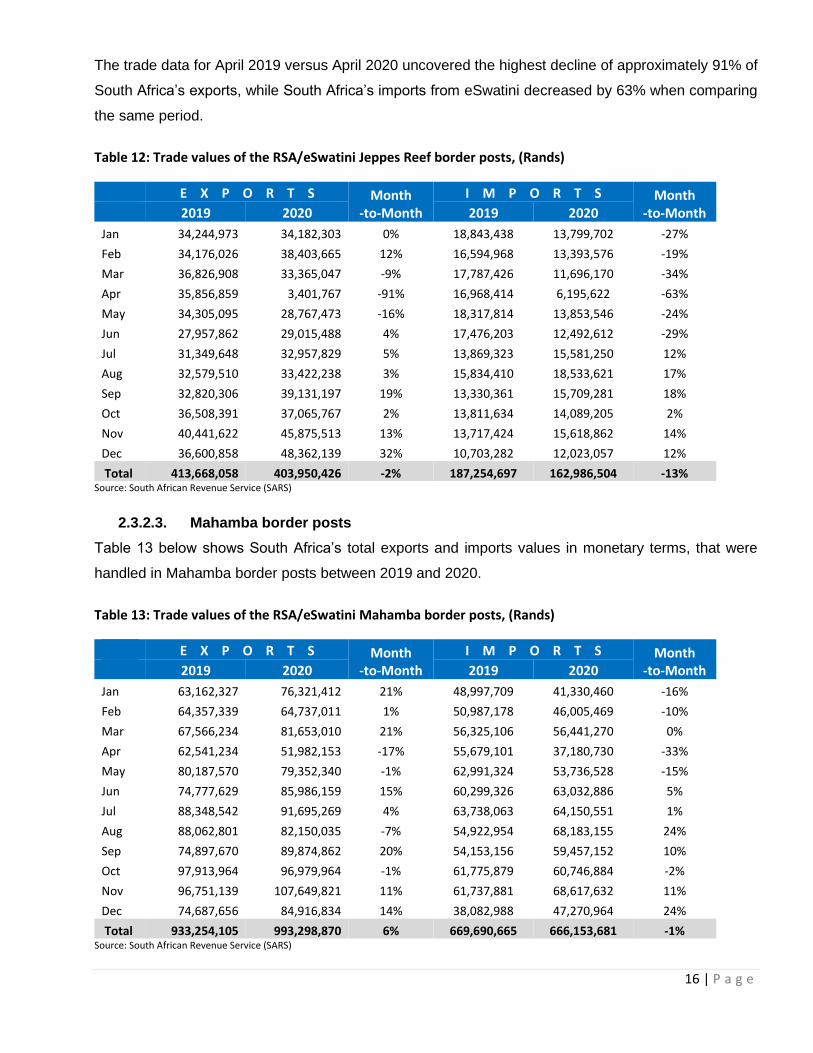
2.3.2.2. Jeppes Reef border posts
Table 12 divulges South Africa’s total exports and imports values in monetary terms, that crossed
Jeppes Reef/Matsomo border posts between 2019 and 2020. South Africa’s total exports handled in
Jeppes Reef border posts to eSwatini recorded about R414 million in 2019 and in 2020, exports valued
about R404 million resulting to a slight reduction of 2%.
South Africa’s imports from eSwatini that passed through Jeppes border post in 2019 valued about R187
million worth of goods although in 2020, imports registered about R163 million resulting a reduction of
13% (Table 12 below).
16 | P a g e
The trade data for April 2019 versus April 2020 uncovered the highest decline of approximately 91% of
South Africa’s exports, while South Africa’s imports from eSwatini decreased by 63% when comparing
the same period.
Table 12: Trade values of the RSA/eSwatini Jeppes Reef border posts, (Rands)
E X P O R T S Month -to-Month
I M P O R T S Month -to-Month 2019 2020 2019 2020
Jan 34,244,973 34,182,303 0% 18,843,438 13,799,702 -27%
Feb 34,176,026 38,403,665 12% 16,594,968 13,393,576 -19%
Mar 36,826,908 33,365,047 -9% 17,787,426 11,696,170 -34%
Apr 35,856,859 3,401,767 -91% 16,968,414 6,195,622 -63%
May 34,305,095 28,767,473 -16% 18,317,814 13,853,546 -24%
Jun 27,957,862 29,015,488 4% 17,476,203 12,492,612 -29%
Jul 31,349,648 32,957,829 5% 13,869,323 15,581,250 12%
Aug 32,579,510 33,422,238 3% 15,834,410 18,533,621 17%
Sep 32,820,306 39,131,197 19% 13,330,361 15,709,281 18%
Oct 36,508,391 37,065,767 2% 13,811,634 14,089,205 2%
Nov 40,441,622 45,875,513 13% 13,717,424 15,618,862 14%
Dec 36,600,858 48,362,139 32% 10,703,282 12,023,057 12%
Total 413,668,058 403,950,426 -2% 187,254,697 162,986,504 -13% Source: South African Revenue Service (SARS)
2.3.2.3. Mahamba border posts
Table 13 below shows South Africa’s total exports and imports values in monetary terms, that were
handled in Mahamba border posts between 2019 and 2020.
Table 13: Trade values of the RSA/eSwatini Mahamba border posts, (Rands)
E X P O R T S Month -to-Month
I M P O R T S Month -to-Month 2019 2020 2019 2020
Jan 63,162,327 76,321,412 21% 48,997,709 41,330,460 -16%
Feb 64,357,339 64,737,011 1% 50,987,178 46,005,469 -10%
Mar 67,566,234 81,653,010 21% 56,325,106 56,441,270 0%
Apr 62,541,234 51,982,153 -17% 55,679,101 37,180,730 -33%
May 80,187,570 79,352,340 -1% 62,991,324 53,736,528 -15%
Jun 74,777,629 85,986,159 15% 60,299,326 63,032,886 5%
Jul 88,348,542 91,695,269 4% 63,738,063 64,150,551 1%
Aug 88,062,801 82,150,035 -7% 54,922,954 68,183,155 24%
Sep 74,897,670 89,874,862 20% 54,153,156 59,457,152 10%
Oct 97,913,964 96,979,964 -1% 61,775,879 60,746,884 -2%
Nov 96,751,139 107,649,821 11% 61,737,881 68,617,632 11%
Dec 74,687,656 84,916,834 14% 38,082,988 47,270,964 24%
Total 933,254,105 993,298,870 6% 669,690,665 666,153,681 -1% Source: South African Revenue Service (SARS)
17 | P a g e
South Africa’s total exports processed in Mahamba border posts to eSwatini documented about R933
million in 2019 and in 2020, South Africa’s exports valued around R993 million recording an upsurge of
6%.
Concerning goods imported from eSwatini to South Africa through Mahamba border post in 2019, South
Africa imported about R670 million worth of goods whereas in 2020, South Africa’s imports registered
about R666 million which is a reduction of 1% (Table 13 below).
The trade data for April 2019 compared to April 2020 uncovered the highest decline of approximately
17% of South Africa’s exports, and 33% reduction of South Africa’s imports from eSwatini when
comparing the same period.
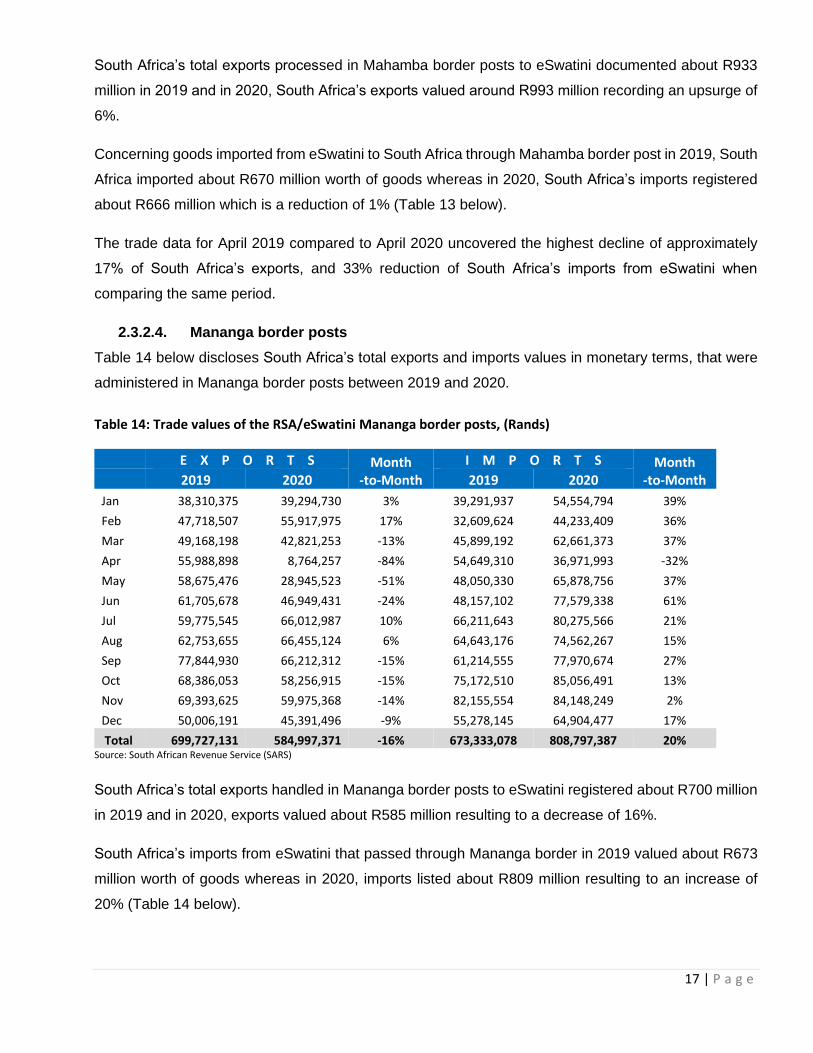
2.3.2.4. Mananga border posts
Table 14 below discloses South Africa’s total exports and imports values in monetary terms, that were
administered in Mananga border posts between 2019 and 2020.
Table 14: Trade values of the RSA/eSwatini Mananga border posts, (Rands)
E X P O R T S Month -to-Month
I M P O R T S Month -to-Month 2019 2020 2019 2020
Jan 38,310,375 39,294,730 3% 39,291,937 54,554,794 39%
Feb 47,718,507 55,917,975 17% 32,609,624 44,233,409 36%
Mar 49,168,198 42,821,253 -13% 45,899,192 62,661,373 37%
Apr 55,988,898 8,764,257 -84% 54,649,310 36,971,993 -32%
May 58,675,476 28,945,523 -51% 48,050,330 65,878,756 37%
Jun 61,705,678 46,949,431 -24% 48,157,102 77,579,338 61%
Jul 59,775,545 66,012,987 10% 66,211,643 80,275,566 21%
Aug 62,753,655 66,455,124 6% 64,643,176 74,562,267 15%
Sep 77,844,930 66,212,312 -15% 61,214,555 77,970,674 27%
Oct 68,386,053 58,256,915 -15% 75,172,510 85,056,491 13%
Nov 69,393,625 59,975,368 -14% 82,155,554 84,148,249 2%
Dec 50,006,191 45,391,496 -9% 55,278,145 64,904,477 17%
Total 699,727,131 584,997,371 -16% 673,333,078 808,797,387 20% Source: South African Revenue Service (SARS)
South Africa’s total exports handled in Mananga border posts to eSwatini registered about R700 million
in 2019 and in 2020, exports valued about R585 million resulting to a decrease of 16%.
South Africa’s imports from eSwatini that passed through Mananga border in 2019 valued about R673
million worth of goods whereas in 2020, imports listed about R809 million resulting to an increase of
20% (Table 14 below).

18 | P a g e
The trade data for April 2019 versus April 2020 exposed the highest decline of approximately 84% of
South Africa’s exports, whereas South Africa’s imports from eSwatini fell by nearly 32% when comparing
the same period. This reduction is affected mainly by introduction of COVID-19 lockdown and
shutdowns between the two economies.
2.3.2.5. Nerston border posts
Table 15 below unveils South Africa’s total exports and imports values in monetary terms, that passed
through Nerston/Sandlane border posts between 2019 and 2020. South Africa’s total exports processed
in Nerston border posts to eSwatini documented about R141 million in 2019 and in 2020, exports valued
about R40 million because Nerston was among the border posts that the President of South Africa
instructed to be closed as part of efforts to halt the spread of SARS-CoV-2, the virus behind COVID-19.
Therefore, the border post operated for only three months from January to March, hence why the severe
reduction of 72% was recorded.
Likewise, goods imported from eSwatini to South Africa through Nerston border in 2019 valued about
R163 million, and in 2020, the border post operated only during the first quarter of the calendar year
registering about R29 million which is a reduction of 82% (Table 15 below).
Table 15: Trade values of the RSA/eSwatini Nerston border posts, (Rands)
E X P O R T S Month -to-Month
I M P O R T S Month -to-Month 2019 2020 2019 2020
Jan 11,366,762 13,643,082 20% 11,068,441 12,840,165 16%
Feb 13,323,420 15,854,415 19% 12,317,746 10,549,486 -14%
Mar 10,779,138 10,343,601 -4% 12,169,915 5,445,668 -55%
Apr 7,898,786 10,459,713
May 7,152,182 16,982,917
Jun 6,324,332 16,673,725
Jul 9,502,622 17,897,419
Aug 11,653,030 15,500,119
Sep 9,189,553 16,434,163
Oct 19,941,871 13,357,516
Nov 18,840,986 11,384,628
Dec 14,794,003 9,002,195
Total 140,766,685 39,841,098 -72% 163,248,497 28,835,319 -82% Source: South African Revenue Service (SARS)
2.3.2.6. Oshoek border posts
Table 16 below unveils South Africa’s total exports and imports values in monetary terms, that passed
through Oshoek/Ngwenya border posts between 2019 and 2020. South Africa’s total exports handled
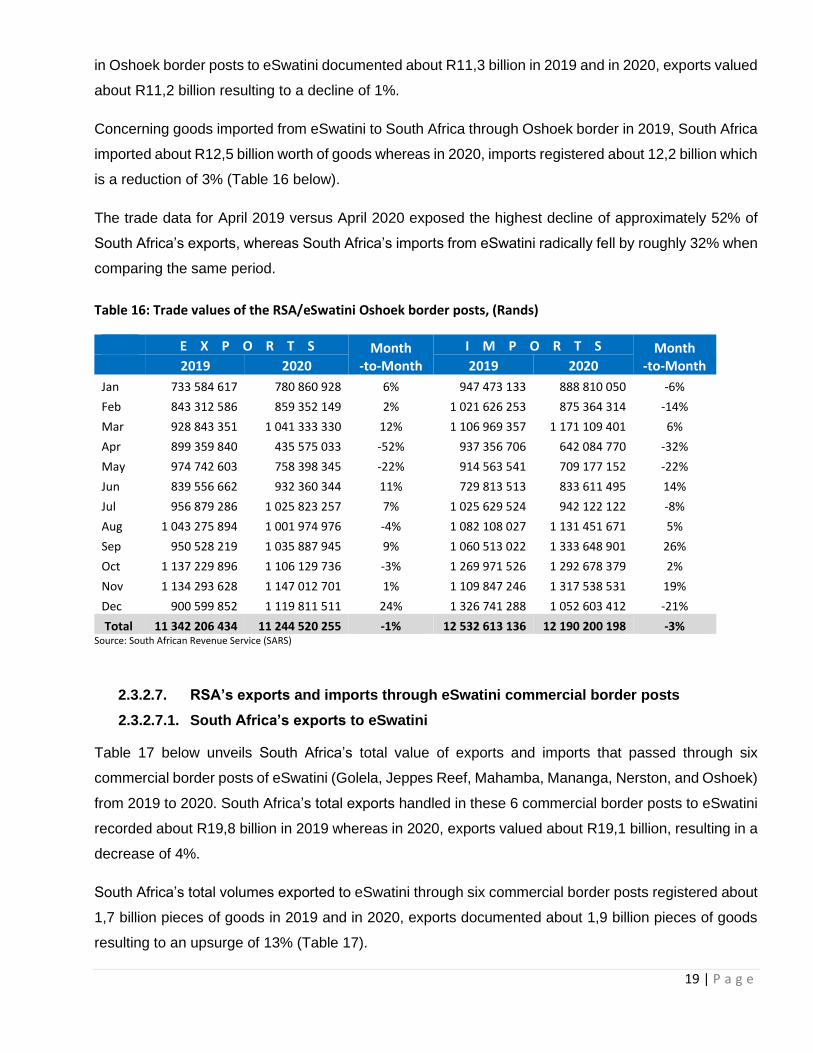
19 | P a g e
in Oshoek border posts to eSwatini documented about R11,3 billion in 2019 and in 2020, exports valued
about R11,2 billion resulting to a decline of 1%.
Concerning goods imported from eSwatini to South Africa through Oshoek border in 2019, South Africa
imported about R12,5 billion worth of goods whereas in 2020, imports registered about 12,2 billion which
is a reduction of 3% (Table 16 below).
The trade data for April 2019 versus April 2020 exposed the highest decline of approximately 52% of
South Africa’s exports, whereas South Africa’s imports from eSwatini radically fell by roughly 32% when
comparing the same period.
Table 16: Trade values of the RSA/eSwatini Oshoek border posts, (Rands)
E X P O R T S Month -to-Month
I M P O R T S Month -to-Month 2019 2020 2019 2020
Jan 733 584 617 780 860 928 6% 947 473 133 888 810 050 -6%
Feb 843 312 586 859 352 149 2% 1 021 626 253 875 364 314 -14%
Mar 928 843 351 1 041 333 330 12% 1 106 969 357 1 171 109 401 6%
Apr 899 359 840 435 575 033 -52% 937 356 706 642 084 770 -32%
May 974 742 603 758 398 345 -22% 914 563 541 709 177 152 -22%
Jun 839 556 662 932 360 344 11% 729 813 513 833 611 495 14%
Jul 956 879 286 1 025 823 257 7% 1 025 629 524 942 122 122 -8%
Aug 1 043 275 894 1 001 974 976 -4% 1 082 108 027 1 131 451 671 5%
Sep 950 528 219 1 035 887 945 9% 1 060 513 022 1 333 648 901 26%
Oct 1 137 229 896 1 106 129 736 -3% 1 269 971 526 1 292 678 379 2%
Nov 1 134 293 628 1 147 012 701 1% 1 109 847 246 1 317 538 531 19%
Dec 900 599 852 1 119 811 511 24% 1 326 741 288 1 052 603 412 -21%
Total 11 342 206 434 11 244 520 255 -1% 12 532 613 136 12 190 200 198 -3% Source: South African Revenue Service (SARS)
2.3.2.7. RSA’s exports and imports through eSwatini commercial border posts
2.3.2.7.1. South Africa’s exports to eSwatini
Table 17 below unveils South Africa’s total value of exports and imports that passed through six
commercial border posts of eSwatini (Golela, Jeppes Reef, Mahamba, Mananga, Nerston, and Oshoek)
from 2019 to 2020. South Africa’s total exports handled in these 6 commercial border posts to eSwatini
recorded about R19,8 billion in 2019 whereas in 2020, exports valued about R19,1 billion, resulting in a
decrease of 4%.
South Africa’s total volumes exported to eSwatini through six commercial border posts registered about
1,7 billion pieces of goods in 2019 and in 2020, exports documented about 1,9 billion pieces of goods
resulting to an upsurge of 13% (Table 17).
20 | P a g e
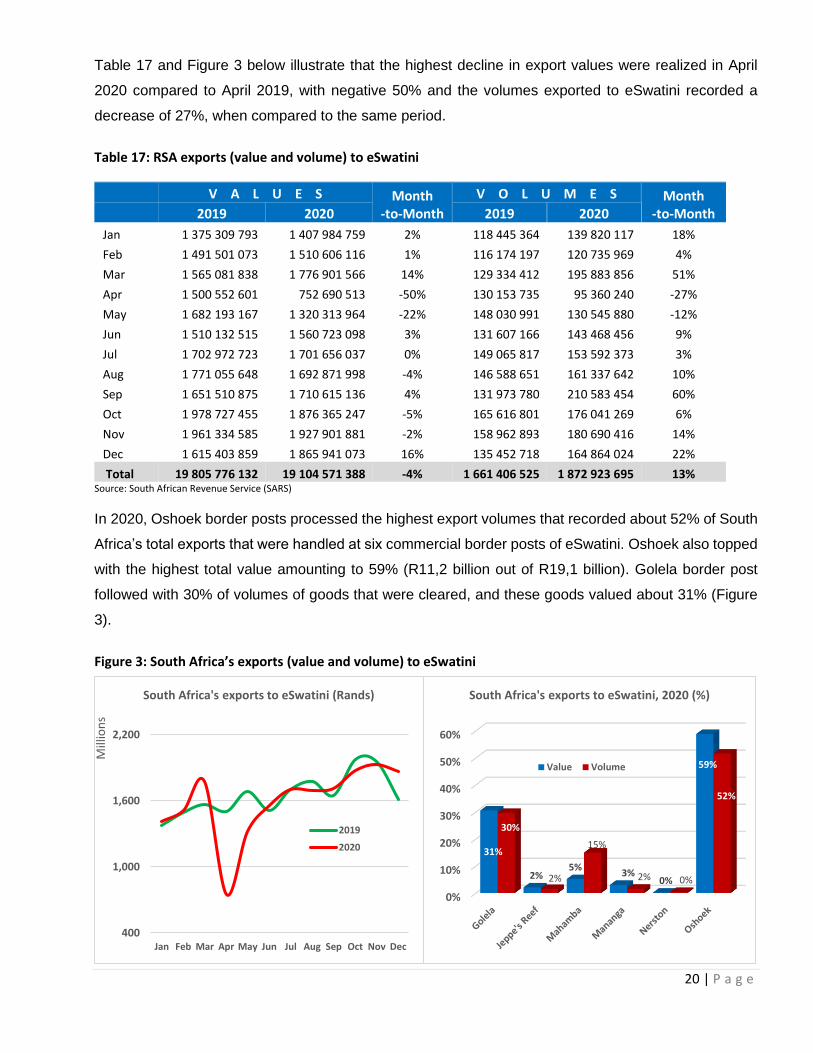
Table 17 and Figure 3 below illustrate that the highest decline in export values were realized in April
2020 compared to April 2019, with negative 50% and the volumes exported to eSwatini recorded a
decrease of 27%, when compared to the same period.
Table 17: RSA exports (value and volume) to eSwatini
V A L U E S Month -to-Month
V O L U M E S Month -to-Month 2019 2020 2019 2020
Jan 1 375 309 793 1 407 984 759 2% 118 445 364 139 820 117 18%
Feb 1 491 501 073 1 510 606 116 1% 116 174 197 120 735 969 4%
Mar 1 565 081 838 1 776 901 566 14% 129 334 412 195 883 856 51%
Apr 1 500 552 601 752 690 513 -50% 130 153 735 95 360 240 -27%
May 1 682 193 167 1 320 313 964 -22% 148 030 991 130 545 880 -12%
Jun 1 510 132 515 1 560 723 098 3% 131 607 166 143 468 456 9%
Jul 1 702 972 723 1 701 656 037 0% 149 065 817 153 592 373 3%
Aug 1 771 055 648 1 692 871 998 -4% 146 588 651 161 337 642 10%
Sep 1 651 510 875 1 710 615 136 4% 131 973 780 210 583 454 60%
Oct 1 978 727 455 1 876 365 247 -5% 165 616 801 176 041 269 6%
Nov 1 961 334 585 1 927 901 881 -2% 158 962 893 180 690 416 14%
Dec 1 615 403 859 1 865 941 073 16% 135 452 718 164 864 024 22%
Total 19 805 776 132 19 104 571 388 -4% 1 661 406 525 1 872 923 695 13% Source: South African Revenue Service (SARS)
In 2020, Oshoek border posts processed the highest export volumes that recorded about 52% of South
Africa’s total exports that were handled at six commercial border posts of eSwatini. Oshoek also topped
with the highest total value amounting to 59% (R11,2 billion out of R19,1 billion). Golela border post
followed with 30% of volumes of goods that were cleared, and these goods valued about 31% (Figure
3).
Figure 3: South Africa’s exports (value and volume) to eSwatini
400
1,000
1,600
2,200
Jan Feb Mar Apr May Jun Jul Aug Sep Oct Nov Dec
Mill
ion
s
South Africa's exports to eSwatini (Rands)
2019
2020
0%
10%
20%
30%
40%
50%
60%
31%
2%5%
3%0%
59%
30%
2%
15%
2% 0%
52%
South Africa's exports to eSwatini, 2020 (%)
Value Volume
21 | P a g e
Mahamba border post registered the third South African exporting passage by processing volumes of
goods equaling to 15% and costing 5% of South Africa’s total exports to eSwatini in 2020. The remaining
border posts administered at most 5% of volumes of goods and values that were less or equal to 5%
(Figure 3 above).
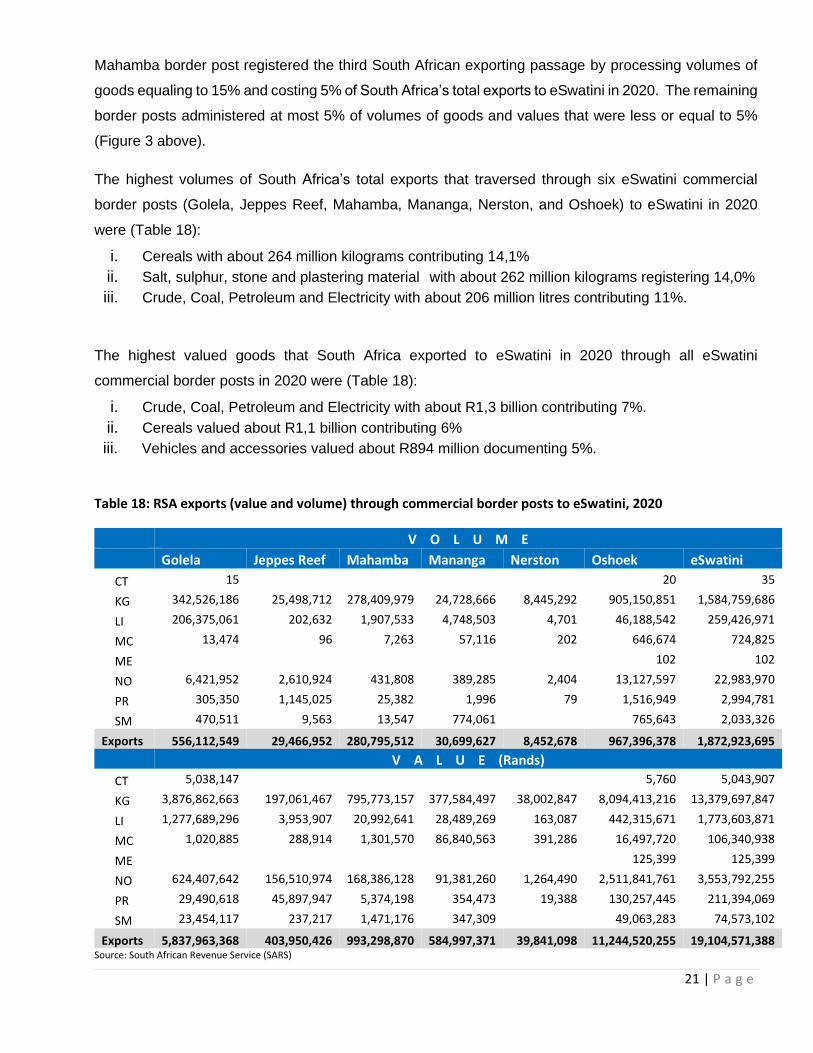
The highest volumes of South Africa’s total exports that traversed through six eSwatini commercial
border posts (Golela, Jeppes Reef, Mahamba, Mananga, Nerston, and Oshoek) to eSwatini in 2020
were (Table 18):
i. Cereals with about 264 million kilograms contributing 14,1%
ii. Salt, sulphur, stone and plastering material with about 262 million kilograms registering 14,0%
iii. Crude, Coal, Petroleum and Electricity with about 206 million litres contributing 11%.
The highest valued goods that South Africa exported to eSwatini in 2020 through all eSwatini
commercial border posts in 2020 were (Table 18):
i. Crude, Coal, Petroleum and Electricity with about R1,3 billion contributing 7%.
ii. Cereals valued about R1,1 billion contributing 6%
iii. Vehicles and accessories valued about R894 million documenting 5%.
Table 18: RSA exports (value and volume) through commercial border posts to eSwatini, 2020
V O L U M E
Golela Jeppes Reef Mahamba Mananga Nerston Oshoek eSwatini
CT 15 20 35
KG 342,526,186 25,498,712 278,409,979 24,728,666 8,445,292 905,150,851 1,584,759,686
LI 206,375,061 202,632 1,907,533 4,748,503 4,701 46,188,542 259,426,971
MC 13,474 96 7,263 57,116 202 646,674 724,825
ME 102 102
NO 6,421,952 2,610,924 431,808 389,285 2,404 13,127,597 22,983,970
PR 305,350 1,145,025 25,382 1,996 79 1,516,949 2,994,781
SM 470,511 9,563 13,547 774,061 765,643 2,033,326
Exports 556,112,549 29,466,952 280,795,512 30,699,627 8,452,678 967,396,378 1,872,923,695
V A L U E (Rands)
CT 5,038,147 5,760 5,043,907
KG 3,876,862,663 197,061,467 795,773,157 377,584,497 38,002,847 8,094,413,216 13,379,697,847
LI 1,277,689,296 3,953,907 20,992,641 28,489,269 163,087 442,315,671 1,773,603,871
MC 1,020,885 288,914 1,301,570 86,840,563 391,286 16,497,720 106,340,938
ME 125,399 125,399
NO 624,407,642 156,510,974 168,386,128 91,381,260 1,264,490 2,511,841,761 3,553,792,255
PR 29,490,618 45,897,947 5,374,198 354,473 19,388 130,257,445 211,394,069
SM 23,454,117 237,217 1,471,176 347,309 49,063,283 74,573,102
Exports 5,837,963,368 403,950,426 993,298,870 584,997,371 39,841,098 11,244,520,255 19,104,571,388 Source: South African Revenue Service (SARS)
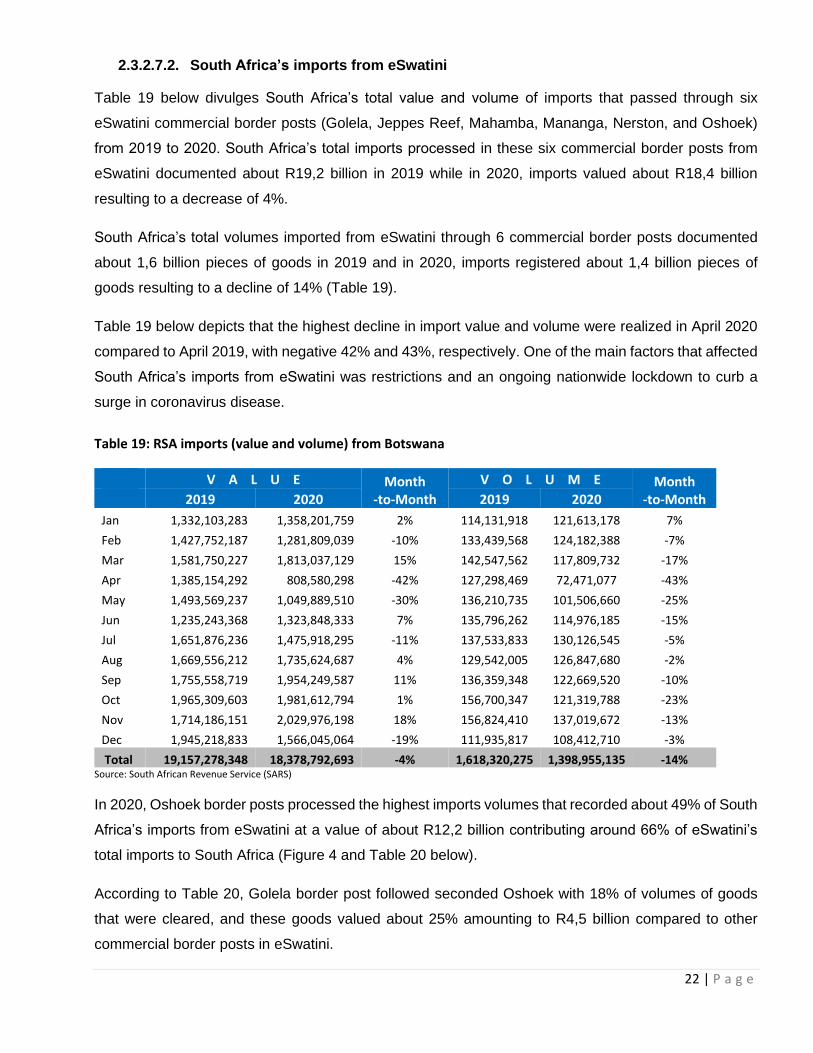
22 | P a g e
2.3.2.7.2. South Africa’s imports from eSwatini
Table 19 below divulges South Africa’s total value and volume of imports that passed through six
eSwatini commercial border posts (Golela, Jeppes Reef, Mahamba, Mananga, Nerston, and Oshoek)
from 2019 to 2020. South Africa’s total imports processed in these six commercial border posts from
eSwatini documented about R19,2 billion in 2019 while in 2020, imports valued about R18,4 billion
resulting to a decrease of 4%.
South Africa’s total volumes imported from eSwatini through 6 commercial border posts documented
about 1,6 billion pieces of goods in 2019 and in 2020, imports registered about 1,4 billion pieces of
goods resulting to a decline of 14% (Table 19).
Table 19 below depicts that the highest decline in import value and volume were realized in April 2020
compared to April 2019, with negative 42% and 43%, respectively. One of the main factors that affected
South Africa’s imports from eSwatini was restrictions and an ongoing nationwide lockdown to curb a
surge in coronavirus disease.
Table 19: RSA imports (value and volume) from Botswana
V A L U E Month -to-Month
V O L U M E Month -to-Month 2019 2020 2019 2020
Jan 1,332,103,283 1,358,201,759 2% 114,131,918 121,613,178 7%
Feb 1,427,752,187 1,281,809,039 -10% 133,439,568 124,182,388 -7%
Mar 1,581,750,227 1,813,037,129 15% 142,547,562 117,809,732 -17%
Apr 1,385,154,292 808,580,298 -42% 127,298,469 72,471,077 -43%
May 1,493,569,237 1,049,889,510 -30% 136,210,735 101,506,660 -25%
Jun 1,235,243,368 1,323,848,333 7% 135,796,262 114,976,185 -15%
Jul 1,651,876,236 1,475,918,295 -11% 137,533,833 130,126,545 -5%
Aug 1,669,556,212 1,735,624,687 4% 129,542,005 126,847,680 -2%
Sep 1,755,558,719 1,954,249,587 11% 136,359,348 122,669,520 -10%
Oct 1,965,309,603 1,981,612,794 1% 156,700,347 121,319,788 -23%
Nov 1,714,186,151 2,029,976,198 18% 156,824,410 137,019,672 -13%
Dec 1,945,218,833 1,566,045,064 -19% 111,935,817 108,412,710 -3%
Total 19,157,278,348 18,378,792,693 -4% 1,618,320,275 1,398,955,135 -14% Source: South African Revenue Service (SARS)
In 2020, Oshoek border posts processed the highest imports volumes that recorded about 49% of South
Africa’s imports from eSwatini at a value of about R12,2 billion contributing around 66% of eSwatini’s
total imports to South Africa (Figure 4 and Table 20 below).
According to Table 20, Golela border post followed seconded Oshoek with 18% of volumes of goods
that were cleared, and these goods valued about 25% amounting to R4,5 billion compared to other
commercial border posts in eSwatini.
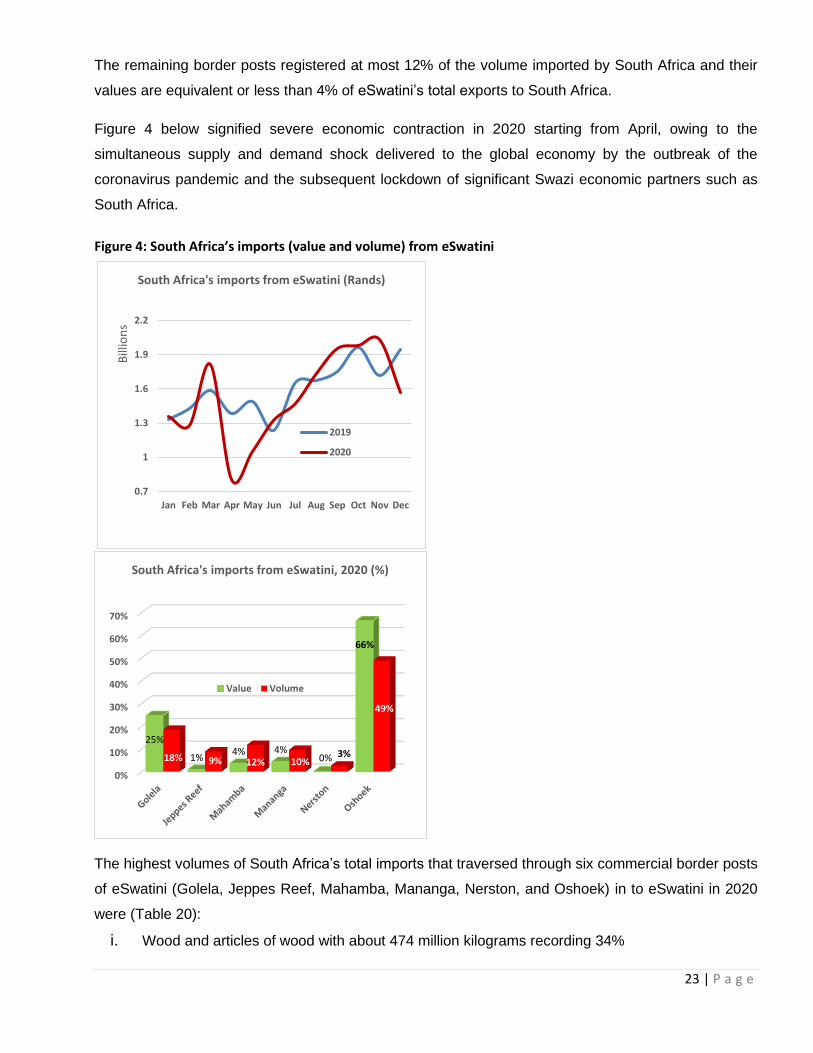
23 | P a g e
The remaining border posts registered at most 12% of the volume imported by South Africa and their
values are equivalent or less than 4% of eSwatini’s total exports to South Africa.
Figure 4 below signified severe economic contraction in 2020 starting from April, owing to the
simultaneous supply and demand shock delivered to the global economy by the outbreak of the
coronavirus pandemic and the subsequent lockdown of significant Swazi economic partners such as
South Africa.
Figure 4: South Africa’s imports (value and volume) from eSwatini
The highest volumes of South Africa’s total imports that traversed through six commercial border posts
of eSwatini (Golela, Jeppes Reef, Mahamba, Mananga, Nerston, and Oshoek) in to eSwatini in 2020
were (Table 20):
i. Wood and articles of wood with about 474 million kilograms recording 34%
0.7
1
1.3
1.6
1.9
2.2
Jan Feb Mar Apr May Jun Jul Aug Sep Oct Nov Dec
Bill
ion
s
South Africa's imports from eSwatini (Rands)
2019
2020
0%
10%
20%
30%
40%
50%
60%
70%
25%
1%4% 4%
0%
66%
18% 9% 12% 10%3%
49%
South Africa's imports from eSwatini, 2020 (%)
Value Volume
24 | P a g e
ii. Sugars and sugar confectionery with about 460 million kilograms recording 33%
iii. Crude, Coal, Petroleum and Electricity with about 164 million kilograms contributing 12%.
The highest valued goods that South Africa imported to eSwatini in 2020 through all eSwatini
commercial border posts in 2020 were (Table 20):
i. Cosmetics, Toiletries and Beverage Syrup with about R4,8 billion documenting 26%
ii. Sugars and sugar confectionery with about R4,7 billion recording 25,8%
iii. Clothing and accessories, not knitted or crocheted; and Chemical products each value about
R1,9 billion recording 10% each.
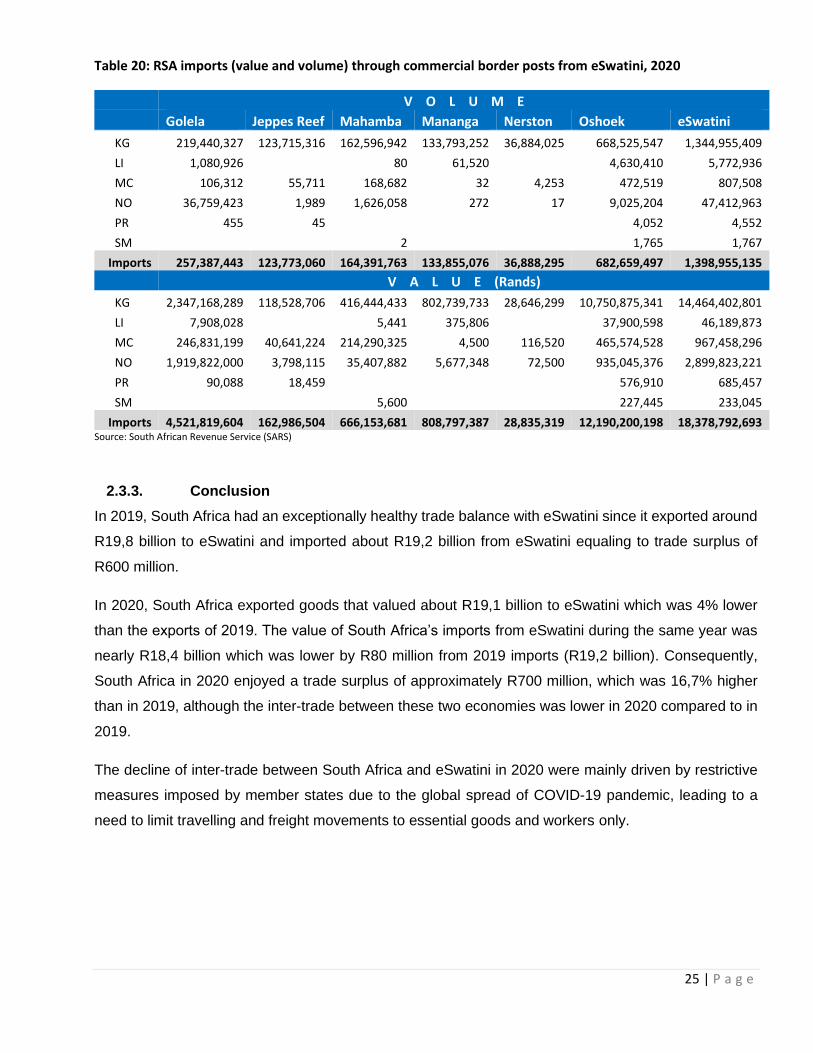
25 | P a g e
Table 20: RSA imports (value and volume) through commercial border posts from eSwatini, 2020
V O L U M E Golela Jeppes Reef Mahamba Mananga Nerston Oshoek eSwatini
KG 219,440,327 123,715,316 162,596,942 133,793,252 36,884,025 668,525,547 1,344,955,409
LI 1,080,926 80 61,520 4,630,410 5,772,936
MC 106,312 55,711 168,682 32 4,253 472,519 807,508
NO 36,759,423 1,989 1,626,058 272 17 9,025,204 47,412,963
PR 455 45 4,052 4,552
SM 2 1,765 1,767
Imports 257,387,443 123,773,060 164,391,763 133,855,076 36,888,295 682,659,497 1,398,955,135
V A L U E (Rands)
KG 2,347,168,289 118,528,706 416,444,433 802,739,733 28,646,299 10,750,875,341 14,464,402,801
LI 7,908,028 5,441 375,806 37,900,598 46,189,873
MC 246,831,199 40,641,224 214,290,325 4,500 116,520 465,574,528 967,458,296
NO 1,919,822,000 3,798,115 35,407,882 5,677,348 72,500 935,045,376 2,899,823,221
PR 90,088 18,459 576,910 685,457
SM 5,600 227,445 233,045
Imports 4,521,819,604 162,986,504 666,153,681 808,797,387 28,835,319 12,190,200,198 18,378,792,693 Source: South African Revenue Service (SARS)
2.3.3. Conclusion
In 2019, South Africa had an exceptionally healthy trade balance with eSwatini since it exported around
R19,8 billion to eSwatini and imported about R19,2 billion from eSwatini equaling to trade surplus of
R600 million.
In 2020, South Africa exported goods that valued about R19,1 billion to eSwatini which was 4% lower
than the exports of 2019. The value of South Africa’s imports from eSwatini during the same year was
nearly R18,4 billion which was lower by R80 million from 2019 imports (R19,2 billion). Consequently,
South Africa in 2020 enjoyed a trade surplus of approximately R700 million, which was 16,7% higher
than in 2019, although the inter-trade between these two economies was lower in 2020 compared to in
2019.
The decline of inter-trade between South Africa and eSwatini in 2020 were mainly driven by restrictive
measures imposed by member states due to the global spread of COVID-19 pandemic, leading to a
need to limit travelling and freight movements to essential goods and workers only.
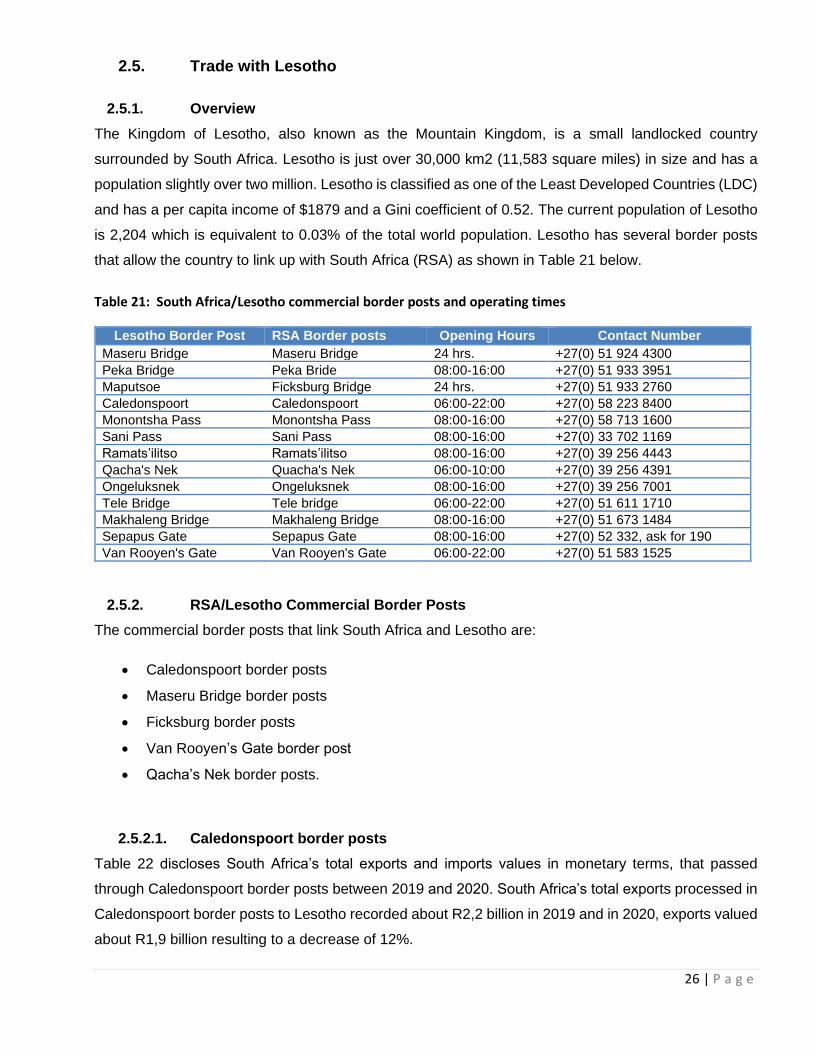
26 | P a g e
2.5. Trade with Lesotho
2.5.1. Overview
The Kingdom of Lesotho, also known as the Mountain Kingdom, is a small landlocked country
surrounded by South Africa. Lesotho is just over 30,000 km2 (11,583 square miles) in size and has a
population slightly over two million. Lesotho is classified as one of the Least Developed Countries (LDC)
and has a per capita income of $1879 and a Gini coefficient of 0.52. The current population of Lesotho
is 2,204 which is equivalent to 0.03% of the total world population. Lesotho has several border posts
that allow the country to link up with South Africa (RSA) as shown in Table 21 below.
Table 21: South Africa/Lesotho commercial border posts and operating times
Lesotho Border Post RSA Border posts Opening Hours Contact Number
Maseru Bridge Maseru Bridge 24 hrs. +27(0) 51 924 4300
Peka Bridge Peka Bride 08:00-16:00 +27(0) 51 933 3951
Maputsoe Ficksburg Bridge 24 hrs. +27(0) 51 933 2760
Caledonspoort Caledonspoort 06:00-22:00 +27(0) 58 223 8400
Monontsha Pass Monontsha Pass 08:00-16:00 +27(0) 58 713 1600
Sani Pass Sani Pass 08:00-16:00 +27(0) 33 702 1169
Ramats’ilitso Ramats’ilitso 08:00-16:00 +27(0) 39 256 4443
Qacha's Nek Quacha's Nek 06:00-10:00 +27(0) 39 256 4391
Ongeluksnek Ongeluksnek 08:00-16:00 +27(0) 39 256 7001
Tele Bridge Tele bridge 06:00-22:00 +27(0) 51 611 1710
Makhaleng Bridge Makhaleng Bridge 08:00-16:00 +27(0) 51 673 1484
Sepapus Gate Sepapus Gate 08:00-16:00 +27(0) 52 332, ask for 190
Van Rooyen's Gate Van Rooyen's Gate 06:00-22:00 +27(0) 51 583 1525
2.5.2. RSA/Lesotho Commercial Border Posts
The commercial border posts that link South Africa and Lesotho are:
• Caledonspoort border posts
• Maseru Bridge border posts
• Ficksburg border posts
• Van Rooyen’s Gate border post
• Qacha’s Nek border posts.
2.5.2.1. Caledonspoort border posts
Table 22 discloses South Africa’s total exports and imports values in monetary terms, that passed
through Caledonspoort border posts between 2019 and 2020. South Africa’s total exports processed in
Caledonspoort border posts to Lesotho recorded about R2,2 billion in 2019 and in 2020, exports valued
about R1,9 billion resulting to a decrease of 12%.
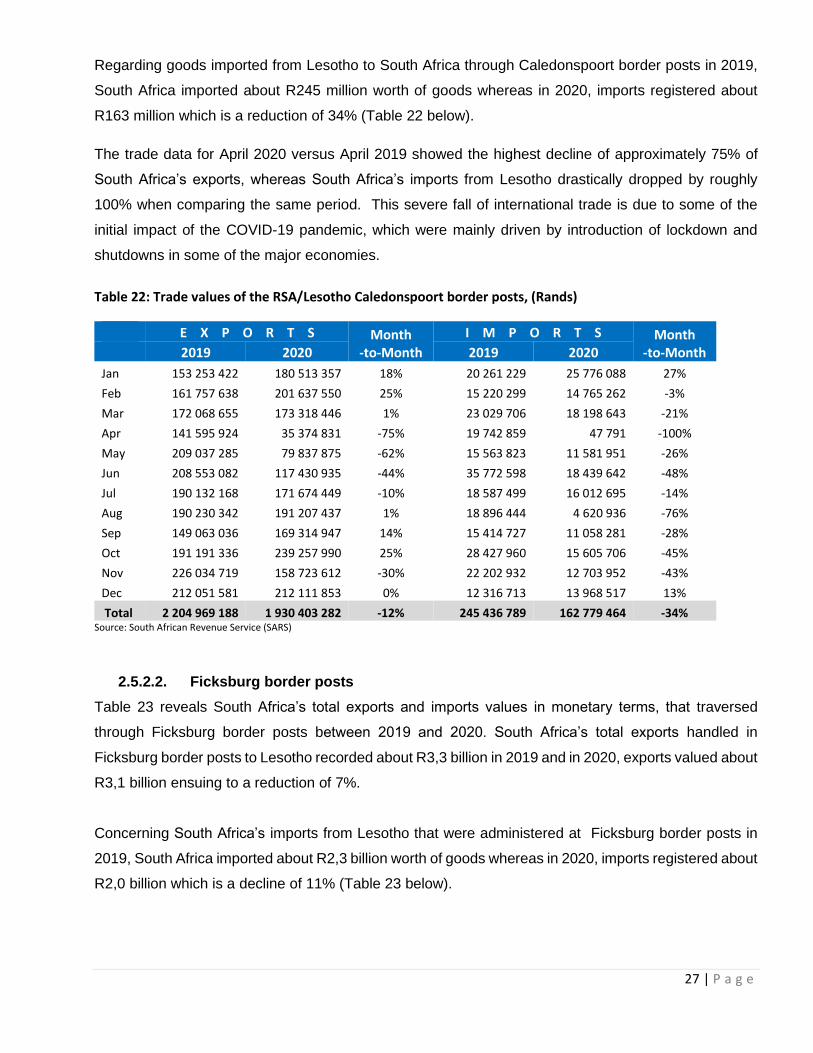
27 | P a g e
Regarding goods imported from Lesotho to South Africa through Caledonspoort border posts in 2019,
South Africa imported about R245 million worth of goods whereas in 2020, imports registered about
R163 million which is a reduction of 34% (Table 22 below).
The trade data for April 2020 versus April 2019 showed the highest decline of approximately 75% of
South Africa’s exports, whereas South Africa’s imports from Lesotho drastically dropped by roughly
100% when comparing the same period. This severe fall of international trade is due to some of the
initial impact of the COVID-19 pandemic, which were mainly driven by introduction of lockdown and
shutdowns in some of the major economies.
Table 22: Trade values of the RSA/Lesotho Caledonspoort border posts, (Rands)
E X P O R T S Month -to-Month
I M P O R T S Month -to-Month 2019 2020 2019 2020
Jan 153 253 422 180 513 357 18% 20 261 229 25 776 088 27%
Feb 161 757 638 201 637 550 25% 15 220 299 14 765 262 -3%
Mar 172 068 655 173 318 446 1% 23 029 706 18 198 643 -21%
Apr 141 595 924 35 374 831 -75% 19 742 859 47 791 -100%
May 209 037 285 79 837 875 -62% 15 563 823 11 581 951 -26%
Jun 208 553 082 117 430 935 -44% 35 772 598 18 439 642 -48%
Jul 190 132 168 171 674 449 -10% 18 587 499 16 012 695 -14%
Aug 190 230 342 191 207 437 1% 18 896 444 4 620 936 -76%
Sep 149 063 036 169 314 947 14% 15 414 727 11 058 281 -28%
Oct 191 191 336 239 257 990 25% 28 427 960 15 605 706 -45%
Nov 226 034 719 158 723 612 -30% 22 202 932 12 703 952 -43%
Dec 212 051 581 212 111 853 0% 12 316 713 13 968 517 13%
Total 2 204 969 188 1 930 403 282 -12% 245 436 789 162 779 464 -34% Source: South African Revenue Service (SARS)
2.5.2.2. Ficksburg border posts
Table 23 reveals South Africa’s total exports and imports values in monetary terms, that traversed
through Ficksburg border posts between 2019 and 2020. South Africa’s total exports handled in
Ficksburg border posts to Lesotho recorded about R3,3 billion in 2019 and in 2020, exports valued about
R3,1 billion ensuing to a reduction of 7%.
Concerning South Africa’s imports from Lesotho that were administered at Ficksburg border posts in
2019, South Africa imported about R2,3 billion worth of goods whereas in 2020, imports registered about
R2,0 billion which is a decline of 11% (Table 23 below).
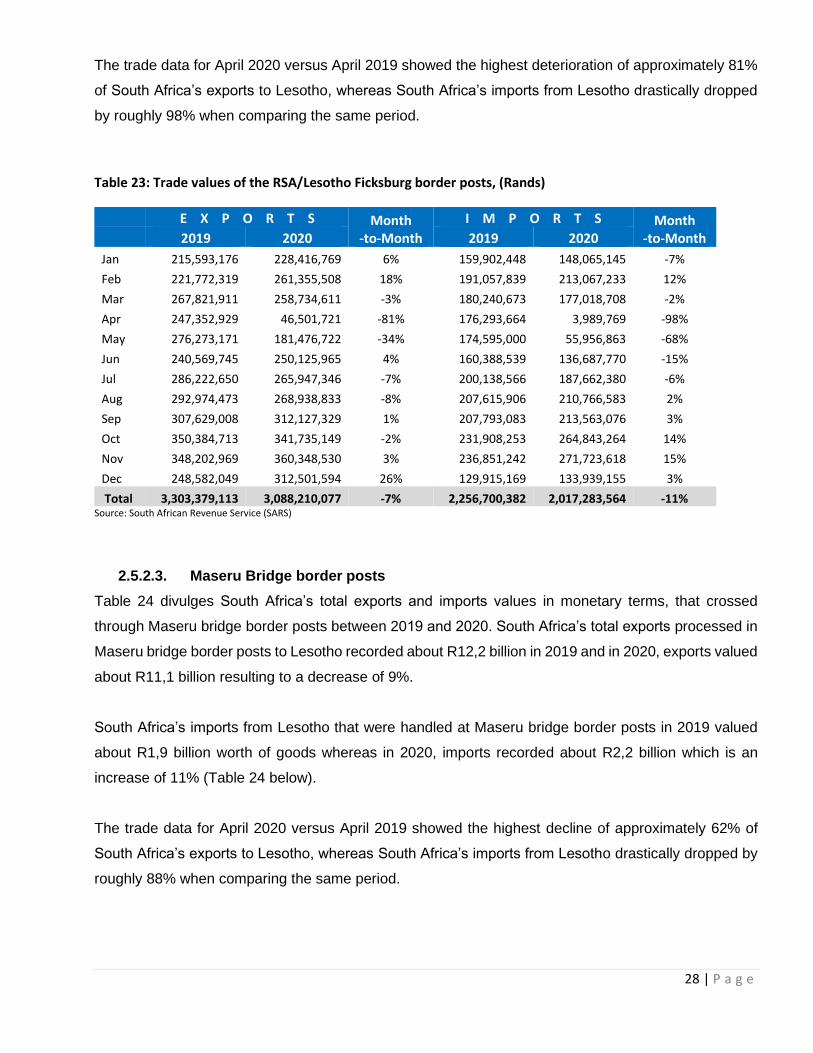
28 | P a g e
The trade data for April 2020 versus April 2019 showed the highest deterioration of approximately 81%
of South Africa’s exports to Lesotho, whereas South Africa’s imports from Lesotho drastically dropped
by roughly 98% when comparing the same period.
Table 23: Trade values of the RSA/Lesotho Ficksburg border posts, (Rands)
E X P O R T S Month -to-Month
I M P O R T S Month -to-Month 2019 2020 2019 2020
Jan 215,593,176 228,416,769 6% 159,902,448 148,065,145 -7%
Feb 221,772,319 261,355,508 18% 191,057,839 213,067,233 12%
Mar 267,821,911 258,734,611 -3% 180,240,673 177,018,708 -2%
Apr 247,352,929 46,501,721 -81% 176,293,664 3,989,769 -98%
May 276,273,171 181,476,722 -34% 174,595,000 55,956,863 -68%
Jun 240,569,745 250,125,965 4% 160,388,539 136,687,770 -15%
Jul 286,222,650 265,947,346 -7% 200,138,566 187,662,380 -6%
Aug 292,974,473 268,938,833 -8% 207,615,906 210,766,583 2%
Sep 307,629,008 312,127,329 1% 207,793,083 213,563,076 3%
Oct 350,384,713 341,735,149 -2% 231,908,253 264,843,264 14%
Nov 348,202,969 360,348,530 3% 236,851,242 271,723,618 15%
Dec 248,582,049 312,501,594 26% 129,915,169 133,939,155 3%
Total 3,303,379,113 3,088,210,077 -7% 2,256,700,382 2,017,283,564 -11% Source: South African Revenue Service (SARS)
2.5.2.3. Maseru Bridge border posts
Table 24 divulges South Africa’s total exports and imports values in monetary terms, that crossed
through Maseru bridge border posts between 2019 and 2020. South Africa’s total exports processed in
Maseru bridge border posts to Lesotho recorded about R12,2 billion in 2019 and in 2020, exports valued
about R11,1 billion resulting to a decrease of 9%.
South Africa’s imports from Lesotho that were handled at Maseru bridge border posts in 2019 valued
about R1,9 billion worth of goods whereas in 2020, imports recorded about R2,2 billion which is an
increase of 11% (Table 24 below).
The trade data for April 2020 versus April 2019 showed the highest decline of approximately 62% of
South Africa’s exports to Lesotho, whereas South Africa’s imports from Lesotho drastically dropped by
roughly 88% when comparing the same period.
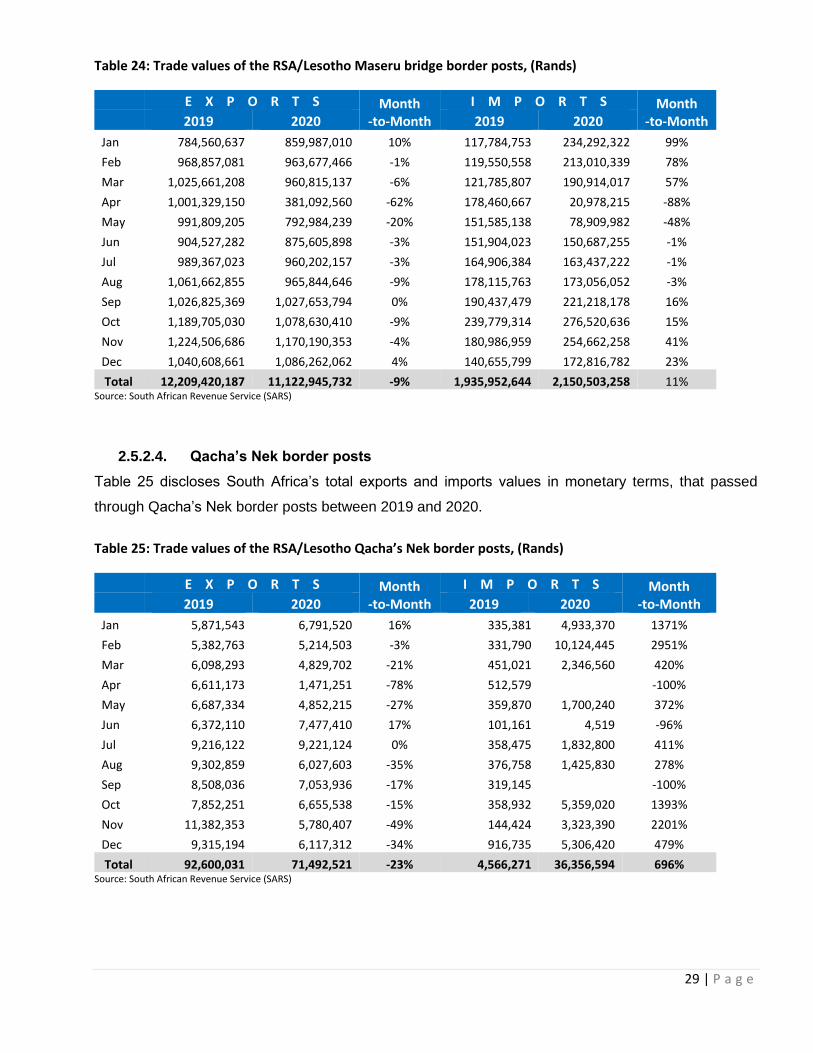
29 | P a g e
Table 24: Trade values of the RSA/Lesotho Maseru bridge border posts, (Rands)
E X P O R T S Month -to-Month
I M P O R T S Month -to-Month 2019 2020 2019 2020
Jan 784,560,637 859,987,010 10% 117,784,753 234,292,322 99%
Feb 968,857,081 963,677,466 -1% 119,550,558 213,010,339 78%
Mar 1,025,661,208 960,815,137 -6% 121,785,807 190,914,017 57%
Apr 1,001,329,150 381,092,560 -62% 178,460,667 20,978,215 -88%
May 991,809,205 792,984,239 -20% 151,585,138 78,909,982 -48%
Jun 904,527,282 875,605,898 -3% 151,904,023 150,687,255 -1%
Jul 989,367,023 960,202,157 -3% 164,906,384 163,437,222 -1%
Aug 1,061,662,855 965,844,646 -9% 178,115,763 173,056,052 -3%
Sep 1,026,825,369 1,027,653,794 0% 190,437,479 221,218,178 16%
Oct 1,189,705,030 1,078,630,410 -9% 239,779,314 276,520,636 15%
Nov 1,224,506,686 1,170,190,353 -4% 180,986,959 254,662,258 41%
Dec 1,040,608,661 1,086,262,062 4% 140,655,799 172,816,782 23%
Total 12,209,420,187 11,122,945,732 -9% 1,935,952,644 2,150,503,258 11% Source: South African Revenue Service (SARS)
2.5.2.4. Qacha’s Nek border posts
Table 25 discloses South Africa’s total exports and imports values in monetary terms, that passed
through Qacha’s Nek border posts between 2019 and 2020.
Table 25: Trade values of the RSA/Lesotho Qacha’s Nek border posts, (Rands)
E X P O R T S Month -to-Month
I M P O R T S Month -to-Month 2019 2020 2019 2020
Jan 5,871,543 6,791,520 16% 335,381 4,933,370 1371%
Feb 5,382,763 5,214,503 -3% 331,790 10,124,445 2951%
Mar 6,098,293 4,829,702 -21% 451,021 2,346,560 420%
Apr 6,611,173 1,471,251 -78% 512,579 -100%
May 6,687,334 4,852,215 -27% 359,870 1,700,240 372%
Jun 6,372,110 7,477,410 17% 101,161 4,519 -96%
Jul 9,216,122 9,221,124 0% 358,475 1,832,800 411%
Aug 9,302,859 6,027,603 -35% 376,758 1,425,830 278%
Sep 8,508,036 7,053,936 -17% 319,145 -100%
Oct 7,852,251 6,655,538 -15% 358,932 5,359,020 1393%
Nov 11,382,353 5,780,407 -49% 144,424 3,323,390 2201%
Dec 9,315,194 6,117,312 -34% 916,735 5,306,420 479%
Total 92,600,031 71,492,521 -23% 4,566,271 36,356,594 696% Source: South African Revenue Service (SARS)

30 | P a g e
South Africa’s total exports that were processed in Qacha’s Nek border posts to Lesotho documented
about R92,6 million in 2019 and in 2020, exports valued about R71,5 million resulting to a decline of
23%.
South Africa’s imports from Lesotho that were handled at Qacha’s Nek border posts in 2019 valued
about R4,6 million worth of goods whereas in 2020, imports recorded about R36,4 million which is an
increase of 696% (Table 25 below).
The trade data for April 2020 versus April 2019 showed the highest deterioration of approximately 78%
of South Africa’s exports to Lesotho, while South Africa’s imports from Lesotho drastically dropped by
roughly 100% as there were no imports in 2020.
2.5.2.5. Van Rooyen’s Gate border posts
Table 26 discloses South Africa’s total exports and imports values in monetary terms, that passed
through Van Rooyen’s Gate border posts between 2019 and 2020.
Table 26: Trade values of the RSA/Lesotho Van Rooyen’s Gate border posts, (Rands)
E X P O R T S Month -to-Month
I M P O R T S Month -to-Month 2019 2020 2019 2020
Jan 59,271,667 57,535,110 -3% 309,494 6,495,358 1999%
Feb 56,715,014 53,644,158 -5% 273,485 11,343,332 4048%
Mar 64,308,535 53,913,212 -16% 260,645 15,370,375 5797%
Apr 65,249,223 29,028,489 -56% 534,491 409,279 -23%
May 61,598,609 47,912,708 -22% 258,962 2,047,072 690%
Jun 58,131,506 80,416,921 38% 126,501 2,532,537 1902%
Jul 60,028,695 63,955,222 7% 320,968 1,214,458 278%
Aug 60,557,333 58,906,525 -3% 428,630 514,966 20%
Sep 52,402,614 64,721,843 24% 456,568 2,042,467 347%
Oct 71,038,620 68,698,621 -3% 798,535 4,405,331 452%
Nov 70,456,879 77,791,149 10% 364,009 7,448,072 1946%
Dec 70,079,548 89,082,066 27% 157,773 1,861,318 1080%
Total 749,838,243 745,606,024 -1% 4,290,061 55,684,565 1198% Source: South African Revenue Service (SARS)
South Africa’s total exports administered in Van Rooyen’s Gate border posts to Lesotho recorded about
R12,2 billion in 2019 and in 2020, exports valued about R746 million resulting to a decrease of 1%.
South Africa’s imports from Lesotho that were handled at Van Rooyen’s Gate border posts in 2019
valued about R4,2 million worth of goods whereas in 2020, imports recorded about R56 million which is
an increase of 1198% (Table 26 above).
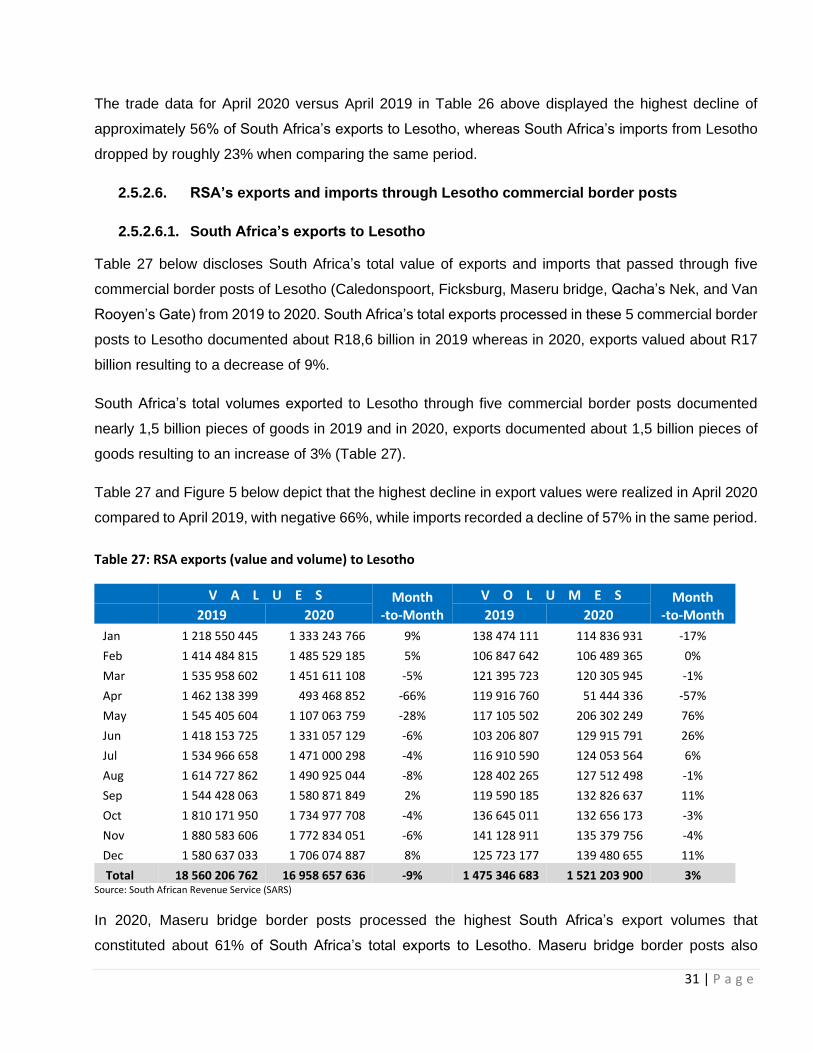
31 | P a g e
The trade data for April 2020 versus April 2019 in Table 26 above displayed the highest decline of
approximately 56% of South Africa’s exports to Lesotho, whereas South Africa’s imports from Lesotho
dropped by roughly 23% when comparing the same period.
2.5.2.6. RSA’s exports and imports through Lesotho commercial border posts
2.5.2.6.1. South Africa’s exports to Lesotho
Table 27 below discloses South Africa’s total value of exports and imports that passed through five
commercial border posts of Lesotho (Caledonspoort, Ficksburg, Maseru bridge, Qacha’s Nek, and Van
Rooyen’s Gate) from 2019 to 2020. South Africa’s total exports processed in these 5 commercial border
posts to Lesotho documented about R18,6 billion in 2019 whereas in 2020, exports valued about R17
billion resulting to a decrease of 9%.
South Africa’s total volumes exported to Lesotho through five commercial border posts documented
nearly 1,5 billion pieces of goods in 2019 and in 2020, exports documented about 1,5 billion pieces of
goods resulting to an increase of 3% (Table 27).
Table 27 and Figure 5 below depict that the highest decline in export values were realized in April 2020
compared to April 2019, with negative 66%, while imports recorded a decline of 57% in the same period.
Table 27: RSA exports (value and volume) to Lesotho
V A L U E S Month -to-Month
V O L U M E S Month -to-Month 2019 2020 2019 2020
Jan 1 218 550 445 1 333 243 766 9% 138 474 111 114 836 931 -17%
Feb 1 414 484 815 1 485 529 185 5% 106 847 642 106 489 365 0%
Mar 1 535 958 602 1 451 611 108 -5% 121 395 723 120 305 945 -1%
Apr 1 462 138 399 493 468 852 -66% 119 916 760 51 444 336 -57%
May 1 545 405 604 1 107 063 759 -28% 117 105 502 206 302 249 76%
Jun 1 418 153 725 1 331 057 129 -6% 103 206 807 129 915 791 26%
Jul 1 534 966 658 1 471 000 298 -4% 116 910 590 124 053 564 6%
Aug 1 614 727 862 1 490 925 044 -8% 128 402 265 127 512 498 -1%
Sep 1 544 428 063 1 580 871 849 2% 119 590 185 132 826 637 11%
Oct 1 810 171 950 1 734 977 708 -4% 136 645 011 132 656 173 -3%
Nov 1 880 583 606 1 772 834 051 -6% 141 128 911 135 379 756 -4%
Dec 1 580 637 033 1 706 074 887 8% 125 723 177 139 480 655 11%
Total 18 560 206 762 16 958 657 636 -9% 1 475 346 683 1 521 203 900 3% Source: South African Revenue Service (SARS)
In 2020, Maseru bridge border posts processed the highest South Africa’s export volumes that
constituted about 61% of South Africa’s total exports to Lesotho. Maseru bridge border posts also
32 | P a g e
recorded the highest value amounting to 66% (R11,1 billion). Ficksburg border post followed with 23%
of volumes of goods that were cleared, and these goods valued about R3,1 billion amounting to 18% of
South Africa’s total exports to Lesotho in 2020 (Figure 5).
Caledonspoort border post registered the third South African exporting passage by processing volumes
of goods equaling to 10% of South Africa’s total exports to Lesotho in 2020. The total value of goods
that were administered in Caledonspoort during the same year was approximately R1,9 billion scoring
11%.
The last two border posts processed the smallest volume of South Africa’s exports that vary between
1% and 5% with value that did not exceed 4% (Figure 5 below). From March 2020 to April 2020 South
Africa’s exports to Lesotho deteriorated by 66%. This drastic decline included the beginning of the
COVID-19 lockdown in South Africa and some of its trading partners.
Figure 5: South Africa’s exports (value and volume) to Lesotho
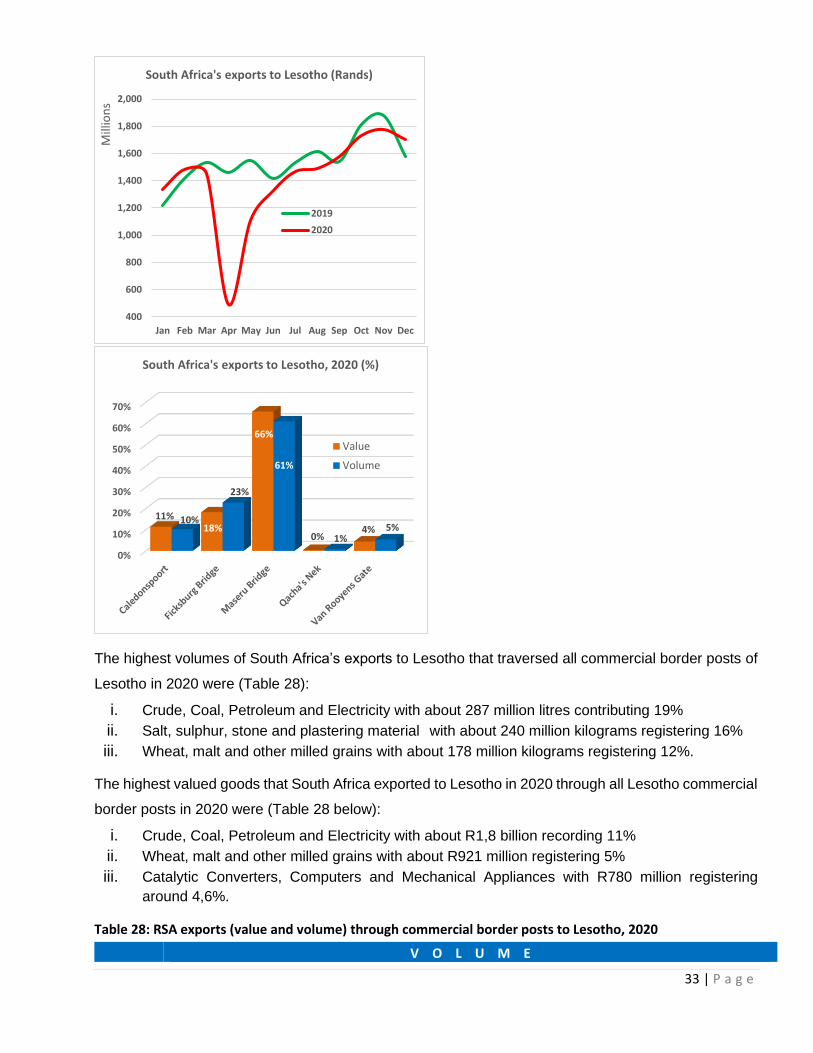
33 | P a g e
The highest volumes of South Africa’s exports to Lesotho that traversed all commercial border posts of
Lesotho in 2020 were (Table 28):
i. Crude, Coal, Petroleum and Electricity with about 287 million litres contributing 19%
ii. Salt, sulphur, stone and plastering material with about 240 million kilograms registering 16%
iii. Wheat, malt and other milled grains with about 178 million kilograms registering 12%.
The highest valued goods that South Africa exported to Lesotho in 2020 through all Lesotho commercial
border posts in 2020 were (Table 28 below):
i. Crude, Coal, Petroleum and Electricity with about R1,8 billion recording 11%
ii. Wheat, malt and other milled grains with about R921 million registering 5%
iii. Catalytic Converters, Computers and Mechanical Appliances with R780 million registering
around 4,6%.
Table 28: RSA exports (value and volume) through commercial border posts to Lesotho, 2020
V O L U M E
400
600
800
1,000
1,200
1,400
1,600
1,800
2,000
Jan Feb Mar Apr May Jun Jul Aug Sep Oct Nov Dec
Mill
ion
s
South Africa's exports to Lesotho (Rands)
2019
2020
0%
10%
20%
30%
40%
50%
60%
70%
11%18%
66%
0%4%
10%
23%
61%
1%5%
South Africa's exports to Lesotho, 2020 (%)
Value
Volume
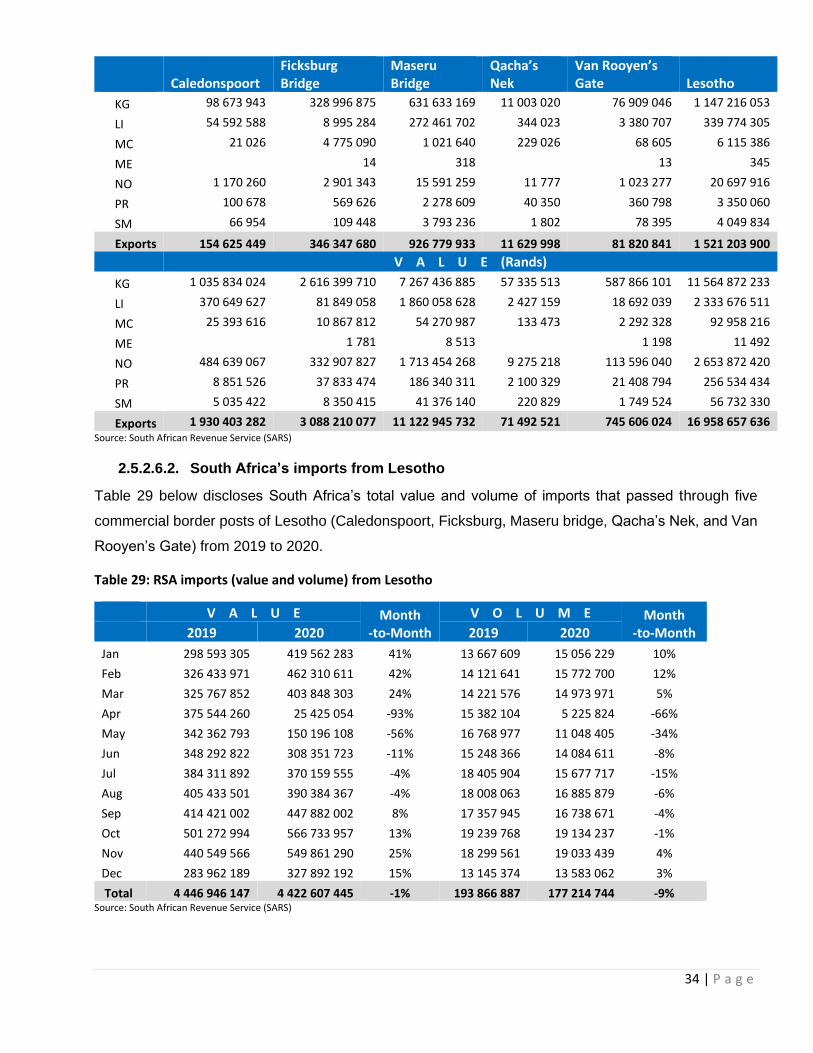
34 | P a g e
Caledonspoort Ficksburg Bridge
Maseru Bridge
Qacha’s Nek
Van Rooyen’s Gate Lesotho
KG 98 673 943 328 996 875 631 633 169 11 003 020 76 909 046 1 147 216 053
LI 54 592 588 8 995 284 272 461 702 344 023 3 380 707 339 774 305
MC 21 026 4 775 090 1 021 640 229 026 68 605 6 115 386
ME 14 318 13 345
NO 1 170 260 2 901 343 15 591 259 11 777 1 023 277 20 697 916
PR 100 678 569 626 2 278 609 40 350 360 798 3 350 060
SM 66 954 109 448 3 793 236 1 802 78 395 4 049 834
Exports 154 625 449 346 347 680 926 779 933 11 629 998 81 820 841 1 521 203 900
V A L U E (Rands)
KG 1 035 834 024 2 616 399 710 7 267 436 885 57 335 513 587 866 101 11 564 872 233
LI 370 649 627 81 849 058 1 860 058 628 2 427 159 18 692 039 2 333 676 511
MC 25 393 616 10 867 812 54 270 987 133 473 2 292 328 92 958 216
ME 1 781 8 513 1 198 11 492
NO 484 639 067 332 907 827 1 713 454 268 9 275 218 113 596 040 2 653 872 420
PR 8 851 526 37 833 474 186 340 311 2 100 329 21 408 794 256 534 434
SM 5 035 422 8 350 415 41 376 140 220 829 1 749 524 56 732 330
Exports 1 930 403 282 3 088 210 077 11 122 945 732 71 492 521 745 606 024 16 958 657 636 Source: South African Revenue Service (SARS)
2.5.2.6.2. South Africa’s imports from Lesotho
Table 29 below discloses South Africa’s total value and volume of imports that passed through five
commercial border posts of Lesotho (Caledonspoort, Ficksburg, Maseru bridge, Qacha’s Nek, and Van
Rooyen’s Gate) from 2019 to 2020.
Table 29: RSA imports (value and volume) from Lesotho
V A L U E Month -to-Month
V O L U M E Month -to-Month 2019 2020 2019 2020
Jan 298 593 305 419 562 283 41% 13 667 609 15 056 229 10%
Feb 326 433 971 462 310 611 42% 14 121 641 15 772 700 12%
Mar 325 767 852 403 848 303 24% 14 221 576 14 973 971 5%
Apr 375 544 260 25 425 054 -93% 15 382 104 5 225 824 -66%
May 342 362 793 150 196 108 -56% 16 768 977 11 048 405 -34%
Jun 348 292 822 308 351 723 -11% 15 248 366 14 084 611 -8%
Jul 384 311 892 370 159 555 -4% 18 405 904 15 677 717 -15%
Aug 405 433 501 390 384 367 -4% 18 008 063 16 885 879 -6%
Sep 414 421 002 447 882 002 8% 17 357 945 16 738 671 -4%
Oct 501 272 994 566 733 957 13% 19 239 768 19 134 237 -1%
Nov 440 549 566 549 861 290 25% 18 299 561 19 033 439 4%
Dec 283 962 189 327 892 192 15% 13 145 374 13 583 062 3%
Total 4 446 946 147 4 422 607 445 -1% 193 866 887 177 214 744 -9% Source: South African Revenue Service (SARS)
35 | P a g e
South Africa’s total imports processed in these 5 commercial border posts from Lesotho documented
about R4,4 billion in 2019 while in 2020, imports valued nearly R4,4 billion resulting to a decline of 1%.
South Africa’s total volumes imported from Lesotho through five commercial border posts documented
about 194 million pieces of goods in 2019 and in 2020, imports registered about 177 million pieces of
goods resulting to a decline of 9% (Table 29).
Table 29 and Figure 6 below depict that the highest decline in import values were realized in April 2020
compared to April 2019, with negative 93%. Measured at month-on-month, the rand value of imports
decreased by 94% from March 2020 (R404 million) downwards to R25 million in April 2020.
Table 29 and Figure 6 below illustrate that the highest decline in import volumes were realized in April
2020 compared to April 2019 with a decline of 66%, whereas on a month-to-month basis import volumes
dropped by 65% from March to April in 2020.
In 2020, Maseru Bridge border posts processed the highest imports volumes that recorded about 59%
of South Africa’s total imports from Lesotho (Figure 6). Maseru Bridge border posts, shown in Table 30
below, topped in processing imports to the value of 49% (R2,2, billion) of South Africa’s imports from
Lesotho (R4,4 billion).
Figure 6: South Africa’s imports (value and volume) from Lesotho
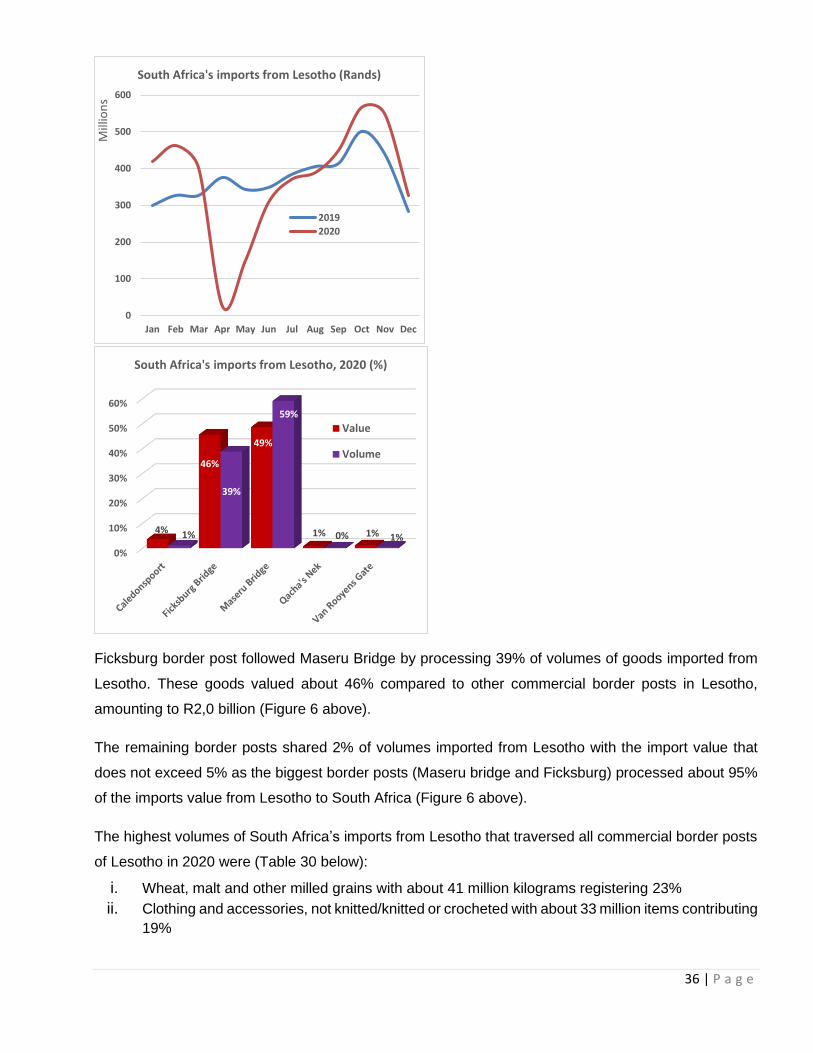
36 | P a g e
Ficksburg border post followed Maseru Bridge by processing 39% of volumes of goods imported from
Lesotho. These goods valued about 46% compared to other commercial border posts in Lesotho,
amounting to R2,0 billion (Figure 6 above).
The remaining border posts shared 2% of volumes imported from Lesotho with the import value that
does not exceed 5% as the biggest border posts (Maseru bridge and Ficksburg) processed about 95%
of the imports value from Lesotho to South Africa (Figure 6 above).
The highest volumes of South Africa’s imports from Lesotho that traversed all commercial border posts
of Lesotho in 2020 were (Table 30 below):
i. Wheat, malt and other milled grains with about 41 million kilograms registering 23%
ii. Clothing and accessories, not knitted/knitted or crocheted with about 33 million items contributing
19%
0
100
200
300
400
500
600
Jan Feb Mar Apr May Jun Jul Aug Sep Oct Nov Dec
Mill
ion
s
South Africa's imports from Lesotho (Rands)
2019
2020
0%
10%
20%
30%
40%
50%
60%
4%
46%
49%
1% 1%1%
39%
59%
0% 1%
South Africa's imports from Lesotho, 2020 (%)
Value
Volume
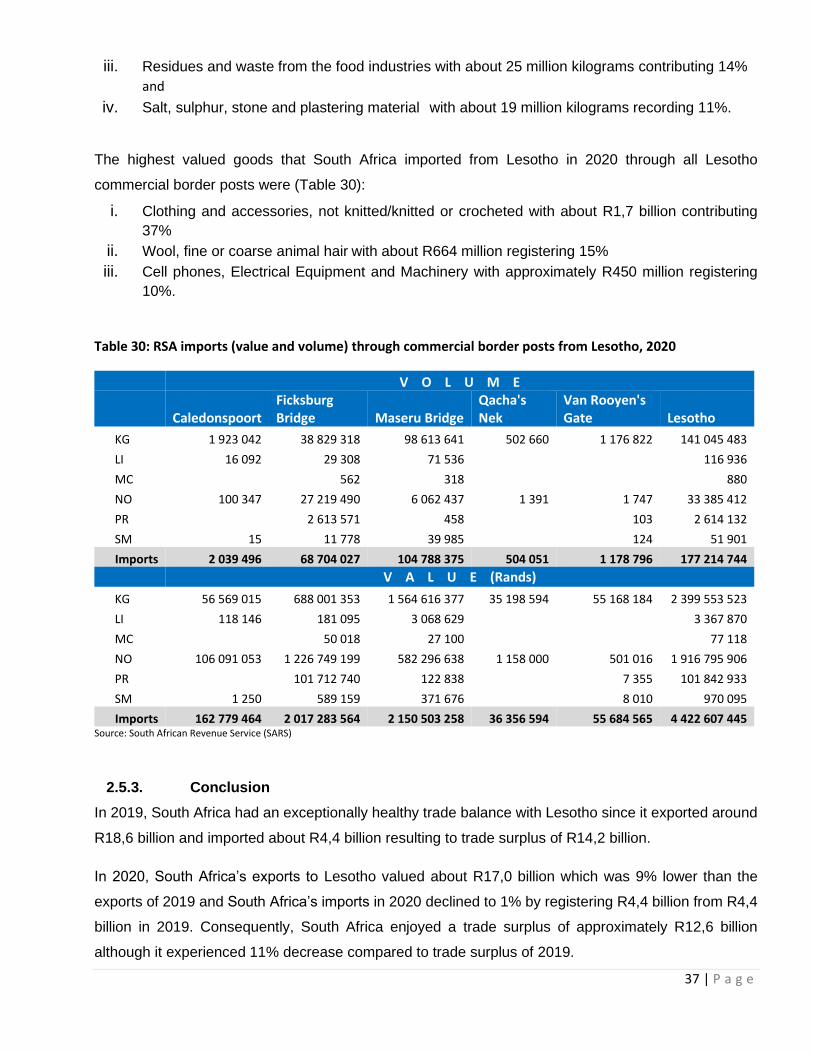
37 | P a g e
iii. Residues and waste from the food industries with about 25 million kilograms contributing 14%
and
iv. Salt, sulphur, stone and plastering material with about 19 million kilograms recording 11%.
The highest valued goods that South Africa imported from Lesotho in 2020 through all Lesotho
commercial border posts were (Table 30):
i. Clothing and accessories, not knitted/knitted or crocheted with about R1,7 billion contributing
37%
ii. Wool, fine or coarse animal hair with about R664 million registering 15%
iii. Cell phones, Electrical Equipment and Machinery with approximately R450 million registering
10%.
Table 30: RSA imports (value and volume) through commercial border posts from Lesotho, 2020
V O L U M E
Caledonspoort Ficksburg Bridge Maseru Bridge
Qacha's Nek
Van Rooyen's Gate Lesotho
KG 1 923 042 38 829 318 98 613 641 502 660 1 176 822 141 045 483
LI 16 092 29 308 71 536 116 936
MC 562 318 880
NO 100 347 27 219 490 6 062 437 1 391 1 747 33 385 412
PR 2 613 571 458 103 2 614 132
SM 15 11 778 39 985 124 51 901
Imports 2 039 496 68 704 027 104 788 375 504 051 1 178 796 177 214 744
V A L U E (Rands)
KG 56 569 015 688 001 353 1 564 616 377 35 198 594 55 168 184 2 399 553 523
LI 118 146 181 095 3 068 629 3 367 870
MC 50 018 27 100 77 118
NO 106 091 053 1 226 749 199 582 296 638 1 158 000 501 016 1 916 795 906
PR 101 712 740 122 838 7 355 101 842 933
SM 1 250 589 159 371 676 8 010 970 095
Imports 162 779 464 2 017 283 564 2 150 503 258 36 356 594 55 684 565 4 422 607 445 Source: South African Revenue Service (SARS)
2.5.3. Conclusion
In 2019, South Africa had an exceptionally healthy trade balance with Lesotho since it exported around
R18,6 billion and imported about R4,4 billion resulting to trade surplus of R14,2 billion.
In 2020, South Africa’s exports to Lesotho valued about R17,0 billion which was 9% lower than the
exports of 2019 and South Africa’s imports in 2020 declined to 1% by registering R4,4 billion from R4,4
billion in 2019. Consequently, South Africa enjoyed a trade surplus of approximately R12,6 billion
although it experienced 11% decrease compared to trade surplus of 2019.
38 | P a g e
In 2020, the highest volumes exported from South Africa to Lesotho by type of commodity were Crude,
Coal, Petroleum and Electricity; Salt, Sulphur, stone and plastering material and Wheat, malt and other
milled grains. The highest valued exports to Lesotho were Crude, Coal, Petroleum and Electricity;
Wheat, malt and other milled grains; and Catalytic Converters, Computers and Mechanical Appliances
In 2020, the highest volumes imported from Lesotho by type of commodity were Wheat, malt and other
milled grains; Clothing and accessories, not knitted/knitted or crocheted; and Residues and waste from
the food industries. The highest valued imports from Lesotho were Clothing and accessories, not
knitted/knitted or crocheted; Wool, fine or coarse animal hair; and Cellphones, Electrical Equipment
and Machinery.
The decline of inter-trade between South Africa and Lesotho in 2020 were mainly driven by national
lockdown to contain the spread of the corona virus.
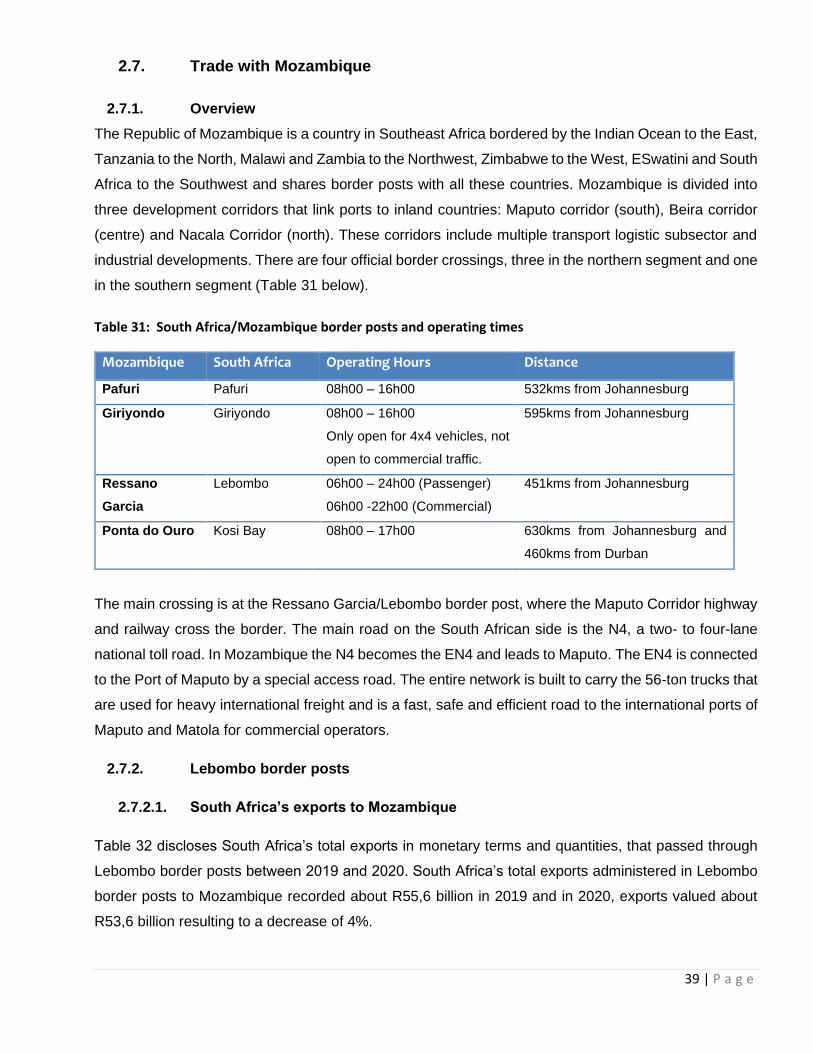
39 | P a g e
2.7. Trade with Mozambique
2.7.1. Overview
The Republic of Mozambique is a country in Southeast Africa bordered by the Indian Ocean to the East,
Tanzania to the North, Malawi and Zambia to the Northwest, Zimbabwe to the West, ESwatini and South
Africa to the Southwest and shares border posts with all these countries. Mozambique is divided into
three development corridors that link ports to inland countries: Maputo corridor (south), Beira corridor
(centre) and Nacala Corridor (north). These corridors include multiple transport logistic subsector and
industrial developments. There are four official border crossings, three in the northern segment and one
in the southern segment (Table 31 below).
Table 31: South Africa/Mozambique border posts and operating times
Mozambique South Africa Operating Hours Distance
Pafuri Pafuri 08h00 – 16h00 532kms from Johannesburg
Giriyondo Giriyondo 08h00 – 16h00
Only open for 4x4 vehicles, not
open to commercial traffic.
595kms from Johannesburg
Ressano
Garcia
Lebombo 06h00 – 24h00 (Passenger)
06h00 -22h00 (Commercial)
451kms from Johannesburg
Ponta do Ouro Kosi Bay 08h00 – 17h00
630kms from Johannesburg and
460kms from Durban
The main crossing is at the Ressano Garcia/Lebombo border post, where the Maputo Corridor highway
and railway cross the border. The main road on the South African side is the N4, a two- to four-lane
national toll road. In Mozambique the N4 becomes the EN4 and leads to Maputo. The EN4 is connected
to the Port of Maputo by a special access road. The entire network is built to carry the 56-ton trucks that
are used for heavy international freight and is a fast, safe and efficient road to the international ports of
Maputo and Matola for commercial operators.
2.7.2. Lebombo border posts
2.7.2.1. South Africa’s exports to Mozambique
Table 32 discloses South Africa’s total exports in monetary terms and quantities, that passed through
Lebombo border posts between 2019 and 2020. South Africa’s total exports administered in Lebombo
border posts to Mozambique recorded about R55,6 billion in 2019 and in 2020, exports valued about
R53,6 billion resulting to a decrease of 4%.
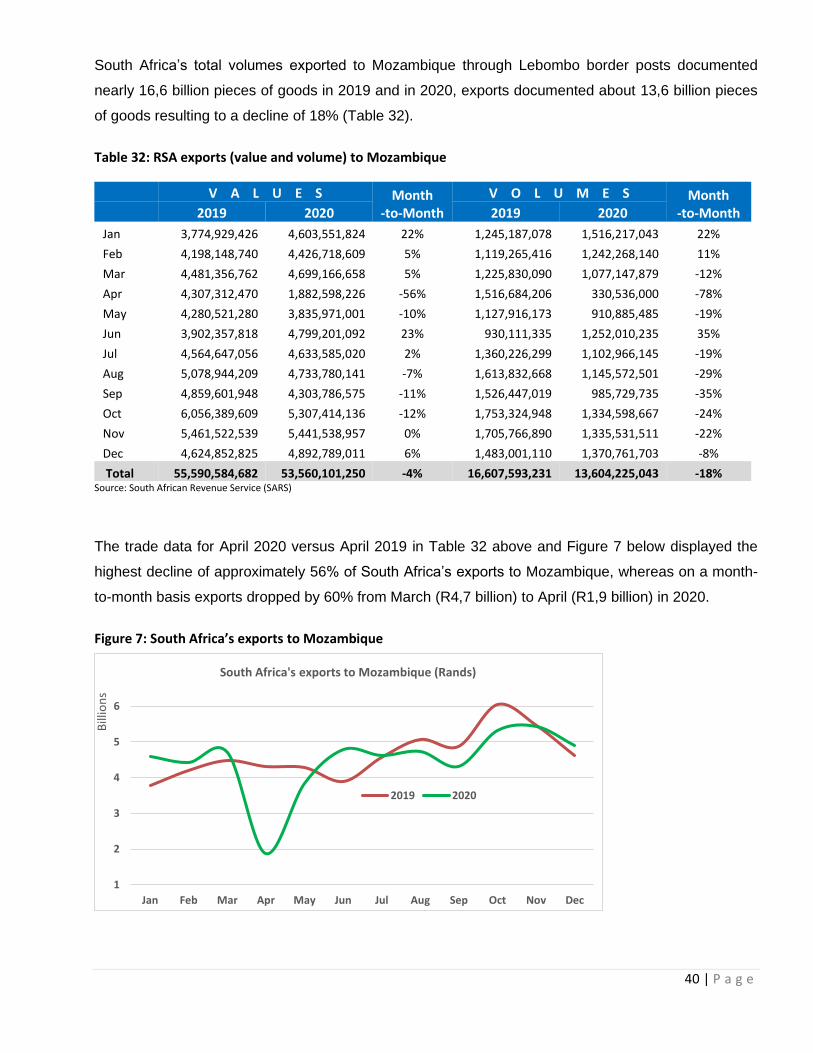
40 | P a g e
South Africa’s total volumes exported to Mozambique through Lebombo border posts documented
nearly 16,6 billion pieces of goods in 2019 and in 2020, exports documented about 13,6 billion pieces
of goods resulting to a decline of 18% (Table 32).
Table 32: RSA exports (value and volume) to Mozambique
V A L U E S Month -to-Month
V O L U M E S Month -to-Month 2019 2020 2019 2020
Jan 3,774,929,426 4,603,551,824 22% 1,245,187,078 1,516,217,043 22%
Feb 4,198,148,740 4,426,718,609 5% 1,119,265,416 1,242,268,140 11%
Mar 4,481,356,762 4,699,166,658 5% 1,225,830,090 1,077,147,879 -12%
Apr 4,307,312,470 1,882,598,226 -56% 1,516,684,206 330,536,000 -78%
May 4,280,521,280 3,835,971,001 -10% 1,127,916,173 910,885,485 -19%
Jun 3,902,357,818 4,799,201,092 23% 930,111,335 1,252,010,235 35%
Jul 4,564,647,056 4,633,585,020 2% 1,360,226,299 1,102,966,145 -19%
Aug 5,078,944,209 4,733,780,141 -7% 1,613,832,668 1,145,572,501 -29%
Sep 4,859,601,948 4,303,786,575 -11% 1,526,447,019 985,729,735 -35%
Oct 6,056,389,609 5,307,414,136 -12% 1,753,324,948 1,334,598,667 -24%
Nov 5,461,522,539 5,441,538,957 0% 1,705,766,890 1,335,531,511 -22%
Dec 4,624,852,825 4,892,789,011 6% 1,483,001,110 1,370,761,703 -8%
Total 55,590,584,682 53,560,101,250 -4% 16,607,593,231 13,604,225,043 -18% Source: South African Revenue Service (SARS)
The trade data for April 2020 versus April 2019 in Table 32 above and Figure 7 below displayed the
highest decline of approximately 56% of South Africa’s exports to Mozambique, whereas on a month-
to-month basis exports dropped by 60% from March (R4,7 billion) to April (R1,9 billion) in 2020.
Figure 7: South Africa’s exports to Mozambique
1
2
3
4
5
6
Jan Feb Mar Apr May Jun Jul Aug Sep Oct Nov Dec
Bill
ion
s
South Africa's exports to Mozambique (Rands)
2019 2020
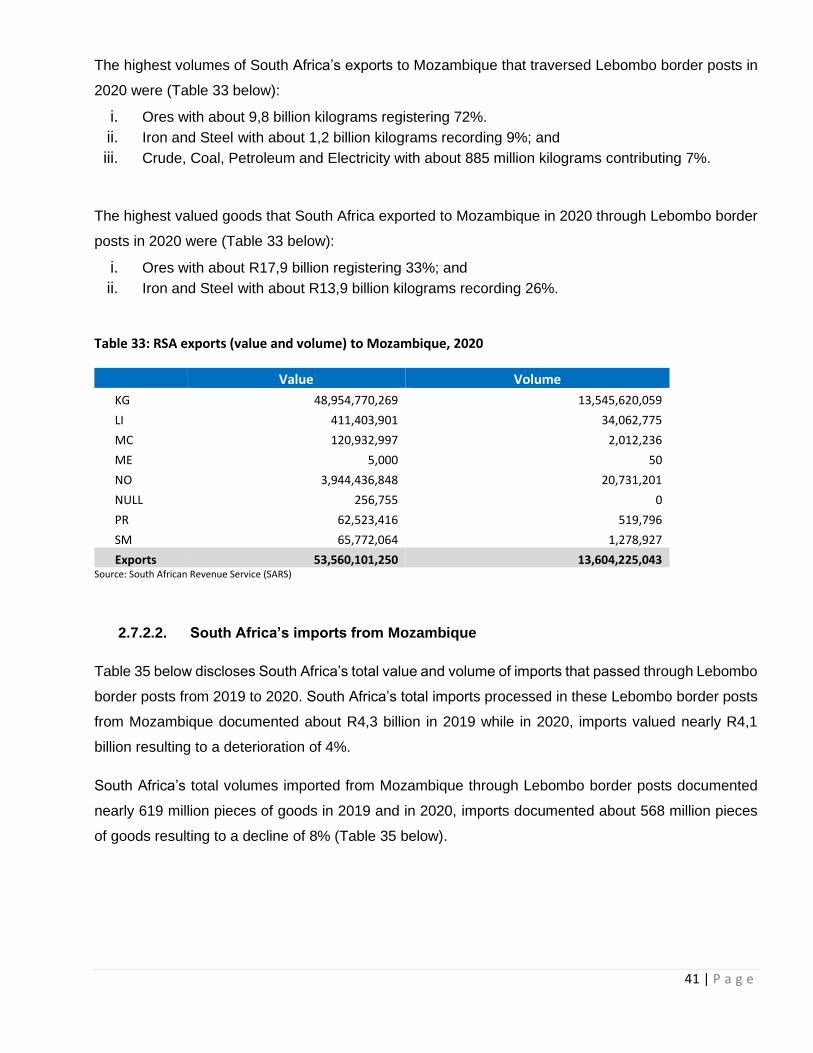
41 | P a g e
The highest volumes of South Africa’s exports to Mozambique that traversed Lebombo border posts in
2020 were (Table 33 below):
i. Ores with about 9,8 billion kilograms registering 72%.
ii. Iron and Steel with about 1,2 billion kilograms recording 9%; and
iii. Crude, Coal, Petroleum and Electricity with about 885 million kilograms contributing 7%.
The highest valued goods that South Africa exported to Mozambique in 2020 through Lebombo border
posts in 2020 were (Table 33 below):
i. Ores with about R17,9 billion registering 33%; and
ii. Iron and Steel with about R13,9 billion kilograms recording 26%.
Table 33: RSA exports (value and volume) to Mozambique, 2020
Value Volume
KG 48,954,770,269 13,545,620,059
LI 411,403,901 34,062,775
MC 120,932,997 2,012,236
ME 5,000 50
NO 3,944,436,848 20,731,201
NULL 256,755 0
PR 62,523,416 519,796
SM 65,772,064 1,278,927
Exports 53,560,101,250 13,604,225,043 Source: South African Revenue Service (SARS)
2.7.2.2. South Africa’s imports from Mozambique
Table 35 below discloses South Africa’s total value and volume of imports that passed through Lebombo
border posts from 2019 to 2020. South Africa’s total imports processed in these Lebombo border posts
from Mozambique documented about R4,3 billion in 2019 while in 2020, imports valued nearly R4,1
billion resulting to a deterioration of 4%.
South Africa’s total volumes imported from Mozambique through Lebombo border posts documented
nearly 619 million pieces of goods in 2019 and in 2020, imports documented about 568 million pieces
of goods resulting to a decline of 8% (Table 35 below).
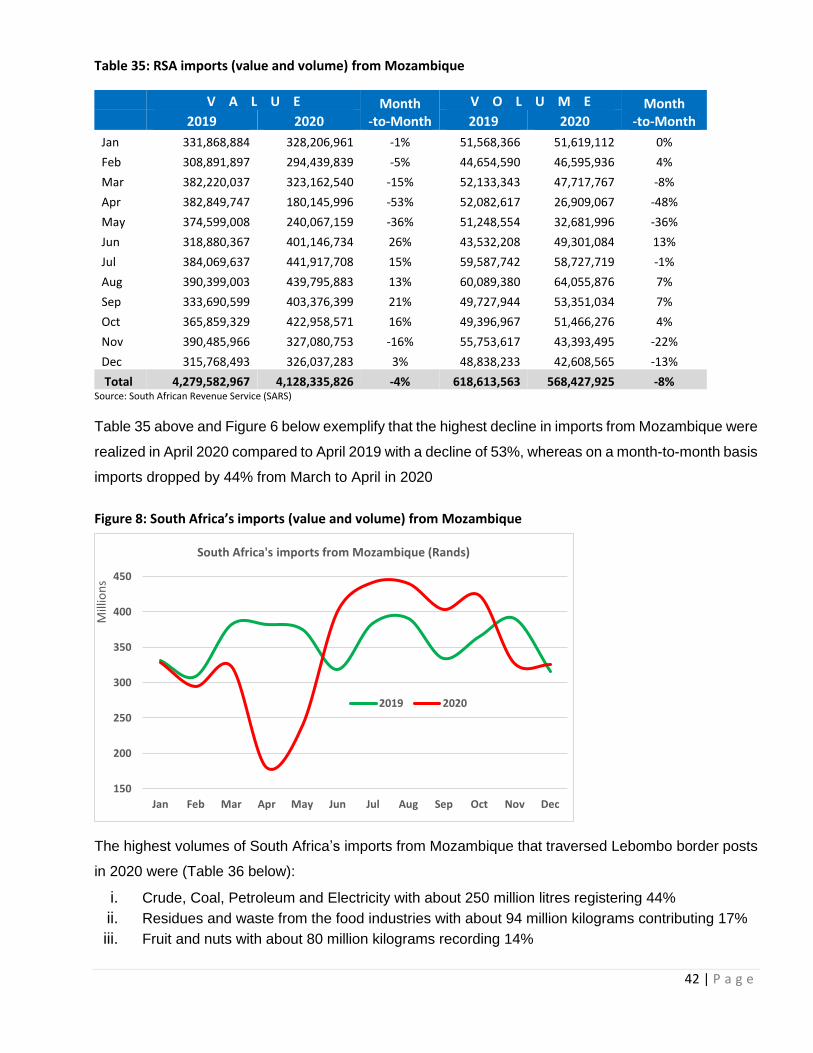
42 | P a g e
Table 35: RSA imports (value and volume) from Mozambique
V A L U E Month -to-Month
V O L U M E Month -to-Month 2019 2020 2019 2020
Jan 331,868,884 328,206,961 -1% 51,568,366 51,619,112 0%
Feb 308,891,897 294,439,839 -5% 44,654,590 46,595,936 4%
Mar 382,220,037 323,162,540 -15% 52,133,343 47,717,767 -8%
Apr 382,849,747 180,145,996 -53% 52,082,617 26,909,067 -48%
May 374,599,008 240,067,159 -36% 51,248,554 32,681,996 -36%
Jun 318,880,367 401,146,734 26% 43,532,208 49,301,084 13%
Jul 384,069,637 441,917,708 15% 59,587,742 58,727,719 -1%
Aug 390,399,003 439,795,883 13% 60,089,380 64,055,876 7%
Sep 333,690,599 403,376,399 21% 49,727,944 53,351,034 7%
Oct 365,859,329 422,958,571 16% 49,396,967 51,466,276 4%
Nov 390,485,966 327,080,753 -16% 55,753,617 43,393,495 -22%
Dec 315,768,493 326,037,283 3% 48,838,233 42,608,565 -13%
Total 4,279,582,967 4,128,335,826 -4% 618,613,563 568,427,925 -8% Source: South African Revenue Service (SARS)
Table 35 above and Figure 6 below exemplify that the highest decline in imports from Mozambique were
realized in April 2020 compared to April 2019 with a decline of 53%, whereas on a month-to-month basis
imports dropped by 44% from March to April in 2020
Figure 8: South Africa’s imports (value and volume) from Mozambique
The highest volumes of South Africa’s imports from Mozambique that traversed Lebombo border posts
in 2020 were (Table 36 below):
i. Crude, Coal, Petroleum and Electricity with about 250 million litres registering 44%
ii. Residues and waste from the food industries with about 94 million kilograms contributing 17%
iii. Fruit and nuts with about 80 million kilograms recording 14%
150
200
250
300
350
400
450
Jan Feb Mar Apr May Jun Jul Aug Sep Oct Nov Dec
Mill
ion
s
South Africa's imports from Mozambique (Rands)
2019 2020
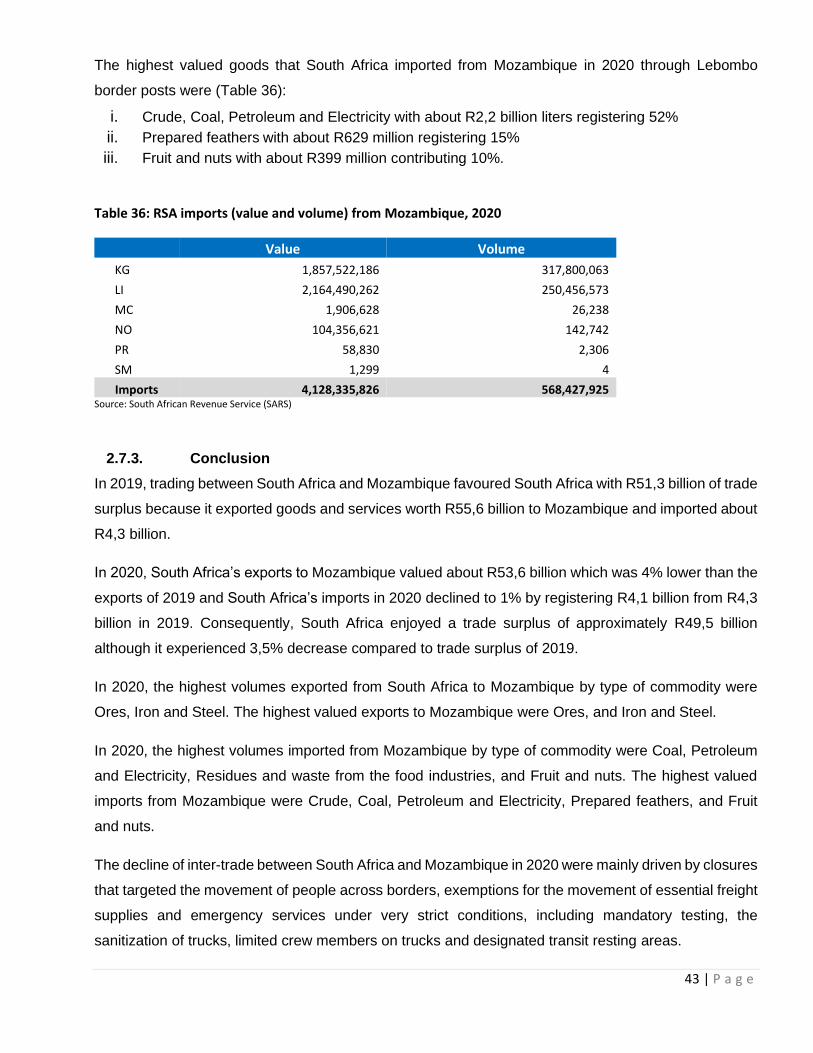
43 | P a g e
The highest valued goods that South Africa imported from Mozambique in 2020 through Lebombo
border posts were (Table 36):
i. Crude, Coal, Petroleum and Electricity with about R2,2 billion liters registering 52%
ii. Prepared feathers with about R629 million registering 15%
iii. Fruit and nuts with about R399 million contributing 10%.
Table 36: RSA imports (value and volume) from Mozambique, 2020
Value Volume
KG 1,857,522,186 317,800,063
LI 2,164,490,262 250,456,573
MC 1,906,628 26,238
NO 104,356,621 142,742
PR 58,830 2,306
SM 1,299 4
Imports 4,128,335,826 568,427,925 Source: South African Revenue Service (SARS)
2.7.3. Conclusion
In 2019, trading between South Africa and Mozambique favoured South Africa with R51,3 billion of trade
surplus because it exported goods and services worth R55,6 billion to Mozambique and imported about
R4,3 billion.
In 2020, South Africa’s exports to Mozambique valued about R53,6 billion which was 4% lower than the
exports of 2019 and South Africa’s imports in 2020 declined to 1% by registering R4,1 billion from R4,3
billion in 2019. Consequently, South Africa enjoyed a trade surplus of approximately R49,5 billion
although it experienced 3,5% decrease compared to trade surplus of 2019.
In 2020, the highest volumes exported from South Africa to Mozambique by type of commodity were
Ores, Iron and Steel. The highest valued exports to Mozambique were Ores, and Iron and Steel.
In 2020, the highest volumes imported from Mozambique by type of commodity were Coal, Petroleum
and Electricity, Residues and waste from the food industries, and Fruit and nuts. The highest valued
imports from Mozambique were Crude, Coal, Petroleum and Electricity, Prepared feathers, and Fruit
and nuts.
The decline of inter-trade between South Africa and Mozambique in 2020 were mainly driven by closures
that targeted the movement of people across borders, exemptions for the movement of essential freight
supplies and emergency services under very strict conditions, including mandatory testing, the
sanitization of trucks, limited crew members on trucks and designated transit resting areas.
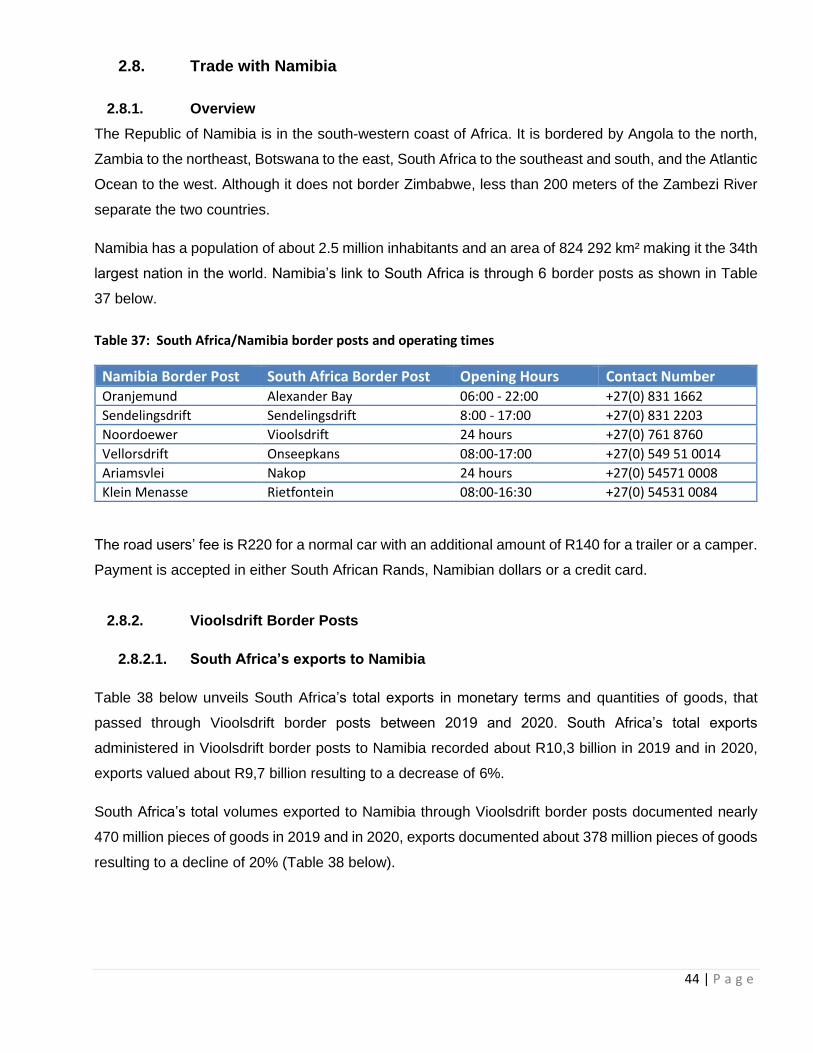
44 | P a g e
2.8. Trade with Namibia
2.8.1. Overview
The Republic of Namibia is in the south-western coast of Africa. It is bordered by Angola to the north,
Zambia to the northeast, Botswana to the east, South Africa to the southeast and south, and the Atlantic
Ocean to the west. Although it does not border Zimbabwe, less than 200 meters of the Zambezi River
separate the two countries.
Namibia has a population of about 2.5 million inhabitants and an area of 824 292 km² making it the 34th
largest nation in the world. Namibia’s link to South Africa is through 6 border posts as shown in Table
37 below.
Table 37: South Africa/Namibia border posts and operating times
Namibia Border Post South Africa Border Post Opening Hours Contact Number Oranjemund Alexander Bay 06:00 - 22:00 +27(0) 831 1662
Sendelingsdrift Sendelingsdrift 8:00 - 17:00 +27(0) 831 2203
Noordoewer Vioolsdrift 24 hours +27(0) 761 8760
Vellorsdrift Onseepkans 08:00-17:00 +27(0) 549 51 0014
Ariamsvlei Nakop 24 hours +27(0) 54571 0008
Klein Menasse Rietfontein 08:00-16:30 +27(0) 54531 0084
The road users’ fee is R220 for a normal car with an additional amount of R140 for a trailer or a camper.
Payment is accepted in either South African Rands, Namibian dollars or a credit card.
2.8.2. Vioolsdrift Border Posts
2.8.2.1. South Africa’s exports to Namibia
Table 38 below unveils South Africa’s total exports in monetary terms and quantities of goods, that
passed through Vioolsdrift border posts between 2019 and 2020. South Africa’s total exports
administered in Vioolsdrift border posts to Namibia recorded about R10,3 billion in 2019 and in 2020,
exports valued about R9,7 billion resulting to a decrease of 6%.
South Africa’s total volumes exported to Namibia through Vioolsdrift border posts documented nearly
470 million pieces of goods in 2019 and in 2020, exports documented about 378 million pieces of goods
resulting to a decline of 20% (Table 38 below).
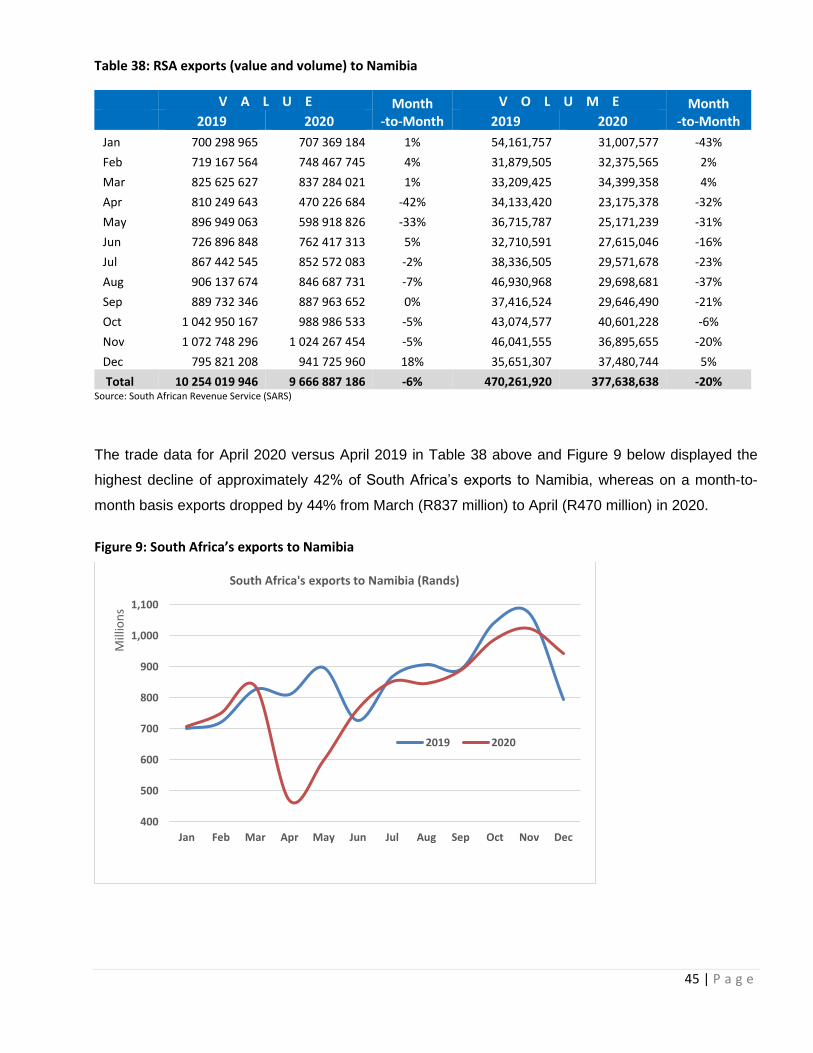
45 | P a g e
Table 38: RSA exports (value and volume) to Namibia
V A L U E Month -to-Month
V O L U M E Month -to-Month 2019 2020 2019 2020
Jan 700 298 965 707 369 184 1% 54,161,757 31,007,577 -43%
Feb 719 167 564 748 467 745 4% 31,879,505 32,375,565 2%
Mar 825 625 627 837 284 021 1% 33,209,425 34,399,358 4%
Apr 810 249 643 470 226 684 -42% 34,133,420 23,175,378 -32%
May 896 949 063 598 918 826 -33% 36,715,787 25,171,239 -31%
Jun 726 896 848 762 417 313 5% 32,710,591 27,615,046 -16%
Jul 867 442 545 852 572 083 -2% 38,336,505 29,571,678 -23%
Aug 906 137 674 846 687 731 -7% 46,930,968 29,698,681 -37%
Sep 889 732 346 887 963 652 0% 37,416,524 29,646,490 -21%
Oct 1 042 950 167 988 986 533 -5% 43,074,577 40,601,228 -6%
Nov 1 072 748 296 1 024 267 454 -5% 46,041,555 36,895,655 -20%
Dec 795 821 208 941 725 960 18% 35,651,307 37,480,744 5%
Total 10 254 019 946 9 666 887 186 -6% 470,261,920 377,638,638 -20% Source: South African Revenue Service (SARS)
The trade data for April 2020 versus April 2019 in Table 38 above and Figure 9 below displayed the
highest decline of approximately 42% of South Africa’s exports to Namibia, whereas on a month-to-
month basis exports dropped by 44% from March (R837 million) to April (R470 million) in 2020.
Figure 9: South Africa’s exports to Namibia
400
500
600
700
800
900
1,000
1,100
Jan Feb Mar Apr May Jun Jul Aug Sep Oct Nov Dec
Mill
ion
s
South Africa's exports to Namibia (Rands)
2019 2020
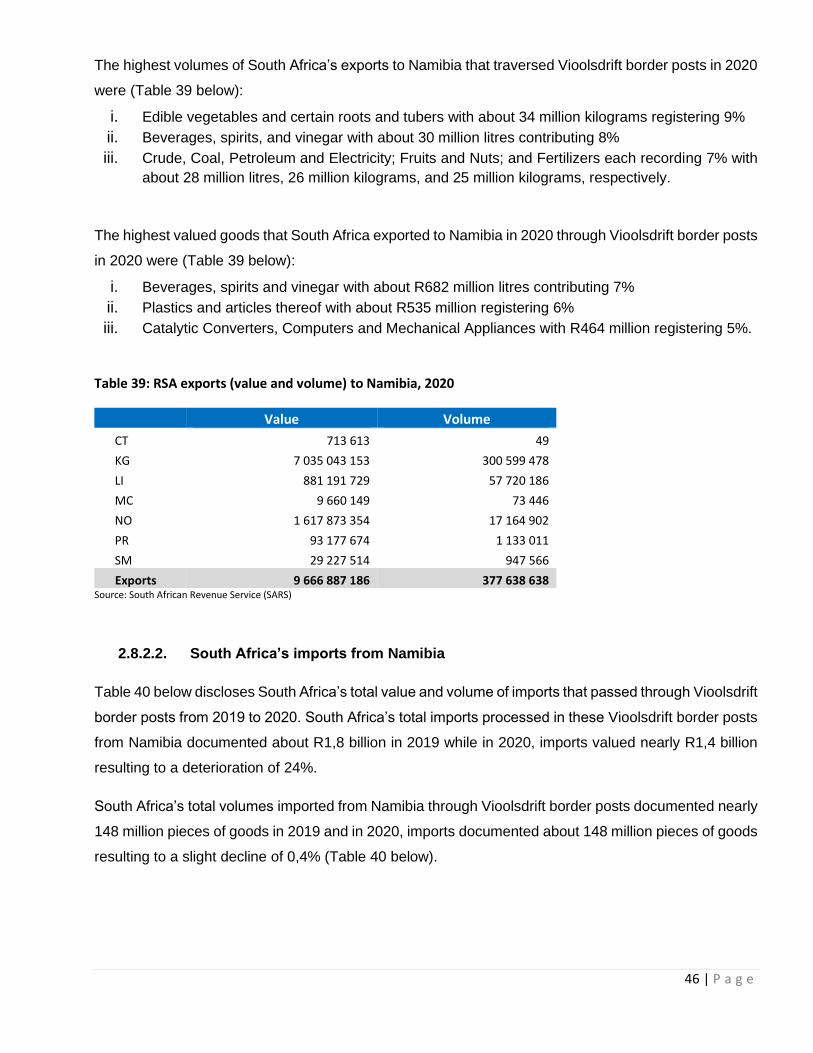
46 | P a g e
The highest volumes of South Africa’s exports to Namibia that traversed Vioolsdrift border posts in 2020
were (Table 39 below):
i. Edible vegetables and certain roots and tubers with about 34 million kilograms registering 9%
ii. Beverages, spirits, and vinegar with about 30 million litres contributing 8%
iii. Crude, Coal, Petroleum and Electricity; Fruits and Nuts; and Fertilizers each recording 7% with
about 28 million litres, 26 million kilograms, and 25 million kilograms, respectively.
The highest valued goods that South Africa exported to Namibia in 2020 through Vioolsdrift border posts
in 2020 were (Table 39 below):
i. Beverages, spirits and vinegar with about R682 million litres contributing 7%
ii. Plastics and articles thereof with about R535 million registering 6%
iii. Catalytic Converters, Computers and Mechanical Appliances with R464 million registering 5%.
Table 39: RSA exports (value and volume) to Namibia, 2020
Value Volume
CT 713 613 49
KG 7 035 043 153 300 599 478
LI 881 191 729 57 720 186
MC 9 660 149 73 446
NO 1 617 873 354 17 164 902
PR 93 177 674 1 133 011
SM 29 227 514 947 566
Exports 9 666 887 186 377 638 638 Source: South African Revenue Service (SARS)
2.8.2.2. South Africa’s imports from Namibia
Table 40 below discloses South Africa’s total value and volume of imports that passed through Vioolsdrift
border posts from 2019 to 2020. South Africa’s total imports processed in these Vioolsdrift border posts
from Namibia documented about R1,8 billion in 2019 while in 2020, imports valued nearly R1,4 billion
resulting to a deterioration of 24%.
South Africa’s total volumes imported from Namibia through Vioolsdrift border posts documented nearly
148 million pieces of goods in 2019 and in 2020, imports documented about 148 million pieces of goods
resulting to a slight decline of 0,4% (Table 40 below).
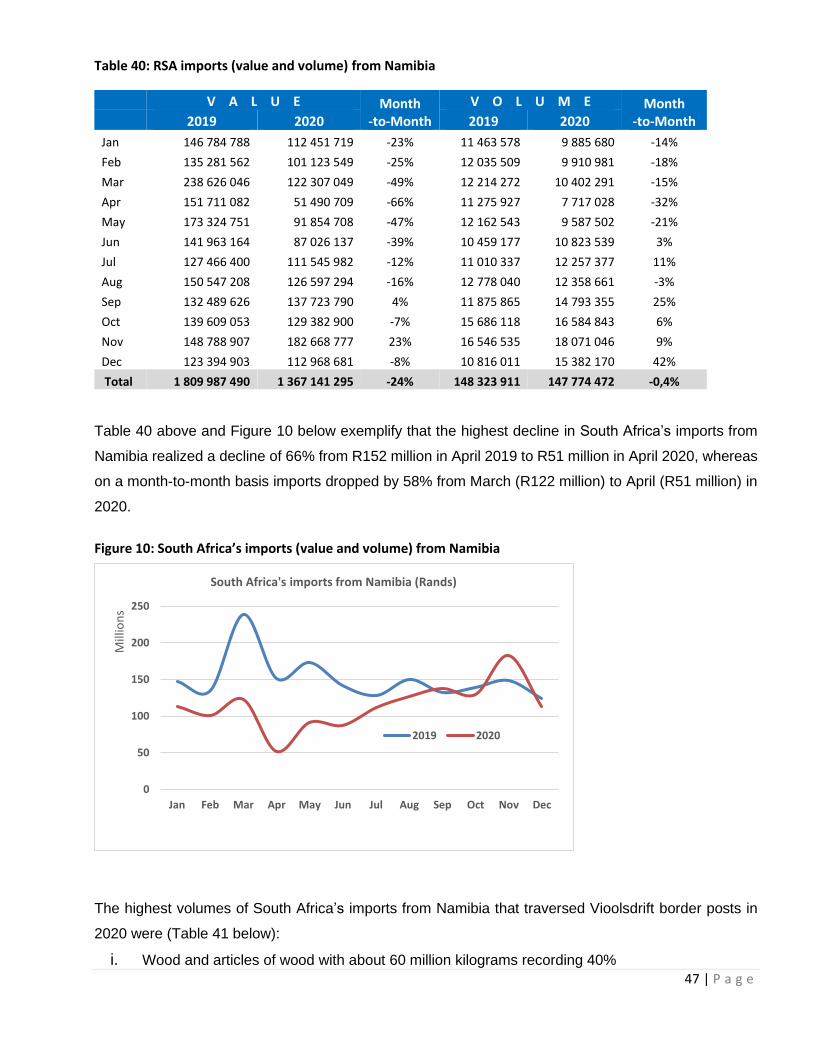
47 | P a g e
Table 40: RSA imports (value and volume) from Namibia
V A L U E Month -to-Month
V O L U M E Month -to-Month 2019 2020 2019 2020
Jan 146 784 788 112 451 719 -23% 11 463 578 9 885 680 -14%
Feb 135 281 562 101 123 549 -25% 12 035 509 9 910 981 -18%
Mar 238 626 046 122 307 049 -49% 12 214 272 10 402 291 -15%
Apr 151 711 082 51 490 709 -66% 11 275 927 7 717 028 -32%
May 173 324 751 91 854 708 -47% 12 162 543 9 587 502 -21%
Jun 141 963 164 87 026 137 -39% 10 459 177 10 823 539 3%
Jul 127 466 400 111 545 982 -12% 11 010 337 12 257 377 11%
Aug 150 547 208 126 597 294 -16% 12 778 040 12 358 661 -3%
Sep 132 489 626 137 723 790 4% 11 875 865 14 793 355 25%
Oct 139 609 053 129 382 900 -7% 15 686 118 16 584 843 6%
Nov 148 788 907 182 668 777 23% 16 546 535 18 071 046 9%
Dec 123 394 903 112 968 681 -8% 10 816 011 15 382 170 42%
Total 1 809 987 490 1 367 141 295 -24% 148 323 911 147 774 472 -0,4%
Table 40 above and Figure 10 below exemplify that the highest decline in South Africa’s imports from
Namibia realized a decline of 66% from R152 million in April 2019 to R51 million in April 2020, whereas
on a month-to-month basis imports dropped by 58% from March (R122 million) to April (R51 million) in
2020.
Figure 10: South Africa’s imports (value and volume) from Namibia
The highest volumes of South Africa’s imports from Namibia that traversed Vioolsdrift border posts in
2020 were (Table 41 below):
i. Wood and articles of wood with about 60 million kilograms recording 40%
0
50
100
150
200
250
Jan Feb Mar Apr May Jun Jul Aug Sep Oct Nov Dec
Mill
ion
s
South Africa's imports from Namibia (Rands)
2019 2020
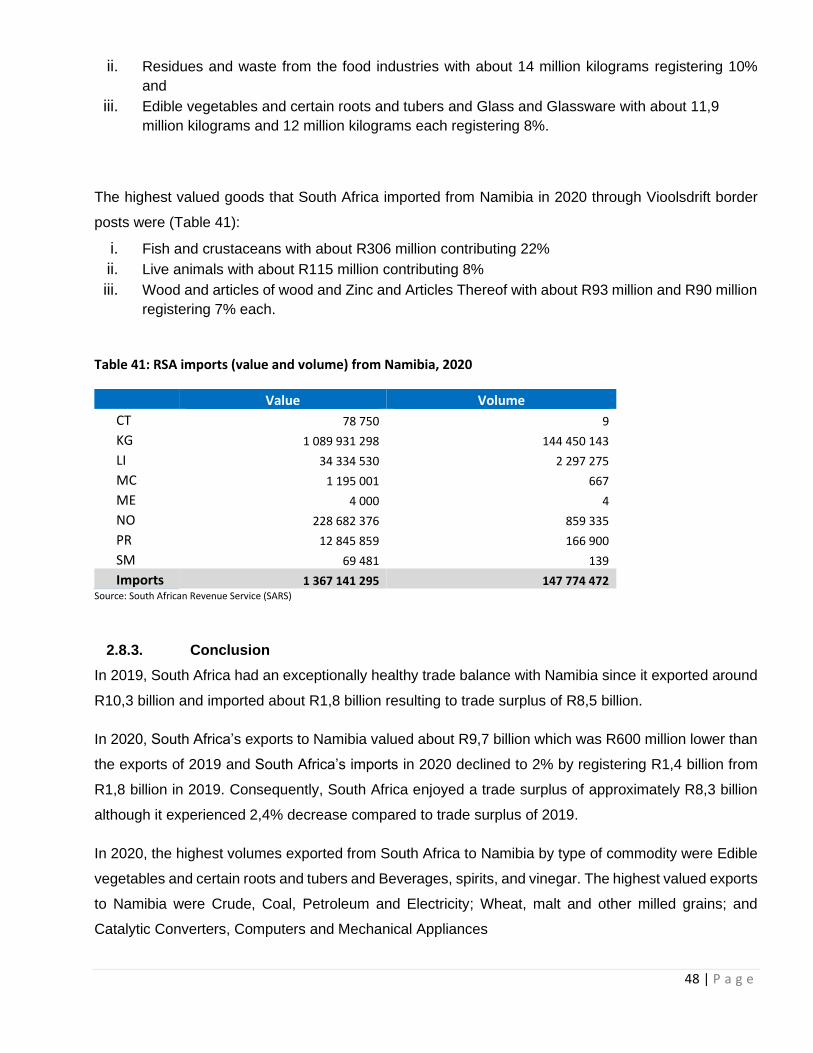
48 | P a g e
ii. Residues and waste from the food industries with about 14 million kilograms registering 10%
and
iii. Edible vegetables and certain roots and tubers and Glass and Glassware with about 11,9
million kilograms and 12 million kilograms each registering 8%.
The highest valued goods that South Africa imported from Namibia in 2020 through Vioolsdrift border
posts were (Table 41):
i. Fish and crustaceans with about R306 million contributing 22%
ii. Live animals with about R115 million contributing 8%
iii. Wood and articles of wood and Zinc and Articles Thereof with about R93 million and R90 million
registering 7% each.
Table 41: RSA imports (value and volume) from Namibia, 2020
Value Volume
CT 78 750 9
KG 1 089 931 298 144 450 143
LI 34 334 530 2 297 275
MC 1 195 001 667
ME 4 000 4
NO 228 682 376 859 335
PR 12 845 859 166 900
SM 69 481 139
Imports 1 367 141 295 147 774 472 Source: South African Revenue Service (SARS)
2.8.3. Conclusion
In 2019, South Africa had an exceptionally healthy trade balance with Namibia since it exported around
R10,3 billion and imported about R1,8 billion resulting to trade surplus of R8,5 billion.
In 2020, South Africa’s exports to Namibia valued about R9,7 billion which was R600 million lower than
the exports of 2019 and South Africa’s imports in 2020 declined to 2% by registering R1,4 billion from
R1,8 billion in 2019. Consequently, South Africa enjoyed a trade surplus of approximately R8,3 billion
although it experienced 2,4% decrease compared to trade surplus of 2019.
In 2020, the highest volumes exported from South Africa to Namibia by type of commodity were Edible
vegetables and certain roots and tubers and Beverages, spirits, and vinegar. The highest valued exports
to Namibia were Crude, Coal, Petroleum and Electricity; Wheat, malt and other milled grains; and
Catalytic Converters, Computers and Mechanical Appliances
49 | P a g e
In 2020, the highest volumes imported from Lesotho by type of commodity were Beverages, spirits and
vinegar, Plastics and articles thereof and Catalytic Converters, Computers and Mechanical Appliances.
The highest valued imports from Lesotho were Fish and crustaceans and live animals.
The decline of inter-trade between South Africa and Namibia in 2020 were mainly driven by the spread
of the corona virus, national lockdowns, disruptions in supply chains, and lower external demand for key
exports and imports that were curtailing economic activity.
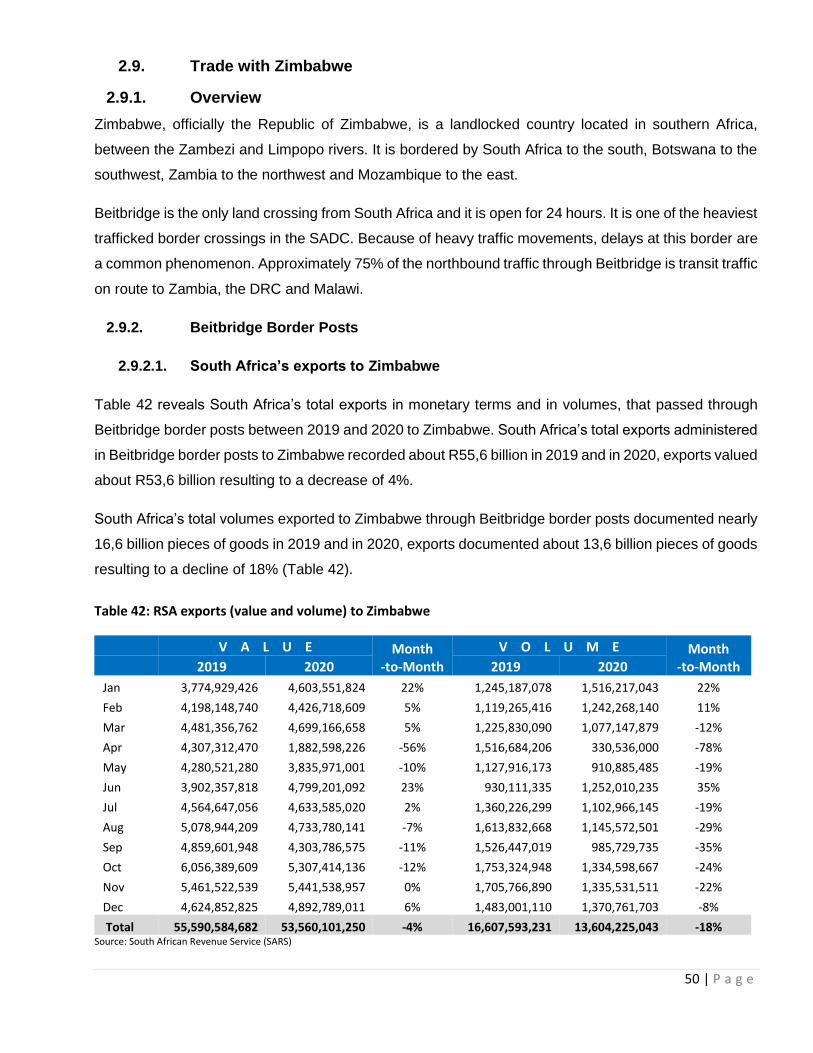
50 | P a g e
2.9. Trade with Zimbabwe
2.9.1. Overview
Zimbabwe, officially the Republic of Zimbabwe, is a landlocked country located in southern Africa,
between the Zambezi and Limpopo rivers. It is bordered by South Africa to the south, Botswana to the
southwest, Zambia to the northwest and Mozambique to the east.
Beitbridge is the only land crossing from South Africa and it is open for 24 hours. It is one of the heaviest
trafficked border crossings in the SADC. Because of heavy traffic movements, delays at this border are
a common phenomenon. Approximately 75% of the northbound traffic through Beitbridge is transit traffic
on route to Zambia, the DRC and Malawi.
2.9.2. Beitbridge Border Posts
2.9.2.1. South Africa’s exports to Zimbabwe
Table 42 reveals South Africa’s total exports in monetary terms and in volumes, that passed through
Beitbridge border posts between 2019 and 2020 to Zimbabwe. South Africa’s total exports administered
in Beitbridge border posts to Zimbabwe recorded about R55,6 billion in 2019 and in 2020, exports valued
about R53,6 billion resulting to a decrease of 4%.
South Africa’s total volumes exported to Zimbabwe through Beitbridge border posts documented nearly
16,6 billion pieces of goods in 2019 and in 2020, exports documented about 13,6 billion pieces of goods
resulting to a decline of 18% (Table 42).
Table 42: RSA exports (value and volume) to Zimbabwe
V A L U E Month -to-Month
V O L U M E Month -to-Month 2019 2020 2019 2020
Jan 3,774,929,426 4,603,551,824 22% 1,245,187,078 1,516,217,043 22%
Feb 4,198,148,740 4,426,718,609 5% 1,119,265,416 1,242,268,140 11%
Mar 4,481,356,762 4,699,166,658 5% 1,225,830,090 1,077,147,879 -12%
Apr 4,307,312,470 1,882,598,226 -56% 1,516,684,206 330,536,000 -78%
May 4,280,521,280 3,835,971,001 -10% 1,127,916,173 910,885,485 -19%
Jun 3,902,357,818 4,799,201,092 23% 930,111,335 1,252,010,235 35%
Jul 4,564,647,056 4,633,585,020 2% 1,360,226,299 1,102,966,145 -19%
Aug 5,078,944,209 4,733,780,141 -7% 1,613,832,668 1,145,572,501 -29%
Sep 4,859,601,948 4,303,786,575 -11% 1,526,447,019 985,729,735 -35%
Oct 6,056,389,609 5,307,414,136 -12% 1,753,324,948 1,334,598,667 -24%
Nov 5,461,522,539 5,441,538,957 0% 1,705,766,890 1,335,531,511 -22%
Dec 4,624,852,825 4,892,789,011 6% 1,483,001,110 1,370,761,703 -8%
Total 55,590,584,682 53,560,101,250 -4% 16,607,593,231 13,604,225,043 -18% Source: South African Revenue Service (SARS)
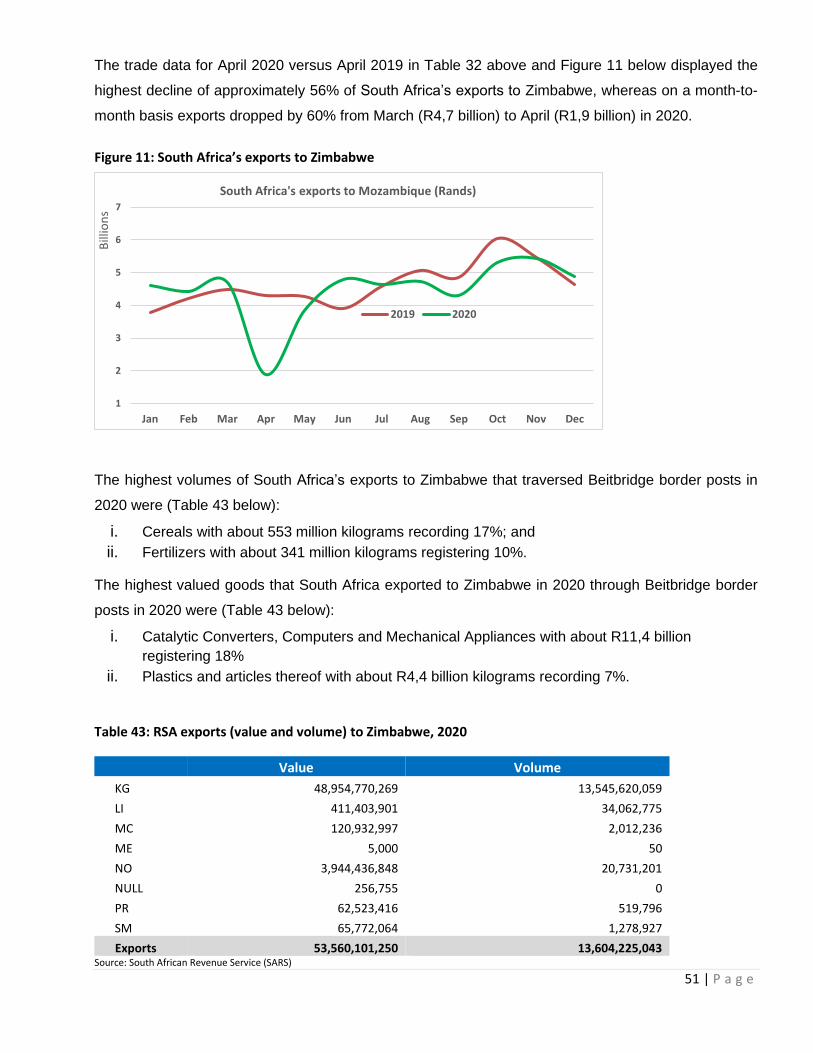
51 | P a g e
The trade data for April 2020 versus April 2019 in Table 32 above and Figure 11 below displayed the
highest decline of approximately 56% of South Africa’s exports to Zimbabwe, whereas on a month-to-
month basis exports dropped by 60% from March (R4,7 billion) to April (R1,9 billion) in 2020.
Figure 11: South Africa’s exports to Zimbabwe
The highest volumes of South Africa’s exports to Zimbabwe that traversed Beitbridge border posts in
2020 were (Table 43 below):
i. Cereals with about 553 million kilograms recording 17%; and
ii. Fertilizers with about 341 million kilograms registering 10%.
The highest valued goods that South Africa exported to Zimbabwe in 2020 through Beitbridge border
posts in 2020 were (Table 43 below):
i. Catalytic Converters, Computers and Mechanical Appliances with about R11,4 billion
registering 18%
ii. Plastics and articles thereof with about R4,4 billion kilograms recording 7%.
Table 43: RSA exports (value and volume) to Zimbabwe, 2020
Value Volume
KG 48,954,770,269 13,545,620,059
LI 411,403,901 34,062,775
MC 120,932,997 2,012,236
ME 5,000 50
NO 3,944,436,848 20,731,201
NULL 256,755 0
PR 62,523,416 519,796
SM 65,772,064 1,278,927
Exports 53,560,101,250 13,604,225,043 Source: South African Revenue Service (SARS)
1
2
3
4
5
6
7
Jan Feb Mar Apr May Jun Jul Aug Sep Oct Nov Dec
Bill
ion
s
South Africa's exports to Mozambique (Rands)
2019 2020
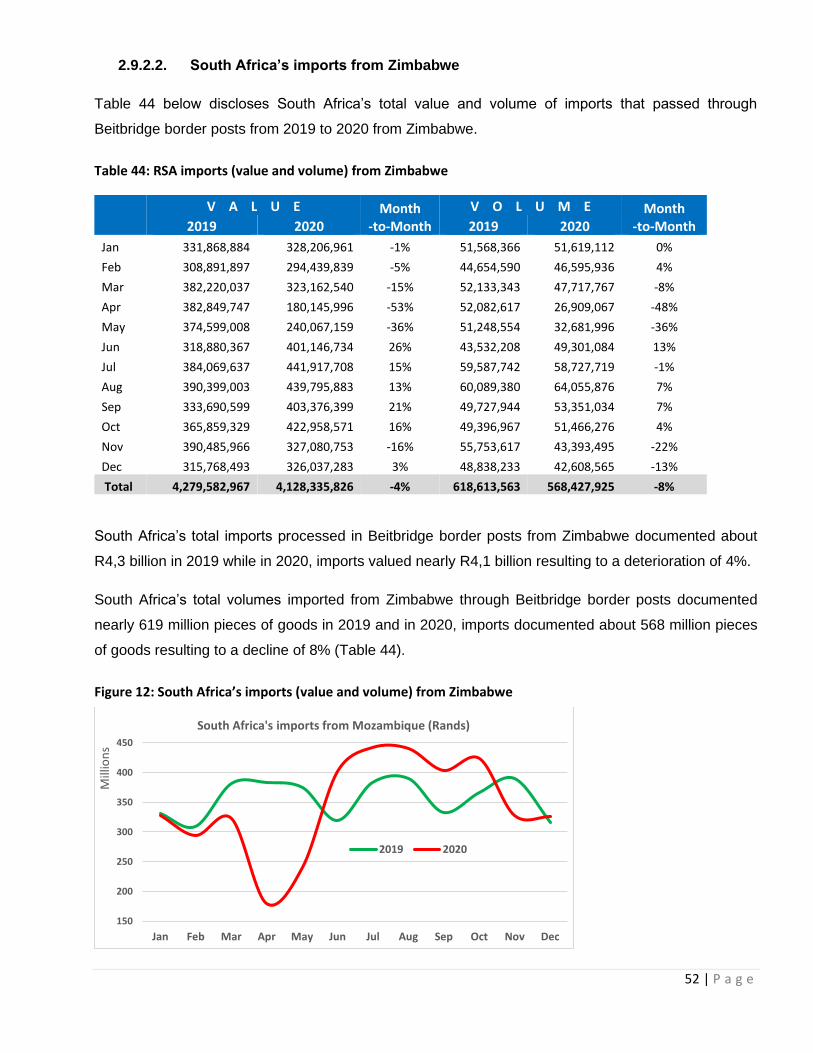
52 | P a g e
2.9.2.2. South Africa’s imports from Zimbabwe
Table 44 below discloses South Africa’s total value and volume of imports that passed through
Beitbridge border posts from 2019 to 2020 from Zimbabwe.
Table 44: RSA imports (value and volume) from Zimbabwe
V A L U E Month -to-Month
V O L U M E Month -to-Month 2019 2020 2019 2020
Jan 331,868,884 328,206,961 -1% 51,568,366 51,619,112 0%
Feb 308,891,897 294,439,839 -5% 44,654,590 46,595,936 4%
Mar 382,220,037 323,162,540 -15% 52,133,343 47,717,767 -8%
Apr 382,849,747 180,145,996 -53% 52,082,617 26,909,067 -48%
May 374,599,008 240,067,159 -36% 51,248,554 32,681,996 -36%
Jun 318,880,367 401,146,734 26% 43,532,208 49,301,084 13%
Jul 384,069,637 441,917,708 15% 59,587,742 58,727,719 -1%
Aug 390,399,003 439,795,883 13% 60,089,380 64,055,876 7%
Sep 333,690,599 403,376,399 21% 49,727,944 53,351,034 7%
Oct 365,859,329 422,958,571 16% 49,396,967 51,466,276 4%
Nov 390,485,966 327,080,753 -16% 55,753,617 43,393,495 -22%
Dec 315,768,493 326,037,283 3% 48,838,233 42,608,565 -13%
Total 4,279,582,967 4,128,335,826 -4% 618,613,563 568,427,925 -8%
South Africa’s total imports processed in Beitbridge border posts from Zimbabwe documented about
R4,3 billion in 2019 while in 2020, imports valued nearly R4,1 billion resulting to a deterioration of 4%.
South Africa’s total volumes imported from Zimbabwe through Beitbridge border posts documented
nearly 619 million pieces of goods in 2019 and in 2020, imports documented about 568 million pieces
of goods resulting to a decline of 8% (Table 44).
Figure 12: South Africa’s imports (value and volume) from Zimbabwe
150
200
250
300
350
400
450
Jan Feb Mar Apr May Jun Jul Aug Sep Oct Nov Dec
Mill
ion
s
South Africa's imports from Mozambique (Rands)
2019 2020
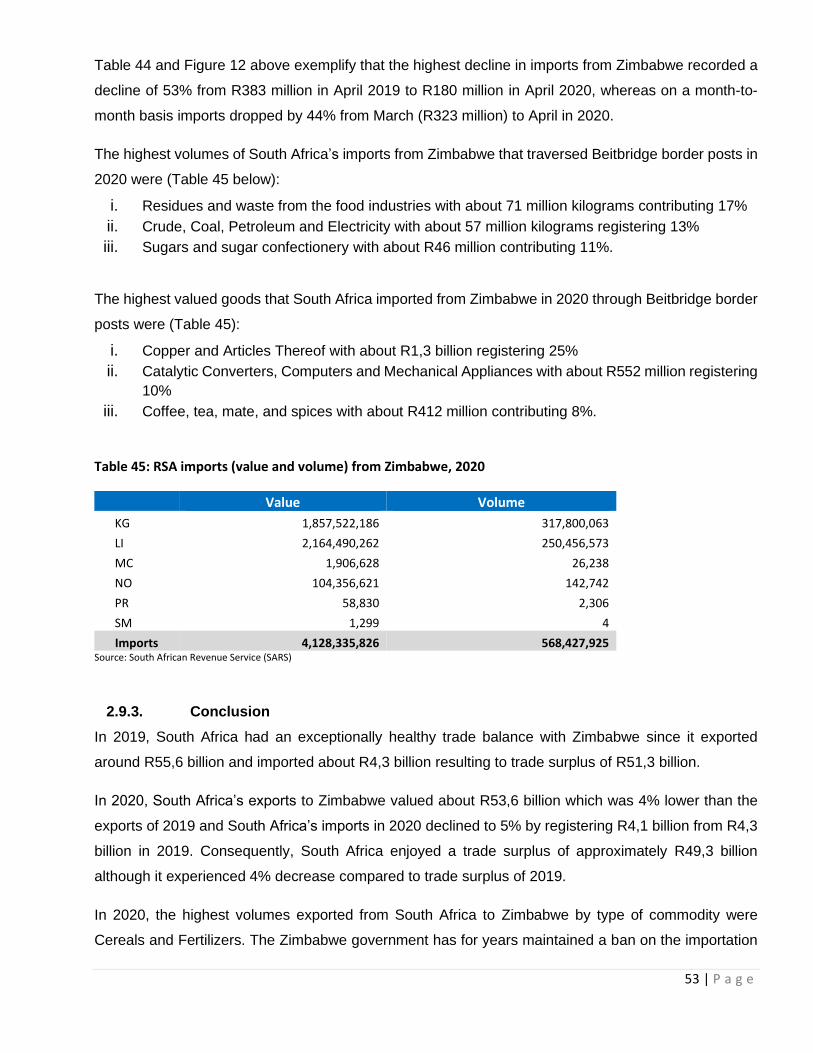
53 | P a g e
Table 44 and Figure 12 above exemplify that the highest decline in imports from Zimbabwe recorded a
decline of 53% from R383 million in April 2019 to R180 million in April 2020, whereas on a month-to-
month basis imports dropped by 44% from March (R323 million) to April in 2020.
The highest volumes of South Africa’s imports from Zimbabwe that traversed Beitbridge border posts in
2020 were (Table 45 below):
i. Residues and waste from the food industries with about 71 million kilograms contributing 17%
ii. Crude, Coal, Petroleum and Electricity with about 57 million kilograms registering 13%
iii. Sugars and sugar confectionery with about R46 million contributing 11%.
The highest valued goods that South Africa imported from Zimbabwe in 2020 through Beitbridge border
posts were (Table 45):
i. Copper and Articles Thereof with about R1,3 billion registering 25%
ii. Catalytic Converters, Computers and Mechanical Appliances with about R552 million registering
10%
iii. Coffee, tea, mate, and spices with about R412 million contributing 8%.
Table 45: RSA imports (value and volume) from Zimbabwe, 2020
Value Volume
KG 1,857,522,186 317,800,063
LI 2,164,490,262 250,456,573
MC 1,906,628 26,238
NO 104,356,621 142,742
PR 58,830 2,306
SM 1,299 4
Imports 4,128,335,826 568,427,925 Source: South African Revenue Service (SARS)
2.9.3. Conclusion
In 2019, South Africa had an exceptionally healthy trade balance with Zimbabwe since it exported
around R55,6 billion and imported about R4,3 billion resulting to trade surplus of R51,3 billion.
In 2020, South Africa’s exports to Zimbabwe valued about R53,6 billion which was 4% lower than the
exports of 2019 and South Africa’s imports in 2020 declined to 5% by registering R4,1 billion from R4,3
billion in 2019. Consequently, South Africa enjoyed a trade surplus of approximately R49,3 billion
although it experienced 4% decrease compared to trade surplus of 2019.
In 2020, the highest volumes exported from South Africa to Zimbabwe by type of commodity were
Cereals and Fertilizers. The Zimbabwe government has for years maintained a ban on the importation
54 | P a g e
or growing of genetically modified maize, but the current food shortages in the country have forced the
government to change its policy stance. The ban on genetically modified maize imports was lifted on
the 31 January 2020 as the country pursued to improve local supplies following yet another poor harvest
season. the lifting of the genetically modified maize import ban had accelerated maize import activity
into Zimbabwe from South Africa and from other leading maize exporting countries such as the United
States, Brazil, Mexico and Russia, among others, who have in the past exported maize to Zimbabwe.
The highest valued exports to Zimbabwe were Catalytic Converters, Computers and Mechanical
Appliances, and Plastics and articles thereof. Catalytic Converters spread throughout the world of cars
and have now became a staple of emissions control and is integrated into virtually every modern exhaust
system.
In 2020, the highest volumes imported by South Africa from Zimbabwe by type of commodity were
Residues and waste from the food industries, Crude, Coal, Petroleum and Sugars and sugar
confectionery.%.
The decline of inter-trade between South Africa and Zimbabwe in 2020 were mainly driven by national
lockdown that imposed several travel restrictions, including the closure of land border posts. Zimbabwe
also imposed similar travel restrictions on foreign nationals to contain the spread of the pandemic and
protect their citizens and her economy.
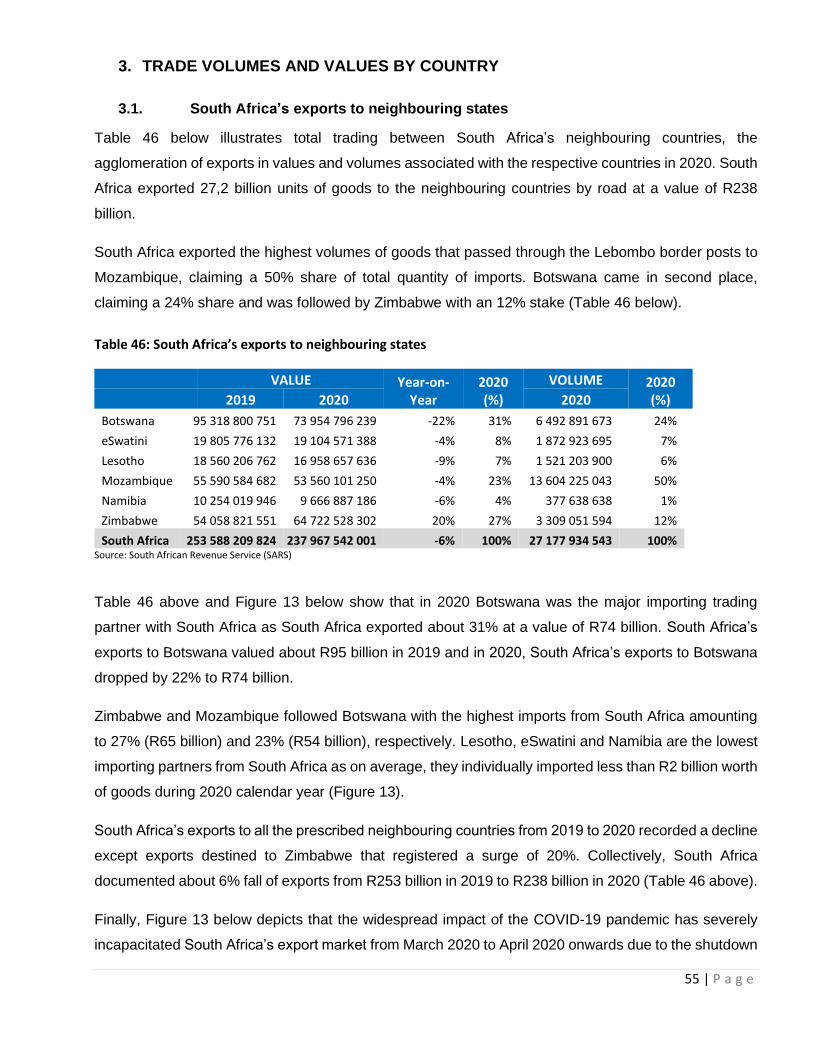
55 | P a g e
3. TRADE VOLUMES AND VALUES BY COUNTRY
3.1. South Africa’s exports to neighbouring states
Table 46 below illustrates total trading between South Africa’s neighbouring countries, the
agglomeration of exports in values and volumes associated with the respective countries in 2020. South
Africa exported 27,2 billion units of goods to the neighbouring countries by road at a value of R238
billion.
South Africa exported the highest volumes of goods that passed through the Lebombo border posts to
Mozambique, claiming a 50% share of total quantity of imports. Botswana came in second place,
claiming a 24% share and was followed by Zimbabwe with an 12% stake (Table 46 below).
Table 46: South Africa’s exports to neighbouring states
VALUE Year-on-Year
2020 (%)
VOLUME 2020 (%) 2019 2020 2020
Botswana 95 318 800 751 73 954 796 239 -22% 31% 6 492 891 673 24%
eSwatini 19 805 776 132 19 104 571 388 -4% 8% 1 872 923 695 7%
Lesotho 18 560 206 762 16 958 657 636 -9% 7% 1 521 203 900 6%
Mozambique 55 590 584 682 53 560 101 250 -4% 23% 13 604 225 043 50%
Namibia 10 254 019 946 9 666 887 186 -6% 4% 377 638 638 1%
Zimbabwe 54 058 821 551 64 722 528 302 20% 27% 3 309 051 594 12%
South Africa 253 588 209 824 237 967 542 001 -6% 100% 27 177 934 543 100% Source: South African Revenue Service (SARS)
Table 46 above and Figure 13 below show that in 2020 Botswana was the major importing trading
partner with South Africa as South Africa exported about 31% at a value of R74 billion. South Africa’s
exports to Botswana valued about R95 billion in 2019 and in 2020, South Africa’s exports to Botswana
dropped by 22% to R74 billion.
Zimbabwe and Mozambique followed Botswana with the highest imports from South Africa amounting
to 27% (R65 billion) and 23% (R54 billion), respectively. Lesotho, eSwatini and Namibia are the lowest
importing partners from South Africa as on average, they individually imported less than R2 billion worth
of goods during 2020 calendar year (Figure 13).
South Africa’s exports to all the prescribed neighbouring countries from 2019 to 2020 recorded a decline
except exports destined to Zimbabwe that registered a surge of 20%. Collectively, South Africa
documented about 6% fall of exports from R253 billion in 2019 to R238 billion in 2020 (Table 46 above).
Finally, Figure 13 below depicts that the widespread impact of the COVID-19 pandemic has severely
incapacitated South Africa’s export market from March 2020 to April 2020 onwards due to the shutdown
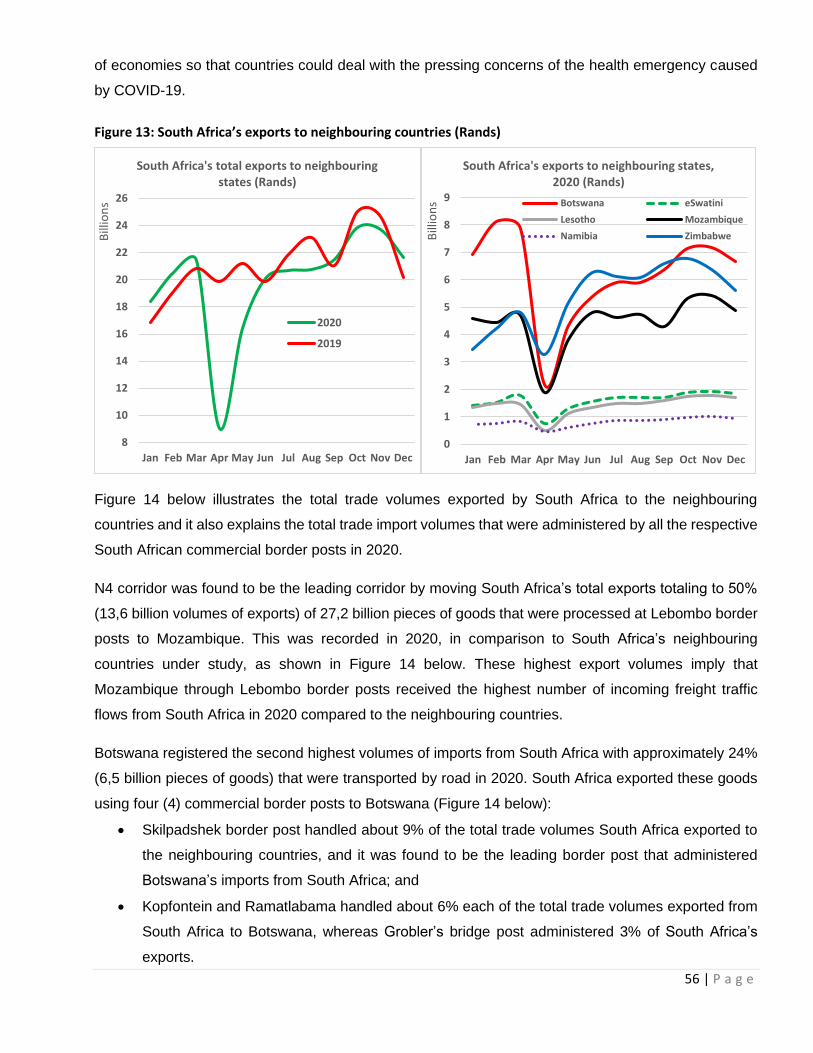
56 | P a g e
of economies so that countries could deal with the pressing concerns of the health emergency caused
by COVID-19.
Figure 13: South Africa’s exports to neighbouring countries (Rands)
Figure 14 below illustrates the total trade volumes exported by South Africa to the neighbouring
countries and it also explains the total trade import volumes that were administered by all the respective
South African commercial border posts in 2020.
N4 corridor was found to be the leading corridor by moving South Africa’s total exports totaling to 50%
(13,6 billion volumes of exports) of 27,2 billion pieces of goods that were processed at Lebombo border
posts to Mozambique. This was recorded in 2020, in comparison to South Africa’s neighbouring
countries under study, as shown in Figure 14 below. These highest export volumes imply that
Mozambique through Lebombo border posts received the highest number of incoming freight traffic
flows from South Africa in 2020 compared to the neighbouring countries.
Botswana registered the second highest volumes of imports from South Africa with approximately 24%
(6,5 billion pieces of goods) that were transported by road in 2020. South Africa exported these goods
using four (4) commercial border posts to Botswana (Figure 14 below):
• Skilpadshek border post handled about 9% of the total trade volumes South Africa exported to
the neighbouring countries, and it was found to be the leading border post that administered
Botswana’s imports from South Africa; and
• Kopfontein and Ramatlabama handled about 6% each of the total trade volumes exported from
South Africa to Botswana, whereas Grobler’s bridge post administered 3% of South Africa’s
exports.
8
10
12
14
16
18
20
22
24
26
Jan Feb Mar Apr May Jun Jul Aug Sep Oct Nov Dec
Bill
ion
s
South Africa's total exports to neighbouring states (Rands)
2020
2019
0
1
2
3
4
5
6
7
8
9
Jan Feb Mar Apr May Jun Jul Aug Sep Oct Nov Dec
Bill
ion
s
South Africa's exports to neighbouring states, 2020 (Rands)
Botswana eSwatini
Lesotho Mozambique
Namibia Zimbabwe
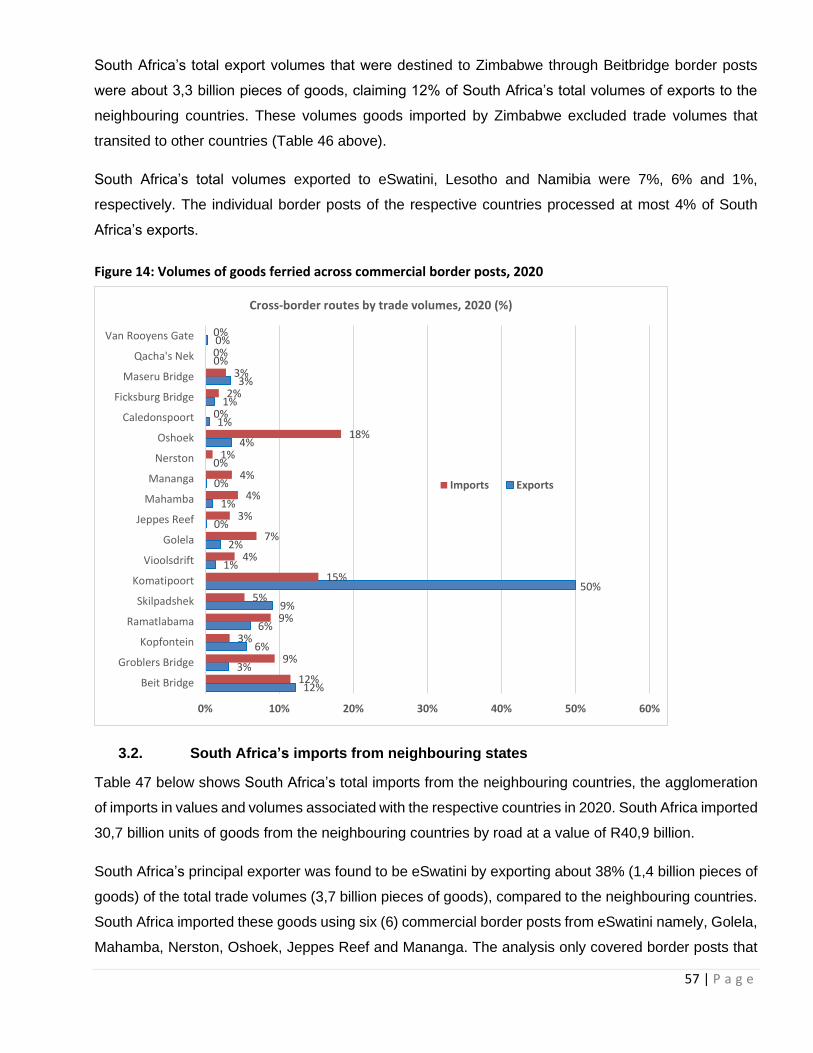
57 | P a g e
South Africa’s total export volumes that were destined to Zimbabwe through Beitbridge border posts
were about 3,3 billion pieces of goods, claiming 12% of South Africa’s total volumes of exports to the
neighbouring countries. These volumes goods imported by Zimbabwe excluded trade volumes that
transited to other countries (Table 46 above).
South Africa’s total volumes exported to eSwatini, Lesotho and Namibia were 7%, 6% and 1%,
respectively. The individual border posts of the respective countries processed at most 4% of South
Africa’s exports.
Figure 14: Volumes of goods ferried across commercial border posts, 2020
3.2. South Africa’s imports from neighbouring states
Table 47 below shows South Africa’s total imports from the neighbouring countries, the agglomeration
of imports in values and volumes associated with the respective countries in 2020. South Africa imported
30,7 billion units of goods from the neighbouring countries by road at a value of R40,9 billion.
South Africa’s principal exporter was found to be eSwatini by exporting about 38% (1,4 billion pieces of
goods) of the total trade volumes (3,7 billion pieces of goods), compared to the neighbouring countries.
South Africa imported these goods using six (6) commercial border posts from eSwatini namely, Golela,
Mahamba, Nerston, Oshoek, Jeppes Reef and Mananga. The analysis only covered border posts that
12%
3%
6%
6%
9%
50%
1%
2%
0%
1%
0%
0%
4%
1%
1%
3%
0%
0%
12%
9%
3%
9%
5%
15%
4%
7%
3%
4%
4%
1%
18%
0%
2%
3%
0%
0%
0% 10% 20% 30% 40% 50% 60%
Beit Bridge
Groblers Bridge
Kopfontein
Ramatlabama
Skilpadshek
Komatipoort
Vioolsdrift
Golela
Jeppes Reef
Mahamba
Mananga
Nerston
Oshoek
Caledonspoort
Ficksburg Bridge
Maseru Bridge
Qacha's Nek
Van Rooyens Gate
Cross-border routes by trade volumes, 2020 (%)
Imports Exports

58 | P a g e
handled at least 4% of the total trade volumes that eSwatini exported to South Africa (Table 47 and
Figure 14 above):
• Oshoek border post administered about 18% (683 million pieces of goods) of the total trade
volumes South Africa imported from the neighbouring countries, and it was found to be the
foremost border post that processed eSwatini’s exports destined to South Africa; and
• Golela followed Oshoek border post by processing 7% of South Africa’s imports from eSwatini,
whereas Mahamba and Mananga border posts recorded about 4% each of South Africa’s total
volumes imported.
Botswana’s exports to South Africa came in second place, claiming a 27% (999 million units of goods)
share as shown in Table 47 below. Amongst four commercial border posts of Botswana, Grobler’s bridge
and Ramatlabama border posts handled the highest volumes of South Africa’s imports each registering
9%.
Mozambique exported about 568 billion pieces of goods to South Africa recording 15% stake and
Zimbabwe registered the fourth exporting partner to South Africa with 12% volumes of goods sold from
Zimbabwe (Table 47 below).
Table 47: South Africa’s imports from neighbouring states
VALUE Year-on-Year
2020 (%)
VOLUME 2020 (%) 2019 2020 2020
Botswana 11 154 480 509 7 304 474 049 -35% 18% 998 670 032 27%
eSwatini 19 157 278 348 18 378 792 693 -4% 45% 1 398 955 135 38%
Lesotho 4 446 946 147 4 422 607 445 -1% 11% 177 214 744 5%
Mozambique 4 279 582 967 4 128 335 826 -4% 10% 568 427 925 15%
Namibia 1 809 987 490 1 367 141 295 -24% 3% 147 774 472 4%
Zimbabwe 5 130 561 764 5 323 791 241 4% 13% 428 453 143 12%
South Africa 45 978 837 225 40 925 142 549 -11% 100% 3 719 495 451 100% Source: South African Revenue Service (SARS)
Table 47 above and Figure 15 below show that in 2020 eSwatini was the major exporting trading partner
with South Africa as South Africa imported about 45% at a value of R18,4 billion. South Africa’s imports
from eSwatini valued about R19,2 billion in 2019 and in 2020, South Africa’s imports from eSwatini
dropped by 4% to R18,4 billion.
Botswana and Zimbabwe followed eSwatini with the highest exports to South Africa amounting to 18%
(R7,3 billion) and 13% (R5,3 billion), respectively. Lesotho, Mozambique, and Namibia participated the
least as they exported R4,4 billion (11%), R4,1 billion and R1,4 billion, respectively.
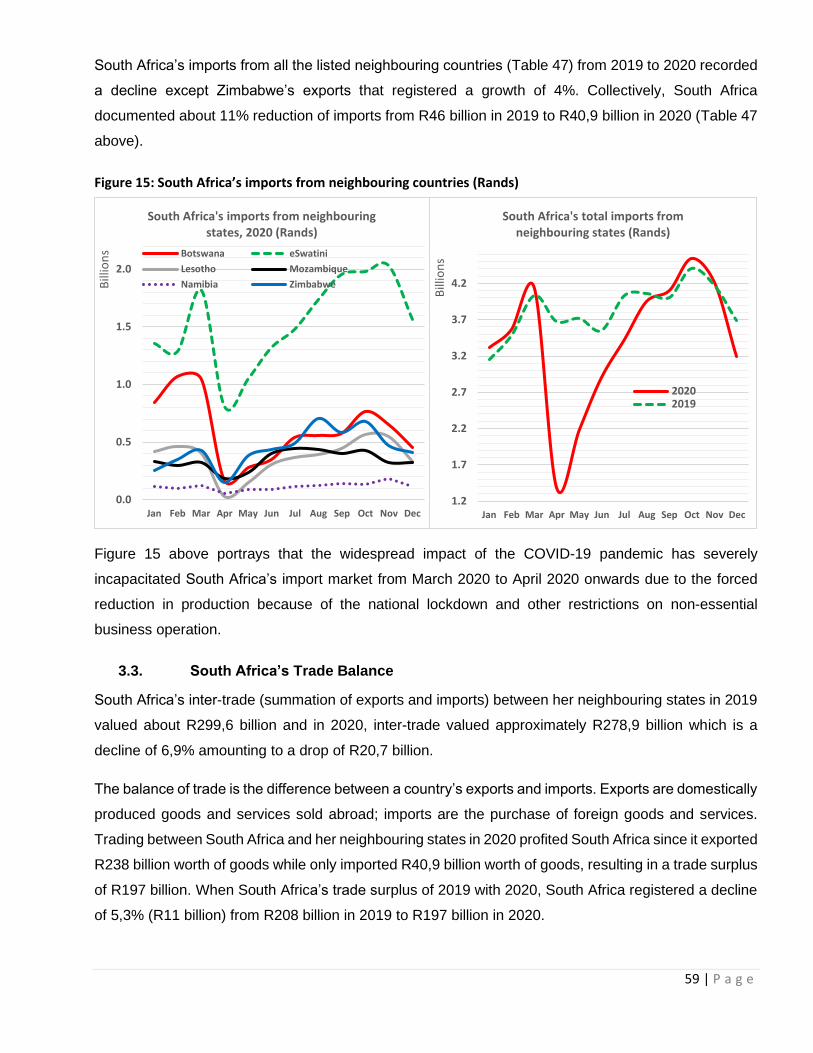
59 | P a g e
South Africa’s imports from all the listed neighbouring countries (Table 47) from 2019 to 2020 recorded
a decline except Zimbabwe’s exports that registered a growth of 4%. Collectively, South Africa
documented about 11% reduction of imports from R46 billion in 2019 to R40,9 billion in 2020 (Table 47
above).
Figure 15: South Africa’s imports from neighbouring countries (Rands)
Figure 15 above portrays that the widespread impact of the COVID-19 pandemic has severely
incapacitated South Africa’s import market from March 2020 to April 2020 onwards due to the forced
reduction in production because of the national lockdown and other restrictions on non-essential
business operation.
3.3. South Africa’s Trade Balance
South Africa’s inter-trade (summation of exports and imports) between her neighbouring states in 2019
valued about R299,6 billion and in 2020, inter-trade valued approximately R278,9 billion which is a
decline of 6,9% amounting to a drop of R20,7 billion.
The balance of trade is the difference between a country’s exports and imports. Exports are domestically
produced goods and services sold abroad; imports are the purchase of foreign goods and services.
Trading between South Africa and her neighbouring states in 2020 profited South Africa since it exported
R238 billion worth of goods while only imported R40,9 billion worth of goods, resulting in a trade surplus
of R197 billion. When South Africa’s trade surplus of 2019 with 2020, South Africa registered a decline
of 5,3% (R11 billion) from R208 billion in 2019 to R197 billion in 2020.
0.0
0.5
1.0
1.5
2.0
Jan Feb Mar Apr May Jun Jul Aug Sep Oct Nov Dec
Bill
ion
s
South Africa's imports from neighbouring states, 2020 (Rands)
Botswana eSwatini
Lesotho Mozambique
Namibia Zimbabwe
1.2
1.7
2.2
2.7
3.2
3.7
4.2
Jan Feb Mar Apr May Jun Jul Aug Sep Oct Nov Dec
Bill
ion
s
South Africa's total imports from neighbouring states (Rands)
20202019
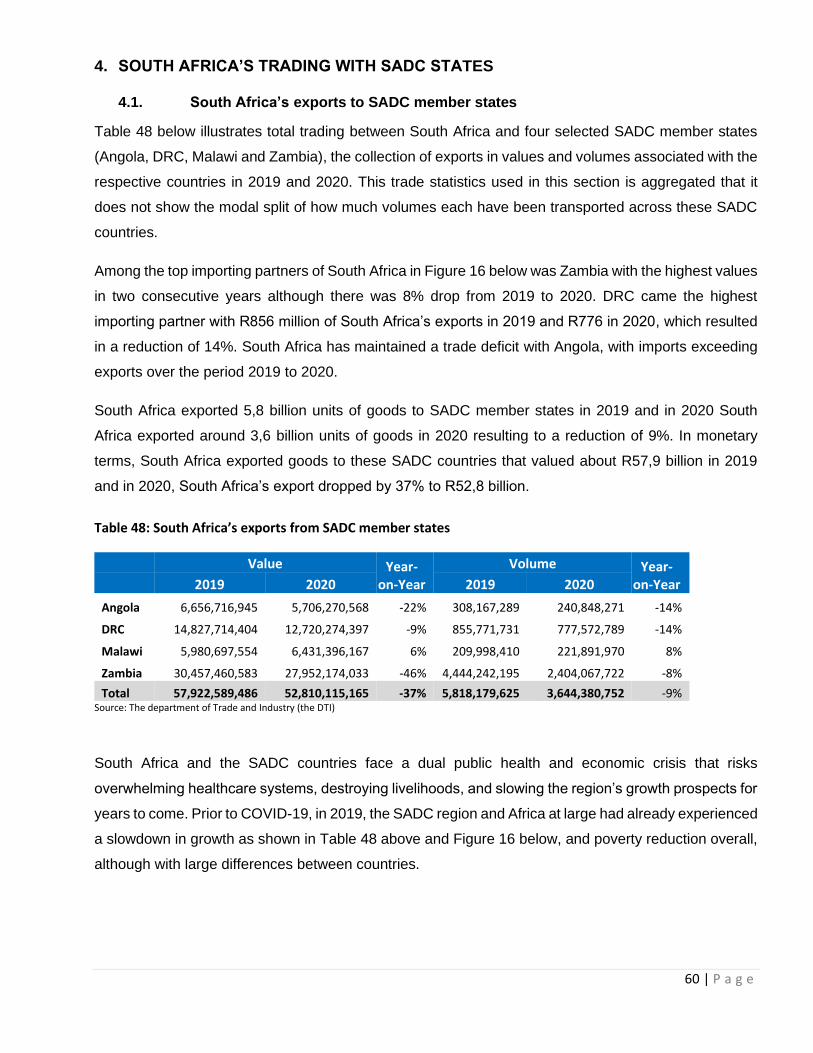
60 | P a g e
4. SOUTH AFRICA’S TRADING WITH SADC STATES
4.1. South Africa’s exports to SADC member states
Table 48 below illustrates total trading between South Africa and four selected SADC member states
(Angola, DRC, Malawi and Zambia), the collection of exports in values and volumes associated with the
respective countries in 2019 and 2020. This trade statistics used in this section is aggregated that it
does not show the modal split of how much volumes each have been transported across these SADC
countries.
Among the top importing partners of South Africa in Figure 16 below was Zambia with the highest values
in two consecutive years although there was 8% drop from 2019 to 2020. DRC came the highest
importing partner with R856 million of South Africa’s exports in 2019 and R776 in 2020, which resulted
in a reduction of 14%. South Africa has maintained a trade deficit with Angola, with imports exceeding
exports over the period 2019 to 2020.
South Africa exported 5,8 billion units of goods to SADC member states in 2019 and in 2020 South
Africa exported around 3,6 billion units of goods in 2020 resulting to a reduction of 9%. In monetary
terms, South Africa exported goods to these SADC countries that valued about R57,9 billion in 2019
and in 2020, South Africa’s export dropped by 37% to R52,8 billion.
Table 48: South Africa’s exports from SADC member states
Value Year-on-Year
Volume Year-on-Year 2019 2020 2019 2020
Angola 6,656,716,945 5,706,270,568 -22% 308,167,289 240,848,271 -14%
DRC 14,827,714,404 12,720,274,397 -9% 855,771,731 777,572,789 -14%
Malawi 5,980,697,554 6,431,396,167 6% 209,998,410 221,891,970 8%
Zambia 30,457,460,583 27,952,174,033 -46% 4,444,242,195 2,404,067,722 -8%
Total 57,922,589,486 52,810,115,165 -37% 5,818,179,625 3,644,380,752 -9% Source: The department of Trade and Industry (the DTI)
South Africa and the SADC countries face a dual public health and economic crisis that risks
overwhelming healthcare systems, destroying livelihoods, and slowing the region’s growth prospects for
years to come. Prior to COVID-19, in 2019, the SADC region and Africa at large had already experienced
a slowdown in growth as shown in Table 48 above and Figure 16 below, and poverty reduction overall,
although with large differences between countries.
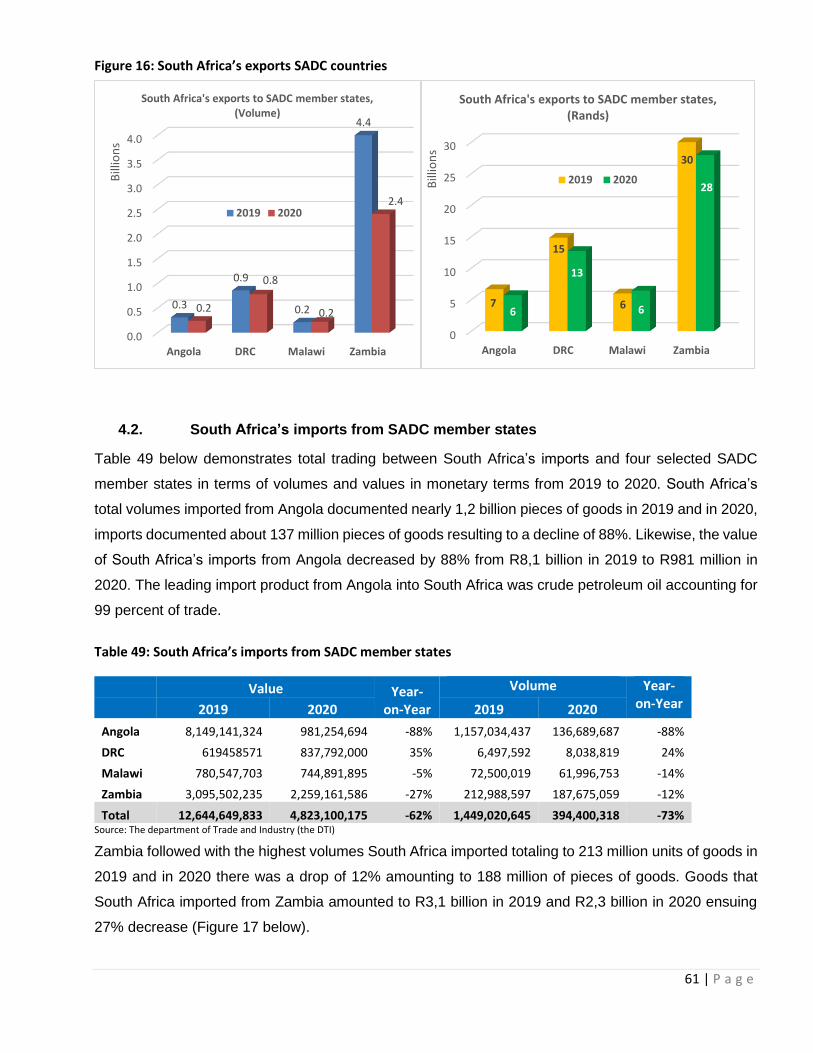
61 | P a g e
Figure 16: South Africa’s exports SADC countries
4.2. South Africa’s imports from SADC member states
Table 49 below demonstrates total trading between South Africa’s imports and four selected SADC
member states in terms of volumes and values in monetary terms from 2019 to 2020. South Africa’s
total volumes imported from Angola documented nearly 1,2 billion pieces of goods in 2019 and in 2020,
imports documented about 137 million pieces of goods resulting to a decline of 88%. Likewise, the value
of South Africa’s imports from Angola decreased by 88% from R8,1 billion in 2019 to R981 million in
2020. The leading import product from Angola into South Africa was crude petroleum oil accounting for
99 percent of trade.
Table 49: South Africa’s imports from SADC member states
Value Year-on-Year
Volume Year-on-Year
2019 2020 2019 2020
Angola 8,149,141,324 981,254,694 -88% 1,157,034,437 136,689,687 -88%
DRC 619458571 837,792,000 35% 6,497,592 8,038,819 24%
Malawi 780,547,703 744,891,895 -5% 72,500,019 61,996,753 -14%
Zambia 3,095,502,235 2,259,161,586 -27% 212,988,597 187,675,059 -12%
Total 12,644,649,833 4,823,100,175 -62% 1,449,020,645 394,400,318 -73% Source: The department of Trade and Industry (the DTI)
Zambia followed with the highest volumes South Africa imported totaling to 213 million units of goods in
2019 and in 2020 there was a drop of 12% amounting to 188 million of pieces of goods. Goods that
South Africa imported from Zambia amounted to R3,1 billion in 2019 and R2,3 billion in 2020 ensuing
27% decrease (Figure 17 below).
0.0
0.5
1.0
1.5
2.0
2.5
3.0
3.5
4.0
Angola DRC Malawi Zambia
0.3
0.9
0.2
4.4
0.2
0.8
0.2
2.4
Bill
ion
s
South Africa's exports to SADC member states, (Volume)
2019 2020
0
5
10
15
20
25
30
Angola DRC Malawi Zambia
7
15
6
30
6
13
6
28Bill
ion
s
South Africa's exports to SADC member states, (Rands)
2019 2020

62 | P a g e
South Africa exported 5,8 billion units of goods to SADC member states in 2019 and in 2020 South
Africa exported around 3,6 billion units of goods in 2020 resulting to a reduction of 9%. In monetary
terms, South Africa imported goods from Zambia that worth about R3,1 billion in 2019 and R2,3 billion
in 2020 resulting to a reduction of 27%.
Collectively, South Africa’s imports from these SADC countries totaled about 1,4 billion pieces of goods
in 2019 and a drastic decline of 73% in 2020 with South Africa’s imports amounting to 394 million pieces
of goods. South Africa’s imports valued about R12,6 billion in 2019 and in 2020, there was a reduction
of 62% (Table 49).
Figure 17: South Africa’s imports from SADC countries
According to this study, South Africa shows that with its economic dominance in the SADC region it has
large trade surplus with R52,8 billion worth of exports in 2020 and R4,8 billion worth of imports from
these SADC countries in the same year. This left South Africa with trade surplus of R48 billion.
0.0 0.3 0.6 0.9 1.2
Angola
DRC
Malawi
Zambia
0.14
0.01
0.06
0.19
1.16
0.01
0.07
0.21
Billions
South Africa's imports from SADC states, (Volume)
2020
2019
0 3 6 9
Angola
DRC
Malawi
Zambia
0.98
0.84
0.74
2.26
8.15
0.62
0.78
3.10
Billions
South Africa's imports from the World, (Rands)
2020
2019
63 | P a g e
5. CONCLUSION
The objectives of this report realised in this report were as follows:
• To support the cross-border road transport industry with meaningful data
• To increase knowledge of market trends
• To support policy formulation
• To develop sustainable means for data collection, data management and data storage of the
trade statistics
• To create an integrated knowledge base of trade with SADC member states and serve the
industry’s stakeholders in improving economic trends and competitiveness.
In 2020, out of R278,9 billion that South Africa traded between her neighbouring states, Botswana was
ranked the leading trade partner to South Africa with R81,3 billion constituting 29% of South Africa’s
exports and imports. Zimbabwe seconded Botswana by trading with South Africa at a value of R70
billion recording 25%.
Mozambique came the third highest trading partner with South Africa with about R57,7 billion worth of
goods and eSwatini, Lesotho and Namibia were the lowest partners with 13%, 8% and 4%, respectively.
The total volumes of goods that South Africa traded (exported and imported) with her neighbouring
states was 30,9 billion. Lebombo border post has processed the highest volumes of goods amounting
to 14,2 billion pieces of goods (46%) signifying that N4 corridor was the busiest route in 2020. South
Africa traded about 7,5 billion pieces of goods (24%) with Botswana followed by Zimbabwe 3,7 billion
volumes of goods registering Beitbridge border post as the second busiest with 12% in processing only
goods were traded between Zimbabwe and South Africa.
Trading between South Africa and her neighbouring states in 2020 favoured South Africa since South
Africa exported R238 billion worth of goods while it imported R40,9 billion worth of goods, ensuing a
trade surplus of R197 billion.
The universal drop of international trade between South Africa and her neighbouring states has been
exacerbated by coronavirus (COVID-19) that has resulted in mass production shutdowns and supply
chain disruptions due to border posts and ports closures in these countries under study and globally,
causing global ripple effects across all economic sectors in a rare “twin supply-demand shock” which is
a sharp, sudden change in the supply and demand for a product or a service. As South Africa is one of
the neighbouring countries’ biggest trading partners, the effects of COVID-19 are already being felt in
the SADC region and in the continent.
This report can be used by the C-BRTA and the Road Transport Management Corporation as the
strategic tool for deployment of law enforcement personnel along the cross-border corridors as it clearly
stated the movement of trade volumes inbound and outbound South Africa. Finally, the data used in this
64 | P a g e
report can be used to assess the correlation between the size of trade volumes versus the number of
permits issued to determine the factors that affect the source of revenue within the C-BRTA.
6. LIMITATIONS
This study experienced the following limitations:
a) The data received lacked specific periods, i.e. date and time when the goods crossed the
borders, and
b) The above also limited further analysis, i.e. it did not enable the user to analyse different times
and days of the week as well as peak and off-peak seasons.
7. RECOMMENDATIONS
The following recommendations cover the operational issues local and across the SADC region:
a) Statistics/Information sharing amongst member states is highly recommended;
b) Joint research studies amongst member states in order to share experiences are recommended;
c) Trade statistics on cross-border modal split, top operators/performers by origin country are
needed in the upcoming studies; and
d) Transiting trade stats is highly recommended as more international exports and imports are
transported between countries and Durban Harbours.
7.1. Report Compilation
Based on the data analysed above, the following recommendations are made:
a) The Agency should triangulate data through comparison with consignment notes and by
developing and updating annual traffic flows, trade values and trade volumes;
b) The C-BRTA must continue to refine research output for purposes of advising stakeholders and
enhancing decision making on cross-border operations, and
c) SARS should be engaged in order to provide trade data of other SADC member states.
7.2. Enhancing Trade Flow and Efficiency
The following recommendations are submitted:
a) The report should be used to inform policy decisions on border post improvement programmes
such as prioritisation of implementation of One Stop Border Posts, Single Window Systems and
Integrated Border Management.
65 | P a g e
b) The Agency should engage border stakeholders, particularly major border posts with high trade
volumes, to determine capacity limitations and the programmes required to enhance trade flow
through the border posts.
c) Stakeholders at border posts should consider matching operational deployments to trade
volumes passing through each border posts.
d) This report should be used to inform decisions pertaining to cross-border permit application
determination within the context of transport services demand, following market demand.
e) The report findings should be used to inform the operational deployment of law enforcement.
f) The report should be used to identify pragmatic methods of advocating some of the key thematic
issues that will emanate from this research as output to relevant stakeholders.
g) Lastly, the report should be used as a tool to engage and influence stakeholders to implement
fit-for-purpose interventions that will improve cross-border road transport movements, eliminate
constraints in corridors and border posts and improve trade between South Africa and its
neighbouring countries.
Related Documents