Statistics on Riemannian Manifolds Tom Fletcher Scientific Computing and Imaging Institute University of Utah August 19, 2009

Welcome message from author
This document is posted to help you gain knowledge. Please leave a comment to let me know what you think about it! Share it to your friends and learn new things together.
Transcript
Statistics on Riemannian Manifolds
Tom FletcherScientific Computing and Imaging Institute
University of Utah
August 19, 2009

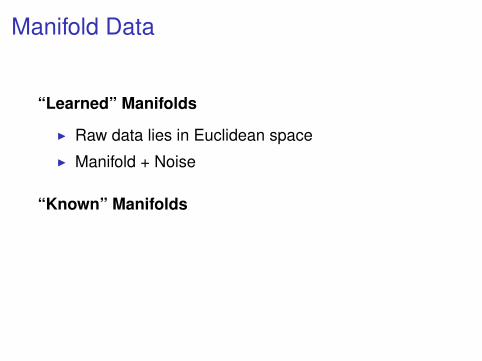
Manifold Data
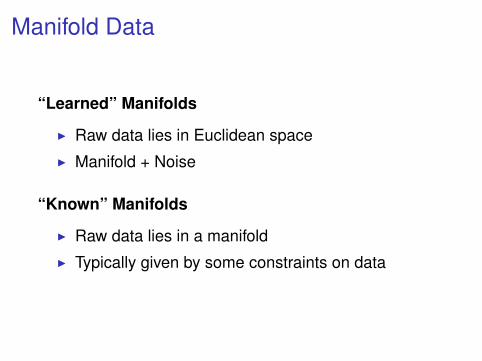
“Learned” Manifolds
I Raw data lies in Euclidean spaceI Manifold + Noise
“Known” Manifolds
I Raw data lies in a manifoldI Typically given by some constraints on data
Manifold Data
“Learned” Manifolds
I Raw data lies in Euclidean spaceI Manifold + Noise
“Known” Manifolds
I Raw data lies in a manifoldI Typically given by some constraints on data
Manifold Data
“Learned” Manifolds
I Raw data lies in Euclidean spaceI Manifold + Noise
“Known” Manifolds
I Raw data lies in a manifoldI Typically given by some constraints on data
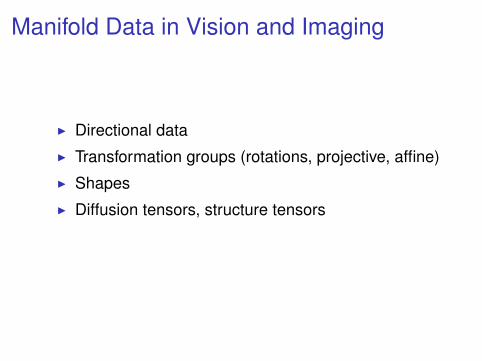
Manifold Data in Vision and Imaging
I Directional data
I Transformation groups (rotations, projective, affine)I ShapesI Diffusion tensors, structure tensorsI Diffeomorphisms (for deformable atlas building)
Manifold Data in Vision and Imaging
I Directional dataI Transformation groups (rotations, projective, affine)
I ShapesI Diffusion tensors, structure tensorsI Diffeomorphisms (for deformable atlas building)
Manifold Data in Vision and Imaging
I Directional dataI Transformation groups (rotations, projective, affine)I Shapes
I Diffusion tensors, structure tensorsI Diffeomorphisms (for deformable atlas building)
Manifold Data in Vision and Imaging
I Directional dataI Transformation groups (rotations, projective, affine)I ShapesI Diffusion tensors, structure tensors
I Diffeomorphisms (for deformable atlas building)
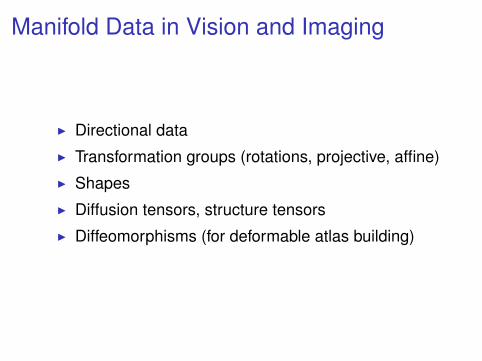
Manifold Data in Vision and Imaging
I Directional dataI Transformation groups (rotations, projective, affine)I ShapesI Diffusion tensors, structure tensorsI Diffeomorphisms (for deformable atlas building)
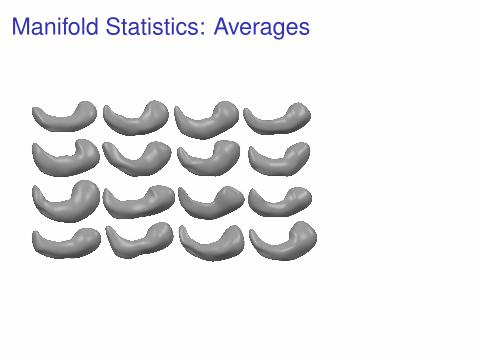
Manifold Statistics: Averages
→

Manifold Statistics: Averages
→
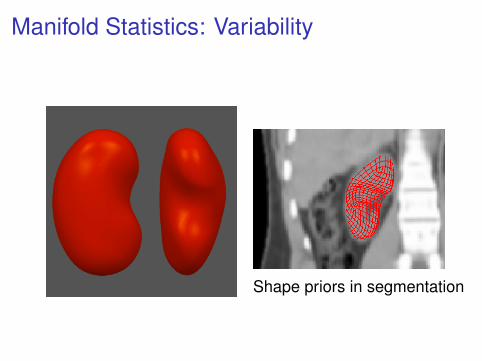
Manifold Statistics: Variability
Shape priors in segmentation
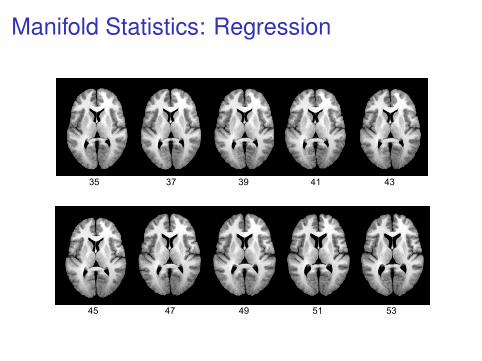
Manifold Statistics: Regression
Application: Healthy Brain Aging
35 37 39 41 43
45 47 49 51 53
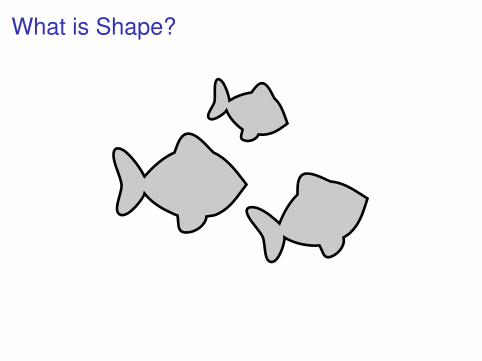
What is Shape?
Shape is the geometry of an object modulo position,orientation, and size.
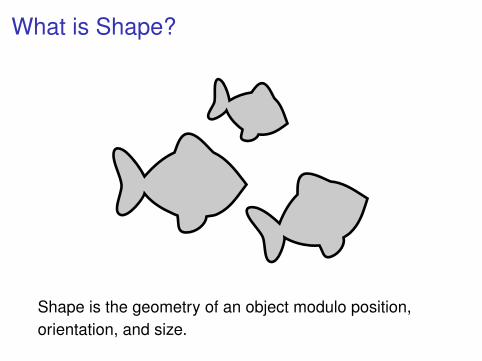
What is Shape?
Shape is the geometry of an object modulo position,orientation, and size.
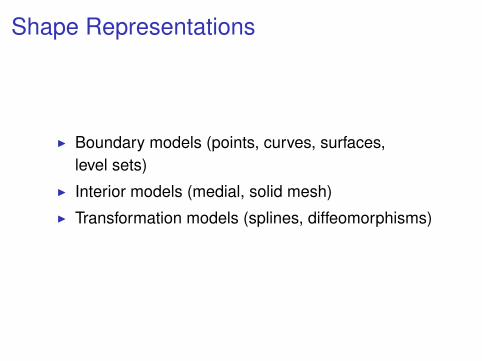
Shape Representations
I Boundary models (points, curves, surfaces,level sets)
I Interior models (medial, solid mesh)I Transformation models (splines, diffeomorphisms)
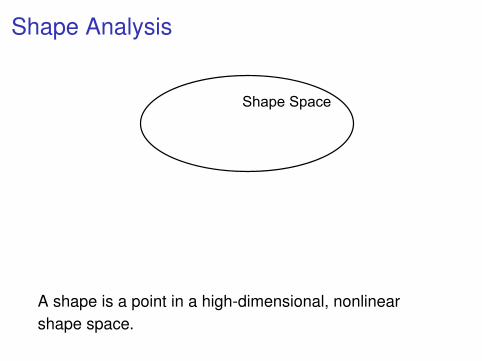
Shape Analysis
Shape Space
A shape is a point in a high-dimensional, nonlinearshape space.
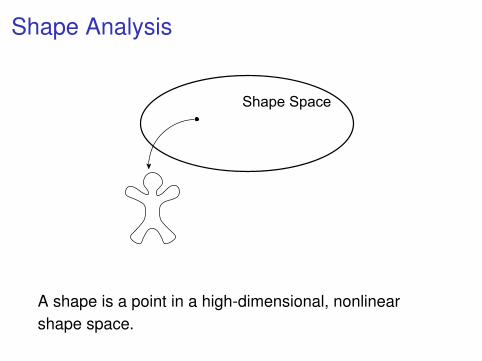
Shape Analysis
Shape Space
A shape is a point in a high-dimensional, nonlinearshape space.

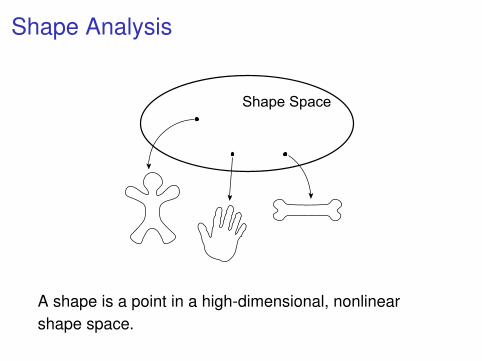
Shape Analysis
Shape Space
A shape is a point in a high-dimensional, nonlinearshape space.
Shape Analysis
Shape Space
A shape is a point in a high-dimensional, nonlinearshape space.
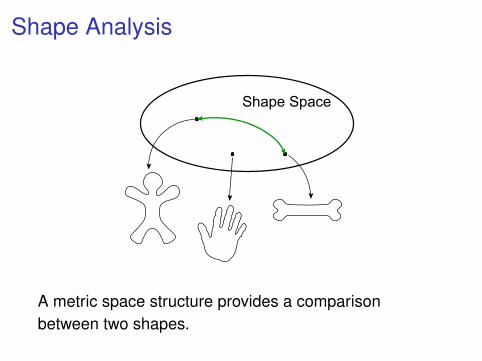
Shape Analysis
Shape Space
A metric space structure provides a comparisonbetween two shapes.
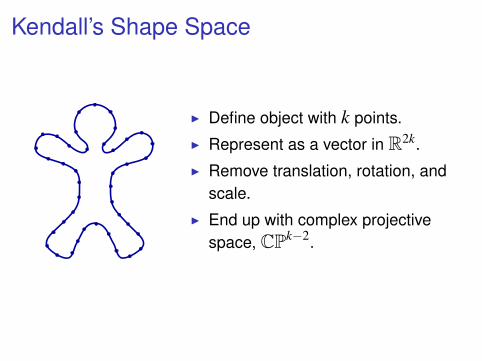
Kendall’s Shape Space
I Define object with k points.I Represent as a vector in R2k.I Remove translation, rotation, and
scale.I End up with complex projective
space, CPk−2.
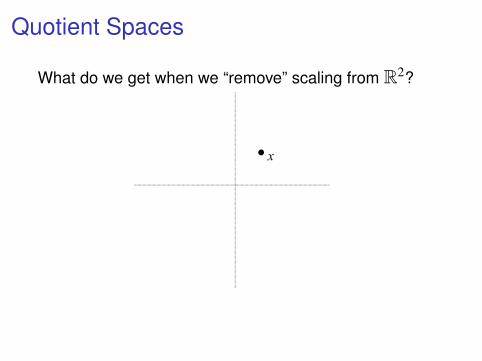
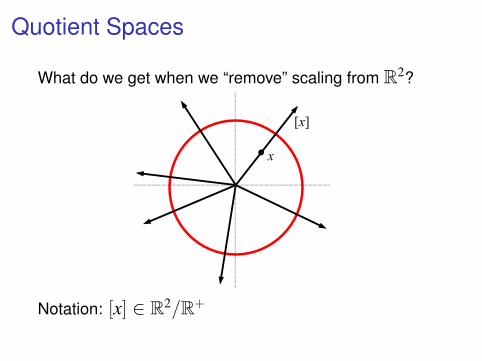
Quotient Spaces
What do we get when we “remove” scaling from R2?
x
Notation: [x] ∈ R2/R+
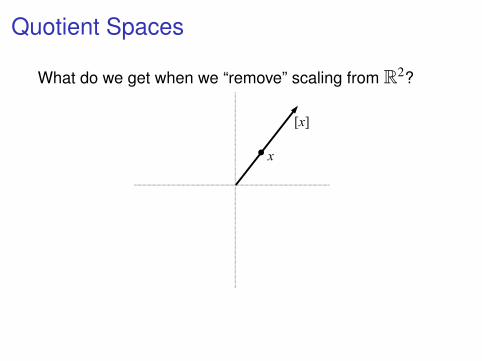
Quotient Spaces
What do we get when we “remove” scaling from R2?
x
[x]
Notation: [x] ∈ R2/R+

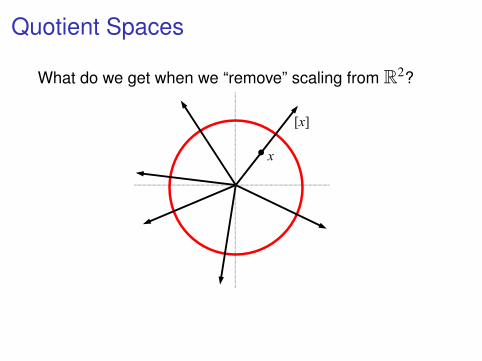
Quotient Spaces
What do we get when we “remove” scaling from R2?
x
[x]
Notation: [x] ∈ R2/R+
Quotient Spaces
What do we get when we “remove” scaling from R2?
x
[x]
Notation: [x] ∈ R2/R+
Quotient Spaces
What do we get when we “remove” scaling from R2?
x
[x]
Notation: [x] ∈ R2/R+
Constructing Kendall’s Shape Space
I Consider planar landmarks to be points in thecomplex plane.
I An object is then a point (z1, z2, . . . , zk) ∈ Ck.I Removing translation leaves us with Ck−1.I How to remove scaling and rotation?

Constructing Kendall’s Shape Space
I Consider planar landmarks to be points in thecomplex plane.
I An object is then a point (z1, z2, . . . , zk) ∈ Ck.
I Removing translation leaves us with Ck−1.I How to remove scaling and rotation?
Constructing Kendall’s Shape Space
I Consider planar landmarks to be points in thecomplex plane.
I An object is then a point (z1, z2, . . . , zk) ∈ Ck.I Removing translation leaves us with Ck−1.
I How to remove scaling and rotation?
Constructing Kendall’s Shape Space
I Consider planar landmarks to be points in thecomplex plane.
I An object is then a point (z1, z2, . . . , zk) ∈ Ck.I Removing translation leaves us with Ck−1.I How to remove scaling and rotation?
Scaling and Rotation in the Complex PlaneIm
Re0
!
r
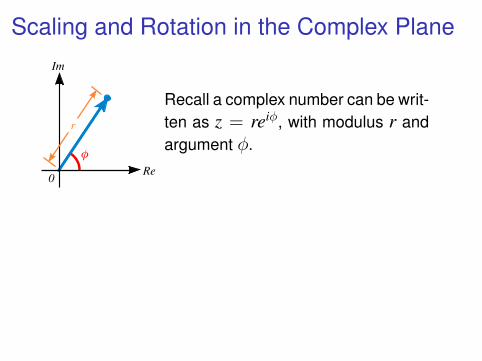
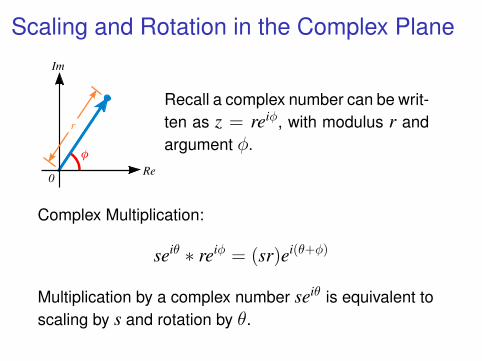
Recall a complex number can be writ-ten as z = reiφ, with modulus r andargument φ.
Complex Multiplication:
seiθ ∗ reiφ = (sr)ei(θ+φ)
Multiplication by a complex number seiθ is equivalent toscaling by s and rotation by θ.
Scaling and Rotation in the Complex PlaneIm
Re0
!
r
Recall a complex number can be writ-ten as z = reiφ, with modulus r andargument φ.
Complex Multiplication:
seiθ ∗ reiφ = (sr)ei(θ+φ)
Multiplication by a complex number seiθ is equivalent toscaling by s and rotation by θ.

Removing Scale and Translation
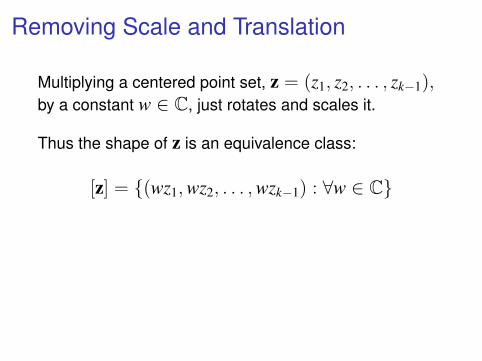
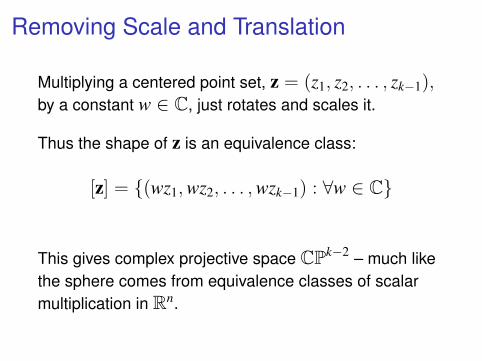
Multiplying a centered point set, z = (z1, z2, . . . , zk−1),by a constant w ∈ C, just rotates and scales it.
Thus the shape of z is an equivalence class:
[z] = {(wz1,wz2, . . . ,wzk−1) : ∀w ∈ C}
This gives complex projective space CPk−2 – much likethe sphere comes from equivalence classes of scalarmultiplication in Rn.
Removing Scale and Translation
Multiplying a centered point set, z = (z1, z2, . . . , zk−1),by a constant w ∈ C, just rotates and scales it.
Thus the shape of z is an equivalence class:
[z] = {(wz1,wz2, . . . ,wzk−1) : ∀w ∈ C}
This gives complex projective space CPk−2 – much likethe sphere comes from equivalence classes of scalarmultiplication in Rn.
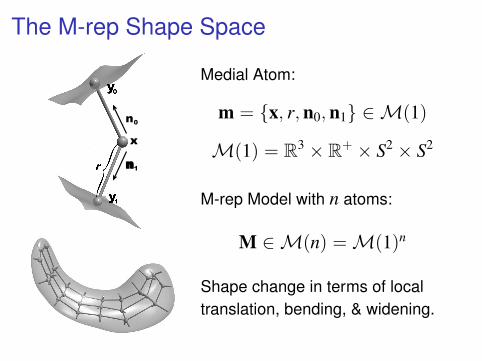
The M-rep Shape Space
n
n
0
1
x
Medial Atom:
m = {x, r,n0,n1} ∈ M(1)
M(1) = R3 × R+ × S2 × S2
M-rep Model with n atoms:
M ∈M(n) =M(1)n
Shape change in terms of localtranslation, bending, & widening.

The Exponential and Log Maps
pT M pExp (X)p
X
M
I The exponential map takes tangent vectors topoints along geodesics.
I The length of the tangent vector equals the lengthalong the geodesic segment.
I Its inverse is the log map – it gives distancebetween points: d(p, q) = ‖Logp(q)‖.
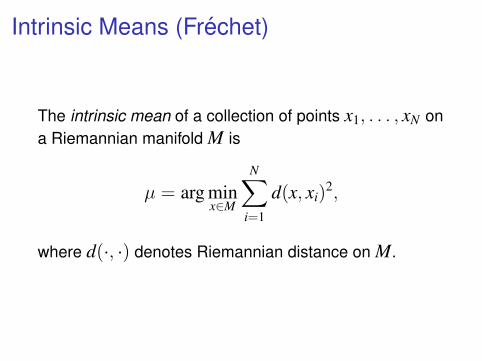
Intrinsic Means (Frechet)
The intrinsic mean of a collection of points x1, . . . , xN ona Riemannian manifold M is
µ = arg minx∈M
N∑
i=1
d(x, xi)2,
where d(·, ·) denotes Riemannian distance on M.

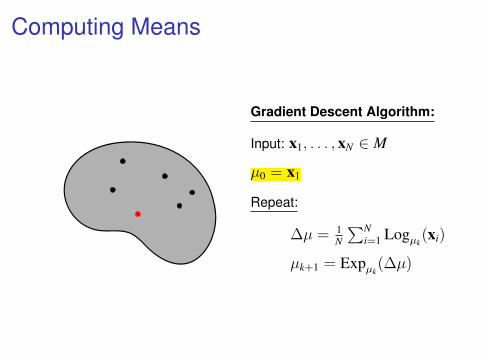
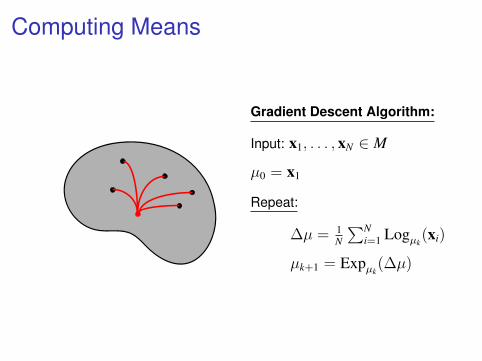
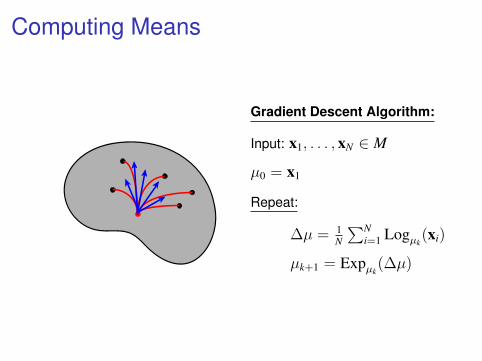
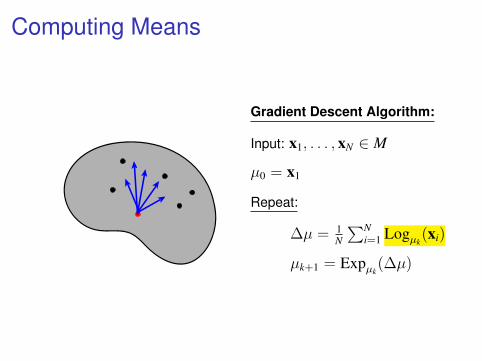
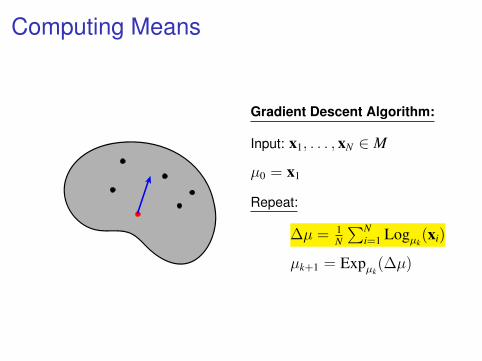
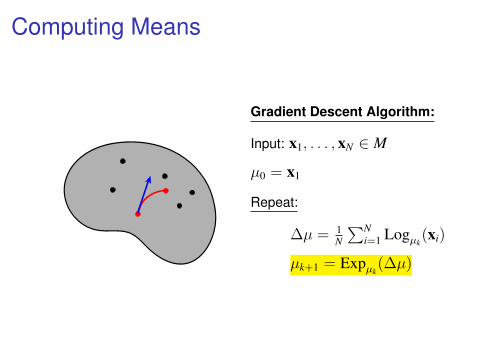
Computing Means
Gradient Descent Algorithm:
Input: x1, . . . , xN ∈ M
µ0 = x1
Repeat:
∆µ = 1N
∑Ni=1 Logµk
(xi)
µk+1 = Expµk(∆µ)

Computing Means
Gradient Descent Algorithm:
Input: x1, . . . , xN ∈ M
µ0 = x1
Repeat:
∆µ = 1N
∑Ni=1 Logµk
(xi)
µk+1 = Expµk(∆µ)
Computing Means
Gradient Descent Algorithm:
Input: x1, . . . , xN ∈ M
µ0 = x1
Repeat:
∆µ = 1N
∑Ni=1 Logµk
(xi)
µk+1 = Expµk(∆µ)
Computing Means
Gradient Descent Algorithm:
Input: x1, . . . , xN ∈ M
µ0 = x1
Repeat:
∆µ = 1N
∑Ni=1 Logµk
(xi)
µk+1 = Expµk(∆µ)
Computing Means
Gradient Descent Algorithm:
Input: x1, . . . , xN ∈ M
µ0 = x1
Repeat:
∆µ = 1N
∑Ni=1 Logµk
(xi)
µk+1 = Expµk(∆µ)
Computing Means
Gradient Descent Algorithm:
Input: x1, . . . , xN ∈ M
µ0 = x1
Repeat:
∆µ = 1N
∑Ni=1 Logµk
(xi)
µk+1 = Expµk(∆µ)
Computing Means
Gradient Descent Algorithm:
Input: x1, . . . , xN ∈ M
µ0 = x1
Repeat:
∆µ = 1N
∑Ni=1 Logµk
(xi)
µk+1 = Expµk(∆µ)
Computing Means
Gradient Descent Algorithm:
Input: x1, . . . , xN ∈ M
µ0 = x1
Repeat:
∆µ = 1N
∑Ni=1 Logµk
(xi)
µk+1 = Expµk(∆µ)

Computing Means
Gradient Descent Algorithm:
Input: x1, . . . , xN ∈ M
µ0 = x1
Repeat:
∆µ = 1N
∑Ni=1 Logµk
(xi)
µk+1 = Expµk(∆µ)

Computing Means
Gradient Descent Algorithm:
Input: x1, . . . , xN ∈ M
µ0 = x1
Repeat:
∆µ = 1N
∑Ni=1 Logµk
(xi)
µk+1 = Expµk(∆µ)
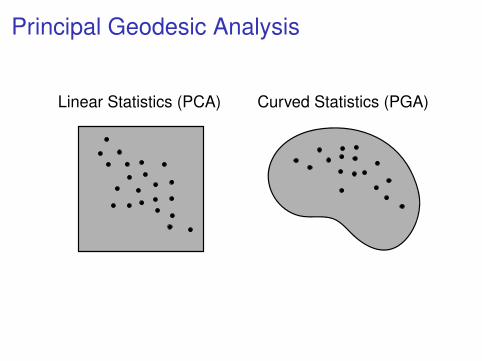
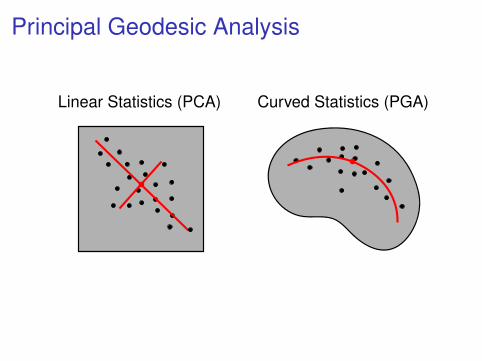
Principal Geodesic Analysis
Linear Statistics (PCA) Curved Statistics (PGA)
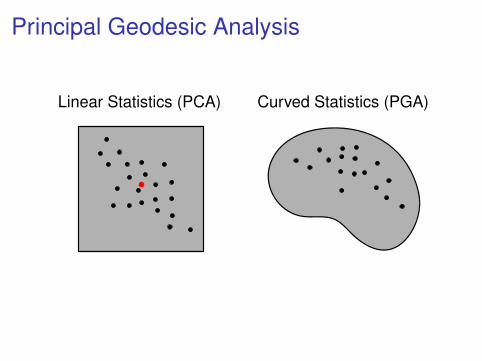
Principal Geodesic Analysis
Linear Statistics (PCA) Curved Statistics (PGA)
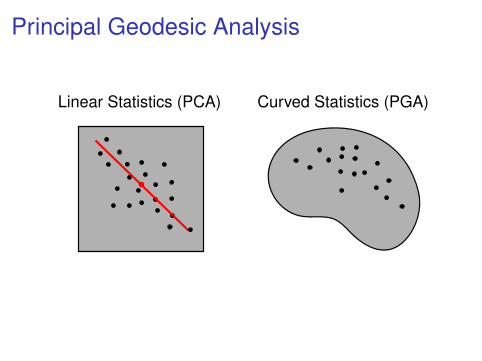
Principal Geodesic Analysis
Linear Statistics (PCA) Curved Statistics (PGA)
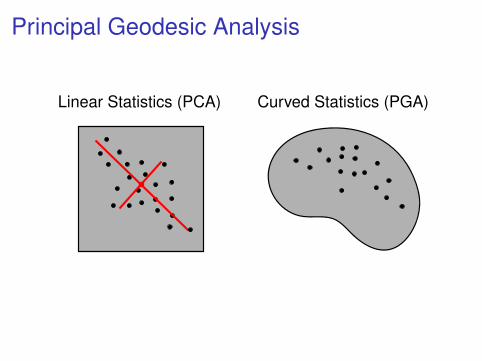
Principal Geodesic Analysis
Linear Statistics (PCA) Curved Statistics (PGA)

Principal Geodesic Analysis
Linear Statistics (PCA) Curved Statistics (PGA)
Principal Geodesic Analysis
Linear Statistics (PCA) Curved Statistics (PGA)

Principal Geodesic Analysis
Linear Statistics (PCA) Curved Statistics (PGA)
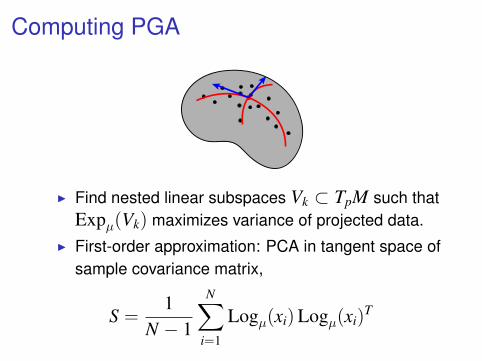
Computing PGA
I Find nested linear subspaces Vk ⊂ TpM such thatExpµ(Vk) maximizes variance of projected data.
I First-order approximation: PCA in tangent space ofsample covariance matrix,
S =1
N − 1
N∑
i=1
Logµ(xi) Logµ(xi)T
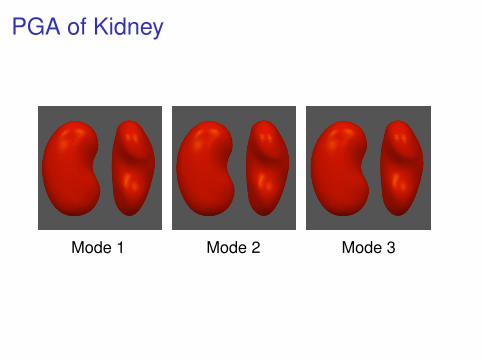
PGA of Kidney
Mode 1 Mode 2 Mode 3
Robust Statistics: Motivation
I The mean is overly influenced by outliers due tosum-of-squares.
I Robust statistical description of shape or othermanifold data.
I Deal with outliers due to imaging noise or datacorruption.
I Misdiagnosis, segmentation error, or outlier in apopulation study.
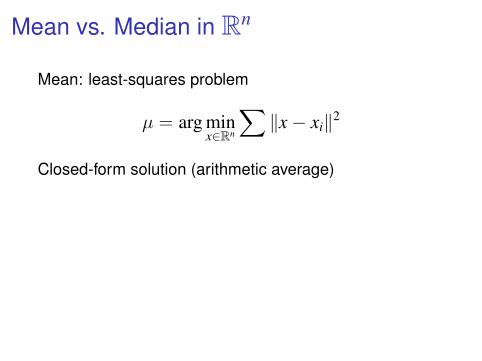
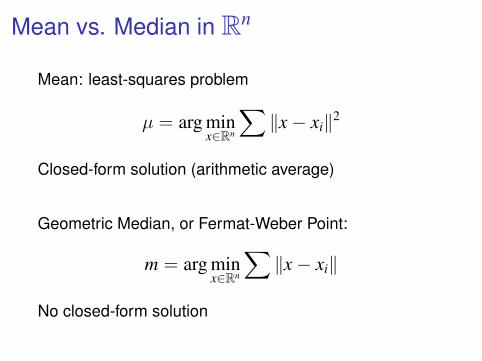
Mean vs. Median in Rn
Mean: least-squares problem
µ = arg minx∈Rn
∑‖x− xi‖2
Closed-form solution (arithmetic average)
Geometric Median, or Fermat-Weber Point:
m = arg minx∈Rn
∑‖x− xi‖
No closed-form solution
Mean vs. Median in Rn
Mean: least-squares problem
µ = arg minx∈Rn
∑‖x− xi‖2
Closed-form solution (arithmetic average)
Geometric Median, or Fermat-Weber Point:
m = arg minx∈Rn
∑‖x− xi‖
No closed-form solution
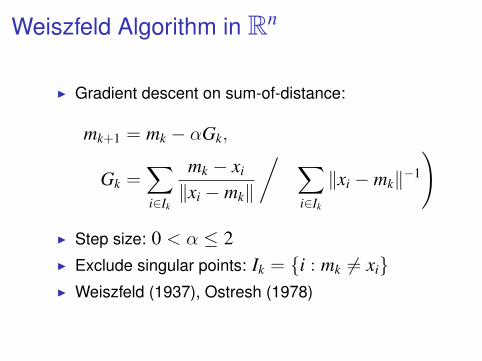
Weiszfeld Algorithm in Rn
I Gradient descent on sum-of-distance:
mk+1 = mk − αGk,
Gk =∑
i∈Ik
mk − xi
‖xi − mk‖
/(∑
i∈Ik
‖xi − mk‖−1
)
I Step size: 0 < α ≤ 2I Exclude singular points: Ik = {i : mk 6= xi}I Weiszfeld (1937), Ostresh (1978)
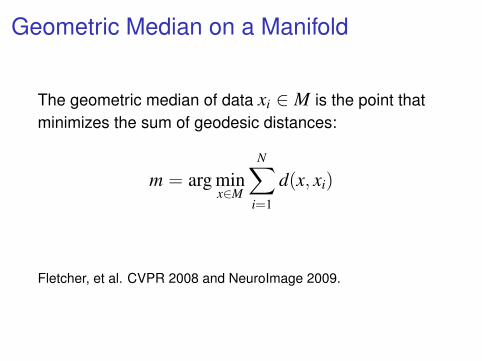
Geometric Median on a Manifold
The geometric median of data xi ∈ M is the point thatminimizes the sum of geodesic distances:
m = arg minx∈M
N∑
i=1
d(x, xi)
Fletcher, et al. CVPR 2008 and NeuroImage 2009.
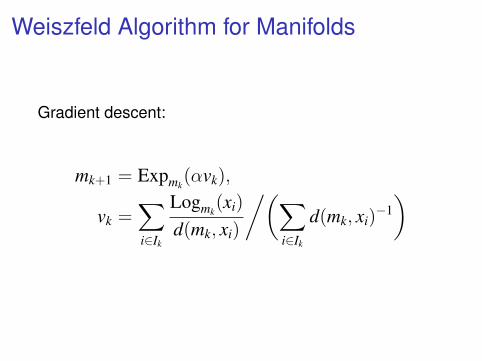
Weiszfeld Algorithm for Manifolds
Gradient descent:
mk+1 = Expmk(αvk),
vk =∑
i∈Ik
Logmk(xi)
d(mk, xi)
/(∑
i∈Ik
d(mk, xi)−1)
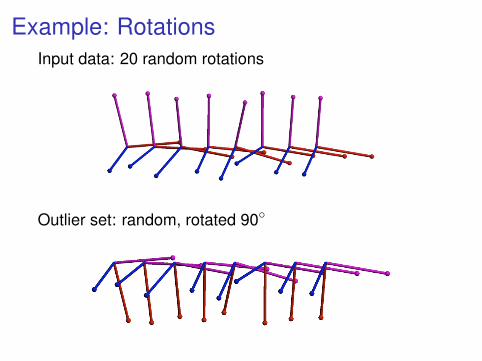
Example: RotationsInput data: 20 random rotations
Outlier set: random, rotated 90◦
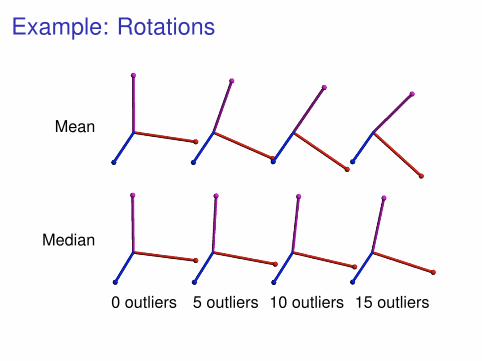
Example: Rotations
Mean
Median
0 outliers 5 outliers 10 outliers 15 outliers
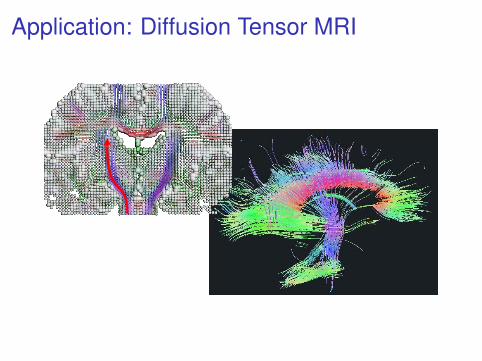
Application: Diffusion Tensor MRI
! !
Space of Positive-Definite Tensors
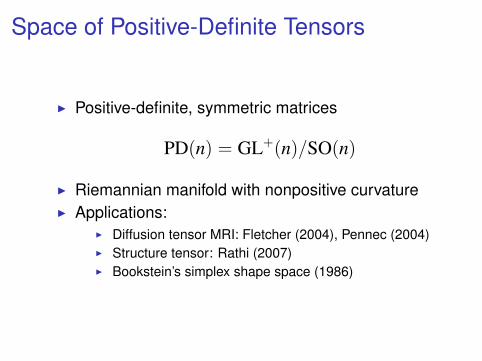
I Positive-definite, symmetric matrices
PD(n) = GL+(n)/SO(n)
I Riemannian manifold with nonpositive curvatureI Applications:
I Diffusion tensor MRI: Fletcher (2004), Pennec (2004)I Structure tensor: Rathi (2007)I Bookstein’s simplex shape space (1986)
Example: PD(2)
a
c
bl
γ
p
p
0
1
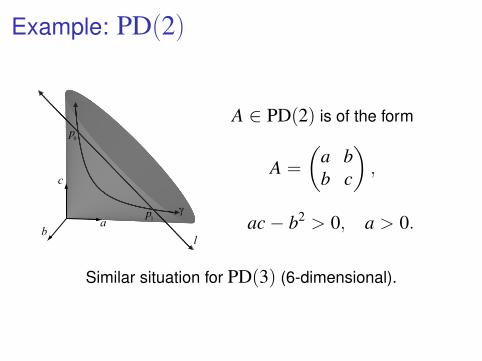
A ∈ PD(2) is of the form
A =
(a bb c
),
ac− b2 > 0, a > 0.
Similar situation for PD(3) (6-dimensional).
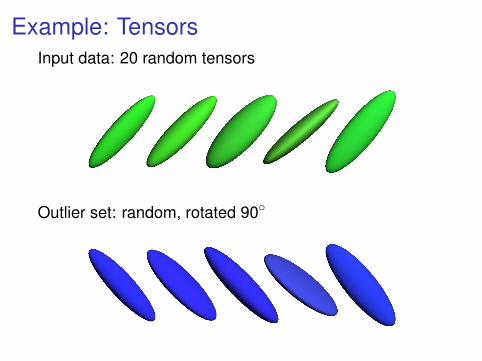
Example: TensorsInput data: 20 random tensors
Outlier set: random, rotated 90◦
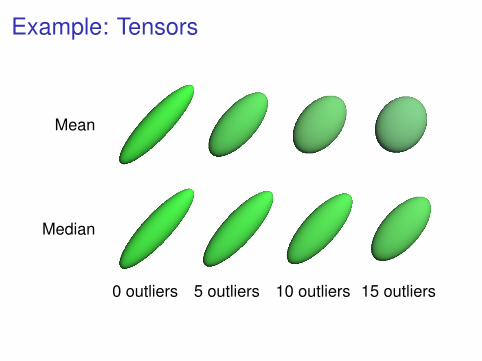
Example: Tensors
Mean
Median
0 outliers 5 outliers 10 outliers 15 outliers

Kendall’s Shape Space
I Define object with k points.I Represent as a vector in R2k.I Remove translation, rotation, and
scale.I End up with complex projective
space, CPk−2.

Example on Kendall Shape Spaces
Hand shapes
Outliers
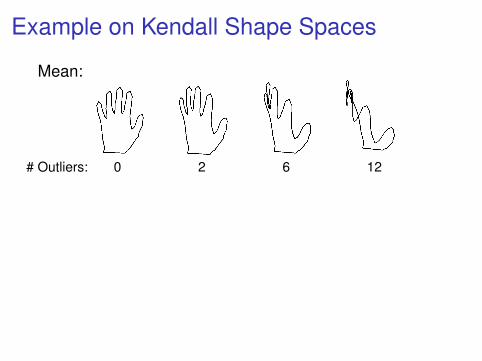
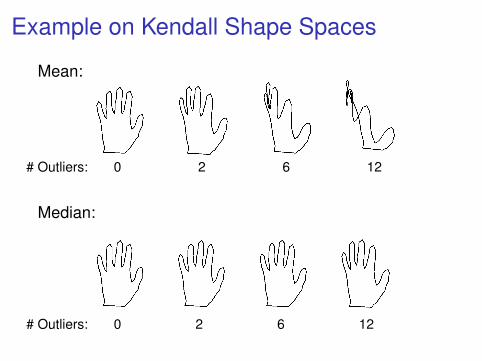
Example on Kendall Shape Spaces
Mean:
# Outliers: 0 2 6 12
Median:
# Outliers: 0 2 6 12
Example on Kendall Shape Spaces
Mean:
# Outliers: 0 2 6 12
Median:
# Outliers: 0 2 6 12
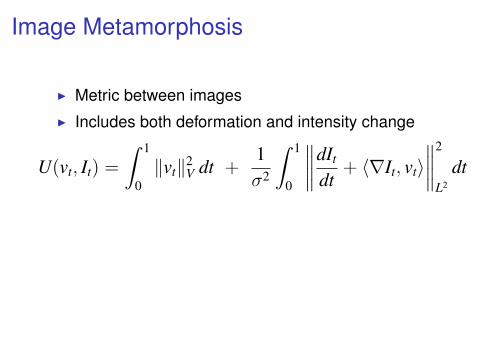
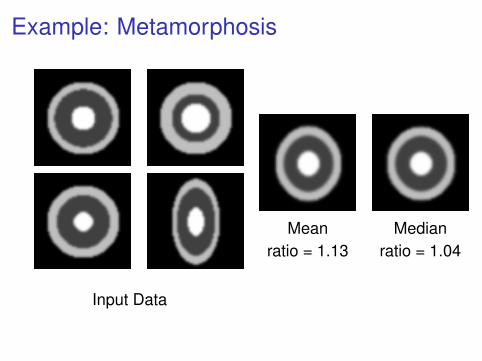
Image Metamorphosis
I Metric between imagesI Includes both deformation and intensity change
U(vt, It) =
∫ 1
0‖vt‖2
V dt +1σ2
∫ 1
0
∥∥∥∥dIt
dt+ 〈∇It, vt〉
∥∥∥∥2
L2
dt
Fig. 1. Metamorphosis geodesic between two 3D brain images. Mid-axial (top row) and mid-coronal (bottom row) slices are shown.
The theory of robust estimation has led to the devel-opment of numerous robust estimators, of which the L1-estimator, also known as the geometric median, is one ofthe best known. Given a set of points {xi, i = 1, · · · , n} !Rd, with the usual Euclidean norm "x", the L1-estimatoris defined as the point m ! Rd minimizing
!ni=1 "m# xi".
It can be shown (Lopuhaa and Rousseeuw, 1991) that thisestimator has a breakdown point of 0.5, which means thathalf of the data needs to be corrupted in order to corruptthis estimator. In Figure 2 we illustrate this by showinghow the geometric median and the mean are displaced inthe presence of a few outliers.
Fig. 2. The geometric median (marked with a !) and mean (marked
with a !) for a collection of points in the plane. Notice how the few
outliers at the top right of the picture have forced the mean awayfrom the points, whereas the median remains centrally located.
The existence and uniqueness of the the median in Rd
follows directly from the convexity of the distance function.In one dimension, the geometric median is the point thatdivides the point set into equal halves on either side (if n isodd) and is any point on the line segment connecting thetwo middle points (if n is even). In general however, com-
puting the geometric median is di!cult; Bajaj has shownthat the solution cannot be expressed using radicals (arith-metic operations, and kth roots) (Bajaj, 1988).
There are two main approaches to computing the geo-metric median of a collection of points in Rd. One way is tocompute an approximate median m such that
!ni=1 "m #
xi" is at most a (1 + !)-factor larger than cost of the op-timal median. This can be computed using the ellipsoidmethod (Chandrasekaran and Tamir, 1990). A more e!-cient algorithm achieving the same result is due to Boseet al. (2003).
These algorithms do not generalize beyond Euclideanspaces. A more general iterative algorithm due to Weiszfeld(1937) and later improved by Kuhn and Kuenne (1962)and Ostresh (1978) converges to the optimal solution inEuclidean spaces (Kuhn, 1973), and was subsequently gen-eralized to Banach spaces by Eckhardt (1980).
Several other robust estimators of centrality have beenproposed in the statistics literature (Maronna et al., 2006).Winsorized means, where a percentage of extreme valuesare clamped, and trimmed means, where extreme values areremoved, have been used for univariate data. The drawbackof these methods is that they require a somewhat arbitraryselection of a threshold. M-estimators (Huber, 1981) area generalization of maximum likelihood methods in whichsome function of the data is minimized. The geometric me-dian is a special case of an M-estimator with an L1 costfunction.
3. The Riemannian Geometric Median
Let M be a Riemannian manifold. Given pointsx1, . . . , xn ! M and corresponding positive real weightswi, . . . , wn, with
!i wi = 1, define the weighted sum-of-
distances function f(x) =!
i wid(x, xi), where d is theRiemannian distance function on M . Throughout, we willassume that the xi lie in a convex set U $ M , i.e., any twopoints in U are connected by a unique shortest geodesic ly-ing entirely in U . We define the weighted geometric median,
3
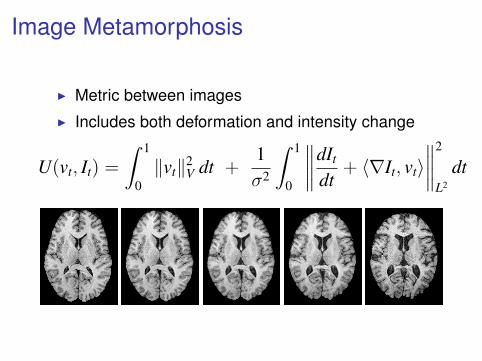

Example: Metamorphosis
Input Data
Mean Medianratio = 1.13 ratio = 1.04
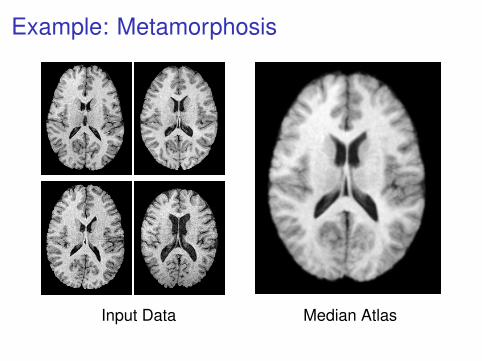
Example: Metamorphosis
Input Data
Mean Medianratio = 1.13 ratio = 1.04
Example: Metamorphosis
Fig. 12. Midaxial slices from the four input 3D MR images (left). The resulting geometric median atlas (right).
Grant R01EB007688-01A1.
ReferencesBajaj, C., 1988. The algebraic degree of geometric opti-
mization problems. Discrete and Computational Geom-etry 3, 177–191.
Barmpoutis, A., Vemuri, B. C., Shepherd, T. M., Forder,J. R., 2007. Tensor splines for interpolation and approx-imation of DT-MRI with application to segmentation ofisolated rat hippocampi. IEEE Transactions on MedicalImaging 26 (11), 1537–1546.
Basser, P. J., Mattiello, J., Bihan, D. L., 1994. MR di!usiontensor spectroscopy and imaging. Biophysics Journal 66,259–267.
Batchelor, P., Moakher, M., Atkinson, D., Calamante, F.,Connelly, A., 2005. A rigorous framework for di!usiontensor calculus. Magnetic Resonance in Medicine 53,221–225.
Bigun, J., Granlund, G., Wiklund, J., 1991. Multidimen-sional orientation estimation with application to textureanalysis and optical flow. IEEE Transactions on PatternAnalysis and Machine Intelligence 13 (8), 775–790.
Bookstein, F. L., 1986. Size and shape spaces for landmarkdata in two dimensions (with discussion). Statistical Sci-ence 1 (2), 181–242.
Bose, P., Maheshwari, A., Morin, P., 2003. Fast approxima-tions for sums of distances, clustering and the fermat–weber problem. Comput. Geom. Theory Appl. 24 (3),135–146.
Buss, S. R., Fillmore, J. P., 2001. Spherical averages andapplications to spherical splines and interpolation. ACMTransactions on Graphics 20 (2), 95–126.
Chandrasekaran, R., Tamir, A., 1990. Algebraic optimiza-tion: The Fermat-Weber problem. Mathematical Pro-gramming 46, 219–224.
Cheeger, J., Ebin, D. G., 1975. Comparison Theorems inRiemannian Geometry. North-Holland.
Cootes, T. F., Taylor, C. J., Cooper, D. H., Graham, J.,1995. Active shape models – their training and appli-cation. Comp. Vision and Image Understanding 61 (1),38–59.
Corouge, I., Fletcher, P. T., Joshi, S., Gouttard, S., Gerig,G., 2006. Fiber tract-oriented statistics for quantitativedi!usion tensor MRI analysis. Medical Image Analysis10 (5), 786–798.
Eckhardt, U., 1980. Weber’s problem and Weiszfeld’s algo-rithm in general spaces. Mathematical Programming 18,186–196.
Fletcher, P. T., Joshi, S., 2004. Principal geodesic analysison symmetric spaces: statistics of di!usion tensors. In:Proceedings of ECCV Workshop on Computer VisionApproaches to Medical Image Analysis. pp. 87–98.
Fletcher, P. T., Lu, C., Joshi, S., 2003. Statistics of shapevia principal geodesic analysis on Lie groups. In: Pro-ceedings of the IEEE Conference on Computer Visionand Pattern Recognition. pp. 95–101.
Fletcher, P. T., Tao, R., Jeong, W.-K., Whitaker, R. T.,2007. A volumetric approach to quantifying region-to-region white matter connectivity in di!usion tensor MRI.In: Proceedings of Information Processing in MedicalImaging (IPMI). pp. 346–358.
Frechet, M., 1948. Les elements aleatoires de nature quel-conque dans un espace distancie. Ann. Inst. H. Poincare10 (3), 215–310.
Garcin, L., Younes, L., 2005. Geodesic image matching: awavelet based energy minimization scheme. In: Work-shop on Energy Minimization Methods in Computer Vi-
11
Input Data Median Atlas
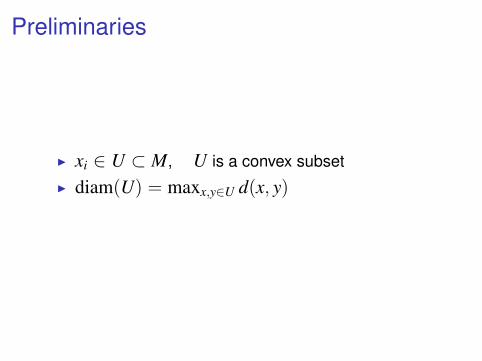
Preliminaries
I xi ∈ U ⊂ M, U is a convex subsetI diam(U) = maxx,y∈U d(x, y)
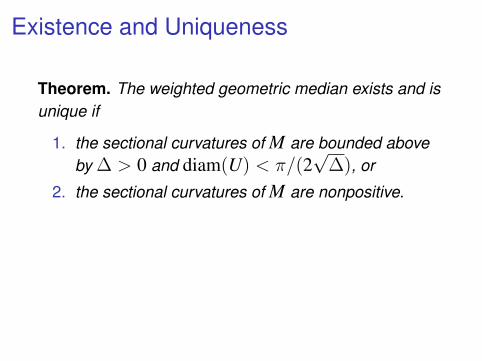
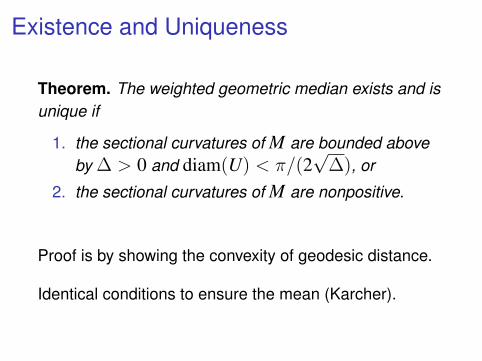
Existence and Uniqueness
Theorem. The weighted geometric median exists and isunique if
1. the sectional curvatures of M are bounded aboveby ∆ > 0 and diam(U) < π/(2
√∆), or
2. the sectional curvatures of M are nonpositive.
Proof is by showing the convexity of geodesic distance.
Identical conditions to ensure the mean (Karcher).
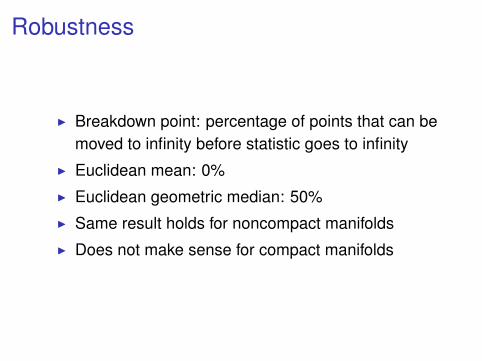
Robustness
I Breakdown point: percentage of points that can bemoved to infinity before statistic goes to infinity
I Euclidean mean: 0%I Euclidean geometric median: 50%I Same result holds for noncompact manifoldsI Does not make sense for compact manifolds
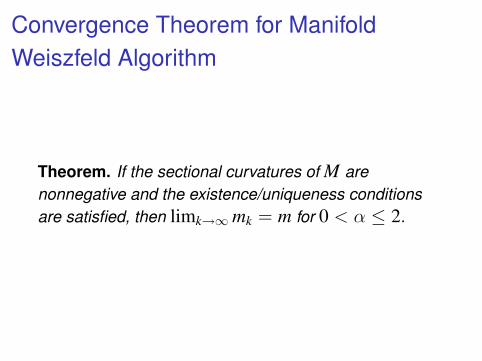
Convergence Theorem for ManifoldWeiszfeld Algorithm
Theorem. If the sectional curvatures of M arenonnegative and the existence/uniqueness conditionsare satisfied, then limk→∞mk = m for 0 < α ≤ 2.
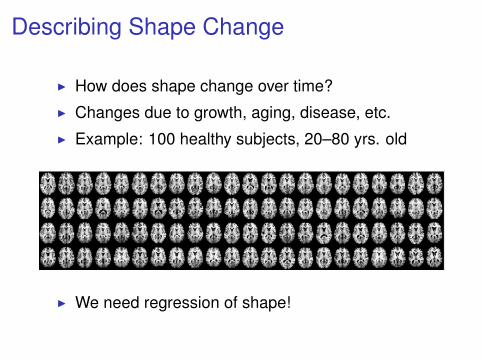
Describing Shape Change
I How does shape change over time?I Changes due to growth, aging, disease, etc.I Example: 100 healthy subjects, 20–80 yrs. old
I We need regression of shape!
Regression Analysis
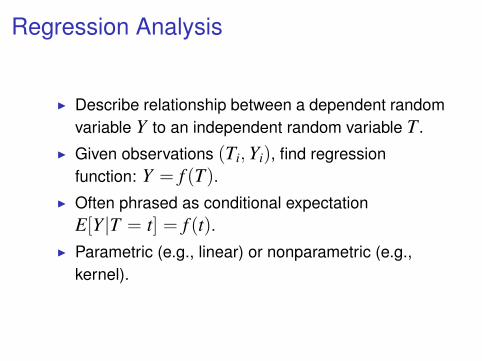
I Describe relationship between a dependent randomvariable Y to an independent random variable T .
I Given observations (Ti,Yi), find regressionfunction: Y = f (T).
I Often phrased as conditional expectationE[Y|T = t] = f (t).
I Parametric (e.g., linear) or nonparametric (e.g.,kernel).
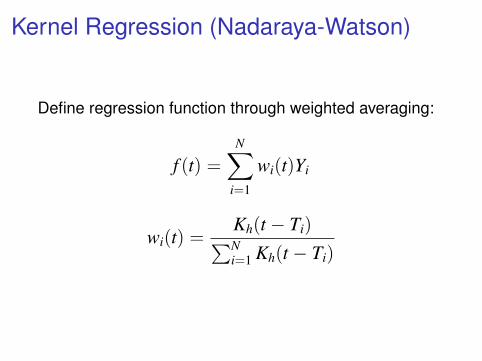
Kernel Regression (Nadaraya-Watson)
Define regression function through weighted averaging:
f (t) =N∑
i=1
wi(t)Yi
wi(t) =Kh(t − Ti)∑Ni=1 Kh(t − Ti)
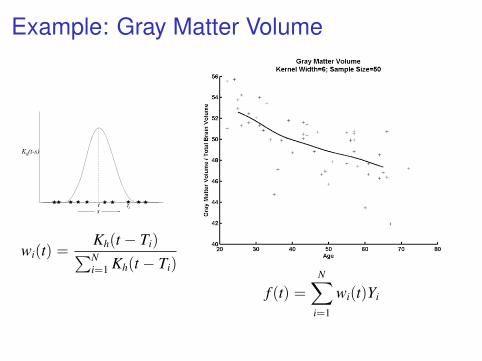
Example: Gray Matter Volume
K (t-s)
t
h
sti
wi(t) =Kh(t − Ti)∑Ni=1 Kh(t − Ti)
f (t) =N∑
i=1
wi(t)Yi
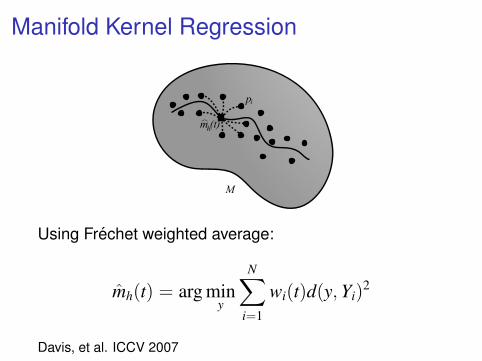
Manifold Kernel Regression
m
M
pi
^ (t)h
Using Frechet weighted average:
mh(t) = arg miny
N∑
i=1
wi(t)d(y,Yi)2
Davis, et al. ICCV 2007
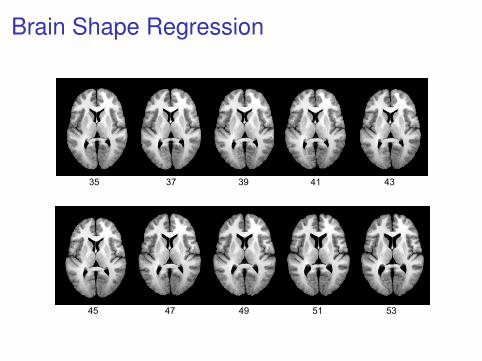
Brain Shape Regression
Application: Healthy Brain Aging
35 37 39 41 43
45 47 49 51 53
Acknowledgements
Collaborators:University of Utah
I Sarang JoshiI Ross WhitakerI Josh CatesI Suresh Venkatasubramanian
I Steve Pizer (UNC)I Brad Davis (Kitware)
Funding:I NA-MIC, NIH U54 EB005149I NIH R01 EB007688-01A1
BooksDryden and Mardia, Statistical Shape Analysis, Wiley, 1998.
Small, The Statistical Theory of Shape, Springer-Verlag, 1996.
Kendall, Barden and Carne, Shape and Shape Theory, Wiley, 1999.
Krim and Yezzi, Statistics and Analysis of Shapes, Birkhauser, 2006.PapersKendall, Shape manifolds, Procrustean metrics, and complexprojective spaces. Bull. London Math. Soc., 16:18–121, 1984.
Fletcher, Joshi, Lu, Pizer, Principal geodesic analysis for the studyof nonlinear statistics of shape, IEEE TMI, 23(8):995–1005, 2004.
Pennec, Intrinsic statistics on Riemannian manifolds: Basic Tools forGeometric Measurements. JMIV, 25(1):127-154, 2006.
Davis, Fletcher, Bullitt, Joshi. Population shape regression fromrandom design data, ICCV 2007.
Fletcher, Venkatasubramanian, Joshi, The geometric median onRiemannian manifolds with application to robust atlas estimation.Neuroimage, 45:S143-52, 2009.
Related Documents