1 HELLENIC REPUBLIC HELLENIC STATISTICAL AUTHORITY Piraeus, 31 July 2020 PRESS RELEASE STATISTICS ON INTERNATIONAL TRADE IN GOODS BY ENTERPRISE CHARACTERISTICS (TEC), 2018 The Hellenic Statistical Authority (ELSTAT) announces through this press release, data on international trade in goods by enterprise characteristics, presenting the value of imports and exports by economic activity sector of NACE Rev.2 and employment size class of the enterprises, for the year 2018. On the basis of the available data, in 2018 the total number of enterprises which carried out imports, exports or both types of transactions amounted to 38,799: out of this number 20,791 enterprises had transactions with EU countries and 28,962 enterprises with third countries. The total value of imports and exports amounted to 82,432.9 million euro: 42,350.9 million euro correspond to transactions with EU countries and 40,082.0 million euro to transactions with third countries. The enterprises in sections “Manufacturing, Electricity, gas, steam and air conditioning supply, Water supply, sewerage, waste management and remediation activities and Mining and quarrying” accounted for 59.7% of the value of transactions; the enterprises belonging to “Agriculture, forestry and fishing, Construction and Other services (excluding wholesale and retail sale, etc.)” accounted for 5.0% of the total value of transactions and the enterprises in the section “Wholesale and retail trade, repair of motor vehicles and motorcycles” stood for 35.3 % of the value of the transactions (Table 1). Information for methodological issues: Information for data provision: Division of Business Statistics Tel. : +30 213 135 2022, 2308, 2310 Section of International Transactions Statistics e-mail : [email protected] Head of the Section: Eleni Pandi Tel. : +30 213 135 2042 Fax : +30 213 135 2398 e-mail : [email protected]

Welcome message from author
This document is posted to help you gain knowledge. Please leave a comment to let me know what you think about it! Share it to your friends and learn new things together.
Transcript
1
HELLENIC REPUBLIC
HELLENIC STATISTICAL AUTHORITY
Piraeus, 31 July 2020
PRESS RELEASE
STATISTICS ON INTERNATIONAL TRADE IN GOODS BY
ENTERPRISE CHARACTERISTICS (TEC), 2018
The Hellenic Statistical Authority (ELSTAT) announces through this press release, data
on international trade in goods by enterprise characteristics, presenting the value of
imports and exports by economic activity sector of NACE Rev.2 and employment size
class of the enterprises, for the year 2018.
On the basis of the available data, in 2018 the total number of enterprises which carried
out imports, exports or both types of transactions amounted to 38,799: out of this
number 20,791 enterprises had transactions with EU countries and 28,962 enterprises
with third countries. The total value of imports and exports amounted to 82,432.9
million euro: 42,350.9 million euro correspond to transactions with EU countries and
40,082.0 million euro to transactions with third countries. The enterprises in sections
“Manufacturing, Electricity, gas, steam and air conditioning supply, Water supply,
sewerage, waste management and remediation activities and Mining and quarrying”
accounted for 59.7% of the value of transactions; the enterprises belonging to
“Agriculture, forestry and fishing, Construction and Other services (excluding wholesale
and retail sale, etc.)” accounted for 5.0% of the total value of transactions and the
enterprises in the section “Wholesale and retail trade, repair of motor vehicles and
motorcycles” stood for 35.3 % of the value of the transactions (Table 1).
Information for methodological issues: Information for data provision: Division of Business Statistics Tel. : +30 213 135 2022, 2308, 2310 Section of International Transactions Statistics e-mail : [email protected] Head of the Section: Eleni Pandi Tel. : +30 213 135 2042 Fax : +30 213 135 2398 e-mail : [email protected]
2
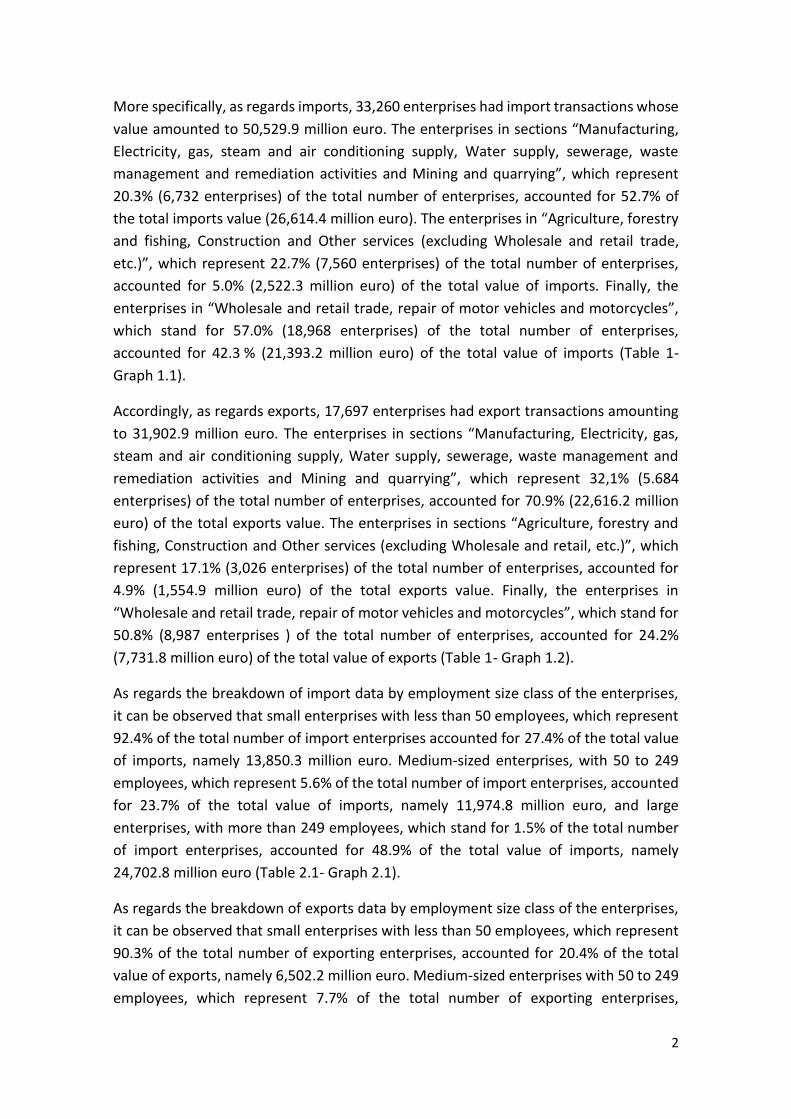
More specifically, as regards imports, 33,260 enterprises had import transactions whose
value amounted to 50,529.9 million euro. The enterprises in sections “Manufacturing,
Electricity, gas, steam and air conditioning supply, Water supply, sewerage, waste
management and remediation activities and Mining and quarrying”, which represent
20.3% (6,732 enterprises) of the total number of enterprises, accounted for 52.7% of
the total imports value (26,614.4 million euro). The enterprises in “Agriculture, forestry
and fishing, Construction and Other services (excluding Wholesale and retail trade,
etc.)”, which represent 22.7% (7,560 enterprises) of the total number of enterprises,
accounted for 5.0% (2,522.3 million euro) of the total value of imports. Finally, the
enterprises in “Wholesale and retail trade, repair of motor vehicles and motorcycles”,
which stand for 57.0% (18,968 enterprises) of the total number of enterprises,
accounted for 42.3 % (21,393.2 million euro) of the total value of imports (Table 1-
Graph 1.1).
Accordingly, as regards exports, 17,697 enterprises had export transactions amounting
to 31,902.9 million euro. The enterprises in sections “Manufacturing, Electricity, gas,
steam and air conditioning supply, Water supply, sewerage, waste management and
remediation activities and Mining and quarrying”, which represent 32,1% (5.684
enterprises) of the total number of enterprises, accounted for 70.9% (22,616.2 million
euro) of the total exports value. The enterprises in sections “Agriculture, forestry and
fishing, Construction and Other services (excluding Wholesale and retail, etc.)”, which
represent 17.1% (3,026 enterprises) of the total number of enterprises, accounted for
4.9% (1,554.9 million euro) of the total exports value. Finally, the enterprises in
“Wholesale and retail trade, repair of motor vehicles and motorcycles”, which stand for
50.8% (8,987 enterprises ) of the total number of enterprises, accounted for 24.2%
(7,731.8 million euro) of the total value of exports (Table 1- Graph 1.2).
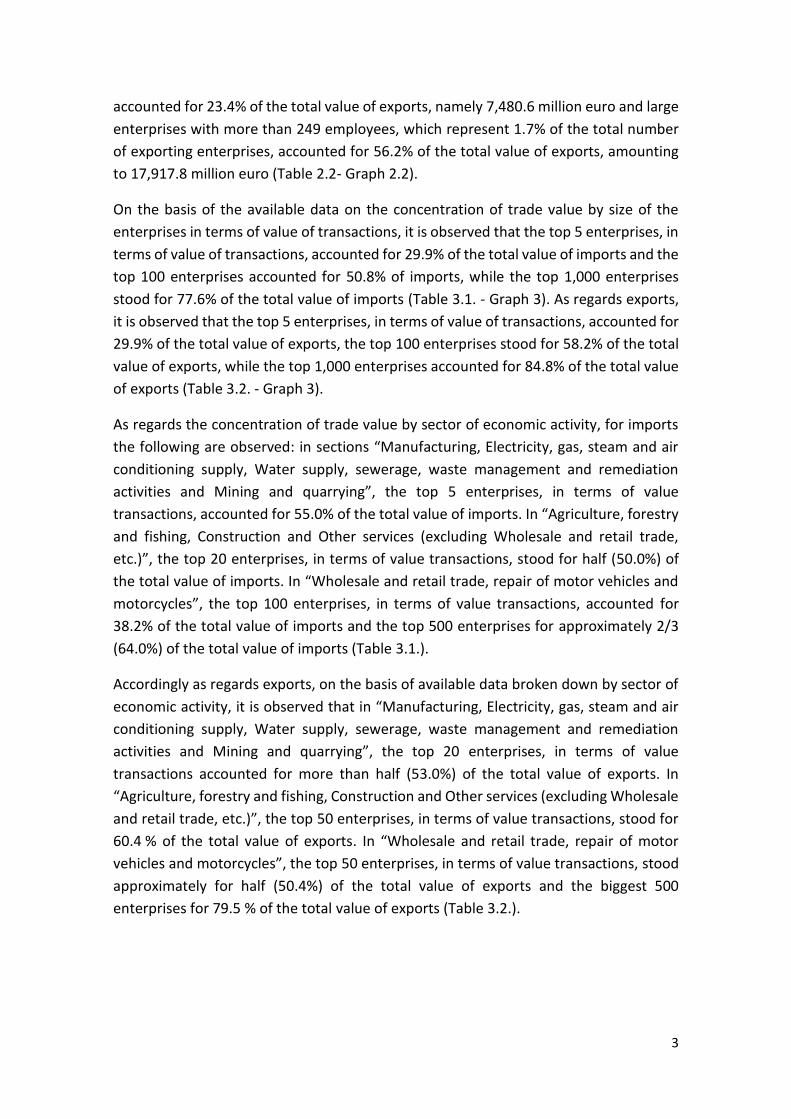
As regards the breakdown of import data by employment size class of the enterprises,
it can be observed that small enterprises with less than 50 employees, which represent
92.4% of the total number of import enterprises accounted for 27.4% of the total value
of imports, namely 13,850.3 million euro. Medium-sized enterprises, with 50 to 249
employees, which represent 5.6% of the total number of import enterprises, accounted
for 23.7% of the total value of imports, namely 11,974.8 million euro, and large
enterprises, with more than 249 employees, which stand for 1.5% of the total number
of import enterprises, accounted for 48.9% of the total value of imports, namely
24,702.8 million euro (Table 2.1- Graph 2.1).
As regards the breakdown of exports data by employment size class of the enterprises,
it can be observed that small enterprises with less than 50 employees, which represent
90.3% of the total number of exporting enterprises, accounted for 20.4% of the total
value of exports, namely 6,502.2 million euro. Medium-sized enterprises with 50 to 249
employees, which represent 7.7% of the total number of exporting enterprises,
3
accounted for 23.4% of the total value of exports, namely 7,480.6 million euro and large
enterprises with more than 249 employees, which represent 1.7% of the total number
of exporting enterprises, accounted for 56.2% of the total value of exports, amounting
to 17,917.8 million euro (Table 2.2- Graph 2.2).
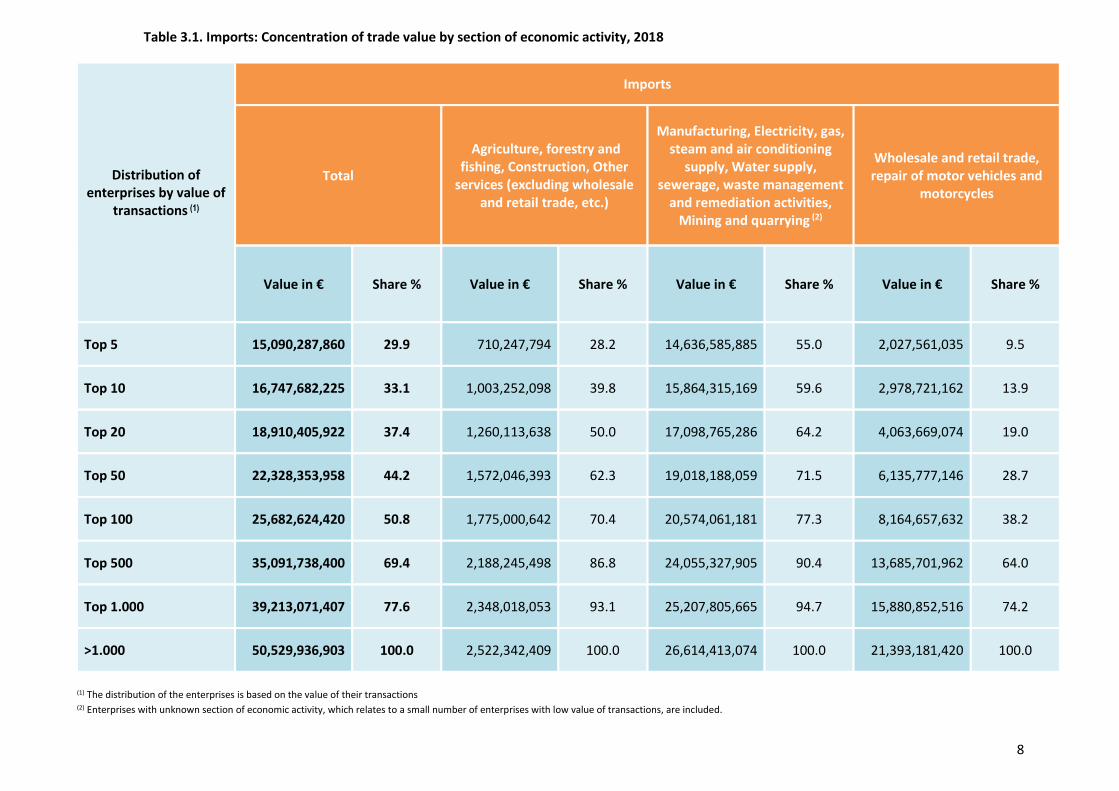
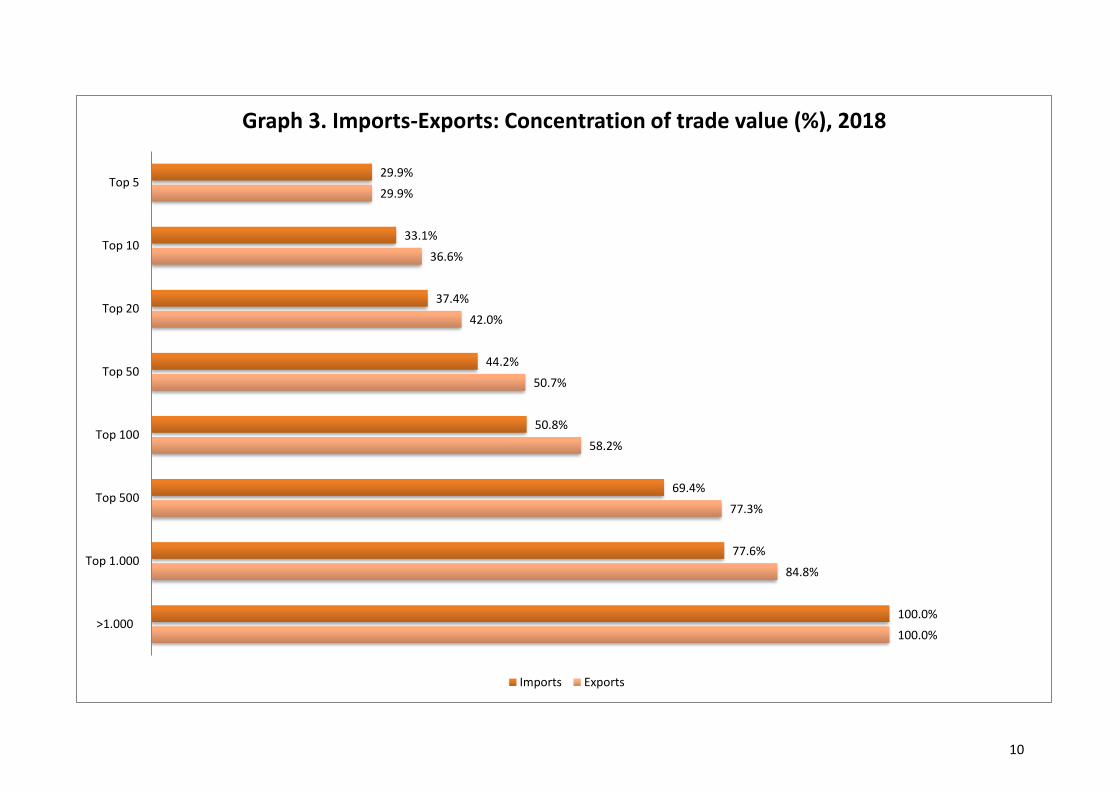
On the basis of the available data on the concentration of trade value by size of the
enterprises in terms of value of transactions, it is observed that the top 5 enterprises, in
terms of value of transactions, accounted for 29.9% of the total value of imports and the
top 100 enterprises accounted for 50.8% of imports, while the top 1,000 enterprises
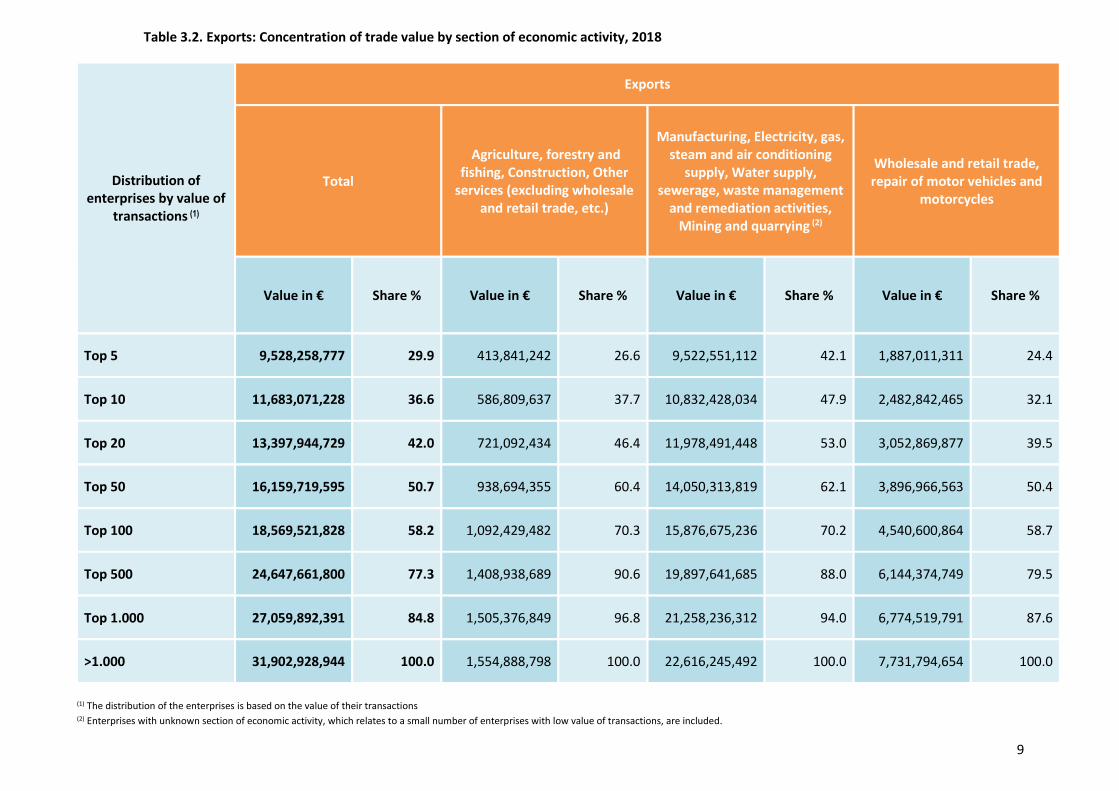
stood for 77.6% of the total value of imports (Table 3.1. - Graph 3). As regards exports,
it is observed that the top 5 enterprises, in terms of value of transactions, accounted for
29.9% of the total value of exports, the top 100 enterprises stood for 58.2% of the total
value of exports, while the top 1,000 enterprises accounted for 84.8% of the total value
of exports (Table 3.2. - Graph 3).
As regards the concentration of trade value by sector of economic activity, for imports
the following are observed: in sections “Manufacturing, Electricity, gas, steam and air
conditioning supply, Water supply, sewerage, waste management and remediation
activities and Mining and quarrying”, the top 5 enterprises, in terms of value
transactions, accounted for 55.0% of the total value of imports. In “Agriculture, forestry
and fishing, Construction and Other services (excluding Wholesale and retail trade,
etc.)”, the top 20 enterprises, in terms of value transactions, stood for half (50.0%) of
the total value of imports. In “Wholesale and retail trade, repair of motor vehicles and
motorcycles”, the top 100 enterprises, in terms of value transactions, accounted for
38.2% of the total value of imports and the top 500 enterprises for approximately 2/3
(64.0%) of the total value of imports (Table 3.1.).
Accordingly as regards exports, on the basis of available data broken down by sector of
economic activity, it is observed that in “Manufacturing, Electricity, gas, steam and air
conditioning supply, Water supply, sewerage, waste management and remediation
activities and Mining and quarrying”, the top 20 enterprises, in terms of value
transactions accounted for more than half (53.0%) of the total value of exports. In
“Agriculture, forestry and fishing, Construction and Other services (excluding Wholesale
and retail trade, etc.)”, the top 50 enterprises, in terms of value transactions, stood for
60.4 % of the total value of exports. In “Wholesale and retail trade, repair of motor
vehicles and motorcycles”, the top 50 enterprises, in terms of value transactions, stood
approximately for half (50.4%) of the total value of exports and the biggest 500
enterprises for 79.5 % of the total value of exports (Table 3.2.).

4
Table 1. International trade in goods, by type of trader and section of economic activity, 2018
Type of Trader Total
Agriculture, forestry and fishing, Construction, Other services
(excluding wholesale and retail trade, etc.)
Manufacturing, Electricity, gas, steam and air conditioning supply,
Water supply, sewerage, waste management and remediation
activities, Mining and quarrying (3)
Wholesale and retail trade, repair of motor vehicles and motorcycles
Number of enterprises
Value in € Number of enterprises
Value in € Number of enterprises
Value in € Number of enterprises
Value in €
Total - Importers and Exporters(1)
Imp
ort
s an
d
Exp
ort
s
World(2) 38,799 82,432,865,847 8,943 4,077,231,207 8,511 49,230,658,566 21,345 29,124,976,074
of which:
European Union 20,791 42,350,902,972 3,321 2,525,027,197 4,904 19,355,392,481 12,566 20,470,483,294
Third countries (other than EU)
28,962 40,081,962,875 6,892 1,552,204,010 7,040 29,875,266,085 15,030 8,654,492,780
Importers
Imp
ort
s
World(2) 33,260 50,529,936,903 7,560 2,522,342,409 6,732 26,614,413,074 18,968 21,393,181,420
of which:
European Union 18,022 25,944,721,828 2,657 1,649,594,274 4,129 8,983,391,747 11,236 15,311,735,807
Third countries (other than EU)
23,423 24,585,215,075 5,690 872,748,135 5,089 17,631,021,327 12,644 6,081,445,613
of which:
Importers only
World(2) 21,102 4,792,999,863 5,917 806,116,827 2,827 506,478,944 12,358 3,480,404,092
of which:
European Union 8,697 3,423,638,934 1,878 398,503,276 1,017 314,241,942 5,802 2,710,893,716
Third countries (other than EU)
14,702 1,369,360,929 4,412 407,613,551 2,141 192,237,002 8,149 769,510,376
Two-way traders(1)
World(2) 12,158 45,736,937,040 1,643 1,716,225,582 3,905 26,107,934,130 6,610 17,912,777,328
of which:
European Union 9,325 22,521,082,894 779 1,251,090,998 3,112 8,669,149,805 5,434 12,600,842,091
Third countries (other than EU)
8,721 23,215,854,146 1,278 465,134,584 2,948 17,438,784,325 4,495 5,311,935,237
Exporters
Exp
ort
s
World(2) 17,697 31,902,928,944 3,026 1,554,888,798 5,684 22,616,245,492 8,987 7,731,794,654
of which:
European Union 11,045 16,406,181,144 1,306 875,432,923 3,601 10,372,000,734 6,138 5,158,747,487
Third countries (other than EU)
12,084 15,496,747,800 2,301 679,455,875 4,428 12,244,244,758 5,355 2,573,047,167
of which:
Exporters only
World(2) 5,539 2,552,458,912 1,383 185,313,929 1,779 321,151,720 2,377 2,045,993,263
of which:
European Union 1,913 1,831,001,572 378 101,766,898 572 215,703,353 963 1,513,531,321
Third countries (other than EU)
4,228 721,457,340 1,081 83,547,031 1,421 105,448,367 1,726 532,461,942
Two-way traders(1)
World(2) 12,158 29,350,470,032 1,643 1,369,574,869 3,905 22,295,093,772 6,610 5,685,801,391
of which:
European Union 9,132 14,575,179,572 928 773,666,025 3,029 10,156,297,381 5,175 3,645,216,166
Third countries (other than EU)
7,856 14,775,290,460 1,220 595,908,844 3,007 12,138,796,391 3,629 2,040,585,225
(1) Two-way traders are recorded only once. (2) The number of enterprises is not the sum of the total number of enterprises because one enterprise may have transactions with both EU countries and Third countries. (3) Enterprises with unknown section of economic activity, which relates to a small number of enterprises with low value of transactions, are included.
5
22.7%20.3%
57.0%
5.0%
52.7%
42.3%
0%
10%
20%
30%
40%
50%
60%
70%
Agriculture, forestry and fishing,Construction, Other services (excluding
wholesae and retail trade, etc.)
Manufacturing, Electricity, gas, steamand air conditioning supply, Water
supply, sewerage, waste managementand remediation activities, Mining and
quarrying
Wholesale and retail trade, repair ofmotor vehicles and motorcycles
Graph 1.1. Imports: Percentage distribution of enterprises and trade value by economic activity section, 2018
Number of enterprises Value in €
17.1%
32.1%
50.8%
4.9%
70.9%
24.2%
0%
10%
20%
30%
40%
50%
60%
70%
80%
Agriculture, forestry and fishing,Construction, Other services (excluding
wholesae and retail trade, etc.)
Manufacturing, Electricity, gas, steamand air conditioning supply, Water
supply, sewerage, waste managementand remediation activities, Mining and
quarrying
Wholesale and retail trade, repair ofmotor vehicles and motorcycles
Graph 1.2. Exports: Percentage distribution of enterprises and trade value by economic activity section, 2018
Number of enterprises Value in €
6
Table 2.1. Imports: Number of enterprises and trade value, by employment size class and section of economic activity, 2018
Enterprise size class
(in terms of number of employees)
Total Agriculture, forestry and fishing, Construction, Other services (excluding Wholesale and retail
trade, etc.)
Manufacturing, Electricity, gas, steam and air conditioning supply, Water supply, sewerage,
waste management and remediation activities, Mining and quarrying (1)
Wholesale and retail trade, repair of motor vehicles and motorcycles
Number of
enterprises
Share %
Value in € Share
%
Number of
enterprises
Share %
Value in € Share
%
Number of
enterprises
Share %
Value in € Share
%
Number of
enterprises
Share %
Value in € Share
%
0 - 9 23,613 71.0 4,709,215,301 9.3 4,762 63.0 396,422,987 15.7 3,721 55.3 696,760,905 2.6 15,130 79.8 3,616,031,409 16.9
10- 49 7,116 21.4 9,141,038,954 18.1 1,761 23.3 723,313,707 28.7 2,178 32.4 1,623,184,746 6.1 3,177 16.7 6,794,540,501 31.8
50 - 249 1,860 5.6 11,974,824,786 23.7 669 8.8 599,797,283 23.8 670 10.0 4,134,517,979 15.5 521 2.7 7,240,509,524 33.8
≥250 506 1.5 24,702,752,729 48.9 274 3.6 802,025,566 31.8 147 2.2 20,159,555,189 75.7 85 0.4 3,741,171,974 17.5
Unknown 165 0.5 2,105,133 0.0 94 1.2 782,866 0.0 16 0.2 394,255 0.0 55 0.3 928,012 0.0
Total 33,260 100.0 50,529,936,903 100.0 7,560 100.0 2,522,342,409 100.0 6,732 100.0 26,614,413,074 100.0 18,968 100.0 21,393,181,420 100.0
(1) Enterprises with unknown section of economic activity, which relates to a small number of enterprises with low value of transactions, are included.
Graph 2.1. Imports: Percentage distribution of enterprises and trade value by employment size class, 2018
Number of enterprises 0 - 9,
71.0%
Number of enterprises 10- 49,
21.4%
Number of enterprises 50 - 249,
5.6%
Number of enterprises ≥250,
1.5%
Number of enterprises Unknown,
0.5%
Percentage distribution of enterprises
by employment size
Value in € 0 - 9, 9.3%
Value in € 10- 49, 18.1%
Value in € 50 - 249, 23.7%
Value in € ≥250, 48.9%
Value in € Unknown,
0.0%
Percentage distributionof trade value
by employment size

7
Table 2.2. Exports: Number of enterprises and trade value, by employment size class and section of economic activity, 2018
Enterprise size class
(in terms of number of employees)
Total Agriculture, forestry and fishing, Construction, Other services (excluding Wholesale and retail
trade, etc.)
Manufacturing, Electricity, gas, steam and air conditioning supply, Water supply, sewerage,
waste management and remediation activities, Mining and quarrying (1)
Wholesale and retail trade, repair of motor vehicles and motorcycles
Number of
enterprises
Share %
Value in € Share
%
Number of
enterprises
Share %
Value in € Share
%
Number of
enterprises
Share %
Value in € Share
%
Number of
enterprises
Share %
Value in € Share
%
0 - 9 11,026 62.3 2,793,221,690 8.8 1,894 62.6 198,011,833 12.7 2,886 50.8 504,960,433 2.2 6,246 69.5 2,090,249,424 27.0
10- 49 4,947 28.0 3,708,997,566 11.6 741 24.5 264,736,014 17.0 2,008 35.3 1,705,073,715 7.5 2,198 24.5 1,739,187,837 22.5
50 - 249 1,365 7.7 7,480,573,795 23.4 265 8.8 552,350,261 35.5 646 11.4 4,095,283,609 18.1 454 5.1 2,832,939,925 36.6
≥250 305 1.7 17,917,817,477 56.2 100 3.3 539,409,972 34.7 133 2.3 16,310,569,768 72.1 72 0.8 1,067,837,737 13.8
Unknown 54 0.3 2,318,416 0.0 26 0.9 380,718 0.0 11 0.2 357,967 0.0 17 0.2 1,579,731 0.0
Total 17,697 100.0 31,902,928,944 100.0 3,026 100.0 1,554,888,798 100.0 5,684 100.0 22,616,245,492 100.0 8,987 100.0 7,731,794,654 100.0
(1) Enterprises with unknown section of economic activity, which relates to a small number of enterprises with low value of transactions, are included.
Graph 2.2. Exports: Percentage distribution of enterprises and trade value by employment size class, 2018
Number of enterprises 0 - 9,
62.3%
Number of enterprises 10- 49,
28.0%
Number of enterprises 50 - 249,
7.7%
Number of enterprises ≥250,
1.7%
Number of enterprises Unknown, 0.3%
Percentage distribution of enterprises
by employment size
Value in € 0 - 9, 8.8%
Value in € 10- 49, 11.6%
Value in € 50 - 249, 23.4%
Value in € ≥250, 56.2%
Value in € Unknown,
0.0%
Percentage distributionof trade value
by employment size
8
Table 3.1. Imports: Concentration of trade value by section of economic activity, 2018
Distribution of enterprises by value of
transactions (1)
Imports
Total
Agriculture, forestry and fishing, Construction, Other
services (excluding wholesale and retail trade, etc.)
Manufacturing, Electricity, gas, steam and air conditioning
supply, Water supply, sewerage, waste management
and remediation activities, Mining and quarrying (2)
Wholesale and retail trade, repair of motor vehicles and
motorcycles
Value in € Share % Value in € Share % Value in € Share % Value in € Share %
Top 5 15,090,287,860 29.9 710,247,794 28.2 14,636,585,885 55.0 2,027,561,035 9.5
Top 10 16,747,682,225 33.1 1,003,252,098 39.8 15,864,315,169 59.6 2,978,721,162 13.9
Top 20 18,910,405,922 37.4 1,260,113,638 50.0 17,098,765,286 64.2 4,063,669,074 19.0
Top 50 22,328,353,958 44.2 1,572,046,393 62.3 19,018,188,059 71.5 6,135,777,146 28.7
Top 100 25,682,624,420 50.8 1,775,000,642 70.4 20,574,061,181 77.3 8,164,657,632 38.2
Top 500 35,091,738,400 69.4 2,188,245,498 86.8 24,055,327,905 90.4 13,685,701,962 64.0
Top 1.000 39,213,071,407 77.6 2,348,018,053 93.1 25,207,805,665 94.7 15,880,852,516 74.2
>1.000 50,529,936,903 100.0 2,522,342,409 100.0 26,614,413,074 100.0 21,393,181,420 100.0
(1) The distribution of the enterprises is based on the value of their transactions (2) Enterprises with unknown section of economic activity, which relates to a small number of enterprises with low value of transactions, are included.
9
Table 3.2. Exports: Concentration of trade value by section of economic activity, 2018
Distribution of enterprises by value of
transactions (1)
Exports
Total
Agriculture, forestry and fishing, Construction, Other
services (excluding wholesale and retail trade, etc.)
Manufacturing, Electricity, gas, steam and air conditioning
supply, Water supply, sewerage, waste management
and remediation activities, Mining and quarrying (2)
Wholesale and retail trade, repair of motor vehicles and
motorcycles
Value in € Share % Value in € Share % Value in € Share % Value in € Share %
Top 5 9,528,258,777 29.9 413,841,242 26.6 9,522,551,112 42.1 1,887,011,311 24.4
Top 10 11,683,071,228 36.6 586,809,637 37.7 10,832,428,034 47.9 2,482,842,465 32.1
Top 20 13,397,944,729 42.0 721,092,434 46.4 11,978,491,448 53.0 3,052,869,877 39.5
Top 50 16,159,719,595 50.7 938,694,355 60.4 14,050,313,819 62.1 3,896,966,563 50.4
Top 100 18,569,521,828 58.2 1,092,429,482 70.3 15,876,675,236 70.2 4,540,600,864 58.7
Top 500 24,647,661,800 77.3 1,408,938,689 90.6 19,897,641,685 88.0 6,144,374,749 79.5
Top 1.000 27,059,892,391 84.8 1,505,376,849 96.8 21,258,236,312 94.0 6,774,519,791 87.6
>1.000 31,902,928,944 100.0 1,554,888,798 100.0 22,616,245,492 100.0 7,731,794,654 100.0
(1) The distribution of the enterprises is based on the value of their transactions (2) Enterprises with unknown section of economic activity, which relates to a small number of enterprises with low value of transactions, are included.
10
29.9%
33.1%
37.4%
44.2%
50.8%
69.4%
77.6%
100.0%
29.9%
36.6%
42.0%
50.7%
58.2%
77.3%
84.8%
100.0%
Top 5
Top 10
Top 20
Top 50
Top 100
Top 500
Top 1.000
>1.000
Graph 3. Imports-Exports: Concentration of trade value (%), 2018
Imports Exports

11
EXPLANATORY NOTES
International trade in goods by enterprise
characteristics
Legal framework Reference period
Frequency Definitions
Methodology
Statistics on International Trade in Goods by Enterprise Characteristics are compiled on a yearly basis and refer to the total value of imports and exports on the basis of the economic activity sector and employment size class of the enterprises. International Trade in Goods Statistics, when combined with data on other characteristics of the enterprises, can provide a more comprehensive view for assessing the economy of a country. The data on International Trade in Goods by Enterprise Characteristics are compiled pursuant to Regulations 222/2009 and 471/2009 of the European Parliament and of the Council. The year 2018. Annual. International Trade in Goods Statistics: It refers to the compilation of statistics on trade with EU countries (Intra Union Trade) and with Third countries (Extra Union Trade), on a monthly basis. The transactions with EU countries are compiled on the basis of the data submitted to the Intrastat system of ELSTAT by the enterprises which have intra EU trade transactions the value of which is above 150,000 euro for imports and 90,000 euro for exports (statistical threshold for 2018), on a yearly basis. The trade transactions with Third countries are compiled on the basis of data transmitted by the Customs Authorities of the country. Type of trader refers to the type of trade transactions of the enterprise, namely if the enterprise is only an importer, only an exporter or a two-way trader (importer and exporter). Classification by section of economic activity: The classification of the enterprises by sector of economic activity is in compliance with the European standard statistical classification of economic activities, NACE Rev.2, as laid down in Annex I of Regulation (EC) 1893/2006 of the European Parliament and of the Council. Economic activities are classified into four distinct breakdown levels, namely: 21 Sections (one-digit level, A-U), 88 Divisions (two-digit level), 272 Groups (three-digit level) and 615 Classes (four-digit level). Size class of the enterprise (employment size class): the classification of the enterprises by size class is based on the number of employees of the enterprise, in accordance with the definitions laid down in Regulation (EC) 295/2008 on Structural Business Statistics. Statistics on International Trade in Goods by Enterprise Characteristics are compiled based on data on imports and exports of international trade in goods and data on the characteristics of these enterprises deriving from the Statistical Business Register. Statistics on International Trade in Goods by Enterprise Characteristics (TEC) are compiled using imports and exports data from Intrastat system regarding the trade with the EU countries and imports and exports data regarding the trade with the Third Countries (Extra-EU Trade), combined with data on enterprises’ characteristics from the Statistical Business Register. In this framework, Statistics on International Trade in Goods by Enterprise Characteristics are compiled, on a yearly basis, by combining information from the aforementioned sources at the level of the enterprise. Subsequently, tables are compiled with aggregate data pertaining to the number of enterprises and the value of international trade transactions by section of economic activity and employment size class of the enterprise. For the purposes of this statistical work, the data are broken down at one-digit level of NACE Rev. 2, namely at the level of the Section. The data of the Sections have been grouped and presented as follows: A) “Manufacturing, Electricity, gas, steam and air conditioning supply, Water supply, sewerage, waste management and remediation activities, Mining and quarrying”. B) “Agriculture, forestry and fishing, Construction and Other services (excluding wholesale and retail trade, etc.)”. It should be noted that “Other services” include: Transportation and storage, Accommodation and food service activities, Information and communication, Financial and insurance activities, Real estate activities, Professional, scientific and technical activities, Public administration and defence, Compulsory social security, Education, Human health and social work activities, Arts, entertainment and recreation, Other service activities, Activities of households as employers, undifferentiated goods- and services-producing activities of households for own use, Activities of extraterritorial organisations and bodies. C) “Wholesale and retail trade, repair of motor vehicles and motorcycles”. Since the year 2016, Eurostat's methodological recommendations to Member States include enterprises with unknown section of economic activity, which have carried out small value transactions. ELSTAT, in the frame of scheduled revisions announced for the year 2019, in accordance with the European Statistics Code of Practice, on 5.7.2019 published revised data concerning
12
References
international trade in good statistics for the years 2010-2018 and the period January – April 2019. The revision of the time series was applied in line with the requirements of the EU Regulations 96/2010 and 113/2010 concerning the implementation of the principle of economic ownership for imports/arrivals and exports/dispatches of ships and aircrafts. In this Press Release announcing data with reference year 2018, the international trade in goods statistics by enterprise characteristics includes the revised data on international trade in goods. ELSTAT informs users that it is estimated that the time series of statistics by enterprise characteristics for the years before 2018 will be updated on the basis of the revised international trade in good statistics within 2020 and the relevant revised tables will be posted on the website. More information concerning Statistics on International Trade in Goods by Enterprise Characteristics can be found on the portal of ELSTAT at: http://www.statistics.gr/en/statistics/itr
Related Documents